Embed Size (px)
Citation preview
�Bayerische Julius�Maximilians�Universit�at
W�urzburg
Institut f�ur InformatikLehrstuhl f�ur Verteilte Systeme
Prof� Dr� P� Tran�Gia
Models and Algorithms for
Demand�oriented Planning of
Telecommunication Systems
Kurt Tutschku
W�urzburger Beitr�age zur
Leistungsbewertung Verteilter Systeme
Bericht ����
W�urzburger Beitr�age zur
Leistungsbewertung Verteilter Systeme
Herausgeber
Prof� Dr� P� Tran�GiaUniversit�at W�urzburgInstitut f�ur InformatikLehrstuhl f�ur Verteilte SystemeAm HublandD������ W�urzburg
Tel�� ���������� ��Fax�� ��������������email� trangia�informatik�uni�wuerzburg�de
Satz
Reproduktionsf�ahige Vorlage vom Autor�Gesetzt in LATEX Computer Modern �pt�
ISSN ���� � ����
Models and Algorithms for
Demand�oriented Planning of
Telecommunication Systems
Dissertation zur Erlangung desnaturwissenschaftlichen Doktorgrades
der Bayerischen Julius�Maximilians�Universit�at W�urzburg
vorgelegt von
Kurt Tutschku
aus
W�urzburg
W�urzburg ����

Eingereicht am� ��� �����bei der Fakult�at f�ur Mathematik und Informatik�� Gutachter� Prof� Dr��Ing� P� Tran�Gia�� Gutachter� Prof� Dr� R� MatharTag der m�undlichen Pr�ufung� ���������
Dank
An erster Stelle gilt der Dank dem Betreuer dieser Arbeit� Herrn Prof�Dr��Ing� P� Tran�Gia� f�ur die vielen wissenschaftlichen Diskussionen undImpulse� die meine Arbeit fachlich stets sehr befruchtet haben� Besondersm�ochte ich sein stetiges Engagement auf nationaler und internationalerEbene hervorheben� das dazu beigetragen hat� da� diese Arbeit wachsenund reifen konnte� Bedanken m�ochte ich auch bei Herrn Prof� Tran�Giaf�ur sein gro�es Vertrauen und Verst�andnis� das er mir die Jahre hindurch�die ich an seinem Lehrstuhl verbringen durfte� entgegen gebracht hat�
Herrn Professor Dr� R� Mathar danke ich f�ur die �Ubernahme desZweitgutachtens und die vertrauensvolle und aufbauende Zusammenar�beit im Laufe der vergangenen Jahre�
I would like to thank Dr� K� Basu and Dr� Sairam Subramanian ofNortel Networks� Richardson Tx�� for their great support in developingthe set cover algorithms�
Meinen Kollegen am Lehrstuhl f�ur Verteilte Systeme� die mich imLaufe der Jahre begleitet haben� gilt ebenfalls ein besonderer Dank�Mathias D�ummler� Dr� Thomas Fritsch� Dr� Notker Gerlich� Frank Heis�ter� Stefan K�ohler� Kenji Leibnitz� Dr� Rainer M�uller� Dr� Michael Rit�ter� Dr� Oliver Rose� Dr� Alexander Sch�omig� Dirk Staehle� Dr� ThomasStock� Norbert Vicari und Patricia Wilcox� Durch die vielen angeregen�den wissenschaftlichen Diskussionen und nicht so sehr wissenschaftlichenEspresso�Runden� hat meine Arbeit sehr viel gewonnen�
Ein weiterer Dank geht an Dr� Michel Mandjes� Dr� Thomas Niessen�Ste�en Reith und Michael Wolfrath f�ur die wertvollen fachlichen Diskus�sionen die ich mit ihnen f�uhren durfte�
Den Studenten Markus Greger� Marius Heuler� Titus Leskien� PeterLiebler� Dirk Sch�afer� Uwe Sch�afer� und Christian Schloter� die mir mitDiplomarbeiten oder als wissenschaftliche Hilfskr�afte zuarbeiteten dankeich f�ur die unterst�utzende Zusammenarbeit�
Bei meinen Freunden� die mir gezeigt haben das es auch noch au�er�
i

Dank
halb der Universit�at und der Studient�atigkeit ein beeindruckendes Uni�versum voller Leben gibt� m�ochte ich mich von ganzen Herzen bedanken�
Zum Schlu� geht mein ganz besonderer Dank geht an meine El�tern� Josef und Wilma Tutschku� Ihre unerm�udliche� aufopfernde undliebevolle Unterst�utzung w�ahrend der Studien� und Promotionsjahregaben mir immer wieder Kraft und Ausdauer an dem gesteckten Zielfestzuhalten� Danke�
ii
Contents
I Planning Concepts for Telecommunication Networks �
� Introduction �
� Functional Models of Telecommunication Networks ���� Basic Telecommunication Network Model � � � � � � � � � ��� Public Wireline Telecommunication Networks � � � � � � � ��� Public Mobile and Wireless Communication Networks � � �
� Network Design Objectives and Requirements ���� General Network Design Objectives � � � � � � � � � � � � � ���� Wireline Networks � � � � � � � � � � � � � � � � � � � � � � ��� New Design Objectives of Mobile and Wireless Networks � ��
� Engineering Methods for Telecommunication Systems ����� Reverse Engineering � � � � � � � � � � � � � � � � � � � � � ����� Forward Engineering � � � � � � � � � � � � � � � � � � � � � ���� Capacity Optimization Cycle � � � � � � � � � � � � � � � � ����� Installation Cycle � � � � � � � � � � � � � � � � � � � � � � � ��� Concluding Remarks � � � � � � � � � � � � � � � � � � � � �
II Demand�oriented TelecommunicationSystem Design ��
� Spatial Customer Trac Estimation and Characterization � �� Spatial Tra�c Estimation � � � � � � � � � � � � � � � � � � �
���� Tra�c Source Models � � � � � � � � � � � � � � � � �
iii
Contents
���� Tra�c Intensity � � � � � � � � � � � � � � � � � � � �� ��� Geographic Network Tra�c Model � � � � � � � � � �� ���� Tra�c Discretization and Demand Nodes � � � � � �
�� Spatial Tra�c Characterization � � � � � � � � � � � � � � � ���� Tra�c Characterization Procedure � � � � � � � � � �
� Demand Node Generation � � � � � � � � � � � � � � � � � �� ��� Partitional Clustering � � � � � � � � � � � � � � � � �� ��� Agglomerative Clustering � � � � � � � � � � � � � � � �� Spatial Evaluation � � � � � � � � � � � � � � � � � � ��
�� Impact of User Clustering on Cell Performance � � � � � � �� ���� Model Description � � � � � � � � � � � � � � � � � � �� ���� Subjective Quality�of�Service in a Clustered Envi�
ronment � � � � � � � � � � � � � � � � � � � � � � � � �� ��� Performance under User Clustering � � � � � � � � � ��
� Application of Demand Node Concept � � � � � � � � � � � �� �� Concluding Remarks � � � � � � � � � � � � � � � � � � � � ��
� Demand�oriented Radio Network Synthesis ���� Automatic Transmitter Locating Algorithms � � � � � � � � ��
����� Adaptive Base Station Posititioning Algorithm � � ������� Other Approaches � � � � � � � � � � � � � � � � � � ��
��� Coverage Models in Cellular Mobile Network Planning � ������� Minimum Set Covering Model � � � � � � � � � � � � ������� Maximal Covering Location Problem � � � � � � � ������ Complexity of Covering Problems � � � � � � � � � � ��
�� Approximation Algorithms for Covering Problems � � � � ������ Greedy Heuristic Solutions � � � � � � � � � � � � � ������ Approximation Capability of Greedy Heuristics � � ����� Objective Cost Function � � � � � � � � � � � � � � � ������ SCBPA Algorithm � � � � � � � � � � � � � � � � � � � ��� Simulated Annealing � � � � � � � � � � � � � � � � � ��
��� The ICEPT Planning Tool Demonstrator � � � � � � � � � ������� Tool Prototype � � � � � � � � � � � � � � � � � � � � ������� Radio Wave Propagation � � � � � � � � � � � � � � ������ Network Design Sequence � � � � � � � � � � � � � � �������� Planning Result � � � � � � � � � � � � � � � � � � � ���
�� Interference Minimizing Radio Network Design � � � � � � ����� �� RF Design Objectives � � � � � � � � � � � � � � � � ����� �� Interference Minimizing Design Algorithms � � � � ����� � Single Stage Design � � � � � � � � � � � � � � � � � ���
iv
Contents
�� �� Micro�Macro Cell Design � � � � � � � � � � � � � � ����� � Summary of the Results � � � � � � � � � � � � � � � ���
��� Concluding Remarks � � � � � � � � � � � � � � � � � � � � � ���
Call Handling Procedures in Cellular Mobile Networks ������ Call Handling Mechanisms � � � � � � � � � � � � � � � � � ���
����� Conventional Handover Mechanisms � � � � � � � � �������� Advanced Handover Procedures � � � � � � � � � � ������� Overview on Analytical Models � � � � � � � � � � � ��
��� Tra�c Models for Call Handling Mechanisms � � � � � � � ������ Single Request Stream Model � � � � � � � � � � � � ������ Repeated Attempts � � � � � � � � � � � � � � � � � ��
�� Tra�c Engineering for Call Handling Mechanisms � � � � ����� Performance Analysis of Call Handling Mechanisms � � � ��
����� Analytical Model � � � � � � � � � � � � � � � � � � � ������� Markov Chain � � � � � � � � � � � � � � � � � � � � ������ Evaluation of the Mechanisms � � � � � � � � � � � � ��
�� Concluding Remarks � � � � � � � � � � � � � � � � � � � � ��
� ABR Service Engineering in Large Scale ATM Networks ������ The ABR Service Category � � � � � � � � � � � � � � � � � ������ ABR Network Model � � � � � � � � � � � � � � � � � � � � ����� Methods for ABR Service Design � � � � � � � � � � � � � � � �
���� ABR Tra�c Model � � � � � � � � � � � � � � � � � � � ����� Common ABR Service Planning � � � � � � � � � � � ���� Design Objectives � � � � � � � � � � � � � � � � � � � ����� Engineering for Stochastic Time�oriented Tra�c � ������ ABR Planning for Volume�oriented Tra�c � � � � � ���
��� Case Study � � � � � � � � � � � � � � � � � � � � � � � � � � ������� Backbone Network � � � � � � � � � � � � � � � � � � ������� Performance Evaluation for Time�oriented Tra�c � ������� ABR Network Dimensioning � � � � � � � � � � � � ���
�� Concluding Remarks � � � � � � � � � � � � � � � � � � � � ���
Conclusion and Outlook ��
Bibliography � �
v

Contents
vi
Part I
Planning Concepts for
Telecommunication
Networks

� Introduction
The continuous deregulation of the telecommunications market in NorthAmerica and Europe has a signi�cant impact on the design and deploy�ment of new telecommunication networks� Before deregulation� publictelecommunication systems were predominately run by government a�l�iated authorities� The main task of these operators was to provide basicand reliable communication services to all customers in their country�Thus� the main engineering objective was to establish connectivity ofthe users to the network� The service cost only was of secondary impor�tance since most network operators were monopolists and their users hadto accept the imposed prices� On the one hand� this resulted in unjusti��ed high tari�s for telecommunication services and� on the other hand�in less e�cient network con�gurations�
The deregulation invited and provoked competition into the telecom�munication market� Commercial companies are now allowed to apply fornetwork licenses and thus to o�er comparable services to customers�They can now choose between old and new operators according to theirown requirements� Due to the competition in the market� supply and de�mand are determining the price of the service� Hence� the tari�s beganto fall while the networks became more e�cient� Moreover� the radi�cal decline of the prices stimulated the demand for telecommunicationservices� Thus� today�s networks are required to be even more e�cient�
At the same time deregulation measures were introduced� the globalexchange of commercial and personal information gained more and moreimportance� In particular� new telecommunication services such as video�multimedia� data� and personal communication services are becomingincreasingly popular towards the end of the nineties� Again� the highpopularity again increases the demand for these services�
In addition� the past years have seen the emergence of new infor�mation networking environments comprising new technologies such asintegrated services digital network �ISDN�� broadband ISDN� the In�
� Introduction
ternet� or wireless communication systems� Some of the new techniquesseverely challenge the old telecommunication network design paradigmsof separated planning procedures for architectural design and teletra�cengineering� For instance� the coverage area of a code division multipleaccess �CDMA� transmitter depends on both the radio wave propagationand user density� cf� Veeravalli et al� �������
The deregulation process� the commercialization of the telecommu�nication and the recent technological innovations led to a fundamentalchange in the network design paradigms� The focus of engineering hasmoved away from the pure technical capability of the network and isnow mainly emphasizing e�ciency objectives� In order to ful�ll thesee�ciency objectives� new models and algorithms for demand�orientedplanning of telecommunications systems are required�
This monograph is organized into two parts� The �rst part introducesthe basic planning concepts for telecommunication systems� Chapter �outlines some fundamental functional models for wireline and wirelesstelecommunication systems� Chapter provides an overview and at�tempts a classi�cation of the conventional and new design objectivesfor state�of�the�art wireline and wireless telecommunications networks�Chapter � outlines the conventional engineering methods for communica�tion networks and introduces a new forward engineering and integratedplanning concept for fast� e�cient and demand�oriented cellular systemdesign� The second part of this monograph deals with the implemen�tation of demand�oriented design methods� Chapter is devoted to anew framework for the estimation and characterization of the expectedteletra�c in mobile communication networks� Chapter � introduces al�gorithms for demand�oriented radio network design� Chapter � discussesthe engineering of e�cient call handling mechanisms in cellular mobilecommunication systems� Chapter � presents a method for available bitrate �ABR� service engineering in large scale asynchronous transfer mode�ATM� networks� Finally� Chapter � summarizes this monograph andprovides an outlook into the future�
�
� Functional Models of
Telecommunication
Networks
The purpose of this chapter is to give an overview on the basic termsand components of telecommunication networks� It introduces some fun�damental functional models for wireline and wireless telecommunicationnetworks and outlines the basic planning and design tasks in these sys�tems� Particular focus is laid on their use in demand�oriented networkdesign�
The chapter is organized as follows� Section ��� outlines general net�work model which is common to the most public telecommunication net�works� Section ��� introduces the speci�c features of wireline networksand Section �� is devoted to the characteristics of public mobile andwireline telecommunication systems�
��� Basic Telecommunication Network
Model
A communication network is a spatially distributed arrangement of hard�ware and software that allows users to exchange information� It consistsof a set of nodes that are interconnected to permit the exchange of in�formation� These nodes are distinguished into terminal nodes and com�munication nodes� A connection commences and terminates at terminalnodes which also provide the interface to the user� The task of com�munication nodes is to establish connectivity among nodes and to relayinformation� The communication nodes are interconnected by links or
� Functional Models of Telecommunication Networks
Trunk
Terminal nodee.g.: telephone
Layer 1
Communication nodee.g.: circuit switch
Local line
Layer 2
Layer 3De
sig
nla
ye
r
Figure ���� Basic communication network
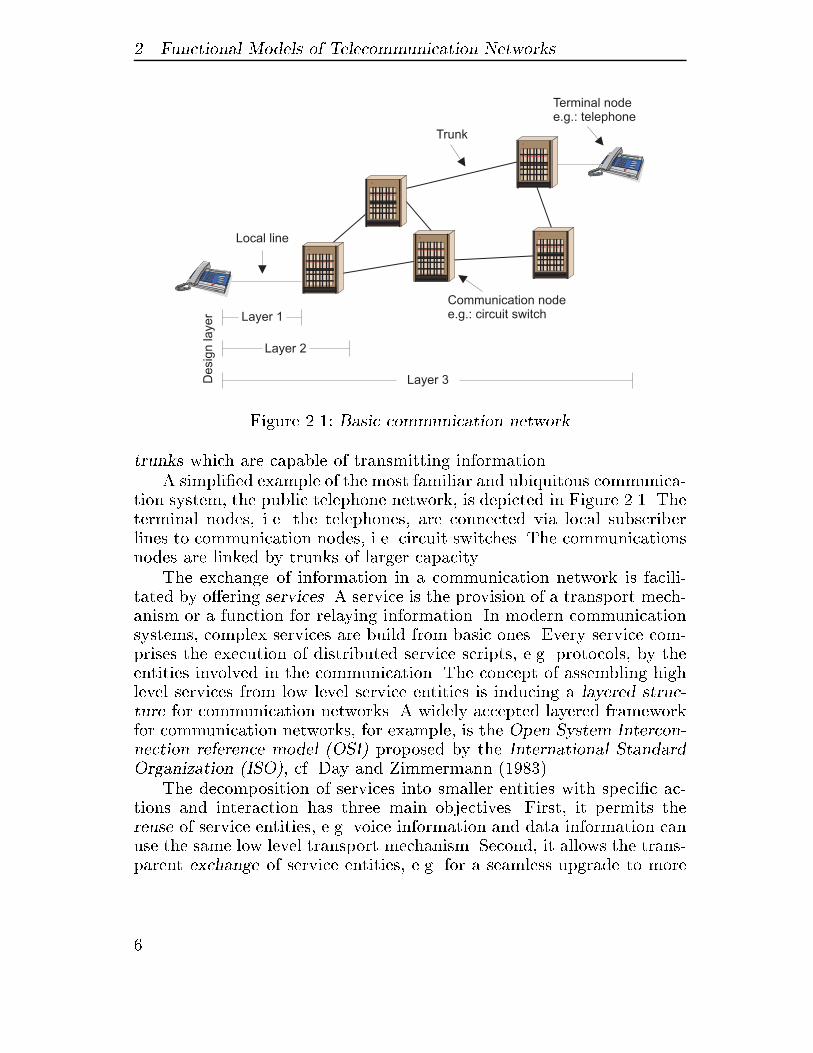
trunks which are capable of transmitting information�A simpli�ed example of the most familiar and ubiquitous communica�
tion system� the public telephone network� is depicted in Figure ���� Theterminal nodes� i�e� the telephones� are connected via local subscriberlines to communication nodes� i�e� circuit switches� The communicationsnodes are linked by trunks of larger capacity�
The exchange of information in a communication network is facili�tated by o�ering services� A service is the provision of a transport mech�anism or a function for relaying information� In modern communicationsystems� complex services are build from basic ones� Every service com�prises the execution of distributed service scripts� e�g� protocols� by theentities involved in the communication� The concept of assembling highlevel services from low level service entities is inducing a layered struc�ture for communication networks� A widely accepted layered frameworkfor communication networks� for example� is the Open System Intercon�nection reference model �OSI� proposed by the International StandardOrganization �ISO�� cf� Day and Zimmermann ������
The decomposition of services into smaller entities with speci�c ac�tions and interaction has three main objectives� First� it permits thereuse of service entities� e�g� voice information and data information canuse the same low level transport mechanism� Second� it allows the trans�parent exchange of service entities� e�g� for a seamless upgrade to more
�
��� Basic Telecommunication Network Model
e�cient technologies� And third� accurately de�ned services facilitate theinteroperability across manufactures and� later on� between networks ofother communication service providers�
An additional feature of service decomposition is that it also per�mits a layered approach to system engineering and network planning�The design layers are directly related to the functional tasks of the maincomponents of the communication system�
Layer �� Transmission mechanism designThe design of low level procedures for propagating the infor�mation through a physical communication channel� e�g� thelocal subscriber line or a radio communication link�
Layer �� Node engineering and dimensioningThe design of the functional features in a single communica�tion node and the appropriate selection of the number of func�tional components in the node which is required for e�cientoperations�
Layer �� Network designThe assessment of the location of communication nodes� theirconnectivity� and the routing of the information through thenetwork�
Besides the structural description of the network� the functionalmodel also has to consider the teletra�c in the system� The term �tele�tra�c� denotes the process of events related to demands for the uti�lization of services or resources in a communication network� cf� ITU�T����a�� In general� the teletra�c in a network is not constant or ho�mogeneous� Hence� in the context of network design it is necessary todistinguish between temporal variability and the spatial variability oftelecommunication tra�c� The temporal variability characterizes the se�quence of service requests and the change of the intensity over time�whereas the spatial variability describes the variation of teletra�c inten�sity due to the location in the network� In particular� the design of largegeographically distributed communication networks has to carefully con�sider the spatial variation of the demand for teletra�c� cf� Chapter �
The variability of the teletra�c has a di�erent impact on the threedesign layers� Transmission mechanisms engineering is only touched ina limited way by time varying tra�c� A well designed mechanism hasto ensure operability� regardless whether there is high or low tra�c in�tensity� In contrast to this� the in�uence of temporal variability on node
�
� Functional Models of Telecommunication Networks
Sectional center
Regional center Primary center
Toll center
directtrunks
incre
ased
degre
eof
inte
rconnection
End office
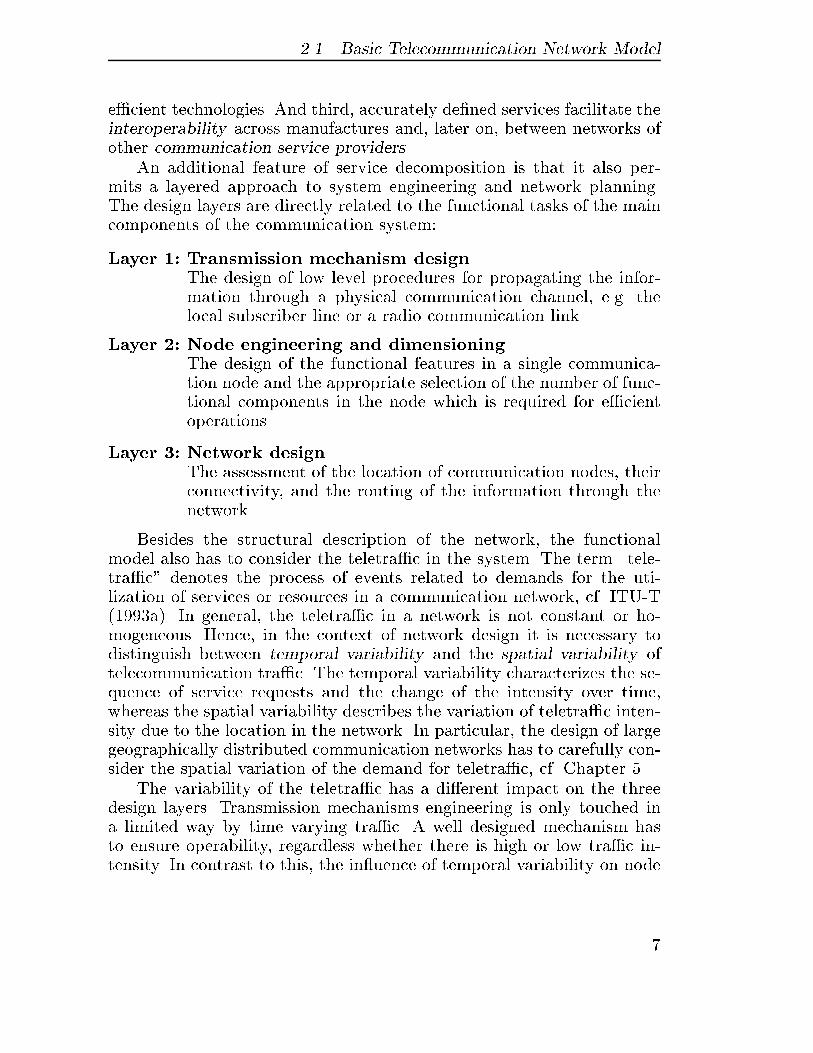
Figure ���� Public wireline telecommunication network
dimensioning is considerably high� A system can operate su�ciently wellfor constant tra�c� however� its performance can degrade extremely fastfor variable tra�c� cf� Section ��� The impact of the spatial variationof the teletra�c increases with the scope of the design layer� Hence� ef��cient and demand�oriented design of communication networks has toconsider both types of variability in order to obtain good network designsolutions�
��� Public Wireline Telecommunication
Networks
The functional model for public wireline telecommunication systems re��ects the basic requirements for these systems� First� these network needto establish the connectivity of users to the system throughout large ser�vice areas� And second� they have to provide the communication service�e�g� voice service� to a huge number of customers� Therefore� public wire�line communication systems posses a distinct hierarchical structure� Inthis way� they can e�ciently cover large areas and are able to process ahuge amount of teletra�c in the system�
Figure ��� shows a functional model of large public telephone net�works used in North America� cf� Martin ������� Subscribers are con�
�
��� Public Mobile and Wireless Communication Networks
nected on local loops to their nearby telephone exchange� called localexchange or end o�ce� Local exchanges are the access facilities for cus�tomers� Interconnecting every end o�ce with every other one would re�quire too many trunks� Therefore� to lessen the number of trunks� furtherlevels of switching are used� Hence� the end o�ces are connected to tollcenters� which are further linked to primary centers� The upper part ofthe switching hierarchy is represented by sectional and regional centers�They establish country�wide and international connectivity� With everyswitching level� the connectivity between the centers and capacity of thetrunks increases� However� the hierarchical structure has not always tobe kept� Direct high capacity trunks are able to interconnect centers withhigh direct tra�c� Thus� reducing the number of hops required to reachthe �nal destination�
The amount of telecommunication tra�c in public wireline networksis characterized by the teletra�c matrix� An entry in the matrix de�scribes the tra�c from the originating to the terminating node� Due tothe tether�bounded access to the network� the spatial tra�c distributionin a wireline system only changes only slowly over time� However� thetemporal variability of the tra�c can be high in these networks�
The planning of public wireline networks comprises three main en�gineering tasks� a� the assessment of the structure� the location and theinterconnection of the nodes� b� the determination of the routing of thetra�c and c� the dimensioning of the trunks�
��� Public Mobile and Wireless
Communication Networks
The main purpose of modern public mobile communication networks isthe provision of tetherless communication services at any place and anytime� Therefore mobile communication systems consist of two main com�ponents� a� the radio network and b� the wireline transport subsystem�
The radio network provides the wireless access to the mobile systemusing a low power radio communication link between a mobile termi�nal� also denoted as a mobile station� and a grid of base stations� Thetransport subsystem is responsible for relaying the communication ser�vice through a conventional wireline network to its �nal destination� Theendpoint of a connection can either be a customer in a wireline system oranother wireless subscriber� The mobile communication system should
�
� Functional Models of Telecommunication Networks
Service area
Mobile terminal
Base station
Radio cell
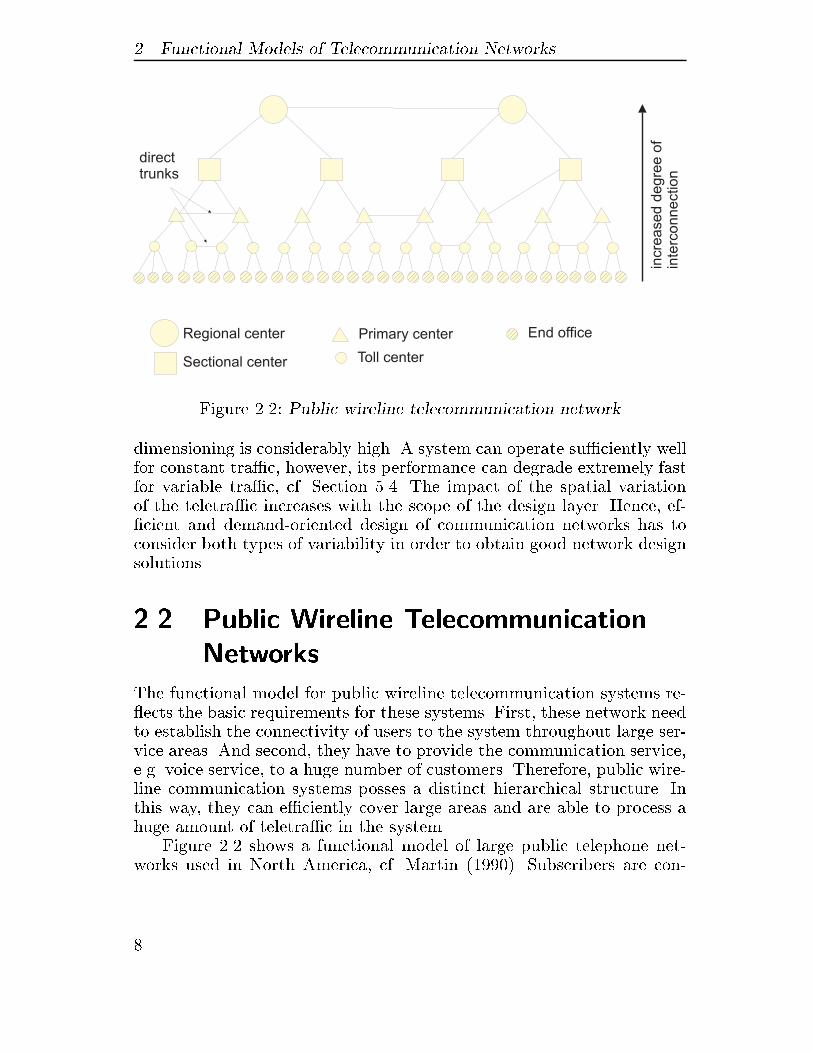
Figure ��� Cellular concept
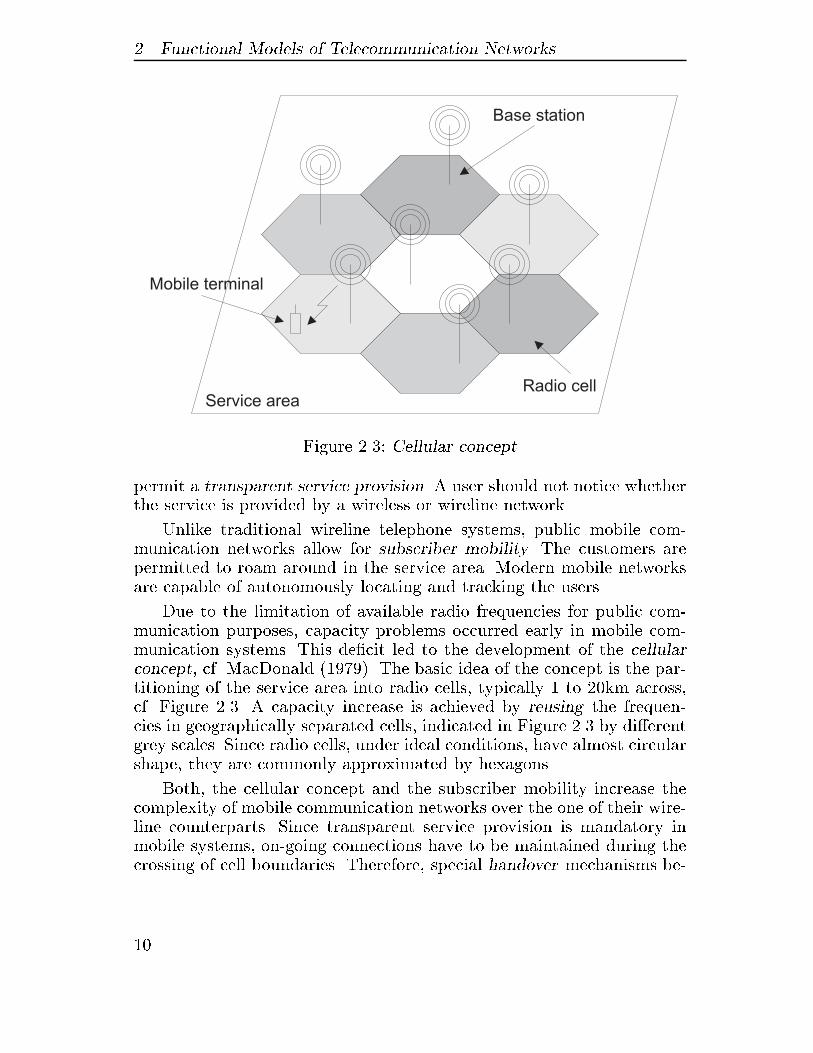
permit a transparent service provision� A user should not notice whetherthe service is provided by a wireless or wireline network�
Unlike traditional wireline telephone systems� public mobile com�munication networks allow for subscriber mobility� The customers arepermitted to roam around in the service area� Modern mobile networksare capable of autonomously locating and tracking the users�
Due to the limitation of available radio frequencies for public com�munication purposes� capacity problems occurred early in mobile com�munication systems� This de�cit led to the development of the cellularconcept� cf� MacDonald ������� The basic idea of the concept is the par�titioning of the service area into radio cells� typically � to ��km across�cf� Figure ��� A capacity increase is achieved by reusing the frequen�cies in geographically separated cells� indicated in Figure �� by di�erentgrey scales� Since radio cells� under ideal conditions� have almost circularshape� they are commonly approximated by hexagons�
Both� the cellular concept and the subscriber mobility increase thecomplexity of mobile communication networks over the one of their wire�line counterparts� Since transparent service provision is mandatory inmobile systems� on�going connections have to be maintained during thecrossing of cell boundaries� Therefore� special handover mechanisms be�
��
��� Public Mobile and Wireless Communication Networks
ISC
MMF MSC
BSBS
MMFMSC
BSBS
MSC
BSBS
MSC
BSBS
MSC
BSBS
MSC
BSBS
MSC
BSBS
MMF MMFMMFMMF
LE/TO LE/TO
International area
Wide/national area
OtherMSCs
Metropolitanarea
OtherLE/TEs
Radio network
LE/TO LE/TO
ISC
National transportnetworkTeletraffic
interface
Teletraffic interface
Internationaltransport network
MTMT MT
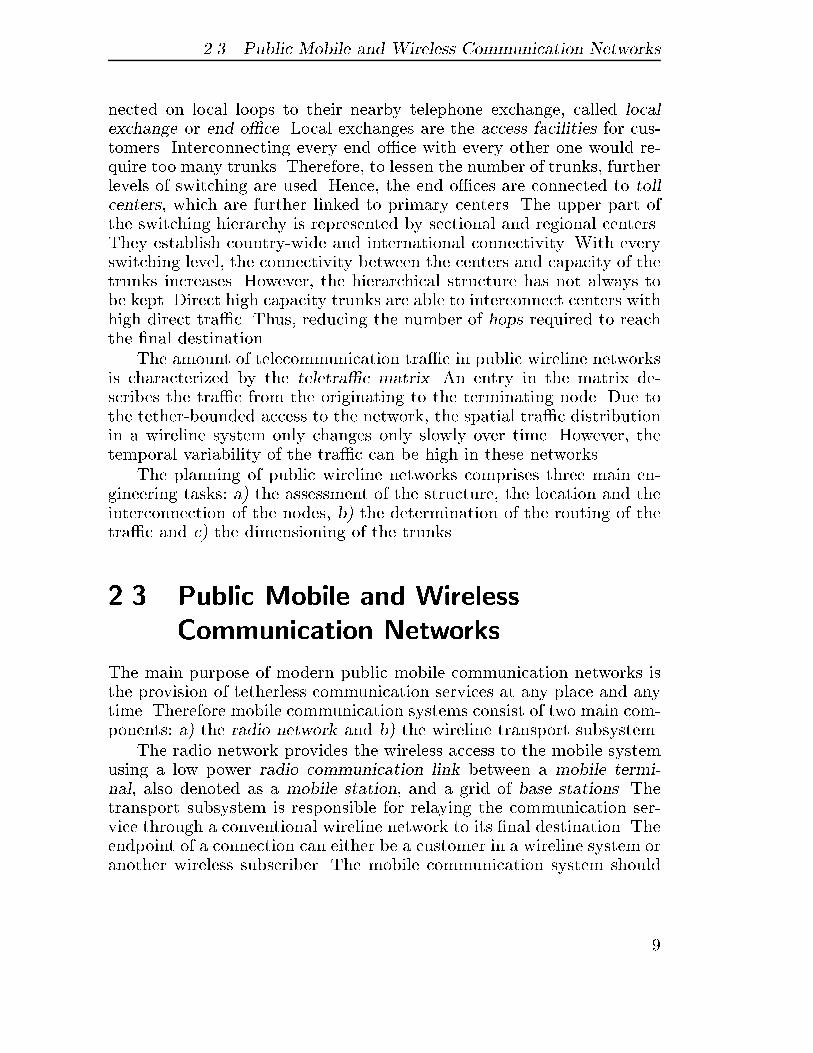
MT: Mobile terminal BS: Base stationMSC: Mobile switching center LE: Local exchangeTO: Toll office ISC: International switching centerMMF: Mobility management function
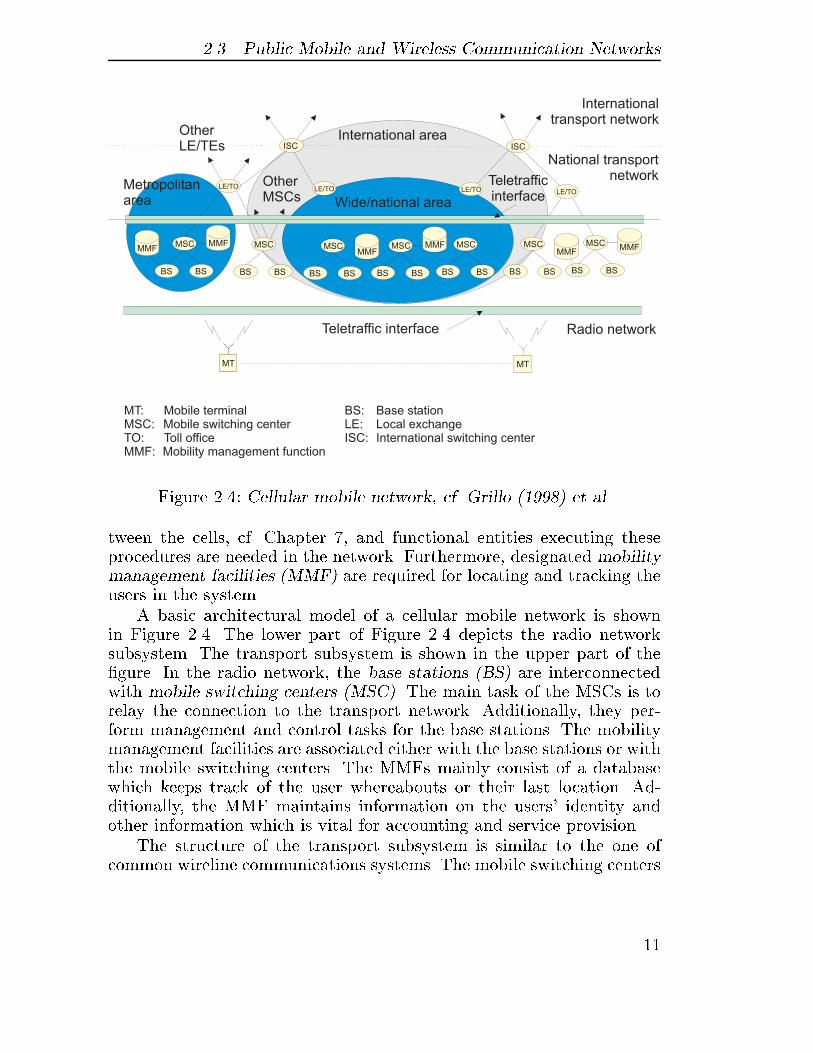
Figure ���� Cellular mobile network cf� Grillo ���� et al�
tween the cells� cf� Chapter �� and functional entities executing theseprocedures are needed in the network� Furthermore� designated mobilitymanagement facilities �MMF� are required for locating and tracking theusers in the system�
A basic architectural model of a cellular mobile network is shownin Figure ���� The lower part of Figure ��� depicts the radio networksubsystem� The transport subsystem is shown in the upper part of the�gure� In the radio network� the base stations �BS� are interconnectedwith mobile switching centers �MSC�� The main task of the MSCs is torelay the connection to the transport network� Additionally� they per�form management and control tasks for the base stations� The mobilitymanagement facilities are associated either with the base stations or withthe mobile switching centers� The MMFs mainly consist of a databasewhich keeps track of the user whereabouts or their last location� Ad�ditionally� the MMF maintains information on the users� identity andother information which is vital for accounting and service provision�
The structure of the transport subsystem is similar to the one ofcommon wireline communications systems� The mobile switching centers
��
� Functional Models of Telecommunication Networks
are linked by high capacity trunks with local exchange centers or otherhigh level switching centers� Additionally� the local exchange centers canact as gateways to other public telephone networks�
A mobile communication network comprises two main teletra�c in�terfaces� cf� Figure ���� The �rst one is located within the radio networkbetween the mobile terminals and the base station� The second teletra�cinterface is located on the boundary between radio network and trans�port subsystem� Both interfaces have to be cautiously addressed duringnetwork dimensioning�
Due to the user mobility� the teletra�c in mobile cellular communica�tion systems reveals both� a high temporal and a large spatial variation�The users are allowed to enter or leave the cells whenever they want�Thus� the o�ered teletra�c in a cell can rapidly change over time� cf�Chapter �� Furthermore� since not every part of the service area of acellular system is equally populated or used in the same way� the spa�tial teletra�c intensity varies signi�cantly� cf� Chapter � The high tele�tra�c variability is a characteristic which makes mobile communicationextremely dependable on careful tra�c engineering�
Conventional mobile communication network engineering is sepa�rated into two main design tasks� a� radio network planning and b� trans�port network engineering� Radio network planning mainly comprises theassessment of both the location and con�guration of base stations� theengineering of radio link parameters� the design of the frequency reuseplan and the dimensioning of the teletra�c interface between the mo�bile terminals and the base stations� Engineering tasks for the trans�port subsystem are similar to the ones of common wireline networks� cf�Section ���� Additionally� special design problems which arise from thedistinct features of mobile systems have to be addressed� The most im�portant tasks comprise� design of location areas� cf� Madhavapeddy andBasu ������� interconnection of base stations with mobile switching cen�ters� and dimensioning of the tra�c interface between the radio networkand transport system�
��
� Network Design Objectives
and Requirements
The planning of future telecommunication networks faces three new ma�jor challenges� First� there is the tremendous increase in the demand forcommunication services� Two decades ago� only a few telecommunicationservices� like telephone� fax� or low speed data service� were required andavailable� In the future a large variety of services are needed to supportvarious demands of new communication applications� like voice�over�IP�electronic commerce� or business process management� Second� the newtechnologies of upcoming networks require demand based planning meth�ods� For example� in third generation mobile networks� the coverage areaof a CDMA transmitter depends on both the radio wave propagation andthe user density� cf� Veeravalli et al� ������� And third� due to the deregu�lation of the telecommunication market� the competition between the ser�vice operators is highly increased� The regulation authorities require theservices to be interchangeable� Hence� the customers can switch almostinstantaneously to the cheapest provider� As a result of the challenges�new systematic planning methodologies are required which facilitate theengineering of e�ective� economic and optimal network con�gurations�To enable a systematic design approach� the network design objectivesand requirements have to be precisely stated� Unfortunately� there existsa large number of technical and economical objectives� Moreover thesedesign requirements are often contrary to each other� The purpose ofthis chapter is to give an overview of the conventional and new designobjectives for state�of�the�art wireline and wireless telecommunicationsnetworks� In addition� it attempts to classify the objectives�
�
� Network Design Objectives and Requirements
��� General Network Design Objectives
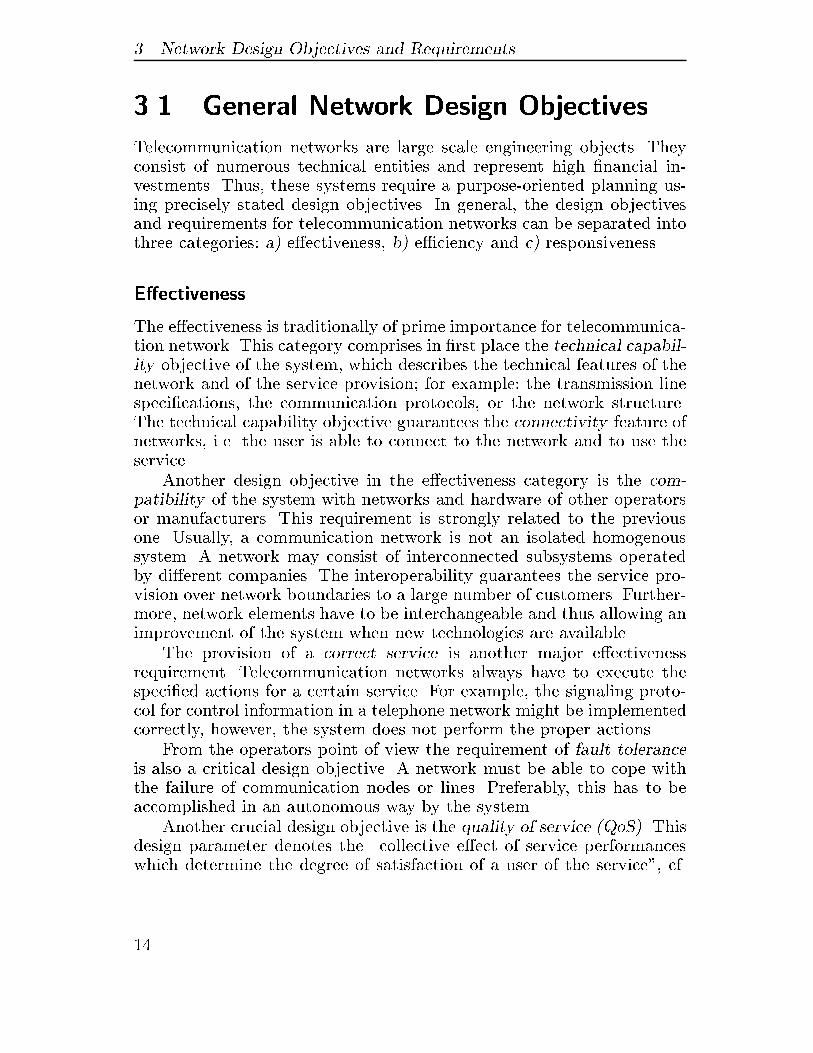
Telecommunication networks are large scale engineering objects� Theyconsist of numerous technical entities and represent high �nancial in�vestments� Thus� these systems require a purpose�oriented planning us�ing precisely stated design objectives� In general� the design objectivesand requirements for telecommunication networks can be separated intothree categories� a� e�ectiveness� b� e�ciency and c� responsiveness�
E�ectiveness
The e�ectiveness is traditionally of prime importance for telecommunica�tion network� This category comprises in �rst place the technical capabil�ity objective of the system� which describes the technical features of thenetwork and of the service provision� for example� the transmission linespeci�cations� the communication protocols� or the network structure�The technical capability objective guarantees the connectivity feature ofnetworks� i�e� the user is able to connect to the network and to use theservice�
Another design objective in the e�ectiveness category is the com�patibility of the system with networks and hardware of other operatorsor manufacturers� This requirement is strongly related to the previousone� Usually� a communication network is not an isolated homogenoussystem� A network may consist of interconnected subsystems operatedby di�erent companies� The interoperability guarantees the service pro�vision over network boundaries to a large number of customers� Further�more� network elements have to be interchangeable and thus allowing animprovement of the system when new technologies are available�
The provision of a correct service is another major e�ectivenessrequirement� Telecommunication networks always have to execute thespeci�ed actions for a certain service� For example� the signaling proto�col for control information in a telephone network might be implementedcorrectly� however� the system does not perform the proper actions�
From the operators point of view the requirement of fault toleranceis also a critical design objective� A network must be able to cope withthe failure of communication nodes or lines� Preferably� this has to beaccomplished in an autonomous way by the system�
Another crucial design objective is the quality of service �QoS�� Thisdesign parameter denotes the �collective e�ect of service performanceswhich determine the degree of satisfaction of a user of the service�� cf�
��
��� General Network Design Objectives
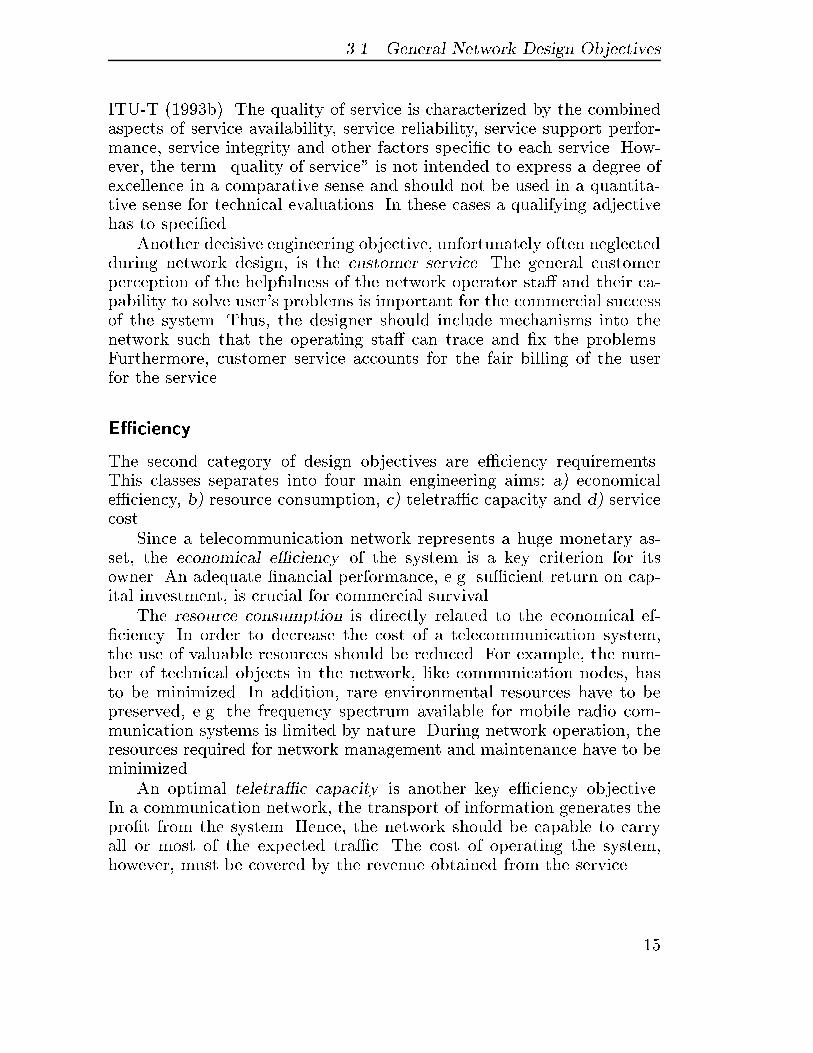
ITU�T ����b�� The quality of service is characterized by the combinedaspects of service availability� service reliability� service support perfor�mance� service integrity and other factors speci�c to each service� How�ever� the term �quality of service� is not intended to express a degree ofexcellence in a comparative sense and should not be used in a quantita�tive sense for technical evaluations� In these cases a qualifying adjectivehas to speci�ed�
Another decisive engineering objective� unfortunately often neglectedduring network design� is the customer service� The general customerperception of the helpfulness of the network operator sta� and their ca�pability to solve user�s problems is important for the commercial successof the system� Thus� the designer should include mechanisms into thenetwork such that the operating sta� can trace and �x the problems�Furthermore� customer service accounts for the fair billing of the userfor the service�
E�ciency
The second category of design objectives are e�ciency requirements�This classes separates into four main engineering aims� a� economicale�ciency� b� resource consumption� c� teletra�c capacity and d� servicecost�
Since a telecommunication network represents a huge monetary as�set� the economical e�ciency of the system is a key criterion for itsowner� An adequate �nancial performance� e�g� su�cient return on cap�ital investment� is crucial for commercial survival�
The resource consumption is directly related to the economical ef��ciency� In order to decrease the cost of a telecommunication system�the use of valuable resources should be reduced� For example� the num�ber of technical objects in the network� like communication nodes� hasto be minimized� In addition� rare environmental resources have to bepreserved� e�g� the frequency spectrum available for mobile radio com�munication systems is limited by nature� During network operation� theresources required for network management and maintenance have to beminimized�
An optimal teletra�c capacity is another key e�ciency objective�In a communication network� the transport of information generates thepro�t from the system� Hence� the network should be capable to carryall or most of the expected tra�c� The cost of operating the system�however� must be covered by the revenue obtained from the service�
�
� Network Design Objectives and Requirements
The context of network e�ciency requires also to consider the ser�vice cost� From the customer perspective� there must be an appropriaterelation between the expense for a service and the bene�t of using it�
Responsiveness
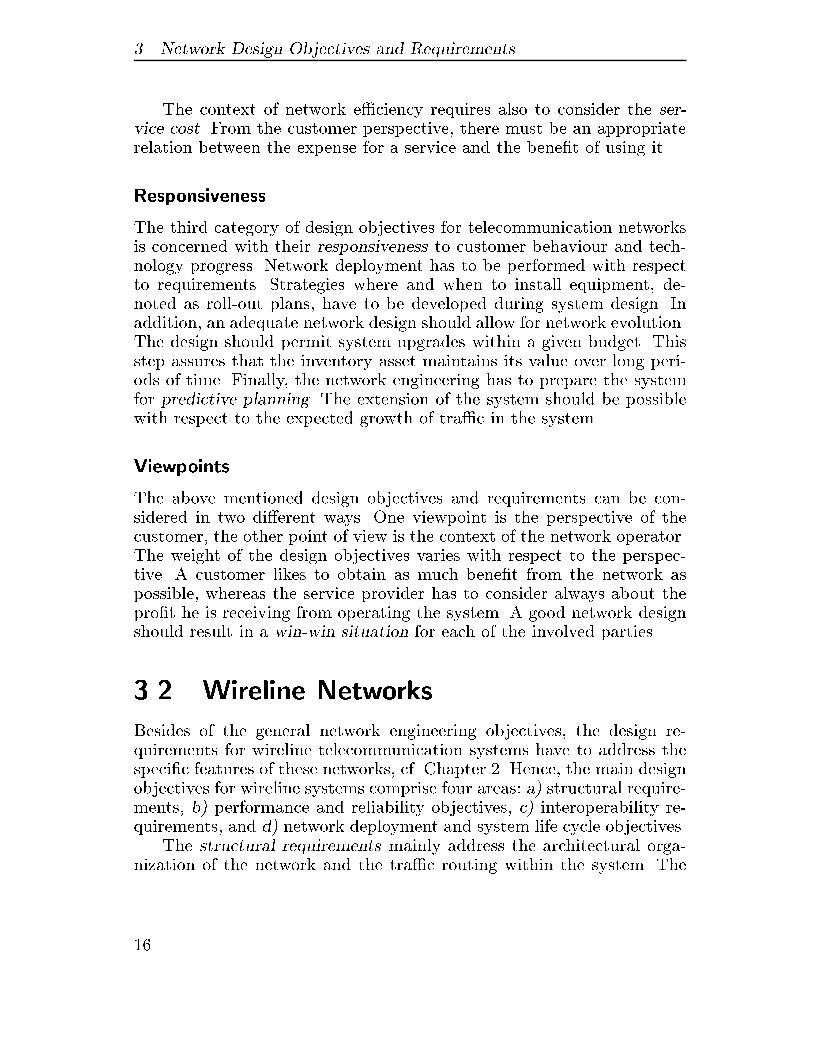
The third category of design objectives for telecommunication networksis concerned with their responsiveness to customer behaviour and tech�nology progress� Network deployment has to be performed with respectto requirements� Strategies where and when to install equipment� de�noted as roll�out plans� have to be developed during system design� Inaddition� an adequate network design should allow for network evolution�The design should permit system upgrades within a given budget� Thisstep assures that the inventory asset maintains its value over long peri�ods of time� Finally� the network engineering has to prepare the systemfor predictive planning� The extension of the system should be possiblewith respect to the expected growth of tra�c in the system�
Viewpoints
The above mentioned design objectives and requirements can be con�sidered in two di�erent ways� One viewpoint is the perspective of thecustomer� the other point of view is the context of the network operator�The weight of the design objectives varies with respect to the perspec�tive� A customer likes to obtain as much bene�t from the network aspossible� whereas the service provider has to consider always about thepro�t he is receiving from operating the system� A good network designshould result in a win�win situation for each of the involved parties�
��� Wireline Networks
Besides of the general network engineering objectives� the design re�quirements for wireline telecommunication systems have to address thespeci�c features of these networks� cf� Chapter �� Hence� the main designobjectives for wireline systems comprise four areas� a� structural require�ments� b� performance and reliability objectives� c� interoperability re�quirements� and d� network deployment and system life cycle objectives�
The structural requirements mainly address the architectural orga�nization of the network and the tra�c routing within the system� The
��
��� Wireline Networks
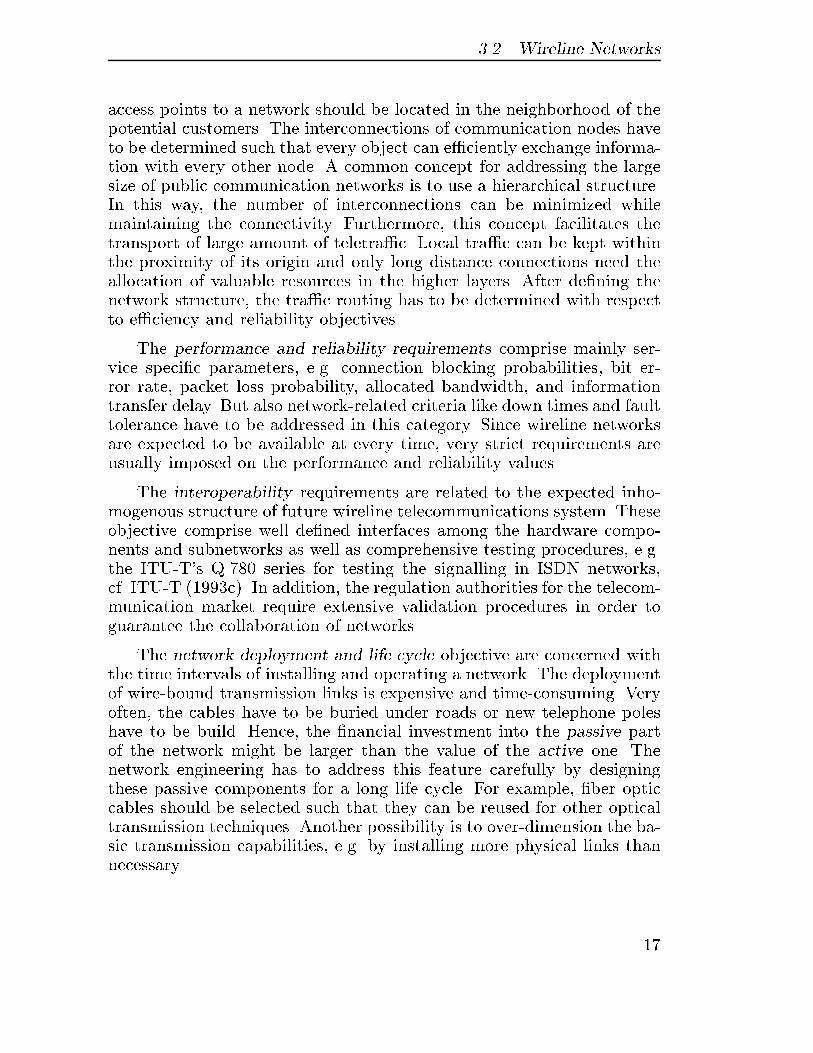
access points to a network should be located in the neighborhood of thepotential customers� The interconnections of communication nodes haveto be determined such that every object can e�ciently exchange informa�tion with every other node� A common concept for addressing the largesize of public communication networks is to use a hierarchical structure�In this way� the number of interconnections can be minimized whilemaintaining the connectivity� Furthermore� this concept facilitates thetransport of large amount of teletra�c� Local tra�c can be kept withinthe proximity of its origin and only long distance connections need theallocation of valuable resources in the higher layers� After de�ning thenetwork structure� the tra�c routing has to be determined with respectto e�ciency and reliability objectives�
The performance and reliability requirements comprise mainly ser�vice speci�c parameters� e�g� connection blocking probabilities� bit er�ror rate� packet loss probability� allocated bandwidth� and informationtransfer delay� But also network�related criteria like down times and faulttolerance have to be addressed in this category� Since wireline networksare expected to be available at every time� very strict requirements areusually imposed on the performance and reliability values�
The interoperability requirements are related to the expected inho�mogenous structure of future wireline telecommunications system� Theseobjective comprise well de�ned interfaces among the hardware compo�nents and subnetworks as well as comprehensive testing procedures� e�g�the ITU�T�s Q���� series for testing the signalling in ISDN networks�cf� ITU�T ����c�� In addition� the regulation authorities for the telecom�munication market require extensive validation procedures in order toguarantee the collaboration of networks�
The network deployment and life cycle objective are concerned withthe time intervals of installing and operating a network� The deploymentof wire�bound transmission links is expensive and time�consuming� Veryoften� the cables have to be buried under roads or new telephone poleshave to be build� Hence� the �nancial investment into the passive partof the network might be larger than the value of the active one� Thenetwork engineering has to address this feature carefully by designingthese passive components for a long life cycle� For example� �ber opticcables should be selected such that they can be reused for other opticaltransmission techniques� Another possibility is to over�dimension the ba�sic transmission capabilities� e�g� by installing more physical links thannecessary�
��
� Network Design Objectives and Requirements
��� New Design Objectives of Mobile and
Wireless Networks
Due to the radical changes in technology and usage� the design criteria ofnext generation cellular networks have altered substantially� Beside theprimary RF �Radio Frequency� objective of providing a reliable radio linkat every location in the planning region� state�of�the�art network designhas to ensure a high quality�of�service as well as considering the aspectsof cutting the cost of deploying a cellular radio system� Hence� the newdesign objectives of mobile networks can be organized in three areas� a�RF objectives� b� capacity and teletra�c engineering objectives� and c�network deployment objectives�
The RF design objectives are usually expressed in terms of radiolink quality measures� In �rst place� a good link design has to ensure asu�cient radio signal level throughout the planning region� Additionally�it has to minimize the signal disturbance by co�channel and adjacent�channel interference� Related to that is the provision of a high marginbetween the signal level and the interference power level in order tosupport� for example� a high user mobility� Advanced RF performancevalues� like a low bit error rate �BER�� or a low call blocking probabilitydue to insu�cient signal strength can be derived from the basic RFperformance values�
The capacity and teletra�c engineering objectives comprise mainlythree criteria� resource requirements� network capacity� and capacity re�lated quality�of�service values seen by the user� Since the available fre�quency spectrum for mobile radio systems is extremely limited� the net�work design has to minimize the number of frequencies required in a cellas well as the overall number of carriers used in the network� To increasethe total system capacity� the design has to enforce a large frequencyreuse factor�
The network deployment objectives mainly address the economic as�pects of operating and engineering a cellular system� Deploying a com�plete new network or installing additional hardware in an operating sys�tem is highly risky� There are signi�cant costs associated with settingup a new facility� Therefore an e�cient network design has to minimizethe hardware cost� for example by using as few base stations as possi�ble or by deploying cost�e�cient facilities� like low�power transmitters�In addition� the cost�e�ciency of the network can be increased if thedeployment of new network equipment is based on the analysis of the
��

��� New Design Objectives of Mobile and Wireless Networks
demand for the o�ered service�
��

� Network Design Objectives and Requirements
��
� Engineering Methods for
Telecommunication Systems
The engineering and architecting of large telecommunication networksis supposed to be both science and art� cf� Rechtin and Maier �������This view is mainly the result of the high complexity of these systems�During the early stages of network engineering� a full assessment of thesystem design problems is di�cult for the network planner� Some ofthe design challenges only arise due to the collaboration of the networkcomponents with each other and can hardly be anticipated� Other engi�neering problems are postponed to later design stages since their analysiswould consume too much time� In particular� e�ciency issues are oftenregarded of minor importance at early network deployment phases� sincethe teletra�c is usually low in new systems� perception of the quality ofa network�
Conventional design methodologies for telecommunication networksaddress only partially the complexity of systems� In addition� they stillrequire a lot of personal experience and manual interference by the net�work designer� Therefore� new design procedures are needed for the en�gineering of future telecommunication networks� The new methods haveto focus early and equally on all of the major design objectives� cf� Chap�ter � In particular� they have to put more emphasis on teletra�c issues�Moreover� the methods should be simple in their application and be ableto attain e�cient network con�gurations in short time�
The purpose of this chapter is to provide an overview on conventionalengineering methods for telecommunication networks� In addition� in thispart� a new planning procedure will be presented for fast� e�cient anddemand�oriented cellular system design� The chapter is organized as fol�lows� In Section ���� the conventional reverse engineering design processis reviewed using the example of cellular network design� Section ���
��
� Engineering Methods for Telecommunication Systems
Network
designer
Performance
requirement
Network
layout
Compare
performance
Analyse
performance
Forward engineering
Re
ve
rse
eng
ine
erin
g
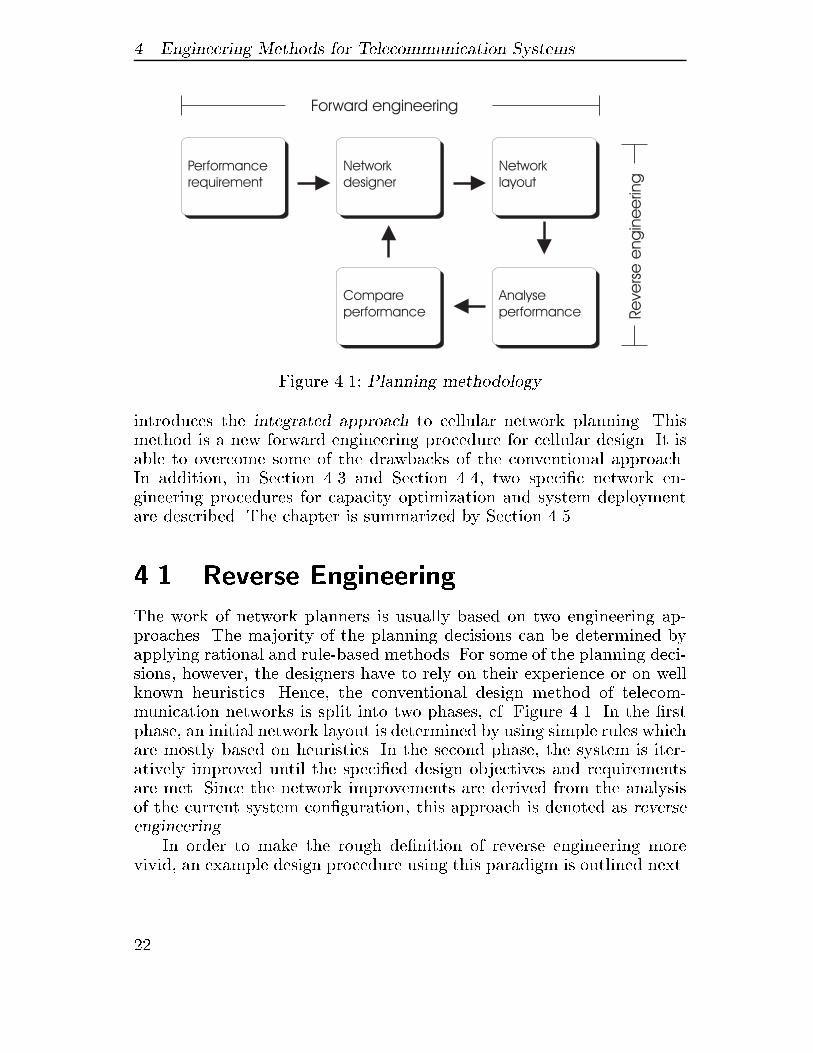
Figure ���� Planning methodology
introduces the integrated approach to cellular network planning� Thismethod is a new forward engineering procedure for cellular design� It isable to overcome some of the drawbacks of the conventional approach�In addition� in Section �� and Section ���� two speci�c network en�gineering procedures for capacity optimization and system deploymentare described� The chapter is summarized by Section �� �
��� Reverse Engineering
The work of network planners is usually based on two engineering ap�proaches� The majority of the planning decisions can be determined byapplying rational and rule�based methods� For some of the planning deci�sions� however� the designers have to rely on their experience or on wellknown heuristics� Hence� the conventional design method of telecom�munication networks is split into two phases� cf� Figure ���� In the �rstphase� an initial network layout is determined by using simple rules whichare mostly based on heuristics� In the second phase� the system is iter�atively improved until the speci�ed design objectives and requirementsare met� Since the network improvements are derived from the analysisof the current system con�guration� this approach is denoted as reverseengineering�
In order to make the rough de�nition of reverse engineering morevivid� an example design procedure using this paradigm is outlined next�
��
��� Reverse Engineering
The investigated example is the conventional design procedure for cel�lular communication networks� The example is particularly interestingsince it is widely used in today�s cellular system engineering but it isexpected to fail in future system design� cf� Cheung et al� �������
Conventional Cellular Network Planning
The conventional design procedure for cellular systems is based on theso�called analytical approach to cellular network planning� cf� Gamstet al� ������� This approach is mainly focused on the determination ofthe transmitter parameters� like transmitter location� antenna type� ortransmitting power� It obeys the in Section � described RF objectivesbut neglects the capacity and the network design objectives during theengineering process� In addition� the analytical approach is the base formost of today�s commercial cellular network planning tools like PEGA�SOS� cf� T�Mobil ������� or PLANET� cf� MSI Plc� �������
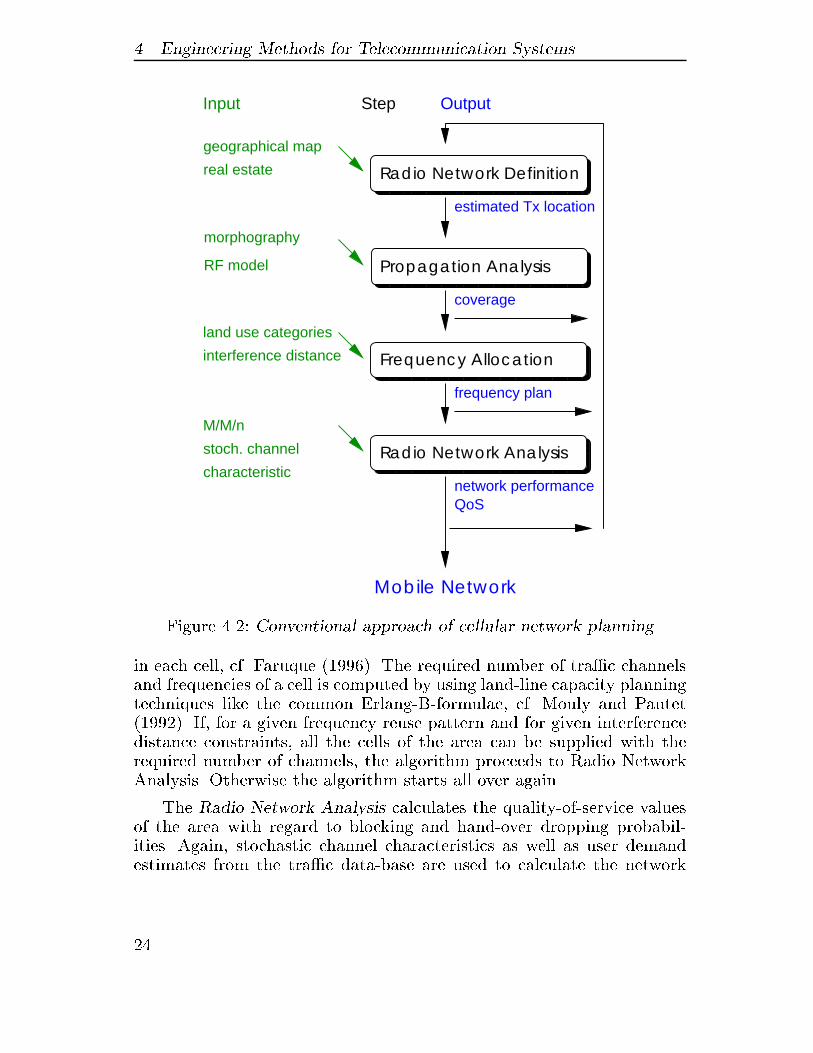
In principle� the analytical approach consists of four phases� RadioNetwork De nition� Propagation Analysis� Frequency Allocation� andRadio Network Analysis� that are passed in several turns iteratively�cf� Figure ����
During the Radio Network De nition phase� a human expert choosesthe cell sites� In order to obtain a regular structure� usually the popularconcept of distributing the transmitters on a hexagonal grid is used inthis step�
Using these transmitter con�gurations� the Propagation Analysis ofthe area evaluates the radio coverage by �eld strength prediction meth�ods� Here� stochastic channel models are applied� Usually� several �eldstrength prediction methods are implemented but the planning tools of�fer little if any support in choosing the appropriate propagation model�If the planning expert decides that the coverage is not su�cient enough�new transmitter locations have to be chosen and the propagation has tobe analyzed again�
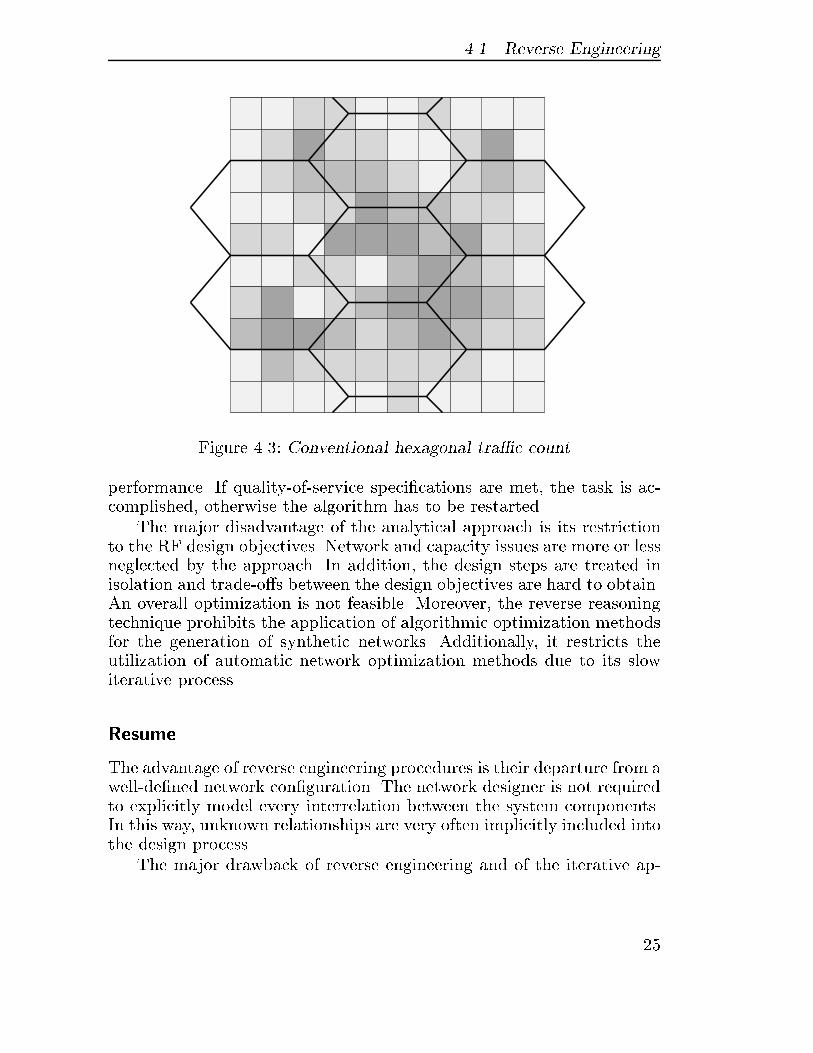
The radio network capacity issues are addressed in the next step�the Frequency Allocation� At �rst� the teletra�c distribution within theplanning region is derived based on rough estimates on the land use ofthe area� The distribution is then stored in a tra�c matrix� In the nextstep� a hexagonal grid representing the cells� is superimposed on theplanning region� cf� Figure ��� The di�erent grey values in Figure �� arerepresenting the di�erent entries in the teletra�c matrix� The tra�c perhexagonal cell is determined by tallying the entries of the tra�c matrix
�
� Engineering Methods for Telecommunication Systems
������������������������������������������������������������������������������������������
������������������������������������������������������������������������������������������
����������������������������������������������������������������������������������������������������������������������������
����������������������������������������������������������������������������������������������������������������������������
������������������������������������������������������������������������������������������������������������������������
������������������������������������������������������������������������������������������������������������������������
real estate ���������������
���������������
���������������
���������������
���������������
���������������
���������������
���������������
geographical map
RF model
morphography
characteristic
stoch. channel
���������������������������������������������������������������������������������������������
���������������������������������������������������������������������������������������������
M/M/n
Mobile Network
frequency plan
����������������������������������������
������������������������������������
estimated Tx location
network performanceQoS
Radio Network Definition
interference distance
Propagation Analysis
land use categories
Frequency Allocation
Radio Network Analysis
coverage
Input Step Output
Figure ���� Conventional approach of cellular network planning
in each cell� cf� Faruque ������� The required number of tra�c channelsand frequencies of a cell is computed by using land�line capacity planningtechniques like the common Erlang�B�formulae� cf� Mouly and Pautet������� If� for a given frequency reuse pattern and for given interferencedistance constraints� all the cells of the area can be supplied with therequired number of channels� the algorithm proceeds to Radio NetworkAnalysis� Otherwise the algorithm starts all over again�
The Radio Network Analysis calculates the quality�of�service valuesof the area with regard to blocking and hand�over dropping probabil�ities� Again� stochastic channel characteristics as well as user demandestimates from the tra�c data�base are used to calculate the network
��
��� Reverse Engineering
Figure ��� Conventional hexagonal tra�c count
performance� If quality�of�service speci�cations are met� the task is ac�complished� otherwise the algorithm has to be restarted�
The major disadvantage of the analytical approach is its restrictionto the RF design objectives� Network and capacity issues are more or lessneglected by the approach� In addition� the design steps are treated inisolation and trade�o�s between the design objectives are hard to obtain�An overall optimization is not feasible� Moreover� the reverse reasoningtechnique prohibits the application of algorithmic optimization methodsfor the generation of synthetic networks� Additionally� it restricts theutilization of automatic network optimization methods due to its slowiterative process�
Resume
The advantage of reverse engineering procedures is their departure from awell�de�ned network con�guration� The network designer is not requiredto explicitly model every interrelation between the system components�In this way� unknown relationships are very often implicitly included intothe design process�
The major drawback of reverse engineering and of the iterative ap�
�
� Engineering Methods for Telecommunication Systems
proach is the time between two improvements� This time can be ratherlong if �eld measurements or hardware modi�cation are involved� Inaddition� an insu�ciently selected initial network con�guration can sig�ni�cantly slow down the network design process� Moreover� automaticnetwork design and optimization procedures can only partially be em�ployed�
To overcome these drawbacks� new e�cient telecommunication net�work design methods have to be developed� The methods should possessthree main features� First� they should eliminate the need of experienceor heuristics rules� Second� they must be able to comprehensively addressthe complexity of the networks and of the design objectives� In partic�ular� they should put more emphasis on e�ciency and teletra�c issues�And third� the methods should attain a speed�up in network design byallowing the application of automatic optimization methods�
��� Forward Engineering
A promising approach to resolve the disadvantages of reverse engineer�ing methods is the application of forward engineering procedures in thedesign of telecommunication networks� Forward engineering proceduresderive a network layout based on high�level requirements speci�ed by thesystem planner or by other decision makers� like marketing departmentsor regulation authorities� cf� Figure ����
Without any re�nements� forward engineering approaches are alsovery limited in their application� However� if the design objectives arewell�de�ned� forward engineering becomes particularly e�cient� There�fore� this design paradigm is mostly used when system planners havealready su�cient experience in network engineering and when they wereable to transfer the knowledge into general applicable rules�
In this section� the description of the forward engineering paradigmwill also be deepened by using a cellular system engineering example�Therefore the so�called integrated approach to cellular network planningwill be introduced next� The integrated approach will form the basis for anew demand�oriented design method for cellular systems which is one ofthe main contributions of the research work presented in this monograph�
��
��� Forward Engineering
Radio
Transmission
Radio
Transmission
Mobile
Subscriber
Mobile
Subscriber
System
Architecture
System
Architecture
Resource
Allocation
Resource
Allocation
Automatic
Network design
Automatic
Network design
Performance Evaluation
& Optimization
Performance Evaluation
& Optimization
EfficiencyEffectiveness
Mobile NetworkMobile Network
Figure ���� Integrated planning approach
Integrated Approach to Cellular Network Planning
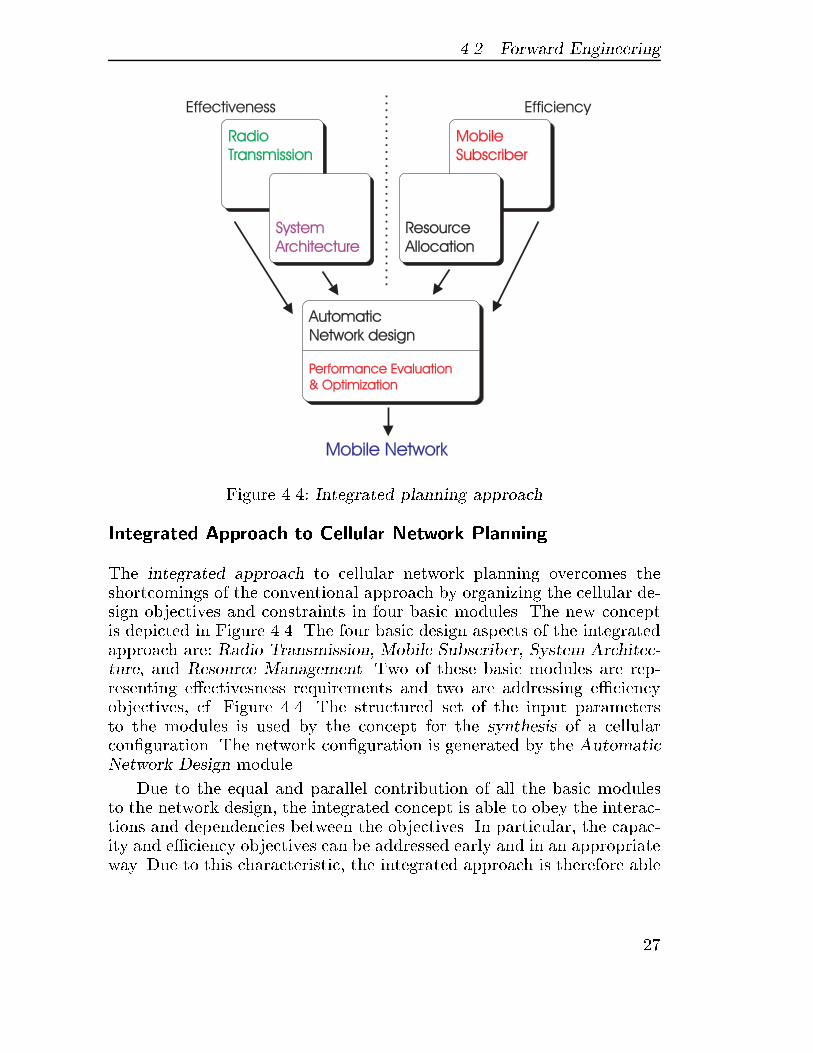
The integrated approach to cellular network planning overcomes theshortcomings of the conventional approach by organizing the cellular de�sign objectives and constraints in four basic modules� The new conceptis depicted in Figure ���� The four basic design aspects of the integratedapproach are� Radio Transmission� Mobile Subscriber� System Architec�ture� and Resource Management� Two of these basic modules are rep�resenting e�ectivesness requirements and two are addressing e�ciencyobjectives� cf� Figure ���� The structured set of the input parametersto the modules is used by the concept for the synthesis of a cellularcon�guration� The network con�guration is generated by the AutomaticNetwork Design module�
Due to the equal and parallel contribution of all the basic modulesto the network design� the integrated concept is able to obey the interac�tions and dependencies between the objectives� In particular� the capac�ity and e�ciency objectives can be addressed early and in an appropriateway� Due to this characteristic� the integrated approach is therefore able
��
� Engineering Methods for Telecommunication Systems
to �nd a trade�o� between contrary objectives and achieves optimizednetwork con�gurations� Moreover� the integrated approach constitutes aforward�engineering technique� Its methodology facilitates the applica�tion of automatic network design algorithms� cf� Chapter �
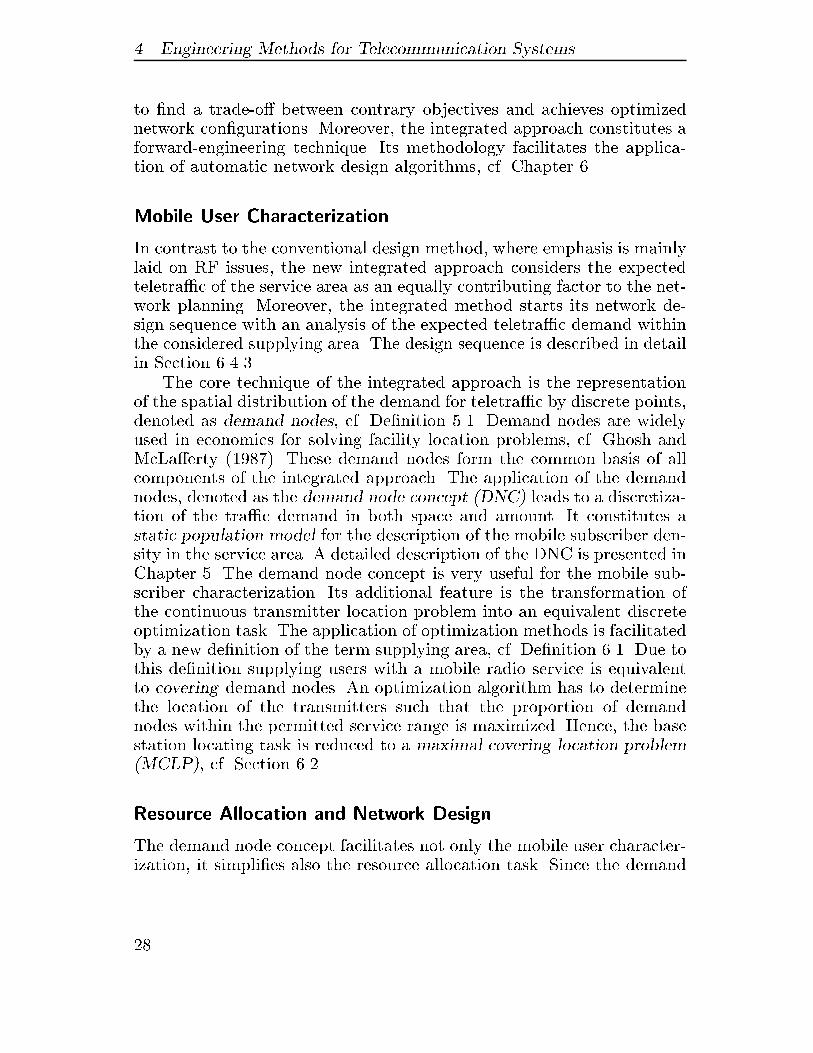
Mobile User Characterization
In contrast to the conventional design method� where emphasis is mainlylaid on RF issues� the new integrated approach considers the expectedteletra�c of the service area as an equally contributing factor to the net�work planning� Moreover� the integrated method starts its network de�sign sequence with an analysis of the expected teletra�c demand withinthe considered supplying area� The design sequence is described in detailin Section �����
The core technique of the integrated approach is the representationof the spatial distribution of the demand for teletra�c by discrete points�denoted as demand nodes� cf� De�nition ��� Demand nodes are widelyused in economics for solving facility location problems� cf� Ghosh andMcLa�erty ������� These demand nodes form the common basis of allcomponents of the integrated approach� The application of the demandnodes� denoted as the demand node concept �DNC� leads to a discretiza�tion of the tra�c demand in both space and amount� It constitutes astatic population model for the description of the mobile subscriber den�sity in the service area� A detailed description of the DNC is presented inChapter � The demand node concept is very useful for the mobile sub�scriber characterization� Its additional feature is the transformation ofthe continuous transmitter location problem into an equivalent discreteoptimization task� The application of optimization methods is facilitatedby a new de�nition of the term supplying area� cf� De�nition ���� Due tothis de�nition supplying users with a mobile radio service is equivalentto covering demand nodes� An optimization algorithm has to determinethe location of the transmitters such that the proportion of demandnodes within the permitted service range is maximized� Hence� the basestation locating task is reduced to a maximal covering location problem�MCLP�� cf� Section ����
Resource Allocation and Network Design
The demand node concept facilitates not only the mobile user character�ization� it simpli�es also the resource allocation task� Since the demand
��
��� Capacity Optimization Cycle
nodes are distributed according to the expected service demand and dueto the new de�nition of the term supplying area� cf� De�nition ���� theexpected tra�c in a speci�c cell can be immediately obtained from thenumber of nodes in a cell� A potential base station site can be veri�edbefore it is selected� whether it obeys the tra�c and hardware constraintsor not� see Chapter �� Thus� it is possible to check if a certain cell con�g�uration is able to carry the expected tra�c� Otherwise� the con�gurationis discarded and not considered for optimization� This veri�cation canenforce� for example� the deployment of small and cheap transmittersover using large and heavily loaded macro�cells� Additionally� this leadsdirectly to a higher frequency reuse and can result in a much easierfrequency allocation task�
Resume
The disadvantage of the forward engineering design approach is its needof a well�de�ned system model and of a precise description of the re�lations between the design objectives� However� this drawback statesimplicitly the strength of the design paradigm� The advantage of theforward engineering method is its e�ciency due to the high�level de�scription of the system� The required simpli�cation of the complexityleads to a concentration on the major design objectives� In addition� theformal description of the relations between the design objectives per�mits the weighing of the relations according to their importance� In thisway� the forward engineering approach enables the application of opti�mization methods and can obtain a trade�o� between contrary designobjectives� Moreover� the forward engineering approach facilitates theimplementation of network planning tools which are able to synthesisnetwork con�gurations�
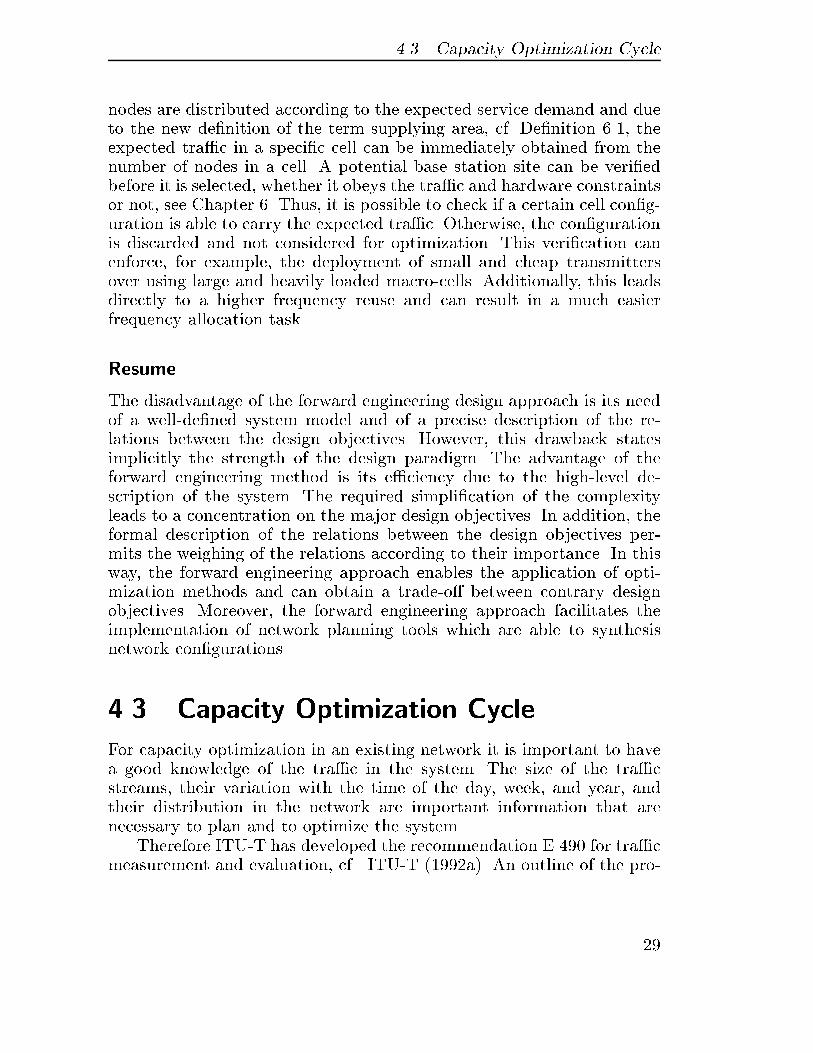
��� Capacity Optimization Cycle
For capacity optimization in an existing network it is important to havea good knowledge of the tra�c in the system� The size of the tra�cstreams� their variation with the time of the day� week� and year� andtheir distribution in the network are important information that arenecessary to plan and to optimize the system�
Therefore ITU�T has developed the recommendation E���� for tra�cmeasurement and evaluation� cf� ITU�T �����a�� An outline of the pro�
��
� Engineering Methods for Telecommunication Systems
Telecommunicationnetworks
Network trafficmanagement actions
Maintenancereconfiguration
Networkextension
Trafficmeasurement
Traffic andfault analysis
Traffic andfault analysis
Traffic analysiscompilation forecasting
1
Minutes, seconds
Weeks, days, hours
Year, months
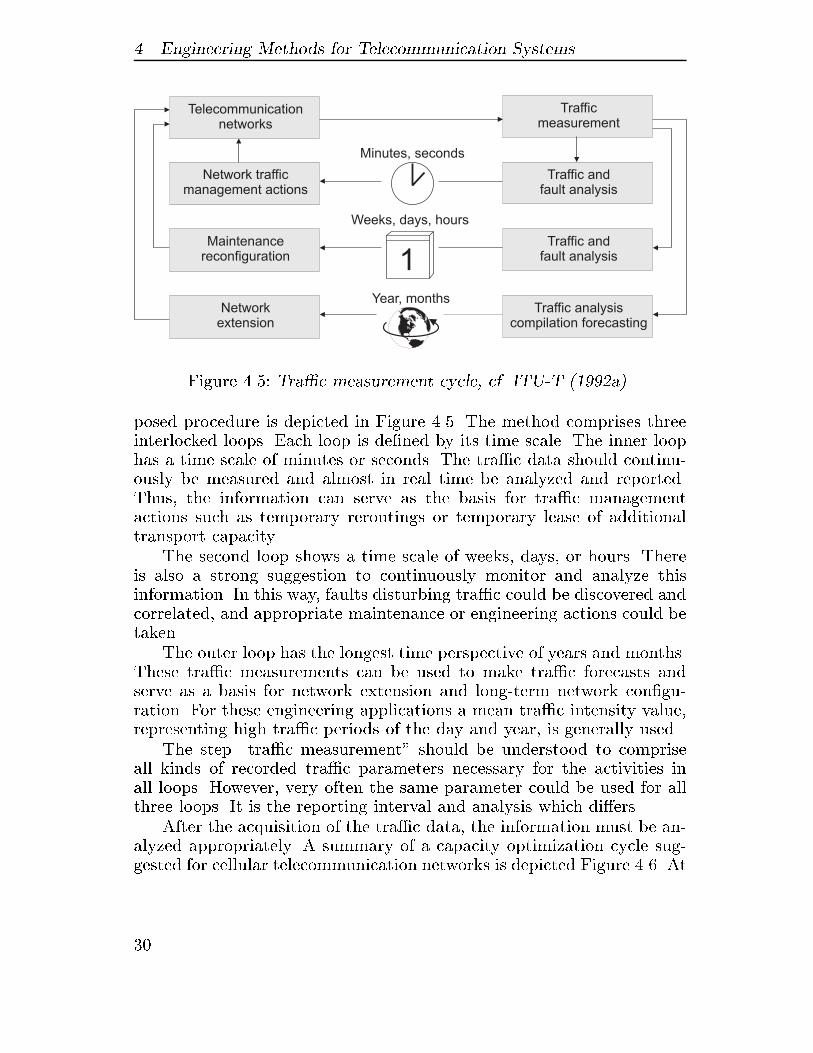
Figure �� � Tra�c measurement cycle cf� ITU�T ���a�
posed procedure is depicted in Figure �� � The method comprises threeinterlocked loops� Each loop is de�ned by its time scale� The inner loophas a time scale of minutes or seconds� The tra�c data should continu�ously be measured and almost in real time be analyzed and reported�Thus� the information can serve as the basis for tra�c managementactions such as temporary reroutings or temporary lease of additionaltransport capacity�
The second loop shows a time scale of weeks� days� or hours� Thereis also a strong suggestion to continuously monitor and analyze thisinformation� In this way� faults disturbing tra�c could be discovered andcorrelated� and appropriate maintenance or engineering actions could betaken�
The outer loop has the longest time perspective of years and months�These tra�c measurements can be used to make tra�c forecasts andserve as a basis for network extension and long�term network con�gu�ration� For these engineering applications a mean tra�c intensity value�representing high tra�c periods of the day and year� is generally used�
The step �tra�c measurement� should be understood to compriseall kinds of recorded tra�c parameters necessary for the activities inall loops� However� very often the same parameter could be used for allthree loops� It is the reporting interval and analysis which di�ers�
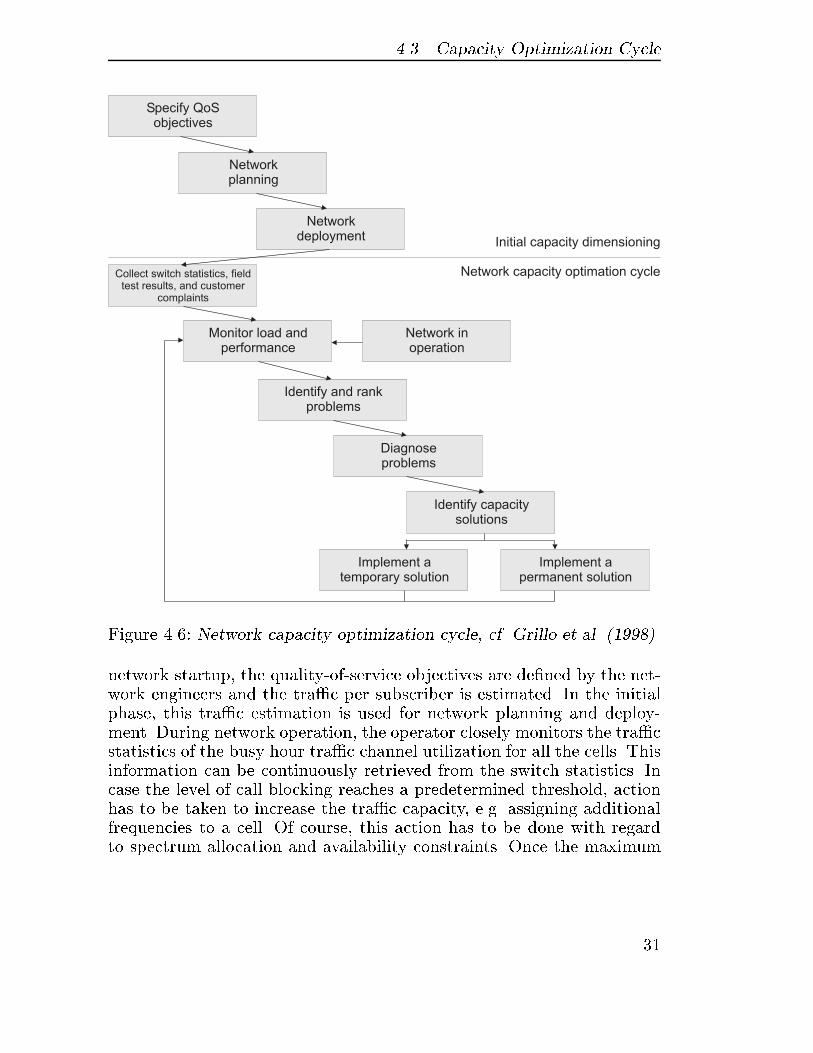
After the acquisition of the tra�c data� the information must be an�alyzed appropriately� A summary of a capacity optimization cycle sug�gested for cellular telecommunication networks is depicted Figure ���� At
�
��� Capacity Optimization Cycle
Specify QoSobjectives
Networkplanning
Networkdeployment
Collect switch statistics, fieldtest results, and customer
complaints
Monitor load andperformance
Identify and rankproblems
Diagnoseproblems
Identify capacitysolutions
Implement apermanent solution
Initial capacity dimensioning
Implement atemporary solution
Network inoperation
Network capacity optimation cycle
Figure ���� Network capacity optimization cycle cf� Grillo et�al� ����
network startup� the quality�of�service objectives are de�ned by the net�work engineers and the tra�c per subscriber is estimated� In the initialphase� this tra�c estimation is used for network planning and deploy�ment� During network operation� the operator closely monitors the tra�cstatistics of the busy hour tra�c channel utilization for all the cells� Thisinformation can be continuously retrieved from the switch statistics� Incase the level of call blocking reaches a predetermined threshold� actionhas to be taken to increase the tra�c capacity� e�g� assigning additionalfrequencies to a cell� Of course� this action has to be done with regardto spectrum allocation and availability constraints� Once the maximum
�
� Engineering Methods for Telecommunication Systems
Traffic dataprocessing
Existing network
Trafficforecasting
Network designstructure - routing
Equipmentinstallation
Workprogramm
Network dimensioningcircuit - trunks
TrafficMeasurement
Initialnetwork
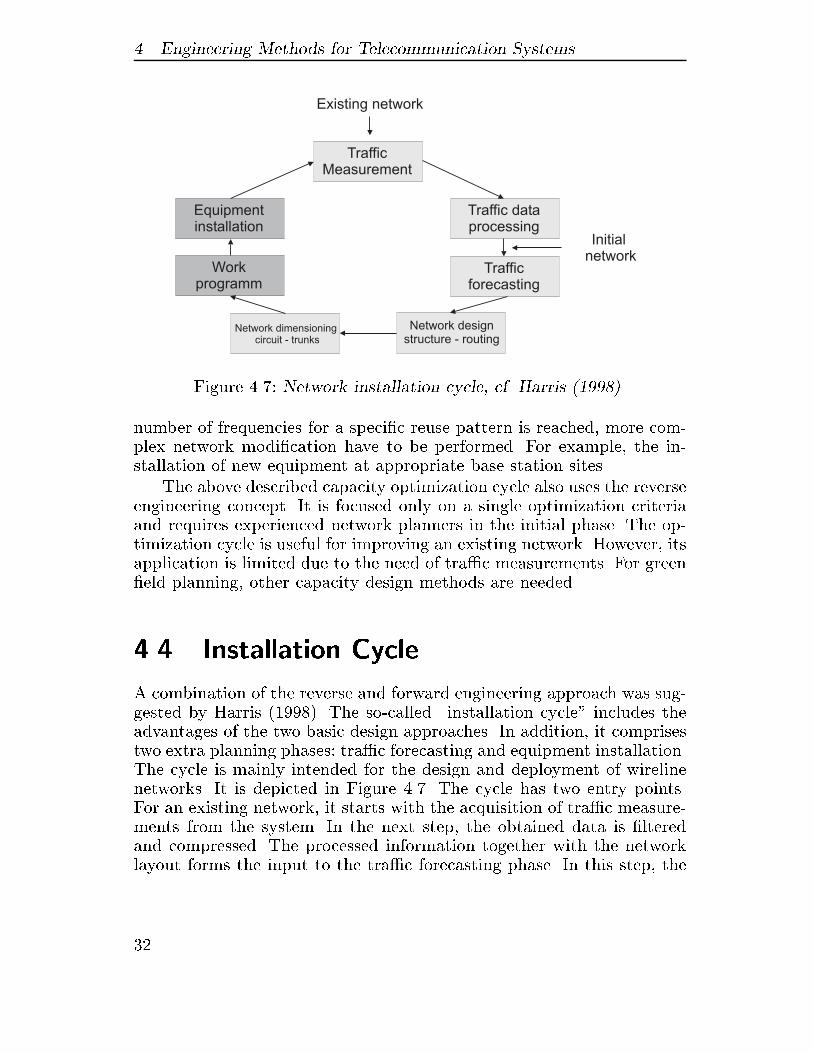
Figure ���� Network installation cycle cf� Harris ����
number of frequencies for a speci�c reuse pattern is reached� more com�plex network modi�cation have to be performed� For example� the in�stallation of new equipment at appropriate base station sites�
The above described capacity optimization cycle also uses the reverseengineering concept� It is focused only on a single optimization criteriaand requires experienced network planners in the initial phase� The op�timization cycle is useful for improving an existing network� However� itsapplication is limited due to the need of tra�c measurements� For green�eld planning� other capacity design methods are needed�
��� Installation Cycle
A combination of the reverse and forward engineering approach was sug�gested by Harris ������� The so�called �installation cycle� includes theadvantages of the two basic design approaches� In addition� it comprisestwo extra planning phases� tra�c forecasting and equipment installation�The cycle is mainly intended for the design and deployment of wirelinenetworks� It is depicted in Figure ���� The cycle has two entry points�For an existing network� it starts with the acquisition of tra�c measure�ments from the system� In the next step� the obtained data is �lteredand compressed� The processed information together with the networklayout forms the input to the tra�c forecasting phase� In this step� the
�
��� Concluding Remarks
future teletra�c is estimated using the tra�c measurements and the as�sumptions on the anticipated use� For the estimation� procedures like theKruithof method are applied� cf� ITU�T �����b�� The forecasting stepserves also as an entry point into the cycle if only an initial networkcon�guration without any tra�c measurements is available� In this case�the measurements can be replaced by rough estimations� The anticipatedtra�c is the major input to the network design phase� In this step� thedesigners determine the structure of the network and the routing of thetra�c� The next step in the cycle is the dimensioning of the communica�tion links� After this item� the network layout is completely de�ned� Inthe next phase� therefore� the planners de�ne the work program for thenetwork deployment� In the installation step� the network equipment is�nally deployed in the service area and brought into operation�
The installation cycle de�nes a practical and complete procedurenetwork planning and deployment process� It combines the advantagesof forward and reverse engineering� The most important feature of thecycle is the inclusion of a tra�c forecasting step� In this way� the networkcan be designed to carry the anticipated tra�c�
��� Concluding Remarks
The success of future telecommunication networks relies on intelligentnetwork planning to achieve superior service quality� high capacity� ande�cient network management� The conventional design methods can notcompletely accomplish the task since these methods are mostly based onpure reverse engineering design approaches� The conventional methodsare either too slow or they are focused on isolated design aspects� Theapplication of forward engineering design procedures can resolve thisde�cit� Despite their high requirements to system modeling� these meth�ods are able to achieve e�cient� demand�oriented� and optimal networkcon�gurations� In this way� they eliminate some of the heuristics widelyapplied in networks design� Of course� the forward engineering designparadigm cannot completely replace the iterative approach� For exam�ple the planning of network prototypes will still use the iterative design�However� if the design objectives are well�de�ned� the forward engineer�ing approach will out�perform the conventional method� This will bedemonstrated for case of cellular network planning in Chapter ��
� Engineering Methods for Telecommunication Systems
�

Part II
Demand�oriented
Telecommunication
System Design

� Spatial Customer Tra�c
Estimation and
Characterization
The primary task of telecommunication network planning is to supplycommunication services to customers which are distributed service area�To provide the service the core task of engineering is to locate and con��gure transmission facilities� i�e�� base stations or switching centers� inthe service area of the network and to interconnect these nodes in anoptimal way� To achieve an e�cient con�guration of these spatially ex�tended systems� new teletra�c models are required to evaluate theirspatial performance� cf� Wirth �������
In particular� the design of mobile networks has to be based on theanalysis of the distribution of the expected spatial teletra�c demand inthe complete service area� However� most of the tra�c models appliedso far for the demand estimation characterize the tra�c only in a singlecell� e�g� Hong and Rappaport ������� Other tra�c models� like the high�way Poisson�Arrival�Location Model �PALM� proposed by Leung et al�������� give deep theoretical insights� but they are too complex for prac�tical use in mobile system engineering� Hence� the demand�based designof mobile communication systems requires e�cient tra�c estimation andcharacterization procedures which are at the same time both accurateand simple to use� An e�cient framework which is capable to meet theserequirements will be introduced in this chapter�
The chapter is organized as follows� Section �� provides �rst anoverview on tra�c source models which are used so far in mobile net�work design� In the second part� a spatial tra�c estimation model isde�ned which takes into account the geographical and demographicalfactors for the expected teletra�c in a service region� Subsequently� the
�
� Spatial Customer Tra�c Estimation and Characterization
Demand Node Concept �DNC� is introduced� which is an e�cient tech�nique to represent the spatial distribution of the teletra�c using discretepoints� called demand nodes� Section �� outlines a tra�c characteriza�tion procedure which is capable to derive a demand node distributionfrom publicly available geographical data� The methods to generate de�mand nodes distributions are presented in Section �� Here� two hier�archical clustering algorithms� a partitional clustering method and anagglomerative procedure� are discussed in detail and evaluated with re�gard to their tra�c characterization capability� Section �� is devotedto the evaluation of the impact of user clustering on mobile networkperformance and Section � outlines some applications of the demandnode concept in telecommunication network engineering� The chapter isconcluded by Section ��� which gives a summary of the results and ashort outlook on the future development of the demand node concept�
��� Spatial Tra�c Estimation
In mobile communication networks the teletra�c originating in the ser�vice area of the system can be described mainly by two tra�c modelswhich di�er by their view of the network� The tra�c source model� whichis also often referred to as the mobility model� describes the system asseen by the mobile station� The tra�c scenario is represented as a pop�ulation of individual tra�c sources performing a random walk throughthe service area and randomly generating demand for resources� i�e�� theradio channels� An overview of these models is provided in Section �����
In contrast� the network tra�c model of a mobile communicationsystem describes the tra�c as observed from the non�moving networkelements� e�g� base stations or switches� This model characterizes thespatial and time�dependent distribution of the teletra�c� The tra�cintensity � is in general measured in call attempts per time unit andspace unit ��calls��sec�km�� �� Taking additionally the mean call durationE�B into account� the o�ered tra�c is a ! � � E�B �in �Erlang�km� ��This measure represents the amount of o�ered tra�c in a de�ned area�
Both tra�c models are used in mobile communication system design�Particularly the latter model is of principal interest when determiningthe location of the main facilities in a mobile network� These componentsshould be located close to the expected tra�c in order to increase thesystem e�ciency� Therefore� we focus in Section ���� in greater detailon this type of models�
�
��� Spatial Tra�c Estimation
����� Tra�c Source Models
Due to their capability to describe the user behavior in detail� tra�csource models are usually applied for the characterization of the tra�cin an individual cell of a mobile network� Using these models� local perfor�mance measures like fresh call blocking probability or handover blockingprobability can be derived from the mobility pattern� Additionally� thesemodels can be used to calculate the subjective Quality�of�Service valuesfor individual users� cf� Section ���
Overview on Tra�c Source Models
A widely used single cell model was �rst introduced by Hong and Rap�paport ������� Their model assumes a uniformly distributed mobile userdensity and a non�directional uniform velocity distribution of the mo�biles� Under this premise� performance values like the mean channel hold�ing time and the average call origination rate in a cell can be computed�
A more accurate modeling of the calling behavior of users in a singlecell was proposed by Tran�Gia and Mandjes ������� The model considersa base station with a �nite customer population and repeated attempts�The appealing characteristic of the model is the assumption of a small��nite user population� However� the model is limited to a single cell anddoes not consider the spatial variation of the teletra�c within the servicearea�
El�Dolil et al� ������ characterized the mobile phone tra�c on vehic�ular highways by assuming a one�dimensional mobility pattern for thecustomers� They derive the performance values by applying a stationary�ow model for the vehicular tra�c� An extended one�dimensional high�way model with a non�uniform density distribution� denoted as the high�way PALM model� was investigated by Leung et al� ������� For the traf��c characterization� �uid �ow models with time�nonhomogeneous andtime�homogeneous tra�c have been used� as well as an approximativestochastic tra�c model�
A limited directional two�dimensional mobility model was investi�gated by Foschini et al� ������ The model assumes a spatially homo�geneous distribution of the demand and an isotropic mobility structure�Chlebus ����� and Chlebus and Ludwin ���� � investigated a mobil�ity model with a homogeneous demand distribution and a non�uniformvelocity distribution� The tra�c orientation is non�directional and uni�formly distributed�
�
� Spatial Customer Tra�c Estimation and Characterization
The application of these tra�c source models in real network plan�ning cases is strongly limited� Some models� like the highway PALMmodel give a deep insight on the impact of the terminal mobility onthe cellular system performance� however they are rather complex to beapplied in real network design� Other models� like the one suggested byHong and Rappaport ������� due to their simpli�cation assumptions� canonly be applied for the determination of the parameters in an isolatedcell�
����� Tra�c Intensity
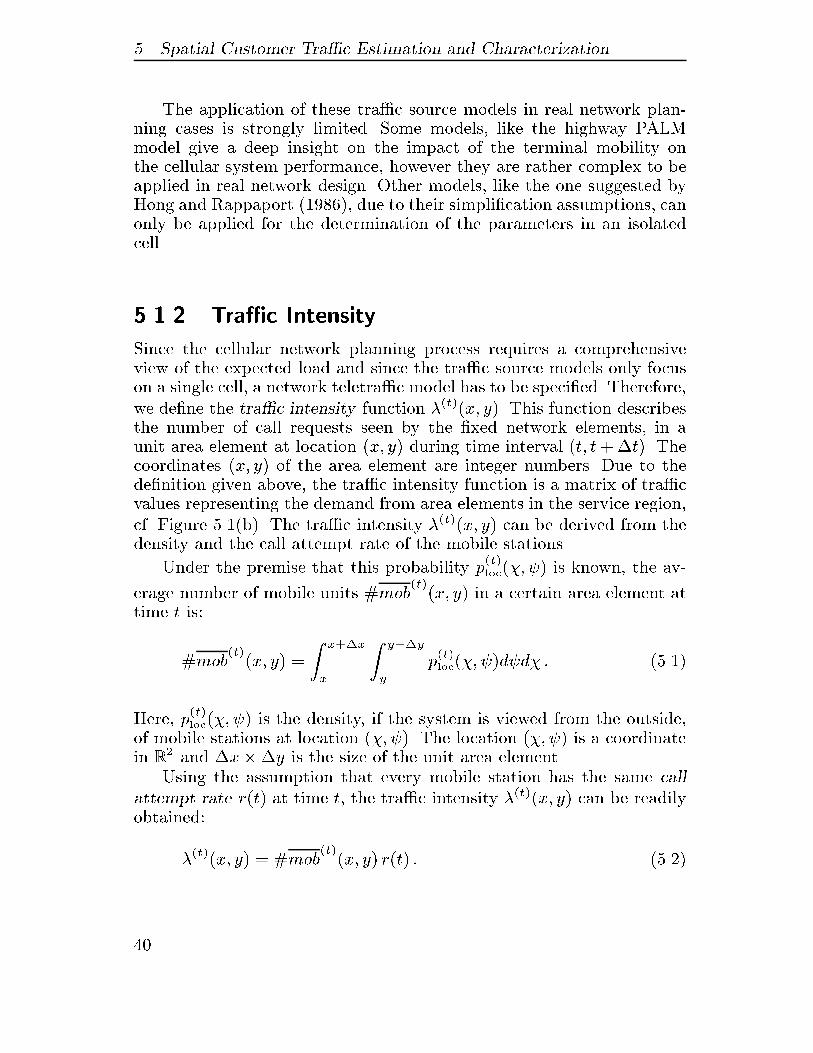
Since the cellular network planning process requires a comprehensiveview of the expected load and since the tra�c source models only focuson a single cell� a network teletra�c model has to be speci�ed� Therefore�we de�ne the tra�c intensity function ��t��x� y�� This function describesthe number of call requests seen by the �xed network elements� in aunit area element at location �x� y� during time interval �t� t "t�� Thecoordinates �x� y� of the area element are integer numbers� Due to thede�nition given above� the tra�c intensity function is a matrix of tra�cvalues representing the demand from area elements in the service region�cf� Figure ���b�� The tra�c intensity ��t��x� y� can be derived from thedensity and the call attempt rate of the mobile stations�
Under the premise that this probability p�t�loc����� is known� the av�
erage number of mobile units #mob�t�
�x� y� in a certain area element attime t is�
#mob�t�
�x� y� !
Z x��x
x
Z y��y
y
p�t�loc�����d�d� � � ���
Here� p�t�loc����� is the density� if the system is viewed from the outside�
of mobile stations at location ������ The location ����� is a coordinatein R� and "x�"y is the size of the unit area element�
Using the assumption that every mobile station has the same callattempt rate r�t� at time t� the tra�c intensity ��t��x� y� can be readilyobtained�
��t��x� y� ! #mob�t�
�x� y� r�t� � � ���
��
��� Spatial Tra�c Estimation
Since in real world planning cases it is almost impossible to directly
calculate the location probability p�t�loc��� �� from the mobility model�
the tra�c intensity has to be derived from indirect statistical measures�
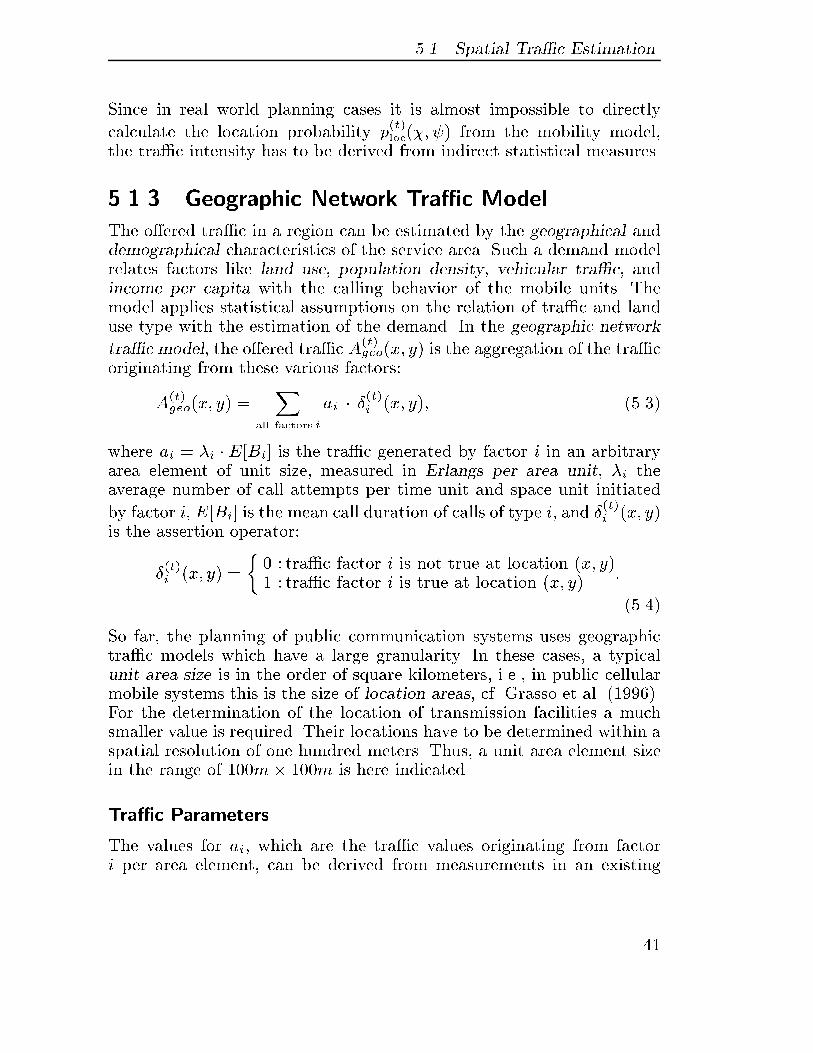
����� Geographic Network Tra�c Model
The o�ered tra�c in a region can be estimated by the geographical anddemographical characteristics of the service area� Such a demand modelrelates factors like land use� population density� vehicular tra�c� andincome per capita with the calling behavior of the mobile units� Themodel applies statistical assumptions on the relation of tra�c and landuse type with the estimation of the demand� In the geographic network
tra�c model� the o�ered tra�c A�t�geo�x� y� is the aggregation of the tra�c
originating from these various factors�
A�t�geo�x� y� !
Xall factors i
ai � ��t�i �x� y�� � ��
where ai ! �i � E�Bi is the tra�c generated by factor i in an arbitraryarea element of unit size� measured in Erlangs per area unit� �i theaverage number of call attempts per time unit and space unit initiated
by factor i� E�Bi is the mean call duration of calls of type i� and ��t�i �x� y�
is the assertion operator�
��t�i �x� y� !
�� � tra�c factor i is not true at location �x� y�� � tra�c factor i is true at location �x� y�
�
� ���
So far� the planning of public communication systems uses geographictra�c models which have a large granularity� In these cases� a typicalunit area size is in the order of square kilometers� i�e�� in public cellularmobile systems this is the size of location areas� cf� Grasso et al� �������For the determination of the location of transmission facilities a muchsmaller value is required� Their locations have to be determined within aspatial resolution of one hundred meters� Thus� a unit area element sizein the range of ���m � ���m is here indicated�
Tra�c Parameters
The values for ai� which are the tra�c values originating from factori per area element� can be derived from measurements in an existing
��
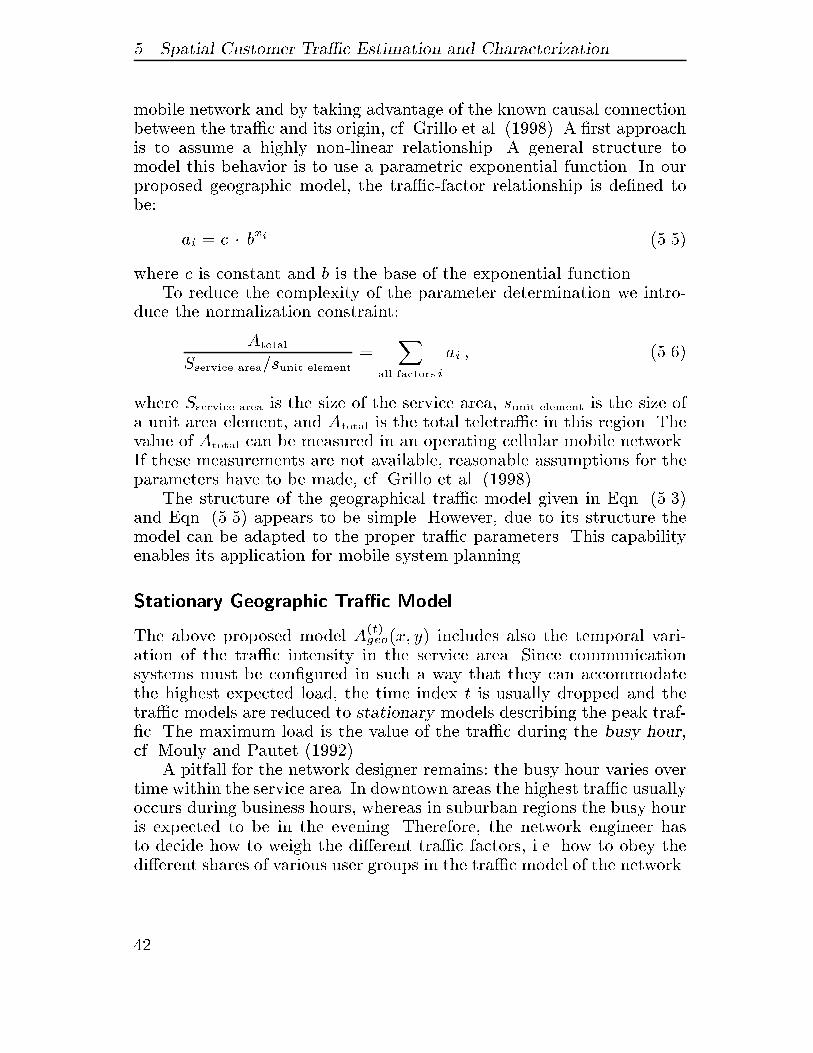
� Spatial Customer Tra�c Estimation and Characterization
mobile network and by taking advantage of the known causal connectionbetween the tra�c and its origin� cf� Grillo et al� ������� A �rst approachis to assume a highly non�linear relationship� A general structure tomodel this behavior is to use a parametric exponential function� In ourproposed geographic model� the tra�c�factor relationship is de�ned tobe�
ai ! c � bxi � � �
where c is constant and b is the base of the exponential function�To reduce the complexity of the parameter determination we intro�
duce the normalization constraint�
Atotal
Sservice area�sunit element
!X
all factors i
ai � � ���
where Sservice area is the size of the service area� sunit element is the size ofa unit area element� and Atotal is the total teletra�c in this region� Thevalue of Atotal can be measured in an operating cellular mobile network�If these measurements are not available� reasonable assumptions for theparameters have to be made� cf� Grillo et al� �������
The structure of the geographical tra�c model given in Eqn� � ��and Eqn� � � � appears to be simple� However� due to its structure themodel can be adapted to the proper tra�c parameters� This capabilityenables its application for mobile system planning�
Stationary Geographic Tra�c Model
The above proposed model A�t�geo�x� y� includes also the temporal vari�
ation of the tra�c intensity in the service area� Since communicationsystems must be con�gured in such a way that they can accommodatethe highest expected load� the time index t is usually dropped and thetra�c models are reduced to stationary models describing the peak traf��c� The maximum load is the value of the tra�c during the busy hour�cf� Mouly and Pautet �������
A pitfall for the network designer remains� the busy hour varies overtime within the service area� In downtown areas the highest tra�c usuallyoccurs during business hours� whereas in suburban regions the busy houris expected to be in the evening� Therefore� the network engineer hasto decide how to weigh the di�erent tra�c factors� i�e� how to obey thedi�erent shares of various user groups in the tra�c model of the network�
��
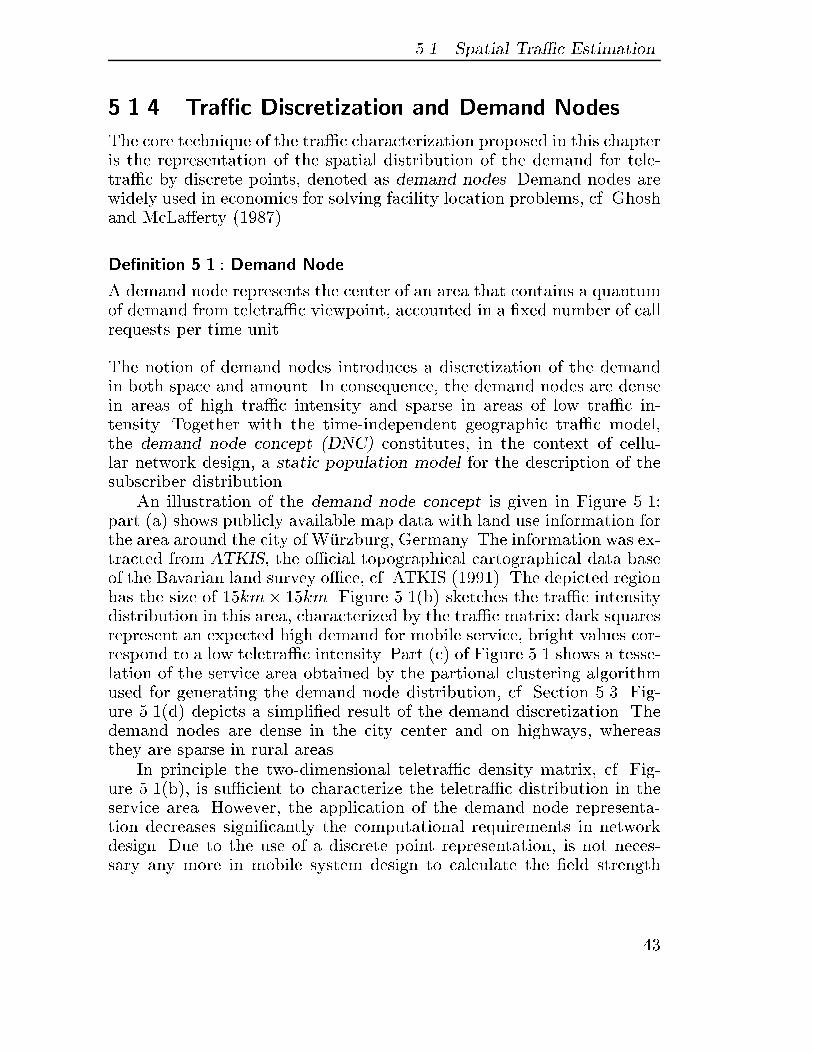
��� Spatial Tra�c Estimation
����� Tra�c Discretization and Demand Nodes
The core technique of the tra�c characterization proposed in this chapteris the representation of the spatial distribution of the demand for tele�tra�c by discrete points� denoted as demand nodes� Demand nodes arewidely used in economics for solving facility location problems� cf� Ghoshand McLa�erty �������
De�nition ��� � Demand Node
A demand node represents the center of an area that contains a quantumof demand from teletra�c viewpoint� accounted in a �xed number of callrequests per time unit�
The notion of demand nodes introduces a discretization of the demandin both space and amount� In consequence� the demand nodes are densein areas of high tra�c intensity and sparse in areas of low tra�c in�tensity� Together with the time�independent geographic tra�c model�the demand node concept �DNC� constitutes� in the context of cellu�lar network design� a static population model for the description of thesubscriber distribution�
An illustration of the demand node concept is given in Figure ���part �a� shows publicly available map data with land use information forthe area around the city of W�urzburg� Germany� The information was ex�tracted from ATKIS� the o�cial topographical cartographical data baseof the Bavarian land survey o�ce� cf� ATKIS ������� The depicted regionhas the size of � km� � km� Figure ���b� sketches the tra�c intensitydistribution in this area� characterized by the tra�c matrix� dark squaresrepresent an expected high demand for mobile service� bright values cor�respond to a low teletra�c intensity� Part �c� of Figure �� shows a tesse�lation of the service area obtained by the partional clustering algorithmused for generating the demand node distribution� cf� Section �� Fig�ure ���d� depicts a simpli�ed result of the demand discretization� Thedemand nodes are dense in the city center and on highways� whereasthey are sparse in rural areas�
In principle the two�dimensional teletra�c density matrix� cf� Fig�ure ���b�� is su�cient to characterize the teletra�c distribution in theservice area� However� the application of the demand node representa�tion decreases signi�cantly the computational requirements in networkdesign� Due to the use of a discrete point representation� is not neces�sary any more in mobile system design to calculate the �eld strength
�
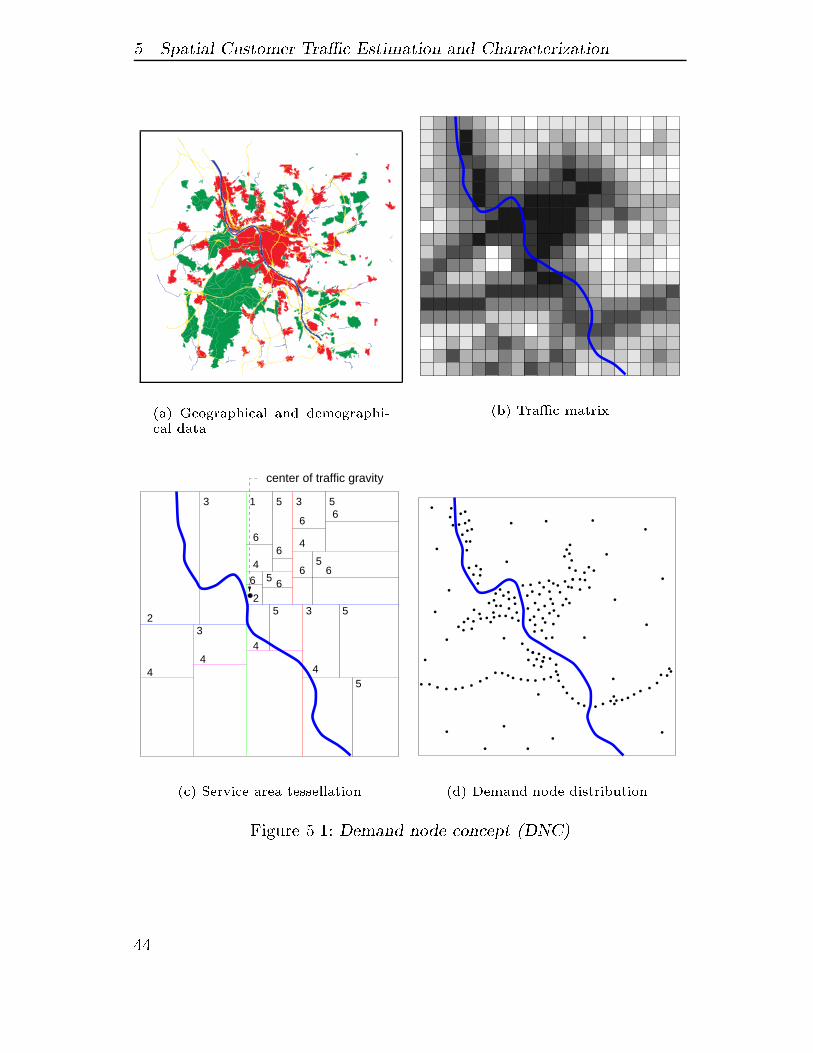
� Spatial Customer Tra�c Estimation and Characterization
�a� Geographical and demographi�cal data
�b� Tra�c matrix
5
2
2
44
4
4
3 1 5 3
54
4
5
5 3
3
5
5
66
66
6 66 6
center of traffic gravity
�c� Service area tessellation
. ......
.....
.
. .......
........
..... .. .
.
...
...
... ... .
.
... .
....
....
.. ... ..
...
..
....
....
...
... ... .
... .... ........
.
.
..
.
.
. .
.
.
..
.
..
..
.
..
. ...
...
....
.
.. .
.
.. ..
......... . . .. .. . .. . .. .... ..
.. ....
.
.
�d� Demand node distribution
Figure ��� Demand node concept �DNC�
��
��� Spatial Tra�c Characterization
at every point in the area� It is su�cient to compute the �eld strengthvalues only at the location of the demand nodes� cf� Chapter �� More�over� the discrete presentation can be used to characterize the clusteringe�ect of users in the service area� The demand node concept enables theevaluation of the impact of this user clumping on network performance�cf� Section ���
��� Spatial Tra�c Characterization
����� Tra�c Characterization Procedure
Based on the estimation method introduced in the previous section� thetra�c characterization procedure has to compute the spatial tra�c in�tensity and its discrete demand node representation from realistic datataken from available databases� In order to handle this type of data� thecomplete characterization process comprises four sequential steps�
Step � Tra�c model de�nition�
Identi�cation of tra�c factors and determination of thetra�c parameters in the geographical tra�c model�
Step � Data preprocessing�
Preprocessing of the information in the geographical anddemographical database�
Step � Tra�c estimation�
Calculation of the spatial tra�c intensity matrix of theservice region�
Step � Demand node generation�
Generation of the discrete demand node distribution bythe application of clustering methods�
Tra�c Model De�nition
The de�nition of the geographical tra�c model in Step � of the char�acterization procedure is based on the arguments given in Section ����A simple but accurate spatial geographic tra�c model is the foundationfor system optimization in the subsequent network design steps�
�
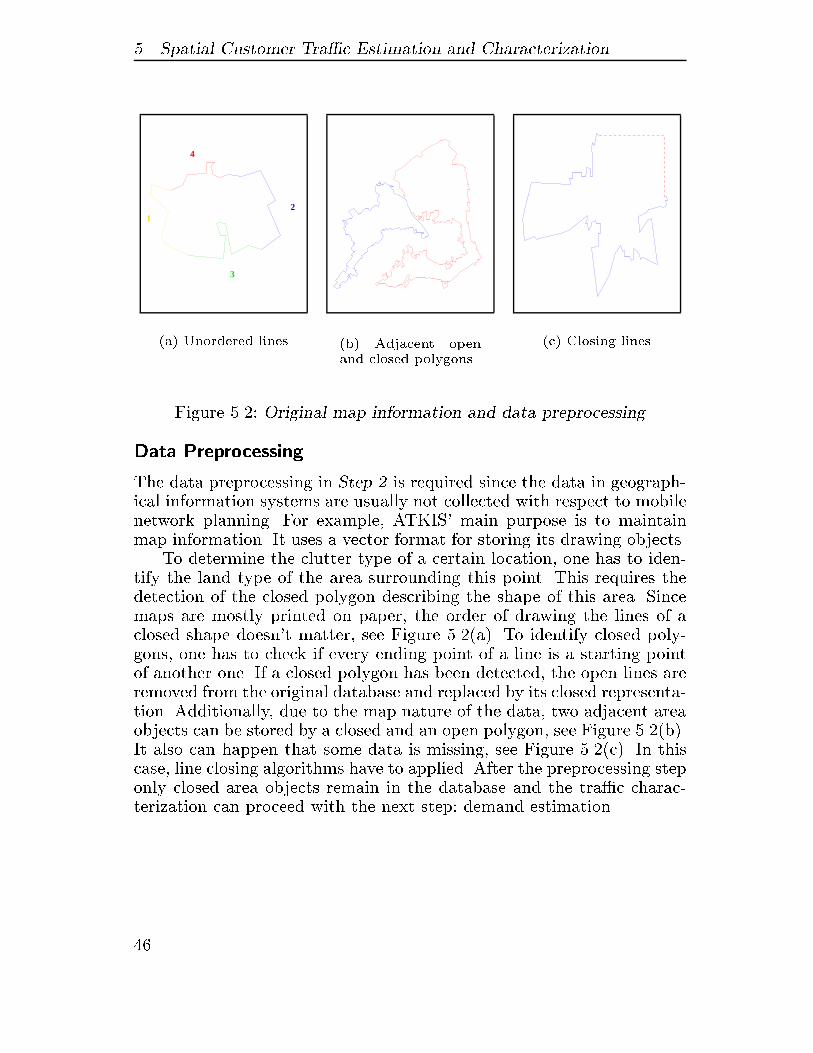
� Spatial Customer Tra�c Estimation and Characterization
1
4
2
3
�a� Unordered lines �b� Adjacent openand closed polygons
�c� Closing lines
Figure ��� Original map information and data preprocessing
Data Preprocessing
The data preprocessing in Step � is required since the data in geograph�ical information systems are usually not collected with respect to mobilenetwork planning� For example� ATKIS� main purpose is to maintainmap information� It uses a vector format for storing its drawing objects�
To determine the clutter type of a certain location� one has to iden�tify the land type of the area surrounding this point� This requires thedetection of the closed polygon describing the shape of this area� Sincemaps are mostly printed on paper� the order of drawing the lines of aclosed shape doesn�t matter� see Figure ���a�� To identify closed poly�gons� one has to check if every ending point of a line is a starting pointof another one� If a closed polygon has been detected� the open lines areremoved from the original database and replaced by its closed representa�tion� Additionally� due to the map nature of the data� two adjacent areaobjects can be stored by a closed and an open polygon� see Figure ���b��It also can happen that some data is missing� see Figure ���c�� In thiscase� line closing algorithms have to applied� After the preprocessing steponly closed area objects remain in the database and the tra�c charac�terization can proceed with the next step� demand estimation�
��
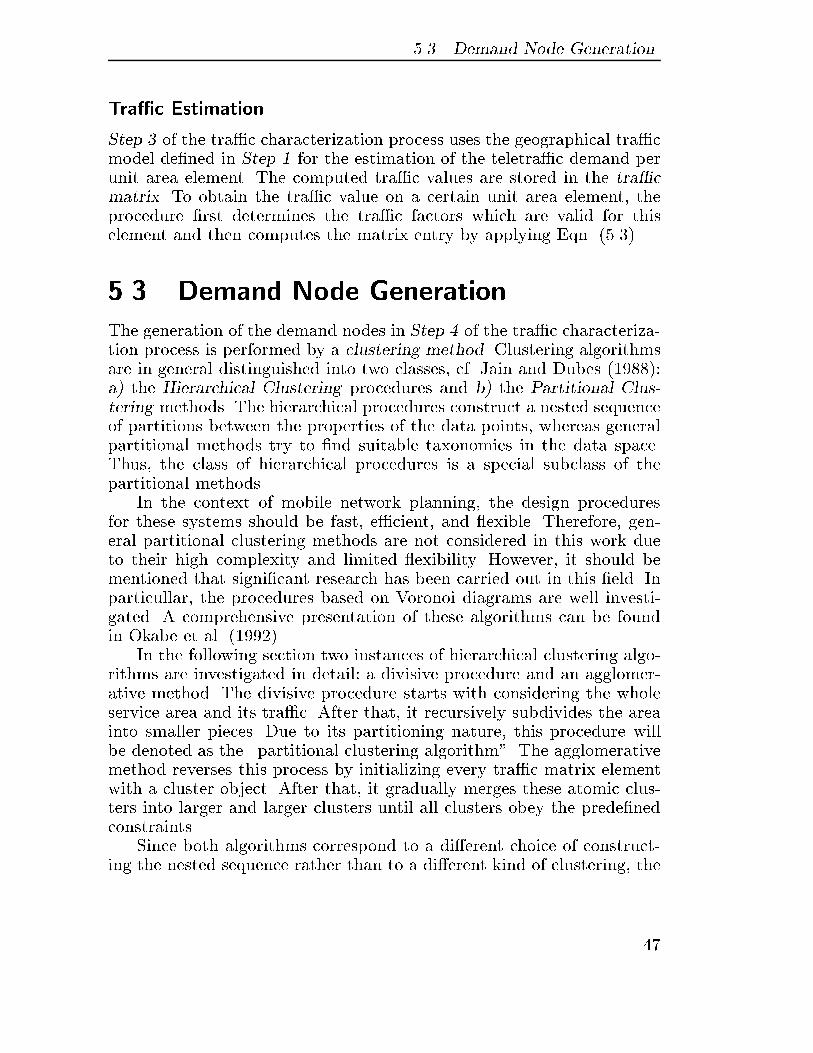
��� Demand Node Generation
Tra�c Estimation
Step � of the tra�c characterization process uses the geographical tra�cmodel de�ned in Step � for the estimation of the teletra�c demand perunit area element� The computed tra�c values are stored in the tra�cmatrix� To obtain the tra�c value on a certain unit area element� theprocedure �rst determines the tra�c factors which are valid for thiselement and then computes the matrix entry by applying Eqn� � ���
��� Demand Node Generation
The generation of the demand nodes in Step � of the tra�c characteriza�tion process is performed by a clustering method� Clustering algorithmsare in general distinguished into two classes� cf� Jain and Dubes �������a� the Hierarchical Clustering procedures and b� the Partitional Clus�tering methods� The hierarchical procedures construct a nested sequenceof partitions between the properties of the data points� whereas generalpartitional methods try to �nd suitable taxonomies in the data space�Thus� the class of hierarchical procedures is a special subclass of thepartitional methods�
In the context of mobile network planning� the design proceduresfor these systems should be fast� e�cient� and �exible� Therefore� gen�eral partitional clustering methods are not considered in this work dueto their high complexity and limited �exibility� However� it should bementioned that signi�cant research has been carried out in this �eld� Inparticullar� the procedures based on Voronoi diagrams are well investi�gated� A comprehensive presentation of these algorithms can be foundin Okabe et al� �������
In the following section two instances of hierarchical clustering algo�rithms are investigated in detail� a divisive procedure and an agglomer�ative method� The divisive procedure starts with considering the wholeservice area and its tra�c� After that� it recursively subdivides the areainto smaller pieces� Due to its partitioning nature� this procedure willbe denoted as the �partitional clustering algorithm�� The agglomerativemethod reverses this process by initializing every tra�c matrix elementwith a cluster object� After that� it gradually merges these atomic clus�ters into larger and larger clusters until all clusters obey the prede�nedconstraints�
Since both algorithms correspond to a di�erent choice of construct�ing the nested sequence rather than to a di�erent kind of clustering� the
��
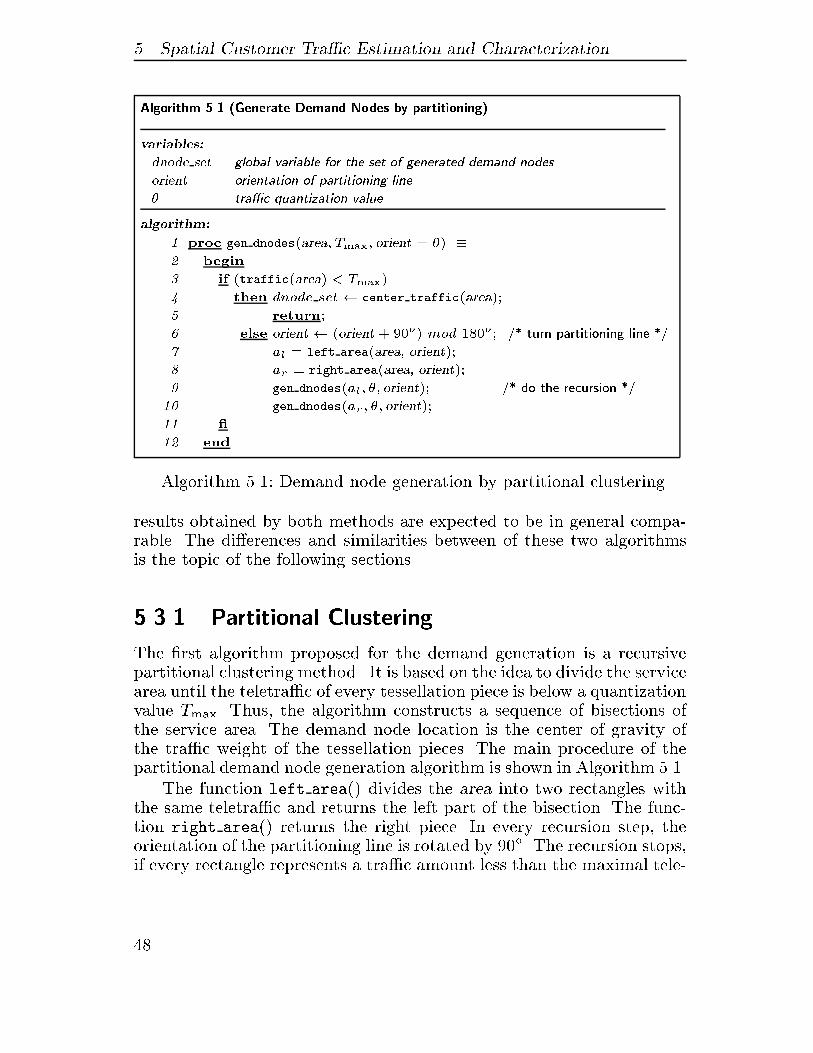
� Spatial Customer Tra�c Estimation and Characterization
Algorithm ��� �Generate Demand Nodes by partitioning�
variables�
dnode set global variable for the set of generated demand nodes
orient orientation of partitioning line
� tra�c quantization value
algorithm�
� proc gen dnodes�area� Tmax� orient � �� �
� begin
� if �traffic�area� � Tmax�
� then dnode set� center traffic�area��
� return�
� else orient � �orient � ��o� mod �o� �� turn partitioning line ��
� al � left area�area� orient��
� ar � right area�area� orient��
gen dnodes�al� �� orient�� �� do the recursion ��
� gen dnodes�ar� �� orient��
�� �
�� end
Algorithm ��� Demand node generation by partitional clustering
results obtained by both methods are expected to be in general compa�rable� The di�erences and similarities between of these two algorithmsis the topic of the following sections�
����� Partitional Clustering
The �rst algorithm proposed for the demand generation is a recursivepartitional clustering method� It is based on the idea to divide the servicearea until the teletra�c of every tessellation piece is below a quantizationvalue Tmax� Thus� the algorithm constructs a sequence of bisections ofthe service area� The demand node location is the center of gravity ofthe tra�c weight of the tessellation pieces� The main procedure of thepartitional demand node generation algorithm is shown in Algorithm ���
The function left area�� divides the area into two rectangles withthe same teletra�c and returns the left part of the bisection� The func�tion right area�� returns the right piece� In every recursion step� theorientation of the partitioning line is rotated by ���� The recursion stops�if every rectangle represents a tra�c amount less than the maximal tele�
��
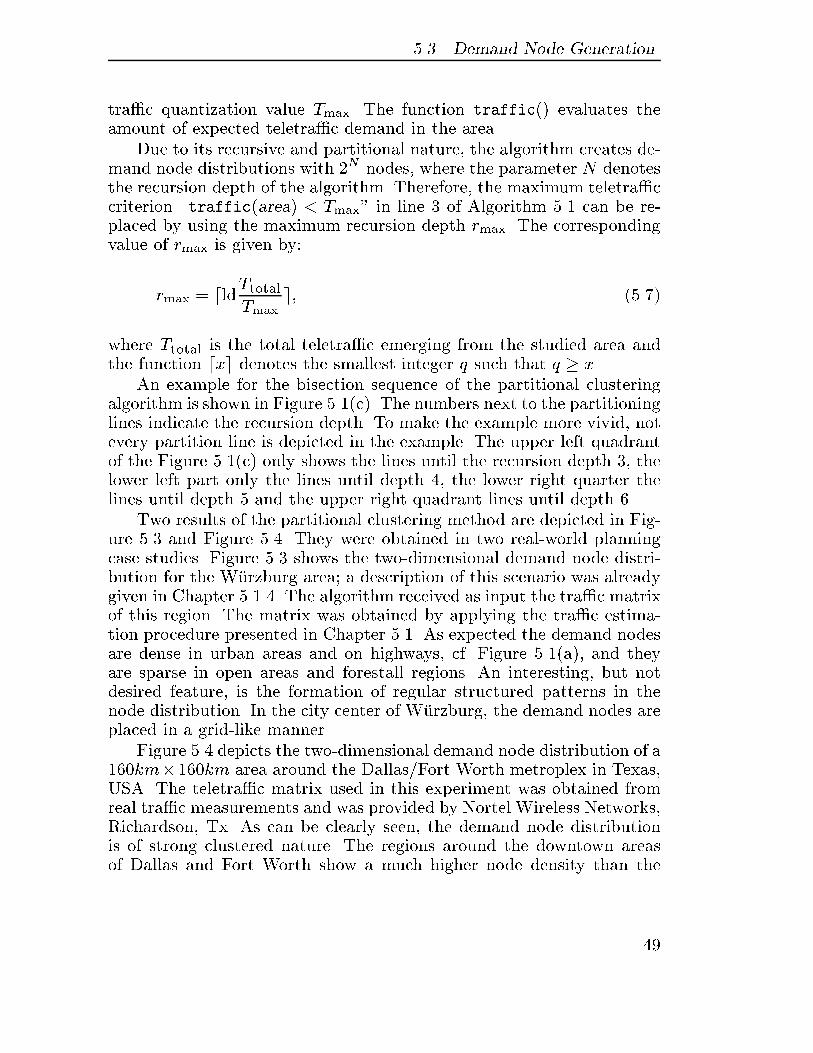
��� Demand Node Generation
tra�c quantization value Tmax� The function traffic�� evaluates theamount of expected teletra�c demand in the area�
Due to its recursive and partitional nature� the algorithm creates de�mand node distributions with �N nodes� where the parameter N denotesthe recursion depth of the algorithm� Therefore� the maximum teletra�ccriterion �traffic�area� � Tmax� in line of Algorithm �� can be re�placed by using the maximum recursion depth rmax� The correspondingvalue of rmax is given by�
rmax ! dldTtotalTmax
e� � ���
where Ttotal is the total teletra�c emerging from the studied area andthe function dxe denotes the smallest integer q such that q � x�
An example for the bisection sequence of the partitional clusteringalgorithm is shown in Figure ���c�� The numbers next to the partitioninglines indicate the recursion depth� To make the example more vivid� notevery partition line is depicted in the example� The upper left quadrantof the Figure ���c� only shows the lines until the recursion depth � thelower left part only the lines until depth �� the lower right quarter thelines until depth and the upper right quadrant lines until depth ��
Two results of the partitional clustering method are depicted in Fig�ure � and Figure ��� They were obtained in two real�world planningcase studies� Figure � shows the two�dimensional demand node distri�bution for the W�urzburg area� a description of this scenario was alreadygiven in Chapter ����� The algorithm received as input the tra�c matrixof this region� The matrix was obtained by applying the tra�c estima�tion procedure presented in Chapter ��� As expected the demand nodesare dense in urban areas and on highways� cf� Figure ���a�� and theyare sparse in open areas and forestall regions� An interesting� but notdesired feature� is the formation of regular structured patterns in thenode distribution� In the city center of W�urzburg� the demand nodes areplaced in a grid�like manner�
Figure �� depicts the two�dimensional demand node distribution of a���km����km area around the Dallas�Fort Worth metroplex in Texas�USA� The teletra�c matrix used in this experiment was obtained fromreal tra�c measurements and was provided by Nortel Wireless Networks�Richardson� Tx� As can be clearly seen� the demand node distributionis of strong clustered nature� The regions around the downtown areasof Dallas and Fort Worth show a much higher node density than the
��
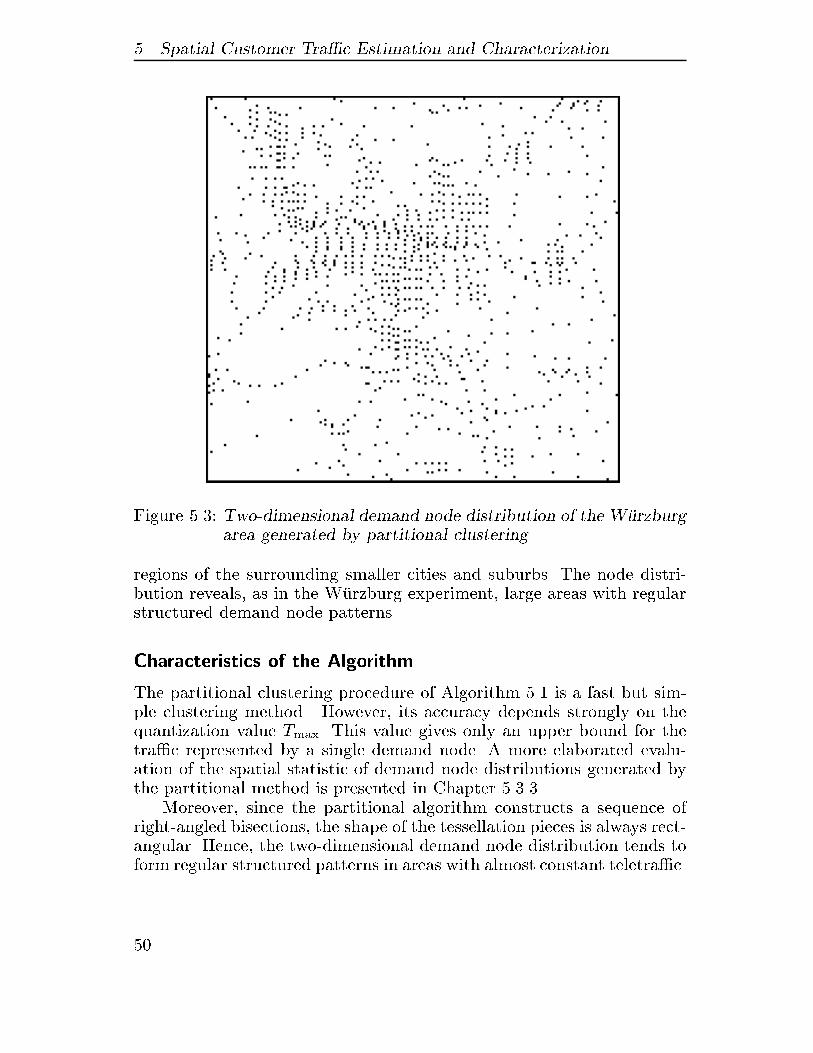
� Spatial Customer Tra�c Estimation and Characterization
Figure �� Two�dimensional demand node distribution of the W�urzburgarea generated by partitional clustering
regions of the surrounding smaller cities and suburbs� The node distri�bution reveals� as in the W�urzburg experiment� large areas with regularstructured demand node patterns�
Characteristics of the Algorithm
The partitional clustering procedure of Algorithm �� is a fast but sim�ple clustering method� However� its accuracy depends strongly on thequantization value Tmax� This value gives only an upper bound for thetra�c represented by a single demand node� A more elaborated evalu�ation of the spatial statistic of demand node distributions generated bythe partitional method is presented in Chapter ���
Moreover� since the partitional algorithm constructs a sequence ofright�angled bisections� the shape of the tessellation pieces is always rect�angular� Hence� the two�dimensional demand node distribution tends toform regular structured patterns in areas with almost constant teletra�c�
�
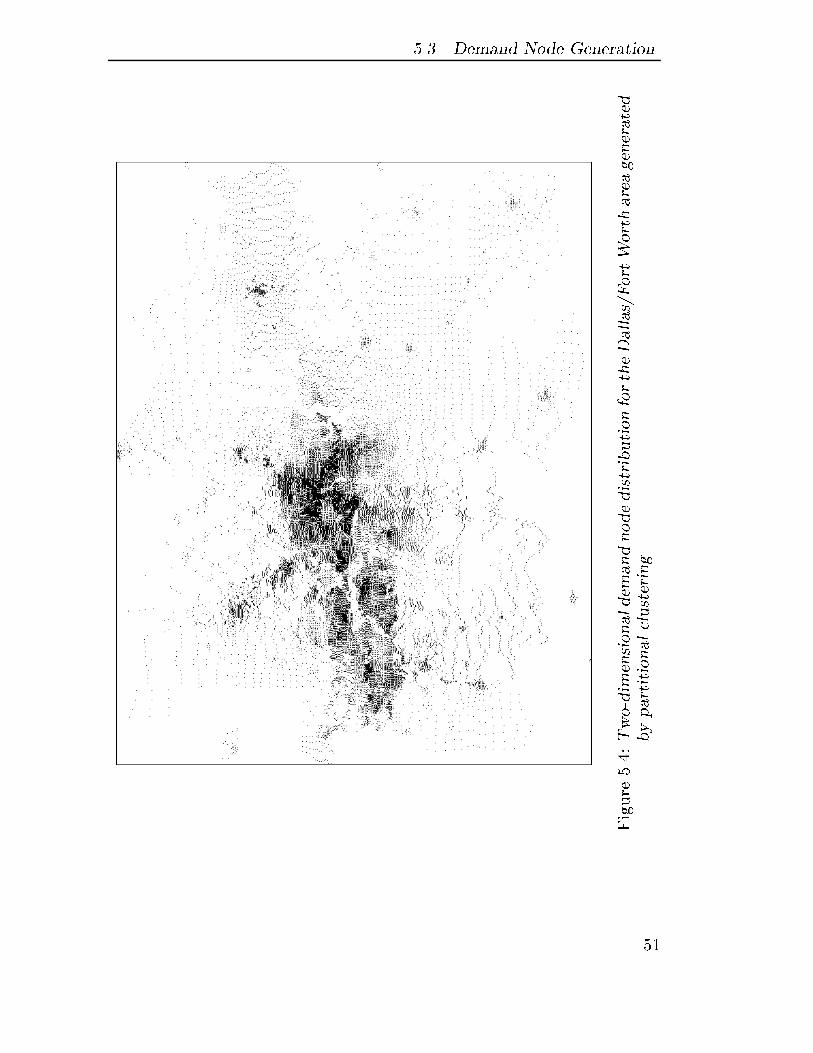
��� Demand Node Generation
Figure ���Two�dimensionaldemandnodedistributionfortheDallas�FortWorthareagenerated
bypartitionalclustering
�
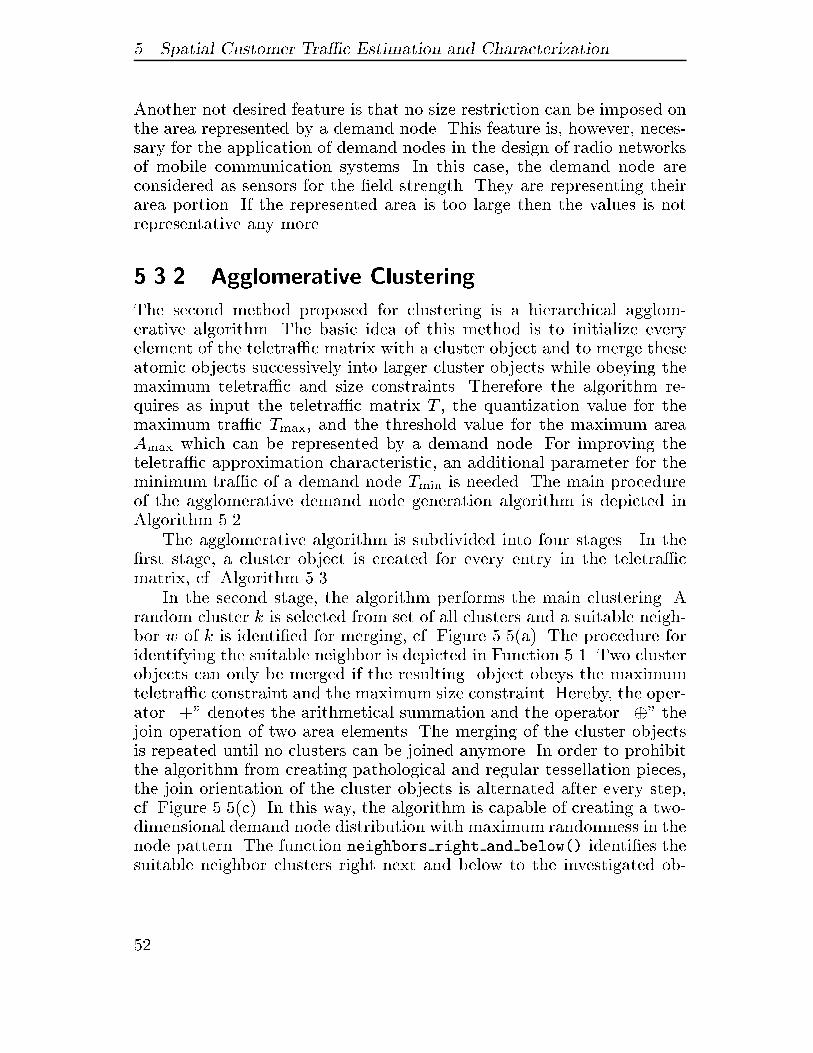
� Spatial Customer Tra�c Estimation and Characterization
Another not desired feature is that no size restriction can be imposed onthe area represented by a demand node� This feature is� however� neces�sary for the application of demand nodes in the design of radio networksof mobile communication systems� In this case� the demand node areconsidered as sensors for the �eld strength� They are representing theirarea portion� If the represented area is too large then the values is notrepresentative any more�
����� Agglomerative Clustering
The second method proposed for clustering is a hierarchical agglom�erative algorithm� The basic idea of this method is to initialize everyelement of the teletra�c matrix with a cluster object and to merge theseatomic objects successively into larger cluster objects while obeying themaximum teletra�c and size constraints� Therefore the algorithm re�quires as input the teletra�c matrix T � the quantization value for themaximum tra�c Tmax� and the threshold value for the maximum areaAmax which can be represented by a demand node� For improving theteletra�c approximation characteristic� an additional parameter for theminimum tra�c of a demand node Tmin is needed� The main procedureof the agglomerative demand node generation algorithm is depicted inAlgorithm ���
The agglomerative algorithm is subdivided into four stages� In the�rst stage� a cluster object is created for every entry in the teletra�cmatrix� cf� Algorithm ��
In the second stage� the algorithm performs the main clustering� Arandom cluster k is selected from set of all clusters and a suitable neigh�bor w of k is identi�ed for merging� cf� Figure � �a�� The procedure foridentifying the suitable neighbor is depicted in Function ��� Two clusterobjects can only be merged if the resulting object obeys the maximumteletra�c constraint and the maximum size constraint� Hereby� the oper�ator �� denotes the arithmetical summation and the operator ��� thejoin operation of two area elements� The merging of the cluster objectsis repeated until no clusters can be joined anymore� In order to prohibitthe algorithm from creating pathological and regular tessellation pieces�the join orientation of the cluster objects is alternated after every step�cf� Figure � �c�� In this way� the algorithm is capable of creating a two�dimensional demand node distribution with maximum randomness in thenode pattern� The function neighbors right and below�� identi�es thesuitable neighbor clusters right next and below to the investigated ob�
�
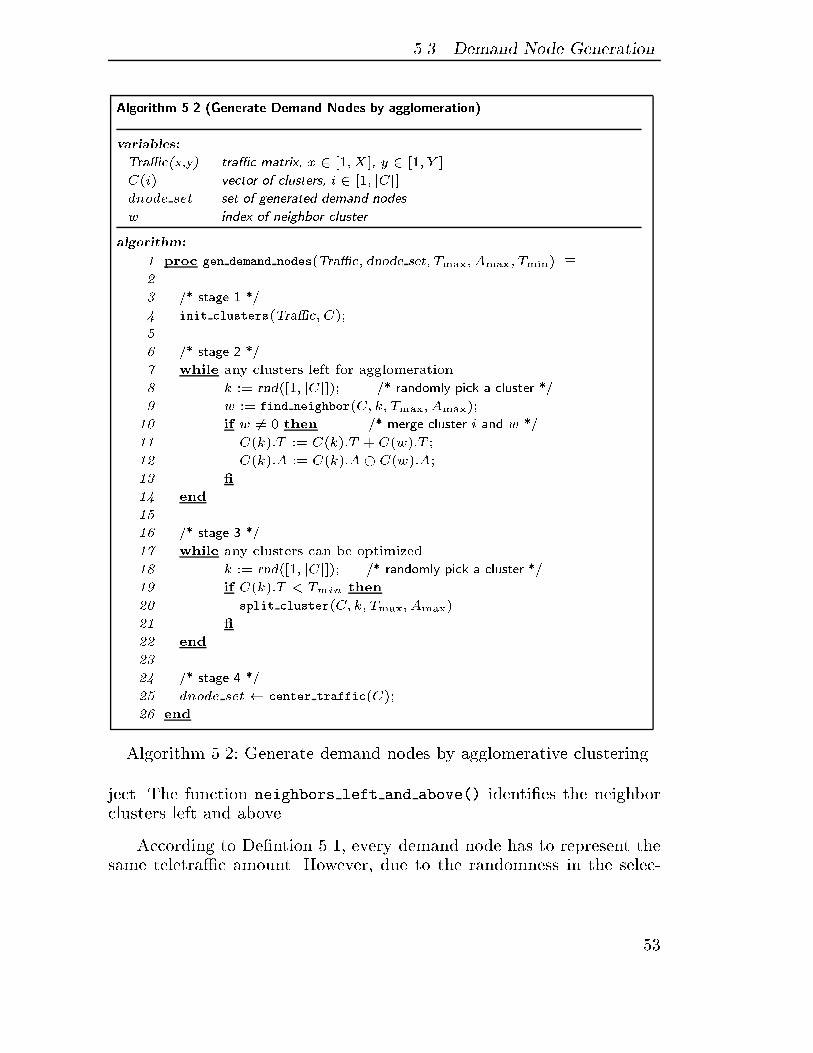
��� Demand Node Generation
Algorithm ��� �Generate Demand Nodes by agglomeration�
variables�
Tra�c�x�y� tra�c matrix� x � �� X � y � �� Y
C�i� vector of clusters� i � �� jCj
dnode set set of generated demand nodes
w index of neighbor cluster
algorithm�
� proc gen demand nodes�Tra�c� dnode set� Tmax� Amax� Tmin� �
�
� �� stage � ��
� init clusters�Tra�c� C��
�
� �� stage � ��
� while any clusters left for agglomeration
� k �� rnd��� jCj �� �� randomly pick a cluster ��
w �� find neighbor�C� k� Tmax� Amax��
� if w �� � then �� merge cluster i and w ��
�� C�k��T �� C�k��T � C�w��T �
�� C�k��A �� C�k��A� C�w��A�
�� �
�� end
��
�� �� stage � ��
�� while any clusters can be optimized
�� k �� rnd��� jCj �� �� randomly pick a cluster ��
� if C�k��T � Tmin then
� split cluster�C� k� Tmax� Amax�
�� �
�� end
��
�� �� stage � ��
�� dnode set� center traffic�C��
�� end
Algorithm ��� Generate demand nodes by agglomerative clustering
ject� The function neighbors left and above�� identi�es the neighborclusters left and above�
According to De�ntion ��� every demand node has to represent thesame teletra�c amount� However� due to the randomness in the selec�
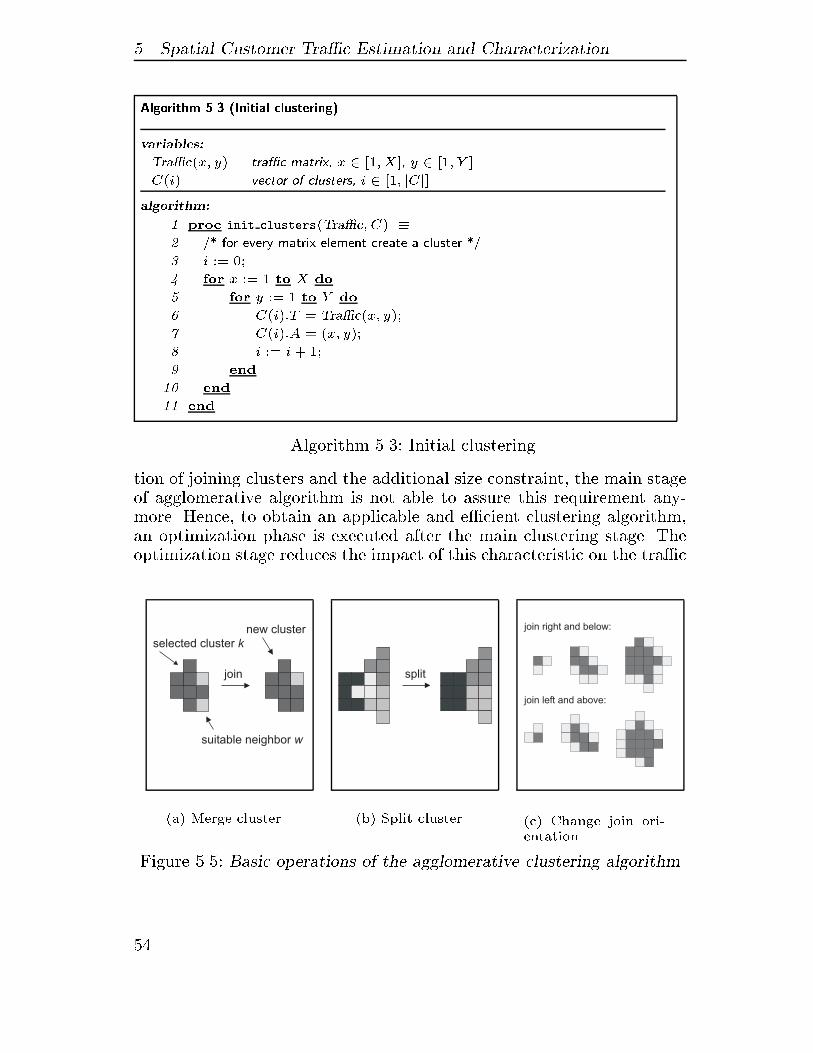
� Spatial Customer Tra�c Estimation and Characterization
Algorithm ��� �Initial clustering�
variables�
Tra�c�x� y� tra�c matrix� x � �� X � y � �� Y
C�i� vector of clusters� i � �� jCj
algorithm�
� proc init clusters�Tra�c� C� �
� �� for every matrix element create a cluster ��
� i �� ��
� for x �� to X do
� for y �� to Y do
� C�i��T � Tra�c�x� y��
� C�i��A � �x� y��
� i �� i� �
end
� end
�� end
Algorithm �� Initial clustering
tion of joining clusters and the additional size constraint� the main stageof agglomerative algorithm is not able to assure this requirement any�more� Hence� to obtain an applicable and e�cient clustering algorithm�an optimization phase is executed after the main clustering stage� Theoptimization stage reduces the impact of this characteristic on the tra�c
join
suitable neighbor w
selected cluster k
new cluster
�a� Merge cluster
split
�b� Split cluster
join right and below:
join left and above:
�c� Change join ori�entation
Figure � � Basic operations of the agglomerative clustering algorithm
�
��� Demand Node Generation
Function ��� �Search for suitable neighbor for cluster k�
variables�
C�i� vector of clusters� i � �� jCj
N�i� vector of neighbor cluster� i � �� jN j
k speci�es the cluster under investigation
algorithm�
� funct find neighbor�C� k� Tmax� Amax� �
�
� �� search for neighbors and change join orientation ��
� if C�k��orient �� �
� then N � neighbors right and below�C� k��
� C�k��orient � �
� else N � neighbors left and above�C� k��
� C�k��orient � ��
�
�
�� �� start with the �rst neighbor ��
�� nmin � N���
��
�� �� search suitable neighbor with smallest tra�c��
�� foreach n � N do
�� if C�n��T � C�k��T � Tmax �
�� C�n��jAj � C�k��jAj � Amax �
�� C�n��T � C�nmin��T
� then nmin � n�
� �
�� end
��
�� return nmin �� return index of neighbor ��
Function ��� Search for a suitable neighbor for merging
representation capability�
In the optimization stage� all cluster objects with a teletra�c valueless then the minimum teletra�c constraint Tmin are split up and theirarea elements are distributed among the neighbors� cf� Figure � �b��The split procedure is depicted in Algorithm ��� Due to this splittingoperation� the algorithm obtains a leveling of the teletra�c values of thecluster objects� The requirement of an equal teletra�c amount for everydemand node is still not sharply obeyed� However� the probability that
� Spatial Customer Tra�c Estimation and Characterization
Algorithm ��� �Split a cluster k by distributing its elements among the neighbors�
variables�
C�i� vector of clusters� i � �� jCj
N�i� vector of nieghbor clusters� i � �� jN j
k speci�es the cluster to be split
e atomic tra�c matrix element
algorithm�
� proc split cluster�C� k� Tmax� Amax�� �
� foreach e � C�k��A do
�
� �� check for neighbors ��
� N � neighbors�C�C�k��A�e���
�
� �� start with the �rst neighbor ��
� nmin � N���
found � FALSE�
�
�� �� search suitable neighbor with smallest tra�c ��
�� foreach n � N do
�� if C�n��T � C�k��A�e��T � Tmax �
�� C�n��jAj � C�k��jA�t�j � Amax �
�� C�n��T � C�nmin��T
�� then nmin � n�
�� found � TRUE�
�� �
� end
�
�� �� move element e to cluster nmin ��
�� if found �� TRUE then
�� C�nmin��T �� C�nmin��T � C�k��T �e��
�� C�nmin��A �� C�nmin��A � C�k��A�e��
�� C�k��T �� C�k��T � C�k��A�e��T �
�� C�k��A �� C�k��A C�k��A�e��
�� �
�� end
� end
Algorithm ��� Split cluster
�
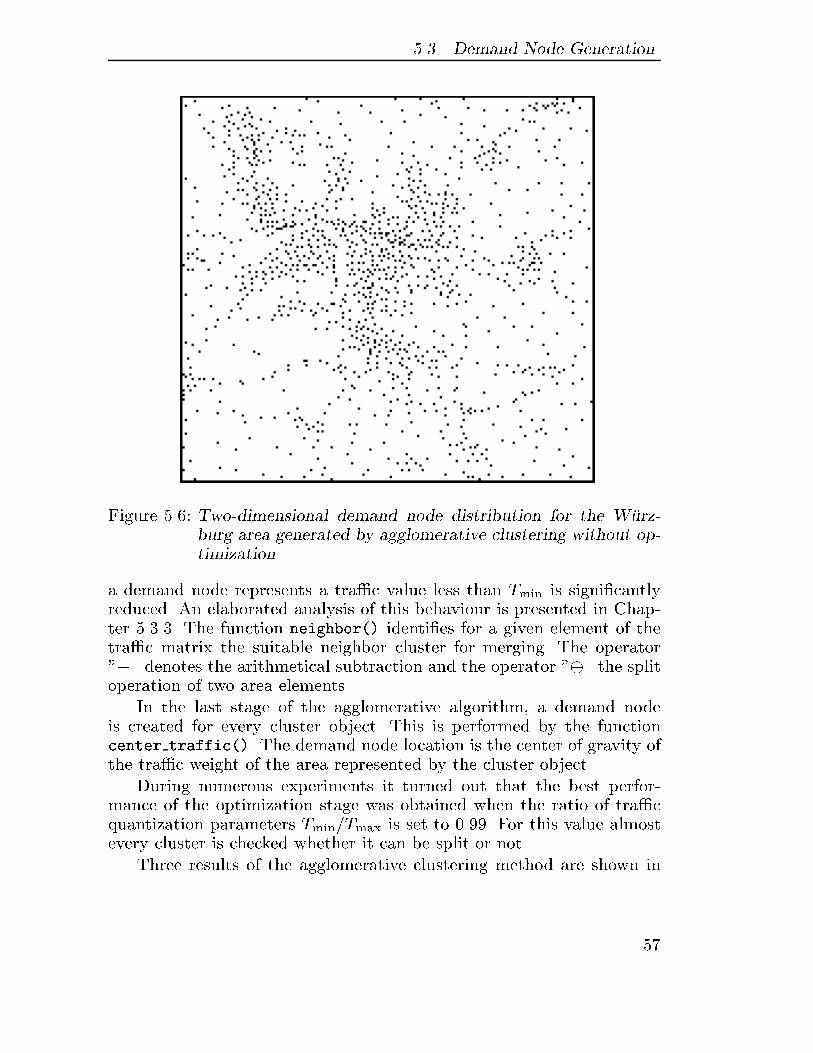
��� Demand Node Generation
Figure ��� Two�dimensional demand node distribution for the W�urz�burg area generated by agglomerative clustering without op�timization
a demand node represents a tra�c value less than Tmin is signi�cantlyreduced� An elaborated analysis of this behaviour is presented in Chap�ter ��� The function neighbor�� identi�es for a given element of thetra�c matrix the suitable neighbor cluster for merging� The operator��� denotes the arithmetical subtraction and the operator ��� the splitoperation of two area elements�
In the last stage of the agglomerative algorithm� a demand nodeis created for every cluster object� This is performed by the functioncenter traffic��� The demand node location is the center of gravity ofthe tra�c weight of the area represented by the cluster object�
During numerous experiments it turned out that the best perfor�mance of the optimization stage was obtained when the ratio of tra�cquantization parameters Tmin�Tmax is set to ����� For this value almostevery cluster is checked whether it can be split or not�
Three results of the agglomerative clustering method are shown in
�
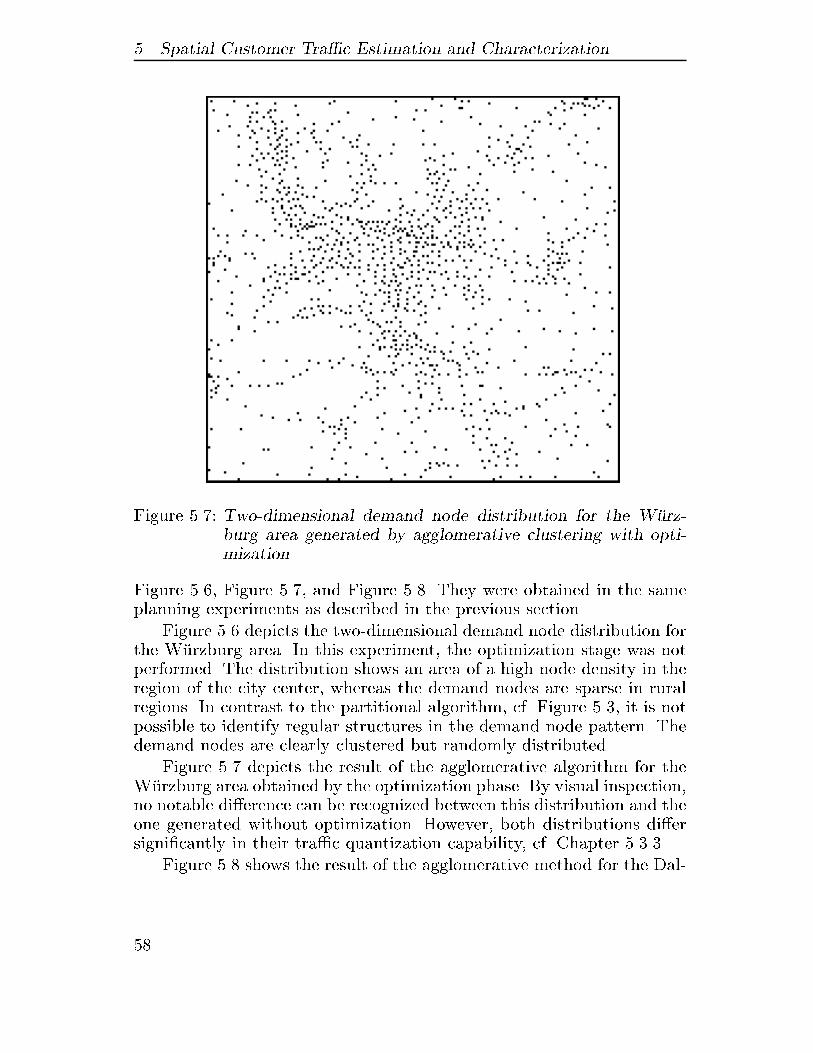
� Spatial Customer Tra�c Estimation and Characterization
Figure ��� Two�dimensional demand node distribution for the W�urz�burg area generated by agglomerative clustering with opti�mization
Figure ��� Figure ��� and Figure ��� They were obtained in the sameplanning experiments as described in the previous section�
Figure �� depicts the two�dimensional demand node distribution forthe W�urzburg area� In this experiment� the optimization stage was notperformed� The distribution shows an area of a high node density in theregion of the city center� whereas the demand nodes are sparse in ruralregions� In contrast to the partitional algorithm� cf� Figure �� it is notpossible to identify regular structures in the demand node pattern� Thedemand nodes are clearly clustered but randomly distributed�
Figure �� depicts the result of the agglomerative algorithm for theW�urzburg area obtained by the optimization phase� By visual inspection�no notable di�erence can be recognized between this distribution and theone generated without optimization� However� both distributions di�ersigni�cantly in their tra�c quantization capability� cf� Chapter ���
Figure �� shows the result of the agglomerative method for the Dal�
�
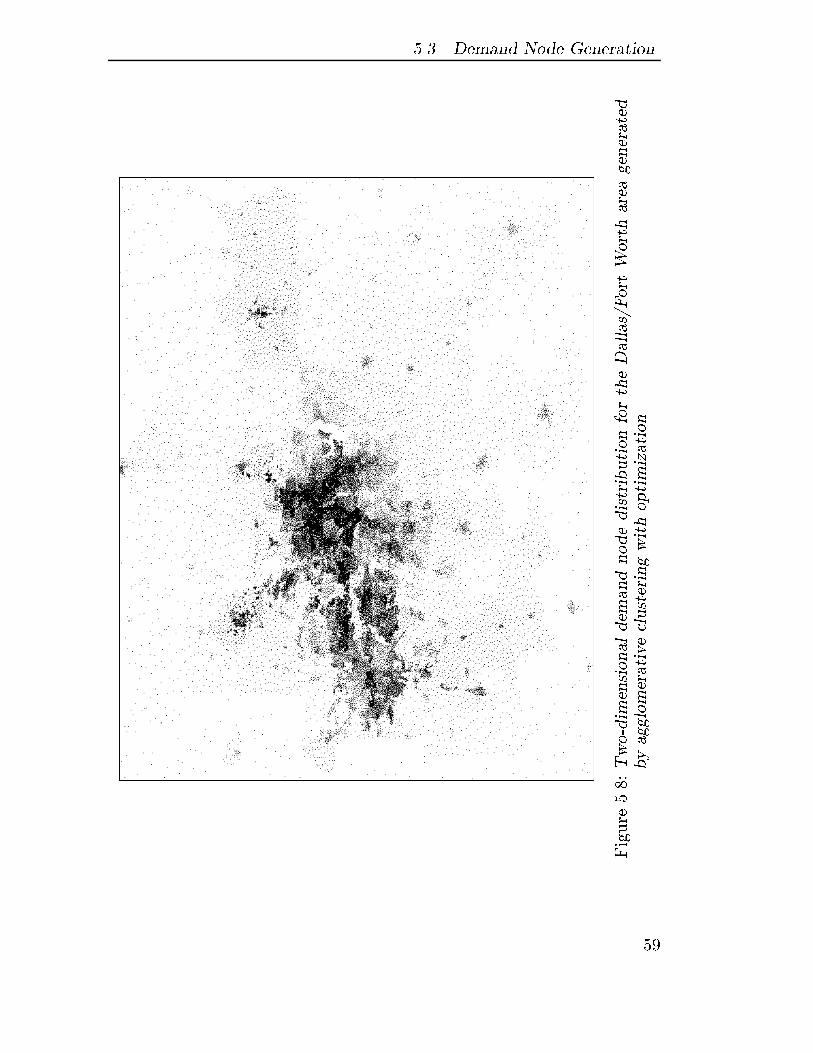
��� Demand Node Generation
Figure ���Two�dimensionaldemandnodedistributionfortheDallas�FortWorthareagenerated
byagglomerativeclusteringwithoptimization
�
� Spatial Customer Tra�c Estimation and Characterization
las�Fort Worth area� The distribution shows a strong clustering of thedemand nodes� However� there are no areas with regular structure visiblein the distribution� This example demonstrates that the agglomerativemethod is able to handle large scale areas for clustering�
Characteristics of the Algorithm
The agglomerative clustering procedure of Algorithm �� is more complexthan the partitional method� It requires a signi�cantly higher computa�tional e�ort� The bottom�up characteristic of the agglomerative approachand the randomness in selecting the cluster objects for merging weakensthe tra�c description concept of the demand node notion� cf� De�n�tion ��� However� the application of an optimization stage reduces theimpact of this property on the teletra�c approximation capability� Theaccuracy of the algorithm depends on the proper selection of the tele�tra�c threshold and quantization values Tmin and Tmax� For a suitablechoice of these parameters� the agglomerative algorithm behaves stable�
Furthermore� the hierarchical agglomerative clustering method is ca�pable to obtain spatial tessellation pieces of arbitrary shape and of pre�de�ned size and tra�c value� Thus� the agglomerative algorithm is ableto overcome the drawbacks of the partitional approach�
����� Spatial Evaluation
The applicability of the clustering algorithms depends on the accuracyof the methods to approximate the spatial properties of the teletra�c inthe study area� The generated demand node distributions have to showthe same spatial variation as the actual teletra�c in this area�
Since the demand node concept introduces a discretization of theteletra�c demand in both amount and space� a demand node represen�tation has to ful�ll two criteria� a� every demand node has to representthe same quantum of teletra�c and b� the spatial statistics of the two�dimensional distributions should be equal to the one in the studied area�In the following section the clustering methods will be validated accord�ing to these properties�
Tra�c Quantization
The partitional algorithm inherently guarantees the quantization crite�rion� The recursive separation of the area in two pieces with the same
��
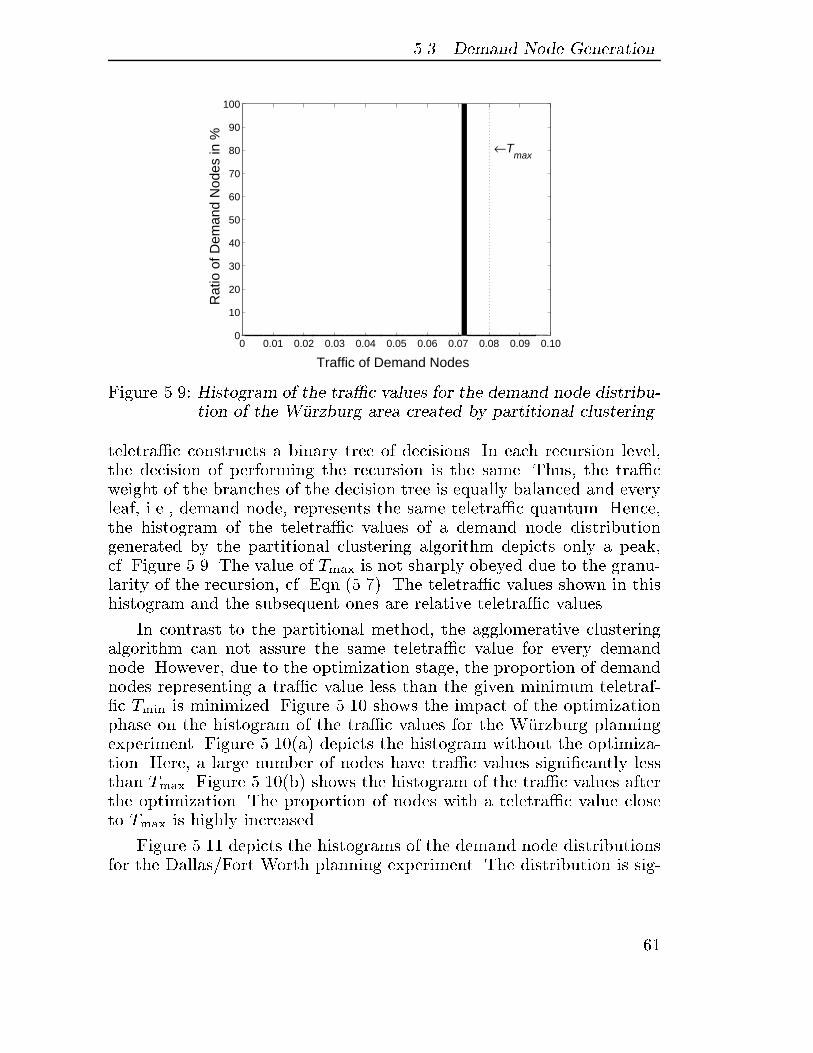
��� Demand Node Generation
Traffic of Demand Nodes
Rat
io o
f Dem
and
Nod
es in
%
0 0.01 0.02 0.03 0.04 0.05 0.06 0.07 0.08 0.09 0.100
10
20
30
40
50
60
70
80
90
100
←Tmax
Figure ��� Histogram of the tra�c values for the demand node distribu�tion of the W�urzburg area created by partitional clustering
teletra�c constructs a binary tree of decisions� In each recursion level�the decision of performing the recursion is the same� Thus� the tra�cweight of the branches of the decision tree is equally balanced and everyleaf� i�e�� demand node� represents the same teletra�c quantum� Hence�the histogram of the teletra�c values of a demand node distributiongenerated by the partitional clustering algorithm depicts only a peak�cf� Figure ��� The value of Tmax is not sharply obeyed due to the granu�larity of the recursion� cf� Eqn�� ���� The teletra�c values shown in thishistogram and the subsequent ones are relative teletra�c values�
In contrast to the partitional method� the agglomerative clusteringalgorithm can not assure the same teletra�c value for every demandnode� However� due to the optimization stage� the proportion of demandnodes representing a tra�c value less than the given minimum teletraf��c Tmin is minimized� Figure ��� shows the impact of the optimizationphase on the histogram of the tra�c values for the W�urzburg planningexperiment� Figure ����a� depicts the histogram without the optimiza�tion� Here� a large number of nodes have tra�c values signi�cantly lessthan Tmax� Figure ����b� shows the histogram of the tra�c values afterthe optimization� The proportion of nodes with a teletra�c value closeto Tmax is highly increased�
Figure ��� depicts the histograms of the demand node distributionsfor the Dallas�Fort Worth planning experiment� The distribution is sig�
��
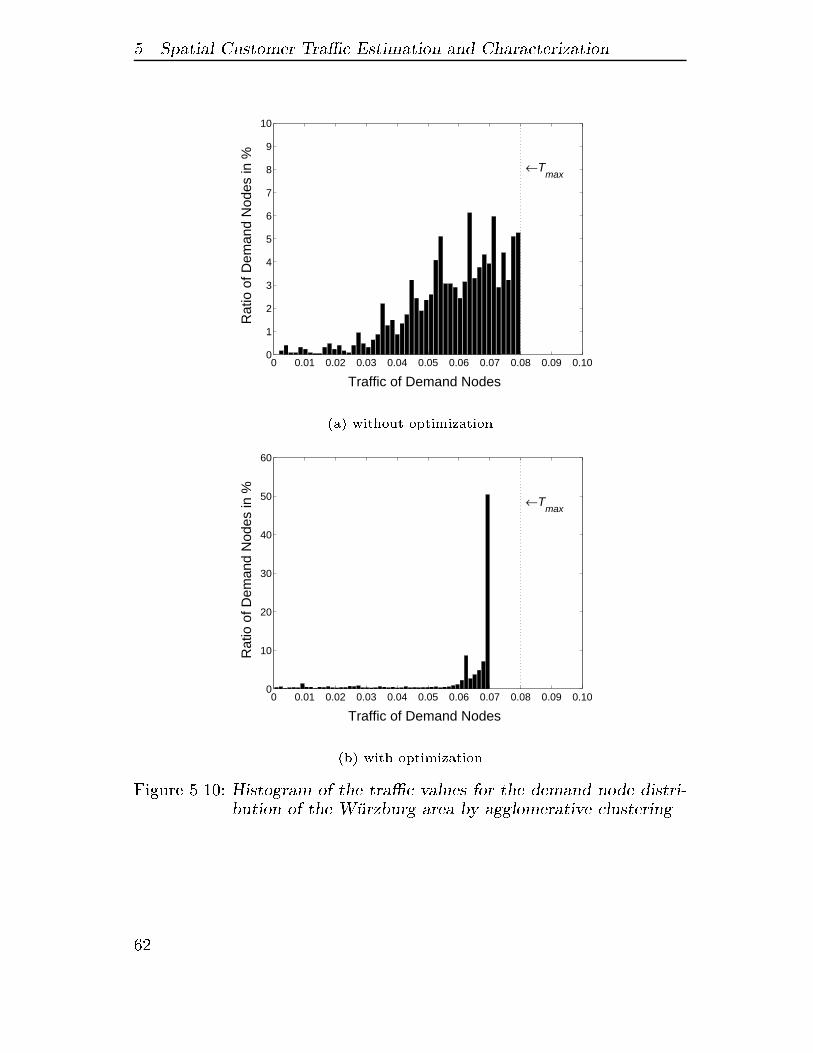
� Spatial Customer Tra�c Estimation and Characterization
Traffic of Demand Nodes
Rat
io o
f Dem
and
Nod
es in
%
0 0.01 0.02 0.03 0.04 0.05 0.06 0.07 0.08 0.09 0.100
1
2
3
4
5
6
7
8
9
10
←Tmax
�a� without optimization
Traffic of Demand Nodes
Rat
io o
f Dem
and
Nod
es in
%
0 0.01 0.02 0.03 0.04 0.05 0.06 0.07 0.08 0.09 0.100
10
20
30
40
50
60
←Tmax
�b� with optimization
Figure ���� Histogram of the tra�c values for the demand node distri�bution of the W�urzburg area by agglomerative clustering
��
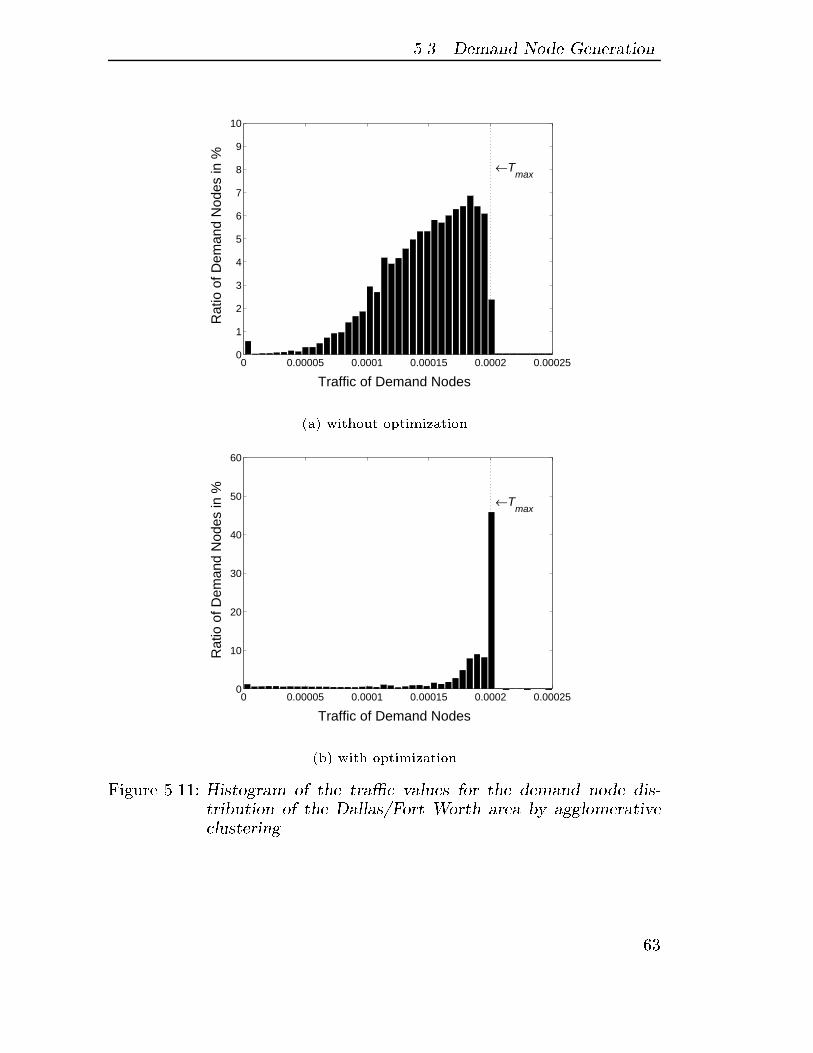
��� Demand Node Generation
Traffic of Demand Nodes
Rat
io o
f Dem
and
Nod
es in
%
0 0.00005 0.0001 0.00015 0.0002 0.000250
1
2
3
4
5
6
7
8
9
10
←Tmax
�a� without optimization
Traffic of Demand Nodes
Rat
io o
f Dem
and
Nod
es in
%
0 0.00005 0.0001 0.00015 0.0002 0.000250
10
20
30
40
50
60
←Tmax
�b� with optimization
Figure ���� Histogram of the tra�c values for the demand node dis�tribution of the Dallas�Fort Worth area by agglomerativeclustering
�
� Spatial Customer Tra�c Estimation and Characterization
ni�cantly improved by the optimization� Moreover� the value of Tmax isreached better since the granularity of elements of the tra�c matrix issmaller�
Accuracy
The second criterion for the clustering algorithms is approximation ac�curacy of the spatial variation of the teletra�c in the studied area� Thespatial statistics of the demand node distribution have to show the sameproperties as the actual teletra�c of the service area represented by thetra�c matrix�
A common procedure to validate the spatial statistic of a discretepoint pattern is the quadrat sampling method� cf� Cressie ������� Quad�drat sampling involves collecting the tra�c count in subsets of the stud�ied area� Traditionally� the subsets are rectangular� therefore the namequadrat� Any other contour of the test sets is also possible� Since in cel�lular mobile communication systems the shape of a cell is more likely acircle� circular test squares are used for the validation of the tra�c�
To evaluate the spatial accuracy of demand node distributions� amodi�cation of the quadrat sampling method has been used� Circulartest quadrats of random diameter have been placed randomly at thesame location in the demand node distribution and in the study area�cf� Figure ��� The teletra�c value of the circular test quadrat in de�mand node distribution Tnodes was sampled by counting the teletra�c ofthe nodes� The tra�c amount of the studied area Tmatrix was obtainedfrom counting the tra�c from the elements of the teletra�c matrix� Thematrices were obtained as described in Section ���� The accuracy of thedemand node distribution was judged by the mean squared error� i�e� thedi�erence of these teletra�c values for circular test quadrats with thesame diameter�
E�mean !
�
N
NXi��
�T�i�
nodes � T�i�
matrix��� � ���
here the parameter N is the number of circular test quadrats with thesame diameter�
Figure ��� depicts the tra�c approximation capabilities of the par�titional and the agglomerative clustering method� Part �a� of Figure ���shows the result for the W�urzburg planning experiment� The blue lineis the mean squared error for the partitional clustering algorithm� The
��
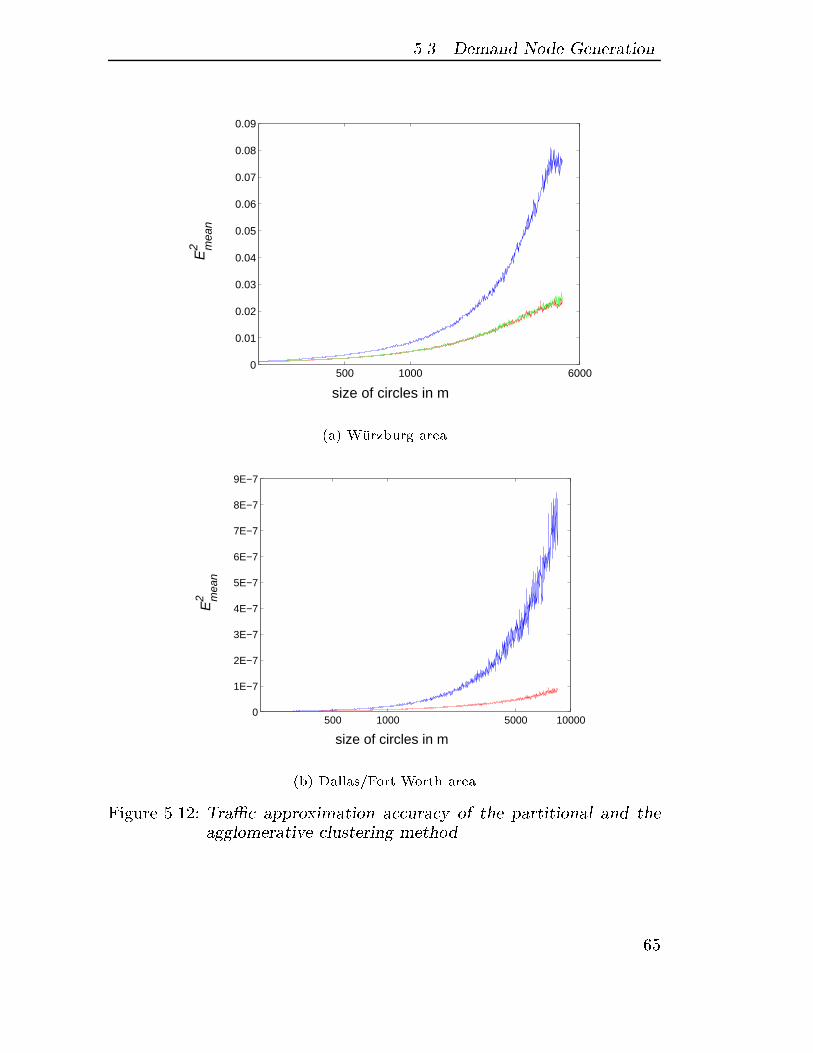
��� Demand Node Generation
size of circles in m
E2 m
ean
500 1000 60000
0.01
0.02
0.03
0.04
0.05
0.06
0.07
0.08
0.09
�a� W�urzburg area
size of circles in m
E2 m
ean
500 1000 5000 100000
1E−7
2E−7
3E−7
4E−7
5E−7
6E−7
7E−7
8E−7
9E−7
�b� Dallas�Fort Worth area
Figure ���� Tra�c approximation accuracy of the partitional and theagglomerative clustering method
�
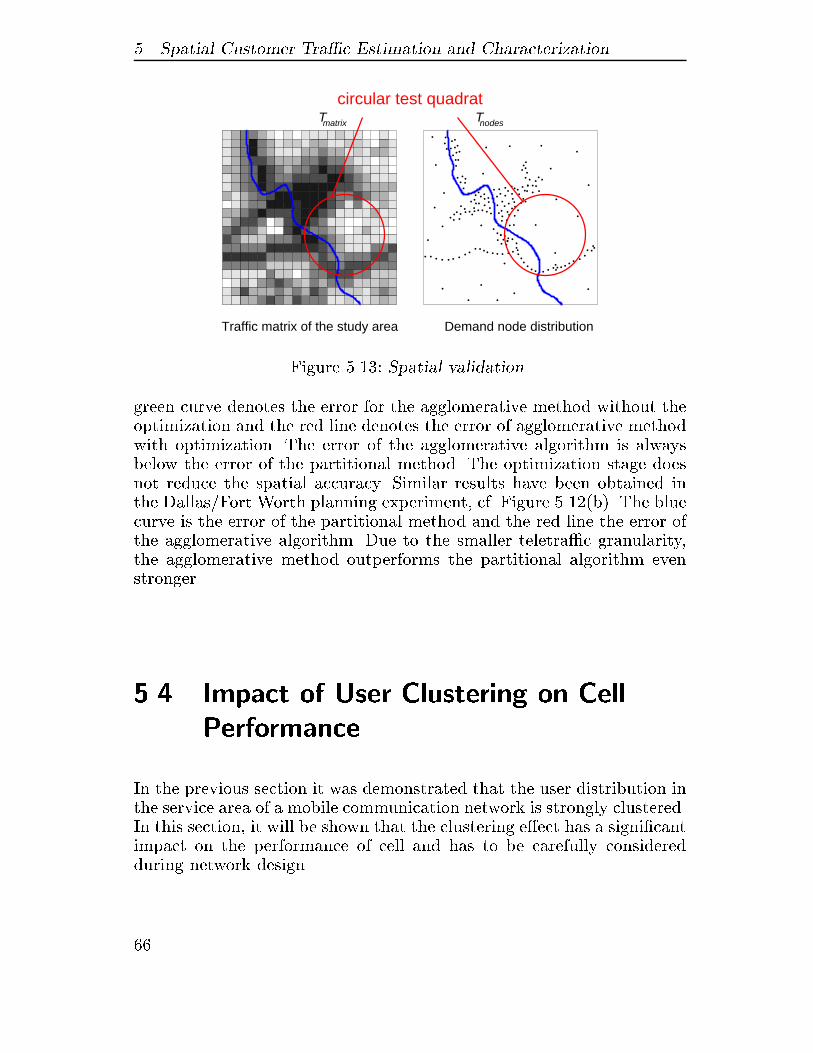
� Spatial Customer Tra�c Estimation and Characterization
. ......
.....
.
. .......
........
..... .. .
.
...
...
... ... .
.
... .
....
....
.. ... ..
...
..
....
....
...
... ... .
... .... ........
.
.
..
.
.
. .
.
.
..
.
..
..
.
..
. ...
...
....
.
.. .
.
.. ..
......... . . .. .. . .. . .. .... ..
.. ....
.
.
circular test quadrat
Demand node distributionTraffic matrix of the study area
TTmatrix nodes
Figure ��� Spatial validation
green curve denotes the error for the agglomerative method without theoptimization and the red line denotes the error of agglomerative methodwith optimization� The error of the agglomerative algorithm is alwaysbelow the error of the partitional method� The optimization stage doesnot reduce the spatial accuracy� Similar results have been obtained inthe Dallas�Fort Worth planning experiment� cf� Figure ����b�� The bluecurve is the error of the partitional method and the red line the error ofthe agglomerative algorithm� Due to the smaller teletra�c granularity�the agglomerative method outperforms the partitional algorithm evenstronger�
��� Impact of User Clustering on Cell
Performance
In the previous section it was demonstrated that the user distribution inthe service area of a mobile communication network is strongly clustered�In this section� it will be shown that the clustering e�ect has a signi�cantimpact on the performance of cell and has to be carefully consideredduring network design�
��
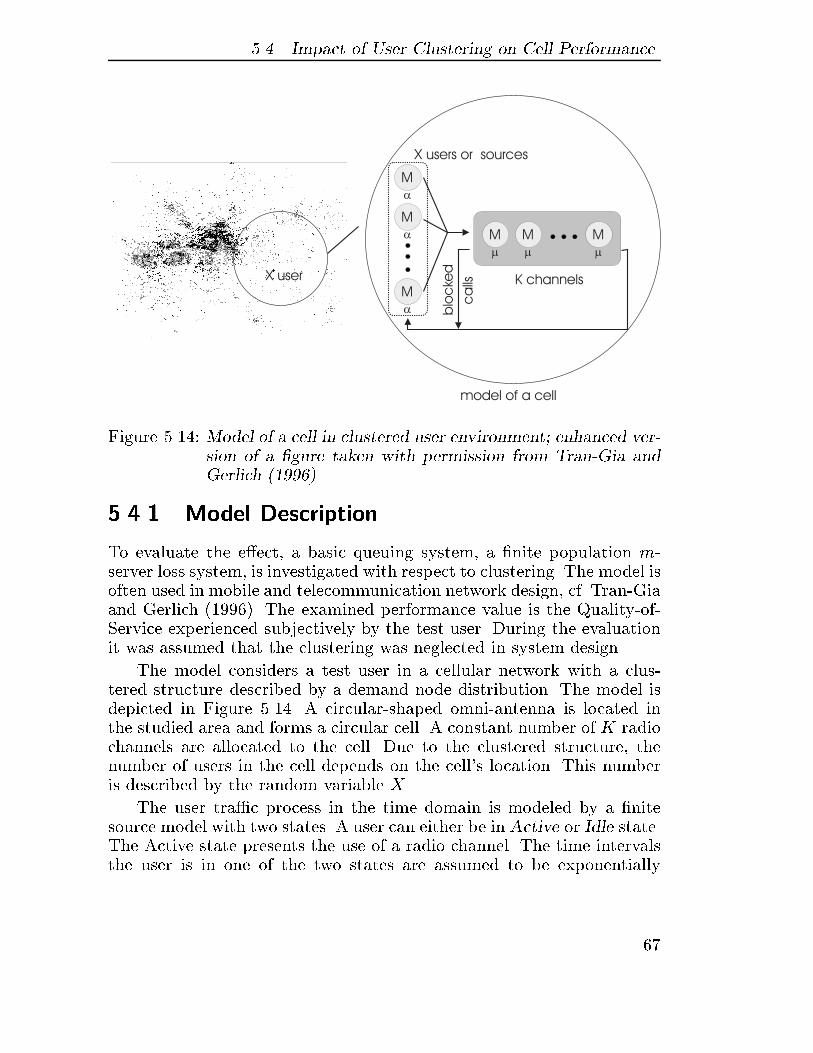
��� Impact of User Clustering on Cell Performance
Figure ���� Model of a cell in clustered user environment� enhanced ver�sion of a gure taken with permission from Tran�Gia andGerlich ����
����� Model Description
To evaluate the e�ect� a basic queuing system� a �nite population m�server loss system� is investigated with respect to clustering� The model isoften used in mobile and telecommunication network design� cf� Tran�Giaand Gerlich ������� The examined performance value is the Quality�of�Service experienced subjectively by the test user� During the evaluationit was assumed that the clustering was neglected in system design�
The model considers a test user in a cellular network with a clus�tered structure described by a demand node distribution� The model isdepicted in Figure ���� A circular�shaped omni�antenna is located inthe studied area and forms a circular cell� A constant number of K radiochannels are allocated to the cell� Due to the clustered structure� thenumber of users in the cell depends on the cell�s location� This numberis described by the random variable X�
The user tra�c process in the time domain is modeled by a �nitesource model with two states� A user can either be in Active or Idle state�The Active state presents the use of a radio channel� The time intervalsthe user is in one of the two states are assumed to be exponentially
��
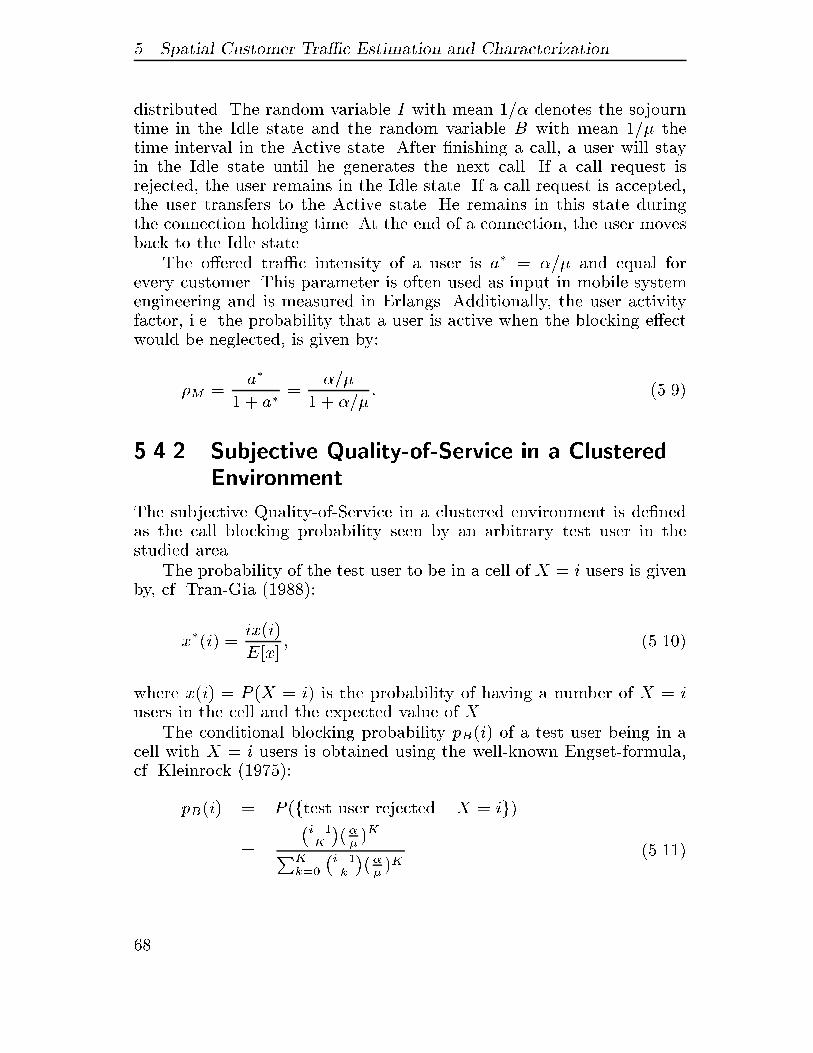
� Spatial Customer Tra�c Estimation and Characterization
distributed� The random variable I with mean �� denotes the sojourntime in the Idle state and the random variable B with mean �� thetime interval in the Active state� After �nishing a call� a user will stayin the Idle state until he generates the next call� If a call request isrejected� the user remains in the Idle state� If a call request is accepted�the user transfers to the Active state� He remains in this state duringthe connection holding time� At the end of a connection� the user movesback to the Idle state�
The o�ered tra�c intensity of a user is a� ! � and equal forevery customer� This parameter is often used as input in mobile systemengineering and is measured in Erlangs� Additionally� the user activityfactor� i�e� the probability that a user is active when the blocking e�ectwould be neglected� is given by�
�M !a�
� a�!
�
� �� � ���
����� Subjective Quality�of�Service in a ClusteredEnvironment
The subjective Quality�of�Service in a clustered environment is de�nedas the call blocking probability seen by an arbitrary test user in thestudied area�
The probability of the test user to be in a cell of X ! i users is givenby� cf� Tran�Gia �������
x��i� !ix�i�
E�x � � ����
where x�i� ! P �X ! i� is the probability of having a number of X ! iusers in the cell and the expected value of X�
The conditional blocking probability pB�i� of a test user being in acell with X ! i users is obtained using the well�known Engset�formula�cf� Kleinrock ���� ��
pB�i� ! P �ftest user rejected j X ! ig�
!
�i��K
���� �KPK
k��
�i��k
����
�K� ����
��
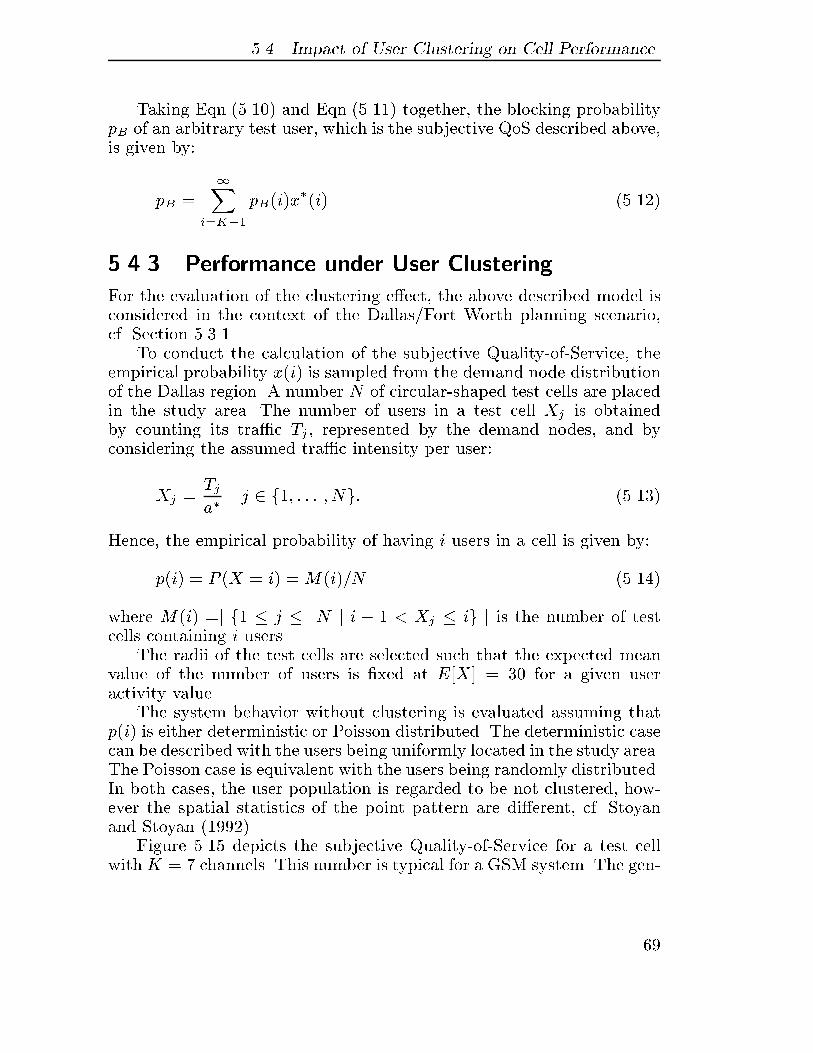
��� Impact of User Clustering on Cell Performance
Taking Eqn�� ���� and Eqn�� ���� together� the blocking probabilitypB of an arbitrary test user� which is the subjective QoS described above�is given by�
pB !�X
i�K��
pB�i�x��i� � ����
����� Performance under User Clustering
For the evaluation of the clustering e�ect� the above described model isconsidered in the context of the Dallas�Fort Worth planning scenario�cf� Section ����
To conduct the calculation of the subjective Quality�of�Service� theempirical probability x�i� is sampled from the demand node distributionof the Dallas region� A number N of circular�shaped test cells are placedin the study area� The number of users in a test cell Xj is obtainedby counting its tra�c Tj� represented by the demand nodes� and byconsidering the assumed tra�c intensity per user�
Xj !Tja�
j � f�� � � � � Ng� � ���
Hence� the empirical probability of having i users in a cell is given by�
p�i� ! P �X ! i� ! M�i��N � ����
where M�i� !j f� � j � N j i � � � Xj � ig j is the number of testcells containing i users�
The radii of the test cells are selected such that the expected meanvalue of the number of users is �xed at E�X ! � for a given useractivity value�
The system behavior without clustering is evaluated assuming thatp�i� is either deterministic or Poisson distributed� The deterministic casecan be described with the users being uniformly located in the study area�The Poisson case is equivalent with the users being randomly distributed�In both cases� the user population is regarded to be not clustered� how�ever the spatial statistics of the point pattern are di�erent� cf� Stoyanand Stoyan �������
Figure �� depicts the subjective Quality�of�Service for a test cellwith K ! � channels� This number is typical for a GSM system� The gen�
��
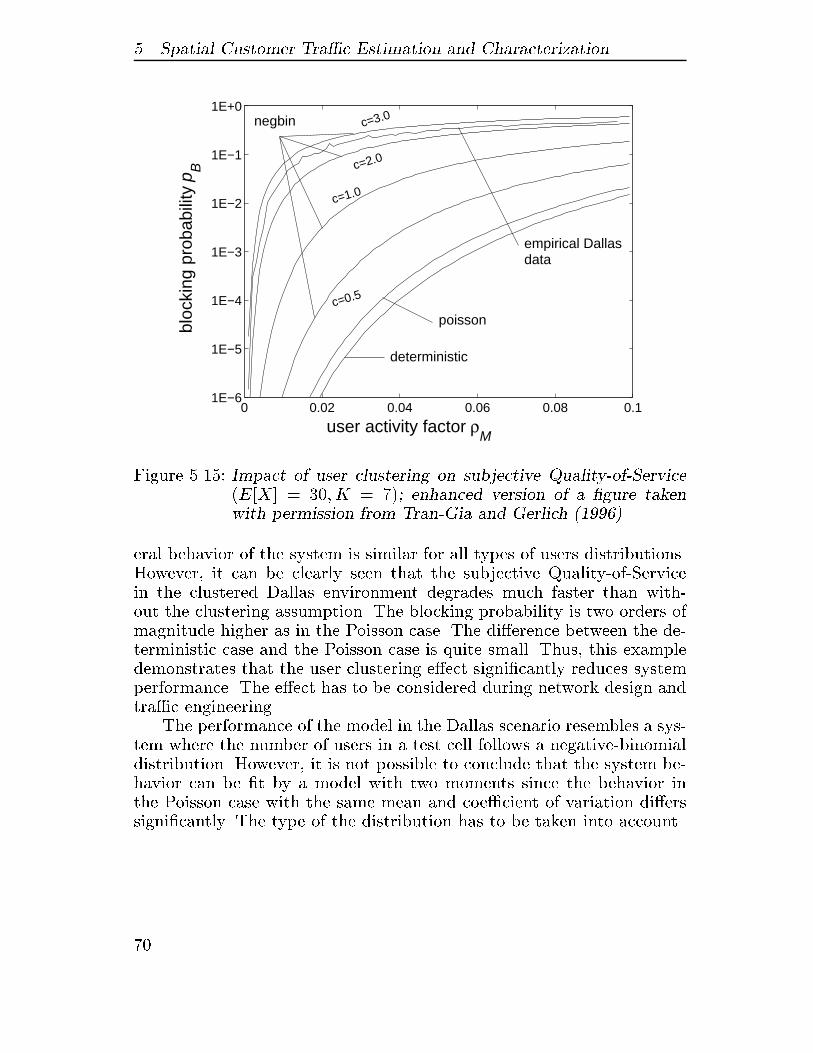
� Spatial Customer Tra�c Estimation and Characterization
user activity factor ρM
bloc
king
pro
babi
lity
p B
0 0.02 0.04 0.06 0.08 0.11E−6
1E−5
1E−4
1E−3
1E−2
1E−1
1E+0
deterministic
poisson
empirical Dallasdata
negbin c=3.0
c=2.0
c=1.0
c=0.5
Figure �� � Impact of user clustering on subjective Quality�of�Service�E�X ! �� K ! ��� enhanced version of a gure takenwith permission from Tran�Gia and Gerlich ����
eral behavior of the system is similar for all types of users distributions�However� it can be clearly seen that the subjective Quality�of�Servicein the clustered Dallas environment degrades much faster than with�out the clustering assumption� The blocking probability is two orders ofmagnitude higher as in the Poisson case� The di�erence between the de�terministic case and the Poisson case is quite small� Thus� this exampledemonstrates that the user clustering e�ect signi�cantly reduces systemperformance� The e�ect has to be considered during network design andtra�c engineering�
The performance of the model in the Dallas scenario resembles a sys�tem where the number of users in a test cell follows a negative�binomialdistribution� However� it is not possible to conclude that the system be�havior can be �t by a model with two moments since the behavior inthe Poisson case with the same mean and coe�cient of variation di�erssigni�cantly� The type of the distribution has to be taken into account�
��
��� Application of Demand Node Concept
��� Application of Demand Node Concept
Due to the e�cient capability to model the spatial teletra�c variationin the service area� the framework of the demand node concept and thedemand node distributions facilitate a large variety of planning and traf��c engineering tasks in telecommunication networks� the demand nodeconcept enables a revenue�oriented system design�
The main area of application of the concept is the demand�orientedlocating of transmission facilities� e�g� base stations or switching centers�In wireless systems� providing a mobile service to a customer can be re�garded as supplying a demand node with a su�cient radio signal� Hence�the base stations have to be located such that the number of nodes inthe service range is maximized� Under this view� the transmitter locatingtask becomes equivalent to the set cover problem which is well known infacility location science� cf� Drezner ���� �� A comprehensive descriptionof automatic radio network design and optimization using the demandnode concept is presented in Chapter �� An extension of the approachwas suggested by Mathar and Niessen ������� The proposed method usesa demand node distribution to optimize the locations of the base stationsas well as for the allocation of the frequencies to the cells in an FDMAcellular system�
Various studies have shown that the multiplexing and access tech�nologies applied in �third generation� mobile systems such as UMTS�cf� Grillo et al� ���� � and Schwarz da Silva et al� ������� require toconsider the customer population carefully during network planning� Es�pecially the performance of CDMA �code division multiple access� sys�tems and of SDMA �space division multiple access� systems is highlysensitive on the spatial user distribution� An analysis of the impact ofclustering on the performance CDMA networks can be found in Tran�Gia et al� ������ and Leibnitz et al� ������� A detailed evaluation ofSDMA systems considering the clustering is presented in Gerlich ������and Remiche �������
However� most of the above mentioned studies utilize theoretical pla�nar point processes to approximate the clustering� Whereas in practicalnetwork design real world customer distributions should be considered�The application of the demand node concept enables the matching ofpractice and theory� cf� Grillo et al� ������� As a result� a �rst methodfor locating of transmitters in a CDMA network using a set cover ap�proach was presented in Yu et al� �������
Future applications of the demand node concept are not limited
��
� Spatial Customer Tra�c Estimation and Characterization
solely to mobile communication systems� The concept can also be usedin �xed network planning scenarios where transmission facilities haveto be deployed in a service area� such as in wireline data networks�In ADSL �Asymmetric Digital Subscriber Line� access networks� theDSLAM �Digital Subscriber Line Access Multiplexer� has to be locatedwithin a certain distance from a customer� cf� Maxwell ������� The po�tential customer locations can be approximated using the demand nodeconcept�
Other applications of discrete point patterns in wireline system en�gineering encompassing the estimation of cable geometry and averagelength in rural and urban areas� cf� Grahovac and LeBourges ������ andthe design of hierarchical long�distance switched networks� cf� Baccelliet al� �������
�� Concluding Remarks
This chapter presented a new and complete framework for the estimationand characterization of the expected spatial demand distribution in mo�bile communication systems� The proposed methods considers the tele�tra�c from the viewpoint of the network� Its tra�c estimation is basedon the geographic tra�c model� which obeys the geographical and demo�graphical factors in the service area for the teletra�c demand estimation�The characterization of the spatial distribution is facilitated by the ap�plication of discrete points� denoted as demand nodes� Additionally� itwas demonstrated how the demand node pattern can be derived fromthe information in publicly available geographical data bases� For thegeneration of the demand node distributions� two clustering algorithmshave been introduced� a recursive partitional clustering algorithm andan agglomerative clustering method� and their tra�c description capa�bility was examined� Furthermore� it was shown that� even for a simplequeuing model� user clumping leads to a decreased system performance�Customer clustering has to be considered during the design of a spatialextended communication network�
However� since in practical cellular system design often only ratherinsu�cient geographical and demographical information is available� itwould be of great interest to generate demand node patterns arti�ciallyby the application of spatial point processes� like the processes describedby Baum ������� Latouche and Ramaswami ������� Stoyan and Stoyan������� and Cressie ������� Furthermore� these reference processes could
��
��� Concluding Remarks
be used to evaluate di�erent planning scenarios�The proposed framework of the demand node concept enables the
matching of practice and theory in mobile network planning� The meth�ods suggested in this chapter have been submitted to the ITU�T�s focusgroup on tra�c engineering for personal communications �FG�TEPC��FG�TEPC is considering how to harmonize the Demand Node frameworkwith the procedures described in ITU�T E�� � series draft recommenda�tions on terminal mobility�
�

� Spatial Customer Tra�c Estimation and Characterization
��
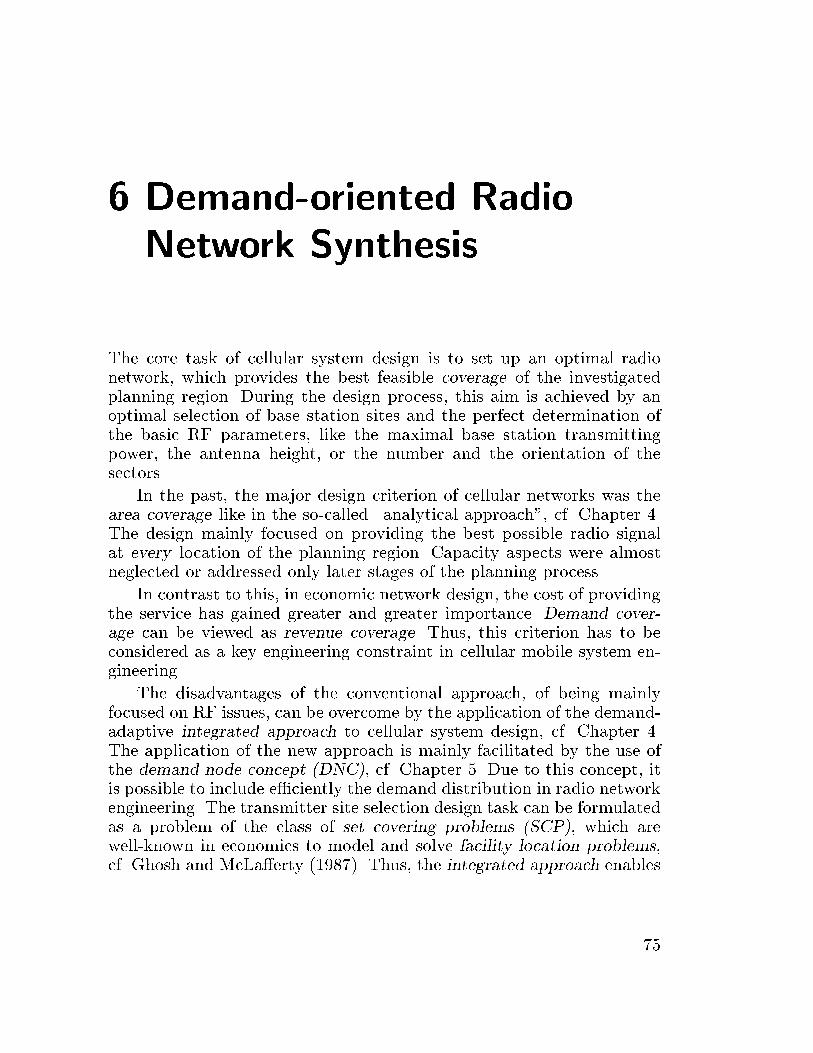
� Demand�oriented Radio
Network Synthesis
The core task of cellular system design is to set up an optimal radionetwork� which provides the best feasible coverage of the investigatedplanning region� During the design process� this aim is achieved by anoptimal selection of base station sites and the perfect determination ofthe basic RF parameters� like the maximal base station transmittingpower� the antenna height� or the number and the orientation of thesectors�
In the past� the major design criterion of cellular networks was thearea coverage like in the so�called �analytical approach�� cf� Chapter ��The design mainly focused on providing the best possible radio signalat every location of the planning region� Capacity aspects were almostneglected or addressed only later stages of the planning process�
In contrast to this� in economic network design� the cost of providingthe service has gained greater and greater importance� Demand cover�age can be viewed as revenue coverage� Thus� this criterion has to beconsidered as a key engineering constraint in cellular mobile system en�gineering�
The disadvantages of the conventional approach� of being mainlyfocused on RF issues� can be overcome by the application of the demand�adaptive integrated approach to cellular system design� cf� Chapter ��The application of the new approach is mainly facilitated by the use ofthe demand node concept �DNC�� cf� Chapter � Due to this concept� itis possible to include e�ciently the demand distribution in radio networkengineering� The transmitter site selection design task can be formulatedas a problem of the class of set covering problems �SCP�� which arewell�known in economics to model and solve facility location problems�cf� Ghosh and McLa�erty ������� Thus� the integrated approach enables
�
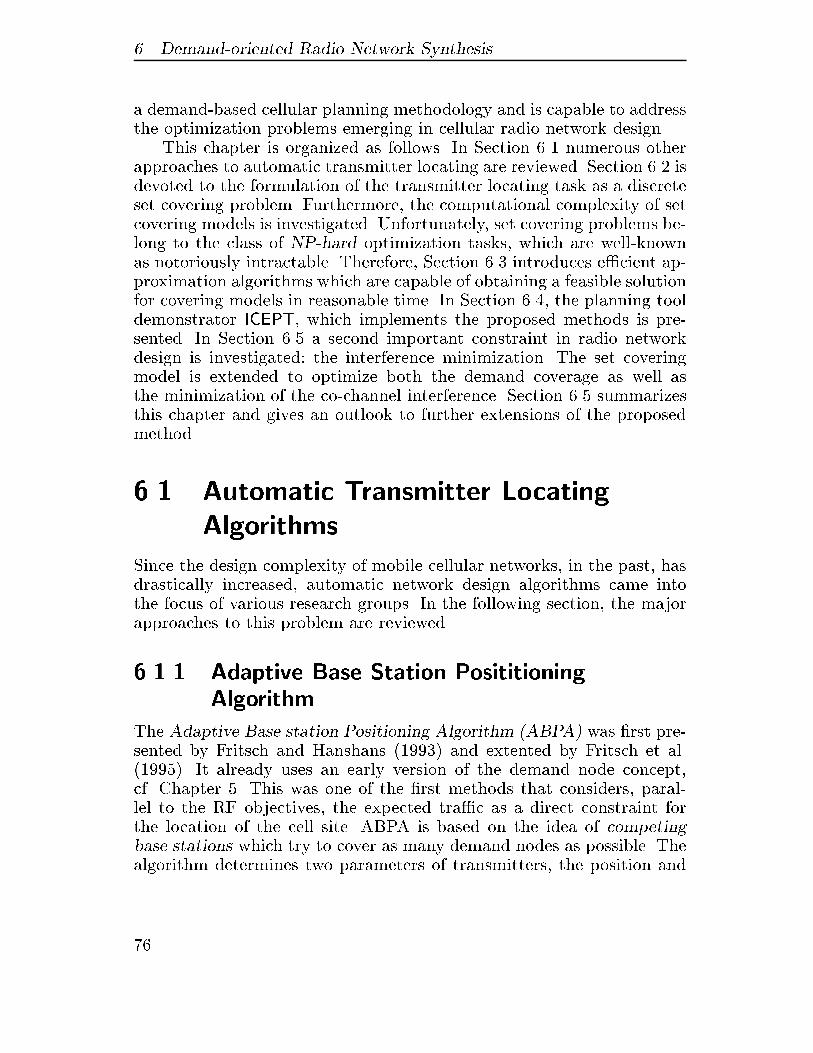
� Demand�oriented Radio Network Synthesis
a demand�based cellular planning methodology and is capable to addressthe optimization problems emerging in cellular radio network design�
This chapter is organized as follows� In Section ��� numerous otherapproaches to automatic transmitter locating are reviewed� Section ��� isdevoted to the formulation of the transmitter locating task as a discreteset covering problem� Furthermore� the computational complexity of setcovering models is investigated� Unfortunately� set covering problems be�long to the class of NP�hard optimization tasks� which are well�knownas notoriously intractable� Therefore� Section �� introduces e�cient ap�proximation algorithms which are capable of obtaining a feasible solutionfor covering models in reasonable time� In Section ���� the planning tooldemonstrator ICEPT� which implements the proposed methods is pre�sented� In Section �� a second important constraint in radio networkdesign is investigated� the interference minimization� The set coveringmodel is extended to optimize both the demand coverage as well asthe minimization of the co�channel interference� Section �� summarizesthis chapter and gives an outlook to further extensions of the proposedmethod�
�� Automatic Transmitter Locating
Algorithms
Since the design complexity of mobile cellular networks� in the past� hasdrastically increased� automatic network design algorithms came intothe focus of various research groups� In the following section� the majorapproaches to this problem are reviewed�
���� Adaptive Base Station PosititioningAlgorithm
The Adaptive Base station Positioning Algorithm �ABPA� was �rst pre�sented by Fritsch and Hanshans ����� and extented by Fritsch et al����� �� It already uses an early version of the demand node concept�cf� Chapter � This was one of the �rst methods that considers� paral�lel to the RF objectives� the expected tra�c as a direct constraint forthe location of the cell site� ABPA is based on the idea of competingbase stations which try to cover as many demand nodes as possible� Thealgorithm determines two parameters of transmitters� the position and
��
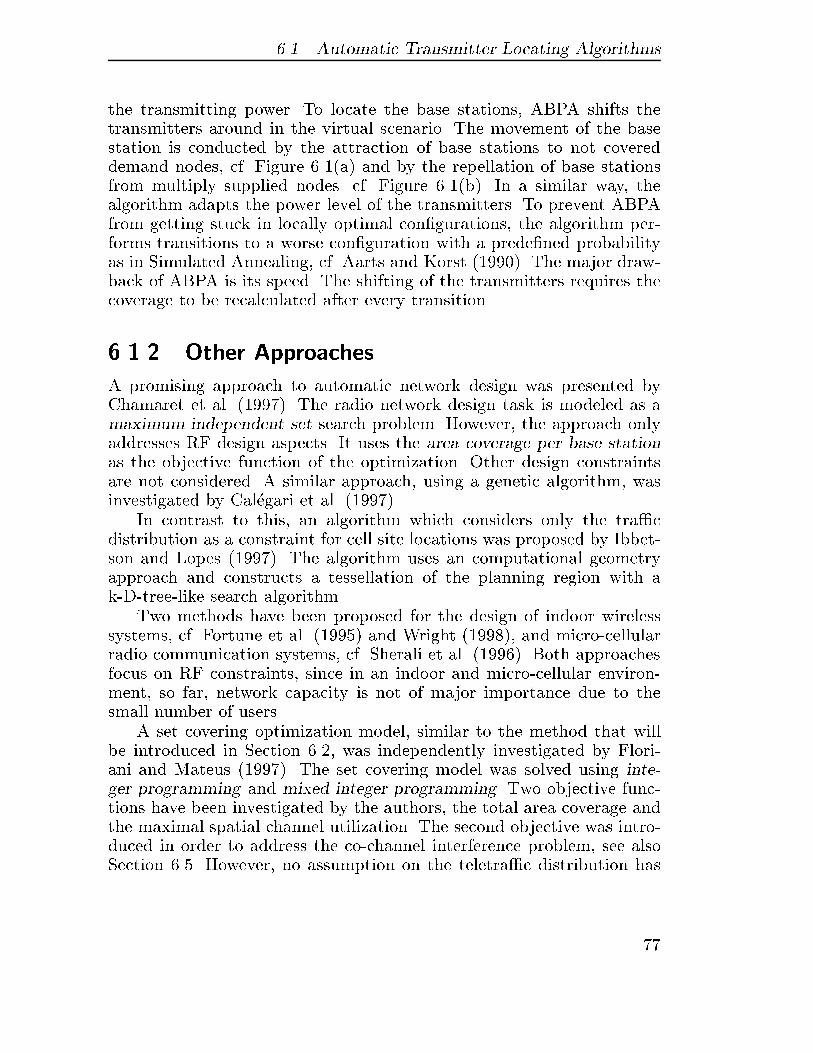
��� Automatic Transmitter Locating Algorithms
the transmitting power� To locate the base stations� ABPA shifts thetransmitters around in the virtual scenario� The movement of the basestation is conducted by the attraction of base stations to not covereddemand nodes� cf� Figure ����a� and by the repellation of base stationsfrom multiply supplied nodes� cf� Figure ����b�� In a similar way� thealgorithm adapts the power level of the transmitters� To prevent ABPAfrom getting stuck in locally optimal con�gurations� the algorithm per�forms transitions to a worse con�guration with a prede�ned probabilityas in Simulated Annealing� cf� Aarts and Korst ������� The major draw�back of ABPA is its speed� The shifting of the transmitters requires thecoverage to be recalculated after every transition�
���� Other Approaches
A promising approach to automatic network design was presented byChamaret et al� ������� The radio network design task is modeled as amaximum independent set search problem� However� the approach onlyaddresses RF design aspects� It uses the area coverage per base stationas the objective function of the optimization� Other design constraintsare not considered� A similar approach� using a genetic algorithm� wasinvestigated by Cal$egari et al� �������
In contrast to this� an algorithm which considers only the tra�cdistribution as a constraint for cell site locations was proposed by Ibbet�son and Lopes ������� The algorithm uses an computational geometryapproach and constructs a tessellation of the planning region with ak�D�tree�like search algorithm�
Two methods have been proposed for the design of indoor wirelesssystems� cf� Fortune et al� ���� � and Wright ������� and micro�cellularradio communication systems� cf� Sherali et al� ������� Both approachesfocus on RF constraints� since in an indoor and micro�cellular environ�ment� so far� network capacity is not of major importance due to thesmall number of users�
A set covering optimization model� similar to the method that willbe introduced in Section ���� was independently investigated by Flori�ani and Mateus ������� The set covering model was solved using inte�ger programming and mixed integer programming� Two objective func�tions have been investigated by the authors� the total area coverage andthe maximal spatial channel utilization� The second objective was intro�duced in order to address the co�channel interference problem� see alsoSection �� � However� no assumption on the teletra�c distribution has
��
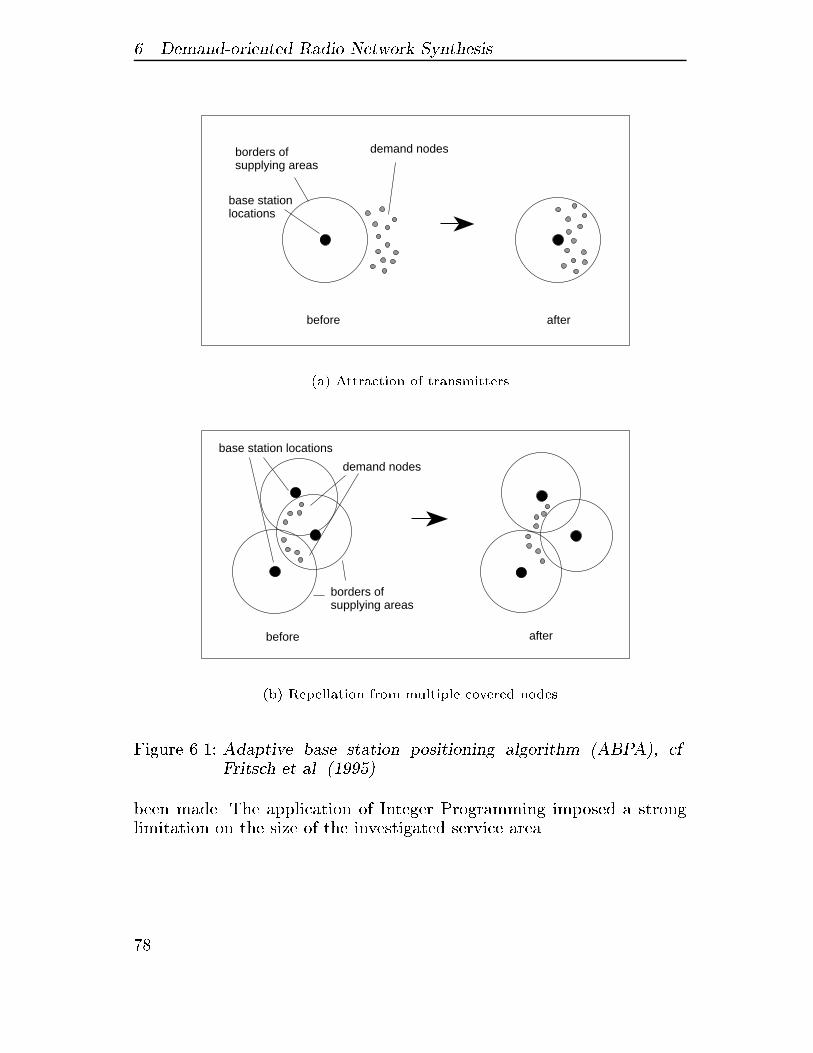
� Demand�oriented Radio Network Synthesis
locationsbase station
borders ofsupplying areas
before
demand nodes
after
�a� Attraction of transmitters
after
demand nodes
supplying areasborders of
base station locations
before
�b� Repellation from multiple covered nodes
Figure ���� Adaptive base station positioning algorithm �ABPA� cf�Fritsch et al� ����
been made� The application of Integer Programming imposed a stronglimitation on the size of the investigated service area�
��
��� Coverage Models in Cellular Mobile Network Planning
�� Coverage Models in Cellular Mobile
Network Planning
The assumption underlying all coverage models for the facility locationproblem is that the accessibility to a service network within some criticalrange is an essential criterion of the service use� Customers beyond theaccess range are not adequately served by the service facilities and aretherefore not likely to utilize the o�ered service� In planning a networkof service centers� a crucial objective is to maximize the proportion ofthe demand within the speci�ed range of the service facilities� cf� Ghoshand McLa�erty ������� In contrast to usual facility location problems�the term range implies� in the context of wireless network planning� notthe physical distance between the demand node and the transmitter�Here� the term range denotes the path loss L of the radio signal strengthbetween the base station and the receiving node� cf� Parsons �������
This covering approach taken together with the demand node con�cept which is used to characterize the demand distribution in the servicearea� cf� Chapter � enables a new and demand�oriented de�nition of theterm coverage area of a given transmitter�
De�nition ��� � Coverage Area
The coverage area of a transmitter is the set of demand nodes which areprovided with a usable radio link� i�e� the path loss from the transmitterto the demand node is less than a certain threshold�
Of course� this de�nition is aimed at an economic approach to cellularradio network engineering� since the demand distribution is a core ingre�dient of the new notion� Nevertheless� the conventional design objectivein cellular engineering of providing a radio signal at any time at any lo�cation is not completely disregarded� In Section � it was outlined thatit is feasible to limit the area size represented by a demand node withoutloosing the ability to accurately characterize the tra�c distribution inthe service area� Hence� demand nodes can be distributed in the servicein such a way that a signi�cant characterization of the path loss in theservice area is possible� Experiments have shown� see Section ������ thatthe application of De�nition ��� together with the demand node conceptis a valid approximative model for the transmitter locating task�
��
� Demand�oriented Radio Network Synthesis
���� Minimum Set Covering Model
The objective of the set covering model in cellular engineering is to de�termine the number of required service centers� i�e� base stations� andtheir location such that all users of the wireless network are served withan adequate service level� i�e� �eld strength level� This model ensuresthat the service level at each demand node is greater than a speci�edlevel if a solutions exists�
In mathematical terms� the minimum set covering problem �SCP� isde�ned as follows� cf� Ghosh and McLa�erty �������
Minimize Z !Xj�J
xj �����
subject to�
Xj�Ni
xj � � j � J�i � I �����
where
Z number of facilities�
J set of potential facility sites �indexed by j��
I set of demand nodes �indexed by i��
xj !
�� if facility at j� otherwise
�
Ni fj j fij � Lg� the set of base stations j located within thestandard range L of demand node i�
fij the path loss between demand node i and potentialbase station location j� the dimension of F ! �fij� isj I j � j J j�
L the maximal eligible path loss for the mobile serviceutilization
The objective in Eqn� ����� is to minimize the number of required facil�ities and the constraint in Eqn� ����� enforces that� in a valid solution�each demand node is covered at least once within the standard range
��
��� Coverage Models in Cellular Mobile Network Planning
L� In the considered set covering model� potential facility locations areequivalent to the location of demand nodes� In mobile network planningthis is not necessarily true� Transmitters can be located only at positionswhere real estate can be purchased or leased� However� it can easily beshown that this constraint can be obeyed by the SCP� Furthermore� as in�troduced in Section �� the objective function should not only comprisethe demand coverage as the sole objective� The cost�e�ectiveness hasto be addressed also in an appropriate way� Therefore� a more detaileddiscussion on the objective cost function is presented further below�
���� Maximal Covering Location Problem
A valid solution of the SCP requires coverage of all demand nodes� nomatter how cost�e�ective the solution is� However� for an economic de�sign of wireless communication networks a trade o� between the costof coverage and the bene�t resulting from covering this area is desired�This objective leads to the de�nition of the transmitter location problemas a location problem that does not require the coverage of all demandnodes� Church and ReVelle ������ de�ne this problem as the maximalcoverage location problem �MCLP�� The MCLP assumes a limited bud�get and includes this point as a constraint on the number of facilities tobe located� Thus� the optimization tries to place a �xed number of basestations p so that the proportion of demand nodes covered by the cellswithin the permitted range is maximized� The mathematical de�nitionof the MLCP is�
Maximize Y !Xi�I
aiyi ����
subject to�
Xj�Ni
xj � yi i � I Xj�J
xj ! p i � I� j � J� �����
��
� Demand�oriented Radio Network Synthesis
As additional notation for the MLCP we use�
Y the weighted coverage�
yi !
�� if demand node i is covered� otherwise
�
p the number of base stations to be deployed� and
ai the population at demand node i�
All other variables and parameters are the same as de�ned in the SCP�The objective of Eqn� ���� is to maximize the sum of covered demandnodes� The �rst constraint in Eqn� ����� states that demand node i can�not be covered unless at least one server is located within the standardrange L� The second constraint of Eqn� ����� de�nes the budget con�straint by forcing the number of placed base stations to be exactly p�
Due to the factors ai� the MCLP maximizes the weighted objec�tive coverage function� cf� Eqn� ����� In the demand node concept theweights ai � which represent the tra�c value� are equal for all nodes i� cf�De�nition ��� Using di�erent values for the weights ai� however� wouldintroduce a prioritization of certain nodes� This can be used to favor thecoverage of important areas within in the planning region� for exampleairports or train stations�
���� Complexity of Covering Problems
Set covering models belong to a class of very intractable problems� de�noted as NP�hard� So far� no e�cient algorithms have been found forsolving them� In the next section� the impact of this feature on �nding afeasible solution for the transmitter location task is outlined� Before pre�senting the results� some basic terms and results from complexity theoryare introduced �rst� cf� Horowitz and Sahni �������
The Classes NP�Hard and NP�Complete
In theoretical computer science� the complexity of an algorithm is charac�terized by the order of the magnitude of its computing time complexity�respectively using its asymptotic notation� The hardness of a problem isexpressed by a function f�n� restricting the number of steps needed tosolve the problem� The number of steps is usually measured by the lengthn of the input� Hence� T �n� ! O�f�n�� denotes that the computing timeof the algorithm is bounded above by the function f�n��
��
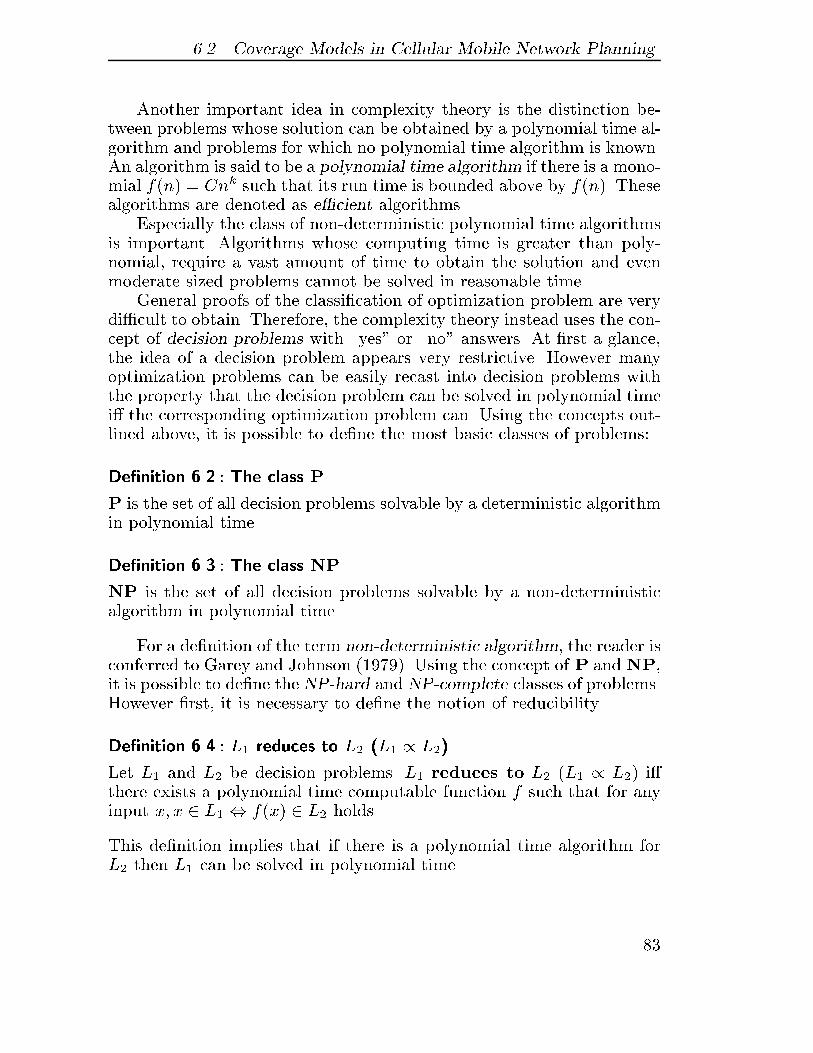
��� Coverage Models in Cellular Mobile Network Planning
Another important idea in complexity theory is the distinction be�tween problems whose solution can be obtained by a polynomial time al�gorithm and problems for which no polynomial time algorithm is known�An algorithm is said to be a polynomial time algorithm if there is a mono�mial f�n� ! Cnk such that its run time is bounded above by f�n�� Thesealgorithms are denoted as e�cient algorithms�
Especially the class of non�deterministic polynomial time algorithmsis important� Algorithms whose computing time is greater than poly�nomial� require a vast amount of time to obtain the solution and evenmoderate sized problems cannot be solved in reasonable time�
General proofs of the classi�cation of optimization problem are verydi�cult to obtain� Therefore� the complexity theory instead uses the con�cept of decision problems with �yes� or �no� answers� At �rst a glance�the idea of a decision problem appears very restrictive� However manyoptimization problems can be easily recast into decision problems withthe property that the decision problem can be solved in polynomial timei� the corresponding optimization problem can� Using the concepts out�lined above� it is possible to de�ne the most basic classes of problems�
De�nition ��� � The class P
P is the set of all decision problems solvable by a deterministic algorithmin polynomial time�
De�nition ��� � The class NP
NP is the set of all decision problems solvable by a non�deterministicalgorithm in polynomial time�
For a de�nition of the term non�deterministic algorithm� the reader isconferred to Garey and Johnson ������� Using the concept of P and NP�it is possible to de�ne the NP�hard and NP�complete classes of problems�However �rst� it is necessary to de�ne the notion of reducibility�
De�nition ��� � L� reduces to L� �L� � L��
Let L� and L� be decision problems� L� reduces to L� �L� � L�� i�there exists a polynomial time computable function f such that for anyinput x� x � L� � f�x� � L� holds�
This de�nition implies that if there is a polynomial time algorithm forL� then L� can be solved in polynomial time�
�
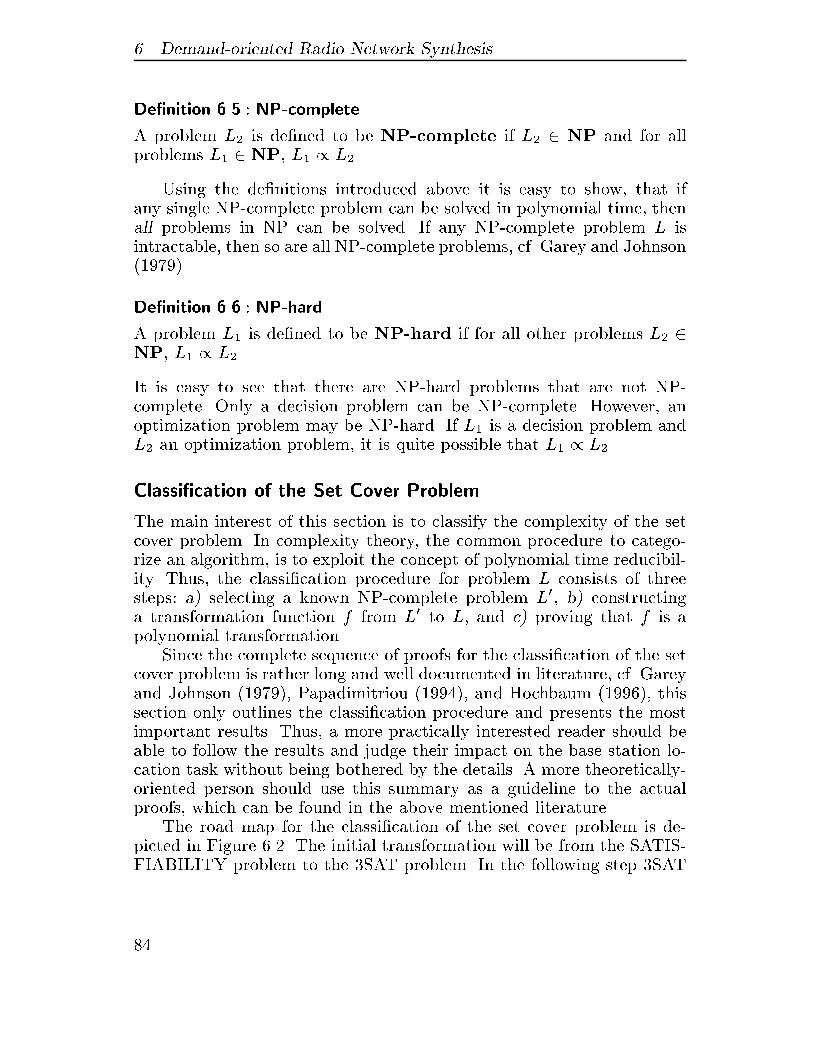
� Demand�oriented Radio Network Synthesis
De�nition ��� � NP�complete
A problem L� is de�ned to be NP�complete if L� � NP and for allproblems L� � NP� L� � L��
Using the de�nitions introduced above it is easy to show� that ifany single NP�complete problem can be solved in polynomial time� thenall problems in NP can be solved� If any NP�complete problem L isintractable� then so are all NP�complete problems� cf� Garey and Johnson������
De�nition ��� � NP�hard
A problem L� is de�ned to be NP�hard if for all other problems L� �NP� L� � L��
It is easy to see that there are NP�hard problems that are not NP�complete� Only a decision problem can be NP�complete� However� anoptimization problem may be NP�hard� If L� is a decision problem andL� an optimization problem� it is quite possible that L� � L��
Classi�cation of the Set Cover Problem
The main interest of this section is to classify the complexity of the setcover problem� In complexity theory� the common procedure to catego�rize an algorithm� is to exploit the concept of polynomial time reducibil�ity� Thus� the classi�cation procedure for problem L consists of threesteps� a� selecting a known NP�complete problem L�� b� constructinga transformation function f from L� to L� and c� proving that f is apolynomial transformation�
Since the complete sequence of proofs for the classi�cation of the setcover problem is rather long and well documented in literature� cf� Gareyand Johnson ������� Papadimitriou ������� and Hochbaum ������� thissection only outlines the classi�cation procedure and presents the mostimportant results� Thus� a more practically interested reader should beable to follow the results and judge their impact on the base station lo�cation task without being bothered by the details� A more theoretically�oriented person should use this summary as a guideline to the actualproofs� which can be found in the above mentioned literature�
The road map for the classi�cation of the set cover problem is de�picted in Figure ���� The initial transformation will be from the SATIS�FIABILITY problem to the SAT problem� In the following step SAT
��
��� Coverage Models in Cellular Mobile Network Planning
SATISFIABILITY
3SAT
VC
SC
Figure ���� Diagram of the sequence used to prove that the MinimumSet cover decision problem is NP�complete
will be transformed to the Vertex Cover �VC� problem� The Set Cover�SC� problem is a special case of the VC problem�
The most basic NP�complete problem is the decision problem fromBoolean logic� which is usually referred to as the SATISFIABILITY�SAT� problem�
De�nition �� � SATISFIABILITY �SAT� problem
Let U ! fu�� u�� � � � � ung denote boolean variables� Let %ui denote thenegation of ui� A literal is either a variable or its negation� A booleanformula C is represented as
Vki�� ci� The ci are clauses each represented
byWlij � The lij are literals� The SATISFIABILITY SAT problem
is de�ned as the decision problem whether there is an assignment for U �such that all clauses in C are simultaneously satis�ed�
Theorem ��� � Cook�s Theorem
SATISFIABILITY is NP�complete�
Proof� see Garey and Johnson ������� pp� �� �
The �SATISFIABILITY problem is just a restricted version of the SAT�ISFIABILITY in which all clauses consists of exactly three literals� Itssimple structure makes it one the most widely used problems for provingother NP�completeness results�
�

� Demand�oriented Radio Network Synthesis
De�nition ��� � ��SATISFIABILITY ��SAT� problem
Let U ! fu�� u�� � � � � ung denote boolean variables� Let C !Vki�� ci be
a boolean formula� where ci are clauses of literals� Let ci ! li� li� li�for � � i � k� The ��SATISFIABILITY �SAT problem is de�nedas the decision problem whether there is an assignment for U � such thatall clauses in C are simultaneously satis�ed�
Theorem ��� �
�SATISFIABILITY is NP�complete�
Sketch of the Proof� Since �SATISFIABILITY is a special case ofSATISFIABILITY� it is in NP� To show NP�completeness of �SATIS�FIABILITY� it is required to demonstrate that there is a polynomial timetransformation from SATISFIABILITY to �SATISFIABILITY� There�fore it is necessary to construct a new boolean formula C � with threeliterals per clause� such that C � is satis�able if and only if C is� Thiscan be obtained by examining the clauses of C one after each other andby replacing each ci by an equivalent set of clauses� each with threeliterals� The detailed construction of the new clauses can be found inPapadimitriou and Steiglitz ������� p� ��
The construction of C � can obviously be carried out in polynomialtime� Thus� a polynomial time transformation from SATISFIABILITYto �SATISFIABILITY has been found� Hence� �SATISFIABILITY isNP�complete� �
The next step in showing that the set cover problem is NP�hard� is to�nd a transformation of the SAT problem to the Vertex Cover problem�
De�nition �� � VERTEX COVER �VC� problem
Let G ! �V�E� be a graph� where V is a set of vertices and E is a setof edges� Let K be a positive integer with K �j V j� The VERTEXCOVER VC problem is de�ned as the decision problem whetherthere is a vertex cover of size K or less for G� that is� a subset V � � Vsuch that j V � j� K and� for each edge fu� vg � E� at least one of u andv belongs to V ��
Theorem ��� �
VERTEX COVER is NP�complete�
��
��� Coverage Models in Cellular Mobile Network Planning
Sketch of the Proof� It is obvious that VC �NP� since a non�determinis�tic algorithm can �nd a subset of vertices and check in polynomial timewhether that subset contains at least one end point of every edge and hassize less equal then K� Now let U ! fu�� u�� � � � � ung and C an instanceof �SATISFIABILITY� SAT can be transformed to VERTEX COVERby constructing a graph G ! �V�E� and a positive integer K �j V jsuch that G has a vertex cover of size less equal K if and only if C issatis�able� This can be obtained by regarding a truth�setting compo�nent Ti ! �Vi� Ei� for each variable ui � U and a satisfaction testingcomponent Sj ! �V �
j � E�j� for each clause cj � C� These components are
augmented by some additional communication edges to form the graph�For details of the construction� the reader is referred to Garey and John�son ������� pp� ��
Obviously� the construction of the graph can be achieved in polyno�mial time� All that remains to be shown is that C is satis�able if andonly if G has a vertex cover of size less equal K��
The VERTEX COVER problem is a special case of the SET COVERproblem� The vertices of G have to be covered by exactly one of twoexisting sets� These two sets correspond to the endpoints of an edge ina bipartite graph� This relationship is illustrated in Figure ��� Part �a�of Figure �� depicts four base stations and their corresponding supply�ing areas� Part �b� of Figure �� shows an equivalent bipartite graphrepresenting the transmitters and their supplying areas�
Hence� it is time to de�ne the SET COVER decision problem�
De�nition ���� � SET COVER �SC� problem
Let C be a collection of subsets of a �nite set S and K �j C j� The SETCOVER SC problem is de�ned as the decision problem whether Ccontains a cover for S of size less equal K� That means� does there exista subset C � � C with j C � j� K such that every element of S belongs toat least one member of C ��
Theorem ��� �
SET COVER is NP�complete�
Sketch of the Proof� It is obvious that SC �NP� since a non�determinis�tic algorithm only needs to guess a subset of C and check in polynomialtime whether that subset contains at least every element of S and has
��
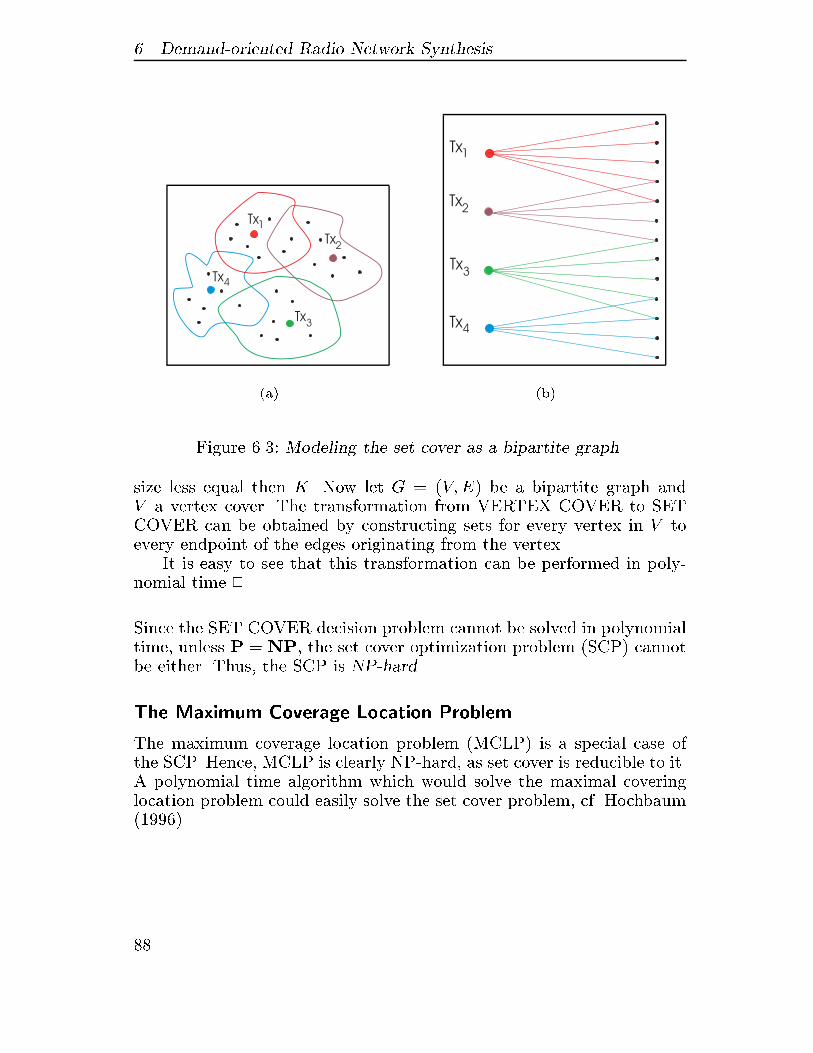
� Demand�oriented Radio Network Synthesis
Tx
Tx
Tx1
Tx2
3
4
�a�
Tx1
Tx2
Tx3
Tx4
�b�
Figure ��� Modeling the set cover as a bipartite graph�
size less equal then K� Now let G ! �V�E� be a bipartite graph andV a vertex cover� The transformation from VERTEX COVER to SETCOVER can be obtained by constructing sets for every vertex in V toevery endpoint of the edges originating from the vertex�
It is easy to see that this transformation can be performed in poly�nomial time��
Since the SET COVER decision problem cannot be solved in polynomialtime� unless P ! NP� the set cover optimization problem �SCP� cannotbe either� Thus� the SCP is NP�hard�
The Maximum Coverage Location Problem
The maximum coverage location problem �MCLP� is a special case ofthe SCP� Hence� MCLP is clearly NP�hard� as set cover is reducible to it�A polynomial time algorithm which would solve the maximal coveringlocation problem could easily solve the set cover problem� cf� Hochbaum�������
��
��� Approximation Algorithms for Covering Problems
Conclusion
set covering models are powerful tools to approach the site selection taskin the cellular radio network engineering� The intuitive view of a basestation supporting a �nite number of users in the coverage area e�cientlyfacilitates the modeling of the problem as a well known combinatorialoptimization task� The mathematically precise de�nition of the problemenables the exact determination of an optimal con�guration� However�it was shown that the class of set covering problems is NP�hard� No ef��cient� i�e� polynomial time� algorithm has yet been found for solvingthem and it is very unlikely that such an algorithm will be found in thenext future� Thus� selecting the optimal solution out of a large num�ber of potential candidate con�gurations still requires a vast amount ofcomputing time� A promising possibility of resolving this dilemma is theapplication of an approximation algorithm and will be discussed in thenext section�
�� Approximation Algorithms for
Covering Problems
From a practical viewpoint� if the optimal solution is unattainable then itis reasonable to sacri�ce optimality and settle for a good feasible solutionthat can be computed e�ciently� Of course� it is obvious that optimalityshould only be restricted as little as possible� while gaining as much aspossible in e�ciency� Trading�o� optimality in favor of tractability is theparadigm of approximation algorithms�
Approximation algorithms are programs which generate feasible solu�tions that are close to the value of an optimal one� Especially� algorithmsrunning in polynomial time are of important interest� In this section�three approximation algorithms for the transmitter location optimiza�tion task are introduced� a� two Greedy�based heuristics �GRH� and b�a Simulated Annealing heuristic �SAH��
���� Greedy Heuristic Solutions
In oder to motivate a Greedy�like heuristic algorithm for solving theset covering problems in radio network engineering� a more detailed settheory de�nition of the SCP according to Chvatal ������ will �rst begiven�
��
� Demand�oriented Radio Network Synthesis
In the SCP� the data consists of �nite sets P�� � � � � Pn and positivenumbers c�� � � � � cn which denote the cost of using the sets Pj� In theset covering approach� these sets correspond to the supplying areas oftransmitters� cf� De�nition ���� For the SCP� the union of all Pj is I !S
�Pj � � � j � n� and I ! f�� � � � �mg and J ! f�� � � � � ng� A subset J�
is called a cover if��j�J�
Pj ! I� ��� �
The cost of this cover is c�J�� !Pj�J�
cj� The problem is to �nd a cover
J� with minimum cost�
Greedy Heuristic for the Set Covering Problem
The original Greedy heuristic algorithm assumes that the desirabilityof using the set j in an optimal cover increases with ratio j Pj j �cj �i�e� the better the ratio of covered demand nodes per cost unit for aset j� the higher the probability that the set is in the optimal cover J��This expectation suggests a recursive procedure for �nding near�optimalcovers� The Greedy algorithm selects� one after the other� the sets whichprovide the best additional coverage per cost ratio� Therefore� the termGreedy is used for the heuristic�
The complete Greedy algorithm for the SCP is depiced in Algo�rithm ���� It starts with an initialization of the solution variable inline �� Hereby� J� denotes the set of selected transmitter con�gurations�
The main philosophy of the Greedy heuristic is located in line ��Here� the algorithm selects the transmitter con�guration k with the bestcoverage per cost�unit ratio� Lines and �� are an adjustment step�The selected base station k is inserted in the solution J�� In line � theremaining sets Pj� with j �! k� are updated� The demand nodes alreadycovered by the selected base station k are removed from the sets thathave been not selected yet� In this way� the number of multiple coverednodes is minimized and the overall number of covered nodes is increased�These steps are repeated until all nodes are covered� Hence� the algorithmstops� returning the solution J��
It is obvious that Algorithm ��� can be computed in polynomial time�For every selected con�guration the Greedy heuristic requires only onesweep through the set of all candidate con�gurations�
��
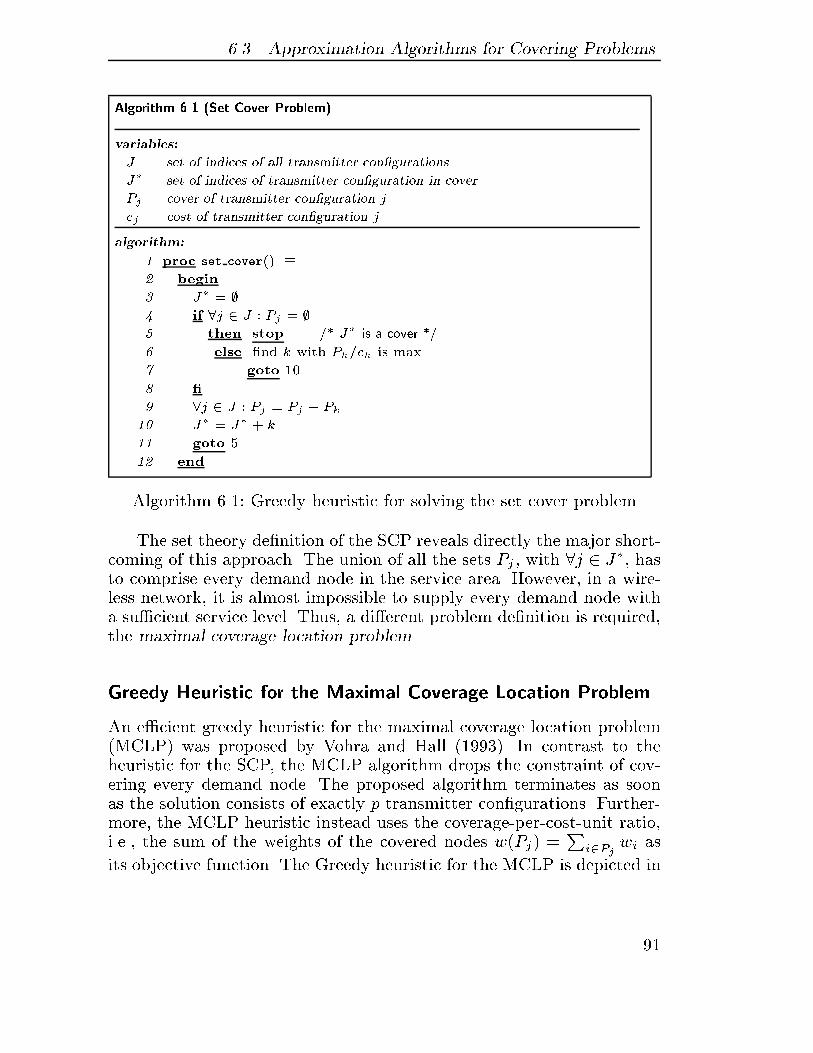
��� Approximation Algorithms for Covering Problems
Algorithm �� �Set Cover Problem�
variables�
J set of indices of all transmitter con�gurations
J� set of indices of transmitter con�guration in cover
Pj cover of transmitter con�guration j
cj cost of transmitter con�guration j
algorithm�
� proc set cover�� �
� begin
� J� �
� if �j � J � Pj �
� then stop �� J� is a cover ��
� else �nd k with Pk�ck is max�
� goto �
� �
�j � J � Pj � Pj � Pk� J� � J� � k
�� goto �
�� end
Algorithm ���� Greedy heuristic for solving the set cover problem
The set theory de�nition of the SCP reveals directly the major short�coming of this approach� The union of all the sets Pj � with j � J�� hasto comprise every demand node in the service area� However� in a wire�less network� it is almost impossible to supply every demand node witha su�cient service level� Thus� a di�erent problem de�nition is required�the maximal coverage location problem�
Greedy Heuristic for the Maximal Coverage Location Problem
An e�cient greedy heuristic for the maximal coverage location problem�MCLP� was proposed by Vohra and Hall ������ In contrast to theheuristic for the SCP� the MCLP algorithm drops the constraint of cov�ering every demand node� The proposed algorithm terminates as soonas the solution consists of exactly p transmitter con�gurations� Further�more� the MCLP heuristic instead uses the coverage�per�cost�unit ratio�i�e�� the sum of the weights of the covered nodes w�Pj� !
Pi�Pj
wi as
its objective function� The Greedy heuristic for the MCLP is depicted in
��
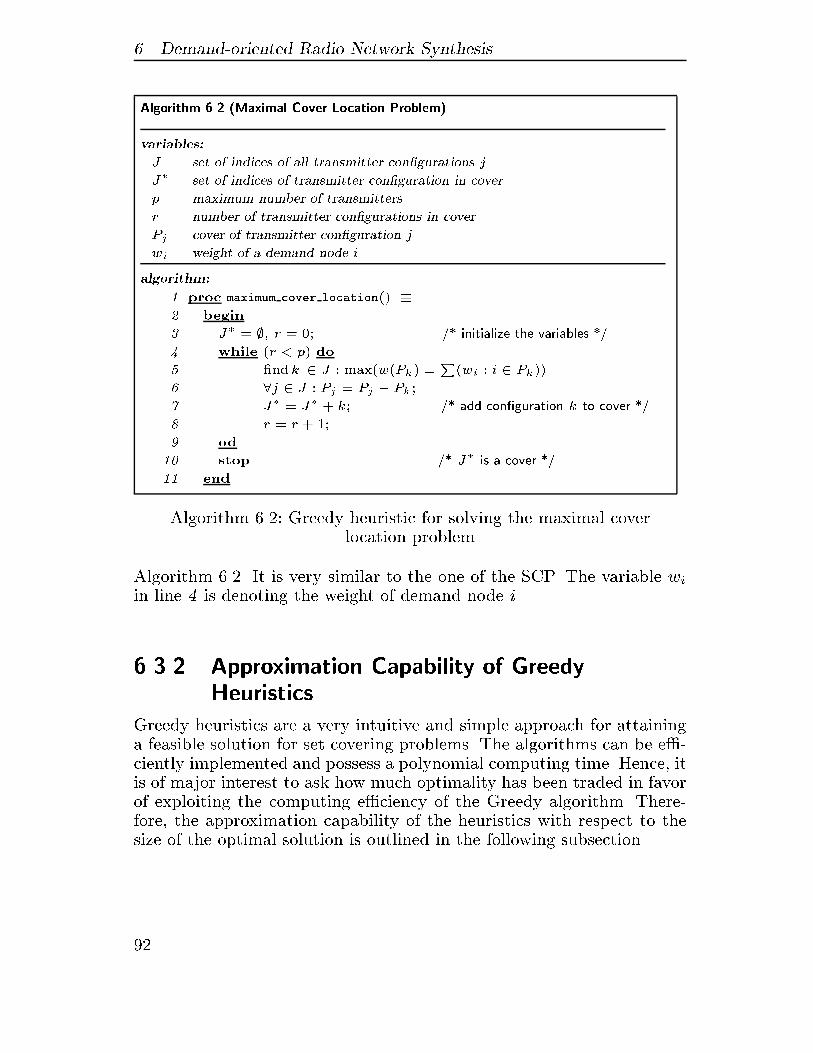
� Demand�oriented Radio Network Synthesis
Algorithm �� �Maximal Cover Location Problem�
variables�
J set of indices of all transmitter con�gurations j
J� set of indices of transmitter con�guration in cover
p maximum number of transmitters
r number of transmitter con�gurations in cover
Pj cover of transmitter con�guration j
wi weight of a demand node i
algorithm�
� proc maximum cover location�� �
� begin
� J� � � r � �� �� initialize the variables ��
� while �r � p� do
� �nd k � J � max�w�Pk� �P�wi � i � Pk��
� �j � J � Pj � Pj � Pk�
� J� � J� � k� �� add con�guration k to cover ��
� r � r � �
od
� stop �� J� is a cover ��
�� end
Algorithm ���� Greedy heuristic for solving the maximal coverlocation problem
Algorithm ���� It is very similar to the one of the SCP� The variable wiin line � is denoting the weight of demand node i�
���� Approximation Capability of GreedyHeuristics
Greedy heuristics are a very intuitive and simple approach for attaininga feasible solution for set covering problems� The algorithms can be e��ciently implemented and possess a polynomial computing time� Hence� itis of major interest to ask how much optimality has been traded in favorof exploiting the computing e�ciency of the Greedy algorithm� There�fore� the approximation capability of the heuristics with respect to thesize of the optimal solution is outlined in the following subsection�
��
��� Approximation Algorithms for Covering Problems
a� Set Cover Problem
Although the Greedy algorithm for the set covering problem can easilybe stated� its analysis is far from trivial� Here only the import resultsare presented and the reader is conferred to the referenced literature forcomplete proofs�
An upper bound for the approximation ratio of the Greedy algorithmfor the weighted set cover problem� as de�ned in Section ����� has beenproved by Chvatal �������
Theorem ��� �
The cost of the cover returned by the Greedy heuristic is at most H�d� !Pdi��
�i times the cost of an optimal cover�
Proof� see Chvatal ������� �
Here� d denotes the size of the largest set� The harmonic function H�d�is bounded by � log d�
A lower threshold for which Set Cover can not be e�ciently approx�imated was shown by Feige �������
Theorem ��� �
Set Cover can not be approximated e�ciently within ���o���� ln d unlessNP has slightly superpolynomial algorithms�
Proof� see Feige ������� �
Thus� the Greedy heuristic is an O�log d��approximation algorithm forany set cover� However� better results can obtained for special cases� forexample high coverage instances� cf� Hochbaum ������ p� ����
b� Maximal Cover Location Problem
The results for the approximation ratio of the MCLP can be obtainedwhen investigating the optimization of a submodular function f� cf� Hoch�baum �������Now� let p the limit for the number of sets in the solution�and w�GREEDY� and w�OPT� the total weight of the elements of thesolution of the Greedy heuristic and the optimal solution� Hence� thefollowing theorem can be stated�
�
� Demand�oriented Radio Network Synthesis
Theorem �� �
w�GREEDY� �
��� ���
�
p�p�w�OPT�
� ����
e�w�OPT�
Proof� see Hochbaum ������� pp� ��� �
As a result� the Greedy heuristic is a �� � �e��approximation algorithm
for the Maximum Coverage Location problem� Hochbaum ������backsup this theory by providing an example which illustrates that the boundis tight�
An interesting extension of the results of Theorem ��� was presentedby Vohra and Hall ������
Theorem ��� �
w�GREEDY� � max
�p
n� �� ���
�
p�p�w�OPT�
Proof� see Vohra and Hall ������ �
The di�erence between the two lower bounds for the MCLP Greedyalgorithm� is the factor p
n� Hereby� p denotes the limit of sets in a solu�
tion and n is the number of candidate sets� i�e� the number of potentialtransmitter con�gurations from which p ones are to be chosen�
If the Greedy has to choose more �� � �e � � n � ���� � n� i�e� the
limit of � � �� � �k
�k for k � �� out of n potential transmitters� thenthe guaranteed bound is lifted up� which indicates a great de�ciency�However� the impact of this feature on radio network engineering is notas signi�cant as one might imagine� Usually a much small number oftransmitter con�guration has to be selected as potential candidates areprovided�
���� Objective Cost Function
The proposed Greedy heuristics assumes that the desirability of havingtransmitter con�guration j� in an optimal cover increases with ratio j Pj j
��
��� Approximation Algorithms for Covering Problems
�cj � with Pj and cj as de�ned in Section ����� Hence� the algorithmsare maximizing the coverage per cost unit�
From an economical viewpoint� the cost of using a speci�c transmittercon�guration at location with index j� i�e� having set j in the solution�usually depends on three factors� a� the speci�c hardware costs� e�g� high�power transmitters are usually more expensive than low�power ones� b�the costs of leasing or purchasing real estate� and c� the infra�structuralcosts of deploying and connecting the cell site to the �xed part of themobile network� e�g� providing electrical power or data connections tothe transport network� is much more expensive in remote regions thanin developed areas�
Apart from the �nancial costs of a transmitter con�guration� it ispossible to de�ne other virtual cost factors of base stations� In this way�complex radio network design constraints which usually require an ex�tensive computational amount can easily be included into the objectivefunction of the optimization� Of course� this is only an approximation ofthe actual design constraint� However� in this way the computing timecan be reduced� as in the case of radio signal interference� A high�powertransmitter which is located on a hill top deteriorates the interferencesituation in the whole network scenario and decreases the cellular capac�ity� see also Section �� � Therefore� using this transmitter in a solutionwould be very �expensive�� Thus� assigning a high value to ck� for a cer�tain transmitter con�guration k which is expected to produce high radiointerference� will reduce the probability of having this con�guration inthe �nal solution�
Nevertheless� an accurate way of including the interference constraintis presented in Section �� � The interference of an investigated base sta�tion j is evaluated by calculating the average interference level of an in�termediate solution J extended by transmitter j at every demand nodelocations� However� the accurate inclusion of the interference will increasethe run time complexity of the transmitter locating task� cf� Section �� �
���� SCBPA Algorithm
Based on the proposed Greedy heuristic for the MCLP presented above�it possible to de�ne the complete set cover base station positioning al�
�
� Demand�oriented Radio Network Synthesis
gorithm �SCBPA�� The algorithm comprises four phases�
Phase � Calculate all possible coverage sets Pj
Phase � Verify the tra�c and hardware constraints for all Pj
Phase � Compute a �rst coverage by using the greedy heuristicfor the MCLP
Phase Optimize the coverage by changing transmitters�optional�
In Phase �� the algorithm computes for all valid cell site locations� alltransmitter power levels� and all possible antenna types the supplyingareas Pj of these con�gurations� Phase � veri�es whether the transmit�ters obey the tra�c and hardware constraints or not� cf� Section �����In Phase �� a rst coverage of the planning region is computed usingthe Greedy algorithm for the MCLP� Due to the heuristic nature of thisprocedure� the obtained solution might only be suboptimal� An improve�ment can be found by the application of an optional Phase � where theresult is improved by exchanging transmitter using a local search algo�rithm� see also Section ��� for an Simulated Annealing approach andPapadimitriou and Steiglitz ������ for other Local Search methods�
���� Simulated Annealing
The second option presented here for solving the maximal cover loca�tion problem in the context of the transmitter locating task a SimulatedAnnealing� Simulated Annealing is a competing approximate methodto solve large scale combinatorial optimization problems� In contrast tothe above introduced Greedy heuristics� which are based on experienceand expectation rules� Simulated Annealing is a more general methodfor solving optimization problems� It belongs to the class of local searchalgorithm� In fact� it is a randomization algorithm and it can be asymp�totically viewed as an optimization algorithm�
In this section the major components of the Simulated Annealingmethod are outlined� A detailed presentation of the theory and applica�tions can be found in Aarts and Korst �������
First� some basic notions required to outline Simulated Annealingare introduced� An instance of a combinatorial optimization problem isgiven by an ordered pair �V� f�� where V is a �nite set and f � V � R
��
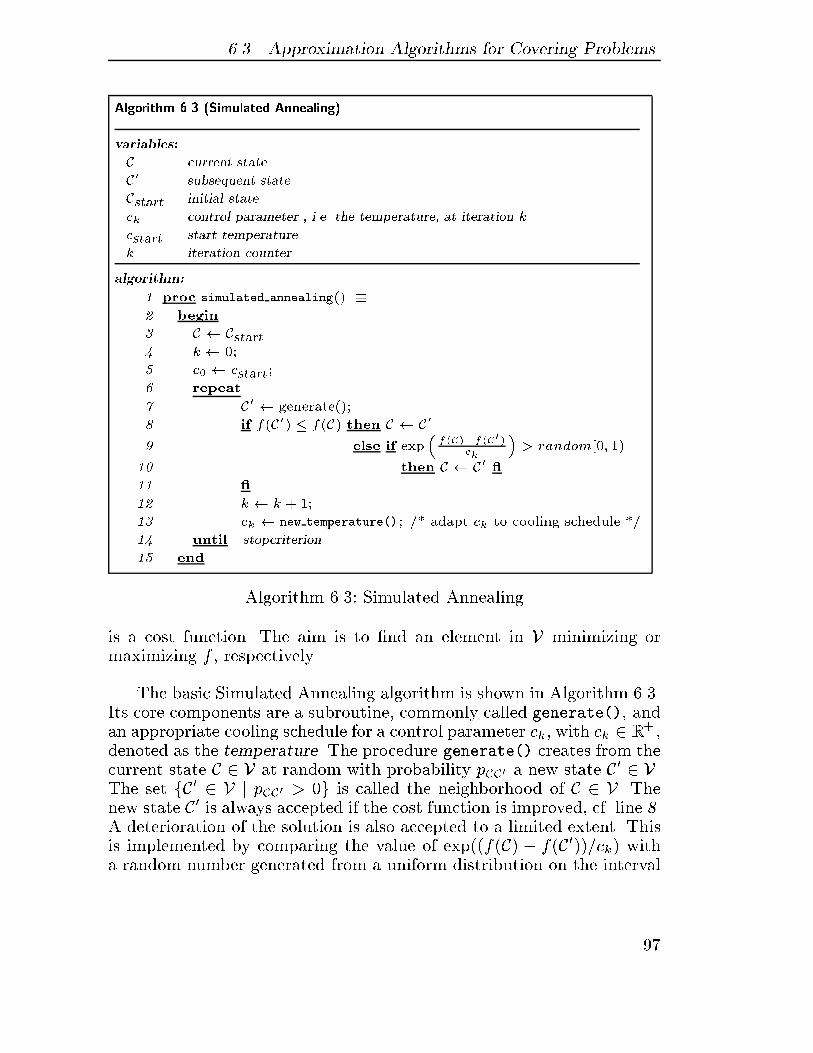
��� Approximation Algorithms for Covering Problems
Algorithm �� �Simulated Annealing�
variables�
C current state
C� subsequent state
Cstart initial state
ck control parameter � i�e� the temperature� at iteration k
cstart start temperature
k iteration counter
algorithm�
� proc simulated annealing�� �
� begin
� C � Cstart� k � ��
� c� � cstart�
� repeat
� C� � generate���
� if f�C�� � f�C� then C � C�
else if exp�f�C��f�C��
ck
�� random��� �
� then C � C� �
�� �
�� k � k � �
�� ck � new temperature��� �� adapt ck to cooling schedule ��
�� until stopcriterion
�� end
Algorithm ��� Simulated Annealing
is a cost function� The aim is to �nd an element in V minimizing ormaximizing f � respectively�
The basic Simulated Annealing algorithm is shown in Algorithm ���Its core components are a subroutine� commonly called generate��� andan appropriate cooling schedule for a control parameter ck� with ck � R
� �denoted as the temperature� The procedure generate�� creates from thecurrent state C � V at random with probability pCC� a new state C� � V�The set fC� � V j pCC� � �g is called the neighborhood of C � V� Thenew state C� is always accepted if the cost function is improved� cf� line ��A deterioration of the solution is also accepted to a limited extent� Thisis implemented by comparing the value of exp��f�C� � f�C����ck� witha random number generated from a uniform distribution on the interval
��
� Demand�oriented Radio Network Synthesis
��� ��� see line � In every iteration� the control parameter ck is adaptedto the cooling schedule by the function new temperture��� cf� line ���
Starting with large values of cstart� Simulated Annealing will acceptlarge deteriorations� As ck decreases� the algorithm will accept only smalldeteriorations� and �nally� as ck � �� no deteriorations will be acceptedat all� Due to this feature� the Simulated Annealing is able to escapefrom local minima while it still exhibits the favorable features of LocalSearch algorithms� i�e� simplicity and general applicability�
Simulated Annealing can easily be be adapted to solve the MCLPproblem� The state space can be described by V ! Sp� where S is the setof all potential transmitter con�gurations and p is the number of trans�mitters to be deployed� Therefore� C ! �c�� � � � � cp� � V correspondsto building base station con�gurations c�� � � � � cp� with neglecting dupli�cates� i�e� ci �! cj for i �! j� Hence� at most p base stations can be selectedin a solution� The cost function f measures the number of covered de�mand nodes� i�e� the amount of served tra�c�
A careful choice of neighborhoods and transition probabilities is es�sential for the performance of Simulated Annealing� Roughly speaking�neighboring states should not di�er too much so that updated states areimproved slowly step by step� To meet this requirement� for each con��guration i a set of con�gurations C�i� is de�ned� Given a current stateC ! �c�� � � � � cp�� the procedure generate�� �rst chooses with probability��p an index j � f�� � � � � pg� Then� the component cj of C is replaced byc�j � C�cj�� where c�j is chosen with probability �� j C�cj� j� The outputof generate�� is the state C� ! �c�� � � � � cj��� c
�j � cj��� � � � � cp��
The procedure generate�� is thus completely described by the setsC�i�� Simulated Annealing performed best on the investigated instances�when each C�i� contains M � � � M � � �� di�erent con�gurationsserving a set of demand nodes close to that of i� Closeness is measuredby the number of commonly served demand nodes�
Due to its generality� the Simulated Annealing approach was inves�tigated in this monograph mainly for the interference minimizing trans�mitter locating task� An elaborated description of the performance andthe results obtained by the Simulated Annealing approach are presentedin Section �� �
��
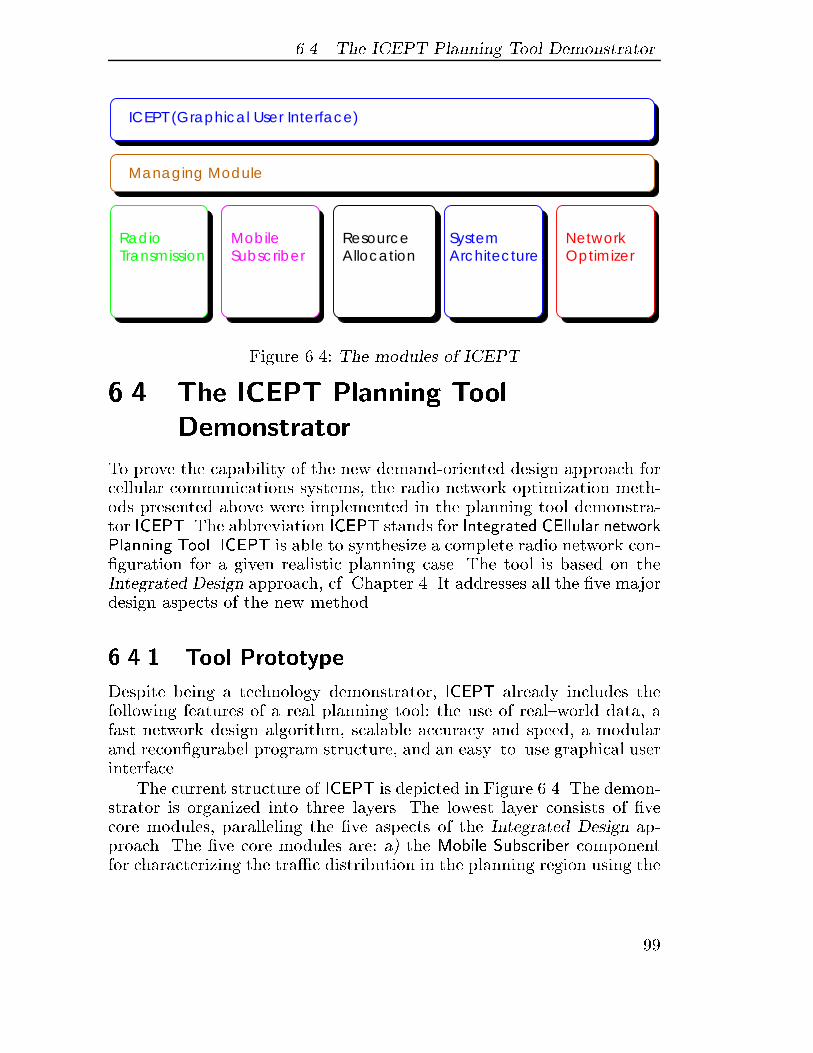
��� The ICEPT Planning Tool Demonstrator
ResourceAllocation
SystemOptimizerSubscriber
Mobile NetworkTransmissionRadio
Architecture
Managing Module
ICEPT (Graphical User Interface)
Figure ���� The modules of ICEPT
�� The ICEPT Planning Tool
Demonstrator
To prove the capability of the new demand�oriented design approach forcellular communications systems� the radio network optimization meth�ods presented above were implemented in the planning tool demonstra�tor ICEPT� The abbreviation ICEPT stands for Integrated CEllular networkPlanning Tool� ICEPT is able to synthesize a complete radio network con��guration for a given realistic planning case� The tool is based on theIntegrated Design approach� cf� Chapter �� It addresses all the �ve majordesign aspects of the new method�
���� Tool Prototype
Despite being a technology demonstrator� ICEPT already includes thefollowing features of a real planning tool� the use of real�world data� afast network design algorithm� scalable accuracy and speed� a modularand recon�gurabel program structure� and an easy�to�use graphical userinterface�
The current structure of ICEPT is depicted in Figure ���� The demon�strator is organized into three layers� The lowest layer consists of �vecore modules� paralleling the �ve aspects of the Integrated Design ap�proach� The �ve core modules are� a� the Mobile Subscriber componentfor characterizing the tra�c distribution in the planning region using the
��
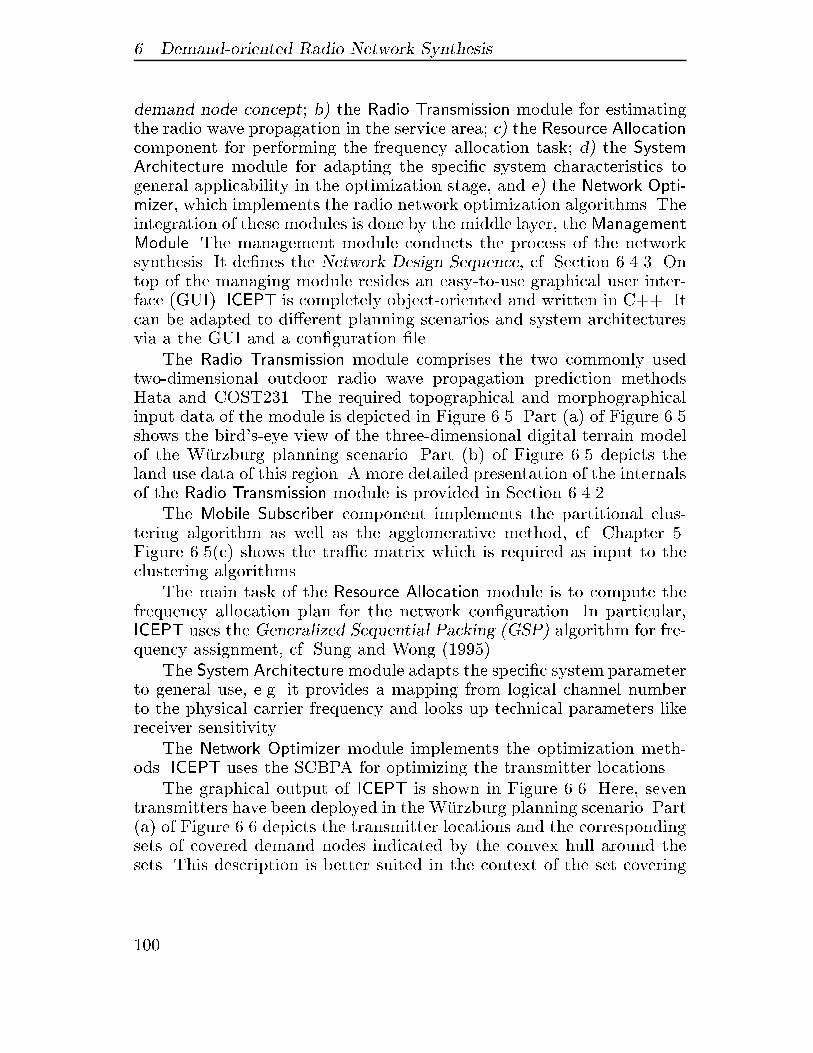
� Demand�oriented Radio Network Synthesis
demand node concept� b� the Radio Transmission module for estimatingthe radio wave propagation in the service area� c� the Resource Allocationcomponent for performing the frequency allocation task� d� the SystemArchitecture module for adapting the speci�c system characteristics togeneral applicability in the optimization stage� and e� the Network Opti�mizer� which implements the radio network optimization algorithms� Theintegration of these modules is done by the middle layer� the ManagementModule� The management module conducts the process of the networksynthesis� It de�nes the Network Design Sequence� cf� Section ����� Ontop of the managing module resides an easy�to�use graphical user inter�face �GUI�� ICEPT is completely object�oriented and written in C� Itcan be adapted to di�erent planning scenarios and system architecturesvia a the GUI and a con�guration �le�
The Radio Transmission module comprises the two commonly usedtwo�dimensional outdoor radio wave propagation prediction methodsHata and COST��� The required topographical and morphographicalinput data of the module is depicted in Figure �� � Part �a� of Figure �� shows the bird�s�eye view of the three�dimensional digital terrain modelof the W�urzburg planning scenario� Part �b� of Figure �� depicts theland use data of this region� A more detailed presentation of the internalsof the Radio Transmission module is provided in Section �����
The Mobile Subscriber component implements the partitional clus�tering algorithm as well as the agglomerative method� cf� Chapter �Figure �� �c� shows the tra�c matrix which is required as input to theclustering algorithms�
The main task of the Resource Allocation module is to compute thefrequency allocation plan for the network con�guration� In particular�ICEPT uses the Generalized Sequential Packing �GSP� algorithm for fre�quency assignment� cf� Sung and Wong ���� ��
The System Architecture module adapts the speci�c system parameterto general use� e�g� it provides a mapping from logical channel numberto the physical carrier frequency and looks up technical parameters likereceiver sensitivity�
The Network Optimizer module implements the optimization meth�ods� ICEPT uses the SCBPA for optimizing the transmitter locations�
The graphical output of ICEPT is shown in Figure ���� Here� seventransmitters have been deployed in the W�urzburg planning scenario� Part�a� of Figure ��� depicts the transmitter locations and the correspondingsets of covered demand nodes indicated by the convex hull around thesets� This description is better suited in the context of the set covering
���
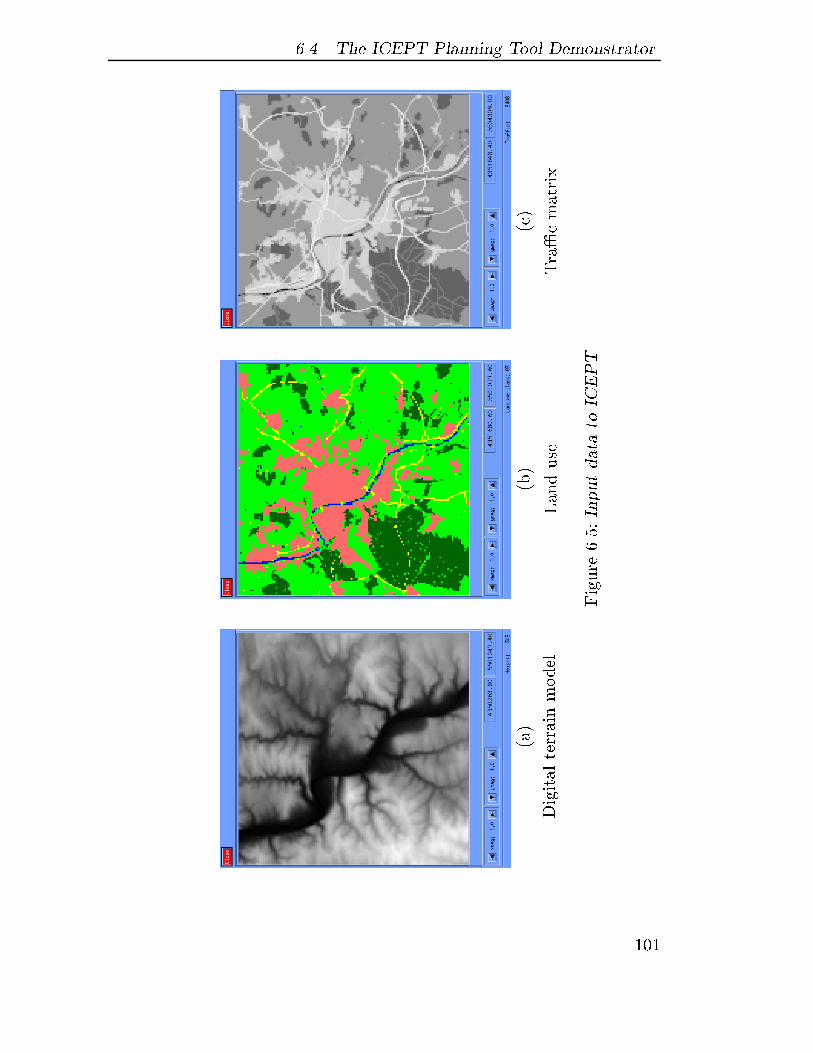
��� The ICEPT Planning Tool Demonstrator
�a�
�b�
�c�
Digitalterrainmodel
Landuse
Tra�cmatrix
Figure�� �InputdatatoICEPT
���
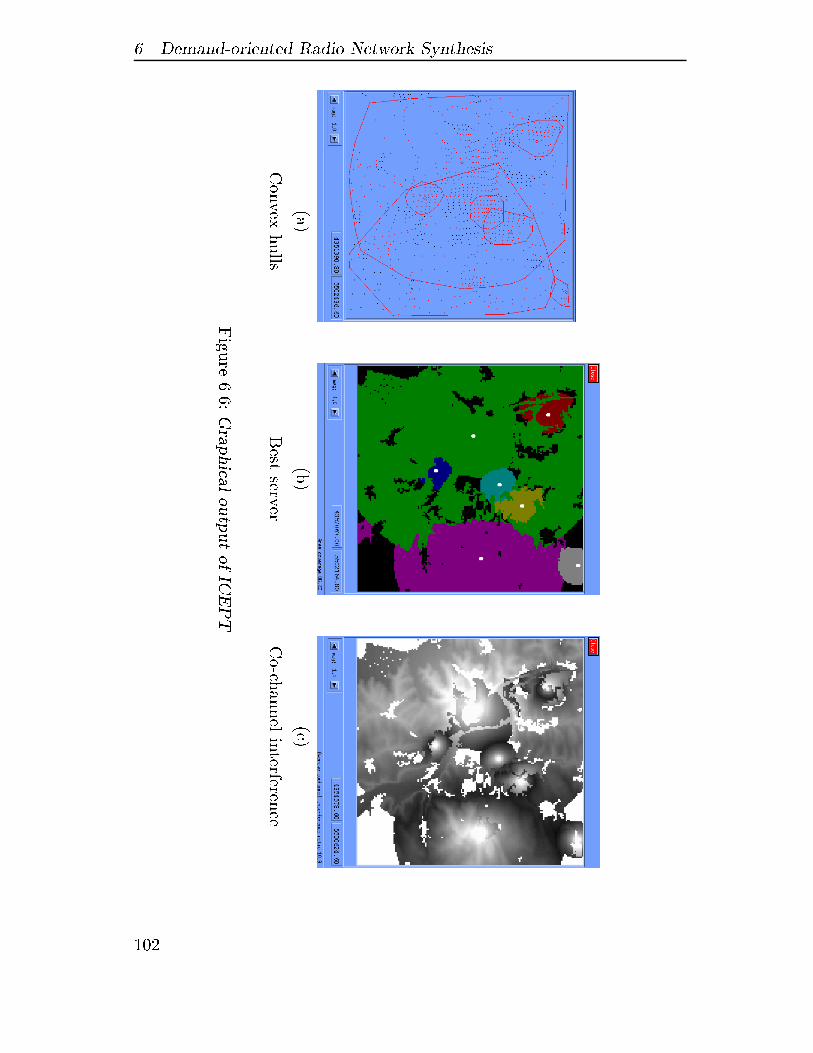
� Demand�oriented Radio Network Synthesis
Figure����GraphicaloutputofICEPT
Convexhulls
Bestserver
Co�channelinterference
�a�
�b�
�c�
���
��� The ICEPT Planning Tool Demonstrator
approach to the transmitter locating task� Figure ����b� shows the bestserver plot for the planning region� which is commonly used in radio net�work engineering� Part �c� of Figure ��� depicts the graphical co�channelinterference evaluation of the service area� Bright values represent a lowinterference� dark values indicate a high interference level�
���� Radio Wave Propagation
The present version of the Radio Transmission module in ICEPT com�prises the outdoor radio wave prediction methods of Hata and COST���cf� Hata ������ and St�uber �������
The Hata model is based on the empirical data collected by Okumuraet al� ������� It is widely used in cellular radio engineering since itsfrequency range covers most of the spectrum used by second generationcellular systems� like the GSM��� cellular system� cf� ETSI ���� a�� Themodel is valid for the following range of parameters� carrier frequency� �MHz � fc � ����MHz� base station antenna height �m � hb ����m� mobile station antenna height �m � hm � ��m� and the distance�km � d � ��km between the transmitter and the mobile station� In theHata model� the path loss L �in dB� at distance d from the transmitteris
L�dB��d� ! ��� ����� � log���fc�� ���� � log���hb�
�ax ������ �� � log���hb�� � log���d� �����
with ax denoting the land use type component�
DenseUrban adu ! �� � �log������� � hm��� � �����
Urban au ! ���� � log���fc�� ���� � hm���� � � log���fc�� �����
Suburban asu ! au �� � � �log���fc�
����
Rural�Open ar ! au ����� ���� � �log���fc���
Outdoor ���� � log���fc��
The COST�� model is an extension of the Hata method for a highercarrier frequency range of � ��MHz � fc � ����MHz� which is com�monly used in the european DCS���� system� cf� ETSI ���� b�� andnorth�american PCS���� cellular systems� cf� ANSI ������� The other
��
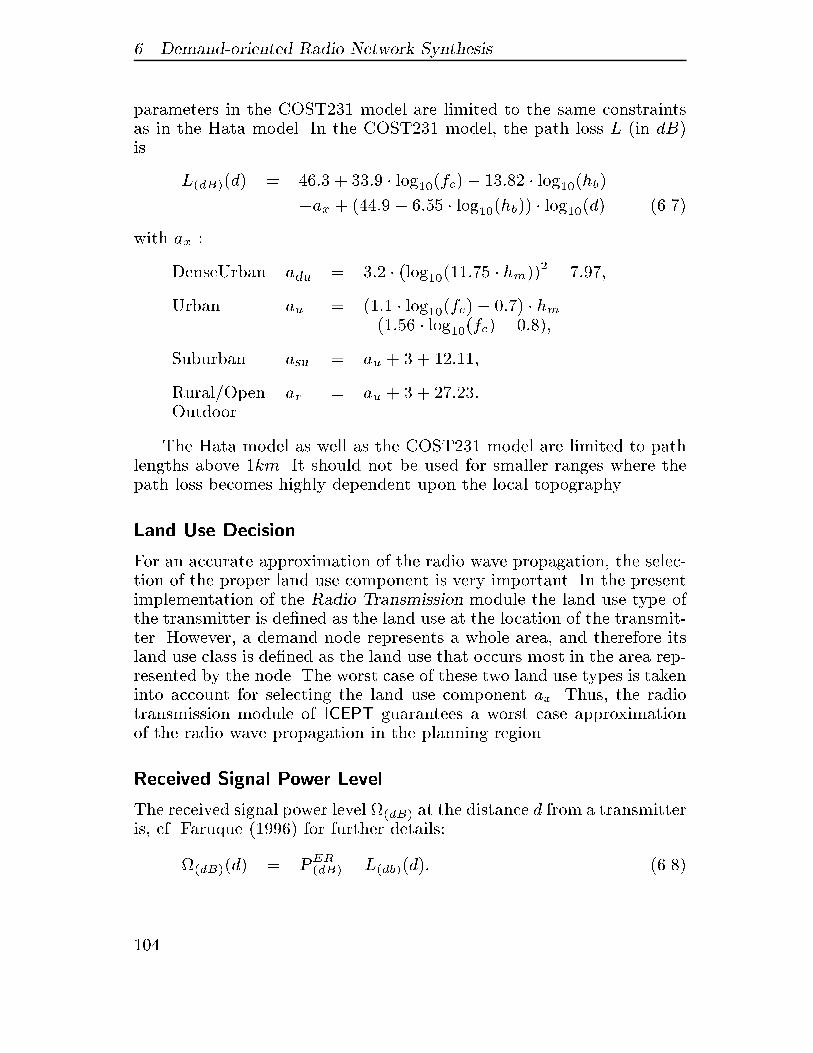
� Demand�oriented Radio Network Synthesis
parameters in the COST�� model are limited to the same constraintsas in the Hata model� In the COST�� model� the path loss L �in dB�is
L�dB��d� ! ��� �� � log���fc�� ���� � log���hb�
�ax ����� � �� � log���hb�� � log���d� �����
with ax �
DenseUrban adu ! �� � �log������� � hm��� � �����
Urban au ! ���� � log���fc�� ���� � hm���� � � log���fc�� �����
Suburban asu ! au ������
Rural�Open ar ! au �����Outdoor
The Hata model as well as the COST�� model are limited to pathlengths above �km� It should not be used for smaller ranges where thepath loss becomes highly dependent upon the local topography�
Land Use Decision
For an accurate approximation of the radio wave propagation� the selec�tion of the proper land use component is very important� In the presentimplementation of the Radio Transmission module the land use type ofthe transmitter is de�ned as the land use at the location of the transmit�ter� However� a demand node represents a whole area� and therefore itsland use class is de�ned as the land use that occurs most in the area rep�resented by the node� The worst case of these two land use types is takeninto account for selecting the land use component ax� Thus� the radiotransmission module of ICEPT guarantees a worst case approximationof the radio wave propagation in the planning region�
Received Signal Power Level
The received signal power level &�dB� at the distance d from a transmitteris� cf� Faruque ������ for further details�
&�dB��d� ! PER�dB� � L�db��d�� �����
���
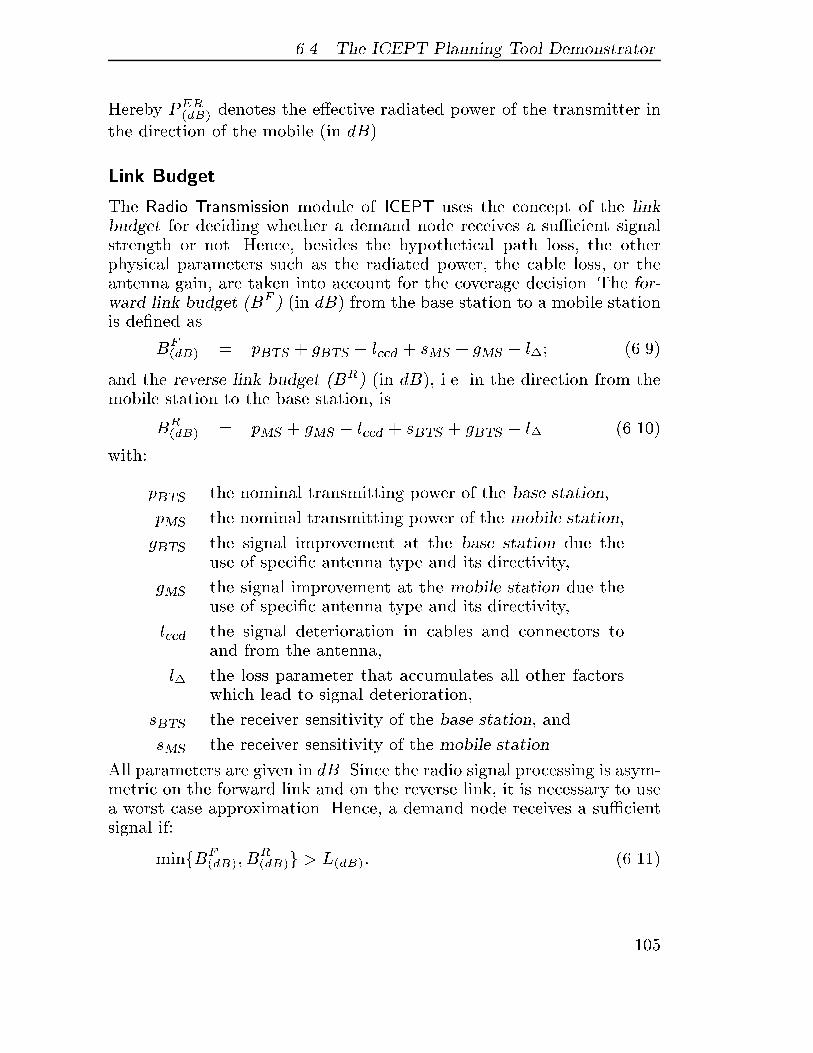
��� The ICEPT Planning Tool Demonstrator
Hereby PER�dB� denotes the e�ective radiated power of the transmitter in
the direction of the mobile �in dB��
Link Budget
The Radio Transmission module of ICEPT uses the concept of the linkbudget for deciding whether a demand node receives a su�cient signalstrength or not� Hence� besides the hypothetical path loss� the otherphysical parameters such as the radiated power� the cable loss� or theantenna gain� are taken into account for the coverage decision� The for�ward link budget �BF � �in dB� from the base station to a mobile stationis de�ned as
BF�dB� ! pBTS gBTS � lccd sMS gMS � l�� �����
and the reverse link budget �BR� �in dB�� i�e� in the direction from themobile station to the base station� is
BR�dB� ! pMS gMS � lccd sBTS gBTS � l� ������
with�
pBTS the nominal transmitting power of the base station�
pMS the nominal transmitting power of the mobile station�
gBTS the signal improvement at the base station due theuse of speci�c antenna type and its directivity�
gMS the signal improvement at the mobile station due theuse of speci�c antenna type and its directivity�
lccd the signal deterioration in cables and connectors toand from the antenna�
l� the loss parameter that accumulates all other factorswhich lead to signal deterioration�
sBTS the receiver sensitivity of the base station� and
sMS the receiver sensitivity of the mobile station�
All parameters are given in dB� Since the radio signal processing is asym�metric on the forward link and on the reverse link� it is necessary to usea worst case approximation� Hence� a demand node receives a su�cientsignal if�
minfBF�dB�� B
R�dB�g � L�dB�� ������
��
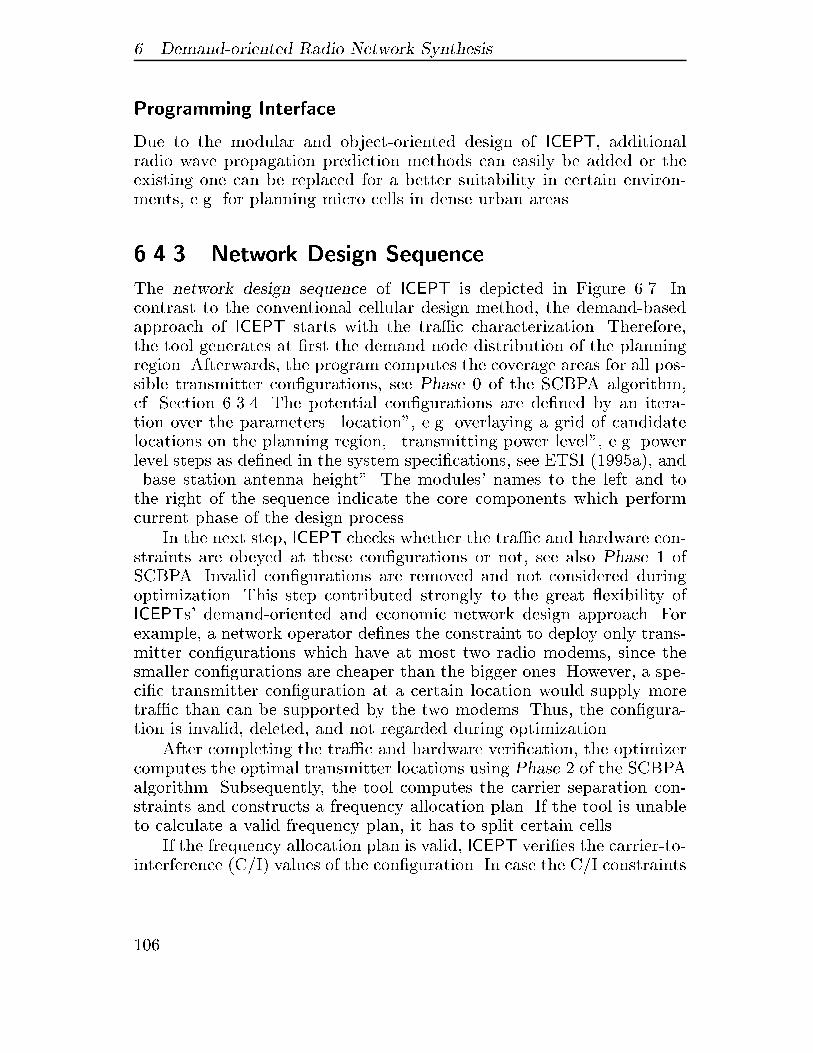
� Demand�oriented Radio Network Synthesis
Programming Interface
Due to the modular and object�oriented design of ICEPT� additionalradio wave propagation prediction methods can easily be added or theexisting one can be replaced for a better suitability in certain environ�ments� e�g� for planning micro cells in dense urban areas�
���� Network Design Sequence
The network design sequence of ICEPT is depicted in Figure ���� Incontrast to the conventional cellular design method� the demand�basedapproach of ICEPT starts with the tra�c characterization� Therefore�the tool generates at �rst the demand node distribution of the planningregion� Afterwards� the program computes the coverage areas for all pos�sible transmitter con�gurations� see Phase � of the SCBPA algorithm�cf� Section ����� The potential con�gurations are de�ned by an itera�tion over the parameters �location�� e�g� overlaying a grid of candidatelocations on the planning region� �transmitting power level�� e�g� powerlevel steps as de�ned in the system speci�cations� see ETSI ���� a�� and�base station antenna height�� The modules� names to the left and tothe right of the sequence indicate the core components which performcurrent phase of the design process�
In the next step� ICEPT checks whether the tra�c and hardware con�straints are obeyed at these con�gurations or not� see also Phase � ofSCBPA� Invalid con�gurations are removed and not considered duringoptimization� This step contributed strongly to the great �exibility ofICEPTs� demand�oriented and economic network design approach� Forexample� a network operator de�nes the constraint to deploy only trans�mitter con�gurations which have at most two radio modems� since thesmaller con�gurations are cheaper than the bigger ones� However� a spe�ci�c transmitter con�guration at a certain location would supply moretra�c than can be supported by the two modems� Thus� the con�gura�tion is invalid� deleted� and not regarded during optimization�
After completing the tra�c and hardware veri�cation� the optimizercomputes the optimal transmitter locations using Phase � of the SCBPAalgorithm� Subsequently� the tool computes the carrier separation con�straints and constructs a frequency allocation plan� If the tool is unableto calculate a valid frequency plan� it has to split certain cells�
If the frequency allocation plan is valid� ICEPT veri�es the carrier�to�interference �C�I� values of the con�guration� In case the C�I constraints
���
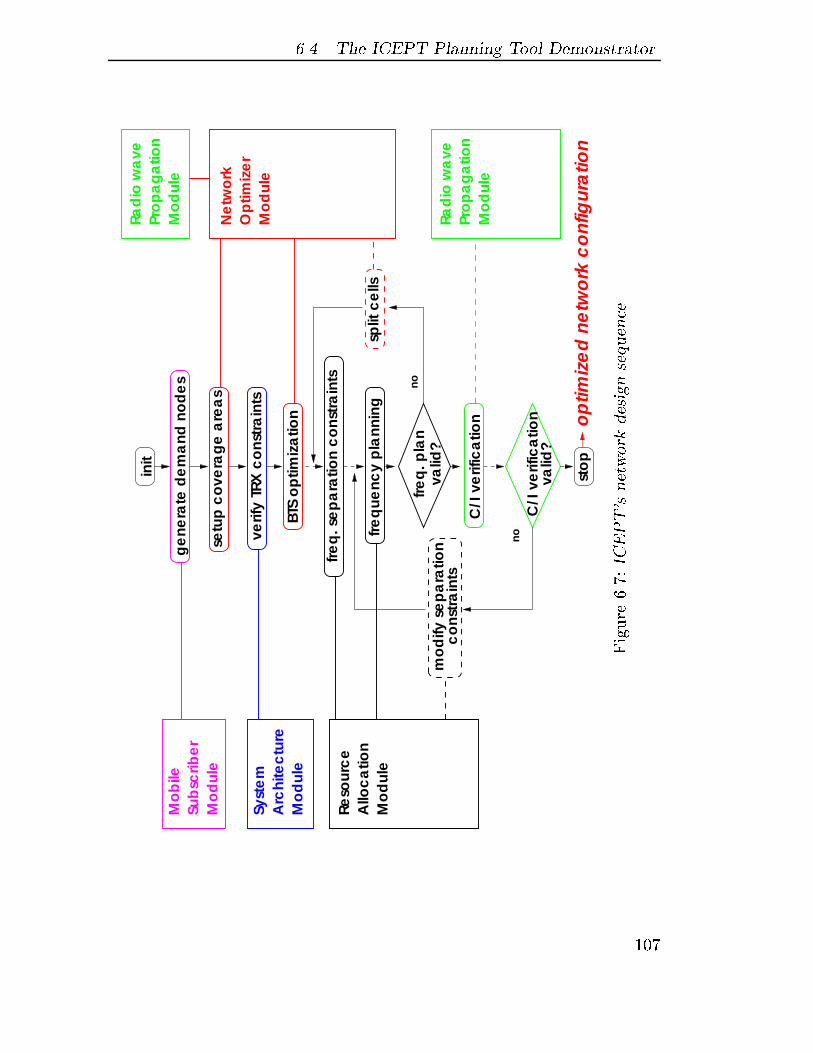
��� The ICEPT Planning Tool Demonstrator
Ne
two
rkO
ptim
ize
r
Reso
urc
e
Mo
dul
e
Mo
dul
e
Mo
bile
Allo
ca
tion
Mo
dul
eSu
bsc
ribe
r
mo
dify
se
pa
ratio
nc
ons
train
ts
split
ce
lls
op
timiz
ed
ne
two
rk c
onf
igur
atio
n
freq
. se
pa
ratio
n c
ons
train
ts
freq
uenc
y p
lann
ing
freq
. pla
nva
lid?
C/I
ve
rific
atio
n
valid
?C
/I v
erif
ica
tion
sto
p
init
ge
nera
te d
em
and
no
de
s
setu
p c
ove
rag
e a
rea
s
verif
y TR
X c
ons
train
ts
BTS
op
timiz
atio
n
no
no
Rad
io w
ave
Pro
pa
ga
tion
Mo
dul
e
Rad
io w
ave
Pro
pa
ga
tion
Mo
dul
e
Syst
em
Arc
hite
ctu
reM
od
ule
Figure����ICEPT�snetworkdesignsequence
���
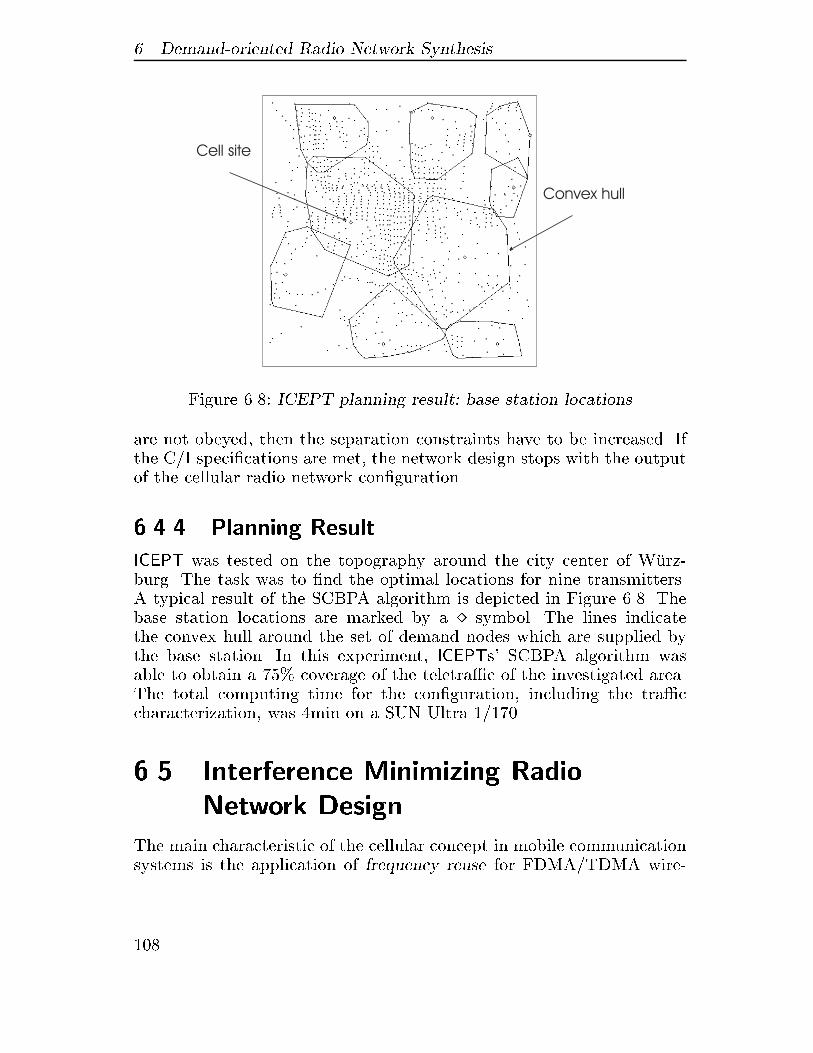
� Demand�oriented Radio Network Synthesis
Figure ���� ICEPT planning result� base station locations
are not obeyed� then the separation constraints have to be increased� Ifthe C�I speci�cations are met� the network design stops with the outputof the cellular radio network con�guration�
���� Planning Result
ICEPT was tested on the topography around the city center of W�urz�burg� The task was to �nd the optimal locations for nine transmitters�A typical result of the SCBPA algorithm is depicted in Figure ���� Thebase station locations are marked by a � symbol� The lines indicatethe convex hull around the set of demand nodes which are supplied bythe base station� In this experiment� ICEPTs� SCBPA algorithm wasable to obtain a � ' coverage of the teletra�c of the investigated area�The total computing time for the con�guration� including the tra�ccharacterization� was �min on a SUN Ultra ������
�� Interference Minimizing Radio
Network Design
The main characteristic of the cellular concept in mobile communicationsystems is the application of frequency reuse for FDMA�TDMA wire�
���
��� Interference Minimizing Radio Network Design
less networks in order to increase the tra�c capacity of the radio partof these systems� Users in geographically separated areas are simulta�neously employing the same carrier frequency� However� the frequencyreuse introduces co� and adjacent�channel interference which limits thetheoretical capacity gain of the reuse if the geographical separation ofcells with the same frequency is too small�
The high capacity design of a cellular network requires that� afterselecting the cell site� frequencies are allocated to the cells in such away that the co�channel and the adjacent channel interference in thecells is minimized� Due to the inhomogeneous tra�c distribution and theirregular shape of the cell boundaries� however� the frequency allocationprocedure is extremely di�cult� In order to decrease the complexity ofthis engineering task� already the selection of cell sites should be carriedout with regard to interference� Especially� the worst case scenario of co�channel interference �CCI� has to be addressed at an early stage duringthe cellular design�
So far� the presented algorithms for solving the base station place�ment problem are based on the set�oriented view of a cell covering acertain number of demand nodes� cf� De�nition ���� The coverage metricis de�ned solely by the maximal eligible path loss from the investigatedtransmitter to the demand nodes� without regarding the other transmit�ters�
The inclusion of the interference value as a design criterion for a singlebase station� however� is quite a challenge� the interference measured ata certain location depends on the one side on the signal disturbanceintroduced by an investigated new base station� and on the other sideon the con�guration of other interfering� already located� transmitters�Hence� every candidate transmitter has to be evaluated in context of allother transmitters in the con�guration� Thus� the run time complexityof the interference minimizing transmitter locating task increases overthe one of the conventional covering problem approach�
In the following section� two e�cient methods are proposed whichare capable to maximize the average CCI ratio while optimizing thetra�c coverage� a� a Greedy�based heuristic and b� an approach basedon Simulated Annealing� Before introducing the interference minimizingdesign algorithms� the basic RF objectives for automatic radio networkengineering and the calculation of the co�channel interference ratio incellular systems are outlined below�
���
� Demand�oriented Radio Network Synthesis
���� RF Design Objectives
Most automatic cellular network design algorithms consider the receivedsignal power level &�dB� at certain test points as their main design ob�jective� cf� Cal$egari et al� ������ and Chamaret et al� ������� However�the consideration of this value as the sole design criterion is insu�cient�The provision of a usable radio link requires at least the ful�llment oftwo constraints�
a� the received signal level &�dB� has to obey the threshold &th��dB��de�ned by the link budget� cf� Faruque �������
&�dB� � &th��dB�� ������
b� the co�channel interference ratio (�dB� is not allowed to exceed theinterference threshold (th��dB��
(�dB� � (th��dB�� �����
The threshold (th��dB� is de�ned by the receiver sensitivity�
Co�channel Interference
Figure ��� depicts a typical co�channel interference scenario of a cellularsystem� A mobile station MS in distance d� receives the strongest sig�nal from base station Tx�� which is denoted as the best server� Thereception of this signal is disturbed by three surrounding interferersTxk� k ! � � � � � Additionally� it is assumed that the interferers are trans�mitting on the same frequency as the best server� The average downlinkCCI ratio at the location of the mobile station is� cf� St�uber �������
(�dB� ! &�dB��d��� �� log��f
NIXk��
���dB��dk����g� ������
where &�dB��dk� is the received signal power level from transmitter Txk�dk is the distance of the mobile station to the transmitter and NI is thenumber of interferers�
���

��� Interference Minimizing Radio Network Design
Figure ���� Interferer scenario
���� Interference Minimizing Design Algorithms
Automatic cell site selection algorithms facilitate the deployment of mo�bile systems in two signi�cant ways� First� they are capable of verifyinga large number of di�erent sites until the optimal set of sites is foundunder the given constraints� Second� automatic selection algorithms ac�celerate the engineering process� A preliminary network con�gurationsynthesized by the algorithms can serve as an immediate starting pointfor the detailed determination of system parameters� Hence� the networkdesigner does not have to deal with invalid sites� These two advantagesof automatic network design algorithms suggest their application in thecomplex task of interference minimizing radio engineering�
The proposed interference minimizing design algorithms are exten�sively exploiting the demand node concept �DNC�� cf� Chapter � How�ever� due to the additional constraint of Eqn� ������ it is necessary toenhance the de�nition of the term coverage area�
De�nition ���� � Coverage Area �with respect to interference�
The coverage area of a transmitter with respect to interference is the setof demand nodes which are provided with a usable radio link accordingto Eqn������� and Eqn�������
���
� Demand�oriented Radio Network Synthesis
An appealing feature of the demand node concept� also taking intoaccount De�nition ����� is the fact� that the validation of the RF per�formance of a new base station only requires the calculation of �eldstrength values at positions where it is highly probable to locate a mo�bile subscriber� It is not necessary any more to compute performancevalues at every location within the service area� Thus� the DNC leads toa signi�cant speed up of the design of cellular systems�
a� Objective Function for Interference Minimization
An interference minimizing design of a cellular network requires that thedecision variable yi� cf� Eqn������ which indicates whether a demandnode is covered or not� obeys the two constraints given by Eqn�������and Eqn������� Hence� the covering criteria is enhanced to�
yi !
��
� �j � Ni � �&�dB��i� j� � &th��dB��
�(�dB��i� � (th��dB��i��
� otherwise
� ���� �
where &�dB��i� j� is the received signal strength at demand node i fromtransmitter j� and (�dB��i� is the co�channel interference according toEqn��������
b� Greedy Heuristic Solution
Due to its �exibility� a Greedy heuristic� cf� Section ����� was selected�rst as a method for solving the interference minimizing transmitter lo�cation task� The algorithm imposes no restriction on the maximum num�ber of potential base station con�gurations� The enhanced Greedy algo�rithm is shown in Algorithm ���� Its major di�erence to Algorithm ��� isthe application of a modi�ed objective function if cover��� depicted inFunction ���� This function calculates the weighted number of covereddemand nodes with respect to interference� cf� Eqn����� ��
To obtain the weighted cover� Function ��� computes for every de�mand node the best serving transmitter� i�e� the base station which pro�vides the highest radio signal level� Afterwards� it validates whether theco�channel interference at the location of the demand node is below thegiven threshold� cf� Eqn������� The co�channel interference is calculated
���
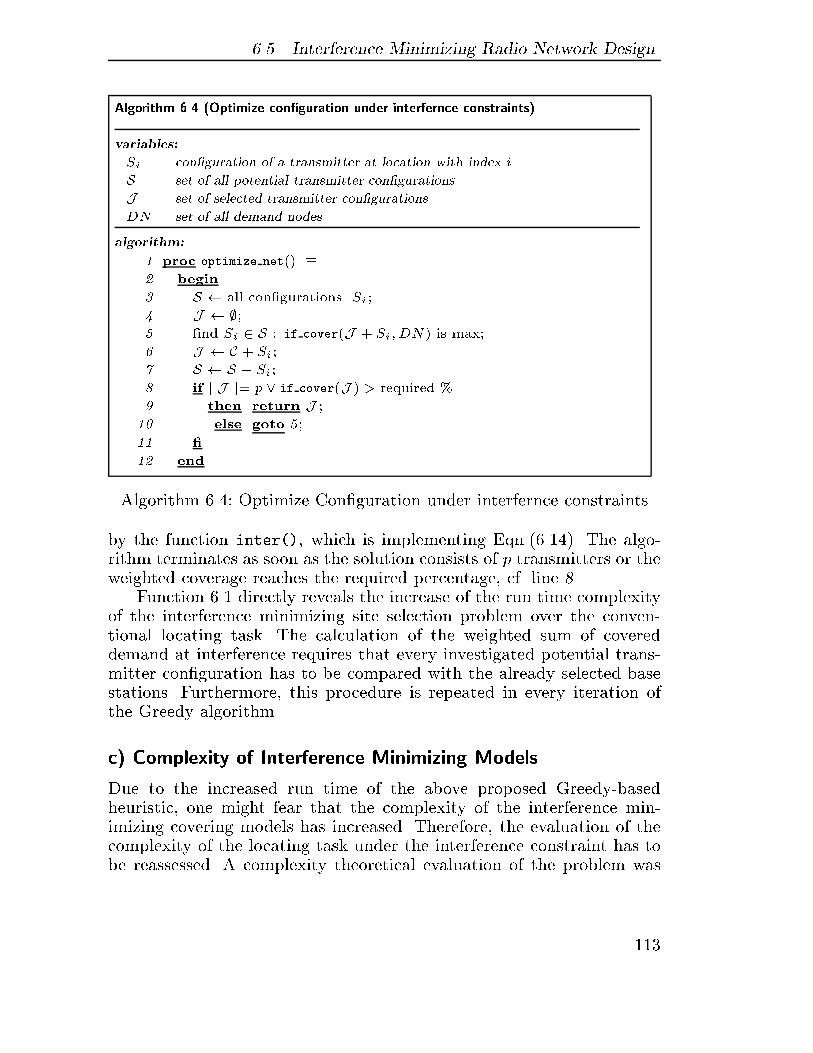
��� Interference Minimizing Radio Network Design
Algorithm �� �Optimize conguration under interfernce constraints�
variables�
Si con�guration of a transmitter at location with index i
S set of all potential transmitter con�gurations
J set of selected transmitter con�gurations
DN set of all demand nodes
algorithm�
� proc optimize net�� �
� begin
� S � all con�gurations Si�
� J � �
� �nd Si � S � if cover�J � Si� DN� is max�
� J � C � Si�
� S � S � Si�
� if j J j� p � if cover�J � � required �
then return J �
� else goto �
�� �
�� end
Algorithm ���� Optimize Con�guration under interfernce constraints
by the function inter��� which is implementing Eqn�������� The algo�rithm terminates as soon as the solution consists of p transmitters or theweighted coverage reaches the required percentage� cf� line ��
Function ��� directly reveals the increase of the run time complexityof the interference minimizing site selection problem over the conven�tional locating task� The calculation of the weighted sum of covereddemand at interference requires that every investigated potential trans�mitter con�guration has to be compared with the already selected basestations� Furthermore� this procedure is repeated in every iteration ofthe Greedy algorithm�
c� Complexity of Interference Minimizing Models
Due to the increased run time of the above proposed Greedy�basedheuristic� one might fear that the complexity of the interference min�imizing covering models has increased� Therefore� the evaluation of thecomplexity of the locating task under the interference constraint has tobe reassessed� A complexity theoretical evaluation of the problem was
��
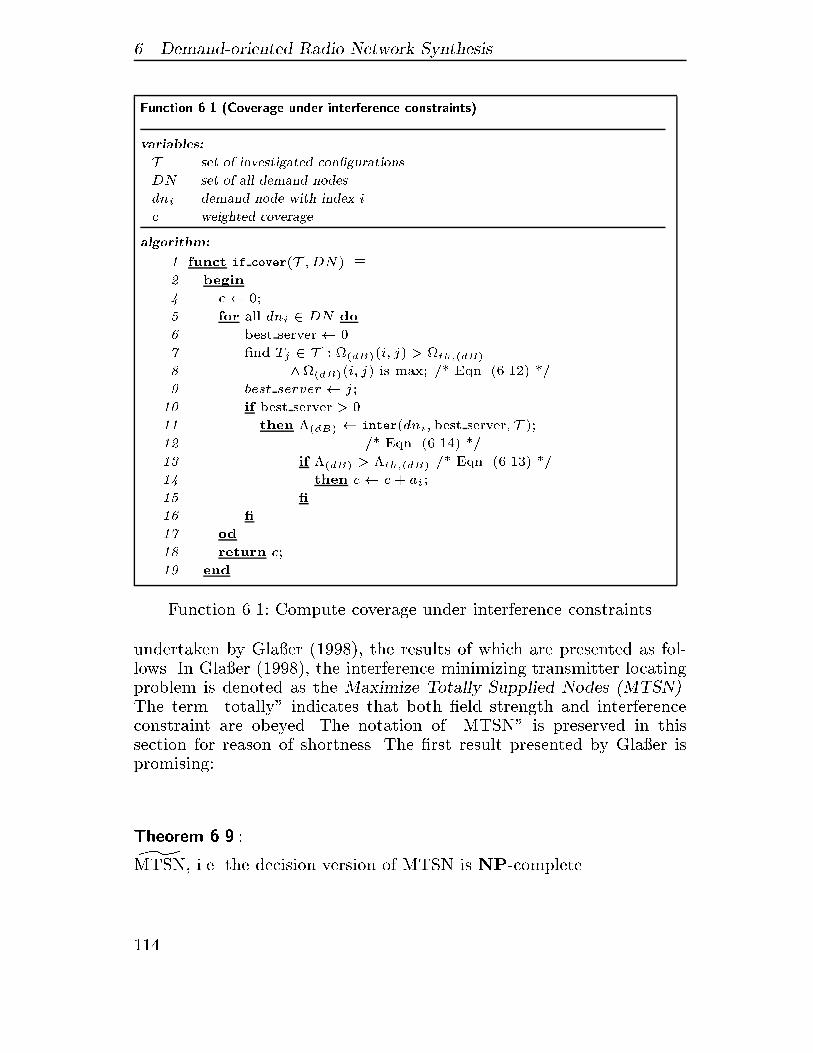
� Demand�oriented Radio Network Synthesis
Function �� �Coverage under interference constraints�
variables�
T set of investigated con�gurations
DN set of all demand nodes
dni demand node with index i
c weighted coverage
algorithm�
� funct if cover�T � DN� �
� begin
� c � ��
� for all dni � DN do
� best server� �
� �nd Tj � T � ��dB��i� j� � �th��dB�
� ���dB��i� j� is max� �� Eqn� ����� ��
best server � j�
� if best server � �
�� then ��dB� � inter�dni� best server�T ��
�� �� Eqn� ����� ��
�� if ��dB� � �th��dB� �� Eqn� ����� ��
�� then c� c� ai�
�� �
�� �
�� od
�� return c�
� end
Function ���� Compute coverage under interference constraints
undertaken by Gla�er ������� the results of which are presented as fol�lows� In Gla�er ������� the interference minimizing transmitter locatingproblem is denoted as the Maximize Totally Supplied Nodes �MTSN��The term �totally� indicates that both �eld strength and interferenceconstraint are obeyed� The notation of �MTSN� is preserved in thissection for reason of shortness� The �rst result presented by Gla�er ispromising�
Theorem �� �
�MTSN� i�e� the decision version of MTSN is NP�complete�
���
��� Interference Minimizing Radio Network Design
In particular� no polynomial time algorithm exists for MTSN optimiza�tion problem unless NP � P�
Proof� see Gla�er ������� �
Thus� the �MTSN problem is of the same complexity class as the SCP� Re�garding the approximation capability of MTSN� Gla�er�s proof providesevidence for the followoing results�
Theorem ���� �
For every � � the following holds�
� MTSN has no �n�����approximation algorithm� unlessNP � ZPP�
� MTSN has no �n�������approximation algorithm� unless NP � P�
Proof� see Gla�er ������� �
The abbreviation ZPP is denotes the class of polynomial randomized al�gorithms with zero probability of error� These algorithms are also knownas Las Vegas algorithms� cf� Papadimitriou ������� At the �rst stage� theyconsist of two Monte Carlo algorithms which return either a �positive��a �negative� or a �no de�nitive� answer� In case of a �no de�nitive� an�swer� the Las Vegas algorithms repeat the execution of the Monte Carloalgorithms until a de�nitive answer is obtained� Thus� the probability ofobtaining the correct answer asymptotically reaches the value of one�
These results show that it is very unlikely that the interference min�imizing transmitter locating problem� as well as the conventional setcover approach� has satisfactory polynomial time approximation algo�rithms� However� this does not mean that the practical cell site selectionproblem is an optimization task which is far too complex for attainingfeasible solutions� It is highly probable that a good heuristic does existwhich can solve the task in most cases with a small error� Furthermore�better approximation algorithms might be obtained by exploiting themetric or the Euclidean space� which are used in practical problems�
d� Simulated Annealing Solution
Due to the increased run time complexity of the Greedy heuristic for theinterference minimizing cell site selection problem� Simulated Annealingheuristic �SAH� was chosen as a second option for solving the task� SAH
��
� Demand�oriented Radio Network Synthesis
promised to be at least as e�cient as the Greedy approach since it consti�tutes a more general approach to combinatorial optimization problems�The applied Simulated Annealing algorithm is outlined in Section ��� �A drawback of the SAH was its limit to the maximal number of candi�date con�gurations which was about ���� However� this constraint wasimposed by the application of a general Simulated Annealing algorithm�
During the experiments� it turned out that the investigated versionof the SAH behaves in an instable way� in the sense that the initial�ization determines the quality of the �nal solution� The reason for thisis partly inherent in the problem� Good solutions tend to have a smallnumber of base stations each serving a large amount of tra�c whereasthe remaining base stations only serve tra�c in small areas� This is anatural �micro�macro� cell design� However� if once the temperature islow� Simulated Annealing unlikely changes the number of �micro� and�macro� cells in the solution� since this could only be achieved by a tem�porary huge decrease of the cost function� To overcome the problem thetemperature was restricted in such a way that with a probability of atmost �' a more worse state is accepted�
���� Single Stage Design
To prove their capability� the proposed interference minimizing designmethods were integrated into the ICEPT planning tool demonstrator� cf�Section ���� and tested in the W�urzburg planning scenario� The task isto �nd optimal locations for seven transmitters in the region around thecity center of W�urzburg� The value seven for the number of transmittersis the real number of base stations deployed in the region by a Germancellular network operator� Serveral case studies were performed with dif�ferent interference constraints and di�erent sets of potential base stationcon�gurations� The algorithms were limited to single design stage� Theteletra�c in the service region is described by ���� demand nodes�
For the optimization� three instances for the set of potential trans�mitter con�gurations were considered� In the basic instance� the numberof potential con�gurations� i�e j Sbasic j� was ����� This instance wasgenerated by overlaying the service region with an equally spaced gridof ���m � ���m and using two power levels� The second and the thirdinstance were modi�cations of the basic one� In the second instance�all potential con�gurations serving more than �' of the total demandnodes were eliminated� since such con�gurations might not be desirable�Thus� a total number of seven base stations were removed� In the third
���
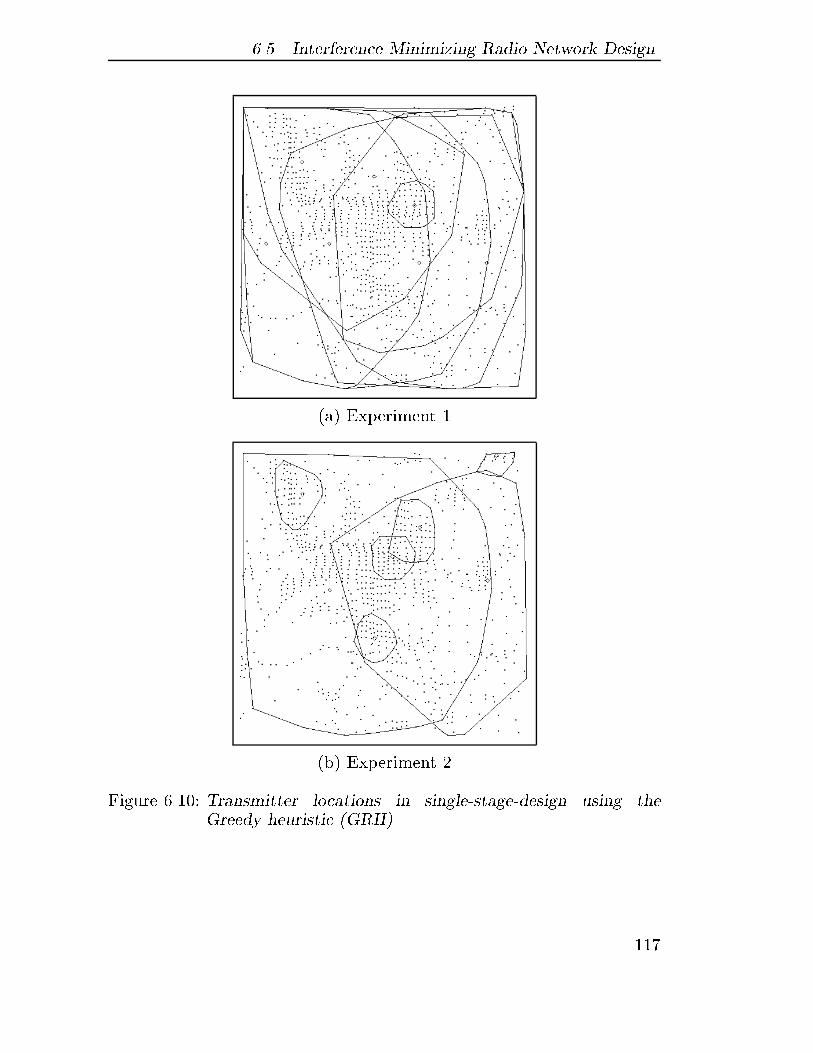
��� Interference Minimizing Radio Network Design
�a� Experiment �
�b� Experiment �
Figure ����� Transmitter locations in single�stage�design using theGreedy heuristic �GRH�
���
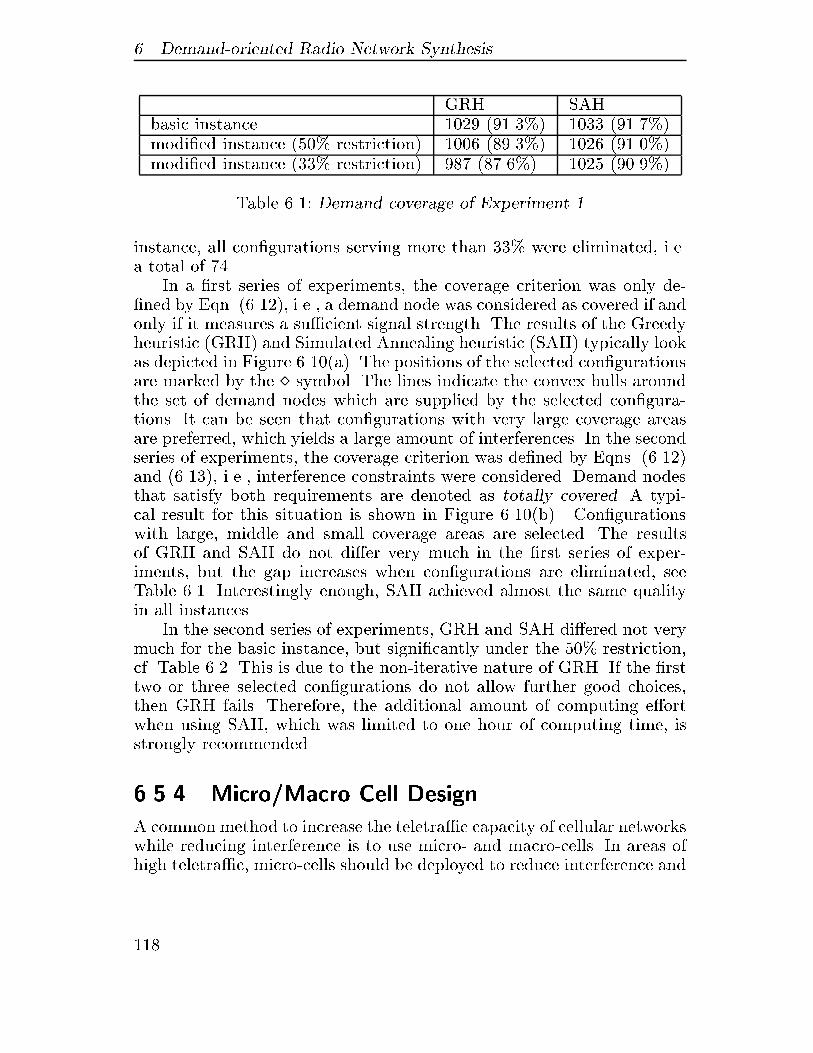
� Demand�oriented Radio Network Synthesis
GRH SAHbasic instance ���� ����'� �� �����'�modi�ed instance � �' restriction� ���� ����'� ���� �����'�modi�ed instance �' restriction� ��� �����'� ��� �����'�
Table ���� Demand coverage of Experiment �
instance� all con�gurations serving more than ' were eliminated� i�e�a total of ���
In a �rst series of experiments� the coverage criterion was only de��ned by Eqn� ������� i�e�� a demand node was considered as covered if andonly if it measures a su�cient signal strength� The results of the Greedyheuristic �GRH� and Simulated Annealing heuristic �SAH� typically lookas depicted in Figure �����a�� The positions of the selected con�gurationsare marked by the � symbol� The lines indicate the convex hulls aroundthe set of demand nodes which are supplied by the selected con�gura�tions� It can be seen that con�gurations with very large coverage areasare preferred� which yields a large amount of interferences� In the secondseries of experiments� the coverage criterion was de�ned by Eqns� ������and ������ i�e�� interference constraints were considered� Demand nodesthat satisfy both requirements are denoted as totally covered� A typi�cal result for this situation is shown in Figure �����b�� Con�gurationswith large� middle and small coverage areas are selected� The resultsof GRH and SAH do not di�er very much in the �rst series of exper�iments� but the gap increases when con�gurations are eliminated� seeTable ���� Interestingly enough� SAH achieved almost the same qualityin all instances�
In the second series of experiments� GRH and SAH di�ered not verymuch for the basic instance� but signi�cantly under the �' restriction�cf� Table ���� This is due to the non�iterative nature of GRH� If the �rsttwo or three selected con�gurations do not allow further good choices�then GRH fails� Therefore� the additional amount of computing e�ortwhen using SAH� which was limited to one hour of computing time� isstrongly recommended�
���� MicroMacro Cell Design
A common method to increase the teletra�c capacity of cellular networkswhile reducing interference is to use micro� and macro�cells� In areas ofhigh teletra�c� micro�cells should be deployed to reduce interference and
���
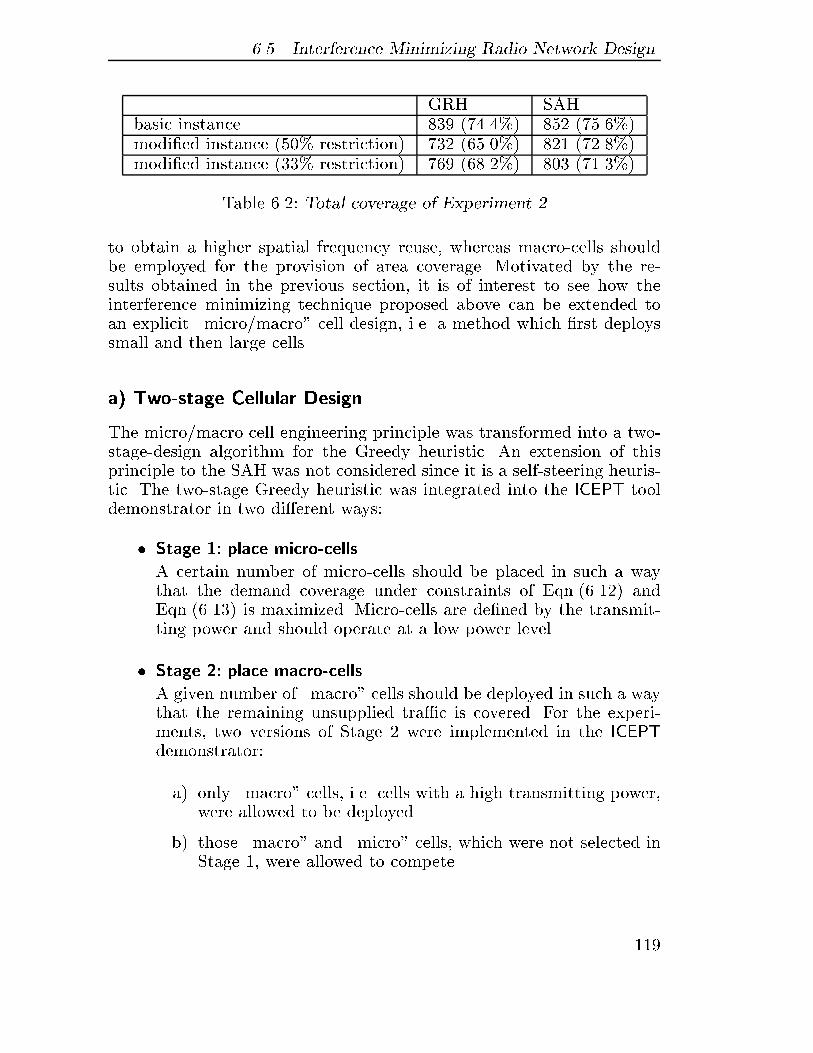
��� Interference Minimizing Radio Network Design
GRH SAHbasic instance �� �����'� � � �� ��'�modi�ed instance � �' restriction� �� �� ��'� ��� �����'�modi�ed instance �' restriction� ��� �����'� �� ����'�
Table ���� Total coverage of Experiment �
to obtain a higher spatial frequency reuse� whereas macro�cells shouldbe employed for the provision of area coverage� Motivated by the re�sults obtained in the previous section� it is of interest to see how theinterference minimizing technique proposed above can be extended toan explicit �micro�macro� cell design� i�e� a method which �rst deployssmall and then large cells�
a� Two�stage Cellular Design
The micro�macro cell engineering principle was transformed into a two�stage�design algorithm for the Greedy heuristic� An extension of thisprinciple to the SAH was not considered since it is a self�steering heuris�tic� The two�stage Greedy heuristic was integrated into the ICEPT tooldemonstrator in two di�erent ways�
� Stage �� place micro�cells�
A certain number of micro�cells should be placed in such a waythat the demand coverage under constraints of Eqn������� andEqn������ is maximized� Micro�cells are de�ned by the transmit�ting power and should operate at a low power level�
� Stage �� place macro�cells�
A given number of �macro� cells should be deployed in such a waythat the remaining unsupplied tra�c is covered� For the experi�ments� two versions of Stage � were implemented in the ICEPTdemonstrator�
a� only �macro� cells� i�e� cells with a high transmitting power�were allowed to be deployed�
b� those �macro� and �micro� cells� which were not selected inStage �� were allowed to compete�
���
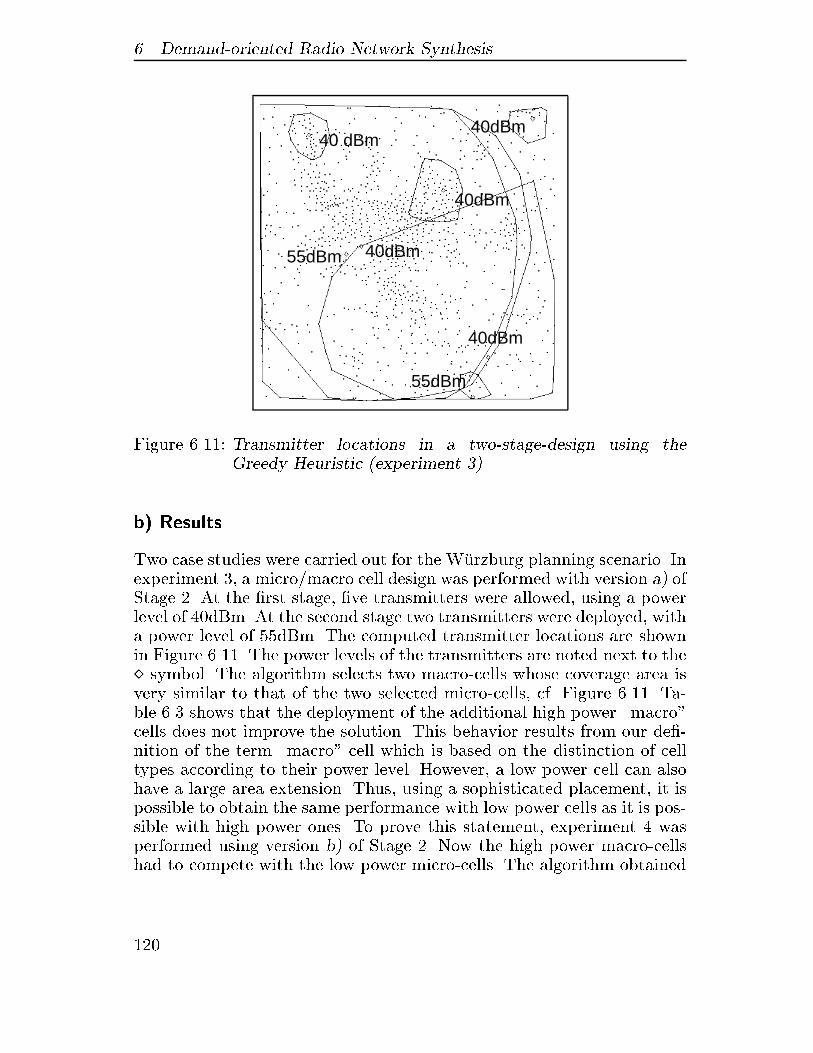
� Demand�oriented Radio Network Synthesis
55dBm 40dBm
40dBm
40dBm
40dBm
55dBm
40 dBm
Figure ����� Transmitter locations in a two�stage�design using theGreedy Heuristic �experiment ��
b� Results
Two case studies were carried out for the W�urzburg planning scenario� Inexperiment � a micro�macro cell design was performed with version a� ofStage �� At the �rst stage� �ve transmitters were allowed� using a powerlevel of ��dBm� At the second stage two transmitters were deployed� witha power level of dBm� The computed transmitter locations are shownin Figure ����� The power levels of the transmitters are noted next to the� symbol� The algorithm selects two macro�cells whose coverage area isvery similar to that of the two selected micro�cells� cf� Figure ����� Ta�ble �� shows that the deployment of the additional high power �macro�cells does not improve the solution� This behavior results from our de��nition of the term �macro� cell which is based on the distinction of celltypes according to their power level� However� a low power cell can alsohave a large area extension� Thus� using a sophisticated placement� it ispossible to obtain the same performance with low power cells as it is pos�sible with high power ones� To prove this statement� experiment � wasperformed using version b� of Stage �� Now the high power macro�cellshad to compete with the low power micro�cells� The algorithm obtained
���
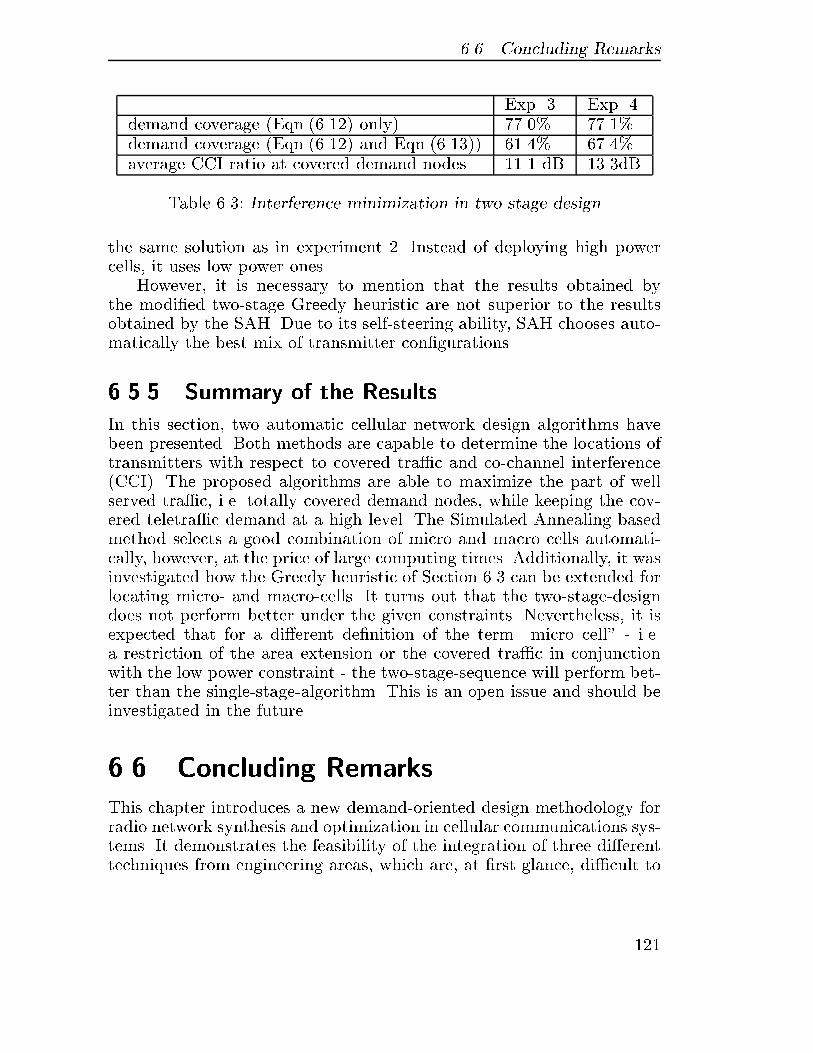
��� Concluding Remarks
Exp� Exp� �demand coverage �Eqn������� only� ����' ����'demand coverage �Eqn������� and Eqn������� ����' ����'average CCI ratio at covered demand nodes ���� dB ��dB
Table ��� Interference minimization in two stage design
the same solution as in experiment �� Instead of deploying high powercells� it uses low power ones�
However� it is necessary to mention that the results obtained bythe modi�ed two�stage Greedy heuristic are not superior to the resultsobtained by the SAH� Due to its self�steering ability� SAH chooses auto�matically the best mix of transmitter con�gurations�
���� Summary of the Results
In this section� two automatic cellular network design algorithms havebeen presented� Both methods are capable to determine the locations oftransmitters with respect to covered tra�c and co�channel interference�CCI�� The proposed algorithms are able to maximize the part of wellserved tra�c� i�e� totally covered demand nodes� while keeping the cov�ered teletra�c demand at a high level� The Simulated Annealing basedmethod selects a good combination of micro and macro cells automati�cally� however� at the price of large computing times� Additionally� it wasinvestigated how the Greedy heuristic of Section �� can be extended forlocating micro� and macro�cells� It turns out that the two�stage�designdoes not perform better under the given constraints� Nevertheless� it isexpected that for a di�erent de�nition of the term �micro cell� � i�e�a restriction of the area extension or the covered tra�c in conjunctionwith the low power constraint � the two�stage�sequence will perform bet�ter than the single�stage�algorithm� This is an open issue and should beinvestigated in the future�
� Concluding Remarks
This chapter introduces a new demand�oriented design methodology forradio network synthesis and optimization in cellular communications sys�tems� It demonstrates the feasibility of the integration of three di�erenttechniques from engineering areas� which are� at �rst glance� di�cult to
���
� Demand�oriented Radio Network Synthesis
combine� a� facility location science� b� tra�c engineering� and c� RFengineering�
In the conventional approach to radio network planning� the designareas are addressed separately� The proposed new method is based onthe forward�engineering procedure of the Integrated Approach to cellularnetwork planning� cf� Chapter �� and is facilitated by the application ofa new discrete population model for the tra�c description� the demandnode concept� This concept enables the formulation of the transmitterlocation task as a maximal coverage location problem �MCLP�� which iswell known in Operations Research to model and solve facility locationproblems� In contrast to usual facility locating tasks� where the metricis mainly the geographical distance� the radio network planning has toregard the reception of a reliable radio link as a measure for coverage�
Unfortunately� by its nature� the MCLP belongs to a class of veryintractable computational optimization problems� it is NP�hard� There�fore approximation methods for obtaining a near optimal solution for thelocating task have to be investigated� Thus� the set cover base station po�sitioning algorithm �SCBPA� was introduced� which is based on a greedyheuristic for solving the MCLP problem� Additionally� a Simulated An�nealing procedure has been considered as an alternative approximationmethod� Both methods have shown to provide e�ciently feasible solu�tions for the maximal coverage location problem�
To demonstrate the applicability of the procedures proposed in thissection� the planning tool prototype ICEPT has been implemented� Dueto its detailed implementation of all the design steps� ICEPT can be usedfor the synthesis of radio network con�gurations in real world designscenarios�
Furthermore� it was shown that the proposed set covering modelscontribute a large bene�t in speci�c RF optimization tasks� The useof the models facilitates the application of optimization methods forco�channel interference minimization� Hence� a radio network designerreceives valuable support by an automatic procedure� It is anticipatedthat the application of optimization methods accelerate signi�cantly thetask of radio network planning�
Due to the demand node concept and the use of e�cient approxi�mation algorithms� the integrated approach is able to obey all the RFdesign objectives as well as the capacity and the network deploymentconstraints� The new method is able to �nd trade�o�s between di�erentdesign objectives� It can obtain an overall optimized network con�gura�tion in acceptable computing time� Thus� the integrated approach meets
���

��� Concluding Remarks
the requirements for the planning methods of future generation networks�The automatic network design enables the integrated approach to gen�erate synthetic networks�
As a result of the research presented in this chapter� set coveringmodels have found application in complex radio network optimizationtasks� e�g� radio network engineering in CDMA systems� cf� Yu et al�������� The methodology is now in commercial use�
��

� Demand�oriented Radio Network Synthesis
���
Call Handling Procedures in
Cellular Mobile Networks
The cellular concept achieves a larger system capacity by the reuse of thesame radio frequencies in geographically separated cells� cf� Chapter ��The drawback of the cellular concept is the increased system complex�ity� The network must be able to handle handover events� on�going callswhich move across cell boundaries have to be transfered into the adja�cent cell without interruption� The event of a new call in a cell� eitheroriginating or terminating at the mobile station� is said to be a freshcall� cf� Figure ���� The schemes which de�ne the modus of processingthe calls are denoted as call handling mechanisms�
The increased system complexity of cellular communication networks�requires an adequate design and engineering methodology� In particular�the performance evaluation of call handling mechanisms has to be care�fully assessed� The performance of these mechanisms depends mainly onthe following design factors�
First� the performance is in�uenced by the capability of the systemarchitecture� e�g� by the complexity of the handover protocol and by theperformance of the involved transport network elements� In the secondplace� it is a�ected by the behavior of the customers within the servicearea� In order to get a good insight into the performance of the system�one has to take into account the distribution of interarrival times andservice times� i�e� tra�c mix� e�g� the fraction of call requests being han�dover and fresh calls� respectively� the user mobility� etc� And third� theperformance depends on the actual con�guration of the network� Looselyspeaking� if the architecture has been determined� the parameters of thesystem have to be chosen� e�g� the network planner has to dimension thenumber of channels allocated to a cell� Furthermore� the strength of thein�uence of these factors depends not only on their direct e�ect� Thefactors interact and amplify each other� e�g� the service availability will
��
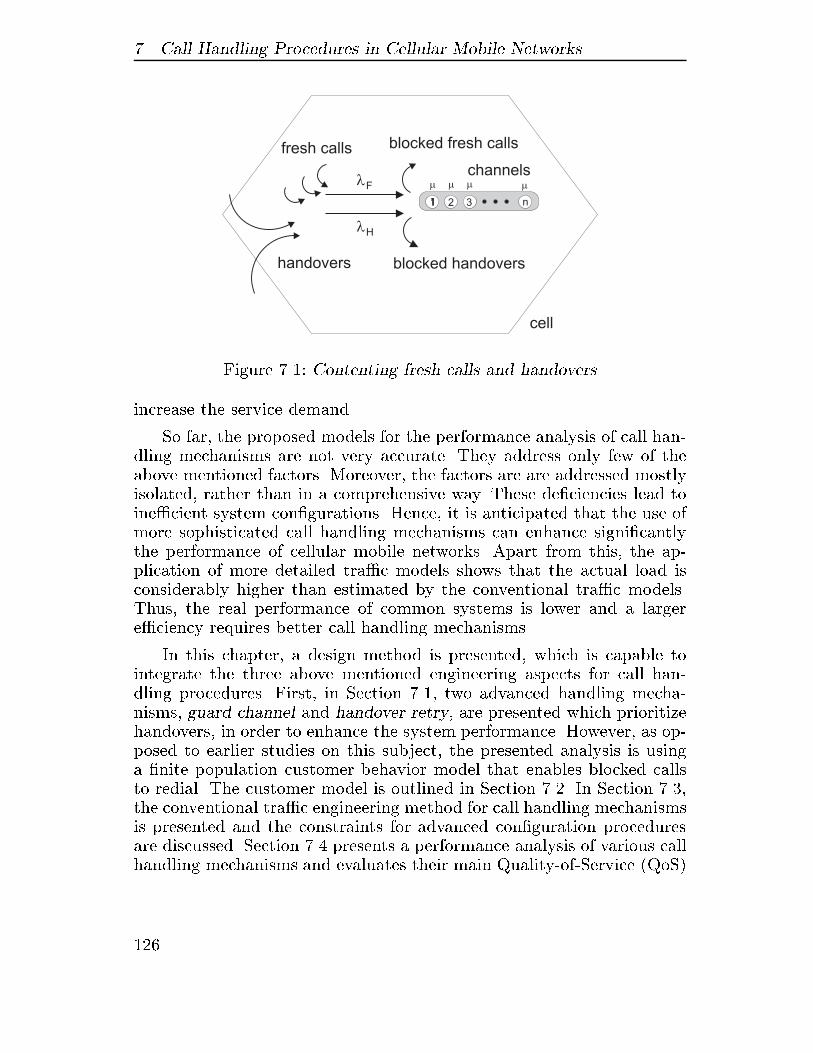
� Call Handling Procedures in Cellular Mobile Networks
1 2 311
��� �channels
handovers
fresh calls
�F
�H
n
cell
blocked handovers
blocked fresh calls
Figure ���� Contenting fresh calls and handovers
increase the service demand�
So far� the proposed models for the performance analysis of call han�dling mechanisms are not very accurate� They address only few of theabove mentioned factors� Moreover� the factors are are addressed mostlyisolated� rather than in a comprehensive way� These de�ciencies lead toine�cient system con�gurations� Hence� it is anticipated that the use ofmore sophisticated call handling mechanisms can enhance signi�cantlythe performance of cellular mobile networks� Apart from this� the ap�plication of more detailed tra�c models shows that the actual load isconsiderably higher than estimated by the conventional tra�c models�Thus� the real performance of common systems is lower and a largere�ciency requires better call handling mechanisms�
In this chapter� a design method is presented� which is capable tointegrate the three above mentioned engineering aspects for call han�dling procedures� First� in Section ���� two advanced handling mecha�nisms� guard channel and handover retry� are presented which prioritizehandovers� in order to enhance the system performance� However� as op�posed to earlier studies on this subject� the presented analysis is usinga �nite population customer behavior model that enables blocked callsto redial� The customer model is outlined in Section ���� In Section ���the conventional tra�c engineering method for call handling mechanismsis presented and the constraints for advanced con�guration proceduresare discussed� Section ��� presents a performance analysis of various callhandling mechanisms and evaluates their main Quality�of�Service �QoS�
���
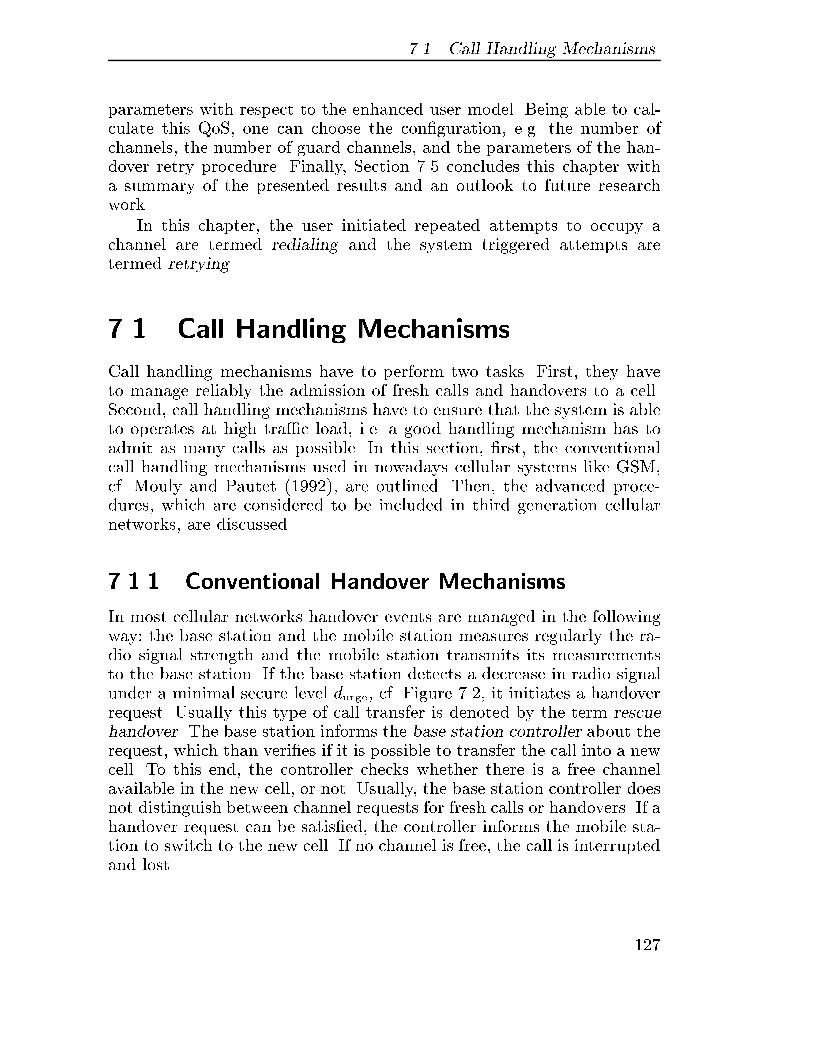
��� Call Handling Mechanisms
parameters with respect to the enhanced user model� Being able to cal�culate this QoS� one can choose the con�guration� e�g� the number ofchannels� the number of guard channels� and the parameters of the han�dover retry procedure� Finally� Section �� concludes this chapter witha summary of the presented results and an outlook to future researchwork�
In this chapter� the user initiated repeated attempts to occupy achannel are termed redialing and the system triggered attempts aretermed retrying�
�� Call Handling Mechanisms
Call handling mechanisms have to perform two tasks� First� they haveto manage reliably the admission of fresh calls and handovers to a cell�Second� call handling mechanisms have to ensure that the system is ableto operates at high tra�c load� i�e� a good handling mechanism has toadmit as many calls as possible� In this section� �rst� the conventionalcall handling mechanisms used in nowadays cellular systems like GSM�cf� Mouly and Pautet ������� are outlined� Then� the advanced proce�dures� which are considered to be included in third generation cellularnetworks� are discussed�
����� Conventional Handover Mechanisms
In most cellular networks handover events are managed in the followingway� the base station and the mobile station measures regularly the ra�dio signal strength and the mobile station transmits its measurementsto the base station� If the base station detects a decrease in radio signalunder a minimal secure level durge� cf� Figure ���� it initiates a handoverrequest� Usually this type of call transfer is denoted by the term rescuehandover� The base station informs the base station controller about therequest� which than veri�es if it is possible to transfer the call into a newcell� To this end� the controller checks whether there is a free channelavailable in the new cell� or not� Usually� the base station controller doesnot distinguish between channel requests for fresh calls or handovers� If ahandover request can be satis�ed� the controller informs the mobile sta�tion to switch to the new cell� If no channel is free� the call is interruptedand lost�
���
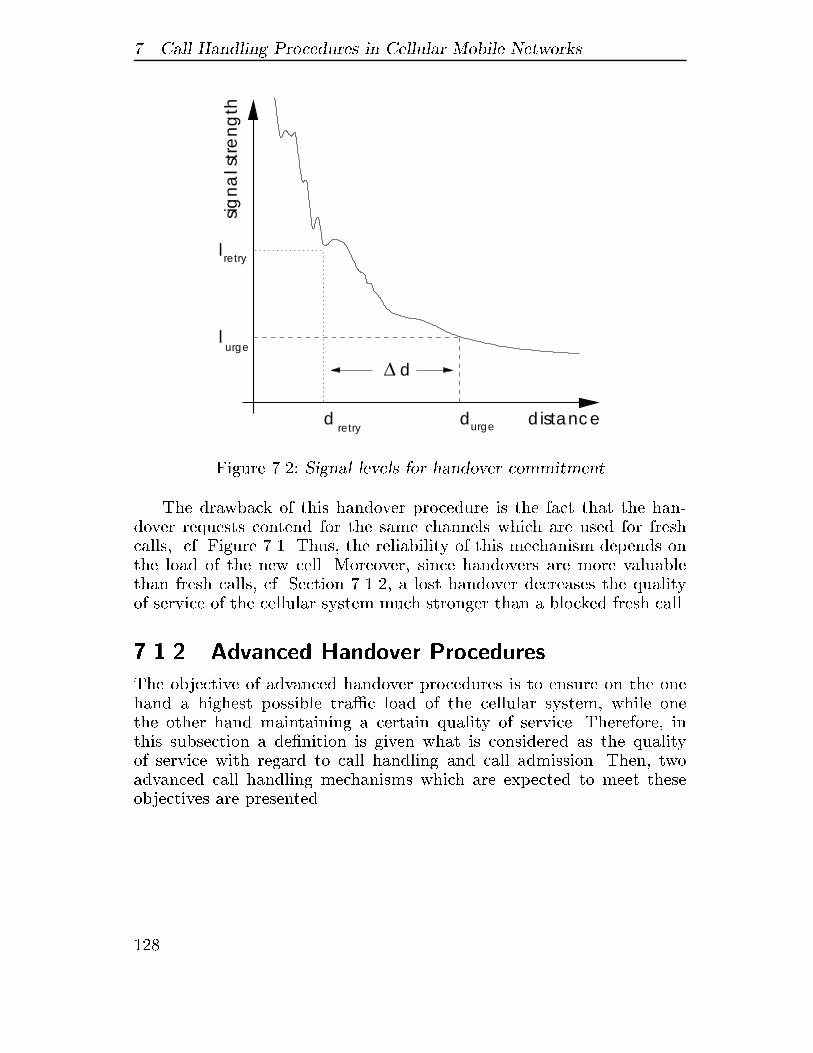
� Call Handling Procedures in Cellular Mobile Networks
sign
al s
tre
ng
th
distanced d
d∆
l
l
retry
retry
urge
urge
Figure ���� Signal levels for handover commitment
The drawback of this handover procedure is the fact that the han�dover requests contend for the same channels which are used for freshcalls� cf� Figure ���� Thus� the reliability of this mechanism depends onthe load of the new cell� Moreover� since handovers are more valuablethan fresh calls� cf� Section ������ a lost handover decreases the qualityof service of the cellular system much stronger than a blocked fresh call�
����� Advanced Handover Procedures
The objective of advanced handover procedures is to ensure on the onehand a highest possible tra�c load of the cellular system� while onethe other hand maintaining a certain quality of service� Therefore� inthis subsection a de�nition is given what is considered as the qualityof service with regard to call handling and call admission� Then� twoadvanced call handling mechanisms which are expected to meet theseobjectives are presented�
���
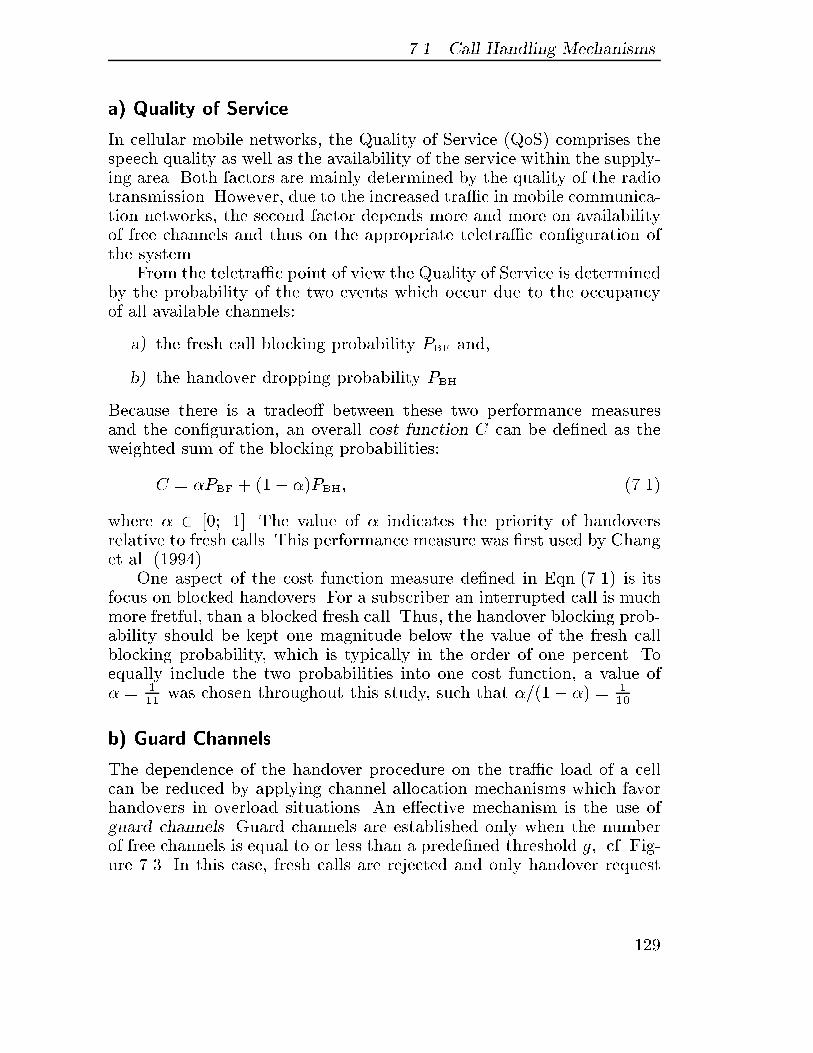
��� Call Handling Mechanisms
a� Quality of Service
In cellular mobile networks� the Quality of Service �QoS� comprises thespeech quality as well as the availability of the service within the supply�ing area� Both factors are mainly determined by the quality of the radiotransmission� However� due to the increased tra�c in mobile communica�tion networks� the second factor depends more and more on availabilityof free channels and thus on the appropriate teletra�c con�guration ofthe system�
From the teletra�c point of view the Quality of Service is determinedby the probability of the two events which occur due to the occupancyof all available channels�
a� the fresh call blocking probability PBF and�
b� the handover dropping probability PBH�
Because there is a tradeo� between these two performance measuresand the con�guration� an overall cost function C can be de�ned as theweighted sum of the blocking probabilities�
C ! PBF ��� �PBH� �����
where � ��� � � The value of indicates the priority of handoversrelative to fresh calls� This performance measure was �rst used by Changet al� �������
One aspect of the cost function measure de�ned in Eqn������ is itsfocus on blocked handovers� For a subscriber an interrupted call is muchmore fretful� than a blocked fresh call� Thus� the handover blocking prob�ability should be kept one magnitude below the value of the fresh callblocking probability� which is typically in the order of one percent� Toequally include the two probabilities into one cost function� a value of ! �
��was chosen throughout this study� such that ���� � ! �
���
b� Guard Channels
The dependence of the handover procedure on the tra�c load of a cellcan be reduced by applying channel allocation mechanisms which favorhandovers in overload situations� An e�ective mechanism is the use ofguard channels� Guard channels are established only when the numberof free channels is equal to or less than a prede�ned threshold g� cf� Fig�ure ��� In this case� fresh calls are rejected and only handover request
���
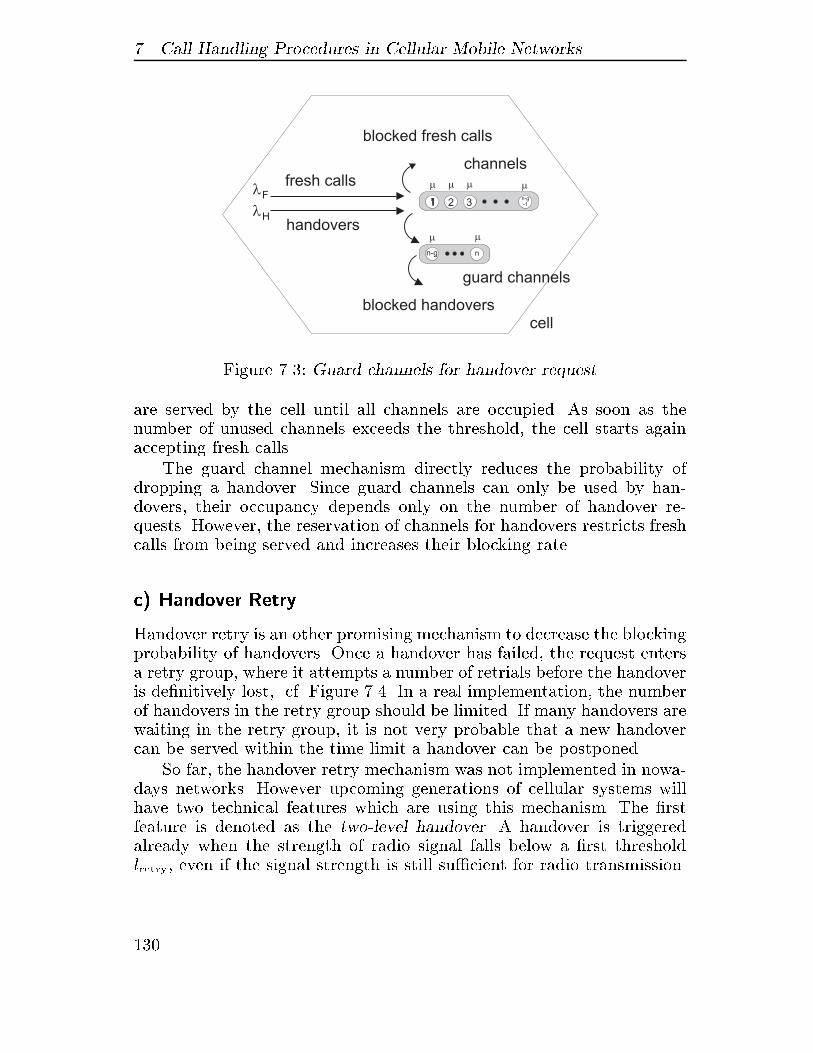
� Call Handling Procedures in Cellular Mobile Networks
1 2 3
n
11
n-g
��� �
��
guard channels
channels
handovers
fresh calls�F n-g-1
blocked handovers
�H
blocked fresh calls
cell
Figure ��� Guard channels for handover request
are served by the cell until all channels are occupied� As soon as thenumber of unused channels exceeds the threshold� the cell starts againaccepting fresh calls�
The guard channel mechanism directly reduces the probability ofdropping a handover� Since guard channels can only be used by han�dovers� their occupancy depends only on the number of handover re�quests� However� the reservation of channels for handovers restricts freshcalls from being served and increases their blocking rate�
c� Handover Retry
Handover retry is an other promising mechanism to decrease the blockingprobability of handovers� Once a handover has failed� the request entersa retry group� where it attempts a number of retrials before the handoveris de�nitively lost� cf� Figure ���� In a real implementation� the numberof handovers in the retry group should be limited� If many handovers arewaiting in the retry group� it is not very probable that a new handovercan be served within the time limit a handover can be postponed�
So far� the handover retry mechanism was not implemented in nowa�days networks� However upcoming generations of cellular systems willhave two technical features which are using this mechanism� The �rstfeature is denoted as the two�level handover� A handover is triggeredalready when the strength of radio signal falls below a �rst thresholdlretry� even if the signal strength is still su�cient for radio transmission�
��
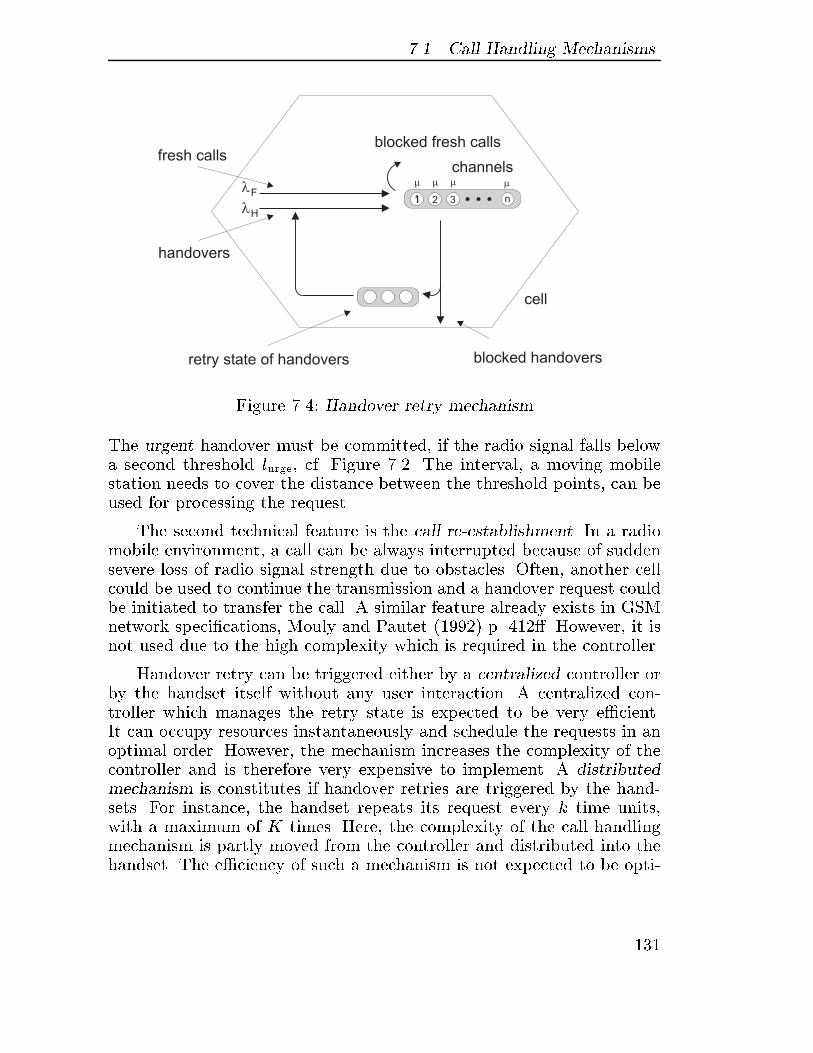
��� Call Handling Mechanisms
1 2 311
��� �channels
handovers
fresh calls
�Fn
retry state of handovers blocked handovers
�H
cell
blocked fresh calls
Figure ���� Handover retry mechanism
The urgent handover must be committed� if the radio signal falls belowa second threshold lurge� cf� Figure ���� The interval� a moving mobilestation needs to cover the distance between the threshold points� can beused for processing the request�
The second technical feature is the call re�establishment� In a radiomobile environment� a call can be always interrupted because of suddensevere loss of radio signal strength due to obstacles� Often� another cellcould be used to continue the transmission and a handover request couldbe initiated to transfer the call� A similar feature already exists in GSMnetwork speci�cations� Mouly and Pautet ������ p� ����� However� it isnot used due to the high complexity which is required in the controller�
Handover retry can be triggered either by a centralized controller orby the handset itself without any user interaction� A centralized con�troller which manages the retry state is expected to be very e�cient�It can occupy resources instantaneously and schedule the requests in anoptimal order� However� the mechanism increases the complexity of thecontroller and is therefore very expensive to implement� A distributedmechanism is constitutes if handover retries are triggered by the hand�sets� For instance� the handset repeats its request every k time units�with a maximum of K times� Here� the complexity of the call handlingmechanism is partly moved from the controller and distributed into thehandset� The e�ciency of such a mechanism is not expected to be opti�
��
� Call Handling Procedures in Cellular Mobile Networks
mal� but as the performance analysis in Section ��� will show� the mech�anism improves the Quality of Service quite well� Furthermore� this typeof mechanism can be implemented cost�e�ciently in the handset�
����� Overview on Analytical Models
An early paper on guard channels was published by Gu$erin in �����The model consists of guard channels and a queue of blocked fresh calls�It does not consider any retry state space for handovers� The serviceof the queue is managed by a central controller� This model was alsoapproached� but from a more computational point of view� by Keilsonand Ibe ���� � and Daigle and Jain ������� Both used a matrix�geometricapproach for the analysis�
Chang et al� ������ considered a more advanced guard channel model�It comprises the guard channel mechanism and two �nite queues for wait�ing fresh calls and handovers� The model allows both types of calls towithdraw from the queues� due to customer impatience or early leavingthe handover area� respectively� The queues are managed by a central�ized scheduling scheme� i�e� a waiting request is served as soon as achannel becomes idle� A similar model was investigated by Zeng et al�������� However� the authors did not consider the reneging of calls dueto impatience�
In contrast to the above mentioned authors� Yoon and Un �����investigate two call call handling mechanism which prioritize handoversbut do not use guard channels� Both models consists of a single queuefor fresh calls and handovers� Handovers are allowed� if they can not beserved immediately� to drive out fresh calls from the head of the waitingline� The two models di�er in the handling of fresh calls� The �rst modelconsiders a last�in� �rst�out �LIFO� strategy for the service of fresh callsand the second model applies a �rst�in� �rst�out �FIFO� scheme� Yoonand Un ����� compare both models with a guard channel model withouta waiting room� In fact� this is the classical trunk reservation model� cf�Roberts ������
��
��� Tra�c Models for Call Handling Mechanisms
�� Tra�c Models for Call Handling
Mechanisms
Tra�c models for the performance analysis and dimensioning of call han�dling mechanisms have to address comprehensively the characteristics ofthe call handling scheme as well as they have to capture accurately thetemporal user behaviour� So far these requirements are ful�lled only to alimited extent and in particular the description of the temporal user be�haviour is insu�cient� In the next section� a comprehensive tra�c modelfor call handling mechanisms is introduced which is capable to meet therequirements�
����� Single Request Stream Model
The commonly used tra�c model for a single cell in mobile communica�tion networks is the single arrival stream model� Handovers of on�goingcalls from adjacent cells and fresh calls are assumed to arrive accordingto a Poisson process with rates �H and �F� Both streams are aggregatedin a single sequence of channel requests� cf� Figure ���� Again� the aggre�gated stream is a Poisson process with rate
�total ! �F �H� �����
In this model� the call duration distribution is assumed to be negativeexponential with mean �� for both types of tra�c�
The major disadvantage of this tra�c model is the aggregation ofall channel request into one single stream� The model can not be usedfor the analysis of advanced call handling mechanisms� which distinguishbetween handovers and fresh calls�
Moreover� the single stream model does not consider any temporaluser behavior� In overload situations� it is very likely that blocked cus�tomer repeat their attempt after a few seconds� Particularly� modernhandsets have the capability to execute the redialing of a phone numberby just one push of a button� The redial rate is usually one or two magni�tudes higher than the normal call arrival rate and thus the o�ered tra�cextremely increases in a very short period of time� It is known from lit�erature on classical switching systems� e�g� Jonin and Sedol ������ andMacfadyen ������� that this redial phenomenon dramatically degradesthe system performance� An accurate tra�c model has to consider this
�
� Call Handling Procedures in Cellular Mobile Networks
redial behavior in order to predict the consequences of the phenomenonduring system operation�
����� Repeated Attempts
An important feature of our study is a new user model which considersthe impatience of customer and models the redial phenomenon� There�fore� a customer behavior model which was introduced by Tran�Gia������ is adopted� It is assumed in the model� that every time a cus�tomer is blocked� he waits for the next attempt with probability �� andwill give up the request with the probability � � ��� If the customerdecides to reattempt� he will try this reattempt after an exponentiallydistributed time with mean ��� � The redial probability �� is not a�ectedby the number of redial attemps� In Tran�Gia ������ an e�cient recur�sive algorithm is given to analyze a loss model with a �nite number ofcustomers� Comprehensive surveys on reattempt queues can be foundin Falin ������ or Yang and Templeton ������� More recent articles�that speci�cally study the e�ect of repeated attempts in cellular mo�bile networks� are Tran�Gia and Mandjes ������ and Choi et al� ���� ��In contrast to the evaluation presented here� these studies focus on thesystem degeneration e�ect of the redial phenomenon�
�� Tra�c Engineering for Call Handling
Mechanisms
A well con�gured call handling mechanism should enable the cell to oper�ate at high tra�c load� However� the disadvantage of running a systemclose to its limits is the higher vulnerability to a service increase in avery short time scale� e�g� mass calling� Such systems degrade quicklyin overload situations� Hence� the application of e�cient call handlingprocedures requires a careful and accurate tra�c engineering and dimen�sioning in these system� In this section� at �rst� the conventional tra�cengineering method for call handling methods in cellular networks isreviewed� Then� the engineering approach for advanced handling mech�anisms is discussed�
��
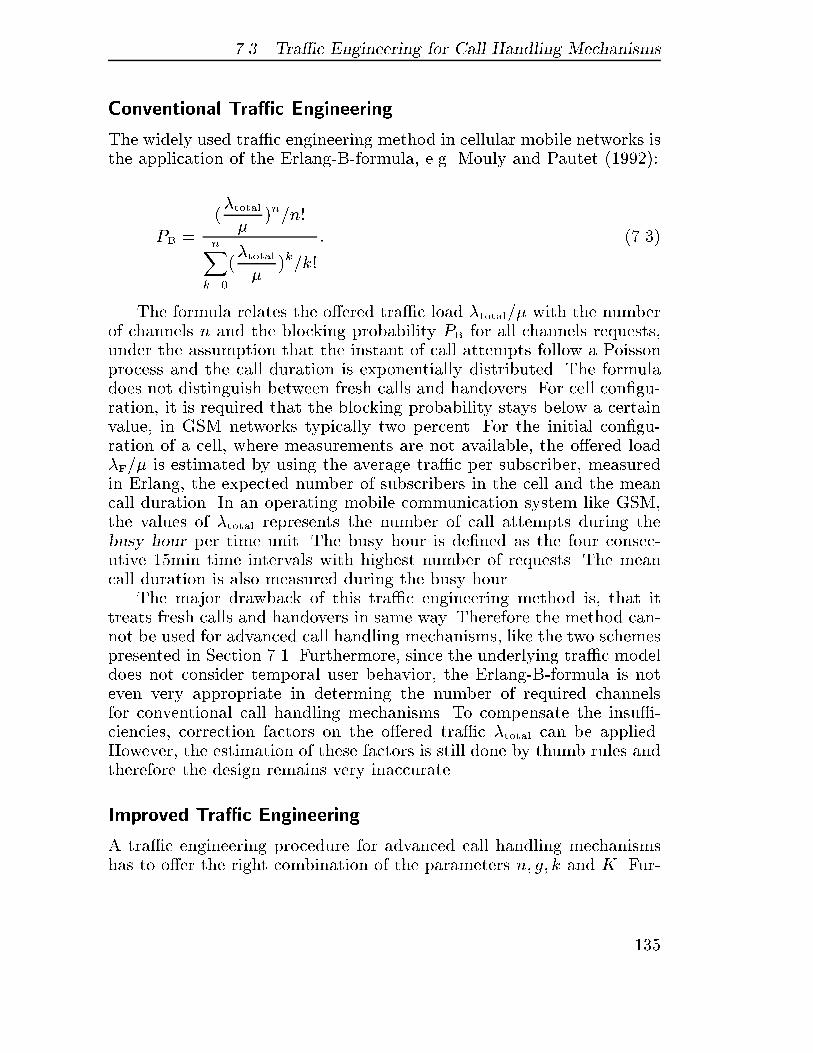
��� Tra�c Engineering for Call Handling Mechanisms
Conventional Tra�c Engineering
The widely used tra�c engineering method in cellular mobile networks isthe application of the Erlang�B�formula� e�g� Mouly and Pautet �������
PB !
��total
�n�n)
nXk��
��total
�k�k)
� ����
The formula relates the o�ered tra�c load �total� with the numberof channels n and the blocking probability PB for all channels requests�under the assumption that the instant of call attempts follow a Poissonprocess and the call duration is exponentially distributed� The formuladoes not distinguish between fresh calls and handovers� For cell con�gu�ration� it is required that the blocking probability stays below a certainvalue� in GSM networks typically two percent� For the initial con�gu�ration of a cell� where measurements are not available� the o�ered load�F� is estimated by using the average tra�c per subscriber� measuredin Erlang� the expected number of subscribers in the cell and the meancall duration� In an operating mobile communication system like GSM�the values of �total represents the number of call attempts during thebusy hour per time unit� The busy hour is de�ned as the four consec�utive � min time intervals with highest number of requests� The meancall duration is also measured during the busy hour�
The major drawback of this tra�c engineering method is� that ittreats fresh calls and handovers in same way� Therefore the method can�not be used for advanced call handling mechanisms� like the two schemespresented in Section ���� Furthermore� since the underlying tra�c modeldoes not consider temporal user behavior� the Erlang�B�formula is noteven very appropriate in determing the number of required channelsfor conventional call handling mechanisms� To compensate the insu��ciencies� correction factors on the o�ered tra�c �total can be applied�However� the estimation of these factors is still done by thumb rules andtherefore the design remains very inaccurate�
Improved Tra�c Engineering
A tra�c engineering procedure for advanced call handling mechanismshas to o�er the right combination of the parameters n� g� k and K� Fur�
�
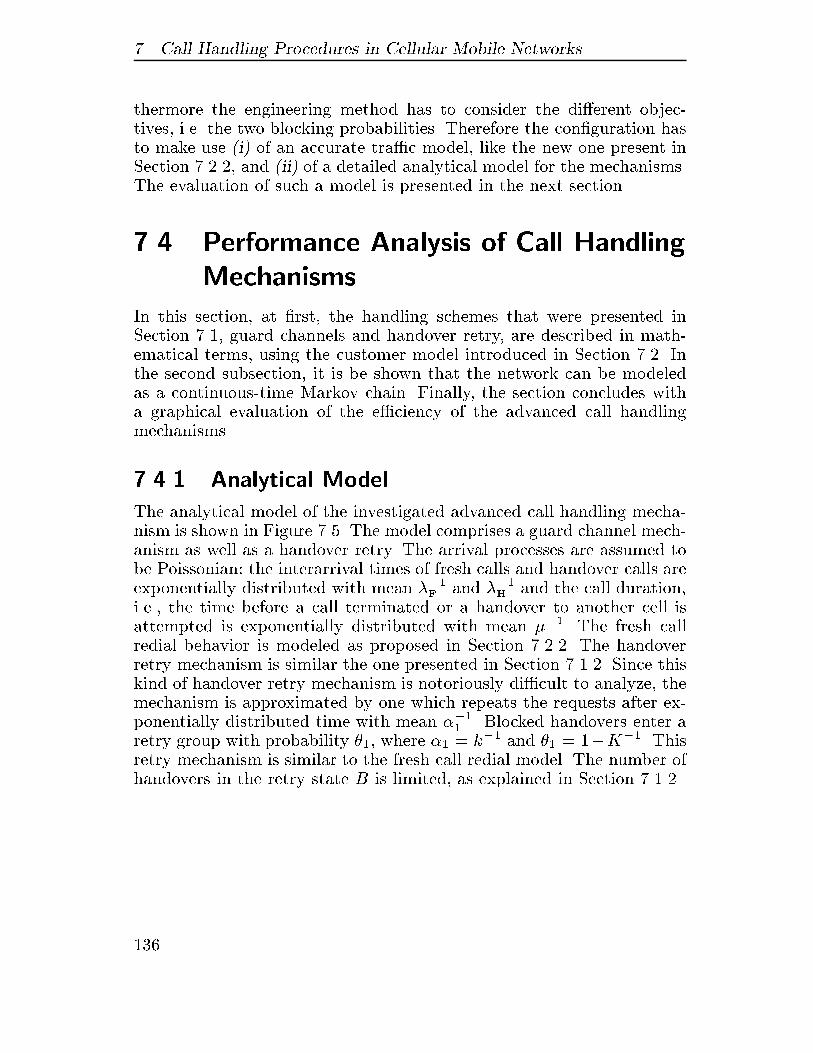
� Call Handling Procedures in Cellular Mobile Networks
thermore the engineering method has to consider the di�erent objec�tives� i�e� the two blocking probabilities� Therefore the con�guration hasto make use �i� of an accurate tra�c model� like the new one present inSection ������ and �ii� of a detailed analytical model for the mechanisms�The evaluation of such a model is presented in the next section�
�� Performance Analysis of Call Handling
Mechanisms
In this section� at �rst� the handling schemes that were presented inSection ���� guard channels and handover retry� are described in math�ematical terms� using the customer model introduced in Section ���� Inthe second subsection� it is be shown that the network can be modeledas a continuous�time Markov chain� Finally� the section concludes witha graphical evaluation of the e�ciency of the advanced call handlingmechanisms�
����� Analytical Model
The analytical model of the investigated advanced call handling mecha�nism is shown in Figure �� � The model comprises a guard channel mech�anism as well as a handover retry� The arrival processes are assumed tobe Poissonian� the interarrival times of fresh calls and handover calls areexponentially distributed with mean ���F and ���H and the call duration�i�e�� the time before a call terminated or a handover to another cell isattempted is exponentially distributed with mean ��� The fresh callredial behavior is modeled as proposed in Section ������ The handoverretry mechanism is similar the one presented in Section ������ Since thiskind of handover retry mechanism is notoriously di�cult to analyze� themechanism is approximated by one which repeats the requests after ex�ponentially distributed time with mean ��� � Blocked handovers enter aretry group with probability ��� where � ! k�� and �� ! ��K��� Thisretry mechanism is similar to the fresh call redial model� The number ofhandovers in the retry state B is limited� as explained in Section ������
��
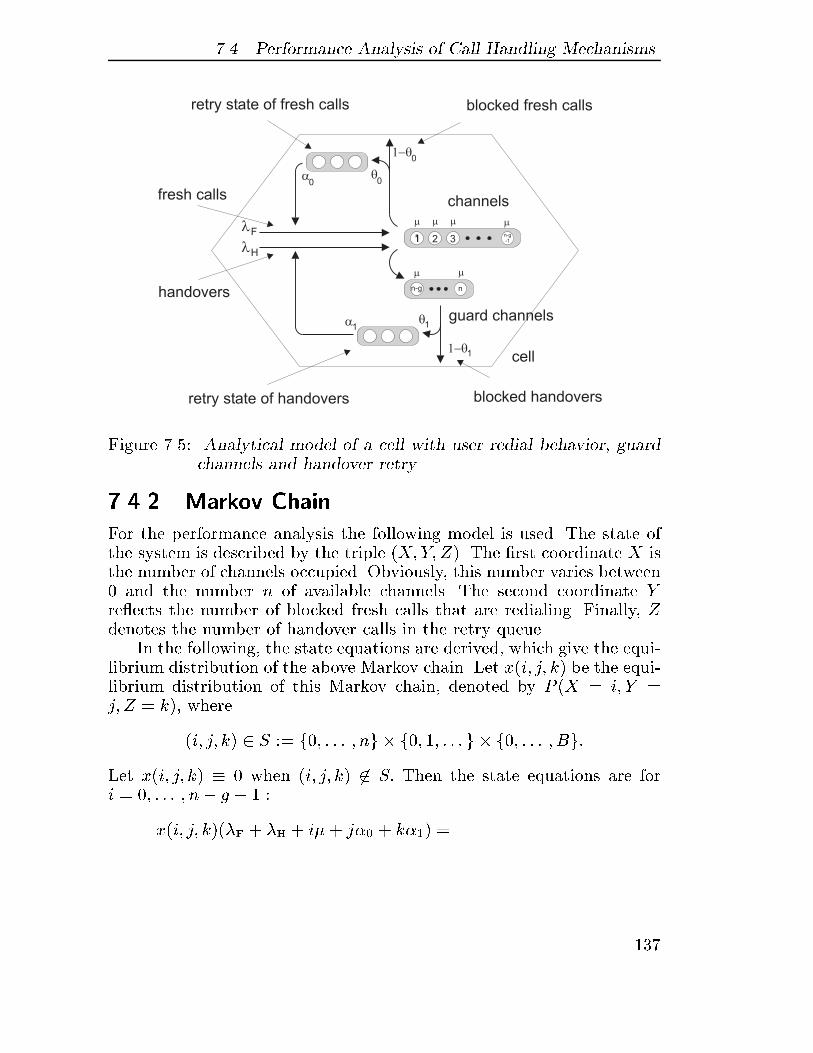
��� Performance Analysis of Call Handling Mechanisms
1 2 3
n
11
n-g
��� �
��
guard channels
channels
�
���
1
1
handovers
fresh calls
�F
1
0
�0
���0
n-g-1
retry state of fresh calls
retry state of handovers blocked handovers
blocked fresh calls
�H
cell
Figure �� � Analytical model of a cell with user redial behavior guardchannels and handover retry
����� Markov Chain
For the performance analysis the following model is used� The state ofthe system is described by the triple �X� Y� Z�� The �rst coordinate X isthe number of channels occupied� Obviously� this number varies between� and the number n of available channels� The second coordinate Yre�ects the number of blocked fresh calls that are redialing� Finally� Zdenotes the number of handover calls in the retry queue�
In the following� the state equations are derived� which give the equi�librium distribution of the above Markov chain� Let x�i� j� k� be the equi�librium distribution of this Markov chain� denoted by P �X ! i� Y !j� Z ! k�� where
�i� j� k� � S �! f�� � � � � ng � f�� �� � � � g � f�� � � � � Bg�
Let x�i� j� k� � � when �i� j� k� �� S� Then the state equations are fori ! �� � � � � n� g � � �
x�i� j� k���F �H i j� k�� !
��
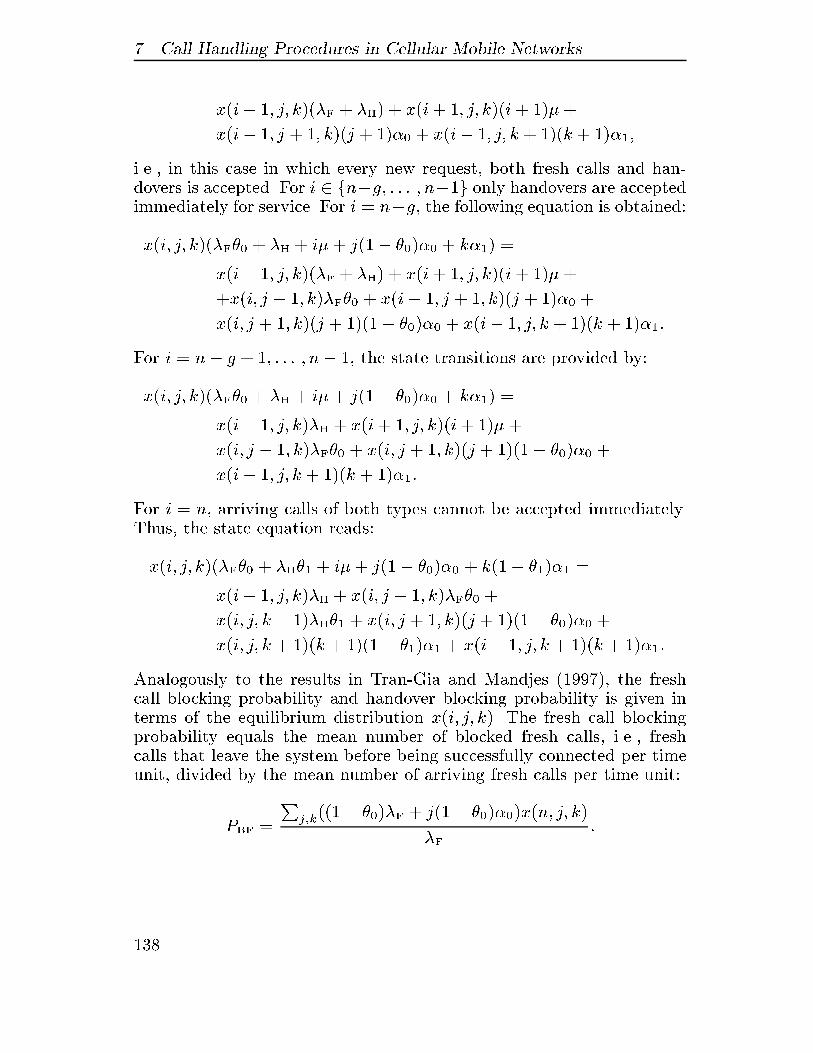
� Call Handling Procedures in Cellular Mobile Networks
x�i� �� j� k���F �H� x�i �� j� k��i ��
x�i� �� j �� k��j ��� x�i� �� j� k ���k ����
i�e�� in this case in which every new request� both fresh calls and han�dovers is accepted� For i � fn�g� � � � � n��g only handovers are acceptedimmediately for service� For i ! n�g� the following equation is obtained�
x�i� j� k���F�� �H i j��� ���� k�� !
x�i� �� j� k���F �H� x�i �� j� k��i ��
x�i� j � �� k��F�� x�i� �� j �� k��j ���
x�i� j �� k��j ����� ���� x�i� �� j� k ���k ����
For i ! n� g �� � � � � n� �� the state transitions are provided by�
x�i� j� k���F�� �H i j��� ���� k�� !
x�i� �� j� k��H x�i �� j� k��i ��
x�i� j � �� k��F�� x�i� j �� k��j ����� ����
x�i� �� j� k ���k ����
For i ! n� arriving calls of both types cannot be accepted immediately�Thus� the state equation reads�
x�i� j� k���F�� �H�� i j��� ���� k��� ���� !
x�i� �� j� k��H x�i� j � �� k��F��
x�i� j� k � ���H�� x�i� j �� k��j ����� ����
x�i� j� k ���k ����� ���� x�i� �� j� k ���k ����
Analogously to the results in Tran�Gia and Mandjes ������� the freshcall blocking probability and handover blocking probability is given interms of the equilibrium distribution x�i� j� k�� The fresh call blockingprobability equals the mean number of blocked fresh calls� i�e�� freshcalls that leave the system before being successfully connected per timeunit� divided by the mean number of arriving fresh calls per time unit�
PBF !
Pj�k���� ����F j��� �����x�n� j� k�
�F�
��
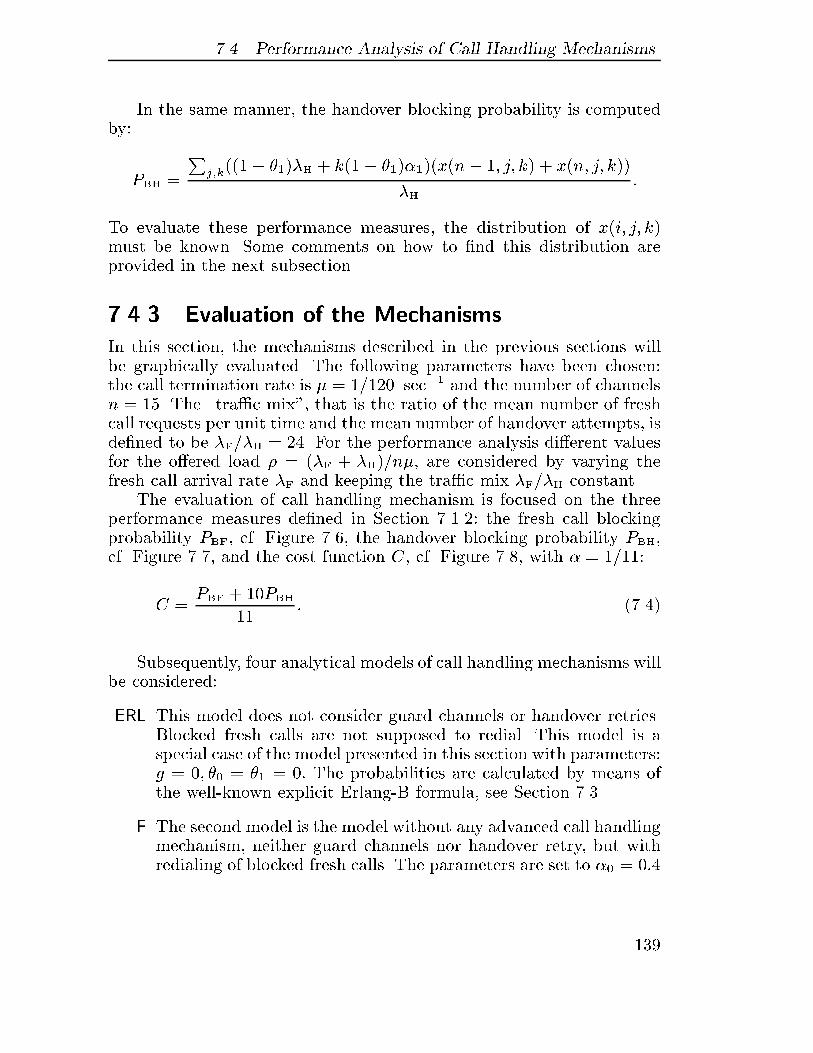
��� Performance Analysis of Call Handling Mechanisms
In the same manner� the handover blocking probability is computedby�
PBH !
Pj�k���� ����H k��� ������x�n� �� j� k� x�n� j� k��
�H�
To evaluate these performance measures� the distribution of x�i� j� k�must be known� Some comments on how to �nd this distribution areprovided in the next subsection�
����� Evaluation of the Mechanisms
In this section� the mechanisms described in the previous sections willbe graphically evaluated� The following parameters have been chosen�the call termination rate is ! ����� sec�� and the number of channelsn ! � � The �tra�c mix�� that is the ratio of the mean number of freshcall requests per unit time and the mean number of handover attempts� isde�ned to be �F��H ! ��� For the performance analysis di�erent valuesfor the o�ered load � ! ��F �H��n� are considered by varying thefresh call arrival rate �F and keeping the tra�c mix �F��H constant�
The evaluation of call handling mechanism is focused on the threeperformance measures de�ned in Section ������ the fresh call blockingprobability PBF� cf� Figure ���� the handover blocking probability PBH�cf� Figure ���� and the cost function C� cf� Figure ���� with ! �����
C !PBF ��PBH
��� �����
Subsequently� four analytical models of call handling mechanisms willbe considered�
ERL This model does not consider guard channels or handover retries�Blocked fresh calls are not supposed to redial� This model is aspecial case of the model presented in this section with parameters�g ! �� �� ! �� ! �� The probabilities are calculated by means ofthe well�known explicit Erlang�B formula� see Section ���
F The second model is the model without any advanced call handlingmechanism� neither guard channels nor handover retry� but withredialing of blocked fresh calls� The parameters are set to � ! ���
��
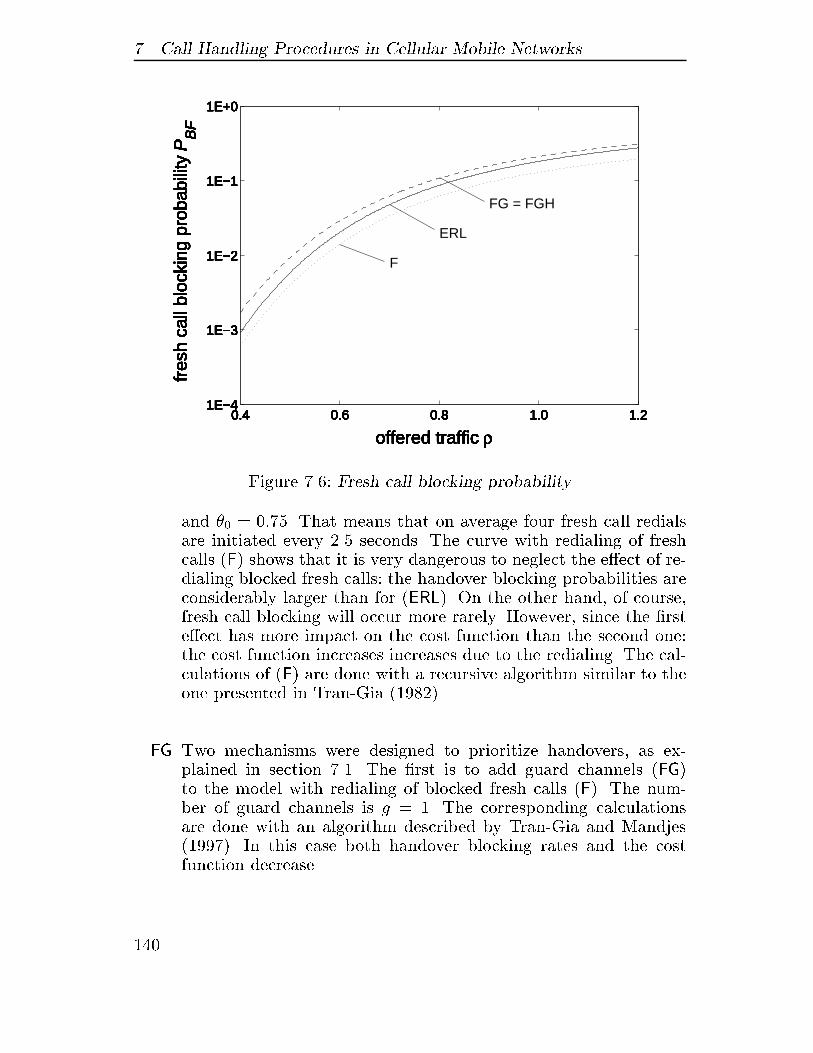
� Call Handling Procedures in Cellular Mobile Networks
offered traffic ρ
fres
h ca
ll bl
ocki
ng p
roba
bilit
y P
BF
0.4 0.6 0.8 1.0 1.21E−4
1E−3
1E−2
1E−1
1E+0
offered traffic ρ
fres
h ca
ll bl
ocki
ng p
roba
bilit
y P
BF
0.4 0.6 0.8 1.0 1.21E−4
1E−3
1E−2
1E−1
1E+0
FG = FGH
offered traffic ρ
fres
h ca
ll bl
ocki
ng p
roba
bilit
y P
BF
0.4 0.6 0.8 1.0 1.21E−4
1E−3
1E−2
1E−1
1E+0
FG = FGH
ERL
F
offered traffic ρ
fres
h ca
ll bl
ocki
ng p
roba
bilit
y P
BF
0.4 0.6 0.8 1.0 1.21E−4
1E−3
1E−2
1E−1
1E+0
FG = FGH
ERL
F
offered traffic ρ
fres
h ca
ll bl
ocki
ng p
roba
bilit
y P
BF
0.4 0.6 0.8 1.0 1.21E−4
1E−3
1E−2
1E−1
1E+0
FG = FGH
ERL
F
offered traffic ρ
fres
h ca
ll bl
ocki
ng p
roba
bilit
y P
BF
0.4 0.6 0.8 1.0 1.21E−4
1E−3
1E−2
1E−1
1E+0
FG = FGH
ERL
F
offered traffic ρ
fres
h ca
ll bl
ocki
ng p
roba
bilit
y P
BF
0.4 0.6 0.8 1.0 1.21E−4
1E−3
1E−2
1E−1
1E+0
FG = FGH
ERL
F
offered traffic ρ
fres
h ca
ll bl
ocki
ng p
roba
bilit
y P
BF
0.4 0.6 0.8 1.0 1.21E−4
1E−3
1E−2
1E−1
1E+0
FG = FGH
ERL
F
offered traffic ρ
fres
h ca
ll bl
ocki
ng p
roba
bilit
y P
BF
0.4 0.6 0.8 1.0 1.21E−4
1E−3
1E−2
1E−1
1E+0
FG = FGH
ERL
F
offered traffic ρ
fres
h ca
ll bl
ocki
ng p
roba
bilit
y P
BF
0.4 0.6 0.8 1.0 1.21E−4
1E−3
1E−2
1E−1
1E+0
FG = FGH
ERL
F
offered traffic ρ
fres
h ca
ll bl
ocki
ng p
roba
bilit
y P
BF
0.4 0.6 0.8 1.0 1.21E−4
1E−3
1E−2
1E−1
1E+0
FG = FGH
ERL
F
offered traffic ρ
fres
h ca
ll bl
ocki
ng p
roba
bilit
y P
BF
0.4 0.6 0.8 1.0 1.21E−4
1E−3
1E−2
1E−1
1E+0
FG = FGH
ERL
F
offered traffic ρ
fres
h ca
ll bl
ocki
ng p
roba
bilit
y P
BF
0.4 0.6 0.8 1.0 1.21E−4
1E−3
1E−2
1E−1
1E+0
FG = FGH
ERL
F
offered traffic ρ
fres
h ca
ll bl
ocki
ng p
roba
bilit
y P
BF
0.4 0.6 0.8 1.0 1.21E−4
1E−3
1E−2
1E−1
1E+0
FG = FGH
ERL
F
offered traffic ρ
fres
h ca
ll bl
ocki
ng p
roba
bilit
y P
BF
0.4 0.6 0.8 1.0 1.21E−4
1E−3
1E−2
1E−1
1E+0
FG = FGH
ERL
F
Figure ���� Fresh call blocking probability
and �� ! ��� � That means that on average four fresh call redialsare initiated every �� seconds� The curve with redialing of freshcalls �F� shows that it is very dangerous to neglect the e�ect of re�dialing blocked fresh calls� the handover blocking probabilities areconsiderably larger than for �ERL�� On the other hand� of course�fresh call blocking will occur more rarely� However� since the �rste�ect has more impact on the cost function than the second one�the cost function increases increases due to the redialing� The cal�culations of �F� are done with a recursive algorithm similar to theone presented in Tran�Gia �������
FG Two mechanisms were designed to prioritize handovers� as ex�plained in section ���� The �rst is to add guard channels �FG�to the model with redialing of blocked fresh calls �F�� The num�ber of guard channels is g ! �� The corresponding calculationsare done with an algorithm described by Tran�Gia and Mandjes������� In this case both handover blocking rates and the costfunction decrease�
���
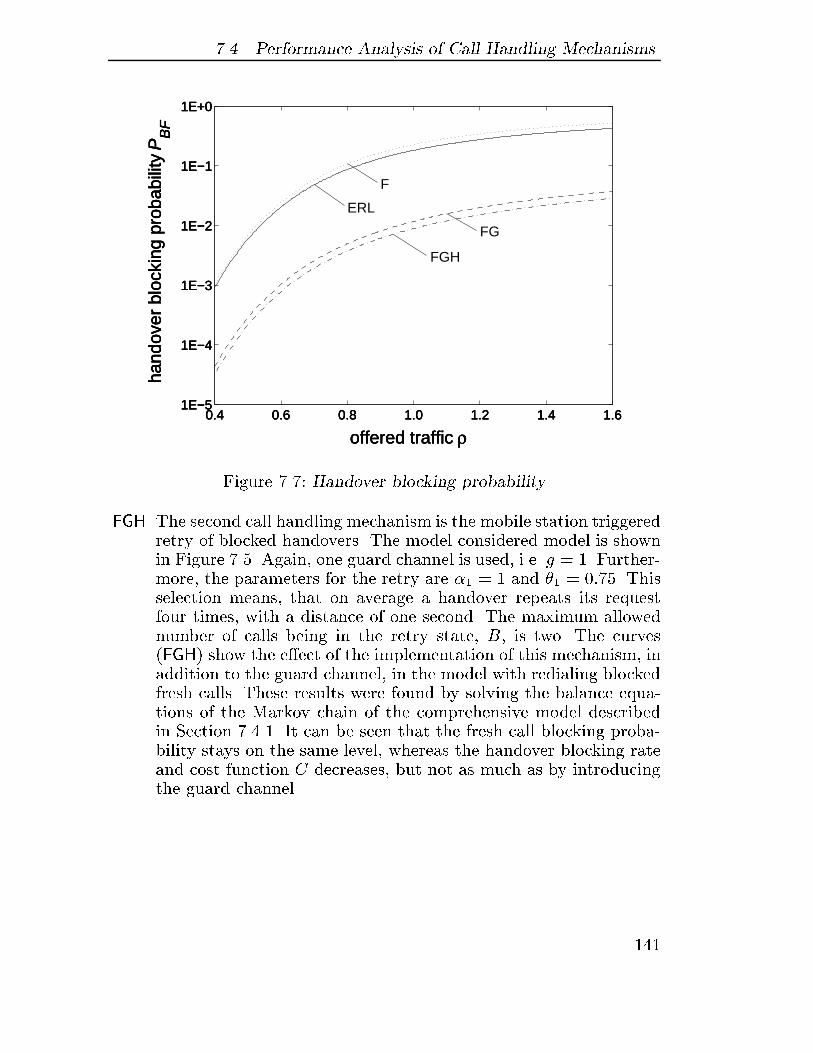
��� Performance Analysis of Call Handling Mechanisms
offered traffic ρ
hand
over
blo
ckin
g pr
obab
ility
PB
F
0.4 0.6 0.8 1.0 1.2 1.4 1.61E−5
1E−4
1E−3
1E−2
1E−1
1E+0
F
ERL
FG
FGH
offered traffic ρ
hand
over
blo
ckin
g pr
obab
ility
PB
F
0.4 0.6 0.8 1.0 1.2 1.4 1.61E−5
1E−4
1E−3
1E−2
1E−1
1E+0
F
ERL
FG
FGH
offered traffic ρ
hand
over
blo
ckin
g pr
obab
ility
PB
F
0.4 0.6 0.8 1.0 1.2 1.4 1.61E−5
1E−4
1E−3
1E−2
1E−1
1E+0
F
ERL
FG
FGH
offered traffic ρ
hand
over
blo
ckin
g pr
obab
ility
PB
F
0.4 0.6 0.8 1.0 1.2 1.4 1.61E−5
1E−4
1E−3
1E−2
1E−1
1E+0
F
ERL
FG
FGH
Figure ���� Handover blocking probability
FGH The second call handling mechanism is the mobile station triggeredretry of blocked handovers� The model considered model is shownin Figure �� � Again� one guard channel is used� i�e� g ! �� Further�more� the parameters for the retry are � ! � and �� ! ��� � Thisselection means� that on average a handover repeats its requestfour times� with a distance of one second� The maximum allowednumber of calls being in the retry state� B� is two� The curves�FGH� show the e�ect of the implementation of this mechanism� inaddition to the guard channel� in the model with redialing blockedfresh calls� These results were found by solving the balance equa�tions of the Markov chain of the comprehensive model describedin Section ������ It can be seen that the fresh call blocking proba�bility stays on the same level� whereas the handover blocking rateand cost function C decreases� but not as much as by introducingthe guard channel�
���
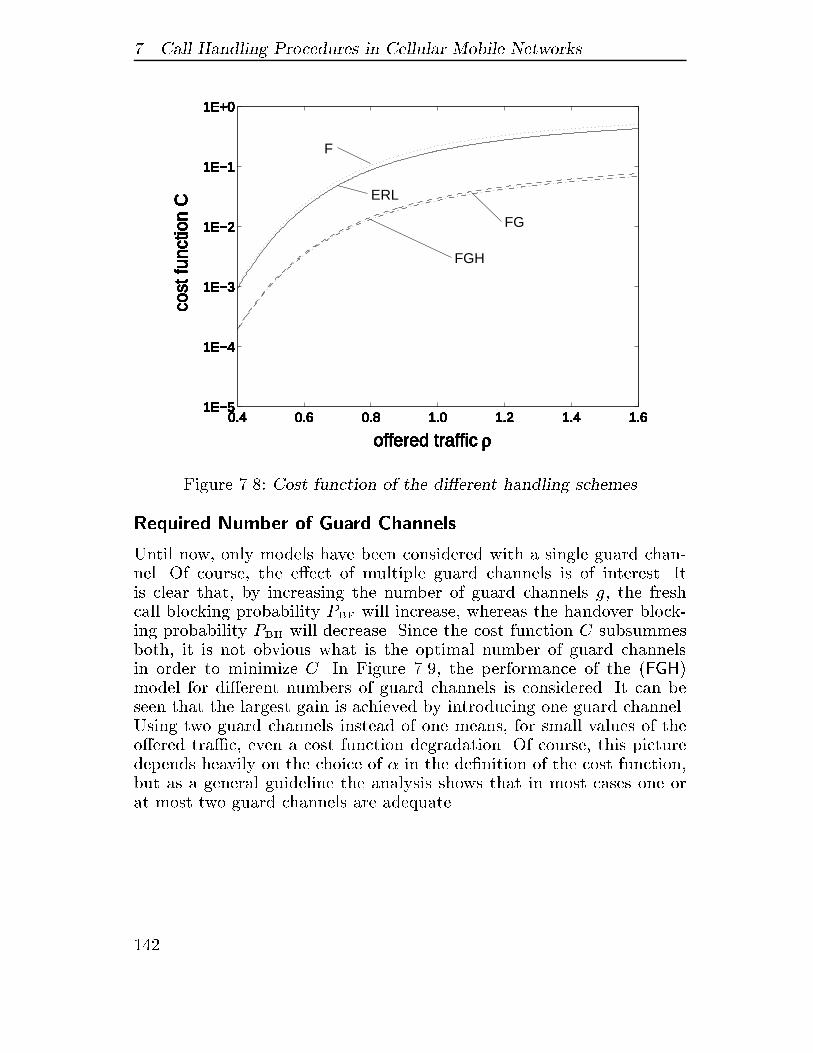
� Call Handling Procedures in Cellular Mobile Networks
offered traffic ρ
cost
func
tion
C
0.4 0.6 0.8 1.0 1.2 1.4 1.61E−5
1E−4
1E−3
1E−2
1E−1
1E+0
F
ERL
FG
FGH
offered traffic ρ
cost
func
tion
C
0.4 0.6 0.8 1.0 1.2 1.4 1.61E−5
1E−4
1E−3
1E−2
1E−1
1E+0
F
ERL
FG
FGH
offered traffic ρ
cost
func
tion
C
0.4 0.6 0.8 1.0 1.2 1.4 1.61E−5
1E−4
1E−3
1E−2
1E−1
1E+0
F
ERL
FG
FGH
offered traffic ρ
cost
func
tion
C
0.4 0.6 0.8 1.0 1.2 1.4 1.61E−5
1E−4
1E−3
1E−2
1E−1
1E+0
F
ERL
FG
FGH
offered traffic ρ
cost
func
tion
C
0.4 0.6 0.8 1.0 1.2 1.4 1.61E−5
1E−4
1E−3
1E−2
1E−1
1E+0
F
ERL
FG
FGH
offered traffic ρ
cost
func
tion
C
0.4 0.6 0.8 1.0 1.2 1.4 1.61E−5
1E−4
1E−3
1E−2
1E−1
1E+0
F
ERL
FG
FGH
offered traffic ρ
cost
func
tion
C
0.4 0.6 0.8 1.0 1.2 1.4 1.61E−5
1E−4
1E−3
1E−2
1E−1
1E+0
F
ERL
FG
FGH
offered traffic ρ
cost
func
tion
C
0.4 0.6 0.8 1.0 1.2 1.4 1.61E−5
1E−4
1E−3
1E−2
1E−1
1E+0
F
ERL
FG
FGH
offered traffic ρ
cost
func
tion
C
0.4 0.6 0.8 1.0 1.2 1.4 1.61E−5
1E−4
1E−3
1E−2
1E−1
1E+0
F
ERL
FG
FGH
offered traffic ρ
cost
func
tion
C
0.4 0.6 0.8 1.0 1.2 1.4 1.61E−5
1E−4
1E−3
1E−2
1E−1
1E+0
F
ERL
FG
FGH
offered traffic ρ
cost
func
tion
C
0.4 0.6 0.8 1.0 1.2 1.4 1.61E−5
1E−4
1E−3
1E−2
1E−1
1E+0
F
ERL
FG
FGH
offered traffic ρ
cost
func
tion
C
0.4 0.6 0.8 1.0 1.2 1.4 1.61E−5
1E−4
1E−3
1E−2
1E−1
1E+0
F
ERL
FG
FGH
offered traffic ρ
cost
func
tion
C
0.4 0.6 0.8 1.0 1.2 1.4 1.61E−5
1E−4
1E−3
1E−2
1E−1
1E+0
F
ERL
FG
FGH
offered traffic ρ
cost
func
tion
C
0.4 0.6 0.8 1.0 1.2 1.4 1.61E−5
1E−4
1E−3
1E−2
1E−1
1E+0
F
ERL
FG
FGH
offered traffic ρ
cost
func
tion
C
0.4 0.6 0.8 1.0 1.2 1.4 1.61E−5
1E−4
1E−3
1E−2
1E−1
1E+0
F
ERL
FG
FGH
offered traffic ρ
cost
func
tion
C
0.4 0.6 0.8 1.0 1.2 1.4 1.61E−5
1E−4
1E−3
1E−2
1E−1
1E+0
F
ERL
FG
FGH
offered traffic ρ
cost
func
tion
C
0.4 0.6 0.8 1.0 1.2 1.4 1.61E−5
1E−4
1E−3
1E−2
1E−1
1E+0
F
ERL
FG
FGH
offered traffic ρ
cost
func
tion
C
0.4 0.6 0.8 1.0 1.2 1.4 1.61E−5
1E−4
1E−3
1E−2
1E−1
1E+0
F
ERL
FG
FGH
offered traffic ρ
cost
func
tion
C
0.4 0.6 0.8 1.0 1.2 1.4 1.61E−5
1E−4
1E−3
1E−2
1E−1
1E+0
F
ERL
FG
FGH
offered traffic ρ
cost
func
tion
C
0.4 0.6 0.8 1.0 1.2 1.4 1.61E−5
1E−4
1E−3
1E−2
1E−1
1E+0
F
ERL
FG
FGH
offered traffic ρ
cost
func
tion
C
0.4 0.6 0.8 1.0 1.2 1.4 1.61E−5
1E−4
1E−3
1E−2
1E−1
1E+0
F
ERL
FG
FGH
offered traffic ρ
cost
func
tion
C
0.4 0.6 0.8 1.0 1.2 1.4 1.61E−5
1E−4
1E−3
1E−2
1E−1
1E+0
F
ERL
FG
FGH
offered traffic ρ
cost
func
tion
C
0.4 0.6 0.8 1.0 1.2 1.4 1.61E−5
1E−4
1E−3
1E−2
1E−1
1E+0
F
ERL
FG
FGH
offered traffic ρ
cost
func
tion
C
0.4 0.6 0.8 1.0 1.2 1.4 1.61E−5
1E−4
1E−3
1E−2
1E−1
1E+0
F
ERL
FG
FGH
offered traffic ρ
cost
func
tion
C
0.4 0.6 0.8 1.0 1.2 1.4 1.61E−5
1E−4
1E−3
1E−2
1E−1
1E+0
F
ERL
FG
FGH
Figure ���� Cost function of the di�erent handling schemes
Required Number of Guard Channels
Until now� only models have been considered with a single guard chan�nel� Of course� the e�ect of multiple guard channels is of interest� Itis clear that� by increasing the number of guard channels g� the freshcall blocking probability PBF will increase� whereas the handover block�ing probability PBH will decrease� Since the cost function C subsummesboth� it is not obvious what is the optimal number of guard channelsin order to minimize C� In Figure ���� the performance of the �FGH�model for di�erent numbers of guard channels is considered� It can beseen that the largest gain is achieved by introducing one guard channel�Using two guard channels instead of one means� for small values of theo�ered tra�c� even a cost function degradation� Of course� this picturedepends heavily on the choice of in the de�nition of the cost function�but as a general guideline the analysis shows that in most cases one orat most two guard channels are adequate�
���
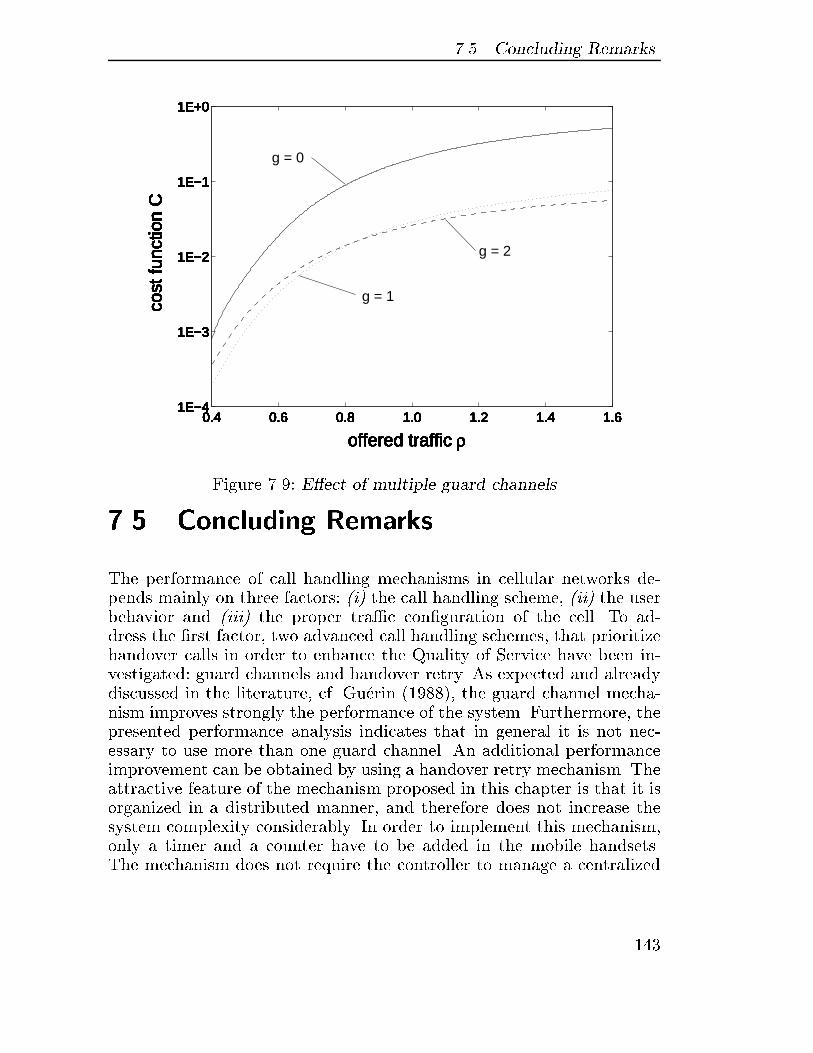
��� Concluding Remarks
offered traffic ρ
cost
func
tion
C
0.4 0.6 0.8 1.0 1.2 1.4 1.61E−4
1E−3
1E−2
1E−1
1E+0
F
ERL
FG
FGH
offered traffic ρ
cost
func
tion
C
0.4 0.6 0.8 1.0 1.2 1.4 1.61E−4
1E−3
1E−2
1E−1
1E+0
g = 0
g = 2
g = 1
offered traffic ρ
cost
func
tion
C
0.4 0.6 0.8 1.0 1.2 1.4 1.61E−4
1E−3
1E−2
1E−1
1E+0
g = 0
g = 2
g = 1
offered traffic ρ
cost
func
tion
C
0.4 0.6 0.8 1.0 1.2 1.4 1.61E−4
1E−3
1E−2
1E−1
1E+0
g = 0
g = 2
g = 1
offered traffic ρ
cost
func
tion
C
0.4 0.6 0.8 1.0 1.2 1.4 1.61E−4
1E−3
1E−2
1E−1
1E+0
g = 0
g = 2
g = 1
offered traffic ρ
cost
func
tion
C
0.4 0.6 0.8 1.0 1.2 1.4 1.61E−4
1E−3
1E−2
1E−1
1E+0
g = 0
g = 2
g = 1
offered traffic ρ
cost
func
tion
C
0.4 0.6 0.8 1.0 1.2 1.4 1.61E−4
1E−3
1E−2
1E−1
1E+0
g = 0
g = 2
g = 1
offered traffic ρ
cost
func
tion
C
0.4 0.6 0.8 1.0 1.2 1.4 1.61E−4
1E−3
1E−2
1E−1
1E+0
g = 0
g = 2
g = 1
offered traffic ρ
cost
func
tion
C
0.4 0.6 0.8 1.0 1.2 1.4 1.61E−4
1E−3
1E−2
1E−1
1E+0
g = 0
g = 2
g = 1
offered traffic ρ
cost
func
tion
C
0.4 0.6 0.8 1.0 1.2 1.4 1.61E−4
1E−3
1E−2
1E−1
1E+0
g = 0
g = 2
g = 1
offered traffic ρ
cost
func
tion
C
0.4 0.6 0.8 1.0 1.2 1.4 1.61E−4
1E−3
1E−2
1E−1
1E+0
g = 0
g = 2
g = 1
offered traffic ρ
cost
func
tion
C
0.4 0.6 0.8 1.0 1.2 1.4 1.61E−4
1E−3
1E−2
1E−1
1E+0
g = 0
g = 2
g = 1
offered traffic ρ
cost
func
tion
C
0.4 0.6 0.8 1.0 1.2 1.4 1.61E−4
1E−3
1E−2
1E−1
1E+0
g = 0
g = 2
g = 1
offered traffic ρ
cost
func
tion
C
0.4 0.6 0.8 1.0 1.2 1.4 1.61E−4
1E−3
1E−2
1E−1
1E+0
g = 0
g = 2
g = 1
offered traffic ρ
cost
func
tion
C
0.4 0.6 0.8 1.0 1.2 1.4 1.61E−4
1E−3
1E−2
1E−1
1E+0
g = 0
g = 2
g = 1
offered traffic ρ
cost
func
tion
C
0.4 0.6 0.8 1.0 1.2 1.4 1.61E−4
1E−3
1E−2
1E−1
1E+0
g = 0
g = 2
g = 1
offered traffic ρ
cost
func
tion
C
0.4 0.6 0.8 1.0 1.2 1.4 1.61E−4
1E−3
1E−2
1E−1
1E+0
g = 0
g = 2
g = 1
offered traffic ρ
cost
func
tion
C
0.4 0.6 0.8 1.0 1.2 1.4 1.61E−4
1E−3
1E−2
1E−1
1E+0
g = 0
g = 2
g = 1
offered traffic ρ
cost
func
tion
C
0.4 0.6 0.8 1.0 1.2 1.4 1.61E−4
1E−3
1E−2
1E−1
1E+0
g = 0
g = 2
g = 1
offered traffic ρ
cost
func
tion
C
0.4 0.6 0.8 1.0 1.2 1.4 1.61E−4
1E−3
1E−2
1E−1
1E+0
g = 0
g = 2
g = 1
offered traffic ρ
cost
func
tion
C
0.4 0.6 0.8 1.0 1.2 1.4 1.61E−4
1E−3
1E−2
1E−1
1E+0
g = 0
g = 2
g = 1
offered traffic ρ
cost
func
tion
C
0.4 0.6 0.8 1.0 1.2 1.4 1.61E−4
1E−3
1E−2
1E−1
1E+0
g = 0
g = 2
g = 1
offered traffic ρ
cost
func
tion
C
0.4 0.6 0.8 1.0 1.2 1.4 1.61E−4
1E−3
1E−2
1E−1
1E+0
g = 0
g = 2
g = 1
offered traffic ρ
cost
func
tion
C
0.4 0.6 0.8 1.0 1.2 1.4 1.61E−4
1E−3
1E−2
1E−1
1E+0
g = 0
g = 2
g = 1
Figure ���� E�ect of multiple guard channels
�� Concluding Remarks
The performance of call handling mechanisms in cellular networks de�pends mainly on three factors� �i� the call handling scheme� �ii� the userbehavior and �iii� the proper tra�c con�guration of the cell� To ad�dress the �rst factor� two advanced call handling schemes� that prioritizehandover calls in order to enhance the Quality of Service have been in�vestigated� guard channels and handover retry� As expected and alreadydiscussed in the literature� cf� Gu$erin ������� the guard channel mecha�nism improves strongly the performance of the system� Furthermore� thepresented performance analysis indicates that in general it is not nec�essary to use more than one guard channel� An additional performanceimprovement can be obtained by using a handover retry mechanism� Theattractive feature of the mechanism proposed in this chapter is that it isorganized in a distributed manner� and therefore does not increase thesystem complexity considerably� In order to implement this mechanism�only a timer and a counter have to be added in the mobile handsets�The mechanism does not require the controller to manage a centralized
��
� Call Handling Procedures in Cellular Mobile Networks
queue�To address the second factor� the temporal user behavior� a sim�
ple but e�cient model was presented that can be used to capture thephenomenon of repeated attempts of blocked calls� As discussed in theevaluation of the mechanisms� in order to guarantee the desired blockingrate for handovers� it is critical to neglect the redial behavior of mobilesubscriber� as seen from the �gures in Section ����
Both adaptations� advanced call handling schemes and improved usermodeling� can be used to obtain a more accurate con�guration methodof the cells in mobile networks� It had been demonstrated in this sec�tion that such a system can be modeled as a continuous�time Markovchain and that the solution of its balance equations is mathematicallytractable� For di�erent scenarios of the parameters� i�e� number of chan�nels n� number of guard channels g� the probability of a retry of a blockedhandover �� and the mean time until the next retry ��� � the relevantperformance measures can easily be calculated� Thus� a network designercan select them in a way that all service criteria� i�e� the blocking proba�bilities of fresh calls and handovers as well as the cost function� are keptbelow a certain predetermined value� The new con�guration method in�creases the e�ciency of the cellular system even in high load situations�
Due to the promising capability of the repeated attempt model ofSection ����� to characterize the user behaviour and in�uenced by theresults of the performance analysis of handling mechanisms� the ITU�T�s focus group on tra�c engineering for personal communications �FG�TEPC� is currently considering to recommend the repeated attemptmodel as a reference model to be included in the E�� � recommenda�tion series� �Tra�c engineering aspects of networks supporting mobileand UPT services�� cf� Grillo et al� �������
���
ABR Service Engineering in
Large Scale ATM Networks
Due to the deregulation of telecommunication markets� cost�e�cient ser�vice provision is mandatory for network operators� Customers can switchalmost instantaneously to the most economical provider� Hence� the net�work operators have to put a communication service product on themarket which is cost�e�cient for the provider and o�ers a considerablebene�t to the customer�
In particular� this proposition is valid for ATM network operators�So far� ATM service is highly expensive� due to its high system complex�ity� Currently� it is not attractive for a large community of customers�To facilitate a low�priced ATM service provision� an additional servicecategory was included in the ATM service architecture� the AvailableBit Rate �ABR� service category� cf� ATM Forum ������� The basic ideaof ABR is to exploit the excess bandwidth in the network which is notused by other service classes� on an �on�availability� and �best�e�ort�basis� At �rst� the ABR service category was intended for sporadic use�Mainly the conventional categories CBR and VBR are supposed to bebooked by customers� However� due to its low price� ABR is expectedto attract a large number new customers� Thus� the provision of ABRservice might become� from a commercial point of view� as important aso�ering the conventional service categories�
At a �rst glance� ABR service planning states a contradiction� Inconventional ATM network planning� the reduction of the unused ca�pacity is the major design objective� In addition� its almost impossibleto predict the availability of unused bandwidth� since the exact amountdepends on the instantaneous use of the network� In contrast to this�the provision of ABR service to a large number of users requires a highservice availability and an assurance of a certain quality for the service�
��
� ABR Service Engineering in Large Scale ATM Networks
These objectives can only be achieved by allocating dedicated bandwidthto ABR and by appropriate service planning� The purpose of this chap�ter is the presentation of a new approach for ABR service engineering inlarge scale ATM networks�
In contrast to earlier investigations of the ABR service category�cf� Chen et al� ������ or Ritter ������� the focus of the work presentedhere� is on connection level engineering� Therefore� the investigated per�formance criteria for ABR are� from a customer�s viewpoint� the connec�tion blocking probability and the throughput�
The chapter is organized as follows� Section ��� is devoted to thefoundations of the ABR service category� In Section ��� the ABR servicemodel investigated in this chapter is outlined� In Section �� three meth�ods� two exact and one approximate� for the performance evaluation ofthe ABR service on connection are introduced� Section ��� presents a casestudy for ABR service planning in large ATM networks� The chapter isconcluded by Section �� which presents a summary of the results�
��� The ABR Service Category
The VBR and CBR service categories are supporting a large variety ofapplications with high service requirements� cf� ATM Forum ������� TheVBR service class o�ers connections up to a speci�ed peak cell rate forvariable�bandwidth real�time or non�real�time applications� e�g� data orcompressed video� Cells can be generated at arbitrary intervals and aredelivered by the ATM network within de�ned limits for the cell delay andthe cell loss ratio �CLR� as required by the application� In addition tothe peak cell rate �PCR�� the burstiness of VBR sources can be indicatedby two optional parameters� denoted as sustainable cell rate �SCR� andburst tolerance �BT�� Together� these values specify upper bounds onthe average rate and burst length�
The CBR service category can be viewed as a special case of the VBRclass with the PCR equal to the average rate� CBR services are used foremulating �xed�bandwidth circuits for real�time applications� e�g� voice�or reliable point�to�point connections� Cells generated at regular periodicintervals are delivered within strict bounds for the end�to�end cell delayand the cell delay variation�
In contrast to the VBR and CBR services� the UBR service categoryis intended for applications which have minimal service requirements�The UBR service does not require any prior information about the ex�
���
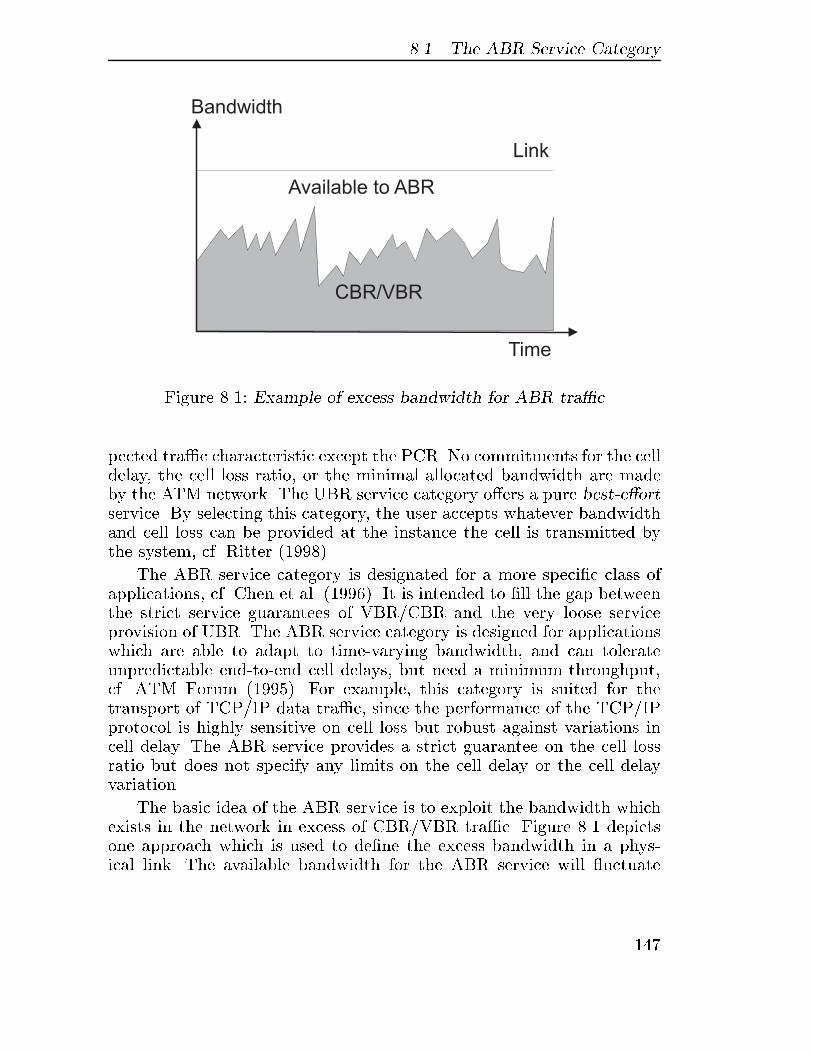
��� The ABR Service Category
Link
Time
Bandwidth
CBR/VBR
Available to ABR
Figure ���� Example of excess bandwidth for ABR tra�c
pected tra�c characteristic except the PCR� No commitments for the celldelay� the cell loss ratio� or the minimal allocated bandwidth are madeby the ATM network� The UBR service category o�ers a pure best�e�ortservice� By selecting this category� the user accepts whatever bandwidthand cell loss can be provided at the instance the cell is transmitted bythe system� cf� Ritter �������
The ABR service category is designated for a more speci�c class ofapplications� cf� Chen et al� ������� It is intended to �ll the gap betweenthe strict service guarantees of VBR�CBR and the very loose serviceprovision of UBR� The ABR service category is designed for applicationswhich are able to adapt to time�varying bandwidth� and can tolerateunpredictable end�to�end cell delays� but need a minimum throughput�cf� ATM Forum ���� �� For example� this category is suited for thetransport of TCP�IP data tra�c� since the performance of the TCP�IPprotocol is highly sensitive on cell loss but robust against variations incell delay� The ABR service provides a strict guarantee on the cell lossratio but does not specify any limits on the cell delay or the cell delayvariation�
The basic idea of the ABR service is to exploit the bandwidth whichexists in the network in excess of CBR�VBR tra�c� Figure ��� depictsone approach which is used to de�ne the excess bandwidth in a phys�ical link� The available bandwidth for the ABR service will �uctuate
���
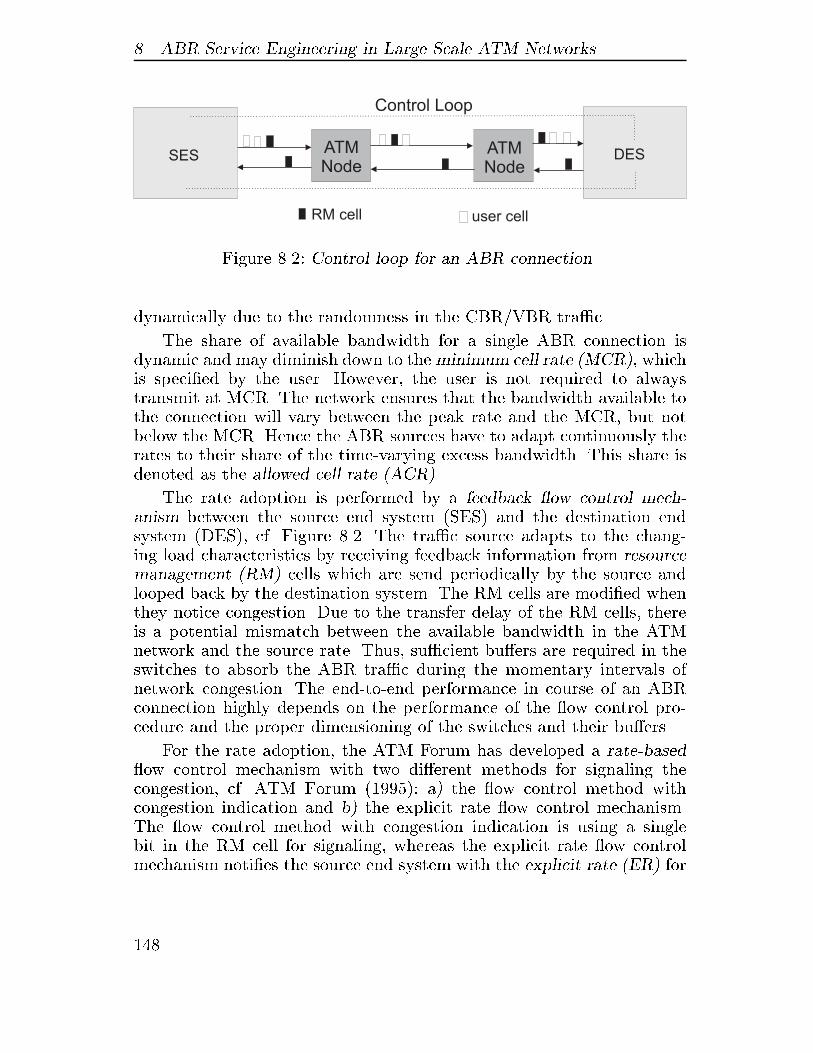
� ABR Service Engineering in Large Scale ATM Networks
SESATMNode
ATMNode
DES
RM cell user cell
Control Loop
Figure ���� Control loop for an ABR connection
dynamically due to the randomness in the CBR�VBR tra�c�
The share of available bandwidth for a single ABR connection isdynamic and may diminish down to the minimum cell rate �MCR�� whichis speci�ed by the user� However� the user is not required to alwaystransmit at MCR� The network ensures that the bandwidth available tothe connection will vary between the peak rate and the MCR� but notbelow the MCR� Hence the ABR sources have to adapt continuously therates to their share of the time�varying excess bandwidth� This share isdenoted as the allowed cell rate �ACR��
The rate adoption is performed by a feedback �ow control mech�anism between the source end system �SES� and the destination endsystem �DES�� cf� Figure ���� The tra�c source adapts to the chang�ing load characteristics by receiving feedback information from resourcemanagement �RM� cells which are send periodically by the source andlooped back by the destination system� The RM cells are modi�ed whenthey notice congestion� Due to the transfer delay of the RM cells� thereis a potential mismatch between the available bandwidth in the ATMnetwork and the source rate� Thus� su�cient bu�ers are required in theswitches to absorb the ABR tra�c during the momentary intervals ofnetwork congestion� The end�to�end performance in course of an ABRconnection highly depends on the performance of the �ow control pro�cedure and the proper dimensioning of the switches and their bu�ers�
For the rate adoption� the ATM Forum has developed a rate�based�ow control mechanism with two di�erent methods for signaling thecongestion� cf� ATM Forum ���� �� a� the �ow control method withcongestion indication and b� the explicit rate �ow control mechanism�The �ow control method with congestion indication is using a singlebit in the RM cell for signaling� whereas the explicit rate �ow controlmechanism noti�es the source end system with the explicit rate �ER� for
���
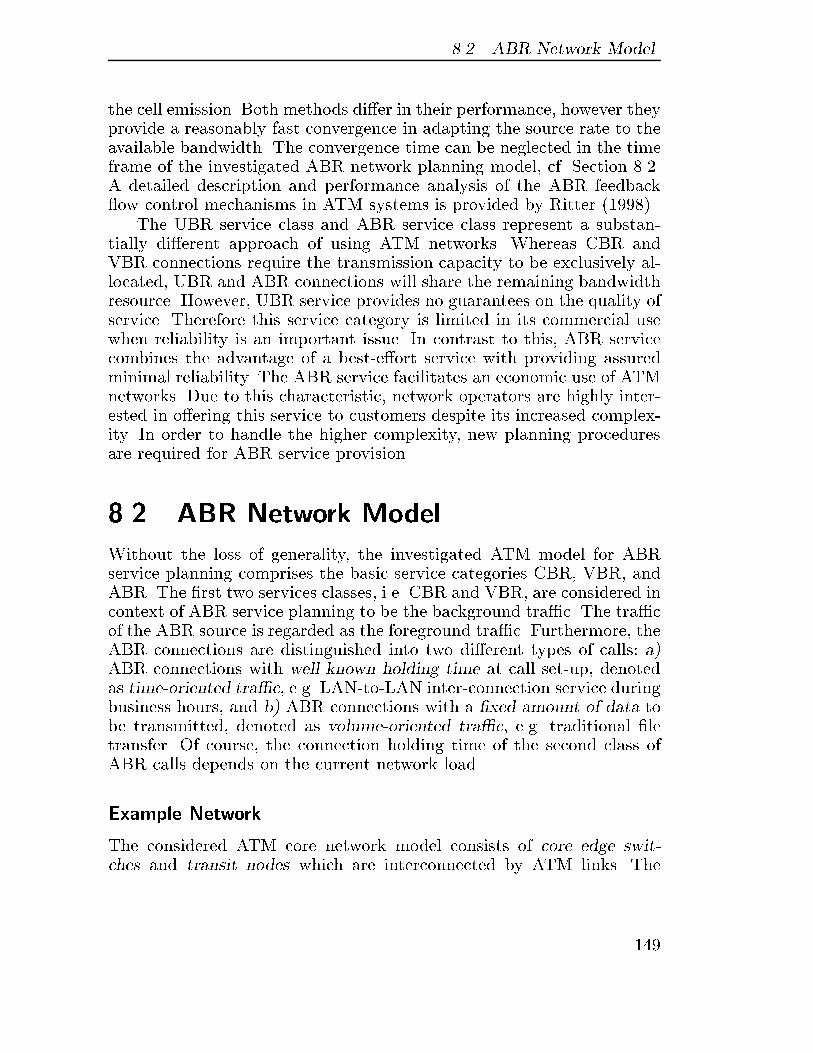
��� ABR Network Model
the cell emission� Both methods di�er in their performance� however theyprovide a reasonably fast convergence in adapting the source rate to theavailable bandwidth� The convergence time can be neglected in the timeframe of the investigated ABR network planning model� cf� Section ����A detailed description and performance analysis of the ABR feedback�ow control mechanisms in ATM systems is provided by Ritter �������
The UBR service class and ABR service class represent a substan�tially di�erent approach of using ATM networks� Whereas CBR andVBR connections require the transmission capacity to be exclusively al�located� UBR and ABR connections will share the remaining bandwidthresource� However� UBR service provides no guarantees on the quality ofservice� Therefore this service category is limited in its commercial usewhen reliability is an important issue� In contrast to this� ABR servicecombines the advantage of a best�e�ort service with providing assuredminimal reliability� The ABR service facilitates an economic use of ATMnetworks� Due to this characteristic� network operators are highly inter�ested in o�ering this service to customers despite its increased complex�ity� In order to handle the higher complexity� new planning proceduresare required for ABR service provision�
��� ABR Network Model
Without the loss of generality� the investigated ATM model for ABRservice planning comprises the basic service categories CBR� VBR� andABR� The �rst two services classes� i�e� CBR and VBR� are considered incontext of ABR service planning to be the background tra�c� The tra�cof the ABR source is regarded as the foreground tra�c� Furthermore� theABR connections are distinguished into two di�erent types of calls� a�ABR connections with well known holding time at call set�up� denotedas time�oriented tra�c� e�g� LAN�to�LAN inter�connection service duringbusiness hours� and b� ABR connections with a xed amount of data tobe transmitted� denoted as volume�oriented tra�c� e�g� traditional �letransfer� Of course� the connection holding time of the second class ofABR calls depends on the current network load�
Example Network
The considered ATM core network model consists of core edge swit�ches and transit nodes which are interconnected by ATM links� The
���
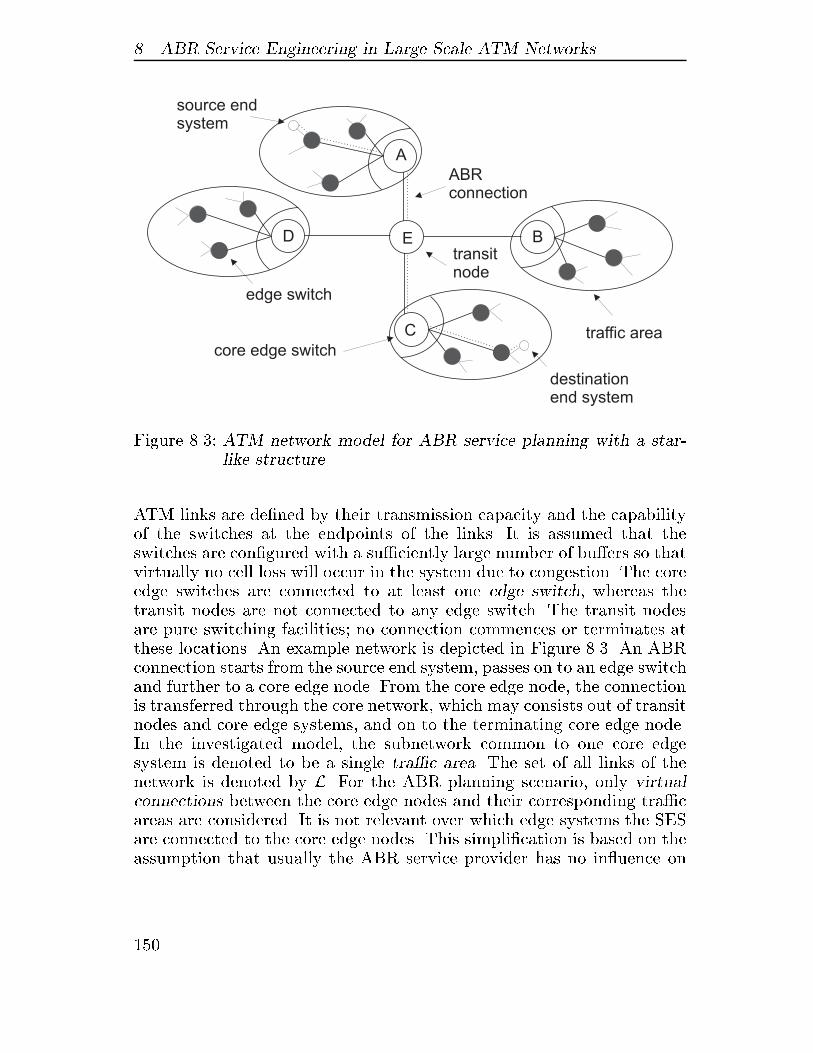
� ABR Service Engineering in Large Scale ATM Networks
E
A
BD
C traffic areacore edge switch
edge switch
transitnode
source endsystem
destinationend system
ABRconnection
Figure ��� ATM network model for ABR service planning with a star�like structure
ATM links are de�ned by their transmission capacity and the capabilityof the switches at the endpoints of the links� It is assumed that theswitches are con�gured with a su�ciently large number of bu�ers so thatvirtually no cell loss will occur in the system due to congestion� The coreedge switches are connected to at least one edge switch� whereas thetransit nodes are not connected to any edge switch� The transit nodesare pure switching facilities� no connection commences or terminates atthese locations� An example network is depicted in Figure ��� An ABRconnection starts from the source end system� passes on to an edge switchand further to a core edge node� From the core edge node� the connectionis transferred through the core network� which may consists out of transitnodes and core edge systems� and on to the terminating core edge node�In the investigated model� the subnetwork common to one core edgesystem is denoted to be a single tra�c area� The set of all links of thenetwork is denoted by L� For the ABR planning scenario� only virtualconnections between the core edge nodes and their corresponding tra�careas are considered� It is not relevant over which edge systems the SESare connected to the core edge nodes� This simpli�cation is based on theassumption that usually the ABR service provider has no in�uence on
� �
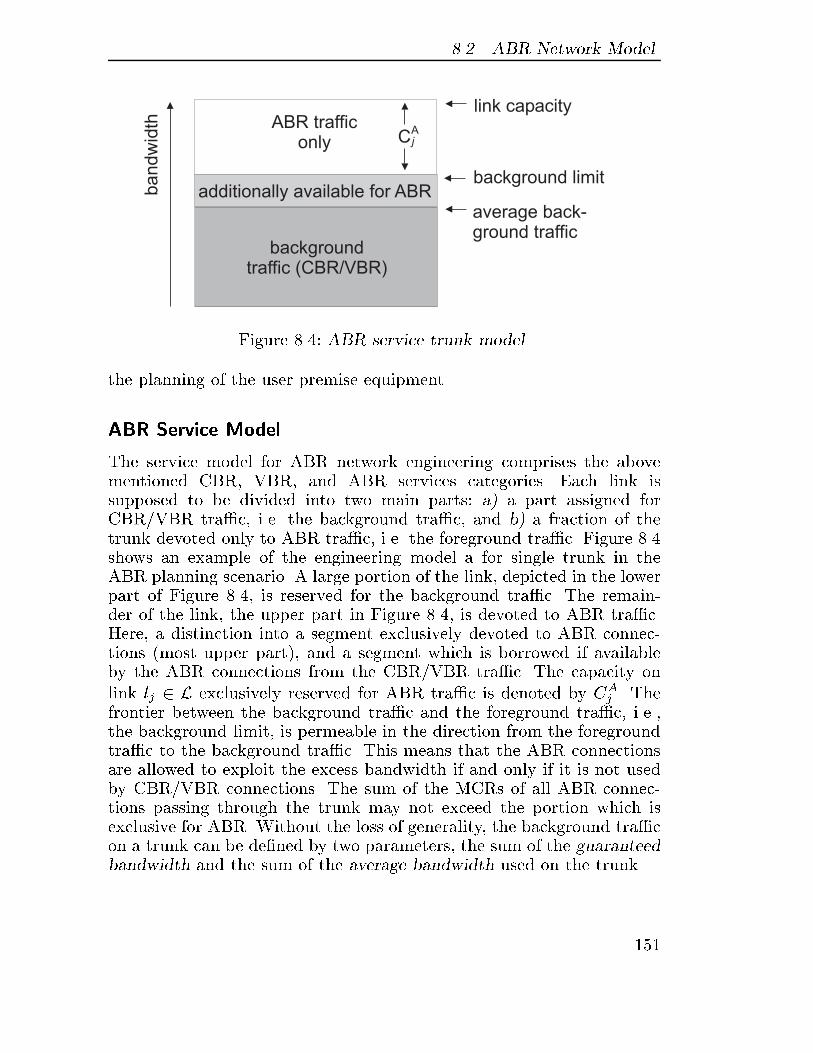
��� ABR Network Model
backgroundtraffic (CBR/VBR)
ABR trafficonly
link capacity
background limit
average back-ground traffic
ba
nd
wid
th
additionally available for ABR
CAj
Figure ���� ABR service trunk model
the planning of the user premise equipment�
ABR Service Model
The service model for ABR network engineering comprises the abovementioned CBR� VBR� and ABR services categories� Each link issupposed to be divided into two main parts� a� a part assigned forCBR�VBR tra�c� i�e� the background tra�c� and b� a fraction of thetrunk devoted only to ABR tra�c� i�e� the foreground tra�c� Figure ���shows an example of the engineering model a for single trunk in theABR planning scenario� A large portion of the link� depicted in the lowerpart of Figure ���� is reserved for the background tra�c� The remain�der of the link� the upper part in Figure ���� is devoted to ABR tra�c�Here� a distinction into a segment exclusively devoted to ABR connec�tions �most upper part�� and a segment which is borrowed if availableby the ABR connections from the CBR�VBR tra�c� The capacity onlink lj � L exclusively reserved for ABR tra�c is denoted by CA
j � Thefrontier between the background tra�c and the foreground tra�c� i�e��the background limit� is permeable in the direction from the foregroundtra�c to the background tra�c� This means that the ABR connectionsare allowed to exploit the excess bandwidth if and only if it is not usedby CBR�VBR connections� The sum of the MCRs of all ABR connec�tions passing through the trunk may not exceed the portion which isexclusive for ABR� Without the loss of generality� the background tra�con a trunk can be de�ned by two parameters� the sum of the guaranteedbandwidth and the sum of the average bandwidth used on the trunk�
� �
� ABR Service Engineering in Large Scale ATM Networks
Since CBR and VBR connections are not always using the reservedbandwidth completely� sophisticated tra�c engineering procedures canexploit this feature� In economic network design only a fraction of theguaranteed bandwidth for CBR�VBR tra�c is actually reserved on thetrunks� In this way� network resources are saved and can be used forthe transport of other connections� The ratio between the guaranteedbandwidth and the average used bandwidth considered in network designis known as the overbooking factor�
De�nition ��� � Overbooking factor
The overbooking factor n is the ratio of the guaranteed bandwidth andthe bandwidth which is reserved in network planning�
However� due to average case assumptions� the application of theoverbooking factor is rather di�cult in ATM network design� On the onehand� if the overbooking factor is too small� the network is not e�cientenough� On the other hand� i�e� if overbooking is too large� the probabilityof violating the assured QoS parameter will remarkably increase�
Foreground Tra�c
The ABR tra�c in the model� i�e�� the foreground tra�c as de�nedabove� is described by a set of virtual connections which are active ata certain instant in time� Each of the virtual ABR connections departsand terminates at a tra�c area� respectively at their corresponding coreedge nodes� Connections departing and terminating at the same coreedge are not considered� The route of the virtual connection is �xed forits duration� Hence� every ABR connection is described by its MCR andits path�
All virtual connections with identical path and equivalent MCR areaccumulated to a set of connections� denoted as a connection class�
De�nition ��� � Connection class
A connection class vi is a set of connections with identical MCR andequivalent path�
The decision operator �i�j� indicates whether connection class vi is using
� �
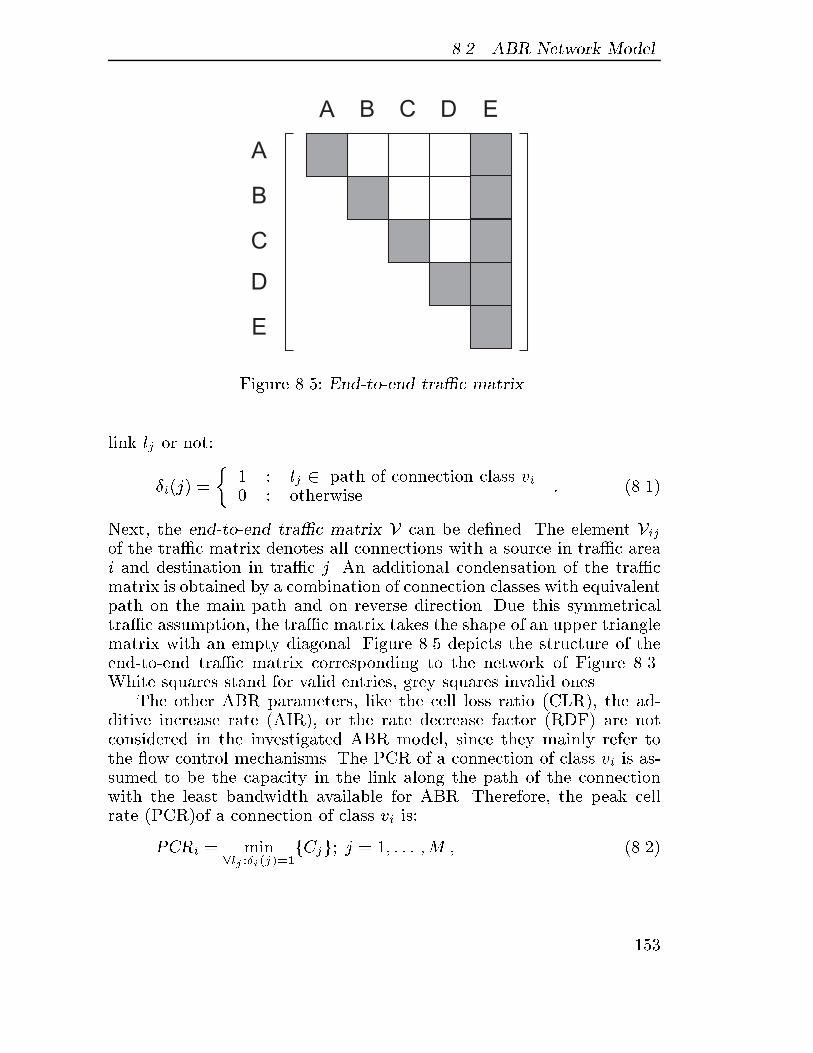
��� ABR Network Model
A
EDCBA
B
C
D
E
Figure �� � End�to�end tra�c matrix
link lj or not�
�i�j� !
�� � lj � path of connection class vi� � otherwise
� �����
Next� the end�to�end tra�c matrix V can be de�ned� The element Vijof the tra�c matrix denotes all connections with a source in tra�c areai and destination in tra�c j� An additional condensation of the tra�cmatrix is obtained by a combination of connection classes with equivalentpath on the main path and on reverse direction� Due this symmetricaltra�c assumption� the tra�c matrix takes the shape of an upper trianglematrix with an empty diagonal� Figure �� depicts the structure of theend�to�end tra�c matrix corresponding to the network of Figure ���White squares stand for valid entries� grey squares invalid ones�
The other ABR parameters� like the cell loss ratio �CLR�� the ad�ditive increase rate �AIR�� or the rate decrease factor �RDF� are notconsidered in the investigated ABR model� since they mainly refer tothe �ow control mechanisms� The PCR of a connection of class vi is as�sumed to be the capacity in the link along the path of the connectionwith the least bandwidth available for ABR� Therefore� the peak cellrate �PCR�of a connection of class vi is�
PCRi ! min�lj ��i�j���
fCjg� j ! �� � � � �M � �����
�
� ABR Service Engineering in Large Scale ATM Networks
where Cj is the capacity on link lj available for ABR �including thecapacity not used by CBR�VBR connections� and M is the number oflinks in the network�
Bandwidth Sharing
The above introduced ABR service model assumes an e�cient sharingof the ABR fraction of the trunk among the active ABR connections�To share the available bandwidth� di�erent policies have been proposedin literature� cf� Roberts et al� ������� The bandwidth sharing policyadopted for the investigated model is complete sharing without band�width reservation�
��� Methods for ABR Service Design
The economic provision of ABR service to a large number of customersrequires a careful design of the ATM system� The increased complexityof the ABR mechanism with its sophisticated bandwidth sharing pol�icy has to be addressed during the network planning phase� Since theABR tra�c model di�ers signi�cantly from the tra�c scenario of theconventional CBR�VBR services in ATM networks� in this section �rstthe investigated ABR tra�c model is outlined and secondly approachesfor ABR service planning are discussed�
����� ABR Tra�c Model
So far� most network planning cases assume static tra�c scenarios� i�e�the number of connections and the amount of tra�c transferred over thenetwork is constant throughout the modeling time� In ATM networkswith a large amount of ABR tra�c� however� this assumption can notbe applied anymore� Due to its nature� the ABR service can be requestedby the customer on a very short notice� Additionally� the arrival rate forABR service requests is expected to be much higher than the rate ofestablishing conventional CBR�VBR connections� Thus� the foregroundtra�c scenario changes continuously� whereas the background tra�c canbe regarded as static�
The considered tra�c scenario for ABR service engineering must beof a detailed stochastic nature� ABR service requests and releases ata core edge node have to be modeled in such a way that they follow
� �
��� Methods for ABR Service Design
a stochastic arrival process� Since the investigated ABR service model�presented in Section ���� comprises two di�erent types of ABR connec�tions� time�oriented and volume�oriented calls� this distinction has to beincluded into the ABR tra�c model� The de�nition of the term connec�tion class has to be extended by the stochastic attributes of the classes�
Time�oriented Stochastic ABR Tra�c
In the time�oriented stochastic ABR tra�c model� the connection hold�ing time does not depend on the amount of transmitted data� The holdingtime is given directly by a distribution function� It is assumed that theholding time TH follows a negative�exponential distribution with param�eter � The mean of the connection holding time is E�TH ! ��� Thearrival process of ABR connections at the core edge switch is modeledas a stationary Poisson process with parameter �� For easier notationthe o�ered tra�c load a ! �� is introduced� Thus� in time�orientedstochastic ABR tra�c model a connection class vi is described by a�tupel consisting of�
� the path of the connection�
� the MCR denoted by MCRi� and
� the o�ered load ai�
Volume�oriented Stochastic ABR Tra�c
In the volume�oriented stochastic ABR tra�c model the connection hold�ing time is not known at call set�up� The holding time depends on theamount of data to be transmitted as well as on the network load dur�ing transmission� The amount of data is modeled by a random variablewhich is negative�exponentially distributed with mean v��� As in thetime�oriented model� the call set�up process is assumed to be a stationaryPoisson process with parameter �� Hence� in the time�oriented stochasticABR tra�c model a connection class v is described by a ��tupel�
� the path of the connection�
� the MCR denoted by MCRi�
� the call arrival parameter �i� and
�
� ABR Service Engineering in Large Scale ATM Networks
� the mean data volume v���
It is important to state at this point that all transmitted cells are as�sumed to be payload cells� The signaling and resource management cellsare neglected� Moreover� the overhead produced by the ATM cell headeris already included in the transfer volume described by the distributionfunction� The allocated rate for a connection at any time is used com�pletely to decrease the data volume� Volume�oriented ABR sources aresaturated for the whole transfer time� Similar assumption are also madefor the time�oriented tra�c model�
����� Common ABR Service Planning
At a �rst glance� the term �ABR service planning� seems to state a con�tradiction in itself� ABR�s basic idea is to exploit the excess bandwidthwhich remains after conventional CBR�VBR tra�c engineering by an�on�availability� principle� In this context� ABR service planning can bereferred to as ABR service engineering at the moment when an ABRconnection is requested� Therefore� the most important issue in conven�tional ABR service planning on connection level scope is the fair and fastallocation of the available bandwidth to the various virtual ABR connec�tions currently active� Usually� in this context� a static tra�c scenario isconsidered� i�e�� the foreground tra�c as well as the background tra�c isassumed to be �xed during the considered time� The tra�c engineeringfor the background tra�c is usually done by applying the overbookingprinciple� cf� Section ����
Fair Rate Allocation
The ATM forum adopted the well known max�min fairness criterion forthe proper allocation of the excess bandwidth in ATM networks� cf� ATMForum ���� �� An intuitive de�nition of max�min fairness is provided inBertsekas and Gallager �������
De�nition ��� � Max�min fairness
Max�min fairness in rate allocation is the maximization of the allocatedbandwidth of each connection i subject to the constraint that an incre�mental increase in i�s allocation does not cause a decrease in some otherconnection�s allocation that is already as small as i or smaller�
� �

��� Methods for ABR Service Design
In the context of the ABR model considered in this chapter� the max�mincriterion attempts to equally allocate the available bandwidth among allconnection classes bottlenecked at a link� Fairness is achieved by allocat�ing an equal share of link bandwidth to all connection classes providedthey can use this fair share� The term bottlenecked connection classesde�nes those connections classes which are unable to achieve their fair�equal� share of bandwidth at a link because of constraints imposedby their PCR requirements or� most likely� by the limited bandwidthavailable at other links� The e�ciency of the max�min principle is themaximization of the throughput for all connections that have minimumallocations in the network� The fair share �FS� can be computed as fol�lows� cf� Arulambalam et al� �������
Fair Share !Cj �
Prates of connec� classes bottlenecked elsewhere
Nj �P
connec� classes bottlenecked elsewhere
����
where Cj is the capacity of link lj available for sharing and Nj is thenumber of connection classes using link lj �
De�nition �� provides a blue print for the formulation of an iterativemax�min fair share rate allocation algorithm�
Step � Find the equal share for the connection classes oneach link
Step � Find the connection class�es� with minimum allocatedrate
Step Subtract this rate at the link and eliminate theconnection classes with minimum allocation
Step � Recompute an equal share of each link in the reducednetwork
Step Repeat procedure ��� until all connection classes areeliminated
The result of the max�min rate allocation algorithm is the fair share ofthe capacity to be distributed� The explicit rate is the sum of the fairshare and the MCR�
An important criterion for rate allocation algorithms is their conver�gence behaviour� It is required to be su�ciently fast in order to assure ane�cient data transmission� In general there exist two approaches for rate
� �
� ABR Service Engineering in Large Scale ATM Networks
allocation procedures� a� approximation algorithms� revealing a fast con�vergence which is traded for accuracy� and b� exact fair rate calculationprocedure� which obtains optimal rates� but require global information�Without the loss of generality� the ABR model investigated in this chap�ter considers an exact fair rate algorithm� The detailed description of thefair rate allocation algorithm used in this study is provided in Staehle�������
����� Design Objectives
The main objective of large scale ABR service engineering is to facilitatethe provision of the ABR service to a commercially signi�cant numberof customers� Hence� ABR service engineering has to deal with a consid�erably large number of on�going ABR connections in the network� Thischaracteristic requires an appropriate tra�c engineering which has to bebased on an accurate performance analysis of the ABR service model�
From a customers� viewpoint� the provision of reliable ABR servicerequires a high availability of the service� The users� connection requesthas to be satis�ed by the network at any time with a su�ciently highprobability� Furthermore� the chance of using the ABR service is substan�tially increased if the users� prospect of obtaining additional bandwidth�in excess to the MCR� is considerably large�
From the perspective of the ABR service provider� large scale ABRservice engineering� on the one hand� has to meet the customer require�ments� On the other hand� it has to ensure a high network utilization�This means that network engineering is required to obtain a high linkutilization as well as to enable as many ABR connections as possible tobe in the system at the same time�
Customers� View
In detail� two major design objectives can be speci�ed from the viewpointof the user� a� a low connection blocking probability and b� a largesustainable cell rate�
Due to the application of the complete sharing without a bandwidthreservation policy� cf� Section ���� the event of blocking a connection ofclass vi in the considered ABR model is de�ned as�
� �
��� Methods for ABR Service Design
De�nition ��� � Blocking of a connection of class vi
Let the parameter CAj denote the capacity on a link lj dedicated ex�
clusively for ABR tra�c� Let n�k be the number of ABR connections ofclass vk at the instance of the arrival of a new connection request andN the total number of connection classes� The arriving ABR connectionrequest of class vi will be blocked i��
�j �
��i�j� ! � �CA
j � �NXk��
�k�j� � n�k �MCRk� � MCRi�
�����
otherwise the connection is accepted�
The resulting blocking probability for connections of class vi is denotedby Bi� Blocked connection requests are assumed to be cleared from thesystem and do not enter the system again�
The second design objective from a customer perspective is the ob�tained sustainable cell rate �SCR�� The SCR parameter describes theaverage source rate which is allocated to a connection by the maxminfair share algorithm� In the investigated ABR model� the SCR is theaverage explicit rate �ER� of the explicit rate �ow control mechanism�cf� Section ����
Providers� View
The main design objective from the provider�s viewpoint is a high uti�lization of the network or the links respectively� In the context of theABR service model considered in this chapter� the utilization of a linkcan be characterized by two di�erent parameters� a� the MCR utilizationand b� the ABR utilization�
The MCR utilization of link lj describes the used fraction of thepart of the trunk which is exclusively reserved for ABR tra�c� Theaverage MCR utilization is of great interest in network engineering� Thisparameter characterizes whether the capacity exclusively reserved forABR has been appropriately planned or not�
The ABR utilization of a link lj characterizes the usage of the overallcapacity available for ABR� i�e� the capacity exclusive for ABR and theremaining portion which is used not by CBR�VBR tra�c� An ABRutilization of less than one indicates that capacity is wasted on the trunk�
Of course� the SCR is also an important engineering objective for theservice provider� From his point of view� the SCR should be chosen in
� �
� ABR Service Engineering in Large Scale ATM Networks
such a way that the customer notices a bene�t by using the ABR service�however� without this decreasing the possible revenue in the system�
����� Engineering for Stochastic Time�orientedTra�c
The main objective of ABR service engineering assuming stochastic time�oriented tra�c is the evaluation of the connection blocking probabilitieswith regard to the speci�c user tra�c behavior� From the blocking proba�bilities� additional Quality�of�Service parameters can be derived� To cal�culate the connection blocking probabilities it is necessary to computethe state probabilities of the system� In this section� �rst� two exactmethods to calculate the state probabilities are introduced� However�since their high computational complexity prohibits their application inlarge scale ABR service engineering� an approximative approach is ad�ditionally presented�
a� Product�Form Solution
The �rst method considered for the performance evaluation of the ABRservice model is a product�form solution� which is well known in queueingnetwork literature� The approach assumes that the state of the networkmodel is changed when an ABR connection is established or terminated�Hence� the state vector in this model is de�ned as�
n ! �n�� � � � � nN � ��� �
where ni is the number of connections of class vi currently active inthe network and N is the total number of connection classes� The statetransitions in the model are denoted by the successive state�
n�i ! �n�� � � � � ni��� ni �� ni��� � � � � nN � �����
n�i ! �n�� � � � � ni��� ni � �� ni��� � � � � nN �� �����
where the state n�i is obtained when a connection of class vi is establishedand n�i is the state after a connection of class vi is released� The set of
���
��� Methods for ABR Service Design
all possible states S is de�ned by�
S ! fn jni � �� for i ! �� � � � � N
andNXi��
niMCRi�i�j� � CAj �lj � Lg�
�����
with L denoting the set of all links in the network� CAj the capacity on
link lj exclusively available for ABR� and MCRi is the minimum cell raterequest by connections of class vi�
According to Kaufman ������� the local balance equation for thestate probabilities of the model is given by�
p�n� !�inii
p�n�i � !ainip�n�i �� for n�n�i � S� �����
where the parameter �i is denoting the arrival rate of connections ofclass vi and ��i is the corresponding average connection holding time�cf� Section ����� The probability p�n� is denoting the probability ofthe system to be in state n� The recursion of Eqn� ����� is solved byinitializing p��� ! p��� � � � � �� ! �� The resulting unnormalized stateprobabilities are�
*p�n� !NYi��
aniini)
�n � S� ������
The state probabilities are obtained from the unnormalized probabilitiesvia the normalization constant G�S��
p�n� !*p�n�
G�S�������
with G�S� !P
n�S *p�n��At last� the blocking probability Bi for connections of class vi is
given by the sum of the probabilities of the states in which an arrivingconnection of class vi is blocked�
Bi !Xn�Si
p�n�� ������
The set Si of the states in which connections of class vi are blocked isde�ned by�
Si ! fn � S j n�i �� Sg� �����
���
� ABR Service Engineering in Large Scale ATM Networks
Computational complexity of the product�form solution
The time complexity of the product�form approach is determined by thesize of the state space S� The cardinality of S is roughly estimated by�cf� Staehle �������
j S j�NYi��
CAmin
MCRi������
where CAmin ! minjfC
Aj j �i�j� ! �g and j � j denoting the size of set S�
Hence� the growth of j S j can be assumed as exponentially� Thereforethe time complexity of the product�form solution is in� cf� Pinsky andConway �������
O
���� max
jfCA
j g
minifMCRig
���A � ���� �
The high computational complexity of the product�form solution pro�hibits its use in the performance analysis of large ATM networks� Onlysmall and medium sized systems can be evaluated with this method�Therefore� a less computational demanding procedure for calculating theblocking probabilities is urgently needed�
b� Kaufman � Roberts Solution
The second method considered for calculating the ABR connection prob�abilities is a multi�dimensional extension of the Kaufman and Robertsmethod for obtaining the blocking probabilities in multi�service mod�els� cf� Kaufman ������ and Roberts ������� The basic idea of Kauf�man and Roberts is the reduction of the cardinality of the state space�This method promises to be more applicable as the product�form so�lution� Hence� in the Kaufman and Roberts method� macro states areapplied in the model which describe the bandwidth already allocated forthe ABR service on a link� This constrasts the product�form approachwhere the number of connections is used to describe the state of themodel� Therefore� a quantization of the allocated bandwidth on everylink is introduced� since link capacities and MCRs are not always integervalues� In the Kaufman and Roberts approach a macro state cu with
���
��� Methods for ABR Service Design
respect to the quantization vector u� cf� Eqn������� is de�ned as�
cu ! �cu� � � � � � cuM �� ������
where cuj is the capacity occupied in link lj� M is the number of links�and j ! �� � � � �M � Thus� a macro state cu in the extended Kaufmanand Roberts model is equivalent to a set of states n in the product�formsolution�
cu +!
�n j
NXi��
ni � bij � uj ! cj� for j ! �� � � � �M
�� ������
The state space of the investigated Kaufman and Roberts model is�
Z ! fcu j � � cuj � Cuj � for j ! �� � � � �Mg� ������
The structure of the state space is an M�dimensional hypercube withedge length of Cu
j � the variable M is denoting the number of linksin the network� Therefore� this approach is also denoted as the multi�dimensional Kaufman and Roberts method�
The blocking probability Bi for connections of class vi is the sum ofthe probabilities of the system to be in a state cu where the free capacityfor ABR on at least one trunk is less than the MCRi� i�e��
Bi !X
cu�Zi
p�cu� ������
with Zi ! fcu j cu � Z �cu MCRi� �� Zg denoting the set of thestates in which a connection of class vi is blocked�
The bandwidth quantum variable uj on a link lj is the greatest com�mon divisor �gcd� of the link capacity and the MCRs of all connectionclasses passing through lj�
uj ! gcdnCAj � fMCRi j �i�j� ! �g
o������
The capacity Cuj on a link lj exclusively available for ABR expressed in
capacity units is�
Cuj !
CAj
uj� for j ! �� � � � �M � ������
��
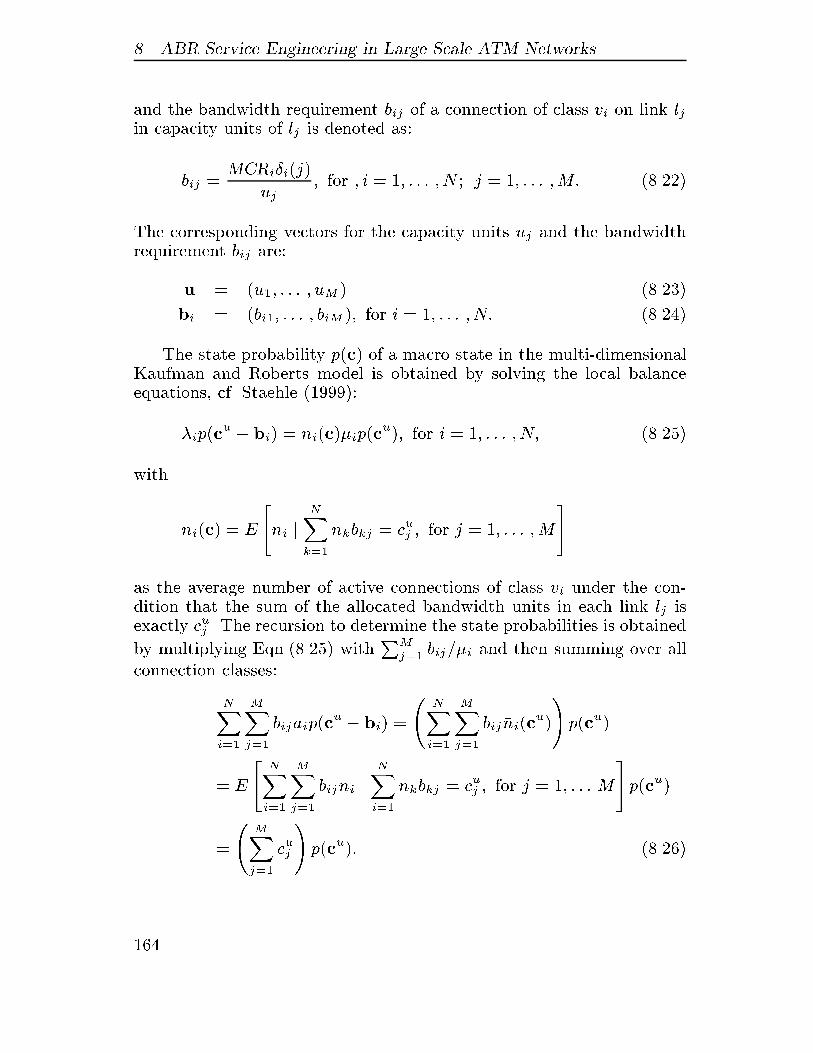
� ABR Service Engineering in Large Scale ATM Networks
and the bandwidth requirement bij of a connection of class vi on link ljin capacity units of lj is denoted as�
bij !MCRi�i�j�
uj� for � i ! �� � � � � N � j ! �� � � � �M� ������
The corresponding vectors for the capacity units uj and the bandwidthrequirement bij are�
u ! �u�� � � � � uM � �����
bi ! �bi�� � � � � biM �� for i ! �� � � � � N� ������
The state probability p�c� of a macro state in the multi�dimensionalKaufman and Roberts model is obtained by solving the local balanceequations� cf� Staehle �������
�ip�cu � bi� ! %ni�c�ip�cu�� for i ! �� � � � � N� ���� �
with
%ni�c� ! E
�ni j
NXk��
nkbkj ! cuj � for j ! �� � � � �M
�
as the average number of active connections of class vi under the con�dition that the sum of the allocated bandwidth units in each link lj isexactly cuj � The recursion to determine the state probabilities is obtained
by multiplying Eqn����� � withPM
j�� bij�i and then summing over allconnection classes�
NXi��
MXj��
bijaip�cu � bi� !
�NXi��
MXj��
bij%ni�cu�
p�cu�
! E
�NXi��
MXj��
bijni jNXi��
nkbkj ! cuj � for j ! �� � � � M
�p�cu�
!
�MXj��
cuj
p�cu�� ������
���
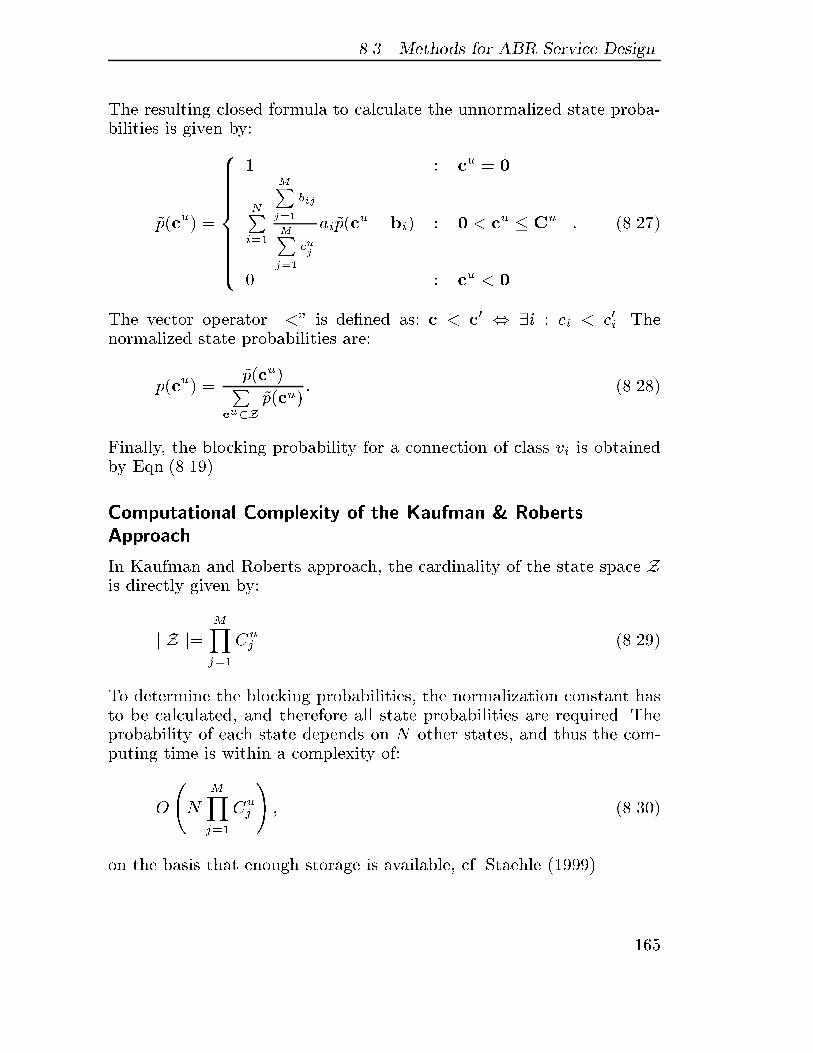
��� Methods for ABR Service Design
The resulting closed formula to calculate the unnormalized state proba�bilities is given by�
*p�cu� !
��
� � cu ! �
NPi��
MP
j��
bij
MP
j��
cuj
ai*p�cu � bi� � � � cu � Cu
� � cu � �
� ������
The vector operator ��� is de�ned as� c � c� � �i � ci � c�i� Thenormalized state probabilities are�
p�cu� !*p�cu�P
cu�Z
*p�cu�� ������
Finally� the blocking probability for a connection of class vi is obtainedby Eqn��������
Computational Complexity of the Kaufman � RobertsApproach
In Kaufman and Roberts approach� the cardinality of the state space Zis directly given by�
j Z j!MYj��
Cuj ������
To determine the blocking probabilities� the normalization constant hasto be calculated� and therefore all state probabilities are required� Theprobability of each state depends on N other states� and thus the com�puting time is within a complexity of�
O
�N
MYj��
Cuj
� �����
on the basis that enough storage is available� cf� Staehle ������
��
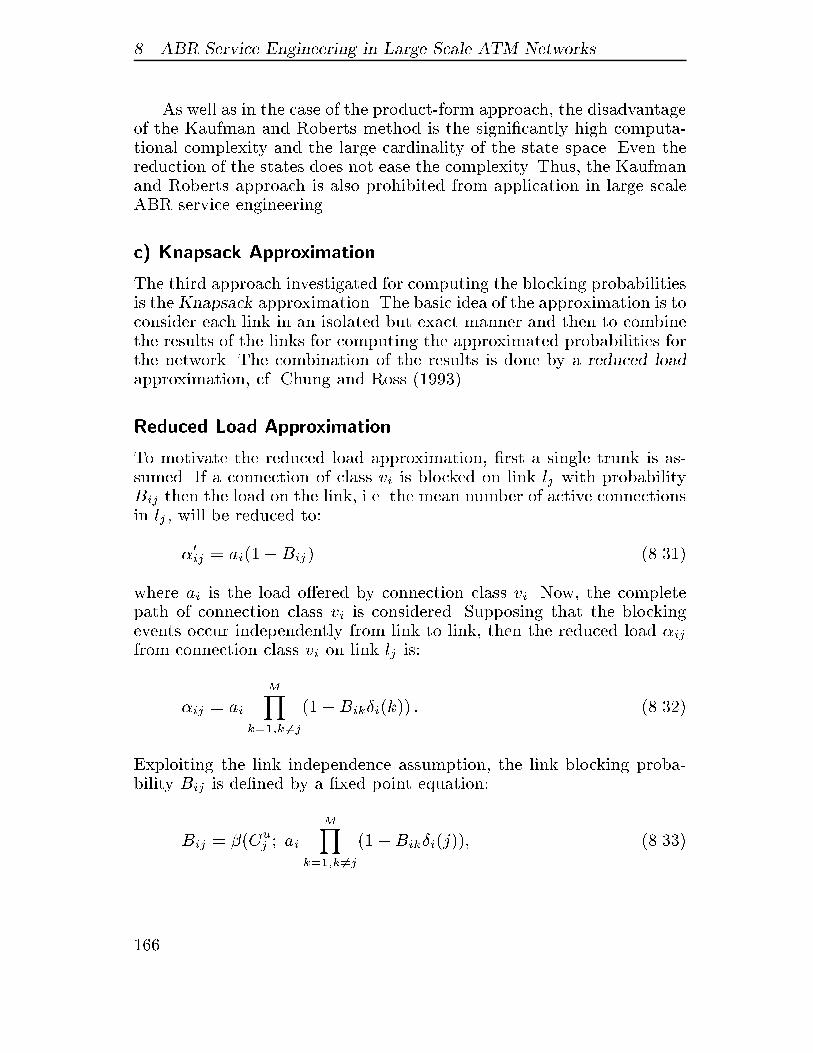
� ABR Service Engineering in Large Scale ATM Networks
As well as in the case of the product�form approach� the disadvantageof the Kaufman and Roberts method is the signi�cantly high computa�tional complexity and the large cardinality of the state space� Even thereduction of the states does not ease the complexity� Thus� the Kaufmanand Roberts approach is also prohibited from application in large scaleABR service engineering�
c� Knapsack Approximation
The third approach investigated for computing the blocking probabilitiesis the Knapsack approximation� The basic idea of the approximation is toconsider each link in an isolated but exact manner and then to combinethe results of the links for computing the approximated probabilities forthe network� The combination of the results is done by a reduced loadapproximation� cf� Chung and Ross ������
Reduced Load Approximation
To motivate the reduced load approximation� �rst a single trunk is as�sumed� If a connection of class vi is blocked on link lj with probabilityBij then the load on the link� i�e� the mean number of active connectionsin lj � will be reduced to�
�ij ! ai���Bij� �����
where ai is the load o�ered by connection class vi� Now� the completepath of connection class vi is considered� Supposing that the blockingevents occur independently from link to link� then the reduced load ijfrom connection class vi on link lj is�
ij ! ai
MYk���k ��j
���Bik�i�k�� � �����
Exploiting the link independence assumption� the link blocking proba�bility Bij is de�ned by a �xed point equation�
Bij ! ��Cuj � ai
MYk���k ��j
���Bik�i�j��� ����
���
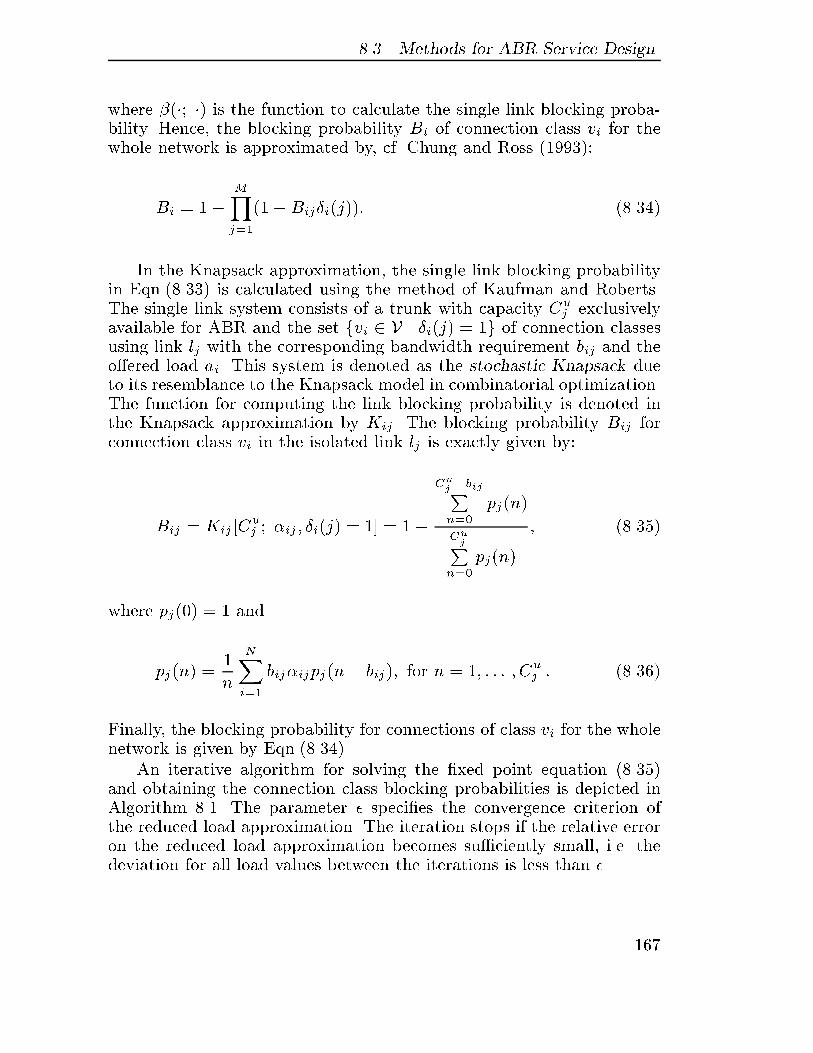
��� Methods for ABR Service Design
where ���� �� is the function to calculate the single link blocking proba�bility� Hence� the blocking probability Bi of connection class vi for thewhole network is approximated by� cf� Chung and Ross ������
Bi ! ��MYj��
���Bij�i�j��� �����
In the Knapsack approximation� the single link blocking probabilityin Eqn����� is calculated using the method of Kaufman and Roberts�The single link system consists of a trunk with capacity Cu
j exclusivelyavailable for ABR and the set fvi � V j �i�j� ! �g of connection classesusing link lj with the corresponding bandwidth requirement bij and theo�ered load ai� This system is denoted as the stochastic Knapsack dueto its resemblance to the Knapsack model in combinatorial optimization�The function for computing the link blocking probability is denoted inthe Knapsack approximation by Kij� The blocking probability Bij forconnection class vi in the isolated link lj is exactly given by�
Bij ! Kij �Cuj � ij� �i�j� ! � ! ��
Cuj�bijP
n��
pj�n�
CujP
n��
pj�n�
� ��� �
where pj��� ! � and
pj�n� !�
n
NXi��
bijijpj�n� bij�� for n ! �� � � � � Cuj � �����
Finally� the blocking probability for connections of class vi for the wholenetwork is given by Eqn�������
An iterative algorithm for solving the �xed point equation ��� �and obtaining the connection class blocking probabilities is depicted inAlgorithm ���� The parameter speci�es the convergence criterion ofthe reduced load approximation� The iteration stops if the relative erroron the reduced load approximation becomes su�ciently small� i�e� thedeviation for all load values between the iterations is less than �
���
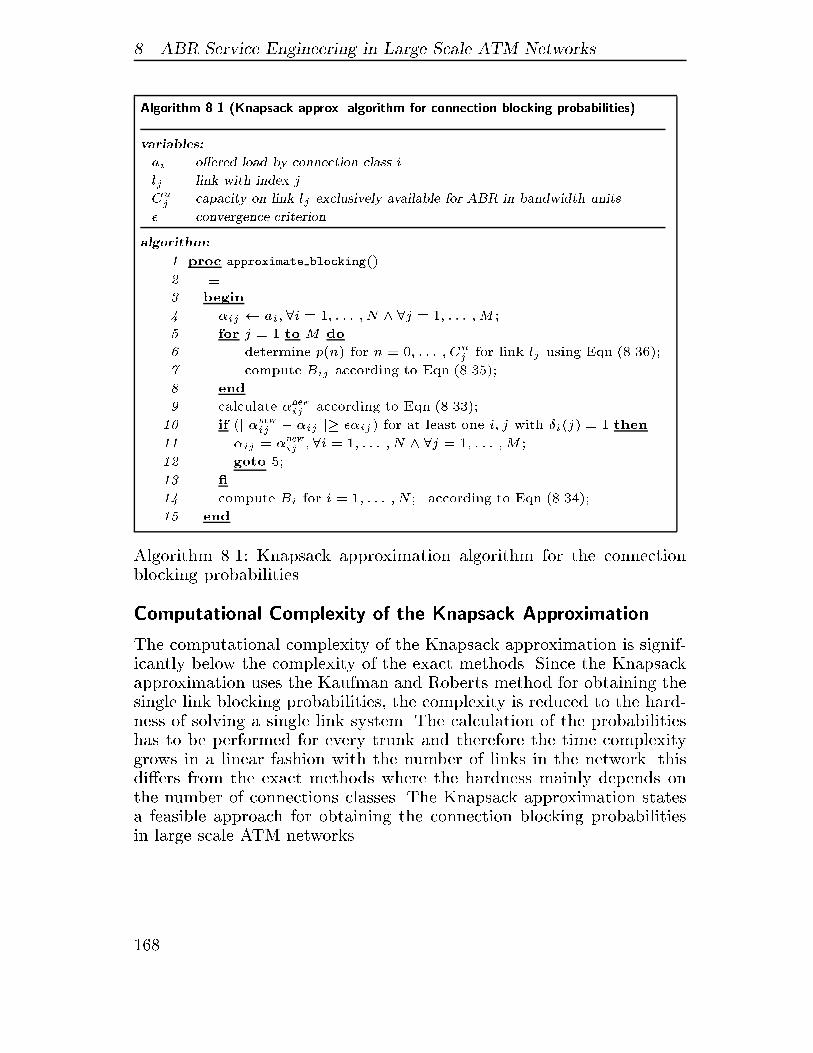
� ABR Service Engineering in Large Scale ATM Networks
Algorithm ��� �Knapsack approx� algorithm for connection blocking probabilities�
variables�
ai oered load by connection class i
lj link with index j
Cuj capacity on link lj exclusively available for ABR in bandwidth units
� convergence criterion
algorithm�
� proc approximate blocking��
� �
� begin
� �ij � ai� �i � � � � � � N � �j � � � � � �M �
� for j � to M do
� determine p�n� for n � �� � � � � Cuj for link lj using Eqn�������
� compute Bij according to Eqn�������
� end
calculate �newij according to Eqn�������
� if �j �newij � �ij j ��ij� for at least one i� j with i�j� � then
�� �ij � �newij � �i � � � � � � N � �j � � � � � �M �
�� goto ��
�� �
�� compute Bi for i � � � � � � N � according to Eqn�������
�� end
Algorithm ���� Knapsack approximation algorithm for the connectionblocking probabilities
Computational Complexity of the Knapsack Approximation
The computational complexity of the Knapsack approximation is signif�icantly below the complexity of the exact methods� Since the Knapsackapproximation uses the Kaufman and Roberts method for obtaining thesingle link blocking probabilities� the complexity is reduced to the hard�ness of solving a single link system� The calculation of the probabilitieshas to be performed for every trunk and therefore the time complexitygrows in a linear fashion with the number of links in the network� thisdi�ers from the exact methods where the hardness mainly depends onthe number of connections classes� The Knapsack approximation statesa feasible approach for obtaining the connection blocking probabilitiesin large scale ATM networks�
���
��� Methods for ABR Service Design
d� QoS Values
The major Quality�of�Service �QoS� parameters for ABR service plan�ning assuming time�oriented tra�c can be derived from the connectionblocking probabilities� The average number of active connections of classvi is directly given by Little�s theorem�
%ni ! ai���Bi� �����
As outlined above� the term utilization is ambiguous in the contextof ABR service engineering� Therefore� two utilization parameters havebeen introduced� cf� Section ���� a� ABR utilization and b� MCR uti�lization�
The average MCR utilization �MCRj for link lj is determined by�
�MCRj !
NPi��
%niMCRi�i�j�
CAj
� �����
To compute the average ABR utilization �ABRj on link lj it is required
to compute the mean explicit rate ERi� also denoted as the SCR� allo�cated to the source of class vi� This rate is the sum of the constant MCRand the additional bandwidth allocated to the source by the maxminfair share algorithm� cf� Section� �����
In case of the product from solution� the mean explicit rate ERi forconnections of class vi can directly be derived from the state probabili�ties�
ERi !
Pn�S
p�n�ERi�n�
p�ni � ��!
Pn�S
p�n�ERi�n�Pn�S�ni��
p�n�� �����
where ERi�n� is the result of the maxmin fair share algorithm in staten a connection of class vi and ni is the number of active connections ofclass vi�
In the Kaufman and Roberts approach� however� the state probabil�ity p�n� is not explicitly known� Hence� it is not possible to compute themean explicit rate ERi exactly� Only an approximation can be providedusing the mean number of active connections�
ERi � ERi�%n�� ������
���
� ABR Service Engineering in Large Scale ATM Networks
where %n ! �%n�� � � � � %nN �� In detail the approximation is based on thefollowing assumptions�
ERi��n� ! ERi
�Xn�S
p�n�n�� � � � �Xn�S
p�n�nN
����
��Pn�S
p�n�n�
p�n� � ��� � � � �
Pn�S
p�n�nN
p�nN � ��
�A
����
Pn�S�ni��
p�n�ERi�n�Pn�S�ni��
p�n�! ERi �
The �rst assumption ��� can be made since the probability� that at leastone connection is active� approaches one for heavy tra�c� The secondassumption ��� is based on a linearization�
The average ABR utilization �ABRj of link lj is approximated by�
�ABRj !
NPi��
ERi%ni�i�j�
CAj
�
NPi��
ERi��n��i�j�
CAj
� ������
Finally� the bandwidth bene�t of a customer using the ABR service
is characterized by the relative additional rate ER�
allocated to thesource�
ER�i !
ERi �MCRi
MCRi� ���� ������
This parameter allows a rough comparison of ABR service and CBRservice� Its value describes the ratio of additional bandwidth allocatedin average to an ABR connection and its MCR� From the view pointof CBR service� the MCR value can be regarded as the constant rate
of a CBR connection� In this context� the value of ER�
represents thebene�t of requesting an ABR connection instead of using a CBR servicewith PCR equal to the MCR of the ABR connection�
���
��� Methods for ABR Service Design
����� ABR Planning for Volume�oriented Tra�c
ABR service engineering assuming stochastic volume�oriented tra�c dif�fers substantially from the service engineering in the time�oriented case�The connection holding time depends on the amount of connections cur�rently active in the network� i�e� the connection holding time is statedependent� Therefore� the above introduced methods for computing theconnection blocking probabilities can not be applied in this case�
In this section� a method for obtaining the connection blocking prob�abilities and other QoS parameters will be outlined� However� the com�putational complexity of the approach is very large� Nevertheless� a pre�sentation of the method in this chapter might initiate some additionalwork towards a procedure with less computational requirements�
State Probabilities
As in the product�form approach� the state of the model for ABR plan�ning with volume�oriented tra�c is denoted by n and characterizes thenumber of active connections of class vi�
n ! �n�� � � � � nN �� �����
Hence� the state space� cf� Eqn������� the state transitions for establishingand terminating an ABR connection� cf� Eqn������ and Eqn������� and theevent of blocking a connection of class vi� cf� Eqn������� are all de�nedin the same way as in the product�form approach which is applied in thetime�oriented model�
The di�erence between the two models is the state transition ratefor the case of terminating an ABR connection� As described above� thetransition rate for connection release depends on the current load of thenetwork� Hence� the transition rates are de�ned as�
q�n�n�i � !
��i � n�i � S� � else
� for n � S� ������
q�n�n�i � !
�ni
��i
ERi�n�� n�i � S
� � else� for n � S� ���� �
The explicit rate ERi�n� is assigned to the source of class vi by themaxmin fair share algorithm� cf� Section ����� Consequently� the con�nection holding time for a call of class vi can be approximated by the
���
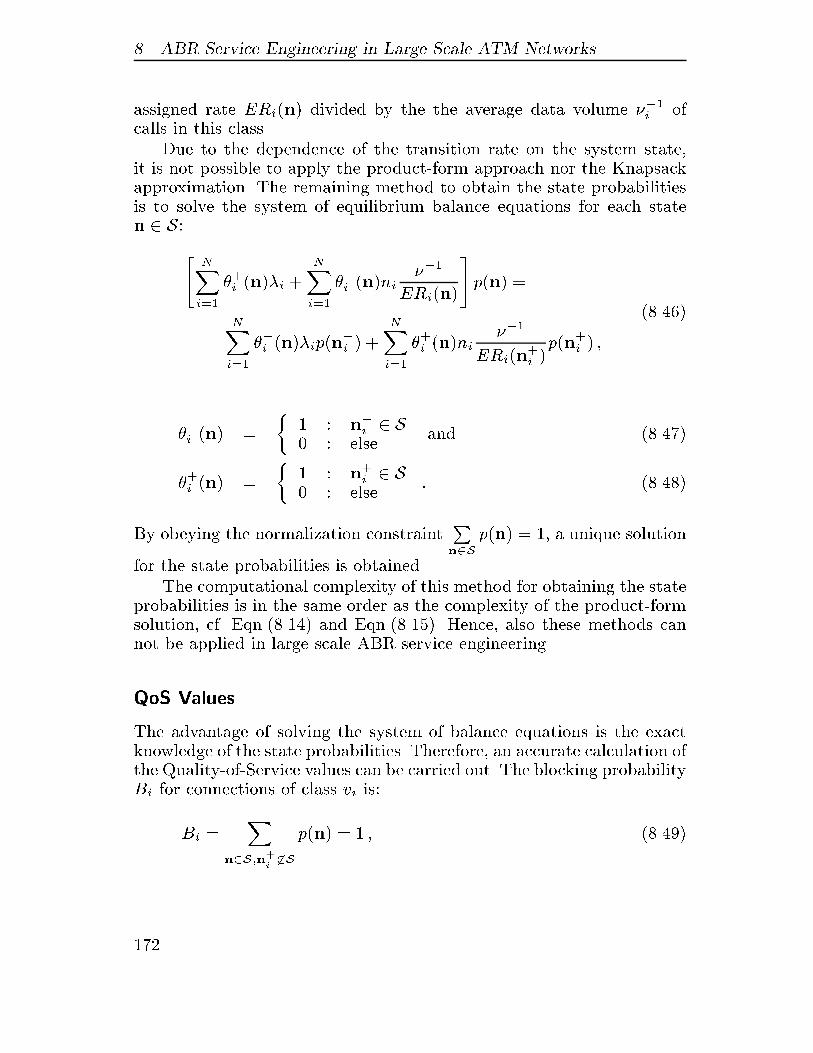
� ABR Service Engineering in Large Scale ATM Networks
assigned rate ERi�n� divided by the the average data volume ���i ofcalls in this class�
Due to the dependence of the transition rate on the system state�it is not possible to apply the product�form approach nor the Knapsackapproximation� The remaining method to obtain the state probabilitiesis to solve the system of equilibrium balance equations for each staten � S�
�NXi��
��i �n��i NXi��
��i �n�ni���
ERi�n�
�p�n� !
NXi��
��i �n��ip�n�i � NXi��
��i �n�ni���
ERi�n�i �
p�n�i � �
������
��i �n� !
�� � n�i � S� � else
and ������
��i �n� !
�� � n�i � S� � else
� ������
By obeying the normalization constraintPn�S
p�n� ! �� a unique solution
for the state probabilities is obtained�The computational complexity of this method for obtaining the state
probabilities is in the same order as the complexity of the product�formsolution� cf� Eqn������� and Eqn����� �� Hence� also these methods cannot be applied in large scale ABR service engineering�
QoS Values
The advantage of solving the system of balance equations is the exactknowledge of the state probabilities� Therefore� an accurate calculation ofthe Quality�of�Service values can be carried out� The blocking probabilityBi for connections of class vi is�
Bi !X
n�S�n�i��S
p�n� ! � � ������
���
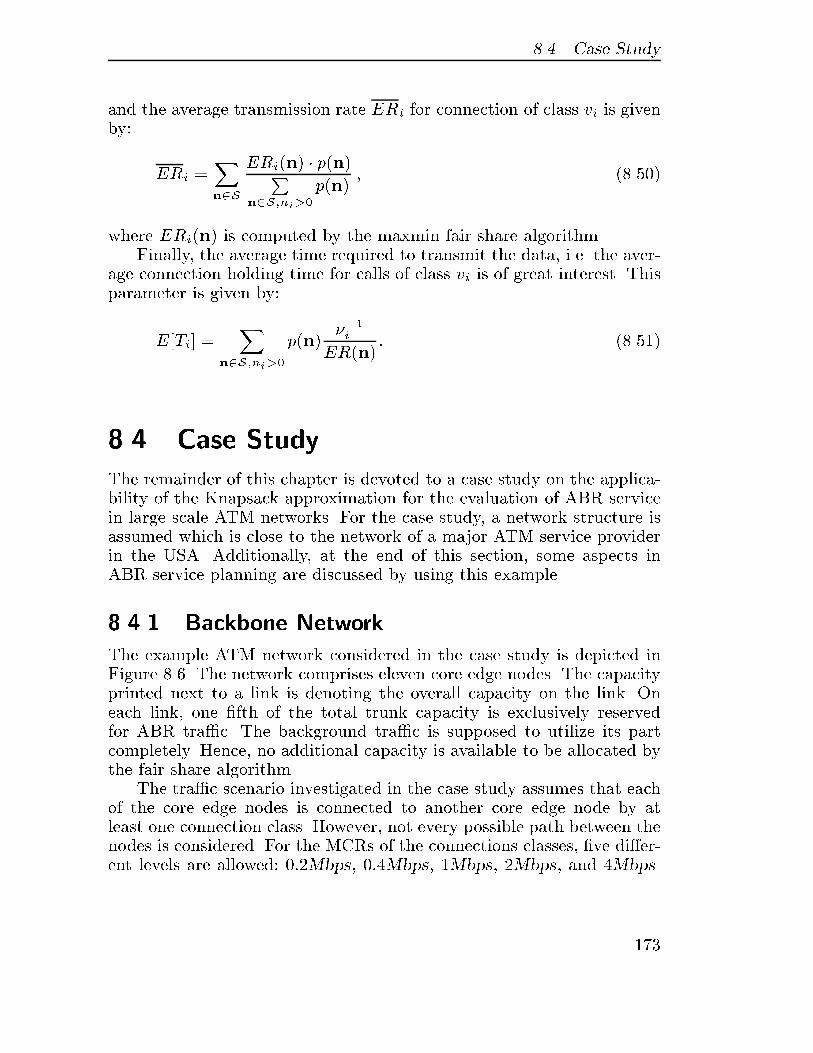
��� Case Study
and the average transmission rate ERi for connection of class vi is givenby�
ERi !Xn�S
ERi�n� � p�n�Pn�S�ni��
p�n�� ��� ��
where ERi�n� is computed by the maxmin fair share algorithm�Finally� the average time required to transmit the data� i�e� the aver�
age connection holding time for calls of class vi is of great interest� Thisparameter is given by�
E�Ti !X
n�S�ni��
p�n����i
ER�n�� ��� ��
��� Case Study
The remainder of this chapter is devoted to a case study on the applica�bility of the Knapsack approximation for the evaluation of ABR servicein large scale ATM networks� For the case study� a network structure isassumed which is close to the network of a major ATM service providerin the USA� Additionally� at the end of this section� some aspects inABR service planning are discussed by using this example�
����� Backbone Network
The example ATM network considered in the case study is depicted inFigure ���� The network comprises eleven core edge nodes� The capacityprinted next to a link is denoting the overall capacity on the link� Oneach link� one �fth of the total trunk capacity is exclusively reservedfor ABR tra�c� The background tra�c is supposed to utilize its partcompletely� Hence� no additional capacity is available to be allocated bythe fair share algorithm�
The tra�c scenario investigated in the case study assumes that eachof the core edge nodes is connected to another core edge node by atleast one connection class� However� not every possible path between thenodes is considered� For the MCRs of the connections classes� �ve di�er�ent levels are allowed� ���Mbps� ���Mbps� �Mbps� �Mbps� and �Mbps�
��
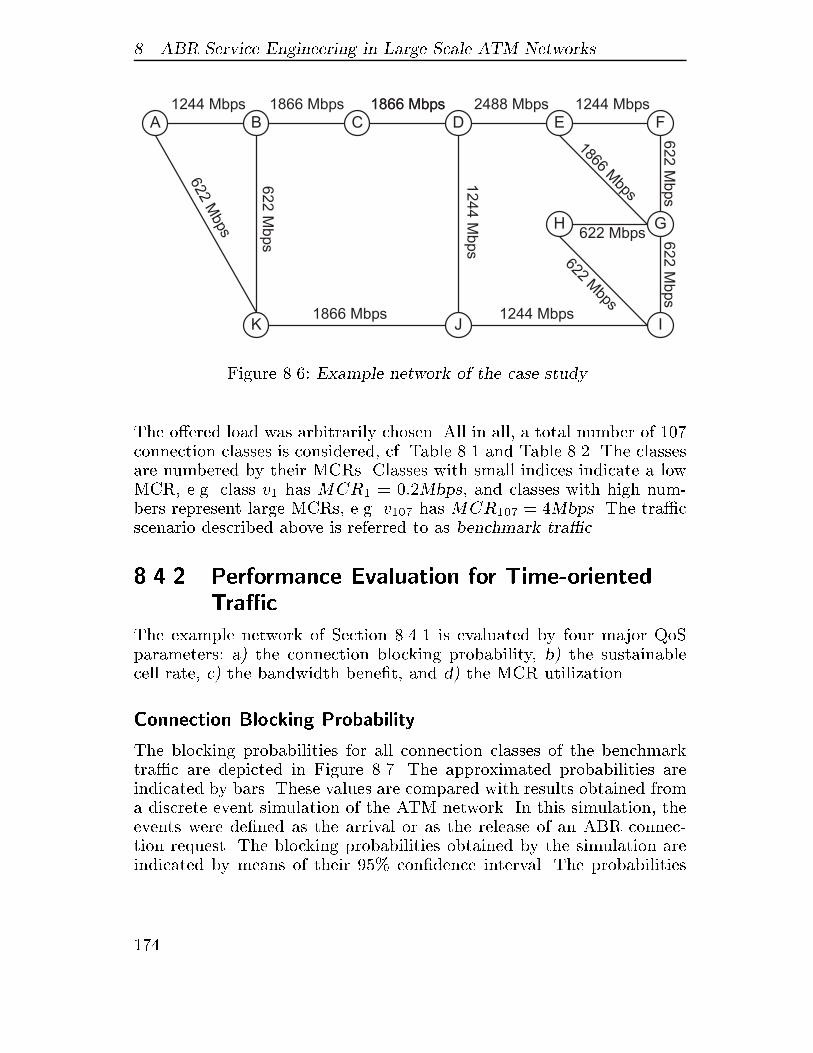
� ABR Service Engineering in Large Scale ATM Networks
BA C D E F
GH
IJK
1866 Mbps 1866 Mbps1244 Mbps 2488 Mbps 1244 Mbps
1244 Mbps1866 Mbps
1244
Mbps
1866 Mbps
1866M
bps
622M
bps
622 Mbps
622
Mbps
622
Mbps
622
Mbps
622
Mbps
Figure ���� Example network of the case study
The o�ered load was arbitrarily chosen� All in all� a total number of ���connection classes is considered� cf� Table ��� and Table ���� The classesare numbered by their MCRs� Classes with small indices indicate a lowMCR� e�g� class v� has MCR� ! ���Mbps� and classes with high num�bers represent large MCRs� e�g� v�� has MCR�� ! �Mbps� The tra�cscenario described above is referred to as benchmark tra�c�
����� Performance Evaluation for Time�orientedTra�c
The example network of Section ����� is evaluated by four major QoSparameters� a� the connection blocking probability� b� the sustainablecell rate� c� the bandwidth bene�t� and d� the MCR utilization�
Connection Blocking Probability
The blocking probabilities for all connection classes of the benchmarktra�c are depicted in Figure ���� The approximated probabilities areindicated by bars� These values are compared with results obtained froma discrete event simulation of the ATM network� In this simulation� theevents were de�ned as the arrival or as the release of an ABR connec�tion request� The blocking probabilities obtained by the simulation areindicated by means of their � ' con�dence interval� The probabilities
���
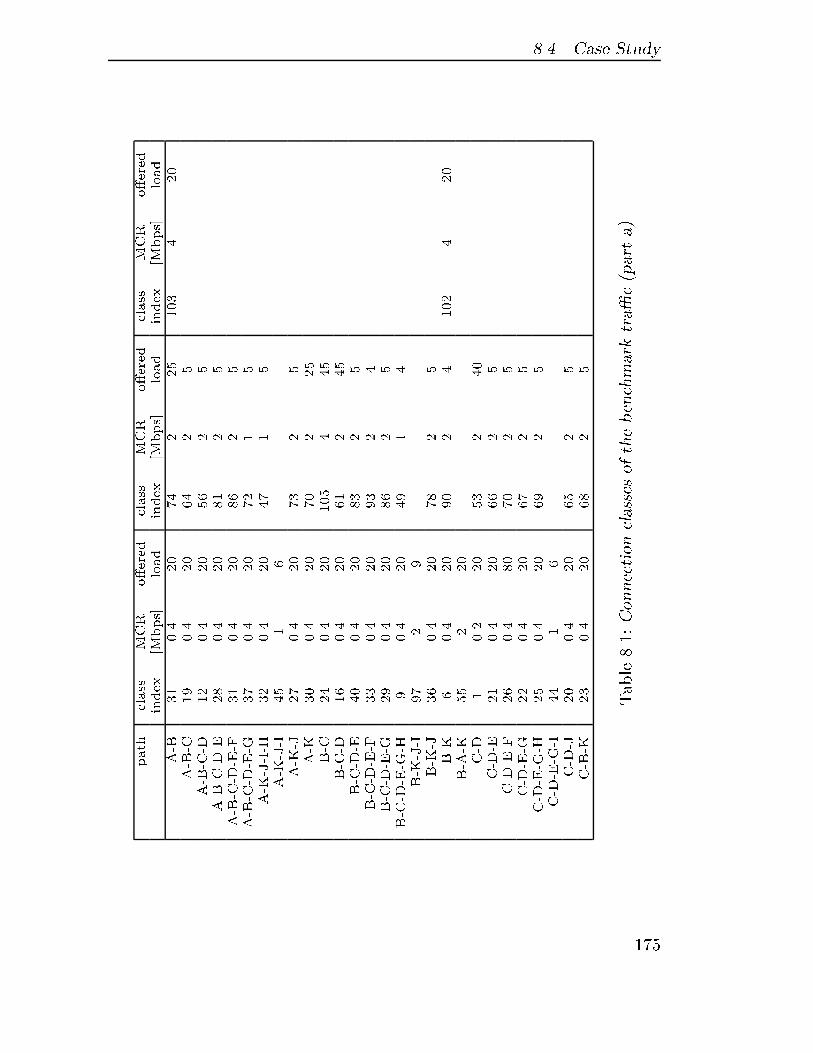
��� Case Study
path
class
MCR
o�ered
class
MCR
o�ered
class
MCR
o�ered
index
�Mbps
load
index
�Mbps
load
index
�Mbps
load
A�B
�
���
��
��
�
��
��
�
��
A�B�C
�
���
��
��
�
�
A�B�C�D
�
���
��
��
�
�
A�B�C�D�E
�
���
��
�
�
A�B�C�D�E�F
�
���
��
�
�
�
A�B�C�D�E�G
��
���
��
��
�
A�K�J�I�H
��
���
��
��
�
A�K�J�I
��
�
A�K�J
��
���
��
��
�
�
A�K
��
���
��
��
�
��
B�C
��
���
��
��
�
��
B�C�D
�
���
��
�
�
��
B�C�D�E
��
���
��
�
�
�
B�C�D�E�F
��
���
��
��
�
�
B�C�D�E�G
��
���
��
�
�
�
B�C�D�E�G�H
�
���
��
��
�
B�K�J�I
��
�
�
B�K�J
��
���
��
�
�
�
B�K
�
���
��
��
�
�
��
�
��
B�A�K
��
�
��
C�D
���
��
��
�
��
C�D�E
�
���
��
��
�
�
C�D�E�F
��
���
�
��
�
�
C�D�E�G
��
���
��
��
�
�
C�D�E�G�H
��
���
��
��
�
�
C�D�E�G�I
��
�
C�D�J
��
���
��
��
�
�
C�B�K
��
���
��
�
�
�
Table����Connectionclassesofthebenchmarktra�c�parta�
��
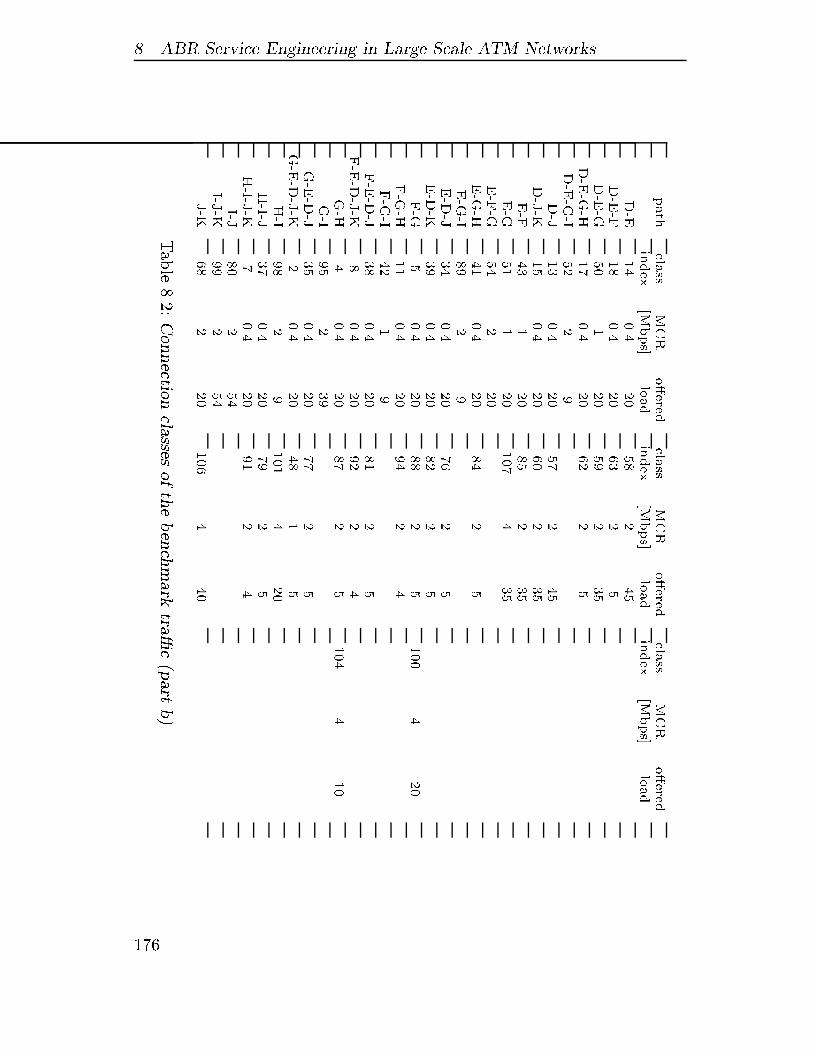
� ABR Service Engineering in Large Scale ATM Networks
path
class
MCR
o�ered
class
MCR
o�ered
class
MCR
o�ered
index
�Mbps
load
index
�Mbps
load
index
�Mbps
load
D�E
�
���
��
�
�
��
D�E�F
���
��
��
�
�
D�E�G
��
��
��
�
��
D�E�G�H
�
���
��
��
�
�
D�E�G�I
��
�
�
D�J
�
���
��
��
�
��
D�J�K
�
���
��
��
�
��
E�F
��
��
�
�
��
E�G
�
��
��
�
��
E�F�G
��
�
��
E�G�H
�
���
��
�
�
�
E�G�I
�
�
�
E�D�J
��
���
��
��
�
�
E�D�K
��
���
��
�
�
�
F�G
�
���
��
�
�
��
�
��
F�G�H
���
��
��
�
�
F�G�I
��
�
F�E�D�J
�
���
��
�
�
F�E�D�J�K
���
��
��
�
�
G�H
�
���
��
�
�
�
��
�
�
G�I
��
�
��
G�E�D�J
��
���
��
��
�
�
G�E�D�J�K
�
���
��
�
�
H�I
�
�
�
�
�
��
H�I�J
��
���
��
��
�
�
H�I�J�K
�
���
��
�
�
�
I�J
�
�
��
I�J�K
��
�
��
J�K
�
�
��
��
�
��
Table����Connectionclassesofthebenchmarktra�c�partb�
���
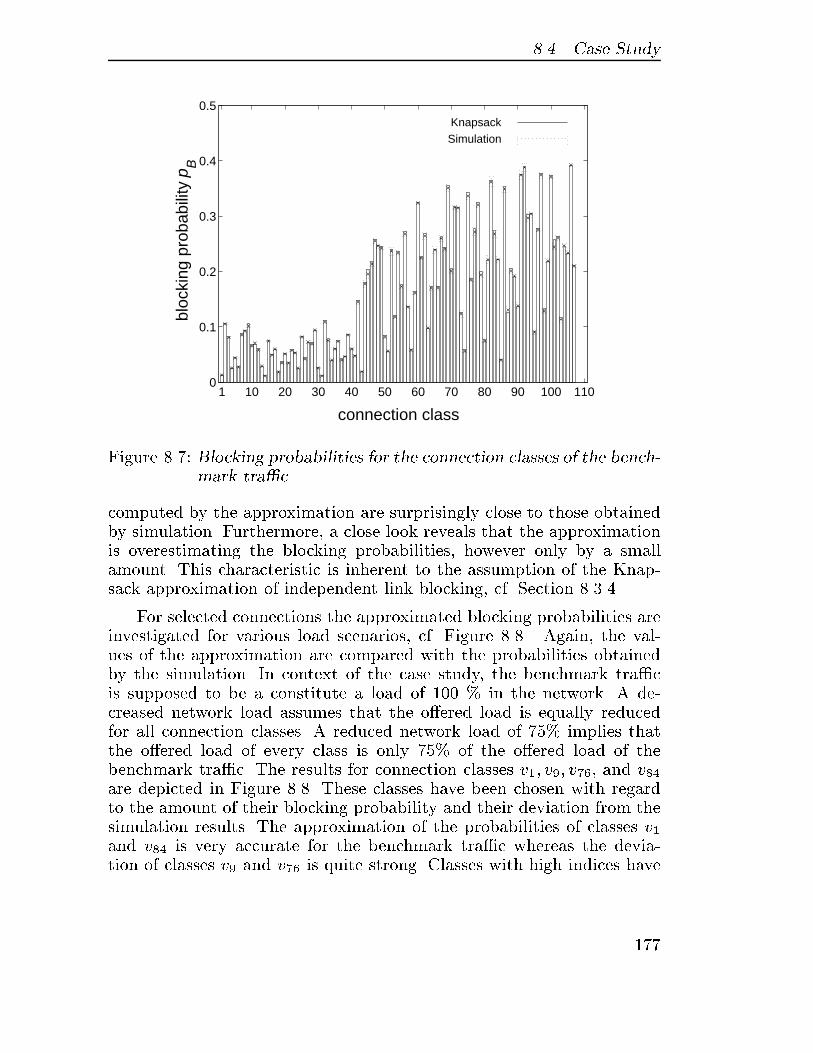
��� Case Study
connection class
bloc
king
pro
babi
lity
p B
1 10 20 30 40 50 60 70 80 90 100 1100
0.1
0.2
0.3
0.4
0.5KnapsackSimulation
Figure ���� Blocking probabilities for the connection classes of the bench�mark tra�c
computed by the approximation are surprisingly close to those obtainedby simulation� Furthermore� a close look reveals that the approximationis overestimating the blocking probabilities� however only by a smallamount� This characteristic is inherent to the assumption of the Knap�sack approximation of independent link blocking� cf� Section �����
For selected connections the approximated blocking probabilities areinvestigated for various load scenarios� cf� Figure ���� Again� the val�ues of the approximation are compared with the probabilities obtainedby the simulation� In context of the case study� the benchmark tra�cis supposed to be a constitute a load of ��� ' in the network� A de�creased network load assumes that the o�ered load is equally reducedfor all connection classes� A reduced network load of � ' implies thatthe o�ered load of every class is only � ' of the o�ered load of thebenchmark tra�c� The results for connection classes v�� v�� v �� and v�are depicted in Figure ���� These classes have been chosen with regardto the amount of their blocking probability and their deviation from thesimulation results� The approximation of the probabilities of classes v�and v� is very accurate for the benchmark tra�c whereas the devia�tion of classes v� and v � is quite strong� Classes with high indices have
���
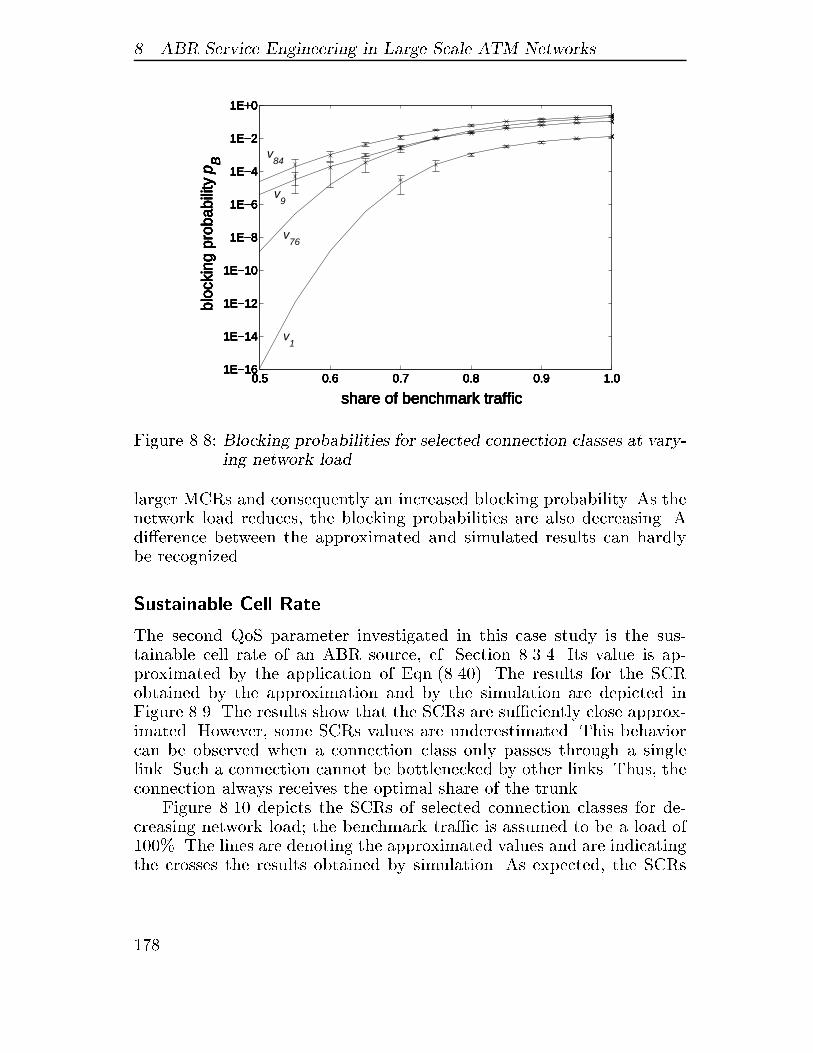
� ABR Service Engineering in Large Scale ATM Networks
share of benchmark traffic
bloc
king
pro
babi
lity
p B
0.5 0.6 0.7 0.8 0.9 1.01E−16
1E−14
1E−12
1E−10
1E−8
1E−6
1E−4
1E−2
1E+0
v1
v76
v9
v84
share of benchmark traffic
bloc
king
pro
babi
lity
p B
0.5 0.6 0.7 0.8 0.9 1.01E−16
1E−14
1E−12
1E−10
1E−8
1E−6
1E−4
1E−2
1E+0
v1
v76
v9
v84
share of benchmark traffic
bloc
king
pro
babi
lity
p B
0.5 0.6 0.7 0.8 0.9 1.01E−16
1E−14
1E−12
1E−10
1E−8
1E−6
1E−4
1E−2
1E+0
v1
v76
v9
v84
share of benchmark traffic
bloc
king
pro
babi
lity
p B
0.5 0.6 0.7 0.8 0.9 1.01E−16
1E−14
1E−12
1E−10
1E−8
1E−6
1E−4
1E−2
1E+0
v1
v76
v9
v84
share of benchmark traffic
bloc
king
pro
babi
lity
p B
0.5 0.6 0.7 0.8 0.9 1.01E−16
1E−14
1E−12
1E−10
1E−8
1E−6
1E−4
1E−2
1E+0
v1
v76
v9
v84
share of benchmark traffic
bloc
king
pro
babi
lity
p B
0.5 0.6 0.7 0.8 0.9 1.01E−16
1E−14
1E−12
1E−10
1E−8
1E−6
1E−4
1E−2
1E+0
v1
v76
v9
v84
share of benchmark traffic
bloc
king
pro
babi
lity
p B
0.5 0.6 0.7 0.8 0.9 1.01E−16
1E−14
1E−12
1E−10
1E−8
1E−6
1E−4
1E−2
1E+0
v1
v76
v9
v84
share of benchmark traffic
bloc
king
pro
babi
lity
p B
0.5 0.6 0.7 0.8 0.9 1.01E−16
1E−14
1E−12
1E−10
1E−8
1E−6
1E−4
1E−2
1E+0
v1
v76
v9
v84
share of benchmark traffic
bloc
king
pro
babi
lity
p B
0.5 0.6 0.7 0.8 0.9 1.01E−16
1E−14
1E−12
1E−10
1E−8
1E−6
1E−4
1E−2
1E+0
v1
v76
v9
v84
Figure ���� Blocking probabilities for selected connection classes at vary�ing network load
larger MCRs and consequently an increased blocking probability� As thenetwork load reduces� the blocking probabilities are also decreasing� Adi�erence between the approximated and simulated results can hardlybe recognized�
Sustainable Cell Rate
The second QoS parameter investigated in this case study is the sus�tainable cell rate of an ABR source� cf� Section ����� Its value is ap�proximated by the application of Eqn�������� The results for the SCRobtained by the approximation and by the simulation are depicted inFigure ���� The results show that the SCRs are su�ciently close approx�imated� However� some SCRs values are underestimated� This behaviorcan be observed when a connection class only passes through a singlelink� Such a connection cannot be bottlenecked by other links� Thus� theconnection always receives the optimal share of the trunk�
Figure ���� depicts the SCRs of selected connection classes for de�creasing network load� the benchmark tra�c is assumed to be a load of���'� The lines are denoting the approximated values and are indicatingthe crosses the results obtained by simulation� As expected� the SCRs
���
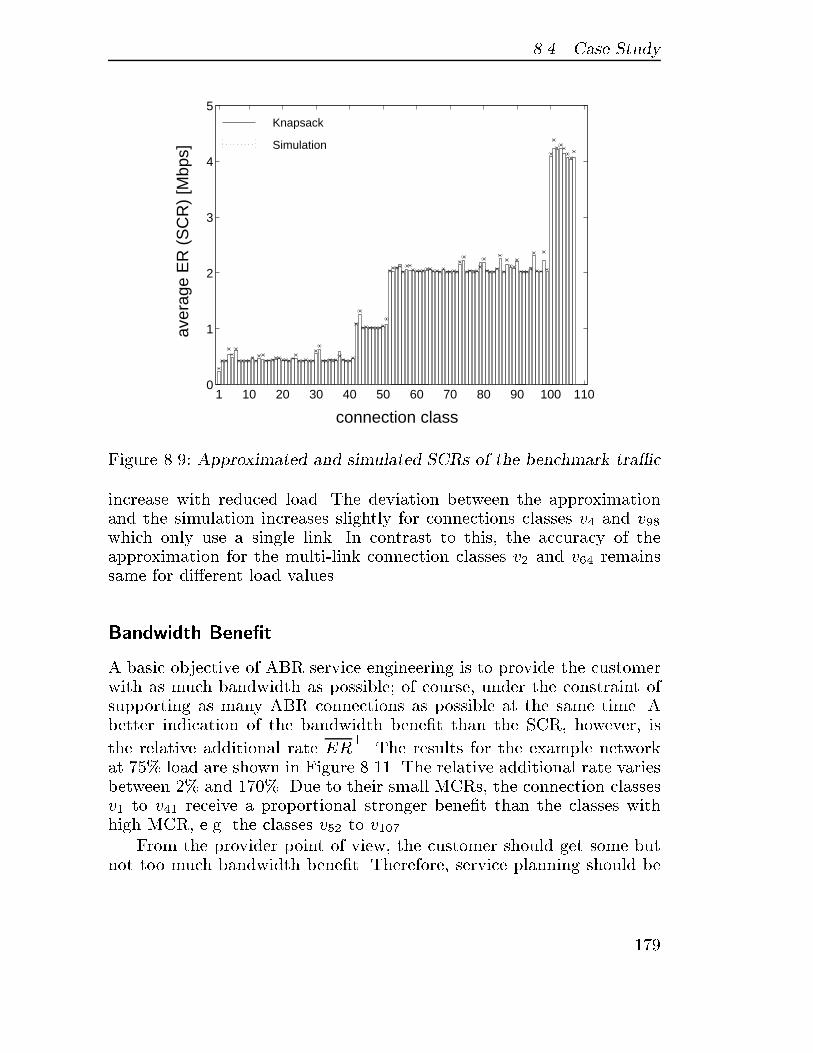
��� Case Study
connection class
aver
age
ER
(S
CR
) [M
bps]
1 10 20 30 40 50 60 70 80 90 100 1100
1
2
3
4
5Knapsack
Simulation
Figure ���� Approximated and simulated SCRs of the benchmark tra�c
increase with reduced load� The deviation between the approximationand the simulation increases slightly for connections classes v� and v�which only use a single link� In contrast to this� the accuracy of theapproximation for the multi�link connection classes v� and v�� remainssame for di�erent load values�
Bandwidth Bene�t
A basic objective of ABR service engineering is to provide the customerwith as much bandwidth as possible� of course� under the constraint ofsupporting as many ABR connections as possible at the same time� Abetter indication of the bandwidth bene�t than the SCR� however� is
the relative additional rate ER�
� The results for the example networkat � ' load are shown in Figure ����� The relative additional rate variesbetween �' and ���'� Due to their small MCRs� the connection classesv� to v�� receive a proportional stronger bene�t than the classes withhigh MCR� e�g� the classes v�� to v�� �
From the provider point of view� the customer should get some butnot too much bandwidth bene�t� Therefore� service planning should be
���
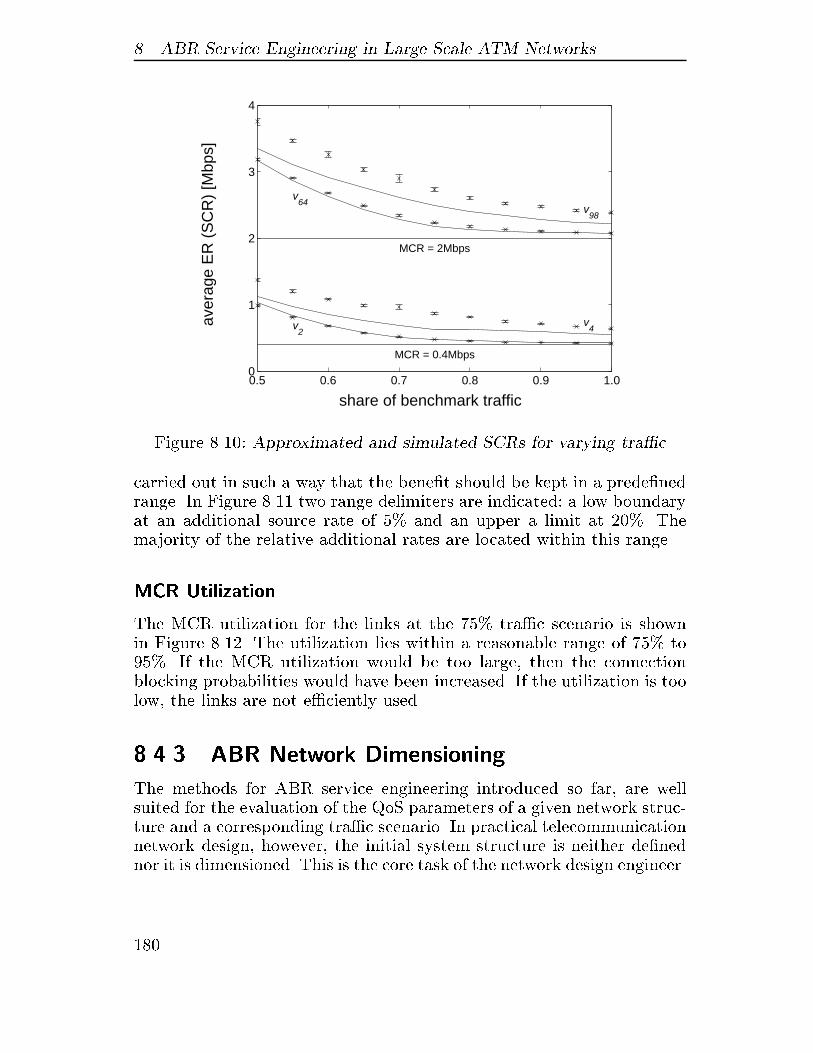
� ABR Service Engineering in Large Scale ATM Networks
share of benchmark traffic
aver
age
ER
(S
CR
) [M
bps]
0.5 0.6 0.7 0.8 0.9 1.00
1
2
3
4
MCR = 0.4Mbps
MCR = 2Mbps
v2
v64
v4
v98
Figure ����� Approximated and simulated SCRs for varying tra�c
carried out in such a way that the bene�t should be kept in a prede�nedrange� In Figure ���� two range delimiters are indicated� a low boundaryat an additional source rate of ' and an upper a limit at ��'� Themajority of the relative additional rates are located within this range�
MCR Utilization
The MCR utilization for the links at the � ' tra�c scenario is shownin Figure ����� The utilization lies within a reasonable range of � ' to� '� If the MCR utilization would be too large� then the connectionblocking probabilities would have been increased� If the utilization is toolow� the links are not e�ciently used�
����� ABR Network Dimensioning
The methods for ABR service engineering introduced so far� are wellsuited for the evaluation of the QoS parameters of a given network struc�ture and a corresponding tra�c scenario� In practical telecommunicationnetwork design� however� the initial system structure is neither de�nednor it is dimensioned� This is the core task of the network design engineer�
���
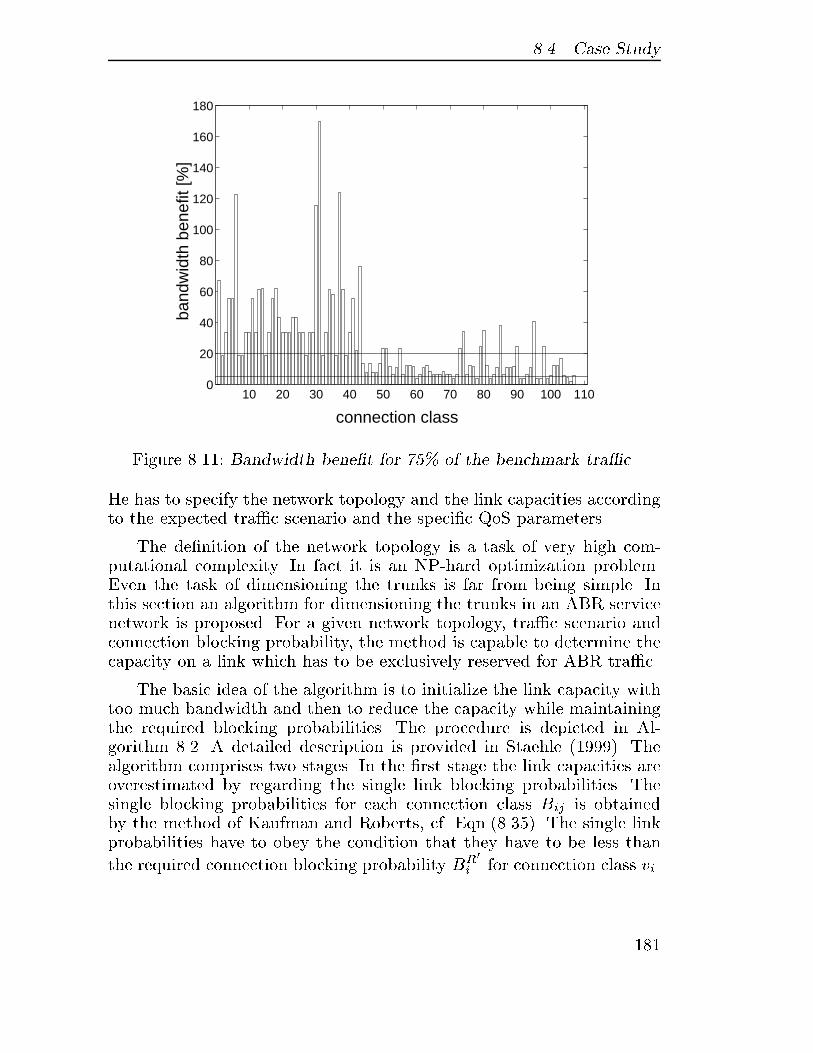
��� Case Study
connection class
band
wid
th b
enef
it [%
]
10 20 30 40 50 60 70 80 90 100 1100
20
40
60
80
100
120
140
160
180
Figure ����� Bandwidth bene t for ��� of the benchmark tra�c
He has to specify the network topology and the link capacities accordingto the expected tra�c scenario and the speci�c QoS parameters�
The de�nition of the network topology is a task of very high com�putational complexity� In fact it is an NP�hard optimization problem�Even the task of dimensioning the trunks is far from being simple� Inthis section an algorithm for dimensioning the trunks in an ABR servicenetwork is proposed� For a given network topology� tra�c scenario andconnection blocking probability� the method is capable to determine thecapacity on a link which has to be exclusively reserved for ABR tra�c�
The basic idea of the algorithm is to initialize the link capacity withtoo much bandwidth and then to reduce the capacity while maintainingthe required blocking probabilities� The procedure is depicted in Al�gorithm ���� A detailed description is provided in Staehle ������� Thealgorithm comprises two stages� In the �rst stage the link capacities areoverestimated by regarding the single link blocking probabilities� Thesingle blocking probabilities for each connection class Bij is obtainedby the method of Kaufman and Roberts� cf� Eqn���� �� The single linkprobabilities have to obey the condition that they have to be less than
the required connection blocking probability BR�
i for connection class vi�
���
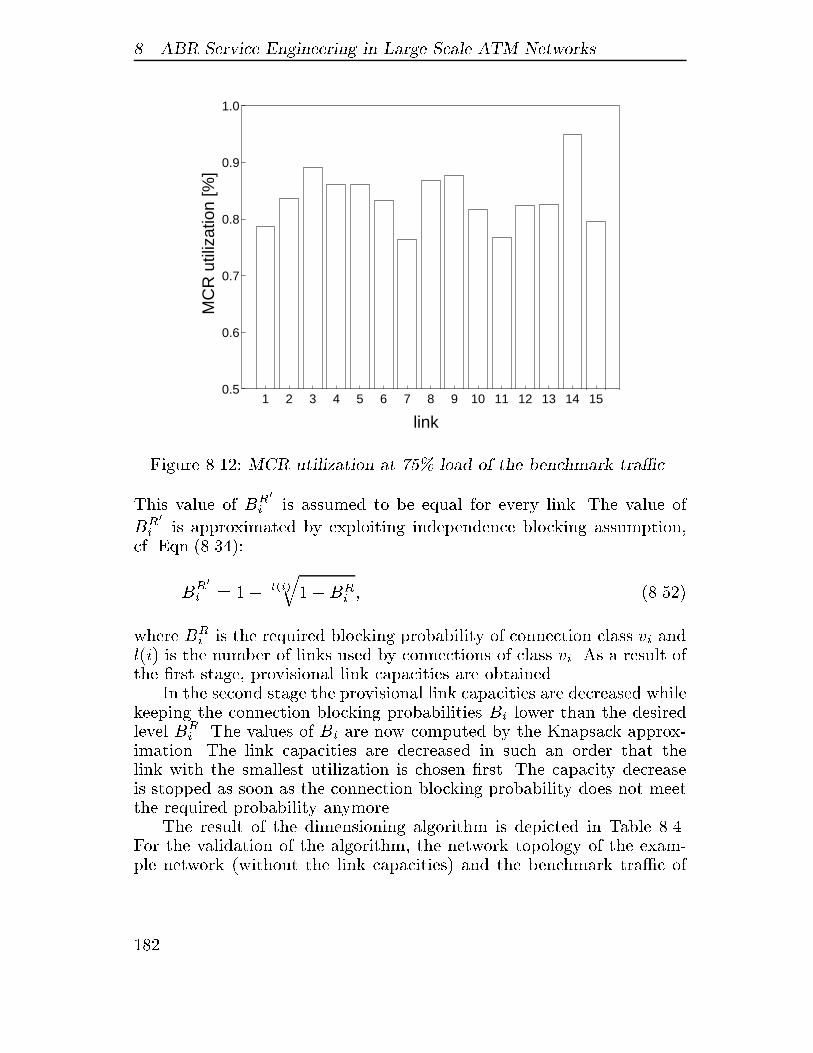
� ABR Service Engineering in Large Scale ATM Networks
link
MC
R u
tiliz
atio
n [%
]
1 2 3 4 5 6 7 8 9 10 11 12 13 14 150.5
0.6
0.7
0.8
0.9
1.0
Figure ����� MCR utilization at ��� load of the benchmark tra�c
This value of BR�
i is assumed to be equal for every link� The value of
BR�
i is approximated by exploiting independence blocking assumption�cf� Eqn�������
BR�
i ! �� l�i�
q��BR
i � ��� ��
where BRi is the required blocking probability of connection class vi and
l�i� is the number of links used by connections of class vi� As a result ofthe �rst stage� provisional link capacities are obtained�
In the second stage the provisional link capacities are decreased whilekeeping the connection blocking probabilities Bi lower than the desiredlevel BR
i � The values of Bi are now computed by the Knapsack approx�imation� The link capacities are decreased in such an order that thelink with the smallest utilization is chosen �rst� The capacity decreaseis stopped as soon as the connection blocking probability does not meetthe required probability anymore�
The result of the dimensioning algorithm is depicted in Table ����For the validation of the algorithm� the network topology of the exam�ple network �without the link capacities� and the benchmark tra�c of
���
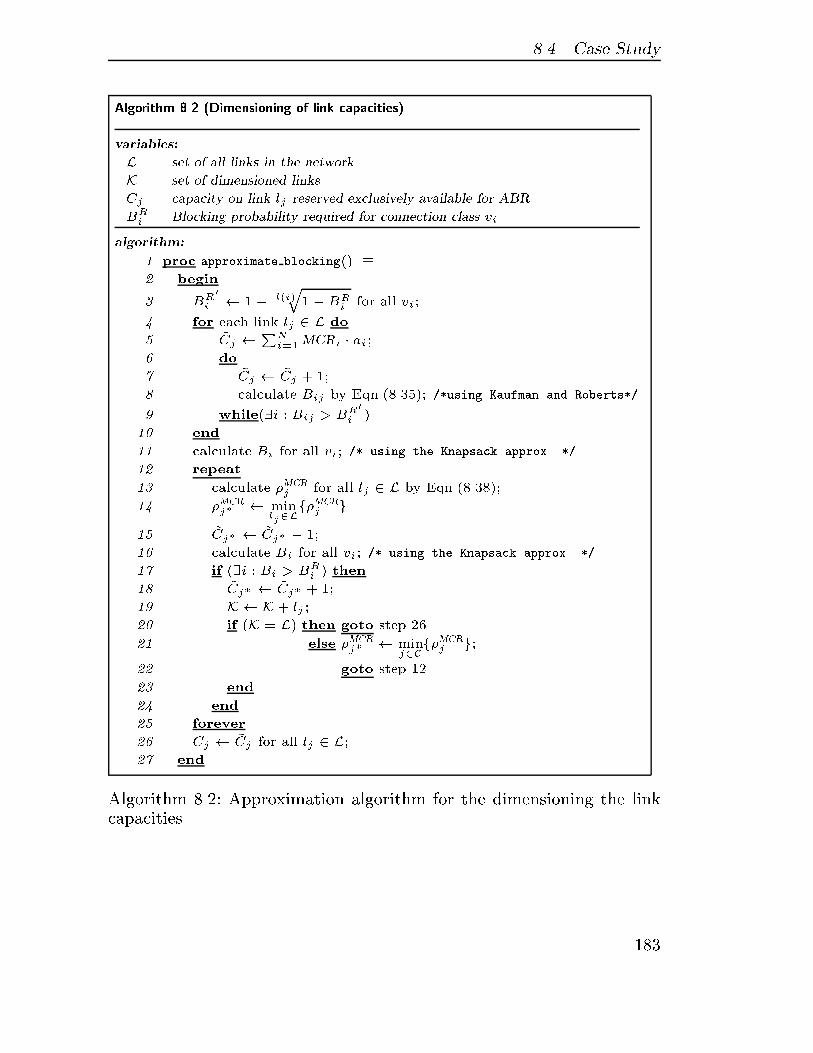
��� Case Study
Algorithm ��� �Dimensioning of link capacities�
variables�
L set of all links in the network
K set of dimensioned links
Cj capacity on link lj reserved exclusively available for ABR
BRi Blocking probability required for connection class vi
algorithm�
� proc approximate blocking�� �
� begin
� BR�
i � � l�i�q�BR
i for all vi�
� for each link lj � L do
� �Cj �PN
i�� MCRi � ai�
� do
� �Cj � �Cj � �
� calculate Bij by Eqn������� ��using Kaufman and Roberts��
while��i � Bij � BR�
i �
� end
�� calculate Bi for all vi� �� using the Knapsack approx� ��
�� repeat
�� calculate MCRj for all lj � L by Eqn������
�� MCRj� � minlj�L
fMCRj g
�� �Cj� � �Cj� � �
�� calculate Bi for all vi� �� using the Knapsack approx� ��
�� if ��i � Bi � BRi � then
�� �Cj� � �Cj� � �
� K � K � lj �
� if �K � L� then goto step ��
�� else MCRj� � minj�C
fMCRj g�
�� goto step �
�� end
�� end
�� forever
�� Cj � �Cj for all lj � L�
�� end
Algorithm ���� Approximation algorithm for the dimensioning the linkcapacities
��
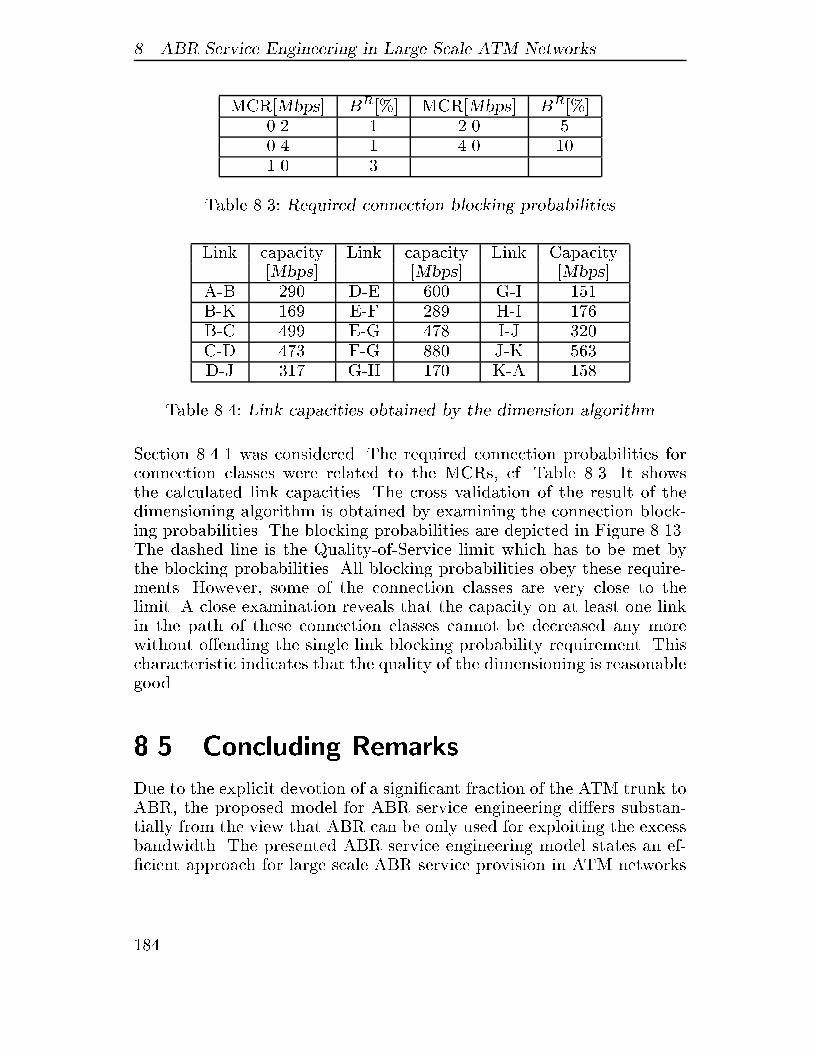
� ABR Service Engineering in Large Scale ATM Networks
MCR�Mbps BR�' MCR�Mbps BR�' ��� � ��� ��� � ��� �����
Table ��� Required connection blocking probabilities
Link capacity Link capacity Link Capacity�Mbps �Mbps �Mbps
A�B ��� D�E ��� G�I � �B�K ��� E�F ��� H�I ���B�C ��� E�G ��� I�J ��C�D �� F�G ��� J�K �D�J �� G�H ��� K�A � �
Table ���� Link capacities obtained by the dimension algorithm
Section ����� was considered� The required connection probabilities forconnection classes were related to the MCRs� cf� Table ��� It showsthe calculated link capacities� The cross validation of the result of thedimensioning algorithm is obtained by examining the connection block�ing probabilities� The blocking probabilities are depicted in Figure ����The dashed line is the Quality�of�Service limit which has to be met bythe blocking probabilities� All blocking probabilities obey these require�ments� However� some of the connection classes are very close to thelimit� A close examination reveals that the capacity on at least one linkin the path of these connection classes cannot be decreased any morewithout o�ending the single link blocking probability requirement� Thischaracteristic indicates that the quality of the dimensioning is reasonablegood�
��� Concluding Remarks
Due to the explicit devotion of a signi�cant fraction of the ATM trunk toABR� the proposed model for ABR service engineering di�ers substan�tially from the view that ABR can be only used for exploiting the excessbandwidth� The presented ABR service engineering model states an ef��cient approach for large scale ABR service provision in ATM networks
���
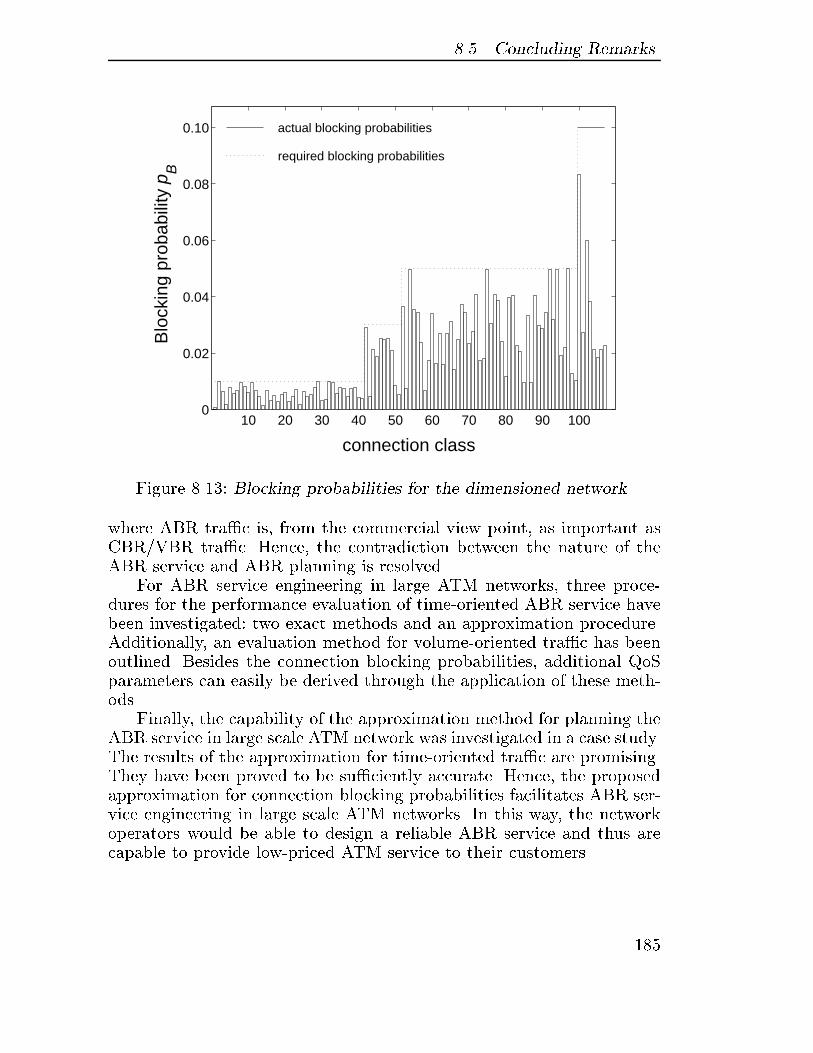
��� Concluding Remarks
connection class
Blo
ckin
g pr
obab
ility
pB
10 20 30 40 50 60 70 80 90 1000
0.02
0.04
0.06
0.08
0.10 actual blocking probabilities
required blocking probabilities
Figure ���� Blocking probabilities for the dimensioned network
where ABR tra�c is� from the commercial view point� as important asCBR�VBR tra�c� Hence� the contradiction between the nature of theABR service and ABR planning is resolved�
For ABR service engineering in large ATM networks� three proce�dures for the performance evaluation of time�oriented ABR service havebeen investigated� two exact methods and an approximation procedure�Additionally� an evaluation method for volume�oriented tra�c has beenoutlined� Besides the connection blocking probabilities� additional QoSparameters can easily be derived through the application of these meth�ods�
Finally� the capability of the approximation method for planning theABR service in large scale ATM network was investigated in a case study�The results of the approximation for time�oriented tra�c are promising�They have been proved to be su�ciently accurate� Hence� the proposedapproximation for connection blocking probabilities facilitates ABR ser�vice engineering in large scale ATM networks� In this way� the networkoperators would be able to design a reliable ABR service and thus arecapable to provide low�priced ATM service to their customers�
��

� ABR Service Engineering in Large Scale ATM Networks
���
� Conclusion and Outlook
The success of future telecommunication networks depends on intelligentnetwork planning to achieve superior service quality� high capacity� ande�cient network management� To facilitate this aim� the planning of thesystems needs to focus in particular on three major design issues� a� theincreased demand for telecommunication services� b� the emerging ofnew transmission technologies� and c� the increased competition amongproviders due the deregulation of the telecommunication market�
Conventional telecommunication system design methods do not suf��ciently accomplish this task� since their procedures are mostly basedon reverse engineering approaches� The methods are often adjusted toisolated design aspects� The application of forward engineering and in�tegrated design procedures can resolve these de�cits� Despite their highrequirements to system modeling� the new methods are able to achievedemand�oriented� e�cient� and optimal network con�gurations� In thisway� the forward engineering design paradigm eliminates some of theheuristics widely applied in networks design and accelerates the deploy�ment of new networks�
This monograph dealt with the implementation of demand�orienteddesign procedures� The aim was to develop new engineering methodsbased on forward design paradigm which considers the demand fortelecommunication services as a key input factor to system design�
Spatial Customer Tra�c Estimation and Characterization
For demand�oriented engineering of wireless and mobile communicationnetworks� the distribution of customers in the service area is of primeimportance� Thus� an e�cient framework for the estimation and char�acterization of the expected spatial demand distribution was developed�The tra�c estimation of the framework is based on the geographic tra�cmodel� which obeys the geographical and demographical factors in the
���
Conclusion and Outlook
service area for the teletra�c demand estimation� The characterizationof the spatial distribution was facilitated by the application of discretepoints� denoted as demand nodes� For the generation of the demand nodedistributions� two hierarchical clustering algorithms� a recursive parti�tional algorithm and an agglomerative method� were introduced andevaluated� In particular� the agglomerative clustering procedure meetsthe requirements of real world planning cases� The demand node con�cept �DNC� permits a matching of theory and practice as claimed byGrillo et al� �������
In addition� the work on user clustering presented in this monographstimulated further investigations of the impact of customer clumping oncellular system performance� New results indicate that a neglect of theclustering e�ect can lead to critical results� it can signi�cantly decreasethe system performance� cf� Tran�Gia et al� ������� Remiche and Leibnitz�������
Demand�oriented Radio Network Synthesis
The application of the demand node concept also facilitates the demand�oriented radio network design in cellular communications systems� Theuse of the DNC in combination with a new de�nition of the term cov�erage area� cf� De�nition ���� permits the formulation of the transmitterlocation task as a speci�c facility location optimization problem� themaximal coverage location problem �MCLP��
Unfortunately� by its nature� the MCLP belongs to the class of NP�hard optimization problems� Hence� approximation methods are requiredfor obtaining a near optimal solution� Thus� two approximation methodswere investigated� a greedy heuristic for solving the MCLP problem anda Simulated Annealing procedure� Both methods were shown to providee�ciently feasible solutions for the maximal coverage location problem�The greedy heuristic turned out here to be more �exible�
To demonstrate the applicability of the proposed procedures for ra�dio network design� the planning tool prototype ICEPT was implemented�Due to its detailed implementation of all the design steps� ICEPT cansupport the synthesis of radio network con�gurations for real world de�sign scenarios�
The application of covering models in radio network design� like theMCLP� enables the integration of three design techniques from engineer�ing areas� which are� at a �rst glance� di�cult to combine� a� facilitylocation science� b� tra�c engineering� and c� RF engineering� The op�
���
timization procedures which were applied� are able to attain a trade�o�between the design objectives� Moreover� a radio network designer re�ceives valuable support from an automatic procedure� In this way� theintegrated approach to cellular system design meets all requirements forthe planning methods of future generation mobile communication net�works�
As a result of the research presented in this monograph� set coveringmodels have found application in complex radio network optimizationtasks� e�g� radio network engineering in CDMA systems� cf� Yu et al�������� The methodology is now being transferred into a commercialprocedure�
Call Handling Procedures in Cellular Mobile Networks
In addition to spatial teletra�c engineering� the performance of cellularcommunication systems largely depends on the temporal user behaviourand on the e�ectiveness of the procedures used to cope with the parti�tioning of the service area� Therefore� an e�cient user model� which cancapture the phenomenon of repeated attempts of blocked calls� was in�vestigated in combination with two advanced call handling mechanisms�namely guard channels and handover retry�
Each of the advanced mechanisms can help to increase the systemperformance� However� a combination of the two provides the most e�ec�tive way of processing calls� The attractive feature of the combined mech�anism is that it is organized in a distributed manner� and therefore doesnot increase the system complexity� In addition� it was demonstratedthat reattempt phenomenon signi�cantly decreases the system perfor�mance� It is critical to neglect this e�ect during system design� Bothadaptations� the advanced call handling schemes and the improved usermodeling� can be used to obtain a more accurate con�guration methodand an increased performance of the cells in mobile networks�
ABR Service Engineering in Large Scale ATM Networks
Demand�oriented design procedures also gain more and more importancein the engineering of wireline data networks� In particular� the provisionof ABR service in large scale ATM system requires a careful networkdesign� Although� ABR service planning� at a �rst glance� states a con�tradiction� The objective of providing the ABR service to a large numberof customers while assuring certain QoS values can only be attained by
���
Conclusion and Outlook
devoting a signi�cant fraction of the ATM trunk to ABR� In order todetermine the dedicated bandwidth� appropriate service planning is re�quired�
Three procedures for the performance evaluation of time�orientedABR service have been investigated� two exact methods and an approx�imation procedure� However� the large computational complexity of theexact methods prohibits their application in large scale ABR service engi�neering� Only the approximation method can be applied in practical net�work planning� Additionally� an evaluation method for volume�orientedtra�c has been considered� This method� however� is also limited tosmall networks�
The capability of the approximation method for planning the ABRservice in large scale ATM network was investigated in a case study� Theresults of the approximation for time�oriented tra�c were su�cientlyaccurate� Hence� the proposed approximation for the connection block�ing probabilities facilitates ABR service engineering in large scale ATMnetworks� In this way� the network operators would be able to design areliable ABR service and thus would be capable of providing a low�pricedATM service to their customers�
Outlook
At the end of this monograph� there should be some space to raise a basicquestion� The demand�oriented design procedures presented in this workas well as conventional teletra�c engineering procedures both rely on theassumption that the amount of the teletra�c generated by a customeris determined �a priori�� which means that the demand for teletra�ccan be related to self�evident propositions� The tra�c estimation proce�dure presented in Chapter � for example� widely exploits this concept�However� it is likely that future telecommunication network and serviceparadigms will question this assumption� since the availability and thequality of the service subsequently also in�uence the ways in which thenetworks are going to be used� A fast changing demand for teletraf��c for instance will rapidly alter the system performance� This can beillustrated by the Internet where the sheer speed of the network stim�ulates an increase in the users rate for requesting information� Such alarge number of requests signi�cantly changes the system�s performance�Thus� new teletra�c models need to be developed which are capable ofcapturing this behaviour� In addition� new design concepts are requiredwhich can scale with the anticipated levels of service provision and the
���

expected customer behaviour�
���

Conclusion and Outlook
���
References
Aarts� E� and J� Korst ������� Simulated Annealing and BoltzmannMachines� Chichester� John Wiley , Sons�
ANSI ������� Personal communications services PCS���� � Air inter�face speci�cation J�STD����� Technical reference� American Na�tional Standards Institute� New York� USA�
Arulambalam� A�� X� Chen� and N� Ansra ������� Allocating fair ratesfor available bit rate service in ATM networks� IEEE Communi�cations Magazine �� ����� �������
ATKIS ������� Amtliches Topographisches Kartographisches Informa�tions System� Bavarian land survey o�ce� Munich� Germany�
ATM Forum ������� User�network interface speci�cation � version��� Technical reference� The ATM Forum Technical Committee�Mountain View� CA� USA�
ATM Forum ���� �� Tra�c management speci�cation � Version���� Technical reference� The ATM Forum Technical Committee�Mountain View� CA� USA�
Baccelli� F�� M� Klein� M� LeBourges� and S� Zuyev ������� Stochasticgeometry and architecture of communication networks� Telecom�munication Systems �� ��������
Baum� D� ������� On Markovian spatial arrival processes for the per�formance analysis of mobile communication systems� In First An�nual Report of the Center of Network Optimization� W�urzburg�Germany�
Bertsekas� D� and R� Gallager ������� Data networks� EnglewoodCli�s� NJ� Prentice Hall� Inc�
Cal$egari� P�� F� Guidec� P� Kuonen� and D� Wagner ������� Geneticapproach to radio network optimization for mobile systems� In Pro�
��
References
ceedings of the IEEEVTS ��th Vehicular Technology Conference�Phoenix� USA�
Chamaret� B�� S� Josselin� P� Kuonen� M� Pizarroso� N� Salas�Manzanedo� and D� Wagner ������� Radio network optimiza�tion with maximum independent set search� In Proceedings of theIEEEVTS ��th Vehicular Technology Conference� Phoenix� USA�
Chang� C��J�� T��T� Su� and Y��Y� Chiang ������� Analysis of a cut�o� priority cellular radio system with �nite queueing and reneg�ing�dropping� IEEEACM Transactions on Networking ���� ������ �
Chen� T� M�� S� S� Liu� and V� K� Samalam ������� The availablebit rate service for data in ATM networks� IEEE CommunicationsMagazine �� � �� �����
Cheung� J� C� S�� M� A� Beach� and J� P� McGeehan ������� Networkplanning for third�generation mobile radio systems� IEEE Com�munications Magazine � ����� �� ��
Chlebus� E� ������ Analytical grade of service evaluation in cellularmobile systems with respect to subscribers� velocity distribution�In Proceedings �th Australian Teletra�c Research Seminar� pp��������
Chlebus� E� and W� Ludwin ���� �� Is hando� tra�c really poissonian�In Proceedings of the ��� Fourth IEEE International Conferenceon Universal Personal Communications� pp� ��� �
Choi� B� D�� K� B� Choi� and Y� W� Lee ���� �� M�G�� retrial queue�ing systems with two types of calls and �nite capacity� QueueingSystems �� �� �����
Chung� S��P� and K� W� Ross ������ Reduced load approximationsfor multirate loss networks� IEEE Transactions on Communica�tions � ���� ���������
Church� R� L� and C� ReVelle ������� The maximal covering locationproblem� Regional Science ��� ��������
Chvatal� V� ������� A greedy heuristic for the set�covering problem�Mathematics of Operations Research � ��� ��� �
Cressie� N� ������� Statistic for Spatial Data� New York� Wiley�
Daigle� J� N� and N� Jain ������� A queueing system with two arrivalstreams and reserved server with application to cellular telephone�In Proceedings of INFOCOM��� pp� ����������
���
References
Day� J� D� and H� Zimmermann ������ The OSI reference model�Proceedings of the IEEE � � �������
Drezner� Z� ���� �� Facility Location� A Survey of Applications andMethods� New York� Springer�
El�Dolil� S� A�� W��C� Wong� and R� Steele ������� Teletra�c perfor�mance of highway microcells with overlay macrocell� IEEE Journalon Selected Areas in Communications � ���� ������
ETSI ���� a�� European digital cellular telecommunications system�phase ��� Base station system �BSS�� Equipment speci�cation�GSM ������� Technical reference� European TelecommunicationsStandards Institute� Sophia Antibolis� France�
ETSI ���� b�� European digital cellular telecommunications system�phase ��� GSM DCS ���� Base station speci�cation �GSM ������ DCS������� Technical reference� European TelecommunicationsStandards Institute� Sophia Antibolis� France�
Falin� G� ������� A survey of retrial queues� Queueing Systems �� ��������
Faruque� S� ������� Cellular Mobile Systems Engineering� Norwood�MA� Artech House Publishers�
Feige� U� ������� A threshold of ln n for approximating set cover� InProceedings of the �th Annual ACM Symposium on the Theory ofComputing� Philadelphia� Pa� USA�
Floriani� L� C� and G� R� Mateus ������� An optimization model forthe BST location problem in outdoor cellular and PCS systems�In Proceedings of the �th International Teletra�c Congress � ITC �� Washington DC� USA�
Fortune� S� J�� D� M� Gay� B� W� Kernighan� O� Landron� R� A� Valen�zuela� � and M� H� Wright ���� �� Wise design of indoor wirelesssystems� practical computation and optimization� IEEE Computa�tional Science � Engineering � �����
Foschini� G� J�� B� Gopinath� and Z� Miljanic ������ Channel costof mobility� IEEE Transactions on Vehicular Technology � ������������
Fritsch� T� and S� Hanshans ������ An integrated approach to cellu�lar mobile communication planning using tra�c data prestructured
��
References
by a self�organizing feature map� In Proceedings of the ��� Inter�national Conference on Neural Networks� pp� ���D����I� IEEE�IEEE Service Center�
Fritsch� T�� K� Tutschku� and K� Leibnitz ���� �� Field strength pre�diction by ray�tracing for adaptive base station positioning in mo�bile communication networks� In Proceedings of the nd ITG Con�ference on Mobile Communication ���� Neu Ulm� VDE�
Gamst� A�� E��G� Zinn� R� Beck� and R� Simon ������� Cellular radionetwork planning� IEEE Aerospace and Electronic Systems Maga�zine ���� �����
Garey� M� R� and D� S� Johnson ������� Computers and Intractabil�ity� A Guide to the Theory of NP�Completeness� New York� W�H�Freemann and Company�
Gerlich� N� ������� On the spatial multiplexing gain of SDMA for wire�less local loop access� In Proceedings of the nd European PersonalMobile Communication Conference� Bonn� Germany�
Ghosh� A� and S� L� McLa�erty ������� Location Strategies for Retailand Service Firms� Lexington� MA� Heath�
Gla�er� C� ������� On thee approximability of problems for cellularnetworks� In First Annual Report of the Center of Network Opti�mization� W�urzburg� Germany�
Grahovac� G� and M� LeBourges ������� A stochastic geometry modelof civil engineering infrastructure in the local loop� In Proceedingsof the �th International Network Planning Symposium �Networks���� Sydney� Australia�
Grasso� S�� F� Mercuri� G� Roso� and D� Tacchino ������� DEMON�A forecasting tool for demand evaluation of mobile network re�sources� In Proceedings of the �th International Network PlanningSymposium �Networks ���� Sydney� Australia� pp� �� �� ��
Grillo� D�� S� T� S� Chia� and N� E� Rouelle ���� �� The europeanpath towards advanced mobile systems� IEEE Personal Commu�nications ����
Grillo� D�� R� A� Skoog� S� Chia� and K� K� Leung ������� Teletra�cengineering for mobile personal communications in ITU�T work �the need for matching practice and theory� IEEE Personal Com�munications � ���� �� ��
���
References
Gu$erin� R� ������� Queueing�blocking system with two arrivalstreams and guard channels� IEEE Transactions on Communica�tions �� ���� � ����
Harris� R� ������� Private Communication� Royal Melbourne Instituteof Technology� Melbourne� Australia�
Hata� M� ������� Empirical formula for propagation loss in land mobileradio services� IEEE Transactions on Vehicular Technology � ������� �
Hochbaum� D� S� ������� Approximation algorithms for NP�hard prob�lems� Boston� Ma� International Thomson Publishing Company�
Hong� D� and S� S� Rappaport ������� Tra�c model and performanceanalysis for cellular mobile radio telephone systems with priori�tized and nonprioritized hando� procedures� IEEE Transactionson Vehicular Technology VT��� ��� ������
Horowitz� E� and S� Sahni ������� Fundamentals of Computer Algo�rithms� Rockville� Md� Computer Science Press�
Ibbetson� L� J� and L� B� Lopes ������� An automatic base site place�ment algorithm� In Proceedings of the IEEEVTS ��th VehicularTechnology Conference� Phoenix� USA�
ITU�T �����a�� Recommendation ITU�T E���� � Tra�c measure�ment and evaluation � General survey� Technical reference� Interna�tional Telecommunication Union� ITU� Place des Nations� CH�����Geneva ��� Switzerland�
ITU�T �����b�� Recommendation ITU�T E� �� � Telephone networkand ISDN � Quality of service� network management and tra�cengineering � Forecasting international tra�c� Technical reference�International Telecommunication Union� ITU� Place des Nations�CH����� Geneva ��� Switzerland�
ITU�T ����a�� Recommendation ITU�T E���� � Terms and de��nitions of tra�c engineering� Technical reference� InternationalTelecommunication Union� ITU� Place des Nations� CH�����Geneva ��� Switzerland�
ITU�T ����b�� Recommendation ITU�T E���� � Quality of ser�vice and dependability vocabulary� Technical reference� Interna�tional Telecommunication Union� ITU� Place des Nations� CH�����Geneva ��� Switzerland�
���
References
ITU�T ����c�� Recommendation ITU�T Q���� � Signalling systemNo� � test speci�cation � General description� Technical reference�International Telecommunication Union� ITU� Place des Nations�CH����� Geneva ��� Switzerland�
Jain� A� K� and R� C� Dubes ������� Algorithms for Clustering Data�Englewood Cli�s� NJ� Prentice Hall�
Jonin� G� L� and J� J� Sedol ������� Telephone systems with repeatedcalls� In Proceedings of the �th International Teletra�c Congress �ITC�� Munich�
Kaufman� J� S� ������� Blocking in a shared resource environment�IEEE Transactions on Communications � ����� ����������
Keilson� J� and O� C� Ibe ���� �� Cuto� priority scheduling in mobilecellular communication systems� IEEE Transactions on Commu�nications �� ������� ������� �
Kleinrock� L� ���� �� Queueing Systems� Vol� � Theory� New York�Wiley�
Latouche� G� and V� Ramaswami ������� Spatial point patterns ofphase type� In Proceedings of the �th International Teletra�cCongress � ITC �� Washington DC� USA�
Leibnitz� K�� P� Tran�Gia� and J� E� Miller ������� Analysis of thedynamics of CDMA reverse link power control� In Proceedings ofthe IEEE Globecom ���� Sydney� Australia�
Leung� K� K�� W� A� Massey� and W� Whitt ������� Tra�c models forwireless communication networks� IEEE Journal on Selected Areasin Communications ���� � �����
MacDonald� V� H� ������� The cellular concept� Bell System TechnicalJournal ��� � ����
Macfadyen� N� W� ������� Statistical observation of repeated attemptsin the arrival process� In Proceedings of the �th International Tele�tra�c Congress � ITC�� Torremolinos�
Madhavapeddy� S� and K� Basu ������� Optimal paging in cellularmobile telephone systems� In Proceedings of the �th InternationalTeletra�c Congress � ITC �� Antibes Juan�les�Pins� pp� ��� ���
Martin� J� ������� Telecommunications and the Computer� EnglewoodCli�s� New Jersey� Prentice Hall�
���
References
Mathar� R� and T� Niessen ������� Optimum positioning of base sta�tions for cellular radio networks� Technical report� Department ofMathematics� Aachen University of Technology�
Maxwell� K� ������� Asymetric digital subscriber line� Interim tech�nology for the next forty years� IEEE Communications Maga�zine �� ����� ��������
Mobile Systems International �MSI� Plc� ������� PlaNET TechnicalReference� London� England�
Mouly� M� and M��B� Pautet ������� The GSM System for MobileCommunications� �� rue Elis$ee Reclus� F������ Palaiseau� France�published by the authors� ISBN� ��� ����������
Okabe� A�� B� Boots� and K� Sugihara ������� Spatial Tesselations�Chichester� John Wiley , Sons�
Okumura� Y�� E� Ohmori� T� Kawano� and K� Fukuda ������� Field�strength and its variability in VHF and UHF land mobile radioservice� Review of the Electrical Communication Laboratory � ������� �� ����
Papadimitriou� C� H� ������� Computational Complexity� Reading�Ma� Addison�Wesley�
Papadimitriou� C� H� and K� Steiglitz ������� Combinatorial Optimiza�tion� Algorithms and Complexity� Englewood Cli�s� Prentice�Hall�
Parsons� D� ������� The Mobile Radio Propagation Channel� London�Pentech Press�
Pinsky� E� and A� Conway ������� Exact computation of blockingprobabilities in state�dependent multi�facility blocking models�In Proceedings of the IFIP WG ��� International Conference onthe Performance of Distributed Systems and Integrated Commu�nication Networks� Amsterdam� The Netherlands� pp� � � ���North�Holland�
Rechtin� E� and M� W� Maier ������� The Art of Systems Architecting�Boca Raton� Florida� CRC Press�
Remiche� M��A� ������� E�ciency of an IPhP � illustratedthrough a model in cellular networks� Temporary DocumentCOST� �TD������ COST�
Remiche� M��A� and K� Leibnitz ������� Adaptive soft�hando� thresh�olds for CDMA systems with spatial tra�c� In Proceedings of the �th International Teletra�c Congress � ITC �� Edinburgh� UK�
���
References
Ritter� M� ������� Modeling of Flow Control Mechanisms for the Avail�able Bit Rate Service� Ph� D� thesis� Insitute of Computer Science�University of W�urzburg�
Roberts� J�� U� Mocci� and J� Virtamo ������� Broadband NetworkTeletra�c � Final Report of Action COST �� Berlin� Springer�
Roberts� J� W� ������� A service system with heterogeneous user re�quirements � application to multi�service telecommunications sys�tems� In G� Pujolle �Ed��� Performance of Data CommunicationsSystems and their Applications� pp� �� � ��� North Holland�Elsevier Science Publishers�
Roberts� J� W� ������ Teletra�c models for the telecom � integratedservices network� In Proceedings of the �th International Teletraf��c Congress � ITC �� Montreal� Canada�
Schwarz da Silva� J�� B� Arroyo�Fernandez� B� Barani� J� Pereira� andD� Ikonomou ������� Mobile and Personal Communications� ACTSand Beyond� pp� ������� Dordrecht� Kluwer Academic Publishers�
Sherali� H� D�� C� M� Pendyala� and T� S� Rappaport ������� Opti�mal location of transmitters for micro�cellular radio communica�tion system design� IEEE Journal on Selected Areas in Communi�cations � ���� �������
Staehle� D� ������� Approximate analytic methods for planning anddimensioning the ABR service category in ATM networks� Master�sthesis� Insitute of Computer Science� University of W�urzburg�
Stoyan� D� and H� Stoyan ������� Fraktale � Formen � Punktfelder�Methoden der Geometrie�Statistik� Berlin� Akademie�Verlag�
St�uber� G� L� ������� Principles of Mobile Communication� Boston�Kluwer Academic Publishers�
Sung� C��W� and W��S� Wong ���� �� A graph theoretic approach tothe channel assignment problem in cellular systems� In Proceedingsof the IEEEVTS ��th Vehicular Technology Conference� Chicago�USA�
T�Mobil ������� Pegasos� Wittichstra�e �� D������ Darmstadt� Ger�many�
Tran�Gia� P� ������� �Uberlastprobleme in rechnergesteuerten Fern�sprechvermittlungssystemen � Modellbildung und Analyse�Bericht �� Institut f�ur Nachrichtenvermittlung und Datenverar�beitung� Universit�at Stuttgart� In German�
���
References
Tran�Gia� P� ������� Zeitdiskrete Analyse in verkehrstheoretischerModelle in Rechner� und Kommunikationssystemen� Bericht ���Institut f�ur Nachrichtenvermittlung und Datenverarbeitung� Uni�versit�at Stuttgart� In German�
Tran�Gia� P� and N� Gerlich ������� Impact of customer clustering onmobile network performance� Research Report Nr� ��� Universityof W�urzburg� Institute of Computer Science�
Tran�Gia� P�� N� Jain� and K� Leibnitz ������� Code division multi�ple access wireless network planning considering clustered spatialcustomer tra�c� In Proceedings of the �th International NetworkPlanning Symposium �Networks ���� Sorrento� Italy�
Tran�Gia� P� and M� Mandjes ������� Modeling of customer retrialphenomenon in cellular mobile networks� IEEE Journal on SelectedAreas in Communications � ���� ����������
Veeravalli� V�� A� Sendonaris� and N� Jain ������� CDMA coverage�capacity and pole capacity� In Proceedings of the IEEEVTS ��thVehicular Technology Conference� Phoenix� USA�
Vohra� R� V� and N� G� Hall ������ A probabilistic analysis of themaximal covering location problem� Discrete Applied Mathemat�ics ��� �� ����
Wirth� P� E� ������� The role of teletra�c modeling in the new com�munication paradigms� IEEE Communications Magazine �� ���������
Wright� M� H� ������� Optimization methods for base station place�ment in wireless applications� In Proceedings of the IEEEVTS��th Vehicular Technology Conference� Ottawa� Canada�
Yang� T� and J� G� C� Templeton ������� A survey on retrial queues�Queueing Systems � �����
Yoon� C� H� and C� K� Un ������ Performance of personal portableradio telephone systems with and without guard channels� IEEEJournal on Selected Areas in Communications ���� ��������
Yu� C�� S� Subramanian� and N� Jain ������� CDMA cell cite opti�mization using a set covering algorithm� In Proceedings of the �thInternational Network Planning Symposium �Networks ���� Sor�rento� Italy�
���

References
Zeng� Q��A�� K� Mukumoto� and A� Fukuda ������� Performance anal�ysis of mobile cellular radio system with priority reservation hand�o� procedures� In Proceedings of the IEEEVTS ��th VehicularTechnology Conference� Stockholm� Sweden� pp� ��������
���

ISSN ���� � ���