Embed Size (px)
Citation preview
I7 Fi I- | i I
Technical Report 821
Modeling the Effects of ArmyAdvertising
0(N
r* Roy D. Howell, James B. Wilcox, and Robert E. WilkesO Texas Tech University
1 November 1988
, ELECTE
1 0 I.F" 9 8 9D
~~ Un ited States Army Research Institutefor the Behavioral and Social Sciences
Approved for pubic release; distlbution is unlimited
0 89 4 07 015

U.S. ARMY RESEARCH INSTITUTE4
FOR THE BEHAVIORAL AND SOCIAL SCIENCES
A Field Operating Agency Under the Jurisdictionof the Deputy Chief of Staff for Personnel
EDGAR M. JOHNSON JON W. BLADESTechnical Director COL, IN
Commanding
Research accomplished under contractfor the Department of the Army
College of Business AdministrationTexas Tech University
Technical review by
Timothy W. EligLeonard White
NOTICES
DISTRIBUTION Primary distribution of this report has been made by ARI. Please addresscorrespondence concerning distribution of reports to: U.S. Army Research Institute for theBehavioral and Social Sciences, ATTN: PERI-POX, 5001 Eisenhower Ave., Alexandria, Virginia22333-5600
FINALDISPOSITION: This report may be destroyed when it is no longer needed. Please do notreturn it to the U.S. Army Research Institute for the Behavioral and Social Sciences.
NOTE The findings in this report are not to be construed as an official Department of the Armyposition, unless so designated by other authorized documents.

UNCLASSIFIED / .SECURITY CLASSIFICATION OF THIS PAGE t A& /
REPORT DOCUMENTATION PAGE Form ApprovedOMB No. 0704-0188
la. REPORT SECURITY CLASSIFICATION lb. RESTRICTIVE MARKINGS
'Unclassified2a. SECURITY CLASSIFICATION AUTHORITY 3. DISTRIBUTIONIAVAILABILITY OF REPORT
- Approved for public release;2b. DECLASSIFICATION/DOWNGRADING SCHEDULE distribution unlimited.
4. PERFORMING ORGANIZATION REPORT NUMBER(S) S. MONITORING ORGANIZATION REzORT NUMBER(S)
ARI Technical Report 8216a. NAME OF PERFORMING ORGANIZAT:ON 6b. OF-iCE SYMBOL 7a. NAME OF MONITORING ORGANIZATION
(if app/icable) U.S. Army Research Institute for the
Dr. James B. Wilcox Behavioral and Social Sciences
6c. ADDRESS (City, State, and ZIP Code) 7b. ADDRESS (Ci7, State, and ZIP Code)College of Business Administration 5001 Eisenhower Avenue
Texas Tech University, Box 4320 Alexandria, VA 22333-5600
Lubbock, TX 79409
8a. NAME OF FUNOING/SPONSORiNG 8b. OF.:;CE SYMBOL 9. PROCURENIENT INSTRUME-NT ID :.T,;FiCATION NUMBERORGANIZATION (If applicable)
.. I DAAL03-86-D001, DO No 0591, TCN 87-454
8c. ADDRESS (City, State, and ZIP Code) 10. SOURCE OF FUNDING NUMBERSPROGRAM PROJECT TASK WOCI U,11. TELEMENT NO. NO. NO. ACCESS":ION NO.62772 A791 2.2.2 C.5
11. TITLE (Include Security Classification)
Modeling the Effects of Army Advertising
12. PERSONAL AUTHOR(S)
Howell, Roy D., Wilcox, James B., and Wilkes, Robert E.
13a. TYPE OF REPORT 13b. TIME COVERED 14. DATE OF REPORT (YearMonh, Day) 15. PAGE COUN,
Final FROM 86/10 TO 87/09 1988, November 104
16. SUPPLEMENTARY NOTATION This task (DO No 0591, TCN 87-454) was pertormed under a scientilicservices agreement between the U.S. Army Research Office and Battelle Laboratories, Researc
Triangle Park, NC 27109. ARI's Technical monitors were Curtis Gilroy and Timothy Elig.
17. COSATI CODES 18. SUBJECT TERMS (Continue on reverse if necessary and identify by block nurM-er)
FIELD GROUP SU .- GROUP Advertising,
05 09 -- Modeling,05 08 -- Recruitment , fz> , ,
19. ABSTRACT (Continue on reverse if necessary and identify by block number)
This research was performed to develop and empirically examine a set of prototype
behavioral models designed to measure the effects of Army advertising on the decision
to enlist in the Army. Data were taken from the Army Communications Objectives Measure-
ment System (ACOMS) project. Psychometric properties of each of the model's components
were assessed and parameters of the overall models were estimated using covariance
structural modeling. The potential benefits of this approach were examined and recom-
mendations were made for development of future models. k lC
20. DISTRIBUTION/AVAILABILITY OF ABSTRACT 21. ABSTRACT SECURITY CLASSIFICATiONOUNCLASSIFIED/UNLIMITED Z SAME AS RPT. 0 OTIC USERS Unclassified
22a. NAME OF RESPONSIBLE INDIVIDUAL 22b. TELEPHONE (Include Area Code) 22c. OFFICE SYMBOL
Timothy W. Elia (202) 274-5610 PERI-RG
DO Form 1473, JUN 86 Previous editions are obsolete. SECURITY CLASSIFICATION OF TPIS PACE
UNCLASSIFIEDiI

Technical Report 821
Modeling the Effects of Army Advertising
Roy D. Howell, James B. Wilcox, and rRobert E. Wilkes -
Texas Tech University
£~i' cTibu . oui
Av --J1 tlitv Codes.'.1.. a' ior
'Dist Special
Manpower and Personnel Policy Research GroupCurtis L. Gilroy, Chief
Manpower and Personnel Research LaboratoryNewell K. Eaton, Director
U.S. Army Research Institute for the Behavioral and Social Sciences5001 Eisenhower Avenue, Alexandria, Virginia 22333-5600
Office, Deputy Chief of Staff for PersonnelDepartment of the Army
November 1988
Army Project Number Manpower, Personnel, and Training20262722A791
Approved for public release; distribution is unlimited.
III

FOREWORD
The U.S. Army uses advertisements to influence the knowl-edge, attitudes, and behavioral intentions of youth in order toeffectively recruit manpower. Both the message content and thedelivery of the message are designed to recruit soldiers who aremost likely to provide effective national defense. The U.S. Armywants to understand the specific impacts of Army advertising onintention to enlist and enlistment behavior. From a managerialperspective, this knowledge will allow more effective design,execution, and presentation of messages to attract the desirednumber and profile of recruits. This research represents a stepin this process by examining the potential of an interdiscipli-nary analytic framework to provide the desired insights.
This work is an essential part of the mission of the ArmyResearch Institute's Manpower and Personnel Policy Research Group(MPPRG) to conduct research to improve the Army's capability toeffectively and efficiently recruit its personnel. This work isbased on the Army Communications Objectives Measurement System(ACOMS), which was undertaken at the direction of the DeputyChief of Staff for Personnel (references: Message 2614317 NOV84, subject: 'Operation Image-Watchdog,' and Memorandum forRecord, ODCSPER, DAPE-ZXA, 3 Feb 86, subject: Army Communica-tions Objectives Survey (ACOMS)). Results reported here werebriefed to the Commander of the U.S. Army Recruiting Command on12 April 1988.
EDGAR M. J HNSONTechnical Director
v

ACKNOWLEDGMENTS
We gratefully acknowledge the efforts of researchers in theManpower and Personnel Policy Research Group of the Army ResearchInstitute. In particular, thanks go to Tim Elig and Roy Nord.
ROY D. HOWELLJAMES B. WILCOXROBERT E. WILKES
vi
MODELING THE EFFECTS OF ARMY ADVERTISING
EXECUTIVE SUMMARY
Requirement:
To construct a prototype behavioral model designed tomeasure the effects of Army advertising on the Army enlistmentdecision.
Procedure:
Data on cognitive, affective, and behavioral variables re-lated to advertising and the enlistment decision were taken fromthe Army Communications Objectives Measurement System (ACOMS)project. Covariance structure analysis was employed to simul-taneously estimate measurement and structural models.
Findings:
* The prototype model fit the youth data, chi-square = 84.4with 113 degrees of freedom.
* The youth model was capable of explaining enlistment re-lated behavior, R2 = .23.
* The youth model was capable of explaining enlistment re-
lated intentions, R2 = .38.
e Youth's beliefs about the Army were multidimensional.
e Advertising had a significant impact on youth's beliefsabout the Army.
e Parents had a significant impact on youth's enlistmentdecisions.
* Peers and others had a significant influence on youth'sperceptions of the Army.
e The parent model fit the data, chi-square = 200, degreesof freedom = 97.
* The parent model explained actions toward youth enlist-ment behavior, R2 = .11.
vii

Utilization of Findings:
The U.S. Army wants to understand the specific impacts ofArmy advertising on intention to enlist and enlistment behavior.From a managerial perspective, this knowledge will allow moreeffective design, execution, and presentation of messages to at-tract the desired number and profile of recruits. This researchrepresents a step in this process by examining the potential ofan interdisciplinary analytic framework to provide the desiredinsights.
viii

MODELING THE EFFECTS OF ARMY ADVERTISING
CONTENTS
Page
OVERVIEW OF THE PROJECT .......................... 1
Introduction ........ .................. . . . 1The General Approach 1..................1Organization of this Report. ............... 7Some Caveats ............ ...................... 7
ANALYTIC STRATEGY .......................... 9
The LISREL Model ........................ 9Rationale for Use ........ .................... 13
MEASUREMENT ISSUES AND OPERATIONALIZATION OF THECONSTRUCTS ..................... . . . . . ........ 15
Introduction .......................... 15Media Habits ...... . .................... 18Advertising Impact ....... ................... 26Knowledge About the Army . . ................. 31Constructs Unique to Parental Sample . . .......... 38Constructs Unique to Youth Sample ... ............ 40Perceptions of Army Attributes .... ............. 47Confirmatory Analysis ....... .................. 53
RESULTS . . . . ............................ 61
Behavior-Last Youth Model.. ................ 64Behavior-First Youth Model ..... ............... 73G-Factor Model . . . . ................. 76Parent Model..........................76
SUMMARY, CONCLUSIONS, AND RECOMMENDATIONS...... . ... 83
Summary ..... .................... 83Conclusions . . ..................... 85Recommendations .......................... 87
REFERENCES .............................. 91
ix
CONTENTS (Continued)
Page
LIST OF TABLES
Table 3-1. Quartiles of parent media habits . . . . . . . . 19
3-2. Coding for parent media hours . . . . . . . . . 19
3-3. Rotated factor pattern structure of parentmedia habits . .................... 21
3-4. Frequency distribution for parent media habits . 22
3-5. Quartiles of youth media habits . . . . . ... 23
3-6. Coding for youth media hours . . . . . . . ... 23
3-7. Rotated factor pattern structure of youthmedia habits ......... . . .......... 24
3-8. Frequency distribution for youth media habitconstructs . . . . . . ................. 25
3-9. How much parents like ads ... ........... .. 28
3-10. How much parents believe ads ... .......... .. 28
3-11. How much parents recall ads . . . . . . . ... 29
3-12. How much youth like ads . . . . ......... 30
3-13. How much youth believe ads ... ........... .. 30
3-14. How much youth recall ads ... ........... .. 30
3-15. Parent knowledge about the Army - means . ... 32
3-16. Parent knowledge about the Army - correlations 33
3-17. Frequency distribution of parental knowledgeconstruct . . . . . . ................. 35
3-18. Youth knowledge about Army - means . . . . . . . 35
3-19. Youth knowledge about the Army - correlations . 36
3-20. Frequency distribution of youth knowledgeconstruct . . . . . . . . . . . . . . . . . . . 37
x

CONTENTS (Continued)
Page
Table 3-21. Parental feelings toward Army . . . ........ 39
3-22. Parental actions toward youth . ........ . 39
3-23. Rotated factor pattern of social influenceon youth . . . . . . . . . . . . ... 42
3-24. Intentions - prob youth will do somethingabout the Army . . o . . . .. ......... 44
3-25. Guttman analysis of youth behaviors withrespect to Army . . o o .. ... . . . . . .. 46
3-26. Variable definitions for youth beliefsabout the Army . . .. .. . . . . . . .... 49
3-27. Perceptions of Army attributes--youth ..... 49
3-28. Rotated factor pattern of youth beliefs(1st factor not rotated) ......... . . . 52
3-29. Rotated factor pattern of parent beliefs(1st factor not rotated) . ............ 58
4-1. Measurement estimates - youth model . . . . . . 65
4-2. LISREL estimates of exogenous effectsin the behavior-last youth model . . o ... 67
4-3. LISREL estimates of endogenous effectsin the behavior-last youth model . ........ 69
4-4. Variance explained in endogenous constructsof youth model with behavior last ....... . 72
4-5. LISREL estimates of exogenous effectsin the youth model with behavior first . ... 74
4-6. LISREL estimates of endogenous effectsin the youth model with behavior first . . . . 74
4-7. Variance explained in endogenous constructsyouth model behavioral first . . . o . ... . 75
4-8. Measurement estimates of youth model withG-factor modeled . . . . . . . . . . . . .. 75
xi

CONTENTS (Continued)
Page
Table 4-9. LISREL estimates of youth model withG-factor modeled and behavior last ......... .. 77
4-10. Variance explained in endogenous constructs
youth model behavior last G-factor modeled . . . 78
4-11. Measurement estimates for parent model . . ... 78
4-12. LISREL estimates of parent model .. ........ .. 81
4-13. Variance explained in endogenous constructsparent model ...... ............... . .. 82
LIST OF FIGURES
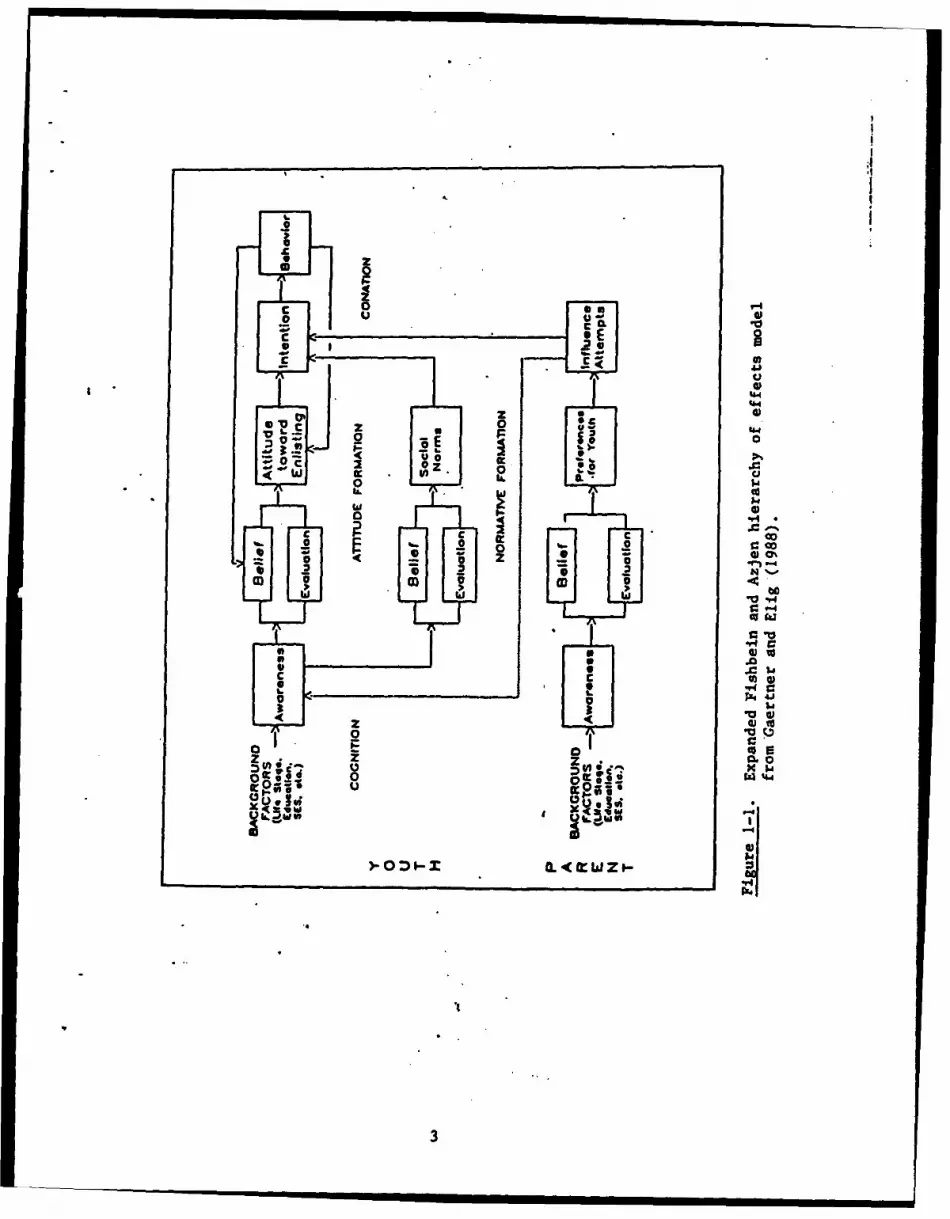
Figure 1-1. Expanded Fishbein & Ajzen hierarchy ofeffects model from Gaertner and Elig (1988) . 3
1-2. Advertising effects model for youth . . .... 5
1-3. Advertising effects model for parents ....... 6
3-1. General-factor model for youth . . . . .... 56
3-2. General-factor model for parents . ...... . 60
4-1. Advertising effects model for youth ........ .. 62
4-2. Advertising effects model for parents ..... .. 63
xii

MODELING THE EFFECTS OF ARMY ADVERTISING
OVERVIEW OF THE PROJECT
Introduction
This report presents the results of an effort toconstruct an analytic framework for a behavioral modeldesigned to measure the effects of Army advertising on theArmy enlistment decision. Previous empirical attempts tocapture this effect have been relatively unsuccessful dueprimarily to the specification of inappropriate economicmodels (Zirk et al., 1987). Characteristically, analysts haveattempted to measure advertising effects within a multipleregression framework where enlistment contracts were thedependent variable and a host of explanatory variables appearon the right-hand side of the equation. Typically, theadvertising variable has been measured in dollar terms. Ithas frequently been the case that the results of these modelshave been insignificant and/or counter-intuitive.
The specific tasks to be performed were:
a. Develop an interdisciplinary analytical frameworkand an empirical behavioral model to measure theeffectiveness of Army advertising on the decisionto enlist. The model will be considered aprototype.
b. Obtain the necessary data to test the model atthe prototype stage.
c. Perform the empirical analyses with these data totest the performance of the model.
It is important to note that the primary objective ofthis effort was not to build a new conceptual model ofadvertising effects, but rather to build a prototype modelwithin an interdisciplinary analytic framework. The questionaddressed is how can we better analyze data from existingmodels of advertising effects in order to learn more fromthem.
The General ADDroach
To perform these tasks requires three major components --the analytic framework, the model to which this framework isapplied, and a database appropriate for the empiricalexamination. Each of these as well as the result of joiningthe model and the database will be considered in turn.
ai t i l I I I I

The Analytic Framework
The analytic framework chosen, covariance structureanalysis (Joreskog, 1978), is one which should overcome thelimitations noted in previous work. It simultaneouslyestimates parameters for a structural model and a measurementmodel, and provides an estimate of the degree to which thehypothesized structure is capable of reproducing the originaldata. With the appropriate data it is also capable oftesting causal hypotheses. This approach is described indetail in the second chapter.
The Conceptual Model
A great deal of work has been performed on behalf of theArmy to develop a model of advertising effects on theenlistment decision (Kralj et al., 1987; McTeigue et al.,1987; Zirk et al., 1987). Numerous alternative models ofchoice were considered from both a theoretical and a datagathering perspective. The model which evolved from thesedeliberations forms the basis for the Army CommunicationsObjectives Measurement System (ACOMS) project (Gaertner andElig, 1988), and will be referred to as the ACOMS model.
* The core constructs and relationships of the ACOMS modelare presented in Figure 1-1 (Gaertner and Elig, 1988). Itconsiders the influence of advertising on both youth and theirparents as well as recognizing the potential influence ofsignificant others. In addition it implies that many of theeffects of advertising will be indirect (ie. through othervariables) rather than suggesting that advertising directlyinfluences behavior.
The general form of the model makes use of the Lavidgeand Steiner (1961) Hierarchy-of-Effects framework (and issimilar to many other communications models as well). In thiscontext, advertising moves an individual through variousstages enroute to a decision. For present purposes these stagesinclude awareness of the Army as a career alternative, knowledgeabout the offerings of the Army, liking or affect for the Army,preference for the Army as an alternative, conviction of thepreference, and enlistment. These stages are generally groupedinto three broader categories descriptive of the process:cognitive, attitude formation, and behavioral.
The ACOMS model conceptualizes attitudes according to amodel frequently referred to as the 'extended Fishbein' model(Fishbein and Ajzen, 1975). In this model, career choice
2
- ..-
L O'1 . .
E 0
01
UO4
M" c -30z
0
F.4.200
u
0
u I-
10Z. x
I M
oO~ yflS "
3

alternatives are conceptualized as being composed of a numberdistinct attributes (e.g. pay, potential for futureemployment). Attitudes concerning career choice are theproduct of the importance of each attribute times the amountof that attribute felt to be possessed by the alternative. Inaddition, attitude toward the act of enlisting (or going tocollege), is included as an influencer of intentions.
Two characteristics of this model deserve particularattention. First, the model reflects the affective, cognitiveand behavioral stages for an indivdual. Thus, individuallevel data are required to examine the model. Attempts toevaluate the relationships implied by the model with aggregatedata would likely be unsuccessful and potentially misleading.Second, the model represents a p which takes place overtime. Cross-sectional data cannot capture this process. Whentaken together, these two characteristics suggest the need forperiodic reinterview of appropriate respondents. These arethe only type of data which can correctly assess therelationships portrayed in the model.
The Database
As suggested above, the ACOMS model was a part of anextensive and multi-objective data gathering effort, intendedto address many issues relating to Army advertising. Theportion of the data which was utilized here was derived from30-minute telephone interviews with a complex sample of youth16-20 years of age. Data were gathered quarterly with anintended sample size of about 1,300 per quarter. Parents of asubset of youth were also interviewed.
The survey instrument contained in excess of 700questions (although not all were to be answered by eachyouth), a portion of which were intended to measure theconstructs in the ACOMS model. Data for the first fourquarters of youth interviews and the first three quarters ofparent interviews were available for the present project.
The EmDirical Model
The actual models to be analyzed appear in Figures 1-2and 1-3, representing models for youth and parents,respectively. These models are the result of joining theconceptual model from ACOMS (Figure 1-1), and the dataavailable to test them from the ACOMS project. Although theACOMS model and the empirical models look somewhat different,they contain essentially the same constructs. For example,Future, Develbp and Experience in the Youth model are elementsof the beliefs segment listed in the ACOMS model. Likewise,Recall in the Youth model corresponds to awareness in Figure1-1. The arrows represent hypothesized relationships and the
4

-,. -, -- ---
S I I II I I
00
4b.
Of,
Ul
VS
QJ
00
op'
00
!Aa,
u.
owl

greek symbols represent the parameters to be estimated. Thecomponents of the empirical models are largely defined by dataavailability.
The empirical models are not necessarily what we wouldrecommend as the best models of advertising effectiveness.Rather, they reflect the best models we could develop forwhich data were available. We will, in the final chapter,make some recommendations regarding certain aspects ofstructure and measurement that we feel would improve themodel. Since, however, model form and data are sointerrelated and since some of the changes we suggest are theresult of empirical analysis, we felt it best to present theempirical results before addressing more conceptual issues.
Organization of This Report
The second chapter describes covariance structuremodeling and suggests why it was selected as the analysisapproach. The third chapter addresses the actual constructsin the model and examines their measurement properties. Theresults of fitting the models are presented in the fourthchapter. In the final chapter we discuss the modeling and thedata-gathering processes and make recommendations concerningboth.
Some Caveats
Before reporting the results of this effort, a few wordsof caution are in order. Many resources were utilized in theexecution of this project, including the findings of a numberof prior projects conducted on behalf of the Army. It isimportant to keep in mind that each project had objectives andgoals which were quite different from those pursued in thiseffort. At various points in this report, these otherprojects will be evaluated in terms of their potentialcontribution to &W& effort. Thus, the criteria used forevaluation are different than those which should be employedto assess the original contribution.
This is particularly true in the case of the projectproviding the primary source of data for testing the model.Recall that ACOMS was a multipurpose project dealing withadvertising effectiveness, advertising strategy efficiency,management of the advertising program and planning anddevelopment of new marketing strategies and segmentation. Itis clearly impossible for a project with this breadth ofobjectives to also satisfy the needs of a project which wasnot part of the original design.
7

Nonetheless, the form and content of ACOMS had asignificant impact on the empirical evaluation of the modelproposed. As described in the third chapter we would havemeasured certain things differently, or indeed, measureddifferent things entirely. This is not a criticism of ACOMSbut rather a recognition of different objectives for differentprojects. It should highlight, however, the fact that themodel and the results reported are prototypical. Theempirical model was shaped to fit the data rather than viceversa. Care should be taken in generalizing specificempirical results.
8
8

ANALYTIC STRATEGY
The basic analytic tool employed in this research is theanalysis of covariance structures, otherwise known as latentvariable structural equations (LVSE) modeling or "causalmodeling." This methodology is implemented through the LISRELVI software developed by Joreskog and Sorbom (1986). Thismethodology has several advantages over other methods forestimating models of the type developed here. The LISRELmodeling approach will be described before we present therationale for the use of LVSE modeling in this study.
In LVSE modeling, a structural equations model is used tospecify the phenomena under study in terms of hypothesizedcause and effect variables (constructs) and their indicators(observables). As noted by Joreskog and Sorbom (1986, p.1.1):
Because each equation in the model represents acausal link rather than a mere empiricalassociation, the structural parameters do not, ingeneral, coincide with coefficients of regressionsamong observed variables. The structuralparameters represent relatively unmixed, invariantand autonomous features of the mechanism thatgenerates the observable variables. The use ofstructural equation models requires statisticaltools which are based upon, but go well beyond,conventional regression analysis and analysis ofvariance.
The LISREL Model
Assuming that all variables are measured as deviationsfrom their respective means, the basic system of (linear)structural equations is
q " P- + +f +
Where- a random vector of latent endogenous (dependent)
constructs;- a random vector of latent exogenous (independent)
constructs;p - an (m x m) matrix of coefficients specifying
relationships among endogenous constructs;r - an (m x n) matrix of coefficients specifying
"the relationships between the exogenous and theendogenous constructs; and
- a random vector of disturbance terms (residuals).
9

It is assumed that r is uncorrelated with 4 and that (I-p)isnon-singular.
The vectors q and J above are not observed. Rather theobsei.vables are vectors y and x, and these are related to thelatent constructs through the measurement equations:
Y - Ay+
and
X - Ax + 6
where
- a vector of errors of measurement in y;5 - a vector of errors of measurement in x;Ay - the (p x m) matrix of regression coefficients of
y on q.Ax - the (q x n) matrix of regression coefficients of
x on f
Further, one can define four other matrices in LISREL:
06 - the (n x n) variance-covariance matrix of 6.Oe - the (m x m) variance-covariance matrix of c.0 - the covariance matrix of .0 - the covariance matrix of .
Thus there are eight parameter matrices to be specified in theLISREL model: Ax, Ay, P, r. *, 0, 06, and 0E.
The elements in each of these matrices can be fixed to aprespecified value, free to be estimated in the model, orcn ine to equal one or more other parameters.
While a variety of fitting functions are available inLISREL, the most desirable properties are available throughMaximum Likelihood estimation. The basic objective of eachestimation method is to minimize some discrepancy functionbetween the observed variance-covariance matrix (S) and thevariance-covariance matrix (Z) reproduced as a function of theeight parameter matrices listed above.
The fitting function minimized under maximum likelihoodestimation is
F - logIZI + tr(S - 1 ) - logiSI'- (p+q).
When the observables are approximately multivariate normally
10

distributed, the value of the fitting function F multiplied bythe sample size follows a chi-square distribution with degreesof freedom equal to the number of unique variances andcovariances among the observables minus the number ofparameters estimated in the model.
While a detailed discussion of estimation methods,identification conditions, and alternative modelspecifications is beyond the scope of this chapter, severalpoints which are important to the development and estimationof the specific model of advertising effects in this studyneed to be explicated:
1. Since the chi-square value is equal to n, the samplesize, times the value of the fitting function at its minimum,it is easily seen that its value is a direct function of thesample size, and that with largesamples, the chi-square valuewill be large even when the discrepancy function F is small.In the chi-square test of model fit, the hypothesized model isthe null-hypothesis, with large values of chi-square leadingto the rejection of the model, which is a reversal of thenormal role of the null-hypothesis. The result is that withlarge sample sizes, no reasonably parsimonious model will"fit" the data.
2. The chi-square statistic, and the standard error estimatesfor the individual parameters are based on the multivariatenormal distribution assumption, and the use of the variance-covariance matrix as the basis for analysis (as opposed to thecorrelation matrix). Vorthe ACOMS data, due to its method ofcollection, and the use of rotating modules such thatcorrelations for different pairs of variables in the inputcorrelation matrix are based on (sometimes widely) differingsample sizes, the multivariate normal assumption is clearlyviolated. Thus, while the parameter estimates themselves aremaximum likelihood estimators, the chi-square value andstandard error estimates mast be interpreted as suggestiveindices rather that strict statistical estimates (Bearden,Sharma, and Teel, 1982).
3. The measurement model relating the unobservable (latent)constructs to the observables is a restricted case of commonfactor analysis known as a cngeneric measurement model(Joreskog, 1971). As such, the observables are conceptualizedas being a function of the unobservables, and the latentconstructs are defined by the intercorrelations of theirrespective observables. Thus, behavioral indices, checklisttasks, and other measurements in vhich the (perhaps weighted)sum of the items is the appropriate conceptualization of theconstruct cannot be used directly in the measurement modelunderlying LISREL. Further, in order to estimate themeasurement model for a casftuct, at least three indicants
11

are necessary for the measurement of that construct to beinternally identified. While in the context of a larger modela two-item construct can often be estimated, in no case canthe measurement parameters of a construct with a singleindicant be estimated by the model. In such cases, one mustestimate the amount of measurement error in the constructoutside the model estimation process itself, or assume areasonable amount of measurement error, and Lx themeasurement error term for the construct to reflect theestimate or assumption (Howell, 1987).
4. All of the parameters, structural and measurement, areestimated simultaneously to reproduce the observed variance-covariance matrix as closely as possible. Thus, thecoefficients of any given equation are partial coefficients,given the other constructs in the equation and the measurementproperties thereof. Further, each equation is estimatedsimultaneously with all other equations using all of theavailable variances and covariances of the observables. Inthis sense, LISREL is a full-information model. The resultis that the model parameter estimates may bear littleresemblance to any given bivariate correlation between twoobservables, and the coefficients of any equation may differsubstantially from the coefficients one would obtain ifequation-by-equation estimation were employed, even if themeasurement model were to be fixed. This is simultaneously astrength and a weakness of the approach. The full-informationnature of the estimation may allow one to find relationshipsin the context of the complete model which would not bedetectable in single equation estimation. On the other hand,this also means that specification error in any equation isnot limited to that equation alone, but may impact on theestimation of the entire model, making a correct specificationof each equation more critical than would be the case iflimited information estimates were used.
5. While there are separate equations for measurement andstructural parameters in the LISREL specification, allparameters, both measurement and structural, are estimated asa single long vector during the minimization process. Thus,the distinction between measurement and structural parametersis entirely pedagogical; the estimation itself does not makesuch a distinction. This is clearly evident when oneconsiders the alternative LVSE specification suggested byBentler and Weeks (1980) and implemented by Bentler (1985).This is important in the context of the second-order factoranalysis model employed in the context of the structural modelof Advertising Effects, wherein measurement parameters for thesecond-order factor are specified as S elements, which arenormally structural estimates.
12

Rationale for Use
The LISREL approach to the estimation of Latent VariableStructural Equations models offers several advantages whichsuggest that it may be the methodology-of-choice for theanalysis of models with the characteristics and objectives ofthe model developed in this report.
In particular, under this methodology, the coefficientsestimated reflect relationships among th i constructs asopposed to observables or linear combinations thereof. As aresult, the estimated coefficients are not attenuated byrandom measurement error which is invariably present in surveydata. Further, the methodology allows an explicit test of thecorrespondence rules relating observables to theoreticconstructs of interest (Bagozzi, 1984).
Also, this approach allows an overall assessment of the"fit" of the entire model, since the entire model is estimatedsimultaneously. This fit, based on the ability of the modelparameters to reproduce the relationships among the observeddata, is assessed by the x2 statistic, the ratio of the chi-square statistic to its degrees of freedom, the goodness-of-fit index, and the root-mean-square residual of the variance-covariance matrix. Additionally, the explanatory power ofeach equation can be assessed through traditional R2
statistics for each endogenous construct. While there arestrengths and weaknesses associated with each index of fit,taken as a group they can provide a reasonable assessment ofthe "goodness" of the overall model which is unavailable inequation by equation methods.
It should finally be emphasized that this methodology cans causalhypoJthesj, not establish causation. In factmodels with different causal directions can exhibit equallygood fit to the data. The cau in causal modeling refers tothe hypotheses tested, not to the findings themselves. In theabsence of experimental control, no cross-sectionalmethodology can unequivocally determine causal direction.
13

MEASUREMENT ISSUES AND OPERATIONALIZATION OF THE CONSTRUCTS
Introduction
As noted in the previous chapter, measurement andstructural relationships are normally estimated simultaneouslyin covariance modelling. Given, however, that the presenteffort deals with data which were not collected with thisapproach in mind, it was necessary to consider the measurementof the various constructs outside the model itself. Thus, inthe sections that follow, each construct is consideredseparately in terms of its conceptual domain, the questionsused to operationalize it, and the particular measurementapproach employed. Within each construct, measurement resultsfor both the Parent Model and the Youth Model are presentedwhen the same construct appears in each. Before considering
* the constructs, however, there are several other topics whichmust be considered, including the subsets of the databasesused, the issue of weighting and how missing data was handled.
The data were taken from the Army CommunicationsObjectives Measurement System (ACOMS) project, conducted byWestat, Inc. on behalf of the Army. The data were collectedby means of a 30-minute interview of a nationwide sample ofyouth (Youth Sample) and parents of a subset of these youth(Parent Sample). The data were gathered and summarizedquarterly, starting in October, 1986 (Nieva, Rhoads, & Elig,1988; Westat, 1988a, 1988b). The data available for thisproject included four quarters for youth and three forparents.
Only a subset of the data available was utilized in thepresent effort. The original intent of this research was tosimultaneously estimate individual-level models for youth andtheir parents, requiring a one-to-one linkage of parents andyouth. This linkage was subsequently discarded when thefourth quarter of data for youth became available, but was notaccompanied by corresponding parental data. Rather thanignore a significant portion of data for the youth, thedecision was made to uncouple the models for estimationpurposes.
Nonetheless, it seemed appropriate to maintaincomparability of the data in both samples. Thus, only thoseyouth who could have been linked to a parental interview (werethe data available) were candidates for the youth sample.Parental interviews in ACOMS were sought if a youth contactedwas in the Primary Enlistment Market and from 16 to 20 years
15

of age. Further restrictions were imposed. Since the mainconcern for enlistment involves males and since it is likelythat a separate model would have been necessary for females,only males were considered. Finally, the majority of analysisto date has been conducted on a subset of the Primary MalesSample (PMS), the Primary Male Analytic Sample (PMAS). Inorder to analyze similar data and to match the content of theYouth Attitude Tracking Study (Research Triangle Institute,1987), this restriction was imposed as well. Thus, the youthsample which formed the basis for this research consisted of16-20 year-olds who were in the Primary Male Analytic Sampleand were interviewed in any of the four quarters of datagathering. The parental sample, based upon three quarters ofdata, was composed of parents who provided information onyouth meeting the above requirements.
The youth data utilized in this report are from telephoneinterviews conducted for ACOMS between 13 October 1986 and 30September 1987. The youth sample for this report consists of.2,534 16- to 24-year-old males, living in the contiguous 48states, who have no prior military service nor contractualcommitment to serve, who are not institutionalized, who havenot completed 2 years of college nor a college-level ROTCcourse, who have received a diploma from a regular high schoolor who arein a diploma-granting regular high school or whoare treated as such by the Army due to college attendance.Not that the sample excludes GED and ABE certifications aswell as high school dropouts unless the individual completedone year of college or was attending college full time wheninterviewed. These sampling specifications were set to matchthe prime market for Army enlistments.
The parental data utilized in this report are fromtelephone interviews conducted for ACOMS between 13 October1986 and 30 July 1987. The parental sample for this reportconsists of 2,534 parent of young men who meet thequalification requirements discussed in the previousparagraph.
WeiahtinaThe ACOMS data were gathered by means of a complex sample
design in that some groups (females) were purposefullyundersampled, while others (Hispanic males) were oversampled.Moreover, the total set of information sought in the study wasso extensive that it was impossible to obtain it all from eachrespondent. Therefore, related questions were treated asmodules, and iandom assignment of modules to respondents wasused to reduce the length of any given interview. Summaryresults based upon these data therefore need to be adjusted toaccount for these departures from simple random sampling.
16

The adjustments are in the form of weights applied toboth the individual respondent and to the modules ofquestions. In all, ACOMS data requires 14 different weightsto bring the sample in line with the population. If pairs ofvariables are considered, it is frequently the case that pairsof weights are also required. There are potentially 91different weighting combinations for bivariate analysis. Theuse of weights in multivariate analysis of the sort requiredby covariance modeling can quickly become unwieldy.
Fortunately, the objective of the research presented herewas not to make marginal distributions of variables look liketheir population distributions. It was the relationship amongthese variables which was of importance. Thus, weightsrequired to adjust for rotating modules were ignored. Sincethese modules were randomly assigned to respondents, no biasshould arise because of different rates of asking thequestions. Weights intended to account for varying incidenceof individuals in the sample were important in order tocorrectly reflect the relationships examined. Therefore, inall of the analysis that follows, case weights (Fullwght foryouth and Parnwght for parents) were used.
Missina Data
The ACOMS data contain (as do all surveys) missing dataattributable to a variety of causes. This is not usually aproblem in bivariate analysis but can become quite significantin multivariate analysis. The problem is that mostmultivariate techniques employ 'list-wise' deletion. That is,if any variable in the set has a missing value for arespondent, all answers for the respondent are deleted (i.e.,the entire case is dropped). Given the rotating module designof the ACOMS survey and the number of variables considered inthe models reported here, list-wise deletion would result in asample size of zero.
There are many alternative ways to overcome this problem(see, for example, BMDP routines 8D and AM), includingsubstituting or imputing values for the missing data (Dixon,1981). While there are pros and cons of each of thesemethods, discussion of these issues is beyond the scope ofthis report. Pair-wise deletion was selected to deal withmissing data in the current study. In pair-wise deletion, acase is dropped if it does not contain responses for each oftwo variables under consideration, but the case is includedfor other pairs of variables. Since the covariance modelscould be estimated from correlation matrices rather than fromraw data, this seemed the most reasonable solution. Thus,each cell in the correlation matrix was estimated separately
17
utilizing all of the data available for that pair ofvariables. The result is a correlation matrix in which eachcell may be based on a different sample size (and may not beinvertable). Nonetheless, it seemed an acceptable compromisebetween having no data and having to substitute values for, insome cases, more than half the sample.
Media Habits
Domain of the construct. The media habits construct wasdesigned to capture parental exposure to media used to conveymessages about the Army.
Ouestions employed. The questions, taken from the Media* Habits Module of the ACOMS questionnaire, were open-ended and
requested the respondent to provide an estimate of the numberof hours he or she spent each week listening/reading/watchingeach of six media:
1. regular TV2. cable TV3. AM radio4. FM radio5. newspapers6. magazines.
Although the Media Habits section of the ACOMS questionnairealso contained many questions which addressed the specifics ofmedia exposure -- section of newspaper read, type of TVprogram watched, type of magazine read -- this level of detailwas felt to be unnecessary for a prototype model.
ADroc. Responses to open-ended questions tend to beless well-behaved than their pre-coded counterparts. For thisreason, distributional properties of the media habit responseswere examined first. Table 3-1 contains the quartile valuesfor the hours of exposure to the six media for parents.
With the possible exception of newspaper hours, thedistributions are all highly skewed. The figures for FMradio, for example, indicate that three-quarters of theparents listen to the radio 20 hours-or less per week, whilethe remaining quarter vary from 20 hours to 140. The presenceof such extreme values can dramatically impact the results ofanalysis. These outliers, by virtue of their extremity, tendto have more influence than should be allowed a singleobservation, particularly on means and correlations.
18

Table 3-1
Ouartiles of Parent Media Habits
Medium' Min 25% 50% 75% Max
Regular TV 0 6 12 20 100Cable TV 0 0 2 7 60Newspaper 0 2 4 7 21Magazine 0 2 3 5 40Radio - AM 0 0 1 6 126Radio - FM 0 3 7 20 140
Table 3-2Codina For Parent Media Hours
Coded CategoriesMedium 0 1 2 3 4
Regular TV 0 1-6 7-12 13-20 21+Cable TV 0 - 1-2 3-7 8+Newspaper 0 1-2 3-4 5-7 8+
* Magazines 0 1-2 3 4-5 6+Radio - AM 0 - 1 2-6 7+Radio - FM 0 1-3 4-7 8-20 21+
19

For this reason, the actual hours of media exposure werereplaced by the number of the interquartile range into whichthey fell. Thus, for example, a parent who watched 10 hoursof regular TV each week would be coded as a 2 since 10 hoursis greater than the first quartile score of 6 hours but lessthanthe second quartile score of 12. This coding scheme foreach of the media is presented in Table 3-2. Notice that thehighest value for a single medium is now four. While thistransformation discards some of the information in theoriginal coding, it sustantially lessens the impact of theoutliers an outcome which was deemed important given thenature of these data.
The recoded variables representing the six media werethen analyzed by means of principal components to identify amore parsimonious structure. The results are presented inTable 3-3. Two components were extracted (via the eigenvalue> I criterion) and rotated (Varimax). The first componentcaptures the television and reading habits of the parentswhile the second relates to radio listenership. It isinteresting to note that while both AM and FM radio loadheavily on the second component, the loadings are of oppositesign. This suggests that while radio listening may bedistinct from other media, it is an either/or proposition.That is, parents who listen to radio, do so to either AM orPM, but not both. Nonetheless, the high absolute magnitudesof the loadings suggest that radio listenership is a separatephenomenon from the other media.
Thus, two constructs were formed to represent the mediaexposure of parents. As noted at the bottom of Table 3-3, thefirst is operationalized by summing the exposure to television(regular and cable) and reading material (newspapers andmagazines), and is referred to as READTV. The secondconstruct is operationalized as simply exposure to FM radio.For all variables included in these constructs, the quartilevalues were substituted for the actual hours of exposure.
Table 3-4 presents the frequency distribution for the twoconstructs READTV and FM. The distributions seem adequate tocapture the desired information.
Youth
Similar procedures were utilized to develop media habitconstructs for youth. The quartile values are presented inTable 3-5 and reflect distributions which are at least asskewed as those of parents. For the same reasons given above,the interquartile range into which these values fell (Table 3-6) were substituted for the actual hours of exposure. Thesevalues were then factor analyzed and the results presented inTable 3-7.
20

Table 3-3Rotated Factor PatternStructure of Parent Media Habits
Factori Factor2
TVREG 0.50866 0.18822TVCAB o.34298 -0.00965PAPER 0.,3304 -0.17561mG 0,73468 -0.01207AN 0.14754 -0.79423FM 0.14177 0,8318
Variance Explained by Each Factor1.495325 1.389236
Ngt: The measurement model basedon this factor analysis involvestwo equations:
TVREAD - ( paper hours+ magazine hours+ TV hours)
FM - FM radio hours
where quartiles are used in placeof actual hours.
21

Table 3-4Freauencv Distribution for Parent Media Habits
cumulative Cumulative
Frequency Percent Frequency Percent
TVREAD5508767 . .
3 26975 2.2 26975 2.24 79009 6.5 105985 8.7
5 76061 6.3 182046 15.06 142895 11.8 324941 26.87 138912 11.4 463853 38.2
a 180363 14.9 644216 53.19 112380 9.3 756596 62.4
10 128305 10.6 884901 72.911 142369 11.7 1027271 84.7
12 90673 7.5 1117944 92.113 47740 3.9 1165684 96.114 29400 2.4 1195085 98.515 14662 1.2 1209746 99.7
16 3602 0.3 1213348 100.0
FM
* 4391287 .
S288932 124 288932 12.41 404558 17.4 693491 29.82 474217 20.3 1167708 50.13 769542 33.0 1937249 83.14 393579 16.9 2330829 100.0
22
Table 3-5Ouartiles of Youth Media Habit.
mdiu Kin 2Lk HRegular TV 0 6 10 20 151Cable TV 0 0 3 10 105Newspaper 0 2 3 5 72Magazine 0 2 3 5 70Radio - AM 0 0 0 0 100Radio - FM 0 8 15 30 168
Table 3-6Coding For Youth Media Hours
Coded CateaoriesMedium 0 1 2 3 4
Regular TV 0 1-6 7-10 11-20 21+Cable TV 0 - 1-3 4-10 11+Newspaper 0 1-2 3 4-5 6+Magazines 0 1-2 3 4-5 6+Radio -AM 0 - - - 1+Radio - FM 0 1-8 9-15 16-30 31+
23
Table 3-7Rotated Factor PatternStructure of Youth Media Habits
Factorl Factor2 Factor3
PAPER 0,75176 0.02419 0.15504MAG 0,78510 0.05090 -0.02484FM 0.55687 0.24897 -0.50355TVREG 0.15217 0,7121 1 -0.11815TVCAB -0.02944 0,79176 0.10373AM 0.13464 0.05691 0.89596
Variance Explained by Each Factor
1.533784 1.202388 1.105674
Note: The measurement model based on thisfactor analysis involves two equations:
READFM- ( paper hours + magazine hours+ FM radio hours)
TV - ( regular TV hours+ cable TV hours)
where quartiles are used in place ofactual hours.
24

Table 3-8Frequencv Distribution for Youth Media Habit Constructs
Cumulative CumulativeFrequency Percent Frequency Percent
READFM5205850
2 18148.6 0.9 18148.6 0.93 159847 8.3 177995 9.34 182329 9.5 360324 18.85 205038 10.7 565362. 29.56 255115 13.3 820477 42.87 243308 12.7 1063786 55.58 242957 .12.7 1306743 68.29 233364 12.2 1540107 80.3
10 133923 7.0 1674031 87.311 165098 8.6 1839129 95.912 78260.3 4.1 1917389 100.0
TV4497259 . •
0 12473.2 0.5 12473.2 0.51 245347 9.3 257820 9.82 194270 7.4 452090 17.23 442277 16.8 894367 34.14 505477 19.2 1399845 53.35 358728 13.7 1758573 67.06 422465 16.1 2181037 83.17 240449 9.2 2421486 92.28 204494 7.8 2625980 100.0
25

The media which load together clearly differ betweenyouth and parents. The first factor consists of reading (bothnewspapers and magazines) and FM radio listenprship. Thesecond factor clearly reflects television viewing habits.The third factor is primarily defined by AM radio listenership(with the FM complement as well). This third factor appearsto be more artifactual than real. Referring back to Table 3-
5, note that even the third quartile for Am radio is zero.That is, less than 25% of the sample of youth listen to theradio (AM) at all. Thus, even substituting quartile range foractual hours doesn't remove the skewness. For this reason andthe fact that at least part of the AM hours are captured bythe first factor, AM radio listenership was not included.
Two media constructs were created for youth. The firstis defined by the sum of the quartile values of newspaperhours, magazine hours and FM radio hours (READFM). The secondconstruct is defined by the sum of quartile hours for regularand cable television (TV). The frequency distribution forboth of these constructs is presented in Table 3-8.
Advertisina Impact
Parents
Domain of the construct. The effects of advertising canbe operationalized in a variety of ways. However, to havethese impacts, advertisements must accomplish severalobjectives. First, to be effective, ads must be remembered.Second, more effective ads are those that are liked. Finally,ads need to be believeable in order to get the intendedmessage across. Thus, within the domain of advertisingeffects there are three constructs: recall of the ad, likingof the ad, and believeability of the ad.
Qioin . The questions, taken from the Attitude TowardArmy Ads Module and the Knowledge Recall Module of the ACOMSquestionnaire, covered these topics for the Army as well asfor other branches of the service. Two questions wereutilized to assess recall of Army advertising:
1. "Now, thinking about radio, newspapers, magazinesand any other sources of advertising, for whatmilitary service or services do you recall seeing orhearing advertising?" (unaided recall]
2. (if 'don't know' to question 1, "Do you recallseeing or hearing any advertising for the Army?"[aided recall]
26

How much the respondent liked Army advertisements was measuredby the question, "Overall, how much do you like the Army adsyou have seen or heard over the past year?" Responses wereobtained on a 5-point scale anchored byd a nlike (1) tolike very much (5). Likewise, believeability was addressed bythe question, "How much do you believe what the ads say?"Responses to this question were also obtained on a 5-pointscale anchored by do not believe (1) to stronalv believe (5).
Appoach. The first two questions were joined to form asingle measure of ad recall. A respondent who had no recallof ads was assigned a value of zero. One who could recallArmy advertising only in the aided condition was assigned avalue of one. Finally, those who recalled advertising withoutaid were coded as a four, the higher number reflecting themuch greater impact of advertising. The frequency
* • distribution of the recall construct is presented in Table 3-9. It does suggest a highly skewed shape with almost three-quarters of the parents in the unaided category. Althoughother questions were considered as possible additions to thisconstruct (including slogan recognition), none were capable ofspreading out this upper category. It is possible that acloser examination of the data in PARNVERB (verbatimimpressions of ads) may suggest a way to enrich thisconstruct. The difficulty in using this data is that theunits into which verbalizations are coded may increase becauseof multiple mentions or because of single, but lengthyresponses.
Liking and believeability were operationalized by directuse of the two questions described above. The frequencydistributions for these questions are presented in Tables 3-10and 3-l1, respectively. Both distributions are reasonablywell-behaved with a slight skew toward the upper end of eachscale.
XouthIdentical constructs were developed for the youth as for
the parents, and similar procedures yielded very similarresults. The frequency distribution for recall of Armyadvertising (Table 3-12) appears even more skewed that that ofthe parents, with over 85% of the youth exhibiting unaidedrecall. Attempts to spread out this category were alsounsuccessful. How much youth like Army advertising (Table 3-13) and how much they believe the ads (Table 3-14) are alsovery similar to the responses provided by parents.
27

Table 3-9How Much Parents Like Ads
Cumulative CumulativeLike Ads Frequency Percent Frequency Percent
DR 88391
Inapplicable 770198
Do Not Like 350888 6.0 350888 6.0
* Scale Point 2 413151 7.0 764039 13.0
Scale Point 3 2239367 38.2 3003406 51.2
Scale Point 4 1383747 23.6 4387153 74.8
Like Very Much 1476373 25.2 5863526 100.0
Table 3-10How Much Parents Believe Ads
Cumulative CumulativeBelieve Ads Frequency Percent Frequency Percent
DK 41803 . .
Inapplicable 770198
Do Not Believe 606430 10.3 606430 10.3
Scale Point 2 848334 14.4 1454764 24.6
Scale Point 3 1823127 30.8 3277892 55.5
Scale Point 4 1307531 22.1 4585422 77.6
Believe Very Much 1324692 22.4 5910115 100.0
28

Table 3-11How Much Parents Recall Ads
Cumulative CumulativeRecall Frequency Percent Frequency Percent
None (0) 770198 11.5 770198 11.5
Aided (1) 959091 14.3 1729289 25.7
Unaided (4) 4992827 74.3 6722116 100.0
29

Table 3-12How Much Youth Like Ads
Cumulative CumulativeLike Ads Frequency Percent Frequency Percent
DK 9555Inapplicable 354037Refused 1667Do Not Like 600763 8.9 600763 8.9Scale Point 2 706846 10.5 1307609 19.3Scale Point 3 2651573 39.2 3959182 58.6Scale Point 4 1679801 24.9 5638984 83.4Like Very Much 1118995 16.6 6757979 100.0
Table 3-13How Much Youth Believe Ads
Cumulative CumulativeBelieve Ads Frequency Percent Frequency Percent
DK 4061INAPPLICABLE 354037REFUSED 1667Do Not Believe 532819 7.9 532819 7:9Scale Point 2 884031 13.1 1416851 20.9Scale Point 3 2016392 29.8 3433243 50.8Scale Point 4 1961023 29.0 5394266 79.8Believe Very Much 1369208 20.2 6763474 100.0
Table 3-14How Much Youth Recall Ads
Cumulative CumulativeRecall Frequency Percent Frequency Percent
None (0) 354C37 5.0 354037 5.0Aided (1). 709427 10.0 1063465 14.9Unaided (4) 6059774 85.1 7123239 100.0
30
Knowledae about The Amy
Domain of the construct. The knowledge construct wasdesigned to capture information regarding what specific factsparents knew about the various offerings of the army.
QueionJJls. The questions, taken from the Knowledge-Awareness Module of the ACOMS questionnaire, were in the formof a test which for most topics provided multiple-choiceresponses. The answers to these questions were subsequentlycoded as right (code - 1) or wrong (code - 0).
Although many topics were covered in this section of thequestionnaire, consideration was limited to those questionswhich related to the active Army, and were the subject of Armyadvertising. Thus, for example, questions assessing knowledgeabout the Marines or Army Reserve were deleted as was aquestion regarding the sponsor of the Scholar-Athlete Awardsince this information was conveyed via high school postersrather than Army advertising.
The six questions which remained dealt with:
1. PXKAEARN: Amount of Army education benefits2. PXKAGIAR: Minimum Army Enlistment period3. PXKADEP: Availability of Army GI Bill4. PXKAEDBN: Army offering educational support5. PXKAYRS: Delayed Entry Program, and6. PXKASAME: Same benefits being available from all
services.
r . The mean values for each of these variablesare presented in Table 3-15 for the parent sample. Since thevariables were coded as a zero or a one depending uponcorrectness, the mean reflects the proportion of parents whoresponded with the correct answer. It is interesting to notethat parents seem well aware that the Army offers funds forcollege and the availability of delayed entry. Considerablyfewer know the amount of these benefits (274) or the minimumenlistment period (40%). Finally, less than five percent wereaware that similar educational benefits were available fromall of the services.
31

Table 3-15Parent Knowledge About The Army -Means
hifla
Variable N Mean
PXKAEARN 842 0.89631150PXKAGIAR 842 0.79220466PXKADEP 842 0.81462073PXKAEDBN 842 0.27168834PXKAYRS 842 0.39840208PXKASAME 842 0.04738262
32

1-0 0 0 04 0
0;000,
40440 4
in 0 % 0a oin
0- 0 %0 0 0 CD
0 4 C4r
*v * 0 * 0 0 *
OCOPw400
$4)
oo % ~~0 4 wN
04 * 0 0e 0
0400,4000
6 va r4 Nr4 0El-Ul0OMNO'
P -i0 %o4n %0
0 % 4O,40000
El 0fl n - (" cq
r4o000o
N 0O4 AN 0ON 0 0
33

The correlations among these knowledge questions arepresented in Table 3-16. As would be expected, therelationships among these questions are modest at best. Thatis, knowledge of one aspect of the total Army offering doesnot imply knowledge (or lack thereof) of the others. Theweakest relationships are those of the question asking aboutsimilar benefits from all services to the other questions.This too was expected since virtually no one was aware of thecorrect answer. The maximum absolute value of the correlationbetween two variables is bounded by the marginal distributionof each variable. Two variables skewed in opposite directionshave a maximum positive correlation which can be considerablyless than one. Two variables skewed in the same directionhave a maximum negative correlation which can be considerablyhigher (i.e., less negative) than -1.
The knowledge construct was operationalized by adding thezero/one coding of these six questions together to form asingle measure. The construct can take on values from zero tosix, with higher values reflecting greater knowledge about theArmy's offerings. It is worth noting that these variableswere not factor analyzed since they are.conceptually distinctelements of knowledge, a fact borne out by the correlations.
The frequency distribution of knowledge scores ispresented in Table 3-17 for the parent sample.
Similar procedures were utilized to develop a knowledgescale for the youth portion of the sample. The samequestions, coded in the same fashion, form this construct aswell. The means of the variables presented in Table 3-18suggest that the pattern of knowledge for youth is much likethat of their parents, although the means are slightly higherfor the youth. The correlations among these variables (Table3-19) for youth are much like those for the parents. Finally,the frequency distribution of the knowledge construct ispresented in Table 3-20 and shows a similarity between parentsand youth as well.
34

Table 3-17Freauencv Distribution of ParentalKnowledae Construct
Cumulative CumulativeSNOW Frequency Percent Frequency Percent
3370029 '0 35264 1.1 35264 12.11 278472 8.3 313737 9.42 489527 14.6 803263 24.03 1052057 31.4 1855321 55.34 1123757 33.5 2979078 88.95 351014 10.5 3330092 99.36 21994 0.7 3352086 100.0
4 • Table 3-18
Youth Knowledae About Army - Means
VARIABLE N MEAN
YXKAEARN 2250 0.95527469YXKAGIAR 2250 0.87547978YXKADEP 2250 0.84005687YXKAEDBN 2250 0.27982382YXKAYRS 2250 0.37958652YXKASAME 2250 0.15893428
35
vo%9c mq
V 0VCt0
o%0mvit
m 0. t- * t.
C 0 4 0O0,4,45.40,4r4 m V4 0 " a
Xe 0 0 0 0 0
> 0 o qv %D 00 SQ 0 0 5 o
00 00
0 4 r-4 0
36

Table 3-20Freauency Distribution of Youth Knowledae Construct
Cumulative CumulativeKnow Frequency Percent Frequency Percent
3524342••0 24034 0.7 24034 0.71 107292 3.0 131326 3.62 474815 13.2 606141 16.83 1231908 34.2 1838049 51.14 1120992 31.1 2959041 82.25 518637 14.4 3477678 96.66 121219 3.4 3598897 100.0
37

Constructs Uniaue to Parental Samole
Parental Feelina Toward Military
Domain of the construct. To the extent that parents areinvolved in planning the future of the youth involved, it isimportant to consider explicitly the parent's feeling towardmilitary service. This construct is intended to capture thatfeeling.
Que.gn. The question, taken from the ParentalInfluence Module of the ACOMS questionnaire, asks For mostyoung M=, do you think service in the military is . . .
*definitely a good idea . . . . . . 4probably a good idea 000 3
probably not a good idea . . . . . 2definitely not a good idea?. . . . 1
Approh. This question was used as a direct measure ofthe parent's feeling about military service. The frequencydistribution is presented in Table 3-21.
Parental Actions Toward Youth
Domain of the construct. The ultimate aim of mostadvertising programs is to enhance the likelihood of responseon the part of the target audience. In the case of Armyadvertising and its influence on parents, the hoped for resultis encouragement by parents for youth to consider Armyenlistment. This construct is intended to capture theinfluence of such encouragement.
Questions. The questions, taken from the ParentalInfluence Module of the ACOMS questionnaire covered a varietyof topics including frequency and nature of parentalinteraction with youth regarding future plans, parentalperceptions of the various alternatives, specific actionstaken, and perceived influence on the youths' ultimatedecision. For present purposes, four questions were selected.They dealt with:
1. parent's influence on enlistment2. parent talked to youth about enlisting3. parent pointed out service advertisements4. parent suggested youth talked to recruiter
38
Table 3-21Parental Feelinas Toward Army
Cumulative CumulativePAFCT Frequency Percent Frequency Percent
336343249053 3.9 249053 3.9
2 799789 12.5 1048842 16.43 3663436 57.4 4712278 73.84 1673495 26.2 6385773 100.0
Note PAFCT - ( 5 - PIMENMIL ), and PIMENMIL - Shouldyoung men serve in Army ?
Table 3-22Parental Actions Toward youth
Cumulative CumulativePACT Frequency Percent Frequency Percent
* 166861o 2824512 43.1 2824512 43.11 849080 13.0 3673592 56.02 1071966 16.4 4745557 72.43 407557 6.2 5153115 78.64 741607 11.3 5894722 89.96 413768 6.3 6308490 96.28 122760 1.9 6431249 98.19 54609 0.8 6485859 98.9
12 69396 1.1 6555254 100.0
Nat&: PACT - ( (5 - PINFMIL) * ( PITLKMIL + PIPOIADS +PISUGREC) ], and PINFMIL: Self-report influence on enlistment
PITLKMIL: Talked to Y about enlistingPIPOIADS: Pointed out service adsPISUGREC: Suggest Y talk to recruiterall are coded as 0 - no, 1 - yes.
39

The first question was a self-report measure of influence ofparent on youth. It utilized a five point scale ranging froma r eat deal of influence (1) to no influence at all (5). Thelast three questions dealt with specific behaviors related toencouraging enlistment and are coded y.W (1), n (2).
ARppzach. The first question was reverse coded so thathigher numbers represented more influence. This is normallyaccomplished by subtracting the response from a value equal toa number one greater than the number of points on the scalethereby flipping the scale end for end. In this case however,the response of no influence at all was taken literally.Thus, the response to the item was subtracted from five(rather than six) resulting in a zero to four scale, wherezero reflected no influence.
The last three questions were recoded to a standard 0• (no), 1 (yes), format. These three questions were then summed
to form the total number of encouraging actions in which theparent engaged. This sum was then multiplied by the responseto the first question to weight it by the self-reportedinfluence. Thus, this operationalization of the constructshould correspond to effective parental influence.
The frequency distribution for the construct is presentedin Table 3-22. It appears as a relatively skewed distributionwith 43% of the parents having no effective influence. Forthe remaining 53% which do claim influence, however, thedistribution seems to exhibit a reasonable spread.
Constructs Unioue to Youth Sample
Social Influence on Youth
Domain of the construct. By the time a youth reachesthe stage of a decision regarding his future, he has developeda number of reference groups which may influence beL-vior. Itis important to consider therefore, the feelings of others (asperceived by the youth). This construct is intended tocapture how the youth perceives a number of others would feelif he were to enlist in the Army.
Questions. The questions, taken from the SocialInfluence Module of the ACOMS questionnaire, ask how the youththinks others would feel about his joining the Army. Theresponses are coded on a five point scale from a very bad idea(1) to a verY ood idea (5). Youths are asked about:
40

1. Father2. Mother3. Army friend4. Friend with Army experience5. Friend with military experience6. Friend with no military experience7. School counselor8. Teachers9. Co-workers
10. Fellow students11. Employer
&Rpzr-h. An additional code of six was used for any ofthe potential influencers who were deceased, not applicable,etc. Values of six were therefore considered as missing datain the analysis. To avoid the possibility that this wouldintroduce significant reduction in sample size, thecorrelation matrix was estimated using pair-wise deletion asdescribed above. This correlation matrix of 11 variables wasthen submitted to a principal components analysis to identifyunderlying dimensions. The results are presented in Table 3-23. Two factors were extracted (via the eigenvalue > 1criterion) and rotated (varimax).
The first factor, characterized by uniformly highloadings, seems to reflect the influence of all but friendswho have some experience with the Army or the military ingeneral. Although even these two variables load positively onthe first factor, they define the second factor. It is likelyhowever, that the incidence of friends in the military isrelatively low. To assess the factor intercorrelation, thefactors were also obliquely rotated (Promax). The relativelyhigh correlation of r - ,44 (Table 3-23, bottom) suggests theappropriateness of a single factor. Therefore, the socialinfluence was operationalized as the sum of responses to these11 questions.
Several additional points deserve mention with regard tothis construct. First, recall that the parent model and theyouth model were not simultaneously estimated in this researchfor the reasons reported above. If both were estimated as apart of the same model (via the parent-linked sample), itwould be advisable to delete both mother and father from thismeasure. Their influence on the youth would moreappropriately be captured by the parental actions construct.Under these conditions, failure to remove them from thismeasure would likely cause estimation difficulties due to lackof discriminant validity.
41

Table 3-23Rotated Factor Pattern ofSocial Influence on Youth
Pactorl Factor2
Father 0,6222 0.32100Mother 02403 0.23975Army Friend 0.18602 0.88997Friend Nil Exp 0,19824 0.88294Friend No Exp Q 0.00548Counselor 0,68481 0.26170Teachers 0.72888 0.23683Co-workers 0,76046 0.17041Students 0,71185 0.15326Employer 0.74268 0.13651
Variance Explained by Each Factor
3.845729 1.927913
i IgNote: Correlation of Factl and Fact2 - .44
42
42

Second, given the nature of the questions asked in thismodule, it is possible that the responses actually reflect theyouth's feelings rather than those of the others asked about.That is, it is possible to imagine these questions more asprojective than substantive. To examine this possibility, the11 questions listed above were factor analyzed with thebeliefs of the youth about the Army. To the extent that theresponses were simply projections of the youth's own beliefs,a single factor should have emerged. It did not. Althoughthere was some shared variance, three distinct factors emergedcorresponding to the structure of beliefs of youth andfeelings of others. Thus, it appears that the socialinfluence construct does reflect how others feel about Armyenlistment for the youth in question.
Youth's Intentions with Reaard to Army
Domain of the construct. Although many factors mayinfluence the ultimate path a youth selects, an importantdeterminate of this choice is intention to at least furtherinvestigate a particular course. This construct is intendedto capture the youth's intentions with regard to the Army.
Q. The question, taken from the Intentions andPropensity Module of the ACOMS questionnaire, asks "How likelyis it that you will do something about joining the Army (suchas, see an Army Recruiter, call a toll-free number, answer anArmy ad, or visit an Army base)? Would you say . . .
definitely . . . . . 1probably . . . . . . 2probably not . . . . 3definitely not . . . 4
Ap roah. The question, used as a single item measure ofintentions, was reverse coded so that higher values reflectedgreater likelihood of taking action to learn more about theArmy. The frequency distribution of this construct ispresented in Table 3-24.
Behaviors of Youth With Respect to the Army
Domain of the construct. The ultimate aim of Armyadvertising is, of course, enlistment on the part of the primeprospect. Thus, a key variable in any investigation ofeffectiveness-is desired behaviors of youth motivated by theadvertising. This construct is intended to capture thosebehaviors which indicate that a youth is considering apositive enlistment decision.
43
" I a a I I I i i i i i

Table 3-24Intentions - Prob Youth Will Do Somethina About The Army
Cumulative Cumulative
YPROBADO Frequency Percent Frequency Percent
DK 45207.4
REFUSED 744.288 . •
DEFINITELY 680112 9.6 680112 9.6
PROBABLY 1501250 21.2 2181362 30.8
PROBABLY NOT 2774266 39.2 4955628 70.0
DEFINITELY NOT 2121660 30.0 7077287 100.0
44
OUesfiJgflE. The questions, taken from the BehaviorsModule of the ACOMS questionnaire, addressed many behaviorsassociated with the information gathering process relating tocareer choice. Questions concerned activities related tooing to college, getting a full-time civilian job, andoining the Army. For present purposes, consideration was
limited to behaviors associated with gathering informationabout the Army as an alternative. The behaviors include:
1. YBAEVEREC: Talking to a military recruiter,2. YBATALK: Talking to anyone about joining the Army,3. YBAGIFT: Responding to an Army ad by sending for gift,
or4. YBAVISIT: Visiting an Army recruiting station.
Other actions related to consideration of the military werealso addressed by the ACOMS questionnaire, but were notnecessarily related to voluntary actions on the part of theyouth. For example, youth were asked if they had ever takenthe ASVAB test. However, some high schools administer thistest to all students and it therefore is not necessarilyrelated to advertising. Questions of this type were notconsidered.
AprAoch. The questions above were coded 0,1 reflectingthat the youth did not/did engage in the behavior,respectively. Since these behaviors were conceptualized asindependent actions, a principal components analysis did notseem appropriate. Rather the items seemed more consistentwith a Scalogram approach developed by Guttman (1941,1944) andextended by others (Proctor 1970). In a Guttman scale, theitems are ordered such that an individual respondingpositively to an item (i.e., engaging in the behavior), wouldbe expected to answer positively to all items below it in theorder. The ability of the items to be ordered in such amanner indicates the degree to which the items form a scale.
The results of Guttman analysis are presented in Table 3-25. Although a variety of measures are available to assessthe fit of the scale, it is obvious that there wereconsiderably fewer errors in classifying individuals thancorrect assignments. In addition, the coefficient ofreproducability seems adequate for present purposes. Thus,the behavior construct was operationalized as the sum of the0,1 codes for the four questions listed above.
One additional point about this measure deserves mention.The questions'which addressed these actions varied in terms ofthe period 4uring which the behaviors could have taken place.Thus for example, the time frame for talking to a recruiterwas ever, while talking to anyone about the Army was
45

Table 3-25Guttman Analysis of Youth Behaviors With Resoect to Army
YBAGIFT YBAVISIT YBATALK YBAEVREC
GUTTMAN No(O) No(O) 1o(O) No(O)SCALESCORE Yes(1) Yes(1) Yes(1) Yes(i) TOTAL
0* 0* 0* 0*4 40
40 40 40 40
186 67* 8* 1*3 262
76* 195 254 261
720 735 116* 43*2 807
87* 72* 691 764
1673 1706 1371 413*1 1721
48* 15* 350* 1308
1593 1593 1593 15930 1593
0* 0* 0* 0*
94 92 69 46PERCENT
6 8 31 54.1i I ,
* RESPONSES IN ERROR
COEFFICIENT OF REPRODUCIBILITY 0.9267MINIMUM MARGINAL REPRODUCIBILITY 0.7763PERCENT IMPROVEMENT 0.1505COEFFICIENT OF SCALILITY 0.6726
46

restricted to the last six months. Even when time frames forquestions were comparable the possible impact of telescoping(Loftus 1986) should be considered. Given that only fourquarters of data were available from the ACOMS project, thesedifferences bring into question where in the model thebehavior construct belongs. This issue is of less concern,however, in a prototype model than for one intended to providethe basis for substantive conclusions.
Backaround Factors
Virtually all efforts at modeling human behavior takeinto account the fact that individuals are different and thatthey cannot be expected to behave identically. Thesedifferences are usually accounted for by what are termed'background factors' that include a host of variables whichare specific to the individual. Frequently these variablesare used to group or segment individuals.
In the case of reactions to, and effects of, Armyadvertising, many of the important background factors arestrongly related the likelihood that an individual will scorein the top categories on the Armed Forces Qualification Text(AFQT), the military's entry test for trainability. TestScore Category I-1lIA is comprised of individuals who score ator above the 50th percentile on the AFQT. The ACOMS databasecontains a measure (Orvis & Gahart, 1987) of the probabilitythat an individual would score in TSC I-IIIA. Since this is adirect measure of the characteristic Of interest and since itis an index which is developed from many of the backgroundfactors which would have been included, it seemed moreefficient to directly use the index itself. Thus, themeasure, HIWGT, labeled as I-IlA Prob in the model wasincorporated as a predictor. Its presence in the model canaccount for the background factors and its relationship to theother constructs will suggest the effect of advertising onmore desirable recruits.
Perceptions of Army Attribute.
A critical component of any model of advertisingeffectiveness is the measurement of the perceptions or beliefsof the target audience about the object being advertised. Thedevelopment and management of perceptions and beliefs isadvertising's primary role, and it is through perceptions orbeliefs that advertising can be expected to exert its primaryinfluence. Thus, the correct modeling of this component ofthe model is critical to the research effort.
- The attributes chosen for inclusion in the ACOMS data areall positive attributes and are all the focus of current or
47

recent Army advertising (see Table 3-26). No "negative"attributes are included, and no attributes which have not beenat least indirectly incorporated in recent campaign themes are
present. As a result, while the attributes are quiteappropriate'as reflections of the result of Army advertising,they may not be the attributes one would choose if the primarygoal of the research effort were the modeling of choice, MerAE.
An examination of Table 3-27, which contains descriptivestatistics for the fourteen Army attributes measured in theACOMS data, suggests that Army advertising has been veryeffective in communicating these beliefs and perceptions toyouth. The vast majority of youth agree or strongly agreewith each of the statements. While this is a stronglyfavorable result for Army advertising, it presents somedifficulties in a modeling effort such as this. If virtuallyall youth bteleve that the Army possesses each of theseattributes, yet only a few take action with regard toenlistment, it is unlikely that the predictive power ofbeliefs about Army attributes will be high. In a purelystatistical sense, the skewed distributions reported in Table3-27 present further difficulties. With all of the availableattributes skewed in the same direction, it is clear thatcorrelations among the attributes, which serve as the basisfor constructing a measurement model, will be generally highand positive, and that distinguishing among the attributes orsubsets of attributes will be difficult.
This is just the result obtained from a common factoranalysis of the Army attributes. The first principalcomponent (or the first factor when common factor analysis isconducted) overwhelms the remaining components. While by somecriteria, and on some subsets of the data, one can rationalizethe rotation of a second component or factor, the dominance ofthe first renders the amount of variance in the original itemsaccounted for by the remaining factors small and difficult tointerpret.
This result is quite similar to that obtained in theWestat analysis of the first three quarterly ACOMS data sets(Wilson, Davis, & Greenlees, 1988), wherein the reportconcludes that there is a single unidimensional "perceptions"construct. However, the usefulness of a single componentrepresenting all available Army attributes is limited, in thatfew actionable recommendations can be made on the basis of asingle global perceptions or beliefs measure, and the richnessof a multiattrtbute characterization of the elements in thechoice set is'lost.
48
Table 3-26Variable Definitions For Youth Beliefs About The Army
Variable Definition
WIDE Wide variety of opportunities to find a job you likeSTEP Advantage over going right from high school to
collegeCIVCAR Great value in civilian career developmentHITECH Chance to work with latest hi-tech equipmentTRAIN Many opportunities for training in useful skill areasHIQUAL Many chances to work with highly-trained peopleSELCON Opportunity to develop self-confidencePOTEN Opportunity to develop your potentialMENTAL Mentally challenging experienceMATURE Opportunity to become more mature and responsibleCASHED Excellent opportunity to obtain money for collegePHYS Physically challenging environmentPROUD Experience you can be proud ofLEADER opportunity to develop leadership skills
Table 3-27Perceptions of ArmyAttributes--Youth
Belief Mean
WIDE 3.57PHYS 4.19PROUD 3.85STEP 3.26LEADER 3.90HITECH 4.09CIVCAR 3.47SELCON 3.90POTEN 3.83MENTAL 3.75MATURE 4.02TRAIN 3.93HIQUAL 3.94CASHED 4.05
49

Modeling the G-Factor
As noted above, the generally high agreement ofrespondents with each of the statements regarding attributesof the Army suggests that recent Army advertising has beenquite successful. On the other hand, not all respondentsagree with every statement, and the item intercorrelations arehigher than the constraints on the correlation coefficientimposed by the marginal distributions indicate they must be.In effect, we find that individuals who agree with any of thestatements tend to agree withall of them, while those who donot agree with any of the statements tend to not agree withall of them. Respondents seem to be failing to makedistinctions among the attributes, and seem to be taking themall-"as a group" and agreeing or disagreeing on the basis ofsome overall perception. It is this overall perception which
* " is contributing, along with the success of Army advertising,to the strong first component.
Such a phenomenon is not uncommon when respondents areasked to assess the attributes of an object. First termed"halo" by Thorndike (1920), it is the result of therespondent's perception of the presence of each attributebeing based on that respondent's general liking or disliking,in a holistic sense, of the object. If a respondent has apositive global predisposition toward an object, he or sherates the object as possessing all of the positive attributes,to a greater or lesser degree, while if the respondent isgenerally negatively predisposed, the object is rated as notpossessing positive attributes, again to a greater or lesserdegree. If the attributes are the "controllable" variables ofinterest, one objective of the modeling effort must be toisolate the correlation among attributes due to generalizedaffective overtones, or halo, in order to proceed with themodeling of structure among the attributes which isattributable-to variations in responses not accounted for bythe global predisposition (Beckwith and Lehman, 1975; Cooper,1981).
Given the long recognition of the problem and the wideuse of ratings of objects on attributes as the core-componentof many modeling efforts, several methods have been suggestedfor dealing with "halo-obscured" data. Among the methodswhich have been suggested are:
1. Defining the first factor as generalized affect, androtating the remaining interpretable factor (Myers, 1965).This suggesti6n is consistent with the interpretation of thefirst unrotated factor as a "general size factor related toaverage differences among subjects."(Cattell, 1966)
50
2. Identifying those attributes which correlate highest withthe first principal component or factors, and regressing eachof the remaining attribute ratings on these strongly affectiveattributes. The residual scores from these multipleregressions are then used for further analysis. This approachessentially operates on the partial correlation matrix, withglobal affect having been partialed out (Holbrook and Huber,1979).
3. Defining each respondent's position on the scale acrossattributes as an indication of generalized affective response,and subtracting it. In this approach, the data matrix is"double centered" by first standardizing the data by column(traditional standardization), followed by a row centeredstandardization, which subtracts each respondent's meanattribute rating from each individual attribute rating. Dataare thus (standardized) differences of each individual aroundhis or her own mean (Dillon et al., 1984). The data astransformed can then be analyzed without the interference ofthe first factor relating to average differences, since eachsubject's average is the same (zero).
While a detailed discussion of the strengths andweaknesses of each of the above approaches is beyond the scopeof this report, procedures generally consistent with each ofthe above were conducted on the ACOMS data to determine ifthere was in fact any interpretable structure in the ratingsof the fourteen Army attributes beyond the first globalfactor. All three approaches yielded similar, although notidentical interpretations. The first approach, that of simplyrotating the second through pth principal factors, is reportedin Table 3-28. It is chosen, despite the limitation noted byHolbrook.(1984) that "it generally produces components withlow and difficult to interpret loadings," on the basis of itsgeneral simplicity and the relative ease of communicating itsresults. Since these results are in general agreement withthe other methods and, as will be discussed, are subjected toa relatively rigorous confirmatory analysis, some confidenceis gained in the legitimacy of the resulting structure.
Findings--Youth Model
A principal axes common factor analysis was conducted onthe fourteen attributes on which the Army was rated. Thestrong first factor found in previous analyses of the ACONSdata remains evident, with an eigenvalue of 6.28, andexplaining over 40% of the common variance (with priorcommunalities estimated using squared multiple correlationcoefficients obtained from regressing each attribute on theremaining thirteen). The next three factors, are associated
51

Table 3-28Rotated Factor Pattern of YouthBeliefs (ist Factor Not Rotated)
Future Experience Develop
WIDE 0,237 0.07272 -0.08743STEP 0 -0.02127 -0.03805CIVCAR 021784 -0.04646 0.04081HITECH -0.06540 0,17887 -0.06735TRAIN 0.03134 0.2 2 950 -0.01463HIQUAL -0.07879 S.2L= -0.04902SELCON -0.08148 -0.17012 0.14268POTEN 0.02133 -0.07663 0,16847MENTAL 0.00651 0.00844 0,126MATURE -0.09304 -0.08387 ..1360CASHED -0.00152 -0.00780 -0.21372PHYS -0.24910 -0.07805 -0.13369PROUD -0.07068 -0.14086 -0.03902LEADER -0.06289 -0.08468 -0.01823
Variance Explained by Each Factor0.26264 0.22105 0.15547
52

with eigenvalues lower than the average initial communalityestimate. Nonetheless, they have eigenvalues that aresubstantially greater than the remaining factors and whichdecline rapidly from factor to factor. The remainingelgenvalues are at a consistently low level. The first factorwas thus dropped, and factors two-through-four were rotatedsubject to the Varimax criterion.
An interpretation of the largest positive loadings ineach of the rotated factors suggests an interpretable andintuitively appealing structure. The first rotated factor(the second factor overall) loads strongly on wide variety ofjobs, stepping stone to college, and civilian careerdevelopment. These attributes seem to be clearly associatedwith future opportunities available after service in the Army,and we have thus labeled this factor Future. The secondrotated factor reflects attributes of the Army experienceitself, loading on items reflecting the use of "high-techequipment", the "opportunity to work with highly skilled co-workers", and "training in useful skills." While these itemsall deal with skills and training, they are the only three ofthe fourteen items which do not have a future or developmentalconnotation, and we have labeled this factor the E.riencfactor. The third rotated factor is the least ambiguous ofthe three, and we have labeled it fl mDto reflect itsassociation with items relating to personal development, suchas develop self-confidence, develop your potential,opportunity to become mature and responsible, and mentallychallenging.
Confirmatory Analysis
The loadings shown in Table 3-28 are uniformly small, andthe factors exhibit larger negative loadings than one usuallyobserves in a common factor analysis. This is expected, basedon the amount of variance accounted for by the first factorand the tendency of this approach, as noted above, to yieldsolutions of this type. As also noted above, other methodsyield highly similar results. In order to more rigorouslyassess this solution, however, a maximum likelihoodconfirmatory analysis was employed to assess the overall fitof the three facet solution with a general factor as comparedwith a one-factor solution.
The confirmatory factor analysis was conducted using theLISREL VI software for the analysis of covariance structures(Joreskog & Sorbom, 1986). This methodology allows theassessment of the fit of data to a hypothesized structure. Asopposed to-exploratory factor analysis, which allows only thespecification of the number of factors to be rotated,confirmatory factor analysis allows a specification of fixed
53
and free loadings in the factor loading matrix, with the fixedelements fixed at any value, including zero. Thus, crossloadings of an observable on more than one factor can berestricted, with a resultant "congeneric" measurement model(Joreskog, 1971). Further, one can specify second-orderfactors which account for covariance among first orderfactors, which themselves are directly related to theobservable variables in the model.
As noted in the second chapter, several measures ofgoodness-of-fit are available, all based on some function ofthe difference between the observed sample covariance orcorrelation matrix and the covariance or correlation matrixreproduced as a function of the estimated parameters in themodel. As such, alternative models can be compared. While inthis case the hypothesized structure was derived from anexploratory analysis of the same data, thus rendering true
* statistical probability statements invalid, competingstructures can be compared and evaluated on the severalgoodness-of-fit criteria.
Second-Order Factor
The hypothesized structure, as suggested by theorthogonal rotation of the second through the fourth principalcomponents derived from exploratory analysis, is depicted inFigure 3-1. Based on the strong first principal component, asdiscussed previously, we suspect a strong general factorrepresenting generalized affect toward the Army, with thefirst order factors representing those Army attributes whichtend to correlate more strongly among themselves than thealready high interattribute correlation attributable togeneralized affective response.
Higher-order factor structures are a common occurrencewith attribute rating-type data (Gerbing and Anderson, 1984).Such higher-order factors may arise from a variety ofcircumstances, including the "halo" or generalized affectiveovertones discussed previously. Whether one chooses to modelthe G-Factor or the orthogonal facets depends on the purposeof the research. For the purposes of theory building anddevelopment, often it is the higher-order factor which is ofinterest. In the case of modeling perceptual response to Armyadvertising, the facets represent the actionable levelaccessible through intervention strategies and message contentadaptation. The model in Figure 3-1 suggests three first-order factors whose intercorrelation is accounted for by asingle second-order factor.
54

The weighted correlation matrix was used as input, and"pairwise" deletion was employed in the case of missing data,such that the correlations which formed the basis for analysiswere based on differing sample sizes. With a matrix of thistype, there is no guarantee that it is positive definite; thiswas not a problem in this analysis. Such a matrix doesviolate the assumptions of the LISREL maximum likelihoodprocedure, in that the chi-square statistic and standarderrors are computed on the basis of the estimated variance-covariance matrix of a sample variance-covariance matrix, nota correlation matrix. The chi-square statistic reported maythus not follow a chi-square distribution, and should be usedonly as an index of fit, and not a statistical test for therejection of the null hypothesis with a specified level ofType I error.
The model was identified by fixing the factor loading ofone of the indicants of each of the constructs (including thesecond order construct) to 1.0. This provides a metric forthe otherwise undefined scale of the unobservable, whileleaving the associated measurement errot variance free to beestimated. This allows for the estimation of the measurementerror associated with each indicant. The loadings of theobservables on the three first-order factors are indicated aselements in LAMBDA, while the second-order measurementloadings are given by the matrix GAMMA. Measurement error inthe first-order observables is contained in the THETA-EPSILONmatrix in this model, while the PSI matrix contains the uniqueand specific error variance associated with the three first-order factors as indicants of the second-order factor. Itshould be noted that the second-order measurement model inthis case is "Just-identified", in the sense that three inter-construct correlations are used to estimate three factorloadings. Thus, this model is functionally equivalent to theestimation of three interfactor-correlations in a first ordermodel.
Results
As can be noted in Figure 3-1, the model provides a goodfit to the observed data. As suggested in the second chapter,the chi-square statistic is a direct function of sample sizeand, due to the use of the correlation matrix as input, maynot be distributed as a chi-square random variable. Itremains a useful index of the fit of the model, however. Forthe Youth data, with an arbitrary sample size of 500, the chi-square value Is 43 with 32 degrees of freedom, suggesting anadequate model. This is corroborated by the Goodness-of-Fitindex produced by the LISREL software, which is .97, with a
55

Genered G-fac tar
Af ect Youth
iiR= 02
Igu 3-T Geea-f o mol fo youh.W
i r a 0 56

maximum value of 1.0. Further, the root-mean-square residual(the square root of the average squared difference between theobserved correlation matrix and the correlation matrixreproduced as a function of the estimated parameters) is .02,which is highly acceptable.
Finding that a given model seems to fit the data does notmean that other models may not also :it. In particular, giventhe previous findings suggesting a unidimensional structure ofbeliefs (Wilson et al., 1988), and the strength of the generalfactor in both the confirmatory and exploratory models, we fita single-factor model to the data, again using LISREL VI. Theone factor model is equivalent to fixing the interfactorcorrelations to 1.0 (or the GAMMA estimates in Figure 3-1)while constraining all latent constructs to a variance of 1.0.The result is a gain of three degrees of freedom, but the fitof the model is reduced substantially. With thirty-fivedegrees of freedom, the chi-square value for theunidimensional model is 112, or alternatively, the gain ofthree degrees of freedom "cost" 69 chi-square points. The GFIdecreased to .95, and the RMSR increased from .2 for thesecond-order three facet model to .04 for the unidimensionalmodel.
Of course, it is not possible to assess the pragmaticusefulness of this solution vis-a-vis a one-factor solutionentirely on the basis of interitem correlations or factorsderived therefrom. If the three factors are predicted equallyby prior constructs in the model, and relate equally to keyconstructs hypothesized to be outcomes of beliefs, then a one-factor solution would be preferred on the basis of parsimony.This will be assessed in the context of model estimation,discussed in the fourth chapter.
Findinas--Parent Model
Procedures followed for the modeling of parental beliefsabout Army attributes were identical to those described abovefor the youth data. The first common factor was againattributed to a combination of success in communicating Armyattributes and to generalized affective response, or halo.All three methods for dealing with the halo effect wereexamined, as were the rotation of from two to four factorsbeyond the first factor. Table 3-29 presents the results ofVarimax rotating factors two through four of a common factoranalysis. The resulting factors seem to be interpretable in amanner quite similar to the youth data. The largest positiveloadings on the Develoment factor are from the same items asthe youth data; i.e., "Self Control"t, "Potential", "MentalChallenge", and "Maturity". The pjec factor is somewhatdifferent in terms of items, but seems similar in terms of
57

Table 3-29Rotated Factor Pattern of ParentBeliefs (1st Factor Not Rotated)
Develop Experien Future
SELCON 0.24665 0.01441 -0.03785POTEN 0.17802 -0.12992 -0.03926MENTAL 0,.11167 -0.03131 0.01148MATURE 0,17572 0.15383 -0.02043PHYS 0.01929 0.2144 -0.03438PROUD 0.02570 0,10570 0.10745HITECH -0.12787 0.03476 -0.17714WIDE -0.17302 -0.09448 0.04831STEP 0.00509 -0.14018 0,22693CASHED -0.08209 0.10979 0,17578LEADER 0.00546 -0.01017 -0.05568CIVCAR -0.01714 -0.15544 -0.03499TRAIN -0.19106 -0.04930 -0.07979HIQUAL -0.18870 -0.04261 -0.02050
Variance Explained by Each Factor0.26239 0.20246 0.14347
58

interpretation. "A Physical Challenge" and "An Experience tobe Proud of" have relatively high positive loadings, while"Use Hi-tech Equipment" was included to attain as muchconsistency as possible with the youth model. The "Mature"item from the Development factor alsoloads on this factor.The Future factor is also similar to that found in the youthmodel, with the exception that "Money for College" isperceived by parents as future-related, rather than "CivilianCareer Development".
As with the youth data, and perhaps more so, the choice ofitems as representative of constructs and the labeling ofconstructs are quite problematic. Thus, a confirmatoryanalysis was conducted to assess the ability of a congenericmeasurement model with a second-order general factor toreproduce the observed data. The results of this analysis(again using LISREL VI software) are presented in Figure 3-2.While the chi-square value for the parent data is 86.5 with 32degrees of freedom, suggesting a less well fitting structurethan for the youth data, the GFI and RMSR both suggest thatthe fit is adequate.
As with the youth data, the "G-factor with three facets"model fits substantially better that a single-factor,unidimensional conceptualization, which results in a chi-square of 133 with 35 d.f. (chi-square difference - 47 with 3d.f.), a slightly lower GFI and a higher RMSR.
Discussion
The three factor solution seems adequate for both theyouth and parent data. The factors, which we suggestrepresent personal development, the Army experience itself,and future opportunities resulting from service in the Armyhave a strong intuitive appeal, and correspond broadly tobasic themes present in Army advertising. Further, thesedimensions correspond quite well to the dimensions of careerchoice suggested by Jepsen and Dilley (1971) in their generalreview of vocational decision making models.
Our confirmatory analysis also suggests the adequacy ofthree factors with the presence of a strong G-factor, while asimilar analysis conducted on a one-factor or unidimensionalmodel of beliefs about Army attributes suggests that such amodel is empirically inadequate.
59

Genral G- factor
ASff4e(-,t Parents
z3t
I0
Experi Develop Future
60
RESULTS
Based on the measurement work described in the previouschapter, and the theoretical considerations discussedpreviously, the model presented in Figure 4-1 was estimatedusing the LISREL VI software discussed in the second chapter.This model has four exogenous constructs: Social Influence(Soc. Infl.), Hours per week of Television Viewing (TV), thejoint construct of hours per week reading and listening to FMradio (Read-FM), and the probability that a youth is I-IIIA.Recruiting-related behavior (Behavior) is the ultimatedependent variable in the model.
Since behavior is a retrospective question covering thelast 6-months, however, an equally compelling model would havebehavior as an exogenous construct, preceding the attitudeformation process. This is not to say that we perceive careerchoice in general and Army enlistment in particular, as a lowinvolvement decision wherein behavior is often prior tocognition and thus attitude formation; this is simply due tothe lack of longitudinal data and the necessity of cross-sectional behavior measures being retrospective. If indeed ayouth has contacted a recruiter, called a toll-free number, orany of the other enlistment-related behaviors, he or she maybe sensitized to the Army media message, may more closelymonitor Army advertising, and may exhibit more knowledge aboutArmy offers, etc. For these reasons, a second model wasestimated with self-report behavior included as an exogenousconstruct.
It is also of interest to determine the value of thethree-facet conceptualization of beliefs about Armyattributes. To the extent that general affect toward the Armyis indeed an important construct, in-and-of itself, and to beconsistent with the Wilson et al. (1988) conceptualization ofa unidimensional belief structure, the second-order constructis modeled as an endogenous construct, itself leading tointentions and behavior. This model is consistent with themodel in Figure 4-1, except that structural paths flowing toand from the three facets of beliefs in figure one are focusedon and emanate from the second order factor.
The Parent Model is then estimated, with three exogenousconstructs and parental actions toward youth enlistment as theultimate exogenous construct. Given adequate data, it wouldbe of interest to estimate both the best available youth modeland the parent model simultaneously for a linked sample inorder to determine the ultimate influence of parental actionson youth intentions and behavior. The Parent Model isdepicted in Figure 4-2.
61

P4J
caa
ISca.
CA2
44
tc4
62

0
JtJ
caa
4
FA
63.

Behavior-Last Youth Model
Measurement
None of the exogenous constructs in Figure 4-1, the YouthBehavior-Last Model, are based on the true-score model or thecommon factor model from which the congeneric model commonlyemployed in LISREL is derived as a more restrictive version.That is, hours of media exposure is not defined by theintercorrelation, but rather by the sum of its indicants; andsocial influence is assessing the impact of several mutuallydistinct significant others in the youth's decision process,not the common component thereof, and is properlyconceptualized as an index rather than a factor. Since itimperative that measurement error in exogenous constructs beaccounted for to avoid downwardly biased parameter estimates,and since the measurement error in LISREL is defined as non-common (unique and specific) variance, it is necessary toaccount for measurement error outside the estimation processof the model itself. As noted by Fornell (1983), "... themore common case is that it is not possible to identify themeasurement residual [of a single item measure].Nevertheless, this does not imply that one has to assumeperfect measurement and a zero residual (p. 446)." Fornellgoes on to note, after discussing large scale findings byAndrews, "... it is probably safe to say that an assumption ofat least a 10 percent measurement residual for almost anybehavioral or attitudinal measure is more realistic than thetraditional assumption of a zero residual (Fornell, 1983;p.446)."
Based on the above, those constructs for which multipleindicators are not available or which do not conform to theassumptions or conceptualization of the restricted commonfactor model are modeled with an assumed measurement error of10%. This is an extremely conservative estimate, since thereliability of a composite, as many of these estimates are, isthe average of the reliabilities of the (equal variance)scales which form the composite. In any event, since greatermeasurement error leads to larger parameter estimates inLISREL, it is preferable from the perspective of avoiding typeI error to employ conservative estimates, while necessary forthe power of the test to employ at least some moderate degreeof measurement error.
The measurement parameters estimates for thoseitems/constructs amenable to the measurement model employed inLISREL are presented in Table 4-1 for both the "Behavior Last"and the "Behavior First" construals of the Youth model, sincefor both models these parameter estimates are the same to atleast two decimal places. As can be noted, the second-orderfactor solution, when estimated in the context of a structural
64
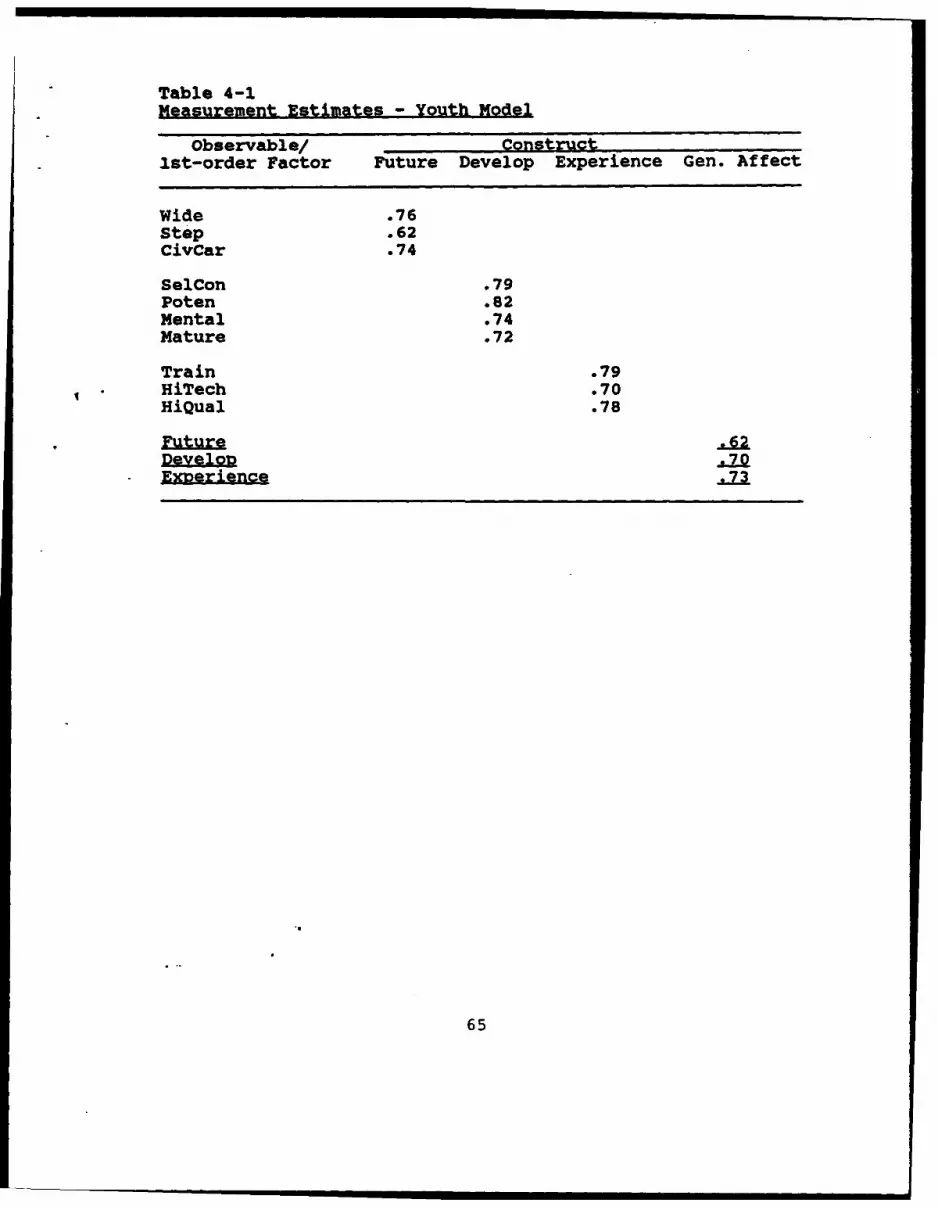
Table 4-1Measurement Estimates - Youth Model
Observable/ Construct1st-order Factor Future Develop Experience Gen. Affect
Wide .76Step .62CivCar .74
SelCon .79Poten .82Mental .74Mature .72
Train .79HiTech .70HiQual .78
Future.6Develop .70E.73
65

model, appears to be quite good. The loadings of the tenobservables on the three first-order factors are uniformlyhigh. The loadings of the first-order factors on the second-order factor are also quite reasonable, and are substantiallylower than the loadings obtained when the measurement model isestimated without consideration for the structural estimates.This indicates that a large portion of the correlation amongthe three facets is due to common predictors, and that theshared variance among them, when viewed as a partialcorrelation after accounting for all shared variance due toprior common exogenous constructs in the model, is high butsubstantially lower than the zero-order correlations. Inparticular, one can compare the loadings in the range of .9 orgreater in Figure 4-1 with the loadings in the .7 range in thebottom portion of Table 4-1. A model postulating 1.0 loadingsof the first-order factor on the second cannot be accepted,accentuating the discriminant validity of the three-facetsolution. As will be noted subsequently, the three facetsneither have identical paths from predictor constructs nor dothey relate equally to subsequent constructs of interest.
The coefficients shown in Table 4-2 and subsequent tablesin this chapter are those which are at least 1.5 times theirrespective standard error estimates, based on a sample size ofn = 1000. Since the weighted correlation matrix computedbased on pairwise deletion of missing data was employed, thecorrect sample size is highly problematic, and standard errorestimates are probably understated for a given sample size dueto violations of the multivariate normal covariance matrixassumption of LISREL. However, since most of the correlationswere based on a sample size of well over 4000, the choice of n- 1000 with a 1.5 standard error cutoff seems to be bothreasonable and conservative for a prototype model such asthis, wherein one wishes to avoid both Type I and Type IIerror in the specification ot future research. The chi-squarevalue is based on n=500, since it is a direct function ofsample size. That is, for samples of over 500, no model willfit the data since even minor departures from perfectreproduction of the input matrix are not likely to be due tosampling error, and the role of the null hypothesis isreversed. Since 500 is a large but clearly acceptable samplesize for this type of analysis, corresponding to the navailable for any two low-incidence rotating module items, itappears to be a reasonable choice. Again it should bereiterated that strict hypothesis testing should be absolutelyavoided in this prototype model, and that while we have a highlevel of cQnfidence in the parameter estimates themselves, theinferential statistics are not to be trusted.
66
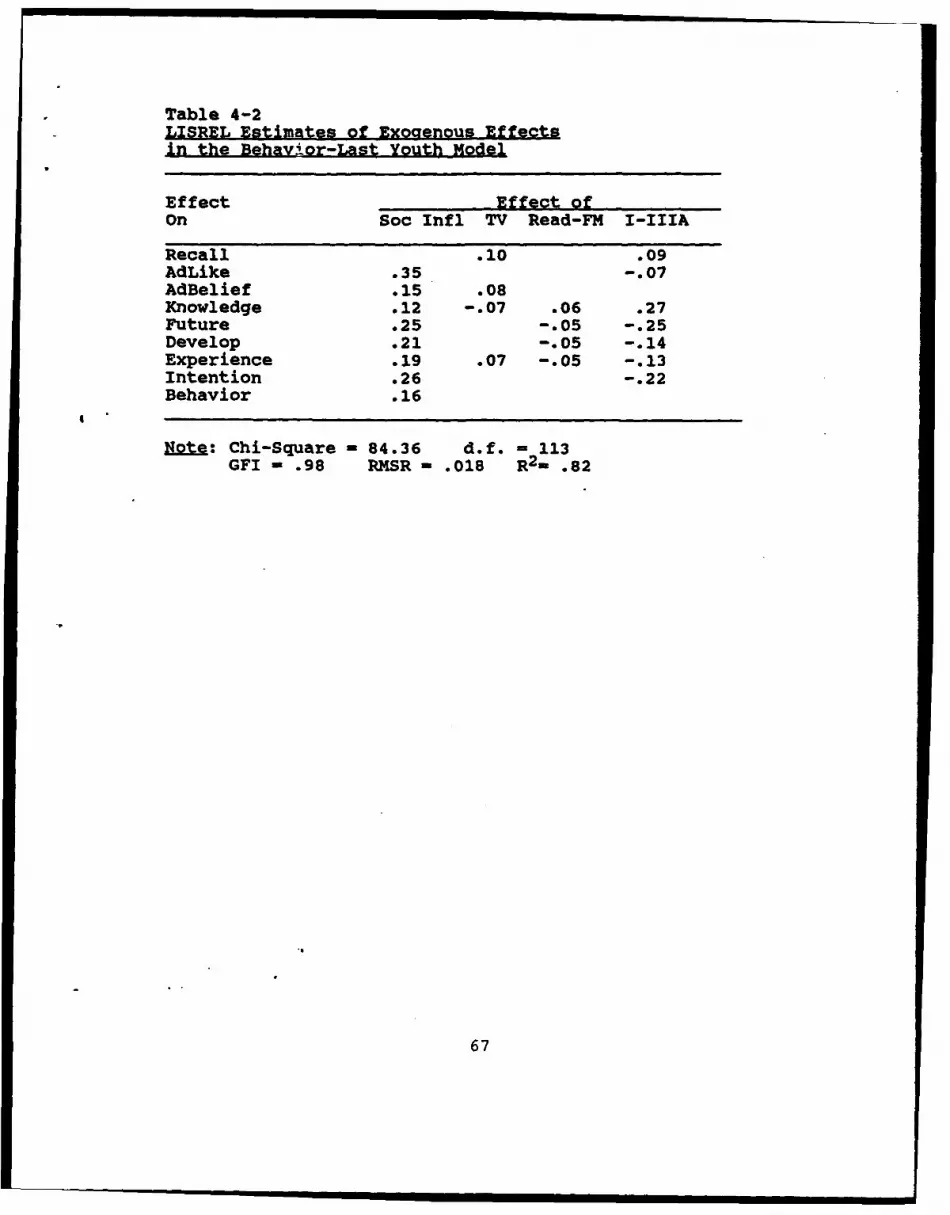
Table 4-2LISREL Estimates of Exogenous Effectsin the Behavior-Last Youth Model
Effect Effect ofOn Soc Infl TV Read-FM I-IIIA
Recall .10 .09AdLike .35 -.07AdBelief .15 .08Knowledge .12 -.07 .06 .27Future .25 -.05 -.25Develop .21 -.05 -.14Experience .19 .07 -.05 -.13Intention .26 -.22Behavior .16
Note: Chi-Square - 84.36 d.f. - 113GFI = .98 RMSR - .018 R2 _ .82
67
The most striking aspect of Table 4-2 showing thestandardized structural estimates from the exogenousconstructs to the endogenous constructs in the Behavior LastYouth Model is the impact of Social Influence. Clearly, thoseyouth who feel that significant others would approve of theirdecision to enlist in the Army have more positive responses toall of the endogenous constructs. Again, causalinterpretations must be avoided, but the relationship isobviously strong and consistent, all the way from liking andbelieving Army ads to intentions and enlistment-relatedbehaviors.
Also of interest is the relationship between I-IIIAprobability and the endogenous constructs. With the exceptionof Recall and Knowledge, the impact is uniformly negative:the more desirable the youth, the less positive are reactionto Army ads, beliefs, and intentions. Note in particular thepositive relationship between I-IIIA probability and Knowledgeof Army Offers. When preliminary model specifications wereexamined prior to the availability of the I-IIIA composite, anegative (and counterintuitive) relationship was found betweenKnowledge and both Intention and Behavior. This finding helpsexplain the earlier negative relationship. It is likely thatI-IIIA youth are more cognitively oriented (and are better attest-taking and the associated processes), and thus, givenexposure, are likely to do well, cetaris paribus, on theknowledge questions. Simultaneously, such youth, givenperhaps a wider perspective and more alternative prospects,are less positive toward the Army, as can be noted in Table 4-2 and 4-3. Thus, when one fails to control for I-IIIAprobability, or the "Quality" construct it represents, onefinds a sprious relationship between Knowledge and positiveoutcomes. Knowing more about Army offers is not related tonegative intentions or beliefs, but the background orindividual factors contributing to a high score on I-IIIAprobability, unfortunately, are.
The media exposure relationships are also of interest.Those who report a larger number of hours per week spentwatching TV are more likely to recall Army ads, are morelikely to believe Army ads, and report higher levels ofperceptions of Army attributes in the Experience construct.At the same time, such youth demonstrate a lower Knowledge ofArmy offerings. The youth who report more hours per weekspent reading and/or listening to FM radio (included as asingle construct due to the similarity in pattern of the twoactivities across respondents) exhibit a different set ofrelationships. They score higher than their low-hourcounterparts in Knowledge of Army offerings, and score loweron all three facets of Perceptions of Army attributes.
68

Table 4-3LTSREL~simates of Mdoaer2W Effein the Behavior-Last Youth Model
Effect Effect ofOn Recall Adlike AdBelief Knowl Future Devel Experi Int
AdLikeAdBelief .38Knowledge .14 .14Future .06 .21 .35Develop .10 .25 .28 .05Experience .09 .18 .31Intention .19 .06 .22 .18 -.29Behavior -.08 .11 .38
INote: Chi-Square = 84.36 d.f. = 113
GFI = .98 RMSR - .018 R2 = .82
69

There are many competing explanations for these findings.It seems likely that the interpretation of the positive TV--Recall relationship is straightforward, in that more TVexposure yields more exposure to Army ads, and a higher recallscore. The positive relationship of TV with Believing Armyads can be similarly interpreted. The reversal of signbetween the TV and Read-FM constructs in their relationshipswith Knowledge of Army offers and perceptions of Experienceattributes, however, deserves a closer examination. It doesnot seem that direct interpretations such as "spending moretime watching TV per week leads to less knowledge of Armyoffers," or "Spending more time reading/listening to FM radioleads to lower perceptions of Army Attributes" areappropriate, in that such interpretations imply a causalmechanism which cannot be investigated outside the context ofexperimental manipulation of media exposure. A moreappropriate interpretation would be "Those who report spendinglarger amounts of time watching TV also score lower on theirKnowledge of Army offers," or "Those who report spending morehours per week reading/listening to FM Radio report lowerbeliefs/perceptions of Army attributes." That is, there maybe basic differences between TV watchers and readers/FMlisteners which account for bth media exposure patterns Anddiffering knowledge or perceptions scores.
As in the discussion of the I-IIIA probability measure andits moderating impact on the knowledge--intentionrelationship, it may well be that other predictor variableswhich tap basic individual life-style and personal differencescould account for both the media exposure patterns and theoutcome measures. In the absence of experimental manipulationor, at a minimum, process level reinterview data, causalinference should be avoided.
Endogenous Constructs
The effects of each endogenous construct on subsequentendogenous constructs in the model are given in Table 4-3. Itcan be noted that Recall is positively related to Knowledgeand the three facets of perception: Future, Development, andExperience, but is not related to either Intention orBehavior. Liking of Army ads is positively related to Beliefof Army advertising, the three facets of perception,Knowledge, and Intention to take action, while Belief of Armyads shows a strong positive relationship with the three facetsof perception. AdBelief shows a weak but negativerelationship with Behavior, however. One interpretationconcerns the retrospective nature of the behavior measureitself: it thy be that those who have engaged in enlistmentrelated behaviors such as talking with Army recruiters orgathering other information are less inclined to find Armyadvertising believable.
70
Knowledge of Army offers is positively related to the"Development" construct, as well as to Intention and Behavior.Perceptions of both the "Future" and "Personal Development"aspects of Army attributes are positively related toIntentions, but not to Behavior. The "Experience Itself"aspect of Army attributes, including items relating toreceiving training, working with hi-tech equipment, andworking with highly trained co-workers, shows a remarkablystrong a relationship with intentions. That is, thoseyouth who most strongly believe that enlistment in the Armywould likely provide these opportunities are less likely thantheir less strongly believing counterparts to intend to takeenlistment-related action. This is a finding which deservesfurther investigation, but for which we have no adequaterationale beyond the straightforward interpretation.
Finally, the strongest relationship in the model occursbetween intention and behavior. This is consistent with thetheory and with previous findings of Nord et al. (1986).Overall, the model fits the observed data quite well. Thechi-square value is less than its associated degrees offreedom, indicating a reasonably good fit although, as notedrepeatedly, it is not to be taken as a true statistical testof the probability of obtaining the sample data from apopulation in which the null hypothesis (the specified model)is true. The goodness-of-fit index is .98, approaching itstheoretical maximum of 1.0, and perhaps most importantly, theroot mean square residual is less than .02. While covariancereproduction is an important criterion, variance explained isof high pragmatic interest. For each of the endogenousconstructs (except Recall), the explained variance, as shownin Table 4-4, is reasonably high given the survey researchcontext and the nature of the constructs themselves. Recallis not well-explained by the exogenous constructs, but this isnot totally unexpected. The rest of the constructs have atleast 12 percent of their variance explained within the model.
The R2 reported for the facets of Perceptions of Armyattributes has been adjusted to reflect only the model-basedcontribution to explanation; that is, the variance explainedby the G-factor, given by the squared loading as reported inTable 4-1, has been subtracted from the total varianceexplained as reported by the LISREL software to provide a morerealistic estimate. The 38% explained variation in Intentionscompares quite favorably with the studies reported by Fishbeinand Ajzen (1975). It thus seems that the model as specifiedperforms quite well. The fit is good, the variance explainedis adequate, lnd the relationships are generally in thehypothesized direction and of the expected magnitude. Whilethere are some unexpected findings, these may represent eithershortcomings in the specification of the model or
71
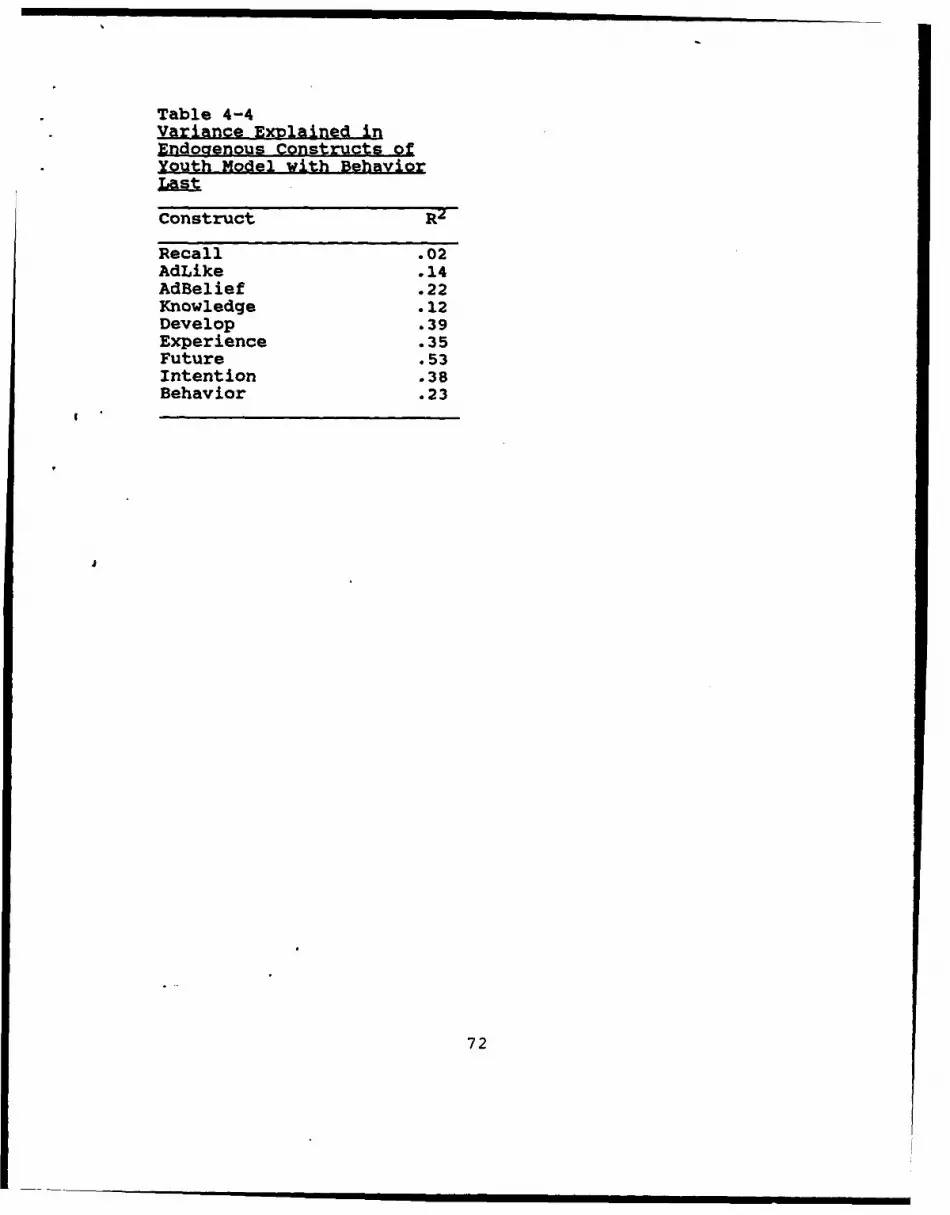
Table 4-4Variance Explained inEndogenous Constructs ofYouth Model with BehaviorLast
Construct Rz
Recall .02AdLike .14AdBelief .22Knowledge .12Develop .39Experience .35Future .53Intention .38Behavior .23
72

opportunities for further analysis as model development moves
beyond the prototype stage.
Behavior-First Youth Model
Since the model development effort in this project isdesigned to construct a prototype, the investigation cannot behalted when a model which seems to adequately fit the data isfound. In fact there may be many alternative models which fitthe data. In this case, the most compelling alternative modelis one which models behavior as an exogenous variable,assuming that the 6-month retrospective nature of the behaviormeasurement encompasses mostly or entirely "past" behavior, asopposed to contemporaneous behavior, however defined. Themeasurement parameter estimates are virtually identical to themeasurement parameters reported in Table 4-1 and are notrepeated. This is encouraging in that it suggests thatinterpretational confounding of measurement with structuralparameters is not a serious problem with these models..
The effects of Behavior, along with the four previouslyinvestigated exogenous constructs, on the remaining endogenousconstructs in the reformulated model are presented in Table 4-5. Enlistment-related behavior is positively related toRecall, Liking of Army ads, Knowledge of Army offers, andIntention. It is of interest to note that the path fromBehavior to Belief of Army ads is not substantial in thismodel, as compared with the small negative path from Ad Beliefto Behavior found in the previous model specification. Therelationships of the other four exogenous constructs seem tobe somewhat invariant to the placement of Behavior in themodel, as are, in general, the relationships among theezdogenous constructs (Table 4-6). The effects of Knowledgeon Intention become less substantial when past behavior isaccounted for, as does the path from "Develop" to Intention.The negative relationship between "Experience" and Intentionremains.
The overall fit of the "Behavior First" model is almostidentical to the fit of the "Behavior Last" model. Chi-squaredecreases modestly with an associated increase in degrees offreedom, while the remaining fit criteria are essentiallyunchanged (Table 4-7). It thus seems that it is not possibleto choose between the two models on purely empirical grounds.Therefore, it seems imperative that individual-levelreinterview data be obtained such that behavior subsequent tointentions anU the other predictors in the model can bemeasured, and behavior can unambiguously take its properposition as the ultimate endogenous construct in the model.
73
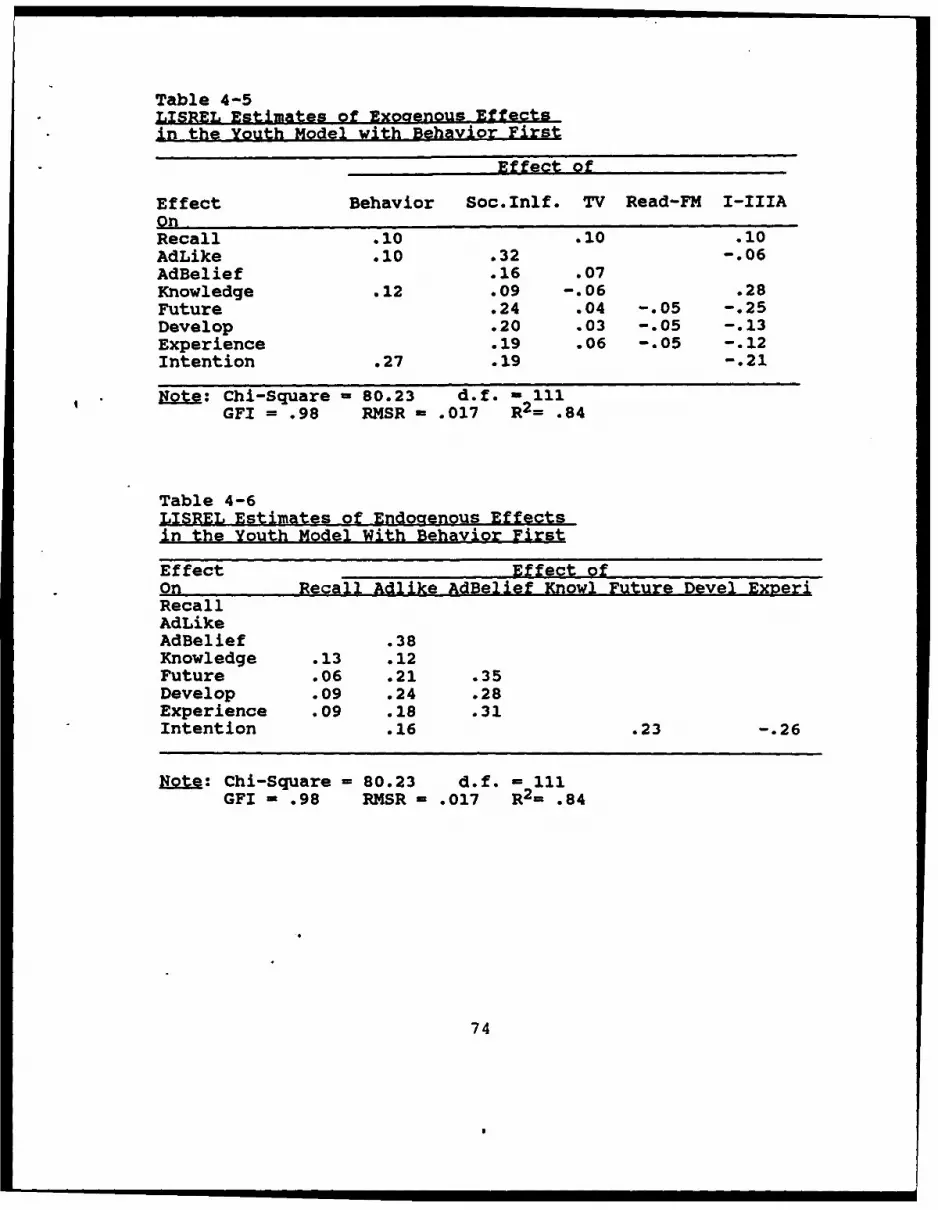
Table 4-5LISREL Estimates of Exoaenous Effectsin the Youth Model with Behavior First
Effect of
Effect Behavior Soc.Inlf. TV Read-FM I-IIIAOnRecall .10 .10 .10AdLike .10 .32 -.06AdBelief .16 .07Knowledge .12 .09 -.06 .28Future .24 .04 -.05 -.25Develop .20 .03 -.05 -.13Experience .19 .06 -.05 -.12Intention .27 .19 -.21
Note: Chi-Square = 80.23 d.f. = 111GFI = .98 RMSR = .017 R2 = .84
Table 4-6LISREL Estimates of Endogenous Effectsin the Youth Model With Behavior First
Effect Effect ofOn Recall Adlike AdBelief Knowl Future Devel ExperiRecallAdLikeAdBelief .38Knowledge .13 .12Future .06 .21 .35Develop .09 .24 .28Experience .09 .18 .31Intention .16 .23 -.26
Note: Chi-Square - 80.23 d.f. = 111GFI - .98 RMSR = .017 R2 _ .84
74
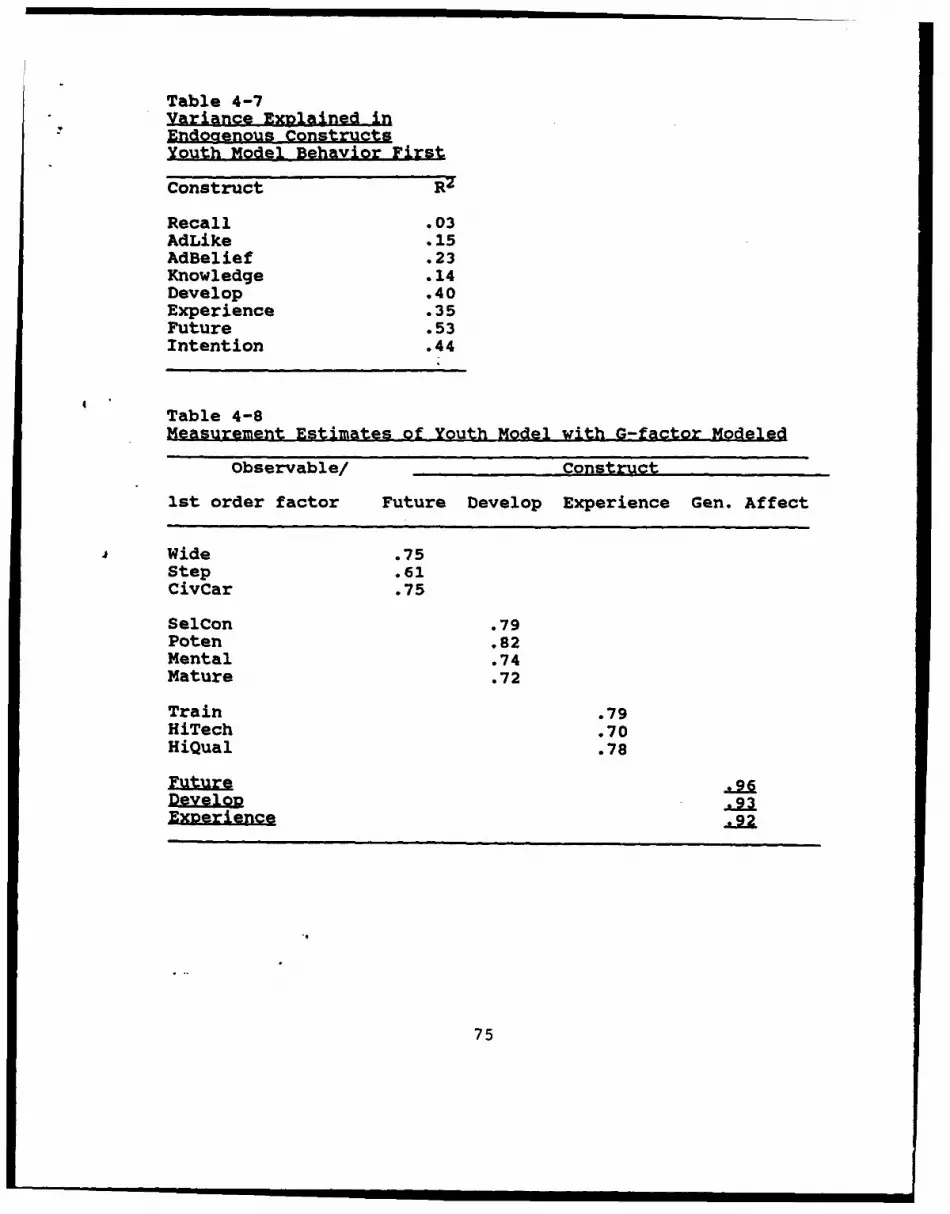
Table 4-7Variance Exlained inEndogenous ConstructsYouth Model Behavior First
Construct RZ
Recall .03AdLike .15AdBelief .23Knowledge .14Develop .40Experience .35Future .53Intention .44
Table 4-8Measurement Estimates of Youth Model with G-factor Modeled
Observable/ Construct
1st order factor Future Develop Experience Gen. Affect
Wide .75Step .61CivCar .75
SelCon .79Poten .82Mental .74Mature .72
Train .79HiTech .70HiQual .78
F.96D.93
75

G-Factor Model
Since by far the most tenuous part of the two modelsdiscussed thus far is the "three-facet with a second orderfactor" structure of perceptions, and since research on thisdata to date had conceptualized these items as unidimensional,the model in Figure 4-1, the behavior last model, wasreestimated with the G-factor itself serving as an endogenousconstruct to be predicted and to in turn predict behavior.The results of the measurement estimation are presented inTable 4-8. When the G-factor is modeled in a structuralcontext, the measurement parameters relating the first-orderconstructs to the individual items are quite similar to thoseobtained from both the preceding facet models and theconfirmatory factor analysis conducted in a strictlymeasurement context. The second order loadings of the threefacets on the G-factor now far more closely resemble theconfirmatory factor loadings than they do the correspondingloadings obtained from the first-order factor oriented model.
The parameter estimates associated with the exogenousconstructs again are changed very little by this modelrespecification. The General Affect second-order construct ispositively related to Social Influence and TV, and negativelyrelated to Read-FM and I-IIIA probability. With regard to theother endogenous constructs, the G-factor is positivelyrelated to Recall, AdLike, AdBelief, and Knowledge. As apredictor of Intention, however the small positive coefficient(.08) in Table 4-9 suggests that the facet model may bepreferred. That is, this low coefficient comes about as aresult of the Future and Develop facets having strong positiverelationships with Intentions, while the Experience facet hasa strong negative effect. The net result is a weak positivecoefficient for the second-order factor. This is reflected inthe fit of the model also, which is marginally worse than thefacet model, given its increase in degrees of freedom. Thedifference in chi-squares for the two models is approximately32, with 20 degrees of freedom, and the RMSR is 33% larger.The variance explained in the endogenous constructs changesvery little in this model (Table 4-10) from the previousformulation, however (see Table 4-4).
Parent Model
The model for the parent sample is depicted in Figure 4-2.The parent model is quite similar to the youth model in Figure4-1, with thd exceptions noted in the third chapter.Specifically, the structure of the media exposure constructsfor the parent sample suggests that TV hours and Reading hourscan be combined as a single construct, while FM radio exposure
76

4)oHel
V 0
$4~0
F4.-EU . 9 .
C) 4-w- qw q U t
0 I
%D to
z V.C 0 oi-to
.44 44
'U 004.4
I1 Hto r- t L
Hw 003-44,
4) 00 V
014 UAM 0 V(w .)ra 9 ) r.
E- I4 IXAC40
77I

Table 4-10Variance Explained inEndocenous ConstructsYouth Model Behavior-LastG-Factor Modeled
Construct Rz
Recall .02AdLike .14AdBelief .22Knowledge .12General Affect .47Intention .36Behavior .23
Table 4-11Measurement Estimates for Parent Model
Observable/ Construct1st-order Factor Future Develop Experience Gen.
Affect
Wide .83Step .66CashEd .69
SelCon .84Poten .88Mental .82Mature .80
Physical .74HiTech .73Proud .83
Future .7Develop~ J22
78

hours per week is the second exogenous construct. The threefacets of generalized affective response underlyingperceptions of Army attributes are similar in nature andcontent, but with some different observable indicants.Finally the ultimate dependent constructs are the parent'saffect toward the Army as a career choice and the parents selfreported activities directed toward the youth's enlistment.
The measurement model for the facets of perceptions ofArmy attributes is presented in Table 4-11. These parameterwere estimated in the context of the overall structural model,and compare favorably with the results of the youth model.Once again we note the lower magnitude of the loadingsrelating the first order facets to the second ordergeneralized construct when the measurement model is embeddedin the structural model. Overall, the measurement model seemsto fit and exhibit both convergent validity (large positivefirst order loadings) and discriminant validity (second orderloadings not equal to 1.0).
Structure
Interestingly, both media exposure constructs arenegatively related to recall of Army ads (Table 4-12). Aswith the youth model, however, it seems that this is likely toreflect background individual difference effects not includedin the model rather than causal relationships. It is highlyunlikely that decreasing media exposure would in fact bringabout an increase in recall. TV-Read is, however, positivelyrelated to the perceptions of Army attributes facets. Recallis positively related to Knowledge, the Develop and Futurefacets of perceptions, and directly to parental action.Liking of Army ads is positively related to AdBelief,Knowledge of Army offers, and all three facets of perceptions,while Belief of Army ads is related to the Develop andExperience facets of perceptions.
Consistent with the youth findings relative tointentions, two of the three facets of perceptions relatepositively to parental affect, while the Experience first-order factor shows a negative relationship. It should benoted, however, that although all three coefficients are largein absolute magnitude, they also exhibit large standarderrors. Nevertheless, the consistency of the negativerelationship between the Experience facet and subsequentendogenous constructs for both the youth and the parent modelssuggests that attributes relating to what is done while in theArmy are, at a minimum, secondary to personal development andpreparation for the future related attributes. There is, asexpected, 4 strong positive relationship between parentalaffect toward the Army and parental action with respect to theyouth's enlistment related activities.
79

The overall fit of the parent model is substantiallyworse than the fit of the youth model in any of its forms.The chi-square value is over twice the degrees of freedomavailable for an amsumed minimum sample size of 500. Thegoodness of fit index is still rather high, however, and theRMSR, while higher than for the youth model, is still highlyacceptable. We would conclude that the parent model providesa fit of the data consistent with the fit obtained in mostreported applications of the covariance structure modelingmethodology, and suffers only by comparison to the extremelygood fit obtained with the youth model. The explainedvariance in many of the endogenous constructs is good (Table4-13), with only the ultimate endogenous construct, parentalaction, exhibiting lower than expected variance explained.This is not surprising since there are many reasons why aparent who has a positive feeling toward the army may or maynot choose, at a particular point in time, to discussenlistment with his or her child.
80
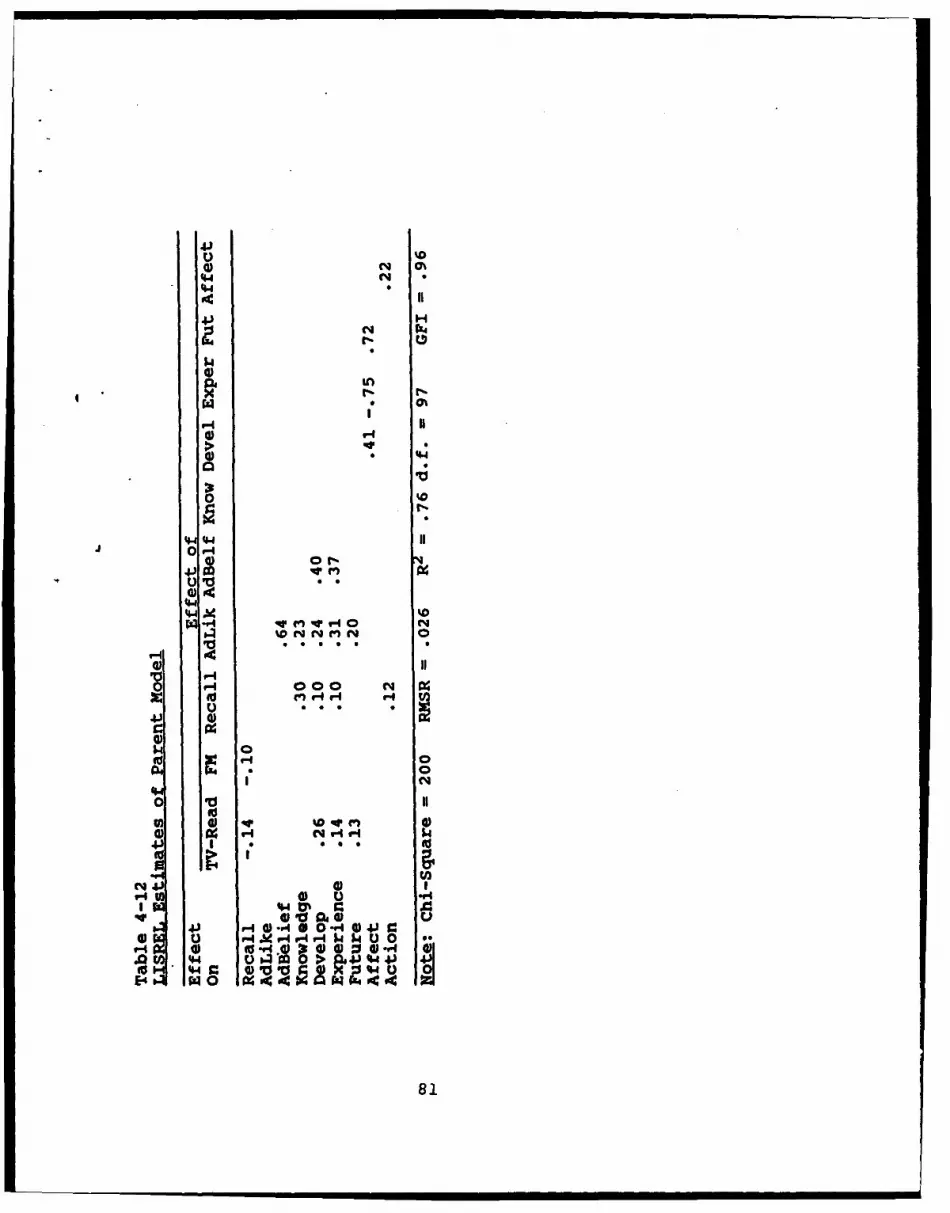
144 (.4
04 1
4J H
0~ In
0 '-
0 t
a0 0-4
14014
44 A4lON -A en v0'ar * q m * *
-4 i0110o 000 (.4
z to).- -4 V
01 4
0?A %0v
V 0 alI &.
o 'to "q41 V 040 IDsc)
0 i- 4 .4 -4i- m4
0- IV VI 1-A 44 u 0 >I#V4-
-4 pa0 4U64 c 04 01
81

Table 4-13Variance Explained inEndogenous ConstructsParent Model
Construct Rz
Recall .03AdLike .01AdBelief .42Knowledge .12Develop .41Experience .32Future .47Affect .31Action .11
82
SUMMARY, CONCLUSIONS, AND RECOMMENDATIONS
In this chapter, we briefly summarize the results of themodeling effort, and conclusions relative to the 3bjectives ofthe project. We also make recommendations for further studyand model development.
Summary
Findings with respect to the overall model and each ofthe endogenous (dependent) constructs in the model aresummarized below. First, the overall prototype modeldeveloped, based on both theoretic considerations and thelimitations and possibilities inherent in the ACOMS data base,
, is discussed. This discussion is followed by a review of thefindings with respect to each endogenous construct, in termsof its structure, predictors, and explained variance.
Overall Youth Model
The basic model developed and estimated consists oftwelve constructs, eight of which are endogenous. Due to theinapplicability of the congeneric measurement model employedin LISREL to many of the constructs, the ability of thecovariance structure modeling approach to incorporatemeasurement error was utilized by assigning a conservativemeasurement error estimate to the single-indicant constructs.In the case of the facets of Beliefs about Army Attributes, asecond-order measurement model was directly estimated.
The overall fit of the basic model is quite good. Thechi-square statistic, interpreted as an index of fit ratherthan a formal test for the rejection of the null hypothesis,is small relative to its degrees of freedom; the overallvariance explained in the model is high (.82) and the goodnessof fit index is very good (.98); and the square root of theaverage squared residual correlation is quite small (.018).
SDecific findings. Findings with respect to theendogenous constructs in the Youth Model are as follows:
Behavor, the self-reported enlistment-related activitiesof youth, are predicted in the model by Social Influence,Knowledge of Army Offers, and Intentions to "do something"about enlistment. Behavior is negatively related to AdBelief. Tweflty-three percent of the variance in behaviors isaccounted for by the model.
83
Intention to engage in enlistment-related activities ispredicted by Knowledge, Liking of Army Ads, and SocialInfluence. It is also positively related to the "Development"and "Future" facets of Beliefs. There is a negativerelationship between Intention and Probability of scoring inTSC I-IIIA, as there is with the "Experience Itself" facet ofBeliefs. R2 for Intention is .38.
Beliefs about the Army are found to be composed of asingle general or second-order factor with three facets orfirst-order factors relating to the opportunities in the Armyfor Personal Development, Future benefits from Army service,and beliefs about the Army Exeiience itself. When thesecond-order general factor is modeled, it is predicted bySocial Influence, TV hours, Reading-FM Radio hours (negative),I-IIIA probability (negative), Recall, Liking, and BelievingArmy Ads, and Knowledge of Army Offers. Forty-seven percentof its variance is explained.
When the three first-order factors or facets are modeled,all three are positively related to Social Influence andnegatively related to Read-FM and I-IIIA probability. Allthree are also positively related to Recall, Liking andBelieving Army Ads, and the Personal development factor isrelated to Knowledge of Army Offers. Variance explained forthe Future, Development, and Experience facets is .53, .39,and .35, respectively.
Knowledge of Army Offers is positively related to Recalland Liking Army Ads, Social Influence, and I-IIIA probability,while negatively related to TV hours. R2 is .12.
Belief of Army Ads is strikingly related to Liking ofArmy Ads, Social Influence, and TV-Hours, while Lijg ArmyAds is positively related to Social Influence and negativelyrelated to I-IIIA probability. Finally, Recal of Army Ads isrelated to hours spent viewing TV.
Alternative Youth Model. As previously discussed, theretrospective nature of the "Behavior" construct renders itsproper placement in the model problematic. In order toaccount for the alternative interpretation, a model similar tothe basic model was estimated with reported enlistment-relatedbehaviors as an exogenous construct rather than an endogenousconstruct. The fit of this Behavior-First model is virtuallyidentical to that of the basic (Behavior-Last) model,providing no substantive grounds for distinguishing betweenthe two models on their ability to reproduce the observedcorrelation matrix. As a result, one must interpret thefindings of each model with the alternative interpretation inmind.
84

Parent Model
A separate model was developed for the Parent dataavailable in ACOMS. The parent model and the youth modelswere estimated separately in order to use all of the availableyouth data. The Parent model contains nine endogenousconstructs and two exogenous constructs, with measurementproperties similar to those in the Youth model. The Parentmodel also fits the data quite well, with a chi-square ofapproximately twice its degrees of freedom, an overallvariance explained of .76, and a goodness of fit index of .96.
Soecific findinas. The overall pattern of relationshipsin the Parent model is surprisingly similar to the findings ofthe Youth model. The ultimate endogenous construct, theintent of the parent to take Action with respect to youthenlistment, is positively related to recall of Army ads and tothe overall positive predisposition (Affect) of the parenttoward the Army, with an R2 of .11.
Parental Affect has an explained variance of .31, and,consistent with the findings of the youth model, is negativelyrelated to the "Experience Itself" facet of Beliefs whilepositively related to the "Development" and "Future" aspects.
Overall, the prototype models developed, subject to thelimitations of the data and the recommendations for furtherwork presented subsequently, seem to be successful in modelingthe complex and often indirect effects of Army Advertising asit affects beliefs, intentions, and behavior. It is perhapsimportant at this point to pay particular attention to therelationship between this prototype modeling effort and theobjective of "modeling the effects of Army advertising". Inparticular, the model assumes a particular role forAdvertising which should be formally stated.
The Role of Advertising
Advertising is a tool which can be used to accomplish oneor more objectives of the sponsor. At the broadest level,advertising objectives are described as those of 1) providinginformation (inform), 2) persuading the potential buyer of therelative superiority of the sponsor's product (persuade), and3) to keep the name of the sponsor in front of the potentialbuyer (remind). A specific ad, however, would pursue a morespecific objective. An ad might seek to increase awareness ofthe product ot service by a specified amount, for example.Or, the objective might be to change the beliefs in the amountof a particular attribute possessed by the product.
85

These objectives are not developed in isolation. They area link in a means-end-chain in which the "end" refers tooverall organizational goals and objectives. Thus, thedevelopment of objectives is a hierarchical process. Basedupon the organizational goals, marketing, for example, mustdevelop its own set of objectives which when accomplished,will contribute to achieving the broader objective. Likewise,advertising derives its objectives from marketing which whenaccomplished will lead to the achievement of marketingobjectives. As a result, objectives for advertising areseldom stated in the same units as those of marketing (nor aremarketing's objectives in units of the organization). Thus,marketing may seek objectives of increasing brand loyalty ormaintaining market share, but virtually never of return oninvestment. Likewise, advertising objectives are almost neverstated in terms of sales.
This does not mean that marketing efforts do notcontribute to ROI nor that advertising is unrelated to sales.It does suggest that these effects are likely to be indirectin nature. In the context of Army advertising, this suggeststhat ads are unlikely to directly cause enlistment. (This maybe the reason that the regression techniques reviewed in thefirst have been unsuccessful). It is intuitively implausiblethat a youth would listen to an ad or ads for the Army andimmediately enlist. Clearly, such a decision would involvemany other factors.
The point of this brief tutorial is that while advertisinghas a role to play in the Army enlistment process, its effectsare necessarily embedded in a broader hierarchy. Theprototype models developed here must be viewed in thiscontext; while they were designed to assess the impact ofadvertising, the means-end-chain linkages must be examined andadvertising effects considered within this framework.
Considering the above, Army advertising appears to havebeen reasonably successful. The respondents tend to recall,like and believe Army ads, and this in turn results inconsistently favorable beliefs about the Army, at least withrespect to those beliefs included in the ACOMS data. Thesebeliefs, then, are generally positively related to intentionsto take some action with respect to enlistment. This chain ofevents is consistent with the role of advertising discussedabove, and suggests that Army advertising does indeed have animpact on those areas where it can be expected to play a role.
While the models estimated include retrospective behavioras a construct, which is positively related to both Beliefsabout Army attributes and Intentions, it should be emphasizedthat these are enlistment-related behaviors, not accessions.If actual accession, the ultimate goal of the recruiting
86
i - ,. -i

process, were taken as the dependent variable, the directimpact of Advertising and its closely related outcomes mightnot, and indeed probably would not, emerge as strongpredictors, given the myriad of other factors which couldresult in a favorably predisposed (perhaps due to Advertising)youth not enlisting or being accepted, and alternatively thepotential of a non-favorably predisposed youth at the time ofinterview eventually enlisting in the Army. The point is,there is a large unexplainable (unmeasured) component inaccessions, from the modeling viewpoint. If accessions areused as an ultimate criterion without the inclusion of otherconditions under which actual behavior could deviate frompredispositions and intentions, biased and misleadingconclusions with respect to the role of advertising in theoverall enlistment process could result.
Recommendations
In conclusion, it is perhaps appropriate to address someof the issues which should be considered as plans are made forfuture research which may be conducted on the effects of Armyadvertising and the enlistment decision, whether baseddirectly on the prototype models developed here or on othermodels for other immediate purposes. These issues will bediscussed as they relate to measurement considerations, modelstructure, and data gathering.
Measurement Issues
Recall, Over 80% of the respondents in the ACOMS datarecall (unaided) one or more Army Ads. This is a testimony tothe effectiveness of the Army advertising program, butpresents difficulties in the modeling process. Since almosteveryone recalls Army ads, it is impossible for this variableto discriminate among those who have favorable and unfavorablebeliefs, intentions, etc. Future research efforts shouldattempt to gather sufficient data, perhaps in the form ofspecific recall of content over a number of ads, to gain adistribution of respondents on this variable rather thanhaving such a high proportion in the single category.
Knowledae of Army life. One of the more intriguingfindings in this prototype model is the negative relationshipbetween the "Experience Itself" facet of Beliefs andIntentions for the Youth sample and between the same facet andAffect for the Parent sample. The "Experience" facet is notparticularly strong, and its labeling must be viewed as bothsubjective and tentative. However, this consistent findingwould seem to warrant further study, through the use of beliefstatements which reflect beliefs about what Army life is, andKnowledge assessment relative to daily life of an Army
87

recruit. It may be that the Army has "sold" American youthand their parents on the value of the Army as a means towardpersonal development and as a road to future opportunities,but has not adequately addressed what the experience in theArmy actually entails, apart perhaps from the sometimesnegative images of basic training emanating from popularmedia.
B If one is to have a well-specified model,avoiding the potential for omitted variable bias, the beliefsabout Army attributes which may be negative, or which at theleast are not the subject of current or recent Armyadvertising, should be included. While these beliefs may havenothing directly to do with the success of the Army in meetingits communications objectives, their presence is necessary ifone is to obtain unbiased estimates of the more relevantparameters in the model, as well as having the potential toprovide additional insight into the enlistment decision. Withrespect to widely held beliefs such as those included in theACOMS data, an effort should be made, either through questionwording or response category labeling, to obtain adistribution of responses with greater variance than thedistribution obtained in this data, which is skewed stronglyto the left and truncated to the right.
Behavior. Given the sequential nature of the impact ofadvertising, and the "over time" nature of behavior, it isimpossible to measure behavior in the same instrument at thesame time as the other components in the model whilemaintaining an unambiguous causal directionality. This arguesstrongly for reinterview data, with behavior (and otherfactors which could have influenced that behavior) assessedafter the other components in the model.
Structural Issues
With respect to model structure, it seems that choieshould be the focus of this model and that relative assessmentof alternatives should be a component. Thus, rather thanrelate attitude score to behavioral intentions as in theFishbein case, we recommend a 'share of attitude' approachsuch as the multinomial logit model (McFadden, 1986). JR thismodel, the probability that an individual will selectalternative is given by:
Pc(i) - EXP(Vi)/ E EXP(Vj).
where Vi is the utility for the ith alternative and is usuallyconsidered alinear function of the belief statements.Intentions.then, would be predicted by these probabilities.
88

Such an approach would explicitly account for the"choice-among-alternatives" nature of the enlistment decision,and should provide additional insight as well as betterpredictive capability. Of course, other factors affecting thechoice would need to be included, and the extensive use ofrotating modules for data collection would be ruled out. Sucha model could be estimated in a covariance structure context,however.
Data Gatherina
First and foremost, as noted previously, a model such asthe prototype developed here is impossible to estimate onstrictly cross-sectional data. Two or more reinterviews ofthe same respondent over the course of the decision "window"leading to enlistment or an alternative choice are imperativeif the model is to be viewed as other than a suggestiveprototype.
While it is fully recognized that the ACOMS data werecollected to serve a variety of purposes, it may well be thata data collection effort more singularly focused on modelingthe effects of Army advertising may prove fruitful. Inparticular, such a data collection effort could:
I. Be designed with the congeneric measurement model employedin covariance structure modeling in mind;
2. Be carried out on a smaller sample, with the nationalrepresentativeness of the sample not an overriding issue;
3. Discard the use of rotating modules and interpenetratingmodules, due to the lower volume of data necessary, and thusmaintain the possibility of meeting the assumptions underlyingthe use of covariance structure models while allowing for a"choice" formulation of the model.
4. Drop the Parent sample from the data collection effort, asthe ACOMS data seem to have demonstrated that a similar modelholds for youth and parents and the importance of parents innow well established.
5. Incorporate two or more reinterviews to truly assess thelinkages between advertising, beliefs, intentions, andbehavior in a time-series context.
89

REFERENCES
Bagozzi, R. P. (1984). A prospectus for theory construction inmarketing. Journal of Marketina, 48 (Winter),11-29.
Bearden, W., Sharma S., & Teel, J. (1982). Sample sizeeffects on chi-square and other statistics used inevaluating causal models. Journal of Marketina Research, 14(November), 425-430.
Beckwith, N. E. & Lehman, D. (1975). The importance ofhalo effects in multi-attribute attitude models. Journalof Marketina Research, 2 (August), 265-275.
Bentler, P. M. & Weeks, D. G. (1980). Linear structuralequations with latent variables. Psvchometrika, 45, 289-308.
Bentler, P. M. (1985). Theory and imDlementation of EOS: Astructural eauations Droaram. Los Angeles: BMDP StatisticalSoftware.
Cattell, R. B. (1966). The scree test for the number offactors. Multivariate Behavioral Research, I (April), 245-276.
Cooper, W. H. (1981). Ubiquitous halo. Psychological Bulletin,90 (2), 218-244.
Dillon, W. R., Mulani, N. & Frederick, D. (1984). Removingperceptual distortion in product space analysis. Journalof Marketing Research, 21 (May), 184-193.
Dixon, W. J. (Ed.). (1981). Biomedical computer Drograms.Berkeley: University of California Press, Ltd.
Fishbein, M. & Azjen, I. (1975). Beliefs. attitude.intention, and behavior: An introduction to theory andresearch. Reading, MA: Addison-Wesley.
Fornell, C. (1983). Issues in the application of covariancestructure analysis: a comment. Journal of ConsumerRe c, (March), 443-448.
Gaertner, G. H. & Elig, T. W. (Eds.). (1988). The ArmyCommunications Objectives Measurement System (ACOMSI:Survey analysis plan (ARI Technical Report 786). AlexandriaVA: U.S. Army Research Institute for the Behavioral andSocial Sciences. (AD A196 588)
91

Gerbing, D. W. & Anderson, J. C. (1984). On the meaning ofwithin-factor correlated measurement errors. Journal 2fConsumer Research, n1 (June), 572-580.
Guttman, L. (1941). The quantification of a class ofattributes: A theory and method of scale construction. InP. Horst et al. (Eds.). The Drediction of personalaldilflre. New York: Social Science Research Council.
Guttman, L. (1944). A basis for scaling qualitative data.American Sociological Review, .1, 139-150.
Holbrook, M. B. (1984). Using a structural model of haloeffect to assess perceptual distortion due to affectiveovertones. Journal of Consumer Research, 12(September), 247-252.
Holbrook, M. B. & Huber, J. (1979). Separating perceptualdimensions from affective overtones: An application toconsumer aesthetics. Journal ofConsumer Research, i(March), 272-283.
Howell, R. D. (1987). Covariance structure modeling inmarketing: A comment on "Intercorrelations among sources ofpower in a channel of distribution." Journal of Marketingeser, 12 (February), 119-126.
Jepsen, D. A. & Dilley, J. S. (1971). Vocational decisionmaking models: A review and comparative analysis. Reviof Educational Research, AA (3), 331-349.
Joreskog, K. G. (1971). Statistical analysis of sets ofcongeneric tests. Psychometrika, j (June), 109-133.
Joreskog, K. G. (1978). Structural analysis of covariance andcorrelation matrices. Psychozetriks, A (December), 443-447.
Joreskog, K. G. & Sorbom, D. (1986). LISRLVI,. Mooresville,IN: Scientific Software, Inc.
Kralj, M. M., Adelman, L., Wilson, M., McTeique, R.J., & Zirk,D.A. (1987). Modelina the individual enlistment decision,Phase I final report (ARI Research Note 87-61). AlexandriaVA: U.S. Army Research Institute for the Behavioral andSocial Sciences. (AD A189 481)
Lavidge, R. J% & Steiner, G. A. (1961). A model for predictivemeasurenents of advertising effectiveness. Jurnal of
...Marketig, 2 (October), 59-62.
92
Loftus, E. (1986). Survey remembering. Proceedings of theSecond Annual Research Conference. Washington, D.C.:Bureau of the Census, 193-207.
McFadden, D. (1986). The choice theory approach to marketresearch. Marketina Science, I (Fall), 275-297.
McTeigue, R. J., Kralj, M. M., Zirk, D. A., Adelman, L. &Wilson, M. (1987). Predecision processes involved in theenlistment decision (ARI Research Note 87-62). Alexandria,VA: U.S. Army Research Institute for the Behavioral andSocial Sciences. (AD A189 597)
Myers, J. H. (1965). Removing halo from job evaluation Factorstructure. Journal of ADDlied Psvcholoav, _4, 217-221.
Nieva, V. F., Rhoads, M. D. & Elg, T. Y. (Eds.). (1988).The Army Communications Obiectives Measurement System(ACOMSI: Survey methods (ARI Technical Report 787).Alexandria, VA: U.S. Army Research Institute for theBehavioral and Social Sciences. (AD A199 441)
Nord, R. D., Schmitz, E. J. & Weiland, T. A. (1986).Prooensity and the enlistment decision (ARI TechnicalReport 723). Alexandria VA: U.S. Army Research Institutefor the Behavioral and Social Sciences. (AD A178 444)
Orvis, B. R. & Gahart, M. T. (1987). Development ofguality-based analysis caDabilitv for national youths (RAND Working Draft WD-3280-FMP, Contract No.MDA903-85-C-0030). Washington, DC: Office, AssistantSecretary of Defense (Force Management and Personnel).
Proctor, C. H. (1970). A probabilistic formulation andstatistical analysis of Guttman scaling. Psvchometrika, 5,73-78.
Research Triangle Institute. (1987). Youth Attitude TrackingStudy II: Supplementary tabulations of data collected inthe Fall. 1986 (Contract No. MDA903-86-C-0066). Arlington,VA: Defense Manpower Data Center.
Thorndike, X. L. (1920). A Consistent Error in psychologicalratings. Journal of ADDlied Psvcholgry, A, 25-29.
Westat, Inc. (1988a). The Army Communications ObjectivesMeasurement System (ACOmSi: Parental user's manual(ARI Research Product 88-07). Alexandria, VA: U.S. ArmyResearch Institute for the Behavioral and Social Sciences.(AD A199 663)
93
Westat, Inc. (1988b). The Army Communications ObjectivesMeasurement System (ACOMS): User's manual (ARI ResearchProduct 88-08). Alexandria, VA: U.S. Army Research Institutefor the Behavioral and Social Sciences. (AD A199 840)
Wilson, M. J., Davis, J. B., & Greenless, J. B. (1988). Branddifferentiation among Army components and military services.In V. F. Nieva, G. H. Gaertner, T. W. Elig, & M. E. Benedict(Eds.). The Army Communications Objectives Measurement System(ACOMS): Annual report, school year 86/87 (ARI TechnicalReport 784). Alexandria, VA: U.S. Army Research Institute forthe Behavioral and Social Sciences. (AD A196 607)
Zirk, D. A., McTeigue, R. J., Wilson, M., Adelman, L., &Pliske, R. (1987). Alternative approaches to modelinq theindividual enlistment decision: A literature review (ARITechnical Report 738). Alexandria, VA: U.S. Army ResearchInstitute for the Behavioral and Social Sciences.(AD A184 498)
94