Embed Size (px)
Citation preview

Modeling Leukocyte-Leukocyte Non-Contact Interactionsin a Lymph NodeNicola Gritti1, Michele Caccia1, Laura Sironi1,3, Maddalena Collini1, Laura D’Alfonso1,
Francesca Granucci2, Ivan Zanoni2, Giuseppe Chirico1*
1 Dipartimento di Fisica, Universita degli studi di Milano-Bicocca, Milano, Italy, 2 Dipartimento di Biotecnologie e Bioscienze, Universita degli studi di Milano-Bicocca,
Milano, Italy, 3 Dynamics of Immune Responses, Division of Immunology, Transplantation and Infectious Diseases, San Raffaele Scientific Institute, Milano, Italy
Abstract
The interaction among leukocytes is at the basis of the innate and adaptive immune-response and it is largely ascribed todirect cell-cell contacts. However, the exchange of a number of chemical stimuli (chemokines) allows also non-contactinteraction during the immunological response. We want here to evaluate the extent of the effect of the non-contactinteractions on the observed leukocyte-leukocyte kinematics and their interaction duration. To this aim we adopt asimplified mean field description inspired by the Keller-Segel chemotaxis model, of which we report an analytical solutionsuited for slowly varying sources of chemokines. Since our focus is on the non-contact interactions, leukocyte-leukocytecontact interactions are simulated only by means of a space dependent friction coefficient of the cells. The analyticalsolution of the Keller-Segel model is then taken as the basis of numerical simulations of interactions between leukocytesand their duration. The mean field interaction force that we derive has a time-space separable form and depends on thechemotaxis sensitivity parameter as well as on the chemokines diffusion coefficient and their degradation rate. All theseparameters affect the distribution of the interaction durations. We draw a successful qualitative comparison betweensimulated data and sets of experimental data for DC-NK cells interaction duration and other kinematic parameters.Remarkably, the predicted percentage of the leukocyte-leukocyte interactions falls in the experimental range and depends(>25% increase) upon the chemotactic parameter indicating a non-negligible direct effect of the non-contact interaction onthe leukocyte interactions.
Citation: Gritti N, Caccia M, Sironi L, Collini M, D’Alfonso L, et al. (2013) Modeling Leukocyte-Leukocyte Non-Contact Interactions in a Lymph Node. PLoSONE 8(10): e76756. doi:10.1371/journal.pone.0076756
Editor: Jason R. Lees, Uniform Services University of the Health Sciences, United States of America
Received March 14, 2013; Accepted August 28, 2013; Published October 28, 2013
Copyright: � 2013 Gritti et al. This is an open-access article distributed under the terms of the Creative Commons Attribution License, which permitsunrestricted use, distribution, and reproduction in any medium, provided the original author and source are credited.
Funding: This work has been partially funded by the FP7 program ENCITE (grant agreement number 201842; http://www.encite.org) to FG and GC and by theRegional Project of Regione Lombardia, ‘‘Accordo Quadro’’ 2009, to GC (http://www.formalavoro.regione.lombardia.it). The funders had no role in study design,data collection and analysis, decision to publish, or preparation of the manuscript.
Competing Interests: The authors have declared that no competing interests exist.
* E-mail: [email protected]
Introduction
The Immune System defends our organism from pathogens via
innate and adaptive immune responses that are triggered by a
cascade of interactions between different leukocytes [1]. One of
the most known cell-cell interactions involves mature Dendritic
Cells (DCs) and T cells leading to the activation of adaptive
immunity. Recent reports showed clear evidence that DCs play a
major role also in the activation of Natural Killer (NK) cells. This
process involves direct DC-NK cell interactions [2–4] and release
of a number of cytokines [5].
The interactions between leukocytes have been visualized with a
number of imaging techniques [6]. Particularly effective to this aim
are recent Two-Photon Microscopy (TPM) studies. This approach
allows to quantify the cell diffusion coefficients, the statistics of the
cell motion [7] and the duration and distribution of cell-cell
interaction times [8–13]. The sensitivity and accuracy of the
algorithms employed to reveal the interactions between the
leukocytes have been specifically questioned recently [7]. The
two-photon in-vivo microscopy experiments provide a wide range
of parameters that characterize the cell diffusion and the cell-cell
interaction. However, several questions can be raised regarding
the operative definition of leukocyte-leukocyte interaction. The
detection of an interaction can be affected by methods used for the
image analysis. Often the detection of the interaction between
leukocytes is made by visual inspection of the acquired images, and
this may introduce unwanted bias to the data. Even when a
quantitative algorithm is employed [7], it is difficult to reduce the
complexity of the motion to a test of few selected kinematic
parameters. Additional problems arise from the limited observa-
tion time window and by the loss of tracking due to poor signal/
noise in the images [7].
These issues could be addressed with the help of numerical
simulations that should take into account a variety of processes. In
particular our thesis here is that leukocyte kinematics in vivo is
affected by membrane receptors mediated direct contacts, but also
by leukocyte-leukocyte signaling producing effective non-contact
interactions. Signaling among cells have been addressed in the
literature [14–16], but these studies were not widely applied to in
vivo two-photon microscopy data analysis. Intermittent directional
motion of the leukocytes [13] observed in-vivo are an indication of
non-contact interactions among leukocytes. These interactions
have also alternative sources, for example direct interaction with
the tissue in their motion, in addition to chemo-attraction
mediated by chemokines [17,18] or chemokinesis [15]. The
PLOS ONE | www.plosone.org 1 October 2013 | Volume 8 | Issue 10 | e76756

outlined scenario is complex and the role played by non-contact
interactions is not easy to be discerned. We are not looking here
for a comprehensive model that describes such complex scenario
and would require further developments that take advantage of the
sophisticated models reported in the literature [19–24]. We
address instead the extent of the effect of non-contact interactions
on the observed kinematics of the leukocytes, primarily on the
interaction duration. To this purpose we will employ a simplified
mean field description of the leukocyte-leukocyte non-contact
interactions. Contact interactions will be accounted for in an a-
specific way by means of a space dependent leukocytes friction
coefficient.
We develop then a simple numerical algorithm that takes into
account the leukocyte diffusion and some sort of action at a
distance between the leukocytes, to simulate which we are inspired
by the general theoretical framework set up by Keller and Segel
[25] to treat chemotaxis. We derive a solution of the Keller-Segel
model for a simplified expression of the cell-cell interaction
potential in the presence of chemokines. This is based on the
assumption that the less mobile dendritic cells act as a slowly
varying source of chemokines that attract the highly mobile NK
cells. We apply this solution to an extensive numerical simulation
study with statistics comparable to that typically obtained by two-
photon microscopy experiments. Several other elegant applica-
tions and solutions of the Keller-Segel model have been reported
in the literature [14–16], also for the analysis of leukocytes motion.
However these works deal with in vitro studies, for example the
Millipore filter diffusion experiment [15] or the under-agarose
migration assay [26] or micro-organisms observations, such as
parasitoids aggregation in response to chemical signaling [14], and
in some cases report full simulative developments of the Keller -
Segel original model [25].
The relevant parameters of the Keller -Segel model are the
chemotaxis sensitivity parameter, x, the chemokine degradation
rate, k and chemokine source density J (r,t) (see Eq.9A, below).
The analytical expression of the effective attractive potential can
be obtained with the assumption that the chemokine production
time is much larger than their diffusion time over a distance of a
few cellular diameters. This solution is then employed in
numerical simulations of the chemokine mediated interaction
between the highly mobile NK cells and the DCs. In this way we
can predict several geometrical and dynamical parameters of the
leukocytes motion, the probability distribution of the duration of
the interactions between NK and dendritic cells and its
dependence on the sensitivity parameter. On this basis we can
draw qualitative comparison with experimental data.
Materials and Methods
Ethic StatementWe declare that all experiments were performed using protocols
approved by the University of Milano-Bicocca Animal Care and
Use Committee (also in agreement with the European rules, 86/
609/EEG and with the International Guiding Principles for
Biomedical Research Involving Animals, as developed by the
Council Organizations of Medical Sciences and the Guide for
the Care and Use of Laboratory Animals; http://ec.europa.eu/
environment/chemicals/lab_animals/revision_en.htm). Mice were
housed in containment facilities of the animal facility and
maintained on a regular 12:12 hour light:dark cycle with food
and water ad libitum.
Free cell diffusion simulationLangevin equation comprises an inertial, a dissipative and a
stochastic term. If we integrate the Langevin equation over times
much larger than the velocity relaxation time, we can get rid of the
inertial term. Within these assumptions the description of the
Brownian motion of a set of identical particles that move in a fluid
at thermal equilibrium can be obtained by the following equations:
[27–30].
cNK
d
dtri(t)~sCi(t)
SCi(tzDt)Cj(t)Tt~dijd Dtð Þ i,j~1,2,::::N
SCi(t)Tt~0
8>><>>: ð1Þ
All symbols used in the equations are listed and defined in
Table 1. The stochastic forces sCi tð Þ have Gaussian distribution
with variance s. The symbol d Dtð Þ indicates the delta function
with argument equal to the integration time Dt. This stems from
the Markovian character of the process and accounts for the
complete decoupling of successive integrations steps [31].
The second line of Eq.1 states that the stochastic forces are
uncorrelated on the scale of the velocity relaxation time,
tVV ~m=c(0)NK , where m and c(0)
NK are the mass and the friction
coefficient of the NK cell. We compute the cell frictional
coefficient, c(0)NK , as that of a rigid sphere of radius rNK >5 mm,
c(0)NK~6pgrNK%94mg=s, and the diffusion coefficient from the
Stokes-Einstein relation, D(0)~KBT=c(0)NK%0:045mm2=s. In these
relations g, T and KB are the solution viscosity and temperature
and the Boltzmann constant. With this choice, the velocity
relaxation time is few microseconds. Finally, the force variance is
related to the cell translational diffusion coefficient, D (0), and the
friction coefficient as:
D(0)~1
2
s
c(0)NK
!2
ð2Þ
The Langevin equation (Eq.1) corresponds to the Fokker-
Planck equation for the conditional probability of the NK cells,
f (ri,t; ri,0,0):
L0f (ri,t; ri,0,0)~1
2
s
c(0)NK
!2
LjLj f (ri,t; ri,0,0) ð3Þ
In Eq.3 and in the main text we use the notation,
Lf gj~0,::3~L=Lt;
L=Lx; L=Ly; L=Lz
n o, LjLj~L2
1zL22zL2
3~+2 and
in general we consider summed the repeated indices. The
integration time chosen here, Dt = 1s, is sufficiently larger than
the velocity relaxation time and allows us to integrate the
intracellular forces as detailed below. The Gaussian distributed
random variable Cj(t), is computed by means of a Box-Mueller
algorithm [32].
Free cell diffusion simulationThe Brownian motion of a set of identical Natural Killer (NK)
cells diffusing (diffusion coefficient D (0)) in a fluid at thermal
Non-Contact Interactions between Leukocytes
PLOS ONE | www.plosone.org 2 October 2013 | Volume 8 | Issue 10 | e76756
equilibrium was simulated, for integration times Dt much larger
than the velocity relaxation time,[31] by means of the following
finite differences algorithm [28,29,33]:
ri(tzDt)~ri(t)z<i(t,Dt)
S<a,i(t,Dt)<b,j(t,Dt)Tt~dijdab2D(0)Dt
S<a,i(t,Dt)Tt~0 i,j~1,2,::::NNK; a,b~x,y,z
8><>: ð4Þ
The above form is the integration of the Langevin equation
(Eq.1) as in the Euler-Maruyama algorithm and the stochastic
variables <i(t,Dt) are normally distributed. The diffusivity s (see
Eq.2) that appears in this equation is related to the random
displacement <a,i(t,Dt). The integration time was assumed Dt
= 1s throughout this study and the simulations included NNK
= 100 NK cells in a 5006500650 mm3 box and were run for a
total number of steps M = 107 with the following parameters (see
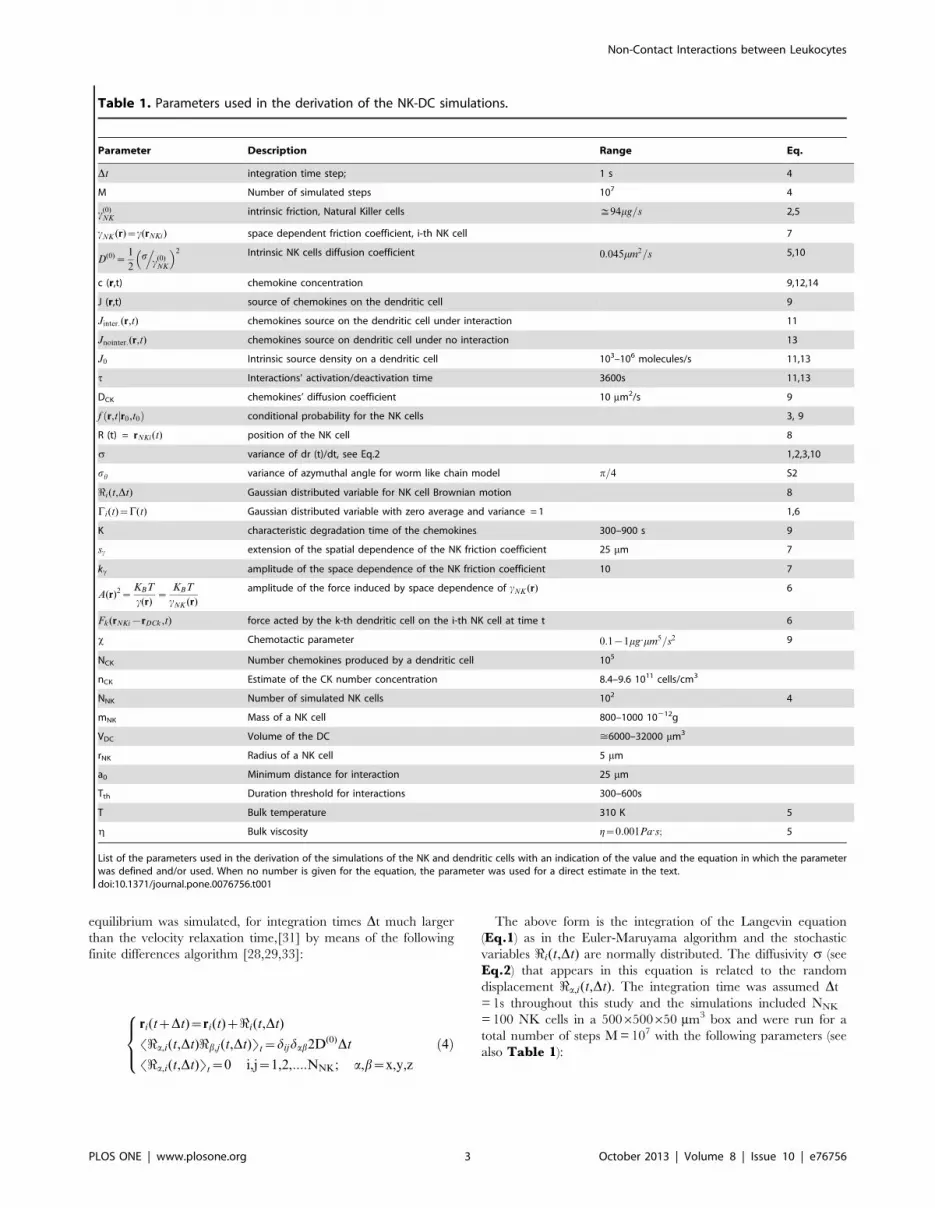
also Table 1):
Table 1. Parameters used in the derivation of the NK-DC simulations.
Parameter Description Range Eq.
Dt integration time step; 1 s 4
M Number of simulated steps 107 4
c(0)NK
intrinsic friction, Natural Killer cells %94mg=s 2,5
cNK (r)~c(rNKi) space dependent friction coefficient, i-th NK cell 7
D(0)~1
2s.
c(0)NK
� �2 Intrinsic NK cells diffusion coefficient 0:045mm2=s 5,10
c (r,t) chemokine concentration 9,12,14
J (r,t) source of chemokines on the dendritic cell 9
Jinter:(r,t) chemokines source on the dendritic cell under interaction 11
Jnointer:(r,t) chemokines source on dendritic cell under no interaction 13
J0 Intrinsic source density on a dendritic cell 103–106 molecules/s 11,13
t Interactions’ activation/deactivation time 3600s 11,13
DCK chemokines’ diffusion coefficient 10 mm2/s 9
f r,t r0,t0jð Þ conditional probability for the NK cells 3, 9
R (t) = rNKi(t) position of the NK cell 8
s variance of dr (t)/dt, see Eq.2 1,2,3,10
sh variance of azymuthal angle for worm like chain model p=4 S2
<i(t,Dt) Gaussian distributed variable for NK cell Brownian motion 8
Ci(t)~C(t) Gaussian distributed variable with zero average and variance = 1 1,6
K characteristic degradation time of the chemokines 300–900 s 9
sc extension of the spatial dependence of the NK friction coefficient 25 mm 7
kc amplitude of the space dependence of the NK friction coefficient 10 7
A(r)2~KBT
c(r)~
KBT
cNK (r)
amplitude of the force induced by space dependence of cNK (r) 6
Fk(rNKi{rDCk ,t) force acted by the k-th dendritic cell on the i-th NK cell at time t 6
x Chemotactic parameter 0:1{1mg:mm5=s2 9
NCK Number chemokines produced by a dendritic cell 105
nCK Estimate of the CK number concentration 8.4–9.6 1011 cells/cm3
NNK Number of simulated NK cells 102 4
mNK Mass of a NK cell 800–1000 10212g
VDC Volume of the DC >6000–32000 mm3
rNK Radius of a NK cell 5 mm
a0 Minimum distance for interaction 25 mm
Tth Duration threshold for interactions 300–600s
T Bulk temperature 310 K 5
g Bulk viscosity g~0:001Pa:s; 5
List of the parameters used in the derivation of the simulations of the NK and dendritic cells with an indication of the value and the equation in which the parameterwas defined and/or used. When no number is given for the equation, the parameter was used for a direct estimate in the text.doi:10.1371/journal.pone.0076756.t001
Non-Contact Interactions between Leukocytes
PLOS ONE | www.plosone.org 3 October 2013 | Volume 8 | Issue 10 | e76756

T~310K;
g~0:001Pa:s;
rNK~5mm;
c(0)NK~94mg=s;
D(0)~0:045mm2=s~2:73mm2=min
8>>>>>><>>>>>>:
ð5Þ
The NK cell friction coefficient, c(0)NK , was computed from the
cell radius, rNK, according to the Stokes-Einstein equation. The
Gaussian distributed random displacement, <a,i(t,Dt)f ga~x,y,zi~1::NNK
,
defined by the first two moments in Eq.4, was computed as
detailed in File S1 (paragraph S1: ‘‘Test of the Random Number
generator’’). The periodic boundary conditions reproduced the
experimental situation in which the number concentration
(number of cells per unit volume) of leukocytes in a field of view
fluctuates around an average value with a Poisson distribution. For
sake of simplicity we kept constant the instantaneous number of
NK cells in the simulation box. If one of the NK cells exits from
the simulation volume at a specific time step, we assume that this
specific NK cell does not re-enter the volume: the track of this
specific NK cell will then be limited to this simulation frame. A
new NK cell is randomly located close to the box boundary at the
next simulation step (Fig 1A).
Tests of the numerical integration were run on the free cell
diffusion by computing the average mean square displacement,
D2 kDtð Þ~ 1
N{k
XN{k
i~1
S ri(tzkDt){ri(t)j j2Tt as a function of
time. From its slope we obtained the cell diffusion coefficient that
resulted always in good agreement (within 160.5%) with the input
value (see File S1, Fig S1 in paragraph S1: ‘‘Test of the Random
Number generator’’).
Interacting cells diffusion algorithmWe consider the interaction of a set of mobile NK cells with
immobile dendritic cells that act as a center of chemokine
production. The situation is modeled by assuming that a source of
chemokines, fixed in space and variable in time, acts as chemo-
attractant for the NK cells. This action is represented by a
deterministic force that depends on the distance between the
dendritic and the NK cells and the time: F (rNK{rDC ,t). We need
to take into account also other major features of the leukocyte
dynamics in our simulations: their interaction with the lymph node
tissue and the contact antigen recognition that occurs between NK
cells and dendritic cells. We assume that the overall effect of these
interactions can be captured by slowing down the NK motion
while approaching the dendritic cells and simulated via a space
dependent friction coefficient (see Eq. 7), c(r), whose spatial
extension is <10–15 mm (sc in Eq. 7). The finite difference
Langevin equation (Dt .. tVV, the velocity correlation time, see
Materials and Methods) becomes then [28,29] (Fig 1B):
c(rNKi)d
dtrNKi(t)~
Xk~inter DC
Fk(rNKi{rDCk,t)zsCi(t)z
�P
k~inter NK
A(rNKi{rDCk)LLr
A(rNKi{rDCk)
SCi(tzDt)Cj(t)Tt~dijd Dtð ÞSCi(t)Tt~0 i, j~1,2,::::N
A(r)2~KBT
c(r)
8>>>>>>>>>>>>><>>>>>>>>>>>>>:
ð6Þ
The sum in Eq. 6 runs over all the dendritic cells that interact
with the selected (i-th) NK cell. The position of the i-th NK cell
and of the k-th dendritic cell are rNKi and rDCk, respectively. The
term Fk(rNKi{rDCk,t) in Eq.6 is the force acting on the i-th NK
cell due to its interaction with the k-th dendritic cell. The friction
coefficient of the NK cells, c rNKð Þ, in the proximity of the
dendritic cells is described by a Gaussian function of the type
(Fig 1C):
c(r)~c(0)NK 1zkc
Xk~inter DC
exp {r{rDC,kj j2
2s2c
" #( )ð7Þ
This friction coefficient corresponds to a reduced diffusion
coefficient, D(rNK ,i)~2s2=c2(rNK ,i) in the proximity of the
dendritic cell, and the space dependent term in the Langevin
equation (A(r)LLr
A(r) in Eq.6) can be assimilated to an attractive
force. The range of the effect of the contact interactions is set to
sc~25mm from the centroid of the dendritic cells (according to
microscopy images of the dendritic cells [1]) and the amplitude to
kc = 10 (see Fig 1D). The space dependence of the friction
coefficient induces a slight slowing down of the NK cell in
proximity of the attracting dendritic cell where the interactions
mediated by chemical signals are most effective (see below section,
Metropolis algorithm for interactions). The specific value of the
amplitude kc, in the range 1# kc #20, does not markedly affect
the result of the simulations discussed in the Results.
The integration of Eq. 6 was performed by sampling three
Gaussian stochastic variables, <x (t), <y (t), <z (t), according to
[28,29,33]:
rNKi(tzDt)~rNKi(t)z
zDt
c(rNKi)
Xk~inter: DC
Fk(rNKi{rDCk,t)
264
375
{Dt A(r)LLr
A(r)
����r~rNKi{rDCk
" #z<i(t,Dt)
S<a,i(t,Dt)<b,j(t,Dt)Tt~dijdab2D(rNKi(t))Dt
S<a,i(t,Dt)Tt~0 i, j~1,2,::::N a, b~x,y,z
8>>>>>>>>>>>>>><>>>>>>>>>>>>>>:
ð8Þ
In our model the interaction forces F (rNK{rDC ,t) are due to
the chemotactic action of the chemokines emitted by the dendritic
cells. We will describe such a contribution within the framework of
the Keller-Segel model of chemotaxis (see Results) [25].
Two-photon microscopyA direct optical microscope (BX51, Olympus) was used to follow
the interactions between dendritic and NK cells in lymph nodes.
The infrared laser source (Mai Tai HP+DeepSee, Spectra Physics,
USA; with pulses of 120 fs full width at half maximum and
80 MHz repetition frequency, DeepSee pulse width compensator)
is coupled to the microscope through the FV300 (Olympus, Japan)
scanning head. All the images were acquired under two-photon
excitation at 800 nm through a 20 X, 0.95 NA, 2 mm WD,
Olympus objective (XLUMPlan FI, Olympus, Japan). The
fluorescence signal is directed to a non-descanned unit and split
into three channels (blue, green and red channel) by two dichroic
Non-Contact Interactions between Leukocytes
PLOS ONE | www.plosone.org 4 October 2013 | Volume 8 | Issue 10 | e76756

beam splitters [34]. The acquisition is performed through the
Olympus Fluoview acquisition program with an extension to a
three channel board (Olympus, Japan). Additional details on the
setup and its optical characterization can be found in [34].
The leukocyte interactions data were acquired on explanted
lymph nodes. All mice were sacrified via cervical dislocation. The
animals from which we explanted lymph nodes were CD11cDTR
mice on BALB/c background [35]. These mice express GFP
under the control of the CD11c promoter, a dendritic cell specific
marker. Therefore GFP is expressed exclusively by dendritic cells.
Lymph nodes were analyzed ex-vivo by keeping them in complete
IMDM medium (IMDM-10 complete medium: IMDM, 10%
heat-inactivated FBS (EuroClone), 2 mM L-glutamine, 100 U/ml
penicillin, 100 mg/ml streptomycin, 50 mM 2-mercaptoethanol
(Sigma-Aldrich)) saturated with oxygen [34].
NK cells were purified from RBC-lysed splenocytes by MACS
positive selection using CD49b (DX5), microbeads (Miltenyi
Biotec, D). Purity was assessed by FACS and was routinely
between 93% and 96%. Cells were labeled with 1 mM CMPTX
(Invitrogen, NL), according to Invitrogen recommendations. NK
after labeling with CMPTX were injected i.v. (tail vein), 10
millions per mouse, 24 hs before the experiment. The fluores-
cently labeled cells were found in the popliteal and brachial lymph
nodes about 24 hours after injection. Their localization persisted
for at least 72 hours. In order to stimulate the dendritic cells we
employed lipopolysaccharide (LPS). This compound was injected
sub cute in the mouse footpad, 1 mg per mouse.
For microscopy experiments on explanted lymph nodes, the
entire microscope is surrounded by a custom made thermostatic
cabinet in which the temperature is kept at 37uC (air thermostat-
ing by ‘‘The Cube’’, Life Imaging Services, Basel, CH) and
physiological conditions are guaranteed during the experiments by
flowing 37uC buffer solutions saturated with a mixture of 95% O2–
5% CO2 in the lymph node chamber on the objective plane. The
lymph-nodes were oriented suitably in order to decrease optical
depth due to undesired fat layers and kept in position by a small
drop of agarose gel [34].
Several tests were performed to validate the ex-vivo analysis of
the data. The motility and distribution of NK cells within the
lymph nodes were evaluated on 2-photon microscopy images and
movies both intravitally and in explanted lymph nodes [34,36]. In
order to set up the ex-vivo microscopy analysis, imaging was first
performed intravital in live animals and ex vivo on explanted
lymph nodes [34,36,37]. The endogenous and exogenous NK cells
were found mainly at the border of the T cell area in both
intravital analyses and explanted lymph nodes (in agreement with
[12]). Non-activated NK cells were highly motile in steady-state
conditions and the mean 3-dimensional (3D) velocities of
transferred NK cells, as measured in vivo and ex vivo experiments,
agreed with data available for endogenous NK cells [12]). Finally
T cells showed an average instantaneous speed of 1262 mm/min
[37] in agreement with available data [11].
Volocity (Perkin-Elmer Inc.) was used to analyze recorded
movies. The extracted traces were then analyzed for the measure
Figure 1. Sketch representing the main features of the simulation algorithm. Panel A: implementation of the boundary conditions. When aNK cell (red dots) exits the simulation volume, another NK cell enters it from a random location. The dendritic cells are represented as fixed green
circles and the solid arrow indicate the chemotactic force xLLr
c(r,t). Panel B sketches action at a distance acted by a dendritic cell that is simulated as
a source of chemokines whose spread is represented by dashed circles and dotted arrows. The red lines represent the actual movement of NK cellsthat is largely determined by the Brownian component. Panel C represent the space dependent NK cell diffusion coefficient DNK (r) normalized to the
intrinsic NK cell diffusion coefficient,D(0)~1
2
s
c(0)NK
!2
.
doi:10.1371/journal.pone.0076756.g001
Non-Contact Interactions between Leukocytes
PLOS ONE | www.plosone.org 5 October 2013 | Volume 8 | Issue 10 | e76756

of the interaction time by means of a specifically designed MatLab
(MathWorks Inc.) code.
The simulation code developed here and used to run the
simulations reported in the results section can be downloaded from
http://moby.mib.infn.it/,chirico/.
Results
The simulation of the NK motion around dendritic cells was
developed within the simplified framework described in the
Introduction. We started from freely diffusing NK cell. Then we
implement the interactions of these cells with the tissue by means
of a Worm like chain method [38]. Finally we implement the
interaction field between the NK cells and the dendritic cells,
which is derived from the Keller-Segel model [25]. This model
was developed in the 970s to describe the chemotaxis of bacteria
particularly in the process of the slime molds aggregation [39].
Keller and Segel takes the cellular motion essentially random with
a flux that is composed of two terms. The first term corresponds to
a chemotactic flux that in analogy to the Fourier’s law of cooling is
proportional to the gradient of the chemo-attractant. The second
term is the random diffusion of the cells. The equation is closed by
providing a diffusion equation for the chemo-attractant with a
degradation term.
The parameters employed in this derivation and their range are
listed in Table 1 and a sketch of the major features of the
algorithm used is reported in Fig 1B and in Fig 2.
Modeling of the interactions between NK and dendriticcells
The modeling of a lymph node (LN), that is already a very
complex system, or even the whole immune system, has been
addressed in the literature with elegant methods [19–24]. This is
not our aim here. We want instead to estimate the effect of non-
contact interactions among leukocytes under the action of an
external stimulus that simulates the presence of a pathogen. We
will assume a well studied model to describe non contact
interactions, the Keller-Segel model [25] of chemotaxis. This
choice must be taken more than an inspiration and a mathemat-
ical tool than the actual description of the variety of possible
leukocyte-leukocyte interactions acting at a distance.
However, we first need to develop a minimal model that
describes the major characteristics of leukocyte dynamics even in
the absence of the stimulus. As discussed in File S1 (S2: Un-
stimulated lymphocyte stochastic motion within a lymph node’’ in File S1) a
model that qualitatively represents the behavior of the correlation
functions of the instantaneous speeds of the leukocytes (measured
on the images time series), the deviation angle of their trajectory
and their square displacement [10,11,23] is the Brownian
Wormlike chain. In this model the single step azimuthal angle of
the trajectory, h (see Fig 3A), is distributed according to a
Gaussian law with standard deviation sh, assumed to be sh~p=4throughout the following studies of the leukocytes interactions.
This is not the only model that can be adopted for the statistical
description of the leukocyte motions in the absence of a stimulus.
Alternatives to the WLC are, for example, the Ornstein-
Uhlenbeck [40] and the Keller-Segel models [25]. All the studies
presented in this report were performed by assuming a WLC-
model for the un-stimulated leukocytes.
In the effort to simplify the extremely complex interplay of
chemokines and their receptors, we assume that no chemokines
are secreted by un-stimulated dendritic cells and that a single class
of chemokines (CKs) is secreted under the action of an external
microbial stimulus, such as CpG DNA or lipopolysaccharide.
Representatives of this chemokines are CXCL9 and CXCL10
[17], two kinds of CXCR3 ligands. CXCR3 is a receptor
expressed primarily on activated T limphocytes but also on the
NK cells [17]. However, the interactions between the two classes
of leukocytes, dendritic and NK cells, are actually much more
complex than the picture depicted above. It is known, for example,
that dendritic cells are made competent for the activation of NKs
by a number of cytokines whose production is triggered by the
external stimulus and also by feedback loops between NK and
dendritic cells [5,41]. The dynamics of these signal channels is
simulated here by a smooth time variation of the secretion of
chemokines by dendritic cells.
In summary, the whole process of interaction between NK and
dendritic cells is studied here within a Brownian Dynamics
approach. The NK cells diffuse around fixed DCs under the action
of a mean field leukocyte-leukocyte interaction force, indicated as
Fk(rNKi{rDCk,t) in Eq.8. These forces are derived from a model
that describes the production, the diffusion and the degradation of
the chemokines (Fig 3B and Fig 2). One of the aims and the
results of this report is the analytical formulation of this interaction
force derived under suitable approximations and implement it in a
mixed Brownian Dynamics/Monte Carlo algorithm (see Fig 2).
To this purpose we work on the Keller-Segel model [25] with
time dependent sources and show that, since the chemokine
production by dendritic cells [1,41,42] and the chemokine
diffusion occur on widely different time scales (few hours
compared to minutes), the chemokine concentration can be
written in a space-time separable form that can be used in simple
Brownian Dynamics simulations.
In the Keller-Segel model one assumes that the cell dynamics is
determined by an effective potential originated by the action of the
chemokines, whose concentration is c (r,t), with efficacy measured
by the chemotaxis sensitivity parameter, x [25]. Within these
assumptions the complete Fokker-Planck equation of a NK cell
that diffuses under the action of the chemokines secreted by an
immobile DC, acting as a chemokine source with current
densityJ(r,t), is [25,27] (see Fig 1B):
LLt
f r,t r0,t0jð Þ~{Lj {DNK rð ÞLjzx
cNK
c(r,t)Lj
� �f r,t r0,t0jð Þ
LLt
c(r,t)~ DCKLjLj{1
k
� �c(r,t)zJ(r,t)
8>>><>>>:
ð9AÞð9BÞ
The function f r,t r0,t0jð Þ represents the probability to find the
NK cell at the distance r from the dendritic cell at time t, when it
was at the distance r0 at the time t0. The chemokines diffuse with
the diffusion coefficient DCK. The aim of these coupled equations
(Eq.9) is to describe the motion of the NK cells as pure random
diffusion in the presence of a drift force that depends on the
gradient of the chemo-attractants. Eq.9B closes the system by
describing the evolution of the chemo-attractants as determined by
random diffusion (with diffusion coefficient DCK) superimposed to
a degradation process with characteristic time k. A variety of
functional forms for x and k have been proposed and adopted for
applications in the case of bacteria motility [43]. We assume here
for simplicity that the chemokines’ degradation rate, 1/k, is
independent of the cell concentration (correct in the limit of low
concentration of the dendritic cells or low inflammation condi-
tions) and that the chemotactic parameter x does not depend on
the chemokine concentration c (r,t). This assumption is valid here
and for a production of chemokine that is about one order of
magnitude larger. In fact, by taking 10 dendritic cells per box,
(9A)
(9B)
Non-Contact Interactions between Leukocytes
PLOS ONE | www.plosone.org 6 October 2013 | Volume 8 | Issue 10 | e76756

5006500650 mm3 in size, an average value NCK >105 of
chemokines per dendritic cell (see Table 1) and k values in the
range 300–600 s the concentration of CKs is approximately nCK
= 1.4 nM. The encounter rate of the chemokines on the NK cells
can be computed by means of the relation [44] c~4pDCK nCK r2NK
(DCK is the diffusion coefficient of the chemokines, nNK is their
concentration, and rNK is the NK cell radius, see Table 1). With
the values adopted here for DCK = 10 mm2/s and rNK = 5 mm we
compute a maximum chemokines consumption rate of approxi-
mately 0.2 s21. This rate is two orders of magnitude less than the
average rate of production of the chemokines, as estimated from
NCK/t >105/(300 s) >330 s21. Therefore our assumption that
the degradation rate is not dependent on the cell concentration
can be considered valid here and for dendritic cell concentrations
at least one order of magnitude larger.
The chemotactic sensitivity, x, is a measure of the effect of the
chemical gradient on the cell motion [25,45], and it can be positive
(chemo-attraction) or negative (chemo-repulsion). In the limit DNK
0, i.e. for vanishing diffusion of the NK cells, the Keller-Segel
model describes a chemotactic collapse leading to aggregates or
Dirac peaks. Here we want to describe instead a dynamic
equilibrium in which NK cells follow the chemical gradient but are
also able to escape the dendritic cell attraction basin.
Under the assumption that the NK distribution function
derivatives are much smaller than the corresponding spatial
derivatives of c (r,t), the Langevin equation that corresponds to
Eq.9A is (see also Eqs. 1, 2):
c(0)NK
LLt
r(t)~xLLr
c(r,t)zsC(t)
1
2
s
c(0)NK
!2
~D(0)
8>>><>>>:
ð10Þ
The term xLLr
c(r,t) plays the role of an effective conservative
force that corresponds to the potential function U(r,t)~{xc(r,t)and equals therefore the force term F(rNK{rDC ,t) in the full
dynamic equation (Eq. 6). The chemokine concentration is then
the fundamental function to be computed since it determines the
effective potential and the NK cell motion. Conversely, its
evolution is determined by the chemokine source term, J(r,t).Therefore we first search for solutions of Eq.9B under different
functional forms of the chemokine source term, J (r,t).
Interacting dendritic-NK cells. Two possible cases can be
envisioned in which the emission of the chemokines by the source
(the dendritic cell), characterized by the current density J(r,t), is
decreasing (interacting case) or increasing (noninteracting case) in time.
This can be due to feedbacks in the chemokines production by the
dendritic cells interacting (abbreviated to ‘‘inter.’’) or non interacting
(abbreviated to ‘‘non-inter.’’) with NK cells. In order to ensure the
convergence of the solution, we have also to assume that the
source is adiabatically switched on at t = 0 with a time constant t.This parameter acts both as a mathematical tool and as the
characteristic time response of the dendritic cell to the stimulus.
For the non interacting case we write the current density as:
Jinter:(r,t)~J0d rð Þ
1zt
t
� �2ð11Þ
The solution of Eq.9B with this source term can be obtained by
Fourier Transform methods (see paragraph S3,‘‘FT solution of the
KS equation’’ in the SI) and it is:
cinter:(r,t)~
J0ptH tð Þ
4pDCK tztð Þð Þ3=2exp {
rj j2
4DCK tztð Þ{tzt
k
" #ð12Þ
The function H tð Þ is the Heaviside function and the variance of
this function increases as 4DCK tztð Þ. The concentration is
decreasing with the functional form &exp { t
k
� �4pDCK tztð Þð Þ3=2
from
the maximum value
cinter:(0,0)&J0pt 4pDCK tztð Þð Þ{3=2exp {t
k
h i(see Fig 4).
When the dendritic and NK cells are not interacting, the source
term decreases and it can be written as:
Jnon{inter:(r,t)~d rð Þ J0{J0
1zt
t
� �2
2664
3775 ð13Þ
Figure 2. Flowchart of the mixed Monte Carlo-BrownianDynamics algorithm for the simulation of the leukocyte-leukocyte non contact interactions.doi:10.1371/journal.pone.0076756.g002
Non-Contact Interactions between Leukocytes
PLOS ONE | www.plosone.org 7 October 2013 | Volume 8 | Issue 10 | e76756

The solution of Eq.9B with this source term can be found by
considering only the time varying part of Eq. 13, by applying the
Fourier Transform to Eq. 9B and by restoring the positiviness of
the solution by adding the concentration value at the source at
t = 0. As a final result (see paragraph S3, ‘‘FT solution of the KS
equation’’ in File S1 for details), we can write the chemokine
concentration for the non-interacting case as:
cnon{inter:(r,t)~
J0ptH tð Þ
4pDCKð Þ3=2
exp {t
k
h itð Þ3=2
{exp {
tzt
k
h itztð Þ3=2
8><>:
9>=>; exp {
rj j2
4DCK tztð Þ
" #ð14Þ
With this assumption, the maximum value of the chemokine
concentration starts from 0 and follows an increasing exponential
trend up to a plateau value, J0pt 4pDCK tð Þ{3=2exp {
t
k
h i, as
shown in Fig 4.
The solutions given in Eq.12 and Eq.14 can now be used to
derive the effective chemotactic interaction force, xLLr
c(r,t), to be
used as force (F (rNK{rDC ,t)) in Eq. 6. A critical point to this
issue is that the chemokines concentration suffers two relaxation
processes due to the diffusion of the chemokines themselves and to
the variation in time of the source, J (r,t). This implies that in the
solution of Eq.9A the diffusive motion of the chemokines is
coupled to that of the NK cells.
Constant source of chemokinesWe first focus on the case of constant source of chemokines.
This is an artificial situation in which there is no feedback between
the two classes of leukocytes (here NK and dendritic cells). We
want to develop a fast algorithm to simulate long trajectories of
dendritic and NK cells. In order to avoid the integration of Eqs.9along with the Brownian dynamics steps of our algorithm we
derived an approximated analytical expression for the chemokine
concentration (see File S1, Eqs. S24 and S25 in paragraph S5:
‘‘Numerical Approximations’’). With these approximations we can
perform long numerical simulations of the interactions between
NK and dendritic cells and study the effect of the chemotactic
term xLLr
c(r,t) (see Eq. 6). Several simulations were run with
different values of the dendritic cell sensitivity parameter x and of
the NK cells density (4000–8000 cells/mm3; 500x500x50mm3
simulation box volume) with integration time step Dt = 1 s. The
following additional parameters were also assumed (see also
Table 1):
Figure 3. Sketch of the NK cell motion. The NK cell is sketched as a red-orange circle: the brightness of the red color codes for increasingsimulation time. Panel A: h is the deviation angle sampled to implement for the Worm Like Chain model for the diffusion of the NK cell in the tissue.Monte Carlo algorithm for the cell-cell interactions: definition of the displacement parameter, Dd, used for the Metropolis test for the interactiononset. The symbols in panels B and C are: c0~cMAX , c1~cinter:(0,t{t0)and c2~cnon{inter:(0,t{t1). Panel B reports an example of the interaction_start
test. The root mean square displacement is d1BD~ffiffiffiffiffiffiffiffiffiffiffiffiffiffiffiffiffi2DNK Dt
p%0:3mm. Depicted are two cases corresponding to cMAX%cnon{inter:(0,t{t0) and
cMAX wwcnon{inter:(0,t{t0). In the first case Eq. 17 is satisfied even if Dd?0{, in the second case Eq. 17 is satisfied only if Ddvv0. Panel C reportsan example of the interaction_stop test. In this case when cMAX wwcinter:(0,t{t0) Eq.18 is satisfied even if Dd?0z while when cMAX%cinter:(0,t{t0)Eq.18 is satisfied only if Ddww0.doi:10.1371/journal.pone.0076756.g003
(14)
Non-Contact Interactions between Leukocytes
PLOS ONE | www.plosone.org 8 October 2013 | Volume 8 | Issue 10 | e76756

D(0)~0:045mm2=s;
t~3600s;
J0~106molecules=s;
DCK~0:5mm2=s;
k~600s
8>>>>>><>>>>>>:
ð15Þ
As discussed in File S1 (paragraph S5, ‘‘Numerical Approxima-
tions’’) this choice of parameters implies a >0.2% error on the
chemokine concentration, due to the first order approximation
derived in Eqs. S24 and S25 (in paragraph S5: ‘‘Numerical
Approximations’’ of the SI).
The chemotactic parameter x can vary widely depending on the
specific system. The chemotactic attraction can indeed change by
a factor as large as 102 [18] varying from T cell (low x) to dendritic
and B cells (high x), and corresponds to an average velocityx
c
LLr
c(r,t)%10{100mm=sfor in-vitro chemotaxis experiments
such as the ‘‘under-agarose cell migration’’ experiments [26,46].
However, the units of ½x�~mg:mm5=s2~10{36J:m3 suggest us to
obtain an estimate of x from the average kinetic energy per
volume according to the following scheme:
dL~Fdr~xdc(r,t)%x
ffiffiffiffiffiffiffiffiffiffiNCK
Vcell
r
? x~Vcellm
2Sv2T
dL~m
2Sv2T
8>>>>><>>>>>:
ð16Þ
where NCK is the average number of chemokines produced per
dendritic cell, mNK is the NK cell mass and VDC is the dendritic
cell average volume (see also Table 1). The typical experimental
value of the average value of the NK speed computed over time
steps >1 s, is 0.2 mm/s [8–13,37]. If we further assume an average
value of chemokines per cell, NCK <105, we obtain for the
chemotactic parameter the estimate x%0:2mg:mm5=s2. We have
therefore decided to assume the range x~0:1{1mg:mm5=s2 in the
following explorative simulation study.
For constant sources of chemokines (J (r)), the only relevant
effect of the chemotactic term is on the RMS displacement (see
Fig 5) that acquires the characteristic upward curvature also
observed in the experiments [10–11,23]. The curvature effect
shown in Fig 5 is overestimated since we are not allowing
leukocyte-leukocyte interactions that would imply an alternating
increase and decrease in the source strength, J (r) (see next
paragraph), which is instead held fixed during the simulation. In
the absence of leukocyte-leukocyte interactions, the chemotactic
force contributes therefore with some additional directional
motion of the NK cells, that is largely accounted for in our
simulation procedure by the Brownian Worm like chain model
(see S2,‘‘Un-stimulated lymphocyte stochastic motion within a lymph node’’
in File S1).
Metropolis algorithm for interactionsWe now takes into account the feedback between the NK and
dendritic cells. This is accounted for by modulating the production
of chemokines by the dendritic cell based on the interaction with
approaching NK cells. The chemotactic force,xLLr
c(r,t), changes
in time because of the diffusion of the chemokines away from a
central dendritic cell and of the time behavior of the source (the
dendritic cell). The production of the chemokines by the dendritic
cell is inhibited by the contact with NK cells or stimulated by the
absence of such interactions. This interplay of interaction and
activation and de-activation of dendritic cells, is simulated by
defining an interaction probability that is based on the distance
between dendritic and NK cells and on the directionality of NK
cell motion. This is a critical point of our study that we approach
by devising a Monte Carlo test on a minimal condition
represented by the direction of relative motion between a NK
cell and the central dendritic cell.
The interaction (an attraction more than a direct contact) can
occur only when the cells are within a threshold radius. This is a
sensible assumption that is also motivated by the need to reduce
the computation time. However, the probability of the interaction
depends on the instantaneous concentration of the chemokines
compared to its maximum value and it can occur also at a distance
between dendritic and NK cells.
The basic idea on which we build the interaction algorithm is
that a dendritic cell produces chemokines when it has not activated
recently a NK cell. Otherwise the chemokine concentration
around the dendritic cell decreases. The second basic idea is that
the NK cell that approaches the dendritic cell feels the chemokine
gradient formed around the dendritic cell (see Eqs. 12 and 14) or
not, depending on the size of the displacement of the NK cell
towards the central dendritic cell. The lower is the chemokine
concentration around the dendritic cell, the larger must be the
approaching leap of the NK cell towards the dendritic cell. The
whole process is a feedback loop. When a NK cell starts an
interaction, the chemokine concentration decreases around the
dendritic cell. Therefore the probability that the dendritic – NK
cell interaction comes to an end, increases. In this case the test on
the interaction stop is made on the size of the NK leap away from
the dendritic cell. The larger is the chemokine concentration on
the dendritic cell, the larger must be the NK jump away from the
dendritic cell in order that the interaction stops.
Taking into account these considerations we have built the
following Metropolis algorithm.
On each time step the interaction test is run only for distances
between NK and dendritic cells that are lower than a0 = 25 mm. If
this condition is fulfilled, we compute Dd~{DrNK: rDC{rNKð Þ=
rDC{rNKj j, where DrNK~rNK (tzDt){rNK (t) is the displace-
ment of the NK cell on the simulation step, and consider two
possible situations (see Fig 3B, C).
1. Interaction_start. If the interaction is not active, the chemotactic
term is xLLr
cnon{inter:(r,t{t0), where t0 is the time at which the
previous interaction was stopped. The interaction begins at
time t1, only if (we recall that cMAX ~cinter:(0,0))
exp {Dd
d1BD
� �w
cMAX
cnon{inter:(0,t{t0)§1, ð17Þ
where d1BDis the root mean square displacement with diffusion
coefficient DNK: d1BD~ffiffiffiffiffiffiffiffiffiffiffiffiffiffiffiffiffi2DNKDt
p%0:3mm. In this test the
random variable is represented by the displacement Dd that
contains the Gaussian distributed displacement of the NK cell.
In such a case, from this time step on, the chemotactic term will
be computed as xLLr
cinter:(r,t{t1).
Non-Contact Interactions between Leukocytes
PLOS ONE | www.plosone.org 9 October 2013 | Volume 8 | Issue 10 | e76756

2. Interaction_stop. If the interaction is active, the chemotactic term
is xLLr
cinter:(r,t{t1), where t1 is the time at which the
interaction started. The interaction is interrupted only if
exp {Dd
d1BD
� �v1{
cinter:(0,t{t1)
cMAX
ƒ1: ð18Þ
It is noteworthy that if the NK cell is moving away from the DC,
an interaction cannot be initiated because Ddw0, the Metropolis
term is exp {Dd
d1BD
� �v1v
cMAX
cnon{inter:(0,t{t0)and the probabil-
ity for the interaction to be stopped is determined by the
chemokine concentration, via the term 1{cinter:(0,t{t1)=cMAX .
Symmetrically, if the NK cell is approaching a dendritic cell, an
ongoing interaction has no chance to be interrupted since Dd
v0 and the Metropolis term is exp {Dd
d1BD
� �w1w1{
cinter:(0,t{t1)
cMAX
. The probability for an interaction to be started
in the case Ddv0 is proportional to the chemokine concentration,
cMAX=cinter:(0,t{t0).
Eqs. 17 and 18 represent a Monte Carlo sampling in which the
random number is embedded in the displacement Dd towards the
dendritic cell. In this way we weigh the probability that an
interaction starts on the direction of motion, i.e. whether NK cells
are approaching a dendritic cell or not.
The overview of the proposed mixed Brownian Dynamics and
Monte Carlo algorithm is shown in Fig 2. We test now the
proposed solution of the KS model for the NK and dendritic cells
in terms of number and duration of specific interactions.
Simulation of the interactions between NK and dendriticcells
We consider two experimental situations that refer to the
stimulated or unstimulated healthy murine system. Various types
of stimuli can be applied to the organism to trigger the initiation of
an immunoresponse to an antigen [47]. One of the most effective
ones is the lipopolysaccharide, a component of the external wall of
gram-positive bacteria [1]. This compound is recognized by the
receptor complexes, including TLR4, CD14 and MD2, and elicits
the production by DCs of several types of chemokines, including
CXCL9 and CXCL10. We consider here for simplicity a single
class of chemokines, though the whole simulation algorithm could
be easily extended to a more complex situation. The dendritic cell
activation time, t in Eqs. 12, 14, could be modulated, in a more
refined algorithm, by cytokines expressed also by NK cells such as
TNFa [42,48]. The diffusion parameter ensures that the average
range of activity of the chemokines in the lymph node isffiffiffiffiffiffiffiffiffiffiffiffiffiffi6DCK t
p%450mm.
We have first run 10 simulations of non-stimulated dendritic
cells (100 NK cells per simulation, x= 0) and focused our analysis
on the number and duration of the interactions as provided
directly by the Monte Carlo tests (Eqs. 17, 18). The histogram of
the interactions’ duration (Fig 6A) decreases rapidly with the
duration: more than 90% of the interactions last for less than 300s.
When stimulated dendritic cells are simulated under high
chemotaxis conditions (x%1mg:mm5=s2), the distribution of the
interactions’ duration (Fig 6B) is much wider and only 60% of the
durations last for less than 300 s.
A small systematic increase of the interaction probability is
found at durations that are correlated to the value of the
chemokines’ degradation times k: the position of the secondary
component at 440s–480s (Fig 6) changes slightly with the value of
the degradation time, k, as can be judged from Fig 7. The position
of the secondary peak in the distribution of the interaction
durations moves to >580640 s for k = 900 s (Fig 7, densely
hatched bars and dashed red line). The width of this component
Figure 4. Evolution of the chemokine concentration. Currentdensity J(r,t) that describes the chemokines production by thedendritic cell when interacting (panel A, Eq.11) or non interacting(panel B, Eq.13) with a NK cell. Panels C and D report the timeevolution of the spatial distribution of the concentration of thechemokines in the two cases of interacting (panel C) and noninteracting (panel D) leukocytes. The chemokine source parameterswere: J0 = 1000 mol/s; k = 600 s; t = 3600 s; DCK = 10 mm2/s (Eq.12, 14).doi:10.1371/journal.pone.0076756.g004
Figure 5. Autocorrelation functions for the NK cells underconstant chemotactic force. Panel A: square displacement
S r(t){r(0)j j2T. Panel B: the single step deviation angle Scos h(t)ð Þ:cos h(0)ð ÞT. Panel C: the velocity autocorrelation function Sv(t):v(0)T.The results are averaged over 100 NK cells. The simulation parametersare reported in the text (Eq.5 and Table 1). The increasing values of
the chemotactic parameter are x= 0.1, 0.2, ….. 0.9, 1.0 mg:mm5=s2 .doi:10.1371/journal.pone.0076756.g005
Non-Contact Interactions between Leukocytes
PLOS ONE | www.plosone.org 10 October 2013 | Volume 8 | Issue 10 | e76756

also increases substantially with the degradation time and for
k = 1200 s it is already not possible to visually single out a defined
cell population with long interaction durations at finite values of
duration times (Fig 7, sparsely hatched bars and dotted green
line), though the presence of long interacting cells is evident from
Fig 7 for any value of k. On the other hand, in the case of very
rapid (k,50–60 s) degradation of the chemokines we expect that
the effect of non-contact interactions on the interaction duration
would vanish.
We focus then our attention on the percentage of the NK –
dendritc cell interactions with durations above a threshold value,
Tt,, as done in most of the experimental studies [9,12,37,49] and
perform a simulation study as a function of the chemotactic
parameter. This procedure allows us to model an increasing
efficiency of the chemokines to attract NK cells and to study its
effect on the number of long lasting interactions. In fact these
interactions are likely related to the chemokine mediated
recognition between leukocytes. From the distributions shown in
Fig 6, 7 it is reasonable to set the threshold value for the long
lasting interactions at Tth = 600s, the position of the secondary
peak in the distribution of the duration times.
The total number of NK – dendritic cell interactions and the
number of interactions with duration above Tth, as a function of
the chemotactic parameter x, are summarized in Fig 8. The
increase of the interactions’ duration (total and long lasting
interaction duration) with x observed in Fig 8 indicates that there
is a definite relation between these two parameters and suggests
that there is an effect of non-contact interactions between
leukocytes on the measured interaction duration, typically taken
as a fingerprint of ongoing contact interaction [8–13]. From a
physical point of view it is clear that a central attraction towards
the dendritic cell is required to sustain the touch and go behavior
observed in most two-photon excitation in-vivo investigations of
the leukocytes interaction [13,37]. Considering the extremely high
dilution of cells within a lymphoid organ, the absence of such a
central attraction would determine a drift of a NK cell away from
the central dendritic cell as soon as an interaction stops, therefore
not allowing for a sustained patrolling of the dendritic cell surface
in a quest for specific recognition.
The simulated values of the total number and of the long
duration interactions agree qualitatively with experimental values.
These were obtained from NK – dendritic cell interaction
experiments in ex-vivo mice lymph nodes (Fig 8) under no
stimulus (black horizontal lines) and when the mice are stimulated
4 hours in advance with lipopolysaccharide (red horizontal lines;
see also Materials and Methods). By visually inspecting the
intersection between the interpolating sigmoidal functions in
Fig 8 with the experimental values we can estimate two values
of the chemotactic parameters, x > 0.1560.15 mg:mm5=s2 and x
> 0.560.2 mg:mm5=s2 that describe simultaneously the long and
total number of interactions under no stimulus and when
lipopolysaccharide was injected in the mice.
Discussion
The mean field model of non-contact interactions developed
here indicates clearly some direct effect of these interactions on the
interaction duration. But this main result might be invalidated by
major flaws arising from the crudeness of our approximations. We
have then carried out a validation of the numerical model
employed here by comparing simulated and experimental data on
an extended set of additional geometrical and kinematic param-
eters of the NK cells motion. To this purpose we have selected
three parameters, namely the confinement ratio of the NK cell
Figure 6. Distribution of the duration times of the interactionbetween NK and dendritic cells. Distribution of the duration timesfor the case of no chemotaxis (x= 0, panel A) and of high chemotacticeffect of the chemokines on the NK cells (x%1mg:mm5=s2 , panel B). Theresults are obtained from the analysis of the interactions of 10independent simulation runs (100 NK cells per simulation). The errorbars are uncertainties obtained by 10 different simulations.doi:10.1371/journal.pone.0076756.g006
Figure 7. Dependence of the duration times of the interactionbetween NK and dendritic cells on the degradation time.Distribution of the duration time of the NK – dendritic cell interaction,as a function of the chemokines’ degradation time, k: k = 600 s (openblack bars, black continuous best fit line); k = 900 s (densely hatched redbars and red open squares best fit line) and k = 1200 s (sparsely hatchedgreen bars and green filled triangles best fit line). The chemotacticparameter was set to x%1mg:mm5=s2 . The lines are best fit to the trial
functionA exp½{t=t1�zB exp { t{t0ð Þ2=s2h i
. Best fit parameters are: A
(600s) = 803628, t1 (600s) = 7066s, B (600s) = 7862, t0 (600s) = 45066s, s (600s) = 250614 s for k = 600s; A (900s) = 859637, t1 (900s)= 7066s, B (900s) = 3862.5, t0 (900s) = 570630s, s (900s) = 380640sfor k = 900s and A (1200s) = 980670, t1 (1200s) = 6666s, B (1200s)= 3863, t0 (1200s) = 6306200s, s (1200s) = 550690s.doi:10.1371/journal.pone.0076756.g007
Non-Contact Interactions between Leukocytes
PLOS ONE | www.plosone.org 11 October 2013 | Volume 8 | Issue 10 | e76756

trajectory (CR, defined as the ratio of the distance run by a NK cell
divided by the trace length), the instant 3D velocity (V3D) of the
NK cells and the length of the cell trajectory (Ltraj). Details on the
experimental conditions and the analysis of the experimental and
simulated data are reported in File S1 (see paragraph S4 ‘‘Analysis
of dendritic and NK cells interactions’’ in File S1).
Interactions on the experimental images were detected by
requiring that (1) the distance between NK and dendritic cells is
less than 25 mm, (2) the confinement ratio is decreasing during the
putative interaction duration and (3) the instantaneous speed is
below a threshold computed as the average of the instantaneous
speed of all NK cells over all frames considered in a field of view
(see paragraph S4,‘‘Analysis of dendritic and NK cell interactions’’
in File S1). Interactions on the simulated data were detected as
from the Monte Carlo tests (see Eqs. 17, 18). The result of this
procedure, applied to >250 experimentally tracked NK cells and
an equal number of simulated cells, is summarized in Fig 9 for the
stimulated (x ?0) and un-stimulated (x= 0) case and for the
subpopulations of interacting and non-interacting cells.
The confinement ratio accounts for the overall volume spanned
by the NK cell during its motion and DC-NK cell interactions lead
to its reduction (Fig 9A, B). The experimental data show wider
distributions and a slightly higher average value than the simulated
ones. However the relative interacting/non-interacting and
stimulated/non-stimulated changes are similar in the simulated
and experimental data. The lower simulated values may arise from
a slight overestimation of the chemotactic parameter (see Fig 8)
that in Fig 9 is kept at x~1mg:mm5=s2.
Regarding the NK cell velocity (Fig 9C, D), the simulated
interacting NK cells again show narrower distributions than the
experimental data but the average values, ,v3D., of the NK cell
velocity are very well reproduced. The average values ,v3D.
under no external stimulus are instead slightly larger than the
experimental ones (Fig 9C, D), indicating that additional
interactions of NK cells with the lymphoid tissue without any
stimulus should be accounted for in a more refined model.
The trajectory length of the simulated NK cells provides an
indirect estimate of the duration of the confined motion. The
interacting NK cells spend much more time in patrolling the
dendritic cell and in so doing drive longer paths. The presence of a
very long tail in the trajectory length distribution is an indication of
the overestimation of the chemotactic parameter assumed in Fig 9and/or an underestimation of the chemokine degradation rate k.
However, the observation of longer trajectories for the stimulated
NK cells, together with their lower average velocity, is an
indication that our numerical mean field model grasps the main
features of the intermittent interaction between NK cells and DCs,
as found experimentally [13,37]. The simulated non-interacting
NK cells have instead a much shorter trajectory length, an
indication of quasi-directional motion: simulated and experimental
non-interacting NK cells display very similar distribution and
average values of the trajectory length.
In summary, the aim of this study was to ascertain the possible
effect of non-contact interactions between leukocytes on the
leukocyte-leukocyte interaction duration under pathogenic stimuli.
To this purpose we have focused ourselves on the recent report
[50] of interactions between dendritic and NK cells. We have
chosen to model the non-contact interactions between leukocytes
by means of the chemotactic potential proposed by Keller and
Segel [25]. Starting from their formulation, we have devised a
space-time separable analytical approximated functional form for
the chemotactic attraction potential and used it in numerical
simulations of the interaction between leukocytes under the action
of chemokines. In order to obtain the overall behavior of NK cells
and DCs under the action of chemotactic (or a generic non-
contact interaction) and contact interactions, we have further
assumed to describe contact leukocyte interactions as a reduction
of the diffusion coefficient of NK cells that approach DCs.
The analysis of the simulations and their comparison to
experimental data, indicates that the mean-field description
adopted to describe the non-contact and contact interactions
allows us to grasp the main features of the observed NK cell
motion within the lymph node and to bring into evidence the
possible effect of non-contact interactions on the geometrical and
kinematic parameters.
In particular, our simulations indicate that the number of
interactions is well described by a smooth sigmoidal trend as a
function of x. The overall fractional increase in the number of
interactions is only 1.4 for the long interactions and it saturates as
the chemotactic parameter increases above x >0.7mg:mm5=s2.
Such an increase is probably difficult to be detected on in-vivo or
ex-vivo data also due to the experimental uncertainties and the
intrinsic variability of the tissue surgical preparation. It is
nevertheless a clear indication of a direct effect of non-contact
interaction on the parameters typically measured to bring into
evidence leukocyte-leukocyte contact interactions.
The analysis reported here suggests also that the discrimination
between interacting and non-interacting leukocytes might be
revised by taking into account also geometrical and kinematics
Figure 8. Dependence of the duration times of the NK –dendritic cell interaction on the chemotactic parameter.Percentage of the interacting cells computed on a set of 10independent simulation runs. The percentage of all the interactingcells (filled squares) and of the long interacting cells (open squares;interaction duration larger than Tth = 600s) are reported. The lines arethe sigmoidal fits to the data (y = 74–33.5/(1+ exp ((x20.54)/0.108)),solid line; y = 53–31/(1+ exp ((x20.674)/0.127)), dashed line). Thehorizontal lines indicate the experimental percentage of the NK cellsinteracting with dendritic cells: total number of interactions (dashedlines) under no stimulus (black) and under the action of lipopolysac-charide stimulus (red); long duration interactions (Tth = 600s) (solidlines) under no stimulus (black) and under the action of lipopolysac-charide stimulus (red). The vertical arrows indicate the most probablevalues of the chemotactic parameter as visually obtained from theintersection of the interpolating sigmoidal curves and the horizontallines. The horizontal dotted arrows indicate the range of variability ofthe chemotactic parameter. The experimental data were obtained fromexperiments in ex-vivo lymph nodes from mice not treated with thelipopolysaccharide stimulus (black horizontal lines) and from micetreated with the lipopolysaccharide stimulus 4 hours in advance (redhorizontal lines; see also Materials and Methods).doi:10.1371/journal.pone.0076756.g008
Non-Contact Interactions between Leukocytes
PLOS ONE | www.plosone.org 12 October 2013 | Volume 8 | Issue 10 | e76756

parameters that are not related only to the leukocyte-leukocyte
distance and therefore to their contact.
Finally, it is noteworthy that the reciprocal activating crosstalk
between dendritic and natural killer cells has received recent
attention in the literature [51]. Much interest has been focused on
functional dendritic – NK cell crosstalk and its role in immune
regulation [41,52,53]. For example, mature dendritic cells can
activate NK cell cytotoxicity and IFN-c production [42].
Conversely NK cells can enhance dendritic cell maturation and
immune-stimulatory capacity. In particular several studies have
reported that NK cells markedly increase their capacity to produce
proinflammatory cytokines [3]. Therefore dendritic and NK cells
seem to guide each other’s functions not only through cell–cell
contact but also through the release of soluble factors, including
cytokines [51]. To this regard the possibility to study in vivo or ex-
vivo in lymph nodes the role of the chemokine mediated
interactions is becoming increasingly important.
Supporting Information
File S1 All supporting information has been included in the
Supporting Information file that covers the following contents: S1,
Test of the Random Number generator. S2, Un-stimulated
lymphocyte stochastic motion within a LN. S3, FT solution of
the KS equation. S4, Analysis of DC and NK cell interactions. S5,
Numerical Approximations.
(DOCX)
Acknowledgments
We are very grateful to Federico Rapuano (university of Milano Bicocca,
Milan (I)) for the useful suggestions regarding the Keller Segel model
solution.
Author Contributions
Conceived and designed the experiments: GC FG. Performed the
experiments: LS M. Caccia IZ LD. Analyzed the data: LS NG GC.
Contributed reagents/materials/analysis tools: FG IZ. Wrote the paper:
GC NG M. Collini. Solution of Keller Segel equations: NG.
References
1. Janeway CA, Travers P, Walport M, Shlomchik MJ (2007) Immunobiology: theimmune system in health and disease, 6th edition. Garland Publishing, New
York, pp. 13–51.
2. Taieb J, Chaput N, Menard C, Apetoh L, Ullrich E, et al. (2006) A noveldendritic cell subset involved in tumor immunosurveillance. Nat. Med. 12: 214–
219.
3. Degli-Esposti MA, Smyth MJ (2005) Close encounters of different kinds:
Dendritic cells and NK cells take center stage. Nat. Rev. Immun. 5: 112–124.
4. Fernandez NC, Lozier A, Flament C, Ricciardi-Castagnoli P, Bellet D, et al.(1999) Dendritic cells directly trigger NK cell functions: cross-talk relevant in
innate anti-tumor immune responses in vivo. Nature Med. 5: 405–411.
5. Smyth MJ, Hayakawa Y, Takeda K, Yagita H (2002) New Aspects of Natural-Killer-cell Surveillance and Therapy of Cancer. Nature, 2: 850–861.
6. Millington OR, Zinselmeyer BH, Brewer JM, Garside P, Rush CM (2007)
Lymphocyte tracking and interactions in secondary lymphoid organs. Inflam.
Res. 56: 391–401.
Figure 9. Result of the analysis of the simulated and experimental trajectories of NK cells. The simulated trajectories were obtained byassuming x%1mg:mm5=s2 and were rebinned to reproduce the experimental time acquisition step (259), as detailed in File S1 (paragraph S4:‘‘Analysisof dendritic and NK cell interactions’’). The NK cell confinement ratio (CR), the 3D speed (v3D) and the trajectory length (Ltraj) computed on more than200 trajectories (NK cells) are reported in Panels A, B (confinement ratio), C, D (speed) and E, F (trajectory length). In each panel the labels‘‘stimulated’’ and ‘‘un-stimulated’’ indicate the cases under stimulus (lipopolysaccharide injected i.v. in the mouse for the experimental data and
x%1mg:mm5=s2 for the simulated data) and under no stimulus (no lipopolysaccharide injected i.v. in the mouse for the experimental data and
x%0mg:mm5=s2 for the simulated data). Interacting and non-interacting NK cells were determined in the experimental and simulated data by theinstantaneous NK cell velocity and the NK – dendritic cell distance, as described in the text. The horizontal bars indicate on each data set the averagevalue.doi:10.1371/journal.pone.0076756.g009
Non-Contact Interactions between Leukocytes
PLOS ONE | www.plosone.org 13 October 2013 | Volume 8 | Issue 10 | e76756

7. Textor J, Peixoto A, Henrickson SE, Sinn M, Von Andrian UH, et al. (2011)
Defining the quantitative limits of intravital two-photon lymphocyte tracking.Proc. Natl. Acad. Sci USA, 108: 12401–12406.
8. Halin C, Mora JR, Sumen C, von Andrian UH (2005) In vivo imaging of
lymphocyte trafficking. Ann. Rev. Cell Develop. Biol. 21: 581–603.
9. Bousso P (2008) T-cell activation by dendritic cells in the lymph node: lessons
from the movies. Nature Rev. Immunol. 8: 675–684.
10. Miller MJ, Wei SH, Cahalan MD, Parker I (2003) Autonomous T cell traffickingexamined in vivo with intravital two-photon microscopy. Proc. Natl. Acad. Sci
USA. 100: 2604–2609.
11. Miller MJ, Wei SH, Parker I, Cahalan MD (2002) Two-Photon Imaging ofLymphocyte Motility and Antigen Response in Intact Lymph Node. Science.
296: 1869–1873.
12. Beuneu H, Deguine J, Breart B, Mandelboim O, Di Santo JP, et al. (2009)
Dynamic behavior of NK cells during activation in lymph nodes. Blood. 114:
3227–3234.
13. Cahalan MD, Parker I, Wei SH, Miller MJ (2003) Real-time imaging of
lymphocytes in vivo. Curr. Opin. Immun. 15: 372–377.
14. Pearce IG, Chaplain MAJ, Schofield PG, Anderson ARA, Hubbard SF (2007)Chemotaxis-induced spatio-temporal heterogeneity in multi-species host-para-
sitoid systems. J. Math. Biol. 55: 365–388.
15. Byrne HM, Cave G, McElwain DLS (1998) The effect of chemotaxis and
chemokinesis on leukocyte locomotion: A new interpretation of experimental
results. IMA J. Math. Appl. Med. Biol. 15: 235–256.
16. Matzavinos A, Chaplain MAJ, Kuznetsov VA (2004) Mathematical modelling of
the spatio-temporal response of cytotoxic T-lymphocytes to a solid tumour. IMAMath. Med. Biol. 21: 1–34.
17. Qin S, Rottman JB, Myers P, Kassam N, Weinblatt M, et al. (1998) The
chemokine receptors CXCR3 and CCR5 mark subsets of T cells associated withcertain inflammatory reactions. J Clin Invest. 101: 746–754.
18. Cyster JG (1999) Chemokines and Cell Migration in Secondary Lymphoid
Organs. Science, 286: 2098–2102.
19. Thakar J, Poss M, Albert R, Long GH, Zhang R (2010) Dynamic models of
immune responses: what is the ideal level of detail? Theor. Biol. Med. Model. 7:35.
20. Baldazzi V, Paci P, Bernaschi M, Castiglione F (2009) Modeling lymphocyte
homing and encounters in lymph nodes. BMC Bioinformatics. 10: 387–398.
21. Beltman JB, Maree AFM, de Boer RJ (2007) Spatial modeling of brief and long
interactions between T cells and dendritic cells. Immun. Cell. Biol. 85: 306–314.
22. Rapin N, Lund O, Bernaschi M, Castiglione F (2010) ComputationalImmunology Meets Bioinformatics: The Use of Prediction Tools for Molecular
Binding in the Simulation of the Immune System. PLOS ONE. 5: e9862.
23. Wei SH, Parker I, Miller MJ, Cahalan MD (2003) A stochastic view oflymphocyte motility and trafficking within the lymph node. Immunol. Rev. 195:
136 –159.
24. Narang V, Decraene J, Wong SY, Aiswarya BS, Wasem AR, et al. (2012)
Systems immunology: a survey of modeling formalisms, applications and
simulation tools. Immun. Res. 53: 251–265.
25. Keller EF, Segel LA (1971) Model for chemotaxis. J. Theor. Biol. 30: 225–234.
26. Tranquillo RT, Zigmond SH, Lauffenburger DA (1988) Measurement of the
chemotaxis coefficient for human neutrophils in the under-agarose migrationassay. Cell Motil. Cytoskel. 11: 1–15.
27. Chavanis PH (2010) A stochastic Keller-Segel model of chemotaxis, Commun.Nonlinear Sci. 15: 60–70.
28. Ermak DL, McCammon JA (1978) Brownian Dynamics with Hydrodynamic
Interactions. Chem. Phys. 69: 1352–1360.
29. Chirico G, Langowski J (1992) Calculating Hydrodynamic Properties of DNA
Through a 2nd-Order Brownian Dynamics Algorithm. Macromolecules. 25:
769–775.
30. Doi M, Edwards SF (1986) The theory of polymer dynamics. Oxford University
Press, UK. pp. 52–55.
31. Risken H (1996) The Fokker Planck Equation: Methods of Solution and
Applications, Springer, NY.32. Press WH, Teukolsky SA, Vetterling WT, Flannery BP (2007) Numerical
recipes: the art of scientific computing, third edition, Cambridge University
Press, New York, pp. 287–290.33. Kloeden PE, Platen E (1994) Numerical solution of stochastic differential
equations, Springer, Applications of Mathematics, vol 23, p.305.34. Caccia M, Sironi L, Collini M, Chirico G, Zanoni I, et al. (2008) Image filtering
for two-photon deep imaging of lymphonodes. Eur. Biophys. J. 37: 979–987.
35. Jung S, Unutmaz D, Wong P, Sano G, De los Santos K, et al. (2002) In vivodepletion of CD11c+ dendritic cells abrogates priming of CD8+ T cells by
exogenous cell-associated antigens. Immunity. 17:211–20.36. Villa CE, Caccia M, Sironi L,, D’Alfonso L, Collini M, et al. (2010)
Accumulative Difference Image Protocol for Particle Tracking in FluorescenceMicroscopy Tested in Mouse Lymphonodes. PLOS ONE 5 Article Number:
e12216.
37. Caccia M, Gorletta T, Sironi L, Zanoni I, Salvetti C, et al. (2010) Two photonmicroscopy intravital study of DC-mediated anti-tumor response of NK cells
(SPIE Proceedings Paper) in W. R. Chen (Eds.) Biophotonics and ImmuneResponses V, Proceedings Vol. 7565.
38. Klenin K, Merlitz H, Langowski J (1998) A Brownian Dynamics Program for
the Simulation of Linear and Circular DNA and Other Wormlike ChainPolyelectrolytes. Biophys. J. 74 780–788.
39. Keller EF (2006) Science as a Medium for friendships: how the Keller-Segelmodels came about. Bull. Math. Biol. 68:1033–1037.
40. Uhlenbeck GE, Ornstein LS (1930) On the Theory of the Brownian Motion.Phys. Rev. 36: 823–841.
41. Walzer T, Dalod M, Vivier E, Zitvogel L (2005) Natural killer cell–dendritic cell
crosstalk in the initiation of immune responses. Expert. Opin. Biol. Ther. 5:S49–S59.
42. Gerosa F, Baldani-Guerra B, Nisii C, Marchesini V, Carra G, et al. (2002)Reciprocal activating interaction between natural killer cells and dendritic cells,
J. Exp. Med. 195: 327–333.
43. Tindall MJ, Maini PK, Porter SL, Armitage JP (2008) Overview ofMathematical Approaches Used to Model Bacterial Chemotaxis II: Bacterial
Populations. Bull. Math. Biol. 70: 1570–1607.44. Eigen M, Rigler R (1994) Sorting single molecules: Application to diagnostics
and evolutionary biotechnology. Proc. Natl. Acad. Sci. USA. 91: 5740–5747.45. Jinquan T, Deleuran B, Cesser B, Maare H, Delewan M, et al. (1995)
Regulation of Human T Lymphocyte Chemotaxis In Vitro by T Cell-Derived
Cytokines IL-2, IFN-y, IL-4, IL-10, and IL-13. J. Immun. 154: 3742–3752.46. Sherratt JA (1994) Chemotaxis and chemokinesis in eukaryotic cells: the Keller-
Segel equations as an approximation to a detailed model. Bull. Math. Biol. 1:129–146.
47. Biron CA (1997) Activation and function of natural killer cell responses during
viral infections, Curr. Opin. Immunol. 9: 24–34.48. Zanoni I, Foti M, Ricciardi-Castagnoli P, Granucci F (2005) TLR-dependent
activation stimuli associated with Th1 responses confer NK cell stimulatorycapacity to mouse dendritic cells. J. Immun. 175: 286–292.
49. Bousso P, Robey EA (2004) Dynamic Behavior of T Cells and Thymocytes inLymphoid Organs as Revealed by Two-Photon Microscopy. Immunity 21: 349–
355.
50. Newman KC, Riley EM (2007) Whatever turns you on: accessory-cell dependentactivation of NK cells by pathogens. Nature Rev. Immunol. 7: 279–291.
51. Harizi H (2013) Reciprocal crosstalk between dendritic cells and natural killercells under the effects of PGE2 in immunity and immunopathology. Cellular &
Molecular Immunology 10: 213–221.
52. Walzer T, Dalod M, Robbins SH, Zitvogel L, Vivier E (2005) Natural-killer cellsand dendritic cells: ’’l’union fait la force’’. Blood 1: 2252–2258.
53. Andoniou CE, van Dommelen SL, Voigt V (2005) Interaction betweenconventional dendritic cells and natural killer cells is integral to the activation
of effective antiviral immunity. Nat Immunol 6: 1011–1019.
Non-Contact Interactions between Leukocytes
PLOS ONE | www.plosone.org 14 October 2013 | Volume 8 | Issue 10 | e76756


