Embed Size (px)
Citation preview

Ml
Ka
b
a
ARRA
KCCSSR
1
tttrvFtaciC
y
0h
Accident Analysis and Prevention 51 (2013) 156– 167
Contents lists available at SciVerse ScienceDirect
Accident Analysis and Prevention
j ourna l ho me pa ge: www.elsev ier .com/ locate /aap
odeling and analyzing traffic safety perceptions: An application to the speedimit reduction pilot project in Edmonton, Alberta
arim El-Basyounya,∗, Mohamed Yahia El-Bassiounib,1
Department of Civil and Environmental Engineering, University of Alberta, Edmonton, AB, Canada T6G 2W2Department of Statistics, United Arab Emirates University, P.O. Box 17555, Al-Ain, Abu Dhabi, United Arab Emirates
r t i c l e i n f o
rticle history:eceived 1 May 2012eceived in revised form 25 October 2012ccepted 8 November 2012
eywords:ommunity perceptiononfirmatory factor analysistructural equations modelpeed limit reductionesidential neighborhood
a b s t r a c t
To address the speeding problem in residential areas, the City of Edmonton initiated a pilot project toreduce the posted speed limit from 50 km/h to 40 km/h within six residential communities. This paperinvestigates the community perceptions of traffic safety within the six pilot communities in two phases:prior to project initiation (pre-pilot) and following the end of the project (post-pilot). This objective wasaccomplished by analyzing the results of two random dialing telephone surveys comprising 300 resi-dents each. A preliminary analysis showed compatible demographic configurations for the two samplesand confirmed that the residents were aware of both the posted speed limits and the adopted speedmanagement controls. For the confirmatory factor analysis (CFA), a two-group (pre-pilot and post-pilot)three-factor model was used to assess the residents’ perceptions of the speeding behavior (Speeding),their concerns about traffic safety issues (Concerns), and their perceptions of traffic safety (Safety). Com-paring the CFA results of the post-pilot survey versus those of the pre-pilot survey, it was evident thatthere was a significant decrease in Speeding and Concerns accompanied by a significant increase in Safety.
A structural equations model (SEM) was also fitted to the data in order to assess the impact of Speedingand Concerns on Safety. The results showed that Concerns increase significantly with Speeding, and thatboth factors have significant negative impacts on Safety. However, while the impact of Concerns on Safetywas direct, that of Speeding on Safety was largely indirect (i.e., mediated through Concerns). Overall, themultivariate analysis has demonstrated that the pilot project was successful in improving the residents’perceptions of traffic safety in their community.. Introduction
In 2010, the City of Edmonton initiated a pilot project to inves-igate the effect of lowering the posted speed limit from 50 km/ho 40 km/h on the level of traffic safety within a group of residen-ial communities. In addition to the support of global practice oneducing speed limits in residential areas, several other factors con-erged to lend support for a speed limit reduction pilot project.or example, multiple Citizen Satisfaction Surveys conducted byhe Edmonton Police Service identified speeding/careless drivings the top community problem in Edmonton. Moreover, City Coun-ilors were receiving ongoing and sustained speeding complaints
n their wards which were not being satisfactorily addressed. Theity of Edmonton became increasingly involved in addressing these∗ Corresponding author. Tel.: +1 780 492 9564.E-mail addresses: [email protected] (K. El-Basyouny),
[email protected] (M.Y. El-Bassiouni).1 Tel.: +971 3 713 3386.
001-4575/$ – see front matter. Crown Copyright © 2012 Published by Elsevier Ltd. All rittp://dx.doi.org/10.1016/j.aap.2012.11.009
Crown Copyright © 2012 Published by Elsevier Ltd. All rights reserved.
speeding issues, which ultimately led the city to decide on the needfor a broader systemic solution.
In late 2009, the City of Edmonton approved work to commenceon the residential speed reduction pilot project. Work started byselecting the residential communities to pilot the speed reduction,setting up a communication plan to keep all stakeholders informed,procurement and deployment of necessary equipment, the devel-opment of an enforcement schedule, data collection plans, etc. Theinstallation of the new 40 km/h signs started in early April (2010)but the signs remained covered for the remainder of the month untilthe bylaws came into effect on May 1, 2010. Data collection, surveysand measurements commenced on April 1, 2010 and concludedOctober 31, 2010.
The follow up analysis to the pilot project includes studying thepilot project’s impact on the frequency and severity of collisions,changes in driver behaviors (i.e., speed and traffic patterns), andthe community perceptions of traffic safety. In addition to quan-
titatively investigating the actual changes in speed and collisions,the City of Edmonton was keen on measuring the community per-ceptions due to the changed speed limit since previous studiesindicated mixed results in regards to people’s attitudes toward bothghts reserved.

nt Ana
cssl
rpiatc
2
2
tawCo
ialfsRvafs
astmgasisl
caiOtdbitm2taiYpt
ta
K. El-Basyouny, M.Y. El-Bassiouni / Accide
urrent speed limits and proposed limit reductions. Studies haveuggested that many people do not necessarily support reducingpeed limits and they often do not adhere to the current speedimits (Lahausse et al., 2010).
Given the potential for a wide-scale implementation to reduceesidential speed limits in the city, it was prudent to explore theerceptions of local residents in an attempt to understand if such
nitiatives would be supported by Edmontonians in the event of complete program rollout. As a result, this paper investigateshe community perceptions toward the pilot project within the sixommunities.
. Background
.1. Speeding and safety
Speeding is a significant traffic safety problem. In fact, it is one ofhe most-reported factors associated with crashes. Between 2002nd 2004, more than 700 people were killed and more than 3500ere seriously injured each year in speed-related crashes aroundanada. The latest statistics showed that 27% of fatalities and 19%f serious injuries involved speeding (Transport Canada, 2011).
Speeding collisions occur due to drivers’ tendency to take risks,ncluding driving over the posted speed limit or at speeds thatre unsafe given the prevailing conditions (i.e., road, weather, oright conditions). Adding to the complexity of the problem is theact that even drivers who do not consider themselves aggres-ive drivers are likely to speed on occasion (NHTSA, 2004; EKOSesearch Associates, 2005). Although most crashes could be pre-ented by changes in driver attitude and behavior, those changesre proving difficult to achieve, in part because too many driversocus on the convenience of speeding rather than the risks to them-elves, their passengers and other road users.
The risk of speeding is clear and so is the rationale. Driving at high speed increases the demands on the driver. A driver who ispeeding is less able to negotiate twists and turns of the road ando steer around hazards. To compensate for a high speed, a driver
ust react more quickly and must always react adequately to aiven situation. The distance needed to stop increases, and the timevailable for stopping or taking evasive action diminishes rapidly aspeed increases. In short, the faster a vehicle is traveling, the longert will take to slow or come to a complete stop. In an emergencyituation, those few extra seconds can mean the difference betweenife and death (Transport Canada, 2008).
Internationally accepted research on the relationship betweenhanges in average traffic speed and crash outcomes showed that
5% speed increase leads to around a 15% increase in seriousnjury crashes and a 22% increase in fatal crashes (Nilsson, 2004;ECD/ECMT, 2006). Other researchers have repeatedly validated
he association between speed and road crashes across a range ofifferent scenarios. The consensus has been that the relationshipetween speed and road safety is causal. This does not mean that
nappropriate or excessive speed is always the dominant factor con-ributing to a crash. It simply suggests that albeit speed is one of
any risk factors, it is indeed a powerful risk factor (Elvik et al.,004). In fact, it was found that an increase in the driving speed isypically associated with a proportional increase in crash rate (Aartsnd van Schagen, 2006) and that the probability and extent of injuryn crashes is a direct function of initial impact speed (Cooper, 1997).et, drivers’ attitudes toward speeding have been found to be moreermissive than toward any other violation, with many admitting
o be occasional speeders (Parker et al., 1996; Blincoe et al., 2006).In general, speed choice is influenced by a wide variety of fac-ors, including individual, vehicle and road variables; the trafficnd weather conditions; the perceived level of crash/injury risk;
lysis and Prevention 51 (2013) 156– 167 157
enforcement; the speed limit and education/promotion (West andHall, 1997; Williams et al., 2006; Mesken et al., 2007; Stradling,2007; Schmid Mast et al., 2008; Tranter and Warn, 2008). Onthe other hand, traffic calming devices (TCDs) such as speedhumps, rumble strips, speed cushions, road signs and chicaneshave been applied in order to reduce driving speeds (Lockwood,1997). Furthermore, center medians and driving lane width areother road countermeasures that can potentially influence drivingspeed (Dixon et al., 1999; Chinn and Elliott, 2002).
A common approach to study driving-related behaviors is thetheory of planned behavior (TPB) (Ajzen, 1991). The TPB was shownto be effective in explaining the speeding behavior (Parker et al.,1992, 1996; Conner et al., 2003). It was also proposed that suchbehavior is determined by weighing the apparent gains against thepotential losses of speeding (Forward, 2006). In fact, an explanationof why speeding is such a common behavior emerges from con-trasting the immediacy and frequency of the benefits of speedingwith those of probable hazards (Lawton et al., 2007). In addition, itwas proposed that attitudes toward exceeding the speed limit arekey determinants of intentions to engage in the speeding behav-ior, which represent conscious decisions to perform the speedingbehavior (Aberg et al., 1997; Fernandes et al., 2007).
In regards to the relationship between speed-related inten-tions and behavior, Warner and Aberg (2008) have suggested thatthe intentions to engage in the speeding behavior are determinednot only by attitudes, but also by beliefs, subjective norms, andperceived behavioral control. Nonetheless, it has been found thatintentions are strongly influenced by habits and that both are socrucial in determining the speeding behavior (De Pelsmacker andJanssens, 2007). Also, it has been acknowledged that the best pre-dictor of future behavior is past behavior, so if people have exceededthe speed limit in the past, they are likely to continue to do so inthe future, unless there is a negative consequence that arises fromspeeding, or there is another external influence which changes theirperception of the speeding behavior (Forward, 2006).
2.2. Speed limits
Speed limits have been used as a way of controlling drivingspeed with the following two main purposes: (i) to enhance safetyby reducing risks imposed by drivers’ speed choices, and (ii) toprovide the basis for enforcement for those who drive at exces-sive speeds and potentially endanger others (DOT, 2002). Althoughspeed limits provide valuable information to the driver about theappropriate driving speed in good conditions (e.g., fine weather,minimal traffic), setting a speed limit does not automatically resultin the desired speeding behavior since exceeding the speed limit isrelatively common, and many drivers have noted the speed limitbeing too low as a reason for them to speed (Haglund and Aberg,2000, 2002). Thus, it appears that the majority of drivers do not con-sider a speed limit to be the maximum driving speed, but rather as aguideline of such speed, with many viewing driving at up to 5 km/hor 10 km/h over the limit as acceptable behavior (EKOS ResearchAssociates, 2005; Goldenbeld and van Schagen, 2007).
Moreover, if the road and its new speed limit are mismatched,lowering the posted speed limit might not result in a reduceddriving speed, as drivers tend to respond poorly to such incom-patible interventions (Morrison et al., 2003). As a consequence, theroad environment should be designed to fit the designated speedlimit, with enforcement and road safety advertising campaigns alsoused to maximize the effectiveness of any existing or newly imple-mented limit reductions (Archer et al., 2008).
It has been proposed that exceeding the speed limit is the mostfrequent traffic offence and is responsible for many severe roadaccidents (De Pelsmacker and Janssens, 2007). Indeed, it has beenestimated that 20% of all people killed on the road would have

1 nt Ana
s2airttaist
2
araiarlS
uadotcstbteps
2
wdfjatflocl
rmAat
3
amOi
58 K. El-Basyouny, M.Y. El-Bassiouni / Accide
urvived if all drivers obeyed the speed limit (Warner and Aberg,008). Another empirical study concluded that drivers traveledn average of 11 km/h faster than when speed restrictions weren place, therefore increasing the crash and serious/fatal injuryisks (Recarte and Nunes, 2002). In this regard, it was arguedhat increasing speed violation penalties would prompt driverso comply with the speed limits to a greater extent (Jorgensennd Pedersen, 2005). However, other research has found thatncreasing speeding fines does not have a direct effect on drivingpeed, leading to the conclusion that it is the threat of punishmenthat influences drivers (Bjomskau and Elvik, 1992).
.3. Speed limits in residential areas
Some recent studies have revealed that speeding was perceiveds a large safety problem in residential communities, with theesults indicating a strong support for enforcement on local roadsnd that driving anywhere above the speed limit in residential areass unacceptable (Forward, 2006; Poulter and McKenna, 2007). Inddition, it was found in another study investigating the impact ofeducing residential speed limits from 60 km/h to 50 km/h that theevel of community support tends to increase over time (Walsh andmith, 1999).
Speeding in residential areas affects the safety of vulnerable roadsers (pedestrians and cyclists) specifically young children. Gener-lly, speeding in residential areas may create a sense of insecurityue to (i) the risk of being involved in a vehicle crash, (ii) the seri-usness of ensuing injuries, and (iii) (on a slightly smaller scale)he potential noise from engine acceleration and tire friction. Thehances of surviving a crash decrease rapidly above certain impactpeeds (OECD/ECMT, 2006). For example, the research indicateshat while most vulnerable (unprotected) road users survive if hity a car traveling at 30 km/h, the majority are killed if hit by a carraveling at 50 km/h. The human tolerance to injury by a car will bexceeded if the vehicle is traveling at more than 30 km/h. As suchedestrians incur a risk of about 80% of being killed at a collisionpeed of 50 km/h (Global Road Safety Partnership, 2008).
.4. Summary
It is clear that speeding is a major risk factor that is associatedith an increase in collision frequency and severity. It is also evi-ent that the choice of speed is influenced by a wide variety ofactors which adds to the complexity of the problem. However,ust as it is influenced by numerous contributing factors there iss much potential prospects to control or manage speed. As such,here are several speed management strategies with speed limitsorming the cornerstone of any speed management policy. Speedimits provide visual cues and valuable information to the drivern the appropriate and safe speed to drive on given normal drivingonditions. However, studies have shown that changing the speedimit alone might not be an effective control strategy.
While driving on higher speeds might be tolerated on main arte-ial roads, it is less acceptable on residential roads where thereight be an increased risk of pedestrian/cycle-vehicle encounters.
palpable countermeasure is to reduce speed limits in residentialreas but previous studies have indicated mixed results in regardso people’s attitudes toward proposed limit reductions.
. Sampling survey design and data collection
The City of Edmonton, Office of Traffic Safety (OTS), conducted
Residential Speed Reduction Pilot Project in six Edmonton com-unities (namely, Beverly Heights, King Edward Park, Woodcroft,ttewell, Westridge/Wolf Willow and Twin Brooks) to test thempact of a lower residential speed limit on the level of traffic
lysis and Prevention 51 (2013) 156– 167
safety. Banister Research & Consulting Inc. was commissioned toconduct a random and representative telephone survey of the cit-izens residing in the six communities during two phases – beforeproject initiation in March 2010 (pre-pilot) and following the endof the project in November 2010 (post-pilot).
The consulting team held an initial meeting with the OTS to dis-cuss (i) the objectives of the project, (ii) the issues and concerns tobe addressed, and (iii) the research methodology. Following this ini-tial meeting, the survey instruments for both phases were designedand a detailed work plan was developed. Once the OTS reviewedthe draft survey instruments, revisions were made and the ques-tionnaires were finalized in consultation with the OTS.
The total number of households in the six pilot communitieswas 10,429 (obtained from the City of Edmonton website as ofthe 2009 Municipal Census). Telephone interviews were conductedfrom March 25th to 31st, 2010 (pre-pilot), and from November 8thto 19th, 2010 (post-pilot) with residents who are 18 years of age orolder. Fifty interviews were conducted per community for a totalof 600 interviews (300 each in the pre- and post-pilot surveys).The overall results are thus accurate to within ±5.6% at the 95%confidence level (in both the pre- and post-pilot surveys).
Using the call summary standard, established by the MarketResearch and Intelligence Association (MRIA, 2012), the responserate was 22%. It is important to note that the calculation used forthe response rate is a conservative estimate and does not necessar-ily measure respondent interest in the subject area. Furthermore,according to the standards and guidelines for the response ratedeveloped by the Advisory Panel on Telephone Public Opinion Sur-vey Quality (Public Works and Government Services Canada, 2012),the recommended response rate target ranges are “10% to 20% insurveys for which only a short time period (less than three weeks) isavailable to conduct the fieldwork and 20% to 40% in surveys of moder-ate to high importance that will be in the field for at least three weeks”.The purpose of these standards is to acknowledge the importanceof the response rate as an indicator of potential risk of nonresponsebias while at the same time requiring that response rate targets takeinto consideration other survey characteristics such as the impor-tance of survey uses, time constraints, respondent burden and datacollection cost. A balanced perspective on response rate was con-sidered important because a relatively lower response rate maynot in fact be associated with nonresponse bias, and undue focus onresponse rate at the survey planning stage could lead to inadequateattention to other aspects of the survey that affect data quality.
4. Methodology
The data analysis used in the current study includes a prelimi-nary analysis and a multivariate analysis using confirmatory factoranalysis (CFA) and structure equation modeling (SEM).
The statistical tools used in the preliminary analysis include: (i)cross-tabulations and chi-square tests (pre- versus post-responses)for nominal data, and (ii) t-tests to determine if there were sig-nificant differences (post minus pre responses) for ordinal andnumerical data. The t-tests for ordinal data are equivalent to thenon-parametric Mann–Whitney tests (Gibbons and Chakraborty,2003).
On the other hand, many of the items in the survey’s ques-tionnaires can be thought of as indicators of latent variables (alsocalled factors or constructs) representing certain notions, conceptsand/or perceptions of the respondents. Unlike the indicators, whichwere observed during the two phases (pre and post) of the pilot
project, the factors (latent variables) are unobservable. However,statistical inference about such factors is possible via the develop-ment of CFA/SEM models. In the current study, the confirmatoryfactor analysis and structural equations modeling involve three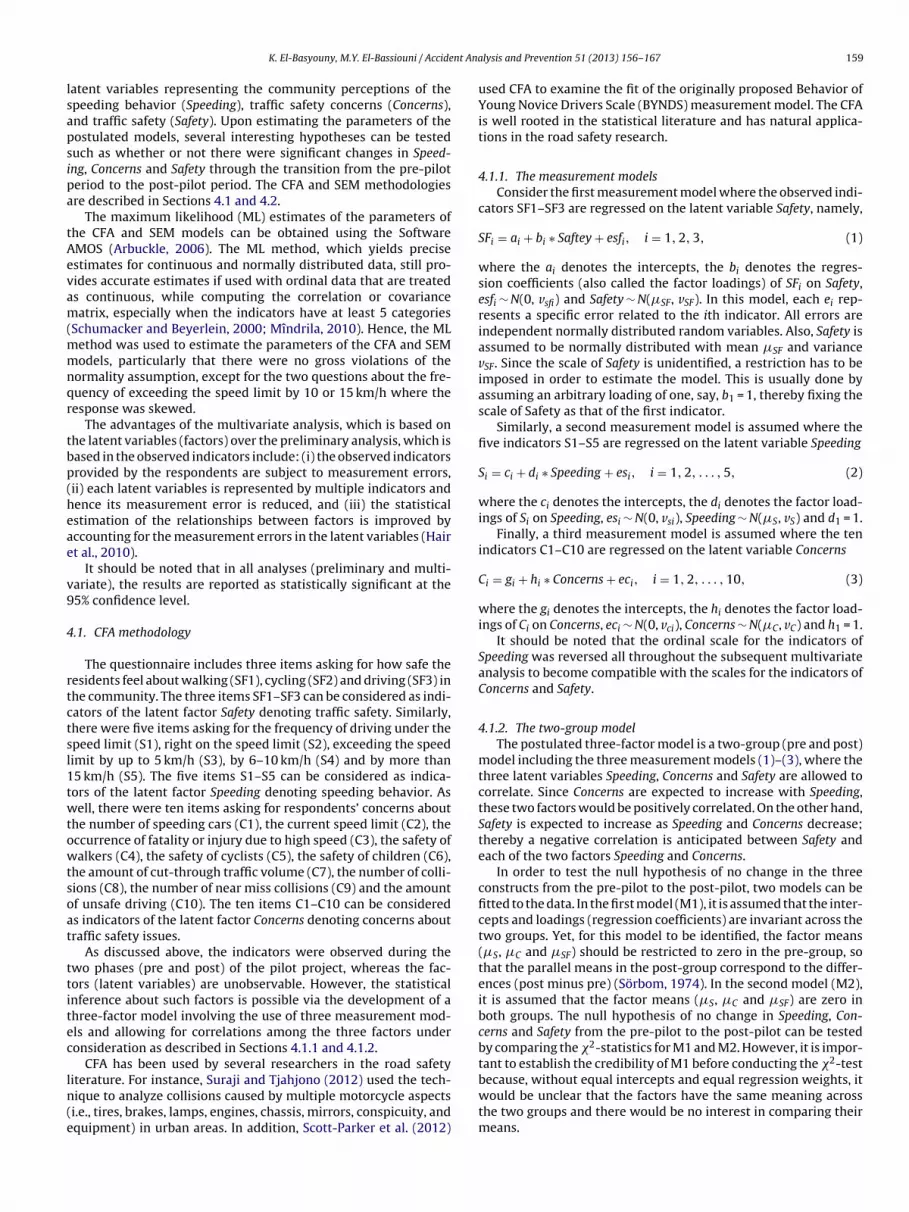
nt Ana
lsapsipa
tAevam(mmnqr
tbp(heae
v9
4
rtctsl1twtowtsoat
ttitec
ln(e
K. El-Basyouny, M.Y. El-Bassiouni / Accide
atent variables representing the community perceptions of thepeeding behavior (Speeding), traffic safety concerns (Concerns),nd traffic safety (Safety). Upon estimating the parameters of theostulated models, several interesting hypotheses can be testeduch as whether or not there were significant changes in Speed-ng, Concerns and Safety through the transition from the pre-piloteriod to the post-pilot period. The CFA and SEM methodologiesre described in Sections 4.1 and 4.2.
The maximum likelihood (ML) estimates of the parameters ofhe CFA and SEM models can be obtained using the SoftwareMOS (Arbuckle, 2006). The ML method, which yields precisestimates for continuous and normally distributed data, still pro-ides accurate estimates if used with ordinal data that are treateds continuous, while computing the correlation or covarianceatrix, especially when the indicators have at least 5 categories
Schumacker and Beyerlein, 2000; Mîndrila, 2010). Hence, the MLethod was used to estimate the parameters of the CFA and SEModels, particularly that there were no gross violations of the
ormality assumption, except for the two questions about the fre-uency of exceeding the speed limit by 10 or 15 km/h where theesponse was skewed.
The advantages of the multivariate analysis, which is based onhe latent variables (factors) over the preliminary analysis, which isased in the observed indicators include: (i) the observed indicatorsrovided by the respondents are subject to measurement errors,ii) each latent variables is represented by multiple indicators andence its measurement error is reduced, and (iii) the statisticalstimation of the relationships between factors is improved byccounting for the measurement errors in the latent variables (Hairt al., 2010).
It should be noted that in all analyses (preliminary and multi-ariate), the results are reported as statistically significant at the5% confidence level.
.1. CFA methodology
The questionnaire includes three items asking for how safe theesidents feel about walking (SF1), cycling (SF2) and driving (SF3) inhe community. The three items SF1–SF3 can be considered as indi-ators of the latent factor Safety denoting traffic safety. Similarly,here were five items asking for the frequency of driving under thepeed limit (S1), right on the speed limit (S2), exceeding the speedimit by up to 5 km/h (S3), by 6–10 km/h (S4) and by more than5 km/h (S5). The five items S1–S5 can be considered as indica-ors of the latent factor Speeding denoting speeding behavior. Asell, there were ten items asking for respondents’ concerns about
he number of speeding cars (C1), the current speed limit (C2), theccurrence of fatality or injury due to high speed (C3), the safety ofalkers (C4), the safety of cyclists (C5), the safety of children (C6),
he amount of cut-through traffic volume (C7), the number of colli-ions (C8), the number of near miss collisions (C9) and the amountf unsafe driving (C10). The ten items C1–C10 can be considereds indicators of the latent factor Concerns denoting concerns aboutraffic safety issues.
As discussed above, the indicators were observed during thewo phases (pre and post) of the pilot project, whereas the fac-ors (latent variables) are unobservable. However, the statisticalnference about such factors is possible via the development of ahree-factor model involving the use of three measurement mod-ls and allowing for correlations among the three factors underonsideration as described in Sections 4.1.1 and 4.1.2.
CFA has been used by several researchers in the road safety
iterature. For instance, Suraji and Tjahjono (2012) used the tech-ique to analyze collisions caused by multiple motorcycle aspectsi.e., tires, brakes, lamps, engines, chassis, mirrors, conspicuity, andquipment) in urban areas. In addition, Scott-Parker et al. (2012)lysis and Prevention 51 (2013) 156– 167 159
used CFA to examine the fit of the originally proposed Behavior ofYoung Novice Drivers Scale (BYNDS) measurement model. The CFAis well rooted in the statistical literature and has natural applica-tions in the road safety research.
4.1.1. The measurement modelsConsider the first measurement model where the observed indi-
cators SF1–SF3 are regressed on the latent variable Safety, namely,
SFi = ai + bi ∗ Saftey + esfi, i = 1, 2, 3, (1)
where the ai denotes the intercepts, the bi denotes the regres-sion coefficients (also called the factor loadings) of SFi on Safety,esfi ∼ N(0, vsfi) and Safety ∼ N(�SF, vSF). In this model, each ei rep-resents a specific error related to the ith indicator. All errors areindependent normally distributed random variables. Also, Safety isassumed to be normally distributed with mean �SF and variancevSF. Since the scale of Safety is unidentified, a restriction has to beimposed in order to estimate the model. This is usually done byassuming an arbitrary loading of one, say, b1 = 1, thereby fixing thescale of Safety as that of the first indicator.
Similarly, a second measurement model is assumed where thefive indicators S1–S5 are regressed on the latent variable Speeding
Si = ci + di ∗ Speeding + esi, i = 1, 2, . . . , 5, (2)
where the ci denotes the intercepts, the di denotes the factor load-ings of Si on Speeding, esi ∼ N(0, vsi), Speeding ∼ N(�S, vS) and d1 = 1.
Finally, a third measurement model is assumed where the tenindicators C1–C10 are regressed on the latent variable Concerns
Ci = gi + hi ∗ Concerns + eci, i = 1, 2, . . . , 10, (3)
where the gi denotes the intercepts, the hi denotes the factor load-ings of Ci on Concerns, eci ∼ N(0, vci), Concerns ∼ N(�C, vC) and h1 = 1.
It should be noted that the ordinal scale for the indicators ofSpeeding was reversed all throughout the subsequent multivariateanalysis to become compatible with the scales for the indicators ofConcerns and Safety.
4.1.2. The two-group modelThe postulated three-factor model is a two-group (pre and post)
model including the three measurement models (1)–(3), where thethree latent variables Speeding, Concerns and Safety are allowed tocorrelate. Since Concerns are expected to increase with Speeding,these two factors would be positively correlated. On the other hand,Safety is expected to increase as Speeding and Concerns decrease;thereby a negative correlation is anticipated between Safety andeach of the two factors Speeding and Concerns.
In order to test the null hypothesis of no change in the threeconstructs from the pre-pilot to the post-pilot, two models can befitted to the data. In the first model (M1), it is assumed that the inter-cepts and loadings (regression coefficients) are invariant across thetwo groups. Yet, for this model to be identified, the factor means(�S, �C and �SF) should be restricted to zero in the pre-group, sothat the parallel means in the post-group correspond to the differ-ences (post minus pre) (Sörbom, 1974). In the second model (M2),it is assumed that the factor means (�S, �C and �SF) are zero inboth groups. The null hypothesis of no change in Speeding, Con-cerns and Safety from the pre-pilot to the post-pilot can be testedby comparing the �2-statistics for M1 and M2. However, it is impor-tant to establish the credibility of M1 before conducting the �2-test
because, without equal intercepts and equal regression weights, itwould be unclear that the factors have the same meaning acrossthe two groups and there would be no interest in comparing theirmeans.
160 K. El-Basyouny, M.Y. El-Bassiouni / Accident Analysis and Prevention 51 (2013) 156– 167
Table 1Distribution of respondents by gender and phase.
Phase Male Female Total
One (pre) 49.3% 50.7% 100.0%Two (post) 42.0% 58.0% 100.0%
Total 45.7% 54.3% 100.0%
Table 2Distribution of respondents by marital status and phase.
Phase Single Marrieda Widowed Separated Divorced Total
One (pre) 9.9% 70.1% 9.2% 1.7% 9.2% 100.0%Two (post) 9.3% 70.0% 11.7% 1.0% 7.9% 100.0%
4
asod(Ioeiso
4
tee
C
S
wrSevct
StigfEb
Table 4Distribution of respondents by ownership of current residence and phase.
Phase Own Rent Total
One (pre) 86.2% 13.8% 100.0%Two (post) 87.1% 12.9% 100.0%
Total 86.6% 13.4% 100.0%
Table 5Distribution of respondents by income and phase.
Phase <50a 50–100a 100–150a 150–200a >200a Total
One (pre) 25.2% 34.8% 23.9% 9.1% 7.0% 100.0%Two (post) 25.8% 32.9% 20.8% 12.1% 8.3% 100.0%
old, respectively. The total household size ranged from 1 to 9 per-
TD
Total 9.6% 70.0% 10.4% 1.4% 8.6% 100.0%
a Or living together as a couple.
.1.3. Goodness-of-fit guidelinesIt is well known that in large samples the �2-statistic will almost
lways be significant, since it is a direct function of the sampleize. Consequently, other measures of overall model goodness-f-fit were suggested, namely, that the ratio �2/df ≤ 3 (where dfenotes the degrees of freedom); that the Incremental Fit IndexIFI), the Non-Normed Fit Index (NNFI), and the Comparative Fitndex (CFI) are greater than or equal to 0.90; and that the valuesf the Root Mean Square Error of Approximation (RMSEA) does notxceed 0.08, which represent reasonable errors of approximationn the population (Lattin et al., 2003; Hair et al., 2010). Also, thetandardized residuals should be inspected for possible violationsf assumptions.
.2. SEM methodology
To study the impact of Speeding and Concerns on Safety acrosshe two phases of the pilot project, the three measurement mod-ls (1)–(3) were complemented by the following two structuralquations
oncerns = q + r ∗ Speeding + e1, (4)
afety = s + t ∗ Speeding + u ∗ Concerns + e2, (5)
here q and s denote the intercepts and r, t and u denote theegression coefficients. The assumptions Concerns ∼ N(�C, vC) andafety ∼ N(�SF, vSF) of the three-factor model are replaced by1 ∼ N(0,v1) and e2 ∼ N(0,v2), but the assumption Speeding ∼ N(�S,S) is still required. To define a two-group SEM, the two inter-epts q and s and the factor mean �S were restricted to zero inhe pre-group.
In order to test the null hypothesis of no change in the impact ofpeeding on Concerns and of both Speeding and Concerns on Safety,wo models can be fitted to the data. In the first model (M3), thentercepts and loadings in Eqs. (1)–(3) were invariant across the tworoups. In the second model (M4), the invariance assumption was
urther extended to include the structural regression coefficients inqs. (4) and (5). The null hypothesis of uniform impact can be testedy comparing the �2-statistics for M3 and M4. However, as was theable 3istribution of respondents by current employment status and phase.
Phase Working full timea Working part timea Homem
One (pre) 48.0% 11.2% 5.1%
Two (post) 44.7% 10.0% 5.8%
Total 46.3% 10.6% 5.5%
a Including self-employment.
Total 25.5% 33.8% 22.3% 10.6% 7.7% 100.0%
a Income in units of 1000 Canadian Dollars.
case in Section 4.1.2, it is important to establish the credibility ofM3 before conducting the �2-test.
5. Preliminary analysis
5.1. Demographic profiles
Table 1 displays the percentages of respondents by gender andphase (one = pre-pilot and two = post-pilot). Although the post pilotsurvey included a 7.3% fewer males compared with the pre-pilotsurvey, the difference was not significant since �2(df = 1), whichdenotes the chi-square statistic with one degree of freedom, was3.251, corresponding to a p-value of 0.071 > 0.05 (the nominal sig-nificance level).
Table 2 displays close distributions of the respondents’ maritalstatus across the pre- and post-pilot surveys. In fact, the differencewas not significant since �2(df = 4) was 1.689, corresponding to ap-value of 0.793.
As well, Table 3 displays close distributions of the respondents’current employment status across the pre- and post-pilot surveys.The difference was not significant since �2(df = 5) was 2.895, corre-sponding to a p-value of 0.716.
Also, Table 4 displays close distributions of respondents’ own-ership of current residence across the two phases. Again, thedifference was not significant since �2(df = 1) was 0.099, corre-sponding to a p-value of 0.753.
Likewise, Table 5 displays close distributions of the respondents’total 2009 household income before taxes across the pre- and post-pilot surveys. Once more, the difference was not significant since�2(df = 4) was 1.890, corresponding to a p-value of 0.756. Yet, itshould be noted that 21.7% of the respondents declined to answerthe rather sensitive income question.
Finally, Table 6 displays the descriptive statistics for age, totalhousehold size and the number of years in current residence byphase. Overall, the respondents’ ages ranged from 20 to 89 yearsold with a mean and a standard deviation of 57.55 and 14.59 years
sons with a mean and a standard deviation of 2.52 and 1.29 persons,respectively. The respondents’ number of years in the current res-idence ranged from 1 to 62 years with a mean and a standard
aker Student Not employed Retired Total
1.7% 3.1% 31.0% 100.0%.7% 3.4% 35.4% 100.0%
1.2% 3.2% 33.2% 100.0%

K. El-Basyouny, M.Y. El-Bassiouni / Accident Analysis and Prevention 51 (2013) 156– 167 161
Table 6Descriptive statistics for age, household size and number of years in current residence by phase.
Phase Statistic Age Household size Years in currentresidence
One (pre) N 289 295 300Minimum 21 1 1Maximum 87 7 62Mean 57.29 2.55 18.54Std. deviation 14.38 1.31 14.52
Two (post) N 290 298 300Minimum 20 1 1Maximum 89 9 60Mean 57.79 2.49 18.95Std. deviation 14.82 1.27 14.61
Total N 579 593 600Minimum 20 1 1Maximum 89 9 62Mean 57.55 2.52 18.75Std. deviation 14.59 1.29 14.55
Post minus pre t-Statistic 0.408 −0.559 0.350p-Value 0.683 0.557 0.726
Table 7t-Tests for the respondents’ travel habits (post minus pre).
How often do you Pre-mean Post mean t-Statistic p-Value
Drive in the community 1.29 1.33 0.551 0.582
dmw−
ttdcp
5
msefdfn5pecnAfs
audcnps
Table 8t-Tests for the respondents’ safety perceptions (post minus pre).
Feeling safe while Pre-mean Post mean t-Statistic p-Value
SF1: walking in thecommunity
4.05 4.35 3.761 <0.001
SF2: cycling in the 3.96 4.07 1.046 0.296
respondents’ concerns about various traffic safety issues in thecommunity. Except for the speed limit where the change in respon-dents’ concerns was not significant (t = 1.219, p-value = 0.223),there was a highly significant decrease in all other concern issues
Table 9t-Tests for the respondents’ speeding perceptions (post minus pre).
Driving in the community Pre-mean Post mean t-Statistic p-Value
S1: under the speed limit 2.06 3.06 6.940 <0.001S2: right on the speed limit 1.79 1.35 −4.660 <0.001S3: up to 5 km/h over the
speed limit3.73 3.35 −2.784 0.006
Walk in the community 2.12 2.08 −0.377 0.706Cycle in the community 3.89 4.28 3.588 <0.001
eviation of 18.75 and 14.55 years, respectively. The t-tests (postinus pre) for age, household size and years in current residenceere not significant as the t-statistics were 0.408 (p-value = 0.683),0.559 (p-value = 0.577) and 0.350 (p-value = 0.726), respectively.
The results of Tables 1–6 demonstrate the close similarity ofhe demographic characteristics of the respondents through thewo phases, as there were no significant structural demographicifferences between the two samples. This paves the way towardonducting comparisons between the results of the pre-pilot andost-pilot surveys.
.2. Current habits: travel, safety and speeding
The respondents were asked to identify how often they, or aember of their family, travel in the community on an ordinal
cale of 1 = daily, 2 = few times a week, 3 = once a week, 4 = oncevery few weeks and 5 = Rarely/Never. Table 7 displays the t-testsor the respondents’ travel habits. The t-tests (post minus pre) forriving and walking were not significant. In contrast, the t-testor cycling was 3.588 with p-value <0.001, indicating a highly sig-ificant decrease in cycling after reducing the speed limit from0 km/h to 40 km/h. The significant decrease in cycling during theost-period is probably due to other factors that may be influ-ncing the perception between the pre and post phases. Indeed,ycling is a popular form of recreation in Canada with its use foron-recreational purposes, especially for work trips, is limited.ccording to the 2006 Canadian Census, 1.4% people use bicycles
or work trips on a regular basis. The unexpected decrease is notedubject to the model’s limitations.
The respondents were next asked to indicate how safe they feelbout traveling in the community on an ordinal scale from 1 = verynsafe to 5 = very safe. Table 8 displays the t-tests for the respon-ents’ safety perceptions. The increase in the perception of safe
ycling was not significant, whereas that of safe driving was sig-ificant at the 0.10 level. On the other hand, the increase in theerception of safe walking was highly significant after reducing thepeed limit.communitySF3: driving in the
community4.31 4.44 1.854 0.064
Considering their driving in the past 6 months, the respondentswere asked to indicate how often they drive in the community atcertain speeds, on an ordinal scale of 1 = daily, 2 = few times a week,3 = once a week, 4 = once every few weeks and 5 = Rarely/Never.Table 9 displays the t-tests for the respondents’ speeding percep-tions. On the negative side, fewer respondents were driving underthe speed limit during the post-period. On the positive side, morerespondents were driving right on the speed limit. But there wasalso a significant increase in the respondents exceeding the speedlimit by up to 5 or 10 km/h. On the other hand, the slight decreasein those exceeding the speed limit by more than 10 km/h duringthe post-period was not significant.
5.3. Traffic safety concerns
The respondents were then asked to indicate their concernsabout certain traffic safety issues in the community on an ordinalscale from 1 = not at all concerned to 5 = very concerned. Table 10displays the t-tests (in descending absolute magnitude) for the
S4: 6–10 km/h over thespeed limit
4.72 4.52 −2.449 0.015
S5: more than 10 km/hover the speed limit
4.89 4.92 0.559 0.576

162 K. El-Basyouny, M.Y. El-Bassiouni / Accident Analysis and Prevention 51 (2013) 156– 167
Table 10t-Tests for the respondents’ concerns about various traffic safety issues in the community (post minus pre).
Concern issues Pre-mean Post mean t-Statistic p-Value
C10: amount of unsafe driving 3.22 2.72 −4.533 <0.001C6: safety of children (due to auto traffic) 3.46 2.97 −4.293 <0.001C5: safety of cyclists (due to auto traffic) 3.07 2.60 −4.240 <0.001C3: occurrence of fatality or injury due to high speed 2.82 2.29 −4.202 <0.001C8: number of collisions 2.52 2.07 −4.139 <0.001C4: safety of walkers (due to auto traffic) 2.91 2.43 −4.129 <0.001C1: number of speeding cars 3.32 2.88 −3.860 <0.001
debpo
5
copk<
tItlac
tseepwe
5
stpwmas
eso
TR
now (where 3 = about the same). About 25.6% stated it was much
C9: number of near miss collisions 2.67
C7: amount of cut-through traffic volume 2.70
C2: current speed limit 2.65
uring the post-period. The most progress has occurred for less-ning the concerns about the amount of unsafe driving, followedy the concerns about the safety of children, whereas the leastrogress has occurred for easing the concerns about the amountf cut-through traffic volume.
.4. Speed limit: awareness, perception and effectiveness
When the respondents were asked if they were aware of theurrent speed limit in their community, the vast majority (97.7%)f respondents were aware that the speed limit was 40 km/h in theost-pilot, representing a significant increase from the 81.1% whonew it was 50 km/h in the pre-pilot (�2(df = 1) = 43.727, p-value0.001).
In the post-pilot, more than half of the respondents (57.6%) felthat the speed limit was just right, while 39% felt it was too low.n the pre-pilot 72.7% felt it was just right (significantly more thanhe post-pilot), while 1.4% felt that it was too low (significantlyess than the post-pilot). The percentages are displayed in Table 11nd the �2-statistic was 162.168, with two degrees of freedom,orresponding to a p-value <0.001.
The respondents were then asked to rate the anticipated effec-iveness of the reduced speed limit to 40 km/h in improving trafficafety in the community, on an ordinal scale from 1 = not at allffective to 5 = very effective. The mean ratings of the anticipatedffectiveness of the reduced speed limit were 2.70 and 3.06 in there- and post-periods, respectively, leading to a t-statistic of 2.987ith p-value = 0.003, which indicates a significant increase in such
ffectiveness during phase two compared with phase one.
.5. Speed monitoring: awareness and effectiveness
When asked, 79.9% of the respondents in the post-pilot surveytated they were aware of the speed trailer, 52.4% were aware ofhe school dolly and 39.9% were aware of the speed watch. All threeercentages were significantly increased from the pre-pilot surveyhere 49.8%, 30.3%, and 23.8 were aware of such speed manage-ent controls, respectively. The �2-statistics were 59.448, 29.657
nd 17.610, respectively, all with one degree of freedom, corre-ponding to a p-value <0.001.
The respondents were subsequently asked to anticipate theffectiveness of the three different speed monitors, on an ordinalcale from 1 = not at all effective to 5 = very effective. The resultsf the t-tests appear in Table 12. For the speed trailer, the t-test
able 11espondents’ perceptions of the speed limit by phase.
Phase Too low Just right Too high Total
One (pre) 1.4% 72.7% 25.9% 100.0%Two (post) 39.3% 57.6% 3.1% 100.0%
Total 20.4% 65.1% 14.5% 100.0%
2.29 −3.336 0.0012.36 −2.678 0.0082.81 1.219 0.223
indicates a highly significant increase in the rating of its anticipatedeffectiveness in the post-period compared with the pre-period.The same holds true for the speed watch, except that the increasein the rating of its anticipated effectiveness is only significant at the0.10 level. On the other hand, the slight increase in the anticipatedeffectiveness of the school dolly was not significant.
5.6. Pilot project: awareness, effectiveness, communityinvolvement and impact
The majority (87%) of the respondents in the post-period indi-cated they were aware that their community had been chosento participate in the pilot project, which is a highly significantincrease from the 46% in the pre-period (�2(df = 1) = 112.236, p-value <0.001).
Subsequently, the respondents were asked to anticipate theoverall effectiveness of the pilot project (including additional speedmanagement controls such as speed watch, speed trailers andschool dollies) in improving traffic safety in the community, onan ordinal scale from 1 = not at all effective to 5 = very effective.The mean ratings of the anticipated overall effectiveness were 3.25and 3.30 in the pre- and post-periods, respectively, leading to anon-significant t-statistic of 0.468 (p-value = 0.640), which indi-cates no practical change in the overall effectiveness through thetwo phases. Yet, the mean ratings of 3.25 and 3.30 are above the midvalue“3” of the scale, indicating favorable responses concerning theanticipated overall effectiveness of the project in both phases. Thedetailed assessment of project effectiveness will be dealt with inSection 6.
Next, the respondents indicated the level of importance of com-munity involvement and support for the success of the pilot projectin improving traffic safety, on an ordinal scale from 1 = not at allimportant to 5 = very important. The mean ratings of importancewere 4.09 and 3.96 in the pre- and post-periods, respectively, lead-ing to non-significant t-statistic of −1.369 (p-value = 0.172), whichindicates no practical change in the rather high ratings of the impor-tance of community involvement through the two phases.
Finally, for the post-pilot survey only, the respondents wereasked how the speed of traffic had changed over the last six months,on an ordinal scale from 1 = much slower now to 5 = much faster
slower, 23.5% slower, 46.5% about the same, 3.4% faster and 1%much faster. The mean rating was 2.31, which is significantly lessthan the value “3” (designating that traffic speed is about the same).
Table 12t-Tests for the respondents’ perceptions of the anticipated effectiveness of differentspeed monitors (post minus pre).
Speed monitors Pre-mean Post mean t-Statistic p-Value
Speed trailer 3.57 3.85 2.758 0.006Speed watch 2.82 3.06 1.768 0.078School dolly 3.66 3.73 0.587 0.558

K. El-Basyouny, M.Y. El-Bassiouni / Accident Analysis and Prevention 51 (2013) 156– 167 163
up mo
Trt
6
6
emreaCstssfi
M
Fig. 1. Graphical representation of the pre-gro
he t-statistic was −12.808 with a p-value <0.001, confirming theespondents’ perceptions that traffic speed has been reduced fromhat of six months ago.
. Multivariate results
.1. CFA model estimates
The two models M1 and M2 were fitted using AMOS. Uponxamining the residual covariance matrices for the three-factorodel M1, large positive covariances were found between the
esiduals (ec4, ec5), (ec5, ec6) and (ec8, ec9). Since ec4 andc5 represent whatever “Safety of walkers (due to auto traffic)”nd “Safety of cyclists (due to auto traffic)” measure other thanoncerns, it is plausible that the two respective indicators mea-ure some characteristics or features additional to Concerns. If so,hen a positive correlation between ec4 and ec5 is expected. Theame holds true for the two remaining pairs of residuals. Hence,
ix covariances (three per group) were added to improve thet.The ML estimates of the parameters of the two-group model1 are displayed in Fig. 1. In this figure, the three factors are
del (top) and the post-group model (bottom).
represented by oval shapes and for each factor there is a set ofobserved indicators represented by rectangles and another setof specific errors represented by circles. The estimated specific(unique) variances appear above the circles, the estimated inter-cepts appear above the rectangles, whereas the estimated loadingsappear above the single arrows pointing from each factor toward itsindicators. The estimated covariances between the factors appearnext to the double arrows connecting the pairs. There are alsothree additional estimated covariances to accommodate the extracorrelations among certain indicators of the latent variable Con-cerns. Finally, the factor means and variances appear above the ovalshapes. As mentioned earlier, the factor means were restricted tozero in the pre-group (for identification), while those in the post-group represent the differences of post-data minus pre-data. Recallalso that the intercepts and loadings were group invariant, but thevariances and covariances were allowed to vary across the twogroups.
For M1, the intercepts were all highly significant and all factor
loadings were highly significant as well, except for S2 (driving righton the speed limit). In addition, the variances were all positive andhighly significant. Also, the six added covariances (three per group)were positive and significant as expected.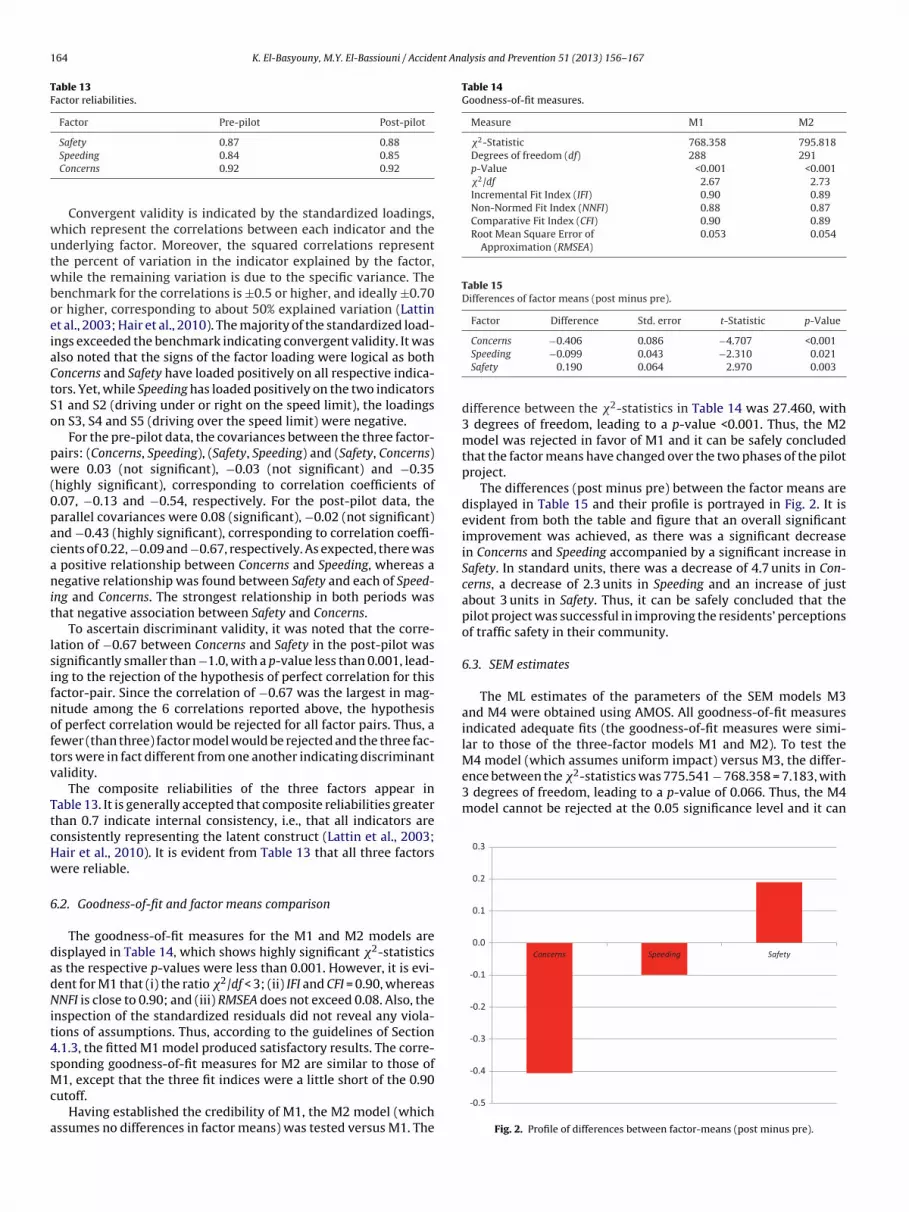
164 K. El-Basyouny, M.Y. El-Bassiouni / Accident Analysis and Prevention 51 (2013) 156– 167
Table 13Factor reliabilities.
Factor Pre-pilot Post-pilot
Safety 0.87 0.88
wutwboeiaCtSo
pw(0pacanit
lsifnoftv
TtcHw
6
dadNit4sMc
a
Table 14Goodness-of-fit measures.
Measure M1 M2
�2-Statistic 768.358 795.818Degrees of freedom (df) 288 291p-Value <0.001 <0.001�2/df 2.67 2.73Incremental Fit Index (IFI) 0.90 0.89Non-Normed Fit Index (NNFI) 0.88 0.87Comparative Fit Index (CFI) 0.90 0.89Root Mean Square Error of
Approximation (RMSEA)0.053 0.054
Table 15Differences of factor means (post minus pre).
Factor Difference Std. error t-Statistic p-Value
M4 model (which assumes uniform impact) versus M3, the differ-ence between the �2-statistics was 775.541 − 768.358 = 7.183, with3 degrees of freedom, leading to a p-value of 0.066. Thus, the M4model cannot be rejected at the 0.05 significance level and it can
-0.4
-0.3
-0.2
-0.1
0.0
0.1
0.2
0.3
Concerns Speeding Safety
Speeding 0.84 0.85Concerns 0.92 0.92
Convergent validity is indicated by the standardized loadings,hich represent the correlations between each indicator and thenderlying factor. Moreover, the squared correlations representhe percent of variation in the indicator explained by the factor,hile the remaining variation is due to the specific variance. The
enchmark for the correlations is ±0.5 or higher, and ideally ±0.70r higher, corresponding to about 50% explained variation (Lattint al., 2003; Hair et al., 2010). The majority of the standardized load-ngs exceeded the benchmark indicating convergent validity. It waslso noted that the signs of the factor loading were logical as bothoncerns and Safety have loaded positively on all respective indica-ors. Yet, while Speeding has loaded positively on the two indicators1 and S2 (driving under or right on the speed limit), the loadingsn S3, S4 and S5 (driving over the speed limit) were negative.
For the pre-pilot data, the covariances between the three factor-airs: (Concerns, Speeding), (Safety, Speeding) and (Safety, Concerns)ere 0.03 (not significant), −0.03 (not significant) and −0.35
highly significant), corresponding to correlation coefficients of.07, −0.13 and −0.54, respectively. For the post-pilot data, thearallel covariances were 0.08 (significant), −0.02 (not significant)nd −0.43 (highly significant), corresponding to correlation coeffi-ients of 0.22, −0.09 and −0.67, respectively. As expected, there was
positive relationship between Concerns and Speeding, whereas aegative relationship was found between Safety and each of Speed-
ng and Concerns. The strongest relationship in both periods washat negative association between Safety and Concerns.
To ascertain discriminant validity, it was noted that the corre-ation of −0.67 between Concerns and Safety in the post-pilot wasignificantly smaller than −1.0, with a p-value less than 0.001, lead-ng to the rejection of the hypothesis of perfect correlation for thisactor-pair. Since the correlation of −0.67 was the largest in mag-itude among the 6 correlations reported above, the hypothesisf perfect correlation would be rejected for all factor pairs. Thus, aewer (than three) factor model would be rejected and the three fac-ors were in fact different from one another indicating discriminantalidity.
The composite reliabilities of the three factors appear inable 13. It is generally accepted that composite reliabilities greaterhan 0.7 indicate internal consistency, i.e., that all indicators areonsistently representing the latent construct (Lattin et al., 2003;air et al., 2010). It is evident from Table 13 that all three factorsere reliable.
.2. Goodness-of-fit and factor means comparison
The goodness-of-fit measures for the M1 and M2 models areisplayed in Table 14, which shows highly significant �2-statisticss the respective p-values were less than 0.001. However, it is evi-ent for M1 that (i) the ratio �2/df < 3; (ii) IFI and CFI = 0.90, whereasNFI is close to 0.90; and (iii) RMSEA does not exceed 0.08. Also, the
nspection of the standardized residuals did not reveal any viola-ions of assumptions. Thus, according to the guidelines of Section.1.3, the fitted M1 model produced satisfactory results. The corre-ponding goodness-of-fit measures for M2 are similar to those of
1, except that the three fit indices were a little short of the 0.90utoff.Having established the credibility of M1, the M2 model (which
ssumes no differences in factor means) was tested versus M1. The
Concerns −0.406 0.086 −4.707 <0.001Speeding −0.099 0.043 −2.310 0.021Safety 0.190 0.064 2.970 0.003
difference between the �2-statistics in Table 14 was 27.460, with3 degrees of freedom, leading to a p-value <0.001. Thus, the M2model was rejected in favor of M1 and it can be safely concludedthat the factor means have changed over the two phases of the pilotproject.
The differences (post minus pre) between the factor means aredisplayed in Table 15 and their profile is portrayed in Fig. 2. It isevident from both the table and figure that an overall significantimprovement was achieved, as there was a significant decreasein Concerns and Speeding accompanied by a significant increase inSafety. In standard units, there was a decrease of 4.7 units in Con-cerns, a decrease of 2.3 units in Speeding and an increase of justabout 3 units in Safety. Thus, it can be safely concluded that thepilot project was successful in improving the residents’ perceptionsof traffic safety in their community.
6.3. SEM estimates
The ML estimates of the parameters of the SEM models M3and M4 were obtained using AMOS. All goodness-of-fit measuresindicated adequate fits (the goodness-of-fit measures were simi-lar to those of the three-factor models M1 and M2). To test the
-0.5
Fig. 2. Profile of differences between factor-means (post minus pre).

K. El-Basyouny, M.Y. El-Bassiouni / Accident Analysis and Prevention 51 (2013) 156– 167 165
EM m
bSt
MopCwsot
aCbaS
ritFwi
7
sfwctrwl
7
aa4mnfgt
Fig. 3. Graphical representation of the pre-group S
e concluded that the impacts of Speeding on Concerns and of bothpeeding and Concerns on Safety, were indeed uniform across thewo phases.
The ML estimates of the structural parameters of the SEM model4 are displayed in Fig. 3, which shows that the direct impact
f Speeding on Safety (t) was not significant (t-statistic = −0.493,-value = 0.622). In contrast, the direct impact of Speeding ononcerns (r) was significant (t-statistic = 2.399, p-value = 0.016),hereas that of Concerns on Safety (u) was highly significant (t-
tatistic = −10.402, p-value <0.001). The indirect impact of Speedingn Safety (computed via r * u) was −0.152, accounting for 77% of theotal impact of Speeding on safety.
It should be noted that the estimates of Speeding, Concernsnd Safety for the post-group SEM model are matching theFA differences shown in Table 15, as can be easily verifiedy substituting the estimated parameters of M4 into Eqs. (4)nd (5) to obtain Concerns = −0.37 + 0.38 * (−0.10) = −0.408, andafety = 0.03 − 0.04 * (−0.10) − 0.40 * (−0.408) = 0.197.
The above results indicate clearly that after a six-month expe-ience with the activities and tasks of the pilot project, themplications of traffic safety concerns on the treated communi-ies’ perceptions of traffic safety have been effectively recognized.urthermore, the perceived effect of Speeding on Safety was note-orthy with its indirect influence (via Concerns) constituting an
ntegral part of the total impact of Speeding on Safety.
. Brief short-term evaluation of actual safety conditions
As mentioned in Section 1, the post project evaluation includestudying the pilot project’s impact on the driving speed and therequency and severity of collisions. The results of this evaluationere reported by El-Basyouny (2011) for the short “After” period
overing the six months May–October 2010. The main results ofhis short-term evaluation are summarized in this section. The fullesults of both the short- and long-term post project evaluationsill be reported in a forthcoming paper as soon as the data for a
onger “After” period becomes available.
.1. Speed analysis
The results of the speed analysis indicated that both the oper-ting speed (85th Percentile Speed) and mean speed were reducedfter the implementation of the new residential speed limit of0 km/h in the six treated communities. This decrease was furtheragnified by the observed increase in speed at the control commu-
ities over the duration of the pilot project. In fact, after accountingor the confounding influence of other factors (using the controlroup), the operating speed was reduced by 7.1%. This correspondso a statistically significant reduction of 3.95 km/h in operating
odel (left) and the post-group SEM model (right).
speed. Similarly, the mean speed was reduced by 7.3% which corre-sponds to a statistically significant reduction of 3.48 km/h in meanspeed.
Further, the analysis showed that drivers in the treated com-munities during the “After” period were much less likely to complyto the lower posted speed limit than drivers in the control com-munities or during the “Before” period. Moreover, the percentcompliance was found to be highly correlated with the speedallowance or tolerance level. The highest percentage of compli-ance (90%) was achieved at approximately 15 km/h over the postedspeed limit.
7.2. Collision analysis
To analyze the effects of the pilot project on the frequency andseverity of collision counts, a bivariate Poisson-Lognormal timeseries intervention model was used within a full Bayes frameworkto conduct a rigorous “Before” and “After” safety evaluation withmatched controls (Li et al., 2008; El-Basyouny and Sayed, 2011).The model accounts for (i) seasonal effects, and (ii) the correlationbetween severe (injury or fatality) and property damage only (PDO)collisions.
The analysis of collision data showed an overall reduction incollision frequency and severity. Indeed, there were 25% and 6%reductions in severe and PDO collisions, respectively. These resultsare consistent with other research showing a reduction in drivingspeed leads to a reduction in severe collisions at the same timeas there is either no change or a slight increase in PDO collisions(Speed Management Report, 2008). The estimated reductions of25% and 6% were not significant, as the 95% credible intervals werevery wide and included zero, implying no change or no effect. Gen-erally, such wide intervals indicate an inadequate sample size (dueto the short “After” period). Consequently, the results of the short-term collision analysis were inconclusive and additional researchis required to substantiate the impact of the pilot project on thefrequency and severity of collisions.
8. Summary and conclusions
The City of Edmonton initiated a pilot project to reduce theposted speed limit from 50 km/h to 40 km/h within six residen-tial communities. The present paper investigated the communityperceptions of traffic safety within the six pilot communities in twophases: prior to project initiation (pre-pilot) and following the end
of the project (post-pilot). The data were collected via two randomdialing telephone surveys comprising 300 residents each. A prelim-inary analysis of the two surveys’ results showed that there wereno significant structural demographic differences between the two
1 nt Ana
sb
atwtarwsmbfit
ustdpi(ofibio(
rtdicrIof
lptaait
A
Tstct
R
A
A
A
A
66 K. El-Basyouny, M.Y. El-Bassiouni / Accide
amples, thereby paving the way toward conducting comparisonsetween the post-pilot versus the pre-pilot results.
In particular, there were no significant changes in the drivingnd walking habits after reducing the speed limit from 50 km/ho 40 km/h, but there was a highly significant decrease in cyclinghich is probably due to confounding seasonal effects. Further,
he vast majority (97.7%) of respondents indicated that they wereware that the speed limit was 40 km/h in the post-pilot survey,epresenting a significant increase from the 81.1% who knew itas 50 km/h in the pre-pilot. Furthermore, in the post-pilot survey,
ignificantly more respondents were aware of such speed manage-ent controls as the speed watch, speed trailers and school dollies,
ut the anticipated effectiveness of such controls in improving traf-c safety in the community was rather low, except for the speedrailers.
A two-group (pre-pilot and post-pilot) three-factor model wassed to assess the residents’ perceptions of the three latent con-tructs: Speeding, Concerns and Safety. Comparing the CFA results ofhe post-pilot survey versus those of the pre-pilot survey, it was evi-ent that there was a significant decrease in the pilot communities’erceptions of Speeding and Concerns accompanied by a significant
ncrease in their perceptions of Safety. A structural equations modelSEM) was also fitted to the data in order to assess the impactf Speeding and Concerns on Safety. The results showed that traf-c safety concerns increase significantly with speeding, and thatoth speeding and traffic safety concerns have significant negative
mpacts on traffic safety. However, while the impact of Concernsn Safety was direct, that of Speeding on Safety was largely indirecti.e., mediated through traffic safety concerns).
As discussed in Section 1, previous studies have reported mixedesults in regards to people’s attitudes toward similar projects. Yet,he proposed multivariate analysis has demonstrated a significantevelopment in the community perceptions of traffic safety-related
ssues. Indeed, it can be concluded that the pilot project was suc-essful in improving the residents’ perceived effectiveness of theeduced speed limit in enhancing traffic safety in their community.t is also reassuring that the results of the short-term evaluationf actual safety conditions have confirmed the conclusions drawnrom analyzing residents’ perceptions.
Given the potential for a wide-scale implementation of simi-ar projects in the City of Edmonton, it is recommended in futurerojects to acquaint the residents of the targeted communities withhe various speed management controls, specially the speed watchnd school dollies, and to focus the educational campaigns andctivities on clarifying the relationships among the drivers’ speed-ng behavior, the residents’ concerns about traffic safety issues andheir perceptions of traffic safety.
cknowledgements
This study was sponsored by the City of Edmonton and Office ofraffic Safety. The authors would like to thank the city and officetaff for their assistance and support. The authors would also likeo extend their thanks to Banister Research & Consulting Inc. foronducting the telephone surveys and for providing the data forhe analysis in this paper.
eferences
arts, L., van Schagen, I., 2006. Driving speed and the risk of road crashes: a review.Accident Analysis and Prevention 38 (2), 215–224.
berg, L., Larsen, L., Glad, A., Beilinsson, L., 1997. Observed vehicle speed and drivers’perceived speed of others. Applied Psychology 46 (3), 287–302.
jzen, L., 1991. The theory of planned behavior. Organizational Behavior and HumanDecision Processes 50, 179–211.
rbuckle, J.L., 2006. Amos 7.0 User’s Guide. SPSS, Chicago.
lysis and Prevention 51 (2013) 156– 167
Archer, J., Fotheringham, N., Symmons, M., Corben, B., 2008. The impact of loweredspeed limits in urban and metropolitan areas. Report No. 276. Monash UniversityAccident Research Centre.
Bjomskau, T., Elvik, R., 1992. Can road traffic law enforcement permanently reducethe number of accidents? Accident Analysis and Prevention 24 (5), 507–520.
Blincoe, K.M., lones, A.P., Sauerzapf, V., Haynes, R., 2006. Speeding drivers’ atti-tudes and perceptions of speed cameras in rural England. Accident Analysis andPrevention 38 (2), 371–378.
Chinn, L., Elliott, M., 2002. The Effect of Road Appearance on Perceived Travel Speed:Final Report. TRL Limited, Crowthorne, UK.
Conner, M.T., Smith, N., McMillan, B., 2003. Examining normative pressure in thetheory of planned behaviour: impact of gender and passengers on intentions tobreak the speed limit. Current Psychology 22 (3), 252–263.
Cooper, P.J., 1997. The relationship between speeding behaviour (as measured byviolation convictions) and crash involvement. Journal of Safety Research 28 (2),83–95.
De Pelsmacker, P., Janssens, W., 2007. The effect of norms, attitudes and habitson speeding behavior: scale development and model building and estimation.Accident Analysis and Prevention 39 (1), 6–15.
Dixon, K.K., Hibbard, J.L., Mroczka, C., 1999. Public perception of median treatmentfor developed urban roads. In: TRB Circular E-C019: Urban Street Symposium.
DOT, 2002. Establishing Realistic Speed Limits, Retrieved from: http://www.dot.state.co.us/Traffic Manuals Guidlines/informational brochures/establishing realistic speed limits brochure.pdf
EKOS Research Associates, 2005. Driver attitude to speed and speed management: aquantitative and qualitative study – final report. Report No. TP 14756 E. Trans-port Canada.
El-Basyouny, K., Sayed, T., 2011. A multivariate intervention model with randomparameters among matched pairs for before–after safety evaluation. AccidentAnalysis and Prevention 43 (1), 87–94.
El-Basyouny, K., 2011. Speed Limit Reduction on Residential Roads: APilot Project, Available at http://www.edmonton.ca/transportation/OTS Speed Limit Reduction Report.pdf
Elvik, R., Christensen, P., Amundsen, A., 2004. Speed and road accidents: an eval-uation of the power model. Report No. 740/2004. The Institute of TransportEconomics, Norway.
Fernandes, R., Job, R.F.S., Hatfield, J., 2007. A challenge to the assumed generalizabil-ity of prediction and countermeasure for risky driving: different factors predictdifferent risky driving behaviors. Journal of Safety Research 38 (1), 59–70.
Forward, S.E., 2006. The intention to commit driving violations – a qualitative study.Transportation Research Part F: Traffic Psychology and Behaviour 9 (6), 412–426.
Gibbons, J.D., Chakraborty, S., 2003. Nonparametric Statistical Inference, 4th edition.Marcel Dekker, New York.
Global Road Safety Partnership, 2008. Speed Management: A Road Safety Manualfor Decision-makers and Practitioners, Available at http://whqlibdoc.who.int/publications/2008/9782940395040 eng.pdf (date accessed: 30.04.12).
Goldenbeld, C., van Schagen, I., 2007. The credibility of speed limits on 80 km/h ruralroads: the effects of road and person(ality) characteristics. Accident Analysis andPrevention 39 (6), 1121–1130.
Haglund, M., Aberg, L., 2000. Speed choice in relation to speed limit and influ-ences from other drivers. Transportation Research Part F: Traffic Psychologyand Behaviour 3 (1), 39–51.
Haglund, M., Aberg, L., 2002. Stability in drivers’ speed choice. TransportationResearch Part F: Traffic Psychology and Behaviour 5 (3), 177–188.
Hair Jr., J.F., Black, W.C., Babin, B.J., Anderson, R.E., 2010. Multivariate Data Analysis,7th edition. Pearson Prentice Hall, New Jersey, USA.
Jorgensen, F., Pedersen, H., 2005. Enforcement of speed limits – actual policy anddrivers’ knowledge. Accident Analysis and Prevention 37 (1), 53–62.
Lahausse, J., van Nes, N., Fildes, B., Langford, J., Keall, M., 2010. Assessing commu-nity attitudes to speed limits: final report. Report No. 293. Monash UniversityAccident Research Centre.
Lattin, J.M., Carroll, J.D., Green, P.E., 2003. Analyzing Multivariate Data.Brooks/Cole/Cengage Learning, USA.
Lawton, R., Conner, M.T., Parker, D., 2007. Beyond cognition: predicting health riskbehaviors from instrumental and affective beliefs. Health Psychology 26 (3),259–267.
Li, W., Carriquiry, A., Pawlovich, M., Welch, T., 2008. The choice of statistical modelsin road safety countermeasures effectiveness studies in Iowa. Accident Analysisand Prevention 40 (4), 1531–1542.
Lockwood, I.M., 1997. ITE traffic calming definition. ITE Journal 67, 22–24 (Wash-ington, D.C.: Institute of Transportation Engineers, July 1997).
Mesken, J., Hagenzieker, M.P., Rothengatter, T., de Waard, D., 2007. Frequency,determinants, and consequences of different drivers’ emotions: an on-the-road study using self-reports, (observed) behaviour, and physiology.Transportation Research Part F: Traffic Psychology and Behaviour 10 (6),458–475.
Mîndrila, D., 2010. Maximum likelihood (ML) and diagonally weighted least squares(DWLS) estimation procedures: a comparison of estimation bias with ordinaland multivariate non-normal data. International Journal of Digital Society (IJDS)1 (1), 60–66.
Morrison, D.S., Petticrew, M., Thomson, H., 2003. What are the most effective ways
of improving population health through transport interventions? Journal of Epi-demiology and Community Health 57, 327–333.MRIA, 2012. Standards: Response Rate Calculation Formula, Available athttp://www.mria-arim.ca/STANDARDS/Response.asp (last accessed in06.04.12).

nt Ana
N
N
OP
P
P
P
R
S
S
S
376–389.West, R., Hall, J., 1997. The role of personality and attitudes in traffic accident risk.
K. El-Basyouny, M.Y. El-Bassiouni / Accide
HTSA, 2004. National survey of speeding and unsafe driving attitudes and behavior:2002. Report No. DOT HS 809 730.
ilsson, G., 2004. Traffic safety dimensions and the power model to describe theeffect of speed on safety. Bulletin 221. Lund Institute of Technology, Lund,Sweden.
ECD/ECMT, 2006. Speed Management. OECD, Paris.arker, D., Manstead, A.S.R., Stradling, S.G., Reason, J.T., 1992. Intention to commit
driving violations: an application of the theory of planned behavior. Journal ofApplied Psychology 77 (1), 94–101.
arker, D., Stradling, S., Manstead, A.S.R., 1996. Modifying beliefs and attitudes toexceeding the speed limit: an intervention study based on the Theory of PlannedBehavior. Journal of Applied Social Psychology 26 (1), 1–19.
oulter, D.R., McKenna, F.P., 2007. Is speeding a “real” antisocial behavior? A com-parison with other antisocial behaviors. Accident Analysis and Prevention 39(2), 384–389.
ublic Works and Government Services Canada, 2012. The AdvisoryPanel on Telephone Public Opinion Survey Quality, Available athttp://www.tpsgc-pwgsc.gc.ca/rop-por/rapports-reports/comitephone-panelphone/page-06-eng.html (date modified: 18.01.12).
ecarte, M.A., Nunes, L., 2002. Mental load and loss of control over speed in realdriving. Towards a theory of attentional speed control. Transportation ResearchPart F: Traffic Psychology and Behaviour 5 (2), 111–122.
chmid Mast, M., Sieverding, M., Esslen, M., Graber, K., Jancke, L., 2008. Masculinitycauses speeding in young men. Accident Analysis and Prevention 40, 840–842.
chumacker, R.E., Beyerlein, S.T., 2000. Teacher’s corner: confirmatory factor analy-
sis with different correlation types and estimation methods. Structural EquationModeling: A Multidisciplinary Journal 7 (4), 629–636.cott-Parker, B., Watson, B., Kinga, M.J., Hydeb, M.K., 2012. Confirmatory factor anal-ysis of the Behaviour of Young Novice Drivers Scale (BYNDS). Accident Analysisand Prevention, http://dx.doi.org/10.1016/j.aap.2012.02.021.
lysis and Prevention 51 (2013) 156– 167 167
Sörbom, D., 1974. A general method for studying differences in factor means andfactor structure between groups. British Journal of Mathematical and StatisticalPsychology 27, 229–239.
Speed management, 2008. A Road Safety Manual for Decision-makers and Practi-tioners. Global Road Safety Partnership, Geneva.
Stradling, S., 2007. Car driver speed choice in Scotland. Ergonomics 50 (8),1196–1208.
Suraji, A., Tjahjono, N., 2012. Confirmatory factor analysis of accidents caused by themotorcycle aspect in urban area. International Journal for Traffic and TransportEngineering 2 (1), 60–69.
Transport Canada, 2008. A Quick Look at Speeding Crashes in Canada, Available athttp://www.tc.gc.ca/eng/roadsafety/tp-tp2436-rs200807-menu-158.htm (datemodified: 21.02.12).
Transport Canada, 2011. Road Safety in Canada, Available at http://www.tc.gc.ca/eng/roadsafety/tp-tp15145-1201.htm (date modified: 19.10.11).
Tranter, P., Warn, J., 2008. Relationships between interest in motor racing and driverattitudes and behaviour amongst mature drivers: an Australian case study. Acci-dent Analysis and Prevention 40 (5), 1683–1689.
Walsh, D., Smith, M., 1999. Effective speed management, the next step forward:saving lives by decreasing speeds in local streets. In: Proceedings of the ResearchPolicing Education Road Safety Conference, vol. 2, pp. 685–694.
Warner, H.W., Aberg, L., 2008. Drivers’ beliefs about exceeding the speed lim-its. Transportation Research Part F: Traffic Psychology and Behaviour 11 (5),
Applied Psychology 46 (3), 253–264.Williams, A.F., Kyrychenko, S.Y., Retting, R.A., 2006. Characteristics of speeders. Jour-
nal of Safety Research 37 (3), 227–232.