Embed Size (px)
Citation preview
AUGUST 1991
RESEARCH PAPER THREE
MOBILIZING DOMESTIC RESOURCES FOR CAPITAL FORMATION IN GHANA The role of Informal Financial Sectors
ERNEST ARYEETEY
FRITZ COCKEL
AFRICAN ECONOMIC RESEARCH CONSORTIUM
CONSORTIUM POUR LA RECHERCHE ECONOMIQUE EN AFRIQUE
Mobilizing domestic resources for capital formation in Ghana
LIBRARY
2 8 WAY 1992 Institute of
Development Studies
Other Publications in the AERC Research Papers Series
Structural Adjustment Programmes and the Coffee Sector in Uganda by Germina Ssemogerere, Research Paper 1.
Real Interest Rates and the Mobilization of Private Savings in Africa by F. M. Mwega, S. M. Ngola and N. Mwangi, Research Paper 2.
The Informal Financial Sector and Macroeconomic Adjustment in Malawi by C. Chipeta and M. L. C. Mkandawire, Research Paper 4.
Mobilizing domestic resources for capital formation in Ghana
The role of informal financial sectors
Ernest Aryeetey
Institute of Statistical, Social and Economic Research, University of Ghana
and
Fritz Gockel
Department of Economics University of Ghana
AERC Research Paper 3 Initiatives Publishers, Nairobi
August 1991
© African Economic Research Consortium, 1991
Published by Initiatives Publishers, a division of Initiatives Ltd., P.O. Box 69313, Nairobi, Kenya, (Tel. 744047, 744095 Fax 743995) for the African Economic Research Consortium, P.O. Box 47543, Nairobi, Kenya
Printed by English Press Ltd., P.O. Box 30127, Nairobi, Kenya
Cataloguing in Publication Data
Mobilizing domestic resources for capital formation in Ghana: the role of informal financial sectors/Ernest Aryeetey and Fritz Gockel.— Nairobi, Kenya, Initiatives Publishers, Initiatives Ltd., 1991.
(African Economic Research Consortium (AERC) Research Papers Series; no. 3)
ISBN 9966-42-019-3
Contents List of tables vi Acknowledgements vii
I Introduction 1 The research problem 2 Research objectives and scope 2 Research methodology and presentation 3
II Rationale for the existence of an informal financial sector in Ghana 5 The nature and structure of demand facing the formal and
informal financial sectors 6 Elasticity of demand for formal savings and lending facilities 8 Credit facilities from formal financial institutions 11
III The relative sizes of the formal and informal financial sectors 14 Does informal saving amount to "genuine" saving? 16
IV Saving in the informal financial sector 18 Informal savers and their backgrounds 18 Urban and rural informal savings facilities 20
V Urban and rural informal lending facilities 27 Lending within the single-collector susu system 27 Lending within the rotating savings susu system 28 The operations of private moneylenders 28
VI Savings behaviour in the informal financial sector 35 The relationship between informal savings and income 35 Choice of portfolio among savers 37
VII Summary and conclusions 39
Annexes 41 References 66
List of tables
1. Nominal and real interest rates 12 2. Ratio of deposit money to money supply, M2 14 3. Formal financial-sector claims on the private sector as percent of GNP 15 4. Characteristics of susu savers 19 5. Some savings characteristics 20 6. A summary of characteristics of the single-collector susu system 21 7. Credit union statistics 26 8. Number of licensed moneylenders in Accra 31 9. Types of savings facilities utilized by urban market women 37
Acknowledgements We acknowledge with much gratitude the support of the African Economic Research Consortium, based in Nairobi, which made this research study pos-sible. This support was in the form of a generous research grant as well as ideas obtained from interacting with more senior colleagues at regular workshops. The comments of the AERC Technical Committee on the preliminary report presented at the Harare Workshop were very helpful..
We would like to acknowledge the valuable contributions made by our re-search assistants Messrs Stephen Opata, Theophilus Appah, Kodwo Ninsin, Ransford Nyarko and Miss Esther Enchill who spent many hours interviewing market women. Mr. Abubakari Addy's exploits with elusive moneylenders in Accra, and Mr. Moses Cofie's interviews with susu collectors gave us valuable insights into the lending aspects of informal financial operations. We also ac-knowledge the assistance of Mr. Charles Nyarko at Swedru.
The editing of questionnaires, preparing data for entry and actually processing the data was carried out by Mr. Kudjo Dovlo. Our secretary, Ms Comfort Agbezudor, worked many weekends to produce our scripts on time. We also acknowledge the editorial work of Dr Ellen Bortei-Doku and thank her for the several useful suggestions she made on "studying women".
Finally, our respondents, who spent time answering questions they sometimes thought were unimportant, need to be aknowledged. We learnt much from talking to them and we are very grateful for the time they spent with us. We also thank those bank officials who assisted us but wish to remain anonymous. We are responsible for any remaining inadequacies in this report.
I. Introduction The Ghanaian financial system has gone through a considerable crisis since 1975—or possibly earlier—and it is not yet clear whether these difficulties are over, following reforms that began in 1985. The period saw Ghana recording low or negative real growth in the economy generally, and the financial sector appears to have accompanied it in this downward trend. Savings did not grow as the real value of M2 fell steadily at 10 percent per annum between 1974 and 1983 and the ability of the financial sector to turn low-yield assets into higher yielding ones was severly compromised by a number of factors, including repressive government financial policies. By 1987, GDS was only 7.8 percent of GDP, although it had been as high as 13.5 percent in 1970.
Aside from the poor performance of domestic savings in the formation of capital for the economy, there is evidence that financial savings, which enhance intermediation, are much less important than non-financial savings in Ghana (IPC, 1988). Indeed, that study estimated that only about 20 percent of total household savings in rural Ghana is in financial assets, while in urban areas the proportion would only be slightly higher. In addition to the low ratio of financial savings to non-financial savings, it is estimated that (particularly in rural areas) financial savings with informal bodies are far greater than those made directly with formal institutions. While informal savings constituted as much as 60 percent of total financial savings in those rural areas, we expect that there would be no significant difference between the two proportions in urban areas.
The term "informal financial sector" is used here to describe participation in all commercial saving and lending activity taking place outside of formal or established financial institutions. In describing this activity as "informal", we are aware of the debate over proper terminology. We describe this activity as informal in view of the widespread usage of that term in Ghana for that activity. This sector of the economy is definitely neither different from what Chandavarkar (1985) calls the "non-institutional financial sector", nor from what has been referred to as the "unofficial money market" (IPC, 1988). We hesitate to use the expression "unofficial" in view of the connotation of illegality it usually holds.
2 RESEARCH PAPER
The research problem
Although it is generally suspected that the informal financial sector in many African countries may be larger than the formal one (Chipeta and Mkandawire, 1989; Aryeetey and Hyuha, 1990), accurate estimate of the two sectors have not received much attention in the literature. This has sometimes led to the notion that only weak links exist between them (Ghatak, 1981). If only weak links exist between them, then orthodox monetary policy becomes ineffective as an instrument for directing the economy in view of the relatively large size of the informal sector. Monetary policy could then become effective either through an improvement "in the link between the two money markets or by having a large amount of credit supplied (by the central bank) directly or indirectly through credit institutions and even through moneylenders" (Wai, 1956). The second approach is almost certainly inflationary, and solving the problems that arise out of that may be beyond the capabilities of the central banks. This calls for efforts to strengthen the links between the two financial markets.
In striving to bring the formal and informal financial sectors closer, there are a number of issues that need to be clarified. These include the following. Why do people want to hold their financial assets either in the formal or informal sector? What makes both sectors thrive, even if unequally, in a dualistic manner? Can one upstage the other, and is it necessary for it to do so? Finally, do they, in their present form, have the capacity to help transform the economy through a strong financial system?
Answering these questions requires a study of the effects of this financial "dualism" on the entire financial system—for example, the allocative effects, dynamic effects and the effects on macro-management through money creation, etc. But all this requires a better understanding of how the informal financial sector operates, who is involved, and what roles various actors play. Equally important is a more realistic picture of its size and the implications of this for the whole financial system.
In Ghana, despite the knowledge of the existence of a significantly large in-formal financial sector, policy makers have long tended to direct economic policy without due consideration to the likely impact informal-sector activity will have on the efficacy of policy (IPC, 1988). It is noteworthy, however, that gradual official recognition of this sector appears imminent. The fact that some government departments/institutions have begun the registration of some informal financial operators for tax purposes seems to testify to this recognition. What is essential now is a fuller understanding of these operations for purposes of developing policy, especially in view of the growing significance of the informal market.
Research objectives and scope
In view of obvious on-going developments in the informal financial sector, as well as its apparent importance for capital formation, this research project, which will be in three phases, has as its goal a determination of ways of en-hancing the role of the informal financial sector in the mobilization of domestic
MOBILIZING DOMESTIC RESOURCES FOR CAPITAL FORMATION IN GHANA 3
r e s o u r c e s i'or capital formation in Ghana. The first phase, covered i n this report, a n a l y s e s the rationale for the existence of an informal financial sector. This is a c c o m p a n i e d b y an estimation of the size of the market and a detailed description of its operations.
The second phase, to be undertaken later, will dwell on the relationship be-tween formal and informal financial sectors, while the third phase considers the efficacy of macro-economic policies, bearing in mind the existence of a strong informal financial sector. It must be pointed out, however, that the three phases will not be carried out in isolation from each other since issues in each phase have direct relevance for other phases of the work.
Thus this first phase has as its objectives: 1. An improvement in the information base with regard to the size, nature and
characteristics of non-bank savers, borrowers and lenders. This will be clone alongside establishing the rationale for the existence of an informal financial market. Here, emphasis will be put on savings behaviour and lending patterns at the micro level.
2. Ascertaining the procedure and channels for informal financial interme-diation. This will also establish the types of economic activity financed from the informal market. These considerations should show the conditions uiuler which the sector operates and the links it has with formal institutions.
3. Describing and analysing credit demand and supply conditions in the in-formal market.
Research methodology and presentation
This empirical study utilized both secondary and primary data on the Ghanaian economy and on individual savers to describe savings behaviour and the oppor-tunities open to potential savers.
Data from a survey undertaken in three Ghanaian cities were utilized to provide empirical support for the argument that the informal sector thrives, among other things, on the difficulties of the formal sector. This is not to suggest that the informal sector lacks its own driving force. Seibel (1988) and Mauri (1987) have already indicated the internal driving force of the sector. Thus this survey, carried out by randomly interviewing 1,000 market women (600 in Accra, 200 each in Kumasi and Takoradi) operating from permanent market stalls, sought wide-ranging information on informal savings and lending facilities, as well as the conditions for operating on the market.
Market women were selected as the focal group for the study (on the savings side) for a variety of reasons. The few data available on the informal economy suggest that women dominate several areas of that sector, especially in trading activities such as the distribution of local foods and small manufactured con-sumer goods (Hafkin and Bay, 1981). There are large-scale traders among these women, but the majority of them can be described as petty traders. Their fi-nancial dealings often involve frequent transactions in cash. Several of them
4 RESEARCH PAPER
also rely on suppliers' credit facilities. The traders are largely illiterate and depend on verbal rather than written transactions. The formal banking system is not designed to accommodate such customers and the majority of them, therefore, have continued their reliance on informal financial systems to sustain their trading activities. They are by far the most important group of participants on the informal financial scene with regard to saving.
On the lending side, we also interviewed 12 moneylenders in Accra, Hohoe and Agona Swedru (the last two being significant commercial towns). This was supplemented by interviews with 17 susu collectors in Accra. These appear to be the major informal lenders.
In addition to the information gathered during our field work, we also used material from the study of rural finance systems in Ghana by a German con-sulting firm, Interdisziplinaere Projekt Consult (IPC, 1988), to supplement our urban survey. This provided the present study with an appropriate rural di-mension. The dependence on the IPC study is due to the lack of other substantial sources of information.
II. Rationale for the existence of an informal financial sector in Ghana
Considering the hypothesis that the proportion of financial savings and lending activity that takes place outside of the formal system is no less significant (and is probably larger) than that within the system, it would be interesting to know how the informal sector manages its affairs in order to stay in business. But why should the informal sector not be doing worse than the formal one when considerably more effort—at least in terms of policy and capital investments— goes into strengthening the latter? A growing formal financial sector is regarded as a major indication of growth and development in the whole economy, but the evidence from Ghana suggests (as will be seen in Section IV) that for a considerable number of years the informal sector grew at the expense of the former. Although "informal" forms of financing have been known to pre-date banking activity in Ghana (Technoserve, 1988), that type of financing was generally expected to lose its significance through an increasing level of mod-ernization and complexity in the economy.
In establishing a rationale for the continuing existence of the informal sector of the financial market, we shall be arguing that the sector derives its dynamism both from developments within the formal sector and also from its own internal characteristics. In this regard it is important to note the suggestion by Aryeetey, et al. (1990) that various indications of the size of formal financial savings showed a declining trend as interest in the informal sector grew between 1976 and 1984. The declining formal activity occurred at the same time that the j number and density of banks increased in Ghana. For example, as bank density j increased from 1.9 to 3.2 banks per 100,000 persons between 1976 and 1984, j the M2/GDP ratio fell from 29 percent to 12.3 percent. Also, claims by the} banking system on the private sector as a percentage of total credit granted by j the banking system declined from 13.6 percent to 6.4 percent between 1977 and) 1982. It will be shown that interest in saving, if not borrowing, within the^;> informal sector grew at the time. In view of these initial observations, the focus in establishing a rationale for the continuing existence of the informal sector in this section is on how developments in the formal sector may contribute to this continuing existence. The infomal sector's own dynamism is discussed in Sections III, IV, V and VI. A brief observation on possible relationships
6 RESEARCH PAPER
between the formal and informal financial sectors precedes, however, the consideration of how the formal sector contributes to the survival of the informal sector. (A detailed analysis of the relationship between the two sectors of the financial market will be carried out in the second phase of this on-going study).
The nature and structure of demand facing the formal and informal f inancial sectors
One question that is often posed in discussions of the informal financial sector is whether the demand for services from the informal sector competes with demand in the formal sector or complements the latter. To answer this question, it must be borne in mind that there is a wide variety of actors in the informal sector, and this makes it difficult to characterize the nature and structure of demand for the entire sector. The structure of informal demand for credit, for example, is much more complex than is generally known, and certainly much more so than demand in the formal sector. In this regard, it is important to establish from the beginning whether a single market exists for all those who offer financial products or separate markets can be identified. The existing theory on market segmentation is not too helpful in this quest (cf. Stapleton and Subrahmanyam, 1977). Without a doubt, the discussion is of a single market that is extensively segmented within its informal components, but interacting actively in several of the segments. To simplify the analysis, we may consider each of the two sectors as a single composite unit and see how they relate to each other, first in terms of product differentiation, considering end-use and other inherent characteristics, and, second, in terms of the way potential users of the facilities view them.
As already indicated, the formal financial sector, dominated by commercial and development banks, has both short-term and long-term credit to offer, aside from few other banking facilities that are not extensively utilized by the household sector. The fact that over 90 percent of these credit facilities are of a short-term nature has been indicated by Aryeetey et al. (1990). The limited availability of long-term finance is attributed to the internal management problems of these banks. Credit from the formal financial sector is often for the financing of working capital and comes mainly through overdraft facilities.
The informal sector, on the other hand, offers similar long-term and short-term credit with more emphasis on the short end. This is also usually available for working capital and consumption purposes. It must be pointed out, however, that it is not always possible to differentiate between borrowing for working capital and consumption, as will be seen in this study. Thus, based on the product alone, one could argue that the informal (e.g. a large part of the urban moneylending business) and formal sectors offer a similar product, which may not be entirely homogeneous. (We illustrate the minor differences in our study of moneylending in Section V.) On this criterion alone, an oligopolistic relationship between the two sectors may be assumed whereby the two products substitute for each other. This assumption may be misleading, however. The two do not always substitute for each other since some complementary relationships
M O B I L I S I N G DOMESTIC RESOURCES FOR CAPITAL FORMATION IN GHANA 7
are also observable. This is explained below. W h a t c o m e s out from the discussions above is that both the formal and in-
formal financial sectors cater to the needs of easily identifiable groups of in-dividuals and businesses, while at the same time jointly serving sections of the total demand for financial services that could switch either way in a competitive relationship or use both sectors concurrently. Thus banks usually satisfy the demand of large established firms engaged in specific economic activities, while creditors from the informal sector, such as moneylenders, attend to individuals, s m a l l - s c a l e commercial activity and the agricultural sector. But participants in either sector may cross to the other depending on many factors, including the s t r e n g t h of institutional barriers, the availability of credit facilities and the ease of physical access. In other words, the total demand for each sector is not e x c l u s i v e , as already suggested. This demand that is common to the two sectors may be described as "non-specific" (following Hemmer and Mannel, 1989), and it is its role that should, in a free and dynamic model, influence relative pricing in the two markets. (For a fuller explanation of this process, see Aryeetey and Ilyuha. 1990.)
'The size of this "non-specific" element in the total demand depends on whether the services of the informal sector are presented either as a substitute or a complement to those of the formal sector. Aryeetey and Hyuha (1990) explain this distinction in the financial markets with an illustration based on the elementary economic principle that complementarity is reflected in joint de-mand:
. . . for the owner of a small processing plant who obtains credit from a commercial bank ID expand his plant size and then borrows from friends to pay for new raw materials, the two sectors certainly complement each other. On the other hand, if tho hank had rejected his application for credit, and he had had to invest in the expansion with credit from friends or a moneylender, such credit would be seen as a substitute for the unavailable formal credit. This does not mean that one can only talk ol substitution when a request is denied. If the potential borrower has doubts abom his eligibility on the formal market and therefore goes elsewhere, one can still talk of substitution (p. 21)
It is difficult to attempt to isolate the "substitution" and "complementary" element* in the demand for credit in both sectors. It is to be expected, however, that the greater the element of "substitution" in the demand (in other words the ease with which assets could be switched), the more "non-specific" that demand would be. By the same token, the size of complementary demand in the informal sector would be directly related to the amount of credit the formal sector is willing to supply. We may propose, then, that demand in the formal market, which is likely to be mainly urban, would have a greater proportion of "non-specificity" (and therefore be more elastic) in view of the relative ease with which urban dwellers and other users of the sector can switch from one to the other. As the evidence in Section III will show, this expected shift from time to time is realistic. The mechanism for regulating this shift from one sector to the other will be studied in the next phase of this on-going research work in view of identified institutional barriers and the relatively small role of interest rates in portfolio choice, (cf. Aryeetey et al., 1990).
8 RESEARCH PAPER
Elasticity of demand for formal savings and lending facilities
When a person operates a deposit account with a bank he/she generally expects a return on the account, either by way of regular payments of interest or any number of other benefits. On the other hand, there are a number of costs that must be reckoned with. These determine the structure of the demand curve for savings facilities. To empirically ascertain the structure of the aggregate demand curve for formal savings facilities, the ideal thing would be to obtain data on the number of deposit facilities people would want to open as costs change. This is almost impossible to capture accurately in a questionnaire, but various observed attitudes to changing costs give acceptable indications of the structure of the demand curve. We consider below various factors that influence the demand for formal savings and lending facilities and relate these to identified structures of demand curves for the formal and informal sectors.
Transaction costs and the demand for savings facilities in Ghana In our survey of 1,000 market women in the three cities of Ghana, it emerged that there are usually three major reasons why respondents would not save with banks. These were that:
1. Their incomes were too low—suggesting that they expected only those with high incomes to deal with banks;
2. There was too much formality at banks—related to paper work which led to an unnecessarily extended transaction time;
3. Banks were usually uninterested in small frequent deposits of torn notes and discouraged market women from making them.
The major factor here, as far as these urban women were concerned, was the time it took them to complete a deposit transaction. Although only about a third of the respondents operate a bank account now, more than half have operated a bank account in the past. Many of the respondents explained that the length of time that needs to be spent at a bank has been increasing steadily over the years—particularly since the government forced the payment of all salaries through banks. On a "normal" day, when no salaries are being paid and there-fore banks are not crowded, a deposit takes an average of 15 minutes, while a withdrawal takes between 20 and 30 minutes in a large urban commercial bank. At the end of each month, when banks are crowded with salaried workers, an average withdrawal at banks in Accra takes one and a quarter hours to complete. In the other regional capitals, at least 45 minutes would be required to make a withdrawal at the end of the month. These times may be compared to the average transaction time of 30 seconds observed susu collectors at the Makola Market in Accra.
Considering the fact that most currency in circulation at the markets is old and torn, and often in small denominations, counting at banks is a painful experience for bank clerks if large sums are involved. They often ask the women to wait until other customers with larger denominations have been served. When only small sums are to be saved, bank clerks are seldom encouraging. Some clerks
MOBILISING DOMESTIC RESOURCES FOR CAPITAL FORMATION IN GHANA 9
feel that the passbooks are filled up rather too quickly and they do not think the e x p e n s e of supplying new passbooks regularly is justified by the small deposits. S u b s e q u e n t l y , many market women find bank clerks "unfriendly".
Travel cost and time do not usually feature prominently in the estimation of t r a n s a c t i o n cost by the urban market women since in any of the three cities there is a bank within a kilometre radius. The average distance to the nearest bank was 0.7 km. To show the relative lack of interest in travel time/cost to the urban w o m e n , more than 40 percent of those who saved with banks did not operate an account with the nearest bank branch. They saved with banks which were, on the average, over 4 km away. Thus, the major component in the transaction cost is the time spent at the banks and the reception accorded savers by bankers. It is generally accepted that opening a bank account in G h a n a is an arduous task, and undoubtedly this has helped to reduce the number of new accounts opened in the last decade.
In smaller communities and rural areas, travel time and costs play a more important role in transaction cost than in large urban communities. IPC (1988) studied 2.414 individual savings accounts held with 37 different rural outlets of formal financial institutions and found "strong corroborating evidence con-cerning the importance of travel time as a determinant of demand for deposit facilities". They found that almost 93 percent of the total deposits in the rural banks they studied were owned by individuals living within easy walking dis-tance of the banks. It is therefore highly likely that many of the rural households that have refrained from keeping deposits with formal institutions did so after reckoning with travel time and cost, though other factors certainly came into play. It confirms the fact that the demand for savings facilities is sensitive to price. In the study by IPC (1988) it was found that individuals from larger rural communities (where banks were very often located) usually had larger deposits in the banks than those who lived in smaller communities, and this they attributed to the fact that those in large communities could do so at a lower average cost.
A problem caused by the long travel time to banks in rural areas is the fact that the liquidity of assets held in banks becomes increasingly doubtful. This is because business opportunities that arise unexpectedly and to which people have to react as quickly as possible, become endangered through delayed reaction. This is especially so in a high-inflation period, with shortages of several items and commodities, thus turning all traders into speculators. In situations where the use of cheques is not widely accepted, such a development is commonplace.
Political costs of saving with formal financial institutions
Much as savers in Ghana recognize the fact that deposits with banks provide the best guarantee for security against physical loss, they are also aware of the fact that losses could be incurred through the political actions of governments.
Between 1979 and the end of 1982, different governments in Ghana put in place policies that directly undermined public confidence in the banking system. These include the following:
10 RESEARCH PAPER
1. The freezing of all bank deposit accounts exceeding 50,000 cedis in order to investigate tax liability and possible corruption or fraud;
2. The recall of bank loans for the financing of trading inventories;
3. The compulsory payment by cheque at all transactions exceeding 1,000 cedis in value by the government and a strong encouragement of the private sector to do likewise.
Aside from these measures, the sudden withdrawal of 50-cedi bank notes in 1982 eroded confidence in the holding of currency. Distrust in the banking system encouraged the holding of assets in physical forms such as building materials that were not going to be used for a long time.
Following these policy measures and their implementation, many people who ordinarily saved or were considering saving with banks thought it no longer wise to do so. Holding of bank financial assets became not only unattractive but also threatened their personal security. Similarly, forcing low-income people to pay for services with cheques had the negative effect of encouraging the habit of issuing dud cheques. This development has forced many organizations, including public concerns, to reject personal cheques as a means of payment, and in turn discourages the holding of bank assets. It is not surprising, therefore, that the private sector significantly reduced its holdings of financial assets. It is estimated that the M2/GDP ratio fell from 20 percent in 1976 to 12 percent in 1984, thereby raising the velocity of circulation of money from 3.4 to 8.1 (World Bank, 1987). (See Annex 1.)
The number of market women in our survey who operated bank accounts fell by about 25 percent between 1982 and 1989. For a half of these people loss of confidence was the major reason for closing the account. This is not surprising given the number of market women and businessmen who had to appear before committees of enquiry to explain the sources of their incomes and savings. It is not yet clear whether the eroded confidence has been restored following reforms introduced into the banking system after 1985. It would be even more difficult to ensure renewed confidence in the private sector since no guarantees against political interference in the financial system are provided. In this regard, the Ghanaian situation is little different from what Venieris and Gupta (1986) found for other developing countries.
Another illustration of the lack of confidence in banks is the fact that while the number of people who operated deposit accounts may have been rising, albeit at a reduced rate at the time, depositors did not seem equally enthusiastic about increasing the sizes of their deposits which would have been a measure of the confidence people have in banks. Between 1987 and 1988, the average deposit per rural bank in Ghana increased by 13.8 percent, while the number of account holders went up by 20.4 percent (Bank of Ghana, 1988). This situation is true of most other formal financial assets since 1979.
MOBILISING DOMESTIC RESOURCES FOR CAPITAL FORMATION IN GHANA 11
Credit facilities from formal financial institutions
Banking institutions generally have four types of credit facilities. These are o v e r d r a f t facilities (which take the greater part of bank lending), short-term loans, medium- and long-term loans, and group loans.
About 90 percent of the lending to the private sector by the average bank b r a n c h is in the form of an overdraft which is usually made to salaried workers, big traders and wealthy farmers who operate current accounts or demand deposits with the branch. Overdrafts are essentially of a short-term nature (usually one month) and interest is calculated on the actual balance. Often this facility is not available to small farmers and traders.
Banks very seldom grant loans exceeding a year's maturity date. Thus all small-scale entrepreneurs, farmers, traders, craftsmen, etc, usually have to apply for short-term loans.
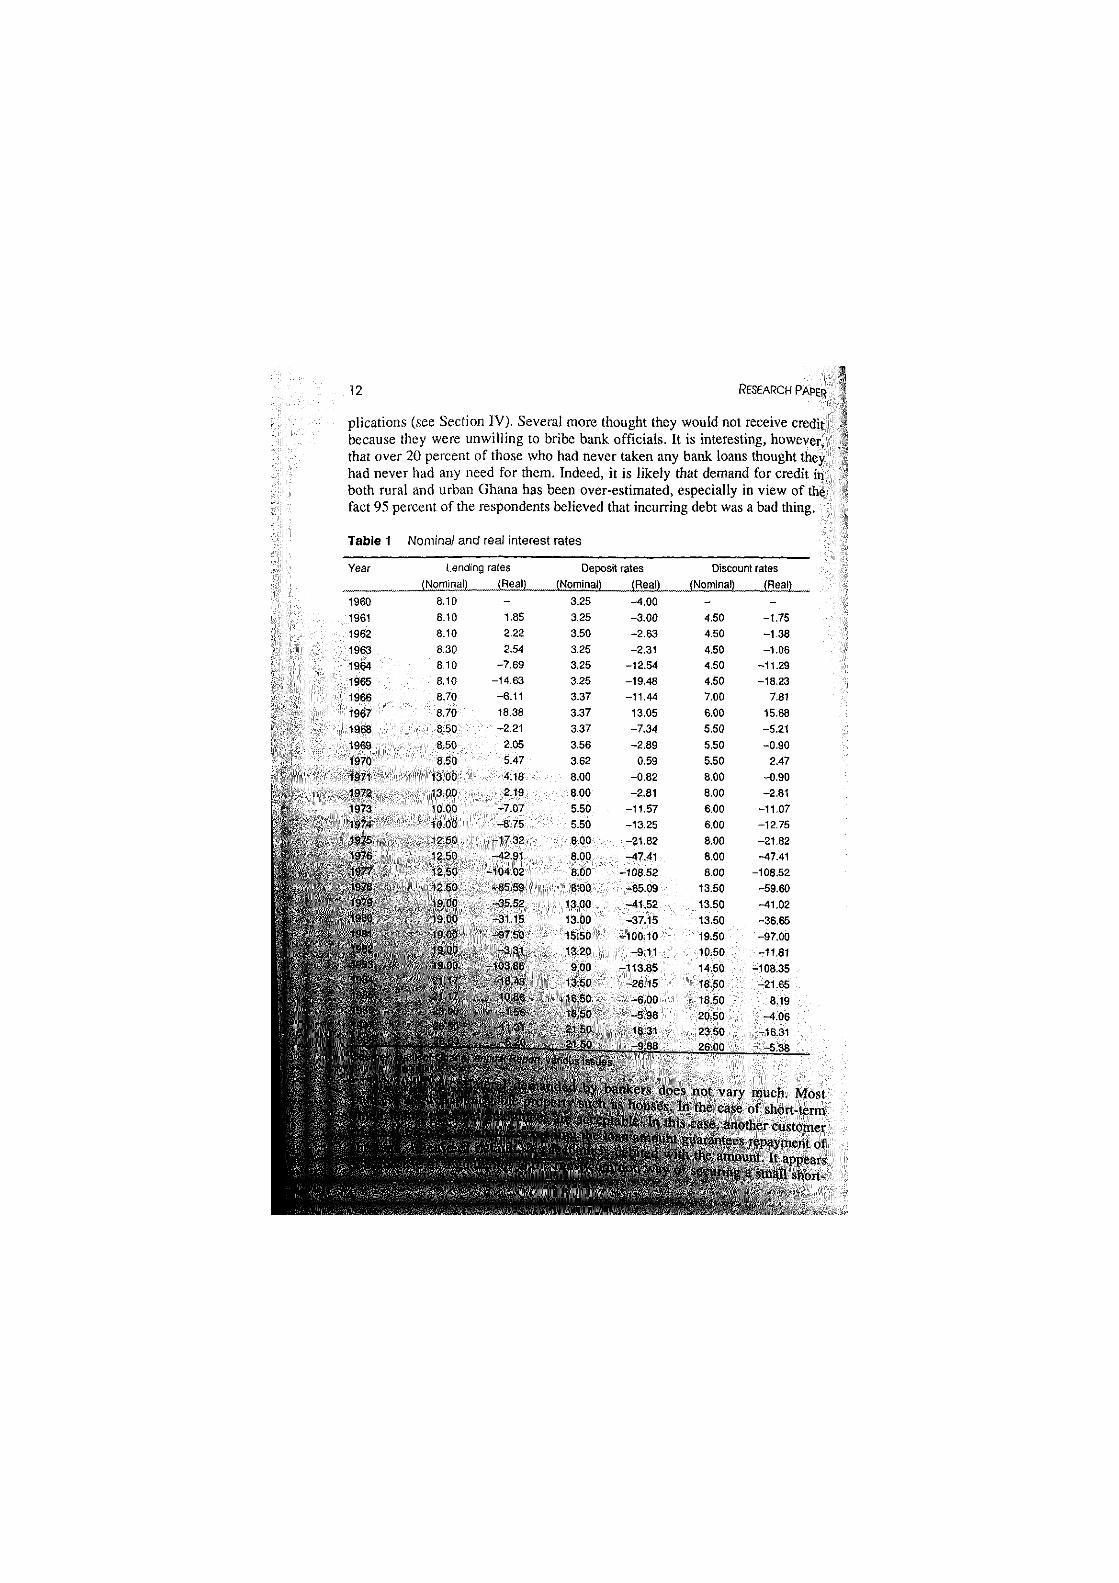
Interest on most short-term loans ranges between 23 percent and 32 percent per annum, depending on the sectoral allocation and bank practice. Thus, for example, loans to the agricultural sector in some banks attract interest of about 23 percent, loans to the industry and service sectors attract 26-28 percent. In addition, however, there are usually a number of fees to be paid, depending on how the loan is utilized and serviced, thereby raising the effective interest rate to anything between 40 percent and 70 percent. Notable among the numerous chargeable fees are the commitment fee on unutilized disbursements and the service fee, which is really a penalty for default. Following the estimated high effective interest rates, it has been concluded that
This effective rate of interest does not appear to be particularly high in relation to the rates in the informal market. However, there is a difference which has far-reaching consequences. In the informal market the terms of a contract are always very clear and seem to be understood by both sides; in the case of a bank loan, the borrowers are told that they are charged, e.g. 25 percent interest plus 5 percent fee, while they feel or even know that the loan is much more costly (IPC, 1988).
It is no wonder, therefore, that demand for credit from formal institutions may not be as high as would be expected. One possible way of estimating the demand would be to look at records of loan applications but, as we were reliably informed by a number of bankers, this would not give us a fair estimate since many people who submitted applications to loans officers were advised to withdraw their applications when it became obvious to the officer that they did not stand much chance of receiving credit. In other words, only a small fraction of actual applications are recorded. We tried, however, to find out from our market women their attitudes to credit-taking from the formal sector.
Of the 1,000 market women interviewed, only 14.7 percent had ever taken credit from a bank. Of those who had never taken any credit, as many as 95 percent had never applied for a bank loan, while the other 5 percent had had their applications rejected. Many of those who did not apply for loans main-tained that they did not think they had adequate collateral to support their ap-
12 RESEARCH PAPER
plications (see Section IV). Several more thought they would not receive credit because they were unwilling to bribe bank officials. It is interesting, however, that over 20 percent of those who had never taken any bank loans thought they had never had any need for them. Indeed, it is likely that demand for credit in both rural and urban Ghana has been over-estimated, especially in view of the fact 95 percent of the respondents believed that incurring debt was a bad thing.
Table 1 Nominal and real interest rates
Year Lending rates Deposit rates Discount rates
(Nominal) (Real) (Nominal) (Real) (Nominal) (Real)
1960 1961 1962
1963 1964 1965 1966 1967
1968 1969 1970 1971 1972 1973 1974 1975 197!) 1977 1978 1979 1980 1981 1982 1983 1984 1985 ) 1986 1987
. 1,".UY j
8.10 8.10 8.10 8.30 8 10 8 10 8.70 8.70 8 50 8 50 8 50
13.00 13.00 10.00 10 00 12 50 12.50 12.50 12.50 19.00 19.00 19.00 19.00 19.00 21.17 21.17 23.00 28.50 2663
1.85 2.22 2.54
-7.69 -14.63
- 6 . 1 1 18.38 - 2 . 2 1
2.05 5.47
4.18 2.19
-7.07 -8.75
- 1 7 32 -42.91
-104.02 -85.59 -35.52 -31.15 -97.50
-3.31 -103.85
-18.43 10.86 -1.56
-11.31 -5.20
3.25 3.25 3.50 3.25 3.25 3.25 3.37 3.37 3.37 3.56 3.62 8.00 8.00 5.50 5.50 8.00 8.00 8.00 8.00
13.00 13.00 15.50 13.20
9.00 13.50 16.50 18.50 21.50 21.50
^t.00 -3 .00 -2.63 -2.31
-12.54 -19.48 -11.44
13.05 -7.34 -2.89
0.59 - 0 . 8 2 -2.81
-11.57 -13.25 -21.82 -47.41
-108.52 -65.09 -41.52 -37.15
- 1 0 0 . 1 0 -9.11
-113.85 - 2 6 15
-6.00 -5 .96 18.31 -9.88
4.50 4.50 4.50 4.50 4.50 7.00 6.00 5.50 5.50 5.50 8.00 8.00 6.00 6.00
8.00 8.00 8 00
13 50 13.50 13.50 19.50 10.50 14.50 18.50 18.50 20.50 23.50 26.00
-1.75 -1.38 - 1 . 0 6
-11.29 -18.23
7.81 15.68 -5.21 -0.90
2.47 -0.90 -2.81
-11.07 -12.75 -21 82 -47.41
-108 52 -59 60 -41 02 -36.65 -97.00 -11.81
-108 35 -21.65
8 19 -4.06
-16.31 -5.38
MOBILISING DOMESTIC RESOURCES FOR CAPITAL FORMATION IN GHANA 13
ten'1
The granting of credit facilities by banks has been reduced significantly since 1985. Two instruments have been employed by the central bank to achieve e f f i c i e n c y in credit allocation following evidence of high default rates as well as i n e f f i c i e n t spreads in deposit and lending rates for different sectors. These are credit ceilings and outright prohibitions, and allocational instruments. Most b a n k s have utilized the first option which seeks to control and regulate the flow of total loans and advances to selected types of economic activity, lending to private and public sectors, ceilings on credits to different loan-size classes, and ceilings on total lending by individual banks. In applying these, the Bank of Ghana directed commercial banks to regard lending to the export trade sector in 1987/88 as special, for which there should be no limitations to credit expansion. Similarly, agriculture, manufacturing, construction, transport, storage and communications needed to be regarded as priority sectors for which a maximum of 20 percent increase in commercial bank credit was allowed. An outright ban was imposed on credit to support import trade.
l;rom experience, many bankers regard lending to the agricultural and con-struction sectors as a high-risk venture in view of the relatively high rates of default in those sectors. One banker at a market town (Techiman, pop. 22,500) disclosed that he expected 70 percent of all loans to the agricultural sector not to be repaid. In view of the high default rates experienced by bankers only very few can afford to grant new loans. Many bank managers outside Accra admit that no new loans have been granted since the beginning of 1989. This is being done while they intensify efforts to collect overdue payments.
Small traders cannot expect to receive credit facilities from the bankers and it is no wonder that many seek such facilities from the informal sector. There is a greater likelihood of their obtaining credit facilities so long as they have maintained good savings records and there are not too many demands on the collector. About 65 percent of the market women indicated that they had access to credit facilities from their susu collectors.
III. The relative sizes of the formal and informal financial sectors
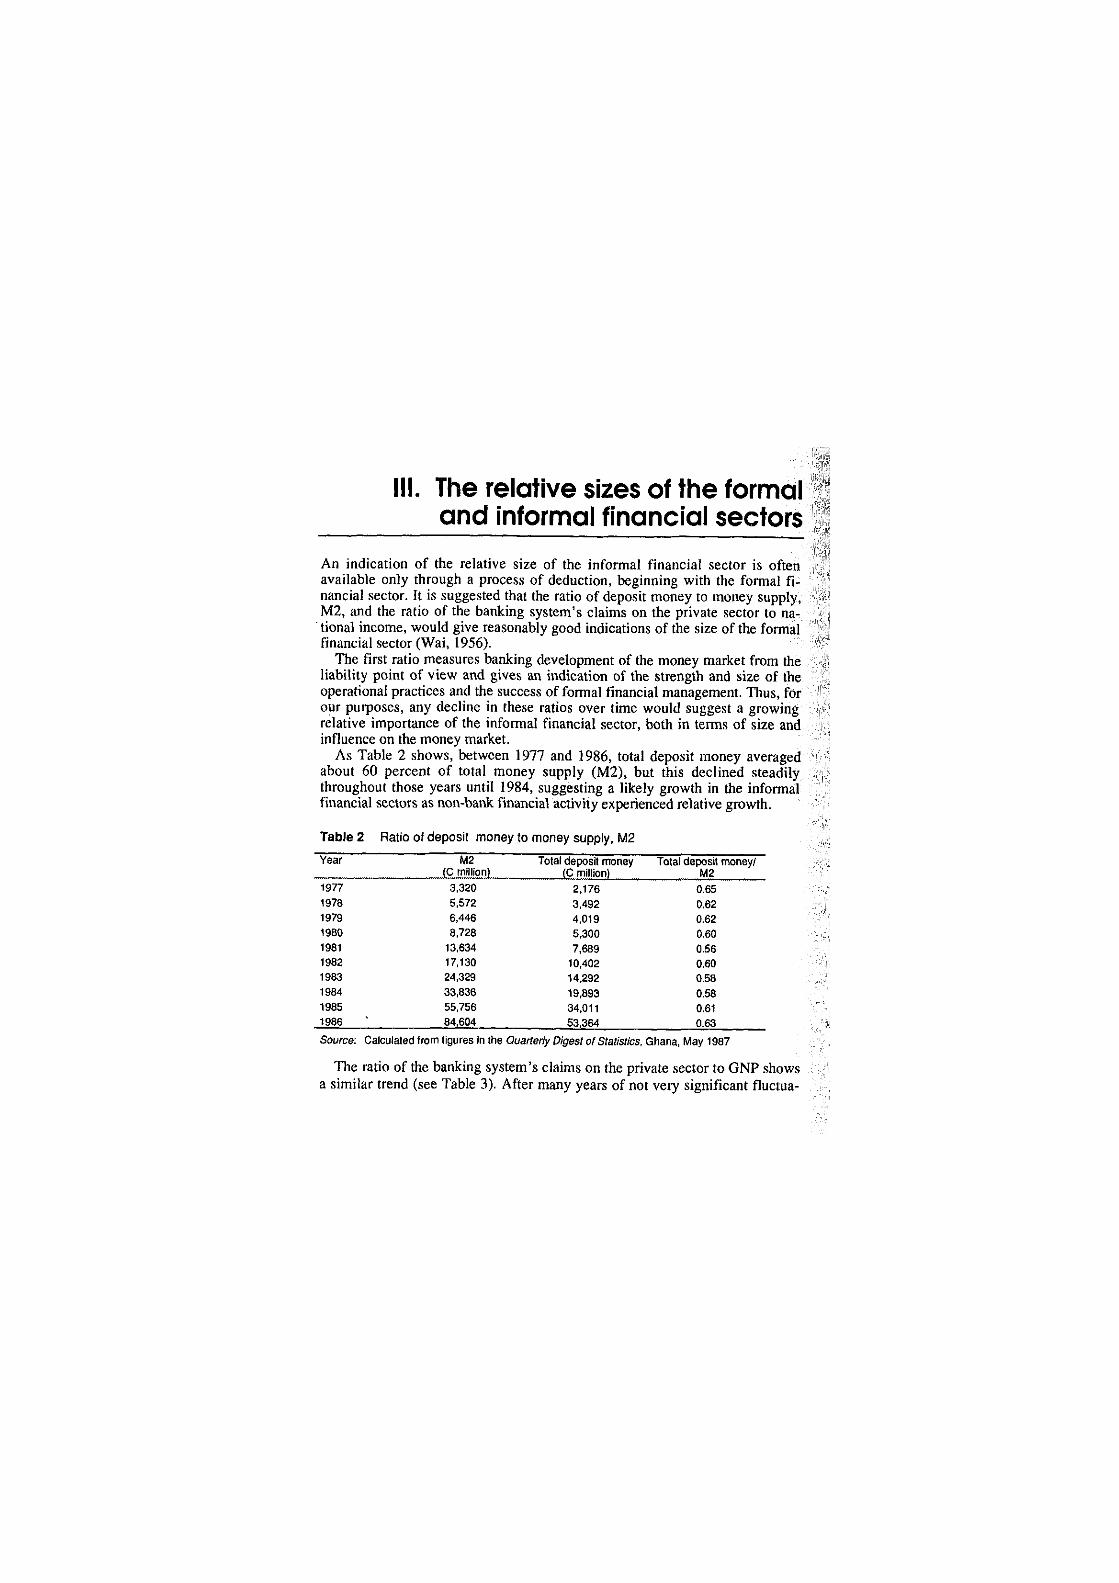
An indication of the relative size of the informal financial sector is often available only through a process of deduction, beginning with the formal fi-nancial sector. It is suggested that the ratio of deposit money to money supply, M2, and the ratio of the banking system's claims on the private sector to na-tional income, would give reasonably good indications of the size of the formal financial sector (Wai, 1956).
The first ratio measures banking development of the money market from the liability point of view and gives an indication of the strength and size of the operational practices and the success of formal financial management. Thus, for our purposes, any decline in these ratios over time would suggest a growing relative importance of the informal financial sector, both in terms of size and influence on the money market.
As Table 2 shows, between 1977 and 1986, total deposit money averaged about 60 percent of total money supply (M2), but this declined steadily throughout those years until 1984, suggesting a likely growth in the informal financial sectors as non-bank financial activity experienced relative growth.
Table 2 Ratio of deposit money to money supply, M2
Year M2 (C million)
Total deposit money (C million)
Total deposit money/ M2
1977 3,320 2,176 0.65 1978 5,572 3,492 0.62 1979 6,446 4,019 0.62 1980 8,728 5,300 0.60 1981 13,634 7,689 0.56 1982 17,130 10,402 0.60 1983 24,329 14,292 0.58 1984 33,836 19,893 0.58 1985 55,756 34,011 0.61 1986 84,604 53,364 0.63
Source: Calculated from figures in the Quarterly Digest of Statistics, Ghana, May 1987
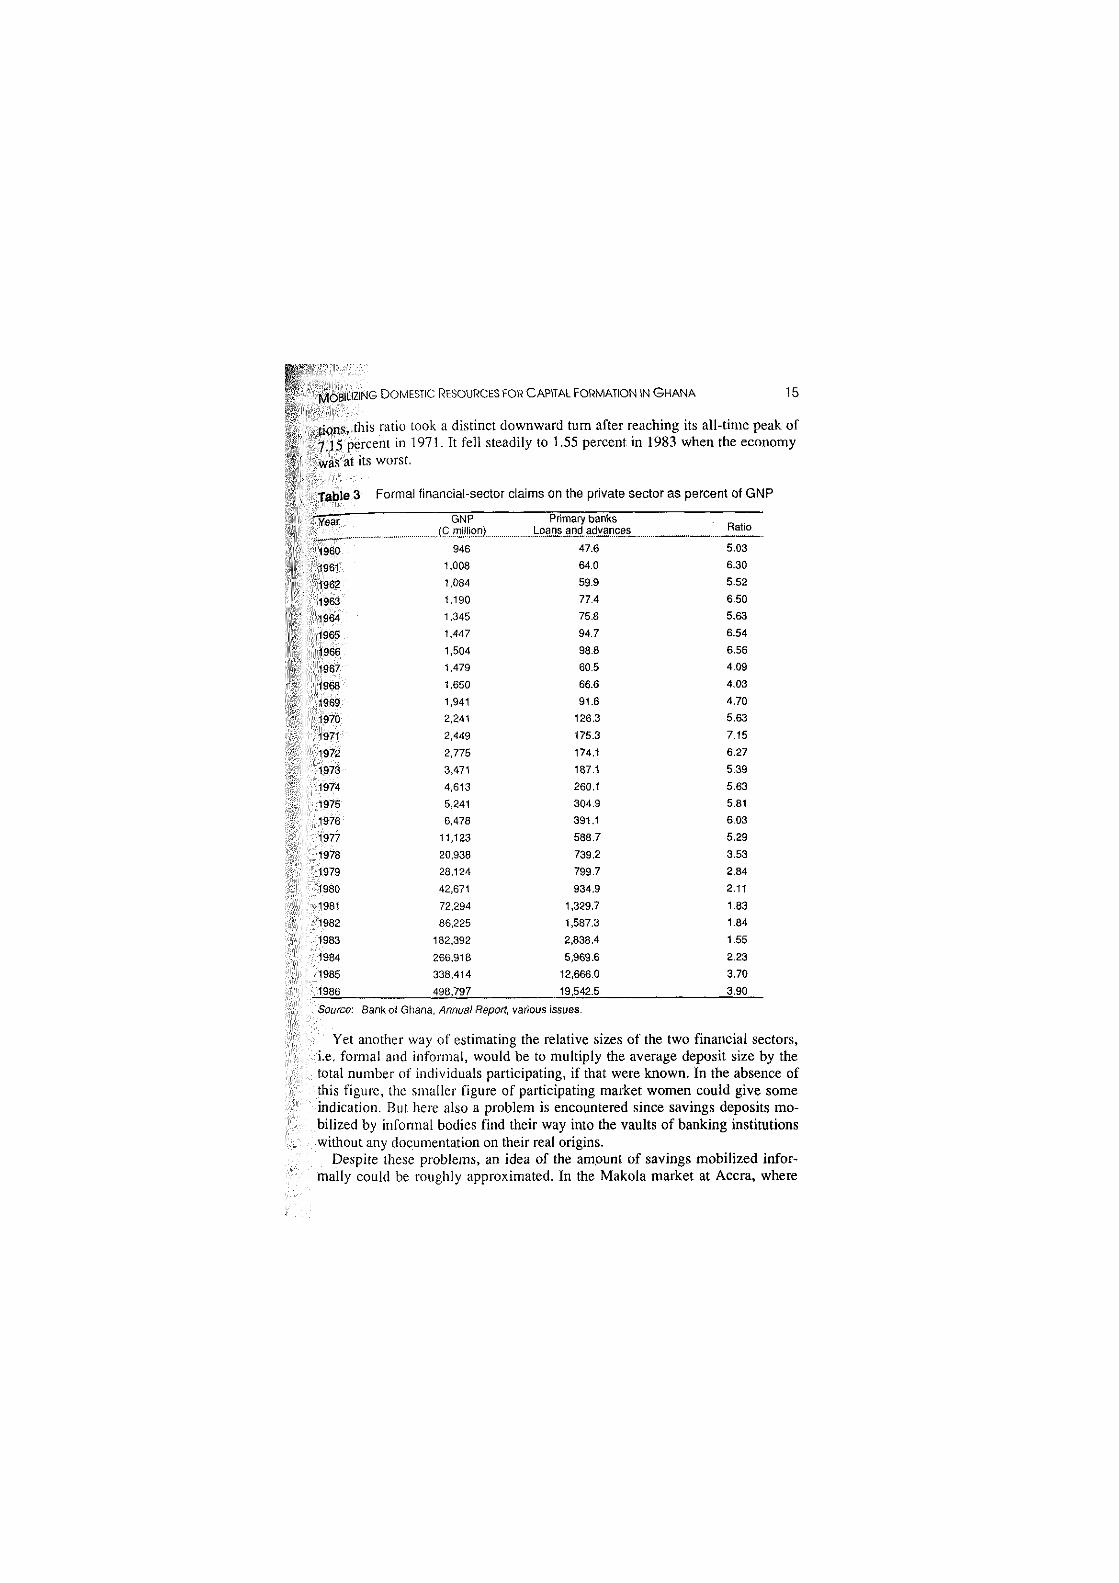
The ratio of the banking system's claims on the private sector to GNP shows a similar trend (see Table 3). After many years of not very significant fluctua-
MOBILIZING DOMESTIC RESOURCES FOR CAPITAL FORMATION IN G H A N A 15
tions. this ratio took a distinct downward turn after reaching its all-time peak of 7.15 percent in 1971. It fell steadily to 1.55 percent in 1983 when the economy was at its worst.
Table 3 Formal financial-sector claims on the private sector as percent of GNP
Year GNP Primary banks Ratio Year
(C million^ Loans and advances Ratio
1960 946 47.6 5.03
1961 1,008 64.0 6.30
1962 1,084 59.9 5.52
1963 1,190 77.4 6.50
1964 1,345 75.8 5.63
1965 1,447 94.7 6.54
1966 1,504 98.8 6.56
1967 1,479 60.5 4.09
1968 1,650 66.6 4.03
1969 1,941 91.6 4.70
1970 2,241 126.3 5.63
1971 2,449 175.3 7.15
1972 2,775 174.1 6.27
1973 3,471 187.1 5.39
1974 4,613 260.1 5.63
1975 5,241 304.9 5.81
1976 6,478 391.1 6.03
1977 11,123 588.7 5.29
1978 20,938 739.2 3.53
1979 28,124 799.7 2.84
1980 42,671 934.9 2.11
1981 72,294 1,329.7 1.83
1982 86,225 1,587.3 1.84
1983 182,392 2,838.4 1.55
1984 266,918 5,969.6 2.23
1985 338,414 12,666.0 3.70
1986 498,797 19,542.5 3.90
Source: Bank of Ghana, Annual Report, various issues.
Yet another way of estimating the relative sizes of the two financial sectors, i.e. formal and informal, would be to multiply the average deposit size by the total number of individuals participating, if that were known. In the absence of this figure, the smaller figure of participating market women could give some indication. But here also a problem is encountered since savings deposits mo-bilized by informal bodies find their way into the vaults of banking institutions without any documentation on their real origins.
Despite these problems, an idea of the amount of savings mobilized infor-mally could be roughly approximated. In the Makola market at Accra, where
16 RESEARCH PAPER
city officials have registered 7,266 traders, we estimate that there will be at least 10,000 people selling various wares on each day, except Sundays. Given that 77 percent of them save with susu collectors and deposit an average of C500 daily, C3.85 million will be mobilized each day, and therefore CI 15.5 million in u month. Counting the other two similar-sized markets in the capital, as well as at least ten other smaller markets in the city, we estimate a minimum savings mobilization of C500 million by the single-collector susu system in a month in Accra alone. Naturally this does not include what is mobilized through rotating savings clubs and mutual assistance groups, etc. This figure may be compared to what the formal system achieves in a month.
In December 1988, total time and savings deposits mobilized by all com-mercial banks was C2,671 million for the whole country. The figure represents the net deposits made in that month alone after withdrawals, thereby not making the comparison ideal. This, however, does not reduce by much the significance of the comparison since they both indicate the volume of financial assets accumulated in either sector of the financial market by the private sector in the month, bearing in mind that withdrawal from the informal sector within the period is zero since it is not permitted. In view of Accra's control of 23 percent of all bank branches, it is not too far-fetched to estimate that a minimum of C614.33 million was mobilized for the month in Accra. Thus, in the urban area, it is estimated that the formal sector controls only about 55 percent of financial savings mobilized in a month. If, however, one took into account the fact that some of the savings counted for the formal sector originated from the susu collectors, it is clear that the market shares of the two sectors in savings mobilization would not be significantly different. (It must be remembered that most of the deposits of the susu collectors are placed in current accounts which we have excluded from our estimate of financial savings with banks.)
Does informal saving amount to "genuine" saving?
In arguing above that there is no difference between the savings market shares of the formal and informal financial sectors, we are aware of the need to dis-tinguish between what may be classified as "genuine" saving and what is not "genuine" saving. The saving behaviour of most informal savers is target-ori-ented—the target not being to accumulate over an indefinite period but to regulate the individual investment and consumption capabilities within a limited period (cf. Deaton, 1990).
Unlike Deaton, we attach more importance to accumulation for small in-vestments than consumption. Most of our market women involved in saving with susu collectors have quite distinct savings plans to help in expanding their level of activity. To illustrate this point, many market women who operate at market places without permanent stalls expect to accumulate enough to pay city officials in order to be allocated a permanent stall which would then make it easier to attract customers and thereby expand their volume of business. Street hawkers selling tins of milk expect to be able to increase the number of tins of
MOBILISING DOMESTIC RESOURCES FOR CAPITAL FORMATION IN GHANA 17
milk they can stockpile in order to raise their daily sales and also their incomes. Our view is that, in spite of the short period over which funds are accumulated, frequent use as working capital and for the expansion of business, permits the transformation of savings into investment, albeit by the same person. What is lacking is a proper intermediation system.
IV. Saving in the informal financial sector
We consider here the usual backgrounds of those who save informally, the facilities available to them, the cost of utilizing these facilities, the extent of patronage, and also the role this facility plays in economic development.
Informal savers and their backgrounds
There are a variety of people, from widely varying educational and occupational backgrounds, involved in savings in the informal sector. Variations also occur in the ages of participants, as children, active workers and retired persons all appear interested in the sector's activities.
These different groups of people choose different types of informal saving?, facilities depending on how those facilities are suited to their economic condi-tions. Thus, for example, while school children who have no regular income may be interested in participating in small clubs for rotating savings, market women may be largely interested in the susu system in which a collector comes daily to them for deposits.
Primary-school children are known to deposit a full-day's pocket money with a chosen member of a susu group at school once a week in order to collect their entire savings at the end of the school term. The lump sum is often used to finance their end-of-term celebrations or the acquisition of toys or clothes.
Junior civil servants, teachers and artisans often set up savings clubs at their work places in which deposits are paid to members of the club in rotation. Lump sums from rotating savings help the savers make large purchases. Miracle et ul. (1980) report members of a group of secondary-school teachers in Cape Coast using their accumulated funds to purchase refrigerators.
Fish traders along the coast in Ghana have also been reported to form clubs for mutual assistance through which part of their contributions is used to finance fish purchases and control fish supply (Lawson and Kwei, 1974).
Urban traders, however, appear to dominate informal financial savings. These traders (mostly women at large markets) tend to go in for the susu operations that involve a known collector coming to them daily at their market stalls.
SIUZING DOMESTIC RESOURCES FOR CAPITAL FORMATION IN G H A N A 19
As'lie from these active groups, retired persons also form associations for mutual assistance and their mobilized funds are used to provide various forms of credit (o participants. The Veterans Association of Ghana, made up mainly of retired Second World War military personnel, is probably the most notable of these.
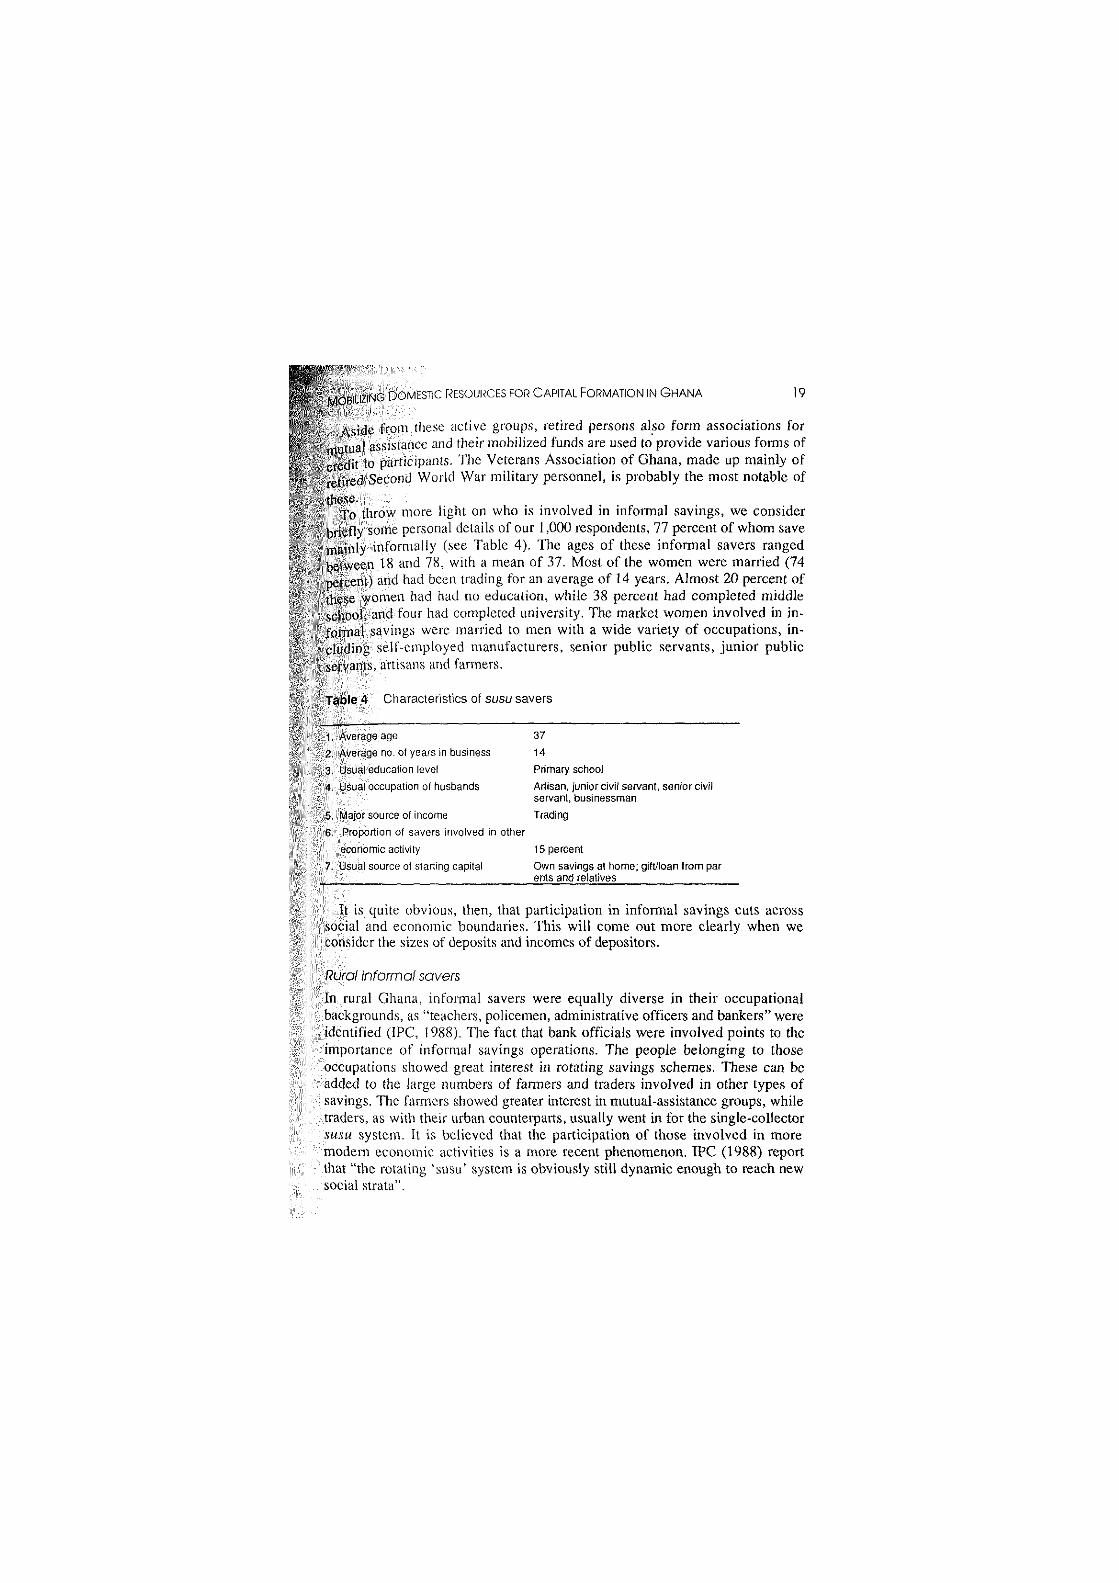
To throw more light on who is involved in informal savings, we consider brie 11 v some personal details of our 1,000 respondents, 77 percent of whom save mainly informally (see Table 4). The ages of these informal savers ranged between 18 and 78, with a mean of 37. Most of the women were married (74 percent) and had been trading for an average of 14 years. Almost 20 percent of these women had had no education, while 38 percent had completed middle school, and four had completed university. The market women involved in in-formal savings were married to men with a wide variety of occupations, in-cluding self-employed manufacturers, senior public servants, junior public servants, artisans and farmers.
Table 4 Characteristics ol susu savers
1. Averngi; age 37
2. Average no. of years in business 14
3. Usual education level Primary school
4. Usual occupation of husbands Artisan, junior civil servant, senior civil
servant, businessman
5. Major source of income Trading
6. Proportion of savers involved in other
economic activity 15 percent 7. Usual source of starting capital Own savings at home; gift/loan from par
ents and relatives
ll is quite obvious, then, that participation in informal savings cuts across social and economic boundaries. This will come out more clearly when we consider the sizes of deposits and incomes of depositors.
Rural Informal savers In rural Ghana, informal savers were equally diverse in their occupational backgrounds, as "teachers, policemen, administrative officers and bankers" were idemilied (IPC, 1988). The fact that bank officials were involved points to the importance of informal savings operations. The people belonging to those occupations showed great interest in rotating savings schemes. These can be added to the large numbers of farmers and traders involved in other types of savings. The farmers showed greater interest in mutual-assistance groups, while traders, as with their urban counterparts, usually went in for the single-collector susu system. It is believed that the participation of those involved in more modern economic activities is a more recent phenomenon. IPC (1988) report that "the rotating 'susu' system is obviously still dynamic enough to reach new social strata".
20 RESEARCH PAPER
Urban and rural informal savings facilities
The types of informal savings facilities available in both rural and urban areas are largely the same, with only minor variations. The commonest informal savings facilities are:
(a) Single-collector susu system; (b) Rotating susu system; (c) Contributions to mutual assistance groups or clubs. It is not clear whether credit unions can be classified as informal organiza-
tions considering the relatively high degree of formality in their operations. But in view of the fact that their operations fall outside the ambit of the banking system, we shall also seek to throw some light on their operations. We consider here only the savings mobilization procedures and the benefits/cost of using the savings facilities they afford.
The single-collector susu system
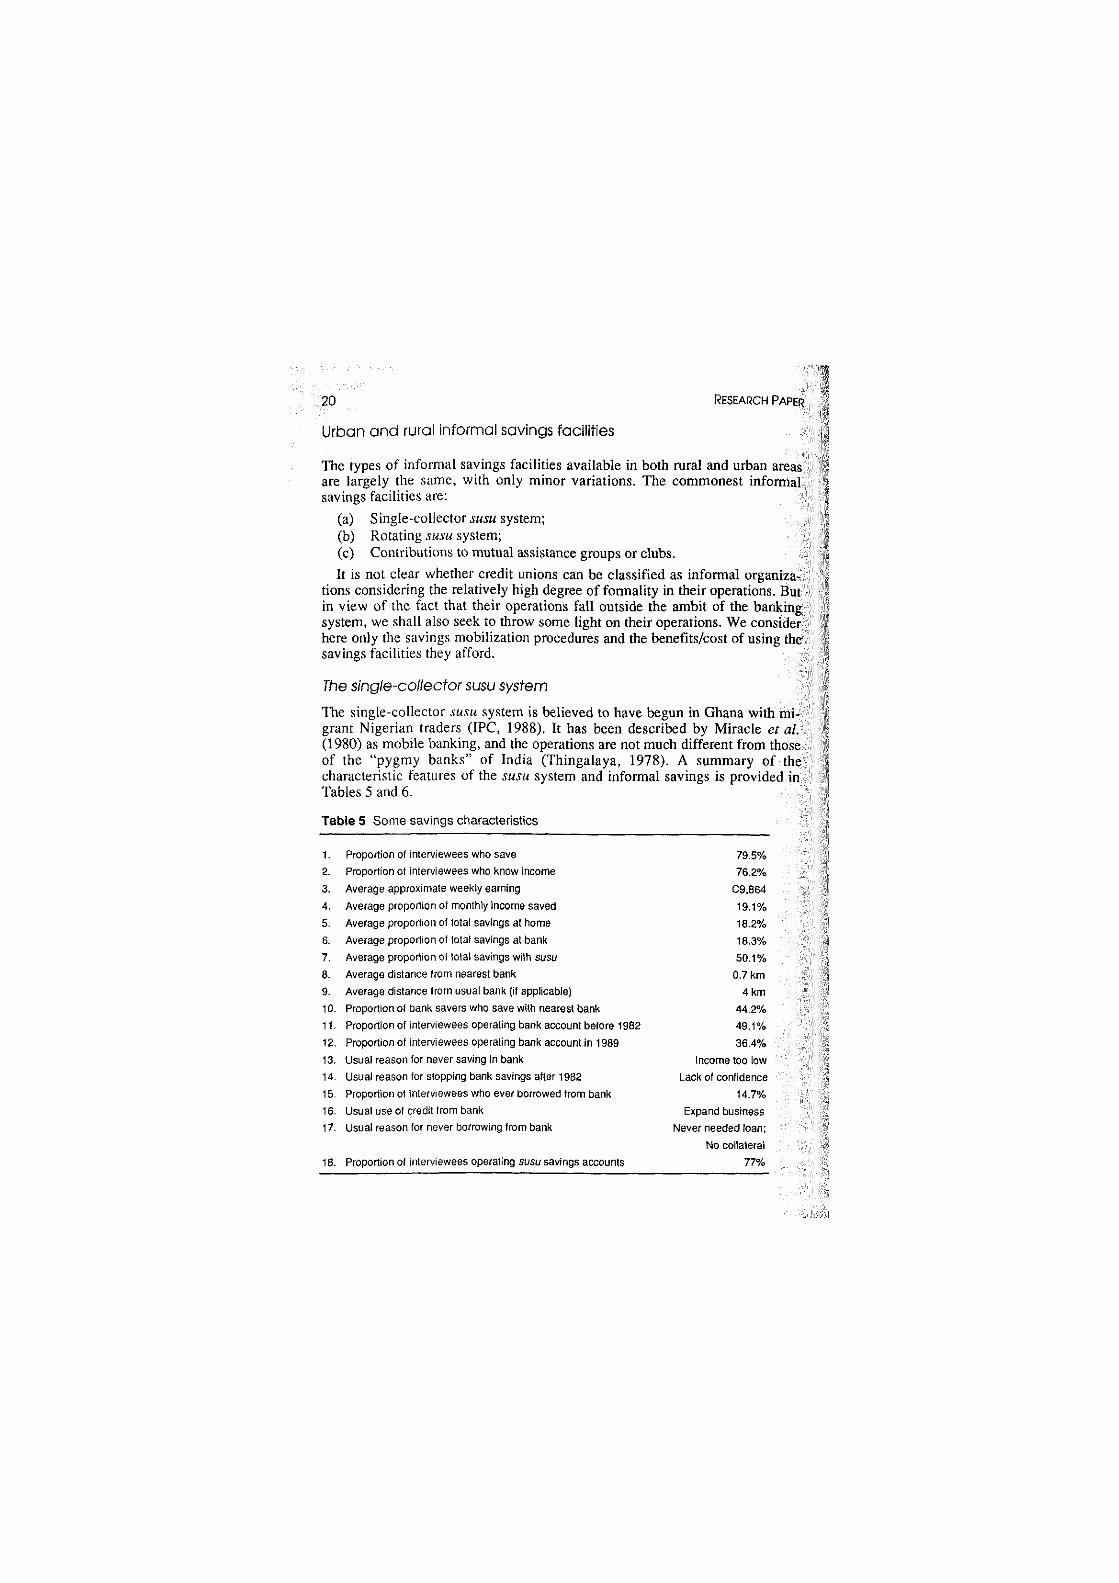
The single-collector susu system is believed to have begun in Ghana with mi-grant Nigerian traders (IPC, 1988). It has been described by Miracle et nl. (1980) as mobile banking, and the operations are not much different from those of the "pygmy banks" of India (Thingalaya, 1978). A summary of the characteristic features of the susu system and informal savings is provided in Tables 5 and 6.
Table 5 Some savings characteristics
1. Proportion of interviewees who save 79.5%
2. Proportion of interviewees who know income 76.2%
3. Average approximate weekly earning C9.864
4. Average proportion of monthly income saved 19.1%
5. Average proportion of total savings at home 18.2%
6. Average proportion of total savings at bank 18.3%
7. Average proportion of total savings with susu 50.1%
8. Average distance from nearest bank 0.7 km
9. Average distance from usual bank (if applicable) 4 km
10. Proportion of bank savers who save with nearest bank 44.2%
11. Proportion of interviewees operating bank account before 1982 49.1%
1 2 . Proportion of interviewees operating bank account in 1 9 8 9 36.4%
13. Usual reason for never saving in bank Income too low
14. Usual reason for stopping bank savings after 1982 Lack of confidence
15. Proportion of interviewees who ever borrowed from bank 14.7%
16. Usual use of credit from bank Expand business
17. Usual reason for never borrowing from bank Never needed loan;
No collateral
18. Proportion of interviewees operating susu savings accounts 77%
MOBILISING DOMESTIC RESOURCES FOR CAPITAL FORMATION IN G H A N A 2 1
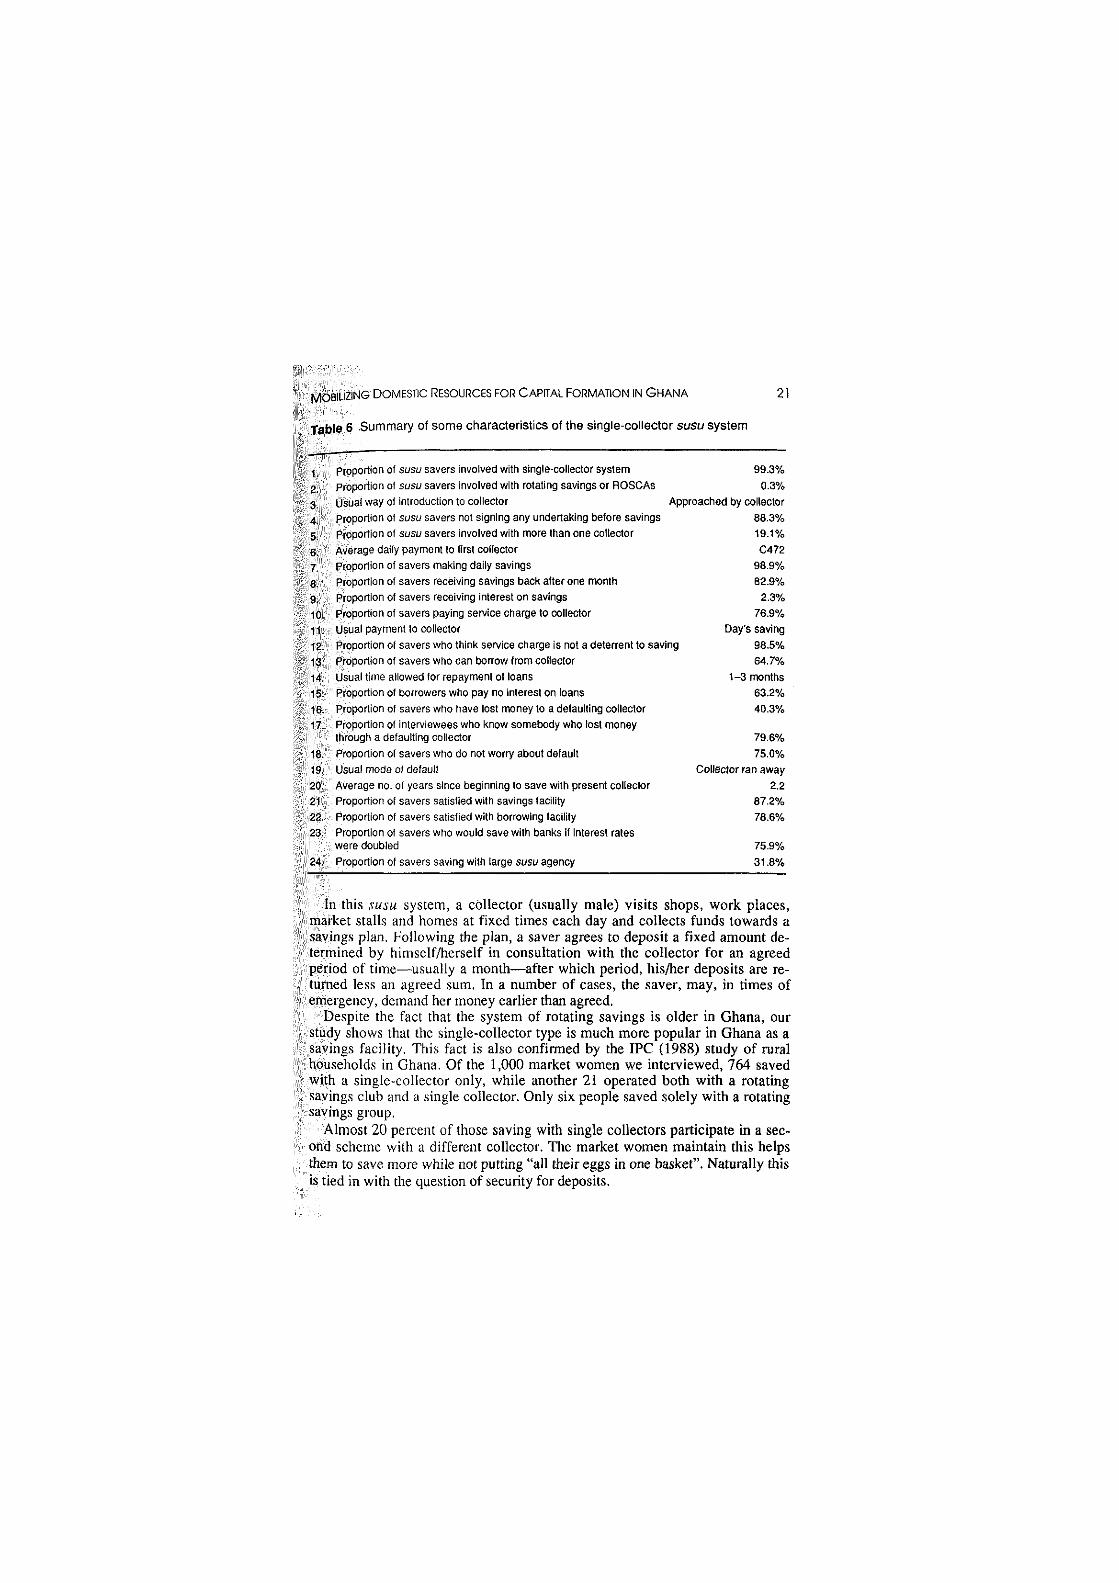
Table 6 Summary of some characteristics of the single-collector susu system
1. proportion of susu savers involved with single-collector system 99.3%
2. proportion of susu savers involved with rotating savings or ROSCAs 0.3%
3. Usual way of introduction to collector Approached by collector
4. proportion of susu savers not signing any undertaking before savings 88.3%
5. proportion of susu savers involved with more than one collector 19.1%
6. Average daily payment to first collector C472
7. proportion of savers making daily savings 98.9%
8. proportion of savers receiving savings back after one month 82.9%
9. proportion of savers receiving interest on savings 2.3%
10. Proportion of savers paying service charge to collector 76.9%
11. Usual payment to collector Day's saving
12. proportion of savers who think service charge is not a deterrent to saving 98.5%
13. proportion of savers who can borrow from collector 64.7%
14. Usual time allowed for repayment of loans 1 - 3 months
15. proportion of borrowers who pay no interest on loans 63.2%
16. proportion of savers who have lost money to a defaulting collector 40.3%
17. Proportion of interviewees who know somebody who lost money through a defaulting collector 79.6%
18. proportion of savers who do not worry about default 75.0%
19. Usual mode of default Collector ran away
20. Average no. of years since beginning to save with present collector 2.2 21. Proportion of savers satisfied with savings facility 87.2% 22. Proportion of savers satisfied with borrowing facility 78.6% 23. Proportion of savers who would save with banks if interest rates
were doubled 75.9% 24. Proportion of savers saving with large susu agency 31.8%
In this susu system, a collector (usually male) visits shops, work places, market stalls and homes at fixed times each day and collects funds towards a savings plan. Following the plan, a saver agrees to deposit a fixed amount de-termined by himself/herself in consultation with the collector for an agreed period of time—usually a month—after which period, his/her deposits are re-turned less an agreed sum. In a number of cases, the saver, may, in times of emergency, demand her money earlier than agreed.
Despite the fact that the system of rotating savings is older in Ghana, our study shows that the single-collector type is much more popular in Ghana as a savings facility. This fact is also confirmed by the IPC (1988) study of rural households in Ghana. Of the 1,000 market women we interviewed, 764 saved with a single-collector only, while another 21 operated both with a rotating savings club and a single collector. Only six people saved solely with a rotating savings group.
Almost 20 percent of those saving with single collectors participate in a sec-ond scheme with a different collector. The market women maintain this helps them to save more while not putting "all their eggs in one basket". Naturally this is tied in with the question of security for deposits.
22 RESEARCH PAPER
Our survey revealed that as many as 40.3 percent of the informal savers had lost money through a collector defaulting with payments. In spite of this large record of losses, 75 percent indicated that they did not worry about their present collectors defaulting in payments to them. This seems strange in view of the fact that most of the women recognized that there were hardly any safeguards for their deposits. It would appear that security for deposits is very weak since about 80 percent of the women know of at least one person who had lost money through default in returning deposits. The usual way of defaulting in payments was through the collector absconding with deposits.
The poor security involved with the single-collector susu savings may be related to the way in which potential depositors are introduced to the scheme. For most of them (60 percent) first contact with the collector was made when they were approached by the collector himself. In a few other cases introduc-tions were made by friends, relations and other market women. Interestingly, it is rare for either party to undertake any contractual obligations. This was so for 88 percent of the savers whose only formal connection to the collector was the card issued to them on which their daily deposits and balances were recorded.
Daily deposits (made by 99 percent of susu savers) to collectors range be-tween CI 00 and CI ,000 in urban areas, with a mean of almost C500. In rural areas the range is between C10 and C500, with a mean of C100. When savers are involved with more than one collector, they usually pay a slightly lower amount to the second collector, where average deposits are about C400. In a few instances deposits are made weekly.
Most savers with single collectors have their deposits returned to them after a month. A few others receive them after six months or even a year. For most savers, the collector retains the equivalent of a day's savings as his charge after a month's saving. In quite a number of cases, however, collectors return the deposits in full, thus raising the issue of how they are compensated. We presume such collectors are compensated with interest they earn on lending to the market women and others. For those who pay a charge for saving, they did not think this was a deterrent to savings.
While 98 percent of savers with single collectors receive no interest on their deposits, the remainder indicated that they enjoy interest payments on their de-posits. These were often savers who committed themselves to saving for more than six months before a return of their deposits. Such savings usually attracted an interest rate of about 5 percent per month. In six cases, interest rates of between 10 and 20 percent per month were observed. This situation is certainly comparable to the holding of time deposits with banks.
People who save with informal agencies, especially single-collector susu systems, often have diverse reasons for doing so. The fundamental motivation for doing so is derived from the lump sum the facility permits them to accu-mulate at very little cost. Other important reasons may be listed as follows:
(a) Easy access to the collector who comes regularly; (b) The fact that collectors accept small sums, often made up of torn notes
and coins;
MOBILISING DOMESTIC RESOURCES FOR CAPITAL FORMATION IN G H A N A 23
(c) Easy access to credit facilities; (d) The personalized relationship between saver and banker which makes
the collector understand her situation when she cannot afford to meet a day's payment on a bad day. He will come back another time without much fuss. He might even allow her to withdraw her money before the end of the month if given adequate notice—may be of one day.
Over the last few years, a number of savings and credit finance companies have been set up by individuals or groups to operate on similar lines to the sinsile-collector susu system. This larger level of operation does not, however, seem to be as popular with the market women as the original version. Only about 31 percent of susu savers are involved with the larger organizations. The women appear wary of the large companies in view of difficulties some of them have had with the return of deposits. In view of this trend, we consider here some of the characteristics of susu collectors.
Characteristics of Susu collectors
Two hundred and fifty single susu collectors are registered in Accra and Kuma.si. For this study, however, we interviewed 17 in Accra, and noted that most of them (12) had another business apart from susu collection. They claimed that the two activities were equally important to them. The major reason for being involved in the susu business was to make extra income. They had all been susu collectors for periods ranging between one and six years.
For more than 70 percent, their clients are mainly traders at the market. They started off with between 15 and 250 clients, with an average of 60 per collector. By 1989, the number of clients ranged between 30 and 1,000, with a mean of 285. They claimed that they often met their clients through their own canvassing, and this ties in with the responses of the market women.
In a number of cases, potential clients insisted on knowing what assets the collcclor held before saving with him. Ten of our collectors owned immovable property. It appears, however, that the response in fact have much influence on the decision whether to save with the collector or not. In most cases the women saved with the collector because they had come to know him. In 80 percent of cases the collectors lived or worked in the same area as their clients.
Savings mobilized by the susu collectors ranged between C15,000 and C3()(),()00 daily. The mean daily collection was C165,000. This figure cannot be used to estimate the size of the informal sector since the number of active collectors is not known.
The views of susu collectors as to why they are patronized by the market women are similar to those of the women themselves, i.e. to obtain a lump sum within a relatively short period while avoiding delays at banks.
The rotating savings system
As mentioned earlier, the rotating savings susu system is more common in the non-commercial economic sectors. In both rural and urban areas, the rotating
24 RESEARCH PAPER
system is patronized by wage-earners on a monthly basis. An example of this system is a group of colleagues at a government office placing an agreed amount of savings into a pool within a few days of wage or salary payments. The system operates completely on the basis of trust. The number of participants usually equals the number of months of operation that the group agrees upon. The group randomly (probably by casting lots) selects the month in which each individual will receive the full lump sum deposited in the pool by the whole group. Once all the participants have had their turn, the group has the option of continuing, expanding, reducing its size or folding up. Most work-place savings groups have 12 members operating for one year, and often undertake more savings cycles.
Although this system is smaller than the single-collector system, more groups are being formed daily as new socio-economic groups are becoming interested in the formation of savings clubs (IPC, 1988).
In addition to wage earners, farmers in rural areas have become significant contributors to rotating savings groups. They have been noted to:
. . . use their "handouts" to purchase productive inputs and trading goods. When the money is used for such purposes, the prescribed sequence for paying out funds is not always maintained; it can be easily changed if one of the members suddenly has an opportunity to buy important items which are necessary for his work (IPC, 1988).
It is obvious that, as with the single-collector type of susu savings, people involved with rotating savings groups or clubs have quite definite economic goals. The usage of these facilities is certainly not simply out of habit or tradi-tion but the result of sound economic considerations.
The new government requirement that all public employees be paid through the banks is likely to affect the practice of rotating savings among such workers. Some public servants who used to make deposits to the fund soon after collecting their pay packets, now find it cumbersome to withdraw money from bank accounts in order to make susu payments.
Savings with mutual assistance groups
There are a number of mutual assistance groups in Ghana whose major pre-occupation is not necessarily the mobilization of savings. When involved in savings mobilization, this function only becomes a means for achieving the groups' other socio-economic goals.
Mutual assistance groups may be found in both urban and rural areas of Ghana; examples are the Nanemei Akpee (Society of Friends) in Accra and the Amasachina groups of northern Ghana which have specific interests in the so-cio-economic advancement of their members.
These groups are often made up of people who share some common charac-teristics such as ethnicity (in large urban areas), occupation, acquaintanceship, etc. The payments made to the groups are usually described as dues instead of savings deposits in view of the variety of uses these can be put to by the groups as against the individual. For example, "the aggregate deposit of a group, or
MOBILISING DOMESTIC RESOURCES FOR CAPITAL FORMATION IN GHANA 2 5
some portion of it, may be earmarked to buy something, or finance a project, of benefit to the entire group, such as building a school, a road or a bridge" (Miracle et al., 1980).
Following a study of Amasachina groups in rural northern Ghana, three di-m e n s i o n s o f their activities have been noted; namely 1 They are business associations by which people try to support one another in
various business activities through the reduction of operating costs or a control of the market against outside interference;
2. They are social organizations through which people help one another in personal emergencies, e.g. in the payment of hospital bills or the finance of funerals and weddings;
3. They are community-development oriented. They participate in the con-struction and financing of clinics, dams, roads and schools, thus making a significant contribution to the general improvement of their local areas (IPC, 1988).
The rural groups are open to anyone provided they are acceptable to the ex-ecutive committee. This implies the vetting of applications to ensure that the groups are well organized and efficient.
People joining Amasachina groups have given the following reasons for their interest in the groups:
• Safe keeping of money; • Mutual trust of members; • Strong orientation towards community development; • Clear leadership structure; « Elaborate control mechanisms.
A number of people regard mutual assistance groups as ensuring greater se-curity for their money than the single-collector susu system. This is a result of the control mechanism inherent in the structures of these groups.
Credit unions in Ghana
Credit unions were first introduced into Ghana in 1955 by Roman Catholic fathers working in the northern part of the country. The credit union is described by the Credit Union Association of Ghana as "a free association of people with a common bond who save and lend money to one another through co-operative principles of productive and provident purposes". This common bond is described as residential, occupational or associational. There are, therefore, parish credit unions, community credit unions and work-place credit unions in Ghana.
Credit unions operate under the co-operative law and are guided by a set of bye-laws. They are managed and controlled by annually elected committees known as Management, Supervisory, Loans/Credit and Education committees.
26 RESEARCH PAPER
The unions operate what they call a regular savings scheme for members which can be likened to the payments made to susu collectors. This can be done daily or monthly, depending on the type of union. The unions usually determine a minimum savings level that each member should keep.
Additionally, credit unions operate a deposit account which permits members to receive credit from the union. The unions have also sought to involve themselves in susu collection from market women. Our study of market women in three cities showed, however, that less than 2 percent of the women saved with credit unions.
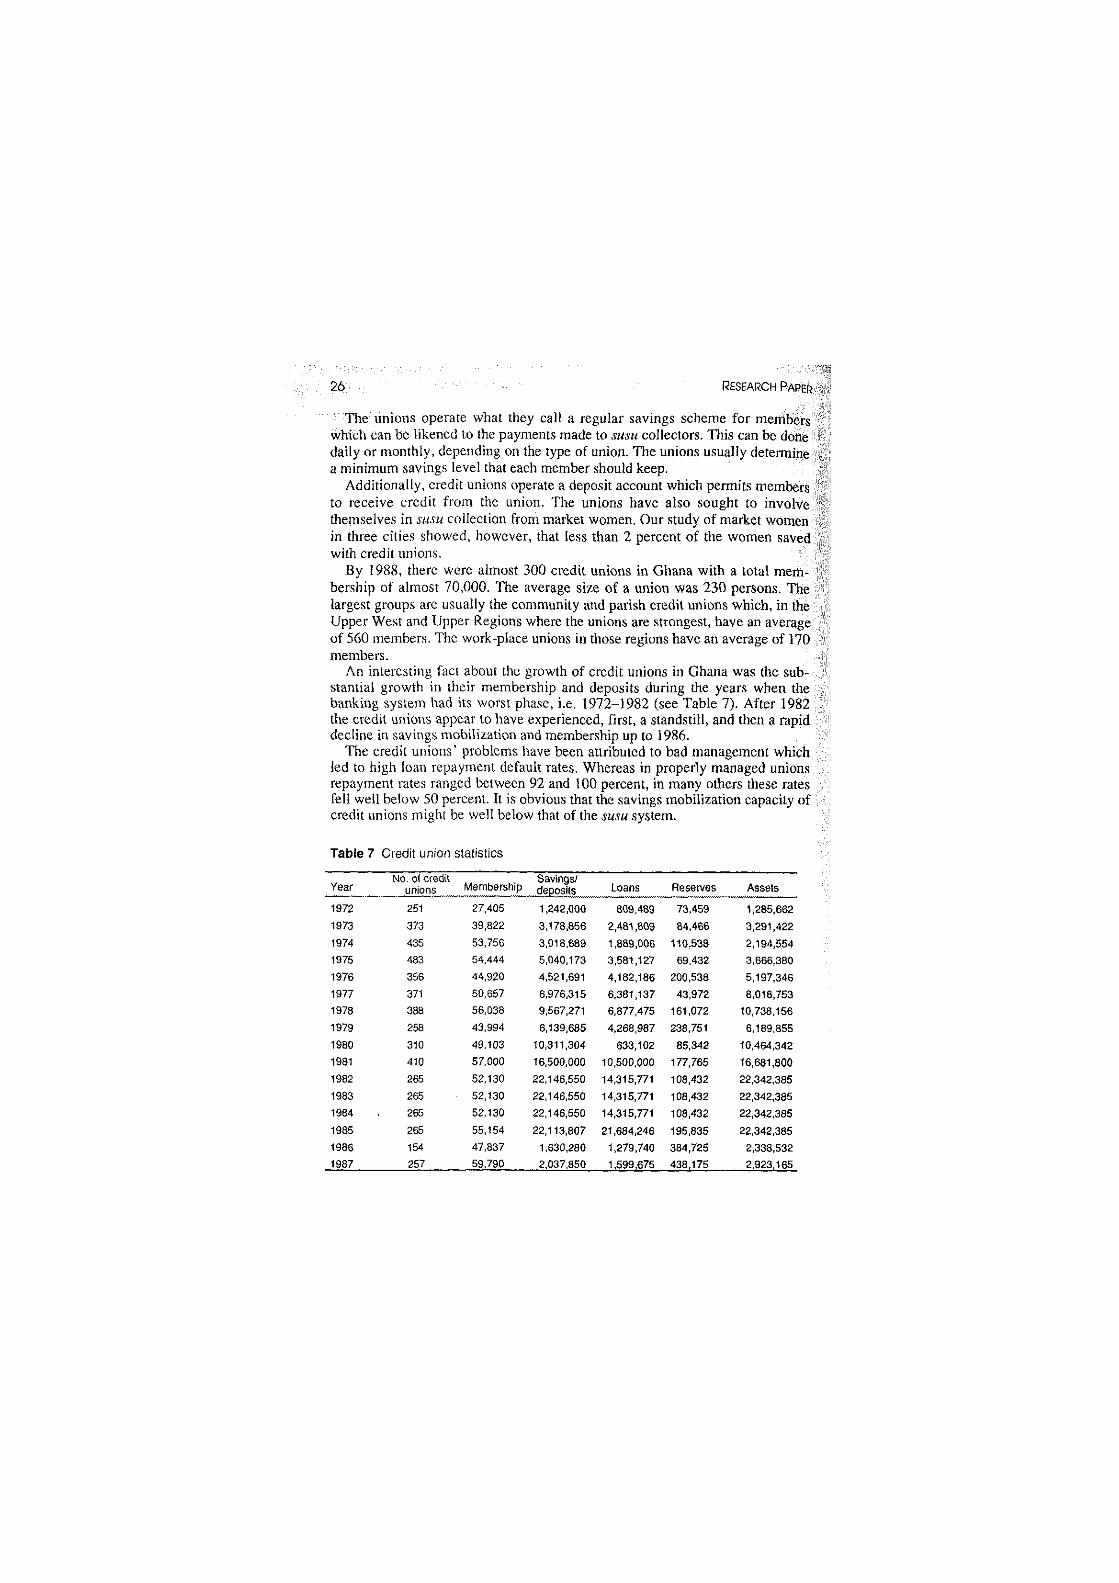
By 1988, there were almost 300 credit unions in Ghana with a total mem-bership of almost 70,000. The average size of a union was 230 persons. The largest groups are usually the community and parish credit unions which, in the Upper West and Upper Regions where the unions are strongest, have an average of 560 members. The work-place unions in those regions have an average of 170 members.
An interesting fact about the growth of credit unions in Ghana was the sub-stantial growth in their membership and deposits during the years when the banking system had its worst phase, i.e. 1972-1982 (see Table 7). After 1982 the credit unions appear to have experienced, first, a standstill, and then a rapid decline in savings mobilization and membership up to 1986.
The credit unions' problems have been attributed to bad management which led to high loan repayment default rates. Whereas in properly managed unions repayment rates ranged between 92 and 100 percent, in many others these rates fell well below 50 percent. It is obvious that the savings mobilization capacity of credit unions might be well below that of the susu system.
Table 7 Credit union statistics
Year No. of credit ,
unions Membership Savings/ deposits Loans Reserves Assets
1972 251 27,405 1,242,000 809,489 73,459 1,285,662
1973 373 39,822 3,178,856 2,481,809 84,466 3,291,422
1974 435 53,756 3,018,689 1,889,006 110,538 2,194,554
1975 483 54,444 5,040,173 3,581,127 69,432 3,666,380
1976 356 44,920 4,521,691 4,182,186 200,538 5,197,346 1977 371 50,657 6,976,315 6,381,137 43,972 8,018,753
1978 388 56,038 9,567,271 6,877,475 161,072 10,738,156
1979 258 43,994 6,139,685 4,268,987 238,751 6,189,855
1980 310 49,103 10,311,304 633,102 85,342 10,464,342
1981 410 57,000 16,500,000 10,500,000 177,765 16,681,800
1982 265 52,130 22,146,550 14,315,771 108,432 22,342,385
1983 265 52,130 22,146,550 14,315,771 108,432 22,342,385 1984 265 52,130 22,146,550 14,315,771 108,432 22,342,385
1985 265 55,154 22,113,807 21,684,246 195,835 22,342,385
1986 154 47,837 1,630,280 1,279,740 384,725 2,338,532
1987 257 59,790 2,037,850 1,599,675 438,175 2,923,165
V. Urban and rural informal lending facilities
In this section we describe various lending facilities afforded by the informal bodies considered earlier, as well as the operations of moneylenders.
Lending within the singie-cotiecto,r susu system
Although most people who save with the susu system look forward to the lump-sum payment it brings them, easier access to credit than is possible from banks is also a major reason for saving with the susu system. For 31 percent of women saving with susu collectors, access to credit on flexible terms was the most important reason for saving. This may not be a high percentage but, as earlier mentioned, as many as 64.7 percent of them indicated they were permitted borrowing facilities by their collectors. This figure, however, is not reflected in the number of lenders who actually lend. Only 5 of the 17 collectors interviewed by us lend to their clients.
A major characteristic of these loans, however, is the fact that they are usually very short term and may or may not carry any interest. Usually such credit must be repaid within one to three months. Indeed in 25 percent of the cases, loans must be repaid after one month. Also, for most of the respondents who could borrow from their collector, no interest was charged for taking a loan. When interest was levied, however, rates varied between 5 and 50 percent per month. The usual interest rate charges is 13.3 percent per month.
The following example of how interest payments are made is typical of those taking credit with interest. A woman who normally deposits C100 daily and accrues C9,000 after three months may be permitted a loan of C4,500 in addition to her lump sum of C9,000 at the end of the period. She then begins to pay CI20 daily to the collector for the next three months. Half her normal deposit (C4,500) comes back to her as returned savings, while the other half and an additional CI,800 go to repay the principal and interest. The women have very little problem with this arrangement since the 40 percent interest rate over three months is paid daily in very small amounts (C20). (This figure compares with an average of 30 percent per annum charged by banks.)
28 RESEARCH PAPER
Susu operators are usually limited in the amount of credit they can give by the size of the assets they control since credit creation is limited by the short-term nature of the deposits held by them. They are able to lend only after doing "quick business" with high turnover rates using the deposits of their customers. No wonder quite a number of susu collectors engage in commerce themselves or in even more risky business such as financing the clearance of goods by importers from ports. In a few cases, adventurous collectors are known to lend to non-customers and such loans usually attract much higher interest rates.
The large new organizations coming into the susu business often attract clients with offers of credit facilities after six months of uninterrupted savings. They are introducing a new dimension into the susu business with their inno-vative ideas.
Lending within the rotating savings susu system
The issue of lending is often taken for granted in view of the very nature of the system. Each time a person saves, or makes his contribution to the pool, another is being lent money (except in the case of the last person to collect from the pool).
The first person to collect from the pool of funds at a typical work-place rotating savings scheme usually obtains a loan equivalent to 11 months' of savings with no interest. Others who follow him (except the last) similarly ob-tain loans but over increasingly shorter periods. The fact that no interest is paid is the characteristic of borrowing from a rotating fund.
In order to ensure that all members receive interest-free loans, it is usually arranged that there will be more cycles of savings in which the order in which individuals collect from the pool will change. This ensures that over a long period each person can be sure of obtaining interest-free loans quite frequently. Borrowing from this system in urban areas is invariably towards the purchase of household equipment which cannot be financed directly from monthly incomes, while in rural areas agricultural implements are purchased.
Since the system operates solely on the basis of mutual trust, in situations where potential participants are considered not so credit-worthy, their partici-pation is discouraged. Also an "arrangement used by associations that has a bearing on defaults is a provision by which members can contribute less to the fund of members they consider to be relatively poor risks" (Miracle et al., 1989). This makes contributions reciprocal since one pays into the fund for a particular member only what one received from that member.
The operations of private moneylenders
Here we examine the characteristic features of moneylending in Ghana. The analysis is based on information gathered from the following sources: the gov-ernment's licensing office; both licensed and unlicensed moneylenders; actual and prospective borrowers; and friends and associates of moneylenders. As
MOBILIZING DOMESTIC RESOURCES FOR CAPITAL FORMATION IN GHANA 29
indicated in the introduction, we interviewed 12 moneylenders in Accra, Hohoe and Agona Swedru.
Some background to moneylending in Ghana
The Moneylenders Ordinance 1951 of Ghana includes under the term "moneylender"
. . . every person whose business is that of moneylending or who carries on or advertises or announces himself or holds himself out in any way as carrying on that business, whether or not he also possesses or owns property or money derived from sources other than the lending of money and whether or not he carries on the business as a principal or as an agent.
The Ordinance further states that, with the exception of some persons, "any person who lends a sum of money at interest or who lends a sum of money in consideration of a larger sum being repaid shall be presumed to be a moneylender".
Following these definitions, two major categories of moneylenders may be found in Ghana:
(a) Those who are licensed to operate under the Moneylenders Ordinance (1951); and
(b) Those lenders who do business without official authority.
Licensed moneylenders The need for official recognition of moneylenders' activities in Ghana arose in the 1930s when the cocoa boom called for some form of agricultural credit. Bank finance was virtually non-existent and whatever credit facility was avail-able depended on the goodwill of relatives and friends (Adjetey, 1978).
As the need for agricultural credit increased, usurers appeared. Following complaints from peasant farmers about the usurious tendencies of some rich farmers in the 1930s, the first ordinance on moneylending came out in 1940. This Ordinance was soon found to be wanting when the registration exercise began, and had to be strengthened in 1951. The regulations and procedures governing the licensing of moneylenders relate to application for a certificate from a government agent in the district and registration of licence by a licensing officer for the district.
The Moneylenders Ordinance makes it clear that the moneylender's contract will not be enforceable unless a written memorandum is made and signed by the parties to the contract. The memorandum is expected to contain all the terms of contract, and in particular should show:
(i) The date on which the loan was made; (ii) The amount of the principal of the loan; and (iii) The rate of interest per annum, and the amount of such interest.
3 0 RESEARCH PAPER
Unlicensed moneylenders
It is almost impossible to estimate the size of this group of lenders in view of the illegal nature of the activity. It is, however, expected to be a much larger group than those operating legally. It is generally believed that they are numerous and scattered all over the country, especially in the farming communities. They are mainly rich cocoa farmers and craftsmen who have some surplus cash and the willingness to assist other farmers.
Fish traders (invariably women) are also known to finance the fishing op-erations of their menfolk on a quite wide scale. "The general rule is that a trader who has lent money to a fisherman to buy a canoe is given the boat's shares of the catch to sell, and also the net's shares if the fisherman has borrowed to buy a net (Vercruijsse, 1984)."
A government committee on agricultural indebtedness reported in 1958 that the moneylender is a valuable social asset to the village farming community and that he is held in high regard. He is also approachable and ready to lend at short notice. Farmers usually borrow money from moneylenders during the planting season to maintain their households until the next harvest. Some, however, seize the opportunity to borrow for "non-essential" expenditure such as funerals and other social events.
Some characteristics of moneylending operations
Personal characteristics
Of the 12 moneylenders interviewed, 11 were also actively engaged in some other economic activity. While two were engaged in real estate—renting out a couple of houses—four others were active traders or owned shops; two owned taxis and mini-buses, two operated restaurants and one was a farmer. Only three regarded moneylending as their major business activity. Before coming into the lending business they had either worked on those other activities or in the public services for a considerable number of years.
Moneylenders are often advanced in age. The lenders we met were aged between 50 and 75, with an average age of 61. This is probably a result of the fact that they have to spend many years accumulating wealth from other ac-tivities before they can lend out money. For a number of these older persons, especially those living in rural areas, moneylending is the only way of ensuring that their accumulated wealth does not depreciate. They often live far from the nearest bank and are illiterate. Thus, for them, it is more worthwhile to lend money to other persons since it is easier to understand this way of investing money than it is to understand what happens when one deposits money with banks. It is also easier to calculate the return on one's investment. Other moneylenders, particularly those in urban areas, engage in the business out of a strong profit motive. For these, lending is a way of obtaining extra income. Sometimes, they insist, sympathy towards the "less endowed" is a major reason for being in the business. The practice of investing one's own accumulated savings, however, distinguishes this form of lending from that of susu collectors who lend out the savings of others.
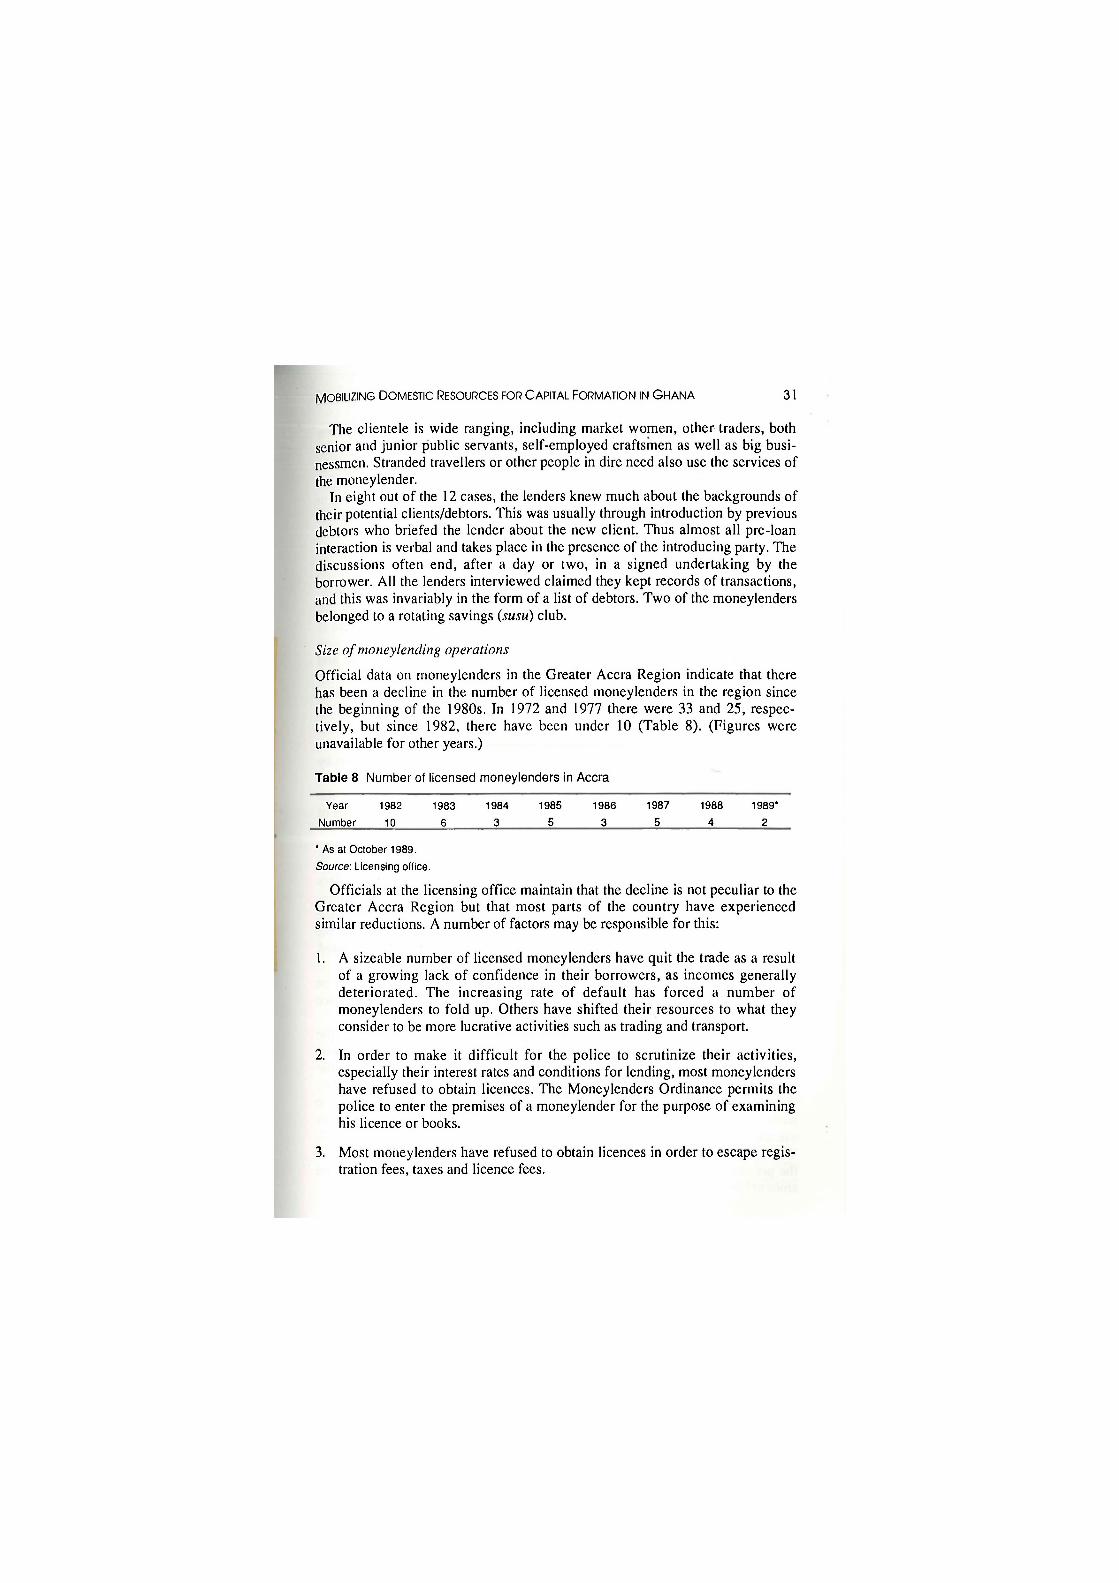
MOBILIZING DOMESTIC RESOURCES FOR CAPITAL FORMATION IN GHANA 31
The clientele is wide ranging, including market women, other traders, both senior and junior public servants, self-employed craftsmen as well as big busi-nessmen. Stranded travellers or other people in dire need also use the services of the moneylender.
In eight out of the 12 cases, the lenders knew much about the backgrounds of their potential clients/debtors. This was usually through introduction by previous debtors who briefed the lender about the new client. Thus almost all pre-loan interaction is verbal and takes place in the presence of the introducing party. The discussions often end, after a day or two, in a signed undertaking by the borrower. All the lenders interviewed claimed they kept records of transactions, and this was invariably in the form of a list of debtors. Two of the moneylenders belonged to a rotating savings (susu) club.
Size of moneylending operations
Official data on moneylenders in the Greater Accra Region indicate that there has been a decline in the number of licensed moneylenders in the region since the beginning of the 1980s. In 1972 and 1977 there were 33 and 25, respec-tively, but since 1982, there have been under 10 (Table 8). (Figures were unavailable for other years.)
Table 8 Number of licensed moneylenders in Accra
Year 1982 1983 1984 1985 1986 1987 1988 1989*
Number 10 6 3 5 3 5 4 2
' As at October 1989.
Source: Licensing office.
Officials at the licensing office maintain that the decline is not peculiar to the Greater Accra Region but that most parts of the country have experienced similar reductions. A number of factors may be responsible for this:
1. A sizeable number of licensed moneylenders have quit the trade as a result of a growing lack of confidence in their borrowers, as incomes generally deteriorated. The increasing rate of default has forced a number of moneylenders to fold up. Others have shifted their resources to what they consider to be more lucrative activities such as trading and transport.
2. In order to make it difficult for the police to scrutinize their activities, especially their interest rates and conditions for lending, most moneylenders have refused to obtain licences. The Moneylenders Ordinance permits the police to enter the premises of a moneylender for the purpose of examining his licence or books.
3. Most moneylenders have refused to obtain licences in order to escape regis-tration fees, taxes and licence fees.
3 2 RESEARCH PAPER
Even though only two lenders were registered in Accra in October 1989, we managed to interview five moneylenders there three months later. This suggests that while moneylending is widespread most moneylenders operate illegally. At the same time, the number of operators has almost certainly decreased in this decade. It is also believed that, especially in rural areas, widespread bush fires in 1982-1984 destroyed a substantial portion of the real assets of the moneylenders forcing them to convert many of their liquid financial assets into real assets.
Conditions for the granting of credit by moneylenders
As observed earlier, moneylending is an activity of those with surplus money. The ability of the moneylenders to expand the volume of available credit de-pends on how much they are willing to invest in the moneylending business at any one time. This appears to be limited since the returns from moneylending are often channelled into other activities, such as real estate development and transport, where the returns may be higher.
The amount lent out may depend first on the relationship between the lender and the client, especially the lender's confidence in the latter; secondly, on the capacity of the borrower to repay; and finally on the lending capacity of the lender. In situations where the lender does not know the borrower well, the amount of credit is limited. We found that the lowest amount of credit given by our 12 moneylenders in 1989 was C4,000, while the highest was C2 million. The average sum lent out to a client was C100,000. At the same time, the number of people who borrowed ranged from 5 to 179. The average number of clients per lender was 50.
The moneylenders' charges are known to have developed out of the tradi-tional share cropping system (Adjetey, 1978). Under this system, also known as the abunu or abusa in the established land tenure system, rich land owners allocate parcels of their land to squatters or migrants with the condition that one-third or one-half of the total produce at each harvest will be given to the landowner as his charge for the use of the land. With the monetization of the economies of the farming communities, these transactions came to be expressed in monetary terms. Thus the big farmer will now grant a loan for cultivation or for other purposes and demand that one-third or one-half of the principal be repaid after every crop harvest until the loan is repaid. Eventually, this practice developed into the modern moneylending business in village communities.
Other traditional systems for repayment that have been identified include the mpemanim and awoba systems of interest rates. With the former, the interest rate is fixed at 100 percent; the borrower therefore pays twice as much as the principal at the end of the specified period. With the awoba system, however, the borrower pledges a valuable or some income-generating property to the lender against the amount borrowed. In this case the lender has every right to use and enjoy all benefits accruing from the property until the amount is repaid. When repayment is effected the lender returns the property to the client. Thus the proceeds or benefits from the property assume the form of interest on the amount lent out.
MOBILISING DOMESTIC RESOURCES FOR CAPITAL FORMATION IN GHANA 33
As far as charges are concerned, moneylenders' current practice suggests that fixed terms belong to the past. Currently there are hardly any fixed terms and conditions for lending since the entire system functions at a very personal level. The terms for lending vary from one moneylender to another, and the personal standing of the borrower plays a significant role in this regard. Rates often vary with debt maturity dates. These maturity periods varied between one and 25 months, with an average of 5-6 months..
Generally, however, two main forms of interest appear to be in vogue. One moneylender described these as "short-term" and "long-term" interest rates. Essentially, the short-term interest rate is on a monthly basis. Here, the borrower pays the principal and the interest one month after contracting the agreement. For some of the lenders, the rates levied vary from one customer to the next within the range of 20-50 percent. For others, no differential rates are levied since they believe it undermines the confidence of potential clients in them. The important aspect of this short-term arrangement is that if the borrower is not able to honour the repayment on schedule, he is expected at least to pay the interest. The rest of the amount is then considered as new credit, and therefore to attract another interest rate at the end of the next month. This arrangement may continue for some time until the borrower pays both the principal and interest.
On the other hand, the long-term interest rate covers several months and may run into a year. In this case, the principal and interest are lumped together and paid in instalments over a period of time agreed upon by the two parties..
In 10 out of the 12 cases studied the lender demanded some form of security, and this was usually in the form of a written undertaking. In a number of cases, however, land and other physical assets such as jewellery, sewing machines, etc, were requested by the lender as in the traditional awoba system.
Moneylenders have been much criticised for excessively high interest rates. Four components of interest rates may be easily identified in moneylending. These are, the risk-free element in the rate of interest (that is, the opportunity cost of funds), a premium for risk, a premium to cover transaction cost, and an element of monopoly profit. What most observers find unacceptable is this element of monopoly profit. It is also likely that moneylenders overestimate the risk element in giving credit, and therefore charge an unfairly high risk premium.
Another explanation often advanced for high interest rates is that the bor-rowers are poorly informed about the market. They may not know about al-ternative sources of finance, whether formal or informal, which may be cheaper.
Apart from these is the fact that there is a general scarcity of capital as well as an increasing default rate among borrowers. Despite the relatively high rates of interest, the popularity of moneylending in Ghana is strongly supportive of the argument that the cost of credit is determined mainly by supply conditions, even though demand may still be significant.
Other characteristics of moneylending operations
The relationship between banks and moneylenders
Eleven of the moneylenders contacted had some business with banks. Of these, eight saved with banks and had actually borrowed money from them before.

This work is licensed under a Creative Commons Attribution - Noncommercial - NoDerivs 3.0 Licence.
To view a copy of the licence please see: http://creativecommons.org/licenses/by-nc-nd/3.0/


