Embed Size (px)
Citation preview
PLEASE SCROLL DOWN FOR ARTICLE
This article was downloaded by: [Bailard, Catie Snow]On: 4 August 2009Access details: Access Details: [subscription number 913658677]Publisher RoutledgeInforma Ltd Registered in England and Wales Registered Number: 1072954 Registered office: Mortimer House,37-41 Mortimer Street, London W1T 3JH, UK
Political CommunicationPublication details, including instructions for authors and subscription information:http://www.informaworld.com/smpp/title~content=t713774515
Mobile Phone Diffusion and Corruption in AfricaCatie Snow Bailard a
a School of Media and Public Affairs, George Washington University,
Online Publication Date: 01 July 2009
To cite this Article Bailard, Catie Snow(2009)'Mobile Phone Diffusion and Corruption in Africa',Political Communication,26:3,333 — 353
To link to this Article: DOI: 10.1080/10584600903053684
URL: http://dx.doi.org/10.1080/10584600903053684
Full terms and conditions of use: http://www.informaworld.com/terms-and-conditions-of-access.pdf
This article may be used for research, teaching and private study purposes. Any substantial orsystematic reproduction, re-distribution, re-selling, loan or sub-licensing, systematic supply ordistribution in any form to anyone is expressly forbidden.
The publisher does not give any warranty express or implied or make any representation that the contentswill be complete or accurate or up to date. The accuracy of any instructions, formulae and drug dosesshould be independently verified with primary sources. The publisher shall not be liable for any loss,actions, claims, proceedings, demand or costs or damages whatsoever or howsoever caused arising directlyor indirectly in connection with or arising out of the use of this material.
Political Communication, 26:333–353, 2009Copyright © Taylor & Francis Group, LLCISSN: 1058-4609 print / 1091-7675 onlineDOI: 10.1080/10584600903053684
333
UPCP1058-46091091-7675Political Communication, Vol. 26, No. 3, Jun 2009: pp. 0–0Political Communication
Mobile Phone Diffusion and Corruption in Africa
Corruption in AfricaCatie Snow Bailard CATIE SNOW BAILARD
The explosion of mobile phones into a region that, until recently, was nearly devoid oftelecommunications infrastructure provides a valuable opportunity to explore thepotential effects of information and communication technology on various economicand social outcomes. This article focuses specifically on the potential influence thatmobile phones will exert on corruption in Africa. Two distinct empirical analyses testthe hypothesis that mobile phones will reduce corruption in Africa, as a result ofdecentralizing information and communication and thereby diminishing the opportuni-ties available to engage in corruption as well as increasing the potential of detectionand punishment. The results of a fixed effects regression of panel data at the countrylevel reveal a significant negative correlation between a country’s degree of mobilephone penetration and that country’s level of perceived corruption. In addition to this,a multivariate regression of survey data reveals that the degree of mobile phone signalcoverage across 13 Namibian provinces is significantly associated with reducedperceptions of corruption at the individual level.
Keywords corruption, Africa, mobile phones, ICT, information and communicationtechnologies
A woman provides for her family by selling the fish she catches from the river. She doesnot own a freezer. So, if she can not find customers quickly enough, the fish putrefy andan entire day of work is wasted. Then she buys a mobile phone. Customers can now callher to tell her if they plan to buy her fish that day, which she keeps tethered in the riveruntil they arrive. Now she knows exactly how many fish she is likely to sell that day,enabling her to provision her time and energy more efficiently (LaFraniere, 2005).
A 45-year-old farmer needs to know how much to sell her fruit for on a given day.Some days she spends hours trudging around in pursuit of a working public pay phone tocall the markets and learn how to best price her fruit. Then the farmer buys a mobile phone.Now, not only can she quickly learn the best price to maximize that day’s sales, but she canalso reliably and instantly connect with customers, brokers, and the market (Ngowi, 2005).
A man wants to open a bank account. Keeping money in his home makes his family atarget for robbery, and it is simply too difficult to amass any sort of savings that way. But
Catie Snow Bailard is Professor in the School of Media and Public Affairs at George WashingtonUniversity.
The work for this article was completed while I was a PhD candidate in the Political ScienceDepartment at the University of California, Los Angeles. For feedback and guidance with the articleand/or beyond, I would like to thank Matt Baum, Tim Groeling, Jeff Lewis, James Lo, Dan Posner,Phil Potter, Lynn Vavreck, and John Zaller. Of course, any shortcomings belonging to the article areentirely my own.
Address correspondence to Catie Snow Bailard, School of Media and Public Affairs,George Washington University, 805 21st St. NW, Suite 400, Washington, DC 20052. E-mail:[email protected]
Downloaded By: [Bailard, Catie Snow] At: 22:45 4 August 2009
334 Catie Snow Bailard
there is no bank branch in his remote village. And, even if there were, he surely could notafford the fees associated with a traditional account. Then the man gets a mobile phone.Using his mobile phone and a government-issued identity number, the man calls into amobile phone banking system. Now it doesn’t matter that there is no bank branch formany miles around. And, with no start-up fees or monthly charges (only a small fee pertransaction), the man can now afford to keep his money in a bank account. Not only is hisfamily’s safety and savings less vulnerable to would-be predators, but he can also buy gro-ceries and conduct a number of other daily business transactions with a simple touch of abutton (Itano, 2005).
Mobile phones are changing daily life in Africa. Anecdotes are already pouring out ofthe continent, highlighting the many ways that mobile phones have reconfigured and stream-lined various daily activities—particularly those in the economic domain. As these real-lifeexamples attest, thanks to mobile phones, buyers and sellers can now connect more readily,creating more efficient markets. Small business owners and individual vendors are also nowless dependent on middlemen, reducing their susceptibility to extortion or simply bad infor-mation (Ross 2004). And bank accounts via mobile phones render business transactions lessvulnerable to default by reducing the risk of nonpayment. As such, these anecdotes are sub-stantiated by a number of recent studies, which have identified mobile phones as contribut-ing to reduced price discrepancies (Aker, 2008), increased consumer and producer welfare(Abraham, 2007; Jensen, 2007), improved productivity (Donner, 2005; Lane, Sweet, Lewin,Sephton, & Petini, 2006; Moloney, 2005), and assistance in finding employment (Frost &Sullivan, 2006; Samuel, Shah, & Hadingham, 2005).
Considering the abject poverty still suffered across the African continent, the fullrange of avenues through which mobile phones may reform and energize African econo-mies is a worthwhile consideration. Accordingly, this article focuses on the mobilephone’s impact within a specific domain of economic activity: corruption. In the follow-ing sections, I review the growth of mobile phones and current state of corruption inAfrica, followed by a discussion of the impact that I hypothesize mobile phones will exerton corruption in this region. In short, I argue that the net effect of the diffusion of mobilephones in Africa will be to reduce corruption by decentralizing information and communi-cation, thereby diminishing the opportunities available to engage in corruption as well asincreasing the potential of detection and punishment.
I then test this hypothesis by means of two distinct empirical analyses. First, I employa fixed effects regression of panel data to test whether the growth in mobile phone pene-tration across 46 African countries, from 1999 to 2006, is correlated with changes in thesecountries’ perceived corruption scores.1 Next, in order to better address the endogeneityand misspecification concerns that accompany such cross-country quantitative analyses,I shift the level of analysis to the individual. To do so, I utilize Afrobarometer survey datato determine whether moving along the spectrum from more to less mobile phone signalcoverage exerts a distinct and significantly more negative influence on corruption percep-tions across the 13 different Namibian provinces in 2006 (when mobile phones werepresent) compared to 1999 (before mobile phones were widely in use).
The findings produced by each of these analyses support the hypothesized negativerelationship between mobile phone diffusion and corruption in Africa. The fixed effectsregression of panel data reveals a significant negative correlation between a country’sdegree of mobile phone penetration and its level of perceived corruption. In addition, theindividual-level regression reveals a significantly greater negative correlation between thedegree of mobile signal coverage in a respondent’s province and that respondent’s percep-tion of corruption in 2006 when compared to 1999.
Downloaded By: [Bailard, Catie Snow] At: 22:45 4 August 2009
Corruption in Africa 335
Mobile Telephones in Africa
As recently as 2000, less than 3% of Africans subscribed to fixed telephone land lines. Asa result, mobile telephone companies initially overlooked the African continent. Assumingthat, whether it be a result of financial limitations or simple lack of interest, the apparentpaucity of demand for land lines among Africans would extend to mobile telephones aswell. “We all misread the market,” admits the chief executive officer of a Kenyan mobileservice provider (Ngowi, 2005).
Despite the number of land-line telephone subscribers continuing to stagnate at lessthan 4%, the number of mobile phone subscribers mushroomed from less than 2% in2000 to nearly 30% in 2007 (International Telecommunications Union [ITU], 2008).And, being that this indicator measures only subscribers—defined as prepaid and post-paid users of “portable phones subscribing to an automatic public mobile telephone ser-vice” (ITU, 2008, p. 125)—the number of individuals with access to mobile phoneslikely reaches considerably higher once neighbors, friends, and family are taken intoaccount. Considering that some remote villages still communicate by beating drums,while in other cases merely passing on a message often meant that “someone may have toleave work, travel for days, spending much more money” (LaFraniere, 2005), this rapidinfusion of mobile phones into Africa suggests a revolution in communication and infor-mation diffusion.
As it turns out, the lack of land-line subscriptions was not at all a result of lack ofinterest in telephonic communication. “The real reason for weak demand was that landlines were expensive, subscribers had to wait for months get hooked up, and the linesoften went down because of poor maintenance, floods, and theft of copper cables”(Ngowi, 2005). As such, once cash-strapped governments began to privatize their tele-communications industries in the mid-1990s, monopolies gave way to more competitiveindustries that offered increasingly affordable and reliable mobile services. Consideringthe myriad ways that mobile telephones have already demonstrably improved daily life onthe continent—from conducting simple business transactions, to calling a doctor when ababy gets sick in the middle of the night, to being able to check in on loved ones living faraway or in war zones—experts do not expect demand to abate any time soon (Sullivan,2006).
In fact, at the moment, it is the supply side that is struggling to keep pace. Mobiletowers cannot be erected quickly enough. In Nigeria, two providers had to suspend salesof subscriber identity module (SIM) cards for a period of months to allow the companiesto strengthen their networks. In the Congo, unwilling to wait for the mobile company toerect a nearby mobile tower, eager villagers built 50-foot-high treehouses to capture sig-nals from remote towers (LaFraniere, 2005). However, villagers such as these may nothave to wait much longer: As of 2007, mobile phone signal coverage reached 64% of theAfrican population (ITU, 2008).
Moreover, as mobile subscriber rates near 100% in developed countries, although themajority of future African subscribers are of low income, providers are nevertheless keento get them onboard. “Existing business models and strategies show that lower revenuesare compensated by masses of new subscribers. Also, studies have shown low-incomegroups are prepared to spend proportionally more of their income on telecommunications”(ITU, 2008, p. 6). As such, mobile providers are producing increasingly affordable mobilehandsets and selling airtime in cheaper and cheaper packets, with the majority of subscrib-ers opting for prepaid plans that offer such features as per-second billing and low denomi-nation airtime recharges (ITU, 2008).
Downloaded By: [Bailard, Catie Snow] At: 22:45 4 August 2009
336 Catie Snow Bailard
Corruption in Africa
Corruption is widely defined in the literature as behavior that “deviates from the formal dutiesof a public role because of private-regarding (personal, close family, private clique) pecuniaryor status gains; or violates rules against the exercise of certain private-regarding behavior”(Klitgaard, 1988, p. 23). Corruption is not unique to Africa, but the extent to which it has ham-strung good governance and economic development may be. As one scholar observes, corrup-tion “is not markedly worse than in many other parts of the developing and former communistworld. . . . Yet corruption in Africa is universally perceived, by external observers and by localreformers alike, as being ‘catastrophic’ in its impact on development” (Szetfel, 2000, p. 427).In brief, scholars have identified corruption as contributing to fiscal deficits, income inequality,market distortion, lack of investment, inefficient public services, low growth rates, authoritari-anism, political instability, and state collapse (Tanzi, 1998; Mauro, 1995, 1997; Szetfel, 2000;Azfar, Lee, & Swamy, 2001; Jackson & Rosberg, 1994).
In Africa, corrupt behavior often takes the form of rent-seeking, in which elites andofficials extract payments in return for special policy, administrative advantages, or otherpolitical goods (LeVine, 1975). Aside from these payments, which Western society gener-ally deems “bribes,” corruption also takes the more passive form of officials and local elitessiphoning away some portion of aid and welfare disbursements for their own private use.For example, a study tracking the distribution of school capitation grants in Uganda foundthat only 14% of the funds intended for the schools actually reached their targets (Reinikka& Svensson, 2004). Similar studies reveal comparable levels of aid lost through misappro-priation in Ghana (49%), Tanzania (57%), and Zambia (76%) (Ye & Canagarajah, 2002;Price Waterhouse Coopers, 1999; Das, Habyarimana, & Krishnan, 2002; Reinikka &Svensson, 2004).
In African nations, the funds derived from corruption frequently fuel clientelist politics(Jackson & Rosberg, 1994; Reinikka & Svensson, 2004), which are defined as “the distribu-tion of public goods—offices, public works projects, permits, tax breaks, and so on—inreturn for loyalty” (Leonard & Scott, 2003, p. 2) On the ground level, clientelist politicsoften also entail vote-buying, in which small monetary payments or staples are provided tovillagers in exchange for their vote commitment. However, portions of these misappropri-ated funds also ultimately line the pockets of officials and elites (Platteau & Gasspart, 2003).
While there tends to be scholarly consensus regarding the deleterious nature ofcorruption,2 the primary causes of corruption in Africa remain much more debated. Somescholars contend that corruption is an artifact of colonialism, in which African leaders ofnewly independent states sought to replicate the material indulgences of their former colo-nial leaders (Greenstone, 1966). However, another line of reasoning contends that corrup-tion derives primarily from precolonial notions of patrimonialism, in which leaders mustcapture funds to satisfy the expectations of traditional kinship networks and ethnic obliga-tions (Olivier de Sardan, 1999). Turning to more economic-based arguments, some arguethat integration into the global market is correlated with decreased corruption as a result ofexposing domestic businesses to international norms and increased demands for transpar-ency (Sandholtz & Koetzel, 2000; Mauro, 1995). However, another school of thoughtcontends that increased participation in the global economy actually encourages corruptionby creating more situations in which companies seeking contracts will find the payment ofbribes to be highly lucrative (Tanzi, 1998). Moving to politics, one body of literature con-tends that more competitive political systems and democracy in general diminish corrup-tion by increasing accountability and transparency (Rose-Ackerman, 1993; Rasmusen &Ramseyer, 1994; Montinola & Jackman, 2002). Conversely, Szetfel (2000) worries that
Downloaded By: [Bailard, Catie Snow] At: 22:45 4 August 2009
Corruption in Africa 337
intense factional competition for political office could escalate political mobilization viapatronage politics, increasing the incentives for leaders to engage in corrupt activities.
Despite these very divergent arguments, which represent only the tip of the iceberg interms of the range of factors argued to contribute to corruption, there are two simplelogical premises that tend to underpin most theories regarding the causes of corruption.First, corrupt behavior most often takes place in secrecy. Corruption prefers the shadowsand abhors transparency, so corruption will thrive in contexts where information and com-munication are centralized into a few, often elite, hands (Reinikka & Svensson, 2004,2005; Schleifer & Vishny, 1993; Sandholtz & Koetzle, 2000). This preference for privacystems from the second logical premise, which posits that individuals will engage in a cost-benefit analysis in the course of deciding whether to commit an act of corruption. Inessence, individuals weigh the likely benefit to be gained from the corrupt act against thepotential cost of committing the act—particularly, the likelihood of detection and punish-ment (Azfar et al., 2001; Schleifer & Vishny, 1993; Bardhan & Mookherjee, 2000;Treisman, 2000). Taking these two premises into account, it is not surprising that corrup-tion has proliferated on the African continent, where telecommunication technologies—the very tools that promote transparency and strengthen oversight mechanisms—were,until recently, nearly nonexistent among the general population.
Theory
Although a number of institutional reforms are necessary to effectively curb corruption,transparency and accountability are consistently cited as integral components of anti-corruption campaigns. Transparency and accountability combat corruption both bydecreasing the number of opportunities available to engage in corruption and increasingthe likelihood of detection and punishment. The historic dearth of telecommunicationsinfrastructure in Africa centralized information and communication into the hands ofelites, creating conditions conducive to the perpetration of corrupt behavior by severelyconstraining the potential for transparency and accountability. As such, I argue that the neteffect of the rapid and massive diffusion of mobile phones in Africa will be the reductionof corruption by decentralizing information and communication, thereby shrinking theveil of secrecy that shields corrupt behavior as well as altering the cost-benefit calculus ofcorrupt behavior by strengthening oversight and punishment mechanisms.
In order to engage in corrupt behavior, the opportunity to do so must first exist.Therefore, it can be plausibly reasoned that the more opportunities that are available, themore likely individuals will engage in corrupt behavior. Opportunities for corruptionincrease when elites, officials, and other influential individuals enjoy some degree ofmonopoly over information and communication. For example, local elites can capture aiddisbursements intended for schools or villages because they represent the exclusive chan-nel for communication between aid agencies and the intended recipients—enabling localelites to falsely report back to aid agencies as well as keep recipients in the dark regardingthe actual amount of intended aid (or the existence of such aid, at all) (Reinikka & Svens-son, 2004, 2005). Bureaucrats and officials can extract bribes because they enjoy sole dis-cretion over the supply of required services, permits, or licenses (Azfar et al., 2001).Moreover, even in instances when officials do not officially possess monopoly discretion,they can exploit villagers’ comparative lack of information regarding the appropriate costsand full range of channels available to procure such services, permits, or licenses.
Mobile phones decrease the prevalence of opportunities for corruption by decentraliz-ing information and communication. Thanks to mobile phones, local elites no longer
Downloaded By: [Bailard, Catie Snow] At: 22:45 4 August 2009
338 Catie Snow Bailard
necessarily serve as the exclusive channel for communication between aid agencies andintended recipients. With mobile phones, aid agencies can directly contact schools andvillagers to ensure that aid was appropriately disbursed. In addition, mobile phones makeit easier for villagers to learn that they are entitled to receive a certain amount of aid,increasing their capacity to demand that aid. Mobile phones also diminish the power oflocal officials to extract bribes by better connecting individuals with alternative officialsor with villagers who can provide information regarding alternative channels, reducing agiven official’s sole discretion over the supply of services, permits, or licenses.
In support of the power of information diffusion to deter local capture, a recent studyrevealed that simply posting a newspaper advertisement stating that aid was meant to bedispersed to certain schools significantly reduced the amount of aid that was lost throughmisappropriation (Reinikka & Svensson, 2005). Notably, this study also found that thefarther a school was geographically located from the closest newspaper outlet, the morefunding that school lost to local capture. Not only do mobile phones serve as an additionalchannel for informing villagers regarding intended aid, adding mobile phones will furtherstrengthen newspaper public information campaigns against corruption by reducing theconstraining effect of geography and literacy.
In addition to these instances, mobile phones can also directly reduce the opportunitiesfor corruption as a result of the spread of affordable bank accounts via mobile phones. Asmore Africans open bank accounts via mobile phones, aid agencies and governments arebeginning to transfer aid, pensions, and grants directly into the bank accounts of recipients(Itano, 2005). As a result, some degree of aid disbursement will bypass local elites entirely,meaning that the opportunity to capture these funds should diminish considerably.
Moving to the next stage, mobile phones also reduce corruption by increasing the likeli-hood of detection and punishment, thereby changing the cost-benefit calculus of corrupt behav-ior. In the past, the dearth of telecommunications infrastructure meant that aid agencies andofficials had to rely on local elites for assurances that aid was disbursed appropriately. If suspi-cious of the veracity of these reports, their only alternative often was embarking on the arduousand timely endeavor of traveling to remote villages to verify in person. Accordingly, it wasoften difficult to definitively determine whether corruption had occurred at all, let alone punishit. In addition, although many African governments have instituted (often sincere) anti-corrup-tion reforms, “experience has shown that these need to be backed up with effective enforce-ment abilities, especially the ability to track down violations” (Harsch, 1993, p. 46)—a ratherdifficult endeavor when control over communication and information is tightly centralizedwithin the same small group of individuals that largely perpetrate the corruption.
Mobile phones reduce the monopoly over information and communication that offi-cials have traditionally exploited to shield their own corrupt behavior. In addition toenabling aid agencies to efficiently and directly follow up with intended aid recipients,mobile phones better equip reformers to track down violations and monitor adherence toanti-corruption campaigns. In support of this, a mobile service provider in Sierra Leonelaunched a toll-free phone number that residents can call to report instances of suspectedcorruption to the nation’s Anti-Corruption Commission (Ogendeji, 2008). Finally, mobilephones also bolster the role that average citizens can play in the fight against corruption byincreasing the ease with which whistle-blowing citizens can contact reformers, govern-ment officials, and the news media. The recent conviction of the son of an Indian politi-cian provides an example of how mobile phones can empower citizens in the fight againstcorruption; in that instance, a massive mobile phone grassroots campaign forced prosecu-tors to retry a case in which a politician’s son had been previously acquitted despite shoot-ing a bartender dead in front of several eyewitnesses (Rautray, 2006).
Downloaded By: [Bailard, Catie Snow] At: 22:45 4 August 2009
Corruption in Africa 339
Note, however, that I do not claim that mobile phones alone will act as a panacea forcorruption. Successful anti-corruption campaigns require a multidimensional approach inwhich mobile phones can only play a partial role. Therefore, although the diffusion ofmobile phones into a region where telecommunications technology was nearly nonexistentmay serve to reduce corruption by decentralizing information and communication, there isno reason to expect mobile phones alone to eradicate corruption. After all, there are a num-ber of countries outside of Africa that boast a lot of phones and a lot of corruption.
Accordingly, in order for mobile phones to decrease corruption, it is necessary thatthere be someone on the other end of the line committed to the fight against corruption.If there are no concerned citizens, aid agency representatives, reformers, or journalists“dialing in” in the fight against corruption, phones alone will likely make little difference.Therefore, the presence of some combination of public awareness campaigns, responsibleand vigilant aid agencies, sincere reform efforts, and/or a vigilant and unfettered newsmedia seems necessary for mobile phones to exert a negative influence on corruption.
Lastly, there exist a number of instances in which the diffusion of mobile phones may actu-ally enhance rather than inhibit corrupt behavior. These instances can be characterized as thosein which some segment of the masses are directly involved in and benefit from the corrupt act.Two examples of this category of corrupt acts are vote-buying and ethnic kinship demands.Villagers directly benefit from the foodstuffs and small monetary payments they receive inexchange for pledging their vote to a given candidate. Mobile phones feasibly make it easier forcandidates and parties to contact these voters for the purposes of making arrangements for thebuying of votes. In addition, mobile phones increase the ease with which villagers can contacttheir officials once elected into office. This will feasibly make it more efficient for villagers toattempt to extract goods by pressuring their officials to honor traditional kinship ties.
Nevertheless, despite the conditional nature of the impact of mobile phone diffusionon corruption and despite the likelihood that mobile phones will increase the feasibility ofspecific types of corrupt acts, this article contends that mobile phone diffusion will inhibitcorrupt behavior more often than facilitate it. In other words, the diffusion of mobilephones will improve the ability to avoid, detect, and/or punish corruption to a greaterextent than it will enhance the ability to collude, conceal, and/or execute corrupt acts. Thisis because a large proportion of corrupt acts in Africa can be characterized as collusionbetween elites to the detriment of the masses. And, long before the diffusion of mobilephones, elites possessed the telephonic resources to orchestrate and commit those acts. Asa consequence, the diffusion of mobile phones should only minimally enhance the capacityfor these elites to collude for the purposes of corruption. On the other hand, the massivediffusion of mobile phones into a region where telecommunications infrastructure wasnearly nonexistent among nonelites greatly decentralizes information and communication.This weakens elites’ monopoly over communication and information, thereby strengthen-ing the potential for transparency and accountability. This will decrease the number ofopportunities available to commit corrupt acts as well as augment the potential to detectand punish corrupt behavior. Accordingly, the following sections test the hypothesis thatthe net effect of mobile phone expansion will be to diminish corruption in African nations.
Country-Level Analysis
Methods
To test whether the diffusion of mobile telephones correlates with decreased perceivedcorruption levels in African nations, I employ a fixed effects OLS multiple regression
Downloaded By: [Bailard, Catie Snow] At: 22:45 4 August 2009
340 Catie Snow Bailard
based on panel data spanning from 1999 to 2006. The dependent variable used in this anal-ysis is Transparency International’s Corruption Perceptions Index (CPI), which is a com-posite measure based on surveys from 3 to 14 different sources of country analysts andresident and nonresident businesspeople.3 The original CPI assigns a score of between 1and 10 (to the 10th unit) to each nation; with lower numeric scores indicating greaterlevels of corruption. However, for ease of interpretation, this article employs an invertedversion of the CPI score, also ranging from 1 to 10—so that higher numeric scores nowrepresent more corrupt nations. Accordingly, a negative correlation coefficient nowindicates that a variable is associated with a decrease in corruption levels, while a positivecoefficient represents a positive relationship between that variable and corruption.
Opting to use the subjective measure of perceived corruption rather than a more objec-tive measure of actual corruption is motivated by two considerations. First, corruption isculturally variable—for example, what some countries might consider bribes, others mayaccept as a necessary cost of doing business—rendering it a very difficult concept todefine consistently and accurately across borders. Second, as the following example fromTransparency International (2007) illustrates, reliable and valid data measuring corruptionare difficult to obtain: “Comparing the number of prosecutions, for example, does notreflect actual levels of corruption but the quality of prosecutors” (p. 2).
As one corruption scholar remarks, “If corruption could be measured, it couldprobably be eliminated. In fact, conceptually it is not even clear what one would want tomeasure”; however, “while there are no direct ways of measuring corruption, there areseveral indirect ways of getting information about its prevalence in a country” (Tanzi,1998, pp. 576–577). Accordingly, the preferred measure of corruption utilized by corrup-tion scholars is Transparency International’s subjective CPI measure. CPI does not forceeach nation to conform to the same cookie-cutter formula of corruption, trusting insteadthat country experts and other individuals well acquainted with each country are bestequipped to determine the extent to which official behavior deviates from acceptednational norms. The high level of correlation between the 14 sources used to build the2007 CPI scores substantiates the reliability of this index, which Pearson’s and Kendall’srank correlations place at .77 and .62, respectively (Transparency International, 2007).
I build the primary independent variable of mobile phone penetration from data pro-vided by the International Telecommunications Union, an agency of the United Nations.This variable measures the number of mobile phone subscribers per 100 persons for eachnation. Recall that this indicator only represents subscribers, meaning that the number ofindividuals with access to mobile phones reaches much higher once the friends, family,and neighbors of mobile subscribers are taken into account. In fact, in some villages indi-viduals have begun using their own mobile phones to start small businesses, renting outtheir mobile phone for a fee (LaFraneire, 2005).
Accordingly, the impact of mobile phone penetration in Africa is best operationalizedas the logged value of the percentage of mobile subscribers in each nation. First, as previ-ously stated, since the ITU’s measure of mobile subscribers only gauges the number ofsubscribers, the number of individuals who have access to these phones and thereforebenefit from them is certainly higher than this measure would indicate.4 Second, as net-work analysts contend, the “value of a telephone network increases with the square of thenumber of users,” since the n + 1st user benefits from being able to communicate with alln prior users, and each of them gains from being able to communicate with her or him(Daly, 2000, p. 288). In other words, as a result of network externalities, the more peoplewho use mobile phones, the larger the number of people those individuals can communi-cate with using those phones, thereby exponentially increasing the value of mobile
Downloaded By: [Bailard, Catie Snow] At: 22:45 4 August 2009
Corruption in Africa 341
phones. Because of these two considerations, I operationalize the value of mobile phonepenetration as the logged value of the number of subscribers in a given country for thisanalysis.
This model also controls for a handful of factors that are correlated with both mobilephone penetration and corruption.5 First, scholars often cite poverty and low wages asexerting causal influences on corruption, since individuals’ need and willingness to capturefunds via corrupt behavior increases the greater their level of deprivation (Sandholtz &Koetzle, 2000). As discussed above, scholars also argue that corruption exerts a reciprocaleffect on poverty by limiting economic development. Since poverty is also feasibly corre-lated with mobile phone penetration, by reducing the number of individuals who canafford mobile phone service, this model incorporates a variable measuring GDP per capita.
Second, researchers have in addition identified a correlation between democracy andcorruption, with corruption levels declining once nations reach the more complete level ofdemocratization (Montinola & Jackman, 2002; Sandholtz & Koetzle, 2000). A strongpositive correlation between democratization and the expansion of telecommunicationsinfrastructure also exists (Kedzie, 1997; Best & Wade, 2005). To account for the poten-tially confounding influence of democracy, this model includes a measure of the strengthof democratic practices available in a nation.6
Third, the degree of privatization of a nation’s telecommunications industry is correlatedwith both mobile phone penetration and corruption. As the International Telecommunica-tions Union (2008) reports, increased competition in the telecommunications industry hasbeen a primary catalyst in the reduction of mobile prices across Africa, contributing toexpanded networks, reduced tariffs, and more affordable service provision. Privatization(or the lack thereof) is also correlated with corruption, since “when the state and its admin-istrative apparatus exercise relatively greater control over the economy, public officialsmake decisions that determine who will enjoy access to economic resources. . . . Thusbribery, extortion, and kickbacks become viable means of influencing distribution ofwealth” (Sandholtz & Koetzle, 2000, p. 37). To control for the correlates of privatization,I include a World Bank governance indicator measuring each nation’s regulatory quality.7
This composite variable captures the degree to which government institutions generallyprotect and promote market-friendly economic competition by means of a number offactors, including business regulations, tax policy, privatization, and protectionism.8
Finally, this analysis controls for fixed effects. The inclusion of year and countryvariables offers several important advantages in the testing of panel data. First, it allows themodel to control for factors that do not change over time, reducing concern that the modelfails to account for influential country-specific factors that are either difficult to identify ordifficult to measure. Fixed effects also confine the analysis to within-country variation, asopposed to across-country variation, which is a more valid means of determining the effectof mobile phone penetration on corruption within a country by minimizing the across-country characteristics that are plausibly correlated with corruption (Allison, 2005).
Results
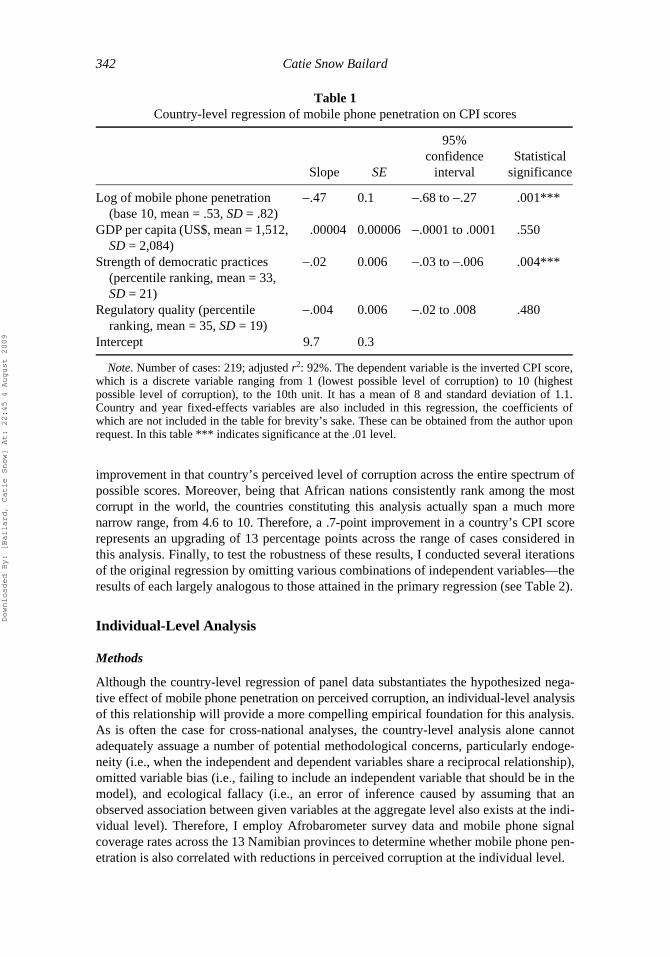
As predicted, greater mobile phone penetration is associated with lower levels of perceivedcorruption, reaching the .01 significance level (see Table 1). In substantive terms, Cameroon’sincrease in mobile penetration from under 1 subscriber in 1999 to 24 subscribers per 100individuals in 2006 (an increase approximate to just under two standard deviations) pre-dicts a decrease in that country’s perceived level of corruption of .7 points. Consideringthat the CPI’s entire scale ranges from 1 to 10, this represents an 8-percentage-point
Downloaded By: [Bailard, Catie Snow] At: 22:45 4 August 2009
342 Catie Snow Bailard
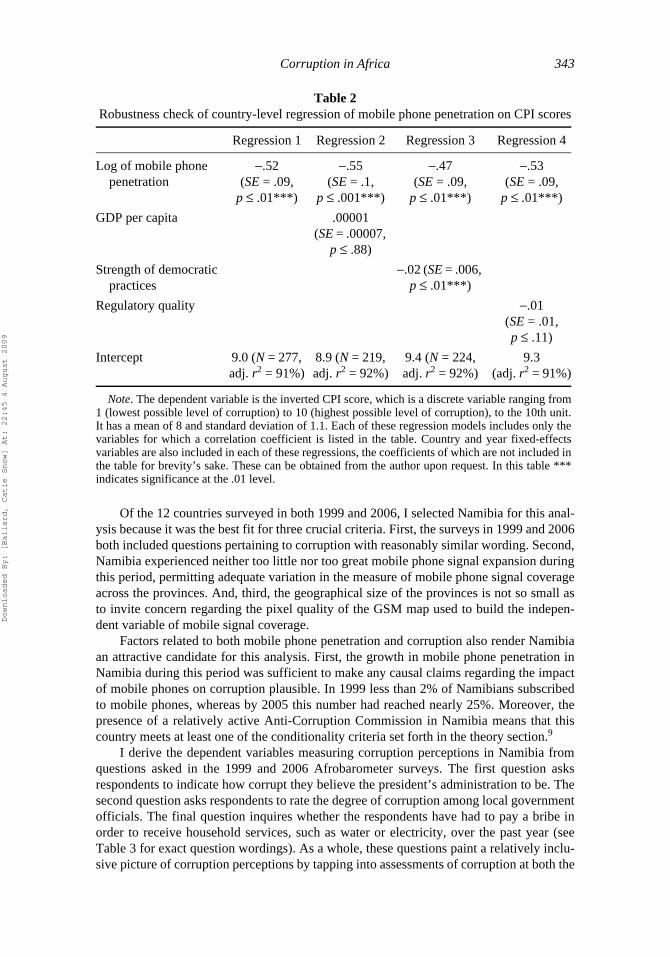
improvement in that country’s perceived level of corruption across the entire spectrum ofpossible scores. Moreover, being that African nations consistently rank among the mostcorrupt in the world, the countries constituting this analysis actually span a much morenarrow range, from 4.6 to 10. Therefore, a .7-point improvement in a country’s CPI scorerepresents an upgrading of 13 percentage points across the range of cases considered inthis analysis. Finally, to test the robustness of these results, I conducted several iterationsof the original regression by omitting various combinations of independent variables—theresults of each largely analogous to those attained in the primary regression (see Table 2).
Individual-Level Analysis
Methods
Although the country-level regression of panel data substantiates the hypothesized nega-tive effect of mobile phone penetration on perceived corruption, an individual-level analysisof this relationship will provide a more compelling empirical foundation for this analysis.As is often the case for cross-national analyses, the country-level analysis alone cannotadequately assuage a number of potential methodological concerns, particularly endoge-neity (i.e., when the independent and dependent variables share a reciprocal relationship),omitted variable bias (i.e., failing to include an independent variable that should be in themodel), and ecological fallacy (i.e., an error of inference caused by assuming that anobserved association between given variables at the aggregate level also exists at the indi-vidual level). Therefore, I employ Afrobarometer survey data and mobile phone signalcoverage rates across the 13 Namibian provinces to determine whether mobile phone pen-etration is also correlated with reductions in perceived corruption at the individual level.
Table 1Country-level regression of mobile phone penetration on CPI scores
Slope SE
95% confidence
intervalStatistical
significance
Log of mobile phone penetration (base 10, mean = .53, SD = .82)
−.47 0.1 −.68 to −.27 .001***
GDP per capita (US$, mean = 1,512, SD = 2,084)
.00004 0.00006 −.0001 to .0001 .550
Strength of democratic practices (percentile ranking, mean = 33, SD = 21)
−.02 0.006 −.03 to −.006 .004***
Regulatory quality (percentile ranking, mean = 35, SD = 19)
−.004 0.006 −.02 to .008 .480
Intercept 9.7 0.3
Note. Number of cases: 219; adjusted r2: 92%. The dependent variable is the inverted CPI score,which is a discrete variable ranging from 1 (lowest possible level of corruption) to 10 (highestpossible level of corruption), to the 10th unit. It has a mean of 8 and standard deviation of 1.1.Country and year fixed-effects variables are also included in this regression, the coefficients ofwhich are not included in the table for brevity’s sake. These can be obtained from the author uponrequest. In this table *** indicates significance at the .01 level.
Downloaded By: [Bailard, Catie Snow] At: 22:45 4 August 2009
Corruption in Africa 343
Of the 12 countries surveyed in both 1999 and 2006, I selected Namibia for this anal-ysis because it was the best fit for three crucial criteria. First, the surveys in 1999 and 2006both included questions pertaining to corruption with reasonably similar wording. Second,Namibia experienced neither too little nor too great mobile phone signal expansion duringthis period, permitting adequate variation in the measure of mobile phone signal coverageacross the provinces. And, third, the geographical size of the provinces is not so small asto invite concern regarding the pixel quality of the GSM map used to build the indepen-dent variable of mobile signal coverage.
Factors related to both mobile phone penetration and corruption also render Namibiaan attractive candidate for this analysis. First, the growth in mobile phone penetration inNamibia during this period was sufficient to make any causal claims regarding the impactof mobile phones on corruption plausible. In 1999 less than 2% of Namibians subscribedto mobile phones, whereas by 2005 this number had reached nearly 25%. Moreover, thepresence of a relatively active Anti-Corruption Commission in Namibia means that thiscountry meets at least one of the conditionality criteria set forth in the theory section.9
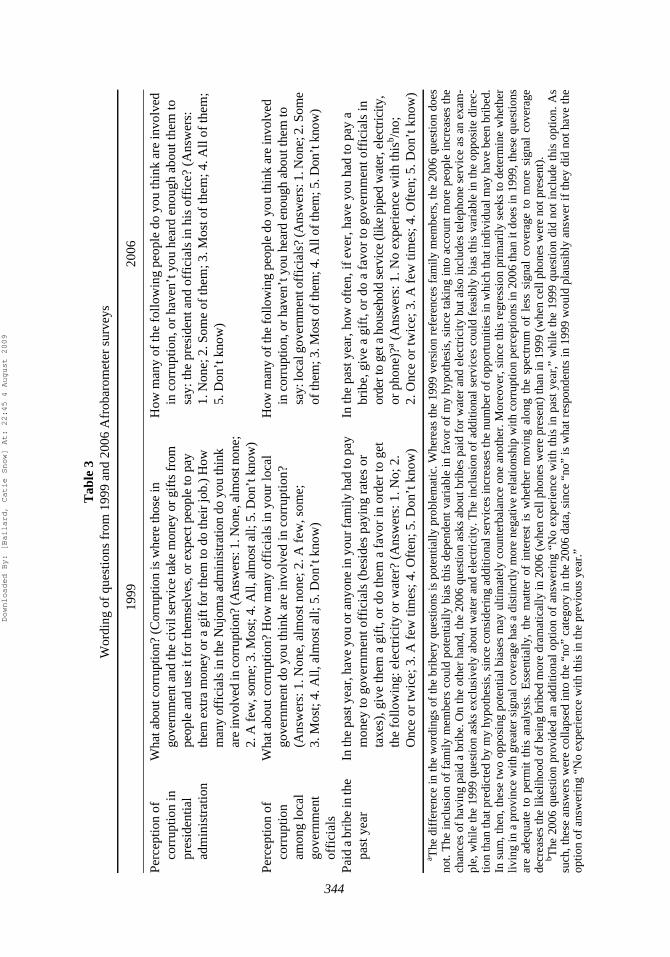
I derive the dependent variables measuring corruption perceptions in Namibia fromquestions asked in the 1999 and 2006 Afrobarometer surveys. The first question asksrespondents to indicate how corrupt they believe the president’s administration to be. Thesecond question asks respondents to rate the degree of corruption among local governmentofficials. The final question inquires whether the respondents have had to pay a bribe inorder to receive household services, such as water or electricity, over the past year (seeTable 3 for exact question wordings). As a whole, these questions paint a relatively inclu-sive picture of corruption perceptions by tapping into assessments of corruption at both the
Table 2Robustness check of country-level regression of mobile phone penetration on CPI scores
Regression 1 Regression 2 Regression 3 Regression 4
Log of mobile phone penetration
−.52 (SE = .09,
p ≤ .01***)
−.55 (SE = .1,
p ≤ .001***)
−.47 (SE = .09,
p ≤ .01***)
−.53 (SE = .09,
p ≤ .01***)
GDP per capita .00001 (SE = .00007,
p ≤ .88)
Strength of democratic practices
−.02 (SE = .006, p ≤ .01***)
Regulatory quality −.01 (SE = .01, p ≤ .11)
Intercept 9.0 (N = 277, adj. r2 = 91%)
8.9 (N = 219, adj. r2 = 92%)
9.4 (N = 224, adj. r2 = 92%)
9.3 (adj. r2 = 91%)
Note. The dependent variable is the inverted CPI score, which is a discrete variable ranging from1 (lowest possible level of corruption) to 10 (highest possible level of corruption), to the 10th unit.It has a mean of 8 and standard deviation of 1.1. Each of these regression models includes only thevariables for which a correlation coefficient is listed in the table. Country and year fixed-effectsvariables are also included in each of these regressions, the coefficients of which are not included inthe table for brevity’s sake. These can be obtained from the author upon request. In this table ***indicates significance at the .01 level.
Downloaded By: [Bailard, Catie Snow] At: 22:45 4 August 2009
344
Tab
le 3
Wor
ding
of
ques
tion
s fr
om 1
999
and
2006
Afr
obar
omet
er s
urve
ys
1999
2006
Perc
epti
on o
f co
rrup
tion
in
pres
iden
tial
ad
min
istr
atio
n
Wha
t abo
ut c
orru
ptio
n? (
Cor
rupt
ion
is w
here
thos
e in
go
vern
men
t and
the
civi
l ser
vice
take
mon
ey o
r gi
fts
from
pe
ople
and
use
it f
or th
emse
lves
, or
expe
ct p
eopl
e to
pay
th
em e
xtra
mon
ey o
r a
gift
for
them
to d
o th
eir
job.
) H
ow
man
y of
fici
als
in th
e N
ujom
a ad
min
istr
atio
n do
you
thin
k ar
e in
volv
ed in
cor
rupt
ion?
(Ans
wer
s: 1
. Non
e, a
lmos
t non
e;
2. A
few
, som
e; 3
. Mos
t; 4.
All,
alm
ost a
ll; 5
. Don
’t k
now
)
How
man
y of
the
foll
owin
g pe
ople
do
you
thin
k ar
e in
volv
ed
in c
orru
ptio
n, o
r ha
ven’
t you
hea
rd e
noug
h ab
out t
hem
to
say:
the
pres
iden
t and
off
icia
ls in
his
off
ice?
(A
nsw
ers:
1.
Non
e; 2
. Som
e of
them
; 3. M
ost o
f th
em; 4
. All
of
them
; 5.
Don
’t k
now
)
Perc
epti
on o
f co
rrup
tion
amon
g lo
cal
gove
rnm
ent
offi
cial
s
Wha
t abo
ut c
orru
ptio
n? H
ow m
any
offi
cial
s in
you
r lo
cal
gove
rnm
ent d
o yo
u th
ink
are
invo
lved
in c
orru
ptio
n?
(Ans
wer
s: 1
. Non
e, a
lmos
t non
e; 2
. A f
ew, s
ome;
3.
Mos
t; 4
. All
, alm
ost a
ll; 5
. Don
’t k
now
)
How
man
y of
the
follo
win
g pe
ople
do
you
thin
k ar
e in
volv
ed
in c
orru
ptio
n, o
r ha
ven’
t you
hea
rd e
noug
h ab
out t
hem
to
say:
loca
l gov
ernm
ent o
ffic
ials
? (A
nsw
ers:
1. N
one;
2. S
ome
of th
em; 3
. Mos
t of
them
; 4. A
ll of
them
; 5. D
on’t
kno
w)
Pai
d a
brib
e in
the
past
yea
rIn
the
past
yea
r, h
ave
you
or a
nyon
e in
you
r fam
ily
had
to p
ay
mon
ey to
gov
ernm
ent o
ffic
ials
(be
side
s pa
ying
rat
es o
r ta
xes)
, giv
e th
em a
gif
t, or
do
them
a f
avor
in o
rder
to g
et
the
follo
win
g: e
lect
rici
ty o
r w
ater
? (A
nsw
ers:
1. N
o; 2
. O
nce
or tw
ice;
3. A
few
tim
es; 4
. Oft
en; 5
. Don
’t k
now
)
In th
e pa
st y
ear,
how
oft
en, i
f ev
er, h
ave
you
had
to p
ay a
br
ibe,
giv
e a
gift
, or
do a
fav
or to
gov
ernm
ent o
ffic
ials
in
orde
r to
get a
hou
seho
ld s
ervi
ce (l
ike
pipe
d w
ater
, ele
ctri
city
, or
pho
ne)?
a (A
nsw
ers:
1. N
o ex
peri
ence
wit
h th
isb /n
o;
2. O
nce
or tw
ice;
3. A
few
tim
es; 4
. Oft
en; 5
. Don
’t k
now
)a T
he d
iffe
renc
e in
the
wor
ding
s of
the
brib
ery
ques
tions
is p
oten
tially
pro
blem
atic
. Whe
reas
the
1999
ver
sion
ref
eren
ces
fam
ily m
embe
rs, t
he 2
006
ques
tion
does
not.
The
incl
usio
n of
fam
ily m
embe
rs c
ould
pot
entia
lly b
ias
this
dep
ende
nt v
aria
ble
in f
avor
of
my
hypo
thes
is, s
ince
taki
ng in
to a
ccou
nt m
ore
peop
le i
ncre
ases
the
chan
ces
of h
avin
g pa
id a
bri
be. O
n th
e ot
her
hand
, the
200
6 qu
estio
n as
ks a
bout
bri
bes
paid
for
wat
er a
nd e
lect
rici
ty b
ut a
lso
incl
udes
tele
phon
e se
rvic
e as
an
exam
-pl
e, w
hile
the
1999
que
stio
n as
ks e
xclu
sive
ly a
bout
wat
er a
nd e
lect
rici
ty. T
he in
clus
ion
of a
dditi
onal
ser
vice
s co
uld
feas
ibly
bia
s th
is v
aria
ble
in th
e op
posi
te d
irec
-tio
n th
an th
at p
redi
cted
by
my
hypo
thes
is, s
ince
con
side
ring
add
ition
al s
ervi
ces
incr
ease
s th
e nu
mbe
r of
opp
ortu
nitie
s in
whi
ch th
at in
divi
dual
may
hav
e be
en b
ribe
d.In
sum
, the
n, th
ese
two
oppo
sing
pot
entia
l bia
ses
may
ulti
mat
ely
coun
terb
alan
ce o
ne a
noth
er. M
oreo
ver,
sin
ce th
is r
egre
ssio
n pr
imar
ily s
eeks
to d
eter
min
e w
heth
erliv
ing
in a
pro
vinc
e w
ith g
reat
er s
igna
l cov
erag
e ha
s a
dist
inct
ly m
ore
nega
tive
rela
tion
ship
with
cor
rupt
ion
perc
eptio
ns in
200
6 th
an it
doe
s in
199
9, th
ese
ques
tions
are
adeq
uate
to
perm
it th
is a
naly
sis.
Ess
entia
lly,
the
mat
ter
of i
nter
est
is w
heth
er m
ovin
g al
ong
the
spec
trum
of
less
sig
nal
cove
rage
to
mor
e si
gnal
cov
erag
ede
crea
ses
the
likel
ihoo
d of
bei
ng b
ribe
d m
ore
dram
atic
ally
in 2
006
(whe
n ce
ll ph
ones
wer
e pr
esen
t) th
an in
199
9 (w
hen
cell
phon
es w
ere
not p
rese
nt).
b The
200
6 qu
estio
n pr
ovid
ed a
n ad
ditio
nal
optio
n of
ans
wer
ing
“No
expe
rien
ce w
ith t
his
in p
ast
year
,” w
hile
the
199
9 qu
estio
n di
d no
t in
clud
e th
is o
ptio
n. A
ssu
ch, t
hese
ans
wer
s w
ere
colla
psed
into
the
“no”
cat
egor
y in
the
2006
dat
a, s
ince
“no
” is
wha
t res
pond
ents
in 1
999
wou
ld p
laus
ibly
ans
wer
if th
ey d
id n
ot h
ave
the
optio
n of
ans
wer
ing
“No
expe
rien
ce w
ith th
is in
the
prev
ious
yea
r.”
Downloaded By: [Bailard, Catie Snow] At: 22:45 4 August 2009
Corruption in Africa 345
national and local levels, as well as the respondents’ actual experience with a particular actof corruption.
Since the Afrobarometer does not ask respondents specifically about their access to amobile phone, the primary independent variable in this model is a measure of the percent-age of each Namibian province that was covered by a mobile phone signal in late 2005.10
This is based on the logical assumption that the likelihood an individual uses a mobilephone is correlated with the likelihood that the geographic area in which he or she residesreceives a mobile phone signal. Using province-level mobile signal coverage as theindependent variable also enables this analysis to address endogeneity concerns that thecountry-level regression could not resolve.
Endogeneity occurs when the independent and dependent variables in a regressionshare a simultaneous relationship, which would be the case if mobile phones and corrup-tion exert a reciprocal influence on one another. This is problematic for an OLS regressionbecause the regression coefficient becomes biased and inconsistent, making it difficult tomeasure or validate the independent and direct influence of mobile phone diffusion onperceived corruption. It is preferable, therefore, to identify an instrument that is correlatedwith the independent variable of interest but uncorrelated with the dependent variable.In this case, this factor should be correlated with mobile phone diffusion but not directlycorrelated with corruption.
Mobile signal coverage arguably meets each of these criteria. First, as discussedabove, the logic connecting mobile phone penetration with mobile signal coverage isevident. Second, the findings of a recent econometric analysis (Buys, Dasgupta, Thomas,& Wheeler, 2008) conducted by the World Bank provide a strong basis for arguing thatmobile signal coverage at the province level is uncorrelated with corruption. This studyreveals that the factors that are most determinant of the presence of cell towers in a spe-cific region include size of adjacent population, costs of maintaining and installing thetowers (i.e., accessibility), and the national competition policy. Of these factors, the vari-able that is most plausibly correlated with corruption is the nation’s competition policy,since market competition and corruption tend to share a negative relationship. However,being that Namibia’s competition policy is determined at the national level and, therefore,applies uniformly to all of its provinces, the competitive climate of the telecommunica-tions industry is likely constant across the provinces included in this analysis. This sug-gests that the degree of mobile signal coverage at the province level is most driven bypopulation density and accessibility factors, and therefore exogenous to the relationshipshared by competition policy and corruption.11
To construct the measure of mobile signal coverage, I overlaid a 50-by-50 grid per10-degree latitude-longitude square over a 2005 map of mobile phone signal coverageacross the Namibian provinces.12 Using this map, I divide the number of grid squarescovered by mobile phone signals by the total number of grid squares that each provinceencompasses. This produces a measure of the percentage of each province’s geographicalspace in which it was possible to use a mobile phone in 2005. The average level of mobilesignal coverage across these 13 provinces is 42% (SD = 25%), with a minimum of 6% inOkavango and a maximum of 85% in Khomas.
In order to test whether gaining access to mobile phones altered respondents’ percep-tions of corruption in Namibia, I conducted an OLS multiple regression of this 2005measure of mobile signal coverage on the respondents’ perceptions of corruption in 1999and 2006. By including an interaction term representing mobile signal coverage in 2006specifically, it is possible to test whether living in a state with a high degree of mobilesignal coverage was correlated with a greater decline in perceived corruption in 2006
Downloaded By: [Bailard, Catie Snow] At: 22:45 4 August 2009
346 Catie Snow Bailard
(when mobile phones were actually present) than in 1999 (when mobile phones were notyet being widely used). Moreover, this interaction term enables the analysis to addressomitted bias concerns that there may be some factors unaccounted for at the provincelevel, which are really driving the proposed relationship shared by mobile phone signalcoverage and corruption perceptions. If this is the case, the analysis should reveal a similarcorrelation between the degree of mobile signal coverage in a province and the level ofcorruption perceived by its residents in both 1999 and 2006. On the other hand, if mobilephones do exert an independent influence on corruption perceptions, the correlationbetween mobile signal coverage and corruption perceptions should be distinct from andsignificantly more negative in 2006 than in 1999.
Finally, this analysis includes several demographic variables to control for personalcharacteristics that are plausibly correlated with both the likelihood of using a cell phoneand attitudes regarding corruption. These factors include gender, age, education, employ-ment status, and whether the individual lives in an urban or rural area. Lastly, the modelincludes dummy variables for each of the 13 Namibian provinces to control for difficult toidentify or difficult to measure province-level factors.
Results
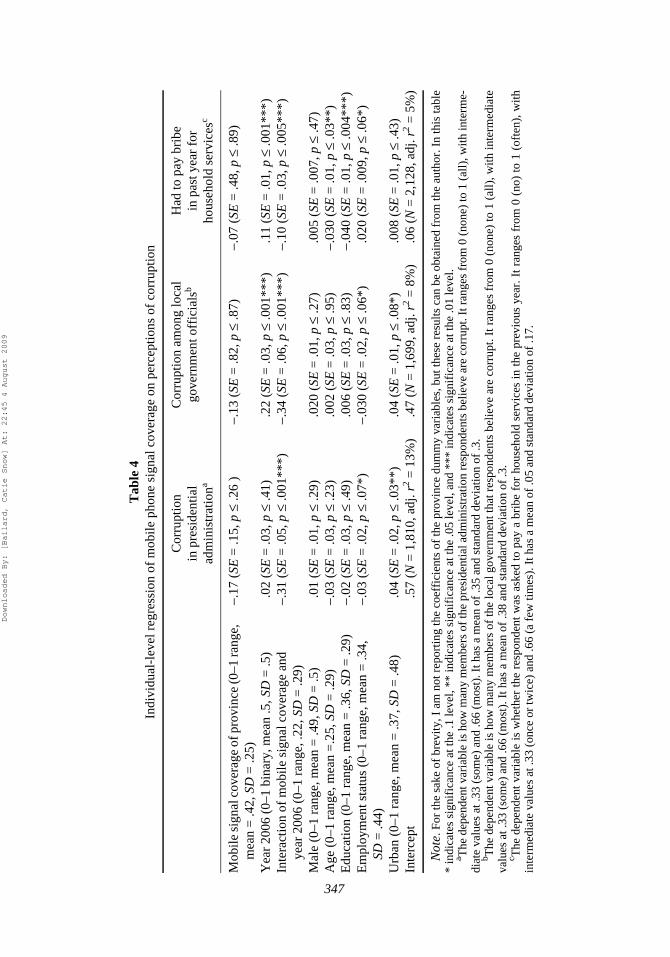
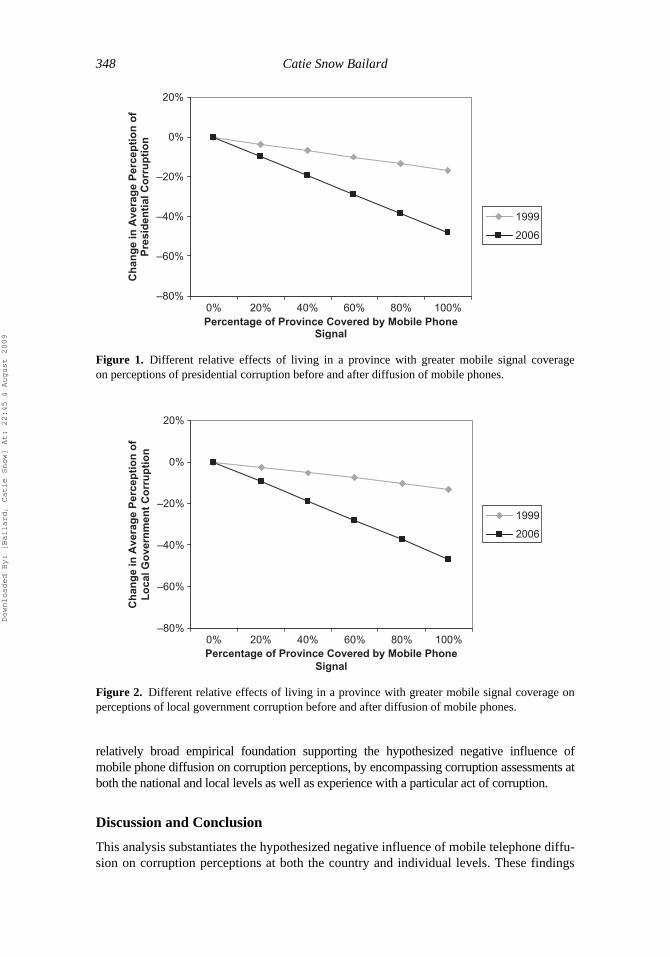
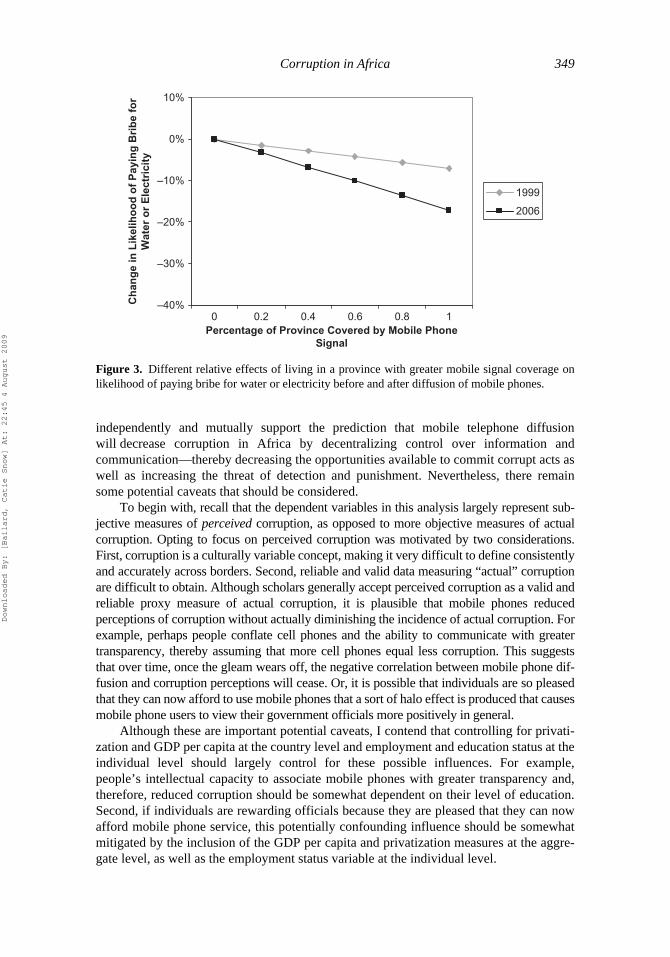
In all three cases, living in a province with greater mobile signal coverage exhibited asignificantly more negative relationship with corruption perceptions in 2006 when comparedto 1999. In other words, moving along the spectrum of more to less mobile signal coverageis associated with a more significant decline in corruption perceptions in 2006 (when mobilephones were actually present) than in 1999 (before mobile phones were widely present).Moreover, in each case, the distinct 2006 relationship shared by mobile signal coverage andcorruption perceptions reaches statistical significance at the .01 level (see Table 4).
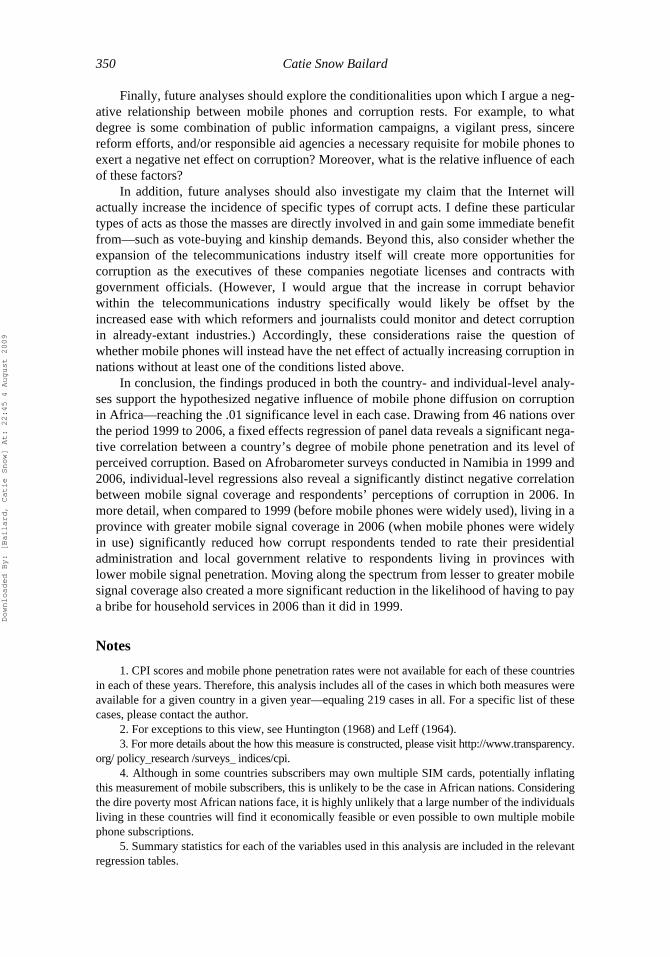
In substantive terms, in 1999 residents of the province of Otjozundjupa (mobile signalcoverage: 60%) rated the presidential administration to be 3 percentage points less corruptthan did residents of Hardap (mobile coverage: 40%). By 2006, residents of Otjozundjuparated the extent of corruption in the presidential administration to be nearly 10 percentagepoints lower than did Hardap residents. The difference in the extent of corruption thatrespondents assigned to their local governments followed a similar trajectory between1999 and 2006. In 1999, the level of corruption that residents assigned to their own localgovernment was 4 percentage points lower in Otjozundjupa (mobile signal coverage:60%) than in Karas (mobile signal coverage: 31%). In 2006, this difference expandedthree-fold, to 14 percentage points. Turning to the matter of bribery, individuals living inthe province of Oshikoto (mobile signal coverage: 83%) were 5 percentage points lesslikely to pay a bribe for household services in 1999 than respondents living in the provinceof Kavango (mobile signal coverage: 6%). By 2006, however, Oshikoto residents hadbecome 15 percentage points less likely to pay a bribe for household services thanKavango residents.
In summary, in all three cases, the effect of moving along the spectrum from lower tohigher mobile signal coverage on corruption perceptions was significantly more negative in2006 than in 1999 (see Figures 1, 2, and 3). When compared to 1999, residents living in prov-inces with a greater degree of mobile signal coverage were significantly less likely to have paida bribe for household services than individuals living in provinces with less mobile coverage in2006. The effect of living in a province with higher signal coverage also diminished the levelof corruption that respondents assigned to the presidential administration and local governmentto a greater extent in 2006 when compared to 1999. Taken collectively, these results provide a
Downloaded By: [Bailard, Catie Snow] At: 22:45 4 August 2009
347
Tab
le 4
Indi
vidu
al-l
evel
reg
ress
ion
of m
obile
pho
ne s
igna
l cov
erag
e on
per
cept
ions
of
corr
upti
on
Cor
rupt
ion
in p
resi
dent
ial
adm
inis
trat
iona
Cor
rupt
ion
amon
g lo
cal
gove
rnm
ent o
ffic
ials
bH
ad to
pay
bri
be
in p
ast y
ear
for
hous
ehol
d se
rvic
esc
Mob
ile
sign
al c
over
age
of p
rovi
nce
(0–1
rang
e,
mea
n =
.42,
SD
= .2
5)−.
17 (
SE =
.15,
p ≤
.26
)−.
13 (
SE =
.82,
p ≤
.87)
−.07
(SE
= .4
8, p
≤ .8
9)
Yea
r 20
06 (
0–1
bina
ry, m
ean
.5, S
D =
.5)
.02
(SE
= .0
3, p
≤ .4
1).2
2 (S
E =
.03,
p ≤
.001
***)
.11
(SE
= .0
1, p
≤ .0
01**
*)In
tera
ctio
n of
mob
ile
sign
al c
over
age
and
year
200
6 (0
–1 r
ange
, .22
, SD
= .2
9)−.
31 (
SE =
.05,
p ≤
.001
***)
−.34
(SE
= .0
6, p
≤ .0
01**
*)−.
10 (
SE =
.03,
p ≤
.005
***)
Mal
e (0
–1 r
ange
, mea
n =
.49,
SD
= .5
).0
1 (S
E =
.01,
p ≤
.29)
.020
(SE
= .0
1, p
≤ .2
7).0
05 (
SE =
.007
, p ≤
.47)
Age
(0–
1 ra
nge,
mea
n =
.25,
SD
= .2
9)−.
03 (
SE =
.03,
p ≤
.23)
.002
(SE
= .0
3, p
≤ .9
5)−.
030
(SE
= .0
1, p
≤ .0
3**)
Edu
cati
on (
0–1
rang
e, m
ean
= .3
6, S
D =
.29)
−.02
(SE
= .0
3, p
≤ .4
9).0
06 (
SE =
.03,
p ≤
.83)
−.04
0 (S
E =
.01,
p ≤
.004
***)
Em
ploy
men
t sta
tus
(0–1
ran
ge, m
ean
= .3
4,
SD =
.44)
−.03
(SE
= .0
2, p
≤ .0
7*)
−.03
0 (S
E =
.02,
p ≤
.06*
).0
20 (
SE =
.009
, p ≤
.06*
)
Urb
an (
0–1
rang
e, m
ean
= .3
7, S
D =
.48)
.04
(SE
= .0
2, p
≤ .0
3**)
.04
(SE
= .0
1, p
≤ .0
8*)
.008
(SE
= .0
1, p
≤ .4
3)In
terc
ept
.57
(N =
1,8
10, a
dj. r
2 = 1
3%)
.47
(N =
1,6
99, a
dj. r
2 = 8
%)
.06
(N =
2,1
28, a
dj. r
2 = 5
%)
Not
e. F
or th
e sa
ke o
f br
evity
, I a
m n
ot r
epor
ting
the
coef
fici
ents
of
the
prov
ince
dum
my
vari
able
s, b
ut th
ese
resu
lts c
an b
e ob
tain
ed f
rom
the
auth
or. I
n th
is ta
ble
* in
dica
tes
sign
ific
ance
at t
he .1
leve
l, **
indi
cate
s si
gnif
ican
ce a
t the
.05
leve
l, an
d **
* in
dica
tes
sign
ific
ance
at t
he .0
1 le
vel.
a The
dep
ende
nt v
aria
ble
is h
ow m
any
mem
bers
of
the
pres
iden
tial a
dmin
istr
atio
n re
spon
dent
s be
lieve
are
cor
rupt
. It r
ange
s fr
om 0
(no
ne)
to 1
(al
l), w
ith in
term
e-di
ate
valu
es a
t .33
(so
me)
and
.66
(mos
t). I
t has
a m
ean
of .3
5 an
d st
anda
rd d
evia
tion
of .3
.b T
he d
epen
dent
var
iabl
e is
how
man
y m
embe
rs o
f th
e lo
cal g
over
nmen
t tha
t res
pond
ents
bel
ieve
are
cor
rupt
. It r
ange
s fr
om 0
(no
ne)
to 1
(al
l), w
ith in
term
edia
teva
lues
at .
33 (
som
e) a
nd .6
6 (m
ost)
. It h
as a
mea
n of
.38
and
stan
dard
dev
iatio
n of
.3.
c The
dep
ende
nt v
aria
ble
is w
heth
er th
e re
spon
dent
was
ask
ed to
pay
a b
ribe
for
hou
seho
ld s
ervi
ces
in t
he p
revi
ous
year
. It
rang
es f
rom
0 (
no)
to 1
(of
ten)
, with
inte
rmed
iate
val
ues
at .3
3 (o
nce
or tw
ice)
and
.66
(a f
ew ti
mes
). I
t has
a m
ean
of .0
5 an
d st
anda
rd d
evia
tion
of .1
7.
Downloaded By: [Bailard, Catie Snow] At: 22:45 4 August 2009
348 Catie Snow Bailard
relatively broad empirical foundation supporting the hypothesized negative influence ofmobile phone diffusion on corruption perceptions, by encompassing corruption assessments atboth the national and local levels as well as experience with a particular act of corruption.
Discussion and Conclusion
This analysis substantiates the hypothesized negative influence of mobile telephone diffu-sion on corruption perceptions at both the country and individual levels. These findings
Figure 1. Different relative effects of living in a province with greater mobile signal coverageon perceptions of presidential corruption before and after diffusion of mobile phones.
–80%
–60%
–40%
–20%
0%
20%
0% 20% 40% 60% 80% 100%Percentage of Province Covered by Mobile Phone
Signal
Ch
ang
e in
Ave
rag
e P
erce
pti
on
of
Pre
sid
enti
al C
orr
up
tio
n
1999
2006
Figure 2. Different relative effects of living in a province with greater mobile signal coverage onperceptions of local government corruption before and after diffusion of mobile phones.
–80%
–60%
–40%
–20%
0%
20%
0% 20% 40% 60% 80% 100%Percentage of Province Covered by Mobile Phone
Signal
Ch
ang
e in
Ave
rag
e P
erce
pti
on
of
Lo
cal G
ove
rnm
ent
Co
rru
pti
on
1999
2006
Downloaded By: [Bailard, Catie Snow] At: 22:45 4 August 2009
Corruption in Africa 349
independently and mutually support the prediction that mobile telephone diffusionwill decrease corruption in Africa by decentralizing control over information andcommunication—thereby decreasing the opportunities available to commit corrupt acts aswell as increasing the threat of detection and punishment. Nevertheless, there remainsome potential caveats that should be considered.
To begin with, recall that the dependent variables in this analysis largely represent sub-jective measures of perceived corruption, as opposed to more objective measures of actualcorruption. Opting to focus on perceived corruption was motivated by two considerations.First, corruption is a culturally variable concept, making it very difficult to define consistentlyand accurately across borders. Second, reliable and valid data measuring “actual” corruptionare difficult to obtain. Although scholars generally accept perceived corruption as a valid andreliable proxy measure of actual corruption, it is plausible that mobile phones reducedperceptions of corruption without actually diminishing the incidence of actual corruption. Forexample, perhaps people conflate cell phones and the ability to communicate with greatertransparency, thereby assuming that more cell phones equal less corruption. This suggeststhat over time, once the gleam wears off, the negative correlation between mobile phone dif-fusion and corruption perceptions will cease. Or, it is possible that individuals are so pleasedthat they can now afford to use mobile phones that a sort of halo effect is produced that causesmobile phone users to view their government officials more positively in general.
Although these are important potential caveats, I contend that controlling for privati-zation and GDP per capita at the country level and employment and education status at theindividual level should largely control for these possible influences. For example,people’s intellectual capacity to associate mobile phones with greater transparency and,therefore, reduced corruption should be somewhat dependent on their level of education.Second, if individuals are rewarding officials because they are pleased that they can nowafford mobile phone service, this potentially confounding influence should be somewhatmitigated by the inclusion of the GDP per capita and privatization measures at the aggre-gate level, as well as the employment status variable at the individual level.
Figure 3. Different relative effects of living in a province with greater mobile signal coverage onlikelihood of paying bribe for water or electricity before and after diffusion of mobile phones.
–40%
–30%
–20%
–10%
0%
10%
0 0.2 0.4 0.6 0.8 1Percentage of Province Covered by Mobile Phone
Signal
Ch
ang
e in
Lik
elih
oo
d o
f P
ayin
g B
rib
e fo
rW
ater
or
Ele
ctri
city
1999
2006
Downloaded By: [Bailard, Catie Snow] At: 22:45 4 August 2009
350 Catie Snow Bailard
Finally, future analyses should explore the conditionalities upon which I argue a neg-ative relationship between mobile phones and corruption rests. For example, to whatdegree is some combination of public information campaigns, a vigilant press, sincerereform efforts, and/or responsible aid agencies a necessary requisite for mobile phones toexert a negative net effect on corruption? Moreover, what is the relative influence of eachof these factors?
In addition, future analyses should also investigate my claim that the Internet willactually increase the incidence of specific types of corrupt acts. I define these particulartypes of acts as those the masses are directly involved in and gain some immediate benefitfrom—such as vote-buying and kinship demands. Beyond this, also consider whether theexpansion of the telecommunications industry itself will create more opportunities forcorruption as the executives of these companies negotiate licenses and contracts withgovernment officials. (However, I would argue that the increase in corrupt behaviorwithin the telecommunications industry specifically would likely be offset by theincreased ease with which reformers and journalists could monitor and detect corruptionin already-extant industries.) Accordingly, these considerations raise the question ofwhether mobile phones will instead have the net effect of actually increasing corruption innations without at least one of the conditions listed above.
In conclusion, the findings produced in both the country- and individual-level analy-ses support the hypothesized negative influence of mobile phone diffusion on corruptionin Africa—reaching the .01 significance level in each case. Drawing from 46 nations overthe period 1999 to 2006, a fixed effects regression of panel data reveals a significant nega-tive correlation between a country’s degree of mobile phone penetration and its level ofperceived corruption. Based on Afrobarometer surveys conducted in Namibia in 1999 and2006, individual-level regressions also reveal a significantly distinct negative correlationbetween mobile signal coverage and respondents’ perceptions of corruption in 2006. Inmore detail, when compared to 1999 (before mobile phones were widely used), living in aprovince with greater mobile signal coverage in 2006 (when mobile phones were widelyin use) significantly reduced how corrupt respondents tended to rate their presidentialadministration and local government relative to respondents living in provinces withlower mobile signal penetration. Moving along the spectrum from lesser to greater mobilesignal coverage also created a more significant reduction in the likelihood of having to paya bribe for household services in 2006 than it did in 1999.
Notes
1. CPI scores and mobile phone penetration rates were not available for each of these countriesin each of these years. Therefore, this analysis includes all of the cases in which both measures wereavailable for a given country in a given year—equaling 219 cases in all. For a specific list of thesecases, please contact the author.
2. For exceptions to this view, see Huntington (1968) and Leff (1964).3. For more details about the how this measure is constructed, please visit http://www.transparency.
org/ policy_research /surveys_ indices/cpi.4. Although in some countries subscribers may own multiple SIM cards, potentially inflating
this measurement of mobile subscribers, this is unlikely to be the case in African nations. Consideringthe dire poverty most African nations face, it is highly unlikely that a large number of the individualsliving in these countries will find it economically feasible or even possible to own multiple mobilephone subscriptions.
5. Summary statistics for each of the variables used in this analysis are included in the relevantregression tables.
Downloaded By: [Bailard, Catie Snow] At: 22:45 4 August 2009
Corruption in Africa 351
6. This measure is derived from the World Bank’s Voice and Accountability governanceindicator. This measure represents the percentile rank of the strength of democratic practices availablein that nation. For more information, please refer to http://www.worldbank.org/wbi/governance/index.htm.
7. For more information regarding how the World Bank constructs the Regulatory QualityIndex, please visit http://www.worldbank.org/wbi/governance/index.htm.
8. The World Bank does not provide measures for the Voice and Accountability and Regula-tory Quality indexes for the years 1999 and 2001. To address this, I calculate the average of theyears immediately preceding and following 1999 and 2001. For example, the 1999 value included inthis analysis is the average of each country’s 1998 and 2000 scores.
9. For a detailed timeline of anti-corruption activities in Namibia, please refer to http://www.anticorruption.info/ corr_in_time.php.
10. Since the Afrobarometer survey was conducted in the first months of 2006 (February 14 toMarch 7), it is reasonable to assume that the 2005 map of mobile signal coverage in Namibia isrepresentative of the degree of coverage present in early 2006 when the respondents were surveyed.
11. One could argue that population density is correlated with corruption. However, a Pearsonproduct-moment correlation of the percentage of a nation’s population that lives in an urban area andeach nation’s CPI reveals that these factors are uncorrelated (−.06). In regard to a possible correla-tion between accessibility and corruption, the most obvious determinant of accessibility is the road-way infrastructure extant in a province. Essentially, the more roads, the easier it will be for mobileservice providers to erect cell towers in a particular region. As to whether the degree of roadwayinfrastructure is correlated with corruption levels at the national level, roadway density [totalroadways (km)/total land area (km2)] is uncorrelated with perceived corruption (Pearson product-moment correlation: .1). At the provincial level in Namibia, road density is only very weakly corre-lated with the average level of corruption that residents assigned to the following in 1999: localgovernment corruption (−.21 ), presidential corruption (−.22), and likelihood of paying bribe (−.33).Moreover, the relationship that these three average perceptions of corruption share with road densityfails to reach statistical significance in all three cases.
12. This map was published in the Information Society and Development Conference’s TheAcacia Atlas 2005: Mapping African ICT Growth, based on information provided by the GSMAssociation. For more details and to view the map, please visit http://www.idrc.ca/uploads/user-S/11836495021Acacia_Atlas_ 2005.pdf.
References
Abraham, R. (2007). Mobile phones and economic development: Evidence from the fishing industryin India. Information Technologies and International Development, 4(1), 5–17.
Aker, J. C. (2008). Does digital divide or provide? The impact of cell phones on grain markets inNiger. Unpublished doctoral dissertation, University of California–Berkeley.
Allison, P. D. (2005). Fixed effects regression methods for longitudinal data using SAS. Cary, NC:SAS Institute.
Azfar, O., Lee, Y., & Swamy, A. (2001). The causes and consequences of corruption. Annals of theAmerican Academy of Political and Social Science, 573, 42–56.
Bardhan, P., & Mookherjee, D. (2000). Capture and governance at local and national levels. AmericanEconomic Review, 90, 135–139.
Best, M. L., & Wade, K. W. (2005). The Internet and democracy: Global catalyst or democraticdud? Retrieved from http://cyber.law.harvard.edu/publications
Buys, P., Dasgupta, S., Thomas, T., & Wheeler, D. (2008). Determinants of a digital divide in Sub-Saharan Africa: A spatial-economteric analysis of cell phone coverage. (The World Bank pol-icy research working paper no. WPS 4516). Washington, DC: The World Bank SustainableRural and Urban Development Team, Development Research Group.
Daly, J. A. (2000). Studying the impacts of the Internet without assuming technological determinism.Aslib Proceedings, 52, 285–300.
Downloaded By: [Bailard, Catie Snow] At: 22:45 4 August 2009
352 Catie Snow Bailard
Das, J., Dercon, S., Habyarimana, J., & Krishnan, P. (2002). Rules vs. discretion: Public and privatefunding in Zambian basic education. Part 1: Funding equity. Washington, DC: World Bank.
Donner, J. (2005). The use of mobile phones by microentrepreneurs in Kigali, Rwanda. Changes toSocial and Business Networks Information Technology and International Development, 3(2),3–19.
Frost & Sullivan. (2006). Social impact of mobile telephony in Latin America. Retrieved from theGSM Latin America Association Web site: http://www.gsmlaa.org/files/content/0/94/Social%20Impact%20of%20Mobile%20Telephony%20in%20Latin%20America.pdf
Greenstone, J. D. (1966). Corruption and self-interest in Kampala and Nairobi. Comparative Studiesin Society and History, 8, 199–210.
Harsch, E. (1993). Accumulators and democrats: Challenging state corruption in Africa. Journal ofModern African Studies, 31, 31–48.
Huntington, S. P. (1968). Political order in changing societies. New Haven, CT: Yale UniversityPress.
International Telecommunications Union. (2008). African Telecommunication/ICT indicators 2008:At a crossroads. Geneva, Switzerland: Author.
Itano, N. (2005). Africa’s cell phone boom creates a base for low-cost banking. Christian ScienceMonitor. Retrieved from http://www.csmonitor.com/2005/0826/p07s01-woaf.html
Jackson, R. H., & Rosberg, C. G. (1994). The political economy of African personal rule. InD. Apter & and C. Rosberg (Eds.), Political development and the new realism in sub-SaharanAfrica (pp. 291–322). Charlottesville, VA: University of Virginia Press.
Jensen, R. (2007). The digital provide: Information (technology), market performance and welfarein the South Indian fisheries. Quarterly Journal of Economics, 3, 879–924
Kedzie, C. R., with Aragon, J. (1997). Coincident revolutions and the emergent dictator’s dilemma:Thoughts on communication and democratization. In J. E. Allison (Ed.), Technology, development,and democracy: International conflict and cooperation in the information age (pp. 105–130).Albany, NY: State University of New York Press.
Klitgaard, R. (1988). Controlling corruption. Berkeley, CA: University of California Press.LaFraniere, S. (2005). Cellphones catapult rural Africa to 21st century. New York Times. Retrieved
from http://www.nytimes.com/2005/08/25/international/africa/25africa.html?ex=1282622400&en=32b49363eac57aae&ei=5090&partner=rssuserland&emc=rss
Lane, B., Sweet, S., Lewin, D., Sephton, J., & Petini, I. (2006). The economic and social benefits ofmobile services in Bangladesh: A case study for the GSM Association. Retrieved from http://www.dirsi.net/english/files/Ovum%20Bangladesh%20Main%20report1f.pdf
Leff, N. (1964). Economic development through bureaucratic corruption. American BehavioralScientist, 8(3), 8–14.
Leonard, D. K., & Straus, S. (2003). Africa’s stalled development: International causes and cures.Boulder, CO: Lynne Rienner.
LeVine, V. T. (1975). Political corruption: The Ghana case. Stanford, CA: Hoover InstitutionPress.
Mauro, P. (1995). Corruption and growth. Quarterly Journal of Economics, 110, 681–712.Mauro, P. (1997). The effects of corruption on growth, investment, and government expenditure:
A cross-country analysis. In K. A. Elliott (Ed.), Corruption in the global economy (pp. 83–107).Washington, DC: Institute for International Economics.
Molony, T. (2005). Food, carvings and shelter: The adoption and appropriation of information andcommunication technologies in Tanzanian micro and small enterprises. Unpublished doctoraldissertation, University of Edinburgh.
Montinola, G. R., & Jackman, R. W. (2002). Sources of corruption: A cross-country study. BritishJournal of Political Science, 32, 147–170.
Ngowi, R. (2005). Africa’s cellphone explosion changes economics, society. USA Today. Retrievedfrom http://www.usatoday.com/tech/products/gear/2005-10-16-africa-cellular_x.htm
Ogendeji, O. A. (2008). GSM operator supports fight against corruption. Network World. Retrieved fromhttp://www.networkworld.com/news/2008/061608-gsm-operator-supports-fight-against.html
Downloaded By: [Bailard, Catie Snow] At: 22:45 4 August 2009
Corruption in Africa 353
Olivier de Sardan, J. P. (1999). A moral economy of corruption? Journal of Modern African Studies,37, 25–52.
Platteau, J.-P., & Gaspart, F. (2003). The risk of resource misappropriation in community-drivendevelopment. World Development, 31, 1687–1703.
Price Waterhouse Coopers. (1999). Health and Education Financial Tracking Study. Report pre-pared for government of Tanzania.
Rasmusen, E., & Ramseyer, J. M. (1994). Cheap bribes and the corruption ban: A coordinationgame among rational legislators. Public Choice, 78, 305–327.
Rautray, S. (2006). Indian politician’s son guilty of model’s murder. Free Republic. Retrieved fromhttp://www.freerepublic.com/focus/f-news/1755260/posts
Reinikka, R., & Svensson, J. (2004). Local capture evidence from a central government transferprogram in Uganda. Quarterly Journal of Economics, 119, 679–706.
Reinikka, R., & Svensson, J. (2005). Fighting corruption to improve schooling: Evidence from anewspaper campaign in Uganda. Journal of the European Economic Association, 2, 259–267.
Rose-Ackerman, S. (1993). Corruption: A study in political economy. New York: Academic Press.Ross, W. (2004). Mobile markets deny middlemen. BBC News. Retrieved from http://news.
bbc.co.uk/go/em/fr/-/2/hi/africa/3321167.stmSamuel, J., Shah, N., & Hadingham, W. (2005). Mobile communications in South Africa, Tanzania
and Egypt: Results from community and business surveys. Vodafone Policy Paper Series, 2,44–52.
Sandholtz, W., & Koetzle, W. (2000). Accounting for corruption: Economic structure, democracy,and trade. International Studies Quarterly, 44, 31–50.
Schleifer, A., & Vishny, R. W. (1993). Corruption. Quarterly Journal of Economics, 108, 599–617.Sullivan, K. (2006, July 9). In war-torn Congo, going wireless to reach home: For poor, cellphones
bridge digital divide. Washington Post, p. A1.Szetfel, M. (2000). Clientelism, corruption, & catastrophe. Review of African Political Economy, 27,
427–441.Tanzi, V. (1998). Corruption around the world: Causes, consequences, scope, and cures. Staff
Papers of the International Monetary Fund, 45, 559–594.Treisman, D. (2000). The causes of corruption: A cross-national study. Journal of Public Economics,
76, 399–457.Ye, X., & Canagarajah, S. (2002). Efficiency of public expenditure distribution and beyond: A report
on Ghana’s 2000 Public Expenditure Tracking Survey of Primary Health and Education.Washington DC: World Bank.
Downloaded By: [Bailard, Catie Snow] At: 22:45 4 August 2009

![(Co-author) "Transparency International: Government Defence Anti-Corruption Index" [Corruption research]](https://img.dokumen.tips/doc/110x75/631f2055d10f1687490fa722/co-author-transparency-international-government-defence-anti-corruption-index.jpg)


