Embed Size (px)
Citation preview

TH
EJ
OU
RN
AL
OF
CE
LL
BIO
LO
GY
JCB: ARTICLE
© 2008 Gilkerson et al. The Rockefeller University Press $30.00J. Cell Biol. Vol. 181 No. 7 1117–1128www.jcb.org/cgi/doi/10.1083/jcb.200712101 JCB 1117
Correspondence to Eric A. Schon: [email protected]
Abbreviations used in this paper: mtDNA, mitochondrial DNA; PEG, polyethyl ene glycol; WT, wild type.
The online version of this paper contains supplemental material.
Introduction Unique among human organelles, mitochondria have a dual
nuclear/mitochondrial genetic makeup: nuclear-encoded proteins
combine with those encoded by mitochondrial DNA (mtDNA)
to comprise the mitochondrial respiratory chain, the fi ve multi-
subunit complexes of oxidative phosphorylation which produce
the bulk of cellular ATP. mtDNA is a 16.6-kb double-stranded
circular molecule encoding 22 transfer RNAs, two ribosomal
RNAs, and 13 polypeptides ( Fig. 1 A ). mtDNA exists in hun-
dreds of identical copies per cell in mammals (homoplasmy)
but can also exist in multiple nonidentical species within an in-
dividual tissue or cell (heteroplasmy). Mutations of mtDNA, in-
cluding point mutations and � -mtDNAs (partial deletions), are
associated with a wide range of systemic and tissue-specifi c
diseases. High levels of � -mtDNAs are found in the substantia
nigra of individuals with Parkinson ’ s disease and aged individuals
( Kraytsberg et al., 2004 ). � -mtDNAs cause the mitochondrial
diseases Kearns-Sayre syndrome and progressive external ophthal-
moplegia. In these disorders, affected tissues typically carry
both mutant and wild-type (WT) mtDNAs. The proportion of
mutant versus WT mtDNA is critically important for pathology
(for review see DiMauro and Schon, 2003 ). Despite this, it is
unclear how mtDNA genotypes are propagated and maintained.
Mitotic segregation caused by random genetic drift has been re-
ported, particularly in mammalian oocytes ( Jenuth et al., 1996 ;
Brown et al., 2001 ). Conversely, directed segregation has been
demonstrated both for ( Yoneda et al., 1992 ) and against ( Rajasimha
et al., 2008 ) mutated mtDNAs. To understand the propagation
and maintenance of mtDNA heteroplasmy, it is necessary to ex-
amine the mechanisms of mtDNA organization and inheritance
within the mitochondrion itself.
Within the organelle, mtDNA is organized into assemblies
called nucleoids. Each nucleoid is composed of 1 – 10 copies of
mtDNA ( Satoh and Kuroiwa, 1991 ; Iborra et al., 2004 ; Legros
et al., 2004 ) and associated proteins, including TFAM (which
acts as both a transcription factor and a DNA packaging pro-
tein), aconitase (in yeast), polymerase � , mitochondrial single-
strand binding protein, branched chain � -ketoacid dehydrogenase
(in yeast), and the mitochondrial helicase Twinkle ( Chen and
Butow, 2005 ; Chen et al., 2005 ; Wang and Bogenhagen, 2006 ).
Nucleoids are distributed throughout the mitochondrial network
at regular spatial intervals ( Capaldi et al., 2002 ) and are suffi -
ciently mobile to repopulate cells lacking mtDNA when introduced
via cell fusion. When mitochondria transition to a fragmented
morphology, each individual organelle contains at least one nu-
cleoid ( Margineantu et al., 2002 ). This is similar to bacterial
nucleoid organization, in which pathways exist to ensure the
proper distribution of nucleoids during bacterial cell divi-
sion ( Rothfi eld et al., 2005 ). However, it is unclear how mtDNA
heteroplasmy is organized at the organellar level. In particular,
Mitochondrial DNA (mtDNA) is packaged into
DNA-protein assemblies called nucleoids, but
the mode of mtDNA propagation via the nucle-
oid remains controversial. Two mechanisms have been
proposed: nucleoids may consistently maintain their mtDNA
content faithfully, or nucleoids may exchange mtDNAs
dynamically. To test these models directly, two cell lines
were fused, each homoplasmic for a partially deleted mtDNA
in which the deletions were nonoverlapping and each
defi cient in mitochondrial protein synthesis, thus allowing
the fi rst unequivocal visualization of two mtDNAs at the
nucleoid level. The two mtDNAs transcomplemented to re-
store mitochondrial protein synthesis but were consistently
maintained in discrete nucleoids that did not intermix
stably. These results indicate that mitochondrial nucleoids
tightly regulate their genetic content rather than freely
exchanging mtDNAs. This genetic autonomy provides a
molecular mechanism to explain patterns of mitochondrial
genetic inheritance, in addition to facilitating therapeutic
methods to eliminate deleterious mtDNA mutations.
Mitochondrial nucleoids maintain genetic autonomy but allow for functional complementation
Robert W. Gilkerson , 1 Eric A. Schon , 1,2 Evelyn Hernandez , 1 and Mercy M. Davidson 1
1 Department of Neurology and 2 Department of Genetics and Development, College of Physicians and Surgeons, Columbia University, New York, NY 10032
on August 22, 2016
jcb.rupress.orgD
ownloaded from
Published June 23, 2008
http://jcb.rupress.org/content/suppl/2008/07/08/jcb.200712101.DC1.html http://jcb.rupress.org/content/suppl/2008/06/30/jcb.200712101.DC2.html Supplemental Material can be found at:

JCB • VOLUME 181 • NUMBER 7 • 2008 1118
Results Validation of mtDNA genotype in parental cell lines with nonoverlapping � -mtDNAs To visualize the two heterologous mtDNA nucleoid popula-
tions, we used two parental cybrid cell lines homoplasmic for
nonoverlapping deletions ( Fig. 1 A ). By using FISH probes
specifi c to the deleted regions, it is possible to distinguish
between the two mtDNA genotypes at nucleoid resolution.
We therefore characterized the mtDNA genotypes of the two
parental cell lines by conventional and long-distance PCR to
ensure the genetic suitability of these cell lines for use in cell
fusion experiments.
The homoplasmic FLP � (deleted for nt 7846 – 9748) and
CW � (deleted for nt 10155 – 15945) cell lines have been reported
previously ( Pallotti et al., 2004 ; Santra et al., 2004 ). Long-
distance PCR of mtDNA from FLP6a39.2 (100% WT mtDNA)
yielded an amplifi cation product of the expected size (14,320 bp),
whereas FLP � and CW � total DNA templates each yielded
a single product consistent with the expected FLP and CW
� -mtDNA products (12,418 bp and 8,530 bp, respectively;
Fig. 2 A ). 143B206 � 0 cells that are devoid of mtDNA ( King
and Attardi, 1989 ) gave no product, as expected ( Fig. 2 A ).
Conventional PCR of total DNA isolated from WT cells gave
an amplifi cation product of the predicted sizes for a fragment
containing a portion of MTND4 (1,244 bp; nt 10849-12093),
hereafter termed ND4, and a fragment containing MTATP8 and
MTATP6 and portions of the fl anking MTCO2 and MTCO3 genes
(1,508 bp; nt 7909 – 9417), hereafter termed CO2/3 ( Fig. 2 B ).
FLP � cells showed an amplifi cation product for ND4 but not
for CO2/3, whereas CW � cells showed a band for CO2/3 but
not ND4, which is consistent with the predicted � -mtDNAs pres-
ent ( Mita et al., 1990 ; Pallotti et al., 2004 ; Santra et al., 2004 ).
how are mtDNAs organized and propagated via the nucleoid?
How does nucleoid organization explain the observed patterns
of mtDNA segregation?
Two models have been proposed to explain how mito-
chondrial nucleoids mediate mtDNA inheritance. Jacobs et al.
(2000) proposed that individual nucleoids replicate only their
own exact genetic content ( Fig. 1 B ). This model maintains
that mtDNA content within a nucleoid is generally static and
that nucleoids do not exchange mtDNAs between each other
(the “ faithful nucleoid ” model). Alternatively, D ’ Aurelio et al.
(2004) proposed that nucleoids are subject to remodeling and
have a dynamic organization allowing nucleoids to exchange
mtDNAs freely (the “ dynamic nucleoid ” model; Fig. 1 B ).
To date, this fundamental question of mitochondrial cell biology
and genetics has remained unanswered because of the experi-
mentally intractable nature of the problem, as it demands both
the isolation of two cell lines with the same nuclear background
and with different mtDNAs and an experimental approach capa-
ble of clearly distinguishing between the two heterologous
mtDNAs at the level of the nucleoid, a suborganellar macro-
molecular assembly.
To determine which model is more accurate, we observed
the segregation of mtDNA nucleoids after the fusion of two
homoplasmic cell lines carrying nonoverlapping partial dele-
tions (FLP6a39.32 � , hereafter referred to as FLP � [ Santra
et al., 2004 ] and CW420-115 � , hereafter referred to as CW �
[ Mita et al., 1990 ; Pallotti et al., 2004 ]; Fig. 1 A ). The two nu-
cleoid populations were clearly distinguishable from each other
when visualized by two-color red-green FISH, using probes
specifi c to each � -mtDNA. The use of nonoverlapping dele-
tions of mtDNA reveals the mode of mtDNA nucleoid inher-
itance through unequivocal subcellular tracking of the two
heterologous mtDNAs.
Figure 1. mtDNAs and experimental design. (A) Linearized maps of mtDNAs discussed. The WT human mtDNA is shown at top. FLP and CW � -mtDNAs are shown below. White box denotes deleted region for each � -mtDNA. Red box denotes CW � -mtDNA FISH probe posi-tion and size. Green box denotes FLP � -mtDNA FISH probe position and size. (B) Schematic of cell fusion experiment. FLP � and CW � homo-plasmic cell lines are fused in the presence of PEG, allowed to recover, and placed in uridine-minus medium to select for mitochondrial func-tion. Homoplasmic FLP � (green) and CW � (red) nucleoids are shown with four to fi ve copies of mtDNA per nucleoid. Two models for comple-mentation are shown: faithful, in which each � -mtDNA (red only or green only) remains segregated from the other in homoplasmic nu-cleoids, and dynamic, in which the � -mtDNAs are exchanged among nucleoids, resulting in heteroplasmic nucleoids (red plus green).
on August 22, 2016
jcb.rupress.orgD
ownloaded from
Published June 23, 2008

1119SEGREGATION OF MITOCHONDRIAL DNA NUCLEOIDS • Gilkerson et al.
7909 – 9417, per the CO2/3 PCR in Fig. 2 B , and was predicted to
hybridize to CW � -mtDNA but not to FLP � -mtDNA ( Fig. 1 A ).
FISH probes localized to the mitochondria (Fig. S1 a, available
at http://www.jcb.org/cgi/content/full/jcb.200712101/DC1) and
showed the punctate distribution typical of mtDNA in fl uorescence
microscopy ( Garrido et al., 2003 ; Legros et al., 2004 ). When these
probes were mixed to examine cells carrying solely WT mtDNA,
cells hybridized with both red and green probes, as WT mtDNA
carries both probe target sequences (colocalizing as yellow; Fig. 3 ,
merge). In contrast, FLP � cells displayed strong green signal but
no signifi cant red signal, whereas CW � cells displayed strong red
signal but no appreciable green signal. 143B206 � 0 cells displayed
no signifi cant signal for either probe, as expected ( Fig. 3 ). These
results confi rmed that the cells used had the expected mtDNA
genotypes and validated our use of FISH in this system.
FC fusion cells carry both CW and FLP � -mtDNAs To examine the segregation of the FLP and CW � -mtDNAs,
we fused the two homoplasmic cell lines FLP � and CW � via
As expected, WT cells gave both products, whereas 143B206 � 0
cells gave no product in either amplifi cation ( Fig. 2 B ).
We examined the mtDNA species present in these cell lines
using FISH, as described previously ( Santra et al., 2004 ). Because
the deletions in the FLP and CW � -mtDNAs are nonoverlapping
( Fig. 1 A ), we were able to design in situ probes unique to each
deletion, allowing for sequence-specifi c visualization of each spe-
cies of � -mtDNA. The 1,244-bp FLP � -mtDNA probe ( Fig. 1 A ,
green) corresponded to mtDNA from nt 10849-12093, per the
ND4 PCR in Fig. 2 B , and was predicted to hybridize to FLP
� -mtDNA but not to CW � -mtDNA, whereas the 1,508-bp CW
� -mtDNA probe ( Fig. 1 A , red) corresponded to mtDNA from nt
Figure 2. mtDNA analysis of cybrid cell lines. (A) Long-distance PCR of mtDNAs. Lanes denote long-distance amplifi cation from 1 ng of template from total cellular DNA of the indicated cell line. Primers amplify 14,320 bp from nt 3066 (forward primer) to nt 812 (reverse primer) of the WT mtDNA molecule, encompassing both deleted regions. (B) Conventional PCR of ND4 and CO2/3 from isolated total DNA of cybrid cell lines. Lanes denote PCR reactions from 100 ng of template. (C) Southern blot analysis of FC II day-90 cells, including schematic of CW and FLP � -mtDNA restriction sites, as well as that of a potential FLP/CW recombinant molecule. Both � -mtDNAs carry a PvuII site. FLP � -mtDNA carries a SnaBI site but not a Tth111I site, whereas CW � -mtDNA carries a Tth111I site but not a SnaBI. 2 μ g of total cellular DNA was digested with the enzymes listed, trans-ferred to PVDF, and probed with DNA corresponding to nt 3778 – 6051 of human mtDNA. Single-lane panel shows a Southern blot of FC II cells subjected to ketogenic selection, digested with SnaBI and Tth111I, and electrophoresed for several days to achieve better separation of the FLP and CW � -mtDNA – linearized molecules to examine for the presence of FC recombinant restriction digest products (13.7 and 11.8 kb) intermediate to the two parental � -mtDNA restriction products (FLP � -mtDNA, 14.7 kb; CW � -mtDNA, 10.8 kb).
Figure 3. Two-color FISH of cultured cells. Green (FLP � -mtDNA) and red (CW � -mtDNA) images were captured sequentially. Bar, 20 μ m.
on August 22, 2016
jcb.rupress.orgD
ownloaded from
Published June 23, 2008

JCB • VOLUME 181 • NUMBER 7 • 2008 1120
the presence of both linearized � -mtDNAs. The single-lane
panel shows a SnaBI – Tth111I lane from a Southern blot of FC
cells grown for 14 d under strong ketogenic selection for mito-
chondrial function ( Santra et al., 2004 ), in which the gel was
run for several days to better resolve the linearized FLP and CW
� -mtDNAs. Importantly, no bands consistent with the expected
FC recombinant restriction digest products (13.7 and 11.8 kb)
were detected migrating on the gel between the FLP- (14.7 kb)
and CW (10.8 kb)-linearized � -mtDNAs, even at long-term ex-
posure ( Fig. 2 C ).
When observed by FISH, FC cells displayed both FLP
� -mtDNA ( Fig. 3 , green) and CW � -mtDNA ( Fig. 3 , red)
signal, indicating that these cells carried both parental � -mtDNAs
( Fig. 3 ), which is consistent with the results observed using
long-distance ( Fig. 2 A ) and conventional ( Fig. 2 B ) PCR,
as well as Southern blotting ( Fig. 2 C ). In contrast, in a con-
trol experiment in which FLP � and CW � cells were mixed
together but not fused with PEG, the cells showed either
only red or only green signal, indicating that these unfused
control cells remained homoplasmic for their respective
� -mtDNA ( Fig. 3 ).
polyethylene glycol (PEG) – mediated fusion, as previously de-
scribed ( Tang et al., 2000 ). Upon fusion, cells were plated in non-
selective high-glucose medium for 48 h to recover, after which
they were given medium lacking uridine to select for mito-
chondrial function ( King and Attardi, 1989 ; Fig. 1 B ). Long-
distance PCR of FLP � /CW � -fused cells (hereafter referred to
as FC cells) revealed two mtDNA species of the same sizes as
the respective parental FLP and CW � -mtDNA amplifi cation
products ( Fig. 2 A ). Conventional PCR amplifi cation of ND4
and CO2/3 from total DNA of FC cells revealed amplifi cation
products of the predicted sizes for both ND4 and CO2/3 ( Fig. 2 B ).
Conventional PCR to detect WT-mtDNA molecules demon-
strated that no WT mtDNAs were present in FC cells (unpub-
lished data). Southern blot analysis of FC cells revealed the
presence of both CW and FLP � -mtDNAs ( Fig. 2 C ). Although
both mtDNAs possess a single PvuII restriction site, the FLP
� -mtDNA harbors a SnaBI restriction site at position 10737 but
lacks a Tth111I site at position 7851, whereas the CW � -mtDNA
harbors the Tth111I site but not the SnaBI site. Single cuts with
each restriction enzyme revealed the appropriate linearized
� -mtDNA, whereas the SnaBI – Tth111I double digest revealed
Figure 4. Immunofl uorescence microscopy of cybrid cell lines. Cells were immunolabeled for fl uorescence microscopy with an antibody against mitochondrially encoded MTCO2 (green). Mitochondria were visualized with MitoTracker (red). Bar, 20 μ m. Outlined boxes in merge are enlarged in merge detail.
on August 22, 2016
jcb.rupress.orgD
ownloaded from
Published June 23, 2008
1121SEGREGATION OF MITOCHONDRIAL DNA NUCLEOIDS • Gilkerson et al.
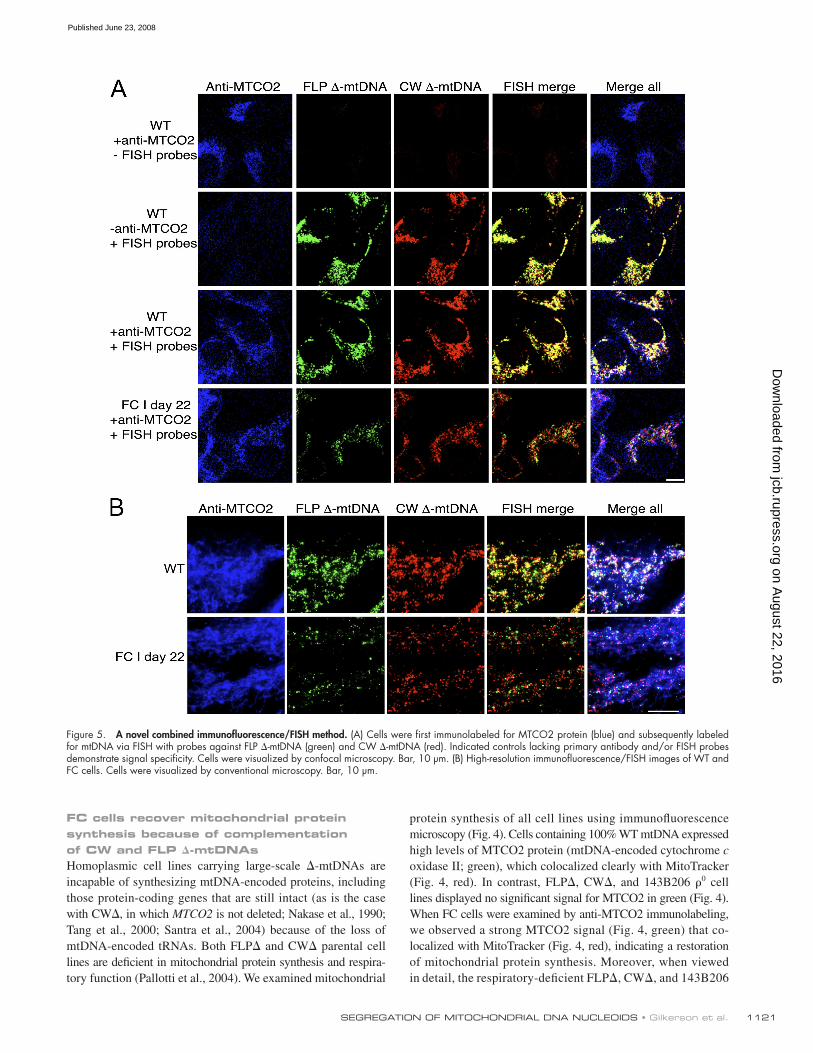
protein synthesis of all cell lines using immunofl uorescence
microscopy ( Fig. 4 ). Cells containing 100% WT mtDNA expressed
high levels of MTCO2 protein (mtDNA-encoded cytochrome c
oxidase II; green), which colocalized clearly with MitoTracker
( Fig. 4 , red). In contrast, FLP � , CW � , and 143B206 � 0 cell
lines displayed no signifi cant signal for MTCO2 in green ( Fig. 4 ).
When FC cells were examined by anti-MTCO2 immunolabeling,
we observed a strong MTCO2 signal ( Fig. 4 , green) that co-
localized with MitoTracker ( Fig. 4 , red), indicating a restoration
of mitochondrial protein synthesis. Moreover, when viewed
in detail, the respiratory-defi cient FLP � , CW � , and 143B206
FC cells recover mitochondrial protein synthesis because of complementation of CW and FLP � -mtDNAs Homoplasmic cell lines carrying large-scale � -mtDNAs are
incapable of synthesizing mtDNA-encoded proteins, including
those protein-coding genes that are still intact (as is the case
with CW � , in which MTCO2 is not deleted; Nakase et al., 1990 ;
Tang et al., 2000 ; Santra et al., 2004 ) because of the loss of
mtDNA-encoded tRNAs. Both FLP � and CW � parental cell
lines are defi cient in mitochondrial protein synthesis and respira-
tory function ( Pallotti et al., 2004 ). We examined mitochondrial
Figure 5. A novel combined immunofl uorescence/FISH method. (A) Cells were fi rst immunolabeled for MTCO2 protein (blue) and subsequently labeled for mtDNA via FISH with probes against FLP � -mtDNA (green) and CW � -mtDNA (red). Indicated controls lacking primary antibody and/or FISH probes demonstrate signal specifi city. Cells were visualized by confocal microscopy. Bar, 10 μ m. (B) High-resolution immunofl uorescence/FISH images of WT and FC cells. Cells were visualized by conventional microscopy. Bar, 10 μ m.
on August 22, 2016
jcb.rupress.orgD
ownloaded from
Published June 23, 2008

JCB • VOLUME 181 • NUMBER 7 • 2008 1122
with the FLP � -mtDNA and CW � -mtDNA in situ signals within
the same cells. The red and green FISH signals showed a hetero-
geneous distribution, unlike the near-complete overlay of these
probes in WT cells. MTCO2 signal delineates the mitochondria,
with red and green signal apparent as nucleoids distributed
throughout ( Fig. 5 B ). These results demonstrate that FC cells
that recovered mitochondrial protein synthesis, as assayed by
MTCO2 immunolabeling, presumably did so via complementa-
tion of polypeptides encoded by the FLP and CW � -mtDNAs
within the cell.
FC cells can rapidly sort FLP and CW � -mtDNAs to near homoplasmy Two independent fusion experiments were performed, yielding
essentially the same results. Fig. 6 A shows confocal FISH
micrographs of FC cells from the fi rst fusion experiment (FC I)
after 22 and 32 d of selection in medium lacking uridine. At day
22, all cells observed (100%) were found to have signal for both
FLP and CW � -mtDNAs ( Fig. 6 A and Table I ), indicating that
all the homoplasmic parental cells had died, which is consistent
with the parental cells ’ inability to grow in uridine-minus selec-
tion for mitochondrial function. Each surviving cell displayed
signal for both probes and appeared to contain high levels of
both red and green nucleoids ( Fig. 6 A , detail). At day 32, how-
ever, we observed that the distribution of the two � -mtDNAs
� 0 cell lines had a fragmented mitochondrial morphology, whereas
the complementing FC cells showed a restoration of reticular mito-
chondrial morphology similar to that in WT cells, concomitant
with restoration of the MTCO2 signal ( Fig. 4 ; Santra et al., 2004 ).
To determine whether the recovery of MTCO2 protein in
FC cells was caused by complementation of the CW and FLP
� -mtDNAs, we developed a method to simultaneously examine
MTCO2 protein and the mtDNA species present using three
different fl uorescent probes. By fi rst immunolabeling for MTCO2
using a blue Alexa Fluor 350 – conjugated secondary antibody
and then performing red/green FISH as before, we were able to
localize MTCO2 protein and the two � -mtDNAs within indi-
vidual cells. Control experiments ( Fig. 5 A ) demonstrated the
specifi city of the technique. When WT cells were processed for
immunofl uorescence/FISH labeling and the FISH probes were
omitted during hybridization, MTCO2 immunolabeling ( Fig. 5 A ,
blue) was the only signal observed. When WT cells were pro-
cessed omitting the anti-MTCO2 primary antibody, only a yellow
signal was observed, indicating colocalization of the red/green
in situ signals. When both the anti-MTCO2 antibody and the
FISH probes were included, we observed colocalization of all
three signals ( Fig. 5 A ). Conversely, no signals were observed
in � 0 cells (unpublished data).
When viewed at higher resolution, immunofl uorescence/
FISH of FC cells showed a strong signal for MTCO2 coinciding
Figure 6. Time course of FC cell fusion. (A) Confocal microscopy images of FC I cells viewed by green/red in situ hybridization at days 22 and 32 of selection in medium lacking uridine. Bar, 20 μ m. Outlined boxes in merge are enlarged in detail. Bar, 10 μ m. (B) Long-term culture of FC II cells visualized by FISH using conventional microscopy. Arrowheads (day 120) denote minority genotype nucleoids in essentially homoplasmic cells ( Table I ). Bar, 20 μ m. (C) Anti-MTCO2 immunofl uorescence microscopy of FC I cells at days 4, 22, 32, 104, and 274 of selection. The boundaries of cells with little or no MTCO2 signal were added freehand in Photoshop. Days 22 and 32 were detected with an Alexa 350 (blue) goat anti – rabbit sec-ondary as in Fig. 5 , and images were pseudo-colored green via ImageJ. Bar, 20 μ m.
on August 22, 2016
jcb.rupress.orgD
ownloaded from
Published June 23, 2008

1123SEGREGATION OF MITOCHONDRIAL DNA NUCLEOIDS • Gilkerson et al.
labeling or displayed only small patches of signal, indicating a
loss of complementation (cells with little or no MTCO2 signal
have been outlined to demonstrate the loss of MTCO2 signal).
This gain-and-loss of MTCO2 signal was also evident at later
time points, as a subset of cells at day 104 displayed high levels
of MTCO2 signal, whereas cells at day 274 displayed either no
signal or small subcellular pockets of MTCO2 signal ( Fig. 6 C ).
In a separate third fusion experiment, FC clones displayed a
periodic gain and loss of MTCO2 immunolabeling similar to
that shown here (not depicted), mirroring the cyclical segrega-
tion of FLP and CW � -mtDNAs observed ( Fig. 6 B and Table I ).
Further, long-term culture of these clones resulted in loss of
most copies of the CW � -mtDNA, whereas the FLP � -mtDNA
was maintained stably, as assayed by Southern blot (unpub-
lished data).
CW and FLP � -mtDNAs do not show frequent stable colocalization within nucleoids To examine the colocalization of the FLP and CW � -mtDNA
nucleoids, we conducted image analysis of FC cells in both fu-
sion experiments at several time points. Image analysis using
ImageJ allowed us to set a threshold for signifi cant FISH signal.
143B206 � 0 cells lacking mtDNA were processed for FISH with
the same probes used for the other samples. When the threshold
was set to eliminate nonspecifi c background, we observed no
meaningful signal, as expected for cells carrying no mtDNA
( Fig. 7 , � 0 ). This technique was applied to numerous images of
FC cells at each time point visualized by FISH. The percentage
of green, red, and white (colocalized) pixels were calculated
as the mean of all micrographs for each time point ( Table II ).
WT cells displayed a 58% colocalization of red and green
probes ( Table II ), a value similar to that obtained when these
cells were double labeled with both a red and a green CW
� -mtDNA probe (unpublished data). This seems to indicate that
was dramatically skewed: most cells observed were essentially
homoplasmic for either red (55%) or green (42%) nucleoids,
having segregated back to near homoplasmy for one genotype
or the other ( Fig. 6 A and Table I ). Only 3% of cells were still
obviously heteroplasmic. A similar shift occurred in the second
fusion experiment (FC II), in which the percentage of hetero-
plasmic cells dropped from 78% at day 22 to 1% at day 32.
In addition, FISH analysis performed at intermediate time points
(days 25, 28, and 30) revealed a steady decrease in heteroplasmic
cells over this period of time ( Table I ).
Long-term culture reveals cycling of complementation and � -mtDNA heteroplasmy When examined by FISH, long-term culture revealed fl uctuat-
ing heteroplasmy of the two mtDNAs. Fig. 6 B shows FISH
images from the second fusion experiment (FC II) at days 30,
60, 90, and 120. At days 30 and 60, a relatively high proportion
of cells were essentially homoplasmic for one mtDNA or the
other, whereas at day 90, a higher proportion of cells carried
both mtDNAs, as demonstrated in the day-90 image. At day
120, there was again a net segregation toward homoplasmy
( Fig. 6 B ). This periodic variation in heteroplasmy was borne
out in the FISH cell scoring of heteroplasmy in both fusion ex-
periments ( Table I ). Very long-term culture revealed a loss of
most CW � -mtDNA, as FC I day-274 cells had high levels of
FLP � -mtDNA but very little CW � -mtDNA as demonstrated
by FISH (Fig. S2 b, available at http://www.jcb.org/cgi/content/
full/jcb.200712101/DC1) and PCR (not depicted).
When examined by MTCO2 immunolabeling, mitochondrial
protein synthesis was restored in a subset of FC I cells as early
as day 4 of selection ( Fig. 6 C ). At day 22, all surviving FC I
cells carried MTCO2 signal, which is consistent with wide-
spread complementation of the two mtDNAs after intercellular
selection. However, at day 32, most cells had either lost MTCO2
Table I. FC cell heteroplasmy as scored by FISH
Homoplasmic CW � Heteroplasmic CW � :FLP � Homoplasmic FLP � Number of cells examined
% % %
FC I
Day 22 0 100 0 93
Day 32 55 3 42 109
Day 51 46 4 50 172
Day 59 12 41 47 116
Day 104 42 55 3 121
FC II
Day 22 3 78 18 132
Day 25 19 50 31 74
Day 28 42 16 41 93
Day 30 54 6 40 110
Day 32 49 1 50 156
Day 60 47 9 44 115
Day 90 22 46 32 122
Day 120 40 12 48 130
Cells for both fusion experiments (FC I and FC II) were scored as heteroplasmic CW � :FLP � if they carried appreciable FISH signal for both CW � -mtDNA (red) and FLP � -mtDNA (green) FISH probes. Cells having predominantly one signal were scored as homoplasmic. For example, the arrowheads in Fig. 6 B at day 120 show nucleoids that are in a clear minority (i.e. red in a predominantly green cell, green in a predominantly red cell). Both cells were considered to be essentially homo-plasmic for the majority nucleoid population and were scored accordingly.
on August 22, 2016
jcb.rupress.orgD
ownloaded from
Published June 23, 2008

JCB • VOLUME 181 • NUMBER 7 • 2008 1124
of colocalization ( Table II ). Even cells having roughly equal
proportions of the two � -mtDNAs had a low incidence of co-
localization at day 32 (unpublished data). This quantitation con-
fi rmed that colocalization of FLP and CW � -mtDNAs underwent
a dramatic decrease between days 22 and 32 and implies that the
observed colocalization at day 22 was transient in nature, includ-
ing that observed at subsequent time points. Moreover, although
colocalization fl uctuates, at no point did we observe a high oc-
currence of red/green colocalization ( Fig. 7 ). The maximum
colocalization observed was only 31% of WT ( Table II , FC I,
day 22), and most time points were well below even this level.
Discussion The experiments shown here provide the fi rst suborganellar
visualization of the segregation of two heterologous mtDNAs.
the 58% colocalization observed for the two probes represents
the maximal colocalization of FISH probes using this protocol.
Fig. 7 shows examples of the FISH images used to quanti-
tate colocalization, demonstrating the segregation of the CW
and FLP � -mtDNAs in FC II cells (second fusion experiment).
Colocalization was demonstrated in Fig. 7 (right) using the ImageJ
analysis described in the previous paragraph (appears as white).
As in FC I, each cell had an intermixed population of red,
green, and red/green colocalized (i.e., white) nucleoids at day 22,
whereas at day 32, most nucleoids had segregated away from
each other, such that only a handful of colocalization sites were
found. Colocalization sites indicated on the micrograph frequently
appeared as partial overlap between red and green nucleoids
(Fig. S2 b, day 22). At day 22, 16% of pixels were determined to
have colocalization of red and green signal. At day 32, this value
fell to 2%, demonstrating a signifi cant decrease in the incidence
Figure 7. Nucleoid segregation in FC cells. Representative FISH images, visualized with conventional microscopy, used to generate the colocalization data in Table II . FLP � -mtDNA is labeled in green, whereas the CW � -mtDNA is labeled in red, with colocalization appearing as yellow in the merge. ImageJ colocalization is shown in white in the far right, illustrating the pixels having both signifi cant red and green signal. WT and � 0 controls are also shown. Bar, 0.5 μ m.
on August 22, 2016
jcb.rupress.orgD
ownloaded from
Published June 23, 2008

1125SEGREGATION OF MITOCHONDRIAL DNA NUCLEOIDS • Gilkerson et al.
typically involved a partial overlap of adjacent red and green
nucleoids (Fig. S2 b, day 22, arrowheads). These fi ndings sug-
gest that the majority of colocalization is not equivalent to a
bona fi de stable fusion of two nucleoids but rather is indicative
of transient proximity of two heterologous nucleoids. Our results
demonstrate that although nucleoids migrate relatively freely
within the cell, which is in agreement with previous studies
( Okamoto et al., 1998 ; Iborra et al., 2004 ; Legros et al., 2004 ),
heterologous nucleoids do not exchange genomes with each other
frequently, which is consistent with the faithful nucleoid model
( Jacobs et al., 2000 ).
The faithful nucleoid model provides a mechanism to ex-
plain both stable persistent heteroplasmy and rapid changes in
heteroplasmy. In both cases, the mtDNA content of the individ-
ual nucleoids is the key determinant of cellular heteroplasmy as
a whole. In a cell fusion with two heterologous nucleoid popula-
tions, such as ours, the faithful nucleoid model predicts that the
two nucleoid populations will swiftly undergo mitotic segrega-
tion toward homoplasmy ( Jacobs et al., 2000 ). We observed such
segregation experimentally in both fusions (for example, Fig. 6 A
and Table I , days 22 and 32). Our results mirror examples of
rapid mitotic segregation caused by random genetic drift, partic-
ularly as has been reported to occur in mammalian oocytes
( Jenuth et al., 1996 ; Brown et al., 2001 ). This mitotic segregation
allows the cell to undergo a purifi cation of deleterious mtDNA
mutations. Conversely, this stochastic segregation can also allow
mutations to reach pathogenically high levels in some oocytes
before mtDNA amplifi cation during development ( Cree et al.,
2008 ). Although the faithful nucleoid model predicts that mitotic
segregation occurs in the absence of selection for mitochondrial
function, we interpret the restoration of mitochondrial protein
synthesis and function in FC cells (as at day 22) as a temporary
suspension of selective pressure within the cell, allowing random
When cells carrying mtDNA nucleoids from two different ge-
netic backgrounds were fused, the two heterologous nucleoid
populations complemented each other functionally to restore
mitochondrial protein synthesis. During this process, the two
nucleoid populations faithfully maintained their original ge-
netic composition rather than frequently exchanging mtDNAs,
which is consistent with the faithful nucleoid model ( Jacobs
et al., 2000 ).
Complementary mtDNAs restore mitochondrial protein synthesis Upon fusion of two cell lines, each homoplasmic for one of two
nonoverlapping deletions, the presence of both complementary
mtDNAs led to a restoration of mitochondrial protein synthesis
in a subset of cells at the fi rst time point examined (day 4 of
selection for mitochondrial function). Intercellular selection
expanded this to all remaining cells by day 22, as nonfused
parental cells died by this time point. Using a novel immuno-
fl uorescence/FISH method, both � -mtDNAs colocalized with
MTCO2 protein within FC cells, demonstrating that the ob-
served restoration of mitochondrial protein synthesis resulted
from transcomplementation of the two mtDNAs. FC cells showed
restoration of mitochondrial protein synthesis, as assayed by
35 S methionine labeling (Fig. S3 a, available at http://www.jcb.org/
cgi/content/full/jcb.200712101/DC1), as well as recovery of
WT-like reticular mitochondrial morphology ( Fig. 4 ), correlating
with WT mitochondrial function ( Gilkerson et al., 2000 ) and
cytochrome c oxidase activity (Fig. S3 b), indicating that FC
cells recover mitochondrial function because of transcomple-
mentation of the two mtDNAs. The recovery of mitochondrial
protein synthesis, cytochrome c oxidase activity, and reticular
mitochondrial morphology are in agreement with Ono et al.
(2001) , who found similar results in a fusion of two cell lines
carrying complementary patient-derived point mutations of
mtDNA. This suggests that heterologous mtDNAs need not be
in the same nucleoid to complement each other. It is likely that
the complementing mRNAs and/or proteins need only be within
diffusible distance of each other within the mitochondrial matrix
to synthesize mtDNA-encoded proteins and restore normal
mitochondrial function. This result further implies that the mito-
chondrial compartment maintains the ability to fuse and exchange
heterologous mitochondrial components, even in respiratory-
defi cient backgrounds. mtDNA transcomplementation has been
demonstrated previously, both between two complementing point
mutations ( Ono et al., 2001 ) and between a point mutation and
a large-scale deletion ( Takai et al., 1999 ), but has never been
shown at nucleoid resolution.
mtDNA nucleoids distribute within cells but remain genetically independent Strikingly, at no time point in either fusion experiment did we
observe frequent colocalization of the two mtDNAs, as visualized
by deletion-specifi c FISH probes. Even in cells carrying both
mtDNAs at roughly equal levels, the maximal colocalization
observed was only 31% of WT colocalization (FC I, day 22).
Most other time points were well below this value (2 – 19%;
Table II ). Further, the majority of colocalization we observed
Table II. CW � -mtDNA/FLP � -mtDNA colocalization in FC cells
ImageJ colocalization Normalized colocalization a
% ± SD %
WT 58 ± 10 ( n = 14) 100
FC I
Day 22 18 ± 7 ( n = 10) 31
Day 32 3 ± 3 ( n = 10) 5
Day 51 7 ± 9 ( n = 10) 12
Day 59 11 ± 7 ( n = 9) 19
Day 104 4 ± 3 ( n = 10) 7
Day 274 2 ± 2 ( n = 11) 3
FC II
Day 22 16 ± 9 ( n = 11) 28
Day 32 2 ± 4 ( n = 10) 4
Day 60 2 ± 2 ( n = 10) 4
Day 90 7 ± 4 ( n = 9) 12
Day 120 7 ± 6 ( n = 8) 12
Day 150 1 ± 2 ( n = 10) 2
Red and green images were thresholded to remove irrelevant pixel intensities (see Materials and methods) and the proportion of pixels carrying meaning-ful signal for both red and green were expressed as a percentage of the total. n = number of images analyzed for each timepoint (see Fig. 7 for examples). a Colocalization expressed as a percentage of WT colocalization.
on August 22, 2016
jcb.rupress.orgD
ownloaded from
Published June 23, 2008

JCB • VOLUME 181 • NUMBER 7 • 2008 1126
FC cells in glucose-minus media, using ketones as a carbon
source to force mitochondrial ATP production ( Santra et al.,
2004 ), resulting in a much harsher selective environment. FC
cells grown in ketogenic media contained no recombinant mol-
ecules as assayed by Southern blot ( Fig. 2 C , bottom right).
Thus, even a harsh selective environment did not induce or se-
lect for recombination of the two parental mtDNAs. Although
D ’ Aurelio et al. (2004) did observe intermolecular recombina-
tion at low levels in a similar cell fusion, it was necessary to de-
plete mtDNA with ethidium bromide to enrich for recombinants.
Collectively, these results suggest that mtDNA nucleoids typi-
cally maintain a consistent genetic composition and are not gen-
erally inclined to fuse and exchange mtDNAs.
Collectively, these results suggest that mitochondrial nu-
cleoid organization typically results in very little free mtDNA,
instead remaining tightly complexed by mtDNA binding pro-
teins (such as TFAM [ Kaufman et al., 2007 ]) into nucleoids.
It is possible that the tightly constrained nature of nucleoid
maintenance does not permit a high degree of physical inter-
action of the two mtDNAs, as is required for intramolecular
recombination. Thus, two heterologous mtDNAs may be spa-
tially and temporally adjacent yet still have little opportunity
to recombine.
Although the faithful nucleoid model of Jacobs et al.
(2000) assumes that an individual nucleoid carries multiple
(approximately fi ve) mtDNAs, the number of mtDNAs carried
within a nucleoid remains somewhat controversial. Using quanti-
tative PCR (to determine copy number per cell) in conjunction
with confocal Z-stack reconstruction (to quantitate nucleoid
number per cell), we found that nucleoids in FC cells contain
a mean of 5.1 ± 2.4 mtDNAs per nucleoid (Fig. S1, b and c),
which is similar to the values determined by others ( Iborra et al.,
2004 ; Legros et al., 2004 ). It remains a formal possibility that
nucleoids may carry only one or two mtDNAs in some cell types
and contexts, which is in accordance with the original estimates
of Satoh and Kuroiwa (1991) ; however, our results are consis-
tent with the faithful nucleoid model of multigenomic nucle-
oids that maintain a consistent genetic composition. Additional
experiments may reveal differences in nucleoid organization
between rapidly dividing and postmitotic cell types.
It remains to be determined whether our fi ndings are a
general property of mtDNA propagation. Different cell and tis-
sue types in other conditions may yield different results. For ex-
ample, it has long been known that mtDNA duplications are
particularly abundant in human heart ( Fromenty et al., 1997 ;
Kajander et al., 2001 ) and that mtDNA isolated from human
heart appears as multigenomic tangles of monomeric and di-
meric mtDNA species (J. Pohjoismaki and H. Jacobs, personal
communication), implying that there may be many mtDNAs
per nucleoid in this tissue. Our experiments involved the use
of a transformed cybrid cell culture system, in which neither
� -mtDNA is typical of the region commonly deleted in mtDNA
( Schon et al., 1989 ; Mita et al., 1990 ).
Despite these caveats, the experiments presented here are
the fi rst unequivocal subcellular tracking of the segregation of
two heterologous mtDNAs, demonstrating that mitochondrial
nucleoids are faithfully inherited as independent genetic entities.
genetic drift to result in the mitotic segregation we observe.
Accordingly, FC cells removed from selection and grown in uridine-
plus media displayed similar rapid mitotic segregation (unpub-
lished data). As functional respiratory chain complexes are turned
over and are not replaced because of segregation via random
genetic drift, we believe that selection is reinforced, resulting in
another round of intercellular selection for cells carrying both
mtDNAs, which is consistent with the outgrowth of colonies
heteroplasmic for the two mtDNAs (Fig. S2 a).
In the absence of selective pressure, as in the oocyte ex-
amples described in the previous paragraph, random segrega-
tion events can result in shifts toward homoplasmy when the
two mtDNAs present occur in heterologous nucleoid popula-
tions. In the presence of selective pressure or replicative ad-
vantage, faithful nucleoid inheritance provides a mechanism
allowing for more directed changes in heteroplasmy, both for
( Yoneda et al., 1992 ; Blok et al., 1997 ) and against ( Fan et al.,
2008 ; Rajasimha et al., 2008 ) mtDNA mutations. Any mtDNA
with a selective or replicative advantage can thus be freely and
preferentially propagated. Nuclear genetic control of mtDNA
segregation has been observed ( Lehtinen et al., 1999 ; Battersby
et al., 2003 ); however, it remains to be determined how nucle-
oid organization, selective pressure, and nuclear-encoded fac-
tors combine to effect mtDNA segregation. Remodeling of
bacterial nucleoids by DNA binding proteins has been shown
to result in widespread transcriptional and metabolic changes
( Kar et al., 2005 ). Mitochondrial nucleoid organization may
play a central role in regulating mitochondrial metabolism by
modulating mtDNA transcription and assembly of respiratory
chain complexes.
mtDNA exchange between nucleoids and mtDNA recombination can occur but are low-frequency events If heterologous nucleoids did undergo frequent exchange of
mtDNAs, we would have observed a relatively stable apprecia-
ble frequency of red/green colocalization at all time points and
a concomitant stable restoration of MTCO2 immunolabeling.
Instead, we observed a low incidence of colocalization, which
fl uctuated greatly as the two genotypes underwent mitotic seg-
regation. The rare stable exchange of mtDNAs between nucle-
oids is most likely represented by the small number of nucleoids
displaying red/green colocalization at day 274. At this time
point, very few nucleoids have a red CW signal that neatly over-
lays with green FLP nucleoids, which is consistent with a truly
fused nucleoid carrying both mtDNAs (Fig. S2 b, day 274,
arrowhead). Further, frequent exchange of � -mtDNAs between
heterologous nucleoids would likely have led to some apprecia-
ble level of intermolecular recombination, but we observed no
evidence of recombination by Southern blotting ( Fig. 2 C ), by
long-distance PCR, or even by Southern blotting of long-distance
PCR products (not depicted). No heteroduplexes or reconstituted
WT molecules were detected.
Although these experiments were conducted in selective
pressure for mitochondrial function, uridine-minus selection in
glucose-containing medium is the gentlest such selection avail-
able, as cells can still synthesize ATP via glycolysis. We placed
on August 22, 2016
jcb.rupress.orgD
ownloaded from
Published June 23, 2008

1127SEGREGATION OF MITOCHONDRIAL DNA NUCLEOIDS • Gilkerson et al.
FISH mtDNA probes were prepared by PCR amplifi cation of the mtDNA CO2/3 and ND4 fragments as in PCR from isolated total cellular DNA. Probe frag-ments were labeled by nick translation to incorporate an aminoallyl deoxy-UTP, followed by subsequent Alexa Fluor labeling using the ARES DNA labeling kit (Invitrogen). The FLP � -mtDNA probe was labeled with Alexa Fluor 488 (green). The CW � -mtDNA probe was labeled with Alexa Fluor 594 (red; Fig. 1 A ). FISH was conducted essentially as described previously ( Margineantu et al., 2002 ; Santra et al., 2004 ). In brief, cells were fi xed in 4% PFA in PBS for 30 min, followed by serial dehydration/rehydration in graded ethanol solutions. Coverslips were treated with DNase-free RNase at 0.1 mg/ml in PBS for 1 h at 37 ° C. Coverslips were prehybridized in 2 × SSC for 30 – 40 min at 37 ° C, dehydrated, air dried, and denatured in 70% formamide in 2 × SSC for 5 min at 72 ° C. FLP � -mtDNA (green) and CW � -mtDNA (red) probes were combined to a fi nal concentration of 2 ng/ μ l (each) in hybridization buffer (50% formamide/20% dextran sulfate in 2 × SSC) and denatured at 72 ° C for 5 min. Probes were applied to cov-erslips and hybridized overnight at 37 ° C in a humid chamber. Coverslips were then washed in 0.3% Tween in 0.4 × SSC for 5 min at 72 ° C, followed by washing in 0.1% Tween in 2 × SSC for 1 min and 2 × SSC for 2 min. Coverslips were mounted with 50% glycerol in PBS.
Combined immunofl uorescence/FISH labeling To examine mitochondrial protein synthesis and mtDNA distribution simul-taneously, we developed a combined immunofl uorescence/FISH method. To maintain adequate hydration, we fi rst immunolabeled cells for MTCO2, followed by the harsher FISH procedure. In brief, cells were fi xed and pro-cessed for immunocytochemistry as described in Immunocytochemistry. After blocking, cells were incubated with anti-MTCO2 primary as described, followed by incubation with Alexa Fluor 350 – conjugated goat anti – rabbit antibody (blue; Invitrogen). After incubation with secondary antibody, cells were fi xed in 4% PFA in PBS and processed for FISH exactly as described in the previous section. The immunolabeling did not work if FISH was per-formed fi rst.
Microscopy Cells were imaged using an inverted microscope (IX70; Olympus) with a UplanFl 100 × /1.3 numerical aperture oil immersion objective (Olympus). Red, green, and blue images were captured sequentially using a SPOT RT digital camera and merged using SPOT RT software (Olympus). Images were processed equally after capture for HSV histogram and contrast ad-justment in SPOT RT. Confocal images were obtained using an LSM 510 NLO multiphoton confocal microscope (Carl Zeiss, Inc.) with a Plan Neo-fl uar 100 × /1.3 numerical aperture objective (Olympus). Red, green, and blue images were acquired with LSM 510 NLO Standard software (Carl Zeiss, Inc.) sequentially and merged using ImageJ (National Institutes of Health). Confocal images were adjusted for brightness/contrast in ImageJ. Images in each fi gure were processed equally. Fluorochromes for FISH and immunofl uorescence were Alexa 488, Alexa 594, and Alexa 350, or MitoTracker RedCMXRos (Invitrogen). All imaging was performed at room temperature. All samples were mounted in 50% glycerol in PBS.
Image analysis Quantifi cation of colocalization in FISH images was performed using ImageJ. By converting individual red and green TIFF images to binary look up table images and setting a threshold level that was empirically determined to elimi-nate background fl uorescence (pixel intensity: green,29 – 255; red, 36 – 255 [arbitrary units]), we were able to obtain the number of green, red, and co-localized green/red pixels for each micrograph. By applying this method identically to all images, we compiled a comprehensive assessment of the level of green/red FISH colocalization for the cell lines quantitated in Table II . Colocalization mask images in Fig. 7 (ImageJ) were generated using co-localization fi nder in ImageJ, in which pixels with meaningful colocalization appear in the image as white ( Fig. 7 ). The region of interest was generated by eliminating the 38 lowest pixel intensities in both the red and green axis.
Online supplemental material Fig. S1 shows mtDNA nucleoid localization and quantifi cation. Fig. S2 shows mitochondrial protein synthesis and function. Fig. S3 shows FC cul-ture growth and nucleoid localization. Online supplemental material is avail-able at http://www.jcb.org/cgi/content/full/jcb.200712101/DC1.
We thank Adrianus DeGroof, Edina Torgyekes, Jorida Coku, Ali Naini, Edu-ardo Bonilla, Winsome Walker, Liza Pon, Theresa Swayne, and Sudhi Swamy for their assistance and suggestions. We also thank the Eric Schon, Michio Hirano, and Salvatore DiMauro laboratories for helpful discussions.
Moreover, the genetic autonomy of mitochondrial nucleoids pro-
vides a mechanism by which to therapeutically eliminate delete-
rious mtDNA mutations ( Santra et al., 2004 ; Bayona-Bafaluy
et al., 2005 ). A better understanding of the mechanisms of mtDNA
propagation and inheritance will allow the development of
mechanism-based therapeutic methods to rescue mitochondrial
function in patients carrying deleterious mtDNA mutations.
Materials and methods Cell lines, cell culture, and cell fusion We studied cybrid cell lines containing mtDNA derived from patients re-ported previously. The FLP � -mtDNA is derived from a heteroplasmic pa-tient with Kearns-Sayre syndrome (Patient 4 [ Zeviani et al., 1988 ] and Patient K11 [ Mita et al., 1990 ]). This deletion removes 1,902 bp from nt 7846 (notation of Anderson et al. [1981] ) in the MTCO2 gene to nt 9748 in the MTCO3 gene ( Fig. 1 A ). The CW � -mtDNA is derived from Patient K13 ( Mita et al., 1990 ). This deletion removes 5,790 bp from nt 10155 in MTND3 to nt 15945 in MTTT ( Fig. 1 A ). Cybrid cell lines FLP6a39.2WT (100% WT), FLP6a39.32 � (100% � ), CW420-115 � (100% � ), and 143B206 � 0 (lacking mtDNA) have been previously described ( Pallotti et al., 2004 ; Santra et al., 2004 ). All cells were grown in high glucose DME with 10% FBS and 50 μ g/ml uridine before selection in the same medium lacking uridine after fusion. CW420-115 � and FLP6a39.32 � cell lines were fused in the presence of PEG (as per King and Attardi [1989] ) and allowed to recover in DME with 10% FBS with uridine. After 48 h of recov-ery, fusion medium was replaced with DME with 10% FBS minus uridine to select for mitochondrial function. For ketogenic selection, cells were grown in DME lacking glucose and uridine, supplemented with 5 mM DL - � - hydroxybutyrate ( Santra et al., 2004 ). FBS was dialyzed with eight changes of buffer before use in cell culture.
Immunocytochemistry Cultured cells were seeded to 22 × 22-mm glass coverslips before process-ing. Coverslips were incubated with MitoTracker Red CMXRos (Invitrogen) before fi xation in 4% PFA in PBS for 30 min, permeabilized with 0.1% Tri-ton X-100 in PBS for 10 min, and blocked in 10% normal goat serum for 30 min. Coverslips were incubated with a rabbit polyclonal antibody to MTCO2 (gift from R. Doolittle, University of California, San Diego, La Jolla, CA) at 1:100 dilution in PBS for 1 h, followed by three washes of 5 min each in PBS. Coverslips were then incubated with Alexa 488 – conjugated goat anti – rabbit secondary antibody (Invitrogen) at 1:100 dilution in PBS for 1 h, again followed by three washes of 5 min each in PBS. Coverslips were washed with PBS and mounted with 50% glycerol in PBS.
PCR from isolated total cellular DNA Total cellular DNA was isolated as previously described ( Zeviani et al., 1988 ), using proteinase K digestion followed by organic extraction and isopropanol/ethanol precipitation. Long-distance PCR was conducted us-ing the LA Taq system (Takara Bio Inc.) with a forward primer correspond-ing to mtDNA nt 3068 – 3100 and reverse primer corresponding to mtDNA nt 817 – 782. Reactions were run on a 0.8% agarose gel. Conventional PCR amplifi cations were as follows: the CO2/3 fragment, corresponding to mtDNA from nt 7909 – 9417, used forward primer ACGAGTACACC-GACTACGGC (nt 7909 – 7928) and reverse primer GTGGCCTTGGTAT-GTGCTTT (nt 9397 – 9417); the ND4 fragment, corresponding to mtDNA from nt 10849 – 12093, used forward primer CCACCCACAGCCTAAT-TATTAGC (nt 10849 – 10865) and reverse primer GAATGGGGGATAGGT-GTATGAAC (nt 12093 – 12071). Reactions were electrophoresed through a 1% agarose gel and photographed using an AlphaImager2200 gel im-aging system (Imgen Technologies).
Southern blotting 2.5 μ g FC total cellular DNA was digested with PvuII, SnaBI, Tth111I, or both SnaBI and Tth111I, run on a 0.8% agarose gel, and transferred to PVDF. A PCR fragment corresponding to nt 3778 – 6051 of human mtDNA was radiolabeled with 32 P-labeled deoxy-CTP. Membranes were pre-hybridized in 0.5% sodium dodecyl sulfate in 0.25 M disodium hydrogen phosphate and hybridized with radiolabeled probe DNA overnight at 65 ° . Membranes were washed, exposed to a screen (Bio-Rad Labora-tories), and visualized using a Molecular Imager FX phosphorimager (Bio-Rad Laboratories).
on August 22, 2016
jcb.rupress.orgD
ownloaded from
Published June 23, 2008

JCB • VOLUME 181 • NUMBER 7 • 2008 1128
Kaufman , B.A. , N. Durisic , J.M. Mativetsky , S. Costantino , M.A. Hancock , P. Grutter , and E.A. Shoubridge . 2007 . The mitochondrial transcription factor TFAM coordinates the assembly of multiple DNA molecules into nucleoid-like structures. Mol. Biol. Cell . 18 : 3225 – 3236 .
King , M.P. , and G. Attardi . 1989 . Human cells lacking mtDNA: Repopulation with exogenous mitochondria by complementation. Science . 246 : 500 – 503 .
Kraytsberg , Y. , M. Schwartz , T.A. Brown , K. Ebralidse , W.S. Kunz , D.A. Clayton , J. Vissing , and K. Khrapko . 2004 . Recombination of human mitochondrial DNA. Science . 304 : 981 .
Legros , F. , F. Malka , P. Frachon , A. Lombes , and M. Rojo . 2004 . Organization and dynamics of human mitochondrial DNA. J. Cell Sci. 117 : 2653 – 2662 .
Lehtinen , S.K. , J.N. Spelbrink , and H.T. Jacobs . 1999 . Heteroplasmic segrega-tion associated with trisomy-9 in cultured human cells. Somat. Cell Mol. Genet. 25 : 263 – 274 .
Margineantu , D.H. , W.G. Cox , L. Sundell , S.W. Sherwood , J.M. Beechem , and R.A. Capaldi . 2002 . Cell cycle dependent morphology changes and as-sociated mitochondrial DNA. Mitochondrion . 1 : 425 – 435 .
Mita , S. , R. Rizzuto , C.T. Moraes , S. Shanske , E. Arnaudo , G.M. Fabrizi , Y. Koga , S. DiMauro , and E.A. Schon . 1990 . Recombination via fl anking direct repeats is a major cause of large-scale deletions of human mito-chondrial DNA. Nucleic Acids Res. 18 : 561 – 567 .
Nakase , H. , C.T. Moraes , R. Rizzuto , A. Lombes , S. DiMauro , and E.A. Schon . 1990 . Transcription and translation of deleted mitochondrial genomes in Kearns-Sayre syndrome: implications for pathogenesis. Am. J. Hum. Genet. 46 : 418 – 427 .
Okamoto , K. , P.S. Perlman , and R.A. Butow . 1998 . The sorting of mitochondrial DNA and mitochondrial proteins in zygotes: preferential transmission of mitochondrial DNA to the medial bud. J. Cell Biol. 142 : 613 – 623 .
Ono , T. , K. Isobe , K. Nakada , and J.I. Hayashi . 2001 . Human cells are protected from mitochondrial dysfunction by complementation of DNA products in fused mitochondria. Nat. Genet. 28 : 272 – 275 .
Pallotti , F. , A. Baracca , E. Hernandez-Rosa , W.F. Walker , G. Solaini , G. Lenaz , G.V. Melzi D ’ Eril , S. Dimauro , E.A. Schon , and M.M. Davidson . 2004 . Biochemical analysis of respiratory function in cybrid cell lines harbour-ing mitochondrial DNA mutations. Biochem. J. 384 : 287 – 293 .
Rajasimha , H.K. , P.F. Chinnery , and D.C. Samuels . 2008 . Selection against pathogenic mtDNA mutations in a stem cell population leads to the loss of the 3243A → G mutation in blood. Am. J. Hum. Genet. 82 : 333 – 343 .
Rothfi eld , L. , A. Taghbalout , and Y.L. Shih . 2005 . Spatial control of bacterial division-site placement. Nat. Rev. Microbiol. 3 : 959 – 968 .
Santra , S. , R. Gilkerson , M. Davidson , and E.A. Schon . 2004 . Ketogenic treat-ment reduces the proportion of mutated mitochondrial DNAs in cells har-boring mtDNA deletions. Ann. Neurol. 56 : 662 – 669 .
Satoh , M. , and T. Kuroiwa . 1991 . Organization of multiple nucleoids and DNA molecules in mitochondria of a human cell. Exp. Cell Res. 196 : 137 – 140 .
Schon , E.A. , R. Rizzuto , C.T. Moraes , H. Nakase , M. Zeviani , and S. DiMauro . 1989 . A direct repeat is a hotspot for large-scale deletions of human mito-chondrial DNA. Science . 244 : 346 – 349 .
Takai , D. , K. Isobe , and J. Hayashi . 1999 . Transcomplementation between differ-ent types of respiration-defi cient mitochondria with different pathogenic mutant mitochondrial DNAs. J. Biol. Chem. 274 : 11199 – 11202 .
Tang , Y. , E.A. Schon , E. Wilichowski , M.E. Vazquez-Memije , E. Davidson , and M.P. King . 2000 . Rearrangements of human mitochondrial DNA (mtDNA): new insights into the regulation of mtDNA copy number and gene expression. Mol. Biol. Cell . 11 : 1471 – 1485 .
Wang , Y. , and D.F. Bogenhagen . 2006 . Human mitochondrial DNA nucleoids are linked to protein folding machinery and metabolic enzymes at the mito-chondrial inner membrane. J. Biol. Chem. 281 : 25791 – 25802 .
Yoneda , M. , A. Chomyn , A. Martinuzzi , O. Hurko , and G. Attardi . 1992 . Marked replicative advantage of human mtDNA carrying a point mutation that causes the MELAS encephalomyopathy. Proc. Natl. Acad. Sci. USA . 89 : 11164 – 11168 .
Zeviani , M. , C.T. Moraes , S. DiMauro , H. Nakase , E. Bonilla , E.A. Schon , and L.P. Rowland . 1988 . Deletions of mitochondrial DNA in Kearns-Sayre syndrome. Neurology . 38 : 1339 – 1346 .
This research was supported by grants from the National Institutes of Health (HD83062, NS11766, and AG08702 to E.A. Schon), the Marriott Foundation, and a Muscular Dystrophy Association Development grant (MDA3869 to R.W. Gilkerson). We thank the Confocal and Specialized Microscopy Shared Resource of the Herbert Irving Comprehensive Cancer Center (supported by National Institutes of Health grant P30 CA13696 and National Institutes of Health Shared Instrumentation Grants S10 RR10506, S10 RR14701, and S10 RR017885).
The authors declare that they have no competing fi nancial interests.
Submitted: 19 December 2007 Accepted: 28 May 2008
References Anderson , S. , A.T. Bankier , B.G. Barrell , M.H.L. de Bruijn , A.R. Coulson , J.
Drouin , I.C. Eperon , D.P. Nierlich , B.A. Roe , F. Sanger , et al . 1981 . Sequence and organization of the human mitochondrial genome. Nature . 290 : 457 – 465 .
Battersby , B.J. , J.C. Loredo-Osti , and E.A. Shoubridge . 2003 . Nuclear genetic control of mitochondrial DNA segregation. Nat. Genet. 33 : 183 – 186 .
Bayona-Bafaluy , M.P. , B. Blits , B.J. Battersby , E.A. Shoubridge , and C.T. Moraes . 2005 . Rapid directional shift of mitochondrial DNA hetero-plasmy in animal tissues by a mitochondrially targeted restriction endo-nuclease. Proc. Natl. Acad. Sci. USA . 102 : 14392 – 14397 .
Blok , R.B. , D.A. Gook , D.R. Thorburn , and H.H. Dahl . 1997 . Skewed segrega-tion of the mtDNA nt 8993 (T → G) mutation in human oocytes. Am. J. Hum. Genet. 60 : 1495 – 1501 .
Brown , D.T. , D.C. Samuels , E.M. Michael , D.M. Turnbull , and P.F. Chinnery . 2001 . Random genetic drift determines the level of mutant mtDNA in human primary oocytes. Am. J. Hum. Genet. 68 : 533 – 536 .
Capaldi , R.A. , R. Aggeler , R. Gilkerson , G. Hanson , M. Knowles , A. Marcus , D. Margineantu , M. Marusich , J. Murray , D. Oglesbee , et al . 2002 . A replicating module as the unit of mitochondrial structure and functioning. Biochim. Biophys. Acta . 1555 : 192 – 195 .
Chen , X.J. , and R.A. Butow . 2005 . The organization and inheritance of the mito-chondrial genome. Nat. Rev. Genet. 6 : 815 – 825 .
Chen , X.J. , X. Wang , B.A. Kaufman , and R.A. Butow . 2005 . Aconitase couples meta-bolic regulation to mitochondrial DNA maintenance. Science . 307 : 714 – 717 .
Cree , L.M. , D.C. Samuels , S.C. de Sousa Lopes , H.K. Rajasimha , P. Wonnapinij , J.R. Mann , H.H. Dahl , and P.F. Chinnery . 2008 . A reduction of mito-chondrial DNA molecules during embryogenesis explains the rapid seg-regation of genotypes. Nat. Genet. 40 : 249 – 254 .
D ’ Aurelio , M. , C.D. Gajewski , M.T. Lin , W.M. Mauck , L.Z. Shao , G. Lenaz , C.T. Moraes , and G. Manfredi . 2004 . Heterologous mitochondrial DNA recombination in human cells. Hum. Mol. Genet. 13 : 3171 – 3179 .
DiMauro , S. , and E.A. Schon . 2003 . Mitochondrial respiratory-chain diseases. N. Engl. J. Med. 348 : 2656 – 2668 .
Fan , W. , K.G. Waymire , N. Narula , P. Li , C. Rocher , P.E. Coskun , M.A. Vannan , J. Narula , G.R. Macgregor , and D.C. Wallace . 2008 . A mouse model of mitochondrial disease reveals germline selection against severe mtDNA mutations. Science . 319 : 958 – 962 .
Fromenty , B. , R. Carrozzo , S. Shanske , and E.A. Schon . 1997 . High proportions of mtDNA duplications in patients with Kearns-Sayre syndrome occur in the heart. Am. J. Med. Genet. 71 : 443 – 452 .
Garrido , N. , L. Griparic , E. Jokitalo , J. Wartiovaara , A.M. van der Bliek , and J.N. Spelbrink . 2003 . Composition and dynamics of human mitochondrial nucleoids. Mol. Biol. Cell . 14 : 1583 – 1596 .
Gilkerson , R.W. , D.H. Margineantu , R.A. Capaldi , and J.M. Selker . 2000 . Mitochondrial DNA depletion causes morphological changes in the mito-chondrial reticulum of cultured human cells. FEBS Lett. 474 : 1 – 4 .
Iborra , F.J. , H. Kimura , and P.R. Cook . 2004 . The functional organization of mitochondrial genomes in human cells. BMC Biol. 2 : 9 .
Jacobs , H.T. , S.K. Lehtinen , and J.N. Spelbrink . 2000 . No sex please, we ’ re mitochondria: a hypothesis on the somatic unit of inheritance of mam-malian mtDNA. Bioessays . 22 : 564 – 572 .
Jenuth , J.P. , A.C. Peterson , K. Fu , and E.A. Shoubridge . 1996 . Random genetic drift in the female germline explains the rapid segregation of mammalian mitochondrial DNA. Nat. Genet. 14 : 146 – 151 .
Kajander , O.A. , P.J. Karhunen , I.J. Holt , and H.T. Jacobs . 2001 . Prominent mito-chondrial DNA recombination intermediates in human heart muscle. EMBO Rep. 2 : 1007 – 1012 .
Kar , S. , R. Edgar , and S. Adhya . 2005 . Nucleoid remodeling by an altered HU protein: reorganization of the transcription program. Proc. Natl. Acad. Sci. USA . 102 : 16397 – 16402 .
on August 22, 2016
jcb.rupress.orgD
ownloaded from
Published June 23, 2008