Embed Size (px)
Citation preview
IEEE TRANSACTIONS ON KNOWLEDGE AND DATA ENGINEERING, VOL. X, NO. X, XXX 20XX 1
Mining Distinction and Commonality acrossMultiple Domains using Generative Model for
Text ClassificationFuzhen Zhuang, Ping Luo, Zhiyong Shen, Qing He, Yuhong Xiong, Zhongzhi Shi, IEEE Senior Member ,
and Hui Xiong, IEEE Senior Member
Abstract—The distribution difference among multiple data domains has been exploited for cross-domain text categorization in recentresearch. Along this line, we show two new observations in this study. First, the data distribution difference is often due to the fact thatdifferent domains use different key words to express the same concept. Second, the association between the conceptual feature andthe document class can be stable across domains. These two observations actually indicate the distinction and commonality acrossdata domains.Inspired by the above observations, we propose a generative statistical model, named Collaborative Dual-PLSA (CD-PLSA), tosimultaneously capture both the domain distinction and commonality among multiple domains. Different from Probabilistic LatentSemantic Analysis (PLSA) with only one latent variable, the proposed model has two latent factors y and z, corresponding to wordconcept and document class respectively. The shared commonality intertwines with the distinctions over multiple domains, and isalso used as the bridge for knowledge transformation. An Expectation Maximization (EM) algorithm is developed to solve the CD-PLSA model, and further its distributed version is exploited to avoid uploading all the raw data to a centralized location and helpto mitigate privacy concerns. After the training phase with all the data from multiple domains we propose to refine the immediateoutputs using only the corresponding local data. In summary, we propose a two-phase method for cross-domain text classification,the first phase for collaborative training with all the data, and the second step for local refinement. Finally, we conduct extensiveexperiments over hundreds of classification tasks with multiple source domains and multiple target domains to validate the superiorityof the proposed method over existing state-of-the-art methods of supervised and transfer learning. It is noted to mention that as shownby the experimental results CD-PLSA for the collaborative training is more tolerant of distribution differences, and the local refinementalso gains significant improvement in terms of classification accuracy.
Index Terms—Statistical Generative Models, Cross-domain Learning, Distinction and Commonality, Classification.
F
1 INTRODUCTION
T O build a learning model, traditional learning methodsusually yield to the fundamental assumption that the
data from different information sources are drawn from thesame data distribution. However, in many emerging real-worldapplications, new test data usually come from fast evolvinginformation sources with different but semantically-relateddistributions. For example, to build an enterprize news portal,we need to classify the news about a certain company intosome predefined categories, such as “merger and acquisition”,“product announcement”, “financial scandal”, and so on. Thisclassification model may be trained from the news about onecompany, and may fail on the news for another company sincethe business areas for the two companies may be different. Todeal with this change of data distributions, one solution is toinclude more labeled data in the new domains into the training
A preliminary version of this work is to appear in ACM CIKM 2010 [1].Fuzhen Zhuang, Qing He and Zhongzhi Shi are with the Key Laboratoryof Intelligent Information Processing, Institute of Computing Technology,Chinese Academy of Sciences. Fuzhen Zhuang is also with the GraduateUniversity of Chinese Academy of Sciences. Ping Luo, Zhiyong Shen are withthe Hewlett-Packard Labs, China. Yuhong Xiong is with Innovation Works. HuiXiong is with the Management Science and Information Systems Department,Rutgers Business School, Rutgers University.Corresponding Author: Ping Luo. Phone: (86)-10-82174020. Email:[email protected].
set. However, it is often expensive or not practical to re-collectthe required amount of new training data. Indeed, it is highlydesirable to reduce the need and efforts to label new data. Thisleads to the research of cross-domain learning (often referredto as transfer learning or domain adaption) [2], [3], [4], [5],[6], [7], [8], [9], [10]. In this paper, the training data and testdata are also referred to source domain and target domain,respectively.
Unlike previous approaches, which consider the distributionof the low-level features of raw words, we exploit high-levelword concepts. Here, any word concept y can be representedby a multinomial distribution p(w|y) over words, and thisdistribution is often domain-dependent. Let us take the wordconcept “products” as an example, if this concept is within thedomain of the HP company, which makes printers, the valuesof p(“printer”|“products”) and p(“LaserJet”|“products”)are large within the domain of HP. If we change the domainto IBM, the representative words of this concept turn tobe some IBM product names, and p(“printer”|“products”)and p(“LaserJet”|“products”) will have a very small valuewithin the domain of IBM. Indeed, Table 6 in the experimentalsection also lists three word concepts with their key wordsfor each of the four domains. In the table, we can observethat different domains may use different words to express anddescribe the same concept.
IEEE TRANSACTIONS ON KNOWLEDGE AND DATA ENGINEERING, VOL. X, NO. X, XXX 20XX 2
Moreover, we observe that, wherever a word concept exists,it has the same implication to the class of the documentwhich contains this concept. Let us consider the word concept“products”. If a news contains the word concept “products”,no matter where it comes from, it is more likely to be anews about “product announcement” rather than about “finan-cial scandal”. In other words, the association between wordconcept y and document class z, represented by their jointprobability p(y, z), is usually stable across domains.
In the above example, p(w|y) and p(y, z) corresponds tothe two sides of a word concept y, extension and intensionrespectively. In general, the extension of a concept is just thecollection of individual objects to which it is correctly applied,while the intension of a concept is the set of features whichare shared by everything to which it applies1. Following thegeneral definitions of concept extension and intension theirdefinitions for word concept are as follows.
Definition 1 (Extension of Word Concept): The extensionof a word concept y is the degree of applicability of thatconcept for each word w, denoted by p(w|y).That is to say, when p(w|y) is large, w is a typical object towhich the word concept y can be applied.
Definition 2 (Intension of Word Concept): The intension ofa word concept y is expressed by its association with eachdocument class z, denoted by their joint probability p(y, z) inthis study.For a word concept y, the values of p(y, z) over differentdocument classes z can be considered as the intrinsic featuresof concept y.
In a similar way, we can also define the extension andintension of document concept z as p(d|z) (a multinomial dis-tribution over document d) and p(y, z) respectively. Since weconsider each document class for classification as a documentconcept here, document class and document concept are inter-changeable in this paper. To make the terminologies “Distinc-tion”, “Commonality”, “Extension” and “Intension” definedin this paper more clear, their relationships are summarized inTable 1. The domain distinction includes the extension of wordconcept and document concept, while domain commonalitycontains the intension of word concept and document concept.Let’s revisit the example of enterprize news classification, thedistinctions among data domains HP and IBM are, 1) the keywords describing the word concept “products” are different;2) the documents in document class “product announcement”are different. On the other hand, the domain commonality isthe shared association between word concept and documentclass, e.g., p(“products”,“product announcement”).
TABLE 1Relationship of the Terminologies
Domain Distinction Domain CommonalityExtension Extension Intension Intensionof word of document of word of document
concept p(w|y) concept p(d|z) concept p(y, z) concept p(y, z)
With the above definitions, we further argue that the ex-tension of any word concept or document concept is often
1. http://www.philosophypages.com/lg/e05.htm
p(w|y,c1)
on Domain 1
p(w|y,cs)
on Domain s
p(d|z,c1)
on Domain 1
p(d|z,cs)
on Domain s
p(d|z,cs+1)
on Domain (s+1)
p(d|z,cs+t)
on Domain (s+t)
s source domains t target domains
Distinction
Commonality
p(w|y,cs+1)
on Domain (s+1)
p(w|y,cs+t)
on Domain (s+t)
Knowledge
Transfer
Distinction
Intension of Word
Concepts and Document
Concepts
p(y,z)
Extension
of Word
Concepts
Extension of
Document
Concepts
Extension
of Word
Concepts
Extension of
Document
Concepts
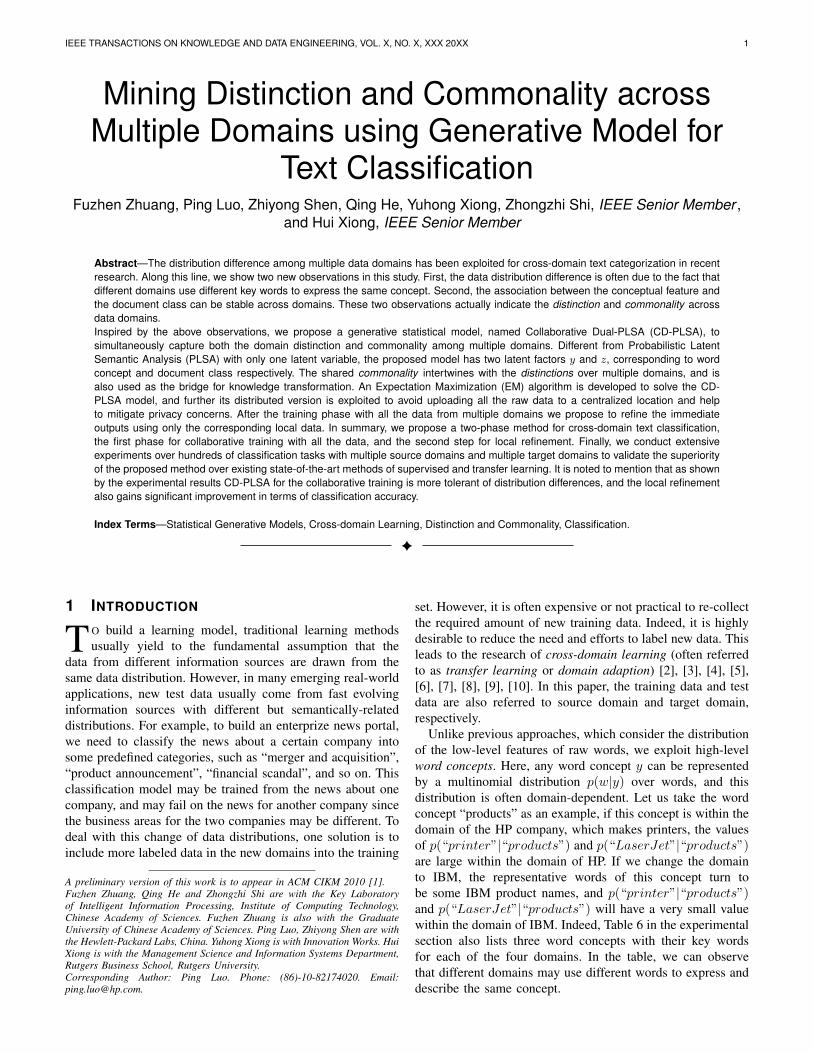
Fig. 1. Extension and Intension of Concepts
domain-dependent, while its intension is often stable acrossdifferent domains. Thus, we propose to exploit the distinctionand commonality across data domains for text categorization.
In the first phase, we develop a generative statistical model,Collaborative Dual-PLSA (CD-PLSA), to simultaneously cap-ture both domain distinction and commonality. The mainidea of this model is illustrated in Figure 1. In this figure,we have s source domains and t target domains (s andt can be any positive integers), represented by the dashedrectangle on the left and right respectively. In each dashedrectangle there are two solid rectangles at the above and below,bounding the extensions of word concepts and documentconcepts respectively. All these extensions, as the distinctionfor each domain, share the same intensions of word anddocument concepts as their commonality (the polygon in themiddle). Since we know the class label of each document inthe source domains, we actually know the extensions of thedocument concepts in the source domains. Thus, these ob-served extensions of the document concepts (the filled circles)are used as the supervision information, which is transferredthrough the bridge of concept intensions (the polygon in themiddle) to the other parts of the model (the unfilled circles).We employ an EM solution to learn the CD-PLSA model.Also in order to handle the situation where the data domainsare geographically separated from each other, we provide adistributed solution to the CD-PLSA model. In this distributedversion only some intermediate statistics are transmitted, ratherthan communicating and exposing the raw data, which canalleviate the privacy concerns to some degrees.
In the second phase, we further exploit the intrinsic structureof the target domains. After solving the CD-PLSA model,we can obtain the intensions of word and document conceptsp(y, z), which are shared by all data domains. Indeed, the
IEEE TRANSACTIONS ON KNOWLEDGE AND DATA ENGINEERING, VOL. X, NO. X, XXX 20XX 3
output intensions p(y, z) from CD-PLSA model may not bethe exact ones for target domains. Thus we propose to refinethe outputs from CD-PLSA model with only the local data intarget domains.
In summary, we propose a two-phase cross-domain ap-proach for text classification. In the first phase, we collab-oratively train a generative model (CD-PLSA) based on allthe domain data to generate the commonality p(y, z) anddistinction p(w|y), p(d|z). In the second phase, we furtherrefine the outputs only with the local data corresponding toeach target domain. Thus, the whole method is called RefinedCD-PLSA (RCD-PLSA for short).
Finally, we conduct extensive experiments to verify theeffectiveness of CD-PLSA and RCD-PLSA on binary-classclassification problems as well as multi-class classificationtasks with multiple source and target domains. Experimentalresults show that CD-PLSA (in the first training phase) is moretolerant of distribution differences, and RCD-PLSA with thelocal refinement in the second phase further gains significantimprovement in terms of classification accuracy.
Overview: The remainder of this paper is organized asfollows. Section 2 introduces the related work. In Section 3we review some preliminaries and then give the problemformulation. Its solution by EM and the two-phase methodare followed in Section 4. Next, a distributed solution to CD-PLSA is described in Section 5 and the experimental resultsto validate our algorithm are described in Section 6. Finally,Sections 7 conclusions.
2 RELATED WORKS AND DISCUSSIONS
In this section, we will survey some related work, and thengive some discussions on generative and discriminative clas-sifiers for cross-domain learning.
2.1 Cross-domain LearningCross-domain Learning has attracted great attention in recentyears, and the works in this field can be grouped into fourcategories based on the different types of techniques used forknowledge transfer, namely feature selection based, featurespace mapping, weight based, and model combination basedmethods.
Feature selection based methods are to identify the commonfeatures (at the level of raw words) between source andtarget domains, which are useful for transfer learning. Jiang etal. [17] argued that the features highly related to class labelsshould be assigned to large weights in the learnt model, thusthey developed a two-step feature selection framework fordomain adaptation. They first selected the general features tobuild a general classifier, and then considered the unlabeledtarget domain to select specific features for training targetclassifier. Zhuang et al. [18] formulated a joint optimizationframework of the two matrix tri-factorizations for the sourceand target domain data respectively, in which the associa-tions between word clusters and document classes are sharedbetween them for knowledge transfer. Although the basicassumption of this method is similar to our method, it lacksthe probabilistic explanation of the model and is not easy
to be extended to handle the tasks with multiple source andtarget domains. Dai et al. [6] proposed a Co-clustering basedapproach for this problem. In this method, they identified theword clusters among the source and target domains, via whichthe class information and knowledge propagated from sourcedomain to target domain.
Feature space mapping based methods are to map the orig-inal high-dimensional features into a low-dimensional featurespace, under which the source and target domains complywith the same data distribution. Pan et al. [19] proposeda dimensionality reduction approach to find out this latentfeature space, in which supervised learning algorithms can beapplied to train classification models. Gu et al. [20] learnt theshared subspace among multiple domains for clustering andtransductive transfer classification. In their problem formula-tion, all the domains have the same cluster centroid in theshared subspace. The label information can also be injectedfor classification tasks in this method. Xie et al. [21] tried tofill up those missing values of disjoint features to drive themarginal distributions of two domains closer, and then foundthe comparable sub-structures in the latent space where bothmarginal and conditional distribution are similar. In this latenspace, given an unlabeled instances in the target domain themost similar labeled instances are retrieved for classification.
Weight based methods can be further grouped into twokinds, i.e. the instance weighting based and model weight-ing based methods. Instance weighting based approaches re-weight the instances in source domains according to the sim-ilarity measure on how they are close to the data in the targetdomain. Specifically, the weight of an instance is increasedif it is close to the data in the target domain, otherwise theweight is decreased. Jiang et al. [22] proposed a generalinstance weighting framework, which has been validated towork well on NLP tasks. Dai et al. [8] extended boosting-style learning algorithm to cross-domain learning, in whichthe training instances with different distribution from the targetdomain are less weighted for data sampling, while the traininginstances with the similar distribution to the target domainare more weighted. On the other side model weighting basedmethods give different weights to the classification modelsin an ensemble. Gao et al. [3] proposed a dynamic modelweighting method for each test example according to thesimilarity between the model and the local structure of thetest example in the target domain.
Model combination based methods, considering the situa-tion of multiple source domains, integrate the source-domainlocal models according to certain criterion. Ping at al [7]proposed the regularization framework which maximizes notonly the posteriori in each source domain, but also theconsensus degree of these models’ prediction results on thetarget domain. Dredze at al [23] proposed a online modelupdate method for each coming instance, which guaranteethat after each iteration the combined model yields a correctprediction for the current instance with high probability whilealso making the smallest change from the existing models fromthe source domains.
The most related works are [24], [9]. The work of Zhaiet al. [24] connects the variations of a topic under different
IEEE TRANSACTIONS ON KNOWLEDGE AND DATA ENGINEERING, VOL. X, NO. X, XXX 20XX 4
contexts by leveraging the same background for this topic.Our work can also use this technique to explore possibleimprovements. In this sense, their work is orthogonal to ours.Xue et al. [9] proposed the model of topic-bridged PLSAfor cross-domain text categorization, and the basic assumptionof this work is that the source and target domains share thesame topics. Specifically, they conduct two topic modelingsover the source and target domains jointly, and induce thesupervision of the labeled source domain data by the pair-wiseconstraints, similar to the must-link and cannot-link constraintsused in semi-supervised clustering. Different from topic-bridged PLSA, our model explicitly explores the commonality(concept intension) and distinction (concept extension) of thetopics across multiple domains rather than assume that thesetopics are exactly the same. Additionally, since our model hastwo latent variables for word concept and document class, itcan naturally include the supervision from the source domain,rather than add a penalty of the pair-wise constraints to theoriginal log-likelihood function.
2.2 Discussion on Generative vs. DiscriminativeClassifiers for Transfer LearningGiven the observed data x and their labels y, we can formu-late the learning of a classifier as calculating the posteriordistribution p(y|x). A discriminative classifier models thisdistribution directly while a generative classifier models thejoint probability p(x, y), after which p(y|x) is calculated viaBays rules. There is a widely-held belief in literatures thatdiscriminative classifiers are preferred to generative ones inpractise. For example, Vapnik articulated in [25] that
One should solve the classification problem directlyand never solve a more general problem as anintermediate step such as modeling p(x|y).
However, when learning and applying discriminative clas-sifiers, we essentially assume that all the data instances aregenerated from the identical distribution. This assumptionmay not hold when data are from different sources. Ideally,the conditional probability p(y|x) may be the same acrossdifferent domains, however, the marginal probability p(x) oneach domain is prone to be different. The problem is thatsince the training of p(y|x) based on the data in a sourcedomain is biased towards the local marginal probability p(x)it is difficult to achieve the ideal p(y|x) by discriminativemodels even using the data from all the source domains.On the other hand, the generative classifiers, like CD-PLSAproposed here, provide us facilities to explicitly model the datadistribution differences across domains. Thus, it may introduceextra values in prediction. Therefore, we argue that generativemodels may be suited for transfer learning.
3 PRELIMINARIES AND PROBLEM FORMULA-TION
In this section, we first briefly review Probabilistic LatentSemantic Analysis (PLSA), and then introduce an extensionof PLSA, Dual-PLSA. Finally, we formulate our problem forcross-domain classification.
3.1 A Review of PLSAProbabilistic Latent Semantic Analysis [11] is a statisticalmodel to analyze co-occurrence data by a mixture decompo-sition. Specifically, given the word-document co-occurrencematrix O whose element Ow,d represents the frequency ofword w appearing in document d, PLSA models O by usinga mixture model with latent topics (each topic is denoted byy) as follows,
p(w, d) =∑
y
p(w, d, y) =∑
y
p(w|y)p(d|y)p(y). (1)
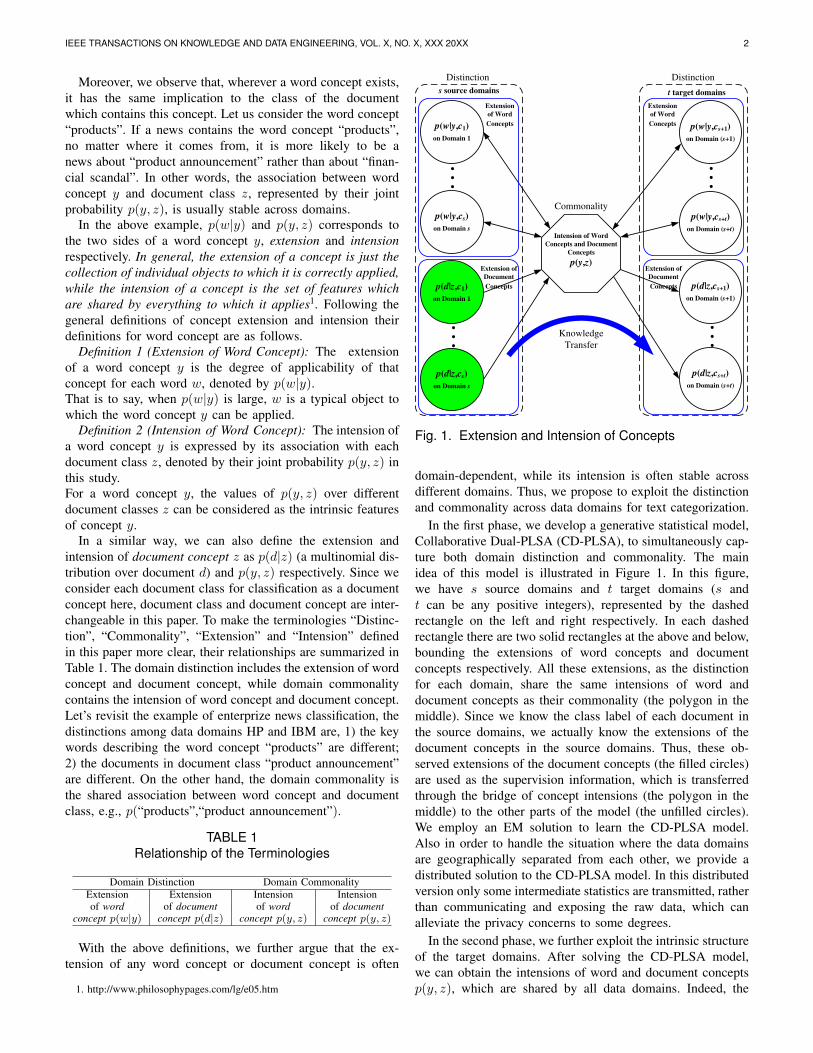
Figure 2(a) shows the graphical model for PLSA. Theparameters of p(w|y), p(d|y), p(y) over all w, d, y are obtainedby the EM solution to the maximum likelihood problem.
w y d
(a) PLSA
w y z d
(b) D-PLSA
w y z d
c
(c) CD-PLSA
Fig. 2. The Graphical Models
3.2 The Dual-PLSA ModelIn the PLSA model, the documents and words share thesame latent variable y. However, documents and words usuallyexhibit different organizations and structures. Specifically, theymay have different kinds of latent topics, denoted by y forword concept and z for document concept. Its graphical modelis shown in Figure 2(b). Since there are two latent variables inthis model we call it Dual-PLSA (D-PLSA for short) in thispaper.
Given the word-document co-occurrence O, we can simi-larly arise a mixture model like Equation (1),
p(w, d) =∑y,z
p(w, d, y, z) =∑y,z
p(w|y)p(d|z)p(y, z). (2)
And the parameters of p(w|y), p(d|z), p(y, z) over allw, d, y, z can also be obtained by the EM solution. In theseparameters p(w|y) and p(d|z) are actually the extensions ofthe word concept y and the document concept z respectively,while p(y, z) is actually their intension.
This model was proposed in [12] for the clustering problem.In this paper we find that since the word topic and documenttopic are separated in this model we can inject the labelinformation into p(d|z) when d is a labeled instance and zis actually a document class. This way this model can also beused for semi-supervised classification. We will detail this inSection 6.1.2.
3.3 The Collaborative Dual-PLSA ModelBased on D-PLSA, we propose a statistical generative modelfor text classification cross multiple domains. Supposed wehave s+ t data domains, denoted as D = (D1, · · · , Ds, Ds+1,· · · , Ds+t). Without loss of generality, we assume the first s
IEEE TRANSACTIONS ON KNOWLEDGE AND DATA ENGINEERING, VOL. X, NO. X, XXX 20XX 5
domains are source domains with label information and the leftt domains are target domains without any label information.Simply, for each domain we can generate its own extensionsand intensions of word and document concepts. However,this simple method generates s + t different sets of conceptintensions. To obtain only one set of concept intensions, thevariables y and z for word concept and document conceptrespectively must be independent of the variable c for thedata domain. Therefore, we propose the graphical model inFigure 2(c) to catch the requirements that 1) y and z areindependent of c; 2) the word w is dependent of both y andc; 3) the document d is dependent of both z and c. Given thisgraphical model the joint probability over all the variables is
p(w, d, y, z, c) = p(w|y, c)p(d|z, c)p(y, z)p(c). (3)
The word-document co-occurrence matrix in the c-th do-main is denoted by Oc, whose element Ow,d,c represents theco-occurrence frequencies of the triple (w, d, c). If we denotethe two latent variables y, z as Z, given the whole data X fromdifferent domains we formulate the problem of maximum loglikelihood as
log p(X|θ) = log∑
Z
p(Z,X|θ), (4)
where θ includes the parameters of p(y, z), p(w|y, c), p(d|z, c)and p(c).
We have to mention that although the extensions of thesame word concept y on different domains are different,these extensions are semantically related to a certain degree.The reason is that they are trained collaboratively by sharingthe same intension of p(y, z). By the experimental resultsin Section 6.4 we will intuitively show the difference andrelatedness among the extensions, which corresponds to thesame word concept, on the multiple domains. In this sense wecall our model Collaborative Dual-PLSA. Next, we developan EM solution to the problem in Equation (4).
4 AN EM SOLUTION TO THE COLLABORATIVEDUAL-PLSA MODEL
An Expectation-Maximization (EM) algorithm [13], [14] is tomaximize the lower bound (via Jensen’s inequality) L0 of (4):
L0 =∑
Z
q(Z)log {p(Z,X|θ)q(Z)
}, (5)
where q(Z) could be arbitrary. We set q(Z) = p(Z|X; θold)and substitute into (5):
L0 =∑
Z
p(Z|X; θold)log p(Z,X|θ)︸ ︷︷ ︸
L
−∑
Z
p(Z|X; θold)log p(Z|X; θold)
︸ ︷︷ ︸const
= L+ const.
(6)
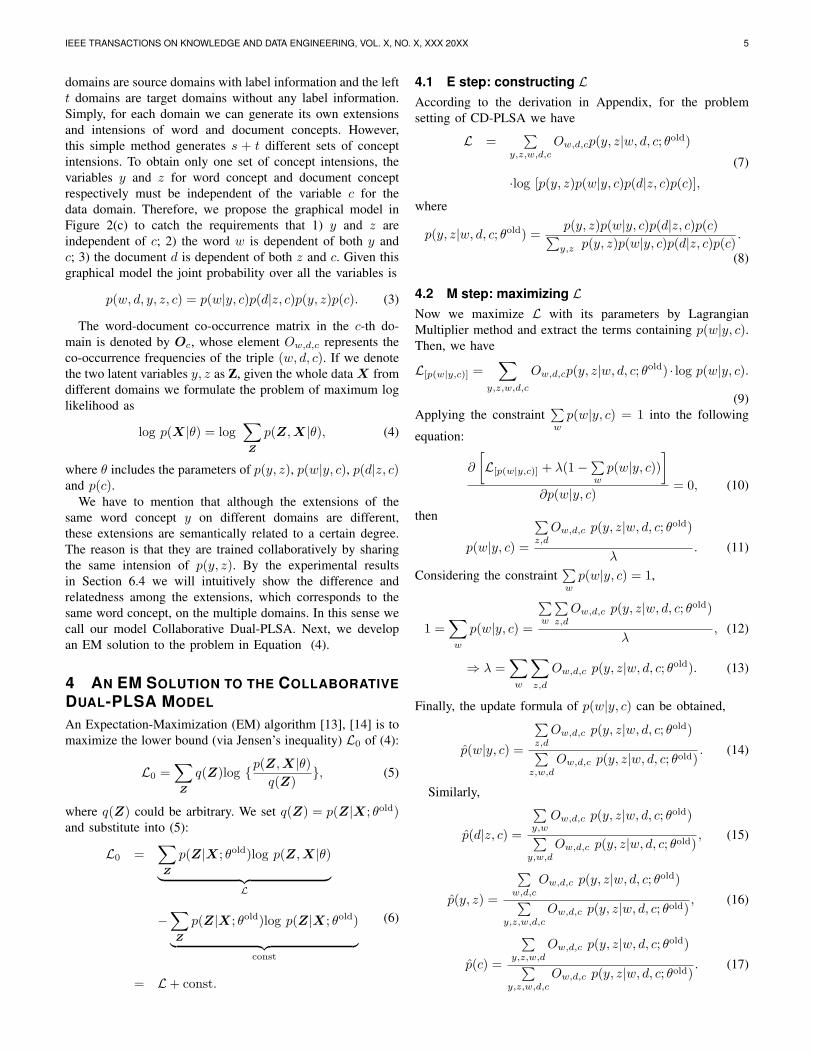
4.1 E step: constructing LAccording to the derivation in Appendix, for the problemsetting of CD-PLSA we have
L =∑
y,z,w,d,c
Ow,d,cp(y, z|w, d, c; θold)
·log [p(y, z)p(w|y, c)p(d|z, c)p(c)],
(7)
where
p(y, z|w, d, c; θold) =p(y, z)p(w|y, c)p(d|z, c)p(c)∑
y,z p(y, z)p(w|y, c)p(d|z, c)p(c).
(8)
4.2 M step: maximizing LNow we maximize L with its parameters by LagrangianMultiplier method and extract the terms containing p(w|y, c).Then, we have
L[p(w|y,c)] =∑
y,z,w,d,c
Ow,d,cp(y, z|w, d, c; θold) · log p(w|y, c).
(9)Applying the constraint
∑w
p(w|y, c) = 1 into the following
equation:
∂
[L[p(w|y,c)] + λ(1−∑
wp(w|y, c))
]
∂p(w|y, c)= 0, (10)
then
p(w|y, c) =
∑z,d
Ow,d,c p(y, z|w, d, c; θold)
λ. (11)
Considering the constraint∑w
p(w|y, c) = 1,
1 =∑w
p(w|y, c) =
∑w
∑z,d
Ow,d,c p(y, z|w, d, c; θold)
λ, (12)
⇒ λ =∑w
∑
z,d
Ow,d,c p(y, z|w, d, c; θold). (13)
Finally, the update formula of p(w|y, c) can be obtained,
p̂(w|y, c) =
∑z,d
Ow,d,c p(y, z|w, d, c; θold)∑
z,w,d
Ow,d,c p(y, z|w, d, c; θold). (14)
Similarly,
p̂(d|z, c) =
∑y,w
Ow,d,c p(y, z|w, d, c; θold)∑
y,w,d
Ow,d,c p(y, z|w, d, c; θold), (15)
p̂(y, z) =
∑w,d,c
Ow,d,c p(y, z|w, d, c; θold)∑
y,z,w,d,c
Ow,d,c p(y, z|w, d, c; θold), (16)
p̂(c) =
∑y,z,w,d
Ow,d,c p(y, z|w, d, c; θold)∑
y,z,w,d,c
Ow,d,c p(y, z|w, d, c; θold). (17)
IEEE TRANSACTIONS ON KNOWLEDGE AND DATA ENGINEERING, VOL. X, NO. X, XXX 20XX 6
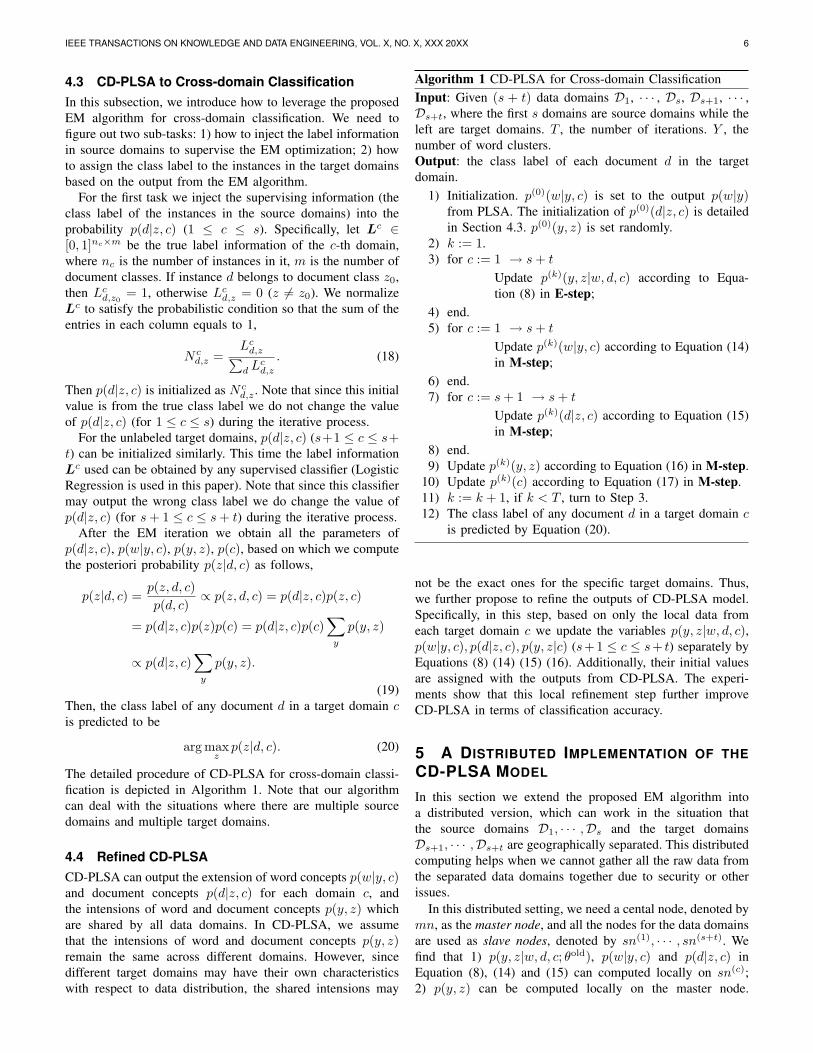
4.3 CD-PLSA to Cross-domain ClassificationIn this subsection, we introduce how to leverage the proposedEM algorithm for cross-domain classification. We need tofigure out two sub-tasks: 1) how to inject the label informationin source domains to supervise the EM optimization; 2) howto assign the class label to the instances in the target domainsbased on the output from the EM algorithm.
For the first task we inject the supervising information (theclass label of the instances in the source domains) into theprobability p(d|z, c) (1 ≤ c ≤ s). Specifically, let Lc ∈[0, 1]nc×m be the true label information of the c-th domain,where nc is the number of instances in it, m is the number ofdocument classes. If instance d belongs to document class z0,then Lc
d,z0= 1, otherwise Lc
d,z = 0 (z 6= z0). We normalizeLc to satisfy the probabilistic condition so that the sum of theentries in each column equals to 1,
N cd,z =
Lcd,z∑
d Lcd,z
. (18)
Then p(d|z, c) is initialized as N cd,z . Note that since this initial
value is from the true class label we do not change the valueof p(d|z, c) (for 1 ≤ c ≤ s) during the iterative process.
For the unlabeled target domains, p(d|z, c) (s+1 ≤ c ≤ s+t) can be initialized similarly. This time the label informationLc used can be obtained by any supervised classifier (LogisticRegression is used in this paper). Note that since this classifiermay output the wrong class label we do change the value ofp(d|z, c) (for s + 1 ≤ c ≤ s + t) during the iterative process.
After the EM iteration we obtain all the parameters ofp(d|z, c), p(w|y, c), p(y, z), p(c), based on which we computethe posteriori probability p(z|d, c) as follows,
p(z|d, c) =p(z, d, c)p(d, c)
∝ p(z, d, c) = p(d|z, c)p(z, c)
= p(d|z, c)p(z)p(c) = p(d|z, c)p(c)∑
y
p(y, z)
∝ p(d|z, c)∑
y
p(y, z).
(19)Then, the class label of any document d in a target domain cis predicted to be
arg maxz
p(z|d, c). (20)
The detailed procedure of CD-PLSA for cross-domain classi-fication is depicted in Algorithm 1. Note that our algorithmcan deal with the situations where there are multiple sourcedomains and multiple target domains.
4.4 Refined CD-PLSACD-PLSA can output the extension of word concepts p(w|y, c)and document concepts p(d|z, c) for each domain c, andthe intensions of word and document concepts p(y, z) whichare shared by all data domains. In CD-PLSA, we assumethat the intensions of word and document concepts p(y, z)remain the same across different domains. However, sincedifferent target domains may have their own characteristicswith respect to data distribution, the shared intensions may
Algorithm 1 CD-PLSA for Cross-domain ClassificationInput: Given (s + t) data domains D1, · · · , Ds, Ds+1, · · · ,Ds+t, where the first s domains are source domains while theleft are target domains. T , the number of iterations. Y , thenumber of word clusters.Output: the class label of each document d in the targetdomain.
1) Initialization. p(0)(w|y, c) is set to the output p(w|y)from PLSA. The initialization of p(0)(d|z, c) is detailedin Section 4.3. p(0)(y, z) is set randomly.
2) k := 1.3) for c := 1 → s + t
Update p(k)(y, z|w, d, c) according to Equa-tion (8) in E-step;
4) end.5) for c := 1 → s + t
Update p(k)(w|y, c) according to Equation (14)in M-step;
6) end.7) for c := s + 1 → s + t
Update p(k)(d|z, c) according to Equation (15)in M-step;
8) end.9) Update p(k)(y, z) according to Equation (16) in M-step.
10) Update p(k)(c) according to Equation (17) in M-step.11) k := k + 1, if k < T , turn to Step 3.12) The class label of any document d in a target domain c
is predicted by Equation (20).
not be the exact ones for the specific target domains. Thus,we further propose to refine the outputs of CD-PLSA model.Specifically, in this step, based on only the local data fromeach target domain c we update the variables p(y, z|w, d, c),p(w|y, c), p(d|z, c), p(y, z|c) (s+1 ≤ c ≤ s+ t) separately byEquations (8) (14) (15) (16). Additionally, their initial valuesare assigned with the outputs from CD-PLSA. The experi-ments show that this local refinement step further improveCD-PLSA in terms of classification accuracy.
5 A DISTRIBUTED IMPLEMENTATION OF THECD-PLSA MODEL
In this section we extend the proposed EM algorithm intoa distributed version, which can work in the situation thatthe source domains D1, · · · ,Ds and the target domainsDs+1, · · · ,Ds+t are geographically separated. This distributedcomputing helps when we cannot gather all the raw data fromthe separated data domains together due to security or otherissues.
In this distributed setting, we need a cental node, denoted bymn, as the master node, and all the nodes for the data domainsare used as slave nodes, denoted by sn(1), · · · , sn(s+t). Wefind that 1) p(y, z|w, d, c; θold), p(w|y, c) and p(d|z, c) inEquation (8), (14) and (15) can computed locally on sn(c);2) p(y, z) can be computed locally on the master node.
IEEE TRANSACTIONS ON KNOWLEDGE AND DATA ENGINEERING, VOL. X, NO. X, XXX 20XX 7
Specifically, let
4(c)y,z =
∑
w,d
Ow,d,c p(y, z|w, d, c; θold), (21)
V(c) =∑
y,z,w,d
Ow,d,c p(y, z|w, d, c; θold), (22)
Then,
p(y, z) =
∑c
4(c)y,z
∑y,z,c
4(c)y,z
, p(c) =V(c)
∑cV(c)
. (23)
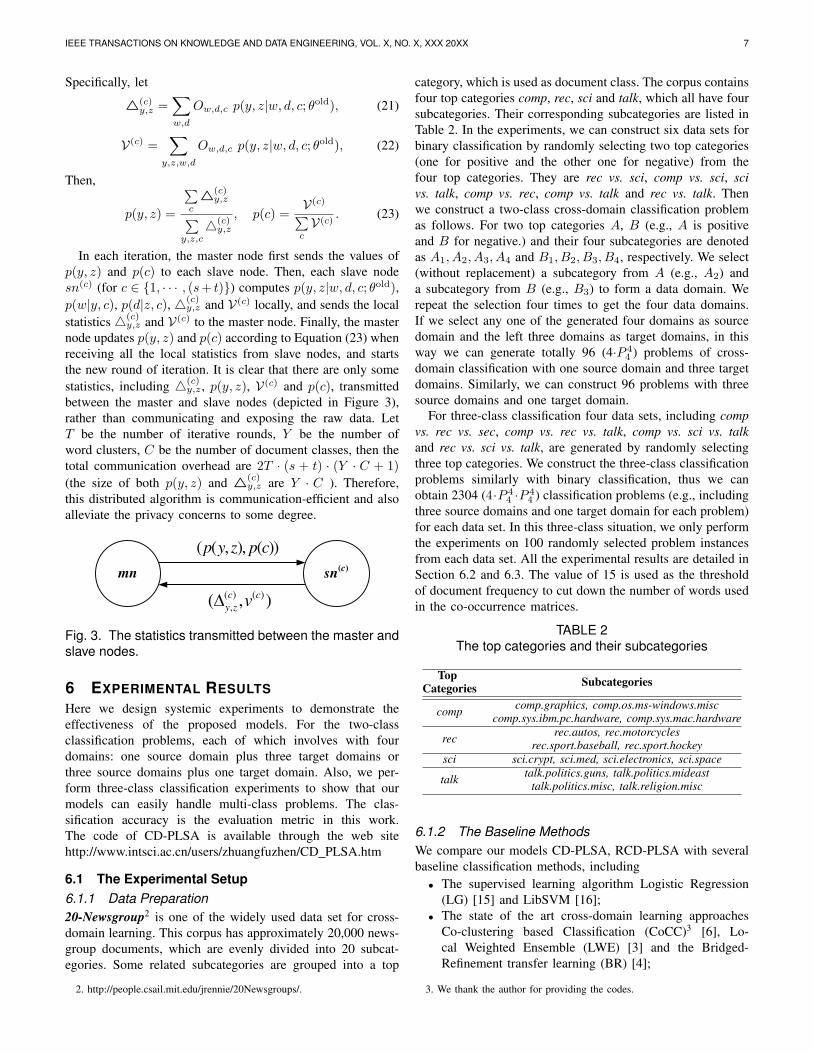
In each iteration, the master node first sends the values ofp(y, z) and p(c) to each slave node. Then, each slave nodesn(c) (for c ∈ {1, · · · , (s+ t)}) computes p(y, z|w, d, c; θold),p(w|y, c), p(d|z, c), 4(c)
y,z and V(c) locally, and sends the localstatistics 4(c)
y,z and V(c) to the master node. Finally, the masternode updates p(y, z) and p(c) according to Equation (23) whenreceiving all the local statistics from slave nodes, and startsthe new round of iteration. It is clear that there are only somestatistics, including 4(c)
y,z , p(y, z), V(c) and p(c), transmittedbetween the master and slave nodes (depicted in Figure 3),rather than communicating and exposing the raw data. LetT be the number of iterative rounds, Y be the number ofword clusters, C be the number of document classes, then thetotal communication overhead are 2T · (s + t) · (Y · C + 1)(the size of both p(y, z) and 4(c)
y,z are Y · C ). Therefore,this distributed algorithm is communication-efficient and alsoalleviate the privacy concerns to some degree.
mn
( ) ( )
,( , )
c c
y zv
( ( , ), ( ))p y z p c
sn(c)
Fig. 3. The statistics transmitted between the master andslave nodes.
6 EXPERIMENTAL RESULTSHere we design systemic experiments to demonstrate theeffectiveness of the proposed models. For the two-classclassification problems, each of which involves with fourdomains: one source domain plus three target domains orthree source domains plus one target domain. Also, we per-form three-class classification experiments to show that ourmodels can easily handle multi-class problems. The clas-sification accuracy is the evaluation metric in this work.The code of CD-PLSA is available through the web sitehttp://www.intsci.ac.cn/users/zhuangfuzhen/CD PLSA.htm
6.1 The Experimental Setup6.1.1 Data Preparation20-Newsgroup2 is one of the widely used data set for cross-domain learning. This corpus has approximately 20,000 news-group documents, which are evenly divided into 20 subcat-egories. Some related subcategories are grouped into a top
2. http://people.csail.mit.edu/jrennie/20Newsgroups/.
category, which is used as document class. The corpus containsfour top categories comp, rec, sci and talk, which all have foursubcategories. Their corresponding subcategories are listed inTable 2. In the experiments, we can construct six data sets forbinary classification by randomly selecting two top categories(one for positive and the other one for negative) from thefour top categories. They are rec vs. sci, comp vs. sci, scivs. talk, comp vs. rec, comp vs. talk and rec vs. talk. Thenwe construct a two-class cross-domain classification problemas follows. For two top categories A, B (e.g., A is positiveand B for negative.) and their four subcategories are denotedas A1, A2, A3, A4 and B1, B2, B3, B4, respectively. We select(without replacement) a subcategory from A (e.g., A2) anda subcategory from B (e.g., B3) to form a data domain. Werepeat the selection four times to get the four data domains.If we select any one of the generated four domains as sourcedomain and the left three domains as target domains, in thisway we can generate totally 96 (4·P 4
4 ) problems of cross-domain classification with one source domain and three targetdomains. Similarly, we can construct 96 problems with threesource domains and one target domain.
For three-class classification four data sets, including compvs. rec vs. sec, comp vs. rec vs. talk, comp vs. sci vs. talkand rec vs. sci vs. talk, are generated by randomly selectingthree top categories. We construct the three-class classificationproblems similarly with binary classification, thus we canobtain 2304 (4·P 4
4 ·P 44 ) classification problems (e.g., including
three source domains and one target domain for each problem)for each data set. In this three-class situation, we only performthe experiments on 100 randomly selected problem instancesfrom each data set. All the experimental results are detailed inSection 6.2 and 6.3. The value of 15 is used as the thresholdof document frequency to cut down the number of words usedin the co-occurrence matrices.
TABLE 2The top categories and their subcategories
Top SubcategoriesCategories
comp comp.graphics, comp.os.ms-windows.misccomp.sys.ibm.pc.hardware, comp.sys.mac.hardware
rec rec.autos, rec.motorcyclesrec.sport.baseball, rec.sport.hockey
sci sci.crypt, sci.med, sci.electronics, sci.space
talk talk.politics.guns, talk.politics.mideasttalk.politics.misc, talk.religion.misc
6.1.2 The Baseline MethodsWe compare our models CD-PLSA, RCD-PLSA with severalbaseline classification methods, including• The supervised learning algorithm Logistic Regression
(LG) [15] and LibSVM [16];• The state of the art cross-domain learning approaches
Co-clustering based Classification (CoCC)3 [6], Lo-cal Weighted Ensemble (LWE) [3] and the Bridged-Refinement transfer learning (BR) [4];
3. We thank the author for providing the codes.
IEEE TRANSACTIONS ON KNOWLEDGE AND DATA ENGINEERING, VOL. X, NO. X, XXX 20XX 8
• Additionally, the algorithm D-PLSA (depicted in Sec-tion 3.2) is also used as the baseline. Since there are notdomain labels in D-PLSA all the instances appear as ifthey are from the same domain. In other words the sourceof each instance is ignored in D-PLSA. Our experimentswill show that ignoring this information results in thesignificant performance sacrifice.
Note that all the classification methods, which can not directlydeal with multiple source domains are adapted as follows,e.g., CoCC, for each source domain and the target domainwe train a CoCC model, and then combine these m modelsby voting with equal weights. The other methods LG (Notethat LG achieves the similar performance when trained on themerged data of all source domains), LibSVM, BR are adaptedto handle multiple source domains similarly with CoCC.
6.1.3 Implementation DetailsSince the models of D-PLSA and CD-PLSA have the randominitialization process, we conduct the experiments three timesand the average results are recorded for these two algorithms.Preliminary test shows that our algorithm is not sensitive to thenumber Y of word clusters (in the range of [25, 28]), thus weset Y to 64. The number of iteration in D-PLSA, CD-PLSA4
and RCD-PLSA is set to 50. The parameters of CoCC, LWEand BR are set to the same values as those in their originalpapers.
6.2 Experimental Results on Two-class Classifica-tionWe compare the proposed models CD-PLSA, RCD-PLSA withbaselines LG, CoCC, LWE and D-PLSA.
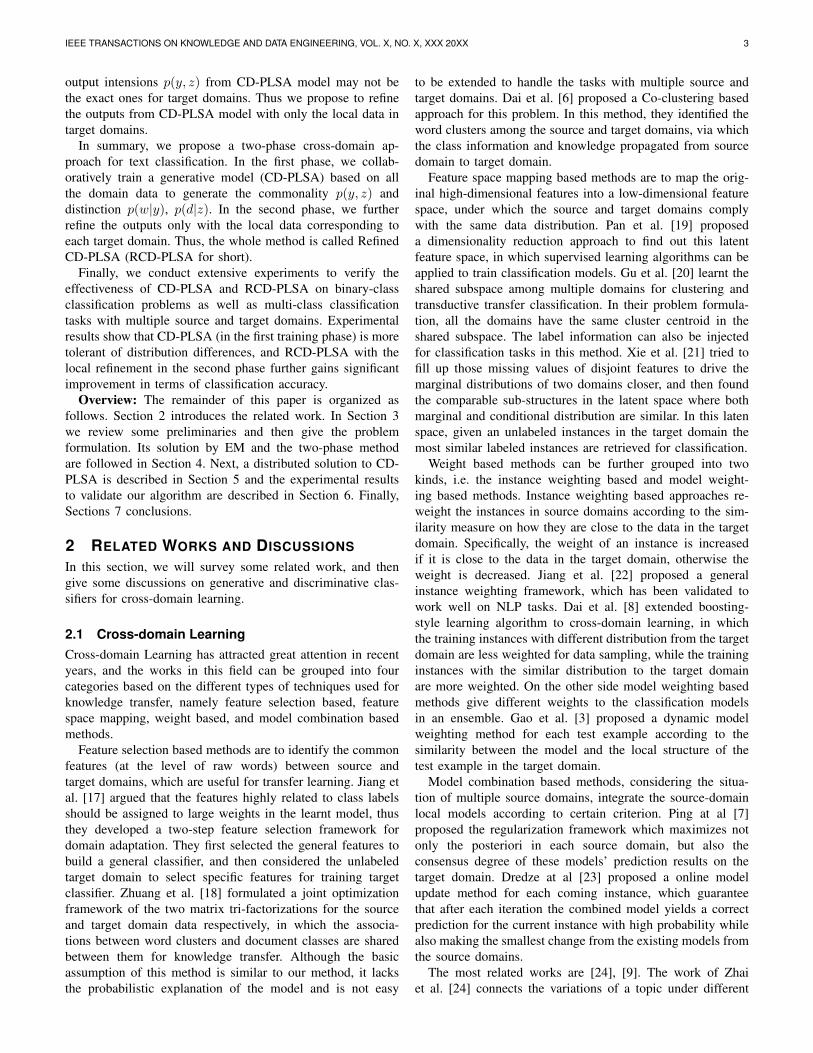
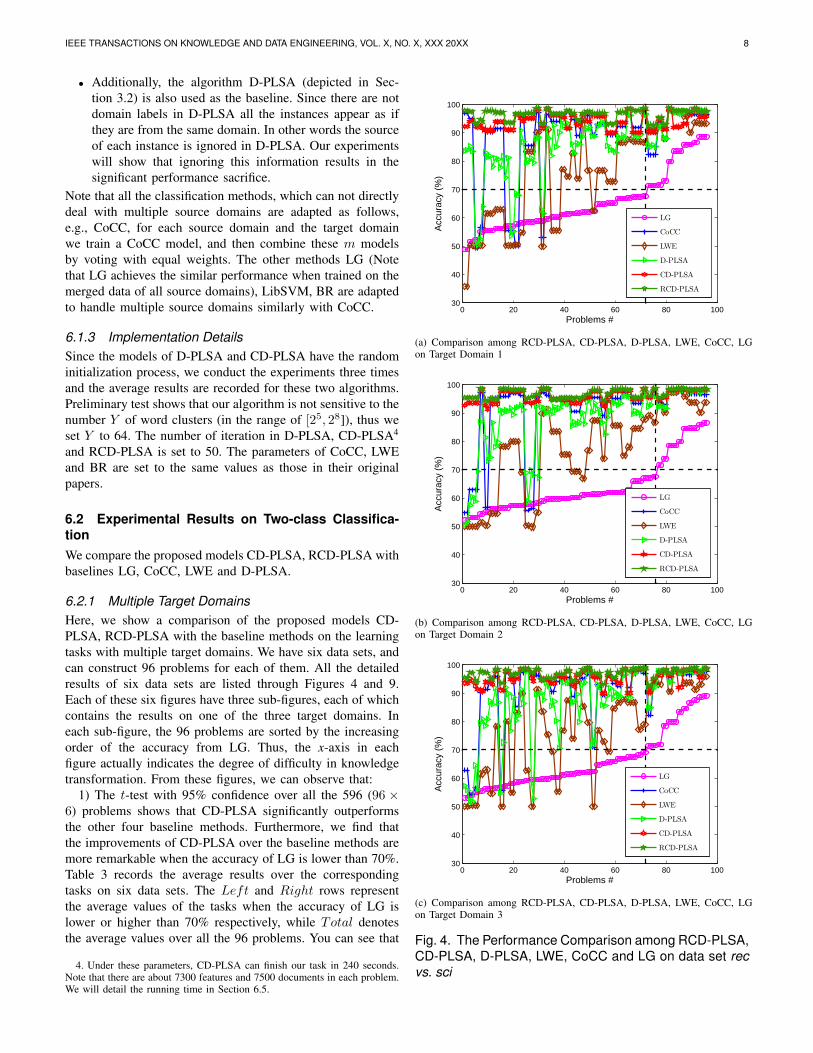
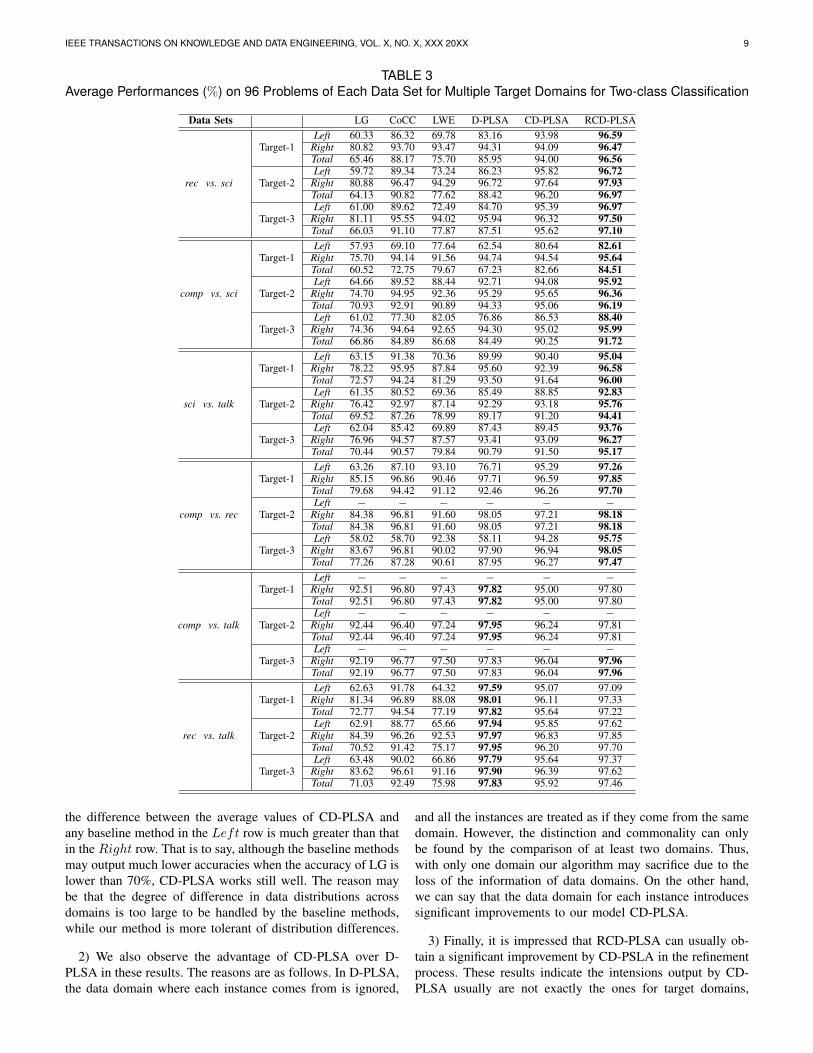
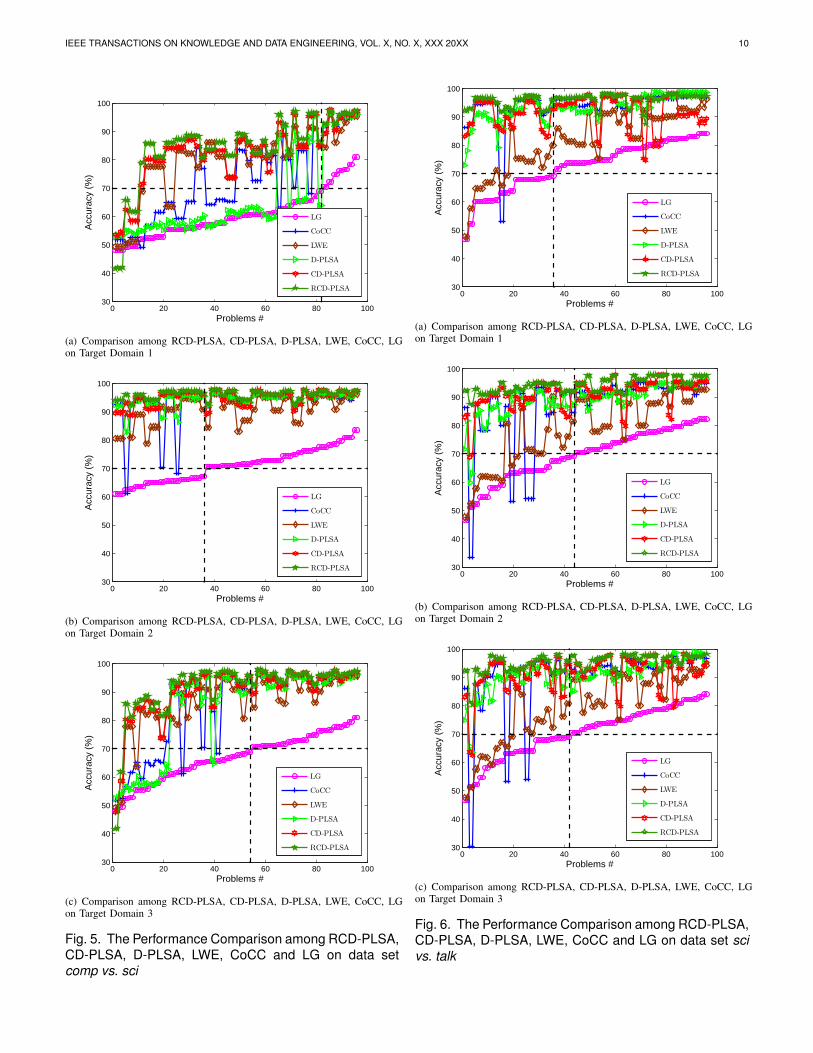
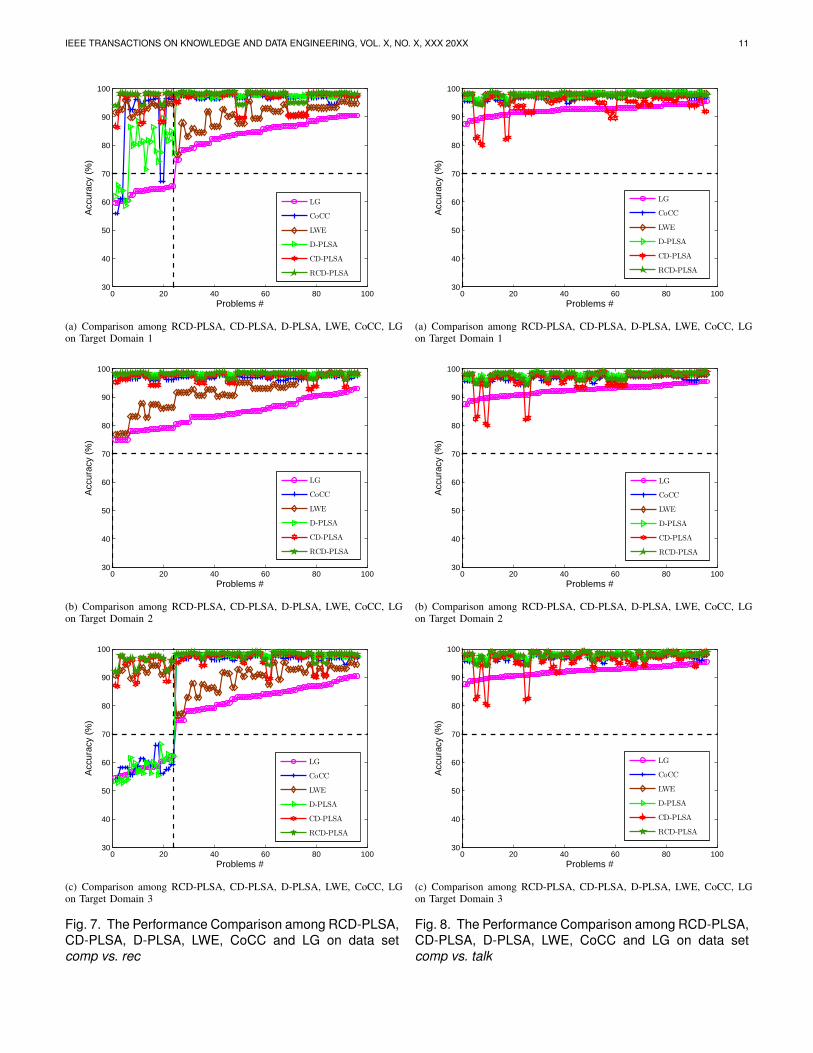
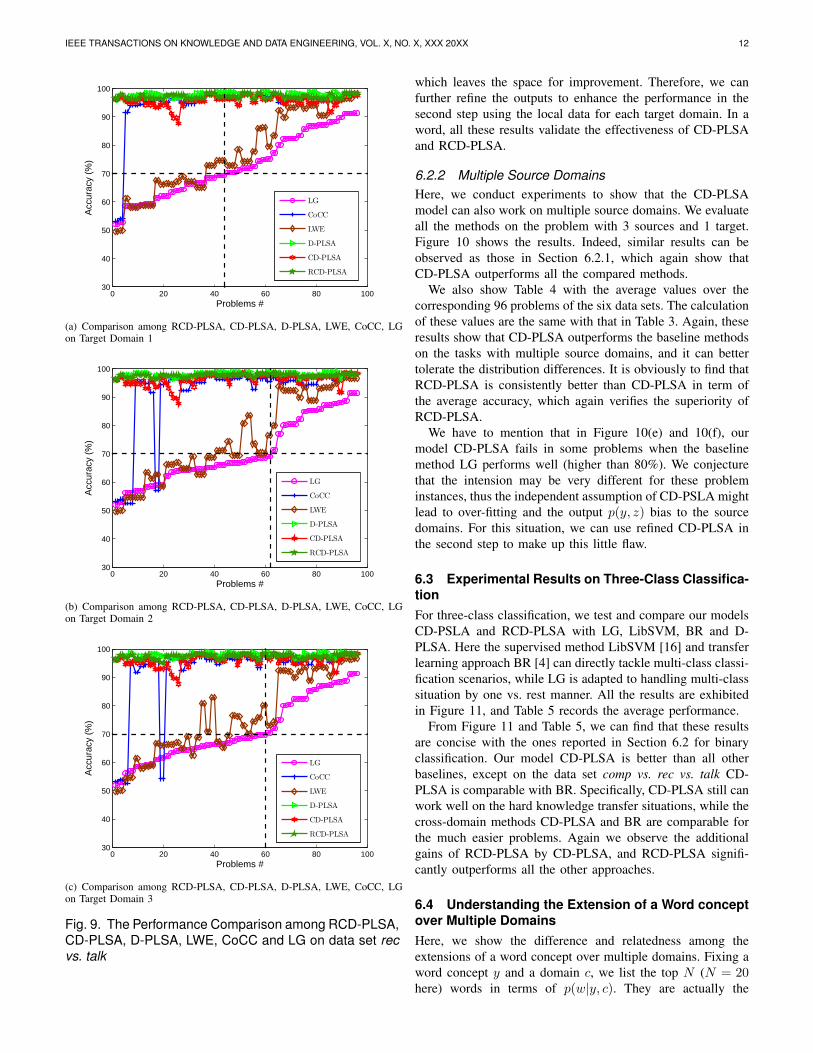
6.2.1 Multiple Target DomainsHere, we show a comparison of the proposed models CD-PLSA, RCD-PLSA with the baseline methods on the learningtasks with multiple target domains. We have six data sets, andcan construct 96 problems for each of them. All the detailedresults of six data sets are listed through Figures 4 and 9.Each of these six figures have three sub-figures, each of whichcontains the results on one of the three target domains. Ineach sub-figure, the 96 problems are sorted by the increasingorder of the accuracy from LG. Thus, the x-axis in eachfigure actually indicates the degree of difficulty in knowledgetransformation. From these figures, we can observe that:
1) The t-test with 95% confidence over all the 596 (96 ×6) problems shows that CD-PLSA significantly outperformsthe other four baseline methods. Furthermore, we find thatthe improvements of CD-PLSA over the baseline methods aremore remarkable when the accuracy of LG is lower than 70%.Table 3 records the average results over the correspondingtasks on six data sets. The Left and Right rows representthe average values of the tasks when the accuracy of LG islower or higher than 70% respectively, while Total denotesthe average values over all the 96 problems. You can see that
4. Under these parameters, CD-PLSA can finish our task in 240 seconds.Note that there are about 7300 features and 7500 documents in each problem.We will detail the running time in Section 6.5.
0 20 40 60 80 10030
40
50
60
70
80
90
100
Problems #
Acc
urac
y (%
)
LG
CoCC
LWE
D-PLSA
CD-PLSA
RCD-PLSA
(a) Comparison among RCD-PLSA, CD-PLSA, D-PLSA, LWE, CoCC, LGon Target Domain 1
0 20 40 60 80 10030
40
50
60
70
80
90
100
Problems #
Acc
urac
y (%
)
LG
CoCC
LWE
D-PLSA
CD-PLSA
RCD-PLSA
(b) Comparison among RCD-PLSA, CD-PLSA, D-PLSA, LWE, CoCC, LGon Target Domain 2
0 20 40 60 80 10030
40
50
60
70
80
90
100
Problems #
Acc
urac
y (%
)
LG
CoCC
LWE
D-PLSA
CD-PLSA
RCD-PLSA
(c) Comparison among RCD-PLSA, CD-PLSA, D-PLSA, LWE, CoCC, LGon Target Domain 3
Fig. 4. The Performance Comparison among RCD-PLSA,CD-PLSA, D-PLSA, LWE, CoCC and LG on data set recvs. sci
IEEE TRANSACTIONS ON KNOWLEDGE AND DATA ENGINEERING, VOL. X, NO. X, XXX 20XX 9
TABLE 3Average Performances (%) on 96 Problems of Each Data Set for Multiple Target Domains for Two-class Classification
Data Sets LG CoCC LWE D-PLSA CD-PLSA RCD-PLSA
rec vs. sci
Target-1Left 60.33 86.32 69.78 83.16 93.98 96.59
Right 80.82 93.70 93.47 94.31 94.09 96.47Total 65.46 88.17 75.70 85.95 94.00 96.56
Target-2Left 59.72 89.34 73.24 86.23 95.82 96.72
Right 80.88 96.47 94.29 96.72 97.64 97.93Total 64.13 90.82 77.62 88.42 96.20 96.97
Target-3Left 61.00 89.62 72.49 84.70 95.39 96.97
Right 81.11 95.55 94.02 95.94 96.32 97.50Total 66.03 91.10 77.87 87.51 95.62 97.10
comp vs. sci
Target-1Left 57.93 69.10 77.64 62.54 80.64 82.61
Right 75.70 94.14 91.56 94.74 94.54 95.64Total 60.52 72.75 79.67 67.23 82.66 84.51
Target-2Left 64.66 89.52 88.44 92.71 94.08 95.92
Right 74.70 94.95 92.36 95.29 95.65 96.36Total 70.93 92.91 90.89 94.33 95.06 96.19
Target-3Left 61.02 77.30 82.05 76.86 86.53 88.40
Right 74.36 94.64 92.65 94.30 95.02 95.99Total 66.86 84.89 86.68 84.49 90.25 91.72
sci vs. talk
Target-1Left 63.15 91.38 70.36 89.99 90.40 95.04
Right 78.22 95.95 87.84 95.60 92.39 96.58Total 72.57 94.24 81.29 93.50 91.64 96.00
Target-2Left 61.35 80.52 69.36 85.49 88.85 92.83
Right 76.42 92.97 87.14 92.29 93.18 95.76Total 69.52 87.26 78.99 89.17 91.20 94.41
Target-3Left 62.04 85.42 69.89 87.43 89.45 93.76
Right 76.96 94.57 87.57 93.41 93.09 96.27Total 70.44 90.57 79.84 90.79 91.50 95.17
comp vs. rec
Target-1Left 63.26 87.10 93.10 76.71 95.29 97.26
Right 85.15 96.86 90.46 97.71 96.59 97.85Total 79.68 94.42 91.12 92.46 96.26 97.70
Target-2Left − − − − − −
Right 84.38 96.81 91.60 98.05 97.21 98.18Total 84.38 96.81 91.60 98.05 97.21 98.18
Target-3Left 58.02 58.70 92.38 58.11 94.28 95.75
Right 83.67 96.81 90.02 97.90 96.94 98.05Total 77.26 87.28 90.61 87.95 96.27 97.47
comp vs. talk
Target-1Left − − − − − −
Right 92.51 96.80 97.43 97.82 95.00 97.80Total 92.51 96.80 97.43 97.82 95.00 97.80
Target-2Left − − − − − −
Right 92.44 96.40 97.24 97.95 96.24 97.81Total 92.44 96.40 97.24 97.95 96.24 97.81
Target-3Left − − − − − −
Right 92.19 96.77 97.50 97.83 96.04 97.96Total 92.19 96.77 97.50 97.83 96.04 97.96
rec vs. talk
Target-1Left 62.63 91.78 64.32 97.59 95.07 97.09
Right 81.34 96.89 88.08 98.01 96.11 97.33Total 72.77 94.54 77.19 97.82 95.64 97.22
Target-2Left 62.91 88.77 65.66 97.94 95.85 97.62
Right 84.39 96.26 92.53 97.97 96.83 97.85Total 70.52 91.42 75.17 97.95 96.20 97.70
Target-3Left 63.48 90.02 66.86 97.79 95.64 97.37
Right 83.62 96.61 91.16 97.90 96.39 97.62Total 71.03 92.49 75.98 97.83 95.92 97.46
the difference between the average values of CD-PLSA andany baseline method in the Left row is much greater than thatin the Right row. That is to say, although the baseline methodsmay output much lower accuracies when the accuracy of LG islower than 70%, CD-PLSA works still well. The reason maybe that the degree of difference in data distributions acrossdomains is too large to be handled by the baseline methods,while our method is more tolerant of distribution differences.
2) We also observe the advantage of CD-PLSA over D-PLSA in these results. The reasons are as follows. In D-PLSA,the data domain where each instance comes from is ignored,
and all the instances are treated as if they come from the samedomain. However, the distinction and commonality can onlybe found by the comparison of at least two domains. Thus,with only one domain our algorithm may sacrifice due to theloss of the information of data domains. On the other hand,we can say that the data domain for each instance introducessignificant improvements to our model CD-PLSA.
3) Finally, it is impressed that RCD-PLSA can usually ob-tain a significant improvement by CD-PSLA in the refinementprocess. These results indicate the intensions output by CD-PLSA usually are not exactly the ones for target domains,
IEEE TRANSACTIONS ON KNOWLEDGE AND DATA ENGINEERING, VOL. X, NO. X, XXX 20XX 10
0 20 40 60 80 10030
40
50
60
70
80
90
100
Problems #
Acc
urac
y (%
)
LG
CoCC
LWE
D-PLSA
CD-PLSA
RCD-PLSA
(a) Comparison among RCD-PLSA, CD-PLSA, D-PLSA, LWE, CoCC, LGon Target Domain 1
0 20 40 60 80 10030
40
50
60
70
80
90
100
Problems #
Acc
urac
y (%
)
LG
CoCC
LWE
D-PLSA
CD-PLSA
RCD-PLSA
(b) Comparison among RCD-PLSA, CD-PLSA, D-PLSA, LWE, CoCC, LGon Target Domain 2
0 20 40 60 80 10030
40
50
60
70
80
90
100
Problems #
Acc
urac
y (%
)
LG
CoCC
LWE
D-PLSA
CD-PLSA
RCD-PLSA
(c) Comparison among RCD-PLSA, CD-PLSA, D-PLSA, LWE, CoCC, LGon Target Domain 3
Fig. 5. The Performance Comparison among RCD-PLSA,CD-PLSA, D-PLSA, LWE, CoCC and LG on data setcomp vs. sci
0 20 40 60 80 10030
40
50
60
70
80
90
100
Problems #
Acc
urac
y (%
)
LG
CoCC
LWE
D-PLSA
CD-PLSA
RCD-PLSA
(a) Comparison among RCD-PLSA, CD-PLSA, D-PLSA, LWE, CoCC, LGon Target Domain 1
0 20 40 60 80 10030
40
50
60
70
80
90
100
Problems #
Acc
urac
y (%
)
LG
CoCC
LWE
D-PLSA
CD-PLSA
RCD-PLSA
(b) Comparison among RCD-PLSA, CD-PLSA, D-PLSA, LWE, CoCC, LGon Target Domain 2
0 20 40 60 80 10030
40
50
60
70
80
90
100
Problems #
Acc
urac
y (%
)
LG
CoCC
LWE
D-PLSA
CD-PLSA
RCD-PLSA
(c) Comparison among RCD-PLSA, CD-PLSA, D-PLSA, LWE, CoCC, LGon Target Domain 3
Fig. 6. The Performance Comparison among RCD-PLSA,CD-PLSA, D-PLSA, LWE, CoCC and LG on data set scivs. talk
IEEE TRANSACTIONS ON KNOWLEDGE AND DATA ENGINEERING, VOL. X, NO. X, XXX 20XX 11
0 20 40 60 80 10030
40
50
60
70
80
90
100
Problems #
Acc
urac
y (%
)
LG
CoCC
LWE
D-PLSA
CD-PLSA
RCD-PLSA
(a) Comparison among RCD-PLSA, CD-PLSA, D-PLSA, LWE, CoCC, LGon Target Domain 1
0 20 40 60 80 10030
40
50
60
70
80
90
100
Problems #
Acc
urac
y (%
)
LG
CoCC
LWE
D-PLSA
CD-PLSA
RCD-PLSA
(b) Comparison among RCD-PLSA, CD-PLSA, D-PLSA, LWE, CoCC, LGon Target Domain 2
0 20 40 60 80 10030
40
50
60
70
80
90
100
Problems #
Acc
urac
y (%
)
LG
CoCC
LWE
D-PLSA
CD-PLSA
RCD-PLSA
(c) Comparison among RCD-PLSA, CD-PLSA, D-PLSA, LWE, CoCC, LGon Target Domain 3
Fig. 7. The Performance Comparison among RCD-PLSA,CD-PLSA, D-PLSA, LWE, CoCC and LG on data setcomp vs. rec
0 20 40 60 80 10030
40
50
60
70
80
90
100
Problems #
Acc
urac
y (%
)
LG
CoCC
LWE
D-PLSA
CD-PLSA
RCD-PLSA
(a) Comparison among RCD-PLSA, CD-PLSA, D-PLSA, LWE, CoCC, LGon Target Domain 1
0 20 40 60 80 10030
40
50
60
70
80
90
100
Problems #
Acc
urac
y (%
)
LG
CoCC
LWE
D-PLSA
CD-PLSA
RCD-PLSA
(b) Comparison among RCD-PLSA, CD-PLSA, D-PLSA, LWE, CoCC, LGon Target Domain 2
0 20 40 60 80 10030
40
50
60
70
80
90
100
Problems #
Acc
urac
y (%
)
LG
CoCC
LWE
D-PLSA
CD-PLSA
RCD-PLSA
(c) Comparison among RCD-PLSA, CD-PLSA, D-PLSA, LWE, CoCC, LGon Target Domain 3
Fig. 8. The Performance Comparison among RCD-PLSA,CD-PLSA, D-PLSA, LWE, CoCC and LG on data setcomp vs. talk
IEEE TRANSACTIONS ON KNOWLEDGE AND DATA ENGINEERING, VOL. X, NO. X, XXX 20XX 12
0 20 40 60 80 10030
40
50
60
70
80
90
100
Problems #
Acc
urac
y (%
)
LG
CoCC
LWE
D-PLSA
CD-PLSA
RCD-PLSA
(a) Comparison among RCD-PLSA, CD-PLSA, D-PLSA, LWE, CoCC, LGon Target Domain 1
0 20 40 60 80 10030
40
50
60
70
80
90
100
Problems #
Acc
urac
y (%
)
LG
CoCC
LWE
D-PLSA
CD-PLSA
RCD-PLSA
(b) Comparison among RCD-PLSA, CD-PLSA, D-PLSA, LWE, CoCC, LGon Target Domain 2
0 20 40 60 80 10030
40
50
60
70
80
90
100
Problems #
Acc
urac
y (%
)
LG
CoCC
LWE
D-PLSA
CD-PLSA
RCD-PLSA
(c) Comparison among RCD-PLSA, CD-PLSA, D-PLSA, LWE, CoCC, LGon Target Domain 3
Fig. 9. The Performance Comparison among RCD-PLSA,CD-PLSA, D-PLSA, LWE, CoCC and LG on data set recvs. talk
which leaves the space for improvement. Therefore, we canfurther refine the outputs to enhance the performance in thesecond step using the local data for each target domain. In aword, all these results validate the effectiveness of CD-PLSAand RCD-PLSA.
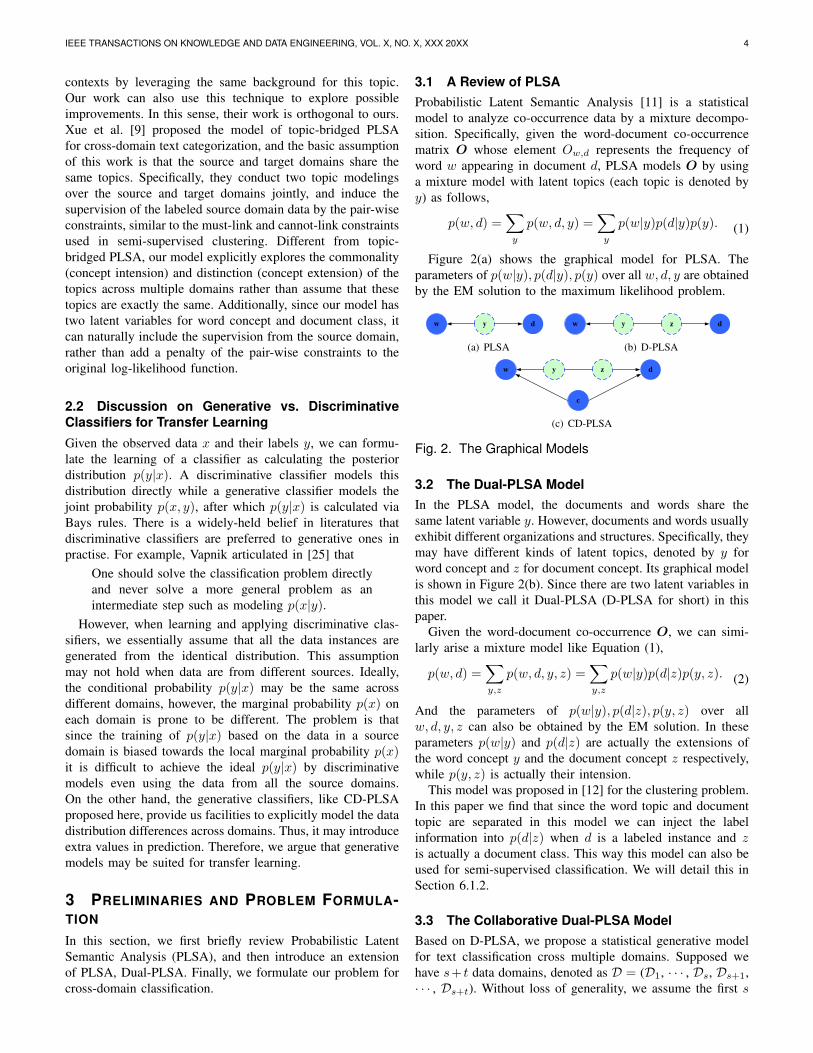
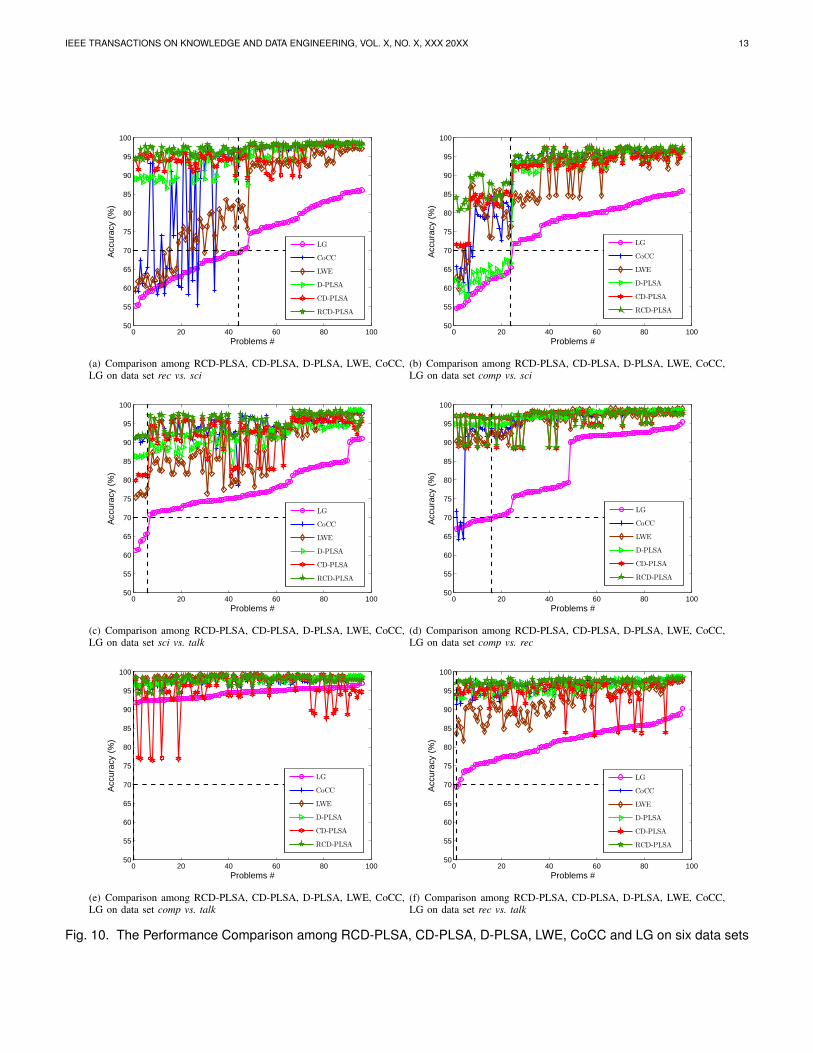
6.2.2 Multiple Source DomainsHere, we conduct experiments to show that the CD-PLSAmodel can also work on multiple source domains. We evaluateall the methods on the problem with 3 sources and 1 target.Figure 10 shows the results. Indeed, similar results can beobserved as those in Section 6.2.1, which again show thatCD-PLSA outperforms all the compared methods.
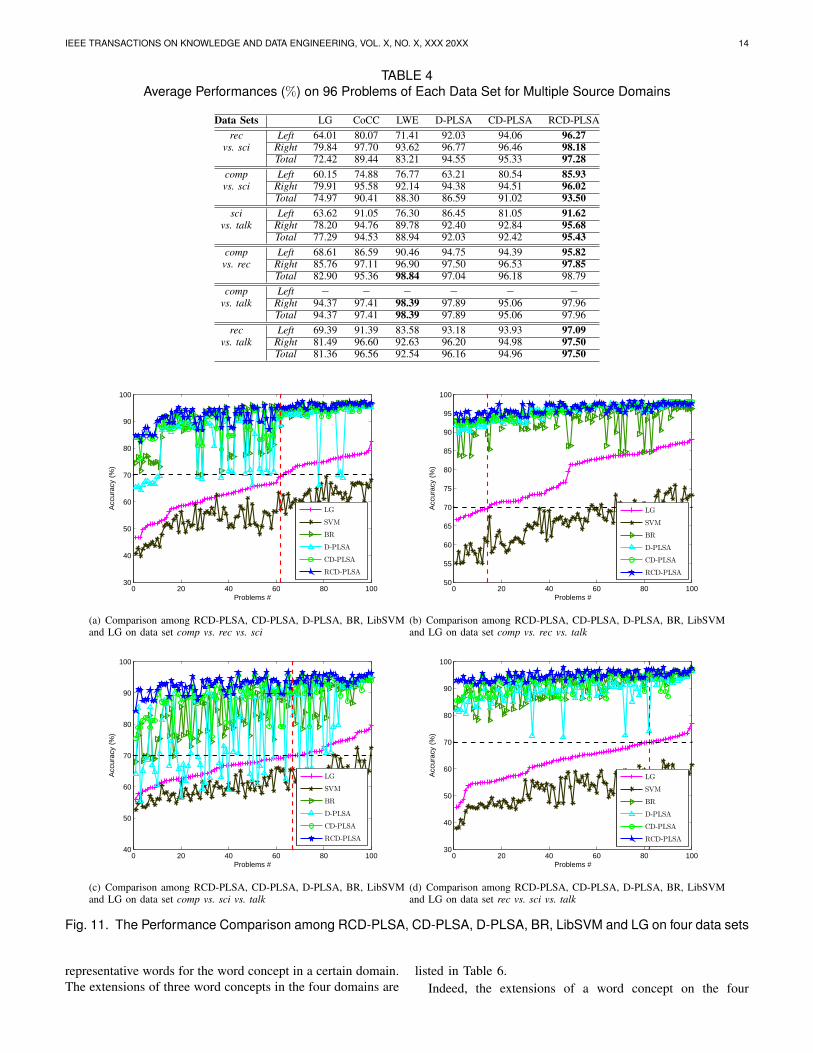
We also show Table 4 with the average values over thecorresponding 96 problems of the six data sets. The calculationof these values are the same with that in Table 3. Again, theseresults show that CD-PLSA outperforms the baseline methodson the tasks with multiple source domains, and it can bettertolerate the distribution differences. It is obviously to find thatRCD-PLSA is consistently better than CD-PLSA in term ofthe average accuracy, which again verifies the superiority ofRCD-PLSA.
We have to mention that in Figure 10(e) and 10(f), ourmodel CD-PLSA fails in some problems when the baselinemethod LG performs well (higher than 80%). We conjecturethat the intension may be very different for these probleminstances, thus the independent assumption of CD-PSLA mightlead to over-fitting and the output p(y, z) bias to the sourcedomains. For this situation, we can use refined CD-PLSA inthe second step to make up this little flaw.
6.3 Experimental Results on Three-Class Classifica-tionFor three-class classification, we test and compare our modelsCD-PSLA and RCD-PLSA with LG, LibSVM, BR and D-PLSA. Here the supervised method LibSVM [16] and transferlearning approach BR [4] can directly tackle multi-class classi-fication scenarios, while LG is adapted to handling multi-classsituation by one vs. rest manner. All the results are exhibitedin Figure 11, and Table 5 records the average performance.
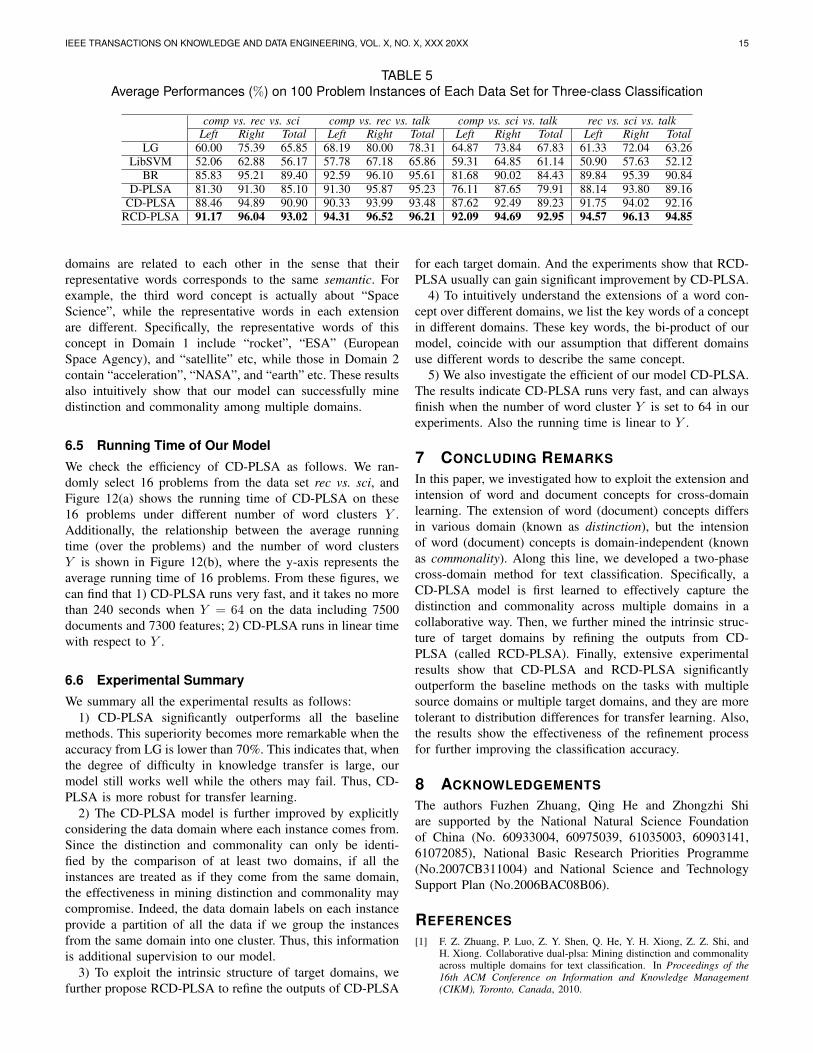
From Figure 11 and Table 5, we can find that these resultsare concise with the ones reported in Section 6.2 for binaryclassification. Our model CD-PLSA is better than all otherbaselines, except on the data set comp vs. rec vs. talk CD-PLSA is comparable with BR. Specifically, CD-PLSA still canwork well on the hard knowledge transfer situations, while thecross-domain methods CD-PLSA and BR are comparable forthe much easier problems. Again we observe the additionalgains of RCD-PLSA by CD-PLSA, and RCD-PLSA signifi-cantly outperforms all the other approaches.
6.4 Understanding the Extension of a Word conceptover Multiple DomainsHere, we show the difference and relatedness among theextensions of a word concept over multiple domains. Fixing aword concept y and a domain c, we list the top N (N = 20here) words in terms of p(w|y, c). They are actually the
IEEE TRANSACTIONS ON KNOWLEDGE AND DATA ENGINEERING, VOL. X, NO. X, XXX 20XX 13
0 20 40 60 80 10050
55
60
65
70
75
80
85
90
95
100
Problems #
Acc
urac
y (%
)
LG
CoCC
LWE
D-PLSA
CD-PLSA
RCD-PLSA
(a) Comparison among RCD-PLSA, CD-PLSA, D-PLSA, LWE, CoCC,LG on data set rec vs. sci
0 20 40 60 80 10050
55
60
65
70
75
80
85
90
95
100
Problems #
Acc
urac
y (%
)
LG
CoCC
LWE
D-PLSA
CD-PLSA
RCD-PLSA
(b) Comparison among RCD-PLSA, CD-PLSA, D-PLSA, LWE, CoCC,LG on data set comp vs. sci
0 20 40 60 80 10050
55
60
65
70
75
80
85
90
95
100
Problems #
Acc
urac
y (%
)
LG
CoCC
LWE
D-PLSA
CD-PLSA
RCD-PLSA
(c) Comparison among RCD-PLSA, CD-PLSA, D-PLSA, LWE, CoCC,LG on data set sci vs. talk
0 20 40 60 80 10050
55
60
65
70
75
80
85
90
95
100
Problems #
Acc
urac
y (%
)
LG
CoCC
LWE
D-PLSA
CD-PLSA
RCD-PLSA
(d) Comparison among RCD-PLSA, CD-PLSA, D-PLSA, LWE, CoCC,LG on data set comp vs. rec
0 20 40 60 80 10050
55
60
65
70
75
80
85
90
95
100
Problems #
Acc
urac
y (%
)
LG
CoCC
LWE
D-PLSA
CD-PLSA
RCD-PLSA
(e) Comparison among RCD-PLSA, CD-PLSA, D-PLSA, LWE, CoCC,LG on data set comp vs. talk
0 20 40 60 80 10050
55
60
65
70
75
80
85
90
95
100
Problems #
Acc
urac
y (%
)
LG
CoCC
LWE
D-PLSA
CD-PLSA
RCD-PLSA
(f) Comparison among RCD-PLSA, CD-PLSA, D-PLSA, LWE, CoCC,LG on data set rec vs. talk
Fig. 10. The Performance Comparison among RCD-PLSA, CD-PLSA, D-PLSA, LWE, CoCC and LG on six data sets
IEEE TRANSACTIONS ON KNOWLEDGE AND DATA ENGINEERING, VOL. X, NO. X, XXX 20XX 14
TABLE 4Average Performances (%) on 96 Problems of Each Data Set for Multiple Source Domains
Data Sets LG CoCC LWE D-PLSA CD-PLSA RCD-PLSArec Left 64.01 80.07 71.41 92.03 94.06 96.27
vs. sci Right 79.84 97.70 93.62 96.77 96.46 98.18Total 72.42 89.44 83.21 94.55 95.33 97.28
comp Left 60.15 74.88 76.77 63.21 80.54 85.93vs. sci Right 79.91 95.58 92.14 94.38 94.51 96.02
Total 74.97 90.41 88.30 86.59 91.02 93.50sci Left 63.62 91.05 76.30 86.45 81.05 91.62
vs. talk Right 78.20 94.76 89.78 92.40 92.84 95.68Total 77.29 94.53 88.94 92.03 92.42 95.43
comp Left 68.61 86.59 90.46 94.75 94.39 95.82vs. rec Right 85.76 97.11 96.90 97.50 96.53 97.85
Total 82.90 95.36 98.84 97.04 96.18 98.79comp Left − − − − − −
vs. talk Right 94.37 97.41 98.39 97.89 95.06 97.96Total 94.37 97.41 98.39 97.89 95.06 97.96
rec Left 69.39 91.39 83.58 93.18 93.93 97.09vs. talk Right 81.49 96.60 92.63 96.20 94.98 97.50
Total 81.36 96.56 92.54 96.16 94.96 97.50
0 20 40 60 80 10030
40
50
60
70
80
90
100
Problems #
Acc
urac
y (%
)
LG
SVM
BR
D-PLSA
CD-PLSA
RCD-PLSA
(a) Comparison among RCD-PLSA, CD-PLSA, D-PLSA, BR, LibSVMand LG on data set comp vs. rec vs. sci
0 20 40 60 80 10050
55
60
65
70
75
80
85
90
95
100
Problems #
Acc
urac
y (%
)
LG
SVM
BR
D-PLSA
CD-PLSA
RCD-PLSA
(b) Comparison among RCD-PLSA, CD-PLSA, D-PLSA, BR, LibSVMand LG on data set comp vs. rec vs. talk
0 20 40 60 80 10040
50
60
70
80
90
100
Problems #
Acc
urac
y (%
)
LG
SVM
BR
D-PLSA
CD-PLSA
RCD-PLSA
(c) Comparison among RCD-PLSA, CD-PLSA, D-PLSA, BR, LibSVMand LG on data set comp vs. sci vs. talk
0 20 40 60 80 10030
40
50
60
70
80
90
100
Problems #
Acc
urac
y (%
)
LG
SVM
BR
D-PLSA
CD-PLSA
RCD-PLSA
(d) Comparison among RCD-PLSA, CD-PLSA, D-PLSA, BR, LibSVMand LG on data set rec vs. sci vs. talk
Fig. 11. The Performance Comparison among RCD-PLSA, CD-PLSA, D-PLSA, BR, LibSVM and LG on four data sets
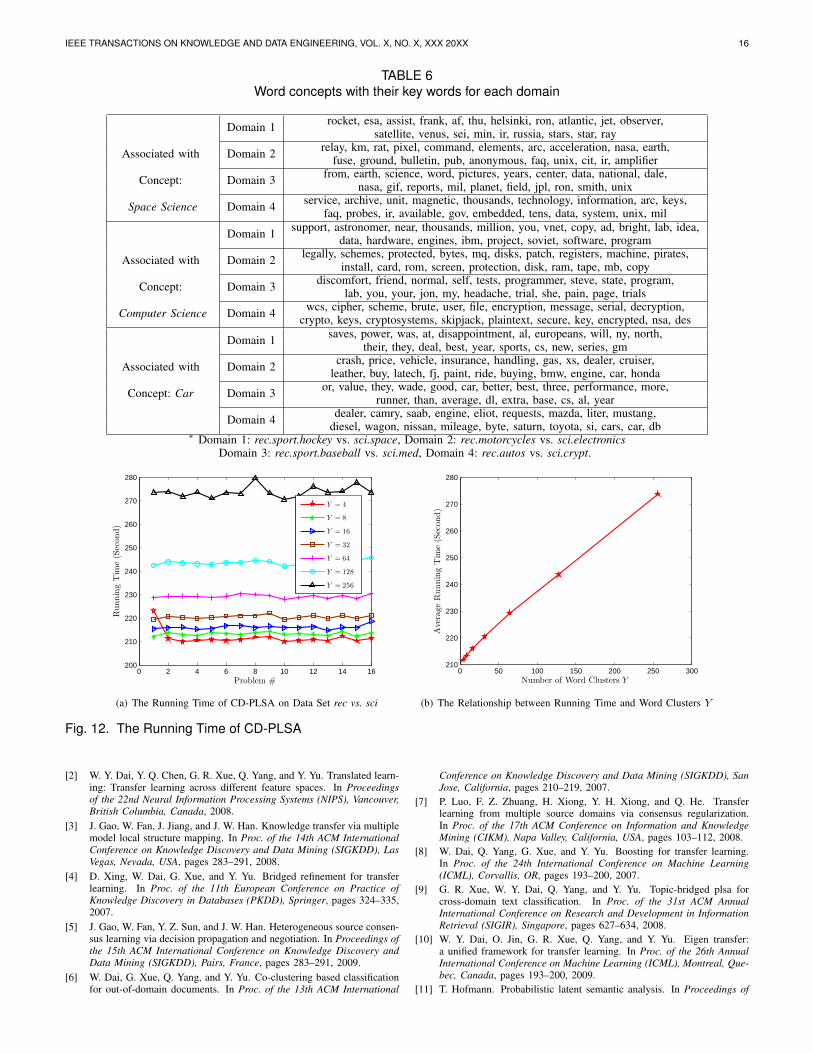
representative words for the word concept in a certain domain.The extensions of three word concepts in the four domains are
listed in Table 6.Indeed, the extensions of a word concept on the four
IEEE TRANSACTIONS ON KNOWLEDGE AND DATA ENGINEERING, VOL. X, NO. X, XXX 20XX 15
TABLE 5Average Performances (%) on 100 Problem Instances of Each Data Set for Three-class Classification
comp vs. rec vs. sci comp vs. rec vs. talk comp vs. sci vs. talk rec vs. sci vs. talkLeft Right Total Left Right Total Left Right Total Left Right Total
LG 60.00 75.39 65.85 68.19 80.00 78.31 64.87 73.84 67.83 61.33 72.04 63.26LibSVM 52.06 62.88 56.17 57.78 67.18 65.86 59.31 64.85 61.14 50.90 57.63 52.12
BR 85.83 95.21 89.40 92.59 96.10 95.61 81.68 90.02 84.43 89.84 95.39 90.84D-PLSA 81.30 91.30 85.10 91.30 95.87 95.23 76.11 87.65 79.91 88.14 93.80 89.16
CD-PLSA 88.46 94.89 90.90 90.33 93.99 93.48 87.62 92.49 89.23 91.75 94.02 92.16RCD-PLSA 91.17 96.04 93.02 94.31 96.52 96.21 92.09 94.69 92.95 94.57 96.13 94.85
domains are related to each other in the sense that theirrepresentative words corresponds to the same semantic. Forexample, the third word concept is actually about “SpaceScience”, while the representative words in each extensionare different. Specifically, the representative words of thisconcept in Domain 1 include “rocket”, “ESA” (EuropeanSpace Agency), and “satellite” etc, while those in Domain 2contain “acceleration”, “NASA”, and “earth” etc. These resultsalso intuitively show that our model can successfully minedistinction and commonality among multiple domains.
6.5 Running Time of Our Model
We check the efficiency of CD-PLSA as follows. We ran-domly select 16 problems from the data set rec vs. sci, andFigure 12(a) shows the running time of CD-PLSA on these16 problems under different number of word clusters Y .Additionally, the relationship between the average runningtime (over the problems) and the number of word clustersY is shown in Figure 12(b), where the y-axis represents theaverage running time of 16 problems. From these figures, wecan find that 1) CD-PLSA runs very fast, and it takes no morethan 240 seconds when Y = 64 on the data including 7500documents and 7300 features; 2) CD-PLSA runs in linear timewith respect to Y .
6.6 Experimental Summary
We summary all the experimental results as follows:1) CD-PLSA significantly outperforms all the baseline
methods. This superiority becomes more remarkable when theaccuracy from LG is lower than 70%. This indicates that, whenthe degree of difficulty in knowledge transfer is large, ourmodel still works well while the others may fail. Thus, CD-PLSA is more robust for transfer learning.
2) The CD-PLSA model is further improved by explicitlyconsidering the data domain where each instance comes from.Since the distinction and commonality can only be identi-fied by the comparison of at least two domains, if all theinstances are treated as if they come from the same domain,the effectiveness in mining distinction and commonality maycompromise. Indeed, the data domain labels on each instanceprovide a partition of all the data if we group the instancesfrom the same domain into one cluster. Thus, this informationis additional supervision to our model.
3) To exploit the intrinsic structure of target domains, wefurther propose RCD-PLSA to refine the outputs of CD-PLSA
for each target domain. And the experiments show that RCD-PLSA usually can gain significant improvement by CD-PLSA.
4) To intuitively understand the extensions of a word con-cept over different domains, we list the key words of a conceptin different domains. These key words, the bi-product of ourmodel, coincide with our assumption that different domainsuse different words to describe the same concept.
5) We also investigate the efficient of our model CD-PLSA.The results indicate CD-PLSA runs very fast, and can alwaysfinish when the number of word cluster Y is set to 64 in ourexperiments. Also the running time is linear to Y .
7 CONCLUDING REMARKS
In this paper, we investigated how to exploit the extension andintension of word and document concepts for cross-domainlearning. The extension of word (document) concepts differsin various domain (known as distinction), but the intensionof word (document) concepts is domain-independent (knownas commonality). Along this line, we developed a two-phasecross-domain method for text classification. Specifically, aCD-PLSA model is first learned to effectively capture thedistinction and commonality across multiple domains in acollaborative way. Then, we further mined the intrinsic struc-ture of target domains by refining the outputs from CD-PLSA (called RCD-PLSA). Finally, extensive experimentalresults show that CD-PLSA and RCD-PLSA significantlyoutperform the baseline methods on the tasks with multiplesource domains or multiple target domains, and they are moretolerant to distribution differences for transfer learning. Also,the results show the effectiveness of the refinement processfor further improving the classification accuracy.
8 ACKNOWLEDGEMENTS
The authors Fuzhen Zhuang, Qing He and Zhongzhi Shiare supported by the National Natural Science Foundationof China (No. 60933004, 60975039, 61035003, 60903141,61072085), National Basic Research Priorities Programme(No.2007CB311004) and National Science and TechnologySupport Plan (No.2006BAC08B06).
REFERENCES[1] F. Z. Zhuang, P. Luo, Z. Y. Shen, Q. He, Y. H. Xiong, Z. Z. Shi, and
H. Xiong. Collaborative dual-plsa: Mining distinction and commonalityacross multiple domains for text classification. In Proceedings of the16th ACM Conference on Information and Knowledge Management(CIKM), Toronto, Canada, 2010.
IEEE TRANSACTIONS ON KNOWLEDGE AND DATA ENGINEERING, VOL. X, NO. X, XXX 20XX 16
TABLE 6Word concepts with their key words for each domain
Domain 1 rocket, esa, assist, frank, af, thu, helsinki, ron, atlantic, jet, observer,satellite, venus, sei, min, ir, russia, stars, star, ray
Associated with Domain 2 relay, km, rat, pixel, command, elements, arc, acceleration, nasa, earth,fuse, ground, bulletin, pub, anonymous, faq, unix, cit, ir, amplifier
Concept: Domain 3 from, earth, science, word, pictures, years, center, data, national, dale,nasa, gif, reports, mil, planet, field, jpl, ron, smith, unix
Space Science Domain 4 service, archive, unit, magnetic, thousands, technology, information, arc, keys,faq, probes, ir, available, gov, embedded, tens, data, system, unix, mil
Domain 1 support, astronomer, near, thousands, million, you, vnet, copy, ad, bright, lab, idea,data, hardware, engines, ibm, project, soviet, software, program
Associated with Domain 2 legally, schemes, protected, bytes, mq, disks, patch, registers, machine, pirates,install, card, rom, screen, protection, disk, ram, tape, mb, copy
Concept: Domain 3 discomfort, friend, normal, self, tests, programmer, steve, state, program,lab, you, your, jon, my, headache, trial, she, pain, page, trials
Computer Science Domain 4 wcs, cipher, scheme, brute, user, file, encryption, message, serial, decryption,crypto, keys, cryptosystems, skipjack, plaintext, secure, key, encrypted, nsa, des
Domain 1 saves, power, was, at, disappointment, al, europeans, will, ny, north,their, they, deal, best, year, sports, cs, new, series, gm
Associated with Domain 2 crash, price, vehicle, insurance, handling, gas, xs, dealer, cruiser,leather, buy, latech, fj, paint, ride, buying, bmw, engine, car, honda
Concept: Car Domain 3 or, value, they, wade, good, car, better, best, three, performance, more,runner, than, average, dl, extra, base, cs, al, year
Domain 4 dealer, camry, saab, engine, eliot, requests, mazda, liter, mustang,diesel, wagon, nissan, mileage, byte, saturn, toyota, si, cars, car, db
∗ Domain 1: rec.sport.hockey vs. sci.space, Domain 2: rec.motorcycles vs. sci.electronicsDomain 3: rec.sport.baseball vs. sci.med, Domain 4: rec.autos vs. sci.crypt.
0 2 4 6 8 10 12 14 16200
210
220
230
240
250
260
270
280
Problem #
Runnin
gT
ime
(Sec
ond)
Y = 4
Y = 8
Y = 16
Y = 32
Y = 64
Y = 128
Y = 256
(a) The Running Time of CD-PLSA on Data Set rec vs. sci
0 50 100 150 200 250 300210
220
230
240
250
260
270
280
Number of Word Clusters Y
Ave
rage
Runnin
gT
ime
(Sec
ond)
(b) The Relationship between Running Time and Word Clusters Y
Fig. 12. The Running Time of CD-PLSA
[2] W. Y. Dai, Y. Q. Chen, G. R. Xue, Q. Yang, and Y. Yu. Translated learn-ing: Transfer learning across different feature spaces. In Proceedingsof the 22nd Neural Information Processing Systems (NIPS), Vancouver,British Columbia, Canada, 2008.
[3] J. Gao, W. Fan, J. Jiang, and J. W. Han. Knowledge transfer via multiplemodel local structure mapping. In Proc. of the 14th ACM InternationalConference on Knowledge Discovery and Data Mining (SIGKDD), LasVegas, Nevada, USA, pages 283–291, 2008.
[4] D. Xing, W. Dai, G. Xue, and Y. Yu. Bridged refinement for transferlearning. In Proc. of the 11th European Conference on Practice ofKnowledge Discovery in Databases (PKDD), Springer, pages 324–335,2007.
[5] J. Gao, W. Fan, Y. Z. Sun, and J. W. Han. Heterogeneous source consen-sus learning via decision propagation and negotiation. In Proceedings ofthe 15th ACM International Conference on Knowledge Discovery andData Mining (SIGKDD), Pairs, France, pages 283–291, 2009.
[6] W. Dai, G. Xue, Q. Yang, and Y. Yu. Co-clustering based classificationfor out-of-domain documents. In Proc. of the 13th ACM International
Conference on Knowledge Discovery and Data Mining (SIGKDD), SanJose, California, pages 210–219, 2007.
[7] P. Luo, F. Z. Zhuang, H. Xiong, Y. H. Xiong, and Q. He. Transferlearning from multiple source domains via consensus regularization.In Proc. of the 17th ACM Conference on Information and KnowledgeMining (CIKM), Napa Valley, California, USA, pages 103–112, 2008.
[8] W. Dai, Q. Yang, G. Xue, and Y. Yu. Boosting for transfer learning.In Proc. of the 24th International Conference on Machine Learning(ICML), Corvallis, OR, pages 193–200, 2007.
[9] G. R. Xue, W. Y. Dai, Q. Yang, and Y. Yu. Topic-bridged plsa forcross-domain text classification. In Proc. of the 31st ACM AnnualInternational Conference on Research and Development in InformationRetrieval (SIGIR), Singapore, pages 627–634, 2008.
[10] W. Y. Dai, O. Jin, G. R. Xue, Q. Yang, and Y. Yu. Eigen transfer:a unified framework for transfer learning. In Proc. of the 26th AnnualInternational Conference on Machine Learning (ICML), Montreal, Que-bec, Canada, pages 193–200, 2009.
[11] T. Hofmann. Probabilistic latent semantic analysis. In Proceedings of
IEEE TRANSACTIONS ON KNOWLEDGE AND DATA ENGINEERING, VOL. X, NO. X, XXX 20XX 17
15th Conference on Uncertainty in Artificial Intelligence (UAI), pages289–296, 1999.
[12] Y. Jiho and S. J. Choi. Probabilistic matrix tri-factorization. In Proc.of the 2009 IEEE International Conference on Acoustics, Speech andSignal Processing, pages 1553–1556, 2009.
[13] A. P. Dempster, N. M. Laird, and D. B. Rubin. Maximum likelihoodfrom incomplete data via the em algorithm. Journal of the RoyalStatistical Society, Series B, 39(1):1–38, 1977.
[14] Sean Borman. The expectation maximization algo-rithm: A short tutorial. unpublished paper available athttp://www.seanborman.com/publications. Technical report, 2004.
[15] David Hosmer and Stanley Lemeshow. Applied Logistic Regression.Wiley, New York, 2000.
[16] C. C. Chang and C. J. Lin. LIBSVM: a library forsupport vector machines, 2001. Software available athttp://www.csie.ntu.edu.tw/ cjlin/libsvm.
[17] J. Jiang and C. X. Zhai. A two-stage approach to domain adaptationfor statistical classifiers. In Proceedings of the 16th ACM Conferenceon Information and Knowledge Management (CIKM), pages 401–410,2007.
[18] F. Z. Zhuang, P. Luo, H. Xiong, Q. He, Y. H. Xiong, and Z. Z. Shi.Exploiting associations between word clusters and document classes forcross-domain text categorization. In Proc. of the SIAM InternationalConference on Data Mining (SDM), Columbus, Ohio, USA, pages 13–24, 2010.
[19] S. J. Pan, J. T. Kwok, and Q. Yang. Transfer learning via dimension-ality reduction. In Proceedings of the 23rd Conference on ArtificialIntelligence (AAAI), pages 677–682, 2008.
[20] Q. Q. Gu and J. Zhou. Learning the shared subspace for multi-task clustering and transductive transfer classification. In Proc. of theInternational Conference on Data Mining (ICDM), Miami, Florida,USA, 2009.
[21] S. H. Xie, W. Fan, J. Peng, O. Verscheure, and J. T. Ren. Latent spacedomain transfer between high dimensional overlapping distributions. InProc. of ACM Conference on World Wide Web (WWW), Madrid, Spain,pages 91–100, 2009.
[22] J. Jiang and C. X. Zhai. Instance weighting for domain adaptation innlp. In Proceedings of the 45th Annual Meeting of the Association forComputational Linguistics (ACL), pages 264–271, 2007.
[23] M. Dredze, A. Kulesza, and K. Crammer. Multi-domain learningby confidence-weighted parameter combination. Journal of MachineLearning, 2009.
[24] C. X. Zhai, A. Velivelli, and B. Yu. A cross-collection mixture modelfor comparative text mining. In Proceedings of the 10th ACM SIGKDDConference on Knowledge Discovery and Data Mining (KDD), Seattle,Washington, USA, pages 743–748, 2004.
[25] V. N. Vapnik. Statictic Learning Theory. New York: Wiely-Interscience,1998.
APPENDIX
First, we consider the log joint probability log p(Z,X|θ) andthe posterior probability of the latent factors p(Z|X; θold)separately.
According to Figure 2 and the d-separation criterion, wehave
log p(Z,X|θ) = log∏n
p(Zn,Xn|θ)
=∑
n
log p(Zn,Xn|θ),(24)
where Xn,Zn are the n-th entries of X and Z respectively.Similarly, we have
p(Z|X; θ) =∏m
p(Zm|X; θ) =∏m
p(Zm|Xm; θ) (25)
Then L become (using (24) and (25)):
L =∑
Z
p(Z|X; θold)log p(Z,X|θ)
=∑
Z
∏m
p(Zm|Xm; θold)∑
n
log p(Zn,Xn|θ)
=∑
n
∑
Z
∏m
p(Zm|Xm; θold)log p(Zn,Xn|θ)
=∑
n
∑
Zn
∑
Z−n
∏
m6=n
p(Zm|Xm; θold)
·p(Zn|Xn; θold)log p(Zn,Xn|θ)
=∑
n
∑
Zn
p(Zn|Xn; θold)log p(Zn,Xn|θ)
· ∑Z−n
∏m6=n
p(Zm|Xm; θold)
=∑
n
∑
Zn
p(Zn|Xn; θold)log p(Zn,Xn|θ).(26)
Now we write the observed data Xn in detail as (w, d, c),each component of Zn as (y, z). Then, we have
L =∑
w,d,c
Ow,d,c
∑y,z
p(y, z|w, d, c; θold) · log p(y, z, w, d, c|θ)
=∑
y,z,w,d,c
Ow,d,cp(y, z|w, d, c; θold)
·log [p(y, z)p(w|y, c)p(d|z, c)p(c)],(27)
where Ow,d,c is the co-occurrence number of w, d, c.
Fuzhen Zhuang is a Ph.D candidate student inthe Institute of Computing Technology, ChineseAcademy of Sciences. His research interestsinclude transfer learning, machine learning, datamining, distributed classification and clustering,natural language processing.
IEEE TRANSACTIONS ON KNOWLEDGE AND DATA ENGINEERING, VOL. X, NO. X, XXX 20XX 18
Ping Luo is currently a Research Scientist in theHewlett-Packard Labs, China. He received thePh.D. degree in computer science from Instituteof Computing Technology, Chinese Academy ofSciences. His general area of research is knowl-edge discovery and machine learning. He haspublished several papers in some prestigiousrefereed journals and conference proceedings,such as IEEE Transactions on Information The-ory, IEEE Transactions on Knowledge and DataEngineering, Journal of Parallel and Distributed
Computing, ACM SIGKDD, ACM CIKM. He is the recipient of the Pres-ident’s Exceptional Student Award, Institute of Computing Technology,CAS, in 2007. Dr. Luo is a member of the IEEE Computer Society andthe ACM.
Zhiyong Shen , who obtained a PhD in StateKey Laboratory of Computer Science, Instituteof Software, Chinese Academy of Sciences in2009, is currently employed as a Post Doc-toral Fellow in the Hewlett-Packard Labs, China.He received his bachelor in statistics from De-partment of Probabilities and Statistics, Schoolof Mathematics Sciences, Peking University in2003. His research areas include data miningand machine learning.
Qing He is a Professor in the Institute of Com-puting Technology, Chinese Academy of Sci-ence (CAS), and he is a Professor at the Gradu-ate University of Chinese (GUCAS). He receivedthe B.S degree from Hebei Normal University,Shijiazhang, P. R. C., in 1985, and the M.S. de-gree from Zhengzhou University, Zhengzhou, P.R. C., in 1987, both in mathematics. He receivedthe Ph.D. degree in 2000 from Beijing NormalUniversity in fuzzy mathematics and artificialintelligence, Beijing, P. R. C. Since 1987 to 1997,
he has been with Hebei University of Science and Technology. He iscurrently a doctoral tutor at the Institute of Computing and Technology,CAS. His interests include data mining, machine learning, classification,fuzzy clustering.
Yuhong Xiong is a senior research scientistand project manager at Hewlett-Packard Labs,China. He received his PhD in Electrical Engi-neering and Computer Sciences from UC Berke-ley and a BS in Electronic Engineering from Ts-inghua University in Beijing, China. His currentresearch interests include Web mining, informa-tion extraction, human-computer collaboration,and information management.
Zhongzhi Shi is a Professor in the Institute ofComputing Technology, CAS, leading the Re-search Group of Intelligent Science. His re-search interests include intelligence science,multi-agent systems, semantic Web, machinelearning and neural computing. He has wona 2nd-Grade National Award at Science andTechnology Progress of China in 2002, two2nd-Grade Awards at Science and TechnologyProgress of the Chinese Academy of Sciencesin 1998 and 2001, respectively. He is a senior
member of IEEE, member of AAAI and ACM, Chair for the WG 12.2 ofIFIP. He serves as Vice President for Chinese Association of ArtificialIntelligence.
Hui Xiong is currently an Associate Professorin the Management Science and InformationSystems department at Rutgers University. Hereceived the B.E. degree from the University ofScience and Technology of China, China, theM.S. degree from the National University of Sin-gapore, Singapore, and the Ph.D. degree fromthe University of Minnesota, USA. His generalarea of research is data and knowledge engi-neering, with a focus on developing effective andefficient data analysis techniques for emerging
data intensive applications. He has published over 80 technical papersin peer-reviewed journals and conference proceedings. He is a co-editorof Clustering and Information Retrieval (Kluwer Academic Publishers,2003) and a co-Editor-in-Chief of Encyclopedia of GIS (Springer, 2008).He is an Associate Editor of the Knowledge and Information Systemsjournal and has served regularly in the organization committees andthe program committees of a number of international conferences andworkshops. He was the recipient of the 2008 IBM ESA Innovation Award,the 2009 Rutgers University Board of Trustees Research Fellowshipfor Scholarly Excellence, the 2007 Junior Faculty Teaching ExcellenceAward and the 2008 Junior Faculty Research Award at the RutgersBusiness School. He is a senior member of the IEEE, and a memberof the ACM.


