Embed Size (px)
Citation preview
Minimization of self-quenching fluorescenceon dyes conjugated to biomolecules withmultiple labeling sites via asymmetricallycharged NIR fluorophoresNatalia G. Zhegalova, Shawn He, Haiying Zhou, David M. Kimand Mikhail Y. Berezin*
Self-aggregation of dyes even at low concentrations poses a considerable challenge in preparing sufficiently brightmolecular probes for in vivo imaging, particularly in the conjugation of near infrared cyanine dyes to polypeptideswithmultiple labeling sites. Such self-aggregation leads to a significant energy transfer between the dyes, resulting insevere quenching and low brightness of the targeted probe. To address this problem, we designed a novel type of dyewith an asymmetrical distribution of charge. Asymmetrical distribution prevents the chromophores from π-stackingthus minimizing the energy transfer and fluorescence quenching. The conjugation of the dye to polypeptides showedonly a small presence of an H-aggregate band in the absorption spectra and, hence, a relatively high quantumefficiency. Copyright © 2014 John Wiley & Sons, Ltd.
Keywords: NIR fluorescence; quenching; labeling; optical probe; antibody
1. INTRODUCTION
The advancement of molecular imaging resulted in the discoveryof novel biomarkers and the development of many target-specific molecules from monoclonal antibodies to monobodies,small bodies, polypeptides, proteins, RNA, nanoparticles and smallmolecules. Conjugation of near-infrared (NIR) dyes to a varietyof the targeting molecules has been established as a powerfulmethod for preclinical imaging of tumors (1,2), inflammatorydiseases (3,4) and the peripheral nervous system (5).However, efficient conjugation of fluorescent dyes to targeting
macromolecules with multiple labeling sites remains challenging.For example, a typical IgG antibody molecule has 90 lysineresidues, many of which are located close to each other [PDBdatabase of IgG, entry 1HZH (6)]. Even at low dye-to-proteinratios, the self-aggregation of the dye becomes substantial owingto preferential labeling of the neighboring residues caused by aself-assembly of the dyes at the surface of the substrate (7). Thisresults in a clustering of the dye molecules, significant quenching(up to 90%) of the fluorescence and low brightness (measured asemission power molar absorptivity) of the imaging probe. Toaddress this issue, Waggoner et al. (7) suggested modifyingbenzoindole groups of polymethine dyes with charged groups,such as sulfonate. Such structural modifications have been shownto significantly decrease the dye-to-dye interactions and increasethe brightness of the probe. However, this did not eliminate theproblem entirely.Herein, we further optimized the structure of the labeling dye
to minimize quenching. Our approach was to eliminate the self-aggregation of the dyes by increasing the asymmetry of thecharge density on the chromophore. We hypothesized that theasymmetry would lead to the repulsion of the fluorophores from
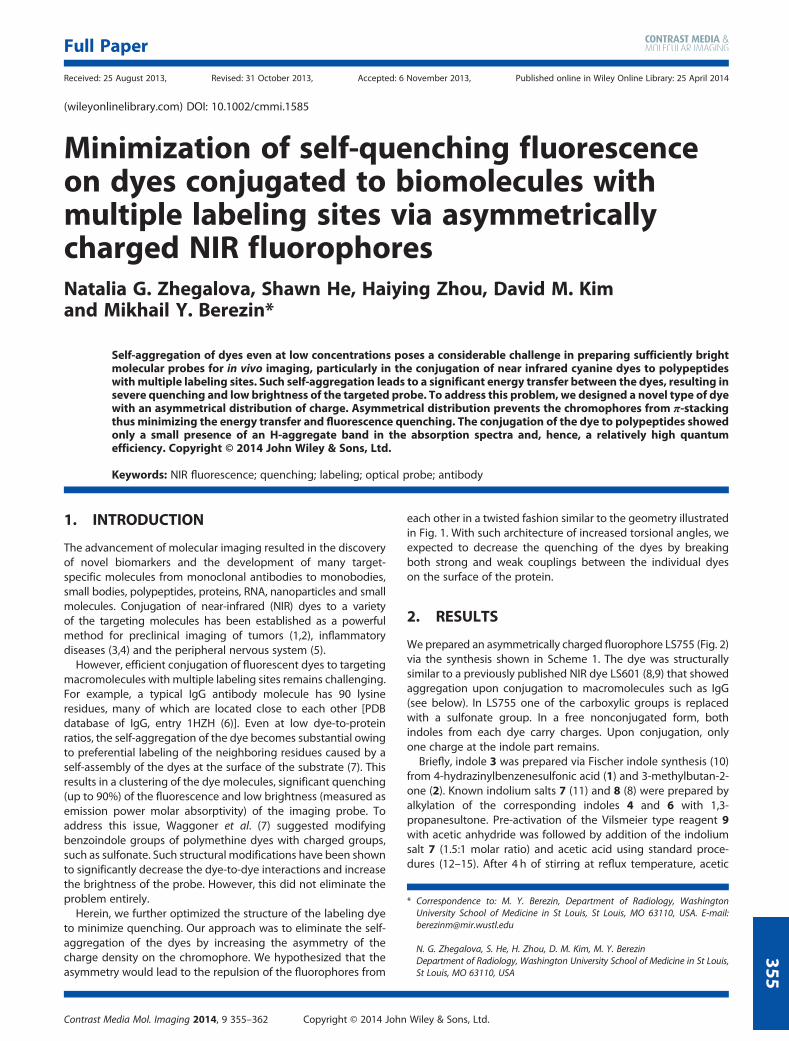
each other in a twisted fashion similar to the geometry illustratedin Fig. 1. With such architecture of increased torsional angles, weexpected to decrease the quenching of the dyes by breakingboth strong and weak couplings between the individual dyeson the surface of the protein.
2. RESULTS
We prepared an asymmetrically charged fluorophore LS755 (Fig. 2)via the synthesis shown in Scheme 1. The dye was structurallysimilar to a previously published NIR dye LS601 (8,9) that showedaggregation upon conjugation to macromolecules such as IgG(see below). In LS755 one of the carboxylic groups is replacedwith a sulfonate group. In a free nonconjugated form, bothindoles from each dye carry charges. Upon conjugation, onlyone charge at the indole part remains.
Briefly, indole 3 was prepared via Fischer indole synthesis (10)from 4-hydrazinylbenzenesulfonic acid (1) and 3-methylbutan-2-one (2). Known indolium salts 7 (11) and 8 (8) were prepared byalkylation of the corresponding indoles 4 and 6 with 1,3-propanesultone. Pre-activation of the Vilsmeier type reagent 9with acetic anhydride was followed by addition of the indoliumsalt 7 (1.5:1 molar ratio) and acetic acid using standard proce-dures (12–15). After 4 h of stirring at reflux temperature, acetic
* Correspondence to: M. Y. Berezin, Department of Radiology, WashingtonUniversity School of Medicine in St Louis, St Louis, MO 63110, USA. E-mail:[email protected]
N. G. Zhegalova, S. He, H. Zhou, D. M. Kim, M. Y. BerezinDepartment of Radiology, Washington University School of Medicine in St Louis,St Louis, MO 63110, USA
Full Paper
Received: 25 August 2013, Revised: 31 October 2013, Accepted: 6 November 2013, Published online in Wiley Online Library: 25 April 2014
(wileyonlinelibrary.com) DOI: 10.1002/cmmi.1585
Contrast Media Mol. Imaging 2014, 9 355–362 Copyright © 2014 John Wiley & Sons, Ltd.
355
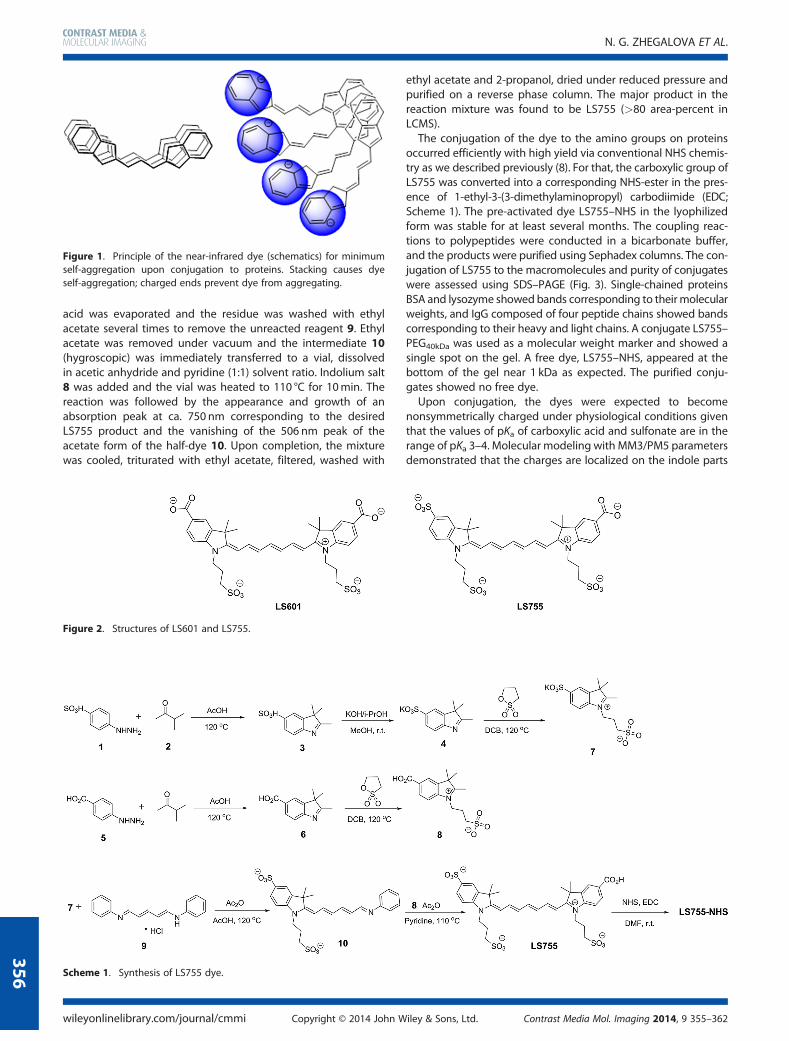
acid was evaporated and the residue was washed with ethylacetate several times to remove the unreacted reagent 9. Ethylacetate was removed under vacuum and the intermediate 10(hygroscopic) was immediately transferred to a vial, dissolvedin acetic anhydride and pyridine (1:1) solvent ratio. Indolium salt8 was added and the vial was heated to 110 °C for 10min. Thereaction was followed by the appearance and growth of anabsorption peak at ca. 750 nm corresponding to the desiredLS755 product and the vanishing of the 506 nm peak of theacetate form of the half-dye 10. Upon completion, the mixturewas cooled, triturated with ethyl acetate, filtered, washed with
ethyl acetate and 2-propanol, dried under reduced pressure andpurified on a reverse phase column. The major product in thereaction mixture was found to be LS755 (>80 area-percent inLCMS).The conjugation of the dye to the amino groups on proteins
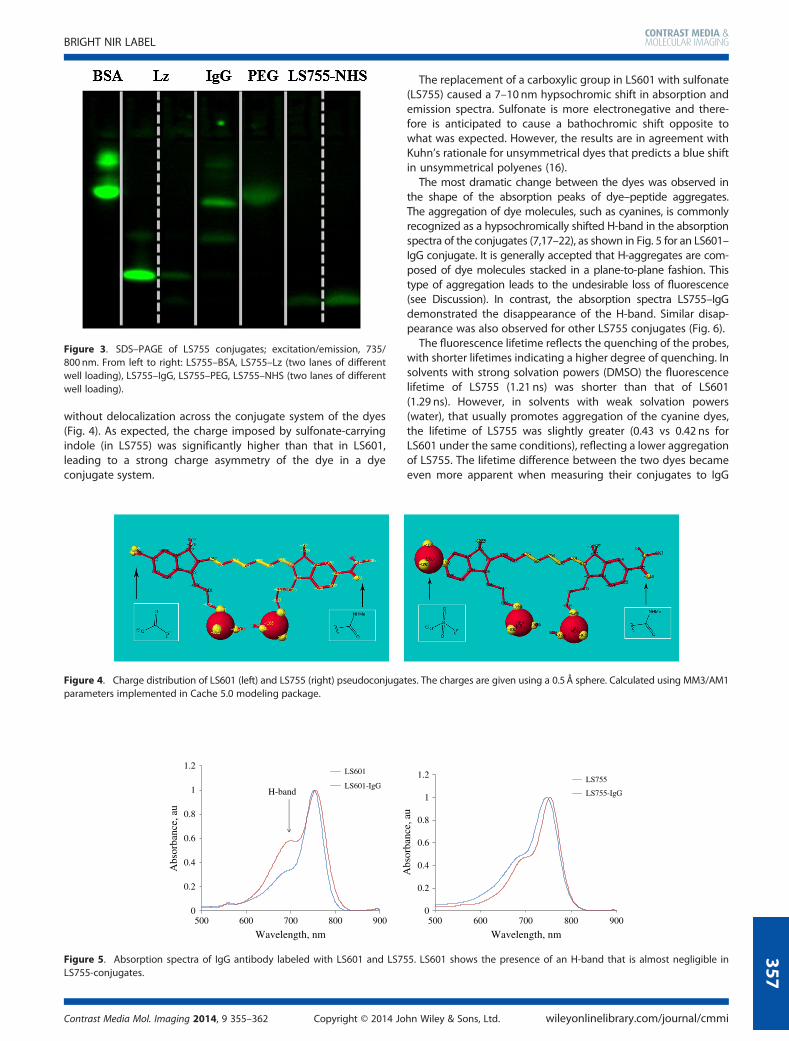
occurred efficiently with high yield via conventional NHS chemis-try as we described previously (8). For that, the carboxylic group ofLS755 was converted into a corresponding NHS-ester in the pres-ence of 1-ethyl-3-(3-dimethylaminopropyl) carbodiimide (EDC;Scheme 1). The pre-activated dye LS755–NHS in the lyophilizedform was stable for at least several months. The coupling reac-tions to polypeptides were conducted in a bicarbonate buffer,and the products were purified using Sephadex columns. The con-jugation of LS755 to the macromolecules and purity of conjugateswere assessed using SDS–PAGE (Fig. 3). Single-chained proteinsBSA and lysozyme showed bands corresponding to theirmolecularweights, and IgG composed of four peptide chains showed bandscorresponding to their heavy and light chains. A conjugate LS755–PEG40kDa was used as a molecular weight marker and showed asingle spot on the gel. A free dye, LS755–NHS, appeared at thebottom of the gel near 1 kDa as expected. The purified conju-gates showed no free dye.Upon conjugation, the dyes were expected to become
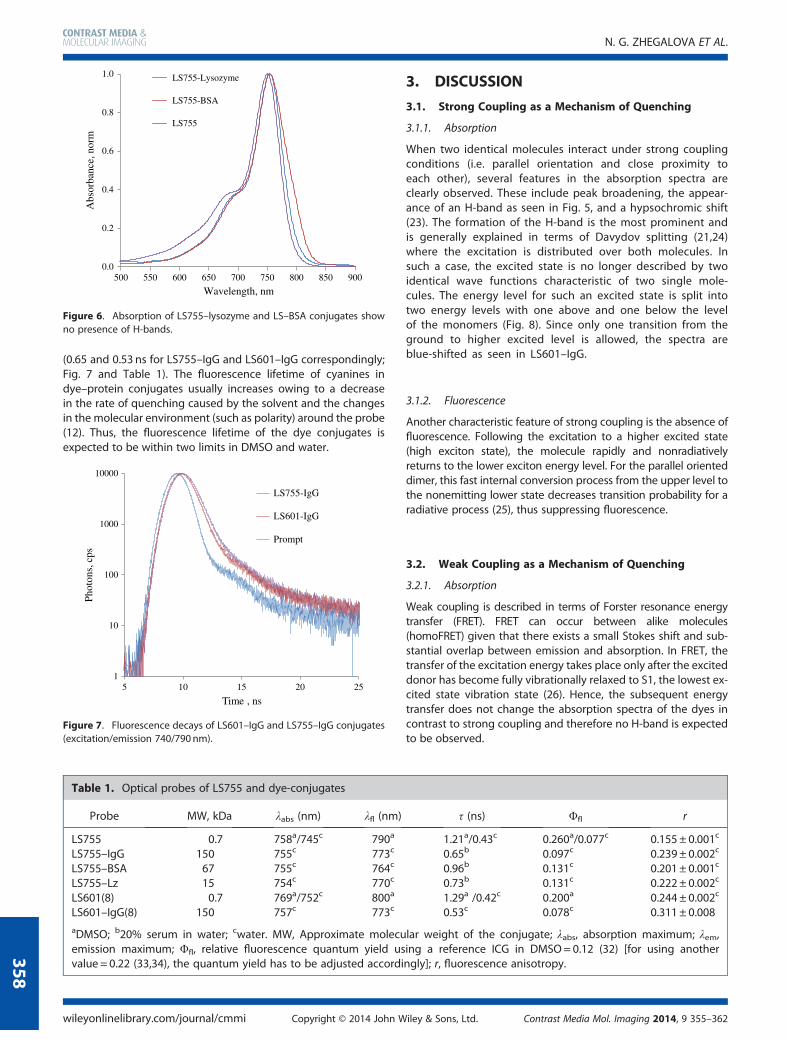
nonsymmetrically charged under physiological conditions giventhat the values of pKa of carboxylic acid and sulfonate are in therange of pKa 3–4. Molecular modeling with MM3/PM5 parametersdemonstrated that the charges are localized on the indole parts
Figure 2. Structures of LS601 and LS755.
Figure 1. Principle of the near-infrared dye (schematics) for minimumself-aggregation upon conjugation to proteins. Stacking causes dyeself-aggregation; charged ends prevent dye from aggregating.
Scheme 1. Synthesis of LS755 dye.
N. G. ZHEGALOVA ET AL.
wileyonlinelibrary.com/journal/cmmi Copyright © 2014 John Wiley & Sons, Ltd. Contrast Media Mol. Imaging 2014, 9 355–362
356
without delocalization across the conjugate system of the dyes(Fig. 4). As expected, the charge imposed by sulfonate-carryingindole (in LS755) was significantly higher than that in LS601,leading to a strong charge asymmetry of the dye in a dyeconjugate system.
The replacement of a carboxylic group in LS601 with sulfonate(LS755) caused a 7–10 nm hypsochromic shift in absorption andemission spectra. Sulfonate is more electronegative and there-fore is anticipated to cause a bathochromic shift opposite towhat was expected. However, the results are in agreement withKuhn’s rationale for unsymmetrical dyes that predicts a blue shiftin unsymmetrical polyenes (16).
The most dramatic change between the dyes was observed inthe shape of the absorption peaks of dye–peptide aggregates.The aggregation of dye molecules, such as cyanines, is commonlyrecognized as a hypsochromically shifted H-band in the absorptionspectra of the conjugates (7,17–22), as shown in Fig. 5 for an LS601–IgG conjugate. It is generally accepted that H-aggregates are com-posed of dye molecules stacked in a plane-to-plane fashion. Thistype of aggregation leads to the undesirable loss of fluorescence(see Discussion). In contrast, the absorption spectra LS755–IgGdemonstrated the disappearance of the H-band. Similar disap-pearance was also observed for other LS755 conjugates (Fig. 6).
The fluorescence lifetime reflects the quenching of the probes,with shorter lifetimes indicating a higher degree of quenching. Insolvents with strong solvation powers (DMSO) the fluorescencelifetime of LS755 (1.21 ns) was shorter than that of LS601(1.29 ns). However, in solvents with weak solvation powers(water), that usually promotes aggregation of the cyanine dyes,the lifetime of LS755 was slightly greater (0.43 vs 0.42 ns forLS601 under the same conditions), reflecting a lower aggregationof LS755. The lifetime difference between the two dyes becameeven more apparent when measuring their conjugates to IgG
Figure 3. SDS–PAGE of LS755 conjugates; excitation/emission, 735/800 nm. From left to right: LS755–BSA, LS755–Lz (two lanes of differentwell loading), LS755–IgG, LS755–PEG, LS755–NHS (two lanes of differentwell loading).
0
0.2
0.4
0.6
0.8
1
1.2
500 600 700 800 900
Abs
orba
nce,
au
Wavelength, nm
LS601
LS601-IgGH-band
0
0.2
0.4
0.6
0.8
1
1.2
500 600 700 800 900
Abs
orba
nce,
au
Wavelength, nm
LS755
LS755-IgG
Figure 5. Absorption spectra of IgG antibody labeled with LS601 and LS755. LS601 shows the presence of an H-band that is almost negligible inLS755-conjugates.
Figure 4. Charge distribution of LS601 (left) and LS755 (right) pseudoconjugates. The charges are given using a 0.5Å sphere. Calculated using MM3/AM1parameters implemented in Cache 5.0 modeling package.
BRIGHT NIR LABEL
Contrast Media Mol. Imaging 2014, 9 355–362 Copyright © 2014 John Wiley & Sons, Ltd. wileyonlinelibrary.com/journal/cmmi
357
(0.65 and 0.53 ns for LS755–IgG and LS601–IgG correspondingly;Fig. 7 and Table 1). The fluorescence lifetime of cyanines indye–protein conjugates usually increases owing to a decreasein the rate of quenching caused by the solvent and the changesin the molecular environment (such as polarity) around the probe(12). Thus, the fluorescence lifetime of the dye conjugates isexpected to be within two limits in DMSO and water.
3. DISCUSSION
3.1. Strong Coupling as a Mechanism of Quenching
3.1.1. Absorption
When two identical molecules interact under strong couplingconditions (i.e. parallel orientation and close proximity toeach other), several features in the absorption spectra areclearly observed. These include peak broadening, the appear-ance of an H-band as seen in Fig. 5, and a hypsochromic shift(23). The formation of the H-band is the most prominent andis generally explained in terms of Davydov splitting (21,24)where the excitation is distributed over both molecules. Insuch a case, the excited state is no longer described by twoidentical wave functions characteristic of two single mole-cules. The energy level for such an excited state is split intotwo energy levels with one above and one below the levelof the monomers (Fig. 8). Since only one transition from theground to higher excited level is allowed, the spectra areblue-shifted as seen in LS601–IgG.
3.1.2. Fluorescence
Another characteristic feature of strong coupling is the absence offluorescence. Following the excitation to a higher excited state(high exciton state), the molecule rapidly and nonradiativelyreturns to the lower exciton energy level. For the parallel orienteddimer, this fast internal conversion process from the upper level tothe nonemitting lower state decreases transition probability for aradiative process (25), thus suppressing fluorescence.
3.2. Weak Coupling as a Mechanism of Quenching
3.2.1. Absorption
Weak coupling is described in terms of Forster resonance energytransfer (FRET). FRET can occur between alike molecules(homoFRET) given that there exists a small Stokes shift and sub-stantial overlap between emission and absorption. In FRET, thetransfer of the excitation energy takes place only after the exciteddonor has become fully vibrationally relaxed to S1, the lowest ex-cited state vibration state (26). Hence, the subsequent energytransfer does not change the absorption spectra of the dyes incontrast to strong coupling and therefore no H-band is expectedto be observed.
0.0
0.2
0.4
0.6
0.8
1.0
500 550 600 650 700 750 800 850 900
Abs
orba
nce,
nor
m
Wavelength, nm
LS755-Lysozyme
LS755-BSA
LS755
Figure 6. Absorption of LS755–lysozyme and LS–BSA conjugates showno presence of H-bands.
Table 1. Optical probes of LS755 and dye-conjugates
Probe MW, kDa λabs (nm) λfl (nm) τ (ns) Φfl r
LS755 0.7 758a/745c 790a 1.21a/0.43c 0.260a/0.077c 0.155 ± 0.001c
LS755–IgG 150 755c 773c 0.65b 0.097c 0.239 ± 0.002c
LS755–BSA 67 755c 764c 0.96b 0.131c 0.201 ± 0.001c
LS755–Lz 15 754c 770c 0.73b 0.131c 0.222 ± 0.002c
LS601(8) 0.7 769a/752c 800a 1.29a /0.42c 0.200a 0.244 ± 0.002c
LS601–IgG(8) 150 757c 773c 0.53c 0.078c 0.311 ± 0.008aDMSO; b20% serum in water; cwater. MW, Approximate molecular weight of the conjugate; λabs, absorption maximum; λem,emission maximum; Φfl, relative fluorescence quantum yield using a reference ICG in DMSO= 0.12 (32) [for using anothervalue = 0.22 (33,34), the quantum yield has to be adjusted accordingly]; r, fluorescence anisotropy.
1
10
100
1000
10000
5 10 15 20 25
Phot
ons,
cps
Time , ns
LS755-IgG
LS601-IgG
Prompt
Figure 7. Fluorescence decays of LS601–IgG and LS755–IgG conjugates(excitation/emission 740/790nm).
N. G. ZHEGALOVA ET AL.
wileyonlinelibrary.com/journal/cmmi Copyright © 2014 John Wiley & Sons, Ltd. Contrast Media Mol. Imaging 2014, 9 355–362
358
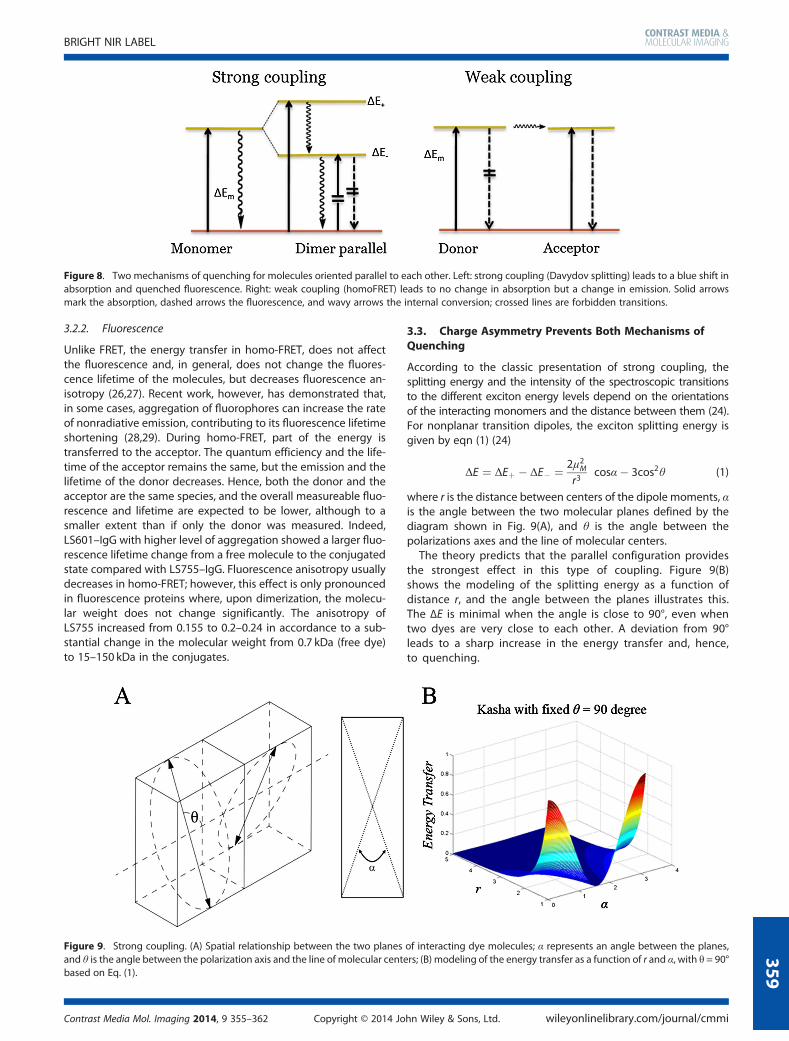
3.2.2. Fluorescence
Unlike FRET, the energy transfer in homo-FRET, does not affectthe fluorescence and, in general, does not change the fluores-cence lifetime of the molecules, but decreases fluorescence an-isotropy (26,27). Recent work, however, has demonstrated that,in some cases, aggregation of fluorophores can increase the rateof nonradiative emission, contributing to its fluorescence lifetimeshortening (28,29). During homo-FRET, part of the energy istransferred to the acceptor. The quantum efficiency and the life-time of the acceptor remains the same, but the emission and thelifetime of the donor decreases. Hence, both the donor and theacceptor are the same species, and the overall measureable fluo-rescence and lifetime are expected to be lower, although to asmaller extent than if only the donor was measured. Indeed,LS601–IgG with higher level of aggregation showed a larger fluo-rescence lifetime change from a free molecule to the conjugatedstate compared with LS755–IgG. Fluorescence anisotropy usuallydecreases in homo-FRET; however, this effect is only pronouncedin fluorescence proteins where, upon dimerization, the molecu-lar weight does not change significantly. The anisotropy ofLS755 increased from 0.155 to 0.2–0.24 in accordance to a sub-stantial change in the molecular weight from 0.7 kDa (free dye)to 15–150 kDa in the conjugates.
3.3. Charge Asymmetry Prevents Both Mechanisms ofQuenching
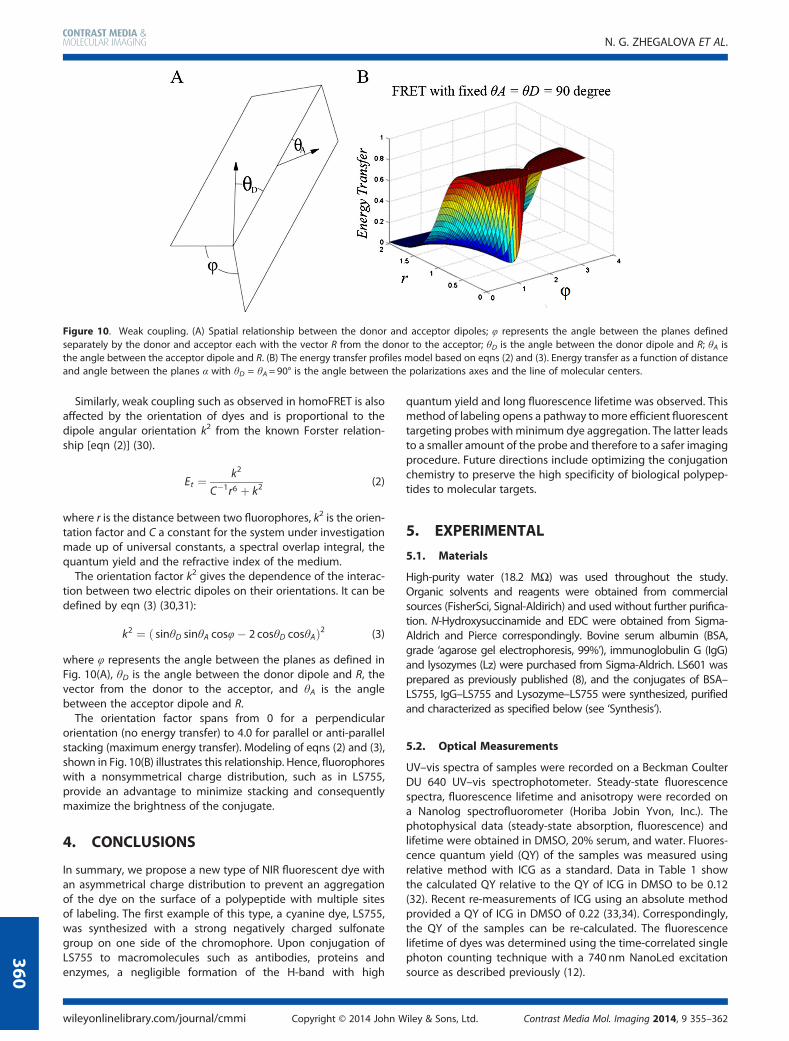
According to the classic presentation of strong coupling, thesplitting energy and the intensity of the spectroscopic transitionsto the different exciton energy levels depend on the orientationsof the interacting monomers and the distance between them (24).For nonplanar transition dipoles, the exciton splitting energy isgiven by eqn (1) (24)
ΔE ¼ ΔEþ � ΔE� ¼ 2μ2M
r3cosα� 3cos2θ� �
(1)
where r is the distance between centers of the dipole moments, αis the angle between the two molecular planes defined by thediagram shown in Fig. 9(A), and θ is the angle between thepolarizations axes and the line of molecular centers.
The theory predicts that the parallel configuration providesthe strongest effect in this type of coupling. Figure 9(B)shows the modeling of the splitting energy as a function ofdistance r, and the angle between the planes illustrates this.The ΔE is minimal when the angle is close to 90°, even whentwo dyes are very close to each other. A deviation from 90°leads to a sharp increase in the energy transfer and, hence,to quenching.
Figure 8. Two mechanisms of quenching for molecules oriented parallel to each other. Left: strong coupling (Davydov splitting) leads to a blue shift inabsorption and quenched fluorescence. Right: weak coupling (homoFRET) leads to no change in absorption but a change in emission. Solid arrowsmark the absorption, dashed arrows the fluorescence, and wavy arrows the internal conversion; crossed lines are forbidden transitions.
Figure 9. Strong coupling. (A) Spatial relationship between the two planes of interacting dye molecules; α represents an angle between the planes,and θ is the angle between the polarization axis and the line of molecular centers; (B) modeling of the energy transfer as a function of r and α, with θ = 90°based on Eq. (1).
BRIGHT NIR LABEL
Contrast Media Mol. Imaging 2014, 9 355–362 Copyright © 2014 John Wiley & Sons, Ltd. wileyonlinelibrary.com/journal/cmmi
359
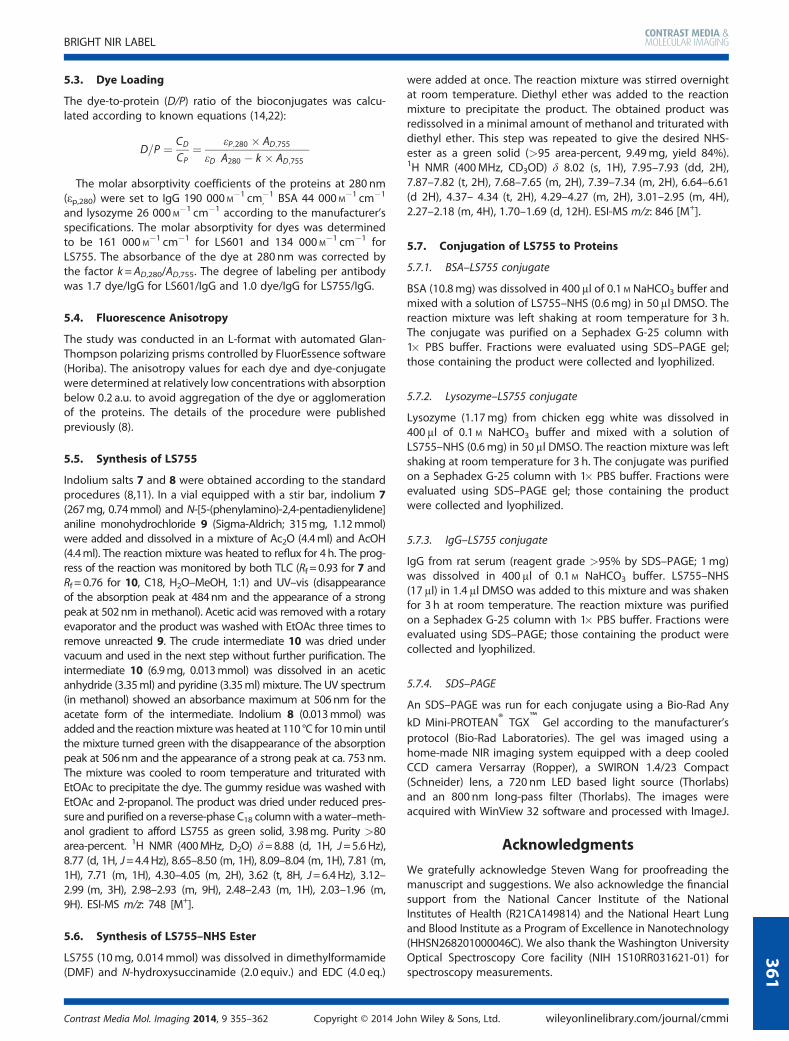
Similarly, weak coupling such as observed in homoFRET is alsoaffected by the orientation of dyes and is proportional to thedipole angular orientation k2 from the known Forster relation-ship [eqn (2)] (30).
Et ¼ k2
C�1r6 þ k2(2)
where r is the distance between two fluorophores, k2 is the orien-tation factor and C a constant for the system under investigationmade up of universal constants, a spectral overlap integral, thequantum yield and the refractive index of the medium.
The orientation factor k2 gives the dependence of the interac-tion between two electric dipoles on their orientations. It can bedefined by eqn (3) (30,31):
k2 ¼ sinθD sinθA cosφ� 2 cosθD cosθAð Þ2 (3)
where φ represents the angle between the planes as defined inFig. 10(A), θD is the angle between the donor dipole and R, thevector from the donor to the acceptor, and θA is the anglebetween the acceptor dipole and R.
The orientation factor spans from 0 for a perpendicularorientation (no energy transfer) to 4.0 for parallel or anti-parallelstacking (maximum energy transfer). Modeling of eqns (2) and (3),shown in Fig. 10(B) illustrates this relationship. Hence, fluorophoreswith a nonsymmetrical charge distribution, such as in LS755,provide an advantage to minimize stacking and consequentlymaximize the brightness of the conjugate.
4. CONCLUSIONS
In summary, we propose a new type of NIR fluorescent dye withan asymmetrical charge distribution to prevent an aggregationof the dye on the surface of a polypeptide with multiple sitesof labeling. The first example of this type, a cyanine dye, LS755,was synthesized with a strong negatively charged sulfonategroup on one side of the chromophore. Upon conjugation ofLS755 to macromolecules such as antibodies, proteins andenzymes, a negligible formation of the H-band with high
quantum yield and long fluorescence lifetime was observed. Thismethod of labeling opens a pathway tomore efficient fluorescenttargeting probes with minimum dye aggregation. The latter leadsto a smaller amount of the probe and therefore to a safer imagingprocedure. Future directions include optimizing the conjugationchemistry to preserve the high specificity of biological polypep-tides to molecular targets.
5. EXPERIMENTAL
5.1. Materials
High-purity water (18.2 MΩ) was used throughout the study.Organic solvents and reagents were obtained from commercialsources (FisherSci, Signal-Aldirich) and used without further purifica-tion. N-Hydroxysuccinamide and EDC were obtained from Sigma-Aldrich and Pierce correspondingly. Bovine serum albumin (BSA,grade ‘agarose gel electrophoresis, 99%’), immunoglobulin G (IgG)and lysozymes (Lz) were purchased from Sigma-Aldrich. LS601 wasprepared as previously published (8), and the conjugates of BSA–LS755, IgG–LS755 and Lysozyme–LS755 were synthesized, purifiedand characterized as specified below (see ‘Synthesis’).
5.2. Optical Measurements
UV–vis spectra of samples were recorded on a Beckman CoulterDU 640 UV–vis spectrophotometer. Steady-state fluorescencespectra, fluorescence lifetime and anisotropy were recorded ona Nanolog spectrofluorometer (Horiba Jobin Yvon, Inc.). Thephotophysical data (steady-state absorption, fluorescence) andlifetime were obtained in DMSO, 20% serum, and water. Fluores-cence quantum yield (QY) of the samples was measured usingrelative method with ICG as a standard. Data in Table 1 showthe calculated QY relative to the QY of ICG in DMSO to be 0.12(32). Recent re-measurements of ICG using an absolute methodprovided a QY of ICG in DMSO of 0.22 (33,34). Correspondingly,the QY of the samples can be re-calculated. The fluorescencelifetime of dyes was determined using the time-correlated singlephoton counting technique with a 740 nm NanoLed excitationsource as described previously (12).
Figure 10. Weak coupling. (A) Spatial relationship between the donor and acceptor dipoles; φ represents the angle between the planes definedseparately by the donor and acceptor each with the vector R from the donor to the acceptor; θD is the angle between the donor dipole and R; θA isthe angle between the acceptor dipole and R. (B) The energy transfer profiles model based on eqns (2) and (3). Energy transfer as a function of distanceand angle between the planes α with θD = θA=90° is the angle between the polarizations axes and the line of molecular centers.
N. G. ZHEGALOVA ET AL.
wileyonlinelibrary.com/journal/cmmi Copyright © 2014 John Wiley & Sons, Ltd. Contrast Media Mol. Imaging 2014, 9 355–362
360
5.3. Dye Loading
The dye-to-protein (D/P) ratio of the bioconjugates was calcu-lated according to known equations (14,22):
D=P ¼ CD
CP¼ εP;280 � AD;755
εD A280 � k � AD;755� �
The molar absorptivity coefficients of the proteins at 280 nm(εp,280) were set to IgG 190 000 M
�1 cm�1, BSA 44 000 M
�1 cm�1
and lysozyme 26 000 M�1 cm�1 according to the manufacturer’s
specifications. The molar absorptivity for dyes was determinedto be 161 000 M
�1 cm�1 for LS601 and 134 000 M�1 cm�1 for
LS755. The absorbance of the dye at 280 nm was corrected bythe factor k=AD,280/AD,755. The degree of labeling per antibodywas 1.7 dye/IgG for LS601/IgG and 1.0 dye/IgG for LS755/IgG.
5.4. Fluorescence Anisotropy
The study was conducted in an L-format with automated Glan-Thompson polarizing prisms controlled by FluorEssence software(Horiba). The anisotropy values for each dye and dye-conjugatewere determined at relatively low concentrations with absorptionbelow 0.2 a.u. to avoid aggregation of the dye or agglomerationof the proteins. The details of the procedure were publishedpreviously (8).
5.5. Synthesis of LS755
Indolium salts 7 and 8 were obtained according to the standardprocedures (8,11). In a vial equipped with a stir bar, indolium 7(267mg, 0.74mmol) and N-[5-(phenylamino)-2,4-pentadienylidene]aniline monohydrochloride 9 (Sigma-Aldrich; 315mg, 1.12mmol)were added and dissolved in a mixture of Ac2O (4.4ml) and AcOH(4.4ml). The reaction mixture was heated to reflux for 4h. The prog-ress of the reaction was monitored by both TLC (Rf = 0.93 for 7 andRf = 0.76 for 10, C18, H2O–MeOH, 1:1) and UV–vis (disappearanceof the absorption peak at 484nm and the appearance of a strongpeak at 502nm in methanol). Acetic acid was removed with a rotaryevaporator and the product was washed with EtOAc three times toremove unreacted 9. The crude intermediate 10 was dried undervacuum and used in the next step without further purification. Theintermediate 10 (6.9mg, 0.013mmol) was dissolved in an aceticanhydride (3.35ml) and pyridine (3.35ml) mixture. The UV spectrum(in methanol) showed an absorbance maximum at 506nm for theacetate form of the intermediate. Indolium 8 (0.013mmol) wasadded and the reactionmixturewas heated at 110 °C for 10min untilthe mixture turned green with the disappearance of the absorptionpeak at 506nm and the appearance of a strong peak at ca. 753nm.The mixture was cooled to room temperature and triturated withEtOAc to precipitate the dye. The gummy residue was washed withEtOAc and 2-propanol. The product was dried under reduced pres-sure and purified on a reverse-phase C18 columnwith awater–meth-anol gradient to afford LS755 as green solid, 3.98mg. Purity >80area-percent. 1H NMR (400MHz, D2O) δ=8.88 (d, 1H, J =5.6Hz),8.77 (d, 1H, J =4.4Hz), 8.65–8.50 (m, 1H), 8.09–8.04 (m, 1H), 7.81 (m,1H), 7.71 (m, 1H), 4.30–4.05 (m, 2H), 3.62 (t, 8H, J =6.4Hz), 3.12–2.99 (m, 3H), 2.98–2.93 (m, 9H), 2.48–2.43 (m, 1H), 2.03–1.96 (m,9H). ESI-MS m/z: 748 [M+].
5.6. Synthesis of LS755–NHS Ester
LS755 (10mg, 0.014mmol) was dissolved in dimethylformamide(DMF) and N-hydroxysuccinamide (2.0 equiv.) and EDC (4.0 eq.)
were added at once. The reaction mixture was stirred overnightat room temperature. Diethyl ether was added to the reactionmixture to precipitate the product. The obtained product wasredissolved in a minimal amount of methanol and triturated withdiethyl ether. This step was repeated to give the desired NHS-ester as a green solid (>95 area-percent, 9.49mg, yield 84%).1H NMR (400MHz, CD3OD) δ 8.02 (s, 1H), 7.95–7.93 (dd, 2H),7.87–7.82 (t, 2H), 7.68–7.65 (m, 2H), 7.39–7.34 (m, 2H), 6.64–6.61(d 2H), 4.37– 4.34 (t, 2H), 4.29–4.27 (m, 2H), 3.01–2.95 (m, 4H),2.27–2.18 (m, 4H), 1.70–1.69 (d, 12H). ESI-MS m/z: 846 [M+].
5.7. Conjugation of LS755 to Proteins
5.7.1. BSA–LS755 conjugate
BSA (10.8mg) was dissolved in 400μl of 0.1 M NaHCO3 buffer andmixed with a solution of LS755–NHS (0.6mg) in 50μl DMSO. Thereaction mixture was left shaking at room temperature for 3 h.The conjugate was purified on a Sephadex G-25 column with1� PBS buffer. Fractions were evaluated using SDS–PAGE gel;those containing the product were collected and lyophilized.
5.7.2. Lysozyme–LS755 conjugate
Lysozyme (1.17mg) from chicken egg white was dissolved in400μl of 0.1 M NaHCO3 buffer and mixed with a solution ofLS755–NHS (0.6mg) in 50μl DMSO. The reaction mixture was leftshaking at room temperature for 3 h. The conjugate was purifiedon a Sephadex G-25 column with 1� PBS buffer. Fractions wereevaluated using SDS–PAGE gel; those containing the productwere collected and lyophilized.
5.7.3. IgG–LS755 conjugate
IgG from rat serum (reagent grade >95% by SDS–PAGE; 1mg)was dissolved in 400μl of 0.1 M NaHCO3 buffer. LS755–NHS(17μl) in 1.4μl DMSO was added to this mixture and was shakenfor 3 h at room temperature. The reaction mixture was purifiedon a Sephadex G-25 column with 1� PBS buffer. Fractions wereevaluated using SDS–PAGE; those containing the product werecollected and lyophilized.
5.7.4. SDS–PAGE
An SDS–PAGE was run for each conjugate using a Bio-Rad Any
kD Mini-PROTEAN® TGX™
Gel according to the manufacturer’sprotocol (Bio-Rad Laboratories). The gel was imaged using ahome-made NIR imaging system equipped with a deep cooledCCD camera Versarray (Ropper), a SWIRON 1.4/23 Compact(Schneider) lens, a 720 nm LED based light source (Thorlabs)and an 800 nm long-pass filter (Thorlabs). The images wereacquired with WinView 32 software and processed with ImageJ.
Acknowledgments
We gratefully acknowledge Steven Wang for proofreading themanuscript and suggestions. We also acknowledge the financialsupport from the National Cancer Institute of the NationalInstitutes of Health (R21CA149814) and the National Heart Lungand Blood Institute as a Program of Excellence in Nanotechnology(HHSN268201000046C). We also thank the Washington UniversityOptical Spectroscopy Core facility (NIH 1S10RR031621-01) forspectroscopy measurements.
BRIGHT NIR LABEL
Contrast Media Mol. Imaging 2014, 9 355–362 Copyright © 2014 John Wiley & Sons, Ltd. wileyonlinelibrary.com/journal/cmmi
361
REFERENCES1. Koo H, Lee S, Na JH, Kim SH, Hahn SK, Choi K, Kwon IC, Jeong SY,
Kim K. Bioorthogonal copper-free click chemistry in vivo for tumor-targeted delivery of nanoparticles. Angew Chem Int Ed Engl 2012;51(47): 11836–11840.
2. Villaraza AJL, Milenic DE, Brechbiel MW. Improved speciation charac-teristics of PEGylated indocyanine green-labeled panitumumab:revisiting the solution and spectroscopic properties of a near-infrared emitting anti-HER1 antibody for optical imaging of cancer.Bioconjug Chem 2010; 21(12): 2305–2312.
3. Oushiki D, Kojima H, Terai T, Arita M, Hanaoka K, Urano Y, Nagano T.Development and application of a near-infrared fluorescence probefor oxidative stress based on differential reactivity of linked cyaninedyes. J Am Chem Soc 2010; 132(8): 2795–2801.
4. Kundu K, Knight SF, Willett N, Lee S, Taylor WR, Murthy N.Hydrocyanines: a class of fluorescent sensors that can image reactiveoxygen species in cell culture, tissue, and in vivo. Angew Chem Int EdEngl 2009; 48(2): 299–303.
5. Gray DC, Kim EM, Cotero VE, Bajaj A, Staudinger VP, Hehir CAT, YazdanfarS. Dual-mode laparoscopic fluorescence image-guided surgery usinga single camera. Biomed Opt Express 2012; 3(8): 1880–1890.
6. Saphire EO, Parren PWHI, Pantophlet R, Zwick MB, Morris GM, RuddPM, Dwek RA, Stanfield RL, Burton DR, Wilson IA. Crystal structureof a neutralizing human IgG against HIV-1: a template for vaccinedesign. Science 2001; 293(5532): 1155–1159.
7. Mujumdar SR,Mujumdar RB, Grant CM,Waggoner AS. Cyanine-labelingreagents: sulfobenzindocyanine succinimidyl esters. Bioconjug Chem1996; 7(3): 356–362.
8. Gustafson TP, Cao Q, Achilefu S, Berezin MY. Defining a polymethinedye for fluorescence anisotropy applications in the near-infraredspectral range. Chemphyschem 2012; 13(3): 716–723.
9. Gustafson TP, Yan Y, Newton P, Hunter DA, Achilefu S, Akers WJ,Mackinnon SE, Johnson PJ, Berezin MY. A NIR dye for development ofperipheral nerve targeted probes. Med ChemComm2012; 3(6): 685–690.
10. Illy H, Funderburk L. Fischer indole synthesis. Direction of cyclizationof isopropylmethyl ketone phenylhydrazone. J Org Chem 1968; 33(11): 4283–4285.
11. Myochin T, Hanaoka K, Komatsu T, Terai T, Nagano T. Design strategyfor a near-infrared fluorescence probe for matrix metalloproteinaseutilizing highly cell permeable boron dipyrromethene. J Am ChemSoc 2012; 134(33): 13730–13737.
12. Berezin MY, Lee H, Akers W, Achilefu S. Near infrared dyes as lifetimesolvatochromic probes for micropolarity measurements of biologicalsystems. Biophys J 2007; 93(8): 2892–2899.
13. Strekowski L, Mokrosz JL, Wilson WD, Mokrosz MJ, Strekowski A.Stereoelectronic factors in the interaction with DNA of small aromaticmolecules substituted with a short cationic chain: importance of thepolarity of the aromatic system of the molecule. Biochemistry 1992;31(44): 10802–10808.
14. Mujumdar RB, Ernst LA, Mujumdar SR, Lewis CJ, Waggoner AS.Cyanine dye labeling reagents: sulfoindocyanine succinimidyl esters.Bioconjug Chem 1993; 4(2): 105–111.
15. Markova LI, Fedyunyayeva IA, Povrozin YA, Semenova OM,Khabuseva SU, Terpetschnig EA, Patsenker LD. Water solubleindodicarbocyanine dyes based on 2,3-dimethyl-3-(4-sulfobutyl)-3H-indole-5-sulfonic acid. Dyes Pigm 2013; 96(2): 535–546.
16. Kuhn H. A quantum mechanical theory of light absorption of organicand similar compounds. J Chem Phys 1949; 17(12): 1198–1212.
17. Berlier JE, Rothe A, Buller G, Bradford J, Gray DR, Filanoski BJ, TelfordWG, Yue S, Liu J, Cheung C-Y, Chang W, Hirsch JD, Beechem RosariaP. Haugland JM, Haugland RP. Quantitative comparison of long-wavelength alexa fluor dyes to Cy dyes: fluorescence of the dyes andtheir bioconjugates. J Histochem Cytochem 2003; 51(12): 1699–1712.
18. Pham W, Lai W-F, Weissleder R, Tung C-H. High efficiency synthesisof a bioconjugatable near-infrared fluorochrome. Bioconjug Chem2003; 14(5): 1048–1051.
19. Matveeva EG, Terpetschnig EA, Stevens M, Patsenker L, Kolosova OS,Gryczynski Z, Gryczynski I. Near-infrared squaraine dyes for fluores-cence enhanced surface assay. Dyes Pigm 2009; 80(1): 41–46.
20. Almutairi A, Guillaudeu SJ, Berezin MY, Achilefu S, Frechet JM. Biode-gradable pH-sensing dendritic nanoprobes for near-infrared fluores-cence lifetime and intensity imaging. J Am Chem Soc 2008; 130(2):444–445.
21. Kang J, Kaczmarek O, Liebscher J, Dahne L. Prevention of H-aggregatesformation in Cy5 labeled macromolecules. Int J Polym Sci 2010; ID264781.
22. Pauli J, Licha K, Berkemeyer J, Grabolle M, Spieles M, Wegner N,Welker P, Resch-Genger U. New fluorescent labels with tunablehydrophilicity for the rational design of bright optical probes formolecular imaging. Bioconjug Chem 2013; 24(7): 1174–1185.
23. Pope M, Swenberg CE. Electronic processes in organic crystals andpolymers. Oxford University Press: New York, 1999.
24. Kasha M, Rawls H, El-Bayoumi MA. The exciton model in molecularspectroscopy. Pure Appl Chem 1965; 11(3–4): 371–392.
25. Rosch U, Yao S, Wortmann R, Wurthner F. Fluorescent H-aggregates ofmerocyanine dyes. Angew Chem Int Ed Engl 2006; 45(42): 7026–7030.
26. Clegg RM, Sener M. From Förster resonance energy transfer to coherentresonance energy transfer and back. International Society for Opticsand Photonics 2010; 75610C–75621.
27. Yan Y, Marriott G. Analysis of protein interactions using fluorescencetechnologies. Curr Opin Chem Biol 2003; 7(5): 635–640.
28. Koushik SV, Vogel SS. Energy migration alters the fluorescence life-time of Cerulean: implications for fluorescence lifetime imagingForster resonance energy transfer measurements. J Biomed Opt2008; 13(3): 031204.
29. Ghukasyan V, Hsu CC, Liu CR, Kao FJ, Cheng TH. Fluorescence lifetimedynamics of enhanced green fluorescent protein in protein aggregateswith expanded polyglutamine. J Biomed Opt 2010; 15(1): 016008.
30. Dale RE, Eisinger J, Blumberg WE. The orientational freedom ofmolecular probes. The orientation factor in intramolecular energytransfer. Biophys J 1979; 26(2): 161–193.
31. Censullo R, Martin J, Cheung H. The use of the isotropic orientationfactor in fluorescence resonance energy transfer (FRET) studies ofthe actin filament. J Fluoresc 1992; 2(3): 141–155.
32. Benson RC, Kues HA. Fluorescence properties of indocyanine greenas related to angiography. Phys Med Biol 1978; 23(1): 159–163.
33. Wurth C, Grabolle M, Pauli J, Spieles M, Resch-Genger U. Relative andabsolute determination of fluorescence quantum yields of transparentsamples. Nat Protoc 2013; 8(8): 1535–1550.
34. Wurth C, Pauli J, Lochmann C, Spieles M, Resch-Genger U. Integratingsphere setup for the traceable measurement of absolutephotoluminescence quantum yields in the near infrared. Anal Meth2012; 84(3): 1345–1352.
N. G. ZHEGALOVA ET AL.
wileyonlinelibrary.com/journal/cmmi Copyright © 2014 John Wiley & Sons, Ltd. Contrast Media Mol. Imaging 2014, 9 355–362
362


