Embed Size (px)
Citation preview
Grafton/Milwaukee Market Analysis
Grafton, WI
August 2015
Hotel Market Analysis Project Feasibility
Grafton, WI
Prepared by: Sean Skellie Vice President of Business Analysis IDM Group, LLC Hospitality Consultants (262) 442-4720
Submitted to: Darrell Hofland Village Administrator Village of Grafton PO Box 125 Grafton, WI 53024 (262) 375-5300
Grafton/Milwaukee Market Analysis
Grafton, WI
August 2015
ii
Market Analysis & Project Feasibility Study Grafton/Milwaukee, WI
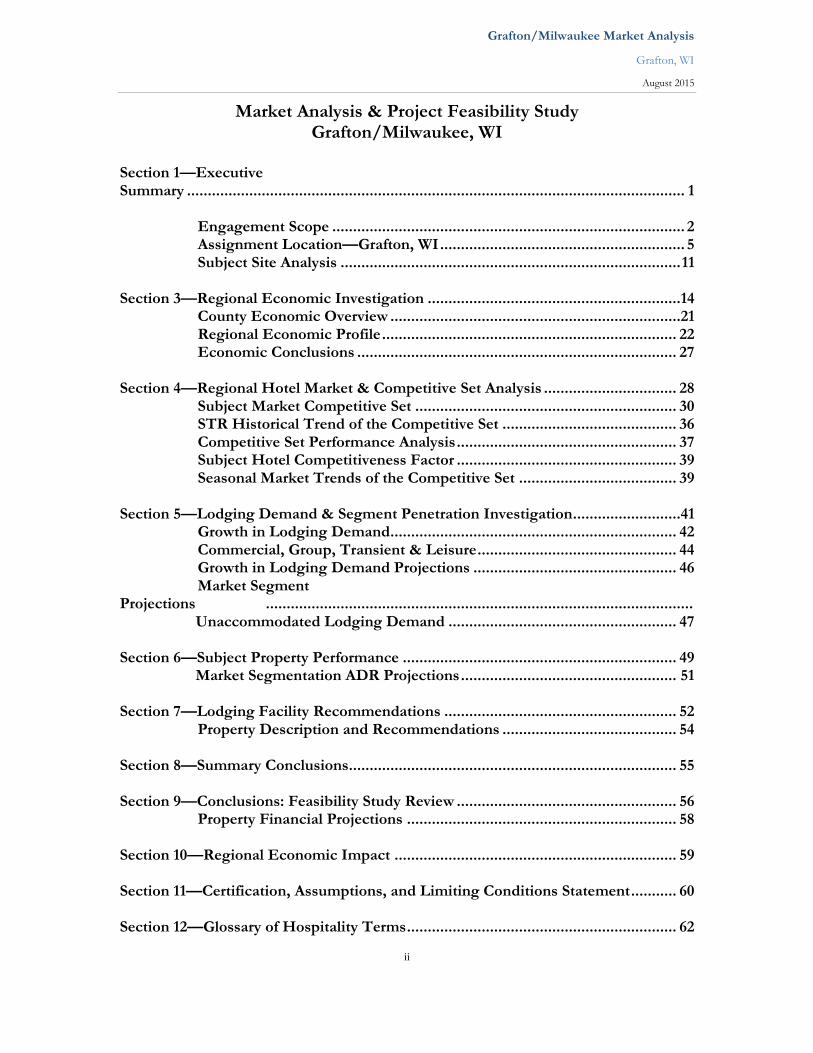
Section 1—Executive Summary ........................................................................................................................ 1 Engagement Scope ..................................................................................... 2 Assignment Location—Grafton, WI ........................................................... 5 Subject Site Analysis .................................................................................. 11 Section 3—Regional Economic Investigation .............................................................14 County Economic Overview ......................................................................21 Regional Economic Profile ....................................................................... 22 Economic Conclusions ............................................................................. 27 Section 4—Regional Hotel Market & Competitive Set Analysis ................................ 28 Subject Market Competitive Set ............................................................... 30 STR Historical Trend of the Competitive Set .......................................... 36 Competitive Set Performance Analysis ..................................................... 37 Subject Hotel Competitiveness Factor ..................................................... 39 Seasonal Market Trends of the Competitive Set ...................................... 39 Section 5—Lodging Demand & Segment Penetration Investigation ..........................41 Growth in Lodging Demand..................................................................... 42 Commercial, Group, Transient & Leisure ................................................ 44 Growth in Lodging Demand Projections ................................................. 46 Market Segment Projections ....................................................................................................... Unaccommodated Lodging Demand ....................................................... 47 Section 6—Subject Property Performance .................................................................. 49 Market Segmentation ADR Projections .................................................... 51 Section 7—Lodging Facility Recommendations ........................................................ 52 Property Description and Recommendations .......................................... 54 Section 8—Summary Conclusions............................................................................... 55 Section 9—Conclusions: Feasibility Study Review ..................................................... 56 Property Financial Projections ................................................................. 58 Section 10—Regional Economic Impact .................................................................... 59 Section 11—Certification, Assumptions, and Limiting Conditions Statement ........... 60 Section 12—Glossary of Hospitality Terms ................................................................. 62
Grafton/Milwaukee Market Analysis
Grafton, WI
August 2015
iii
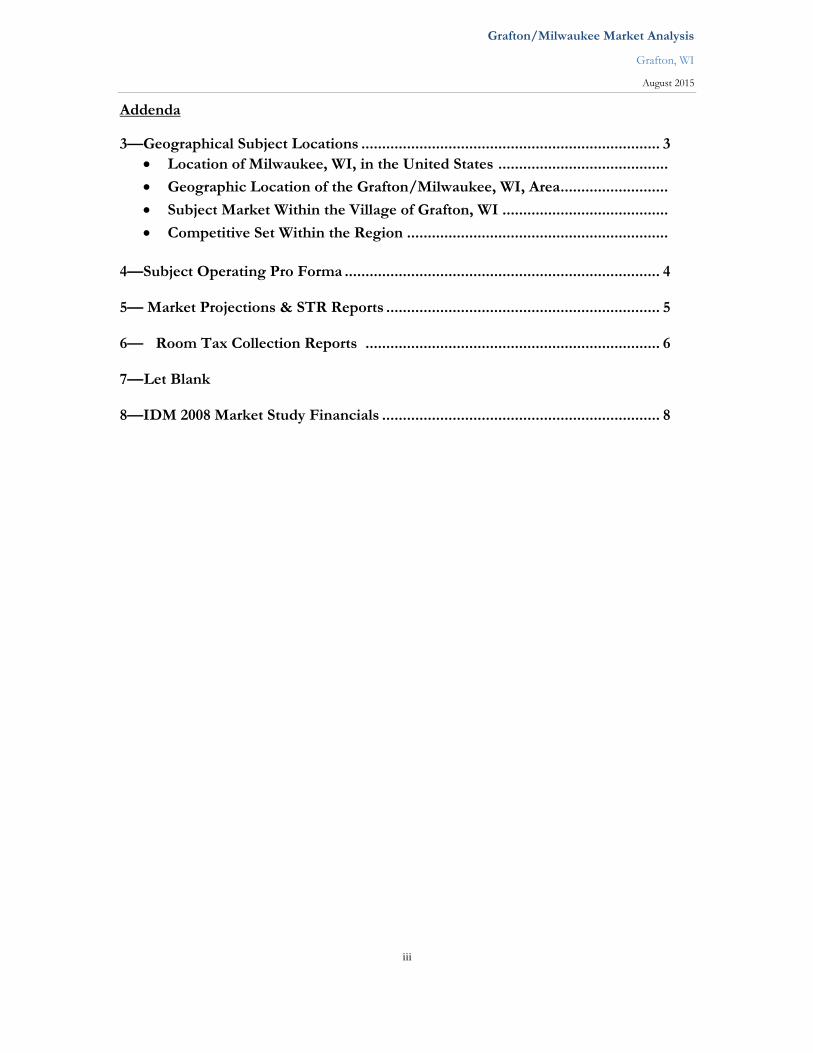
Addenda
3—Geographical Subject Locations ........................................................................ 3
Location of Milwaukee, WI, in the United States .........................................
Geographic Location of the Grafton/Milwaukee, WI, Area ..........................
Subject Market Within the Village of Grafton, WI ........................................
Competitive Set Within the Region ...............................................................
4—Subject Operating Pro Forma ............................................................................ 4 5— Market Projections & STR Reports .................................................................. 5 6— Room Tax Collection Reports ....................................................................... 6 7— Let Blank 8—IDM 2008 Market Study Financials ................................................................... 8
Grafton/Milwaukee Market Analysis
Grafton, WI
August 2015
1
EXECUTIVE SUMMARY
The Village of Grafton engaged IDM Group, LLC to produce the following report for the
potential development of an upscale, select-service hotel with meeting and conference facilities
in Grafton, Wisconsin, located in Ozaukee County. The purpose of the study is to analyze the
surrounding community and cities to determine the feasibility of the market and understand
the risks associated with a development. The study is an update to the original study completed
by IDM in 2008 and updated in 2011.
Given the size and pace of the economic activity in Grafton and its surrounding area—the
nearby communities of Mequon and Cedarburg, the location of the subject site and its
proximity to the greater Milwaukee market—it seems apparent that there is a base demand for
a hotel and possible meeting facilities. There was new guest room supply recently added to the
Village of Grafton and competitive subject market. The potential for development in the area
is promising, and IDM is engaged to verify market demand and overall market observation.
This study includes a preliminary Economic Analysis Section that will further verify the
potential of building a hotel in Grafton and Ozaukee County.
Initially, IDM is engaged to provide a Competitive Market Overview, a Comprehensive
Statistical Market Study, and all project economics from operations to development. This
includes operational speculations providing an overview of market, potential development
information concerning the Grafton market area, and market factors that would affect the
possible development of a hotel at this location. The goal is to provide a Competitive Market
Overview, a Comprehensive Statistical Market Study, and all Project Economics—from
operations to development—on operational speculations.
Given the consultants’ development experience, existing hotel management, and knowledge
of the hospitality industry, they are fully aligned to develop first-class hotels and qualified to
offer market analyses. All parties remain confident that an independent review of this report
would support our findings.
This report may or may not be acceptable for external investing and/or lending purposes and
may depend upon this market’s ability to support this hotel, additional requirements, and the
desire for more specific information.
Grafton/Milwaukee Market Analysis
Grafton, WI
August 2015
2
ENGAGEMENT SCOPE
This study presents the current and potential demand for hotel accommodations and analysis
of existing facilities in the Grafton market and the greater surrounding competitive market. It
recommends the scope and general characteristics of the hotel and other project amenities to
complement the development. These characteristics will be driven by architectural site
limitations, functionality of the operation, and the market’s ability to sustain the business.
Process Overview and Scope
For market analysis, the consultants interviewed area businesses and data from the Convention
and Visitors Bureau, regional developers, major franchise chains, and independent hotel
facilities regarding the status of their businesses and future plans for each market addressed in
the analysis. Forecasts were made based on the market’s historic performance, the growth in
demand, and anticipated supply. The proposed hotel’s accommodation occupancy levels
through the first several years of operation are based on those historical trends.
The market analysis determines the current and potential market for hotel accommodations
and amenities, including the necessary components, and further determines the appropriate
size, positioning, and scope of facilities to best serve the market, including market share and
competitive advantages and disadvantages. These recommendations will be presented in a
narrative and tables that set forth the hotel description, meeting space, breakout rooms, largest
room, potential mix and type of guest rooms, recommended facilities and amenities, and other
commentary on the development of a conferencing facility. The consultants will also identify
recommended price points and estimated levels of utilization.
Based on recommendations regarding project design, the consultants will prepare a
consolidated statement of estimated annual operating results for the proposed facility,
complete with sources and level of revenues, related and unallocated expenses for the property
through available cash flow for debt service and return on equity. The estimate will address a
typical year in the property’s operation in current value dollars and set forth the anticipated
first several years of operating results in inflationary dollars.
The first step of this process involved an extensive market visit and tour. We identified the
site location and existing facility conditions, reviewed site goals, possibilities, objectives, and
the competitive markets to be analyzed.
To be competitive and successful within a subject market is of major importance. We provide
factors important to this hotel’s success and address factors necessary for the hotel’s site. The
factors that we address in the market study are:
Project site and its accessibility.
Visibility from various points.
Grafton/Milwaukee Market Analysis
Grafton, WI
August 2015
3
Regional demand generators and their impact.
Benefit of support amenities and services, once expanded.
Facility amenities and design enhancements to the existing product.
General economics of the proposed market and operating hotel.
Comparison to competitive hotels’ characteristics.
Continuity with your overall development strategy or Master Plan.
Lodging demand within the subject market and property market share.
Competitive set investigation and comparison.
The conclusion of this analysis includes:
A review of the statistical history of competitive hotels within the market.
Forecast of occupancy, ADR, and revenue trends for the subject market and potential
subject property.
Detailed operational projections for sales and expenses for guest rooms, and food and
beverage such as banquet and catering departments. We will also review past and
current trends to industry averages.
Market segment contribution projections to determine hotel amenities.
Ten-year operational profit & loss and sales projections, evaluated in today’s dollar.
Economic impact within the region.
Research This report focuses on the supply and demand in hotel accommodations within the subject
market. To best understand the current market dynamics and relative positioning of potential
development, we looked at current demographics, market analysis from independent
resources, and a physical inspection of the most competitive and comparable hotels, meeting,
and banquet facilities. Our research identified the historic and projected occupancy, Average
Daily Rate (ADR), market segmentation mix, and operational positioning of the project. Our
research leads to the review of the facilities, amenities, services, and general condition of the
competition to position the hotel.
Similar trends affect the economics of hotel operations and the demand for hotel
accommodations. To forecast these operational projections, we used industry standards,
relevant data from managed properties, area demographics, and industry statistics. To
determine if the business environment could sustain the added hotel supply, we gathered and
analyzed relevant data such as current and proposed demand generators, population growth
and demographics, and employment growth. This information is found in the Hotel Lodging
Demand section.
Grafton/Milwaukee Market Analysis
Grafton, WI
August 2015
4
Market Performance and Facilities Recommendations
The consultants utilized independent statistical data to project both the supply of and the
demand for hotel lodging and meeting facilities in the competitive set or potential market. The
consultants looked at the market history and considered the viability of a subject facility based
on market trends.
Next, in detailed fashion, we project the occupancy, average rate, and revenues for the first 10
years of operation based on historical trends within the subject market. We used those
projections to recommend the size, type, and characteristics of the hotel and the amenities
offered. We will meet with you to discuss the feasibility and align various interests of the
developer and operator.
Development Costs & Operational Costs: Economic Analysis
The Economic Analysis was not part of the original proposal in the market study but could
be expanded to show development and construction estimates based on our experience and
industry-supplied data (such as industry averages) to complement the revenue and expense
pro forma analysis for this hotel project. These figures will be compared with the estimated
development costs for a full understanding of risk level. Whole debt service assumptions and
equity return are not modeled or directly addressed.
Grafton/Milwaukee Market Analysis
Grafton, WI
August 2015
5
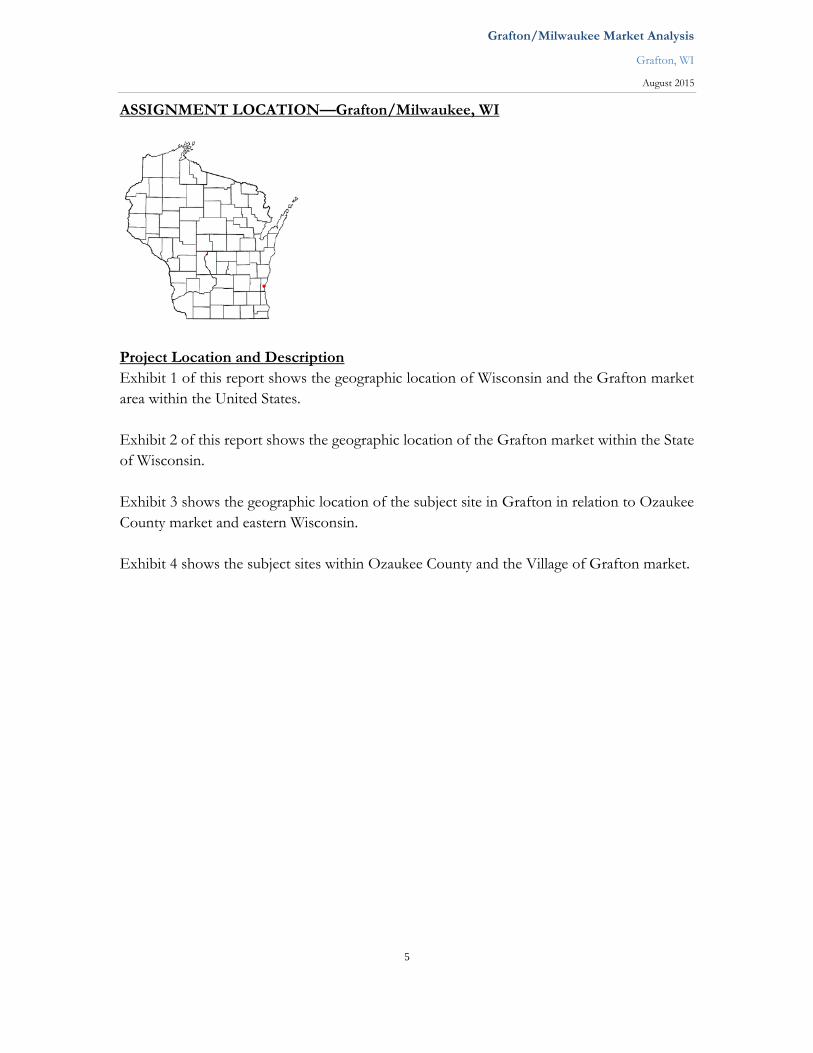
ASSIGNMENT LOCATION—Grafton/Milwaukee, WI
Project Location and Description
Exhibit 1 of this report shows the geographic location of Wisconsin and the Grafton market
area within the United States.
Exhibit 2 of this report shows the geographic location of the Grafton market within the State
of Wisconsin.
Exhibit 3 shows the geographic location of the subject site in Grafton in relation to Ozaukee
County market and eastern Wisconsin.
Exhibit 4 shows the subject sites within Ozaukee County and the Village of Grafton market.
Grafton/Milwaukee Market Analysis
Grafton, WI
August 2015
6
Grafton, Wisconsin, Overview
Grafton is a village in Ozaukee County, WI, United States. The last census reported the
population at 11,467. The village is adjacent to the Town of Grafton and the City of
Cedarburg. Grafton is situated at the eastern end of the state at the intersection of Highway 60
and Interstate 43, the main north/south corridor for the region, and offers a high quality of
personal and economic lifestyle that draws people and businesses alike to this community.
Grafton offers a diverse array of stores, shops, restaurants, and industrial enterprises along
with a variety of recreational activities. This popular suburb, just 20 miles north of Milwaukee,
has experienced a great deal of development over the last 10 years.
The Village is 4.53 square miles in size and was incorporated in 1896.
1900s to the Present
Grafton has developed into a community of varied industries, including fabricated metal and
plastic products, machinery, printing and publishing, electric and electronic equipment, and
various other manufacturing concerns.
Grafton Today
Grafton is a desirable community of relative wealth and small-town charm. Located an easy
commute north of Milwaukee, a hub of economic activity in Wisconsin, this Village is a great
place to live, work, and play. The community tagline is “Quality Life. Naturally.”
Ozaukee County History In the early 1800s, the only residents of Ozaukee County were Potawatomi and Menominee
Indians. The land comprising Ozaukee County was part of Milwaukee County, Michigan
Territory. In 1835, Michigan Territory was in the midst of petitioning Congress to become a
state. One of the requirements was that Michigan assist Wisconsin in becoming a separate
territory. The U.S. government moved the process along by advertising land for public sale in
Wisconsin, prompting thousands of New Englanders to come to Wisconsin. People traveled
by way of the Great Lakes on ships to Wisconsin where they found cheap land at $1.25 per
acre.
Rich deposits of limestone and excellent fishing led to early development of quarries and
harbors. Early settlers formed trails through Ozaukee County, which became major
transportation routes to other areas of the state. Two Indian trails met in an area that grew to
become the Village of Saukville. The old Green Bay Road served as the primary pathway
between Milwaukee and Green Bay. Numerous small communities grew along the original
trail to support the travelers, including an unincorporated area known as Hamilton in the
Town of Cedarburg.
Grafton/Milwaukee Market Analysis
Grafton, WI
August 2015
7
Fertile ground, moderate temperatures, and numerous small creeks and streams prompted
development of agriculture and dairy farming. Octagonal stone barns were commonplace
throughout the county, several of which remain standing today as evidence of this cultural
heritage. Larger, modern farm buildings in use today dwarf these historic smaller buildings.
Today
Ozaukee County’s 2010 census population was 86,395. Its county seat is Port Washington.
Ozaukee County has the smallest land mass of any county in the State of Wisconsin. The
county covers 235 square miles of land area. Located on 25 miles of the western shore of Lake
Michigan, the county encompasses approximately 900 square miles of Lake Michigan waters.
The greater community, as listed below, has a varied industry base that includes fabricated
metal, plastic products, machinery, printing, and various other manufacturing.
As of the 2000 Census, Ozaukee County had the second-lowest poverty rate of any county in
the United States, at 2.6 percent. In terms of per capita income, it is the 25th wealthiest county
in the country, as determined by the U.S. Census Bureau. Bolstered by low crime rates and
school districts with high graduation rates, Forbes Magazine ranked Ozaukee County No. 2 on
its list of “America's Best Places to Raise a Family” in June 2008.
Milwaukee, WI, Overview Milwaukee, Grafton’s neighboring city to the south, is a community where history celebrates
life. From its obscure beginnings as an Indian settlement and its hopeful days as a booming
Great Lakes port, Milwaukee has emerged as a stronghold of industries and immigrants,
displaying bold experiments in municipal government and a gradual immersion in national and
global affairs.
By the early twentieth century, Milwaukee had developed a national reputation based on three
related hallmarks: Germanism, Socialism, and beer. Today, all three have faded in
importance—but, as the new century began, the Milwaukee Idea retains a thoroughly
distinctive sense of place. Choice and circumstance have combined to produce a unique
community, one whose character reflects influences as diverse as Harley-Davidson and Pabst
Blue Ribbon, Golda Meir and Father Groppi, the German revolutionaries of 1848 and the
Milwaukee Braves of 1957. (Source: Historian John Gurda from his book The Making of Milwaukee.)
History of the City of Milwaukee
Milwaukee is the largest city within the State of Wisconsin and 26th largest in the United States
based on population. Located on the southwestern shore of Lake Michigan, the city is the
county seat of Milwaukee County. As of the 2010 U.S. Census estimate, Milwaukee County
had a population of 947,735. Milwaukee is the main cultural and economic center of the
Grafton/Milwaukee Market Analysis
Grafton, WI
August 2015
8
Milwaukee–Racine–Waukesha Metropolitan Area with a population of 1,533,034 as of the
2010 census. Milwaukee is also the regional center of the seven counties that comprise the
Greater Milwaukee Area, with an estimated population of 2,014,032 as of 2008.
The first Europeans to pass through were French missionaries and fur traders. In 1818,
Frenchman Solomon Juneau settled in the area, and in 1846, Juneau’s town combined with
two neighboring towns to incorporate as the City of Milwaukee. Large numbers of German
and other nationalities’ immigrants helped increase the city’s population during the 1840s and
the following decades.
Milwaukee residents are known as Milwaukeeans. Milwaukee is known as “The City of
Festivals” for its great number of ethnic and musical festivals, the largest of which is
Summerfest. It has also been called “Brew City” due to Milwaukee having been home to
several major breweries throughout its history.
1960 to the Present
Milwaukee, like many northern industrial cities, continued to grow vigorously until the late
1950s. Milwaukee was home to immigrants from Ireland, Germany, Hungary, Poland, and
other Central European nations. There was also great northward migration of African
Americans from the Southern United States. With the large influx of immigrants, Milwaukee
became one of the 15 largest cities in the nation, and by the mid-1960s, its population reached
nearly 750,000. Starting in the late 1960s, like many cities in the Great Lakes “rust belt,”
Milwaukee saw its population start to decline due to various factors, including the loss of blue-
collar jobs and the phenomenon of “white flight.”
In recent years, the city began to make strides in improving its economy, neighborhoods, and
image, resulting in the revitalization of neighborhoods such as the Historic Third Ward, the
East Side and, more recently, Bay View, along with attracting new businesses to its downtown
area. The city continues to make plans for increasing its revitalization through various projects.
In 2006—largely due to its efforts to preserve its history—Milwaukee was named one of the
“Dozen Distinctive Destinations” by the National Trust for Historic Preservation. The city is
also home to the Milwaukee Bar Association, the fourth oldest of such organization in the
United States. Founded in 1858, it now has more than 2,600 members.
Like other historically industrial northern cities, Milwaukee has taken steps over the past few
years to reshape its image, in large part by reviving its downtown. In the past decade, new
additions to downtown have included the Riverwalk, the Frontier Airlines Center (formally
the Midwest Airlines Center), Miller Park, an internationally renowned addition to the
Grafton/Milwaukee Market Analysis
Grafton, WI
August 2015
9
Milwaukee Art Museum, and Pier Wisconsin, as well as the major renovations to the
Milwaukee Auditorium and U.S. Cellular Arena.
Businesses in Milwaukee
Once known almost exclusively as a brewing and manufacturing powerhouse, Milwaukee has
taken steps in recent years to reshape its image. In addition to the major venues mentioned,
the city has many new skyscrapers, condos, lofts, and apartments, all constructed in
neighborhoods on and near the lakefront and riverbanks.
Greater Milwaukee markets nationally and internationally to tourists and to convention and
meeting planners, dedicated to ensuring its guests are warmly welcomed and enjoy an enriching
experience in this jewel of the Great Lakes. VISIT (the GMCVB-Greater Milwaukee
Convention and Visitors Bureau) has nearly 700 members, including hotels/motels,
restaurants, attractions, services, and other area businesses. Tourism generated $2.3 billion in
spending in Greater Milwaukee in 2009 and supported more than 57,813 local jobs. The Spirit
of Milwaukee and Potawatomi Bingo Casino are strategic partners with VISIT Milwaukee,
providing funding support for conventions and tourism programs.
Major Industries and Commercial Activity
As a commercial and industrial hub for the Great Lakes region, Milwaukee is home to six
Fortune 1000 manufacturers—including Harley-Davidson, Inc., Rockwell Automation, and
Johnson Controls—banks, and diversified service companies as well as one of the nation’s 10
largest insurance firms. The metropolitan area places among the top manufacturing centers in
the United States, ranking second among major metropolitan areas in the percentage of its
workforce in manufacturing. The economy is dominated by small- to medium-size firms with
representatives in nearly every industrial classification.
Metropolitan area firms are engaged primarily in the manufacture of machinery. Contrary to
Milwaukee’s reputation as a brewery capital, less than 1 percent of the city’s industrial output
is related to brewing. In recent years, the metro region has earned a reputation as a center for
precision manufacturing. It leads the nation in the production of industrial controls, X-ray
equipment, steel foundry parts, and mining machinery. The area is also considered a printing
and publishing center, housing more than 11 percent of the top 70 printing companies in
North America. Publishers and printers combined employ more than 21,000 people, about
2.5 percent of the workforce.
Professional and managerial positions are the fastest-growing occupations in Milwaukee,
accounting for almost 27 percent of the workforce. Service businesses constitute the largest
sector of the local economy, and healthcare positions account for about 27 percent of service
sector jobs. The area is home to four major multi-hospital health systems. Other major areas
of service employment include business services (27 percent), educational services (7 percent),
Grafton/Milwaukee Market Analysis
Grafton, WI
August 2015
10
and social services (10 percent).
Nearly a quarter of Wisconsin’s high-tech firms, employing more than one-third of the state’s
technology industry staff, are located in Milwaukee County. Between 1990 and 1999,
Milwaukee led Wisconsin in the creation of high-tech jobs, adding 10,000 positions.
Milwaukee’s healthcare industry includes several health systems. The Milwaukee Regional
Medical Complex, located between 8700–9200 West Wisconsin Avenue, is on the former
Milwaukee County Fairgrounds. This area includes the Children’s Hospital of Wisconsin,
Froedtert Hospital, Blood Center of Wisconsin, the Ronald McDonald House, Curative
Rehabilitation, and the Medical College of Wisconsin. Children’s Hospital of Wisconsin was
ranked in the top three children’s hospitals in the United States in 2006. Aurora Health Care
includes St. Luke’s Medical Center, Aurora Sinai Medical Center, West Allis Memorial, and St.
Luke’s South Shore. Wheaton Franciscan Healthcare includes St. Joseph’s Hospital, Elmbrook
Memorial (Brookfield), and others in the Milwaukee area. Columbia St. Mary’s Hospital is on
Milwaukee’s lakeshore and has established affiliations with Froedtert Hospital and the Medical
College of Wisconsin. The Medical College of Wisconsin is one of two medical schools in
Wisconsin and the only one in Milwaukee.
Tourism is also a major contributor to the local economy. Milwaukee hosts many festivals and
parades throughout the year and is home to nationally recognized museums, a zoo,
professional sports teams, and entertainment venues. All together, these attractions bring more
than 5 million tourists and generate $1.9 billion annually.
Items and goods produced: automobile frames and parts, heavy pumping machinery, gas
engines, heavy lubricating and agricultural equipment, large mining shovels, dredges, sawmill
and cement machinery, malt drinks and products, packaged meat, boots, shoes, leather
products, knit goods, women’s sportswear, gloves, children’s clothes, diesel engines,
motorcycles, outboard motors, electrical equipment, products of iron and steel foundries, and
metal fabricators.
Grafton/Milwaukee Market Analysis
Grafton, WI
August 2015
11
SUBJECT SITE ANALYSIS
The market being studied in this analysis is the Village of Grafton, WI. The area started as a
lumber town. Grafton is located at the crossroads of two major highways. The downtown area
of Grafton is located on the Milwaukee River.
Safety The area is regarded as a safe community. Surrounding residents in this area are mostly families
and professionals. Crime rate in the Grafton Market has an index average of 72 compared to
the average index in the US at 323.2, as reported by the FBI Crime Index in 2006. There has
been no violent crime recently committed and most reported were 150+ incidences of
property crimes. According to MOVOTO a website that uses statistics and the 2012 FBI
Uniform Crime Report to compare crime data; the Village of Grafton was rated the 6th safest
in the state.
The downtown Milwaukee market is regarded as a borderline area and an area of concern.
Violent crime in Milwaukee has declined substantially since the late 1990s. For several years,
Milwaukee ranked among the 10 most dangerous large cities in the United States, although in
recent years, it no longer appears even among the 25 most dangerous cities. However, despite
its improvements, Milwaukee still fares worse than average when comparing specific crime
types to the national average (e.g., homicide, rape, robbery); only aggravated assaults occur less
frequently in Milwaukee than the national average. In 2008, Milwaukee’s homicide rate fell to
a 23-year low, according to the Milwaukee Journal Sentinel, which credits targeted policing,
cooperation among law enforcement agencies, and a focus on gang violence as main reasons
for the decline.
Safety in the City Center has driven residents, retail, jobs, and development to neighboring
suburbs such as Grafton.
Visibility In the 2008 study performed by IDM, two sites were considered regarding site visibility. The
first site, occupying a downtown geographical area, has less visibility from one of the region’s
busiest interstates, Interstate 43. The secondary development site considered is positioned
parallel to the Interstate 43 corridor. This area has seen significant retail, medical, and office
development in the past few years. Traffic counts indicate over 25,000+ vehicles travel pass
the site daily. The idea of a downtown hotel seems intriguing and yet not practical. The
Interstate 43 interchange has grown significantly and its visibility and access to traveler support
services lends a higher degree of compatibility than a downtown location. The village has
multiple sites and it is our opinion that visibility will be important to the hotel’s success.
Grafton/Milwaukee Market Analysis
Grafton, WI
August 2015
12
Accessibility
The Village of Grafton is located off Interstate 43, a major state throughway in the State of
Wisconsin, and is easily accessible by automobile or air travel. Below is a list of major regional
cities, their distances, and approximate drive times to Grafton:
Milwaukee—24 miles (½ hour)
Chicago—112 miles (2 hours)
Minneapolis—356 miles (5¾ hours)
Madison—97 miles (1¾ hours)
Green Bay—95 miles (1½ hours)
Indianapolis—273 miles (4½ hours)
Air Transportation
The closest major international airport that grants access to the Grafton market is the
Milwaukee airport, General Mitchell. Milwaukee is home to two airports: General Mitchell
International Airport on the southern edge of the city, and the smaller Timmerman Field on
the north side. Mitchell is served by a dozen airlines that offer roughly 250 daily departures
and 245 daily arrivals. Approximately 115 cities are served nonstop or direct from Mitchell
International, which is the largest airport in Wisconsin. The airport terminal is open 24 hours
a day.
In August of 2010, the airport had the largest average airfare decline (cost of tickets) in the
country’s top 100 airports in the first quarter of the year. This was related to the aggressive
expansion of Air Tran and Frontier Airlines, combined with the entrance of Southwest
Airlines into the market. Fares are so reasonable, the airport is finding an increase of region
travelers to the airport, making it a regional choice (regarding accessibility and affordability)
over Chicago’s airports.
Milwaukee County executives announced that an all-time one-month high number of
passengers traveled through General Mitchell International Airport in June 2010. It was the
first month in which the airport served more than 900,000 passengers, with a count of 922,984,
an increase of 212,197 (+29.86 percent) over last June’s 710,767 passengers. The June total
marks 10 straight months of record passenger growth and beats the previous one-month high
of 896,598 passengers in March 2010.
In the first half of 2010, the airport served 1,225,221 more passengers than over the same
period in 2009, a 34.41 percent increase from the 3,560,224 passengers. The increase of
travelers has a direct effect on tourism spending in the Greater Milwaukee area.
Grafton/Milwaukee Market Analysis
Grafton, WI
August 2015
13
In October 2008, a Condé Nast Traveler poll ranked Milwaukee County’s General Mitchell
International Airport fourth in the nation in the categories of Location and Access, Design,
Customs and Baggage, Perceived Safety and Security, as well as Food, Shops and Amenities.
Train and Bus Transportation
The Milwaukee Intermodal Station
Milwaukee’s Amtrak station was renovated in 2007 to create the Intermodal Transportation
Station near downtown Milwaukee and the Third Ward. The renovated station hosts Amtrak,
Greyhound Lines, and Jefferson Lines intercity bus transportation. Milwaukee is served by the
Hiawatha Amtrak express service up to seven times daily between downtown Milwaukee and
downtown Chicago, including a stop at the Milwaukee Airport Rail Station, Sturtevant (near
Racine), and Glenview, IL. Amtrak operates its Empire Builder passenger train daily between
Chicago and the Pacific Northwest, with stops near Madison, Wisconsin Dells, and
Minneapolis.
The Badger Bus and station in downtown Milwaukee provides bus service between Milwaukee
and Madison. Stops include the UW-Madison Memorial Union, Madison Bus Depot, Johnson
Creek, Goerkes Corners, Milwaukee 84th St., Milwaukee Bus Depot (downtown Milwaukee),
and Milwaukee Airport.
Education
Higher Education
Milwaukee has one of the highest per capita student populations, ranking sixth among U.S.
and Canadian cities in number of college students per 100 residents, according to a January
2000 study from McGill University.
Primary and Secondary Education
Milwaukee maintains Milwaukee Public Schools (MPS), the largest school district in Wisconsin
and fifth in the nation. As of 2007, it had an enrollment of 392,395 students and as of 2006,
employed 11,100 full-time and substitute teachers in 323 schools. Milwaukee Public Schools
operate as magnet schools, with individualized specialty areas for interests in academics or the
arts. (Source: Wikipedia.com)
Grafton/Milwaukee Market Analysis
Grafton, WI
August 2015
14
WISCONSIN REGIONAL ECONOMIC INVESTIGATION
Tourism and Demand Generators
It is our intent to measure the strength of regional tourism the Greater Milwaukee market.
Tourism is the region’s primary source of revenue and is represented by the local
accommodations. Later in the report we document the trends of occupancy in the area and
greater region. The area has long been a tourist market and popular destination for seasonal
travel and vacation homes.
Tourism plays a vital role in the county, and businesses that cater to tourism—such as resorts,
hotels, campgrounds, bed & breakfasts, and retail stores—complement the hundred miles of
biking trails as well as the many parks, golf courses, historic sites, and area attractions.
Wisconsin’s Tourism Investment
In this section of the market study, we will define the current level of tourism-related business
within the state as provided in the Wisconsin Economic Impact Industry Report 2015
completed by according to research conducted by Tourism Economics and Longwood’s
International.
In 2014, Wisconsin’s $18 billion tourism industry remained one of the core strengths of the
state’s economy. The rise in visitor spending and overall travelers was up significantly, based
on the state’s impact report delivered in April 2015. The report published the following
statistics:
Tourism activity in the state was up $1 billion, from $17.5 billion in 2013 to $18.5
billion in 2014. This 5.5% growth was prompted by increases in both visits and
spending per trip.
The past four years have been outstanding for Wisconsin’s tourism industry. Since
2010, tourism activity is up by $3.7 billion, a 25% increase. This is the first time in
four years that all 72 counties posted a positive increase in visitor spending.
Visitor growth in 2014 topped 102 million, an increase of 7 million visits since 2010.
Other positive industry indicators included a 5.3% increase in per trip spending led by
recreation and entertainment (7.8%), lodging (7.2%), and food and beverage (6.4%).
Wisconsin’s lodging sector had their strongest year since 2011, with room demand
growing by 3.5% and average room rates increasing by 3.7%.
Grafton/Milwaukee Market Analysis
Grafton, WI
August 2015
15
Traveler spending is a significant source of employment and taxes. Largely comprised
of small businesses, travel and hospitality jobs can’t be outsourced or exported.
Tourism supported 187,643 jobs with a total personal income of $4.8 billion. The
tourism industry added over 6,200 jobs to Wisconsin’s total employment since 2011.
Visitors generated $1.4 billion in state and local revenue, saving Wisconsin taxpayers
$620 per household.
Tourism plays a vital role in Wisconsin. Travel and tourism is a revenue-generating machine
for state and local governments. It is the main employer in many communities throughout the
state, providing stability and diversity, and complementing manufacturing, agriculture, and the
state’s knowledge-based sectors.
Marketing Wisconsin
For every $1 the Department spent on summer and fall advertising in 2012, $6 was
returned to the state in additional tax revenue.
Tourism generates a positive impression of the state’s image, which is critical for
economic development.
Longwood’s International conducted research to measure how tourism advertising
and visitation influences consumers’ perception of the state. Travelers who have
visited Wisconsin in the past two years rate the state much higher in attributes such as
a good place to live, start a business, attend college, or purchase a retirement home
than those who have not visited the state.
The Department markets the state as the premier destination for fun, whether it’s
leveraging the power of celebrities with Wisconsin ties in ad campaigns, bringing in
the nation’s top travel writers to experience our destinations, providing reliable and
inspiring travel information to potential visitors, or attracting lucrative sporting events,
meetings and conventions.
The most recent TV ad starring UW Madison basketball coach Bo Ryan aired during
the Big Ten and NCAA Championships and received over 6 million impressions. In
addition, it has been viewed online over 526,000 times, a record for any ad in the
Department’s history.
Last year’s public relations efforts generated over $114 million in earned media with
coverage in The New York Times, Chicago Tribune, Singapore Times, the Miami
Herald, the Japan Times, the Washington Post and the LA Times. Over the last four
years, earned media topped $284 million.
A record 5 million users visited TravelWisconsin.com, an increase of 146%.
The Department’s public relations, social media and marketing efforts have garnered
65 state, regional, national and international awards and recognitions since May 2011.
Grafton/Milwaukee Market Analysis
Grafton, WI
August 2015
16
The Tourism Outlook for 2015
U.S. travel is returning to high levels of optimism with positive travel intentions for
2015. In fact, 32% of U.S. leisure travelers plan to increase their travel spending in
2015 and 57% indicate they plan to spend about the same according to the “State of
the American Traveler” survey.
Lower gas prices have produced a positive impact on consumers’ discretionary
incomes and travel habits.
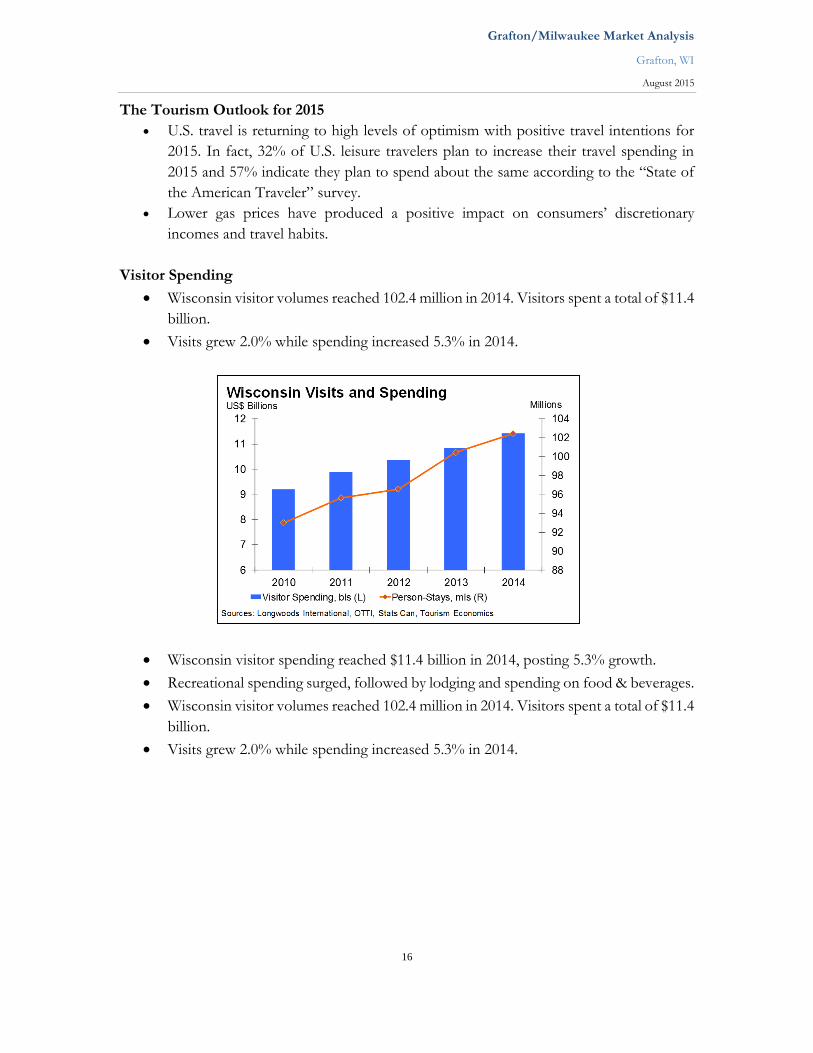
Visitor Spending
Wisconsin visitor volumes reached 102.4 million in 2014. Visitors spent a total of $11.4
billion.
Visits grew 2.0% while spending increased 5.3% in 2014.
Wisconsin visitor spending reached $11.4 billion in 2014, posting 5.3% growth.
Recreational spending surged, followed by lodging and spending on food & beverages.
Wisconsin visitor volumes reached 102.4 million in 2014. Visitors spent a total of $11.4
billion.
Visits grew 2.0% while spending increased 5.3% in 2014.
Grafton/Milwaukee Market Analysis
Grafton, WI
August 2015
17
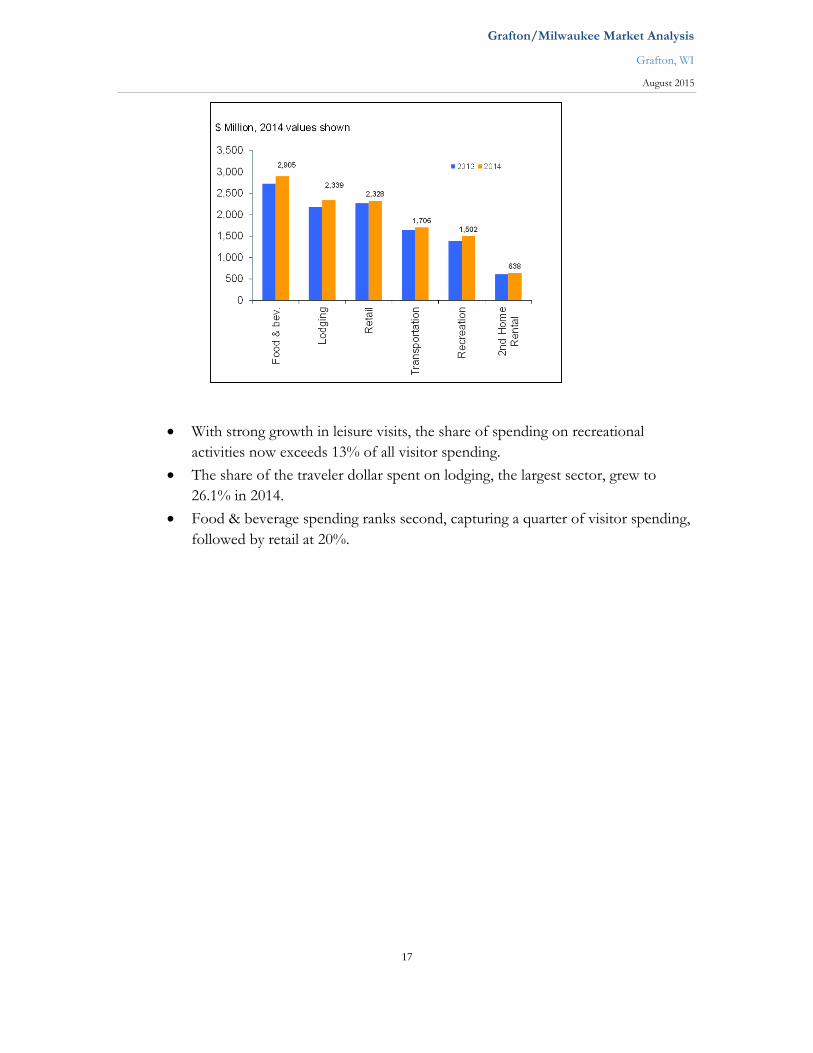
With strong growth in leisure visits, the share of spending on recreational
activities now exceeds 13% of all visitor spending.
The share of the traveler dollar spent on lodging, the largest sector, grew to
26.1% in 2014.
Food & beverage spending ranks second, capturing a quarter of visitor spending,
followed by retail at 20%.
Grafton/Milwaukee Market Analysis
Grafton, WI
August 2015
18
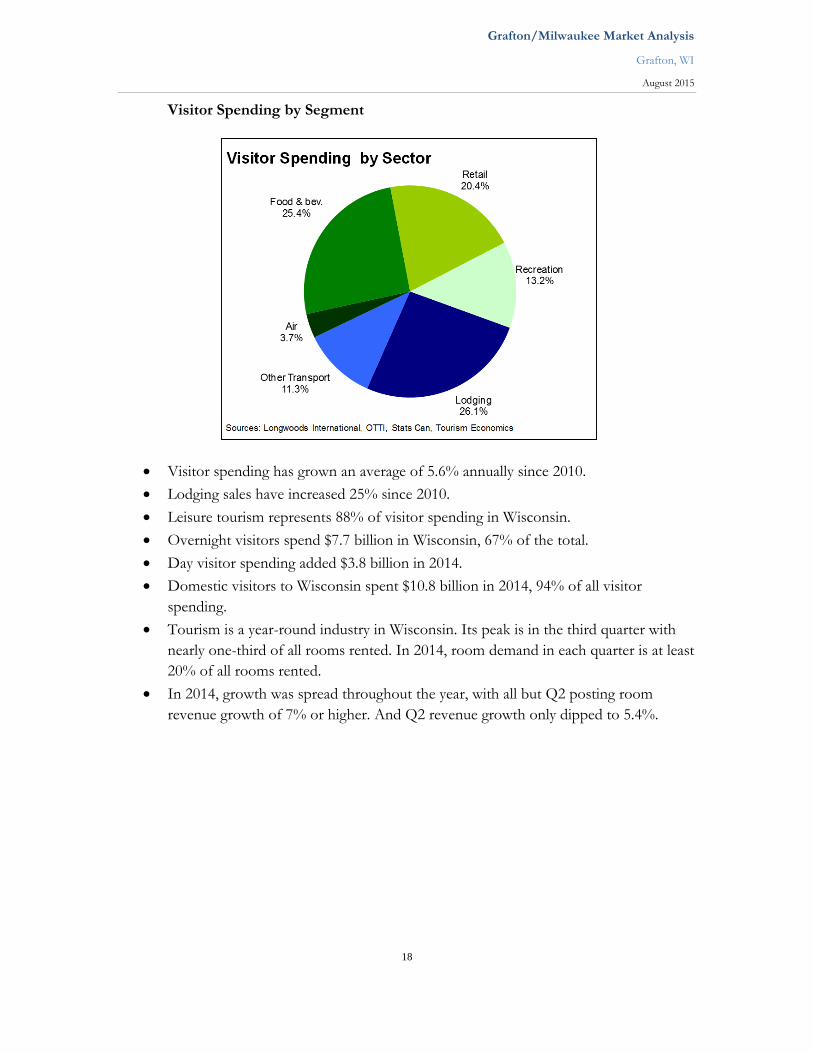
Visitor Spending by Segment
Visitor spending has grown an average of 5.6% annually since 2010.
Lodging sales have increased 25% since 2010.
Leisure tourism represents 88% of visitor spending in Wisconsin.
Overnight visitors spend $7.7 billion in Wisconsin, 67% of the total.
Day visitor spending added $3.8 billion in 2014.
Domestic visitors to Wisconsin spent $10.8 billion in 2014, 94% of all visitor
spending.
Tourism is a year-round industry in Wisconsin. Its peak is in the third quarter with
nearly one-third of all rooms rented. In 2014, room demand in each quarter is at least
20% of all rooms rented.
In 2014, growth was spread throughout the year, with all but Q2 posting room
revenue growth of 7% or higher. And Q2 revenue growth only dipped to 5.4%.
Grafton/Milwaukee Market Analysis
Grafton, WI
August 2015
19
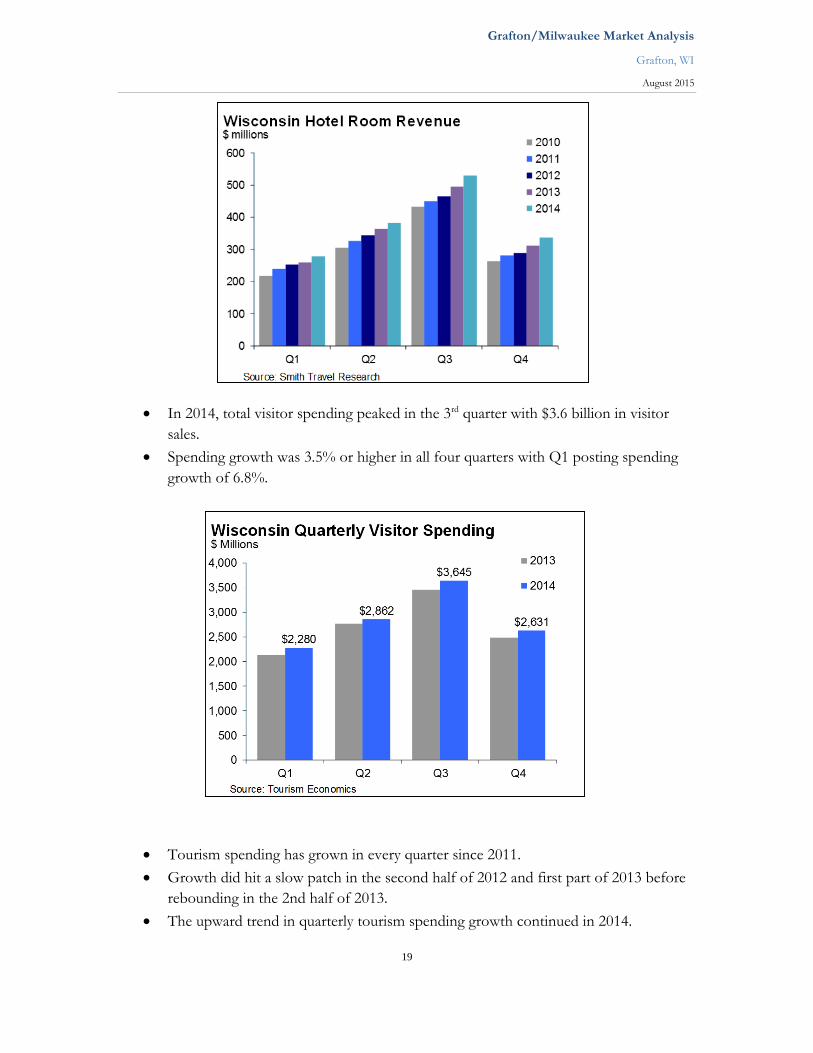
In 2014, total visitor spending peaked in the 3rd quarter with $3.6 billion in visitor
sales.
Spending growth was 3.5% or higher in all four quarters with Q1 posting spending
growth of 6.8%.
Tourism spending has grown in every quarter since 2011.
Growth did hit a slow patch in the second half of 2012 and first part of 2013 before
rebounding in the 2nd half of 2013.
The upward trend in quarterly tourism spending growth continued in 2014.
Grafton/Milwaukee Market Analysis
Grafton, WI
August 2015
20
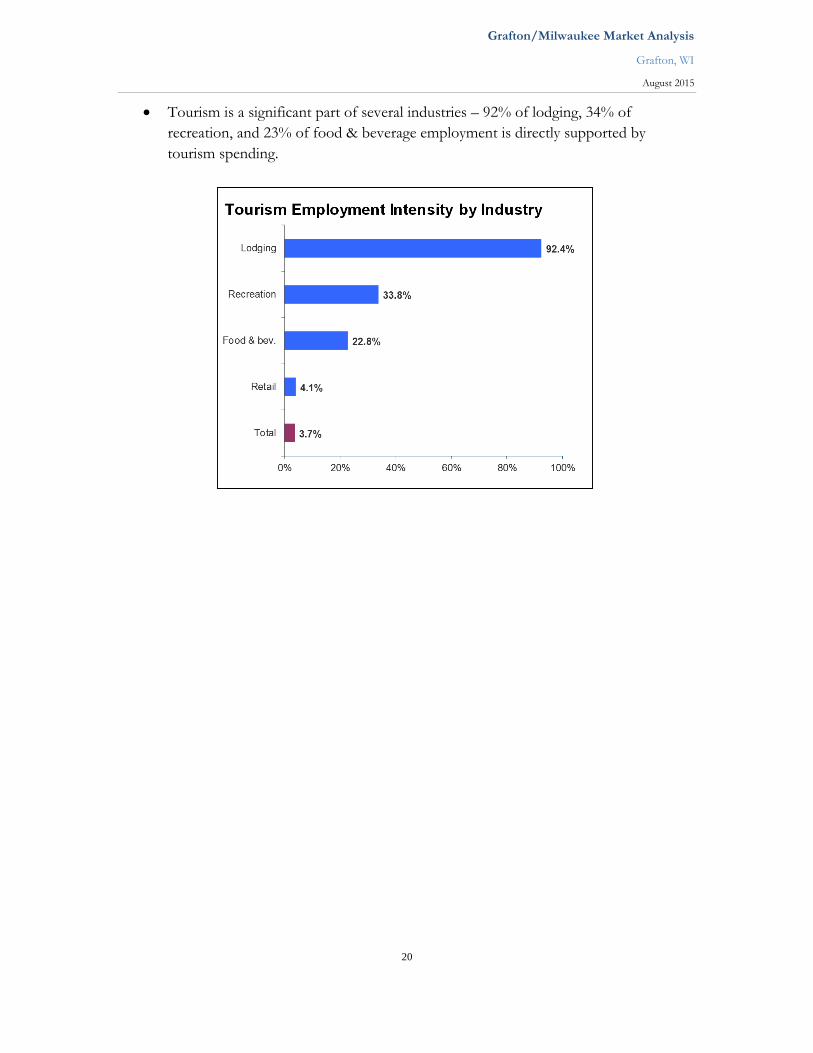
Tourism is a significant part of several industries – 92% of lodging, 34% of
recreation, and 23% of food & beverage employment is directly supported by
tourism spending.
Grafton/Milwaukee Market Analysis
Grafton, WI
August 2015
21
Ozaukee County Tourism Overview
The following information is specific to the subject market in county regional markets, as
reported in the Annual 2015 Wisconsin Tourism’s Economic Impact Study published in
May 2014.
Tourism spending in Ozaukee County as it relates to direct visitor spending was up 3.49%
to $87.6 million in 2014 compared to a 5.34% increase in the State of Wisconsin to $11.4
billion.
Tourism spending in Ozaukee as it relates to total business sales was up 4.58% to $177
million in 2014 compared to a 5.47% increase in the State of Wisconsin to $18.4 billion.
Of Wisconsin’s 72 counties, Milwaukee County ranks No. 28 in the state for traveler
spending and total tourism revenues.
The tourism industry provides work across the spectrum of employment, from entry-level
and part-time jobs to management and executive-level positions. In fact, traveler spending
in 2014 supported nearly 2,000 full-time equivalent jobs in the county, an report relatively
no increase from 2013. Ozaukee County paid more than $52.7 million in wages and
salaries.
Travel spending in Ozaukee County generated a total impact of $11.4 million in state and
local taxes, an increase of 2.54%.
Grafton/Milwaukee Market Analysis
Grafton, WI
August 2015
22
Village of Grafton Economic Profile
Population
Of the households, 34.5 percent have children under the age of 18; 61.4 percent are married
couples living together; 7.2 percent have a female householder with no husband present; and
28.9 percent are non-families. Of all households, 24.2 percent are made up of individuals, and
8.4 percent are someone living alone who is 65 years of age or older. The average household
size is 2.54, and the average family size is 3.06.
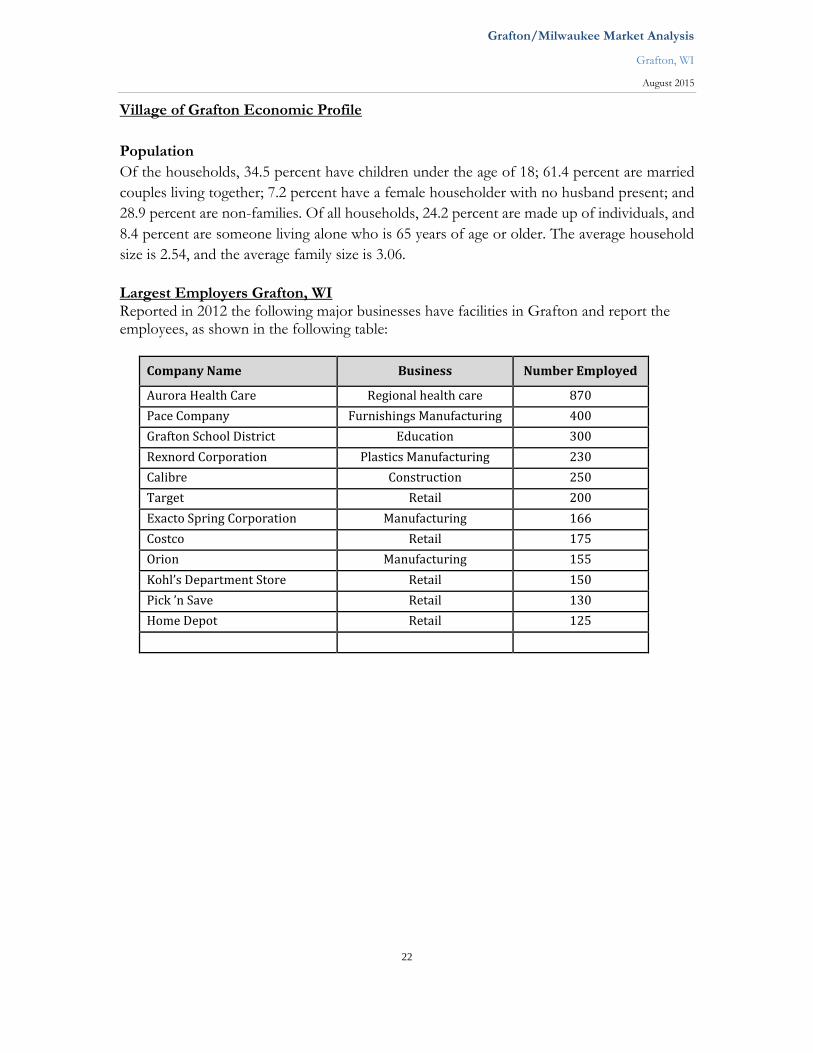
Largest Employers Grafton, WI Reported in 2012 the following major businesses have facilities in Grafton and report the employees, as shown in the following table:
Company Name Business Number Employed
Aurora Health Care Regional health care 870
Pace Company Furnishings Manufacturing 400
Grafton School District Education 300
Rexnord Corporation Plastics Manufacturing 230
Calibre Construction 250
Target Retail 200
Exacto Spring Corporation Manufacturing 166
Costco Retail 175
Orion Manufacturing 155
Kohl’s Department Store Retail 150
Pick ’n Save Retail 130
Home Depot Retail 125
Grafton/Milwaukee Market Analysis
Grafton, WI
August 2015
23
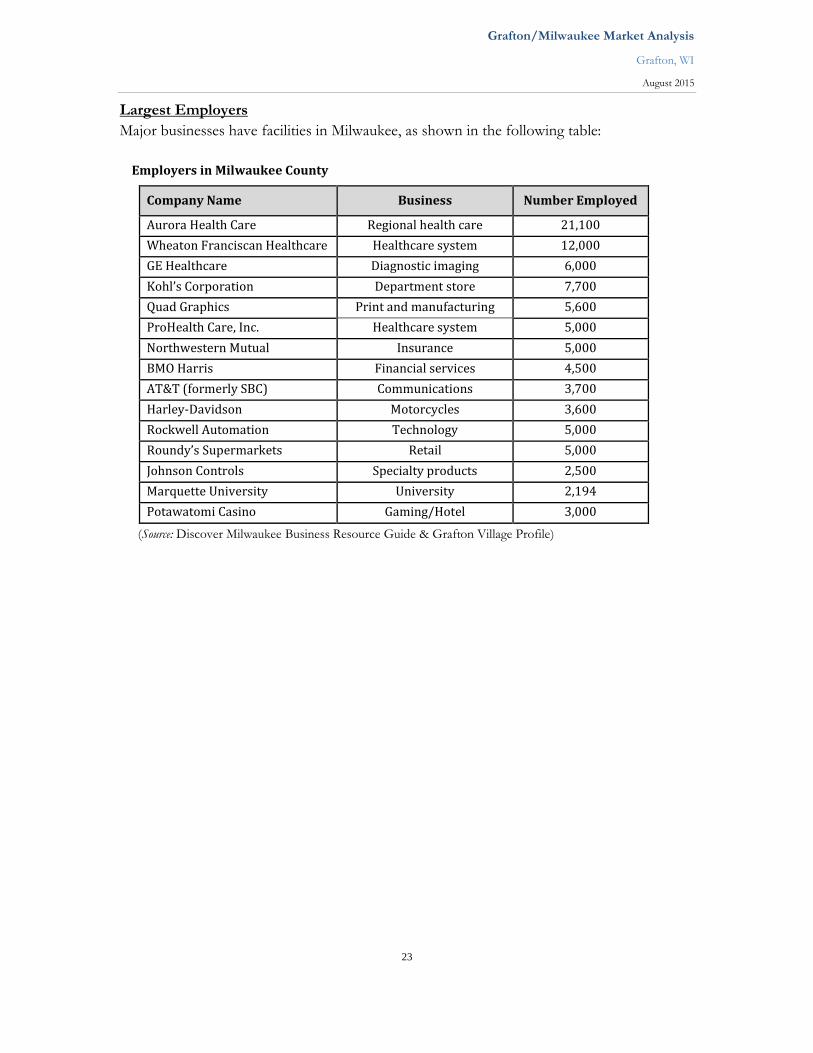
Largest Employers
Major businesses have facilities in Milwaukee, as shown in the following table:
Employers in Milwaukee County
Company Name Business Number Employed
Aurora Health Care Regional health care 21,100
Wheaton Franciscan Healthcare Healthcare system 12,000
GE Healthcare Diagnostic imaging 6,000
Kohl’s Corporation Department store 7,700
Quad Graphics Print and manufacturing 5,600
ProHealth Care, Inc. Healthcare system 5,000
Northwestern Mutual Insurance 5,000
BMO Harris Financial services 4,500
AT&T (formerly SBC) Communications 3,700
Harley-Davidson Motorcycles 3,600
Rockwell Automation Technology 5,000
Roundy’s Supermarkets Retail 5,000
Johnson Controls Specialty products 2,500
Marquette University University 2,194
Potawatomi Casino Gaming/Hotel 3,000
(Source: Discover Milwaukee Business Resource Guide & Grafton Village Profile)
Grafton/Milwaukee Market Analysis
Grafton, WI
August 2015
24
Subject Site Regional Tourism Demand Generators
The Grafton market, as a suburb of the greater Milwaukee area, is centrally located among
many of the area’s largest businesses. Following, we have identified a few of those core
businesses that drive regional demand and cause market compression and overflow of guest
room demand outside the immediate Milwaukee market. This demand is both seasonally and
business generated. This is not an extensive list of all area businesses or demand generators.
The 2008 Market Analysis has a through list of regional business and demand generating
businesses.
Major Tourism Demand-Generating Businesses
Harley Davidson Museum
400 Canal St.
Milwaukee, WI 53203
Harley-Davidson is an American motorcycle manufacturer founded in Milwaukee during the
first decade of the twentieth century. It is one of two major American motorcycle
manufacturers to survive the Great Depression. Harley-Davidson also survived a period of
poor quality control and competition from Japanese manufacturers.
The company sells heavyweight (over 750 cc) motorcycles designed for cruising on the
highway. Harley-Davidson motorcycles (popularly known as “Harleys”) have a distinctive
design, exhaust note, and the tradition of heavy customization that gave rise to the chopper-
style motorcycle.
Harley has two significant sources of demand sites that drive business to the area hotels. The
Wauwatosa and Menomonee Falls Powertrain Operation Plants are operational factories that
produce engines for bikes; they sell merchandise and offer two types of tours to the public.
The Harley-Davidson Museum in downtown Milwaukee is an archive of Harleys, offering
exhibits of people, products, and culture. The museum draws an estimated 300,000 visitors
annually. The Harley-Davidson Museum includes 130,000 square feet of display space. The
culture of Harley-Davidson shown in various exhibits that tell stories of the people and history.
There is an extensive collection of Harley-Davidson motorcycles, photographs, videos, and
clothing. A portion of the Harley-Davidson archives that has previously been closed to the
public is now on display.
Grafton/Milwaukee Market Analysis
Grafton, WI
August 2015
25
MillerCoors
Visitor Center
4251 West State St.
Milwaukee, WI 53208
Miller Brewing Company merged with Coors Brewing Company on July 1, 2008, to become
MillerCoors. Prior to the joint venture, Miller Brewing was the second-largest brewing
company in the United States behind Anheuser-Busch and was based in Milwaukee. Miller
Brewing Company was founded in 1855 by Frederick Miller when he purchased the small
Plank-Road Brewery. The brewery’s location in the Menomonee Valley provided easy access
to raw materials produced on nearby farms.
Miller Park
201 South 46th St.
Milwaukee, WI 53214
Miller Park is a baseball park located in Milwaukee and home to the National League’s
Milwaukee Brewers. The stadium was built in 2001 as a replacement for Milwaukee County
Stadium. The park is located just southwest of the intersection of I-94, US-41, and Miller Park
Way, 2.4 miles from the subject hotel. The title sponsor is MillerCoors. Miller’s contract with
the stadium was for $40 million and runs until 2020.
The park, completed in 2001, features North America’s only fan-shaped convertible roof,
which can open and close in less than 10 minutes. Large panes of glass allow natural grass to
grow. In 2005, Sports Illustrated conducted fan surveys that rated Miller Park the best ballpark
based on value per dollar spent.
Although attendance dropped after the 2001 opening season to a low of 20,993 per game in
2003, attendance rebounded in subsequent seasons. In 2008, the Brewers set a franchise record
for attendance with more than 3 million. This was ninth among the 30 major league teams,
despite Milwaukee being one of the smallest markets in baseball.
Summerfest
Henry Maier Park
200 N. Harbor Dr.
Milwaukee, WI 53202
“Summerfest (also known as “The Big Gig”) is a yearly music festival held at the 75-acre Henry
Maier Festival Park along the lakefront in Milwaukee. The festival lasts for 11 days, and since
the mid-1970s, has run from late June through early July—always including the Fourth of July
Grafton/Milwaukee Market Analysis
Grafton, WI
August 2015
26
holiday. Summerfest attracts almost 1 million people each year. Summerfest promotes itself as
“The World’s Largest Music Festival,” a title certified by the Guinness World Records in 1999.
Summerfest is run by the non-profit Milwaukee World Festival, Inc.
Summerfest features both local and nationally known music talent from a variety of music
genres. The event also provides the opportunity to sample a wide variety of food from many
Milwaukee restaurants. Other Summerfest attractions include comedy acts, shopping booths,
fireworks (including “The Big Bang” by Bartolotta Fireworks on opening night), karaoke,
children’s activities, and more.
Live musical acts are offered on 12 stages throughout the grounds, including the 23,000-seat
Marcus Amphitheater. With the exception of headlining acts at the Marcus Amphitheater, all
shows are free with a Summerfest admission ticket. Admission tickets cost between $10 and
$20, depending on the time of day; there are numerous promotions for discounted or free
tickets.
Grafton/Milwaukee Market Analysis
Grafton, WI
August 2015
27
Economic Conclusions
This section identified a wide variety of economic indicators that are pertinent to the market
area. In review, the tourism economy has been stable over the past 10 years and is growing
and remaining somewhat stable in this economic recession. The diversity of the business and
economy are above average. Workforce, population, redevelopment, and growth in the market
are projected to be in recovery, and growth is slow for the village, city, and county. The tourism
industry is stable and somewhat seasonal. The outlook for the area is generally favorable, and
growth should recover through the near term, although some recession indicators are present.
Subject site strengths include:
Excellent, easy access from the region’s corridors. Milwaukee seems to be the most
influential white-collar city amongst the Wisconsin Region, having both a vibrant
tourism and arts following and a business-minded community.
The subject market is competitively priced at a value to the other downtown hotels
and easily accessible. The area offers comparable services and amenities at a reasonable
price.
Tourism is a significant regional industry, and travelers are driven based on location,
price, and amenities. The combined tourism impact on Greater Milwaukee County is
estimated at $18.5 billion in Wisconsin and Milwaukee County leads the overall market
impact.
Of Wisconsin’s 72 counties, Milwaukee County ranks first in the state for traveler
spending, accounting for $3.1 billion in revenues collected up about 6 percent over
2014. The Milwaukee market drives compression to the surrounding markets, and the
subject market is in close proximity.
Easily accessible to largest market businesses, demand generators, and corporate
businesses. The area has increased traveler support services for dining and retail
options within a walkable distance, and retail in the area continues to expand.
Subject site weaknesses include:
The subject market has seen a recent increase in rooms available, as discussed later.
Competition is growing, and most branded hotels drive demand to the chain.
The current existing hotels are well established within the market given their age, and
travelers and companies have strong relationships with those properties.
The site is more than 20 miles north of the core of City Center hotels in downtown
Milwaukee. There is significant supply in the core, and the subject market may be a
destination market hotel is a destination site of its own, yet easily accessible to that
core market.
Grafton/Milwaukee Market Analysis
Grafton, WI
August 2015
28
REGIONAL HOTEL MARKET &
COMPETITIVE SET ANALYSIS
When analyzing a market, it is important to understand the trends of occupancy, average rate,
and revenue for groups of hotel, whole market patterns, and segments of properties. Smith
Travel Research (STR) from Hendersonville, TN, is the industry leader in gathering and
sourcing hospitality data and is used specifically to gather trend information. STR has the most
comprehensive database of hotel performance information available. All branded and
franchised hotel chains in the world report their performance to STR. Reports are available
for specific markets and individuals properties and were used in the study.
Regional Market Supply and Demand History
Smith Travel Reports, requested by the Wisconsin Hotel & Lodging Association, compares
the Top 13 market regions around the state. The December 2014 year-end report shows a full
two-year comparison of the subject market with that of the surrounding markets. The Grafton
and Port Washington markets identified in this report participate in the Milwaukee Region.
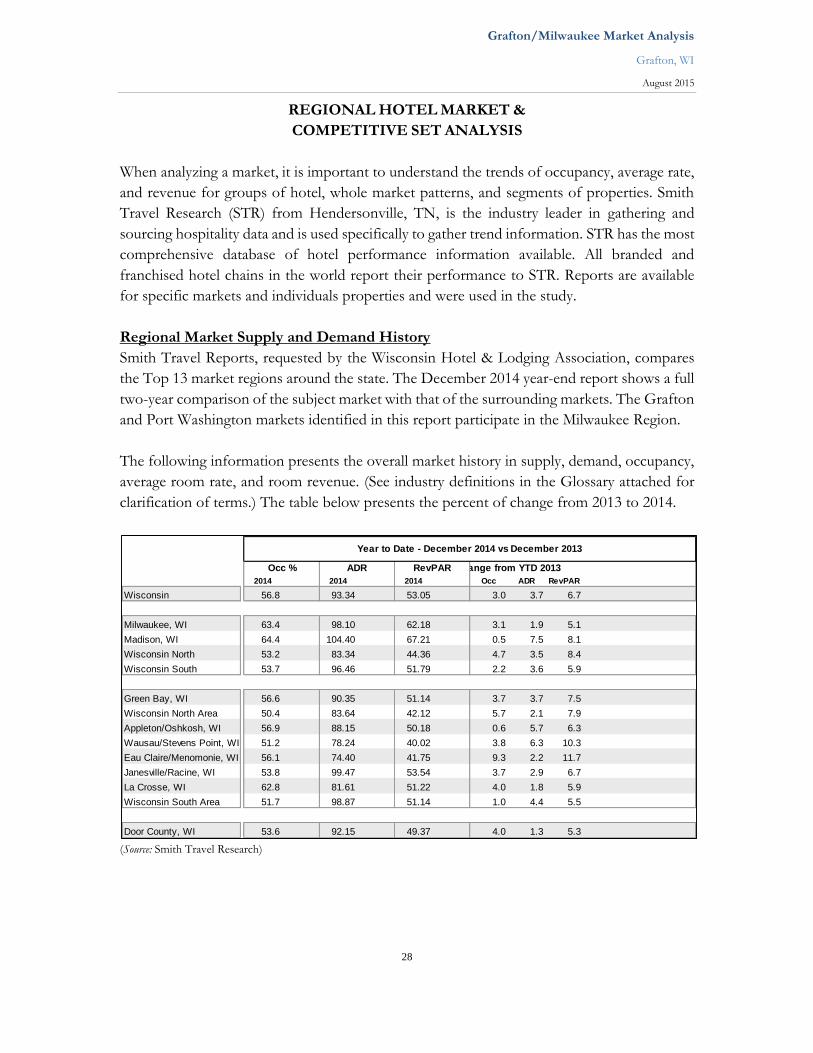
The following information presents the overall market history in supply, demand, occupancy,
average room rate, and room revenue. (See industry definitions in the Glossary attached for
clarification of terms.) The table below presents the percent of change from 2013 to 2014.
(Source: Smith Travel Research)
Percent Change from YTD 2013
2014 2014 2014 Occ ADR RevPAR
Wisconsin 56.8 93.34 53.05 3.0 3.7 6.7
Milwaukee, WI 63.4 98.10 62.18 3.1 1.9 5.1
Madison, WI 64.4 104.40 67.21 0.5 7.5 8.1
Wisconsin North 53.2 83.34 44.36 4.7 3.5 8.4
Wisconsin South 53.7 96.46 51.79 2.2 3.6 5.9
Green Bay, WI 56.6 90.35 51.14 3.7 3.7 7.5
Wisconsin North Area 50.4 83.64 42.12 5.7 2.1 7.9
Appleton/Oshkosh, WI 56.9 88.15 50.18 0.6 5.7 6.3
Wausau/Stevens Point, WI 51.2 78.24 40.02 3.8 6.3 10.3
Eau Claire/Menomonie, WI 56.1 74.40 41.75 9.3 2.2 11.7
Janesville/Racine, WI 53.8 99.47 53.54 3.7 2.9 6.7
La Crosse, WI 62.8 81.61 51.22 4.0 1.8 5.9
Wisconsin South Area 51.7 98.87 51.14 1.0 4.4 5.5
Door County, WI 53.6 92.15 49.37 4.0 1.3 5.3
RevPARADROcc %
Year to Date - December 2014 vs December 2013
Grafton/Milwaukee Market Analysis
Grafton, WI
August 2015
29
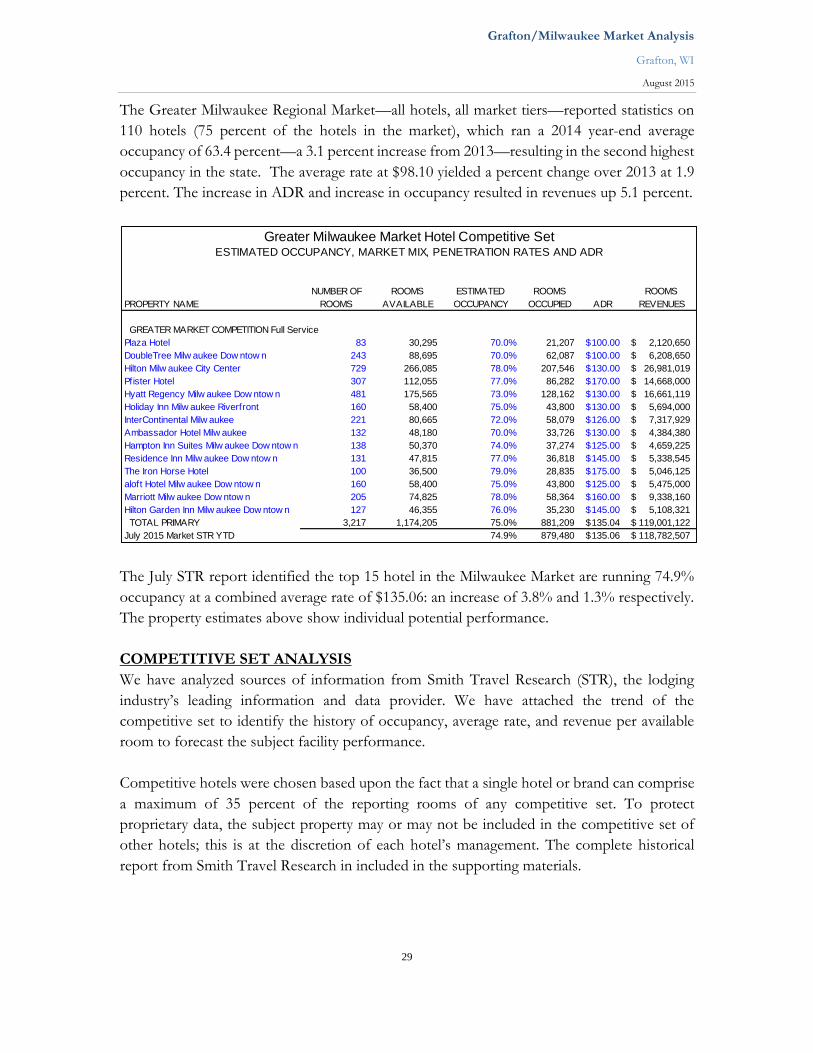
The Greater Milwaukee Regional Market—all hotels, all market tiers—reported statistics on
110 hotels (75 percent of the hotels in the market), which ran a 2014 year-end average
occupancy of 63.4 percent—a 3.1 percent increase from 2013—resulting in the second highest
occupancy in the state. The average rate at $98.10 yielded a percent change over 2013 at 1.9
percent. The increase in ADR and increase in occupancy resulted in revenues up 5.1 percent.
The July STR report identified the top 15 hotel in the Milwaukee Market are running 74.9%
occupancy at a combined average rate of $135.06: an increase of 3.8% and 1.3% respectively.
The property estimates above show individual potential performance.
COMPETITIVE SET ANALYSIS
We have analyzed sources of information from Smith Travel Research (STR), the lodging
industry’s leading information and data provider. We have attached the trend of the
competitive set to identify the history of occupancy, average rate, and revenue per available
room to forecast the subject facility performance.
Competitive hotels were chosen based upon the fact that a single hotel or brand can comprise
a maximum of 35 percent of the reporting rooms of any competitive set. To protect
proprietary data, the subject property may or may not be included in the competitive set of
other hotels; this is at the discretion of each hotel’s management. The complete historical
report from Smith Travel Research in included in the supporting materials.
Greater Milwaukee Market Hotel Competitive SetESTIMATED OCCUPANCY, MARKET MIX, PENETRATION RATES AND ADR
NUMBER OF ROOMS ESTIMATED ROOMS ROOMS
PROPERTY NAME ROOMS AVAILABLE OCCUPANCY OCCUPIED ADR REVENUES
GREATER MARKET COMPETITION Full Service
Plaza Hotel 83 30,295 70.0% 21,207 100.00$ 2,120,650$
DoubleTree Milw aukee Dow ntow n 243 88,695 70.0% 62,087 100.00$ 6,208,650$
Hilton Milw aukee City Center 729 266,085 78.0% 207,546 130.00$ 26,981,019$
Pfister Hotel 307 112,055 77.0% 86,282 170.00$ 14,668,000$
Hyatt Regency Milw aukee Dow ntow n 481 175,565 73.0% 128,162 130.00$ 16,661,119$
Holiday Inn Milw aukee Riverfront 160 58,400 75.0% 43,800 130.00$ 5,694,000$
InterContinental Milw aukee 221 80,665 72.0% 58,079 126.00$ 7,317,929$
Ambassador Hotel Milw aukee 132 48,180 70.0% 33,726 130.00$ 4,384,380$
Hampton Inn Suites Milw aukee Dow ntow n 138 50,370 74.0% 37,274 125.00$ 4,659,225$
Residence Inn Milw aukee Dow ntow n 131 47,815 77.0% 36,818 145.00$ 5,338,545$
The Iron Horse Hotel 100 36,500 79.0% 28,835 175.00$ 5,046,125$
aloft Hotel Milw aukee Dow ntow n 160 58,400 75.0% 43,800 125.00$ 5,475,000$
Marriott Milw aukee Dow ntow n 205 74,825 78.0% 58,364 160.00$ 9,338,160$
Hilton Garden Inn Milw aukee Dow ntow n 127 46,355 76.0% 35,230 145.00$ 5,108,321$
TOTAL PRIMARY 3,217 1,174,205 75.0% 881,209 135.04$ 119,001,122$
July 2015 Market STR YTD 74.9% 879,480 135.06$ 118,782,507$
Grafton/Milwaukee Market Analysis
Grafton, WI
August 2015
30
Grafton Competitive Sets: Defined for Subject Property
A competitive set consists of a group of hotel properties that directly compete for room nights
due to proximity and similarity of product. A competitive set enables individuals to compare
property performance with the aggregate performance of their direct competition.
We have identified properties that would be competitive with the proposed hotel project for
room accommodations, banquets/meetings, and food & beverage. This competitive set was
determined through consideration of factors such as location, size, consumer attraction,
amenities offered, rate structure, management, and demand generators. It includes properties
within a five-mile radius of the subject hotel. We have excluded hotels within the local market
that we view as uncompetitive due to their size, location, facility, or focus market.
In the Grafton area, there are six competitive hotels totaling 534 rooms. These hotels range
from full-service facilities to limited-service properties, some with full suites. The average-
sized hotel in the market is 89 rooms, the largest at 149 rooms, and the smallest at 54 rooms.
Grafton/Milwaukee Market Analysis
Grafton, WI
August 2015
31
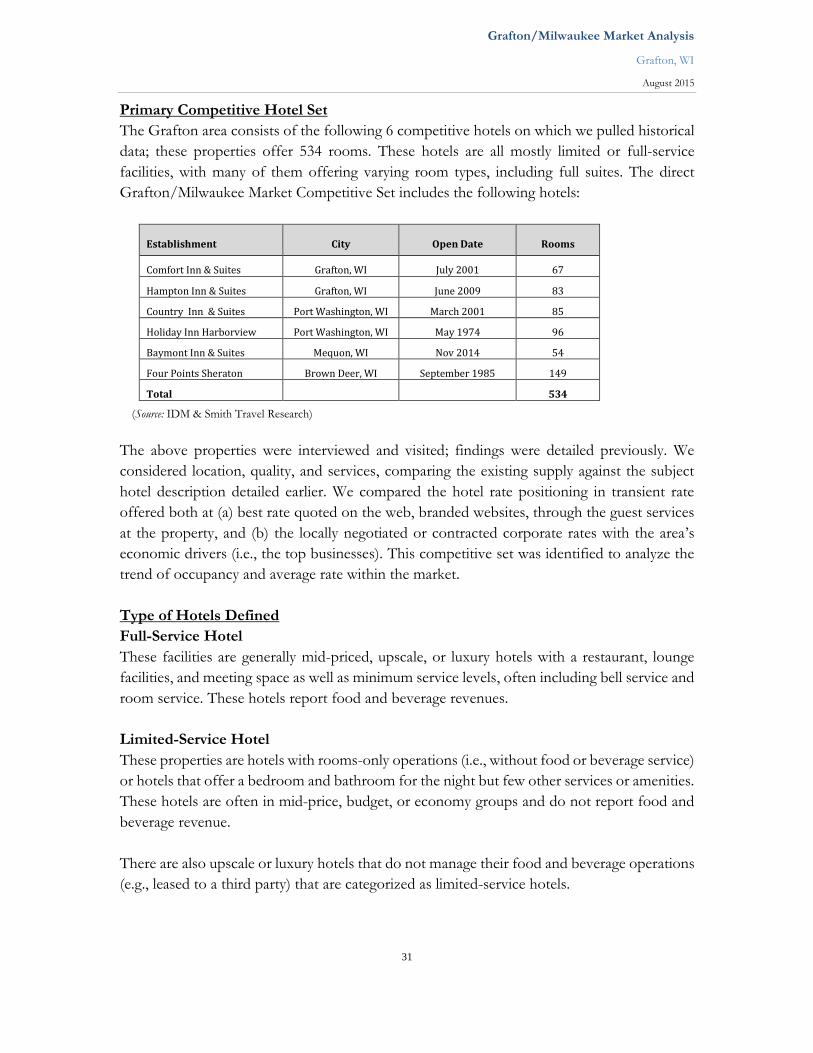
Primary Competitive Hotel Set
The Grafton area consists of the following 6 competitive hotels on which we pulled historical
data; these properties offer 534 rooms. These hotels are all mostly limited or full-service
facilities, with many of them offering varying room types, including full suites. The direct
Grafton/Milwaukee Market Competitive Set includes the following hotels:
Establishment City Open Date Rooms
Comfort Inn & Suites Grafton, WI July 2001 67
Hampton Inn & Suites Grafton, WI June 2009 83
Country Inn & Suites Port Washington, WI March 2001 85
Holiday Inn Harborview Port Washington, WI May 1974 96
Baymont Inn & Suites Mequon, WI Nov 2014 54
Four Points Sheraton Brown Deer, WI September 1985 149
Total 534
(Source: IDM & Smith Travel Research)
The above properties were interviewed and visited; findings were detailed previously. We
considered location, quality, and services, comparing the existing supply against the subject
hotel description detailed earlier. We compared the hotel rate positioning in transient rate
offered both at (a) best rate quoted on the web, branded websites, through the guest services
at the property, and (b) the locally negotiated or contracted corporate rates with the area’s
economic drivers (i.e., the top businesses). This competitive set was identified to analyze the
trend of occupancy and average rate within the market.
Type of Hotels Defined
Full-Service Hotel
These facilities are generally mid-priced, upscale, or luxury hotels with a restaurant, lounge
facilities, and meeting space as well as minimum service levels, often including bell service and
room service. These hotels report food and beverage revenues.
Limited-Service Hotel
These properties are hotels with rooms-only operations (i.e., without food or beverage service)
or hotels that offer a bedroom and bathroom for the night but few other services or amenities.
These hotels are often in mid-price, budget, or economy groups and do not report food and
beverage revenue.
There are also upscale or luxury hotels that do not manage their food and beverage operations
(e.g., leased to a third party) that are categorized as limited-service hotels.
Grafton/Milwaukee Market Analysis
Grafton, WI
August 2015
32
Subject Market Competitive Set
The primary set of competitive hotels were the properties that leveraged location and
amenities to complement the transient nature of their businesses and offer guests a place to
meet, celebrate, and spent more money.
The primary competitive set of hotels was evaluated and information gathered through various
online travel agents or OTAs. The star ratings and rates were taken from current peer
evaluation sites, such as Trip Advisor, and industry evaluation organizations. The competitive
hotels are comprised of the following properties. These hotels are:
Comfort Inn & Suites (formally Baymont Inn & Suites)
1415 Port Washington Road
Grafton, WI 53024
(262) 387-1180
www.Choicehotels.com
Nightly rates recently viewed: $99.00–$119.00
AAA Rating: 3 Diamonds
Trip Advisor: 2½ Stars
The hotel opened in July of 2001. It offers 67 rooms and suites with the typical amenities of a
limited-service hotel that includes a heated indoor swimming pool, business center, fitness
center, and free wireless Internet in all guest rooms. All stays include a complimentary
breakfast and free USA Today in the lobby. In-room, there is a coffee maker with coffee, iron
and ironing board, and 25-inch TV with HBO or Showtime, Lodgenet pay-per-view movies,
and Nintendo. Pets are also allowed.
The hotel is part of the Choice International guest loyalty program which offers travel rewards
program where you can earn points redeemable for multiple brand locations.
The hotel offers one 575-square-foot meeting room that accommodates 40 people. There are
no catering services available onsite, and AV is limited. Local companies use this room
frequently because there are few meeting rooms in the market and its location within the
market.
The rate positioning for the hotel offers midweek rates starting at $99.00 and locally negotiated
rates with businesses at $89. This is a 15 percent discount off the transient rate. The hotel also
has direct-billing privileges, which implies they have a large volume of business at the property.
Grafton/Milwaukee Market Analysis
Grafton, WI
August 2015
33
Hampton Inn & Suites
2633 Washington Street
Grafton, WI 53024
(262) 474-1000
www.hilton.com
Nightly rates recently viewed: $139.00–$159.00
AAA Rating: 3 Diamonds
Trip Advisor: 3 Stars
The Hampton Inn and Suites is the latest hotel to be built in the immediate market, opening
in June 2009 with 83 rooms and suites. The hotel is part of the Hilton family of hotels.
Hampton Inn is a leading chain of quality, value-priced hotels. It offers comfortable rooms
standard with coffee maker, iron and ironing board, and free in-room movie channels. Free
local calls and complimentary high-speed Internet access, complimentary On the House hot
breakfast, complimentary copies of USA Today (Monday through Friday), free coffee and tea
in the lobby 24 hours a day, and 24-hour front desk message and fax service. The property
also features microwaves and refrigerators available in all rooms, an indoor pool, hot tub, and
fitness center.
The property offers 944 square feet of flexible meeting and banquet space for up to 25−40
people with audio/visual equipment and a business center. The hotel offers in-house
audio/visual services and local vendor catering.
The Hampton is likely the strongest and closest competitor in the market in close proximity
to Grafton. The Hampton brand has a strong history of the transient market segment,
following in the industry through the Hilton brand affiliation and Honors Points Program;
that, coupled with the small meeting facility, allows the property to attract social functions.
The offerings at the Hampton should be similar to the offerings of the subject hotel, with the
subject hotel’s extension of evening dining options and a superior product.
The rate positioning for the hotel offers midweek rates starting a $139.00 and locally
negotiated rates or corporate rates for area businesses over $90.00. This is a 30 percent
discount off the transient rate.
Country Inn & Suites
350 East Seven Hills Road
Port Washington, WI 53074
(262) 284-2100
Grafton/Milwaukee Market Analysis
Grafton, WI
August 2015
34
www.countryinns.com
Nightly rates recently viewed: $94.00–$134.00
AAA Rating: 3 Diamonds
Trip Advisor: 2½ Stars
This hotel, opened in March of 2001, offers 85 rooms and suites and is a typical Country Inns
& Suites hotel. It offers value along with services and amenities within a smaller, informal
setting. With charming décor and comfortable amenities, the Port Washington hotel caters to
business and leisure travelers.
All of the guest rooms offer a country-style décor that seems a bit dated and not upscale by
any means. Guest rooms offer free high-speed Internet access and continental breakfast, cable
TV with HBO, coffee makers, hair dryers and irons with ironing boards. Some suites also
include whirlpools and fireplaces.
The hotel has a heated indoor swimming pool, whirlpool, and fitness center. Other amenities
include guest laundry facilities, complimentary USA Today newspaper, and complimentary
local telephone calls. The meeting space offers 8,500 square feet of flexible space.
The chain is part of Minneapolis-based Carlson Hotels Worldwide, which also includes
Regent Hotels & Resorts, Radisson Hotels & Resorts, Park Plaza Hotels & Resorts, and Park
Inn.
This hotel offers 8,500+ square feet of meeting space with theatre-style seating capacity for
400 people. The hotel offers onsite catering and bar service through Saz’s Catering. There is
a 450-square-foot meeting room and a board-style room. AV is available.
The rate positioning for the hotel offers midweek rates range from $94.00−$109.00 and locally
negotiated rates with business or corporate rate are $84.00−$94.00; this is a 15- to 20-percent
discount off the transient rate.
Grafton/Milwaukee Market Analysis
Grafton, WI
August 2015
35
Holiday Inn Harborview
135 East Grand Avenue
Port Washington, WI 53074
(262) 284-9461
www.ichotelsgroup.com
Nightly rates recently viewed: $109.00–$147.00
AAA Rating: 3 Diamonds
Trip Advisor: 3 Stars
This hotel is the oldest in the competitive set, opening in May of 1974. The hotel offers
96 rooms of which 32 are suites. This typical aging Holiday Inn offers value along with a
unique waterside location. On the shores of Lake Michigan, this hotel is popular with leisure
travelers in the summer and business travelers through the year. Some of the services and
amenities offered include an onsite restaurant serving breakfast and dinner, small meeting
space, small fitness facility, indoor pool, sauna, and whirlpool.
The rate positioning for the hotel offers midweek rates starting a $109.00 and locally
negotiated rates with businesses at $89; this is a 20 percent discount off the transient rate.
Baymont Inn & Suites Mequon
10330 N. Port Washington Road
Mequon, WI 53092
(262) 241-3677
www.quiethouse.com
Nightly rates recently viewed: $109.00–$139.00
AAA Rating: 3 Diamonds
Trip Advisor: 2½ Stars
This hotel formally the Best Western hotel opened in May of 1995 and offers 54 rooms, all
which include a spacious living room area. All rooms have a microwave and refrigerator, hair
dryer, iron and ironing board, coffee maker, free high-speed Internet, indoor swimming pool
and whirlpool, as well as other expected amenities.
The Baymont Inn is a two property regional ownership with properties in Mequon and
Dodgeville, Wisconsin. Meeting rooms are not available, and this hotel is uncompetitive for
group or small meetings.
Grafton/Milwaukee Market Analysis
Grafton, WI
August 2015
36
Sheraton Four Points Milwaukee North
8900 North Kildeer Court
Brown Deer, WI 53209
(414) 355-8585
www.sheraton.com
Nightly rates recently viewed: $129.00–$144.00
AAA Rating: 3 Diamonds
Trip Advisor: 3 Stars
This hotel opened in November of 2000 and offers 149 guest rooms plus 6 meeting and
function rooms. This is the most direct competition for a full-service facility in the market.
The hotel restaurant, 8900 Bar & Bistro, has full menu and bar options.
The Sheraton Four Points is part of the Starwood Hotel & Resorts Collection, and it focuses
on the value-minded traveler, offering no extra charges for the basics such as high-speed
Internet access and in-room bottled water. The indoor and outdoor pool, whirlpool, sauna,
local shuttle, and fitness room are all free for guests as well.
With more than 7,000 square feet of flexible meeting space, the hotel can accommodate
various groups of up to 385 people. All-day meeting packages and wedding packages are
available.
This Starwood Hotel has full-service meeting and catering accommodations, with attractive
and flexible meeting space to accommodate corporate meetings and banquet up to 250 people.
This property offers all the necessary services, professional staff, and menu choices to plan a
quality event.
The rate positioning for the hotel offers midweek rates starting a $119.00 and locally
negotiated rates with business under $89.00; this is a 25 percent discount off the transient rate.
Grafton/Milwaukee Market Analysis
Grafton, WI
August 2015
37
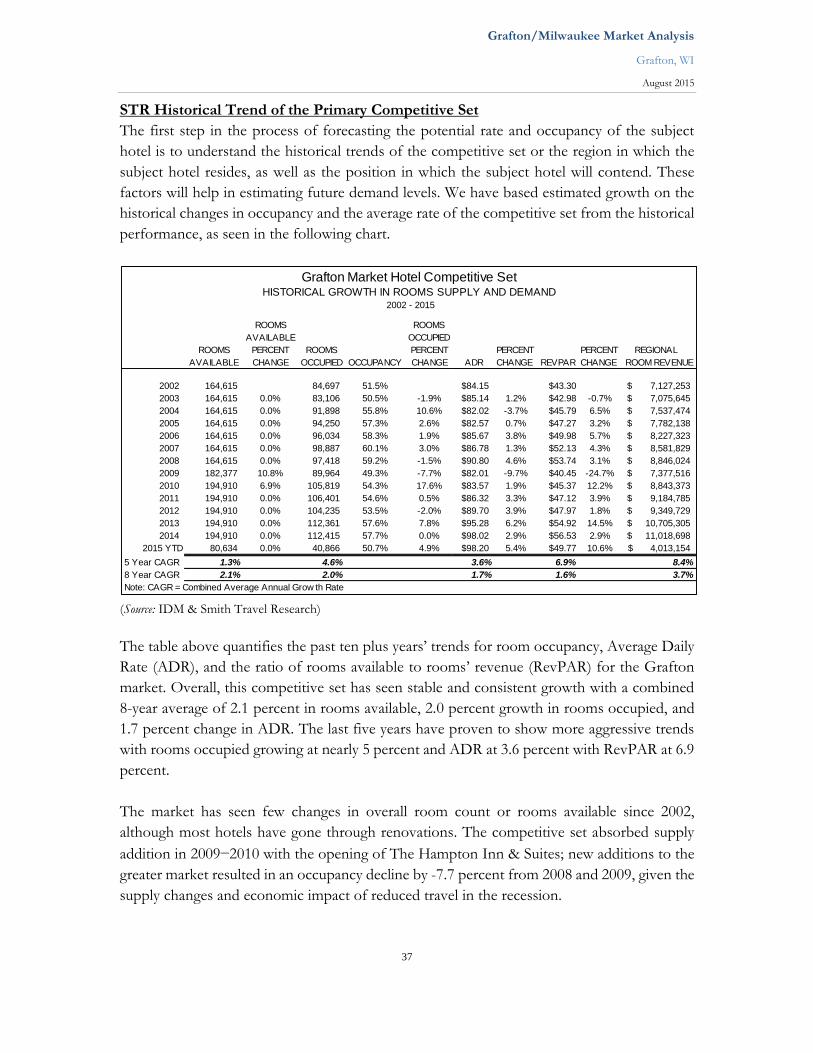
STR Historical Trend of the Primary Competitive Set
The first step in the process of forecasting the potential rate and occupancy of the subject
hotel is to understand the historical trends of the competitive set or the region in which the
subject hotel resides, as well as the position in which the subject hotel will contend. These
factors will help in estimating future demand levels. We have based estimated growth on the
historical changes in occupancy and the average rate of the competitive set from the historical
performance, as seen in the following chart.
(Source: IDM & Smith Travel Research)
The table above quantifies the past ten plus years’ trends for room occupancy, Average Daily
Rate (ADR), and the ratio of rooms available to rooms’ revenue (RevPAR) for the Grafton
market. Overall, this competitive set has seen stable and consistent growth with a combined
8-year average of 2.1 percent in rooms available, 2.0 percent growth in rooms occupied, and
1.7 percent change in ADR. The last five years have proven to show more aggressive trends
with rooms occupied growing at nearly 5 percent and ADR at 3.6 percent with RevPAR at 6.9
percent.
The market has seen few changes in overall room count or rooms available since 2002,
although most hotels have gone through renovations. The competitive set absorbed supply
addition in 2009−2010 with the opening of The Hampton Inn & Suites; new additions to the
greater market resulted in an occupancy decline by -7.7 percent from 2008 and 2009, given the
supply changes and economic impact of reduced travel in the recession.
ROOMS ROOMS
AVAILABLE OCCUPIED
ROOMS PERCENT ROOMS PERCENT PERCENT PERCENT REGIONAL
AVAILABLE CHANGE OCCUPIED OCCUPANCY CHANGE ADR CHANGE REVPAR CHANGE ROOM REVENUE
2002 164,615 84,697 51.5% $84.15 $43.30 7,127,253$
2003 164,615 0.0% 83,106 50.5% -1.9% $85.14 1.2% $42.98 -0.7% 7,075,645$
2004 164,615 0.0% 91,898 55.8% 10.6% $82.02 -3.7% $45.79 6.5% 7,537,474$
2005 164,615 0.0% 94,250 57.3% 2.6% $82.57 0.7% $47.27 3.2% 7,782,138$
2006 164,615 0.0% 96,034 58.3% 1.9% $85.67 3.8% $49.98 5.7% 8,227,323$
2007 164,615 0.0% 98,887 60.1% 3.0% $86.78 1.3% $52.13 4.3% 8,581,829$
2008 164,615 0.0% 97,418 59.2% -1.5% $90.80 4.6% $53.74 3.1% 8,846,024$
2009 182,377 10.8% 89,964 49.3% -7.7% $82.01 -9.7% $40.45 -24.7% 7,377,516$
2010 194,910 6.9% 105,819 54.3% 17.6% $83.57 1.9% $45.37 12.2% 8,843,373$
2011 194,910 0.0% 106,401 54.6% 0.5% $86.32 3.3% $47.12 3.9% 9,184,785$
2012 194,910 0.0% 104,235 53.5% -2.0% $89.70 3.9% $47.97 1.8% 9,349,729$
2013 194,910 0.0% 112,361 57.6% 7.8% $95.28 6.2% $54.92 14.5% 10,705,305$
2014 194,910 0.0% 112,415 57.7% 0.0% $98.02 2.9% $56.53 2.9% 11,018,698$
2015 YTD 80,634 0.0% 40,866 50.7% 4.9% $98.20 5.4% $49.77 10.6% 4,013,154$
5 Year CAGR 1.3% 4.6% 3.6% 6.9% 8.4%
8 Year CAGR 2.1% 2.0% 1.7% 1.6% 3.7%
Note: CAGR = Combined Average Annual Grow th Rate
Grafton Market Hotel Competitive SetHISTORICAL GROWTH IN ROOMS SUPPLY AND DEMAND
2002 - 2015
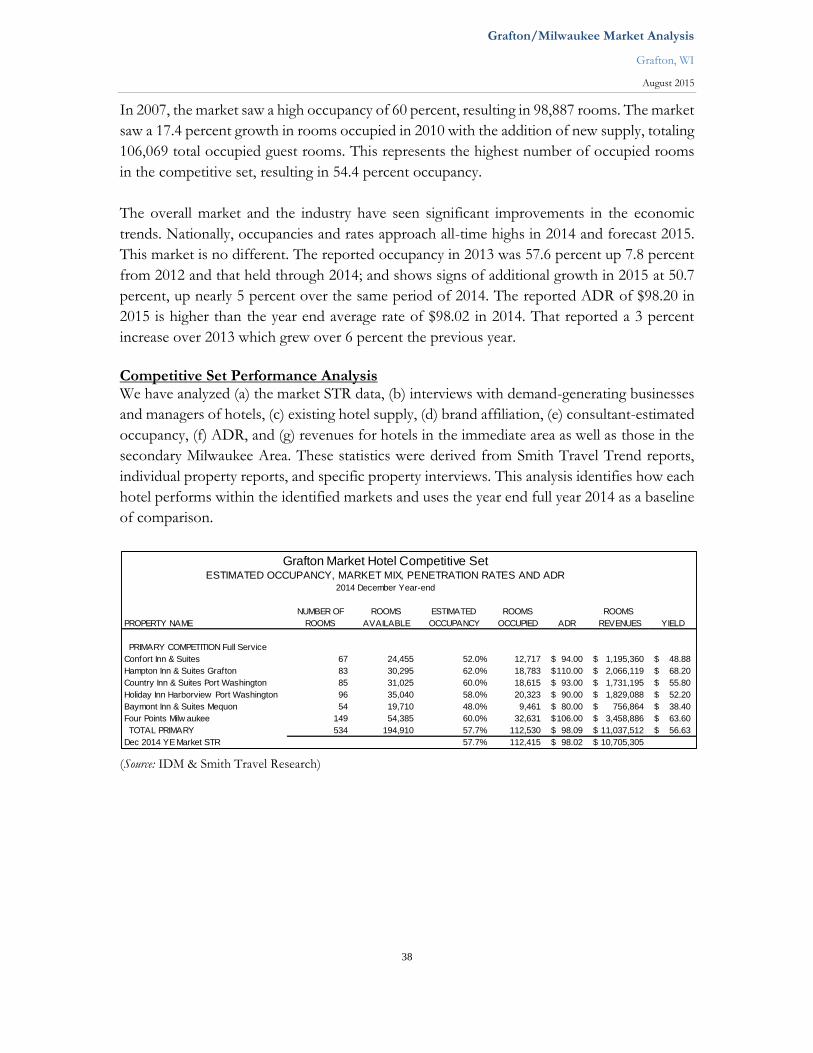
Grafton/Milwaukee Market Analysis
Grafton, WI
August 2015
38
In 2007, the market saw a high occupancy of 60 percent, resulting in 98,887 rooms. The market
saw a 17.4 percent growth in rooms occupied in 2010 with the addition of new supply, totaling
106,069 total occupied guest rooms. This represents the highest number of occupied rooms
in the competitive set, resulting in 54.4 percent occupancy.
The overall market and the industry have seen significant improvements in the economic
trends. Nationally, occupancies and rates approach all-time highs in 2014 and forecast 2015.
This market is no different. The reported occupancy in 2013 was 57.6 percent up 7.8 percent
from 2012 and that held through 2014; and shows signs of additional growth in 2015 at 50.7
percent, up nearly 5 percent over the same period of 2014. The reported ADR of $98.20 in
2015 is higher than the year end average rate of $98.02 in 2014. That reported a 3 percent
increase over 2013 which grew over 6 percent the previous year.
Competitive Set Performance Analysis We have analyzed (a) the market STR data, (b) interviews with demand-generating businesses
and managers of hotels, (c) existing hotel supply, (d) brand affiliation, (e) consultant-estimated
occupancy, (f) ADR, and (g) revenues for hotels in the immediate area as well as those in the
secondary Milwaukee Area. These statistics were derived from Smith Travel Trend reports,
individual property reports, and specific property interviews. This analysis identifies how each
hotel performs within the identified markets and uses the year end full year 2014 as a baseline
of comparison.
(Source: IDM & Smith Travel Research)
Grafton Market Hotel Competitive SetESTIMATED OCCUPANCY, MARKET MIX, PENETRATION RATES AND ADR
2014 December Year-end
NUMBER OF ROOMS ESTIMATED ROOMS ROOMS
PROPERTY NAME ROOMS AVAILABLE OCCUPANCY OCCUPIED ADR REVENUES YIELD
PRIMARY COMPETITION Full Service
Confort Inn & Suites 67 24,455 52.0% 12,717 94.00$ 1,195,360$ 48.88$
Hampton Inn & Suites Grafton 83 30,295 62.0% 18,783 110.00$ 2,066,119$ 68.20$
Country Inn & Suites Port Washington 85 31,025 60.0% 18,615 93.00$ 1,731,195$ 55.80$
Holiday Inn Harborview Port Washington 96 35,040 58.0% 20,323 90.00$ 1,829,088$ 52.20$
Baymont Inn & Suites Mequon 54 19,710 48.0% 9,461 80.00$ 756,864$ 38.40$
Four Points Milw aukee 149 54,385 60.0% 32,631 106.00$ 3,458,886$ 63.60$
TOTAL PRIMARY 534 194,910 57.7% 112,530 98.09$ 11,037,512$ 56.63$
Dec 2014 YE Market STR 57.7% 112,415 98.02$ 10,705,305$
Grafton/Milwaukee Market Analysis
Grafton, WI
August 2015
39
Positioning Against the Competitive Set
Given the few number of full-service hotels present in the market, it is essential that this
proposed hotel be positioned at the mid-scale to upper mid-scale tier of the competition at a
3+-Star level and perceived as an efficient, select-service hotel, discussed in detail later. This
allows a new subject hotel to be competitive within both the limited- and full-service
properties and capture market share from both distinct types of properties. An upscale yet
approachable full-service hotel property will compete against the market and draw business
for the dated product in the area. The more established full-service branded hotels are
currently perceived to be exceeding the subject market comp set in occupancy and ADR.
The more established full-service branded hotels are currently exceeding the subject market
comp set not in occupancy but ADR. The proposed hotel must deliver a high-end feel,
products, and offer unparalleled service to compete directly in the market for occupancy and
may rely on meeting space to increase that market share.
Meeting space seems important for social business and corporate group business. Meeting
space would allow the hotel to be competitive against both groups of meeting or group hotels
and not be perceived just as a high-priced transient hotel. The immediate market lacks meeting
and event space and this may give it a competitive edge.
Subject Hotel Competitiveness Factor
We have factored the competitive lodgings’ overall market performance for occupancy,
growth of supply and demand, market penetration, average rate, and revenue to rank the
competitive set. The subject hotel should participate in the primary market as follows:
Least Competitive Competitive Most Competitive
Holiday Inn Harborview Comfort Inn & Suites Hampton Inn & Suites
Baymont Inn & Suites Country Inn and Suites Sheraton Four Points
The subject site will have a favorable competitive edge to the identified market segment
leaders. Due to the location, accessibility to demand areas, and its new product design in the
market, the subject hotel should slowly capture room nights and grow in occupancy. This
hotel, if located in a highly visible section of the market and offer unique amenities, should
yield positive long-term benefits in performance. The support services and accessibility to the
subject hotel and area attractions are equally as important to the viability of the subject hotel.
Seasonal Market Trends
It is typical of the hospitality industry overall, and especially in the Midwest, to experience
occupancy trends tied to demand generators such as weather, seasons, and travel
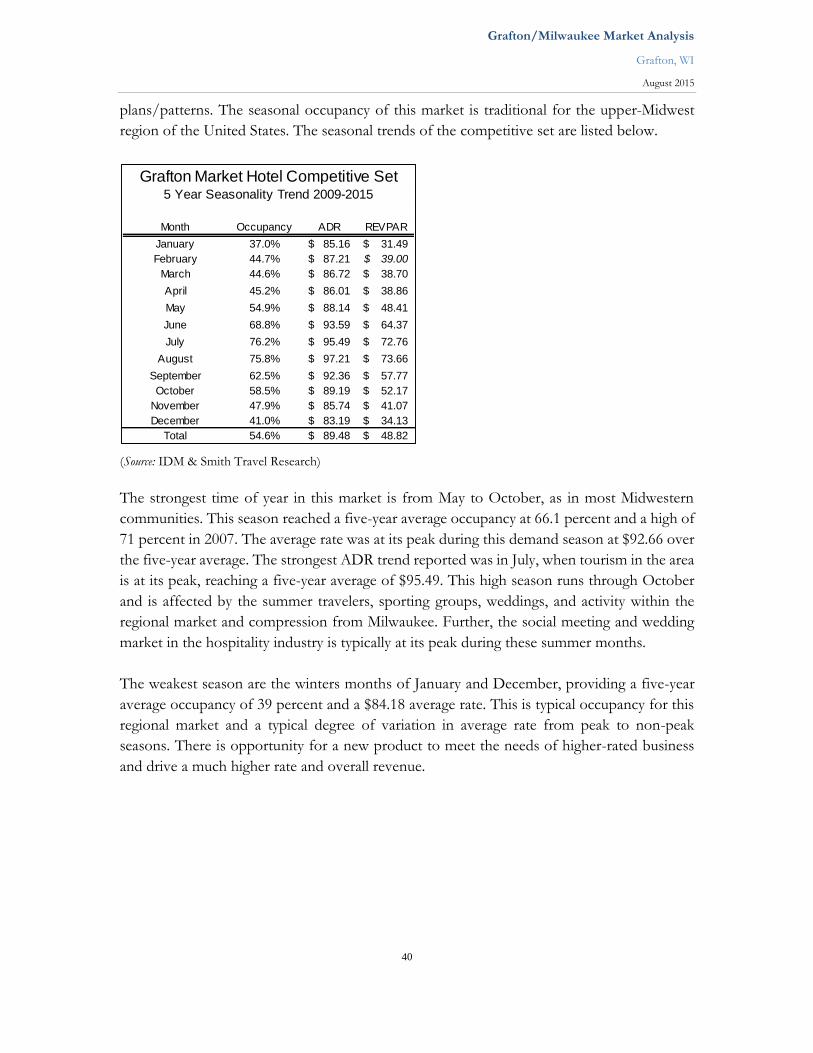
Grafton/Milwaukee Market Analysis
Grafton, WI
August 2015
40
plans/patterns. The seasonal occupancy of this market is traditional for the upper-Midwest
region of the United States. The seasonal trends of the competitive set are listed below.
(Source: IDM & Smith Travel Research)
The strongest time of year in this market is from May to October, as in most Midwestern
communities. This season reached a five-year average occupancy at 66.1 percent and a high of
71 percent in 2007. The average rate was at its peak during this demand season at $92.66 over
the five-year average. The strongest ADR trend reported was in July, when tourism in the area
is at its peak, reaching a five-year average of $95.49. This high season runs through October
and is affected by the summer travelers, sporting groups, weddings, and activity within the
regional market and compression from Milwaukee. Further, the social meeting and wedding
market in the hospitality industry is typically at its peak during these summer months.
The weakest season are the winters months of January and December, providing a five-year
average occupancy of 39 percent and a $84.18 average rate. This is typical occupancy for this
regional market and a typical degree of variation in average rate from peak to non-peak
seasons. There is opportunity for a new product to meet the needs of higher-rated business
and drive a much higher rate and overall revenue.
Occupancy ADR REVPAR
37.0% 85.16$ 31.49$
44.7% 87.21$ 39.00$
44.6% 86.72$ 38.70$
45.2% 86.01$ 38.86$
54.9% 88.14$ 48.41$
68.8% 93.59$ 64.37$
76.2% 95.49$ 72.76$
75.8% 97.21$ 73.66$
62.5% 92.36$ 57.77$
58.5% 89.19$ 52.17$
47.9% 85.74$ 41.07$
41.0% 83.19$ 34.13$
54.6% 89.48$ 48.82$ Total
December
April
May
June
July
August
September
March
October
November
Grafton Market Hotel Competitive Set5 Year Seasonality Trend 2009-2015
Month
January
February
Grafton/Milwaukee Market Analysis
Grafton, WI
August 2015
41
LODGING DEMAND & SEGMENT
PENETRATION INVESTIGATION
Hospitality market segmentation is an approach that encompasses identification of different
groups of customers who have different needs, price points, and stay patterns. The market
segmentation process also considers which segments to target and when, through different
sales efforts. There will be distinct differences among travel patterns for each segment as well
as buying patterns of goods and services to meet each group’s requirements. For the hotel
market properties deemed competitive with the subject hotel and larger area market, the STR
reports compare regional statistics and do not identify market segments, which are gathered
through the interview process.
The following is a brief description of the Lodging Demand source profiles identified for this
market.
Transient or Individual Markets
Retail Premium-rated business (non-discounted) booked at peak opportunity BAR (Best
Available Rates and weekend rates)—the going rate changes based upon demand
Corporate Negotiated Contract business discounted based on volume
Qualified Discount Business in non-demand periods, AAA, AARP, military
Opaque Internet Consumers purchasing at discount price point regardless of hotel
Hotwire, Priceline, Expedia/Travelocity/Orbitz (Internet) package
Packages Packages, bed & breakfasts, getaways
Extended Stay Discounts due to multiple consecutive nights (7+ and 14+)
Group Markets
Corporate Companies holding training meetings/vendor or supplier meetings
Social Leisure Weddings, fraternal organizations, and retreats/reunions (SMERF)
Association State and regional meetings
Tour & Travel Bus tours and traveling organizations
The transient or individual, corporate, and commercial markets are made up of several major
sources of business: (a) government, insurance, and health care, (b) general transient
corporate/commercial, (c) leisure business, and (d) social, leisure, and discount AAA & AARP
business. The market has a significant source of transient business, with the overall market
performance estimated at 70 percent. The corporate and leisure market will likely be the
primary sources of business for the market.
Group demand in this market is currently minimal and rate driven. As indicated above, the
individual travel segments will total 70 percent, reducing group demand to 30 percent. It is
expected that this market will remain highly transient/demand focused. This market is not a
Grafton/Milwaukee Market Analysis
Grafton, WI
August 2015
42
large group market with existing hotels that offer 15,000 to 20,000 square feet of meeting
space and multiple breakout rooms. Those needs are met in the greater Milwaukee market.
While social/leisure business is important to this area, there is a wide supply of hotels in the
region offering a variety of hotel accommodations. The social/leisure consumer is price driven
and sometimes brand driven; however, the movement in this segment is “unique experience”
driven. The region offers a sought-out destination or distinctive pricing reason to stay. The
rate in the high season capitalizes on the leisure weekender market. Weddings, which drive
social weekend business, are not currently a prominent source of rooms and tend to focus on
properties where they can have the wedding function and rooms. The market is somewhat
underserved due to the lack of meeting space, especially given the proximity to the Milwaukee
market.
If amenities are structured properly and marketing strategies are aligned to capture the high-
rated social business, the proposed hotel should capture more group business, capitalizing on
the weekend, summer, and special events within the county.
The Competitive Market Performance for this market is as follows:
Individual Travelers 70% of Hotel Business
Retail Transient Travelers 30%
Corporate Accounts 20%
Social/Leisure 20%
Group-Related Business** 30% of Hotel Business
Association Business 5%
Corporate Functions/Meetings 10%
Social Events 15%
** Group-related business may be greater; however, it depends on the total hotel size, room count, and
amount/number of usable meeting space and break-out rooms.
Projections for a hotel operation are based upon historic statistics and current operating
performance in the market area. Occupancy, ADR, and Revenue projections for the hotel
were based upon a detailed review of the field research data and preliminary estimates of ADR,
Lodging Demand, and Lodging Supply Growth. In addition, recommendations as to the
property type, suggested property size and density, and services and amenities to offer are
included but are at the discretion of the developer.
This study suggests that the Growth in Lodging Demand should remain positive yet show
continued growth for the subject market and property by year’s end. The variety of Lodging
Demand is diverse and competitive in the region. With the market is showing positive trending
Grafton/Milwaukee Market Analysis
Grafton, WI
August 2015
43
through year-end 2014 and 2015, we estimated that the year will end with a 4.5 percent growth
over 2014. The total U.S. market is expected to see a 5 percent increase in overall demand by
year-end 2015.*
At this time, the Growth of Lodging Supply set should be a concern in the next 2 years. Although
the recent number of hotels entering the greater Milwaukee market near the interstate
corridors and downtown due to the aggressive interest in financing and development, there is
current discussion about three new hotels in the Milwaukee City Center. The increase in supply
growth will have a favorable effect on transient, leisure, and group business for the market.
The total U.S. market is expected to see a 4 percent increase in overall supply by year’s end
2015.*
Room Rate Competition will be critical for the proposed hotel among primary competitive hotels.
Proper rate positioning will be required, and competing with branded hotels in the interstate
corridor will be crucial, while maintaining a competitive local presence. The subject hotel
should generate a higher average ADR yield compared to the other immediate market hotels.
The facility should operate at 100 percent to 120 percent yield to the market. This hotel will
still need to be rate-sensitive to the market upon opening for both transient guests and
contracted rates alike, driving rates as the product matures and the hotel’s recognition
escalates.
This hotel will still need to be rate-sensitive to the market upon repositioning for both transient
guests and contracted rates alike, driving rates as the product matures and the historic hotel’s
recognition escalates. The total U.S. market is expected to see a 3.0 percent increase in 2015.*
* Reported STR Hotel Data Conference, August 2015
Growth in Lodging Demand
The growth in lodging demand showed positive trends in 2013 and 2014; 2015 is expected to
show stronger demand than historically reported and is currently out pacing the previous year
nationally and in this market.
The overall market in Milwaukee and the Grafton competitive set has recovered from the
downturn in 2008−2009 and growing in demand due the various industries generating travel;
demand generators, as mentioned earlier, are driving business, which should show strong
improvements in occupancy and ADR growth in the competitive set.
Looking at historical trends, occupancy is forecasted with the competitive set occupancy and
ADR, taking into consideration the market supply/demand factors and current economic
trend. Growth rates will be discussed in detail by market segment as well as total overview.
The competitive market, with a potential new project entering the set, is forecasted as shown
below.
Grafton/Milwaukee Market Analysis
Grafton, WI
August 2015
44
(Source: IDM & Smith Travel Research)
These projections show, rooms available and rooms occupied in the market remain stable and
show growth from 2014 to 2020. We have demonstrated a potential new project entering the
market in 2017 (estimated at 75 rooms), affecting the competitive set and resulting in increased
supply. The potential subject hotel opening 2017 (for study purposes, showing a full-year
impact) shows a 14 percent in supply change.
Given this increase in supply, the growth in occupied rooms is forecasted to increase from
121,588 to 126,036 but affect set occupancy with a -9.1 percent change in total occupancy. We
are taking into consideration the impact of supply as the potential subject hotel opens and
spreads demand among the set, which will slowly rebuild occupancy. Since there are several
hotels located in the region, all will directly compete for local corporate and leisure business;
therefore, the subject hotel should take a conservative approach to occupancy growth and
average rate.
The future demand of the competitive set can be analyzed by looking at the trends in demand
by market segments. We have estimated and evaluated market penetration potential for each
segment by comparing the advantages and disadvantages of the subject facility to those of the
competitive set. Factors affecting penetrations include location, accessibility, property size
(total rooms and meeting capacity), finish and quality levels, service, room rates, food &
beverage outlets, guest amenities, new build versus renovation, and brand.
Estimated penetrations should be considered in relation to the hotel’s fair market share. If
demand were distributed evenly in accordance with the ratio of hotels rooms to the total
supply of the market, the proposed hotel would capture 100 percent of each segment.
Rooms
Available
Rooms
Occupied
Occupancy Rooms
Occupied %
Change
Average
Daily Rate
Percent
Change
REVPAR Percent
Change
Market Total
Room Revenue
2012 194,910 0.0% 104,235 53.5% -2.0% 89.70$ 3.92% 47.97$ 1.80% 9,349,880$
2013 194,910 0.0% 112,361 57.6% 7.8% 95.28$ 6.22% 54.92$ 14.49% 10,705,756$
2014 194,910 0.0% 112,415 57.7% 0.0% 98.02$ 2.88% 56.53$ 2.93% 11,018,918$
2015 194,910 0.0% 116,912 60.0% 4.0% 100.94$ 2.98% 60.55$ 7.10% 11,801,057$
2016 194,910 0.0% 121,588 62.4% 4.0% 103.97$ 3.00% 64.86$ 7.12% 12,641,292$
2017 222,285 14.0% 126,036 56.7% -9.1% 107.09$ 3.00% 60.72$ -6.38% 13,497,144$
2018 222,285 0.0% 130,679 58.8% 3.7% 110.31$ 3.00% 64.85$ 6.80% 14,414,592$
2019 222,285 0.0% 135,527 61.0% 3.7% 113.62$ 3.00% 69.27$ 6.82% 15,398,216$
2020 222,285 0.0% 140,589 63.2% 3.7% 115.89$ 2.00% 73.30$ 5.81% 16,293,216$
2021 222,285 0.0% 145,875 65.6% 3.8% 118.21$ 2.00% 77.58$ 5.84% 17,244,348$
2022 222,285 0.0% 151,394 68.1% 3.8% 120.58$ 2.00% 82.13$ 5.86% 18,255,285$
CAGR 2.7% 3.8% 1.1% 3.0% 4.1% 6.9%
CAGR is Combined Average Grow th Rate 5 year starting 2014
Grafton Market Hotel Competitive SetESTIMATED FUTURE GROWTH IN SUPPLY AND DEMAND
Grafton/Milwaukee Market Analysis
Grafton, WI
August 2015
45
It was reported that the competitive properties in 2014 experienced demand of 112,415 room
nights for a combined level of occupancy of 57.7 percent, derived from STR Trend Report.
The market segmentation demand is summarized as follows and is based on the study,
experience, and market reviews:
Market Segment Estimated Room Nights
Transient & Commercial 44,966 40%
Social & Leisure 33,725 30%
Group 33,725 30%
Total 112,415 100%
Commercial
The continued growth in the commercial or contract-rate markets is now in recovery as
indicated by recent trends in economic indicators and corporate travel in the competitive set.
While the current economy is recovering from the lack of corporate travel, the diversity of
industry and global headquarters in the market make the area viable and somewhat “safe” for
added hotel supply. With the additional market growth and current expansion in the business
community, we estimate increases in demand accommodated in Years 2–5
(2014–2017) at an average of 4.0 percent. This would be an accelerated increase in occupancy
over the combined market average or total average occupancy increase historically.
Transient & Leisure The transient/leisure market contends to be one of the strongest sources of business within
the market. With Wisconsin and Illinois expanding its seasonal tourism and business culture,
a following of professional enthusiasts and leisure-focused travelers have increased travel
throughout the area. We estimate increases in demand accommodated in Years 2–5 at an
average of 4.0 percent in the area.
Group
The group market is the least susceptible segment within the market; this is due to the high
level of supply and price sensitivity plush competition luring business from the downtown
markets. Many convention and meeting groups are on a rotation schedule through the area
and throughout the state. We estimate minimal increases in demand accommodated in
Years 2–5 at an average of 3 percent. This segment of business is completely at the discretion
of the facility management and needs to be revenue-managed not to displace higher-rated
transient and leisure business.

Grafton/Milwaukee Market Analysis
Grafton, WI
August 2015
46
Projections The market forecast is represented as follows, based on the 2014 market statistics and assumptions.
(Source: IDM)
Year 1 Year 2 Year 3 Year 4 Year 5
2014 2015 2016 2017 2018 2019 2020 2021
ROOMS SUPPLY 194,910
ADDITIONS TO SUPPLY
Hotel 75 Rooms 27,375
First full year of operation 2017
TOTAL ADDITIONS 0 0 0 27,375 0 0 0 0
TOTAL ANNUAL ROOM NIGHTS 194,910 194,910 194,910 222,285 222,285 222,285 222,285 222,285
GROWTH OVER PRIOR YEAR 0.0% 0.0% 0.0% 14.0% 0.0% 0.0% 0.0% 0.0%
EXISTING DEMAND SATISFIED
Existing Transient & Commercial 44,966 40%
Existing Leisure 33,725 30%
Existing Group 33,725 30%
TOTAL EXISTING DEMAND 112,415
DEMAND INDUCED
Transient & Commercial 0 0 0 500 538 578 621 668
Leisure 0 0 0 0 0 0 0 0
Group 0 0 0 300 325 350 375 400
TOTAL INDUCED/UNSATISFIED/UNRECOGNIZED DEMAND 0 0 0 800 863 928 996 1068
GROWTH RATES
Transient & Commercial 0.0% 4.0% 4.0% 3.0% 3.0% 3.0% 3.0% 3.0%
Leisure 0.0% 4.0% 4.0% 3.0% 3.0% 3.0% 3.0% 3.0%
Group 0.0% 4.0% 4.0% 3.0% 3.0% 3.0% 3.0% 3.0%
TOTAL DEMAND
Existing Transient & Commercial 44,966 46,765 48,635 50,094 52,112 54,229 56,451 58,784
Commercial Not Recognized, Induced & Displaced 0 0 0 500 537.5 577.8125 621.148438 667.73457
TOTAL 44,966 46,765 48,635 50,594 52,650 54,807 57,072 59,452
GROWTH OVER PRIOR YEAR 4.0% 4.0% 4.0% 4.1% 4.1% 4.1% 4.2%
Existing Leisure 33,725 35,073 36,476 37,571 38,698 39,859 41,055 42,286
T&L Not Recognized, Induced & Displaced 0 0 0 0 0 0 0 0
TOTAL 33,725 35,073 36,476 37,571 38,698 39,859 41,055 42,286
GROWTH OVER PRIOR YEAR 4.0% 4.0% 3.0% 3.0% 3.0% 3.0% 3.0%
Group 33,725 35,073 36,476 37,571 39,007 40,512 42,088 43,737
Group Not Recognized, Induced & Displaced 0 0 0 300 325 350 375 400
TOTAL 33,725 35,073 36,476 37,871 39,332 40,862 42,463 44,137
GROWTH OVER PRIOR YEAR 4.0% 4.0% 3.8% 3.9% 3.9% 3.9% 3.9%
TOTAL DEMAND 112,415 116,912 121,588 126,036 130,679 135,527 140,589 145,875
GROWTH OVER PRIOR YEAR 0.0% 4.0% 4.0% 3.7% 3.7% 3.7% 3.7% 3.8%
OVERALL MARKET OCCUPANCY 57.7% 60.0% 62.4% 56.7% 58.8% 61.0% 63.2% 65.6%
MARKET ADR $95.28 100.94$ 103.97$ 107.09$ 110.31$ 113.62$ 115.89$ 118.21$
GROWTH OVER PRIOR YEAR 2.9% 5.9% 3.0% 3.0% 3.0% 3.0% 2.0% 2.0%
Grafton Market Hotel Competitive SetESTIMATED FUTURE GROWTH IN SUPPLY AND DEMAND
Grafton/Milwaukee Market Analysis
Grafton, WI
August 2015
47
Unaccommodated Lodging Demand Unaccommodated demand—that is, accommodations that cannot be fulfilled or displaced
within a sampling of hotels—is described two ways: The first is lodging demand that prefers to stay
in the market or competitive set but currently uses hotels in other locations. At present, this occurs during
peak-demand periods such as times of sporting events, summer travel weekends, major
community/city events, and conventions. In these peak periods, occupancy overflows or spills
out to area hotels in nearby markets, such as the Brookfield and Waukesha. While these
consumers would rather stay in the competitive set area (City Center), supply is completely
consumed. This is known as displaced demand.
The second definition of unaccommodated lodging demand is guests who are currently staying in
the competitive set but prefer hotel accommodations—for instance, at a higher level—within the set. As an
example, a traveler who normally stays at full-service hotels has booked his or her reservation
at an area’s new select-service property because other supply is not appropriate or too old,
thus not meeting needs. This type of demand, induced, creates a new market or choice of hotel
in a given market and is difficult to estimate. However, with the choices in the immediate
downtown market and lack of unique boutique properties, new facilities with desirable
amenities, the number of consumers in the niche of unaccommodated demand is high.
For the purpose of the market study, we identified and estimated about 800 to 1,500 rooms
annually that the subject hotel should capture starting in 2017. This is an estimate of all market
segments displaced and induced due to the lack guest rooms in peak times and new meeting
facilities creating a new hotel attraction. The breakdown is as follows:
Displaced Demand
Transient/commercial/social demand was estimated that the market properties exceed
average occupancies on Tuesday, Wednesday, and Saturday nights 10 to 12 times a year.
Typically, guests who would prefer to book at first-choice properties are displaced and must
choose alternatives. We estimated the subject hotel could capture at a minimum 5−10 rooms
each night, resulting in nearly 500 rooms for the subject hotel in 2017.
Induced Demand We estimated transient demand based on 35 rooms on Tuesday and Wednesday nights for 35
weeks a year. This induced demand business is derived from a new boutique hotel positioned
in the upscale market, creating a new venue of choice for high-end travelers. Some of this
induced demand could also be leisure or weekend based. The estimate results in 1950 rooms
for the subject hotel in 2017 with a 4 percent annual growth rate.
With the potential subject hotel positioned to fill the market need as a group hotel and offering
upscale meeting facilities, the property is sure to attract local attention. The property is

Grafton/Milwaukee Market Analysis
Grafton, WI
August 2015
48
estimated to have two sources of group business: first, the social market, focusing on
weddings, should attract a minimum of 20 peak wedding dates with nearly 20 rooms per event.
Group induced demand was estimated at 20 upscale weddings or other social events, creating
a minimum of 20 room nights each event, growing by one per year. This demand was
estimated at 300 to 500 rooms annually.
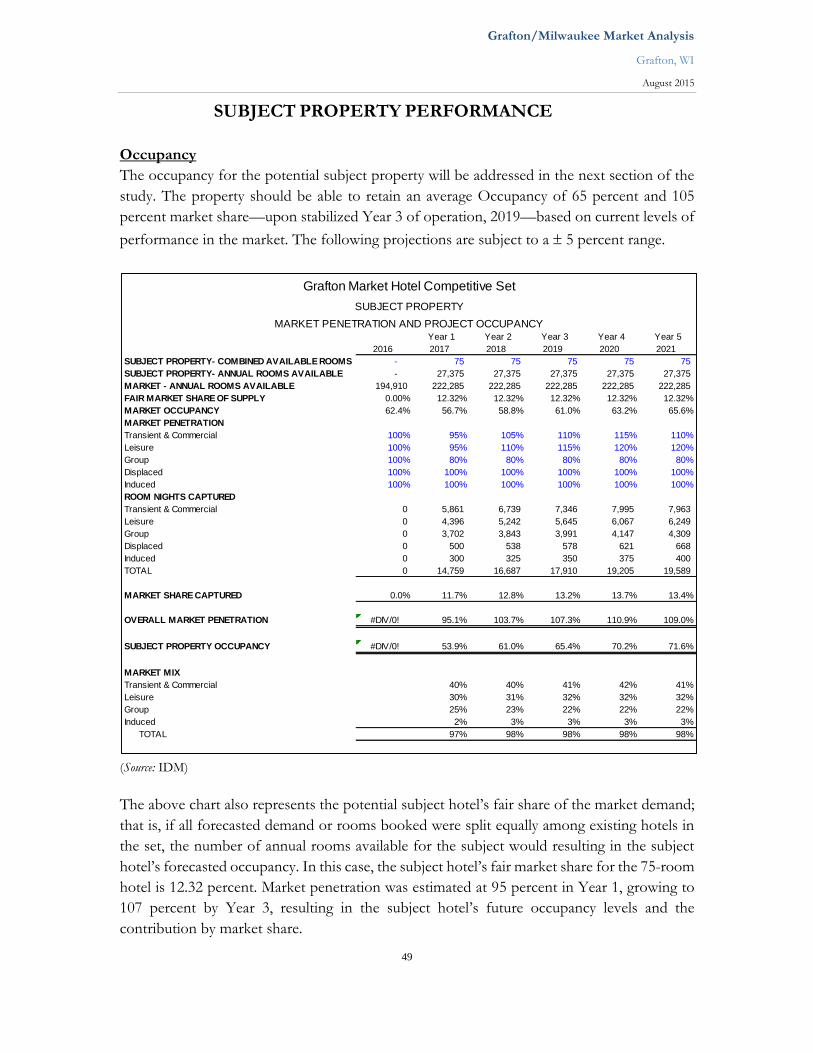
Grafton/Milwaukee Market Analysis
Grafton, WI
August 2015
49
SUBJECT PROPERTY PERFORMANCE
Occupancy
The occupancy for the potential subject property will be addressed in the next section of the
study. The property should be able to retain an average Occupancy of 65 percent and 105
percent market share—upon stabilized Year 3 of operation, 2019—based on current levels of
performance in the market. The following projections are subject to a 5 percent range.
(Source: IDM)
The above chart also represents the potential subject hotel’s fair share of the market demand;
that is, if all forecasted demand or rooms booked were split equally among existing hotels in
the set, the number of annual rooms available for the subject would resulting in the subject
hotel’s forecasted occupancy. In this case, the subject hotel’s fair market share for the 75-room
hotel is 12.32 percent. Market penetration was estimated at 95 percent in Year 1, growing to
107 percent by Year 3, resulting in the subject hotel’s future occupancy levels and the
contribution by market share.
Year 1 Year 2 Year 3 Year 4 Year 5
2016 2017 2018 2019 2020 2021
SUBJECT PROPERTY- COMBINED AVAILABLE ROOMS - 75 75 75 75 75
SUBJECT PROPERTY- ANNUAL ROOMS AVAILABLE - 27,375 27,375 27,375 27,375 27,375
MARKET - ANNUAL ROOMS AVAILABLE 194,910 222,285 222,285 222,285 222,285 222,285
FAIR MARKET SHARE OF SUPPLY 0.00% 12.32% 12.32% 12.32% 12.32% 12.32%
MARKET OCCUPANCY 62.4% 56.7% 58.8% 61.0% 63.2% 65.6%
MARKET PENETRATION
Transient & Commercial 100% 95% 105% 110% 115% 110%
Leisure 100% 95% 110% 115% 120% 120%
Group 100% 80% 80% 80% 80% 80%
Displaced 100% 100% 100% 100% 100% 100%
Induced 100% 100% 100% 100% 100% 100%
ROOM NIGHTS CAPTURED
Transient & Commercial 0 5,861 6,739 7,346 7,995 7,963
Leisure 0 4,396 5,242 5,645 6,067 6,249
Group 0 3,702 3,843 3,991 4,147 4,309
Displaced 0 500 538 578 621 668
Induced 0 300 325 350 375 400
TOTAL 0 14,759 16,687 17,910 19,205 19,589
MARKET SHARE CAPTURED 0.0% 11.7% 12.8% 13.2% 13.7% 13.4%
OVERALL MARKET PENETRATION #DIV/0! 95.1% 103.7% 107.3% 110.9% 109.0%
SUBJECT PROPERTY OCCUPANCY #DIV/0! 53.9% 61.0% 65.4% 70.2% 71.6%
MARKET MIX
Transient & Commercial 40% 40% 41% 42% 41%
Leisure 30% 31% 32% 32% 32%
Group 25% 23% 22% 22% 22%
Induced 2% 3% 3% 3% 3%
TOTAL 97% 98% 98% 98% 98%
Grafton Market Hotel Competitive Set
SUBJECT PROPERTY
MARKET PENETRATION AND PROJECT OCCUPANCY
Grafton/Milwaukee Market Analysis
Grafton, WI
August 2015
50
The chart on the following page forecasts the ADR by market segment, starting at the 2014
overall market rate of $98.20. The average rate is estimated and forecasted by market segment
for both the competitive set and subject hotel.
As projected, the subject hotel could outperform the competitive rate with that of the market,
based on a new facility, in a competitive location, focused management performance and
amenities that exceed customer satisfaction.
The subject hotel is estimated to stabilize in 2019 (Year 3) with an ADR of $128 and the
occupancy of 65 percent.
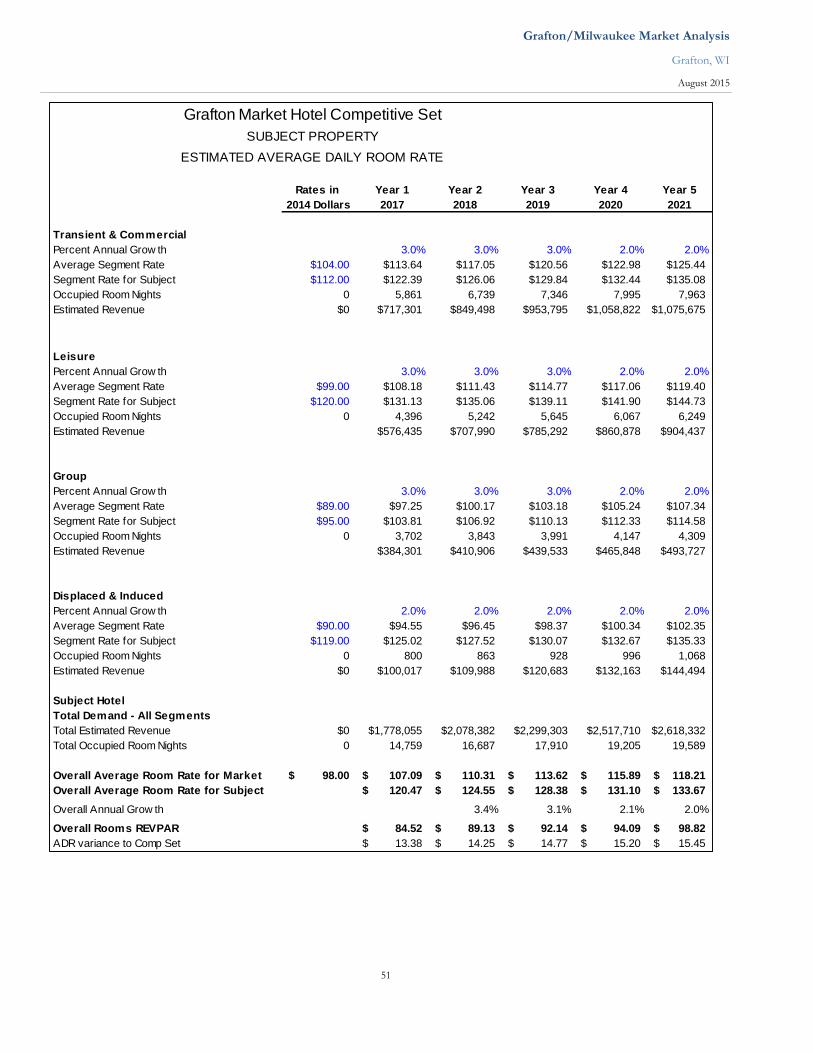
Grafton/Milwaukee Market Analysis
Grafton, WI
August 2015
51
Grafton Market Hotel Competitive Set
SUBJECT PROPERTY
ESTIMATED AVERAGE DAILY ROOM RATE
Rates in Year 1 Year 2 Year 3 Year 4 Year 5
2014 Dollars 2017 2018 2019 2020 2021
Transient & Commercial
Percent Annual Grow th 3.0% 3.0% 3.0% 2.0% 2.0%
Average Segment Rate $104.00 $113.64 $117.05 $120.56 $122.98 $125.44
Segment Rate for Subject $112.00 $122.39 $126.06 $129.84 $132.44 $135.08
Occupied Room Nights 0 5,861 6,739 7,346 7,995 7,963
Estimated Revenue $0 $717,301 $849,498 $953,795 $1,058,822 $1,075,675
Leisure
Percent Annual Grow th 3.0% 3.0% 3.0% 2.0% 2.0%
Average Segment Rate $99.00 $108.18 $111.43 $114.77 $117.06 $119.40
Segment Rate for Subject $120.00 $131.13 $135.06 $139.11 $141.90 $144.73
Occupied Room Nights 0 4,396 5,242 5,645 6,067 6,249
Estimated Revenue $576,435 $707,990 $785,292 $860,878 $904,437
Group
Percent Annual Grow th 3.0% 3.0% 3.0% 2.0% 2.0%
Average Segment Rate $89.00 $97.25 $100.17 $103.18 $105.24 $107.34
Segment Rate for Subject $95.00 $103.81 $106.92 $110.13 $112.33 $114.58
Occupied Room Nights 0 3,702 3,843 3,991 4,147 4,309
Estimated Revenue $384,301 $410,906 $439,533 $465,848 $493,727
Displaced & Induced
Percent Annual Grow th 2.0% 2.0% 2.0% 2.0% 2.0%
Average Segment Rate $90.00 $94.55 $96.45 $98.37 $100.34 $102.35
Segment Rate for Subject $119.00 $125.02 $127.52 $130.07 $132.67 $135.33
Occupied Room Nights 0 800 863 928 996 1,068
Estimated Revenue $0 $100,017 $109,988 $120,683 $132,163 $144,494
Subject Hotel
Total Demand - All Segments
Total Estimated Revenue $0 $1,778,055 $2,078,382 $2,299,303 $2,517,710 $2,618,332
Total Occupied Room Nights 0 14,759 16,687 17,910 19,205 19,589
Overall Average Room Rate for Market 98.00$ 107.09$ 110.31$ 113.62$ 115.89$ 118.21$
Overall Average Room Rate for Subject #DIV/0! 120.47$ 124.55$ 128.38$ 131.10$ 133.67$
Overall Annual Grow th #DIV/0! 3.4% 3.1% 2.1% 2.0%
Overall Rooms REVPAR #DIV/0! 84.52$ 89.13$ 92.14$ 94.09$ 98.82$
ADR variance to Comp Set #DIV/0! 13.38$ 14.25$ 14.77$ 15.20$ 15.45$
Grafton/Milwaukee Market Analysis
Grafton, WI
August 2015
52
LODGING FACILITY RECOMMENDATIONS
Subject Hotel Competitive Facilities Description
For the potential hotel to become a premier select-service hotel, whether branded or
independent, the property will need to include certain market and guest amenities, often
perceived as necessary or common. The concept focus should offer guests a sophisticated yet
relaxed contemporary design that is stylish, comfortable, and defines its city. These necessary
amenities and services should include:
Modern upscale décor, keeping within distinct attributes that make guests feel
sophisticated, such as modern baths and interesting room features and design. Guests
should experience upscale amenities such as in-room refreshment centers, upscale
bedding, recognized name-brand bath amenities and/or recognized name-brand products
throughout the hotel.
The proposed structure of the hotel should offer approximately 70–85 guest rooms in a
low- mid-rise structure featuring a variety of guest suites. Although the exact mix of rooms
will not be determined or considered in this report, sample room layouts in the attached
addendum should be considered and could be comprised of:
o Multi-room suites to accommodate long-term market demand or extended stay
business.
o King and double-queen executive or traditional guest rooms.
o More double queen rooms than standard king rooms to attract groups and social
leisure market segments.
Conference and meeting space will be a significant part of the potential project and assume
some additional risk. There have been many cases in which branded hotels haves made
concessions to their brand model and included large meeting space. This variance to the
brand standards allows for a competitive advantage over market competitions. Many
independent hotels also take on this strategy.
The meeting space will be needed to create weekend demand at the subject hotel, especially
in the conference, social gathering, and wedding market. The conference and meeting
space should be comprised of:
o Meeting space for small gatherings.
o Pre-function area.
o Décor that is competitive in the wedding market and elegant in design.
o Private boardroom and breakout rooms offering flexible meeting space.
o Kitchen, storage, restroom, and back-of-house space with built-in bar.
o Necessary support or service kitchens.
Grafton/Milwaukee Market Analysis
Grafton, WI
August 2015
53
The surface-level accessible parking, offering a safe, secure environment that is easily
accessible and well lit. Adjacent and accessible parking will be needed when the meeting
facility is in use and the hotel is fully occupied.
Health and fitness facility offering expanded fitness options with state-of-the-art
equipment; a contemporary water feature or pool would be preferred.
Food & Beverage area, a place for guests to get ready for their day and relax and unwind
in the evening. This area should reflect style and comfort, with the following minimum
basic services:
o Premium coffee selections.
o Full breakfast service.
o Full-service attractive bar offering limited dining options.
o Upscale entertainment features such as high-end TVs and sound systems.
A restaurant or coffee shop that may not need to be full-service or offer lunch and
extensive dinner options, room service, and support service for banquets. It should instead
offer limited meal options that are simple to prepare and execute. The facility should offer
limited breakfast and limited evening dining options. Latest technologies that offer
seamless interface from office to hotel room, including:
o High-speed wired and wireless network throughout the facility.
o In-room premium TV service provider, music and sound.
o Business-minded facilities or resource center.
The proposed hotel should deliver a full-service experience with select-service building design
and operating strategy. It should offer a fully functional kitchen with the capability to support
breakfast, evening appetizers, bar business, and possibly limited banquet functions. Room
service may be facilitated by either the onsite kitchen or other local dining establishments.
The guest rooms will offer similar amenities throughout the mix of rooms. These amenities
could include a microwave, refrigerator (in all rooms), and full kitchens in the suites portion
of the complex, in-room beverage and snack selections, coffee maker, iron and ironing board,
desk with computer access and ergonomic seating, task lighting, and multiple accessible power
outlets. This is the project standard of quality and amenities by which the competitive set will
compare itself.
Grafton/Milwaukee Market Analysis
Grafton, WI
August 2015
54
Property Description and Recommendations
The facility description for the proposed hotel will be an upscale select-service product
category, a boutique style highlighting to the important nature of the area. A new independent
or lifestyle hotel—unique to the Grafton/Milwaukee neighborhood, and offering unparalleled
regional quality and focused service—should be highly competitive in the region and
successful long term. This is a good market for a hybrid brand modified prototype if a branded
hotel is valued. This hotel will be a destination facility. The market will likely react moderately
to the regional tourism and, over time, support the subject hotel.
The size of this hotel is recommended for 70-85 guest rooms. The suggested expansion at 75
rooms was used for the purposes of economic modeling and is feasible given the current
stabilization of the properties occupancies and the market demand rebound.
The amenities of the hotel will need to address what the market is attracting. This includes the
following amenities:
Meeting rooms for groups, especially those that can accommodate 100–125 people in one
venue and additional breakout rooms are marketable and should be serviced solely by the
hotel staff.
A health/exercise facility should be included or available nearby for guest use, with the
hotel contracting to allow guest access. However, an onsite exercise room with multiple
pieces of cardiovascular equipment should be available 24/7.
The hotel should be designed for leisure travelers yet meet the needs of a corporate guest.
It should feature suites for both business and pleasure travelers. Leisure travelers would
likely support the weekends and summer high seasons. Elaborate suites with a focus on
contemporary and modern interior design will be necessary.
Extended-stay suites would support the long-term guests that are in the market utilizing
the two extended-stay hotels in the area. Currently, the long-term guest demand is not
being met by anyone in the immediate market. Full business services—including business
center services located in an active lounge surrounding, state-of-the-art Wi-Fi, 42” HD
flat-screen TVs, task lighting, efficient work space in the guestroom and lobby—should
be offered.
The guest room configuration will need to address the market segmentation profiles. This
will require having guest rooms comparable to the business and social/leisure markets.
The mix of hotel rooms needs to be further considered. At this time, the hotel should have
a balance of two-bedded and king-bedded rooms.
Grafton/Milwaukee Market Analysis
Grafton, WI
August 2015
55
SUMMARY CONCLUSIONS
Subject hotel must offer a competitive product against the branded supply in the area at
the high end of the spectrum. This can be accomplished with a variety of guest
accommodations and critical meeting spaces as proposed earlier.
Visible site, accessible easily from various directions, and unique market positioning.
Site offers both visibility and accessibility to transient and social demand generators. The
market drives a stable occupancy and consistent average rate that is not seasonally driven.
Location has many risks/advantages over the competitive set because of its accessibility
and location. It is the only new project in the market to date.
Market and greater Milwaukee market shows stable economic trends.
Hotels have continued to grow occupancy and average rate from 2010−2015 regardless of
their age or lack of desired amenities, although impacted by the recession in 2008 and
2009, with the market now showing significant recovery.
Subject market average rate of $98.02 and occupancy of 57.7 percent year-end 2014 is just
below the complete Milwaukee market average of $98.10 ADR and 62.18 percent
occupancy. This year-end sampling from STR compares more than 129 hotels totaling
over 15,000 guest rooms (90 percent market share), with an average hotel of 116 rooms.
Strong economic sector in industrial and government business within the county. Tourism
is an economic driver in area through the summer and early fall seasons.
Suitable supply of area workforce within the subject market. Service-driven region that
offers a favorable workforce for the retail and hospitality industry given the 140+ total
market properties and nearly 16,010 guest rooms. The ability to find a quality staff for a
high-level hotel is extremely important.
The subject hotel will likely run occupancy upon opening in the high 50 percent range and
possibly close to 55 percent, below market average, at a likely rate of $115 (low) to $125
(high) range, based on services and amenities, above the market average.
Occupancy should be expected to reach a five-year average of 70 percent (low) to 73
percent (high) and stabilize occupancy in the mid-60 percent range by Year 3, at or near
65 percent.
Grafton/Milwaukee Market Analysis
Grafton, WI
August 2015
56
CONCLUSIONS: FEASIBILITY STUDY REVIEW
The following financial analyses scenario is presented for the potential subject property based
on industry guidelines and regional trends. Meeting space and hotel revenues were assumed
based on a hotel design at the above-mentioned standards or guidelines. The pro forma does
not include estimated property taxes.
Hotel
Based on the projections and prior information prepared, the consultant projects a five-year
operating pro forma for a 75-room hotel within the Grafton market with restaurant facility
including flexible meeting space. The comparison will be identified between the subject hotel
and national average performance.
More specifically, we have reviewed all estimated performance and, for discussion and
comparison purposes, will discuss Year 3 of operation (2019) as the stabilized year of business.
Hotel revenue projections indicate that at Year 3 of stabilized business, the facility would
generate estimated revenues of $3.2 million—to include room revenues of $2.2 million and
$98,000 in miscellaneous revenues; food & beverage revenues of $790,000. The property
should achieve this by running occupancy at or near 65 percent occupancy and an ADR at a
premium over the competitive set at $128.00.
Food & beverage revenue projections are estimated from a limited restaurant venue and
banquet service. This typical-sized hotel could potentially generate between $500,000 (low)
and $800,000 (based on a two-meal period service and in-house catering) in total revenue with
limited food service facilities and some meeting business, given the space allocated. In Year 3
of operation, it was estimated that the F&B contribution of revenue would be $790,000. This
is significantly under the national average of food and beverage revenues for U.S. as reported
by STR. The national average is $9,500 per available rooms. This source of revenue will also
have revenue contributions from nightly guests in the limited food service area for
breakfast/dinner/room service/bar and banquet and catering events. Also forecast are
additional revenues from overnight guests and local consumers, with other revenues—such as
the refreshment center, movies, and miscellaneous—at $90,000 annually.
Rooms Departmental Expense estimates are projected at 20% of room revenue. Such expenses
include payroll for both guest services and related property cleaning, and departmental direct
expenses. The departmental expenses include reservation processing fees (for either
independent or franchised hotels), cost of guest supplies, laundry and linen, uniforms, and
other related costs.
Grafton/Milwaukee Market Analysis
Grafton, WI
August 2015
57
Food & Beverage expenses include payroll, the direct cost of inventory for both food and
beverage items, and all related expenses related to the food outlets. Costs or expenses would
be estimated at a minimum of 80% of food & beverage revenues; this is comparable to similar
operations and industry comparisons.
Undistributed Expenses relate to items not directly attributed to specific operating departments.
This category includes utilities, estimated at $7.59 per occupied room, which is within the
acceptable range. Repairs and maintenance are projected at 3.6% of revenues or $6.56 per
occupied room night.
Administrative & General costs include payroll and related expenses of the hotel management
staffing and the cost of various administrative functions and supplies such as credit card
commissions, professional fees, and miscellaneous. This category is projected at 7.5% of total
revenue.
Marketing Expenses include payroll and related expenses, the cost of advertising and promotion,
direct mail, publications, printing and placement, e-mail and Internet campaigns at a total of
5% of property revenues. On both of these measures, the evaluation is within the typical range
and meets industry performance standards.
Management Fees are estimated at 3.5% of total hotel revenue, which is within the range of
typical customary fees for hotel management. It does not include an incentive to the
management company based upon performance of preferred return to investor group, typical
within the industry. Actual fees will vary depending upon other contract terms.
Fixed Expenses include items that are relatively fixed and not sensitive to the operating levels
of the facility. Property taxes were not estimated. Insurance was estimated at the regional
average of $215 per room available, totaling $13,000. Franchise fees were estimated into the
evaluation due to the uncertainty of the hotel, but it is customary for the brand to charge 7 to
11 percent of revenues; 5 percent was modeled.
In summary, the overall cash flow available for debt service and taxes is projected at 38% of
total revenue or $1.2 million; this is above customary range and can be characterized as good
performance. The national average in 2014 was only 14.1% for independent hotels and closer
to 33.5 percent for franchise hotels.
The first full 5-year operating pro forma produced by the consultant for the subject hotel is
shown on the following page.
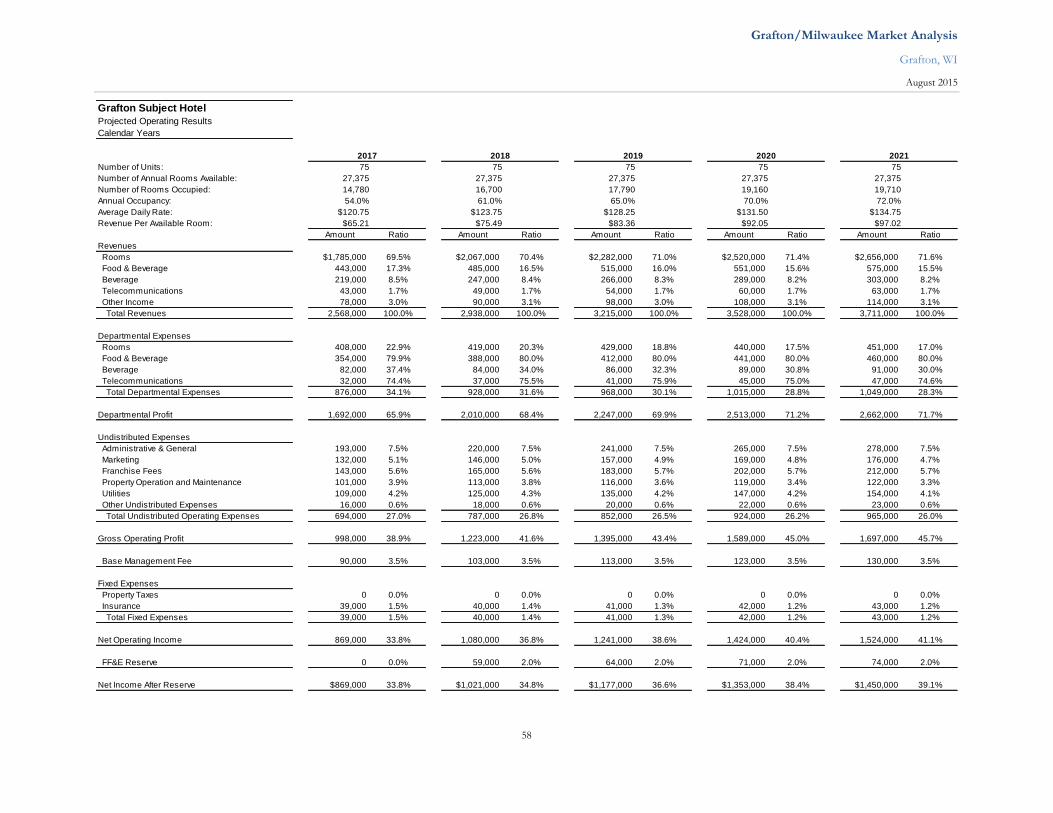
Grafton/Milwaukee Market Analysis
Grafton, WI
August 2015
58
Grafton Subject Hotel
Projected Operating Results
Calendar Years
2017 2018 2019 2020 2021
Number of Units: 75 75 75 75 75
Number of Annual Rooms Available: 27,375 27,375 27,375 27,375 27,375
Number of Rooms Occupied: 14,780 16,700 17,790 19,160 19,710
Annual Occupancy: 54.0% 61.0% 65.0% 70.0% 72.0%
Average Daily Rate: $120.75 $123.75 $128.25 $131.50 $134.75
Revenue Per Available Room: $65.21 $75.49 $83.36 $92.05 $97.02
Amount Ratio Amount Ratio Amount Ratio Amount Ratio Amount Ratio
Revenues
Rooms $1,785,000 69.5% $2,067,000 70.4% $2,282,000 71.0% $2,520,000 71.4% $2,656,000 71.6%
Food & Beverage 443,000 17.3% 485,000 16.5% 515,000 16.0% 551,000 15.6% 575,000 15.5%
Beverage 219,000 8.5% 247,000 8.4% 266,000 8.3% 289,000 8.2% 303,000 8.2%
Telecommunications 43,000 1.7% 49,000 1.7% 54,000 1.7% 60,000 1.7% 63,000 1.7%
Other Income 78,000 3.0% 90,000 3.1% 98,000 3.0% 108,000 3.1% 114,000 3.1%
Total Revenues 2,568,000 100.0% 2,938,000 100.0% 3,215,000 100.0% 3,528,000 100.0% 3,711,000 100.0%
Departmental Expenses
Rooms 408,000 22.9% 419,000 20.3% 429,000 18.8% 440,000 17.5% 451,000 17.0%
Food & Beverage 354,000 79.9% 388,000 80.0% 412,000 80.0% 441,000 80.0% 460,000 80.0%
Beverage 82,000 37.4% 84,000 34.0% 86,000 32.3% 89,000 30.8% 91,000 30.0%
Telecommunications 32,000 74.4% 37,000 75.5% 41,000 75.9% 45,000 75.0% 47,000 74.6%
Total Departmental Expenses 876,000 34.1% 928,000 31.6% 968,000 30.1% 1,015,000 28.8% 1,049,000 28.3%
Departmental Profit 1,692,000 65.9% 2,010,000 68.4% 2,247,000 69.9% 2,513,000 71.2% 2,662,000 71.7%
Undistributed Expenses
Administrative & General 193,000 7.5% 220,000 7.5% 241,000 7.5% 265,000 7.5% 278,000 7.5%
Marketing 132,000 5.1% 146,000 5.0% 157,000 4.9% 169,000 4.8% 176,000 4.7%
Franchise Fees 143,000 5.6% 165,000 5.6% 183,000 5.7% 202,000 5.7% 212,000 5.7%
Property Operation and Maintenance 101,000 3.9% 113,000 3.8% 116,000 3.6% 119,000 3.4% 122,000 3.3%
Utilities 109,000 4.2% 125,000 4.3% 135,000 4.2% 147,000 4.2% 154,000 4.1%
Other Undistributed Expenses 16,000 0.6% 18,000 0.6% 20,000 0.6% 22,000 0.6% 23,000 0.6%
Total Undistributed Operating Expenses 694,000 27.0% 787,000 26.8% 852,000 26.5% 924,000 26.2% 965,000 26.0%
Gross Operating Profit 998,000 38.9% 1,223,000 41.6% 1,395,000 43.4% 1,589,000 45.0% 1,697,000 45.7%
Base Management Fee 90,000 3.5% 103,000 3.5% 113,000 3.5% 123,000 3.5% 130,000 3.5%
Fixed Expenses
Property Taxes 0 0.0% 0 0.0% 0 0.0% 0 0.0% 0 0.0%
Insurance 39,000 1.5% 40,000 1.4% 41,000 1.3% 42,000 1.2% 43,000 1.2%
Total Fixed Expenses 39,000 1.5% 40,000 1.4% 41,000 1.3% 42,000 1.2% 43,000 1.2%
Net Operating Income 869,000 33.8% 1,080,000 36.8% 1,241,000 38.6% 1,424,000 40.4% 1,524,000 41.1%
FF&E Reserve 0 0.0% 59,000 2.0% 64,000 2.0% 71,000 2.0% 74,000 2.0%
Net Income After Reserve $869,000 33.8% $1,021,000 34.8% $1,177,000 36.6% $1,353,000 38.4% $1,450,000 39.1%
Grafton/Milwaukee Market Analysis
Grafton, WI
August 2015
59
REGIONAL ECONOMIC IMPACT
For the purposes of this engagement, we will estimate the positive economic impact to the
village of Grafton from the increases in hotel occupancy taxes and retail sales taxes in Year 5
(2021) of the hotel operation.
Year 5/2021 projections indicate that the new facility offering 75 rooms/suites will be able to
draw approximately 19,710 additional lodging room nights into the community than the
property is expected to draw in 2014. We further estimate that the overall market will absorb
the additional market supply of the newly expanded hotel and collectively reach an occupancy
level of 65 percent, on average, given the new supply. Adjusting for inflation at 2.5 percent
annually, the average rate of the market hotel inventory in Year 5 would be $118.00. It is
estimated that the newly positioned subject hotel in Year 5 will achieve an average rate of
$133.00, a premium of nearly $15.00 compared to the competitive market.
Currently, the Milwaukee market and the subject market collects tax revenue from overnight
accommodations. The local economy stands to benefit from further development and
repositioning of the hotel to attract new travelers whose needs are not currently being satisfied.
The tax revenue alone in Year 5 would approach $300,000 in total taxes collected; room tax
in excess of $100,000 and sales tax in excess of $190,000 based on $3.7 million in total revenue
and total hotel revenue of 3.1 million (on other hotel revenues, including food & beverage).
There are other benefits to the village and the community not noted, such as additional
property taxes, employee spending, and business expansions or relocations. It is clear that the
local economy will derive substantial benefits from the addition of this facility.
Grafton/Milwaukee Market Analysis
Grafton, WI
August 2015
60
CERTIFICATION, ASSUMPTIONS, AND
LIMITING CONDITIONS STATEMENT
The above report is presented to provide information on the market in which the subject
property will perform. The report is to be used in whole and not in part. The research provided
in this report was obtained from review of supportive data and information. Sketches,
photographs, maps, and other exhibits are included to assist the reader in visualizing the
property and market.
All information, financial operating statements, estimates, and opinions obtained from parties
not employed by the consultant are assumed true. It should be understood that normal
economic and marketplace conditions change constantly. The consultant assumes no
responsibility for information that becomes outdated once this report is written, nor is it
responsible for keeping this information current after September 2015. The consultant takes
no responsibility for any events or circumstances that take place subsequent to the date of our
field inspection.
None of this material may be reproduced in any form without the consultants’ written
permission, and the report cannot be disseminated to the public through advertising, news,
sales, or other media.
It should be understood that the results presented in this report are the opinions of the
consultant team and are based upon the information available at this time. These opinions
infer proper and professional management of the business operation. The opinions also infer
that market conditions do not change.
The estimated operating results presented in the report are based on an evaluation of the
overall economy. The quality of a hotel facility’s onsite management has a direct effect on a
property’s economic viability. The financial forecasts presented in this analysis assume the
responsible ownership and competent management. Any departure from this assumption may
have a significant negative impact on the projected operating results.
The consultants’ company routinely seeks opportunities to consult, develop, and manage
boutique and branded hotels in the region. Our consulting engagements include a fee structure
for a specific scope of work. These engagements occasionally result in a minor equity interest
or long-term management contract for a prospect facility. The consultant has no current or
contemplated interests in the real estate that is the subject of this report. The fee paid for the
preparation of this report is not contingent upon the conclusions, upon occurrence of a
subsequent event directly related to the intended use of this report, or that our engagement
was contingent upon developing or reporting predetermined results.
Grafton/Milwaukee Market Analysis
Grafton, WI
August 2015
61
Evaluating and comprising financial forecasts for hotels is both a science and an art. Although
this analysis employs various mathematical calculations to provide value indications, the final
forecasts are subjective and may be influenced by the consultants’ experience and other factors
not specifically set forth in this report. If the reader is making a fiduciary or individual
investment decisions and has questions concerning the material presented, it is recommended
that the reader contact the consultants.
The consultants prepared this study. The statements of fact presented in this report are true
and correct to the best of the consultants’ knowledge and are rendered by the staff of the
consultants as employees rather than as individuals. The reported analyses, opinions, and
conclusions presented in this report are limited only by the assumptions and limiting
conditions set forth, and they are the consultants’ personal, impartial, and unbiased
professional analyses, opinions, and conclusions. The consultants have extensive experience
in the hospitality industry, hotel & restaurant management, hospitality development, and in
the evaluation of hotels; the consultants believe that we are competent to undertake this study.
This report may or may not prove to be acceptable for external investing and/or lending
purposes. An investor or lender may require additional information concerning this market’s
ability to support this hotel. Our responsibility is limited to the client, and the use of the final
report by others shall be solely at the risk of the client and/or third parties. The report is also
subject to the terms and conditions set forth in our engagement letter with the client.
Grafton/Milwaukee Market Analysis
Grafton, WI
August 2015
62
GLOSSARY OF HOSPITALITY TERMS
The following definitions of industry terminology are derived from the Uniform System of
Accounts for the Lodging Industry (10th Revised Edition).
Type of Hotel
Full-Service Hotel – Generally mid-price, upscale, or luxury hotels with a restaurant, lounge
facilities, and meeting space as well as minimum service levels that often include bell service
and room service. These hotels report food & beverage revenue.
Limited-Service Hotel – Hotels with rooms-only operations (i.e., without food & beverage
service) or hotels that offer a bedroom and bathroom for the night but few other services and
amenities. These hotels are often in the mid-price, and budget or economy groups and do not
report food & beverage revenue.
There are also upscale or luxury hotels that do not manage their food & beverage operations
(e.g., leased to a third party) that are categorized as limited-service hotels.
Revenues
Rooms – Revenues derived from the rental of sleeping rooms at the hotel, net of any rebates
and discounts.
Food – Revenues derived from the sale of food, including coffee, milk, tea, and soft drinks.
This is also often reported by the various meal periods served: breakfast, lunch, dinner, and
room service.
Beverage – Revenues derived from the sale of beverages, including beer, wine, and liquors.
Also includes banquet beverage revenues.
Other Food & Beverage – Revenues derived from other sources such as meeting room
rentals, cover or service charges, or revenues derived from the sale of goods or services made
in connection with banquets, such as equipment rental, music, decorations, and souvenirs.
Also includes banquet service charges.
Telecommunications – Revenues derived from guest use of telephones in the hotel,
including local and long-distance calls, service charges, high-speed or wireless Internet, and
commissions.
Other Operated Departments – Revenues generated from garage and parking, guest
laundry, golf and tennis, health club, spa, swimming pool, barber/beauty shop, gift shop,
newsstand, etc., when operated by the hotel (excluding casinos).
Grafton/Milwaukee Market Analysis
Grafton, WI
August 2015
63
Rentals and Other – Income from rentals of space for business purposes, including
concessions in any of the departments mentioned under Other Operated Departments.
Includes income generated from sources not included elsewhere but excludes investment
income.
Cancellation Fees – Fees incurred as a result of group cancellations (e.g., group attrition
fees).
Departmental Expenses
Rooms – Rooms departmental expenses include labor costs such as salaries and wages for
front desk, housekeeping, reservations, bell staff, and laundry, plus employee benefits. Other
operating expenses in the rooms department include linen, cleaning supplies, guest supplies,
uniforms, central or franchise reservation fees, equipment leases, and travel agent
commissions.
Food and Beverage (F&B) – Food & Beverage departmental expenses include the cost of
goods sold (food & beverages), labor and related benefits, and other operating expenses. Labor
costs include departmental management, cooks and kitchen personnel, service staff, banquet
staff, and bartenders. Other operating expenses include china, silverware, linens, restaurant
and kitchen supplies, menus and printing, and special promotions.
Telecommunications – Telecommunications departmental expenses include costs of calls,
cost of Internet service, and other related expenses but exclude capital lease payments.
Other Operated Departments & Rentals – Other departmental expenses would comprise
those expenses (labor and other) that offset the revenue generated by other operated
departments, such as garage, guest laundry, athletic facilities, and gift shop, as well as rental
activity.
Undistributed Operating Expenses
Administrative and General (A&G) – Included in this category are the payroll and related
expenses for the general manager, human resources and training, security, clerical staff,
controller, and accounting staff. Other A&G expenses include office supplies, computer
services, accounting and legal fees, cash overages and shortages, bad debt expenses, travel
insurance, credit card commissions, transportation (non-guest), and travel and entertainment.
Marketing – Marketing expense includes payroll and related expenses for the sales and
marketing staff, direct sales expenses, advertising and promotion, travel expenses for the sales
staff, and civic and community projects. Includes national advertising fee or assessment paid
to franchise company plus cost of frequent guest stay programs.
Grafton/Milwaukee Market Analysis
Grafton, WI
August 2015
64
Utility Costs – Utility expenses typically include electricity, fuel (oil, gas, and coal), purchased
steam, and water. Includes central plant and energy management systems.
Property Operations and Maintenance – This category includes payroll and related
expenses for maintenance personnel, cost of maintenance supplies, cost of repairs and
maintenance of the building, furniture and equipment, the grounds, and the removal of waste
matter.
Franchise Fee – Includes only the royalty fees charged by franchise companies.
Management Fees – Fees charged by management organizations for management services
or supervision. Includes both base and incentive fees.
Fixed Charges
Property Taxes – Typically include taxes on real estate, business and occupation, personal
property, utilities, and other municipal taxes.
Insurance – Cost of insuring the hotel building and contents against fire, weather, sprinkler
leakage, boiler explosion, plate glass breakage, or other perils such as terrorism. Includes all
insurance except workers’ compensation.
Land and Building Rent – Includes charges for lease of land and/or building.
Equipment Rental – Includes capital leases for rental of data processing equipment,
telephone equipment, and other major items.
Interest – Includes all interest expenses on any obligations such as mortgages, notes payable,
bonds, debentures, taxes in arrears, or any other indebtedness on which interest is charged.
Depreciation and Amortization – Deductions on the building, leaseholds and leasehold
improvements, furnishings and equipment, and assets held under capital leases.
Other Fixed Charges – Includes any other expenses that relate to the ownership of the hotel,
and gains or losses from any sale of assets.
Other Terms
Number of Occupied Room Nights – Rooms occupied by hotel guests on a paid basis.
Price Category – Categories of properties defined through price perception to the consumer:
Luxury, Upscale, Mid-Price, and Economy.
Location – Urban, suburban, airport, interstate, resort, small metro/town.
Grafton/Milwaukee Market Analysis
Grafton, WI
August 2015
65
Chain Scale – Luxury chain, upper upscale chain, upscale chain, midscale chain with food
& beverage (F&B), midscale chain without F&B, economy chain, independents.
Reserve for Capital Replacement – Amount set aside for replacement of furniture, fixtures,
and equipment (as may be required by loan, franchise, or management agreement).
Average Daily Rate (ADR) – Room revenue divided by rooms sold. The currency used to
express ADR is shown on each report.
Demand (Rooms Sold) – The number of rooms sold or rented (excludes complimentary
rooms).
Market – A geographic area within a country. Markets are defined by STR and STR Global.
Occupancy – Rooms sold divided by rooms available multiplied by 100. Occupancy is always
expressed as a percentage of rooms occupied.
Percent Change – Amount of growth: up, flat, or down; this period versus same period last
year (month or year-to-date). Calculated as ((TY - LY) / LY) * 100.
RevPAR – Revenue per Available Room or room revenue divided by rooms available.