Embed Size (px)
Citation preview

Master’s Thesis 2020 30 ECTS
Faculty of Biosciences, Chemistry, Biotechnology and Food Sciences
Microscopic examination of banana,
potato, wheat and oat: influence of
pre-digestive processing on cellularity
and structure
Karoline Lyngstad Skjerve
Food Science, Food production and Product development

0

1
Preface
Food science and human nutrition have always spiked my interest. When the cellularity
hypothesis was presented to me, my curiousness spiked. I felt privileged to be given the
opportunity to contribute with relevant results for the discussion of CARBFUNC. During
research of the cellularity hypothesis and the food structure, I rapidly learned that this topic
was more complex than earlier presumed. However, I was eager to investigate the cellular
structure using varied microscopy techniques, to find out if the claims could be substantiated.
Firstly, I would like to thank my supervisors Birger Svihus and Simon Dankel for guidance,
support and inspiration. Also, a huge appreciation should be directed towards CARBFUNC, a
study conducted at the MOHN nutrition research laboratory for sponsoring the use of
microscopes and training at the Imaging center. I would also like to thank Inge Lindseth for
being a good source of information and sparring partner. I am very grateful for Lene Cecilie
Hermansen and Hilde Raanaas Kolstad´s contributions at the Imaging center and for
brightening up my days with their cheerful presence and support. Finally, I would like to
thank Mats Andrè Figenschau for correcting my grammar and making me lough at stressful
times.
During the research and writing prosses I have gained a lot of new knowledge and skills
regarding microscopy techniques and structural features of food plants. I was fascinated by
the beautiful structures, which made the microscopy part of this thesis my favourite.
Hopefully, my micrographs will become useful for later studies regarding cellular structure in
foods.
Ås, may 2020
_____________________________
Karoline Lyngstad Skjerve

2
Abstract
Cellularity has recently become a term that describes the cellular intactness of foods. Cellular
structure has been studied in the context of texture and other sensorial aspects, as well as
mentioned in studies focusing on human metabolic health. As of today, no studies have
mapped the cellularity of different foods and the changes in cellularity after processing and
chewing, though some information exists through indirect studies. This thesis aimed to
investigate differences in cellular structure and cell wall intactness in food after different
processing methods, including chewing. The selected foods were potato (raw, boiled, boiled
and masticated, homemade mashed and instant mashed potatoes), banana (fresh, masticated,
and blended as in smoothie for 15 and 30 seconds), oat (whole, fast cooking and premium oat
flakes), and wheat (whole, refined and fine whole wheat flour, commercial and stone ground
milling techniques). The results were presented as micrographs and quantification of intact
cells, as well as explanation of observations. Unprocessed foods, as well as boiled potato were
considered to have ~100% intact cellular structure. In vivo mastication decreased the
percentage of intact cells with approximately 20 in both banana and boiled potato. The results
of potato and banana samples indicated a relationship between increased processing degree
and decreased percentage of intact cells. For instance, lowest percentage of intact cells were
found in the instant mashed potatoes and in the banana sample blended for the highest time.
For cereals, both milling and rolling resulted in extensive structural destruction. In oat flakes,
the particle size seemed to influence the size of the coherent aleurone layer. These studies
demonstrated that some types of processing, such as grinding for smoothie production,
destroyed cellular structure in banana, while other processing methods, such as boiling of
whole potato did not.
3
Table of content
Preface ...............................................................................................................................................1
Abstract .............................................................................................................................................2
Table of content ................................................................................................................................3
Abbreviations and explanation of words ..........................................................................................5
1. Introduction ..............................................................................................................................6
2. Background ...............................................................................................................................7
2.1. Aims and objectives ............................................................................................................... 11
3. Theory ..................................................................................................................................... 12
3.1. The cell wall........................................................................................................................... 13
3.2. Gelatinization of starch ........................................................................................................... 14
3.3. Oat ......................................................................................................................................... 15
3.3.1. The structure of the oat kernel ......................................................................................... 15
3.3.2. Oat milling ...................................................................................................................... 16
3.4. Wheat .................................................................................................................................... 18
3.4.1. Commercial milling ......................................................................................................... 19
3.4.2. Stone ground milling ....................................................................................................... 20
3.5. Potato ..................................................................................................................................... 21
3.6. Banana ................................................................................................................................... 22
3.7. Cellularity and access to nutrients ........................................................................................... 22
3.8. Cellular structure and glycemic index ..................................................................................... 23
3.9. Cell wall intactness and microbiota......................................................................................... 24
3.10. Microscopy .......................................................................................................................... 25
3.10.1. Stains ............................................................................................................................ 26
4. Materials and methods ............................................................................................................ 27
4.1. Plant materials and processing ................................................................................................ 27
4.2. Sample preparation SEM ........................................................................................................ 28
4.3. Sample preparation LM and stereo microscope ....................................................................... 29
4.4. Sample preparation CLSM ..................................................................................................... 29
4.5.1. SEM ................................................................................................................................ 30
4.5.2. Light microscopy and stereo microscopy .......................................................................... 30
4.5.3. CLSM .............................................................................................................................. 30
4.6. Quantification of intact cells ................................................................................................... 31
4.7. Choosing of micrographs presented in the thesis ..................................................................... 31
5. Results ..................................................................................................................................... 33

4
5.1. Oat ......................................................................................................................................... 33
5.1.1. Whole oat ........................................................................................................................ 33
5.1.2. Dry oat flakes .................................................................................................................. 34
5.1.3. Cold swollen oat flakes .................................................................................................... 39
5.1.4. Boiled oat flakes .............................................................................................................. 43
5.1.5. Oat bread ........................................................................................................................ 47
5.2. Wheat .................................................................................................................................... 49
5.2.1. Whole wheat .................................................................................................................... 49
5.2. Wheat flours ....................................................................................................................... 51
5.3. Wheat bread ....................................................................................................................... 53
5.3. Potato ..................................................................................................................................... 55
5.3.2. Masticated boiled potato.................................................................................................. 60
5.3.3. Mashed potato ................................................................................................................. 63
5.4. Banana ................................................................................................................................... 66
5.4.1. Fresh banana .................................................................................................................. 66
5.4.2. Masticated banana .......................................................................................................... 67
5.4.3. Banana smoothie ............................................................................................................. 69
5.5. Quantification of intact cells ................................................................................................... 70
6. Discussion ................................................................................................................................ 72
7. Conclusion ............................................................................................................................... 81
8. References ............................................................................................................................... 82

5
Abbreviations and explanation of words
Ad libitum - As much or as often as necessary or desired.
AOAC method 991.43 - Fiber measurement method based on enzymatic removal of other
protein and starch in the sample and further measurements of the remaining components.
Insoluble dietary fiber are separated by filtration, while high-molecular weight soluble dietary
fibers are precipitated by 78% ethanol before filtration. The fiber fractions are then dried and
weighted. Collectively the fiber fractions give the total dietary fiber content.
CLSM - Confocal Laser Scanning Microscope
GI - Glycemic index, a relative ranking of carbohydrate in foods according to how they affect
blood glucose levels.
In vivo – Testing on whole living organisms or cells
In vitro – Testing outside a living organism
Integrated Fiber method - Total dietary fiber determination method based on enzymatic
and gravimetric methods. The samples are dried before gelatinized along with heat stable α-
amylase. Further the samples are added protease and amyloglucosidase for protein and starch
removal. The soluble dietary fiber is precipitated with ethanol before filtered and washed with
ethanol and acetone. Then, the residue is weighed after drying and by subtracting the weight
from the proteins and ash analyzed, the remaining weight equals the total dietary fiber
content.
LM - Light Microscope
Micrograph - A photograph taken by means of a microscope
SEM - Scanning Electron Microscope

6
1. Introduction
This thesis was written as a contribution to the CARBFUNC study (Dietary Carbohydrate and
Internal Body Fat Mass in Women and Men With Obesity), for novel information about the
changes of internal structure of different foods with different processing degree. CARBFUNC
is an ongoing (January 2018- April 2021) randomized controlled study attempting to
investigate differences between low processed and highly processed diets on visceral fat and
postprandial insulin and lipids in obese humans. In the study, participants were divided into
three groups; 1: acellular carbohydrate diet, 2: cellular carbohydrate diet and 3: low-
carbohydrate high-fat diet. In the acellular carbohydrate diet the carbohydrate sources were
for instance refined flour/bakery products, whereas in the cellular carbohydrate diet the
carbohydrate sources were for instance root vegetables, fruits, whole grain rice, and non-flour
grain products. Both groups were instructed to eat at least 500 g fruits/vegetables per day. The
macronutrient balance was equal between group 1 and 2; 45 energy percent (E%)
carbohydrates, 38 E% fat and 17% protein. Multiple secondary outcome measures, amongst
change in fecal microbiome composition by 16S sequencing, BMI, and compliance was
included. The aim of this study was to investigate the cellularity of frequently consumed
foods in the cellular carbohydrate diet to contribute more information regarding the cellular
structure. The cellularity of potato, banana, oat, and wheat with different degrees and methods
of processing was therefore investigated by different microscopy techniques.
Cellularity in the context of food is a relatively new term created to describe the cellular
structure in foods and was first introduced by Spreadbury in 2012 (Spreadbury, 2012).
Cellularity of foods is suggested to serve as a measure of dietary quality, both in terms of
individual foods and a person’s or group’s overall dietary pattern. Cellularity of foods has
however not been mentioned specifically to a large extent during the later years, except from
a few reviews. As of today, no mapping of the cellularity in foods with different degree of
processing has been performed. Hopefully these results might illuminate some of the
uncertainties concerning changes in cellularity during processing of different foods. Besides,
the results might contribute towards making a new characterization of foods, not based on
their processing degree, but based on their degree of cellularity.

7
2. Background
Food structure, in the context of food quality has over the later years been recognized as
important for health (Singh et al., 2014). For example, the ongoing development of obesity
worldwide has been linked to changes in dietary patterns, which include the introduction of
more “processed” foods and pre-prepared meals. There are different definitions of what
constitutes “processed” food, and ongoing discussions about how different foods should be
categorized according to the degree of food processing. A popular categorization is the
NOVA food categorization for food processing using terms such as “unprocessed”,
“minimally processed”, “processed” and “ultra-processed” (Monteiro et al., 2016). According
to this definition, unprocessed food can be described as food in its natural form, such as fresh
fruits, vegetables, meat, eggs, and fish. Minimally processed food includes all foods processed
with for example drying, milling, heat treatments or freezing, but does not contain additives.
Dried rice and cereals/grains, frozen berries and meat/fish, and dried legumes are all included
in this category. Minimally processed foods containing additives is categorized as processed
food, and also include fermenting and higher heat treatments. Pickled or fermented
vegetables, cheese, bread, and cured/smoked meat are all considered processed foods. Ultra-
processed foods are described as industrial products not similar to their original raw material.
They often consist of extracted components as vegetable oils, sugar and starch in addition to
other additives prepared in laboratories. Ultra-processed foods include for instance cookies,
ice cream, half fabricated foods, candy, sausages, frozen pizza, and sweetened breakfast
cereals such as Honey smacks (sweetened puffed wheat breakfast cereal made by Kellogg's).
The NOVA classification has been included in France, Uruguay and Brazil´s dietary
guidelines as a proxy for products healthiness (Publique, 2018, Mialon et al., 2018, da Silva
Oliveira and Silva-Amparo, 2018), and was also a mentioned in several publications in the
Journal Public Health Nutrition (Kelly and Jacoby, 2018). However, the NOVA classification
of foods is contested, and has been criticized in a number of different scientific articles
(Mialon et al., 2018). For instance, in an article discussing the contribution of processed foods
to nutrition and food security claims that the subjective definition does not characterize foods
in a helpful manner (Weaver et al., 2014). Instead the authors suggest a characterization of
food by the use of objective criteria that address specific attributes of the foods, or nutritional
terms for dietary standards. By the NOVA food categorization, the inclusion of additives
automatically transfers a food into the description of “processed”, while milling of grain,
which disrupts the food structure, decreases the particle size, and often removes fibrous

8
structures, is considered “minimally processed”. Thus, regarding human health, the NOVA
food categorization, might not be advantageous, and additional concepts are needed to
separate foods by their quality and health effects, even more accurately.
In this thesis, food structure or intactness of foods is discussed on the basis of the cellularity,
including cellular structure, starch structure, and particle size. However, in terms of medicine,
cellularity is the number and type of cells in a given tissue (Venes, 2017). Epidemiological
research on whole versus ultra-processed foods in human diets supports the hypothesis that
ultra-processed foods have a negative impact on human health. Disruption of cellular structure
is suggested to play a role in the negative impact of ultra-processed foods (Spreadbury, 2012).
It may appear logical to assume a decrease in cellularity when foods are processed by for
example milling, taking the processing method and particle size into consideration.
Nonetheless, as earlier mentioned, as of today no studies have been performed with the
intention of tracking the cellularity of different foods and its different processing methods, nor
the effect chewing has on cellularity of food.
The access of processed and ultra-processed foods began in the 1970s, where semi-finished
and finished foods became popular in households. Overweight in humans is defined by a
Body Mass Index (BMI) between 25 and 30 kg/m2, obesity is defined as BMI over 30 kg/m2
(Heart et al., 1998). An increase of overweight and obesity for the world’s population, in
general, began approximately around the 1980s, with good documentation suggesting large
socio-economic disparities (Smith, 2012). Nevertheless, a significant increase of processed
culinary ingredients and ultra-processed foods from 1988 to 2003 was reported in a household
study, including both lower- and upper-income groups in Brazil (Monteiro et al., 2010). There
appears to be many hypotheses on why obesity rates have increased, where some blame the
decrease of meals made from fresh raw materials/whole foods or the increase of semi-finished
(ultra-processed) products during cooking. For instance, a nationwide analysis from Sweden
concluded with increased consumption of ultra-processed products mirrors the increased
prevalence of obesity (Juul and Hemmingsson, 2015), and this could particularly be linked to
increased consumption of carbohydrates (Sturm and An, 2014).
The Paleolithic diet, based on the assumed Paleolithic ancestor’s diet is composed of mainly
lean meat, fish, vegetables, root tubers, eggs, and nuts, and excludes grains (Jönsson et al.,
2010). Overall, this diet consists of very little processed foods, except for boiling and other
heat treatments. The diet is also relatively low in starch content. Furthermore, the Paleolithic
diet has been implied to reduce energy intake compared to a Mediterranean diet, due to higher

9
satiety and generally a lower energy concentration of the foods used (Jönsson et al., 2010).
Evolutionary changes seem central in Spreadburys`s hypothesis, where a grain-free whole
food diet is suggested to perhaps induce an upper gastrointestinal microbial flora more fitting
with our evolutionary past and symbiosis with microbes (Spreadbury, 2012). This argument is
then used as a basis for explaining why the Paleolithic diet appears favourable considering
satiety and metabolism. Spreadbury suggests that a diet consisting of mainly acellular foods
may influence towards an inflammatory gut microbiota, where “gut microbiota” seems to be
used as a term due to lack of evidence pointing towards a specific location within the upper
digestive tract (Spreadbury, 2012). Cellular foods are described as foods containing cell walls,
which enclose the nutrients, while acellular foods are described as foods where the nutrients
are not enclosed within cell walls and the nutrients, therefore, become available for rapid
digestion and absorption. Assumed acellular foods such as flour and sugar have high
carbohydrate density, and cellularity and carbohydrate density are therefore seemingly used
interchangeably in this hypothesis. Spreadbury explains that living cells store their
carbohydrates in fiber-walled organelles, and that they remain mostly intact during cooking.
He refers to a couple of studies investigating the dissolving of the middle lamella in boiled
potato and the cell wall chemistry of carrot during boiling in relation to firmness of carrot
tissues to substantiate this claim (Ng and Waldron, 1997, Parker et al., 2001). To corroborate
his claim of flours being acellular, he refers to a microscopy study describing the
microstructural changes in wheat flour (Roman-Gutierrez et al., 2002). However, apart from
this, he neglects to explain the physio-chemical properties of plant cells any further.
Spreadbury proposed that a primary difference between a whole food diet and a more
processed diet is carbohydrate density, a property suggested to be rather independent of
glycemic index (Spreadbury, 2012). The proportional mass of carbohydrates in a diet
consisting of processed food, is proposed to be much higher compared to the carbohydrate
density found in cellular plant foods. The cofoundation of two different independent
properties of foods, cellularity and carbohydrate density, makes it challenging to assess and
test the hypothesis.
The nutrient/starch/sugar availability from the acellular foods is according to the hypothesis
suggested to influence the gut microbiota, possibly leading to leptin resistance and metabolic
disease (Spreadbury, 2012). Spreadbury suggests that consumption of acellular dense
carbohydrates leading to obesity includes the production of an inflammatory microbiota,
starting in the mouth. The oral inflammatory microbiota together with a possibly

10
inflammatory microbiota in the small bowel is suggested to make the small bowel exposed to
lipopolysaccharide (LPS) and other pathogen associated molecular patterns (PAMs). The
inflammatory mediators could then according to the hypothesis, induce leptin resistance and
hyperphagia with a systemic absorption of these endotoxins enhanced by dietary fat. Leptin
resistance is then suggested to increase appetite through vagal afferents and lead to obesity.
This hypothesis is however not fully documented in regards to A: cellularity and microflora
and B: microflora and leptin resistance. The wide and strangely both specific and unspecific
cellularity hypothesis remains somewhat unclear, especially regarding the gut microbiome.
However, with the diets that were planned to differ in the degree of carbohydrate cellularity,
the CARBFUNC study might substantiate or weaken some of the claims in Spreadbury`s
hypothesis.
Since leptin resistance is a central part of the cellularity hypothesis, this will be explained
further. Leptin is a hormone expressed and secreted from the adipose cells, which stimulate
specific receptors in the hypothalamus which further regulates appetite and weight through
hunger regulating signals (Caro et al., 1996, Masuzaki et al., 1995, Kolaczynski et al., 1996).
One difference pointed out between non-Westernized and Westernized populations is serum
leptin concentrations, and high levels of circulating leptin are commonly found in obese
individuals (Sáinz et al., 2015). Leptin resistance mechanisms remain unclear, but could lead
to unbalances in energy homeostasis, perhaps through excessive hunger sensations. The
leptin-obesity cascade is complicated and much studied, but the details will not be presented
in the current study. The background for this leptin-obesity-hypothesis is investigations of
eating habits in different populations and specific observed differences in serum leptin.
Kitavans located at Papua New Guinea consumes mainly tubers, fish, fruit, vegetables, and
coconut, and are supposedly not practically affected by westernized dietary habits (Lindeberg
et al., 2001). Kitawans are also reported to have a very low prevalence of overweight.
Kitavans were observed to have lower leptin levels, blood glucose and fasting insulin
compared with supposedly healthy Western populations, despite similar food access and
overlap of glycemic index and macronutrients (Lindeberg et al., 1999, Lindeberg et al., 2001).
A human study also indicated a favorable effect on the leptin levels from eating larger
amounts of rice, considered a cellular food, relative to flour-based foods, considered acellular
(Mente et al., 2010). This appears to be in line with another study where a 12 weeks of ad
libitum Paleolithic diet, supposedly a cellular diet, reduced the leptin levels by 31% in a
Westernized population (Jönsson et al., 2010). The reduced energy intake in the Paleolithic

11
diet could be one of the reasons for the decreased serum leptin concentrations, where
decreased fat stores would lead to less serum leptin production. However, if the hypothesis is
correct, inflamed gut microflora could possibly be a partial explanation for leptin resistance,
where higher leptin sensitivity could be an explanation for the energy decrease itself. Taken
together, an increased intake of acellular carbohydrate during the last decades has been
strongly linked to obesity, giving a strong motivation for further and more detailed study of
the carbohydrate quality of foods.
2.1. Aims and objectives
The present thesis sought to investigate the cellularity of carbohydrate-rich foods frequently
used in the “cellular” diet of the CARBFUNC study, including banana, oat, wheat, and potato,
and to discuss the relationship between cellularity and processing in these foods. Also, the
project sought to examine how chewing affects the cellularity of banana and potato.
Cellularity was assessed by different microscopy techniques on samples of the different foods
with different processing degree, as well as after chewing. The percentage of intact cells was
sought to be quantified by counting cells in micrographs.

12
3. Theory
Potato, banana, oat, and wheat were investigated with respect to their cellular structure.
Description of the cell wall in general, gelatinization of starch, and structural composition of
the investigated foods will here be presented. In addition, relevant literature on cell structure
in relation to A: glycemic index, B: nutrient availability, and C: microbiota will be mentioned.
Finally, the theory section explains the implemented microscopy techniques and stains.
Potato consumption in Norway has decreased over the last 60 years (SSB, 2017). In 2012 the
average consumption vas 27.4 kg per capita, where 22.1 kg was boiled potato and the
remaining intake included other processed potato products as French fries and potato chips.
However, over the last 60 years the consumption of processed potato products has increased.
In Norway, as well as many European countries, potatoes are still an important source of
carbohydrates in the diet (Frost et al., 2016). Differences in processing degree and methods
have shown to influence the glycemic impact of potato, among other factors such as maturity
and environmental conditions during growth (Tian et al., 2016). Starch digestibility and
structure are affected by variation in cooking methods due to varying degrees of starch
gelatinization. Tissue microstructure and non-starch components, as well as the
physiochemical properties, could influence the starch digestibility. Not all mechanisms behind
this theory are fully known, but the gelatinization degree of the starch in combination with
changes due to processing will probably be of importance regarding the digestibility of the
starch (Svihus and Hervik, 2016).
The Norwegian government recommends eating at least 500 g of fruit, vegetables, and berries
a day (Melnæs et al.). Even so, these recommendations are not met by the general population.
Smoothies appear to have become an increasingly popular source for the intake of fruits and
berries over the recent years. Studies have suggested that high sugar concentration in
combination with the low fiber content in juice, to be associated with excess weight gain,
metabolic syndrome, and liver injury in kids (Wojcicki and Heyman, 2012). Thus, In
America, it is not recommended to drink more than one glass of 100% fruit juice a day.
Blending of whole fruits in smoothies indicated an increase in the soluble dietary fiber content
by 10%, which may lead to changes of fiber functionality in the gut (Chu et al., 2017). Since
the whole fruit is blended in a smoothie, the same nutrients are present. However, the
processing might disrupt cellular structures which again could change nutrient availability.
13
Public health recommendations claim that refined grains should be replaced by whole grains
in the diet. The protective role of whole grains on the development of type 2 diabetes have
been indicated, and the authors suggest the fiber content to be a major reason (Meyer et al.,
2000). Intake of whole grains is also associated with a reduced risk of several non-
communicable diseases, such as coronary heart disease and metabolic syndrome, as opposed
to refined grains (Aune et al., 2013). Particle size has been discussed in a previous study on
cereals, maize, and rice (Heaton et al., 1988). Where larger food particles were suggested to
have reduced access to enzymes due to a lower surface-to-volume ratio, in addition to the
presence of intact cell walls. Coarser structure in processed carbohydrate rich foods are also
suggested to increase the resistance of starch digestion, leading to increased satiety and
decreased glycemic response (Svihus and Hervik, 2016).
3.1. The cell wall
There is a wide range of cell types and cell wall compositions (Ding et al., 2012). The primary
wall provides sufficient stiffness to the cell but is plastically deformable to allow growth
processes. It has a flexible polymer network, with a matrix of predominantly hemicelluloses,
pectin, and structural proteins. The secondary walls consist of a rigid network of cellulose
fibrils, as well as matrix substances, mainly hemicelluloses, and lignin, which provides
mechanical stability in living and dead cells. Cellulose is synthesized in the plasma membrane
and is composed of β-(1-4)-linked glucan chains, ranging from hundred to tens of thousands
(Wallace and Anderson, 2012). Cell wall pores, also called plasmodesmata, are
communication channels that allow molecules to pass between cells and communication
signals to be transferred between individual plant cells (Maule, 2008).
The middle lamella cements the cell wall of plant cells together and is the outermost layer of
the cell wall in mature plant cells. It consists of predominantly pectin, which forms a
continuous layer between the cells (Hoff and Castro, 1969). During heat treatment, pectic
substances in the cell wall and in the middle lamella degrade (Shomer, 1995). However, in
fried potato chips the middle lamella phase still seems to be intact, even during hydration of
the chips (Dhital et al., 2018). Degradation of the cell wall and middle lamella as a result of
heating is mostly studied in the context of texture and sensory quality (Marle et al., 1997). For
example, the cell wall and the middle lamella of potato tuber is suggested to have a profound

14
effect on its textural properties of the raw tuber and the processed potato tissue (Hoff and
Castro, 1969).
3.2. Gelatinization of starch
In the presence of water and heat, a process occurs where the intermolecular bonds of starch
molecules begin to dissolve (Zobel, 1984). The hydrogen bond sites engage more water, and
the starch granules begin to swell. The amylopectin and amylose molecules are arranged in
crystalline structures, which do not allow water absorption. In amylopectin, the water is
absorbed in the less structurally ordered (amorphous) regions. When heat is applied,
crystalline regions in amylopectin begin to diffuse and the crystalline regions become fewer
and smaller (Awuchi et al., 2019). Water penetration increases the randomness of the starch
granule structure, which causes the swelling. Also, with time, amylose molecules will leak
into the surrounding water as the granule structure disintegrates.
Plant type and amount of water present determines the gelatinization temperature of the
starch, in addition to pH and other ingredients, such as salt and sugar if present (Awuchi et al.,
2019). Damaged starch, typically produced during wheat milling, will in addition swell faster
than intact starch granules. The gelatinization process improves the digestibility of native
starch, which is poorly digestible, by allowing for amylase hydrolysis. Pregelatinized starch or
partially gelatinized starch is commonly used in food manufacturing. The starch becomes
cold-water soluble, making it a functional ingredient able to thicken foods such as soups and
sauces (Awuchi et al., 2019). This pregelatinized starch, could, for instance be produced by
rapid heat treatment by steam and drying or by extrusion, and allows the cooking time of the
product to decrease. Retrogradation is a process where the gelatinized starch starts to
rearrange itself into a more crystalline structure (Morris, 1990). For instance, in boiled or
heat-treated potatoes, some of the gelatinized starch will retrograde if the potatoes are cooled
for a long enough period. This re-crystallization is also the cause of staling in bread. For
potato, changes in starch have been indicated to vary depending on the treatment methods
(Narwojsz et al., 2020). “Dry” heat treatment methods such as grilling or microwaving had in
this study higher content of resistant starch compared to tubers prepared with “wet” methods
such as boiling or steaming. This might be transferrable to other food starches and possibly
indicates that all heat processing methods will not affect starch digestion equally. Studies

15
have indicated the digestibility of the different starch structures to be ordered; native starch <
partially gelatinized starch < retrograded starch < gelatinized starch (Chung et al., 2006,
Lehmann and Robin, 2007).
3.3. Oat
Oats belong to the Poaceae family, also called the Gramineae family, and Avena sativa is the
most important crop among the cultivated oats (Arendt and
Zannini, 2013b).
3.3.1. The structure of the oat kernel
The fruit, called caryopsis or groat is enclosed within the
hull or husk, which make up 30-40% of the total grain
weight (Arendt and Zannini, 2013b). Figure 3.1 gives an
illustration of a longitudinal section of an oat kernel, while
figure 3.2 shows a SEM micrograph of a cross-section of the
oat kernel. Both figures illustrate the oat structure and its
different components. The caryopsis has a similar
appearance to other cereals such as wheat, but the shape is
generally longer and slenderer. The main parts of the
caryopsis consist of bran, endosperm, and germ. The
outermost layer of the endosperm is called the aleurone and the sub aleurone layer, where the
cells are cuboidal (Miller and Fulcher, 2011). These cells have thicker walls compared to the
relatively thin walls of endosperm cells, which also have more of an elongated shape. The
starchy endosperm represents 55 – 70% of the weight and is the primary storage organ of
starch, protein, lipid, and β-glucan. β-glucan is found mainly in the endosperm cell wall
(Arendt and Zannini, 2013b). Two types of starch granule structures can be detected in the
starchy endosperm and is separated into simple starch granules and compound granules
composed of multiple simple granules. Generally, the average size of the starch granules
varies from 3–10 μm. The last compound, the oat germ or the embryo represents
approximately 3% of the total kernel weight. The high amounts of non-starchy
Figure 3.1: Longitudinal section through
an out kernel (Arendt and Zannini,
2013b) (permission asked)

16
polysaccharides in the oat grain can be subdivided into water-soluble (gum, mucilage, pectin,
hemicellulose, beta-glucan, and arbinoxylan) and water-insoluble fractions (mainly lignin),
known as fiber. The total fiber content of the oat caryopsis is determined to be 10.2-12.1%.
Figure 3.2: Cross-section of whole oat grain taken in the SEM showing bran, aleurone layer, sub aleurone layer,
and simple and complex starch granules. Magnification = 600x.
3.3.2. Oat milling
The hull can be removed from the oat kernel with minimal disruption to the kernel since the
hull and kernel are not fused together (Arendt and Zannini, 2013b). This process is called
hulling, and usually, either impact or stone-hulling systems are used. During dehulling the
hulls are chipped off the groat. Groats are then separated based on their physical
characteristics: groat size and weight. Unhulled oats are recycled back to the dehuller.
Further, a heat-treatment called kiln drying is completed to inactivate lipase, lipoxygenase,
and peroxidase systems, to prevent rancidity and bitterness. Moisture and temperature profiles
may vary from mill to mill, but normally in the kilning process, the groat is steamed until the

17
groat temperature is at ~100 °C (Lookhart et al., 1986). Dry heat (>95 °C) is then performed,
normally for over 70 min, to decrease moisture. The caryopsis gets stabilized and a slightly
brown color and a toasted-oat flavor develops in this step (Arendt and Zannini, 2013b). The
temperature treatment, along with the low moisture content will improve quality by reducing
mold and bacterial levels. The groats are separated into small or broken groats and large
groats, and the further treatment differs respectively. To produce instant oat flakes, the
caryopsis is chopped into different sizes with a rotary granulator, which is a revolving
perforated drum with a series of knives mounted outside the lower half. The groats are cut
into two to four pieces depending on the groat size. A tempering process performed with
steam under pressure, adds 3-5% moisture and reduces the groats fragility before flaking. The
steel-cut groats are then flattened between two large rollers, and fast cooking oats, also
referred to as small oat flakes are produced. Premium, also called large oat flakes are
produced similarly, but the large groats are not cut before the tempering and rolling process.
A flow chart of the process is illustrated in figure 3.3.
Figure 3.3: Flow diagram of oat flake processing, after oat intake, precleaning, storage and cleaning (Arendt
and Zannini, 2013b).

18
3.4. Wheat
Similar to oat, the wheat belongs to the
Poaceae family and is considered one of the
most important field crops in the world
(Arendt and Zannini, 2013a). The structure
and composition of bread wheat, T.
aestivarum is shown in Figures 3.4
(illustrated longitudinal section) and 3.5
(SEM micrograph of a cross-section). In dry
matter, the wheat grains contain 2-3% germ,
13-17% bran and 80-85% endosperm. The
whole seed is surrounded by the pericarp,
which is composed of outer epidermis,
hypodermis, cross cells, tube cells, seed coat
and nucellar tissue. The inner starchy
endosperm is enclosed in a single layer of aleurone cells, which is heavy-walled, cube-shaped,
and normally one cell thick in wheat. However, the miller regards the aleurone layer as the
innermost layer of the bran and removes them simultaneously during roller milling. The
wheat embryo or also called the germ has a high concentration of lipids; 16% and the highest
moisture content compared to the other constituents of the grain at maturity. It has poor
stability (include the presence of anti-nutritional factors; raffinose, phytic acid and wheat
germ agglutinin) and is therefore sorted out of flour. The starchy endosperm, occurring as a
solid mass in the kernel center, is composed of three types of cells that vary in size, shape, and
location. Subaleurone cells (adjacent to the aleurone cells), prismatic starchy cells (seven
layers next to the subaleurone cells), and central cells, which are more irregular in regards to
shape and size compared to the aforementioned cell types. Starch and protein are the major
components in the bulk of the endosperm. Starch granules are surrounded by the matrix of
protein, mainly gluten. The endosperm in the wheat kernel (T. aestivarum) consists of 85%
carbohydrates (of which is ~80% starch) measured in wet weight at maturity. The starch is
formed in amyloplasts, with one starch granule per amyloplast. The starch granules in wheat
can be divided into small (spherical) and large (lens-shaped) granules. Wheat starch normally
consists of 25% amylose and 75% amylopectin. The endosperm cell walls in wheat consists of
Figure 3.4: Longitudinal and cross-sections of a wheat
kernel (Arendt and Zannini, 2013a) (permission asked)

19
14-15% protein and 75% non-starch polysaccharides (Toole et al., 2013). The non-starch
polysaccharides consist of 70% arabinoxylan, 20% (1−3) (1−4)-β-D-glucan, 7% is β-
glucomannan and 2% cellulose (Arendt and Zannini, 2013a). Wheat is also a source of fiber,
in which non-starch polysaccharides arabinoxylan, beta-glucan, cellulose and lignin, all cell
wall components, are the most important dietary fiber components.
Figure 3.5: Cross-section of whole wheat taken in the SEM showing bran, aleurone layer and starch granules in
a protein matrix.
3.4.1. Commercial milling
Flour milling is grinding and fractionating of the kernel, and is achieved through a series of
size reduction and separation processes. Yielding the final result with increased palatability
and digestibility (Arendt and Zannini, 2013a). During the production of refined flour, the aim
is to separate the endosperm, bran, and germ. Tempering or conditioning increases the
moisture of the grain and optimizes the separation of the bran from the endosperm during
milling. The bran is removed as large flakes, adhered aleurone cells, and oil-rich germ

20
components during the separation process. This process is carried out with corrugated or
fluted rollers (break rollers), made of iron, rotating in opposite directions at different speeds.
A sifting system distributes endosperm particles ready for further milling. Bran particles are
sorted out as a pure product, and bran particles adhering to the endosperm are transferred to
the next break roll for further separation. Reduction of the particle size of the endosperm
particles is carried out in roller mills with a smooth surface called reduction rolls. Thereafter,
the ground endosperm particles are followed up by a sifting process completed with sieve
boxes with flour cloths with different qualities and pore size. The fractions are then finished,
or transferred to the roller mill for further reduction of the particles. The remaining steps of
flour production consist of milling and sifting of the grain until the desired particle size is
achieved. Whole wheat flour has at least a 95% extraction rate, meaning all of the components
are included. Nonetheless, the inclusion of the germ appears to vary. The bran and germ
separated from the endosperm are then heat-treated to prevent rancidity before being added
back to the endosperm particles. Particle size in flour varies with country, equipment, and the
intended application of the flours.
The water absorption of the flour is among other factors determined by the hardness of the
wheat and the level of damaged starch (Arendt and Zannini, 2013a). Commercial bread wheat
is considered as hard wheat, where the milling of the kernel will result in damaged starch in
the endosperm. The hardness of the wheat is determined by the protein matrix enclosing the
starch granules and the amount of damaged starch is also dependent on the milling process.
Some degree of damaged starch in flours is beneficial for water absorption during baking due
to the release of fermentable sugars exploited by the yeast cells for gas production.
3.4.2. Stone ground milling
Stone grounding of flour is a different milling technique. As opposite to roller milling, the
grain is not water tempered before grounding (Gélinas et al., 2004). The whole kernel is
placed between two millstones, one revolving and one fixed. All the fractions of the kernel are
included in the product (if not sifted out) (Kihlberg et al., 2006). Stone ground flour has
normally bigger particle sizes compared to commercially milled flour, but this property varies
according to the abrasiveness of the stones (Gélinas et al., 2004). The coarse flour includes
both large and fine bran fractions.

21
3.5. Potato
Potato (Solanum tuberosum L.) has an average nutritional composition of 18% carbohydrate,
2% protein, 0.1% lipid and <0.1% minerals and vitamins (Salunkhe and Kadam, 1998, Jarvis
et al., 1981). About 80% of the total solids in potato consists of carbohydrates, mainly starch
(Schwimmer et al., 1954). The cell walls make up about 1-1.5% of the tubers wet weight
(Jarvis et al., 1981). Starch is a carbon reserve in plants and consists of a variety of glucose
polymers which is arranged into starch granules (Martin and Smith, 1995). By chemical
fractionation and electrophoresis, it is suggested that the cell wall contains many molecular
compounds differing in composition (Jarvis et al., 1981). The amount of RG-1 galactan
interacting with cellulose in the potato cell wall is suggested to have an interaction with the
sturdiness of the cell wall and further the resistance against solubilization during heat
treatment (Frost et al., 2016). During heat treatment the potato cells separate as the middle
lamella dissolves, but the starch gelatinizes and remains within the intact structure of the cell
wall (Shomer, 1995, Tian et al., 2016).
Potato can be processed into many different side dishes such as mashed potatoes, French fries,
potato crisps, and potato wedges. Several products can be bought at the store as “fast food”
products, some more processed then others. In the current study, the cellular structure of raw
and boiled potato, as well as homemade and instant mashed potato are studied. Instant mashed
potato powder is normally produced according to the description shown in figure 3.6.
Figure 3.6: Flow chart diagram of the production line of instant mashed potato powder/flakes.
Boiling of potatoesAddition of
additives
Mashing and transfeering mash
to roll drier
Drying of large flakes/sheets
Grinding of flakes to correct size
Storage in siloes
Packaging

22
Compared to homemade mashed potato, which is usually made by boiling potatoes and
mashing them with butter and/or other ingredients, the instant mashed potato undergoes a
higher degree of processing.
3.6. Banana
Banana (Musa acuminate) is a tropical crop consumed worldwide (Rongkaumpan et al.,
2019). Banana cells generally have an elongated shape, even though the shape and size vary.
Cell separation occurs easily under mild mechanical stress, but the cells are apparently not as
easily ruptured when compared to spherical mango cells. Fruit cell walls are relatively thinner
compared to those in legumes and nuts, but appear resilient. During ripening the cell wall and
middle lamellae disassembles, resulting in separation of the cells. It is suggested that banana
cells have a weak middle lamella, but a stronger primary wall, and seems to retain aggregated
material on the surface. The aggregated materials on the surface mask fibrous structures and
are presumed to be insolubilized middle lamella remnants from cell separation. Bananas have
a reported total dietary fiber content of 1.79%.
3.7. Cellularity and access to nutrients
Cell wall structures act as natural barriers to enzymatic digestion of the cellular contents, as
the natural structures encapsulate the macronutrients (Tian et al., 2016, Grundy et al., 2016a).
Due to fibrous cell walls, the content of plant cells is less available for absorption in the small
intestine. In order to hydrolyze starch in the digestive system, a group of enzymes called
amylases must gain access (Rogers, 2010). The digestive process starts in the mouth where
salivary α-amylase is excreted and the mastication process is necessary for amylase to
penetrate the food bolus. α-amylase hydrolyzes α-1,4 glycosidic linkages in starch starting in
the mouth and continues after the food has reached the stomach. In the stomach, gastric acid
inactivates α-amylase when completely penetrated the bolus. At the time when the bolus
reaches the duodenum, pancreatic amylase continues the degradation of complex
polysaccharides into simple polysaccharides, which is absorbable through the enterocytes.
Reduced access to enzymes and a higher degree of cellularity is suggested to change the
23
digestion and uptake from the enterocytes, as well as providing the small intestinal microbiota
with other nutrients (Zinöcker and Lindseth, 2018).
The cell wall structure or the cell wall intactness in foods will influence nutrient digestion and
availability (Chu et al., 2017). Ruptured cells will release nutrients along the small intestine,
while some of the cellular nutrients will not be released and pass straight through (Grundy et
al., 2016b, Noah et al., 1998). Studies suggest that fruit and vegetable functionality in the gut
are affected by the intactness of the cellular structures (Chu et al., 2017). As of today, studies
on cellular structures have focused mainly on foods with relatively thick and rigid cell walls,
such as legumes and nuts (Berg et al., 2012). In legumes, amylase could not penetrate intact
cells, but when applied mechanical force, the cell wall was damaged and the starch became
accessible to amylase (Dhital et al., 2016, Brummer et al., 2015). Intact cells after thermal
treatment were isolated, which indicates that thermal treatment alone may not be sufficient to
damage the cell wall. It has also been suggested that the intactness of the cell wall structure
regulate the rate of lipolysis in nuts (Ellis et al., 2004).
3.8. Cellular structure and glycemic index
Glycemic index has been emphasized as an important factor regarding healthy eating habits,
especially in the context of diabetes and obesity. Glycemic responses to different starch-rich
foods have been studied widely, and glycemic indexes have been investigated for several food
groups. The availability of the starch to amylase for digestion and further absorption in the
small intestine seems to be one of the major factors for differences in glycemic response
(Edwards et al., 2015).
A study was conducted with porridge made from finely milled flour (<0.2 mm) and coarsely
milled macroparticles (~2 mm) on metabolic responses in healthy participants with
ileostomies (Edwards et al., 2015). The results indicated lower blood glucose and insulin after
consumption of porridge with coarse macroparticles compared with the responses after
consumption of the smooth porridge. Imaging of the cell structure in the study showed intact
cell structures in the coarse macroparticles and no intact cell structures in the finely milled
flour. A study performed on wheat, maize and oat suggested that particle size of wheat and
maize influenced digestion rate and metabolic effects, where higher glucose and insulin
responses were correlated with smaller particle sizes (Heaton et al., 1988). This study seems

24
to be in line with another study performed on finger millet flour, where commercial milling
and stone ground milling were compared (Jayasinghe et al., 2013). The authors of this study
concluded with differences in particle size was the major contributor to the higher GI of foods
made with commercially milled flour compared to stone ground flour. In the study,
micrographs of the two flours were taken, but the cells structure was not clear and neither
commented on.
For potato, the glycemic index has been calculated for different cooking methods in different
studies (Eisenhauer, 2007). The mean values of the calculated glycemic indexes were reported
from lowest to highest respectively to peeled and boiled potato, frozen French fried, mashed
potatoes, potato baked without fat, microwaved potato, and instant mashed potatoes. High GI
in foods are considered to have values ≥ 70, whereas mashed, instant mashed, baked potato
without fat and microwaved potato reputedly exceeded this limit. However, the potato species
appeared to have an influence on GI in Eisenhauers review of the different studies.
The cell structure in foods is suggested to influence nutrient digestion and availability (Chu et
al., 2017). Akilen suggested that postprandial satiety and gut hormone response of different
carbohydrate rich foods does not follow the glycemic index (Akilen et al., 2016). In their
study on the effect of ad libitum potatoes and other carbohydrate side dishes in children,
boiled mashed potatoes eaten with meat resulted in ~40% lower energy intake due to higher
satiety compared with baked French fries, pasta, and rice. The results of a study in adult men
suggested 31% and 23% lower energy intake from a potato meal along with 150 g of meat
compared with pasta and rice meals respectively, due to higher satiety (Erdmann et al., 2007).
3.9. Cell wall intactness and microbiota
Plant cell walls can hinder the digestive enzyme action, and the nutrients will then be
fermented in the large intestine (Dhital et al., 2016). The resident microbiota can then release
the cell contents and utilize it as nutrition and energy. All plant cells are not similar in regards
to the cell wall structure and cell content. Rongkaumpan mentioned mango cell walls to be
more fragile compared to banana cell walls, which led to more intact banana cells fermenting
in the large intestine (Rongkaumpan et al., 2019). In the large intestine, fiber degrading
bacteria will hydrolyze the cell walls of intact cells and its content will then become available.
The composition of the microbiota is suggested to rapidly change upon dietary changes

25
(David et al., 2014). Negative changes in the composition of the microbiota is further
suggested to possibly lead to inflammation and metabolic disturbances in humans, as shown
in mouse studies (Turnbaugh et al., 2008). Acellular nutrients might provide enterocytes and
microbial cells more easily digestible substrates, and is as mentioned hypothesized to
influence bacterial growth adversely with regards to human health (Spreadbury, 2012). The
increase in nutrient availability from acellular foods, compared to cellular foods in the diet is
suggested to be one of the decisive factors for the microbiota-mediated effects in the small
intestine (Zinöcker and Lindseth, 2018). Whereas the favoring growth of fiber-degrading
bacteria in the large intestine might be one of the explanations for the protective effects from
cellular foods seen in the paleolithic diet in regards to positive health outcomes.
3.10. Microscopy
Light microscopy gives transmission of the light from the light source to the specimen and
objective, where the magnification can be selected on coveted details (Chandler and
Roberson, 2009). In the Light microscope (LM), a magnified image is produced through a
series of glass lenses with a light source over and beneath the sample. Samples imaged in the
LM should be thin, preferably 1-100 μm, for the light beneath the sample to shine through and
give a clear image of the structures of the sample. Confocal scanning light microscope
(CLSM) provides optical laser sectioning of the sample and allows visualization of the cell
structures throughout the sample by visualizing a 3D-image of the structure. A fluorescence
microscope with a confocal lens gives the ability to produce in-focus images from selected
depths, by changing the focus and if desired stacking of images with a different focus. A
fluorochrome must be added to the sample as staining before imaging and makes it possible to
easily identify different stained structures in the sample. Samples imaged in the CLSM can be
thicker compared to ones imaged in the LM, due to the selected depth of focus. Scanning
electron microscope (SEM) provides scanning of the surface of a sample, using a beam of
electrodes with selected focus. The system is under vacuum, where the electrons in the beam
interact with the atoms in the sample, and signals containing information about the surface
topography is produced. Samples observed in the SEM must be able to undergo the high
vacuum, which demands the sample to be free of water. Water containing samples must,
therefore, be prepared by fixation, dehydration, drying, and conductivity. Often samples are
coated with gold palladium by using a sputter coater. The different microscopes presented,

26
gives different information about samples and requires different sample preparation.
Depending on the sample and desired information, different techniques might be more
beneficial.
3.10.1. Stains
Identifying structures in cells during microscopy can be challenging without any indicator.
Usually stains or fluorochromes that bind to specific components in the sample are used to
identify, confirm, and give a better resolution of the structure.
Multiple dyes which binds to various polysaccharide types exists, where Calcofluor white,
ruthenium red, Aniline blue, and Congo red appears to be most often used as imaging tools
for cell walls in plants (Wallace and Anderson, 2012). Anderson et al. report Calcofluor white
to be the most promising stain for Arabidopsis root, due to increased fluorescence when
cellulose and xyloglucan were present (Anderson et al., 2010). Calcofluor white binds to β-(1-
3)- and β-(1-4)-polysaccharides on cellulose and chitin, and are fluorescent when exposed to
UV-light. The fluorescence stain has been used for both banana cells and potato cells in
previous research (Tian et al., 2016 2018, Rongkaumpan, 2019). Calcofluor white
fluorescents in the presence of (1-3)-β-glucans, which is found in the cell walls in the
endosperm of wheat and oat (Arendt and Zannini, 2013a, Arendt and Zannini, 2013b).
Therefore, the stain can also be used to stain cell walls in products such as flour, bread, and
oatmeal, though this method was not found in any other studies. Congo red stains cellulose
and is often used to quantify cellulase content in plant cells (Kerstens and Verbelen, 2002).
Congo red binds to cellulose fibrils and allows for visualization of cell structures, but
demands polarized lights in a confocal microscope to fluorescence. For staining of starch,
iodine potassium solution is frequently used (Parker et al., 2008). Iodine potassium solution
form a complex with amylose and stains starch and starch granules dark blue or black.
Staining of starch in samples gives the ability to differentiate the position of the starch in
relation to the cell.

27
4. Materials and methods
4.1. Plant materials and processing
“Beate” is the most sold potato in Norway, and was therefore chosen as the investigated
potato tuber in the current study (Bama.no, 2020). The consistency is firm, and the potato
tuber has a low degree of mealiness. Raw, boiled and homemade mashed potato samples was
taken from the same package bought at a local grocery store. The homemade mashed potato
was made by boiling two potatoes with skin, peeling and mashing them with a kitchen fork. A
small amount of water was added during mashing. The masticated boiled potato samples were
prepared by chewing a medium piece of boiled potato for approximately 20 chews, with a
duration of 15 seconds. Determination of the number of chews was based on when the bolus
felt ready to swallow. The samples were prepared and imaged microscopically directly after
processing.
For the powdered mashed potato sample, “Mills original mashed potato” with 98% potatoes
was used (unspecified species, Norway), bought at a local grocery store. Other ingredients
listed were natural aroma, emulsifier, stabilator, antioxidants, sunflower oil, salt, citric acid
and sugar. The instant mashed potato was made following the description on the package,
except only water was added. The production method of instant mashed potato is described in
the theory section. Bananas were bought at the local grocery store (Musa acuminata,
Colombia) the same day as the sample preparation. Degree of maturity was considered as
stage 5 for all the bananas used in the current study (Madan et al., 2014). The banana
smoothies were made by mixing 50 g banana and 50ml water in a smoothie blender (Kulz
KUPB10BL Sports blender, Power) for 15 and 30 seconds. The masticated banana samples
were prepared by chewing a normal bite-size piece of banana for 20 chews until the bolus felt
ready to swallow.
Instant and large oat flakes of the brand Axa (unspecified species), was bought at the local
grocery store. Both kinds were swollen in cold water for 15 minutes and microwaved (44-
1561, Clas Ohlson`s own brand) at maximum strength (700 W) for 2 minutes with a ratio of
1:10 oats to water. Two oat bread was made, one with instant oats and one with premium oat
flakes. They were both made by blending 80 g oat flakes with 100 ml water, 1 teaspoon
baking soda and 0.5 teaspoon salt. The mixture was smeared to a baking sheet with

28
approximately 1.5 cm thickness and oven baked at 200 °C for 13 minutes. The production
methods of small and large oat flakes are described in the theory section.
Both standard roller mill ground and stone grounded wheat flours were bought at Meny in
Ski, Norway. The studied flours were whole wheat flour fine ground (mix of Mirakel, Ozon,
Kuban, Magnifico produced in Norway and 15% unspecified import from Poland, Møllerens)
and refined wheat flour (mix of Zebra, Krabat, Ozon, Kuban and Magnifik produced in
Norway, Møllerens), whole wheat fine stone grounded flour (Mirakel, produced in Norway,
Holli mølle) and stone grounded sifted/refined wheat flour (unspecified species, Kvelde
mølle). One small bread was made with each of the different wheat flours. Bread samples
were made by blending 250 g flour with 150 ml water (37 °C), 7 g dry yeast and 0.5 teaspoon
salt and blended by hand for approximately 5 minutes. The dough was leavened for 1 hour
before it was shaped into a round shape and leavened again for 30 minutes. All of the bread
was baked at 200 °C for 25 minutes. Whole wheat grains (Mix of Mrakel, Ozon, Kuban,
Magnifico produced in Norway, Møllerens) were bought at Rema 1000 in Ås, Norway.
Whole oat grains (Mix of Kerstin, Galant and Sol, produced in Sweden, Saltå kvern) were
bought at a local health store. The production methods of standard roller milled flours and
stone grounded flours are described in the theory section.
4.2. Sample preparation SEM
Raw potato, boiled potato, fresh banana, dry oats, oats swollen in cold water, boiled oats and
flours were imaged in the SEM. For the raw potato sample, potato at room temperature was
peeled and a sample of approximately 2*2*2 mm was cut out 0.5 cm from the surface with a
razor blade. The boiled potato sample was cut into a sample of approximately 2*2 mm. The
oat flakes were imaged as a cross-section made by breaking the oat flakes by hand after SEM-
preparations described in the next paragraph. Whole wheat and oat grains were cut in
longitudinal and cross-sections with a razor blade by hand. The flours and the whole grain
sections from wheat and oat were added directly to the SEM specific sample holders (stubs)
before coating and imaged in the SEM.
All samples mentioned in the paragraph above, except dry flour and dry oat flakes were put in
a fixation liquid of 1.25% glutaraldehyde and 2% formaldehyde in a 0,1 M buffer pH 7.4. The
samples were left overnight before the liquid fix were washed of and replaced with a 0.1 M

29
pipes buffer solution (3*15 minutes). The samples were dehydrated by replacing the liquid
with increasing concentration with ethanol (30%, 50%, 70%, 90%, 96% and 3*100%, 15
minutes each step). The dehydrated samples were then placed in the critical point dryer (CPD
030), which dried the samples without damaging the structure.
All samples were placed on (stubs and coated with gold palladium 100 seconds*2 in the
sputter coater (SC7640 auto/manuel high resolution).
4.3. Sample preparation LM and stereo microscope
The sample preparation was repeated for three parallels, three samples per parallel.
A section (1 cm*0.5 cm*0.5 cm) was cut from both raw and boiled potato and sectioned with
a vibratome (Leica VT1200S). The sections were 10 μm. Fresh banana samples were
sectioned with the same vibratome and the sections were 10 μm. The whole grains were
soaked in cold water for one hour before sectioned longitudinal with a razor blade by hand,
approximately 100 μm. The flours, masticated potato and banana, mashed potato and banana
smoothie were added in small amounts directly to the slides by using a pipette or tweezers.
All samples were transferred to polylysine coated microscope slides (Superfrost, Fischer
scientific) and added one drop of Calcofluor white stain (18909, Sigma Aldrich) and one drop
of 10% Potassium hydroxide (221473, Sigma Aldrich) directly on the slides for cellulose
fluorescent staining. For cellulose staining without fluorescent the samples were added one
drop of Congo red, amyloid stain (HT60-1KT, Sigma Aldrich) directly on the slides. Identical
samples were added one drop of Potassium iodine solution (3D-118, Waldeck) to stain starch
granules. The sections of the whole grains and the flour were only stained with Calcofluor
white and potassium hydroxide after transferred to the slides.
4.4. Sample preparation CLSM
Two samples per bread were cut out with a razor blade (2 cm*0.5 cm*0.5 cm) from two
different places (crust not included) and stained with Calcofluor white and potassium
hydroxide and potassium hydroxide before imaged in the CLSM.

30
4.5. Microscopy
Microscopy was completed at the Imaging Center in Ås, Norway.
4.5.1. SEM
The SEM (Zeizz EVO50) used in the current study
is shown in figure 4.1. Micrographs were taken at
different magnifications, but mostly 312x
magnification for overview imaging and 1040x
magnification for cellular close up.
4.5.2. Light microscopy and stereo
microscopy
All stained samples were imaged in a light
microscope (Leica DM6B), shown in figure
4.2. Micrographs were taken at bright field at
25x, 100x and 200x magnification, except
samples stained with Calcofluor white and
potassium hydroxide which was imaged with
ultraviolet light (UVG LIGHT filter cube with
excitation wavelength: 395-415 nm, emission
wavelength: 500-550 nm). The whole grain
sections were also imaged in the stereo
microscope (ZEIZZ AXIO Zoom.V16) for
imaging of the whole longitudinal grain
section.
4.5.3. CLSM
All bread samples were imaged in the
confocal microscope (Leica TCS SP 5),
shown in figure 4.3. The mission ranged from
440 nm to 510 nm and the excitation ranged
from 405 nm. Micrographs were taken at
100x and 200x magnification.
Figure 4.2: Leica DM6B light microscope (NMBU,
2020)
Figure 4.1: Zeiss EVO50 EP Scanning electron
microscope (NMBU, 2020)
Figure 4.3: LEICA TCS SP 5 Confocal laser scanning
microscope (NMBU, 2020)

31
4.6. Quantification of intact cells
Samples of boiled potato, masticated boiled potato, homemade mashed potato, instant mashed
potato, masticated banana, banana smoothie blended for 15 seconds, and banana smoothie
blended for 30 seconds stained with Calcofluor white and potassium hydroxide were used for
quantification of intact cells. Micrographs with samples stained with potassium iodine
solution were used for quantification of masticated boiled potato. Micrographs from 3*3
parallels (3 sample preparations and 3 samples per sample preparation) were used for
analyzing. Micrographs were taken systematically throughout the whole sample, from left
sample edge to right. However, it was not possible to determine whether the structure of some
cells was intact due to overlap, poor focus or other reasons. Only micrographs taken at
magnification 100x or higher were used in the quantification. In some samples, clusters of
cells were identified which was counted and analyzed with greatest effort. Overlap of two or
more individual cells could not be identified as intact or not, due to difficulties in
determination of the cell wall intactness. However, clusters of cells gave in some micrograph
clear information about the cell structure and could therefore be included in the quantification.
Observations during microscopy were taken into consideration during the determination of the
micrographs. The cell structure was classified as intact, destroyed (cells clearly ripped or
missing a piece of the cell wall), perforated or possibly perforated. The percentage of intact
cells was calculated from the total number cells counted using Excel. From the micrographs,
as many cells as possible were counted. From the boiled samples, fewer cells were possible to
quantify, due to the overlapping of cells in the micrographs.
4.7. Choosing of micrographs presented in the thesis
Selected micrographs were chosen to illustrate what was identified during microscopy.
However, the micrographs were taken by scanning over the surface of the samples, and the
selected micrographs in the results section might not be from the exact same structures in oat
flakes, oat bread, and wheat flour bread. Oat, wheat, banana, and potato have different cell
structures and texture, especially after different processing methods. A single microscopy
method was therefore not selected for all of the different samples in the results section, but
rather the most beneficial was chosen to get informative micrographs of the cell structure. The

32
micrographs chosen in the results gave relevant information about the observed structures
during microscopy. The micrographs alone should not be used to compare the cellular
structures in foods, but are included to illustrate observations during microscopy.

33
5. Results
All micrographs taken during microscopy are not shown in this results chapter. The
micrographs selected appeared to give relevant information about cell structure. Results in the
format of micrographs are shown for each food separately. Results from the quantification of
intact cells are shown at the end.
5.1. Oat
Micrographs of whole oat, dry oat flakes, cold swollen oat flakes, and boiled oat flakes will be
presented in separate sections below.
5.1.1. Whole oat
The micrograph of a longitudinal section of whole oat grain is presented in figure 5.1. Cellular
structure was observed throughout the whole sample, as shown in the magnified section of the
original micrograph.
Figure 5.1: Micrograph of a longitudinal cross-section from a whole oat grain stained with Calcofluor white
from the stereo microscope.

34
5.1.2. Dry oat flakes
Micrographs of cross-sections of dry fast cooking and premium oat flakes are shown in
Figures 5.3-5.6. Only cell wall fractures were identified in the prepared samples, no intact
cellular structures were observed. Starch granules appeared intact and were identified as
simple starch granules and compound granules typical of oat. Simple and compound granules
composed of multiple simple granules are presented as an SEM micrograph in figure 5.2,
along with small cell wall fractures. The starchy endosperm is centered in all micrographs
shown of dry oat flakes.
Figure 5.2: Micrograph of small and large starch granules from a cross-section of a dry fast cooking oat flake
from the SEM.

35
Figure 5.3: Micrograph of a cross-section from a dry fast cooking oat flake from the SEM.
Figures 5.3 and 5.4, both showing micrographs of dry oat flakes at different magnifications,
gives an illustration of the starch and cell wall structure. At 312x magnification, a high
concentration of starch granules meets the eye, with no clear division by cell walls. At 1040x
magnification in figure 5.4, cell wall structures are present and divide the starch somewhat
into more cellular structures. However, the extent of cellular structures seen in figure 5.4, was
not regularly detected while scanning over the whole samples. In some areas large cell wall
structures were identified, in other areas only small fractures were present.

36
Figure 5.4: Micrograph of a cross-section from a dry fast cooking oat flake from the SEM.
The structures identified in fast cooking oat flakes were also identified for premium oat flakes
in a dry state. Figure 5.6 showing a micrograph of a premium dry oat flake was taken in an
area without cell wall fractures present. However, while scanning the surface cell wall,
structures as seen in fast cooking oat flakes was identified. There were not detected any
notably differences of the structures between small and large oat flakes.

37
Figure 5.5: Micrograph of a cross-section from a dry premium oat flake from the SEM.

38
Figure 5.6: Micrograph of a cross-section from a dry premium oat flake from the SEM.

39
5.1.3. Cold swollen oat flakes
Micrographs of cold swollen fast cooking and premium oat flakes are shown in Figures 5.7-
5.10. Only cell wall fractures were identified in the prepared samples, with no visible intact
cellular structures, except from partial intactness of the aleurone layer. Starch granules
appeared intact and were identified as small and compound granules composed of multiple
simple granules similar in shape and size to the ones found in dry oat flakes. In Figures 5.7
and 5.8, the aleurone layer and the surface of the oat flake is visible. In Figures 5.9 and 5.10,
the starchy endosperm is centered.
Figure 5.7: Micrograph of a cold swollen fast cooking oat flake from the SEM.

40
Figure 5.8: Micrograph of a cold swollen fast cooking oat flake from the SEM.
Compared to the dry oat flakes, no or very little differences were detected. The starch
granules were identified with the same shape and size as in dry oat flakes. In Figures 5.7 and
5.8 the aleurone layer is centered to illustrate the steady structures in these oat components.
This steady aleurone layer was also identified in the dry oat flakes. The subaleurone layer was
not clearly identified in either dry or cold swollen oat flakes. In figure 5.8, some of the starch
appears disrupted, which was most likely due to flattening of the swollen starch by the racer
blade, before dehydrating and coating.

41
Figure 5.9: Micrograph of a cold swollen premium oat flake from the SEM.

42
Figure 5.10: Micrograph of a cold swollen premium oat flake from the SEM.
In figure 5.10, small and compound starch granules, along with cell wall fractions are visible.
Similar to dry oat flakes, the cell wall fractions are hard to identify at 312x magnification, as
shown in figure 5.9. At 1040x magnification, cell wall fractions are clearly present, as shown
in figure 5.10. Differences between cold swollen fast cooking and premium oat flakes was not
detected.
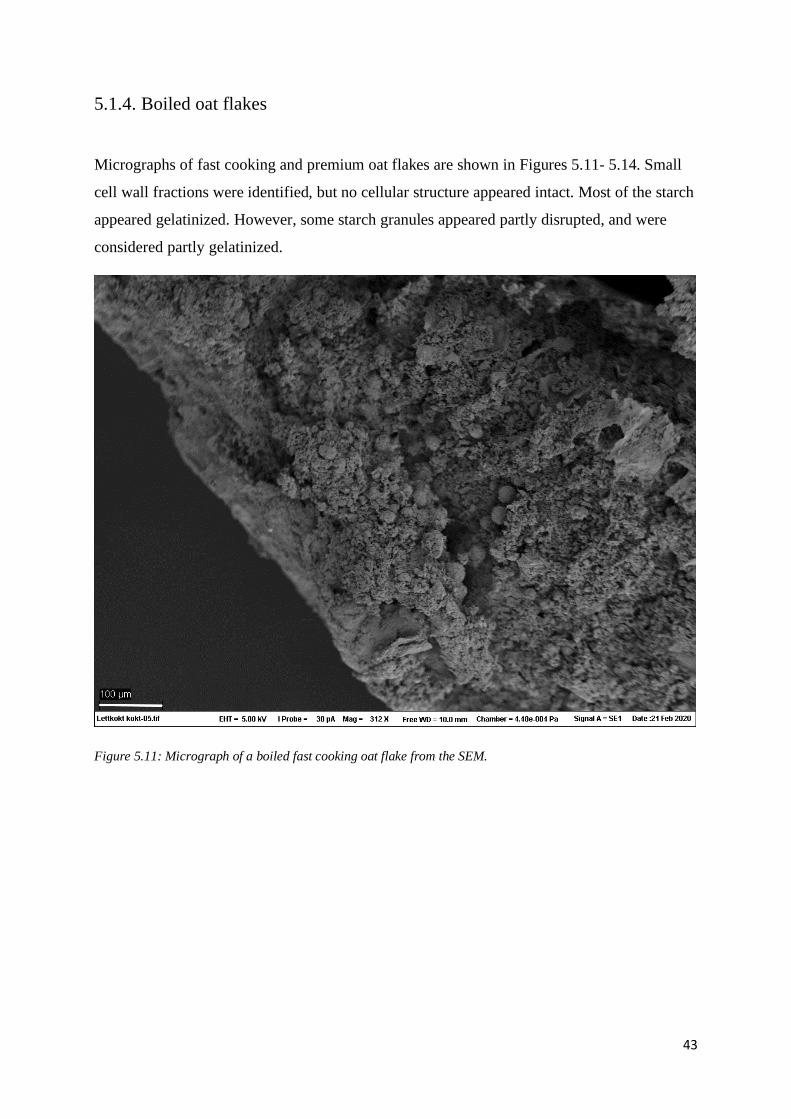
43
5.1.4. Boiled oat flakes
Micrographs of fast cooking and premium oat flakes are shown in Figures 5.11- 5.14. Small
cell wall fractions were identified, but no cellular structure appeared intact. Most of the starch
appeared gelatinized. However, some starch granules appeared partly disrupted, and were
considered partly gelatinized.
Figure 5.11: Micrograph of a boiled fast cooking oat flake from the SEM.

44
Figure 5.12: Micrograph of a boiled fast cooking oat flake from the SEM.
In Figures 5.11 and 5.12, where fast cooking boiled oat flakes are presented with different
magnifications, the small starch granules were gelatinized. However, the compound granules
composed of multiple simple granules were partly gelatinized, with changed structures
compared to ones identified in dry and cold swollen oat flakes. No intact cell wall structures
were identified. However, there were areas as shown in figure 5.13 where cell wall structures
were clearly visible. Nevertheless, these areas were not observed frequently, and the cell
structure was not identified as intact.

45
Figure 5.13: Micrograph of a boiled premium oat flake from the SEM.

46
Figure 5.14: Micrograph of a boiled premium oat flake from the SEM.
No clear differences were identified between fast cooking and premium boiled oat flakes. In
figure 5.13 and 5.14 large cell wall fractions are visible, and starch granules are either fully or
partly gelatinized.

47
5.1.5. Oat bread
Micrographs of oat bread made with fast cooking and premium oat flakes are shown in
Figures 5.15 and 5.16 respectively.
Figure 5.15: Micrographs of an oat bread made with fast cooking oat flakes from the CLSM. Magnification =
100x. “Alu” indicates the aleurone layer.

48
Figure 5.16: Micrographs of a oat bread made with premium oat flakes from the CLSM. Magnification = 100.
“Alu” indicates the aleurone layer and “Endo” indicates inner endosperm.
Fractions of bran and intact aleurone layer were identified in both oat bread, while the inner
part of the endosperm appeared to have no intact cells. Cell wall fractures from the inner part
of the endosperm was seen within the aleurone layer, as well as surrounding the structures.
However, these structures were identified as very small. When comparing the bread made
with fast cooking oat flakes with the bread made with premium oat flakes, the bread made
with premium oat flakes appeared to have larger fractions of coherent aleurone cells.
Presented micrographs gives no information about the starch granule intactness or
gelatinization degree.

49
5.2. Wheat
Micrographs of whole wheat, wheat flour, and wheat flour bread are presented in separate
sections below.
5.2.1. Whole wheat
Figures 5.17-5.19 all show micrographs of longitudinal sections of whole wheat grain. As
calcofluor binds to the fiber structures, as cellulose in the cell wall, the thickness of the cell
walls will influence the strength of the color. In Figures 5.17 and 5.18, stronger colors are
present in the aleurone and sub-aleurone layers of the grain. However, cellular structures or
division was observed in the endosperm as well. In figure 5.19, the cellular structure of the
endosperm with intact starch granules in the LM is presented.
Figure 5.17: Micrograph of a longitudinal section from a whole wheat grain stained with Calcofluor white from
the stereo microscope.

50
Figure 5.18: Micrograph of a longitudinal section from a whole wheat grain stained with Calcofluor white from
the LM with UVG-light, showing the bran, aleurone layer, and the starchy endosperm. Magnification = 100x

51
Figure 5.19: Micrograph of a longitudinal cross-section from unstained a whole wheat grain from the LM with
dark field applied, showing starch granules within endosperm cells. Magnification = 100x.
5.2. Wheat flours
Micrographs of standard roller mill ground wheat flour (refined and whole wheat flour) and
stone ground wheat flour (refined and whole wheat flour) are shown in figure 5.20. Cell wall
fractions were identified in all samples as small dots, while larger particles were identified as
bran particles. No intact cell structure was identified in neither of the flours. The micrographs
show no information about the starch.

52
Figure 5.20: Micrographs of flours stained with Calcofluor white from the LM. The micrographs shows
standard roller milled refined wheat flour (A), standard roller milled whole wheat flour (B), stone ground
refined wheat flour (C), and stone ground whole wheat flour (D). Magnification = 100x.
Imaging the samples in the microscope, there were clear differences in particle size. All of the
samples contained small cell fractures as seen in standard roller milled refined flour (figure
5.20A), but the other samples also contained larger particles. The standard roller milled whole
wheat flour contained larger particles than the refined standard roller milled flour, identified
as bran fractions. The fractions of the bran were all somewhat similar in size, not exceeding
~100 μm. In both of the stone ground flours larger particles were observed, frequently
exceeding 200 μm. Both fractions of the aleurone layer and bran fractions were identified in
both. However, larger particles in the stone ground refined wheat flour were less frequently
identified compared to the stone ground whole wheat flour.

53
5.3. Wheat bread
Four different bread was baked, one of each flour mentioned above. Micrographs of bread
baked with refined and whole standard roller mill ground wheat flour, and refined and whole
stone ground wheat flour are shown in figure 5.21.
Figure 5.21: Micrographs of wheat bread stained with Calcofluor white from the CLSM. The micrographs
shows bread of A: standard roller milled refined wheat flour, B: stone ground refined wheat flour, C: standard
roller milled whole wheat flour, and D: stone ground whole wheat flour. Magnification = 100x, scale bar = 250
μm.

54
Stained fiber structures fluoresce during microscopy; hence the micrographs show no
information about the starch. Only cell wall fractions appeared as present in the bread made
with standard roller milled refined wheat flour. No cellular intactness was identified, and the
particles identified were small as shown in figure 5.20A. In the bread made with stone ground
refined wheat flour some larger particles were identified, which also appeared in figure 5.20C.
Fractions of intact aleurone layer and bran were identified in both whole wheat bread.
However, no intact endosperm cells were identified in these bread.

55
5.3. Potato
Micrographs of raw and boiled potato and homemade and instant mashed potatoes are shown
separately below.
5.3.1. Raw and boiled potato
SEM micrographs of raw and boiled potato are shown in Figures 5.22-5.25. Clear and intact
cell structures were identified in both raw and boiled potato samples. In raw potato, intact
starch granules were identified within the cells with the shape of slightly oblong spheres. In
boiled potato, gelatinized starch was identified within a ruptured cell. The majority of the
cells were identified as intact, and the seldom cell destruction was probably caused from
mechanical treatment during microtomy.
Figure 5.22: Micrograph of a cross-section from a raw potato from the SEM.
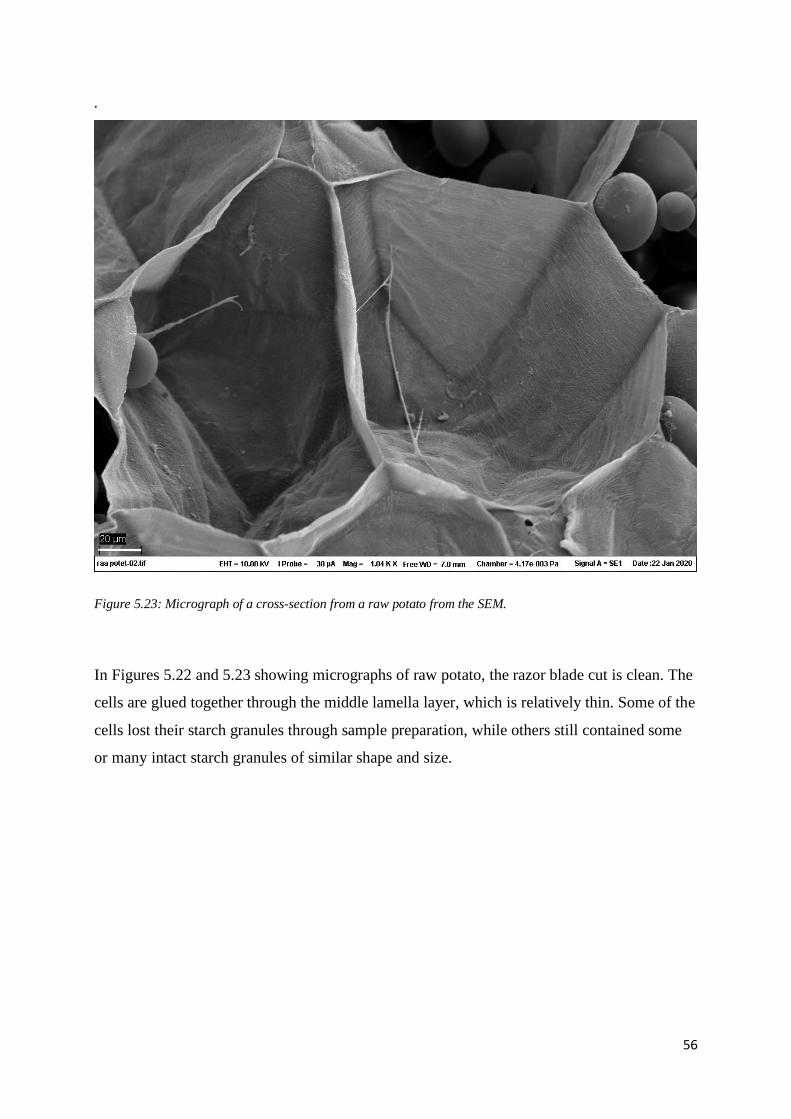
56
.
Figure 5.23: Micrograph of a cross-section from a raw potato from the SEM.
In Figures 5.22 and 5.23 showing micrographs of raw potato, the razor blade cut is clean. The
cells are glued together through the middle lamella layer, which is relatively thin. Some of the
cells lost their starch granules through sample preparation, while others still contained some
or many intact starch granules of similar shape and size.

57
Figure 5.24: Micrograph of a cross-section from a boiled potato from the SEM.

58
Figure 5.25: Micrograph of a cross-section from a boiled potato from the SEM.
Some dissolving of the middle lamella was observed in the boiled potato, as shown in Figures
5.24 and 5.25. The cell walls appeared more wrinkled in the boiled potato samples compared
to the raw potato samples. As shown in figure 5.25, the starch appeared fully gelatinized
inside the cell structures.
Micrographs of raw and boiled potato stained with potassium iodine solution are shown in
Figures 5.26 and 5.27 respectively. Intact cellular structures were identified in both raw and
boiled potato, equally to the SEM micrographs. Intact starch granules were identified inside
the cell structure in raw potato, while it was gelatinized within the cell wall in the boiled
potato sample. The LM micrographs compliment the SEM micrographs and were included to
show different microscopically appearances of the potato cells.

59
Figure 5.26: Micrograph of a raw potato section stained with potassium iodine solution from the LM with bright
field. Magnification = 200x.

60
Figure 5.27: Micrograph of a boiled potato section stained with potassium iodine solution from the LM with
bright field. Magnification = 200x.
5.3.2. Masticated boiled potato
Several micrographs of masticated boiled potato samples with different staining are included
in this section. In the SEM micrographs of boiled potato shown in Figures 5.28 and 5.29,
wrinkled cells were identified. However, the cell content appeared to be located inside the
cells. The cell wall structure was identified as intact for the majority of the cells, but wrinkles
was clearly visible.
Samples stained with potassium iodine solution showed dark purple colored cells which
indicates starch inside the cells. However, also colorless cells was identified, which imply that
the cells most probably lost their starch content to the surroundings. Micrograph of masticated
boiled potato cells stained with potassium iodine solution is shown in figure 5.30.

61
Figure 5.28: Micrograph of a masticated boiled potato sample stained with Calcofluor white from the LM with
UVG light. Magnification = 100x.

62
Figure 5.29: Micrograph of a masticated boiled potato sample stained with Congo red from the LM with bright
field. Magnification = 25x.
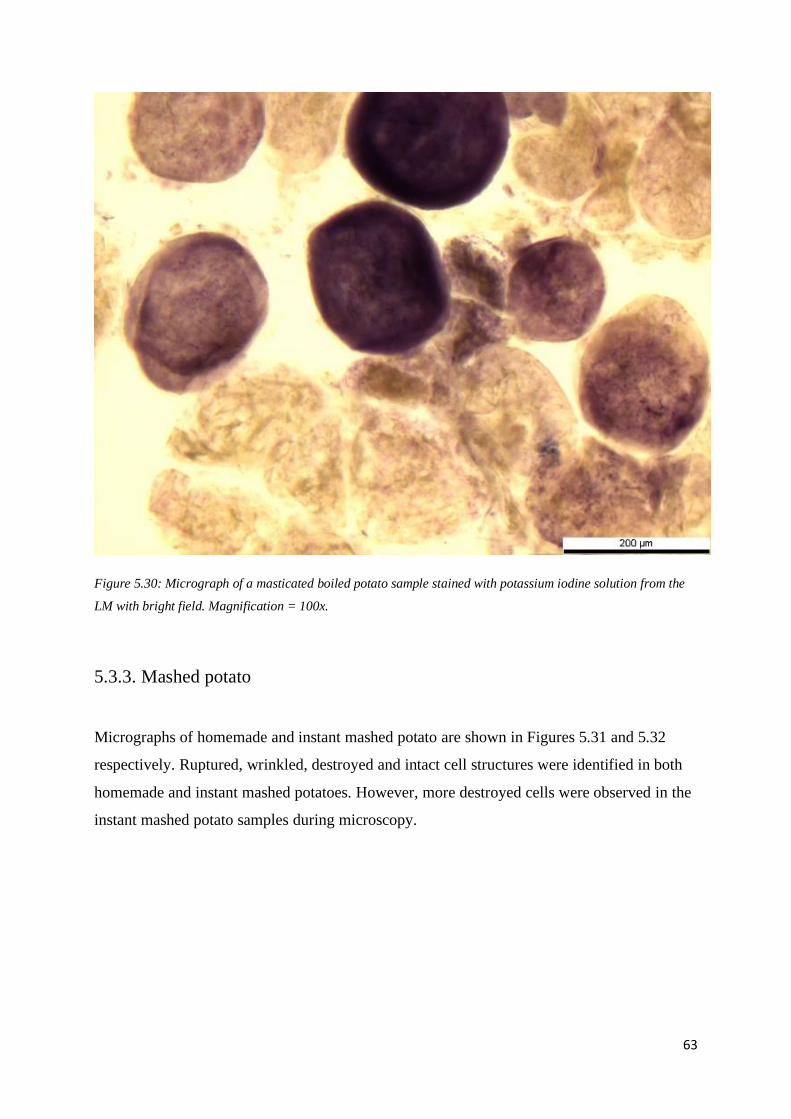
63
Figure 5.30: Micrograph of a masticated boiled potato sample stained with potassium iodine solution from the
LM with bright field. Magnification = 100x.
5.3.3. Mashed potato
Micrographs of homemade and instant mashed potato are shown in Figures 5.31 and 5.32
respectively. Ruptured, wrinkled, destroyed and intact cell structures were identified in both
homemade and instant mashed potatoes. However, more destroyed cells were observed in the
instant mashed potato samples during microscopy.

64
Figure 5.31: Micrograph of a homemade mashed potato sample stained with Calcofluor white from the LM.
Magnification = 100x

65
Figure 5.32: Micrograph of a homemade instant potato sample stained with Calcofluor white and potassium
hydroxide from the LM. Magnification = 100x
The spherical cell structures of the potato cells were observed in all of the samples. Some of
them appeared intact, but many cells displayed holes, ruptures, or were missing a piece of the
cell structure. Also, cell wall fractions were observed, indicating that some cells had been cut
in two or more pieces. Small pores in the cell walls were identified as plasmodesmata; cell
wall communication channels.

66
5.4. Banana
Micrographs for fresh, masticated and blended banana are shown separately in the sections
below.
5.4.1. Fresh banana
A SEM micrograph of fresh banana in the is shown in figure 5.33. The cellular structure of
banana differs from potato, wheat, and oat by appearing as oblong in its shape. Different
shapes and sizes were identified during microscopy, along with banana seeds and residues
from middle lamella.
Figure 5.33: Micrograph of fresh a banana sample from the SEM.
In figure 5.33, intact banana cells can be identified in different shapes and sizes, as well as
pointing in opposite directions. Other components shown in the micrographs were identified
as middle lamella remnants or other non-cellular banana structures.

67
5.4.2. Masticated banana
Micrographs of masticated banana are shown in figure 5.34. Intact cell structures, perforated
cells, wrinkled cells, and destroyed cells were identified during microscopy. The small visible
pores on the cell walls were identified as plasmodesmata, which also indicate the position the
cells were glued together by middle lamella.
Figure 5.34: Micrograph of a masticated banana sample stained with Calcofluor white from the LM with UVG
light. Magnification = 100x.

68
Figure 5.35: Micrograph of a masticated banana sample stained with potassium iodine solution from the LM
with bright field. Magnification = 25x.
During microscopy of samples stained with potassium iodine solution it appeared to be mostly
intact cells with starch granules within the cell structures. However, cells without starch
content were also identified as shown in micrograph 5.35, which indicates some extent of cell
disruption.

69
5.4.3. Banana smoothie
Micrographs of banana blended for 15 and 30 seconds are shown in Figures 5.36 and 5.37
respectively. Cells with intact cell structure, destroyed cell structure, perforated cells, and
wrinkled cells were identified for both of the banana smoothies.
Figure 5.36: Micrograph of a banana smoothie sample, blended for 15 seconds stained with Calcofluor white
from the LM with UVG light. Magnification = 100x.
In figure 5.36 showing a micrograph of banana blended for 15 seconds, cells with different
sizes and shapes are present. The micrograph is highly representative for what was observed
frequently during microscopy. In the left upper corner two large oblong intact banana cells
with plasmodesmata pores are visible. In the right lower corner, a ruptured banana cell is
present. During microscopy, clusters of intact cells were also observed.

70
Figure 5.37: Micrograph of a banana smoothie sample, blended for 30 seconds stained with Calcofluor white
from the LM with UVG light. Magnification = 100x.
Also, in figure 5.37 showing a micrograph of banana blended for 30 seconds, cells with
different sizes and shapes are present. The differences between the two banana smoothies
appeared somewhat small during microscopy. However, there were fewer clusters of intact
cells in the samples of banana blended for 30 seconds compared to the banana blended for 15
seconds. A somewhat bigger degree of destroyed cells was also observed.
5.5. Quantification of intact cells
For the samples with observed intact cellular structure, a quantification of intact cells was
completed to the best of measures. All micrographs used for the quantification were stained
with Calcofluor white and potassium hydroxide for better identification of the cell wall
structures. The cell structures were compared to the cell structures identified in other

71
micrographs from differently stained samples. Staining with potassium iodine solution gave a
clear identification of the starch localization. When comparing different micrographs of
masticated boiled potato, cells stained with Calcofluor white and potassium hydroxide could
give a misleading image. Cells would appear intact, but when compared to micrographs of
samples stained with potassium iodine solution it was observed that the majority of the cells
had lost their content of starch. However, the cells were quantified as intact, since the cell
wall was apparently intact. Unprocessed samples were considered 100% intact after
observations during microscopy. Cooked potato was also considered to have ~100% intact
cells since the few ruptured cells in boiled potato samples were considered to be present due
to mechanical force during sample preparation. Heat treatment appeared to result in more
fragile cell walls, and microtomy of cooked samples resulted in more cell damage compared
to raw samples. The samples quantified were masticated banana, banana smoothie, masticated
boiled potato, homemade mashed potato, and instant mashed banana, shown in table 5.1.
Table 5.1: Quantification of intact cells
Counted cells Intact cells Percentage of intact cells
Masticated banana 126 102 80.95
Banana smoothie, 15 sec 553 151 27.31
Banana smoothie, 30 sec 445 65 14.61
Masticated boiled potato 142 111 78.17
Homemade mashed potato 479 256 53.44
Instant mashed potato 455 87 19.12
For banana, the results from the quantification of intact cells indicated highest percentage of
intact cells in masticated banana (80.95), compared to banana smoothie. Results indicated the
time of blending during the preparation of banana smoothie to have an impact on the number
of intact cells, where blending for 15 seconds gave a higher percentage of intact cells (27.31)
compared to blending for 30 seconds (14.61). The results for potato samples indicated the
highest percentage of intact cells in masticated boiled potato (78.17) compared to homemade
mashed potato (53.44) and instant mashed potato (19.12).

72
6. Discussion
In the current study, intact cellular structures in unprocessed foods were observed, as
expected. The processing degree seemed to influence the percentage of intact cells in potato
and banana, where an increasing degree of processing correlated with a decreasing percentage
of intact cells. All flours investigated were observed as acellular. In oat flakes, no clear
cellular structure were observed, except varying sizes of intact coherent aleurone layer. Since
the investigated foods differ in structure and composition, they will further be discussed
separately.
Bananas composition is not typical compared to other fruits, due to its relatively high starch
content. In most fruits, the starch content is high when the fruit is immature, while during
maturation the starch degrades into fermentable sugars as the sweetness of the fruit increases
(Warrington et al., 1999, Peroni et al., 2008). 100 g of ripe banana contains ~18 g
carbohydrates, of which ~14 g are mono- and disaccharides and ~4.4 g are starch (NFSA and
UIO, 2020). Raw banana starch has been reported to be resistant to in vivo small intestinal
digestion in humans (Faisant et al., 1995). However, in very ripe bananas, almost all of the
starch is converted to fermentable sugars (Blankenship et al., 1993). GI of ripe bananas are on
average 51 ± 3 (Atkinson et al., 2008).
In the current study, the cellularity of masticated banana and banana blended in a household
smoothie blender for different time intervals, were investigated and quantified. A study on the
cellular structure in masticated fresh fruits, commercial smoothies, and fruit purées indicated
the presence of a high share of intact cellular fruit structures (Chu et al., 2017). In Chu et al´s
study, the smoothie samples were homogenized, while the fresh fruit samples were crushed
with an extrusion probe designed to simulate mastication before microscopic observation.
Total dietary fiber, soluble dietary fiber, and insoluble dietary fiber were determined in order
to measure the changes in cellular structures. The INFOGEST protocol (static in vitro
simulation of gastrointestinal food digestion) was carried out on the smoothie samples, and
the supernatant was observed microscopically. Similarly, as observed in the current study,
clusters of intact cells in the “masticated’’ fruits, were observed in different sizes depending
on the fruit type. Stained banana starch granules were observed within banana cells, similar to
the findings in the current study, while none were imaged in mango or apple cells. The
suspended banana smoothie was estimated based on fiber analysis to contain 3300 intact cells
73
per ml. They also microscopically imaged cells with Toluidine staining, where the
cytoplasmic content was observed within intact cells. Due to the different quantification
methods, comparing the current study with the results of Chu et al´s study is somewhat
difficult. Both studies have quantification weaknesses. Chu et al postulated the cell wall
structure would affect fiber measurements and therefore total dietary fiber, soluble dietary
fiber, and insoluble dietary fiber content, which was measured by standard AOAC method
991.43 and the Integrated Fiber method. Even though these methods give an indication of the
amount of cell wall material in the samples and the fiber functionality, it will probably not
separate cells with perforations from intact cells. By quantifying intact cells through
microscopy, perforations are easily observed. LM gives a clear image of only one side of the
cell, therefore ruptures on the cell wall out of focus could be missed. This may have led to
false calculations regarding the percentage of intact cells. However, in most cases, the shape
of the cell would disclose this rupture, and larger disruptions were observed easily on all sides
of the cell wall. The results found in the current study point towards a much lower percentage
of intact banana cells after blending compared with Chu et al´s study (Chu et al., 2017). The
extent of blending might differ in commercial smoothies compared to a smoothie prepared at
home, which is one of the reasons why different blending times were included in the current
study. Not surprisingly, the results presented a decrease in the percentage of intact cells with
increasing blending time. Chewing of fresh whole banana presented a much higher percentage
of intact cells in comparison with blending. Analysis of the cell wall after mastication have
seemingly not been reported in the literature before. Cellular structures were reported intact
following the simulated gastric digestion of smoothie and after 16 hours of intestinal digestion
(Chu et al., 2017). Thus, the authors suggest the parenchyma cell walls withstand the human
digestive enzymes.
Low et al argues the structure of insoluble fiber fractions to be mostly retained during in vivo
mastication and in vitro gastrointestinal digestion (Low et al., 2015). In their study on banana
and mango cells, a standardized batch fermentation model with a swine fecal inoculum was
performed after in vivo human mastication and in vitro digestion processing. The fermentation
with supposedly intensive metabolic activity resulted in degradation of cell walls, which were
intact after the in vitro digestion processing. Encapsulated cell content was then released and
became a substrate for further microbial metabolism, indicated by measuring gas as an end
product. The cell walls were reportedly not detected after fermentation, but liberated starch
granules were supposedly still clearly visible. However, the smooth surface on some of the

74
intact starch granules were roughed or scratched, which might indicate partial fermentation.
The digestibility coefficient of the edible part of the banana was not found in the literature.
Even so, the data from Faisant and Low indicate that at least some raw starch granules remain
intact through the whole digestive tract (Faisant et al., 1995, Low et al., 2015).
Considering the cellularity hypothesis and the different effects cellular and acellular foods
supposedly have on the upper gastrointestinal microbiome, a whole banana might have a
different footprint compared to a banana smoothie, due to more encapsulation of the nutrients
in the cells. Since raw starch granules are not easily digestible, it might not pose a difference
for the “gut microbiota” if the starch granules are “locked” inside cells or not, as the
cellularity hypothesis claims. Nevertheless, the ripeness of the banana could impact the
hydrolyzation and absorption in the small intestine, given that the starch content decreases
with ripeness (Englyst and Cummings, 1986). Banana starch might not be accessible for
degradation and absorption in the small intestine independent of the cell wall structure, but the
larger share of mono- and disaccharides might leak out or be enzymatically degraded from
within intact cells. The fragility of fruit cell walls has been proven to differ, together with the
starch content, and therefore these results might not be comparable to other fruits
(Rongkaumpan et al., 2019). Nonetheless, chewing of whole fresh fruits would presumably
result in less cell damage compared to blending. Therefore, according to Spreadbury, it might
be logical to assume that blended fruits might contribute with greater amounts of accessible
sugars compared to masticated whole fruits.
As opposed to banana, heat treatment of the potato tuber is necessary to transform the
consistency, palatability, and digestibility, since raw potato starch is digestive resistant
(Kingman and Englyst, 1994). Heat treatment leads to gelatinization of the starch, but as
observed in the current study mechanical treatment seems required for destruction of the tuber
cells. However, even though potato cells seemingly are intact during and after boiling, the
gelatinized starch still occurs available and digestible (Tian et al., 2016). Worldwide, a wide
range of different potato species exists, where e.g. starch content, mealiness, and GI varies
(Harris, 1992). The improvement of starch digestibility in raw potato starch as an effect of
heat treatment is explained in the theory section. A study investigating the digestibility of
differently processed potato products reported that boiled and mashed potatoes had the
highest rate of digestion, due to the lowest rate of resistant starch (García‐Alonso and Goni,
2000). In a review of different studies investigating GI of different potato species and
different processing methods, the following GI was reported: 65 ± 37 for boiled potatoes, 78 ±

75
8 for mashed potatoes, and 83 ± 10 instant mashed potatoes (Buyken and Kroke, 2005). The
increase of GI seems to correlate with the degree of cell disruption quantifies in the current
study.
Few studies seem to have investigated the cellular structure in processed potato, apart from
studies related to microstructure and digestibility and sensorial aspects of processing (Tian et
al., 2016, Marle et al., 1997, Dhital et al., 2018, Shomer and Levy, 1988). General changes
during heat treatment have been studied at some extent, and the literature appears to agree
regarding the degradation of pectic substances in the middle lamella and cell wall, in addition
to starch gelatinization. In the current study, only one potato tuber species was investigated,
and the results might, therefore, be somewhat different compared to other potato species. Tian
et al investigated the in vitro digestibility and structural characteristics of starch in boiled,
cooled and reheated potato, in addition to analyzing the cell structure with a SEM (Tian et al.,
2016). Potato samples were hydrolyzed in an in vitro simulated gastric system. During gastric
digestion, all samples were found to a large extent undigested. In the simulated small
intestinal digestion, the hydrolysis significantly increased as expected, owing to pancreatic
amylases. After 120 min of small intestinal digestion, the boiled potato cells appeared as
empty parenchyma cells, proposedly because of the starch hydrolysis by the digestive
enzymes from within cells. In the current study, starch leakage was observed in micrographs
from apparently intact cells in masticated boiled potato, pointing towards that amylase
hydrolyzation is starting in the mouth. However, the time interval from chewing to imaging
was longer compared to when the bolus is swallowed directly after chewing. This pause might
allow the saliva α-amylase to degrade the starch to a greater extent. Starch leakage has also
been measured during boiling of raw potato cubes, where the results pointed towards non-
enzymatic continuous starch leakage which increased during the boiling time (Shomer, 1995).
Stored potatoes apparently leaked more starch compared to fresh potatoes, and the reason was
suggested to stem from an increased amount of starch molecules smaller than cell wall pores
(<600 kDa proteins) and changes in cell wall strength during storage. Substantial changes in
pectic molecules in the potato cell wall during storage has been reported in a textural study on
fresh potatoes (van Dijk et al., 2002), which could explain the changes in cell wall strength.
Leakage of starch granules was not observed in masticated banana, which is logical
considering the intactness of the starch granules and the size of the plasmodesmata pores
compared to the size of the starch granules. The results from Tian et al together with the
current study suggests that gelatinized starch will hydrolyze in the small intestine independent

76
of the potato cell wall intactness (Tian et al., 2016). However, one can argue that gelatinized
starch is more available and digested faster outside of the cells, compared to inside intact cells
where the enzymes must enter through plasmodesmata pores. A higher percentage of intact
cells indicates chewing to be a gentler mashing method compared to fork mashing. Also,
when the mashed potato is masticated, it is logical to assume that further degradation may
occur during mastication. Considering the fact that heat processing of instant mashed potato
during manufacturing is more excessive compared to homemade mashed potato, the lower
percentage of intact cells was not surprising. Prepared mashed potato might not be masticated
to the same extent, depending on individual preferences and whether the mash is masticated
simultaneously with other components in the meal. Even though the starch apparently is
hydrolyzed from within intact cells and leaks out, it might be more rapidly hydrolyzed if the
gelatinized starch is not enclosed in parenchyma cell walls. Further research on the time
interval of hydrolyzation and absorption in the small intestine in relation to cell wall
intactness is necessary.
Grains are composed of multiple layers of cellular structures, which also was observed during
microscopy in the current study. Spreadbury refers to dried grains as dense storages of starch
and suggests they should be excluded from a cellular diet, due to high carbohydrate density,
their design for rapid enzymatic mobilization during germination, and their claimed absence
off living cells (Spreadbury, 2012). Carbohydrate density ranges from ~54-80 g/100 g in
whole dried cereals (NFSA and UIO, 2020), which supports Spreadbury´s claim of high
carbohydrate density. However, whole grains are still cellular, meaning the starch is “locked”
inside cell walls. Several studies have pointed out beneficial effects of whole grains on weight
control due to the promotion of satiety (Bazzano et al., 2005, Liu et al., 2003, Ye et al., 2012,
Jenkins et al., 1988, Jenkins et al., 1987). Increased consumption of whole grains have also
been indicated to likely reduce the risk of developing cardiovascular diseases (Mellen et al.,
2008), and other non-metabolic diseases such as colorectal cancer (Aune et al., 2011).
Nevertheless, grains effect on human metabolic health is controversial.
Studies on cellular structure in oat flakes or flours were not found in the literature. In the
current study, intact cellular structures were not observed in the different wheat flours and oat
flakes, except for varying sizes of adherent aleurone cells which seemed intact. Since the
particle size of ground endosperm is smaller than endosperm cells themselves, it is reasonable
to assume that no intact cellular structures were observed. In the whole wheat flours, larger
fractions of bran and adherent aleurone cells were observed. In oat flakes, on the other hand, it

77
might be logical to expect a larger share of intact cellular structures, taking the particle size
and processing method in consideration. However, the rolling process is extensive and the
pressure applied during rolling may be the reason for the observed destruction of cellular
structures. Another possible explanation is the effect of the microwaves on the cell structure,
but little is known about whether microwaving would have a different effect on the cellularity
compared to boiling. As expected, the starch structure in cold swollen oat flakes was
seemingly identical compared to the structure in dry oat flakes. Swelling of the starch
granules was not expected, as seen in other studies (Hoover and Vasanthan, 1992), due to
SEM sample preparation. In many contexts, oats are used for porridge, where premium oat
flakes, fast cooking oat flakes, instant oats and, steel cut groats are frequently used (Webster
and Wood, 2011). The oat flaking process is described in the theory section. Generally,
neither of the heat treatments during production of fast cooking or premium oat flakes results
in extensive starch gelatinization (Gates et al., 2008). In the current study, gelatinized starch
was neither observed in uncooked fast cooking or premium oat flakes, as expected.
The glycemic responses have been indicated to be significantly lower in porridges made from
steel cut and premium oat flakes compared with porridge made from instant oats (Tosh and
Chu, 2015). The difference was proposedly related to particle size, more extensive degree of
starch gelatinization during cooking, and increased amount of disruption of the groat and
gelatinization of the starch during production. The different particle sizes seem to influence
the digestion rate and GI, due to reduced enzyme access with lower surface-to-volume ratio
and the presence of intact cell walls (Heaton et al., 1988). The studies from Tosh and Chu and
Heaton indicated that particle size and cellularity might affect nutrient availability and GI.
However, no significant difference was found comparing the GI from steel cut oats and
premium oat flakes in porridges.
The distance between the oat rollers determines the oat flake thickness and is adjusted to
produce different products (Decker et al., 2014). Fast cooking oat flakes are generally thinner
than premium oat flakes, allowing the starch to absorb water more rapidly and hence reduce
the cooking time. In the current study, all of the starch was fully or partly gelatinized. A
somewhat bigger extent of partly gelatinized starch was observed in the premium compared to
the fast cooking oat flakes, as in line with the theory. However, this was not measured to
detail. For the cellularity of the oat flake, the thickness might not pose any difference, as
observed for the premium and fast cooking oat flakes in the current study. The particle size of
the groat before flaking, will however determine the size of the continuous adherent intact

78
aleurone layer, as imaged in the oat bread. Whether the size of the coherent aleurone layer
would affect digestion or the microbiota in the small intestine, is not known. Steel cut oats
were not investigated in the current study, neither was boiled whole groats. In “raw” whole
oat groats, cellular structures were observed throughout the entire groat. Since the cellularity
in potato did not change when boiled in the current study, and the same principal was found in
legumes (Dhital et al., 2016, Brummer et al., 2015), this might also refer to cereals. However,
further research is necessary to substantiate this hypothesis.
Wheat is frequently consumed as flour-based products, but wheat flakes are also consumed in
breakfast cereals such as muesli and granola (Arendt and Zannini, 2013a). Wheat flour is a
popular ingredient in bread, sweet bakery treats, pasta, pizza, and many other processed foods
and is considered an important crop worldwide. In terms of baking technology, smaller
particle size is usually equal to better baking properties and therefore preferred for a better
end result. However, regarding health, this trend of refining flour and excluding the fibrous
structures as bran, might not be favorable. It has been argued that refined flours, in addition to
other highly processed ingredients and foods might be one of the reasons for the Western
metabolic health problems when compared with non-westernized diets (Spreadbury, 2012).
Some would also argue that the human species are not adapted to eating cereal grains at all
(Lindeberg, 2013). Even though larger particles were observed, including some fractions of
adherent aleurone cells in the stone ground flours, the particle size is far too small to include
intact endosperm cells. Digestibility of raw cereal starch is indicated to be much higher
compared to for instance raw potato starch (Holm et al., 1988). However, flour is usually heat
treated before consumption, which leads to gelatinization of the starch and higher
digestibility. Taking the particle size into consideration, refined flour majorly consists of
highly digestible starch, with little to no signs of cellular structures.
Heaton reported a stepwise plasma insulin increase ranged: whole grains < cracked grains <
coarse flour < refined flour (Heaton et al.). The stepwise increase was also reported for oat,
where the plasma insulin increase was ranked: whole groats < rolled oats < fine oatmeal. In
cereals, the GI seems to correlate with cellularity and/or particle size. In whole grains, the
starch is “locked up” in cell walls, as discussed earlier. For cracked and steel cut cereals, it is
reasonable to assume that the cell structure is intact, but the particle size is however smaller
than the whole cereals. The cellularity of cracked and steel cut cereals was not investigated in
the current study, and studies of their cellularity was nor found in the literature. Mastication of
whole and steel cut cereals probably results in far larger particle sizes compared to the particle

79
size in refined flour, which could imply a higher degree of cellularity. Therefore, the nutrients
might be less accessible to the human digestive system compared to in refined flour.
Some processing methods allowed within the classification of minimally processed foods,
according to the NOVA food categorization, would disrupt cellular structures in foods.
Processing methods such as rolling and milling resulted in excessive cellular disruption in the
current study. Blending of banana also proved to disrupt a large share of the cellular structure,
which substantiates that processing methods allowed within the categorization of “minimally
processed” could more or less destroy all cellular structures. Thus, foods might rather, or in
addition, be categorized according to the processing methods output on food.
Regarding cereals and cellularity, the results of the current study points towards whole and
steel cut cereals could seemingly be included in a cellular diet while processing methods as
rolling and milling results in extensive structural destructions. Another question is, however,
whether cereals should be a part of a cellular diet at all, taking the carbohydrate density in to
consideration. Bringing carbohydrate density into the cellularity hypothesis results in
confusion and difficulties when deciding whether a food should be included or not. Grains are
arguably not an “ancestral” food, which brings up the evolutionary part of the hypothesis.
Nevertheless, a randomized cross trial conducted on free-living adults with type 2 diabetes
were advised to replace all grain foods in their diet with whole-grain products, drew the
conclusion that less-processed whole-grain foods improved the glycemia over a two week
period (Åberg et al., 2020). Thus, the consumption of minimally processed whole grains
seems advantageous in comparison with processed grains, despite the relatively high
carbohydrate density found in both. It could seem like a categorization of food based on
cellularity, especially regarding if the carbohydrate density is included might be complicated.
Carbohydrate density or starch content/availability could, therefore, be a better or less
complicated measure. The categorization of fruit products has been suggested to be
problematic when measuring intake by analyzing dietary surveys with the intention of finding
dietary shifts over time (Ridoutt et al., 2016). Though the contents of nutrients might not
differ significantly in whole fresh fruit compared to processed fruit products, the structural
changes could possibly impact human metabolic health. Food structure could influence the
body and the gut microbiotas response to food, but little is known about this mechanism. The
term cellularity is not only limited to the availability of glucose and starch. Cellular foods
have a wide range of glycemic indexes. For instance, fresh banana ~51 and rice ~80.
However, a study reported different glycemic responses of the same food across people,

80
which might indicate that GI also could be affected by a number of individual factors,
including potentially gut microbiota (Korem et al., 2017). Although, this does not seem to be
the most logical major impact compared to e.g. differences in mastication and other
behavioral and physiological individual differences affecting starch digestibility. Cellularity
could possibly influence the nutrient density in the upper gastrointestinal microbiota, by
encapsulating the intracellular nutrients. Apart from the encapsulation of cell content, a
calculation of nutrient density should preferably also include the maturity degree of fruits,
starch gelatinization degree, and digestibility as well as carbohydrate density. If, however, the
intactness of cells is important as a nutritional aspect/regarding human metabolic health, the
following advice could be given:
- Whole bananas preferable over banana smoothies or purées (preferable not very ripe,
(as in brown spotted or brown))
- Boiled potato preferable over more highly processed potato products such as instant
mashed potatoes (boiled potato > homemade mashed potato > instant mashed potato).
- Whole or steel cut cereals preferable over flaked or flour milled cereals.
The results of the current study may be of importance for further research and to clarify the
present hypothesis suggesting cellularity has a major impact on human metabolic health.
Further research investigating the cellularity of other foods in addition to the link between gut
microbiota and cellularity/carbohydrate density is needed before establishing guidelines in
light of this hypothesis.

81
7. Conclusion
These studies demonstrated that some types of processing, such as grinding for smoothie
production, disrupted cellular structure in banana, while other processing methods, such as
boiling of the whole potato did not. For cereals, both milling and rolling results in extensive
structural disruption. Thus, the current study demonstrates that thorough microscopy methods
can and should be carried out to test hypotheses in regards to the effect of processing on e.g.
human health, when the hypothesis is linked to structural claims, such as in the cellularity
hypothesis.

82
8. References
AKILEN, R., DELJOOMANESH, N., HUNSCHEDE, S., SMITH, C., ARSHAD, M., KUBANT, R. & ANDERSON, G. 2016. The effects of potatoes and other carbohydrate side dishes consumed with meat on food intake, glycemia and satiety response in children. Nutrition & diabetes, 6, e195-e195.
ANDERSON, C. T., CARROLL, A., AKHMETOVA, L. & SOMERVILLE, C. 2010. Real-Time Imaging of Cellulose Reorientation during Cell Wall Expansion in Arabidopsis Roots1 (W)(OA). Plant physiology, 152.
ARENDT, E. & ZANNINI, E. 2013a. Wheat. Cereal Grains for the Food and Beverage Industries: Woodhead Publishing Series in Food Science, Technology and Nutrition 248. United Kingdom: Woodhead Publishing Ltd.
ARENDT, E. K. & ZANNINI, E. 2013b. Oats. Cereal grains for the food and beverage industries. Philadelphia, PA: Woodhead Pub.
ATKINSON, F. S., FOSTER-POWELL, K. & BRAND-MILLER, J. C. 2008. International tables of glycemic index and glycemic load values: 2008. Diabetes care, 31, 2281-2283.
AUNE, D., CHAN, D. S., LAU, R., VIEIRA, R., GREENWOOD, D. C., KAMPMAN, E. & NORAT, T. 2011. Dietary fibre, whole grains, and risk of colorectal cancer: systematic review and dose-response meta-analysis of prospective studies. Bmj, 343, d6617.
AUNE, D., NORAT, T., ROMUNDSTAD, P. & VATTEN, L. J. 2013. Whole grain and refined grain consumption and the risk of type 2 diabetes: a systematic review and dose–response meta-analysis of cohort studies. European journal of epidemiology, 28, 845-858.
AWUCHI, C. G., IGWE, V. S. & ECHETA, C. K. 2019. The Functional Properties of Foods and Flours. International Journal of Advanced Academic Research, 5, 139-160.
BAMA.NO. 2020. Beate (Online). Bama.no. Available: https://www.bama.no/poteter/beate/ (Accessed 12.01.2020 Bama).
BAZZANO, L. A., SONG, Y., BUBES, V., GOOD, C. K., MANSON, J. E. & LIU, S. 2005. Dietary intake of whole and refined grain breakfast cereals and weight gain in men. Obesity research, 13, 1952-1960.
BERG, T., SINGH, J., HARDACRE, A. & BOLAND, M. J. 2012. The role of cotyledon cell structure during in vitro digestion of starch in navy beans. Carbohydrate polymers, 87, 1678-1688.
BLANKENSHIP, S. M., ELLSWORTH, D. D. & POWELL, R. L. 1993. A ripening index for banana fruit based on starch content. HortTechnology, 3, 338-339.
BRUMMER, Y., KAVIANI, M. & TOSH, S. M. 2015. Structural and functional characteristics of dietary fibre in beans, lentils, peas and chickpeas. Food Research International, 67, 117-125.
BUYKEN, A. E. & KROKE, A. 2005. Glycemic index of potatoes: myth and reality from a European perspective. Br J Nutr, 94, 1035-1037.
CARO, J. F., SINHA, M. K., KOLACZYNSKI, J. W., ZHANG, P. L. & CONSIDINE, R. V. 1996. Leptin: the tale of an obesity gene. Diabetes, 45, 1455-1462.
CHANDLER, D. E. & ROBERSON, R. W. 2009. Bioimaging : current techniques in light and electron microscopy, Sudbury, Mass, Jones and Bartlett.
CHU, J., IGBETAR, B. & ORFILA, C. 2017. Fibrous cellular structures are found in a commercial fruit smoothie and remain intact during simulated digestion. Journal of Nutrition and Food Sciences, 7.
CHUNG, H.-J., LIM, H. S. & LIM, S.-T. 2006. Effect of partial gelatinization and retrogradation on the enzymatic digestion of waxy rice starch. Journal of Cereal Science, 43, 353-359.
DA SILVA OLIVEIRA, M. S. & SILVA-AMPARO, L. 2018. Food-based dietary guidelines: a comparative analysis between the Dietary Guidelines for the Brazilian Population 2006 and 2014. Public health nutrition, 21, 210-217.
DAVID, L. A., MAURICE, C. F., CARMODY, R. N., GOOTENBERG, D. B., BUTTON, J. E., WOLFE, B. E., LING, A. V., DEVLIN, A. S., VARMA, Y. & FISCHBACH, M. A. 2014. Diet rapidly and reproducibly alters the human gut microbiome. Nature, 505, 559-563.

83
DECKER, E. A., ROSE, D. J. & STEWART, D. 2014. Processing of oats and the impact of processing operations on nutrition and health benefits. British Journal of Nutrition, 112, S58-S64.
DHITAL, S., BAIER, S. K., GIDLEY, M. J. & STOKES, J. R. 2018. Microstructural properties of potato chips. Food Structure, 16, 17-26.
DHITAL, S., BHATTARAI, R. R., GORHAM, J. & GIDLEY, M. J. 2016. Intactness of cell wall structure controls the in vitro digestion of starch in legumes. Food & function, 7, 1367-1379.
DING, S.-Y., LIU, Y.-S., ZENG, Y., HIMMEL, M. E., BAKER, J. O. & BAYER, E. A. 2012. How does plant cell wall nanoscale architecture correlate with enzymatic digestibility? Science (New York, N.Y.), 338, 1055.
EDWARDS, C. H., GRUNDY, M. M., GRASSBY, T., VASILOPOULOU, D., FROST, G. S., BUTTERWORTH, P. J., BERRY, S. E., SANDERSON, J. & ELLIS, P. R. 2015. Manipulation of starch bioaccessibility in wheat endosperm to regulate starch digestion, postprandial glycemia, insulinemia, and gut hormone responses: a randomized controlled trial in healthy ileostomy participants. The American journal of clinical nutrition, 102, 791-800.
EISENHAUER, C. 2007. The New Glucose Revolution: The Authoritative Guide to The Glycemic Index—The Dietary Solution for Lifelong Health. Family & Community Health, 30, 86.
ELLIS, P. R., KENDALL, C. W., REN, Y., PARKER, C., PACY, J. F., WALDRON, K. W. & JENKINS, D. J. 2004. Role of cell walls in the bioaccessibility of lipids in almond seeds. The American journal of clinical nutrition, 80, 604-613.
ENGLYST, H. N. & CUMMINGS, J. H. 1986. Digestion of the carbohydrates of banana (Musa paradisiaca sapientum) in the human small intestine. The American journal of clinical nutrition, 44, 42-50.
ERDMANN, J., HEBEISEN, Y., LIPPL, F., WAGENPFEIL, S. & SCHUSDZIARRA, V. 2007. Food intake and plasma ghrelin response during potato-, rice-and pasta-rich test meals. European journal of nutrition, 46, 196-203.
FAISANT, N., BULEON, A., COLONNA, P., MOLIS, C., LARTIGUE, S., GALMICHE, J. & CHAMP, M. 1995. Digestion of raw banana starch in the small intestine of healthy humans: structural features of resistant starch. British journal of nutrition, 73, 111-123.
FROST, J. K., FLANAGAN, B. M., BRUMMELL, D. A., O'DONOGHUE, E. M., MISHRA, S., GIDLEY, M. J. & MONRO, J. A. 2016. Composition and structure of tuber cell walls affect in vitro digestibility of potato (Solanum tuberosum L.). Food & function, 7, 4202-4212.
GARCÍA‐ALONSO, A. & GONI, I. 2000. Effect of processing on potato starch: in vitro availability and glycemic index. Food/Nahrung, 44, 19-22.
GATES, F., SONTAG-STROHM, T., STODDARD, F., DOBRASZCZYK, B. & SALOVAARA, H. 2008. Interaction of heat–moisture conditions and physical properties in oat processing: II. Flake quality. Journal of cereal science, 48, 288-293.
GÉLINAS, P., DESSUREAULT, K. & BEAUCHEMIN, R. 2004. Stones adjustment and the quality of stone‐ground wheat flour. International journal of food science & technology, 39, 459-463.
GRUNDY, M. M.-L., EDWARDS, C. H., MACKIE, A. R., GIDLEY, M. J., BUTTERWORTH, P. J. & ELLIS, P. R. 2016a. Re-evaluation of the mechanisms of dietary fibre and implications for macronutrient bioaccessibility, digestion and postprandial metabolism. British Journal of Nutrition, 116, 816-833.
GRUNDY, M. M. L., LAPSLEY, K. & ELLIS, P. R. 2016b. A review of the impact of processing on nutrient bioaccessibility and digestion of almonds. International journal of food science & technology, 51, 1937-1946.
HARRIS, P. M. 1992. The potato crop : the scientific basis for improvement, London, Chapman and Hall.
HEART, N., LUNG, INSTITUTE, B., DIABETES, N. I. O., DIGESTIVE & DISEASES, K. 1998. Clinical guidelines on the identification, evaluation, and treatment of overweight and obesity in adults: the evidence report, National Heart, Lung, and Blood Institute.

84
HEATON, K. W., MARCUS, S., EMMETT, P. & BOLTON, C. 1988. Particle size of wheat, maize, and oat test meals: effects on plasma glucose and insulin responses and on the rate of starch digestion in vitro. The American journal of clinical nutrition, 47, 675-682.
HOFF, J. & CASTRO, M. D. 1969. Chemical composition of potato cell wall. Journal of Agricultural and Food Chemistry, 17, 1328-1331.
HOLM, J., LUNDQUIST, I., BJÖRCK, I., ELIASSON, A.-C. & ASP, N.-G. 1988. Degree of starch gelatinization, digestion rate of starch in vitro, and metabolic response in rats. The American journal of clinical nutrition, 47, 1010-1016.
HOOVER, R. & VASANTHAN, T. 1992. Studies on isolation and characterization of starch from oat (Avena nuda) grains. Carbohydrate Polymers, 19, 285-297.
JARVIS, M., HALL, M., THRELFALL, D. & FRIEND, J. 1981. The polysaccharide structure of potato cell walls: Chemical fractionation. An International Journal of Plant Biology, 152, 93-100.
JAYASINGHE, M., EKANAYAKE, S. & NUGEGODA, D. 2013. Effect of different milling methods on glycemic response of foods made with finger millet (Eucenea coracana) flour. Ceylon Medical Journal, 58.
JENKINS, D., WESSON, V., WOLEVER, T., JENKINS, A. L., KALMUSKY, J., GUIDICI, S., CSIMA, A., JOSSE, R. G. & WONG, G. S. 1988. Wholemeal versus wholegrain bread: proportion of whole or cracked grain and the glycemic response. Bmj, 297, 958-960.
JENKINS, D. J., JENKINS, A. L., WOLEVER, T. M., COLLIER, G. R., RAO, A. V. & THOMPSON, L. U. 1987. Starchy foods and fiber: reduced rate of digestion and improved carbohydrate metabolism. Scandinavian Journal of Gastroenterology, 22, 132-141.
JUUL, F. & HEMMINGSSON, E. 2015. Trends in consumption of ultra-processed foods and obesity in Sweden between 1960 and 2010. Public health nutrition, 18, 3096-3107.
JÖNSSON, T., GRANFELDT, Y., ERLANSON-ALBERTSSON, C., AHRÉN, B. & LINDEBERG, S. 2010. A paleolithic diet is more satiating per calorie than a mediterranean-like diet in individuals with ischemic heart disease. Nutrition & metabolism, 7, 85.
KELLY, B. & JACOBY, E. 2018. Public Health Nutrition special issue on ultra-processed foods. Public health nutrition, 21, 1-4.
KERSTENS, S. & VERBELEN, J. P. 2002. Cellulose orientation in the outer epidermal wall of angiosperm roots: implications for biosystematics. Annals of botany, 90, 669-676.
KIHLBERG, I., ÖSTRÖM, Å., JOHANSSON, L. & RISVIK, E. 2006. Sensory qualities of plain white pan bread: Influence of farming system, year of harvest and baking technique. Journal of Cereal Science, 43, 15-30.
KINGMAN, S. M. & ENGLYST, H. N. 1994. The influence of food preparation methods on the in-vitro digestibility of starch in potatoes. Food Chemistry, 49, 181-186.
KOLACZYNSKI, J. W., NYCE, M. R., CONSIDINE, R. V., BODEN, G., NOLAN, J. J., HENRY, R., MUDALIAR, S. R., OLEFSKY, J. & CARO, J. F. 1996. Acute and chronic effect of insulin on leptin production in humans: studies in vivo and in vitro. Diabetes, 45, 699-701.
KOREM, T., ZEEVI, D., ZMORA, N., WEISSBROD, O., BAR, N., LOTAN-POMPAN, M., AVNIT-SAGI, T., KOSOWER, N., MALKA, G. & REIN, M. 2017. Bread affects clinical parameters and induces gut microbiome-associated personal glycemic responses. Cell metabolism, 25, 1243-1253. e5.
LEHMANN, U. & ROBIN, F. 2007. Slowly digestible starch–its structure and health implications: a review. Trends in Food Science & Technology, 18, 346-355.
LINDEBERG, S. 2013. Food and western disease. Wiley-Blackwell. LINDEBERG, S., ELIASSON, M., LINDAHL, B. & AHRÉN, B. 1999. Low serum insulin in traditional Pacific
Islanders—the Kitava Study. Metabolism, 48, 1216-1219. LINDEBERG, S., SÖDERBERG, S., AHREN, B. & OLSSON, T. 2001. Large differences in serum leptin
levels between nonwesternized and westernized populations: the Kitava study. Journal of internal medicine, 249, 553-558.
LIU, S., WILLETT, W. C., MANSON, J. E., HU, F. B., ROSNER, B. & COLDITZ, G. 2003. Relation between changes in intakes of dietary fiber and grain products and changes in weight and

85
development of obesity among middle-aged women. The American journal of clinical nutrition, 78, 920-927.
LOOKHART, G., ALBERS, L. & POMERANZ, Y. 1986. The effect of commercial processing on some chemical and physical properties of oat groats. Cereal Chem, 63, 280-282.
LOW, D. Y., WILLIAMS, B. A., D'ARCY, B. R., FLANAGAN, B. M. & GIDLEY, M. J. 2015. In vitro fermentation of chewed mango and banana: particle size, starch and vascular fibre effects. Food & function, 6, 2464-2474.
MADAN, A., JAIN, R. & NANDANE, A. 2014. Development of Active Modified Atmosphere Lab Scale Setup to Study the Effect on Shelf-life of Banana (var.‘Robusta’). Journal of Food Science & Technology, 3.
MARLE, J. T. V., STOLLE-SMITS, T., DONKERS, J., DIJK, C. V., VORAGEN, A. G. J. & RECOURT, K. 1997. Chemical and microscopic characterization of potato (Solanum tuberosum L.) cell walls during cooking. Chemical and microscopic characterization of potato (Solanum tuberosum L.) cell walls during cooking, 50-58.
MARTIN, C. & SMITH, A. M. 1995. Starch biosynthesis. The plant cell, 7, 971. MASUZAKI, H., OGAWA, Y., ISSE, N., SATOH, N., OKAZAKI, T., SHIGEMOTO, M., MORI, K., TAMURA, N.,
HOSODA, K. & YOSHIMASA, Y. 1995. Human obese gene expression: adipocyte-specific expression and regional differences in the adipose tissue. Diabetes, 44, 855-858.
MAULE, A. J. 2008. Plasmodesmata: structure, function and biogenesis. Current opinion in plant biology, 11, 680-686.
MELLEN, P. B., WALSH, T. F. & HERRINGTON, D. M. 2008. Whole grain intake and cardiovascular disease: a meta-analysis. Nutrition, Metabolism and Cardiovascular Diseases, 18, 283-290.
MELNÆS, B. K., LUNDBERG-HALLÉN, N., HELLAND-KIGEN, K. M., LUND-BLIX, N. A., MYHRE, J. B., JOHANSEN, A. M. W., LØKEN, E. B. & ANDERSEN, L. F. Heftets tittel: Norkost 3 En landsomfattende kostholdsundersøkelse blant menn og kvinner i Norge i alderen 18-70 år, 2010-11. Utgitt: 06/2012 Bestillingsnummer: IS-2000.
MENTE, A., RAZAK, F., BLANKENBERG, S., VUKSAN, V., DAVIS, A. D., MILLER, R., TEO, K., GERSTEIN, H., SHARMA, A. M. & YUSUF, S. 2010. Ethnic variation in adiponectin and leptin levels and their association with adiposity and insulin resistance. Diabetes care, 33, 1629-1634.
MEYER, K. A., KUSHI, L. H., JACOBS JR, D. R., SLAVIN, J., SELLERS, T. A. & FOLSOM, A. R. 2000. Carbohydrates, dietary fiber, and incident type 2 diabetes in older women. The American journal of clinical nutrition, 71, 921-930.
MIALON, M., SÊRODIO, P. & SCAGLIUSI, F. B. 2018. Criticism of the NOVA classification: who are the protagonists? World Nutrition, 9, 176-240.
MILLER, S. & FULCHER, R. 2011. Microstructure and chemistry of the oat kernel. Oats: Chemistry and technology, 77-94.
MONTEIRO, C. A., CANNON, G., LEVY, R., MOUBARAC, J.-C., JAIME, P., MARTINS, A. P., CANELLA, D., LOUZADA, M. & PARRA., D. 2016. The food system, NOVA. World Nutrition, 7.
MONTEIRO, C. A., LEVY, R. B., CLARO, R. M., DE CASTRO, I. R. R. & CANNON, G. 2010. Increasing consumption of ultra-processed foods and likely impact on human health: evidence from Brazil. Public health nutrition, 14, 5-13.
MORRIS, V. 1990. Starch gelation and retrogradation. Trends in Food Science & Technology, 1, 2-6. NARWOJSZ, A., BOROWSKA, E. J., POLAK-ŚLIWIŃSKA, M. & DANOWSKA-OZIEWICZ, M. 2020. Effect of
Different Methods of Thermal Treatment on Starch and Bioactive Compounds of Potato. Plant Foods for Human Nutrition, 1-7.
NFSA & UIO 2020. Matvaretabellen. Norge. NG, A. & WALDRON, K. W. 1997. Effect of cooking and pre‐cooking on cell‐wall chemistry in relation
to firmness of carrot tissues. Journal of the Science of Food and Agriculture, 73, 503-512. NMBU. 2020. Equipment (Online). Ås, Norway: Imaging centre. Available:
https://www.nmbu.no/en/services/centers/imaging-centre/equipment (Accessed).

86
NOAH, L., GUILLON, F., BOUCHET, B., BULEON, A., MOLIS, C., GRATAS, M. & CHAMP, M. 1998. Digestion of carbohydrate from white beans (Phaseolus vulgaris L.) in healthy humans. The Journal of nutrition, 128, 977-985.
PARKER, C. C., PARKER, M. L., SMITH, A. C. & WALDRON, K. W. 2001. Pectin distribution at the surface of potato parenchyma cells in relation to cell− cell adhesion. Journal of agricultural and food chemistry, 49, 4364-4371.
PARKER, M. L., KIRBY, A. R. & MORRIS, V. J. 2008. In situ imaging of pea starch in seeds. Food Biophysics, 3, 66-76.
PERONI, F. H. G. A., KOIKE, C., LOURO, R. P., PURGATTO, E., DO NASCIMENTO, J. O. R. O., LAJOLO, F. M. & CORDENUNSI, B. R. 2008. Mango starch degradation. II. The binding of α-amylase and β-amylase to the starch granule. Journal of agricultural and food chemistry, 56, 7416-7421.
PUBLIQUE, H. C. D. L. S. 2018. Avis relatif aux objectifs de santé publique quantifiés pour la politique nutritionnelle de santé publique (PNNS) 2018–2022.(Internet).
RIDOUTT, B., BAIRD, D., BASTIAANS, K., HENDRIE, G., RILEY, M., SANGUANSRI, P., SYRETTE, J. & NOAKES, M. 2016. Changes in food intake in Australia: Comparing the 1995 and 2011 National Nutrition Survey Results disaggregated into basic foods. Foods, 5, 40.
ROGERS, K. 2010. The digestive system, Britannica Educational Publishing. ROMAN-GUTIERREZ, A. D., GUILBERT, S. & CUQ, B. 2002. Description of microstructural changes in
wheat flour and flour components during hydration by using environmental scanning electron microscopy. LWT-Food Science and Technology, 35, 730-740.
RONGKAUMPAN, G., AMSBURY, S., ANDABLO-REYES, E., LINFORD, H., CONNELL, S., KNOX, J. P., SARKAR, A., BENITEZ-ALFONSO, Y. & ORFILA, C. 2019. Cell Wall Polymer Composition and Spatial Distribution in Ripe Banana and Mango Fruit: Implications for Cell Adhesion and Texture Perception. Frontiers in plant science, 10.
SÁINZ, N., BARRENETXE, J., MORENO-ALIAGA, M. J. & MARTÍNEZ, J. A. 2015. Leptin resistance and diet-induced obesity: central and peripheral actions of leptin. Metabolism, 64, 35-46.
SALUNKHE, D. K. & KADAM, S. S. 1998. Handbook of vegetable science and technology : production, composition, storage, and processing, New York, Marcel Dekker.
SCHWIMMER, S., BEVENUE, A., WESTON, W. J. & POTTER, A. L. 1954. Potato Composition, Survey of Major and Minor Sugar and Starch Components of White Potato. Journal of Agricultural and Food Chemistry, 2, 1284-1290.
SHOMER, I. 1995. Swelling behaviour of cell wall and starch in potato (Solanum tuberosum L.) tuber cells—I. Starch leakage and structure of single cells. Carbohydrate Polymers, 26, 47-54.
SHOMER, I. & LEVY, D. 1988. Cell wall mediated bulkiness as related to the texture of potato (Solanum tuberosum L.) tuber tissue. Potato research, 31, 321-334.
SINGH, J., BERG, T., HARDACRE, A. & BOLAND, M. J. 2014. Cotyledon Cell Structure and In Vitro Starch Digestion in Navy Beans. Food structures, digestion and health. Elsevier.
SMITH, T. G. 2012. Obesity and the economics of prevention: fit not fat. Oxford University Press. SPREADBURY, I. 2012. Comparison with ancestral diets suggests dense acellular carbohydrates
promote an inflammatory microbiota, and may be the primary dietary cause of leptin resistance and obesity. Diabetes, metabolic syndrome and obesity: targets and therapy, 5, 175.
SSB 2017. Potetferien er avlyst. 17.10.2017 ed. SSB.no: Statistisk sentralbyrå. STURM, R. & AN, R. 2014. Obesity and economic environments. CA: a cancer journal for clinicians, 64,
337-350. SVIHUS, B. & HERVIK, A. K. 2016. Digestion and metabolic fates of starch, and its relation to major
nutrition‐related health problems: A review. Starch‐Stärke, 68, 302-313. TIAN, J., CHEN, S., WU, C., CHEN, J., DU, X., CHEN, J., LIU, D. & YE, X. 2016. Effects of preparation
methods on potato microstructure and digestibility: An in vitro study. Food chemistry, 211, 564-569.

87
TOOLE, G. A., SELVATICO, E., SALT, L. J., LE GALL, G., COLQUHOUN, I. J., WELLNER, N., SHEWRY, P. R., MILLS, E. N. C. & TOOLE, G. A. 2013. Effect of dough mixing on wheat endosperm cell walls. Journal of agricultural and food chemistry, 61, 2522-2529.
TOSH, S. M. & CHU, Y. 2015. Systematic review of the effect of processing of whole-grain oat cereals on glycemic response. British Journal of Nutrition, 114, 1256-1262.
TURNBAUGH, P. J., BÄCKHED, F., FULTON, L. & GORDON, J. I. 2008. Diet-induced obesity is linked to marked but reversible alterations in the mouse distal gut microbiome. Cell host & microbe, 3, 213-223.
VAN DIJK, C., BEEKHUIZEN, J.-G., GIBCENS, T., BOERIU, C., FISCHER, M. & STOLLE-SMITS, T. 2002. Texture of cooked potatoes (Solanum tuberosum). 2. Changes in pectin composition during storage of potatoes. Journal of agricultural and food chemistry, 50, 5089-5097.
VENES, D. 2017. Taber's cyclopedic medical dictionary, FA Davis. WALLACE, I. & ANDERSON, C. T. 2012. Small molecule probes for plant cell wall polysaccharide
imaging. Frontiers in plant science, 3, 89. WARRINGTON, I., FULTON, T., HALLIGAN, E. & DE SILVA, H. 1999. Apple fruit growth and maturity are
affected by early season temperatures. Journal of the American Society for Horticultural Science, 124, 468-477.
WEAVER, C. M., DWYER, J., FULGONI III, V. L., KING, J. C., LEVEILLE, G. A., MACDONALD, R. S., ORDOVAS, J. & SCHNAKENBERG, D. 2014. Processed foods: contributions to nutrition. The American journal of clinical nutrition, 99, 1525-1542.
WEBSTER, F. & WOOD, P. 2011. Oat utilization: past, present and future. Oats: chemistry and technology, 347-361.
WOJCICKI, J. M. & HEYMAN, M. B. 2012. Reducing childhood obesity by eliminating 100% fruit juice. American journal of public health, 102, 1630-1633.
YE, E. Q., CHACKO, S. A., CHOU, E. L., KUGIZAKI, M. & LIU, S. 2012. Greater whole-grain intake is associated with lower risk of type 2 diabetes, cardiovascular disease, and weight gain. The Journal of nutrition, 142, 1304-1313.
ZINÖCKER, M. K. & LINDSETH, I. A. 2018. The Western diet–microbiome-host interaction and its role in metabolic disease. Nutrients, 10, 365.
ZOBEL, H. F. 1984. Gelatinization of starch and mechanical properties of starch pastes. Starch: chemistry and technology. Elsevier.
ÅBERG, S., MANN, J., NEUMANN, S., ROSS, A. B. & REYNOLDS, A. N. 2020. Whole-Grain Processing and Glycemic Control in Type 2 Diabetes: A Randomized Crossover Trial. Diabetes Care, May 2020.