Embed Size (px)
Citation preview
~e~roscje~ce Vol. 63, No. I, pp. 151-161, 1994 Eisevier Science Ltd
Copyright Q 1994 IBRO
0306-4522(94)EO203-G Printed in Great Britain. All rights reserved 0306-4522/94 87.00 t 0.00
MEMBRANE POTENTIAL OSCILLATIONS UNDERLYING
FIRING PATTERNS IN NEOCORTICAL NEURONS
Y. AMITAI
Center for Brain Research, Unit of Physiology, Box 653 Faculty of Health Sciences, Ben-Gurion Umversity, Beer-Sheva, 84105 Israel
Ahstraet-Membrane potential oscillations were studied in slices of rat somatosensory cortex maintained in vim, using in~acellular recordings from cells in layers 2/3 and 5. The cells were class&xi according to their firina natterns during long (0.8-l s) depolarizing current steps. Subthreshold voltage oscillations were revealed by depolarizing themembrane tovoltages-around threshold for action potentials; however, these were obvious mainly in cells showing marked spike adaptation. When neurons of all firing patterns were stimulated to fire at 40-M) Hz for tens of seconds, spikes abruptly inactivated. Hyperpolarizing the &Is bv S-IO mV ore&&ted pronounced o~illatioos in 24 out of 35 cells. These oscillations existed in a narrow voltage range, and their frequency varied between 7 and 40 Hz, in a voltage-dependent manner. Spiking frequency was faster than the oscillation frequency for the same membrane potential in a given cell. The Na+ channel blocker tetrodotoxin abolished both the spikes and the oscillations, and blockade of KC channels by tetrae~ylammonium converted the oscillations into prolonged and irregular plateaus. Blocking Ca” conductance with Co*+ reduced the o~iilations amplitude and frequency in two out of three cells. The oscillations that followed spike inactivation varied in amplitude, frequency and persistence among different cells. Layer 5 nonadapting cells possessed the most periodic oscillations, as judged by autocorrelation analysis, Oscillations were also most persistent in this group, maintaining a stable steady-state. In other cell types, the oscillations were less regular and decayed with time. There was no difference among cell groups in the maximal peak to peak ~plitude of the o~llations, or their frequency range.
It is suggested that the oscillations are generated by ionic conductances that operate within the voltage range just above and below spike threshold, and thus can shape the cells’ firing pattern. The prominence of the oscillations in a specific subset of layer 5 cells may indicate the mechanism that underlies the rhythmic firing pattern of those cells.
Activity in the cerebral cortex can be highly rhythmic, depending upon the animal’s behavior and state of arousal. Cortical el~troen~ph~o~aphic rhythms vary from the slow (0.54 Hz) delta waves of sleep, to the fast (IQ-60 Hz), low amplitude frequencies that dominate alertness. While the sleep rhythms are most probably driven by the thalamus,‘03~ other rhythmic activities are presumably generated by the cortical network itself.J~‘1~3Z However, little is known about the mechanisms by which the cortical circuit might gener- ate these rhythms.
One possibility is that the neuronal population oscillations are a pure product of the network, a result of excitatory and inhibitory inputs on each of the cells that determine their firing output. This mechanism has been proposed for visually evoked 40.Hz oscillations in striate cortex.i6 Another possi- bility is that some cortical neurons possess an intrin- sic propensity to generate rhythmic o~illatio~, and they can conceivably serve as pacemakers for the
Abbreuiarions: ACSF, artificial cerebrospinal fluid; AHP, afierhyperpolarization; IB, intrinsically bursting; RF, rhythmi~ly firin& RS, regular spikes; SSI, slow spike inactivations TTX, tetrodotoxin.
cortical network. This may happen in other central structures such as the inferior olive***’ and thalamic reticular nucleus.3s Rhythmic firing patterns in both structures are dependent upon a low threshold Ca2+ current.”
It is still questionable whether neurons in the cortex can drive the rest of the network by virtue of their intrinsic membrane properties. The neocortical circuit is composed of a heterogenous population of neurons, which vary in their firing patterns and rno~holo~.~~~~‘~*~*’ Sub~r~hold Na+~e~ndent os- cillations of the membrane voltage have been ob- served in intemeurons and pyramidal cells in layer 4 of the neocortex,21~30 and it has been proposed that these oscillations serve to synchronize large aggre- gates of neurons around a 40-Hz rhythm. Another potential rhythm generator in the neocortex is a group of layer 5 pyramidal cells that can intrinsically generate prolonged periods of S-12 Hz rhythmic firing.” This firing pattern is also Na+-dependent, but detailed underlying mechanisms have not been de- scribed. This study explores the nature of membrane potential oscillations, and their relationship to the firing patterns of neocortical neurons.
151
152
EXPERIMENTAL PROCEDURES
Y. Amitai
The methods for preparing and maintaining slices of ncocortex have been described.s,6,* Briefly, Wistar rats (six to eight weeks old, IX--200g) were anesthetized by sodium pentobarbital, decapitated, and their brain quickly removed
J loo-
2 : ,” - E -
B + .so- e - L -
1 .
0 - t000
Time (ms)
I imo a chilled (about 4 C), oxygenated artificia! cere- brospinal fluid (ACSF). The ACSF contained (in mMf 123.0 NaCI, 5.0 KCI, 2.0 MgSO,, 1.25 NaHPOJ. 2.0 CdCI,. 26.0 NaHCO,, and 10.0 dextrose. and was saturated with 95% O2 5% CO? (pH 7.4). Coronal slices (400 pm thick) were cut on a Vibratome (Campden Instruments) from the primary
3
0 500 loo0
Time (ms)
.
loo-
8
~ i_
6 g 2 JO
-I
20mV 8
100 ms
Time (ms)
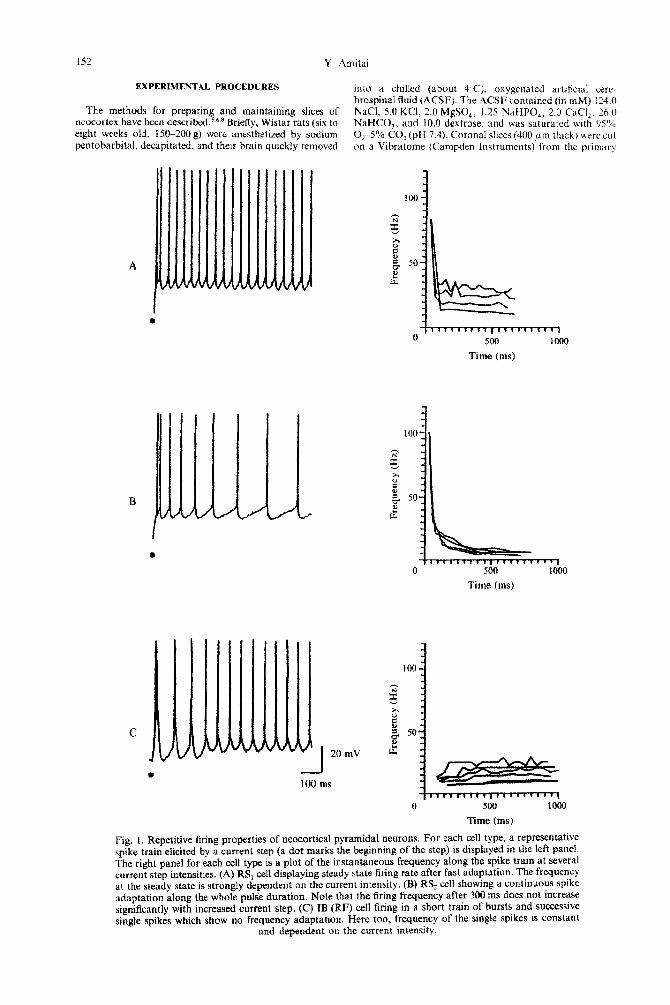
Fig. I. Repetitive firing properties of neocortical pyramidal neurons. For each cell type, a representative spike train elicited by a current step (a dot marks the beginning of the step) is displayed in the left panel. The right panel for each cell type is a plot of the instantaneous frequency along the spike train at several current step intensities. (A) RS, cell displaying steady state firing rate after fast adaptation. The frequency at the steady state is strongly dependent on the current intensity. (B) RS, cell showing a continuous spike adaptation along the whole pulse duration. Note that the firing frequency after 300 ms does not increase significantly with increased current step. (C) IB (RF) cell firing in a short train of bursts and successive single spikes which show no frequency adaptation. Here too, frequency of the single spikes is constant
and dependent on the current intensity.
Membrane potential oscillations in neocortical neurons 153
somatosensory cortex and kept in holding bottles which contained ACSF at room temperature, continuously bub- bled by 95% O,d% CO,. Recording was done in a fluid-gas interface chamber thermostatically controlled to 35-36”C, after at least 1 h of incubation.
In the chamber it was possible to distinguish some cortical lamination,5 which served as convenient landmarks for the placement of the electrodes. Cells were recorded either in layer 2/3 or layer 5. Intracellular micropipettes were filled with 4 M potassium acetate (80-120 MR), and recordings were made with an Axoclamp 2A amplifier. All the drugs were bath-applied. Data were recorded on VCR tapes and analysed off-line (Pclamp, Axon Instruments).
All cells were characterized according to their firing pattern during 100 ms and 0.8-l-s long depolarizing current pulses. Spike inactivation was achieved by depolarizing the cells with continuous current. A 100-m duration current pulse of 0.14.3 nA was delivered every 3 s to continuously monitor the bridge balance.
To analyse membrane oscillations, autocorrelation func- tions were calculated on 1 s long epochs recorded at different membrane potentials. The first peak after the zero time- point was used to determine the dominant frequency of the oscillations and their relative rhythmicity, as expressed by the amplitude of this peak.
RESULTS
Eighty-four neurons were recorded in layers 2/3 and 5. All cells had stable resting potentials more negative than -60mV for at least IOmin, an input resistance higher than 25 MR. and an action potential amplitude of at least 75 mV. All cells were classified according to their intrinsic firing properties as regular spiking (RS) or intrinsically bursting (IB).‘,5,8,9.” This classification is based on the properties of the individ- ual action potentials, their afterpotentials and the spiking behavior close to threshold. All the cells in
A
0.1 nA
I
0.2 nA
0.5 nA
10 mV
200 ms
superficial layers (n = 28) were RS. Layer 5 contained cells of the two types described above: RS (n = 34) and IB (n = 23).
Repetitive firing properties of neocortical neurons
All recorded cells were stimulated by prolonged (0.8-l s) suprathreshold current steps to analyse their adaptation. Repetitive firing properties were studied quantitatively in 29 cells from layers 2/3 and 5. Three types of behavior could be distinguished, and the rest of the cells were classified accordingly. Fig. I shows an example of each.
Thirty-three out of the 84 cells from both superfi- cial and deep laminae displayed marked adaptation over the first 200ms of the current pulse, then reached a steady-state rate. Increasing the current intensity resulted in a higher rate of steady-state firing (Fig. 1A). All these cells belong to the RS group, and will be referred to as RS,
Some RS cells (n = 28) continued to adapt over hundreds of milliseconds until they stopped firing altogether, even though the stimulus was not termi- nated. If the stimulus proceeded or increased, some of these cells resumed firing at a very irregular rate. Increasing the current step intensity in this subclass of cells caused shortening of the first few interspike intervals, but it had little effect on the spike frequency after 20&300 ms (Fig. 1 B). (.4Iso described in Refs I, 5.) These cells will be referred to as RS,.
Of special interest is the third group, which dis- played no frequency adaptation. When their mem- brane potential was held between -65 and -60 mV,
they sustained long periods (up to several seconds) of
B
I
50 ms
C
0.8 nA 10mV
200 ms
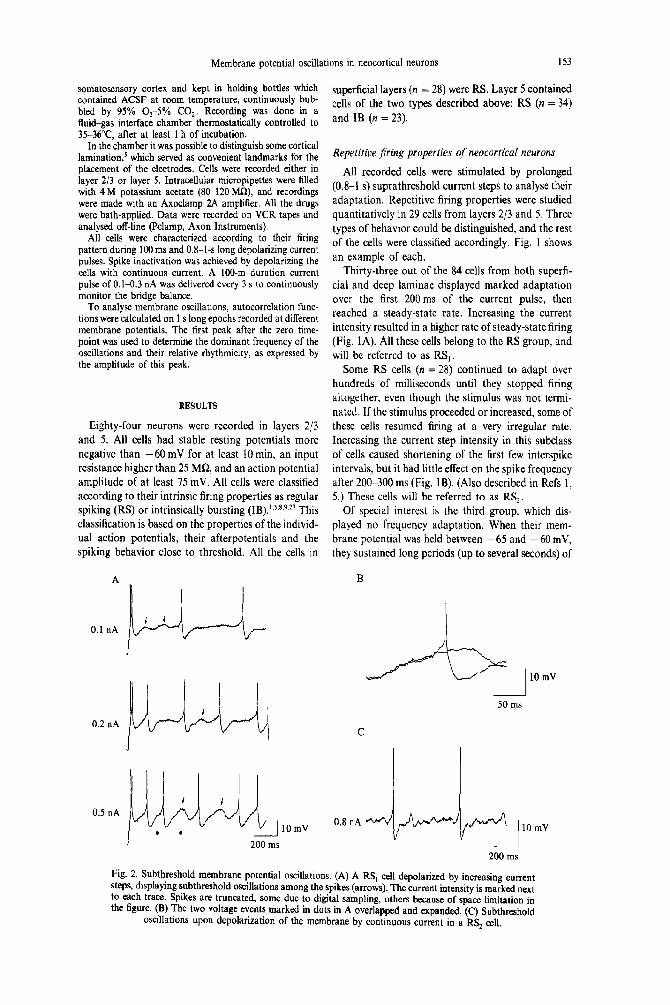
Fig. 2. Subthreshold membrane potential oscillations. (A) A RS, cell depolarized by increasing current steps, displaying subthreshold oscillations among the spikes (arrows). The current intensity is marked next to each trace. Spikes are truncated, some due to digital sampling, others because of space limitation in the figure. (B) The two voltage events marked in dots in A overlapped and expanded. (C) Subthreshold
oscillations upon depolarization of the membrane by continuous current in a RS, cell.
regular, rhythmic firing (Fig. 1C). Most of the cells in this group were capable of generating intrinsic spike bursts, and thus belong to the IB class. However, others which did not burst, and were classified as RS cells, showed the same pattern of rhythmic, non- adapting firing.32 For the purpose of this report both IB and RS cells that showed such rhythmic firing are grouped together and will be referred to as rhythmi- cally firing (RF) cells.
Subthreshold membrane oscillations
In some cells of all types it was possible to detect oscillations of the membrane potential when it was depolarized to just around spike threshold.2’J0 Figure 2A displays the voltage traces of a RS, cell that was depolarized by three current steps of increasing inten- sity. Subthreshold depolarizations appeared between the spikes in all three traces (arrows), Their amplitude increased with the growing depola~zatjon~ while the spike frequency increased as well. Two conspicuous oscillations that did not reach spike threshold appear in the third trace (0.5nA). Figure 2B shows a sub- threshold depolarization overlaid on an adjacent spike. The rising slopes of the two are superimpos- able. Moreover, the spike’s takeoff point is on the rising slope and below the peak of the oscillation, Once a spike was generated, repolarization became much faster, and a deep fast after hyperpolarization (AHP) followed. The average duration of ramp- spike*AHP events in this cell was 95 f 31 ms (n = 6),
154 Y. Amitai
while the average duration ofsubthreshold oscillation cycles was 169 142 ms ()I = 6), demonstrating that the spike speeds up the events and resets the phase. In this particular cell, further increase in the current intensity produced more consistent firing at higher frequencies, and diminjshed the occurrence of sub- threshold membrane oscillations. On the other hand, longer periods (hundred of milliseconds) of sub- threshold oscillations of membrane potential oc- curred in RS, ceils (Fig. 2C). Their oscillation frequency varied between IO and 20 Hz, becoming faster as the membrane was depolarized (not shown).z1 The oscillation pattern and amplitude in RS, cells was somewhat irregular, and occasionally an oscillation cycle reached threshold for spiking (Fig. 2~).
Changes in the oscillation frequency with varying membrane potential suggested that the source of the oscillations is intrinsic ta the membrane itself. The Na’ channel blocker tetrodotoxin (TTX) (10e6M) blocked both the spikes and the subthreshold oscil- lations described above (n = 4, not shown, also de- scribed by Llinas et a[.*‘), therefore both phenomena are dependent on Na’ conductance.
membrane potential oscillations fo~~o~in~ sIow spike inactivation
Unlike the cells described in the previous section, most neocortical cells did not easily generate sub- threshold oscillations. as they spiked reliably when
D
30 nl”
-- -l 1 I I
- - 1nA
-46 mV
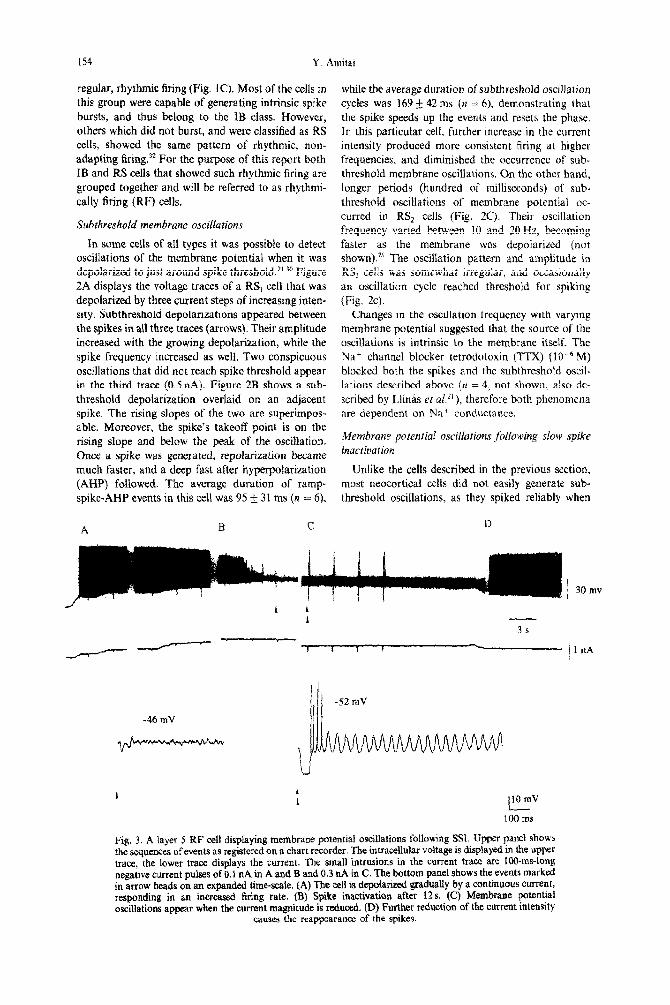
Fig. 3. A Iayer I RF cell displaying membrane potential oscillations following SSI. Upper panel shows the sequences of events as registered on a chart recorder. The intracellular voltage is ~sp~ayed in the upper trace, the lower trace displays the current. The small intrusions in the current trace are LOO-ms-long negative current pulses of 0.1 nA in A and B and 0.3 nA in C. The bottom panel shows the events marked in arrow heads on an expanded time-s&e. (A} The ceIeI1 is detiarized gradually by a continuous current, responding in au increased firing rate. (B) Spike inactivation after 12s. (C) Membrane potential oscillations appear when the current magnitude is reduced. (D) Further reduction of the current intensity
causes the reappearance of the spikes.
Membrane potential oscillations in neocortical neurons 155
stimulated with current. Similar oscillations could be The membrane voltage at this point was between
revealed, however, when spikes were inactivated after -45 and - 35 mV, and in some celis it displayed
prolonged stimuiation (Fig. 3). To achieve this, cells small (about l-2 mV) and quick waverings (Fig. 3B,
were depolarized by continuous current (up to 2 nA), arrowhead). This process was termed “slow spike
until they fired at rates of 4U-60 Hz (n = 40 cells). inactivation” (SSI). Following SSI, h~~ola~~ng
After 10-20 s of firing, spikes suddenly decreased in the membrane by 5-10mV resulted in pronounced
amplitude and dissipated in all cells but five (Fig. 3B). oscillations (Fig. 3C). The oscillations existed in a
A B C 1.0 -1.1 nA
---0.8 nA
1.1 nA 0.8 ._.-.-..&7 r,A
0.6
0.4
0.8 oA 0.2
0 0 -0.2
0.7 nA -0.4
I 25mV I I0 mV
1
50 ms lOtis -0.8 \‘. I J Time (ms)
-1.0
0.75 nA
G H
-li
0.5 nA
0.4 nail
0.3 nA W&%&PM J Ir\lLu\
F
-0.9 nA ---0.8 nA ._._._._0.75 nA
1
-0.4 nA ---0.4 nA ._._._.. 0.3 nA
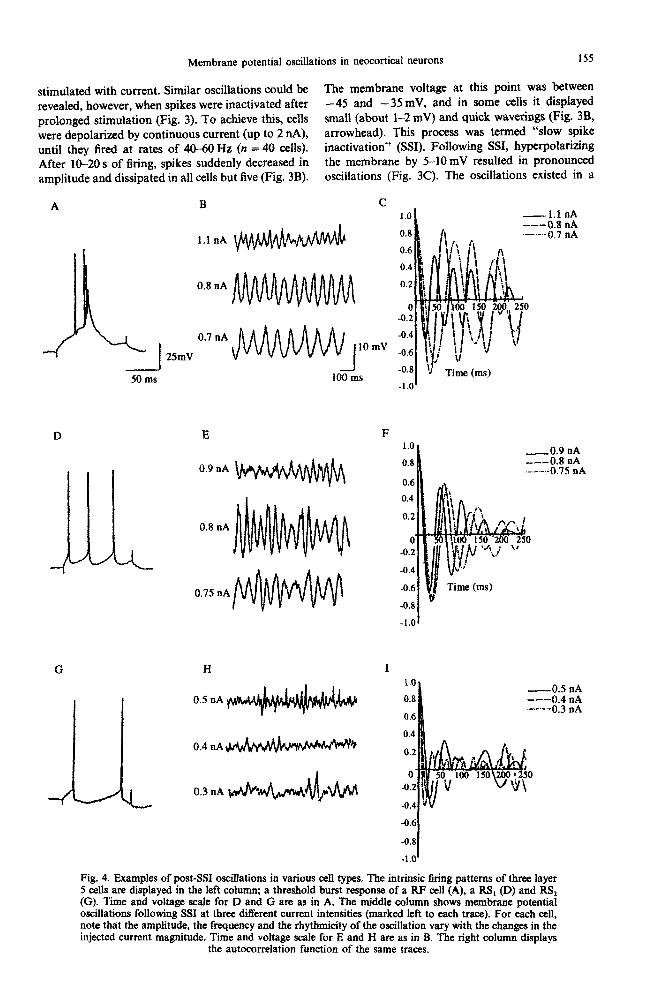
Fig. 4. Examples of post-SSI oscillations in various cell types. The intrinsic firing patterns of three layer 5 cells are displayed in the left column; a threshold burst response of a RF cell (A), a Rs, (D) and RS2 (0). Time and voltage scale for D and G are as in A. The middle column shows membrane potential oscillations following SSI at three different current intensities (marked left to each trace). For each cell, note that the amplitude, the frequency and the rhythmicity of the oscillation vary with the changes in the injected current magnitude, Time and voltage scale for E and H are as in B. The right column displays
the autocorrelation function of the same traces.
156 Y. Amitai
narrow voltage range on the order of 10 mV (around - 4.5 to - 55 mV): depolarizing the membrane poten- tial beyond this range abolished the oscillations, and further hyperpolarization of the membrane below this range induced the re-appearance of action poten- tials (Fig. 3D). A 0.3-nA hyperpolarizing current pulse of 100 ms duration which was delivered to monitor the bridge balance was also sufficient to
release three to four action potentials upon return to the former membrane potential (Fig. 3C. two arrow- heads).
Correlation between attributes ofpost -slow spike inac-
thation oscillations and cell classes
About one-third of the cells (1 l/35) did not reveal any oscillations, either among the spikes or after the spikes were inactivated. All were RS cells, from both superficial and deep laminae. In those cells which did display oscillations following SSI. there were wide variations in the degree of rhythmicity, the amplitude and the specific frequency range obtained.
Figure 4 illustrates examples of three different layer 5 cells identified by their intrinsic firing patterns (left column). Plotted for each cell are examples of post- SSI oscillations at three different membrane poten- tials (middle column). The autocorrelation function for each trace is shown in the right column. Figure 4A shows an intrinsically bursting cell, which qualifies as an RF cell according to its repetitive firing pattern. The rhythmicity of this cell’s oscillations is clearly shown by the autocorrelation function, which has several large, distinct peaks at regular intervals. Both the frequency and amplitude of the side peaks change with membrane potential (Fig. 48, C). The largest peak occurred at - 52 mV (in response to stimulation of 0.8 nA), with an interval of 65 ms (15 Hz) and an
amplitude of 0.85.
A B
0.9 26 / .
0.8 24
T 22 7
The cell in Fig. 4D is an RS, cell. Its oscillation frequencies were relatively stable, but amplitudes varied considerably from moment-to-moment and at different membrane potentials. The first side peaks of the autocorrelation function were at intervals of 52. 62 and 70ms (i.e. 19. 16 and 14 Hz), and their amplitudes varied from 0.5 to 0.6.
The third cell (Fig. 4G) is an RSZ cell which showed
a continuous adaptation as in Fig. lB. The oscil- lations of this cell were faster than those of the previous two, had lower amplitude, and were less regular. The autocorrelation functions disclosed peaks at 25,43 and 60 ms (16.23 and 40 Hz), and had much lower amplitudes (0.24.38) than the dther cell types. Both illustrated RS cells showed inactivation of the oscillations (the one in Fig. 4D after about 2 min, the one in Fig. 4G after 30 s), while the RF cell sustained its membrane oscillations as long as the membrane was kept at that potential.
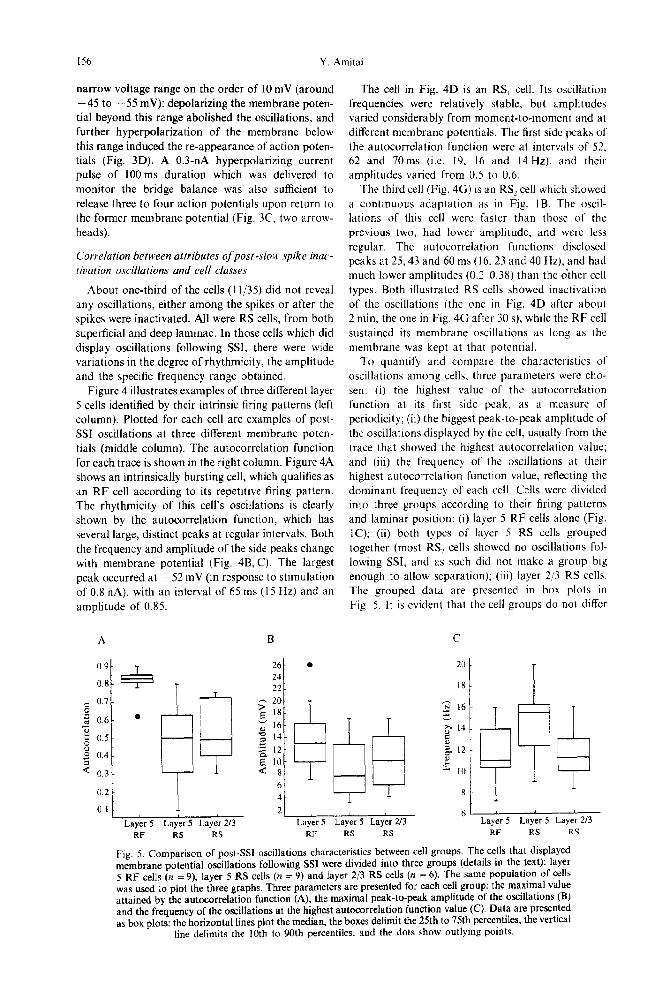
To quantify and compare the characteristics 01 oscillations among cells, three parameters were cho- sen: (i) the highest value of the autocorrelation function at its first side peak, as a measure of periodicity; (ii) the biggest peak-to-peak amplitude of the oscillations displayed by the ccl], usually from the trace that showed the highest autocorrelation value; and (iii) the frequency of the oscillations at their highest autocorrelation function value, reflecting the dominant frequency of each cell. Cells were divided into three groups according to their firing patterns and laminar position: (i) layer 5 RF cells alone (Fig. IC); (ii) both types of layer 5 RS cells grouped together (most RS2 cells showed no oscillations fol- lowing SSI, and as such did not make a group big enough to allow separation); (iii) layer 2/3 RS cells. The grouped data are presented in box plots in Fig. 5. It is evident that the cell groups do not differ
C
Layer 5 Layer 5 Layer 213 RF RS RS RF RS RS RF RS RS
Fig. 5. Comparison of post-W oscillations characteristics between cell groups. The cells that displayed membrane potential oscillations following SSI were divided into three groups (details in the text): layer 5 RF cells (n = 9), layer 5 RS cells (n = 9) and layer 2/3 RS cells (n = 6). The same population of cells was used io plot the three graphs. Three parameters are presented for each cell group: the maximal value attained by the autocorrelation function (A), the maximal peak-to-peak amplitude of the oscillations (B) and the frequency of the oscillations at the highest autocorrelation function value (C). Data are presented as box plots: the horizontal lines plot the median, the boxes delimit the 25th to 75th percentiles, the vertical
line delimits the 10th to 90th percentiles, and the dots show outlying points.
Membrane potential oscillations in neocortical neurons
B
157
60s
10mv
--- 30 s - 45 s __._._._ 60 s
200 ms
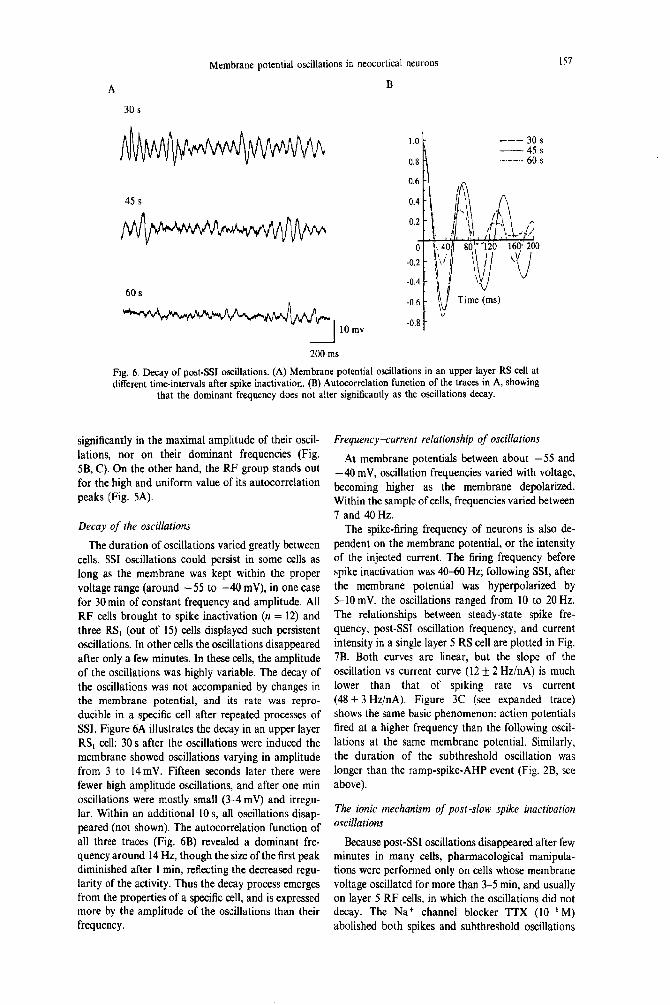
Fig. 6. Decay of post-SSI oscillations. (A) Membrane potential oscillations in an upper layer RS cell at different time-intervals after spike inactivation. (B) Autocorrelation function of the traces in A, showing
that the dominant frequency does not alter significantly as the oscillations decay.
significantly in the maximal amplitude of their oscil- lations, nor on their dominant frequencies (Fig. 5B, C). On the other hand, the RF group stands out for the high and uniform value of its autocorrelation peaks (Fig. 5A).
Decay of the oscillations
The duration of oscillations varied greatly between cells. SSI oscillations could persist in some cells as long as the membrane was kept within the proper voltage range (around -55 to -40 mV), in one case for 30 min of constant frequency and amplitude. All RF cells brought to spike inactivation (n = 12) and three RS, (out of 15) cells displayed such persistent oscillations. In other cells the oscillations disappeared after only a few minutes. In these cells, the amplitude of the oscillations was highly variable. The decay of the oscillations was not accompanied by changes in the membrane potential, and its rate was repro- ducible in a specific cell after repeated processes of SSI. Figure 6A illustrates the decay in an upper layer RS, cell: 30 s after the oscillations were induced the membrane showed oscillations varying in amplitude from 3 to 14mV. Fifteen seconds later there were fewer high amplitude oscillations, and after one min oscillations were mostly small (3-4mV) and irregu- lar. Within an additional 10 s, all oscillations disap- peared (not shown). The autocorrelation function of all three traces (Fig. 6B) revealed a dominant fre- quency around 14 Hz, though the size of the first peak diminished after 1 min, reflecting the decreased regu- larity of the activity. Thus the decay process emerges from the properties of a specific cell, and is expressed more by the amplitude of the oscillations than their frequency.
Frequency-current relationship of oscillations
At membrane potentials between about -55 and -40 mV, oscillation frequencies varied with voltage, becoming higher as the membrane depolarized. Within the sample of cells, frequencies varied between 7 and 40 Hz.
The spike-firing frequency of neurons is also de- pendent on the membrane potential, or the intensity of the injected current. The firing frequency before spike inactivation was 40-60 Hz; following SSI, after the membrane potential was hyperpolarized by 5-10 mV, the oscillations ranged from 10 to 20 Hz. The relationships between steady-state spike fre- quency, post-%1 oscillation frequency, and current intensity in a single layer 5 RS cell are plotted in Fig. 7B. Both curves are linear, but the slope of the oscillation vs current curve (12 f 2 Hz/nA) is much lower than that of spiking rate vs current (48 k 3 Hz/nA). Figure 3C (see expanded trace) shows the same basic phenomenon: action potentials fired at a higher frequency than the following oscil- lations at the same membrane potential. Similarly, the duration of the subthreshold oscillation was longer than the ramp-spike-AHP event (Fig. 2B, see above).
The ionic mechanism of post-slow spike inactivation
oscillations
Because post-SSI oscillations disappeared after few minutes in many cells, pharmacological manipula- tions were performed only on cells whose membrane voltage oscillated for more than 3-5 min, and usually on layer 5 RF cells, in which the oscillations did not decay. The Nat channel blocker TTX (10m6 M) abolished both spikes and subthreshold oscillations
158 Y. Amitai
A
1.60 nA
I .46 nA
1.24 nA
1.02 nA
0.85 nA
. Spikes l Oscilations
01 / 3 0.7 0.8 0.9 1 0 1.1 1.2 1.3 1.4 1.5 1.6
Current (nA)
10mV
200 ms
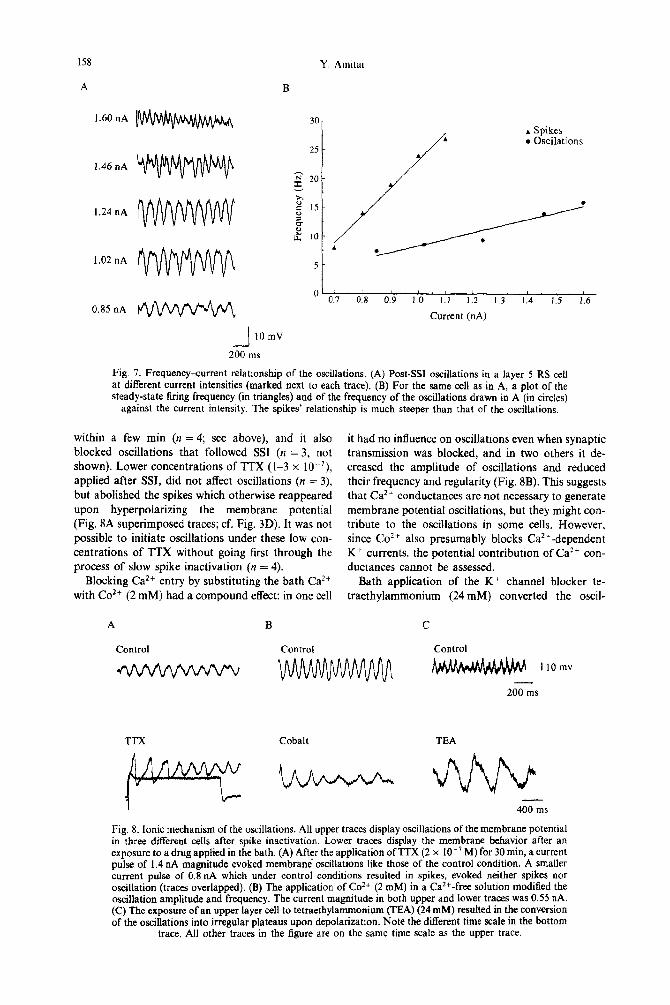
Fig. 7. Frequency-current relationship of the oscillations. (A) Post-W oscillations in a layer 5 RS cell at different current intensities (marked next to each trace). (B) For the same cell as in A, a plot of the steady-state firing frequency (in triangles) and of the frequency of the oscillations drawn in A (in circles)
against the current intensity. The spikes’ relationship is much steeper than that of the oscillations,
within a few min (n = 4; see above), and it also blocked oscillations that followed SSI (n = 3, not
shown). Lower concentrations of TTX (l-3 x lo-‘), applied after SSI, did not affect oscillations (n = 3) but abolished the spikes which otherwise reappeared upon hyperpolarizing the membrane potential (Fig. 8A superimposed traces; cf. Fig. 3D). It was not possible to initiate oscillations under these low con- centrations of TTX without going first through the process of slow spike inactivation (n = 4).
Blocking Ca*+ entry by substituting the bath Ca*+ with Co*+ (2 mM) had a compound effect: in one cell
it had no influence on oscillations even when synaptic transmission was blocked, and in two others it de- creased the amplitude of oscillations and reduced their frequency and regularity (Fig. 8B). This suggests that Ca*+ conductances are not necessary to generate membrane potential oscillations, but they might con- tribute to the oscillations in some cells. However, since Co’+ also presumably blocks Ca*‘-dependent K+ currents, the potential contribution of Ca2+ con- ductances cannot be assessed.
Bath application of the K+ channel blocker te- traethylammonium (24 mM) converted the oscil-
A B C
Control Control Control
1 &&&&h&h IlOmv
200 ms
TTX Cobalt
I 400 ms
Fig. 8. Ionic mechanism of the oscillations. All upper traces display oscillations of the membrane potential in three different cells after spike inactivation. Lower traces display the membrane behavior after an exposure to a drug applied in the bath. (A) After the application of TTX (2 x lo-’ M) for 30 min, a current pulse of 1.4 nA magnitude evoked membrane‘ oscillations like those of the control condition. A smaller current pulse of 0.8 nA which under control conditions resulted in spikes, evoked neither spikes nor oscillation (traces overlapped). (B) The application of Co*+ (2 mM) in a Ca2+-free solution modified the oscillation amplitude and frequency. The current magnitude in both upper and lower traces was 0.55 nA. (C) The exposure of an upper layer cell to tetraethylammonium (TEA) (24 mM) resulted in the conversion of the oscillations into irregular plateaus upon depolarization. Note the different time scale in the bottom
trace, All other traces in the figure are on the same time scale as the upper trace.

Membrane potential oscillations in neocortical neurons 159
lations into prolonged plateaus at comparable mem- brane potentials (Fig. 8C). The plateaus became longer in duration and very irregular as the mem- brane was depolarized further (n = 3). Thus it seems that the repolarizing phase of the oscillations was contributed mostly by tetraethylammonium sensitive K+ conductances.
DISCUSSION
This study demonstrates that most pyramidal cells display oscillations of their membrane potential during prolonged depolarization. Two types of oscil- lations were observed: (i) subthreshold depolarizing waves that were evident between fast spikes, observed most commonly in cells that showed marked spike adaptation (R$); and (ii) oscillations of the mem- brane potential that appeared only following SSI. Emphasis was put on the second type which has never been studied in detail. The post-SSI oscillations ap- peared in two-thirds of the cells, and were most periodic and persistent in layer 5 RF cells.
The mechanisms of membrane potential oscillations
Post-%1 oscillations occurred after spikes were inactivated following long periods of firing at a high rate. Thus, some aspect of the membrane physiology must change slowly, reducing fast-spike excitability and increasing or unmasking slower oscillatory ac- tivity. The nature of this change is unclear. Slow inactivation of spikes has been described in several preparations. In the superior colliculus it was as- cribed to an increase in Ca2+-dependent potassium conductance.” The same mechanism was proposed for neocortical cells; repeated 1 -s, strong depolarizing pulses cause progressive hyperpolarization and a decrease in firing rate in both cat3’ and human?6 On the other hand, a process of slow inactivation has been described for sodium channels of invertebrate axons and muscles.‘s~3’ Recent work on guinea-pig neocortical cells suggested that the slow inactivation of spikes following strong repetitive stimuli is most probably due to a slow inactivation of the sodium channels responsible for the spike generation.‘!
Whatever the mechanism of spike inactivation, it may or may not be relevant to the mechanism that leads to persistent oscillations of the membrane po- tential. These oscillations are similar to subthreshold oscillations in some ways: both phenomena have similar frequency ranges, and they appear to be generated by similar ionic conductances. Pharmaco- logical manipulations indicate that post-SSI oscil- lations depend critically upon a Na+ current. This could be the non-inactivating sodium current2.*’ which exists in many mammalian neutons,zo includ- ing neocottical neurons from several species (for cat, see Refs 33, 34; for guinea-pig, see Refs 8, 37). Possibly a Ca*+ conductance is also activated at higher depolarizations. Tetraethylammonium-snsi- tive K’ currents seem to be responsible for the
tepolarization phase. A similar ionic mechanism has been proposed for subthreshold oscillations in hippo- campal neuronsI and in neocortical neurons.21
The functional sign&ance of membrane potential os-
cillations
Membrane potential oscillations have been ob- served in neurons of several structures of the central nervous system, most notably the inferior oliveZ4.” and the thalamus.‘s In general, subthreshold oscil- lations provide an underlying rhythmic drive that will bias the timing of a cell’s action potentials, forcing them toward certain output frequencies.
Several specific functions for membrane oscil- lations have been proposed. For example, the pto- nounced subthreshold oscillations exhibited by inferior olivary neurons may serve, via electrical coupling, to synchronize output from the olive, lead- ing to rhythmic climbing fiber input to cerebellar Purkinje cells.” Within the thalamus, several types of intrinsic oscillations correlate with certain states of arousal, and contribute to rhythmic, synchronized output. Both spindle and slow waves of sleep, usually recorded over the cortex, have been attributed to intrinsic pacemaker activity of reticular thalamic neurons35 and relay cells,‘oJ7~28~29 which supposedly project a rhythmic synchrony to the cortex. The oscillations in single thalamic cells are suprathreshold, in this case; rhythms ate created by bursts of spikes riding on slow depolarizations, due mostly to a low threshold Ca2+ conductance.
It is more difficult to assign a functional signifi- cance to membrane oscillations of cortical neurons. The simplest possibility is that they serve as the drive for certain intrinsic cortical rhythms. Subthreshold oscillations of 2-10 Hz have been observed in hippo- campal pyramidal cells.‘9 Oscillations over a wide range of frequencies have also been observed in both spiny and nonspiny cells of the neocortex.2’,30 All of these appeared upon membrane depolarization to around spike threshold, and their ionic mechanism was similar to those described here. Assuming that the cells occasionally generate their spikes close to the peak of the oscillatory depolarizing wave, it was suggested that these subthreshold oscillations facili- tate the binding of each cell in the network to a specific rhythm, such as theta in the hippocampus, or the 40 Hz synchrony observed during sensory stimuli in the visual cortex.“J3J4
The relationship between oscillations and spiking are more complex, however. It is shown here that the frequency of spike firing always differs from that of the membrane oscillations. Once the spike conduc- tances ate added to those of ongoing oscillations, the timing of each event ate modified and shortened. While the membrane potential oscillations have a relatively narrow range of frequencies (7-40 Hz), the cells’ actual spike firing ranges much higher, to greater than 100 Hz.
160 Y. Amltai
The only group of cells in the neocortex shown to have the intrinsic propensity to oscillate in a repetitive firing mode is the group of layer 5 RF cells.‘2 Their frequencies of firing depend again on their membrane potential, ranging from about 8-12 Hz for repetitive spike bursts, and up to around 60 Hz in a sin&-spike
mode. As shown here, this same cell group produces membrane oscillations with the most periodic and persistent form. Layer 5 in general. and these cells specifically, have been shown to drive the rest of the cortical cell population during various synchronous processes. When inhibition was abolished pharmaco- logically in slices, the synchronous population event was initiated in middle cortical Iaminae.’ Layer 5 was also implicated in initiating rhythmic oscillatory ac- tivity when N-methyl+aspartate receptors were fa- cilitated.32 IB cells, which can be perceived as a subgroup of RF cells. were also shuwn LO be the main source for synchronous, epileptiform excitatory drive to other neuronal elements when inhibition was par- tially blocked.5 It was inferred from these studies that layer 5 RF cells are strongly connected to each other. This possibility was supported by reconstruction of layer 5 dye-labeled IB and RS cells: these physiologi- cal cell groups were shown to be morphologically distinct,6.‘8,39 and to possess different patterns of local axonal arborizations. While the axons of RS cells arborizad mainly in superficial laminae, the local
axons of IS cells extend horizontally and arborize extensively within the same lamina.’ In addition, initial information suggests that the inhibitory con- nectivity of these two cell groups might differ. and at least some of IB cells receive less inhibitory contacts
on their somata.“’ Though information about the
local connectivity of physiological cell types in scant, the few hints we have support the possibility that the synaptic organization of a local population of layer 5 RF cells may allow them to synchronize their firing.
CONCLUSJONS
It is suggested that the membrane oscillations reflect fundamental membrane properties that are important for determining firing rate and rhythmic- ity. While they do not entirely determine the final firing rate of a specific neocortical cell, their highly rhythmic and persistent nature in a subset of layer 5 cells constitutes the mechanism by which these cells, under certain conditions, can operate as pacemakers for the rest of the neocortical population.
Acknowledgements-l thank E. White, M. J. Gutnick, B. W. Connors and L. R. Silva for helpful comments on the manuscript. This work was supported by the United States-Israel Binational Science Foundation grant no. 91- 00197, and SFB grant no. 194.
REFERENCES
1. Agmon A. and Connors B. W. (1992) Correlation between intrinsic firing patterns and thalamocortical synaptic responses of neurons in mouse barrel cortex. J. Neurosci. 12, 319-329.
2. Alonso A. and Llinas R. (1989) Subthreshold Na+-dependent theta-like rhythmicity in stellate cells of entorhinal cortex layer II. Narure 342, 175-177.
3. Bouyer J. J., Montaron M. F., Vahnee J. M., Albert M. P. and Rouge1 A. (1987) Anatomical localization of cortical beta rhythms in cat. Neuroscience 22, 863-869.
4. Calvin W. H. and Sypert G. W. (1976) Fast and slow pyramidal tract neurons: an intracellular analysis of their contrasting repetitive firing properties in the cat. J. Neurophysiol. 39, 420 434.
5. Chagnac-Amitai Y. and Connors B. W. (1989) Synchronized excitation and inhibition driven by intrinsically bursting neurons in neocortex. J. Neurophysiol. 62, 1149-l 162.
6. Chagnac-Amitai Y., Luhmann H. J. and Prince D. A. (1990) Burst generating and regular spiking layer 5 pyramidal neurons of rat neocortex have different morphological features. J. camp. Neurof. 296, 598-613.
7. Connors B. W. (1984) Initiation of synchronized neuronal bursting in neocortex. Nature 310, 685-687. 8. Connors B. W., Gutnick M. J. and Prince D. A. (1982) Electrophysiological properties of neocortical neurons ii~ oitro.
9.
10.
11.
12.
13.
14.
15. 16.
17.
18.
J. Neurophysiol. 48, 1302-1320. Connors B. W. and Gutnick M. J. (1990) Intrinsic firing patterns of diverse neocortical neurons. Trends Neurosci. 13, 99-104. Curr6 Dossi R., Nutiez A. and Steriade M. (1992) Electrophysiology of slow (0.54 Hz) intrinsic oscillation of cat thalamocortical neurons in oic~o. J. Physiol., Land. 447, 21 S-234. Engel A. K., Konig P., Kreiter A. K., Schillen T. B. and Singer W. (1992) Temporal coding in the visual cortex: new vistas on integration in the nervous system. Trends Neurosci. 15, 218-226. Friedman A. (1991) Active and Passive Properties of Neocortical Neurons and Their Role in Determining Neuronul Firing Putlern. PhD thesis, Ben-Gurion university, Beer-Sheva, Israel. Gray C. M. and Singer W. (1989) Stimulus-specific neuronal oscillations in orientations columns of the cat visual cortex. Proc. natn. Acad. Sci. U.S.A. 86, 1698-1702. Gray C. M., Konig P., Engel A. K. and Singer W. (1989) Oscillatory responses in cat visual cortex exhibit inter-columnar synchronization which reflects global stimulus properties. Nature 338, 334337. Hille B. (1992) In Ionic Channels of Excitable Membranes, p. 495. Sinauer Associates, Sunderland, MA. Jagadeesh B., Gray C. M. and Ferster D. (1992) Visually evoked oscillations of membrane potential in cells of cat visual cortex. Science 257, 552-554. Jahnsen H. and Llinls R. (1984) Ionic basis for the electroresponsiveness and oscillatory properties of guinea-pig thalamic neurones in v&o. J. Physoi., Land. 349, 227-247. Larkman A. and Mason A. (1990) Correlation between morphology and electrophysiology of pyramidal neurons in slices of rat visual cortex. I. Establishment of cell classes. J. Neurosci. 10, 1407-1414.
Membrane potential oscillations in neocortical neurons 161
19. bung L. S. and Yim C. C. (1991) Intrinsic membrane potential oscillations in hippocampal neurons in uifro. Brain Res. 553, 261-274.
20. Llin& R. (1988) The intrinsic electrophysiological properties of mammalian neurons: insights into central nervous system function. Science 242, 16541664.
21, LlinHs R., Grace A. A. and Yarom Y. (1991) In vitro neurons in mammalian cortical layer 4 exhibit intrinsic oscillatory activity in the lo- to 50-Hz frequency range. Proc. mtn. Acad. Sci. U.S.A. 88, 897-901.
22. Llinbs R. and Lopes-Bameo J. (1988) Electrophysiology of mammalian tectal neurons in vitro. II. Long term adaptation. J. Neuroph~siol. 60, 869-878.
23. Llinls R. and Sasaki K. (1989) The functional organization of the olive-cerebellar system as examined by multiple Purkinje cell recordings. Eur. J. Neurosci. 1, 587402.
24. Llines R. and Yarom Y. (1981) Electrophysiology of mammalian inferior olivary neurons in vitro. Different types of voltage-dependent ionic conductances. J. Physioi., Lond. 315, 549-567.
25, Llines R. and Yarom Y. (1986) Oscillatory properties of guinea-pig inferior olivary neurons and their pharmacological modulation: an in cure study. J. Physiol., Lond. 376, 163-182.
26. Lorenzon N. M. and Foehring R. C. (1992) Relationship between firing and afterhyperpolarizations in human neocortical neurons. J. NeurophysioL 67, 35&363.
27. McCormick D. A., Connors B. W., Lighthall J. W. and Prince D. A. (1985) Comparative electrophysiology of pyramidal and sparsely spiny stellate neurons of the neocortex. J. Neurophysiol. 54, 782-806.
28. McCormick D. A. and Pape H.-C. (1990) Properties of a hyperpolarization-activated cation current and its role in rhythmic oscillation in thalamic relay neurones. 1. Physiol., Lond. 431, 291-318.
29. McCormick D. A. and Prince D. A. (1988) Noradrenergic modulation of firing pattern in guinea-pig and cat thalamic neurons in vitro. J. Neurophysiol. 59, 978-996.
30. Nufiez A., Amzica F. and Steriade M. (1992) Voltage-dependent fast (2&40 Hz) oscillations in long-axoned neocortical neurons. Neuroscience 51, 7-10.
31. Patlak J. (1991) Molecular kinetics of voltage-dependent Nat channels. Physiol. Rec. 71, 1047-1080. 32. Silva L. R., Amitai Y. and Connors B. W. (1991) Intrinsic oscillations of neocortex generated by layer 5 pyramidal
neurons. Science 251, 432435. 33. Staftstrom C. E., Schwindt P. C. and Crill W. E. (1982) Negative slope conductance due to a persistent subthreshold
sodium current in cat neocortical neurons in cifro. Brain Res. 236, 221-226. 34. Staftstrom C. E., Schwindt P. C. and Grill W. E. (1984) Repetitive firing in layer 5 neurons from cat neocortex in oitro.
J. Neurophysiol. 52, 264-277. 35. Steriade M. and Llimis R. (1988) The functional states of the thalamus and the associated neuronal interplay. Physio~.
Rev. 68, 649-142. 36. Steriade M., Currb Dossi R. and Nuiiez A. (1991) Network modulation of a slow intrinsic oscillation of cat
thalamocortical neurones implicated in sleep delta waves: cortically induced synchronization and brainstem cholinergic suppression. J. Newosci. 11, 320&3217.
37. Schwindt P. C., Spain R. C., Foehring R. C., Chubb M. C. and Grill M. C. (1988) Slow conductances in neurons from cat sensorimotor cortex in oitro and their role in slow excitability changes. J. Neurophysiol. 59, 450-467.
38. Tanaka E., Higashi H. and Nishi S. (1991) Membrane properties of guinea pig cingulate cortical neurons in ailro. J. Neurophysiol. 65, 808-821,
39. Wang Z. and McCormick D. A. (19%) Control of firing mode of corticotectal and corticopontine layer V burst generating neurons by norepinephrine, acetylcholine and lS, 3R-ACPD. J. Neurosci. 13, 2199-2216.
40. Whte E., Anitai Y. and Gutnick M. I. (1994) A comparison of synapses onto the somata of intrinsically bursting and regular spiking neurons. J. camp. Neural. 340, l-14.
(Accepted 13 April 1994)