Embed Size (px)
Citation preview
Membrane Emulsification to Produce
Perfume Microcapsules
By
Xuemiao Pan
A thesis submitted to
The University of Birmingham
For the Degree of
DOCTOR OF PHILOSOPHY
School of Chemical Engineering
The University of Birmingham
United Kingdom
July 2013
University of Birmingham Research Archive
e-theses repository This unpublished thesis/dissertation is copyright of the author and/or third parties. The intellectual property rights of the author or third parties in respect of this work are as defined by The Copyright Designs and Patents Act 1988 or as modified by any successor legislation. Any use made of information contained in this thesis/dissertation must be in accordance with that legislation and must be properly acknowledged. Further distribution or reproduction in any format is prohibited without the permission of the copyright holder.

Abstract
I
Abstract
Microencapsulation is an efficient technology to deliver perfume oils from consumer
products onto the surface of fabrics. The work presented in this thesis aims to prepare
perfume microcapsules with different shell and core materials using membrane
emulsification to achieve uniform microcapsule size/mechanical strength, which may
provide better end-use performance than those currently produced in industry.
Membrane emulsification in a dispersion cell followed by in-situ polymerization was
used to prepare melamine-formaldehyde (MF) microcapsules with narrow size
distribution, which contained several types of oil-based fragrances or ingredients.
Investigated in this study are the parameters impacting on the size and size
distribution of the droplets and final MF microcapsules, and the optimum conditions
to produce the microcapsules with narrowest size distribution have been identifies.
A pilot plant-scale cross-flow membrane system was also used to produce MF
microcapsules, demonstrating that the membrane emulsification process has potential
to be scaled up for industrial applications. The mechanical strength of the formed MF
microcapsules was measured using a micromanipulation technique. It has been found
that microcapsules with narrower size distribution also had narrower distribution in
mechanical strength parameters.
Abstract
II
Moreover, user- and environmentally- friendly poly (methyl methacrylate) (PMMA)
microcapsules with narrow size distribution were prepared for the first time using the
dispersion cell membrane emulsification system.
Several newly developed techniques have been applied to PMMA microcapsules, in
order to determine their various properties. Confocal laser scanning microscopy
(CLSM) was used to determine the shell thickness of PMMA microcapsules labelled
with a fluorescence dye instead of transmission electron microscopy (TEM).
Characterization methods previously used for thin-shell MF microcapsules were
expanded to analyse PMMA microcapsules with thick shells. The intrinsic mechanical
properties of PMMA with thick shells were determined using a micromanipulation
technique and finite element analysis (FEM). The structure of MF and PMMA
microcapsules was also characterised in the determination of the permeability and
diffusivity of the perfume oils in the shell of microcapsules.
Acknowledgements
III
Acknowledgements
I will begin by thanking my supervisors, Prof. Zhibing Zhang, Prof. Jon Preece and
Prof. David York, for their excellent supervision, and the past and present members of
Micromanipulation Group for their support throughout these years. Their experience
and help have been important for my research and they have always been ready to help
me when I needed. .
A special thank goes to Dr Theresa Morris, Dr James Bowen and Dr Paul Young for
their technical support on using technical equipment; thanks also go to Dr Stephen
Collins (University of Leeds) for his support to run the cross-flow membrane system
experiment; I also acknowledge Prof. H. Chen (Department of Chemical and Materials
Engineering, National Central University, Jhongli City, Taiwan), Dr Raul Rodrigo
Gomez (Procter & Gamble, Brussels) and Dr Y. Long (Chinese Academy of Sciences,
Beijing) for technical discussions; I am very grateful to Dr. Johan Smets, Ms Susana
Fernandez Prieto, Dr Carols Amador from Procter & Gamble for their support on this
project; I am very grateful to all the people from inprotec Germany; I would like to
convey my deepest thanks to all the people in the Department of Chemical
Engineering.
I would like to thank School of Chemical Engineering, University of Birmingham for
administrative support and providing laboratory facilities, as well as China Scholarship
Council and Procter and Gamble for the financial support.

Acknowledgements
IV
I would like to mention my family and friends in China and Spain, because they were
distant only in geographical terms, and they were all by my side, throughout my
troubles and glory; I would like to thank all my friends in Birmingham because life is
more than engineering and they were always ready for supporting me!
Last but not least, I would like to thank Prof. Ruben Mercadé Prieto not only for his
support to my PhD study but also for his encourage and motivation. I couldn’t have
done it without him.
Table of Contents
V
Table of Contents
Abstract.......................................................................................I
Acknowledgements..................................................................III
Table of Contents......................................................................V
List of Figures.......................................................................XIV
List of Tables......................................................................XXVI
Nomenclature..................................................................XXVIII
Greek Symbol..................................................................XXXIV
Abbreviations..................................................................XXXVI
List of Publications......................................................XXXVIII
Chapter 1 Introduction ..........................................................1
Chapter 2 Literature work.....................................................7
2.1 Introduction......................................................................................................7
2.2 Microencapsulation .........................................................................................8
2.2.1 Introduction...............................................................................................8
2.2.2 Perfumes used in detergents......................................................................9
2.2.3 Perfume microcapsules…........................................................................11
2.3 Emulsification................................................................................................16
2.3.1 Emulsion and emulsion stability.............................................................16
Table of Contents
VI
2.3.2 Emulsification methods...........................................................................17
2.3.2.1 Homogenization...............................................................................17
2.3.2.2 Other emulsification methods..........................................................19
2.3.3 Membrane emulsification........................................................................21
2.3.3.1 Introduction of membrane emulsification........................................21
2.3.3.2 Flat membrane combined with a stirrer system (Dispersion cell) ...23
2.3.4 Theoretical models to describe droplet formation at the membrane
surface...............................................................................................................25
2.4 Encapsulation techniques...............................................................................34
2.4.1 Chemical processes.................................................................................34
2.4.2 Physico-chemical processes....................................................................37
2.4.3 Mechanical processes..............................................................................37
2.5 Shell materials................................................................................................38
2.5.1 Melamine formaldehyde..........................................................................38
2.5.1.1 Chemical structure of melamine-formaldehyde precondensate.......39
2.5.1.2 Application of melamine-formaldehyde microcapsules...................42
2.5.1.3 Limitation of melamine-formaldehyde............................................47
2.5.1.4 Poly (methyl methacrylate) (PMMA) .............................................49
2.6 Characterization of microcapsules.................................................................53
2.6.1 Characterisation of size and size distribution..........................................54
2.6.2 Measurement of the mechanical strength of single microcapsules.........57
2.6.2.1 Control of microcapsule size and strength distribution....................61
2.6.3 Release test and shell permeability.........................................................64
2.6.4 Morphology, microstructure and shell thickness ...................................72
2.7 Conclusions....................................................................................................74
Table of Contents
VII
Chapter 3 Materials and experimental techniques..........77
3.1 Introduction....................................................................................................77
3.2 Materials.........................................................................................................78
3.2.1 Materials used to prepare melamine formaldehyde (MF)
Microcapsule….................................................................................................78
3.2.2 Materials used to prepare poly (methyl methacrylate) (PMMA)
microcapsules...................................................................................................79
3.3 Technique to prepare microcapsules.............................................................79
3.3.1 Dispersion cell system...........................................................................79
3.3.1.1 Cell system......................................................................................79
3.3.1.2 The membrane..................................................................................82
3.3.2 Cross flow membrane system ..............................................................86
3.3.2.1 Cross flow membrane system .......................................................86
3.3.2.2 Membrane Tube...............................................................................90
3.4 Technique to characterise microcapsules.......................................................92
3.4.1 Malvern size analyzer - laser diffraction ...............................................92
3.4.1.1 Typical data generated ...................................................................95
3.4.2 Micromanipulation technique................................................................97
3.4.2.1 Typical data generated ..................................................................101
3.4.3 Ultraviolet-Visible spectrophotometery (UV-Vis) ...............................104
3.4.3.1 Typical data generated .................................................................106
3.4.4 Environmental scanning electron microscopy (ESEM) .....................107
3.4.4.1 Typical ESEM image.....................................................................109
3.4.5 Transmission electron microscopy (TEM)...........................................110
3.4.5.1 Typical TEM image…...................................................................111
Table of Contents
VIII
3.4.6 Confocal laser scanning microscopy (CLSM) ...................................112
3.4.6.1 Typical CLSM image.....................................................................114
3.4.7 Contact angle measurement device.....................................................114
3.4.8 Tensiometer...........................................................................................115
3.4.8.1 Typical data generated .................................................................118
3.4.9 Rheometer...........................................................................................119
3.4.9.1 Typical data obtained....................................................................120
Chapter 4 S i z e a n d S t r e n g t h D i s t r i b u t i o n s o f
Melamine-formaldehyde Microcapsules Prepared by
Membrane Emulsification.....................................................121
4.1 Introduction..................................................................................................121
4.2 Experimental section...................................................................................122
4.2.1 Preparation of microcapsules...............................................................122
4.2.1.1 Preparation of microcapsules using membrane emulsification......122
4.2.1.2 Preparation of microcapsules using conventional
homogenization……………………………………………………………123
4.2.1.3 Preparation of microcapsules with fluorescent dye........................124
4.2.2 Morphology and shell thickness of microcapsule................................124
4.2.3 Size analysis........................................................................................125
4.2.4 Measurement of the mechanical strength of single microcapsules......126
4.3 Results and discussion..................................................................................127
4.3.1 The effect of membrane surface hydrophilicity on the mean size and size
distribution of oil droplets..............................................................................127
4.3.2 Stability of the oil/water emulsion.......................................................132
4.3.3 Effects of process conditions on the mean size and size distribution of
Table of Contents
IX
oil droplets......................................................................................................134
4.3.4 Effects of reaction temperature on the mean size and size distribution of
microcapsules.................................................................................................139
4.3.5 Morphology...........................................................................................140
4.3.6 Shell thickness.......................................................................................142
4.3.7 Size analysis of microcapsules..............................................................145
4.3.8 Mechanical properties of microcapsules ..............................................147
4.4 Conclusions..................................................................................................153
Chapter 5 Scale-up of Membrane Emulsification to
Prepare Melamine-formaldehyde Microcapsules and
Microencapsulation of Different Oils……………………...154
5.1 Introduction..................................................................................................154
5.2 Experimental methods.................................................................................155
5.2.1 Scale up experiment with cross-flow membrane emulsification...........155
5.2.2 Preparation of microcapsules with different core oils using a dispersion
cell...................................................................................................................157
5.2.3 Characterization of MF microcapsules..................................................157
5.3 Results and discussion..................................................................................160
5.3.1 Cross-flow membrane system..............................................................160
5.3.1.1 Stability of the oil/water emulsion.................................................160
5.3.1.2 Effect of the processing conditions on the mean size and size
distribution of oil droplets...........................................................................162
5.3.2 Preparation of MF microcapsules with different core oils using a
dispersion cell.................................................................................................166
5.3.2.1 The effect of membrane configurations on the size distribution of
Table of Contents
X
droplets in emulsion.....................................................................................167
5.3.2.2 Effect of the two phases physical properties on the size distribution
of droplets of different oils.............................................................168
5.3.2.3 The effects of processing conditions on size distribution of droplets
with different oils. .......................................................................................172
5.3.2.3.1 Impeller agitation speed..........................................................172
5.3.2.3.2 Dispersed phase flux...............................................................175
5.3.3 Morphology of emulsion droplets and microcapsules.........................179
5.3.4 Shell thickness of MF microcapsules .................................................182
5.4 Conclusions..................................................................................................185
Chapter 6 Structure and Mechanical Properties of
Consumer-friendly PMMA Microcapsules.........................186
6.1 Introduction..................................................................................................186
6.2 Experimental section...................................................................................188
6.2.1 Preparation of microcapsules..............................................................188
6.2.1.1 Preparation of PMMA precondensate............................................188
6.2.1.2 Preparation of emulsion using conventional homogenization…...188
6.2.1.3 Preparation of double emulsions using the dispersion cell............189
6.2.1.4 Preparation of PMMA microcapsules............................................189
6.2.2 Morphology and shell thickness of microcapsules................................189
6.2.2.1 Morphology....................................................................................189
6.2.2.2 Determination shell thickness of microcapsules............................190
6.2.2.3 Shell thickness and radius corrections from CSLM
measurements……………………………………………………………...191
6.2.3 Size analysis........................................................................................193
Table of Contents
XI
6.2.4 Determination of the mechanical properties of PMMA
microcapsules.................................................................................................194
6.3 Results and discussion.................................................................................195
6.3.1 Stability of the oil/water emulsion......................................................195
6.3.2 Size and size distribution of oil droplets and microcapsules...............197
6.3.3 Morphology.........................................................................................200
6.3.4 Determination of the shell thickness using CLSM..............................201
6.3.5 Experimental determination of the mechanical properties of PMMA
microcapsules.................................................................................................205
6.3.5.1 Fractional deformation at the elastic limit���...............................212
6.3.5.2 Elastic modulus E...........................................................................218
6.3.5.3 Failure force ���............................................................................221
6.3.5.4 Failure stresses σp..........................................................................223
6.3.5.5 Weibull distribution analysis for failure stress...............................227
6.4 Conclusion....................................................................................................232
Chapter 7 Determination of Perfume Release Rate and the
Shell Permeability of Microcapsules....................................234
7.1 Introduction..................................................................................................234
7.2 Experimental methods.................................................................................236
7.2.1 Formation of MF and PMMA microcapsules......................................236
7.2.2 Perfume oil calibration using UV-Vis spectrophotometry...................237
7.2.3 Solubility Measurements.....................................................................238
7.2.4 Encapsulation efficiency measurement..............................................239
7.2.5 Continuous release experiment…………………................................240
7.2.6 Perfume solubility in PMMA microspheres………………………....242
Table of Contents
XII
7.3 Release models for spherical microcapsules................................................244
7.3.1 Oil release from a thin-shell microcapsule..........................................244
7.3.2 Oil release from a homogenous microsphere.......................................245
7.3.3 Oil release from a thick shell microcapsule.........................................247
7.4 Results and discussion.................................................................................248
7.4.1 Co-solvent selection and solubility measurements..............................248
7.4.2 Encapsulation efficiency.......................................................................253
7.4.3 Determination of permeability of thin shell microcapsules from release
data..................................................................................................................255
7.4.4 Oil release from full microspheres.......................................................262
7.4.5 Oil release from a thick shell microcapsule.........................................264
7.5 Conclusions..................................................................................................268
Chapter 8 Overall Conclusions and Future Plan.............270
8.1 Overall Conclusions...................................................................................270
8.1.1 Membrane emulsification process ......................................................275
8.1.2 Preparation of PMMA microcapsules.................................................276
8.1.3 Novel methodology development ......................................................276
8.1.3.1 Determination of shell thickness using CLSM..............................276
8.1.3.2 Investigation of intrinsic mechanical properties of microcapsules
with different shell thickness.......................................................................277
8.1.3.3 Investigation of intrinsic mass transfer parameters of microcapsules
shell with different shell material and thickness..........................................278
8.2 Future work..................................................................................................279
Appendix A.............................................................................283
Table of Contents
XIII
Finite Element Modelling (FEM) of the compression of thick
shell microcapsules
Appendix B.............................................................................294
MATLAB code for calculating shell permeability of PMMA
microcapsules
References...............................................................................311
List of Figures
XIV
List of Figures
Figure 2-1. Environmental factors that can cause perfume loss during manufacturing
and storage...................................................................................................................10
Figure 2-2 (a) SEM and (b) TEM image of core/shell perfume oil microcapsules with
a melamine -formaldehyde shell……..........................................................................12
Figure 2-3 Schematic graph of basic steps of microencapsulation process.................13
Figure 2-4. Release of perfumery ingredient Doremox® in (a) free form and (b)
encapsulated form in a fabric softener.........................................................................15
Figure 2-5 Different mechanisms that induce emulsion instability................................17
Figure 2-6 Schematic graph and picture of a rotor-stator high shear homogenizer.....18
Figure 2-7 Schematic illustration of dispersion cell, which has a two-blade paddle
impeller above a membrane with pores...........................................................................24
Figure 2-8 Schematic of a droplet formation...................................................................26
Figure 2-9 Schematic microencapsulation process based on in situ polymerization...35
Figure 2-10 The schematic diagram showing an in situ MF polymerization process to
encapsulate a perfume oil....................................................................................................36
Figure 2-11 Chemical structures of melamine and formaldehyde...............................40
Figure 2-12 Schematic representation of classical MF precondensate products from
the condensation of MF reaction with different M/F ratios.........................................41
Figure 2-13 Mechanism of polymerization to form melamine formaldehyde resin in
acid condition...............................................................................................................42

List of Figures
XV
Figure 2-14 Mechanism of MMA free radical polymerization....................................52
Figure 2-15 A typical schematic diagram of the mechanical measurement using
micromanipulation rig..................................................................................................59
Figure 2-16 The relationship between the rupture force and diameter for
microcapsules...............................................................................................................61
Figure 2-17 Examples of perfume microcapsules applied in papers............................63
Figure 2-18 Release experiments for perfume microcapsules.....................................65
Figure 2-19 A schematic diagram of encapsulated perfume oil release through MF
shell..............................................................................................................................68
Figure 2-20 Typical release curve from thin-shell microcapsules................................69
Figure 2-21 Example of the use of CLSM for the observation of the microcapsules
shell cross section.........................................................................................................73
Figure 3-1 Illustration of the dispersion cell system....................................................80
Figure 3-2 The set-up diagram of membrane emulsification process..........................81
Figure 3-3 Agitation speed of the stirrer in continuous phase vs voltage of the DC
motor driving the paddle stirrer....................................................................................82
Figure 3-4 The schematic diagrams and the SEM micrographs of representative flat
membrane used……………………………………………………………………….83
Figure 3-5 Pilot plant-scale cross-flow membrane apparatus (from the rear)..............87
Figure 3-6 Front view of the control panel...................................................................88
Figure 3-7 Disperse phase tank lid showing the gas pressure dial (12) and gas release
valve (13), enlargement of (1) in Figure 3-5................................................................89
List of Figures
XVI
Figure 3-8 Schematic diagram showing emulsification of oil in water in the membrane
system...........................................................................................................................89
Figure 3-9 Photo showing the cross-section of the membrane tube with seven
star-shaped channels……………………………………….........................................90
Figure 3-10 SEM images of the substrate material of 0.2 µm cross-flow membrane
tube…………………………………………………………………………...............91
Figure 3-11 SEM images of the cross-flow membrane tube channel from inside. The
rough porous inside surface of the channel, has pores with the average size of
0.2µm…………………………………………………………………………............92
Figure 3-12 Schematic diagram of laser light rays interacting with a solid particle....94
Figure 3-13 Schematic diagram of laser light rays interacting with particles of
different sizes...............................................................................................................94
Figure 3-14 Schematic representation of laser diffraction instrument.........................95
Figure 3-15 A typical size distribution curve of MF microcapsules obtained from laser
diffraction measurement..............................................................................................96
Figure 3-16 Schematic diagram of the micromanipulation rig....................................99
Figure 3-17 Photographs of a micromanipulation rig to compress single
microcapsules……………………………………………………………………..100
Figure 3-18 Typical curve of compressing a single microcapsule.............................103
Figure 3-19 Example to calculate the extinction coefficients using calibration
plats............................................................................................................................105
Figure 3-20 A typical curve showing perfume oil released from MF microcapsules in
List of Figures
XVII
60% v/v glycerol obtained using the UV-Vis spectrophotometry..............................107
Figure 3-21 Schematic representation of environmental scanning electron microscopy
(ESEM).......................................................................................................................108
Figure 3-22 Schematic representation of the environmental secondary detector with
gas...............................................................................................................................109
Figure 3-23 A typical image of MF microcapsules obtained by ESEM in wet mode at
an accelerating voltage of 10.0 kV.............................................................................110
Figure 3-24 A TEM image of the cross section of MF microcapsules.......................112
Figure 3-25 Schematic representation of confocal laser scanning microscopy
(CLSM).…………………………………………………………………………….113
Figure 3-26 A CLSM micro-image of the cross-section of PMMA microcapsules...114
Figure 3-27 Schematic diagram of the device for measuring the contact angle........115
Figure 3-28 Photography of the tensiometer K100 used in this study......................116
Figure 3-29 Schematic of the Wilhelmy plate method applied to an interface of two
liquid phases……………………………………………………...............................117
Figure 3-30 A interfacial tension versus time curve obtained through a
Tensiometer…………………………………………………………………………118
Figure 3-31 Photo of the rheometer AR1000 used in this study……………............119
Figure 3-32 Viscosity of peppermint oil tested with the rheometer...........................120
Figure 4-1 Schematic diagram of preparing MF microcapsules using a flat membrane
combined with a stirred system.................................................................................123
Figure 4-2. Effect of concentration of the wetting agent on (a) the size distribution of
List of Figures
XVIII
the droplets in the emulsion and (b) the size of the droplets in the emulsion and
contact angle of water on membrane surface, prepared using an agitation speed of
1080 rpm, dispersed phase flux of 1.6×10⁻⁵ m s-1, and a membrane "15 rcia A".......129
Figure 4-3. Size distribution of droplets in emulsions generated by different
membrane materials...................................................................................................131
Figure 4-4. The (a) mean diameter (D4,3) and (b) CV and SPAN values of the oil
emulsions measured at different times after their formation at 25°C. Emulsions were
prepared using an agitation speed of 1080 rpm, dispersed phase flux of 1.6×10⁻⁵ m s-1
and a "15rcia A" membrane.......................................................................................133
Figure 4-5. The effect of agitation speed in the dispersion cell on the (a) size and (b)
size distribution of the droplets in emulsion, prepared with a dispersed phase flux of
1.6×10⁻⁵ m s-1, and "15 rcia A" membrane. Some of the error bars are smaller than the
symbols used.………………….................................................................................135
Figure 4-6. The influence of the flux of the dispersed phase pumped through the
membrane on (a) the size and (b) size distribution of the droplets in emulsion prepared
using an agitation speed of 1080 rpm and a membrane "15 rcia
A".…………………..................................................................................................137
Figure 4-7. Size distributions of the emulsion droplets and the formed microcapsules,
prepared by membrane emulsification using an agitation speed of 1080 rpm, dispersed
phase flux of 1.6×10⁻⁵ m s-1 and a membrane "15 rcia
A"...............................................................................................................................138
List of Figures
XIX
Figure 4-8. Size distribution of the microcapsules prepared at different temperature by
membrane emulsification (with an agitation speed of 1080 rpm, dispersed phase flux
of 1.6×10⁻⁵ m s-1 and a "15rcia A" membrane).…………………………………….140
Figure 4-9. Micrographs of the microcapsules obtained using (a) optical microscopy,
(b) and (c) ESEM.…………………….………………………………………….…141
Figure 4-10. TEM micrographs of microcapsules prepared using the membrane
emulsification and homogenization methods.……………………………………....143
Figure 4-11. CLSM micrographs of microcapsules prepared using the membrane
emulsification and homogenization methods.…………………………………...….144
Figure 4-12. Size distribution of the microcapsules prepared by two different methods:
homogenization (at 600 rpm) and membrane emulsification (with an agitation speed
of 1080 rpm, dispersed phase flux of 1.6×10⁻⁵ m s-1 , a "15 rcia A" membrane wetted
with an agent concentration of 0.5% (v/v)).………………………………………...145
Figure 4-13. Double logarithmic representation of the effect of the agitation speed on
D3,2 for MF microcapsules prepared using homogenization.……………………….146
Figure 4-14. Typical profiles of force divided by diameter of microcapsules versus
fractional deformation at rupture εB.……………………………………..………….147
Figure 4-15. Strength parameter distributions of the microcapsules prepared by two
different methods.………………………………………………………………..…151
Figure 5-1 The (a) mean diameter (D4,3) and (b) size distribution (CV and SPAN
values) of the oil droplets measured at different storage times without agitation at
room temperature.……………………………………………………………….….161
List of Figures
XX
Figure 5-2 The effect of oil pressure on the (a) size and (b) size distribution of the
emulsions droplets, prepared with a circulation flow rate of 1.1×10⁻⁴ m3·s-1 and a
dispersed phase pressure of 0.3 × 10�Pa.…………………………………………163
Figure 5-3 Size distribution of the emulsion droplets and the formed MF
microcapsules, prepared using a circulation flow rate of 1.1×10⁻⁴ m3 s-1 and an oil
pressure of0.3 × 10�Pa.………………………………………...………………….164
Figure 5-4. Size distributions of microcapsules prepared by three different methods:
lab- scale membrane emulsification (with an agitation speed of 1080 rpm and
dispersed phase flux of 1.6×10⁻⁵ m s-1), pilot plant-scale membrane emulsification
(using a flow rate of 1.1×10⁻⁴ m3 s-1 and oil pressure of 0.3 × 10�Pa) and lab-scale
homogenization (600 rpm).………………………………………………….…….165
Figure 5-5. Size distributions of droplets in the emulsions generated using membranes
with different pore locations. "15 rcia A" (square) and "15 cia" (circle).……….….168
Figure 5-6. Experimental measurements and theoretical predictions of droplets sizes
in the emulsions with varying physical properties.…………………………………171
Figure 5-7. The model predictions and experimental measurements of droplet size in
the emulsions versus agitation speed in the dispersion cell.……………………..…174
Figure 5-8 The effect of agitation speed in the dispersion cell on size distribution of
droplets of different oils in emulsions.…………………………...…………………175
Figure 5-9 The influence of the flux of the dispersed phase pumped through the
membrane on the (a) size and (b) size distribution of the droplets in emulsion.…...178
Figure. 5-10. Images of the oil droplets in emulsion and microcapsules obtained by
List of Figures
XXI
optical microscopy.………………………………………………………………….180
Figure. 5-11. Micrographs of MF microcapsules with different core oils obtained by
ESEM..……………………………………………………………………………..181
Figure. 5-12. Typical TEM micro-images of MF microcapsules with different core
oils prepared using the dispersion cell.……………………………………………..184
Figure 6-1. Schematic diagram of a cross section measurement plane at a distance αr
from the equatorial plane.………………………………………………………….192
Figure 6-2. Correction factor of the measured shell thickness ratio from simulations
with different maximum measurement planes away from the equator, parameter α as
described in Figure 6-1..…………………………………………………………….193
Figure 6-3 The mean diameter (D4,3) and CV values of the oil droplets measured at
different times after their formation, which were prepared by membrane
emulsification using an agitation speed of 1080rpm and dispersed phase flux of
1.6×10⁻⁵ m s-1.………………………………………..……...………………………196
Figure 6-4. Effect of the process parameters: agitation speed (diamonds) and dispersed
phase flux (squares) on the mean size and the size distribution of the resultant emulsion
droplets.……………………………………………………………………………..197
Figure 6-5. Size distributions of the emulsion droplets and microcapsules with reaction
time 4 h, prepared by two different methods: membrane emulsification (with an
agitation speed of 1080 rpm and dispersed phase flux of 1.6×10⁻⁵ m s-1) and
homogenization (800 rpm).…………………………………...…………………….198
List of Figures
XXII
Figure 6-6. Micrographs of PMMA microcapsules with reaction time 4 h, obtained
using (a) optical microscopy and (b-c) ESEM.……………………………….....….200
Figure 6-7. CLSM micrographs of oil droplets and PMMA microcapsules at different
stages of polymerization.………………………………………………..………..…202
Figure 6-8. CLSM micrograph (inset) and fluorescence intensity profiles of a
microcapsule (52 μm) measured at four different directions.……………………....203
Figure 6-9. Shell thickness h measured with CSLM for microcapsules larger than 40
µm prepared by membrane emulsification (empty points) and homogenization (filled
points), after a reaction time of 1 h (circles) and 4 h (triangles).………………..….205
Figure 6-10. Typical normalized compression force profiles of 1 h, 4 h and 24 h
PMMA microcapsules, together with that of a MF microcapsule………………….208
Figure 6-11. Force versus εm1.5 data for compression of a PMMA capsule (47 µm in
diameter) formed after a reaction time of 24 h. The straight line in red represents the
fitting by Hertz model. The Young’s modulus value estimated by Hertz model is 423
MPa.…………………………………………………………………………….….209
Figure 6-12. Experimental compression results of single PMMA microcapsules made
of different reaction time and simulation profiles of the initial elastic regime.…….211
Figure 6-13. Fractional deformation at the elastic limit εLE of individual
microcapsules larger than 40 µm prepared by both emulsification methods, which
were determined using two different models: 1 h (thin-shell model : triangles), 4 h
(linear model: filled diamonds and power law model: empty diamonds) and 24 h
(power law model: circles) PMMA microcapsules.………..……………………….214
List of Figures
XXIII
Figure 6-14. Fractional deformation at bursting point εB (squares) and fractional
deformation at the elastic limit εLE (triangles) versus diameter for 1 h PMMA
microcapsules prepared by membrane emulsification (filled points) and
homogenization (empty points).………………...…………………………………..215
Figure 6-15. (a) Elastic limit, (b) elastic modulus and (c) force at the elastic limit of
individual 4 h PMMA microcapsules prepared by membrane emulsification (filled
points) and homogenization (empty points) determined using different methodologies:
power law model (diamonds) and linear model (circles)….………………………...216
Figure 6-16. Comparison between experimental compression data (points) and the best
fit profiles of elastic regime from FEM simulations (lines) of individual PMMA
microcapsules produced with different reaction times: 1 h (thin-shell model), 4 h
(continuous line - linear model; dashed line - power law model), and 24 h (power law
model) PMMA microcapsules. The E and ��� values determined from the best fitting
curves are shown in the legend (for 4 h PMMA microcapsules, average of the two
models is given).………………………………………………………………..…..217
Figure 6-17. Compression profiles of four different PMMA microcapsules 4h with two
different sizes, < 30 µm and > 60 µm………………………...…………………….219
Figure 6-18. (a) Elastic modulus and (b) force at the elastic limit determined for
individual PMMA microcapsules prepared at different reaction times: PMMA 1 h
(thin-shell model : triangles), 4 h (linear model: filled diamonds and power law model:
empty diamonds) and 24 h (power law model: circles).………………….………….220
List of Figures
XXIV
Figure 6-19. Bursting force FB (squares) and force at elastic limited FLE (triangles)
versus diameter for 1 h PMMA microcapsules prepared by membrane emulsification
(filled points) and homogenization (empty points).………………………………...223
Figure 6-20. Largest tensile (empty points) and compressive (filled points) principal
stress determined for individual PMMA microcapsules at εLE prepared at different
reaction times: PMMA 1 h (triangles), 4 h (diamonds) and 24 h (circles)…………...227
Figure 6-21. Three- parameter Weibull distribution using the median ranks method
fitting with experimental compressive stress data of 4 h (d > 40µm) PMMA
microcapsules……………………………………………………………………….229
Figure 6-22. Cumulative failure probability using a compressive stress failure
criterion of 1 h (a), 4 h (d > 40µm) (b) and 24 h (c) PMMA microcapsules.……….230
Figure 7-1 Schematic diagram of the device used to conduct continuous release
experiments.………………………………………………………………………...242
Figure 7-2 Schematic diagram of PMMA perfume microcapsules with different shell
thicknesses.…………………………………….…………………………………...244
Figure 7-3 Determination of P using the thin-shell method. The red line is the best
fitting of the linear regime for R <0.6 and R > Woil.……………………………...…255
Figure 7-4 Comparison of the release profiles of MF microcapsules prepared with
different methods in 60% v/v glycerol aqueous solution: membrane (Sample No.1 in
Table 7-1) and homogenization (Sample No.2).……………………………………257
Figure 7-5 Comparison of release profiles of MF microcapsules containing same core
oil A exposed to different co-solvents………..……………………………………..258
List of Figures
XXV
Figure 7-6 Modified permeability results of MF microcapsules prepared with same
process conditions but with two different kinds of core oil; the microcapsules were
tested using different co-solvents, given in the legend…….………...……………..260
Figure 7-7 Comparison of the release profiles of MF microcapsules (Sample No.1)
and 1 h PMMA microcapsules (Sample No.5).……………………………………..262
Figure 7-8 Experimental and best-fitted release profile for 24 h PMMA microspheres
(Sample No. 7) tested in 60% (v/v) glycerol aqueous solution. The best fitted
diffusion coefficient value is � = 3.2 × 10���m�s�� using the homogenous sphere
model for R (t)<0.8 (Section 7.3.2), the continuous line shows all the predicted
release.........................................................................................................................264
Figure 7-9 Release profiles of 4 h PMMA microcapsules analysed using the sphere
and hollow sphere models.……….…………...………………...…………………..266
Figure 7-10 Experimental release profile of 1 h PMMA microcapsules (Sample No.5)
tested in 60% (v/v) glycerol aqueous solution. The blue line shows the best fits using
the hollow sphere model.…………………………………………………...………267

List of Tables
XXVI
List of Tables
Table 2-1 Patented manufacturing processes on the microencapsulation of fragrances
using MF for consumer product applications...............................................................44
Table 2-2 Techniques for characterizing size and size distribution of particles............56
Table 3-1 Summary of membrane area (Am), porosity φ, pore active membrane area
(Aac =Am ×φ), the inner radium (Rin), the outer radium (Rout), pore distance L, pore
diameter dp, number of pores of the membranes N
studied..........................................................................................................................85
Table 4-1. Summary of the mechanical property data of the microcapsules prepared
by membrane emulsification and homogenization. Confidence intervals represent the
standard error of the mean, with 50 microcapsules for each
group.……………………………………………………………………….……….152
Table 5-1. Refractive indexes of the materials used in the study on encapsulation of
different core oils by MF…………………………….…………………………...…159
Table 5-2. Physical properties of the dispersed and continuous phases: viscosity,
density and interfacial tension between the two phases. Error represents the standard
error of the mean.………………………………………………………………..….169
Table 5-3 Summary of sizes of the droplets and microcapsules as well as shell
thickness obtained through laser diffraction and TEM.………………….………...183
Table 7-1 Formulations and operation conditions used for preparation of
microcapsules in this study...……………………………………………………….237
List of Tables
XXVII
Table 7-2. The wavelength where absorbance is maximum (λmax), extinction
coefficients (ε) as well as the saturation concentration (��) of oil A and oil HS in
water and in aqueous co-solvent solutions. The viscosities (μcs) of the pure
compounds and aqueous solutions at room temperature 25 ± 1 ºC are taken from the
literature.………………………..…...…………………………………………..….252
Table 7-3. The list of encapsulation efficiency s EE %, the total amount of perfume
oil in the slurry ɸslurry % and waste oil in slurry Woil % of MF and PMMA
microcapsules.……………………………………………………………………....254
Table 8-1. Overview summary of shell materials, reaction conditions, encapsulation
efficiency, size and size distribution, mechanical properties and permeability data of
microcapsules.…………………………………………………………………..…..272
Nomenclature
XXVIII
Nomenclature A Absorbance of sample
Aac Pore active membrane area (m2)
Ah Proportionality constants for equation D3,2 = AhωmB
B Proportionality constants for equation D3,2 = AhωmB
b Width of the paddle (m)
C Concentration of the sample (g ml-1 )
Cs Perfume oil solubility in the solvent (g ml-1)
�������� Saturation solubility of the core oil in the shell material (g ml-1)
���� Concentration of perfume oil in suspension (g ml-1)
� !(�) and �$�%(�) Oil concentrations (w/v) at the inner and outer side of the
shell-fluid interface (g ml-1)
� !and �$�% Oil concentrations in the solvent inside and outside the microcapsule
(g ml-1)
� !∞ Concentration inside the particle at the end of release (g ml-1)
�$�%∞ Concentration outside the particle at the end of release (g ml-1)
� !& Initial concentration inside the particle (g ml-1)
D Diffusivity of microcapsules shell (m2 s-1)
D90 Diameter under which the cumulative volume of the droplets/microcapsules is
90% (m)
D10 Diameter under which the cumulative volume of the droplets/microcapsules is
10% (m)
Nomenclature
XXIX
D50 Diameter under which the cumulative volume of the droplets/microcapsules is
50% (m)
Dp Diameter of paddle impeller (m)
D4,3 Volume mean diameter (m)
D3,2 Sauter mean diameter (m)
'��( Particle size to test using laser diffraction (m)
') Droplet diameter before detachment, varies with time, dp ≤ dc ≤ dd (m)
'* Droplet diameter during detachment (m)
'+ Diameter of "neck" at the membrane pore surface (m)
', Diameter of the pore on the membrane (m)
di Diameter of single droplets/microcapsules (m)
'̅ Number- based mean diameter (m)
E Young's modulus of microcapsules (MPa)
EE Encapsulation efficiency (% w/w)
�./ Buoyancy force when droplets forming on the membrane surface (N)
FB Force at the bursting point (mN)
�* Drag force (N)
�*� Dynamic lift force (N)
�� Linear momentum force (N)
FLE Force at ��� (mN)
���,1Force at ��� using power law model (mN)
���,1Force at ��� using linear model (mN)
Nomenclature
XXX
�,��� Push off force (N)
�3 Interfacial tension force (N)
�� Force generated by shear stress (N)
��%(% Force due to a static pressure difference between the two phases (N)
Ftension Force on the Wilhelmy plate during the measurement (N)
g Acceleration of gravity (m s-2)
h Shell thickness (m)
hm Measured shell thickness (m)
H Height of the continuous phase
4�) Intensity of scattered light (w m-2)
4 ! Intensity of laser light (w m-2)
It Intensity of the transmitted light (w m-2)
I0 Intensity of the incident light (w m-2)
J Perfume oil flux passing through the microcapsule shell (m s-1)
5* Flux of dispersed phase (m s-1)
kB Boltzmann's constant
67� Viscosity modification factor for the dispersed phase
K Partition coefficients
8, = 9:;∞9<=>∞ Partition coefficient
l Optical path length (cm), in this study, it could be dimension of the cuvette, which
is 1cm
lw Length of the wetted area of the Wilhelmy plate (m)
Nomenclature
XXXI
? Gap between pores (m)
m Linear slope used to estimate the elastic modulus of microcapsule
mslurry Weight of slurry (g)
Mcz Torque when droplets forming on the membrane surface (N m)
N Number of pores of the membranes
n Number of root of equation
nb Number of paddle
ni Number of droplets/microcapsules measured
@ !*�A Relative refraction index of the particle and the medium
P Permeability of microcapsules shell (m2 s-1)
BCD Modified shell permeability of microcapsules, BCD( for τ = 2/3, BCDE for τ = 1
B/ℎCCCCC Mean permeability of a microcapsule shell divided by its shell thickness (m s-1)
Q Actual flow rate of the dispersed phase through the pore (m3 s-1)
H! Non-zero positive roots of the transcendent equationH! = �I;�JKI;L
r Radius of microcapsules (m)
M !!�N Inner radius of thick shell microcapsules (m)
rm Measured radius of microcapsules (m)
M, Radius of the pore (m)
M%N(!� Transitional radius (m)
MN Distance from the centre of particle/microcapsule to the location where
parameters are simulated in the equations (m)
rsolute Radius of the solute particle (m)

Nomenclature
XXXII
O ! Inner radius of membrane's ring area (m)
O$�% Outer radius of membrane's ring area(m)
O(P) Relative oil release by weight (s-1)
Re Reynolds number
'O/'PCCCCCCCCC Mean slope release profile for thin-shell microcapsules (s-1)
PN Microcapsules release time (s)
P�!* End of microcapsules release time (s)
P* Duration of detachment period (s)
T Diameter of the vessel with the membrane fixed at the bottom (m)
Tab Absolute temperature (K)
TB Nominal wall tension, defined as the rupture force normalized by the
circumference of the uncompressed microcapsule (MPa)
Q* Velocity of dispersions phase (m s-1)
R) Velocity of the continuous phase is (m s-1)
ν Poisson ratio
V Co-solvent aqueous solution (ml)
Va Voltage of the DC motor (v)
S* Volume of droplet (m�)
ST Final volume of a droplet (m3)
SU Initial volume of the droplet (m3)
Vs Volume of the particle released in co-solvent solution (ml)
Vsus Volume of microcapsule suspension (ml)

Nomenclature
XXXIII
VWXY Percentage of waste oil in slurry (% w/w)
x Compressive stress of microcapsules for three- parameter Weibull distribution
x0 Location parameter, (xc+x0) is about the median value for three- parameter
Weibull distribution
Greek Symbol
XXXIV
Greek Symbol
α Radius corrections factor
αZ = S S[⁄ 8, Ratio of oil released to that remaining in the particle at equilibrium
β Shape parameter of microcapsules for three- parameter Weibull distribution
� Extinction coefficients of the concentration calibration curve (ml g-1 cm-1)
εB Fractional deformation at rupture
��� Fractional deformation above which there is a continuously increasing
difference between the experimental force profile and the theoretical elastic profile
���,1 ��� using power law model
���,1 ��� using linear model
εm Fractional deformation of microcapsules
λmax Maximum absorbance wavelength (nm)
]��( Wavelength of the laser light (nm)
ɸ$ �& Initial concentration of perfume oil used in slurry(g g-1)
ɸ���NN^ Total amount of perfume oil in the slurry (% w/w)
φ Porosity of the membrane
_ Contact angle between membrane and pure water (。)
_`ab Light scattering angle of the laser diffraction instrument (。)
θp Contact angle between the heavier phase and the Wilhelmy plate (。)
c9 Density of continuous phase (kg m-3)
c* Density of dispersions phase (kg m-3)
Greek Symbol
XXXV
d Interfacial tension of the two phases (N/m)
e Fitted constant for equation � ∝ gha�i
τj Shear stress at the membrane surface (Pa)
eD(A Maximum shear stress at the membrane surface (Pa)
e(k Average shear stress of the whole membrane at the membrane surface (Pa)
e(kl !U Average shear stress of the ring area where the pores located (Pa)
σp Microcapsules failure stress (MPa)
m1,n Principle tensile stresses of microcapsules (MPa)
m1,9 Principle compressive stressesof microcapsules (MPa)
o Boundary layer thickness (m).
o. Nominal rupture stress, defined by the ratio of the rupture force to the initial
cross sectional area of the microcapsule (MPa)
g) Viscosity of continuous phase (Pa s)
μcs Viscosity of co-solvent for oil release (Pa s)
g* Dispersed phase viscosity (Pa s)
p Angular velocity of the stirred impeller (rad s-1)
pD Agitation speed (rpm)
Abbreviations
XXXVI
Abbreviations
AIBN 2,20-azobisisobutyronitril
CDF(x) Cumulative distribution function
CFD Computational fluid dynamics
CLSM Confocal laser scanning microscopy
CV Coefficient of variation
EGDMA Ethylene glycol dimethacrylate
ESEM Environmental scanning electron microscopy
FEM Finite Element Modelling
HG Homogenization
HS Hexyl salicylate
LALLS Low angle laser light scattering
ME Membrane emulsification
MF Melamine formaldehyde
MMA Methyl methacrylate
NaCl Sodium chloride
P Peppermint
P&G Procter & Gamble
PMMA Poly (methyl methacrylate)
PVA Polyvinyl alcohol 18-88
RB Rhodamine B
Abbreviations
XXXVII
S Sunflower
SD Standard deviation
SE Standard error
SEM Scanning electron microscopy
TEM Transmission electron microscopy
UF Urea-formaldehyde
UV-Vis Ultraviolet-visible spectrophotometry
Chapter1 : Introduction
XXXVIII
List of Publications
Xuemiao. Pan, R. Mercadé-Prieto, J. A. Preece, D. York, and Z. Zhang. “Preparation
and Characterisation of User-friendly PMMA Microcapsules for Consumer Care”.
Powders & Grains. University of New South Wales (UNSW), Australia, 8-12 July
2013.
Xuemiao. Pan, R. Mercadé-Prieto, J. A. Preece, D. York, and Z. Zhang. “Structure
and Mechanical Properties of Consumer-friendly PMMA Microcapsules”. 2013.
accepted by Industrial & Engineering Chemistry Research.
R. Mercadé-Prieto, Xuemiao. Pan, A. Fernández-González, Z. Zhang, S. Bakalis.
“Quantification of perfume microcapsules deposited in cotton fabrics before and after
abrasion using fluorescence microscopy”. Industrial & Engineering Chemistry
Research. 2012. (51): 16741–16749
Xuemiao. Pan, J. A. Preece, D. York, and Z. Zhang. “Size and Strength Distribution
of Melamine-formaldehyde Microcapsules Prepared by Membrane Emulsification”.
Powder Technology, 2012(227): 43-50.
Xuemiao. Pan, R. Mercadé-Prieto, J. A. Preece, D. York, and Z. Zhang, “Preparation
and Characterization of Consumer-friendly PMMA Microcapsules for Liquid
Detergents”. The 19th Joint Annual Conference of CSCST-UK and SCI-CS,
University of Reading, 15 Sept. 2012.

Chapter1 : Introduction
XXXIX
R. Mercadé-Prieto, Xuemiao. Pan, A. Fernández-González, Z. Zhang, S. Bakalis.
“Effect of drying on the survival of microcapsules deposited in cotton fabrics during
abrasion.” 18th international drying symposium, Xiamen, 11 Nov. 2012.
Xuemiao. Pan, J. A. Preece, D. York, and Z. Zhang. ”Factors Influencing the Size
and Size Distribution of Oil-filled Melamine-formaldehyde Microcapsules Prepared
using Membrane Emulsification”. 3rd UK-China Particle Technology Forum,
Birmingham, 4-6 July 2011.
Xuemiao. Pan, J. A. Preece, D. York, and Z. Zhang, “Preparation of Uniform-sized
Melamine-formaldehyde Microcapsules by Membrane Emulsification”.2nd UK-China
Particle Technology Forum, Guiyang, 1-3 Sept. 2009.
Xuemiao. Pan, J. A. Preece, D. York, and Z. Zhang, “Using Membrane
Emulsification to Prepare Microcapsules with Narrow Strength Distribution”. 10th
UK Particle Technology Forum, Birmingham, 1 July 2009.
Chapter1 : Introduction
1
Chapter 1 Introduction
There is a rising need to deliver and deposit “active ingredients” on solid surfaces,
covering a wide range of applications, from consumer products (Vladisavljevic and
Williams, 2005) to pharmaceuticals (Fukumori et al., 1991). Of special interest in the
present study is the controlled release of functional oils to fabric surfaces.
Unfortunately, many active components, particularly functional oils, are sensitive and
volatile. They can be susceptible to environmental conditions, such as changes in the
pH value or temperature, and they can lose their activity during storage due to
oxidation, evaporation, and even reaction with outside agents (Hsieh et al., 2006). For
this purpose, microencapsulation techniques have been used in the past to preserve
aromas for laundry applications for long periods (Long et al., 2009), and in addition
they may also provide special functions to textiles, such as temperature control or
colour maintenance (Nelson, 2002).
Microencapsulation is one of suitable solution to stabilize active ingredients during
storage, but it can also be used to control the release of the encapsulated functional
oils. One shell material that is commonly used for coating functional oils in industry
and for research purposes is melamine formaldehyde (MF) (Zhu et al., 2012). MF is
fairly inexpensive, highly stable and has ample applications in consumer products
Chapter1 : Introduction
2
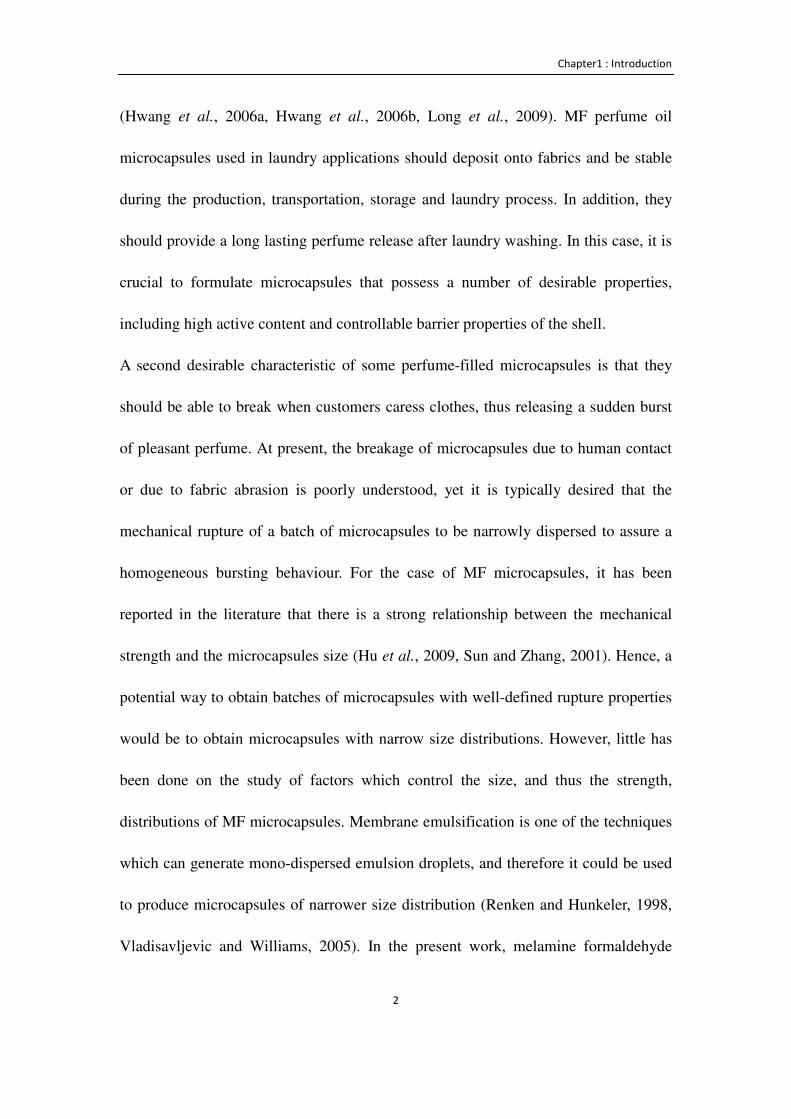
(Hwang et al., 2006a, Hwang et al., 2006b, Long et al., 2009). MF perfume oil
microcapsules used in laundry applications should deposit onto fabrics and be stable
during the production, transportation, storage and laundry process. In addition, they
should provide a long lasting perfume release after laundry washing. In this case, it is
crucial to formulate microcapsules that possess a number of desirable properties,
including high active content and controllable barrier properties of the shell.
A second desirable characteristic of some perfume-filled microcapsules is that they
should be able to break when customers caress clothes, thus releasing a sudden burst
of pleasant perfume. At present, the breakage of microcapsules due to human contact
or due to fabric abrasion is poorly understood, yet it is typically desired that the
mechanical rupture of a batch of microcapsules to be narrowly dispersed to assure a
homogeneous bursting behaviour. For the case of MF microcapsules, it has been
reported in the literature that there is a strong relationship between the mechanical
strength and the microcapsules size (Hu et al., 2009, Sun and Zhang, 2001). Hence, a
potential way to obtain batches of microcapsules with well-defined rupture properties
would be to obtain microcapsules with narrow size distributions. However, little has
been done on the study of factors which control the size, and thus the strength,
distributions of MF microcapsules. Membrane emulsification is one of the techniques
which can generate mono-dispersed emulsion droplets, and therefore it could be used
to produce microcapsules of narrower size distribution (Renken and Hunkeler, 1998,
Vladisavljevic and Williams, 2005). In the present work, melamine formaldehyde
Chapter1 : Introduction
3
microcapsules with an oil-based active ingredient have been prepared using one
lab-scale membrane emulsification technique, a dispersion cell system (Holdich et al.,
2010), and one pilot plant-scale membrane emulsification system, a cross-flow
membrane system (Yuan et al., 2008a). Different core materials were used during
membrane emulsification in order to explore its manufacturing capability. For this
reason, the effect of processing conditions on the size and size distribution of
microcapsules has been investigated thoroughly in the present work.
The manufacturing of MF microcapsules results in small amounts of free
formaldehyde in the solutions, which due to its high toxicity is a key concern for
consumer product applications. For this reason, a new shell material should be
developed for future manufacturing. The potential of polymethylmethacrylate
(PMMA), an environmentally friendly material, to encapsulate perfume oil is a
second area of study in the present dissertation. The properties of the new PMMA
microcapsules created have been extensively characterised in order to evaluate their
potential applications.
Some mechanical strength parameters such as the rupture force, and the displacement
at rupture can be determined directly using a micromanipulation technique (Sun and
Zhang, 2001, Sun and Zhang, 2002). Intrinsic mechanical properties of thin shell
microcapsules (eg. MF microcapsules), such as Young’s modulus and the rupture
Chapter1 : Introduction
4
stress were addressed and calculated in literature (Mercade-Prieto et al., 2011a,
Mercade-Prieto et al., 2011b). However, little has been done for thick-shell
microcapsules. In this project, the mechanical properties of PMMA microcapsules
with different thicknesses were determined using the micromanipulation technique
and finite element analysis.
Recently, Mercadé-Prieto et al. (2012b) has developed a methodology to determine
the shell permeability of thin-shell MF microcapsules with a single fragrance
compound. However, there is not much work done on the shell permeability of
microcapsules with real perfume oils, which are complex mixtures of many chemicals
with various functionalities. In this project, a methodology was developed to
determine the permeability of MF microcapsules with real complex perfume oils and
this methodology was applied to PMMA microcapsules with a wide range of shell
thicknesses, in order to better understand the effects of formulation and processing
conditions on the microcapsules wall properties.
A summary of this thesis is given as below:
In Chapter 2, a literature review on membrane emulsification and encapsulation
methods is provided. This chapter provides an overview of how encapsulation
processes affect the size of liquid droplets in emulsions and the corresponding
microcapsules. Industrial applications of microcapsules, especially those with MF or
Chapter1 : Introduction
5
PMMA shell materials are then presented. A general survey on characterization
methods for microcapsules is also presented.
In Chapter 3, the materials, methods and equipment used in this study are described in
detail.
Chapter 4 describes the encapsulation of perfume oils by membrane emulsification
using MF as a shell material. The experimental conditions and procedures are also
described in detail. The effects of process conditions and membrane surface properties
on the size and size distribution of the oil droplets produced in the emulsification
stage and of the final microcapsules are reported. The physical and mechanical
properties of the resulting microcapsules are characterized.
Chapter 5 examines the feasibility to scale up the encapsulation of perfume oils with
membranes by using a cross-flow membrane system. Lab-scale results from Chapter 4
are compared with those from a pilot plant-scale membrane system. Different core
oils are encapsulated with MF in order to study the effect of different liquids
properties, such as the interfacial tension and viscosities of two phases, on the size
and size distribution of microcapsules.

Chapter1 : Introduction
6
Chapter 6 focuses on the formulation and encapsulation process using PMMA as a
shell material. The size and the shell thickness of resulting PMMA microcapsules are
studied with confocal laser scanning microscopy (CLSM). The intrinsic mechanical
properties of the PMMA shells, such as the elastic modulus and the rupture stress, are
determined using the micromanipulation technique and finite element modelling
(FEM).
In Chapter 7 results are reported on the release of perfume oils from the MF and
PMMA microcapsules described in Chapters 4 and 6. Further investigation of the
shell structural properties, such as the shell permeability and diffusivity are reported.
Chapter 8 presents an overall summary of the work presented in this thesis, followed
by recommendations for further work.

Chapter2 : Literature Review
7
Chapter 2 Literature Review
2.1 Introduction
In this chapter previous literature on theoretical models, experimental techniques and
industrial applications of microencapsulation are reviewed. The literature review is
divided into five sections. The first section provides a general introduction on
emulsions and encapsulation techniques for perfume oils. In the second section a
literature review is provided on emulsion and emulsification, with emphasis on
membrane emulsification. A brief introduction is provided of theoretical models that
describe droplet formation during membrane emulsification. In the third section a
literature survey is given on encapsulation methods which are commonly used for
perfume microcapsules. In the forth section, the current industrial applications of the
shell materials melamine formaldehyde (MF) and poly (methyl methacrylate)
(PMMA) are introduced. The last section deals with experimental techniques used to
characterize microcapsules.

Chapter2 : Literature Review
8
2.2 Microencapsulation
2.2.1 Introduction
Microencapsulation is the process to produce individual capsules in the micron size
range with a core that can be a solid (Fukumori et al., 1991), a liquid (Sohn et al.,
2007) or a gas (Madene et al., 2006), surrounded by a shell made of natural (Lan et al.,
2011) or synthetic materials (Su et al., 2012). Since this technique was first applied to
carbonless copying papers in the 1930’s by the National Cash Register Co. (NCR)
from USA (Green, 1957), it has now been introduced into diverse industry sectors.
For example it is used to encapsulate cells (Murua et al., 2008, Renken and Hunkeler,
1998) and enzymes (Inomata et al., 1995) for pharmaceutical and biomedical
applications. It is applied to stabilise flavours or to mask tastes in food manufacturing
(Charcosset, 2009), to deliver fine fragrances in consumer products (Anton et al.,
2008, Hong and Park, 1999a), as well as for coating pressure - sensitive materials or
inks for the paper industry (Schmidt et al., 2000). In addition, the solid final capsules
are commonly easier to handle than their liquid cores, as in the case of pesticides for
agriculture (Liu et al., 2006), which facilitates the deposition of functional ingredients
in added-value textiles for example (Rodrigues et al., 2008, Teixeira et al., 2012a,
Zuckerman et al., 2003). The main advantages of encapsulating active ingredients, as
opposed to deliver them in free form, are to
• enhance the stability (Sotoyama et al., 1999);
Chapter2 : Literature Review
9
• allow control release applications (Madene et al., 2006, Sun and Zhang, 2001),
for example using temperature as a trigger parameter (An et al., 2010, Katagiri
et al., 2011), light (Volodkin et al., 2009), pH (Ma et al., 2012, Song et al.,
2012, Yuan et al., 2010a), or mechanical rupture (Moira, 1986, Okada and
Igarashi, 1984, Okada and Igarashi, 1985, Sinclair, 1981);
• allow targeting delivery (Ghosh, 2006b);
• reduce chemical hazards which may damage the environment or human health
(Li et al., 2009);
• shield undesirable odour or taste (Balentine et al., 1997, Madene et al., 2006);
• separate the reactive components in a product (Madene et al., 2006);
• facilitate handling , as well as improve mixing (Ghosh, 2006b, Hwang et al.,
2006a), solubility (Ghosh, 2006b, Hwang et al., 2006a), dispensability (Ghosh,
2006b, Hwang et al., 2006a), and flow-ability (Berry et al., 1995, Ghosh,
2006a).
2.2.2 Perfumes used in detergents
Perfume oils, such as those used in detergents, can be highly complex mixtures,
including aliphatic compounds, acyclic terpenes, cyclic terpenes, alcohols, ethers,
aldehydes and ketones (Bauer et al., 2001). The pleasant fragrance of fabrics washed
with perfume-containing detergents is considered a key purchase factor in customers
Chapter2 : Literature Review
10
(Happi, 2009). Perfume oils also provide other special functions to detergents, such as
helping to release consumers stress (Gobel et al., 1994, Salari et al., 2006). They are
associated with specific images and emotional benefits in the consumer's mind,
enhancing the product value (Retiveau, 2012). Importantly, perfumes are one of the
most expensive ingredients in detergents (Retiveau, 2012), hence there is a
commercial desire to minimize its loss and to enhance its delivery.
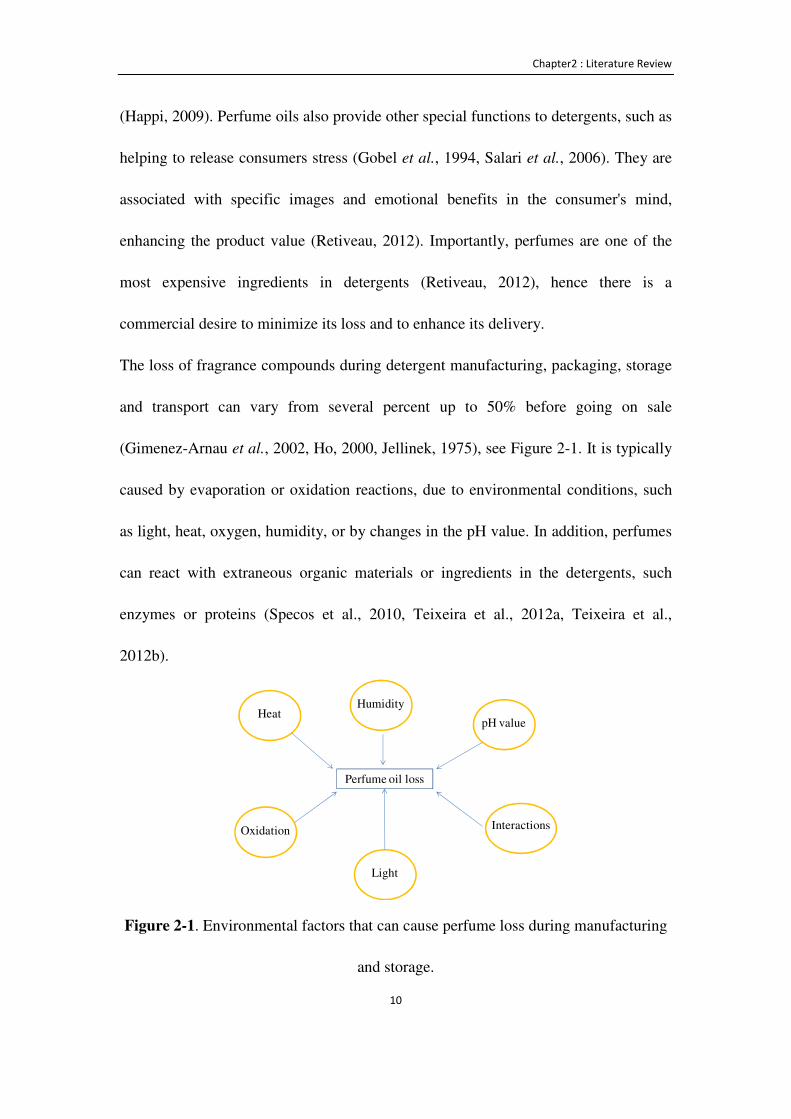
The loss of fragrance compounds during detergent manufacturing, packaging, storage
and transport can vary from several percent up to 50% before going on sale
(Gimenez-Arnau et al., 2002, Ho, 2000, Jellinek, 1975), see Figure 2-1. It is typically
caused by evaporation or oxidation reactions, due to environmental conditions, such
as light, heat, oxygen, humidity, or by changes in the pH value. In addition, perfumes
can react with extraneous organic materials or ingredients in the detergents, such
enzymes or proteins (Specos et al., 2010, Teixeira et al., 2012a, Teixeira et al.,
2012b).
Figure 2-1. Environmental factors that can cause perfume loss during manufacturing
and storage.
Perfume oil loss
HeatpH value
InteractionsOxidation
Light
Humidity
Chapter2 : Literature Review
11
Perfume oils may be washed away by the surfactants inside the detergents during
laundry processes, especially when they are highly water soluble, as discussed by
Haefliger et al. (2010). They may also evaporate during the drying process after
washing (Haefliger et al., 2010). In addition, it is difficult to deposit perfume oil onto
the fibre surface (Haefliger et al., 2010) and to release perfume oil at the right
moment (after the wash) (Mercadé-Prieto et al., 2012a).
2.2.3 Perfume microcapsules
Microcapsules containing fragrances are commonly employed in detergents, fabric
softeners and functional fabrics (Hu et al., 2012, Hu et al., 2011, Mihranyan et al.,
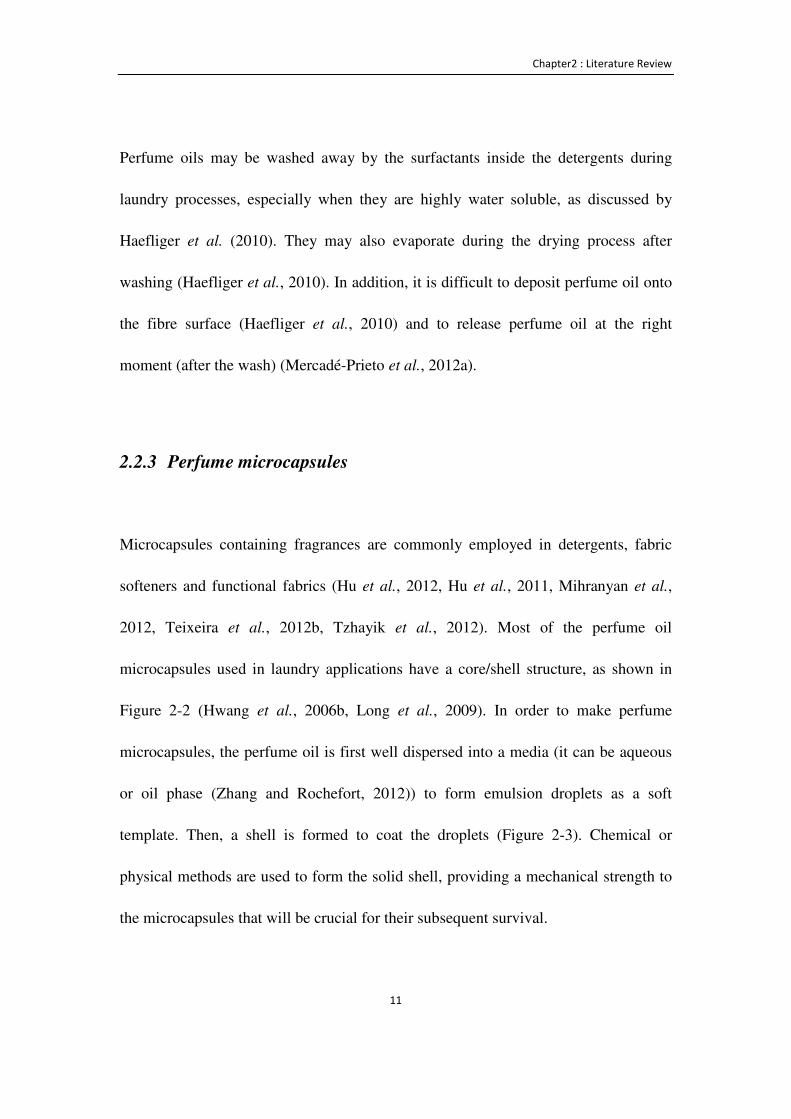
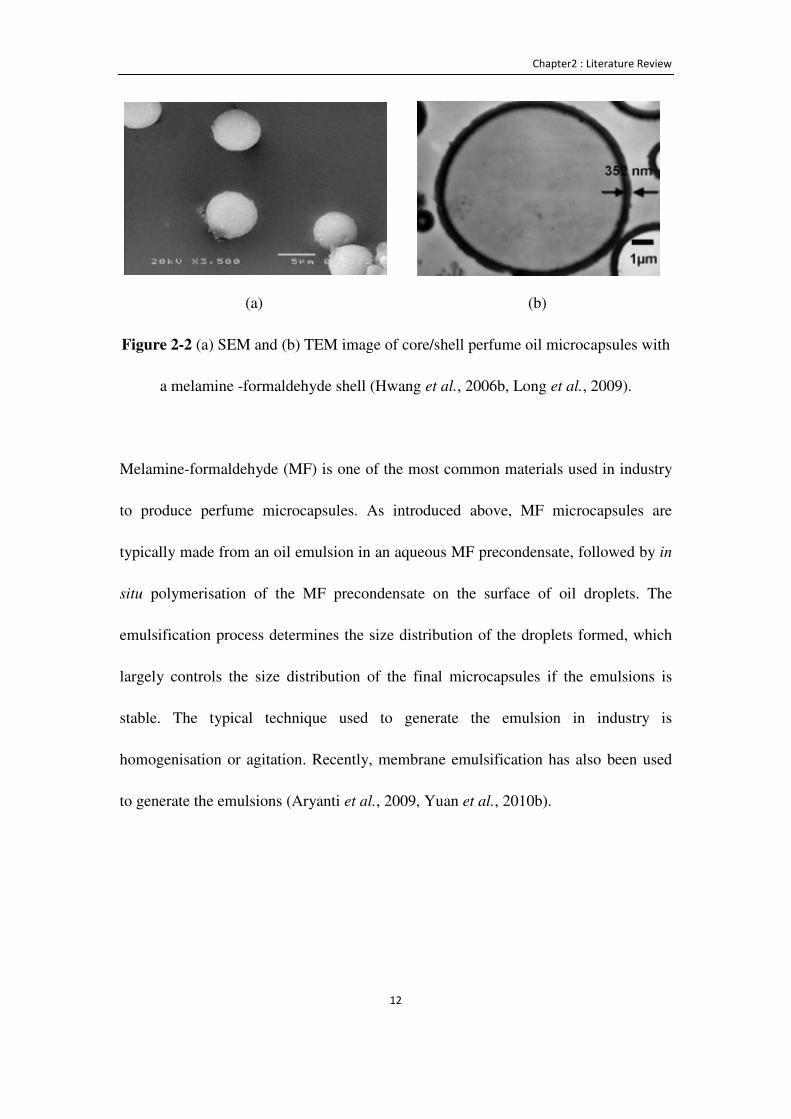
2012, Teixeira et al., 2012b, Tzhayik et al., 2012). Most of the perfume oil
microcapsules used in laundry applications have a core/shell structure, as shown in
Figure 2-2 (Hwang et al., 2006b, Long et al., 2009). In order to make perfume
microcapsules, the perfume oil is first well dispersed into a media (it can be aqueous
or oil phase (Zhang and Rochefort, 2012)) to form emulsion droplets as a soft
template. Then, a shell is formed to coat the droplets (Figure 2-3). Chemical or
physical methods are used to form the solid shell, providing a mechanical strength to
the microcapsules that will be crucial for their subsequent survival.
Chapter2 : Literature Review
12
(a)
(b)
Figure 2-2 (a) SEM and (b) TEM image of core/shell perfume oil microcapsules with
a melamine -formaldehyde shell (Hwang et al., 2006b, Long et al., 2009).
Melamine-formaldehyde (MF) is one of the most common materials used in industry
to produce perfume microcapsules. As introduced above, MF microcapsules are
typically made from an oil emulsion in an aqueous MF precondensate, followed by in
situ polymerisation of the MF precondensate on the surface of oil droplets. The
emulsification process determines the size distribution of the droplets formed, which
largely controls the size distribution of the final microcapsules if the emulsions is
stable. The typical technique used to generate the emulsion in industry is
homogenisation or agitation. Recently, membrane emulsification has also been used
to generate the emulsions (Aryanti et al., 2009, Yuan et al., 2010b).

Chapter2 : Literature Review
13
Figure 2-3 Schematic graph of basic steps of microencapsulation process.
The improved performance and delivery of perfume microcapsules for laundry
applications has been shown at length in the past (Bone et al., 2011, Hu et al., 2011,
Pena et al., 2011, Pena et al., 2012, Zhang and Rochefort, 2012). As discussed
previously to microcapsules in general, the encapsulated perfumes have improved
stability and durability during prolonged storage (Specos et al., 2010, Teixeira et al.,
2012a, Teixeira et al., 2012b); increase the perfume oil content in detergents (Zhang
and Rochefort, 2012); increase the total oil deposited on fabrics (Monllor et al., 2007);
and reduce perfume dermatitis due to the contact of perfume in detergents (Ezendam
et al., 2009).
Core/shell structure
Oil droplet
Shell material
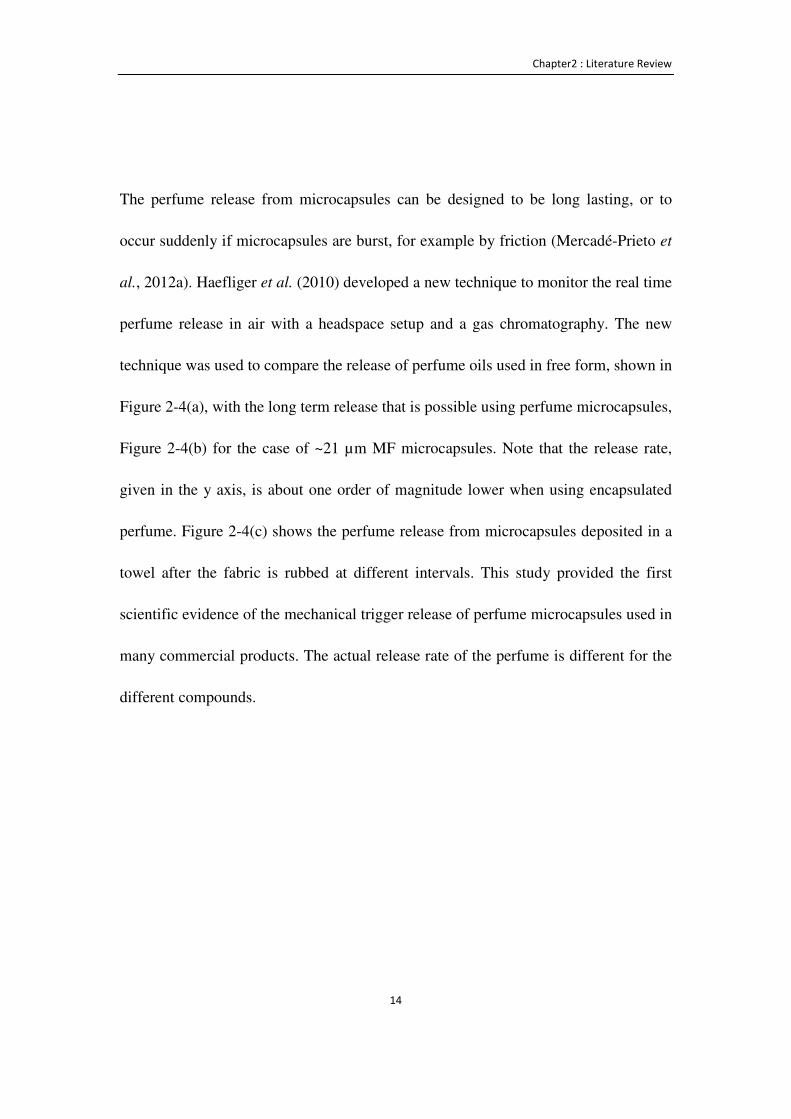
Chapter2 : Literature Review
14
The perfume release from microcapsules can be designed to be long lasting, or to
occur suddenly if microcapsules are burst, for example by friction (Mercadé-Prieto et
al., 2012a). Haefliger et al. (2010) developed a new technique to monitor the real time
perfume release in air with a headspace setup and a gas chromatography. The new
technique was used to compare the release of perfume oils used in free form, shown in
Figure 2-4(a), with the long term release that is possible using perfume microcapsules,
Figure 2-4(b) for the case of ~21 µm MF microcapsules. Note that the release rate,
given in the y axis, is about one order of magnitude lower when using encapsulated
perfume. Figure 2-4(c) shows the perfume release from microcapsules deposited in a
towel after the fabric is rubbed at different intervals. This study provided the first
scientific evidence of the mechanical trigger release of perfume microcapsules used in
many commercial products. The actual release rate of the perfume is different for the
different compounds.
Chapter2 : Literature Review
15
(a)
(b)
(c)
Figure 2-4. Release of perfumery ingredient Doremox® in (a) free form and (b) encapsulated form in a fabric softener (Haefliger et al., 2010). A
wet cotton towel with perfume was dried in an air stream from which the perfume oil release was determined using low thermal mass gas
chromatography. (c) The experiment (b) was repeated, but here the towel with microcapsules was suddenly rubbed for 0, 178, and 356 min (as
shown by the red solid line in the figure) to rupture the microcapsules and release the perfume oils.
Time (min)
Rel
ease
rate
(n
gm
in-1
) so
lid
lin
e
% R
elease d
otted
line
Time (min)
Rel
ease
rate
(n
gm
in-1
) so
lid
lin
e%
Relea
se dotted
line
Time (min)
Rel
ease
ra
te (
ng
min
-1)
soli
d l
ine
% R
elease d
otted
line
0 min 178 min 356 min
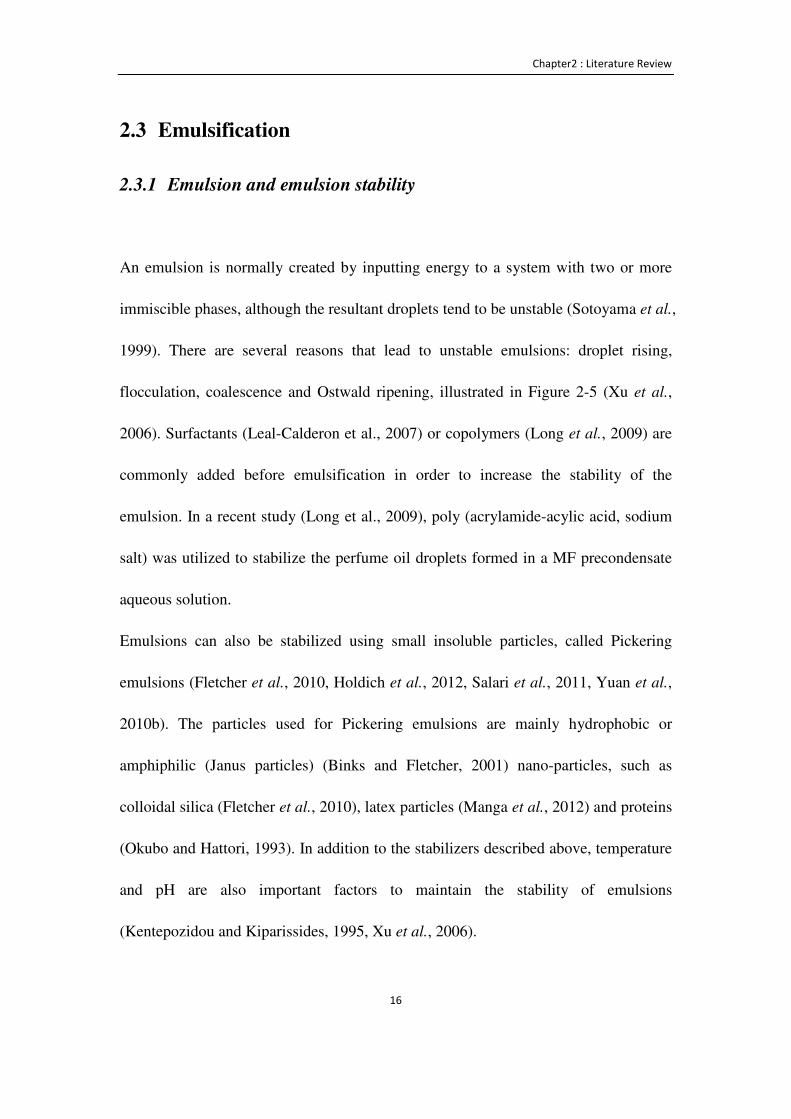
Chapter2 : Literature Review
16
2.3 Emulsification
2.3.1 Emulsion and emulsion stability
An emulsion is normally created by inputting energy to a system with two or more
immiscible phases, although the resultant droplets tend to be unstable (Sotoyama et al.,
1999). There are several reasons that lead to unstable emulsions: droplet rising,
flocculation, coalescence and Ostwald ripening, illustrated in Figure 2-5 (Xu et al.,
2006). Surfactants (Leal-Calderon et al., 2007) or copolymers (Long et al., 2009) are
commonly added before emulsification in order to increase the stability of the
emulsion. In a recent study (Long et al., 2009), poly (acrylamide-acylic acid, sodium
salt) was utilized to stabilize the perfume oil droplets formed in a MF precondensate
aqueous solution.
Emulsions can also be stabilized using small insoluble particles, called Pickering
emulsions (Fletcher et al., 2010, Holdich et al., 2012, Salari et al., 2011, Yuan et al.,
2010b). The particles used for Pickering emulsions are mainly hydrophobic or
amphiphilic (Janus particles) (Binks and Fletcher, 2001) nano-particles, such as
colloidal silica (Fletcher et al., 2010), latex particles (Manga et al., 2012) and proteins
(Okubo and Hattori, 1993). In addition to the stabilizers described above, temperature
and pH are also important factors to maintain the stability of emulsions
(Kentepozidou and Kiparissides, 1995, Xu et al., 2006).
Chapter2 : Literature Review
17
(a) rising
(b) flocculation
(c) coalescence
(d) Ostwald ripening
Figure 2-5 Different mechanisms that induce emulsion instability
There are many different techniques to add the energy required to create emulsion, as
spontaneous emulsions are rare (Capek, 1999). The most common techniques include
homogenisation (Turchiuli et al., 2013), agitation (Choi and Lee, 2010) and
membrane emulsification (Peng and Williams, 1998a).
2.3.2 Emulsification methods
2.3.2.1 Homogenization
Homogenization is one of the most frequent technique to generate emulsions in
industry. There are two types of conventional homogenizers which are regularly used:

Chapter2 : Literature Review
18
high pressure homogenizer and rotor-stator high shear homogenizer (Turchiuli et al.,
2013). The high pressure homogenizer is mainly used to generate nano-emulsions
(Turchiuli et al., 2013), whereas the high shear homogenizer is used for micron-sized
emulsions (Rueger and Calabrese). Compared with conventional agitators, a
rotor-stator high shear homogenizer has an extra membrane tube surrounding the rotor
blades, as shown in Figure 2-6. During emulsification, the high speed rotation of the
blades mixes well of the two phases, forming a coarse emulsion, which is
subsequently broken down and refined when it is pushed through the membrane tube
by centrifugal forces. This process occurs continuously until an emulsion with a
constant size is formed (Turchiuli et al., 2013).
Figure 2-6 Schematic graph and picture of a rotor-stator high shear homogenizer. The
homogenizer has a 4 blade impeller (Φ 30 mm) in the middle, surrounded by metal
cylinder (Φ 35 mm) with regular round pores (Model L4RT, Silverson Machines Ltd.,
UK).
Chapter2 : Literature Review
19
The size of the emulsion droplets generated by an homogenizer highly depends on the
agitation speed. Calabrese et al. (1986b) described the relationship between the Sauter
mean diameter D3,2 of droplets in an emulsion and the agitation speed in a stirred
vessel, Equation 2.1. This equation was later applied to describe the effect of a
homogenizer on MF microcapsules (Hu et al., 2009).
D3,2 = AhωmB (Equation 2.1)
where Ah and B are proportionality constants and ωm is the agitation speed (rpm).
Homogenization is easy to scale up and not expensive process compared with
membrane emulsification, which provides a convenient method to generate the
emulsion with reasonable size distributions. The coefficient of variation (CV value)
that quantifies the size distribution of emulsions (Section 4.3) is typically around 30%
to 40% in the lab (Long et al., 2009) and in the pilot scale (Turchiuli et al., 2013).
2.3.2.2 Other emulsification methods
Some innovative approaches have been proposed recently to generate uniform
emulsions, such as emulsification in a micro-channel (Kawakatsu et al., 2001,
Chapter2 : Literature Review
20
Vladisavljevic et al., 2008), using a micropipette (Kamat et al., 2011), using
microchips (van Dijke et al., 2010), micro-fluidics (Zhao and Middelberg, 2011) or a
flow focusing (co-extrusion) device (Anna et al., 2003, Martin-Banderas et al., 2005,
Sakai et al., 2011, Ward et al., 2005). They may generate an emulsion with highly
uniform oil droplets, with coefficient of variation (CV value) lower than 15%, even
2-5% in some cases (Kawakatsu et al., 2001, Kuroiwa et al., 2009, Li, 2010, Stoffel et
al., 2012, Vladisavljevic et al., 2008). However, most of the devices are still in the
development phase, they are difficult to scale up, or they can be costly (Charcosset et
al., 2004).
Previous literature work (Nazir et al., 2010) has mentioned a "premix" technique
based on a direct cross-flow membrane emulsification system. Emulsions are
circulated in the system several times in order to narrow the size distribution of the
initial emulsion (Nazir et al., 2010). This technique can provide much narrower
distributions compared to single-pass cross-flow systems (Joseph and Bunjes, 2012,
Kou et al., 2012, Vladisavljevic et al., 2004), although it presents some limitations:
membrane fouling or even membrane blocking in some cases (Nazir et al., 2010).

Chapter2 : Literature Review
21
2.3.3 Membrane emulsification
2.3.3.1 Introduction of membrane emulsification
Membrane emulsification was reported for the first time in 1988 at the Autumn
Conference of the Society of Chemical Engineering in Japan (Nakashima and
Shimizu, 1988, Nakashima et al., 1991). Since then, membrane emulsification has
become a widely used method to produce emulsions. In membrane emulsification the
dispersed phase liquid is pumped through a membrane with uniform pores, in most
cases, into the continuous phase, to form a emulsion. Droplets are formed one by one
at the pore openings at the membrane surface. Compared with common industrial
equipment, such as, homogenizers or stirrer vessels, a membrane system is a
promising technique to provide emulsion droplets with a narrower size distribution,
and without high energy consumption (Aryanti et al., 2009, Yuan et al., 2010b).
Membrane emulsification systems have been demonstrated with different kinds of
membrane materials: ceramic (Schroder et al., 1998, Schroder and Schubert, 1999),
glass (Omi et al., 2001), polytetrafluoroethene (Ribeiro et al., 2005) or metal (Holdich
et al., 2010, Kosvintsev et al., 2008, Kosvintsev et al., 2005).
There are mainly three types of membrane systems for emulsification: cross flow
membranes, vibrating (or rotating) membranes and flat membranes in conjunction
Chapter2 : Literature Review
22
with a mechanical stirrer (also called a dispersion cell) (Dragosavac et al., 2008,
Manga et al., 2012, Vladisavljevic and Williams, 2005). The vibrating (or rotating)
membrane can be used to control the size and size distribution of the droplets, but it is
relatively expensive to operate (Aryanti et al., 2009, Aryanti et al., 2006, Holdich et
al., 2010, Yuan et al., 2009b).
Cross flow membranes are one of the most widely used membrane systems (Peng and
Williams, 1998a, Peng and Williams, 1998b, Williams et al., 1998). The dispersed
phase was forced through the membrane pores using pressurized gas. The flowing
continuous phase at the other size of the membrane provides constant shear that will
help to break the forming droplets from the pores (Nazir et al., 2010). It is a simple
device that is scaled up in many applications (Yuan et al., 2009a, Yuan et al., 2009c).
However, it needs a long operation time, during which the droplets generated may
change their size due to breakage or coalescence. In addition, the system may also be
difficult to clean (Charcosset et al., 2004).
Membrane emulsification is a simple method to produce oil droplets with a narrow
size distribution (Nakashima et al., 1991), which could scale up easily. Cross-flow
membrane system (Charcosset, 2009) or vibration membrane system, such as
oscillating membrane system (Holdich et al., 2010) and pulsed flow membrane
Chapter2 : Literature Review
23
(Holdich et al., 2013) etc. are techniques that have great potential for industrial
manufacturing.
2.3.3.2 Flat membrane combined with a stirrer system (Dispersion cell)
The dispersion cell, pioneered by Kosvintsev et al. (2005), is based on a flat
membrane with an overhead stirrer (Figure 2-7). Compared to other more complex
membrane systems, it is relatively cheap to own and operate. The dispersion cell has
been used in research studies to investigate the influence of different parameters on
the sizes and size distributions of emulsions. The different parameters studied include:
membrane properties (Bromley et al., 2002, Egidi et al., 2008, Ullah et al., 2012a,
Ullah et al., 2012b), physical properties of the dispersed and continuous phases
(Dragosavac et al., 2008, Kosvintsev et al., 2005), and process conditions, such as
dispersed phase flux and agitation speed of continuous phase (Dragosavac et al., 2008,
Gasparini et al., 2010, Kosvintsev et al., 2008). The dispersion cell has been
successfully used to generate oil in water emulsions (O/W) (Dragosavac et al., 2008,
Kosvintsev et al., 2005) and water in oil in water double emulsions (W/O/W)
(Dragosavac et al., 2012a, Gasparini et al., 2010) with narrow size distribution. It has
also used to produce mono-dispersed silica particles (Dragosavac et al., 2012b,
Vladisavljevic and Williams, 2005) and PLGA microcapsules (Gasparini et al., 2010,
Gasparini et al., 2008).
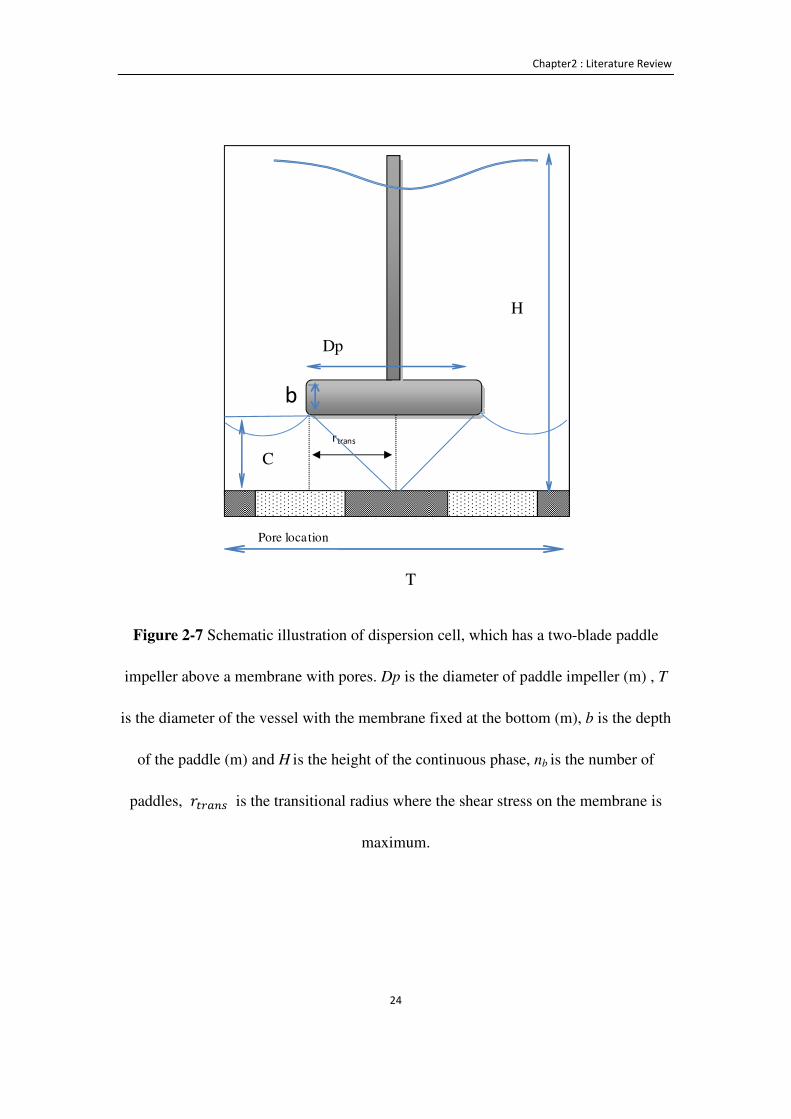
Chapter2 : Literature Review
24
Figure 2-7 Schematic illustration of dispersion cell, which has a two-blade paddle
impeller above a membrane with pores. Dp is the diameter of paddle impeller (m) , T
is the diameter of the vessel with the membrane fixed at the bottom (m), b is the depth
of the paddle (m) and H is the height of the continuous phase, nb is the number of
paddles, M%N(!� is the transitional radius where the shear stress on the membrane is
maximum.
Pore location
rtrans
T
H
C
Dp
b

Chapter2 : Literature Review
25
2.3.4 Theoretical models to describe droplet formation at the
membrane surface
There have been a number of studies on the formation of droplets using membranes in
order to understand the emulsification process better and to design improved systems.
Imaging devices have been applied to observe the formation of droplets at the
membrane surface (Xu et al., 2005, Zhu and Barrow, 2005), which has allowed the
development of numerical models for the formation of single droplets. Several
common methodologies have been used in the previous literature work to numerically
analyze droplet formation. At the microscopic level, work has been performed using
computational fluid dynamics (CFD) modelling (Abrahamse et al., 2001, Kobayashi
et al., 2007, Timgren et al., 2010), Rayner et al.’s (2005, 2004) work using surface
evolver (surface evolver is an interactive program for the study of surfaces shaped by
surface tension and other energies, and subject to various constraints), lattice
Boltzmann simulations (De Luca et al., 2008, van der Graaf et al., 2006). At
macroscopic level studies have used force balances (De Luca and Drioli, 2006) or
torque balances (Charcosset et al., 2004, De Luca et al., 2008) to understand droplet
formation. Among all these models, the one based on torque balances was frequently
applied on various membrane system (Charcosset et al., 2004). Torque balance
models have been developed for the dispersion cell membrane system, showing good
agreement with the experimental data (Kosvintsev et al., 2005). In this section, a brief

Chapter2 : Literature Review
26
overview is provided on the different theoretical analysis in the literature for droplet
formation using torque balances.
Figure 2-8 Schematic of droplet formation (Charcosset et al., 2004, Xu et al., 2005).
(a) Initial stage of droplet formation in a pore membrane, where B* is the pressure of
the dispersed phase (Pa), B) is the pressure of the continuous phase (Pa), B)( is the
pressure of the capillary (Pa). (b) Torque balance in a droplet formed without a neck,
where')is the droplet diameter before detachment (m), ',is diameter of the pore on
the membrane (m), �� is the he force generated by shear stress (N) and �3is the
interfacial tension force (N). (c) Torque balance in a droplet considering neck
formation, where '*is the droplet diameter during detachment, '+is diameter of the
“neck” (m),�./ is the buoyancy force when droplets forming on the membrane
surface (N), �* is the drag force (N), �*� is the dynamic lift force (N), �� is the
linear momentum force (N), ��%(% is the force due to a static pressure difference
between the two phases (N), �3��%(% = �3 − ��%(% (N).
Pd
Pc
Pcadp
dN
neck
Fd
c
FBG, Fl, Fdl
dd
Fr-stat
Fr
dcFS
a b
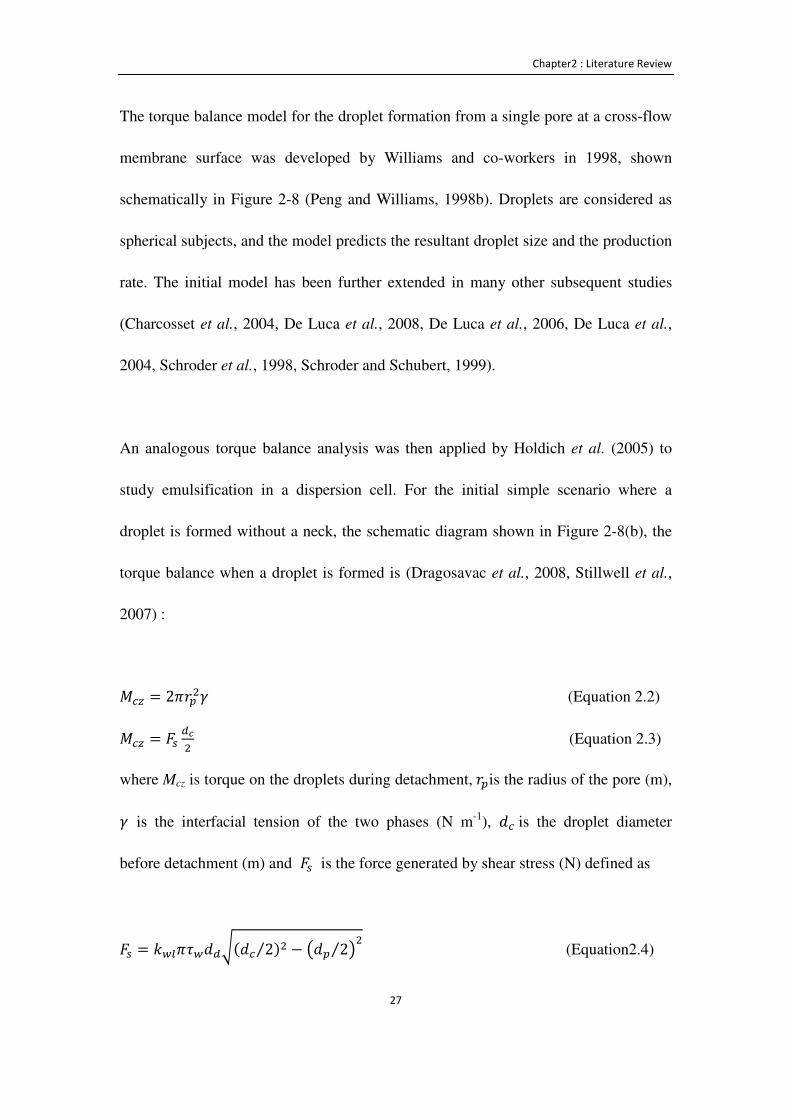
Chapter2 : Literature Review
27
The torque balance model for the droplet formation from a single pore at a cross-flow
membrane surface was developed by Williams and co-workers in 1998, shown
schematically in Figure 2-8 (Peng and Williams, 1998b). Droplets are considered as
spherical subjects, and the model predicts the resultant droplet size and the production
rate. The initial model has been further extended in many other subsequent studies
(Charcosset et al., 2004, De Luca et al., 2008, De Luca et al., 2006, De Luca et al.,
2004, Schroder et al., 1998, Schroder and Schubert, 1999).
An analogous torque balance analysis was then applied by Holdich et al. (2005) to
study emulsification in a dispersion cell. For the initial simple scenario where a
droplet is formed without a neck, the schematic diagram shown in Figure 2-8(b), the
torque balance when a droplet is formed is (Dragosavac et al., 2008, Stillwell et al.,
2007) :
r)s = 2tM,�d (Equation 2.2)
r)s = �� *u� (Equation 2.3)
where Mcz is torque on the droplets during detachment,M,is the radius of the pore (m),
d is the interfacial tension of the two phases (N m-1), ') is the droplet diameter
before detachment (m) and �� is the force generated by shear stress (N) defined as
�� = 67�te7'*v(') 2⁄ )� − w', 2⁄ x� (Equation2.4)
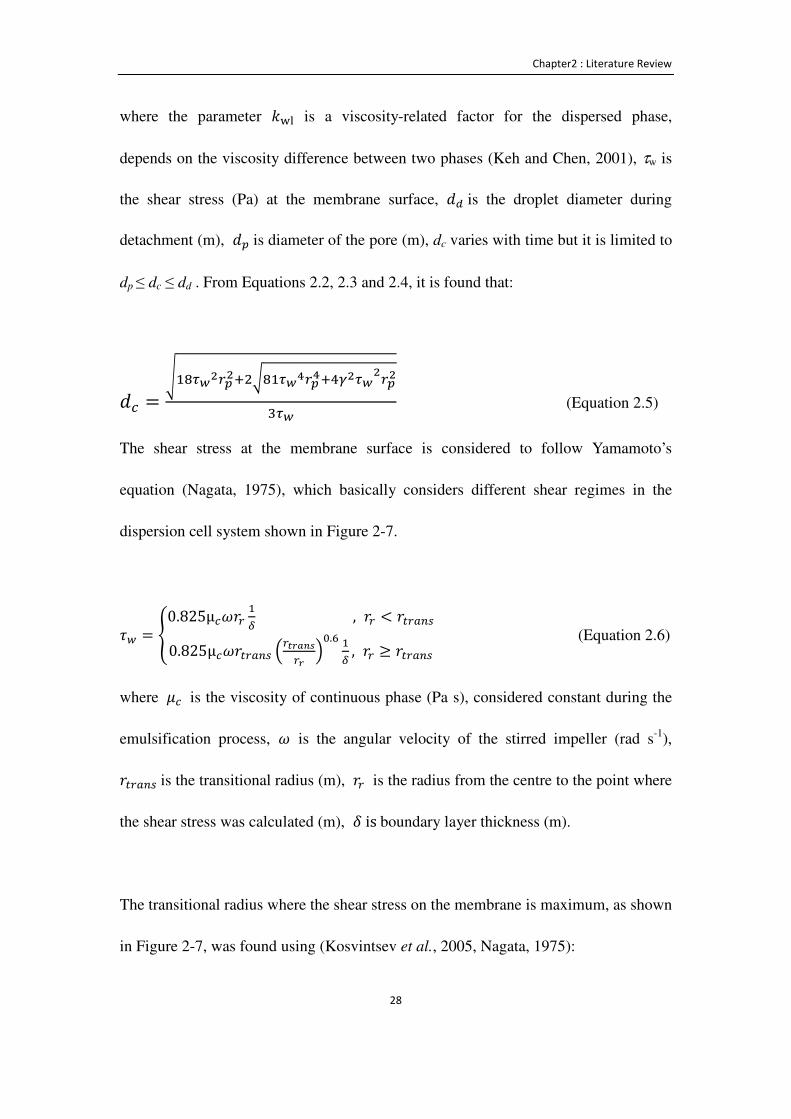
Chapter2 : Literature Review
28
where the parameter 6j` is a viscosity-related factor for the dispersed phase,
depends on the viscosity difference between two phases (Keh and Chen, 2001), τw is
the shear stress (Pa) at the membrane surface, '* is the droplet diameter during
detachment (m), ',is diameter of the pore (m), dc varies with time but it is limited to
dp ≤ dc ≤ dd . From Equations 2.2, 2.3 and 2.4, it is found that:
') = y�zi{LN|LJ�vz�i{}N|}J~3Li{LN|L�i{ (Equation 2.5)
The shear stress at the membrane surface is considered to follow Yamamoto’s
equation (Nagata, 1975), which basically considers different shear regimes in the
dispersion cell system shown in Figure 2-7.
e7 = �0.825μ)pMN �� , MN < M%N(!�0.825μ)pM%N(!� �N>��;�N� �&.� �� , MN ≥ M%N(!�
� (Equation 2.6)
where g) is the viscosity of continuous phase (Pa s), considered constant during the
emulsification process, p is the angular velocity of the stirred impeller (rad s-1),
M%N(!�is the transitional radius (m), MN is the radius from the centre to the point where
the shear stress was calculated (m), oisboundary layer thickness (m).
The transitional radius where the shear stress on the membrane is maximum, as shown
in Figure 2-7, was found using (Kosvintsev et al., 2005, Nagata, 1975):
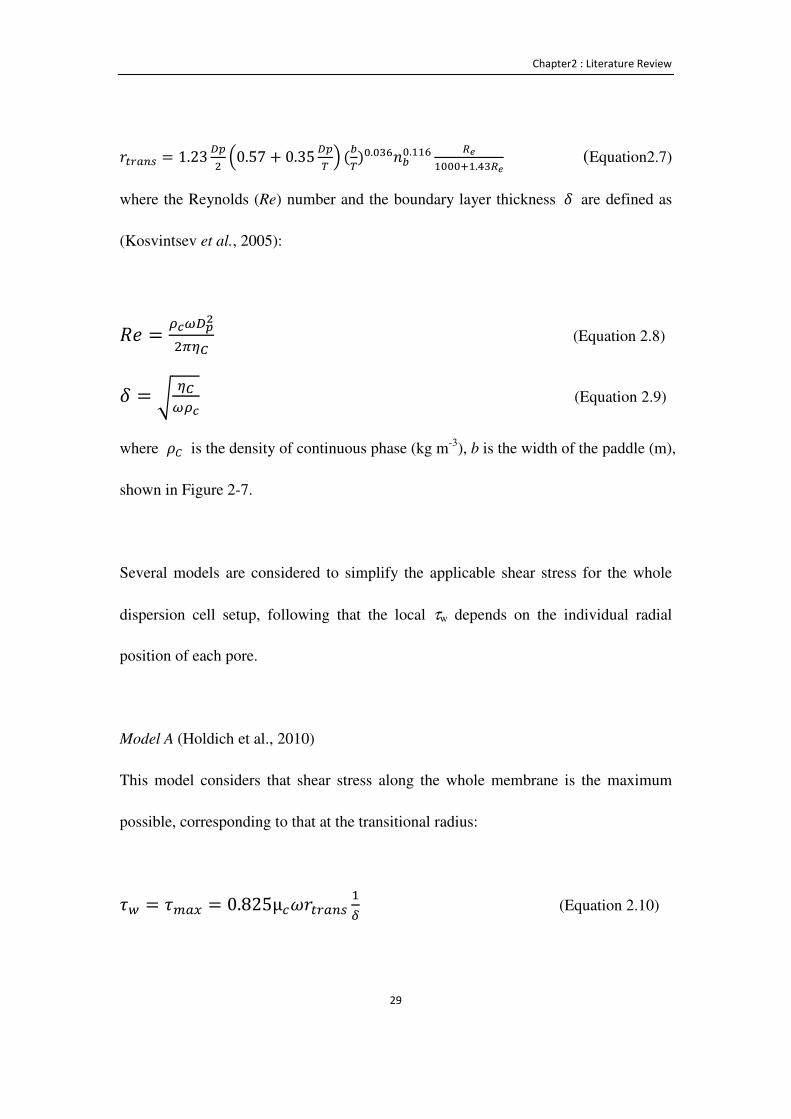
Chapter2 : Literature Review
29
M%N(!� = 1.23 �,� �0.57 + 0.35 �,n � (En)&.&��@E&.��� l��&&&J�.~�l� (Equation2.7)
where the Reynolds (Re) number and the boundary layer thickness o are defined as
(Kosvintsev et al., 2005):
O� = �u��|L���� (Equation 2.8)
o = v ����u (Equation 2.9)
where c9 is the density of continuous phase (kg m-3), b is the width of the paddle (m),
shown in Figure 2-7.
Several models are considered to simplify the applicable shear stress for the whole
dispersion cell setup, following that the local τw depends on the individual radial
position of each pore.
Model A (Holdich et al., 2010)
This model considers that shear stress along the whole membrane is the maximum
possible, corresponding to that at the transitional radius:
e7 = eD(A = 0.825μ)pM%N(!� �� (Equation 2.10)
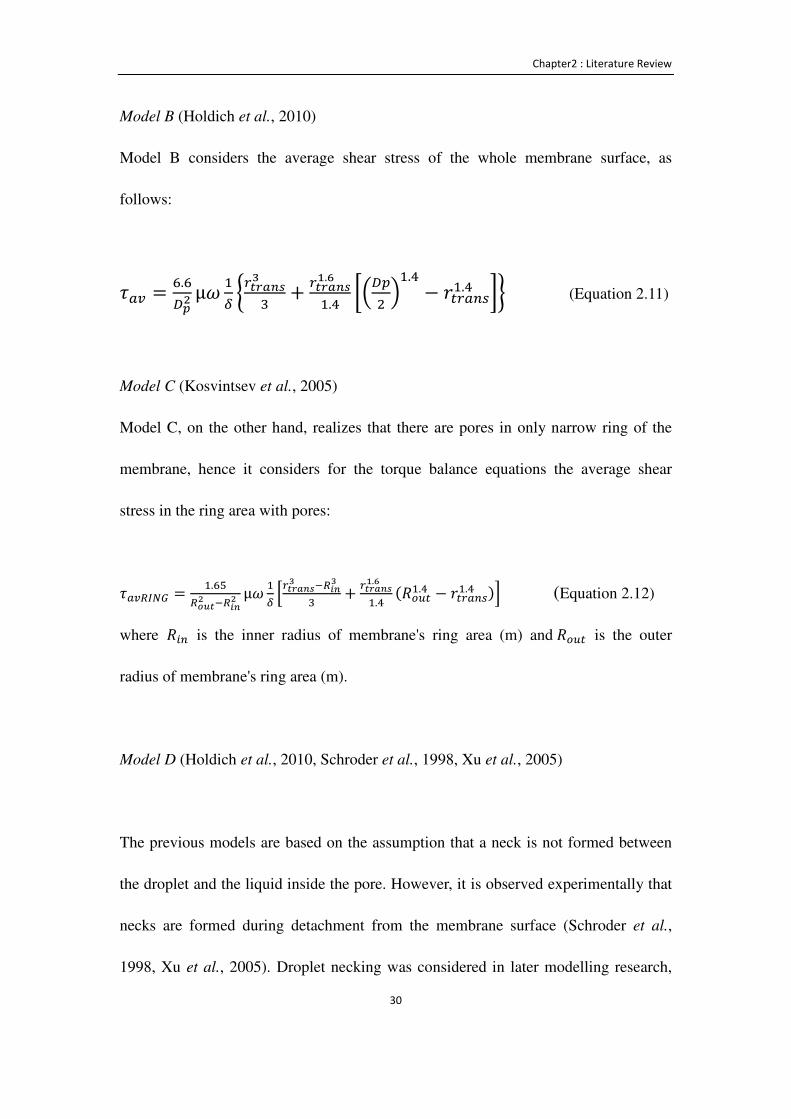
Chapter2 : Literature Review
30
Model B (Holdich et al., 2010)
Model B considers the average shear stress of the whole membrane surface, as
follows:
e(k = �.��|L μp �� �N>��;��� + N>��;��.�
�.~ ���,� ��.~ − M%N(!��.~ �� (Equation 2.11)
Model C (Kosvintsev et al., 2005)
Model C, on the other hand, realizes that there are pores in only narrow ring of the
membrane, hence it considers for the torque balance equations the average shear
stress in the ring area with pores:
e(kl�+/ = �.��l<=>L �l:;L μp �� N>��;�� �l:;�� + N>��;��.��.~ (O$�%�.~ − M%N(!��.~ )¡ (Equation 2.12)
where O ! is the inner radius of membrane's ring area (m) andO$�% is the outer
radius of membrane's ring area (m).
Model D (Holdich et al., 2010, Schroder et al., 1998, Xu et al., 2005)
The previous models are based on the assumption that a neck is not formed between
the droplet and the liquid inside the pore. However, it is observed experimentally that
necks are formed during detachment from the membrane surface (Schroder et al.,
1998, Xu et al., 2005). Droplet necking was considered in later modelling research,
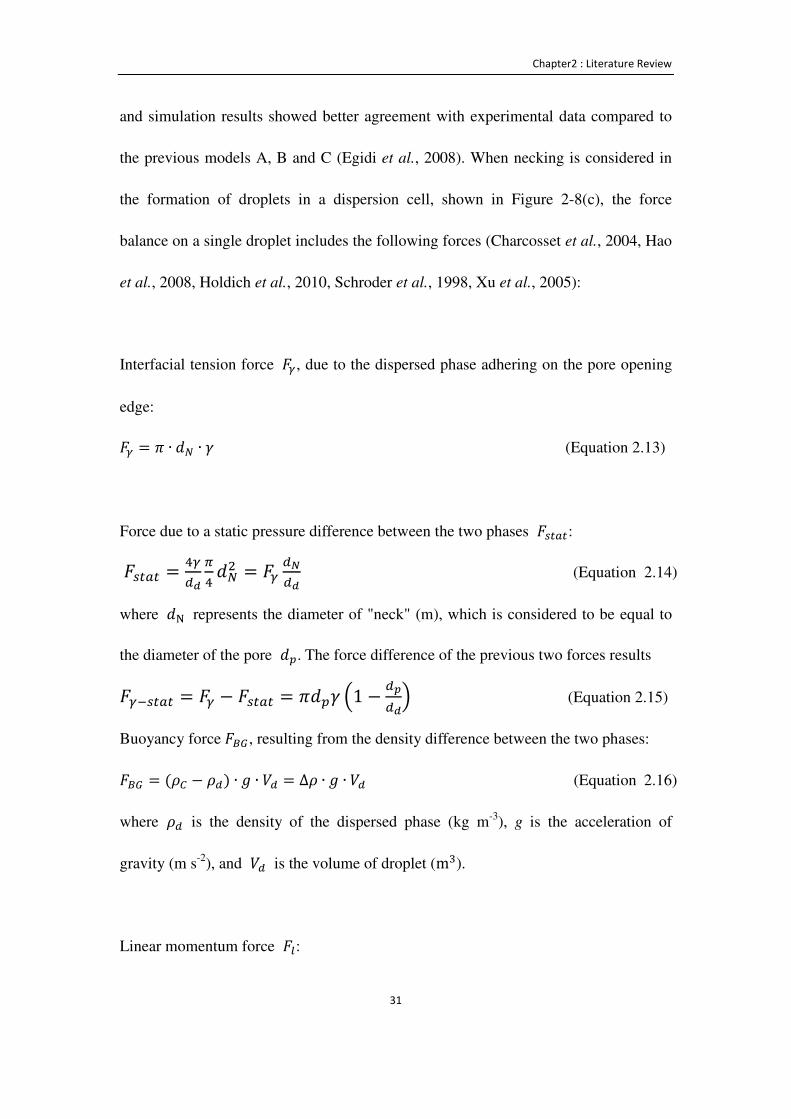
Chapter2 : Literature Review
31
and simulation results showed better agreement with experimental data compared to
the previous models A, B and C (Egidi et al., 2008). When necking is considered in
the formation of droplets in a dispersion cell, shown in Figure 2-8(c), the force
balance on a single droplet includes the following forces (Charcosset et al., 2004, Hao
et al., 2008, Holdich et al., 2010, Schroder et al., 1998, Xu et al., 2005):
Interfacial tension force �3, due to the dispersed phase adhering on the pore opening
edge:
�3 = t ∙ '+ ∙ d (Equation 2.13)
Force due to a static pressure difference between the two phases ��%(%:
��%(% = ~3*£�~ '+� = �3 *¤*£ (Equation 2.14)
where '¥ represents the diameter of "neck" (m), which is considered to be equal to
the diameter of the pore ',. The force difference of the previous two forces results
�3��%(% = �3 − ��%(% = t',d �1 − *|*£� (Equation 2.15)
Buoyancy force�./ , resulting from the density difference between the two phases:
�./ = (c9 − c*) ∙ ¦ ∙ S* = ∆c ∙ ¦ ∙ S* (Equation 2.16)
where c* is the density of the dispersed phase (kg m-3), g is the acceleration of
gravity (m s-2), and S* is the volume of droplet (m�).
Linear momentum force ��:
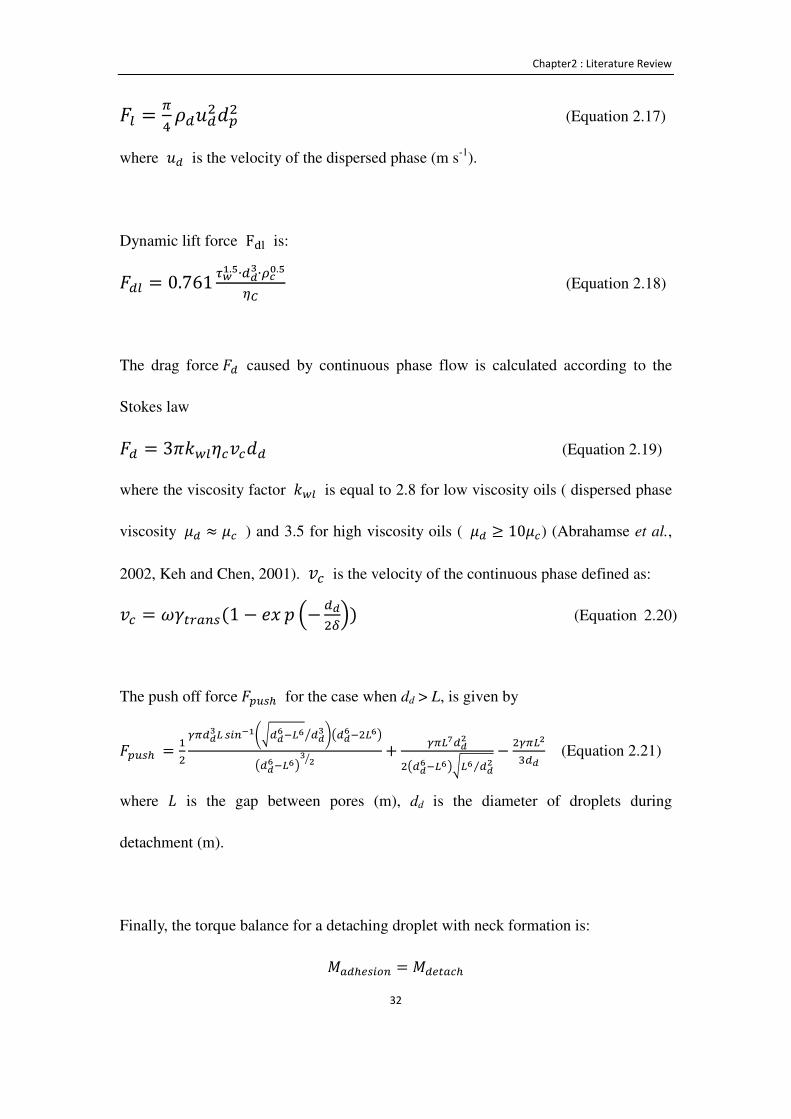
Chapter2 : Literature Review
32
�� = �~ c*Q*�',� (Equation 2.17)
where Q* is the velocity of the dispersed phase (m s-1).
Dynamic lift force F¨` is:
�*� = 0.761 i{�.ª∙*£�∙�u«.ª�� (Equation 2.18)
The drag force�* caused by continuous phase flow is calculated according to the
Stokes law
�* = 3t67�¬)R)'* (Equation 2.19)
where the viscosity factor 67� is equal to 2.8 for low viscosity oils ( dispersed phase
viscosity g* ≈ g) ) and 3.5 for high viscosity oils ( g* ≥ 10g)) (Abrahamse et al.,
2002, Keh and Chen, 2001). R) is the velocity of the continuous phase defined as:
R) = pd%N(!�(1 − �® ¯ �− *£���) (Equation 2.20)
The push off force�,��� for the case when dd > L, is given by
�,��� = ��3�*£�� � !°�±v*£���� *£�² ³w*£�����x
w*£����x� L² + 3��´*£L�w*£����xv�� *£L⁄ − �3��L�*£ (Equation 2.21)
where ? is the gap between pores (m), dd is the diameter of droplets during
detachment (m).
Finally, the torque balance for a detaching droplet with neck formation is:
r(*��� $! = r*�%()�
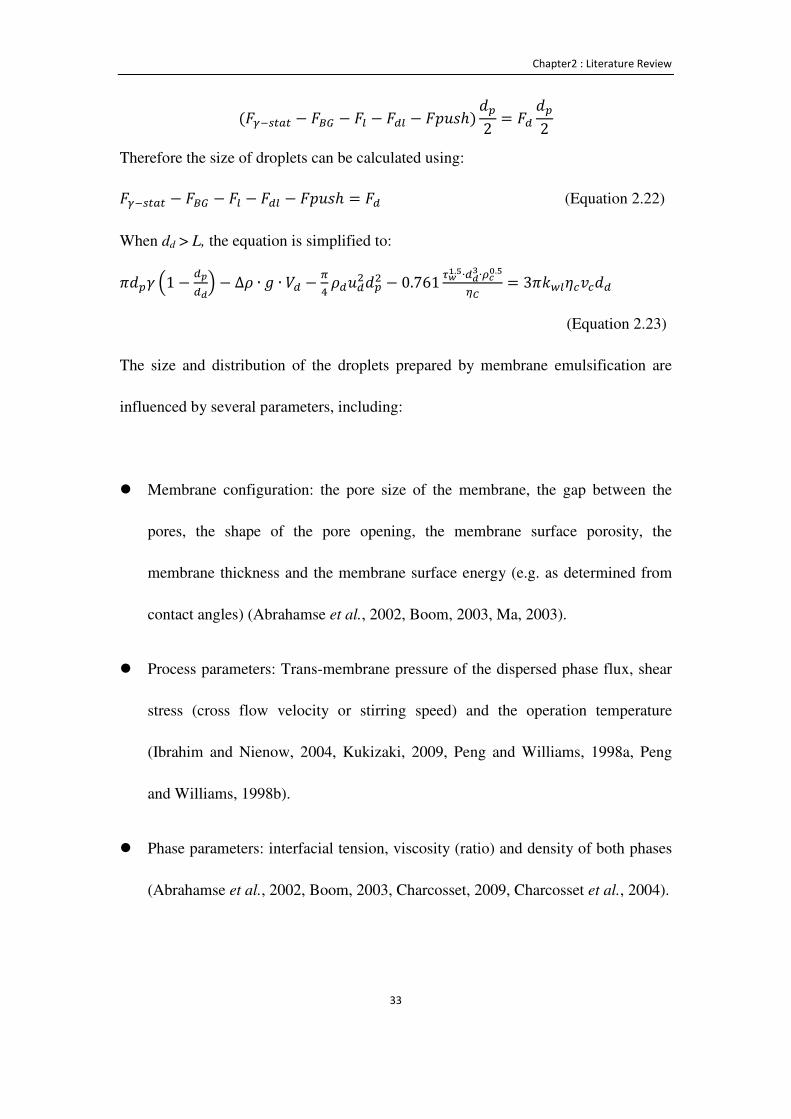
Chapter2 : Literature Review
33
(�3��%(% − �./ − �� − �*� − �¯Qµℎ) ',2 = �* ',2
Therefore the size of droplets can be calculated using:
�3��%(% − �./ − �� − �*� − �¯Qµℎ = �* (Equation 2.22)
When dd > L, the equation is simplified to:
t',d �1 − *|*£� − ∆c ∙ ¦ ∙ S* − �~ c*Q*�',� − 0.761 i{�.ª∙*£� ∙�u«.ª�� = 3t67�¬)R)'*
(Equation 2.23)
The size and distribution of the droplets prepared by membrane emulsification are
influenced by several parameters, including:
� Membrane configuration: the pore size of the membrane, the gap between the
pores, the shape of the pore opening, the membrane surface porosity, the
membrane thickness and the membrane surface energy (e.g. as determined from
contact angles) (Abrahamse et al., 2002, Boom, 2003, Ma, 2003).
� Process parameters: Trans-membrane pressure of the dispersed phase flux, shear
stress (cross flow velocity or stirring speed) and the operation temperature
(Ibrahim and Nienow, 2004, Kukizaki, 2009, Peng and Williams, 1998a, Peng
and Williams, 1998b).
� Phase parameters: interfacial tension, viscosity (ratio) and density of both phases
(Abrahamse et al., 2002, Boom, 2003, Charcosset, 2009, Charcosset et al., 2004).
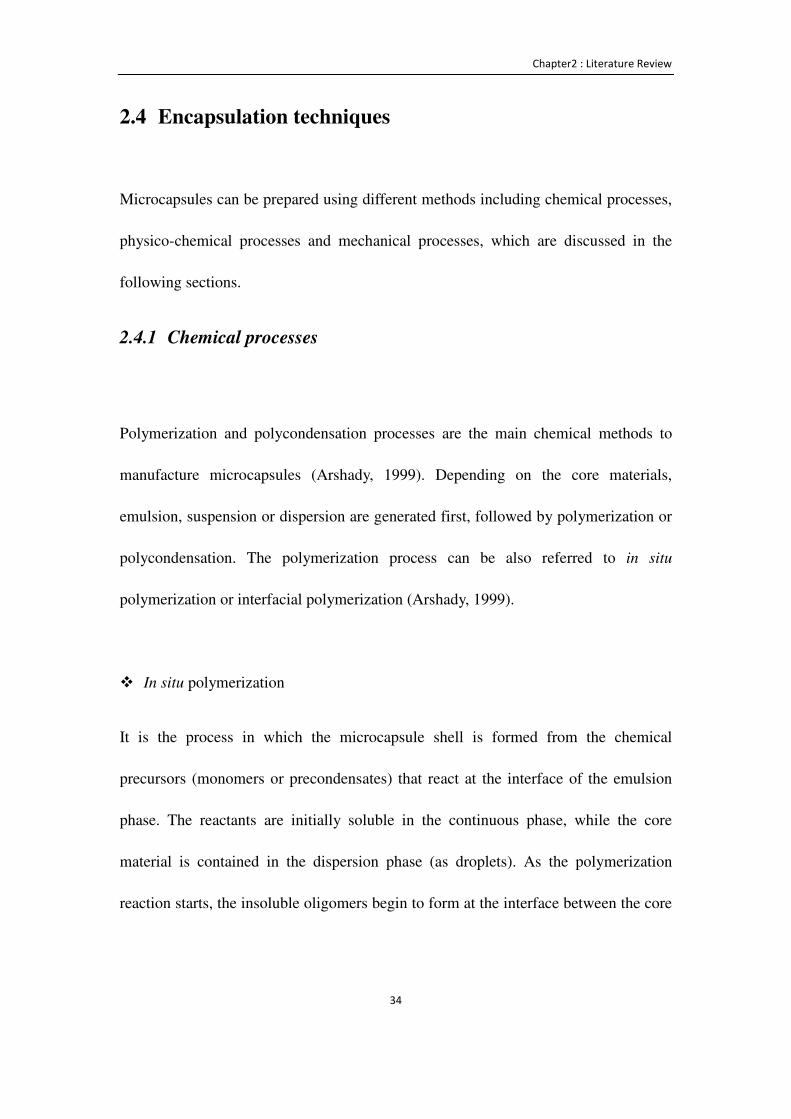
Chapter2 : Literature Review
34
2.4 Encapsulation techniques
Microcapsules can be prepared using different methods including chemical processes,
physico-chemical processes and mechanical processes, which are discussed in the
following sections.
2.4.1 Chemical processes
Polymerization and polycondensation processes are the main chemical methods to
manufacture microcapsules (Arshady, 1999). Depending on the core materials,
emulsion, suspension or dispersion are generated first, followed by polymerization or
polycondensation. The polymerization process can be also referred to in situ
polymerization or interfacial polymerization (Arshady, 1999).
� In situ polymerization
It is the process in which the microcapsule shell is formed from the chemical
precursors (monomers or precondensates) that react at the interface of the emulsion
phase. The reactants are initially soluble in the continuous phase, while the core
material is contained in the dispersion phase (as droplets). As the polymerization
reaction starts, the insoluble oligomers begin to form at the interface between the core
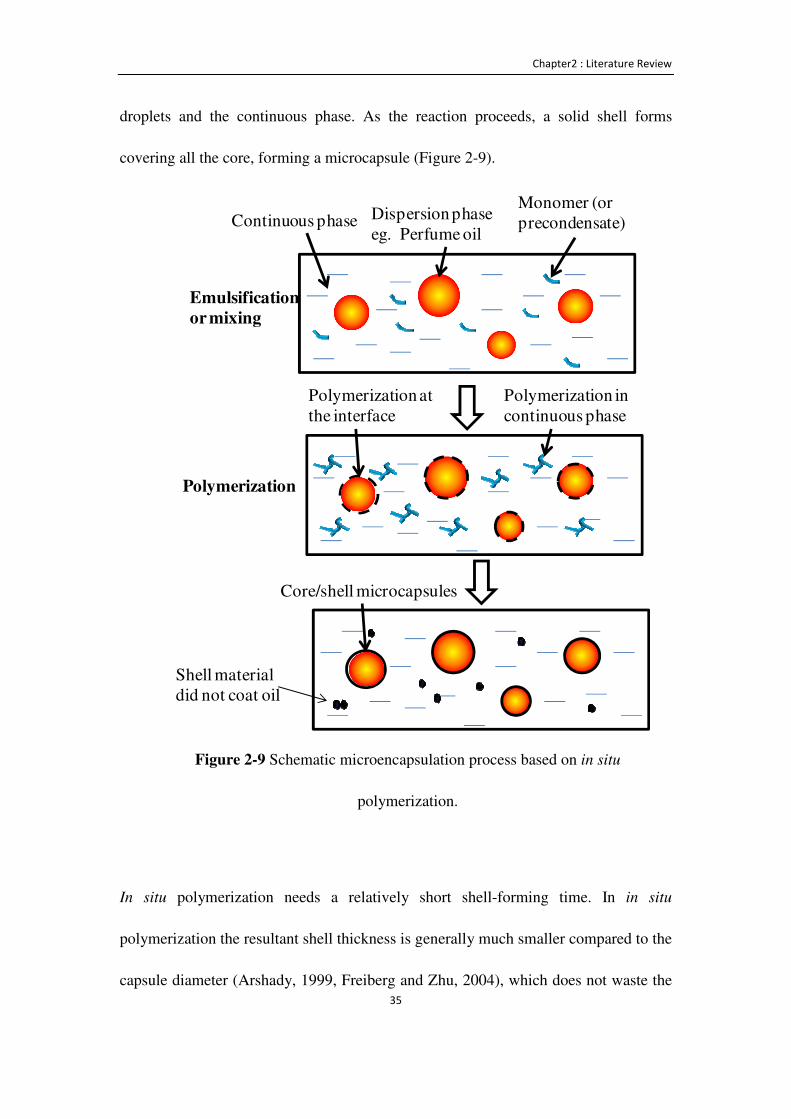
Chapter2 : Literature Review
35
droplets and the continuous phase. As the reaction proceeds, a solid shell forms
covering all the core, forming a microcapsule (Figure 2-9).
Figure 2-9 Schematic microencapsulation process based on in situ
polymerization.
In situ polymerization needs a relatively short shell-forming time. In in situ
polymerization the resultant shell thickness is generally much smaller compared to the
capsule diameter (Arshady, 1999, Freiberg and Zhu, 2004), which does not waste the
Continuous phase Dispersion phaseeg. Perfume oil
Monomer (or precondensate)
Polymerization at the interface
Polymerization in continuous phase
Core/shell microcapsules
Emulsification
or mixing
Polymerization
Shell material did not coat oil

Chapter2 : Literature Review
36
shell materials (Zhang and Wang, 2009). It is possible to control the size and size
distribution of microcapsules by controlling the emulsion droplets. It is a process
suitable to prepare various kinds of microcapsules, including the encapsulation of
perfume oils (Arshady, 1999, Ghosh, 2006a). Aminoplast based resins are the most
common materials used for in situ polymerization. Urea-formaldehyde (Jo et al., 2011,
Saeki et al., 1981) or melamine-formaldehyde (Hong and Park, 1999b, Long et al.,
2009, Sinclair, 1981) systems are examples of encapsulation by in situ polymerization.
Figure 2-10 shows a typical process to prepare microcapsules consisting of a MF shell
and a perfume oil core via in situ polymerization (Long et al., 2009).
Figure 2-10 The schematic diagram showing an in situ MF polymerization
process to encapsulate a perfume oil (Long et al., 2009).
in situ polymerization
Shell material in water phase

Chapter2 : Literature Review
37
2.4.2 Physico-chemical processes
Physico-chemical encapsulation processes involve the formation of the shell materials
through heat, changes in pH value or addition of electrolytes (Umer et al., 2011)
resulting in:
� Solvent evaporation/phase separation (Zydowicz et al., 2002)
� Coacervation (simple, complex and organic) (Xu et al., 2006, Zuidam and
Shimoni, 2010)
2.4.3 Mechanical processes:
Polymeric materials are typically used in these methods where no chemical reactions
are involved (Dubey et al., 2009). Typical mechanical encapsulation processes are:
� Fluidized bed coating (Jono et al., 2000, Zuidam and Shimoni, 2010)
� Spray drying, spray cooling/chilling (Edwards and Instone, 2001, Zuidam and
Shimoni, 2010)
� Rotational suspension separation (spinning disk) (Gouin, 2004)
� Extrusion/dripping (Barbosa-Cánovas et al., 2005, Xie et al., 2008, Xu et al.,
2006)
� Supercritical carbon dioxide processing (Hertz et al., 2006)

Chapter2 : Literature Review
38
2.5 Shell materials
The selection of the shell material is crucial in order to develop a successful
microencapsulation process. There are several factors that should be considered in the
shell selection process:
• The shell should be compatible with the active ingredients to be encapsulated.
• The shell material has suitable mechanical properties and stability.
• The initial formulation and the final product should be safe and non-toxic.
• The process should be scalable easily and at low cost.
2.5.1 Melamine-formaldehyde
Melamine-formaldehyde (MF) resin is one of the predominant commercial shell
materials for the manufacturing of perfume microcapsules (Hunt and O' Neil, 2004,
Hwang et al., 2006a, Hwang et al., 2006b, Long et al., 2009, Monllor et al., 2007,
Pluyter and Anastasiou, 2006). MF has considerable stability in many consumer
products (Li et al., 2007a, Okano and Ogata, 1952) and appropriate strength (Sun and
Zhang, 2001, Sun and Zhang, 2002), can resist water, acid and alkaline conditions to
Chapter2 : Literature Review
39
great extents (Li et al., 2007a, Okano and Ogata, 1952) and it is fairly inexpensive for
industrial applications (Arshady, 1999, Pretzl et al., 2012).
2.5.1.1 Chemical structure of melamine-formaldehyde precondensate
Since it was first discovered by Liebig in 1834, as mentioned by Bone et. al (2011),
the MF polymerization reaction has been the focus of many studies (Bauer, 1986,
Okano and Ogata, 1952, Sato, 1968, Vo et al., 2008, Wang et al., 2009). The
polymerization reaction is controlled by the temperature and pH (Berge et al., 1969,
Berge et al., 1970). At a temperature around 65°C, melamine
(1,3,5-triamino-2,4,6-triazine) (M) and formaldehyde (F), shown in Figure 2-11, first
pre-cross-link to form a MF precondensate.
MF precondensates are commonly used as a starting material for encapsulation
applications because monomeric melamine has a low solubility in water (Gattner and
Ribka, 1975). In addition, as they are used for many other industrial applications, MF
precondensates are commercially available. There are several choices of commercial
MF precondensate, such as Hilamin M562® (Dynea, Krems, Austria) (Gindl et al.,
2003), Melapret NF70/M® (Kočevje, Slovenia) (Alic et al., 2012), Beetle resin
PT336® (BPI, UK) (Hunt and O' Neil, 2004, Long et al., 2009) and Cytec 385®
(Cytec, USA) (Bobnock et al., 2010). These MF precondensates have various F/M

Chapter2 : Literature Review
40
molar ratios (Kumar and Katiyar, 1990). Figure 2-12 depicts some examples of
typical chemical structures of MF precondensates originating from the condensation
step using only high temperatures (Lee et al., 2001, Vo et al., 2008, Yuan et al., 2007).
In acid conditions, at pH values of 2-4, the MF precondensates further react to form a
MF resin (Lee et al., 2001) (Figure 2-13).
(a) formaldehyde
molecular weight: 30.03
(b) melamine
molecular weight: 126.12
Figure 2-11 Chemical structures of melamine and formaldehyde.
H H
O
N NN NH2NH2H2N
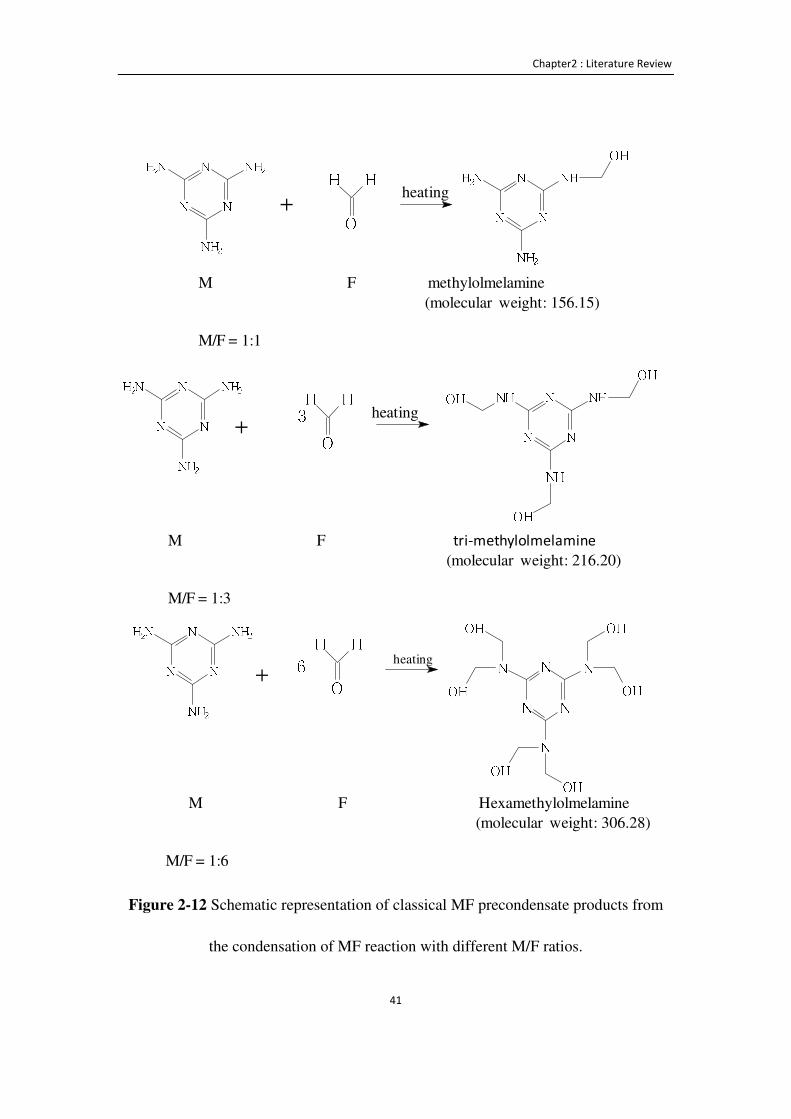
Chapter2 : Literature Review
41
Figure 2-12 Schematic representation of classical MF precondensate products from
the condensation of MF reaction with different M/F ratios.
N NN NHNH2H2N OHN NN NH2NH2
H2N H HO+
M F methylolmelamine(molecular weight: 156.15)
M/F = 1:1
heating
N NN NH OHNHOH
NHOHN NN NH2NH2H2N H HO+
3M F tri-methylolmelamine
(molecular weight: 216.20)
M/F = 1:3
heating
N NN NH2NH2H2N 6 H HO+
heating N NN N OHOHNOH OHNOHOH
M F Hexamethylolmelamine(molecular weight: 306.28)
M/F = 1:6
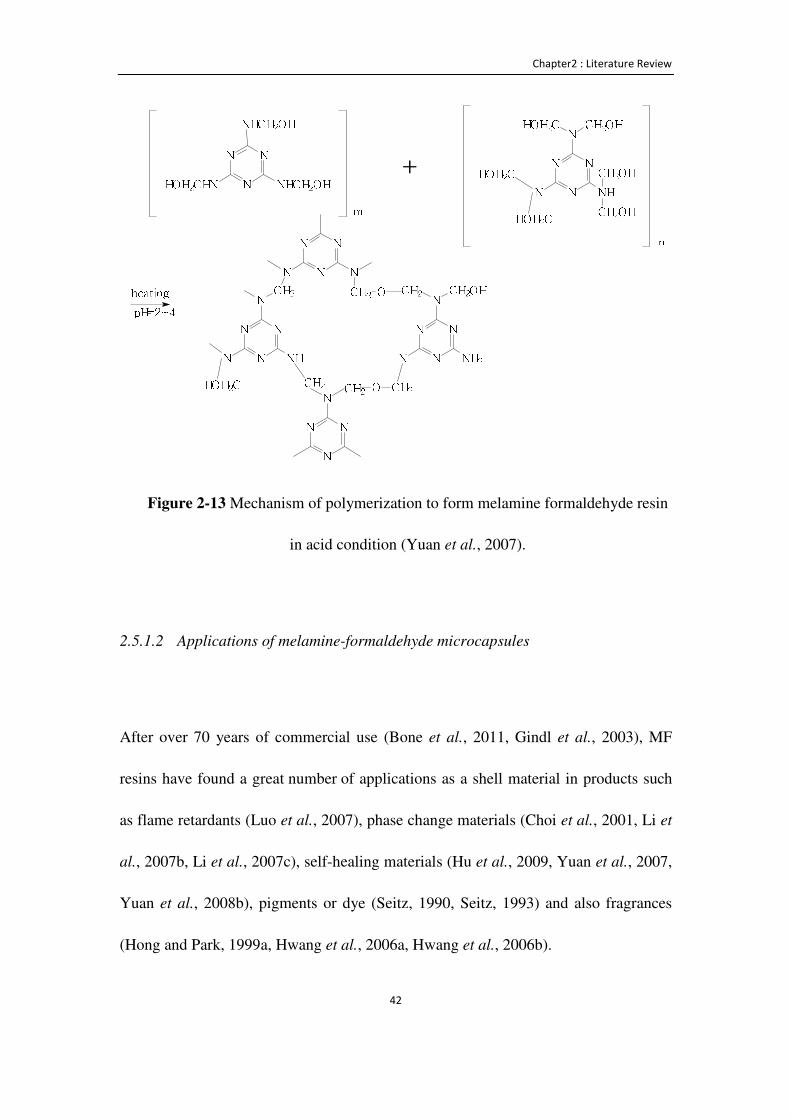
Chapter2 : Literature Review
42
Figure 2-13 Mechanism of polymerization to form melamine formaldehyde resin
in acid condition (Yuan et al., 2007).
2.5.1.2 Applications of melamine-formaldehyde microcapsules
After over 70 years of commercial use (Bone et al., 2011, Gindl et al., 2003), MF
resins have found a great number of applications as a shell material in products such
as flame retardants (Luo et al., 2007), phase change materials (Choi et al., 2001, Li et
al., 2007b, Li et al., 2007c), self-healing materials (Hu et al., 2009, Yuan et al., 2007,
Yuan et al., 2008b), pigments or dye (Seitz, 1990, Seitz, 1993) and also fragrances
(Hong and Park, 1999a, Hwang et al., 2006a, Hwang et al., 2006b).
N N N NHCH2OHNHCH2OHHOH2CHN N N NNHOH2C CH2OHNHOH2CHOH2C NHCH2OHCH2OHN N NNN N NNHOH2C NHN CH2CH2
NCH2 OO CH2N N NNCH2 CH2OHN NH2N N NN CH2
heatingpH=2~4+m n
Chapter2 : Literature Review
43
In 1971 MF microcapsules with a core organic oil were for the first time patented by
Ciba company (Schibler, 1971); the same year, Fuji applied MF to encapsulate
pigments (Masataka and Yasuhiro, 1976). Two years later NCR used MF resin to
encapsulate ink (Foris et al., 1978). A significant commercial success for MF
microcapsules came when the companies Appleton and The Wiggins Teape Group
Limited (WTG) developed pressure sensitive MF microcapsules to produce
carbonless copy paper (Hayford, 1984, Sinclair, 1981). In addition, there are many
patented work on MF microcapsules related to the encapsulation of fragrances,
summarized in Table 2-1.
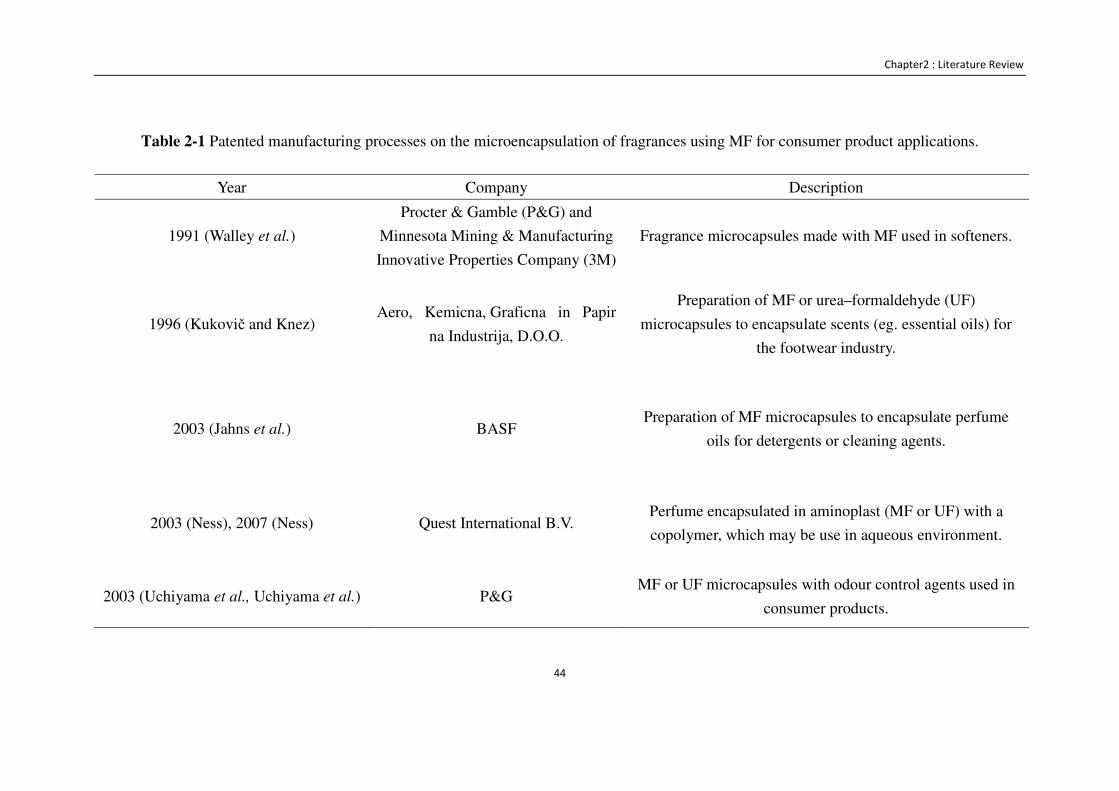
Chapter2 : Literature Review
44
Table 2-1 Patented manufacturing processes on the microencapsulation of fragrances using MF for consumer product applications.
Year Company Description
1991 (Walley et al.)
Procter & Gamble (P&G) and
Minnesota Mining & Manufacturing
Innovative Properties Company (3M)
Fragrance microcapsules made with MF used in softeners.
1996 (Kukovič and Knez) Aero, Kemicna, Graficna in Papir
na Industrija, D.O.O.
Preparation of MF or urea–formaldehyde (UF)
microcapsules to encapsulate scents (eg. essential oils) for
the footwear industry.
2003 (Jahns et al.) BASF Preparation of MF microcapsules to encapsulate perfume
oils for detergents or cleaning agents.
2003 (Ness), 2007 (Ness) Quest International B.V. Perfume encapsulated in aminoplast (MF or UF) with a
copolymer, which may be use in aqueous environment.
2003 (Uchiyama et al., Uchiyama et al.) P&G MF or UF microcapsules with odour control agents used in
consumer products.
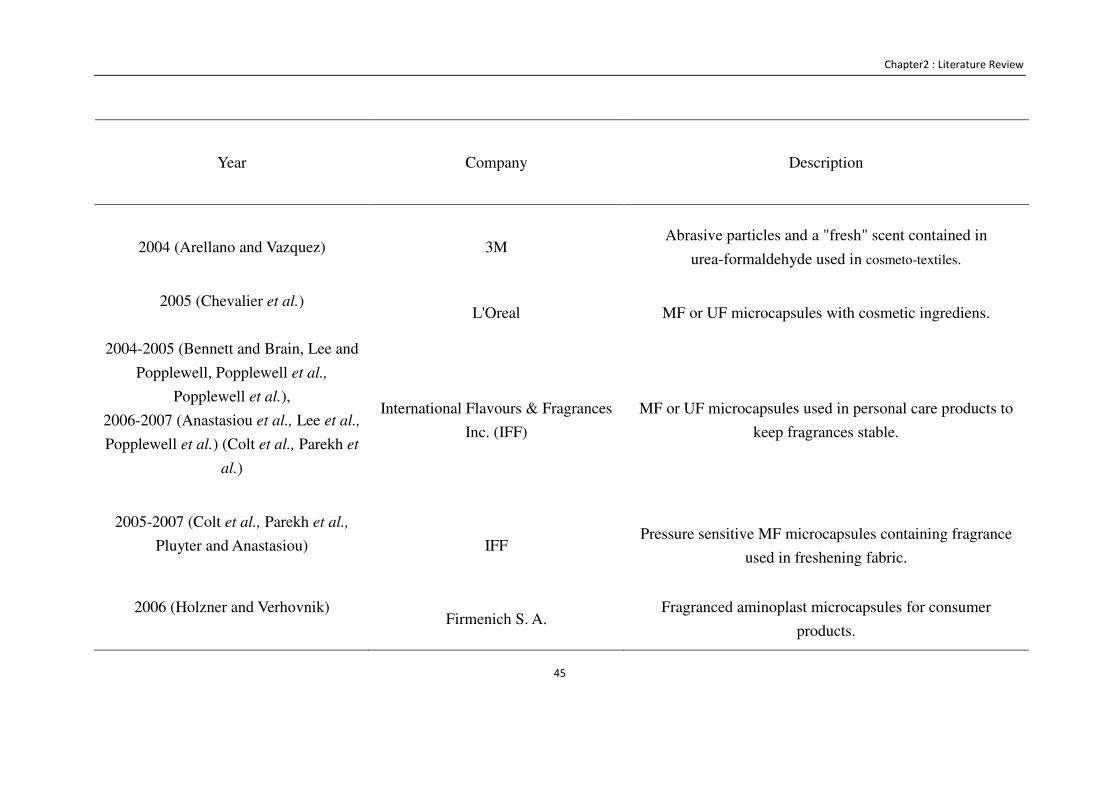
Chapter2 : Literature Review
45
Year Company Description
2004 (Arellano and Vazquez) 3M Abrasive particles and a "fresh" scent contained in
urea-formaldehyde used in cosmeto-textiles.
2005 (Chevalier et al.)
L'Oreal MF or UF microcapsules with cosmetic ingrediens.
2004-2005 (Bennett and Brain, Lee and
Popplewell, Popplewell et al.,
Popplewell et al.),
2006-2007 (Anastasiou et al., Lee et al.,
Popplewell et al.) (Colt et al., Parekh et
al.)
International Flavours & Fragrances
Inc. (IFF)
MF or UF microcapsules used in personal care products to
keep fragrances stable.
2005-2007 (Colt et al., Parekh et al.,
Pluyter and Anastasiou)
IFF Pressure sensitive MF microcapsules containing fragrance
used in freshening fabric.
2006 (Holzner and Verhovnik)
Firmenich S. A.
Fragranced aminoplast microcapsules for consumer
products.
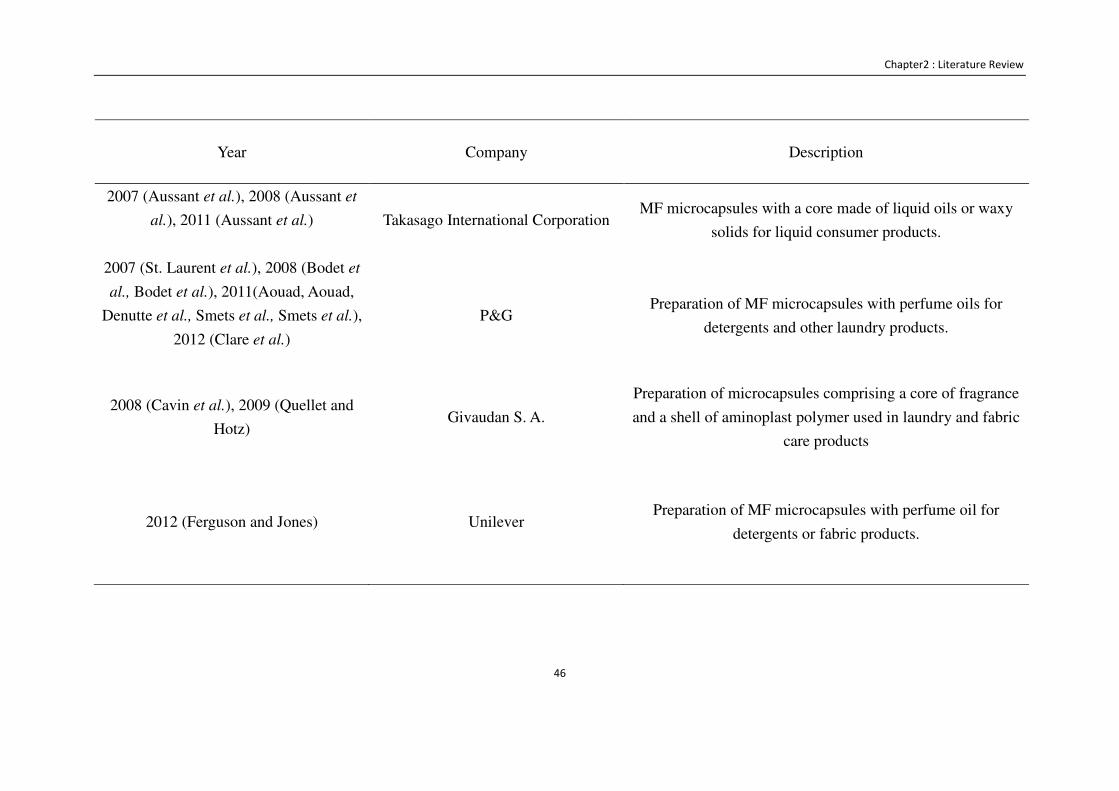
Chapter2 : Literature Review
46
Year Company Description
2007 (Aussant et al.), 2008 (Aussant et
al.), 2011 (Aussant et al.)
Takasago International Corporation MF microcapsules with a core made of liquid oils or waxy
solids for liquid consumer products.
2007 (St. Laurent et al.), 2008 (Bodet et
al., Bodet et al.), 2011(Aouad, Aouad,
Denutte et al., Smets et al., Smets et al.),
2012 (Clare et al.)
P&G Preparation of MF microcapsules with perfume oils for
detergents and other laundry products.
2008 (Cavin et al.), 2009 (Quellet and
Hotz) Givaudan S. A.
Preparation of microcapsules comprising a core of fragrance
and a shell of aminoplast polymer used in laundry and fabric
care products
2012 (Ferguson and Jones) Unilever Preparation of MF microcapsules with perfume oil for
detergents or fabric products.
Chapter2 : Literature Review
47
2.5.1.3 Limitation of melamine formaldehyde
Although MF microcapsules have many commercial advantages, there are
unavoidable health and safety concerns due to the use of formaldehyde.
Formaldehyde is a well-known human carcinogen (Cole et al., 2010, Hernandez et al.,
1994, Lazenby et al., 2012, Yepes and Cremades, 2011). In addition, it also causes
indoor air pollution (Kelly et al., 1999, Li et al., 2007b), which increases the chance
for children to have allergy (Garrett et al., 1999). Furthermore, there are safety
concerns and many precautions have to be taken during manufacturing and processing
(Nesic et al., 2010), as well as to the potential release to the environment. In 1973
Japan was the first country that passed a law controlling harmful substances in
household products (Sumiga et al., 2011), including formaldehyde. At present, most
European countries and some Asian countries allow very limited amounts of
formaldehyde in consumer products (Sumiga et al., 2011). The Oeko-tex standard 100
and EU eco label clearly define that the maximum amount of free formaldehyde in
infant clothes is 20 ppm and 30 ppm for all other textile products (Sumiga et al.,
2011). For this reason, extensive research has been conducted on reducing the
formaldehyde residue in MF microcapsules (Bone et al., 2011, Frank et al., 2001, Li
et al., 2007a, Su et al., 2007, Su et al., 2011, Zhang and Wang, 2009). For example,
the companies WTG (Moira, 1986), P&G (Bodet et al., 2008b), BASF (Frank et al.,
2001, Hoffman and Eisermann, 2003), IFF (Anastasiou et al., 2007b), NAICOM
(Karyakin et al., 2012) and Givaudan (Quellet and Hotz, 2009) all have patents on
Chapter2 : Literature Review
48
“formaldehyde-free” MF microcapsules. In the case of Givaudan, it has declared that
the amount of formaldehyde in their final products must be much lower than 50 ppm
after storage (Bone et al., 2011).
Consumer and institutional pressures are nevertheless leading to the complete removal
of cancer-inducing chemicals from consumer products, despite being present at lower
concentrations than required by regulations. Although the amount of free
formaldehyde in the final product is very small, there is a still the concern of a gradual
slow release from the polymerized product during storage (Long et al., 2009). Some
companies have been addressing this issue of using formaldehyde in consumer
product, such as Johnson & Johnson, by phasing out all carcinogens altogether from
their products (Brian, 2012). From this point of view, it is clear that new shell
materials are needed instead of MF to encapsulate perfume oils.
These new shell materials ought to be environmentally friendly and safe to use in
consumer products. Like MF, they should also present good mechanical properties
and chemical stability. There are many shell materials which have recently been used
to encapsulate perfume oils for textile applications. Some natural materials, such as
β-cyclodextrin (Wang and Chen, 2005), chitosan (Hu et al., 2011) and bovine serum
albumin protein (Tzhayik et al., 2012) are environmental friendly but expensive.
Polymeric materials have also been used to coat perfumes. Examples include
polysulfones, with a good high mechanical strength but low stability (Pena et al.,
2012); polyurethanes-urea, chemical stable but toxic (Rodrigues et al., 2009, Teixeira
Chapter2 : Literature Review
49
et al., 2012b); polyamides, good mechanical properties but they absorb large amounts
of water (Arshady, 1989, Ichiura et al., 2012). Framed within the growing industrial
need to find suitable materials to encapsulate perfume oils, the potential use of poly
(methyl methacrylate) (PMMA) is analysed in the next section.
2.5.1.4 Poly (methyl methacrylate) (PMMA)
PMMA is a polymer with excellent properties, such as good mechanical strength and
chemical resistance (Rasmussen, 2001). In addition, it is environmentally friendly and
non toxic (Rasmussen, 2001). PMMA has already found diverse applications as a
coating material, from the encapsulation of liquid crystals (Cho et al., 2002, Ju et al.,
2002, Park et al., 2002, Ryu et al., 2004), to phase change materials (Alay et al., 2011,
Zhang and Rochefort, 2012, Zhang et al., 2012), dyes (Zydowicz et al., 2002),
self-healing materials (Nordstierna et al., 2010), active ingredients for pharmaceutical
applications (Bakeine et al., 2007, Kim et al., 2004, Lee et al., 2007a) as well as
fragrances (Jafari et al., 2007, Kantor et al., 1997). Jafari (2007) described a phase
separation method to coat perfume oils, resulting in microcapsules of around 400 nm
that would subsequently aggregate forming 40 μm granules. Emisphere technology
Inc. patented a method to coat perfume oil by PMMA polymerization (Kantor et al.,
1997).
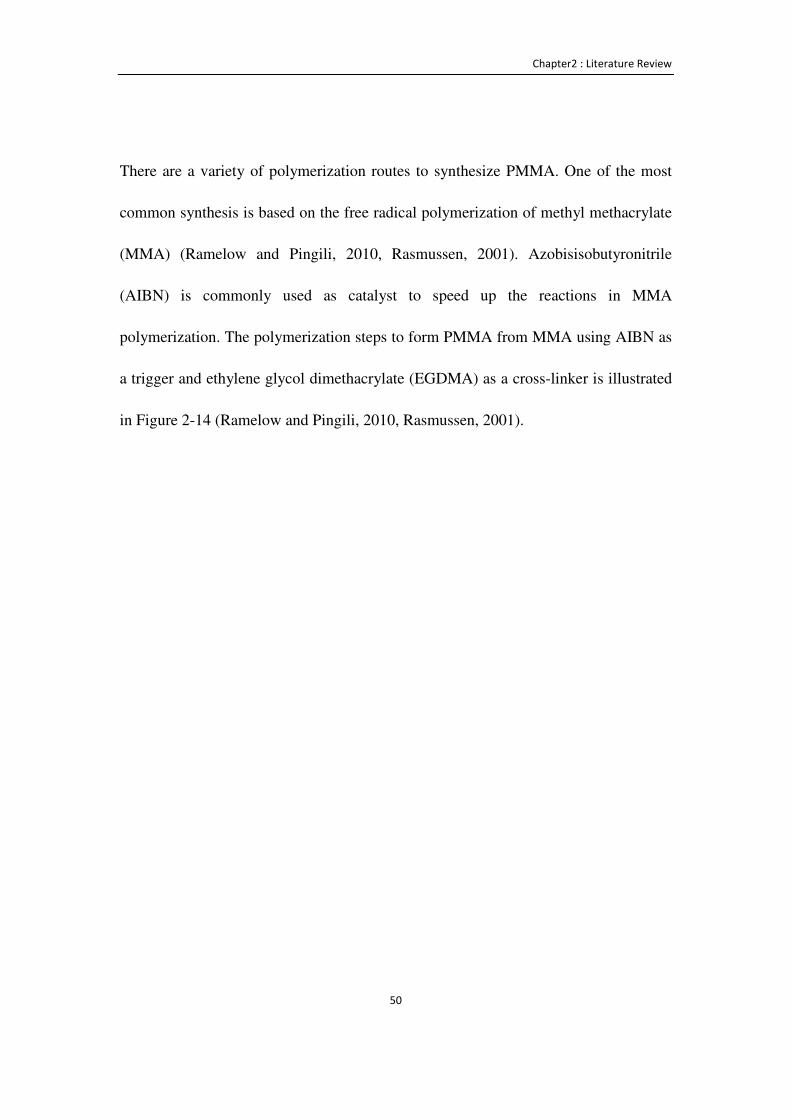
Chapter2 : Literature Review
50
There are a variety of polymerization routes to synthesize PMMA. One of the most
common synthesis is based on the free radical polymerization of methyl methacrylate
(MMA) (Ramelow and Pingili, 2010, Rasmussen, 2001). Azobisisobutyronitrile
(AIBN) is commonly used as catalyst to speed up the reactions in MMA
polymerization. The polymerization steps to form PMMA from MMA using AIBN as
a trigger and ethylene glycol dimethacrylate (EGDMA) as a cross-linker is illustrated
in Figure 2-14 (Ramelow and Pingili, 2010, Rasmussen, 2001).
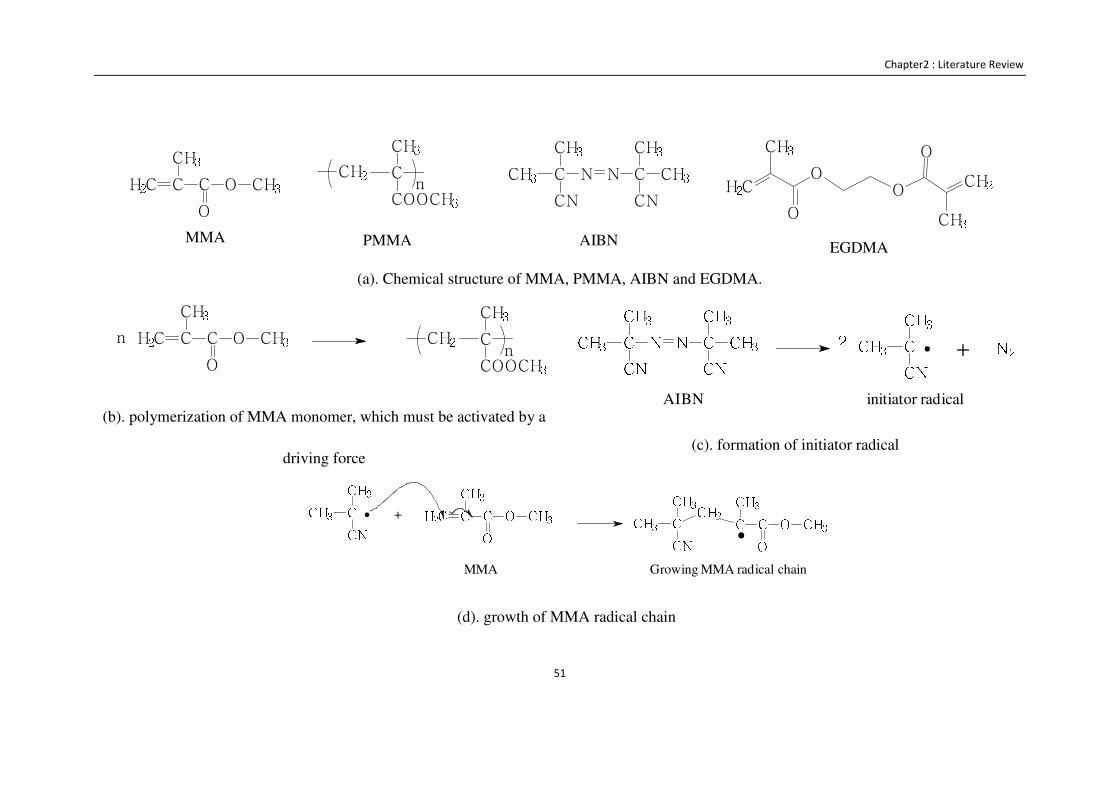
Chapter2 : Literature Review
51
MMA
PMMA
AIBN EGDMA
(a). Chemical structure of MMA, PMMA, AIBN and EGDMA.
(b). polymerization of MMA monomer, which must be activated by a
driving force
(c). formation of initiator radical
(d). growth of MMA radical chain
H2C C C
CH3O CH3
O
CH2 C
CH3COOCH3n
C NCH3 CH3CN
N C CH3CH3CN
CH3H2C
O
O
O
O
CH3CH2
H2C C C
CH3O CH3
O
CH2 C
CH3COOCH3n
n C NCH3 CH3CN N C CH3CH3CN CCH3 CH3CN2.
+ N2AIBN initiator radical
MMA
CCH3 CH3CN CH2CCH3 CH3CN. H2C C CCH3 O CH3O+ C CCH3 O CH3O.Growing MMA radical chain
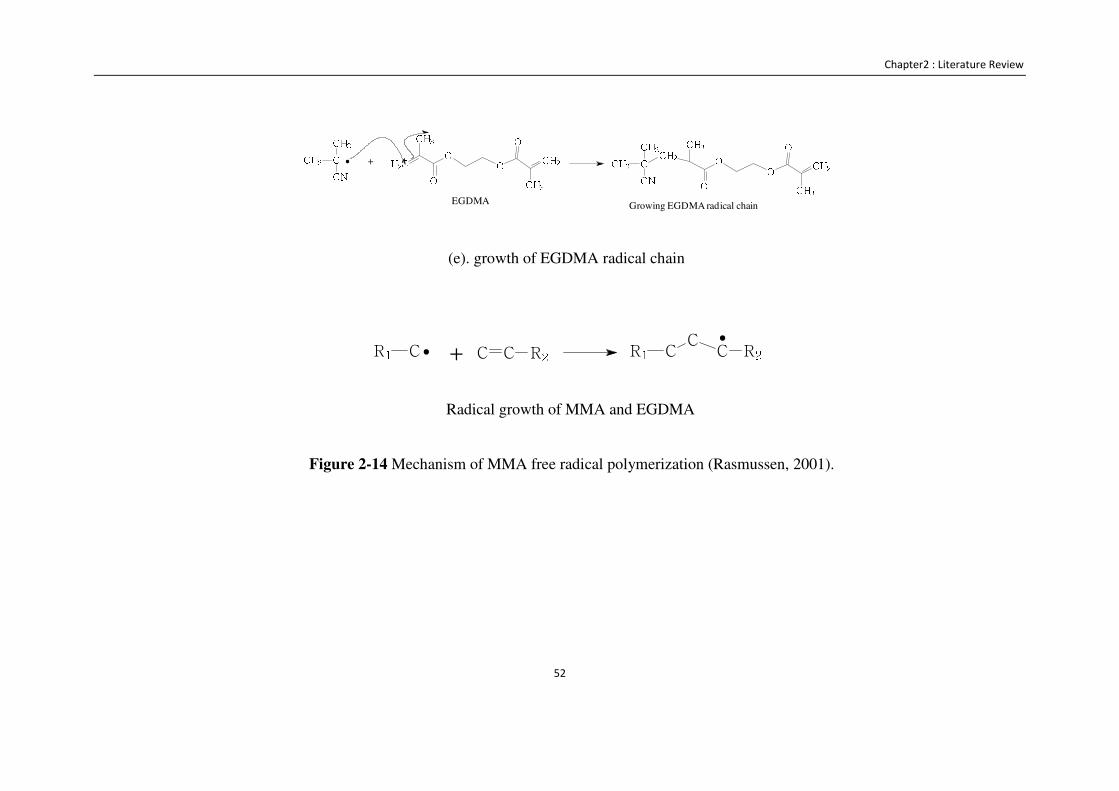
Chapter2 : Literature Review
52
(e). growth of EGDMA radical chain
Radical growth of MMA and EGDMA
Figure 2-14 Mechanism of MMA free radical polymerization (Rasmussen, 2001).
CH3H2C O O O O CH3CH2CCH3 CH3CN. + CCH3 CH3CN CH2 CH3O O O O CH3CH2Growing EGDMA radical chainEGDMA
CR1 .
+ C C R2 CR1 C .
C R2

Chapter2 : Literature Review
53
PMMA is widely used to make microcapsules in industry. Several methods have been
reported to prepare PMMA microcapsules, such as polymerization (emulsion
polymerization) (Chang et al., 2009, Kim et al., 2003, Sari et al., 2009), seeded
suspension polymerization (Taguchi et al., 2007) and surface-initiated photo
polymerization (Chen et al., 2011)), solvent evaporation (Lee et al., 2007a, Loxley
and Vincent, 1998, Xu et al., 2008, Zydowicz et al., 2002) and supercritical carbon
dioxide processing (Hertz et al., 2006). These methods produce microcapsules which
have either wide size distributions (Chang et al., 2009) or they involve complex
reaction conditions, such as using seed particles (oil absorbable polymer particles
(Taguchi et al., 2007), CaCO3 particles (Sato et al., 2012), latex particles (Yuan et al.,
2010a)), supercritical carbon dioxide (Hertz et al., 2006) or using nitrogen gas (Sari et
al., 2009), which can be expensive to scale up for industrial production.
2.6 Characterization of microcapsules
The detailed characterization of manufactured products is essential for successful
formulation, and the same principle applies to perfume microcapsules. The
performance of perfume microcapsules will depend on many parameters, from
extrinsic parameters like their size, to intrinsic parameters like the shell permeability
and mechanical strength. This section reviews common techniques previously used to

Chapter2 : Literature Review
54
characterize microcapsules. However, it must be emphasized that due to the primarily
commercial application of perfume microcapsules, there are not clear performance
indicators that can be used by independent researchers to evaluate microcapsules. This
kind of information, if it exists, is kept secret by the different companies involved in
the trade, public information is scarce and ambiguous.
2.6.1 Determination of size and size distribution
The size and the size distribution of emulsion droplets and microcapsules are basic
physical properties. Commercially available particle sizing methods used in research
and industry are summarized in Table 2-2 (Webb, 2000). Among all these techniques,
microscopy combined with image analysis (Aryanti et al., 2009), laser diffraction
(Zhang et al., 2008, Zhou et al., 2009) and sieving and screening (Ichikawa and
Fukumori, 2000) are well established and widely reported in literature work for
measuring size and size distribution of microcapsules.
Sieving is a simple well-established technique which has been used for particle
separation as well as particle sizing. It is suitable to determine size and size
distribution of dry or wet microcapsules with size ranges from microns to millimetres.
However, it is more commonly used to measure solid particles than droplets and in
most cases the resolution is poor (Malvern instruments limited, 2012). Laser
Chapter2 : Literature Review
55
diffraction is a rapid and robust technique for quantifying the size and size
distribution of droplets and microcapsules with a spherical shape. Most instruments
measure tens of thousands of microcapsules within a couple of seconds. It covers a
wide range of particle sizes, typically from 0.02 to 2000 µm, and the results have a
high resolution and repeatability. It has been widely used in research as well as in
industry to measure polymeric particles (Salgi and Rajagopalan, 1993, Zhou et al.,
2007), foams (Pugh, 2005), emulsion droplets (Zhang et al., 2008) and biomaterials
(Godderz et al., 2005). The operating principle is described in Chapter 3.

Chapter2 : Literature Review
56
Table 2-2 Techniques for characterizing particle sizes (Webb, 2000). The
techniques mentioned in texts are framed in the table.
Microscopy Methods
Optical Microscopy and Imaging Analysis
Transmission Electron Microscopy
Scanning Electron Microscopy
Atomic Force Microscopy
Light Interaction Methods
Laser Diffraction
Photon Correlation Spectroscopy
Single Particle Light Scattering
Multi-Angle Light Scattering
Single Particle light Obscuration
Time of Flight
Fiber Optic Doppler
Anemometry (FODA)
Electrical Property Methods
Coulter (Electro zone) Principle
Differential Mobility Analyzer (DMA)
Zeta Potential
Sedimentation Methods
Photo sedimentation
Centrifugal Sedimentation
X-ray Sedimentation
Sorting and Classification Methods
Fluorescence Activated Cell Sorting
Field Flow Fractionation (FFF)
Sieving and Screening
Air Classification
Chapter2 : Literature Review
57
Microscopy or SEM combined image analysis (or automated image analysis) is
another commonly used technique for the determination of microcapsules or droplets
size. It is possible to determine the shape and morphology at the same time, and is
particularly suitable for non-spherical particles. Furthermore, it can provide specific
shape parameters that can be used, for example, to detect agglomeration. Compared
with laser diffraction, most of microscopy or SEM combined image analysis are time
consuming for investigating a large number of microcapsules (Malvern instruments
limited, 2012, Malvern Instruments Ltd, 2007, Sympatec, 2012).
2.6.2 Measurement of the mechanical strength of single microcapsules
As mentioned in Section 2.4, the mechanical properties of microcapsules should be
considered in many applications. For instance, the mechanical properties may also
affect the adhesion properties of microcapsules (Fery and Weinkamer, 2007), as well
as the shell permeability (Stenekes et al., 2000). Knowing the mechanical properties
of microcapsules can help formulators in selecting the right material for specific
applications.
There are several techniques described in the literature to characterize the mechanical
properties of microcapsules. Some techniques involve the characterization of whole
populations of microcapsules, examples include compression of a layer of
Chapter2 : Literature Review
58
microcapsules between two parallel plates (Ohtsubo et al., 1991) or against a fixed
balance (Taguchi and Tanaka, 2001, Taguchi et al., 2007), determination of the
breakage of microcapsules with a fixed shear force (Peirone et al., 1998, Yin et al.,
2003), agitating microcapsules in a tube with glass beads (Leblond et al., 1996) and
by osmotic pressure shocks (Vinogradova, 2004, Zhang and Wang, 2009).
Other techniques are based on the determination of the mechanical properties for
individual microcapsules. These techniques not only allow the determination of
average population values, but can measure the variability of the mechanical
properties, essential to analyse the performance perfume microcapsules.
The most common methodology to analyse individual microcapsules is by
compressing them between two very small parallel plates. The technique was first
developed in Japan to test rupture force of sea urchin eggs (Hiramoto, 1963). The
compression force between the plates is measured with force transducers (Taguchi
and Tanaka, 2001) or with a balance (Gaumann et al., 2000).
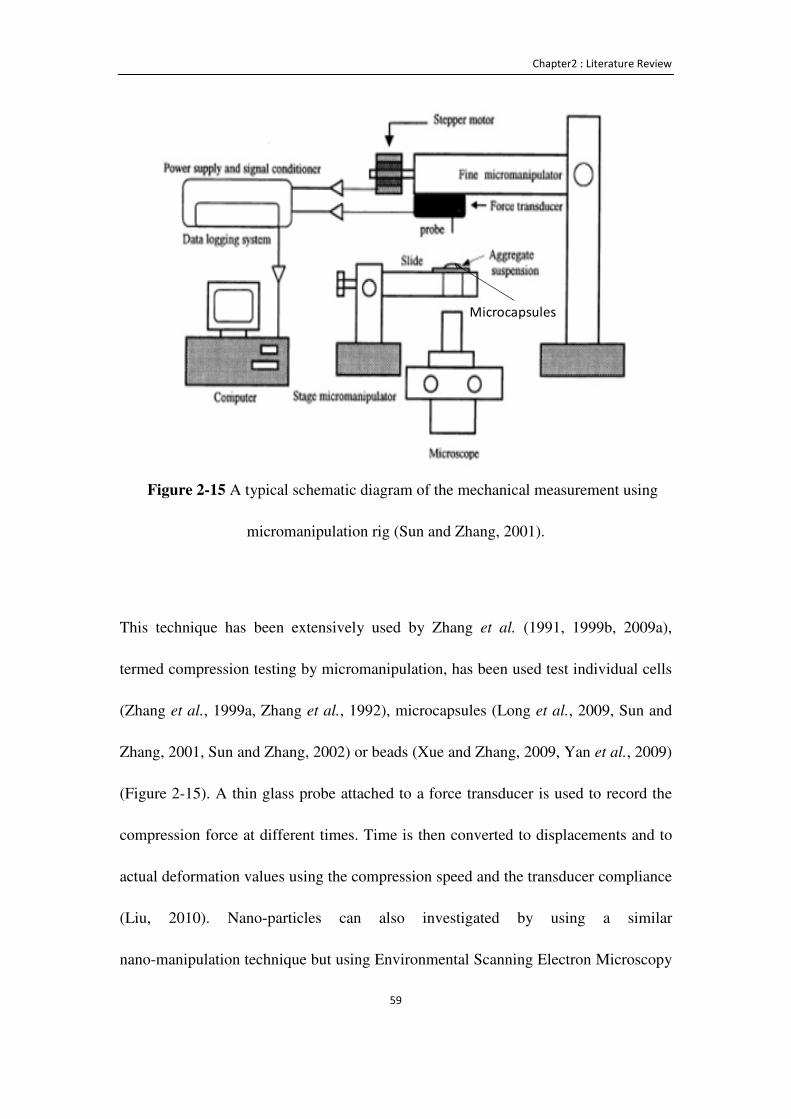
Chapter2 : Literature Review
59
Figure 2-15 A typical schematic diagram of the mechanical measurement using
micromanipulation rig (Sun and Zhang, 2001).
This technique has been extensively used by Zhang et al. (1991, 1999b, 2009a),
termed compression testing by micromanipulation, has been used test individual cells
(Zhang et al., 1999a, Zhang et al., 1992), microcapsules (Long et al., 2009, Sun and
Zhang, 2001, Sun and Zhang, 2002) or beads (Xue and Zhang, 2009, Yan et al., 2009)
(Figure 2-15). A thin glass probe attached to a force transducer is used to record the
compression force at different times. Time is then converted to displacements and to
actual deformation values using the compression speed and the transducer compliance
(Liu, 2010). Nano-particles can also investigated by using a similar
nano-manipulation technique but using Environmental Scanning Electron Microscopy
Microcapsules
Chapter2 : Literature Review
60
(ESEM) to monitor the testing (Liu et al., 2005b, Ren et al., 2007). The
micromanipulation apparatus can perform different kind of experiments such as
loading and unloading, compressions at different speeds, and compression until
rupture (Hu et al., 2009, Sun and Zhang, 2001).
A critical and difficult part is to determine the mechanical properties from the
experimental force-displacement data; this is valid for the micromanipulation as well
as for other techniques. This is usually solved with a reverse engineering approach:
analytical models or simulations are performed at different initial conditions, for
example at different Young’s modulus, obtaining force-deformation curves to which
the experimental ones are compared.
Intrinsic mechanical properties of microcapsules, such as the Young's modulus and
failure stress are fundamental properties of their materials. However, little has been
done in past studies. Recently, the intrinsic mechanical properties have been
determined for thin-shell microcapsules using a micromanipulation rig and finite
element modelling (FEM) (Mercade-Prieto et al., 2012a, Mercade-Prieto et al.,
2011a).
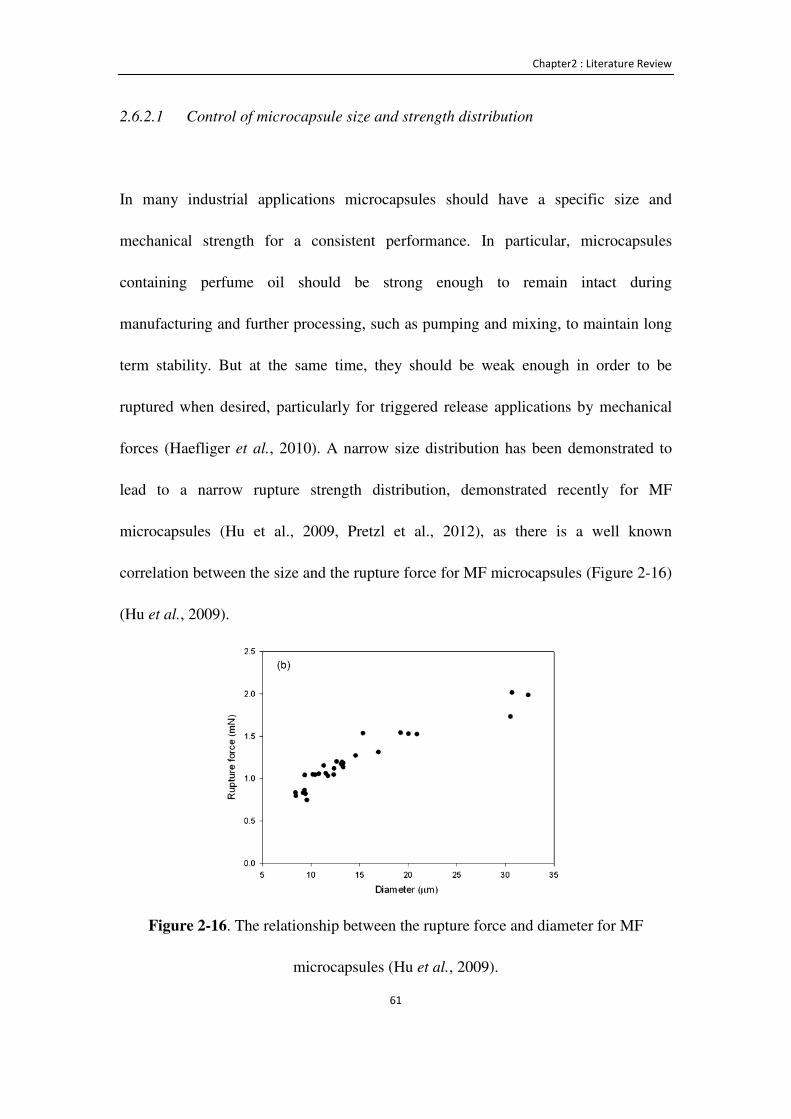
Chapter2 : Literature Review
61
2.6.2.1 Control of microcapsule size and strength distribution
In many industrial applications microcapsules should have a specific size and
mechanical strength for a consistent performance. In particular, microcapsules
containing perfume oil should be strong enough to remain intact during
manufacturing and further processing, such as pumping and mixing, to maintain long
term stability. But at the same time, they should be weak enough in order to be
ruptured when desired, particularly for triggered release applications by mechanical
forces (Haefliger et al., 2010). A narrow size distribution has been demonstrated to
lead to a narrow rupture strength distribution, demonstrated recently for MF
microcapsules (Hu et al., 2009, Pretzl et al., 2012), as there is a well known
correlation between the size and the rupture force for MF microcapsules (Figure 2-16)
(Hu et al., 2009).
Figure 2-16. The relationship between the rupture force and diameter for MF
microcapsules (Hu et al., 2009).

Chapter2 : Literature Review
62
Perfume microcapsules applied to detergents or softeners should survive in all
processing steps from manufacturing to washing, after drying when deposited on
fabric surface after washing, and until being ruptured by mechanical rubbing (Specos
et al., 2010). Another example are perfume microcapsules used in the paper industry
for advertisement magazines, books or catalogues (Schaab and Tararuj, 1988). Figure
2-17(a) shows an example where perfume microcapsules are prepared and dried into
powder, then printed inside a fold flap. The microcapsules need to be stable inside the
flap, during the printing process, transportation and storage. When the flap is opened,
the microcapsules rapture and the perfume is set free (Figure 2-17). Another highly
successful application is typically known as “stretch-and-sniff ”, used since the 1970’s,
whereby encapsulated scents printed in a paper are released by the active rubbing
(Nelson, 2002). An example of this technology used in a commercial advertisement is
given Figure 2-17(b).
A broad size distribution of microcapsules should be avoided, which is difficult for an
industrial product. Homogenization or agitation are generally applied in consumer
manufacturing production and provide relatively wide distributions compared with
other emulsification methods, such as, membrane and micro-channel emulsification,
as mentioned in Section 2.3.2 (Sgraja et al., 2008, Wang et al., 2009). Therefore, it is
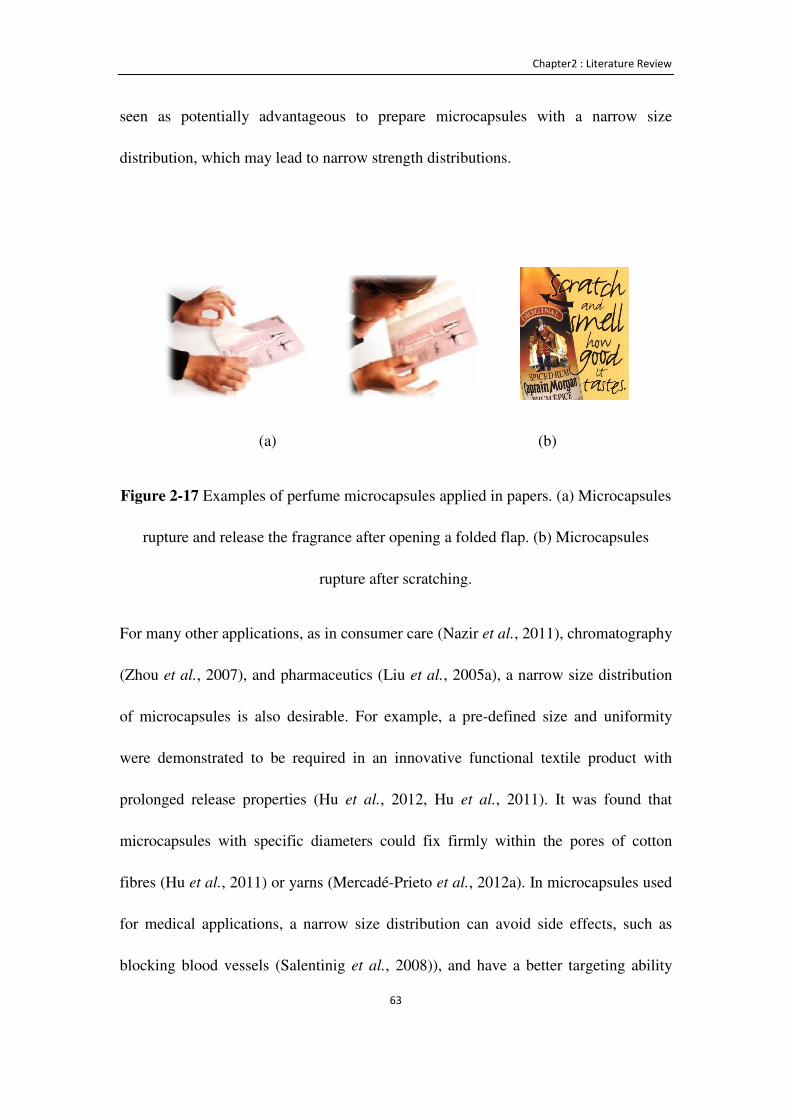
Chapter2 : Literature Review
63
seen as potentially advantageous to prepare microcapsules with a narrow size
distribution, which may lead to narrow strength distributions.
(a) (b)
Figure 2-17 Examples of perfume microcapsules applied in papers. (a) Microcapsules
rupture and release the fragrance after opening a folded flap. (b) Microcapsules
rupture after scratching.
For many other applications, as in consumer care (Nazir et al., 2011), chromatography
(Zhou et al., 2007), and pharmaceutics (Liu et al., 2005a), a narrow size distribution
of microcapsules is also desirable. For example, a pre-defined size and uniformity
were demonstrated to be required in an innovative functional textile product with
prolonged release properties (Hu et al., 2012, Hu et al., 2011). It was found that
microcapsules with specific diameters could fix firmly within the pores of cotton
fibres (Hu et al., 2011) or yarns (Mercadé-Prieto et al., 2012a). In microcapsules used
for medical applications, a narrow size distribution can avoid side effects, such as
blocking blood vessels (Salentinig et al., 2008)), and have a better targeting ability
Chapter2 : Literature Review
64
and control release behaviour (Freiberg and Zhu, 2004), since the rate of active
release is proportional to the surface area of the microcapsules (Sawalha et al., 2008).
Moreover, from a characterization point of view, a narrow size distribution can help
to determine their intrinsic properties and increase reproducibility (Liu et al., 2005a,
Wang et al., 2006). For example, in release experiments to determine the shell
permeability, microcapsules with a narrow size distribution are desirable to avoid
poly-dispersity effects (Mercade-Prieto et al., 2012b).
2.6.3 Release tests and shell permeability
The purpose of the microcapsule shell is to act as a barrier between the core and the
capsule environment. For this reason, it is important to know the barrier properties of
the shell as they will determine the release of the core. The release rate of a liquid
active ingredient may be controlled by the diffusion inside the microcapsules, within
the shell or by the mass transfer from the shell to environment; release can also be
affected by the swelling or degradation of the shell (Zhang et al., 2010). In order to
predict the perfume release rate, the mass transfer mechanism of microcapsules
containing perfume needs to be characterized. Laundering or rubbing tests (Erkan et
al., 2010, Monllor et al., 2007) or weight loss test (Hwang et al., 2006b) were applied
in industrial trials for quantifying perfume release rate.

Chapter2 : Literature Review
65
(a) (b)
Figure 2-18 Release experiments for perfume microcapsules. (a) Microcapsules are
suspended in water; the perfume oil is quantified in the organic solvent above the
aqueous solution. (b) A co-solvent is used in the aqueous phase with the
microcapsules to avoid the mass transfer through a liquid-liquid interface as in (a).
One of the ways to test the release of perfume microcapsules is to add a slurry of
microcapsules into a certain release solution, in most cases an aqueous solution with a
fixed volume (Park et al., 2005). Perfume oil is only partially dissolved in the solution
typically due to poor solubility in water. Release is enhanced by adding an organic
phase on top as shown in Figure 2-18(a), extracting the perfume oil from the aqueous
phase. Hexane is commonly used as the organic phase because it is a good solvent to
many chemicals found in perfumes. The oil concentration in the organic solvent is
then evaluated, for example using gas chromatography (Long et al., 2009), in order to
calculate the oil release.
Organic
Aqueous
Stirrer
Co-solvent
Stirrer
Chapter2 : Literature Review
66
This methodology can be applied in some cases to compare the relative release of
different microcapsules, but it cannot provide information of the intrinsic barrier
properties of the shell. As mentioned above, many perfume ingredients are poorly
soluble in water, resulting in a very slow solubilisation process that is not related to
the barrier properties of the shell (Mercade-Prieto et al., 2012b). In addition, the
extraction step to the organic phase is controlled by the mass transfer in the
inter-phase. Due to the limited agitation possible, and due to the small contact area,
this step can be very slow. Therefore, the release rate measured in the organic phase
includes many other mass transfer barriers than the microcapsules shells, which are
rate-limiting for low solubility chemicals. For this reasons, release experiments
performed with this methodology result in artificially very slow release profiles.
Another way to study release behaviour of microcapsules has been developed recently
(Mercade-Prieto et al., 2012b). In that study, thin-shell MF microcapsules (shell
thickness to radius of microcapsules h/r < 0.07) with a single fragrance compound
were studied as model systems. Instead of a two phase system with an aqueous
solution and organic solvent, which presents many additional complications as
discussed above, a single liquid phase was considered, thus greatly facilitating the
mathematical analysis of the release (Figure 2-18(b)). The main problem when using
a single phase is the low solubility of many of the perfume components as discussed
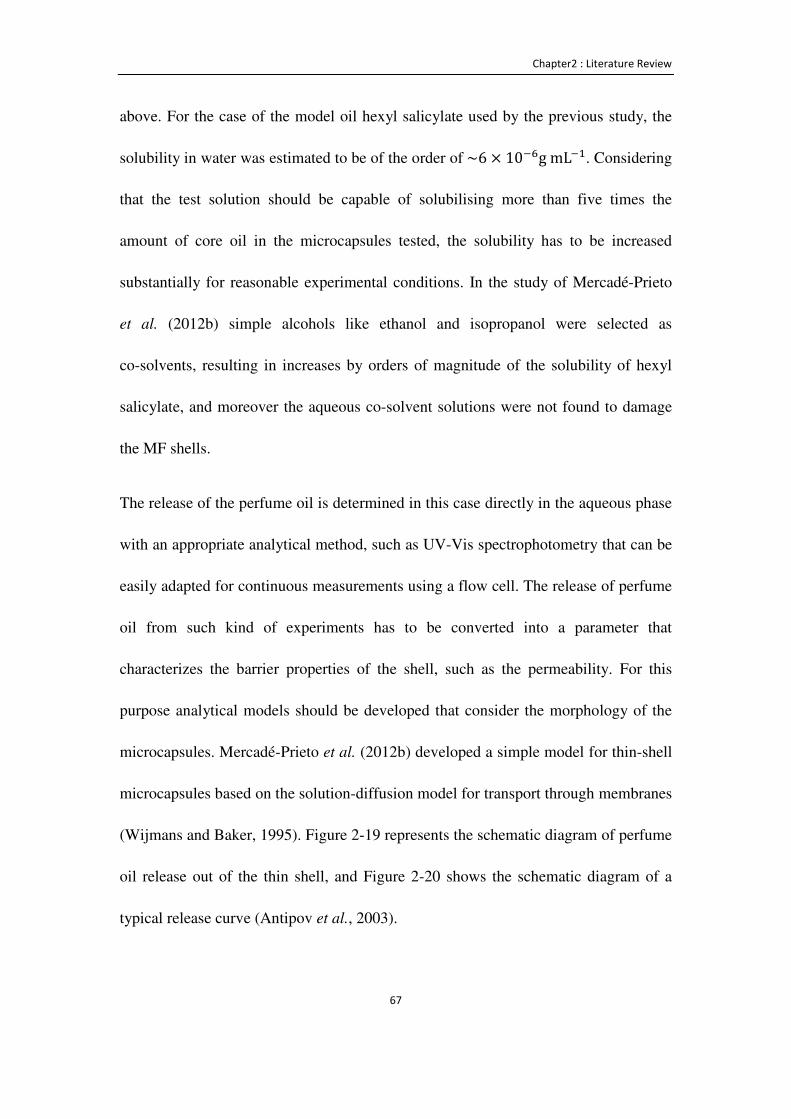
Chapter2 : Literature Review
67
above. For the case of the model oil hexyl salicylate used by the previous study, the
solubility in water was estimated to be of the order of~6 × 10��gmL��. Considering
that the test solution should be capable of solubilising more than five times the
amount of core oil in the microcapsules tested, the solubility has to be increased
substantially for reasonable experimental conditions. In the study of Mercadé-Prieto
et al. (2012b) simple alcohols like ethanol and isopropanol were selected as
co-solvents, resulting in increases by orders of magnitude of the solubility of hexyl
salicylate, and moreover the aqueous co-solvent solutions were not found to damage
the MF shells.
The release of the perfume oil is determined in this case directly in the aqueous phase
with an appropriate analytical method, such as UV-Vis spectrophotometry that can be
easily adapted for continuous measurements using a flow cell. The release of perfume
oil from such kind of experiments has to be converted into a parameter that
characterizes the barrier properties of the shell, such as the permeability. For this
purpose analytical models should be developed that consider the morphology of the
microcapsules. Mercadé-Prieto et al. (2012b) developed a simple model for thin-shell
microcapsules based on the solution-diffusion model for transport through membranes
(Wijmans and Baker, 1995). Figure 2-19 represents the schematic diagram of perfume
oil release out of the thin shell, and Figure 2-20 shows the schematic diagram of a
typical release curve (Antipov et al., 2003).
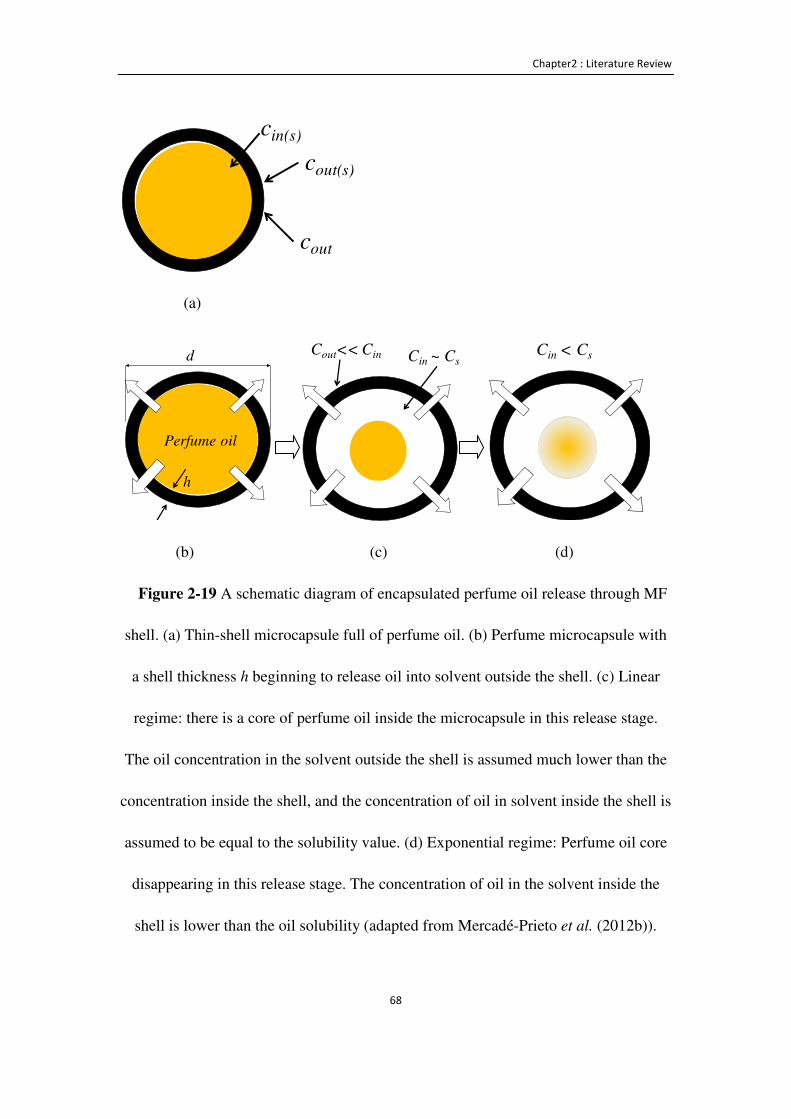
Chapter2 : Literature Review
68
(a)
(b) (c) (d)
Figure 2-19 A schematic diagram of encapsulated perfume oil release through MF
shell. (a) Thin-shell microcapsule full of perfume oil. (b) Perfume microcapsule with
a shell thickness h beginning to release oil into solvent outside the shell. (c) Linear
regime: there is a core of perfume oil inside the microcapsule in this release stage.
The oil concentration in the solvent outside the shell is assumed much lower than the
concentration inside the shell, and the concentration of oil in solvent inside the shell is
assumed to be equal to the solubility value. (d) Exponential regime: Perfume oil core
disappearing in this release stage. The concentration of oil in the solvent inside the
shell is lower than the oil solubility (adapted from Mercadé-Prieto et al. (2012b)).
cin(s)
cout(s)
cout
d
h
Perfume oil
Cout<< Cin Cin ~ CsCin < Cs
Chapter2 : Literature Review
69
Figure 2-20 Typical release curve from thin-shell microcapsules. There are two stages
on the release curve: the linear release regime and exponential release regime
(Antipov et al., 2003). The red line fits the slope of the linear release regime.
The perfume oil flux (J) passing through a single microcapsule shell, as shown in
Figure 2-19(a), is defined using Fick’s first law:
5 = �� w� !(�) − �$�%(�)x (Equation 2.23)
where D is the diffusivity of the pure oil within the shell, � !(�) and �$�%(�) are the
oil concentrations (w/v) at the inner and outer side of the shell-fluid interface.
Considering the partition coefficient in the shell
5 = ¹�� (� ! − �$�%)=1� (� ! − �$�%) (Equation 2.24)
where � !and �$�% are the oil concentrations in the solvent inside and outside the
microcapsule, and 8 = 9:;9:;(�) = 9<=>9<=>(�) is the partition coefficient, where it can be
Linear
Exponential
Chapter2 : Literature Review
70
assumed that 8 ≈ 9�°�º�»»9� (Schwarb et al., 1999). Here, �������� is the saturation
solubility of core oil in the shell material, and ��is saturation solubility of core oil in
the co-solvent solution and h is the shell thickness of the microcapsules, P is the
permeability of the oil in the shell.
The model considers the following assumptions:
I. Fast mass transfer inside the capsule, from the perfume oil core to the inner
side of the shell, resulting in � ! ≈ �� at all times. This assumption is
reasonable if P/ℎ ≪ �7(%�N/M , where�7(%�N is the diffusivity of core oil in
water.
II. Experiments are designed in order that the oil concentration in the solution is
much lower than the solubility concentration at all times, �$�% ≪ �� , in order
that Equation 2.22 can be simplified to 5 ≅ 1� ��;
III. The co-solvent solution is well-mixed at all times, resulting in that there is no
concentration gradient in the co-solvent.
Considering these assumption, Equation 2.24 can be simplified to:
�$�% ≅ �*L¾u� 1� ��PN (Equation 2.25)
where, S)� is the volume of the co-solvent, PN is the diffusion time, �� is the
solubility of oil in the co-solvent, d is the diameter of the microcapsules.
Therefore, it is predicted for a single microcapsule that �$�%increases linearly with
the release time, as shown in Figure 2-19 (c), allowing to calculate P/h from the slope
Chapter2 : Literature Review
71
of the release profile (red solid line in Figure in 2-20), called the linear regime
(Antipov et al., 2003).
After extensive release a point is reached when the concentration inside the
microcapsule cannot be kept constant to that of the solubility. When this occurs at the
late stage of release, � ! < ��, as shown in Figure 2-19(d), the relative release is no
longer linear with time, but follows an exponential decay (Antipov et al., 2003),
called exponential regime (Figure 2-20). The concentration of the released oil in the
co-solvent in the exponential regime is given by :
�$�%~(1 − ��¿£LÀu� Áº%�) (Equation 2.26)
The relative oil release by weight O(PN)at a time tr is defined as:
O(PN) = ¾u�9<=>(%�)�/��(*���)��<:» (Equation 2.27)
where c$ � is the density of the core oil. For the linear regime, Equation 2.27 can be
simplified for thin-shell capsules (ℎ ≪ ') as follows:
O(PN) ≅ �*�<:» 1� Â�PN (Equation 2.28)
This model predicts for a single capsule, or a mono-dispersed group of capsules, with
a fairly insoluble core oils that most of the relative release with be linear. However, if
the microcapsules are poly-dispersed, the model will predict an exponential-like
release like in Figure 2-19, despite the fact that the individual release of all the
microcapsules is mostly linear.
As discussed in a previous work (Mercade-Prieto et al., 2012b), the desirable
Chapter2 : Literature Review
72
experimental release time should be about 102 to 104 s. The final release time can be
estimated from the expected end of the linear regime (termed tmax in Figure 2-20) as
follows :
P�!*(6) = �<:»£Ã�)�1/� (Equation 2.29)
where '̅ is the number mean diameter of the microcapsules.
2.6.4 Morphology, microstructure and shell thickness
There are many techniques to physically observe the existence of microcapsules, for
example to verify the core-shell structure expected. Optical microscopy is a direct and
simple technique commonly used for investigating the morphology, shape, structure
as well as size of microcapsules (Bone et al., 2011, Pretzl et al., 2012), particularly
when combined with image analysis software. In order to obtain high resolution
images of microcapsules or even nano-capsules, scanning electron microscopy (SEM)
or ESEM have been applied for the evaluation of their morphology and microstructure
(Hong and Park, 1999a, Hwang et al., 2006a, Ren et al., 2007).
Transmission electron microscopy (TEM) has been extensively used to determine the
shell thickness of microcapsules due to its excellent nano-scale resolution (Yang et al.,
2008). Before obtaining TEM images, microcapsules are pre-treated by embedding
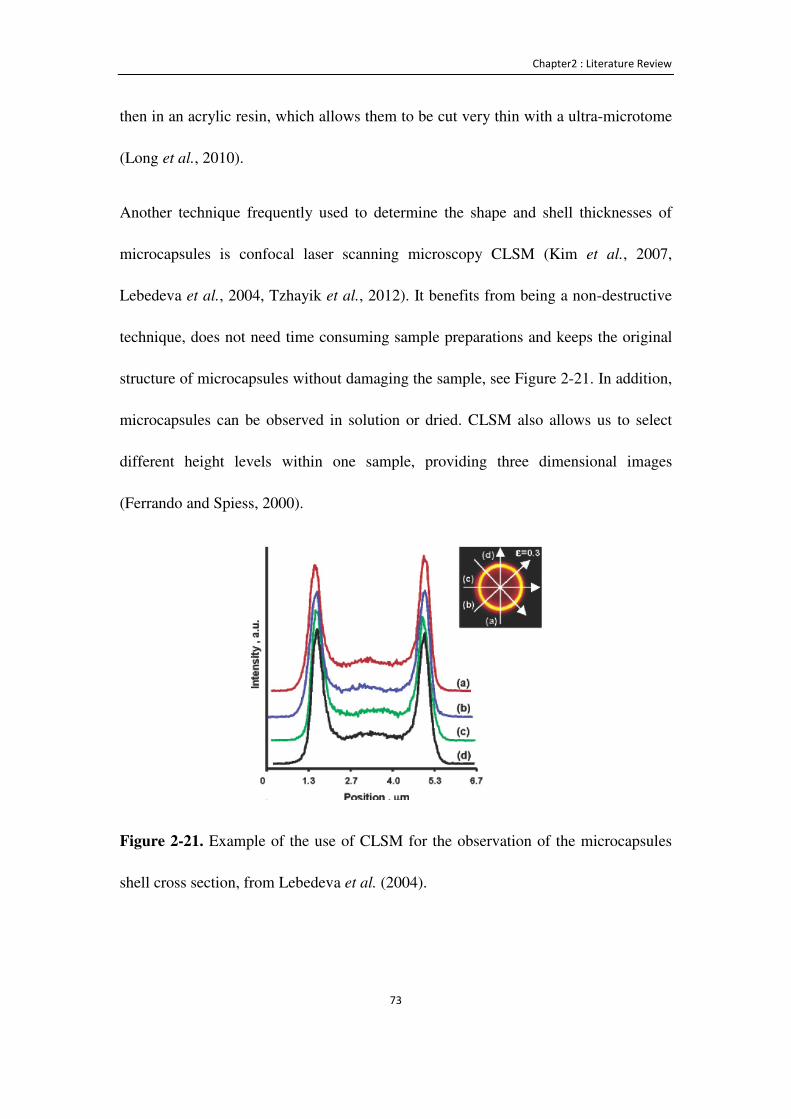
Chapter2 : Literature Review
73
then in an acrylic resin, which allows them to be cut very thin with a ultra-microtome
(Long et al., 2010).
Another technique frequently used to determine the shape and shell thicknesses of
microcapsules is confocal laser scanning microscopy CLSM (Kim et al., 2007,
Lebedeva et al., 2004, Tzhayik et al., 2012). It benefits from being a non-destructive
technique, does not need time consuming sample preparations and keeps the original
structure of microcapsules without damaging the sample, see Figure 2-21. In addition,
microcapsules can be observed in solution or dried. CLSM also allows us to select
different height levels within one sample, providing three dimensional images
(Ferrando and Spiess, 2000).
Figure 2-21. Example of the use of CLSM for the observation of the microcapsules
shell cross section, from Lebedeva et al. (2004).
Chapter2 : Literature Review
74
2.7 Conclusions
In this chapter the composition, manufacturing and applications of perfume
microcapsules has been reviewed. This chapter covers basic aspects of emulsification
and encapsulation methods, the importance to control the size and uniformity of
microcapsules, the applications of MF and PMMA microcapsules and methods to
characterize microcapsules reported in the literature.
The main use considered is that for microcapsules added to laundry detergents,
increasing significantly the amount of perfume deposited on fabrics and thus reducing
the amount of expensive material that is wasted. Microcapsules also allow a much
prolonged perfume release compared when perfumes are added in free form, and
particularly allow sudden “on demand” release when microcapsules are broken upon
rubbing. The latter release mechanism is particularly interesting because it focuses the
release of perfume mainly when the customer is handling the clothes, not when the
clothes are idle in the wardrobe. Although the understanding on the performance of
perfume microcapsules in real applications is still in its infancy, it is expected that
microcapsules with well-defined properties are desirable to microcapsules with broad
ones. A key property typically considered for perfume microcapsules, where burst
upon rubbing is desired, is the mechanical strength under compression.
Chapter2 : Literature Review
75
The initial step to manufacture perfume microcapsules is typically to form an aqueous
emulsion of the perfume. This step is commonly followed by an in situ
polymerization reaction to form a shell, as in the case of melamine-formaldehyde (MF)
microcapsules that are extensively used in the industry. The mechanical strength
distribution of previous MF microcapsules is quite variable, which is primarily due to
the large size distributions in the batches made. Hence, one way to improve the
performance of MF microcapsules would be to narrow the size distribution of the
microcapsules, and therefore of the initial emulsions. Of the different emulsification
techniques available, membrane emulsification is found to have great potential for this
purpose and furthermore has the potential to be used in large scale operations.
A second improvement that the market requires for perfume microcapsules is to be
able to formulate them from non-hazardous products or ones less than currently used
for MF microcapsules. PMMA is considered to be a good candidate for perfume
encapsulation, considering that it has already found many other encapsulation
applications. In order to test the applicability of new kinds of microcapsules, and to
compare them with the better-known MF ones, extensive characterization tests should
be applied.
By taking the industrial needs and literature into consideration, this PhD project aims
to encapsulate perfume oils in MF microcapsules with narrow size and strength
distributions via membrane emulsification, and also to prepare user-friendly PMMA

Chapter2 : Literature Review
76
microcapsules including characterisation of their physical, structural and mechanical
properties.
Chapter3 : Materials and Experimental Techniques
77
Chapter 3 Materials and Experimental
Techniques
3.1 Introduction
This chapter describes the materials used to prepare melamine-formaldehyde (MF)
and poly (methyl methacrylate) (PMMA) microcapsules, as well as the techniques
utilized for preparing and characterizing the microcapsules. A conventional
homogenisation system and membrane emulsification systems were used to prepare
the oil-water emulsions from which microcapsules were formed. The mean size and
size distribution of the oil droplets produced in the stage of emulsification and the
final microcapsules were determined using a laser diffraction technique. A
well-established micromanipulation technique based on the parallel compression of
single microcapsules was used to evaluate their mechanical properties (Sun and
Zhang, 2001, Zhang et al., 1999b). The microcapsules’ morphology was analysed by
optical microscopy, florescence microscopy, scanning electron microscope (SEM),
environmental scanning electron microscopy (ESEM), transmission electron
microscope (TEM). The wall thickness of microcapsules was determined using TEM
and confocal laser scanning microscopy (CLSM). The physical properties of the
encapsulating oils, like the viscosity and the interfacial tension, were determined
using a rheometer and tensiometer, respectively. The rate of the oil release from
Chapter3 : Materials and Experimental Techniques
78
microcapsules was tested with a continuous release testing method using UV-Vis
spectrophotometry. Details of these techniques are discussed in this chapter.
3.2 Materials
3.2.1 Materials used to prepare melamine formaldehyde (MF)
microcapsules
The melamine formaldehyde (MF) precondensate used in this study (70 % (aq) w/w,
formaldehyde to melamine molar ratio 0.20), Beetle resin PT336®, was supplied by
British Industrial Plastics Ltd., Birmingham, UK. Formaldehyde (37 % (aq) w/w),
acetic acid, sodium hydroxide (NaOH) and the fluorescent dye Rhodamine B (RB)
were purchased from Sigma-Aldrich, UK, and polyacrylamide-co-acrylic acid-sodium
salt was obtained from Polymersciences, Inc., US. Polyalkyleneoxide modified
heptamethyltrisiloxane (as a membrane wetting agent) was supplied by Micropore
Technologies Ltd., UK. The model core oils used were industrial precursor perfume
oil A and perfume oil B, a key component of perfume oil is hexyl salicylate (oil HS),
sunflower oil (oil S) and peppermint oil (oil P). Perfume oil A, perfume oil B and oil
HS were supplied by Procter & Gamble (P&G), UK. Sunflower oil (oil S) and
peppermint oil (oil P) were purchased from Sigma-Aldrich, UK. All the materials were
used without further purification.
Chapter3 : Materials and Experimental Techniques
79
3.2.2 Materials used to prepare poly (methyl methacrylate) (PMMA)
microcapsules
Methyl methacrylate (MMA), ethylene glycol dimethacrylate (EGDMA),
2,20-azobisisobutyronitril (AIBN), polyvinyl alcohol 18-88 (PVA), toluene, sodium
chloride (NaCl), propenal-1 and glycerol were purchased from Sigma-Aldrich, UK.
Partly hydrophobic fumed silica Aerosil® R816 was kindly provided by Evonik,
Degussa A.G., Germany. The florescent dye pyrromethene 546 (PM 546) was
supplied by Exciton, Ohio, US. The perfume oil used was an industrial precursor from
Procter & Gamble (P&G), UK. All the materials were used without further
purification.
3.3 Techniques to prepare microcapsules
3.3.1 Dispersion cell system
3.3.1.1 Cell system
The dispersion cell used to generate oil/water emulsions was purchased from
Micropore Technologies Ltd., UK, shown in Figures 3-1 and 3-2. It is a batch
membrane emulsification system with a mechanical stirrer on top of a flat membrane.
The membrane with homogenous pores was placed on a PTFE base, connected with a
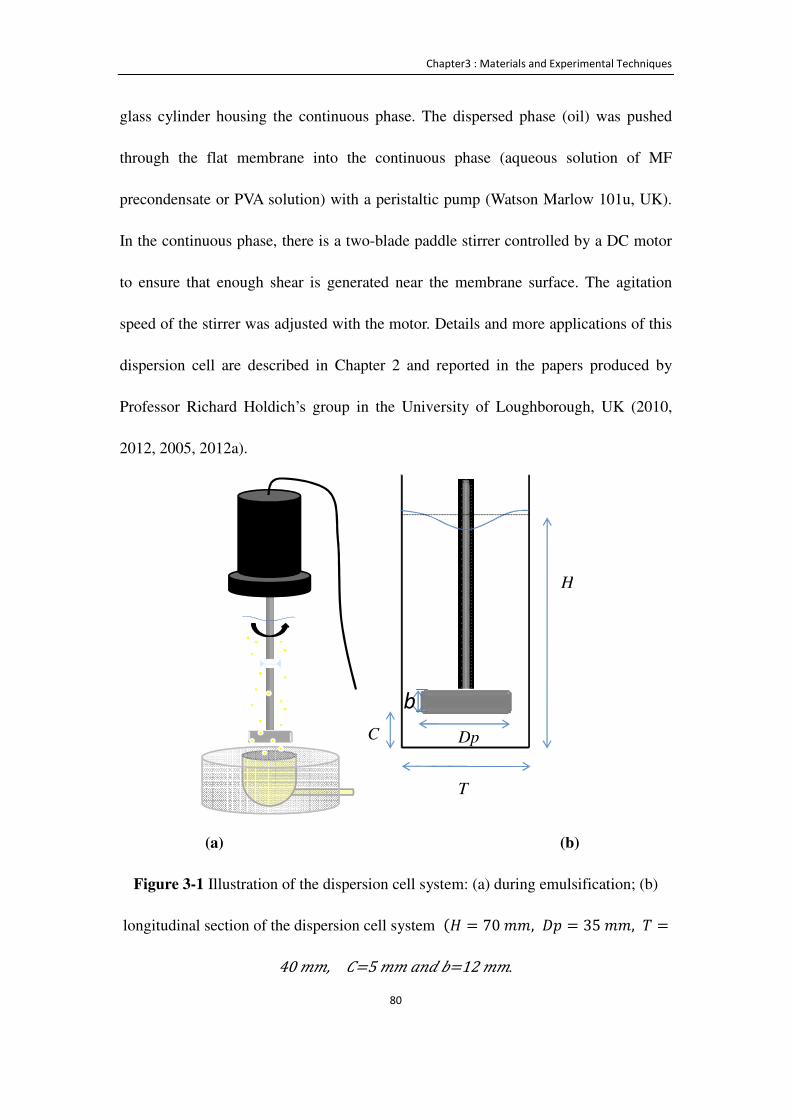
Chapter3 : Materials and Experimental Techniques
80
glass cylinder housing the continuous phase. The dispersed phase (oil) was pushed
through the flat membrane into the continuous phase (aqueous solution of MF
precondensate or PVA solution) with a peristaltic pump (Watson Marlow 101u, UK).
In the continuous phase, there is a two-blade paddle stirrer controlled by a DC motor
to ensure that enough shear is generated near the membrane surface. The agitation
speed of the stirrer was adjusted with the motor. Details and more applications of this
dispersion cell are described in Chapter 2 and reported in the papers produced by
Professor Richard Holdich’s group in the University of Loughborough, UK (2010,
2012, 2005, 2012a).
(a) (b)
Figure 3-1 Illustration of the dispersion cell system: (a) during emulsification; (b)
longitudinal section of the dispersion cell system (Ä = 70ÅÅ, �¯ = 35ÅÅ, Æ =40ÅÅ, �=5ÅÅÈ@'É=12ÅÅ.
T
H
C Dp
b
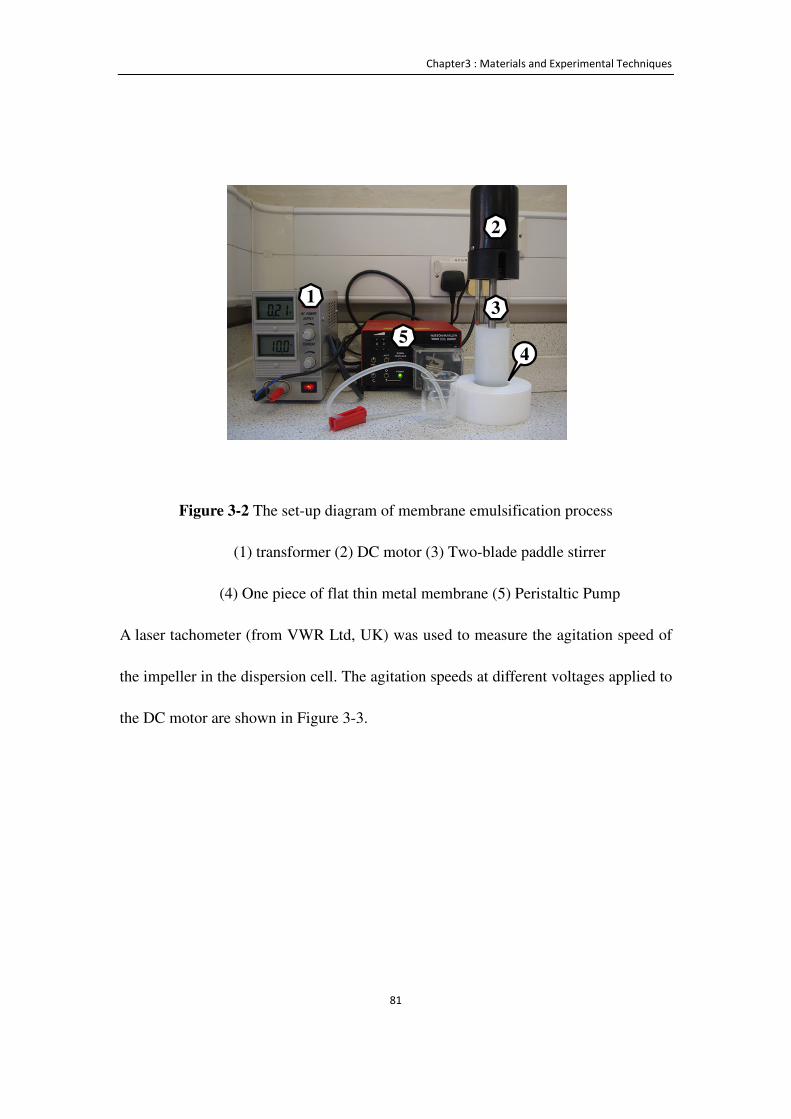
Chapter3 : Materials and Experimental Techniques
81
Figure 3-2 The set-up diagram of membrane emulsification process
(1) transformer (2) DC motor (3) Two-blade paddle stirrer
(4) One piece of flat thin metal membrane (5) Peristaltic Pump
A laser tachometer (from VWR Ltd, UK) was used to measure the agitation speed of
the impeller in the dispersion cell. The agitation speeds at different voltages applied to
the DC motor are shown in Figure 3-3.
1
2
3
54
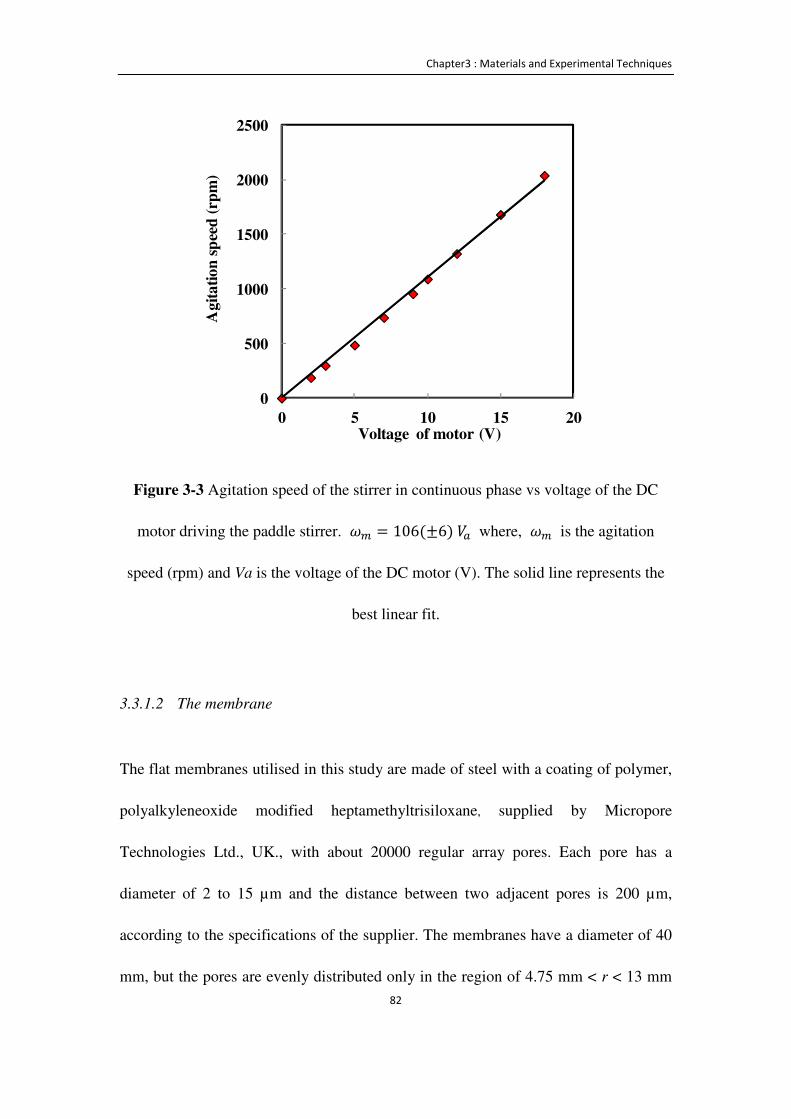
Chapter3 : Materials and Experimental Techniques
82
Figure 3-3 Agitation speed of the stirrer in continuous phase vs voltage of the DC
motor driving the paddle stirrer. pD = 106(±6)S( where, pD is the agitation
speed (rpm) and Va is the voltage of the DC motor (V). The solid line represents the
best linear fit.
3.3.1.2 The membrane
The flat membranes utilised in this study are made of steel with a coating of polymer,
polyalkyleneoxide modified heptamethyltrisiloxane, supplied by Micropore
Technologies Ltd., UK., with about 20000 regular array pores. Each pore has a
diameter of 2 to 15 µm and the distance between two adjacent pores is 200 µm,
according to the specifications of the supplier. The membranes have a diameter of 40
mm, but the pores are evenly distributed only in the region of 4.75 mm < r < 13 mm
0
500
1000
1500
2000
2500
0 5 10 15 20
Ag
ita
tio
n s
pee
d (
rpm
)
Voltage of motor (V)

Chapter3 : Materials and Experimental Techniques
83
or 13 mm < r < 17.5 mm, where r is the distance from the centre of the membrane, as
shown in Figure 3-4.
(a)
(b)
(c)
(d)
Figure 3-4 The schematic diagrams and the SEM micrographs of
representative flat membrane used. (a) The annular radial ring membrane; (b)
schematic diagram showing regular distribution of the pores in the membrane;
(c) SEM micrograph of the pores; (d) SEM image of one pore in the
membrane 15rcia. The pore diameter has been estimated from the narrower
end.
Am
Rin
Rout
L
dp
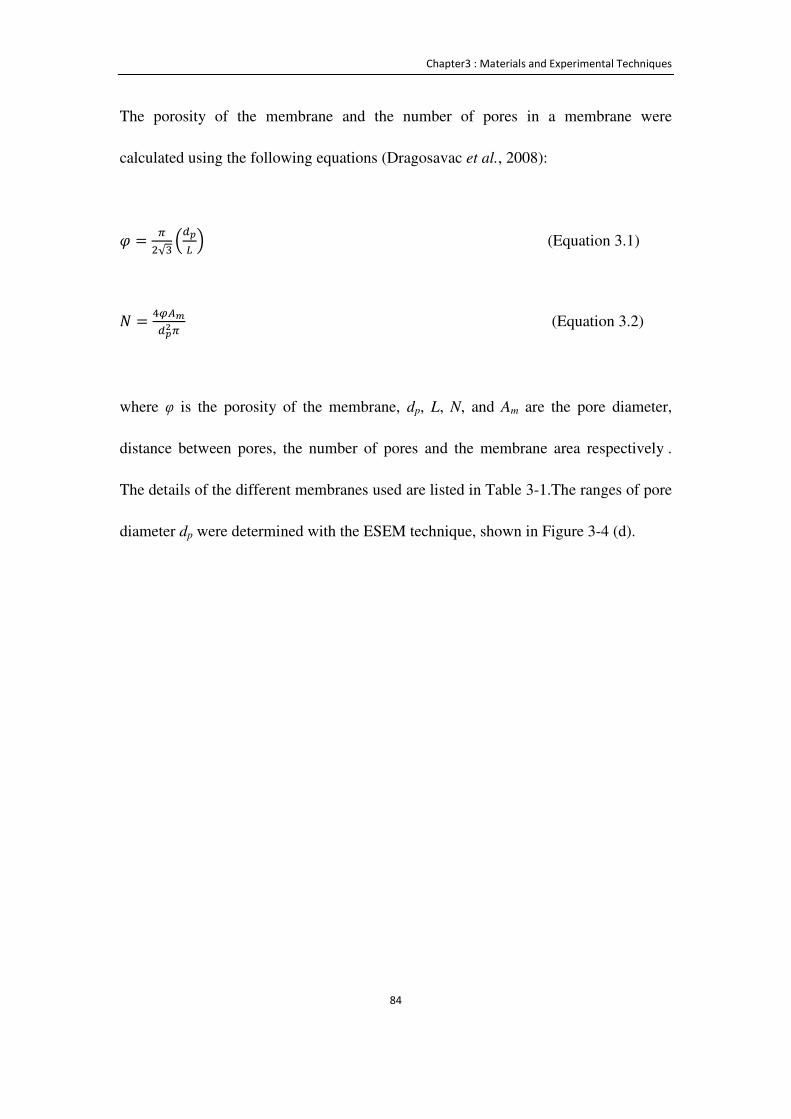
Chapter3 : Materials and Experimental Techniques
84
The porosity of the membrane and the number of pores in a membrane were
calculated using the following equations (Dragosavac et al., 2008):
Ë = ��√� �*|� � (Equation 3.1)
Í = ~ÎÏÐ*|L� (Equation 3.2)
where φ is the porosity of the membrane, dp, L, N, and Am are the pore diameter,
distance between pores, the number of pores and the membrane area respectively .
The details of the different membranes used are listed in Table 3-1.The ranges of pore
diameter dp were determined with the ESEM technique, shown in Figure 3-4 (d).
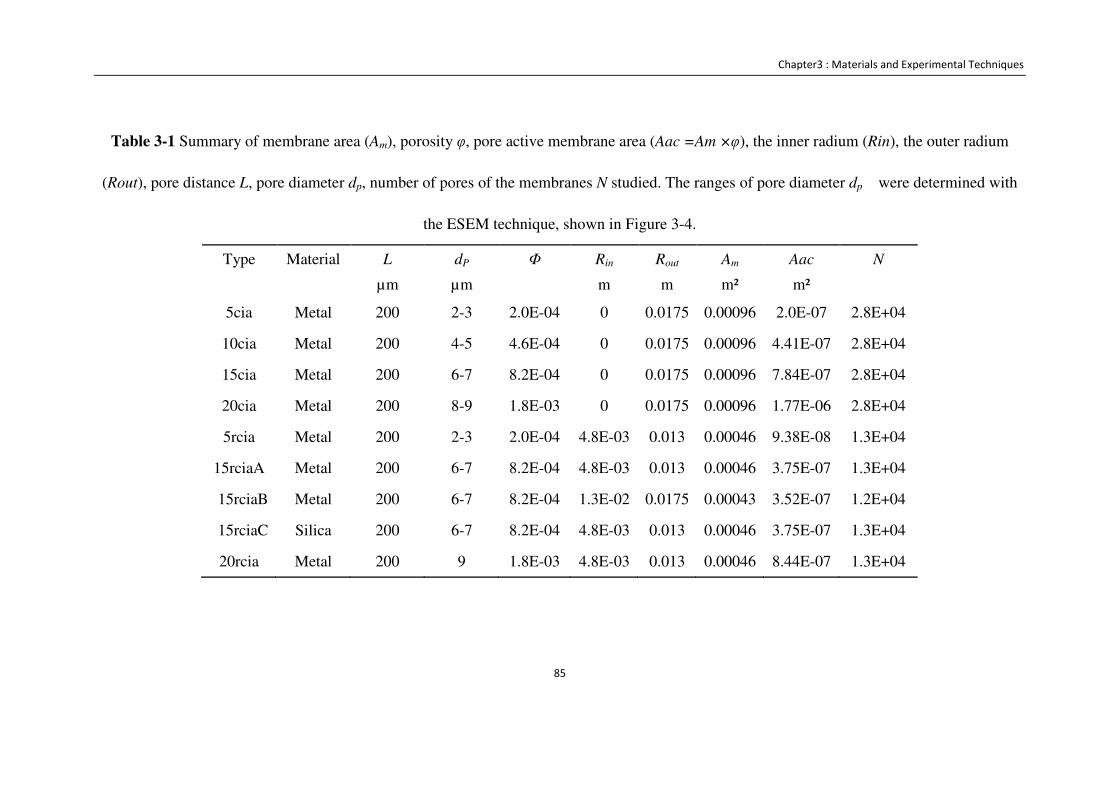
Chapter3 : Materials and Experimental Techniques
85
Table 3-1 Summary of membrane area (Am), porosity φ, pore active membrane area (Aac =Am ×φ), the inner radium (Rin), the outer radium
(Rout), pore distance L, pore diameter dp, number of pores of the membranes N studied. The ranges of pore diameter dp were determined with
the ESEM technique, shown in Figure 3-4.
Type Material L dP Φ Rin Rout Am Aac N
µm µm m m m² m²
5cia Metal 200 2-3 2.0E-04 0 0.0175 0.00096 2.0E-07 2.8E+04
10cia Metal 200 4-5 4.6E-04 0 0.0175 0.00096 4.41E-07 2.8E+04
15cia Metal 200 6-7 8.2E-04 0 0.0175 0.00096 7.84E-07 2.8E+04
20cia Metal 200 8-9 1.8E-03 0 0.0175 0.00096 1.77E-06 2.8E+04
5rcia Metal 200 2-3 2.0E-04 4.8E-03 0.013 0.00046 9.38E-08 1.3E+04
15rciaA Metal 200 6-7 8.2E-04 4.8E-03 0.013 0.00046 3.75E-07 1.3E+04
15rciaB Metal 200 6-7 8.2E-04 1.3E-02 0.0175 0.00043 3.52E-07 1.2E+04
15rciaC Silica 200 6-7 8.2E-04 4.8E-03 0.013 0.00046 3.75E-07 1.3E+04
20rcia Metal 200 9 1.8E-03 4.8E-03 0.013 0.00046 8.44E-07 1.3E+04
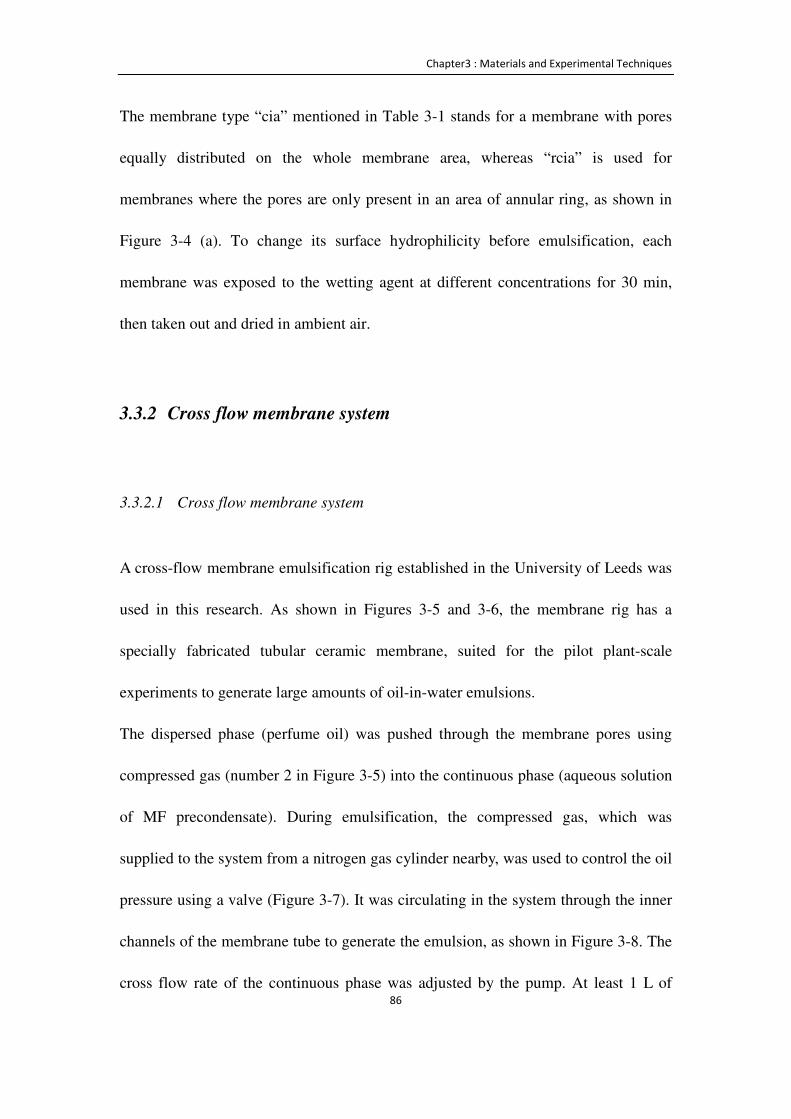
Chapter3 : Materials and Experimental Techniques
86
The membrane type “cia” mentioned in Table 3-1 stands for a membrane with pores
equally distributed on the whole membrane area, whereas “rcia” is used for
membranes where the pores are only present in an area of annular ring, as shown in
Figure 3-4 (a). To change its surface hydrophilicity before emulsification, each
membrane was exposed to the wetting agent at different concentrations for 30 min,
then taken out and dried in ambient air.
3.3.2 Cross flow membrane system
3.3.2.1 Cross flow membrane system
A cross-flow membrane emulsification rig established in the University of Leeds was
used in this research. As shown in Figures 3-5 and 3-6, the membrane rig has a
specially fabricated tubular ceramic membrane, suited for the pilot plant-scale
experiments to generate large amounts of oil-in-water emulsions.
The dispersed phase (perfume oil) was pushed through the membrane pores using
compressed gas (number 2 in Figure 3-5) into the continuous phase (aqueous solution
of MF precondensate). During emulsification, the compressed gas, which was
supplied to the system from a nitrogen gas cylinder nearby, was used to control the oil
pressure using a valve (Figure 3-7). It was circulating in the system through the inner
channels of the membrane tube to generate the emulsion, as shown in Figure 3-8. The
cross flow rate of the continuous phase was adjusted by the pump. At least 1 L of

Chapter3 : Materials and Experimental Techniques
87
emulsion was generated during each experiment (Yuan et al., 2009a, Yuan et al.,
2008a).
Figure 3-5 Pilot plant-scale cross-flow membrane apparatus (from the rear).
1 – Disperse phase tank lid (enlarged in Figure 3-6), 2 – Compressed gas line, 3 –
Control valve for compressed gas (enlarged in Figure 3-7), 4 – Disperse phase tank, 5
– Control panel (Rear), 6 – Release valve (disperse phase tank), 7 – Disperse phase
valve, 8 – Pump, 9 – Membrane housing, 10 – Continuous phase tank release tap, 11 –
Continuous phase tank
1
2
4
5
3
9
7
6
10
11
8
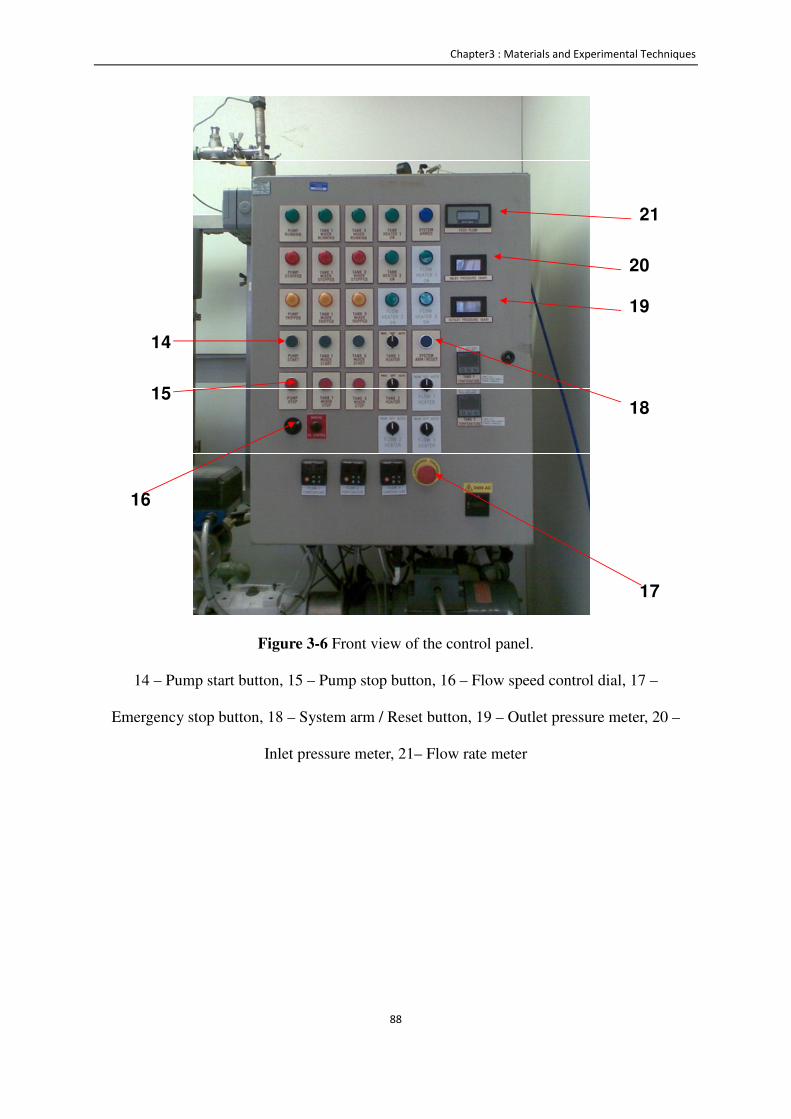
Chapter3 : Materials and Experimental Techniques
88
Figure 3-6 Front view of the control panel.
14 – Pump start button, 15 – Pump stop button, 16 – Flow speed control dial, 17 –
Emergency stop button, 18 – System arm / Reset button, 19 – Outlet pressure meter, 20 –
Inlet pressure meter, 21– Flow rate meter
14
15
17
18
19
20
21
16
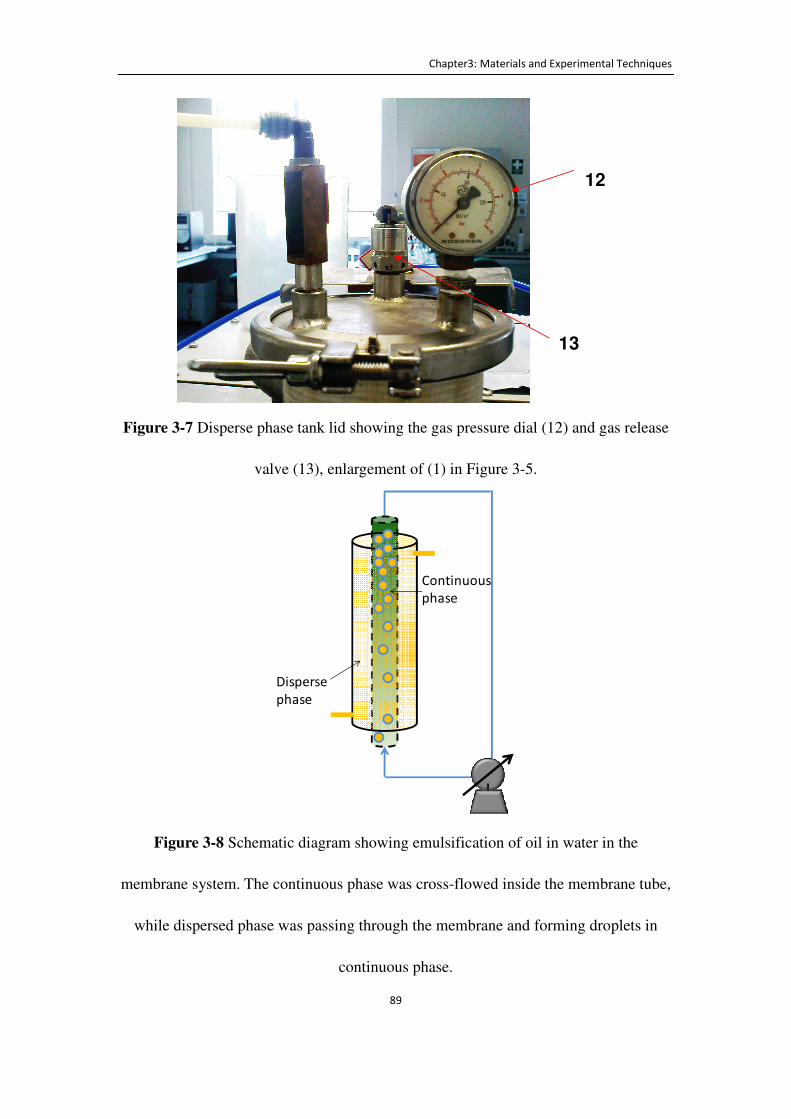
Chapter3: Materials and Experimental Techniques
89
Figure 3-7 Disperse phase tank lid showing the gas pressure dial (12) and gas release
valve (13), enlargement of (1) in Figure 3-5.
Figure 3-8 Schematic diagram showing emulsification of oil in water in the
membrane system. The continuous phase was cross-flowed inside the membrane tube,
while dispersed phase was passing through the membrane and forming droplets in
continuous phase.
13
12
Disperse
phase
Continuous
phase
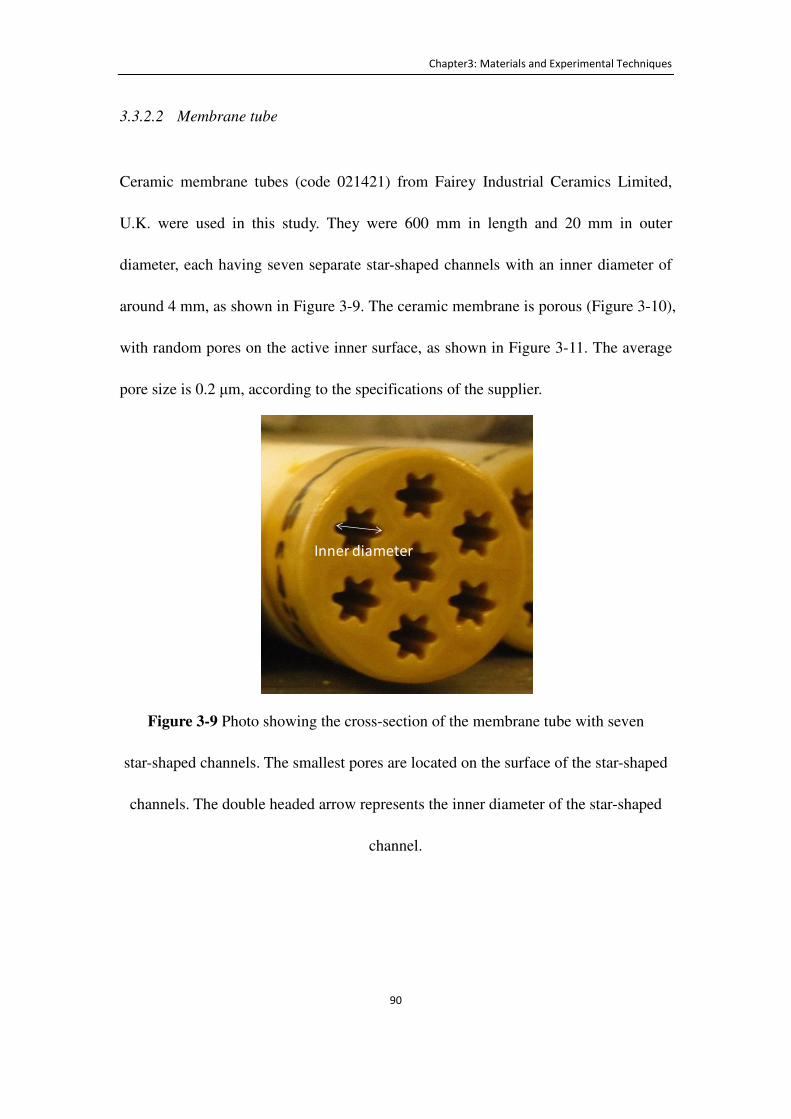
Chapter3: Materials and Experimental Techniques
90
3.3.2.2 Membrane tube
Ceramic membrane tubes (code 021421) from Fairey Industrial Ceramics Limited,
U.K. were used in this study. They were 600 mm in length and 20 mm in outer
diameter, each having seven separate star-shaped channels with an inner diameter of
around 4 mm, as shown in Figure 3-9. The ceramic membrane is porous (Figure 3-10),
with random pores on the active inner surface, as shown in Figure 3-11. The average
pore size is 0.2 μm, according to the specifications of the supplier.
Figure 3-9 Photo showing the cross-section of the membrane tube with seven
star-shaped channels. The smallest pores are located on the surface of the star-shaped
channels. The double headed arrow represents the inner diameter of the star-shaped
channel.
Inner diameter

Chapter3: Materials and Experimental Techniques
91
Fig 3-10 SEM images of the substrate material of 0.2 µm (pore size at the interface)
cross-flow membrane tube. Broken portions of 0.2 µm cross-flow membrane tube
(code 021421, 7 hole star shape) were mounted on a stub using Leit-c-plast (Agar)
and then coated with gold for 4 (or 8) min, before being examined using SEM.

Chapter3: Materials and Experimental Techniques
92
Fig 3-11 SEM images of the cross-flow membrane tube channel from inside. The
rough porous inside surface of the channel, has pores with the nominal size of 0.2µm.
3.4 Techniques to characterise microcapsules
3.4.1 Particle size analyzer - laser diffraction
Laser diffraction or low angle laser light scattering (LALLS) is a technique which
determines the size and size distribution of droplets or microcapsules in wet or dry
samples (Webb, 2000). It is based on Mie theory, described by Equation 3.3 below,
which predicts the angular intensity of light scattered by the interaction between the
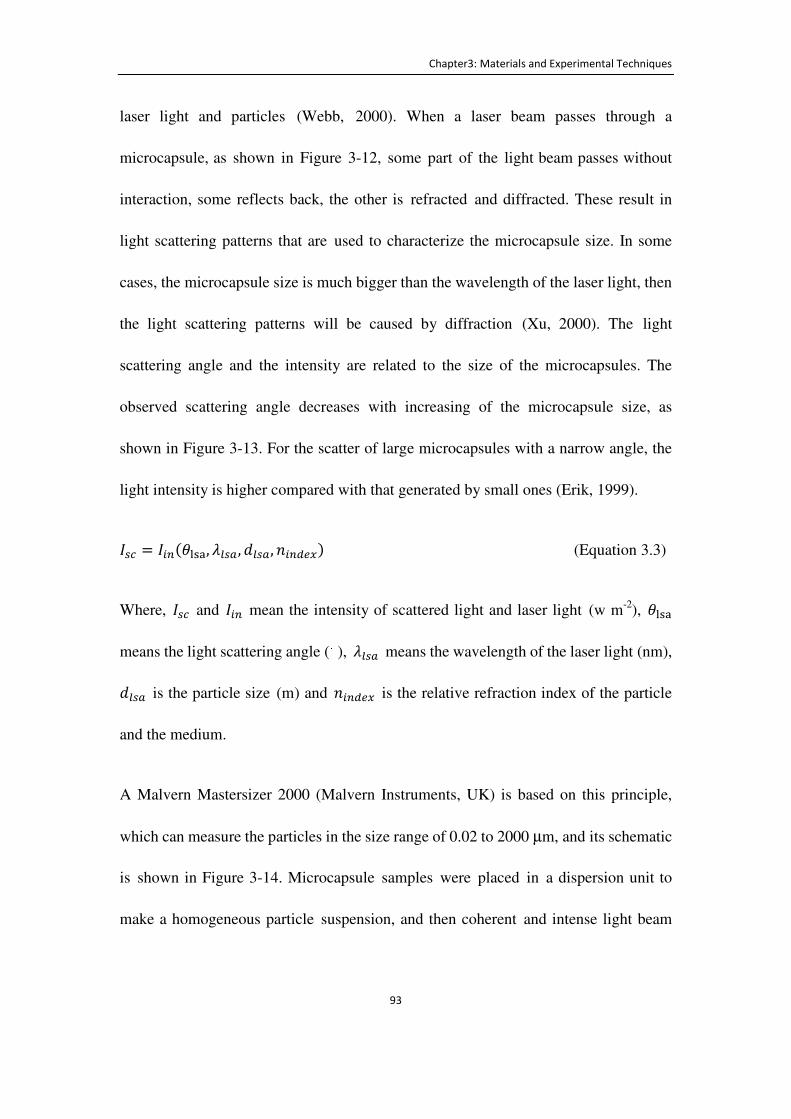
Chapter3: Materials and Experimental Techniques
93
laser light and particles (Webb, 2000). When a laser beam passes through a
microcapsule, as shown in Figure 3-12, some part of the light beam passes without
interaction, some reflects back, the other is refracted and diffracted. These result in
light scattering patterns that are used to characterize the microcapsule size. In some
cases, the microcapsule size is much bigger than the wavelength of the laser light, then
the light scattering patterns will be caused by diffraction (Xu, 2000). The light
scattering angle and the intensity are related to the size of the microcapsules. The
observed scattering angle decreases with increasing of the microcapsule size, as
shown in Figure 3-13. For the scatter of large microcapsules with a narrow angle, the
light intensity is higher compared with that generated by small ones (Erik, 1999).
4�) = 4 !(_`ab, ]��(, '��(, @ !*�A) (Equation 3.3)
Where, 4�) and 4 ! mean the intensity of scattered light and laser light (w m-2), _`ab
means the light scattering angle (。), ]��( means the wavelength of the laser light (nm),
'��( is the particle size (m) and @ !*�A is the relative refraction index of the particle
and the medium.
A Malvern Mastersizer 2000 (Malvern Instruments, UK) is based on this principle,
which can measure the particles in the size range of 0.02 to 2000 µm, and its schematic
is shown in Figure 3-14. Microcapsule samples were placed in a dispersion unit to
make a homogeneous particle suspension, and then coherent and intense light beam

Chapter3: Materials and Experimental Techniques
94
with a fixed wavelength which is provided by a light source passes through it. At the
end, a large angle detector measures the scattered light in a wide range of angles.
Figure 3-12 Schematic diagram of laser light rays interacting with a solid particle.
Figure 3-13 Schematic diagram of laser light rays interacting with particles of
different sizes.
No interaction ray
Reflected ray
Refracted ray
Diffracted ray
Scattering=reflection+ refraction+ diffraction
Incident light
Small angle scattering
Incident light
Big angle scattering
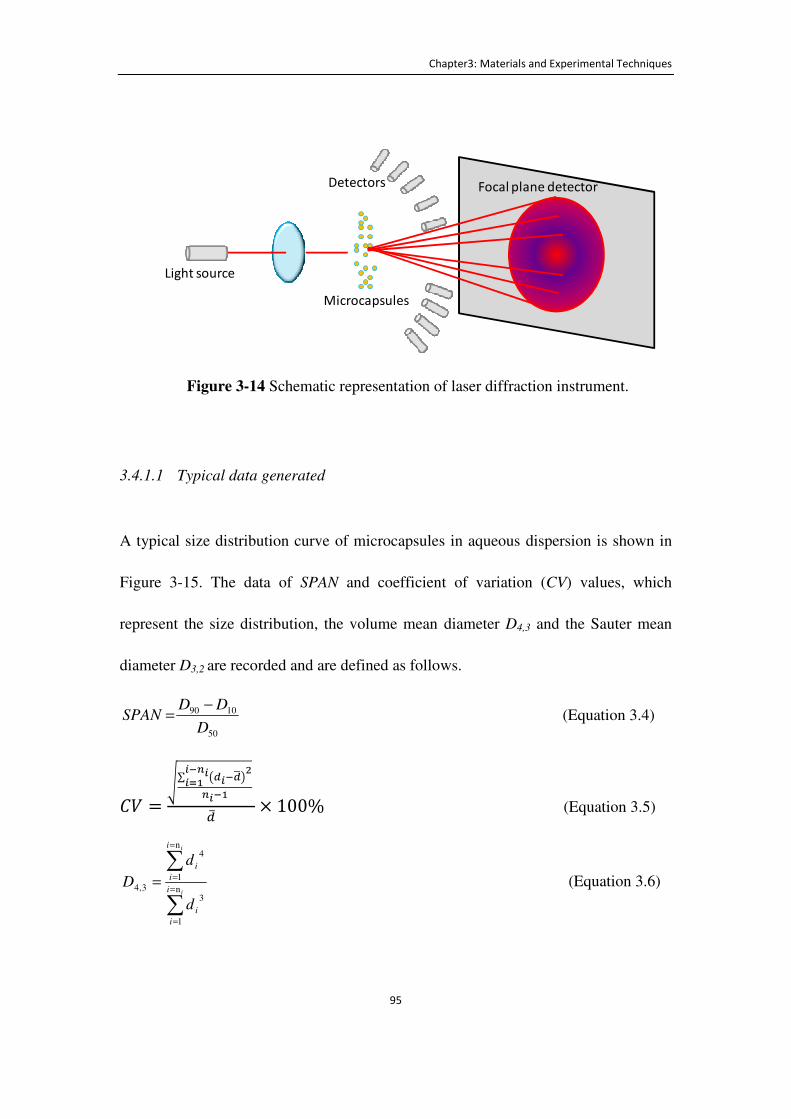
Chapter3: Materials and Experimental Techniques
95
Figure 3-14 Schematic representation of laser diffraction instrument.
3.4.1.1 Typical data generated
A typical size distribution curve of microcapsules in aqueous dispersion is shown in
Figure 3-15. The data of SPAN and coefficient of variation (CV) values, which
represent the size distribution, the volume mean diameter D4,3 and the Sauter mean
diameter D3,2 are recorded and are defined as follows.
50
1090
D
DDSPAN
−= (Equation 3.4)
�S = y∑ w£:°£ÃxL:°;::Ò�;:°� *C × 100% (Equation 3.5)
∑
∑=
=
=
==i
i
i
i
i
i
i
i
d
d
Dn
1
3
n
1
4
3,4 (Equation 3.6)
Light source
Microcapsules
Detectors Focal plane detector
Chapter3: Materials and Experimental Techniques
96
∑
∑=
=
=
==i
i
i
i
i
i
i
i
d
d
Dn
1
2
n
1
3
2,3 (Equation 3.7)
Where D90, D10 and D50 represent the diameter under which the cumulative volume of
the droplets/microcapsules is 90%, 10% and 50% respectively; and di means the
diameter of single droplets/microcapsules; '̅ is the number- based mean diameter
and ni is the number of droplets/microcapsules measured.
Figure 3-15 A typical size distribution curve of MF microcapsules obtained from
laser diffraction measurement. The preparation details of the MF microcapsules are
described in Section 4.2.1.
0
2
4
6
8
10
12
14
16
18
0.01 0.1 1 10 100 1000 10000
Vo
lum
e (%
)
Particle size (mm)
Chapter3: Materials and Experimental Techniques
97
3.4.2 Micromanipulation technique
A well-established micromanipulation technique has been used to perform parallel
compression of single microcapsules (Mashmoushy et al., 1998, Mercade-Prieto and
Zhang, 2012, Sun and Zhang, 2002). The experimental data of the compression force
F versus displacement until rupture, diameter of single microcapsules were directly
obtained by this technique. The intrinsic material properties of the microcapsule shells,
such as failure stress σp, Young's modulus E, were calculated using finite element
modelling (FEM, see Appendix A) based on the data generated by the
micromanipulation rig (Section 6.2.4).
The schematic diagram of the micromanipulation rig (Micro Instruments Ltd., Oxon,
UK) is shown in Figure 3-16. One drop of microcapsule suspension was placed on the
top of a glass slide, subsequently placed on the sample stage to dry for 2-3 min. A
single microcapsule was found through the microscope with both side and bottom
view cameras and the image shown on the monitor, as seen in Figure 3-17(b). The
size of the microcapsule was measured through the microscope and recorded, which
can be verified later through the probe displacement data. A glass probe glued to a
force transducer (Models 403A, 405A or 406A with different maximum operating
Chapter3: Materials and Experimental Techniques
98
forces, up to 5 mN, 1mN, and 0.5mN, respectively; from Aurora Scientific Inc.,
Canada) held by a fine micromanipulator, shown in Figure 3-17(a), was programmed
to travel towards the microcapsule at a speed of 2 µm/s to compress it on the glass
slide (Figure 3-17(b)). The force transducer was connected to a data acquisition card
where the voltage generated from the transducer due to compression of the
microcapsule was collected. The system used can measure forces with a precision of ±
0.1 µN and probe displacement of ± 0.2 µm (Thomas et al., 2000). For each sample
20 to 50 microcapsules were randomly selected.
The glass probes in this study were made of borosilicate glass capillaries with an inner
diameter of 0.58 mm and outer diameter of 1.0 mm. Each probe was first heated up in
the middle by a glass puller (Micro Forge, MF-900 Narishige, Japan) and then pulled
down to obtain two separate glass needles. One of them was placed on a grinding
machine (EG-40, Narishige, Japan) for 24 hours, in order to flatten the contact surface.
The probe was then attached to a force transducer using commercial superglue
(01-30379 cyanoacrylate adhesive, Loctite, UK), as shown in Figure 3-17(a). To
make sure microcapsules can be trapped between the two parallel surfaces (the flat
surface of probe and sample glass slide), the diameter of the glass probe is required to
be at least 2 times bigger than the microcapsule diameter, which in the case of the
microcapsules tested in this work corresponds to about 160 to 200 μm.

Chapter3: Materials and Experimental Techniques
99
Figure 3-16 Schematic diagram of the micromanipulation rig. (1) TV Monitor, (2)
side view camera, (3) force transducer connected to a probe, (4) microcapsule, (5)
sample stage, (6) bottom view camera, (7) micromanipulator controlled by a
servomotor, (8) power supply and motor control box, (9) computer with data
acquisition board
0.00
1 2
6
9
3
54
8
7
Jkjohhohg
454654546454

Chapter3: Materials and Experimental Techniques
100
(a)
(b)
Figure 3-17 Photographs of a micromanipulation rig to compress single
microcapsules. (a) Force transducer with an attached glass probe for the
compression of single microcapsules. (b) The glass probe (top) with a
microcapsule ready to be compressed.
Side view microscopy
Sample-holding slide
Force transducer
Probe with flat surface
microcapsule
probe
Chapter3: Materials and Experimental Techniques
101
3.4.2.1 Typical data generated
Figure 3-18 (a) shows a typical force versus displacement curve from compressing a
single microcapsule to rupture using the micromanipulation rig. The force was
calculated from the output voltage of the transducer signal multiplied by the
transducer sensitivity, which defines the maximum force range of the transducer. Due
to the material properties of an elastic beam inside the transducer, to which the glass
probes are connected, there is deflection of the probe during compression of
microcapsules. The compressive displacement here is defined as the result of the
transducer probe moving distance minus the deflection of the probe. At Point A in
Figure 3-18 (a), the probe made contact with the microcapsule. From A to B to C, the
force increased as the microcapsule was compressed by the probe. B was defined as a
pseudo-yield point in previous work (Sun and Zhang, 2001). At point C the
microcapsule burst and the core oil was released.
A different situation occurred when the micromanipulation rig was used to compress a
single microcapsule with thick shells. For this kind of microcapsule, the compression
force increased constantly, without a clear bursting point (Figure 3-18 (b)), even if
rupture was observed on the monitor. In such kind of capsules, the compression forces
eventually soars to values larger than the maximum operational force of the transducer,
which stops the test for safety. It is expected when this happens that the top and
Chapter3: Materials and Experimental Techniques
102
bottom parts of the shell are touching each other, and therefore the rig is not
compressing a solid material, no longer a core-shell structure.
The fractional deformation εm in the compression profile is defined as the
displacement normalized by the capsule diameter. It is required to compare the
compression profiles of capsules with different diameters, as well as to calculate
intrinsic mechanical properties like the shells elastic modulus E and failure stress σp.
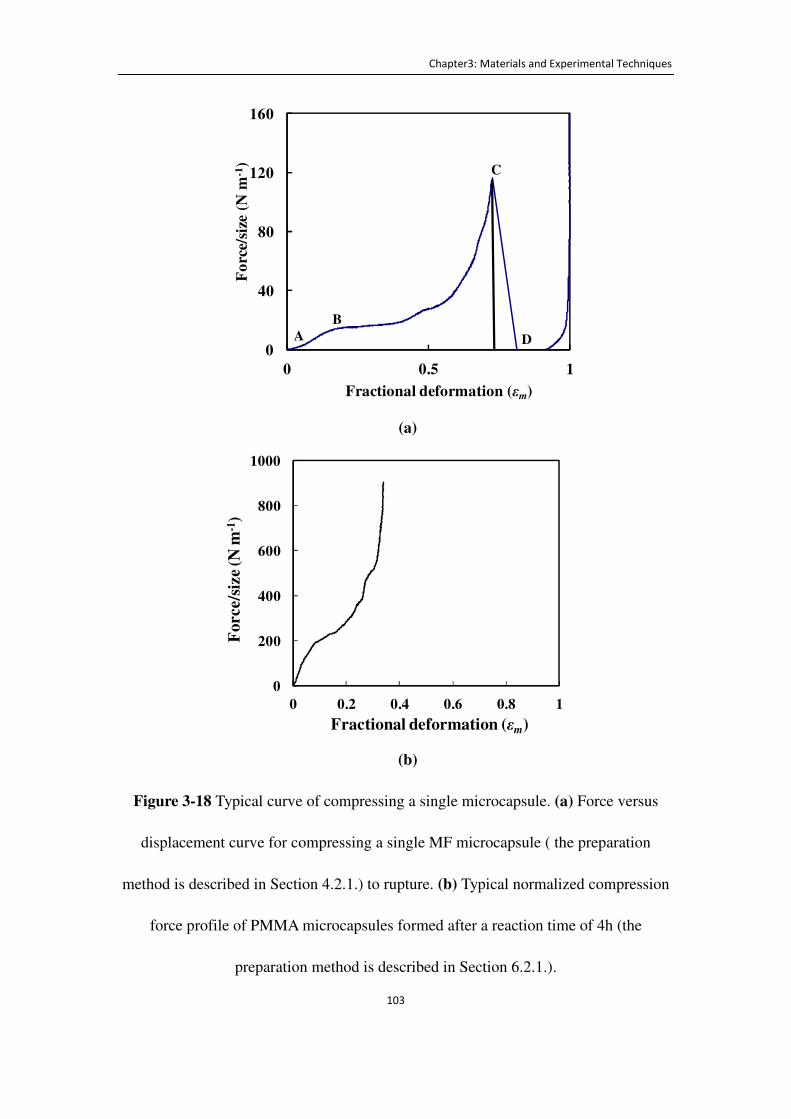
Chapter3: Materials and Experimental Techniques
103
(a)
(b)
Figure 3-18 Typical curve of compressing a single microcapsule. (a) Force versus
displacement curve for compressing a single MF microcapsule ( the preparation
method is described in Section 4.2.1.) to rupture. (b) Typical normalized compression
force profile of PMMA microcapsules formed after a reaction time of 4h (the
preparation method is described in Section 6.2.1.).
0
40
80
120
160
0 0.5 1
Fo
rce/
size
(N m
-1)
Fractional deformation (εm)
A
C
D
B
0
200
400
600
800
1000
0 0.2 0.4 0.6 0.8 1
Force/s
ize (N
m-1
)
Fractional deformation (εm)

Chapter3: Materials and Experimental Techniques
104
3.4.3 Ultraviolet-Visible spectrophotometry (UV-Vis)
Ultraviolet-visible (UV-Vis) spectrophotometry is a versatile technique to identify or
quantify organic and inorganic compounds in solution. There are basic requirements
for this instrument, such as: a radiation light with a suitable range of wavelengths, a
monochromator and optical geometry, a sample holder and a detector. (Skoog et al.,
1999).
The principle of this technique is based on Beer-Lambert law, equation 3.8 (Skoog et
al., 1999, Weckhuysen, 2004).
Ô = YW¦ �«�> = � × Y × Â (Equation 3.8)
Where, A is the absorbance of sample, It is the intensity of the transmitted light, I0 is
the intensity of the incident light, l is optical path length (cm), in this study, which is 1
cm for the cuvette used here. c is the concentration of the sample (g mL-1) and � is
the extinction coefficients (mL g-1 cm-1), which is constant for a given material at a
particular wavelength. The solution concentration can be obtained through the
absorbance measurement and calculated by Equation 3.8, for a certain solute in a
given solvent if the extinction coefficients � is known.
A calibration of solution concentration versus absorbance is necessary to perform
before using UV-Vis to detect solution concentration. The solution was first scanned
over a range of wavelength to figure out the particular wavelength where absorbance
is maximum λmax (nm). The pure solvent was then scanned to use as a blank for
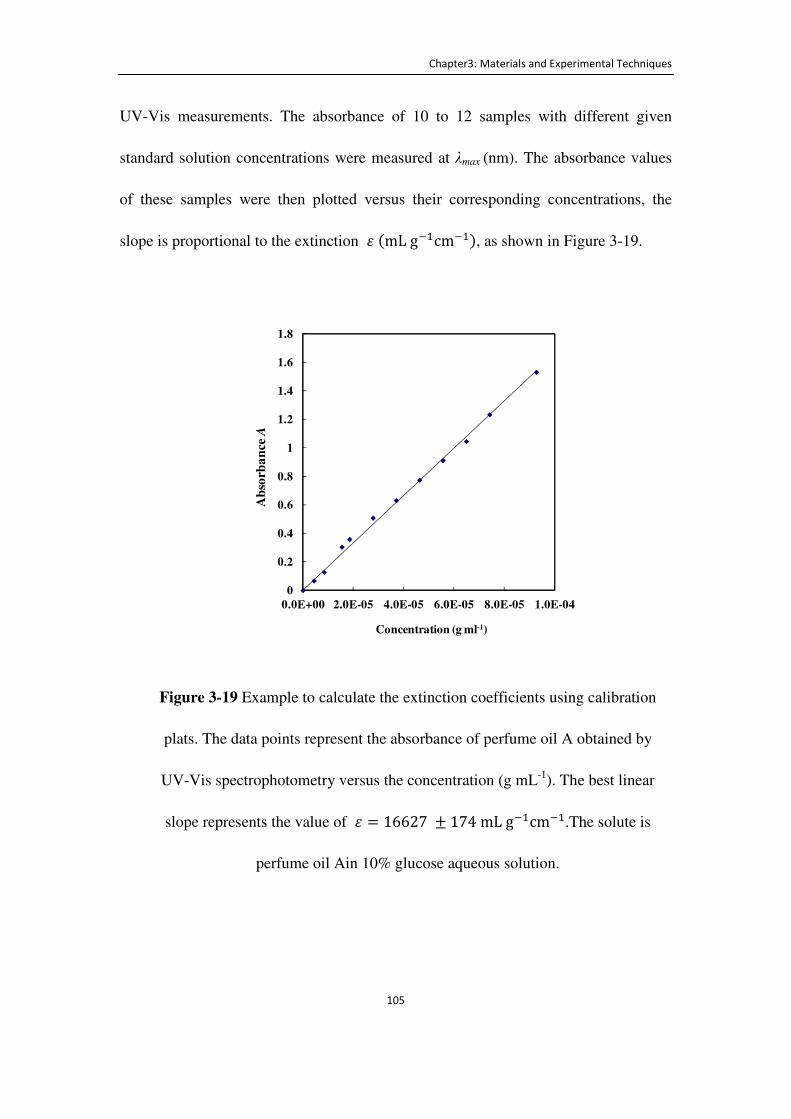
Chapter3: Materials and Experimental Techniques
105
UV-Vis measurements. The absorbance of 10 to 12 samples with different given
standard solution concentrations were measured at λmax (nm). The absorbance values
of these samples were then plotted versus their corresponding concentrations, the
slope is proportional to the extinction �(mLg��cm��), as shown in Figure 3-19.
Figure 3-19 Example to calculate the extinction coefficients using calibration
plats. The data points represent the absorbance of perfume oil A obtained by
UV-Vis spectrophotometry versus the concentration (g mL-1). The best linear
slope represents the value of � = 16627 ± 174mLg��cm��.The solute is
perfume oil Ain 10% glucose aqueous solution.
0
0.2
0.4
0.6
0.8
1
1.2
1.4
1.6
1.8
0.0E+00 2.0E-05 4.0E-05 6.0E-05 8.0E-05 1.0E-04
Ab
sorb
an
ce A
Concentration (g ml-1)
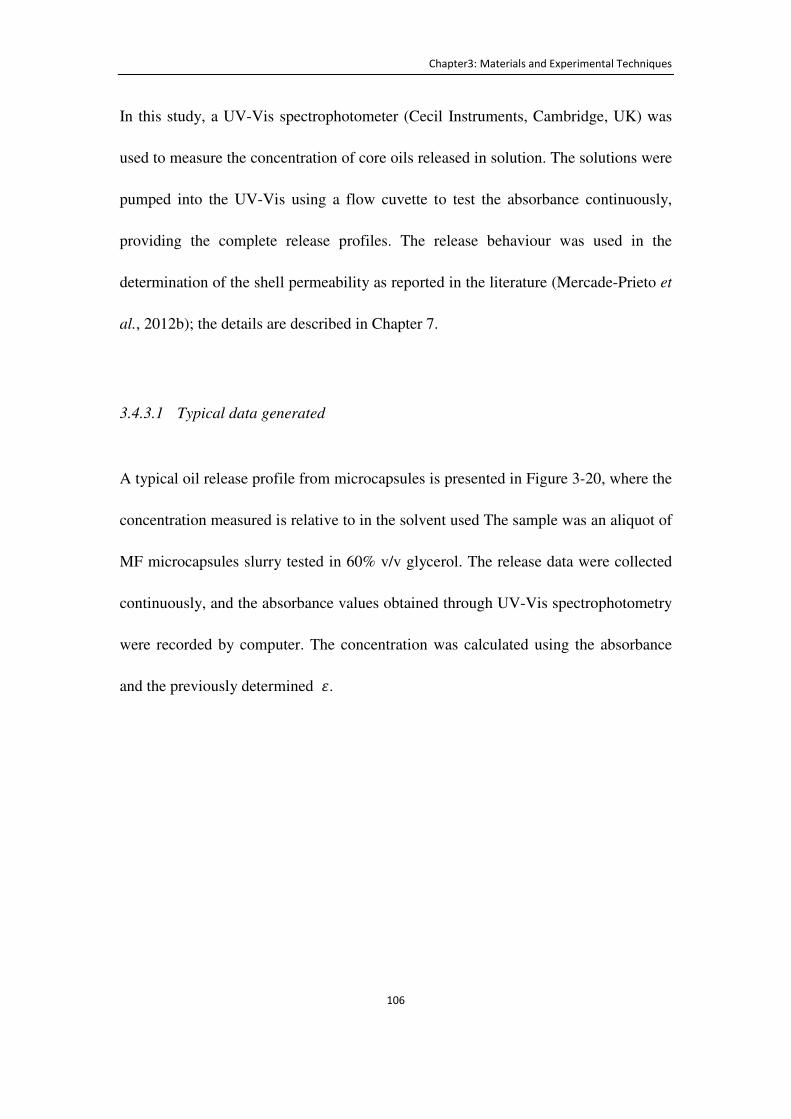
Chapter3: Materials and Experimental Techniques
106
In this study, a UV-Vis spectrophotometer (Cecil Instruments, Cambridge, UK) was
used to measure the concentration of core oils released in solution. The solutions were
pumped into the UV-Vis using a flow cuvette to test the absorbance continuously,
providing the complete release profiles. The release behaviour was used in the
determination of the shell permeability as reported in the literature (Mercade-Prieto et
al., 2012b); the details are described in Chapter 7.
3.4.3.1 Typical data generated
A typical oil release profile from microcapsules is presented in Figure 3-20, where the
concentration measured is relative to in the solvent used The sample was an aliquot of
MF microcapsules slurry tested in 60% v/v glycerol. The release data were collected
continuously, and the absorbance values obtained through UV-Vis spectrophotometry
were recorded by computer. The concentration was calculated using the absorbance
and the previously determined �.
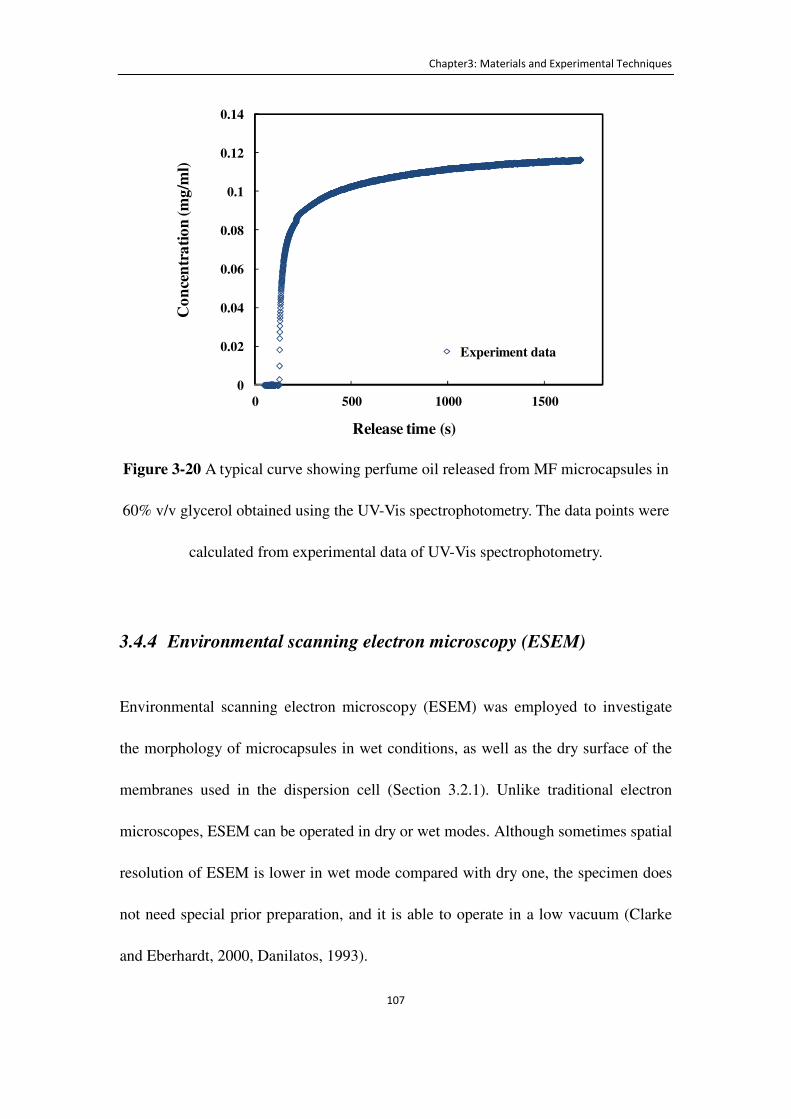
Chapter3: Materials and Experimental Techniques
107
Figure 3-20 A typical curve showing perfume oil released from MF microcapsules in
60% v/v glycerol obtained using the UV-Vis spectrophotometry. The data points were
calculated from experimental data of UV-Vis spectrophotometry.
3.4.4 Environmental scanning electron microscopy (ESEM)
Environmental scanning electron microscopy (ESEM) was employed to investigate
the morphology of microcapsules in wet conditions, as well as the dry surface of the
membranes used in the dispersion cell (Section 3.2.1). Unlike traditional electron
microscopes, ESEM can be operated in dry or wet modes. Although sometimes spatial
resolution of ESEM is lower in wet mode compared with dry one, the specimen does
not need special prior preparation, and it is able to operate in a low vacuum (Clarke
and Eberhardt, 2000, Danilatos, 1993).
0
0.02
0.04
0.06
0.08
0.1
0.12
0.14
0 500 1000 1500
Co
nce
ntr
ati
on
(m
g/m
l)
Release time (s)
Experiment data
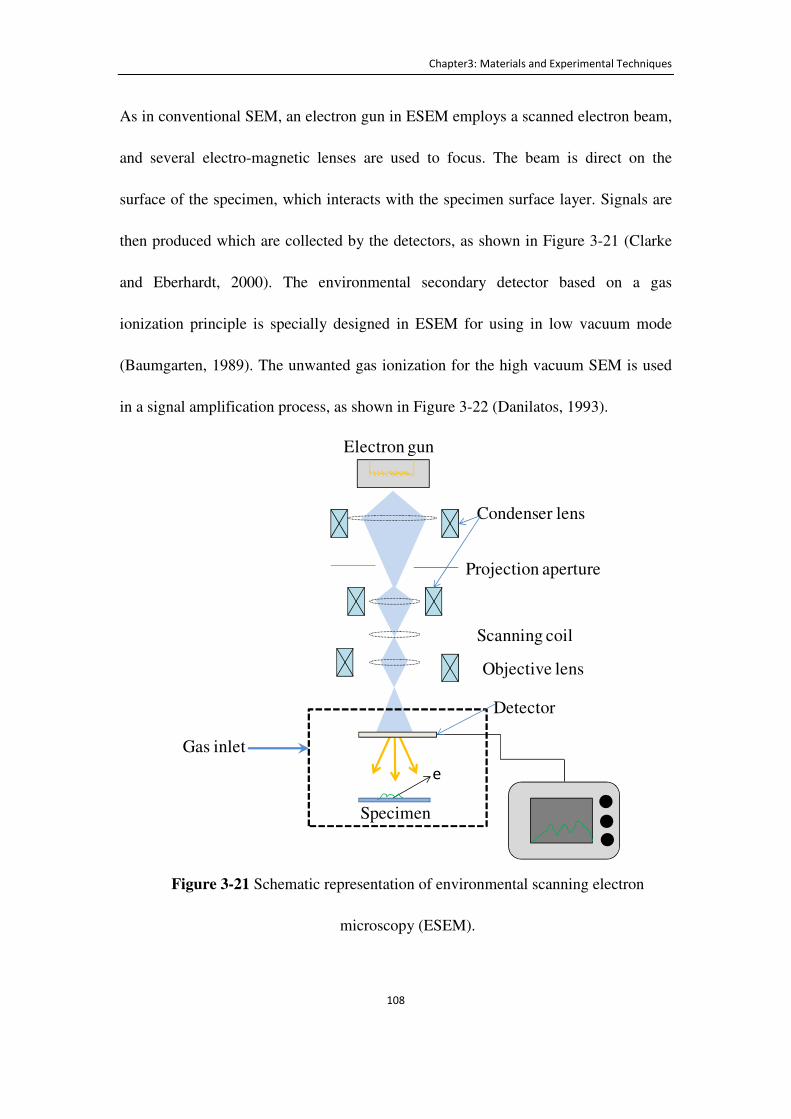
Chapter3: Materials and Experimental Techniques
108
As in conventional SEM, an electron gun in ESEM employs a scanned electron beam,
and several electro-magnetic lenses are used to focus. The beam is direct on the
surface of the specimen, which interacts with the specimen surface layer. Signals are
then produced which are collected by the detectors, as shown in Figure 3-21 (Clarke
and Eberhardt, 2000). The environmental secondary detector based on a gas
ionization principle is specially designed in ESEM for using in low vacuum mode
(Baumgarten, 1989). The unwanted gas ionization for the high vacuum SEM is used
in a signal amplification process, as shown in Figure 3-22 (Danilatos, 1993).
Figure 3-21 Schematic representation of environmental scanning electron
microscopy (ESEM).
e
Electron gun
Condenser lens
Projection aperture
Scanning coil
Objective lens
Detector
Gas inlet
Specimen

Chapter3: Materials and Experimental Techniques
109
Figure 3-22 Schematic representation of the environmental secondary detector
with gas.
3.4.4.1 Typical ESEM image
The ESEM system used in this study was a Philips XL30, Netherlands. The sample
was directly loaded into the ESEM for characterisation when using the wet mode at an
accelerating voltage from 10.0 to 15.0kV. Specimen preparation was needed when
using the dry mode. In this case, the sample was first loaded in a sputter coater
(Polaron S07640, Quorum Technologies Ltd, UK) to coat with a thin layer of gold
(about 5-6 nm) for 3 min. After rendering the microcapsule surface conductive, the
sample was loaded in ESEM and an accelerating voltage used varied from 15.0 to
20.0 kV.
A typical ESEM image of microcapsules is shown in Figure 3-23.
Gas inlet
A
Electron
Positive ion
Gas
Electron avalanche
Specimen

Chapter3: Materials and Experimental Techniques
110
Figure 3-23 A typical image of MF microcapsules obtained by ESEM (Philips XL30)
in wet mode at an accelerating voltage of 10.0 kV. The MF microcapsules were
generated in a homogenizer, see Section 4.2.1 .
3.4.5 Transmission electron microscopy (TEM)
Transmission electron microscopy (TEM) has been used to determine the shell
thickness of microcapsules (Yang et al., 2008). Microcapsules were embedded in a
LR acrylic resin, cut into thin slices, and are then made conductive by coating with
gold. All TEM measurements are taken in vacuum conditions. A coherent beam,
which is produced by an electron gun and condenser lenses, transmits through the thin
specimen to generate an image. The image is then magnified by projector lenses in the
TEM. The thicker or the denser part of the sample has less electrons transmitted
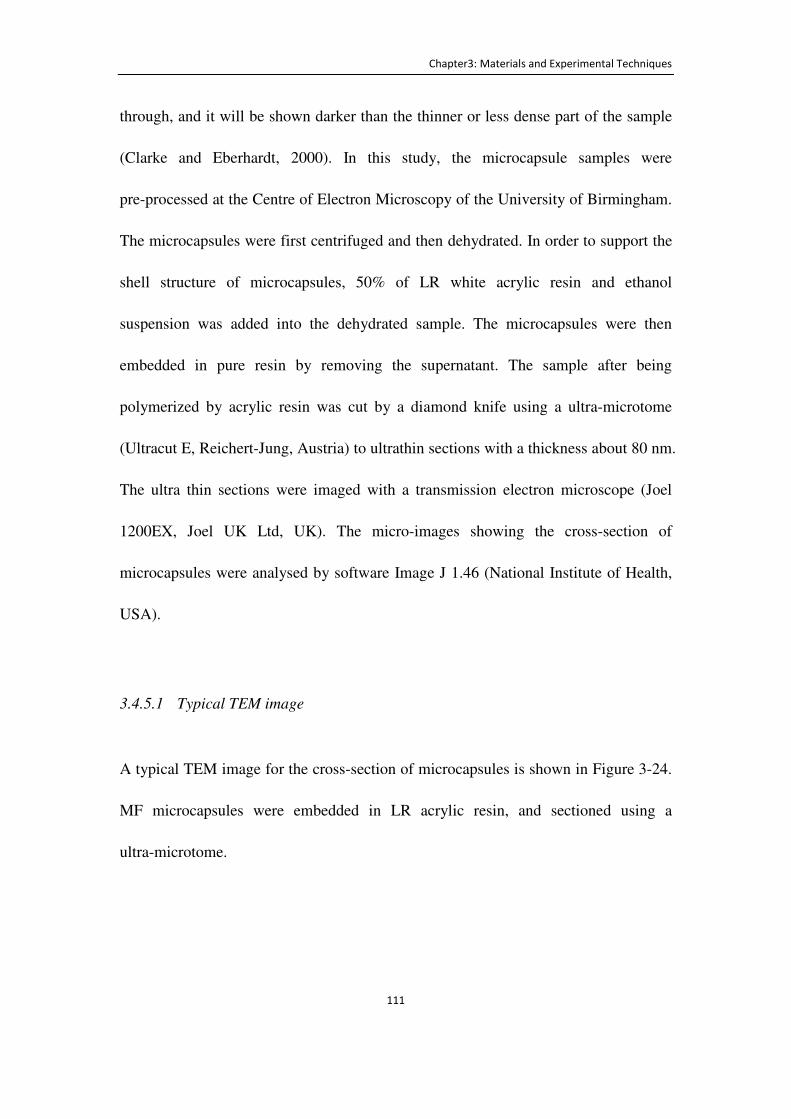
Chapter3: Materials and Experimental Techniques
111
through, and it will be shown darker than the thinner or less dense part of the sample
(Clarke and Eberhardt, 2000). In this study, the microcapsule samples were
pre-processed at the Centre of Electron Microscopy of the University of Birmingham.
The microcapsules were first centrifuged and then dehydrated. In order to support the
shell structure of microcapsules, 50% of LR white acrylic resin and ethanol
suspension was added into the dehydrated sample. The microcapsules were then
embedded in pure resin by removing the supernatant. The sample after being
polymerized by acrylic resin was cut by a diamond knife using a ultra-microtome
(Ultracut E, Reichert-Jung, Austria) to ultrathin sections with a thickness about 80 nm.
The ultra thin sections were imaged with a transmission electron microscope (Joel
1200EX, Joel UK Ltd, UK). The micro-images showing the cross-section of
microcapsules were analysed by software Image J 1.46 (National Institute of Health,
USA).
3.4.5.1 Typical TEM image
A typical TEM image for the cross-section of microcapsules is shown in Figure 3-24.
MF microcapsules were embedded in LR acrylic resin, and sectioned using a
ultra-microtome.
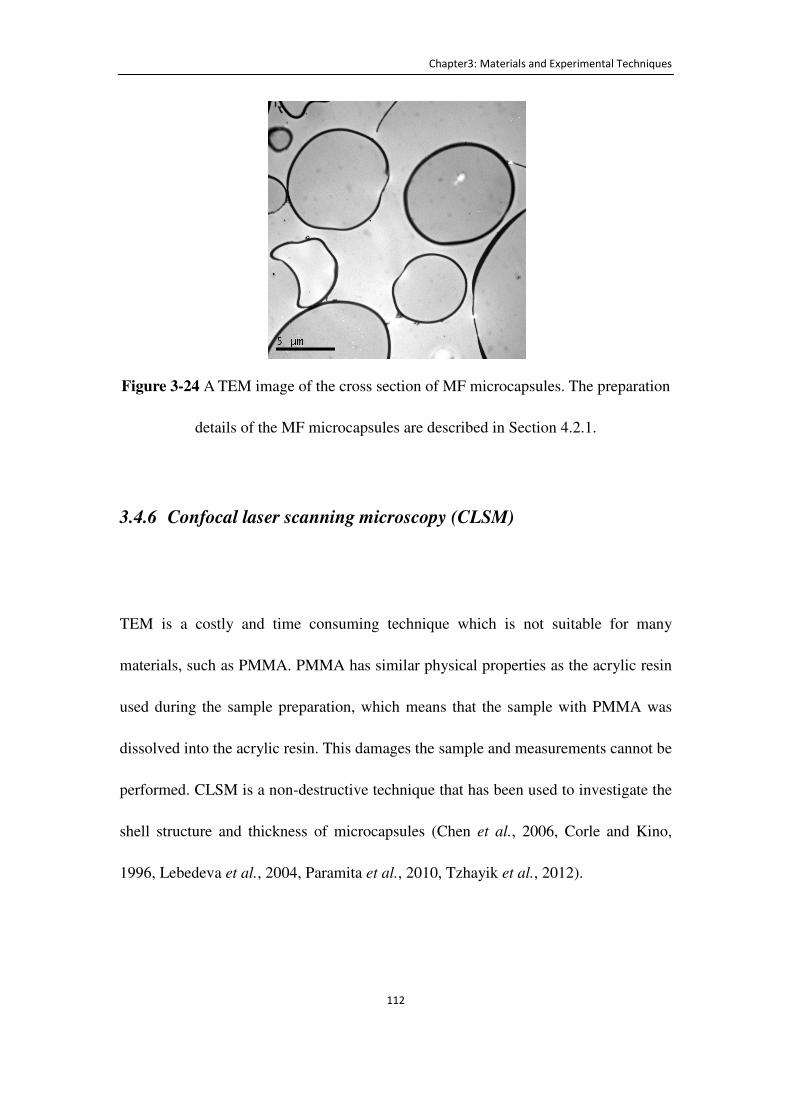
Chapter3: Materials and Experimental Techniques
112
Figure 3-24 A TEM image of the cross section of MF microcapsules. The preparation
details of the MF microcapsules are described in Section 4.2.1.
3.4.6 Confocal laser scanning microscopy (CLSM)
TEM is a costly and time consuming technique which is not suitable for many
materials, such as PMMA. PMMA has similar physical properties as the acrylic resin
used during the sample preparation, which means that the sample with PMMA was
dissolved into the acrylic resin. This damages the sample and measurements cannot be
performed. CLSM is a non-destructive technique that has been used to investigate the
shell structure and thickness of microcapsules (Chen et al., 2006, Corle and Kino,
1996, Lebedeva et al., 2004, Paramita et al., 2010, Tzhayik et al., 2012).

Chapter3: Materials and Experimental Techniques
113
CLSM permits observation of a selected layer within a relatively thick specimen, and
allows 3D image reconstruction. A laser gives a focused light spot, which passes
through an aperture and focuses within or on the surface of a specimen. In order to
use CLSM under fluorescence condition, a fluorescence dye needs to be added into
the sample before microencapsulation. Reflected light from the specimen is
recollected and separated by dichroic mirror. The reflected emission fluorescence
light then passes a pinhole, discarding all the light which does not come from the
desired focal plane. Finally, the light intensity is quantified in a photomultiplier tube
(PMT). The whole process is shown in Figure 3-25 (Chen et al., 2006, Corle and Kino,
1996, Lebedeva et al., 2004, Paramita et al., 2010, Tzhayik et al., 2012).
Figure 3-25 Schematic representation of confocal laser scanning microscopy
(CLSM).
specimen
Focus
plane
Laser
Light source
Aperture
Pinhole
Light detector
Dichroic mirror
PMT
Chapter3: Materials and Experimental Techniques
114
3.4.6.1 Typical CLSM image
A typical CLSM image of the cross section of the microcapsules is shown in Figure
3-26.
Figure 3-26 A CLSM micro-image of the cross-section of PMMA microcapsules.
3.4.7 Contact angle measurement device
A home-built apparatus with a side view microscope was used to determine the
contact angle of water on the membrane, see Figure 3-27 (Pranzetti et al., 2012).
Contact angles were used to understand the hydrophilic or hydrophobic nature of the
membrane surface used in the dispersion cell system (Micropore Technologies Ltd.,
UK.). Experiments were performed at a room temperature of 25ºC. A drop of
Millipore water (approximately 0.01 mL, Millipore, UK) was carefully placed on the
top of the membrane surface, particularly in a flat area between the pores. The image
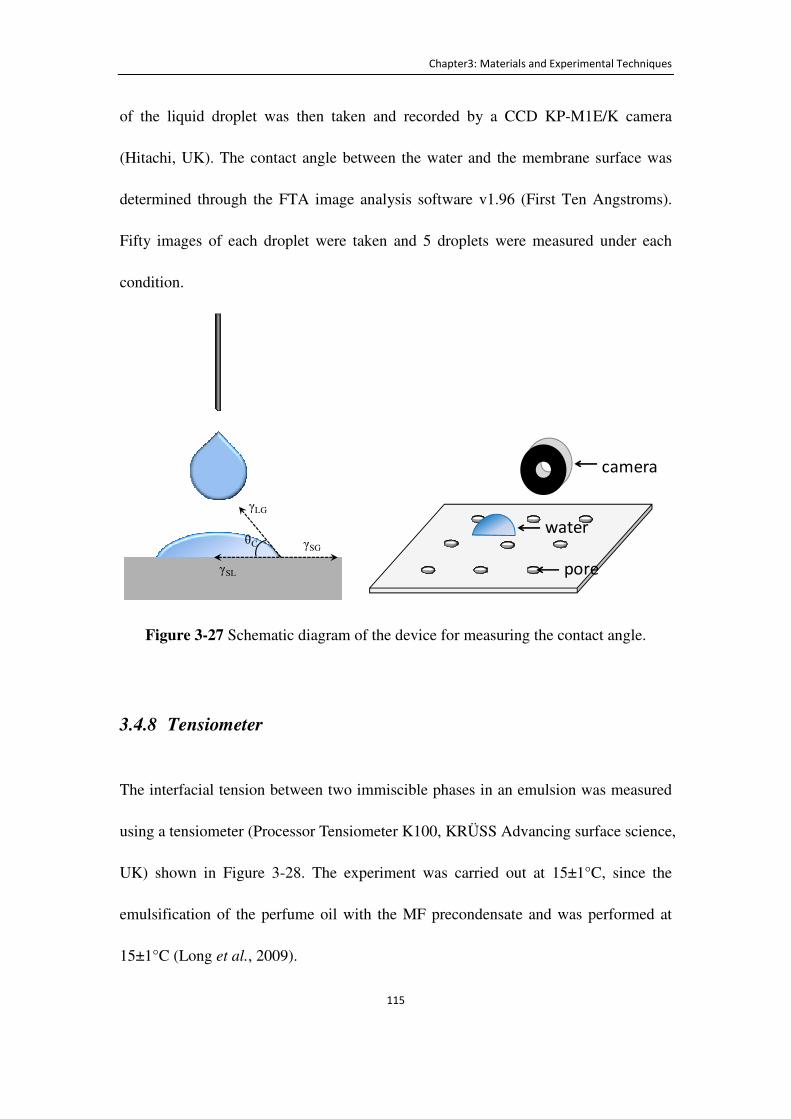
Chapter3: Materials and Experimental Techniques
115
of the liquid droplet was then taken and recorded by a CCD KP-M1E/K camera
(Hitachi, UK). The contact angle between the water and the membrane surface was
determined through the FTA image analysis software v1.96 (First Ten Angstroms).
Fifty images of each droplet were taken and 5 droplets were measured under each
condition.
Figure 3-27 Schematic diagram of the device for measuring the contact angle.
3.4.8 Tensiometer
The interfacial tension between two immiscible phases in an emulsion was measured
using a tensiometer (Processor Tensiometer K100, KRÜSS Advancing surface science,
UK) shown in Figure 3-28. The experiment was carried out at 15±1°C, since the
emulsification of the perfume oil with the MF precondensate and was performed at
15±1°C (Long et al., 2009).
γLG
θC
γSL
γSG
camera
water
pore

Chapter3: Materials and Experimental Techniques
116
Figure 3-28 Photography of the tensiometer K100 used in this study
Interfacial tension measurements were performed using a Wilhelmy plate (Drelich et
al., 2002, Mulqueen and Huibers, 2002) (Processor Tensiometer K100, KRÜSS
Advancing surface science, UK). The two tested liquid phases were placed in one
vessel, with the heavy phase at the bottom and lighter phase added onto the top. The
Wilhelmy plate is a thin platinum plate with an area of a few square centimetres,
oriented perpendicularly to the interface of the two phases during the measurement.
The plate was pushed up slowly and the force changes on the plate were measured by
a force transducer inside the tensiometer, as shown in Figure 3-29. During the process,
the force versus time data points were recorded through the tensiometer (Processor
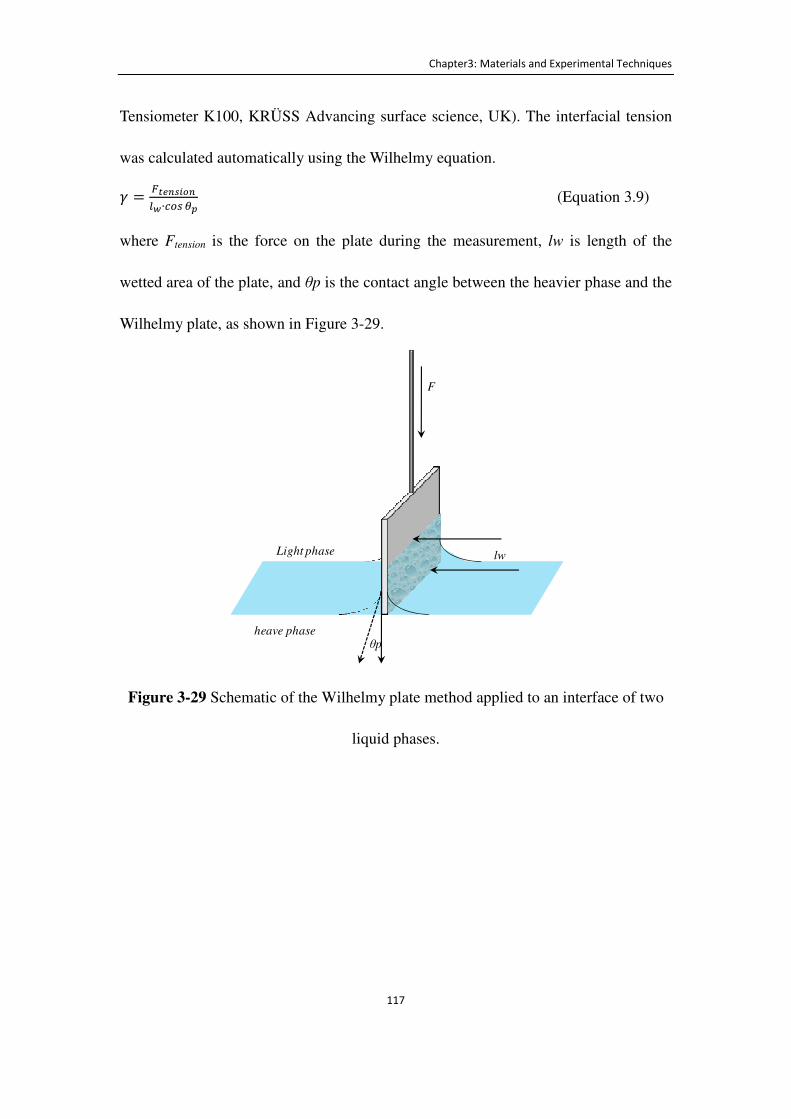
Chapter3: Materials and Experimental Techniques
117
Tensiometer K100, KRÜSS Advancing surface science, UK). The interfacial tension
was calculated automatically using the Wilhelmy equation.
d = Ö>�;�:<;�{∙)$� ×| (Equation 3.9)
where Ftension is the force on the plate during the measurement, lw is length of the
wetted area of the plate, and θp is the contact angle between the heavier phase and the
Wilhelmy plate, as shown in Figure 3-29.
Figure 3-29 Schematic of the Wilhelmy plate method applied to an interface of two
liquid phases.
F
lw
θp
Light phase
heave phase
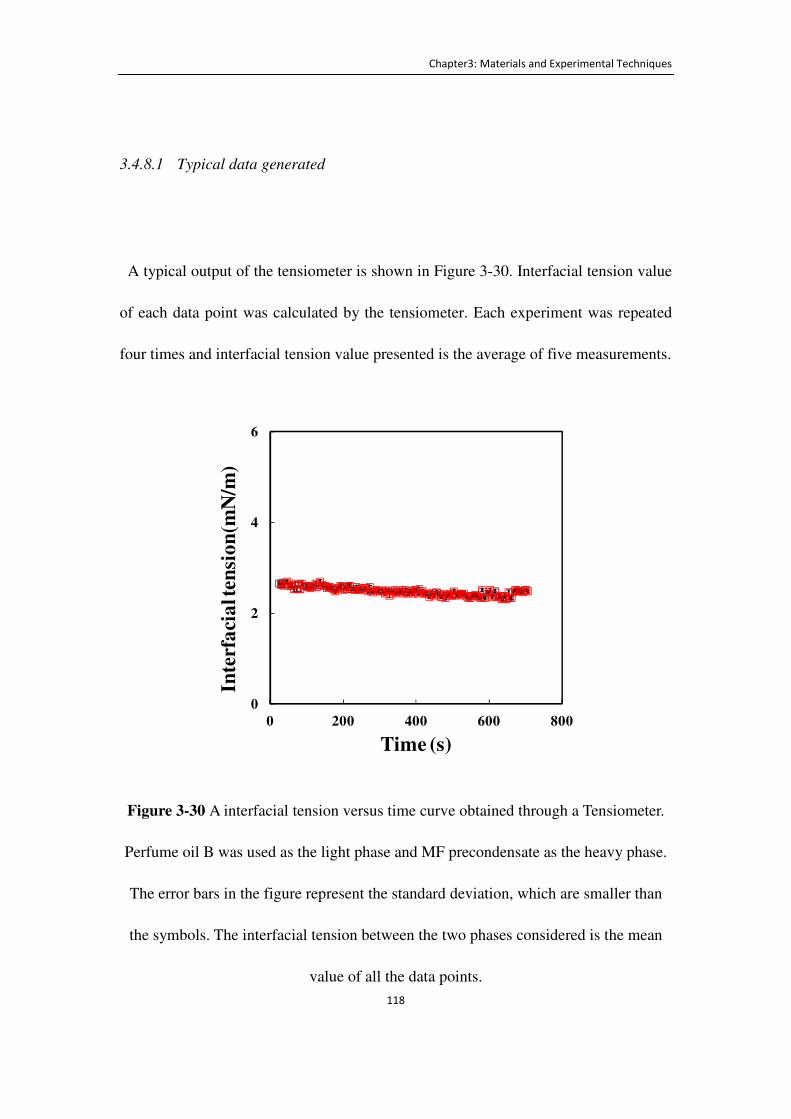
Chapter3: Materials and Experimental Techniques
118
3.4.8.1 Typical data generated
A typical output of the tensiometer is shown in Figure 3-30. Interfacial tension value
of each data point was calculated by the tensiometer. Each experiment was repeated
four times and interfacial tension value presented is the average of five measurements.
Figure 3-30 A interfacial tension versus time curve obtained through a Tensiometer.
Perfume oil B was used as the light phase and MF precondensate as the heavy phase.
The error bars in the figure represent the standard deviation, which are smaller than
the symbols. The interfacial tension between the two phases considered is the mean
value of all the data points.
0
2
4
6
0 200 400 600 800
Inte
rfa
cia
l ten
sio
n(m
N/m
)
Time (s)
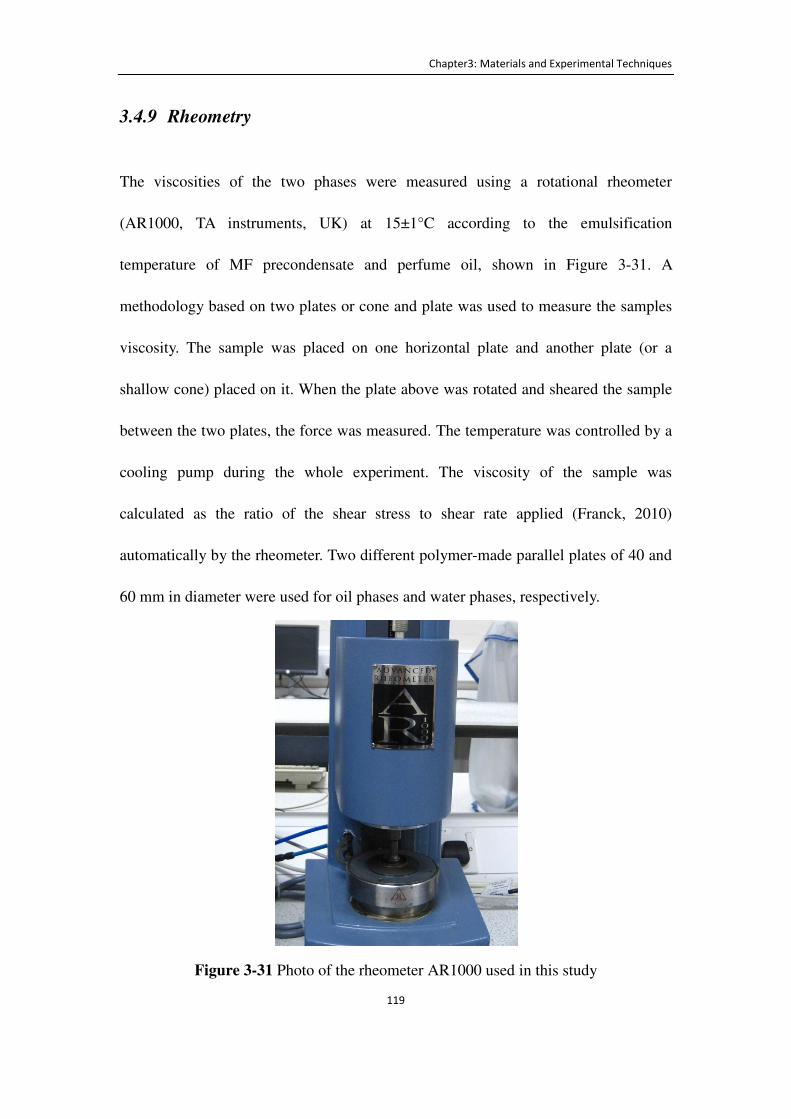
Chapter3: Materials and Experimental Techniques
119
3.4.9 Rheometry
The viscosities of the two phases were measured using a rotational rheometer
(AR1000, TA instruments, UK) at 15±1°C according to the emulsification
temperature of MF precondensate and perfume oil, shown in Figure 3-31. A
methodology based on two plates or cone and plate was used to measure the samples
viscosity. The sample was placed on one horizontal plate and another plate (or a
shallow cone) placed on it. When the plate above was rotated and sheared the sample
between the two plates, the force was measured. The temperature was controlled by a
cooling pump during the whole experiment. The viscosity of the sample was
calculated as the ratio of the shear stress to shear rate applied (Franck, 2010)
automatically by the rheometer. Two different polymer-made parallel plates of 40 and
60 mm in diameter were used for oil phases and water phases, respectively.
Figure 3-31 Photo of the rheometer AR1000 used in this study
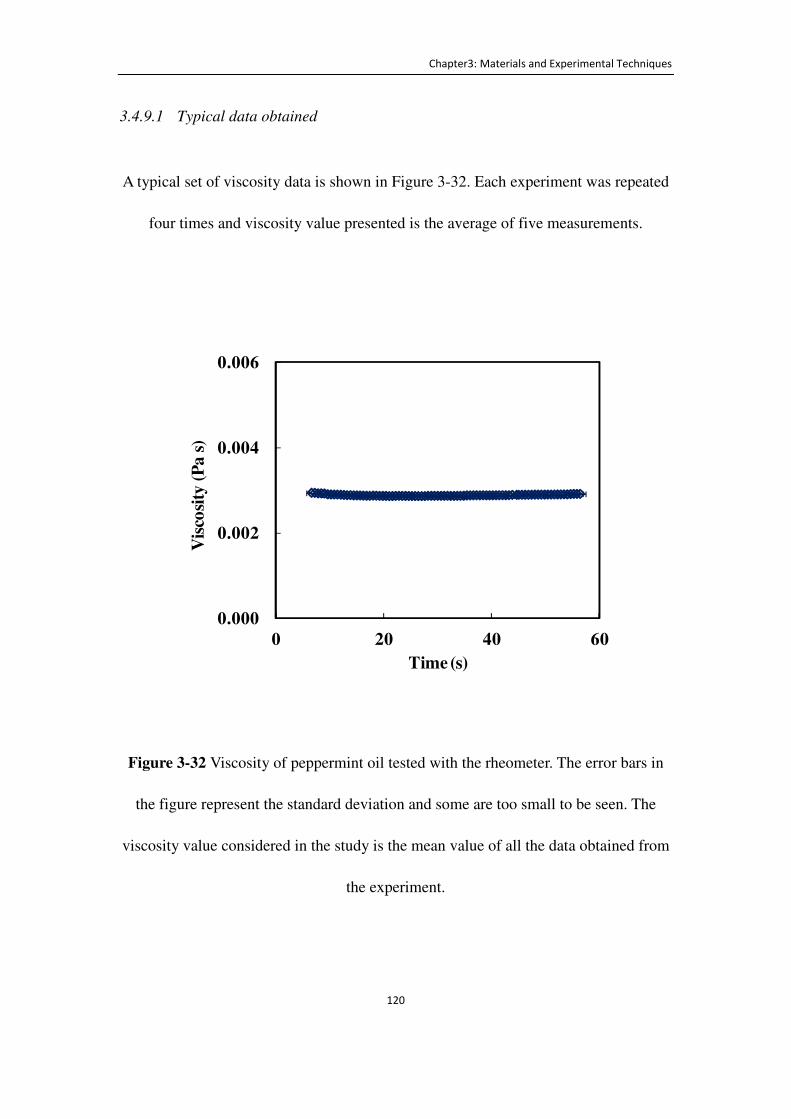
Chapter3: Materials and Experimental Techniques
120
3.4.9.1 Typical data obtained
A typical set of viscosity data is shown in Figure 3-32. Each experiment was repeated
four times and viscosity value presented is the average of five measurements.
Figure 3-32 Viscosity of peppermint oil tested with the rheometer. The error bars in
the figure represent the standard deviation and some are too small to be seen. The
viscosity value considered in the study is the mean value of all the data obtained from
the experiment.
0.000
0.002
0.004
0.006
0 20 40 60
Vis
cosi
ty (
Pa
s)
Time (s)

Chapter4 : Size and Strength Distributions of Melamine-formaldehyde Microcapsules Prepared by Membrane
Emulsification
121
Chapter 4 Size and Strength
Distributions of Melamine-
formaldehyde Microcapsules
Prepared by Membrane
Emulsification
4.1 Introduction
In this chapter, melamine formaldehyde (MF) microcapsules containing an oil-based
active ingredient (oil A) were prepared using the dispersion cell system presented in
Section 3.3. The generated emulsions were encapsulated by the in situ polymerization
of melamine formaldehyde precondensate at the interface. The effect of the process
conditions were investigated on the size and size distribution of the oil droplets
produced in the stage of emulsification and the final microcapsule. The contact angle
of the membrane surface was also studied in order to understand its impact on size
and uniformity of droplets. A simple homogenization system was also used to prepare
the microcapsules in order to compare with those produced by the membrane system.
The effect of the homogenizer agitation speed on the formed droplets was studied.
The microcapsules were characterized as described in the previous chapter.
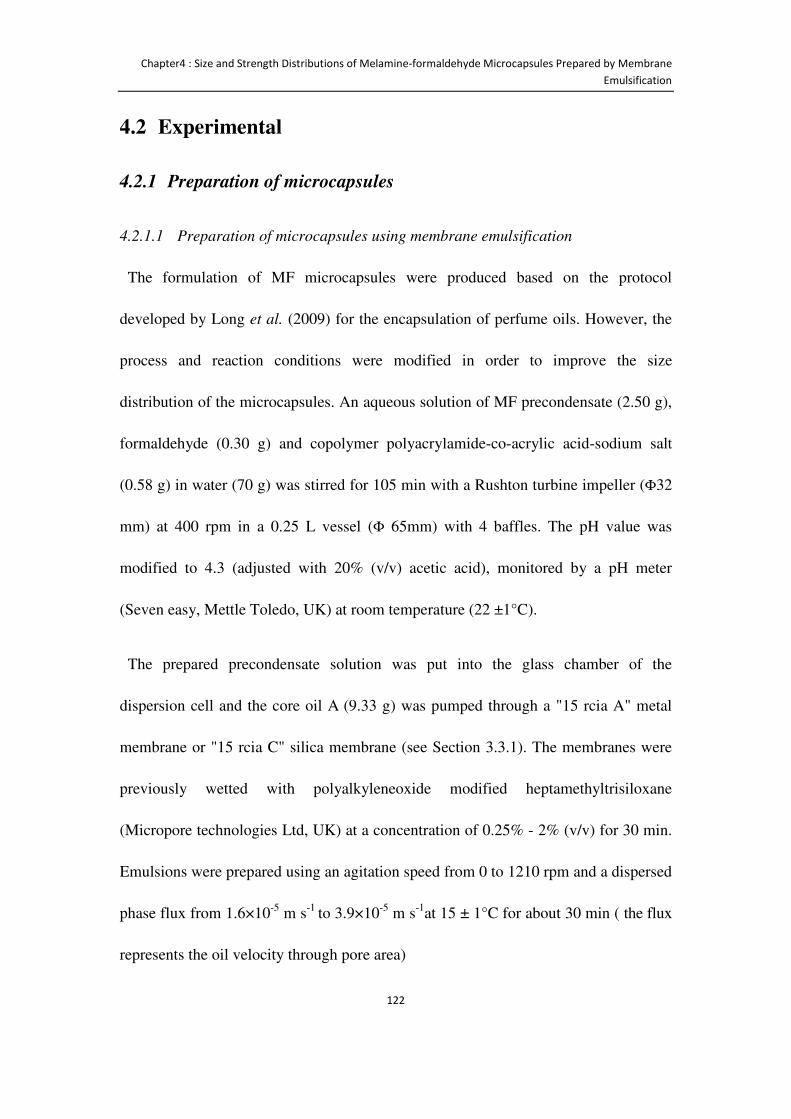
Chapter4 : Size and Strength Distributions of Melamine-formaldehyde Microcapsules Prepared by Membrane
Emulsification
122
4.2 Experimental
4.2.1 Preparation of microcapsules
4.2.1.1 Preparation of microcapsules using membrane emulsification
The formulation of MF microcapsules were produced based on the protocol
developed by Long et al. (2009) for the encapsulation of perfume oils. However, the
process and reaction conditions were modified in order to improve the size
distribution of the microcapsules. An aqueous solution of MF precondensate (2.50 g),
formaldehyde (0.30 g) and copolymer polyacrylamide-co-acrylic acid-sodium salt
(0.58 g) in water (70 g) was stirred for 105 min with a Rushton turbine impeller (Φ32
mm) at 400 rpm in a 0.25 L vessel (Φ 65mm) with 4 baffles. The pH value was
modified to 4.3 (adjusted with 20% (v/v) acetic acid), monitored by a pH meter
(Seven easy, Mettle Toledo, UK) at room temperature (22 ±1°C).
The prepared precondensate solution was put into the glass chamber of the
dispersion cell and the core oil A (9.33 g) was pumped through a "15 rcia A" metal
membrane or "15 rcia C" silica membrane (see Section 3.3.1). The membranes were
previously wetted with polyalkyleneoxide modified heptamethyltrisiloxane
(Micropore technologies Ltd, UK) at a concentration of 0.25% - 2% (v/v) for 30 min.
Emulsions were prepared using an agitation speed from 0 to 1210 rpm and a dispersed
phase flux from 1.6×10⁻⁵ m s-1 to 3.9×10⁻⁵ m s-1at 15 ± 1°C for about 30 min ( the flux
represents the oil velocity through pore area)
Chapter4 : Size and Strength Distributions of Melamine-formaldehyde Microcapsules Prepared by Membrane
Emulsification
123
The resulting emulsion was transferred back to the stirred vessel, where it was
agitated again with the Rushton turbine impeller at 125 rpm to make sure there was no
oil droplet breakage at 15 ± 1°C for 30 min. Finally, the emulsion was placed into a
water bath at room temperature (SUB SQUA5, Grant Instruments Cambridge Ltd.,
UK); which was then heated to 45 ± 1°C, 55 ± 1°C or 65 ± 1 °C., The high
temperatures induced the polymerization of the MF precondensate, which were left
for 6 h. The resulting microcapsules in suspension were cooled to 25 ± 1 °C, and the
pH was raised to 10 (adjusted with 1 M NaOH) to terminate the polymerization
reaction. The whole process is schematically shown in Figure 4-1.
Figure 4-1 Schematic diagram of preparing MF microcapsules using a flat membrane
combined with a stirred system.
(a) Pre-cross-linking (b) Emulsification (c) Polymerization
4.2.1.2 Preparation of microcapsules using conventional homogenization
Microcapsules were also prepared using a conventional homogenizer for comparison
with a widely used technique. A homogenizer with 4 blades impeller (Φ 30mm) in the
Chapter4 : Size and Strength Distributions of Melamine-formaldehyde Microcapsules Prepared by Membrane
Emulsification
124
middle coated with a membrane tube (Φ 35mm) with regular round pores (Model
L4RT, Silverson Machines Ltd., UK) was applied to generate broad emulsions.
Emulsions were generated at speeds from 400 rpm to 2500 rpm for 30 min at 15 ±
1 °C. The rest of the process conditions were the same as those for preparation of MF
microcapsules by the membrane emulsification.
4.2.1.3 Preparation of microcapsules with fluorescent dye
Microcapsules with a fluorescent dye were prepared under the same conditions
described above except that Rhodamine B with a concentration of 0.01% (w/w) was
added to the core oil before the emulsification step.
4.2.2 Morphology and shell thickness of microcapsules
The surface morphology of the microcapsules was characterised by optical
microscopy (Leica DMRBE, Leica, UK) and environmental scanning electron
microscopy (ESEM) (FEI/Philips XL30 ESEM-FEG, Philips, UK).
The structure and thickness of the microcapsule shell were studied by transmission
electron microscopy (TEM) (JEOL 1200EX, Jeol Ltd, UK). The ultrathin
microcapsule sections of microcapsules were captured at an acceleration voltage of
Chapter4 : Size and Strength Distributions of Melamine-formaldehyde Microcapsules Prepared by Membrane
Emulsification
125
10.0kV through TEM. For each batch, 50 microcapsules were randomly selected;
8-10 measurements along the circumference were made on each single microcapsule.
Confocal laser scanning microscopy (CLSM) (Leica TCS SPE, Germany) was also
used to determine shell thicknesses of microcapsules with a fluorescent dye. The
excitation wavelength (510 nm) was chosen according to the fluorescent dye
Rhodamine B. For each batch, 20 microcapsules with the fluorescent dye RB were
randomly selected and 4 measurements were performed on the cross-section at
different directions. The micro-images obtained by both techniques: TEM and CLSM
were then analysed by Image J 1.46 (National Institute of Health, USA).
4.2.3 Size analysis
The mean size and size distribution of the oil droplets produced in the stage of
emulsification and the final microcapsules were determined using a laser diffraction
technique (Mastersizer 2000, Malvern Instruments, UK). The data of SPAN, CV,
Sauter mean diameters D3,2 and volume mean diameter D4,3 were recorded.
The experiments to measure oil droplet and microcapsule size distributions were
performed at 25 ± 1 °C. The refractive index of the oil is 1.497 (given by the supplier
P&G, UK) and that of the microcapsules is 1.65 (Long et al., 2009). The values of the
Chapter4 : Size and Strength Distributions of Melamine-formaldehyde Microcapsules Prepared by Membrane
Emulsification
126
mean diameter and size distribution data of droplets as well as microcapsules are the
average of five measurements.
4.2.4 Measurement of the mechanical strength of single microcapsules
The rupture force, displacement at rupture, and diameter of single microcapsules were
determined by a well-established micromanipulation technique (Sun and Zhang,
2001). One drop of suspension with microcapsules was diluted with double distilled
water and placed on a glass slide and the microcapsules were left to dry in air for 2-3
min. Single microcapsules were observed with side-view and bottom-view
microscopes (Micro Instruments Ltd., Oxon, UK). A glass probe of 160 μm in
diameter which was connected to a force transducer (Model 405A, Aurora Scientific
Inc., Canada) that was mounted on a fine micromanipulator (Micro Instruments Ltd.,
Oxon, UK), which was programmed to travel towards a single microcapsule at a
speed of 2µm/s to compress the microcapsule to rupture. 50 microcapsules in each
sample were randomly selected and tested at 25 ± 1°C. Details of this technique are
described in Section 3.4.2.
Chapter4 : Size and Strength Distributions of Melamine-formaldehyde Microcapsules Prepared by Membrane
Emulsification
127
4.3 Results and discussion
4.3.1 The effect of membrane surface hydrophilicity on the mean size
and size distribution of oil droplets
The properties of the membrane can influence the performances of the emulsification
process using the dispersion cell system (Peng and Williams, 1998b). The membrane
surface hydrophilicity is one of the factors which may affect the size and size
distribution of emulsion droplets produced by the membrane system. Contact angle
between pure water and the membrane surface is one of the parameters used to
determine the membrane surface hydrophilicity. Hydrophilic surface will have smaller
contact angle using pure water than hydrophobic ones. This characterization is
important because a hydrophilic membrane surface is one of the conditions to obtain
uniform emulsion droplets (Wang et al., 2005, Zhou et al., 2007). One of the common
ways to change the membrane surface hydrophilicity is by soaking the membrane into
a wetting agent or in the solution used as the continuous phase (Boom, 2003). It is
also mentioned in the literature that wetting the membrane with the dispersed phase
must be avoided in order to generate mono-sized droplets (Nakashima et al., 1991,
Nakashima et al., 2000). In this study, a special wetting agent was used to treat the
membrane surface.
Chapter4 : Size and Strength Distributions of Melamine-formaldehyde Microcapsules Prepared by Membrane
Emulsification
128
Figure 4-2 (a) shows the mean droplet diameter D4,3, CV and SPAN values for a given
agitation speed of 1080 rpm and dispersed phase flux 1.6×10⁻⁵ m s-1, using a
membrane "15 rcia A", treated with different concentrations of wetting agent for 30
min. The mean diameter and SPAN values of the oil droplets are broadly in good
agreement with those reported for sunflower oil droplets produced using a similar
device (Kosvintsev et al., 2005).
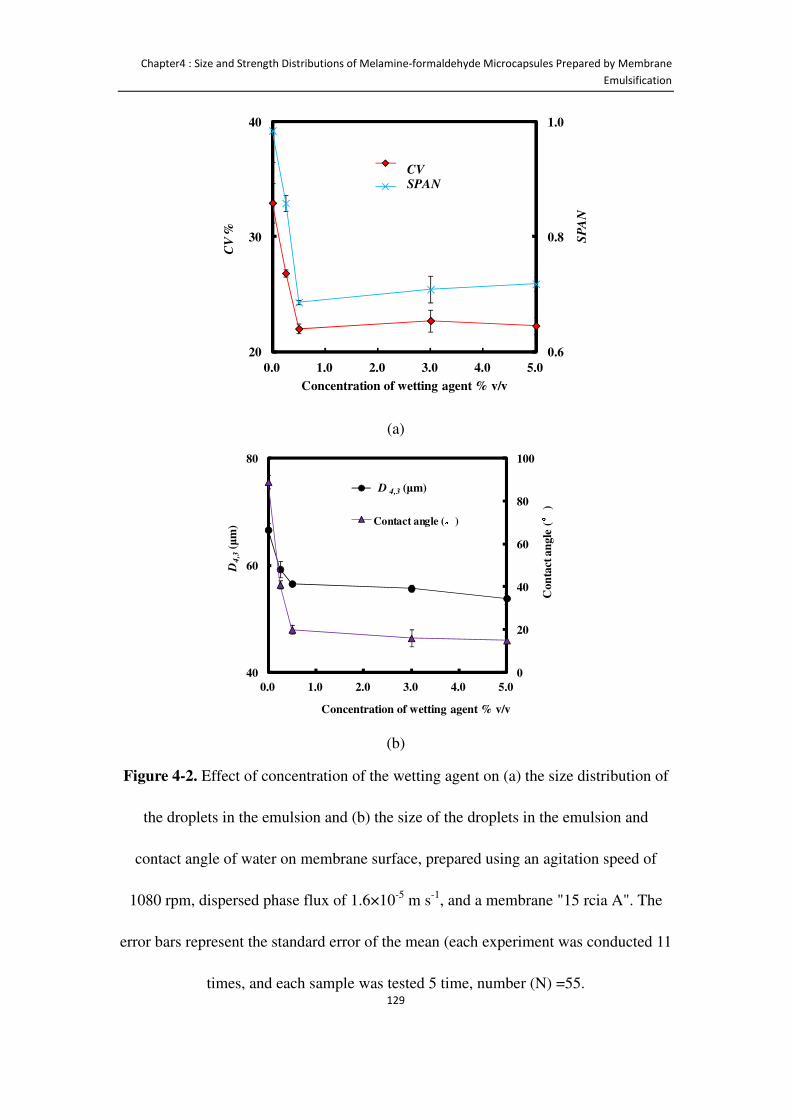
Chapter4 : Size and Strength Distributions of Melamine-formaldehyde Microcapsules Prepared by Membrane
Emulsification
129
(a)
(b)
Figure 4-2. Effect of concentration of the wetting agent on (a) the size distribution of
the droplets in the emulsion and (b) the size of the droplets in the emulsion and
contact angle of water on membrane surface, prepared using an agitation speed of
1080 rpm, dispersed phase flux of 1.6×10⁻⁵ m s-1, and a membrane "15 rcia A". The
error bars represent the standard error of the mean (each experiment was conducted 11
times, and each sample was tested 5 time, number (N) =55.
0.6
0.8
1.0
20
30
40
0.0 1.0 2.0 3.0 4.0 5.0
SP
AN
CV
%
Concentration of wetting agent % v/v
CV
SPAN
CVSPAN
0
20
40
60
80
100
40
60
80
0.0 1.0 2.0 3.0 4.0 5.0
Con
tact
an
gle
(
°°°°)
D4
,3(μ
m)
Concentration of wetting agent % v/v
Diameter
Contact angle (。。。。)
D 4,3 (μm)
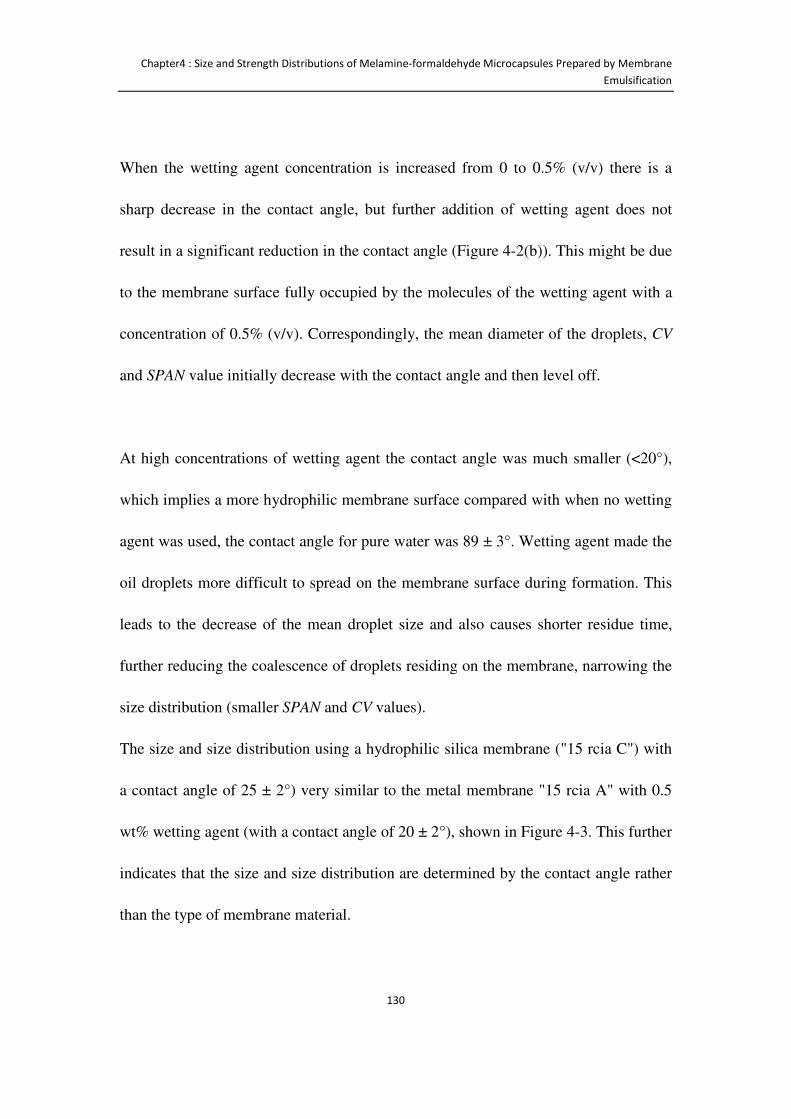
Chapter4 : Size and Strength Distributions of Melamine-formaldehyde Microcapsules Prepared by Membrane
Emulsification
130
When the wetting agent concentration is increased from 0 to 0.5% (v/v) there is a
sharp decrease in the contact angle, but further addition of wetting agent does not
result in a significant reduction in the contact angle (Figure 4-2(b)). This might be due
to the membrane surface fully occupied by the molecules of the wetting agent with a
concentration of 0.5% (v/v). Correspondingly, the mean diameter of the droplets, CV
and SPAN value initially decrease with the contact angle and then level off.
At high concentrations of wetting agent the contact angle was much smaller (<20°),
which implies a more hydrophilic membrane surface compared with when no wetting
agent was used, the contact angle for pure water was 89 ± 3°. Wetting agent made the
oil droplets more difficult to spread on the membrane surface during formation. This
leads to the decrease of the mean droplet size and also causes shorter residue time,
further reducing the coalescence of droplets residing on the membrane, narrowing the
size distribution (smaller SPAN and CV values).
The size and size distribution using a hydrophilic silica membrane ("15 rcia C") with
a contact angle of 25 ± 2°) very similar to the metal membrane "15 rcia A" with 0.5
wt% wetting agent (with a contact angle of 20 ± 2°), shown in Figure 4-3. This further
indicates that the size and size distribution are determined by the contact angle rather
than the type of membrane material.
Chapter4 : Size and Strength Distributions of Melamine-formaldehyde Microcapsules Prepared by Membrane
Emulsification
131
Figure 4-3. Size distribution of droplets in emulsions generated by different
membrane materials. Squares: "15 rcia C" silica membrane; diamonds: "15 rcia A"
metal membrane. The emulsions were prepared using an agitation speed of 1080 rpm
and dispersed phase flux of 1.6×10⁻⁵ m s-1. For "15 rcia A", a wetting agent
concentration of 0.5% (v/v) was used.
Since the contact angle did not decrease significantly when the concentration of the
wetting agent was greater than 0.5% (v/v) (Figure 4-2), this concentration was used in
further experiments.
0
5
10
15
20
25
10 100
Vo
lum
e (%
)
Droplets size (μm)
15 rcia C 15 rcia A
Chapter4 : Size and Strength Distributions of Melamine-formaldehyde Microcapsules Prepared by Membrane
Emulsification
132
4.3.2 Stability of the oil/water emulsion
The size distribution of the droplets in the formed emulsion was measured after being
stored up to 4 h to assess their storage stability. This was performed since it took a
quite few minutes before microcapsules where formed from the emulsions. Figure 4-4
shows that there is no significant change of the values of mean diameter D4,3, CV and
SPAN of the droplets within 4 h. Therefore, the emulsions were considered stable
during this period.
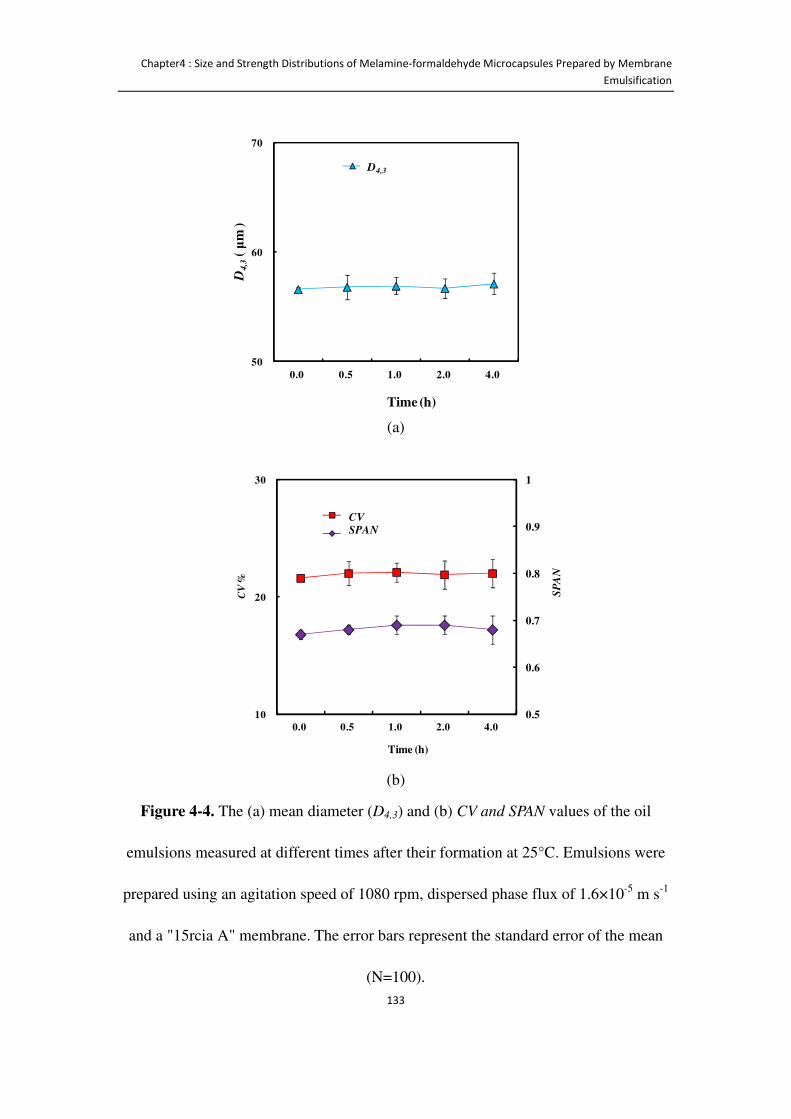
Chapter4 : Size and Strength Distributions of Melamine-formaldehyde Microcapsules Prepared by Membrane
Emulsification
133
(a)
(b)
Figure 4-4. The (a) mean diameter (D4,3) and (b) CV and SPAN values of the oil
emulsions measured at different times after their formation at 25°C. Emulsions were
prepared using an agitation speed of 1080 rpm, dispersed phase flux of 1.6×10⁻⁵ m s-1
and a "15rcia A" membrane. The error bars represent the standard error of the mean
(N=100).
50
60
70
0.0 0.5 1.0 2.0 4.0
D4,3
( μ
m )
Time (h)
D 4,3D4,3
0.5
0.6
0.7
0.8
0.9
1
10
20
30
0.0 0.5 1.0 2.0 4.0
SP
AN
CV
%
Time (h)
CV
SPAN
CV
SPAN

Chapter4 : Size and Strength Distributions of Melamine-formaldehyde Microcapsules Prepared by Membrane
Emulsification
134
4.3.3 Effects of process conditions on the mean size and size
distribution of oil droplets
Figure 4-5 presents the effect of the agitation speed in the dispersion cell on the
droplet size and size distribution at a fixed dispersed phase flux. The SPAN/CV values
first decrease and then increase with increasing agitation speed, reaching a minimum
at an agitation speed of ~1080 rpm. In contrast, the mean diameter D4,3 decreases
continuously with increasing agitation speed. When droplets are formed on the
membrane surface, they can stay there for a period of time, and their size can grow
(Christov et al., 2002). To a certain point, the adjacent droplets may meet each other
and coalesce, which can result in an increase in the size distribution, i.e. increase in
SPAN/CV values. As the stirred speed increases, the shear force generated on the
membrane surface also increases, which reduces the residence time of the formed
droplets on the surface, leading to smaller mean droplet diameter and less coalescence
(reducing SPAN/CV values), as observed in Figure 4-5. However, a too high agitation
speed ( > 1080rpm) might cause breakage of the droplets, resulting in further
reduction in the mean size but also a wider size distribution. It is difficult to predict
the optimum agitation speed theoretically, but the speed can be determined from
experiments.
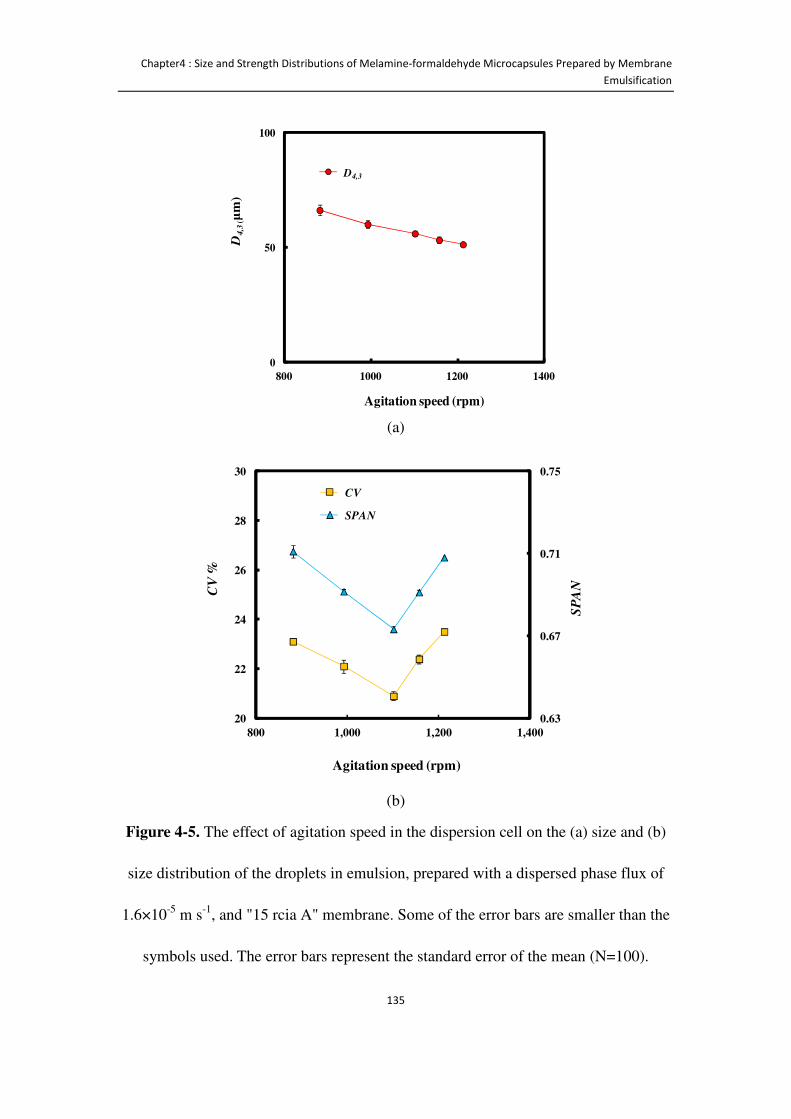
Chapter4 : Size and Strength Distributions of Melamine-formaldehyde Microcapsules Prepared by Membrane
Emulsification
135
(a)
(b)
Figure 4-5. The effect of agitation speed in the dispersion cell on the (a) size and (b)
size distribution of the droplets in emulsion, prepared with a dispersed phase flux of
1.6×10⁻⁵ m s-1, and "15 rcia A" membrane. Some of the error bars are smaller than the
symbols used. The error bars represent the standard error of the mean (N=100).
0
50
100
800 1000 1200 1400
D4,3
(μm
)
Agitation speed (rpm)
D4,3D4,3
0.63
0.67
0.71
0.75
20
22
24
26
28
30
800 1,000 1,200 1,400
SP
ANCV
%
Agitation speed (rpm)
CV
SPAN
CV
SPAN
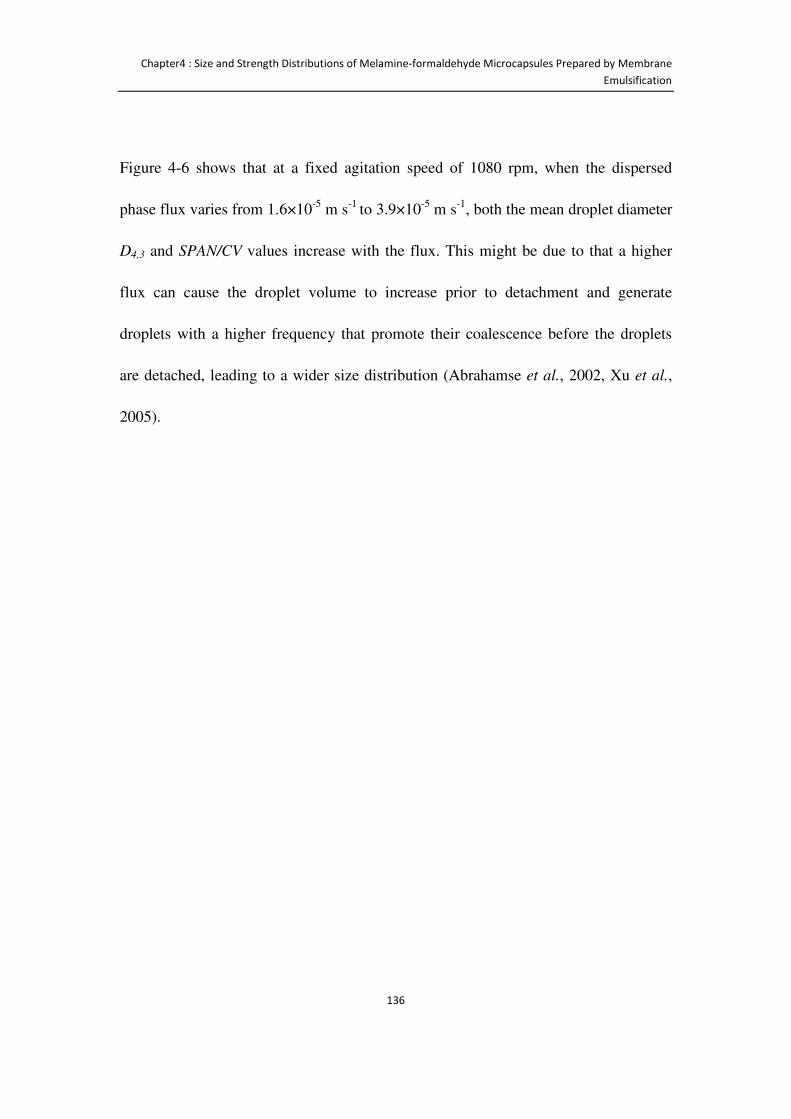
Chapter4 : Size and Strength Distributions of Melamine-formaldehyde Microcapsules Prepared by Membrane
Emulsification
136
Figure 4-6 shows that at a fixed agitation speed of 1080 rpm, when the dispersed
phase flux varies from 1.6×10⁻⁵ m s-1 to 3.9×10⁻⁵ m s-1, both the mean droplet diameter
D4,3 and SPAN/CV values increase with the flux. This might be due to that a higher
flux can cause the droplet volume to increase prior to detachment and generate
droplets with a higher frequency that promote their coalescence before the droplets
are detached, leading to a wider size distribution (Abrahamse et al., 2002, Xu et al.,
2005).
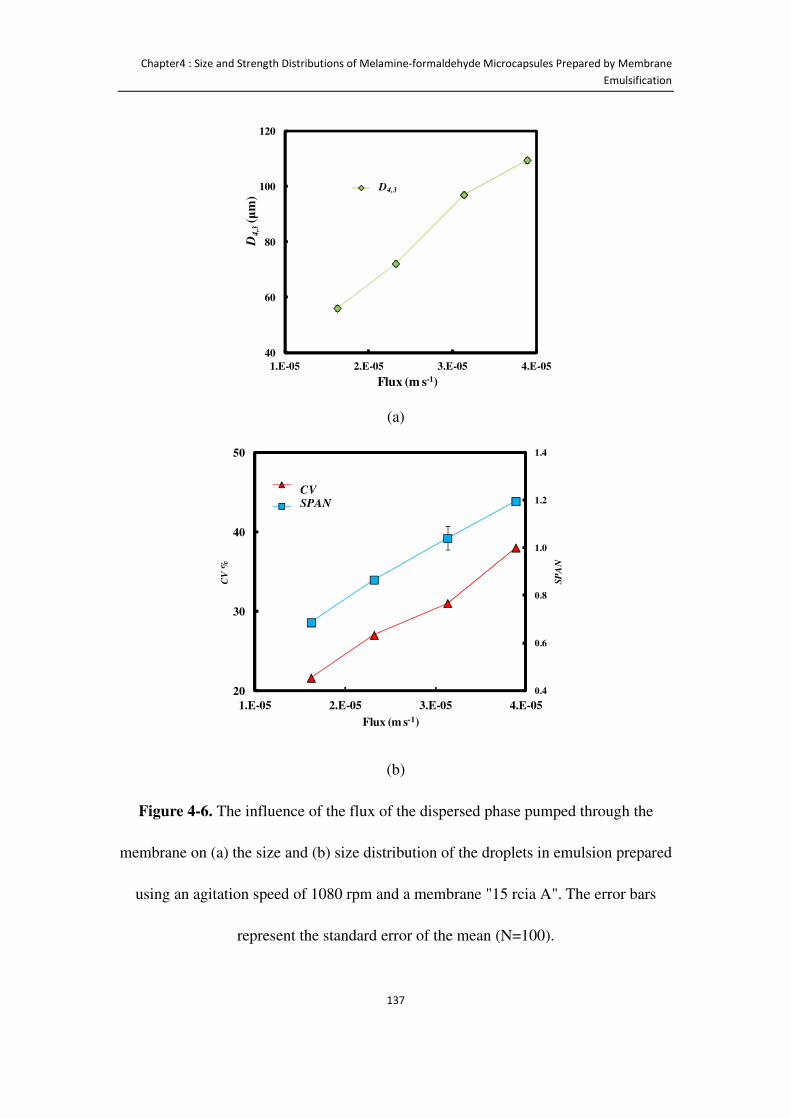
Chapter4 : Size and Strength Distributions of Melamine-formaldehyde Microcapsules Prepared by Membrane
Emulsification
137
(a)
(b)
Figure 4-6. The influence of the flux of the dispersed phase pumped through the
membrane on (a) the size and (b) size distribution of the droplets in emulsion prepared
using an agitation speed of 1080 rpm and a membrane "15 rcia A". The error bars
represent the standard error of the mean (N=100).
40
60
80
100
120
1.E-05 2.E-05 3.E-05 4.E-05
D4
,3(μ
m)
Flux (m s-1)
D4,3D4,3
0.4
0.6
0.8
1.0
1.2
1.4
20
30
40
50
1.E-05 2.E-05 3.E-05 4.E-05
SP
AN
CV
%
Flux (m s-1)
CV
SPAN
CVSPAN
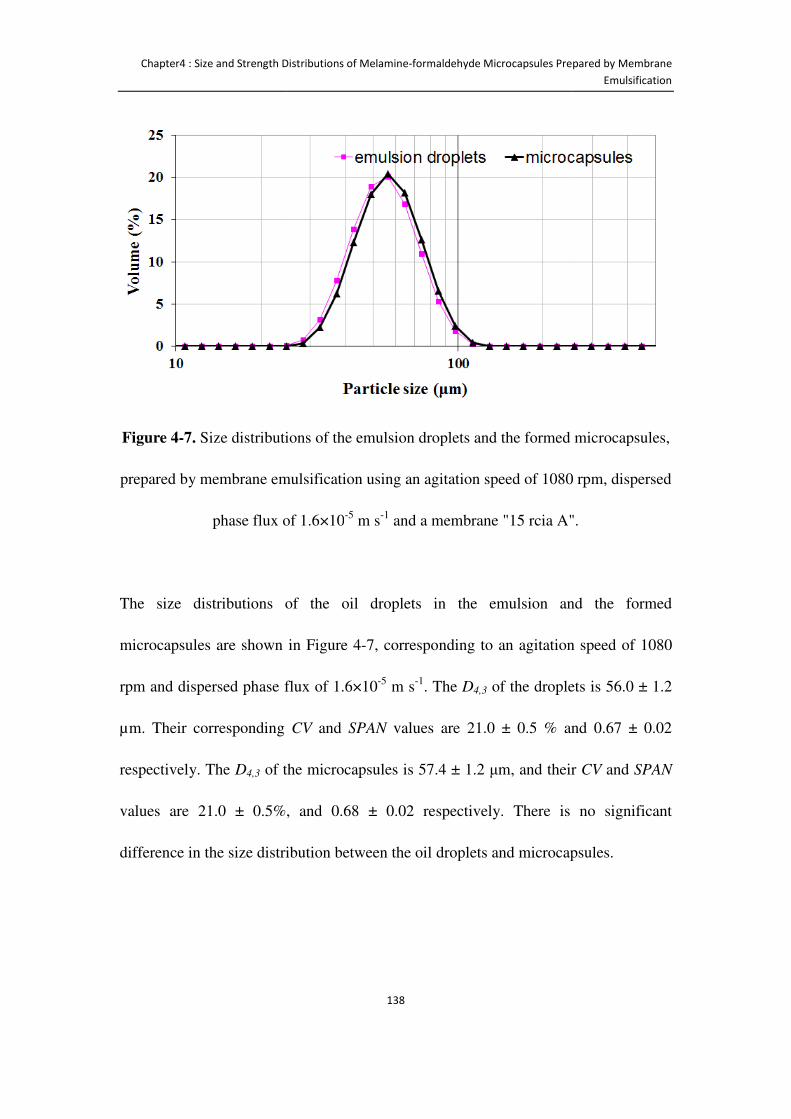
Chapter4 : Size and Strength Distributions of Melamine
Figure 4-7. Size distributions of the emulsion droplets and the formed microcapsules,
prepared by membrane emulsification using an agitat
phase flux of 1.6×10
The size distributions of the oil droplets in the emulsion and the formed
microcapsules are shown in Figure 4
rpm and dispersed phase flux of
µm. Their corresponding
respectively. The D4,3 of the microcapsules is 57.4
values are 21.0 ± 0.5%, and 0.68
difference in the size distribution between the oil droplets and microcapsules.
Chapter4 : Size and Strength Distributions of Melamine-formaldehyde Microcapsules Prepared by Membrane
138
Size distributions of the emulsion droplets and the formed microcapsules,
prepared by membrane emulsification using an agitation speed of 1080 rpm, dispersed
phase flux of 1.6×10⁻⁵ m s-1 and a membrane "15 rcia A"
ize distributions of the oil droplets in the emulsion and the formed
microcapsules are shown in Figure 4-7, corresponding to an agitation speed of 1080
dispersed phase flux of 1.6×10⁻⁵ m s-1. The D4,3 of the droplets is 56.0 ± 1.2
µm. Their corresponding CV and SPAN values are 21.0 ± 0.5 % and 0.67 ± 0.02
of the microcapsules is 57.4 ± 1.2 μm, and their
%, and 0.68 ± 0.02 respectively. There is no significant
difference in the size distribution between the oil droplets and microcapsules.
Microcapsules Prepared by Membrane
Emulsification
Size distributions of the emulsion droplets and the formed microcapsules,
ion speed of 1080 rpm, dispersed
a membrane "15 rcia A".
ize distributions of the oil droplets in the emulsion and the formed
7, corresponding to an agitation speed of 1080
of the droplets is 56.0 ± 1.2
values are 21.0 ± 0.5 % and 0.67 ± 0.02
m, and their CV and SPAN
. There is no significant
difference in the size distribution between the oil droplets and microcapsules.

Chapter4 : Size and Strength Distributions of Melamine-formaldehyde Microcapsules Prepared by Membrane
Emulsification
139
4.3.4 Effects of reaction temperature on the mean size and size
distribution of microcapsules
The effect of the reaction temperature on the formation of microcapsules was also
investigated. As shown in Figure 4-8, when the reaction temperature is set at 45°C the
size distribution of the microcapsules is very broad, the CV value is 64.2 ± 1.1 % and
D4,3 of the microcapsules is 56.7 ± 1.2 µm. This might be due to the slow reaction rate
at 45°C in forming a solid MF shell. The droplets were susceptible to agitation,
allowing them to break and coalesce, before a solid shell was formed. When the
reaction temperature is increased to 55°C, the CV value drops to 22.4 ± 0.3 %, and the
volume mean diameter increases slightly to 64.7 ± 1.1 µm. The size distribution only
changes marginally when the reaction temperature is increased from 55°C to 65°C.
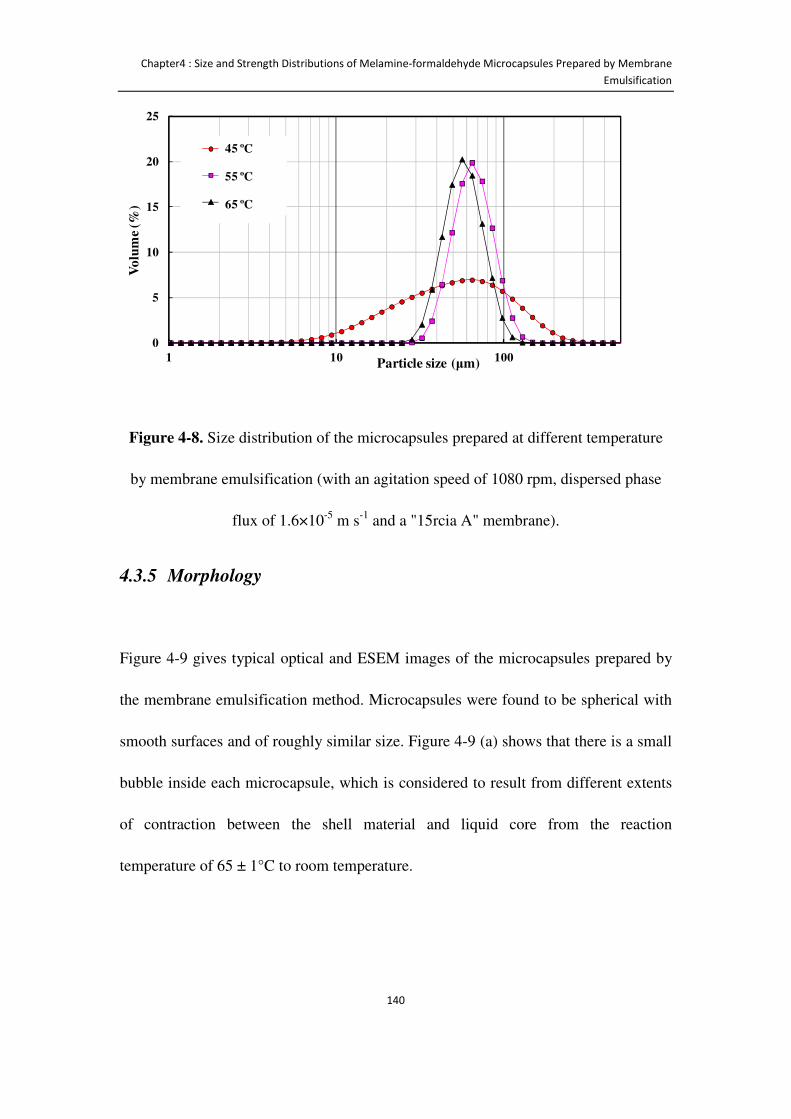
Chapter4 : Size and Strength Distributions of Melamine-formaldehyde Microcapsules Prepared by Membrane
Emulsification
140
Figure 4-8. Size distribution of the microcapsules prepared at different temperature
by membrane emulsification (with an agitation speed of 1080 rpm, dispersed phase
flux of 1.6×10⁻⁵ m s-1 and a "15rcia A" membrane).
4.3.5 Morphology
Figure 4-9 gives typical optical and ESEM images of the microcapsules prepared by
the membrane emulsification method. Microcapsules were found to be spherical with
smooth surfaces and of roughly similar size. Figure 4-9 (a) shows that there is a small
bubble inside each microcapsule, which is considered to result from different extents
of contraction between the shell material and liquid core from the reaction
temperature of 65 ± 1°C to room temperature.
0
5
10
15
20
25
1 10 100
Vo
lum
e (%
)
Particle size (μm)
45degree
55degree
65degree
45 ºC
55 ºC
65 ºC
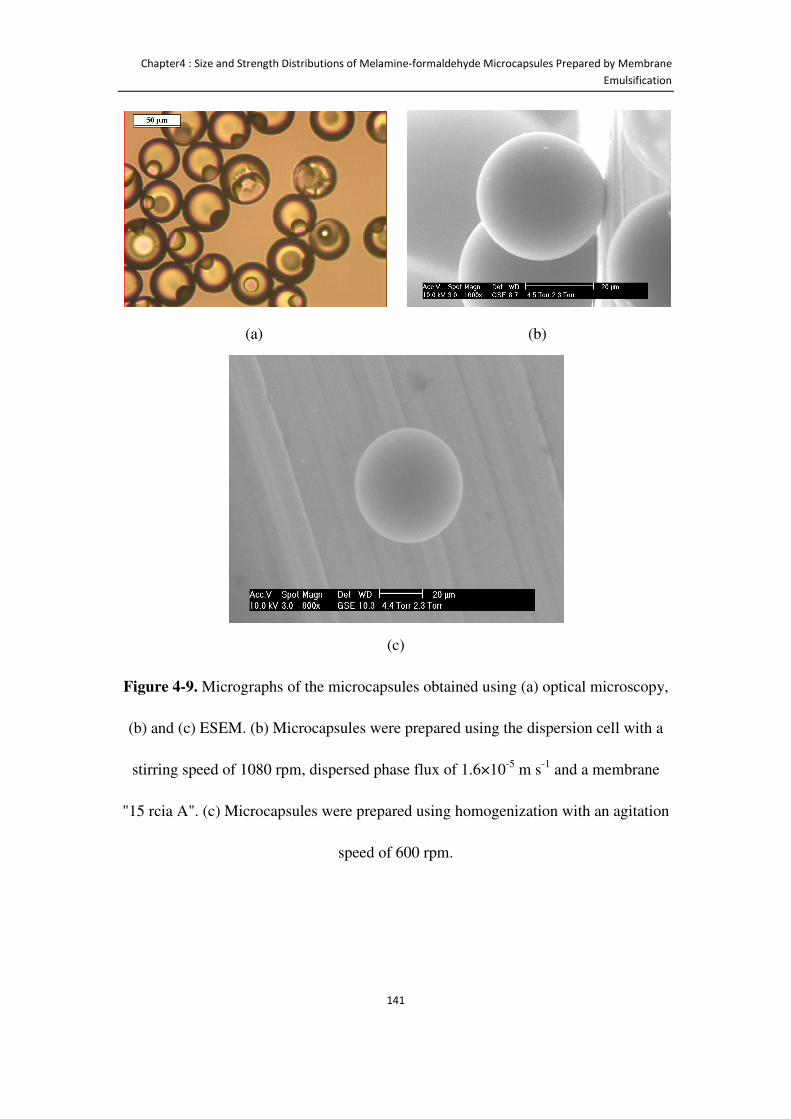
Chapter4 : Size and Strength Distributions of Melamine-formaldehyde Microcapsules Prepared by Membrane
Emulsification
141
(a)
(b)
(c)
Figure 4-9. Micrographs of the microcapsules obtained using (a) optical microscopy,
(b) and (c) ESEM. (b) Microcapsules were prepared using the dispersion cell with a
stirring speed of 1080 rpm, dispersed phase flux of 1.6×10⁻⁵ m s-1 and a membrane
"15 rcia A". (c) Microcapsules were prepared using homogenization with an agitation
speed of 600 rpm.
Chapter4 : Size and Strength Distributions of Melamine-formaldehyde Microcapsules Prepared by Membrane
Emulsification
142
4.3.6 Shell thickness
The typical TEM and CLSM micrographs of microcapsules prepared using the
membrane emulsification and homogenization methods are presented in Figures 4-10
and 4-11, respectively. The shell thickness is reasonably homogeneous within a given
cross-section. TEM measurements for the MF sample made using membrane
emulsification resulted in a mean diameter of 57.3 ± 1.4 μm (Standard error, number
of microcapsules analyzed n = 50) and a mean shell thickness of 408 ± 3 nm (n = 50);
for the sample using homogenization a mean diameter of 63.8 ± 2.3 μm (n = 50) and
mean shell thickness of 395 ± 10 nm (n = 50) were obtained. The results of
microcapsules with a Rhodamine B florescence dye measured under CLSM are
shown in Figure 4-11. The sample prepared by membrane emulsification had a mean
diameter of 56.1 ± 9.0 μm (SE, n = 20) and mean shell thickness of 450 ± 36 nm (n =
20), whereas the sample by homogenization had a mean diameter of 64.5 ± 4.0 μm (n
= 20) and mean shell thickness of 435 ± 44 nm (n = 20). The diameter of MF
microcapsules determined by two different methods (TEM and CLSM) gave slightly
different values, which may be due to different resolutions of these two techniques.
The results obtained through TEM had higher accuracy compared with CLSM, which
is consistent with the reports in literature (Ferrando and Spiess, 2000, Poux and Meier,
2005) .
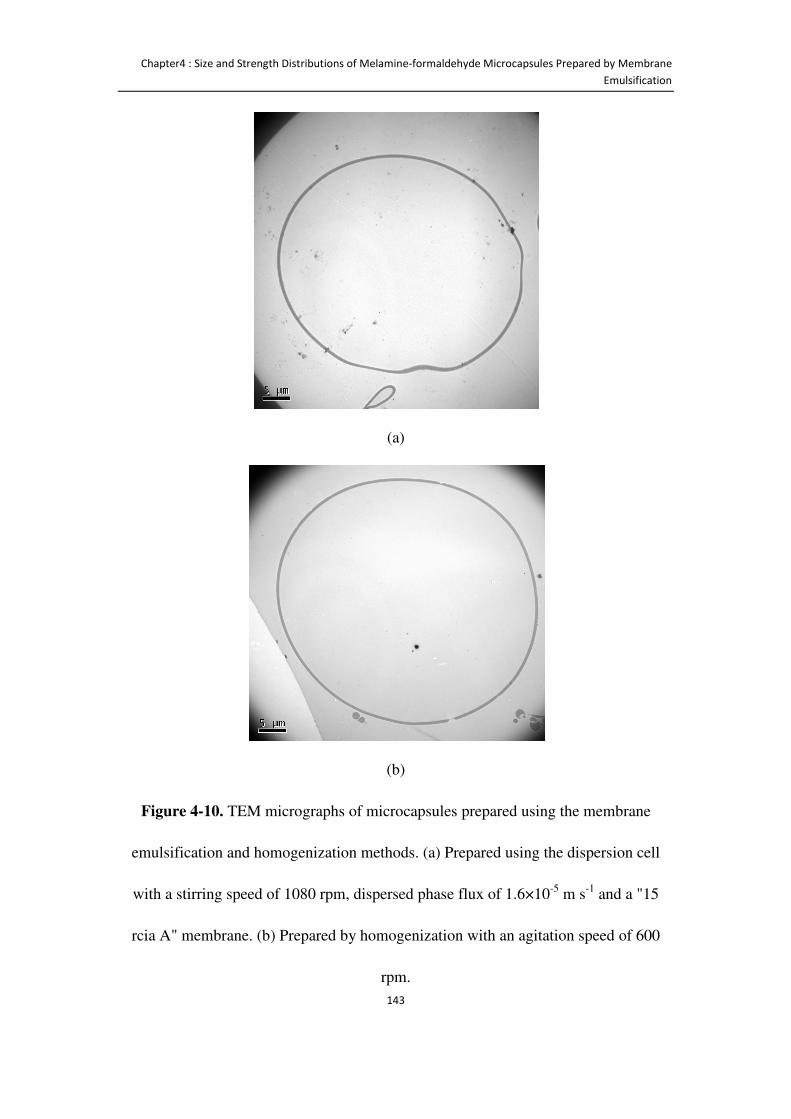
Chapter4 : Size and Strength Distributions of Melamine-formaldehyde Microcapsules Prepared by Membrane
Emulsification
143
(a)
(b)
Figure 4-10. TEM micrographs of microcapsules prepared using the membrane
emulsification and homogenization methods. (a) Prepared using the dispersion cell
with a stirring speed of 1080 rpm, dispersed phase flux of 1.6×10⁻⁵ m s-1 and a "15
rcia A" membrane. (b) Prepared by homogenization with an agitation speed of 600
rpm.
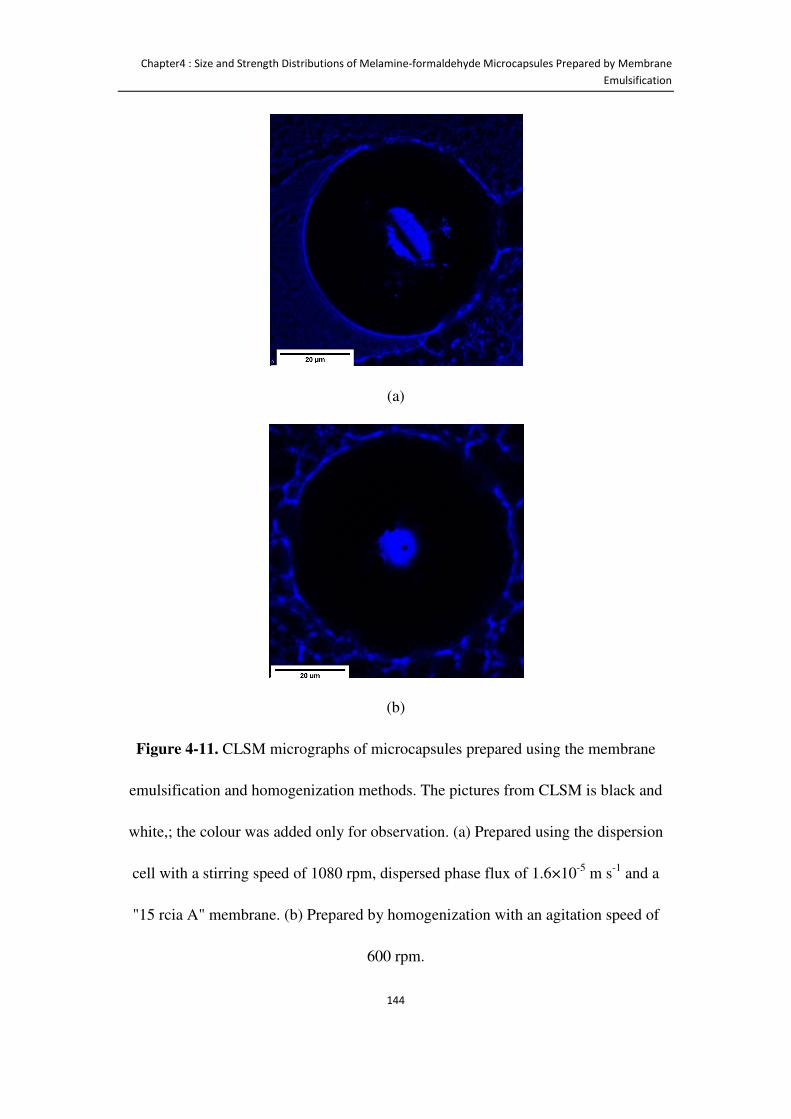
Chapter4 : Size and Strength Distributions of Melamine-formaldehyde Microcapsules Prepared by Membrane
Emulsification
144
(a)
(b)
Figure 4-11. CLSM micrographs of microcapsules prepared using the membrane
emulsification and homogenization methods. The pictures from CLSM is black and
white,; the colour was added only for observation. (a) Prepared using the dispersion
cell with a stirring speed of 1080 rpm, dispersed phase flux of 1.6×10⁻⁵ m s-1 and a
"15 rcia A" membrane. (b) Prepared by homogenization with an agitation speed of
600 rpm.
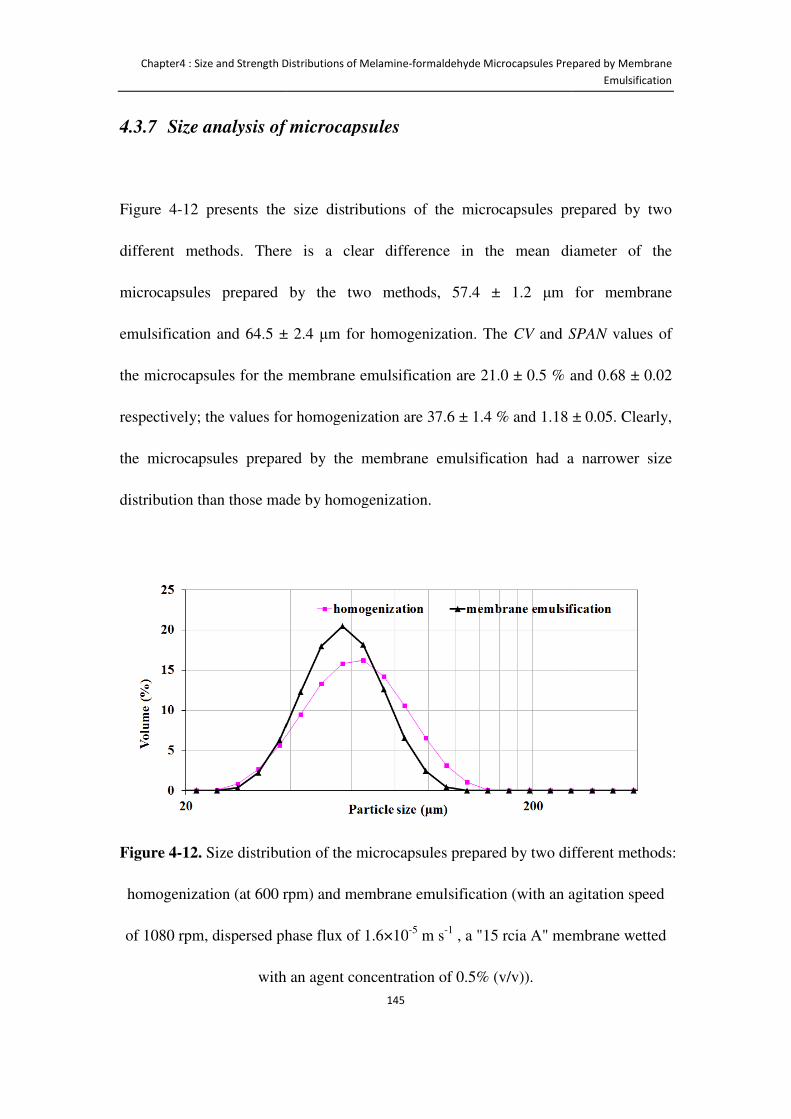
Chapter4 : Size and Strength Distributions of Melamine
4.3.7 Size analysis of microcapsules
Figure 4-12 presents the size distributions of the microcapsules prepared by two
different methods. There is a clear difference in
microcapsules prepared by the two methods,
emulsification and 64.5 ±
the microcapsules for the membrane emulsification are 21
respectively; the values for homogenization are
the microcapsules prepared by the membrane emulsification had a narrower size
distribution than those made by homogenization.
Figure 4-12. Size distribution of the microcapsules prepared by two different methods:
homogenization (at 600 rpm) and
of 1080 rpm, dispersed phase flux of 1.6×10
with an agent concentration of 0.5% (v/v)
Chapter4 : Size and Strength Distributions of Melamine-formaldehyde Microcapsules Prepared by Membrane
145
Size analysis of microcapsules
presents the size distributions of the microcapsules prepared by two
different methods. There is a clear difference in the mean diameter of the
microcapsules prepared by the two methods, 57.4 ± 1.2 μm
64.5 ± 2.4 μm for homogenization. The CV and SPAN
the microcapsules for the membrane emulsification are 21.0 ± 0.5 % and
the values for homogenization are 37.6 ± 1.4 % and 1.18 ± 0.05.
microcapsules prepared by the membrane emulsification had a narrower size
distribution than those made by homogenization.
Size distribution of the microcapsules prepared by two different methods:
homogenization (at 600 rpm) and membrane emulsification (with an agitation speed
of 1080 rpm, dispersed phase flux of 1.6×10⁻⁵ m s-1 , a "15 rcia A" membrane
with an agent concentration of 0.5% (v/v)).
Microcapsules Prepared by Membrane
Emulsification
presents the size distributions of the microcapsules prepared by two
the mean diameter of the
for membrane
SPAN values of
and 0.68 ± 0.02
1.18 ± 0.05. Clearly,
microcapsules prepared by the membrane emulsification had a narrower size
Size distribution of the microcapsules prepared by two different methods:
membrane emulsification (with an agitation speed
"15 rcia A" membrane wetted
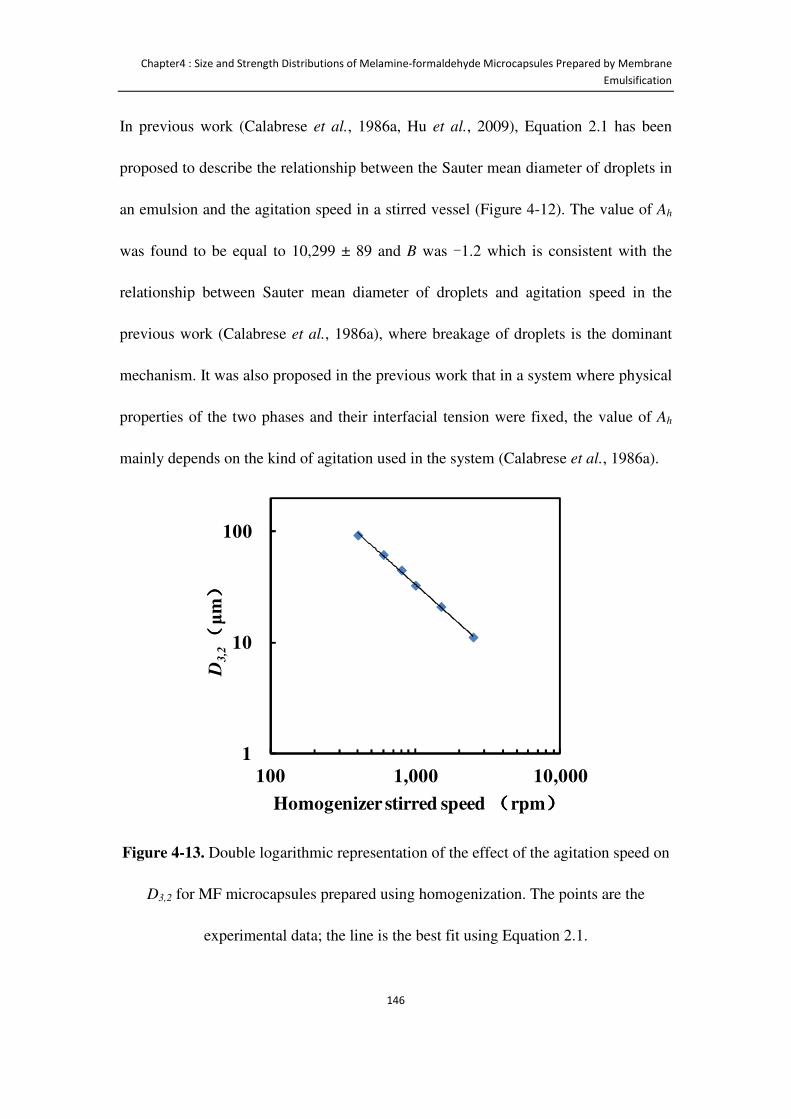
Chapter4 : Size and Strength Distributions of Melamine-formaldehyde Microcapsules Prepared by Membrane
Emulsification
146
In previous work (Calabrese et al., 1986a, Hu et al., 2009), Equation 2.1 has been
proposed to describe the relationship between the Sauter mean diameter of droplets in
an emulsion and the agitation speed in a stirred vessel (Figure 4-12). The value of Ah
was found to be equal to 10,299 ± 89 and B was -1.2 which is consistent with the
relationship between Sauter mean diameter of droplets and agitation speed in the
previous work (Calabrese et al., 1986a), where breakage of droplets is the dominant
mechanism. It was also proposed in the previous work that in a system where physical
properties of the two phases and their interfacial tension were fixed, the value of Ah
mainly depends on the kind of agitation used in the system (Calabrese et al., 1986a).
Figure 4-13. Double logarithmic representation of the effect of the agitation speed on
D3,2 for MF microcapsules prepared using homogenization. The points are the
experimental data; the line is the best fit using Equation 2.1.
1
10
100
100 1,000 10,000
D3
,2 (( ((μ
m)) ))
Homogenizer stirred speed ((((rpm))))
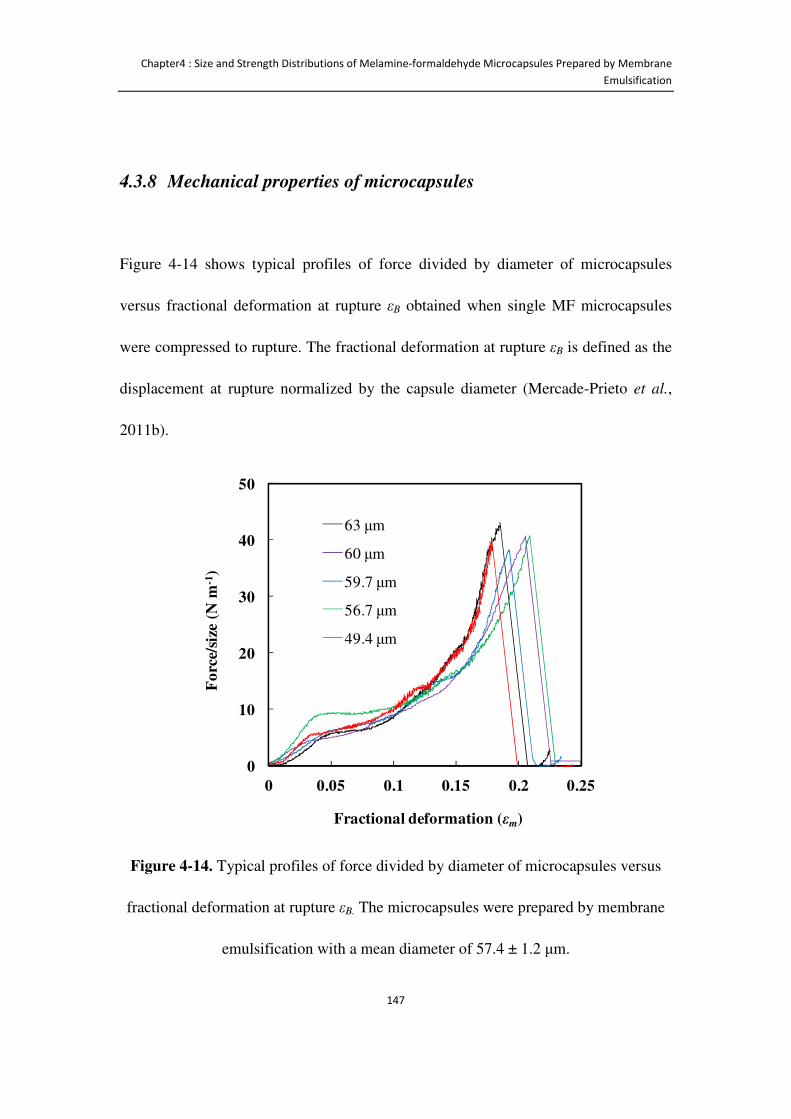
Chapter4 : Size and Strength Distributions of Melamine-formaldehyde Microcapsules Prepared by Membrane
Emulsification
147
4.3.8 Mechanical properties of microcapsules
Figure 4-14 shows typical profiles of force divided by diameter of microcapsules
versus fractional deformation at rupture εB obtained when single MF microcapsules
were compressed to rupture. The fractional deformation at rupture εB is defined as the
displacement at rupture normalized by the capsule diameter (Mercade-Prieto et al.,
2011b).
Figure 4-14. Typical profiles of force divided by diameter of microcapsules versus
fractional deformation at rupture εB. The microcapsules were prepared by membrane
emulsification with a mean diameter of 57.4 ± 1.2 μm.
0
10
20
30
40
50
0 0.05 0.1 0.15 0.2 0.25
Fo
rce/
size
(N
m-1
)
Fractional deformation (εm)
63 μm
60 μm
59.7 μm
56.7 μm
49.4 μm
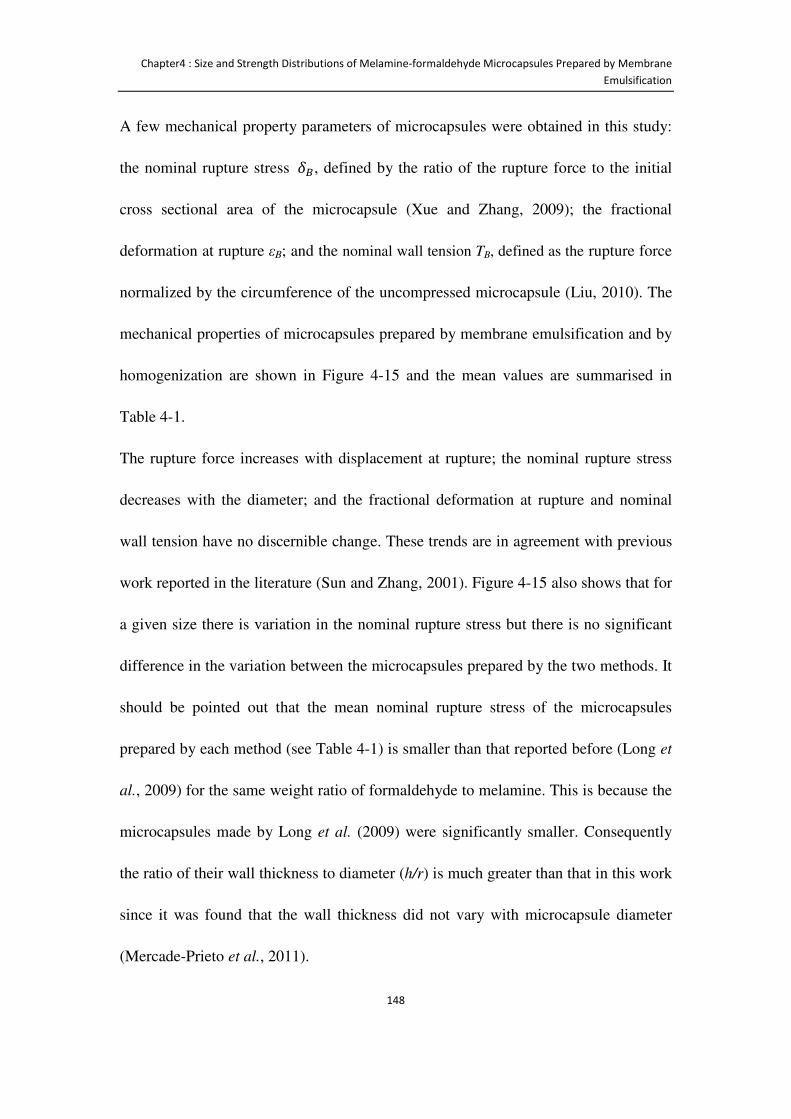
Chapter4 : Size and Strength Distributions of Melamine-formaldehyde Microcapsules Prepared by Membrane
Emulsification
148
A few mechanical property parameters of microcapsules were obtained in this study:
the nominal rupture stress o., defined by the ratio of the rupture force to the initial
cross sectional area of the microcapsule (Xue and Zhang, 2009); the fractional
deformation at rupture εB; and the nominal wall tension TB, defined as the rupture force
normalized by the circumference of the uncompressed microcapsule (Liu, 2010). The
mechanical properties of microcapsules prepared by membrane emulsification and by
homogenization are shown in Figure 4-15 and the mean values are summarised in
Table 4-1.
The rupture force increases with displacement at rupture; the nominal rupture stress
decreases with the diameter; and the fractional deformation at rupture and nominal
wall tension have no discernible change. These trends are in agreement with previous
work reported in the literature (Sun and Zhang, 2001). Figure 4-15 also shows that for
a given size there is variation in the nominal rupture stress but there is no significant
difference in the variation between the microcapsules prepared by the two methods. It
should be pointed out that the mean nominal rupture stress of the microcapsules
prepared by each method (see Table 4-1) is smaller than that reported before (Long et
al., 2009) for the same weight ratio of formaldehyde to melamine. This is because the
microcapsules made by Long et al. (2009) were significantly smaller. Consequently
the ratio of their wall thickness to diameter (h/r) is much greater than that in this work
since it was found that the wall thickness did not vary with microcapsule diameter
(Mercade-Prieto et al., 2011).
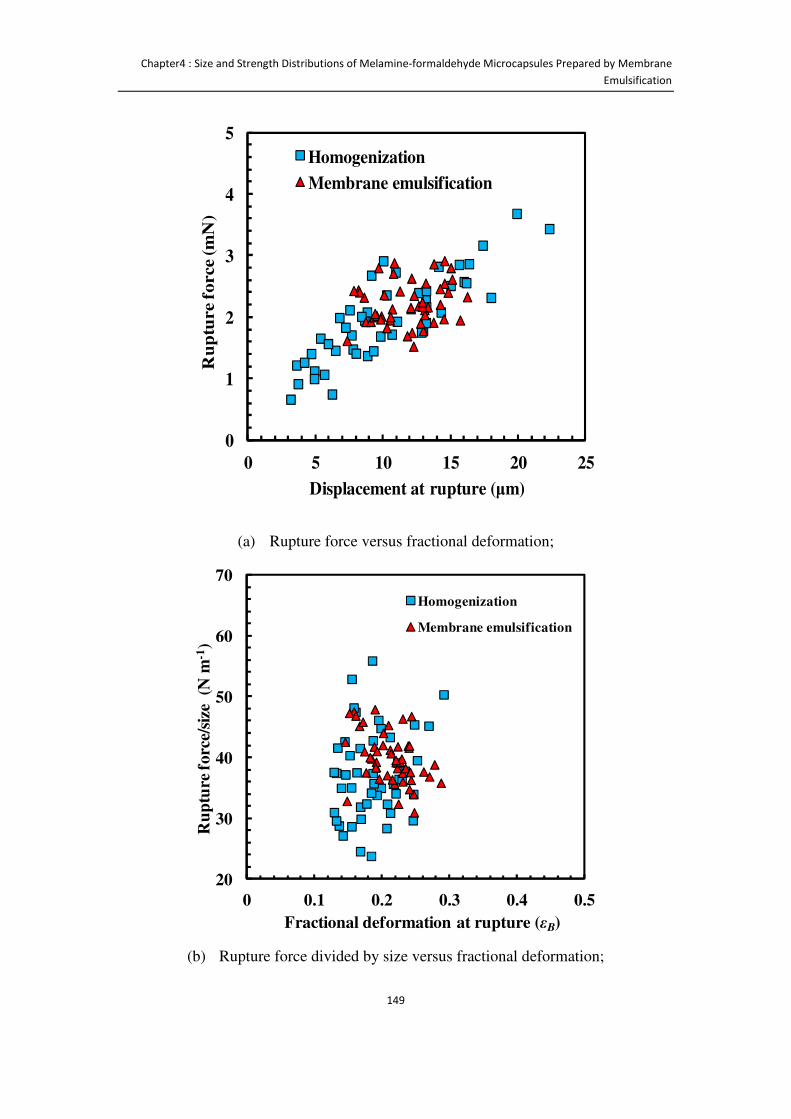
Chapter4 : Size and Strength Distributions of Melamine-formaldehyde Microcapsules Prepared by Membrane
Emulsification
149
(a) Rupture force versus fractional deformation;
(b) Rupture force divided by size versus fractional deformation;
0
1
2
3
4
5
0 5 10 15 20 25
Ru
ptu
re f
orce (m
N)
Displacement at rupture (μm)
Homogenization
Membrane emulsification
20
30
40
50
60
70
0 0.1 0.2 0.3 0.4 0.5
Ru
ptu
re f
orc
e/si
ze
(N m
-1)
Fractional deformation at rupture (εB)
Homogenization
Membrane emulsification
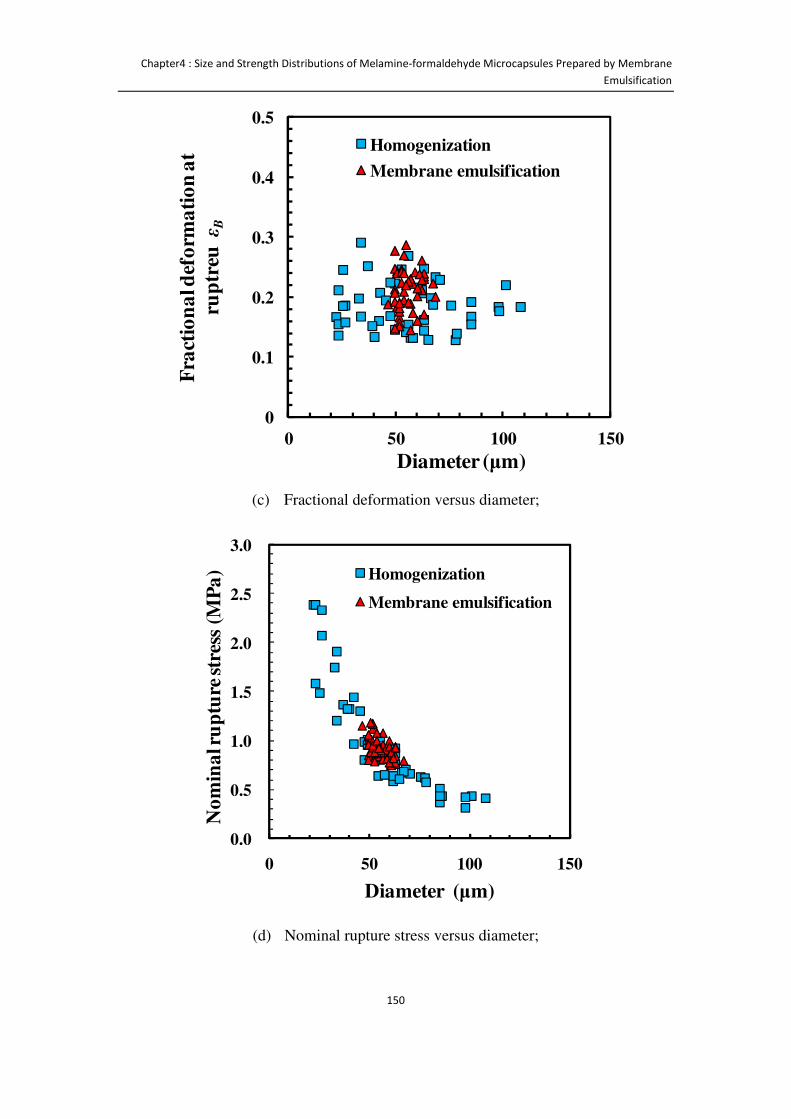
Chapter4 : Size and Strength Distributions of Melamine-formaldehyde Microcapsules Prepared by Membrane
Emulsification
150
(c) Fractional deformation versus diameter;
(d) Nominal rupture stress versus diameter;
0
0.1
0.2
0.3
0.4
0.5
0 50 100 150
Fra
ctio
na
l def
orm
ati
on
at
rup
treu
εB
Diameter (μm)
Homogenization
Membrane emulsification
0.0
0.5
1.0
1.5
2.0
2.5
3.0
0 50 100 150
No
min
al r
up
ture
str
ess
(MP
a)
Diameter (μm)
Homogenization
Membrane emulsification
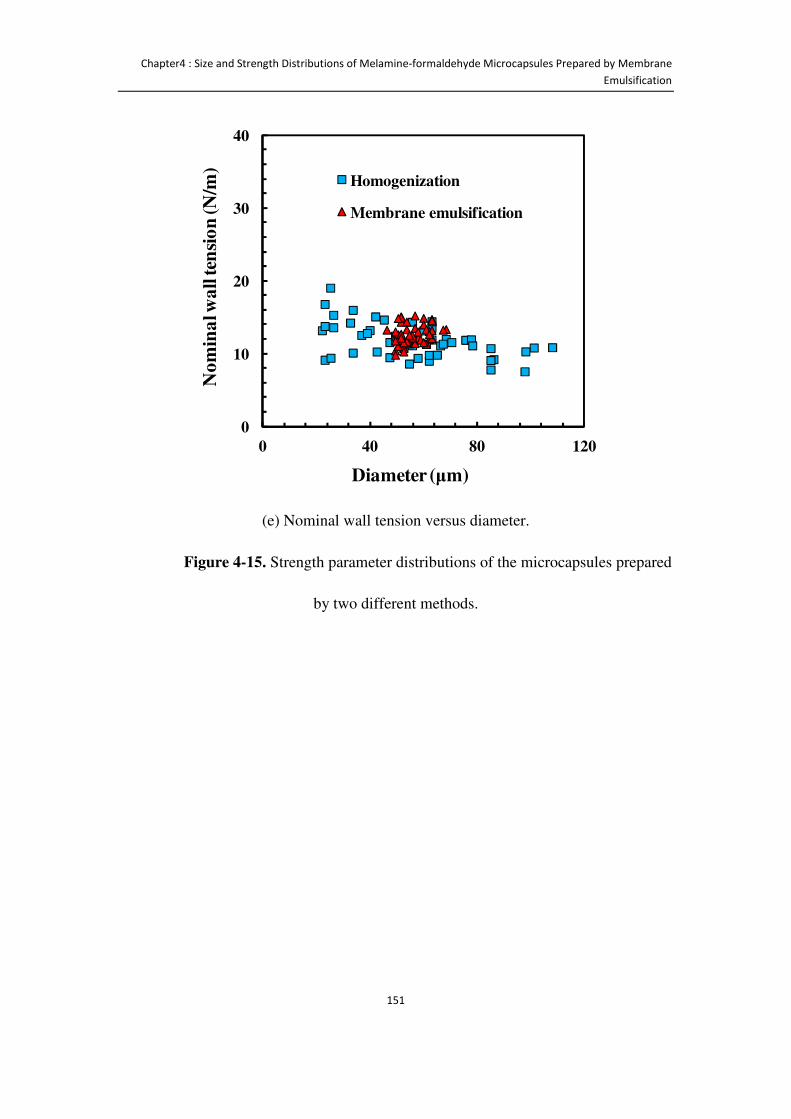
Chapter4 : Size and Strength Distributions of Melamine-formaldehyde Microcapsules Prepared by Membrane
Emulsification
151
(e) Nominal wall tension versus diameter.
Figure 4-15. Strength parameter distributions of the microcapsules prepared
by two different methods.
0
10
20
30
40
0 40 80 120
No
min
al w
all
ten
sio
n (N
/m)
Diameter (μm)
Homogenization
Membrane emulsification
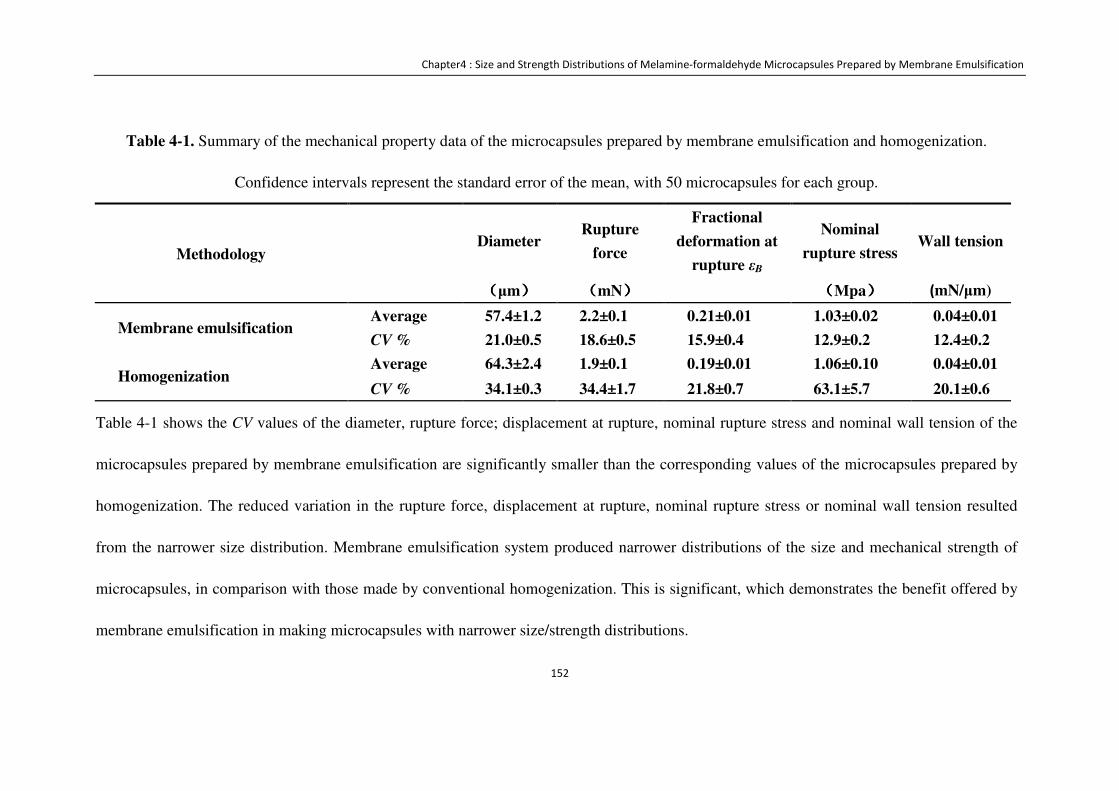
Chapter4 : Size and Strength Distributions of Melamine-formaldehyde Microcapsules Prepared by Membrane Emulsification
152
Table 4-1. Summary of the mechanical property data of the microcapsules prepared by membrane emulsification and homogenization.
Confidence intervals represent the standard error of the mean, with 50 microcapsules for each group.
Methodology Diameter
Rupture
force
Fractional
deformation at
rupture εB
Nominal
rupture stress Wall tension
((((μm)))) ((((mN)))) ((((Mpa)))) (mN/μm)
Membrane emulsification Average 57.4±1.2 2.2±0.1 0.21±0.01 1.03±0.02 0.04±0.01
CV % 21.0±0.5 18.6±0.5 15.9±0.4 12.9±0.2 12.4±0.2
Homogenization Average 64.3±2.4 1.9±0.1 0.19±0.01 1.06±0.10 0.04±0.01
CV % 34.1±0.3 34.4±1.7 21.8±0.7 63.1±5.7 20.1±0.6
Table 4-1 shows the CV values of the diameter, rupture force; displacement at rupture, nominal rupture stress and nominal wall tension of the
microcapsules prepared by membrane emulsification are significantly smaller than the corresponding values of the microcapsules prepared by
homogenization. The reduced variation in the rupture force, displacement at rupture, nominal rupture stress or nominal wall tension resulted
from the narrower size distribution. Membrane emulsification system produced narrower distributions of the size and mechanical strength of
microcapsules, in comparison with those made by conventional homogenization. This is significant, which demonstrates the benefit offered by
membrane emulsification in making microcapsules with narrower size/strength distributions.
Chapter2 : Literature Review
153
4.4 Conclusions
A membrane emulsification method was employed to prepare microcapsules with MF
as a shell material and an oil-based industrial precursor as core with narrow size and
strength distributions. The mean diameter and size distribution of the microcapsules
depended on not only the process conditions of the dispersion cell (agitation speed
and dispersed phase flux through the membrane in the emulsification stage), but also
on the membrane surface hydrophilicity (contact angle). The best condition to
minimise the size distribution has been found to be an agitation speed of 1080 rpm
and dispersed phase flux of 1.6×10⁻⁵ m s-1 with a concentration of the wetting agent of
0.5% (v/v) for the conditions investigated. Correspondingly, the distributions of the
size and mechanical strength of microcapsules prepared by the membrane
emulsification had been significantly narrowed, in comparison with those made by
conventional homogenization. In Chapter 5, the results on how the mean size and size
distribution of microcapsules may be affected by the physical properties of different
core material and a different membrane system will be presented.
Chapter5 : Scale-up of Membrane Emulsification to Prepare Melamine-formaldehyde Microcapsules and
Microencapsulation of Different Oils
154
Chapter 5 Scale-up of Membrane
Emulsification to Prepare
Melamine-formaldehyde
Microcapsules and
Microencapsulation of Different Oils
5.1 Introduction
Microcapsules with narrow size distribution have shown unique advantages in
consumer industrial productions, especially, for perfume oil microcapsules used in
detergents, as mentioned Chapter 4. Current industrial manufacturing practices to
generate microcapsules include homogenization or simple agitation, which despite
their simple operation they produce emulsions with broad size distributions. Hence, in
order for narrow size microcapsules to become industrially feasible in the future, it is
required to test the scale up capability of membrane emulsification systems.
The focus of this chapter is to formulate Melamine-formaldehyde (MF) microcapsules
with a narrow size distribution using a pilot plant-scale cross flow membrane
emulsification system. The size and size distribution of the droplets in the emulsions,
as well as the MF microcapsules formed in the later stage of the operation, were

Chapter5 : Scale-up of Membrane Emulsification to Prepare Melamine-formaldehyde Microcapsules and
Microencapsulation of Different Oils
155
compared with those obtained from the lab-scale dispersion cell described in Chapter
4.
The effect of different processing parameters on the droplets formed were studied in
order to improve our understanding of what determines the size and size distribution
of the oil droplets produced in the emulsification stage. For instance, MF
microcapsules were made with emulsions made with different core oils. Other
parameters studied included the membrane properties (e.g. membranes with different
pore locations), the physical properties of the two phases (e.g. viscosities, interfacial
tension), and the processing conditions (e.g. agitation speed in the continuous phase
and dispersed phase flux). The obtained experimental data were compared with
predictions of theoretical models developed in the literature. The morphology, the
shell thickness and microstructure of the microcapsules were investigated by optical
microscopy, environmental-scanning electron microscopy (ESEM) and transmission
electron microscopy (TEM) respectively.
5.2 Experimental methods
5.2.1 Scale up experiment with cross-flow membrane emulsification
The scale up experiment was carried out on a cross-flow membrane rig which had
been established in the University of Leeds, the details of which was described in
Section 3.3.2.

Chapter5 : Scale-up of Membrane Emulsification to Prepare Melamine-formaldehyde Microcapsules and
Microencapsulation of Different Oils
156
Firstly, aqueous solution of MF precondensate (34.3 g), formaldehyde (2.9 g) and
polyacrylamide-co-acrylic acid-sodium salt (8.3 g) in water (1000.0 g) was stirred
(200 rpm) for 105 min in a 2 L standard stirred vessel and its pH value was kept at 4.3
(adjusted using 20% (v/v) acetic acid) at room temperature (23 ± 2 °C), following the
method described in Section 4.2.1.
Secondly, the prepared aqueous phase was cooled down to 15 ± 1 °C , then put into an
open tank reservoir (Figure 3-5 (11) in Section 3.3.2), i.e. continuous phase tank.
The core oil A (133.0 g) was added into the disperse phase tank ( see Figure 3-7). The
dispersed phase was then pushed through the membrane pores into the continuous
phase, which passed through the inner channels of the membrane with a flow rate of
1.1×10⁻⁴ m3 s-1, under an oil phase pressure from 0.3 × 10�Pa to 1 × 10�Pa for
about 20 min (Figure 3-8 ).
Thirdly, the resulting emulsion was transferred back to the standard vessel, and stirred
at a speed of 200 rpm at room temperature 23 ± 2 °C for 30 min.
Finally, the emulsion was placed into a water bath (Clifton, Nickel-electro Ltd., UK)
at 65 ± 1 °C, allowing the MF polymerization reaction for 4 h. The suspension was
Chapter5 : Scale-up of Membrane Emulsification to Prepare Melamine-formaldehyde Microcapsules and
Microencapsulation of Different Oils
157
cooled to room temperature, and its pH increased to 10 (adjusted with 1M NaOH) to
terminate the polymerization reaction.
5.2.2 Preparation of microcapsules with different core oils using a
dispersion cell
Microcapsules with different core oils were also prepared using a dispersion cell
illustrated in Section 3.3.1. The model core oils used were perfume oil B, sunflower
oil, a key component of perfume oil hexyl salicylate and peppermint oil. Membranes
"15 rcia A" and "15 cia" were used to generate emulsions; the details of membranes
are provided in Section 3.3.1. The rest of the process conditions were the same as
those for preparation of MF microcapsules with core oil A, which are described in
Section of 4.2.1.
5.2.3 Characterization of MF microcapsules
The surface morphology and micro-structure of the microcapsules were characterised
by optical microscopy (Leica DMRBE, Leica, UK), environmental-scanning electron
microscopy (ESEM) (FEI/Philips XL30 ESEM-FEG, Philips, UK) respectively.
Samples were imaged at high vacuum mode, and the operating voltage is shown on
the images (Figure 5-17).
Chapter5 : Scale-up of Membrane Emulsification to Prepare Melamine-formaldehyde Microcapsules and
Microencapsulation of Different Oils
158
Shell thickness of the microcapsules was measured by transmission electron
microscopy (TEM) (JEOL 1200EX, Jeol Ltd, UK). Samples were embedded in the
LR white hard grade acrylic resin, and the ultra thin sections were obtained using a
ultra-cut microtome apparatus (Reichert-Jung). The operating voltage was 10.0 kV.
The mean size and size distribution of the oil droplets produced in the stage of
emulsification and the final microcapsules were determined using a laser fraction
technique (Malvern Instruments Mastersizer 2000). The data of SPAN, CV value, D4,3
and D3,2 were recorded. All the oils used for the work presented in this chapter can be
considered insoluble in water (solubility are less than 0.01g/g). The refractive indexes
of the materials used are listed in Table 5-1.

Chapter5 : Scale-up of Membrane Emulsification to Prepare Melamine-formaldehyde Microcapsules and Microencapsulation of Different Oils
159
Table 5-1. Refractive indexes of the materials used in the study on encapsulation of different core oils by MF.
oil A oil B Sunflower oil (oil S) Hexyl salicylate oil (oil HS) Peppermint oil (oil P) MF
1.497* 1.496* 1.475 (Fereidoon, 2005) 1.505** 1.46*** 1.65 (Long et al., 2009)
*given by the supplier P&G, UK
**given by the supplier SAFC, USA
***given by the supplier Sigma-Aldrich, UK
The details of encapsulation experiments are described in Section 4.2.1.
The densities of the oils were measured with a pycnometer. The interfacial tension between the two phases was measured by a Tensiometer
(Processor Tensiometer K100, KRUSS) at 15 ± 1°C. Details are described in Section 3.4.8. The viscosities of the two phases were measured with
a rheometer (AR1000, TA Instrument), at 15 ± 1°C. The Wilhelmy plate method was used to measure the interfacial tension and a method based
on using the two plates (or a cone and plate) was used to measure the viscosity. Details are described in Section 3.4.9.
Chapter5 : Scale-up of Membrane Emulsification to Prepare Melamine-formaldehyde Microcapsules and
Microencapsulation of Different Oils
160
5.3 Results and discussion
5.3.1 Cross-flow membrane system
5.3.1.1 Stability of the oil/water emulsion
The storage stability of the emulsion was investigated for 72 h since a few hours are
required to form microcapsules from the emulsion. Figure 5-1 shows that there is no
significant change of the values of mean diameter D4,3, coefficient of variance (CV)
and SPAN of the droplets in the emulsion. Therefore, the emulsion is considered to be
stable during this period.
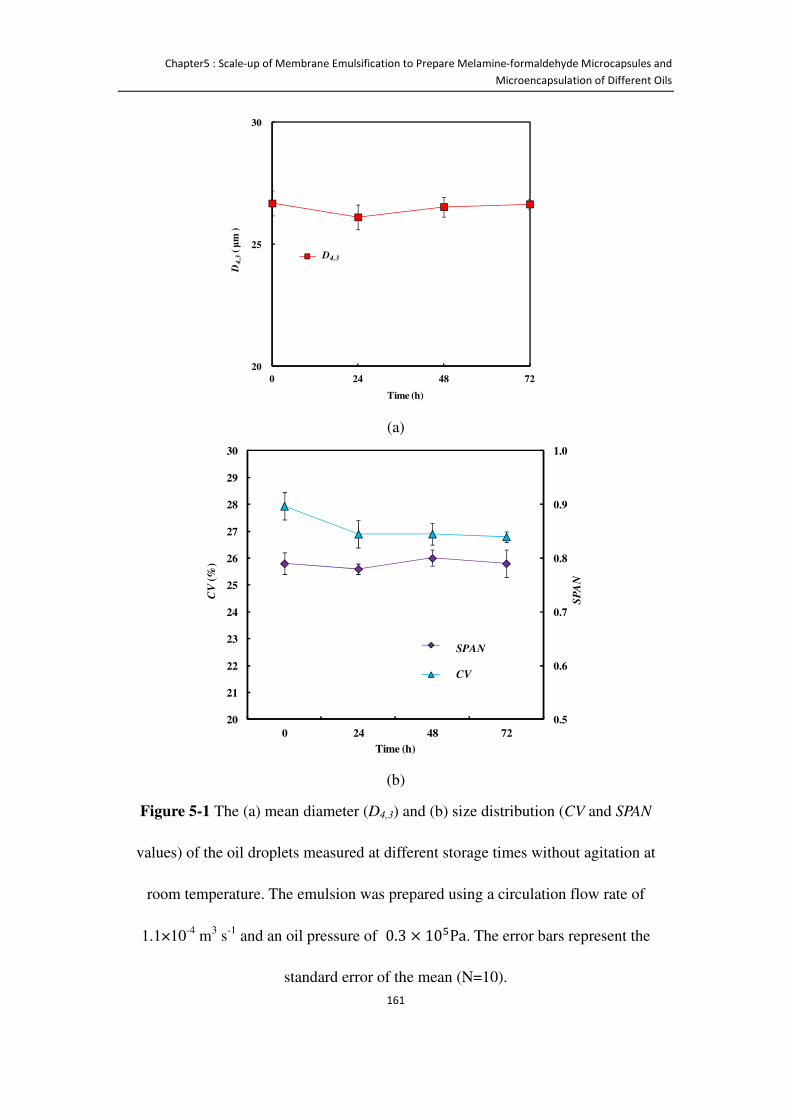
Chapter5 : Scale-up of Membrane Emulsification to Prepare Melamine-formaldehyde Microcapsules and
Microencapsulation of Different Oils
161
(a)
(b)
Figure 5-1 The (a) mean diameter (D4,3) and (b) size distribution (CV and SPAN
values) of the oil droplets measured at different storage times without agitation at
room temperature. The emulsion was prepared using a circulation flow rate of
1.1×10⁻⁴ m3 s-1 and an oil pressure of 0.3 × 10�Pa. The error bars represent the
standard error of the mean (N=10).
20
25
30
0 24 48 72
D4
,3( μ
m )
Time (h)
D4,3
20
21
22
23
24
25
26
27
28
29
30
0 24 48 72
0.5
0.6
0.7
0.8
0.9
1.0
CV
(%)
Time (h)
SP
AN
SPAN
CV
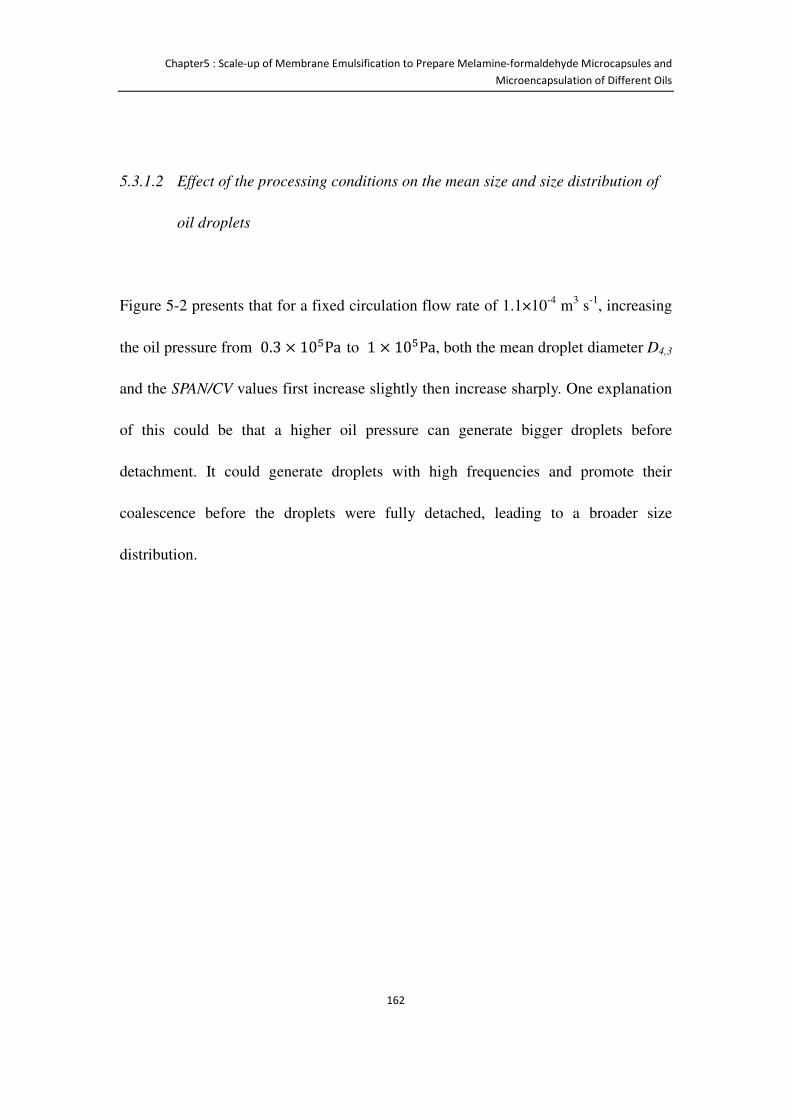
Chapter5 : Scale-up of Membrane Emulsification to Prepare Melamine-formaldehyde Microcapsules and
Microencapsulation of Different Oils
162
5.3.1.2 Effect of the processing conditions on the mean size and size distribution of
oil droplets
Figure 5-2 presents that for a fixed circulation flow rate of 1.1×10⁻⁴ m3 s-1, increasing
the oil pressure from 0.3 × 10�Pa to 1 × 10�Pa, both the mean droplet diameter D4,3
and the SPAN/CV values first increase slightly then increase sharply. One explanation
of this could be that a higher oil pressure can generate bigger droplets before
detachment. It could generate droplets with high frequencies and promote their
coalescence before the droplets were fully detached, leading to a broader size
distribution.

Chapter5 : Scale-up of Membrane Emulsification to Prepare Melamine-formaldehyde Microcapsules and
Microencapsulation of Different Oils
163
(a)
(b)
Figure 5-2 The effect of oil pressure on the (a) size and (b) size distribution of the
emulsions droplets, prepared with a circulation flow rate of 1.1×10⁻⁴ m3·s-1 and a
dispersed phase pressure of 0.3 × 10�Pa. Error bars represent the standard error of
the mean (N=10).
20
25
30
35
40
0.E+00 2.E+04 4.E+04 6.E+04 8.E+04 1.E+05 1.E+05
D4
,3(μ
m)
Dispersed phase pressure (Pa)
D 4,3
0.0
0.4
0.8
1.2
1.6
2.0
2.4
20
40
60
80
100
0.E+00 2.E+04 4.E+04 6.E+04 8.E+04 1.E+05 1.E+05
SP
AN
CV
(%
)
Dispersed phase pressure (Pa)
CV
SPAN

Chapter5 : Scale-up of Membrane Emulsification to Prepare Melamine-formaldehyde Microcapsules and
Microencapsulation of Different Oils
164
An example of the size distributions of the oil droplets and the formed microcapsules
are shown in Figure 5-3. The D4,3 of the droplets is 26.7 ± 0.7 µm. Their
corresponding CV and SPAN values are 27.9 ± 0.8% and 0.81 ± 0.02 respectively. The
D4,3 of the microcapsules is 26.5 ± 0.7 μm, and their CV and SPAN values are 30.5 ±
0.9%, and 0.88 ± 0.02 respectively. Statistical analysis shows that both the size
distributions can be fitted with Gaussian, with 95% confidence, and there is no
significant difference in the size distribution between the oil droplets and
microcapsules.
Figure 5-3 Size distribution of the emulsion droplets and the formed MF
microcapsules, prepared using a circulation flow rate of 1.1×10⁻⁴ m3 s-1 and an oil
pressure of0.3 × 10�Pa.
0
3
6
9
12
15
18
1 10 100
Volu
me (
%)
D 4,3 (μm)
Emulsion droplets
Microcapsules
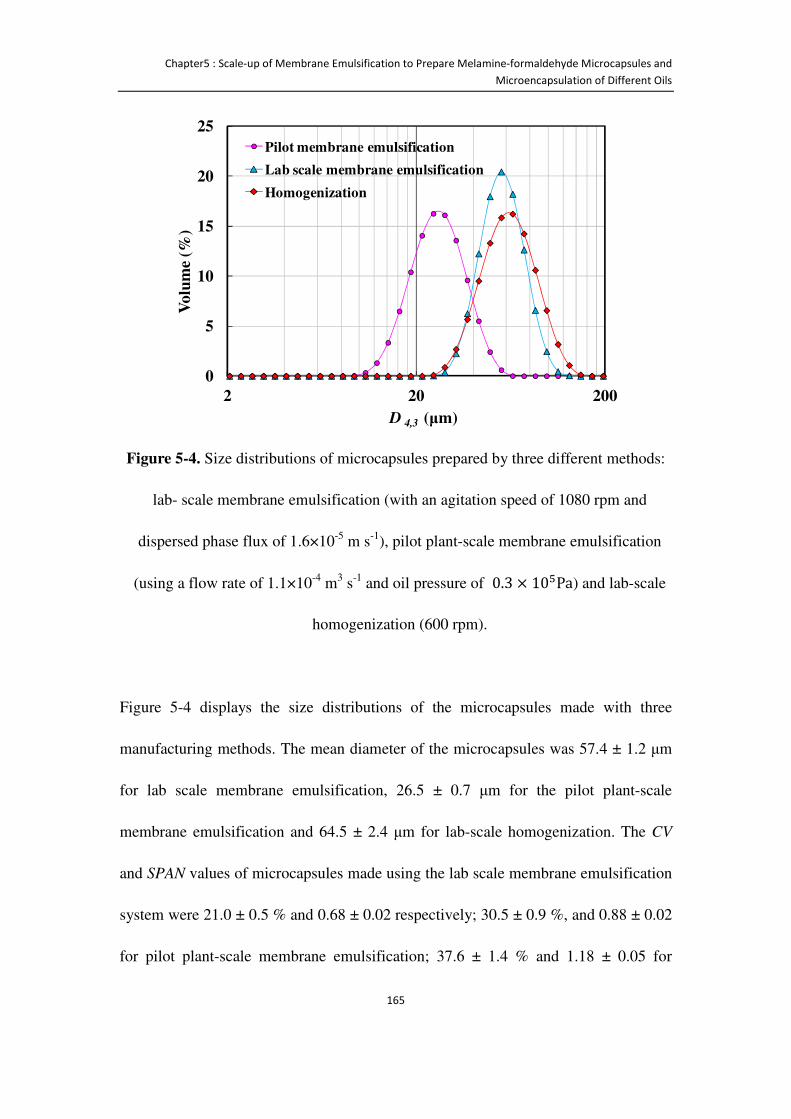
Chapter5 : Scale-up of Membrane Emulsification to Prepare Melamine-formaldehyde Microcapsules and
Microencapsulation of Different Oils
165
Figure 5-4. Size distributions of microcapsules prepared by three different methods:
lab- scale membrane emulsification (with an agitation speed of 1080 rpm and
dispersed phase flux of 1.6×10⁻⁵ m s-1), pilot plant-scale membrane emulsification
(using a flow rate of 1.1×10⁻⁴ m3 s-1 and oil pressure of 0.3 × 10�Pa) and lab-scale
homogenization (600 rpm).
Figure 5-4 displays the size distributions of the microcapsules made with three
manufacturing methods. The mean diameter of the microcapsules was 57.4 ± 1.2 μm
for lab scale membrane emulsification, 26.5 ± 0.7 μm for the pilot plant-scale
membrane emulsification and 64.5 ± 2.4 μm for lab-scale homogenization. The CV
and SPAN values of microcapsules made using the lab scale membrane emulsification
system were 21.0 ± 0.5 % and 0.68 ± 0.02 respectively; 30.5 ± 0.9 %, and 0.88 ± 0.02
for pilot plant-scale membrane emulsification; 37.6 ± 1.4 % and 1.18 ± 0.05 for
0
5
10
15
20
25
2 20 200
Vo
lum
e (
%)
D 4,3 (μm)
Pilot membrane emulsification
Lab scale membrane emulsification
Homogenization
Chapter5 : Scale-up of Membrane Emulsification to Prepare Melamine-formaldehyde Microcapsules and
Microencapsulation of Different Oils
166
lab-scale homogenization. The microcapsules prepared by the lab-scale membrane
emulsification were more uniform than using the other two methods. Note that the
pilot plant-scale experiment used a cross-flow membrane system, which is different
from the lab-scale dispersion cell membrane system. Different systems or even
different membranes may deliver various results (Vladisavljevic and Williams, 2005).
For example, SPG membrane may produce the microcapsules with typical CV values
of 11 % - 23 %, and polyamide hollow fibres may generate the emulsion with a CV
value of 33 % (Vladisavljevic and Williams, 2005). The cross-flow system used in
this study could produce the mono-dispersed droplets with CV value around 30 %
(Yuan et al., 2009a, Yuan et al., 2009c) which is slightly bigger than the common CV
value of dispersion cell, around 20 % (Egidi et al., 2008, Stillwell et al., 2007). The
difference in the CV and SPAN values resulting from the dispersion cell and the cross
flow membrane system might not be due to the effect of scale up, rather than due to
different membrane systems. It may become one of the future developments in
membrane emulsification systems.
5.3.2 Preparation of MF microcapsules with different core oils using a
dispersion cell
In Section 4.3.3, it is demonstrated that the size distribution of microcapsules mainly
depended on the operation conditions during the membrane emulsification. In this
Chapter5 : Scale-up of Membrane Emulsification to Prepare Melamine-formaldehyde Microcapsules and
Microencapsulation of Different Oils
167
section the effects of different membrane configurations, the physical properties of the
two liquid phases and processing conditions on the size distribution of oil droplets
produced using a dispersion cell are presented.
5.3.2.1 The effect of membrane configurations on the size distribution of droplets in
emulsion
Two membranes "15 cia" and "15 rcia A" were used subsequently, having the same
pore size but different pore locations. Membrane "15 cia" has the pores fully located
on the membrane surface, whilst membrane "15 rcia A" presents pores only in a ring
between 48mm ≤ M ≤ 130mm as shown in Figure 3-4 (Section 3.3.1). The size
distributions of the oil droplets generated with the two membranes are presented in
Figure 5-5. D4,3 using membrane "15 cia" was 57.6 ± 1.5μm, similar to that using
membrane "15 rcia A", 56.0 ± 1.2 µm. However, the CV and SPAN values with
membrane "15 cia" are 26.3 ± 0.5 % and 0.72 ± 0.02, larger than those prepared by
membrane "15 rcia A", 21.0 ± 0.5% and 0.67 ± 0.02, respectively. The membrane
which had the pores located in a ring area under rtrans, as shown in Figure 2-7, resulted
in a narrower size distribution. This may be due to the existence of a more
homogeneous shear stress distribution in the ring area on membrane surface,
generated by the impeller than the whole membrane area in the latter case (Horie et al.,
2011). For this reason, membrane "15 rcia A" was selected for subsequent
experiments.
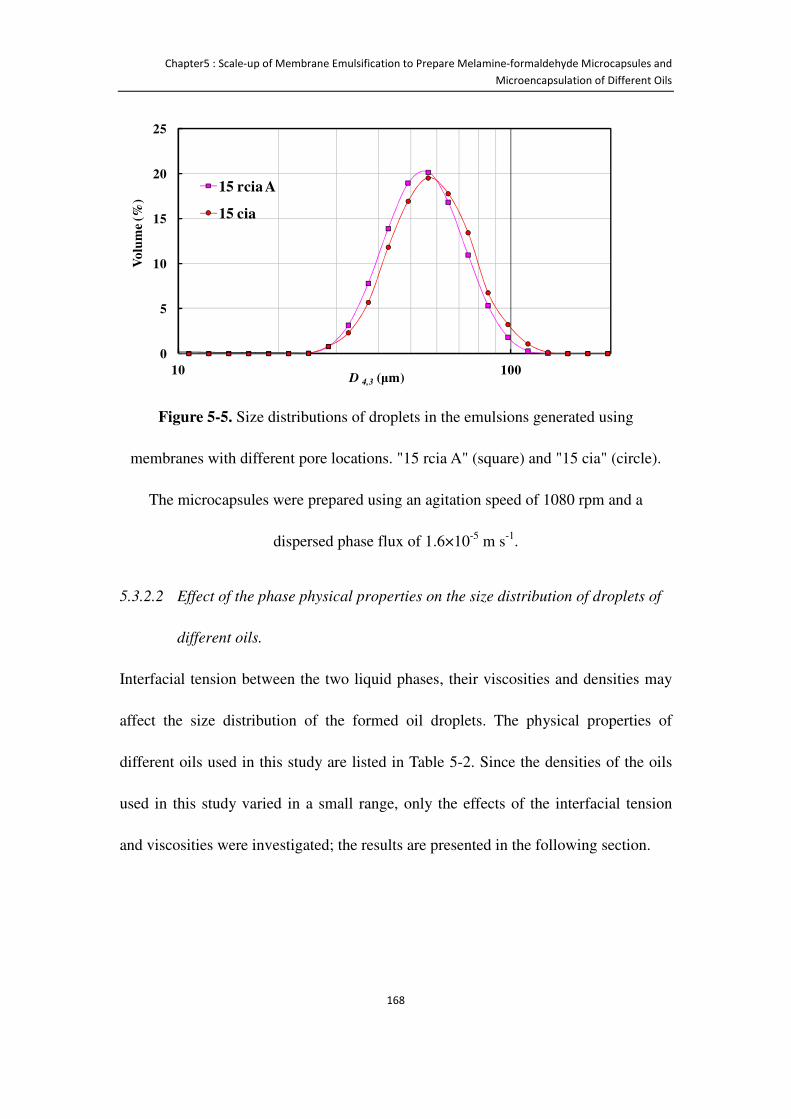
Chapter5 : Scale-up of Membrane Emulsification to Prepare Melamine-formaldehyde Microcapsules and
Microencapsulation of Different Oils
168
Figure 5-5. Size distributions of droplets in the emulsions generated using
membranes with different pore locations. "15 rcia A" (square) and "15 cia" (circle).
The microcapsules were prepared using an agitation speed of 1080 rpm and a
dispersed phase flux of 1.6×10⁻⁵ m s-1.
5.3.2.2 Effect of the phase physical properties on the size distribution of droplets of
different oils.
Interfacial tension between the two liquid phases, their viscosities and densities may
affect the size distribution of the formed oil droplets. The physical properties of
different oils used in this study are listed in Table 5-2. Since the densities of the oils
used in this study varied in a small range, only the effects of the interfacial tension
and viscosities were investigated; the results are presented in the following section.
0
5
10
15
20
25
10 100
Vo
lum
e (%
)
D 4,3 (μm)
15 rcia A
15 cia
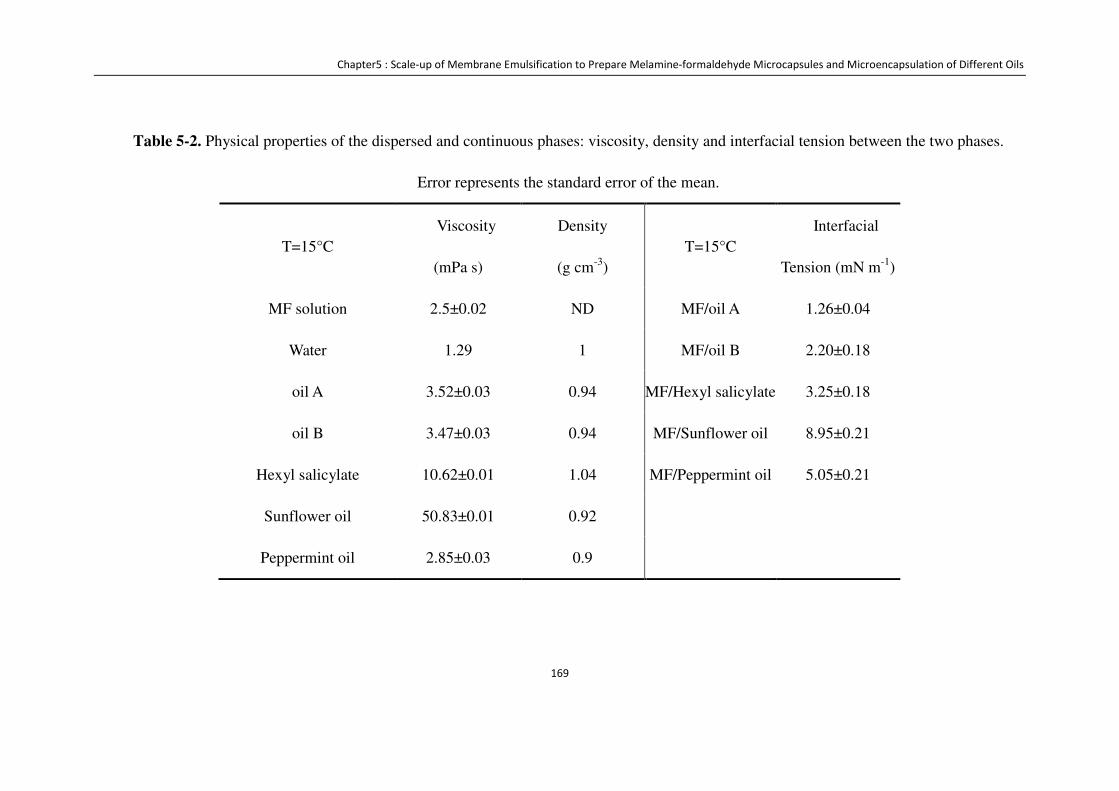
Chapter5 : Scale-up of Membrane Emulsification to Prepare Melamine-formaldehyde Microcapsules and Microencapsulation of Different Oils
169
Table 5-2. Physical properties of the dispersed and continuous phases: viscosity, density and interfacial tension between the two phases.
Error represents the standard error of the mean.
T=15°C Viscosity
(mPa s)
Density
(g cm-3) T=15°C
Interfacial
Tension (mN m-1)
MF solution 2.5±0.02 ND MF/oil A 1.26±0.04
Water 1.29 1 MF/oil B 2.20±0.18
oil A 3.52±0.03 0.94 MF/Hexyl salicylate 3.25±0.18
oil B 3.47±0.03 0.94 MF/Sunflower oil 8.95±0.21
Hexyl salicylate 10.62±0.01 1.04 MF/Peppermint oil 5.05±0.21
Sunflower oil 50.83±0.01 0.92
Peppermint oil 2.85±0.03 0.9
Chapter5 : Scale-up of Membrane Emulsification to Prepare Melamine-formaldehyde Microcapsules and
Microencapsulation of Different Oils
170
At 15 ± 1°C, the viscosity of the pre-cross linked MF aqueous solution was 2.5 ± 0.02
mPa s (Table 5-2). The interfacial tension between the MF precondensate solution and
the oil to be encapsulated varied in the range of 1.26 ± 0.04 to 8.95 ± 0.21 mN/m
(Table 5-2) with all the oils considered.
Figure 5-6 shows the experimental data of droplet size versus interfacial tension. It
increases with the interfacial tension, as expected. The model D, which was described
in Section 2.3.3, has been used to predict the droplet size; the results are also
presented in Figure 5-6. 67� represents viscosity modification factors. For oils with
different viscosities, two dispersion phase viscosity modification factors 67� =2.8
(μ¨ < 10μh,model D-1) and 67� =3.5 (g* ≥ 10g) ,model D-2) were used. The
model D developed previously (Holdich et al., 2010) underestimates the predicted
droplet size, which may be due to that the model does not consider the affect of
dispersion phase flux on the size. Nevertheless, the experimental trend whereby the
droplet size increases with the interfacial tension is also observed in the model.
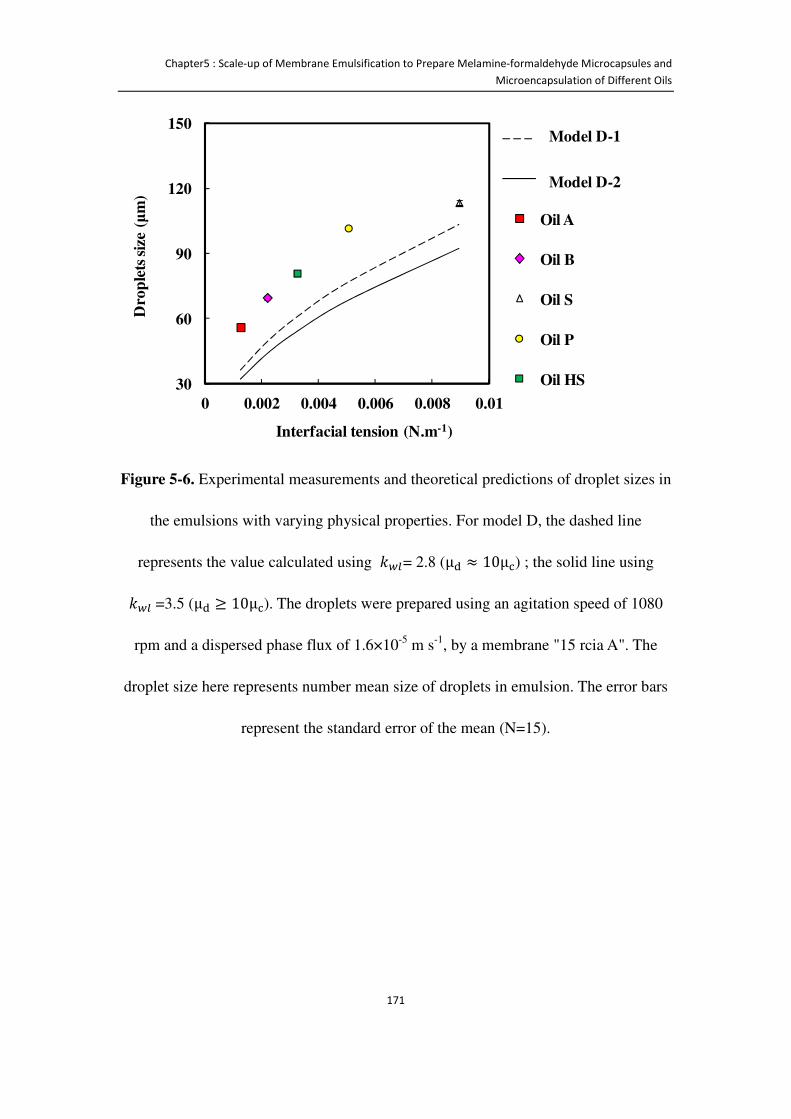
Chapter5 : Scale-up of Membrane Emulsification to Prepare Melamine-formaldehyde Microcapsules and
Microencapsulation of Different Oils
171
Figure 5-6. Experimental measurements and theoretical predictions of droplet sizes in
the emulsions with varying physical properties. For model D, the dashed line
represents the value calculated using 67�= 2.8 (μ¨ ≈ 10μh) ; the solid line using
67� =3.5 (μ¨ ≥ 10μh). The droplets were prepared using an agitation speed of 1080
rpm and a dispersed phase flux of 1.6×10⁻⁵ m s-1, by a membrane "15 rcia A". The
droplet size here represents number mean size of droplets in emulsion. The error bars
represent the standard error of the mean (N=15).
30
60
90
120
150
0 0.002 0.004 0.006 0.008 0.01
Dro
ple
ts s
ize
(μm
)
Interfacial tension (N.m-1)
Oil A
Oil B
Oil S
Oil P
Oil HS
Model D-1
Model D-2
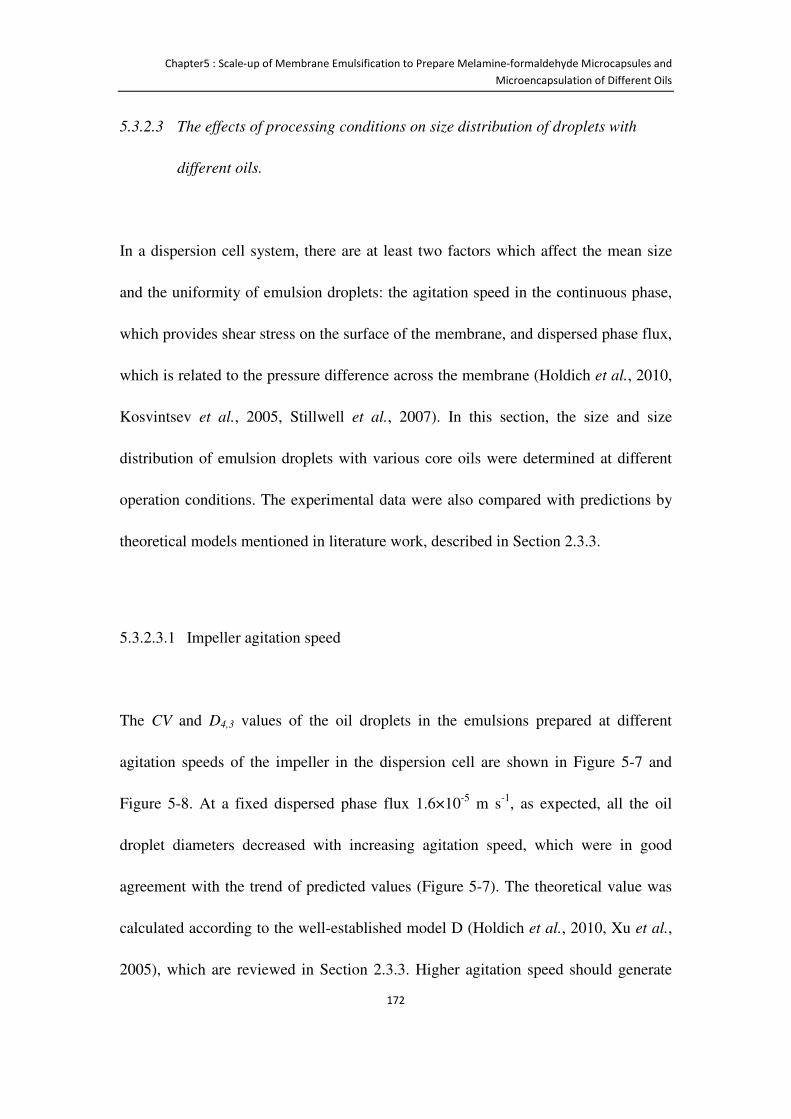
Chapter5 : Scale-up of Membrane Emulsification to Prepare Melamine-formaldehyde Microcapsules and
Microencapsulation of Different Oils
172
5.3.2.3 The effects of processing conditions on size distribution of droplets with
different oils.
In a dispersion cell system, there are at least two factors which affect the mean size
and the uniformity of emulsion droplets: the agitation speed in the continuous phase,
which provides shear stress on the surface of the membrane, and dispersed phase flux,
which is related to the pressure difference across the membrane (Holdich et al., 2010,
Kosvintsev et al., 2005, Stillwell et al., 2007). In this section, the size and size
distribution of emulsion droplets with various core oils were determined at different
operation conditions. The experimental data were also compared with predictions by
theoretical models mentioned in literature work, described in Section 2.3.3.
5.3.2.3.1 Impeller agitation speed
The CV and D4,3 values of the oil droplets in the emulsions prepared at different
agitation speeds of the impeller in the dispersion cell are shown in Figure 5-7 and
Figure 5-8. At a fixed dispersed phase flux 1.6×10⁻⁵ m s-1, as expected, all the oil
droplet diameters decreased with increasing agitation speed, which were in good
agreement with the trend of predicted values (Figure 5-7). The theoretical value was
calculated according to the well-established model D (Holdich et al., 2010, Xu et al.,
2005), which are reviewed in Section 2.3.3. Higher agitation speed should generate
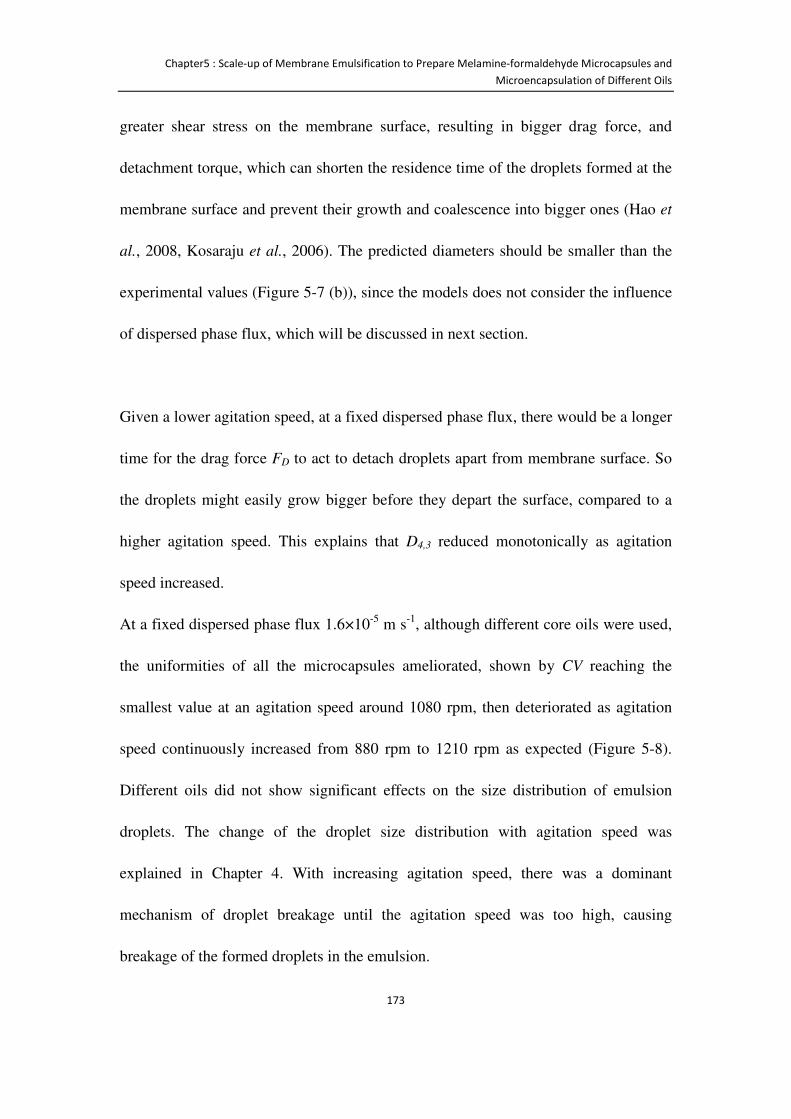
Chapter5 : Scale-up of Membrane Emulsification to Prepare Melamine-formaldehyde Microcapsules and
Microencapsulation of Different Oils
173
greater shear stress on the membrane surface, resulting in bigger drag force, and
detachment torque, which can shorten the residence time of the droplets formed at the
membrane surface and prevent their growth and coalescence into bigger ones (Hao et
al., 2008, Kosaraju et al., 2006). The predicted diameters should be smaller than the
experimental values (Figure 5-7 (b)), since the models does not consider the influence
of dispersed phase flux, which will be discussed in next section.
Given a lower agitation speed, at a fixed dispersed phase flux, there would be a longer
time for the drag force FD to act to detach droplets apart from membrane surface. So
the droplets might easily grow bigger before they depart the surface, compared to a
higher agitation speed. This explains that D4,3 reduced monotonically as agitation
speed increased.
At a fixed dispersed phase flux 1.6×10⁻⁵ m s-1, although different core oils were used,
the uniformities of all the microcapsules ameliorated, shown by CV reaching the
smallest value at an agitation speed around 1080 rpm, then deteriorated as agitation
speed continuously increased from 880 rpm to 1210 rpm as expected (Figure 5-8).
Different oils did not show significant effects on the size distribution of emulsion
droplets. The change of the droplet size distribution with agitation speed was
explained in Chapter 4. With increasing agitation speed, there was a dominant
mechanism of droplet breakage until the agitation speed was too high, causing
breakage of the formed droplets in the emulsion.
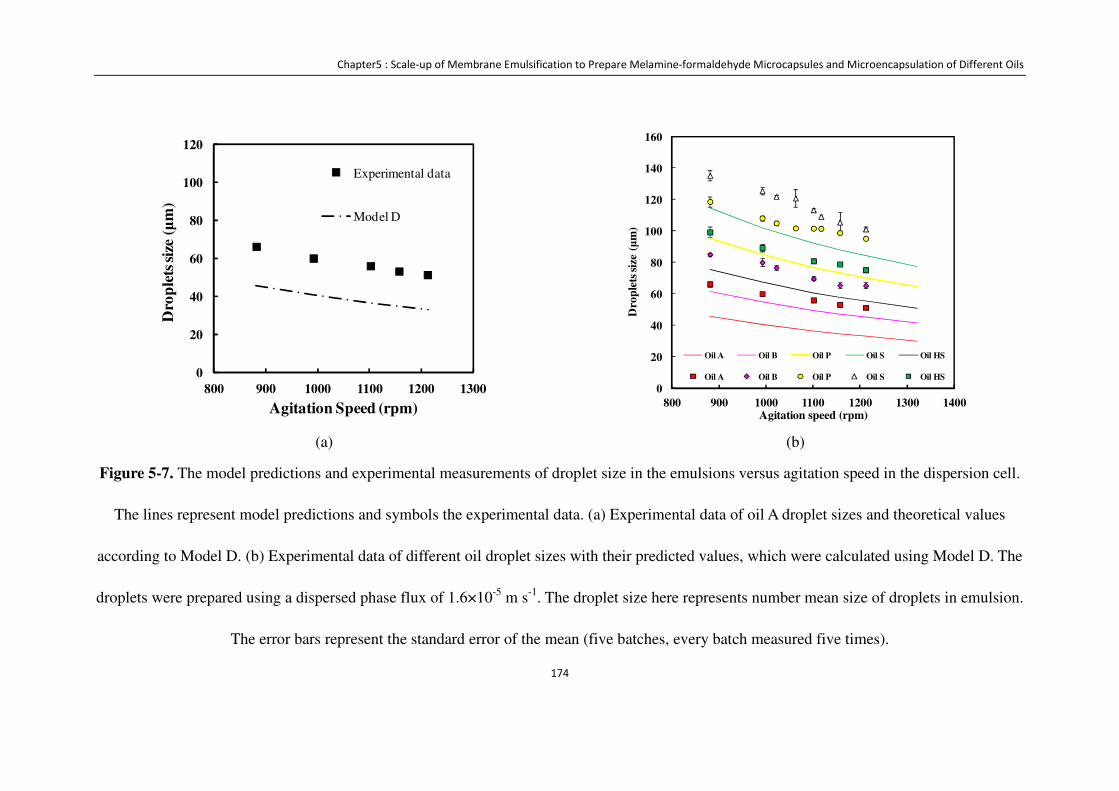
Chapter5 : Scale-up of Membrane Emulsification to Prepare Melamine-formaldehyde Microcapsules and Microencapsulation of Different Oils
174
(a)
(b)
Figure 5-7. The model predictions and experimental measurements of droplet size in the emulsions versus agitation speed in the dispersion cell.
The lines represent model predictions and symbols the experimental data. (a) Experimental data of oil A droplet sizes and theoretical values
according to Model D. (b) Experimental data of different oil droplet sizes with their predicted values, which were calculated using Model D. The
droplets were prepared using a dispersed phase flux of 1.6×10⁻⁵ m s-1. The droplet size here represents number mean size of droplets in emulsion.
The error bars represent the standard error of the mean (five batches, every batch measured five times).
0
20
40
60
80
100
120
800 900 1000 1100 1200 1300
Dro
ple
ts s
ize
(μm
)
Agitation Speed (rpm)
Experimental data
Model D
0
20
40
60
80
100
120
140
160
800 900 1000 1100 1200 1300 1400
Dro
ple
ts s
ize
(μm
)
Agitation speed (rpm)
Oil A Oil B Oil P Oil S Oil HS
Oil A Oil B Oil P Oil S Oil HS
Chapter5 : Scale-up of Membrane Emulsification to Prepare Melamine-formaldehyde Microcapsules and
Microencapsulation of Different Oils
175
Figure 5-8 The effect of agitation speed in the dispersion cell on size distribution of
droplets of different oils in emulsions. The error bars represent the standard error of
the mean (N=15). The droplets were prepared using a dispersed phase flux of 1.6×10⁻⁵
m s-1.
5.3.2.3.2 Dispersed phase flux
Figure 5-9 shows that at a fixed agitation speed of 1080 rpm increasing the dispersed
phase flux increases both the size and the size distribution parameters of the droplets.
Size of emulsion droplets was changing with three variables: the interfacial tension of
the two phases d (N/m), the viscosity of dispersed phase g* (Pa s), the flux of
0.2
0.21
0.22
0.23
0.24
800 900 1000 1100 1200 1300
CV
Agitation speed (rpm)
Oil A
Oil B
Oil HS
Oil P
Oil S
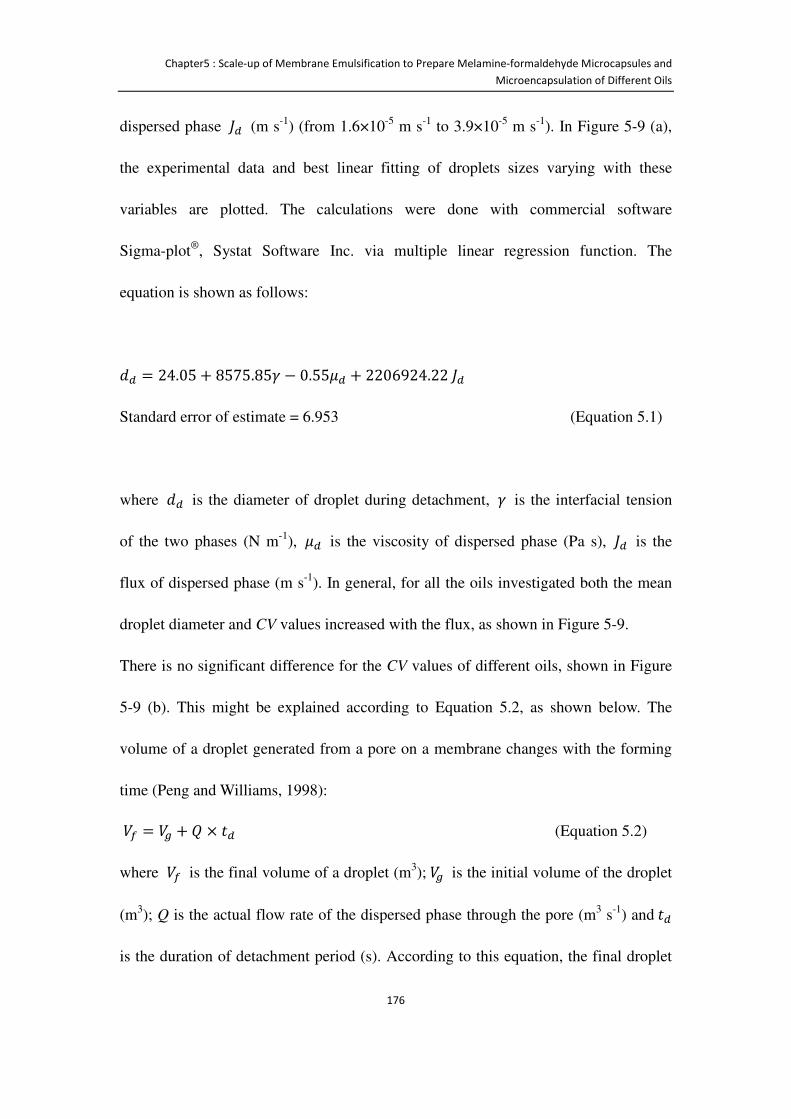
Chapter5 : Scale-up of Membrane Emulsification to Prepare Melamine-formaldehyde Microcapsules and
Microencapsulation of Different Oils
176
dispersed phase 5* (m s-1) (from 1.6×10⁻⁵ m s-1 to 3.9×10⁻⁵ m s-1). In Figure 5-9 (a),
the experimental data and best linear fitting of droplets sizes varying with these
variables are plotted. The calculations were done with commercial software
Sigma-plot®, Systat Software Inc. via multiple linear regression function. The
equation is shown as follows:
'* = 24.05 + 8575.85d − 0.55g* + 2206924.225*
Standard error of estimate = 6.953 (Equation 5.1)
where '* is the diameter of droplet during detachment, d is the interfacial tension
of the two phases (N m-1), g* is the viscosity of dispersed phase (Pa s), 5* is the
flux of dispersed phase (m s-1). In general, for all the oils investigated both the mean
droplet diameter and CV values increased with the flux, as shown in Figure 5-9.
There is no significant difference for the CV values of different oils, shown in Figure
5-9 (b). This might be explained according to Equation 5.2, as shown below. The
volume of a droplet generated from a pore on a membrane changes with the forming
time (Peng and Williams, 1998):
ST = SU + Ú × P* (Equation 5.2)
where ST is the final volume of a droplet (m3);SU is the initial volume of the droplet
(m3); Q is the actual flow rate of the dispersed phase through the pore (m3 s-1) andP*
is the duration of detachment period (s). According to this equation, the final droplet
Chapter5 : Scale-up of Membrane Emulsification to Prepare Melamine-formaldehyde Microcapsules and
Microencapsulation of Different Oils
177
diameter will increase linearly with the flux of the dispersed phase if P* remained as
a constant. The higher flux may cause generation of droplets with a higher frequency,
and lead to bigger droplets prior to detachment. In addition, droplets produced at a
higher frequency tend to coalesce more given a stirring speed, leading to a wider size
distribution (Abrahamse et al., 2002, Xu et al., 2005), as observed here (Figure
2-9(b)).
Despite considerable difference in physical properties of the two liquid phases and
operating conditions utilized, MF droplets with a CV value as small as 21.0 ± 0.5%
were readily produced from the dispersion cell. This demonstrates that membrane
emulsification based on using the dispersion cell is a fairly reliable technique to
prepare different emulsion droplets and microcapsules of narrow size distributions.
Chapter5 : Scale-up of Membrane Emulsification to Prepare Melamine-formaldehyde Microcapsules and Microencapsulation of Different Oils
178
(a)
(b)
Figure 5-9 The influence of the flux of the dispersed phase pumped through the membrane on the (a) size and (b) size distribution of the
droplets in emulsion. (a) The experimental measurements and mathematical calculations of droplet size in the emulsions of core oil with
viscosity of dispersed phase and interfacial tension versus dispersed phase flux in the dispersion cell. The symbols represent experimental data
and lines are the best fitting through Sigma-plot® multiple linear regression calculation. The droplets were prepared using a agitation speed of
1080 rpm. The error bars represent the standard error of the mean (N=15).
0
20
40
60
80
100
120
140
160
180
1.00E-05 2.00E-05 3.00E-05 4.00E-05
D4,3
(μm
)
Flux (m s-1)
Oil A Oil BOil HS Oil POil S Oil A simulationOil B simulation Oil HS simulationOil P simulation Oil S simulation
20
22
24
26
28
30
32
34
36
38
40
1.00E-05 2.00E-05 3.00E-05 4.00E-05
CV
(%)
Flux (m s-1)
Oil A
Oil B
Oil HS
Oil P
Oil S
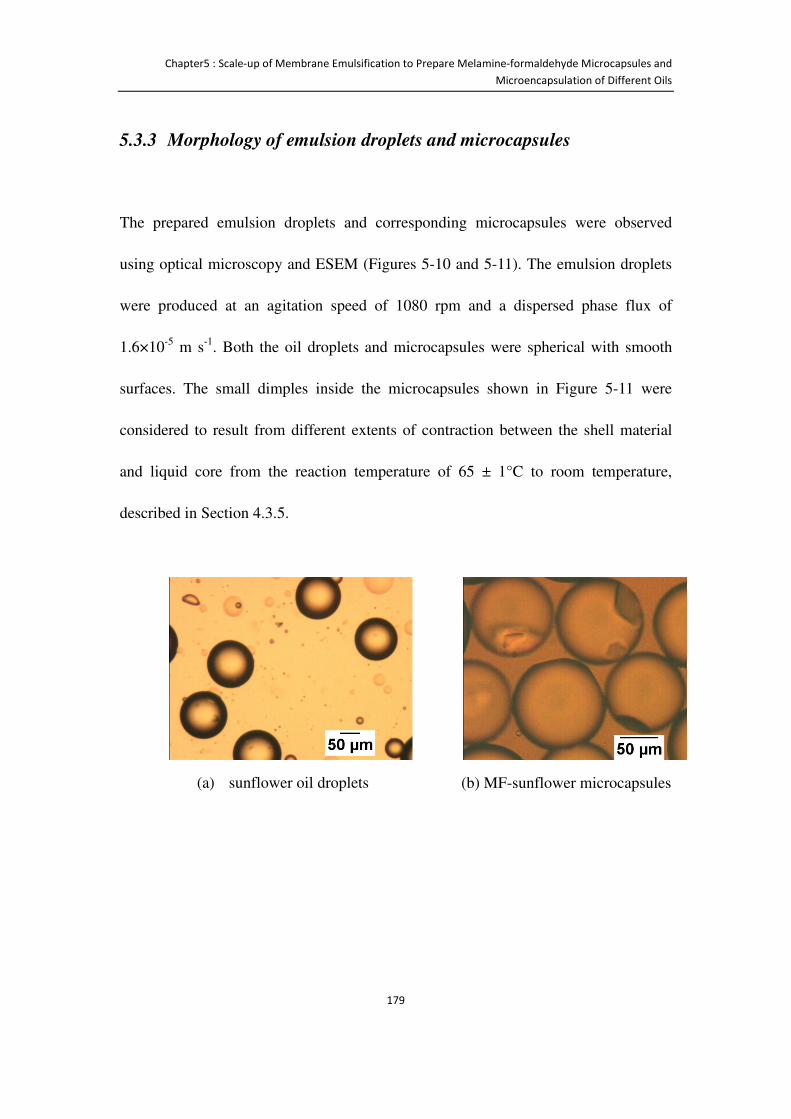
Chapter5 : Scale-up of Membrane Emulsification to Prepare Melamine-formaldehyde Microcapsules and
Microencapsulation of Different Oils
179
5.3.3 Morphology of emulsion droplets and microcapsules
The prepared emulsion droplets and corresponding microcapsules were observed
using optical microscopy and ESEM (Figures 5-10 and 5-11). The emulsion droplets
were produced at an agitation speed of 1080 rpm and a dispersed phase flux of
1.6×10⁻⁵ m s-1. Both the oil droplets and microcapsules were spherical with smooth
surfaces. The small dimples inside the microcapsules shown in Figure 5-11 were
considered to result from different extents of contraction between the shell material
and liquid core from the reaction temperature of 65 ± 1°C to room temperature,
described in Section 4.3.5.
(a) sunflower oil droplets (b) MF-sunflower microcapsules
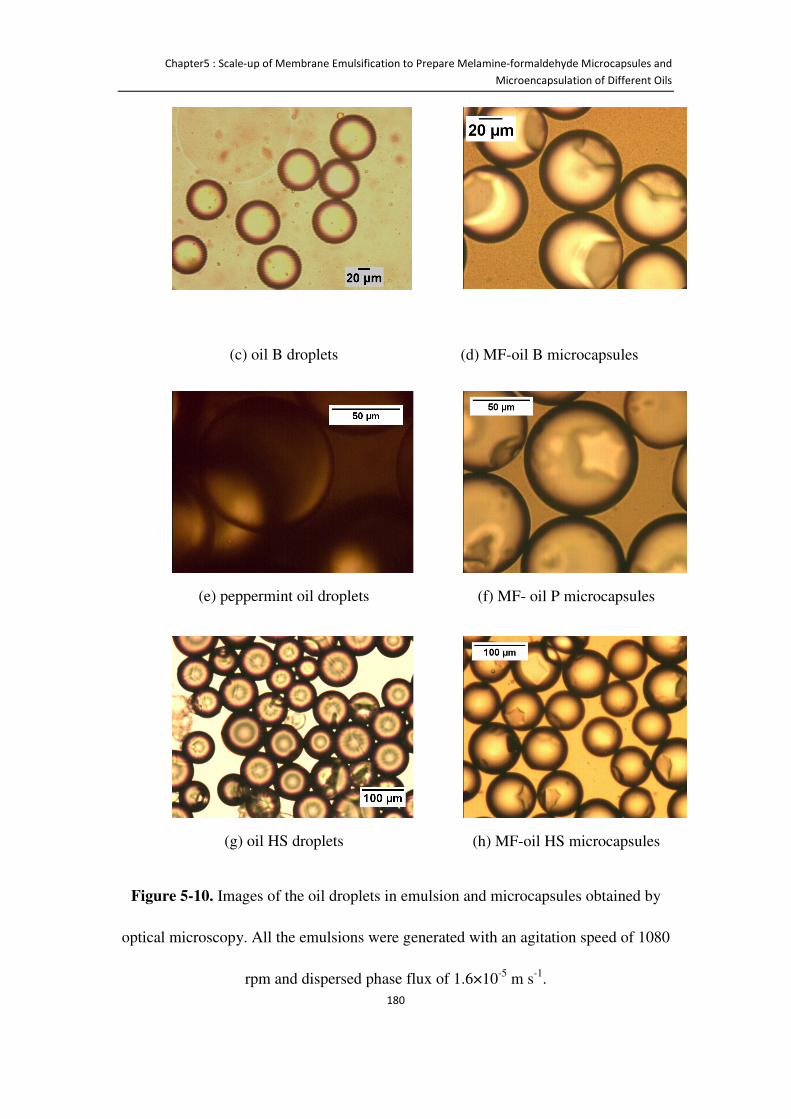
Chapter5 : Scale-up of Membrane Emulsification to Prepare Melamine-formaldehyde Microcapsules and
Microencapsulation of Different Oils
180
(c) oil B droplets
(d) MF-oil B microcapsules
(e) peppermint oil droplets (f) MF- oil P microcapsules
(g) oil HS droplets (h) MF-oil HS microcapsules
Figure 5-10. Images of the oil droplets in emulsion and microcapsules obtained by
optical microscopy. All the emulsions were generated with an agitation speed of 1080
rpm and dispersed phase flux of 1.6×10⁻⁵ m s-1.
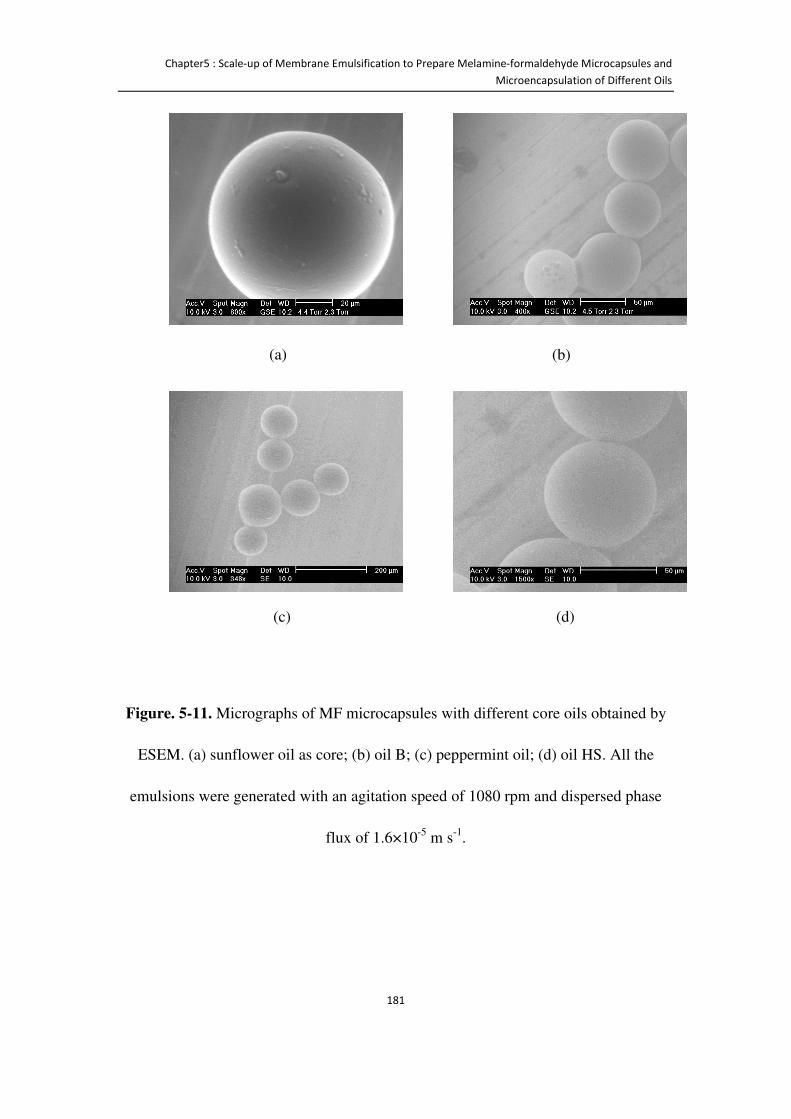
Chapter5 : Scale-up of Membrane Emulsification to Prepare Melamine-formaldehyde Microcapsules and
Microencapsulation of Different Oils
181
(a) (b)
(c)
(d)
Figure. 5-11. Micrographs of MF microcapsules with different core oils obtained by
ESEM. (a) sunflower oil as core; (b) oil B; (c) peppermint oil; (d) oil HS. All the
emulsions were generated with an agitation speed of 1080 rpm and dispersed phase
flux of 1.6×10⁻⁵ m s-1.
Chapter5 : Scale-up of Membrane Emulsification to Prepare Melamine-formaldehyde Microcapsules and
Microencapsulation of Different Oils
182
5.3.4 Shell thickness of MF microcapsules
The shell thicknesses of microcapsules was determined using TEM. The typical
micrographs of MF microcapsules prepared with different core oils are presented in
Figure 5-12. The sample with sunflower oil had a mean diameter of 113.9 ± 2.4 (SE, n
= 50) μm and mean shell thickness of 385 ± 12 nm (SE, n = 50); the sample with
peppermint oil had a mean diameter of 100.5 ± 2.2 μm and mean shell thickness of
420 ± 11 nm; with oil B had a mean diameter of 69.3 ± 1.5 μm and mean shell
thickness of 410 ± 10 nm; and with oil HS had a mean diameter of 79.6 ± 1.7 μm and
mean shell thickness of 396 ± 12 nm. The mean size of the microcapsules in each
sample obtained from TEM has no significant difference compared with the one
measured using laser diffraction, see Table 5-3. The core oils had no noticeable effect
on the shell thickness of microcapsules, based on the TEM measurements.
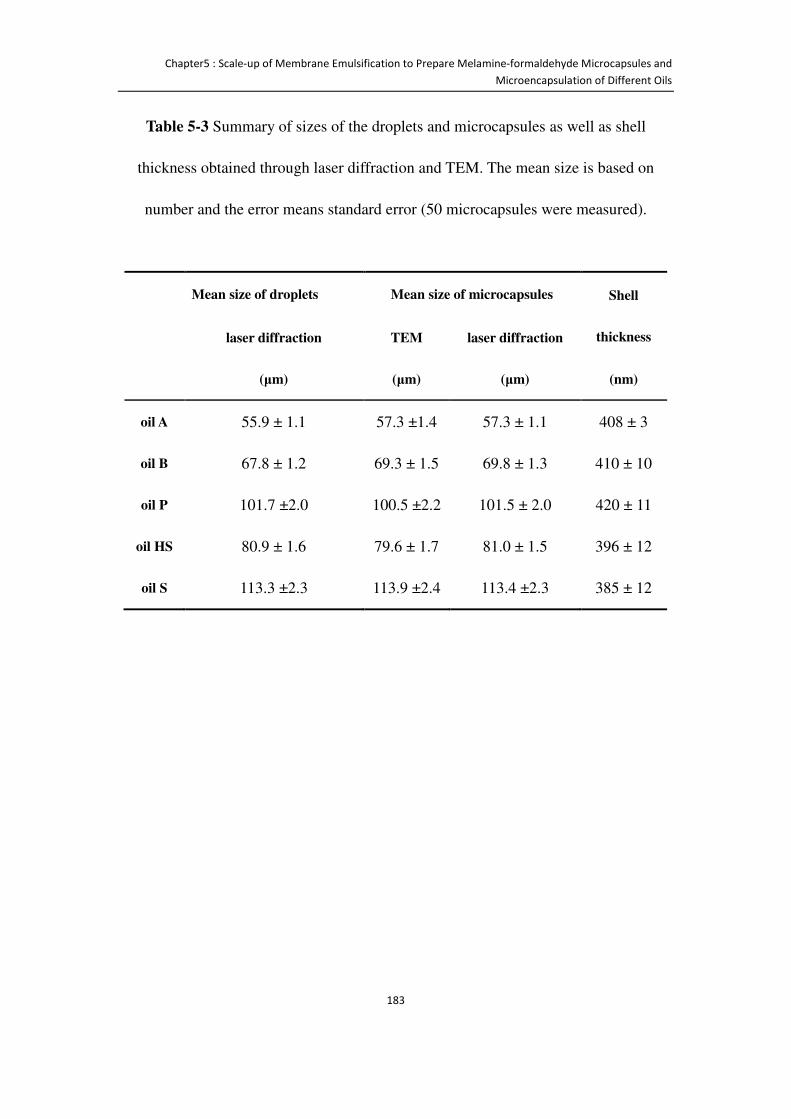
Chapter5 : Scale-up of Membrane Emulsification to Prepare Melamine-formaldehyde Microcapsules and
Microencapsulation of Different Oils
183
Table 5-3 Summary of sizes of the droplets and microcapsules as well as shell
thickness obtained through laser diffraction and TEM. The mean size is based on
number and the error means standard error (50 microcapsules were measured).
Mean size of droplets Mean size of microcapsules Shell
thickness laser diffraction TEM laser diffraction (μm) (μm) (μm) (nm)
oil A 55.9 ± 1.1 57.3 ±1.4 57.3 ± 1.1 408 ± 3
oil B 67.8 ± 1.2 69.3 ± 1.5 69.8 ± 1.3 410 ± 10
oil P 101.7 ±2.0 100.5 ±2.2 101.5 ± 2.0 420 ± 11
oil HS 80.9 ± 1.6 79.6 ± 1.7 81.0 ± 1.5 396 ± 12
oil S 113.3 ±2.3 113.9 ±2.4 113.4 ±2.3 385 ± 12
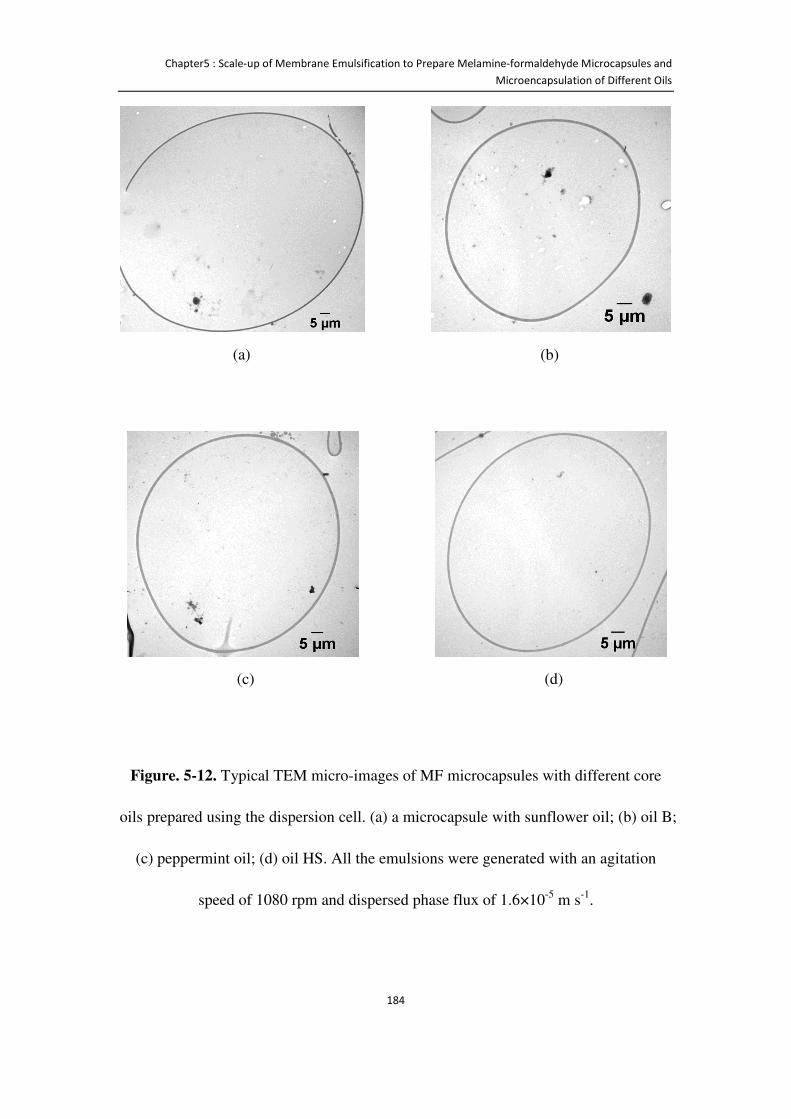
Chapter5 : Scale-up of Membrane Emulsification to Prepare Melamine-formaldehyde Microcapsules and
Microencapsulation of Different Oils
184
(a)
(b)
(c)
(d)
Figure. 5-12. Typical TEM micro-images of MF microcapsules with different core
oils prepared using the dispersion cell. (a) a microcapsule with sunflower oil; (b) oil B;
(c) peppermint oil; (d) oil HS. All the emulsions were generated with an agitation
speed of 1080 rpm and dispersed phase flux of 1.6×10⁻⁵ m s-1.
Chapter5 : Scale-up of Membrane Emulsification to Prepare Melamine-formaldehyde Microcapsules and
Microencapsulation of Different Oils
185
5.4 Conclusions
MF microcapsules containing an oil-based industrial precursor were prepared using a
pilot plant-scale cross-flow membrane system. Compared with the results obtained
from the dispersion cell, the cross flow membrane system produced MF
microcapsules with a slightly wider the size distribution. This difference likely
resulted from different membranes used, rather than the effect of scale up since the
oil-MF precondensate emulsion was stable for at least 4 h. Different core oils were
encapsulated with a MF shell through membrane emulsification and then in situ
polymerization. The size and size distribution of the droplets were affected by
membrane configurations, physical properties of the two liquid phases and operation
conditions. The experimental data were compared with the predictions of a model
reported in the literature. The model overall underestimates the mean droplet size
since it does not consider the effect of the dispersed phase flux. Therefore, a new
correlation to account for the dispersed phase flux has been proposed. Moreover, the
morphology and shell thickness of the microcapsules were determined through
microscopy, ESEM and TEM, respectively.
Though MF microcapsules have found industrial applications, there is a safety
concern about using formaldehyde in consumer products, Therefore, there is a
demand for new coating materials. In this study, environmental friendly PMMA
microcapsules were prepared and characterized, and the details will be described in
Chapter 6.

Chapter5 : Scale-up of Membrane Emulsification to Prepare Melamine-formaldehyde Microcapsules and
Microencapsulation of Different Oils
186
Chapter 6 Structure and Mechanical
Properties of Consumer-friendly
PMMA Microcapsules
The modelling part was performed in collaboration with Dr. R. Mercadé-Prieto at the
University of Birmingham, shown in Appendix A.
6.1 Introduction
Preparation and characterization of MF microcapsules containing perfume oil with
narrow size and strength distributions have been extensively described in Chapters 4
and 5. Although MF microcapsules are currently used in industry, there are potential
health and safety concerns of formaldehyde usage in consumer product, as mentioned
in Section 2.5.1. Therefore, it would be desirable to make perfume microcapsules
using formaldehyde-free shell material.
In this chapter, the research work presented is to focus on preparation and
characterization of environmentally and consumer-friendly poly (methyl methacrylate)
(PMMA) microcapsules containing perfume oils, with the aim to be delivered to
fabric surfaces via liquid detergents. Microcapsules were produced using a membrane
Chapter5 : Scale-up of Membrane Emulsification to Prepare Melamine-formaldehyde Microcapsules and
Microencapsulation of Different Oils
187
emulsification system; the results are compared with those obtained using a standard
homogenization procedure.
Proper characterization and understanding of novel microcapsules is necessary to
evaluate their potential applications, especially to compare with the better known MF
microcapsules. Transmission electron microscopy (TEM) is commonly used to
determine the wall thickness of microcapsules, though sample preparation is
expensive. However, acrylic resin used during the sample preparation for TEM is not
suitable for many materials, for example, PMMA. In the work presented in this
chapter, a non-destructive technique confocal laser scanning microscopy (CLSM) was
used to measure the wall thickness of microcapsules.
A micromanipulation was commonly used to test the mechanical properties of single
microcapsules. The data of diameter, rupture force and displacement at rupture of
single microcapsules can be obtained. However, in order to determine intrinsic
mechanical property parameters of the shell materials, such as elastic modulus,
theoretical or numerical models combined with the experimental data are required.
Previous modelling work was based on thin-shell microcapsules, such as MF
microcapsules mentioned in Chapter 4. There has been no report on modelling of
microcapsules with various thick shell. Compression testing by micromanipulation
together with finite element modelling (FEM) has been applied to PMMA
microcapsules with different shell thickness in order to determine their mechanical
properties.
Chapter5 : Scale-up of Membrane Emulsification to Prepare Melamine-formaldehyde Microcapsules and
Microencapsulation of Different Oils
188
6.2 Experimental section
6.2.1 Preparation of microcapsules
6.2.1.1 Preparation of PMMA precondensate
The protocol developed by Chang et al. (2009) for encapsulation of phase transfer
materials was adopted to encapsulate perfume oil A, but the formulation and reaction
conditions were modified in order to improve the size distribution of the
microcapsules. A PMMA precondensate was obtained by mixing toluene (10 g),
MMA (9 g), a cross-linker EGDMA (1 g), and a trigger AIBN (0.5 g). The mixture
was stirred at 300 rpm with a two-paddle impeller (Φ 75 mm) in a 250 mL 3-necked
flask with round bottom, connected to an Allihn condenser. The precondensate was
allowed to react for 60 min at 60 ± 1°C.
6.2.1.2 Preparation of emulsion using conventional homogenization
A stock of fluorescent dye was first prepared by dissolving 0.1 wt% of PM546 in
acetone. Primary oil in water emulsion was made by homogenizing (Model L4RT,
Silverson Machines Ltd., UK) perfume oil A (10 g) with 0.3 wt% of dye-acetone
solution and 150 g of an aqueous solution of 0.1 wt% PVA with 5 wt% NaCl for 30
min at 800 rpm. AIBN (0.5g) was added into the precondensate, followed by mixing
Chapter5 : Scale-up of Membrane Emulsification to Prepare Melamine-formaldehyde Microcapsules and
Microencapsulation of Different Oils
189
with the primary emulsion in the homogenizer for 5 min at 400 to 800 rpm at 25 ±
1 °C.
6.2.1.3 Preparation of double emulsions using the dispersion cell
Emulsion droplets with narrow size distributions were generated by pushing 75 g of
an emulsion generated by homogenization at 400 rpm through the membrane system
into 75 g of 0.1 wt% PVA and 5 wt% NaCl aqueous solution, using an agitation speed
from 880 to 1210 rpm and a dispersed phase flux from 1.6×10⁻⁵ m s-1 to 3.1×10⁻⁵ m s-1
at 25 ± 1 °C.
6.2.1.4 Preparation of PMMA microcapsules
The emulsion formed using a homogenizer or the dispersion cell was transferred
back to the round bottom flask, where it was agitated with the double paddle impeller
at 150 rpm. The flask was placed into a water bath and its temperature increased to 65
± 1 °C, allowing the in situ-polymerization reaction of the PMMA to take place for 1
to 24 h. The resulting microcapsules in suspension were cooled to 25 ± 1°C, filtered
and washed with distilled water.
6.2.2 Morphology and shell thickness of microcapsules
6.2.2.1 Morphology
Optical microscopy (Leica DMRBE, Leica, Germany) and environmental scanning
electron microscopy (ESEM) (FEI/Philips XL30 ESEM-FEG, Philips, UK) were used
Chapter5 : Scale-up of Membrane Emulsification to Prepare Melamine-formaldehyde Microcapsules and
Microencapsulation of Different Oils
190
to characterise the surface morphology and the core/shell structure of the
microcapsules.
6.2.2.2 Determination of shell thickness of microcapsules
The shape of the oil droplets produced during emulsification and the shell thickness
(h) of the microcapsules at different stages of the polymerization reaction were also
studied with confocal laser scanning microscopy (CLSM) (Leica TCS SPE). The
excitation wavelength (540 nm) was chosen according to the fluorescent dye PM546
added into the core oil. In order to prove that the dye can diffuse and is soluble in
PMMA in the presence of perfume oil A, PMMA micro-particles of ~100 µm were
prepared with the methodology described above but without adding perfume oil A.
The PMMA micro-particles were then soaked into labelled perfume oil A for one to
two weeks, in order to let the oil and dye diffuse into the polymer. Afterwards, the
particles were filtered out, and observed under CLSM, which showed strong
fluorescence.
The shell thickness and diameter of microcapsules were determined from the cross
section of CLSM micrographs using Image J 1.46 (Pretzl et al., 2012). The
thicknesses and diameters were determined from the intensity midpoints of the
cross-section profiles. A correction factor was applied following that the cross-section
Chapter5 : Scale-up of Membrane Emulsification to Prepare Melamine-formaldehyde Microcapsules and
Microencapsulation of Different Oils
191
image was not necessarily taken at the equator (Mercade-Prieto et al., 2011b) (see
Figure. 6-1 and 6-2). For each batch, 20 microcapsules were randomly selected and 4
measurements were performed on the cross-section at different directions.
6.2.2.3 Shell thickness and radius corrections from CSLM measurements
When measuring radius and shell thicknesses of microcapsules from cross sectional
images, as in previous work using TEM or in the present work using CSLM, it is
required to correct the measured values considering that the measurement plane is
likely to be different from the equator of the capsules (Figure. 6-1), the only plane
where the measured shell thickness (hm) and radius (rm) are equal to the real shell
thickness (h) and radius (r). Smith et al. (2000) developed the trigonometric equations
for a given plane, and Mercade-Prieto et al. (2011b) estimated the typical shell
thickness correction for MF microcapsules. Here, what is desired is a correction factor
of the shell thickness ratio h/r for capsules with a wide range of h/r values. The
correction factor has been calculated using the equations described by Smith et al.
(2000) in a Matlab program that simulates 106 random measurement cuts, in
microcapsules with a random size between 40 to 70 µm. The measurement plane is
randomly distributed within a distance αri from the equatorial plane. When the
maximum α = 1, all the planes possible where a core-shell structure is still observed
are considered, but not when only shell is measured. As discussed by Mercadé-Prieto
et al. (2011b), measurements planes very close to the shell (α ≈ 1) are unlikely to
occur in practice, meanwhile they heavily influence the mean correction factor. For
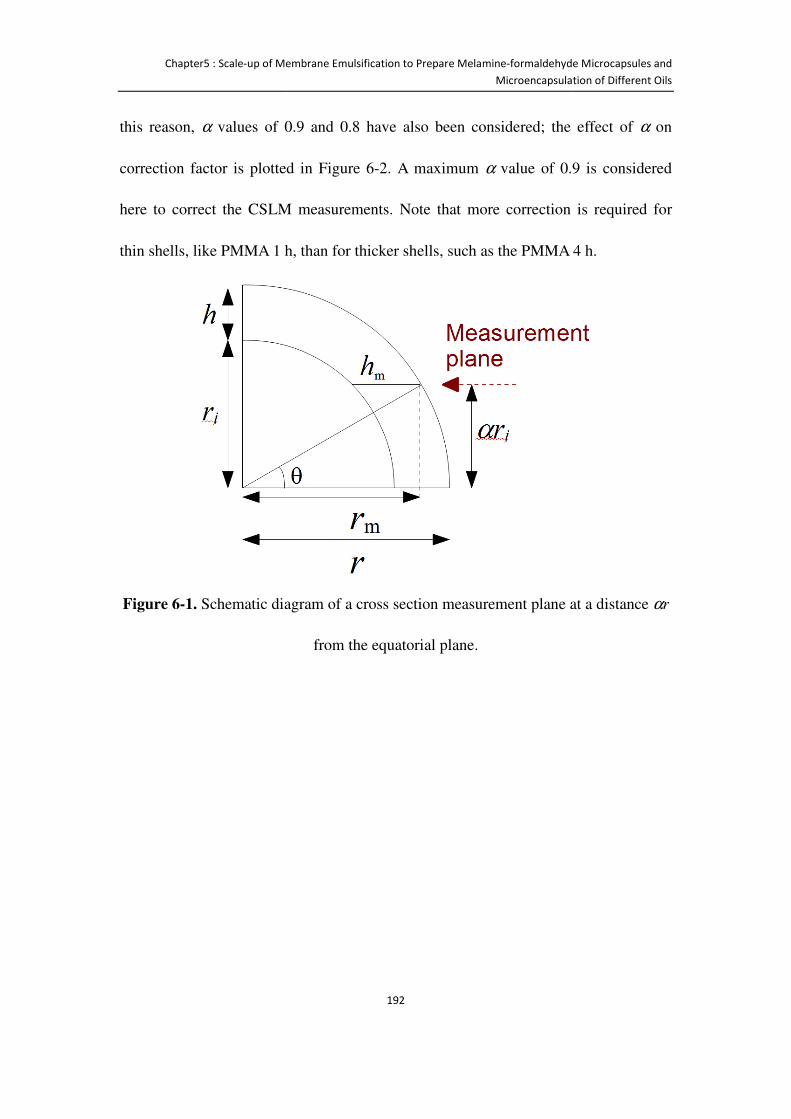
Chapter5 : Scale-up of Membrane Emulsification to Prepare Melamine
this reason, α values of 0.9 and 0.8 have also been considered; the effect of
correction factor is plotted in Figure 6
here to correct the CSLM measurements. Note that more correction is required for
thin shells, like PMMA 1 h, than for thicker shells, such as the PMMA 4 h.
Figure 6-1. Schematic diagram of
up of Membrane Emulsification to Prepare Melamine-formaldehyde Microcapsules and
Microencapsulation of Different Oils
192
values of 0.9 and 0.8 have also been considered; the effect of
s plotted in Figure 6-2. A maximum α value of 0.9 is considered
here to correct the CSLM measurements. Note that more correction is required for
thin shells, like PMMA 1 h, than for thicker shells, such as the PMMA 4 h.
Schematic diagram of a cross section measurement plane at a distance
from the equatorial plane.
formaldehyde Microcapsules and
Microencapsulation of Different Oils
values of 0.9 and 0.8 have also been considered; the effect of α on
value of 0.9 is considered
here to correct the CSLM measurements. Note that more correction is required for
thin shells, like PMMA 1 h, than for thicker shells, such as the PMMA 4 h.
a cross section measurement plane at a distance αr

Chapter5 : Scale-up of Membrane Emulsification to Prepare Melamine-formaldehyde Microcapsules and
Microencapsulation of Different Oils
193
Figure 6-2. Correction factor of the measured shell thickness ratio from simulations
with different maximum measurement planes away from the equator, parameter α as
described in Figure 6-1.
6.2.3 Size analysis
The mean size and size distribution of the oil droplets produced in the emulsification
step and the final microcapsules were determined using laser diffraction
(Mastersizer 2000, Malvern Instruments, UK). The values of SPAN, coefficient of
variance (CV), and the volume-based mean diameter D4,3 were recorded. The
refractive index of the perfume oil A was 1.497 (given by the supplier P&G) and that
of the microcapsules was 1.49 (Huisman et al., 2012). The size values given are the
average of five measurements.
0.6
0.65
0.7
0.75
0.8
0.85
0.9
0.95
1
0.0 0.1 0.2 0.3 0.4 0.5 0.6 0.7 0.8
Co
rre
ctio
n f
act
or
(h/r
)/(h
m/r
m)
Measured hm/rm
max α = 0.8
max α = 0.9
max α = 1
Chapter5 : Scale-up of Membrane Emulsification to Prepare Melamine-formaldehyde Microcapsules and
Microencapsulation of Different Oils
194
6.2.4 Determination of the mechanical properties of PMMA
microcapsules
The parallel compression of single microcapsules was performed by a
well-established micromanipulation technique (Sun and Zhang, 2001), and more
details are described in Chapter 3, Section 3.3.
One drop of suspension with microcapsules was placed on a glass slide and left to dry
for 2-3 min. Single microcapsules were observed from a side-view video camera
(Micro Instruments Ltd., Oxon, UK). A glass probe of 160 μm in diameter connected
to a force transducer (Maximum scale 5mN, Model 403A, Aurora Scientific Inc.,
Canada) held by a fine micromanipulator was programmed to travel towards a single
microcapsule at a speed of 2 µm s-1. The system used can measure forces with a
precision of ± 0.1 µN and probe displacement of ± 0.2 µm (Thomas et al., 2000). For
each sample 20 to 30 microcapsules were randomly selected.
Theoretically, the capsule shell can be elastic, viscoelastic and elastic-plastic. Full
characterisation of these properties requires a series of carefully designed experiments,
including compression to different deformations and holding, loading and unloading,
and compression at different speeds, as carried out on melamine formaldehyde
microcapsules with difference cores (Hu et al., 2009, Sun and Zhang, 2001) and
Chapter5 : Scale-up of Membrane Emulsification to Prepare Melamine-formaldehyde Microcapsules and
Microencapsulation of Different Oils
195
polymer pharmaceutical excipients (Yap et al., 2008). It has been found the capsule
shell and these polymeric particles were mainly elastic-plastic, and the viscous effect
was negligible. Moreover, previous work on the viscoelasticity of a macroscopic
PMMA material (Capodagli and Lakes, 2008) showed that it was mainly elastic and
its apparent Young’s modulus varied only by approximately ± 10%, measured by a
broadband viscoelasticity spectrometer when the applied frequency was changed by
several orders of magnitude. Therefore single microcapsules were only compressed at
a given speed to large deformations or rupture. The parallel compression of
microcapsules with thick shells was studied using finite element modelling (FEM) to
determine their elastic-plastic properties; the details are given in Appendix A.
6.3 Results and Discussion
6.3.1 Stability of the oil/water emulsion
The size distribution of the emulsion droplets during storage was measured since it
took a few hours to form microcapsules from the emulsion. The mean diameter D4,3
varied from 55.1 ± 1.2 µm when the emulsification was finished to 55.8 ± 1.3 µm
after 72 h, while the corresponding CV value varied from 22.1 ± 0.5 % to 23.5 ± 0.6%.
Therefore, the emulsion droplets were considered to be stable during this period
(Figure 6-3).

Chapter5 : Scale-up of Membrane Emulsification to Prepare Melamine-formaldehyde Microcapsules and
Microencapsulation of Different Oils
196
Figure 6-3 The mean diameter (D4,3) and CV values of the oil droplets measured at
different times after their formation, which were prepared by membrane
emulsification using an agitation speed of 1080 rpm and dispersed phase flux of
1.6×10⁻⁵ m s-1.
15
20
25
30
35
50
53
55
58
60
0 24 48 72
CV
(%)
D4
,3( μ
m )
Time (h)
D4,3
CV
D4,3
CV
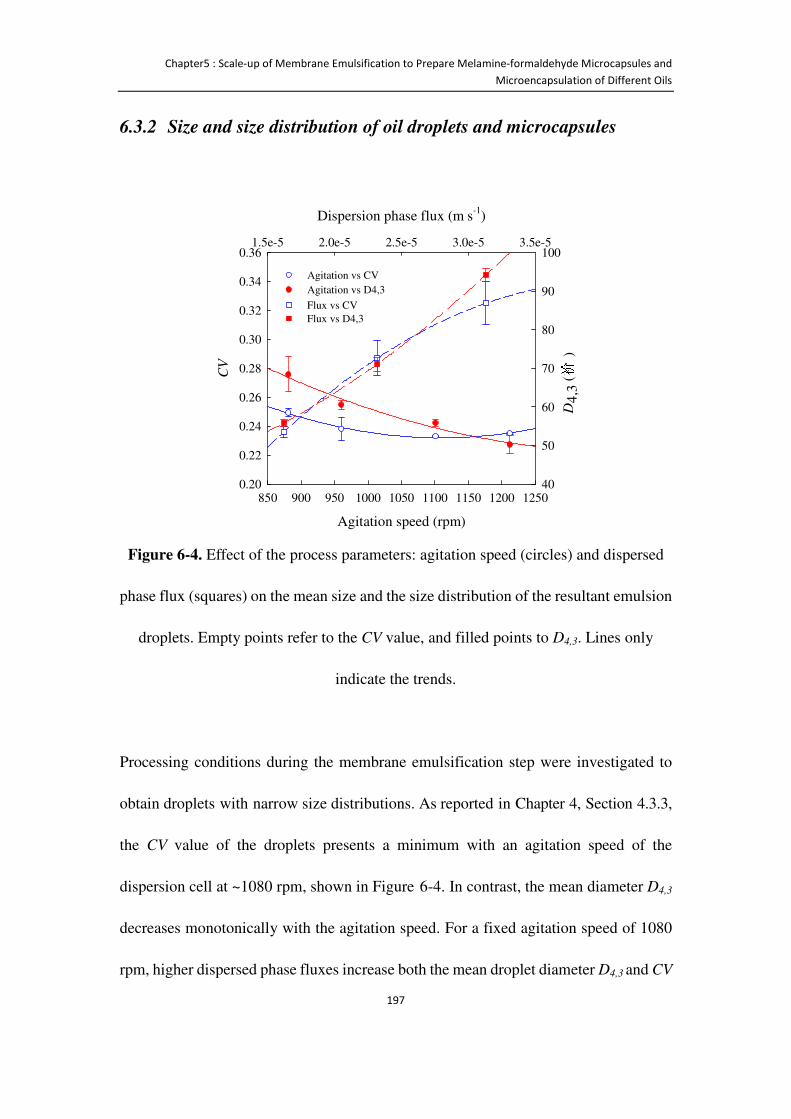
Chapter5 : Scale-up of Membrane Emulsification to Prepare Melamine-formaldehyde Microcapsules and
Microencapsulation of Different Oils
197
6.3.2 Size and size distribution of oil droplets and microcapsules
Figure 6-4. Effect of the process parameters: agitation speed (circles) and dispersed
phase flux (squares) on the mean size and the size distribution of the resultant emulsion
droplets. Empty points refer to the CV value, and filled points to D4,3. Lines only
indicate the trends.
Processing conditions during the membrane emulsification step were investigated to
obtain droplets with narrow size distributions. As reported in Chapter 4, Section 4.3.3,
the CV value of the droplets presents a minimum with an agitation speed of the
dispersion cell at ~1080 rpm, shown in Figure 6-4. In contrast, the mean diameter D4,3
decreases monotonically with the agitation speed. For a fixed agitation speed of 1080
rpm, higher dispersed phase fluxes increase both the mean droplet diameter D4,3 and CV
Agitation speed (rpm)
850 900 950 1000 1050 1100 1150 1200 1250
CV
0.20
0.22
0.24
0.26
0.28
0.30
0.32
0.34
0.36
Dispersion phase flux (m s-1)
1.5e-5 2.0e-5 2.5e-5 3.0e-5 3.5e-5
D4,
3 (祄)
40
50
60
70
80
90
100
Agitation vs CV
Agitation vs D4,3
Flux vs CVFlux vs D4,3
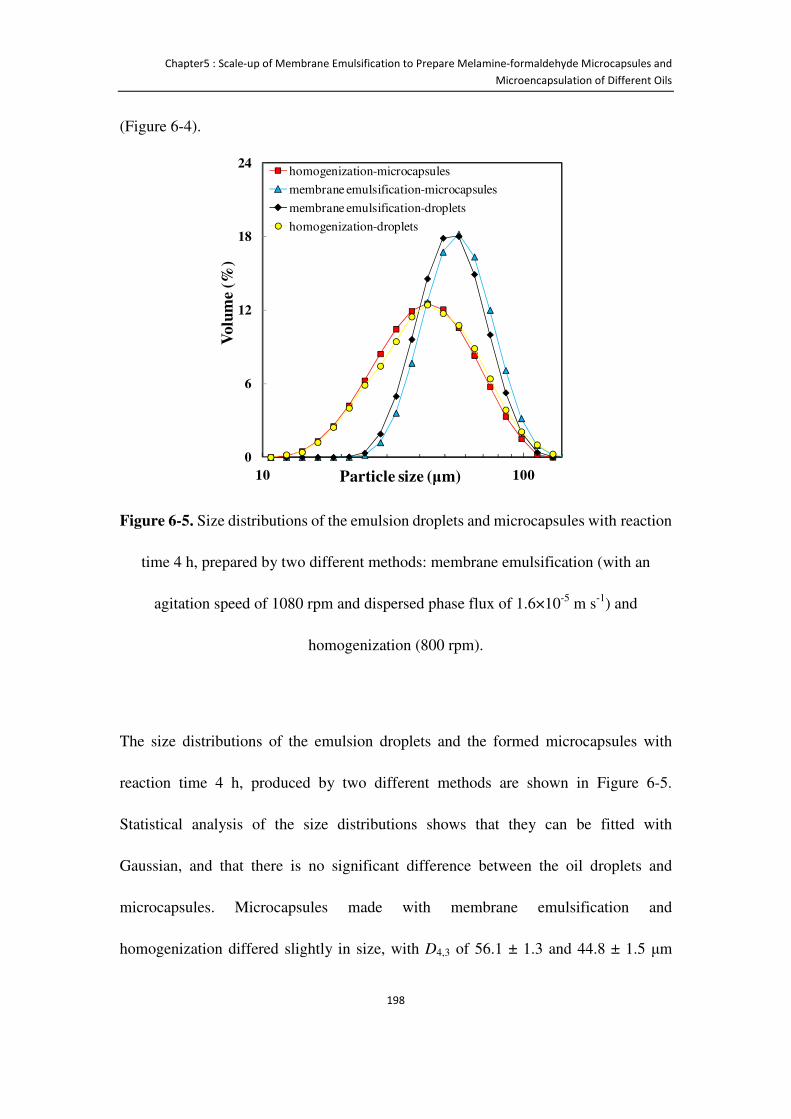
Chapter5 : Scale-up of Membrane Emulsification to Prepare Melamine-formaldehyde Microcapsules and
Microencapsulation of Different Oils
198
(Figure 6-4).
Figure 6-5. Size distributions of the emulsion droplets and microcapsules with reaction
time 4 h, prepared by two different methods: membrane emulsification (with an
agitation speed of 1080 rpm and dispersed phase flux of 1.6×10⁻⁵ m s-1) and
homogenization (800 rpm).
The size distributions of the emulsion droplets and the formed microcapsules with
reaction time 4 h, produced by two different methods are shown in Figure 6-5.
Statistical analysis of the size distributions shows that they can be fitted with
Gaussian, and that there is no significant difference between the oil droplets and
microcapsules. Microcapsules made with membrane emulsification and
homogenization differed slightly in size, with D4,3 of 56.1 ± 1.3 and 44.8 ± 1.5 μm
0
6
12
18
24
10 100
Volu
me (
%)
Particle size (μm)
homogenization-microcapsules
membrane emulsification-microcapsules
membrane emulsification-droplets
homogenization-droplets
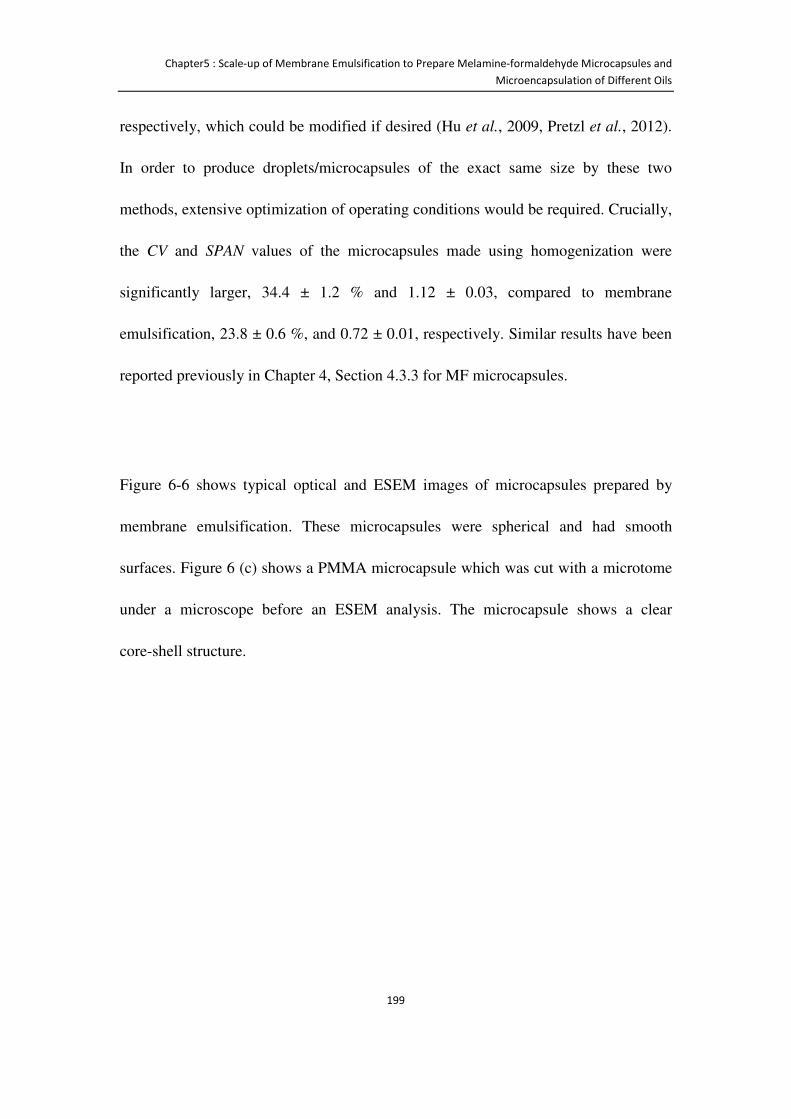
Chapter5 : Scale-up of Membrane Emulsification to Prepare Melamine-formaldehyde Microcapsules and
Microencapsulation of Different Oils
199
respectively, which could be modified if desired (Hu et al., 2009, Pretzl et al., 2012).
In order to produce droplets/microcapsules of the exact same size by these two
methods, extensive optimization of operating conditions would be required. Crucially,
the CV and SPAN values of the microcapsules made using homogenization were
significantly larger, 34.4 ± 1.2 % and 1.12 ± 0.03, compared to membrane
emulsification, 23.8 ± 0.6 %, and 0.72 ± 0.01, respectively. Similar results have been
reported previously in Chapter 4, Section 4.3.3 for MF microcapsules.
Figure 6-6 shows typical optical and ESEM images of microcapsules prepared by
membrane emulsification. These microcapsules were spherical and had smooth
surfaces. Figure 6 (c) shows a PMMA microcapsule which was cut with a microtome
under a microscope before an ESEM analysis. The microcapsule shows a clear
core-shell structure.
Chapter5 : Scale-up of Membrane Emulsification to Prepare Melamine-formaldehyde Microcapsules and Microencapsulation of Different Oils
200
6.3.3 Morphology
(a)
(b)
(c)
Figure 6-6. Micrographs of PMMA microcapsules with reaction time 4 h, obtained using (a) optical microscopy and (b-c) ESEM. In (c) the
microcapsule was cut with a microtome under a microscope. Microcapsules were prepared using the dispersion cell with an agitation speed of
1080 rpm and dispersed phase flux of 1.6×10⁻⁵ m s-1.
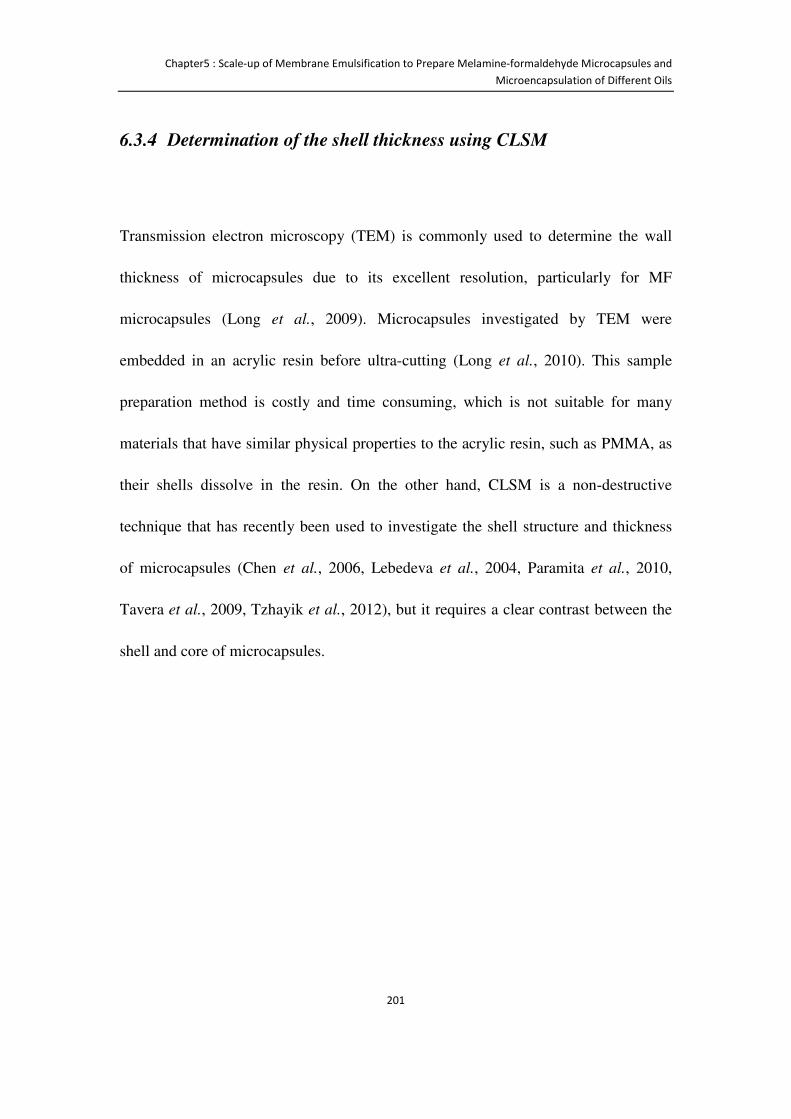
Chapter5 : Scale-up of Membrane Emulsification to Prepare Melamine-formaldehyde Microcapsules and
Microencapsulation of Different Oils
201
6.3.4 Determination of the shell thickness using CLSM
Transmission electron microscopy (TEM) is commonly used to determine the wall
thickness of microcapsules due to its excellent resolution, particularly for MF
microcapsules (Long et al., 2009). Microcapsules investigated by TEM were
embedded in an acrylic resin before ultra-cutting (Long et al., 2010). This sample
preparation method is costly and time consuming, which is not suitable for many
materials that have similar physical properties to the acrylic resin, such as PMMA, as
their shells dissolve in the resin. On the other hand, CLSM is a non-destructive
technique that has recently been used to investigate the shell structure and thickness
of microcapsules (Chen et al., 2006, Lebedeva et al., 2004, Paramita et al., 2010,
Tavera et al., 2009, Tzhayik et al., 2012), but it requires a clear contrast between the
shell and core of microcapsules.
Chapter5 : Scale-up of Membrane Emulsification to Prepare Melamine-formaldehyde Microcapsules and
Microencapsulation of Different Oils
202
Figure 6-7. CLSM micrographs of oil droplets and PMMA microcapsules at different
stages of polymerization. The scale bar is 25 µm for all 6 images. Microcapsules were
prepared using the dispersion cell with an agitation speed of 1080 rpm and dispersed
phase flux of 1.6×10⁻⁵ m s-1.
The morphology of oil droplets and of PMMA microcapsules at different stages of
polymerization was visualized with CLSM; typical micrographs are shown in Figure
6-7. Before polymerization, when only an emulsion was present, the fluorescent dye
was uniformly distributed inside the oil droplets. After reaction for 0.5 h, the dye had
a punctuated distribution inside the droplets, which could be caused by an incipient
shell formation. After 1 h, an outer shell is clearly discernible in the micrograph, with
an average thickness h = 2.4 ± 0.2 µm. After a shell was formed, h increased with the
Emulsion 1h0.5h
2h4h24h24h
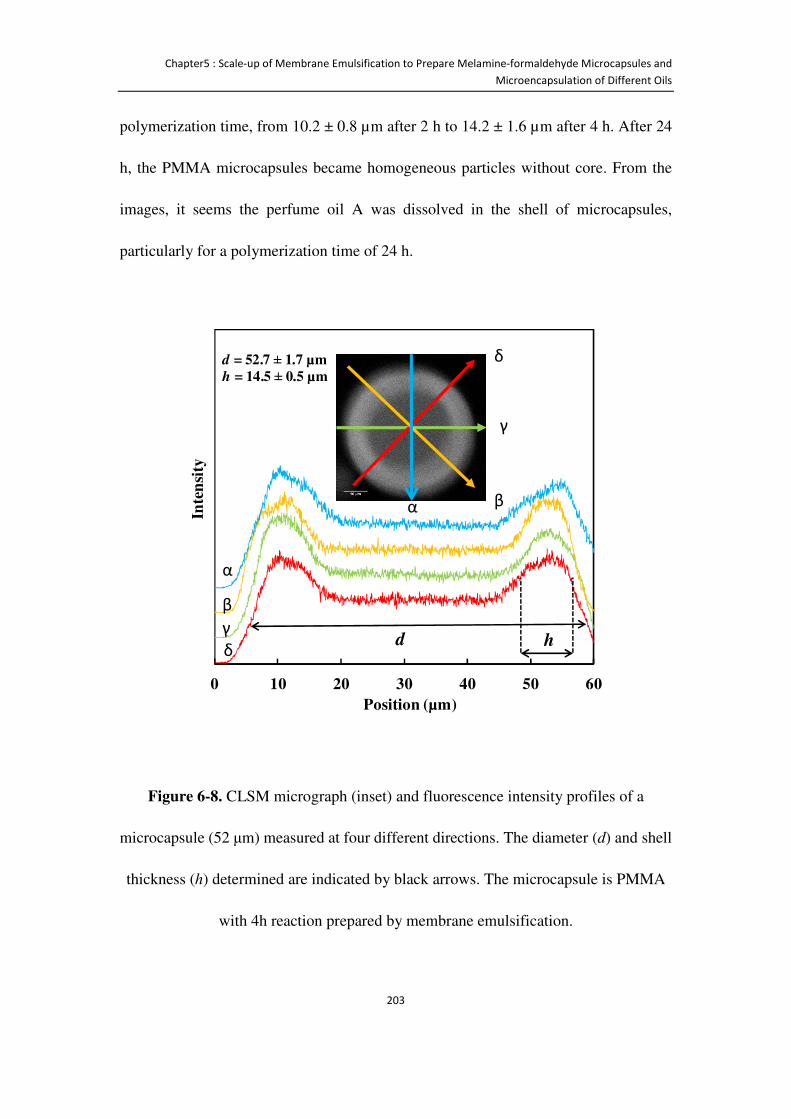
Chapter5 : Scale-up of Membrane Emulsification to Prepare Melamine-formaldehyde Microcapsules and
Microencapsulation of Different Oils
203
polymerization time, from 10.2 ± 0.8 µm after 2 h to 14.2 ± 1.6 µm after 4 h. After 24
h, the PMMA microcapsules became homogeneous particles without core. From the
images, it seems the perfume oil A was dissolved in the shell of microcapsules,
particularly for a polymerization time of 24 h.
Figure 6-8. CLSM micrograph (inset) and fluorescence intensity profiles of a
microcapsule (52 μm) measured at four different directions. The diameter (d) and shell
thickness (h) determined are indicated by black arrows. The microcapsule is PMMA
with 4h reaction prepared by membrane emulsification.
0 10 20 30 40 50 60
Inte
nsi
ty
Position (µm)
d = 52.7 ± 1.7 µm
h = 14.5 ± 0.5 µm
α
β
γ
δ
α β
γ
δ
d h
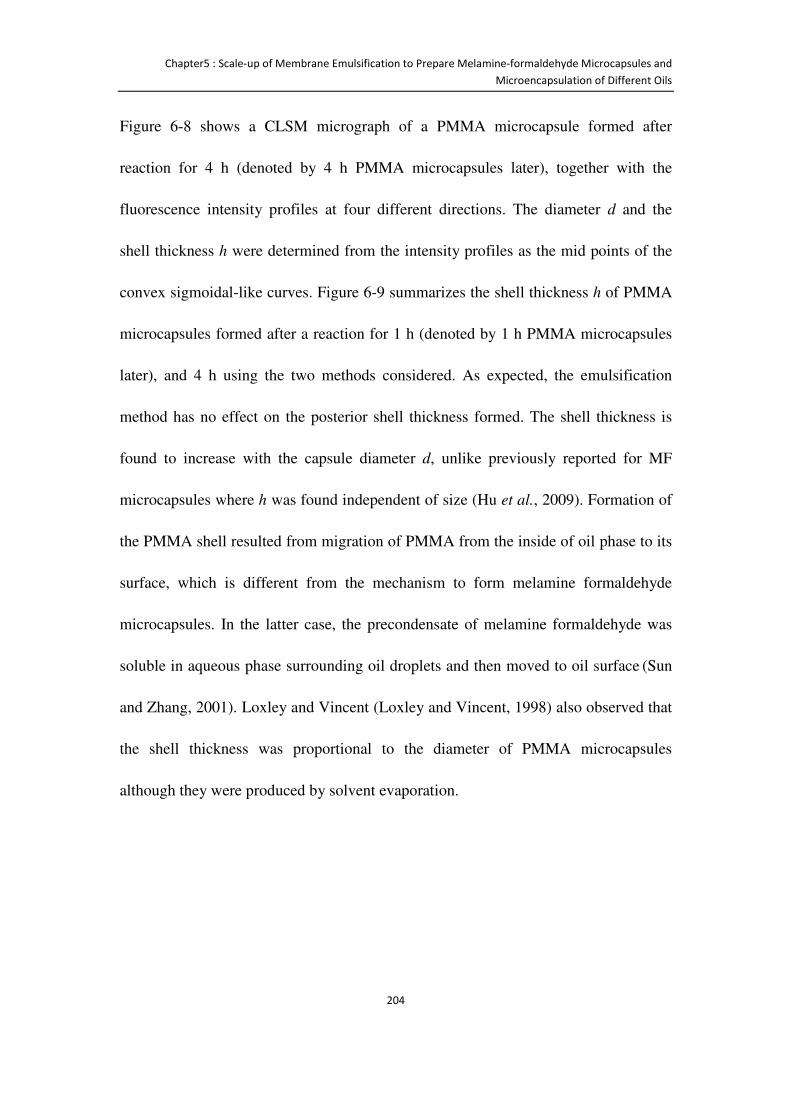
Chapter5 : Scale-up of Membrane Emulsification to Prepare Melamine-formaldehyde Microcapsules and
Microencapsulation of Different Oils
204
Figure 6-8 shows a CLSM micrograph of a PMMA microcapsule formed after
reaction for 4 h (denoted by 4 h PMMA microcapsules later), together with the
fluorescence intensity profiles at four different directions. The diameter d and the
shell thickness h were determined from the intensity profiles as the mid points of the
convex sigmoidal-like curves. Figure 6-9 summarizes the shell thickness h of PMMA
microcapsules formed after a reaction for 1 h (denoted by 1 h PMMA microcapsules
later), and 4 h using the two methods considered. As expected, the emulsification
method has no effect on the posterior shell thickness formed. The shell thickness is
found to increase with the capsule diameter d, unlike previously reported for MF
microcapsules where h was found independent of size (Hu et al., 2009). Formation of
the PMMA shell resulted from migration of PMMA from the inside of oil phase to its
surface, which is different from the mechanism to form melamine formaldehyde
microcapsules. In the latter case, the precondensate of melamine formaldehyde was
soluble in aqueous phase surrounding oil droplets and then moved to oil surface (Sun
and Zhang, 2001). Loxley and Vincent (Loxley and Vincent, 1998) also observed that
the shell thickness was proportional to the diameter of PMMA microcapsules
although they were produced by solvent evaporation.
Chapter5 : Scale-up of Membrane Emulsification to Prepare Melamine-formaldehyde Microcapsules and
Microencapsulation of Different Oils
205
Figure 6-9. Shell thickness h measured with CSLM for microcapsules larger than 40
µm prepared by membrane emulsification (empty points) and homogenization (filled
points), after a reaction time of 1 h (circles) and 4 h (triangles). The error bars
represent the standard deviation of the mean. Continuous lines are the best linear fits,
for 1 h PMMA microcapsules:ℎ = 0.009' + 1.9; and 4 h PMMA microcapsules:
ℎ = 0.12' + 7.8. Dashed lines represent the 95% confidence intervals of the linear
fits.
6.3.5 Experimental determination of the mechanical properties of
PMMA microcapsules
The mechanical characterization of single microcapsules is commonly performed
using a parallel plate compression apparatus (Zhang et al., 2009b). The compression
Capsule diameter d (µm)
40 45 50 55 60 65 70
Shel
l thi
ckne
ss h
(µ
m)
2.0
2.5
12.0
14.0
16.0
18.0
20.0PMMA 1h homogenizerPMMA 1h membranePMMA 4h homogenizerPMMA 4h membrane
Chapter5 : Scale-up of Membrane Emulsification to Prepare Melamine-formaldehyde Microcapsules and
Microencapsulation of Different Oils
206
force profiles with the fractional deformation εm, defined as the displacement
normalized by the capsule diameter, are used to calculate the mechanical properties of
the shell, such as the elastic modulus. Theoretical or numerical models are required to
perform this analysis, and the right model to use depends on the characteristics of the
shell, particularly the shell thickness to radius ratio (h/r). Most of the previous
characterization studies have been carried out on MF or similar microcapsules, which
have thinner shells compared to the PMMA microcapsules of the present study. The
wide range of h/r values for PMMA microcapsules formed at different reaction times,
see the micrographs of Figure 6-7, results in very different compression force profiles,
shown in Figure 6-10, which are summarized as follows:
(a) Compression profiles of thin-shell microcapsules with a bursting point
A bursting point is observed when there is a sudden decrease of the force. The force
can decrease to zero after bursting, as commonly observed from MF microcapsules
(point A in Figure 6-10) (Hu et al., 2009, Long et al., 2009, Mercade-Prieto et al.,
2011b, Pretzl et al., 2012), or a residual strength can still be present in the shell that
maintains a significant resistance force after bursting, as observed for
urea-formaldehyde (UF) (Brown et al., 2003) and silica-based microcapsules
(Mercade-Prieto et al., 2012a, O'Sullivan et al., 2009). Bursting is observed from
microcapsules with thin shells, typically h/r < 0.07 for MF and UF microcapsules, and
h/r < 0.25 for silica-based microcapsules (Mercade-Prieto et al., 2012a, O'Sullivan et
Chapter5 : Scale-up of Membrane Emulsification to Prepare Melamine-formaldehyde Microcapsules and
Microencapsulation of Different Oils
207
al., 2009). The 1 h PMMA microcapsules, where 0.08 < h/r < 0.11, also show a
bursting point as shown by point B in Figure 6-10.
(b) Compression profiles of thick-shell microcapsules without a bursting point
PMMA microcapsules produced after a polymerization time of 4 h or longer had
much thicker shells (for capsules larger than 40 µm 0.47 < h/r < 0.62) than any other
microcapsules reported in the literature where the mechanical properties have been
investigated. For 4 h PMMA microcapsules, the compression force increases
continuously with deformation, up to a point where the both shells touch each other in
the compressed capsule (point C in Figure 6-10), which can be confirmed using the
expected h/r ratio of the capsule from Figure 6-9. Although 4 h PMMA microcapsules
without a doubt break during compression, as observed from the debris left after the
compression experiment, there is not a clear force drop that can uniquely indentify at
which deformation the capsules break.
(c) Compression profiles of full spheres
After polymerizing for 24 h, PMMA microcapsules became full homogenous spheres
as inferred from CLSM micrographs (Figure 6-7). Similar to 4 h PMMA
microcapsules, a bursting point is not observed either, with the compression force
soared at small fractional deformations (point D in Figure 6-10). The force versus
displacement corresponding to small deformations for 24 h PMMA microcapsules
may be fitted using Hertz model to estimate the Young’s modulus, see (Equation A2)
in Appendix A and Figure 6-11. There is a single case in the literature whereby type
Chapter5 : Scale-up of Membrane Emulsification to Prepare Melamine-formaldehyde Microcapsules and
Microencapsulation of Different Oils
208
(a) and (b) compression profiles have been observed from a same batch of alginate
microcapsules (Rehor et al., 2001). Due to the large variability in the shell thickness,
1.9% < h/r < 47.1%, only 55% of the measurements showed a clear bursting point.
The presence of a bursting point is important because it has been used in the past as a
simple strength parameter (Long et al., 2009). However, under this approach it is
impossible to analyze samples that do not burst, like 4 h and 24 h PMMA
microcapsules.
Figure 6-10. Typical normalized compression force profiles of 1 h, 4 h and 24 h
PMMA microcapsules, together with that of a MF microcapsule described
elsewhere (Mercade-Prieto et al., 2011a). Points A and B are the bursting points of
MF and 1 h PMMA microcapsules, respectively.
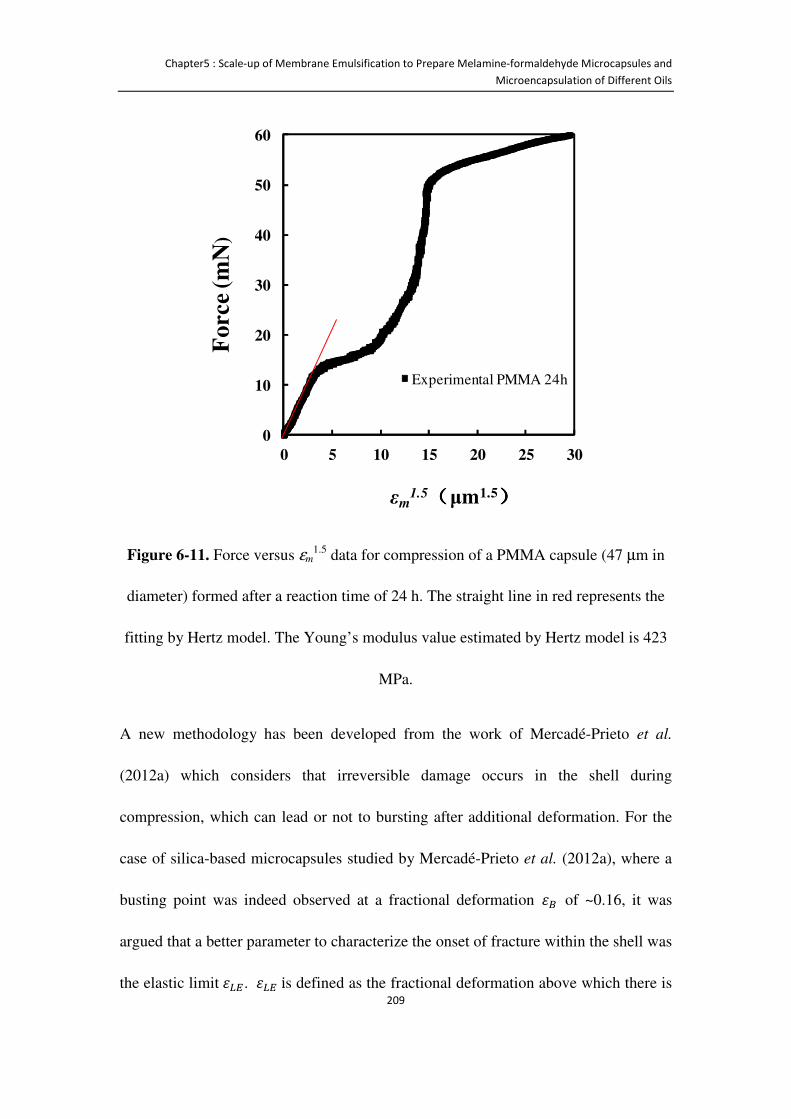
Chapter5 : Scale-up of Membrane Emulsification to Prepare Melamine-formaldehyde Microcapsules and
Microencapsulation of Different Oils
209
Figure 6-11. Force versus εm1.5 data for compression of a PMMA capsule (47 µm in
diameter) formed after a reaction time of 24 h. The straight line in red represents the
fitting by Hertz model. The Young’s modulus value estimated by Hertz model is 423
MPa.
A new methodology has been developed from the work of Mercadé-Prieto et al.
(2012a) which considers that irreversible damage occurs in the shell during
compression, which can lead or not to bursting after additional deformation. For the
case of silica-based microcapsules studied by Mercadé-Prieto et al. (2012a), where a
busting point was indeed observed at a fractional deformation�. of ~0.16, it was
argued that a better parameter to characterize the onset of fracture within the shell was
the elastic limit���. ��� is defined as the fractional deformation above which there is
0
10
20
30
40
50
60
0 5 10 15 20 25 30
Force
(mN
)
εm1.5((((μm1.5
))))
Experimental PMMA 24h
Chapter5 : Scale-up of Membrane Emulsification to Prepare Melamine-formaldehyde Microcapsules and
Microencapsulation of Different Oils
210
a continuously increasing difference between the experimental force profile and the
theoretical elastic profile (Mercade-Prieto et al., 2011a). As has been discussed
elsewhere (Mercade-Prieto et al., 2012a), it at present is not possible to determine if
the non elastic behaviour above ��� is caused by the onset of fracture within the shell
or due to yielding of the material, leading to plastic deformation. Pure PMMA is
known to be brittle at room temperatures (Vincent, 1972), and it has been described as
a semi-brittle glassy polymer between 20-40°C (Shen et al., 1985), but the crystalline
state of the PMMA in the microcapsules is not known, and amorphous PMMA
presents extensive plastic deformation before rupture (Stachurski, 2003).
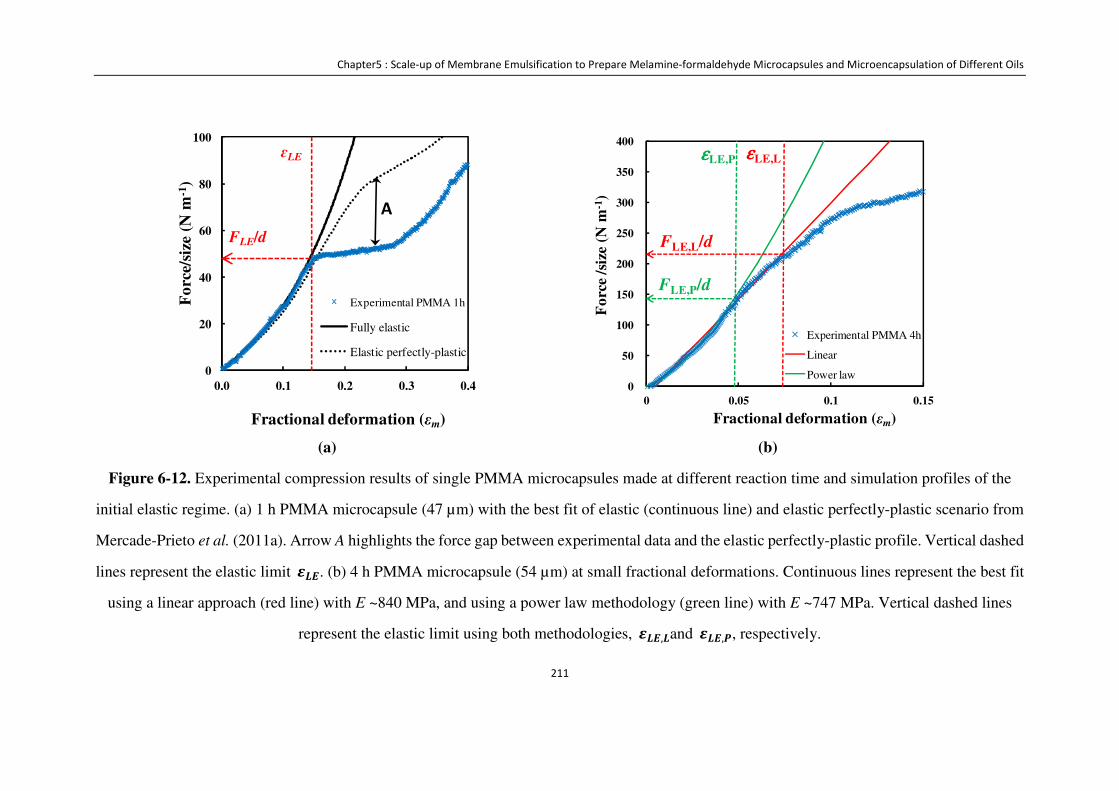
Chapter5 : Scale-up of Membrane Emulsification to Prepare Melamine-formaldehyde Microcapsules and Microencapsulation of Different Oils
211
(a)
(b)
Figure 6-12. Experimental compression results of single PMMA microcapsules made at different reaction time and simulation profiles of the
initial elastic regime. (a) 1 h PMMA microcapsule (47 µm) with the best fit of elastic (continuous line) and elastic perfectly-plastic scenario from
Mercade-Prieto et al. (2011a). Arrow A highlights the force gap between experimental data and the elastic perfectly-plastic profile. Vertical dashed
lines represent the elastic limit ���. (b) 4 h PMMA microcapsule (54 µm) at small fractional deformations. Continuous lines represent the best fit
using a linear approach (red line) with E ~840 MPa, and using a power law methodology (green line) with E ~747 MPa. Vertical dashed lines
represent the elastic limit using both methodologies, ���,�and ���,Û, respectively.
0
20
40
60
80
100
0.0 0.1 0.2 0.3 0.4
Fo
rce/
size
(N
m-1
)
Fractional deformation (εm)
Experimental PMMA 1h
Fully elastic
Elastic perfectly-plastic
ɛLE
A
FLE/d
0
50
100
150
200
250
300
350
400
0 0.05 0.1 0.15
Fo
rce
/siz
e (N
m-1
)
Fractional deformation (εm)
Experimental PMMA 4h
Linear
Power law
εεεεLE,P εεεεLE,L
FLE,L/d
FLE,P/d
Chapter6 : Structure and Mechanical Properties of Consumer-friendly PMMA Microcapsules
212
6.3.5.1 Fractional deformation at the elastic limit���
The elastic limit ��� has two key functions: (i) to provide the maximum fractional
deformation value whereupon the elastic regime exists, and wherein the elastic
modulus can be calculated; and (ii) allows determining a lower threshold value of the
shell rupture stress (m.) (Mercade-Prieto et al., 2012a). Further discussion on the
nature of this rupture stress is provided later. How ��� is determined depends on the
h/r value of the microcapsules measured. For the 1 h thin-shell PMMA microcapsules
(type (a)), ��� was determined following the model developed by Mercadé-Prieto et
al. (Mercade-Prieto et al., 2011a, 2011b) for MF microcapsules with 0.04 < h/r <
0.12. Figure 6-12 (a) shows an example of how ��� is determined from the point
where the predicted elastic behaviour deviates from the experimental data. Note that
��� is determined by fitting the force profile, hence it primarily determines large
deviations from a linear elastic behaviour. Therefore, if a plastic hardening regime
exists with a modulus similar to E, it could not be differentiated, as discussed in
details elsewhere (Mercade-Prieto et al., 2012a). Unique characterization of elastic
behaviour at fractional deformation smaller than ��� would require
loading-unloading and loading-holding experiments (Hu et al., 2009, Sun and Zhang,
2001), but due to the small value of ��� this was not performed.
In order to analyze the 4 h PMMA microcapsules with thicker shells (type (b)), a new
methodology has been developed to estimate the elastic regime, described in
Appendix A. Two approaches are proposed, one considering a linear increase of the
Chapter6 : Structure and Mechanical Properties of Consumer-friendly PMMA Microcapsules
213
force at small fractional deformations, and a second approach considering a power
law increase. In general, both methods provide reasonably good fits for all the
microcapsules tested, however the ��� estimated with each method can be different,
being that determined with the power law model (���,1) lower than with the linear
model (���,�) (Figure 6-12 (b)). For the analysis of full spheres (type (c) profiles),
such as 24 h PMMA microcapsules, only the power law model was used to
determine��� by plotting the force versus fractional deformation on a log-log scale
(graphs not shown).
Figure 6-13 shows the individual results for microcapsules larger than 40 µm
prepared using membrane emulsification and homogenization methods. Note that
despite the significant scatter, no trend is observed between ��� and the capsules size,
as reported previously (Mercade-Prieto et al., 2012a). The mean population ���
values determined for 4 h PMMA microcapsules made by membrane emulsification
were ���,1= 0.031 ± 0.012 (SD, number of compressions n=30) and ���,�= 0.053 ±
0.018, and using homogenization ���,1= 0.036 ± 0.013 (n=30) and ���,�= 0.053 ±
0.017, resulting in a total average of ���= 0.043 ± 0.014. Similar values were
obtained for 24 h PMMA microcapsules, ���,1= 0.036 ± 0.018 (n=20), whereas much
higher values were determined for 1 h PMMA microcapsules ���= 0.11 ± 0.04 (n=24)
using membrane emulsification and ���= 0.12 ± 0.05 (n=29) using homogenization
(Figure 6-14). No statistical difference in ��� is found between the capsules made by
membrane emulsification and homogenization (Figure 6-15 (a)).
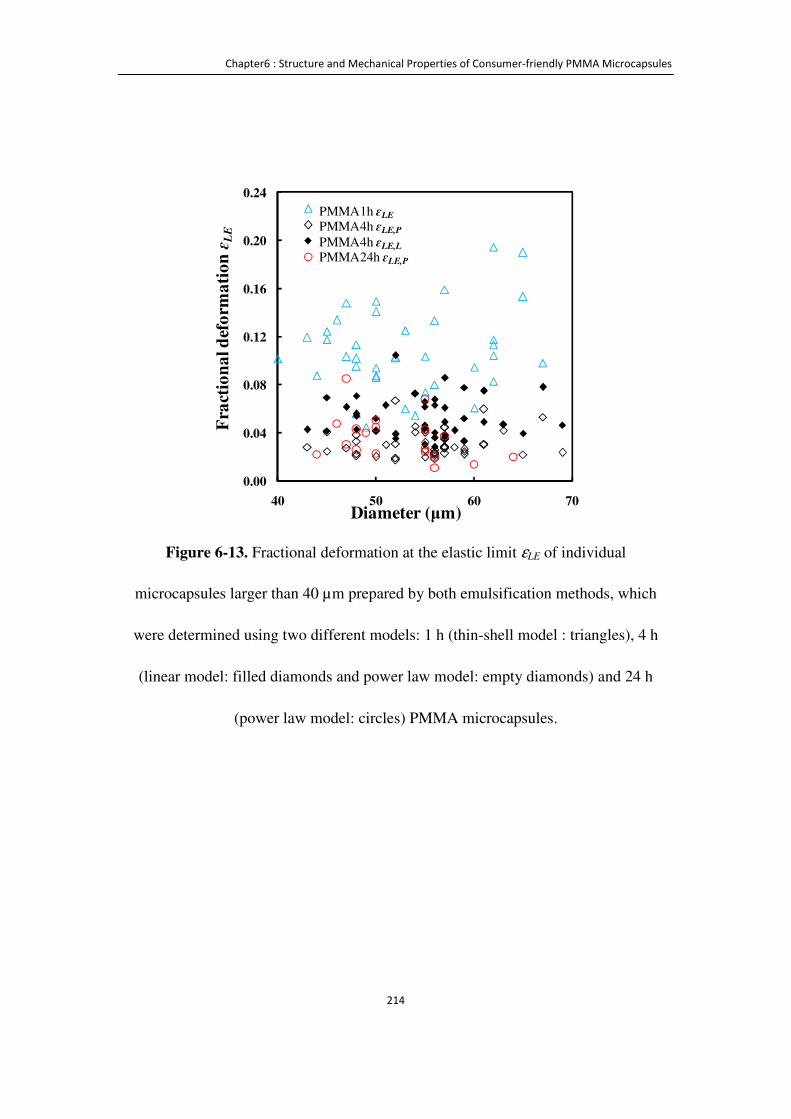
Chapter6 : Structure and Mechanical Properties of Consumer-friendly PMMA Microcapsules
214
Figure 6-13. Fractional deformation at the elastic limit εLE of individual
microcapsules larger than 40 µm prepared by both emulsification methods, which
were determined using two different models: 1 h (thin-shell model : triangles), 4 h
(linear model: filled diamonds and power law model: empty diamonds) and 24 h
(power law model: circles) PMMA microcapsules.
0.00
0.04
0.08
0.12
0.16
0.20
0.24
40 50 60 70
Fra
ctio
na
l d
efo
rma
tio
n ɛ
LE
Diameter (μm)
PMMA1h ɛLE
PMMA4h ɛLE,P
PMMA4h ɛLE,L
PMMA24h ɛLE,P
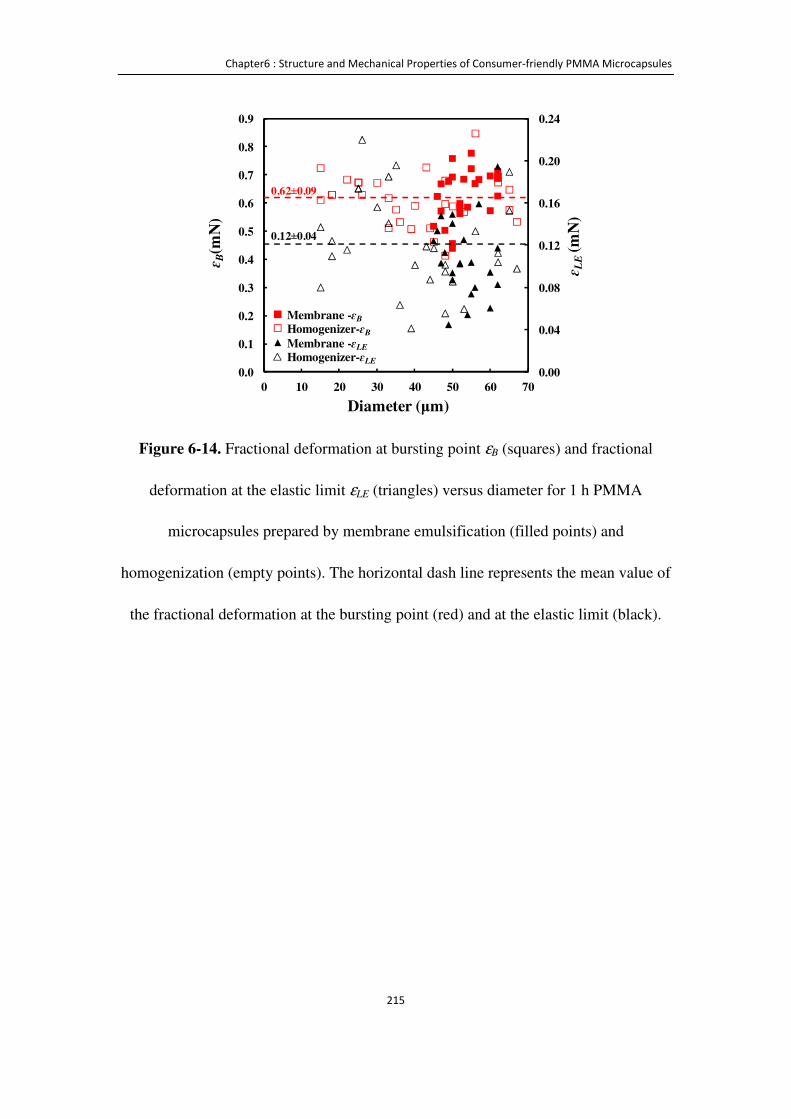
Chapter6 : Structure and Mechanical Properties of Consumer-friendly PMMA Microcapsules
215
Figure 6-14. Fractional deformation at bursting point εB (squares) and fractional
deformation at the elastic limit εLE (triangles) versus diameter for 1 h PMMA
microcapsules prepared by membrane emulsification (filled points) and
homogenization (empty points). The horizontal dash line represents the mean value of
the fractional deformation at the bursting point (red) and at the elastic limit (black).
0.00
0.04
0.08
0.12
0.16
0.20
0.24
0.0
0.1
0.2
0.3
0.4
0.5
0.6
0.7
0.8
0.9
0 10 20 30 40 50 60 70
ɛ LE
(mN
)
ɛ B(m
N)
Diameter (μm)
Membrane -ɛB
Homogenizer-ɛB
Membrane -ɛLE
Homogenizer-ɛLE
0.62±0.09
0.12±0.04

Chapter6 : Structure and Mechanical Properties of Consumer-friendly PMMA Microcapsules
216
(a)
(b)
(c)
Figure 6-15. (a) Elastic limit, (b) elastic modulus and (c) force at the elastic limit of individual 4 h PMMA microcapsules prepared by membrane
emulsification (filled points) and homogenization (empty points) determined using different methodologies: power law model (diamonds) and
linear model (circles).
0.00
0.02
0.04
0.06
0.08
0.10
0.12
10 20 30 40 50 60 70
Fra
ctio
na
l d
efo
rma
tio
n ɛ
LE
Diameter (μm)
Membrane-ɛLE,P
Homogenizer-ɛLE,P
Membrane-ɛLE,L
Homogenizer-ɛLE,L
0
400
800
1200
1600
10 20 30 40 50 60 70
Ela
stic
mo
du
lus
E(M
Pa
)
Diameter (μm)
Membrane-ELE,P
Homogenizer-ELE,P
Membrane-ELE,L
Homogenizer-ELE,L 2
4
6
8
10
12
10 20 30 40 50 60 70
FL
E(m
N)
Diameter (μm)
Membrane-FLE,P
Homogenizer-FLE,P
Membrane-FLE,L
Homogenizer-FLE,L

Chapter6 : Structure and Mechanical Properties of Consumer-friendly PMMA Microcapsules
217
Figure 6-16. Comparison between experimental compression data (points) and the best
fit profiles of elastic regime from FEM simulations (lines) of individual PMMA
microcapsules produced with different reaction times: 1 h (thin-shell model
(Mercade-Prieto et al., 2011a, Mercade-Prieto et al., 2011b)), 4 h (continuous line -
linear model; dashed line - power law model), and 24 h (power law model) PMMA
microcapsules. The E and ��� values determined from the best fitting curves are
shown in the legend (for 4 h PMMA microcapsules, average of the two models is
given).
0
10
20
30
40
50
60
0
50
100
150
200
250
300
350
0 0.02 0.04 0.06 0.08 0.1
1h
Force/s
ize (N
m-1
)
4 h
& 2
4 h
Fo
rce/s
ize (N
m-1
)
Fractional deformation (εm)
24h 55µm;0.05; 100%;767 MPa
4h 47µm; 0.02; 57%; 865 MPa
1h 62µm; 0.12;7.6% ; 950 MPa
d ɛLE h/r E
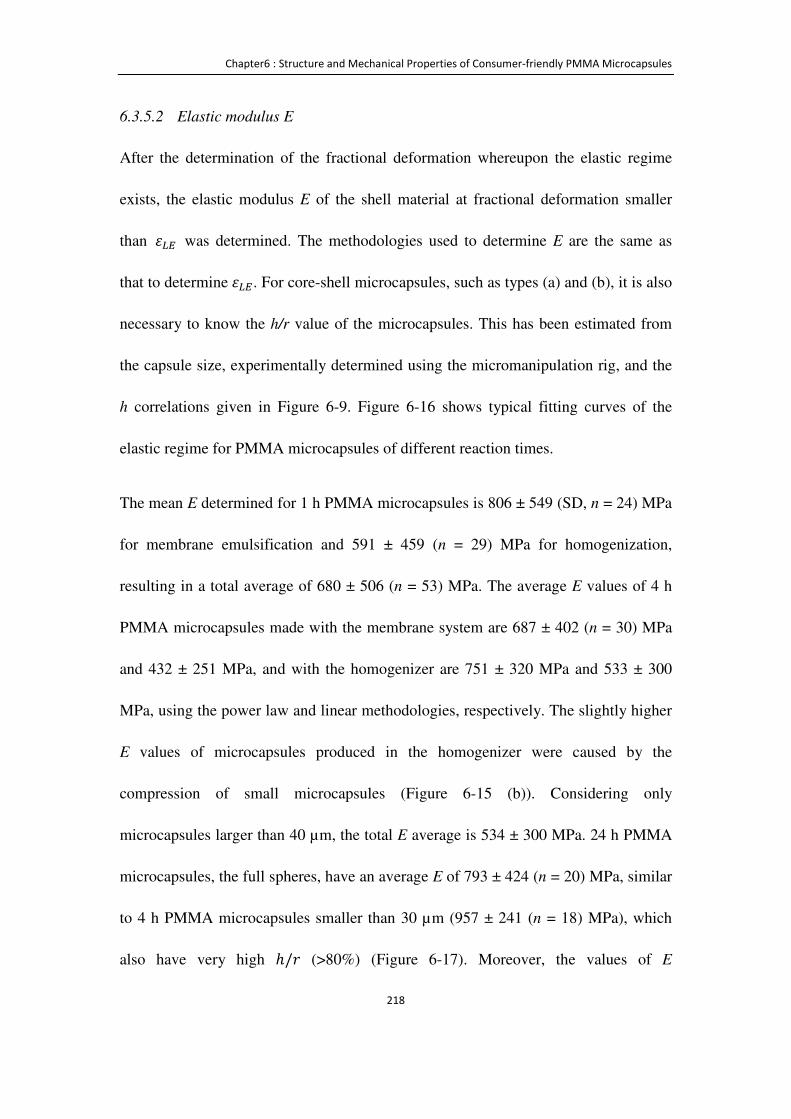
Chapter6 : Structure and Mechanical Properties of Consumer-friendly PMMA Microcapsules
218
6.3.5.2 Elastic modulus E
After the determination of the fractional deformation whereupon the elastic regime
exists, the elastic modulus E of the shell material at fractional deformation smaller
than ��� was determined. The methodologies used to determine E are the same as
that to determine���. For core-shell microcapsules, such as types (a) and (b), it is also
necessary to know the h/r value of the microcapsules. This has been estimated from
the capsule size, experimentally determined using the micromanipulation rig, and the
h correlations given in Figure 6-9. Figure 6-16 shows typical fitting curves of the
elastic regime for PMMA microcapsules of different reaction times.
The mean E determined for 1 h PMMA microcapsules is 806 ± 549 (SD, n = 24) MPa
for membrane emulsification and 591 ± 459 (n = 29) MPa for homogenization,
resulting in a total average of 680 ± 506 (n = 53) MPa. The average E values of 4 h
PMMA microcapsules made with the membrane system are 687 ± 402 (n = 30) MPa
and 432 ± 251 MPa, and with the homogenizer are 751 ± 320 MPa and 533 ± 300
MPa, using the power law and linear methodologies, respectively. The slightly higher
E values of microcapsules produced in the homogenizer were caused by the
compression of small microcapsules (Figure 6-15 (b)). Considering only
microcapsules larger than 40 µm, the total E average is 534 ± 300 MPa. 24 h PMMA
microcapsules, the full spheres, have an average E of 793 ± 424 (n = 20) MPa, similar
to 4 h PMMA microcapsules smaller than 30 µm (957 ± 241 (n = 18) MPa), which
also have very high ℎ/M (>80%) (Figure 6-17). Moreover, the values of E
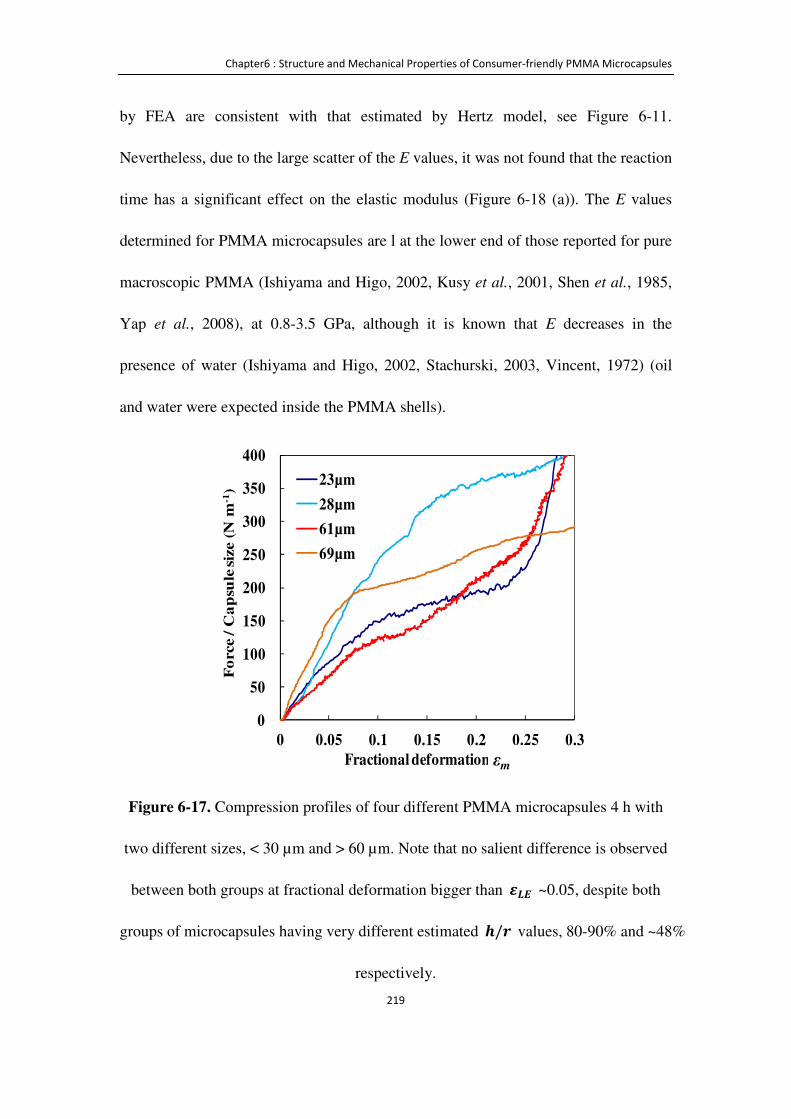
Chapter6 : Structure and Mechanical Properties of Consumer-friendly PMMA Microcapsules
219
by FEA are consistent with that estimated by Hertz model, see Figure 6-11.
Nevertheless, due to the large scatter of the E values, it was not found that the reaction
time has a significant effect on the elastic modulus (Figure 6-18 (a)). The E values
determined for PMMA microcapsules are l at the lower end of those reported for pure
macroscopic PMMA (Ishiyama and Higo, 2002, Kusy et al., 2001, Shen et al., 1985,
Yap et al., 2008), at 0.8-3.5 GPa, although it is known that E decreases in the
presence of water (Ishiyama and Higo, 2002, Stachurski, 2003, Vincent, 1972) (oil
and water were expected inside the PMMA shells).
Figure 6-17. Compression profiles of four different PMMA microcapsules 4 h with
two different sizes, < 30 µm and > 60 µm. Note that no salient difference is observed
between both groups at fractional deformation bigger than ��� ~0.05, despite both
groups of microcapsules having very different estimated Ü/Ý values, 80-90% and ~48%
respectively.
0
50
100
150
200
250
300
350
400
0 0.05 0.1 0.15 0.2 0.25 0.3
Fo
rce / C
ap
sule
siz
e (
N m
-1)
Fractional deformation ε
23µm
28µm
61µm
69µm
εm
Chapter6 : Structure and Mechanical Properties of Consumer-friendly PMMA Microcapsules
220
(a)
(b)
Figure 6-18. (a) Elastic modulus and (b) force at the elastic limit determined for individual PMMA microcapsules prepared at different reaction
times: PMMA 1 h (thin-shell model : triangles), 4 h (linear model: filled diamonds and power law model: empty diamonds) and 24 h (power law
model: circles).
0
500
1000
1500
2000
2500
10 20 30 40 50 60 70
Ela
stic
mo
du
lus
E(M
Pa
)
Diameter (μm)
PMMA1h ELE
PMMA4h ELE,P
PMMA4h ELE,L
PMMA24h ELE,P
0
2
4
6
8
10
12
10 20 30 40 50 60 70
Force F
LE(m
N)
Diameter (μm)
PMMA1h FLE
PMMA4h FLE,P
PMMA4h FLE,L
PMMA24h FLE,P
Chapter6 : Structure and Mechanical Properties of Consumer-friendly PMMA Microcapsules
221
6.3.5.3 Failure force ���
The data of force at the bursting point (FB) are useful to compare
melamine-formaldehyde microcapsules made under different formulation and
processing conditions. A similar approach can also be applied to non-bursting
microcapsules. For this purpose, the force at ��� termed FLE (Figure 6-12) was
chosen. Above FLE the compression force deviates from the elastic fit. Like ��� and
E, ��� was calculated by different models: the thin-shell model for 1 h PMMA
microcapsules, the linear (���,�) and power law (���,1) models for 4 h PMMA
microcapsules, and the power law model for 24 h PMMA microcapsules.
For the 4 h PMMA microcapsules, ��� was found to increase with the capsule
diameter, but there was no clear linear trend between them (Figure 6-15 (c)). In
addition, there is no significant difference in ��� between the two preparation
methods: ���,� = 7.6 ± 2.6 (SD, n = 30) mN and ���,1 = 4.8 ± 1.8 mN for
membrane emulsification, and ���,� = 5.6 ± 2.3 (n = 30) mN and ���,1 = 3.6 ±1.6 mN for homogenization. Note the large variability of ��� for a given capsule
size, which is quantified for the whole sample using CV values (as in Equation 2). The
CV value of ��� using membrane emulsification is 32 ± 11% (SD), and that using
Chapter6 : Structure and Mechanical Properties of Consumer-friendly PMMA Microcapsules
222
homogenization is 41 ± 17%, which are not statistically different, unlike when
membrane emulsification was used for the formation of MF microcapsules (see
Section 4.3.8). Similar behaviour, where the rupture force was heavily scattered and
no trend was observed with the capsule size, was reported for the silica-based
microcapsules discussed previously (Mercade-Prieto et al., 2012a), which despite
having a thinner shell also failed at small deformations (���,� ~0.09). The force
results for the full spheres of 24 h PMMA, ���,1 =6.1 ± 2.3 mN, are similar to those
for 4 h PMMA.
For the 1 h thin-shell PMMA microcapsules, it is possible to determine the bursting
force �. as well as���. For the batch of microcapsules made using homogenization,
which had a wide size distribution, it was found that �. increases with the capsule
size (Figure 6-19), despite�.being constant with size at 0.62 ± 0.09 (Figure 6-14).
The CV value of ��� is 47 ± 22%. Less scattered �.values were found for the
microcapsules made using membrane emulsification, with a CV of 26 ± 7% mainly
due to the narrower size distribution. However, the �. scatter is so large in a narrow
size range, such as 45-60 µm for the microcapsules using membrane emulsification.
Consequently, the benefit of having a narrower size distribution is limited (Figure
6-18 (b)). Similar results were obtained from the analysis of���, with a mean value of
0.9 ± 0.6 mN.
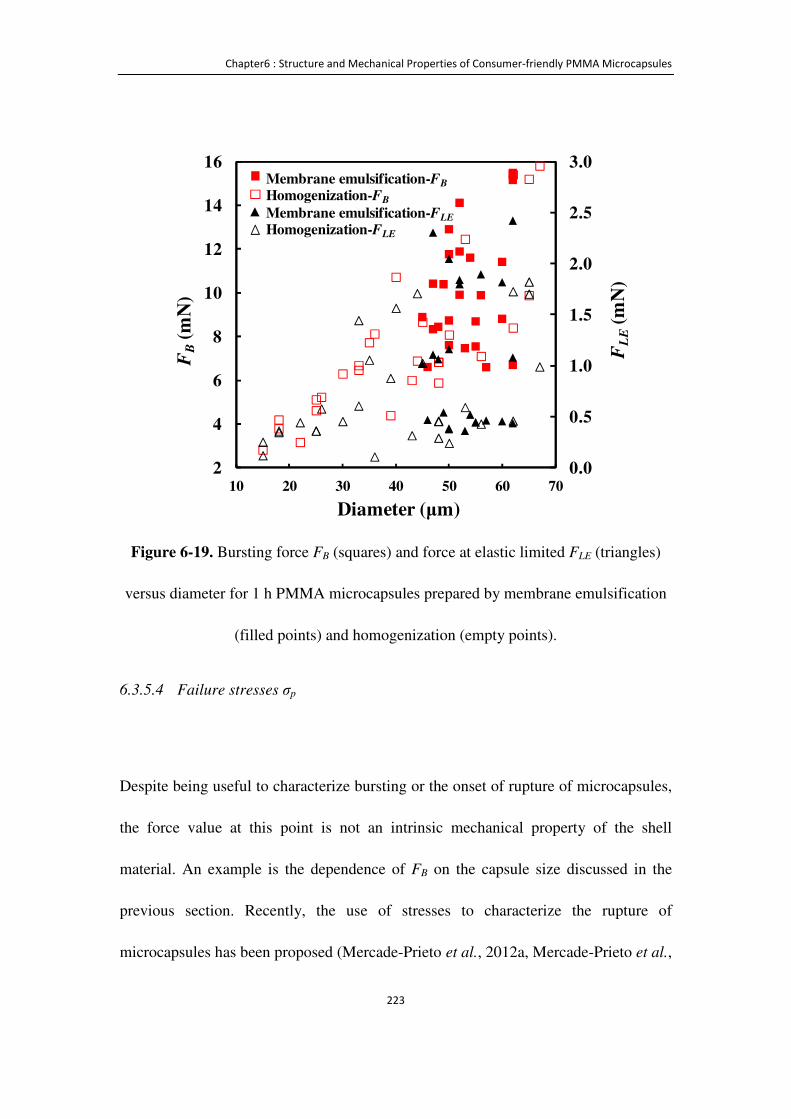
Chapter6 : Structure and Mechanical Properties of Consumer-friendly PMMA Microcapsules
223
Figure 6-19. Bursting force FB (squares) and force at elastic limited FLE (triangles)
versus diameter for 1 h PMMA microcapsules prepared by membrane emulsification
(filled points) and homogenization (empty points).
6.3.5.4 Failure stresses σp
Despite being useful to characterize bursting or the onset of rupture of microcapsules,
the force value at this point is not an intrinsic mechanical property of the shell
material. An example is the dependence of FB on the capsule size discussed in the
previous section. Recently, the use of stresses to characterize the rupture of
microcapsules has been proposed (Mercade-Prieto et al., 2012a, Mercade-Prieto et al.,
0.0
0.5
1.0
1.5
2.0
2.5
3.0
2
4
6
8
10
12
14
16
10 20 30 40 50 60 70
FL
E(m
N)
FB
(m
N)
Diameter (μm)
Membrane emulsification-FB
Homogenization-FB
Membrane emulsification-FLE
Homogenization-FLE

Chapter6 : Structure and Mechanical Properties of Consumer-friendly PMMA Microcapsules
224
2011a, Mercade-Prieto and Zhang, 2012), in the same way that they are used for any
other materials. In the absence of the full stress-strain relationship of the shell material,
the elastic limit ��� represents the largest deformation whereupon the shell is largely
expected to be undamaged. At higher εm the force deviation from a fully elastic
behaviour can either be due to incipient cracking of the shell, or due to yielding of the
shell material (Mercade-Prieto et al., 2012a). At present, it is not possible to analyze
the nature of rupture due to the small size of the microcapsules, and therefore both
mechanisms ought to be considered in the absence of further evidence.
Analysis of the compression profiles of 1 h PMMA microcapsules suggests,
however, that a brittle rupture mechanism is the most likely scenario. Firstly, a severe
discontinuity around ��� was commonly observed, as shown in Figure 6-12 (a).
Secondly, if the force deviation above ��� was due to yielding, an elastic
perfectly-plastic fit of the force profile should provide at least force values lower than
the experimental ones. However, Figure 6-12 (a) shows clearly that the experimental
force above ��� is significantly lower than what would be obtained due to yielding,
strongly suggesting a brittle failure for 1 h PMMA microcapsules. The force profiles
of the 4 h and 24 h PMMA microcapsules do not provide equal hints of a brittle
rupture, but it is considered unlikely that they would behave differently.
Chapter6 : Structure and Mechanical Properties of Consumer-friendly PMMA Microcapsules
225
Considering a brittle failure for all PMMA microcapsules, rupture will start to occur
at fractional deformation bigger than ��� when the largest principal stress σp in the
shell equals the material rupture stress (von Mises stresses should be used if yielding
was a plausible hypothesis as discussed elsewhere (Mercade-Prieto et al., 2012a)).
There are two likely places in the shell where failure can start to occur. As discussed
in Figure A6, if failure occurs in the inner side of the shell it will be due to tensile
stressesm1,n, whereas if it occurs in the external side of the shell it will be due to
compressive stressesm1,9.
The largest principal stresses σp were estimated using the mean���, E and h/r for
each microcapsule, as described in Appendix A. The population mean values for 4 h
PMMA microcapsules larger than 40 µm were m1,9 = 87 ± 44(SD, n = 47) MPa,
and m1,n = 11 ± 5 MPa; whereas for those smaller than 30 µm, where h/r >0.8,
m1,9 = 147 ± 93(n = 5) MPa andm1,n = 9 ± 3 MPa. For the 24 PMMA spheres
m1,9 = 117 ± 43(n = 20) MPa, andm1,n = 3.9 ± 1.3 MPa; whereas for the 1 h
thin-shell PMMA microcapsulesm1,9 = 122 ± 76 (n = 52) MPa, and m1,n = 51 ±44 MPa. It was thus found that the compressive principal stress did not change
significantly with the reaction time. The most likely mode of failure, under tension or
compression, is discussed subsequently.
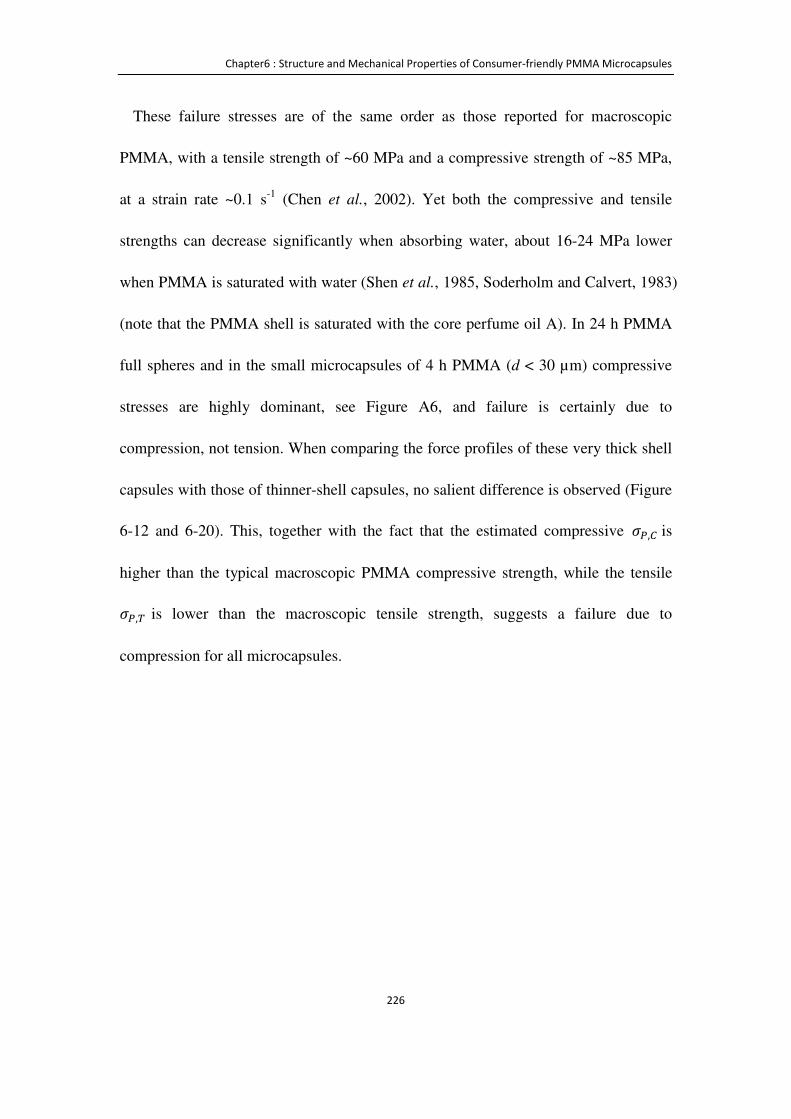
Chapter6 : Structure and Mechanical Properties of Consumer-friendly PMMA Microcapsules
226
These failure stresses are of the same order as those reported for macroscopic
PMMA, with a tensile strength of ~60 MPa and a compressive strength of ~85 MPa,
at a strain rate ~0.1 s-1 (Chen et al., 2002). Yet both the compressive and tensile
strengths can decrease significantly when absorbing water, about 16-24 MPa lower
when PMMA is saturated with water (Shen et al., 1985, Soderholm and Calvert, 1983)
(note that the PMMA shell is saturated with the core perfume oil A). In 24 h PMMA
full spheres and in the small microcapsules of 4 h PMMA (d < 30 µm) compressive
stresses are highly dominant, see Figure A6, and failure is certainly due to
compression, not tension. When comparing the force profiles of these very thick shell
capsules with those of thinner-shell capsules, no salient difference is observed (Figure
6-12 and 6-20). This, together with the fact that the estimated compressive m1,9 is
higher than the typical macroscopic PMMA compressive strength, while the tensile
m1,n is lower than the macroscopic tensile strength, suggests a failure due to
compression for all microcapsules.
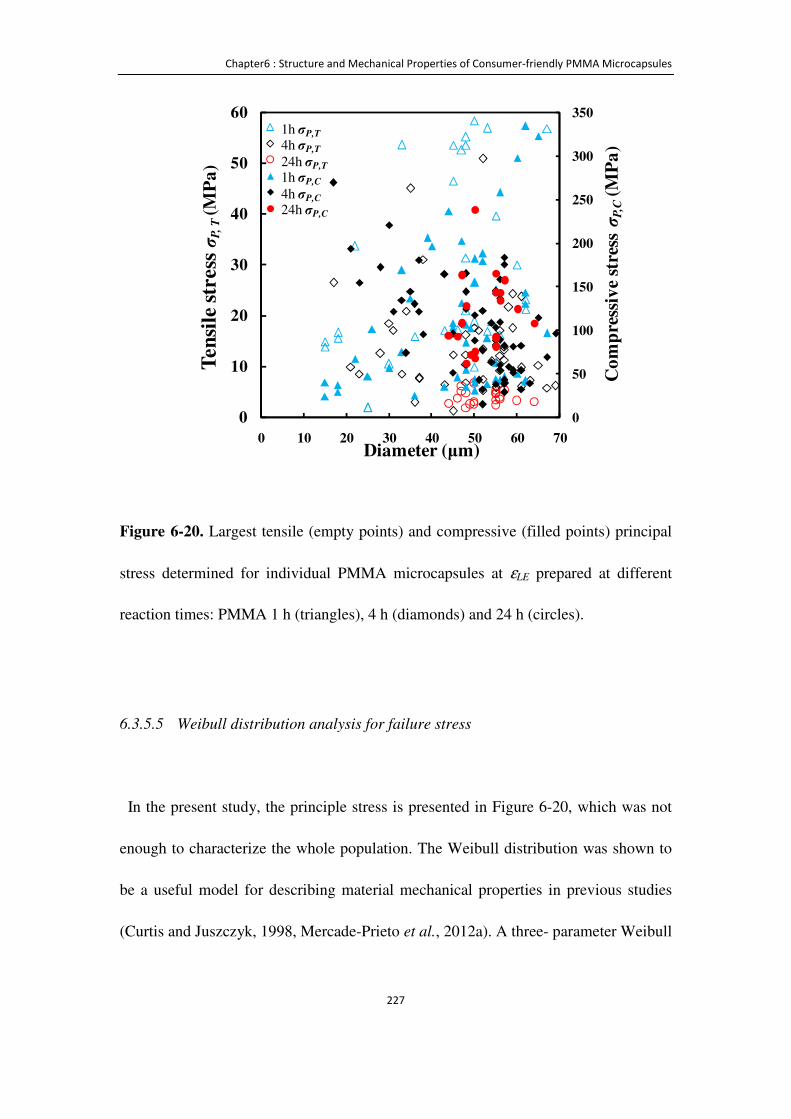
Chapter6 : Structure and Mechanical Properties of Consumer-friendly PMMA Microcapsules
227
Figure 6-20. Largest tensile (empty points) and compressive (filled points) principal
stress determined for individual PMMA microcapsules at εLE prepared at different
reaction times: PMMA 1 h (triangles), 4 h (diamonds) and 24 h (circles).
6.3.5.5 Weibull distribution analysis for failure stress
In the present study, the principle stress is presented in Figure 6-20, which was not
enough to characterize the whole population. The Weibull distribution was shown to
be a useful model for describing material mechanical properties in previous studies
(Curtis and Juszczyk, 1998, Mercade-Prieto et al., 2012a). A three- parameter Weibull
0
50
100
150
200
250
300
350
0
10
20
30
40
50
60
0 10 20 30 40 50 60 70
Co
mp
ress
ive
stre
ss σ
P,C
(M
Pa
)
Ten
sile
str
ess
σP, T
(M
Pa
)
Diameter (μm)
1h σP,T
4h σP,T
24h σP,T
1h σP,C
4h σP,C
24h σP,C
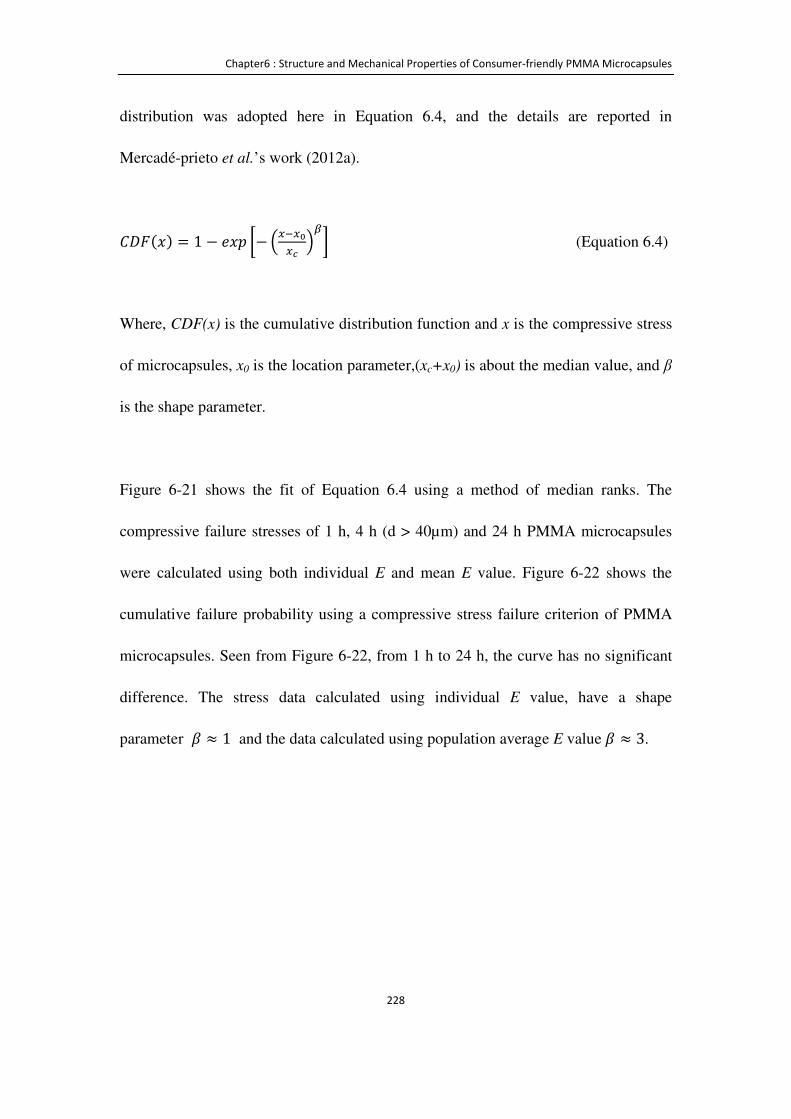
Chapter6 : Structure and Mechanical Properties of Consumer-friendly PMMA Microcapsules
228
distribution was adopted here in Equation 6.4, and the details are reported in
Mercadé-prieto et al.’s work (2012a).
���(®) = 1 − �®¯ �− �A�A«Au �Þ� (Equation 6.4)
Where, CDF(x) is the cumulative distribution function and x is the compressive stress
of microcapsules, x0 is the location parameter,(xc+x0) is about the median value, and β
is the shape parameter.
Figure 6-21 shows the fit of Equation 6.4 using a method of median ranks. The
compressive failure stresses of 1 h, 4 h (d > 40µm) and 24 h PMMA microcapsules
were calculated using both individual E and mean E value. Figure 6-22 shows the
cumulative failure probability using a compressive stress failure criterion of PMMA
microcapsules. Seen from Figure 6-22, from 1 h to 24 h, the curve has no significant
difference. The stress data calculated using individual E value, have a shape
parameter ß ≈ 1 and the data calculated using population average E valueß ≈ 3.
Chapter6 : Structure and Mechanical Properties of Consumer-friendly PMMA Microcapsules
229
Figure 6-21. Three- parameter Weibull distribution using the median ranks method
fitting with experimental compressive stress data of 4 h (d > 40µm) PMMA
microcapsules.
-6
-5
-4
-3
-2
-1
0
1
2
3
0 2 4 6
Ln
Ln
(1
/(1
-med
ian
ra
nk
s))
Ln( Average critical stress)
4h> 40µm
β

Chapter6 : Structure and Mechanical Properties of Consumer-friendly PMMA Microcapsules
230
(a) 1 h PMMA microcapsules
(b) 4 h (d > 40µm) microcapsules
(c) 24 h microcapsules
Figure 6-22. Cumulative failure probability using a compressive stress failure criterion of PMMA microcapsules. Red diamond symbols
represent the compressive stress calculated using individual E value and the black square ones using population average E value.
0
0.1
0.2
0.3
0.4
0.5
0.6
0.7
0.8
0.9
1
0 100 200 300 400
Co
mlu
ati
ve
fail
ure
pro
ba
bil
ity
Compressive stress σP,C (MPa)
Individual E
Population average E~ 680 MPa
β= 0.95±0.02
β= 3.50±0.21
1h
0
0.1
0.2
0.3
0.4
0.5
0.6
0.7
0.8
0.9
1
20 70 120 170
Co
mlu
ati
ve
fail
ure
pro
ba
bil
ity
Compressive stress σP,C (MPa)
Individual E
Population average E~ 534MPa
4h > 40µm
β= 1.56±0.02
β= 3.11±0.07
0
0.1
0.2
0.3
0.4
0.5
0.6
0.7
0.8
0.9
1
40 80 120 160 200
Co
mlu
ati
ve
fail
ure
pro
ba
bil
ity
Compressive stress σP,C (MPa)
Individual E
Population average E~ 793MPa
24h
β= 0.92±0.05
β= 2.88±0.11
Chapter6 : Structure and Mechanical Properties of Consumer-friendly PMMA Microcapsules
231
Despite the huge effect of the reaction time on the shell thickness, it is remarkable that
the mechanical properties of the shell remain unchanged by taking into account the
large variability of mean population values. As discussed above, both the elastic
modulus E and the rupture stress m1,9 are found to be independent of shell thickness
(polymerisation time) based on the experimental data measured when factional
deformation is smaller than 0.15. Because the shell grows inwards with the reaction
time, this could simply imply that the external section of the shell remains unchanged,
but may not affect the later formed inner part of the shell. This may also indicate the
formed shell of microcapsules was porous, which allowed MMA molecules to
penetrate through it from the outside and to polymerise inside. If the microcapsules
are required to be incorporated in liquid detergents, they should possess not only
optimum mechanical properties, but also no or very low shell permeability, which
requires further study.
PMMA microcapsules are the second system that has been characterized, and they
likely fail at small deformations due to brittle failure (Mercade-Prieto et al., 2012a).
These microcapsules seem to be characterized by a huge variation of the mechanical
properties, probably caused by the random presence of micro-cracks or flaws in the
shell. In comparison, microcapsules fail after extensive plastic deformation, such as
MF ones, present more homogeneous mechanical properties (Mercade-Prieto et al.,
2011a). Hence, systems that can produce microcapsules with a narrow size

Chapter6 : Structure and Mechanical Properties of Consumer-friendly PMMA Microcapsules
232
distribution, such as the dispersion cell used here, can do little to improve the
variability of the mechanical properties.
6.4 Conclusions
In this chapter, preparation of microcapsules with PMMA as a shell material and an
oil-based industrial precursor as core with narrow size distributions has been
demonstrated through membrane emulsification. The CV and SPAN values of the
microcapsules generated by membrane emulsification are significantly smaller
compared with the ones made by homogenization. CLSM has been used to determine
the shell thickness h of the PMMA microcapsules labelled with a lipophilic
fluorescence dye, showing that h increased with the reaction time until the core-shell
capsules became homogeneous spheres. Experiments based on compression of single
microcapsules showed different force-displacement profiles depending on the h/r
value: thin-shell microcapsules showed a clear bursting point, whereas for thicker
shells no bursting was observed. Intrinsic mechanical properties were obtained from
the analysis of FEM simulations and micromanipulation experiments. The elastic
modulus and the rupture stress, determined with different models according to h/r,
were found constant with the polymerization reaction time despite large variations in
h.
Chapter6 : Structure and Mechanical Properties of Consumer-friendly PMMA Microcapsules
233
The major difference between the present PMMA microcapsules and any other
microcapsule used for encapsulation of perfumes is the much thicker shells of the
former. The polymerization reaction time had a major effect on the capsules’ shell
thickness. Novel methodologies were required to characterize these thick shells,
which are described here at length for the benefit of future researchers. At short
reaction times, thin-shell microcapsules were formed that burst under compression,
similar to MF microcapsules. The capability of microcapsules to burst is an essential
property to achieve sudden perfume release when clothes are being worn, as described
in Chapter 4. However, bursting may not be desirable for long lasting applications if
microcapsules cannot survive mechanically challenging environments. PMMA
capsules reacted for more than 1 h did not show bursting points under compression,
hence even if the capsules were completely broken the perfume oil would not release
instantaneously. Future work includes investigation of the permeability of PMMA
microcapsules, and how it can be controlled by changing formulation and processing
conditions will be described in Chapter 7.
Chapter7 : Determination of Perfume Release Rate and the Shell Permeability of Microcapsules
234
Chapter 7 Determination of Perfume
Release Rate and the Shell
Permeability of Microcapsules
7.1 Introduction
In Chapters 4 and 6, the preparation and characterization details of MF and PMMA
microcapsules were described. In this chapter, the release behaviour of perfume
microcapsules was studied to understand the properties of microcapsules better.
In previous work (Long et al., 2009), perfume microcapsule slurry was added into
aqueous solution in contact with but phase separated from an organic solvent. The
perfume oil concentration resulting from the release was evaluated in the organic
phase (Long et al., 2009). Following this methodology, the mass transfer of perfume
between aqueous and the organic phases likely limits the release rate, especially when
the solubilities of the perfume oil components are low in water. Therefore, the release
profiles from these previous experiments cannot be used to characterize the intrinsic
properties of the shell, such as the permeability, as it depends on many other
parameters, the most important of all being the mass transfer coefficient between the
aqueous and organic phases.

Chapter7 : Determination of Perfume Release Rate and the Shell Permeability of Microcapsules
235
This limitation was solved in a recent study by using instead a single miscible release
liquid (Mercade-Prieto et al., 2012b). Instead of an aqueous solution and an organic
solvent, a "co-solvent" was added to the aqueous phase for the release of perfume
from microcapsules. In this way, the total mass transfer problem is simplified
enormously by eliminating the mass transfer coefficient between two phases, which
depends on many parameters such as the stirring conditions. This study proved this
methodology with a single component model oil (hexyl salicylate – oil HS), whereas
real perfume oils used in industrial applications are complex mixtures of many
chemicals with various functionalities. In this chapter this methodology will be used
with oil A, an industrial precursor containing a mixture of several perfume
components, as well as oil HS as a single component of perfume oil for comparison
purposes.
The mathematical modelling detailed in Section 2.7.3 to analyse release data was
developed for thin shells with ℎ ≪ M, where h is the shell thickness, and r is the
radius of microcapsules, as in the case of MF microcapsules. On the other hand, the
PMMA microcapsules discussed in Section 6.3 present a wide range of shell
thicknesses that cannot be analyzed with thin-shell models. For this reason, in
addition to the release model discussed by Mercade-Prieto et al. (Mercade-Prieto et
al., 2012b) for thin shell, two new models will be developed for thick shell (0.47 <
h/r < 0.62) and full spheres (h/r ~ 1). The shell permeability and diffusivity values
will be calculated compared with the different methodologies.
Chapter7 : Determination of Perfume Release Rate and the Shell Permeability of Microcapsules
236
7.2 Experimental methods
7.2.1 Formation of MF and PMMA microcapsules
Section 4.2.1 describes the preparation processes of MF microcapsules containing oil
A and oil HS, and Section 6.2.1 describes the preparation of PMMA microcapsules
containing oil A using a dispersion cell and homogenizer. The different formulations
and operation conditions used are shown in Table 7-1. Membrane "15 rcia A" was
used to generate an oil-aqueous emulsion; the details of the membrane are given in
Section 3.3.1.

Chapter7 : Determination of Perfume Release Rate and the Shell Permeability of Microcapsules
237
Table 7-1 Formulations and operation conditions used for preparation of
microcapsules in this study. ME represents membrane emulsification, HG represents
homogenization in this chapter.
No.
Shell
material
Oil Operation method
Reaction
time (h)
h/r
1 MF A Membrane
emulsification (ME) 6 < 0.07
2 MF A Homogenization
(HG) 6 < 0.07
3 MF HS ME 6 < 0.07
4 MF HS HG 6 < 0.07
5 PMMA A ME 1 0.08< h/r<0.11
6 PMMA A ME 4 0.47< h/r<0.62
7 PMMA A ME 24 = 1
7.2.2 Perfume oil calibration using UV-Vis spectrophotometry
The concentration of the perfume oils in the aqueous solutions was measured with a
UV-Vis spectrophotometer (Cecil Instruments, Cambridge, UK).
Chapter7 : Determination of Perfume Release Rate and the Shell Permeability of Microcapsules
238
Standard calibrations were performed for each different solvent considered. Each
perfume oil was dissolved into a solvent to make 10-12 standard solutions
concentrations lower than10�~gmL��. The solutions were first scanned between
250-300 nm at 5 nm s-1 in order to determine the wavelength where absorbance was
maximum, termed λmax, using pure solvent as a blank. The absorbance A of 10-12
standard solutions with concentrations C (g mL-1) was measured at λmax (nm) to obtain
a calibration plot, an example is shown in Figure 3-19. The extinction coefficients ε
(mL g-1 cm-1) are calculated using Equation 3.8 with least squares fitting of the linear
slope.
7.2.3 Solubility measurements
The solubility of the perfume oil in a solvent was determined as follows. About 0.5 g
of perfume oil was initially mixed in 10 mL of solution, kept at 25 ± 1°C. The
perfume oil concentration in the aqueous phase, measured with the UV-Vis
spectrometer as described above, was monitored until a constant value was obtained,
typically in less than 24 h. This final constant concentration is considered the perfume
oil solubility in the solvent, termed (Cs g mL-1). Reported solubility values are the
mean of triplicate experiments.
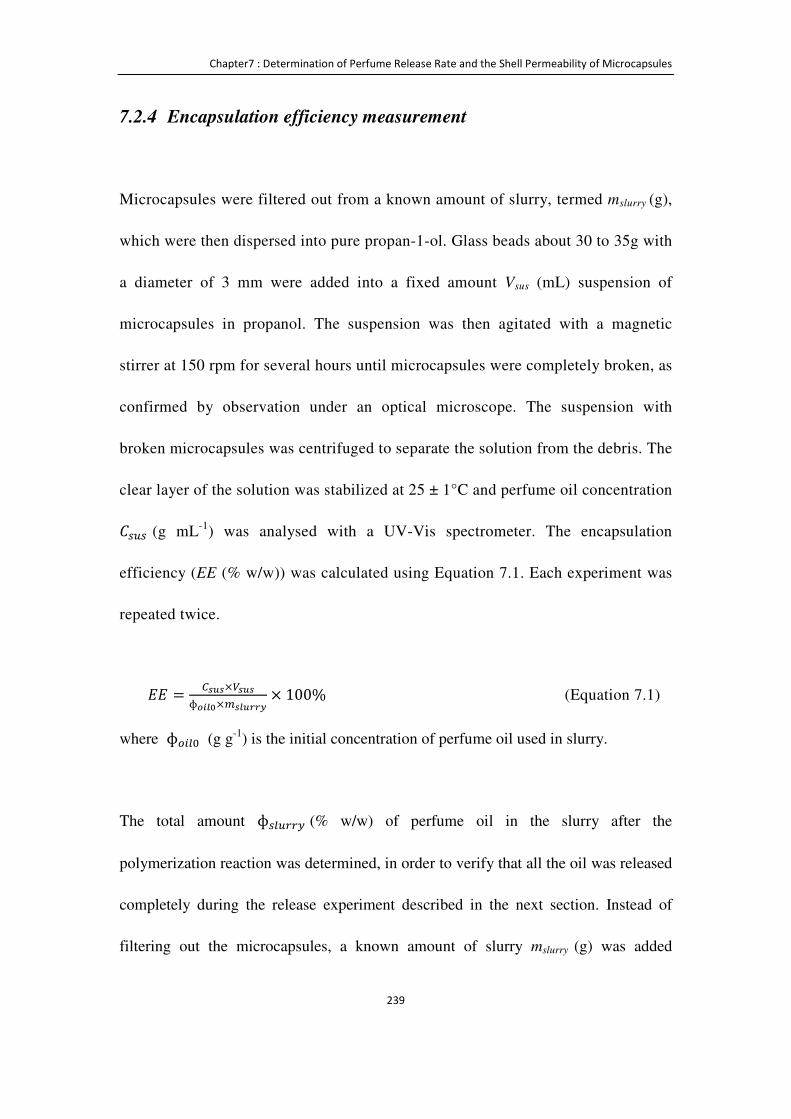
Chapter7 : Determination of Perfume Release Rate and the Shell Permeability of Microcapsules
239
7.2.4 Encapsulation efficiency measurement
Microcapsules were filtered out from a known amount of slurry, termed mslurry (g),
which were then dispersed into pure propan-1-ol. Glass beads about 30 to 35g with
a diameter of 3 mm were added into a fixed amount Vsus (mL) suspension of
microcapsules in propanol. The suspension was then agitated with a magnetic
stirrer at 150 rpm for several hours until microcapsules were completely broken, as
confirmed by observation under an optical microscope. The suspension with
broken microcapsules was centrifuged to separate the solution from the debris. The
clear layer of the solution was stabilized at 25 ± 1°C and perfume oil concentration
���� (g mL-1) was analysed with a UV-Vis spectrometer. The encapsulation
efficiency (EE (% w/w)) was calculated using Equation 7.1. Each experiment was
repeated twice.
àà = 9�=�×¾�=�ɸ<:»«×D�»=��â × 100% (Equation 7.1)
where ɸ$ �& (g g-1) is the initial concentration of perfume oil used in slurry.
The total amount ɸ���NN^ (% w/w) of perfume oil in the slurry after the
polymerization reaction was determined, in order to verify that all the oil was released
completely during the release experiment described in the next section. Instead of
filtering out the microcapsules, a known amount of slurry mslurry (g) was added
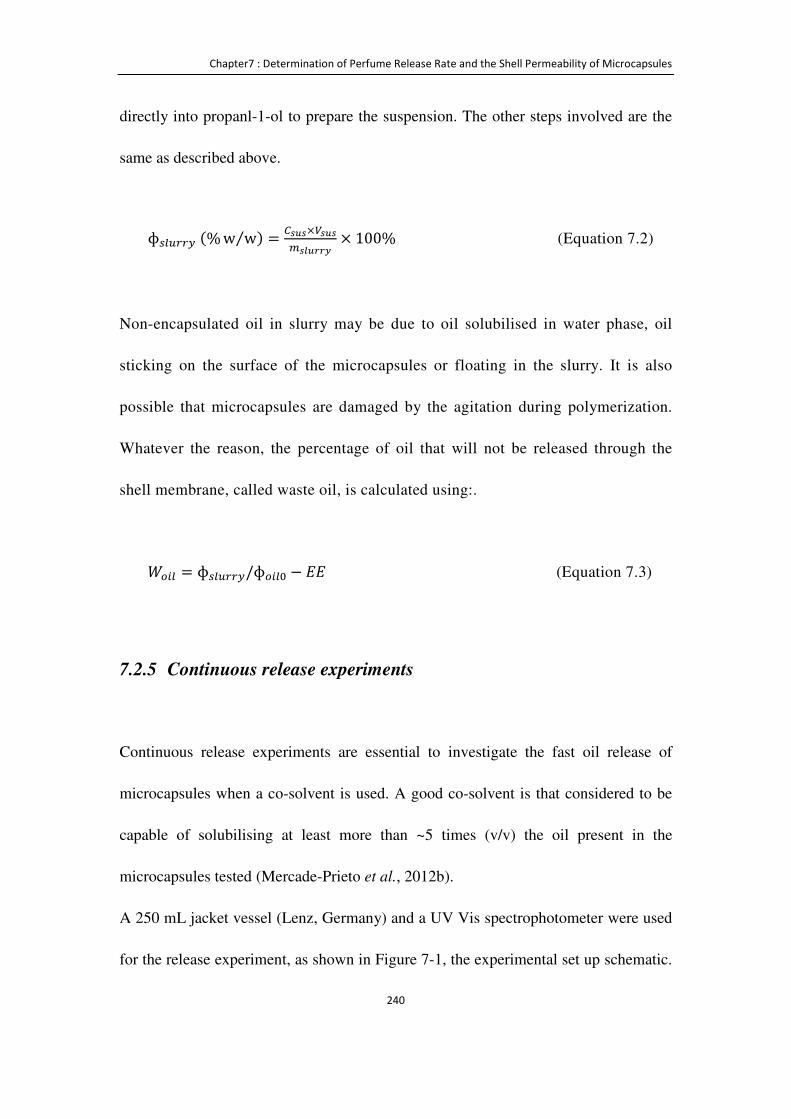
Chapter7 : Determination of Perfume Release Rate and the Shell Permeability of Microcapsules
240
directly into propanl-1-ol to prepare the suspension. The other steps involved are the
same as described above.
ɸ���NN^(%w w⁄ ) = 9�=�×¾�=�D�»=��â × 100% (Equation 7.2)
Non-encapsulated oil in slurry may be due to oil solubilised in water phase, oil
sticking on the surface of the microcapsules or floating in the slurry. It is also
possible that microcapsules are damaged by the agitation during polymerization.
Whatever the reason, the percentage of oil that will not be released through the
shell membrane, called waste oil, is calculated using:.
V$ � = ɸ���NN^/ɸ$ �& − àà (Equation 7.3)
7.2.5 Continuous release experiments
Continuous release experiments are essential to investigate the fast oil release of
microcapsules when a co-solvent is used. A good co-solvent is that considered to be
capable of solubilising at least more than ~5 times (v/v) the oil present in the
microcapsules tested (Mercade-Prieto et al., 2012b).
A 250 mL jacket vessel (Lenz, Germany) and a UV Vis spectrophotometer were used
for the release experiment, as shown in Figure 7-1, the experimental set up schematic.
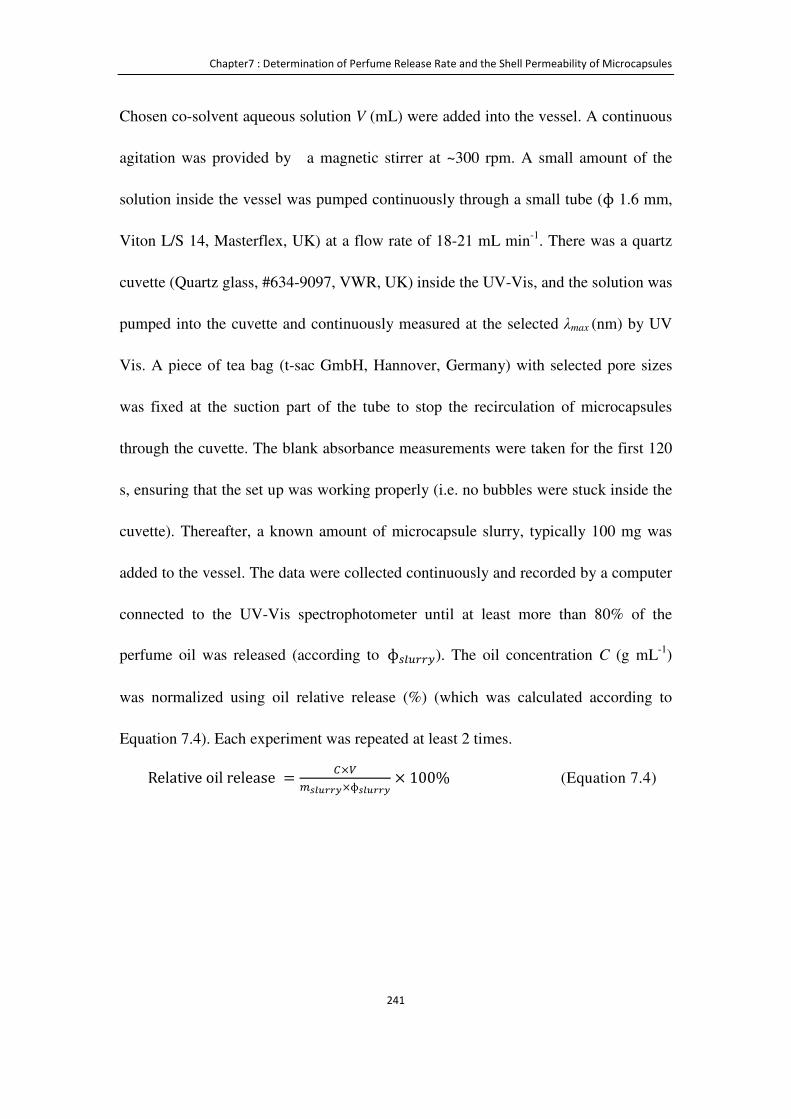
Chapter7 : Determination of Perfume Release Rate and the Shell Permeability of Microcapsules
241
Chosen co-solvent aqueous solution V (mL) were added into the vessel. A continuous
agitation was provided by a magnetic stirrer at ~300 rpm. A small amount of the
solution inside the vessel was pumped continuously through a small tube (ɸ 1.6 mm,
Viton L/S 14, Masterflex, UK) at a flow rate of 18-21 mL min-1. There was a quartz
cuvette (Quartz glass, #634-9097, VWR, UK) inside the UV-Vis, and the solution was
pumped into the cuvette and continuously measured at the selected λmax (nm) by UV
Vis. A piece of tea bag (t-sac GmbH, Hannover, Germany) with selected pore sizes
was fixed at the suction part of the tube to stop the recirculation of microcapsules
through the cuvette. The blank absorbance measurements were taken for the first 120
s, ensuring that the set up was working properly (i.e. no bubbles were stuck inside the
cuvette). Thereafter, a known amount of microcapsule slurry, typically 100 mg was
added to the vessel. The data were collected continuously and recorded by a computer
connected to the UV-Vis spectrophotometer until at least more than 80% of the
perfume oil was released (according to ɸ���NN^). The oil concentration C (g mL-1)
was normalized using oil relative release (%) (which was calculated according to
Equation 7.4). Each experiment was repeated at least 2 times.
Relativeoilrelease = 9×¾D�»=��â×ɸ�»=��â × 100% (Equation 7.4)
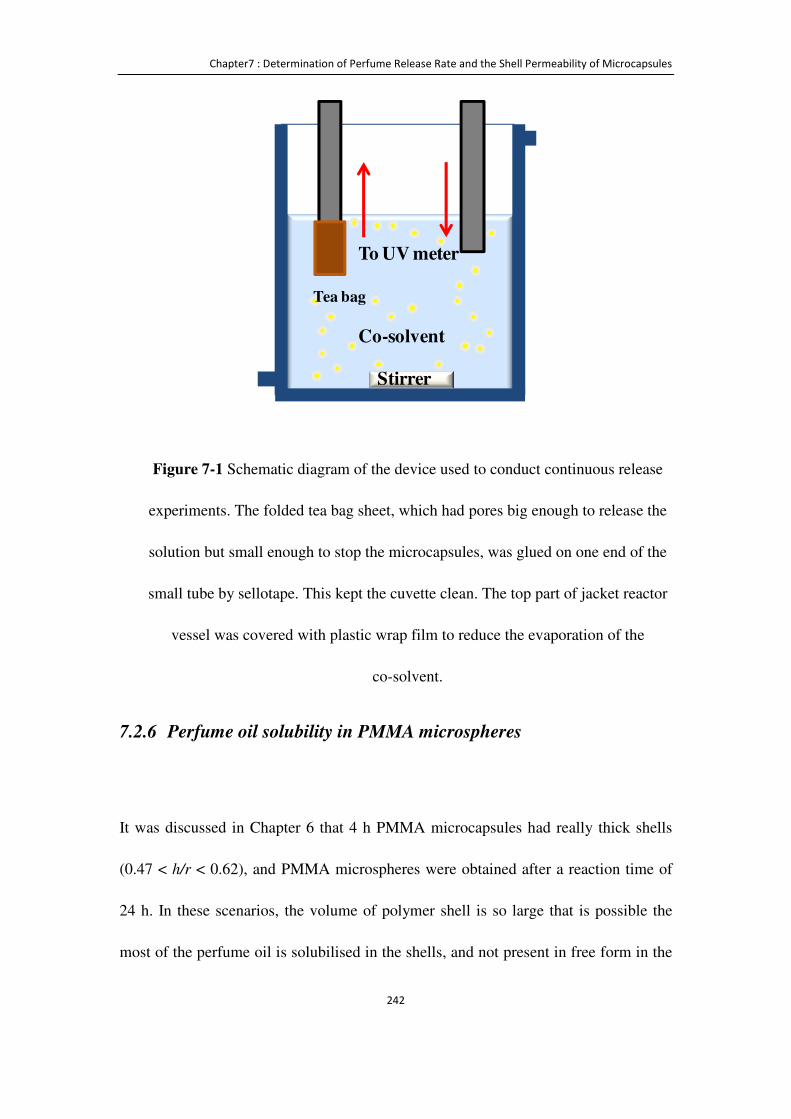
Chapter7 : Determination of Perfume Release Rate and the Shell Permeability of Microcapsules
242
Figure 7-1 Schematic diagram of the device used to conduct continuous release
experiments. The folded tea bag sheet, which had pores big enough to release the
solution but small enough to stop the microcapsules, was glued on one end of the
small tube by sellotape. This kept the cuvette clean. The top part of jacket reactor
vessel was covered with plastic wrap film to reduce the evaporation of the
co-solvent.
7.2.6 Perfume oil solubility in PMMA microspheres
It was discussed in Chapter 6 that 4 h PMMA microcapsules had really thick shells
(0.47 < h/r < 0.62), and PMMA microspheres were obtained after a reaction time of
24 h. In these scenarios, the volume of polymer shell is so large that is possible the
most of the perfume oil is solubilised in the shells, and not present in free form in the
Co-solvent
Stirrer
To UV meter
Tea bag
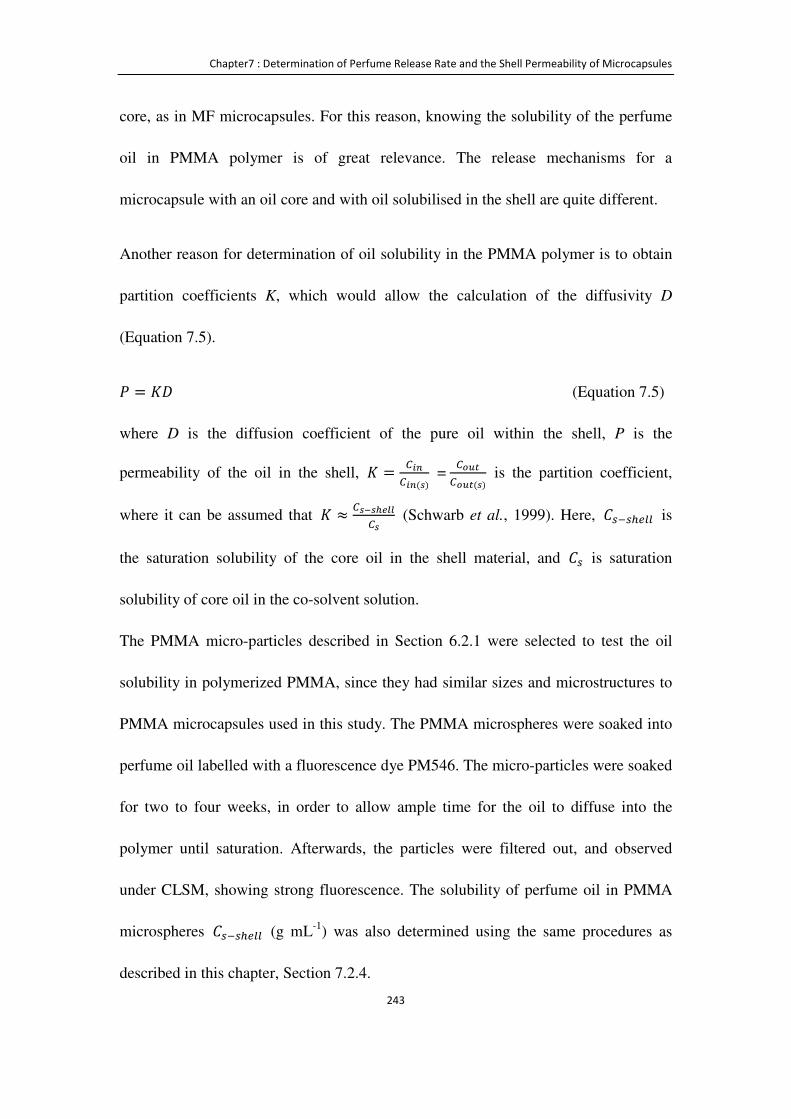
Chapter7 : Determination of Perfume Release Rate and the Shell Permeability of Microcapsules
243
core, as in MF microcapsules. For this reason, knowing the solubility of the perfume
oil in PMMA polymer is of great relevance. The release mechanisms for a
microcapsule with an oil core and with oil solubilised in the shell are quite different.
Another reason for determination of oil solubility in the PMMA polymer is to obtain
partition coefficients K, which would allow the calculation of the diffusivity D
(Equation 7.5).
B = 8� (Equation 7.5)
where D is the diffusion coefficient of the pure oil within the shell, P is the
permeability of the oil in the shell, 8 = 9:;9:;(�) = 9<=>9<=>(�) is the partition coefficient,
where it can be assumed that 8 ≈ 9�°�º�»»9� (Schwarb et al., 1999). Here, �������� is
the saturation solubility of the core oil in the shell material, and �� is saturation
solubility of core oil in the co-solvent solution.
The PMMA micro-particles described in Section 6.2.1 were selected to test the oil
solubility in polymerized PMMA, since they had similar sizes and microstructures to
PMMA microcapsules used in this study. The PMMA microspheres were soaked into
perfume oil labelled with a fluorescence dye PM546. The micro-particles were soaked
for two to four weeks, in order to allow ample time for the oil to diffuse into the
polymer until saturation. Afterwards, the particles were filtered out, and observed
under CLSM, showing strong fluorescence. The solubility of perfume oil in PMMA
microspheres �������� (g mL-1) was also determined using the same procedures as
described in this chapter, Section 7.2.4.
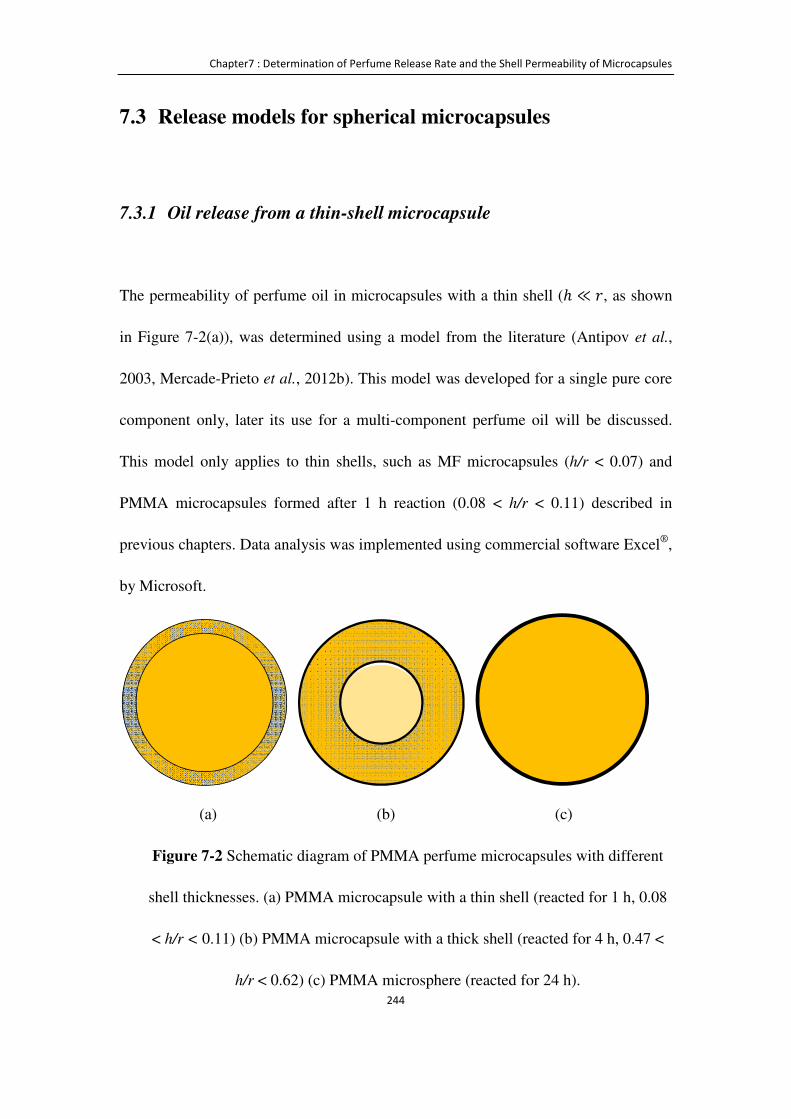
Chapter7 : Determination of Perfume Release Rate and the Shell Permeability of Microcapsules
244
7.3 Release models for spherical microcapsules
7.3.1 Oil release from a thin-shell microcapsule
The permeability of perfume oil in microcapsules with a thin shell (ℎ ≪ M, as shown
in Figure 7-2(a)), was determined using a model from the literature (Antipov et al.,
2003, Mercade-Prieto et al., 2012b). This model was developed for a single pure core
component only, later its use for a multi-component perfume oil will be discussed.
This model only applies to thin shells, such as MF microcapsules (h/r < 0.07) and
PMMA microcapsules formed after 1 h reaction (0.08 < h/r < 0.11) described in
previous chapters. Data analysis was implemented using commercial software Excel®,
by Microsoft.
(a) (b) (c)
Figure 7-2 Schematic diagram of PMMA perfume microcapsules with different
shell thicknesses. (a) PMMA microcapsule with a thin shell (reacted for 1 h, 0.08
< h/r < 0.11) (b) PMMA microcapsule with a thick shell (reacted for 4 h, 0.47 <
h/r < 0.62) (c) PMMA microsphere (reacted for 24 h).

Chapter7 : Determination of Perfume Release Rate and the Shell Permeability of Microcapsules
245
The release equation developed from Fick's first law was described in Section 2.6.3.
The relative release at a given time in the linear regime is given by Equation 2.27. In
this study, the density of core oil c* ≈ 1gmL�� and �� < 0.01gmL�� for all the
oils used (as shown later in Table 7-2). Therefore in the exponential regime release
curve discussed for Figure 2-15, there is less than the one percent of the total oil
released. For this reason, the exponential regime is not considered in the model. The
whole release profile will be analysed based on the linear regime for thin-shell
microcapsules (h<<r) (Equation 2.28).
The above model was developed for a single microcapsule. For a population of
microcapsules with the same size, the same Equation 2.28 is obtained. For the real
case scenario of poly-dispersed microcapsules, it has been shown that the relative
release R is fairly linear with time at least up to R ~0.6. It is in this early stage of
release where the permeability will be determined.
7.3.2 Oil release from a homogeneous microsphere
The previous methodology valid for core-shell spheres cannot be applied when the
microcapsule no longer has a liquid core, as in the case of PMMA microcapsules
formed after a reaction time of 24 h (shown in Figure 7-2(c)). The release of oil from
Chapter7 : Determination of Perfume Release Rate and the Shell Permeability of Microcapsules
246
a solid spherical matrix has been considered before in the literature (Crank, 1975,
Polakovic et al., 1999). The model describes the diffusion within in a sphere placed in
a well-stirred solution of limited volume. The diffusion equation within a spheres is
given by the second Fick law:
ë9:;ë%� = � �ëL9:;ëN�L + 2 ë9:;ëN� � (Equation 7.6)
where MN is the distance from the centre of the spherical particle to the location where
the concentration of the oil is calculated (gmL��),PN is the microcapsules release
time (s). The oil balance at the boundary surface is:
S ë9<=>ë%� = − ¾¹| �ë9:;ë%� �N�ìN = �¾íl � �ë9:;ëN� �N�ìN (Equation 7.7)
where Vs is the volume of the sphere, r is the radius of microcapsule. 8, = ):;∞)<=>∞ is
the partition coefficient, the ratio of the concentration inside (� !∞) and outside
(�$�%∞) the particle at the end of release, which are calculated using Equation 7.8:
Vï� !& = S�$�%∞ + Vï�$�%∞8, (Equation 7.8)
where � !& is the initial concentration inside the particle. The analytical solutions of
Equations 7.6, 7.7 and 7.8 can be found somewhere else (Crank, 1975):
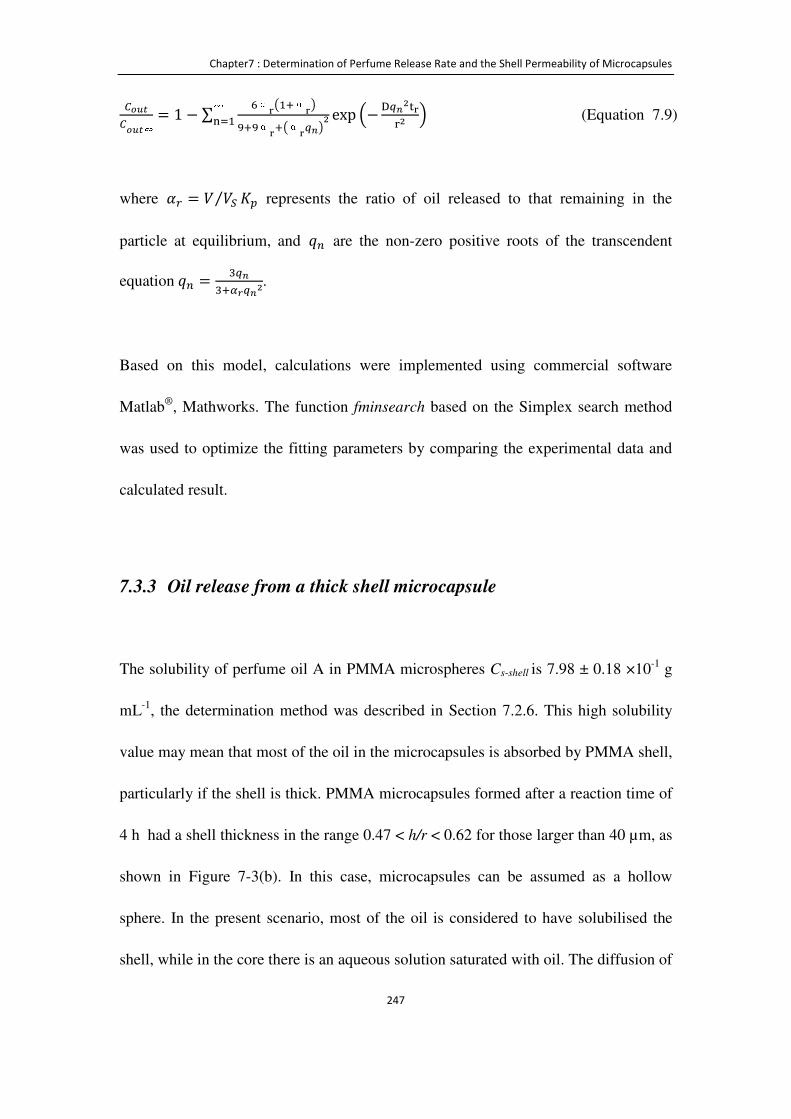
Chapter7 : Determination of Perfume Release Rate and the Shell Permeability of Microcapsules
247
9<=>9<=>∞ = 1 − ∑ �αðw�JαðxñJñαðJwαðI;xL∞òì� exp �− õI;LöðZL �(Equation 7.9)
where ÷N = S S[⁄ 8, represents the ratio of oil released to that remaining in the
particle at equilibrium, and H! are the non-zero positive roots of the transcendent
equationH! = �I;�JK�I;L.
Based on this model, calculations were implemented using commercial software
Matlab®, Mathworks. The function fminsearch based on the Simplex search method
was used to optimize the fitting parameters by comparing the experimental data and
calculated result.
7.3.3 Oil release from a thick shell microcapsule
The solubility of perfume oil A in PMMA microspheres Cs-shell is 7.98 ± 0.18 ×10⁻¹ g
mL-1, the determination method was described in Section 7.2.6. This high solubility
value may mean that most of the oil in the microcapsules is absorbed by PMMA shell,
particularly if the shell is thick. PMMA microcapsules formed after a reaction time of
4 h had a shell thickness in the range 0.47 < h/r < 0.62 for those larger than 40 µm, as
shown in Figure 7-3(b). In this case, microcapsules can be assumed as a hollow
sphere. In the present scenario, most of the oil is considered to have solubilised the
shell, while in the core there is an aqueous solution saturated with oil. The diffusion of
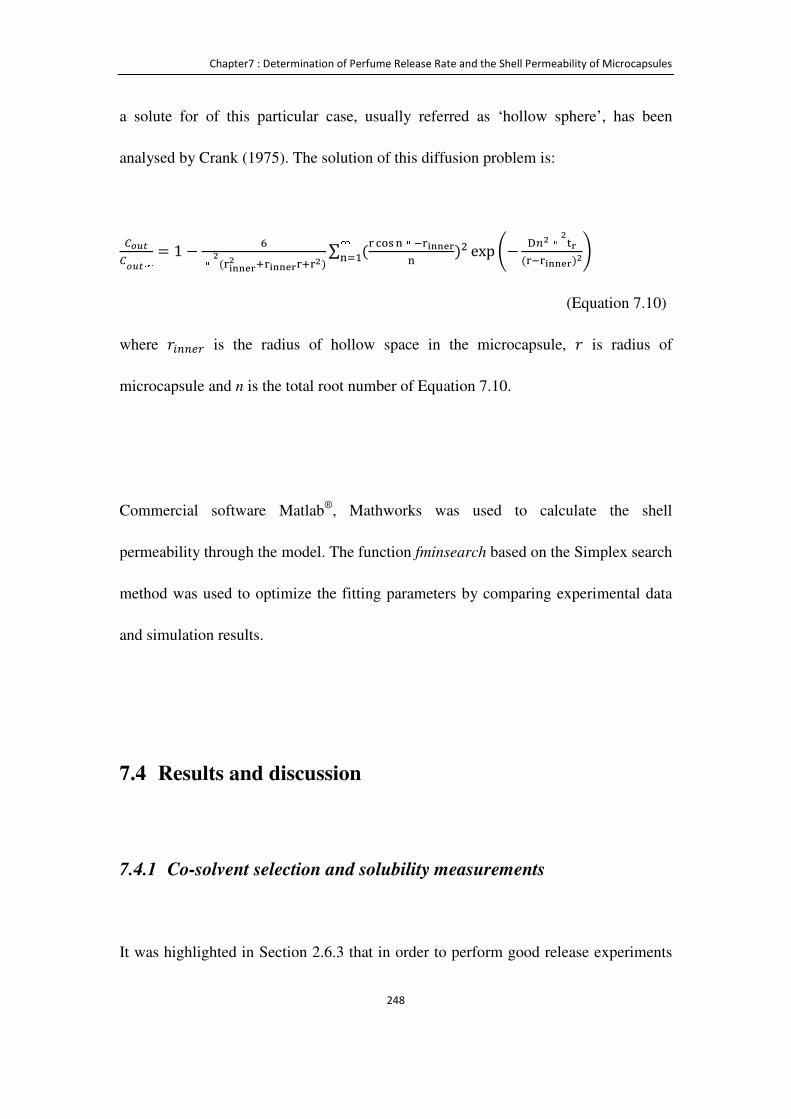
Chapter7 : Determination of Perfume Release Rate and the Shell Permeability of Microcapsules
248
a solute for of this particular case, usually referred as ‘hollow sphere’, has been
analysed by Crank (1975). The solution of this diffusion problem is:
9<=>9<=>∞ = 1 − �πL(ZøùùúðL JZøùùúðZJZL) ∑ (Z hûaòπ�Zøùùúðò )�∞òì� exp ±− õ!LπLöð(Z�Zøùùúð)L³
(Equation 7.10)
where M !!�N is the radius of hollow space in the microcapsule, M is radius of
microcapsule and n is the total root number of Equation 7.10.
Commercial software Matlab®, Mathworks was used to calculate the shell
permeability through the model. The function fminsearch based on the Simplex search
method was used to optimize the fitting parameters by comparing experimental data
and simulation results.
7.4 Results and discussion
7.4.1 Co-solvent selection and solubility measurements
It was highlighted in Section 2.6.3 that in order to perform good release experiments
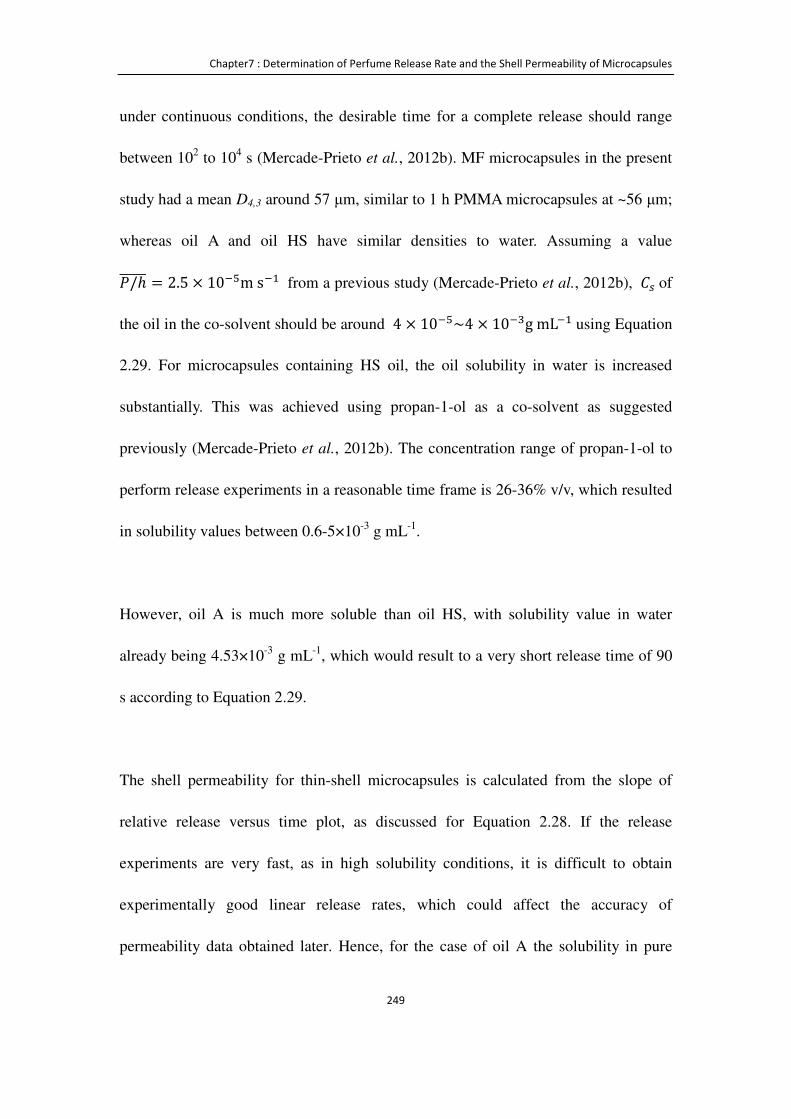
Chapter7 : Determination of Perfume Release Rate and the Shell Permeability of Microcapsules
249
under continuous conditions, the desirable time for a complete release should range
between 102 to 104 s (Mercade-Prieto et al., 2012b). MF microcapsules in the present
study had a mean D4,3 around 57 μm, similar to 1 h PMMA microcapsules at ~56 μm;
whereas oil A and oil HS have similar densities to water. Assuming a value
B/ℎCCCCC = 2.5 × 10��ms�� from a previous study (Mercade-Prieto et al., 2012b), ��of
the oil in the co-solvent should be around 4 × 10��~4 × 10��gmL��using Equation
2.29. For microcapsules containing HS oil, the oil solubility in water is increased
substantially. This was achieved using propan-1-ol as a co-solvent as suggested
previously (Mercade-Prieto et al., 2012b). The concentration range of propan-1-ol to
perform release experiments in a reasonable time frame is 26-36% v/v, which resulted
in solubility values between 0.6-5×10⁻³ g mL-1.
However, oil A is much more soluble than oil HS, with solubility value in water
already being 4.53×10⁻³ g mL-1, which would result to a very short release time of 90
s according to Equation 2.29.
The shell permeability for thin-shell microcapsules is calculated from the slope of
relative release versus time plot, as discussed for Equation 2.28. If the release
experiments are very fast, as in high solubility conditions, it is difficult to obtain
experimentally good linear release rates, which could affect the accuracy of
permeability data obtained later. Hence, for the case of oil A the solubility in pure

Chapter7 : Determination of Perfume Release Rate and the Shell Permeability of Microcapsules
250
water is considered already quite high, and therefore different kind of co-solvents had
to be found in order to increase the total release time, not decrease as in the case of
using oil HS.
Several limitations have to be observed in the selection of a new co-solvent for release
tests. The co-solvent has to be fully miscible with water, avoiding multiple phases,
and it should not interfere with the perfume oil detection method (here UV-Vis
spectroscopy). Following Equation 2.29, the only parameter that can be easily
modified to increase significantly tend is the permeability P. The shell permeability P,
as defined in Equation 7.5, incorporates the oil diffusion coefficient in the shell D. D
can be externally modified by changing the viscosity of the solution, following the
well-known Stokes-Einstein equation (Equation 7.11) for small solutes.
Mercadé-Prieto et, al. (2012b) already showed that the measured P will be reduced
when using highly viscous co-solvents. A similar approach was performed here by
selecting glucose and glycerol as co-solvents. They were found to successfully
increase the viscosity of aqueous solutions, thus resulting in slower release profiles,
while fulfilling the other co-solvent requirements for release tests. Note that glucose
slightly decreased the oil solubility but is increased with glycerol (Table 7-2).
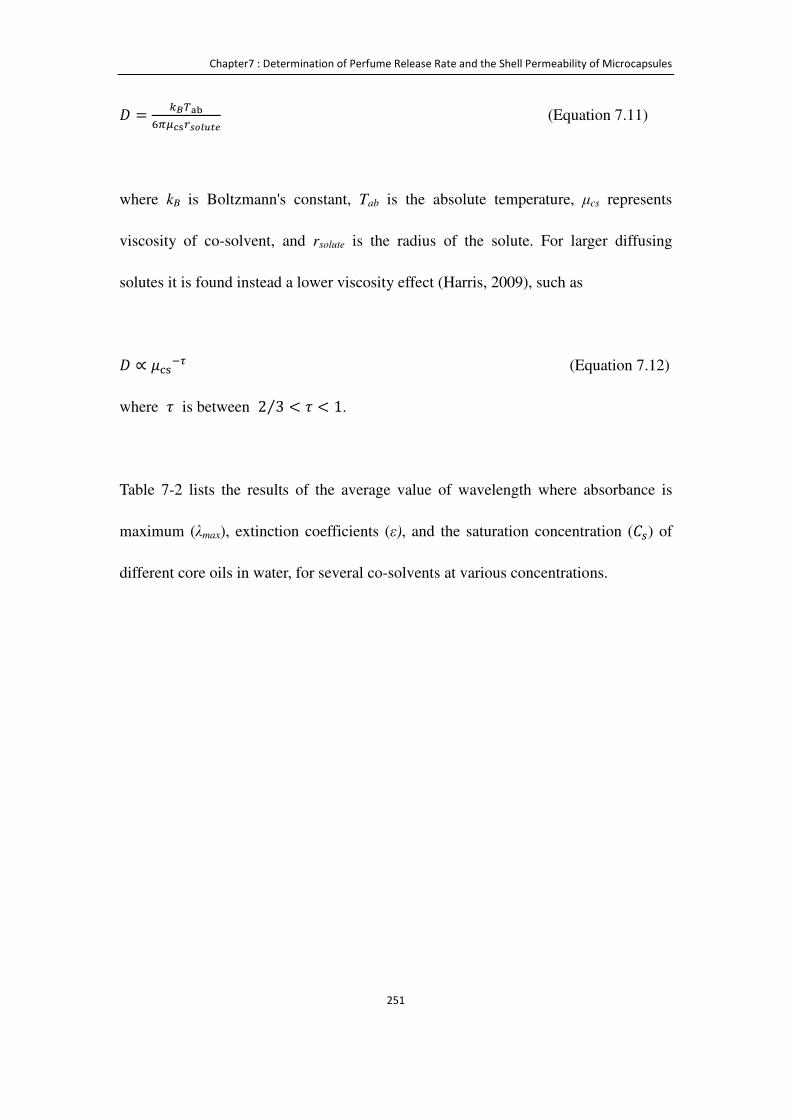
Chapter7 : Determination of Perfume Release Rate and the Shell Permeability of Microcapsules
251
� = üýnþ������N�<»=>� (Equation 7.11)
where kB is Boltzmann's constant, Tab is the absolute temperature, μcs represents
viscosity of co-solvent, and rsolute is the radius of the solute. For larger diffusing
solutes it is found instead a lower viscosity effect (Harris, 2009), such as
� ∝ gha�i (Equation 7.12)
where e is between 2 3⁄ < e < 1.
Table 7-2 lists the results of the average value of wavelength where absorbance is
maximum (λmax), extinction coefficients (ε), and the saturation concentration (��) of
different core oils in water, for several co-solvents at various concentrations.
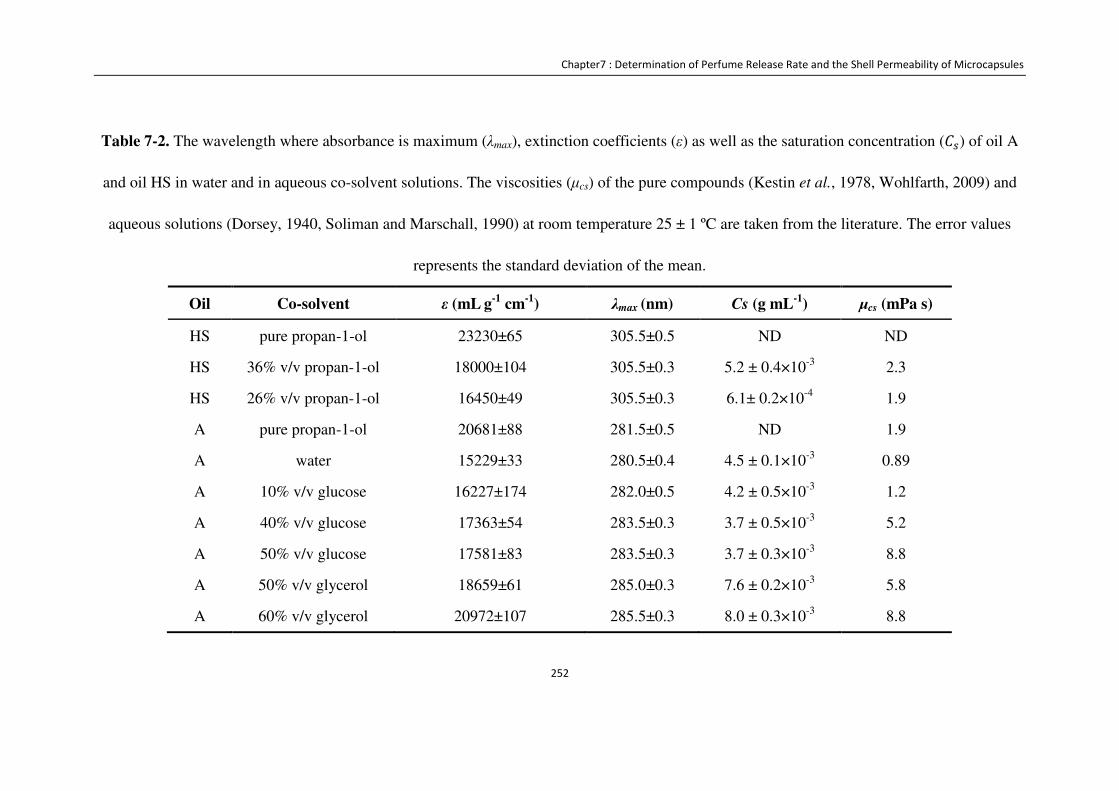
Chapter7 : Determination of Perfume Release Rate and the Shell Permeability of Microcapsules
252
Table 7-2. The wavelength where absorbance is maximum (λmax), extinction coefficients (ε) as well as the saturation concentration (��) of oil A
and oil HS in water and in aqueous co-solvent solutions. The viscosities (μcs) of the pure compounds (Kestin et al., 1978, Wohlfarth, 2009) and
aqueous solutions (Dorsey, 1940, Soliman and Marschall, 1990) at room temperature 25 ± 1 ºC are taken from the literature. The error values
represents the standard deviation of the mean.
Oil Co-solvent ε (mL g
-1 cm
-1) λmax (nm) Cs (g mL
-1) μcs (mPa s)
HS pure propan-1-ol 23230±65 305.5±0.5 ND ND
HS 36% v/v propan-1-ol 18000±104 305.5±0.3 5.2 ± 0.4×10⁻³ 2.3
HS 26% v/v propan-1-ol 16450±49 305.5±0.3 6.1± 0.2×10⁻⁴ 1.9
A pure propan-1-ol 20681±88 281.5±0.5 ND 1.9
A water 15229±33 280.5±0.4 4.5 ± 0.1×10⁻³ 0.89
A 10% v/v glucose 16227±174 282.0±0.5 4.2 ± 0.5×10⁻³ 1.2
A 40% v/v glucose 17363±54 283.5±0.3 3.7 ± 0.5×10⁻³ 5.2
A 50% v/v glucose 17581±83 283.5±0.3 3.7 ± 0.3×10⁻³ 8.8
A 50% v/v glycerol 18659±61 285.0±0.3 7.6 ± 0.2×10⁻³ 5.8
A 60% v/v glycerol 20972±107 285.5±0.3 8.0 ± 0.3×10⁻³ 8.8
Chapter7 : Determination of Perfume Release Rate and the Shell Permeability of Microcapsules
253
7.4.2 Encapsulation efficiency
The encapsulation efficiency EE, the total amount of perfume oil in the slurry ɸslurry %
and waste oil in slurry Woil % of MF and PMMA microcapsules prepared with
different formulations and using different preparation methods are listed in Table 7-3.
The encapsulation efficiency for all MF microcapsules was about 73.7%. EE was
found independent of the core oil and the method used to generate the emulsions. The
encapsulation efficiency for PMMA microcapsules was slightly lower, about 70.1%,
but did not vary with the reaction time and the preparation methods either. Most
probably, the core oil loss was due to high solubility of oil A in water, as well as the
waste oil in slurry, and the evaporation caused by using elevated temperature (65 °C
to 70 °C ).

Chapter7 : Determination of Perfume Release Rate and the Shell Permeability of Microcapsules
254
Table 7-3. The list of encapsulation efficiency s EE %, the total amount of perfume oil in the slurry ɸslurry % and waste oil in slurry Woil % of
MF and PMMA microcapsules. The figures after +/- represent the standard deviation of the mean. ME represents membrane emulsification, HG
represents homogenization in this chapter.
No. Shell material Operation method Reaction time (h) Oil EE (%) ɸɸɸɸslurry (%) Woil (%)
1 MF ME 6 A 74.1 ± 1.2 12.0± 0.5 32.1 ± 1.3
2 MF HG 6 A 73.3± 0.9 11.9± 0.2 32.0± 1.3
3 MF ME 6 HS 73.5± 1.1 12.0± 0.3 12.0± 1.3
4 MF HG 6 HS 73.2± 0.7 11.9± 0.5 11.9± 1.3
5 PMMA ME 1 A 70.1± 1.5 5.1± 0.2 28.0 ± 1.1
6 PMMA ME 4 A 69.8± 0.8 5.0± 0.1 26.4± 0.5
7 PMMA ME 24 A 70.3± 1.3 5.1± 0.1 27.8± 0.4
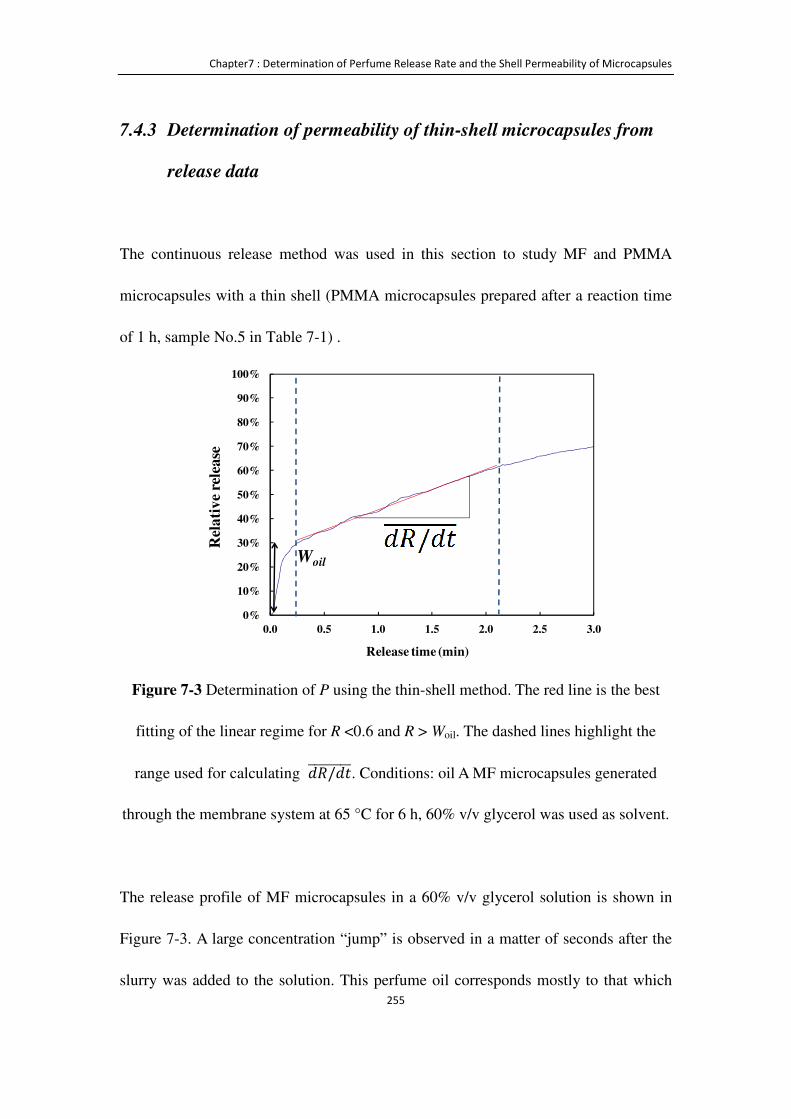
Chapter7 : Determination of Perfume Release Rate and the Shell Permeability of Microcapsules
255
7.4.3 Determination of permeability of thin-shell microcapsules from
release data
The continuous release method was used in this section to study MF and PMMA
microcapsules with a thin shell (PMMA microcapsules prepared after a reaction time
of 1 h, sample No.5 in Table 7-1) .
Figure 7-3 Determination of P using the thin-shell method. The red line is the best
fitting of the linear regime for R <0.6 and R > Woil. The dashed lines highlight the
range used for calculating 'O/'PCCCCCCCC. Conditions: oil A MF microcapsules generated
through the membrane system at 65 °C for 6 h, 60% v/v glycerol was used as solvent.
The release profile of MF microcapsules in a 60% v/v glycerol solution is shown in
Figure 7-3. A large concentration “jump” is observed in a matter of seconds after the
slurry was added to the solution. This perfume oil corresponds mostly to that which
0%
10%
20%
30%
40%
50%
60%
70%
80%
90%
100%
0.0 0.5 1.0 1.5 2.0 2.5 3.0
Rel
ati
ve
rele
ase
Release time (min)
Woil
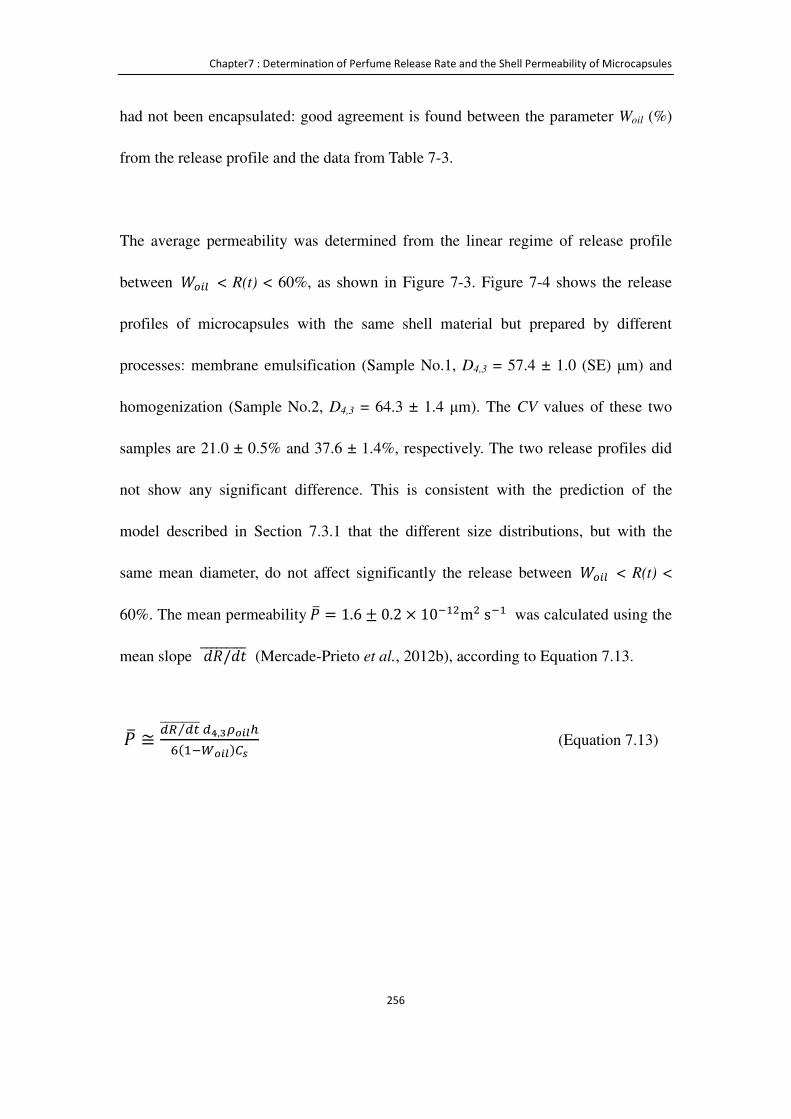
Chapter7 : Determination of Perfume Release Rate and the Shell Permeability of Microcapsules
256
had not been encapsulated: good agreement is found between the parameter Woil (%)
from the release profile and the data from Table 7-3.
The average permeability was determined from the linear regime of release profile
between V$ � < R(t) < 60%, as shown in Figure 7-3. Figure 7-4 shows the release
profiles of microcapsules with the same shell material but prepared by different
processes: membrane emulsification (Sample No.1, D4,3 = 57.4 ± 1.0 (SE) μm) and
homogenization (Sample No.2, D4,3 = 64.3 ± 1.4 μm). The CV values of these two
samples are 21.0 ± 0.5% and 37.6 ± 1.4%, respectively. The two release profiles did
not show any significant difference. This is consistent with the prediction of the
model described in Section 7.3.1 that the different size distributions, but with the
same mean diameter, do not affect significantly the release between V$ � < R(t) <
60%. The mean permeabilityBC = 1.6 ± 0.2 × 10���m�s�� was calculated using the
mean slope 'O/'PCCCCCCCCC (Mercade-Prieto et al., 2012b), according to Equation 7.13.
BC ≅ *l *%⁄CCCCCCCCC*},��<:»��(���<:»)9� (Equation 7.13)
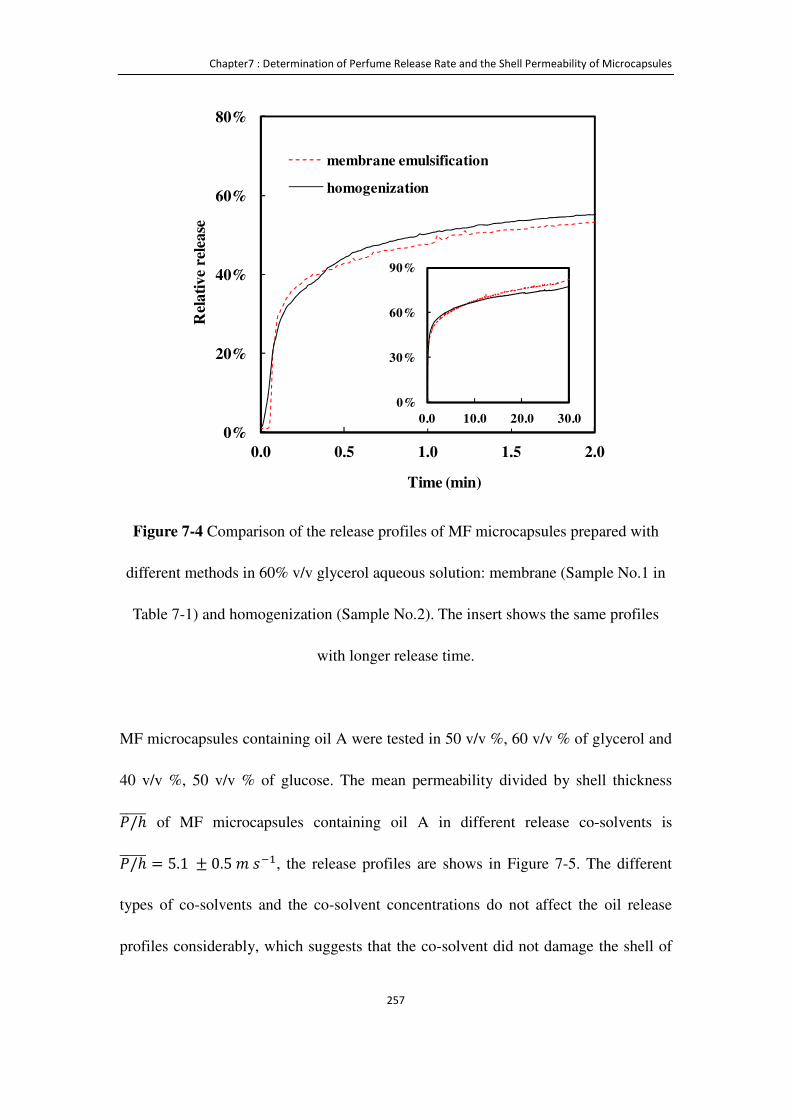
Chapter7 : Determination of Perfume Release Rate and the Shell Permeability of Microcapsules
257
Figure 7-4 Comparison of the release profiles of MF microcapsules prepared with
different methods in 60% v/v glycerol aqueous solution: membrane (Sample No.1 in
Table 7-1) and homogenization (Sample No.2). The insert shows the same profiles
with longer release time.
MF microcapsules containing oil A were tested in 50 v/v %, 60 v/v % of glycerol and
40 v/v %, 50 v/v % of glucose. The mean permeability divided by shell thickness
B/ℎCCCCC of MF microcapsules containing oil A in different release co-solvents is
B/ℎCCCCC = 5.1 ± 0.5ŵ��, the release profiles are shows in Figure 7-5. The different
types of co-solvents and the co-solvent concentrations do not affect the oil release
profiles considerably, which suggests that the co-solvent did not damage the shell of
0%
20%
40%
60%
80%
0.0 0.5 1.0 1.5 2.0
Rel
ati
ve
rele
ase
Time (min)
membrane emulsification
homogenization
0%
30%
60%
90%
0.0 10.0 20.0 30.0

Chapter7 : Determination of Perfume Release Rate and the Shell Permeability of Microcapsules
258
microcapsules. The slight differences among the release profiles due to the viscosity
divergences and the different solubilities of the oil in co-solvents. Due to the effect
of the viscosity of co-solvent (μcs) on diffusion coefficient (D), as shown in Equation
7.12, for non-ideal systems, (Harris, 2009, Hiss and Cussler, 1973), Equation 7.13
was correspondingly modified to :
BD(CCCCC = BC ×g)�L� ≅ *l *%⁄CCCCCCCCC*},��<:»��(���<:»)9� × gL� for τ = 2/3 (Equation 7.14)
Or BDECCCCC = BC × g)� ≅ *l *%⁄CCCCCCCCC*},��<:»��(���<:»)9� × g for τ = 1 (Equation 7.15)
Figure 7-5 Comparison of release profiles of MF microcapsules containing same core
oil A exposed to different co-solvents. The black diamonds are for 50 v/v% glycerol,
blue squares for 60% glycerol, red triangles for 40% glucose and purple circles for 50%
glucose. The MF microcapsules were generated with the dispersion cell after a
reaction time of 6 h at 65 °C.
0%
20%
40%
60%
80%
100%
0.0 2.0 4.0 6.0 8.0 10.0
Rel
ativ
e re
leas
e
Release time (min)
50% glycerol
60% glycerol
40% glucose
50% glucose
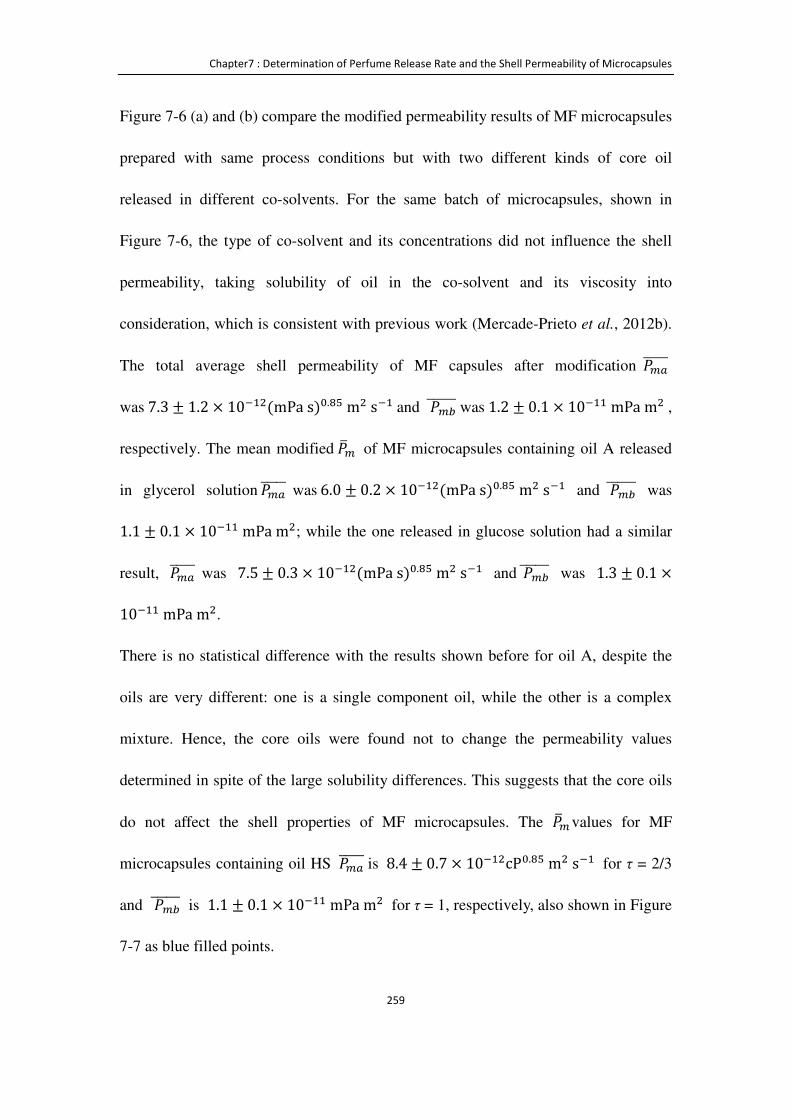
Chapter7 : Determination of Perfume Release Rate and the Shell Permeability of Microcapsules
259
Figure 7-6 (a) and (b) compare the modified permeability results of MF microcapsules
prepared with same process conditions but with two different kinds of core oil
released in different co-solvents. For the same batch of microcapsules, shown in
Figure 7-6, the type of co-solvent and its concentrations did not influence the shell
permeability, taking solubility of oil in the co-solvent and its viscosity into
consideration, which is consistent with previous work (Mercade-Prieto et al., 2012b).
The total average shell permeability of MF capsules after modification BD(CCCCC was 7.3 ± 1.2 × 10���(mPas)&.z�m�s�� and BDECCCCCC was 1.2 ± 0.1 × 10���mPam� ,
respectively. The mean modifiedBCD of MF microcapsules containing oil A released
in glycerol solution BD(CCCCC was 6.0 ± 0.2 × 10���(mPas)&.z�m�s�� and BDECCCCCC was
1.1 ± 0.1 × 10���mPam�; while the one released in glucose solution had a similar
result, BD(CCCCC was 7.5 ± 0.3 × 10���(mPas)&.z�m�s�� and BDECCCCCC was 1.3 ± 0.1 ×10���mPam�.
There is no statistical difference with the results shown before for oil A, despite the
oils are very different: one is a single component oil, while the other is a complex
mixture. Hence, the core oils were found not to change the permeability values
determined in spite of the large solubility differences. This suggests that the core oils
do not affect the shell properties of MF microcapsules. The BCD values for MF
microcapsules containing oil HS BD(CCCCCis 8.4 ± 0.7 × 10���cP&.z�m�s�� for τ = 2/3
and BDECCCCCC is 1.1 ± 0.1 × 10���mPam� for τ = 1, respectively, also shown in Figure
7-7 as blue filled points.
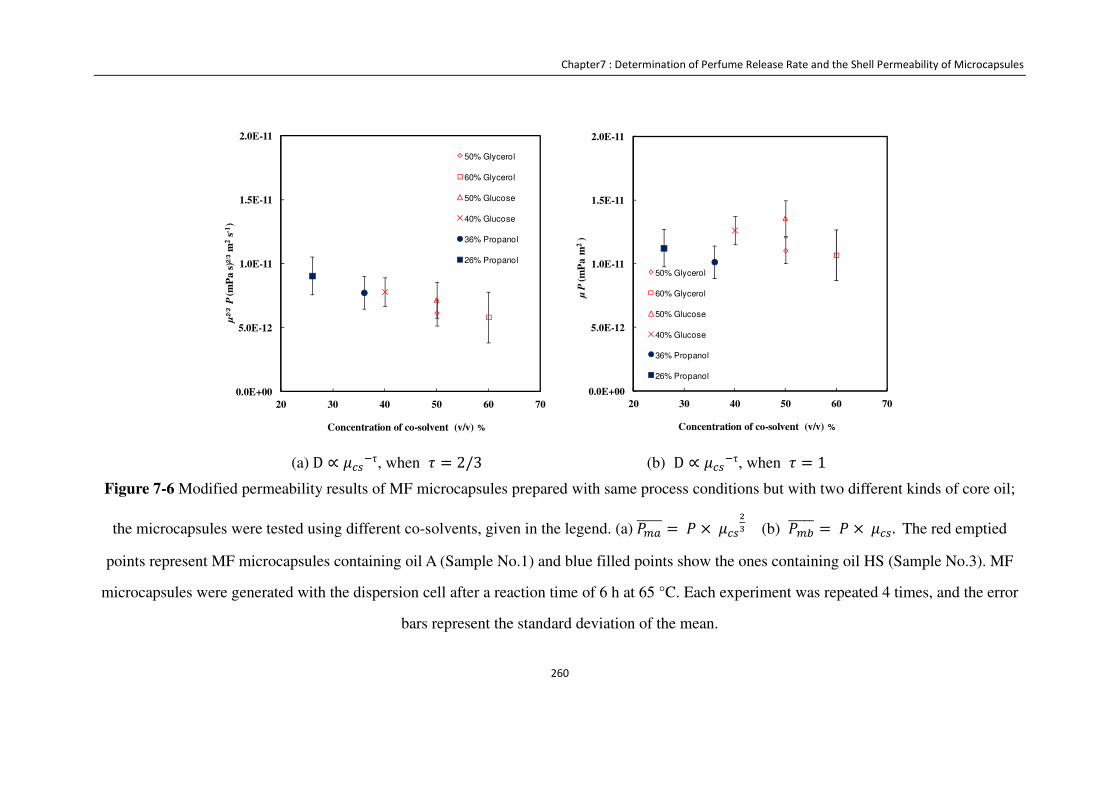
Chapter7 : Determination of Perfume Release Rate and the Shell Permeability of Microcapsules
260
(a)D ∝ g)��τ, when e = 2/3
(b) D ∝ g)��τ, when e = 1
Figure 7-6 Modified permeability results of MF microcapsules prepared with same process conditions but with two different kinds of core oil;
the microcapsules were tested using different co-solvents, given in the legend. (a)BD(CCCCC = B ×g)�L� (b) BDECCCCC = B ×g)�.The red emptied
points represent MF microcapsules containing oil A (Sample No.1) and blue filled points show the ones containing oil HS (Sample No.3). MF
microcapsules were generated with the dispersion cell after a reaction time of 6 h at 65 °C. Each experiment was repeated 4 times, and the error
bars represent the standard deviation of the mean.
0.0E+00
5.0E-12
1.0E-11
1.5E-11
2.0E-11
20 30 40 50 60 70
μ2/3
P (
mP
a s
)2/3
m2
s-1)
Concentration of co-solvent (v/v) %
50% Glycerol
60% Glycerol
50% Glucose
40% Glucose
36% Propanol
26% Propanol
0.0E+00
5.0E-12
1.0E-11
1.5E-11
2.0E-11
20 30 40 50 60 70
μP
(m
Pa m
2)
Concentration of co-solvent (v/v) %
50% Glycerol
60% Glycerol
50% Glucose
40% Glucose
36% Propanol
26% Propanol
Chapter7 : Determination of Perfume Release Rate and the Shell Permeability of Microcapsules
261
The thin-shell PMMA microcapsules (0.08 < h/r <0.11) containing oil A, made
through membrane emulsification after a reaction time of 1 h, were tested using the
same method described above. The release profile of MF and PMMA microcapsules
tested in an aqueous solution with 60% v/v glycerol is shown in Figure 7-7. The two
samples have a comparable amount of waste oil Woil, consistent with the results of
Table 7-3. The release profile of PMMA microcapsules is much steeper than for MF.
The figure also shows that in PMMA microcapsules most of the perfume oil (around
80%) is released within two minutes.
The permeability of microcapsule shell is related to the shell material, the solute and
the solvent used, as discussed in the literature (Mercade-Prieto et al., 2012b, Shen et
al., 2011). In this case where the solute and the solvent are the same, the permeability
difference is related to the properties of the shell material. A higher permeability could
be due to a more porous structure, or due to the presence of larger pores, which could
imply that a reaction time of 1 h was not enough to form a dense shell for PMMA, but
it could also be due to a higher solubility of the oil in the shell. The permeability
values adjusted with the solvent viscosity for 1 h PMMA microcapsules are
B × g)�L� = 1.3 ± 0.2 × 10��&(mPas)&.z�m�s�� for τ = 2/3 and B ×g)� = 2.7 ±0.3 × 10��&mPam� for τ = 1, respectively. These values are higher than those found
for MF microcapsules generated by the same equipment.
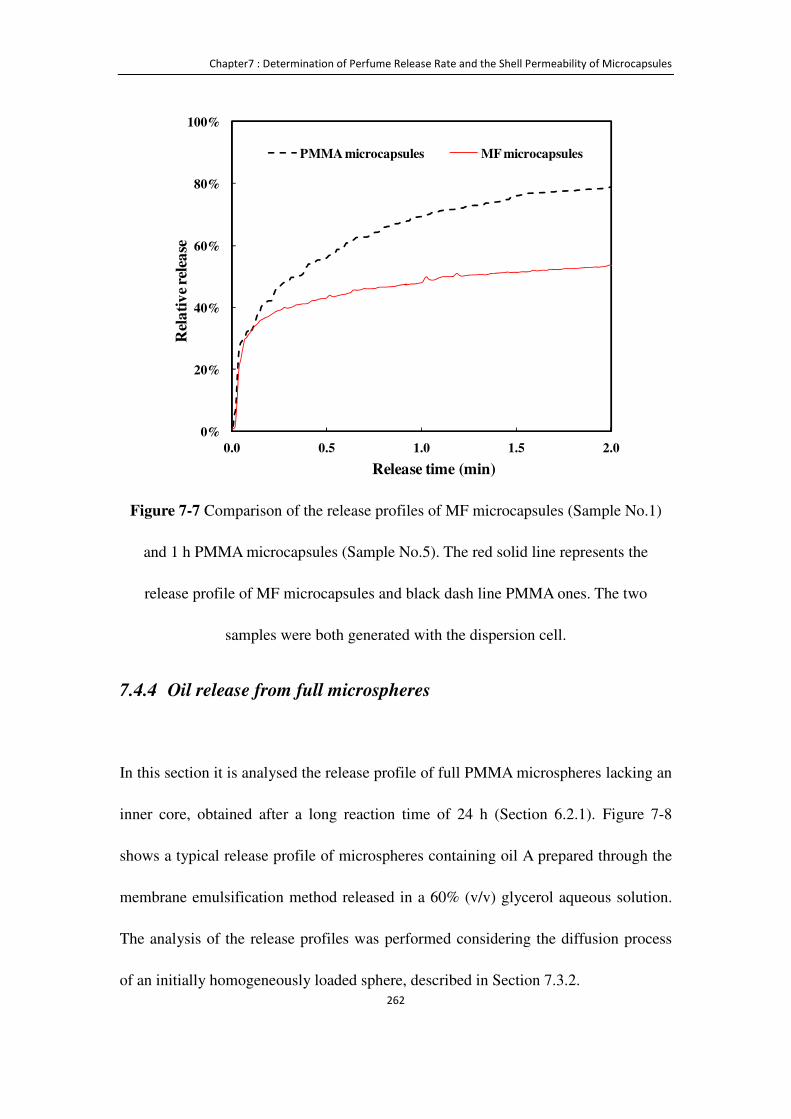
Chapter7 : Determination of Perfume Release Rate and the Shell Permeability of Microcapsules
262
Figure 7-7 Comparison of the release profiles of MF microcapsules (Sample No.1)
and 1 h PMMA microcapsules (Sample No.5). The red solid line represents the
release profile of MF microcapsules and black dash line PMMA ones. The two
samples were both generated with the dispersion cell.
7.4.4 Oil release from full microspheres
In this section it is analysed the release profile of full PMMA microspheres lacking an
inner core, obtained after a long reaction time of 24 h (Section 6.2.1). Figure 7-8
shows a typical release profile of microspheres containing oil A prepared through the
membrane emulsification method released in a 60% (v/v) glycerol aqueous solution.
The analysis of the release profiles was performed considering the diffusion process
of an initially homogeneously loaded sphere, described in Section 7.3.2.
0%
20%
40%
60%
80%
100%
0.0 0.5 1.0 1.5 2.0
Rel
ati
ve
rele
ase
Release time (min)
PMMA microcapsules MF microcapsules
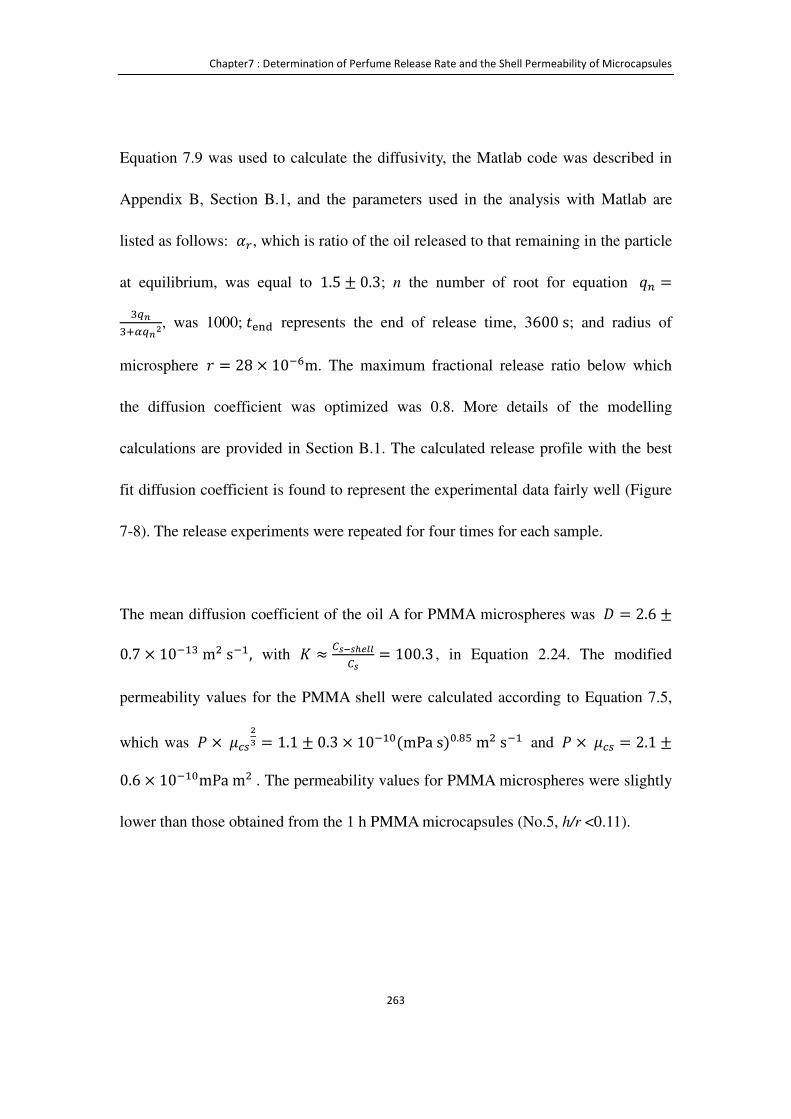
Chapter7 : Determination of Perfume Release Rate and the Shell Permeability of Microcapsules
263
Equation 7.9 was used to calculate the diffusivity, the Matlab code was described in
Appendix B, Section B.1, and the parameters used in the analysis with Matlab are
listed as follows: ÷N, which is ratio of the oil released to that remaining in the particle
at equilibrium, was equal to 1.5 ± 0.3; n the number of root for equation H! =�I;�JKI;L, was 1000;P�ò¨ represents the end of release time, 3600s; and radius of
microsphere M = 28 × 10��m. The maximum fractional release ratio below which
the diffusion coefficient was optimized was 0.8. More details of the modelling
calculations are provided in Section B.1. The calculated release profile with the best
fit diffusion coefficient is found to represent the experimental data fairly well (Figure
7-8). The release experiments were repeated for four times for each sample.
The mean diffusion coefficient of the oil A for PMMA microspheres was � = 2.6 ±0.7 × 10���m�s��, with 8 ≈ 9�°�º�»»9� = 100.3 , in Equation 2.24. The modified
permeability values for the PMMA shell were calculated according to Equation 7.5,
which was B ×g)�L� = 1.1 ± 0.3 × 10��&(mPas)&.z�m�s�� and B ×g)� = 2.1 ±0.6 × 10��&mPam�. The permeability values for PMMA microspheres were slightly
lower than those obtained from the 1 h PMMA microcapsules (No.5, h/r <0.11).
Chapter7 : Determination of Perfume Release Rate and the Shell Permeability of Microcapsules
264
Figure 7-8 Experimental and best-fitted release profile for 24 h PMMA microspheres
(Sample No. 7) tested in 60% (v/v) glycerol aqueous solution. The best fitted
diffusion coefficient value is � = 3.2 × 10���m�s�� using the homogenous sphere
model for R (t)<0.8 (Section 7.3.2), the continuous line shows all the predicted
release.
7.4.5 Oil release from a thick shell microcapsules
The intermediate scenario of the previous two sections, with very thin shells or a full
sphere, is considered here for the 4 h PMMA microcapsules. As shown in Section
7.3.3, these microcapsules had shell thickness ratios 0.47 < h/r < 0.62, resulting in
that most of the encapsulated oil was solubilised in the thick shell, as shown in Figure
0 20 40 60 80 100 120 140 160 180 2000
0.1
0.2
0.3
0.4
0.5
0.6
0.7
0.8
0.9
1
Time (min)
Rel
ativ
e re
leas
e
Experimental data
D = 3.2e-013 m2/s
Chapter7 : Determination of Perfume Release Rate and the Shell Permeability of Microcapsules
265
7-3, and the liquid core was not made of pure oil as in the case of MF microcapsules.
Figure 7-8 shows an example of the release profile of such samples (Sample No. 6,
0.47 < h/r < 0.62) in 60% (v/v) glycerol aqueous solution. In addition, the best fits of
the hollow sphere as well as full sphere models are shown for comparison. The model
parameters used in Equation 7.9 and Equation 7.10 are: M !!�N = 1.7 ± 0.2, n =1000,
t�ò¨ = 3600s, M = 28 × 10��m, and the inner radius of microcapsules M !!�N =11.8 × 10��m. The maximum fractional release considered to optimize the diffusivity
of the permeability was 0.8. The experiments were repeated four times for each
sample. More details of the modelling calculations are described in Appendix B,
Section B.2.
The hollow sphere model was found to be able to reproduce satisfactorily the release
profile for the whole release, unlike the full sphere model that can only fit part of the
release data. The mean diffusion coefficient value for PMMA microspheres using the
hollow sphere model is � = 3.0 ± 0.1 × 10���m�s��, and the one for the sphere
model is � = 3.8 ± 0.3 × 10���m�s�� . For 8 ≈ 9�°�º�»»9� = 100.3 , according to
Equation 7.5, the modified permeability values for the PMMA shell using the hollow
sphere model were B ×g)�L� = 1.3 ± 0.4 × 10��&(mPas)&.z�m�s�� and B ×g)� = 2.7 ± 0.9 × 10��&mPam�, which was slightly higher than those obtained
from the 24 h PMMA microcapsules (No.7), which are not significantly different
compared with 1 h PMMA microcapsules (No. 5) and MF microcapsules with the
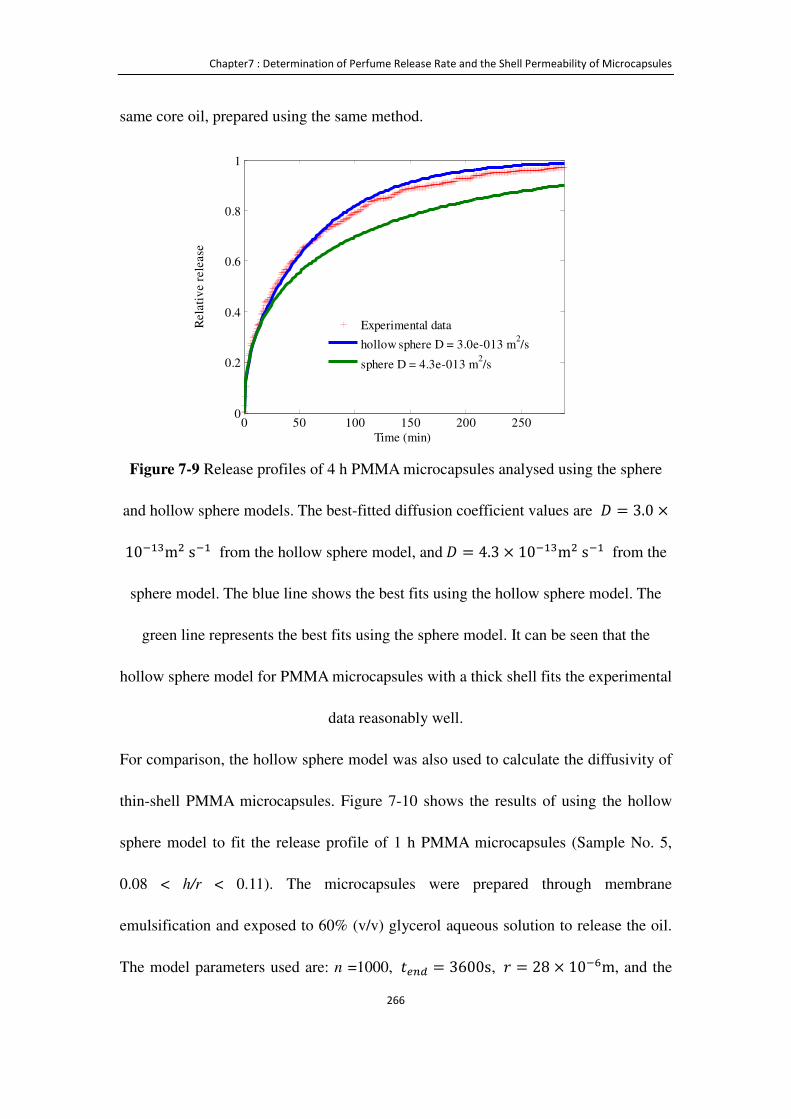
Chapter7 : Determination of Perfume Release Rate and the Shell Permeability of Microcapsules
266
same core oil, prepared using the same method.
Figure 7-9 Release profiles of 4 h PMMA microcapsules analysed using the sphere
and hollow sphere models. The best-fitted diffusion coefficient values are � = 3.0 ×10���m�s�� from the hollow sphere model, and� = 4.3 × 10���m�s�� from the
sphere model. The blue line shows the best fits using the hollow sphere model. The
green line represents the best fits using the sphere model. It can be seen that the
hollow sphere model for PMMA microcapsules with a thick shell fits the experimental
data reasonably well.
For comparison, the hollow sphere model was also used to calculate the diffusivity of
thin-shell PMMA microcapsules. Figure 7-10 shows the results of using the hollow
sphere model to fit the release profile of 1 h PMMA microcapsules (Sample No. 5,
0.08 < h/r < 0.11). The microcapsules were prepared through membrane
emulsification and exposed to 60% (v/v) glycerol aqueous solution to release the oil.
The model parameters used are: n =1000, P�!* = 3600s, M = 28 × 10��m, and the
0 50 100 150 200 2500
0.2
0.4
0.6
0.8
1
Time (min)
Rel
ativ
e re
leas
e
Experimental data
hollow sphere D = 3.0e-013 m2/s
sphere D = 4.3e-013 m2/s

Chapter7 : Determination of Perfume Release Rate and the Shell Permeability of Microcapsules
267
inner radius of microcapsules M !!�N = 21.6 × 10��m . The maximum fractional
release ratio is 0.7. The simulation profile using the hollow sphere model is
inconsistent with the experimental data, but the thin-shell model provides better fitting
for the linear regime at R(t) <0.6, as presented in Figure 7-10. For the PMMA
microcapsules with 0.08 < h/r < 0.11, the thin-shell model is more desirable rather
than the hollow sphere model.
Figure 7-10 Experimental release profile of 1 h PMMA microcapsules (Sample No.5)
tested in 60% (v/v) glycerol aqueous solution. The blue line shows the best fits using
the hollow sphere model. The black solid line represents calculated relative release
using the thin-shell model in the linear regime at R(t) <0.6. The diffusion coefficient
value � = 1.3 × 10��~m�s�� from the thin-shell model; and � = 8.9 ×10���m�s�� from the hollow sphere model.
0%
20%
40%
60%
80%
100%
0.0 0.5 1.0 1.5 2.0 2.5 3.0
Rel
ati
ve
rele
ase
Time (min)
Experimental data
Hollow sphere simulation
Linear calculated rate
D = 8.9x10⁻¹⁵m2 s-1
D = 1.3x10⁻¹⁴m2 s-1
Chapter7 : Determination of Perfume Release Rate and the Shell Permeability of Microcapsules
268
7.5 Conclusions
MF and PMMA microcapsules with different types of core oil and prepared using
different conditions were tested in different co-solvents to release the encapsulated
oils usually close to completion. The oil release was analyzed using three
mathematical models to calculate the shell permeability and diffusion coefficient,
corresponding to the three different kinds of microcapsules formed here:
microcapsules with a thin shell (h/r < 0.11), thick shell ( 0.47 < h/r < 0.62) and full
spheres.
For MF or PMMA microcapsules, the shell permeability mainly depends on the
structure properties of the shell material and solute. It was found out that for a fixed
size, the same shell material and reaction conditions, neither the size distribution of
microcapsules nor core oil or co-solvent which were selected in this study, would be
able to have a manifest impact on the shell permeability. The thin-shell model
reported by Mercadé-Prieto et al. (2012b) is more suitable for the thin-shell
microcapsules within the linear regime, such as the MF microcapsules or the 1 h
PMMA microcapsules in this study. The hollow sphere model reported by Crank
(1975) was used for the release data of 4 h PMMA microcapsules. The sphere model
reported by Crank (1975) is the best to describe the release profiles the 24 h PMMA

Chapter7 : Determination of Perfume Release Rate and the Shell Permeability of Microcapsules
269
microspheres. Using these approaches, the intrinsic mass transfer parameters for the
shell, such as permeability and diffusion coefficient of the oil, have been obtained.
This allows a comparison based on physical shell properties between very different
microcapsules prepared using different formulations, processing conditions and core
perfume oils.
Chapter8 : Overall Conclusions and Recommendations for Future Work
270
Chapter 8 Overall Conclusions and
Recommendations for Future Work
8.1 Overall conclusions
This PhD project aimed to produce various perfume microcapsules with narrow size
and strength distributions using membrane emulsification. The endeavour was to
advance the understanding of encapsulation process of complex functional oils and
to characterize the microcapsules, in order to improve the quality of the
microcapsules in industrial products and to control release of the functional
ingredients to solid surface.
Perfume oils were selected with multifaceted compositions, added into liquid
detergents and expected to be delivered to the fabric surface. A membrane
emulsification method was used to generate uniform sized oil droplets in order to
provide microcapsules with narrow mechanical strength distribution, which may
provide better release performance. A number of factors which impact on size and
size distribution of microcapsules were investigated, including operation conditions,
phase properties and membrane properties. Melamine formaldehyde (MF) was used
as a shell material and microcapsules were produced from an in-situ polymerization
Chapter8 : Overall Conclusions and Recommendations for Future Work
271
method. Subsequently, membrane emulsification was employed on a larger scale; the
encapsulation method with MF shell material was later applied to various core oils.
An environmentally friendly shell material poly-methyl-methacrylate (PMMA) was
employed to produce perfume oil microcapsules instead of MF, in order to remove
completely formaldehyde from the formulation. Various properties of the
microcapsules were investigated, such as the morphology, shell thickness, size and
size distribution and mechanical properties. Innovative methodologies were applied
to the new microcapsules to understand their intrinsic mechanical properties and
shell permeability. Table 8-1 summarizes the encapsulation efficiency, size and size
distribution, mechanical properties and shell permeability of all the microcapsules
made in this study.
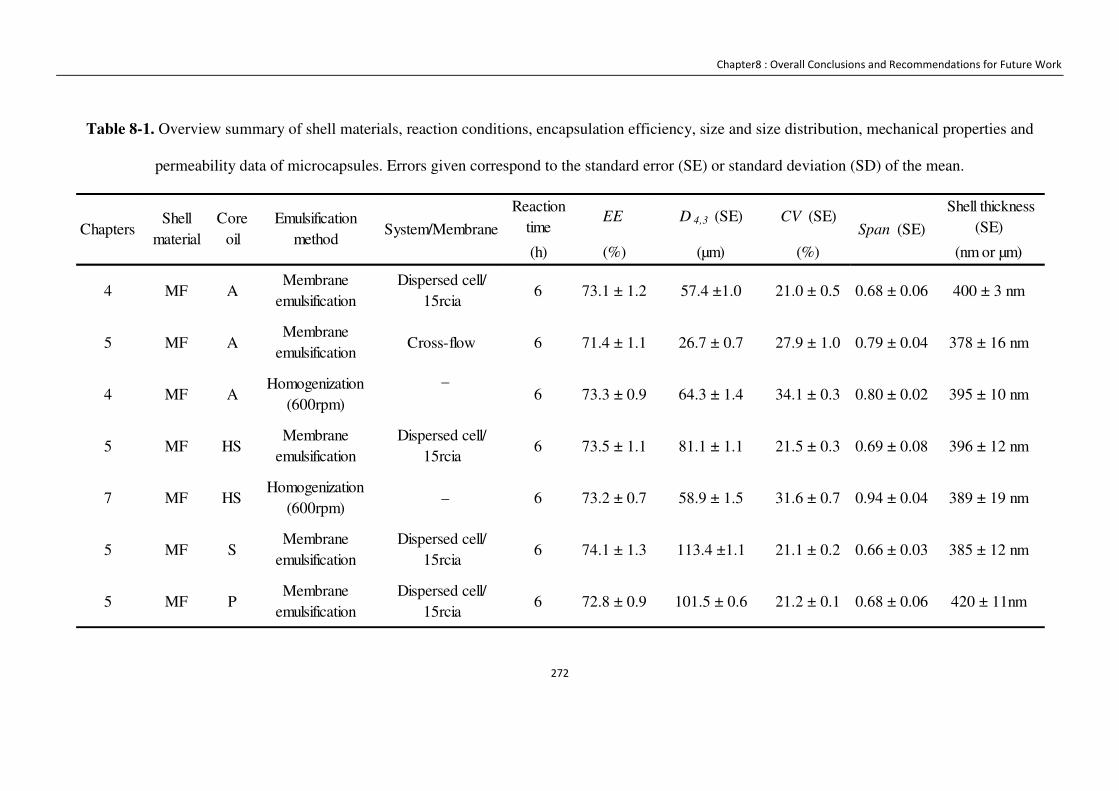
Chapter8 : Overall Conclusions and Recommendations for Future Work
272
Table 8-1. Overview summary of shell materials, reaction conditions, encapsulation efficiency, size and size distribution, mechanical properties and
permeability data of microcapsules. Errors given correspond to the standard error (SE) or standard deviation (SD) of the mean.
Reactiontime
EE D 4,3 (SE) CV (SE) Shell thickness
(SE)
(h) (%) (µm) (%) (nm or µm)
–
4 MF AMembrane
emulsificationDispersed cell/
15rcia6 73.1 ± 1.2 57.4 ±1.0 21.0 ± 0.5
ChaptersShell
materialCore
oilEmulsification
methodSystem/Membrane Span (SE)
5 MF AMembrane
emulsificationCross-flow 6
0.68 ± 0.06 400 ± 3 nm
4 MF AHomogenization
(600rpm)6 73.3 ± 0.9 64.3 ± 1.4 34.1 ± 0.3 0.80 ± 0.02
71.4 ± 1.1 26.7 ± 0.7 27.9 ± 1.0 0.79 ± 0.04 378 ± 16 nm
395 ± 10 nm
5 MF HSMembrane
emulsificationDispersed cell/
15rcia
7 MF HSHomogenization
(600rpm) – 6 73.2 ± 0.7 58.9 ± 1.5 31.6 ± 0.7
6 73.5 ± 1.1 81.1 ± 1.1 21.5 ± 0.3 0.69 ± 0.08 396 ± 12 nm
0.94 ± 0.04 389 ± 19 nm
5 MF SMembrane
emulsificationDispersed cell/
15rcia6 74.1 ± 1.3 113.4 ±1.1
420 ± 11nm
21.1 ± 0.2 0.66 ± 0.03 385 ± 12 nm
5 MF PMembrane
emulsificationDispersed cell/
15rcia6 72.8 ± 0.9 101.5 ± 0.6 21.2 ± 0.1 0.68 ± 0.06
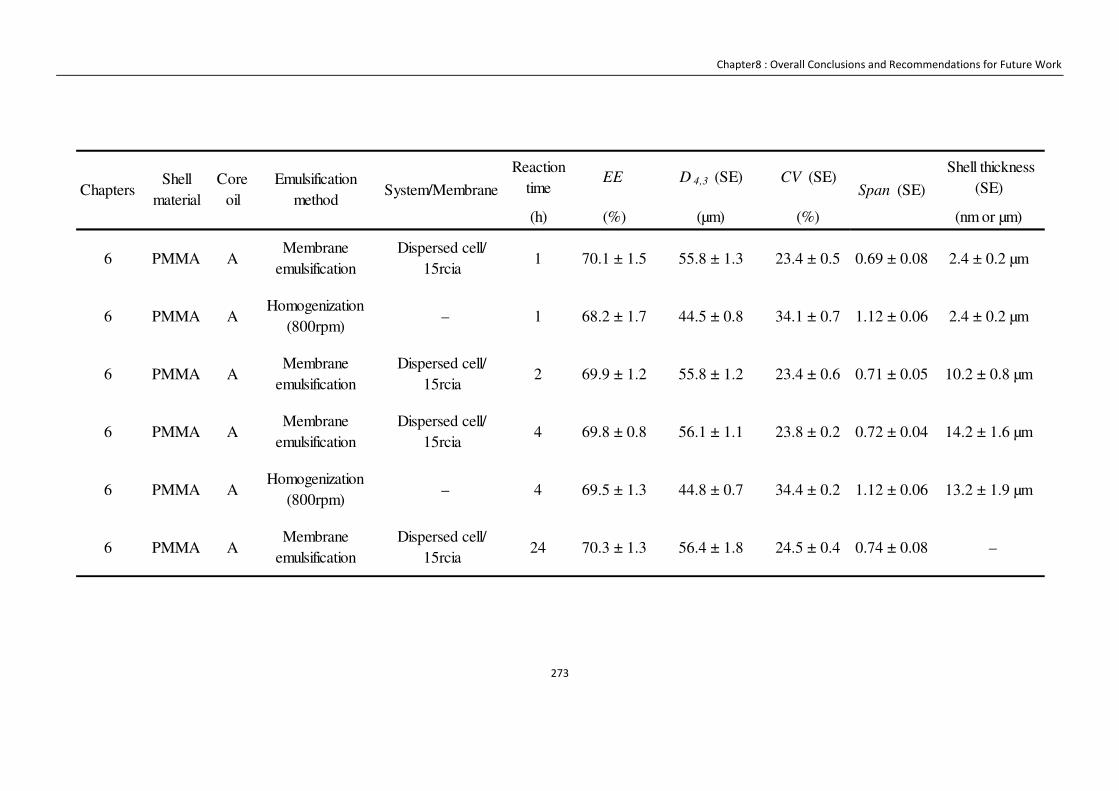
Chapter8 : Overall Conclusions and Recommendations for Future Work
273
Reactiontime
EE D 4,3 (SE) CV (SE) Shell thickness
(SE)
(h) (%) (µm) (%) (nm or µm)
ChaptersShell
materialCore
oilEmulsification
methodSystem/Membrane Span (SE)
6 PMMA AMembrane
emulsificationDispersed cell/
15rcia
6 PMMA AHomogenization
(800rpm) – 1 68.2 ± 1.7 44.5 ± 0.8 34.1 ± 0.7
1 70.1 ± 1.5 55.8 ± 1.3 23.4 ± 0.5 0.69 ± 0.08 2.4 ± 0.2 µm
1.12 ± 0.06 2.4 ± 0.2 µm
6 PMMA AMembrane
emulsificationDispersed cell/
15rcia2 69.9 ± 1.2 55.8 ± 1.2 23.4 ± 0.6 0.71 ± 0.05 10.2 ± 0.8 µm
6 PMMA AMembrane
emulsificationDispersed cell/
15rcia4 69.8 ± 0.8
6 PMMA AHomogenization
(800rpm) – 4 69.5 ± 1.3
56.1 ± 1.1 23.8 ± 0.2 0.72 ± 0.04 14.2 ± 1.6 µm
6 PMMA AMembrane
emulsificationDispersed cell/
15rcia24 70.3 ± 1.3 56.4 ± 1.8
44.8 ± 0.7
24.5 ± 0.4 0.74 ± 0.08 –
34.4 ± 0.2 1.12 ± 0.06 13.2 ± 1.9 µm
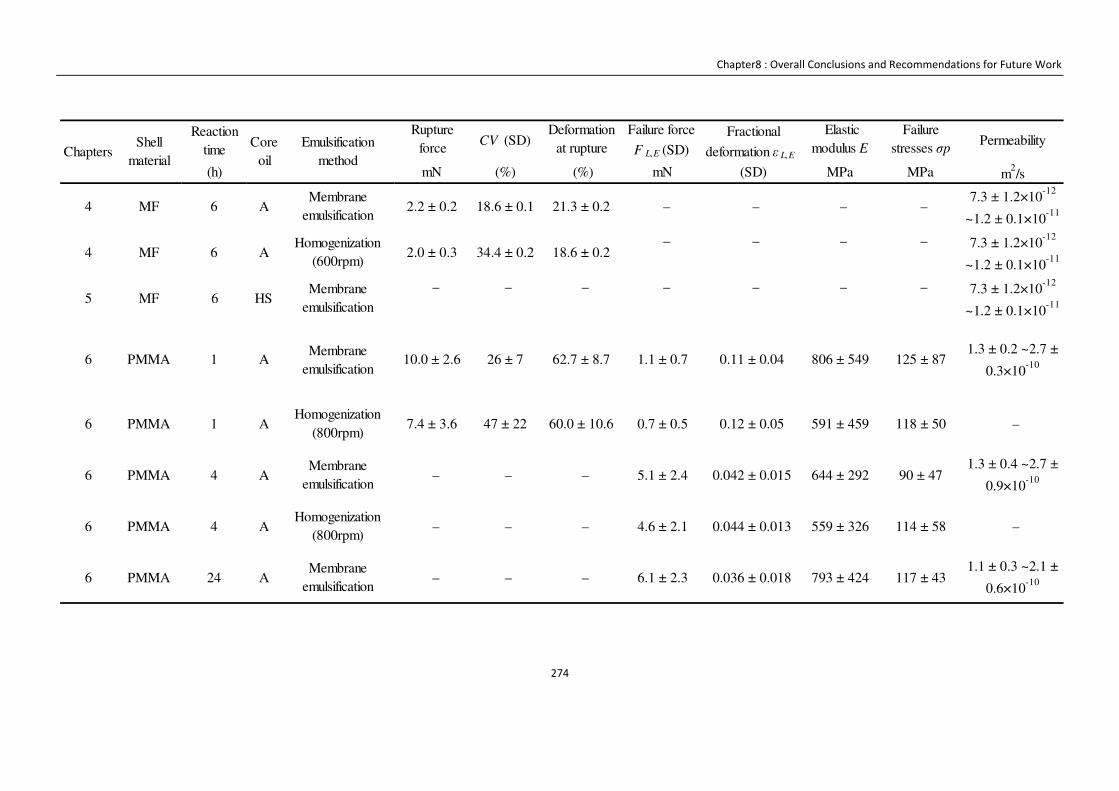
Chapter8 : Overall Conclusions and Recommendations for Future Work
274
Reactiontime
Ruptureforce
(Standard
CV (SD)Deformation
at rupture
(SD)
Failure force
F L,E (SD)
Elasticmodulus E
(SD)
Failurestresses σp
(SD)
Permeability
(h) mN (%) (%) mN MPa MPa m2/s
– – – –
– – – – – – –
–
0.12 ± 0.05 591 ± 459 118 ± 50 –
559 ± 326 114 ± 580.044 ± 0.013
644 ± 292 90 ± 471.3 ± 0.4 ~2.7 ±
0.9×10⁻¹⁰
117 ± 431.1 ± 0.3 ~2.1 ±
0.6×10⁻¹⁰
10.0 ± 2.6 26 ± 7 62.7 ± 8.7 1.1 ± 0.7 0.11 ± 0.04 806 ± 549 125 ± 871.3 ± 0.2 ~2.7 ±
0.3×10⁻¹⁰
6.1 ± 2.3 0.036 ± 0.018 793 ± 424 – – –6 PMMA AMembrane
emulsification
4.6 ± 2.16 PMMA AHomogenization
(800rpm) – – –4
24
5.1 ± 2.4 0.042 ± 0.0156 PMMA AMembrane
emulsification – – –4
47 ± 22 60.0 ± 10.6 0.7 ± 0.5
6 PMMA AMembrane
emulsification
6 PMMA AHomogenization
(800rpm)7.4 ± 3.6
1
1
7.3 ± 1.2×10⁻¹²
~1.2 ± 0.1×10⁻¹¹
2.0 ± 0.3 34.4 ± 0.2 18.6 ± 0.27.3 ± 1.2×10
-12
~1.2 ± 0.1×10⁻¹¹
5 MF HSMembrane
emulsification
4 MF AHomogenization
(600rpm)6
6
– –7.3 ± 1.2×10
-12
~1.2 ± 0.1×10-112.2 ± 0.2 18.6 ± 0.1 21.3 ± 0.2 –
Fractional
deformation ε L,E
(SD)
4 MF AMembrane
emulsification
ChaptersShell
materialCore
oilEmulsification
method
–6
Chapter8 : Overall Conclusions and Recommendations for Future Work
275
8.1.1 Membrane emulsification process
The size and size distribution of droplets were studied with a membrane
emulsification process based on using a dispersion cell. They were impacted by
operation conditions, such as dispersed phase flux and impeller agitation speed,
membrane properties, including membrane surface hydrophilicity and membrane
configurations as well as physical properties of the two liquid phases, such as
viscosity and interfacial tension. Among these factors, operation conditions provided
the biggest influence on the sizes of droplets and their uniformity. The best condition
to minimise the size distribution has been found to be an agitation speed of 1080 rpm
and dispersed phase flux of 1.6×10⁻⁵ m s-1 for the conditions investigated. The
experimental data were compared with the predictions of a model reported in the
literature, which show the same trend as the existing model.
A pilot plant-scale cross-flow membrane system was used for scale up of the process
of membrane emulsification and a homogenizer was also used for comparison as a
common manufacturing device. Compared with the cross-flow membrane system, the
dispersion cell system produced MF microcapsules with a narrower size distribution.
This is attributed to the different membrane systems used. Nevertheless, the
oil-aqueous MF precondensate produced in the pilot plant-scale membrane system
was found stable for 72 h, which demonstrates that it is possible to scale up the
process of membrane emulsification to produce MF microcapsules.

Chapter8 : Overall Conclusions and Recommendations for Future Work
276
8.1.2 Preparation of PMMA microcapsules
The environmental friendly shell material PMMA was used for the first time to
generate perfume microcapsules with a narrow size distribution in this study.
Oil/water/MMA emulsions were produced through both a homogenizer and
dispersion cell membrane system. The CV values of PMMA microcapsules generated
through the membrane system with different reaction times are all below 25%,
significantly smaller than those produced by the homogenizer, which are around 35%.
8.1.3 Novel methodology development
8.1.3.1 Determination of shell thickness using CLSM
In this study, the shell thickness of PMMA microcapsules was determined using
CLSM and fluorescent dyes. It is a fast and low-cost method compared with the
traditional TEM approach extensively used for MF microcapsules. This methodology
was developed to solve the problem with PMMA microcapsules that could not be
analyzed with TEM, since PMMA has similar properties to the poly acrylic resin used
for TEM sample preparation. The shell thickness of PMMA microcapsules increased
with the reaction time until 24 h when the core-shell capsules became homogeneous
spheres.
Chapter8 : Overall Conclusions and Recommendations for Future Work
277
8.1.3.2 Investigation of intrinsic mechanical properties of microcapsules with
different shell thickness
PMMA microcapsules with different h/r values were prepared with different reaction
times: thin-shell microcapsules (h/r < 0.11) with 1 h reaction time, thick-shell ( 0.47 <
h/r < 0.62) with 4 h and full spheres with 24 h. These microcapsules had different
force-displacement profiles obtained from experiments based on compression of
single microcapsules by micromanipulation. The intrinsic mechanical properties of
PMMA microcapsules with different shell thickness was obtained for the first time
from the analysis of FEM simulations and micromanipulation data. The elastic
modulus and the rupture stress, determined with different models according to h/r: the
thin-shell model for thin-shell (h/r < 0.11) microcapsules, the linear and power law
models for thick-shell ( 0.47 < h/r < 0.62) microcapsules, and the power law model
for full spheres. The intrinsic mechanical properties of PMMA microcapsules were
found constant with the polymerization reaction time despite large variations in h.
This novel approach could also be used in the future to determine the intrinsic
mechanical properties of other microcapsules with a thick shell.
Chapter8 : Overall Conclusions and Recommendations for Future Work
278
8.1.3.3 Investigation of intrinsic mass transfer parameters for microcapsules with
different shell material and thickness
The encapsulated oil release from microcapsules with different shell materials,
different types of core oil and prepared through different processes was studied using
a novel methodology. An aqueous solution in which the core oil has a high solubility
was selected as a "co-solvent" for the release the perfume oils, Experiments were
performed under continuous operation, allowing observation of the whole release
profiles in its completeness, and furthermore allowing the determination of the
intrinsic mass transfer parameters. Three mathematical models were used to calculate
the shell permeability and diffusion coefficient, corresponding to the three different
kinds of microcapsules formed here: the thin-shell model for thin-shell (h/r < 0.11)
microcapsules within the linear regime, the hollow sphere model for thick-shell ( 0.47
< h/r < 0.62) microcapsules and the sphere model for full spheres. This allows a
comparison based on intrinsic mass transfer parameters, which are mainly determined
by the shell structure and the core oil, between very different microcapsules prepared
using different formulations, processing conditions and core perfume oils.
Chapter8 : Overall Conclusions and Recommendations for Future Work
279
8.2 Future work
In the work presented in Chapters 4 and 6, MF as well as PMMA microcapsules with
narrow size and strength distributions were prepared with a dispersion cell membrane
system. The best CV value among all the samples was ~20%. To produce
microcapsules with even narrower size distribution, micro-channel (Vladisavljevic et
al., 2008) or flow-focusing (Takeuchi et al., 2005) techniques could be applied in the
future.
In the study presented in Chapter 5, a cross-flow membrane system was used for
scaling up to pilot plant-scale. Further studies could include scale up of other
membrane systems, including the dispersion cell membrane system and recently
developed membrane systems, the oscillating system and the pulsed (oscillatory) flow
membrane system (Holdich et al., 2010, Piacentini et al., 2013), which may have a
great potential for using in industrial manufacture of microcapsules.
Different models to describe droplet formation at the membrane surface were
reviewed in Chapter 2, with " Model D" used to analyse the experimental data in this
study. However, this model does not consider the effect of dispersed phase flux on
size and size distribution of emulsion droplets. A technique to observe and determine
the single droplet formation on the membrane surface was mentioned in literature,
Chapter8 : Overall Conclusions and Recommendations for Future Work
280
which was used in a cross-flow membrane system (Peng and Williams, 1998b). This
technique may determine the whole process of droplet formation on the membrane
surface online. Also, the percentage of active pores during the membrane
emulsification stage could be determined. It can be extremely helpful for determining
the duration of the detachment period, which can be used to calculate a real volume of
a droplet according to Equation 5.2 (Peng and Williams, 1998).
ST = SU + Ú × P* (Equation 5.2)
where ST is the final volume of a droplet (m3);SU is the initial volume of the droplet
(m3); Q is the actual flow rate of the dispersed phase through the pore (m3 s-1) andP*
is the duration of detachment period (s).
PMMA microcapsules produced in this study had a narrow size distribution.
However, their shell permeability is slightly higher than that of MF microcapsules,
especially for the 1 h PMMA microcapsules. In the future, organic or inorganic
material could be used together with PMMA to make double shell microcapsules to
reduce the shell permeability, including silica (Hu et al., 2004) , zinc oxide (Tang et
al., 2006), and methacrylic acid (MAA) (Tan et al., 2009).
In this study, PMMA microcapsule shells was saturated with core perfume oil, which
could influence their shell material mechanical properties. In order to compare
PMMA shells with macroscopic PMMA, PMMA beads without perfume oil could be
Chapter8 : Overall Conclusions and Recommendations for Future Work
281
prepared and determined using the micromanipulation rig. The intrinsic mechanical
properties of macroscopic PMMA could then be determined using the methodology
mentioned in Chapter 6, section 6.2.4.
In this study, release behaviours of PMMA microcapsules were studied, PMMA shell
permeability and diffusivity were determined. Further research could focus on finding
how formulation and reaction conditions affect the properties of microcapsules in
order to reduce the oil release rate, including determination the release rate is sensitive
to size and size distribution of PMMA microcapsules.
In this study, several novel approaches were applied to MF and PMMA microcapsules
with different shell thickness, such as using CLSM to determine the shell thickness of
microcapsules labelled with a florescence dye, using FEM simulation and
micromanipulation measurements to determine the intrinsic mechanical properties of
microcapsules, using a co-solvent and UV-Vis spectrophotometer to measure perfume
oil release from microcapsules continuously in order determine intrinsic mass transfer
parameters. These methodologies could be applied to microcapsules with various core
and shell materials. They could provide further evidence of improvement in the
quality of microcapsules by new formulation and processing conditions. For example,
big molecular core material could be used in MF microcapsules to determine the
impact of solute on relative permeability.
Chapter8 : Overall Conclusions and Recommendations for Future Work
282
In this study, the properties of microcapsules were extensively studied, from their size
and strength distributions to their intrinsic mechanical properties. However, further
study could still be carried out on the release behaviour of microcapsules with
external force. Some literature work determined the deposition of perfume
microcapsules on fabric surface and their abrasion by friction (Mercadé-Prieto et al.,
2012b). To determine the release behaviour of microcapsules under friction force
through a tribometer can be very interesting, since it is exact condition under which
perfume microcapsules are expected to rupture and release oil.
Appendix A
283
Appendix A
Finite Element Modelling (FEM) of the compression of
thick-shell microcapsules
The parallel compression of elastic microcapsules with thick shells was studied with
finite element modelling (FEM) using Abaqus® 6.5. The top half of a core-shell
sphere was simulated in 3D using S8R shell elements (about 38k elements) for thin
shells (h/r < 10%), and C3D8R hexagonal solid elements (about 50-100k) for thicker
shells. A rigid parallel plate was considered as the compressing probe, with
frictionless contact with the shell. The capsule shell was assumed to be
incompressible (Poisson ratio 0.5) and was modelled as a linear elastic material.
Because only small compression displacements were simulated (�D < 0.12), the
effect of the liquid core was found to be insignificant both from previous work (Fery
and Weinkamer, 2007, Taber, 1982) and preliminary finite element simulations of 2D
shells with and without a liquid core, see Figure A1.Therefore, the liquid core was not
considered in further finite element modelling.

Appendix A
284
Figure A1. Simulation of 2D shells with and without a liquid core based on FEA (h/r
= 0.15).
A.1 Estimation of the elastic modulus
The key parameter varied during the simulations was the shell thickness h to the
capsule radius r ratio (ℎ M⁄ ). At low ℎ M⁄ values, the dimensionless parameter �/àMℎ
increases linearly with the displacement, εm ~0.5 ℎ M⁄ , as shown in Figure A2 (a). The
linear slope m is calculated using
mmεErh
F= (Equation A1)
0
0.01
0.02
0.03
0.04
0.05
0.06
0 0.02 0.04 0.06 0.08 0.1 0.12
F/E
rh
Fractional deformation εεεεm
2D Empty
2D Liquid
Appendix A
285
The linearity of Equation A1 at small deformations is caused by the relevance of shell
bending during the compression (Dubreuil et al., 2003, Hutchinson, 2004). However,
at large ℎ M⁄ values, for example at ℎ M⁄ = 1 when the microcapsule becomes a full
homogenous sphere without a core, there is no or limited shell bending but
compressive deformation. Under these conditions, the classic Hertz equation of a
sphere between two parallel plates applies for small deformations (typically εm < 0.1)
(Liu et al., 1998).
( )5.1
22 13
4m
Er
Fε
ν−= (Equation A2)
where ν is Poisson ratio. Thus, it is assumed that at large ℎ M⁄ values the compression
force increases in a power law manner with the fractional deformation, such as
b
maEr
Fε=
2 (Equation A3)
where a and b are fitting parameters. Hence, between low ℎ M⁄ (<20%) and full
sphere behaviour (ℎ M⁄ ≈ 1) there is an intermediate regime whereby the force
increases with εm in a power law manner with b between ~1 (linear behaviour) and
~1.5 (Equ. A2); an example of the FEM results for ℎ M⁄ = 44% is given in Figure
A2 (b).
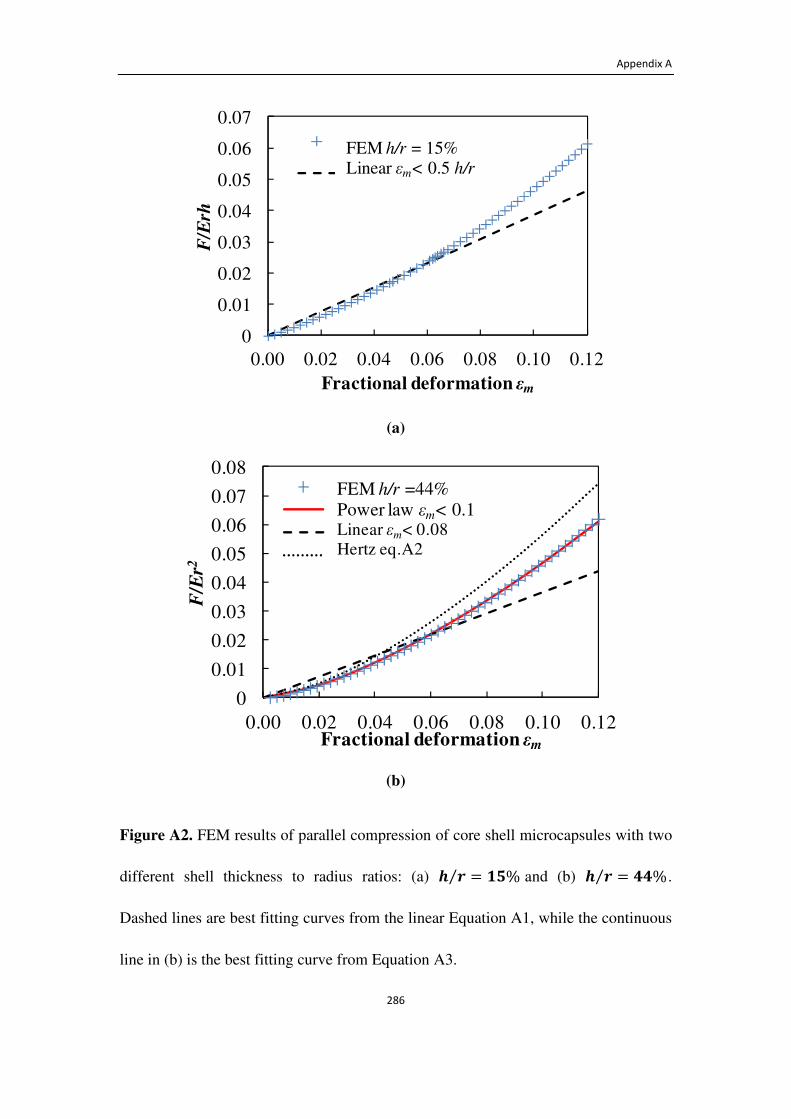
Appendix A
286
(a)
(b)
Figure A2. FEM results of parallel compression of core shell microcapsules with two
different shell thickness to radius ratios: (a) Ü Ý = �%⁄ and (b) Ü Ý = %⁄ .
Dashed lines are best fitting curves from the linear Equation A1, while the continuous
line in (b) is the best fitting curve from Equation A3.
0
0.01
0.02
0.03
0.04
0.05
0.06
0.07
0.00 0.02 0.04 0.06 0.08 0.10 0.12
F/E
rh
Fractional deformation εm
FEM h/r = 15%
Linear ε < 0.5h/r
FEM h/r = 15%Linear εm< 0.5 h/r
0
0.01
0.02
0.03
0.04
0.05
0.06
0.07
0.08
0.00 0.02 0.04 0.06 0.08 0.10 0.12
F/E
r2
Fractional deformation εm
FEM h/r = 44%Power law ε<0.1Linear ε<0.08Hertz eq. A2
FEM h/r =44%Power law εm< 0.1Linear εm< 0.08Hertz eq.A2
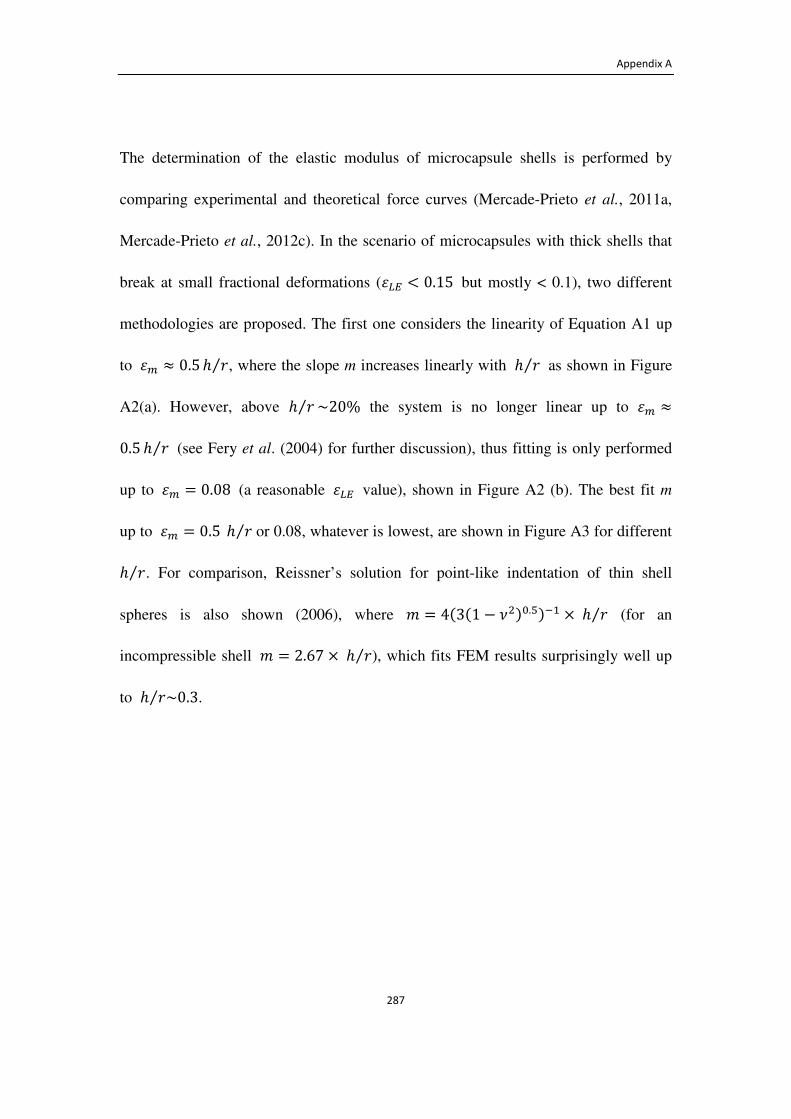
Appendix A
287
The determination of the elastic modulus of microcapsule shells is performed by
comparing experimental and theoretical force curves (Mercade-Prieto et al., 2011a,
Mercade-Prieto et al., 2012c). In the scenario of microcapsules with thick shells that
break at small fractional deformations (��� < 0.15 but mostly < 0.1), two different
methodologies are proposed. The first one considers the linearity of Equation A1 up
to �D ≈ 0.5 ℎ M⁄ , where the slope m increases linearly with ℎ M⁄ as shown in Figure
A2(a). However, above ℎ M⁄ ~20% the system is no longer linear up to �D ≈0.5 ℎ M⁄ (see Fery et al. (2004) for further discussion), thus fitting is only performed
up to �D = 0.08 (a reasonable ��� value), shown in Figure A2 (b). The best fit m
up to �D = 0.5 ℎ M⁄ or 0.08, whatever is lowest, are shown in Figure A3 for different
ℎ M⁄ . For comparison, Reissner’s solution for point-like indentation of thin shell
spheres is also shown (2006), where Å = 4(3(1 − ��)&.�)�� ×ℎ M⁄ (for an
incompressible shell Å = 2.67 ×ℎ M⁄ ), which fits FEM results surprisingly well up
to ℎ M~0.3⁄ .
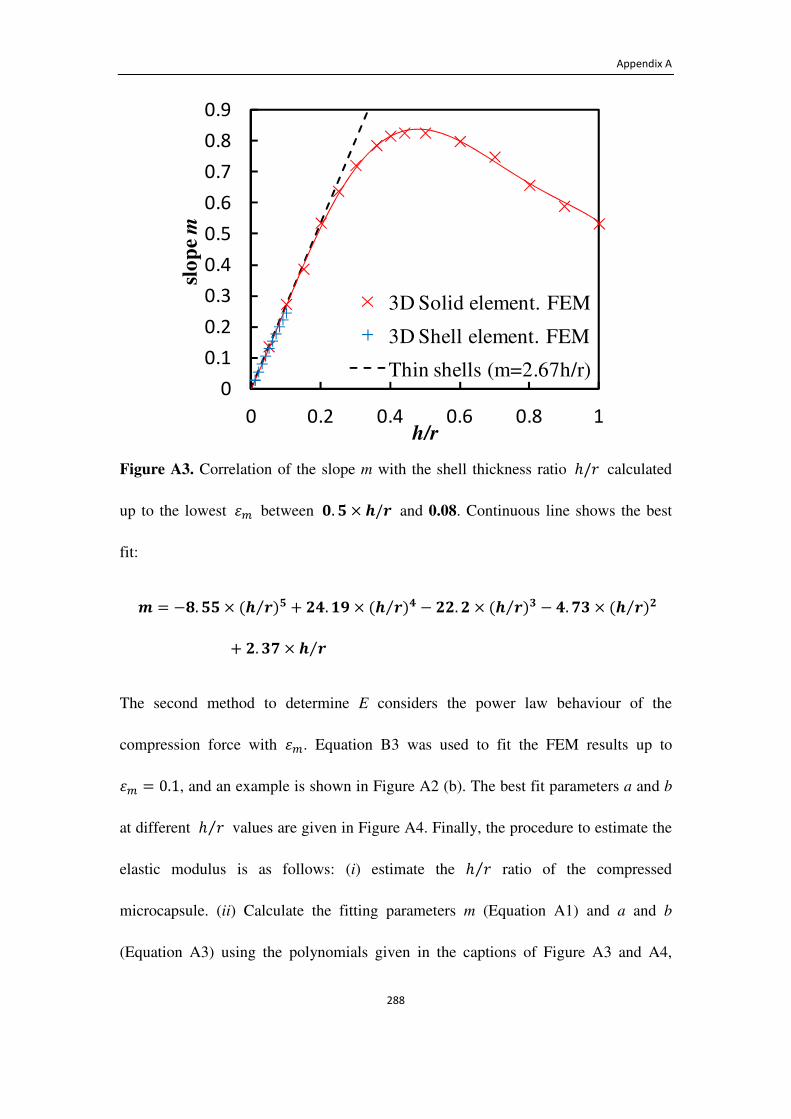
Appendix A
288
Figure A3. Correlation of the slope m with the shell thickness ratio ℎ/M calculated
up to the lowest �D between �. × Ü/Ý and 0.08. Continuous line shows the best
fit:
= −�. × (Ü Ý⁄ ) + �.�� × (Ü Ý⁄ ) − ��.� × (Ü Ý⁄ )� − .�� × (Ü Ý⁄ )�+ �.�� × Ü Ý⁄
The second method to determine E considers the power law behaviour of the
compression force with �D. Equation B3 was used to fit the FEM results up to
�D = 0.1, and an example is shown in Figure A2 (b). The best fit parameters a and b
at different ℎ M⁄ values are given in Figure A4. Finally, the procedure to estimate the
elastic modulus is as follows: (i) estimate the ℎ M⁄ ratio of the compressed
microcapsule. (ii) Calculate the fitting parameters m (Equation A1) and a and b
(Equation A3) using the polynomials given in the captions of Figure A3 and A4,
0
0.1
0.2
0.3
0.4
0.5
0.6
0.7
0.8
0.9
0 0.2 0.4 0.6 0.8 1
slo
pe
m
h/r
3D Solid element. FEM
3D Shell element. FEM
Thin shells (m=2.67h/r)
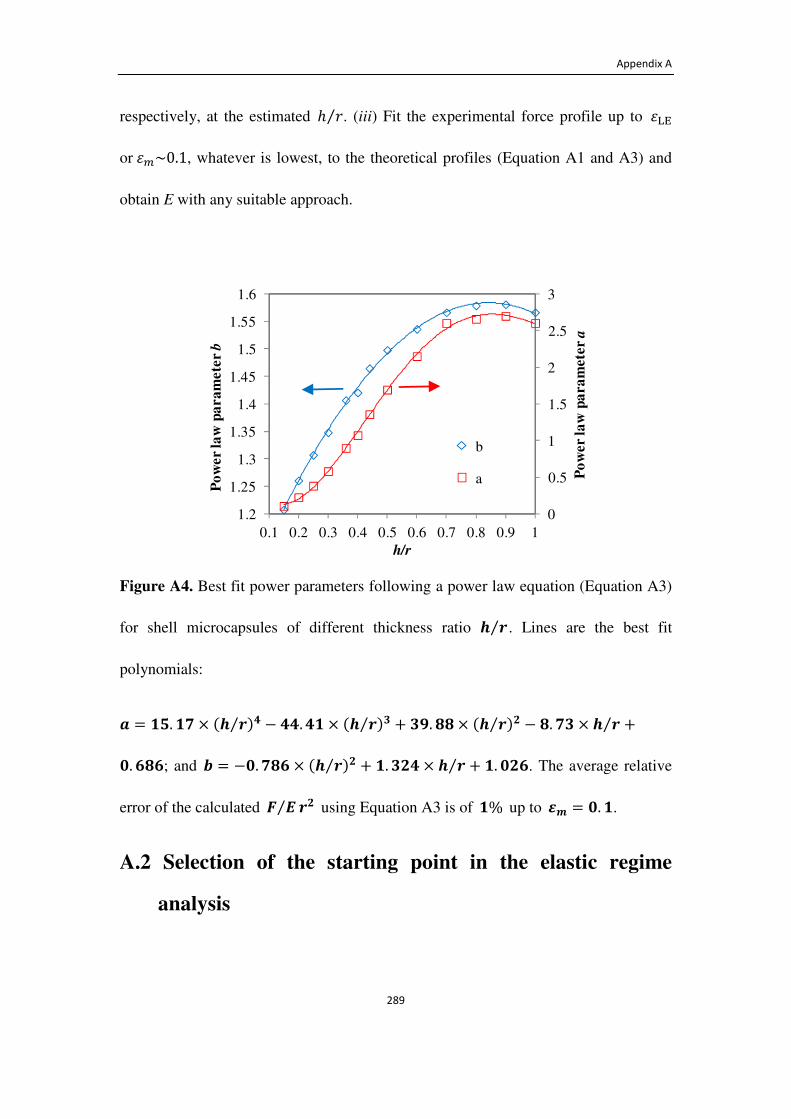
Appendix A
289
respectively, at the estimatedℎ M⁄ . (iii) Fit the experimental force profile up to ���
or�D~0.1, whatever is lowest, to the theoretical profiles (Equation A1 and A3) and
obtain E with any suitable approach.
Figure A4. Best fit power parameters following a power law equation (Equation A3)
for shell microcapsules of different thickness ratio Ü Ý⁄ . Lines are the best fit
polynomials:
� = �.�� × (Ü Ý⁄ ) − .� × (Ü Ý⁄ )� + ��.��× (Ü Ý⁄ )� − �.�� × Ü Ý⁄ +�.���; and � = −�.��� × (Ü Ý⁄ )� + �.��× Ü Ý⁄ + �.���. The average relative
error of the calculated � �⁄ Ý� using Equation A3 is of �% up to � = �.�.
A.2 Selection of the starting point in the elastic regime
analysis
0
0.5
1
1.5
2
2.5
3
1.2
1.25
1.3
1.35
1.4
1.45
1.5
1.55
1.6
0.1 0.2 0.3 0.4 0.5 0.6 0.7 0.8 0.9 1
Po
wer la
w p
ara
mete
r a
Po
wer la
w p
ara
mete
r b
h/r
b
a
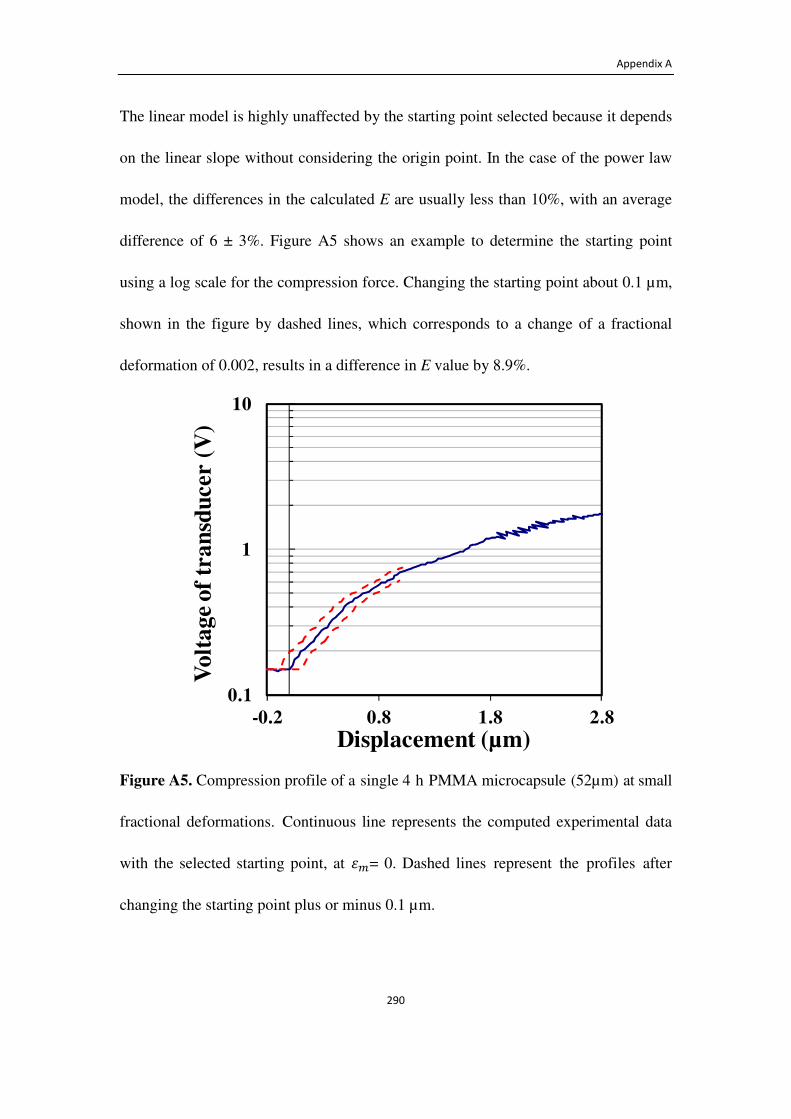
Appendix A
290
The linear model is highly unaffected by the starting point selected because it depends
on the linear slope without considering the origin point. In the case of the power law
model, the differences in the calculated E are usually less than 10%, with an average
difference of 6 ± 3%. Figure A5 shows an example to determine the starting point
using a log scale for the compression force. Changing the starting point about 0.1 µm,
shown in the figure by dashed lines, which corresponds to a change of a fractional
deformation of 0.002, results in a difference in E value by 8.9%.
Figure A5. Compression profile of a single 4 h PMMA microcapsule (52µm) at small
fractional deformations. Continuous line represents the computed experimental data
with the selected starting point, at �D= 0. Dashed lines represent the profiles after
changing the starting point plus or minus 0.1 µm.
0.1
1
10
-0.2 0.8 1.8 2.8
Vo
lta
ge o
f tr
an
sdu
cer (
V)
Displacement (µm)
Appendix A
291
A.3 Estimation of the rupture stress
When thick-shell microcapsules start rupturing under compression at very small
���, the largest stressed area occurs in the shell area under the compressing planes, as
discussed by Carlisle et al. (2007) for carbon micro-balloons. Figure A6 shows the 3D
FEM distribution of the principal stress m, normalized with E at a fractional
deformation �D of 0.06, around the ��� of the PMMA microcapsules. The rupture
stress m. is found from such FEM results considering that rupture will start to occur
at ��� at the position where the stress is largest (Mercade-Prieto et al., 2012a). It is
assumed, therefore, that the shell material exhibits fully elastic behaviour until rupture.
The highest principal stresses m, can be of tensile (positive values) or compressive
(negative) origin, which are found from Figure A6(a) and (b) respectively. The
compressive stresses (negative m, ) at the outer part of the shell are larger in
magnitude than the tensile stresses of the inner part of the shell in contact with the
liquid core.
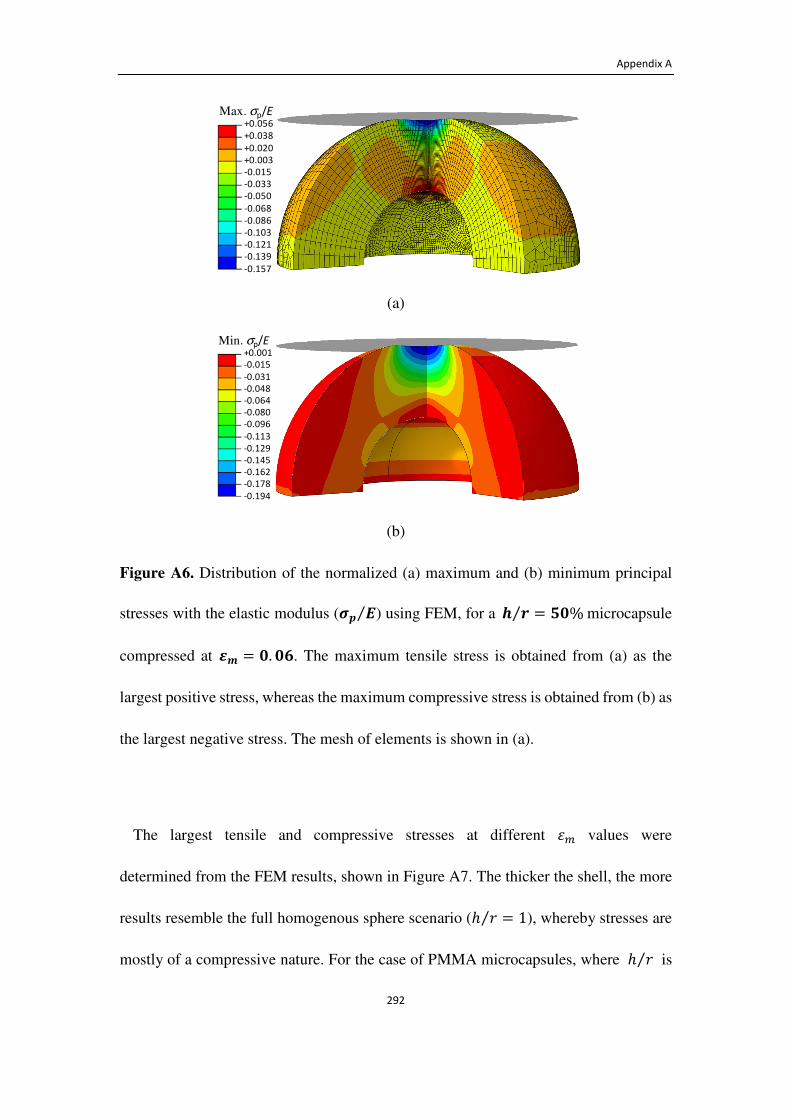
Appendix A
292
(a)
(b)
Figure A6. Distribution of the normalized (a) maximum and (b) minimum principal
stresses with the elastic modulus (�� �⁄ ) using FEM, for a Ü Ý⁄ = �%microcapsule
compressed at � = �.��. The maximum tensile stress is obtained from (a) as the
largest positive stress, whereas the maximum compressive stress is obtained from (b) as
the largest negative stress. The mesh of elements is shown in (a).
The largest tensile and compressive stresses at different �D values were
determined from the FEM results, shown in Figure A7. The thicker the shell, the more
results resemble the full homogenous sphere scenario (ℎ M⁄ = 1), whereby stresses are
mostly of a compressive nature. For the case of PMMA microcapsules, where ℎ M⁄ is
+0.056
+0.038
+0.020
+0.003
-0.015
-0.033
-0.050
-0.068
-0.086
-0.103
-0.121
-0.139
-0.157
Max. σp/E
+0.001
-0.015
-0.031
-0.048
-0.064
-0.080
-0.096
-0.113
-0.129
-0.145
-0.162
-0.178
-0.194
Min. σp/E
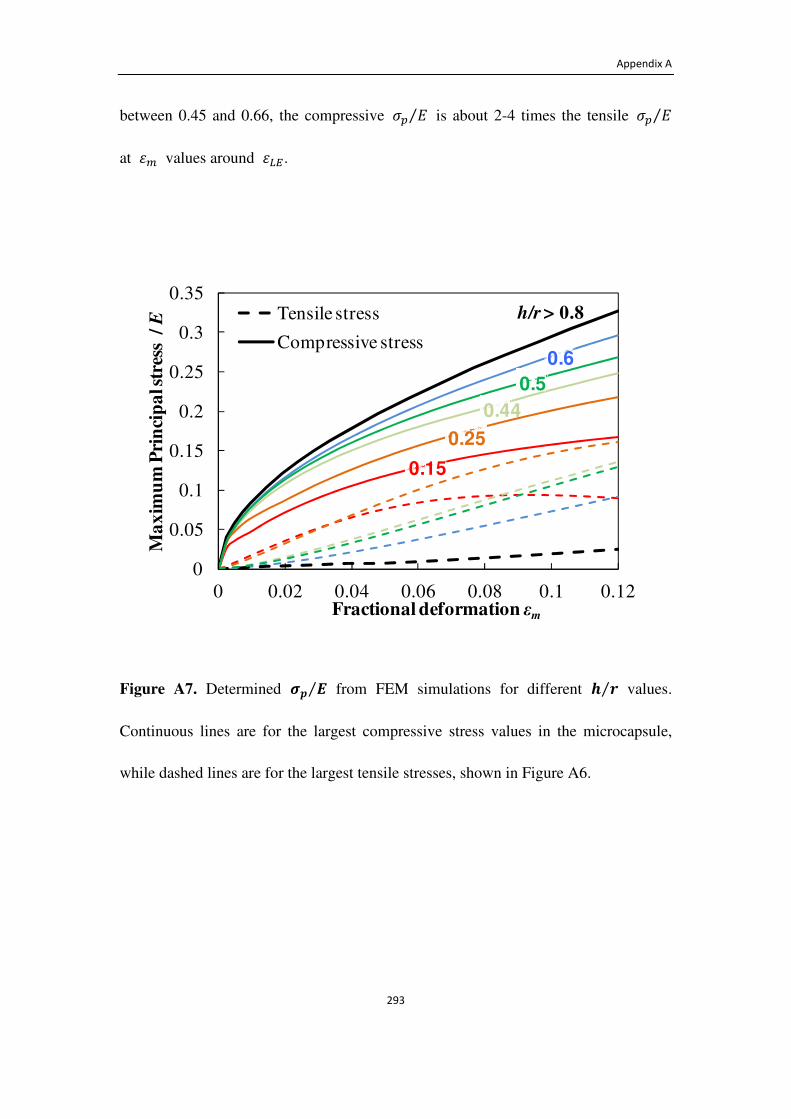
Appendix A
293
between 0.45 and 0.66, the compressive m, à⁄ is about 2-4 times the tensile m, à⁄
at �D values around ���.
Figure A7. Determined �� �⁄ from FEM simulations for different Ü Ý⁄ values.
Continuous lines are for the largest compressive stress values in the microcapsule,
while dashed lines are for the largest tensile stresses, shown in Figure A6.
0
0.05
0.1
0.15
0.2
0.25
0.3
0.35
0 0.02 0.04 0.06 0.08 0.1 0.12
Ma
xim
um
Pri
nci
pa
l str
ess
/ E
Fractional deformation εm
Tensile stress
Compressive stress0.6
0.5
0.44
0.25
0.15
h/r > 0.8
Appendix B
294
Appendix B
MATLAB code for calculating shell permeability for PMMA
microcapsules
B.1 Oil release from a microsphere
The calculation of shell permeability for a 24 PMMA microsphere was based on
Equation 7.11, which was described in Section 7.3.2.
9<=>9<=>∞ = 1 − ∑ �αðw�Jαðx
ñJñαðJwαðI;xL∞òì� exp �− õI;Löð
ZL �(Equation 7.9)
where αZ = S S[⁄ 8, represents the ratio of oil released to that remaining in the
particle at equilibrium, and H! are the non-zero positive roots of the transcendent
equation
H! = �I;�JKI;L.
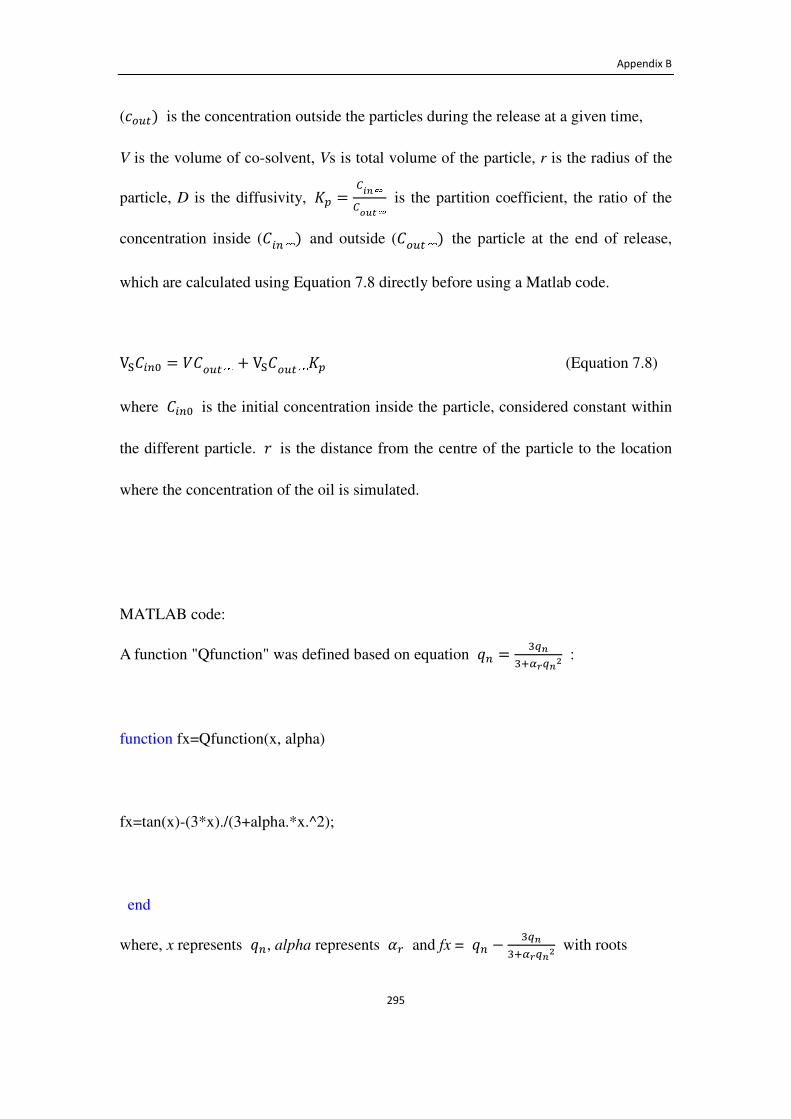
Appendix B
295
(Â$�%) is the concentration outside the particles during the release at a given time,
V is the volume of co-solvent, Vs is total volume of the particle, r is the radius of the
particle, D is the diffusivity, 8, =9:;∞9<=>∞ is the partition coefficient, the ratio of the
concentration inside (� !∞) and outside (�$�%∞) the particle at the end of release,
which are calculated using Equation 7.8 directly before using a Matlab code.
Vï� !& = S�$�%∞ + Vï�$�%∞8, (Equation 7.8)
where � !& is the initial concentration inside the particle, considered constant within
the different particle. M is the distance from the centre of the particle to the location
where the concentration of the oil is simulated.
MATLAB code:
A function "Qfunction" was defined based on equation H! = �I;�JK�I;L :
function fx=Qfunction(x, alpha)
fx=tan(x)-(3*x)./(3+alpha.*x.^2);
end
where, x represents H!, alpha represents ÷N and fx = H! − �I;�JK�I;L with roots
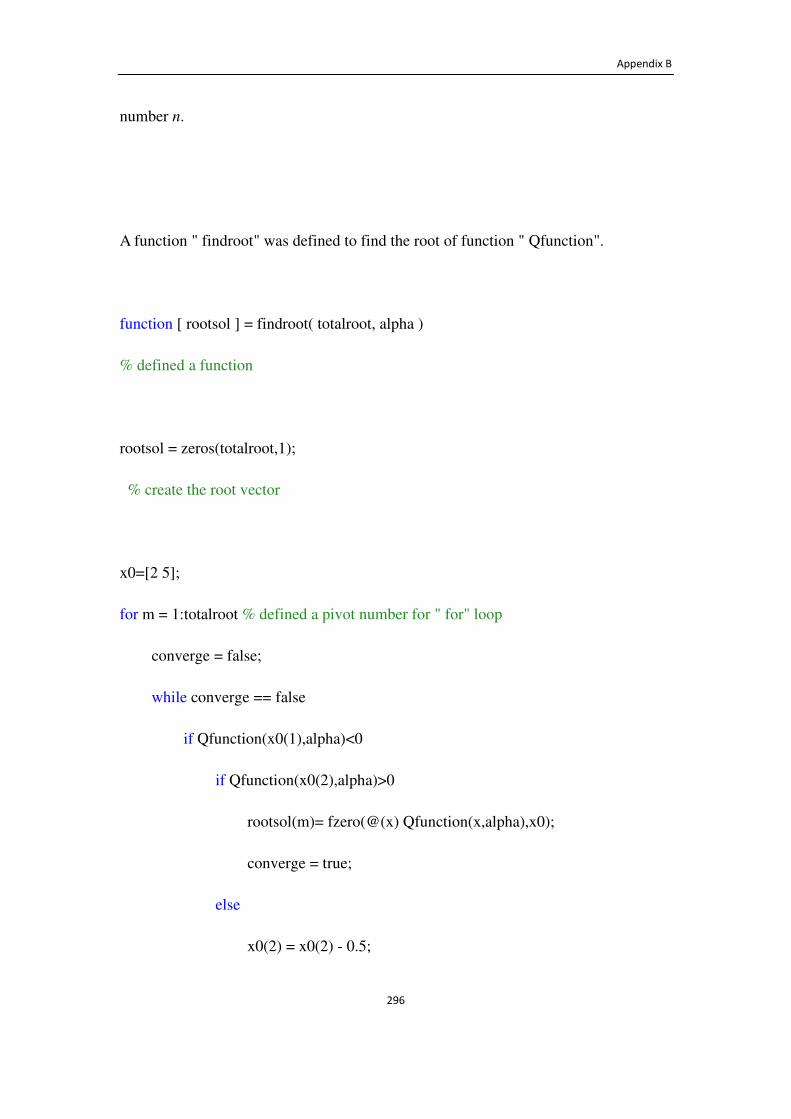
Appendix B
296
number n.
A function " findroot" was defined to find the root of function " Qfunction".
function [ rootsol ] = findroot( totalroot, alpha )
% defined a function
rootsol = zeros(totalroot,1);
% create the root vector
x0=[2 5];
for m = 1:totalroot % defined a pivot number for " for" loop
converge = false;
while converge == false
if Qfunction(x0(1),alpha)<0
if Qfunction(x0(2),alpha)>0
rootsol(m)= fzero(@(x) Qfunction(x,alpha),x0);
converge = true;
else
x0(2) = x0(2) - 0.5;
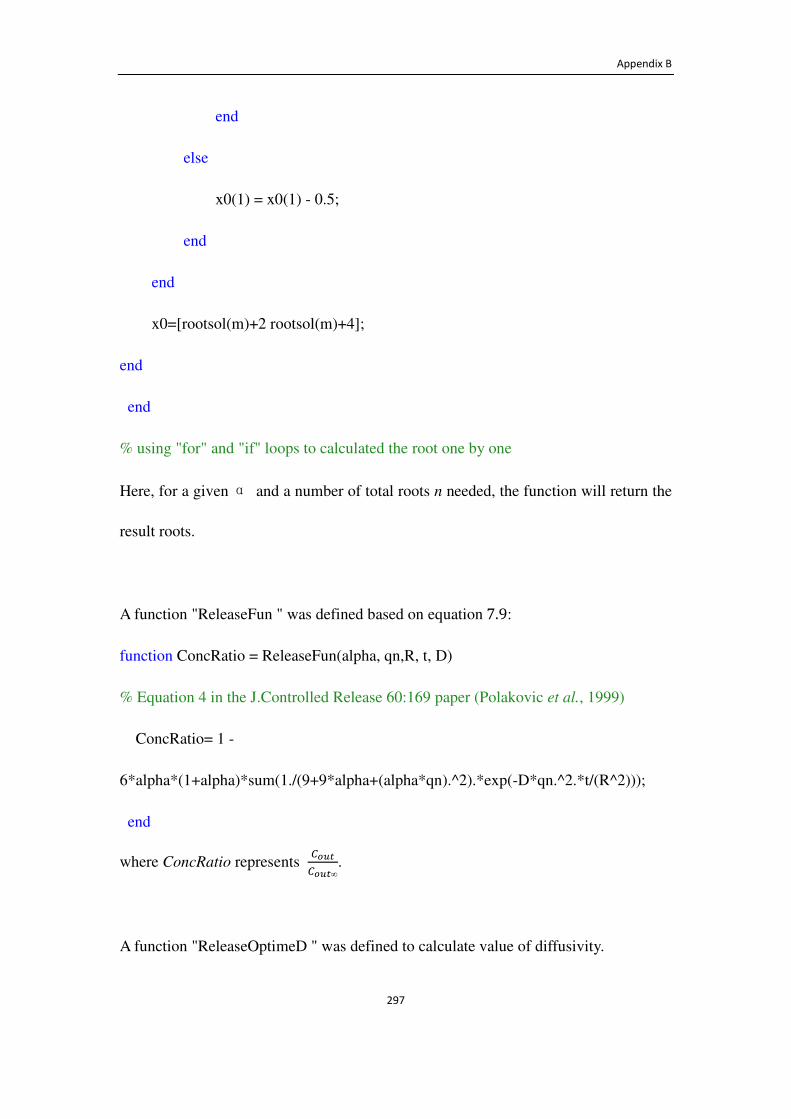
Appendix B
297
end
else
x0(1) = x0(1) - 0.5;
end
end
x0=[rootsol(m)+2 rootsol(m)+4];
end
end
% using "for" and "if" loops to calculated the root one by one
Here, for a givenα and a number of total roots n needed, the function will return the
result roots.
A function "ReleaseFun " was defined based on equation7.9:
function ConcRatio = ReleaseFun(alpha, qn,R, t, D)
% Equation 4 in the J.Controlled Release 60:169 paper (Polakovic et al., 1999)
ConcRatio= 1 -
6*alpha*(1+alpha)*sum(1./(9+9*alpha+(alpha*qn).^2).*exp(-D*qn.^2.*t/(R^2)));
end
where ConcRatio represents 9<=>9<=>∞.
A function "ReleaseOptimeD " was defined to calculate value of diffusivity.
Appendix B
298
function [ Doptim ] = ReleaseOptimeD( )
% Function to optimize the value of the diffusivity
ExcelFile = '0103-24-3.xlsx';
% define a excel file "ExcelFile" with release data inside, in order to use it later
ExpData = xlsread(ExcelFile);
% read the data from "ExcelFile", time (Minute), Fractional release (%)
ExpData(:,1) = ExpData(:,1)*60;
% changed release time from minutes to seconds
% start User variables
MaxRelease = 0.8; %Maximum fractional release (%), below which diffusivity is
optimized
VolRatio = 5000; % V Vï⁄ , Volume ratio between the amount of capsules and
solution solvent
Kp = 4225.4608; % Partition coefficient
Dinitial = 1.0e-013;
% estimated Diffusivity (m2 s-1), used in "fminsearch" function for more accurate
calculation;

Appendix B
299
r = 26e-6; % radius of spheres (m)
% end User variables
alpha = VolRatio/Kp; %α = V Vï⁄ K�
Doptim = fminsearch(@(D) ReleasePlot(D,ExpData, alpha, R, MaxRelease),Dinitial);
% calculated diffusivity (m2 s-1 ) using "fminsearch" function, with estimated
diffusivity value "Dinitial".
ReleasePlot(Doptim, ExpData, alpha, R, MaxRelease)
% Plot release profile using "ReleasePlot" function, with optimized diffusivity value
end
A function "ReleasePlot" was defined to plot the release profile of a microsphere.
function [ Res ] = ReleasePlot(D, ExpData, alpha, R, MaxRelease)
% defined a function to optimize the residual sum of squares of microsphere
fractional release
% Plot the release profile of a microsphere
% ExpData is the experimental data read from "ExcelFile", will be plotted later
% MaxRelease is the maximum percentage of release rate will be modeled in this case
Appendix B
300
close all
% close all the figures
% start User variables
EndTime = ExpData(end,1); % Final release time (seconds)
NumPoints = 1000;
% total number of roots for equation qò = ��ù�Jαð�ùL
% end User variables
rootsol = findroot( 1000, alpha ); % returned "findroot" result into the vector "rootsol"
t = [0:EndTime/(NumPoints-1):EndTime]'; % created the vector for time
ConcRatio = zeros(size(t)); % created the fractional release (%) root vector
for j = 1:NumPoints % defined a pivot number for "for" loop
ConcRatio(j) = ReleaseFun(alpha, rootsol ,R, t(j), D);
% calculated fractional release (%), returned result into root vector
end
YCalc = spline(t,ConcRatio, ExpData(ExpData(:,2) < MaxRelease,1));
Appendix B
301
Res = sum((YCalc - ExpData(ExpData(:,2) < MaxRelease,2)).^2);
% calculated "Res" the residual sum of squares, which equals to
Res = ∑ w� − (® )x! ì� �
figure1 = figure; % created a figure "figure1"
axes1 = axes('Parent',figure1,'FontSize',12,'FontName','Times New Roman');
box(axes1,'on');
hold(axes1,'all');
% graph format
plot(ExpData(:,1), ExpData(:,2),'Parent',axes1,'Marker','+','LineStyle','none','Color',[1
0 0],'DisplayName','Experimental data')
% plot experimental data into "figure1"
hold on
plot(t, ConcRatio,'Parent',axes1,'LineWidth',3,'DisplayName','D = 3.2e-013 m^2/s')
% plot modeling data in the same figure
xlabel('Time (min)','FontSize',12,'FontName','Times New Roman');
ylabel('Relative release,''}c,'FontSize',12,'FontName','Times New Roman');
legend1 = legend(axes1,'show');
set(legend1,'EdgeColor',[1 1 1],'YColor',[1 1 1],'XColor',[1 1 1],...
'Position',[0.5268215974333 0.324042111214441 0.332142857142857
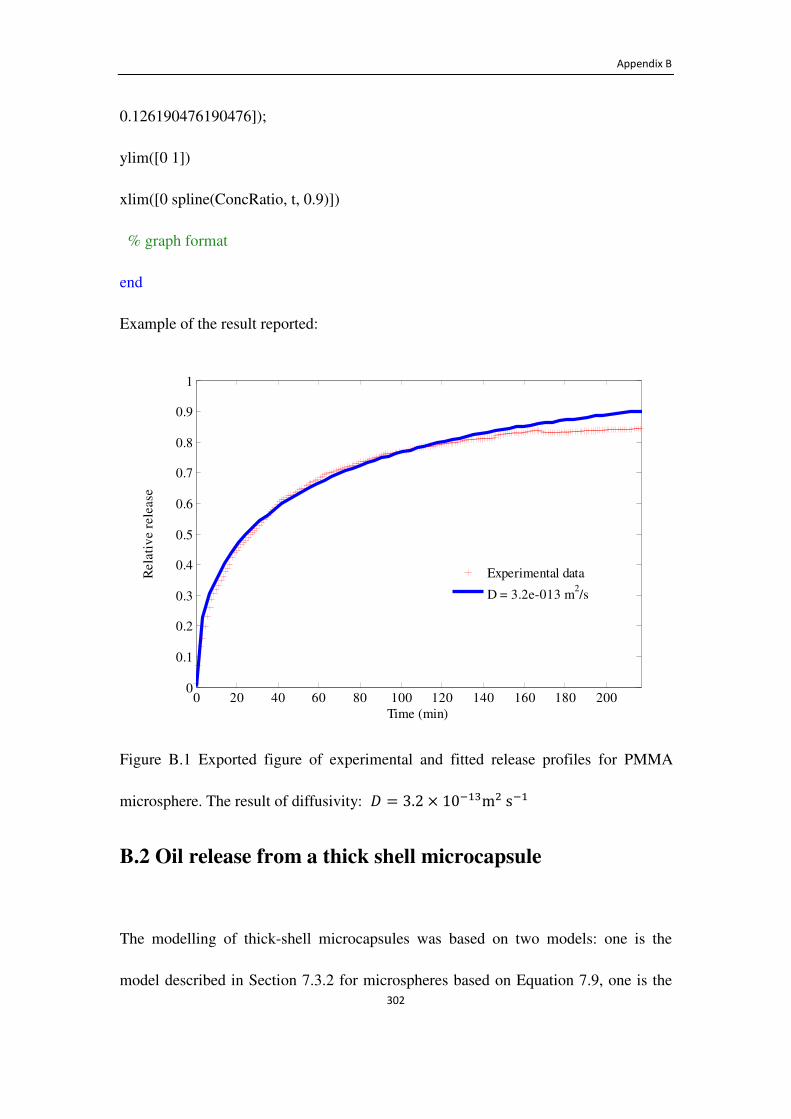
Appendix B
302
0.126190476190476]);
ylim([0 1])
xlim([0 spline(ConcRatio, t, 0.9)])
% graph format
end
Example of the result reported:
Figure B.1 Exported figure of experimental and fitted release profiles for PMMA
microsphere. The result of diffusivity: � = 3.2 × 10���m�s��
B.2 Oil release from a thick shell microcapsule
The modelling of thick-shell microcapsules was based on two models: one is the
model described in Section 7.3.2 for microspheres based on Equation 7.9, one is the
0 20 40 60 80 100 120 140 160 180 2000
0.1
0.2
0.3
0.4
0.5
0.6
0.7
0.8
0.9
1
Time (min)
Rel
ativ
e re
leas
e
Experimental data
D = 3.2e-013 m2/s

Appendix B
303
model mentioned in Section 7.3.3 as "hollow sphere" model, based on Equation 7.10.
The first model used in this section was the same as the microsphere model,
mentioned in Section B.1.
�$�%�$�%∞= 1 − 6
π
�(r!òò�Z� + r!òò�Zr + r�)"(r cos nπ − r!òò�Zn )�∞
òì� exp$− D@�π
�tZ(r − r!òò�Z)�%
(Equation 7.10)
where rinner is the radius of the hollow space in the microcapsule, r is radius of the
microcapsule and n is the total root number of Equation 7.10.
MATLAB code is shown as follow:
A function "Releasefun4 h1" was defined based on equation 7.10 :
function ConcRatio = ReleaseFun4 h1(a, b, n, t, D)
% Equation 6.49 in crank's book p98 (Crank, 1975).
ConcRatio= 1 -
6/(3.1415926^2*(a^2+a*b+b^2))*sum((((b*cos(3.1415926*n)-a)).^2./n.^2.).*exp(-D*
n.^2.*3.1415926^2*t/(b-a)^2));
end
where ConcRatio represents 9<=>9<=>∞.
Appendix B
304
A function "ReleaseoptimeD4 h1" was defined to optimize the value of the diffusivity.
function [ Doptim, Doptims] = ReleaseOptimeD4 h1( )
% Function to optimize the value of the diffusivity
ExcelFile = '0103-4-3.xlsx';
% define a excel file "ExcelFile" with release data inside, in order to use it later
ExpData = xlsread(ExcelFile);
% read the data from "ExcelFile", time (Minute), Fractional release (%)
ExpData(:,1) = ExpData(:,1)*60;
% changed release time from minutes to seconds
% start User variables
MaxRelease = 0.8; %Maximum fractional release (%), below which diffusivity is
optimized
Dinitial = 4e-013; % estimated diffusivity (m2 s-1), used in "fminsearch"
function for more accurate calculation;
b = 26e-6; % outer radius of the hollow spheres (m)
a = 11.8e-6; % inner radius of the hollow spheres (m)
VolRatio = 5000; % V Vï⁄ ,volume ratio between the amount of capsules and
solution solvent

Appendix B
305
Kp = 2572.006936; %Partition coefficient
R = 26e-6; % radius of spheres (m)
% end User variables
alpha = VolRatio/Kp; %α = V Vï⁄ K�
Doptim = fminsearch(@(D) ReleasePlot4 h1(D, ExpData, a, b, alpha, R,
MaxRelease),Dinitial);
% calculated diffusivity ( m2 s-1) using "fminsearch" function with estimated
diffusivity value "Dinitial" using "hollow sphere model" and " sphere model"
ReleasePlot4 h1(Doptim, ExpData, a, b, alpha, R, MaxRelease)
% Plot release profile using "ReleasePlot4 h1" function, with optimized diffusivity
value
end
A function "ReleasePlot4 h1" was defined to plot the release profile of a thick shell
microcapsule and the fitting with two models.
function [ Res ] = ReleasePlot4 h1(D, ExpData, a, b, alpha, R, MaxRelease)
% defined a function to optimize the residual sum of squares of microcapsule
Appendix B
306
fractional release
% Plot the release of a thick shell microcapsule
% ExpData is the experimental data read from "ExcelFile", will be plotted later
% MaxRelease is the maximum percentage of release rate will be modeled in this case
close all
% close all the figures
%start User variables
EndTime = ExpData(end,1); % Final release time (s)
NumPoints = 1000; % number of roots for equation 7.10.
%end User variables
rootsol = findroot( 1000, alpha ); % returned "findroot" result into the vector "rootsol"
n = [1:1:1000]'; % created a root vector
t = [0:EndTime/(NumPoints-1):EndTime]'; % created the vector for time
ConcRatio = zeros(size(t)); % created the fractional release (%) root vector for
"hollow sphere model"
ConcRatio1 = zeros(size(t)); % created the fractional release (%) root vector for "
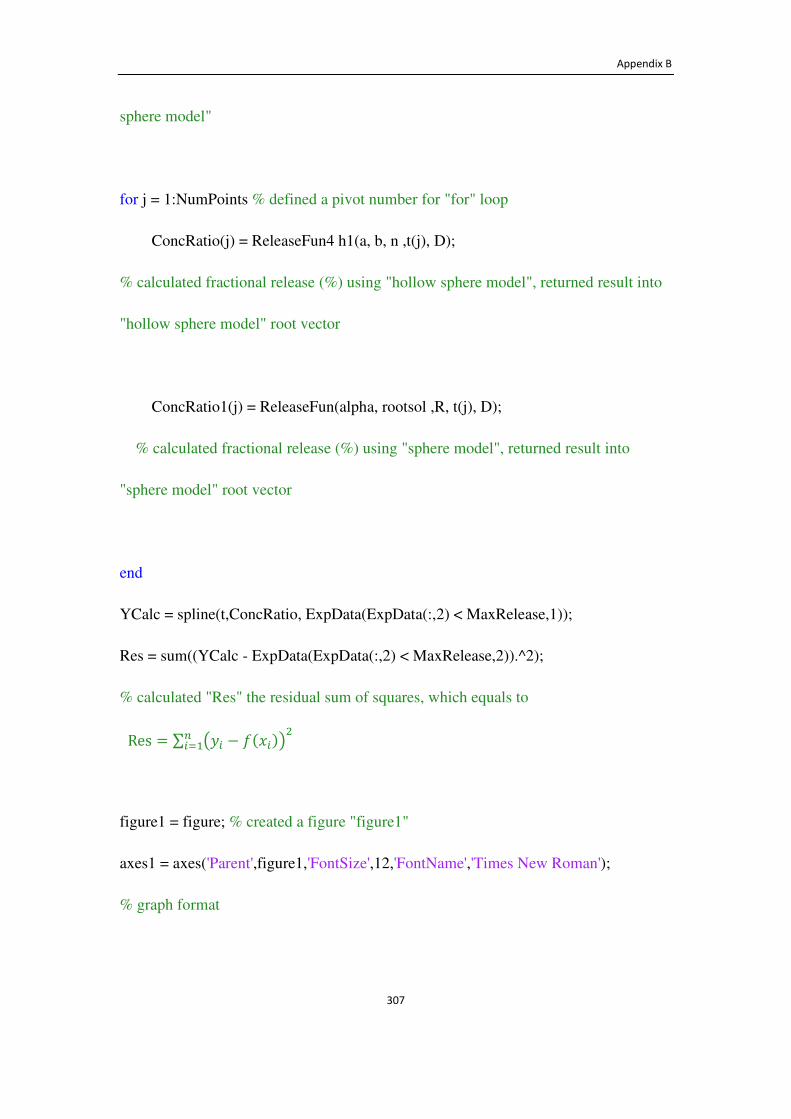
Appendix B
307
sphere model"
for j = 1:NumPoints % defined a pivot number for "for" loop
ConcRatio(j) = ReleaseFun4 h1(a, b, n ,t(j), D);
% calculated fractional release (%) using "hollow sphere model", returned result into
"hollow sphere model" root vector
ConcRatio1(j) = ReleaseFun(alpha, rootsol ,R, t(j), D);
% calculated fractional release (%) using "sphere model", returned result into
"sphere model" root vector
end
YCalc = spline(t,ConcRatio, ExpData(ExpData(:,2) < MaxRelease,1));
Res = sum((YCalc - ExpData(ExpData(:,2) < MaxRelease,2)).^2);
% calculated "Res" the residual sum of squares, which equals to
Res = ∑ w� − (® )x! ì� �
figure1 = figure; % created a figure "figure1"
axes1 = axes('Parent',figure1,'FontSize',12,'FontName','Times New Roman');
% graph format

Appendix B
308
box(axes1,'on');
hold(axes1,'all');
plot(ExpData(:,1), ExpData(:,2),'Parent',axes1,'Marker','+','LineStyle','none','Color',[1
0 0],'DisplayName','Experimental data')
% plot experimental data into "figure1"
hold on
plot(t, ConcRatio,'Parent',axes1,'LineWidth',3,'DisplayName','hollow sphere D =
3.0e-013 m^2/s')
% plot "hollow sphere" modeling data in the same figure
hold on
plot(t, ConcRatio1,'Parent',axes1,'LineWidth',3,'Color',[0 0.498039215803146
0],'DisplayName','sphere D = 4.3e-013 m^2/s')
% plot "sphere" modeling data in the same figure
xlabel('Time (min)','FontSize',12,'FontName','Times New Roman');
ylabel({'Relative release',''},'FontSize',12,'FontName','Times New Roman');
legend1 = legend(axes1,'show');
set(legend1,'EdgeColor',[1 1 1],'YColor',[1 1 1],'XColor',[1 1 1],...
'Position',[0.5268215974333 0.324042111214441 0.332142857142857
0.126190476190476]);
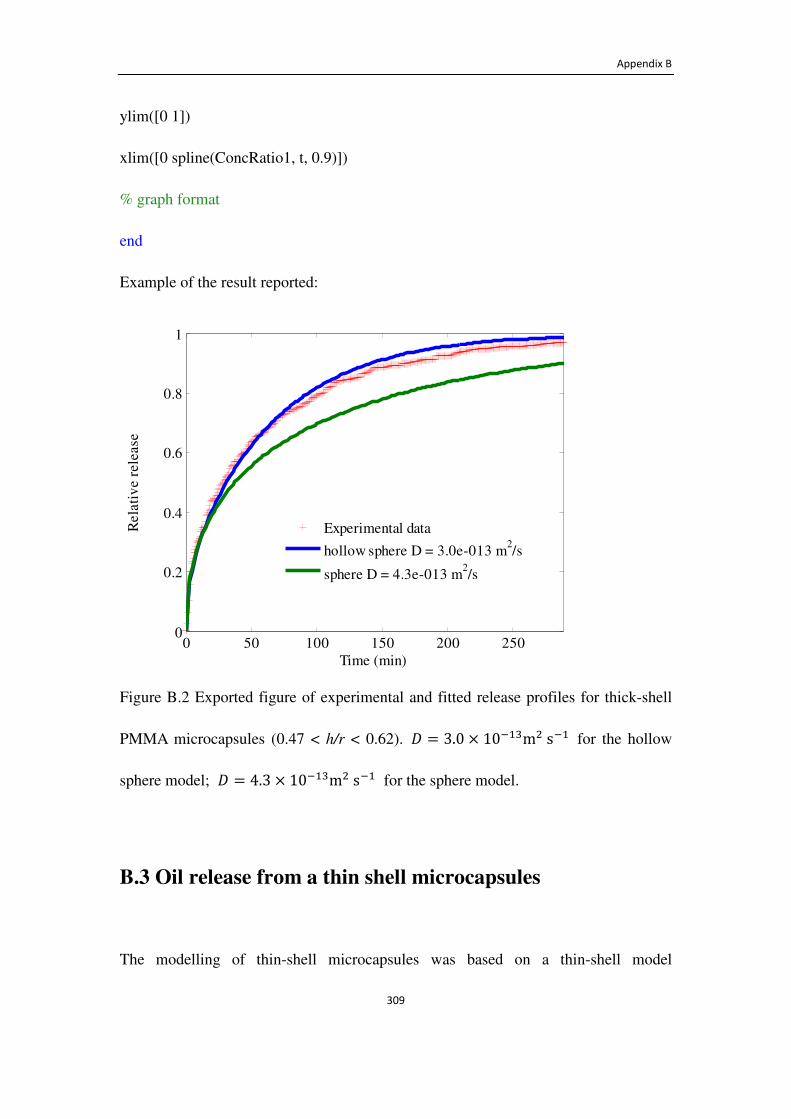
Appendix B
309
ylim([0 1])
xlim([0 spline(ConcRatio1, t, 0.9)])
% graph format
end
Example of the result reported:
Figure B.2 Exported figure of experimental and fitted release profiles for thick-shell
PMMA microcapsules (0.47 < h/r < 0.62). � = 3.0 × 10���m�s�� for the hollow
sphere model; � = 4.3 × 10���m�s�� for the sphere model.
B.3 Oil release from a thin shell microcapsules
The modelling of thin-shell microcapsules was based on a thin-shell model
0 50 100 150 200 2500
0.2
0.4
0.6
0.8
1
Time (min)
Rel
ativ
e re
leas
e
Experimental data
hollow sphere D = 3.0e-013 m2/s
sphere D = 4.3e-013 m2/s

Appendix B
310
(Mercade-Prieto et al., 2012b), which was described in Section 7.3.1. For comparison,
the "hollow sphere" model was also used, which was described in Section 7.3.3, based
on Equation 7.10. The details were explained in Section B.1, and the calculated data
from "hollow sphere" model were exported. Data analysis was implemented using
commercial software Excel®, Microsoft.
Example of the result reported:
Figure B.3 Exported figure of experimental and fitted release profiles for thin-shell
PMMA microcapsules (h/r < 0.11). � = 1.3 × 10��~m�s�� for the thin-shell
model;� = 8.9 × 10���m�s�� for the "hollow sphere" model.
0%
10%
20%
30%
40%
50%
60%
70%
80%
90%
100%
0.0 0.5 1.0 1.5 2.0 2.5 3.0
Rel
ati
ve
rele
ase
Time (min)
Experimental data
Hollow sphere simulation
Linear calculated rate
References
311
References
Abrahamse, A. J., Van Der Padt, A., Boom, R. M. & De Heij, W. B. C. 2001. Process
fundamentals of membrane emulsification: Simulation with CFD. Aiche Journal, 47,
1285-1291.
Abrahamse, A. J., Van Lierop, R., Van Der Sman, R. G. M., Van Der Padt, A. & Boom, R. M.
2002. Analysis of droplet formation and interactions during cross-flow membrane
emulsification. Journal of Membrane Science, 204, 125-137.
Alay, S., Gode, F. & Alkan, C. 2011. Synthesis and Thermal Properties of Poly(n-butyl
acrylate)/n-Hexadecane Microcapsules Using Different Cross-Linkers and Their
Application to Textile Fabrics. Journal of Applied Polymer Science, 120, 2821-2829.
Alic, B., Sebenik, U. & Krajnc, M. 2012. Microencapsulation of butyl stearate with
melamine-formaldehyde resin: Effect of decreasing the pH value on the composition and
thermal stability of microcapsules. Express Polymer Letters, 6, 826-836.
An, P. Y., Ba, X. W. & Lu, S. A. 2010. Preparation and characterization of crosslinked
poly(methylmethacrylate) heat sensitive color-developing nanocapsules. Polymer Bulletin,
64, 375-386.
Anastasiou, T. J., Lee, K. & Popplewell, L. M., inventors; International Flavors and
Frangrances, Inc., assignee. Process for preparing a high stability microcapsule product and
method for using same. The United Kingdom, patent EP1797946 A2. 2007a.
Anastasiou, T. J., Pluyter, J. G. L., Lei, Y., Lee, K. D. & Popplewell, L. M., inventors;
International Flavors & Fragrances Inc., assignee. Encapsulated active material with
reduced formaldehyde potential. USA, patent US 2007/0138674. 2007b.
Anna, S. L., Bontoux, N. & Stone, H. A. 2003. Formation of dispersions using "flow focusing"
in microchannels. Applied Physics Letters, 82, 364-366.
Antipov, A. A., Sukhorukov, G. B. & Mohwald, H. 2003. Influence of the ionic strength on the
polyelectrolyte multilayers' permeability. Langmuir, 19, 2444-2448.

References
312
Anton, N., Benoit, J. P. & Saulnier, P. 2008. Design and production of nanoparticles formulated
from nano-emulsion templates - A review. Journal of Controlled Release, 128, 185-199.
Aouad, Y. G., inventor The Procter and Gamble Company, assignee. Laundry scent additive.
USA, patent US 7871976. 2011a.
Aouad, Y. G., inventor The Procter and Gamble Company, assignee. Laundry scent additive.
USA, patent US 7867968. 2011b.
Arellano, R. M. & Vazquez, E. P., inventors; Minnesota Mining & Manufacturing Innovative
Properties Company, assignee. Abrasive item for cleaning wit scented abrasive fibres. USA,
patent US 2004/0242133 A1. 2004.
Arshady, R. 1989. Preparation of Microspheres and Microcapsules by Interfacial
Polycondensation Techniques. Journal of Microencapsulation, 6, 13-28.
Arshady, R. 1999. Microspheres, Microcapsules & Liposomes, Volume 1: Preparation &
Chemical Applications, London, Citus Books.
Aryanti, N., Hou, R. Z. & Williams, R. A. 2009. Performance of a rotating membrane
emulsifier for production of coarse droplets. Journal of Membrane Science, 326, 9-18.
Aryanti, N., Williams, R. A., Hou, R. Z. & Vladisavljevic, G. T. 2006. Performance of rotating
membrane emulsification for o/w production. Desalination, 200, 572-574.
Aussant, E., Fraser, S., Unno, M. & Warr, J., inventors; Takasago International Corporation,
assignee. Perfume for capsule composition. USA, patent US20070149424. 2007.
Aussant, E., Fraser, S., Unno, M. & Warr, J., inventors; Takasago International Corporation,
assignee. Encapsulation of bulky fragrance molecules, patent EP 1894603 A1. 2008.
Aussant, E., Fraser, S. & Warr, J., inventors; Takasago International Corporation, assignee.
Fragrance-containing core shell microcapsules, patent EP 2397120 A1. 2011.
Bakeine, G. J., Bertolotti, A., Latina, M., Congiu, T., Prati, U., Roveda, L., Trotta, F., Tormen,
M., Di Fabrizio, E., Carlini, G., Facoetti, A. & Nano, R. 2007. Surface properties and
implantation site affect the capsular fibrotic overgrowth. Journal of Biomedical Materials
Research Part A, 83A, 965-969.
Balentine, D. A., Wiseman, S. A. & Bouwens, L. C. M. 1997. The chemistry of tea flavonoids.
Critical Reviews in Food Science and Nutrition, 37, 693-704.
References
313
Barbosa-Cánovas, G. V., Ortega-Rivas, E., Juliano, P. & Yan, H. 2005. Food Powders:
Physical Properties, Processing, and Functionality. Springer.
Bauer, D. R. 1986. Melamine/Formaldehyde Crosslinkers: Characterization, Network
Formation and Crosslink Degradation. Progress in Organic Coatings, 14, 193-218.
Bauer, F., Garbe, D. & Surburg, H. 2001. Common Fragrance and Flavor Materials,
Weinheim, New York, Chichester, Brisbane, Singapore, Toronto, Wiley-vch.
Baumgarten, N. 1989. Environmental Sem Premieres. Nature, 341, 81-82.
Bennett, S. W. & Brain, J., inventors; International Flavors & Fragrances Inc., assignee.
Encapsulated fragrance chemicals. USA, patent US 2004/0072719 A1. 2004.
Berge, A., Gudmunds.S & Ugelstad, J. 1969. Melamine-Formaldehyde Compounds .I.
Alkaline Decomposition of Methylol Melamines and Methoxymethyl Melamines.
European Polymer Journal, 5, 171-&.
Berge, A., Kvaeven, B. & Ugelstad, J. 1970. Melamine-Formaldehyde Compounds .2. Acid
Decomposition of Methylol Melamines and Methoxymethyl Melamines. European
Polymer Journal, 6, 981-&.
Berry, G., Marynowski, J. M. & Kinne, K. W. 1995. Perfume-containing capsules with good
flowability for laundry detergents. Zeolites, 15, 183.
Binks, B. P. & Fletcher, P. D. I. 2001. Particles adsorbed at the oil-water interface: A theoretical
comparison between spheres of uniform wettability and "Janus" particles. Langmuir, 17,
4708-4710.
Bobnock, S. R., Debraal, C. J., Dihora, O. J., Druckrey, K. A., Hart, T. G., Kirksey, T. S. &
Vanderveken, J. W. F., inventors; Appleton Papers Inc., assignee. Delivery particle. USA,
patent WO2010014172. 2010.
Bodet, F. J., Carrara, G., Chung, H. A., Ditullio, J. D. D., Dykstra, R. R., Finley, M. K., Fossum,
D. R., Ketcha, M. M., Liu, Z., Morgan, I. K. G. & Vinson, K. P., inventors; The Procter and
Gamble Company, assignee. Perfuming method and product, patent WO2008111007A2.
2008a.
References
314
Bodet, J.-F., Dihora, O. J., Fossum, D. R., Jordan, I. T. G., Kirksey, J. T. S. & Waits, D. L.,
inventors; The Procter and Gamble Company, assignee. Fabric care compositions
comprising formaldehyde scavengers. Belgium, patent EP 1991648. 2008b.
Bone, S., Vautrin, C., Barbesant, V., Truchon, S., Harrison, I. & Geffroy, C. 2011.
Microencapsulated Fragrances in Melamine Formaldehyde Resins. Chimia, 65, 177-181.
Boom, R. M. 2003. Membrane Emulsification: Process Principle. PhD, wageningen university.
Brian, B. 2012. J&J to Remove 'Toxic' Chemicals from Products. The Chemical Engineer 6.
Bromley, A. J., Holdich, R. G. & Cumming, I. W. 2002. Particulate fouling of surface
microfilters with slotted and circular pore geometry. Journal of Membrane Science, 196,
27-37.
Brown, E. N., Kessler, M. R., Sottos, N. R. & White, S. R. 2003. In situ
poly(urea-formaldehyde) microencapsulation of dicyclopentadiene. Journal of
Microencapsulation, 20, 719-730.
Calabrese, R. V., Chang, T. P. K. & Dang, P. T. 1986a. Drop Breakup in Turbulent
Stirred-Tank Contactors .1. Effect of Dispersed-Phase Viscosity. Aiche Journal, 32,
657-666.
Calabrese, R. V., Wang, C. Y. & Bryner, N. P. 1986b. Drop Breakup in Turbulent Stirred-Tank
Contactors .3. Correlations for Mean Size and Drop Size Distribution. Aiche Journal, 32,
677-681.
Capek, I. 1999. Microemulsion polymerization of styrene in the presence of anionic emulsifier.
Advances in Colloid and Interface Science, 82, 253-273.
Capodagli, J. & Lakes, R. 2008. Isothermal viscoelastic properties of PMMA and LDPE over
11 decades of frequency and time: a test of time–temperature superposition. Rheologica
Acta, 47, 777-786.
Carlisle, K. B., Lewis, M., Chawla, K. K., Koopman, M. & Gladysz, G. M. 2007. Finite
element modeling of the uniaxial compression behavior of carbon microballoons. Acta
Materialia, 55, 2301-2318.
Cavin, L., Geffroy, C., Harrison, I., Michael, Hotz, J., Matys, M. & Quellet, C., inventors;
Givaudan SA assignee. Microcapsules, patent WO2008098387. 2008.
References
315
Chang, C. C., Tsai, Y. L., Chiu, J. J. & Chen, H. 2009. Preparation of Phase Change Materials
Microcapsules by Using PMMA Network-Silica Hybrid Shell Via Sol-Gel Process. Journal
of Applied Polymer Science, 112, 1850-1857.
Charcosset, C. 2009. Preparation of emulsions and particles by membrane emulsification for
the food processing industry. Journal of Food Engineering, 92, 241-249.
Charcosset, C., Limayem, I. & Fessi, H. 2004. The membrane emulsification process - a review.
Journal of Chemical Technology and Biotechnology, 79, 209-218.
Chen, F. T., Jiang, X. S., Liu, R. & Yin, J. 2011. Polymeric vesicles with well-defined
poly(methyl methacrylate) (PMMA) brushes via surface-initiated photopolymerization
(SIPP). Polymer Chemistry, 2, 614-618.
Chen, H. M., Ouyang, W., Lawuyi, B. & Prakash, S. 2006. Genipin cross-linked
alginate-chitosan microcapsules: Membrane characterization and optimization of
cross-linking reaction. Biomacromolecules, 7, 2091-2098.
Chen, W., Lu, F. & Cheng, M. 2002. Tension and compression tests of two polymers under
quasistatic and dynamic loading. Polymer Testing, 21, 113-121.
Chevalier, V., Hurel, V. & Simon, P., inventors; L'Oreal, assignee. Cosmetic composition
containing melamine-formaldehyde or urea-formaldehyde particles and its uses, patent EP
1046388. 2005.
Cho, S. A., Park, N. H., Kim, J. W. & Suh, K. D. 2002. Preparation of mono-sized
PMMA/liquid crystal microcapsules by solute co-diffusion method. Colloids and Surfaces
a-Physicochemical and Engineering Aspects, 196, 217-222.
Choi, J. K., Lee, J. G., Kim, J. H. & Yang, H. S. 2001. Preparation of microcapsules containing
phase change materials as heat transfer media by in-situ polymerization. Journal of
Industrial and Engineering Chemistry, 7, 358-362.
Choi, Y.-H. & Lee, W.-K. 2010. Effects of agitation in emulsion polymerization of vinyl
acetate, ethylene, and N-methylol acrylamide. Journal of Industrial and Engineering
Chemistry, 16, 431-436.
Christov, N. C., Ganchev, D. N., Vassileva, N. D., Denkov, N. D., Danov, K. D. & Kralchevsky,
P. A. 2002. Capillary mechanisms in membrane emulsification: oil-in-water emulsions
References
316
stabilized by Tween 20 and milk proteins. Colloids and Surfaces A: Physicochemical and
Engineering Aspects, 209, 83-104.
Clare, R. J., Cunningham, A. P., Denutte, R. G. H., Medina, J., Orlandini, L. & Smets, J.,
inventors; The Procter and Gamble Company, assignee. Perfumes and perfume encapsulates.
Blegium, patent EP 2512406A1. 2012.
Clarke, A. R. & Eberhardt, C. N. 2000. Microscopy Techniques for Materials Science,
Cambridge, Woodhead publishing limited.
Cole, P., Adami, H. O., Trichopoulos, D. & Mandel, J. 2010. Formaldehyde and
lymphohematopoietic cancers: A review of two recent studies. Regulatory Toxicology and
Pharmacology, 58, 161-166.
Colt, K. K., Fernandez, G. H. & Parekh, P. P., inventors; International Flavors & Fragrances
Inc., assignee. Melamine-formaldehyde microcapsule slurries for fabric article freshening.
The United Kingdom, patent EP1533415. 2007.
Corle, T. R. & Kino, G. S. 1996. Confocal Scanning Optical Microscopy and Related Imaging
Systems, Elsevier Inc.
Crank, J. 1975. The Mathematics of diffusion, Oxford, Oxford University Press.
Curtis, R. V. & Juszczyk, A. S. 1998. Analysis of strength data using two- and three-parameter
Weibull models. Journal of Materials Science, 33, 1151-1157.
Danilatos, G. D. 1993. Introduction to the Esem Instrument. Microscopy Research and
Technique, 25, 354-361.
De Luca, G., Di Maio, F. P., Di Renzo, A. & Drioli, E. 2008. Droplet detachment in cross-flow
membrane emulsification: Comparison among torque- and force-based models. Chemical
Engineering and Processing, 47, 1150-1158.
De Luca, G., Di Renzo, A., Di Maio, F. P. & Drioli, E. 2006. Modelling droplet formation in
cross-flow membrane emulsification. Desalination, 199, 177-179.
De Luca, G. & Drioli, E. 2006. Force balance conditions for droplet formation in cross-flow
membrane emulsifications. Journal of Colloid and Interface Science, 294, 436-448.
References
317
De Luca, G., Sindona, A., Giorno, L. & Drioli, E. 2004. Quantitative analysis of coupling
effects in cross-flow membrane emulsification. Journal of Membrane Science, 229,
199-209.
Denutte, H. R. G., Clare, R. J., Medina, J., Cunningham, A. P., Smets, J. & Orlandini, L.,
inventors; The Procter and Gamble Company, assignee. Encapsulates. USA, patent US
2011/0152146 A1. 2011.
Dorsey, N. E. 1940. PROPERTIES OF ORDINARY WATER-SUBSTANCE. News Edition,
American Chemical Society, 18, 215.
Dragosavac, M. M., Holdich, R. G., Vladisavljevic, G. T. & Sovilj, M. N. 2012a. Stirred cell
membrane emulsification for multiple emulsions containing unrefined pumpkin seed oil
with uniform droplet size. Journal of Membrane Science, 392, 122-129.
Dragosavac, M. M., Sovilj, M. N., Kosvintsev, S. R., Holdich, R. G. & Vladisavljevic, G. T.
2008. Controlled production of oil-in-water emulsions containing unrefined pumpkin seed
oil using stirred cell membrane emulsification. Journal of Membrane Science, 322, 178-188.
Dragosavac, M. M., Vladisavljevic, G. T., Holdich, R. G. & Stillwell, M. T. 2012b. Production
of Porous Silica Microparticles by Membrane Emulsification. Langmuir, 28, 134-143.
Drelich, J., Fang, D. Y. & White, C. L. 2002. Measurement of interfacial tension in fluid-fluid
systems. In: SOMASUNDARAN, P. (ed.) Encyclopedia of Surface and Colloid Science.
New York: Taylor & Francis.
Dubey, R., Shami, T. C. & Rao, K. U. B. 2009. Microencapsulation Technology and
Applications. Defence Science Journal, 59, 82-95.
Dubreuil, F., Elsner, N. & Fery, A. 2003. Elastic properties of polyelectrolyte capsules studied
by atomic-force microscopy and RICM. European Physical Journal E, 12, 215-221.
Edwards, M. F. & Instone, T. 2001. Particulate products - their manufacture and use. Powder
Technology, 119, 9-13.
Egidi, E., Gasparini, G., Holdich, R. G., Vladisavljevic, G. T. & Kosvintsev, S. R. 2008.
Membrane emulsification using membranes of regular pore spacing: Droplet size and
uniformity in the presence of surface shear. Journal of Membrane Science, 323, 414-420.
References
318
Environmental-Protection-Agency. Health and Environmental Effects Profile for
Formaldehyde. Cincinnati: Environmental Criteria and Assessment Office.; 1985 oct.1985.
Erik, K. 1999. Dispersions : Characterization, Testing, and Measurement, New York, Marcel
Dekker Inc.
Erkan, G., Sariisik, M. & Pazarlioglu, N. K. 2010. The Microencapsulation of Terbinafine via
In Situ Polymerization of Melamine-Formaldehyde and Their Application to Cotton Fabric.
Journal of Applied Polymer Science, 118, 3707-3714.
Ezendam, J., Te Biesebeek, J. D. & Wijnhoven, S. W. P. The presence of fragrance allergens in
scented consumer products. Bilthoven: Rijksinstituut voor Volksgezondheid en Milieu
RIVM; 2009 2010-03-08.
Fereidoon, S. 2005. Edible Oil and Fat Products: Edible Oils. In: FEREIDOON, S. (ed.)
Bailey's Industrial Oil and Fat Products. Hoboken: John Wiley and Sons.
Ferguson, P. & Jones, C. C., inventors; Unilever NV & Unilever PLC, assignee. Laundry
compositions, patent EP 2496676 A1. 2012.
Ferrando, M. & Spiess, W. E. L. 2000. Review: Confocal scanning laser microscopy. A
powerful tool in food science. Food Science and Technology International, 6, 267-284.
Fery, A., Dubreuil, F. & Mohwald, H. 2004. Mechanics of artificial microcapsules. New
Journal of Physics, 6.
Fery, A. & Weinkamer, R. 2007. Mechanical properties of micro- and nanocapsules:
Single-capsule measurements. Polymer, 48, 7221-7235.
Fletcher, P. D. I., Binks, B. P., Holt, B. L., Parker, J., Beaussoubre, P. & Wong, K. 2010. Drop
sizes and particle coverage in emulsions stabilised solely by silica nanoparticles of irregular
shape. Physical Chemistry Chemical Physics, 12, 11967-11974.
Foris, P. L., Brown, R. W. & Phillips, J. P. S., inventors; National Cash Register Corporation,
assignee. Capsule manufacture. USA, patent US 4100103. 1978.
Franck, A. Application of Rheology of Polymers: TA Instruments Germany; 2010.
Frank, G., Biastoch, R. & Kummer, M., inventors; BASF Aktiengesellschaft, assignee.
Microcapsules of low-formaldehyde melamine/formaldehyde resins. USA, patent US
6261483B1. 2001.
References
319
Freiberg, S. & Zhu, X. 2004. Polymer microspheres for controlled drug release. International
Journal of Pharmaceutics, 282, 1-18.
Fukumori, Y., Ichikawa, H., Yamaoka, Y., Akaho, E., Takeuchi, Y., Fukuda, T., Kanamori, R.
& Osako, Y. 1991. Effect of Additives on Physical-Properties of Fine Ethyl Cellulose
Microcapsules Prepared by the Wurster Process. Chemical & Pharmaceutical Bulletin, 39,
164-169.
Garrett, M. H., Hooper, M. A., Hooper, B. M., Rayment, P. R. & Abramson, M. J. 1999.
Increased risk of allergy in children due to formaldehyde exposure in homes. Allergy, 54,
330-337.
Gasparini, G., Holdich, R. G. & Kosvintsev, S. R. 2010. PLGA particle production for
water-soluble drug encapsulation: Degradation and release behaviour. Colloids and
Surfaces B-Biointerfaces, 75, 557-564.
Gasparini, G., Kosvintsev, S. R., Stillwell, M. T. & Holdich, R. G. 2008. Preparation and
characterization of PLGA particles for subcutaneous controlled drug release by membrane
emulsification. Colloids and Surfaces B-Biointerfaces, 61, 199-207.
Gattner, H. & Ribka, J., inventors; Cassella Farbwerke Mainkur Aktiengesellschaft, assignee.
Melamine resin and dye mixtures. USA. 1975.
Gaumann, A., Laudes, M., Jacob, B., Pommersheim, R., Laue, C., Vogt, W. & Schrezenmeir, J.
2000. Effect of media composition on long-term in vitro stability of barium alginate and
polyacrylic acid multilayer microcapsules. Biomaterials, 21, 1911-1917.
Ghosh, S. K. 2006a. Functional Coatings, Weinheim, WILEY-VCH
Ghosh, S. K. 2006b. Functional Coatings and Microencapsulation: A General Perspective. In:
GHOSH, S. K. (ed.) Functional Coatings. Weinheim: WILEY-VCH
Gimenez-Arnau, A., Gimenez-Arnau, E., Serra-Baldrich, E., Lepoittevin, J. P. & Camarasa, J.
G. 2002. Principles and methodology for identification of fragrance allergens in consumer
products. Contact Dermatitis, 47, 345-352.
Gindl, W., Zargar-Yaghubi, F. & Wimmer, R. 2003. Impregnation of softwood cell walls with
melamine-formaldehyde resin. Bioresource Technology, 87, 325-330.
References
320
Gobel, H., Schmidt, G. & Soyka, D. 1994. Effect of Peppermint and Eucalyptus Oil
Preparations on Neurophysiological and Experimental Algesimetric Headache Parameters.
Cephalalgia, 14, 224-234.
Godderz, L. J., Peak, M. M. & Rodgers, K. K. 2005. Analysis of biological macromolecular
assemblies using static light scattering methods. Current Organic Chemistry, 9, 899-908.
Gouin, S. 2004. Microencapsulation: industrial appraisal of existing technologies and trends.
Trends in Food Science & Technology, 15, 330-347.
Green, B. K., inventor National Cash Register Corporation, assignee. Oil-contanting
microscopic capsules and method of making them. USA, patent US2800458. 1957.
Haefliger, O. P., Jeckelmann, N., Ouali, L. & Leon, G. 2010. Real-Time Monitoring of
Fragrance Release from Cotton Towels by Low Thermal Mass Gas Chromatography Using
a Longitudinally Modulating Cryogenic System for Headspace Sampling and Injection.
Analytical Chemistry, 82, 729-737.
Hao, D. X., Gong, F. L., Hu, G. H., Zhao, Y. J., Lian, G. P., Ma, G. H. & Su, Z. G. 2008.
Controlling factors on droplets uniformity in membrane emulsification: Experiment and
modeling analysis. Industrial & Engineering Chemistry Research, 47, 6418-6425.
Happi 2009. Household & Personal Products Industry, Rodman Publishing Corporation.
Harris, K. R. 2009. The fractional Stokes--Einstein equation: Application to Lennard-Jones,
molecular, and ionic liquids. The Journal of Chemical Physics, 131, 054503.
Hayford, D. E., inventor Appleton Papers Inc., assignee. Capsules manufacture. USA, patent
US 4444699. 1984.
Hernandez, O., Rhomberg, L., Hogan, K., Siegelscott, C., Lai, D., Grindstaff, G., Henry, M. &
Cotruvo, J. A. 1994. Risk Assessment of Formaldehyde. Journal of Hazardous Materials,
39, 161-172.
Hertz, A., Sarrade, S., Guizard, C. & Julbe, A. 2006. Synthesis and encapsulation of yttria
stabilized zirconia particles in supercritical carbon dioxide. Journal of the European
Ceramic Society, 26, 1195-1203.
Hiramoto, Y. 1963. Mechanical Properties of Sea Urchin Eggs .1. Surface Force and Elastic
Modulus of Cell Membrane. Experimental Cell Research, 32, 59-&.
References
321
Hiss, T. G. & Cussler, E. L. 1973. Diffusion in high viscosity liquids. Aiche Journal, 19,
698-703.
Ho, T. T. L. 2000. Formulating Detergents and Personal Care Products: A Complete Guide to
Product Development.
Hoffman, D. & Eisermann, H., inventors; BASF Aktiengesellschaft, assignee. Low-viscosity,
melamine-formaldehyde resin microcapsule dispersions with reduced formaldehyde. USA,
patent US 2003/0004226 A1. 2003.
Holdich, R. G., Dragosavac, M. M., Vladisavljevic, G. T. & Kosvintsev, S. R. 2010. Membrane
Emulsification with Oscillating and Stationary Membranes. Industrial & Engineering
Chemistry Research, 49, 3810-3817.
Holdich, R. G., Dragosavac, M. M., Vladisavljević, G. T. & Piacentini, E. 2013. Continuous
membrane emulsification with pulsed (oscillatory) flow. Industrial and Engineering
Chemistry Research, 52, 507-515.
Holdich, R. G., Ipek, I. Y., Lazrigh, M. & Shama, G. 2012. Production and Evaluation of
Floating Photocatalytic Composite Particles Formed Using Pickering Emulsions and
Membrane Emulsification. Industrial & Engineering Chemistry Research, 51,
12509-12516.
Holzner, G. & Verhovnik, G., inventors; Firmenich S. A., assignee. Stabilized liquid rinse-off
compositions comprising fragranced aminoplast capsules, patent WO2006018694A1. 2006.
Hong, K. & Park, S. 1999a. Melamine resin microcapsules containing fragrant oil: synthesis
and characterization. Materials Chemistry and Physics, 58, 128-131.
Hong, K. & Park, S. 1999b. Preparation of polyurethane microcapsules with different soft
segments and their characteristics. Reactive & Functional Polymers, 42, 193-200.
Horie, T., Nakatsune, K., Matsumoto, T., Tateishi, K. & Ohmura, N. 2011. Liquid-liquid two
phase flow of millichannel with a dynamic mixer. Chemical Engineering and Processing,
50, 1-8.
Hsieh, W. C., Chang, C. P. & Gao, Y. L. 2006. Controlled release properties of Chitosan
encapsulated volatile Citronella Oil microcapsules by thermal treatments. Colloids and
Surfaces B-Biointerfaces, 53, 209-214.

References
322
Hu, J., Xiao, Z. B., Ma, S. S., Zhou, R. J., Wang, M. X. & Li, Z. 2012. Properties of osmanthus
fragrance-loaded chitosan-sodium tripolyphosphate nanoparticles delivered through cotton
fabrics. Journal of Applied Polymer Science, 123, 3748-3754.
Hu, J., Xiao, Z. B., Zhou, R. J., Ma, S. S., Li, Z. & Wang, M. X. 2011. Comparison of
compounded fragrance and chitosan nanoparticles loaded with fragrance applied in cotton
fabrics. Textile Research Journal, 81, 2056-2064.
Hu, J. F., Chen, H. Q. & Zhang, Z. B. 2009. Mechanical properties of melamine formaldehyde
microcapsules for self-healing materials. Materials Chemistry and Physics, 118, 63-70.
Hu, Y.-H., Chen, C.-Y. & Wang, C.-C. 2004. Viscoelastic properties and thermal degradation
kinetics of silica/PMMA nanocomposites. Polymer Degradation and Stability, 84, 545-553.
Huisman, S. G., Dennis P.M. Van Gils & Sun, C. 2012. Applying laser Doppler anemometry
inside aTaylor–Couette geometry using aray-tracer to correct for curvatureeffects.
European Journal of Mechanics - B/Fluids.
Hunt, A. & O' Neil, R. M., inventors; BASF Se, assignee. Process for the Preparation of
Microcapsules. USA, patent US 7807076. 2004.
Hutchinson, I. H. 2004. Spin stability of asymmetrically charged plasma dust. New Journal of
Physics, 6.
Hwang, J. S., Kim, J. N., Wee, Y. J., Jang, H. G., Kim, S. H. & Ryu, H. W. 2006a. Factors
affecting the characteristics of melamine resin microcapsules containing fragrant oils.
Biotechnology and Bioprocess Engineering, 11, 391-395.
Hwang, J. S., Kim, J. N., Wee, Y. J., Yun, J. S., Jang, H. G., Kim, S. H. & Ryu, H. W. 2006b.
Preparation and characterization of melamine-formaidehyde resin microcapsules containing
fragrant oil. Biotechnology and Bioprocess Engineering, 11, 332-336.
Ibrahim, S. & Nienow, A. W. 2004. Suspension of microcarriers for cell culture with axial flow
impellers. Chemical Engineering Research & Design, 82, 1082-1088.
Ichikawa, H. & Fukumori, Y. 2000. A novel positively thermosensitive controlled-release
microcapsule with membrane of nano-sized poly(N-isopropylacrylamide) gel dispersed in
ethylcellulose matrix. Journal of Controlled Release, 63, 107-119.
References
323
Ichiura, H., Takayama, M., Nishida, N. & Otani, Y. 2012. Interfacial polymerization
preparation of functional paper coated with polyamide film containing volatile essential oil.
Journal of Applied Polymer Science, 124, 242-247.
Inomata, Y., Kasuya, Y., Fujimoto, K., Handa, H. & Kawaguchi, H. 1995. Purification of
Membrane-Receptors with Peptide-Carrying Affinity Latex-Particles. Colloids and
Surfaces B-Biointerfaces, 4, 231-241.
Ishiyama, C. & Higo, Y. 2002. Effects of humidity on Young's modulus in poly(methyl
methacrylate). Journal of Polymer Science Part B-Polymer Physics, 40, 460-465.
Jafari, M. H. S., Parvinzadeh, M. & Najafi, F. Year. Preparation of Fragrant Microencapsules
and Coating on Textiles. In: AIP Conference Proceedings, 2007. American Institute of
Physics. .
Jahns, E., Boeckh, D., Bertleff, W. & Neumann, P., inventors; BASF Aktiengesellschaft,
assignee. Microcapsule Preparations And Detergents And Cleaning Agents Containing
Microcapsules. USA, patent US 20030125222. 2003.
Jellinek, J. S. 1975. The Use of Fragrance in Consumer Products, New
York/London/Sydney/Toronto, John Wiley & Sons Inc.
Jo, Y. H., Song, Y. K., Yu, H. C., Cho, S. Y., Kumar, S. V., Ryu, B. C. & Chung, C. M. 2011.
Microencapsulation of Phenyl Acetate with Poly(urea-formaldehyde). Polymer-Korea, 35,
152-156.
Jono, K., Ichikawa, H., Miyamoto, M. & Fukumori, Y. 2000. A review of particulate design for
pharmaceutical powders and their production by spouted bed coating. Powder Technology,
113, 269-277.
Joseph, S. & Bunjes, H. 2012. Preparation of Nanoemulsions and Solid Lipid Nanoparticles by
Premix Membrane Emulsification. Journal of Pharmaceutical Sciences, 101, 2479-2489.
Ju, H. K., Kim, J. W., Han, S. H., Chang, I. S., Kim, H. K., Kang, H. H., Lee, O. S. & Suh, K. D.
2002. Thermotropic liquid-crystal/polymer microcapsules prepared by in situ suspension
polymerization. Colloid and Polymer Science, 280, 879-885.
Kamat, N. P., Lee, M. H., Lee, D. & Hammer, D. A. 2011. Micropipette aspiration of double
emulsion-templated polymersomes. Soft Matter, 7, 9863-9866.
References
324
Kantor, M. L., Barantsevitch, E. & Milstein, S. J., inventors; Emisphere tech. Inc., assignee.
Microencapsulated frangrances and method for preparation, patent WO9747288A1. 1997.
Karyakin, K., Lavrinenko, A. & Naydenov, I., inventors; Société anonyme NAICOM, assignee.
Production method of urea-melamine-formaldehyde resin, patent EP 2402379 A1. 2012.
Katagiri, K., Imai, Y., Koumoto, K., Kaiden, T., Kono, K. & Aoshima, S. 2011.
Magnetoresponsive On-Demand Release of Hybrid Liposomes Formed from Fe3O4
Nanoparticles and Thermosensitive Block Copolymers. Small, 7, 1683-1689.
Kawakatsu, T., Tragardh, G. & Tragardh, C. 2001. Production of W/O/W emulsions and
S/O/W pectin microcapsules by microchannel emulsification. Colloids and Surfaces
a-Physicochemical and Engineering Aspects, 189, 257-264.
Keh, H. J. & Chen, P. Y. 2001. Slow Motion of a Droplet between Two Parallel Plane Walls.
Chemical Engineering Science, 56, 6863-6871.
Kelly, T. J., Smith, D. L. & Satola, J. 1999. Emission rates of formaldehyde from materials and
consumer products found in California homes. Environmental Science & Technology, 33,
81-88.
Kentepozidou, A. & Kiparissides, C. 1995. Production of Water-Containing Polymer
Microcapsules by the Complex Emulsion Solvent Evaporation Technique - Effect of
Process Variables on the Microcapsule Size Distribution. Journal of Microencapsulation,
12, 627-638.
Kestin, J., Sokolov, M. & Wakeham, W. A. 1978. Viscosity of liquid water in the range -8 ºC to
150 ºC. Journal of Physical and Chemical Reference Data, 7, 941-948.
Kim, B. S., Lobaskin, V., Tsekov, R. & Vinogradova, O. I. 2007. Dynamics and stability of
dispersions of polyelectrolyte-filled multilayer microcapsules. Journal of Chemical Physics,
126.
Kim, J. W., Ko, J. Y., Jun, J. B., Chang, I. S., Kang, H. H. & Suh, K. D. 2003. Multihollow
polymer microcapsules by water-in-oil-in-water emulsion polymerization: morphological
study and entrapment characteristics. Colloid and Polymer Science, 281, 157-163.
Kim, J. W., Lee, K. S., Ju, H. K., Ryu, J. H., Han, S. H., Chang, I. S., Kang, H. H., Oh, S. G. &
Suh, K. D. 2004. Microencapsulation of cholesteryl alkanoate by polymerization-induced
References
325
phase separation and its association with drugs. Journal of Polymer Science Part a-Polymer
Chemistry, 42, 2202-2213.
Kobayashi, I., Uemura, K. & Nakajima, M. 2007. CFD analysis of generation of soybean
oil-in-water emulsion droplets using rectangular straight-through microchannels. Food
Science and Technology Research, 13, 187-192.
Kosaraju, S. L., D'ath, L. & Lawrence, A. 2006. Preparation and characterisation of chitosan
microspheres for antioxidant delivery. Carbohydrate Polymers, 64, 163-167.
Kosvintsev, S. R., Gasparini, G. & Holdich, R. G. 2008. Membrane emulsification: Droplet
size and uniformity in the absence of surface shear. Journal of Membrane Science, 313,
182-189.
Kosvintsev, S. R., Gasparini, G., Holdich, R. G., Cumming, I. W. & Stillwell, M. T. 2005.
Liquid-liquid membrane dispersion in a stirred cell with and without controlled shear.
Industrial & Engineering Chemistry Research, 44, 9323-9330.
Kou, X., Li, Q., Lei, J. D., Geng, L. Y., Deng, H. Q., Zhang, G. F., Ma, G. H., Su, Z. G. & Jiang,
Q. Y. 2012. Preparation of molecularly imprinted nanospheres by premix membrane
emulsification technique. Journal of Membrane Science, 417, 87-95.
Kukizaki, M. 2009. Shirasu porous glass (SPG) membrane emulsification in the absence of
shear flow at the membrane surface: Influence of surfactant type and concentration,
viscosities of dispersed and continuous phases, and transmembrane pressure. Journal of
Membrane Science, 327, 234-243.
Kukovič, M. & Knez, E., inventors; Aero, Kemicna, Graficna in Papirna Industrija, D.O.O.,
assignee. Process for preparing carriers saturated or coated with microencapsulated scents,
patent WO 96/09114. 1996.
Kumar, A. & Katiyar, V. 1990. Modeling and Experimental Investigation of Melamine
Formaldehyde Polymerization. Macromolecules, 23, 3729-3736.
Kuroiwa, T., Kiuchi, H., Noda, K., Kobayashi, I., Nakajima, M., Uemura, K., Sato, S.,
Mukataka, S. & Ichikawa, S. 2009. Controlled preparation of giant vesicles from uniform
water droplets obtained by microchannel emulsification with bilayer-forming lipids as
emulsifiers. Microfluidics and Nanofluidics, 6, 811-821.
References
326
Kusy, R. P., Whitley, J. Q. & Kalachandra, S. 2001. Mechanical properties and
interrelationships of poly(methyl methacrylate) following hydration over saturated salts.
Polymer, 42, 2585-2595.
Lan, C. W., Niu, G. C. C., Chang, S. J., Yao, C. H. & Kuo, S. M. 2011. Chitosan in Applications
of Biomedical Devices. Biomedical Engineering-Applications Basis Communications, 23,
51-62.
Lazenby, V., Hinwood, A., Callan, A. & Franklin, P. 2012. Formaldehyde personal exposure
measurements and time weighted exposure estimates in children. Chemosphere, 88,
966-973.
Leal-Calderon, F., Thivilliers, F. & Schmitt, V. 2007. Structured emulsions. Current Opinion
in Colloid & Interface Science, 12, 206-212.
Lebedeva, O. V., Kim, B. S. & Vinogradova, O. I. 2004. Mechanical properties of
polyelectrolyte-filled multilayer microcapsules studied by atomic force and confocal
microscopy. Langmuir, 20, 10685-10690.
Leblond, F. A., Tessier, J. & Halle, J. P. 1996. Quantitative method for the evaluation of
biomicrocapsule resistance to mechanical stress. Biomaterials, 17, 2097-2102.
Lee, D. H., Sim, G. S., Kim, J. H., Lee, G. S., Pyo, H. B. & Lee, B. C. 2007a. Preparation and
characterization of quercetin-loaded polymethyl methacrylate microcapsules using a
polyol-in-oil-in-polyol emulsion solvent evaporation method. Journal of Pharmacy and
Pharmacology, 59, 1611-1620.
Lee, K. & Popplewell, L. M., inventors; International Flavors & Fragrances Inc., assignee.
Stable fragrance microcapsule suspension and process for using same. USA, patent US
2005/0227907 A1. 2005.
Lee, K. D., Popplewell, L. M. & Anastasiou, T. J., inventors; International Flavors &
Fragrances Inc., assignee. Process for preparing a high stability microcapsule product and
method for using same. USA, patent US 2007/0138673 A1. 2007b.
Lee, Y. H., Kim, C. A., Jang, W. H., Choi, H. J. & Jhon, M. S. 2001. Synthesis and
electrorheological characteristics of microencapsulated polyaniline particles with
melamine-formaldehyde resins. Polymer, 42, 8277-8283.
References
327
Li, J. H., Guan, Y. X., Wang, H. Q. & Yao, S. J. 2009. Dehydrogenation of 11
alpha-hydroxy-16 alpha, 17-epoxyprogesterone by encapsulated Arthrobacter simplex cells
in an aqueous/organic solvent two-liquid-phase system. Journal of Chemical Technology
and Biotechnology, 84, 208-214.
Li, W. 2010. Integrated Droplet-Based Microfluidics for Chemical Reactions and Processes
Doctor of Philosophy, University of Toronto.
Li, W., Wang, J., Wang, X., Wu, S. & Zhang, X. 2007a. Effects of ammonium chloride and heat
treatment on residual formaldehyde contents of melamine-formaldehyde microcapsules.
Colloid and Polymer Science, 285, 1691-1697.
Li, W., Wang, J. P., Wang, X. C., Wu, S. Z. & Zhang, X. X. 2007b. Effects of ammonium
chloride and heat treatment on residual formaldehyde contents of melamine-formaldehyde
microcapsules. Colloid and Polymer Science, 285, 1691-1697.
Li, W., Zhang, X. X., Wang, X. C. & Niu, J. J. 2007c. Preparation and characterization of
microencapsulated phase change material with low remnant formaldehyde content.
Materials Chemistry and Physics, 106, 437-442.
Liu, F., Wen, L. X., Li, Z. Z., Yu, W., Sun, H. Y. & Chen, J. F. 2006. Porous hollow silica
nanoparticles as controlled delivery system for water-soluble pesticide. Materials Research
Bulletin, 41, 2268-2275.
Liu, K. K., Williams, D. R. & Briscoe, B. J. 1998. The large deformation of a single
micro-elastomeric sphere. Journal of Physics D-Applied Physics, 31, 294-303.
Liu, M. 2010. Understanding the Mechanical Strength of Microcapsules and Their Adhesion
on Fabric Surfaces. DOCTOR OF PHILOSOPHY, University of Birmingham.
Liu, R., Ma, G. H., Meng, F. T. & Su, Z. G. 2005a. Preparation of uniform-sized PLA
microcapsules by combining Shirasu Porous Glass membrane emulsification technique and
multiple emulsion-solvent evaporation method. Journal of Controlled Release, 103, 31-43.
Liu, T., Donald, A. M. & Zhang, Z. 2005b. Novel manipulation in environmental scanning
electron microscope for measuring mechanical properties of single nanoparticles. Materials
Science and Technology, 21, 289-294.
References
328
Long, Y., Vincent, B., York, D., Zhang, Z. B. & Preece, J. A. 2010. Organic-inorganic double
shell composite microcapsules. Chemical Communications, 46, 1718-1720.
Long, Y., York, D., Zhang, Z. B. & Preece, J. A. 2009. Microcapsules with low content of
formaldehyde: preparation and characterization. Journal of Materials Chemistry, 19,
6882-6887.
Loxley, A. & Vincent, B. 1998. Preparation of poly(methylmethacrylate) microcapsules with
liquid cores. Journal of Colloid and Interface Science, 208, 49-62.
Luo, W. J., Yang, W., Jiang, S., Feng, J. M. & Yang, M. B. 2007. Microencapsulation of
decabromodiphenyl ether by in situ polymerization: Preparation and characterization.
Polymer Degradation and Stability, 92, 1359-1364.
Ma, G. 2003. Control of polymer particle size using porous glass membrane emulsification: A
review. China Particuology, 1, 105-114.
Ma, L. W., Liu, M. Z. & Shi, X. 2012. pH- and temperature-sensitive self-assembly
microcapsules/microparticles: Synthesis, characterization, in vitro cytotoxicity, and drug
release properties. Journal of Biomedical Materials Research Part B-Applied Biomaterials,
100B, 305-313.
Madene, A., Jacquot, M., Scher, J. & Desobry, S. 2006. Flavour encapsulation and controlled
release - a review. International Journal of Food Science and Technology, 41, 1-21.
Malvern Instruments Limited. A Basic Guide to Particle Characterization. Worcestershire:
Malvern instruments limited; 2012.
Malvern Instruments Ltd. Optical property validation: Comparing laser diffraction and image
analysis measurements Worcestershire; 2007.
Manga, M. S., Cayre, O. J., Williams, R. A., Biggs, S. & York, D. W. 2012. Production of
solid-stabilised emulsions through rotational membrane emulsification: influence of particle
adsorption kinetics. Soft Matter, 8, 1532-1538.
Martin-Banderas, L., Flores-Mosquera, M., Riesco-Chueca, P., Rodriguez-Gil, A., Cebolla, A.,
Chavez, S. & Ganan-Calvo, A. M. 2005. Flow focusing: A versatile technology to produce
size-controlled and specific-morphology microparticles. Small, 1, 688-692.
References
329
Masataka, K. & Yasuhiro, O., inventors; Fuji photo fim, assignee. Process for preparing
microcapsules. USA, patent US 3981821. 1976.
Mashmoushy, H., Zhang, Z. & Thomas, C. R. 1998. Micromanipulation measurement of the
mechanical properties of baker's yeast cells. Biotechnology Techniques, 12, 925-929.
Mercade-Prieto, R., Allen, R., York, D., Preece, J. A., Goodwin, T. E. & Zhang, Z. 2012a.
Determination of the Failure Stresses for Fluid-filled Microcapsules that Rupture Near the
Elastic Regime. Experimental Mechanics, 52, 1435-1445.
Mercade-Prieto, R., Allen, R., York, D., Preece, J. A., Goodwin, T. E. & Zhang, Z. B. 2011a.
Compression of elastic-perfectly plastic microcapsules using micromanipulation and finite
element modelling: Determination of the yield stress. Chemical Engineering Science, 66,
1835-1843.
Mercade-Prieto, R., Allen, R., York, D., Preece, J. A., Goodwin, T. E. & Zhang, Z. B. 2012b.
Determination of the shell permeability of microcapsules with a core of oil-based active
ingredient. Journal of Microencapsulation, 29, 463-474.
Mercade-Prieto, R., Allen, R., Zhang, Z. B., York, D., Preece, J. A. & Goodwin, T. E. 2012c.
Failure of elastic-plastic core-shell microcapsules under compression. Aiche Journal, 58,
2674-2681.
Mercade-Prieto, R., Nguyen, B., Allen, R., York, D., Preece, J. A., Goodwin, T. E. & Zhang, Z.
B. 2011b. Determination of the elastic properties of single microcapsules using
micromanipulation and finite element modeling. Chemical Engineering Science, 66,
2042-2049.
Mercadé-Prieto, R., Pan, X., Fernández-González, A., Zhang, Z. & Bakalis, S. 2012a.
Quantification of Microcapsules Deposited in Cotton Fabrics before and after Abrasion
Using Fluorescence Microscopy. Industrial & Engineering Chemistry Research, 51,
16741-16749.
Mercadé-Prieto, R., Pan, X., Fernández-González, A., Zhang, Z. & Bakalis, S. 2012b.
Quantification of Microcapsules Deposited in Cotton Fabrics before and after Abrasion
Using Fluorescence Microscopy. Industrial & Engineering Chemistry Research, 51,
16741–16749.
References
330
Mercade-Prieto, R. & Zhang, Z. B. 2012. Mechanical characterization of microspheres -
capsules, cells and beads: a review. Journal of Microencapsulation, 29, 277-285.
Mihranyan, A., Ferraz, N. & Stromme, M. 2012. Current status and future prospects of
nanotechnology in cosmetics. Progress in Materials Science, 57, 875-910.
Moira, P. P. D., inventor The Wiggins Teape Group Limited, assignee. Self-contained pressure
sensitive copying material and its production. USA, patent US 4612556. 1986.
Monllor, P., Bonet, M. A. & Cases, F. 2007. Characterization of the behaviour of flavour
microcapsules in cotton fabrics. European Polymer Journal, 43, 2481-2490.
Mulqueen, M. & Huibers, P. D. T. 2002. Measuring Equilibrium Surface Tensions. Analysis
and characterization in surface chemistry. Cambridge, USA: John Wiley and Sons.
Murua, A., Portero, A., Orive, G., Hernandez, R. M., De Castro, M. & Pedraz, J. L. 2008. Cell
microencapsulation technology: Towards clinical application. Journal of Controlled
Release, 132, 76-83.
Nagata, S. 1975. Mixing: Principles and Applications and Research in Food Processing,
Tokyo, Halsted Press.
Nakashima, T. & Shimizu, M. 1988. Porous glass from calcium alumino borosilicate glass.
Ceramics, 21, 408.
Nakashima, T., Shimizu, M. & Kukizaki, M. Membrane Emulsification, Operation Manual.
Miyazaki, Japan: Industrial Research Institute of Miyazaki Prefecture; 1991.
Nakashima, T., Shimizu, M. & Kukizaki, M. 2000. Particle control of emulsion by membrane
emulsification and its applications. Advanced Drug Delivery Reviews, 45, 47-56.
Nazir, A., Schroen, K. & Boom, R. 2010. Premix emulsification: A review. Journal of
Membrane Science, 362, 1-11.
Nazir, H., Lv, P. P., Wang, L. Y., Lian, G. P., Zhu, S. P. & Ma, G. H. 2011. Uniform-sized
silicone oil microemulsions: Preparation, investigation of stability and deposition on hair
surface. Journal of Colloid and Interface Science, 364, 56-64.
Nelson, G. 2002. Application of microencapsulation in textiles. International Journal of
Pharmaceutics, 242, 55-62.
References
331
Nesic, V., Sipetic, S., Vlajinac, H., Stosic-Divjak, S. & Jesic, S. 2010. Risk Factors for the
Occurrence of Undifferentiated Carcinoma of Nasopharyngeal Type: A Case-Control Study.
Srpski Arhiv Za Celokupno Lekarstvo, 138, 6-10.
Ness, N. J., inventor Quest International B.V., assignee. Perfume encapsulates. The United
Kingdom, patent EP1368115 A1. 2003.
Ness, N. J., inventor Quest International Services B.V. , assignee. Perfume encapsulates USA,
patent US 7238655. 2007.
Nordstierna, L., Abdalla, A. A., Nordin, M. & Nyden, M. 2010. Comparison of release
behaviour from microcapsules and microspheres. Progress in Organic Coatings, 69, 49-51.
O'sullivan, M., Zhang, Z. B. & Vincent, B. 2009. Silica-Shell/Oil-Core Microcapsules with
Controlled Shell Thickness and Their Breakage Stress. Langmuir, 25, 7962-7966.
Ohtsubo, T., Tsuda, S. & Tsuji, K. 1991. A Study of the Physical Strength of Fenitrothion
Microcapsules. Polymer, 32, 2395-2399.
Okada, Y. & Igarashi, Y., inventors; Kureha Kagaku Kogyo Kabushiki Kaisha, assignee.
Process for producing a microcapsule. USA, patent US 4460722. 1984.
Okada, Y. & Igarashi, Y., inventors; Kureha Kagaku Kogyo Kabushiki Kaisha, assignee.
Microcapsule for pressure-sensitive recording paper and process for producing the same.
USA, patent US 4562116. 1985.
Okano, M. & Ogata, Y. 1952. Kinetics of the Condensation of Melamine with Formaldehyde.
74, 5728-5731.
Okubo, M. & Hattori, H. 1993. Studies on Suspension and Emulsion .138. Competitive
Adsorption of Fibrinogen and Albumin onto Polymer Microspheres Having
Hydrophilic/Hydrophobic Heterogeneous Surface-Structures. Colloid and Polymer Science,
271, 1157-1164.
Omi, S., Kanetaka, A., Shimamori, Y., Supsakulchai, A., Nagai, M. & Ma, G. H. 2001.
Magnetite (Fe3O4) microcapsules prepared using a glass membrane and solvent removal.
Journal of Microencapsulation, 18, 749-765.
References
332
Paramita, V., Iida, K., Yoshii, H. & Furuta, T. 2010. Effect of Feed Liquid Temperature on the
Structural Morphologies of d-Limonene Microencapsulated Powder and Its Preservation.
Journal of Food Science, 75, E39-E45.
Parekh, P. P., Fernandez, G. H. & Colt, K. K., inventors; International Flavors & Fragrances
Inc., assignee. Melamine-formaldehyde microcapsule slurries for fabric article freshening.
USA, patent US 2005/0113282. 2005.
Park, S.-J., Kim, K.-S. & Kim, S.-H. 2005. Effect of poly(ethylene oxide) on the release
behaviors of poly(ɛ-caprolactone) microcapsules containing erythromycin. Colloids and
Surfaces B: Biointerfaces, 43, 238-244.
Park, S. I., Park, N. H. & Suh, K. D. 2002. The effect of mono-sized liquid crystal domains on
electro-optical properties in a polymer dispersed liquid crystal prepared by using
monodisperse poly(methylmethacrylate)/liquid crystal microcapsules. Liquid Crystals, 29,
783-787.
Peirone, M. A., Delaney, K., Kwiecin, J., Fletch, A. & Chang, P. L. 1998. Delivery of
recombinant gene product to canines with nonautologous microencapsulated cells. Human
Gene Therapy, 9, 195-206.
Pena, B., De Menorval, L. C., Garcia-Valls, R. & Gumi, T. 2011. Characterization of
Polysulfone and Polysulfone/Vanillin Microcapsules by H-1 NMR Spectroscopy,
Solid-State C-13 CP/MAS-NMR Spectroscopy, and N-2 Adsorption Desorption Analyses.
Acs Applied Materials & Interfaces, 3, 4420-4430.
Pena, B., Panisello, C., Areste, G., Garcia-Valls, R. & Gumi, T. 2012. Preparation and
characterization of polysulfone microcapsules for perfume release. Chemical Engineering
Journal, 179, 394-403.
Peng, S. J. & Williams, R. A. 1998a. Controlled production of emulsions using a crossflow
membrane. Particle & Particle Systems Characterization, 15, 21-25.
Peng, S. J. & Williams, R. A. 1998b. Controlled production of emulsions using a crossflow
membrane part I: Droplet formation from a single pore. Chemical Engineering Research &
Design, 76, 894-901.
References
333
Piacentini, E., Giorno, L., Dragosavac, M. M., Vladisavljević, G. T. & Holdich, R. G. 2013.
Microencapsulation of oil droplets using cold water fish gelatine/gum arabic complex
coacervation by membrane emulsification. Food Research International, 53, 362-372.
Pluyter, J. G. L. & Anastasiou, T. J., inventors; International flavors & fragrances., assignee.
Encapsulated Fragrance Materials and Methods for Making Same. The United Kingdom,
patent EP 1719554. 2006.
Polakovic, M., Gorner, T., Gref, R. & Dellacherie, E. 1999. Lidocaine loaded biodegradable
nanospheres II. Modelling of drug release. Journal of Controlled Release, 60, 169-177.
Popplewell, L. M., Brain, J., Pluyter, J. G. L., Zhen, Y. & Lee, K. D., inventors; International
Flavors & Fragrances Inc., assignee. Encapsulated materials. USA, patent US 20050112152.
2005.
Popplewell, L. M., Guerry, R., Zhen, Y. & Joyce, C., inventors; International Flavors &
Fragrances Inc., assignee. Hard surface cleaning compositions and methods for making
same. USA, patent US 2006/0258557. 2006.
Popplewell, L. M., Lee, K. & Pluyter, J. G. L., inventors; International Flavors & Fragrances
Inc., assignee. Encapsulated fragrance chemicals. USA, patent US 2004/0071742 A1. 2004.
Poux, S. & Meier, W. 2005. Synthesis and characterization of new polymer nanocontainers.
Macromolecular Symposia, 222, 157-162.
Pranzetti, A., Salaun, S., Mieszkin, S., Callow, M. E., Callow, J. A., Preece, J. A. & Mendes, P.
M. 2012. Model Organic Surfaces to Probe Marine Bacterial Adhesion Kinetics by Surface
Plasmon Resonance. Advanced Functional Materials, 22, 3672-3681.
Pretzl, M., Neubauer, M., Tekaat, M., Kunert, C., Kuttner, C., Leon, G., Berthier, D., Erni, P.,
Ouali, L. & Fery, A. 2012. Formation and Mechanical Characterization of Aminoplast
Core/Shell Microcapsules. Acs Applied Materials & Interfaces, 4, 2940-2948.
Pugh, R. J. 2005. Experimental techniques for studying the structure of foams and froths.
Advances in Colloid and Interface Science, 114, 239-251.
Quellet, C. & Hotz, J., inventors; Givaudan SA, assignee. Product, patent WO 2009100553.
2009.
References
334
Ramelow, U. S. & Pingili, S. 2010. Synthesis of Ethylene Glycol Dimethacrylate-Methyl
Methacrylate Copolymers, Determination of their Reactivity Ratios, and a Study of Dopant
and Temperature Effects on their Conductivities Polymers, 2, 265-285.
Rasmussen, W. L. C. 2001. Novel Carbazole Based Methacrylates, Acrylates, and
Dimethacrylates to Produce High Refractive Index Polymers. Doctor of Philosophy,
Virginia Polytechnic Institute and State University.
Rayner, M., Tragardh, G. & Tragardh, C. 2005. The impact of mass transfer and interfacial
expansion rate on droplet size in membrane emulsification processes. Colloids and Surfaces
a-Physicochemical and Engineering Aspects, 266, 1-17.
Rayner, M., Tragardh, G., Tragardh, C. & Dejmek, P. 2004. Using the Surface Evolver to
model droplet formation processes in membrane emulsification. Journal of Colloid and
Interface Science, 279, 175-185.
Rehor, A., Canaple, L., Zhang, Z. B. & Hunkeler, D. 2001. The compressive deformation of
multicomponent microcapsules: Influence of size, membrane thickness, and compression
speed. Journal of Biomaterials Science-Polymer Edition, 12, 157-170.
Reissner 2006. Elsner Progr Colloid Polym Sci, 132, 117-123.
Ren, Y. L., Donald, A. M. & Zhang, Z. B. 2007. Investigation of radiation damage to
microcapsules in environmental SEM. Materials Science and Technology, 23, 857-864.
Renken, A. & Hunkeler, D. 1998. Microencapsulation: a review of polymers and technologies
with a focus on bioartificial organs. Polimery, 43, 530-539.
Retiveau, A. The Role of Fragrance in Personal Care Products; 2012.
Ribeiro, H. S., Rico, L. G., Badolato, G. G. & Schubert, H. 2005. Production of O/W emulsions
containing astaxanthin by repeated Premix membrane emulsification. Journal of Food
Science, 70, E117-E123.
Rodrigues, S. N., Fernandes, I., Martins, I. M., Mata, V. G., Barreiro, F. & Rodrigues, A. I.
2008. Microencapsulation of limonene for textile application. Industrial & Engineering
Chemistry Research, 47, 4142-4147.
References
335
Rodrigues, S. N., Martins, I. M., Fernandes, I. P., Gomes, P. B., Mata, V. G., Barreiro, M. F. &
Rodrigues, A. E. 2009. Scentfashion (R): Microencapsulated perfumes for textile
application. Chemical Engineering Journal, 149, 463-472.
Rueger, P. E. & Calabrese, R. V. Dispersion of water into oil in a rotor–stator mixer. Part 1:
Drop breakup in dilute systems. Chemical Engineering Research and Design.
Ryu, J. H., Lee, S. G. & Suh, K. D. 2004. The influence of nematic liquid crystal content on the
electrooptical properties of a polymer dispersed liquid crystal prepared with monodisperse
liquid crystal microcapsules. Liquid Crystals, 31, 1587-1593.
Saeki, K., Matsukawa, H. & Satomura, M., inventors; Fuji Photo Film Co., Ltd., assignee.
Method for preparing microcapsules. USA, patent US 4251386. 1981.
Sakai, S., Ito, S., Inagaki, H., Hirose, K., Matsuyama, T., Taya, M. & Kawakami, K. 2011.
Cell-enclosing gelatin-based microcapsule production for tissue engineering using a
microfluidic flow-focusing system. Biomicrofluidics, 5.
Salari, J. W. O., Leermakers, F. A. M. & Klumperman, B. 2011. Pickering Emulsions: Wetting
and Colloidal Stability of Hairy Particles-A Self-Consistent Field Theory. Langmuir, 27,
6574-6583.
Salari, M. H., Amine, G., Shirazi, M. H., Hafezi, R. & Mohammadypour, M. 2006.
Antibacterial effects of Eucalyptus globulus leaf extract on pathogenic bacteria isolated
from specimens of patients with respiratory tract disorders. Clinical Microbiology and
Infection, 12, 194-196.
Salentinig, S., Yaghmur, A., Guillot, S. & Glatter, O. 2008. Preparation of highly concentrated
nanostructured dispersions of controlled size. Journal of Colloid and Interface Science, 326,
211-220.
Salgi, P. & Rajagopalan, R. 1993. Polydispersity in Colloids - Implications to Static Structure
and Scattering. Advances in Colloid and Interface Science, 43, 169-288.
Sari, A., Alkan, C., Karaipekli, A. & Uzun, O. 2009. Microencapsulated n-octacosane as phase
change material for thermal energy storage. Solar Energy, 83, 1757-1763.
Sato, K. 1968. Condensation of Methylolmelamine. Bulletin of the chemical society of Japan,
41, 7-17.
References
336
Sato, K., Nakajima, T. & Anzai, J. 2012. Preparation of poly(methyl methacrylate)
microcapsules by in situ polymerization on the surface of calcium carbonate particles.
Journal of Colloid and Interface Science, 387, 123-126.
Sawalha, H., Fan, Y. X., Schroen, K. & Boom, R. 2008. Preparation of hollow polylactide
microcapsules through premix membrane emulsification-Effects of nonsolvent properties.
Journal of Membrane Science, 325, 665-671.
Schaab, C. K. & Tararuj, C., inventors; Webcraft Technologies, Inc., assignee. Powder and
microcapsule fragrance enhanced sampler. USA, patent US 4952400 A. 1988.
Schibler, L., inventor Ciba, Limited., assignee. Process for the Encapsulation of Dispersible
Materials USA, patent US 3594328. 1971.
Schmidt, C. J., Tebbett, I. R. & Couch, M. W. 2000. Carbonless copy paper: A review of its
chemical components and health hazards. American Industrial Hygiene Association Journal,
61, 214-222.
Schroder, V., Behrend, O. & Schubert, H. 1998. Effect of dynamic interfacial tension on the
emulsification process using microporous, ceramic membranes. Journal of Colloid and
Interface Science, 202, 334-340.
Schroder, V. & Schubert, H. 1999. Production of emulsions using microporous, ceramic
membranes. Colloids and Surfaces a-Physicochemical and Engineering Aspects, 152,
103-109.
Schwarb, F., Imanidis, G., Smith, E., Haigh, J. & Surber, C. 1999. Effect of Concentration and
Degree of Saturation of Topical Fluocinonide Formulations on In Vitro Membrane
Transport and In Vivo Availability on Human Skin. Pharmaceutical Research, 16, 909-915.
Seitz, M. E., inventor The Standard Register Company, assignee. Melamine-formaldehyde
microencapsulation in aqueous solutions containing high concentrations of organic solvent.
USA, patent US 5268130. 1990.
Seitz, M. E., inventor The Standard Register Company, assignee. Microencapsulation process
using melamine-formaldehyde and microcapsules producted thereby. USA, patent US
5204185. 1993.
References
337
Sgraja, M., Blomer, J., Bertling, J. & Jansens, P. J. 2008. In Situ Encapsulation of Tetradecane
Droplets in Oil-in-Water Emulsions Using Amino Resins. Journal of Applied Polymer
Science, 110, 2366-2373.
Shen, J., Chen, C. C. & Sauer, J. A. 1985. Effects of Sorbed Water on Properties of Low and
High Molecular-Weight Pmma .1. Deformation and Fracture-Behavior. Polymer, 26,
511-518.
Shen, J., Qin, Y., Wang, G. X., Fu, X., Wei, C. & Lei, B. 2011. Relative permeabilities of gas
and water for different rank coals. International Journal of Coal Geology, 86, 266-275.
Sinclair, P., inventor The Wiggins Teape Group Limited, assignee. Production of
microcapsules. The United Kingdom, patent GB2073132. 1981.
Skoog, D. A., West, D. M., Holler, F. J. & Crouch, S. R. 1999. Analytical Chemistry: An
Introduction Thomson Learning.
Smets, J., Nair, R. J., Pintens, A., Yasuhara, T. & Iwasaki, T., inventors; The Procter and
Gamble Company, assignee. Microcapsule and method of producing same. USA, patent US
7901772. 2011a.
Smets, J., Vansteenwinckel, P. C. A., Gizaw, Y., Hulskotter, F., Boechh, D. & Haehnle, H.-J.,
inventors; The Procter and Gamble Company, assignee. High-efficiency perfume capsules.
USA, patent US 2011/0111999. 2011b.
Smith, A. E., Zhang, Z. & Thomas, C. R. 2000. Wall material properties of yeast cells: Part 1.
Cell measurements and compression experiments. Chemical Engineering Science, 55,
2031-2041.
Soderholm, K. J. & Calvert, P. D. 1983. Effects of Water on Glass-Filled Methacrylate Resins.
Journal of Materials Science, 18, 2957-2962.
Sohn, S. O., Lee, S. M., Kim, Y. M., Yeum, J. H., Choi, J. H. & Do Ghim, H. 2007. Aroma
finishing of PET fabrics with PVAc nanoparticles containing lavender oil. Fibers and
Polymers, 8, 163-167.
Soliman, K. & Marschall, E. 1990. Viscosity of selected binary, ternary, and quaternary liquid
mixtures. Journal of Chemical & Engineering Data, 35, 375-381.
References
338
Song, Y. C., Tong, W. J. & Gao, C. Y. 2012. Regulation of Free Carboxylate Groups of
Alginate Microspheres with Nacl Solution and Its Effect in Doxorubicin Loading and
Release. Acta Polymerica Sinica, 771-777.
Sotoyama, K., Asano, Y., Ihara, K., Takahashi, K. & Doi, K. 1999. Water oil emulsions
prepared by the membrane emulsification method and their stability. Journal of Food
Science, 64, 211-215.
Specos, M. M. M., Escobar, G., Marino, P., Puggia, C., Tesoriero, M. V. D. & Hermida, L.
2010. Aroma Finishing of Cotton Fabrics by Means of Microencapsulation Techniques.
Journal of Industrial Textiles, 40, 13-32.
St. Laurent, C. T. R. J. B., Carrara, G., Denutte, G. R. H., D'hardemare, R., Gray, G. P., Mariani,
M., Merere, I., Orchard, J. A., Topkara, H. S. & Smets, J., inventors; The Procter and
Gamble Company, assignee. Perfuming method and product, patent WO2007030511A1.
2007.
Stachurski, Z. H. 2003. Strength and deformation of rigid polymers: the stress-strain curve in
amorphous PMMA. Polymer, 44, 6067-6076.
Stenekes, R. J. H., De Smedt, S. C., Demeester, J., Sun, G. Z., Zhang, Z. B. & Hennink, W. E.
2000. Pore sizes in hydrated dextran microspheres. Biomacromolecules, 1, 696-703.
Stillwell, M. T., Holdich, R. G., Kosvintsev, S. R., Gasparini, G. & Cumming, I. W. 2007.
Stirred cell membrane emulsification and factors influencing dispersion drop size and
uniformity. Industrial & Engineering Chemistry Research, 46, 965-972.
Stoffel, M., Wahl, S., Lorenceau, E., Hohler, R., Mercier, B. & Angelescu, D. 2012. Study of a
new multi channel foam and emulsion generator. MRS Proceedings, 1425.
Su, J. F., Wang, L. X., Ren, L. & Huang, Z. 2007. Mechanical properties and thermal stability
of double-shell thermal-energy-storage microcapsules. Journal of Applied Polymer Science,
103, 1295-1302.
Su, J. F., Wang, S. B., Zhang, Y. Y. & Huang, Z. 2011. Physicochemical properties and
mechanical characters of methanol-modified melamine-formaldehyde (MMF) shell
microPCMs containing paraffin. Colloid and Polymer Science, 289, 111-119.
References
339
Su, J. F., Wang, X. Y. & Dong, H. 2012. Influence of temperature on the deformation behaviors
of melamine-formaldehyde microcapsules containing phase change material. Materials
Letters, 84, 158-161.
Sumiga, B., Knez, E., Vrtacnik, M., Savec, V. F., Staresinic, M. & Boh, B. 2011. Production of
Melamine-Formaldehyde PCM Microcapsules with Ammonia Scavenger used for Residual
Formaldehyde Reduction. Acta Chimica Slovenica, 58, 14-25.
Sun, G. & Zhang, Z. 2001. Mechanical properties of melamine-formaldehyde microcapsules.
Journal of Microencapsulation, 18, 593-602.
Sun, G. & Zhang, Z. 2002. Mechanical strength of microcapsules made of different wall
materials. International Journal of Pharmaceutics, 242, 307-311.
Sympatec. Image Analysis; 2012.
Taber, L. A. 1982. Large Deflection of a Fluid-Filled Spherical-Shell under a Point Load.
Journal of Applied Mechanics-Transactions of the Asme, 49, 121-128.
Taguchi, Y. & Tanaka, M. 2001. Preparation of microcapsules composed of waste-expanded
polystyrene and paper fiber by semichemical recycle. Journal of Applied Polymer Science,
80, 2662-2669.
Taguchi, Y., Yokoyama, H., Kado, H. & Tanaka, M. 2007. Preparation of PCM microcapsules
by using oil absorbable polymer particles. Colloids and Surfaces a-Physicochemical and
Engineering Aspects, 301, 41-47.
Takeuchi, S., Garstecki, P., Weibel, D. B. & Whitesides, G. M. 2005. An axisymmetric
flow-focusing microfluidic device. Advanced Materials, 17, 1067-+.
Tan, T. F., Wang, S. R., Li, X. G., Wang, C. Y. & An, Y. 2009. Facile preparation and
characterization of hollow poly(St-co-MMA-co-BA-co-MAA) core-double shell latex
nanoparticles for electrophoretic displays. Current Applied Physics, 9, 989-992.
Tang, E., Cheng, G. & Ma, X. 2006. Preparation of nano-ZnO/PMMA composite particles via
grafting of the copolymer onto the surface of zinc oxide nanoparticles. Powder Technology,
161, 209-214.
References
340
Tavera, E. M., Kadali, S. B., Bagaria, H. G., Liu, A. W. & Wong, M. S. 2009. Experimental and
modeling analysis of diffusive release from single-shell microcapsules. Aiche Journal, 55,
2950-2965.
Teixeira, C. S. N. R., Martins, I. M. D., Mata, V. L. G., Barreiro, M. F. F. & Rodrigues, A. E.
2012a. Characterization and evaluation of commercial fragrance microcapsules for textile
application. Journal of the Textile Institute, 103, 269-282.
Teixeira, M. A., Rodriguez, O., Rodrigues, S., Martins, I. & Rodrigues, A. E. 2012b. A case
study of product engineering: Performance of microencapsulated perfumes on textile
applications. Aiche Journal, 58, 1939-1950.
Thomas, C. R., Zhang, Z. & Cowen, C. 2000. Micromanipulation measurements of biological
materials. Biotechnology Letters, 22, 531-537.
Timgren, A., Tragardh, G. & Tragardh, C. 2010. A model for drop size prediction during
cross-flow emulsification. Chemical Engineering Research & Design, 88, 229-238.
Turchiuli, C., Lemarié, N., Cuvelier, M.-E. & Dumoulin, E. 2013. Production of fine emulsions
at pilot scale for oil compounds encapsulation. Journal of Food Engineering, 115, 452-458.
Tzhayik, O., Cavaco-Paulo, A. & Gedanken, A. 2012. Fragrance release profile from
sonochemically prepared protein microsphere containers. Ultrasonics Sonochemistry, 19,
858-863.
Uchiyama, H., Cetti, J. R., Alonso, M., Montezinos, D. L. & Cobb, D. S., inventors; The
Procter and Gamble Company, assignee. Compositions comprising a dispersant and
microcapsules containing an active material. USA, patent US 2003/0216488 A1. 2003a.
Uchiyama, H., Cetti, J. R., Alonso, M., Montezinos, D. L. & Cobb, D. S., inventors; The
Procter and Gamble Company, assignee. Malodor-controlling compositions comprising
odor control agents and microcapsules containing an active material. USA, patent US
2003/0215417 A1. 2003b.
Ullah, A., Holdich, R. G., Naeem, M. & Starov, V. M. 2012a. Shear enhanced microfiltration
and rejection of crude oil drops through a slotted pore membrane including migration
velocities. Journal of Membrane Science, 421, 69-74.
References
341
Ullah, A., Holdich, R. G., Naeem, M. & Starov, V. M. 2012b. Stability and deformation of oil
droplets during microfiltration on a slotted pore membrane. Journal of Membrane Science,
401, 118-124.
Umer, H., Nigam, H., Tamboli, A. M. & Nainar, M. S. M. 2011. Microencapsulation: Process,
Techniques and Applications. International Journal of Research in Pharmaceutical and
Biomedical Sciences, 2, 474-481.
Van Der Graaf, S., Nisisako, T., Schroen, C. G. P. H., Van Der Sman, R. G. M. & Boom, R. M.
2006. Lattice Boltzmann simulations of droplet formation in a T-shaped microchannel.
Langmuir, 22, 4144-4152.
Van Dijke, K. C., Schroen, K., Van Der Padt, A. & Boom, R. 2010. EDGE emulsification for
food-grade dispersions. Journal of Food Engineering, 97, 348-354.
Vincent, P. I. 1972. Correlation between Critical Tensile-Strength and Polymer
Cross-Sectional Area. Polymer, 13, 558-&.
Vinogradova, O. I. 2004. Mechanical properties of polyelectrolyte multilayer microcapsules.
Journal of Physics-Condensed Matter, 16, R1105-R1134.
Vladisavljevic, G. T., Kobayashi, I. & Nakajima, M. 2008. Generation of highly uniform
droplets using asymmetric microchannels fabricated on a single crystal silicon plate: Effect
of emulsifier and oil types. Powder Technology, 183, 37-45.
Vladisavljevic, G. T., Shimizu, M. & Nakashima, T. 2004. Preparation of monodisperse
multiple emulsions at high production rates by multi-stage premix membrane emulsification.
Journal of Membrane Science, 244, 97-106.
Vladisavljevic, G. T. & Williams, R. A. 2005. Recent developments in manufacturing
emulsions and particulate products using membranes. Advances in Colloid and Interface
Science, 113, 1-20.
Vo, T. D. T., Himmelsbach, M., Haunschmidt, M., Buchberger, W., Schwarzinger, C. &
Klampfl, C. W. 2008. Improved analysis of melamine-formaldehyde resins by capillary
zone electrophoresis-mass spectrometry using ion-trap and quadrupole-time-of-flight mass
spectrometers. Journal of Chromatography A, 1213, 83-87.

References
342
Volodkin, D. V., Delcea, M., Mohwald, H. & Skirtach, A. G. 2009. Remote Near-IR Light
Activation of a Hyaluronic Acid/Poly(L-lysine) Multilayered Film and Film-Entrapped
Microcapsules. Acs Applied Materials & Interfaces, 1, 1705-1710.
Walley, D. R., Buttery, H. J., Norbury, R. J., Schmidt, D. G. & Michael, W. R., inventors; The
Procter and Gamble Company and Minnesota Mining & Manufacturing Innovative
Properties Company, assignee. Coated perfume particles. USA, patent US 5066419. 1991.
Wang, C. X. & Chen, S. L. 2005. Aromachology and its application in the textile field. Fibres
& Textiles in Eastern Europe, 13, 41-44.
Wang, H. P., Yuan, Y. C., Rong, M. Z. & Zhang, M. Q. 2009. Microencapsulation of styrene
with melamine-formaldehyde resin. Colloid and Polymer Science, 287, 1089-1097.
Wang, L. Y., Gu, Y. H., Zhou, Q. Z., Ma, G. H., Wan, Y. H. & Su, Z. G. 2006. Preparation and
characterization of uniform-sized chitosan microspheres containing insulin by membrane
emulsification and a two-step solidification process. Colloids and Surfaces B-Biointerfaces,
50, 126-135.
Wang, L. Y., Ma, G. H. & Su, Z. G. 2005. Preparation of uniform sized chitosan microspheres
by membrane emulsification technique and application as a carrier of protein drug. Journal
of Controlled Release, 106, 62-75.
Ward, T., Faivre, M., Abkarian, M. & Stone, H. A. 2005. Microfluidic flow focusing: Drop size
and scaling in pressure versus flow-rate-driven pumping. Electrophoresis, 26, 3716-3724.
Webb, P. A. A Primer on Particle Sizing by Static Laser Light Scattering: Micromeritics
Instrument Corp.; 2000 01.2000.
Weckhuysen, B. M. 2004. Ultraviolet-Visible Spectroscopy. In: WECKHUYSEN, B. M. (ed.)
In-situ Spectroscopy of Catalysts. American Scientific Publishers.
Wijmans, J. G. & Baker, R. W. 1995. The Solution-Diffusion Model - a Review. Journal of
Membrane Science, 107, 1-21.
Williams, R. A., Peng, S. J., Wheeler, D. A., Morley, N. C., Taylor, D., Whalley, M. &
Houldsworth, D. W. 1998. Controlled production of emulsions using a crossflow membrane
part II: Industrial scale manufacture. Chemical Engineering Research & Design, 76,
902-910.
References
343
Wohlfarth, C. 2009. Viscosity of propan-1-ol. In: LECHNER, M. D. (ed.) Supplement to IV/18.
Springer Berlin Heidelberg.
Xie, J. W., Ng, W. J., Lee, L. Y. & Wang, C. H. 2008. Encapsulation of protein drugs in
biodegradable microparticles by co-axial electrospray. Journal of Colloid and Interface
Science, 317, 469-476.
Xu, H. X., Fang, Z. P. & Tong, L. F. 2008. Effect of microencapsulated curing agents on the
curing behavior for diglycidyl ether of bisphenot a epoxy resin systems. Journal of Applied
Polymer Science, 107, 1661-1669.
Xu, J. H., Luo, G. S., Chen, G. G. & Wang, J. D. 2005. Experimental and theoretical
approaches on droplet formation from a micrometer screen hole. Journal of Membrane
Science, 266, 121-131.
Xu, R. 2000. Particle Characterization: Light Scattering Methods, Norwell, Kluwer Academic
Publishers.
Xu, S., Zhang, X., Xia, S. & Zhang, W. 2006. Principle and Application of Microencapsulation
Technique, Beijing, Chemical industry Press.
Xue, J. & Zhang, Z. B. 2009. Physical, Structural, and Mechanical Characterization of
Calcium-Shellac Microspheres as a Carrier of Carbamide Peroxide. Journal of Applied
Polymer Science, 113, 1619-1625.
Yan, Y., Zhang, Z. B., Stokes, J. R., Zhou, Q. Z., Ma, G. H. & Adams, M. J. 2009. Mechanical
characterization of agarose micro-particles with a narrow size distribution. Powder
Technology, 192, 122-130.
Yang, G. H., Tan, Y. S., Han, Y. Z., Qiu, J. S. & Tsubaki, N. 2008. Increasing the shell
thickness by controlling the core size of zeolite capsule catalyst: Application in iso-paraffin
direct synthesis. Catalysis Communications, 9, 2520-2524.
Yap, S. F., Adams, M. J., Seville, J. P. K. & Zhang, Z. B. 2008. Single and bulk compression of
pharmaceutical excipients: Evaluation of mechanical properties. Powder Technology, 185,
1-10.
References
344
Yepes, M. E. G. & Cremades, L. V. 2011. Characterization of Wood Dust from Furniture by
Scanning Electron Microscopy and Energy-dispersive X-ray Analysis. Industrial Health, 49,
492-500.
Yin, C., Chia, S. M., Quek, C. H., Yu, H. R., Zhuo, R. X., Leong, K. W. & Mao, H. Q. 2003.
Microcapsules with improved mechanical stability for hepatocyte culture. Biomaterials, 24,
1771-1780.
Yuan, L., Liang, G. Z., Xie, J. Q. & He, S. B. 2007. Synthesis and characterization of
microencapsulated dicyclopentadiene with melamine-formaldehyde resins. Colloid and
Polymer Science, 285, 781-791.
Yuan, Q. C., Aryanti, N., Gutierrez, G. & Williams, R. A. 2009a. Enhancing the Throughput of
Membrane Emulsification Techniques To Manufacture Functional Particles. Industrial &
Engineering Chemistry Research, 48, 8872-8880.
Yuan, Q. C., Aryanti, N., Hou, R. Z. & Williams, R. A. 2009b. Performance of slotted pores in
particle manufacture using rotating membrane emulsification. Particuology, 7, 114-120.
Yuan, Q. C., Cayre, O. J., Fujii, S., Armes, S. P., Williams, R. A. & Biggs, S. 2010a.
Responsive Core-Shell Latex Particles as Colloidosome Microcapsule Membranes.
Langmuir, 26, 18408-18414.
Yuan, Q. C., Cayre, O. J., Manga, M., Williams, R. A. & Biggs, S. 2010b. Preparation of
particle-stabilized emulsions using membrane emulsification. Soft Matter, 6, 1580-1588.
Yuan, Q. C., Hou, R. Z., Aryanti, N., Williams, R. A., Biggs, S., Lawson, S., Silgram, H.,
Sarkar, M. & Birch, R. 2008a. Manufacture of controlled emulsions and particulates using
membrane emulsification. Desalination, 224, 215-220.
Yuan, Q. C., Williams, R. A. & Biggs, S. 2009c. Surfactant selection for accurate size control
of microcapsules using membrane emulsification. Colloids and Surfaces a-Physicochemical
and Engineering Aspects, 347, 97-103.
Yuan, Y. C., Rong, M. Z. & Zhang, M. Q. 2008b. Preparation and characterization of poly
(melamine-formaldehyde) walled microcapsules containing epoxy. Acta Polymerica Sinica,
472-480.
References
345
Zhang, H. Z. & Wang, X. D. 2009. Fabrication and performances of microencapsulated phase
change materials based on n-octadecane core and resorcinol-modified
melamine-formaldehyde shell. Colloids and Surfaces a-Physicochemical and Engineering
Aspects, 332, 129-138.
Zhang, Y. & Rochefort, D. 2012. Characterisation and applications of microcapsules obtained
by interfacial polycondensation. Journal of Microencapsulation, 1-14.
Zhang, Y. J., Lu, Y. B., Guo, F., Peng, C., Li, M. M. & Xu, W. J. 2012. Preparation of
microencapsulated ammonium polyphosphate with montmorillonite-melamine
formaldehyde resin and its flame retardancy in EVM. Polymers for Advanced Technologies,
23, 166-170.
Zhang, Y. L., Lian, G. P., Zhu, S. P., Wang, L. Y., Wei, W. & Ma, G. H. 2008. Investigation on
the uniformity and stability of sunflower oil/water emulsions prepared by a shirasu porous
glass membrane. Industrial & Engineering Chemistry Research, 47, 6412-6417.
Zhang, Z., Blewett, J. M. & Thomas, C. R. 1999a. Modelling the effect of osmolality on the
bursting strength of yeast cells. Journal of Biotechnology, 71, 17-24.
Zhang, Z., Ferenczi, M. A., Lush, A. C. & Thomas, C. R. 1991. A Novel Micromanipulation
Technique for Measuring the Bursting Strength of Single Mammalian-Cells. Applied
Microbiology and Biotechnology, 36, 208-210.
Zhang, Z., Ferenczi, M. A. & Thomas, C. R. 1992. A Micromanipulation Technique with a
Theoretical Cell Model for Determining Mechanical-Properties of Single Mammalian-Cells.
Chemical Engineering Science, 47, 1347-1354.
Zhang, Z., Law, D. & Lian, G. 2010. Characterization Methods of Encapsulates. In: ZUIDAM,
N. J. & NEDOVIC, V. (eds.) Encapsulation Technologies for Active Food Ingredients and
Food Processing. New York: Springer
Zhang, Z., Saunders, R. & Thomas, C. R. 1999b. Mechanical strength of single microcapsules
determined by a novel micromanipulation technique. Journal of Microencapsulation, 16,
117-124.

References
346
Zhang, Z., Stenson, J. D. & Thomas, C. R. 2009a. Chapter 2 Micromanipulation in Mechanical
Characterisation of Single Particles. In: JINGHAI, L. (ed.) Advances in Chemical
Engineering. Academic Press.
Zhang, Z., Stenson, J. D. & Thomas, C. R. 2009b. Micromanipulation in Mechanical
Characterisation of Single Particles. In: LI, J. (ed.) Advances in Chemical Engineering.
Elsevier Inc.
Zhao, C. X. & Middelberg, A. P. J. 2011. Two-phase microfluidic flows. Chemical
Engineering Science, 66, 1394-1411.
Zhou, Q. Z., Ma, G. H. & Su, Z. G. 2009. Effect of membrane parameters on the size and
uniformity in preparing agarose beads by premix membrane emulsification. Journal of
Membrane Science, 326, 694-700.
Zhou, Q. Z., Wang, L. Y., Ma, G. H. & Su, Z. G. 2007. Preparation of uniform-sized agarose
beads by microporous membrane emulsification technique. Journal of Colloid and Interface
Science, 311, 118-127.
Zhu, J. & Barrow, D. 2005. Analysis of droplet size during crossflow membrane emulsification
using stationary and vibrating micromachined silicon nitride membranes. Journal of
Membrane Science, 261, 136-144.
Zhu, K. Y., Qi, H. Z., Wang, S., Zhou, J. W., Zhao, Y. H., Su, J. F. & Yuan, X. Y. 2012.
Preparation and Characterization of Melamine-Formaldehyde Resin Micro- and
Nanocapsules Filled with n-Dodecane. Journal of Macromolecular Science Part B-Physics,
51, 1976-1990.
Zuckerman, J. L., Pushaw, R. J., Perry, B. T. & Wyner, D. M., inventors; Outlast Technologies,
Inc., assignee. Frbric coating containing energy absorbing phase chage meterial and method
of manufacturing same. USA, patent US 6514362 B1. 2003.
Zuidam, N. J. & Shimoni, E. 2010. Overview of Microencapsulates for Use in Food Products or
Processes and Methods to Make Them. In: ZUIDAM, N. J. & NEDOVIC, V. (eds.)
Encapsulation Technologies for Active Food Ingredients and Food Processing. Springer.
References
347
Zydowicz, N., Nzimba-Ganyanad, E. & Zydowicz, N. 2002. PMMA microcapsules containing
water-soluble dyes obtained by double emulsion/solvent evaporation technique. Polymer
Bulletin, 47, 457-463.