Embed Size (px)
Citation preview
MEDIATING ROLE OF PERFORMANCE APPRAISAL ON THE
RELATIONSHIP BETWEEN EMPLOYEE ENGAGEMENT STRATEGY
AND SUSTAINABLE FIRM PERFORMANCE OF
COMMERCIAL BANKS IN ELDORET
WENDY ELDAH APIYO
A THESIS SUBMITTED IN PARTIAL FULFILMENT OF THE
REQUIREMENT FOR THE DEGREE OF MASTER OF BUSINESS
MANAGEMENT IN THE SCHOOL OF BUSINESS AND MANAGEMENT
SCIENCE, UNIVERSITY OF ELDORET, KENYA
2019
ii
DECLARATION
Declaration by Candidate
This research thesis is my original work and has not been presented for any academic
award in any institution, and shall not be reproduced in part or full, or any part without
prior written permission from the author or University of Eldoret.
Wendy Eldah Apiyo
REG NO.BMS/PGMBM /2014/14
Signature…………………………………… Date…………………………..…….
Declaration by the Supervisors
The research thesis has been submitted with our approval as university supervisors.
Dr. Evaline Bartocho
Lecturer, University of Eldoret
Department of Business Management
Signature…………………………………… Date…………………………..…….
Dr. Emmanuel Tanui
Lecturer, University of Eldoret
Department of Business Management
Signature…………………………………… Date…………………………..…….
iii
DEDICATION
I dedicate this thesis to my parents Mr and Mrs Odhiambo and my siblings whose
sacrifice, love, encouragement and support have gotten me this far.
iv
ABSTRACT
Employee engagement strategy deals with what an organisation has to do to get the best
from its employees. Employees are a very important part of any organisation and in
today’s competitive business; world organisations should always pursue an employee
engagement strategy if they are interested in retaining their employees. The purpose of
this study was to determine the mediating role of performance appraisal on the
relationship between employee engagement strategy and sustainable firm performance.
The objectives of the study were to determine the effect of goal setting, motivation,
leadership, and training and performance appraisal on sustainable firm performance.
This study was based on Social exchange theory, competitive theory, and Goal theory.
The study adopted an explanatory survey design with the target population being 1150
employees. The sample size was obtained using slovin’s formula and a sample size of
297 was used. A structured questionnaire was administered to the respondents and
administered by the researcher herself. A pilot test was carried out in Nakuru and
experts analyzed the results for validity. Cronbach’s alpha was used to test reliability.
Data was analyzed using descriptive and inferential statistics. This study could benefit
organizations as they could get a clear view on the drivers of employee engagement
strategy. Descriptive statistics includes frequencies, percentages and means while
inferential statistics was correlation and multiple regressions. Analysed data were
presented in form of tables. The linear regression results indicated that R2 =0.624, this
showed that employee engagement strategies predict 62.4% of the variation in
sustainable firm performance. The goal setting (β1=0.336, p<0.05), motivation
(β2=0.219, p<0.05), leadership (β3=0.197, p<0.05) and training (β4= 0.156, p<0.05) had
significant effect on sustainable firm performance. On indirect effect the model results
[β = 0.327, t (153) = 8.98, p = <.000] indicated that performance appraisal controlling
for employee engagement strategy predicted 69.3% of sustainable firm performance.
The effect of employee engagement strategy on sustainable firm performance
controlling for performance appraisal was significant, [β = 0.634, t (153) = 13.696, p =
<.000]. Effect of employee engagement strategy on performance appraisal, was
significant, β = 0.301, t (154) = 3.03, p = <.000. Performance appraisal partially
mediated the relationship between employee engagement strategy and sustainable firm
performance. The study recommended that employees should be given clear and
specific goals, Employees should be able to satisfy both their organizational and
personal goals in line with organizational goals. Leaders should demonstrate strong
leadership skills, employees should be trained in order for them to do well in their job
and finally performance appraisal should be optimised for effective decision making.
The study suggests that a similar study should be done on other government parastatals.
v
TABLE OF CONTENTS
DECLARATION ..................................................................................................... ii
DEDICATION ........................................................................................................ iii
ABSTRACT ............................................................................................................ iv
TABLE OF CONTENTS ........................................................................................ v
LIST OF TABLES ................................................................................................ viii
LIST OF FIGURES ................................................................................................ ix
ABRREVIATIONS AND ACRONYMS................................................................. x
ACKNOWLEDGEMENT ...................................................................................... xi
CHAPTER ONE ...................................................................................................... 1
INTRODUCTION ................................................................................................... 1
1.0 Overview to the Chapter ................................................................................... 1
1.1 Background of the Study ................................................................................. 1
1.2 Statement of the Problem ................................................................................. 5
1.3 General Objective............................................................................................. 6
1.3.1 Specific Objectives .................................................................................... 6
1.4 Research Hypotheses ........................................................................................ 7
1.5 Significance of the Study .................................................................................. 7
1.6 Scope of the Study ........................................................................................... 8
1.6 Limitation of the Study ..................................................................................... 8
1.8 Operational Definition of Terms ....................................................................... 9
CHAPTER TWO ................................................................................................... 10
LITERATURE REVIEW...................................................................................... 10
2.0 Introduction .................................................................................................... 10
2.1 The Concept of Sustainable Firm performance ............................................... 10
2.2 Employee Engagement Strategy ..................................................................... 12
2.2.1 Goal Setting ............................................................................................. 13
2.2.2 Motivation ............................................................................................... 16
2.2.3 Leadership ............................................................................................... 17
2.2.4 Training ................................................................................................... 18
2.3 Performance Appraisal ................................................................................... 19
2.4 Theoretical Framework .................................................................................. 21
2.4.1 Social Exchange Theory .......................................................................... 21
vi
2.4.2 Competitive Theory ................................................................................. 21
2.4.3 Goal Theory ............................................................................................. 22
2.5 Conceptual Framework .................................................................................. 23
CHAPTER THREE ............................................................................................... 25
RESEARCH METHODOLOGY .......................................................................... 25
3.0 Introduction .................................................................................................... 25
3.1 The Study Area .............................................................................................. 25
3.2 Research Design ............................................................................................. 25
3.3 Target Population ........................................................................................... 26
3.4 Sample Size and Procedures ........................................................................... 26
3.5 Data Collection .............................................................................................. 27
3.6 Validity and Reliability of Data ...................................................................... 28
3.6.1 Measurement of Variables ...................................................................... 28
3.6.2 Regression Assumptions ........................................................................ 29
3.7 Data Analysis ................................................................................................. 29
3.7.1 Model specification ..................................................................................... 30
3.8 Ethical Considerations ................................................................................... 33
CHAPTER FOUR ................................................................................................. 34
RESEARCH FINDINGS AND DISCUSSIONS ................................................... 34
4.0 Introduction .................................................................................................... 34
4.1 Questionnaire Return Rate .............................................................................. 34
4.2 Demographic Information .............................................................................. 35
4.2.1 Gender of the Respondents ...................................................................... 35
4.2.2 Age bracket of the Respondents ............................................................... 35
4.2.3 Length of Service in the Organization ...................................................... 36
4.2.4 Level of Education of the Respondents .................................................... 36
4.3 Descriptive Statistics ...................................................................................... 37
4.3.1 Goal Setting ............................................................................................. 37
4.3.2 Motivation on Sustainable Firm Performance........................................... 40
4.3.3 Leadership on Sustainable Firm Performance........................................... 43
4.3.4 Training on Sustainable Firm Performance .............................................. 45
4.3.5 Performance Appraisal ............................................................................. 48
4.3.6 Sustainable Firm Performance ................................................................. 50
4.4 Testing Assumptions of the Multiple Regression Model ................................. 53
vii
4.4.1 Test for Autocorrelation ........................................................................... 53
4.4.2 Test for Multicollinearity ......................................................................... 54
4.4.3 Normality Assumptions ........................................................................... 54
4.4.4 Linearity Assumptions ............................................................................. 55
4.5 Correlation Analysis ....................................................................................... 57
4.6 Multiple Regression Analysis. ........................................................................ 58
4.6.1 Model Summary ...................................................................................... 59
4.6.2 Summary of Hypotheses Testing .............................................................. 61
4.7 Mediation Analysis ........................................................................................ 62
4.7.1 Total effect .............................................................................................. 63
4.7.2 Direct effect ............................................................................................. 64
4.7.3 Indirect effect........................................................................................... 65
4.7.4 Confirming Mediation Effect ................................................................... 67
4.7.5 Normal theory tests for indirect effect .................................................... 67
CHAPTER FIVE ................................................................................................... 69
SUMMARY CONCLUSION AND RECOMMENDATIONS ........................ 69
5.0 Introduction .................................................................................................... 69
5.1 Summary of the Study Findings ..................................................................... 69
5.1.1 Goal setting on sustainable firm performance ........................................... 69
5.1.2 Motivation on sustainable firm performance ............................................ 69
5.1.3 Leadership on sustainable firm performance ............................................ 70
5.1.4 Training on sustainable firm performance ................................................ 70
5.2 Conclusions .................................................................................................... 71
5.3 Implication of the Study ................................................................................. 72
5.4 Recommendations .......................................................................................... 73
5.5 Suggestions for further study .......................................................................... 74
REFERENCES ...................................................................................................... 75
APPENDICES ....................................................................................................... 84
APPENDIX I: INTRODUCTORY LETTER ...................................................... 84
APPENDIX II: QUESTIONNAIRES ................................................................... 85
APPENDIX III:RESEARCH AUTHORIZATION ............................................. 89
APPENDIX IV: RESEARCH PERMIT ............................................................... 90
APPENDIX V: SAMPLE SIZE TABLE .............................................................. 91
APPENDIX VI : SIMILARITY REPORT ........................................................... 93
viii
LIST OF TABLES
Figure 3.1: Mediation conceptual model (Model 4)............................................... 32
Table 4.1 Questionnaire return rate ......................................................................... 34
Table 4.2 Gender of the respondents ....................................................................... 35
Table 4.3Age bracket of the respondents ................................................................ 36
Table 4.4 Length of service in the organization ..................................................... 36
Table 4.5 Level of education of the respondents .................................................... 37
Table 4.6 Goal setting on sustainable firm performance ....................................... 39
Table 4.7 Motivation on sustainable firm performance ......................................... 42
Table 4.8 Leadership on sustainable firm performance ......................................... 44
Table 4.9 Training on sustainable firm performance ............................................. 47
Table 4.10 Performance Appraisal .......................................................................... 49
Table 4.11 Firm performance .................................................................................. 51
Table 4.12 Autocorrelation ...................................................................................... 53
Table 4.13 Multicollinearity .................................................................................... 54
Table 4.13 Normality-One-Sample Kolmogorov-Smirnov Test ........................... 55
Table 4.14 Linearity test .......................................................................................... 56
Table 4.15: Correlation Coefficient Matrix ............................................................ 58
Table 4.16 Model Summary .................................................................................... 59
Table 4.17 Analysis of Variance ............................................................................. 60
Table 4.18 Coefficient of Sustainable Firm Performance ...................................... 60
Table 4.19 Total Effect Model (Outcome: Sustainable firm performance) .......... 64
Table 4.20 Model Summary (Outcome: Performance appraisal) .......................... 65
Table 4.21 Indirect Effects Model Summary (Outcome: Sustainable firm
performance)……………………… ....................................................................... 66
Table 4.22 Total, Direct, and Indirect Effects ........................................................ 67
Table 4.23 Normal theory tests for indirect effect .................................................. 68
ix
LIST OF FIGURES
Figure 2.1: Conceptual framework of mediating role of performance appraisal
on the relationship between employee engagement strategy and sustainable
firm performance. ..................................................................................................... 24
Figure 3.1: Mediation conceptual model (Model 4)............................................... 32
Figure 4.1 Analytical model (Total effect) ............................................................. 64
Figure 4.2 Analytical Model; Direct and indirect effect ........................................ 66
x
ABRREVIATIONS AND ACRONYMS
CIPD Chartered Institute of Personnel Development
EES Employee engagement strategy
EBIT Earnings Before Interest and Taxes
MBO Management by Objective
MSF Multi source Feedback
ROE Return on Equity
ROI Return on investment
SPSS Statistical Package for Social Sciences
SWOT Strengths Weaknesses Opportunities and Threats
UOE University of Eldoret
xi
ACKNOWLEDGEMENT
First and foremost, I want to thank God for the gift of life, wisdom, strength, knowledge
and good health that have enabled me finish this thesis. I wish to sincerely thank my
supervisors Dr. Bartocho and Dr. Tanui for the tireless effort, input and guidance to
ensure the document is in accordance to the university standards and has made this
research thesis writing a success. I also wish to thank our coordinator Dr. Makomere
for stepping in and assigning us with wonderful supervisors and ensuring that we were
moving forward with our studies. I wish to thank the University of Eldoret for providing
me with a convenient environment for my studies.
I am grateful to my classmates who we have worked together and offered each other
moral support. My special appreciation to my father for his input and financial
assistance my mother for her love and care and all my siblings John, Brian, Winnie,
Laura, Juliet, Maureen, Mony and Newton your diverse success has given me the
challenge and strength to fight on. There are many others I haven’t been able to mention
by name who contributed to the success of this research thesis as it has taken a village
to come up with this thesis. Please accept my heartfelt gratitude to you.
1
1
CHAPTER ONE
INTRODUCTION
1.0 Overview to the Chapter
This chapter introduces the study. It presents the background of the study, statement of
the problem, general objectives, specific objectives, research hypotheses, significance
of the study and scope of the study.
1.1 Background of the Study
Sustainable firm performance can be defined as the gauge of prescribed pointers of
effectiveness, efficiency, and ecological responsibility such as environment
responsibility, profitability, productivity and waste reductions (Ahmed et al., 2010).
Financial statement prepared by the company can give the sustainability of firm’s
performance. A company that is performing well will reinforce management for
disclosure report (Herly & Sisnuhadi, 2011). A company’s sustainable performance can
represent growth internally or externally. External expansion is the leading cause of
corporate growth (Selvam et al., 2014).
The employee's future growth prospects can emerge because of factors outside of
managerial decision-making, and this can be demonstrated by the size of the business
(Shan & McIver, 2011). More studies have shown that the growth of workforce is a
major contributor to a policy of loyalty to employees that affects organizational quality
(Abu & Som, 2013). Employees want to work for companies and positions that make
them feel highly valued and are keen to improve and progress continuously. Employees
and workers appreciate sustainable firm performance. According to a report by Towers
2
2
Watson (2014) organisations want to introduce sustainable firm performance but
because of lack of employee engagement strategy organisations fail at delivering and
some cannot affirm if the programs are efficiently working.
It is disengaged employees that bring about a high turnover according to Gallup
(2013).It was expected of employees to be committed to the organisation before the
1980s in exchange of employment security. In the 1980s this started to change with
organizations realizing that they needed to be more innovative and engaging in their
employees’ performance due to increased global competition to attain best results
employers should create an overall employee engagement strategy (Welbourne, 2007).
Employee engagement strategy is an enabling corporate strategy that sets out how to
create an environment where employees’ individual objectives are aligned to corporate
outcomes and that they have the support they need to perform at their best (Walsh &
Loudon, 2015). Employee engagement strategy tends to increase the staff survey
response rate engagement score and supports the development of a more engaged
workforce who can deliver organisational plan (Heilman, 2011).
In Africa, employee engagement strategy has risen over the past years and stood at
67%. As at 2014, Hewitt (2015) investigated and found that this is attributed to the
economic opportunities in the region. This has led to more engaged employees who
have focused on motivation, goals, training and leadership. According to Abbott
(2014), in Africa the proportion of disengaged employees is similar to that of engaged
employees for all professional employees working in organizations and those who have
attained higher levels of education.
3
3
According to Deloitte Consulting (2014) Kenya ranked employee engagement strategy
as their number one priority for retention. According to their report, employee
engagement strategy is ranked among the top five most urgent trend to address with the
largest capability gap of 28%. The government of Kenya commits to develop its
employees and encourage them to train and upgrade their knowledge, skills, attitudes
and competencies for performance improvement, effective service delivery and
sustainable firm performance. It encourages public servants to undertake firm
performance management programs and requires all servants to be eligible for training
for at least five days of training in a year and be promoted after 3 years (HRM policies,
2016). This is extended to all commercial banks in Kenya.
According to the Banking Amendment act of Kenya (2009) commercial banks are
financial institutions that accept deposits from customers and give loans and provide
other services such as mobile banking, internet banking, and Automated Teller Machine
services among others to the public. According to the Central Bank of Kenya (2016)
currently there are 43 licensed commercial banks and one mortgage finance company.
Out of the 43 banking institutions in Kenya 40 were privately owned while the Kenya
Government had majority ownership in 3 institutions. Of the 40 privately owned banks,
25 were locally owned while 15 were foreign-owned. The banks use performance
appraisal for organizational development, employees’ performance, salary increment
or distribution of rewards, performance appraisal method used by banks are clearly
defined goals, graphic rating scales and comparative banking method (CBK, 2016).
One of the major objectives of performance appraisals is to provide employees with
targeted feedback and guidance to help them learn grow and develop. Without a
development component, performance appraisals would be relegated to the role of a
4
4
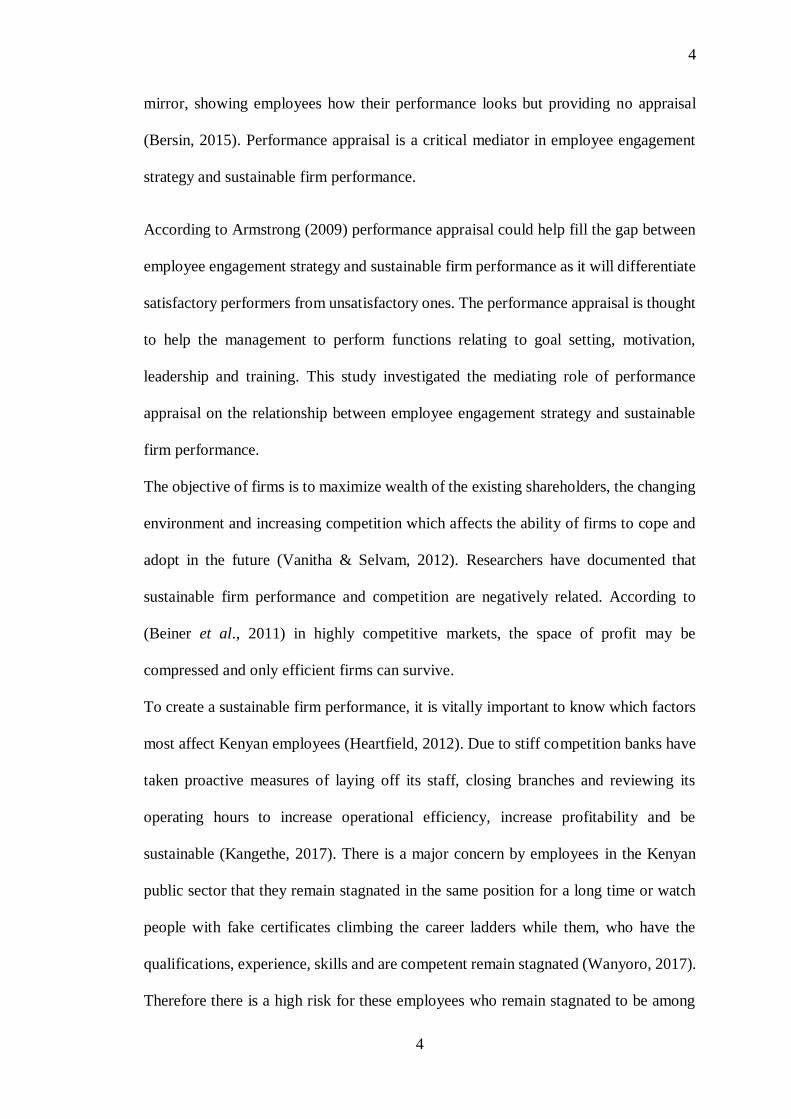
mirror, showing employees how their performance looks but providing no appraisal
(Bersin, 2015). Performance appraisal is a critical mediator in employee engagement
strategy and sustainable firm performance.
According to Armstrong (2009) performance appraisal could help fill the gap between
employee engagement strategy and sustainable firm performance as it will differentiate
satisfactory performers from unsatisfactory ones. The performance appraisal is thought
to help the management to perform functions relating to goal setting, motivation,
leadership and training. This study investigated the mediating role of performance
appraisal on the relationship between employee engagement strategy and sustainable
firm performance.
The objective of firms is to maximize wealth of the existing shareholders, the changing
environment and increasing competition which affects the ability of firms to cope and
adopt in the future (Vanitha & Selvam, 2012). Researchers have documented that
sustainable firm performance and competition are negatively related. According to
(Beiner et al., 2011) in highly competitive markets, the space of profit may be
compressed and only efficient firms can survive.
To create a sustainable firm performance, it is vitally important to know which factors
most affect Kenyan employees (Heartfield, 2012). Due to stiff competition banks have
taken proactive measures of laying off its staff, closing branches and reviewing its
operating hours to increase operational efficiency, increase profitability and be
sustainable (Kangethe, 2017). There is a major concern by employees in the Kenyan
public sector that they remain stagnated in the same position for a long time or watch
people with fake certificates climbing the career ladders while them, who have the
qualifications, experience, skills and are competent remain stagnated (Wanyoro, 2017).
Therefore there is a high risk for these employees who remain stagnated to be among
5
5
the first to be cut off during tough economic times without having an opportunity to
grow.
According to Yarnall (2008) performance appraisal is the process used as a basis for
dialogue about feedback, career aspirations and sustainable firm performance. However
competent performance appraisal is an indispensable part of any firm as it helps with
employee engagement strategy and sustainable firm growth (Selvarajan & Cloninger,
2016). Despite most organizations conducting performance appraisals, the role of this
exercise contributing to sustainable firm performance is unclear. This study therefore
investigated the mediating role of performance appraisal on the relationship between
employee engagement strategy and sustainable firm performance.
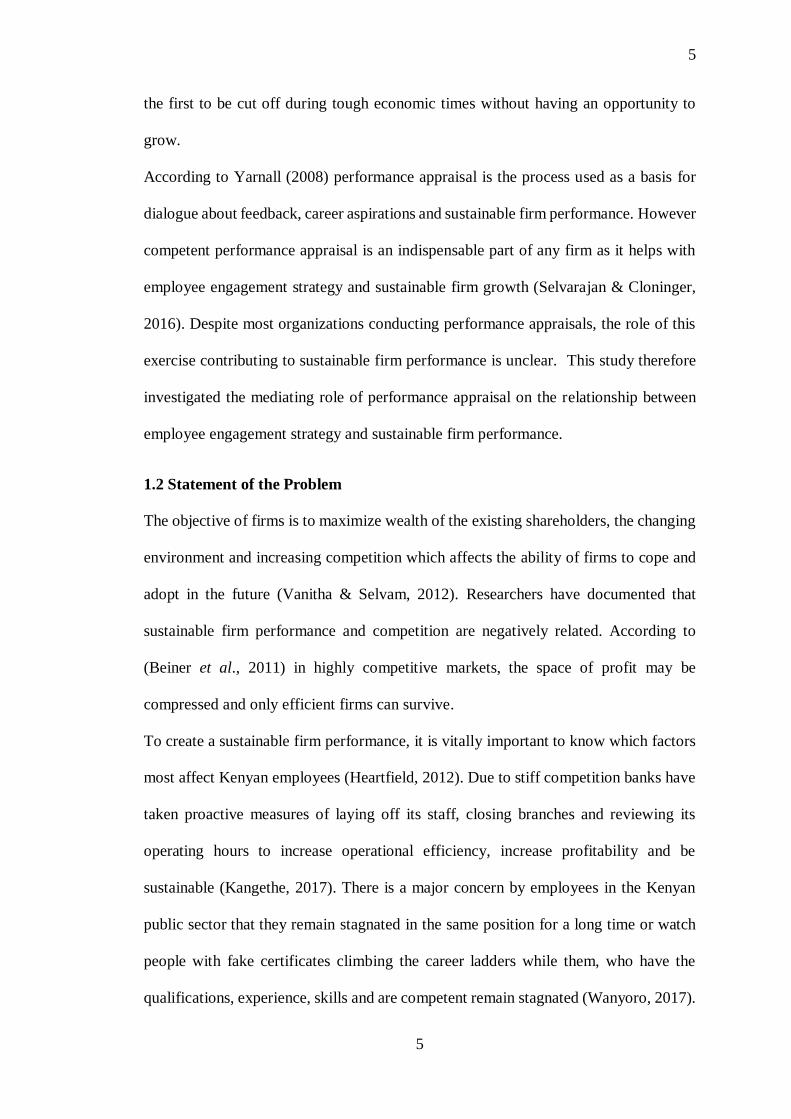
1.2 Statement of the Problem
The objective of firms is to maximize wealth of the existing shareholders, the changing
environment and increasing competition which affects the ability of firms to cope and
adopt in the future (Vanitha & Selvam, 2012). Researchers have documented that
sustainable firm performance and competition are negatively related. According to
(Beiner et al., 2011) in highly competitive markets, the space of profit may be
compressed and only efficient firms can survive.
To create a sustainable firm performance, it is vitally important to know which factors
most affect Kenyan employees (Heartfield, 2012). Due to stiff competition banks have
taken proactive measures of laying off its staff, closing branches and reviewing its
operating hours to increase operational efficiency, increase profitability and be
sustainable (Kangethe, 2017). There is a major concern by employees in the Kenyan
public sector that they remain stagnated in the same position for a long time or watch
people with fake certificates climbing the career ladders while them, who have the
qualifications, experience, skills and are competent remain stagnated (Wanyoro, 2017).
6
6
Therefore there is a high risk for these employees who remain stagnated to be among
the first to be cut off during tough economic times without having an opportunity to
grow.
According to Yarnall (2008) performance appraisal is the process used as a basis for
dialogue about feedback, career aspirations and sustainable firm performance. However
competent performance appraisal is an indispensable part of any firm as it helps with
employee engagement strategy and sustainable firm growth (Selvarajan & Cloninger,
2016). Despite most organizations conducting performance appraisals, the role of this
exercise contributing to sustainable firm performance is unclear. This study therefore
investigated the mediating role of performance appraisal on the relationship between
employee engagement strategy and sustainable firm performance.
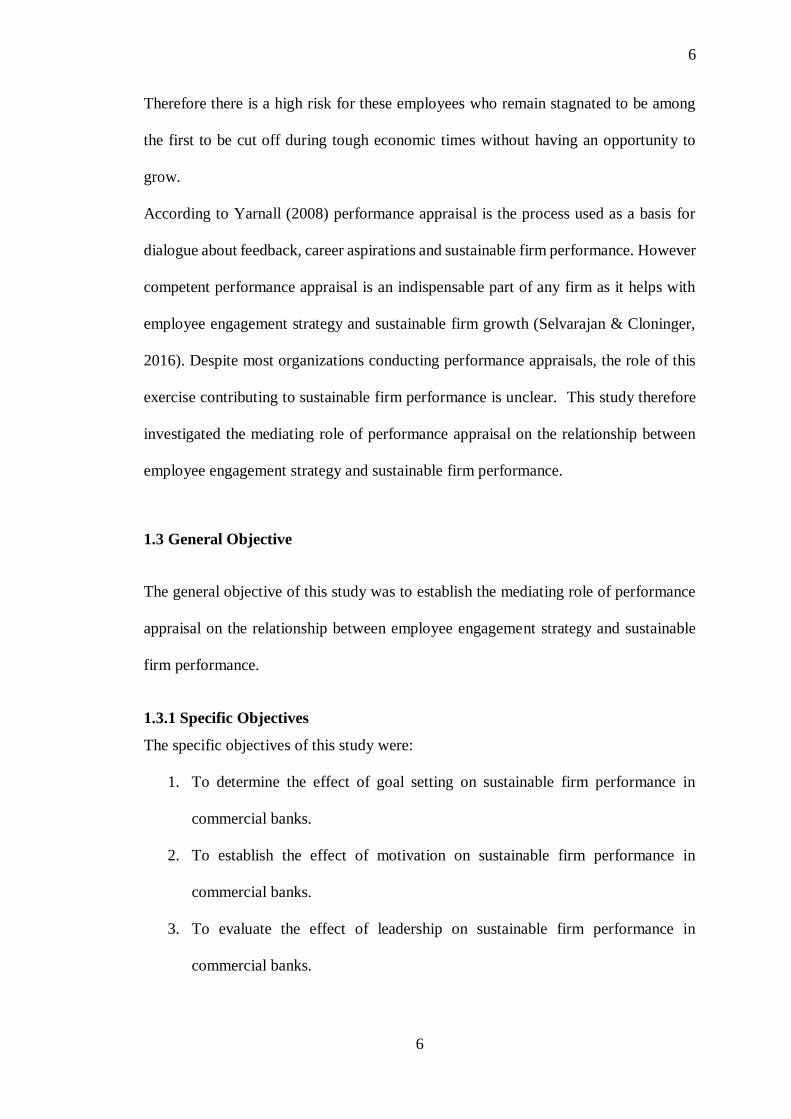
1.3 General Objective
The general objective of this study was to establish the mediating role of performance
appraisal on the relationship between employee engagement strategy and sustainable
firm performance.
1.3.1 Specific Objectives
The specific objectives of this study were:
1. To determine the effect of goal setting on sustainable firm performance in
commercial banks.
2. To establish the effect of motivation on sustainable firm performance in
commercial banks.
3. To evaluate the effect of leadership on sustainable firm performance in
commercial banks.
7
7
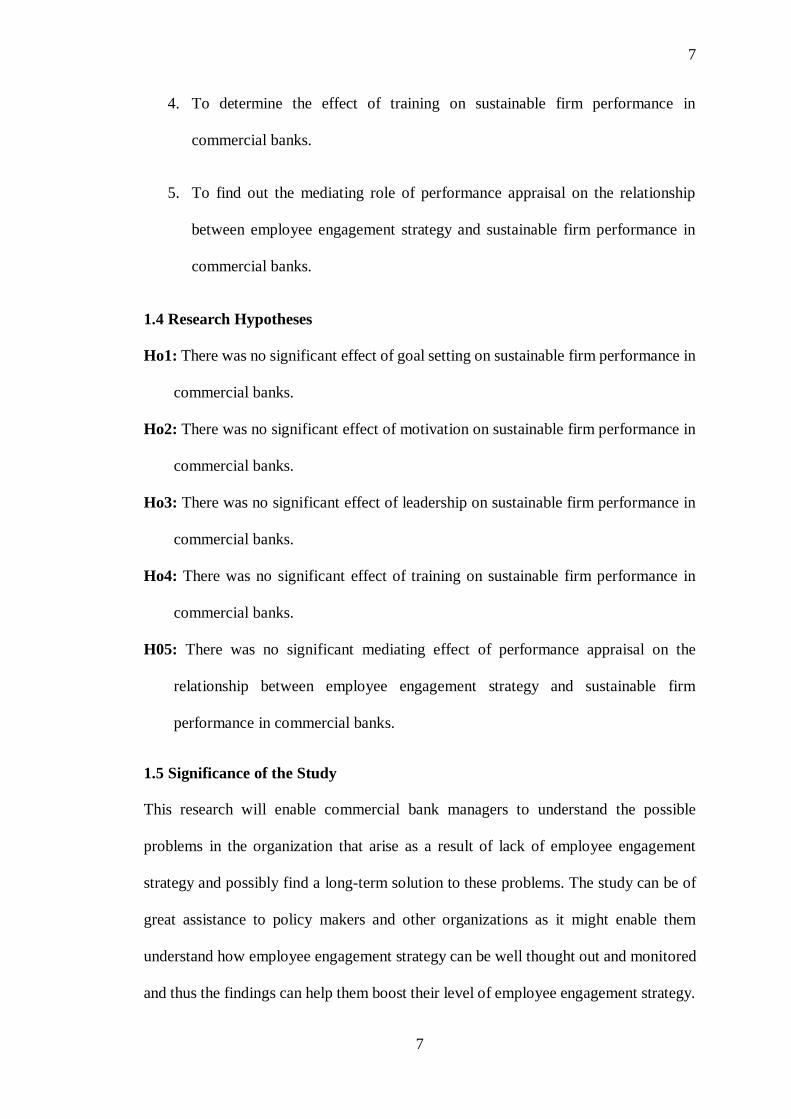
4. To determine the effect of training on sustainable firm performance in
commercial banks.
5. To find out the mediating role of performance appraisal on the relationship
between employee engagement strategy and sustainable firm performance in
commercial banks.
1.4 Research Hypotheses
Ho1: There was no significant effect of goal setting on sustainable firm performance in
commercial banks.
Ho2: There was no significant effect of motivation on sustainable firm performance in
commercial banks.
Ho3: There was no significant effect of leadership on sustainable firm performance in
commercial banks.
Ho4: There was no significant effect of training on sustainable firm performance in
commercial banks.
H05: There was no significant mediating effect of performance appraisal on the
relationship between employee engagement strategy and sustainable firm
performance in commercial banks.
1.5 Significance of the Study
This research will enable commercial bank managers to understand the possible
problems in the organization that arise as a result of lack of employee engagement
strategy and possibly find a long-term solution to these problems. The study can be of
great assistance to policy makers and other organizations as it might enable them
understand how employee engagement strategy can be well thought out and monitored
and thus the findings can help them boost their level of employee engagement strategy.
8
8
Finally, the study might be of great benefit to scholars as it contributes to the body of
knowledge. Scholars should be able to read, understand and contribute to this study and
its application.
1.6 Scope of the Study
The study was conducted in 43 commercial banks in Eldoret. The researcher collected
the data from the employees in commercial banks in the month of August 2018.The
respondents were managers and employees. The target number of respondents were
1150 and the sample size was 297. The study sought to find out the mediating role of
performance appraisal on the relationship between employee engagement strategy and
sustainable firm performance in commercial banks.
1.7 Limitations of the study
One limitation was that the study being carried out in the banking industry respondents
were not willing to share out information that was useful to the study. However it was
explained to them that the study was only carried out for educational purpose and thus
information collected was highly confidential.
9
9
1.8 Operational Definition of Terms
Employee engagement strategy: it refers to the ability to capture the heads, hearts and
souls of your employees to instil an intrinsic desire and passion for organisational
excellence (McEwen, 2011).
Goal setting: it refers to desired work or business outcomes, as well as the intention or
plan of employees to act towards them within a specific time limit (Chartered Institute
of Personnel Development, 2016).
Leadership: it is the process of influencing others to understand and agree about what
needs to be done and how to do it (Yukl, 2010).
Motivation: it is an internal state that causes people to behave in a particular way to
accomplish particular goals and purposes (Denhardt et al., 2008)
Performance Appraisal: it is the key process through which work gets done. It is how
organization communicates expectations and drive behaviours to achieve important
goals (Pulakos, 2009).
Sustainable performance: it is a business approach that creates long-term shareholder
value by embracing opportunities and managing risks deriving from economic,
environmental and social developments (Nelson, 2013).
Training: it is the preparation for an occupation or for specific skills (Torrington et al.,
2010).
10
CHAPTER TWO
LITERATURE REVIEW
2.0 Introduction
This chapter presents a review of literature relevant to this study. It commences with
the concept of sustainable firm performance and employee engagement strategy in an
attempt to provide a strong basis on the concept of theoretical framework and
conceptual framework.
2.1 The Concept of Sustainable Firm performance
Sustainable firm performance deals with the environmental standards, social integrity
and economic well-being of a business (Bensman, 2014). According to Carter and
Rogers (2008) sustainable firm performance is defined as the strategic, transparent
integration and achievement of an organization’s social, environmental, and economic
goals in the systemic coordination of key inter organizational business processes for
improving the long-term economic firm performance of the individual company and its
supply chains.
There are different ways to measure sustainable firm performance. A common
categorization has been to divide performance into financial and non-financial
performance (Ittner, 2008). Traditional accounting measurements of financial
performance have included sales growth, return on equity (ROE), earnings before
interest and taxes (EBIT) and return on investment (ROI), among others (Eldenburg et
al., 2010).
11
According to (Hahn et al., 2010) a single monetary indicator that is based on
opportunity costs called sustainable added value can be used to measure the value
created by a firm when it reduces or increases the use of different environmental and
social resources. Sustainability is a duty that concerns firms’ performance.
Sustainability practices are associated with an increase in business and profit, and are
related to lower expenditures. When firms handle their options in terms of where and
how to do business, firm sustainability approaches may be decisive and be different in
a positive sense (McElroy & Weng, 2016).
Firms that insist on sustainable added value businesses helps to account for sustainable
performance (Ben et al., 2011) found that, stakeholder value is positively related to
sustainable firm performance in terms of financial performance, employee engagement,
and corporate reputation. Sustainability is effective as an organizing criterion for
internal business betterment strategies. Organizations must focus mainly towards the
betterment of their society (Abu & Ameer, 2011).
In light of global developments, the perspectives on commercial banks operations have
expanded from economic to environmental and social aspects in current trends.
Commercial banks are not only aiming to improve operations in terms of flexibility,
delivery, quality, and cost, but also attempting to be sustainable and competitive in
terms of environmental and social issues (Caniëls et al., 2013).
Firms that are operating in a competitive global environment, studying sustainability
issues is necessary and should be prioritized in the decision-making processes by
company management (Wu & Pagell, 2011). Commercial banks adopting innovation,
in turn, can help firms to increase their market share and to reduce their costs, resulting
in greater financial gains and sustainability as supported by (Hofer et al., 2012). At the
same time, some studies have suggested that there is a negative relationship between
12
employee engagement strategy and sustainable firm performance. The main argument
here is that sustainable initiatives often increase operational costs and boost product
prices, thus having a negative impact on firm performance and market share (Brammer
& Millington, 2008).
Given the complexity of the current global operations environment, for instance firms
in supply chains should integrate suppliers into their consideration of strategy
development. Otherwise, focal companies may face a variety of risks, such as
environmental, economic and social risks (Tang & Musa, 2011). According to
(Ehrenfeld, 2008) sustainable firm performance should be attained and not managed.
2.2 Employee Engagement Strategy
As a concept that has developed over time, employee engagement strategy has been
defined in numerous ways and every person seems to have their own definition (Macey
& Schneider, 2008). A study by Juan (2010) indicated that the number of engaged
employees falls below average and shows employee engagement strategy has not been
effectively managed in many organizations and firms loose between 5%-15% of sales
revenue as a result of lack of attention to employee engagement strategy.
Certain barriers may lead to low employee engagement at work which, in turn, brings
about complications for employees and challenges for leaders. Moreover, a decline in
employee engagement strategy can have an effect on productivity, customer service and
performance this is according to (Gatenby et al., 2009). Developing an employee
engagement strategy will help avoid pitfalls in the organisation but the management
team should be part of the strategy and be ready to invest financially (Mone et al.,
2011). Organizations that aspire to have engaged employees should spend considerable
13
resources to train and motivate employees to improve employee engagement strategy
as an effective and sustained employee engagement strategy requires input and buy-in
from employees, leadership and other stakeholders, but it is well worth the effort (Xu
& Thomas, 2011).
An engaged workforce produces tangible outcomes such as reduced turnover or
increased profitability. These are the ultimate goals of an employee engagement
strategy and the metrics against which it is evaluated (Van & Oehler, 2013). An
employee engagement strategy should include a plan to identify the drivers of employee
engagement that is critical in determining employees’ level of engagement. There are
numerous ways to identify drivers of engagement, including sophisticated statistical
modelling of engagement data, holding focus groups discussions to ask employees what
is most important or including survey items to the engagement surveys (Christian et al.,
2011).
Additionally, employers should communicate to employees that engagement efforts are
sincerely geared toward improving the quality of sustainable firm performance
(Attridge, 2009). Organisational leaders should never assume they have all the answers
as solutions may lie with the employees furthermore employee’s participation in
making decisions increases their motivation levels as is stated by (Jagoda et al., 2013)
that the best employee engagement strategy is from the bottom up. Therefore, this study
will be guided by the following elements; goal setting, motivation leadership and
training.
2.2.1 Goal Setting
Goal setting refers to desired work or business outcomes, as well as the intention or
plan to act towards them within a specific time limit (Chartered Institute of Personnel
14
Development, 2016). Involving employee in setting personal and organisational goals
is important for sustainable firm performance (Locke & Latham, 2013). Employee goal
setting brings about growth this is according to (Moynihan, 2008) who found that
setting specific goals allows continuous improvement in objectives and sustainable firm
performance.
Moreover, Reed (2012) adds that employee goals are related with enhancement of
sustainable firm performance because they organize effort, direct attention and
encourages determination and plan development. However, Bazerman (2009) pointed
out that in some circumstances there might be rise of conflict between the personal
goals and firm’s goals. Murphy (2013) suggested that measurable and complex goals
can contribute to the motivational increase of the individuals and thus enhance the
sustainability of firm performance levels.
Yet, complexity of goals does not always motivate employees as argued by (Sinnema
& Robinson, 2012) high complexity of goals with a strict time bound might make the
goals unattainable. In contrast Lunenburg (2011) opined that goals have an unavoidable
influence on the behaviour of the employees and thus influence the long-term
performance of the employees and the organization if it is time bound. The acceptance
of the goal is the initial step towards the motivation of individuals.
Rug and Wallace (2012) commented that if the goal is attainable and realistic then the
rate of acceptance is high and with the acceptance, the individual applies the required
degree of determination and self-efficacy in order to complete the goal. But this only
depends if the goal is viewed as important by the employee as Lawlor (2012) said the
rate of commitment may be hampered if the individual does not find the goal to be
important.
15
Goals should be set according to an individual’s skills as not all employees have the
same level of skills as pointed out by (Simões et al., 2012) They suggested that
difficulty level of the goal should depend upon the human skills present within the
organization so that the level is achievable otherwise the goal difficulty with a defined
timeline can motivate the employees and reduce their productivity. According to
(Ordóñez et al., 2009) individuals tend to act or respond dishonestly in case the goals
become unattainable and the time is limited compared to their skills. Thus, it is essential
for the organization to set the difficulty levels correctly in order to enhance the
sustainability of firm performance.
In order to do so the organizations can conduct a strength weakness opportunities and
threats (SWOT) analysis that will reveal the internal strengths weaknesses opportunities
and threats of the company in order to help them generate the necessary goal standards.
Bennett (2009) concluded that the level of sustainable firm performance sharply
declines with the increase in the level of goal difficulty as it creates a convenient
environment where the employees engage in corruption, dishonesty and hampers the
quality of the firm performance.
Feedback is important in giving direction to employees. However, Krausert (2009)
insisted that feedback should be constructive. The leaders and the goal makers should
try to be specific while giving feedbacks. They should clearly mention the changes they
require. In this regard, Greenberg (2011) commented that feedback could be process
oriented or outcome oriented. Thus, by receiving the feedbacks the individuals will be
aware that their work is being evaluated and this will minimize their chances of
mistakes and act as a moral support for them.
16
2.2.2 Motivation
Definition of motivation according to Society for Human Resource Management (2010)
is the psychological forces that determine the direction of a person’s level of effort, as
well as a person’s persistence in the face of obstacles. The motivation element in
employee engagement is intrinsic this is according to (Macey et al., 2009) who
commented that when the work itself is meaningful extrinsic motivation does not need
to come into play by giving more pay or recognition but the employee yields positive
feelings of engagement by the work itself.
Price (2009) pointed out, that all leaders should address themselves to issues of
employee motivation because the life span of organizations depends very much on their
ability to achieve personal and organizational goals as our behaviour as human beings
is “goal-seeking”. According to (Robbins et al., 2011) future leaders ought to be
selected on the basis of their ability to stimulate organizational motivation. Employees,
especially young people, get discouraged when they feel there is little chance of
personal growth in their career as young people seek upward movement in their early
years of working. Mullins (2010) found that when employees get to know that each one
of them has an equal chance of succeeding; it becomes easy for them to put in their
best.
Michael and Crispen (2009) stated that having a motivated workforce provides the
sustainable firm performance that the firm seeks and better employee performance
helps the firm be more sustainable. If employees do not feel that they are fairly
evaluated and motivated as well as getting what they deserve either a salary increase or
a higher position, they will feel like they are unimportant to the business and hence this
can lead them to leave the company which will led to negative impact on the firm’s
performance sustainability.
17
A view by (Mansoor, 2008) concluded that motivated and satisfied employees directly
affect firm’s performance, sustainability, profitability, and eventually its stability.
Employee motivation is one of the policies of managers to increase effectual job
management amongst employees in organizations (Shadare et al., 2009). Employer
must bear in mind that things that what once worked as motivators such as steady job,
good working conditions and reasonable pay might later on work as de motivators.
Employers need to know that motivators are not on-going they will wear off and needs
constant updating (Bagshawe, 2011).
2.2.3 Leadership
Yukl (2010) defines leadership as the process of influencing others to understand and
agree about what needs to be done and how to do it, and the process of facilitating
individual and collective efforts to accomplish shared objectives. Robbins and Judge
(2012) considered the core objective of a leader is to assist subordinates in achieving
their objectives successfully, providing the necessary guidance and assistance to attain
their goals in addition to those of the organization. Leadership style components that
inspire and promote employee opportunities to exercise their abilities and consequently
improve job-related resources have positive effects on employee engagement strategy
(Breevaart et al., 2014).
According to (Zhu et al., 2009) leadership is linked to employee engagement strategy
and the development of dynamic, visionary and creative employees. Leaders
demonstrating high levels of engagement encourage employees to be innovative and
increase sustainable firm performance levels as engagement impacts the cognitive and
emotional aspects of the employees (Kular et al., 2008). Kelly (2009) noted employee
effectiveness is influenced by the leaders’ charisma, confidence and influence as this is
the essence of leadership it is about influencing the behaviour of others.
18
Additionally, (Golde et al., 2010) stated that leadership demands a sense of purpose
and an ability to influence others, interpret situations negotiate and express their views,
often in the face of opposition. Two viewpoints on leadership were made by (Lee &
Wei, 2008) one is leader-focused, concentrating on leaders’ behaviours and traits which
are linked to individual, group or organizational outcomes, another one is relationship-
focused.
According to Tavanti (2008) leaders who exhibit specific leadership skills usually are
known for the ability to obtain results, to control results through structures and
processes to solve problems to plan and organise. Moreover (Bennis, 2010) commented
that the ability to inspire, trust not charisma is what enables leaders to recruit others to
cause a difference. Research conducted by the work foundation (Tamkin et al., 2010)
found that outstanding leaders are highly motivated to achieve excellence and are
focused on organisation outcomes, visions and purpose, they understand they cannot
create a sustainable firm performance themselves but are conduits of sustainable firm
performance through their influence on others.
2.2.4 Training
According to (Torrington et al., 2009) training usually implies preparation for an
occupation or for specific skills and it is more job-oriented than personal. According to
(Lepak & Gowan, 2009) training and development is needed to ensure that new
employees are able to do their jobs well. They also add that not only the new employees
need training, the changing environment results in change of products, equipment and
the way the work is done therefore need to ensure all employees are able to do their
work.
Strongman (2013) opines that training motivates employee and makes them more
productive innovative and boosts sustainable firm performance. Training has various
19
forms it can be on the job training, off the job training, classroom training amongst
others (Lee et al., 2010). For firms to maintain high levels of productivity, competitive
forces dictate that organisations employ staff that are competent, adaptable, progressive
and generally flexible in their demand (Nikondrou et al., 2008).
Firms must ensure their employees are properly trained for their tasks. Intense training
enhances employee’s abilities (Zhang & Li, 2009), when employees have the drive and
initiative to expand their knowledge, it is a good sign that they will be able to benefit
the company further. Mayfield and Taber (2010) suggested that management should be
involved in creating a favourable climate or culture in an organisation, stimulating
organizational improvement, and then self-training for additional organisational
responsibility, they concluded saying organisations can offer to pay for advancement
courses so that their employees will perform at a higher standard.
Furthermore, (Gold & Thorpe, 2010) found that employee attitudes such as company
dedication signalled that an individual found the work inspiring and therefore
experienced a sense of enthusiasm, significance, pride and challenge in completing
tasks. Training of employees is beneficial for the firm as (Johnson, 2011) found out that
firms that trains and develops some or all of their employees are more likely to develop
and survive than those firms that did not train at all.
2.3 Performance Appraisal
Performance appraisal can be defined as what is expected to be delivered by an
individual or a set of individuals within a timeframe. What is expected to be delivered
could be stated in terms of results or efforts, tasks and quality, with specification of
conditions under which it is 0to be delivered (Kumari & Malhotra, 2012). Another
definition is given by (Aguinis,2009) who said performance appraisal is a process that
20
provides an analysis of a person’s overall capabilities and potential allowing informed
decisions to be made for a particular purpose. It is usually completed by an interview,
once or twice a year between an employee and his line manager.
According to Obisi (2011), high sustainable firm performance and its resultant
efficiency and effectiveness can only be achieved when individuals are continuously
appraised and evaluated. This explains why almost every organisation carries out some
form of performance appraisal either on its own or as part of their performance
management system. When organisations fail to do this, they are slowly reducing the
lifespans of their organisation as suggested by Capelli (2008) who wrote that when
employees fail in their jobs, part of the organisation also fails.
Performance appraisal is an opportunity for individual employees and those concerned
with their performance, typically line managers, to engage in a dialogue about their
performance and development, as well as the support required from the manager
(Chartered Institute of Personnel Development, 2013). According to Postuma and
Campion (2008) performance appraisal is considered to be a key tool for identifying
development needs of an individual. Brown (2011) assert that performance appraisal
presents a dilemma on managers since one hand they need to give constructive feedback
and on the other hand they dislike giving negative feedback therefore managers avoid
the process altogether
In recent years, there has been growth in popularity of multisource feedback (MSF)
during which individuals receives feedback from different people including peers,
subordinates’ staff, and customers. This is referred to as 360-degree appraisal feedback
(McCarthy, 2010). According to Mullins (2011) there are many advantages associated
with the implementation of a performance appraisal, motivation and self-esteem is
increased and an improvement in the sustainable firm performance as well is noticed.
21
2.4 Theoretical Framework
This will cover Social exchange theory, Competitive theory and Goal theory.
2.4.1 Social Exchange Theory
According to (Saks, 2006) a strong theoretical rationale for employee engagement
strategy was provided by social exchange theory as he described it. Social exchange
theory argues that obligations are generated through a series of interactions between
parties who are in a state of reciprocal interdependence. A basic tenet of social exchange
theory is that relationships evolve over time into trusting loyal and mutual commitments
as long as the parties abide by certain rules of exchange. These usually involve
reciprocity of repayment rules such that actions of one party lead to a response or
actions by other party. He argued that one way for individuals to repay their
organisation is through their level of engagement.
In other words, employees will choose to engage themselves to varying degrees and in
response to the resources that they receive from their organisation. Balain and Sparrow
(2009) concluded that to understand what really causes employee engagement strategy
and what it causes in turn need to be embedded in a well-founded theory .Social
exchange theory is the most appropriate for employee engagement strategy as it sees
feelings of loyalty commitment and discretionary efforts as all being forms of
reciprocation by employees to their employer over a period of time. Employees are only
willing to give back as much as they feel is invested in them.
2.4.2 Competitive Theory
The theory of competitive advantage on sustainable firm performance provides a tool
for analysing competitiveness with all its implications. Porter’s theory contributes to
understanding the sustainable firm performance in trade and profit and giving an edge
22
to any organisation. Its core, however, focuses upon individual firms in which the
principles of sustainable firm performance are applied. His theory begins from
individual industries and builds up to the economy as a whole. Since firms compete
with each other understanding the way firms create and sustain firm is key.
Consideration of the different facets of the competitive diamond of the whole nation is
needed. His study is based on four determinants; demand conditions, firm strategy
structure and rivalry, related firms and factor conditions which deals with human,
physical, knowledge, capital and infrastructure resources (Porter,1990).
2.4.3 Goal Theory
Goal theory, as developed by Latham and Locke (1979) highlights four mechanisms
that connect goals to performance outcomes; they direct attention to priorities; they
stimulate effort; they challenge people to bring their knowledge and skills to bear to
increase their chances of success; and the more challenging the goal the more people
will draw on their full repertoire of skills. This theory underpins the emphasis in
performance appraisal on sitting and agreeing on goals against which performance can
be measured and managed.
According to (Cole & Kelly, 2011) the real aim of goal setting is for people to know
exactly what it is they have to do, when they have to do it and why they have to do it.
Goal setting and allowing employee involvement creates higher levels of commitment
performance goals and higher chances of sustainable firm performance. Goal-setting
theory asserts that people with specific and challenging goals perform better than those
with vague goals, such as improve your performance. Thus, goal-setting theory assumes
that there is a direct relation between the definition of specific and measurable goals
and sustainable firm performance (Locke & Latham, 2002). Goal theory supports the
23
agreement of objectives, feedback and therefore agrees with review aspects of
performance appraisal. In performance appraisal goal setting cannot be overlooked
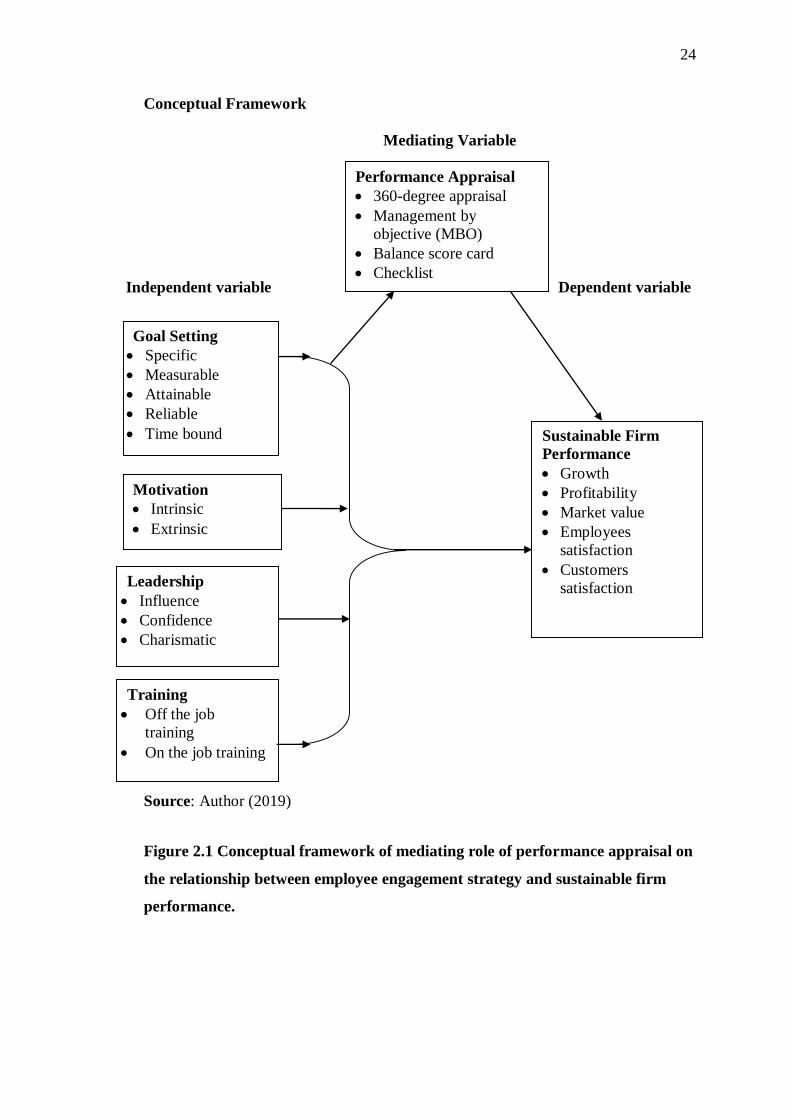
2.5 Conceptual Framework
The conceptual framework above shows the relationship between employee
engagement strategy and sustainable firm performance. The independent variable of the
study is employee engagement strategy which looked at the importance of goal setting
and focused on setting specific, measurable, attainable, reliable and time bound
(SMART) goals. The dependent variable for the study is sustainable firm performance
which looked at growth and employee satisfaction. The mediating role of the study is
performance appraisal. This shows the relationship between employee engagement
strategy and sustainable firm performance
24
Conceptual Framework
Mediating Variable
Independent variable Dependent variable
Source: Author (2019)
Figure 2.1 Conceptual framework of mediating role of performance appraisal on
the relationship between employee engagement strategy and sustainable firm
performance.
Leadership
Influence
Confidence
Charismatic
Training
Off the job
training
On the job training
Goal Setting
Specific
Measurable
Attainable
Reliable
Time bound Sustainable Firm
Performance
Growth
Profitability
Market value
Employees
satisfaction
Customers
satisfaction
Performance Appraisal
360-degree appraisal
Management by
objective (MBO)
Balance score card
Checklist
Motivation
Intrinsic
Extrinsic
25
CHAPTER THREE
RESEARCH METHODOLOGY
3.0 Introduction
This chapter looks at the research methodology relevant to this study. It looks at the
study area, research design, target population, sampling size and sampling procedures,
data collection, validity and reliability of research instruments, measurement of
variables, data analysis, model specifications and ethical considerations.
3.1 The Study Area
The study was conducted in commercial banks in Eldoret. This is because most
commercial banks in Kenya are struggling to be profitable, sustainable and competitive
at the same time and is characterised by laying off its employees during tough times
(Omondi, 2016). Eldoret town was able to provide the significant information needed
to understand sustainable performance of commercial banks in Kenya.
3.2 Research Design
According to Kombo and Tromp (2006) a research design can be regarded as an
arrangement of conditions for collection in a manner that aims at combining relevance
with the research purpose. The study employed explanatory research design as it is
useful in conducting a study not studied in depth. This design helped in understanding
the mediating role of performance appraisal on the relationship between employee
engagement strategy and sustainable firm performance. A survey research design
26
generally entails investigating populations by selecting samples to analyze and discover
occurrences (Mugenda & Mugenda, 1999). Survey design was appropriate for this
study as it enabled the researcher to collect as much information as possible and make
conclusions from the findings of the study.
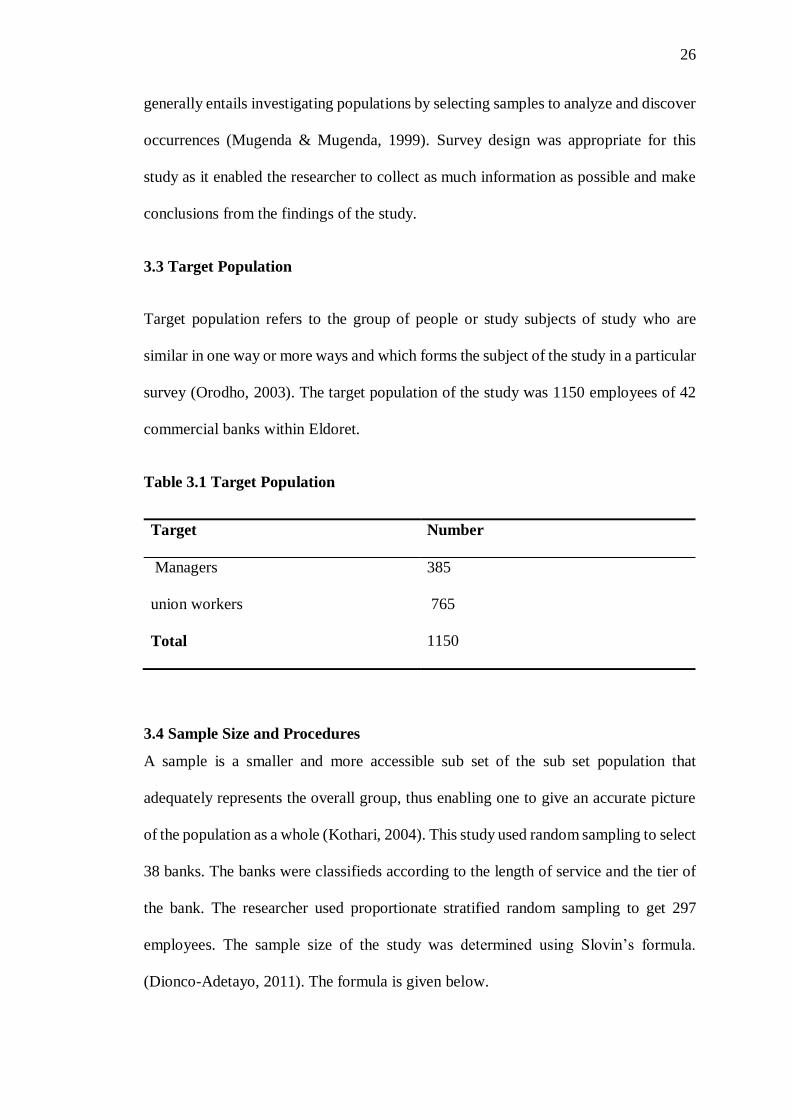
3.3 Target Population
Target population refers to the group of people or study subjects of study who are
similar in one way or more ways and which forms the subject of the study in a particular
survey (Orodho, 2003). The target population of the study was 1150 employees of 42
commercial banks within Eldoret.
Table 3.1 Target Population
Target Number
Managers 385
union workers 765
Total 1150
3.4 Sample Size and Procedures
A sample is a smaller and more accessible sub set of the sub set population that
adequately represents the overall group, thus enabling one to give an accurate picture
of the population as a whole (Kothari, 2004). This study used random sampling to select
38 banks. The banks were classifieds according to the length of service and the tier of
the bank. The researcher used proportionate stratified random sampling to get 297
employees. The sample size of the study was determined using Slovin’s formula.
(Dionco-Adetayo, 2011). The formula is given below.
27
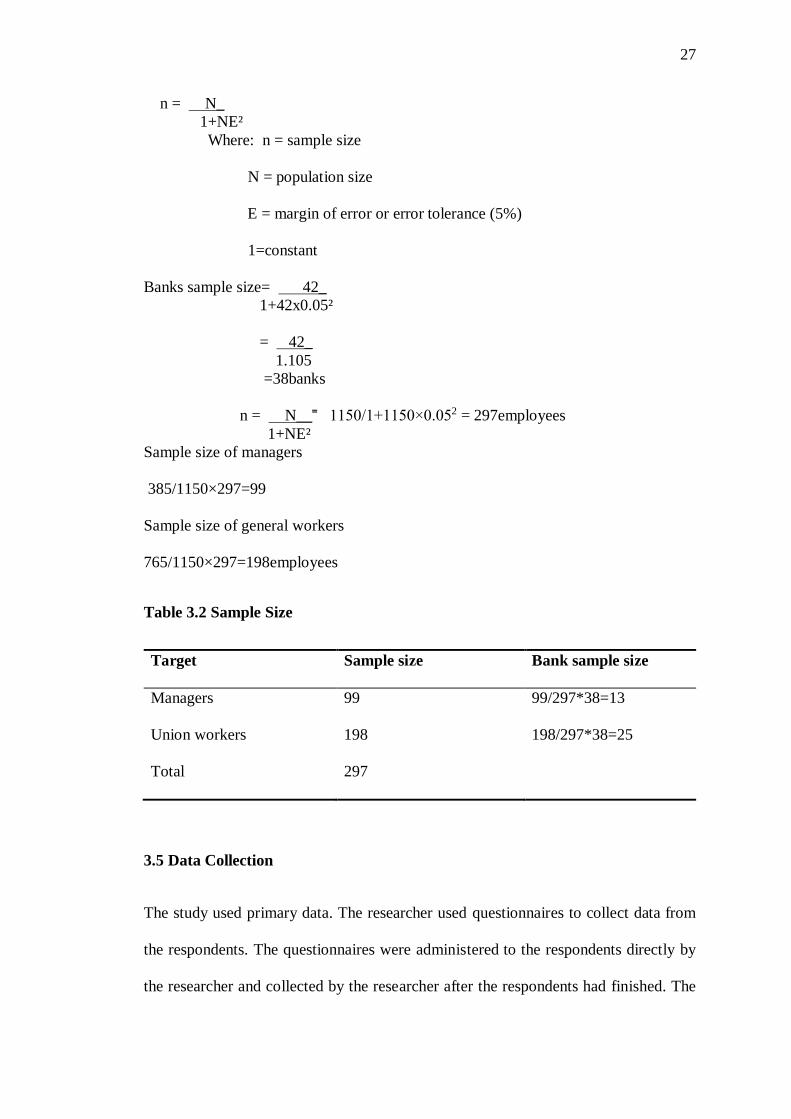
n = N_
1+NE²
Where: n = sample size
N = population size
E = margin of error or error tolerance (5%)
1=constant
Banks sample size= 42_
1+42x0.05²
= 42_
1.105
=38banks
n = N__˭ 1150/1+1150×0.052 = 297employees
1+NE²
Sample size of managers
385/1150×297=99
Sample size of general workers
765/1150×297=198employees
Table 3.2 Sample Size
Target Sample size Bank sample size
Managers 99 99/297*38=13
Union workers 198 198/297*38=25
Total 297
3.5 Data Collection
The study used primary data. The researcher used questionnaires to collect data from
the respondents. The questionnaires were administered to the respondents directly by
the researcher and collected by the researcher after the respondents had finished. The
28
researcher used closed-ended questionnaires to collect data from employees using five
Point Likert-type Scales.The questionnaires were divided into two sections. Section A
containing questions on the personal information of the selected respondents; Section
B on various questions of interest that gave an insight of sustainable practices among
commercial banks in Kenya. Respondents were the managers and employees of
commercial banks in Eldoret Kenya.
3.6 Validity and Reliability of Data
Validity indicates the degree to which instruments measure what they are supposed to
measure (Kothari, 2004). The researcher carried out a pilot test in commercial banks in
Nakuru.The questionnaires used in this study were given to the independent experts and
supervisors to evaluate it for face and content validity as well as for conceptual clarity
and investigative bias.
Orodho (2003) notes that reliability of research instruments concerns with the degree
to which a particular measuring procedure gives similar results of a number of repeated
trials. The study employed the Cronbach’s alpha coefficient to measure the internal
consistency of the questionnaire. As a general rule a value of α>0.7 was determined by
the researcher reliable enough for each of the data sets where α is the item being tested
for reliability.
3.6.1 Measurement of Variables
Both the dependent and independent variables were based on multiple-item constructs,
and were measured through Likert-type scales. The measurement was adopted from
previous studies, 8 items on goal setting was adopted from Stairs and Galpin (2010) 15
items on performance appraisal was adopted from a scale used by Denisi (2011), 11
29
items on motivation was adopted from Harter and Hayes (2012), 7 items on leadership
measures was adopted from Arnold(2013), 6 items on training was adopted from
Afshan (2012) and finally 10items on sustainable firm performance was adopted from
(Stringer & Shantapriyan, 2012) All were slightly modified to suit the study.
3.6.2 Regression Assumptions
The study was guided by the following assumptions; Homoscedasticity, auto-
correlation, normality, linearity and multicollinearity. Normality of data was assessed
by examining each scale in terms of skewness and kurtosis. Besides, a visual check on
the p-p plots and the histograms together with Kolmogorov-Smirnov test statistic was
also used. Though, Tabachnick and Fidell (2007) suggest that samples (> 200) are
unlikely to be affected by the skewedness of the data. Multicollinearity was checked
using Variance Inflation Factor (VIF) as recommended by Cooper and Schindler
(2006). Linearity of relationships of the independent variable and the dependent
variables was checked using bivariate scatter plots; plots presenting an oval shape along
a straight line confirm linearity of variables. The study used Durbin-Watson test to
check on auto-correlation.
3.7 Data Analysis
Data obtained from the field was coded, cleaned, and entered into the computer for
analysis using the SPSS. The data was summarized in order to see emerging trends and
issues around specific themes, which were dependent on the variables and objectives.
The researcher computed the scores from indicators for the variables from various
indicators into indices.
30
According to Kothari (2009) data analysis is the use of descriptive and inferential
techniques to determine the effect of independent variable on the dependent variables
and its relation as per the number of respondents in the study. Data was analyzed using
descriptive and inferential statistics. Descriptive statistical was used to analyse data that
included: means, standard deviation, frequencies and percentage. Inferential statistical
analysis such as multiple regression model and correlation analysis and PROCESS
Macro procedure by Hayes (2013) was used.
3.7.1 Model specification
To test the four hypotheses, several models were derived so as to facilitate testing.
Multiple regression equations were developed and utilized to test the hypothesized
effects. To achieve objectives 1, 2, 3 and 4 being multiple linear regression models were
using enter method was used for purpose of hypotheses HO1 to HO4. This was possible
after crafting regression equations constituting the models to be tested. To determine
the influence of the independent variables on the dependent variable as captured by the
null hypotheses H01 to H04 multiple regression was undertaken using multiple regression
models as follows:
Y = β0 + β1X1 + β2X2 + β3X3 + β4X4+℮ ………………………………...Model 1
Where,
Y = Sustainable firm performance
X1= Goal setting
X2= Motivation
X3= Leadership
X4= Training
β0=Constant
β1 – β4=Regression coefficients
31
℮= Error term
A mediator explains why there is a causal relationship between variables. This means
that the independent variable causes the mediator and the mediator in turn causes the
dependent variable (Wu et al., 2008). In this study, it would be more informative to
interrogate by what means Employee engagement strategy exerts its influence on
Sustainable firm performance. This lays the basis for testing the mediation hypothesis,
whose procedure was pioneered by Baron and Kenny, (1986). Muller et al., (2005);
Preacher et al., (2007 and Preacher and Hayes (2008) acknowledge this procedure. The
procedure involves running three regression models thus;
Model I; the predictor variable must significantly predict the outcome variable. Model
II; the predictor variable must significantly predict the mediator. Model III; the
mediator must then significantly predict the outcome variable in the presence of IV.
And for decision rule, the IV must predict the DV less strongly in model III than in
model I to confirm a mediated effect.
The study hypothesized that Performance appraisal (PA) is not responsible for the
causal effect of Employee engagement strategy (EES) on Sustainable firm performance
(SFP). Mediation was tested using PROCESS macro which provides for a bootstrap
procedure to correct for biases and testing for significance at 95% confidence interval.
Following the guideline stated above, the following processes were undertaken;
Step I; the relationship between Employee engagement strategy and SFP was tested
and checked for significance; this was a prerequisite to testing the subsequent models
(Model 1 and 2).
Step II; The relationship between employee engagement strategy and Performance
appraisal by setting the later as the outcome variable in the regression equation was
32
tested. The objective was to ascertain the significant relationship between Employee
engagement strategy and Performance appraisal to proceed.
Step III; The relationship between Performance appraisal and sustainable firm
performance while controlling for Employee engagement strategy which involves
including both the independent variable and the mediating variable in the regression
equation was assessed.
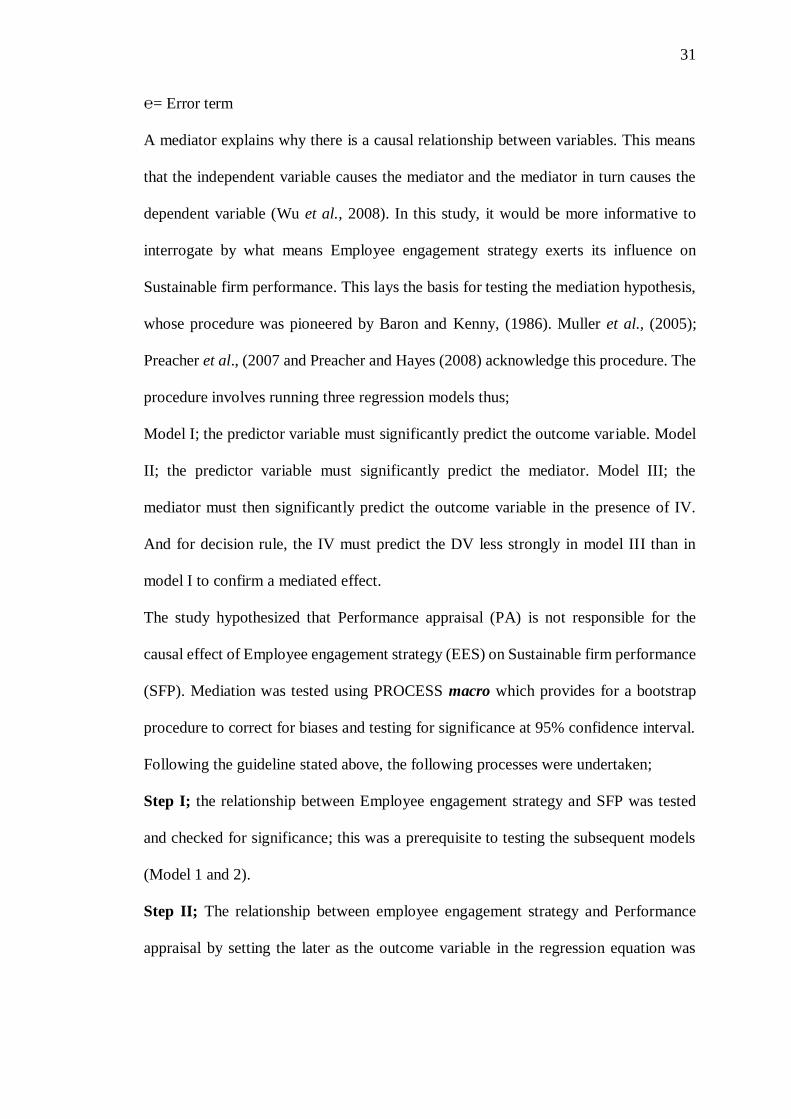
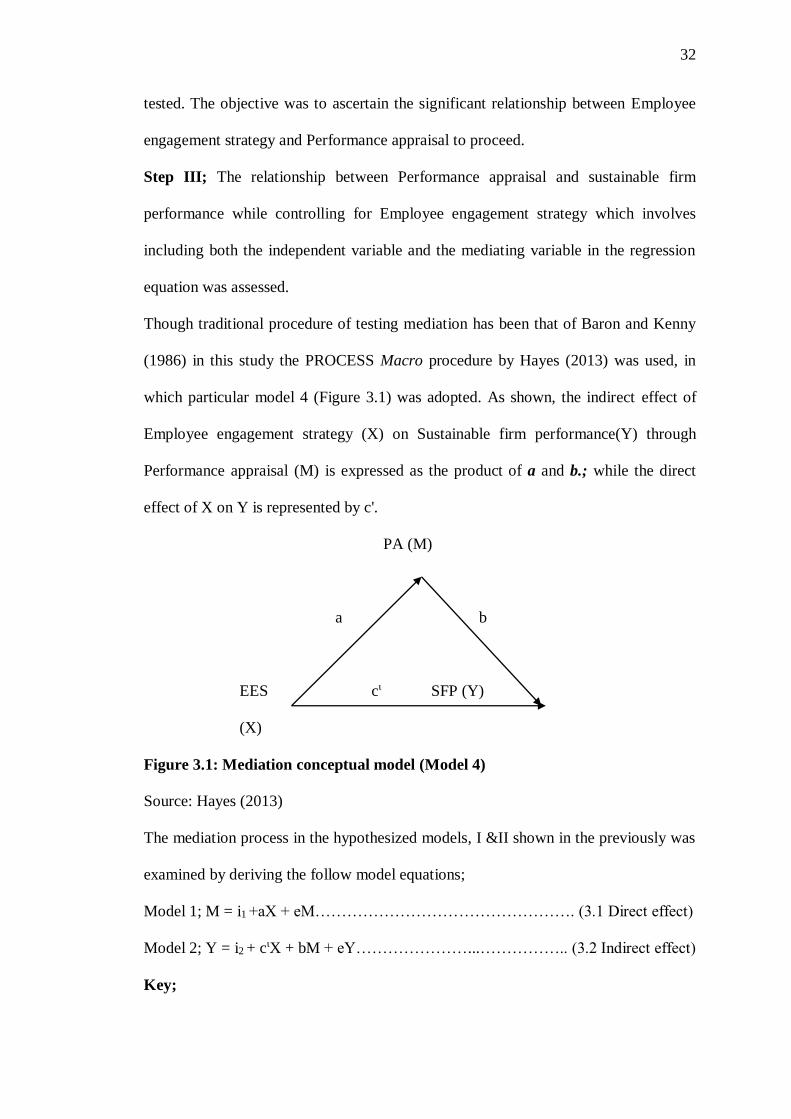
Though traditional procedure of testing mediation has been that of Baron and Kenny
(1986) in this study the PROCESS Macro procedure by Hayes (2013) was used, in
which particular model 4 (Figure 3.1) was adopted. As shown, the indirect effect of
Employee engagement strategy (X) on Sustainable firm performance(Y) through
Performance appraisal (M) is expressed as the product of a and b.; while the direct
effect of X on Y is represented by c'.
PA (M)
a b
EES cι SFP (Y)
(X)
Figure 3.1: Mediation conceptual model (Model 4)
Source: Hayes (2013)
The mediation process in the hypothesized models, I &II shown in the previously was
examined by deriving the follow model equations;
Model 1; M = i1 +aX + eM…………………………………………. (3.1 Direct effect)
Model 2; Y = i2 + cιX + bM + eY…………………...…………….. (3.2 Indirect effect)
Key;
33
X : Represents Independent variable Employee engagement strategy
Y: Represents sustainable firm performance.
M : Represents mediating variable performance appraisal.
i1 -i2; Represents the Y and M intercepts (Constant)
a : Represents the slope coefficients denoting the effect of employee engagement
strategy on performance appraisal
b : Represents the slope coefficients denoting effect of Performance appraisal on
Sustainable firm performance
cι ; Represents the slope coefficients denoting the indirect effect of Employee
engagement strategy on Sustainable firm performance
eM ; Represents error on the predicted Performance appraisal
eY ; Represents error on the predicted Sustainable firm performance
Accordingly, if the effects of employee engagement strategy becomes less significant
in model III compared to model I, this is evidence of mediation. To confirm mediation,
a Sobel (1982) test result was used and if it turns a significance result then there is a
mediated effect.
3.8 Ethical Considerations
The researcher got an introductory letter from University of Eldoret (UOE) and used it
to obtain permission to conduct research at the commercial banks. The researcher
explained the purpose of the research to the respondents that it was for educational
purpose and got their approval before the data was collected. The researcher observed
confidentiality from all the data collected. The respondents’ information names were
not required but instead they used numbers to assure them of anonymity.
34
CHAPTER FOUR
RESEARCH FINDINGS AND DISCUSSIONS
4.0 Introduction
This chapter discusses the interpretations and presentations of the findings. The purpose
of the study was to establish the mediating role of performance appraisal on the
relationship between employee engagement strategy and sustainable firm performance.
4.1 Questionnaire Return Rate
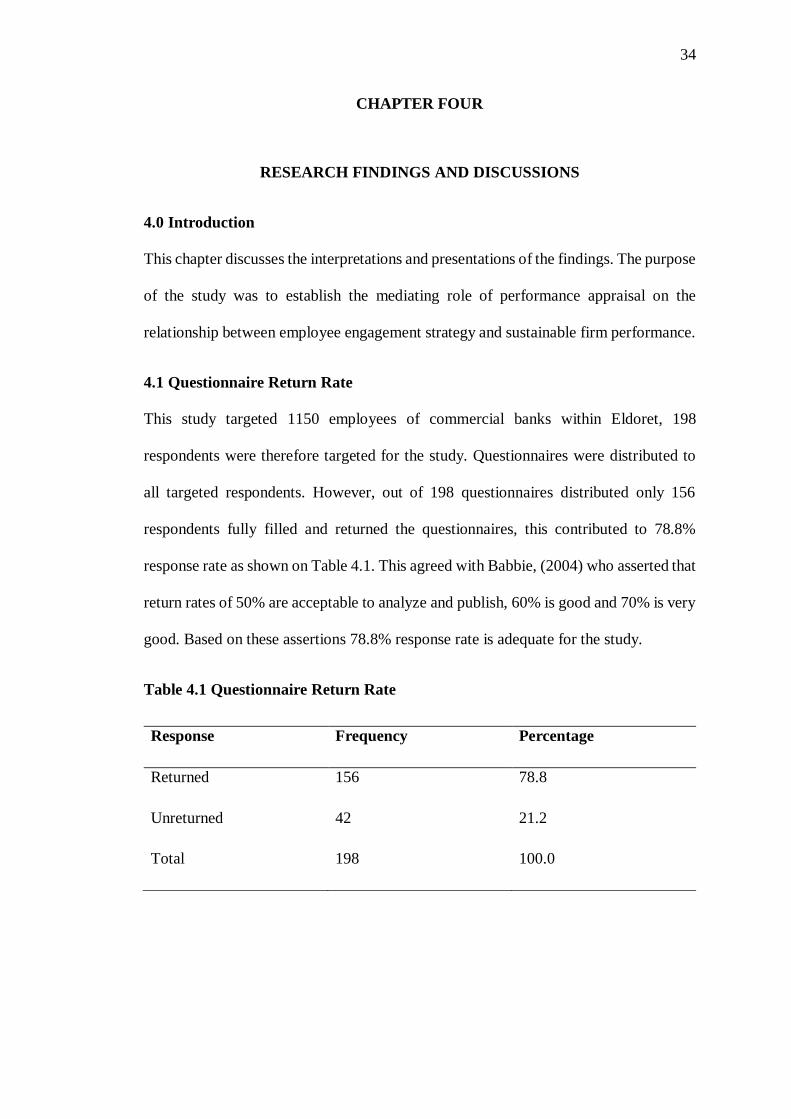
This study targeted 1150 employees of commercial banks within Eldoret, 198
respondents were therefore targeted for the study. Questionnaires were distributed to
all targeted respondents. However, out of 198 questionnaires distributed only 156
respondents fully filled and returned the questionnaires, this contributed to 78.8%
response rate as shown on Table 4.1. This agreed with Babbie, (2004) who asserted that
return rates of 50% are acceptable to analyze and publish, 60% is good and 70% is very
good. Based on these assertions 78.8% response rate is adequate for the study.
Table 4.1 Questionnaire Return Rate
Response Frequency Percentage
Returned 156 78.8
Unreturned 42 21.2
Total 198 100.0
35
4.2 Demographic Information
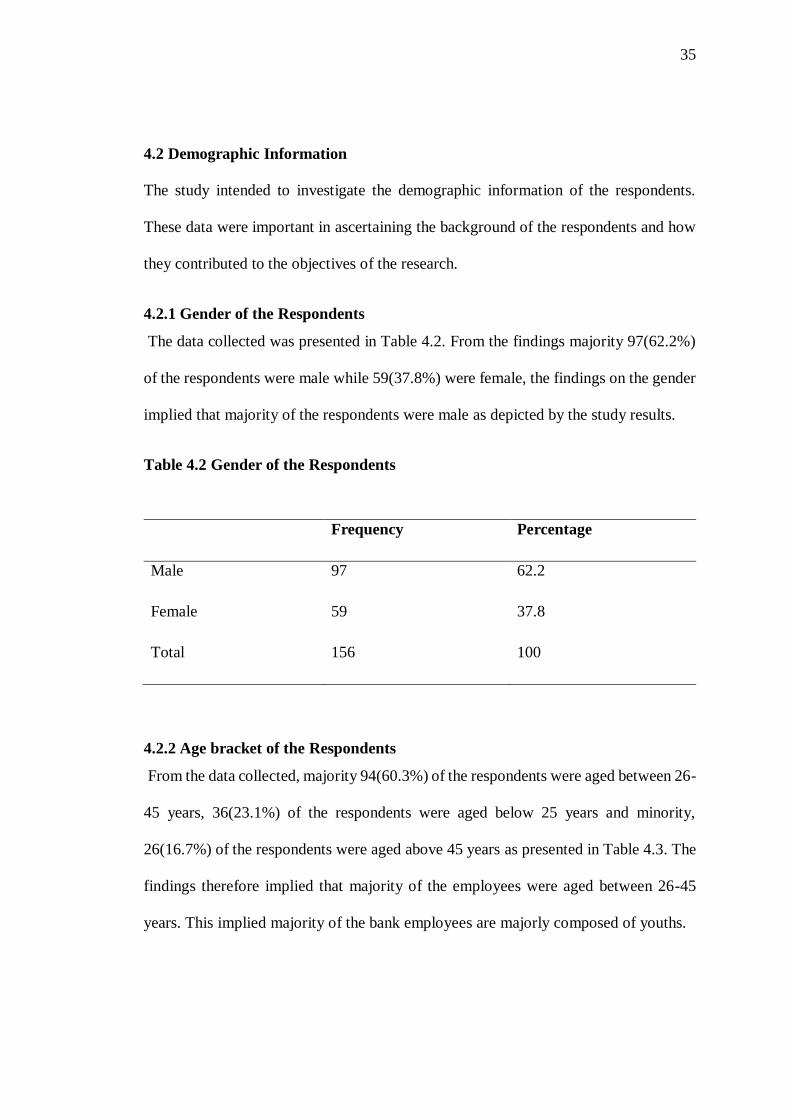
The study intended to investigate the demographic information of the respondents.
These data were important in ascertaining the background of the respondents and how
they contributed to the objectives of the research.
4.2.1 Gender of the Respondents
The data collected was presented in Table 4.2. From the findings majority 97(62.2%)
of the respondents were male while 59(37.8%) were female, the findings on the gender
implied that majority of the respondents were male as depicted by the study results.
Table 4.2 Gender of the Respondents
Frequency Percentage
Male 97 62.2
Female 59 37.8
Total 156 100
4.2.2 Age bracket of the Respondents
From the data collected, majority 94(60.3%) of the respondents were aged between 26-
45 years, 36(23.1%) of the respondents were aged below 25 years and minority,
26(16.7%) of the respondents were aged above 45 years as presented in Table 4.3. The
findings therefore implied that majority of the employees were aged between 26-45
years. This implied majority of the bank employees are majorly composed of youths.
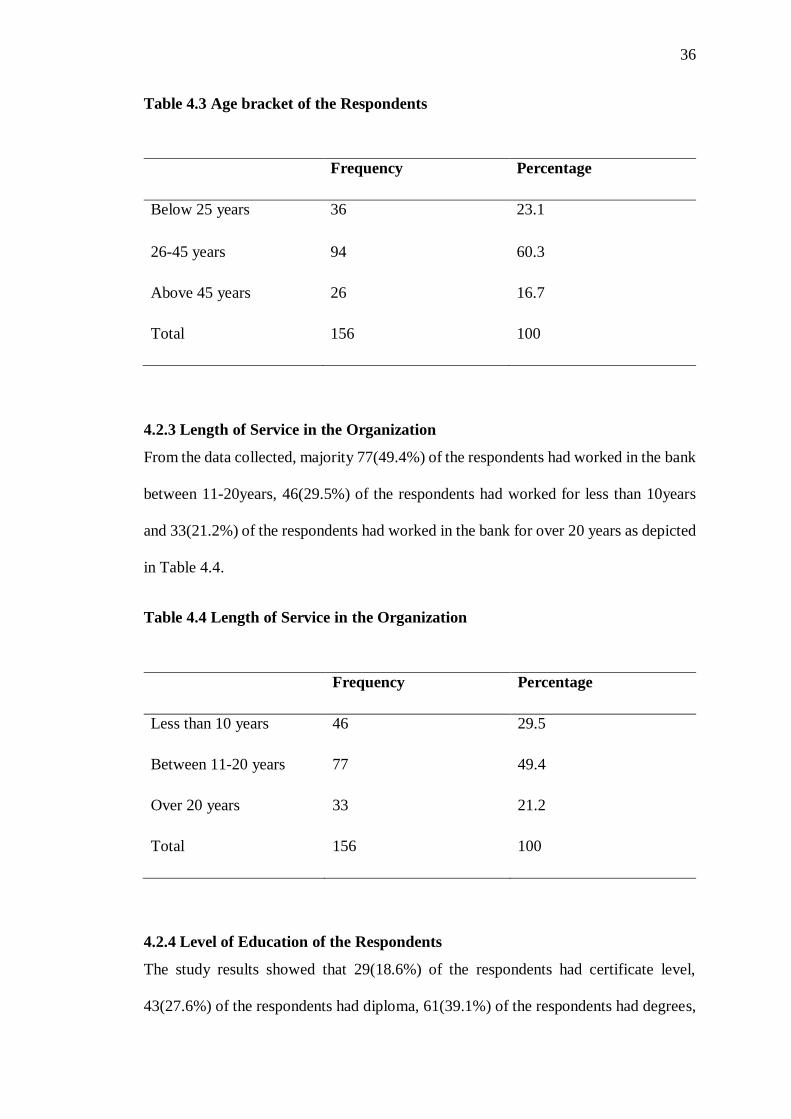
36
Table 4.3 Age bracket of the Respondents
Frequency Percentage
Below 25 years 36 23.1
26-45 years 94 60.3
Above 45 years 26 16.7
Total 156 100
4.2.3 Length of Service in the Organization
From the data collected, majority 77(49.4%) of the respondents had worked in the bank
between 11-20years, 46(29.5%) of the respondents had worked for less than 10years
and 33(21.2%) of the respondents had worked in the bank for over 20 years as depicted
in Table 4.4.
Table 4.4 Length of Service in the Organization
Frequency Percentage
Less than 10 years 46 29.5
Between 11-20 years 77 49.4
Over 20 years 33 21.2
Total 156 100
4.2.4 Level of Education of the Respondents
The study results showed that 29(18.6%) of the respondents had certificate level,
43(27.6%) of the respondents had diploma, 61(39.1%) of the respondents had degrees,
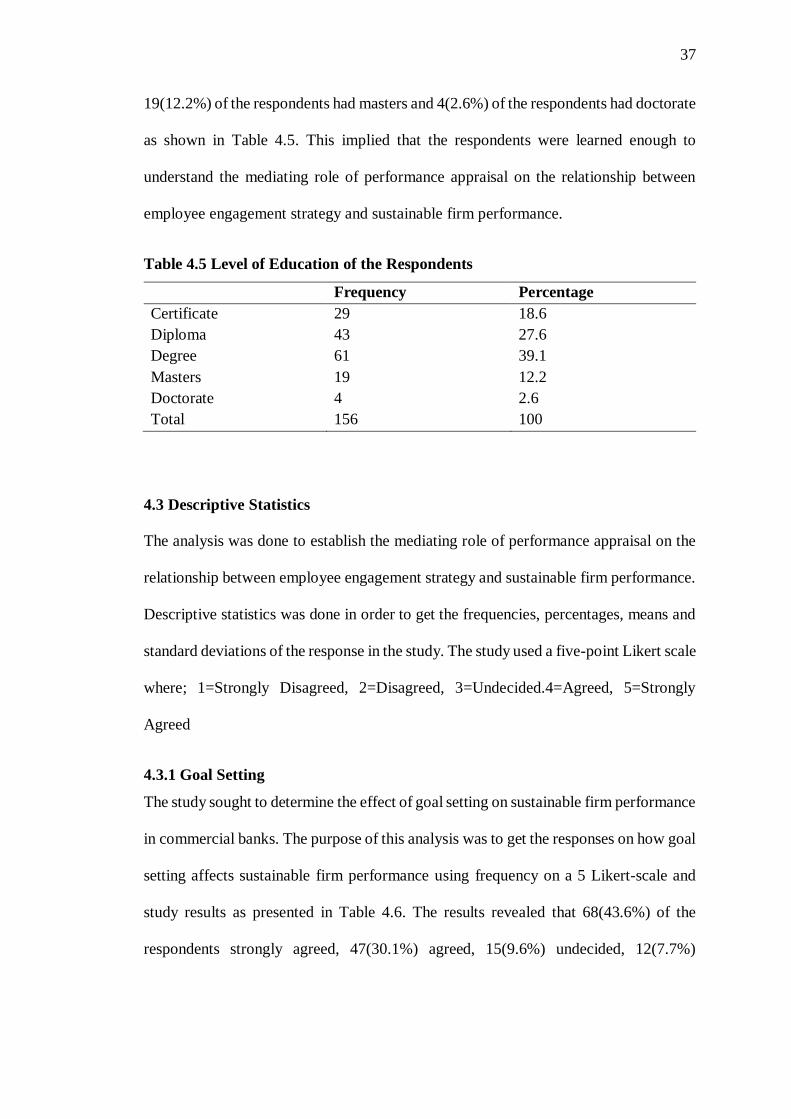
37
19(12.2%) of the respondents had masters and 4(2.6%) of the respondents had doctorate
as shown in Table 4.5. This implied that the respondents were learned enough to
understand the mediating role of performance appraisal on the relationship between
employee engagement strategy and sustainable firm performance.
Table 4.5 Level of Education of the Respondents
Frequency Percentage
Certificate 29 18.6
Diploma 43 27.6
Degree 61 39.1
Masters 19 12.2
Doctorate 4 2.6
Total 156 100
4.3 Descriptive Statistics
The analysis was done to establish the mediating role of performance appraisal on the
relationship between employee engagement strategy and sustainable firm performance.
Descriptive statistics was done in order to get the frequencies, percentages, means and
standard deviations of the response in the study. The study used a five-point Likert scale
where; 1=Strongly Disagreed, 2=Disagreed, 3=Undecided.4=Agreed, 5=Strongly
Agreed
4.3.1 Goal Setting
The study sought to determine the effect of goal setting on sustainable firm performance
in commercial banks. The purpose of this analysis was to get the responses on how goal
setting affects sustainable firm performance using frequency on a 5 Likert-scale and
study results as presented in Table 4.6. The results revealed that 68(43.6%) of the
respondents strongly agreed, 47(30.1%) agreed, 15(9.6%) undecided, 12(7.7%)
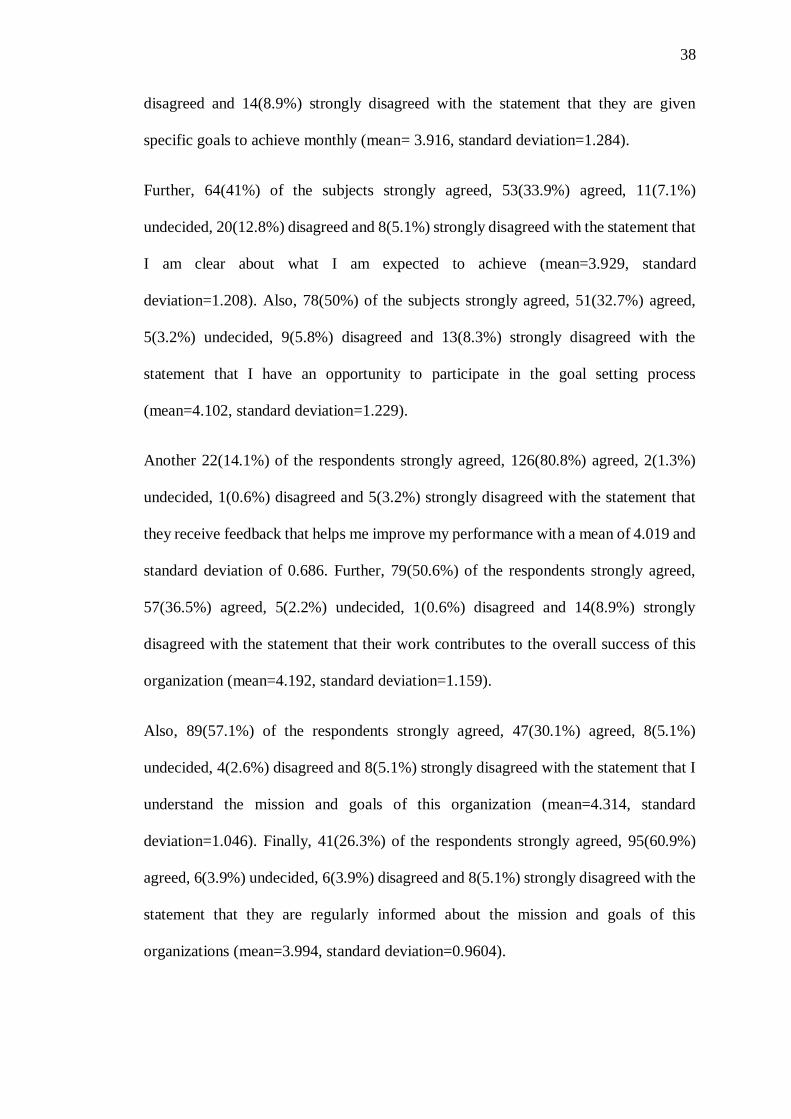
38
disagreed and 14(8.9%) strongly disagreed with the statement that they are given
specific goals to achieve monthly (mean= 3.916, standard deviation=1.284).
Further, 64(41%) of the subjects strongly agreed, 53(33.9%) agreed, 11(7.1%)
undecided, 20(12.8%) disagreed and 8(5.1%) strongly disagreed with the statement that
I am clear about what I am expected to achieve (mean=3.929, standard
deviation=1.208). Also, 78(50%) of the subjects strongly agreed, 51(32.7%) agreed,
5(3.2%) undecided, 9(5.8%) disagreed and 13(8.3%) strongly disagreed with the
statement that I have an opportunity to participate in the goal setting process
(mean=4.102, standard deviation=1.229).
Another 22(14.1%) of the respondents strongly agreed, 126(80.8%) agreed, 2(1.3%)
undecided, 1(0.6%) disagreed and 5(3.2%) strongly disagreed with the statement that
they receive feedback that helps me improve my performance with a mean of 4.019 and
standard deviation of 0.686. Further, 79(50.6%) of the respondents strongly agreed,
57(36.5%) agreed, 5(2.2%) undecided, 1(0.6%) disagreed and 14(8.9%) strongly
disagreed with the statement that their work contributes to the overall success of this
organization (mean=4.192, standard deviation=1.159).
Also, 89(57.1%) of the respondents strongly agreed, 47(30.1%) agreed, 8(5.1%)
undecided, 4(2.6%) disagreed and 8(5.1%) strongly disagreed with the statement that I
understand the mission and goals of this organization (mean=4.314, standard
deviation=1.046). Finally, 41(26.3%) of the respondents strongly agreed, 95(60.9%)
agreed, 6(3.9%) undecided, 6(3.9%) disagreed and 8(5.1%) strongly disagreed with the
statement that they are regularly informed about the mission and goals of this
organizations (mean=3.994, standard deviation=0.9604).
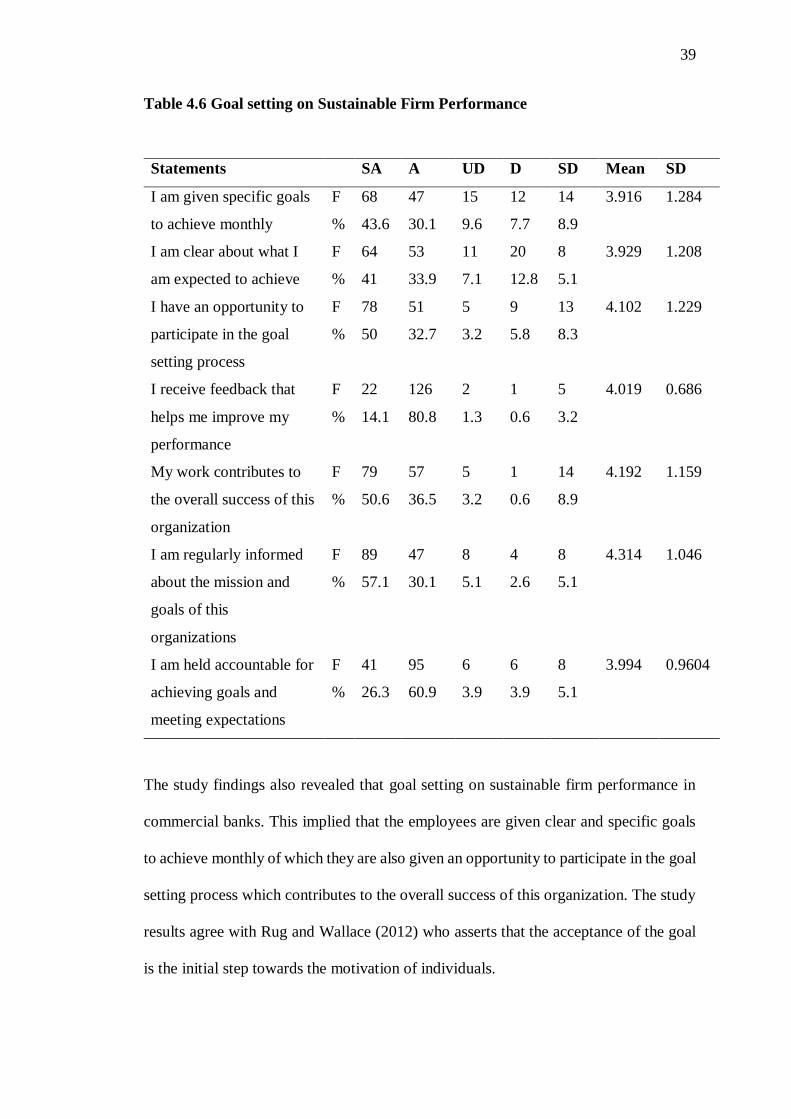
39
Table 4.6 Goal setting on Sustainable Firm Performance
Statements SA A UD D SD Mean SD
I am given specific goals
to achieve monthly
F 68 47 15 12 14 3.916 1.284
% 43.6 30.1 9.6 7.7 8.9
I am clear about what I
am expected to achieve
F 64 53 11 20 8 3.929 1.208
% 41 33.9 7.1 12.8 5.1
I have an opportunity to
participate in the goal
setting process
F 78 51 5 9 13 4.102 1.229
% 50 32.7 3.2 5.8 8.3
I receive feedback that
helps me improve my
performance
F 22 126 2 1 5 4.019 0.686
% 14.1 80.8 1.3 0.6 3.2
My work contributes to
the overall success of this
organization
F 79 57 5 1 14 4.192 1.159
% 50.6 36.5 3.2 0.6 8.9
I am regularly informed
about the mission and
goals of this
organizations
F 89 47 8 4 8 4.314 1.046
% 57.1 30.1 5.1 2.6 5.1
I am held accountable for
achieving goals and
meeting expectations
F 41 95 6 6 8 3.994 0.9604
% 26.3 60.9 3.9 3.9 5.1
The study findings also revealed that goal setting on sustainable firm performance in
commercial banks. This implied that the employees are given clear and specific goals
to achieve monthly of which they are also given an opportunity to participate in the goal
setting process which contributes to the overall success of this organization. The study
results agree with Rug and Wallace (2012) who asserts that the acceptance of the goal
is the initial step towards the motivation of individuals.
40
If the goal is attainable and realistic then the rate of acceptance is high and with the
acceptance, the individual applies the required degree of determination and self-
efficacy in order to complete the goal. The study results also concur with Reed (2012)
who asserts that employee goals are related with enhancement of sustainable firm
performance because they organize effort directs attention and encourages
determination and plan development.
4.3.2 Motivation on Sustainable Firm Performance
The study sought to determine the effect of motivation on sustainable firm performance
in commercial banks. The purpose of this analysis was to get the responses on how
motivation affects sustainable firm performance using frequency on a 5 Likert-scale as
presented in the table 4.7. The findings indicated that 43(27.5%) of the respondents
strongly agreed, 76(48.7%) agreed, 8(5.1%) undecided, 15(9.6%) disagreed and
14(8.9%) strongly disagreed with the statement that they are able to satisfy both my
organizational and personal goals this is also evidenced by mean of 3.763 and standard
deviation of 1.213. Also, 36(23.1%) of the subjects strongly agreed, 99(63.5%) agreed,
1(0.6%) undecided, 10(6.4%) disagreed and strongly 10(6.4%) disagreed with the
statement that their senior treats everyone fairly this is also evidenced by mean of 3.903
and standard deviation of 1.033.
Further, 30(19.2%) of strongly agreed, 109(69.9%) agreed, 7(4.5%) undecided,
6(3.8%) disagreed and strongly 4(2.6%) disagreed with the statement that they feel
sufficiently motivated by my supervisors this is also evidenced by mean of 3.994 and
standard deviation of 0.719 while 26(16.7%) of the respondents strongly agreed,
123(78.8%) agreed, 1(0.6%) undecided, 1(0.6%) disagreed and strongly 5(3.2)
disagreed with the statement that their level of motivation affects my performance this
is also evidenced by mean of 4.044 and standard deviation of 0.721.
41
Another, 11(7.1%) of the respondents strongly agreed, 115(73.5%) agreed, 9(5.8%)
undecided, 14(8.9%) disagreed and 7(4.5%) strongly disagreed with the statement that
their senior understands the benefits of maintaining a balance between work and
personal life this is also evidenced by mean of 3.698 and standard deviation of 0.897.
Furthermore, 21(13.5%) of the respondents strongly agreed, 122(78.2%) agreed,
4(2.6%) undecided, 4(2.6%) disagreed and 5(3.2%) strongly disagreed with the
statement that they get excited about going to work this is also evidenced by mean of
3.962 and standard deviation of 0.743. Also, 22(14.1%) of the respondents strongly
agreed, 117(75%) agreed, 5(3.2%) undecided, 6(3.8%) disagreed and 6(3.8%) strongly
disagreed with the statement that I intend to go on working for this organization this is
also evidenced by mean of 3.917 and standard deviation of 0.819.
Another, 27(17.3%) of the respondents strongly agreed, 111(71.2%) agreed, 1(0.6%)
undecided, 18(11.5%) disagreed and 8(5.1%) strongly disagreed with the statement that
they are prepared to put myself out to do my work this is also evidenced by mean of
3.935 and standard deviation of 0.824. Further, 31(19.9%) of the respondents strongly
agreed, 98(62.8%) agreed, 1(0.6%) undecided, 18(11.5%) disagreed and 8(5.1%)
strongly disagreed with the statement that my senior fully recognized my achievements
this year this is also evidenced by mean of 3.807 and standard deviation of 1.047.
Finally, 36(23.1%) of the subjects strongly agreed, 99(63.5%) agreed, 11(7.1%)
undecided, 1(0.6%) disagreed and strongly 9(5.8%) disagreed with the statement that
my senior praises and recognizes when they do a good job this is also evidenced by
mean of 3.783 and standard deviation of 1.187.
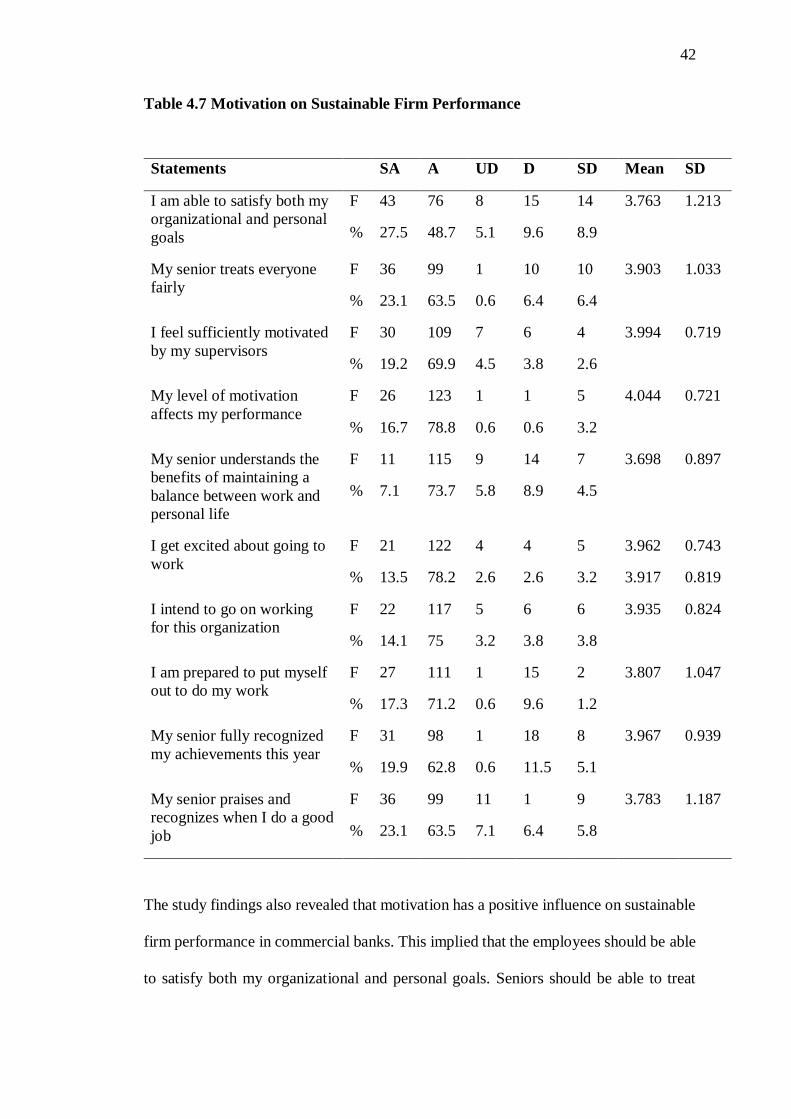
42
Table 4.7 Motivation on Sustainable Firm Performance
Statements SA A UD D SD Mean SD
I am able to satisfy both my
organizational and personal
goals
F 43 76 8 15 14 3.763 1.213
% 27.5 48.7 5.1 9.6 8.9
My senior treats everyone
fairly
F 36 99 1 10 10 3.903 1.033
% 23.1 63.5 0.6 6.4 6.4
I feel sufficiently motivated
by my supervisors
F 30 109 7 6 4 3.994 0.719
% 19.2 69.9 4.5 3.8 2.6
My level of motivation
affects my performance
F 26 123 1 1 5 4.044 0.721
% 16.7 78.8 0.6 0.6 3.2
My senior understands the
benefits of maintaining a
balance between work and
personal life
F 11 115 9 14 7 3.698 0.897
% 7.1 73.7 5.8 8.9 4.5
I get excited about going to
work
F 21 122 4 4 5 3.962 0.743
% 13.5 78.2 2.6 2.6 3.2 3.917 0.819
I intend to go on working
for this organization
F 22 117 5 6 6 3.935 0.824
% 14.1 75 3.2 3.8 3.8
I am prepared to put myself
out to do my work
F 27 111 1 15 2 3.807 1.047
% 17.3 71.2 0.6 9.6 1.2
My senior fully recognized
my achievements this year
F 31 98 1 18 8 3.967 0.939
% 19.9 62.8 0.6 11.5 5.1
My senior praises and
recognizes when I do a good
job
F 36 99 11 1 9 3.783 1.187
% 23.1 63.5 7.1 6.4 5.8
The study findings also revealed that motivation has a positive influence on sustainable
firm performance in commercial banks. This implied that the employees should be able
to satisfy both my organizational and personal goals. Seniors should be able to treat
43
employees fairly. Seniors should understand the benefits of maintaining a balance
between work and personal life and the employees should be recognized for the work
well done in order to realize improvement in the organization.
The study results concur with Price (2009) who points out, that all leaders should
address themselves to issues of employee motivation because the life span of
organizations depends very much on their ability to achieve personal and organizational
goals as our behaviour as human beings is “goal-seeking”. The study also concurs with
(Robbins et al., 2011) who asserts that future leaders ought to be selected on the basis
of their ability to stimulate organizational motivation. Employees, especially young
people, get discouraged when they feel there is little chance of personal growth in their
career as young people seeks upward movement in their early years of working.
4.3.3 Leadership on Sustainable Firm Performance
The study sought to determine the effect of leadership on sustainable firm performance
in commercial banks. The purpose of this analysis was to get the responses on how
leadership affects sustainable firm performance using frequency on a 5 Likert-scale.
The findings indicated that 51(32.7%) of the respondents strongly agreed, 72(46.2%)
agreed, 12(7.7%) undecided, 10(6.4%) disagreed and 11(7.1%) strongly disagreed with
the statement that their senior demonstrates strong leadership skills evidenced by mean
of 3.910 and standard deviation of 1.138.
Further, 42(26.9%) of the subjects strongly agreed, 79(50.6%) agreed, 10(6.4%)
undecided, 17(10.9%) disagreed and 8(5.1%) strongly disagreed with the statement that
their senior challenges me to think of problems in a different way evidenced by mean
of 3.833 and standard deviation of 1.100. Also, 44(28.2%) of the respondents strongly
agreed, 89(57.1%) agreed, 9(5.8%) undecided, 7(4.5%) disagreed and 7(4.5%) strongly
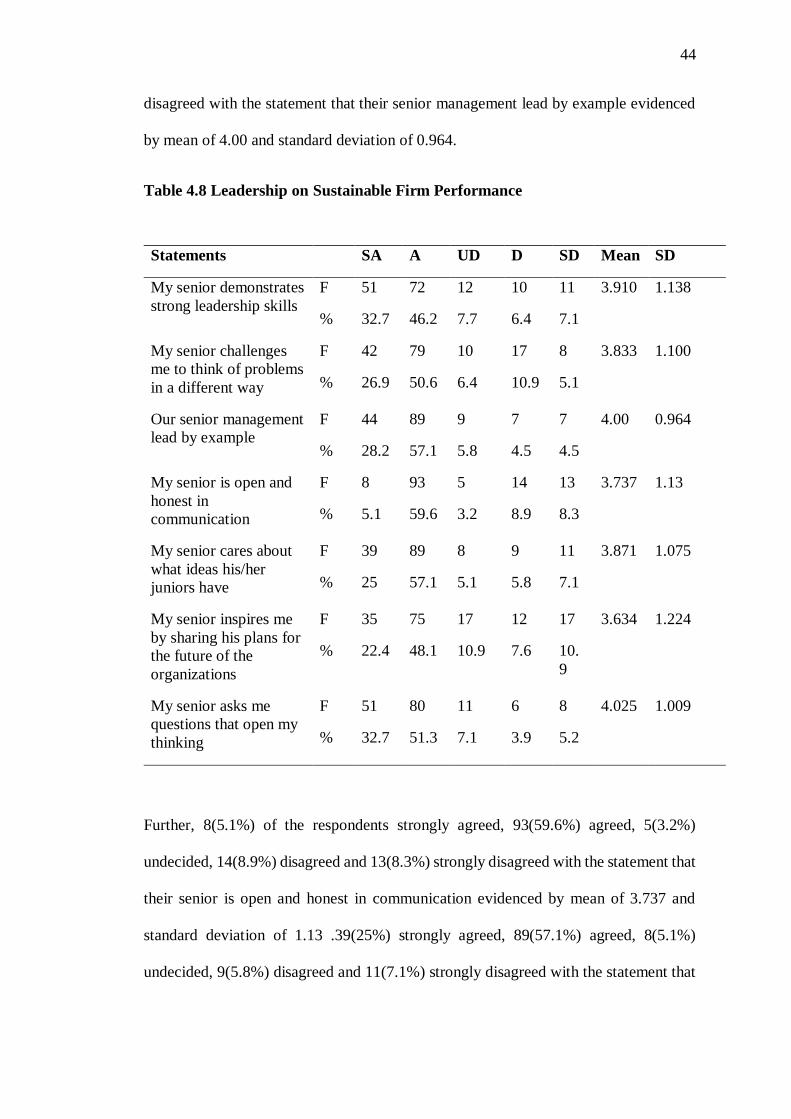
44
disagreed with the statement that their senior management lead by example evidenced
by mean of 4.00 and standard deviation of 0.964.
Table 4.8 Leadership on Sustainable Firm Performance
Statements SA A UD D SD Mean SD
My senior demonstrates
strong leadership skills
F 51 72 12 10 11 3.910 1.138
% 32.7 46.2 7.7 6.4 7.1
My senior challenges
me to think of problems
in a different way
F 42 79 10 17 8 3.833 1.100
% 26.9 50.6 6.4 10.9 5.1
Our senior management
lead by example
F 44 89 9 7 7 4.00 0.964
% 28.2 57.1 5.8 4.5 4.5
My senior is open and
honest in
communication
F 8 93 5 14 13 3.737 1.13
% 5.1 59.6 3.2 8.9 8.3
My senior cares about
what ideas his/her
juniors have
F 39 89 8 9 11 3.871 1.075
% 25 57.1 5.1 5.8 7.1
My senior inspires me
by sharing his plans for
the future of the
organizations
F 35 75 17 12 17 3.634 1.224
% 22.4 48.1 10.9 7.6 10.
9
My senior asks me
questions that open my
thinking
F 51 80 11 6 8 4.025 1.009
% 32.7 51.3 7.1 3.9 5.2
Further, 8(5.1%) of the respondents strongly agreed, 93(59.6%) agreed, 5(3.2%)
undecided, 14(8.9%) disagreed and 13(8.3%) strongly disagreed with the statement that
their senior is open and honest in communication evidenced by mean of 3.737 and
standard deviation of 1.13 .39(25%) strongly agreed, 89(57.1%) agreed, 8(5.1%)
undecided, 9(5.8%) disagreed and 11(7.1%) strongly disagreed with the statement that
45
my senior cares about what ideas his/her juniors have evidenced by mean of 3.871and
standard deviation of 1.075 as presented in the table below
Finally, 35(22.4%) of the respondents strongly agreed, 75(48.1%) agreed, 17(10.9%)
undecided, 12(7.6%) disagreed and 17(10.9%) strongly disagreed with the statement
that my senior inspires me by sharing his plans for the future of the organizations
evidenced by mean of 4.025 and standard deviation of 1.009 while51(32.7%) of the
subjects strongly agreed, 80(51.3%) agreed, 11(7.1%) undecided, 6(3.9%) disagreed
and 8(5.2%) strongly disagreed with the statement that their senior asks me questions
that open my thinking.
The study also revealed that leadership has a positive influence on sustainable firm
performance in commercial banks. This implied that in order for the banks to realize
sustainable performance a leader should demonstrate strong leadership skills, lead by
example, care about what ideas his/her juniors have and inspire the juniors by sharing
his/her plans for the future of the organizations.
The study results concur with Kelly (2009) who noted that employee effectiveness is
influenced by the leaders’ charisma, confidence and influence as this is the essence of
leadership it is about influencing the behaviour of others. It also concurs with (Golde
et al., 2010) who stated that leadership demands a sense of purpose and an ability to
influence others, interpret situations negotiate and express their views, often in the face
of opposition.
4.3.4 Training on Sustainable Firm Performance
The study sought to determine the effect of training on sustainable firm performance in
commercial banks. The purpose of this analysis was to get the responses on how
training affects sustainable firm performance using frequency on a 5 Likert-scale.The
46
findings indicated that 51(32.7%) strongly agreed, 64(41%) agreed, 15(9.6%)
undecided, 11(7.1%) disagreed and 15(9.6%) strongly disagreed with the statement that
they receive the training they need to do the job well (mean=3.801, standard
deviation=1.241).
Further, 47(30.1%) of the subjects strongly agreed, 82(52.6%) agreed, 14(8.9%)
undecided, 5(3.2%) disagreed and 8(5.2%) strongly disagreed with the statement that I
get plenty of opportunities to learn from this job (mean=3.994, standard
deviation=0.994). Also, 34(21.8%) of the respondents strongly agreed, 97(62.2%)
agreed, 11(7.1%) undecided, 6(3.9%) disagreed and 8(5.2%) strongly disagreed with
the statement that supervisors tell employees whether they are doing their work as per
the training imparted or not (mean=3.917, standard deviation=0.950).
Another, 24(15.4%) of the respondents strongly agreed, 101(64.7%) agreed, 9(5.8%)
undecided, 10(6.4%) disagreed and 12(7.7%) strongly disagreed with the statement that
training opportunities are provided whenever there is change of technology or
promotions (mean=3.737, standard deviation=1.048). Furthermore, 36(23 .1%) of the
subjects strongly agreed, 106(67.9%) agreed, 7(4.5%) undecided, 2(1.3%) disagreed
and 5(3.2%) strongly disagreed with the statement that supervisors support the use of
techniques learned in training that employees bring back to their jobs (mean=4.067,
standard deviation=0.784).
Finally, 38(24.4%) of the respondents strongly agreed, 75(48.1%) agreed, 19(12.2%)
undecided, 12(7.7%) disagreed and 12(7.7%) strongly disagreed with the statement that
supervisors help employees set realistic goals for performing their work as a result of
training (mean=3.737, standard deviation=1.142) as indicated in table 4.10.
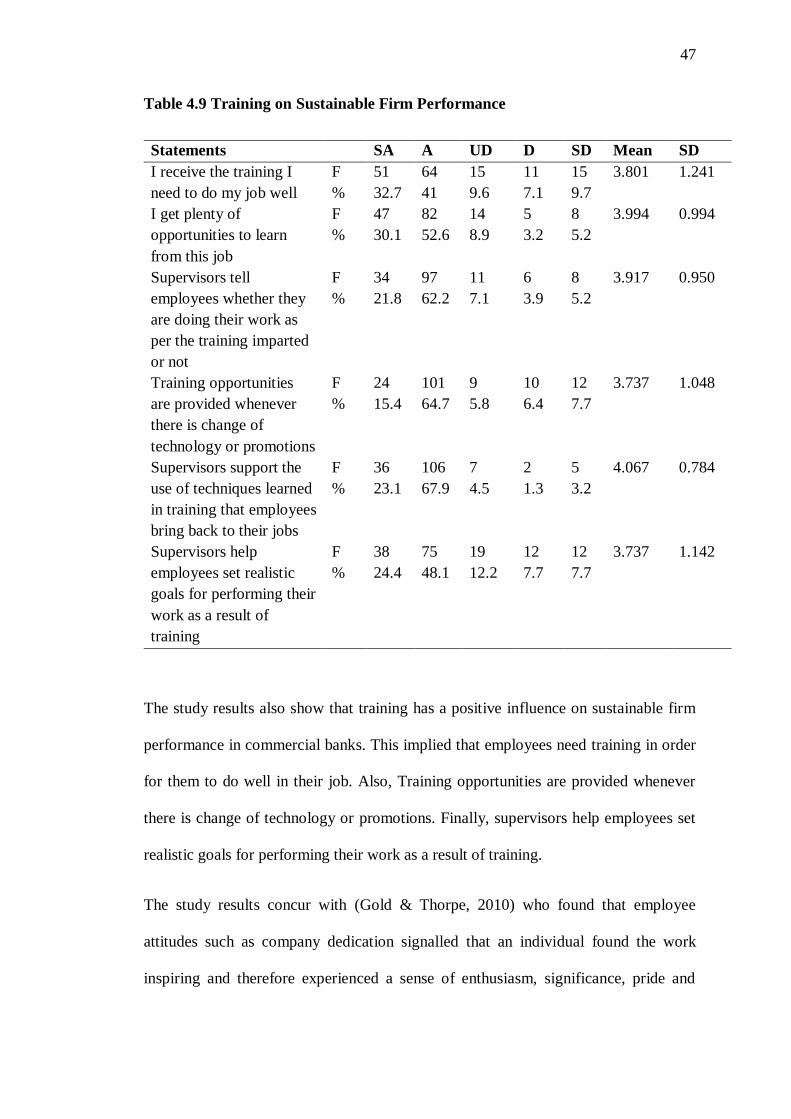
47
Table 4.9 Training on Sustainable Firm Performance
Statements SA A UD D SD Mean SD
I receive the training I
need to do my job well
F 51 64 15 11 15 3.801 1.241
% 32.7 41 9.6 7.1 9.7
I get plenty of
opportunities to learn
from this job
F 47 82 14 5 8 3.994 0.994
% 30.1 52.6 8.9 3.2 5.2
Supervisors tell
employees whether they
are doing their work as
per the training imparted
or not
F 34 97 11 6 8 3.917 0.950
% 21.8 62.2 7.1 3.9 5.2
Training opportunities
are provided whenever
there is change of
technology or promotions
F 24 101 9 10 12 3.737 1.048
% 15.4 64.7 5.8 6.4 7.7
Supervisors support the
use of techniques learned
in training that employees
bring back to their jobs
F 36 106 7 2 5 4.067 0.784
% 23.1 67.9 4.5 1.3 3.2
Supervisors help
employees set realistic
goals for performing their
work as a result of
training
F 38 75 19 12 12 3.737 1.142
% 24.4 48.1 12.2 7.7 7.7
The study results also show that training has a positive influence on sustainable firm
performance in commercial banks. This implied that employees need training in order
for them to do well in their job. Also, Training opportunities are provided whenever
there is change of technology or promotions. Finally, supervisors help employees set
realistic goals for performing their work as a result of training.
The study results concur with (Gold & Thorpe, 2010) who found that employee
attitudes such as company dedication signalled that an individual found the work
inspiring and therefore experienced a sense of enthusiasm, significance, pride and
48
challenge in completing tasks. The study also concurs with (Johnson, 2011) who found
out that firms that trains and develops some or all of their employees are more likely to
develop and survive than those firms that did not train at all.
4.3.5 Performance Appraisal
The study sought to determine the mediating role of performance appraisal on the
relationship between employee engagement strategy and sustainable firm performance
in commercial banks. The purpose of this analysis was to get the responses on the
meditating role of performance appraisal on the relationship between employee
engagement strategy and sustainable firm performance in commercial banks using
frequency on a 5 Likert-scale.
The results indicated that 60(38.5%) strongly agreed, 63(40.4%) agreed, 17(10.9%)
undecided, 7(4.5%) disagreed and 9(5.8%) strongly disagreed with the statement that
they are quite satisfied that the objectives agreed upon were fair (mean=4.013, standard
deviation=1.095). Also, 30(19.2%) of the respondents strongly agreed, 98(62.8%)
agreed, 11(7.1%) undecided, 8(5.1%) disagreed and 9(5.8%) strongly disagreed with
the statement that the objectives and standards of performance helped me to focus on
what they should be aiming to achieve (mean=3.846, standard deviation=0.985).
Further, 33(21.1%) of the strongly agreed, 96(61.6%) agreed, 9(5.8%) undecided,
7(4.5%) disagreed and 11(7.1%) strongly disagreed with the statement that their senior
is always prepared to provide guidance when I face challenges at work (mean=3.853,
standard deviation=1.033).
Another, 49(31.4%) strongly agreed, 75(48.1%) agreed, 10(6.4%) undecided, 8(3.2%)
disagreed and 14(8.9%) strongly disagreed with the statement that they are encouraged
to learn from my mistakes (mean=3.878, standard deviation=1.177). Also, 44(28.2%)
of the respondents strongly agreed, 88(56.4%) agreed, 9(5.8%) undecided, 6(3.9%)
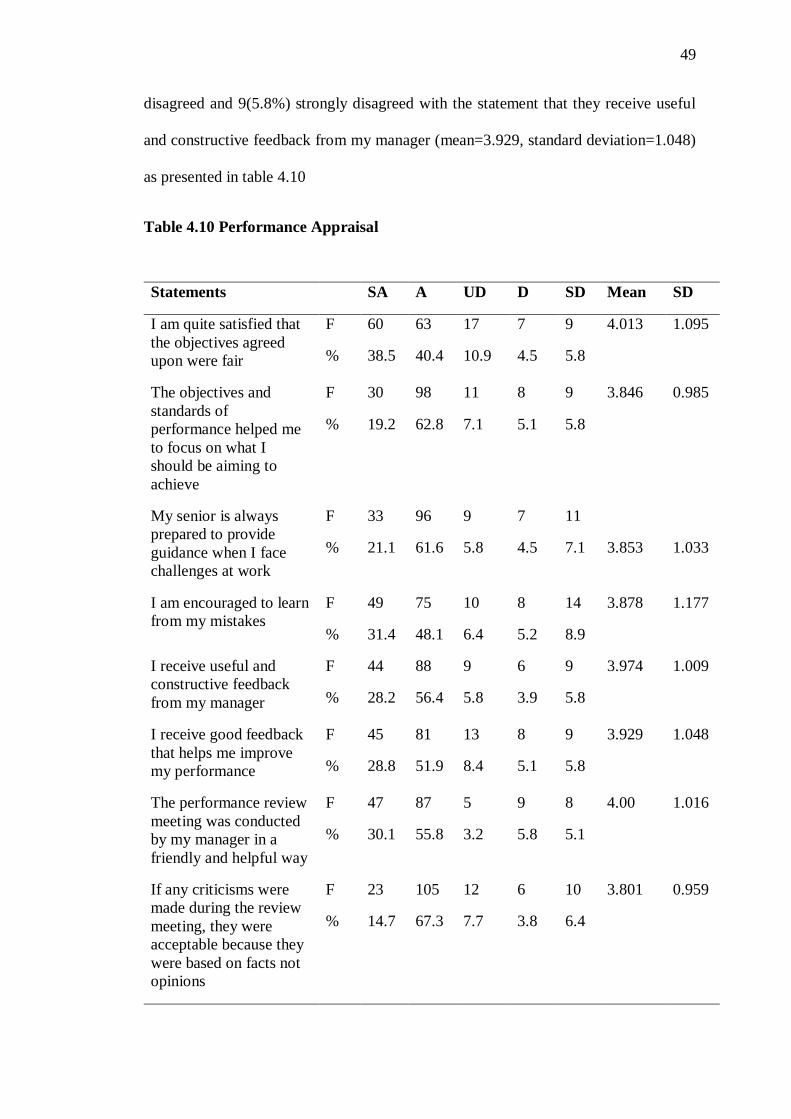
49
disagreed and 9(5.8%) strongly disagreed with the statement that they receive useful
and constructive feedback from my manager (mean=3.929, standard deviation=1.048)
as presented in table 4.10
Table 4.10 Performance Appraisal
Statements SA A UD D SD Mean SD
I am quite satisfied that
the objectives agreed
upon were fair
F 60 63 17 7 9 4.013 1.095
% 38.5 40.4 10.9 4.5 5.8
The objectives and
standards of
performance helped me
to focus on what I
should be aiming to
achieve
F 30 98 11 8 9 3.846 0.985
% 19.2 62.8 7.1 5.1 5.8
My senior is always
prepared to provide
guidance when I face
challenges at work
F 33 96 9 7 11
% 21.1 61.6 5.8 4.5 7.1 3.853 1.033
I am encouraged to learn
from my mistakes
F 49 75 10 8 14 3.878 1.177
% 31.4 48.1 6.4 5.2 8.9
I receive useful and
constructive feedback
from my manager
F 44 88 9 6 9 3.974 1.009
% 28.2 56.4 5.8 3.9 5.8
I receive good feedback
that helps me improve
my performance
F 45 81 13 8 9 3.929 1.048
% 28.8 51.9 8.4 5.1 5.8
The performance review
meeting was conducted
by my manager in a
friendly and helpful way
F 47 87 5 9 8 4.00 1.016
% 30.1 55.8 3.2 5.8 5.1
If any criticisms were
made during the review
meeting, they were
acceptable because they
were based on facts not
opinions
F 23 105 12 6 10 3.801 0.959
% 14.7 67.3 7.7 3.8 6.4
50
Also, 45(28.8%) of the respondents strongly agreed, 81(51.9%) agreed, 13(8.4%)
undecided, 8(5.1%) disagreed and 9(5.8%) strongly disagreed with the statement that I
receive good feedback that helps me improve my performance (mean=4.00, standard
deviation=1.016) while 47(30.1%) of the respondents strongly agreed, 87(55.8%)
agreed, 5(3.2%) undecided, 9(5.8%) disagreed and 8(5.1%) strongly disagreed with the
statement that the performance review meeting was conducted by my manager in a
friendly and helpful way (mean=3.801, standard deviation=0.959).
Finally, 23(14.7%) of the subjects strongly agreed, 105(67.3%) agreed, 12(7.7%)
undecided, 6(8.3%) disagreed and 10(6.4%) strongly disagreed with the statement that
If any criticisms were made during the review meeting, they were acceptable because
they were based on facts not opinions. The study results also revealed that performance
appraisal had a positive influence as a mediating factor between employee engagement
and sustainable firm performance.
4.3.6 Sustainable Firm Performance
The study sought to determine the effect of employee engagement strategy and
sustainable firm performance. The purpose of this analysis was to get the responses on
employee engagement strategy and sustainable firm performance using frequency and
study results presented in Table 4.11. The findings indicated that 55(35.3%) of the
respondents strongly agreed, 76(48.7%) agreed, 7(4.5%) undecided, 10(6.4%)
disagreed and 8(5.1%) strongly disagreed with the statement that in the past year the
company has introduced new products (mean=4.026, standard deviation=1.059).
Also, 42(26.9%) of the respondents strongly agreed, 97(62.2%) agreed, 3(19%)
undecided, 2(1.2%) disagreed and 12(7.7%) strongly disagreed with the statement that
in the past year the company has entered into new markets (mean=3.994, standard
deviation=1.019). Further, 37(23.7%) of the respondents strongly agreed, 92(58.9%)
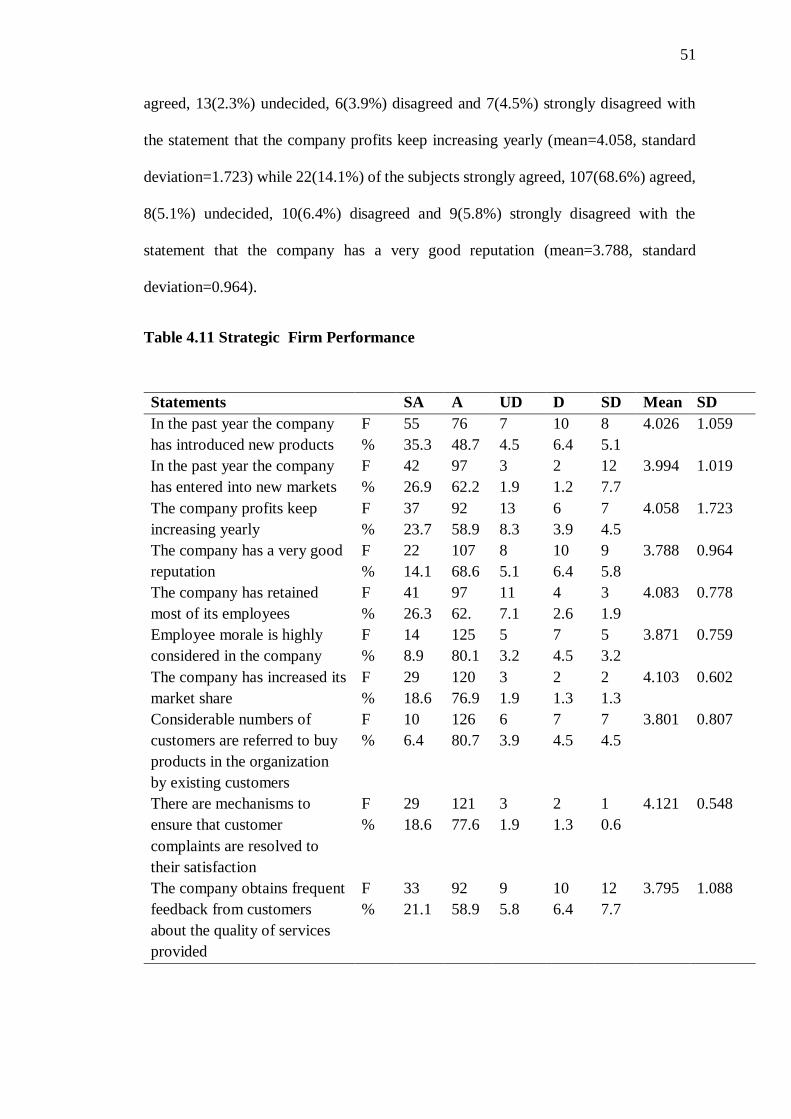
51
agreed, 13(2.3%) undecided, 6(3.9%) disagreed and 7(4.5%) strongly disagreed with
the statement that the company profits keep increasing yearly (mean=4.058, standard
deviation=1.723) while 22(14.1%) of the subjects strongly agreed, 107(68.6%) agreed,
8(5.1%) undecided, 10(6.4%) disagreed and 9(5.8%) strongly disagreed with the
statement that the company has a very good reputation (mean=3.788, standard
deviation=0.964).
Table 4.11 Strategic Firm Performance
Statements SA A UD D SD Mean SD
In the past year the company
has introduced new products
F 55 76 7 10 8 4.026 1.059
% 35.3 48.7 4.5 6.4 5.1
In the past year the company
has entered into new markets
F 42 97 3 2 12 3.994 1.019
% 26.9 62.2 1.9 1.2 7.7
The company profits keep
increasing yearly
F 37 92 13 6 7 4.058 1.723
% 23.7 58.9 8.3 3.9 4.5
The company has a very good
reputation
F 22 107 8 10 9 3.788 0.964
% 14.1 68.6 5.1 6.4 5.8
The company has retained
most of its employees
F 41 97 11 4 3 4.083 0.778
% 26.3 62. 7.1 2.6 1.9
Employee morale is highly
considered in the company
F 14 125 5 7 5 3.871 0.759
% 8.9 80.1 3.2 4.5 3.2
The company has increased its
market share
F 29 120 3 2 2 4.103 0.602
% 18.6 76.9 1.9 1.3 1.3
Considerable numbers of
customers are referred to buy
products in the organization
by existing customers
F 10 126 6 7 7 3.801 0.807
% 6.4 80.7 3.9 4.5 4.5
There are mechanisms to
ensure that customer
complaints are resolved to
their satisfaction
F 29 121 3 2 1 4.121 0.548
% 18.6 77.6 1.9 1.3 0.6
The company obtains frequent
feedback from customers
about the quality of services
provided
F 33 92 9 10 12 3.795 1.088
% 21.1 58.9 5.8 6.4 7.7
52
Another, 41(26.3%) of the respondents strongly agreed, 97(62%) agreed, 11(7.1%)
undecided, 4(2.6%) disagreed and 3(1.9%) strongly disagreed with the statement that
the company has retained most of its employees (mean=4.083, standard
deviation=0.778). Also, 14(8.9%) of the respondents strongly agreed, 125(80.1%)
agreed, 5(3.2%) undecided, 7(4.5%) disagreed and 5(3.2%) strongly disagreed with the
statement that employee morale is highly considered in the company (mean=3.871,
standard deviation=0.759).
Also, 29(18.6%) of the respondents strongly agreed, 120(76.9%) agreed, 3(1.9%)
undecided, 2(1.3%) disagreed and 2(1.3%) strongly disagreed with the statement that
the company has increased its market share (mean=4.101, standard
deviation=0.602).Finally, 10(6.4%) of the subjects strongly agreed, 126(80.7%) agreed,
6(3.9%) undecided, 7(4.5%) disagreed and 7(4.5%) strongly disagreed with the
statement that Considerable numbers of customers are referred to buy products in the
organization by existing customers (mean=3.801, standard deviation=0.807).
Furthermore, 29(18.6%) of the respondents strongly agreed, 121(77.6%) agreed,
3(1.9%) undecided, 2(1.3%) disagreed and 1(0.6%) strongly disagreed with the
statement that there are mechanisms to ensure that customer complaints are resolved to
their satisfaction (mean=4.121, standard deviation=0.548) while 33(21.1%) of the
respondents strongly agreed, 92(58.9%) agreed, 9(5.8%) undecided, 10(6.4%)
disagreed and 12(7.7%) strongly disagreed with the statement that the company obtains
frequent feedback from customers about the quality of services provided (mean=3.795,
standard deviation=1.088).
The study results also reveal that employee engagement has a positive influence on
sustainable firm performance. The study findings agreed with (Mone et al., 2011) who
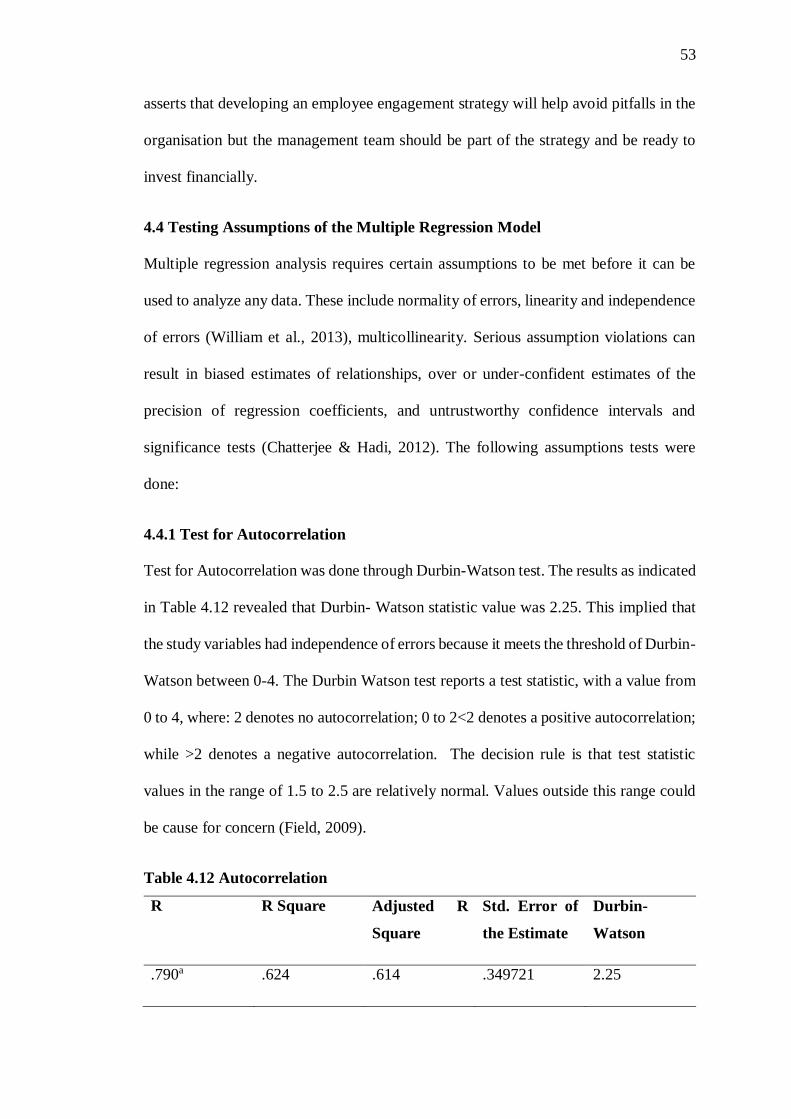
53
asserts that developing an employee engagement strategy will help avoid pitfalls in the
organisation but the management team should be part of the strategy and be ready to
invest financially.
4.4 Testing Assumptions of the Multiple Regression Model
Multiple regression analysis requires certain assumptions to be met before it can be
used to analyze any data. These include normality of errors, linearity and independence
of errors (William et al., 2013), multicollinearity. Serious assumption violations can
result in biased estimates of relationships, over or under-confident estimates of the
precision of regression coefficients, and untrustworthy confidence intervals and
significance tests (Chatterjee & Hadi, 2012). The following assumptions tests were
done:
4.4.1 Test for Autocorrelation
Test for Autocorrelation was done through Durbin-Watson test. The results as indicated
in Table 4.12 revealed that Durbin- Watson statistic value was 2.25. This implied that
the study variables had independence of errors because it meets the threshold of Durbin-
Watson between 0-4. The Durbin Watson test reports a test statistic, with a value from
0 to 4, where: 2 denotes no autocorrelation; 0 to 2<2 denotes a positive autocorrelation;
while >2 denotes a negative autocorrelation. The decision rule is that test statistic
values in the range of 1.5 to 2.5 are relatively normal. Values outside this range could
be cause for concern (Field, 2009).
Table 4.12 Autocorrelation
R R Square Adjusted R
Square
Std. Error of
the Estimate
Durbin-
Watson
.790a .624 .614 .349721 2.25
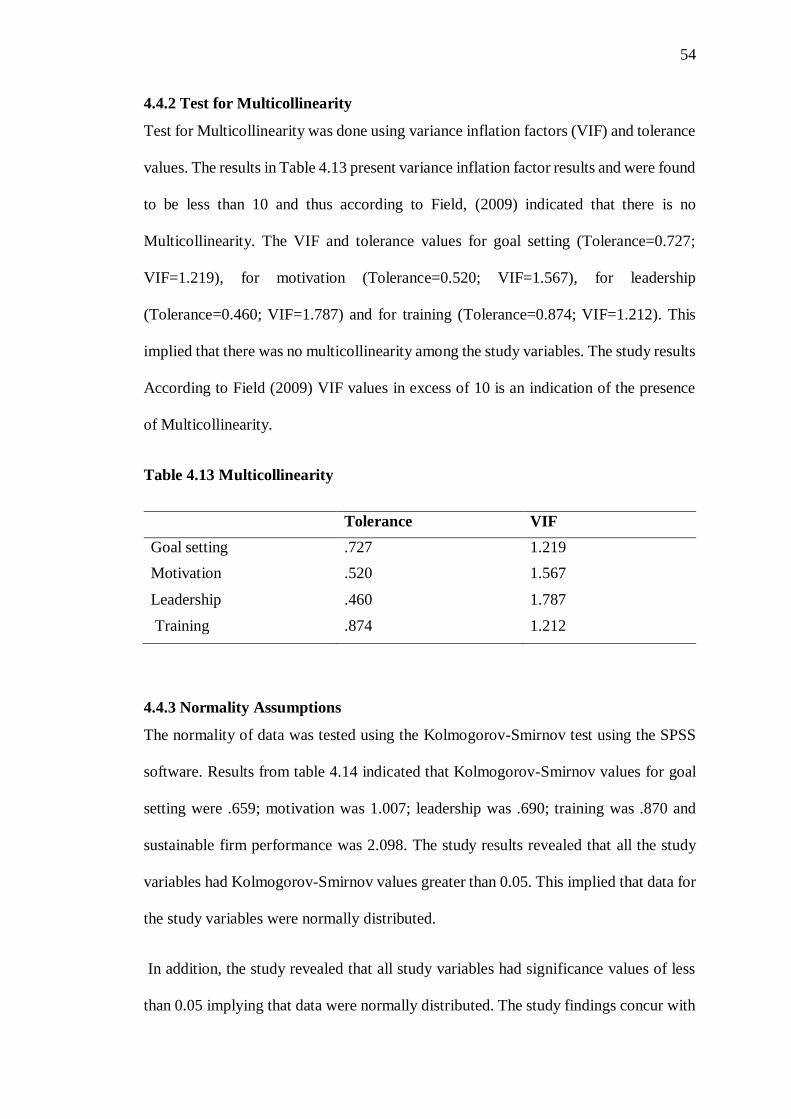
54
4.4.2 Test for Multicollinearity
Test for Multicollinearity was done using variance inflation factors (VIF) and tolerance
values. The results in Table 4.13 present variance inflation factor results and were found
to be less than 10 and thus according to Field, (2009) indicated that there is no
Multicollinearity. The VIF and tolerance values for goal setting (Tolerance=0.727;
VIF=1.219), for motivation (Tolerance=0.520; VIF=1.567), for leadership
(Tolerance=0.460; VIF=1.787) and for training (Tolerance=0.874; VIF=1.212). This
implied that there was no multicollinearity among the study variables. The study results
According to Field (2009) VIF values in excess of 10 is an indication of the presence
of Multicollinearity.
Table 4.13 Multicollinearity
Tolerance VIF
Goal setting .727 1.219
Motivation .520 1.567
Leadership
tr
.460 1.787
Training .874 1.212
4.4.3 Normality Assumptions
The normality of data was tested using the Kolmogorov-Smirnov test using the SPSS
software. Results from table 4.14 indicated that Kolmogorov-Smirnov values for goal
setting were .659; motivation was 1.007; leadership was .690; training was .870 and
sustainable firm performance was 2.098. The study results revealed that all the study
variables had Kolmogorov-Smirnov values greater than 0.05. This implied that data for
the study variables were normally distributed.
In addition, the study revealed that all study variables had significance values of less
than 0.05 implying that data were normally distributed. The study findings concur with
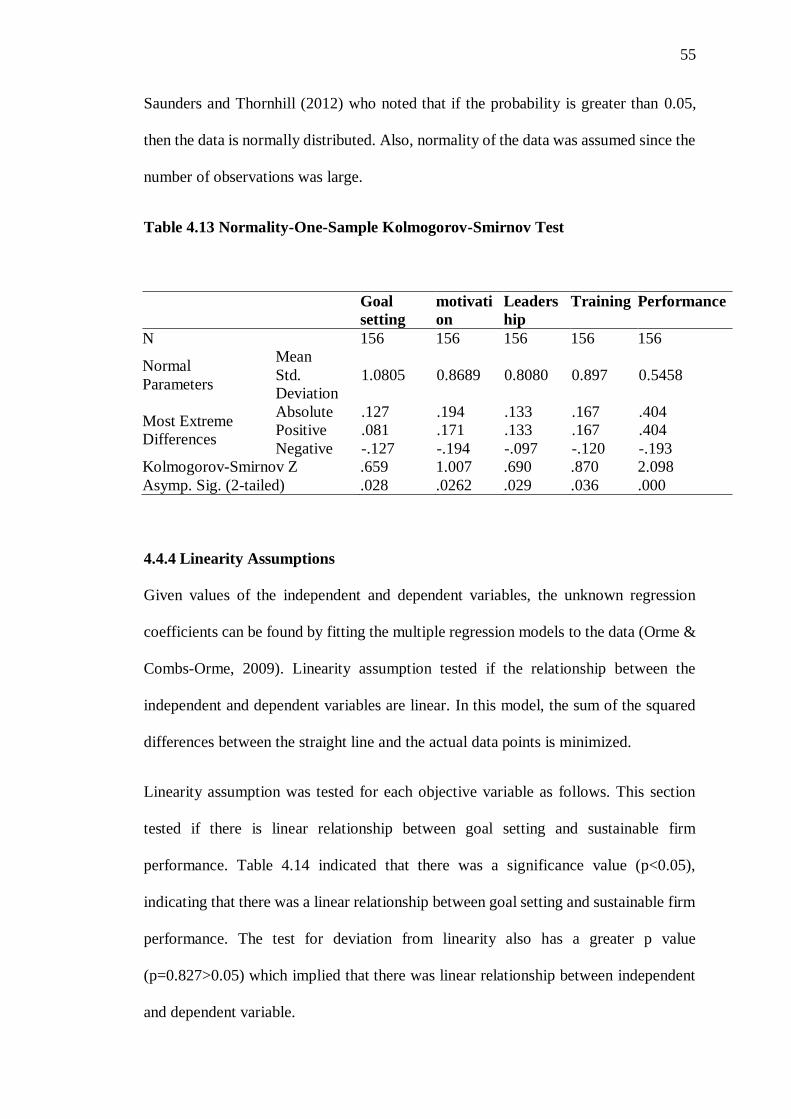
55
Saunders and Thornhill (2012) who noted that if the probability is greater than 0.05,
then the data is normally distributed. Also, normality of the data was assumed since the
number of observations was large.
Table 4.13 Normality-One-Sample Kolmogorov-Smirnov Test
Goal
setting
motivati
on
Leaders
hip
Training Performance
N 156 156 156 156 156
Normal
Parameters
Mean
Std.
Deviation
1.0805 0.8689 0.8080 0.897 0.5458
Most Extreme
Differences
Absolute .127 .194 .133 .167 .404
Positive .081 .171 .133 .167 .404
Negative -.127 -.194 -.097 -.120 -.193
Kolmogorov-Smirnov Z .659 1.007 .690 .870 2.098
Asymp. Sig. (2-tailed) .028 .0262 .029 .036 .000
4.4.4 Linearity Assumptions
Given values of the independent and dependent variables, the unknown regression
coefficients can be found by fitting the multiple regression models to the data (Orme &
Combs-Orme, 2009). Linearity assumption tested if the relationship between the
independent and dependent variables are linear. In this model, the sum of the squared
differences between the straight line and the actual data points is minimized.
Linearity assumption was tested for each objective variable as follows. This section
tested if there is linear relationship between goal setting and sustainable firm
performance. Table 4.14 indicated that there was a significance value (p<0.05),
indicating that there was a linear relationship between goal setting and sustainable firm
performance. The test for deviation from linearity also has a greater p value
(p=0.827>0.05) which implied that there was linear relationship between independent
and dependent variable.
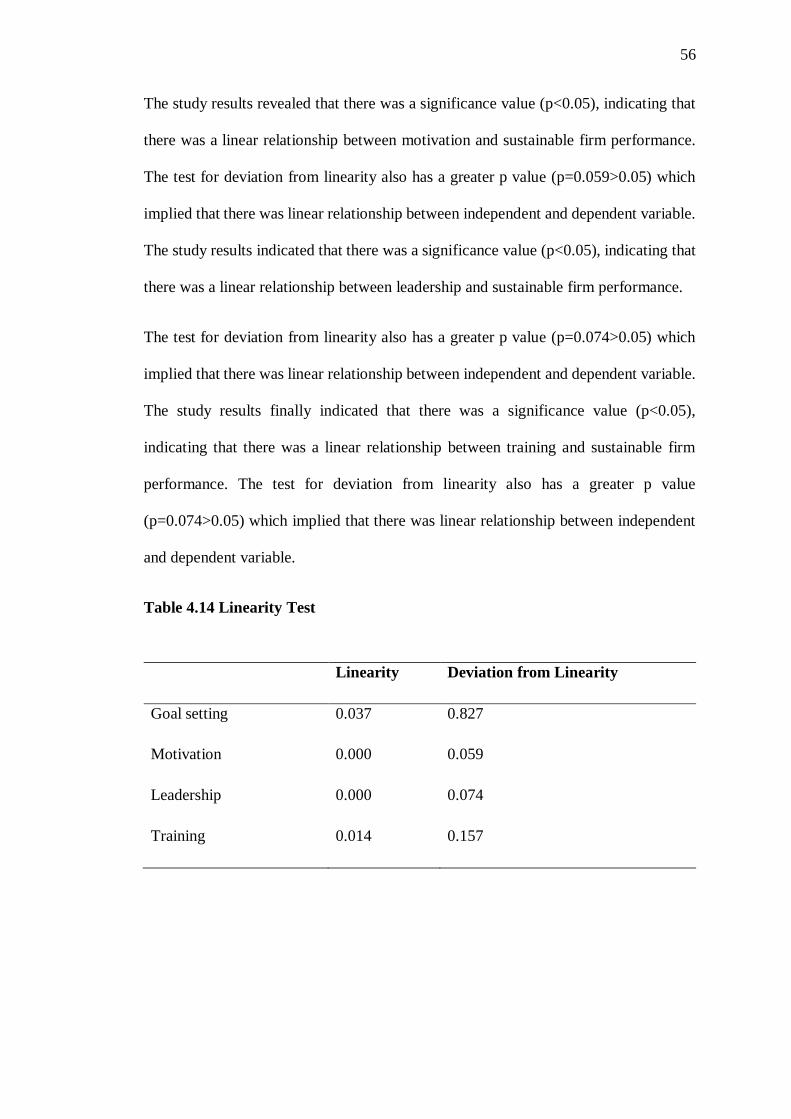
56
The study results revealed that there was a significance value (p<0.05), indicating that
there was a linear relationship between motivation and sustainable firm performance.
The test for deviation from linearity also has a greater p value (p=0.059>0.05) which
implied that there was linear relationship between independent and dependent variable.
The study results indicated that there was a significance value (p<0.05), indicating that
there was a linear relationship between leadership and sustainable firm performance.
The test for deviation from linearity also has a greater p value (p=0.074>0.05) which
implied that there was linear relationship between independent and dependent variable.
The study results finally indicated that there was a significance value (p<0.05),
indicating that there was a linear relationship between training and sustainable firm
performance. The test for deviation from linearity also has a greater p value
(p=0.074>0.05) which implied that there was linear relationship between independent
and dependent variable.
Table 4.14 Linearity Test
Linearity Deviation from Linearity
Goal setting 0.037 0.827
Motivation 0.000 0.059
Leadership 0.000 0.074
Training 0.014 0.157
57
4.5 Correlation Analysis
Preliminary analysis was carried out to determine whether there were significant
associations between goal settings, motivation, leadership, training and sustainable firm
performance. Pearson’s product –moment correlation (r) was used to explore the
relationship between the variables, specifically to assess both the direction and strength.
Pearson’s product-moment correlation coefficient (r) was used to measure the extent of
correlation between variables of the study and to show the strength of the linear
relationship between variables in the regression ranges between +1 and -1. Correlation
results showed that relationship between goal setting and sustainable firm performance
was positive and statistically significant (r=0.717, p<0.05) as shown in Table 4.15,
motivation and sustainable firm performance was positive and significant (r=0.669,
p<0.05). The leadership and sustainable firm performance were positive and significant
(r=0.601, p<0.05) and training and sustainable firm performance was positive and
significant (r=0.512, p<0.05).
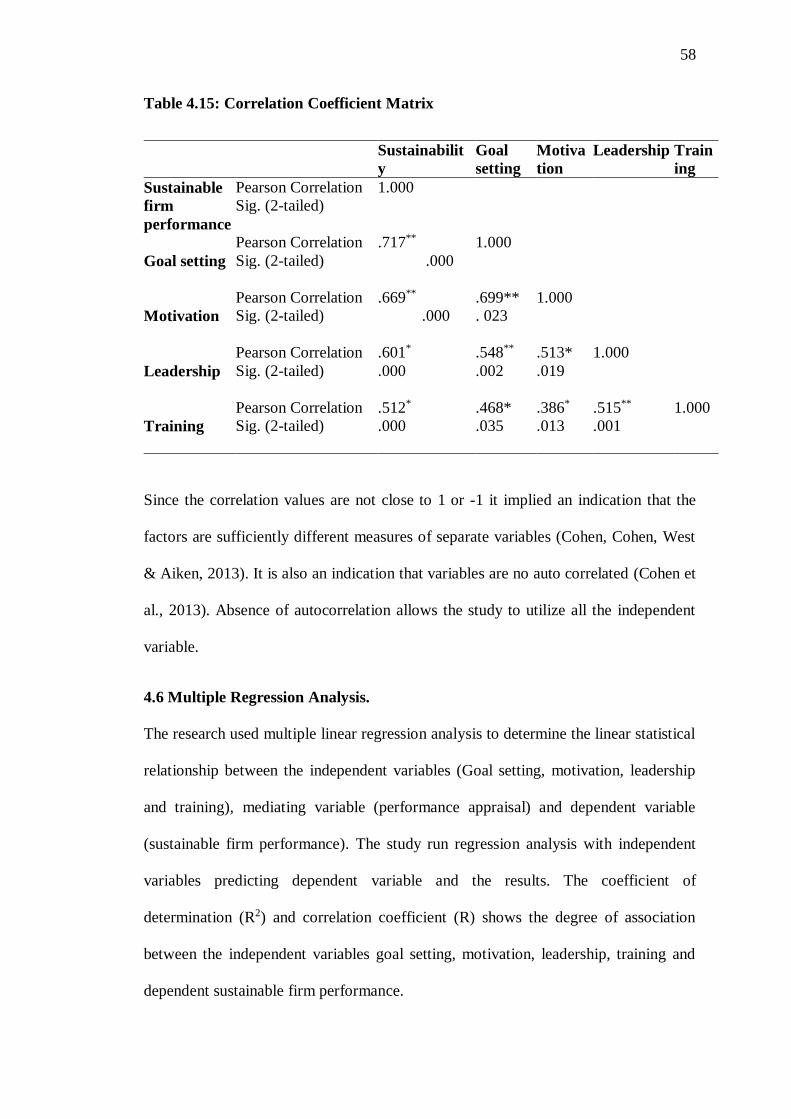
58
Table 4.15: Correlation Coefficient Matrix
Sustainabilit
y
Goal
setting
Motiva
tion
Leadership Train
ing
Sustainable
firm
performance
Pearson Correlation 1.000
Sig. (2-tailed)
Goal setting
Pearson Correlation .717** 1.000
Sig. (2-tailed) .000
Motivation
Pearson Correlation .669** .699** 1.000
Sig. (2-tailed) .000 . 023
Leadership
Pearson Correlation .601* .548** .513* 1.000
Sig. (2-tailed) .000 .002 .019
Training
Pearson Correlation .512* .468* .386* .515** 1.000
Sig. (2-tailed) .000 .035 .013 .001
Since the correlation values are not close to 1 or -1 it implied an indication that the
factors are sufficiently different measures of separate variables (Cohen, Cohen, West
& Aiken, 2013). It is also an indication that variables are no auto correlated (Cohen et
al., 2013). Absence of autocorrelation allows the study to utilize all the independent
variable.
4.6 Multiple Regression Analysis.
The research used multiple linear regression analysis to determine the linear statistical
relationship between the independent variables (Goal setting, motivation, leadership
and training), mediating variable (performance appraisal) and dependent variable
(sustainable firm performance). The study run regression analysis with independent
variables predicting dependent variable and the results. The coefficient of
determination (R2) and correlation coefficient (R) shows the degree of association
between the independent variables goal setting, motivation, leadership, training and
dependent sustainable firm performance.
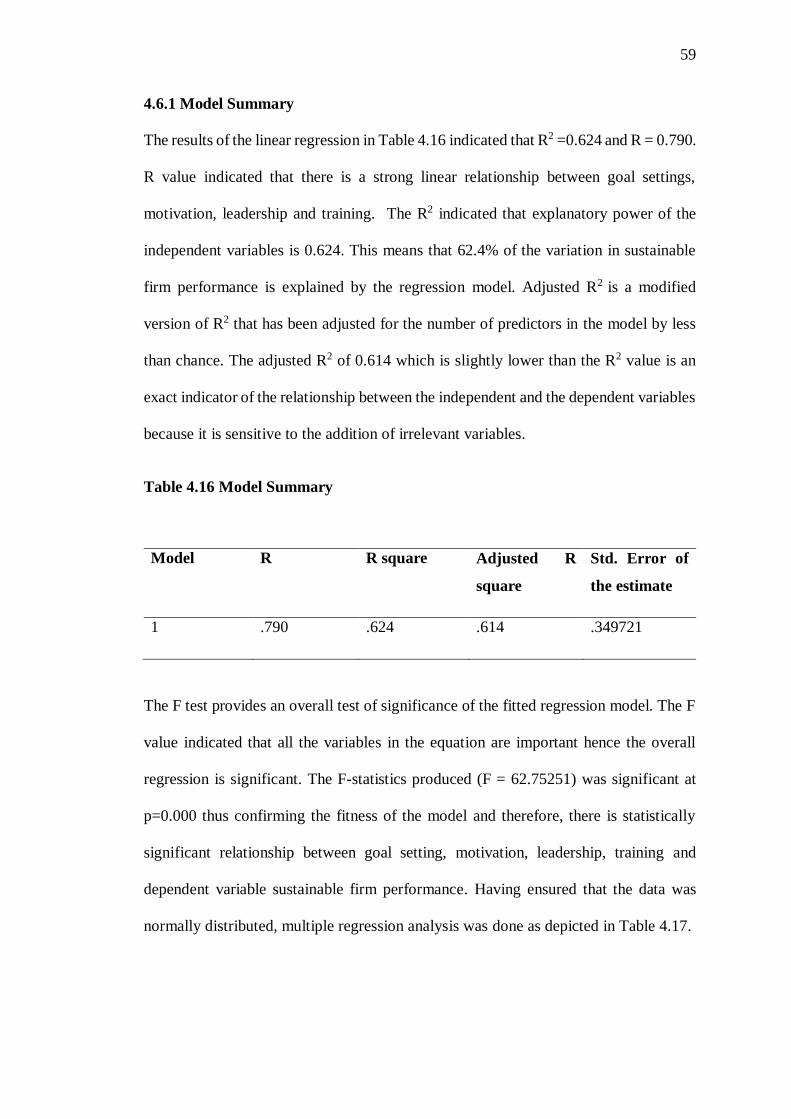
59
4.6.1 Model Summary
The results of the linear regression in Table 4.16 indicated that R2 =0.624 and R = 0.790.
R value indicated that there is a strong linear relationship between goal settings,
motivation, leadership and training. The R2 indicated that explanatory power of the
independent variables is 0.624. This means that 62.4% of the variation in sustainable
firm performance is explained by the regression model. Adjusted R2 is a modified
version of R2 that has been adjusted for the number of predictors in the model by less
than chance. The adjusted R2 of 0.614 which is slightly lower than the R2 value is an
exact indicator of the relationship between the independent and the dependent variables
because it is sensitive to the addition of irrelevant variables.
Table 4.16 Model Summary
Model R R square Adjusted R
square
Std. Error of
the estimate
1 .790 .624 .614 .349721
The F test provides an overall test of significance of the fitted regression model. The F
value indicated that all the variables in the equation are important hence the overall
regression is significant. The F-statistics produced (F = 62.75251) was significant at
p=0.000 thus confirming the fitness of the model and therefore, there is statistically
significant relationship between goal setting, motivation, leadership, training and
dependent variable sustainable firm performance. Having ensured that the data was
normally distributed, multiple regression analysis was done as depicted in Table 4.17.
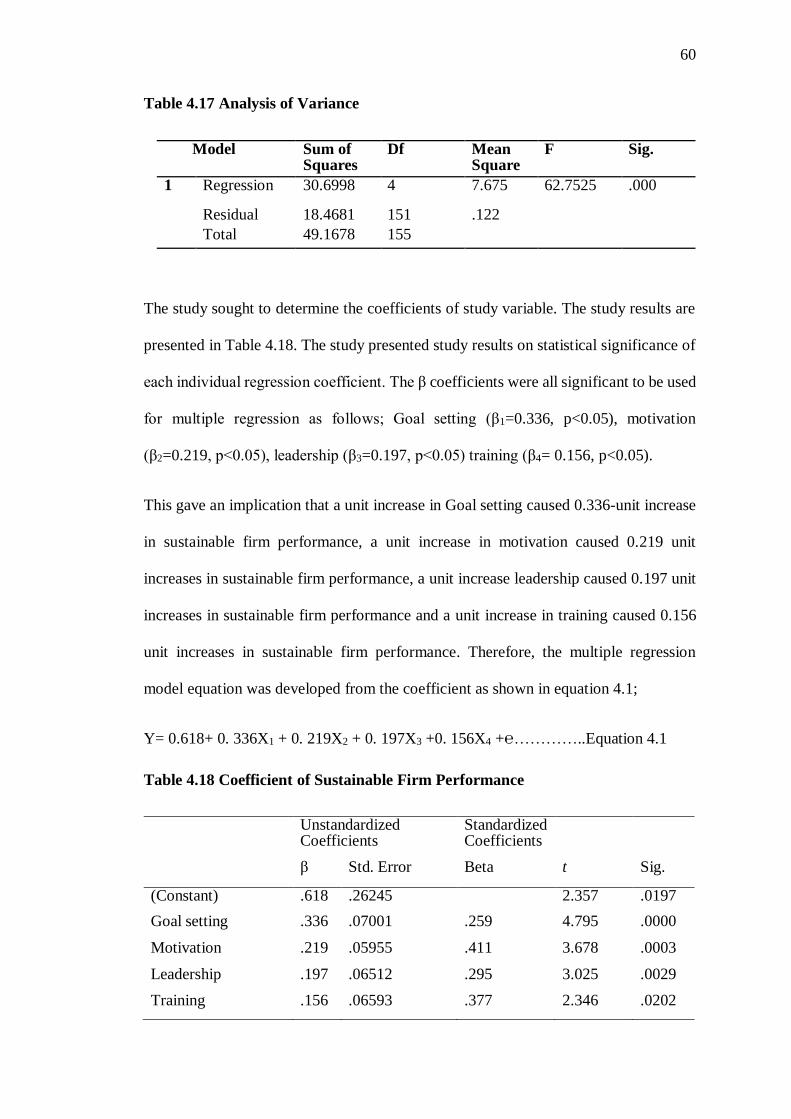
60
Table 4.17 Analysis of Variance
Model Sum of Squares
Df Mean Square
F Sig.
1 Regression 30.6998 4 7.675 62.7525 .000
Residual 18.4681 151 .122
Total 49.1678 155
The study sought to determine the coefficients of study variable. The study results are
presented in Table 4.18. The study presented study results on statistical significance of
each individual regression coefficient. The β coefficients were all significant to be used
for multiple regression as follows; Goal setting (β1=0.336, p<0.05), motivation
(β2=0.219, p<0.05), leadership (β3=0.197, p<0.05) training (β4= 0.156, p<0.05).
This gave an implication that a unit increase in Goal setting caused 0.336-unit increase
in sustainable firm performance, a unit increase in motivation caused 0.219 unit
increases in sustainable firm performance, a unit increase leadership caused 0.197 unit
increases in sustainable firm performance and a unit increase in training caused 0.156
unit increases in sustainable firm performance. Therefore, the multiple regression
model equation was developed from the coefficient as shown in equation 4.1;
Y= 0.618+ 0. 336X1 + 0. 219X2 + 0. 197X3 +0. 156X4 +℮…………..Equation 4.1
Table 4.18 Coefficient of Sustainable Firm Performance
Unstandardized
Coefficients Standardized Coefficients
β Std. Error Beta t Sig.
(Constant) .618 .26245 2.357 .0197
Goal setting .336 .07001 .259 4.795 .0000
Motivation .219 .05955 .411 3.678 .0003
Leadership .197 .06512 .295 3.025 .0029
Training .156 .06593 .377 2.346 .0202
61
4.6.2 Summary of Hypotheses Testing
For each hypothesis the decision rule was that if the p –value is less than conventional
0.05 the null hypothesis was rejected and when its above 0.05 we fail to reject the null
hypothesis. The null hypothesis H01 stated that there is no effect of goal setting on
sustainable firm performance in commercial banks. However, the study results revealed
that goal setting has a positive effect on sustainable firm performance in commercial
banks (β=0.336, p<0.05).
Therefore, the study findings rejected the null hypothesis. These study findings concur
with Bennett (2009) who found out that the level of sustainable firm performance
sharply declines with the increase in the level of goal difficulty as it creates a convenient
environment where the employees engage in corruption, dishonesty and hampers the
quality of the firm performance.
The null hypothesis H02 stated that there is no effect of motivation on sustainable firm
performance in commercial banks. However, the study results revealed that motivation
has a positive effect on sustainable firm performance in commercial banks (β=0. 219,
p<0.05). Therefore, the study findings rejected the null hypothesis. These study
findings concur with Michael and Crispen (2009) who stated that having a motivated
workforce provides the sustainable firm performance that the firm seeks and better
employee performance helps the firm be more sustainable. If employees do not feel that
they are fairly evaluated and motivated as well as getting what they deserve either a
salary increase or a higher position, they will feel like they are unimportant to the
business and hence this can lead them to leave the company which will led to negative
impact on the firm’s performance sustainability.
62
The null hypothesis H03 stated that there is no effect of leadership on sustainable firm
performance in commercial banks. However, the study results revealed that leadership
has a positive effect on sustainable firm performance in commercial banks (β=0.197,
p<0.05). Therefore, the study findings rejected the null hypothesis. These study
findings concur with (Tamkin et al.,2010) who found that outstanding leaders are
highly motivated to achieve excellence and are focused on organisation outcomes,
visions and purpose, they understand they cannot create a sustainable firm performance
themselves but are conduits of sustainable firm performance through their influence on
others.
The null hypothesis H04 stated that there is no effect of training on sustainable firm
performance in commercial banks. However, the study results revealed that training has
a positive effect on sustainable firm performance in commercial banks (β=0.156,
p<0.05). Therefore, the study findings rejected the null hypothesis. These study
findings concur with (Gold & Thorpe, 2010) found that employee attitudes such as
company dedication signalled that an individual who found out that the work inspiring
and therefore experienced a sense of enthusiasm, significance, pride and challenge in
completing tasks.
4.7 Mediation Analysis
The fifth objective was to examine the mediation effect of performance appraisal on the
relationship between employee engagement strategy and Sustainable firm performance
(SFP). The independent variables representing employee engagement strategy were
computed as an independent variable. It was established in the literature that employee
engagement strategy influences sustainable firm performance, however the mechanism
is unknown, therefore the study hypothesized that one of the mechanisms was
performance appraisal. The mediation effect of performance appraisal was
63
conveniently tested using a special PROCESS Macro tool developed by Hayes (2013)
using the regular linear regression menu item in SPSS application version 22.
PROCESS Macro tool is an inbuilt measurement tool with a bootstrapped confidence
interval request procedure prescribed by Preacher and Hayes (2008). Mediation effect
was tested since the data met the assumptions prescribed by Hayes (2014). The four
stages of the mediation process were followed as shown below;
1. Confirmed the significance of the relationship between employee engagement
strategy and SFP (X → Y)
2. Checked and confirmed the significance of the relationship between employee
engagement strategy and performance appraisal (X → M)
3. Ascertained the significance of the relationship between the performance appraisal
and the SFP in the presence of employee engagement strategy (M|X → Y)
4. Examined whether the insignificance (or the meaningful reduction in effect) of the
relationship between employee engagement strategy and the SFP in the presence of
performance appraisal (X|M → Y) is there.
The first part of the output indicates all variables in the analysis as hypothesized ‒ the
dependent variable SFP→ (Y), independent variable employee engagement strategy
(EES) → (X) and mediator performance appraisal (PA) → (M). The mediation effect
of performance appraisal on the relationship between employee engagement strategy
and sustainable firm performance was checked by establishing the indirect, direct and
total effect.
4.7.1 Total effect
This was assessed by determining the relationship between employee engagement
strategy and sustainable firm performance, (Table 4.19). The model results showed
R2=0.532 and was significant (p<0.000) an indication that employee engagement
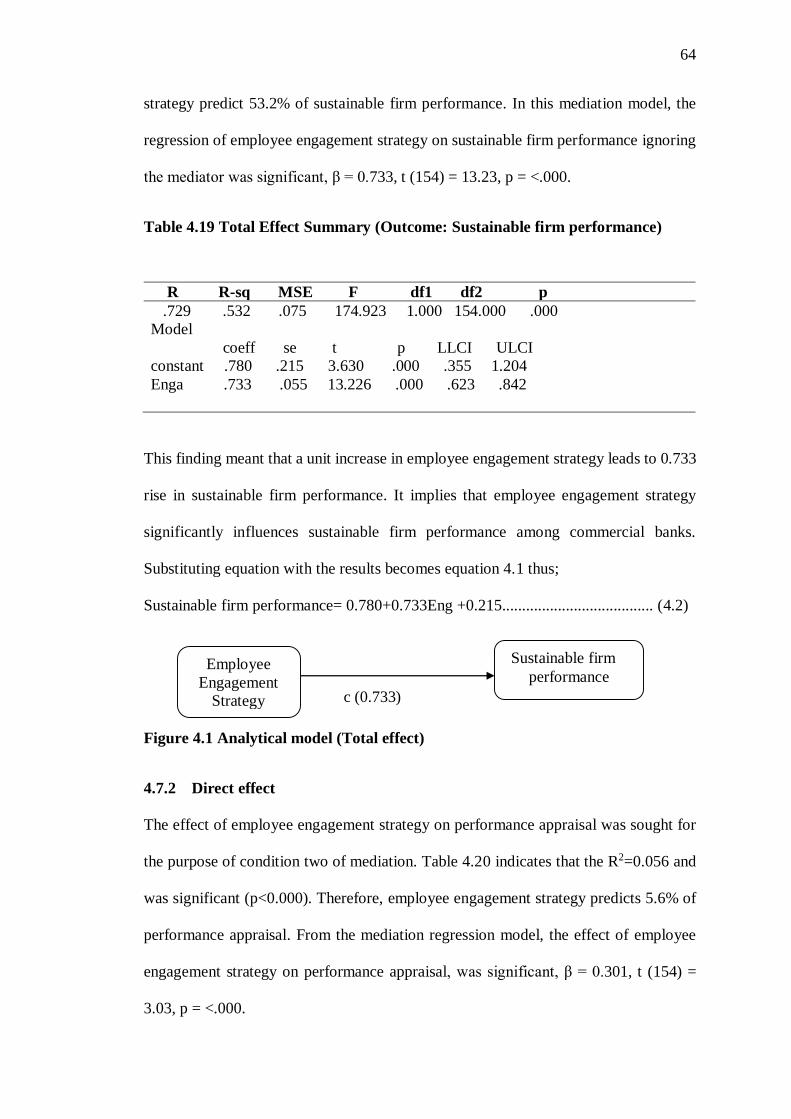
64
strategy predict 53.2% of sustainable firm performance. In this mediation model, the
regression of employee engagement strategy on sustainable firm performance ignoring
the mediator was significant, β = 0.733, t (154) = 13.23, p = <.000.
Table 4.19 Total Effect Summary (Outcome: Sustainable firm performance)
R R-sq MSE F df1 df2 p
.729 .532 .075 174.923 1.000 154.000 .000
Model
coeff se t p LLCI ULCI
constant .780 .215 3.630 .000 .355 1.204
Enga .733 .055 13.226 .000 .623 .842
This finding meant that a unit increase in employee engagement strategy leads to 0.733
rise in sustainable firm performance. It implies that employee engagement strategy
significantly influences sustainable firm performance among commercial banks.
Substituting equation with the results becomes equation 4.1 thus;
Sustainable firm performance= 0.780+0.733Eng +0.215...................................... (4.2)
c (0.733)
Figure 4.1 Analytical model (Total effect)
4.7.2 Direct effect
The effect of employee engagement strategy on performance appraisal was sought for
the purpose of condition two of mediation. Table 4.20 indicates that the R2=0.056 and
was significant (p<0.000). Therefore, employee engagement strategy predicts 5.6% of
performance appraisal. From the mediation regression model, the effect of employee
engagement strategy on performance appraisal, was significant, β = 0.301, t (154) =
3.03, p = <.000.
Employee
Engagement
Strategy
Sustainable firm
performance
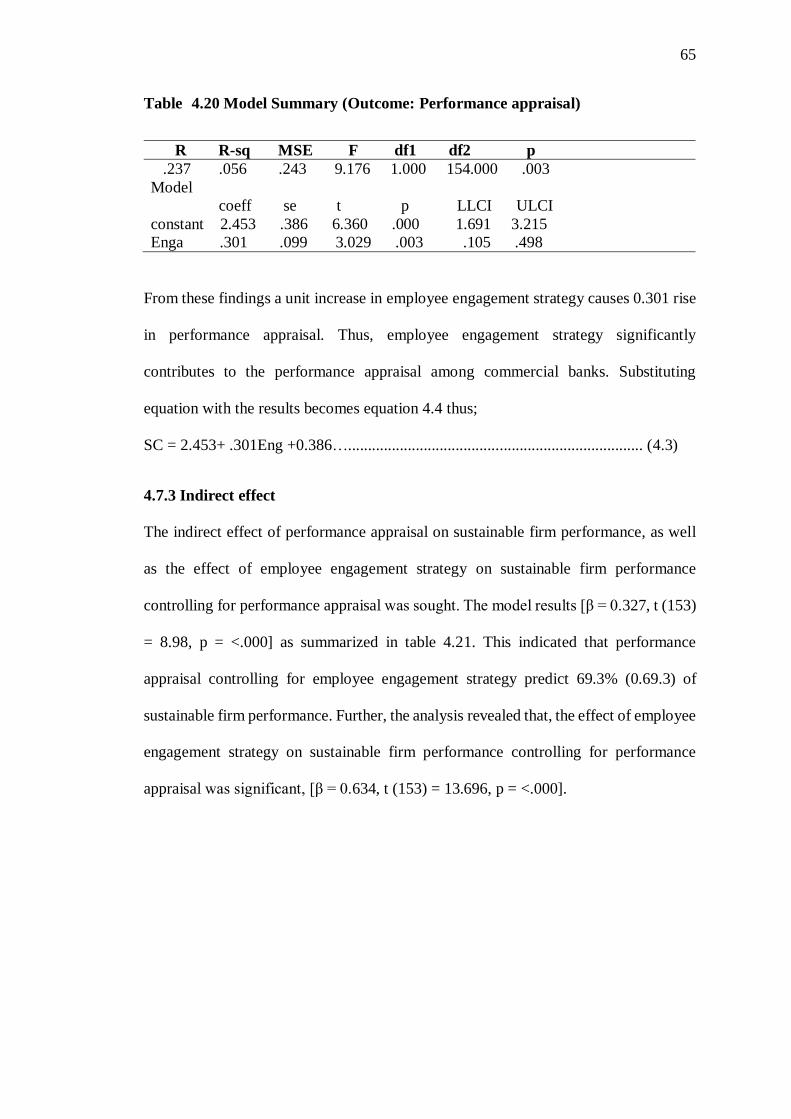
65
Table 4.20 Model Summary (Outcome: Performance appraisal)
R R-sq MSE F df1 df2 p
.237 .056 .243 9.176 1.000 154.000 .003
Model
coeff se t p LLCI ULCI
constant 2.453 .386 6.360 .000 1.691 3.215
Enga .301 .099 3.029 .003 .105 .498
From these findings a unit increase in employee engagement strategy causes 0.301 rise
in performance appraisal. Thus, employee engagement strategy significantly
contributes to the performance appraisal among commercial banks. Substituting
equation with the results becomes equation 4.4 thus;
SC = 2.453+ .301Eng +0.386….......................................................................... (4.3)
4.7.3 Indirect effect
The indirect effect of performance appraisal on sustainable firm performance, as well
as the effect of employee engagement strategy on sustainable firm performance
controlling for performance appraisal was sought. The model results [β = 0.327, t (153)
= 8.98, p = <.000] as summarized in table 4.21. This indicated that performance
appraisal controlling for employee engagement strategy predict 69.3% (0.69.3) of
sustainable firm performance. Further, the analysis revealed that, the effect of employee
engagement strategy on sustainable firm performance controlling for performance
appraisal was significant, [β = 0.634, t (153) = 13.696, p = <.000].
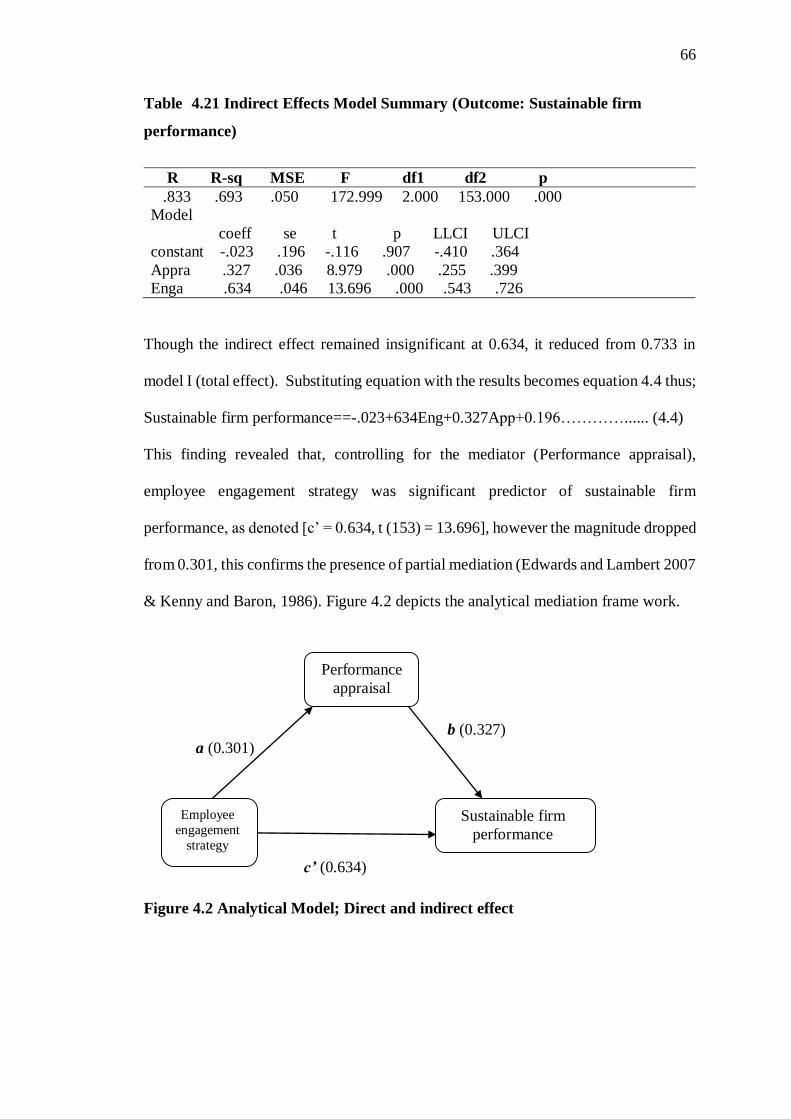
66
Table 4.21 Indirect Effects Model Summary (Outcome: Sustainable firm
performance)
R R-sq MSE F df1 df2 p
.833 .693 .050 172.999 2.000 153.000 .000
Model
coeff se t p LLCI ULCI
constant -.023 .196 -.116 .907 -.410 .364
Appra .327 .036 8.979 .000 .255 .399
Enga .634 .046 13.696 .000 .543 .726
Though the indirect effect remained insignificant at 0.634, it reduced from 0.733 in
model I (total effect). Substituting equation with the results becomes equation 4.4 thus;
Sustainable firm performance==-.023+634Eng+0.327App+0.196…………...... (4.4)
This finding revealed that, controlling for the mediator (Performance appraisal),
employee engagement strategy was significant predictor of sustainable firm
performance, as denoted [c’ = 0.634, t (153) = 13.696], however the magnitude dropped
from 0.301, this confirms the presence of partial mediation (Edwards and Lambert 2007
& Kenny and Baron, 1986). Figure 4.2 depicts the analytical mediation frame work.
b (0.327)
a (0.301)
c’ (0.634)
Figure 4.2 Analytical Model; Direct and indirect effect
Performance
appraisal
appraisal
Employee
engagement
strategy
Sustainable firm
performance
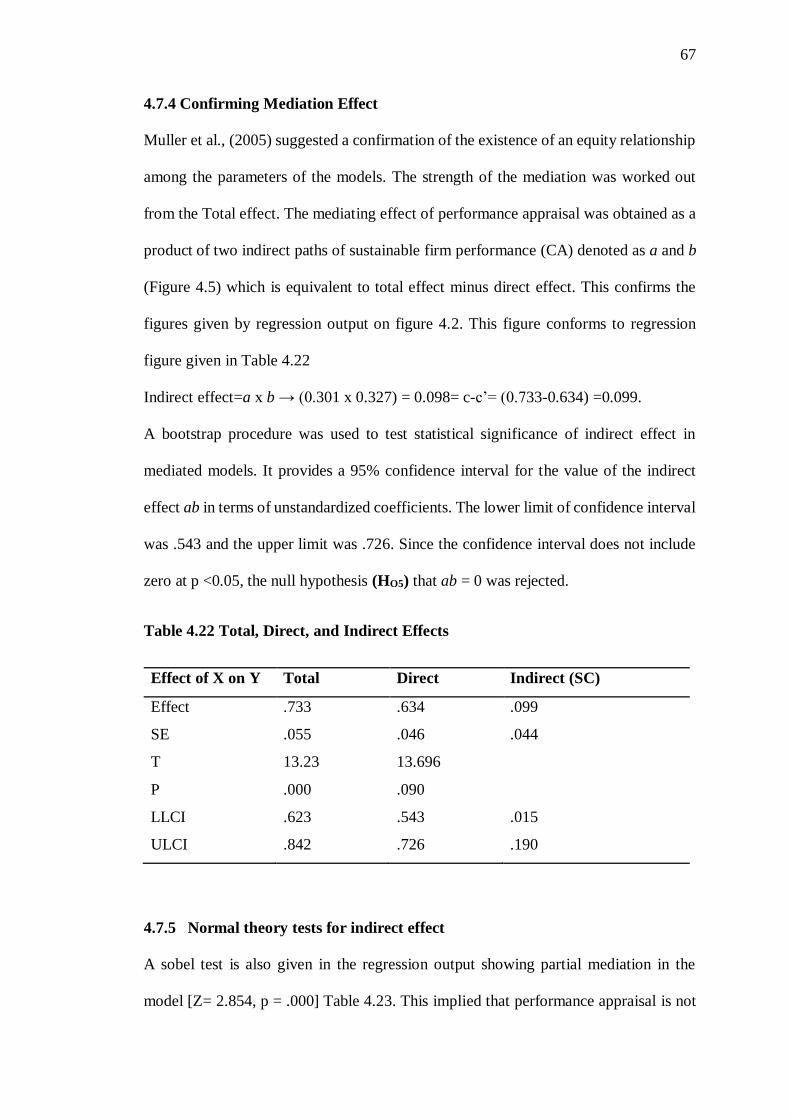
67
4.7.4 Confirming Mediation Effect
Muller et al., (2005) suggested a confirmation of the existence of an equity relationship
among the parameters of the models. The strength of the mediation was worked out
from the Total effect. The mediating effect of performance appraisal was obtained as a
product of two indirect paths of sustainable firm performance (CA) denoted as a and b
(Figure 4.5) which is equivalent to total effect minus direct effect. This confirms the
figures given by regression output on figure 4.2. This figure conforms to regression
figure given in Table 4.22
Indirect effect=a x b → (0.301 x 0.327) = 0.098= c-c’= (0.733-0.634) =0.099.
A bootstrap procedure was used to test statistical significance of indirect effect in
mediated models. It provides a 95% confidence interval for the value of the indirect
effect ab in terms of unstandardized coefficients. The lower limit of confidence interval
was .543 and the upper limit was .726. Since the confidence interval does not include
zero at p <0.05, the null hypothesis (HO5) that ab = 0 was rejected.
Table 4.22 Total, Direct, and Indirect Effects
Effect of X on Y Total Direct Indirect (SC)
Effect .733 .634 .099
SE .055 .046 .044
T 13.23 13.696
P .000 .090
LLCI .623 .543 .015
ULCI .842 .726 .190
4.7.5 Normal theory tests for indirect effect
A sobel test is also given in the regression output showing partial mediation in the
model [Z= 2.854, p = .000] Table 4.23. This implied that performance appraisal is not
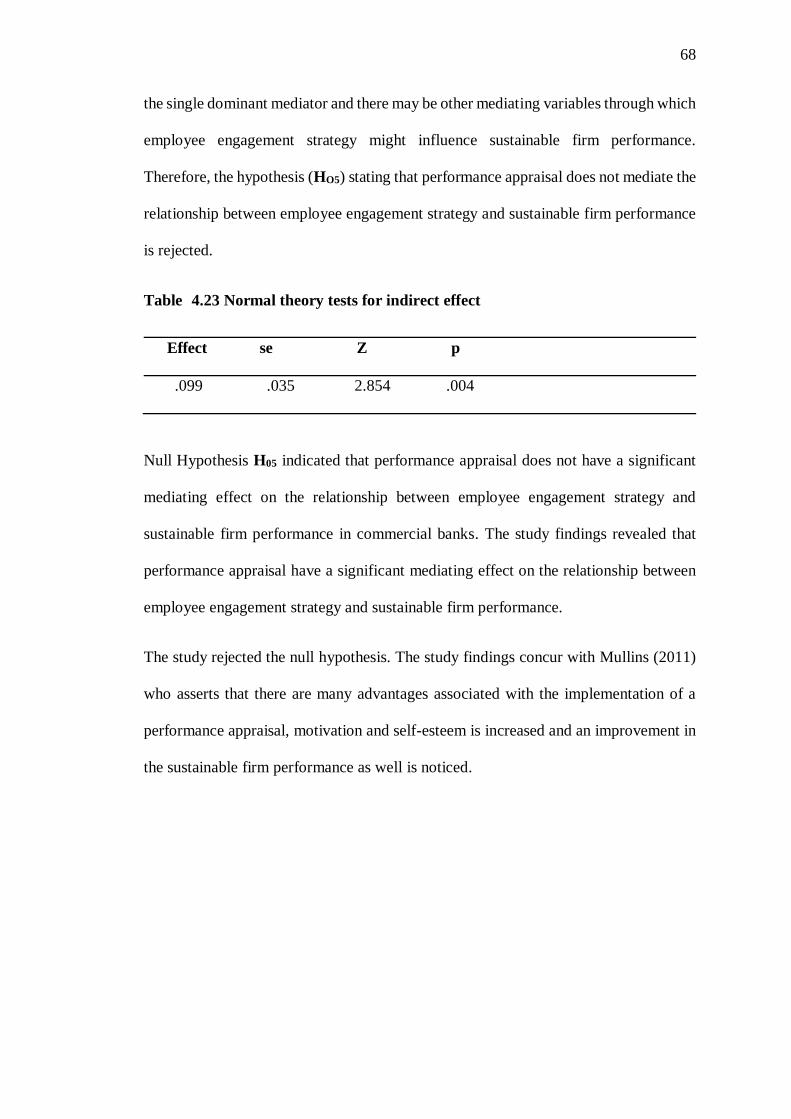
68
the single dominant mediator and there may be other mediating variables through which
employee engagement strategy might influence sustainable firm performance.
Therefore, the hypothesis (HO5) stating that performance appraisal does not mediate the
relationship between employee engagement strategy and sustainable firm performance
is rejected.
Table 4.23 Normal theory tests for indirect effect
Effect se Z p
.099 .035 2.854 .004
Null Hypothesis H05 indicated that performance appraisal does not have a significant
mediating effect on the relationship between employee engagement strategy and
sustainable firm performance in commercial banks. The study findings revealed that
performance appraisal have a significant mediating effect on the relationship between
employee engagement strategy and sustainable firm performance.
The study rejected the null hypothesis. The study findings concur with Mullins (2011)
who asserts that there are many advantages associated with the implementation of a
performance appraisal, motivation and self-esteem is increased and an improvement in
the sustainable firm performance as well is noticed.
69
CHAPTER FIVE
SUMMARY CONCLUSION AND RECOMMENDATIONS
5.0 Introduction
This section will discuss the summary of the findings, conclusions and
recommendations. The purpose of the study was to determine the mediating role of
performance appraisal on the relationship between employee engagement strategy and
sustainable firm performance.
5.1 Summary of the Study Findings
Based on data analysis in chapter four, the findings are summarized in this section. The
study established the mediating role of performance appraisal on the relationship
between employee engagement strategy and sustainable firm performance.
5.1.1 Goal setting on sustainable firm performance
The first study objective sought to determine the influence of goal setting on sustainable
firm performance in commercial banks. The study found out that the respondents agreed
on all aspects of Goal setting. The study findings also showed that Goal setting was
statistically significant and has a positive influence on sustainable firm performance in
commercial banks.
The study rejected the null hypothesis that there is no statistically significant influence
of goal setting on sustainable firm performance in commercial banks. The study
findings revealed that goal setting has a positive influence on sustainable firm
performance.
5.1.2 Motivation on sustainable firm performance
The second study objective sought to determine the influence of motivation on
sustainable firm performance in commercial banks. The study found out that the
70
respondents agreed on all aspects of motivation. The study findings also showed that
motivation was statistically significant and has a positive influence on sustainable firm
performance in commercial banks. The study rejected the null hypothesis that there is
no statistically significant influence of motivation on sustainable firm performance in
commercial banks.
The study findings also revealed that motivation has a positive influence on sustainable
firm performance in commercial banks.
5.1.3 Leadership on sustainable firm performance
The third study objective sought to determine the influence of leadership on sustainable
firm performance in commercial banks. The study found out that the respondents agreed
on all aspects of leadership. The study findings also showed that leadership was
statistically significant and has a positive influence on sustainable firm performance in
commercial banks. The study rejected the null hypothesis that there is no statistically
significant influence of leadership on sustainable firm performance in commercial
banks. The study findings also revealed that leadership has a positive influence on
sustainable firm performance in commercial banks...
5.1.4 Training on sustainable firm performance
The fourth study objective sought to determine the influence of training on sustainable
firm performance in commercial banks. The study found out that the respondents agreed
on all aspects of training. The study findings also showed that training was statistically
significant and has a positive influence on sustainable firm performance in commercial
banks. The study rejected the null hypothesis that there is no statistically significant
influence of training on sustainable firm performance in commercial banks.
The study findings also revealed that training has a positive influence on sustainable
firm performance in commercial banks.
71
A sobel test given in the regression showed a partial mediation in the model. This
implies that performance appraisal is not the single dominant mediator and there may
be other mediating variables through which employee engagement strategy might
influence sustainable firm performance. Performance appraisal partially mediate the
relationship between employee engagement strategy and sustainable firm performance
is rejected.
5.2 Conclusions
The study concludes that the employees are given clear and specific goals to achieve
monthly of which they are also given an opportunity to participate in the goal setting
process which contributes to the overall success of this organization.
The study also concludes that the employees should be able to satisfy both
organizational and personal goals. Seniors should be able to treat employees fairly.
Leaders should understand the benefits of maintaining a balance between work and
personal life and the employees should be recognized for the work well done in order
to realize improvement in the organization.
The study further concludes that that in order for banks to realize sustainable
performance a leader should demonstrate strong leadership skills, lead by example, care
about what ideas his/her juniors have and inspire the juniors by sharing his/her plans
for the future of the organizations.
The study finally concludes that that employees need training in order for them to do
well in their job. Also, Training opportunities are provided whenever there is change of
technology or promotions.
72
The study concludes that an effective appraisal system can enhance the motivation and
performance of the employees leading to the completion of specified work or for
attaining or exceeding specified performance targets.
5.3 Implication of the Study
Performance appraisal contributes to the enhancement of cooperation in a
company/organization, which in turn is essential for achieving goals. In the common
effort of achieving goals, after the performance appraisal procedure, which helps in
setting and achieving them, it is more possible to see people cooperating and helping
each other. Through the performance appraisal procedure, meaningful goals setting and
effort to achieve them end up in motivation and satisfaction/engagement. Constructive
criticism that comes as a result of appraisal and its aim is to improve a person's behavior,
encouraging positive changes, influences motivation and job satisfaction.
In an environment where performance appraisal helps communication, where an
employee can express his/her needs, where strengths are exploited and there is an effort
for weaknesses to be improved, employee feels motivated and satisfied. An effective
appraisal system can enhance the interest and performance of the employees leading to
the completion of specified targets and attainment of specified performance goals. This
means that the lack of a fair appraisal score may make the employees work at a normal
pace or work below expectation due to how it is conducted.
Performance appraisal gives the staff the opportunity to express their ideas and
expectations for meeting the strategic goals of the company. Performance appraisal
should be encouraged among the employees to express their ideas and expectations for
meeting the strategic goals of the company. Performance appraisal can make the
employees’ to be aware of what is expected from them and the consequences of their
73
performance. Performance appraisal should lead to improved employee performance.
Performance appraisal should be optimized for effective decision making. This can lead
the employees to complete their specified work and exceeding their normal work
performance.
5.4 Recommendations
The organization should give clear and specific goals to employees for them to achieve
monthly and give them an opportunity to participate in the goal setting process. This
will contribute to the overall success of this organization.
The study further recommends that seniors should always treat employees fairly,
understand the benefits of maintaining a balance between work and personal life and
the employees should be recognized for the work well done in order to realize
improvement in the organization.
The study also recommends that leaders should demonstrate strong leadership skills,
lead by example, and care about what ideas his /her juniors have and inspire the juniors
by sharing his /her plans for the future of the organizations.
The study finally recommends that the employees should be trained always in order for
them to do well in their job. There is need for management to enhance the performance
appraisal of employees through engagement strategy in order to achieve sustainable
firm performance in commercial banks.
The study recommends that the performance appraisal should be optimized to improve
the performance of the employees. Performance reviews should be focused on the
contributions of the individual employees to meet the organizational goals.
74
5.5 Suggestions for further study
The researcher suggests that a similar study to be done on other government parastatals
for comparison of findings and a general conclusion to be drawn on the perceived
relationship between employee engagement strategy and sustainable firm performance.
75
REFERENCES
Abbott, P. (2014). Employee Engagement. Pretoria, SA: SABPP
Abu Bakar, A. S., & Ameer, R.(2011). Readability of employee engagement strategy communication in Malaysia. Employee engagement strategy and Environmental Management. 18(1), 50-60.
AbuKhalifeh & Som, A. (2013). The Antecedents Affecting Employee Engagement and Organisational Performance. Asian Social Science. International Journal of World Research, 9(7), 41-46.
Afshan, S., Sobia, I., Kamran, A., & Nasir, M. (2012). Impact of training on employee performance: a study of telecommunication sector in Pakistan. Interdisciplinary Journal of Contemporary Research in Business. 6(1), 49-64.
Aguinis, H. (2009). Performance Management International Edition, Ed 2. Pearson Higher Education.
Ahmed, Z., Shields, F., White, R., & Wilbert, J. (2010). Managerial communication: The link between frontline leadership and organizational performance. Journal of Organizational Culture, Communications and Conflict. In First Annual General Business Conference Conference Proceedings (p. 69).
Armstrong, M. (2009). Handbook of Performance Management: 4th Edition. Kogan Page. London
Arnold, M. B. (Ed.). (2013). Feelings and emotions: The Loyola symposium (Vol. 7). Academic Press.
Attridge, M. (2009). Employee work engagement: Best practices for employers. Research Works, Washington, DC: American Psychiatric Foundation.
Babbie, E. (2004). The Practice of Social Research Thomson. Wadsworth: California.
Bagshawe, A. (2011). How to improve motivation. Bookboon.
Balain, S., & Sparrow, P. (2009).Engaged to perform; A new perspective on employee engagement, Lancaster, Lancaster University Management, School Canadian Federation of Independent Business.
Bank Supervision Annual Report (2016). Central Bank of Kenya.
Banking Amendment Act (2009). Central Bank of Kenya.
Baron, A. (2009). Performance management; A discussion Paper London, CIPD
Baron, M.,& Kenny, A.(1986). The Moderator-mediator variable distinction in Social psychological Research; Conceptual, Strategic and Statistical Considerations. Journal of Personality and Social Psychology, 51(6), 1173
Bazerman, M. (2009). When Goal Setting Goes Bad. Working Knowledge. Harvard Business School. Behaviour in Public and Non-profit Organizations. Sage Publications, Inc.
76
Beiner, S., Schmid, M. M., & Wanzenried, G. (2011). Product market competition, managerial incentives and firm valuation. European Financial Management, 17(2), 331-366.
Ben Brik, A., Rettab, B., & Mellahi, K. (2011). Market orientation, employee engagement strategy, and business performance. Journal of Business Ethics. 99(3), 307-324.
Bennett, D. (2009). Ready, aims... fail. Why setting goals can backfire. The Boston Globe, C1
Bennis, W., & Goldsmith, J. (2010). Learning to lead: A workbook on becoming a leader. Basic Books.
Bensman, D. (2014). Misclassification: Workers in the borderland. Journal of Self-Governance and Management Economics, 2(2), 7-25.
Bersin, J. (2015), Becoming irresistible a new model of employee engagement, Deloitte Report Global workforce study.
Brammer, S., & Millington, A. (2008). Does it pay to be different? An analysis of the relationship between corporate social and financial performance. Strategic Management Journal, 29(12), 1325-1343.
Breevaart, K., Bakker, A., Hetland, J., Demerouti, E., Olsen, K.,& Espevik, R. (2014), “Daily transactional and transformational leadership and daily employee engagement”, Journal of Occupational and Organizational Psychology, 87(1), 138-157.
Brown, D. (2011). Performance management can it ever work? Manager, Summer, Education Summer Program 2013. Louisville, KY: Galt House.
Caniëls, M.C.J., Gehrsitz, M.H., & Semeijn, J. (2013), "Participation of suppliers in greening supply chains: An empirical analysis of German automotive suppliers", Journal of Purchasing and Supply Management, 19(3), 134-143.)
Cappelli, P (2008). Talent on Demand; Managing talent in uncertain age, Boston, MA, Harvard Business School Press.
Carter, C.R., & Rogers, D.S. (2008). "A framework of sustainable supply chain management: Moving toward new theory", International Journal of Physical Distribution &Logistics Management, 38(5), 360-387.
Chartered Institute of Personnel Development (2013). Managing for Sustainable employee engagement. Guidance for employers and managers. London, CIPD
Chartered Institute of Personnel Development (2016). Rapid evidence assessment of the research literature on the effect of goal setting on workplace performance. CIPD, London
Chatterjee, S., & Hadi, A. S. (2012). Variable selection procedures. Regression analysis by example. 5th ed: Wiley, 306.
Christian, M. S., Garza, A. S., & Slaughter, J. E. (2011). Work engagement: A quantitative review and test of its relations with task and contextual performance. Personnel Psychology,
77
Cohen, J., Cohen, P., West, S. G., & Aiken, L. S. (2013). Applied multiple regression/correlation analysis for the behavioural sciences, Nahwah.
Cole, G. A. & Kelly, P. (2011). Management Theory and Practice. London, UK:
Cooper, D. R., & Schindler, P. S. (2006). Business Research Methods o" ed). Boston: McGraw-Hill.
Deloitte Consulting. (2014). Human Capital Trends Report. Engaging the 21st-century workforce. Kenya: Deloitte Development LLC.
Denhardt, R. B., Denhardt, J. V., Aristigueta, M. P., & Rawlings, K. C. (2018). Managing human behavior in public and nonprofit organizations. CQ Press.
DeNisi, A. S. (2011). Managing performance to change behaviour. Journal of Organizational Behaviour & Management, 31(4), 262-276.
Dionco-Adetayo, E. (2011). Guide to Business research and Thesis Writing,2nd Edition, Rasmed Publications Limited, Ibadan, Nigeria
Edwards, J. R., & Lambert, L. S. (2007). Methods for integrating moderation and mediation: a general analytical framework using moderated path analysis. Psychological methods, 12(1), 1.
Ehrenfeld, J.R. (2008). Sustainability needs to be attained not managed: Science, Practice, & Policy,
Eldenburg, L., Soderstrom, N., Willis, V. & Wu, A. 2010,Behavioral changes following the collaborative development of an accounting information system", Accounting Organizations and society , Journal of Operations Management, framework of corporate governance and firm valuation, European Finance Eldenburg, 35(2), 222-237.
Field, A. (2009). Logistic regression. Discovering statistics using SPSS, 264, 315.
Gallup, Inc (2013) State of the American Workplace: insights for U.S Business Leaders Reports
Gatenby, M., Rees, C., Soane, E., & Truss, C. (2009), “Employee engagement in context”, Chartered Institute of Personnel and Development, London.
Gold, J.,&Thorpe, R. (2010). Leadership and management development in SMEs. The Gower Handbook of Leadership and Management Development, Aldersot; Gower
Greenberg, J. (2011). Behaviour in organizations (10th ed.) Upper Saddle River, NJ: Prentice Hall
Hahn, T., Figge, F., Liesen, A., & Barkemeyer, R. (2010). Opportunity cost-based analysis of corporateeco-efficiency: A methodology and its application to the CO2-efficiency of German companies. Journal of Environmental Management, 91(10), 1997-2007.
Harter, C., Schmidt, C. & Hayes, D. (2012). Performance Appraisal systems, Productivity, and Motivation. Public Personnel Management.
78
Harter, J.K., Schmidt, F. L., & Hayes, T. L (2002). Business Unit level relationship between employee satisfaction, employee engagement and business outcome; a meta-analysis, Journal of applied psychology, 87(2), 268.
Hayes, F. A. (2013). Introduction to Mediation, Moderation, and Conditional Process Analysis: A Regression-Based Approach. Guilford Publications.
Hayes, F. A. (2014). An Index and Test of Linear Moderated Mediation. Multivariate Behavioral Research, (50) 1–22
Heartfield, S. M. (2012). Keys to Employee Satisfaction: What You Can Do to Increase Employee Satisfaction. World Applied Sciences Journal, 26(10), 1304-1309.
Heilmann, P. (2011). The dialectics between boundary less career and competence development findings among Finnish ICT and paper managers. The International Journal of Human Resource Management, 22(01), 181-196.
Herly, M.,& SIsnuhadi. (2011) Corporate Governance and Firm performance in Indonesia: International Journal of Governance, 1(1), 1-20.
Hewitt. (2015). Trends in Global Employee Engagement. Washington, DC: Virtual Press Office
Hofer, C., Cantor, D. E., & Dai, J. (2012). The competitive determinants of a firm's environmental management activities: Evidence from US manufacturing industries. Journal of Operations Management, 30(1-2), 69-84.
Ittner, C. D. (2008). Does measuring intangibles for management purposes improve performance? A review of the evidence. Accounting and business research, 38(3), 261-272.
Jagoda, K., Lonseth, R. and Lonseth, A. (2013), “A bottom-up approach for productivity measurement and improvement”, International Journal of Productivity and Performance Management, 62(4), 387-406.
Johnson, M. (2011). Workforce Deviance and the business case for employee engagement. The journal for quality and participation, 34(2), 11.
Juan, A. B. (2010). Job demands and job resources. Burnout and engagement a Multi-sample study, Journal of Organizational Behavior, 7(25), 293-315.
Kangethe, K. (2017, June 9). Kenyans to transfer money, bank to bank for free over 2 months. Capital Business.
Kelly, P. (2009). International Business and Management, Engage Learning EMEA.
Kombo, D., & Tromp, D. (2006). Proposal and Thesis writing: An introduction
Nairobi: Pauline’s Publications Africa, 5, 814-30.
Kothari, A. (2009). Focus Groups. A practical guide for Applied Research. Thousand Oaks. Sage
Kothari, C.R. (2004). Research Methodology: Methods and techniques: New Age International.
Krausert, A. (2009). Performance management for Different Employee Groups; A Contribution to Employment Systems Theory, New York; Springer Science &Business Media
79
Kular, S., Gatenby, M., Rees, C., Soane, E., & Truss, K. (2008). Employee engagement: a literature review, Working Paper No. 19, Kingston Business School, Kingston University.
Kumari, N. & Malhotra, R. (2012).Effective Performance Management System for Enhancing Growth, Global Management Journal, 4(1/2)
Latham, G.P., & Locke, E.A. (1979). Goal setting- a motivational technique that works, Organizational Dynamics, 8(2), 68-80,
Lawlor, K. B. (2012). Smart Goals: How the Application of Smart Goals can contribute to Achievement of Student Learning Outcomes. Developments in Business Simulation and Experiential Learning, Proceedings of the Annual ABSEL conference (Vol. 39).
Lee, F., Lee, T., &Wu, W. (2010). The relationship between human resource management practices business strategy and firm performance: evidence from steel industry in Taiwan. The international journal of Human Resource Management, 21(9), 1351-1372.
Lee, J., & Wei., F. (2008). Uncover the black-box of leadership effectiveness: Leader member exchange as the mediator. Frontiers of Business Research in China, 2(2), 240.
Lepak, D., & Gowan, M. (2009). Human Resource Management International Edition, Pearson Edition Upper saddle River, United States.
Locke, E.A., & Latham, G. P. (2013). New Developments in Goal Setting and Task Performance, (pp.27-39). Routledge.
Locke, E.A., & Latham, G.P. (2002). Building a practically useful theory of goal setting and task motivation: a 35-year odyssey. American Psychologist, 57(9), 705.
Locke, G., & Latham, E,A. (2009). Has goal setting gone wild or has its attacker’s abandoned good scholarship? Academy of Management, Academy of Management Perspectives, 23(1), 17-23.
Love, F., & Singh, P. (2011). Workplace branding; Leveraging Human Resources Management Practices for Sustainable firm performance Through Best Employer. Journal of Psychology, 26(2), 175.
Lunenburg, F. (2011). Goal-Setting Theory of Motivation. International journal of management, business, and administration, 15(1), 1-6.
Macey, W. H., & Schneider, B. (2008). The Meaning of Employee Engagement, industrial and organisational Psychology, 1(1), 3-30.
Macey, W. H., Schneider, B., Barbera, K. M., & Young, S. A. (2009). Employee engagement: Tools for analysis, practice, and Competitive Advantage, Wiley-Blackwell, Oxford, UK. doi, 10, 9781444306538
Mansoor, H. (2008). “Motivation: A Challenge for Oil and Gas Companies an Omani Case Study”, Oil and Gas Business.
Mayfield, C.O., & Taber.T.D. (2010).Producing sustainable firm performance through the effective management of people. Academy of management executives, 25(7), 741-763.
80
McCarthy, S. (2010). Business urged to keep on ecotrack. Globe and Mail, Nov 24
McElroy, J. C., & Weng, Q. (2016). The connections between careers and organizations in the new career era: Questions answered, questions raised. Journal of Career Development, 43(1), 3-10.
McEwen, D. (2011). Employee Engagement: A Systemic Approach to High Employee Engagement.
Michael, O. S.,& Crispen, C. (2009).Employee retention and turnover: Using motivational variables as a panacea, African Journal of Business Management, 3(9), 410-415.
Mone, E. M., & London, M. (2010). Employee Engagement through Effective Performance Management: A Practical Guide for Managers. New York, NY: Routledge.
Mone, E., Eising, C., Guggenheim, K., Price, B., & Stine, C. (2011). Performance Management at the wheel; driving employee engagement in organisations. Journal of business and psychology, Journal of Business and Psychology, 26(2), 205-212
Moynihan, D.P. (2008). The Dynamics of Performance Management: Constructing Information and Reform. Georgetown: Georgetown University Press.
Mugenda, O.M., & Mugenda, A.G. (1999).Research Methods, Quantitative and Qualitative Analysis. African Center for Technology Studies Nairobi
Muller, D., Judd, C. M., & Yzerbyt, V. Y. (2005). When moderation is mediated and mediation is moderated. Journal of personality and social psychology, 89(6), 852.
Mullins, L. (2010). Management and Organization Behaviour, Ed, 9. Financial Times Press
Mullins, L. (2011). Essentials of organisational behaviour. Harlow, England: Financial Times Prentice Hall Pearson.
Murphy, D., Duggan, M., & Joseph, S.(2013). Relationship-based social work and its compatibility with the person-centred approach: Principled versus instrumental perspectives. The British journal of social work, 43(4), 703-719.
Nelson, Q. (2013). Principles of Organisational Behaviour, Boston, MA: Cengage
Nikandrou, L., Apospori, E., Panayotopoulou, L., Staurou, E.T., &Papalexandris, N. (2008) Training and firm performance in Europe: The impact of national and organizational characteristics. The international journal of Human Resource Management, 19(11), 2057-2078.
Obisi, C. (2011). Employee Performance Appraisal and its implication for Individual and Organisational Growth', Australian Journal of Business & Management Research, 1(9), 92.
81
Ordóñez, L., Schweitzer, M., Galinsky, A., & Bazerman, M. (2009). Goals gone wild: The systematic side effects of over-prescribing goal setting. HBS Working Paper,
Orme, J. G., & Combs-Orme, T. (2009). Multiple regression with discrete dependent variables. Oxford University Press.
Orodho, C.(2003). Research methodology: Methods and techniques. New Age International Publishers.
Porter, M.(1990). The Sustainable firm performance of Nations, THE FREE PRESS, A Division of McMillan, Inc., New York, 1990, p. xii
Postuma, R. A., & Campion, M. A. (2008). Twenty best practices for just employee performance reviews: employers can use a model to achieve performance reviews that increase employee satisfaction, reduce the likelihood of litigation and boost motivation. Compensation & Benefits Review, 40(1), 47-55.
Preacher, K. J., Rucker, D. D.,& Hayes, A., F.,(2007) Addressing Moderated Mediation Hypotheses: Theory, Methods, and Prescriptions. Multivariate Behavioural Research 185–227
Preacher, K., & Hayes, A. F. (2008). Asymptotic and resampling strategies for assessing and comparing indirect effects in multiple mediator models. Behaviour Research Methods 40 (3), 879-891
Price, A. (2009). Human Resource Management in a Business Context. Cengage Learning EMEA.
Public Service Commission (2016). Human Resource Policies and Procedures Manual for the Public Service. GOK printers
Pulakos, W.D. (2009). Performance Management; Chichester, Wiley-Blackwell
Reitman, F., & Schneer, J. A. (2008). Enabling the new careers of the 21st century. Organization Management Journal, 5(1), 17-28.
Robbins,S. P., & Judge, A. (2012).Essentials of Organizational Behavior, 14th ed., Prentice Hall, Upper Saddle River, NJ.
Robbins, S. P., DeCenzo, D. A.,& Coulter, M. (2011). Fundamentals of management. 7th edition. New Jersey: Pearson Prentice Hall
Robbins, Stephen P., DeCenzo, David A., Moon, Henry. (2008). Fundamentals of management: essential concepts and applications. 6thedition. New Jersey: Pearson Prentice Hall
Rug, H., & Wallace, M. (2012). Goal Sharing. Scottsdale: WorldatWork Press.
Saks, A. M., & Gruman, J. A. (2011). Manage employee engagement to manage performance. Industrial and Organizational Psychology, 4(2), 204-207.
Saks, A.M., (2006). Antecedents and consequences of employee engagement, Journal of Managerial Psychology, 21(7), 600-619.
Saunders, M., Lewis, P., & Thornhill, A. (2012). Research methods for business students (6. utg.). Harlow: Pearson.
82
Selvam S, Manimaran G, Sivasubramanian P.,& Seshunarayana T. (2014). Geo-environmental resource assessment using remote sensing and GIS: a case study from southern coastal region.
Selvarajan, T. T., & Cloninger, P. A. (2012). ‘Can performance appraisals motivate employees to improve performance? A Mexican study. International Journal of Human Resource Management, 23(15), 3063-3084.
Shadare, O. A.,& Hammed, T. Ayo. (2009). Influence of Work Motivation, Leadership Effectiveness and Time Management on Employees’ Performance in Some Selected Industries in Ibadan, Oyo State, Nigeria. European Journal of Economics, Finance and Administrative Sciences, (16).
Shan, G. Y., & Mclver, R. P. (2011). Corporate governance mechanisms and financial performance in china: panel data evidence on listed non-financial companies. Asia Pacific Business Review, 17(3), 301-324.
Simões, P., Vasconcelos-Raposo, J., Silva., & Fernandes, H. (2012). Effects of a Process-Oriented Goal Setting Model on Swimmer's Performance. Journal of Human Kinetics. 32, 65-76.
Sinnema, C., & Robinson, V. (2012). Goal Setting in Principal Evaluation: Goal Quality and Predictors of Achievement. Leadership and Policy in Schools
Sobel, M. E. (1982). Asymptotic confidence intervals for indirect effects in structural equation models. Sociological methodology, 13, 290-312.
Society for Human Resource Management. (2010). Motivation in Today’s Workplace: The Link to Performance. SHRM, Research Quarterly, 2
Stairs, M., & Galpin, M. (2010). Positive engagement: From employee engagement into workplace happiness.
Stringer, C., & Shantapriyan, P. (2012). Setting performance targets. Business Expert Press. [New York, N.Y.] (222 East 46th Street, New York, NY 10017).
Strongman, L. (2013). The psychology of social undermining in organisational behaviour. The Australasian Journal of Organisational Psychology, 6.
Tabachnick, B., & Fidell, L. S. (2007). Using Multivariate Statistics (5th ed). Boston: Pearson Education Inc.
Tamkin, P, Perarson, G, Hirsh, W., & Constable, S. (2010). Exceeding Expectations; The principles of outstanding leadership, London the work Foundation
Tang, O., & Musa, S.N. 2011, "Identifying risk issues and research advancements in supply chain risk management", International Journal of Production Economics, vol. 133, no.1, pp. 25-34.
Tavanti, M. (2008). Transactional leadership. Leadership: The key concepts, 166-170.
Torrington, D., Hall, L., Taylor, S., &Atkinson, C. (2009). Fundamentals of Human Resource Management; Managing People at work. Pearson Education
Towers Watson (2014). Career Management; Making It Work for Employees and Employers
83
Van Rooy, D. L., & Oehler, K. (2013). The evolution of employee opinion surveys: The voice of employees as a strategic business management tool.
Vanitha, d., & Selvam, D. (2012). The effect of mergers and acquisitions on shareholders wealth–an empirical analysis. Chief patron chief patron.
Walsh, D.,& Loudon, S. (2015). A place people choose to live, learn, work and do business. Making it happen.
Wanyoro, C. (2017.May 7). Help us get Promoted auditors tell Uhuru, Business Daily.
Welbourne, T.M., (2007). Employee engagement: Beyond the fad and into the executive suite.
Wu, Z. & Pagell, M. 2011, "Balancing priorities: Decision-making in sustainable supply chain management", Journal of Operations Management, 29(6), 577-590.
Xu, J., & Cooper Thomas, H. (2011). How can leaders achieve high employee engagement?. Leadership & Organization Development Journal, 32(4), 399-416.
Yarnall, J. (2007). Strategic Career Management. Routledge.
Yukl, G. (2010). Leadership in Organizations: Global Edition. Harlow: Pearson.
Zhang, Y., &Li, S. (2009) High Performance work practices and firm performance; Evidence from the Pharmaceutical industry in China. The International journal of Human Resource Management,20(11),23331-2348.
Zhu, W., Avolio, J.,& Walumbwa, O. (2009).Mediating role of follower characteristics with transformational leadership and follower work engagement”, Group & Organization Management. Group & Organization Management, 34(5), 590-619.
84
APPENDICES
APPENDIX I: INTRODUCTORY LETTER
Dear Respondent,
I am a post graduate student at the University of Eldoret. In order to fulfil the
requirement for the award of a master’s degree in Business Management, I am
conducting a research entitled the mediating role of performance appraisal on the
relationship between employee engagement strategy and sustainable firm performance.
The purpose of this letter is to seek your permission to collect the relevant data from
you. The information collected will be treated with utmost confidentiality and will be
used for the intended purpose.
Thank you,
Yours faithfully,
Wendy Apiyo
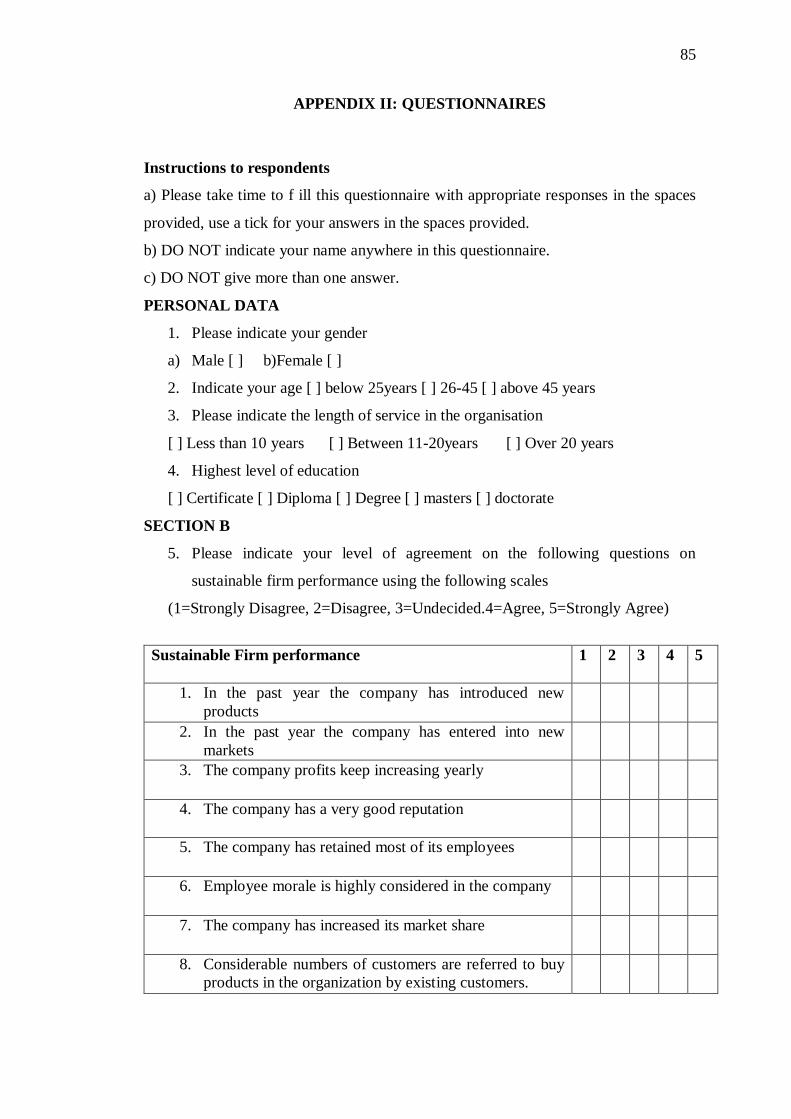
85
APPENDIX II: QUESTIONNAIRES
Instructions to respondents
a) Please take time to f ill this questionnaire with appropriate responses in the spaces
provided, use a tick for your answers in the spaces provided.
b) DO NOT indicate your name anywhere in this questionnaire.
c) DO NOT give more than one answer.
PERSONAL DATA
1. Please indicate your gender
a) Male [ ] b)Female [ ]
2. Indicate your age [ ] below 25years [ ] 26-45 [ ] above 45 years
3. Please indicate the length of service in the organisation
[ ] Less than 10 years [ ] Between 11-20years [ ] Over 20 years
4. Highest level of education
[ ] Certificate [ ] Diploma [ ] Degree [ ] masters [ ] doctorate
SECTION B
5. Please indicate your level of agreement on the following questions on
sustainable firm performance using the following scales
(1=Strongly Disagree, 2=Disagree, 3=Undecided.4=Agree, 5=Strongly Agree)
Sustainable Firm performance 1 2 3 4 5
1. In the past year the company has introduced new
products
2. In the past year the company has entered into new
markets
3. The company profits keep increasing yearly
4. The company has a very good reputation
5. The company has retained most of its employees
6. Employee morale is highly considered in the company
7. The company has increased its market share
8. Considerable numbers of customers are referred to buy
products in the organization by existing customers.
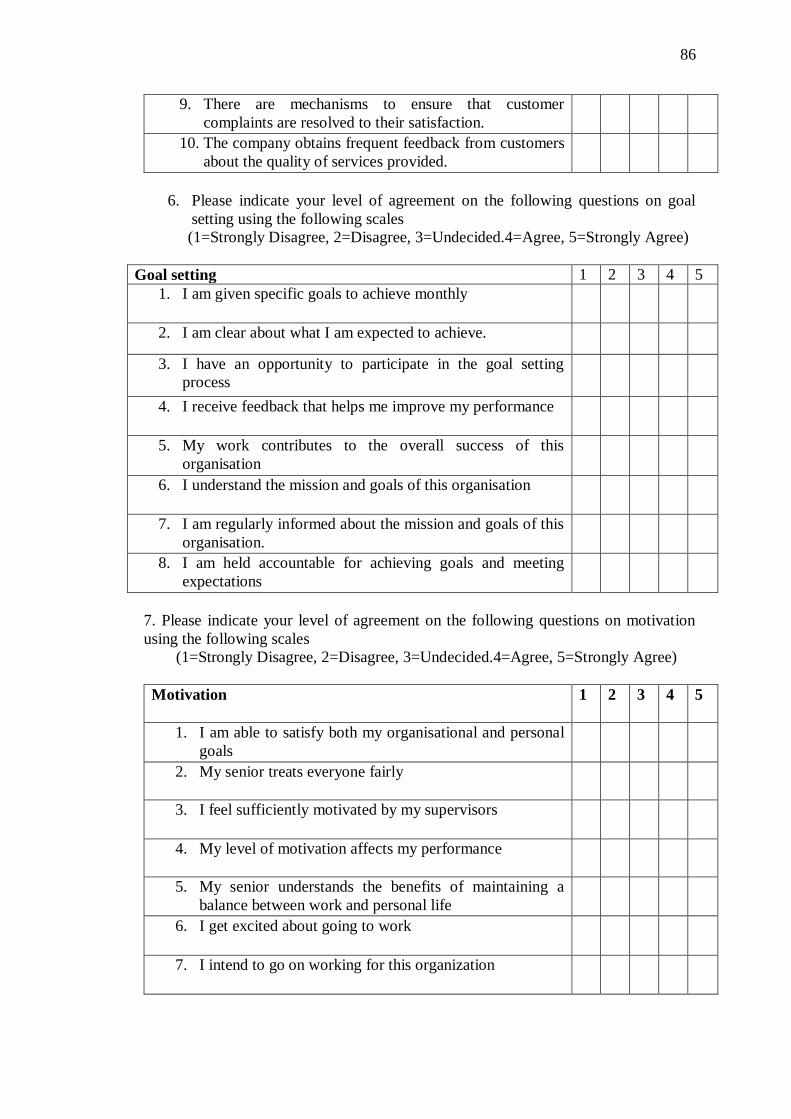
86
9. There are mechanisms to ensure that customer
complaints are resolved to their satisfaction.
10. The company obtains frequent feedback from customers
about the quality of services provided.
6. Please indicate your level of agreement on the following questions on goal
setting using the following scales
(1=Strongly Disagree, 2=Disagree, 3=Undecided.4=Agree, 5=Strongly Agree)
Goal setting 1 2 3 4 5
1. I am given specific goals to achieve monthly
2. I am clear about what I am expected to achieve.
3. I have an opportunity to participate in the goal setting
process
4. I receive feedback that helps me improve my performance
5. My work contributes to the overall success of this
organisation
6. I understand the mission and goals of this organisation
7. I am regularly informed about the mission and goals of this
organisation.
8. I am held accountable for achieving goals and meeting
expectations
7. Please indicate your level of agreement on the following questions on motivation
using the following scales
(1=Strongly Disagree, 2=Disagree, 3=Undecided.4=Agree, 5=Strongly Agree)
Motivation 1 2 3 4 5
1. I am able to satisfy both my organisational and personal
goals
2. My senior treats everyone fairly
3. I feel sufficiently motivated by my supervisors
4. My level of motivation affects my performance
5. My senior understands the benefits of maintaining a
balance between work and personal life
6. I get excited about going to work
7. I intend to go on working for this organization
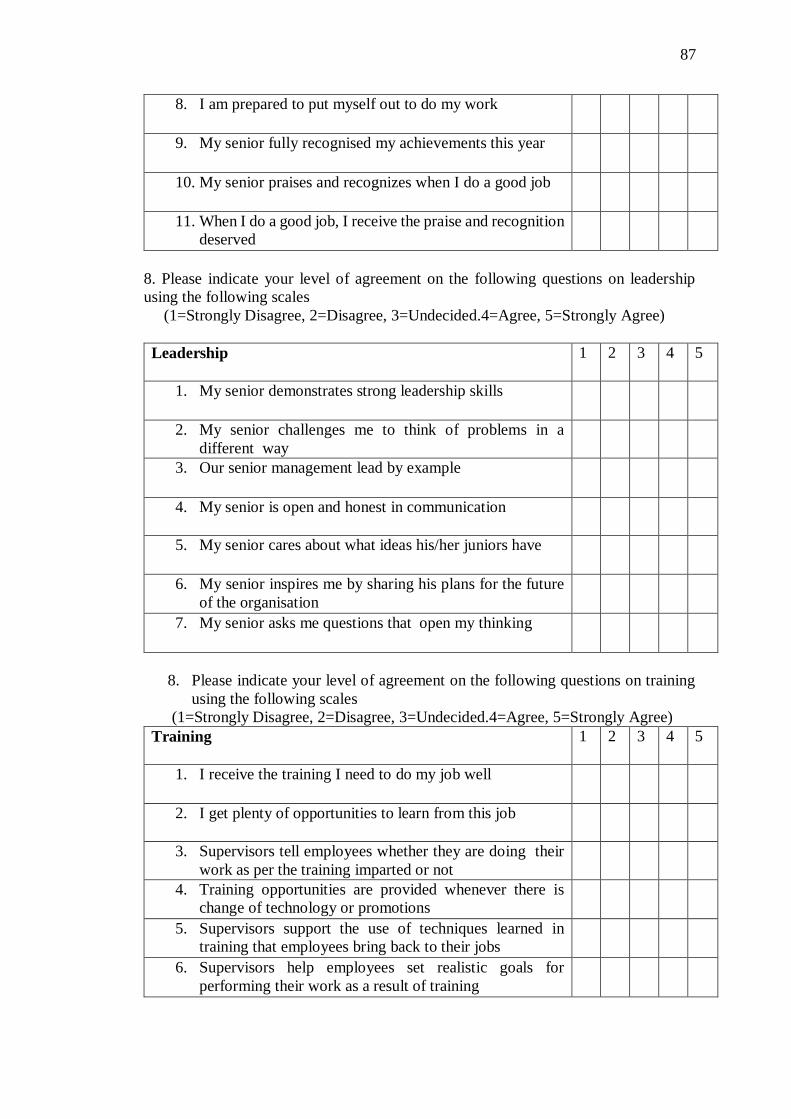
87
8. I am prepared to put myself out to do my work
9. My senior fully recognised my achievements this year
10. My senior praises and recognizes when I do a good job
11. When I do a good job, I receive the praise and recognition
deserved
8. Please indicate your level of agreement on the following questions on leadership
using the following scales
(1=Strongly Disagree, 2=Disagree, 3=Undecided.4=Agree, 5=Strongly Agree)
Leadership 1 2 3 4 5
1. My senior demonstrates strong leadership skills
2. My senior challenges me to think of problems in a
different way
3. Our senior management lead by example
4. My senior is open and honest in communication
5. My senior cares about what ideas his/her juniors have
6. My senior inspires me by sharing his plans for the future
of the organisation
7. My senior asks me questions that open my thinking
8. Please indicate your level of agreement on the following questions on training
using the following scales
(1=Strongly Disagree, 2=Disagree, 3=Undecided.4=Agree, 5=Strongly Agree)
Training 1 2 3 4 5
1. I receive the training I need to do my job well
2. I get plenty of opportunities to learn from this job
3. Supervisors tell employees whether they are doing their
work as per the training imparted or not
4. Training opportunities are provided whenever there is
change of technology or promotions
5. Supervisors support the use of techniques learned in
training that employees bring back to their jobs
6. Supervisors help employees set realistic goals for
performing their work as a result of training
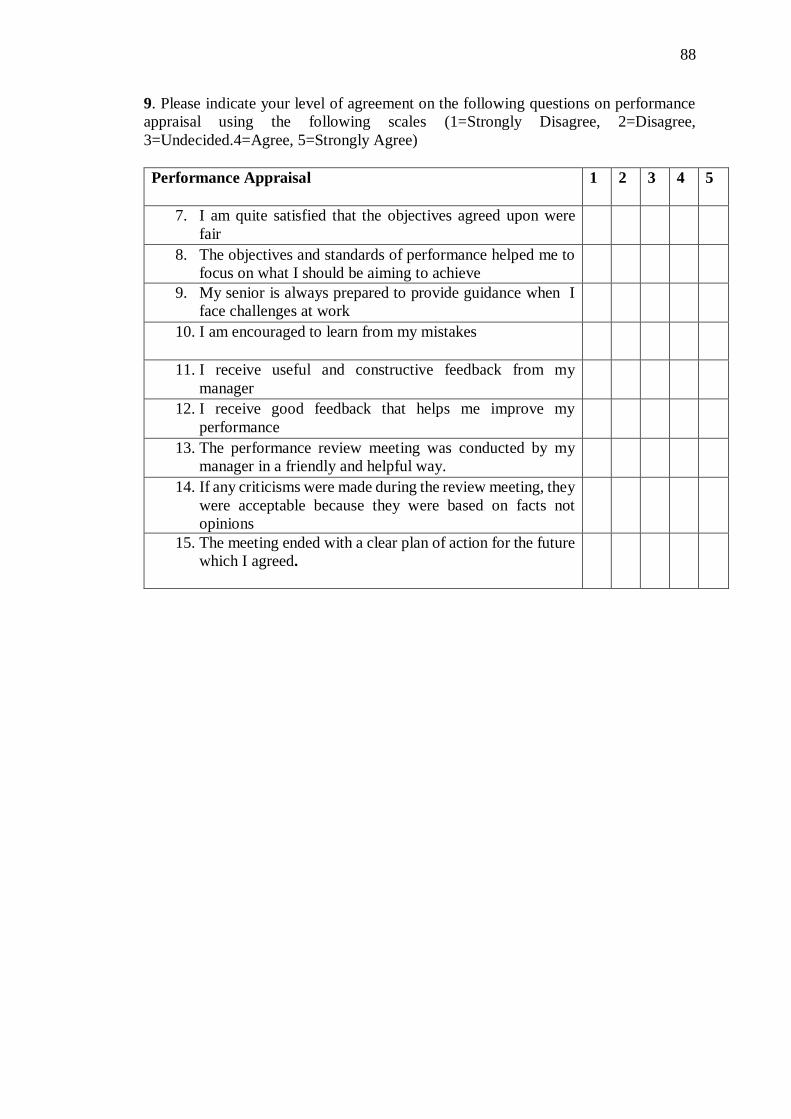
88
9. Please indicate your level of agreement on the following questions on performance
appraisal using the following scales (1=Strongly Disagree, 2=Disagree,
3=Undecided.4=Agree, 5=Strongly Agree)
Performance Appraisal 1 2 3 4 5
7. I am quite satisfied that the objectives agreed upon were
fair
8. The objectives and standards of performance helped me to
focus on what I should be aiming to achieve
9. My senior is always prepared to provide guidance when I
face challenges at work
10. I am encouraged to learn from my mistakes
11. I receive useful and constructive feedback from my
manager
12. I receive good feedback that helps me improve my
performance
13. The performance review meeting was conducted by my
manager in a friendly and helpful way.
14. If any criticisms were made during the review meeting, they
were acceptable because they were based on facts not
opinions
15. The meeting ended with a clear plan of action for the future
which I agreed.
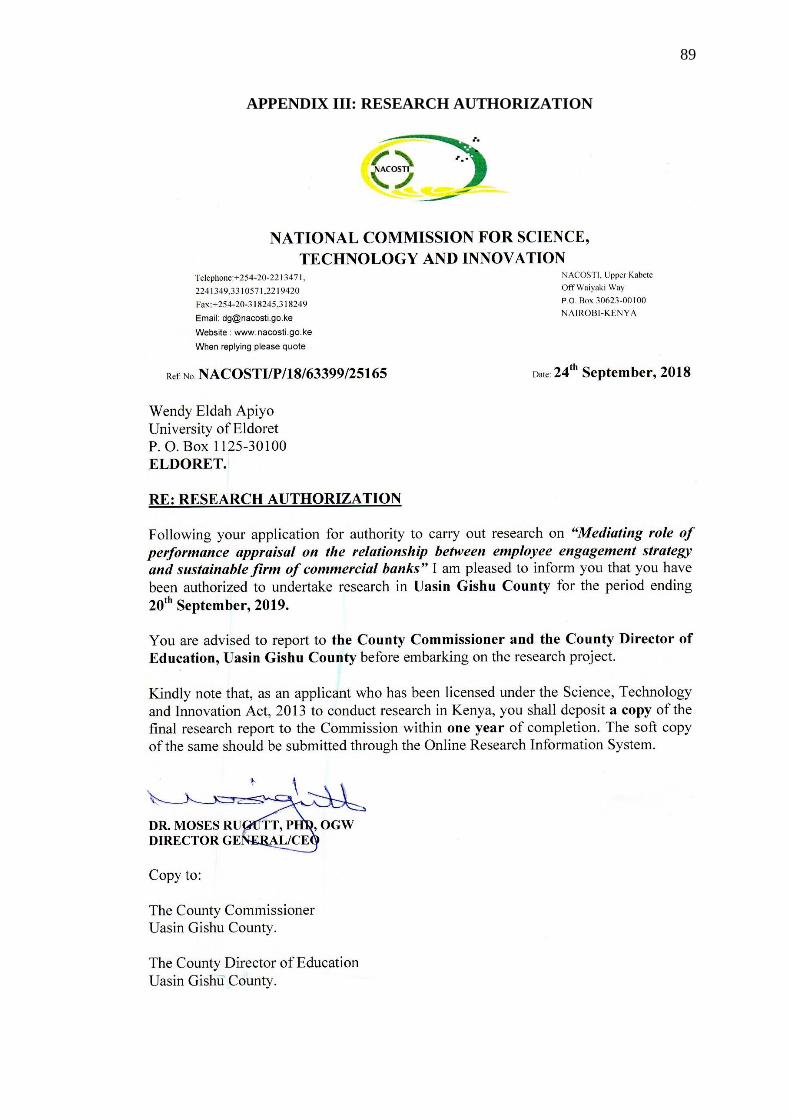
89
APPENDIX III: RESEARCH AUTHORIZATION
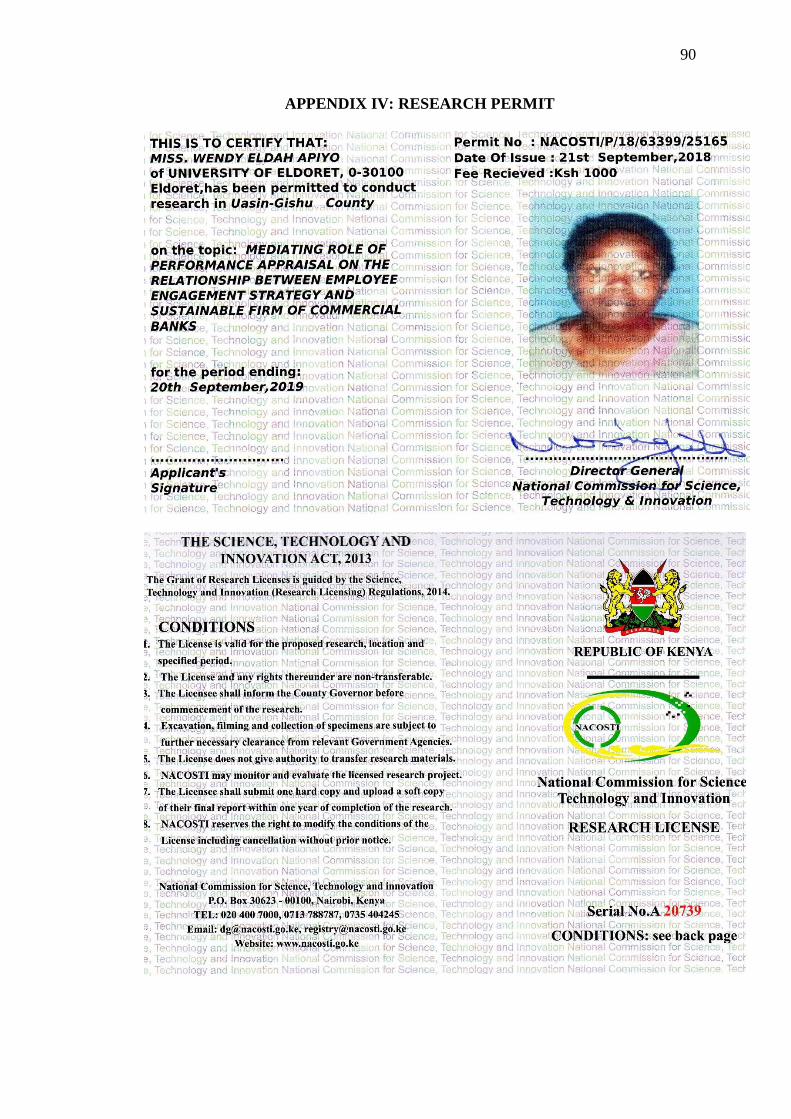
90
APPENDIX IV: RESEARCH PERMIT
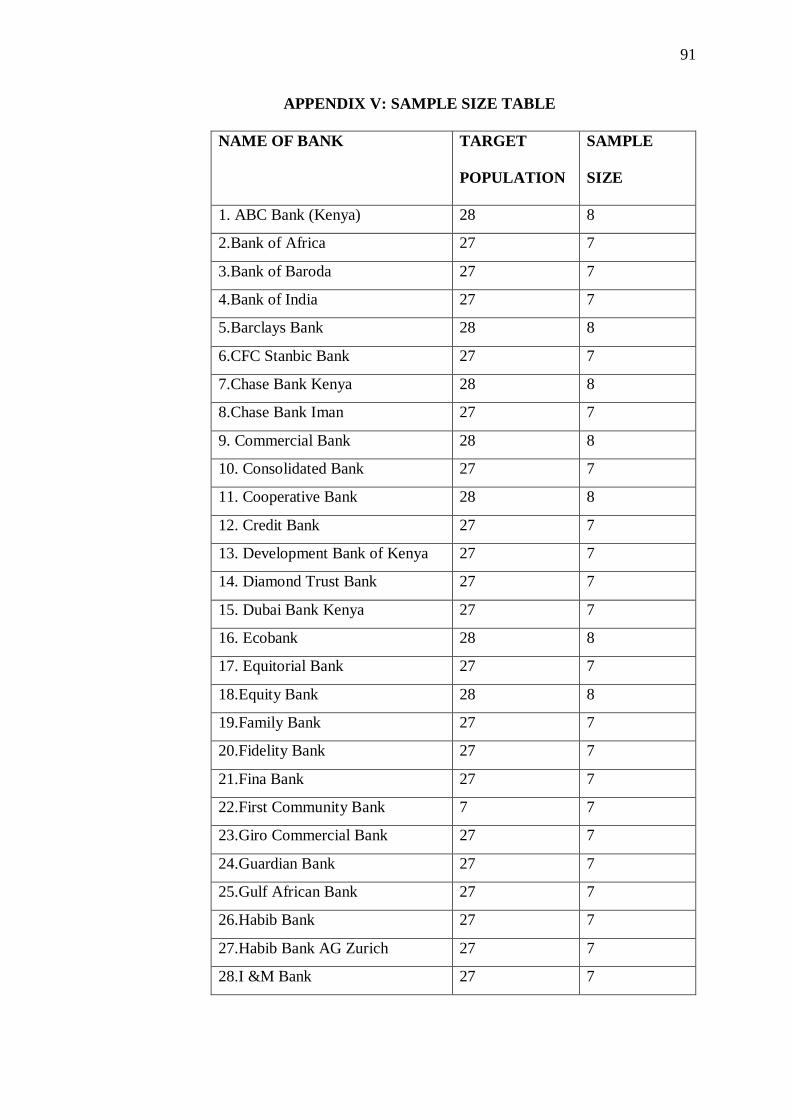
91
APPENDIX V: SAMPLE SIZE TABLE
NAME OF BANK TARGET
POPULATION
SAMPLE
SIZE
1. ABC Bank (Kenya) 28 8
2.Bank of Africa 27 7
3.Bank of Baroda 27 7
4.Bank of India 27 7
5.Barclays Bank 28 8
6.CFC Stanbic Bank 27 7
7.Chase Bank Kenya 28 8
8.Chase Bank Iman 27 7
9. Commercial Bank 28 8
10. Consolidated Bank 27 7
11. Cooperative Bank 28 8
12. Credit Bank 27 7
13. Development Bank of Kenya 27 7
14. Diamond Trust Bank 27 7
15. Dubai Bank Kenya 27 7
16. Ecobank 28 8
17. Equitorial Bank 27 7
18.Equity Bank 28 8
19.Family Bank 27 7
20.Fidelity Bank 27 7
21.Fina Bank 27 7
22.First Community Bank 7 7
23.Giro Commercial Bank 27 7
24.Guardian Bank 27 7
25.Gulf African Bank 27 7
26.Habib Bank 27 7
27.Habib Bank AG Zurich 27 7
28.I &M Bank 27 7
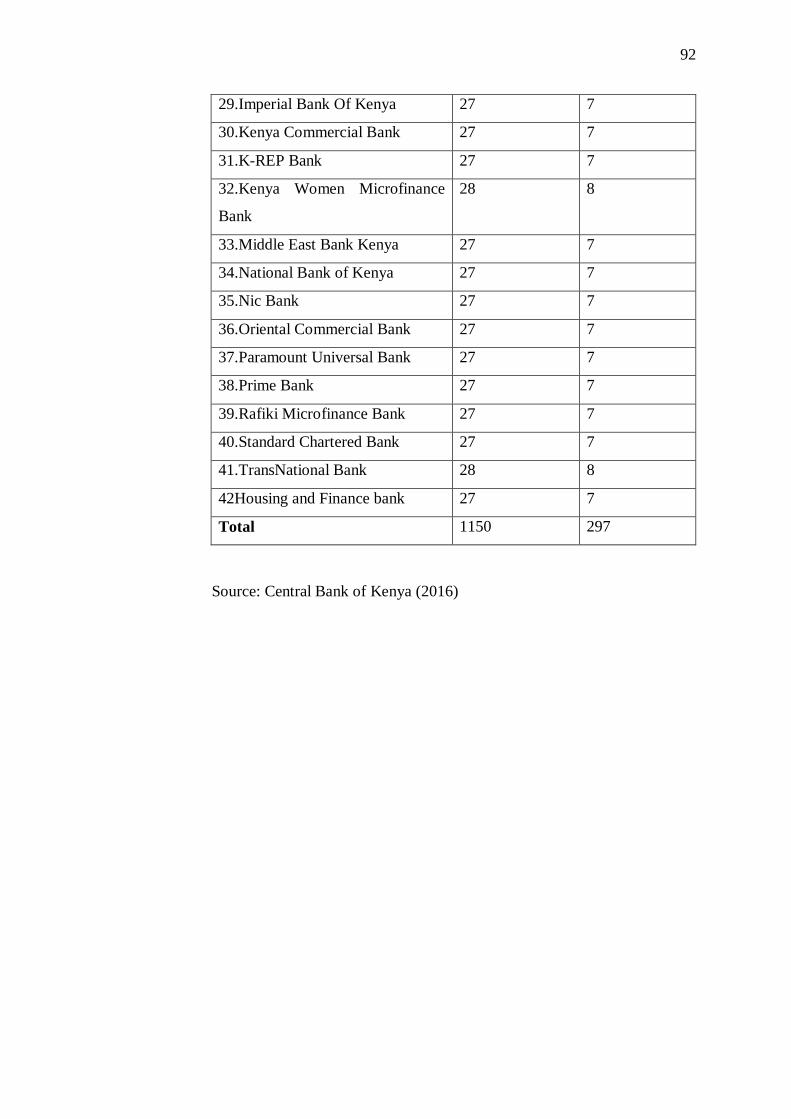
92
29.Imperial Bank Of Kenya 27 7
30.Kenya Commercial Bank 27 7
31.K-REP Bank 27 7
32.Kenya Women Microfinance
Bank
28 8
33.Middle East Bank Kenya 27 7
34.National Bank of Kenya 27 7
35.Nic Bank 27 7
36.Oriental Commercial Bank 27 7
37.Paramount Universal Bank 27 7
38.Prime Bank 27 7
39.Rafiki Microfinance Bank 27 7
40.Standard Chartered Bank 27 7
41.TransNational Bank 28 8
42Housing and Finance bank 27 7
Total 1150 297
Source: Central Bank of Kenya (2016)
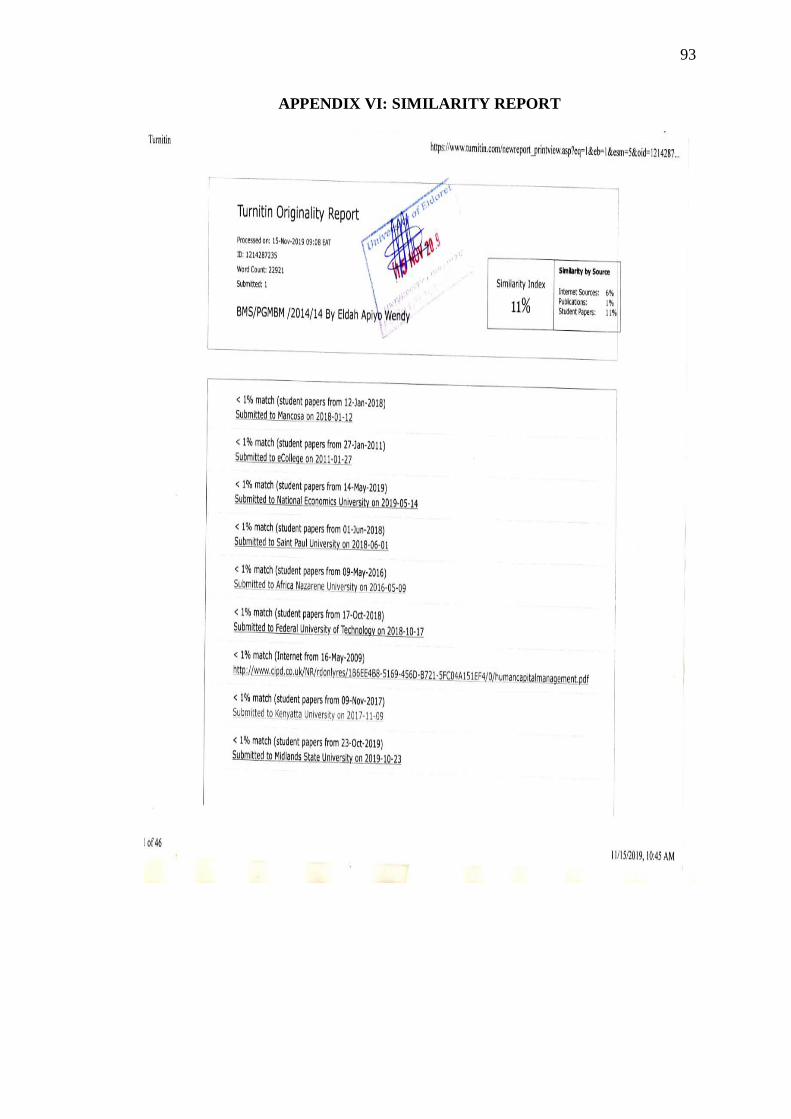
93
APPENDIX VI: SIMILARITY REPORT