Embed Size (px)
Citation preview
ISSN: 2308-7056 Kumari (2013)
116
Impact of Perceived Fairness of Performance Appraisal on
Employee Performance
NEERAJ KUMARI Assistant Professor (Department of Humanities & Management)
Faculty of Engineering & Technology Manav Rachna International University Faridabad, India.
Email: [email protected]
Abstract
The study aims at developing a strong impact of perceived fairness of performance appraisal on employee
performance. The study is based on descriptive research. Data was collected from the respondents through
a standardized questionnaire .Sample Unit consists of 80 employees from Vodafone and Tata Docomo.
Analysis of data is done through quantitative method that is numerical figure. Instrument used for data
analysis is SPSS. The analysis of responses was done by using correlation and regression analysis.
Correlation analysis says that there exists a relationship between perceived fairness of performance
appraisal and employee performance. In regression analysis, the nature of the relationship between the
dependent and the independent variables was analyzed and the result was that there exists a significant
impact of perceived fairness of performance appraisal on employee performance.
Key Words: Appraisal System, expected performance, role and targets, self review, self -serving bias, and
training & development needs.
Introduction
Globalization is being experienced by most of the organizations in India. The Opportunities and Challenges
of Leadership and Management are significantly different from that of the past and the last decade in
particular. There have been transformational management initiatives all over the world. Assessment and
development centers, HRD scorecard, human capital index and 360-degree feedback are some of the major
HR initiatives. To walk shoulder-to-shoulder with the fast pace of development it is important to adopt the
latest trends and techniques. The feedback forms include questions that are measured on a rating scale and
it also asks the respective raters to provide written comments for their colleagues. The person, who receives
the feedback, fills a self-rating survey. It includes the same questions that others receive in their respective
forms. The managers in the organization use the feedback process to get a better picture of their strengths
and weaknesses. The results are automatically tabulated in a proper format thus it helps in creating a
development plan. The responses that are received from individual and other people are combined in the
same category in order to preserve the anonymity and provide the employees an understanding of his or her
strengths and weaknesses. There is immense competition but opportunities are also high. Performance is
the key word hence the evaluation should be on the basis of performance. Thus, with so many challenges it
becomes important to have a fair evaluation system. With the focus on customers (both internal and
external) and emphasis on softer dimensions of performance (leadership, innovation, team work, initiative,
emotional intelligence, entrepreneurship, etc.) it has become necessary to get multiple assessments for a
more objective assessment. Almost every Fortune 500 company is using this in some form or the other. In
this system, the candidate is assessed periodically (once in a year and sometimes even half yearly) by a
number of assessors including his boss, immediate subordinates, colleagues, and internal and external
I
www.irbas.academyirmbr.com September 2013
International Review of Basic and Applied Sciences Vol. 1 Issue.4
R B A S
ISSN: 2308-7056 Kumari (2013)
117
customers. The assessment is made on a questionnaire specially designed to measure behavior considered
critical for performance. The appraisal is done anonymously and the assessment is collected by an external
agent (consultant) or specially designated internal agent (for example the HRD department). The
assessment is consolidated; feedback profiles are prepared and given to the participant after a workshop or
directly by his boss or the HRD department in a performance review discussion session. Due to the
innumerable variations possible in the 360 Degree Feedback and Appraisals, and its potency as a
competency identification and development tool, it is important to understand the process and its dynamics.
Literature Review
Coens and Jenkins (2000) suggest that performance appraisal is a mandated process in which, for a
specified period of time, all or a group of an employee's work behaviors or traits are individually rated,
judged, or described by a rater and the results are kept by the organization.
Karol (1996) considered performance appraisal to include a communication event scheduled between a
manager and an employee expressly for the purposes of evaluating that employee's past job performance
and discussing relevant areas for future job performance. He indicated that performance appraisal is an
exercise in social perception and cognition embedded in an organizational context requiring both formal
and implicit judgment.
Bernardin and Beatty (1984) suggested that relative measures of the attitudinal kind may ultimately prove
to be better measure and predictors of rating validity than such traditional psychometric variables as
leniency, halo, and discriminability. A performance appraisal system can be psychometrically sound in
design and construction but still wholly ineffective in practice due to resistance or lack of acceptance on the
part of users. Thus, the effectiveness of a system is particularly contingent on the attitudes of the system
users, both raters and rates.
Landy, Barnes, and Murphy (1978) studied employee perceptions of the fairness and accuracy of a
performance appraisal system. The researchers found that frequency of evaluation, identification of goals to
eliminate weaknesses, and supervisory knowledge of a subordinate’s level of performance and job duties
were significantly related to perceptions of fairness and accuracy of performance appraisal. The results
confirmed traditionally held perceptions that performance appraisal should be done as frequently as
possible, that the supervisor should work with the subordinate to agree on responsibilities; and, that the
supervisor should devote sufficient time to observe and evaluate and employee’s performance.
Greenberg (1986) studied 217 private sector middle managers and asked them on an open-ended
questionnaire what single factor made a recent performance evaluation fair or unfair. Factor analysis of the
results indicated that soliciting employee input, two-way performance interview communication, and the
ability to challenge or rebut the performance ratings account for a significant proportion of the variance in
perceived efficacy of the performance appraisal system.
Brockner (2002) reviewed studies on the effects of outcome favorability and procedural fairness on
people’s support for decisions, decision makers and the organizations. The interactions found indicated that
high procedural fairness reduces the effect of an outcome’s favorability or people’s support, relative to
when procedural fairness is low. He suggested that it is not the procedural fairness that interacts with the
outcome favorability but rather it is the degree of trust resulting from procedural fairness of others that
interacts with outcome favorability to influence employee support.
Roberts and Reed (1996) found evidence of a positive relationship between satisfaction and acceptance of
performance appraisal outcomes with employee perceptions that their supervisors encouraged participation,
assisted in goal setting and provided frequent feedback.
I
www.irbas.academyirmbr.com September 2013
International Review of Basic and Applied Sciences Vol. 1 Issue.4
R B A S
ISSN: 2308-7056 Kumari (2013)
118
Cobb and Frey (1996) studied the effects of procedurally fair leadership and payment outcomes on
subordinate reactions to the supervisor. Subordinate’s reactions were measured for perceptions of
supervisory fairness (both procedural and distributive) and the subordinate’s relationships with the
supervisor. The results indicated that procedurally fair leadership was linked to subordinate perceptions of
leader fairness and on their relationships with the leaders. Subordinates discerned differences in leadership
behaviors that enact procedural fairness. These behaviors affected subordinate assessment of supervisor
fairness and relationships with the supervisor. The researchers found some evidence that unfair behavior
can have negative effects on favorable outcomes. When leaders act unfairly their decisions are seen as
unfair even when subordinates benefit from them.
Research Methodology
Research Objectives:
To study the impact of perceived fairness of Performance Appraisal on employee performance.
Major Hypothesis (s):
H1- Performance Appraisal satisfaction has a significant impact on employee’s performance in Telecom
Sector.
H0- Performance Appraisal satisfaction does not have a significant impact on impact on employee’s
performance in Telecom Sector.
Research Design:
Descriptive research design was used.
Questionnaire development:
Standardized Questionnaire was designed based on the research objectives, through this questionnaire data
was collected from the respondents.
Sampling Design:
Sample size: 80
Sample Unit: Employees of Vodafone and Tata Docomo working in M.P
Sampling Technique: Convenience Sampling
Data Analysis Technique: Analysis of data is done through quantitative method that is numerical figure.
Data Analysis Instrument: Instrument used for data analysis is SPSS
Data Analysis and Interpretations
Correlation Analysis
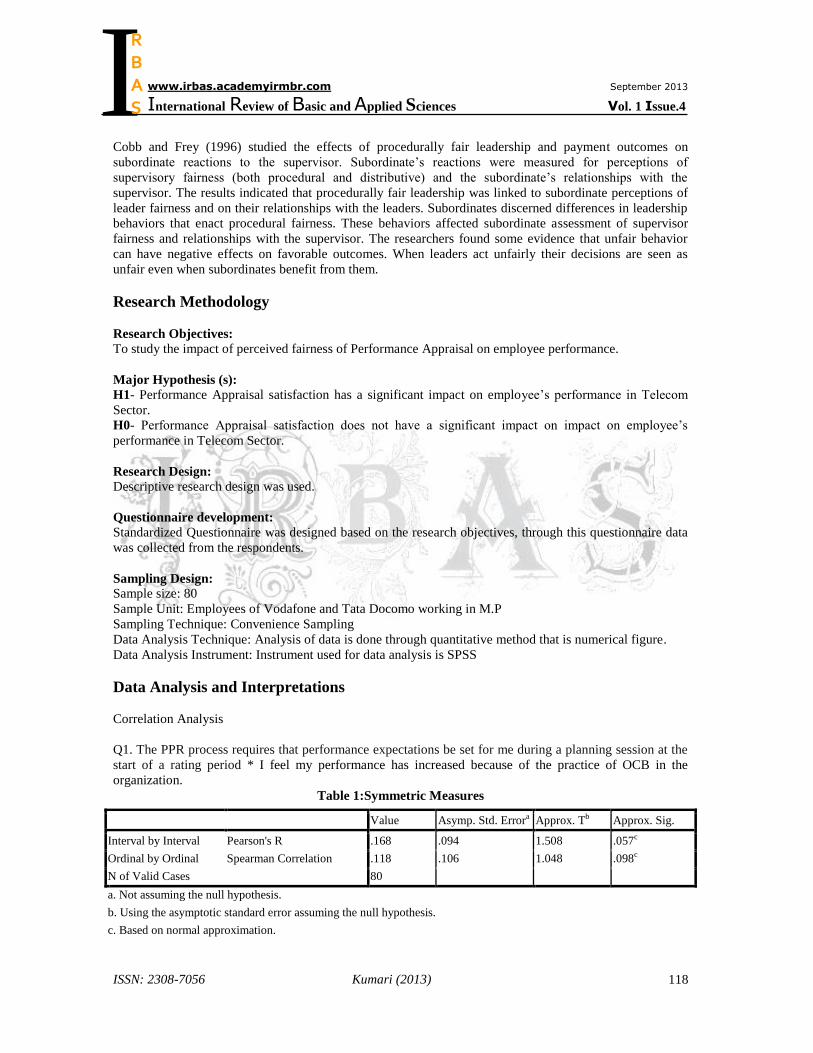
Q1. The PPR process requires that performance expectations be set for me during a planning session at the
start of a rating period * I feel my performance has increased because of the practice of OCB in the
organization.
Table 1:Symmetric Measures
Value Asymp. Std. Errora Approx. Tb Approx. Sig.
Interval by Interval Pearson's R .168 .094 1.508 .057c
Ordinal by Ordinal Spearman Correlation .118 .106 1.048 .098c
N of Valid Cases 80
a. Not assuming the null hypothesis.
b. Using the asymptotic standard error assuming the null hypothesis.
c. Based on normal approximation.
I
www.irbas.academyirmbr.com September 2013
International Review of Basic and Applied Sciences Vol. 1 Issue.4
R B A S
ISSN: 2308-7056 Kumari (2013)
119
Interpretation
From the above (The PPR process requires that performance expectations be set for me during a planning
session at the start of a rating period * I feel my performance has increased because of the practice of OCB
in the organization) it is seen that the significant value is .057 which is lesser than 0.1.Thus, the null
hypothesis is negative and there exist a positive relation between the two variables.
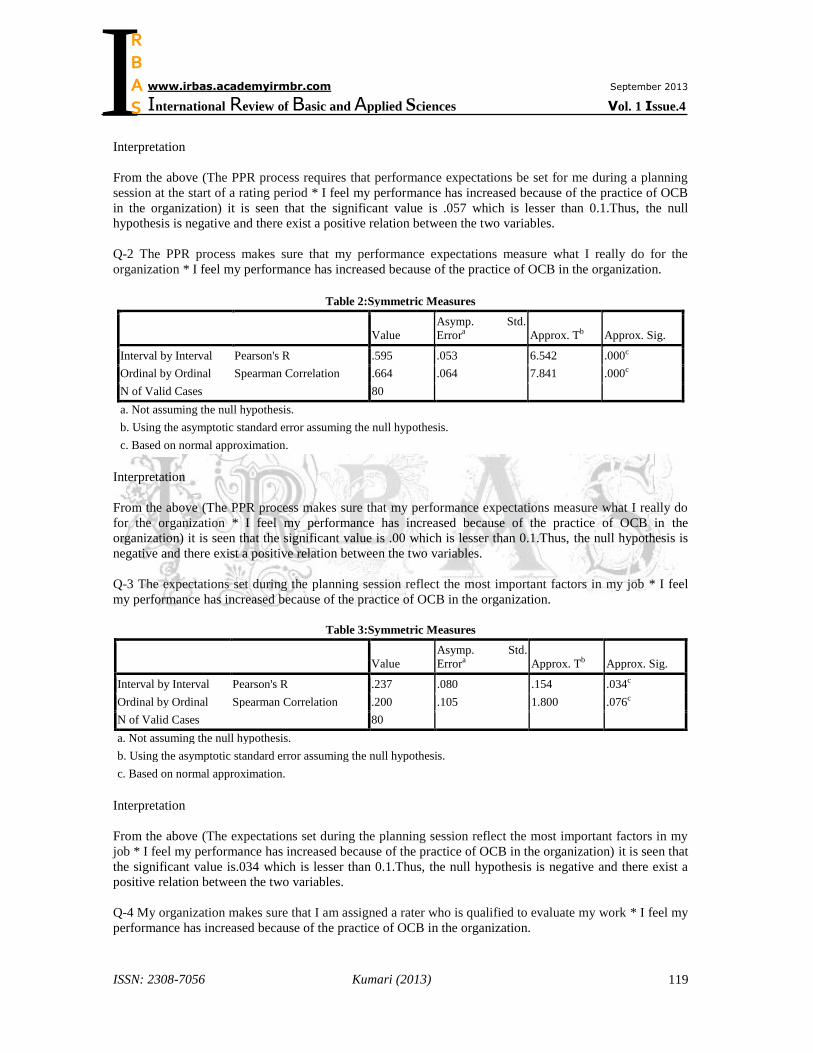
Q-2 The PPR process makes sure that my performance expectations measure what I really do for the
organization * I feel my performance has increased because of the practice of OCB in the organization.
Table 2:Symmetric Measures
Value
Asymp. Std.
Errora Approx. Tb Approx. Sig.
Interval by Interval Pearson's R .595 .053 6.542 .000c
Ordinal by Ordinal Spearman Correlation .664 .064 7.841 .000c
N of Valid Cases 80
a. Not assuming the null hypothesis.
b. Using the asymptotic standard error assuming the null hypothesis.
c. Based on normal approximation.
Interpretation
From the above (The PPR process makes sure that my performance expectations measure what I really do
for the organization * I feel my performance has increased because of the practice of OCB in the
organization) it is seen that the significant value is .00 which is lesser than 0.1.Thus, the null hypothesis is
negative and there exist a positive relation between the two variables.
Q-3 The expectations set during the planning session reflect the most important factors in my job * I feel
my performance has increased because of the practice of OCB in the organization.
Table 3:Symmetric Measures
Value
Asymp. Std.
Errora Approx. Tb Approx. Sig.
Interval by Interval Pearson's R .237 .080 .154 .034c
Ordinal by Ordinal Spearman Correlation .200 .105 1.800 .076c
N of Valid Cases 80
a. Not assuming the null hypothesis.
b. Using the asymptotic standard error assuming the null hypothesis.
c. Based on normal approximation.
Interpretation
From the above (The expectations set during the planning session reflect the most important factors in my
job * I feel my performance has increased because of the practice of OCB in the organization) it is seen that
the significant value is.034 which is lesser than 0.1.Thus, the null hypothesis is negative and there exist a
positive relation between the two variables.
Q-4 My organization makes sure that I am assigned a rater who is qualified to evaluate my work * I feel my
performance has increased because of the practice of OCB in the organization.
I
www.irbas.academyirmbr.com September 2013
International Review of Basic and Applied Sciences Vol. 1 Issue.4
R B A S
ISSN: 2308-7056 Kumari (2013)
120
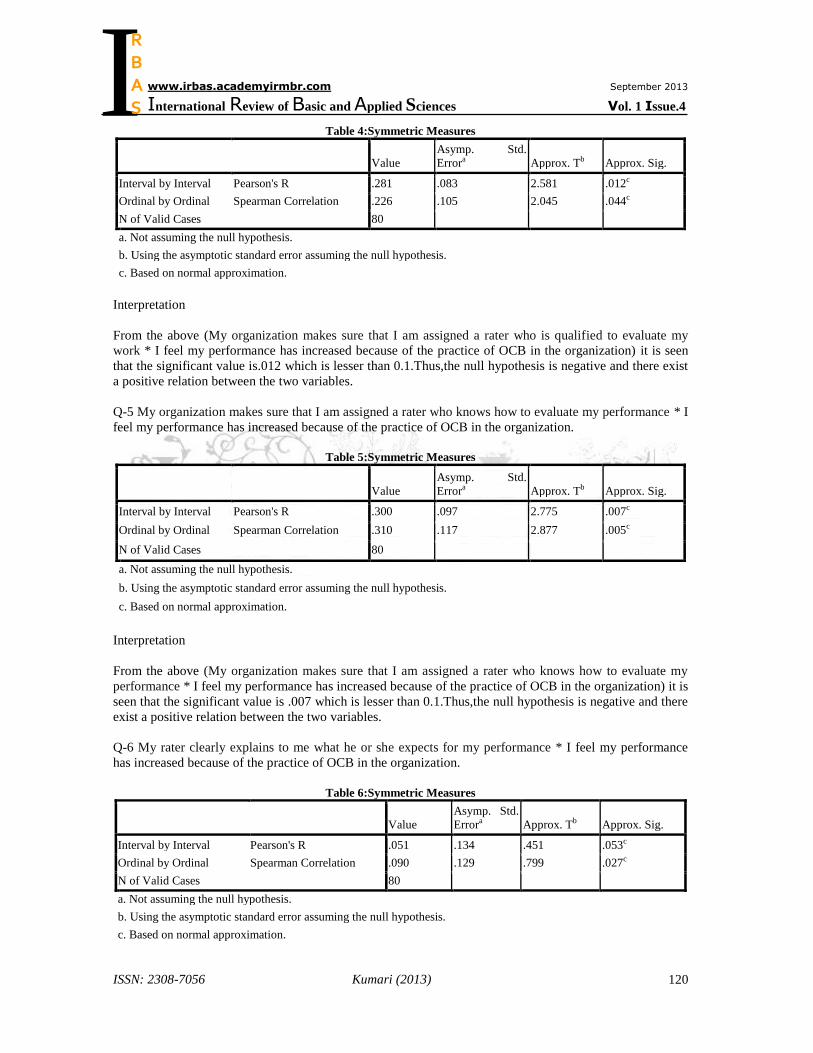
Table 4:Symmetric Measures
Value
Asymp. Std.
Errora Approx. Tb Approx. Sig.
Interval by Interval Pearson's R .281 .083 2.581 .012c
Ordinal by Ordinal Spearman Correlation .226 .105 2.045 .044c
N of Valid Cases 80
a. Not assuming the null hypothesis.
b. Using the asymptotic standard error assuming the null hypothesis.
c. Based on normal approximation.
Interpretation
From the above (My organization makes sure that I am assigned a rater who is qualified to evaluate my
work * I feel my performance has increased because of the practice of OCB in the organization) it is seen
that the significant value is.012 which is lesser than 0.1.Thus,the null hypothesis is negative and there exist
a positive relation between the two variables.
Q-5 My organization makes sure that I am assigned a rater who knows how to evaluate my performance * I
feel my performance has increased because of the practice of OCB in the organization.
Table 5:Symmetric Measures
Value
Asymp. Std.
Errora Approx. Tb Approx. Sig.
Interval by Interval Pearson's R .300 .097 2.775 .007c
Ordinal by Ordinal Spearman Correlation .310 .117 2.877 .005c
N of Valid Cases 80
a. Not assuming the null hypothesis.
b. Using the asymptotic standard error assuming the null hypothesis.
c. Based on normal approximation.
Interpretation
From the above (My organization makes sure that I am assigned a rater who knows how to evaluate my
performance * I feel my performance has increased because of the practice of OCB in the organization) it is
seen that the significant value is .007 which is lesser than 0.1.Thus,the null hypothesis is negative and there
exist a positive relation between the two variables.
Q-6 My rater clearly explains to me what he or she expects for my performance * I feel my performance
has increased because of the practice of OCB in the organization.
Table 6:Symmetric Measures
Value
Asymp. Std.
Errora Approx. Tb Approx. Sig.
Interval by Interval Pearson's R .051 .134 .451 .053c
Ordinal by Ordinal Spearman Correlation .090 .129 .799 .027c
N of Valid Cases 80
a. Not assuming the null hypothesis.
b. Using the asymptotic standard error assuming the null hypothesis.
c. Based on normal approximation.
I
www.irbas.academyirmbr.com September 2013
International Review of Basic and Applied Sciences Vol. 1 Issue.4
R B A S
ISSN: 2308-7056 Kumari (2013)
121
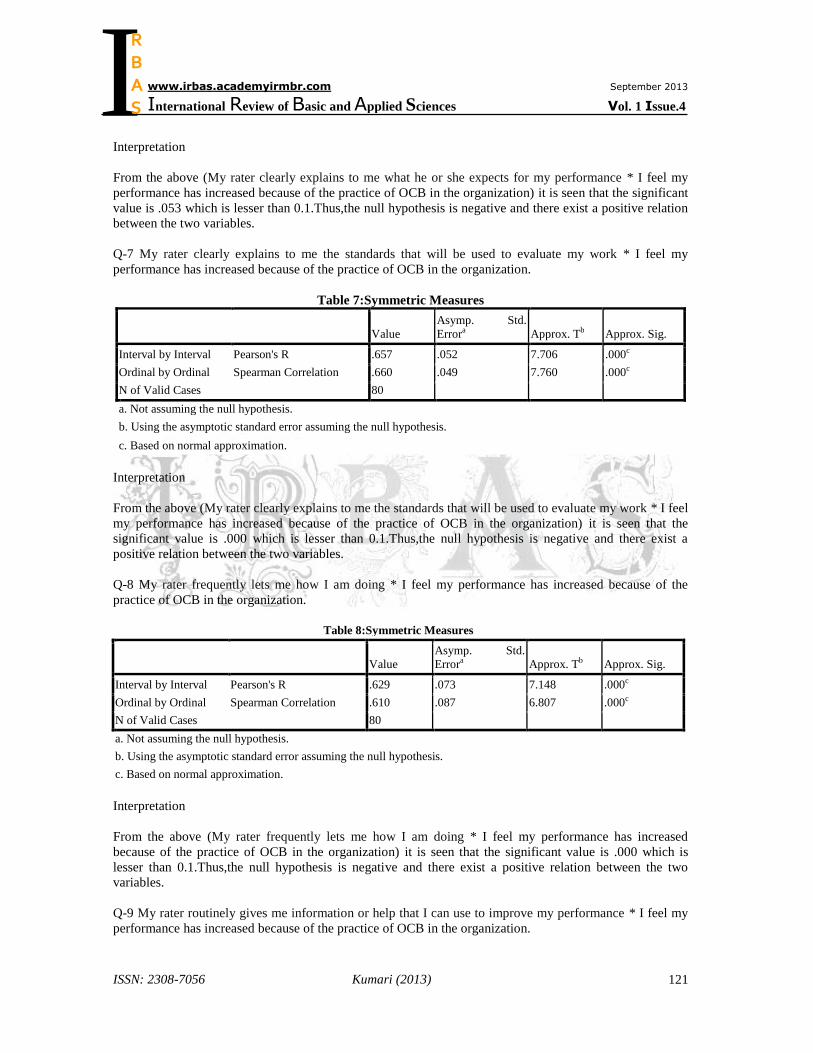
Interpretation
From the above (My rater clearly explains to me what he or she expects for my performance * I feel my
performance has increased because of the practice of OCB in the organization) it is seen that the significant
value is .053 which is lesser than 0.1.Thus,the null hypothesis is negative and there exist a positive relation
between the two variables.
Q-7 My rater clearly explains to me the standards that will be used to evaluate my work * I feel my
performance has increased because of the practice of OCB in the organization.
Table 7:Symmetric Measures
Value
Asymp. Std.
Errora Approx. Tb Approx. Sig.
Interval by Interval Pearson's R .657 .052 7.706 .000c
Ordinal by Ordinal Spearman Correlation .660 .049 7.760 .000c
N of Valid Cases 80
a. Not assuming the null hypothesis.
b. Using the asymptotic standard error assuming the null hypothesis.
c. Based on normal approximation.
Interpretation
From the above (My rater clearly explains to me the standards that will be used to evaluate my work * I feel
my performance has increased because of the practice of OCB in the organization) it is seen that the
significant value is .000 which is lesser than 0.1.Thus,the null hypothesis is negative and there exist a
positive relation between the two variables.
Q-8 My rater frequently lets me how I am doing * I feel my performance has increased because of the
practice of OCB in the organization.
Table 8:Symmetric Measures
Value
Asymp. Std.
Errora Approx. Tb Approx. Sig.
Interval by Interval Pearson's R .629 .073 7.148 .000c
Ordinal by Ordinal Spearman Correlation .610 .087 6.807 .000c
N of Valid Cases 80
a. Not assuming the null hypothesis.
b. Using the asymptotic standard error assuming the null hypothesis.
c. Based on normal approximation.
Interpretation
From the above (My rater frequently lets me how I am doing * I feel my performance has increased
because of the practice of OCB in the organization) it is seen that the significant value is .000 which is
lesser than 0.1.Thus,the null hypothesis is negative and there exist a positive relation between the two
variables.
Q-9 My rater routinely gives me information or help that I can use to improve my performance * I feel my
performance has increased because of the practice of OCB in the organization.
I
www.irbas.academyirmbr.com September 2013
International Review of Basic and Applied Sciences Vol. 1 Issue.4
R B A S
ISSN: 2308-7056 Kumari (2013)
122
Table 9:Symmetric Measures
Value
Asymp. Std.
Errora Approx. Tb Approx. Sig.
Interval by Interval Pearson's R .219 .087 1.983 .051c
Ordinal by Ordinal Spearman Correlation .219 .096 1.983 .051c
N of Valid Cases 80
a. Not assuming the null hypothesis.
b. Using the asymptotic standard error assuming the null hypothesis.
c. Based on normal approximation.
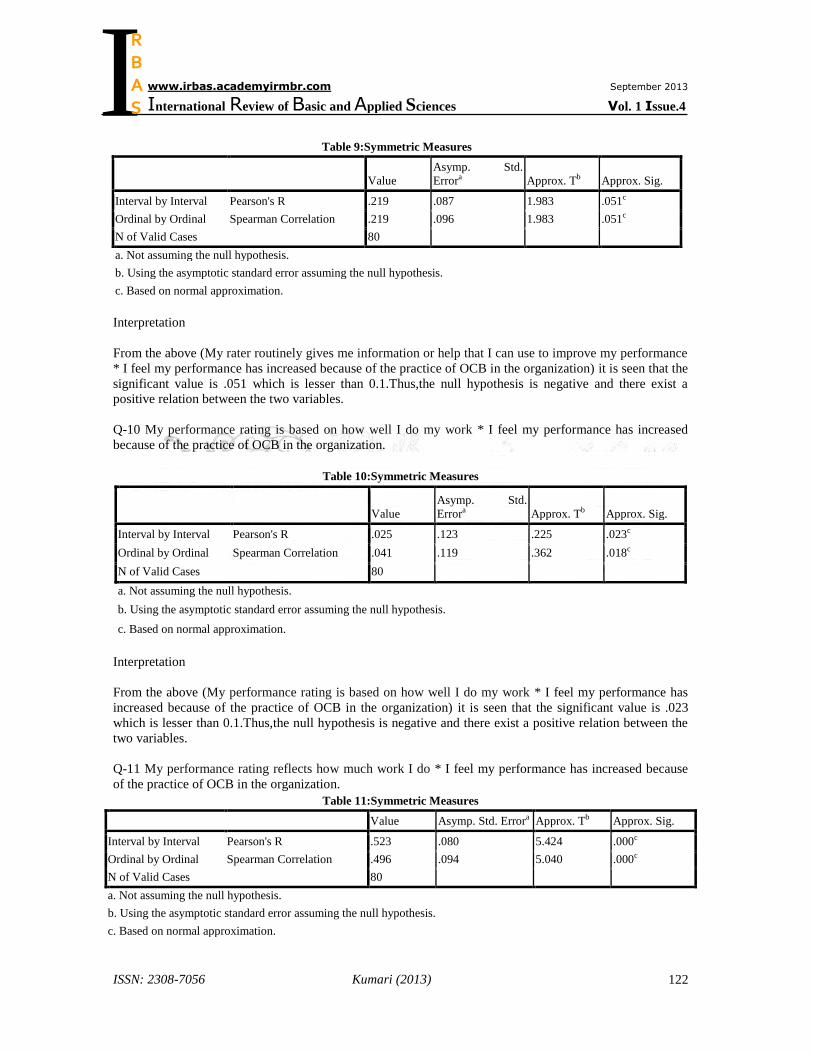
Interpretation
From the above (My rater routinely gives me information or help that I can use to improve my performance
* I feel my performance has increased because of the practice of OCB in the organization) it is seen that the
significant value is .051 which is lesser than 0.1.Thus,the null hypothesis is negative and there exist a
positive relation between the two variables.
Q-10 My performance rating is based on how well I do my work * I feel my performance has increased
because of the practice of OCB in the organization.
Table 10:Symmetric Measures
Value
Asymp. Std.
Errora Approx. Tb Approx. Sig.
Interval by Interval Pearson's R .025 .123 .225 .023c
Ordinal by Ordinal Spearman Correlation .041 .119 .362 .018c
N of Valid Cases 80
a. Not assuming the null hypothesis.
b. Using the asymptotic standard error assuming the null hypothesis.
c. Based on normal approximation.
Interpretation
From the above (My performance rating is based on how well I do my work * I feel my performance has
increased because of the practice of OCB in the organization) it is seen that the significant value is .023
which is lesser than 0.1.Thus,the null hypothesis is negative and there exist a positive relation between the
two variables.
Q-11 My performance rating reflects how much work I do * I feel my performance has increased because
of the practice of OCB in the organization.
Table 11:Symmetric Measures
Value Asymp. Std. Errora Approx. Tb Approx. Sig.
Interval by Interval Pearson's R .523 .080 5.424 .000c
Ordinal by Ordinal Spearman Correlation .496 .094 5.040 .000c
N of Valid Cases 80
a. Not assuming the null hypothesis.
b. Using the asymptotic standard error assuming the null hypothesis.
c. Based on normal approximation.
I
www.irbas.academyirmbr.com September 2013
International Review of Basic and Applied Sciences Vol. 1 Issue.4
R B A S
ISSN: 2308-7056 Kumari (2013)
123
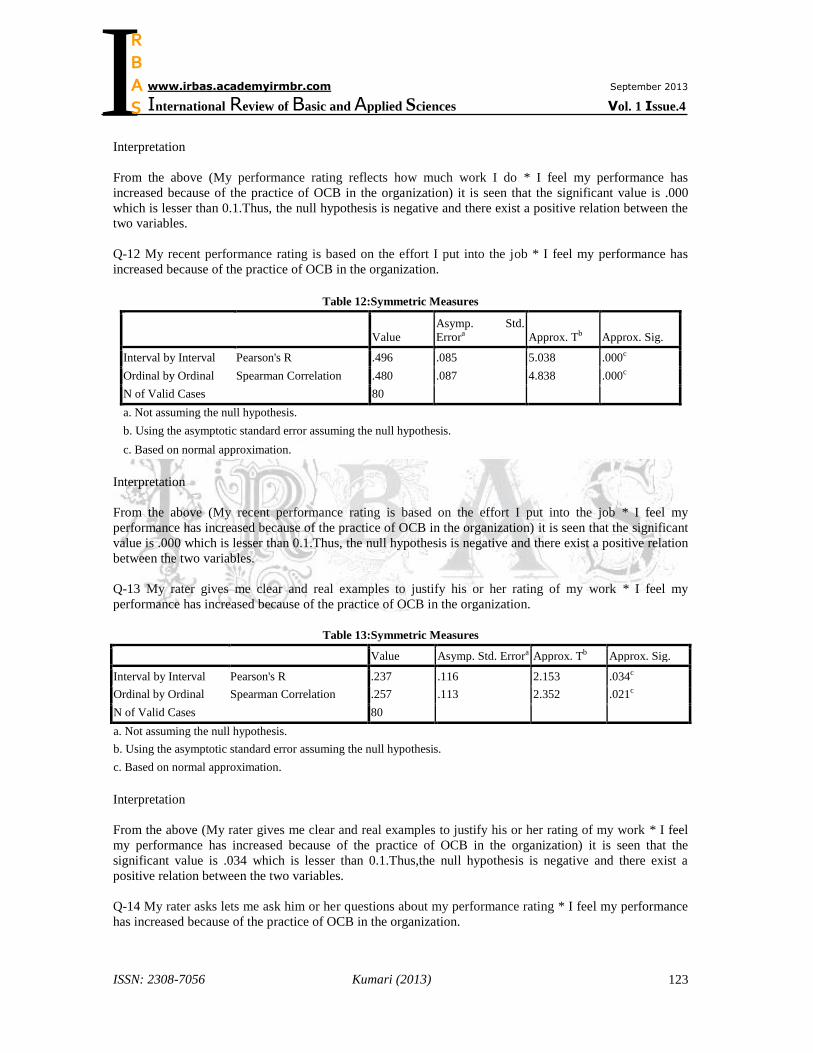
Interpretation
From the above (My performance rating reflects how much work I do * I feel my performance has
increased because of the practice of OCB in the organization) it is seen that the significant value is .000
which is lesser than 0.1.Thus, the null hypothesis is negative and there exist a positive relation between the
two variables.
Q-12 My recent performance rating is based on the effort I put into the job * I feel my performance has
increased because of the practice of OCB in the organization.
Table 12:Symmetric Measures
Value
Asymp. Std.
Errora Approx. Tb Approx. Sig.
Interval by Interval Pearson's R .496 .085 5.038 .000c
Ordinal by Ordinal Spearman Correlation .480 .087 4.838 .000c
N of Valid Cases 80
a. Not assuming the null hypothesis.
b. Using the asymptotic standard error assuming the null hypothesis.
c. Based on normal approximation.
Interpretation
From the above (My recent performance rating is based on the effort I put into the job * I feel my
performance has increased because of the practice of OCB in the organization) it is seen that the significant
value is .000 which is lesser than 0.1.Thus, the null hypothesis is negative and there exist a positive relation
between the two variables.
Q-13 My rater gives me clear and real examples to justify his or her rating of my work * I feel my
performance has increased because of the practice of OCB in the organization.
Table 13:Symmetric Measures
Value Asymp. Std. Errora Approx. Tb Approx. Sig.
Interval by Interval Pearson's R .237 .116 2.153 .034c
Ordinal by Ordinal Spearman Correlation .257 .113 2.352 .021c
N of Valid Cases 80
a. Not assuming the null hypothesis.
b. Using the asymptotic standard error assuming the null hypothesis.
c. Based on normal approximation.
Interpretation
From the above (My rater gives me clear and real examples to justify his or her rating of my work * I feel
my performance has increased because of the practice of OCB in the organization) it is seen that the
significant value is .034 which is lesser than 0.1.Thus,the null hypothesis is negative and there exist a
positive relation between the two variables.
Q-14 My rater asks lets me ask him or her questions about my performance rating * I feel my performance
has increased because of the practice of OCB in the organization.
I
www.irbas.academyirmbr.com September 2013
International Review of Basic and Applied Sciences Vol. 1 Issue.4
R B A S
ISSN: 2308-7056 Kumari (2013)
124
Table 14:Symmetric Measures
Value
Asymp. Std.
Errora Approx. Tb Approx. Sig.
Interval by Interval Pearson's R .262 .108 2.398 .019c
Ordinal by Ordinal Spearman Correlation .195 .120 1.753 .084c
N of Valid Cases 80
a. Not assuming the null hypothesis.
b. Using the asymptotic standard error assuming the null hypothesis.
c. Based on normal approximation.
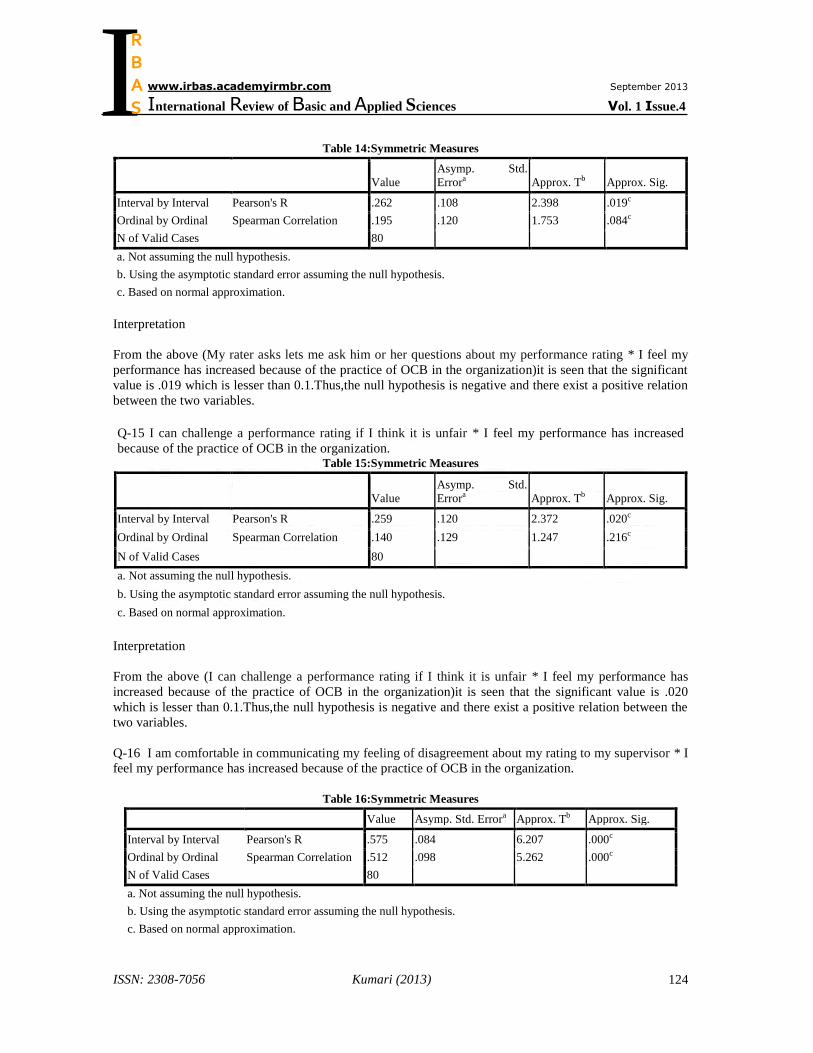
Interpretation
From the above (My rater asks lets me ask him or her questions about my performance rating * I feel my
performance has increased because of the practice of OCB in the organization)it is seen that the significant
value is .019 which is lesser than 0.1.Thus,the null hypothesis is negative and there exist a positive relation
between the two variables.
Q-15 I can challenge a performance rating if I think it is unfair * I feel my performance has increased
because of the practice of OCB in the organization. Table 15:Symmetric Measures
Value
Asymp. Std.
Errora Approx. Tb Approx. Sig.
Interval by Interval Pearson's R .259 .120 2.372 .020c
Ordinal by Ordinal Spearman Correlation .140 .129 1.247 .216c
N of Valid Cases 80
a. Not assuming the null hypothesis.
b. Using the asymptotic standard error assuming the null hypothesis.
c. Based on normal approximation.
Interpretation
From the above (I can challenge a performance rating if I think it is unfair * I feel my performance has
increased because of the practice of OCB in the organization)it is seen that the significant value is .020
which is lesser than 0.1.Thus,the null hypothesis is negative and there exist a positive relation between the
two variables.
Q-16 I am comfortable in communicating my feeling of disagreement about my rating to my supervisor * I
feel my performance has increased because of the practice of OCB in the organization.
Table 16:Symmetric Measures
Value Asymp. Std. Errora Approx. Tb Approx. Sig.
Interval by Interval Pearson's R .575 .084 6.207 .000c
Ordinal by Ordinal Spearman Correlation .512 .098 5.262 .000c
N of Valid Cases 80
a. Not assuming the null hypothesis.
b. Using the asymptotic standard error assuming the null hypothesis.
c. Based on normal approximation.
I
www.irbas.academyirmbr.com September 2013
International Review of Basic and Applied Sciences Vol. 1 Issue.4
R B A S
ISSN: 2308-7056 Kumari (2013)
125
Interpretation
From the above ( I am comfortable in communicating my feeling of disagreement about my rating to my
supervisor * I feel my performance has increased because of the practice of OCB in the organization)it is
seen that the significant value is .000 which is lesser than 0.1.Thus,the null hypothesis is negative and there
exist a positive relation between the two variables.
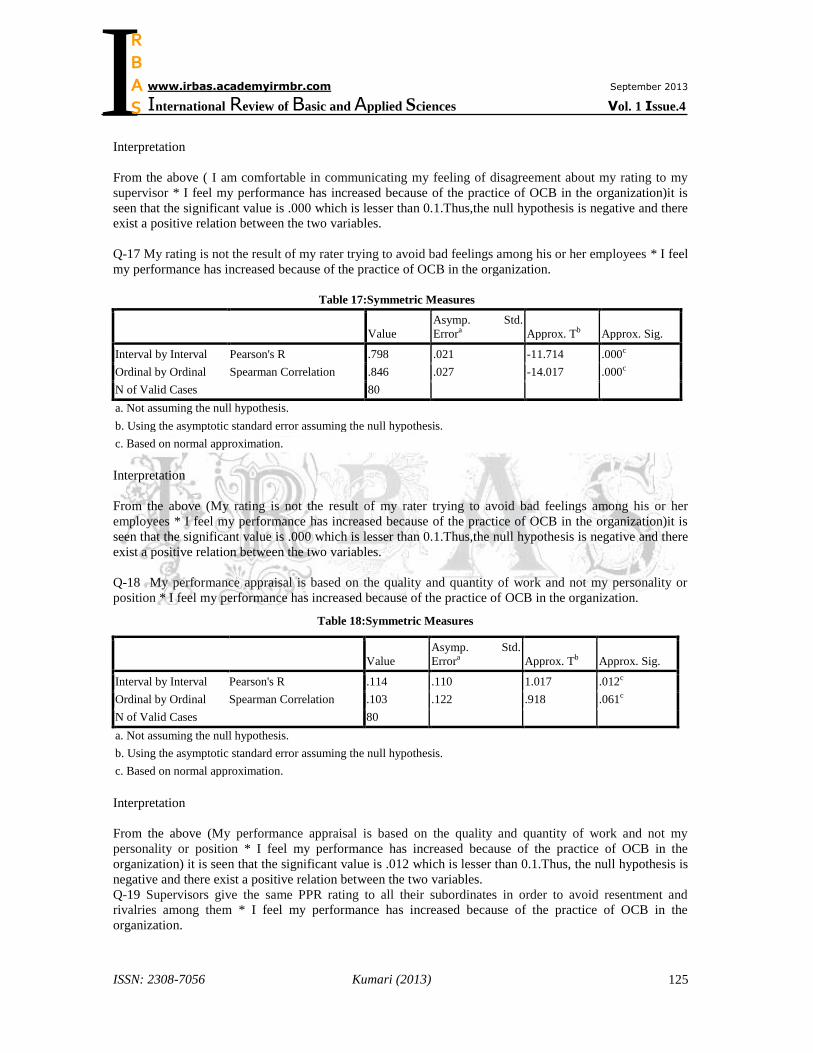
Q-17 My rating is not the result of my rater trying to avoid bad feelings among his or her employees * I feel
my performance has increased because of the practice of OCB in the organization.
Table 17:Symmetric Measures
Value
Asymp. Std.
Errora Approx. Tb Approx. Sig.
Interval by Interval Pearson's R .798 .021 -11.714 .000c
Ordinal by Ordinal Spearman Correlation .846 .027 -14.017 .000c
N of Valid Cases 80
a. Not assuming the null hypothesis.
b. Using the asymptotic standard error assuming the null hypothesis.
c. Based on normal approximation.
Interpretation
From the above (My rating is not the result of my rater trying to avoid bad feelings among his or her
employees * I feel my performance has increased because of the practice of OCB in the organization)it is
seen that the significant value is .000 which is lesser than 0.1.Thus,the null hypothesis is negative and there
exist a positive relation between the two variables.
Q-18 My performance appraisal is based on the quality and quantity of work and not my personality or
position * I feel my performance has increased because of the practice of OCB in the organization.
Table 18:Symmetric Measures
Value
Asymp. Std.
Errora Approx. Tb Approx. Sig.
Interval by Interval Pearson's R .114 .110 1.017 .012c
Ordinal by Ordinal Spearman Correlation .103 .122 .918 .061c
N of Valid Cases 80
a. Not assuming the null hypothesis.
b. Using the asymptotic standard error assuming the null hypothesis.
c. Based on normal approximation.
Interpretation
From the above (My performance appraisal is based on the quality and quantity of work and not my
personality or position * I feel my performance has increased because of the practice of OCB in the
organization) it is seen that the significant value is .012 which is lesser than 0.1.Thus, the null hypothesis is
negative and there exist a positive relation between the two variables.
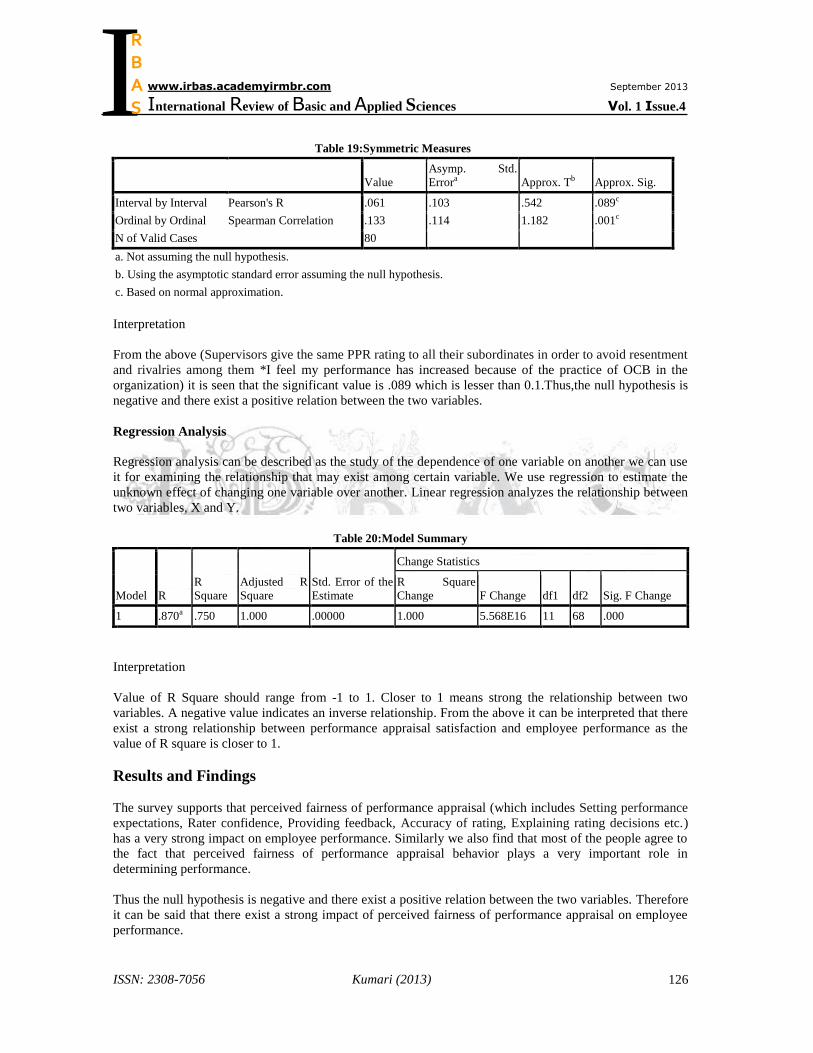
Q-19 Supervisors give the same PPR rating to all their subordinates in order to avoid resentment and
rivalries among them * I feel my performance has increased because of the practice of OCB in the
organization.
I
www.irbas.academyirmbr.com September 2013
International Review of Basic and Applied Sciences Vol. 1 Issue.4
R B A S
ISSN: 2308-7056 Kumari (2013)
126
Table 19:Symmetric Measures
Value
Asymp. Std.
Errora Approx. Tb Approx. Sig.
Interval by Interval Pearson's R .061 .103 .542 .089c
Ordinal by Ordinal Spearman Correlation .133 .114 1.182 .001c
N of Valid Cases 80
a. Not assuming the null hypothesis.
b. Using the asymptotic standard error assuming the null hypothesis.
c. Based on normal approximation.
Interpretation
From the above (Supervisors give the same PPR rating to all their subordinates in order to avoid resentment
and rivalries among them *I feel my performance has increased because of the practice of OCB in the
organization) it is seen that the significant value is .089 which is lesser than 0.1.Thus,the null hypothesis is
negative and there exist a positive relation between the two variables.
Regression Analysis
Regression analysis can be described as the study of the dependence of one variable on another we can use
it for examining the relationship that may exist among certain variable. We use regression to estimate the
unknown effect of changing one variable over another. Linear regression analyzes the relationship between
two variables, X and Y.
Interpretation
Value of R Square should range from -1 to 1. Closer to 1 means strong the relationship between two
variables. A negative value indicates an inverse relationship. From the above it can be interpreted that there
exist a strong relationship between performance appraisal satisfaction and employee performance as the
value of R square is closer to 1.
Results and Findings
The survey supports that perceived fairness of performance appraisal (which includes Setting performance
expectations, Rater confidence, Providing feedback, Accuracy of rating, Explaining rating decisions etc.)
has a very strong impact on employee performance. Similarly we also find that most of the people agree to
the fact that perceived fairness of performance appraisal behavior plays a very important role in
determining performance.
Thus the null hypothesis is negative and there exist a positive relation between the two variables. Therefore
it can be said that there exist a strong impact of perceived fairness of performance appraisal on employee
performance.
Table 20:Model Summary
Model R
R
Square
Adjusted R
Square
Std. Error of the
Estimate
Change Statistics
R Square
Change F Change df1 df2 Sig. F Change
1 .870a .750 1.000 .00000 1.000 5.568E16 11 68 .000
I
www.irbas.academyirmbr.com September 2013
International Review of Basic and Applied Sciences Vol. 1 Issue.4
R B A S
ISSN: 2308-7056 Kumari (2013)
127
Conclusions
Organizations want and need employees who will do those things that aren’t in any job description. And the
evidence indicates that those organizations that have such employees outperform. Perceived fairness of
performance appraisal behaviors has often been conceptualized as inherently a socially desirable class of
behaviors. It has been the purpose of this report to show the impact of perceived fairness of performance
appraisal behavior on employee performance.
Perceived fairness of performance appraisal is discretionary behavior that is part of an employee’s formal
job requirements, and at the same time it nevertheless promotes the effective functioning of the
organization by increasing employee performance. Successful organizations need employees who will do
more than their usual job duties and provide performance that is beyond expectations. The rationale of this
research was to test the impact perceived fairness of performance appraisal behavior on employee
performance. It basically tested as to how the perceived fairness of performance appraisal behavior can
lead to a better performance of the employee.
The analysis of responses was done by using correlation and regression analysis which supported that
perceived fairness of performance appraisal has a very strong impact on employee performance.
Thus the null hypothesis that there is no impact of perceived fairness of performance appraisal behavior on
employee performance was rejected and therefore it can be said that there exist a strong impact of perceived
fairness of performance appraisal on employee performance. Research has shown that perceived fairness of
performance appraisal behavior plays a very vital role in contributing to organizational functioning and
performance thereby giving a better clarity to the relation between employee performance and perceived
fairness of performance appraisal.
References
Arvey, R. D. and Murphy, K. R. (1998). Performance Evaluation in Work Settings. Annual Review
Psychology, 49, 141-168.
Ashford, S. J. and Cummings, L.L. (1983). Feedback as an Individual Resource: Personal Strategies of
Creating Information. Organizational Behavior And Human Performance, 32, 370-398.
Banks, C. G. and Murphy, K.R. (1985). Toward Narrowing the Research- Practice Gap in Performance
Appraisal. Personnel Psychology, 39, 335-345.
Dhiman, Amit,
Singh, Manjari
(2007). “Appraisal Politics: Revisiting from Assessors' Perspective.”
Vikalpa: The Journal for Decision Makers; Jan-Mar2007, Vol. 32 Issue 1, p75-87.
Greenberg, J. (1986a). Determinants of Perceived Fairness In Performance Evaluation. Journal Of Applied
Psychology, 71, 340-342.
Moorman, R., Blakely, G., & Neihoff, B. (1995). Does received Organizational support mediate the
relationship between procedural justice and perceived fairness of performance appraisal behavior
Academy of Management Journal,. Vol. 41. No.3, 351-371
Mert, Ibrahim Sani (2011). “The Perception of the Employees toward the Outcomes and Detriments of
Performance Appraisal System.” Business & Economics Research Journal, Vol. 2 Issue 3, p87-108
Roberts, et al. (2005). The structure of Conscientiousness: an empirical investigation based on seven major
personality questionnaires. Personal psychology, 58, 103-139.
I
www.irbas.academyirmbr.com September 2013
International Review of Basic and Applied Sciences Vol. 1 Issue.4
R B A S
ISSN: 2308-7056 Kumari (2013)
128
Sanson. C., Wiebe, D., & Morgan, C. (1999). Self-Regulating Interest: The Moderating Role of Hardiness
and Conscientiousness. Journal of Personality 67:4, August 1999.
Steel, Robert P.
,Ovalle, Nestor K.(1994). “SELF-APPRAISAL BASED UPON SUPERVISORY
FEEDBACK. Personnel Psychology; Winter84, Vol. 37 Issue 4, p667-685, 19p.
Turnipseed, D., & Rassuli, A. (2005). Performance Perceptions of Organizational Citizenship Behaviours at
Work: a Bi-Level Study among Managers and Employees. British Journal of Management, Vol. 16,
231–244
Yen, H., & Neihoff, B. (2004). Perceived fairness of performance appraisal behavior and organizational
effectiveness: Finding relationship in Taiwanese banks.Journal of Applied Social Psychology, 2004,
34, 8, pp. 161 7-1 637.
I
www.irbas.academyirmbr.com September 2013
International Review of Basic and Applied Sciences Vol. 1 Issue.4
R B A S