Embed Size (px)
Citation preview
Jørgen Gausdal Jacobsen
Mechanistic Modelling of RadialPolymer Flow in Porous Media
2020
Thesis for the degree of Philosophiae Doctor (PhD)University of Bergen, Norway
at the University of Bergen
Avhandling for graden philosophiae doctor (ph.d )
ved Universitetet i Bergen
.
2017
Dato for disputas: 1111
Jørgen Gausdal Jacobsen
Mechanistic Modelling of RadialPolymer Flow in Porous Media
Thesis for the degree of Philosophiae Doctor (PhD)
Date of defense: 29.09.2020

The material in this publication is covered by the provisions of the Copyright Act.
Print: Skipnes Kommunikasjon / University of Bergen
© Copyright Jørgen Gausdal Jacobsen
Name: Jørgen Gausdal Jacobsen
Title: Mechanistic Modelling of Radial Polymer Flow in Porous Media
Year: 2020

III
Scientific environment
This dissertation was submitted June 22nd 2020 as part of the fulfilment for the degree
of Philosophiae Doctor (PhD) at the University of Bergen (UoB), Department of
Chemistry. The thesis is based on simulations carried out at the Norwegian Research
Centre (NORCE), formerly Uni Research, during the period 2017-2020. The doctoral
fellowship position was funded by the Research Council of Norway as part of the
PETROMAKS 2 project “Upscaling EOR LAB2FIELD”.

IV

V
Acknowledgements
First and foremost, I would like to express my sincere gratitude and appreciation to my
supervisor, Professor Arne Skauge. Thank you for providing me with the opportunity
to be admitted to the PhD programme at the University of Bergen. Your astonishing
professional knowledge, motivational abilities and guidance have been key success
factors during my PhD.
I would also like to thank my co-supervisor, Øystein Pettersen, for his many
contributions in terms of discussions and general inputs to the research methodology
applied in this thesis.
Special thanks goes to Ken Sorbie and Tormod Skauge who have contributed greatly
to my PhD in terms of good ideas and fruitful discussions.
Gratitude is also extended towards Hege Ommedal for her administrative guidance as
PhD-coordinator at the Department of Chemistry.
Furthermore, I am very grateful for the financial support of the Research Council of
Norway and Energi Simulation.
My colleagues at Norce have been invaluable to me during my PhD. Especially Abdul
Majid Murad, Iselin Salmo, Morten Aarra, Jonas Solbakken and Mohammed Alzaabi.
Thank you for being such good colleagues and creating an excellent work environment.
Finally, I would like to thank my dear family for their unconditional support throughout
this process. In particular, my fantastic mother and father (Hildegunn and Åge), and
also my brothers (Petter and Kristoffer) who have been very motivating, and for that I
will always be grateful. Lastly, I would like to thank my amazing girlfriend (Stina) for
her love and support during this hectic period of my life.

VI

VII
Abstract
Polymer flooding is one of the most successful chemically enhanced oil recovery
(EOR) methods, and has primarily been implemented to accelerate oil production by
sweep improvement. However, research from the last couple of decades have identified
several additional benefits associated with polymer flooding. Firstly, improved
polymer properties have extended their use in reservoirs with high temperature and
high salinity. Secondly, improved understanding of the viscoelastic flow behavior of
flexible polymers have revealed that they may in some cases mobilize capillary trapped
oil as well. Despite of the recent progress, extensive research remains to quantify the
appropriate flow mechanisms and accurately describe polymer flow in porous media.
Simulations and history match operations performed in this thesis are aimed at
improving the modelling of radial polymer flow in porous media. This has been
achieved by (1) evaluating the accuracy and robustness of two different history match
methods which are used to estimate the in-situ rheology of non-Newtonian fluids in
radial flow, (2) investigating potential rate and memory effects (at the Darcy scale) of
viscoelastic polymer solutions in radial flow, and (3) quantifying polymer in-situ
rheology and polymer injectivity.
The accuracy and robustness of both history match methods which are used to estimate
the in-situ rheology of non-Newtonian fluids in radial flow was clearly demonstrated
in radial flow experiments where effective (or cumulative) error was below 5 % of the
maximum preset transducer pressure range. Thereby, the observed shear-thinning
behavior of partially hydrolyzed polyacrylamide (HPAM) at low flux in porous media
could not be attributed to insufficiently accurate pressure transducers during in-house
flow experiments, as suggested by some researchers.
The estimation of polymer in-situ rheology showed invariance between excluding and
including the polymer pressure data outside the near-wellbore region. Thus, it was
proposed that the polymer in-situ rheology is mainly defined by the pressure data
originating from the near-wellbore region during radial polymer flow. Results showed
that not only could the polymer in-situ rheology be (quantitatively) estimated from
VIII
measurements of stabilized pressure, but could also be (qualitatively) identified from
the pressure build-up during radial flow experiments. Consequently, the anchoring data
from the pressure build-up during radial polymer flow was proposed as an additional
tool for history matching field injectivity tests.
Rate and memory effects (at the Darcy scale) of several HPAM polymers were
investigated in flow through Bentheimer sandstone discs. Results showed that no rate
effects occurred for mechanically undegraded polymer (Flopaam 3330S). However,
rate effects were observed for mechanically degraded polymers (Flopaam 3630S and
Flopaam 5115SH) where the onset of shear-thickening increased with volumetric
injection rate. While memory effects (at the Darcy scale) were absent for the
mechanically undegraded and relatively low molecular weight polymer, Flopaam
3330S, the mechanically degraded and relatively higher molecular weight (18 MDa)
polymer, Flopaam 3630S, exhibited memory effects in which apparent viscosity
decreased with radial distance. As mechanical degradation is suggested to be confined
to the near-wellbore region in radial polymer flow, the memory effect was proposed to
originate from the elastic properties of the polymer.
In accordance with recent literature, the in-situ rheology of HPAM was shown to
depend on flow geometry. During single and two-phase polymer flow, the shear-
thinning behavior of HPAM was much more pronounced, and the extent of shear-
thickening significantly reduced in radial compared to linear flow. Furthermore, the
onset of shear-thickening during single-phase flow occurred at significantly higher
velocities in radial relative to linear flow. However, this behavior was not consistent
during two-phase flow as the onset of shear-thickening during linear and radial polymer
flow coincided. Moreover, comparative studies of polymer flow in radial versus linear
flow geometries during single and two-phase flow revealed that the impact of oil was
to reduce apparent in-situ viscosity of HPAM. The low-flux in-situ rheology behavior
was addressed and showed Newtonian behavior in linear flow while significant shear-
thinning was observed during radial flow. Thus, both flow geometry and presence of
oil were suggested to be key factors for estimating polymer in-situ rheology.
IX
List of publications
Paper 1:
Skauge, A., Zamani, N., Jacobsen, J. G., Shiran, B. S., Al-Shakry, B. & Skauge, T.
(2018): Polymer Flow in Porous Media: Relevance to Enhanced Oil Recovery,
Colloids and Interfaces, Vol. 2: 1-27.
Paper 2:
Jacobsen, J. G., Alzaabi, M., Skauge, T., Sorbie, K. & Skauge, A. (2019): Analysis and
Simulation of Polymer Injectivity. Presented at the 20th European Symposium
on Improved Oil Recovery, Pau, France, 8-11 April.
Paper 3:
Jacobsen, J. G., Shiran, B. S., Skauge, T., Sorbie, K. S. & Skauge, A. (2020):
Qualification of New Methods for Measuring In Situ Rheology of Non-
Newtonian Fluids in Porous Media, Polymers, Vol 11: 1-13.
Paper 4:
Alzaabi, M., Jacobsen, J. G., Sumaiti, A. A., Masalmeh, S., Pettersen, Ø. & Skauge, A.
(2020): Polymer Injectivity Test Design Using Numerical Simulation,
Polymers, Vol. 12: 1-23.
All papers were either open access or overdue copyright. Reprints were made with permission
from the Multidisciplinary Digital Publishing Institute (MDPI) and the European Association
of Geoscientists & Engineers (EAGE).

X

XI
Contents
Scientific environment…………………………………………………………….. III
Acknowledgements………………………………………………………………..... V
Abstract…………………………………………………………………………… VII
List of publications………………………………………………………………… IX
List of figures ……………………………………………………………………... XV
Nomenclature…………………………………………………………………... XVII
1. Introduction……………………………………………………………………… 1
1.1 Motivation of study……………………………………………………………. 2
1.2 Main objectives……………………………………………………………….. 3
1.3 Paper contents…………………………………………………………………. 3
1.4 Organization of thesis…………………………………………………………. 4
2. Oil recovery.…………………………………………………………………........ 5
2.1 Conventional recovery mechanisms…………………………………………... 5
2.2 Recovery efficiency …………………………………………………………... 6
2.3 Enhanced oil recovery (EOR)…………………………………………………. 6
3. Polymer flooding technology……………………………………………………. 9
3.1 Introduction…………………………………………………………………… 9
3.2 Polymers……………………………………………………………………... 10
3.3 Polymer retention……………………………………………………………. 12
3.4 Polymer degradation…………………………………………………………. 13
3.5 Resistance factors……………………………………………………………. 15
3.6 Field experience……………………………………………………………… 16
4. Polymer rheology……………………………………………………………….. 17
4.1 Bulk rheology………………………………………………………………... 17

XII
4.1.1 Upper Newtonian plateau (1)………………………………………………… 19
4.1.2 Shear-thinning region (2)…………………………………………………….. 19
4.1.3 Lower Newtonian plateau (3)………………………………………………… 19
4.2 Viscoelastic fluids…………………………………………………………… 20
4.3 In-situ rheology……………………………………………………………… 22
4.4 Viscoelastic flow in porous media…………………………………………… 24
4.4.1 Upper Newtonian plateau (1)………………………………………………… 25
4.4.2 Shear-thinning region (2)…………………………………………………….. 26
4.4.3 Lower Newtonian plateau (3)………………………………………………… 28
4.4.4 Shear-thickening region (4)………………………………………………….. 28
4.4.5 Mechanical degradation (5)………………………………………………….. 31
4.5 Reduction of residual oil by viscoelastic polymers…………………………... 32
5. Polymer injectivity……………………………………………………………… 33
5.1 Factors influencing polymer injectivity……………………………………… 33
5.1.1 Debris in the polymer (1)……………………………………………………... 33
5.1.2 In-situ polymer rheology (2)………………………………………………….. 34
5.1.3 Polymer mechanical degradation (3)……………………………………….. 35
5.2 Injectivity models……………………………………………………………. 35
6. Estimation of polymer in-situ rheology………………………………………... 37
6.1 Polymer in-situ rheology from linear flow experiments……………………... 37
6.2 Polymer in-situ rheology from radial flow experiments……………………... 38
6.3 History match methods for radial flow experiments…………………………. 40
6.3.1 Single port match method (SPMM)………………………………………….. 40
6.3.2 Disc match method (DMM)…………………………………………………... 41
6.4 Simulation and history match tools…………………………………………... 42
6.4.1 Simulation tool …………………………………………………………. 42
6.4.2 Automatic history match tool………………………………………………… 42
6.5 Radial simulation model and sensitivity analysis…………………………….. 43

XIII
7. Results and discussion …………………………………………………………. 47
7.1 Introduction………………………………………………………………….. 47
7.2 Qualification of history match methods for radial flow……………………… 48
7.2.1 Pressure measurement noise analysis………………………………………. 48
7.2.2 Pressure measurement error analysis………………………………………. 51
7.2.3 Evaluation of radial history match methods………………………………... 53
7.2.4 Analysis of pressure build-up during radial polymer flow……………….. 55
7.3 Rate and memory effects of HPAM in radial flow…………………………… 57
7.3.1 Rate effects……………………………………………………………………... 58
7.3.2 Memory effects…………………………………………………………………. 62
7.4 Quantification of polymer in-situ rheology and injectivity…………………... 64
7.4.1 Impact of flow geometry………………………………………………………. 64
7.4.2 Impact of oil……………………………………………………………………. 68
7.4.3 Behavior of HPAM at low flux in porous media…………………………… 72
7.5 Summary of observations……………………………………………………. 74
7.5.1 Qualification of history match methods for radial flow…………………… 74
7.5.2 Rate and memory effects of HPAM in radial flow…………………………. 75
7.5.3 Quantification of polymer in-situ rheology and injectivity……………….. 76
8. Conclusions and suggestions for future studies……………………………….. 79
8.1 Conclusions………………………………………………………………….. 79
8.1.1 Qualification of history match methods for radial flow…………………… 79
8.1.2 Rate and memory effects of HPAM in radial flow…………………………. 80
8.1.3 Quantification of polymer in-situ rheology and injectivity……………….. 80
8.2 Suggestions for future studies………………………………………………... 81
References………………………………………………………………………….. 83
Appendix: Papers (1-4)……………………………………………………………. 95

XIV

XV
List of Figures
Figure 1.1: Primary energy consumption by fuel and resulting CO2 emissions in four
different scenarios…………………………………….……………………………… 1
Figure 2.1: Oil recovery classifications………………………………………………. 7
Figure 3.1: The primary chain structure of HPAM………………………………….. 10
Figure 4.1: Schematic illustration of a dynamic fluid volume in simple shear flow… 17
Figure 4.2: Typical shear viscosity curve for polymer solutions in simple shear
flow…………………………………………………………………………………. 19
Figure 4.3: Relaxation times for Flopaam 3630S in low salinity (left) and high salinity
(right) brine solutions……………………………….………………………………. 21
Figure 4.4: Schematic illustration of viscoelastic polymer flow in porous media…... 22
Figure 4.5: Schematic illustration of a typical in-situ rheology curve for viscoelastic
fluids (e.g. HPAM)………………………………………………………………….. 25
Figure 6.1: Schematic illustration of linear flow experiment………………………... 37
Figure 6.2: Disc used for radial flow experiments…………………………………... 39
Figure 6.3: Simulation model used in conjunction with simulations in STARS…….. 44
Figure 6.4: Sensitivity analysis of grid block size…………………………………… 45
Figure 7.1: Comparison of reference and estimated in-situ rheology curves after ±10
% pressure measurement noise, using the DMM……………………………………. 49
Figure 7.2: Comparison of reference and arithmetic average of estimated in-situ
rheology curves (0.5 – 3.0 mL/min) after ±10 % pressure measurement noise, using
the DMM……………………………………………………………………………. 50
Figure 7.3: Comparison of reference and estimated in-situ rheology curves after ±10
% pressure measurement noise, using the DMM with (a) 9 pressure ports (entire disc)
and (b) 5 pressure ports (first 4 cm of the radial distance)…………………………... 51
Figure 7.4: Comparison of reference and estimated in-situ rheology curves after typical
(±1 %) pressure measurement error, using the DMM………..................................... 52
Figure 7.5: Comparison of reference and estimated in-situ rheology curves after typical
(±1 %) pressure measurement error, using the SPMM……………………………… 53

XVI
Figure 7.6: In-situ rheology curves obtained from history matching a radial polymer
flow experiment, using the DMM and SPMM………………………………………. 54
Figure 7.7: Injection BHP versus time during initial (prior to polymer flow) and final
brine flood (after polymer tapering)………………………………………………… 56
Figure 7.8: Injection BHP versus time during polymer flow………………………... 57
Figure 7.9: In-situ rheology curves obtained from history matching mechanically
undegraded HPAM (Flopaam 3330S), using the DMM…………………………….. 58
Figure 7.10: In-situ rheology curves obtained from history matching mechanically
degraded HPAM (Flopaam 5115SH), using the DMM……………………………… 59
Figure 7.11: In-situ rheology curves obtained from history matching mechanically
degraded HPAM (Flopaam 3630S), using the DMM……………………………….. 60
Figure 7.12: Onset of shear-thickening (velocity) as a function of volumetric injection
rate for mechanically degraded HPAM (Flopaam 3630S)…………………………... 61
Figure 7.13: In-situ rheology curves obtained from history matching mechanically
undegraded HPAM (Flopaam 3330S), using the SPMM……………………………. 62
Figure 7.14: In-situ rheology curves obtained from history matching mechanically
degraded HPAM (Flopaam 3630S), using the SPMM………………………………. 63
Figure 7.15: Impact of flow geometry on polymer in-situ rheology in 1-phase
flow…………………………………………………………………………………. 65
Figure 7.16: Effects of polymer concentration on in-situ rheology during linear single-
phase flow…………………………………………………………………………... 67
Figure 7.17: Impact of flow geometry on polymer in-situ rheology in 2-phase
flow…………………………………………………………………………………. 67
Figure 7.18: Impact of oil on polymer in-situ rheology in linear flow………………. 69
Figure 7.19: Impact of oil on polymer in-situ rheology in radial flow………………. 70
Figure 7.20: (a) Linear and (b) polynomial fit to pressure data during brine flow….. 71
Figure 7.21: Resistance factor calculations using linear and polynomial fit to the brine
flow pressure data obtained after polymer flow……………………………………... 72
Figure 7.22: Impact of flow geometry on polymer in-situ rheology in (a) linear, and (b)
radial flow…………………………………………………………………………... 73
XVII
Nomenclature
Abbreviations:
𝐴 area, cross sectional area
BHP bottom-hole pressure
BP British Petroleum
CMG Computer Modelling Group Ltd.
∆𝑃 generated pressure drop
dP differential pressure
D Darcy, diameter
Da Dalton
DMM disc match method
EAGE European Association of Geoscientists & Engineers
𝐸𝐷 microscopic displacement efficiency
𝐸𝑅 recovery efficiency
𝐸𝑉 macroscopic (or volumetric) sweep efficiency
EOR enhanced oil recovery
𝐹 force
FHF field history file
𝐺 Young’s modulus
𝐺′ storage modulus
𝐺′′ loss modulus
GDP gross domestic product
ℎ disc thickness
HPAM partially hydrolyzed polyacrylamide
𝐼 injectivity
IOR improved oil recovery
IPV inaccessible pore volume
𝑘 permeability
𝑘𝑟 relative permeability
𝐾 flow consistency index
𝐿 length
𝑀 mobility ratio
MCMC Markow Chain Monte Carlo
MDPI Multidisciplinary Digital Publishing Institute
𝑛 power law flow behavior index
𝑁𝐷𝑒 Deborah number
𝑁𝑅𝑒 Reynolds number
NORCE Norwegian Research Centre

XVIII
PhD philosophiae doctor
PSO Particle Swarm Optimization
𝑄 volumetric injection rate
𝑟 radius, radial distance
𝑅𝐹 resistance factor
𝑅𝐾 permeability reduction factor
𝑅𝑅𝐹 residual resistance factor
SPMM single port match method
𝑆𝑜𝑟 residual oil saturation
𝑡 time
𝑢 Darcy velocity
UoB University of Bergen
𝑣 velocity
WAG water-alternating-gas
Greek Letters
𝛼 correction factor
𝜆 mobility, polymer relaxation time
𝜇 viscosity
𝜔 frequency
𝜙 porosity
𝜌 density
𝜏 shear stress
𝜃 time
𝛾 strain
�̇� shear rate
Subscripts
0 zero-shear
∞ infinite-shear
𝑎 after
𝑎𝑝𝑝 apparent
𝑏 before, brine
𝑐 critical
𝑒 production rim
𝑓 polymer relaxation
𝑚 amplitude
𝑝 polymer, polymer process
1
1. Introduction
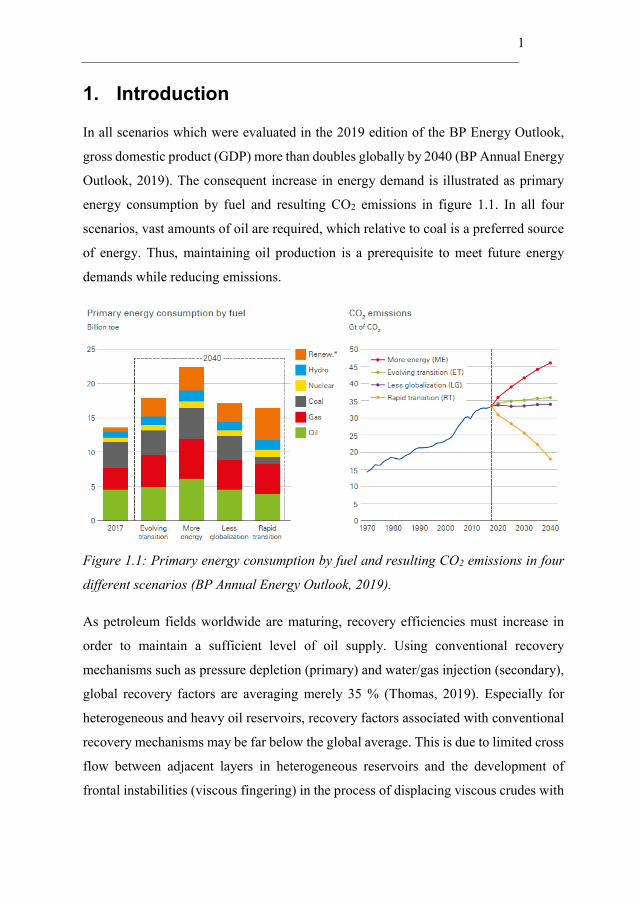
In all scenarios which were evaluated in the 2019 edition of the BP Energy Outlook,
gross domestic product (GDP) more than doubles globally by 2040 (BP Annual Energy
Outlook, 2019). The consequent increase in energy demand is illustrated as primary
energy consumption by fuel and resulting CO2 emissions in figure 1.1. In all four
scenarios, vast amounts of oil are required, which relative to coal is a preferred source
of energy. Thus, maintaining oil production is a prerequisite to meet future energy
demands while reducing emissions.
Figure 1.1: Primary energy consumption by fuel and resulting CO2 emissions in four
different scenarios (BP Annual Energy Outlook, 2019).
As petroleum fields worldwide are maturing, recovery efficiencies must increase in
order to maintain a sufficient level of oil supply. Using conventional recovery
mechanisms such as pressure depletion (primary) and water/gas injection (secondary),
global recovery factors are averaging merely 35 % (Thomas, 2019). Especially for
heterogeneous and heavy oil reservoirs, recovery factors associated with conventional
recovery mechanisms may be far below the global average. This is due to limited cross
flow between adjacent layers in heterogeneous reservoirs and the development of
frontal instabilities (viscous fingering) in the process of displacing viscous crudes with
2
lower viscosity fluids. Consequently, large volumes of oil are bypassed and tremendous
potential remains for unconventional, or enhanced oil recovery (EOR) methods.
Polymer flooding is the most frequently implemented chemical EOR process, and has
received increased attention after several successful polymer flood projects have been
reported in the literature (Standnes & Skjevrak, 2014; Sheng et al., 2015). It has
primarily been used to accelerate oil production by sweep improvement. However,
promising results have emerged in recent years, suggesting it may be able to mobilize
capillary trapped oil as well (Azad & Trivedi, 2019). During polymer flooding, the
injection brine is viscosified by adding water-soluble polymers, thereby stabilizing the
displacement process by means of improved crossflow and reduction of the viscosity
contrast between the injected solution and displaced fluids.
In subsequent chapters, background material concerning the inadequacies of
conventional recovery mechanisms, potential for polymer flooding, and flow
mechanisms of polymer solutions, is presented. These theoretical sections should be
adequate to comprehend the results presented in this thesis.
1.1 Motivation of study
Polymer flooding is a mature subject of study, which dates back to the early 1960s
(Pye, 1964; Sandiford, 1964). With the advent of extensive research, the perception of
polymer flooding has shifted from a simple augmented water flood towards being
identified as an extremely complex EOR process. This is mainly due to the non-
Newtonian nature of polymers as they flow through porous media. Despite nearly sixty
years of research, significant controversy and uncertainties are still associated with
several topics within polymer flooding technology.
One of these controversial topics constitute polymer in-situ rheology. In contrast to the
prevailing paradigm, results from recent years indicate that polymer in-situ rheology
and, by extension, polymer injectivity, is significantly different in linear compared to
radial flow (Skauge et al., 2016). Since radial flow geometry best mimics the polymer
flow out from the injector in oil reservoirs, polymer in-situ rheology should be

3
estimated from radial rather than linear flow experiments. Furthermore, it has been
implicitly assumed that polymer in-situ rheology is unaffected by the presence of oil,
as the majority of polymer in-situ rheology studies have been based on single-phase
experiments. If oil has a significant effect on polymer in-situ rheology, it should be
quantified and included in the modelling of polymer flow in porous media.
1.2 Main objectives
Based on the aforementioned issues related to the modelling of polymer in-situ
rheology, the following main objectives of this thesis are stated as follows:
- Evaluate the accuracy and robustness of the history match methods used to
estimate polymer in-situ rheology and injectivity from radial flow experiments.
- Investigate potential rate and memory effects of viscoelastic polymers (at the
Darcy scale) during radial flow experiments.
- Quantify polymer in-situ rheology and polymer injectivity in porous media.
1.3 Paper contents
Paper 1 (Skauge et al., 2018) provides a comprehensive review of recent
developments within the research of polymer flow in porous media, with emphasis on
polymer in-situ rheology and injectivity. Furthermore, the impact of oil on polymer in-
situ rheology is quantified in Bentheimer sandstone. Results from both linear and radial
flow experiments are included in the paper.
Paper 2 (Jacobsen et al., 2019) investigate the influence of pressure measurement
noise on the estimated polymer in-situ rheology, using a recently developed history
match method which is applicable for radial flow experiments with internal pressure
ports. Moreover, the sensitivity of polymer in-situ rheology to the disc size used for
radial flow experiments, is assessed.

4
Paper 3 (Jacobsen et al., 2020) evaluate the robustness and accuracy of two different
history match methods which are used to estimate polymer in-situ rheology from radial
flow experiments. In addition, an analysis of potential rate and memory effects of an
undegraded partially hydrolyzed polyacrylamide (HPAM) polymer in flow through a
radial Bentheimer sandstone disc was performed.
Paper 4 (Alzaabi et al., 2020) focus on maximizing the anchoring data from field
injectivity tests, which are used to estimate polymer in-situ rheology. Consequently,
pressure build-up and stabilized injection bottom-hole pressure (BHP) during radial
polymer flow was analysed at both the laboratory and field scale.
1.4 Organization of thesis
In chapter 1, the overarching motivation and main objectives of this thesis is briefly
stated. Chapter 2 introduces conventional petroleum production and associated
challenges. Chapter 3 gives an overview of polymer flooding technology, where
relevant topics for this particular thesis are included. In chapter 4 and 5, the main topics
of this thesis are presented, i.e. polymer (in-situ) rheology and injectivity, respectively.
Estimation of polymer in-situ rheology from flow experiments, simulation tools,
history match methods and sensitivity analyses are provided in chapter 6. Chapter 7
summarize and discuss the principal results and observations obtained during the
course of this thesis. Finally, general conclusions and suggestions for future studies are
reviewed in chapter 8.
5
2. Oil recovery
In this chapter, how petroleum hydrocarbons are produced is discussed in terms of
recovery mechanisms and corresponding efficiencies at both the microscopic and
macroscopic scale. Inadequacies of conventional recovery mechanisms are emphasized
and the rationale for implementation of enhanced recovery methods is highlighted.
2.1 Conventional recovery mechanisms
The production of petroleum hydrocarbons from subsurface reservoirs may be divided
into three different production phases: primary, secondary and tertiary recovery. The
initial production phase is generally characterized by primary recovery and refers to
the volume of hydrocarbons produced as a result of the natural energy prevailing in the
reservoir (Thomas, 2019). Mechanisms of primary recovery may be exemplified by
depletion drive, gravity drainage, gas cap drive, rock and/or liquid expansion and
aquifer drive. As reservoir pressure decrease during primary recovery, it may at some
point drop below the bubble point and dissolved gas will start to bubble out from the
oil solution. Since gas is much more mobile relative to oil, some oil will be left behind
in the reservoir and production impairment occurs. To counteract this occurrence,
secondary recovery by water flooding is conventionally implemented. Here, the
injection of water aims to maintain pressure above the bubble point and displace
hydrocarbons towards the producers. Water injection is by far the most frequently
applied secondary recovery mechanism, mainly due to its availability (especially
offshore) and low cost. In some cases, secondary recovery may constitute gas injection
if economic incentives are prevailing. Water and gas may also be injected into the same
reservoir by the process of water-alternating-gas (WAG) injection.
Primary and secondary recovery mechanisms may be efficient for producing light oils,
but can be severely inefficient in producing heavier crudes and in heterogeneous
reservoirs. This is mainly due to the viscosity contrast between the injected water
solution and the viscous oil, which may induce front instabilities. The mobility ratio is
a helpful parameter in assessing the stability of the displacement front, and is defined
6
as the ratio of the mobility of the displacing fluid, 𝜆1, to the mobility of the displaced
fluid, 𝜆2, (Lake et al., 2014):
𝑀 =𝜆1
𝜆2
=𝑘𝑟,1 𝜇2
𝑘𝑟,2 𝜇1
Eq. 2.1
where 𝑘𝑟 is relative permeability to the particular fluid and 𝜇 is fluid viscosity. As the
mobility ratio increase, the displacement front between the two immiscible fluids
becomes increasingly unstable.
2.2 Recovery efficiency
The recovery efficiency, 𝐸𝑅, during petroleum production from a subsurface reservoir
is the ratio of produced fluid volume to the fluid volume originally in place. It may also
be defined as the product of the microscopic displacement efficiency, 𝐸𝐷, and the
macroscopic (or volumetric) sweep efficiency, 𝐸𝑉 (Fanchi & Christiansen, 2017):
𝐸𝑅 = 𝐸𝐷 × 𝐸𝑉 Eq. 2.2
The microscopic displacement efficiency is a measure of how much capillary trapped
oil is mobilized (or displaced) at the pore scale, and thus depends predominantly on
interfacial tensions and wettability states. In contrast, the macroscopic sweep efficiency
refers to the volume of oil contacted by the injected fluid and is thereby influenced
principally by viscous rather than capillary forces. Thus, bypassed oil is defined as the
macroscopically uncontacted oil, while residual oil saturation constitutes the capillary
trapped oil in conjunction with the microscopic displacement efficiency. Since
recovery efficiencies in heterogeneous reservoirs containing viscous crudes are
typically much lower than the global average of 35 %, tremendous potential remains
for EOR methods.
2.3 Enhanced oil recovery (EOR)
EOR can be defined as incremental oil recovery by the injection of materials not
normally present in the reservoir (Lake et al., 2014). This may be achieved by either

7
increasing the viscous forces of the injected material or by reducing the capillary forces
between the materials involved in the displacement process. The principal classes of
EOR methods include thermal, solvent, chemical and others (figure 2.1).
Figure 2.1: Oil recovery classifications (Lake et al., 2014).
EOR is often associated with tertiary recovery due to its frequent implementation in
the tertiary production phase. However, this need not be the case as EOR methods may
be implemented at both the primary and secondary recovery stage. A well-known
example concerns the production of sufficiently viscous crudes, when uneconomic
flow during primary and secondary recovery mechanisms precludes their
implementation. In these situations, thermal EOR may be the only means of recovering
significant amounts of oil. Thus, the EOR method applied in this case would
chronologically be considered primary recovery (Green & Willhite, 1998).
During recent decades, improved oil recovery (IOR) has sometimes been used
interchangeably with EOR. Although the distinction between them is ambiguous, IOR
typically refers to any process that improves oil recovery. Thereby, IOR encompass
EOR processes, but also other practices such as waterflooding, pressure maintenance,
infill drilling and horizontal wells (Lake et al., 2014).

8

9
3. Polymer flooding technology
3.1 Introduction
Polymer flooding consists of adding polymers (powder or emulsion) to the injection
brine during a waterflood, thereby viscosifying the water and reducing its mobility
(Thomas, 2019). It has primarily been implemented to mitigate the propensity for
viscous instabilities, thus accelerating oil production by sweep improvement.
The concept of using viscosified water to increase the efficiency of a water flood dates
back to the early 1940s, when Detling (Shell Development Company) obtained a patent
covering the use of several additives for viscous water flooding (Sandiford, 1964).
However, the viscosifying agents patented at that time were deemed economically
infeasible due to the quantities required to bring about a substantial mobility reduction.
It was not until the mid 1960s, after the pioneering work of several researchers (Pye,
1964; Sandiford, 1964; Mungan et al., 1966; Gogarty, 1967), that the synthetic polymer
HPAM was identified as a potential economic viscosifying agent. Their experimental
results showed that addition of HPAM in low quantities to the injected solution could
significantly increase oil recovery from rock cores. The significant viscosity increase
by adding small amounts of HPAM in solution was attributed to its high intrinsic
viscosity, which is a measure of its polymer molecular weight (Sorbie, 1991). HPAM
was originally proposed as a mobility control agent due to its large commercial
availability and low production costs.
Polymers may be injected into oil reservoirs for purposes other than polymer flooding.
During conformance, or water shut-off treatments, concentrated polymer gels are
injected to mitigate excessive water production by plugging high permeability thief
zones. Consequently, the injection water is diverted to less permeable, unswept zones
of the reservoir, thus improving volumetric sweep efficiency (Seright, 1995; Seright et
al., 2012). In contrast, polymer floods are intended to directly displace oil from less
permeable zones, and thereby substitute rather than compliment pure water injection.
10
3.2 Polymers
Polymers are macromolecular compounds made up of repeating units, named after the
monomer(s) used in the polymerization process (Carraher, 2003). Their molecular
weight may range from a few thousand to several million Daltons (Da), potentially
yielding extremely viscous materials. However, due to the complex process of polymer
synthesis, polymers are usually polydisperse, i.e. they have a wide molecular weight
distribution. Consequently, polymer samples are generally comprised of
macromolecules of the same chemical structure, but with varying chain lengths.
Both the biopolymer Xanthan and the synthetic polymer HPAM have been used in
conjunction with polymer flooding projects (Standnes & Skjevrak, 2014; Sheng et al.,
2015). Since HPAM is by far the most frequently applied polymer, it will be of sole
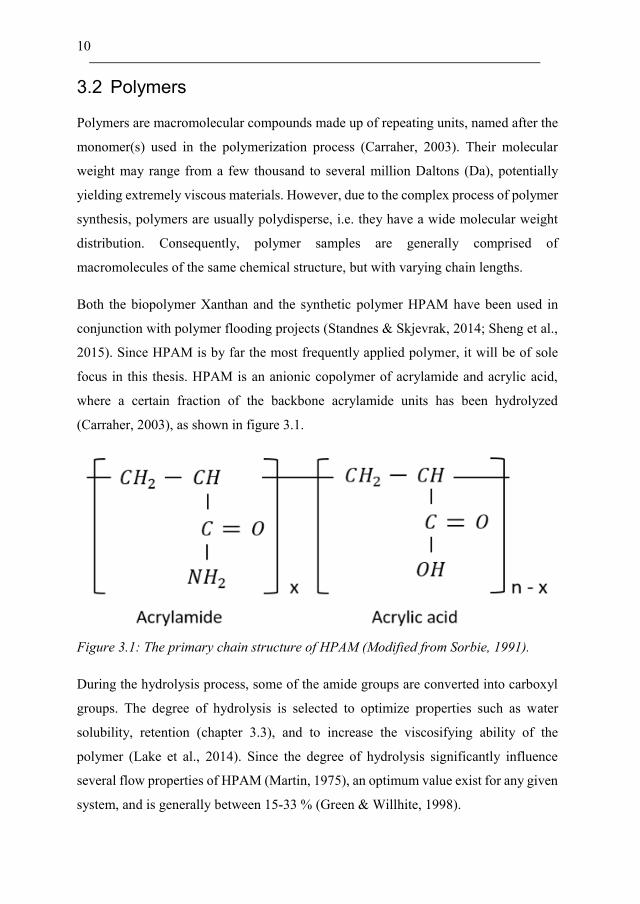
focus in this thesis. HPAM is an anionic copolymer of acrylamide and acrylic acid,
where a certain fraction of the backbone acrylamide units has been hydrolyzed
(Carraher, 2003), as shown in figure 3.1.
Figure 3.1: The primary chain structure of HPAM (Modified from Sorbie, 1991).
During the hydrolysis process, some of the amide groups are converted into carboxyl
groups. The degree of hydrolysis is selected to optimize properties such as water
solubility, retention (chapter 3.3), and to increase the viscosifying ability of the
polymer (Lake et al., 2014). Since the degree of hydrolysis significantly influence
several flow properties of HPAM (Martin, 1975), an optimum value exist for any given
system, and is generally between 15-33 % (Green & Willhite, 1998).

11
Polyelectrolytes such as HPAM are generally distinguished from non-ionic polymers
by the significant impact that ionic species (e.g. salt) and pH have on their viscosity
(Sorbie, 1991). The anionic polymer molecules in aqueous solution will be surrounded
by a cloud of oppositely charged counterions, thus forming an electrical double layer.
When these clouds of counterions approach each other, they will be repelled
coulombically. Due to the flexible chain structure of the HPAM molecule, this
repulsion will increase the hydrodynamic size of the molecule, thereby increasing
solution viscosity. However, in solutions containing positively charged ionic species,
the thickness of the electrical double layer decrease, and consequently, polymer
viscosity is reduced. The reduction in viscosity becomes more severe with ionic
valence, i.e. divalent ions (e.g. Ca2+) reduce viscosity more than monovalent ions (e.g.
Na+) (Mungan, 1972; Ward & Martin, 1981; Guetni et al., 2019).
In accordance with the aforementioned ionic species, the effect of lowering the pH of
a polymer solution is to neutralize the ionic carboxylate groups, thereby promoting a
reduction in electrostatic effects (Sorbie, 1991). Consequently, the hydrodynamic size
and viscosity of the polymer decrease (Mungan, 1969). This effect is more pronounced
in low-salinity solutions where the propensity for hydrodynamic size reduction is more
severe. However, pH has very limited effect on polymer viscosity in the pH range
normally encountered in oil reservoirs (Szabo, 1979).
The average molecular weight of HPAMs used in EOR operations is in the range of 2-
35 MDa (Thomas, 2019), depending on reservoir properties such as permeability and
connate water salinity. Since higher molecular weights enable lower concentrations of
added polymer to achieve a certain solution viscosity, project economics will always
favor maximizing polymer molecular weight. However, to avoid plugging of the
formation, and to ensure technical success of the project, lower molecular weights than
the economic optimum are generally chosen (Guo, 2017).
Polymer floods are typically applying concentrations in the semi-dilute regime mainly
due to the viscosifying abilities of polymers above the critical overlap concentration,
coupled with their favorable flow properties in porous media (Skauge et al., 2016).
12
3.3 Polymer retention
In flow through porous media, polymer molecules may be retained by mechanisms
such as adsorption, mechanical entrapment and hydrodynamic retention/entrapment
(Sorbie, 1991). The former mechanism may occur both statically and dynamically,
while the two latter are exclusively dynamic mechanisms, i.e. they only occur in flow
through porous media. Collectively, these phenomena will retard the flow of polymer
solutions and may decrease permeability of the porous medium.
Adsorption refers to either physiosorption, in which electrostatic forces act between
porous media and polymer solutions, or chemiosorption where chemical bonds
between porous media walls and polymer molecules are formed. Polymer adsorption
of HPAM on rock surfaces is dominated by physiosorption, and is considered
instantaneous and irreversible (Zhang & Seright, 2014). In the semi-dilute
concentration regime, the amount of polymer adsorption increase with molecular
weight (Hirasaki & Pope, 1974; Wever et al. 2018), concentration (Szabo, 1975;
Dominguez & Willhite, 1977; Zhang & Seright, 2014), salinity (Smith, 1970; Szabo,
1975; Broseta, 1995), in carbonates compared to silica (Smith, 1970), and in absence
compared to presence of residual oil (Szabo, 1975; Broseta et al., 1995; Wever et al.,
2018).
Due to the relatively large hydrodynamic size of polymer molecules, retention may
also occur in terms of mechanical entrapment. Here, polymer molecules are trapped (or
lodged) between narrow pore throats in the porous medium (Dominguez & Willhite,
1977). The mechanism of mechanical entrapment is very similar to the well-known
phenomenon of deep bed filtration (Herzig et al., 1970; Tien & Payatakes, 1979).
According to the physical picture of mechanical entrapment in porous media, the
distribution of mechanically entrapped polymer is expected to be largest at the inlet
and decrease exponentially along the core. Not surprisingly, mechanical entrapment
increase with the ratio of polymer hydrodynamic size to pore throat size, i.e. with
increasing molecular weight and decreasing porous medium permeability (Mungan et
al., 1966; Gogarty, 1967; Szabo, 1975; Dominguez & Willhite, 1977).
13
The last, and perhaps least understood retention mechanism constitute hydrodynamic
retention/entrapment. Here, polymer molecules are temporarily trapped in stagnant
flow regions by hydrodynamic drag forces (Sorbie, 1991). During hydrodynamic
retention, the total level of retention increase with flow rate (Maerker, 1973;
Dominguez & Willhite, 1977; Chauveteau, 1981). Observations show that
hydrodynamic retention in porous media increase with polymer molecular weight and
decrease with core permeability (Chen et al., 2016). However, hydrodynamic retention
is considered reversible (Maerker, 1973; Chauveteau, 1981; Zhang & Seright, 2015;
Chen et al., 2016) and is suggested to have limited effect on polymer in-situ rheology
(Zhang & Seright, 2015).
3.4 Polymer degradation
Polymers may be degraded during propagation through porous media by three principal
mechanisms, namely: chemical, biological and mechanical degradation.
Chemical degradation refers to the breakdown of polymer molecules by short-term
reactions with contaminants (e.g. oxygen) or through attack of the backbone
acrylamide units by processes such as hydrolysis (Sorbie, 1991). At elevated
temperatures, chemical degradation may sometimes be referred to as thermal
degradation. However, even though reaction rates are thermally accelerated, the
degradation process is normally classified as chemical rather than thermal (Sorbie,
1991; Lake et al., 2014; Sheng, 2015). Polymer flow experiments that were history
matched in this thesis were of low duration (weeks to months) and were conducted at
room temperature. Consequently, process kinetics were limited, and chemical
degradation was of minor significance for the HPAM polymers investigated.
Biological degradation refers to the microbial breakdown of polymer molecules by
reaction with bacteria. Addition of a biocide is generally used to prevent occurences of
biological degradation. The synthetic HPAM polymers investigated in this thesis were
not exposed to any significant extent of biological degradation during flow experiments
due to their synthetic rather than biological nature.

14
The flexible coil structure of HPAM renders it highly susceptible to mechanical
degradation during flow through porous media. Mechanical degradation refers to the
breakdown (i.e. rupture) of polymer molecules as they are exposed to high mechanical
stresses in flow through the porous medium (Sorbie, 1991). The effect of mechanical
degradation is to significantly reduce the average molecular weight of the injected
solution, thereby decreasing the hydrodynamic size of the polymer molecules. This can
strongly reduce the polymer solution effectiveness in improving the mobility ratio
inside the reservoir. The level of mechanical degradation experienced by semi-dilute
polymer solutions in flow through porous media generally increase with polymer
molecular weight (Morris & Jackson, 1978; Noïk et al., 1995; Stavland et al., 2010),
solvent salinity (Smith, 1970; Maerker, 1975; Noïk et al., 1995), with decreasing
porous medium permeability (Smith, 1970; Maerker, 1975; Morris & Jackson, 1978),
and is independent of polymer concentration (Maerker, 1975; Noïk et al., 1995).
Several attempts have been made to predict the degree of HPAM mechanical
degradation in porous media by using correlating groups, depending on factors such as
stretch rate, dimensionless length, and maximum polymer flux at the sandface
(Maerker, 1975; Morris & Jackson, 1978; Seright, 1983). Moreover, Seright (1983)
showed that linear regression of internal pressure readings during polymer flow may
be used to estimate the entrance pressure drop, and thus the degree of mechanical
degradation experienced by the polymer in flow through linear core plugs. However,
the flow out from the injectors in oil reservoirs are best mimicked by radial flow
geometry, and mechanical degradation is thereby confined to the near-wellbore region
where the injected solution attain its maximum velocities (Åsen et al., 2019). In
contrast, the flow velocity remains constant in linear flow such that mechanical
degradation of the polymer persists far beyond the injection point (Al-Shakry et al.,
2018b). Consequently, the degree of polymer mechanical degradation occurring under
realistic reservoir flow conditions may be overestimated based on linear core floods.
Mechanical degradation is typically measured by either screen factor measurements,
or injected versus effluent viscosity measurements (Sorbie, 1991). During screen factor
measurements, polymer solutions and corresponding solvents are typically flown

15
through a pack of five 100-mesh screens of known mesh density (Jennings et al., 1971).
The screen factor is defined as the ratio of the flow time for the polymer solution to the
flow time for the corresponding solvent. During injected versus effluent measurements,
polymer viscosity is measured before injection and compared to viscosity measured
after flow in porous media. In both measurement methods, the loss of screen factor and
viscosity, respectively, are correlated to the irreversible viscosity loss associated with
the occurrence of mechanical degradation in flow through porous media.
3.5 Resistance factors
Since polymers not only viscosify injected solutions, but also reduce the permeability
of the porous medium by means of retention mechanisms, the polymer pressure
response will be coupled by these two contributors during porous media flow. To
separate the flow resistance caused by the viscosity enhancement from that caused by
permeability reduction, three different factors have been introduced.
The resistance factor, 𝑅𝐹, is a measure of how much a single-phase polymer solution
is able to reduce fluid mobility, relative to that of brine. Consequently, the resistance
factor encompass both the polymer viscosity enhancement and permeability reduction
caused by the polymer, and is defined as (Lake et al., 2014),
𝑅𝐹 =𝜆𝑏
𝜆𝑝
= 𝑅𝑘
𝜇𝑝
𝜇𝑏
Eq. 3.1
where 𝑅𝑘 is the permeability reduction factor, defined as the ratio of permeability to
brine and permeability to the polymer. The permeability reduction factor thus
encompass both the reversible and irreversible permeability reduction caused by the
polymer. Lastly, the residual resistance factor (𝑅𝑅𝐹) is a sole measure of the irreversible
permeability reduction due to polymer retention, and is defined as the ratio of brine
mobility before (𝜆𝑏,𝑏) and after (𝜆𝑏,𝑎) polymer flow:
𝑅𝑅𝐹 =𝜆𝑏,𝑏
𝜆𝑏,𝑎
Eq. 3.2

16
3.6 Field experience
Polymer flooding is the most frequently implemented chemical EOR technique, and
extensive field experience have been reported in the literature (Standnes & Skjevrak,
2014; Sheng et al., 2015). A comprehensive literature review encompassing 72
implemented and well-documented polymer field projects were reported by Standnes
and Skjevrak (2014). Technical assessment of these projects revealed that 40 of them
were classified as successes and only 6 were deemed discouraging. The remaining
projects were either classified as promising (11), too early to tell (8), inconclusive (2),
not evaluated (2), or did not report the technical assessment (3). In 92 % of the projects,
HPAM was used as the polymer, while the remaining projects were implemented using
biopolymers.
Various causes were reported as being responsible for the 6 technically discouraging
cases. Mechanical degradation was reported in two of these projects, resulting in an
irreversible viscosity loss which induced a lower target in-situ viscosity than expected.
In another project, the salinity effect on polymer solution viscosity from mixing low
salinity injection brine with high salinity formation water, was underestimated.
Injectivity decline was reported in four cases and was suggested to be caused by
plugging (mechanical entrapment) in low permeable media, and due to unexpectedly
high levels of polymer adsorption.
During the last decade, polymer flooding has been evaluated for implementation in an
increasing number of fields, both offshore and onshore. However, the discouraging
cases demonstrate the need for improved polymer flow models for porous media.
Accurate estimation of in-situ rheology and injectivity are crucial for evaluating both
the technical and economic feasibility of any polymer flood project. Improving the
modelling of polymer flow in porous media may not only facilitate an increase in
implementation by de-risking projects, but may also help to avoid technical failures in
circumstances where polymer flooding is not the best suited enhanced oil recovery
mechanism. For these reasons, the main focus of this thesis is on the modelling of
rheology and injectivity during polymer flow in porous media.

17
4. Polymer rheology
4.1 Bulk rheology
Rheology is the study of the flow behavior of fluids as they undergo deformation, and
is a vast area of research (Sorbie, 1991). For polymer flooding applications, viscosity
is of special interest, and is a measure of the internal resistance of fluids to deformation
at a specified rate. For purely viscous fluids, the viscosity may be defined as its
resistance to shear. The shearing stress, 𝜏, between two thin fluid layers is given by,
𝜏 =𝐹
𝐴 Eq. 4.1
where F is the force vector parallel to the contact area, A, between the two fluid layers.
As fluids are subjected to external shear stress, velocities of internal layers will be
accelerated by means of viscous friction. To envisage the influence of shear stress on
the velocities of internal fluid layers, we may consider a dynamic fluid volume
confined between two plates, as shown in figure 4.1.
Figure 4.1: Schematic illustration of a dynamic fluid volume in simple shear flow.
While the upper plate is moving at a particular velocity, 𝑣, the bottom plate is stationary
(𝑣 = 0). Thus, the fluid volume is subjected to an external shear stress originating from
the upper plate. This results in a deformation of the fluid as fluid layers are accelerated
in the flow direction. However, the resulting velocity of each fluid layer will decrease

18
with distance, 𝑟, from the moving plate, and the fluid layer immediately adjacent to the
stationary plate will attain zero velocity. Thus, as a fluid is subjected to an external
shear stress, a velocity gradient will develop within the fluid. This velocity gradient is
known as shear rate, �̇�, and is defined as,
�̇� =𝑑𝑣
𝑑𝑟 Eq. 4.2
The relatively simple case where only shear stress is acting on the fluid volume and
normal stress components are absent, is referred to as simple shear flow. Most low
molecular weight substances exhibit Newtonian flow characteristics, i.e. in simple
shear flow at constant pressure and temperature, the velocity gradient (shear rate) is
linear. Consequently, shear stress will be proportional to the rate of shear, and the
constant of proportionality is the dynamic fluid viscosity, 𝜇 (Deshpande et al., 2010),
𝜏 = 𝜇�̇� Eq. 4.3
Thus, for Newtonian fluids, their viscosity value is independent of shear rate. However,
for a large class of high molecular weight substances, such as polymers, flow
characteristics deviate significantly from Newtonian behavior, and are collectively
classified as non-Newtonian fluids. For these fluids, the apparent viscosity, 𝜇𝑎𝑝𝑝, is a
viscosity function that depends on the shear rate,
𝜏 = 𝜇𝑎𝑝𝑝(�̇�)�̇� Eq. 4.4
and is typically measured as a function of shear rate using a rheometer. During the
measurement process, polymer solutions in simple shear flow are subjected to various
shear rates in a stepwise manner. It is not until steady state conditions are achieved that
viscosity measurements are performed, and at this state is referred to as bulk viscosity.
In simple shear flow, polymer solutions (e.g. HPAM) in the semi-dilute concentration
regime typically exhibit a shear viscosity curve as shown in figure 4.2.

19
Figure 4.2: Typical shear viscosity curve for polymer solutions in simple shear flow.
4.1.1 Upper Newtonian plateau (1)
The hydrodynamic size of polymer coils and their concentration determines the
polymer solution viscosity at low shear rates. In this shear rate regime, the interactions
between polymer coils remains unchanged, and Newtonian behavior prevails. This
region is typically referred to as the upper Newtonian plateau where the polymer attains
its zero-shear viscosity value (𝜇0).
4.1.2 Shear-thinning region (2)
As shear rates are increased beyond the upper Newtonian plateau, polymer coils are
effectively forced apart and aligned in the flow direction. Consequently, interactions
between polymer coils decrease and less friction forces arise as the polymer solution is
flowing. Thus, the viscosity decreases with shear in this regime, and is referred to as
shear-thinning (or pseudoplastic) behavior. The onset of shear-thinning is generally
referred to as the critical shear rate, �̇�𝑐.
4.1.3 Lower Newtonian plateau (3)
At shear rates exceeding those in the shear-thinning regime, interactions between
polymer coils cease to exist and the polymer attain a minima viscosity value. This
region is typically referred to as the lower Newtonian plateau where the polymer attains
its infinite-shear viscosity value (𝜇∞).

20
In the literature, several models have been suggested to describe polymer viscosity as
a function of shear rate in simple shear flow. The most commonly encountered
analytical model is the power law model, which consider only the shear-thinning region
of the viscosity – shear rate relationship (Bird et al., 1960),
𝜇(�̇�) = 𝐾�̇�𝑛−1 Eq. 4.5
where K is the flow consistency index and 𝑛 is the flow behavior index (Deshpande et
al., 2010). Thus, for a Newtonian fluid, 𝑛 approach unity and K is merely the constant
viscosity.
Another widely used model, which describes the three possible polymer behaviors in
simple shear flow (figure 4.2) is given by the Carreau equation (Carreau, 1972),
𝜇(�̇�) = 𝜇∞ + (𝜇0 − 𝜇∞)[1 + (𝜆�̇�)2](𝑛−1)/2 Eq. 4.6
where 𝜇0 is the zero-shear viscosity, 𝜇∞ is the infinite-shear viscosity, 𝜆 is the polymer
relaxation time (chapter 4.2), and 𝑛 is the power law flow behavior index.
4.2 Viscoelastic fluids
For an ideal elastic solid, shear stress is directly proportional to strain, 𝛾, and the
constant of proportionality is the Young’s modulus, 𝐺, (Deshpande et al., 2010) i.e.,
𝜏 = 𝐺𝛾 Eq. 4.7
At the other extreme, Newtonian behavior was previously mentioned where shear
stress was proportional to the rate of shear. In contrast to purely viscous fluids or
perfectly elastic (Hookean) solids, viscoelastic fluids (e.g. HPAM) might demonstrate
viscous and elastic responses simoutaneously as they undergo deformation.
Viscoelastic fluids are commonly characterized by oscillatory shear flow
measurements, which may be performed by rheometers. This characterization is
performed by evaluating the response of viscoelastic fluids to strain that varies
sinusoidally with time, 𝑡 (Sorbie, 1991),
21
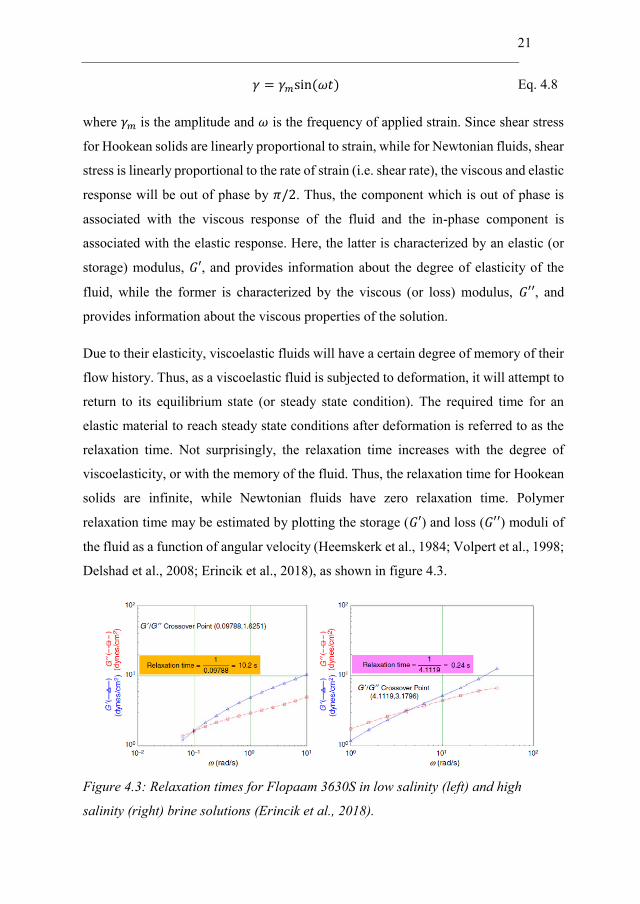
𝛾 = 𝛾𝑚sin (𝜔𝑡) Eq. 4.8
where 𝛾𝑚 is the amplitude and 𝜔 is the frequency of applied strain. Since shear stress
for Hookean solids are linearly proportional to strain, while for Newtonian fluids, shear
stress is linearly proportional to the rate of strain (i.e. shear rate), the viscous and elastic
response will be out of phase by 𝜋/2. Thus, the component which is out of phase is
associated with the viscous response of the fluid and the in-phase component is
associated with the elastic response. Here, the latter is characterized by an elastic (or
storage) modulus, 𝐺′, and provides information about the degree of elasticity of the
fluid, while the former is characterized by the viscous (or loss) modulus, 𝐺′′, and
provides information about the viscous properties of the solution.
Due to their elasticity, viscoelastic fluids will have a certain degree of memory of their
flow history. Thus, as a viscoelastic fluid is subjected to deformation, it will attempt to
return to its equilibrium state (or steady state condition). The required time for an
elastic material to reach steady state conditions after deformation is referred to as the
relaxation time. Not surprisingly, the relaxation time increases with the degree of
viscoelasticity, or with the memory of the fluid. Thus, the relaxation time for Hookean
solids are infinite, while Newtonian fluids have zero relaxation time. Polymer
relaxation time may be estimated by plotting the storage (𝐺′) and loss (𝐺′′) moduli of
the fluid as a function of angular velocity (Heemskerk et al., 1984; Volpert et al., 1998;
Delshad et al., 2008; Erincik et al., 2018), as shown in figure 4.3.
Figure 4.3: Relaxation times for Flopaam 3630S in low salinity (left) and high
salinity (right) brine solutions (Erincik et al., 2018).

22
4.3 In-situ rheology
Polymer molecules are subjected to significantly different flow conditions in porous
media compared to simple shear flow. Porous media exhibit an inherently complex
geometry, including variations in pore sizes and geometries, where successive
contraction-expansion channels (i.e. pore throats and pore bodies) have significant
influence on the flow properties of viscoelastic polymers, as shown in figure 4.4
(Urbissinova et al., 2010).
Figure 4.4: Schematic illustration of viscoelastic polymer flow in porous media
(Urbissinova et al., 2010).
In contrast to simple shear flow, polymer solutions are exposed to a wide range of local
shear rates at a particular volumetric flow rate in the porous medium. Furthermore,
flow phenomena such as polymer retention and mechanical degradation adds on to the
complexity of the polymer flow. To account for the contrasting flow conditions in
simple shear compared to porous media flow, the macroscopic parameter apparent in-
situ viscosity, 𝜇𝑎𝑝𝑝, has been suggested to describe the fluid flow behavior of polymer
solutions in porous media (Sorbie, 1991). This parameter is derived from Darcy’s law
for single-phase, non-Newtonian fluids,
𝜇𝑎𝑝𝑝 =𝑘𝐴
𝑄
∆𝑃
𝐿 Eq. 4.9
23
where k is porous medium (or absolute) permeability, A is cross sectional area of
flow, 𝑄 is volumetric flow rate, and ∆P is pressure drop across a core of length, L.
Since polymer in-situ viscosity cannot be measured directly, it is typically estimated
based on pressure measurements during flow experiments in rock cores, where brine
and polymer solutions are injected alternatingly. While the pressure drop during brine
flow is used to calculate porous medium permeability, pressure drop during polymer
flow is used to estimate polymer in-situ viscosity as a function of flow rate (or Darcy
velocity). However, since the polymer is retained as it flows through porous media,
permeability to brine after polymer flooding may deviate significantly from the value
obtained prior to polymer flow, i.e. the residual resistance factor (𝑅𝑅𝐹) is above unity.
There is an ongoing debate in the scientific community regarding which of these
permeability values is the most representative to obtain the correct (or ‘true’) in-situ
viscosity for the polymer (Skauge et al., 2015).
Advocates of using permeability to brine before polymer flow stresses the fact that
some polymer typically remains in the porous medium, even after significant amount
of post flush. Consequently, as the porous medium is flooded with brine after polymer
flow, rate effects (e.g. hydrodynamic retention) may significantly affect pressure
measurements, and in turn the permeability obtained. The polymer in-situ viscosity is
therefore represented by the resistance factor (𝑅𝐹) in circumstances where permeability
to brine before polymer flow is used, and thereby incorporate both the viscosity
enhancement and permeability reducing capability of polymer relative to brine.
Researchers favouring the use of permeability to brine after polymer flow asserts that
since most of the polymer can be removed from the porous media after tapering
(stepwise reduction of polymer concentration during injection) and significant post
flush, polymer phenomena should be minimized during the subsequent brine flow.
Furthermore, they claim that the flow of polymer may significantly alter the flow path
of the subsequent brine through the porous medium. Therefore, the permeability
obtained before polymer flow may not be representative of the actual flow path of the
polymer and thus is an incorrect measure of the permeability to polymer. In cases where
24
permeability after polymer flow is used, the polymer in-situ viscosity is represented by
the ratio of resistance factor to residual resistance factor (𝑅𝐹/𝑅𝑅𝐹), and thus decouples
the viscosity enhancement ability from the permeability reducing capability of the
polymer relative to that of brine.
Due to the time-consuming and costly nature of polymer in-situ rheology
measurements by core flood experiments, several attempts have been made to relate
bulk and in-situ rheology based on polymer solution and porous media properties
(Christopher & Middleman, 1965; Savins, 1969; Teeuw & Hesselink, 1980; Cannella
et al., 1988; Sorbie et al., 1989; Fletcher et al., 1991; Pearson & Tardy, 2002; Lopez et
al., 2003; Sochi, 2010). The various methods for describing the flow of non-Newtonian
fluids in porous media consists of continuum models, capillary bundle models,
numerical models, and pore-scale network models (Sochi, 2010).
To effectively relate the bulk and in-situ rheology of non-Newtonian fluids, flow
velocities must be converted into ‘apparent’ shear rates within the porous medium
(Sorbie, 1991). A widely used expression for relating the Darcy velocity, 𝑢, of flowing
polymer solutions in porous media to the apparent (or effective) shear rate, �̇�, was
developed empirically by Chauveteau & Zaitoun (1981),
�̇� = 𝛼4𝑢
√8𝑘/𝜙 Eq. 4.10
where 𝛼 is a correction factor which is characteristic of the geometry and tortuosity of
the porous medium, 𝑘 is porous medium permeability and 𝜙 is porosity. However,
since no universally accepted model for relating bulk and in-situ rheology exists, in-
situ polymer rheology is modelled by performing flow experiment in rock cores.
4.4 Viscoelastic flow in porous media
The different rheological behaviors of viscoelastic fluids (e.g. HPAM) in flow through
porous media, as estimated by flow experiments in rock cores, are shown in figure 4.5.

25
Figure 4.5: Schematic illustration of a typical in-situ rheology curve for viscoelastic
fluids (e.g. HPAM).
4.4.1 Upper Newtonian plateau (1)
In accordance with its behavior in bulk flow, polymers may attain the zero-shear
viscosity value at the upper Newtonian plateau. However, the zero-shear in-situ
viscosity of polymers may be below the bulk fluid viscosity (Sorbie, 1991; Chauveteau
et al., 1984; Zaitoun & Kohler, 1987). In these cases, the reduced in-situ viscosity could
indicate that the polymer had a lower apparent concentration within the porous medium
or that a slip effect was in operation where the layer adjacent to porous media walls
was depleted of polymer. Within the semi-dilute concentration regime, the in-situ
viscosity of HPAM is below its value in bulk for both adsorbing and non-adsorbing
porous media (Chauveteau et al., 1984). Due to the relative increase of polymer
concentration in the faster streamlines in the centre of pores, the effect of surface
exclusion from pore walls is to accelerate the polymer solution through porous media.
Another effect which accelerates polymer solutions relative to brine in flow through
porous media is the inaccessible pore volume (IPV) phenomenon (Dawson & Lantz,
1972; Lötsch et al., 1985). In such circumstances, the polymer macromolecules are too
large to enter a certain fraction of pore throats and are thereby not able to propagate
through the entire pore space. Consequently, polymer molecules move in a subset of
(larger) pores and tend to move ahead of tracer species which are transported through
all pores.
26
Although they both accelerate the flow of polymer solutions in porous media, the
mechanisms of the IPV and depleted layer phenomena, are significantly different.
While the IPV phenomenon is due to steric hindrance of polymer molecules through
small pores and only occurs in low permeability porous media, the depleted layer effect
is due to the mechanism of steric repulsion between polymer molecules and pore walls,
and occurs in all permeability ranges. In contrast, aforementioned polymer flow
phenomena such as irreversible adsorption, mechanical entrapment and hydrodynamic
retention will delay rather than promote earlier breakthrough of the polymer front.
4.4.2 Shear-thinning region (2)
As viscoelastic fluids propagate through porous media, the flow is generally
characterized by both shear and extensional flow components. In the shear-thinning (or
pseudoplastic) regime, viscous flow dominates and extension (or stretching) of the
polymer molecules is negligible (Jones & Walters, 1989). Thus, the mechanism
responsible for the shear-thinning behavior is very similar to that in bulk flow where
separation of polymer coils and alignment in the flow direction reduce resistance to
flow.
While the occurrence of shear-thinning in simple shear flow is well established, the
behavior of semi-dilute polymer solutions at low flux through linear core plugs has
been ambiguously reported in the literature. Based on flow experiments in linear core
plugs, there has been reported Newtonian or near-Newtonian (Pye, 1964; Smith, 1970;
Jennings et al., 1971; Seright et al., 2009; Seright et al., 2011; Rodriguez et al., 2014;
Skauge et al., 2015; Zhang & Seright, 2015; Al-Shakry et al., 2018b), mild shear-
thinning (Heemskerk et al., 1984; Masuda et al., 1992) and significant shear-thinning
behavior of HPAM (Gogarty, 1967; Dupas et al., 2013; Manichand et al., 2013;
Delamaide et al., 2014).
Seright et al. (2011) attempted to clarify the observed behavior of HPAM at low flux
in flow through porous media by suggesting a set of limiting conditions for which
occurrence of shear-thinning behavior was likely to occur. They suggested that
occurences of significant shear-thinning for undegraded HPAM in low permeability
27
porous media was caused by ultrahigh molecular weight polymers, or microgels. Due
to their high propensity for being mechanically entrapped by the porous medium, these
high molecular weight species are likely to reduce permeability and significantly
increase the resistance factor at low flux. However, they suspected that these high
molecular weight species would not propagate very far into the reservoir formation and
that they might be retained by filtration or mechanically degraded at realistic reservoir
conditions. They did recognize that in low salinity conditions (below 0.3% TDS),
where the probability of mechanical degradation is limited (Maerker, 1975), and in
very permeable porous media (above 1 Darcy permeability) where ultrahigh molecular
weight species are able to effectively propagate far into the formation without forming
external or internal filter cakes, shear-thinning behavior was likely to occur. In
circumstances beyond their limitations, they suggested that the observed shear-thinning
of HPAM could be an experimental artifact due to the use of insufficiently accurate
pressure tranducers during flow experiments. Indeed, in all aforementioned
investigations where significant shear-thinning was reported, either the salinity of the
make-up brine was below 0.3% TDS (Gogarty, 1967), or the porous medium
permeability was significantly higher than 1 Darcy (Dupas et al., 2013; Manichand et
al., 2013; Delamaide et al., 2014).
In contrast to the explanation provided by Seright et al. (2011), where microgels were
considered responsible for the shear-thinning behavior or HPAM, Al-Shakry et al.
(2019a) showed that concentrated solutions which had been either prefiltered or
presheared, i.e. microgel-free, still exhibited shear-thinning behavior in porous media.
Furthermore, Skauge et al. (2016) showed that linear and radial polymer flow were
significantly different for a viscoelastic HPAM polymer in flow through Bentheimer
sandstone. While Newtonian behavior was observed at low flux in linear flow,
significant shear-thinning was observed during radial flow experiments.
Thus, it may appear that the mechanism(s) responsible for the existence of shear-
thinning behavior of viscoelastic polymer solutions in porous media are still not
quantified and that the flow geometry should be taken into account when modelling
polymer flow in porous media.
28
Whether an EOR polymer shows Newtonian or shear-thinning behavior at low flux
may have tremendous influence on the polymer solution’s ability to provide improved
mobility ratio conditions deep in the reservoir. Since shear-thinning solutions generally
provide much higher viscosities at low flux (i.e. deep reservoir velocities) compared to
Newtonian solutions, expected recovery will be significantly affected by the choice of
polymer behavior. Consequently, modelling the polymer flow in an oil reservoir using
Newtonian behavior if the fluid actually exhibits shear-thinning behavior would
underestimate the economic and technical feasibility of the polymer flood project.
4.4.3 Lower Newtonian plateau (3)
While the lower Newtonian plateau is associated with the decreasing and ultimate cease
of interactions between polymer coils in bulk flow, the situation is significantly
different for viscoelastic fluids in flow through porous media. In porous medium flow,
the lower Newtonian plateau represents the flux interval where neither the viscous nor
elastic components of viscoelastic fluids dominate. Consequently, the flow behavior is
apparently Newtonian. For fluids which shows no shear-thinning behavior in porous
media, this region will merge with the upper Newtonian plateau.
4.4.4 Shear-thickening region (4)
Above some critical flow rate (�̇�𝐶2), but still in the laminar flow regime, the elastic
nature of HPAM will dominate its viscous counterpart. Consequently, the polymer
molecules are subjected to significant amounts of stretching as the flow becomes
extensional dominated. The significant increase in flow resistance during extensional
flow is referred to as shear-thickening behavior and was first reported for viscoelastic
polymer flow through porous glass beads (Dauben & Menzie, 1967).
Shear-thickening behavior has been used interchangeably in the polymer literature with
extensional viscosity (Zamani et al. 2015), elongational viscosity (Vik et al. 2018),
strain-thickening behavior (Glasbergen et al., 2015) dilatant behavior (Skauge et al.
2016) and viscoelastic behavior (Seright et al. 2011). However, these terminologies
may not necessarily be identical since the origin of the increased flow resistance might
be deviating. While concepts such as elongational viscosity and viscoelastic behavior

29
explicitly state that the increased flow resistance is (at least partly) due to the elastic
properties of the polymer, concepts such as shear-thickening and dilatant behavior are
more general and does not specify the origin of the increased flow resistance. In this
thesis, shear-thickening behavior is used to describe the increased flow resistance with
flux, and may originate from inelastic (viscous) and elastic polymer behavior.
Even though the shear-thickening behavior of HPAM in porous media is well-
documented (Pye, 1964; Smith, 1970; Heemskerk et al., 1984; Masuda et al., 1992;
Seright et al., 2011; Skauge et al., 2016; Al-Shakry, 2019a), and wide consensus exist
concerning its occurrence, there is an ongoing debate in the scientific community
regarding its origin (Rodriguez et al., 1993). Two main theories are adhered to by
researchers, namely the coil stretch theory (De Gennes, 1974) and the transient network
theory (Odell et al., 1988).
According to the coil stretch theory, the elongation (or stretching) of polymer
molecules is accompanied by an accumulation of polymer molecules at the fluid
surface rather than in the bulk of the fluid volume. Consequently, interactions between
polymer molecules and porous media walls increase, which promotes higher resistance
to flow. In contrast, the transient network theory asserts that the increased flow
resistance as polymer molecules are stretched is due to the formation of transient
networks internally in the fluid rather than increased friction forces at the fluid surface.
The flow of Newtonian fluids is often characterized by the dimensionless Reynolds
number, 𝑁𝑅𝑒, where the transition between different flow regimes such as laminar and
turbulent flow may be quantified. The Reynolds number expresses the ratio of inertial
to viscous forces, and for flow through a conduit may be defined as (Fanchi and
Christiansen, 2017),
𝑁𝑅𝑒 =𝜌𝑣𝐷
𝜇 Eq. 4.11
where 𝜌 is fluid density, 𝑣 is velocity through the conduit, 𝐷 is diameter of the conduit,
and 𝜇 is the bulk fluid viscosity. The Reynolds number is often of interest since the
shift from laminar to turbulent flow for Newtonian fluids typically accompanies a
30
significant increase in flow resistance. However, for viscoelastic fluid flow in porous
media, the sharp increase in flow resistance associated with shear-thickening behavior
occurs in the laminar flow regime. Thus, the Reynolds number is not an appropriate
parameter to differentiate between the different flow regimes of interest within polymer
flooding applications. Thus, for viscoelastic polymeric fluids, the onset of shear-
thickening (�̇�𝐶2) associated with the transition from viscous to elastic dominated flow
has been determined by using the Deborah number rather than the Reynolds number.
The Deborah number, 𝑁𝐷𝑒, may be interpreted as the ratio of elastic to viscous forces
and is generally defined as the ratio of the characteristic time of the polymeric fluid,
𝜃𝑓, to the duration of the process, 𝜃𝑝 (Sorbie, 1991):
𝑁𝐷𝑒 =𝜃𝑓
𝜃𝑝
Eq. 4.12
For flow of viscoelastic polymer solutions through a porous medium, the characteristic
time corresponds to the polymer relaxation time and the process time is equivalent to
the travel time between successive pore throats. Consequently, the Deborah number is
zero for Newtonian fluids (zero relaxation time) and infinite for Hookean solids
(infinite relaxation time). The Deborah number has been used extensively in the
literature to describe the polymer’s viscoelastic effects (Marshall & Metzner, 1967;
Savins, 1969; Bird et al. 1987; Vorwerk & Brunn, 1991; Kozicki, 2002) and
particularly during polymer flooding studies (Heemskerk et al., 1984; Azad & Trivedi,
2017; Qi et al., 2017; Erincik et al., 2018).
Large discrepancies exist in the magnitude of the reported Deborah number in the
literature, which is suggested to be the consequence of the inconsistency in using
different relaxation and residential times (Azad & Trivedi, 2019). Furthermore, the
Deborah number does not take into account the microscopic features of the porous
medium, which have significant impact on the onset of extensional flow (Zamani et al.,
2015). Thus, the Deborah number on its own is not considered to be adequate to predict
the onset of extensional flow for viscoelastic polymer solutions in porous media.
31
The onset of shear-thickening for EOR polymers is of great concern for polymer
flooding applications. As polymer solutions becomes increasingly shear-thickening,
injection pressure increase and thus the injectivity (how easily the polymer may be
injected) decreases. Consequently, as the onset of shear-thickening shifts towards
lower velocities, the injectability at a particular volumetric injection rate is reduced.
Thereby, the onset of shear-thickening has been given high attention in the literature.
Based on flow experiments using HPAM solutions in the semi-dilute concentration
regime, the onset of shear-thickening shifts towards lower velocities with increasing
polymer molecular weight (Heemskerk et al., 1984; Seright et al., 2009; Dupas et al.,
2013; Skauge et al., 2015), aspect ratio of the porous medium (Chauveteau, 1981), in
linear compared to radial flow (Skauge et al., 2016), with decreasing permeability
(Heemskerk et al., 1984; Seright et al., 2011; Al-Shakry et al., 2019b), temperature
(Heemskerk et al., 1984), and solvent salinity (Heemskerk et al., 1984; Chauveteau,
1981), and is independent of concentration (Seright et al., 2011; Skauge et al., 2015;
Clarke et al., 2016).
4.4.5 Mechanical degradation (5)
As the flow resistance increases during extensional flow, the stress will at some point
become so large that the bonds between the polymer molecules in solution are
effectively pulled apart, and is referred to as mechanical degradation of the polymer
(as described in chapter 3.4). This is an irreversible process where the solution viscosity
abruptly decreases. As shear rates are increased further, the degree of mechanical
degradation increases until the viscosity ultimately approach that of the solvent at
infinitely high shear rates.
32
4.5 Reduction of residual oil by viscoelastic polymers
Although polymer flooding has primarily been implemented to accelerate oil
production by sweep improvement, results from recent decades indicate that injection
of viscoelastic polymer solutions may increase the microscopic displacement
efficiency as well (Azad & Trivedi, 2019). The elastic properties of polymer solutions
in flow through porous media are considered responsible for the reduction in residual
oil saturation (𝑆𝑜𝑟), where the majority of pore scale studies explain the 𝑆𝑜𝑟-reduction
through the development of normal stress components during extensional flow (Wang
et al., 2000; Xia et al., 2004; Yin et al., 2006; Jiang et al., 2008; Urbissinova et al.,
2010; Afsharpoor & Balhoff, 2013; Vermolen et al., 2014; Qi et al., 2017).
Furthermore, adsorption (Zaitoun & Kohler, 1987), elastic turbulence (Clarke et al.
2016), and wettability alteration (Seright, 2017) have been suggested as additional
mechanisms that reduce 𝑆𝑜𝑟 during polymer flooding.
33
5. Polymer injectivity
The injectability of polymer solutions into an oil reservoir is crucial to the economic
feasibility of any polymer flood project (Wang et al., 2007; Sheng et al., 2015). Indeed,
based on a simple cost analysis performed by Seright (2010), poor injectivity was
suggested to have a more pronounced effect on the economics of heavy oil projects
than the cost of the polymer itself. Injectivity, 𝐼, may be defined as the ratio of
volumetric injection rate, 𝑄, to the generated injection pressure, ∆𝑃, (Seright, 1983):
𝐼 =𝑄
∆𝑃 Eq. 5.1
5.1 Factors influencing polymer injectivity
While the viscosifying ability of water soluble polymers, which is imperative for
mobility control, is the most obvious reason for an anticipated injectivity decline,
several other mechanisms may have an impact as well. The three principal properties
of EOR polymers which affect injectivity are (1) debris in the polymer, (2) in-situ
polymer rheology, and (3) polymer mechanical degradation (Seright et al., 2009; Dupas
et al., 2013; De Simoni et al., 2018).
5.1.1 Debris in the polymer (1)
During injection into oil reservoirs, debris in the polymer solution may accumulate at
the sandface and lead to near-wellbore plugging (Burnett, 1975). As an external filter
cake develops at the sandface, the generated injection pressure will increase and
injectivity is reduced. Typically, filter tests using membrane or sand filters are used to
assess plugging (Sorbie, 1991). However, since throughputs during lab filter tests are
much lower than field throughputs, significant uncertainties in measurements may
ensue (Seright et al. 2009). Formation plugging by polymers may be mitigated by pre-
filtering or pre-shearing the polymer solution before injection (Glasbergen et al., 2015).
While pre-filtering a polymer solution constitutes removing the insoluble particles
which may accumulate at the sandface during injection, pre-shearing the polymer
solution effectively removes the high molecular weight part of the molecular weight
34
distribution by mechanically shearing the polymer prior to injection. In conjunction
with results reported by Dupas et al. (2013), Al-Shakry et al. (2019a) showed that pre-
shearing HPAM solutions could improve injectivity while maintaining the low-flux in-
situ viscosities. Thereby, injectivity could be improved while maintaining the mobility
control properties of the injected solution which provides enhanced mobility ratio
conditions for the displacement process. However, as polymer solutions were pre-
sheared, the viscoelastic properties, which are considered responsible for the reduction
of residual oil saturation, were less pronounced. Thus, the increasing injectivity may
be at the cost of incremental oil recovery. In contrast, pre-filtering may improve the
filterability of the polymer solution without affecting its viscoelastic properties and
may be the preferred mitigation measure in some cases.
5.1.2 In-situ polymer rheology (2)
The non-Newtonian rheology of polymers as they flow through porous media is
suggested to be the most crucial factor that affects polymer injectivity (Yerramilli et
al., 2013; Li & Delshad, 2014). Since the flow out from the injectors in oil reservoirs
is radial, the principal pressure drop occurs in the near-wellbore region where the
injected fluid attains its maximum flow velocities. In this flow regime, viscoelastic
polymer solutions such as HPAM typically exhibit shear-thickening flow behavior.
Since the degree (or slope) of shear-thickening increase with molecular weight
(Heemskerk et al., 1984; Dupas et al., 2013; Al-Shakry et al., 2019a), pre-shearing may
be a viable option to reduce the viscoelastic properties and the associated shear-
thickening ability of the polymer solution. However, since the viscoelastic properties
of the polymer solution are considered responsible for its ability to improve
microscopic displacement efficiency during flooding, it might again become a trade-
off between injectivity and incremental oil recovery. Reduction in polymer
concentration, which reduces polymer solution viscosity, can be another obvious
mitigation for injectivity decline in cases where polymer in-situ rheology is the
principal cause. However, this may reduce the polymer solution effectiveness in
improving the mobility ratio deep inside the reservoir.

35
5.1.3 Polymer mechanical degradation (3)
As flow velocities are increased beyond some critical value, mechanical degradation
of the polymer and an associated entrance pressure drop is recorded (Seright, 1983;
Seright et al., 2011). Consequently, an irreversible viscosity reduction is imparted on
the injected polymer solution as the high molecular weight polymer species are
degraded into smaller ones. Due to the radial flow out from the injector in oil reservoirs,
mechanical degradation occurs in the near-wellbore region where the polymer solution
attain its highest velocities. Thus, mechanical degradation is considered to be a near-
well effect with only minor degradation occurring deeper in the formation (Åsen et al.,
2019). In conjunction with the mitigation measure for the shear-thickening behavior of
HPAM solutions, preshearing may be performed to reduce mechanical degradation of
the polymer in the near-wellbore region.
Polymer injection above the formation-parting pressure, and associated fracture
growth, are often crucial to achieve acceptable injectivities (Seright, 2017). Indeed,
under the proper circumstances, fractures can increase fluid injectivity, oil productivity,
and sweep efficiency (Wang et al., 2008). In addition, fractures reduces the risk of
mechanical degradation for polyacrylamide solutions. The key is to predict how the
fractures would extend in the formation to determine whether the fracture growth will
be adverse or favorable for the reservoir sweep efficiency. In cases where fracture
growth is detrimental to the reservoir sweep and needs to be avoided, injection rates
must be lowered and thus injectivity decline ensues. Additional details concerning the
effects of fracture growth on injectivity can be found elsewhere (Saripalli et al., 1999;
Gadde & Sharma, 2001; Wang et al., 2008; Lee et al., 2011; Zechner et al., 2015).
5.2 Injectivity models
Several researchers have proposed different models to estimate the injectivity of
viscoelastic polymers. Seright (1983) developed a simple model for predicting polymer
injectivity for viscoelastic fluids. His model separates the generated injection pressure
into individual contributions for Newtonian flow, two-phase flow, entrance pressure
(mechanical degradation) and shear-thickening. However, the model appears to
36
significantly overestimate the injection pressure drop during radial flow, especially at
high flux, which is most critical for injectivity.
Yerramilli et al. (2013) proposed a numerical model for predicting polymer injectivity
during single-phase flow of polymer solutions in porous media. However, since this
model is only valid in the shear-thinning regime, it may not be able to provide accurate
estimates for viscoelastic polymer solutions which additionally exhibit shear-
thickening behavior in the porous medium.
Li & Delshad (2014) developed and implemented an analytical polymer injectivity
model in simulation software. The model improved calculations, especially for coarse
well block sizes, and was able to incorporate both the shear-thinning and shear-
thickening behavior of polymers. Polymer injectivity was successfully captured by
simulation of a pilot field-scale polymer flood without the need to introduce empirical
parameters.
Lotfollahi et al. (2016) proposed an injectivity model which they successfully used to
history match field injection pressures at different rate steps. Furthermore, they
attributed the pressure increase in polymer injectors to (1) the formation of an oil bank,
(2) shear-thickening behavior near the wellbore, and (3) external cake build-up by
polymer plugging.
Despite of extensive research and improved injectivity models, the prediction of
polymer injectivity remains elusive. Indeed, polymer injectivity is subject to a high
degree of controversy and discussions in the literature. In particular, it has been
implicitly assumed that the in-situ rheology of polymers may be estimated from linear
flow experiments. However, significant deviation was observed between linear and
radial polymer flow by Skauge et al. (2016) which suggest that the radial flow geometry
of polymer solutions as they are injected into oil reservoirs should be taken into
account. Thus, before accurate and reliable polymer injectivity models can be
developed, polymer in-situ rheology must be quantified in radial flow since it best
mimickes the flow out from the injector in oil reservoirs. Consequently, the focus of
this thesis in on the mechanistic modelling of radial polymer flow in porous media.
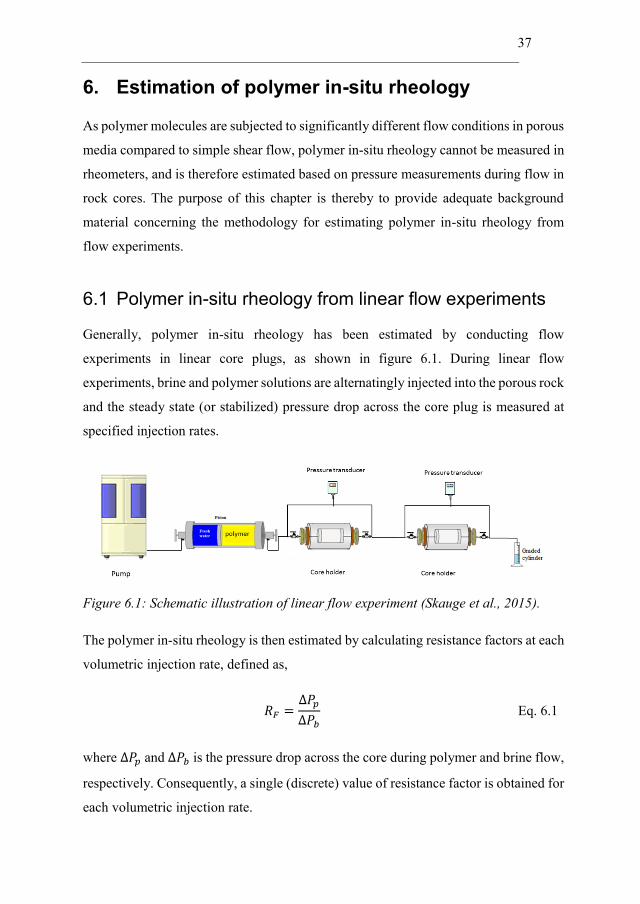
37
6. Estimation of polymer in-situ rheology
As polymer molecules are subjected to significantly different flow conditions in porous
media compared to simple shear flow, polymer in-situ rheology cannot be measured in
rheometers, and is therefore estimated based on pressure measurements during flow in
rock cores. The purpose of this chapter is thereby to provide adequate background
material concerning the methodology for estimating polymer in-situ rheology from
flow experiments.
6.1 Polymer in-situ rheology from linear flow experiments
Generally, polymer in-situ rheology has been estimated by conducting flow
experiments in linear core plugs, as shown in figure 6.1. During linear flow
experiments, brine and polymer solutions are alternatingly injected into the porous rock
and the steady state (or stabilized) pressure drop across the core plug is measured at
specified injection rates.
Figure 6.1: Schematic illustration of linear flow experiment (Skauge et al., 2015).
The polymer in-situ rheology is then estimated by calculating resistance factors at each
volumetric injection rate, defined as,
𝑅𝐹 =∆𝑃𝑝
∆𝑃𝑏
Eq. 6.1
where ∆𝑃𝑝 and ∆𝑃𝑏 is the pressure drop across the core during polymer and brine flow,
respectively. Consequently, a single (discrete) value of resistance factor is obtained for
each volumetric injection rate.
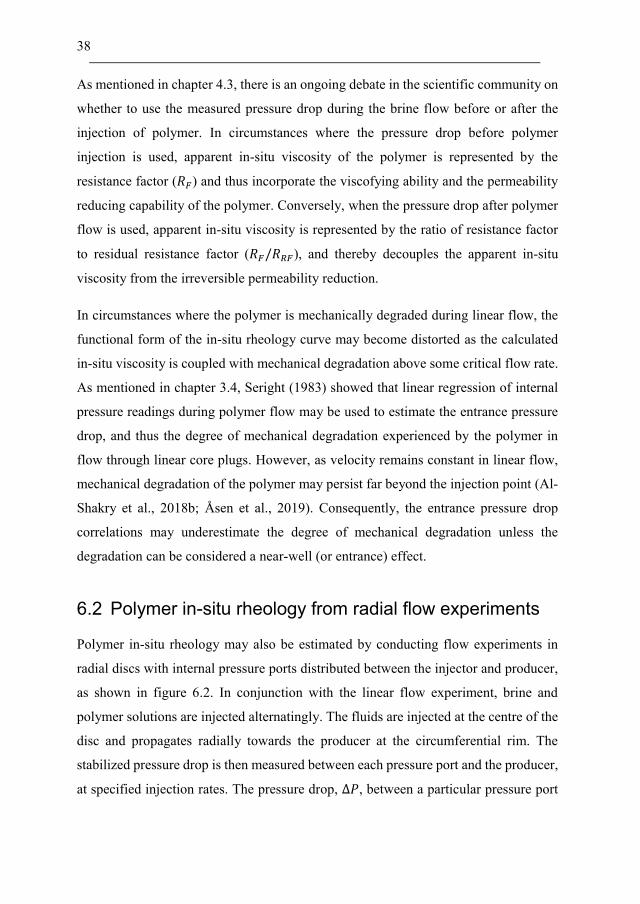
38
As mentioned in chapter 4.3, there is an ongoing debate in the scientific community on
whether to use the measured pressure drop during the brine flow before or after the
injection of polymer. In circumstances where the pressure drop before polymer
injection is used, apparent in-situ viscosity of the polymer is represented by the
resistance factor (𝑅𝐹) and thus incorporate the viscofying ability and the permeability
reducing capability of the polymer. Conversely, when the pressure drop after polymer
flow is used, apparent in-situ viscosity is represented by the ratio of resistance factor
to residual resistance factor (𝑅𝐹/𝑅𝑅𝐹), and thereby decouples the apparent in-situ
viscosity from the irreversible permeability reduction.
In circumstances where the polymer is mechanically degraded during linear flow, the
functional form of the in-situ rheology curve may become distorted as the calculated
in-situ viscosity is coupled with mechanical degradation above some critical flow rate.
As mentioned in chapter 3.4, Seright (1983) showed that linear regression of internal
pressure readings during polymer flow may be used to estimate the entrance pressure
drop, and thus the degree of mechanical degradation experienced by the polymer in
flow through linear core plugs. However, as velocity remains constant in linear flow,
mechanical degradation of the polymer may persist far beyond the injection point (Al-
Shakry et al., 2018b; Åsen et al., 2019). Consequently, the entrance pressure drop
correlations may underestimate the degree of mechanical degradation unless the
degradation can be considered a near-well (or entrance) effect.
6.2 Polymer in-situ rheology from radial flow experiments
Polymer in-situ rheology may also be estimated by conducting flow experiments in
radial discs with internal pressure ports distributed between the injector and producer,
as shown in figure 6.2. In conjunction with the linear flow experiment, brine and
polymer solutions are injected alternatingly. The fluids are injected at the centre of the
disc and propagates radially towards the producer at the circumferential rim. The
stabilized pressure drop is then measured between each pressure port and the producer,
at specified injection rates. The pressure drop, ∆𝑃, between a particular pressure port
39
at radius 𝑟𝑖 and the production rim at 𝑟𝑒, may be described by Darcy’s law for radial
flow,
∆𝑃 =𝜇𝑎𝑝𝑝𝑄
2𝜋ℎ𝑘𝑏
𝑙𝑛𝑟𝑒
𝑟𝑖
Eq. 6.2
where 𝜇𝑎𝑝𝑝 is apparent (in-situ) viscosity, 𝑄 is volumetric injection rate, ℎ is disc
thickness, and 𝑘𝑏 is permeability to brine.
Figure 6.2: Disc used for radial flow experiments.
In contrast to the linear flow regime, velocity decreases as 1/𝑟 in radial flow. Thus, the
polymer is exposed to an interval of flow velocities at each volumetric injection rate,
ranging from the maximum velocity at the injection point to the minimum velocity at
the production rim.
Unlike linear flow experiments where a single (discrete) value of in-situ viscosity is
obtained at each injection rate, continuous in-situ rheology curves are obtained from
each injection rate in radial flow experiments. Thus, to estimate permeability and
polymer in-situ viscosity from brine and polymer floods during radial flow
experiments, respectively, history matching of the pressure data may be performed.
History matching is a type of inverse problem where an observed behavior is used to
estimate model variables that caused the behavior (Oliver & Chen, 2011). In radial flow
experiments, the observed behavior (pressure drop) is used to estimate model variables
that caused the behavior such as permeability and polymer in-situ rheology.
40
In the process of history matching radial flow experiments, the permeability obtained
during brine flow (either before or after polymer flow) is used as a constant input
parameter when the polymer flow pressure data is being history matched. Thus, history
matching radial flow experiments to obtain the polymer in-situ rheology relies on the
assumption that permeability to brine and polymer are equal. In cases where the flow
path of the polymer deviates significantly from that of brine, indicated by high values
of the 𝑅𝑅𝐹, the assumption of equal permeabilities could induce uncertainties to the
interpretation of results. However, in polymer flow experiments with low values of the
𝑅𝑅𝐹, the assumption of equal permeability to brine and polymer may be justified.
6.3 History match methods for radial flow experiments
For radial flow experiments with internal pressure ports distributed between the
injector and producer, differential pressure may be history matched as a function of
either volumetric injection rate, dP(Q), or radial distance dP(r).
6.3.1 Single port match method (SPMM)
Using the single port match method (SPMM), differential pressure during polymer
flow is history matched as a function of volumetric injection rate, dP(Q), yielding
continuous in-situ rheology curves based on the pressure drop between each pressure
port and the producer. While the in-situ rheology curve obtained from history matching
the pressure drop between injection bottom-hole pressure (BHP) and the producer
spans the entire velocity interval of the polymer, differential pressure between internal
pressure ports and the producer span decreasing intervals of the complete in-situ
rheology curve as we move towards the producer.
In flow through porous media, polymer solutions will contract and expand in pore
throats and pore bodies, respectively. Through a series of pore scale experiments,
Chauveteau (1981) showed that the in-situ rheology of HPAM depends on the number
of prior contraction events experienced by the fluid, i.e. on the polymer history. Since
the number of contraction events increase with radial distance, the polymer will have
a different pre-history at different locations in the radial disc. Thus, to investigate
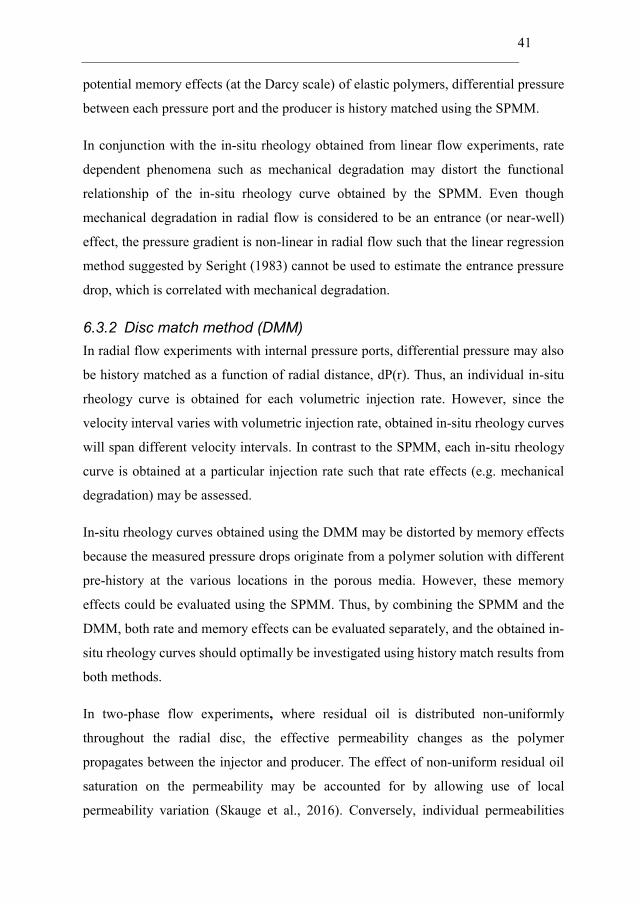
41
potential memory effects (at the Darcy scale) of elastic polymers, differential pressure
between each pressure port and the producer is history matched using the SPMM.
In conjunction with the in-situ rheology obtained from linear flow experiments, rate
dependent phenomena such as mechanical degradation may distort the functional
relationship of the in-situ rheology curve obtained by the SPMM. Even though
mechanical degradation in radial flow is considered to be an entrance (or near-well)
effect, the pressure gradient is non-linear in radial flow such that the linear regression
method suggested by Seright (1983) cannot be used to estimate the entrance pressure
drop, which is correlated with mechanical degradation.
6.3.2 Disc match method (DMM)
In radial flow experiments with internal pressure ports, differential pressure may also
be history matched as a function of radial distance, dP(r). Thus, an individual in-situ
rheology curve is obtained for each volumetric injection rate. However, since the
velocity interval varies with volumetric injection rate, obtained in-situ rheology curves
will span different velocity intervals. In contrast to the SPMM, each in-situ rheology
curve is obtained at a particular injection rate such that rate effects (e.g. mechanical
degradation) may be assessed.
In-situ rheology curves obtained using the DMM may be distorted by memory effects
because the measured pressure drops originate from a polymer solution with different
pre-history at the various locations in the porous media. However, these memory
effects could be evaluated using the SPMM. Thus, by combining the SPMM and the
DMM, both rate and memory effects can be evaluated separately, and the obtained in-
situ rheology curves should optimally be investigated using history match results from
both methods.
In two-phase flow experiments, where residual oil is distributed non-uniformly
throughout the radial disc, the effective permeability changes as the polymer
propagates between the injector and producer. The effect of non-uniform residual oil
saturation on the permeability may be accounted for by allowing use of local
permeability variation (Skauge et al., 2016). Conversely, individual permeabilities

42
between each pressure port and the producer (during brine flow) may be estimated
using the SPMM. Consequently, the polymer pressure response could be normalized
to the same permeability such that deviating flow conditions due to the permeability
variation are effectively decoupled from the polymer pressure response. While local
permeability variation was used to account for the non-uniform residual oil saturation
in Paper 1, correction factors were calculated and the polymer pressure data was
normalized in Papers 2-4.
6.4 Simulation and history match tools
6.4.1 Simulation tool
The reservoir simulation tool used to history match radial flow experiments in this
thesis is the STARS (black oil) simulator by Computer Modelling Group (CMG).
STARS was chosen due to its applicability for advanced modelling of polymer flooding
processes, and due to its ability to incorporate the full spectrum of possible rheology
behaviors exhibited by HPAM in flow through porous media, i.e. shear-thinning,
Newtonian and shear-thickening fluid behavior.
In addition to general petrophysical and fluid properties, the script files used to run
simulations in STARS contained polymer specific properties and corresponding
keywords such as velocity dependent viscosity (SHEARTAB), adsorption
(ADSTABLE), inaccessible pore volume (PORFT) and residual resistance factor
(RRFT). For additional details regarding keywords and governing mass conservation
equations used by the simulator tool, the reader is referred to the STARS user manual
(Computer Modelling Group, 2016).
6.4.2 Automatic history match tool
The investigation of noise and cumulative pressure measurement error on in-situ
rheology from radial flow experiments (Paper 2 and 3) was performed by using the
automatic history match tool CMOST by CMG. History match operations were
conducted automatically rather than manually to exclude any pre-biasness from
affecting the ultimate outcome of the investigations.

43
Several different history match engines are available to perform automatic history
match operations in CMOST. In this thesis, the Particle Swarm Optimization (PSO)
engine was mainly used, and proved to be time-efficient and converged to acceptable
global history match minima in most cases. However, as mentioned in Paper 2 and
Paper 3, the PSO engine experienced difficulties converging towards acceptable global
minimum values in a few cases. For these cases, the more robust, albeit more time
consuming engine, Bayesian Markow Chain Monte Carlo (MCMC), was used.
To perform automatic history match operations, a field history file (FHF) containing
the generic pressure data from an arbitrarily chosen in-situ rheology curve was loaded
into the CMOST application. CMOST would then attempt to history match the
provided pressure data by determining six various parameters in an implemented fluid
equation. The fluid equation which was used in CMOST is an extended version of the
Carreau equation (Delshad et al., 2008), which include the shear-thinning, Newtonian
and shear-thickening behavior of viscoelastic fluids in flow through porous media:
𝜇𝑎𝑝𝑝 = 𝜇∞ +𝜇0 − 𝜇∞
(1 + (𝜆1𝑢)2)1−𝑛1
2
+ 𝜇𝑚𝑎𝑥[1 − exp (−(𝜆2𝑢)𝑛2−1)] Eq. 6.3
where 𝜇𝑎𝑝𝑝 is apparent in-situ viscosity, 𝜇∞ and 𝜇0 are limiting Newtonian viscosities
at high and low shear limits, respectively, λ and 𝑛 are empirical constants, 𝑢 is
superficial velocity of the polymer and 𝜇𝑚𝑎𝑥 is the shear-thickening plateau viscosity.
6.5 Radial simulation model and sensitivity analysis
The simulation model used in conjunction with the STARS simulation tool is illustrated
in figure 6.3, which shows the decreasing velocity with distance from the injector in
radial flow. In accordance with the discs used for the radial flow experiments which
were history matched in this thesis, the simulation model consisted of a radial disc with
radius of 15 cm and thickness between 2-3 cm. The radial grid was made up of 150
concentric rings with uniform length, ∆𝑟=0.1cm.

44
Figure 6.3: Simulation model used in conjunction with simulations in STARS.
Prior to history matching the radial flow experiments, a comprehensive sensitivity
analysis on the simulation model was performed, where the following parameters (with
associated keywords) were investigated: grid block size, maximum timestep
(DTMAX), molecular weight (CMM), polymer adsorption (ADSTABLE),
inaccessible pore volume (PORFT), and residual resistance factor (RRFT).
The grid block size of the concentric rings making up the simulation model had
significant impact on the stabilized pressure drop. Indeed, the rapid pressure drop with
distance from the injector during radial flow increase the sensitivity of the calculations
to grid block size. As grid block size approached 0.1 cm, negligible accuracy
improvements were obtained, as shown in figure 6.4. Consequently, the simulation
model was ran with 150 grid blocks for all simulations conducted in this thesis.
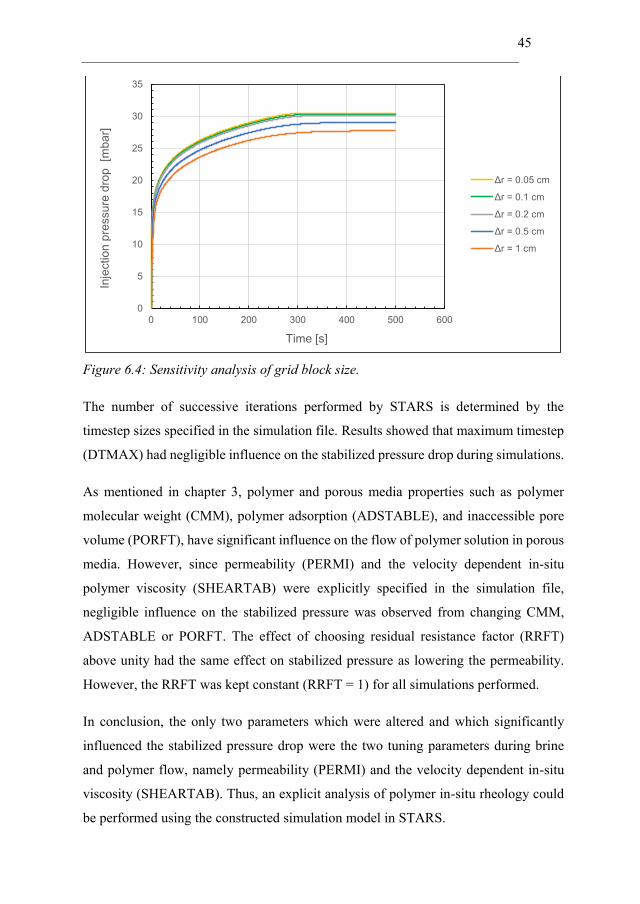
45
Figure 6.4: Sensitivity analysis of grid block size.
The number of successive iterations performed by STARS is determined by the
timestep sizes specified in the simulation file. Results showed that maximum timestep
(DTMAX) had negligible influence on the stabilized pressure drop during simulations.
As mentioned in chapter 3, polymer and porous media properties such as polymer
molecular weight (CMM), polymer adsorption (ADSTABLE), and inaccessible pore
volume (PORFT), have significant influence on the flow of polymer solution in porous
media. However, since permeability (PERMI) and the velocity dependent in-situ
polymer viscosity (SHEARTAB) were explicitly specified in the simulation file,
negligible influence on the stabilized pressure was observed from changing CMM,
ADSTABLE or PORFT. The effect of choosing residual resistance factor (RRFT)
above unity had the same effect on stabilized pressure as lowering the permeability.
However, the RRFT was kept constant (RRFT = 1) for all simulations performed.
In conclusion, the only two parameters which were altered and which significantly
influenced the stabilized pressure drop were the two tuning parameters during brine
and polymer flow, namely permeability (PERMI) and the velocity dependent in-situ
viscosity (SHEARTAB). Thus, an explicit analysis of polymer in-situ rheology could
be performed using the constructed simulation model in STARS.
0
5
10
15
20
25
30
35
0 100 200 300 400 500 600
Inje
ction
pre
ssu
re d
rop
[m
bar]
Time [s]
Δr = 0.05 cm
Δr = 0.1 cm
Δr = 0.2 cm
Δr = 0.5 cm
Δr = 1 cm

46

47
7. Results and discussion
7.1 Introduction
The current chapter contain three different sections that summarize and discuss the
principal results and observations obtained during the course of this thesis. The chapter
is concluded with a final section (7.5) which summarizes the results presented.
Section 7.2 presents the qualification of history match methods which are used to
estimate polymer in-situ rheology from radial flow experiments. Herein, the principal
results from Paper 2 and Paper 3 are presented, where the effects of pressure
measurement noise and cumulative measurement error during radial flow experiments
on the obtained in-situ rheology curves, are assessed. Lastly, results from Paper 4 are
shown where the pressure build-up during radial polymer flow is analysed to increase
anchoring data for in-situ rheology estimation from field injectivity tests.
Section 7.3 summarizes the results on rate and memory effects of the HPAM polymers
investigated in Paper 2 and Paper 3. In addition, unpublished results on the rate and
memory effects of a higher molecular weight HPAM polymer, is presented.
Section 7.4 quantifies polymer in-situ rheology and polymer injectivity. Here, the main
results from Paper 1 are presented, where the impact of oil on polymer in-situ rheology
was investigated. Furthermore, additional analysis is presented on the impact of flow
geometry on in-situ rheology in both absence and presence of oil. Lastly, the behavior
of HPAM at low flux is addressed and new insights are given.

48
7.2 Qualification of history match methods for radial flow
Conventionally, pressure drop versus volumetric injection rate data from linear core
floods have been used to measure the in-situ rheology of non-Newtonian fluids in
porous media. However, linear flow is characterized by steady-state conditions, in
contrast to radial flow where both pressure and shear-forces have non-linear gradients.
Indeed, Skauge et al. (2016) demonstrated that linear and radial polymer flow in porous
media is significantly different, and suggested that the observed deviation was a
consequence of the time-dependent nature of the polymer. In their work, the recently
developed history match method for radial flow (the disc match method) was employed
where differential pressure was history matched as a function of radial distance, dP(r).
7.2.1 Pressure measurement noise analysis
Although the disc match method (DMM) has been applied in several papers recently
(Skauge et al., 2016; Skauge et al., 2018), effects of measurement noise from pressure
transducers on the estimated in-situ rheology curves, has not been quantified.
Moreover, it has been suggested that the observed shear-thinning behavior of HPAM
at low flux in porous media may in some cases be an experimental artifact due to the
use of insufficiently accurate pressure transducers (Seright et al., 2009).
To quantify the effect of pressure measurement noise on the estimated polymer in-situ
rheology using the DMM, a reference (base case) in-situ rheology curve was
constructed by specifying the six parameters required in the extended Carreau equation
(Eq. 6.3), as shown in Paper 2. This completely generic reference curve was then used
as input during simulation runs in STARS in order to create a dataset which was perfect,
i.e. without any influence of measurement noise on the pressure data. Furthermore, this
dataset was randomly ‘contaminated’ with different degrees of pressure measurement
noise (5, 10, and 20 %) to identify the upper noise limit below which reliable estimates
of the reference in-situ rheology could be made. Thus, how much pressure
measurement noise is tolerable during radial flow experiments (using the DMM) before
the estimated in-situ rheology significantly deviate from the reference behavior, and
the polymer in-situ rheology signal is lost in noise?

49
Results from the pressure measurement noise analysis showed that the upper noise limit
below which accurate estimates of polymer in-situ rheology could be made (using the
DMM) was ±10 % pressure measurement noise, as shown in figure 7.1.
Figure 7.1: Comparison of reference and estimated in-situ rheology curves after ±10
% pressure measurement noise, using the DMM.
At low to intermediate flux, all estimated in-situ rheology curves was in agreement
with the reference behavior, i.e. significant shear-thinning behavior was observed. At
intermediate to high flux, a significant deviation from the reference rheology was
observed (Q = 0.6 mL/min), in which the estimated in-situ rheology curve displayed
shear-thinning rather than the shear-thickening reference behavior. However, the
overall behavior of the estimated in-situ rheology curves was compelling, which was
evident from their arithmetic average (figure 7.2). Here, the only occurrence of non-
negligible deviation from the reference behavior was located at the upper velocity
boundary where the number of rates spanning the velocity interval is at its minimum.
Thus, reliable estimates of polymer in-situ rheology from history matching radial flow
experiments could be made at pressure measurement noise below 10 %, using the
DMM.
10
100
0.01 0.1 1 10
Ap
pa
ren
t vis
co
sity [
cP
]
Superficial velocity [m/day]
Reference curve
dP(r), Q = 0.5 mL/min
dP(r), Q = 0.6 mL/min
dP(r), Q = 0.7 mL/min
dP(r), Q = 0.8 mL/min
dP(r), Q = 0.9 mL/min
dP(r), Q = 1.0 mL/min
dP(r), Q = 1.2 mL/min
dP(r), Q = 1.4 mL/min
dP(r), Q = 1.6 mL/min
dP(r), Q = 1.8 mL/min
dP(r), Q = 2.0 mL/min
dP(r), Q = 2.2 mL/min
dP(r), Q = 2.4 mL/min
dP(r), Q = 2.6 mL/min
dP(r), Q = 2.8 mL/min
dP(r), Q = 3.0 mL/min

50
Figure 7.2: Comparison of reference and arithmetic average of estimated in-situ
rheology curves (0.5 – 3.0 mL/min) after ±10 % pressure measurement noise, using
the DMM.
Fuji FCX series pressure tranducers are typically used in conjunction with in-house
radial flow experiments, and the manufacturer state a maximum uncertainty of ±0.04
% of the full-scale (or maximum preset) pressure range. Thus, the assertion made by
Seright et al. (2009) that insufficiently accurate pressure transducers is responsible for
the observed shear-thinning behavior of HPAM at low flux in porous media is
considered very unlikely for in-house flow experiments.
The flow distance between the injector and the production rim, i.e. the radius of the
Bentheimer discs used in conjunction with the radial flow experiments which were
history matched in this thesis, was 15 cm. To assess the sensitivity of the estimated in-
situ rheology to disc radius, the reference dataset containing ±10 % pressure
measurement noise was history matched a second time using the DMM. However,
during the second history match operation, only the pressure data originating from
pressure ports distributed between the injector and radial distance of 4 cm was used.
Thus, the number of pressure ports used to estimate in-situ rheology by history
matching was reduced from 9 to 5.
10
100
0.01 0.1 1 10
Ap
pa
ren
t vis
co
sity [
cP
]
Superficial velocity [m/day]
Reference curve
Arithmetic average(0.5 - 3.0 mL/min)
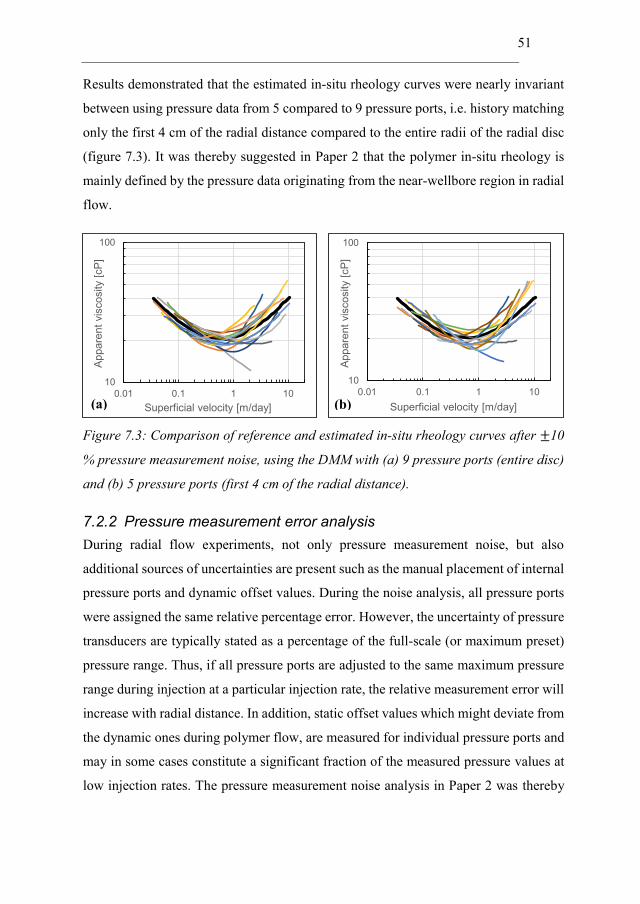
51
Results demonstrated that the estimated in-situ rheology curves were nearly invariant
between using pressure data from 5 compared to 9 pressure ports, i.e. history matching
only the first 4 cm of the radial distance compared to the entire radii of the radial disc
(figure 7.3). It was thereby suggested in Paper 2 that the polymer in-situ rheology is
mainly defined by the pressure data originating from the near-wellbore region in radial
flow.
Figure 7.3: Comparison of reference and estimated in-situ rheology curves after ±10
% pressure measurement noise, using the DMM with (a) 9 pressure ports (entire disc)
and (b) 5 pressure ports (first 4 cm of the radial distance).
7.2.2 Pressure measurement error analysis
During radial flow experiments, not only pressure measurement noise, but also
additional sources of uncertainties are present such as the manual placement of internal
pressure ports and dynamic offset values. During the noise analysis, all pressure ports
were assigned the same relative percentage error. However, the uncertainty of pressure
transducers are typically stated as a percentage of the full-scale (or maximum preset)
pressure range. Thus, if all pressure ports are adjusted to the same maximum pressure
range during injection at a particular injection rate, the relative measurement error will
increase with radial distance. In addition, static offset values which might deviate from
the dynamic ones during polymer flow, are measured for individual pressure ports and
may in some cases constitute a significant fraction of the measured pressure values at
low injection rates. The pressure measurement noise analysis in Paper 2 was thereby
10
100
0.01 0.1 1 10
Ap
pa
ren
t vis
co
sity
[cP
]
Superficial velocity [m/day]
10
100
0.01 0.1 1 10
Ap
pa
ren
t vis
co
sity
[cP
]
Superficial velocity [m/day](a) (b)
52
expanded in Paper 3 to quantify the influence of effective (or realistic) pressure
measurement error during radial flow experiments.
In accordance with the noise analysis in paper 2, a reference (base case) in-situ
rheology curve was constructed using the extended Carreau equation (Eq. 6.3) to obtain
a reference dataset, free of pressure measurement error. While the generic (or
reference) dataset in Paper 2 was ‘contaminated’ with a constant relative percentage
noise for all pressure ports, the relative error increased with radial distance in the
pressure measurement error analysis in Paper 3. Pressure measurement error during in-
house radial flow experiments was suggested to be below ±1 % of the maximum preset
pressure, and was therefore added to the reference dataset and automatically history
matched in CMOST using both history match methods, the DMM (figure 7.4) and the
SPMM (figure 7.5), as thoroughly explained in Paper 3.
Figure 7.4: Comparison of reference and estimated in-situ rheology curves after
typical (±1 %) pressure measurement error, using the DMM.
Excellent agreement between the reference and history matched in-situ rheology curves
are observed using both the DMM and the SPMM. These results clearly demonstrate
the robustness of each method under experimentally realistic error conditions. As
expected, the deviation from the reference in-situ rheology increase with radial distance
10
100
0.001 0.01 0.1 1 10
Ap
pa
ren
t vis
co
sity [
cP
]
Superficial velocity [m/day]
Reference curve
dP(r), Q = 0.05 mL/min
dP(r), Q = 0.1 mL/min
dP(r), Q = 0.3 mL/min
dP(r), Q = 0.5 mL/min
dP(r), Q = 0.7 mL/min
dP(r), Q = 1.0 mL/min
dP(r), Q = 1.2 mL/min
dP(r), Q = 1.5 mL/min
dP(r), Q = 1.7 mL/min
dP(r), Q = 2.0 mL/min
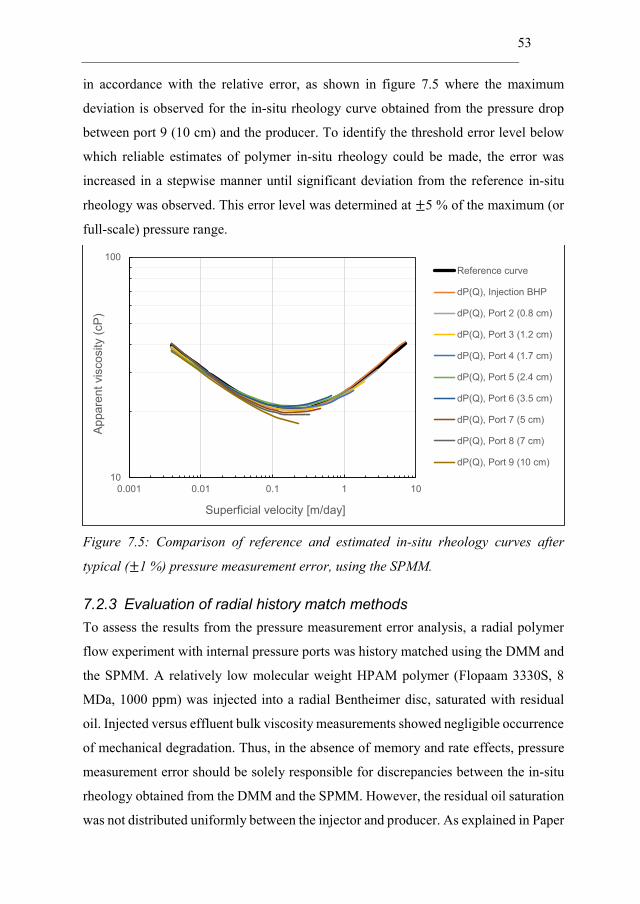
53
in accordance with the relative error, as shown in figure 7.5 where the maximum
deviation is observed for the in-situ rheology curve obtained from the pressure drop
between port 9 (10 cm) and the producer. To identify the threshold error level below
which reliable estimates of polymer in-situ rheology could be made, the error was
increased in a stepwise manner until significant deviation from the reference in-situ
rheology was observed. This error level was determined at ±5 % of the maximum (or
full-scale) pressure range.
Figure 7.5: Comparison of reference and estimated in-situ rheology curves after
typical (±1 %) pressure measurement error, using the SPMM.
7.2.3 Evaluation of radial history match methods
To assess the results from the pressure measurement error analysis, a radial polymer
flow experiment with internal pressure ports was history matched using the DMM and
the SPMM. A relatively low molecular weight HPAM polymer (Flopaam 3330S, 8
MDa, 1000 ppm) was injected into a radial Bentheimer disc, saturated with residual
oil. Injected versus effluent bulk viscosity measurements showed negligible occurrence
of mechanical degradation. Thus, in the absence of memory and rate effects, pressure
measurement error should be solely responsible for discrepancies between the in-situ
rheology obtained from the DMM and the SPMM. However, the residual oil saturation
was not distributed uniformly between the injector and producer. As explained in Paper
10
100
0.001 0.01 0.1 1 10
Ap
pa
ren
t vis
co
sity (
cP
)
Superficial velocity [m/day]
Reference curve
dP(Q), Injection BHP
dP(Q), Port 2 (0.8 cm)
dP(Q), Port 3 (1.2 cm)
dP(Q), Port 4 (1.7 cm)
dP(Q), Port 5 (2.4 cm)
dP(Q), Port 6 (3.5 cm)
dP(Q), Port 7 (5 cm)
dP(Q), Port 8 (7 cm)
dP(Q), Port 9 (10 cm)
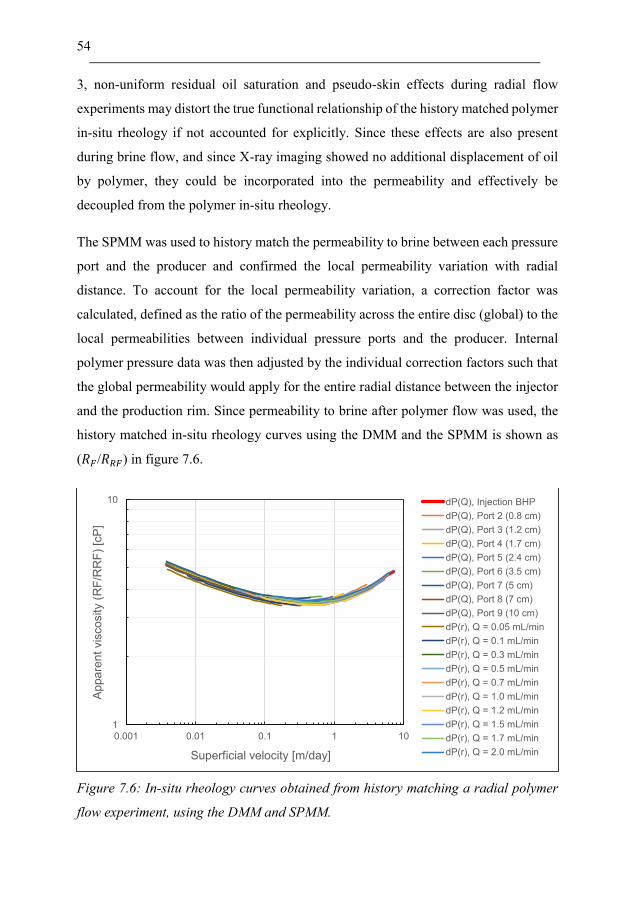
54
3, non-uniform residual oil saturation and pseudo-skin effects during radial flow
experiments may distort the true functional relationship of the history matched polymer
in-situ rheology if not accounted for explicitly. Since these effects are also present
during brine flow, and since X-ray imaging showed no additional displacement of oil
by polymer, they could be incorporated into the permeability and effectively be
decoupled from the polymer in-situ rheology.
The SPMM was used to history match the permeability to brine between each pressure
port and the producer and confirmed the local permeability variation with radial
distance. To account for the local permeability variation, a correction factor was
calculated, defined as the ratio of the permeability across the entire disc (global) to the
local permeabilities between individual pressure ports and the producer. Internal
polymer pressure data was then adjusted by the individual correction factors such that
the global permeability would apply for the entire radial distance between the injector
and the production rim. Since permeability to brine after polymer flow was used, the
history matched in-situ rheology curves using the DMM and the SPMM is shown as
(𝑅𝐹/𝑅𝑅𝐹) in figure 7.6.
Figure 7.6: In-situ rheology curves obtained from history matching a radial polymer
flow experiment, using the DMM and SPMM.
1
10
0.001 0.01 0.1 1 10
Ap
pa
ren
t vis
co
sity (
RF
/RR
F)
[cP
]
Superficial velocity [m/day]
dP(Q), Injection BHP
dP(Q), Port 2 (0.8 cm)
dP(Q), Port 3 (1.2 cm)
dP(Q), Port 4 (1.7 cm)
dP(Q), Port 5 (2.4 cm)
dP(Q), Port 6 (3.5 cm)
dP(Q), Port 7 (5 cm)
dP(Q), Port 8 (7 cm)
dP(Q), Port 9 (10 cm)
dP(r), Q = 0.05 mL/min
dP(r), Q = 0.1 mL/min
dP(r), Q = 0.3 mL/min
dP(r), Q = 0.5 mL/min
dP(r), Q = 0.7 mL/min
dP(r), Q = 1.0 mL/min
dP(r), Q = 1.2 mL/min
dP(r), Q = 1.5 mL/min
dP(r), Q = 1.7 mL/min
dP(r), Q = 2.0 mL/min

55
The estimated in-situ rheology curves using the DMM and the SPMM confirms the
conclusions drawn from the pressure measurement error analysis in Paper 3. In the
absence of memory and rate effects, both history match methods clearly demonstrate
overlapping polymer in-situ rheology curves. Based on the strong consistency and
accuracy observed, it was concluded that both history match methods are very strong
tools for determining polymer in-situ rheology in radial flow systems.
7.2.4 Analysis of pressure build-up during radial polymer flow
While the controlled environment associated with laboratory experiments of radial
polymer flow in porous media enable robust and accurate estimation of polymer in-situ
rheology, pressure data from field tests are typically exposed to significantly higher
uncertainties. In addition, the number of rate steps conducted during field tests are
typically sparse such that the pressure data obtained is relatively limited.
History match methods used to estimate in-situ rheology from radial flow experiments
(DMM and SPMM) showed robustness up to ±5 % of the maximum preset pressure
range. However, the robustness at these error conditions was in part due to the high
number of injection rates, which provided accurate average in-situ rheology curves, as
exemplified in figure 7.2. In field tests where the number of injection rates are low, the
accuracy and robustness will diminish as the maximum tolerable error is reduced.
Furthermore, in contrast to the laboratory radial flow experiment, internal pressure
ports are not available during field tests. Thus, the only option available is to history
match injection BHP as a function of volumetric injection rate, i.e. using the SPMM,
which only provides a single in-situ rheology curve. Thereby, the functional
relationship of the polymer in-situ rheology is defined by a limited number of rate steps
such that the degree of non-uniqueness of the history match will be high. At least
compared to the uniqueness of the in-situ rheology obtained from history matching
radial flow experiments using the combination of the DMM and SPMM. For this
reason, additional anchoring in the pressure data is desirable to obtain a more accurate
and unique polymer in-situ rheology description from field tests.

56
To increase the anchoring data from the pressure measurements obtained during
polymer flow, pressure build-up data from the two-phase radial polymer flow
experiment described in chapter 7.2.3, was analysed. Specifically, the stabilization time
between rate steps was investigated during both brine (figure 7.7) and polymer flow
(figure 7.8). The stabilization time during brine flow was used as a Newtonian
reference such that the polymer in-situ rheology behavior could be evaluated based on
the relative differences in pressure build-up.
Figure 7.7: Injection BHP versus time during initial (prior to polymer flow) and final
brine flood (after polymer tapering).
Injection BHP stabilization time during both brine floods (40 s) was independent of
volumetric injection rate. For Newtonian fluids, zero stabilization time is expected in
cases where pressure communication in the experimental setup is perfect. The non-zero
stabilization time was suggested to be a consequence of partly incomplete pressure
communication in the experimental setup due to low values of counter pressure from
the production line (2-4 mbar).
0
50
100
150
200
250
300
350
400
450
500
0 500 1000 1500 2000 2500 3000 3500 4000 4500
Inje
ction
BH
P [
mb
ar]
Time [s]
Initial brine flood Final brine flood
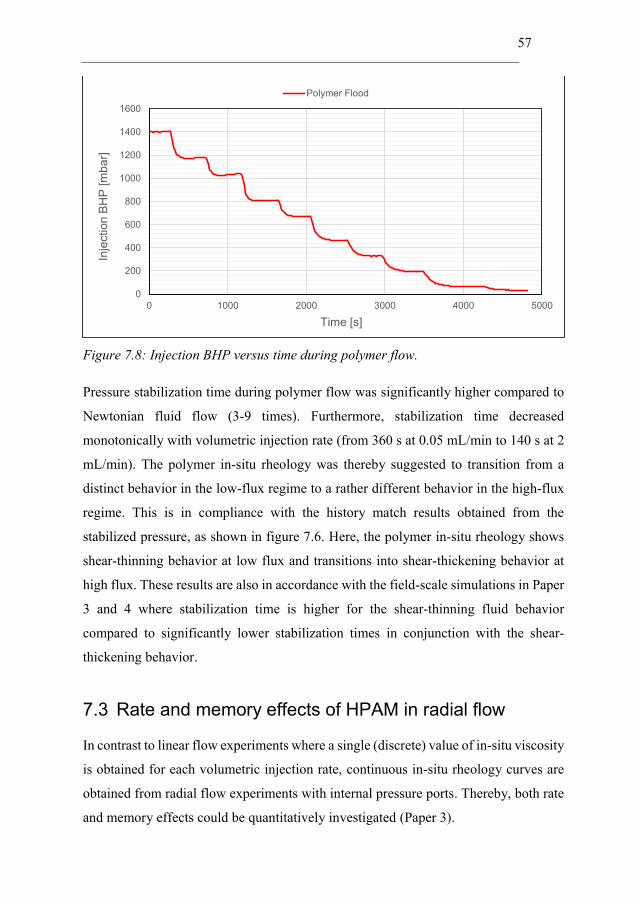
57
Figure 7.8: Injection BHP versus time during polymer flow.
Pressure stabilization time during polymer flow was significantly higher compared to
Newtonian fluid flow (3-9 times). Furthermore, stabilization time decreased
monotonically with volumetric injection rate (from 360 s at 0.05 mL/min to 140 s at 2
mL/min). The polymer in-situ rheology was thereby suggested to transition from a
distinct behavior in the low-flux regime to a rather different behavior in the high-flux
regime. This is in compliance with the history match results obtained from the
stabilized pressure, as shown in figure 7.6. Here, the polymer in-situ rheology shows
shear-thinning behavior at low flux and transitions into shear-thickening behavior at
high flux. These results are also in accordance with the field-scale simulations in Paper
3 and 4 where stabilization time is higher for the shear-thinning fluid behavior
compared to significantly lower stabilization times in conjunction with the shear-
thickening behavior.
7.3 Rate and memory effects of HPAM in radial flow
In contrast to linear flow experiments where a single (discrete) value of in-situ viscosity
is obtained for each volumetric injection rate, continuous in-situ rheology curves are
obtained from radial flow experiments with internal pressure ports. Thereby, both rate
and memory effects could be quantitatively investigated (Paper 3).
0
200
400
600
800
1000
1200
1400
1600
0 1000 2000 3000 4000 5000
Inje
ction
BH
P [
mb
ar]
Time [s]
Polymer Flood
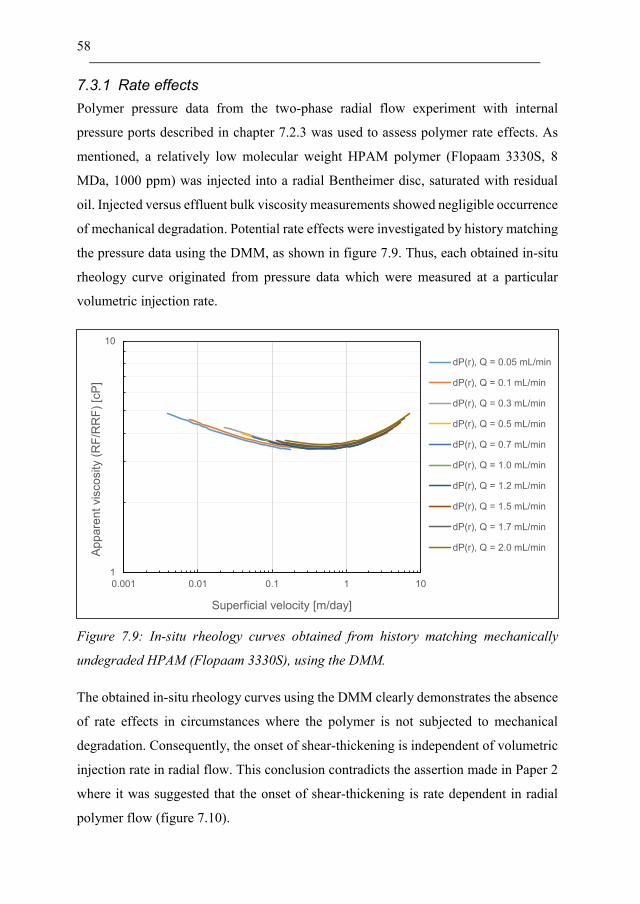
58
7.3.1 Rate effects
Polymer pressure data from the two-phase radial flow experiment with internal
pressure ports described in chapter 7.2.3 was used to assess polymer rate effects. As
mentioned, a relatively low molecular weight HPAM polymer (Flopaam 3330S, 8
MDa, 1000 ppm) was injected into a radial Bentheimer disc, saturated with residual
oil. Injected versus effluent bulk viscosity measurements showed negligible occurrence
of mechanical degradation. Potential rate effects were investigated by history matching
the pressure data using the DMM, as shown in figure 7.9. Thus, each obtained in-situ
rheology curve originated from pressure data which were measured at a particular
volumetric injection rate.
Figure 7.9: In-situ rheology curves obtained from history matching mechanically
undegraded HPAM (Flopaam 3330S), using the DMM.
The obtained in-situ rheology curves using the DMM clearly demonstrates the absence
of rate effects in circumstances where the polymer is not subjected to mechanical
degradation. Consequently, the onset of shear-thickening is independent of volumetric
injection rate in radial flow. This conclusion contradicts the assertion made in Paper 2
where it was suggested that the onset of shear-thickening is rate dependent in radial
polymer flow (figure 7.10).
1
10
0.001 0.01 0.1 1 10
Ap
pa
ren
t vis
co
sity (
RF
/RR
F)
[cP
]
Superficial velocity [m/day]
dP(r), Q = 0.05 mL/min
dP(r), Q = 0.1 mL/min
dP(r), Q = 0.3 mL/min
dP(r), Q = 0.5 mL/min
dP(r), Q = 0.7 mL/min
dP(r), Q = 1.0 mL/min
dP(r), Q = 1.2 mL/min
dP(r), Q = 1.5 mL/min
dP(r), Q = 1.7 mL/min
dP(r), Q = 2.0 mL/min

59
Figure 7.10: In-situ rheology curves obtained from history matching mechanically
degraded HPAM (Flopaam 5115SH), using the DMM.
However, the injected HPAM polymer in Paper 2 (Flopaam 5115SH, 15 MDa, 1000
ppm) was exposed to mechanical degradation. Furthermore, since bulk viscosity
measurements showed that effluent viscosities decreased with injection rate,
mechanical degradation appeared to be rate dependent. As the injection rate, and
consequently the degree of mechanical degradation increase, the pressure drop of
successively lower molecular weight polymer solutions are measured. Observations
from the literature clearly shows that the onset of shear-thickening is shifted towards
higher velocities with decreasing molecular weight of the polymer (Heemskerk et al.,
1984; Seright et al., 2009; Dupas et al., 2013; Skauge et al., 2015). Thus, the rate
dependent onset of shear-thickening in figure 7.10 is suggested to be a mechanical
degradation effect rather than a consequence of radial flow.
A curious observation was made in figure 7.10 where apparent viscosity increased with
volumetric injection rate as clearly demonstrated by the lower Newtonian plateau
viscosities. This could be interpreted as a rate effect associated with some elastic
polymer property in flow through Bentheimer sandstone. However, further analysis of
1
10
100
1000
0.1 1 10 100
Ap
pa
ren
t vis
co
sity (
RF
) [c
P]
Superficial velocity [m/day]
dP(r), Q = 3 mL/min
dP(r), Q = 4 mL/min
dP(r), Q = 5 mL/min
dP(r), Q = 7 mL/min
dP(r), Q = 9 mL/min
dP(r), Q = 12 mL/min
dP(r), Q = 15 mL/min
dP(r), Q = 18 mL/min
dP(r), Q = 20 mL/min

60
the polymer pressure data revealed injection rate hysteresis. Successive polymer
retention during pressure measurements was thereby suggested to be responsible for
the increasing apparent viscosity with injection rate. An additional radial flow
experiment was therefore history matched to investigate if the observed rate effect was
in fact due to polymer retention not being completely satisfied during the measurement
process or if the rate dependent behavior could be due to some polymer property which
was accentuated with injection rate. A relatively high molecular weight HPAM
polymer (Flopaam 3630S, 18 MDa, 2000 ppm) at the upper limit of the semi-dilute
concentration regime (Skauge et al., 2015) was injected into a radial Bentheimer disc,
saturated with residual oil. Since the elasticity of the polymer increase with molecular
weight (Azad & Trivedi, 2019), the higher molecular weight solution should contribute
to more pronounced rate effects if they originate from the elastic nature of the polymer.
In accordance with the Flopaam 5115SH polymer, the Flopaam 3630S polymer in this
experiment was mechanically degraded, as evident by the increasing onset of shear-
thickening with volumetric injection rate (figure 7.11).
Figure 7.11: In-situ rheology curves obtained from history matching mechanically
degraded HPAM (Flopaam 3630S), using the DMM.
1
10
100
0.001 0.01 0.1 1 10
Ap
pa
ren
t vis
co
sity (
RF
) [c
P]
Superficial velocity [m/day]
dP(r), Q = 0.03 mL/min
dP(r), Q = 0.05 mL/min
dP(r), Q = 0.08 mL/min
dP(r), Q = 0.1 mL/min
dP(r), Q = 0.2 mL/min
dP(r), Q = 0.4 mL/min
dP(r), Q = 0.5 mL/min
dP(r), Q = 0.6 mL/min
dP(r), Q = 0.8 mL/min
dP(r), Q = 1 mL/min
dP(r), Q = 1.2 mL/min
dP(r), Q = 1.4 mL/min
dP(r), Q = 1.6 mL/min
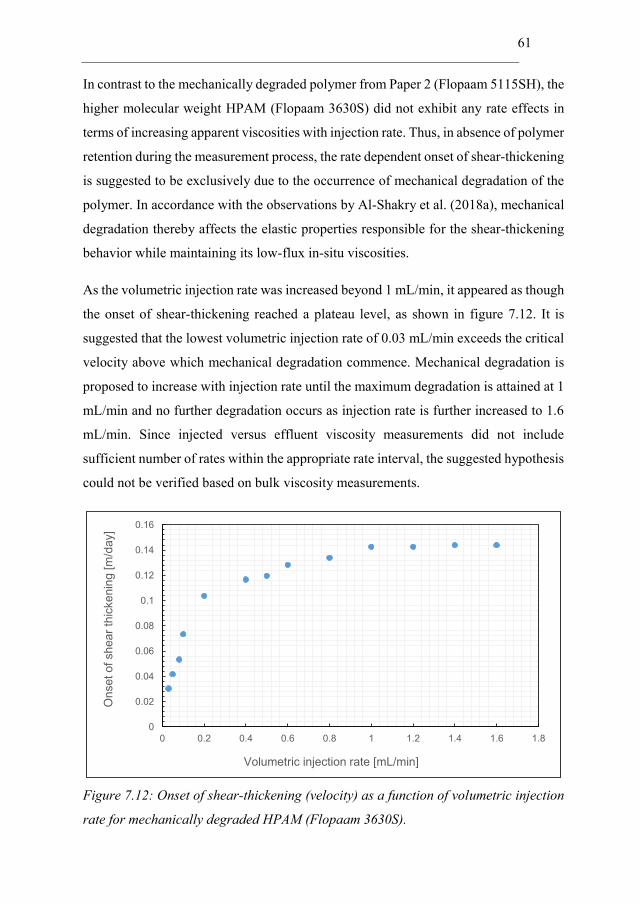
61
In contrast to the mechanically degraded polymer from Paper 2 (Flopaam 5115SH), the
higher molecular weight HPAM (Flopaam 3630S) did not exhibit any rate effects in
terms of increasing apparent viscosities with injection rate. Thus, in absence of polymer
retention during the measurement process, the rate dependent onset of shear-thickening
is suggested to be exclusively due to the occurrence of mechanical degradation of the
polymer. In accordance with the observations by Al-Shakry et al. (2018a), mechanical
degradation thereby affects the elastic properties responsible for the shear-thickening
behavior while maintaining its low-flux in-situ viscosities.
As the volumetric injection rate was increased beyond 1 mL/min, it appeared as though
the onset of shear-thickening reached a plateau level, as shown in figure 7.12. It is
suggested that the lowest volumetric injection rate of 0.03 mL/min exceeds the critical
velocity above which mechanical degradation commence. Mechanical degradation is
proposed to increase with injection rate until the maximum degradation is attained at 1
mL/min and no further degradation occurs as injection rate is further increased to 1.6
mL/min. Since injected versus effluent viscosity measurements did not include
sufficient number of rates within the appropriate rate interval, the suggested hypothesis
could not be verified based on bulk viscosity measurements.
Figure 7.12: Onset of shear-thickening (velocity) as a function of volumetric injection
rate for mechanically degraded HPAM (Flopaam 3630S).
0
0.02
0.04
0.06
0.08
0.1
0.12
0.14
0.16
0 0.2 0.4 0.6 0.8 1 1.2 1.4 1.6 1.8
On
set o
f sh
ea
r th
icke
nin
g [m
/day]
Volumetric injection rate [mL/min]
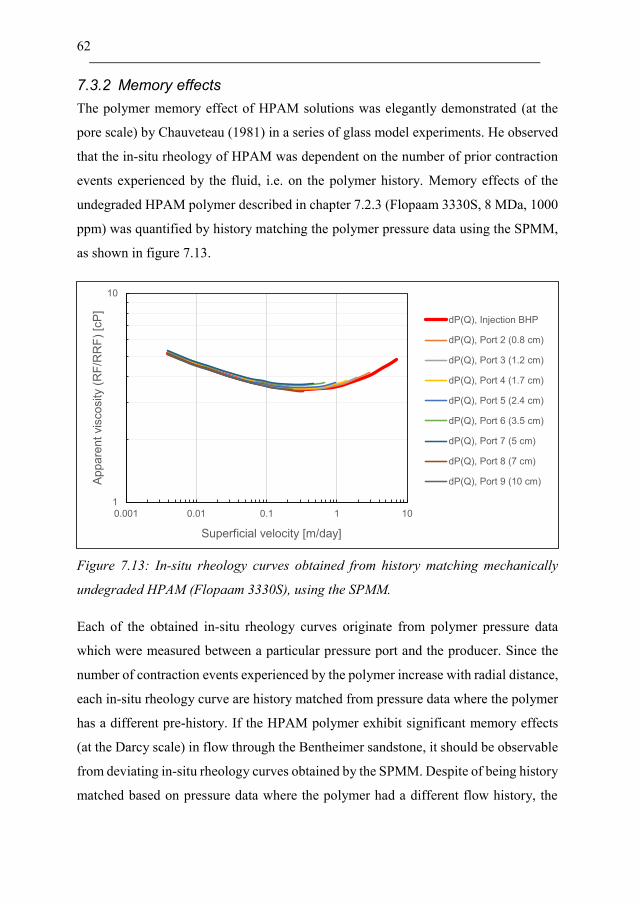
62
7.3.2 Memory effects
The polymer memory effect of HPAM solutions was elegantly demonstrated (at the
pore scale) by Chauveteau (1981) in a series of glass model experiments. He observed
that the in-situ rheology of HPAM was dependent on the number of prior contraction
events experienced by the fluid, i.e. on the polymer history. Memory effects of the
undegraded HPAM polymer described in chapter 7.2.3 (Flopaam 3330S, 8 MDa, 1000
ppm) was quantified by history matching the polymer pressure data using the SPMM,
as shown in figure 7.13.
Figure 7.13: In-situ rheology curves obtained from history matching mechanically
undegraded HPAM (Flopaam 3330S), using the SPMM.
Each of the obtained in-situ rheology curves originate from polymer pressure data
which were measured between a particular pressure port and the producer. Since the
number of contraction events experienced by the polymer increase with radial distance,
each in-situ rheology curve are history matched from pressure data where the polymer
has a different pre-history. If the HPAM polymer exhibit significant memory effects
(at the Darcy scale) in flow through the Bentheimer sandstone, it should be observable
from deviating in-situ rheology curves obtained by the SPMM. Despite of being history
matched based on pressure data where the polymer had a different flow history, the
1
10
0.001 0.01 0.1 1 10
Ap
pa
ren
t vis
co
sity (
RF
/RR
F)
[cP
]
Superficial velocity [m/day]
dP(Q), Injection BHP
dP(Q), Port 2 (0.8 cm)
dP(Q), Port 3 (1.2 cm)
dP(Q), Port 4 (1.7 cm)
dP(Q), Port 5 (2.4 cm)
dP(Q), Port 6 (3.5 cm)
dP(Q), Port 7 (5 cm)
dP(Q), Port 8 (7 cm)
dP(Q), Port 9 (10 cm)
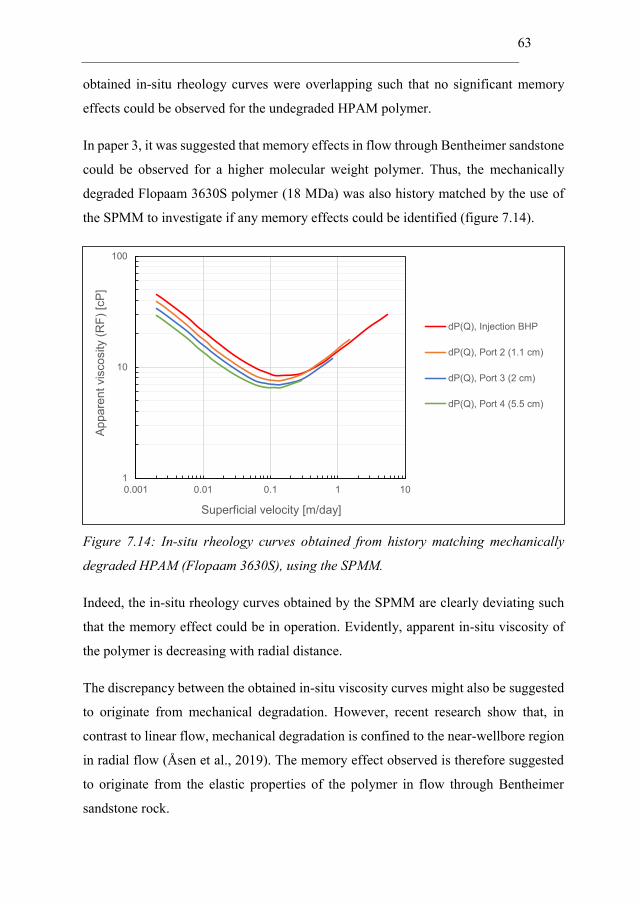
63
obtained in-situ rheology curves were overlapping such that no significant memory
effects could be observed for the undegraded HPAM polymer.
In paper 3, it was suggested that memory effects in flow through Bentheimer sandstone
could be observed for a higher molecular weight polymer. Thus, the mechanically
degraded Flopaam 3630S polymer (18 MDa) was also history matched by the use of
the SPMM to investigate if any memory effects could be identified (figure 7.14).
Figure 7.14: In-situ rheology curves obtained from history matching mechanically
degraded HPAM (Flopaam 3630S), using the SPMM.
Indeed, the in-situ rheology curves obtained by the SPMM are clearly deviating such
that the memory effect could be in operation. Evidently, apparent in-situ viscosity of
the polymer is decreasing with radial distance.
The discrepancy between the obtained in-situ viscosity curves might also be suggested
to originate from mechanical degradation. However, recent research show that, in
contrast to linear flow, mechanical degradation is confined to the near-wellbore region
in radial flow (Åsen et al., 2019). The memory effect observed is therefore suggested
to originate from the elastic properties of the polymer in flow through Bentheimer
sandstone rock.
1
10
100
0.001 0.01 0.1 1 10
Ap
pa
ren
t vis
co
sity (
RF
) [c
P]
Superficial velocity [m/day]
dP(Q), Injection BHP
dP(Q), Port 2 (1.1 cm)
dP(Q), Port 3 (2 cm)
dP(Q), Port 4 (5.5 cm)
64
7.4 Quantification of polymer in-situ rheology and injectivity
The success of polymer flooding depends on the ability of injected solutions to provide
enhanced mobility ratio conditions for the displacement process. A prerequisite for
accurate evaluation of polymer performance is the control of polymer in-situ rheology
and, by extension, polymer injectivity. Despite of nearly sixty years of research,
significant controversy and uncertainties is still associated with several topics within
polymer in-situ rheology. In this section, the impact of flow geometry and presence of
oil on in-situ rheology and polymer injectivity, has been studied. Furthermore, new
insights are given on the flow behavior of HPAM at low flux in porous media.
7.4.1 Impact of flow geometry
Pressure drop versus volumetric injection rate data from linear core floods have
conventionally been used to measure polymer in-situ rheology. However, Skauge et al.
(2016) observed significant differences in the flow behavior of HPAM through
Bentheimer sandstone in linear cores compared to radial discs. They observed that the
degree of shear-thickening was more pronounced in linear flow while the extent of
shear-thinning was more pronounced in radial flow. Furthermore, onset of shear-
thickening was shifted towards higher velocities in radial flow. Consequently, polymer
injectivity and its apparent in-situ viscosity at low flux was expected to be
underestimated by the modelling of polymer flow in linear cores as opposed to radial
discs.
Results presented by Skauge et al. (2016) were based on polymer flow experiments
conducted in the absence of oil. In this thesis, both single and two-phase polymer flow
experiments were history matched in an attempt to generalize the effects of flow
geometry on polymer in-situ rheology. Comparative studies were conducted in
accordance with the study performed by Skauge et al. (2016) where all properties (rock
type, polymer type, make-up brine) were equal for the linear and radial flow
experiments such that the only influential and deviating factor was the flow geometry.
In conjunction with their flow experiments, the relatively high molecular weight
HPAM polymer (Flopaam 3630S, 18 MDa) was injected into Bentheimer core plugs

65
and radial discs. Permeability to brine before polymer flow were used to history match
the polymer pressure data from the radial flow experiments. Accordingly, pressure drop
during brine flow prior to polymer injection was used to calculate resistance factors
from the linear flow experiments. Figure 7.15 shows the impact of flow geometry on
the in-situ rheology during single-phase flow. Since the injected polymer solutions
were 1500 and 2000-ppm in the linear and radial flow experiment, respectively,
apparent in-situ viscosities were normalized to the same lower Newtonian plateau.
Figure 7.15: Impact of flow geometry on polymer in-situ rheology in 1-phase flow.
In conjunction with the results reported by Skauge et al. (2016), onset of shear-
thickening increase in radial compared to linear flow. Furthermore, while the extent of
shear-thinning was more pronounced in radial flow, the degree of shear-thickening was
reduced. The observed differences between the in-situ rheology obtained in linear
relative to radial flow were suggested to be the consequence of the time-dependent
elastic nature of the polymer.
According to the Maxwell-model for a viscoelastic fluid (Sorbie, 1991), the fluid
behavior is comprised of viscous and elastic response to stress. While the viscous
response is related to the inelastic and time-independent behavior of the fluid, the
elastic response may be comprised of non-equilibrium phenomena such as kinetic and
10
100
1000
0.1 1 10 100
No
rma
lize
d a
pp
are
nt vis
co
sity (
RF
) [c
P]
Superficial velocity [m/day]
Linear flow, 1-phase
Radial flow, 1-phase
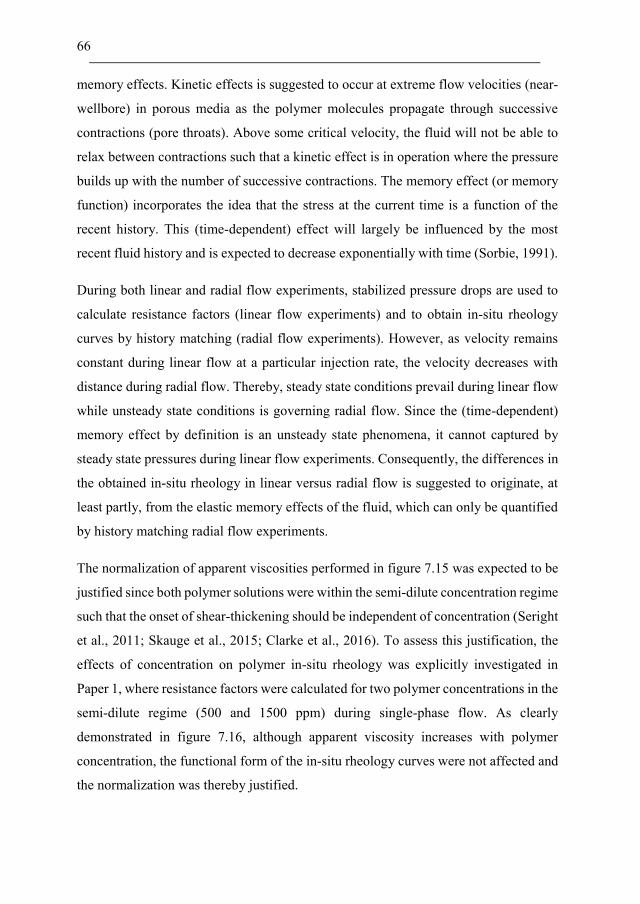
66
memory effects. Kinetic effects is suggested to occur at extreme flow velocities (near-
wellbore) in porous media as the polymer molecules propagate through successive
contractions (pore throats). Above some critical velocity, the fluid will not be able to
relax between contractions such that a kinetic effect is in operation where the pressure
builds up with the number of successive contractions. The memory effect (or memory
function) incorporates the idea that the stress at the current time is a function of the
recent history. This (time-dependent) effect will largely be influenced by the most
recent fluid history and is expected to decrease exponentially with time (Sorbie, 1991).
During both linear and radial flow experiments, stabilized pressure drops are used to
calculate resistance factors (linear flow experiments) and to obtain in-situ rheology
curves by history matching (radial flow experiments). However, as velocity remains
constant during linear flow at a particular injection rate, the velocity decreases with
distance during radial flow. Thereby, steady state conditions prevail during linear flow
while unsteady state conditions is governing radial flow. Since the (time-dependent)
memory effect by definition is an unsteady state phenomena, it cannot captured by
steady state pressures during linear flow experiments. Consequently, the differences in
the obtained in-situ rheology in linear versus radial flow is suggested to originate, at
least partly, from the elastic memory effects of the fluid, which can only be quantified
by history matching radial flow experiments.
The normalization of apparent viscosities performed in figure 7.15 was expected to be
justified since both polymer solutions were within the semi-dilute concentration regime
such that the onset of shear-thickening should be independent of concentration (Seright
et al., 2011; Skauge et al., 2015; Clarke et al., 2016). To assess this justification, the
effects of concentration on polymer in-situ rheology was explicitly investigated in
Paper 1, where resistance factors were calculated for two polymer concentrations in the
semi-dilute regime (500 and 1500 ppm) during single-phase flow. As clearly
demonstrated in figure 7.16, although apparent viscosity increases with polymer
concentration, the functional form of the in-situ rheology curves were not affected and
the normalization was thereby justified.
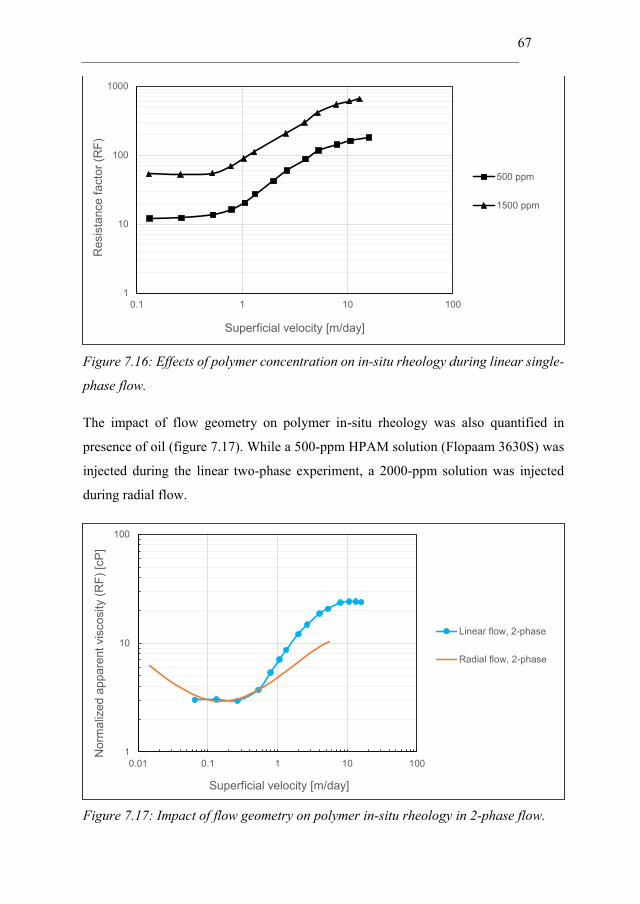
67
Figure 7.16: Effects of polymer concentration on in-situ rheology during linear single-
phase flow.
The impact of flow geometry on polymer in-situ rheology was also quantified in
presence of oil (figure 7.17). While a 500-ppm HPAM solution (Flopaam 3630S) was
injected during the linear two-phase experiment, a 2000-ppm solution was injected
during radial flow.
Figure 7.17: Impact of flow geometry on polymer in-situ rheology in 2-phase flow.
1
10
100
1000
0.1 1 10 100
Re
sis
tance
fa
cto
r (R
F)
Superficial velocity [m/day]
500 ppm
1500 ppm
1
10
100
0.01 0.1 1 10 100
No
rma
lize
d a
pp
are
nt vis
co
sity (
RF
) [c
P]
Superficial velocity [m/day]
Linear flow, 2-phase
Radial flow, 2-phase

68
Since the injected polymer solutions were both within the semi-dilute concentration
regime (Skauge et al., 2015), they were also normalized to the same lower Newtonian
plateau. Although the extent of shear-thinning and shear-thickening are consistent with
the results obtained during single-phase flow, the onset of shear-thickening commence
at the same flow velocity in linear and radial geometry during two-phase polymer flow.
Thus, the presence of oil eliminate the shift observed during single-phase flow. This is
suggested to be a consequence of the differing velocity distributions in linear compared
to radial flow, which are much more pronounced in single-phase compared to two-
phase flow. During single-phase flow, the rough surface of the porous media walls and
the polymer solutions will generate significant hydrodynamic drag forces. Since steady
state conditions are achieved in linear flow while radial flow is governed by unsteady
state conditions, the velocity distributions and thus the onset of shear-thickening may
be significantly different. However, in two-phase flow, the pore walls are coated with
oil films such that the hydrodynamic drag forces are significantly reduced. Thus, as the
drag forces are below some critical value, the velocity distributions remains relatively
similar such that the onset of shear thickening coincide during two-phase polymer flow
in linear cores compared to radial discs.
7.4.2 Impact of oil
In-situ rheology studies of HPAM has mainly been investigated in the absence of oil
during single-phase flow experiments in rock cores (Pye, 1964; Smith, 1970; Jennings
et al. 1971; Chauveteau, 1981b; Heemskerk et al., 1984; Seright et al., 2009; Seright et
al., 2011; Dupas et al., 2013; Manichand et al., 2013; Rodriguez et al., 2014; Zhang &
Seright, 2015; Skauge et al., 2015; Skauge et al., 2016). Even though a few in-situ
rheology studies of HPAM has been performed in presence of oil (Gogarty, 1967;
Masuda et al., 1992; Delamaide et al., 2014), the impact of oil on in-situ rheology has
not been quantitatively investigated.
To quantify the impact of oil on polymer in-situ rheology, pressure data from linear
and radial flow experiments were used to obtain the in-situ rheology by calculation
(linear flow) and history matching (radial flow), as shown in figure 7.18. Flopaam
3630S at 500 ppm and 1500 ppm was injected into the linear cores and radial discs,

69
respectively. These polymer concentrations were chosen to investigate the impact of
oil at the upper and lower concentrations limits of the semi-dilute concentration regime,
which would be economically viable for polymer flooding in an oil field.
Figure 7.18: Impact of oil on polymer in-situ rheology in linear flow.
The calculated resistance factors clearly demonstrate that the impact of oil is to reduce
apparent viscosity in linear flow. The lower resistance factors in the presence of oil is
suggested to result from lower adsorption/retention of polymer molecules on the rock
surface, in accordance with observations reported by Broseta et al. (1995).
Furthermore, the oil layer coating the oil-wet pores is proposed to reduce the
hydrodynamic drag forces between the injected polymer solution and the porous media
which reduces resistance to flow and thus the calculated resistance factors.
While the onset of shear-thickening is not affected by the presence of residual oil, the
slope (degree) of apparent shear-thickening shows strong dependence on the oil
presence. Indeed, even though injected versus effluent viscosities revealed that
significant degradation (~20 %) occurred during single-phase polymer flow, the extent
of shear-thickening remained more pronounced in absence compared to presence of
oil. This result could be explained by the mechanism of oil redistribution in the porous
1
10
100
1000
0.1 1 10 100
Re
sis
tance
fa
cto
r (R
F)
Superficial velocity [m/day]
Linear flow, 1-phase
Linear flow, 2-phase
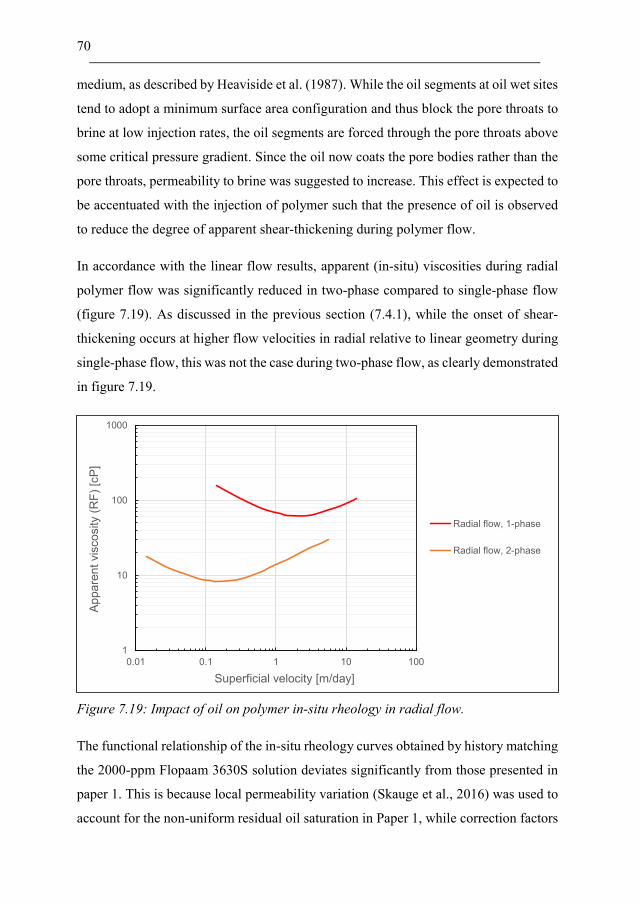
70
medium, as described by Heaviside et al. (1987). While the oil segments at oil wet sites
tend to adopt a minimum surface area configuration and thus block the pore throats to
brine at low injection rates, the oil segments are forced through the pore throats above
some critical pressure gradient. Since the oil now coats the pore bodies rather than the
pore throats, permeability to brine was suggested to increase. This effect is expected to
be accentuated with the injection of polymer such that the presence of oil is observed
to reduce the degree of apparent shear-thickening during polymer flow.
In accordance with the linear flow results, apparent (in-situ) viscosities during radial
polymer flow was significantly reduced in two-phase compared to single-phase flow
(figure 7.19). As discussed in the previous section (7.4.1), while the onset of shear-
thickening occurs at higher flow velocities in radial relative to linear geometry during
single-phase flow, this was not the case during two-phase flow, as clearly demonstrated
in figure 7.19.
Figure 7.19: Impact of oil on polymer in-situ rheology in radial flow.
The functional relationship of the in-situ rheology curves obtained by history matching
the 2000-ppm Flopaam 3630S solution deviates significantly from those presented in
paper 1. This is because local permeability variation (Skauge et al., 2016) was used to
account for the non-uniform residual oil saturation in Paper 1, while correction factors
1
10
100
1000
0.01 0.1 1 10 100
Ap
pa
ren
t vis
co
sity (
RF
) [c
P]
Superficial velocity [m/day]
Radial flow, 1-phase
Radial flow, 2-phase

71
were calculated and the polymer pressure was directly adjusted when in-situ rheology
curves presented in figure 7.19 was obtained by history matching.
As mentioned in chapter 4.3, discussions are ongoing in the scientific community
regarding which brine flood, prior or post polymer flow, is the most appropriate to use
as the Newtonian reference to obtain the correct (or ‘true’) apparent viscosity of
polymers in porous media. Since some polymer typically remains in the porous
medium, even after significant amount of post flush, permeability might be rate
dependent. Thus, if permeability is assumed to be constant in these conditions, the true
functional relationship of the polymer might be distorted such that rate effects due to
porous media permeability is mistaken for polymer rheological behavior. Furthermore,
this non-linearity was observed to be accentuated during two-phase flow and was
suggested to originate from minor redistributions of oil within the porous media as the
flow rate was increased during brine flow, even in circumstances where no oil
production was observed (Heaviside et al. 1987).
To investigate the effects of rate dependent permeability on the obtained polymer in-
situ rheology, the relationship between pressure drop and volumetric injection rate
during brine flow was treated linearly (rate independent) and as a polynomial function
(rate dependent), as shown in figure 7.20.
Figure 7.20: (a) Linear and (b) polynomial fit to pressure data during brine flow.
The brine flow data clearly shows a non-linear relationship between pressure drop and
volumetric injection rate during brine flow after polymer injection. Interpolation using
R² = 0.9949
0
200
400
600
800
1000
1200
1400
0 5 10
Pre
ssu
re d
rop
[m
bar]
Volumetric injection rate [mL/min]
R² = 0.9991
0
200
400
600
800
1000
1200
1400
0 5 10
Pre
ssu
re d
rop
[m
bar]
Volumetric injection rate [mL/min](a) (b)

72
the trendlines shown in figure 7.20 was then used to calculate resistance factors for the
highest molecular weight HPAM polymer (Flopaam 3630S, 18 MDa, 2000 ppm) in
two-phase flow through a radial Bentheimer sandstone disc.
Results (figure 7.21) show that while a minor vertical shift is observed between the two
obtained in-situ rheology curves, their functional relationship remains approximately
equal. Thus, the non-linearity in the current polymer flow experiment was not sufficient
to distort the true functional relationship of the in-situ rheology. Furthermore, since
polymer retention and pseudo skin-effects associated with polymer injection is
incorporated into the pressure data, the in-situ rheology signal is effectively isolated
when using the brine data after polymer injection, as explained in Paper 3. Conversely,
if brine data before polymer flow is used, the obtained polymer in-situ rheology will
be coupled by these skin and retention effects such that the true in-situ rheology of the
polymer might be difficult to obtain.
Figure 7.21: Resistance factor calculations using linear and polynomial fit to the brine
flow pressure data obtained after polymer flow.
7.4.3 Behavior of HPAM at low flux in porous media
The behavior of HPAM at low flux through linear core plugs has been ambiguously
reported in the literature. Based on flow experiments in linear core plugs, there has
been reported Newtonian or near-Newtonian (Pye, 1964; Smith, 1970; Jennings et al.,
1
10
100
0.1 1 10
Re
sis
tance
fa
cto
r (R
F)
Superficial velocity [m/day]
Linear
Polynomial

73
1971; Seright et al., 2009; Seright et al., 2011; Rodriguez et al., 2014; Skauge et al.,
2015; Zhang & Seright, 2015; Al-Shakry et al., 2018b; Al-Shakry et al., 2019a), mild
shear-thinning (Heemskerk et al., 1984; Masuda et al., 1992) and significant shear-
thinning behavior of HPAM (Gogarty, 1967; Dupas et al., 2013; Manichand et al.,
2013; Delamaide et al., 2014).
Seright et al. (2011) attempted to clarify the low-flux behavior of HPAM in porous
media and suggested that the observed shear-thinning behavior was either a
permeability effect due to plugging of ultrahigh molecular weight species or that these
species were able to penetrate deep into the very high permeable formations such that
shear-thinning behavior in fact occurred. They concluded that under practical
conditions where HPAM is used in conjunction with EOR processes (permeability
below 1 D and salinity above 0.3 TDS), the degree of shear-thinning would be slight
or non-existent. However, this clarification was based on polymer rheology estimation
from linear core flow experiments. Results obtained during the course of this thesis
clearly demonstrate the importance of flow geometry on the polymer rheology, as
shown in figure 7.22.
Figure 7.22: Impact of flow geometry on polymer in-situ rheology in (a) linear, and (b)
radial flow.
Clearly, while Newtonian behavior at low flux during linear flow in Bentheimer
sandstone is in agreement with the clarification by Seright et al. (2011) and the
1
10
100
1000
0.1 1 10 100
Appare
nt
vis
cosity
(RF
) [c
P]
Superficial velocity [m/day]
Linear flow, 1-phase
Linear flow, 2-phase
1
10
100
1000
0.01 0.1 1 10 100
Ap
pa
ren
t V
isco
sity (
RF
) [c
P]
Superficial velocity [m/day]
Radial flow, 1-phase
Radial flow, 2-phase
(a) (b)
74
aforementioned literature, significant shear-thinning behavior is observed during radial
polymer flow. It should be emphasized once again that all properties (rock type,
polymer type, make-up brine) were the same for the linear and radial flow experiments
and the only deviating factor being the flow regime. Thus, the flow geometry is
suggested to be a key factor for modelling the low-flux behavior of HPAM in porous
media and needs to be taken into account.
7.5 Summary of observations
7.5.1 Qualification of history match methods for radial flow
A comprehensive measurement noise analysis was performed using the recently
developed disc match method (DMM) for polymer in-situ rheology estimation from
radial flow experiments. An upper acceptable noise level of ~10 % on the pressure
measurements was identified below which accurate estimates of polymer in-situ
rheology could be made. The polymer in-situ rheology estimation showed invariance
between excluding and including the pressure response outside the near-wellbore
region at the upper acceptable noise level. It was thereby proposed that the polymer in-
situ rheology was mainly defined by the pressure data originating from the near-
wellbore region in the radial flow experiment.
A comprehensive analysis was also made on the effective (or cumulative) pressure
measurement error during radial flow experiments, using the DMM and the SPMM for
in-situ rheology estimation. Here, an upper error level of 5 % of the maximum preset
pressure was identified below which accurate estimates of polymer in-situ rheology
could be made. History matching pressure data from a radial flow experiment, where a
mechanically undegraded polymer (Flopaam 3330S) was injected, clearly
demonstrated the robustness and accuracy of the DMM and SPMM in accordance with
the generic pressure measurement error analysis.
Analysis of the pressure build-up during radial polymer flow revealed that the in-situ
rheological behavior of HPAM could be qualitatively identified based on pressure
stabilization time between rate steps. While injection BHP stabilization time during

75
brine floods was independent of volumetric injection rate, the corresponding
stabilization time during polymer flow was significantly increased compared to brine
flow, and decreased monotonically with increasing injection rate. The polymer in-situ
rheology qualitatively estimated by the pressure build-up was in agreement with the
quantitative estimation from stabilized pressure, using the DMM and SPMM.
7.5.2 Rate and memory effects of HPAM in radial flow
Potential rate effects of HPAM in radial flow was investigated by history matching the
pressure data from radial flow experiments where mechanically undegraded (Flopaam
3330S) and degraded (Flopaam 5115SH and Flopaam 3630S) HPAM was injected into
Bentheimer sandstone rock. Rate effects could be investigated using the DMM since
the obtained in-situ rheology curves originate from history matching pressure data at
different volumetric injection rates. While no rate effects were observed for the
undegraded polymer, significant rate effects were observed for the two degraded
polymers, where the onset of shear-thickening occurred at higher flow velocities as
mechanical degradation increased. The Flopaam 5115SH polymer displayed rate
effects in which apparent in-situ viscosity increased with injection rate. However, this
was suggested to be a retention effect where pressure measurements were initiated
before polymer retention was satisfied, as revealed by injection rate hysteresis. Indeed,
the obtained in-situ rheology from the higher molecular weight polymer, which too was
mechanically degraded, confirmed that the rate effects observed in terms of increasing
apparent viscosity in fact was due to a retention effect rather than due to the elastic
properties of the polymer. Thus, in accordance with observations made by Al-Shakry
et al. (2018a), mechanical degradation affected the elastic properties responsible for
the shear-thickening behavior while maintaining the low-flux in-situ viscosities of the
polymer.
Potential memory effects of HPAM in radial flow was investigated by history matching
the pressure data from radial flow experiments where the mechanically undegraded
(Flopaam 3330S) and degraded (Flopaam 3630S) HPAM was injected into Bentheimer
sandstone rock. Memory effects could be investigated using the SPMM since the
polymer has a different flow history at each individual pressure port. Since each
76
obtained in-situ rheology curve originate from the differential pressure between a
specific pressure port and the producer, the obtained rheologies will originate from
different memory states of the polymer. While no memory effects was observed for the
undegraded and relatively low molecular weight polymer (Flopaam 3330S), the
mechanically degraded and high molecular weight polymer (Flopaam 3630S) showed
signs of an apparent memory effect in that the obtained rheology curves showed
significant discrepancies. As the polymer propagated out from the injector, apparent
viscosity decreased with radial distance. The proposed explanations to this observation
was either a polymer memory effect or successive mechanical degradation of the
polymer between the injector and producer. Since mechanical degradation is assumed
to be a near-wellbore phenomenon during radial polymer flow, the memory effect was
suggested to originate from the elastic properties of the polymer.
7.5.3 Quantification of polymer in-situ rheology and injectivity
Single and two-phase radial flow experiments were performed to assess the impact of
flow geometry and oil on polymer in-situ rheology. Furthermore, the low-flux in-situ
rheology behavior of HPAM was addressed and clarified.
The impact of flow geometry on polymer in-situ rheology was investigated by history
matching comparative experiments where all properties such as rock type, make-up
brine and polymer type were equal for the linear and radial flow experiments. Thus,
the only influential and deviating factor was the flow geometry. In accordance with the
results reported by Skauge et al. (2016) for single-phase polymer flow, the extent of
shear-thinning was more pronounced, the onset of shear-thickening occurred at higher
flow velocities, and the degree of shear-thickening was reduced in radial compared to
linear flow. However, during two-phase polymer flow, the onset of shear-thickening
occurred at the same flow velocity in linear and radial flow. This was suggested to
result from the magnitude of the hydrodynamic drag forces in single-phase compared
to two-phase flow. The hydrodynamic drag forces between the polymer and the porous
medium are assumed to be above some threshold (or critical) value during single-phase
flow such that the velocity distribution, and thus the onset of shear-thickening, deviate
significantly in radial relative to linear flow. Conversely, during two-phase flow, the
77
residual oil reduce polymer retention and provides a lubricating effect such that the
hydrodynamic drag forces are believed to be below the threshold value and the velocity
distribution remains relatively similar for linear and radial flow. Consequently, the
onset of shear-thickening coincide in linear and radial flow geometries during two-
phase flow.
Results showed that the presence of oil reduce apparent in-situ viscosity in both linear
and radial flow. Furthermore, is was observed that while the onset of shear-thickening
was not affected by the presence of oil, the degree of shear-thickening showed a strong
dependence. Indeed, the extent of shear-thickening remained more pronounced in
single-phase compared to two-phase flow despite of significant mechanical
degradation (~20 %) occurring during the single-phase flow experiment. This was
explained by the mechanism of oil redistribution in the porous medium, as described
by Heaviside et al. (1987).
To investigate the effects of using rate-dependent pressure drop during brine flow after
polymer injection, a sensitivity analysis was performed where resistance factors were
calculated based on linear and non-linear pressure drops with injection rate during brine
flow. Results showed that the non-linearity seen during brine flow after polymer
injection from in-house experiments is not sufficient to distort the true functional
relationship of the obtained polymer in-situ rheology. Indeed, since polymer retention
and pseudo skin-effects associated with polymer injection is incorporated into the
pressure data, the in-situ rheology signal is effectively isolated when using the brine
data after polymer injection.
Lastly, the low-flux behavior of HPAM in porous media was addressed and the
clarification made by Seright et al. (2011) was assessed. Even though the linear flow
experiments, which showed Newtonian rheology behavior, was in agreement with their
clarification, radial flow experiments consistently showed shear-thinning behavior for
HPAM at low flux in porous media. Thus, flow geometry was proposed to be a key
factor for modelling the low-flux behavior of HPAM in porous media.

78

79
8. Conclusions and suggestions for future studies
8.1 Conclusions
In this thesis, mechanistic modelling of radial polymer flow in porous media has been
performed by simulation, and through history matching of polymer flow experiments.
The objective was to improve the modelling of polymer rheology and injectivity in
porous media. This has been conducted by (1) evaluating the accuracy and robustness
of the history match methods used to estimate polymer in-situ rheology and injectivity
from radial flow experiments, (2) investigating potential rate and memory effects of
viscoelastic polymers at the Darcy scale during radial flow experiments, and (3)
quantifying polymer rheology and polymer injectivity in porous media.
8.1.1 Qualification of history match methods for radial flow
Based on the robustness and accuracy demonstrated by the history match methods to
pressure measurement noise, the assertion that the level of accuracy of pressure
transducers may be responsible for the observed shear-thinning behavior in radial flow
experiments, is concluded to be very improbable. Furthermore, radial polymer flow
experiments should be performed in an experimental setup where effective (or
cumulative) measurement error is well below 5 % of the maximum preset pressure to
obtain reliable estimates of polymer in-situ rheology.
The in-situ rheology of polymers are mainly defined by the pressure data in the near-
wellbore region. Thereby, accurate estimates of polymer in-situ rheology is expected
from radial flow experiments performed on discs with radii below one third of the
current size (15 cm) for all flow rates applied.
Polymer in-situ rheology may be identified based on the stabilized pressure
(quantitatively) and pressure build-up (qualitatively) during radial polymer flow. The
additional anchoring data from the analysis of pressure build-up should increase the
confidence in estimated in-situ rheologies from field test.
80
8.1.2 Rate and memory effects of HPAM in radial flow
In presence of mechanical degradation and successive retention before rheology
pressure measurements, the HPAM polymers investigated showed no signs of rate
effects that could be attributed to their elastic properties. Thus, onset of shear-
thickening should be independent of rate for mechanically undegraded polymers in
radial flow. Since mechanical degradation was observed to be rate dependent, its
occurence could be identified by radial flow experiments where the onset of shear-
thickening increase with injection rate.
Memory effects may have a significant impact on polymer in-situ rheology during
radial flow. The apparent memory effect observed in this thesis where apparent
viscosity decreased with radial distance is suggested to originate from the elastic
properties of the polymer.
8.1.3 Quantification of polymer in-situ rheology and injectivity
Flow geometry and oil has a significant impact on the in-situ rheology of polymer as
they flow through porous media. In both single and two-phase flow, extent of shear-
thinning is more pronounced and the degree of shear-thickening is significantly
reduced in radial relative to linear flow. Thus, modelling the performance of a polymer
flood application using linear flow geometry will significantly underestimate both the
mobility ratio inside the reservoir and the polymer injectivity.
The onset of shear-thickening occurs at significantly higher flow velocities in radial
compared to linear flow during single-phase polymer flow. This is believed to be the
consequence of the hydrodynamic drag forces being above some critical value such
that the velocity distributions are altered in linear vs radial flow. However, during two-
phase flow, the presence of oil reduce the hydrodynamic drag forces between the
polymer and the porous media such that the velocity distribution remains relatively
unchanged in linear as opposed to radial flow. Thus, the onset of shear-thickening
coincide for linear and radial flow geometries during two-phase flow. Consequently,
the wettability of the reservoir should be taken into account when modelling polymer
in-situ rheology and injectivity.

81
The impact of oil is to reduce apparent in-situ viscosity, independent of flow geometry.
The reduced apparent viscosity in presence of oil is suggested to result from lower
adsorption/retention of polymer molecules on the rock surface (Broseta et al., 1995)
and the reduction in hydrodynamic drag forces. Additionally, it is proposed that the
presence of oil reduce the degree of shear-thickening more than mechanical
degradation. This was explained by the rate dependent oil redistribution during fluid
flow in porous media, as described by Heaviside et al. (1987).
The low-flux behavior of HPAM agrees with the conclusions made by Seright et al.
(2011) during linear flow experiments. However, radial flow experiments showed
significant shear-thinning behavior and demonstrated the importance of modelling
polymer in-situ rheology in the appropriate flow geometry. As the flow out from the
injectors in oil reservoirs typically is governed by a radial flow regime, the low flux in-
situ rheology obtained from linear flow experiments would significant underestimate
the viscosity enhancement ability of the polymer at low flux in porous media.
8.2 Suggestions for future studies
Despite nearly sixty years of research, significant controversy and uncertainties are still
associated with several topics within polymer flooding technology. In particular,
polymer in-situ rheology and injectivity are heavily debated subjects in the scientific
community. Indeed, as the flow properties of the polymer still is far from completely
understood, much work remains to quantify the appropriate mechanisms during porous
media flow.
Since the radial flow experiment enable investigation of the unsteady (time-dependent)
properties of the polymer, it should be used to further investigate the mechanisms
responsible for the differences between linear and radial polymer flow. This entails
quantifying the rate and memory effects of polymer solutions as they flow through
porous media.
More specifically, the rate dependent mechanical degradation observed in this thesis
could be quantitatively investigated by performing radial polymer flow experiments
82
where a high number of injection rates are performed. By measuring both the porous
medium pressure drops and the injected versus effluent viscosities at these rates, the
rate dependency can be more thoroughly assessed and compared from the behavior in
bulk versus in the porous medium.
The mechanism responsible for the memory effects of the high molecular weight
polymer (Flopaam 3630S) was suggested to originate from elastic polymer properties,
but could not be completely quantified due to the possible influence of mechanical
degradation if not constrained to the near-wellbore region. Thus, it would be interesting
to see whether an undegraded and relatively high molecular weight polymer still
exhibit apparent memory effects in the absence of mechanical degradation.

83
References
Afsharpoor, A. & Balhoff, M. (2013): Static and Dynamic CFD Modeling of
Viscoelastic Polymer: Trapped Oil Displacement and Deformation at the
Pore-Level. Presented at the SPE Annual Technical Conference and
Exhibition, New Orleans, Louisiana, USA, 30 September - 2 October 2013.
https://doi.org/10.2118/166114-MS.
Al-Shakry, B., Shiran, B. S., Skauge, T. & Skauge, A. (2018a): Enhanced Oil
Recovery by Polymer Flooding: Optimizing Polymer Injectivity. Presented at
the SPE Kingdom of Saudi Arabia Annual Technical Symposium and
Exhibition, Dammam, Saudi Arabia, 23-26 April 2018.
https://doi.org/10.2118/192437-MS.
Al-Shakry, B., Skauge, T., Shiran, B. S. & Skauge, A. (2018b): Impact of Mechanical
Degradation on Polymer Injectivity in Porous Media, Polymers, Vol. 10: 1-
23. https://doi.org/10.3390/polym10070742.
Al-Shakry, B., Skauge, T., Shiran, B. S. & Skauge, A. (2019a): Polymer Injectivity:
Investigation of Mechanical Degradation of Enhanced Oil Recovery Polymers
Using In-Situ Rheology, Energies, Vol. 12: 1-25.
https://doi.org/10.3390/en12010049.
Al-Shakry, B., Shiran, B. S., Skauge, T. & Skauge, A. (2019b): Polymer Injectivity:
Influence of Permeability in the Flow of EOR Polymers in Porous Media.
Presented at the SPE Europec featured at the 81st EAGE Conference and
Exhibition, London, England, 3-6 June 2019. https://doi.org/10.2118/195495-
MS.
Alzaabi, M. A., Jacobsen, J. G., Masalmeh, S., Sumaiti, A. A., Pettersen, Ø. &
Skauge, A. (2020): Polymer Injectivity Test Design Using Numerical
Simulation, Polymers, Vol. 12: 1-23. https://doi.org/10.3390/polym12040801.
Azad, M. S. & Trivedi, J. J. (2017): Injectivity Behavior of Copolymer and
Associative Polymer Decoded Using Extensional Viscosity Characterization:
Effect of Hydrophobic Association. Presented at the SPE Western Regional
Meeting, Bakersfield, California, 21-23 April 2017.
https://doi.org/10.2118/185668-MS.
Azad, M. S. & Trivedi, J. J. (2019): Quantification of the Viscoelastic Effects During
Polymer Flooding: A Critical Review, Society of Petroleum Engineers
Journal, Vol. 24: 1-27. https://doi.org/10.2118/195687-PA.
Bird, R. B., Steward, W. E. & Lightfoot, E. N. (1960): Transport Phenomena, New
York, USA, Wiley.

84
Bird, R. B., Armstrong, R. C. & Hassager, O. (1987): Dynamics of Polymeric
Liquids, New York, USA, John Wiley & Sons Inc.
BP. (2019): Annual Energy Outlook 2019. Available from:
http://www.bp.com/content/dam/bp/business-
sites/en/global/corporate/pdfs/energy-economics/energy-outlook/bp-energy-
outlook-2019.pdf.
Broseta, D., Medjahed, F., Lecourtier, J. & Robin, M. (1995): Polymer
Adsorption/Retention in Porous Media: Effects of Core Wettability and
Residual Oil, Society of Petroleum Engineers Advanced Technology Series,
Vol. 3: 103-112. https://doi.org/10.2118/24149-PA.
Burnett, D. B. (1975): Laboratory Studies of Biopolymer Injectivity Behavior
Effectiveness of Enzyme Clarification. Presented at the 45th Annual California
Regional Meeting of the Society of Petroleum Engineers of AIME, Venture,
California, USA, 2-4 April 1975. https://doi.org/10.2118/5372-MS.
Cannella, W. J., Huh, C. & Seright, R. S. (1988): Prediction of Xanthan Rheology in
Porous Media. Presented at the SPE Annual Technical Conference and
Exhibition, Houston, Texas, USA, 2-5 October 1988.
https://doi.org/10.2118/18089-MS.
Carraher, C. E., Jr. (2003): Polymer Chemistry, New York, USA: Marcel Dekker Inc.
Carreau, P. J. (1972): Rheological Equations from Molecular Network Theories,
Transactions of the Society of Rheology, Vol. 16: 99-127.
https://doi.org/10.1122/1.549276.
Chauveteau, G. (1981): Molecular Interpretation of Several Different Properties of
Flow of Coiled Polymer Solutions Through Porous Media in Oil Recovery
Conditions. Presented at the SPE Annual Technical Conference and
Exhibition, San Antonio, Texas, USA, 4-7 October 1981.
https://doi.org/10.2118/10060-MS.
Chauveteau, G. & Zaitoun, A. (1981): Basic rheological behavior of xanthan
polysaccharide solutions in porous media: effects of pore size and polymer
concentration. Presented at the First European Symposium on EOR,
Bournemouth, England, September 1981.
Chauveteau, G., Tirrell, M. & Omari, A. (1984): Concentration Dependence of the
Effective Viscosity of Polymer Solutions in Small Pores with Repulsive or
Attractive Walls, Journal of Colloid and Interface Science, Vol. 100: 41-54.
https://doi.org/10.1016/0021-9797(84)90410-7.
85
Chen, Z., Du, C., Kurnia, I., Lou, J., Zhang, G., Yu, J. & Lee, R. L. (2016): A Study
of Factors Influencing Polymer Hydrodynamic Retention in Porous Media.
Presented at the SPE Improved Oil Recovery Conference, Tulsa, Oklahoma,
USA, 11-13 April 2016. https://doi.org/10.2118/179607-MS.
Christopher, R. H. & Middleman, S. (1965): Power-Law Flow through a Packed
Tube, Industrial & Engineering Chemistry Fundamentals, Vol. 4: 422-426.
https://doi.org/10.1021/i160016a011.
Clarke, A., Howe, A. M., Mitchell, J., Staniland, J. & Hawkes, L. A. (2016): How
Viscoelastic-Polymer Flooding Enhances Displacement Efficiency, Society of
Petroleum Engineers Journal, Vol. 21: 675-687.
https://doi.org/10.2118/174654-PA.
Computer Modelling Group (2016): STARS User Guide Advanced Processes &
Thermal Reservoir Simulator, Calgary, Alberta, Canada.
Dauben, D. L. & Menzie, D. E. (1967): Flow of Polymer Solutions Through Porous
Media, Journal of Petroleum Technology, Vol. 19: 1065-1073.
https://doi.org/10.2118/1688-PA.
Dawson, R. & Lantz, R. B. (1972): Inaccessible Pore Volume in Polymer Flooding,
Society of Petroleum Engineers Journal, Vol. 12: 448-452.
https://doi.org/10.2118/3522-PA.
De Gennes, P. G. (1974): Coil-stretch transition of dilute flexible polymers under
ultrahigh velocity gradients, Journal of Chemical Physics, Vol. 60: 5030-
5042. https://doi.org/10.1063/1.1681018.
De Simoni, M., Boccuni, F., Sambiase, M., Spagnuolo, M., Albertini, M., Tiani, A. &
Masserano, F. (2018): Polymer Injectivity Analysis and Subsurface Polymer
Behavior Evaluation. Presented at the SPE EOR Conference at Oil and Gas
West Asia, Muscat, Oman, 26-28 March 2018.
https://doi.org/10.2118/190383-MS.
Delamaide, E., Tabary, R., Renard, G. & Dwyer, P. (2014): Field Scale Polymer
Flooding of Heavy Oil: the Pelikan Lake Story. Presented at the 21st World
Petroleum Congress, Moscow, Russia, 15-19 June 2014.
Delshad, M., Kim, D. H., Magbagbeola, O. A., Huh, C., Pope, G. A. & Tarahhom, F.
(2008): Mechanistic Interpretation and Utilization of Viscoelastic Behavior of
Polymer Solutions for Improved Polymer-Flood Efficiency. Presented at the
SPE Symposium on Improved Oil Recovery, Tulsa, Oklahoma, USA, 20-23
April 2008. https://doi.org/10.2118/113620-MS.
Deshpande, A., Krishnan, J. M. & Kumar, P. B. (2010): Rheology of Complex
Fluids, New York, USA: Springer.

86
Dominguez, J. G. & Willhite, G. P. (1977): Retention and Flow Characteristics of
Polymer Solutions in Porous Media, Society of Petroleum Engineers Journal,
Vol. 17: 111-121. https://doi.org/10.2118/5835-PA.
Dupas, A., Henaut, I., Rousseau, D., Poulain, P., Tabary, R., Argillier, J. F. & Aubry,
T. (2013): Impact of Polymer Mechanical Degradation on Shear and
Extensional Viscosities: Towards Better Injectivity Forecasts in Polymer
Flooding Operations. Presented at the SPE International Symposium on
Oilfield Chemistry, The Woodlands, Texas, USA, 8-10 April 2013.
https://doi.org/10.2118/164083-MS.
Erincik, M. Z., Qi, P., Balhoff, M. T. & Pope, G. A. (2018): New Method to Reduce
Residual Oil Saturation by Polymer Flooding, Society of Petroleum
Engineers Journal, Vol. 23: 1944-1956. https://doi.org/10.2118/187230-PA.
Fanchi, J. R. & Christiansen, R. L. (2017): Introduction to Petroleum Engineering,
New Jersey, USA: John Wiley & Sons Ltd.
Fletcher, A. J. P., Flew, S. R. G., Lamb, S. P., Lund, T., Bjørnestad, E., Stavland, A.
& Gjøvikli, N. B. (1991): Measurements of Polysaccharide Polymer
Properties in Porous Media. Presented at the SPE International Symposium
on Oilfield Chemistry, Anaheim, California, USA, 20-22 February 1991.
https://doi.org/10.2118/21018-MS.
Gadde, P. B. & Sharma, M. M. (2001): Growing Injection Well Fractures and Their
Impact on Waterflood Performance. Presented at the SPE Annual Technical
Conference and Exhibition, New Orleans, Louisiana, USA, 30 September – 3
October 2001. https://doi.org/10.2118/71614-MS.
Glasbergen, G., Wever, D., Keijzer, E. & Farajzadeh, R. (2015): Injectivity Loss in
Polymer Floods: Causes, Preventions and Mitigations. Presented at the SPE
Kuwait Oil and Gas Show and Conference, Mishref, Kuwait, 11-14 October
2015. https://doi.org/10.2118/175383-MS.
Gogarty, W. B. (1967): Mobility Control With Polymer Solutions, Society of Petroleum
Engineers Journal, Vol. 7: 161-173. https://doi.org/10.2118/1566-B.
Green, D. W. & Willhite, G. P. (1998): Enhanced Oil Recovery, Texas, USA: Henry
L. Doherty Memorial Fund of AIME, Society of Petroleum Engineers.
Guetni, I., Marliere, C., Rousseau, D., Bihannic, I., Pelletier, M. & Villieras, F.
(2019): Transport of HPAM Solutions in low Permeability Porous Media:
Impacts of Salinity and Clay Content. Presented at the SPE Europec featured
at 81st EAGE Conference and Exhibition, London, England, 3-6 June 2019.
https://doi.org/10.2118/195434-MS.
87
Guo, H. (2017): How to Select Polymer Molecular Weight and Concentration to
Avoid Blocking in Polymer Flooding. Presented at the SPE Symposium:
Production Enhancement and Cost Optimisation, Kuala Lumpur, Malaysia, 7-
8 November 2017. https://doi.org/10.2118/189255-MS.
Heaviside, J., Brown, C. E. & Gamble, I. J. A. (1987): Relative Permeability for
Intermediate Wettability Reservoirs. Presented at the SPE Annual Technical
Conference and Exhibition, Dallas, Texas, USA, 27-30 September 1987.
https://doi.org/10.2118/16968-MS.
Heemskerk, J., Rosmalen, R., Janssen-van, R., Holtslag, R. J. & Teeuw, D. (1984):
Quantification of Viscoelastic Effects of Polyacrylamide Solutions. Presented
at the SPE Enhanced Oil Recovery Symposium, Tulsa, Oklahoma, USA, 15-
18 April 1984. https://doi.org/10.2118/12652-MS.
Herzig, J. P., Leclerc, D. M. & Le Goff, P. (1970): Flow of Suspensions through
Porous Media – Application to Deep Filtration, Journal of Industrial &
Engineering Chemistry Research, Vol. 62: 8-35.
https://doi.org/10.1021/ie50725a003.
Hirasaki, G. J. & Pope, G. A. (1974): Analysis of Factors Influencing Mobility and
Adsorption in the Flow of Polymer Solution Through Porous Media, Society
of Petroleum Engineers Journal, Vol. 14: 337-346.
https://doi.org/10.2118/4026-PA.
Jacobsen, J. G., Alzaabi, M., Skauge, T., Sorbie, K. & Skauge, A. (2019): Analysis
and Simulation of Polymer Injectivity. Presented at the 20th European
Symposium on Improved Oil Recovery, Pau, France, 8-11 April 2019.
https://doi.org/10.3997/2214-4609.201900115.
Jacobsen, J. G., Shiran, B. S., Skauge, T., Sorbie, K. S. & Skauge, A. (2020):
Qualification of New Methods for Measuring In Situ Rheology of Non-
Newtonian Fluids in Porous Media, Polymers, Vol. 12: 1-13.
https://doi.org/10.3390/polym12020452.
Jennings, R. R., Rogers, J. H. & West, T. J. (1971): Factors Influencing Mobilty
Control by Polymer Solutions, Journal of Petroleum Technology, Vol. 23:
391-401. https://doi.org/10.2118/2867-PA.
Jiang, H., Wu, W., Wang, D., Zeng, Y., Zhao, S. & Nie, J. (2008): The Effect of
Elasticity on Displacement Efficiency in the Lab and Results of High
Concentration Polymer Flooding in the Field. Presented at the 2008 SPE
Annual Technical Conference and Exhibition, Denver, Colorado, USA, 21-24
September 2008. https://doi.org/10.2118/115315-MS.
Jones, D. M. & Walters, K. (1989): The behavior of polymer solutions in extension-
dominated flows, with applications to Enhanced Oil Recovery, Rheologica
Acta, Vol. 28: 482-498. https://doi.org/10.1007/BF01332919.

88
Kozicki, W. (2002): Flow of a FENE Fluid in Packed Beds or Porous Media,
Canadian Journal of Chemical Engineering, Vol. 80: 818-829.
https://doi.org/10.1002/cjce.5450800505.
Lake, L. W., Johns, R., Rossen, B. & Pope, G. (2014): Fundamentals of Enhanced
Oil Recovery, New Jersey, USA: Society of Petroleum Engineers.
Lee, K., Huh, C. & Sharma, M. M. (2011): Impact of Fracture Growth on Well
Injectivity and Reservoir Sweep during Waterflood and Chemical EOR
Processes. Presented at the SPE Annual Technical Conference and
Exhibition, Denver, Colorado, USA, 30 October – 2 November 2011.
https://doi.org/10.2118/146778-MS.
Li, Z. & Delshad, M. (2014): Development of an Analytical Injectivity Model for
Non-Newtonian Polymer Solutions, Society of Petroleum Engineers Journal,
Vol. 19: 381-389. https://doi.org/10.2118/163672-PA.
Lopez, X., Valvatne, P. H. & Blunt, M. J. (2003): Predictive network modeling of
single-phase non-Newtonian flow in porous media, Journal of Colloid and
Interface Science, Vol. 264: 256-265. https://doi.org/10.1016/S0021-
9797(03)00310-2.
Lotfollahi, H., Farajzadeh, R., Delshad, M., Al-Abri, A., Wassing, B. M., Al-Mjeni,
R., Awan, K. & Bedrikovetsky, P. (2016): Mechanistic Simulation of Polymer
Injectivity in Field Tests, Society of Petroleum Engineers Journal, Vol. 21:
1178-1191. https://doi.org/10.2118/174665-PA.
Lötsch, T., Müller, T. & Pusch, G. (1985): The Effect of Inaccessible Pore Volume on
Polymer Coreflood Experiments. Presented at the International Symposium
on Oilfield and Geomthermal Chemistry, Phoenix, Arizona, USA, 9-11 April
1985. https://doi.org/10.2118/13590-MS.
Maerker, J. M. (1973): Dependence of Polymer Retention on Flow Rate, Journal of
Petroleum Technology, Vol. 25: 1307-1308. https://doi.org/10.2118/4423-PA.
Maerker, J. M. (1975): Shear Degradation of Partially Hydrolyzed Polyacrylamide
Solutions, Society of Petroleum Engineers Journal, Vol. 15: 311-322.
https://doi.org/10.2118/5101-PA.
Manichand, R. N., Let, K. P. M. S., Gil, L., Quillien, B. & Seright, R. S. (2013):
Effective Propagation of HPAM Solutions Through the Tambaredjo Reservoir
During a Polymer Flood, Society of Petroleum Engineers Production &
Operations, Vol. 28: 358-368. https://doi.org/10.2118/164121-PA.
Marshall, R. J. & Metzner, A. B. (1967): Flow of Viscoelastic Fluids Through Porous
Media, Industrial & Engineering Chemistry Fundamentals, Vol. 6: 393-400.
https://doi.org/10.1021/i160023a012.
89
Martin, F. D. (1975): The Effect of Hydrolysis of Polyacrylamide on Solution
Viscosity, Polymer Retention and Flow Resistance Properties. Presented at
the Rocky Mountain Regional Meeting of the Society of Petroleum Engineers
of AIME, Denver, Colorado, USA, 7-9 April 1975.
https://doi.org/10.2118/5339-MS.
Masuda, Y., Tang, K., Miyazawa, M. & Tanaka, S. (1992): 1D Simulation of Polymer
Flooding Including the Viscoelastic Effect of Polymer Solution, Society of
Petroleum Engineers Reservoir Engineering, Vol. 7: 247-252.
https://doi.org/10.2118/19499-PA.
Morris, C. W. & Jackson, K. M. (1978): Mechanical Degradation of Polyacrylamide
Solutions in Porous Media. Presented at the SPE Symposium on Improved
Methods of Oil Recovery, Tulsa, Oklahoma, USA, 16-17 April 1978.
https://doi.org/10.2118/7064-MS.
Mungan, N., Smith, F. W. & Thompson, J. L. (1966): Some Aspects of Polymer
Floods, Journal of Petroleum Technology, Vol. 18: 1143-1150.
https://doi.org/10.2118/1628-PA.
Mungan, N. (1969): Rheology and Adsorption of Aqueous Polymer Solutions, Journal
of Canadian Petroleum Technology, Vol. 8: 45-50. https://doi.org/10.2118/69-
02-01.
Mungan, N. (1972): Shear Viscosities of Ionic Polyacrylamide Solutions, Society of
Petroleum Engineers Journal, Vol. 12: 469-473. https://doi.org/10.2118/3521-
PA.
Noïk, C., Delaplace, P. & Muller, G. (1995): Physico-Chemical Characteristics of
Polyacrylamide Solutions after Mechanical Degradation through a Porous
Medium. Presented at the SPE International Symposium on Oilfield
Chemistry, San Antonio, Texas, USA, 14-17 February 1995.
https://doi.org/10.2118/28954-MS.
Odell, J. A., Müller, A. J. & Keller, A. (1988): Non-Newtonian behavior of
hydrolysed polyacrylamide in strong elongational flows: a transient network
approach, Polymer, Vol. 29: 1179-1190. https://doi.org/10.1016/0032-
3861(88)90042-0.
Oliver, D. S. & Chen, Y. (2011): Recent progress on reservoir history matching: a
review, Computational Geosciences, Vol. 15: 185-221.
https://doi.org/10.1007/s10596-010-9194-2.
Pearson, J. R. A. & Tardy, P. M. J. (2002): Models for flow of non-Newtonian and
complex fluids through porous media, Journal of Non-Newtonian Fluid
Mechanics, Vol. 102: 447-473. https://doi.org/10.1016/S0377-
0257(01)00191-4.

90
Pye, D. J. (1964): Improved Secondary Recovery by Control of Water Mobility,
Journal of Petroleum Technology, Vol. 16: 911-916.
https://doi.org/10.2118/845-PA.
Qi, P., Ehrenfriend, D. H., Koh, H. & Balhoff, M. T. (2017): Reduction of Residual
Oil Saturation in Sandstone Cores by Use of Viscoelastic Polymers, Society
of Petroleum Engineers Journal, Vol. 22: 447-458.
https://doi.org/10.2118/179689-PA.
Rodriguez, F., Rousseau, D., Bekri, S., Djabourov, M. & Bejarano, C. (2014):
Polymer Flooding for Extra-Heavy Oil: New Insights on the Key Polymer
Transport Properties in Porous Media. Presented at the SPE International
Heavy Oil Conference and Exhibition, Mangaf, Kuwait, 8-10 December
2014. https://doi.org/10.2118/172850-MS.
Rodriguez, S., Romero, C., Sargenti, M. L., Müller, A. J., Sáez, A. E. & Odell, J. A.
(1993): Flow of polymer solutions through porous media, Journal of Non-
Newtonian Fluid Mechanics, Vol. 49: 63-85. https://doi.org/10.1016/0377-
0257(93)85023-4.
Sandiford, B. B. (1964): Laboratory and Field Studies of Water Floods Using
Polymer Solutions to Increase Oil Reservoirs, Journal of Petroleum
Technology, Vol. 16: 917-922. https://doi.org/10.2118/844-PA.
Saripalli, K. P., Bryant, S. L. & Sharma, M. M. (1999): Role of Fracture Face and
Formation Plugging in Injection Well Fracturing and Injectivity Decline.
Presented at the SPE/EPA Exploration and Production Environmental
Conference, Austin, Texas, USA, 1-3 March 1999.
https://doi.org/10.2118/52731-MS.
Savins, J. G. (1969): Non-Newtonian Flow Through Porous Media, Industrial &
Engineering Chemistry, Vol. 61: 18-47. https://doi.org/10.1021/ie50718a005.
Seright, R. S. (1983): The Effects of Mechanical Degradation and Viscoelastic
Behavior on Injectivity of Polyacrylamide Solutions, Society of Petroleum
Engineers Journal, Vol. 23: 475-485. https://doi.org/10.2118/9297-PA.
Seright, R. S. (1995): Gel Placement in Fractured Systems, Society of Petroleum
Engineers Production & Facilities, Vol. 10: 241-248.
https://doi.org/10.2118/27740-PA.
Seright, R. S., Seheult, J. M. & Talashek, T. (2009): Injectivity Characteristics of
EOR Polymers, Society of Petroleum Engineers Reservoir Evaluation &
Engineering, Vol. 12: 783-792. https://doi.org/10.2118/115142-PA.
Seright, R. S. (2010): Potential for Polymer Flooding Reservoirs With Viscous Oils,
Society of Petroleum Engineers Reservoir Evaluation & Engineering, Vol. 13:
730-740. https://doi.org/10.2118/129899-PA.

91
Seright, R. S., Fan, T., Wavrik, K. & Balaban, R. d. C. (2011): New Insights into
Polymer Rheology in Porous Media, Society of Petroleum Engineers Journal,
Vol. 16: 35-42. https://doi.org/10.2118/129200-PA.
Seright, R. S., Zhang, G. & Wang, D. (2012): A Comparison of Polymer Flooding
With In-Depth Profile Modification, Journal of Canadian Petroleum
Technology, Vol. 51: 393-402. https://doi.org/10.2118/146087-PA.
Seright, R. S. (2017): How Much Polymer Should Be Injected During a Polymer
Flood? Review of Previous and Current Practices, Society of Petroleum
Engineers Journal, Vol. 22: 1-18. https://doi.org/10.2118/179543-PA.
Sheng, J. J. (2015): Modern Chemical Enhanced Oil Recovery, Waltham
Massachusetts, USA: Gulf Professional Publishing.
Sheng, J. J., Leonhardt, B. & Azri, N. (2015): Status of Polymer-Flooding
Technology, Journal of Canadian Petroleum Technology, Vol. 54: 116-126.
https://doi.org/10.2118/174541-PA.
Skauge, T., Kvilhaug, O. A., Skauge, A. (2015): Influence of Polymer Structural
Conformation and Phase Behavior on In-situ Viscosity. Presented at the 18th
European Symposium on Improved Oil Recovery, Dresden, Germany, 14-16
April 2015. https://doi.org/10.3997/2214-4609.201412154.
Skauge, T., Skauge, A., Salmo, I. C., Ormehaug, P. A., Al-Azri, N., Wassing, L. M.,
Glasbergen, G., van Wunnik, J. N. & Masalmeh, S. K. (2016): Radial and
Linear Polymer Flow – Influence on Injectivity. Presented at the SPE
Improved Oil Recovery Conference, Tulsa, Oklahoma, USA, 11-13 April
2016. https://doi.org/10.2118/179694-MS.
Skauge, A., Zamani, N., Jacobsen, J. G., Shiran, B. S., Al-Shakry, B. & Skauge, T.
(2018): Polymer Flow in Porous Media: Relevance to Enhanced Oil
Recovery, Colloids and Interfaces, Vol. 2: 1-27.
https://doi.org/10.3390/colloids2030027.
Smith, F. W. (1970): The Behavior of Partially Hydrolyzed Polyacrylamide Solutions
in Porous Media, Journal of Petroleum Technology, Vol. 22: 148-156.
https://doi.org/10.2118/2422-PA.
Sochi, T. (2010): Non-Newtonian flow in porous media, Polymer, Vol. 51: 5007-
5023. https://doi.org/10.1016/j.polymer.2010.07.047.
Sorbie, K. S., Clifford, P. J. & Jones, E. R. W. (1989): The rheology of pseudoplastic
fluids in porous media using network modeling, Journal of Colloid and
Interface Science, Vol. 130: 508-534. https://doi.org/10.1016/0021-
9797(89)90128-8.
Sorbie, K. S. (1991): Polymer-Improved Oil Recovery, Glasgow: Blackie & Son Ltd.

92
Standnes, D. C. & Skjevrak, I. (2014): Literature review of implemented polymer
field projects, Journal of Petroleum Science and Engineering, Vol. 122: 761-
775. https://doi.org/10.1016/j.petrol.2014.08.024.
Stavland, A., Jonsbråten, H. C. & Lohne, A. (2010): Polymer Flooding – Flow
Properties in Porous Media Versus Rheological Parameters. Presented at the
SPE EUROPEC/EAGE Annual Conference and Exhibition, Barcelona, Spain,
14-17 June 2010. https://doi.org/10.2118/131103-MS.
Szabo, M. T. (1975): Some Aspects of Polymer Retention in Porous Media Using a
C14-Tagged Hydrolyzed Polyacrylamide, Society of Petroleum Engineers
Journal, Vol. 15: 323-337. https://doi.org/10.2118/4668-PA.
Szabo, M. T. (1979): An Evaluation of Water-Soluble Polymers for Secondary Oil
Recovery – Parts 1 and 2, Journal of Petroleum Technology, Vol. 31: 553-
570. https://doi.org/10.2118/6601-PA.
Thomas, A. (2019): Essentials of Polymer Flooding Technique, New Jersey, USA:
John Wiley & Sons Ltd.
Teeuw, D. & Hesselink, F. T. (1980): Power-Law Flow And Hydrodynamic Behavior
Of Biopolymer Solutions In Porous Media. Presented at the SPE Oilfield and
Geothermal Chemistry Symposium, Stanford, California, USA, 28-30 May
1980. https://doi.org/10.2118/8982-MS.
Tien, C. & Payatakes, A. C. (1979): Advances in Deep Bed Filtration, American
Institute of Chemical Engineering Journal, Vol. 25: 737-759.
https://doi.org/10.1002/aic.690250502.
Urbissinova, T. S., Trivedi, J. & Kuru, E. (2010): Effect of Elasticity During
Viscoelastic Polymer Flooding: A Possible Mechanism of Increasing the
Sweep Efficiency, Journal of Canadian Petroleum Technology, Vol. 49: 49-56.
https://doi.org/10.2118/133471-PA.
Vermolen, E. C. M., Haasterecht, M. J. T. & Masalmeh, S. K. (2014): A Systematic
Study of the Polymer Visco-Elastic Effect on Residual Oil Saturation by Core
Flooding. Presented at the SPE EOR Conference at Oil and Gas West Asia,
Muscat, Oman, 31 March – 2 April 2014. https://doi.org/10.2118/169681-MS.
Vik, B., Kedir, A., Kippe, V., Sandengen, K., Skauge, T., Solbakken, J. & Zhu, D.
(2018): Viscous Oil Recovery by Polymer Injection; Impact of In-Situ
Polymer Rheology on Water Front Stabilization. Presented at the SPE
Europec featured at the 80th EAGE Conference and Exhibition, Copenhagen,
Denmark, 11-14 June 2018. https://doi.org/10.2118/190866-MS.
Volpert, E., Selb, J. & Candau, F. (1998): Associating behavior of polyacrylamides
hydrophobically modified with dihexylacrylamide, Polymer, Vol. 39: 1025-
1033. https://doi.org/10.1016/S0032-3861(97)00393-5.
93
Vorwerk, J. & Brunn, P. O. (1991): Porous medium flow of the fluid A1: effects of
shear and elongation, Journal of Non-Newtonian Fluid Mechanics, Vol. 41:
119-131. https://doi.org/10.1016/0377-0257(91)87038-Y.
Wang, D., Cheng, J., Yang, Q., Gong, W., Li, Q. & Chen, F. (2000): Viscous-Elastic
Polymer Can Increase Microscale Displacement Efficiency in Cores.
Presented at the 2000 SPE Annual Technical Conference and Exhibition,
Dallas, Texas, 1-4 October 2000. https://doi.org/10.2118/63227-MS.
Wang, D., Seright, R. S., Shao, Z. & Wang, J. (2007): Key Aspects of Project Design
for Polymer Flooding at the Daqing Oil Field, Society of Petroleum
Engineers Reservoir Evaluation & Engineering, Vol. 11: 1117-1124.
https://doi.org/10.2118/109682-PA.
Wang, D., Han, P., Shao, Z., Hou, W. & Seright, R. S. (2008): Sweep-Improvement
Options for the Daqing Oil Field, Society of Petroleum Engineers Reservoir
Evaluation & Engineering, Vol. 11: 18-26. https://doi.org/10.2118/99441-PA.
Ward, J. S. & Martin, F. D. (1981): Prediction of Viscosity for Partially Hydrolyzed
Polyacrylamide Solutions in the Presence of Calcium and Magnesium Ions,
Society of Petroleum Engineers Journal, Vol. 21: 623-631.
https://doi.org/10.2118/8978-PA.
Wever, D. A. Z., Bartlema, H., ten Berge, A. B. G. M., Al-Mjeni, R. & Glasbergen,
G. (2018): The Effect of the Presence of Oil on Polymer Retention in Porous
Media from Clastic Reservoirs in the Sultanate of Oman. Presented at the SPE
EOR Conference at Oil and Gas West Asia, Muscat, Oman, 26-28 March
2018. https://doi.org/10.2118/190430-MS.
Xia, H., Ju, Y., Kong, F. & Wu, J. (2004): Effect of Elastic Behavior of HPAM
Solutions on Displacement Efficiency Under Mixed Wettability Conditions.
Presented at the 2004 SPE International Petroleum Conference, Puebla,
Mexico, 8-9 November 2004. https://doi.org/10.2118/90234-MS.
Yerramilli, S. S., Zitha, P. L. J. & Yerramilli, R. C. (2013): Novel Insight into
Polymer Injectivity for Polymer Flooding. Presented at the SPE European
Formation Damage Conference & Exhibition, Noordwijk, The Netherlands,
5-7 June 2013. https://doi.org/10.2118/165195-MS.
Yin, H., Wang, D. & Zhong, H. (2006): Study on Flow Behaviors of Viscoelastic
Polymer Solution in Micropore With Dead End. Presented at the 2006 SPE
Annual Technical Conference and Exhibition, San Antonio, Texas, USA, 24-
27 September 2006. https://doi.org/10.2118/101950-MS.
Zaitoun, A. & Kohler, N. (1987): The Role of Adsorption in Polymer Propagation
Through Reservoir Rocks. Presented at the SPE International Symposium on
Oilfield Chemistry, San Antonio, Texas, USA, 4-6 February 1987.
https://doi.org/10.2118/16274-MS.

94
Zamani, N., Bondino, I., Kaufmann, R. & Skauge, A. (2015): Effect of porous media
properties on the onset of polymer extensional viscosity, Journal of Petroleum
Science and Engineering, Vol. 133: 483-495.
https://doi.org/10.1016/j.petrol.2015.06.025.
Zechner, M., Clemens, T., Suri, A. & Sharma, M. M. (2015): Simulation of Polymer
Injection Under Fracturing Conditions – An Injectivity Pilot in the Matzen
Field, Austria, Society of Petroleum Engineers Reservoir Evaluation &
Engineering, Vol. 18: 236-249. https://doi.org/10.2118/169043-PA.
Zhang, G. & Seright, R. S. (2014): Effect of Concentration on HPAM Retention in
Porous Media, Society of Petroleum Engineers Journal, Vol. 19: 373-380.
https://doi.org/10.2118/166265-PA.
Zhang, G. & Seright, R. S. (2015): Hydrodynamic Retention and Rheology of EOR
Polymers in Porous Media. Presented at the SPE International Symposium on
Oilfield Chemistry, The Woodlands, Texas, USA, 13-15 April 2015.
https://doi.org/10.2118/173728-MS.
Åsen, S. M., Stavland, A., Strand, D. & Hiorth, A. (2019): An Experimental
Investigation of Polymer Mechanical Degradation at the Centimeter and
Meter Scale, Society of Petroleum Engineers Journal, Vol. 24: 1700-1713.
https://doi.org/10.2118/190225-PA.

95
Appendix: Papers (1-4)


Paper 1:
Polymer Flow in Porous Media: Relevance to Enhanced Oil Recovery


colloids and interfaces
Article
Polymer Flow in Porous Media: Relevance toEnhanced Oil Recovery
Arne Skauge 1,2,*, Nematollah Zamani 3, Jørgen Gausdal Jacobsen 1,3, Behruz Shaker Shiran 3,Badar Al-Shakry 1 ID and Tormod Skauge 2
1 Department of Chemistry, University of Bergen, Allegaten 41, N-5020 Bergen, Norway;[email protected] (J.G.J.); [email protected] (B.A.-S.)
2 Energy Research Norway, N-5020 Bergen, Norway; [email protected] Uni Research, N-5020 Bergen, Norway; [email protected] (N.Z.); [email protected] (B.S.S.)* Correspondence: [email protected]; Tel.: +47-5558-3358
Received: 1 June 2018; Accepted: 3 July 2018; Published: 10 July 2018�����������������
Abstract: Polymer flooding is one of the most successful chemical EOR (enhanced oil recovery)methods, and is primarily implemented to accelerate oil production by sweep improvement.However, additional benefits have extended the utility of polymer flooding. During the last decade,it has been evaluated for use in an increasing number of fields, both offshore and onshore. This is aconsequence of (1) improved polymer properties, which extend their use to HTHS (high temperaturehigh salinity) conditions and (2) increased understanding of flow mechanisms such as those for heavyoil mobilization. A key requirement for studying polymer performance is the control and prediction ofin-situ porous medium rheology. The first part of this paper reviews recent developments in polymerflow in porous medium, with a focus on polymer in-situ rheology and injectivity. The second part ofthis paper reports polymer flow experiments conducted using the most widely applied polymer forEOR processes, HPAM (partially hydrolyzed polyacrylamide). The experiments addressed highrate,near-wellbore behavior (radial flow), reservoir rate steady-state flow (linear flow) and the differencesobserved in terms of flow conditions. In addition, the impact of oil on polymer rheology wasinvestigated and compared to single-phase polymer flow in Bentheimer sandstone rock material.Results show that the presence of oil leads to a reduction in apparent viscosity.
Keywords: EOR; polymer flooding; in-situ rheology; non-Newtonian flow in porous medium
1. Introduction
The success of polymer flooding depends on the ability of injected solutions to transport polymermolecules deep into a reservoir, thus providing enhanced mobility ratio conditions for the displacementprocess. In the following sections, we focus on the principal parameters that are crucial in thedecision-making process for designing a satisfactory polymer flood design.
The application of polymer flooding to tertiary oil recovery may induce high injection pressures,resulting in injectivity impairment. Since the volumetric injection rate during polymer floodingis constrained by formation fracture pressure, project economics may be significantly affected.Thus, injectivity is a critical parameter and key risk factor for implementation of polymer flood projects.
A large number of injectivity studies, both theoretical and experimental, have been performed inporous media during recent decades, albeit they were mainly studies of linear cores in the absenceof residual oil [1–7]. Recently, Skauge et al. [8] performed radial injectivity experiments showingsignificant reduction in differential pressure compared to linear core floods. This discrepancy inpolymer flow in linear cores compared to that in radial disks is partly explained by the of differingpressure conditions that occur when polymer molecules are exposed to transient and semi-transient
Colloids Interfaces 2018, 2, 27; doi:10.3390/colloids2030027 www.mdpi.com/journal/colloids

Colloids Interfaces 2018, 2, 27 2 of 27
pressure conditions in radial disks, as opposed to the steady state conditions experienced in linear corefloods. In addition, they observed that the onset of apparent shear thickening occurs at significantlyhigher flux in radial floods. Based on these results, injectivity was suggested to be underestimatedfrom experiments performed in linear core plugs. However, these experiments were performed in theabsence of residual oil. If residual oil has a significant effect on polymer propagation in porous media,experiments performed in its absence will not be able to accurately predict polymer performance.
Experimental studies investigating the effects of residual oil on polymer propagation throughporous media have been sparse, although they have generally shown decreasing levels of polymerretention in the presence of residual oil [9,10].
The polymer adsorbs to the rock surface and may also block pores due to polymer size (straining)and flow rate (hydrodynamic retention). In addition, different trapping mechanisms may take place.The polymer retention phenomena influence the flow of polymer in porous media, however, theseeffects are beyond the scope of this paper. The subject has been reviewed in several other books andpapers, e.g., Sorbie [11] and Lake [12].
History matches performed in this study aim to highlight the injectivity of partially hydrolyzedpolyacrylamides (HPAMs) in radial disks saturated with residual oil, as these conditions best mimicactual flow conditions in oil reservoirs. Results show that the presence of residual oil reduces theapparent viscosity of HPAM in flow through porous media, thus improving injectivity. These resultsmay facilitate increased implementation of polymer EOR (enhanced oil recovery) projects, as previousprojects deemed infeasible may now be economically viable.
2. Theory
2.1. In-Situ Rheology
Polymer viscosity as a function of shear rate is usually measured using a rheometer. During themeasurement process, polymer solutions are exposed to different shear rates in a stepwise manner.For each shear rate, polymer viscosity is measured after steady state conditions are achieved; at thisstate, it is referred to as bulk viscosity. However, polymer molecules experience significantly differentflow conditions in rheometers compared to porous media. In particular:
(I) unlike rheometers, porous media exhibit an inherently complex geometry;(II) phenomena such as mechanical degradation may change rheological properties;(III) although they only demonstrate shear thinning behavior in rheometers, polymer solutions may
exhibit apparent shear thickening behavior above a certain critical flow rate;(IV) due to the tortuosity of porous media and existence of several contraction-expansion channels,
polymer solutions are exposed to a wide range of shear rates at each flow rate and whereextensional viscosity becomes more dominant, resulting in significantly different rheologybehavior compared to bulk flow.
To account for these contrasting flow conditions, in-situ viscosity has been suggested to describethe fluid flow behavior of polymer solutions in porous media. In-situ viscosity is a macroscopicparameter that can be calculated using Darcy’s law for single-phase non-Newtonian fluids:
µapp =KAQ
∆PL
(1)
It is generally measured in core flood experiments as a function of Darcy velocity. Comparison ofin-situ and bulk rheology (Figure 1) shows vertical and horizontal shifts between viscosity curves.Vertical shifts may be due to phenomena such as mechanical degradation, while horizontal shifts aredue to a conversion factor between in-situ shear rate and Darcy velocity, shown as α. The red line inFigure 1 shows an increase in apparent viscosity, which is due to polymer adsorption. The adsorbedlayer of polymer reduces the effective pore size and blocks smaller pores, both leading to increased
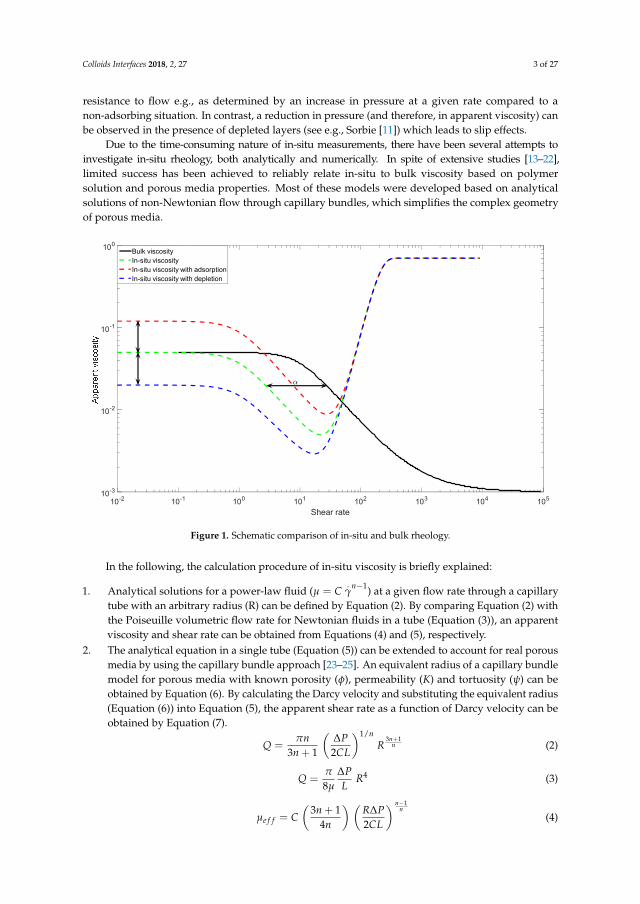
Colloids Interfaces 2018, 2, 27 3 of 27
resistance to flow e.g., as determined by an increase in pressure at a given rate compared to anon-adsorbing situation. In contrast, a reduction in pressure (and therefore, in apparent viscosity) canbe observed in the presence of depleted layers (see e.g., Sorbie [11]) which leads to slip effects.
Due to the time-consuming nature of in-situ measurements, there have been several attempts toinvestigate in-situ rheology, both analytically and numerically. In spite of extensive studies [13–22],limited success has been achieved to reliably relate in-situ to bulk viscosity based on polymersolution and porous media properties. Most of these models were developed based on analyticalsolutions of non-Newtonian flow through capillary bundles, which simplifies the complex geometryof porous media.
Colloids Interfaces 2018, 2, x FOR PEER REVIEW 3 of 27
resistance to flow e.g., as determined by an increase in pressure at a given rate compared to a non-adsorbing situation. In contrast, a reduction in pressure (and therefore, in apparent viscosity) can be observed in the presence of depleted layers (see e.g., Sorbie [11]) which leads to slip effects.
Due to the time-consuming nature of in-situ measurements, there have been several attempts to investigate in-situ rheology, both analytically and numerically. In spite of extensive studies [13–22], limited success has been achieved to reliably relate in-situ to bulk viscosity based on polymer solution and porous media properties. Most of these models were developed based on analytical solutions of non-Newtonian flow through capillary bundles, which simplifies the complex geometry of porous media.
Figure 1. Schematic comparison of in-situ and bulk rheology.
In the following, the calculation procedure of in-situ viscosity is briefly explained:
1. Analytical solutions for a power-law fluid ( = ) at a given flow rate through a capillary tube with an arbitrary radius (R) can be defined by Equation (2). By comparing Equation (2) with the Poiseuille volumetric flow rate for Newtonian fluids in a tube (Equation (3)), an apparent viscosity and shear rate can be obtained from Equations (4) and (5), respectively.
2. The analytical equation in a single tube (Equation (5)) can be extended to account for real porous media by using the capillary bundle approach [23–25]. An equivalent radius of a capillary bundle model for porous media with known porosity (φ), permeability (K) and tortuosity (ψ) can be obtained by Equation (6). By calculating the Darcy velocity and substituting the equivalent radius (Equation (6)) into Equation (5), the apparent shear rate as a function of Darcy velocity can be obtained by Equation (7). = / (1)
= 8 Δ (2)
= 3 + 14 Δ2 (4)
Shear rate10-2 10-1 100 101 102 103 104 105
10-3
10-2
10-1
100Bulk viscosityIn-situ viscosityIn-situ viscosity with adsorptionIn-situ viscosity with depletion
Figure 1. Schematic comparison of in-situ and bulk rheology.
In the following, the calculation procedure of in-situ viscosity is briefly explained:
1. Analytical solutions for a power-law fluid (µ = C.γ
n−1) at a given flow rate through a capillarytube with an arbitrary radius (R) can be defined by Equation (2). By comparing Equation (2) withthe Poiseuille volumetric flow rate for Newtonian fluids in a tube (Equation (3)), an apparentviscosity and shear rate can be obtained from Equations (4) and (5), respectively.
2. The analytical equation in a single tube (Equation (5)) can be extended to account for real porousmedia by using the capillary bundle approach [23–25]. An equivalent radius of a capillary bundlemodel for porous media with known porosity (φ), permeability (K) and tortuosity (ψ) can beobtained by Equation (6). By calculating the Darcy velocity and substituting the equivalent radius(Equation (6)) into Equation (5), the apparent shear rate as a function of Darcy velocity can beobtained by Equation (7).
Q =πn
3n + 1
(∆P2CL
)1/nR
3n+1n (2)
Q =π
8µ
∆PL
R4 (3)
µe f f = C(
3n + 14n
) (R∆P2CL
) n−1n
(4)

Colloids Interfaces 2018, 2, 27 4 of 27
µapp = C.γ
n−1app ⇒
.γapp =
(3n + 1
4n
) 1n−1(
R∆P2CL
)1/n(5)
Req =
√8Kψ
φ(6)
.γapp = 4
(3n + 1
4n
) nn−1 U√
8Kφψ(7)
3. The above expressions are considered as an analytical basis for calculating apparent viscosityin porous media. Based on Equation (7), a simplified linear correlation between apparent shearrate and Darcy velocity is generally suggested, i.e., Equation (8), in which the correction factor (α)is the key factor. Some proposed equations for the correction factor are summarized in Table 1.By comparing different coefficients, different values for apparent viscosity may be obtained.
.γapp = α
U√Kφ
(8)
Table 1. Summary of proposed models for correction factor (α).
Model Equation for Correction Factor (α) Description
Analytical solution 4(
3n+14n
) nn−1 n is the power index in power-law region
Hirasaki and Pope [26] 12√150
(3n+1
4n
) nn−1 n is the power index in power-law region
Cannella et al. [16] β√Sw
(3n+1
n
) nn−1 n is the power index in power-law region, Sw is
water saturation, β is a constant equal to 6.
Based on the capillary bundle approach, other models were also proposed by Bird et al. [24],Christopher and Middleman [25], and Teeuw and Hesselink [15], in which the modified Blake-Kozenymodel is used for power-law fluids (Equation (9)) and apparent viscosity is obtained usingEquation (10).
U =
(K
µapp
∆PL
)1/n(9)
µapp = C(
3n + 14n
)n (Kφ
β
)(1−n)/2(10)
Based on the discussion given by Teeuw and Hesselink [15], tortuosity has a dual effect on bothshear rate and shear stress calculations. Christopher and Middleman [25] only incorporated tortuosityin shear stress calculations, while Bird et al. [24] incorporated tortuosity into the shear rate term.The various values of β chosen by different authors are summarized in Table 2.
Table 2. β values applied by different authors where ψ = 25/12.
Model B
Bird et al. [24]√
2ψ
Christopher and Middleman [25]√
2ψ
Teeuw and Hesselink [15]√
2
Hirasaki and Pope [26] conducted several core flood experiments where permeability was in therange 7–23 mD, porosity in the range 18–20% and residual oil between 20% and 32%. Based on these
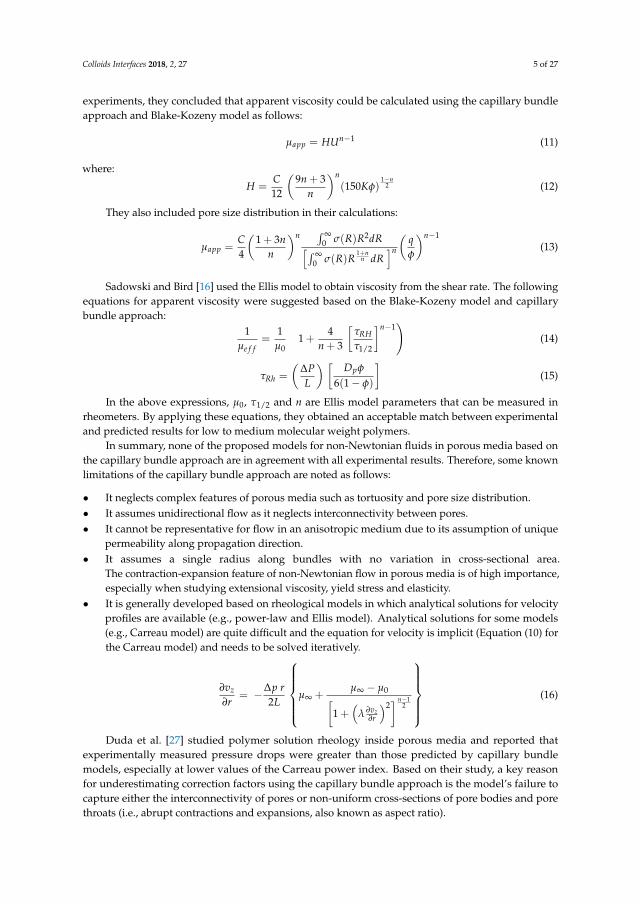
Colloids Interfaces 2018, 2, 27 5 of 27
experiments, they concluded that apparent viscosity could be calculated using the capillary bundleapproach and Blake-Kozeny model as follows:
µapp = HUn−1 (11)
where:
H =C12
(9n + 3
n
)n(150Kφ)
1−n2 (12)
They also included pore size distribution in their calculations:
µapp =C4
(1 + 3n
n
)n ∫ ∞0 σ(R)R2dR[∫ ∞
0 σ(R)R1+n
n dR]n
(qφ
)n−1(13)
Sadowski and Bird [16] used the Ellis model to obtain viscosity from the shear rate. The followingequations for apparent viscosity were suggested based on the Blake-Kozeny model and capillarybundle approach:
1µe f f
=1
µ0
(1 +
4n + 3
[τRHτ1/2
]n−1)
(14)
τRh =
(∆PL
) [Dpφ
6(1− φ)
](15)
In the above expressions, µ0, τ1/2 and n are Ellis model parameters that can be measured inrheometers. By applying these equations, they obtained an acceptable match between experimentaland predicted results for low to medium molecular weight polymers.
In summary, none of the proposed models for non-Newtonian fluids in porous media based onthe capillary bundle approach are in agreement with all experimental results. Therefore, some knownlimitations of the capillary bundle approach are noted as follows:
• It neglects complex features of porous media such as tortuosity and pore size distribution.• It assumes unidirectional flow as it neglects interconnectivity between pores.• It cannot be representative for flow in an anisotropic medium due to its assumption of unique
permeability along propagation direction.• It assumes a single radius along bundles with no variation in cross-sectional area.
The contraction-expansion feature of non-Newtonian flow in porous media is of high importance,especially when studying extensional viscosity, yield stress and elasticity.
• It is generally developed based on rheological models in which analytical solutions for velocityprofiles are available (e.g., power-law and Ellis model). Analytical solutions for some models(e.g., Carreau model) are quite difficult and the equation for velocity is implicit (Equation (10) forthe Carreau model) and needs to be solved iteratively.
∂vz
∂r= −∆p r
2L
µ∞ +µ∞ − µ0[
1 +(
λ ∂vz∂r
)2] n−1
2
(16)
Duda et al. [27] studied polymer solution rheology inside porous media and reported thatexperimentally measured pressure drops were greater than those predicted by capillary bundlemodels, especially at lower values of the Carreau power index. Based on their study, a key reasonfor underestimating correction factors using the capillary bundle approach is the model’s failure tocapture either the interconnectivity of pores or non-uniform cross-sections of pore bodies and porethroats (i.e., abrupt contractions and expansions, also known as aspect ratio).
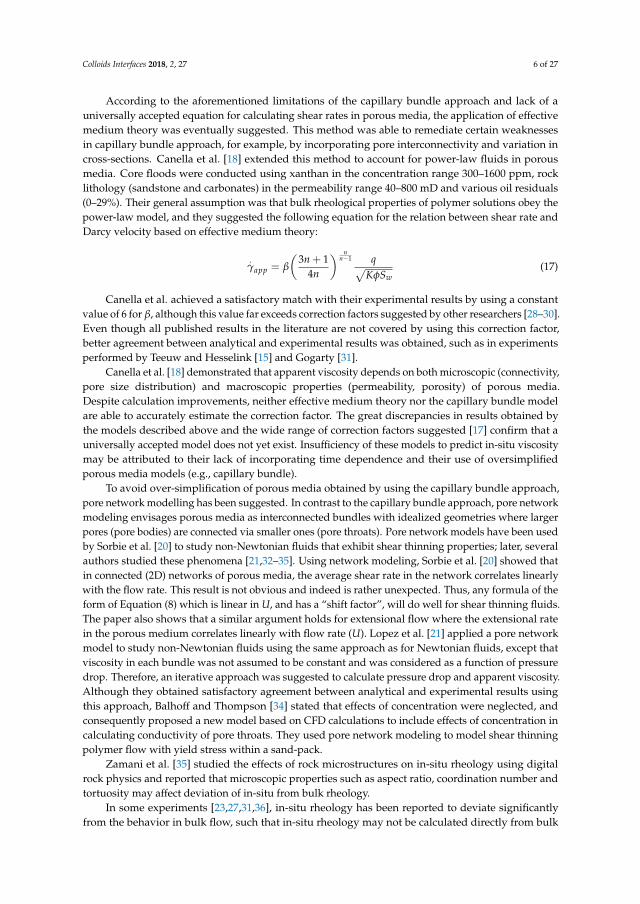
Colloids Interfaces 2018, 2, 27 6 of 27
According to the aforementioned limitations of the capillary bundle approach and lack of auniversally accepted equation for calculating shear rates in porous media, the application of effectivemedium theory was eventually suggested. This method was able to remediate certain weaknessesin capillary bundle approach, for example, by incorporating pore interconnectivity and variation incross-sections. Canella et al. [18] extended this method to account for power-law fluids in porousmedia. Core floods were conducted using xanthan in the concentration range 300–1600 ppm, rocklithology (sandstone and carbonates) in the permeability range 40–800 mD and various oil residuals(0–29%). Their general assumption was that bulk rheological properties of polymer solutions obey thepower-law model, and they suggested the following equation for the relation between shear rate andDarcy velocity based on effective medium theory:
.γapp = β
(3n + 1
4n
) nn−1 q√
KφSw(17)
Canella et al. achieved a satisfactory match with their experimental results by using a constantvalue of 6 for β, although this value far exceeds correction factors suggested by other researchers [28–30].Even though all published results in the literature are not covered by using this correction factor,better agreement between analytical and experimental results was obtained, such as in experimentsperformed by Teeuw and Hesselink [15] and Gogarty [31].
Canella et al. [18] demonstrated that apparent viscosity depends on both microscopic (connectivity,pore size distribution) and macroscopic properties (permeability, porosity) of porous media.Despite calculation improvements, neither effective medium theory nor the capillary bundle modelare able to accurately estimate the correction factor. The great discrepancies in results obtained bythe models described above and the wide range of correction factors suggested [17] confirm that auniversally accepted model does not yet exist. Insufficiency of these models to predict in-situ viscositymay be attributed to their lack of incorporating time dependence and their use of oversimplifiedporous media models (e.g., capillary bundle).
To avoid over-simplification of porous media obtained by using the capillary bundle approach,pore network modelling has been suggested. In contrast to the capillary bundle approach, pore networkmodeling envisages porous media as interconnected bundles with idealized geometries where largerpores (pore bodies) are connected via smaller ones (pore throats). Pore network models have been usedby Sorbie et al. [20] to study non-Newtonian fluids that exhibit shear thinning properties; later, severalauthors studied these phenomena [21,32–35]. Using network modeling, Sorbie et al. [20] showed thatin connected (2D) networks of porous media, the average shear rate in the network correlates linearlywith the flow rate. This result is not obvious and indeed is rather unexpected. Thus, any formula of theform of Equation (8) which is linear in U, and has a “shift factor”, will do well for shear thinning fluids.The paper also shows that a similar argument holds for extensional flow where the extensional ratein the porous medium correlates linearly with flow rate (U). Lopez et al. [21] applied a pore networkmodel to study non-Newtonian fluids using the same approach as for Newtonian fluids, except thatviscosity in each bundle was not assumed to be constant and was considered as a function of pressuredrop. Therefore, an iterative approach was suggested to calculate pressure drop and apparent viscosity.Although they obtained satisfactory agreement between analytical and experimental results usingthis approach, Balhoff and Thompson [34] stated that effects of concentration were neglected, andconsequently proposed a new model based on CFD calculations to include effects of concentration incalculating conductivity of pore throats. They used pore network modeling to model shear thinningpolymer flow with yield stress within a sand-pack.
Zamani et al. [35] studied the effects of rock microstructures on in-situ rheology using digitalrock physics and reported that microscopic properties such as aspect ratio, coordination number andtortuosity may affect deviation of in-situ from bulk rheology.
In some experiments [23,27,31,36], in-situ rheology has been reported to deviate significantlyfrom the behavior in bulk flow, such that in-situ rheology may not be calculated directly from bulk
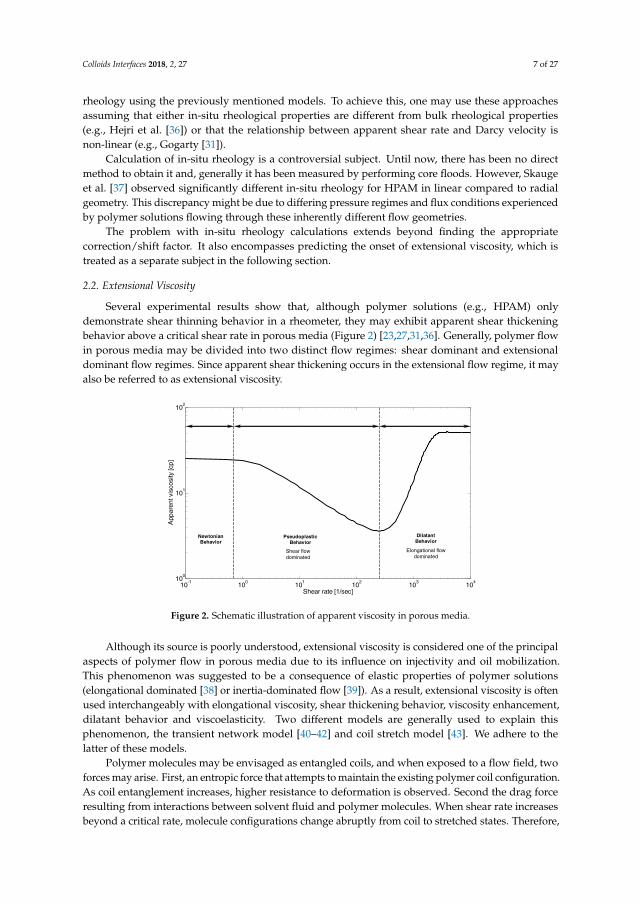
Colloids Interfaces 2018, 2, 27 7 of 27
rheology using the previously mentioned models. To achieve this, one may use these approachesassuming that either in-situ rheological properties are different from bulk rheological properties(e.g., Hejri et al. [36]) or that the relationship between apparent shear rate and Darcy velocity isnon-linear (e.g., Gogarty [31]).
Calculation of in-situ rheology is a controversial subject. Until now, there has been no directmethod to obtain it and, generally it has been measured by performing core floods. However, Skaugeet al. [37] observed significantly different in-situ rheology for HPAM in linear compared to radialgeometry. This discrepancy might be due to differing pressure regimes and flux conditions experiencedby polymer solutions flowing through these inherently different flow geometries.
The problem with in-situ rheology calculations extends beyond finding the appropriatecorrection/shift factor. It also encompasses predicting the onset of extensional viscosity, which istreated as a separate subject in the following section.
2.2. Extensional Viscosity
Several experimental results show that, although polymer solutions (e.g., HPAM) onlydemonstrate shear thinning behavior in a rheometer, they may exhibit apparent shear thickeningbehavior above a critical shear rate in porous media (Figure 2) [23,27,31,36]. Generally, polymer flowin porous media may be divided into two distinct flow regimes: shear dominant and extensionaldominant flow regimes. Since apparent shear thickening occurs in the extensional flow regime, it mayalso be referred to as extensional viscosity.
Colloids Interfaces 2018, 2, x FOR PEER REVIEW 7 of 27
Hejri et al. [36]) or that the relationship between apparent shear rate and Darcy velocity is non-linear (e.g., Gogarty [31]).
Calculation of in-situ rheology is a controversial subject. Until now, there has been no direct method to obtain it and, generally it has been measured by performing core floods. However, Skauge et al. [37] observed significantly different in-situ rheology for HPAM in linear compared to radial geometry. This discrepancy might be due to differing pressure regimes and flux conditions experienced by polymer solutions flowing through these inherently different flow geometries.
The problem with in-situ rheology calculations extends beyond finding the appropriate correction/shift factor. It also encompasses predicting the onset of extensional viscosity, which is treated as a separate subject in the following section.
2.2. Extensional Viscosity
Several experimental results show that, although polymer solutions (e.g., HPAM) only demonstrate shear thinning behavior in a rheometer, they may exhibit apparent shear thickening behavior above a critical shear rate in porous media (Figure 2) [23,27,31,36]. Generally, polymer flow in porous media may be divided into two distinct flow regimes: shear dominant and extensional dominant flow regimes. Since apparent shear thickening occurs in the extensional flow regime, it may also be referred to as extensional viscosity.
Figure 2. Schematic illustration of apparent viscosity in porous media.
Although its source is poorly understood, extensional viscosity is considered one of the principal aspects of polymer flow in porous media due to its influence on injectivity and oil mobilization. This phenomenon was suggested to be a consequence of elastic properties of polymer solutions (elongational dominated [38] or inertia-dominated flow [39]). As a result, extensional viscosity is often used interchangeably with elongational viscosity, shear thickening behavior, viscosity enhancement, dilatant behavior and viscoelasticity. Two different models are generally used to explain this phenomenon, the transient network model [40–42] and coil stretch model [43]. We adhere to the latter of these models.
Polymer molecules may be envisaged as entangled coils, and when exposed to a flow field, two forces may arise. First, an entropic force that attempts to maintain the existing polymer coil configuration. As coil entanglement increases, higher resistance to deformation is observed. Second the drag force resulting from interactions between solvent fluid and polymer molecules. When shear rate increases beyond a critical rate, molecule configurations change abruptly from coil to stretched states. Therefore, polymer coils start to deform, resulting in anisotropy and stress differences between elongation and compression. Consequently, normal stresses and elastic properties become more dominant.
10-1 100 101 102 103 104100
101
102
Shear rate [1/sec]
App
aren
t vis
cosi
ty [c
p]
Elongational flowdominated
DilatantBehavior
NewtonianBehavior
Shear flowdominated
PseudoplasticBehavior
Figure 2. Schematic illustration of apparent viscosity in porous media.
Although its source is poorly understood, extensional viscosity is considered one of the principalaspects of polymer flow in porous media due to its influence on injectivity and oil mobilization.This phenomenon was suggested to be a consequence of elastic properties of polymer solutions(elongational dominated [38] or inertia-dominated flow [39]). As a result, extensional viscosity is oftenused interchangeably with elongational viscosity, shear thickening behavior, viscosity enhancement,dilatant behavior and viscoelasticity. Two different models are generally used to explain thisphenomenon, the transient network model [40–42] and coil stretch model [43]. We adhere to thelatter of these models.
Polymer molecules may be envisaged as entangled coils, and when exposed to a flow field, twoforces may arise. First, an entropic force that attempts to maintain the existing polymer coil configuration.As coil entanglement increases, higher resistance to deformation is observed. Second the drag forceresulting from interactions between solvent fluid and polymer molecules. When shear rate increasesbeyond a critical rate, molecule configurations change abruptly from coil to stretched states. Therefore,

Colloids Interfaces 2018, 2, 27 8 of 27
polymer coils start to deform, resulting in anisotropy and stress differences between elongation andcompression. Consequently, normal stresses and elastic properties become more dominant.
Choplin and Sabatie [40] suggested that when polymer molecules are exposed to a simple shearflow at a constant shear rate (
.γ), molecules rotate at a constant angular velocity (ω) proportional to
applied shear rate, and in each rotation polymer molecules are stretched and compressed. The timebetween each rotation can be calculated by Equation (18).
t =π
2k
.γ (18)
where k is a constant of proportionality, related to viscosity. If t is higher than the Zimm relaxationtime, no dilatant behavior occurs. Consequently, the critical shear rate at the onset of dilatant behaviormay be calculated based on Zimm relaxation time as follows:
λz =6
π2Mw
RT[µ]0µs (19)
t ≤ λz,.γ ≥ γ∗
We =.γλz⇒ We∗ = λz ∗
.γ∗=
π
2k (20)
Polymer viscosity behavior in extensional flow may be entirely different from its behavior in pureshear flow, i.e., polymer solution may show simultaneous shear thinning and extension thickeningbehavior. Theoretically, extensional viscosity can be calculated from Equation (21), where N1 is normalstress difference and
.ε is stretch rate. The relative importance of extensional viscosity and shear
viscosity is defined by a dimensionless parameter known as the Trouton ratio (Equation (22)), initiallyproposed by Trouton [44]. For non-Newtonian fluids (especially viscoelastic fluids), Tr can reach verylarge values, such as 103 to 104 (i.e., when polymer solution demonstrates shear thinning and extensionthickening simultaneously).
µe =N1
.ε
(21)
Tr =µe
µs(22)
In Figure 2, the in-situ viscosity of viscoelastic polymers is depicted in both shear and extensionalflow regime. At the onset of polymer flow, the generated hydrodynamic force from fluid flow (i.e., dragforce) is below the threshold value in terms of overcoming entropic forces. Therefore, polymerconfiguration persists in a coil shape, and viscosity remains constant and equal to the zero-shearrate viscosity (upper Newtonian plateau). As flow rate increases, polymer molecules are exposed tolarger drag forces that disentangle polymer coils and aligns them along the flow direction. This coilalignment reduces resistance to flow (i.e., induces viscosity reduction) and is referred to as shearthinning. When the orientation of polymer molecules is completely aligned, they will start to stretch atincreasing flow rates. A change in the deformation of polymer molecules may cause normal stressdifferences. At low stretch rates (
.ε), N1 is very low and by increasing the stretch rate, N1 dramatically
increases. In other words, beyond the critical shear rate (.γc), instead of intramolecular interaction,
intermolecular interactions will develop which generate amorphous structures much larger thanaverage polymer chain dimensions [28,45].
Within the extensional flow regime, the apparent viscosity generally reaches a maximum value,subsequently followed by a decreasing viscosity interval. This phenomenon may be interpreted ashigh viscoelastic stresses causing polymer rupture and chain halving, and it has been reported as beingmore severe in low-permeability porous media [46]. As molecular rupture occurs, new molecularweight distributions emerge (larger molecular weight fractions are distorted) and viscosity behavior ofthe polymer may be governed by a new molecular weight distribution.
The onset of extensional viscosity-the transition point between shear-dominant and extensionaldominant flow-depends on polymer, solvent, and porous media properties. The effects of polymer

Colloids Interfaces 2018, 2, 27 9 of 27
properties on extensional viscosity can be investigated by using special rheometers that only generatepure extensional flow [47–56]. In the following, the effects of polymer, solvent and porous mediaproperties on the onset of extensional viscosity are explained.
2.2.1. Polymer Concentration
Chauveteau [55] reported that the maximum relaxation time increases with polymer concentration,thus dilatant behavior commences at lower shear rates (Figure 3). He also included the effect ofconcentration in the expression for Zimm relaxation time, producing Equation (23).
λz =6
π2 µsµro − 1
CMw
RT(23)
Colloids Interfaces 2018, 2, x FOR PEER REVIEW 9 of 27
2.2.1. Polymer Concentration
Chauveteau [55] reported that the maximum relaxation time increases with polymer concentration, thus dilatant behavior commences at lower shear rates (Figure 3). He also included the effect of concentration in the expression for Zimm relaxation time, producing Equation (23). = 6 − 1 (23)
Figure 3. Effect of polymer concentration on the onset of extensional viscosity in a model with 45 successive constrictions. Reproduced with permission from [55].
The effect of concentration on extensional viscosity was also investigated by Lewandowska [56]. In contrast to Chauveteau, he reported that dilatant behavior commences at higher shear rates with increasing polymer concentration. He attributed this observation to the higher degree of entanglement as the concentration increases, thus increasing the extent of the shear thinning region.
Briscoe et al. [57] could not identify a consistent trend between polymer concentration and onset of extensional viscosity. They assumed that only a narrow region of polymer concentrations is able to generate apparent shear thickening behavior. Below a critical concentration limit, defined as the critical overlap concentration (C*), few polymer chains are able to form transient networks. At concentrations above C*, the extent of shear thinning may increase and, consequently, the onset of apparent shear thickening may be delayed. This effect was also studied by Dupuis et al. [58], where they observed that the onset of dilatant behavior decreased with polymer concentration. However, rheological behavior above the critical shear rate deviated among different concentration ranges (low: 30–60 ppm; medium: 120–240 ppm; and high: 480–960 ppm). Jiang et al. [59] also confirmed scattered data for the onset of extensional viscosity as function of polymer concentration. Clarke et al. [60] reported that the onset of extensional viscosity is independent of concentration and only depends on molecular weight.
2.2.2. Molecular Weight
The lengths of polymer chains increase with molecular weight, resulting in higher inter- and intramolecular entanglement. Thus, the extent of the shear thinning region increases and, consequently, delay the onset of dilatant behavior [56]. However, this explanation directly contradicts the expression for the Zimm relaxation time (Equation (23)), where the latter increases with molecular weight and causes critical shear rate to occur at a lower shear rate.
Jiang et al. [59] also studied the effects of molecular weight on the onset of extensional viscosity. They concluded that relaxation time increases with molecular weight, thus the onset of extensional
Figure 3. Effect of polymer concentration on the onset of extensional viscosity in a model with 45successive constrictions. Reproduced with permission from [55].
The effect of concentration on extensional viscosity was also investigated by Lewandowska [56].In contrast to Chauveteau, he reported that dilatant behavior commences at higher shear rates withincreasing polymer concentration. He attributed this observation to the higher degree of entanglementas the concentration increases, thus increasing the extent of the shear thinning region.
Briscoe et al. [57] could not identify a consistent trend between polymer concentration and onsetof extensional viscosity. They assumed that only a narrow region of polymer concentrations is able togenerate apparent shear thickening behavior. Below a critical concentration limit, defined as the criticaloverlap concentration (C*), few polymer chains are able to form transient networks. At concentrationsabove C*, the extent of shear thinning may increase and, consequently, the onset of apparent shearthickening may be delayed. This effect was also studied by Dupuis et al. [58], where they observed thatthe onset of dilatant behavior decreased with polymer concentration. However, rheological behaviorabove the critical shear rate deviated among different concentration ranges (low: 30–60 ppm; medium:120–240 ppm; and high: 480–960 ppm). Jiang et al. [59] also confirmed scattered data for the onset ofextensional viscosity as function of polymer concentration. Clarke et al. [60] reported that the onset ofextensional viscosity is independent of concentration and only depends on molecular weight.
2.2.2. Molecular Weight
The lengths of polymer chains increase with molecular weight, resulting in higher inter- andintramolecular entanglement. Thus, the extent of the shear thinning region increases and, consequently,delay the onset of dilatant behavior [56]. However, this explanation directly contradicts the expressionfor the Zimm relaxation time (Equation (23)), where the latter increases with molecular weight andcauses critical shear rate to occur at a lower shear rate.

Colloids Interfaces 2018, 2, 27 10 of 27
Jiang et al. [59] also studied the effects of molecular weight on the onset of extensional viscosity.They concluded that relaxation time increases with molecular weight, thus the onset of extensionalviscosity occurs at lower shear rates. In addition, they observed that this trend was not valid above acritical molecular weight.
Clarke et al. [60] proposed the following correlation for the dependency of the onset of extensionalviscosity on polymer molecular weight:
λext ∝ MW2C0p (24)
2.2.3. Salinity Effect
The effect of salinity on polymer rheology may be crucial in some reservoir conditions [11,61,62],and depends on polymer type. For typical EOR polymers (e.g., xanthan, HPAM, or generallynon-hydrolyzed polymers), increasing salinity generally reduces coil gyration and hydrodynamicradius. Due to the repulsion between ionic groups in HPAM solutions, increasing salinity compressesthe electrical double layer on molecular chains and electrostatic repulsion decreases. In the caseof HPAM, the reaction mechanism varies for different metal ions i.e., either monovalent (Na+) ordivalent (Ca2+) cations. In the monovalent case, it may suppress the charge effect and reduce thehydrodynamic radius. In the divalent case, reactions between cations (i.e., Ca2+) can play the role ofcross-linkers and influence the conformation and rheological properties of HPAM. In both cases, largershear rates are required to uncoil polymers and the apparent shear thickening commences at largershear rates [57,58,63].
2.2.4. Degree of Hydrolysis
When HPAM is dissolved in water, electrostatic repulsion forces cause polymer molecules toexpand easily and the shear thinning region is shortened. Therefore, as the degree of hydrolysisincreases, the onset of apparent shear thickening decreases [56].
2.2.5. Pressure and Temperature Effect
Although polymers are considered incompressible fluids, they do exhibit some degree ofcompressibility. Thus, pressure may have an impact on viscosity. By increasing pressure, the freevolume between polymer molecules decreases and Brownian motion of polymer chains is inhibited,consequently resulting in viscosity increase of polymer solution. Experimental results [64] indicatethat the onset of extensional viscosity decrease significantly with pressure.
The effects of temperature on polymer rheology has also been studied extensively [57,59,65,66]and results show that the critical shear rate and onset of dilatant behavior are retarded with increasingtemperature. This behavior may have the following two explanations. Firstly, polymer relaxationtime and solvent viscosity should both decrease with increasing temperature, based on Equation (23).Secondly, solvent quality decreases with temperature. By decreasing solvent quality, coil size isreduced, and to compensate for this reduction, a larger shear rate is needed to uncoil and elongate thepolymer. Therefore, the onset of extensional viscosity occurs at higher shear rates.
2.2.6. Porous Media Properties
In addition to polymer properties, porous media may also significantly influence the generationof extensional flow, as shown by several experimental [25] and numerical studies [67]. Due to variationin cross-sectional area along its propagation path, polymer molecules are forced to accelerate anddecelerate. Consequently, they will experience both stretch and shear flow in porous media, and abovea critical flow rate, extensional flow will dominate shear flow.
To envisage polymer flow in porous media, the latter may be considered as a simplifiedcontraction-expansion channel. As polymer molecules enter contractions, they will be compressed andstretched. If the flow is below a critical velocity, deformed polymer molecules have sufficient time to
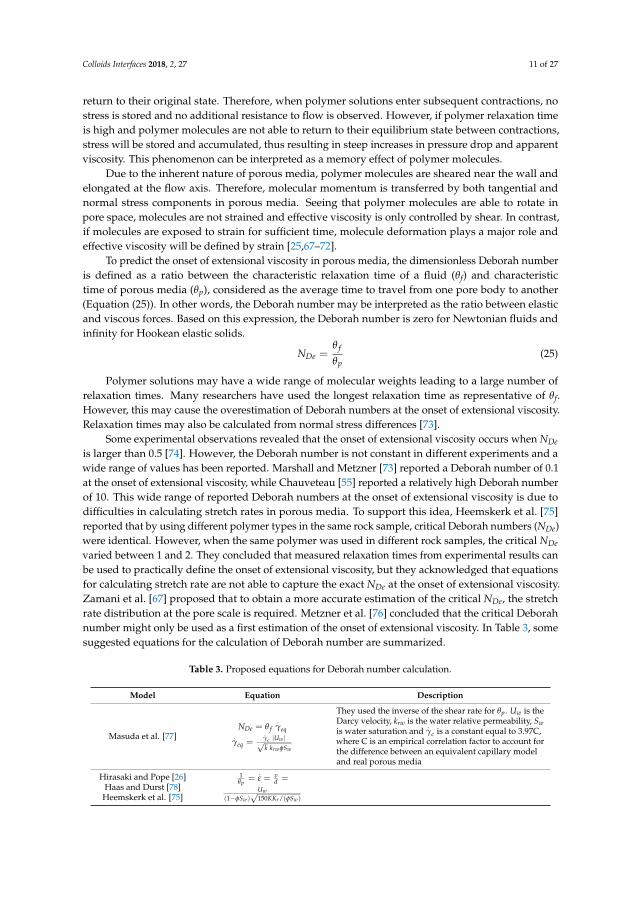
Colloids Interfaces 2018, 2, 27 11 of 27
return to their original state. Therefore, when polymer solutions enter subsequent contractions, nostress is stored and no additional resistance to flow is observed. However, if polymer relaxation timeis high and polymer molecules are not able to return to their equilibrium state between contractions,stress will be stored and accumulated, thus resulting in steep increases in pressure drop and apparentviscosity. This phenomenon can be interpreted as a memory effect of polymer molecules.
Due to the inherent nature of porous media, polymer molecules are sheared near the wall andelongated at the flow axis. Therefore, molecular momentum is transferred by both tangential andnormal stress components in porous media. Seeing that polymer molecules are able to rotate inpore space, molecules are not strained and effective viscosity is only controlled by shear. In contrast,if molecules are exposed to strain for sufficient time, molecule deformation plays a major role andeffective viscosity will be defined by strain [25,67–72].
To predict the onset of extensional viscosity in porous media, the dimensionless Deborah numberis defined as a ratio between the characteristic relaxation time of a fluid (θf) and characteristictime of porous media (θp), considered as the average time to travel from one pore body to another(Equation (25)). In other words, the Deborah number may be interpreted as the ratio between elasticand viscous forces. Based on this expression, the Deborah number is zero for Newtonian fluids andinfinity for Hookean elastic solids.
NDe =θ f
θp(25)
Polymer solutions may have a wide range of molecular weights leading to a large number ofrelaxation times. Many researchers have used the longest relaxation time as representative of θf.However, this may cause the overestimation of Deborah numbers at the onset of extensional viscosity.Relaxation times may also be calculated from normal stress differences [73].
Some experimental observations revealed that the onset of extensional viscosity occurs when NDeis larger than 0.5 [74]. However, the Deborah number is not constant in different experiments and awide range of values has been reported. Marshall and Metzner [73] reported a Deborah number of 0.1at the onset of extensional viscosity, while Chauveteau [55] reported a relatively high Deborah numberof 10. This wide range of reported Deborah numbers at the onset of extensional viscosity is due todifficulties in calculating stretch rates in porous media. To support this idea, Heemskerk et al. [75]reported that by using different polymer types in the same rock sample, critical Deborah numbers (NDe)were identical. However, when the same polymer was used in different rock samples, the critical NDevaried between 1 and 2. They concluded that measured relaxation times from experimental results canbe used to practically define the onset of extensional viscosity, but they acknowledged that equationsfor calculating stretch rate are not able to capture the exact NDe at the onset of extensional viscosity.Zamani et al. [67] proposed that to obtain a more accurate estimation of the critical NDe, the stretchrate distribution at the pore scale is required. Metzner et al. [76] concluded that the critical Deborahnumber might only be used as a first estimation of the onset of extensional viscosity. In Table 3, somesuggested equations for the calculation of Deborah number are summarized.
Table 3. Proposed equations for Deborah number calculation.
Model Equation Description
Masuda et al. [77]NDe = θ f
.γeq
.γeq =
.γc |Uw |√k krwφSw
They used the inverse of the shear rate for θp. Uw is theDarcy velocity, krw is the water relative permeability, Swis water saturation and
.γc is a constant equal to 3.97C,
where C is an empirical correlation factor to account forthe difference between an equivalent capillary modeland real porous media
Hirasaki and Pope [26]Haas and Durst [78]
Heemskerk et al. [75]
1θp
=.ε = v
d =Uw
(1−φSw)√
150KKr /(φSw)
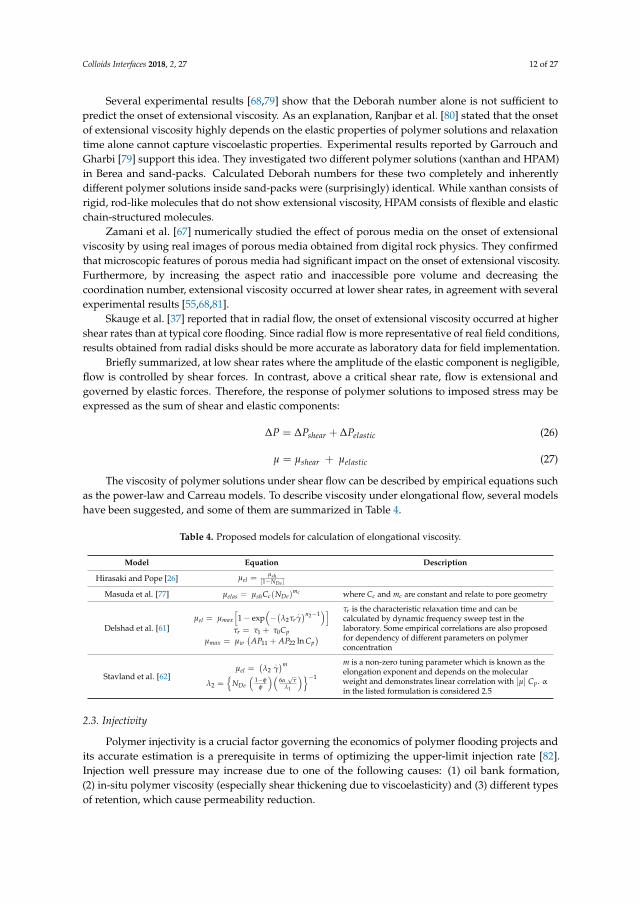
Colloids Interfaces 2018, 2, 27 12 of 27
Several experimental results [68,79] show that the Deborah number alone is not sufficient topredict the onset of extensional viscosity. As an explanation, Ranjbar et al. [80] stated that the onsetof extensional viscosity highly depends on the elastic properties of polymer solutions and relaxationtime alone cannot capture viscoelastic properties. Experimental results reported by Garrouch andGharbi [79] support this idea. They investigated two different polymer solutions (xanthan and HPAM)in Berea and sand-packs. Calculated Deborah numbers for these two completely and inherentlydifferent polymer solutions inside sand-packs were (surprisingly) identical. While xanthan consists ofrigid, rod-like molecules that do not show extensional viscosity, HPAM consists of flexible and elasticchain-structured molecules.
Zamani et al. [67] numerically studied the effect of porous media on the onset of extensionalviscosity by using real images of porous media obtained from digital rock physics. They confirmedthat microscopic features of porous media had significant impact on the onset of extensional viscosity.Furthermore, by increasing the aspect ratio and inaccessible pore volume and decreasing thecoordination number, extensional viscosity occurred at lower shear rates, in agreement with severalexperimental results [55,68,81].
Skauge et al. [37] reported that in radial flow, the onset of extensional viscosity occurred at highershear rates than at typical core flooding. Since radial flow is more representative of real field conditions,results obtained from radial disks should be more accurate as laboratory data for field implementation.
Briefly summarized, at low shear rates where the amplitude of the elastic component is negligible,flow is controlled by shear forces. In contrast, above a critical shear rate, flow is extensional andgoverned by elastic forces. Therefore, the response of polymer solutions to imposed stress may beexpressed as the sum of shear and elastic components:
∆P = ∆Pshear + ∆Pelastic (26)
µ = µshear + µelastic (27)
The viscosity of polymer solutions under shear flow can be described by empirical equations suchas the power-law and Carreau models. To describe viscosity under elongational flow, several modelshave been suggested, and some of them are summarized in Table 4.
Table 4. Proposed models for calculation of elongational viscosity.
Model Equation Description
Hirasaki and Pope [26] µel =µsh
[1−NDe ]
Masuda et al. [77] µelas = µshCc(NDe)mc where Cc and mc are constant and relate to pore geometry
Delshad et al. [61]µel = µmax
[1− exp
(−(λ2τr
.γ)n2−1
)]τr = τ1 + τ0Cp
µmax = µw(
AP11 + AP22 ln Cp)
τr is the characteristic relaxation time and can becalculated by dynamic frequency sweep test in thelaboratory. Some empirical correlations are also proposedfor dependency of different parameters on polymerconcentration
Stavland et al. [62]µel =
(λ2
.γ)m
λ2 ={
NDe
(1−φ
φ
)(6α√
τλ1
)}−1
m is a non-zero tuning parameter which is known as theelongation exponent and depends on the molecularweight and demonstrates linear correlation with [µ] Cp. αin the listed formulation is considered 2.5
2.3. Injectivity
Polymer injectivity is a crucial factor governing the economics of polymer flooding projects andits accurate estimation is a prerequisite in terms of optimizing the upper-limit injection rate [82].Injection well pressure may increase due to one of the following causes: (1) oil bank formation,(2) in-situ polymer viscosity (especially shear thickening due to viscoelasticity) and (3) different typesof retention, which cause permeability reduction.

Colloids Interfaces 2018, 2, 27 13 of 27
The highest pressure drops observed during polymer flooding are located in the vicinity ofthe injection wellbore due to dramatic variations in flow rate. Therefore, it is important to includenon-Newtonian effects of polymer solutions to accurately predict polymer injectivity. Although bothHPAM and xanthan demonstrate shear thinning behavior at low to moderate shear rates, HPAMexhibits apparent shear thickening above a critical flow rate due to its inherent viscoelastic nature. Forfield applications, injection rates in the vicinity of the injection well may easily exceed the onset ofextensional viscosity, and injectivity will then dramatically decrease. In contrast to HPAM, xanthanshows exclusively shear thinning behavior and will attain its highest value of injectivity in thenear-wellbore region.
Injectivity investigations at the lab scale are required before implementing field applications,and effects of polymer solution properties, in-situ rheology, temperature, pH, level of retentionand the nature of porous media should be accurately measured [83,84]. Furthermore, if screeningcriteria for polymer type are disregarded, polymer entrapment in narrow pore throats can havesignificant effects on its injection rate. The salinity of solutions can also affect polymer solubility,resulting in filter cake formation near injection wells or precipitation of polymer molecules in thereservoir. Inaccurate measurement of in-situ rheology and especially the onset of extensional viscositymay lead to either an underestimation or overestimation of injectivity. In some polymer floodingprojects, measured injectivity may differ significantly from the simulation or analytical forecast.These unexpected injectivities may be due to the occurrence of mechanical degradation [82,85,86],induced fractures [87–89], or even inaccurate analytical models for calculating in-situ rheology andpredicting extensional viscosity.
3. Radial In-Situ Rheology
Injectivity (I) may be defined as the ratio of volumetric injection rate, Q, to the pressure drop, ∆P,associated with polymer propagation between injection well and producer [1]:
I =Q
∆P(28)
As previously mentioned, formation fracture pressure may constrain the value of volumetricinjection rate. Due to its significant effect on project economics, accurate determination of differentialpressure, and hence injectivity, at a given injection rate is essential. To achieve this, all factors affectingdifferential pressure during polymer flooding must be quantified. Darcy’s law for radial flow may beexpressed in terms of differential pressure as follows:
∆P =µappQ2πhke,i
lnre
rw(29)
where µapp is apparent viscosity, h is disk thickness, ke,i is effective permeability to polymer solution,re is disk radius and rw is injection well radius.
In this paper, the ratio of resistance factor (RF) to residual resistance factor (RRF) is used torepresent apparent viscosity of polymer solutions propagating through porous media, thus isolatingits viscous behavior, i.e.,
µapp =RF
RRF(30)
where the resistance factor (RF) represents the pressure increase of polymer relative to brine and theresidual resistance factor (RRF) is defined as the ratio of pressure before and after polymer injection(i.e., pressure caused by irreversible permeability reduction induced by retention mechanisms).
Due to their inherent viscoelastic behavior in porous media, synthetic polymers (e.g., HPAM)will exhibit shear-dependent apparent viscosity. Although the common consensus on apparent shearthickening as a phenomenon is accepted, its viscosifying magnitude is still an ongoing topic of debatein scientific communities.
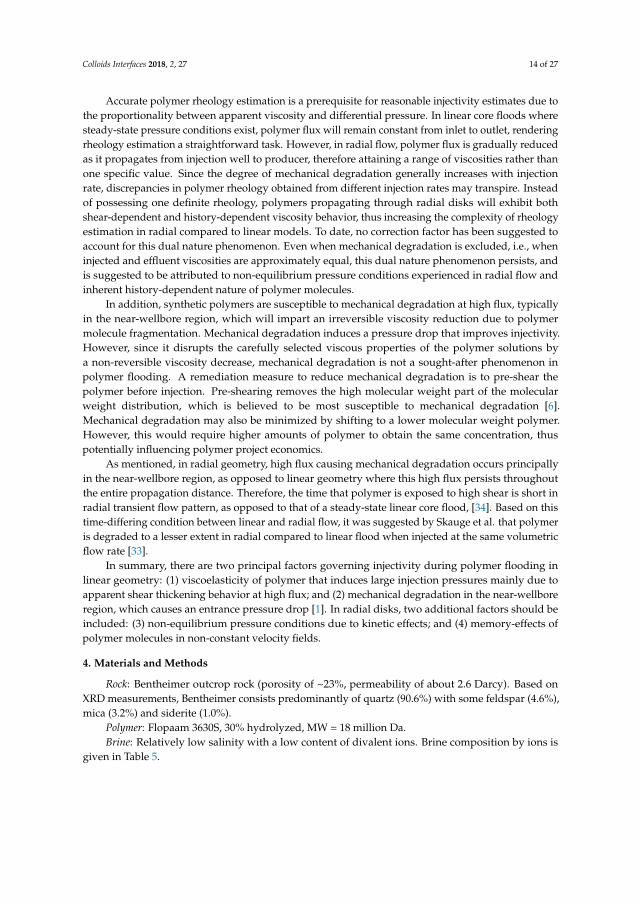
Colloids Interfaces 2018, 2, 27 14 of 27
Accurate polymer rheology estimation is a prerequisite for reasonable injectivity estimates due tothe proportionality between apparent viscosity and differential pressure. In linear core floods wheresteady-state pressure conditions exist, polymer flux will remain constant from inlet to outlet, renderingrheology estimation a straightforward task. However, in radial flow, polymer flux is gradually reducedas it propagates from injection well to producer, therefore attaining a range of viscosities rather thanone specific value. Since the degree of mechanical degradation generally increases with injectionrate, discrepancies in polymer rheology obtained from different injection rates may transpire. Insteadof possessing one definite rheology, polymers propagating through radial disks will exhibit bothshear-dependent and history-dependent viscosity behavior, thus increasing the complexity of rheologyestimation in radial compared to linear models. To date, no correction factor has been suggested toaccount for this dual nature phenomenon. Even when mechanical degradation is excluded, i.e., wheninjected and effluent viscosities are approximately equal, this dual nature phenomenon persists, andis suggested to be attributed to non-equilibrium pressure conditions experienced in radial flow andinherent history-dependent nature of polymer molecules.
In addition, synthetic polymers are susceptible to mechanical degradation at high flux, typicallyin the near-wellbore region, which will impart an irreversible viscosity reduction due to polymermolecule fragmentation. Mechanical degradation induces a pressure drop that improves injectivity.However, since it disrupts the carefully selected viscous properties of the polymer solutions bya non-reversible viscosity decrease, mechanical degradation is not a sought-after phenomenon inpolymer flooding. A remediation measure to reduce mechanical degradation is to pre-shear thepolymer before injection. Pre-shearing removes the high molecular weight part of the molecularweight distribution, which is believed to be most susceptible to mechanical degradation [6].Mechanical degradation may also be minimized by shifting to a lower molecular weight polymer.However, this would require higher amounts of polymer to obtain the same concentration, thuspotentially influencing polymer project economics.
As mentioned, in radial geometry, high flux causing mechanical degradation occurs principallyin the near-wellbore region, as opposed to linear geometry where this high flux persists throughoutthe entire propagation distance. Therefore, the time that polymer is exposed to high shear is short inradial transient flow pattern, as opposed to that of a steady-state linear core flood, [34]. Based on thistime-differing condition between linear and radial flow, it was suggested by Skauge et al. that polymeris degraded to a lesser extent in radial compared to linear flood when injected at the same volumetricflow rate [33].
In summary, there are two principal factors governing injectivity during polymer flooding inlinear geometry: (1) viscoelasticity of polymer that induces large injection pressures mainly due toapparent shear thickening behavior at high flux; and (2) mechanical degradation in the near-wellboreregion, which causes an entrance pressure drop [1]. In radial disks, two additional factors should beincluded: (3) non-equilibrium pressure conditions due to kinetic effects; and (4) memory-effects ofpolymer molecules in non-constant velocity fields.
4. Materials and Methods
Rock: Bentheimer outcrop rock (porosity of ~23%, permeability of about 2.6 Darcy). Based onXRD measurements, Bentheimer consists predominantly of quartz (90.6%) with some feldspar (4.6%),mica (3.2%) and siderite (1.0%).
Polymer: Flopaam 3630S, 30% hydrolyzed, MW = 18 million Da.Brine: Relatively low salinity with a low content of divalent ions. Brine composition by ions is
given in Table 5.

Colloids Interfaces 2018, 2, 27 15 of 27
Table 5. Brine ionic composition.
Ion Concentration (ppm, w/w)
Na 1741K 28Ca 26Mg 17SO4 160Cl 2687
TDS 4659Ionic strength 0.082
Hardness 43
Linear core floods: Core data are summarized in Table 6. All experiments were performed at roomtemperature and pressure.
Radial core floods: Bentheimer disks were prepared by coating with epoxy resin, vacuuming andsaturating with brine. One disk was then drained with an extra heavy oil and aged for 3 weeks at50 ◦C to a non-water-wet state. The crude had an initial viscosity of about 7000 cP. The extra heavy oilused for drainage and aging, was then exchanged with a flooding oil of 210 cP. Both experiments wereperformed at room temperature and pressure. Core data are given in Table 7. The pressure ports werelocated in the injection and production wells and at radii 0.5, 1.0, 1.5, 2.0, 3.0, 4.0 and 5.0 cm for thedisk without oil and at radii 1.1, 2.0, and 5.0 cm for the disk containing oil.
The Bentheimer cores show a pore-throat distribution function similar to other outcrop sandstonematerial, Figure 4. All porous media have local pore-size variation, involving continuous contractionand expansion of pore-scale transport.
Table 6. Core data for linear core floods.
Experiment Conc. L (cm) D (cm) φ (-) Kwi (Darcy) Kwf (Darcy) RRF (-) ηi (cP) ηe (cP)
No oil 500 ppm 9.54 3.77 0.24 2.48 1.35 1.84 6.81 6.62No oil 1500 ppm 4.89 3.79 0.24 1.99 0.32 6.29 33.76 32.87
With oil, not aged 500 ppm 10.44 3.78 0.23 1.83 0.36 5.08 6.65 6.77With oil, aged 500 ppm 9.85 3.78 0.23 2.27 0.27 8.41 6.99 5.90
Table 7. Core data for radial core floods.
Experiment Diameter(cm)
Thickness(cm)
Well Radius(cm)
φ(-)
PV(mL)
Soi(frac)
Sorw(frac)
Kw,abs(Darcy)
Kw,Sorw(Darcy)
Kwf(Darcy)
No oil 30.00 2.20 0.15 0.24 373 n.a. n.a. 2.600 n.a. 0.056With oil 29.90 2.21 0.30 0.23 352 0.91 0.22 1.551 0.041 0.039
Colloids Interfaces 2018, 2, x FOR PEER REVIEW 15 of 27
Linear core floods: Core data are summarized in Table 6. All experiments were performed at room temperature and pressure.
Radial core floods: Bentheimer disks were prepared by coating with epoxy resin, vacuuming and saturating with brine. One disk was then drained with an extra heavy oil and aged for 3 weeks at 50 °C to a non-water-wet state. The crude had an initial viscosity of about 7000 cP. The extra heavy oil used for drainage and aging, was then exchanged with a flooding oil of 210 cP. Both experiments were performed at room temperature and pressure. Core data are given in Table 7. The pressure ports were located in the injection and production wells and at radii 0.5, 1.0, 1.5, 2.0, 3.0, 4.0 and 5.0 cm for the disk without oil and at radii 1.1, 2.0, and 5.0 cm for the disk containing oil.
The Bentheimer cores show a pore-throat distribution function similar to other outcrop sandstone material, Figure 4. All porous media have local pore-size variation, involving continuous contraction and expansion of pore-scale transport.
Table 6. Core data for linear core floods.
Experiment Conc. L (cm) D (cm) (-) Kwi (Darcy) Kwf (Darcy) RRF (-) Ƞ (cP) Ƞ (cP) No oil 500 ppm 9.54 3.77 0.24 2.48 1.35 1.84 6.81 6.62 No oil 1500 ppm 4.89 3.79 0.24 1.99 0.32 6.29 33.76 32.87
With oil, not aged 500 ppm 10.44 3.78 0.23 1.83 0.36 5.08 6.65 6.77 With oil, aged 500 ppm 9.85 3.78 0.23 2.27 0.27 8.41 6.99 5.90
Table 7. Core data for radial core floods.
Experiment Diameter
(cm) Thickness
(cm)
Well Radius
(cm) (-) PV
(mL) Soi
(frac) Sorw (frac)
Kw,abs
(Darcy) Kw,Sorw
(Darcy) Kwf
(Darcy)
No oil 30.00 2.20 0.15 0.24 373 n.a. n.a. 2.600 n.a. 0.056 With oil 29.90 2.21 0.30 0.23 352 0.91 0.22 1.551 0.041 0.039
Figure 4. Mercury injection derived pore throat distribution for Bentheimer core material used in the polymer flow experiments.
Simulation: The experimental set-up enabled detailed monitoring of pressure by internal pressure ports located at various distance from the injection well. Differential pressure as function of radial distance was history matched using the STARS simulator, developed by Computer Modeling Group (CMG). The simulation model encompassed a radial grid with 360 sectors, each consisting of 150 grid block cells in radial direction, where the grid block cell size is 1 mm. Porous media permeability (tuning parameter) was obtained by history matching water floods prior to polymer flooding. Local permeability variation improved the history match compared to analytical solution (Darcy’s law for radial flow). Permeability data obtained from water floods were used in subsequent polymer floods to isolate the effects of polymer apparent viscosity on differential pressure. In polymer floods, as the permeability obtained from the precursor water flood was held constant, apparent viscosity could be quantitatively investigated as a function of velocity and was used as the
0.00
0.20
0.40
0.60
0.80
1.00
0.10 1.00 10.00 100.00Nor
m. P
ore
Siz
e D
istr
. Fun
ct.
Pore Throat Radius (microns)
2 Darcy Bentheimer
Figure 4. Mercury injection derived pore throat distribution for Bentheimer core material used in thepolymer flow experiments.

Colloids Interfaces 2018, 2, 27 16 of 27
Simulation: The experimental set-up enabled detailed monitoring of pressure by internal pressureports located at various distance from the injection well. Differential pressure as function of radialdistance was history matched using the STARS simulator, developed by Computer Modeling Group(CMG). The simulation model encompassed a radial grid with 360 sectors, each consisting of 150 gridblock cells in radial direction, where the grid block cell size is 1 mm. Porous media permeability(tuning parameter) was obtained by history matching water floods prior to polymer flooding.Local permeability variation improved the history match compared to analytical solution (Darcy’slaw for radial flow). Permeability data obtained from water floods were used in subsequent polymerfloods to isolate the effects of polymer apparent viscosity on differential pressure. In polymer floods,as the permeability obtained from the precursor water flood was held constant, apparent viscositycould be quantitatively investigated as a function of velocity and was used as the tuning parameter tohistory match differential pressure. The STARS simulation tool can include both shear thinning andthickening behavior of viscoelastic fluids.
Due to the inherent grid averaging calculation method of the simulation tool, the velocity in thefirst grid block after the injection well was below its analytical value. Because of a rapid velocitydecrease with distance in radial models, this phenomenon was addressed by decreasing the injectionwell radius, thus effectively parallel shifting the position of the first grid block towards the injectionwell until the correct velocity was attained. This was a necessary step, since the tuning parameter isapparent viscosity as a function of velocity.
5. Polymer In-Situ Rheology in Linear Cores
Four Bentheimer outcrop cores were used to study polymer in-situ rheology in linear systems.Petro-physical properties of core samples as well as properties of polymer solutions are given inTable 6. Two experiments were carried out to examine the effect of polymer concentration on in-siturheology of the polymer solution. Partially-hydrolyzed Flopaam 3630S at 500 ppm and 1500 ppmwas injected into the cores and the in-situ rheology of the polymer solutions was measured. The twoconcentrations were chosen to give viscosities representative of the upper and lower limit of whatwould be economically viable for polymer flooding in an oil field. Both concentrations are above thepolymer critical overlap concentration, C*. The results are presented in Table 6 and Figure 5. The bulkviscosity of 1500 ppm 3630S is about 34 cP which is about 5 times that of 500 ppm 3630S. Comparingin-situ rheology of 500 ppm and 1500 ppm 3630S shows that the onset and degree of apparent shearthickening behavior are fairly similar for both concentrations. This is in line with observations bySkauge et al. [8] and Clarke et al. [60] that the onset of extensional viscosity is independent of polymerconcentration and only depends on polymer molecular weight. It is noted that this is generally onlytrue for C* < C < Clim, where Clim is the economic limit for polymer concentration, typically between1500 and 2500 ppm. Table 6 and Figure 5 show that the magnitude of resistance factor (RF) and residualresistance factor (RRF) are about 4 and 3 times higher for 1500 ppm compared to 500 ppm, respectively.This implies that polymer injectivity is a function of polymer concentration, and better injectivity isachieved with lower polymer concentrations.
A series of experiments was also performed to study the effect of the presence of residual oilon polymer in-situ rheology. In these experiments, Bentheimer cores at residual oil saturations ofabout 22% and different initial wettability states were flooded with polymer and the in-situ rheologybehavior was compared to that of single-phase polymer injection in absence of residual oil. Prior topolymer injection, the cores containing oil were water flooded to residual oil saturation. At the end ofthe water flood, the flow rates were increased to generate pressures higher than that expected for thesubsequent polymer flood. This was performed in order to avoid oil mobilization during the polymerflood and, indeed, no oil production was observed during the subsequent polymer flood. The resultsare presented and compared in Figure 6. As this figure shows, the onset of apparent shear thickeningis not affected by the presence of residual oil or the wettability state of the cores. However, the slope ofapparent shear thickening and magnitude of resistance factor is significantly affected by oil presence in

Colloids Interfaces 2018, 2, 27 17 of 27
the cores. That is, although onset of apparent shear thickening is independent of oil presence in porousmedia and its wettability condition, the results show that the degree of apparent shear thickening islower when oil is present in the porous media.
Figure 5. Resistance factor versus interstitial velocity of pre-filtered Flopaam 3630S HPAM polymerdissolved in 1 wt% NaCl brine.
Colloids Interfaces 2018, 2, x FOR PEER REVIEW 17 of 27
the subsequent polymer flood. This was performed in order to avoid oil mobilization during the polymer flood and, indeed, no oil production was observed during the subsequent polymer flood. The results are presented and compared in Figure 6. As this figure shows, the onset of apparent shear thickening is not affected by the presence of residual oil or the wettability state of the cores. However, the slope of apparent shear thickening and magnitude of resistance factor is significantly affected by oil presence in the cores. That is, although onset of apparent shear thickening is independent of oil presence in porous media and its wettability condition, the results show that the degree of apparent shear thickening is lower when oil is present in the porous media.
Figure 6. Resistance factor versus interstitial velocity of 500 ppm pre-filtered Flopaam 3630S partially hydrolyzed polyacrylamide (HPAM) polymer dissolved in 1 wt% NaCl brine, single-phase polymer flow and polymer flow at residual oil saturation.
It is important to note that a lower resistance factor in the presence of oil is achieved while porous media is partially occupied by residual oil. Therefore, unlike the single-phase system, in which the pore volume (assuming no inaccessible pore volume) is available for polymer flow, only PV*(1-Sor) is available for polymer flow in two-phase system. This influences and reduces permeability and therefore an even higher resistance factor is expected in the presence of oil. However, the results do not show such an effect, and a lower resistance factor and polymer injectivity is observed with the presence of oil in porous media, which supports the significance of the positive effect of oil on polymer injectivity. The effluent polymer viscosity is reduced by 18% compared to the injected polymer solution for the single-phase, water-wet case, while there is no reduction in effluent viscosity for the two-phase experiments (water-wet and non-water-wet). Shiran and Skauge [90] studied wettability using the same crude oil for aging and found that intermediate wettability was achieved. The end-point water relative permeability confirms that a similar condition was obtained.
Polymer injection in cores with residual oil results in a lower resistance factor which means better polymer injectivity. Furthermore, the resistance factor in the aged core with the non-water-wet state is lower than the resistance factor in the water-wet core. The lower resistance factor in the presence of oil could be attributed to lower adsorption/retention of polymer molecules on rock surface, as reported by Broseta et al. [10]. The rock surface in the presence of an oil film, and especially in less water-wet conditions is partially covered by crude oil polar components during flooding. Therefore, in comparison to single-phase systems, the rock surface has fewer adsorption sites to adsorb polymer molecules. The analysis of reduced apparent viscosity in the presence of oil, assumes that end-point water relative permeability remains constant for polymer as it does for water. The RRF measured with brine after the polymer injection is assumed constant for all rate variation of polymer flow. Under these assumptions a lower resistance factor and better polymer injectivity is expected.
1
10
100
1000
0.1 1 10 100 1000
Res
ista
nce
Fact
or (-
)
Interstitial Velocity (m/day)
1-phase, pre-filtered2-phase, pre-filtered-unaged core2-phase, pre-filtered-aged core
Figure 6. Resistance factor versus interstitial velocity of 500 ppm pre-filtered Flopaam 3630S partiallyhydrolyzed polyacrylamide (HPAM) polymer dissolved in 1 wt% NaCl brine, single-phase polymerflow and polymer flow at residual oil saturation.
It is important to note that a lower resistance factor in the presence of oil is achieved while porousmedia is partially occupied by residual oil. Therefore, unlike the single-phase system, in which thepore volume (assuming no inaccessible pore volume) is available for polymer flow, only PV*(1-Sor)is available for polymer flow in two-phase system. This influences and reduces permeability andtherefore an even higher resistance factor is expected in the presence of oil. However, the results donot show such an effect, and a lower resistance factor and polymer injectivity is observed with thepresence of oil in porous media, which supports the significance of the positive effect of oil on polymerinjectivity. The effluent polymer viscosity is reduced by 18% compared to the injected polymer solution

Colloids Interfaces 2018, 2, 27 18 of 27
for the single-phase, water-wet case, while there is no reduction in effluent viscosity for the two-phaseexperiments (water-wet and non-water-wet). Shiran and Skauge [90] studied wettability using thesame crude oil for aging and found that intermediate wettability was achieved. The end-point waterrelative permeability confirms that a similar condition was obtained.
Polymer injection in cores with residual oil results in a lower resistance factor which means betterpolymer injectivity. Furthermore, the resistance factor in the aged core with the non-water-wet stateis lower than the resistance factor in the water-wet core. The lower resistance factor in the presenceof oil could be attributed to lower adsorption/retention of polymer molecules on rock surface, asreported by Broseta et al. [10]. The rock surface in the presence of an oil film, and especially in lesswater-wet conditions is partially covered by crude oil polar components during flooding. Therefore, incomparison to single-phase systems, the rock surface has fewer adsorption sites to adsorb polymermolecules. The analysis of reduced apparent viscosity in the presence of oil, assumes that end-pointwater relative permeability remains constant for polymer as it does for water. The RRF measured withbrine after the polymer injection is assumed constant for all rate variation of polymer flow. Under theseassumptions a lower resistance factor and better polymer injectivity is expected.
6. Polymer In-Situ Rheology in Radial Flow
Recently, polymer injectivity was analyzed by matching field injectivity tests [5,6,91,92].In addition to history matching, modification of equations to incorporate fractures and polymerdegradation in the near-wellbore zone were reported. The laboratory experiment simplifies theanalysis as additional complications like fractures and strong heterogeneity can be avoided.
In earlier studies of radial flow experiments, Skauge et al. [37] used local pressure taps as afunction of radial distance from the injection well to derive in-situ rheology. These experimentsdemonstrated both shear thinning and strong apparent shear thickening behavior.
Two radial flow experiments were performed on circular Bentheimer sandstone disks of 1.6 and2.6 D permeability with 30 cm diameter and 2.2 cm thickness, see Table 7. The first experimentwas performed on a disk that was drained with crude oil and aged to non-water-wet conditions.The second experiment was performed in the absence of oil on a water-wet disk. For the firstexperiment, the disk was flooded extensively with brine to reach residual oil saturation, Sorw = 0.22.Bump rates were applied to avoid oil mobilization by viscous forces during the subsequent polymerflood. The polymer flood was performed by first saturating the disk with polymer at a low rate to avoidmechanical degradation due to shearing. Thereafter, rate variations were performed to determinein-situ rheology of the polymer. A brine flush was performed between concentration slugs to removenon-adsorbed polymer.
Concentrations of 800 and 2000 ppm were chosen to represent lower and upper boundaries of thesemi-dilute region. The second experiment included the same steps, except for water flooding to Sorw.In this case, the water flood was performed to obtain a pressure reference for the subsequent polymerflood. No oil production was detected during polymer floods.
Differential pressure was measured by internal pressure ports located at different radii from theinjection well. The 800-ppm HPAM solution was injected in the presence of residual oil at flow rates of2.2 and 2.8 mL/min, and in the absence of residual oil at 2.0 and 4.0 mL/min. Differential pressuredecay as a function of radial distance from injector is shown in Figure 7. The pressure transitionzone from semi-steady-state to steady-state is extended compared to the case without oil. Mostnotable is the difference in pressure in the injection well. While differential pressures measured frominternal pressure ports are higher for the two-phase system (as expected), well injection pressure issignificantly lower in the presence of residual oil. Taking the pressure ratio of pressure ports at ~1cm from injection well as a reference, injection pressure should be 5–6 times higher for the disk withoil, compared to the one without. Instead, the injection pressure is 25% lower. There may be severalreasons for this observed result. One reason may be that the presence of oil reduces the effective porevolume, thereby leading to higher flow velocities for the polymer in the near-well region. This would

Colloids Interfaces 2018, 2, 27 19 of 27
subsequently lead to higher effective shear forces on the polymer, producing mechanical degradation.If mechanical degradation occurs, it has only a minor effect on the shear viscosity. The shear viscosity is15.1 mPas for the effluent sample taken at 2.0 mL/min, while it was 16.0 mPas for the injected solution(measured at 22 ◦C, 10 1/s). However, as discussed in Section 2.2, it is the extensional viscosity that isthe determining factor for high pressures in near-well region. Changes in extensional viscosity areintrinsically hard to measure and were not performed here. It is still possible that the increase in shearforces for the case with residual oil lead to a reduction in extensional viscosity but not for the casewithout oil where the effective pore volume was larger. The two other reasons are related to the wettingstate of the porous media. If the oil is located in smaller pores, polymer flow is diverted to larger poreswhere it flows at higher velocities (higher flux). Since the velocity increase takes place in larger pores,only minor degradation would be expected. A third reason may be that porous media is fractionallyoil-wet and that there is a difference in the slip conditions for the water-wet and the oil–wet surfaces.This may reduce effective shear for the oil-wet surfaces leading to reduced mechanical degradation.Although there have been speculations on the “lubricating” effect of oil-wet surfaces, no clear evidenceof the effect on apparent viscosity or injectivity for core material have been shown to date. It is notpossible to differentiate between the three phenomena based on the pressure data alone.Colloids Interfaces 2018, 2, x FOR PEER REVIEW 19 of 27
Figure 7. Differential pressure profiles for 800-ppm HPAM floods in the presence and absence of residual oil in radial geometry as a function of distance from injector to producer for four flow rates.
Figure 8. Apparent viscosity from history match of differential pressure for 800 ppm HPAM in presence and absence of residual oil in radial geometry.
Each of the polymer floods were history matched using STARS (CMG). The measured differential pressures as a function of distance from injection well were used as history match
0
500
1000
1500
2000
2500
3000
3500
4000
0 1 2 3 4 5 6
Diffe
rent
ial P
ress
ure
[mba
r]
Radial Distance [cm]
Presence of Residual Oil, Q = 2.8 mL/min
History Match, Q = 2.8 mL/min
Presence of Residual Oil, Q = 2.2 mL/min
History Match, Q = 2.2 mL/min
Absence of Residual Oil, Q = 4.0 mL/min
History Match, Q = 4.0 mL/min
Absence of Residual Oil, Q = 2.0 mL/min
History Match, Q = 2.0 mL/min
1
10
100
1000
0.1 1 10 100
Appa
rent
Vis
cosi
ty [c
P]
u [m/day]
Presence of Residual Oil, Q = 2.8 mL/min
Presence of Residual Oil, Q = 2.2 mL/min
Absence of Residual Oil, Q = 4.0 mL/min
Absence of Residual Oil, Q = 2.0 mL/min
Figure 7. Differential pressure profiles for 800-ppm HPAM floods in the presence and absence ofresidual oil in radial geometry as a function of distance from injector to producer for four flow rates.
Each of the polymer floods were history matched using STARS (CMG). The measured differentialpressures as a function of distance from injection well were used as history match parameters, whilepolymer apparent viscosity was used as a tuning variable. History matches and polymer rheologyfrom both experiments for 800-ppm HPAM floods are shown in Figures 7 and 8, respectively. It isevident from Figure 8 that the polymer rheology is significantly influenced by the presence of residualoil. In terms of absolute values, the apparent viscosity is between a factor of 5 and 10, and it is higherin the absence, compared to the presence of residual oil. Furthermore, the onset of apparent shearthickening shifts to lower velocities in the presence of residual oil. This occurrence is suggestedto result from reduced propagation cross-section caused by the residual oil saturation. When flow

Colloids Interfaces 2018, 2, 27 20 of 27
channels in porous media become narrower, the extensional flow regime is reached at a lower flux, andHPAM exhibits viscoelastic behavior at an earlier stage, thus the onset of apparent shear thickeningcommences at a lower flux. The effect of shifting the onset of apparent shear thickening to a lower fluxmay be detrimental for injectivity. However, since the apparent shear thickening seems to be muchmore extensive in the absence of residual oil, the rheology shows that overall injectivity is significantlyimproved in presence of residual oil.
Colloids Interfaces 2018, 2, x FOR PEER REVIEW 19 of 27
Figure 7. Differential pressure profiles for 800-ppm HPAM floods in the presence and absence of residual oil in radial geometry as a function of distance from injector to producer for four flow rates.
Figure 8. Apparent viscosity from history match of differential pressure for 800 ppm HPAM in presence and absence of residual oil in radial geometry.
Each of the polymer floods were history matched using STARS (CMG). The measured differential pressures as a function of distance from injection well were used as history match
0
500
1000
1500
2000
2500
3000
3500
4000
0 1 2 3 4 5 6Di
ffere
ntia
l Pre
ssur
e [m
bar]
Radial Distance [cm]
Presence of Residual Oil, Q = 2.8 mL/min
History Match, Q = 2.8 mL/min
Presence of Residual Oil, Q = 2.2 mL/min
History Match, Q = 2.2 mL/min
Absence of Residual Oil, Q = 4.0 mL/min
History Match, Q = 4.0 mL/min
Absence of Residual Oil, Q = 2.0 mL/min
History Match, Q = 2.0 mL/min
1
10
100
1000
0.1 1 10 100
Appa
rent
Vis
cosi
ty [c
P]
u [m/day]
Presence of Residual Oil, Q = 2.8 mL/min
Presence of Residual Oil, Q = 2.2 mL/min
Absence of Residual Oil, Q = 4.0 mL/min
Absence of Residual Oil, Q = 2.0 mL/min
Figure 8. Apparent viscosity from history match of differential pressure for 800 ppm HPAM in presenceand absence of residual oil in radial geometry.
History matches and polymer rheology in the presence and absence of residual oil for 2000 ppmfloods are shown in Figures 9 and 10, respectively. In order to evaluate the influence of polymerconcentration on in-situ rheology, 2000 ppm HPAM was injected in both disks. The differentialpressures are shown in Figure 9. In this case, the injection rates were Q = 2.0 and 5.0 mL/min for thedisk with no oil, and Q = 1.4 and 1.6 mL/min for the disk with oil. These data show the same trend asfor the 800 ppm injection: strong reduction in injection well pressure in the presence of residual oil andextension of the transition zone.
In accordance with the 800 ppm solution, polymer viscosity was significantly higher in theabsence compared to presence of residual oil, and ranged between a factor of 6 and 16 in their jointvelocity interval, Figure 10. In addition, the 2000 ppm solution also showed a decrease in the onsetof apparent shear thickening in the presence of residual oil, consistent with the lower concentrationsolution investigated. Similar to the 800 ppm solution, apparent shear thickening is observed to bemuch more extensive in absence of residual oil, thus improved injectivity in the presence of residualoil is further corroborated.

Colloids Interfaces 2018, 2, 27 21 of 27
Colloids Interfaces 2018, 2, x FOR PEER REVIEW 20 of 27
parameters, while polymer apparent viscosity was used as a tuning variable. History matches and polymer rheology from both experiments for 800-ppm HPAM floods are shown in Figures 7 and 8, respectively. It is evident from Figure 8 that the polymer rheology is significantly influenced by the presence of residual oil. In terms of absolute values, the apparent viscosity is between a factor of 5 and 10, and it is higher in the absence, compared to the presence of residual oil. Furthermore, the onset of apparent shear thickening shifts to lower velocities in the presence of residual oil. This occurrence is suggested to result from reduced propagation cross-section caused by the residual oil saturation. When flow channels in porous media become narrower, the extensional flow regime is reached at a lower flux, and HPAM exhibits viscoelastic behavior at an earlier stage, thus the onset of apparent shear thickening commences at a lower flux. The effect of shifting the onset of apparent shear thickening to a lower flux may be detrimental for injectivity. However, since the apparent shear thickening seems to be much more extensive in the absence of residual oil, the rheology shows that overall injectivity is significantly improved in presence of residual oil.
Figure 9. Differential pressure profiles for 2000 ppm 3630S HPAM floods in presence and absence of residual oil in radial geometry as a function of distance from injector to producer for four flow rates.
History matches and polymer rheology in the presence and absence of residual oil for 2000 ppm floods are shown in Figures 9 and 10, respectively. In order to evaluate the influence of polymer concentration on in-situ rheology, 2000 ppm HPAM was injected in both disks. The differential pressures are shown in Figure 9. In this case, the injection rates were Q = 2.0 and 5.0 mL/min for the disk with no oil, and Q = 1.4 and 1.6 mL/min for the disk with oil. These data show the same trend as for the 800 ppm injection: strong reduction in injection well pressure in the presence of residual oil and extension of the transition zone.
0
500
1000
1500
2000
2500
3000
3500
4000
4500
0 1 2 3 4 5 6
Diffe
rent
ial P
ress
ure
[mba
r]
Radial Distance [cm]
Presence of Residual Oil, Q = 1.6 mL/minHistory Match, Q = 1.6 mL/minPresence of Residual Oil, Q = 1.4 mL/minHistory Match, Q = 1.4 mL/minAbsence of Residual Oil, Q = 5.0 mL/minHistory Match, Q = 5.0 mL/minAbsence of Residual Oil, Q = 2.0 mL/minHistory Match, Q = 2.0 mL/min
Figure 9. Differential pressure profiles for 2000 ppm 3630S HPAM floods in presence and absence ofresidual oil in radial geometry as a function of distance from injector to producer for four flow rates.Colloids Interfaces 2018, 2, x FOR PEER REVIEW 21 of 27
Figure 10. Apparent viscosity from the history match of differential pressure for 2000 ppm 3630S HPAM in the presence and absence of residual oil in radial geometry.
In accordance with the 800 ppm solution, polymer viscosity was significantly higher in the absence compared to presence of residual oil, and ranged between a factor of 6 and 16 in their joint velocity interval, Figure 10. In addition, the 2000 ppm solution also showed a decrease in the onset of apparent shear thickening in the presence of residual oil, consistent with the lower concentration solution investigated. Similar to the 800 ppm solution, apparent shear thickening is observed to be much more extensive in absence of residual oil, thus improved injectivity in the presence of residual oil is further corroborated.
7. Conclusions
A review of polymer flow in a porous medium was presented. The available EOR analytical models we evaluated have limitations in accurately describing flow of polymer at high shear rates, e.g., near injector, and this leads to underestimating or overestimating of polymer injectivity.
The experimental results presented expand our insight into polymer flow in a porous medium. Shear thinning behavior may be present in core floods while bulk rheology is predominant from rheometer measurements. Linear polymer flow experiments are dominated by apparent shear thickening which is not measured in standard rheometers. The extensional viscosity, which is the main cause of the apparent shear thickening behavior, occurs at flow velocities strongly influenced by the porous media.
Linear core floods are commonly used for evaluating polymer in-situ rheology and injectivity, but they suffer from steady-state conditions throughout the core as opposed to the well injection situation where both pressure and shear forces are nonlinear gradients.
In the linear core floods, the onset of apparent shear thickening is independent of polymer concentration, when polymer type, brine composition and porous media are held constant. It is also independent of the presence of oil and wettability for the three cases evaluated here.
Radial flow injections show more complex in-situ rheology. The in-situ rheology shows a much higher degree of apparent shear thickening in the presence of oil. This may be due to restrictions in the pore space available. In the absence of oil, high concentration polymer (2000 ppm) showed shear thinning behavior. The onset of apparent shear thickening was shifted to higher flow velocities. There
1
10
100
1000
0.01 0.1 1 10 100
Appa
rent
Vis
cosi
ty [c
P]
u [m/day]
Presence of Residual Oil, Q = 1.6 mL/min
Absence of Residual Oil, Q = 5.0 mL/min
Presence of Residual Oil, Q = 1.4 mL/min
Absence of Residual Oil, Q = 2.0 mL/min
Figure 10. Apparent viscosity from the history match of differential pressure for 2000 ppm 3630SHPAM in the presence and absence of residual oil in radial geometry.

Colloids Interfaces 2018, 2, 27 22 of 27
7. Conclusions
A review of polymer flow in a porous medium was presented. The available EOR analyticalmodels we evaluated have limitations in accurately describing flow of polymer at high shear rates,e.g., near injector, and this leads to underestimating or overestimating of polymer injectivity.
The experimental results presented expand our insight into polymer flow in a porous medium.Shear thinning behavior may be present in core floods while bulk rheology is predominant fromrheometer measurements. Linear polymer flow experiments are dominated by apparent shearthickening which is not measured in standard rheometers. The extensional viscosity, which is the maincause of the apparent shear thickening behavior, occurs at flow velocities strongly influenced by theporous media.
Linear core floods are commonly used for evaluating polymer in-situ rheology and injectivity, butthey suffer from steady-state conditions throughout the core as opposed to the well injection situationwhere both pressure and shear forces are nonlinear gradients.
In the linear core floods, the onset of apparent shear thickening is independent of polymerconcentration, when polymer type, brine composition and porous media are held constant. It is alsoindependent of the presence of oil and wettability for the three cases evaluated here.
Radial flow injections show more complex in-situ rheology. The in-situ rheology shows a muchhigher degree of apparent shear thickening in the presence of oil. This may be due to restrictionsin the pore space available. In the absence of oil, high concentration polymer (2000 ppm) showedshear thinning behavior. The onset of apparent shear thickening was shifted to higher flow velocities.There is a need for further development of numerical models that incorporate memory effects andpossible kinetic effects for high polymer flow rates in the near-well region.
Both linear and radial experiments confirm lower apparent viscosity when oil is present in theporous medium. This conclusion is based on the assumption that brine end-point relative permeabilityis unchanged for polymer injection compared to two-phase flow by water injection. No extra oil wasproduced during polymer injection and this support the lowering of in-situ polymer viscosity in thepresence of oil.
Author Contributions: A.S., B.S.S., and T.S. were responsible for the experimental program and simulation study.N.Z. structured the review contribution, while B.A.-S. and J.G.J. are Ph.D. students working on polymer injectivity,including the experimental study and simulation work. All authors contributed in writing the paper.
Funding: This research received no direct external funding.
Acknowledgments: The authors gratefully acknowledge support from the Norwegian Research Council,Petromaks 2 program. Badar Al-Shakry acknowledge support from, PDO, Petroleum Development Oman.Arne Skauge acknowledge support from Energi Simulations, Canada as the Energi Simulation EOR chair atUniversity of Bergen.
Conflicts of Interest: The authors declare no conflicts of interest.
Nomenclature
A Cross section areaC Power-law constantCp Polymer concentrationDp Grain size diameterDe Deborah numberh Disk thicknessH Constant, equation 11k Constant, equation 18Kei Effective permeability to polymerK PermeabilityL Length of modelMw Polymer molecular weightN1 Normal stress difference
Colloids Interfaces 2018, 2, 27 23 of 27
n Ellis, Carreau or power-law constantP PressureQ Flow rateR Radiusre Disk radiusrw Injection well radiusRF Resistance factorRRF Residual resistance factorReq Equivalent radius obtained from Blake-Kozeny modelSw Water saturationT TemperatureTr Trouton ratioU Darcy velocityWi Weissenberg numberI Injectivityα Correction factorβ Constant, equation 10ω Angular velocity.ε Stretch rate∆P Pressure drop.γ Shear rateτ1/2 Ellis model parameter.γe f f Effective shear rate.γapp Apparent shear rate
.γc Critical shear rateλ Polymer relaxation timeλz Zimm relaxation timeµ Viscosityµapp Apparent viscosityµe f f Effective viscosityµ0 Upper Newtonian plateauµs Solvent viscosityµsh Shear rate viscosityµe Elongational viscosityµ∞ Lower Newtonian plateauφ Porosityψ Tortuosityθ f Characteristic relaxation time of fluidθp Characteristic time of porous media
References
1. Seright, R.S. The Effects of Mechanical Degradation and Viscoelastic Behavior on Injectivity ofPolyacrylamide Solutions. Soc. Pet. Eng. J. 1983, 23, 475–485. [CrossRef]
2. Shuler, P.J.; Kuehne, D.L.; Uhl, J.T.; Walkup, G.W., Jr. Improving Polymer Injectivity at West Coyote Field,California. Soc. Pet. Eng. Reserv. Eng. 1987, 2, 271–280. [CrossRef]
3. Southwick, J.G.; Manke, C.W. Molecular Degradation, Injectivity, and Elastic Properties of Polymer Solutions.Soc. Pet. Eng. Reserv. Eng. 1988, 3, 1193–1201. [CrossRef]
4. Yerramilli, S.S.; Zitha, P.L.J.; Yerramilli, R.C. Novel Insight into Polymer Injectivity for Polymer Flooding.Presented at the SPE European Formation Damage Conference and Exhibition, Noordwijk, The Netherlands,5–7 June 2013. [CrossRef]
5. Lotfollahi, M.; Farajzadeh, R.; Delshad, M.; Al-Abri, K.; Wassing, B.M.; Mjeni, R.; Awan, K.; Bedrikovetsky, P.Mechanistic Simulation of Polymer Injectivity in Field Tests. Presented at the SPE Enhanced Oil RecoveryConference, Kuala Lumpur, Malaysia, 11–13 August 2015. [CrossRef]
6. Glasbergen, G.; Wever, D.; Keijzer, E.; Farajzadeh, R. Injectivity Loss in Polymer Floods: Causes, Preventionsand Mitigations. Presented at the SPE Kuwait Oil & Gas Show and Conference, Mishref, Kuwait,11–14 October 2015. [CrossRef]
Colloids Interfaces 2018, 2, 27 24 of 27
7. Al-Shakry, B.; Shiran, B.S.; Skauge, T.; Skauge, A. Enhanced Oil Recovery by Polymer Flooding: OptimizingPolymer Injectivity. Presented at the SPE Kingdom of Saudi Arabia Technical Symposium and Exhibition,Dammam, Saudi Arabia, 23–26 April 2018.
8. Skauge, T.; Kvilhaug, O.A.; Skauge, A. Influence of Polymer Structural Conformation and Phase Behaviouron In-situ Viscosity. Presented at the 18th European Symposium on Improved Oil Recovery, Dresden,Germany, 14–16 April 2015. [CrossRef]
9. Hughes, D.S.; Teeuw, D.; Cottrell, C.W.; Tollas, J.M. Appraisal of the Use of Polymer Injection To SuppressAquifer Influx and To Improve Volumetric Sweep in a Viscous Oil Reservoir. Soc. Pet. Eng. 1990, 5, 33–40.[CrossRef]
10. Broseta, D.; Medjahed, F.; Lecourtier, J.; Robin, M. Polymer Adsorption/Retention in Porous Media: Effectsof Core Wettability on Residual Oil. Soc. Pet. Eng. 1995, 3, 103–112. [CrossRef]
11. Sorbie, K.S. Polymer-Improved Oil Recovery; Blackie and Son Ltd.: Glasgow, UK, 1991.12. Lake, L.W. Enhanced Oil Recovery; Prentice Hall: Upper Saddle River, NJ, USA, 1989.13. Savins, J.G. Non-Newtonian Flow through Porous Media. Ind. Eng. Chem. 1969, 61, 18–47. [CrossRef]14. Sadowski, T.J. Non-Newtonian Flow through Porous Media. II. Experimental. J. Rheol. 1965, 9, 251–271.
[CrossRef]15. Sochi, T. Non-Newtonian flow in porous media. Polymer 2010, 51, 5007–5023. [CrossRef]16. Sadowski, T.J.; Bird, R.B. Non-Newtonian Flow through Porous Media. I. J. Rheol. 1965, 9, 243–250. [CrossRef]17. Teeuw, D.; Hesselink, F.T. Power-Law Flow And Hydrodynamic Behaviour of Biopolymer Solutions In
Porous Media. Presented at the SPE Fifth International Symposium on Oilfield and Geothermal Chemistry,Stanford, CA, USA, 28–30 May 1980. [CrossRef]
18. Cannella, W.J.; Huh, C.; Seright, R.S. Prediction of Xanthan Rheology in Porous Media. Presented at the63rd Annual Technical Conference and Exhibition of the Society of Petroleum Engineers, Houston, TX, USA,2–5 October 1988. [CrossRef]
19. Fletcher, A.J.P.; Flew, S.R.G.; Lamb, S.P.; Lund, T.; Bjornestad, E.; Stavland, A.; Gjovikli, N.B. Measurementsof Polysaccharide Polymer Properties in Porous Media. Prepared for presentation at the SPE InternationalSymposium on Oilfield Chemistry, Anaheim, CA, USA, 20–22 February 1991. [CrossRef]
20. Sorbie, K.S.; Clifford, P.J.; Jones, E.R.W. The Rheology of Pseudoplastic Fluids in Porous Media UsingNetwork Modeling. J. Colloid Interface Sci. 1989, 130, 508–534. [CrossRef]
21. Lopez, X.; Valvatne, P.H.; Blunt, M.J. Predictive network modeling of single-phase non-Newtonian flow inporous media. J. Colloid Interface Sci. 2003, 264, 256–265. [CrossRef]
22. Pearson, J.R.A.; Tardy, P.M.J. Models for flow of non-Newtonian and complex fluids through porous media.J. Non-Newton. Fluid Mech. 2002, 102, 447–473. [CrossRef]
23. Willhite, G.P.; Uhl, J.T. Correlation of the Flow of Flocon 4800 Biopolymer with Polymer Concentration andRock Properties in Berea Sandstone. In Water-Soluble Polymers for Petroleum Recovery; Springer Publishing:Manhattan, NY, USA, 1988.
24. Bird, R.B.; Stewart, W.E.; Lightfoot, E.N. Transport Phenomena; John Wiley and Sons, Inc.: New York, NY,USA, 1960.
25. Christopher, R.H.; Middleman, S. Power-Law Flow through a Packed Tube. Ind. Eng. Chem. Fundam. 1965, 4,422–426. [CrossRef]
26. Hirasaki, G.J; Pope, G.A. Analysis of Factors Influencing Mobility and Adsorption in the Flow of PolymerSolution Through Porous Media. Soc. Pet. Eng. J. 1974, 14, 337–346. [CrossRef]
27. Duda, J.L.; Hong, S.-A.; Klaus, E.E. Flow of Polymer-Solutions in Porous-Media—Inadequacy of the CapillaryModel. Ind. Eng. Chem. Fundam. 1983, 22, 299–305. [CrossRef]
28. Kishbaugh, A.J.; McHugh, A.J. A rheo-optical study of shear-thickening and structure formation in polymersolutions. Part I: Experimental. Rheol. Acta 1993, 32, 9–24. [CrossRef]
29. Pope, D.P.; Keller, A. Alignment of Macromolecules in Solution by Elongational Flow—Study of Effect ofPure Shear in a 4 Roll Mill. Colloid Polym. Sci. 1977, 255, 633–643. [CrossRef]
30. Binding, D.M.; Jones, D.M.; Walters, K. The Shear and Extensional Flow Properties of M1. J. Non-Newton.Fluid Mech. 1990, 35, 121–135. [CrossRef]
31. Gogarty, W.B. Rheological Properties of Pseudoplastic Fluids in Porous Media. Soc. Pet. Eng. J. 1967, 7,149–160. [CrossRef]

Colloids Interfaces 2018, 2, 27 25 of 27
32. Perrin, C.L.; Tardy, P.M.J.; Sorbie, K.S.; Crawshaw, J.C. Experimental and modeling study of Newtonianand non-Newtonian fluid flow in pore network micromodels. J. Colloid Interface Sci. 2006, 295, 542–550.[CrossRef] [PubMed]
33. Sochi, T.; Blunt, M.J. Pore-scale network modeling of Ellis and Herschel–Bulkley fluids. J. Pet. Sci. Eng. 2008,60, 105–124. [CrossRef]
34. Balhoff, M.T.; Thompson, K.E. A macroscopic model for shear-thinning flow in packed beds based onnetwork modeling. Chem. Eng. Sci. 2006, 61, 698–719. [CrossRef]
35. Zamani, N.; Bondino, I.; Kaufmann, R.; Skauge, A. Computation of polymer in-situ rheology using directnumerical simulation. J. Pet. Sci. Eng. 2017, 159, 92–102. [CrossRef]
36. Hejri, S.; Willhite, G.P.; Green, D.W. Development of Correlations to Predict Biopolymer Mobility in PorousMedia. SPE Reserv. Eng. 1991, 6, 91–98. [CrossRef]
37. Skauge, T.; Skauge, A.; Salmo, I.C.; Ormehaug, P.A.; Al-Azri, N.; Wassing, L.M.; Glasbergen, G.;Van Wunnik, J.N.; Masalmeh, S.K. Radial and Linear Polymer Flow—Influence on Injectivity. Prepared forpresentation at the SPE Improved Oil Recovery Conference, Tulsa, Oklahoma, 11–13 April 2016. [CrossRef]
38. Faber, T.E. Fluid Dynamics for Physicists; Cambridge University Press: Cambridge, UK, 1995.39. Brown, E.; Jaeger, H.M. The role of dilation and confining stresses in shear thickening of dense suspensions.
J. Rheol. 2012, 56, 875–923. [CrossRef]40. Choplin, L.; Sabatie, J. Threshold-Type Shear-Thickening in Polymeric Solutions. Rheol. Acta 1986, 25,
570–579. [CrossRef]41. Indei, T.; Koga, T.; Tanaka, F. Theory of shear-thickening in transient networks of associating polymer.
Macromol. Rapid Commun. 2005, 26, 701–706. [CrossRef]42. Odell, J.A.; Müller, A.J.; Keller, A. Non-Newtonian behaviour of hydrolysed polyacrylamide in strong
elongational flows: A transient network approach. Polymer 1988, 29, 1179–1190. [CrossRef]43. Degennes, P.G. Coil-Stretch Transition of Dilute Flexible Polymers under Ultrahigh Velocity-Gradients.
J. Chem. Phys. 1974, 60, 5030–5042. [CrossRef]44. Trouton, F.T. On the coefficient of viscous traction and its relation to that of viscosity. R. Soc. 1906, 77, 426–440.
[CrossRef]45. Edwards, B.J.; Keffer, D.I.; Reneau, C.W. An examination of the shear-thickening behavior of high molecular
weight polymers dissolved in low-viscosity newtonian solvents. J. Appl. Polym. Sci. 2002, 85, 1714–1735.[CrossRef]
46. Hatzignatiou, D.G.; Moradi, H.; Stavland, A. Experimental Investigation of Polymer Flow through Water-and Oil-Wet Berea Sandstone Core Samples. Presented at the EAGE Annual Conference & Exhibitionincorporationg SPE Europec, London, UK, 10–13 June 2013. [CrossRef]
47. McKinley, G.H.; Sridhar, T. Filament-stretching rheometry of complex fluids. Annu. Rev. Fluid Mech. 2002,34, 375–415. [CrossRef]
48. Fuller, G.G.; Cathey, C.A.; Hubbard, B.; Zebrowski, B.E. Extensional Viscosity Measurements forLow-Viscosity Fluids. J. Rheol. 1987, 31, 235–249. [CrossRef]
49. Meadows, J.; Williams, P.A.; Kennedy, J.C. Comparison of the Extensional and Shear Viscosity Characteristicsof Aqueous Hydroxyethylcellulose Solutions. Macromolecules 1995, 28, 2683–2692. [CrossRef]
50. Anna, S.L.; McKinley, G.H.; Nguyen, D.A.; Sridhar, T.; Muller, S.J.; Huang, J.; James, J.F. An interlaboratorycomparison of measurements from filament-stretching rheometers using common test fluids. J. Rheol. 2001,45, 83–114. [CrossRef]
51. Shipman, R.W.G.; Denn, M.M.; Keunings, R. Mechanics of the Falling Plate Extensional Rheometer.J. Non-Newton. Fluid Mech. 1991, 40, 281–288. [CrossRef]
52. Sridhar, T.; Tirtaatmadja, V.; Nguyen, D.A.; Gupta, R.K. Measurement of Extensional Viscosity ofPolymer-Solutions. J. Non-Newton. Fluid Mech. 1991, 40, 271–280. [CrossRef]
53. Tirtaatmadja, V.; Sridhar, T. A Filament Stretching Device for Measurement of Extensional Viscosity. J. Rheol.1993, 37, 1081–1102. [CrossRef]
54. James, D.F.; Chandler, G.M.; Armour, S.J. A Converging Channel Rheometer for the Measurement ofExtensional Viscosity. J. Non-Newton. Fluid Mech. 1990, 35, 421–443. [CrossRef]

Colloids Interfaces 2018, 2, 27 26 of 27
55. Chauveteau, G. Moluecular interpretation of several different properties of flow of coiled polymer solutionsthrough porous media in oil recovery conditions. Presented at the 56th Annual Fall Technical Conferenceand Exhibition of the society of Petroleum Engineers of AIME, San Antonio, TX, USA, 5–7 October 1981.[CrossRef]
56. Lewandowska, K. Comparative studies of rheological properties of polyacrylamide and partially hydrolyzedpolyacrylamide solutions. J. Appl. Polym. Sci. 2007, 103, 2235–2241. [CrossRef]
57. Briscoe, B.; Luckham, P.; Zhu, S.P. Pressure influences upon shear thickening of poly(acrylamide) solutions.Rheol. Acta 1999, 38, 224–234. [CrossRef]
58. Dupuis, D.; Lewandowski, F.Y.; Steiert, P.; Wolff, C. Shear Thickening and Time-Dependent Phenomena—TheCase of Polyacrylamide Solutions. J. Non-Newton. Fluid Mech. 1994, 54, 11–32. [CrossRef]
59. Jiang, B.; Keffer, D.J.; Edwards, B.J.; Allred, J.N. Modeling shear thickening in dilute polymer solutions:Temperature, concentration, and molecular weight dependencies. J. Appl. Polym. Sci. 2003, 90, 2997–3011.[CrossRef]
60. Clarke, A.; Howe, A.M.; Mitchell, J.; Staniland, J.; Hawkes, L.A. How Viscoelastic-Polymer FloodingEnhances Displacement Efficiency. Soc. Pet. Eng. J. 2016, 21, 675–687. [CrossRef]
61. Delshad, M.; Kim, D.H.; Magbagbeola, O.A.; Huh, C.; Pope, G.A.; Tarahhom, F. Mechanistic Interpretationand Utilization of Viscoelastic Behavior of Polymer Solutions for Improved Polymer-Flood Efficiency.Prepared for presentation at the 2008 SPE/DOE Improved Oil Recovery Symposium, Tulsa, OK, USA,19–23 April 2008. [CrossRef]
62. Stavland., A.; Jonsbråten, H.C.; Lohne, A.; Moen, A.; Giske, N.H. Stavland. A.; Jonsbråten, H.C.; Lohne, A.;Moen, A.; Giske, N.H. Polymer Flooding—Flow Properties in Porous Media Versus Rheological Parameters.Presented at the SPE EUROPEC/EAGE Annual Conference and Exhibition, Barcelona, Spain, 14–17 June 2010.[CrossRef]
63. Aitkadi, A.; Carreau, P.J.; Chauveteau, G. Rheological Properties of Partially Hydrolyzed PolyacrylamideSolutions. J. Rheol. 1987, 31, 537–561. [CrossRef]
64. Lee, K.; Huh, C.; Sharma, M.M. Impact of Fractures Growth on Well Injectivity and Reservoir Sweep duringWaterflood and Chemical EOR Processes. Presented at the SPE Annual Technical Conference and Exhibition,Denver, CO, USA, 30 October–2 November 2011. [CrossRef]
65. Hu, Y.; Wang, S.Q.; Jamieson, A.M. Rheological and Rheooptical Studies of Shear-Thickening PolyacrylamideSolutions. Macromolecules 1995, 28, 1847–1853. [CrossRef]
66. Cho, Y.H.; Dan, K.S.; Kim, B.C. Effects of dissolution temperature on the rheological properties of polyvinylalchol solutions in dimethyl sulfoxide. Korea-Aust. Rheol. J. 2008, 20, 73–77.
67. Zamani, N.; Bondino, I.; Kaufmann, R.; Skauge, A. Effect of porous media properties on the onset of polymerextensional viscosity. J. Pet. Sci. Eng. 2015, 133, 483–495. [CrossRef]
68. Gupta, R.K.; Sridhar, T. Viscoelastic Effects in Non-Newtonian Flows through Porous-Media. Rheol. Acta1985, 24, 148–151. [CrossRef]
69. Smith, F.W. Behavior of Partially Hydrolyzed Polyacrylamide Solutions in Porous Media. J. Pet. Technol.1970, 22, 148–156. [CrossRef]
70. Kemblowski, Z.; Dziubinski, M. Resistance to Flow of Molten Polymers through Granular Beds. Rheol. Acta1978, 17, 176–187. [CrossRef]
71. Wissler, E.H. Viscoelastic Effects in the Flow of Non-Newtonian Fluids through a Porous Medium. Ind. Eng.Chem. Fundam. 1971, 10, 411–417. [CrossRef]
72. Vossoughi, S.; Seyer, F.A. Pressure-Drop for Flow of Polymer-Solution in a Model Porous-Medium. Can. J.Chem. Eng. 1974, 52, 666–669. [CrossRef]
73. Marshall, R.J.; Metzner, A.B. Flow of Viscoelastic Fluids through Porous Media. Ind. Eng. Chem. Fundam.1967, 6, 393–400. [CrossRef]
74. Durst, F.; Haas, R.; Interthal, W. Laminar and Turbulent Flows of Dilute Polymer-Solutions—A PhysicalModel. Rheol. Acta 1982, 21, 572–577. [CrossRef]
75. Heemskerk, J.; Rosmalen, R.; Janssen-van, R.; Holtslag, R.J.; Teeuw, D. Quantification of Viscoelastic Effectsof Polyacrylamide Solutions. Presented at the SPE/DOE Fourth Symposium on Enhanced Oil Recovery,Tulsa, OK, USA, 15–18 April 1984. [CrossRef]

Colloids Interfaces 2018, 2, 27 27 of 27
76. Metzner, A.B.; White, J.L.; Denn, M.M. Constitutive equations for viscoelastic fluids for short deformationperiods and for rapidly changing flows: Significance of the deborah number. AIChE J. 1966, 12, 863–866.[CrossRef]
77. Masuda, Y.; Tang, K.-C.; Miyazawa, M.; Tanaka, S. 1D Simulation of Polymer Flooding Including theViscoelastic Effect of Polymer Solution. SPE Reverv. Eng. 1992, 7, 247–252. [CrossRef]
78. Haas, R.; Durst, F. Viscoelastic Flow of Dilute Polymer-Solutions in Regularly Packed-Beds. Rheol. Acta 1982,21, 566–571. [CrossRef]
79. Garrouch, A.A.; Gharbi, R.C. A Novel Model for Viscoelastic Fluid Flow in Porous Media. Presented atthe 2006 SPE Annual Technical Conference and Exhibition, San Antonio, TX, USA, 24–27 September 2006.[CrossRef]
80. Ranjbar, M.; Rupp, J.; Pusch, G.; Meyn, R. Quantification and Optimization of Viscoelastic Effects of PolymerSolutions for Enhanced Oil Recovery. Presented at the SPE/DOE Eight Symposium on Enhanced OilRecovery, Tulsa, OK, USA, 22–24 April 1992. [CrossRef]
81. Kawale, D.; Marques, E.; Zitha, P.L.J.; Kreutzer, M.T.; Rossen, W.R.; Boukany, P.E. Elastic instabilities duringthe flow of hydrolyzed polyacrylamide solution in porous media: effect of pore-shape and salt. Soft Matter2017, 13, 765–775. [CrossRef] [PubMed]
82. Seright, R.S.; Seheult, J.M.; Talashek, T. Injectivity Characteristics of EOR Polymers. SPE Reserv. Eval. Eng.2009, 12, 783–792. [CrossRef]
83. Kulawardana, E.U.; Koh, H.; Kim, D.H.; Liyanage, P.J.; Upamali, K.; Huh, C.; Weerasooriya, U.; Pope, G.A.Rheology and Transport of Improved EOR Polymers under Harsh Reservoir Conditions. Presented at theEighteenth SPE Improved Oil Recovery Symposium, Tulsa, OK, USA, 14–18 April 2012. [CrossRef]
84. Sharma, A.; Delshad, M.; Huh, C.; Pope, G.A. A Practical Method to Calculate Polymer Viscosity Accuratelyin Numerical Reservoir Simulators. Presented at the SPE Annual Technical Conference and Exhibition,Denver, CO, USA, 31 October–2 November 2011. [CrossRef]
85. Manichand, R.N.; Moe Soe Let, K.P.; Gil, L.; Quillien, B.; Seright, R.S. Effective Propagation of HPAMSolutions Through the Tambaredjo Reservoir During a Polymer Flood. SPE Prod. Oper. 2013, 28, 358–368.[CrossRef]
86. Zaitoun, A.; Makakou, P.; Blin, N.; Al-Maamari, R.S.; Al-Hashmi, A.-A.R.; Abdel-Goad, M.; Al-Sharji, H.H.Shear Stability of EOR Polymers. SPE J. 2011, 17, 335–339. [CrossRef]
87. Suri, A.; Sharma, M.M.; Peters, E. Estimates of Fracture Lengths in an Injection Well by History MatchingBottomhole Pressures and Injection Profile. SPE Reserv. Eval. Eng. 2011, 14, 405–417. [CrossRef]
88. Zechner, M.; Clemens, T.; Suri, A.; Sharma, M.M. Simulation of Polymer Injection under FracturingConditions—A Field Pilot in the Matzen Field, Austria. SPE Reserv. Eval. Eng. 2014, 18, 236–249. [CrossRef]
89. Van den Hoek, P.; Mahani, H.; Sorop, T.; Brooks, D.; Zwaan, M.; Sen, S.; Shuaili, K.; Saadi, F. Applicationof Injection Fall-Off Analysis in Polymer flooding. Presented at the 74th EAGE Conference & Exhibitionincorporating SPE EUROPEC 2012, Copenhagen, Denmark, 4–7 June 2012. [CrossRef]
90. Shiran, B.S.; Skauge, A. Wettability and Oil Recovery by Polymer and Polymer Particles. Presented at the SPEAsia Pacific Enhanced Oil Recovery Conference, Kuala Lumpur, Malaysia, 11–13 August 2015. [CrossRef]
91. Al-Abri, K.; Al-Mjeni, R.; Al-Bulushi, N.K.; Awan, K.; Al-Azri, N.; Al-Riyami, O.; Al-Rajhi, S.; Teeuwisse, S.;Ghulam, J.; Abu-Shiekha, I.; et al. Reducing Key Uncertainities Prior to a Polymer Injection Trial in a HeavyOil Reservoir in Oman. Presented at SPE EOR Conference at OGWA, Muscat, Oman, 31 March–2 April 2014.[CrossRef]
92. Li, Z.; Delshad, M. Development of an Analytical Injectivity Model for Non-Newtonian Polymer Solutions.Presented at the SPE Reservoir Simulation Symposium, Woodlands, TX, USA, 18–20 February 2014.[CrossRef]
© 2018 by the authors. Licensee MDPI, Basel, Switzerland. This article is an open accessarticle distributed under the terms and conditions of the Creative Commons Attribution(CC BY) license (http://creativecommons.org/licenses/by/4.0/).


Paper 2:
Analysis and Simulation of Polymer Injectivity


Paper 3:
Qualification of New Methods for Measuring In Situ Rheology of Non-Newtonian
Fluids in Porous Media


polymers
Article
Qualification of New Methods for Measuring In SituRheology of Non-Newtonian Fluids in Porous Media
Jørgen Gausdal Jacobsen 1,2,*, Behruz Shaker Shiran 2, Tormod Skauge 3 ,Kenneth Stuart Sorbie 3,4 and Arne Skauge 1,3
1 Department of Chemistry, University of Bergen, Allegaten 41, N-5020 Bergen, Norway; [email protected] Norce, Norwegian Research Centre AS, Allegaten 41, N-5020 Bergen, Norway; [email protected] Energy Research Norway, N-5020 Bergen, Norway; [email protected] (T.S.);
[email protected] (K.S.S.)4 Institute of Petroleum Engineering, Heriot Watt University, Edinburgh EH14 4AS, UK* Correspondence: [email protected]; Tel.: +47-9283-2044
Received: 29 November 2019; Accepted: 15 January 2020; Published: 14 February 2020�����������������
Abstract: Pressure drop (∆P) versus volumetric injection rate (Q) data from linear core floods havetypically been used to measure in situ rheology of non-Newtonian fluids in porous media. However,linear flow is characterized by steady-state conditions, in contrast to radial flow where both pressureand shear-forces have non-linear gradients. In this paper, we qualify recently developed methodsfor measuring in situ rheology in radial flow experiments, and then quantitatively investigate therobustness of these methods against pressure measurement error. Application of the new methods toexperimental data also enabled accurate investigation of memory and rate effects during polymer flowthrough porous media. A radial polymer flow experiment using partially hydrolyzed polyacrylamide(HPAM) was performed on a Bentheimer sandstone disc where pressure ports distributed between acentral injector and the perimeter production line enabled a detailed analysis of pressure variationwith radial distance. It has been suggested that the observed shear-thinning behavior of HPAMsolutions at low flux in porous media could be an experimental artifact due to the use of insufficientlyaccurate pressure transducers. Consequently, a generic simulation study was conducted where thelevel of pressure measurement error on in situ polymer rheology was quantitatively investigated.Results clearly demonstrate the robustness of the history match methods to pressure measurementerror typical for radial flow experiments, where negligible deviations from the reference rheologywas observed. It was not until the error level was increased to five-fold of typical conditions thatsignificant deviation from the reference rheology emerged. Based on results from pore networkmodelling, Chauveteau (1981) demonstrated that polymer flow in porous media may at some rate beinfluenced by the prior history. In this paper, polymer memory effects could be evaluated at the Darcyscale by history matching the pressure drop between individual pressure ports and the producer as afunction of injection rate (conventional method). Since the number of successive contraction eventsincreases with radial distance, the polymer has a different pre-history at the various pressure ports.Rheology curves obtained from history matching the radial flow experiment were overlapping, whichshows that there is no influence of geometry on in-situ rheology for the particular HPAM polymerinvestigated. In addition, the onset of shear-thickening was independent of volumetric injection ratein radial flow.
Keywords: EOR; polymer flooding; in situ rheology; non-Newtonian flow; polymer memory effect
Polymers 2020, 12, 452; doi:10.3390/polym12020452 www.mdpi.com/journal/polymers

Polymers 2020, 12, 452 2 of 13
1. Introduction
Polymer flooding is a mature enhanced oil recovery (EOR) technique that has received increasedattention during recent years. Water-soluble polymers are added to the injection brine to increaseeffective viscosity of the injected solution, thus changing the mobility ratio and thereby improvingsweep efficiency. The synthetic polymer partially hydrolyzed polyacrylamide (HPAM) is by far themost frequently used polymer for oil recovery purposes [1] and is therefore the focus of this paper.While biopolymers are purely viscous in solution and thus only exhibit Newtonian and shear-thinningbehavior, elastic polymers such as HPAM additionally exhibit shear-thickening behavior in flowthrough porous media.
Accurate measurements of polymer in situ rheology is crucial for obtaining reliable estimatesof the mobility ratio between the displacing polymer solution and the displaced oil. Due to thetime-consuming nature of in situ measurements, extensive efforts have been made to relate bulk andin situ rheology. Despite numerous attempts, no universally accepted analytical or numerical modelexist [2]. Consequently, polymer in situ rheology is estimated from polymer flow experiments inporous media. Generally, these experiments have been performed on linear core plugs [3–7]. However,results from recent years indicate that linear and radial polymer flow are inherently different [2,8].In addition, it has been observed that presence of residual oil significantly reduces polymer in situeffective viscosity compared to single-phase flow [2]. Based on these results, the radial polymer flowexperiment that was history matched in this paper was performed in radial flow geometry in thepresence of residual oil since these conditions best mimic the polymer flow out from the injector inoil reservoirs.
Until recently, in situ polymer rheology was mainly calculated from the pressure drop (∆P)along a linear core as a function of volumetric injection rate (Q). Using this ∆P versus Q data directly,the behavior of the in situ ‘effective viscosity’ could be calculated using Darcy’s law. Consequently,a single effective viscosity value could be obtained for each volumetric injection rate. Unlike the casein linear flow, the velocity is decreasing with distance from the injector in a radial flow system. Thus,internal pressures in radial flow provide a much richer description of the local pressure response fromboth the shear-thickening regime in the near-wellbore region and the shear-thinning regime furtherfrom the injection well. Even though internal pressure ports are also used in linear core floods, theyare unable to provide any additional detail from the polymer pressure response due to the constantvelocity field in linear flow. Extrapolation of internal pressures may be performed to obtain the polymerentrance pressure drop in linear flow, which is correlated with the degree of mechanical degradation [9].However, recent results show that the degree of mechanical degradation is significantly reduced inradial compared to linear flow [8]. Therefore, it is the authors’ view that linear flow experimentsshould not be used as basis for determining the degree of mechanical degradation in radial flow.
A common aspect of all polymer flow experiments, regardless of flow geometry, arises fromuncertainties originating from pressure measurement error, which may significantly influence thehistory match results. Moreover, it has been suggested that the observed shear-thinning behavior ofHPAM solutions may be an experimental artifact due to the use of insufficiently accurate pressuretransducers [7]. A generic simulation study was therefore performed to establish the sensitivity of bothhistory match methods to pressure measurement error. Initially, a reference (base case) rheology curvewas constructed and used as input for radial polymer flow simulations to create a reference dataset. Thisreference dataset was then randomly ‘contaminated’ with different degrees of pressure measurementerror. Rheology curves used to history match datasets with different levels of pressure measurementerror were then compared to the reference rheology curve. Consequently, the effect of pressuremeasurement error on the resulting polymer rheology function could be quantitatively evaluated.
Due to the rapidly changing velocity field in radial flow (radial velocity decreases as 1/r), differentflow regimes may exist within the propagation path between injector and producer for elastic polymers.When the volumetric injection rate and resulting flow velocities are below a certain threshold value,the polymer will have sufficient time to relax completely between each contraction during the entire

Polymers 2020, 12, 452 3 of 13
propagation distance and the fluid can then be treated as an inelastic fluid for modeling purposes.However, at velocities exceeding this threshold value, the polymer is unable to fully relax betweencontractions and the elastic nature of the polymer must be considered. Chauveteau (1981) [10] showedthat for elastic fluids, a memory effect is observed where the polymer rheology is dependent onthe number of prior contraction events that the fluid experiences. These experimental observationshave also been reproduced by numerical simulation [11], where it was demonstrated that porousmedia properties such as; aspect ratio, coordination number, and tortuosity, significantly influencepolymer rheology.
The use of internal pressure ports in the radial flow experiment, where the number of contractionevents increase with distance from injection well, enabled an investigation at the Darcy scale into thememory effects of the elastic HPAM polymer considered in this paper.
2. Materials and Methods
2.1. Rock Material
The radial flow experiment history matched in this paper was performed on a circular Bentheimersandstone disc. Based on XRD measurements, Bentheimer consists predominantly of quartz (90.6%)with some feldspar (4.6%), mica (3.2%), and trace amounts of minerals such as siderite, calcite, andpyrite (1.6%). Mercury intrusion tests performed on the Bentheimer outcrop rock showed a uniformand relatively narrow pore size distribution with median pore throat size of approximately 14.7 µm [12].Dispersion tests were also performed, where the flow behavior of the experimental brine and a tracerbrine confirmed homogeneous flow conditions. Table 1 shows the properties of the Bentheimersandstone disc used in this study.
Table 1. Disc properties
Radius r cm 15.0
Injection well radius rw cm 0.325
Thickness h cm 2.00
Pore volume Vp mL 350.0
Porosity Φ - 0.25
Permeability K mD 2200
The sample was prepared according to a method previously described in the literature for circularBentheimer discs with internal pressure ports [2,8,13]. The rock sample preparation was completed byageing with a heavy crude oil of 7000 cP, followed by flooding with brine to residual oil saturation of0.34. Pressure ports were located in the injection well and production line and at radii of, r = 0.8, 1.2,1.7, 2.4, 3.5, 5, 7, and 10 cm (Figure 1). As evident from the illustration, the entire rim of the radial discconstitutes the production line.
Fuji FCX series pressure transducers were used to measure the absolute pressure for individualpressure ports. These pressure sensors have a pressure range of 0–5 bara with a resolution within±0.2% of the preset maximum pressure value. Differential pressures between individual pressureports and production line were then calculated from the measured absolute pressures. In radialflow experiments with internal pressure ports, measurement error originate from both pressuremeasurement noise in pressure tranducers and uncertainties from the manual placement of internalpressure ports. Consequently, the effective (or cumulative) pressure measurement error was estimatedat approximately ±1% of the preset maximum value for the radial polymer flow experiment conductedin this paper.

Polymers 2020, 12, 452 4 of 13
Polymers 2020, 12, 452 3 of 13
Chauveteau (1981) [10] showed that for elastic fluids, a memory effect is observed where the polymer rheology is dependent on the number of prior contraction events that the fluid experiences. These experimental observations have also been reproduced by numerical simulation [11], where it was demonstrated that porous media properties such as; aspect ratio, coordination number, and tortuosity, significantly influence polymer rheology.
The use of internal pressure ports in the radial flow experiment, where the number of contraction events increase with distance from injection well, enabled an investigation at the Darcy scale into the memory effects of the elastic HPAM polymer considered in this paper.
2. Materials and Methods
2.1. Rock Material
The radial flow experiment history matched in this paper was performed on a circular Bentheimer sandstone disc. Based on XRD measurements, Bentheimer consists predominantly of quartz (90.6%) with some feldspar (4.6%), mica (3.2%), and trace amounts of minerals such as siderite, calcite, and pyrite (1.6%). Mercury intrusion tests performed on the Bentheimer outcrop rock showed a uniform and relatively narrow pore size distribution with median pore throat size of approximately 14.7 µm [12]. Dispersion tests were also performed, where the flow behavior of the experimental brine and a tracer brine confirmed homogeneous flow conditions. Table 1 shows the properties of the Bentheimer sandstone disc used in this study.
Table 1. Disc properties
Radius 𝑟 cm 15.0 Injection well radius 𝑟 cm 0.325
Thickness ℎ cm 2.00 Pore volume 𝑉 mL 350.0
Porosity Φ - 0.25 Permeability 𝐾 mD 2200
The sample was prepared according to a method previously described in the literature for circular Bentheimer discs with internal pressure ports [2,8,13]. The rock sample preparation was completed by ageing with a heavy crude oil of 7000 cP, followed by flooding with brine to residual oil saturation of 0.34. Pressure ports were located in the injection well and production line and at radii of, r = 0.8, 1.2, 1.7, 2.4, 3.5, 5, 7, and 10 cm (Figure 1). As evident from the illustration, the entire rim of the radial disc constitutes the production line.
Figure 1. Schematic representation of the circular Bentheimer disc showing the distribution of internal pressure ports mounted between injection well and production line.
Figure 1. Schematic representation of the circular Bentheimer disc showing the distribution of internalpressure ports mounted between injection well and production line.
2.2. Fluids
The brine used in this study was of relatively low salinity and did not contain any divalentions. Total dissolved salt content was equal to 7000 ppm, with composition given by 6000 mg/LNaCl and 1000 mg/L NaHCO3. Brine viscosity was 1.02 cP at the experimental temperature of 22 ◦C.The 1000-ppm polymer solution reported in this paper was prepared by diluting a 5000 ppm mothersolution (Flopaam 3330S, 8 MDa, 30% hydrolysis, from SNF Floerger, Andrèzieux-Bouthèon, France) inbrine according to the API method (RP 63, 1900, American Petroleum Institute, Washington, DC, USA).According to the classification of polymer phase categories [14], the polymer solution was within thesemi-dilute regime.
The relatively low molecular weight polymer used in this study was chosen to reduce the amountof mechanical degradation and to minimize the residual resistance factor (RRF). In addition, the ratherlow polydispersity of the HPAM sample was expected to ensure low mechanical degradation comparedto a wider distribution [7].
Shear viscosity of the polymer solution (11.5 cP at 10 s−1) was measured at 22 ◦C using a cone-plategeometry on a Malvern Kinexus Pro rheometer. Shear viscosity was measured for shear rates in theinterval 0.1 to 1000 s−1 using a 50 mm titanium spindle with a 2◦ inclination. The low density of thespindle allowed for accurate measurements at low torque values. The plate was 65 mm in diameter andthe gap set to 70 µm at the tip. The solution was viscous dominated. Effluent viscosity measurementsshowed negligible deviation from injected viscosity, indicating that mechanical degradation did notoccur during the radial polymer flow experiment.
2.3. Disc Flooding Procedure
Firstly, brine was injected at ten different flow rates (0.05–2 mL/min) to determine effectivepermeability to brine in presence of residual oil. Effective permeability to brine (kb,init) was obtainedfrom Darcy’s law for radial flow
kb,init = −µQ
2πh∆Pln
rre
(1)
where µ is brine viscosity, Q is volumetric injection rate, h is disc thickness, ∆P is the pressure dropbetween a specified pressure port at radius r and the producer at re.
The 1000-ppm polymer solution was then injected at low flow rate (0.1 mL/min) for at least twopore volumes to ensure that polymer retention was completely satisfied and to achieve stable pressureconditions. Then, the polymer solution was injected at 2 mL/min and the injection rate was reducedand measured in a stepwise manner (10 rate steps) until the stabilized pressure had been recorded forthe lowest rate of 0.05 mL/min.
Polymers 2020, 12, 452 5 of 13
Apparent viscosity of polymer solutions flowing in porous media is represented by the resistancefactor (RF), defined as
RF =∆PP
∆Pb,init(2)
where ∆PP is the pressure drop during polymer flow and ∆Pb,init is the pressure drop during brineflow before polymer was introduced to the porous media.
Following the 1000-ppm HPAM flood, tapering was performed to minimize residual resistancefactor [15], where 700, 400, and 100 ppm polymer solutions were injected sequentially. Lastly, the finalbrine flood was injected at 10 different flow rates (0.05–2 mL/min) to determine final permeability tobrine and to calculate the RRF, defined as
RRF =kb,init
kb, f inal(3)
where kb,init is effective permeability to brine before introduction of polymer to the porous media andkb, f inal is effective permeability to brine after polymer tapering.
2.4. Simulation
The simulation model used for the generic simulation study and for history matching the radialpolymer flow experiment was constructed in the STARS simulator (Computer Modeling Group,Calgary, Alberta, Canada). Concentric grid blocks of uniform length delineated the radial grid withradius of 15 cm between injector and producer. After sensitivity analysis, grid block length wasoptimally chosen to be ∆r = 0.1 cm, resulting in a radial model with 150 concentric rings.
The rheology curves constructed in this paper were generated using an extended version of theCarreau model [16] that incorporates the Newtonian, shear-thinning, and shear-thickening behavior ofelastic polymers, as
µapp = µ∞ +µ0 − µ∞
(1 + (λ1u)2)1−n1
2
+ µmax[1− exp(−
(λ2u)n2−1
)](4)
where µapp is polymer apparent viscosity, µ∞ and µ0 are limiting Newtonian viscosities at high andlow shear limits, respectively, λ and n are empirical polymer constants, u is the superficial velocity ofthe polymer in porous media and µmax is the shear-thickening plateau viscosity.
2.5. History Match Methods
To model radial polymer flow, Darcy’s law may be applied as
∆P = −µappQ
2πhkb, f inalln
rre
(5)
where ∆P is the pressure drop between a specified pressure port at radius r and the producer at re, µapp
is polymer apparent viscosity, Q is volumetric injection rate, h is disc thickness and kb, f inal is effectivepermeability to brine after polymer flow.
Permeability obtained from the final brine flood was used as input during history matching of thepolymer flood in order to obtain the flow-dependent rheology behavior of the HPAM solution. Thus,we assumed that effective permeability to brine (after polymer flow) and to polymer were equal. Thisassumption was justified since X-ray imaging showed no additional oil mobilization during polymerflooding beyond the water flood residual oil saturation.
Using Darcy’s law for radial flow and assuming constant brine permeability, the differentialpressure during polymer flow may be history matched as a function of either volumetric injection rate(conventional method [13], denoted dP(Q)) or radial distance (new method [2,8], dP(r)):

Polymers 2020, 12, 452 6 of 13
• dP(Q): Using the conventional method, injection bottom-hole pressure (BHP) is history matchedas function of volumetric injection rate, yielding a single polymer in situ rheology curve. Due tothe experimental set up using internal pressure ports distributed between injector and producer,differential pressure between each pressure port and producer may also be history matched as afunction of injection rate, yielding an individual in situ rheology curve for each pressure port.While the rheology curve obtained from history matching injection BHP spans the entire velocityinterval of the polymer rheology from injector to producer, differential pressure between internalpressure ports span decreasing velocity intervals of the complete rheology curve as we movetowards the producer.
• dP(r): Using the new method, differential pressure is history matched as a function of radialdistance, yielding an individual rheology curve for each volumetric injection rate. Here, rheologycurves obtained from each injection rate span different velocity intervals.
Throughout the remainder of this paper, dP(Q) and dP(r) are referred to as the single port matchmethod (SPMM) and the disc match method (DMM), respectively.
2.6. Pretreatment of Polymer Pressure Response: Decoupling Polymer In Situ Rheology
Polymer pressure response from radial flow experiments does not exclusively contain contributionsfrom the in situ rheology. If not accounted for, experimental conditions such as non-uniform residual oilsaturation and pseudo-skin effects may distort the true functional relationship of the polymer rheology.However, since these conditions also were present during brine flow, and since X-ray imaging showedno additional displacement of oil by polymer, they can be incorporated into the permeability andeffectively be decoupled from the polymer rheology.
Effective permeability to brine across the entire disc (obtained from history matching injection BHPas a function of injection rate during brine flow) was used to history match the polymer flow experiment.However, since the permeability across the entire disc deviated from the local permeabilities betweenindividual pressure ports and producer, correction factors were calculated and internal pressures forthe polymer flow were adjusted. Using this pretreatment technique, all experimental factors such asnon-uniform residual oil saturation and pseudo-skin effects, which were also present during brine flow,were effectively decoupled from the polymer pressure response. Thus, the contribution of polymer insitu rheology on the radial pressure response could be effectively isolated. The calculated correctionfactors were between 0.5 – 1.3, and were monotonically decreasing with radial distance.
2.7. Pressure Measurement Error Analysis
To quantify the effect of pressure measurement error on the obtained polymer in situ rheology, theparameter values summarized in Table 2 were used in conjunction with the extended Carraeu model,i.e., Equation (4), to create a reference (base case) rheology curve (Figure 2). This synthetic base caserheology curve is essentially our ‘truth’ case if the data were perfect.
Table 2. Carreau parameters used to create the reference (base case) rheology curve
µ∞ (cP) µ0 (cP) µmax (cP) λ1 (day/m) λ2 (day/m) n1 n2
1 50 75 5·107 5·103 0.7 1.5

Polymers 2020, 12, 452 7 of 13
Polymers 2020, 12, 452 6 of 13
• dP(r): Using the new method, differential pressure is history matched as a function of radial distance, yielding an individual rheology curve for each volumetric injection rate. Here, rheology curves obtained from each injection rate span different velocity intervals. Throughout the remainder of this paper, dP(Q) and dP(r) are referred to as the single port match
method (SPMM) and the disc match method (DMM), respectively.
2.6. Pretreatment of Polymer Pressure Response: Decoupling Polymer In Situ Rheology
Polymer pressure response from radial flow experiments does not exclusively contain contributions from the in situ rheology. If not accounted for, experimental conditions such as non-uniform residual oil saturation and pseudo-skin effects may distort the true functional relationship of the polymer rheology. However, since these conditions also were present during brine flow, and since X-ray imaging showed no additional displacement of oil by polymer, they can be incorporated into the permeability and effectively be decoupled from the polymer rheology.
Effective permeability to brine across the entire disc (obtained from history matching injection BHP as a function of injection rate during brine flow) was used to history match the polymer flow experiment. However, since the permeability across the entire disc deviated from the local permeabilities between individual pressure ports and producer, correction factors were calculated and internal pressures for the polymer flow were adjusted. Using this pretreatment technique, all experimental factors such as non-uniform residual oil saturation and pseudo-skin effects, which were also present during brine flow, were effectively decoupled from the polymer pressure response. Thus, the contribution of polymer in situ rheology on the radial pressure response could be effectively isolated. The calculated correction factors were between 0.5 – 1.3, and were monotonically decreasing with radial distance.
2.7. Pressure Measurement Error Analysis
To quantify the effect of pressure measurement error on the obtained polymer in situ rheology, the parameter values summarized in Table 2 were used in conjunction with the extended Carraeu model, i.e., Equation (4), to create a reference (base case) rheology curve (Figure 2). This synthetic base case rheology curve is essentially our ‘truth’ case if the data were perfect.
Table 2. Carreau parameters used to create the reference (base case) rheology curve 𝝁 (cP) 𝝁𝟎 (cP) 𝝁𝒎𝒂𝒙 (cP) 𝝀𝟏 (day/m) 𝝀𝟐 (day/m) 𝒏𝟏 𝒏𝟐 1 50 75 5 ∙ 10 5 ∙ 10 0.7 1.5
Figure 2. Reference (base case) rheology curve used for pressure measurement error analysis.
10
100
0.001 0.01 0.1 1 10
Appa
rent
vis
cosi
ty (c
P)
Superficial velocity (m/day)
Reference rheology curve
Figure 2. Reference (base case) rheology curve used for pressure measurement error analysis.
The reference rheology curve was then used as input in our radial polymer flow simulations inSTARS to generate a reference dataset. In accordance with the radial polymer flow experiment thatwas history matched in this paper, the reference rheology curve was used in simulation runs with thesame 10 injection rates within the rate interval of 0.05–2 mL/min.
2.8. Automatic History Match Tool
To prevent any pre-bias from affecting the results of the error analysis, the automatic historymatch tool CMOST by Computer Modeling Group (Calgary, Alberta, Canada) was chosen to performthe history match operations. To evaluate the convergence ability of CMOST, the reference datasetwas history matched using the particle swarm optimization (PSO) engine. The parameter intervalsin Table 3 were selected for all automatic history match operations during the error analysis. Theseare chosen to give a wide parameter space containing the ‘correct’ value for the base case in siturheology curve.
Table 3. Carreau parameter intervals used for automatic history match operations in CMOST
µ∞ (cP) µ0 (cP) µmax (cP) λ1 (day/m) λ2 (day/m) n1 n2
1 1–100 1–100 104–108 1–104 0.3–1 1.3–2
History match results using the PSO engine showed good convergence in most situations.However, in some cases, the engine experienced difficulties converging towards acceptable globalminimum values. In these cases, the more robust, although more time consuming engine, BayesianMarkov Chain Monte Carlo (MCMC), was used. During the evaluation of CMOST, where the referencedataset was history matched, average history match error of 1% was set as the convergence criterion.In this work, the average percentage history match error is defined as
1n
n∑1
∣∣∣∣∣HM−RR
∣∣∣∣∣× 100 (6)
where n is the number of pressure ports, HM is the differential pressure obtained by CMOST, and R isthe corresponding reference differential pressure.

Polymers 2020, 12, 452 8 of 13
The history match results obtained using both methods (Figures 3 and 4) confirm the convergenceability of CMOST, and we can conclude that it is an appropriate history match tool for the purpose ofthis analysis.
Polymers 2020, 12, 452 7 of 13
The reference rheology curve was then used as input in our radial polymer flow simulations in STARS to generate a reference dataset. In accordance with the radial polymer flow experiment that was history matched in this paper, the reference rheology curve was used in simulation runs with the same 10 injection rates within the rate interval of 0.05–2 mL/min.
2.8. Automatic History Match Tool
To prevent any pre-bias from affecting the results of the error analysis, the automatic history match tool CMOST by Computer Modeling Group (Calgary, Alberta, Canada) was chosen to perform the history match operations. To evaluate the convergence ability of CMOST, the reference dataset was history matched using the particle swarm optimization (PSO) engine. The parameter intervals in Table 3 were selected for all automatic history match operations during the error analysis. These are chosen to give a wide parameter space containing the ‘correct’ value for the base case in situ rheology curve.
Table 3. Carreau parameter intervals used for automatic history match operations in CMOST 𝝁 (cP) 𝝁𝟎 (cP) 𝝁𝒎𝒂𝒙 (cP) 𝝀𝟏 (day/m) 𝝀𝟐 (day/m) 𝒏𝟏 𝒏𝟐 1 1–100 1–100 10 –10 1–10 0.3–1 1.3–2
History match results using the PSO engine showed good convergence in most situations.
However, in some cases, the engine experienced difficulties converging towards acceptable global minimum values. In these cases, the more robust, although more time consuming engine, Bayesian Markov Chain Monte Carlo (MCMC), was used. During the evaluation of CMOST, where the reference dataset was history matched, average history match error of 1% was set as the convergence criterion. In this work, the average percentage history match error is defined as 1𝑛 𝐻𝑀 − 𝑅𝑅 × 100 (6)
where 𝑛 is the number of pressure ports, 𝐻𝑀 is the differential pressure obtained by CMOST, and 𝑅 is the corresponding reference differential pressure.
The history match results obtained using both methods (Figures 3 and 4) confirm the convergence ability of CMOST, and we can conclude that it is an appropriate history match tool for the purpose of this analysis.
Figure 3. Comparison of the reference rheology curve (black) and rheology curves obtained in CMOST when the reference dataset was history matched using the DMM.
10
100
0.001 0.01 0.1 1 10
Appa
rent
vis
cosi
ty (c
P)
Superficial velocity (m/day)
Reference rheology curve
dP(r), Q = 0.05 mL/min
dP(r), Q = 0.1 mL/min
dP(r), Q = 0.3 mL/min
dP(r), Q = 0.5 mL/min
dP(r), Q = 0.7 mL/min
dP(r), Q = 1.0 mL/min
dP(r), Q = 1.2 mL/min
dP(r), Q = 1.5 mL/min
dP(r), Q = 1.7 mL/min
dP(r), Q = 2.0 mL/min
Figure 3. Comparison of the reference rheology curve (black) and rheology curves obtained in CMOSTwhen the reference dataset was history matched using the DMM.Polymers 2020, 12, 452 8 of 13
Figure 4. Comparison of the reference rheology curve (black) and rheology curves obtained in CMOST when the reference dataset was history matched using the SPMM.
To investigate the robustness of both history match methods, pressure measurement errors typical for in-house radial flow experiments were randomly added or subtracted from the reference dataset and this contaminated dataset was then history matched. In accordance with the effective pressure measurement error related to the experimental setup in the radial polymer flow experiment, the dataset was randomly contaminated with ±1% of the preset maximum pressure. The maximum pressure was set equal to the reference injection BHP response for each individual injection rate. Thereafter, the error was increased in a stepwise manner until the threshold level was identified above which the in situ rheology pressure contribution was lost in pressure measurement error.
3. Results and Discussion
3.1. Pressure Measurement Error Analysis
In typical experimental error conditions (1% uncertainty of maximum preset pressure), rheology curves using both history match methods showed negligible deviations from the reference rheology curve (Figures 5 and 6).
Figure 5. Comparison of the reference rheology curve (black) and rheology curves obtained in CMOST after influence of typical pressure measurement error using the DMM.
10
100
0.001 0.01 0.1 1 10
Appa
rent
vis
cosi
ty (c
P)
Superficial velocity (m/day)
Reference rheology curve
dP(Q), Injection BHP
dP(Q), Port 2 (0.8 cm)
dP(Q), Port 3 (1.2 cm)
dP(Q), Port 4 (1.7 cm)
dP(Q), Port 5 (2.4 cm)
dP(Q), Port 6 (3.5 cm)
dP(Q), Port 7 (5 cm)
dP(Q), Port 8 (7 cm)
dP(Q), Port 9 (10 cm)
10
100
0.001 0.01 0.1 1 10
Appa
rent
vis
cosi
ty (c
P)
Superficial velocity (m/day)
Reference rheology curve
dP(r), Q = 0.05 mL/min
dP(r), Q = 0.1 mL/min
dP(r), Q = 0.3 mL/min
dP(r), Q = 0.5 mL/min
dP(r), Q = 0.7 mL/min
dP(r), Q = 1.0 mL/min
dP(r), Q = 1.2 mL/min
dP(r), Q = 1.5 mL/min
dP(r), Q = 1.7 mL/min
dP(r), Q = 2.0 mL/min
Figure 4. Comparison of the reference rheology curve (black) and rheology curves obtained in CMOSTwhen the reference dataset was history matched using the SPMM.
To investigate the robustness of both history match methods, pressure measurement errors typicalfor in-house radial flow experiments were randomly added or subtracted from the reference datasetand this contaminated dataset was then history matched. In accordance with the effective pressuremeasurement error related to the experimental setup in the radial polymer flow experiment, the datasetwas randomly contaminated with ±1% of the preset maximum pressure. The maximum pressure wasset equal to the reference injection BHP response for each individual injection rate. Thereafter, theerror was increased in a stepwise manner until the threshold level was identified above which the insitu rheology pressure contribution was lost in pressure measurement error.
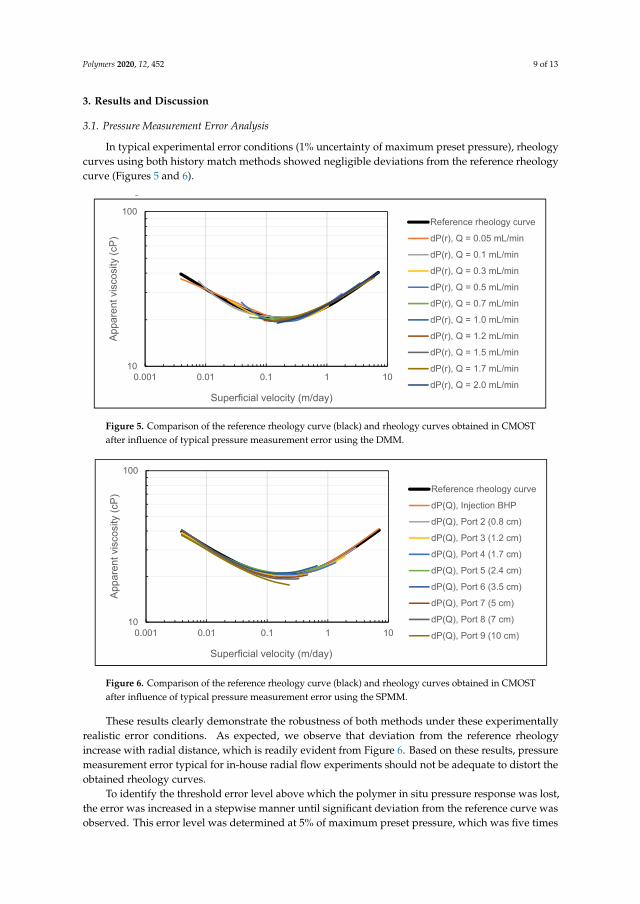
Polymers 2020, 12, 452 9 of 13
3. Results and Discussion
3.1. Pressure Measurement Error Analysis
In typical experimental error conditions (1% uncertainty of maximum preset pressure), rheologycurves using both history match methods showed negligible deviations from the reference rheologycurve (Figures 5 and 6).
Polymers 2020, 12, 452 8 of 13
Figure 4. Comparison of the reference rheology curve (black) and rheology curves obtained in CMOST when the reference dataset was history matched using the SPMM.
To investigate the robustness of both history match methods, pressure measurement errors typical for in-house radial flow experiments were randomly added or subtracted from the reference dataset and this contaminated dataset was then history matched. In accordance with the effective pressure measurement error related to the experimental setup in the radial polymer flow experiment, the dataset was randomly contaminated with ±1% of the preset maximum pressure. The maximum pressure was set equal to the reference injection BHP response for each individual injection rate. Thereafter, the error was increased in a stepwise manner until the threshold level was identified above which the in situ rheology pressure contribution was lost in pressure measurement error.
3. Results and Discussion
3.1. Pressure Measurement Error Analysis
In typical experimental error conditions (1% uncertainty of maximum preset pressure), rheology curves using both history match methods showed negligible deviations from the reference rheology curve (Figures 5 and 6).
Figure 5. Comparison of the reference rheology curve (black) and rheology curves obtained in CMOST after influence of typical pressure measurement error using the DMM.
10
100
0.001 0.01 0.1 1 10
Appa
rent
vis
cosi
ty (c
P)
Superficial velocity (m/day)
Reference rheology curve
dP(Q), Injection BHP
dP(Q), Port 2 (0.8 cm)
dP(Q), Port 3 (1.2 cm)
dP(Q), Port 4 (1.7 cm)
dP(Q), Port 5 (2.4 cm)
dP(Q), Port 6 (3.5 cm)
dP(Q), Port 7 (5 cm)
dP(Q), Port 8 (7 cm)
dP(Q), Port 9 (10 cm)
10
100
0.001 0.01 0.1 1 10
Appa
rent
vis
cosi
ty (c
P)
Superficial velocity (m/day)
Reference rheology curve
dP(r), Q = 0.05 mL/min
dP(r), Q = 0.1 mL/min
dP(r), Q = 0.3 mL/min
dP(r), Q = 0.5 mL/min
dP(r), Q = 0.7 mL/min
dP(r), Q = 1.0 mL/min
dP(r), Q = 1.2 mL/min
dP(r), Q = 1.5 mL/min
dP(r), Q = 1.7 mL/min
dP(r), Q = 2.0 mL/min
Figure 5. Comparison of the reference rheology curve (black) and rheology curves obtained in CMOSTafter influence of typical pressure measurement error using the DMM.Polymers 2020, 12, 452 9 of 13
Figure 6. Comparison of the reference rheology curve (black) and rheology curves obtained in CMOST after influence of typical pressure measurement error using the SPMM.
These results clearly demonstrate the robustness of both methods under these experimentally realistic error conditions. As expected, we observe that deviation from the reference rheology increase with radial distance, which is readily evident from Figure 6. Based on these results, pressure measurement error typical for in-house radial flow experiments should not be adequate to distort the obtained rheology curves.
To identify the threshold error level above which the polymer in situ pressure response was lost, the error was increased in a stepwise manner until significant deviation from the reference curve was observed. This error level was determined at 5% of maximum preset pressure, which was five times the typical error level. Thus, radial polymer flow experiments should be performed in an experimental setup where effective pressure measurement error is well below 5% of the maximum preset pressure.
3.2. History Match of Radial Flow Experiment
The polymer memory effect of HPAM solutions was elegantly demonstrated by Chauveteau (1981) [10] in a series of pore scale experiments in glass models. In said paper, the in situ rheology of HPAM was shown to depend on the number of prior contraction events experienced by the fluid, i.e., on the polymer history. This result was later reproduced by numerical simulation [11], where the polymer memory effect was shown to depend on polymer properties such as molecular weight and porous media properties such as contraction aspect ratio and tortuosity.
To investigate potential polymer memory effects at the Darcy scale of the elastic HPAM polymer used in this study, differential pressure between each pressure port and producer was history matched as a function of volumetric injection rate. Since the number of contraction events increase with radial distance, the polymer had a different pre-history at different locations in the porous medium. The results from applying this approach are shown in Figure 7, where we observe that all polymer rheology curves are overlapping.
Firstly, this is a strong indication that the pretreatment technique applied to the experimental data was successful in isolating the pressure contribution from the polymer in-situ rheology. However, in circumstances where the polymer is subjected to mechanical degradation, we expect rheology curves obtained from internal pressure ports to deviate from the rheology curve obtained from injection BHP since mechanical degradation mainly occurs in the near wellbore region in radial flow [9]. Thus, injection BHP contains pressure contributions from both degraded and undegraded polymer, in contrast to internal pressures where only pressure response from degraded polymer is recorded. Consequently, we expect the polymer rheology curve obtained from injection BHP to be
10
100
0.001 0.01 0.1 1 10
Appa
rent
vis
cosi
ty (c
P)
Superficial velocity (m/day)
Reference rheology curve
dP(Q), Injection BHP
dP(Q), Port 2 (0.8 cm)
dP(Q), Port 3 (1.2 cm)
dP(Q), Port 4 (1.7 cm)
dP(Q), Port 5 (2.4 cm)
dP(Q), Port 6 (3.5 cm)
dP(Q), Port 7 (5 cm)
dP(Q), Port 8 (7 cm)
dP(Q), Port 9 (10 cm)
Figure 6. Comparison of the reference rheology curve (black) and rheology curves obtained in CMOSTafter influence of typical pressure measurement error using the SPMM.
These results clearly demonstrate the robustness of both methods under these experimentallyrealistic error conditions. As expected, we observe that deviation from the reference rheologyincrease with radial distance, which is readily evident from Figure 6. Based on these results, pressuremeasurement error typical for in-house radial flow experiments should not be adequate to distort theobtained rheology curves.
To identify the threshold error level above which the polymer in situ pressure response was lost,the error was increased in a stepwise manner until significant deviation from the reference curve wasobserved. This error level was determined at 5% of maximum preset pressure, which was five times
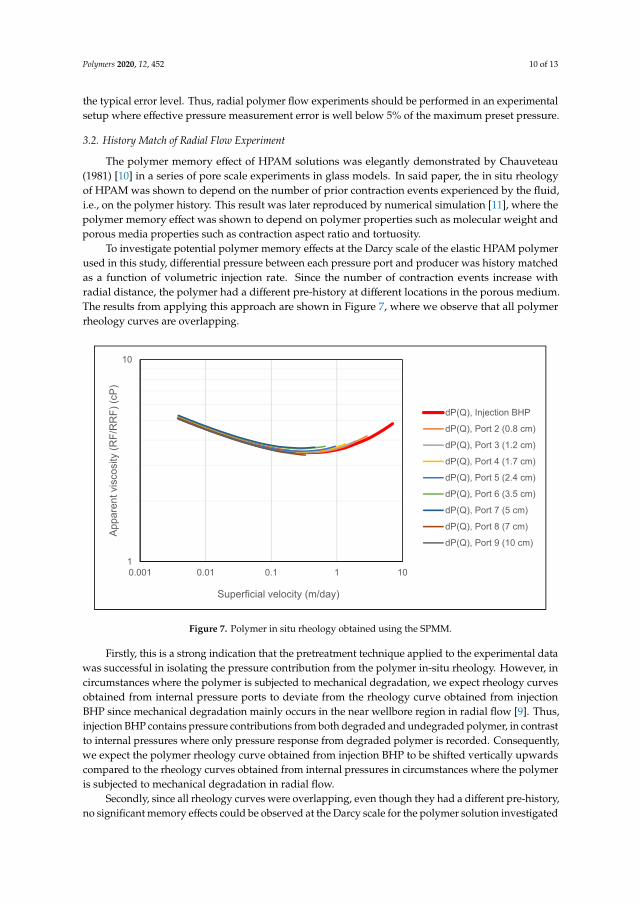
Polymers 2020, 12, 452 10 of 13
the typical error level. Thus, radial polymer flow experiments should be performed in an experimentalsetup where effective pressure measurement error is well below 5% of the maximum preset pressure.
3.2. History Match of Radial Flow Experiment
The polymer memory effect of HPAM solutions was elegantly demonstrated by Chauveteau(1981) [10] in a series of pore scale experiments in glass models. In said paper, the in situ rheologyof HPAM was shown to depend on the number of prior contraction events experienced by the fluid,i.e., on the polymer history. This result was later reproduced by numerical simulation [11], where thepolymer memory effect was shown to depend on polymer properties such as molecular weight andporous media properties such as contraction aspect ratio and tortuosity.
To investigate potential polymer memory effects at the Darcy scale of the elastic HPAM polymerused in this study, differential pressure between each pressure port and producer was history matchedas a function of volumetric injection rate. Since the number of contraction events increase withradial distance, the polymer had a different pre-history at different locations in the porous medium.The results from applying this approach are shown in Figure 7, where we observe that all polymerrheology curves are overlapping.
Polymers 2020, 12, 452 10 of 13
shifted vertically upwards compared to the rheology curves obtained from internal pressures in circumstances where the polymer is subjected to mechanical degradation in radial flow.
Secondly, since all rheology curves were overlapping, even though they had a different pre-history, no significant memory effects could be observed at the Darcy scale for the polymer solution investigated in this study. Since Bentheimer sandstone is a relatively homogeneous rock, the micro-scale memory effects are most likely averaged out when viewed from a Darcy scale perspective. In accordance with the results demonstrated by Zamani et al. [11], we suggest that memory effects might be observable at the Darcy scale with increasing molecular weight of the polymer and with increasing heterogeneity of the porous medium.
Figure 7. Polymer in situ rheology obtained using the SPMM.
Figure 8 shows the obtained polymer in situ rheology when history matching differential pressures using the DMM. Results show no rate effects in that all rheology curves are overlapping. Consequently, the onset of shear-thickening is independent of volumetric injection rate in radial flow. However, in cases where the polymer is subjected to mechanical degradation, rate effects are expected because the amount of mechanical degradation generally increases with volumetric injection rate. In these cases, we do not expect the obtained polymer rheology curves to be overlapping.
1
10
0.001 0.01 0.1 1 10
Appa
rent
vis
cosi
ty (R
F/R
RF)
(cP)
Superficial velocity (m/day)
dP(Q), Injection BHP
dP(Q), Port 2 (0.8 cm)
dP(Q), Port 3 (1.2 cm)
dP(Q), Port 4 (1.7 cm)
dP(Q), Port 5 (2.4 cm)
dP(Q), Port 6 (3.5 cm)
dP(Q), Port 7 (5 cm)
dP(Q), Port 8 (7 cm)
dP(Q), Port 9 (10 cm)
Figure 7. Polymer in situ rheology obtained using the SPMM.
Firstly, this is a strong indication that the pretreatment technique applied to the experimental datawas successful in isolating the pressure contribution from the polymer in-situ rheology. However, incircumstances where the polymer is subjected to mechanical degradation, we expect rheology curvesobtained from internal pressure ports to deviate from the rheology curve obtained from injectionBHP since mechanical degradation mainly occurs in the near wellbore region in radial flow [9]. Thus,injection BHP contains pressure contributions from both degraded and undegraded polymer, in contrastto internal pressures where only pressure response from degraded polymer is recorded. Consequently,we expect the polymer rheology curve obtained from injection BHP to be shifted vertically upwardscompared to the rheology curves obtained from internal pressures in circumstances where the polymeris subjected to mechanical degradation in radial flow.
Secondly, since all rheology curves were overlapping, even though they had a different pre-history,no significant memory effects could be observed at the Darcy scale for the polymer solution investigated

Polymers 2020, 12, 452 11 of 13
in this study. Since Bentheimer sandstone is a relatively homogeneous rock, the micro-scale memoryeffects are most likely averaged out when viewed from a Darcy scale perspective. In accordance withthe results demonstrated by Zamani et al. [11], we suggest that memory effects might be observable atthe Darcy scale with increasing molecular weight of the polymer and with increasing heterogeneity ofthe porous medium.
Figure 8 shows the obtained polymer in situ rheology when history matching differential pressuresusing the DMM. Results show no rate effects in that all rheology curves are overlapping. Consequently,the onset of shear-thickening is independent of volumetric injection rate in radial flow. However, incases where the polymer is subjected to mechanical degradation, rate effects are expected because theamount of mechanical degradation generally increases with volumetric injection rate. In these cases,we do not expect the obtained polymer rheology curves to be overlapping.Polymers 2020, 12, 452 11 of 13
Figure 8. Polymer in situ rheology obtained using the DMM.
To investigate the consistency between the two different history match methods and their accuracy, all rheology curves obtained from both history match methods are collectively shown in Figure 9. Very good consistency is observed between all curves in Figure 9 in that both history match methods provide overlapping in situ rheology curves. Based on the strong consistency observed, we can conclude that both history match methods are very strong tools for determining polymer in situ rheology in radial flow systems.
Figure 9. Summary of polymer in situ rheology obtained from both history match methods.
1
10
0.001 0.01 0.1 1 10
Appa
rent
vis
cosi
ty (R
F/R
RF)
(cP)
Superficial velocity (m/day)
dP(r), Q = 0.05 mL/min
dP(r), Q = 0.1 mL/min
dP(r), Q = 0.3 mL/min
dP(r), Q = 0.5 mL/min
dP(r), Q = 0.7 mL/min
dP(r), Q = 1.0 mL/min
dP(r), Q = 1.2 mL/min
dP(r), Q = 1.5 mL/min
dP(r), Q = 1.7 mL/min
dP(r), Q = 2 mL/min
1
10
0.001 0.01 0.1 1 10
Appa
rent
vis
cosi
ty (R
F/R
RF)
(cP)
Superficial velocity (m/day)
dP(Q), Injection BHPdP(Q), Port 2 (0.8 cm)dP(Q), Port 3 (1.2 cm)dP(Q), Port 4 (1.7 cm)dP(Q), Port 5 (2.4 cm)dP(Q), Port 6 (3.5 cm)dP(Q), Port 7 (5 cm)dP(Q), Port 8 (7 cm)dP(Q), Port 9 (10 cm)dP(r), Q = 0.05 mL/mindP(r), Q = 0.1 mL/mindP(r), Q = 0.3 mL/mindP(r), Q = 0.5 mL/mindP(r), Q = 0.7 mL/mindP(r), Q = 1.0 mL/mindP(r), Q = 1.2 mL/mindP(r), Q = 1.5 mL/mindP(r), Q = 1.7 mL/mindP(r), Q = 2.0 mL/min
Figure 8. Polymer in situ rheology obtained using the DMM.
To investigate the consistency between the two different history match methods and their accuracy,all rheology curves obtained from both history match methods are collectively shown in Figure 9.Very good consistency is observed between all curves in Figure 9 in that both history match methodsprovide overlapping in situ rheology curves. Based on the strong consistency observed, we canconclude that both history match methods are very strong tools for determining polymer in siturheology in radial flow systems.
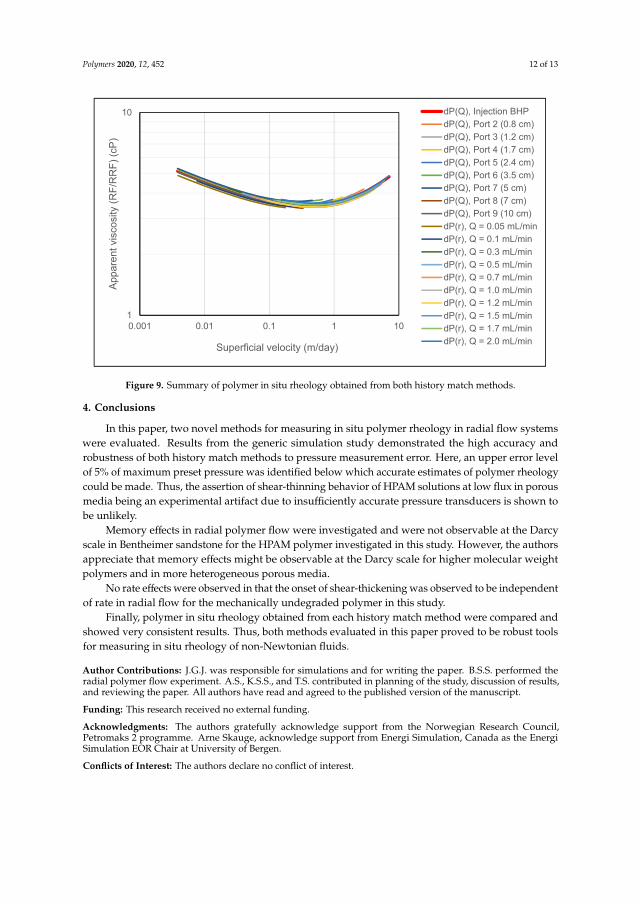
Polymers 2020, 12, 452 12 of 13
Polymers 2020, 12, 452 11 of 13
Figure 8. Polymer in situ rheology obtained using the DMM.
To investigate the consistency between the two different history match methods and their accuracy, all rheology curves obtained from both history match methods are collectively shown in Figure 9. Very good consistency is observed between all curves in Figure 9 in that both history match methods provide overlapping in situ rheology curves. Based on the strong consistency observed, we can conclude that both history match methods are very strong tools for determining polymer in situ rheology in radial flow systems.
Figure 9. Summary of polymer in situ rheology obtained from both history match methods.
1
10
0.001 0.01 0.1 1 10
Appa
rent
vis
cosi
ty (R
F/R
RF)
(cP)
Superficial velocity (m/day)
dP(r), Q = 0.05 mL/min
dP(r), Q = 0.1 mL/min
dP(r), Q = 0.3 mL/min
dP(r), Q = 0.5 mL/min
dP(r), Q = 0.7 mL/min
dP(r), Q = 1.0 mL/min
dP(r), Q = 1.2 mL/min
dP(r), Q = 1.5 mL/min
dP(r), Q = 1.7 mL/min
dP(r), Q = 2 mL/min
1
10
0.001 0.01 0.1 1 10
Appa
rent
vis
cosi
ty (R
F/R
RF)
(cP)
Superficial velocity (m/day)
dP(Q), Injection BHPdP(Q), Port 2 (0.8 cm)dP(Q), Port 3 (1.2 cm)dP(Q), Port 4 (1.7 cm)dP(Q), Port 5 (2.4 cm)dP(Q), Port 6 (3.5 cm)dP(Q), Port 7 (5 cm)dP(Q), Port 8 (7 cm)dP(Q), Port 9 (10 cm)dP(r), Q = 0.05 mL/mindP(r), Q = 0.1 mL/mindP(r), Q = 0.3 mL/mindP(r), Q = 0.5 mL/mindP(r), Q = 0.7 mL/mindP(r), Q = 1.0 mL/mindP(r), Q = 1.2 mL/mindP(r), Q = 1.5 mL/mindP(r), Q = 1.7 mL/mindP(r), Q = 2.0 mL/min
Figure 9. Summary of polymer in situ rheology obtained from both history match methods.
4. Conclusions
In this paper, two novel methods for measuring in situ polymer rheology in radial flow systemswere evaluated. Results from the generic simulation study demonstrated the high accuracy androbustness of both history match methods to pressure measurement error. Here, an upper error levelof 5% of maximum preset pressure was identified below which accurate estimates of polymer rheologycould be made. Thus, the assertion of shear-thinning behavior of HPAM solutions at low flux in porousmedia being an experimental artifact due to insufficiently accurate pressure transducers is shown tobe unlikely.
Memory effects in radial polymer flow were investigated and were not observable at the Darcyscale in Bentheimer sandstone for the HPAM polymer investigated in this study. However, the authorsappreciate that memory effects might be observable at the Darcy scale for higher molecular weightpolymers and in more heterogeneous porous media.
No rate effects were observed in that the onset of shear-thickening was observed to be independentof rate in radial flow for the mechanically undegraded polymer in this study.
Finally, polymer in situ rheology obtained from each history match method were compared andshowed very consistent results. Thus, both methods evaluated in this paper proved to be robust toolsfor measuring in situ rheology of non-Newtonian fluids.
Author Contributions: J.G.J. was responsible for simulations and for writing the paper. B.S.S. performed theradial polymer flow experiment. A.S., K.S.S., and T.S. contributed in planning of the study, discussion of results,and reviewing the paper. All authors have read and agreed to the published version of the manuscript.
Funding: This research received no external funding.
Acknowledgments: The authors gratefully acknowledge support from the Norwegian Research Council,Petromaks 2 programme. Arne Skauge, acknowledge support from Energi Simulation, Canada as the EnergiSimulation EOR Chair at University of Bergen.
Conflicts of Interest: The authors declare no conflict of interest.
Polymers 2020, 12, 452 13 of 13
References
1. Pope, G.A. Recent Developments and Remaining Challenges of Enhanced Oil Recovery. J. Pet. Technol. 2011,63, 65–68. [CrossRef]
2. Skauge, A.; Zamani, N.; Jacobsen, J.G.; Shiran, B.S.; Al-Shakry, B.; Skauge, T. Polymer Flow in Porous Media:Relevance to Enhanced Oil Recovery. Colloids Interfaces 2018, 2, 27. [CrossRef]
3. Pye, D.J. Improved Secondary Recovery by Control of Water Mobility. J. Pet. Technol. 1964, 16, 911–916.[CrossRef]
4. Smith, F.W. The Behavior of Partially Hydrolyzed Polyacrylamide Solutions in Porous Media. J. Pet. Technol.1970, 22, 148–156. [CrossRef]
5. Jennings, R.R.; Rogers, J.H.; West, T.J. Factors Influencing Mobility Control by Polymer Solutions. J. Pet.Technol. 1971, 23, 391–401. [CrossRef]
6. Heemskerk, J.; Janssen-van, R.; Rosmalen, R.; Teeuw, D. Quantification of Viscoelastic Effects ofPolyacrylamide Solutions. In Proceedings of the SPE/DOE 4th Symposium on Enhanced Oil Recovery, Tulsa,OK, USA, 15–18 April 1984.
7. Seright, R.S.; Fan, T.; Wavrik, K.; Balaban, R.C. New Insights into Polymer Rheology in Porous Media. SPEJ2011, 16, 35–42. [CrossRef]
8. Skauge, T.; Skauge, A.; Salmo, I.C.; Ormehaug, P.A.; Al-Azri, N.; Wassing, L.M.; Glasbergen, G.; VanWunnik, J.N.; Masalmeh, S.K. Radial and Linear Polymer Flow—Influence on Injectivity. In Proceedings ofthe SPE Improved Oil Recovery Conference, Tulsa, OK, USA, 11–13 April 2016.
9. Seright, R.S. The Effects of Mechanical Degradation and Viscoelastic Behavior on Injectivity of PolyacrylamideSolutions. Soc. Pet. Eng. J. 1983, 23, 475–485. [CrossRef]
10. Chauveteau, G. Molecular Interpretation of Several Different Properties of Flow of Coiled Polymer SolutionsThrough Porous Media in Oil Recovery Conditions. In Proceedings of the 56th Annual Fall TechnicalConference and Exhibition of the Society of Petroleum Engineers of AIME, San Antonio, TX, USA, 5–7October 1981.
11. Zamani, N.; Bondino, I.; Kaufmann, R.; Skauge, A. Effect of porous media properties on the onset of polymerextensional viscosity. J. Petrol. Sci. Eng. 2015, 133, 483–495. [CrossRef]
12. Vik, B.; Kedir, A.; Kippe, V.; Sandengen, K.; Skauge, T.; Solbakken, J.; Zhu, D. Viscous Oil Recovery byPolymer Injection; Impact of In Situ Polymer Rheology on Water Front Stabilization. In Proceedings of theSPE Europec featured at the 80th EAGE Conference and Exhibition, Copenhagen, Denmark, 11–14 June 2018.
13. Skauge, T.; Djurhuus, K.; Zimmermann, T.; Bittner, C.; Reichenbach-Klinke, R. Radial Injectivity of anAssociative Polymer for EOR. In Proceedings of the 20th European Symposium on Improved Oil Recovery,Pau, France, 8–11 April 2019.
14. Skauge, T.; Kvilhaug, O.A.; Skauge, A. Influence of Polymer Structural Conformation and Phase Behavioron In Situ Viscosity. In Proceedings of the 18th European Symposium on Improved Oil Recovery, Dresden,Germany, 14–16 April 2015.
15. Al-Shakry, B.; Shiran, B.S.; Skauge, T.; Skauge, A. Enhanced Oil Recovery by Polymer Flooding: OptimizingPolymer Injectivity. In Proceedings of the SPE Kingdom of Saudi Arabia Annual Technical Symposium andExhibition, Dammam, Saudi Arabia, 23–26 April 2018.
16. Delshad, M.; Kim, D.H.; Magbagbeola, O.A.; Huh, C.; Pope, G.A.; Tarahhom, F. Mechanistic Interpretationand Utilization of Viscoelastic Behavior of Polymer Solutions for Improved Polymer-Flood Efficiency. InProceedings of the SPE Symposium on Improved Oil Recovery, Tulsa, OK, USA, 20–23 April 2008.
© 2020 by the authors. Licensee MDPI, Basel, Switzerland. This article is an open accessarticle distributed under the terms and conditions of the Creative Commons Attribution(CC BY) license (http://creativecommons.org/licenses/by/4.0/).

Paper 4:
Polymer Injectivity Test Design Using Numerical Simulation

polymers
Article
Polymer Injectivity Test Design UsingNumerical Simulation
Mohamed Adel Alzaabi 1,* , Jørgen Gausdal Jacobsen 1,2, Shehadeh Masalmeh 3,Ali Al Sumaiti 3, Øystein Pettersen 2 and Arne Skauge 1,4
1 Department of Chemistry, University of Bergen, 5007 Bergen, Norway; [email protected] (J.G.J.);[email protected] (A.S.)
2 Norwegian Research Center, 5008 Bergen, Norway; [email protected] Abu Dhabi National Oil Company, P.O. Box 898 Abu Dhabi, UAE; [email protected] (S.M.);
[email protected] (A.A.S.)4 Energy Research Norway, 5007 Bergen, Norway* Correspondence: [email protected]
Received: 17 January 2020; Accepted: 20 March 2020; Published: 3 April 2020�����������������
Abstract: Polymer flooding is an enhanced oil recovery (EOR) process, which has received increasinginterest in the industry. In this process, water-soluble polymers are used to increase injected waterviscosity in order to improve mobility ratio and hence improve reservoir sweep. Polymer solutions arenon-Newtonian fluids, i.e., their viscosities are shear dependent. Polymers may exhibit an increase inviscosity at high shear rates in porous media, which can cause injectivity loss. In contrast, at low shearrates they may observe viscosity loss and hence enhance the injectivity. Therefore, due to the complexnon-Newtonian rheology of polymers, it is necessary to optimize the design of polymer injectivitytests in order to improve our understanding of the rheology behavior and enhance the design ofpolymer flood projects. This study has been addressing what information that can be gained frompolymer injectivity tests, and how to design the test for maximizing information. The main source ofinformation in the field is from the injection bottom-hole pressure (BHP). Simulation studies haveanalyzed the response of different non-Newtonian rheology on BHP with variations of rate and time.The results have shown that BHP from injectivity tests can be used to detect in-situ polymer rheology.
Keywords: chemical EOR; polymer flooding; in situ rheology; polymer injectivity; polymer modeling
1. Introduction
Polymer flooding is a well-established chemical enhanced oil recovery (CEOR) method that hasbeen widely used for more than half a century. It was initially introduced to alleviate the issuesrelated to unfavorable mobility ratio, induced by reservoir heterogeneity and/or high oil viscosity.These issues were remediated by adding polymers to the injected water to improve overall aerial andvolumetric sweep efficiency [1]. The main mechanisms of polymer flooding are sweep improvementthat consists of mitigating viscous fingering and improving crossflow between vertical heterogeneouslayers [2,3]. In addition, numerous studies indicate that non-Newtonian polymer solutions can improvemicroscopic displacement efficiency and may reduce water-flood residual oil saturation [3,4].
The most commonly used polymer for CEOR applications is synthetic polymer partially hydrolyzedpolyacrylamide (HPAM), with a typical hydrolysis degree range of 15%–33%. In bulk flow, viscositymeasurements from rheometers show that HPAM exhibit shear thinning behavior, which can beexplained by the disentanglement and realignment of polymer coils as velocity increases in the laminarflow regime. In addition, numerous polymer flow experiments in porous media have shown thatHPAM exhibits an apparent shear thickening behavior beyond a critical shear rate [5]. Consequently,
Polymers 2020, 12, 801; doi:10.3390/polym12040801 www.mdpi.com/journal/polymers

Polymers 2020, 12, 801 2 of 23
apparent viscosity attains a maximum value in the immediate near-wellbore region. This viscosityincrement is often referred to as extensional or elongational viscosity as it is attributed to the extensionalflow regime of the polymer. Both the coil-stretch theory and transient network theory has beensuggested to account for the extensional flow phenomenon. According to the coil-stretch theory, whichis adhered to by the authors of this paper, the flexible coiled molecules of HPAM experience stretching,entanglement and collisions at high shear, which results in a larger flow resistance, i.e., apparent shearthickening behavior. This behavior is a special property of elastic polymers in flow through porousmedia and is not observed for biopolymers such as xanthan [6].
Injectivity is one of the most important parameters in the design of any reservoir floodingapplication. Failure in estimating injectivity within acceptable error margins can have a significantimpact on the expected recovery increment and thus on the economic feasibility of the project.For polymer flooding applications, accurate estimation of injectivity is more significant due to thepolymer high viscosity and its non-Newtonian behavior. This behavior may result in the well operatingnear (or under) formation fracturing conditions, which can significantly affect in-situ polymer rheology.
Several important observations have been made in recent years that may explain the deviationbetween field injectivity results compared to initial expectations. Skauge et al. demonstrated thatonset of shear thickening occurs at significantly higher velocities in radial compared to linear flow [7].In addition, the extent of shear thinning was more pronounced in radial flow, while the extent ofshear thickening was reduced compared to linear flow. The presence of residual oil is another factorthat may have a significant impact on polymer in-situ rheology. Authors of [5] observed a significantreduction of polymer in-situ viscosity in the presence versus absence of residual oil. Furthermore,it was demonstrated through experimental work that the preshearing polymer before injection helpsin improving injectivity by reducing elastic properties of the polymer while maintaining viscousproperties, i.e., reducing or eliminating the extensional shear thickening behavior at high shear ratesnear the well-bore [8].
1.1. Modeling and Simulation of Polymer Injectivity
Numerical simulation is an essential tool for the assessment of polymer flooding lab results andfundamental theory. It is also important for designing polymer field projects as well as predicting theperformance and outcomes of the project.
One of the early attempts to model polymer flooding was by Zeito (1968) [9]. He created a3D numerical simulation to predict the performance of polymer flooding in any type of reservoir.His model, however, was missing the component of in-situ non-Newtonian behavior of polymer,which was later found to be fundamental in polymer flooding mechanisms. Bondor et al. (1972)added the polymer in-situ rheology impact through using modified Blake-Kozeny power law forfluids [10]. They also included the impact of other factors such as permeability reduction and non-linearmixing of polymer and water. Seright (1983) developed an analytical model for injectivity in radialcoordinates [11]. His model combined a mechanical degradation correlation, linear core flood results ofresistance factor and Darcy equation in radial flow, to calculate total injection pressure drop. Recently,Lotfollahi et al. (2016) have proposed an injectivity model to simulate polymer injectivity declinein both laboratory and field tests [12]. Their model coupled the effects of deep-bed filtration andexternal filter-cake formation caused by polymer adsorption/retention, to the viscoelastic polymerrheology. They also emphasized the advantage of using radial coordinates with a fine gridding schemeto reduce the error of velocity calculation in the near-wellbore area and hence capture polymer rheologymore accurately. Some commercial reservoir simulation software have also included modules tomodel polymer flooding such as STARS of Computer Modeling Group Ltd. (CMG), ECLIPSE 100 ofSchlumberger, and REVEAL of Petroleum Experts [13]. The simulator used in this study is STARS ofCMG, which includes polymer modules that accounts for polymer rheology dependence on the shearrate or velocity, polymer adsorption, permeability reduction and impact of polymer concentration andsalinity on viscosity.

Polymers 2020, 12, 801 3 of 23
1.2. Paper Objective
This study aims to utilize numerical simulation of polymer flooding on both lab and field scalesin order to optimize the design of field polymer injectivity tests. The main objective is to analyze therelationship between the injector bottom-hole pressure (BHP) and polymer in-situ rheology. Besiderheology, the impact of simple heterogeneity is also investigated along with the impact of permeabilityreduction because of polymer adsorption in low-permeability layers. This is to simplify the process ofinterpreting field tests data, since the sole source of data in the field is usually BHP variations withtime and BHP as a function of different injection rates.
2. Materials and Methods (Lab Scale)
The radial flow experiment history matched in this paper was performed on a circular Bentheimerdisc (radius = 15 cm, thickness = 2 cm, injection well radius = 0.325 cm and porosity = 0.25). Beforeoil was introduced, absolute permeability was measured and was equal to 2200 mD. The sample wasprepared according to the method described in the literature for circular Bentheimer discs with internalpressure taps [6,7]; including ageing with heavy crude oil, followed by brine flooding to residual oilsaturation of 0.34. Pressure ports were mounted both internally and in an injection well and producer,as depicted in Figure 1.
Polymers 2020, 12, x FOR PEER REVIEW 3 of 23
dependence on the shear rate or velocity, polymer adsorption, permeability reduction and impact of polymer concentration and salinity on viscosity.
1.2. Paper Objective
This study aims to utilize numerical simulation of polymer flooding on both lab and field scales in order to optimize the design of field polymer injectivity tests. The main objective is to analyze the relationship between the injector bottom-hole pressure (BHP) and polymer in-situ rheology. Beside rheology, the impact of simple heterogeneity is also investigated along with the impact of permeability reduction because of polymer adsorption in low-permeability layers. This is to simplify the process of interpreting field tests data, since the sole source of data in the field is usually BHP variations with time and BHP as a function of different injection rates.
2. Materials and Methods (Lab Scale)
The radial flow experiment history matched in this paper was performed on a circular Bentheimer disc (radius = 15 cm, thickness = 2 cm, injection well radius = 0.325 cm and porosity = 0.25). Before oil was introduced, absolute permeability was measured and was equal to 2200 mD. The sample was prepared according to the method described in the literature for circular Bentheimer discs with internal pressure taps [6,7]; including ageing with heavy crude oil, followed by brine flooding to residual oil saturation of 0.34. Pressure ports were mounted both internally and in an injection well and producer, as depicted in Figure 1.
Figure 1. Illustration of the circular Bentheimer disc with pressure ports.
A relatively low salinity brine (7000 ppm TDS) was used in this study, with a viscosity of 1.02 cP at 22 °C. A 1000 ppm HPAM polymer solution was used (Flopaam 3330S, 8 MDa, 30% hydrolysis, SNF Floerger) and prepared according to the API method (RP 63, 1990, American Petroleum Institute). Shear viscosity of the polymer solution was measured to be 11.5 cP at 10 𝑠 , with zero shear viscosity extrapolated to 13.9 cP. It was concluded that negligible mechanical degradation occurred based on injected versus effluent viscosity measurements.
Initially, the brine solution was injected at ten different flow rates (0.05–2 mL/min) and effective permeability to brine (𝑘 , ) was calculated from Darcy’s law for radial flow: 𝑘 , = − 𝜇𝑄2𝜋ℎ∆𝑃 𝑙𝑛 𝑟𝑟
where 𝜇 is brine viscosity, 𝑄 is volumetric injection rate, ℎ is disc thickness, ∆𝑃 is the pressure drop between a specified port at radius 𝑟 and the producer at 𝑟.
Following the initial brine flood, a 1000-ppm HPAM solution was injected at similar injection rates (0.05–2.0 mL/min). Before measurements began, the polymer solution was injected at 0.1 mL/min for at least two pore volumes to ensure that retention was satisfied. Tapering was also performed and the final step of the radial polymer flood experiment consisted of a final brine flood
Figure 1. Illustration of the circular Bentheimer disc with pressure ports.
A relatively low salinity brine (7000 ppm TDS) was used in this study, with a viscosity of 1.02cP at 22 ◦C. A 1000 ppm HPAM polymer solution was used (Flopaam 3330S, 8 MDa, 30% hydrolysis,SNF Floerger) and prepared according to the API method (RP 63, 1990, American Petroleum Institute).Shear viscosity of the polymer solution was measured to be 11.5 cP at 10 s−1, with zero shear viscosityextrapolated to 13.9 cP. It was concluded that negligible mechanical degradation occurred based oninjected versus effluent viscosity measurements.
Initially, the brine solution was injected at ten different flow rates (0.05–2 mL/min) and effectivepermeability to brine (kb,init) was calculated from Darcy’s law for radial flow:
kb,init = −µQ
2πh∆Pln
rir
where µ is brine viscosity, Q is volumetric injection rate, h is disc thickness, ∆P is the pressure dropbetween a specified port at radius ri and the producer at r.
Following the initial brine flood, a 1000-ppm HPAM solution was injected at similar injectionrates (0.05–2.0 mL/min). Before measurements began, the polymer solution was injected at 0.1 mL/minfor at least two pore volumes to ensure that retention was satisfied. Tapering was also performed andthe final step of the radial polymer flood experiment consisted of a final brine flood to determine thepermeability after the polymer flood and to calculate the residual resistance factor (RRF), which was

Polymers 2020, 12, 801 4 of 23
equal to 1.2 for this experiment. Since permeability values obtained from initial brine flood was usedin simulations, apparent viscosity is equal to resistance factor (RF) in this paper, where RF is defined as:
RF =∆Pp
∆Pb,init
where ∆Pp is the pressure drop during polymer flow and ∆Pb,init is the pressure drop during brineflow before polymer was introduced to the porous media.
Simulation of Radial Flow Experiments
A radial grid with 360 sectors constituted the simulation model. Each of these sectors consist of150 grid blocks, where the grid block cell size was 1 mm. Sensitivity analysis showed a negligibleaccuracy improvement when reducing the grid block size below 1 mm. Residual oil saturationafter the brine flood resulted in a non-uniform oil saturation profile between the injector andproducer. The history match of the brine differential pressure between internal pressure ports and theproducer enabled determination of local permeabilities. Since Bentheimer sandstone is assumed tobe homogeneous, the average effective permeability was used together with local permeabilities tocalculate correction factors accounting for the non-uniform oil saturation.
3. Results and Discussion (Lab Scale)
Average effective permeability was 33.8 and 28 mD using the differential pressure response fromthe initial and final brine flood, respectively. Injection BHP build-up was also recorded for eachindividual injection rate during both brine floods as shown in Figure 2.
Polymers 2020, 12, x FOR PEER REVIEW 4 of 23
to determine the permeability after the polymer flood and to calculate the residual resistance factor (RRF), which was equal to 1.2 for this experiment. Since permeability values obtained from initial brine flood was used in simulations, apparent viscosity is equal to resistance factor (RF) in this paper, where RF is defined as: 𝑅𝐹 = ∆𝑃∆𝑃 ,
where ∆𝑃 is the pressure drop during polymer flow and ∆P , is the pressure drop during brine flow before polymer was introduced to the porous media.
Simulation of Radial Flow Experiments
A radial grid with 360 sectors constituted the simulation model. Each of these sectors consist of 150 grid blocks, where the grid block cell size was 1 mm. Sensitivity analysis showed a negligible accuracy improvement when reducing the grid block size below 1 mm. Residual oil saturation after the brine flood resulted in a non-uniform oil saturation profile between the injector and producer. The history match of the brine differential pressure between internal pressure ports and the producer enabled determination of local permeabilities. Since Bentheimer sandstone is assumed to be homogeneous, the average effective permeability was used together with local permeabilities to calculate correction factors accounting for the non-uniform oil saturation.
3. Results and Discussion (Lab Scale) Average effective permeability was 33.8 and 28 mD using the differential pressure response from
the initial and final brine flood, respectively. Injection BHP build-up was also recorded for each individual injection rate during both brine floods as shown in Figure 2.
Figure 2. Injection bottom-hole pressure (BHP) versus time for initial (prior to polymer flood) and final brine flood (after polymer tapering).
Injection BHP stabilization time was independent of volumetric injection rate and equal to 40 s for both brine floods. However, pressure stabilization was expected to occur instantaneously when injecting a Newtonian fluid. Thus, it was concluded that the system had a delay of 40 s. The delay was attributed to incomplete pressure communication due to low values of counter pressure from the production line (2–4 mbar). To investigate if stabilization time is dependent on polymer rheology, the injection BHP build-up for the polymer (Figure 3) was also recorded.
Figure 2. Injection bottom-hole pressure (BHP) versus time for initial (prior to polymer flood) and finalbrine flood (after polymer tapering).
Injection BHP stabilization time was independent of volumetric injection rate and equal to 40 sfor both brine floods. However, pressure stabilization was expected to occur instantaneously wheninjecting a Newtonian fluid. Thus, it was concluded that the system had a delay of 40 s. The delaywas attributed to incomplete pressure communication due to low values of counter pressure fromthe production line (2–4 mbar). To investigate if stabilization time is dependent on polymer rheology,the injection BHP build-up for the polymer (Figure 3) was also recorded.
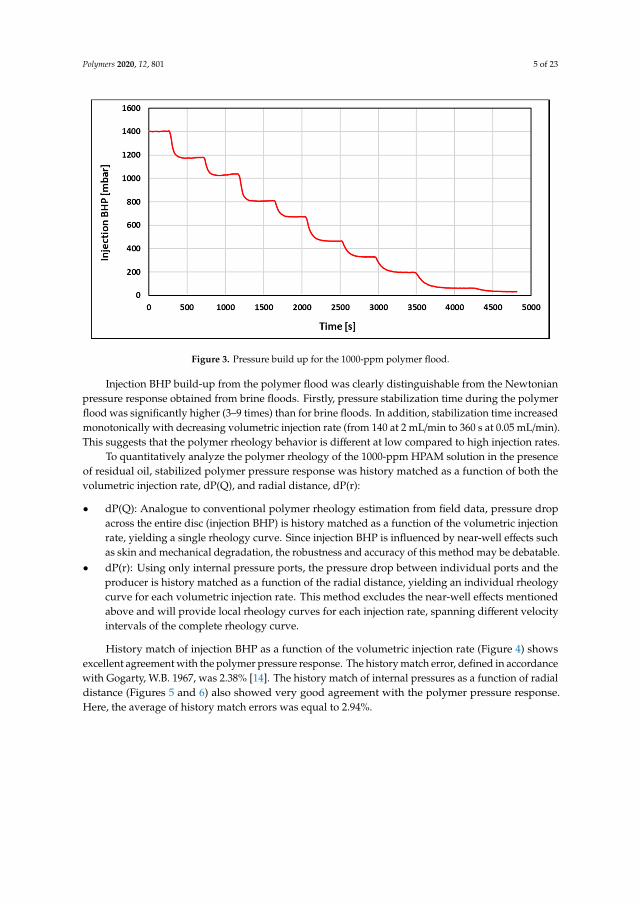
Polymers 2020, 12, 801 5 of 23
Polymers 2020, 12, x FOR PEER REVIEW 5 of 23
Figure 3. Pressure build up for the 1000-ppm polymer flood.
Injection BHP build-up from the polymer flood was clearly distinguishable from the Newtonian pressure response obtained from brine floods. Firstly, pressure stabilization time during the polymer flood was significantly higher (3–9 times) than for brine floods. In addition, stabilization time increased monotonically with decreasing volumetric injection rate (from 140 at 2 mL/min to 360 s at 0.05 mL/min). This suggests that the polymer rheology behavior is different at low compared to high injection rates.
To quantitatively analyze the polymer rheology of the 1000-ppm HPAM solution in the presence of residual oil, stabilized polymer pressure response was history matched as a function of both the volumetric injection rate, dP(Q), and radial distance, dP(r):
• dP(Q): Analogue to conventional polymer rheology estimation from field data, pressure drop across the entire disc (injection BHP) is history matched as a function of the volumetric injection rate, yielding a single rheology curve. Since injection BHP is influenced by near-well effects such as skin and mechanical degradation, the robustness and accuracy of this method may be debatable.
• dP(r): Using only internal pressure ports, the pressure drop between individual ports and the producer is history matched as a function of the radial distance, yielding an individual rheology curve for each volumetric injection rate. This method excludes the near-well effects mentioned above and will provide local rheology curves for each injection rate, spanning different velocity intervals of the complete rheology curve.
History match of injection BHP as a function of the volumetric injection rate (Figure 4) shows excellent agreement with the polymer pressure response. The history match error, defined in accordance with Gogarty, W.B. 1967, was 2.38% [14]. The history match of internal pressures as a function of radial distance (Figures 5 and 6) also showed very good agreement with the polymer pressure response. Here, the average of history match errors was equal to 2.94%.
Figure 3. Pressure build up for the 1000-ppm polymer flood.
Injection BHP build-up from the polymer flood was clearly distinguishable from the Newtonianpressure response obtained from brine floods. Firstly, pressure stabilization time during the polymerflood was significantly higher (3–9 times) than for brine floods. In addition, stabilization time increasedmonotonically with decreasing volumetric injection rate (from 140 at 2 mL/min to 360 s at 0.05 mL/min).This suggests that the polymer rheology behavior is different at low compared to high injection rates.
To quantitatively analyze the polymer rheology of the 1000-ppm HPAM solution in the presenceof residual oil, stabilized polymer pressure response was history matched as a function of both thevolumetric injection rate, dP(Q), and radial distance, dP(r):
• dP(Q): Analogue to conventional polymer rheology estimation from field data, pressure dropacross the entire disc (injection BHP) is history matched as a function of the volumetric injectionrate, yielding a single rheology curve. Since injection BHP is influenced by near-well effects suchas skin and mechanical degradation, the robustness and accuracy of this method may be debatable.
• dP(r): Using only internal pressure ports, the pressure drop between individual ports and theproducer is history matched as a function of the radial distance, yielding an individual rheologycurve for each volumetric injection rate. This method excludes the near-well effects mentionedabove and will provide local rheology curves for each injection rate, spanning different velocityintervals of the complete rheology curve.
History match of injection BHP as a function of the volumetric injection rate (Figure 4) showsexcellent agreement with the polymer pressure response. The history match error, defined in accordancewith Gogarty, W.B. 1967, was 2.38% [14]. The history match of internal pressures as a function of radialdistance (Figures 5 and 6) also showed very good agreement with the polymer pressure response.Here, the average of history match errors was equal to 2.94%.

Polymers 2020, 12, 801 6 of 23
Polymers 2020, 12, x FOR PEER REVIEW 6 of 23
Figure 4. History match of injection BHP as a function of volumetric injection rate, dP(Q), for polymer flood.
Figure 5. History match of internal pressures as a function of radial distance, dP(r), for volumetric injection rates of 0.05–0.7 mL/min.
Figure 4. History match of injection BHP as a function of volumetric injection rate, dP(Q),for polymer flood.
Polymers 2020, 12, x FOR PEER REVIEW 6 of 23
Figure 4. History match of injection BHP as a function of volumetric injection rate, dP(Q), for polymer flood.
Figure 5. History match of internal pressures as a function of radial distance, dP(r), for volumetric injection rates of 0.05–0.7 mL/min.
Figure 5. History match of internal pressures as a function of radial distance, dP(r), for volumetricinjection rates of 0.05–0.7 mL/min.

Polymers 2020, 12, 801 7 of 23
Polymers 2020, 12, x FOR PEER REVIEW 7 of 23
Figure 6. History match of internal pressures as function of radial distance, dP(r), for volumetric injection rates of 1.0–2.0 mL/min.
Polymer rheology curves obtained from both history match methods are shown in Figure 7. Since permeability obtained from the initial brine flood (before polymer flood) was used, apparent viscosity is represented by RF. Here, polymer rheology curves obtained by history matching differential pressure as a function of radial distance from the injection well are denoted dP(r). Using this history match method, individual rheology curves are obtained for each volumetric injection rate. However, since each curve was obtained at different injection rates, their maximum velocities at the injection point and their minimum velocity at the production rim were different. Rheology curves obtained at the lowest injection rates spanned the lower velocity interval, and were representing the shear-thinning rheology regime. In contrast, the highest injection rates spanned the higher velocity interval where the polymer behavior was increasingly shear-thickening. Even though they represent different injection rates and resulting velocity ranges of the polymer rheology, overlapping rheology curves were obtained, thus excluding the occurrence of rate effects. In addition, differential pressure was history matched as a function of the volumetric injection rate using injection BHP. This curve is denoted dP(Q) and shows the same shape as the remaining rheology curves.
Figure 6. History match of internal pressures as function of radial distance, dP(r), for volumetricinjection rates of 1.0–2.0 mL/min.
Polymer rheology curves obtained from both history match methods are shown in Figure 7. Sincepermeability obtained from the initial brine flood (before polymer flood) was used, apparent viscosityis represented by RF. Here, polymer rheology curves obtained by history matching differential pressureas a function of radial distance from the injection well are denoted dP(r). Using this history matchmethod, individual rheology curves are obtained for each volumetric injection rate. However, sinceeach curve was obtained at different injection rates, their maximum velocities at the injection point andtheir minimum velocity at the production rim were different. Rheology curves obtained at the lowestinjection rates spanned the lower velocity interval, and were representing the shear-thinning rheologyregime. In contrast, the highest injection rates spanned the higher velocity interval where the polymerbehavior was increasingly shear-thickening. Even though they represent different injection ratesand resulting velocity ranges of the polymer rheology, overlapping rheology curves were obtained,thus excluding the occurrence of rate effects. In addition, differential pressure was history matched asa function of the volumetric injection rate using injection BHP. This curve is denoted dP(Q) and showsthe same shape as the remaining rheology curves.
Therefore, all polymer rheology curves show approximately the same functional relationship(shape) and two distinct flow regimes: Shear dominant flow is occurring at low to intermediate rateswhile extensional dominant flow is predominant in the high velocity regime. This rheology behavioris in accordance with the injection BHP build-up response where stabilization time was decreasingwith injection rate, thus representing the transition from shear thinning behavior at a low rate to shearthickening behavior at higher injection rates.

Polymers 2020, 12, 801 8 of 23
Polymers 2020, 12, x FOR PEER REVIEW 8 of 23
Figure 7. Polymer rheology curves obtained from history matching injection BHP as a function of the volumetric injection rate (red) and internal differential pressures as a function of radial distance (remainder of curves).
Therefore, all polymer rheology curves show approximately the same functional relationship (shape) and two distinct flow regimes: Shear dominant flow is occurring at low to intermediate rates while extensional dominant flow is predominant in the high velocity regime. This rheology behavior is in accordance with the injection BHP build-up response where stabilization time was decreasing with injection rate, thus representing the transition from shear thinning behavior at a low rate to shear thickening behavior at higher injection rates.
The parallel shift between rheology curves obtained from injection BHP versus curves obtained from internal pressures is a consequence of performing history matches using the initial permeability (before the polymer is introduced). Since pressure measurements were conducted after retention was satisfied, permeability would be reduced both internally mainly due to adsorption, but also at a greater extent in the near wellbore region due to mechanical entrapment of polymer molecules. The greater local permeability reduction in the wellbore region versus the internal reduction would induce a higher pressure response for injection BHP and thus effectively shift the apparent viscosity to higher values due to retention effects. However, the consistency between the functional relationship obtained from injection BHP and internal pressures shows that injection BHP is a robust tool for estimating in-situ polymer rheology.
4. Field Scale Simulation Approach
A radial model was built using CMG STARS to simulate the field-scale polymer injection test at several injection rates for different in-situ rheology cases. The objective was to confirm the findings from the lab scale experimental and simulation studies in order to assess the design of polymer injectivity tests and define in-situ rheology signatures on BHP responses.
The model was used to test three different in-situ rheology behaviors: Shear thinning only, shear thickening only and shear thickening followed by shear thinning (combined). These three cases represent nearly all possible in-situ rheology behaviors expected in the near wellbore area of a polymer injector. The shear thinning case is representative for xanthan biopolymer, as well as types of synthetic polymers (such as HPAM) at certain low molecular weight and/or low concentrations, where shear flow dominates the in-situ behavior of polymer even at high shear [7]. In contrast, at certain high molecular weights or high concentrations, synthetic polymers might observe only shear thickening behavior in the near-wellbore region if they were dominated by extensional flow for the
Figure 7. Polymer rheology curves obtained from history matching injection BHP as a function ofthe volumetric injection rate (red) and internal differential pressures as a function of radial distance(remainder of curves).
The parallel shift between rheology curves obtained from injection BHP versus curves obtainedfrom internal pressures is a consequence of performing history matches using the initial permeability(before the polymer is introduced). Since pressure measurements were conducted after retention wassatisfied, permeability would be reduced both internally mainly due to adsorption, but also at a greaterextent in the near wellbore region due to mechanical entrapment of polymer molecules. The greaterlocal permeability reduction in the wellbore region versus the internal reduction would induce a higherpressure response for injection BHP and thus effectively shift the apparent viscosity to higher valuesdue to retention effects. However, the consistency between the functional relationship obtained frominjection BHP and internal pressures shows that injection BHP is a robust tool for estimating in-situpolymer rheology.
4. Field Scale Simulation Approach
A radial model was built using CMG STARS to simulate the field-scale polymer injection test atseveral injection rates for different in-situ rheology cases. The objective was to confirm the findingsfrom the lab scale experimental and simulation studies in order to assess the design of polymerinjectivity tests and define in-situ rheology signatures on BHP responses.
The model was used to test three different in-situ rheology behaviors: Shear thinning only, shearthickening only and shear thickening followed by shear thinning (combined). These three casesrepresent nearly all possible in-situ rheology behaviors expected in the near wellbore area of a polymerinjector. The shear thinning case is representative for xanthan biopolymer, as well as types of syntheticpolymers (such as HPAM) at certain low molecular weight and/or low concentrations, where shear flowdominates the in-situ behavior of polymer even at high shear [7]. In contrast, at certain high molecularweights or high concentrations, synthetic polymers might observe only shear thickening behaviorin the near-wellbore region if they were dominated by extensional flow for the whole spectrum ofencountered shear rates, shadowing the thinning behavior even at low shear rates. The third case(combined) represents the in-situ behavior observed in the lab for synthetic polymers where apparentshear thickening occurs at high shear rates followed by shear thinning away from the injection point.

Polymers 2020, 12, 801 9 of 23
Generic in-situ rheology curves were constructed using a modified version of the extendedCarreau model introduced by Delshad et al. 2008 that relates apparent viscosity to Darcy velocity andincludes both shear and extensional components [15]:
µapp =
[µ∞ +
[(µo − µ∞) ∗
[1 + (λ1u)2
] n1−12
]]+
[µmax ∗
(1− e−[λ2u]n2−1
)]where µapp is polymer apparent viscosity, µ∞ and µ0 are limiting Newtonian viscosities at high andlow shear limits, respectively, λ and n are empirical polymer constants, u is the superficial velocity ofthe polymer in porous media and µmax is the shear-thickening plateau viscosity.
Using this equation, apparent viscosity was calculated for the range of expected velocities inthe near-wellbore region for all injection rates (Figure 8). The first part of the equation (shear flowcomponent) was used for the shear thinning only case while the second part (extensional flowcomponent) was used for the shear thickening only case. The sum of both parts was used forthe combined rheology case. In order to ensure coverage of the entire expected velocity spectrumencountered in the reservoir, the model was first tested with the highest and lowest injection rates,then the velocity profiles were used as references for the rheology calculation. “µ∞” was set at 1 cpsince it represents pure solvent viscosity (water in our case). Other viscosity terms in the equation (µmax
and µ0) represent the endpoints of the rheology curve and can be obtained from lab measurementswith reasonable accuracy. Both were assumed at 10 cp in our study. λ and n parameters were tuned sothat the curves are smooth and consistent for all rheology cases without compromising model stability.The sensitivity of shear thinning and shear thickening curves to λ and n parameters is illustrated inFigures A1–A4. Table 1 below shows a summary of the extended Carreau model parameters used forrheology curves.
Polymers 2020, 12, x FOR PEER REVIEW 9 of 23
whole spectrum of encountered shear rates, shadowing the thinning behavior even at low shear rates. The third case (combined) represents the in-situ behavior observed in the lab for synthetic polymers where apparent shear thickening occurs at high shear rates followed by shear thinning away from the injection point.
Generic in-situ rheology curves were constructed using a modified version of the extended Carreau model introduced by Delshad et al. 2008 that relates apparent viscosity to Darcy velocity and includes both shear and extensional components [15]: 𝜇 = 𝜇 + 𝜇 − 𝜇 ∗ 1 + 𝜆 𝑢 + 𝜇 ∗ 1 − 𝑒
where μapp is polymer apparent viscosity, μ∞ and μ0 are limiting Newtonian viscosities at high and low shear limits, respectively, λ and n are empirical polymer constants, u is the superficial velocity of the polymer in porous media and μmax is the shear-thickening plateau viscosity.
Using this equation, apparent viscosity was calculated for the range of expected velocities in the near-wellbore region for all injection rates (Figure 8). The first part of the equation (shear flow component) was used for the shear thinning only case while the second part (extensional flow component) was used for the shear thickening only case. The sum of both parts was used for the combined rheology case. In order to ensure coverage of the entire expected velocity spectrum encountered in the reservoir, the model was first tested with the highest and lowest injection rates, then the velocity profiles were used as references for the rheology calculation. “𝜇 ” was set at 1 cp since it represents pure solvent viscosity (water in our case). Other viscosity terms in the equation (μmax and μ0) represent the endpoints of the rheology curve and can be obtained from lab measurements with reasonable accuracy. Both were assumed at 10 cp in our study. λ and n parameters were tuned so that the curves are smooth and consistent for all rheology cases without compromising model stability. The sensitivity of shear thinning and shear thickening curves to λ and n parameters is illustrated in Figures A1–A4. Table 1 below shows a summary of the extended Carreau model parameters used for rheology curves.
Figure 8. In-situ rheology curves obtained using extended Carreau model
Table 1. Extended Carreau model parameters used for rheology cases. 𝝁 𝝁𝒐 𝝀𝟏 𝒏𝟏 𝝀𝟐 𝒏𝟐 𝝁𝒎𝒂𝒙 1 10 1.0 × 10⁶ 0.46 1.0 × 10⁴ 1.4 10
4.1. Model Description
Figure 8. In-situ rheology curves obtained using extended Carreau model
Table 1. Extended Carreau model parameters used for rheology cases.
µ∞ µo λ1 n1 λ2 n2 µmax
1 10 1.0 × 10⁶ 0.46 1.0 × 10⁴ 1.4 10

Polymers 2020, 12, 801 10 of 23
4.1. Model Description
The radial coordinates system was selected to minimize the error in the velocity calculationinduced by the smear of the velocity front in the Cartesian gridding scheme. A grid system ofexponentially increasing grid size was applied for the near-wellbore area around the injector up toa 100 ft. radius (Figure 9). This gridding scheme was selected in order to accurately capture theexpected exponentially decreasing velocity profile, and to improve simulation efficiency by avoidingunnecessary fine gridding further away from wellbore. The size of the innermost grid (injector grid)was set at 0.41 ft. while the size of the outermost grid was 5.58 ft. with a total of 60 grids in theradial direction.
Polymers 2020, 12, x FOR PEER REVIEW 10 of 23
The radial coordinates system was selected to minimize the error in the velocity calculation induced by the smear of the velocity front in the Cartesian gridding scheme. A grid system of exponentially increasing grid size was applied for the near-wellbore area around the injector up to a 100 ft. radius (Figure 9). This gridding scheme was selected in order to accurately capture the expected exponentially decreasing velocity profile, and to improve simulation efficiency by avoiding unnecessary fine gridding further away from wellbore. The size of the innermost grid (injector grid) was set at 0.41 ft. while the size of the outermost grid was 5.58 ft. with a total of 60 grids in the radial direction.
Figure 9. 2D aerial map showing the radial gridding scheme of the model.
This gridding system was generated automatically through the CMG Builder tool by defining a specific outer radius, the number of grids along the radius, and the size of the inner-most grid size (well grid). The arbitrarily selected grid sizing was based on the criterion of achieving sufficiently fine grids around the well-bore while maintaining model stability over all encountered viscosities at all injection rates. This is based on the fact that the finest-grid case represents the closest approximation to the realistic Darcy velocity at the wellbore sand-face and near-wellbore region, which is the only parameter that influences the predefined non-Newtonian viscosity functions that are inputted in the model as viscosity–velocity tables. Hence, grid sensitivity was not an issue of concern in this study.
Likewise, the model radius selection was subjective since it may not represent actual near-well bore area in many reservoirs as it varies widely based on reservoir properties. However, the radius was assumed at 100-ft to cover a wider spectrum of Darcy velocities/shear rates since the main objective is to inspect theoretical in-situ rheology impact on injection pressure rather than representing actual field cases. Therefore, the model was also assumed to be homogenous with no fractures or faults and saturated with water only.
Other factors that might impact BHP such as polymer adsorption and compressibility were not included as well. Polymer was injected at 800 ppm concentration represented by a 1.8 × 10⁻⁶ mole fraction input. Polymer adsorption was neglected and linear mixing rule was assumed between polymer and water viscosities. The range of tested rates is between 1000 and 10,000 bbl/day, which covers typical injection rates in field applications. The parameters of the model are summarized in Table 2 below.
Figure 9. 2D aerial map showing the radial gridding scheme of the model.
This gridding system was generated automatically through the CMG Builder tool by defining aspecific outer radius, the number of grids along the radius, and the size of the inner-most grid size(well grid). The arbitrarily selected grid sizing was based on the criterion of achieving sufficiently finegrids around the well-bore while maintaining model stability over all encountered viscosities at allinjection rates. This is based on the fact that the finest-grid case represents the closest approximationto the realistic Darcy velocity at the wellbore sand-face and near-wellbore region, which is the onlyparameter that influences the predefined non-Newtonian viscosity functions that are inputted in themodel as viscosity–velocity tables. Hence, grid sensitivity was not an issue of concern in this study.
Likewise, the model radius selection was subjective since it may not represent actual near-wellbore area in many reservoirs as it varies widely based on reservoir properties. However, the radius wasassumed at 100-ft to cover a wider spectrum of Darcy velocities/shear rates since the main objectiveis to inspect theoretical in-situ rheology impact on injection pressure rather than representing actualfield cases. Therefore, the model was also assumed to be homogenous with no fractures or faults andsaturated with water only.
Other factors that might impact BHP such as polymer adsorption and compressibility were notincluded as well. Polymer was injected at 800 ppm concentration represented by a 1.8 × 10⁻⁶ molefraction input. Polymer adsorption was neglected and linear mixing rule was assumed between

Polymers 2020, 12, 801 11 of 23
polymer and water viscosities. The range of tested rates is between 1000 and 10,000 bbl/day, whichcovers typical injection rates in field applications. The parameters of the model are summarized inTable 2 below.
Table 2. Basic parameters and assumptions of the field scale model.
Parameter Value
Well type Vertical
Thickness 50 ft
Injector grid size 0.41 ft
Porosity 15%
Permeability 100 mD
Initial water saturation 100%
Reservoir pressure 2000 psi
4.2. Producers Pattern Sensitivity
A simple sensitivity study was performed to assess the impact of the number of producers on thesimulation output in order to optimize the model’s pattern selection. The aim was to isolate the effectof polymer’s non-Newtonian viscosity by increasing the number of producers placed at the model’soutermost grids and thus eliminating a no-flow boundary impact on the injection pressure response.However, this may come at the price of increasing computation time by increasing the total number ofgrids in the model and hence lowering the simulation efficiency. The examined producer patternswere one producer only, two producers, four producers (five-spot), eight producers (nine-spot) and12 producers. Figure A5 shows 2D maps of producer pattern sensitivity cases. Figure 10 shows theBHP response for each pattern under the conditions of an injecting polymer at 6000 bbl/day with ashear thickening in-situ rheology. The case with one producer shows a significant boundary effectafter injecting 1 PV while the nine-spot and 12-producers patterns shows almost a no boundary effect.It takes 20 s to run the case with one producer compared to 120 s for the 12-producers case. It wasdecided that a nine-spot pattern was the most suitable for the purpose of this study, since the resultswere very close to the 12-produers case while simulation efficiency was not compromised significantly.
Polymers 2020, 12, x FOR PEER REVIEW 11 of 23
Table 2. Basic parameters and assumptions of the field scale model.
Parameter Value Well type Vertical Thickness 50 ft
Injector grid size 0.41 ft Porosity 15%
Permeability 100 mD Initial water saturation 100%
Reservoir pressure 2000 psi
4.2. Producers Pattern Sensitivity
A simple sensitivity study was performed to assess the impact of the number of producers on the simulation output in order to optimize the model’s pattern selection. The aim was to isolate the effect of polymer’s non-Newtonian viscosity by increasing the number of producers placed at the model’s outermost grids and thus eliminating a no-flow boundary impact on the injection pressure response. However, this may come at the price of increasing computation time by increasing the total number of grids in the model and hence lowering the simulation efficiency. The examined producer patterns were one producer only, two producers, four producers (five-spot), eight producers (nine-spot) and 12 producers. Figure A5 shows 2D maps of producer pattern sensitivity cases. Figure 10 shows the BHP response for each pattern under the conditions of an injecting polymer at 6000 bbl/day with a shear thickening in-situ rheology. The case with one producer shows a significant boundary effect after injecting 1 PV while the nine-spot and 12-producers patterns shows almost a no boundary effect. It takes 20 s to run the case with one producer compared to 120 s for the 12-producers case. It was decided that a nine-spot pattern was the most suitable for the purpose of this study, since the results were very close to the 12-produers case while simulation efficiency was not compromised significantly.
Figure 10. BHP response for each producer pattern at 6000 bbl/day with a shear thickening in-situ rheology.
4.3. Viscosity Mixing in the Reservoir
One of the concerns when modeling polymer flooding is the mixing of polymer viscosity with other reservoir fluids viscosities, especially at the front of polymer slug. As the front is progressing, polymer viscosity behind it is following the predefined viscosity–velocity functions of the model. However, the viscosity ahead of the front will follow a viscosity mixing rule that creates a transition
Figure 10. BHP response for each producer pattern at 6000 bbl/day with a shear thickeningin-situ rheology.

Polymers 2020, 12, 801 12 of 23
4.3. Viscosity Mixing in the Reservoir
One of the concerns when modeling polymer flooding is the mixing of polymer viscosity withother reservoir fluids viscosities, especially at the front of polymer slug. As the front is progressing,polymer viscosity behind it is following the predefined viscosity–velocity functions of the model.However, the viscosity ahead of the front will follow a viscosity mixing rule that creates a transitionbetween polymer viscosity and reservoir fluid viscosity (Figure 11), and hence it would have an impacton the injector’s BHP that does not follow input viscosity functions. To isolate the non-Newtonianbehavior effect on injector’s BHP, a minimum of 1 PV of polymer is required to be injected in orderto achieve the intended viscosity profile within the near-wellbore region (Figure 12). In this study,STARS default linear mixing rule was applied between polymer and water viscosities.
Polymers 2020, 12, x FOR PEER REVIEW 12 of 23
between polymer viscosity and reservoir fluid viscosity (Figure 11), and hence it would have an impact on the injector’s BHP that does not follow input viscosity functions. To isolate the non-Newtonian behavior effect on injector’s BHP, a minimum of 1 PV of polymer is required to be injected in order to achieve the intended viscosity profile within the near-wellbore region (Figure 12). In this study, STARS default linear mixing rule was applied between polymer and water viscosities.
Figure 11. Viscosity profile after injecting 0.06 PV at 5000 bbl/day for shear thinning rheology.
Figure 12. Viscosity profile after injecting 1 PV at 5000 bbl/day for shear thinning rheology.
4.4. Impact of High-Permeability Layers and Residual Resistance Factor
Heterogeneity of reservoirs adds more complexity to the challenges in determining in-situ rheology of a polymer from the injectivity test data. The presence of thief zones such as high permeability layers, open fractures, vuggy channels, etc., exposes the polymer to several different shear fields in the reservoir and creates the possibility of having several in-situ rheology behaviors occurring at the same time in different locations. Besides, the skin effect induced by polymer adsorption and/or mechanical entrapment in low permeable zones is another factor to be considered when tackling heterogeneity. The skin effect is usually addressed through the residual resistance factor (RRF), which is a parameter measured in lab core-floods and defined as the ratio between differential pressure after and before polymer injection.
To test the impact of different polymer in-situ rheology on layered reservoirs, the base model was modified to have alternating high and low permeability layers. High permeable zones were assigned a permeability value of 1000 mD, while low permeability zones were at 100 mD (Figure 13).
Figure 11. Viscosity profile after injecting 0.06 PV at 5000 bbl/day for shear thinning rheology.
Polymers 2020, 12, x FOR PEER REVIEW 12 of 23
between polymer viscosity and reservoir fluid viscosity (Figure 11), and hence it would have an impact on the injector’s BHP that does not follow input viscosity functions. To isolate the non-Newtonian behavior effect on injector’s BHP, a minimum of 1 PV of polymer is required to be injected in order to achieve the intended viscosity profile within the near-wellbore region (Figure 12). In this study, STARS default linear mixing rule was applied between polymer and water viscosities.
Figure 11. Viscosity profile after injecting 0.06 PV at 5000 bbl/day for shear thinning rheology.
Figure 12. Viscosity profile after injecting 1 PV at 5000 bbl/day for shear thinning rheology.
4.4. Impact of High-Permeability Layers and Residual Resistance Factor
Heterogeneity of reservoirs adds more complexity to the challenges in determining in-situ rheology of a polymer from the injectivity test data. The presence of thief zones such as high permeability layers, open fractures, vuggy channels, etc., exposes the polymer to several different shear fields in the reservoir and creates the possibility of having several in-situ rheology behaviors occurring at the same time in different locations. Besides, the skin effect induced by polymer adsorption and/or mechanical entrapment in low permeable zones is another factor to be considered when tackling heterogeneity. The skin effect is usually addressed through the residual resistance factor (RRF), which is a parameter measured in lab core-floods and defined as the ratio between differential pressure after and before polymer injection.
To test the impact of different polymer in-situ rheology on layered reservoirs, the base model was modified to have alternating high and low permeability layers. High permeable zones were assigned a permeability value of 1000 mD, while low permeability zones were at 100 mD (Figure 13).
Figure 12. Viscosity profile after injecting 1 PV at 5000 bbl/day for shear thinning rheology.
4.4. Impact of High-Permeability Layers and Residual Resistance Factor
Heterogeneity of reservoirs adds more complexity to the challenges in determining in-situ rheologyof a polymer from the injectivity test data. The presence of thief zones such as high permeabilitylayers, open fractures, vuggy channels, etc., exposes the polymer to several different shear fields in thereservoir and creates the possibility of having several in-situ rheology behaviors occurring at the same
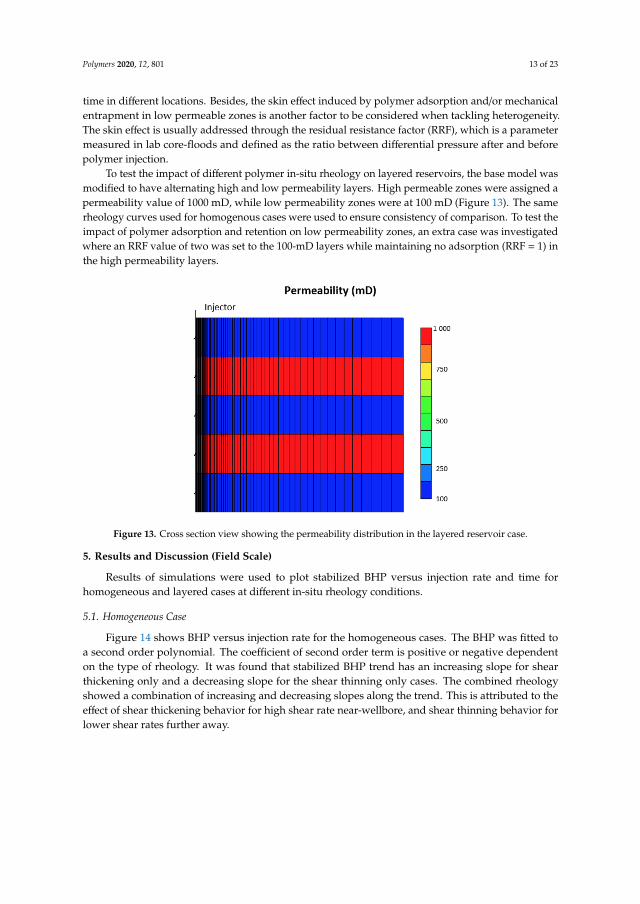
Polymers 2020, 12, 801 13 of 23
time in different locations. Besides, the skin effect induced by polymer adsorption and/or mechanicalentrapment in low permeable zones is another factor to be considered when tackling heterogeneity.The skin effect is usually addressed through the residual resistance factor (RRF), which is a parametermeasured in lab core-floods and defined as the ratio between differential pressure after and beforepolymer injection.
To test the impact of different polymer in-situ rheology on layered reservoirs, the base model wasmodified to have alternating high and low permeability layers. High permeable zones were assigned apermeability value of 1000 mD, while low permeability zones were at 100 mD (Figure 13). The samerheology curves used for homogenous cases were used to ensure consistency of comparison. To test theimpact of polymer adsorption and retention on low permeability zones, an extra case was investigatedwhere an RRF value of two was set to the 100-mD layers while maintaining no adsorption (RRF = 1) inthe high permeability layers.
Polymers 2020, 12, x FOR PEER REVIEW 13 of 23
The same rheology curves used for homogenous cases were used to ensure consistency of comparison. To test the impact of polymer adsorption and retention on low permeability zones, an extra case was investigated where an RRF value of two was set to the 100-mD layers while maintaining no adsorption (RRF = 1) in the high permeability layers.
Figure 13. Cross section view showing the permeability distribution in the layered reservoir case.
5. Results and Discussion (Field Scale)
Results of simulations were used to plot stabilized BHP versus injection rate and time for homogeneous and layered cases at different in-situ rheology conditions.
5.1. Homogeneous Case
Figure 14 shows BHP versus injection rate for the homogeneous cases. The BHP was fitted to a second order polynomial. The coefficient of second order term is positive or negative dependent on the type of rheology. It was found that stabilized BHP trend has an increasing slope for shear thickening only and a decreasing slope for the shear thinning only cases. The combined rheology showed a combination of increasing and decreasing slopes along the trend. This is attributed to the effect of shear thickening behavior for high shear rate near-wellbore, and shear thinning behavior for lower shear rates further away.
Figure 13. Cross section view showing the permeability distribution in the layered reservoir case.
5. Results and Discussion (Field Scale)
Results of simulations were used to plot stabilized BHP versus injection rate and time forhomogeneous and layered cases at different in-situ rheology conditions.
5.1. Homogeneous Case
Figure 14 shows BHP versus injection rate for the homogeneous cases. The BHP was fitted toa second order polynomial. The coefficient of second order term is positive or negative dependenton the type of rheology. It was found that stabilized BHP trend has an increasing slope for shearthickening only and a decreasing slope for the shear thinning only cases. The combined rheologyshowed a combination of increasing and decreasing slopes along the trend. This is attributed to theeffect of shear thickening behavior for high shear rate near-wellbore, and shear thinning behavior forlower shear rates further away.
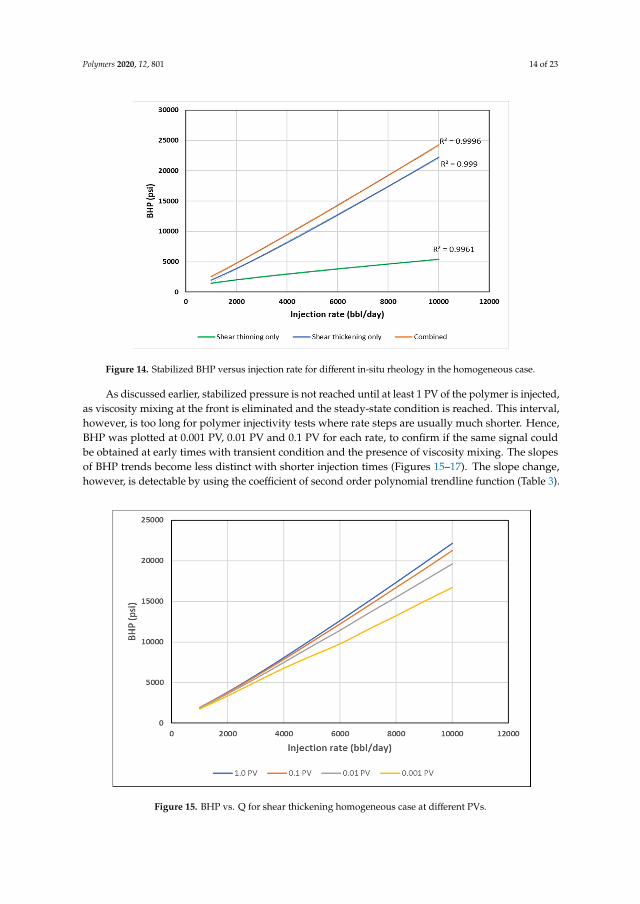
Polymers 2020, 12, 801 14 of 23
Polymers 2020, 12, x FOR PEER REVIEW 14 of 23
Figure 14. Stabilized BHP versus injection rate for different in-situ rheology in the homogeneous case.
As discussed earlier, stabilized pressure is not reached until at least 1 PV of the polymer is injected, as viscosity mixing at the front is eliminated and the steady-state condition is reached. This interval, however, is too long for polymer injectivity tests where rate steps are usually much shorter. Hence, BHP was plotted at 0.001 PV, 0.01 PV and 0.1 PV for each rate, to confirm if the same signal could be obtained at early times with transient condition and the presence of viscosity mixing. The slopes of BHP trends become less distinct with shorter injection times (Figures 15–17). The slope change, however, is detectable by using the coefficient of second order polynomial trendline function (Table 3).
Figure 15. BHP vs. Q for shear thickening homogeneous case at different PVs.
Figure 14. Stabilized BHP versus injection rate for different in-situ rheology in the homogeneous case.
As discussed earlier, stabilized pressure is not reached until at least 1 PV of the polymer is injected,as viscosity mixing at the front is eliminated and the steady-state condition is reached. This interval,however, is too long for polymer injectivity tests where rate steps are usually much shorter. Hence,BHP was plotted at 0.001 PV, 0.01 PV and 0.1 PV for each rate, to confirm if the same signal couldbe obtained at early times with transient condition and the presence of viscosity mixing. The slopesof BHP trends become less distinct with shorter injection times (Figures 15–17). The slope change,however, is detectable by using the coefficient of second order polynomial trendline function (Table 3).
Polymers 2020, 12, x FOR PEER REVIEW 14 of 23
Figure 14. Stabilized BHP versus injection rate for different in-situ rheology in the homogeneous case.
As discussed earlier, stabilized pressure is not reached until at least 1 PV of the polymer is injected, as viscosity mixing at the front is eliminated and the steady-state condition is reached. This interval, however, is too long for polymer injectivity tests where rate steps are usually much shorter. Hence, BHP was plotted at 0.001 PV, 0.01 PV and 0.1 PV for each rate, to confirm if the same signal could be obtained at early times with transient condition and the presence of viscosity mixing. The slopes of BHP trends become less distinct with shorter injection times (Figures 15–17). The slope change, however, is detectable by using the coefficient of second order polynomial trendline function (Table 3).
Figure 15. BHP vs. Q for shear thickening homogeneous case at different PVs. Figure 15. BHP vs. Q for shear thickening homogeneous case at different PVs.

Polymers 2020, 12, 801 15 of 23
Polymers 2020, 12, x FOR PEER REVIEW 15 of 23
Figure 16. BHP vs. Q for shear thinning homogeneous case at different PVs.
Figure 17. BHP vs. Q for combined rheology homogeneous case at different PVs.
Table 3. Coefficients of 2nd order polynomial trendline functions of BHP vs. injection rate at different injected PV’s for different rheology cases.
Coefficient of 2nd Order Polynomial Trendline Function (×10−5) 0.001 PV 0.01 PV 0.1 PV 1.0 PV
Rheology High Med Low High Med Low High Med Low High Med Low Shear
thinning 0.8 −0.4 −0.2 −0.03 −0.3 −1.0 0.3 −0.4 −2.0 −0.2 −0.5 -4.0
Figure 16. BHP vs. Q for shear thinning homogeneous case at different PVs.
Polymers 2020, 12, x FOR PEER REVIEW 15 of 23
Figure 16. BHP vs. Q for shear thinning homogeneous case at different PVs.
Figure 17. BHP vs. Q for combined rheology homogeneous case at different PVs.
Table 3. Coefficients of 2nd order polynomial trendline functions of BHP vs. injection rate at different injected PV’s for different rheology cases.
Coefficient of 2nd Order Polynomial Trendline Function (×10−5) 0.001 PV 0.01 PV 0.1 PV 1.0 PV
Rheology High Med Low High Med Low High Med Low High Med Low Shear
thinning 0.8 −0.4 −0.2 −0.03 −0.3 −1.0 0.3 −0.4 −2.0 −0.2 −0.5 -4.0
Figure 17. BHP vs. Q for combined rheology homogeneous case at different PVs.
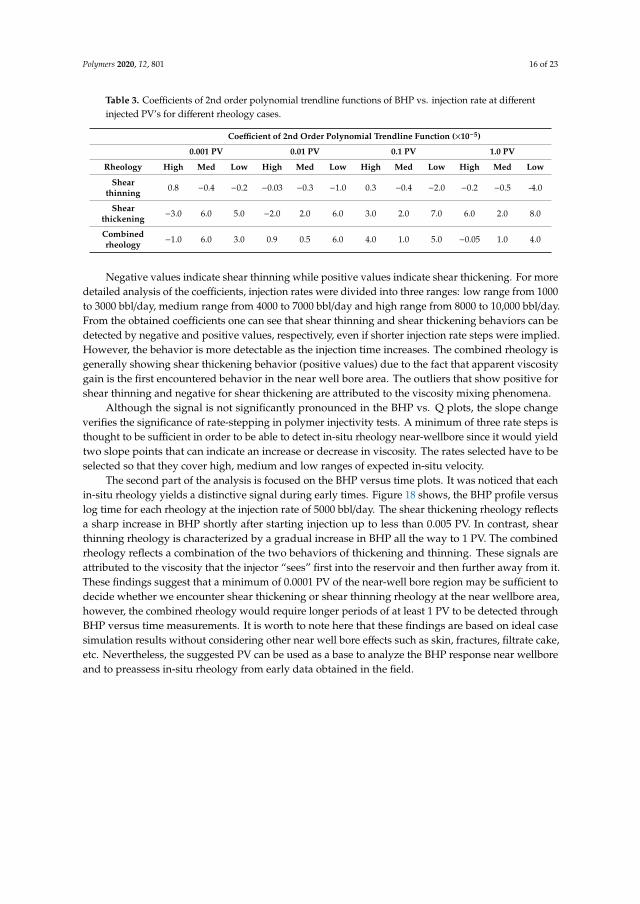
Polymers 2020, 12, 801 16 of 23
Table 3. Coefficients of 2nd order polynomial trendline functions of BHP vs. injection rate at differentinjected PV’s for different rheology cases.
Coefficient of 2nd Order Polynomial Trendline Function (×10−5)
0.001 PV 0.01 PV 0.1 PV 1.0 PV
Rheology High Med Low High Med Low High Med Low High Med Low
Shearthinning 0.8 −0.4 −0.2 −0.03 −0.3 −1.0 0.3 −0.4 −2.0 −0.2 −0.5 -4.0
Shearthickening −3.0 6.0 5.0 −2.0 2.0 6.0 3.0 2.0 7.0 6.0 2.0 8.0
Combinedrheology −1.0 6.0 3.0 0.9 0.5 6.0 4.0 1.0 5.0 −0.05 1.0 4.0
Negative values indicate shear thinning while positive values indicate shear thickening. For moredetailed analysis of the coefficients, injection rates were divided into three ranges: low range from 1000to 3000 bbl/day, medium range from 4000 to 7000 bbl/day and high range from 8000 to 10,000 bbl/day.From the obtained coefficients one can see that shear thinning and shear thickening behaviors can bedetected by negative and positive values, respectively, even if shorter injection rate steps were implied.However, the behavior is more detectable as the injection time increases. The combined rheology isgenerally showing shear thickening behavior (positive values) due to the fact that apparent viscositygain is the first encountered behavior in the near well bore area. The outliers that show positive forshear thinning and negative for shear thickening are attributed to the viscosity mixing phenomena.
Although the signal is not significantly pronounced in the BHP vs. Q plots, the slope changeverifies the significance of rate-stepping in polymer injectivity tests. A minimum of three rate steps isthought to be sufficient in order to be able to detect in-situ rheology near-wellbore since it would yieldtwo slope points that can indicate an increase or decrease in viscosity. The rates selected have to beselected so that they cover high, medium and low ranges of expected in-situ velocity.
The second part of the analysis is focused on the BHP versus time plots. It was noticed that eachin-situ rheology yields a distinctive signal during early times. Figure 18 shows, the BHP profile versuslog time for each rheology at the injection rate of 5000 bbl/day. The shear thickening rheology reflectsa sharp increase in BHP shortly after starting injection up to less than 0.005 PV. In contrast, shearthinning rheology is characterized by a gradual increase in BHP all the way to 1 PV. The combinedrheology reflects a combination of the two behaviors of thickening and thinning. These signals areattributed to the viscosity that the injector “sees” first into the reservoir and then further away from it.These findings suggest that a minimum of 0.0001 PV of the near-well bore region may be sufficient todecide whether we encounter shear thickening or shear thinning rheology at the near wellbore area,however, the combined rheology would require longer periods of at least 1 PV to be detected throughBHP versus time measurements. It is worth to note here that these findings are based on ideal casesimulation results without considering other near well bore effects such as skin, fractures, filtrate cake,etc. Nevertheless, the suggested PV can be used as a base to analyze the BHP response near wellboreand to preassess in-situ rheology from early data obtained in the field.
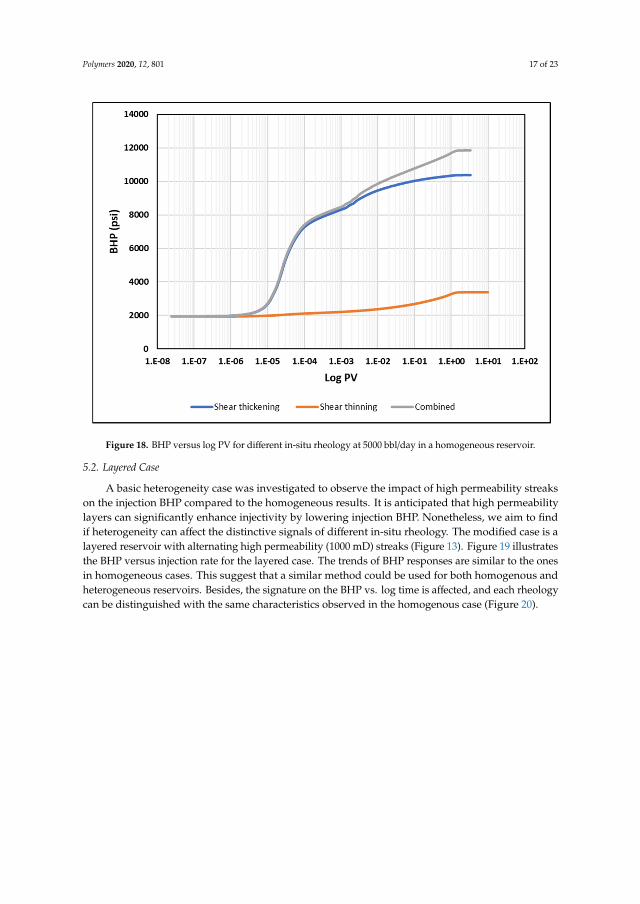
Polymers 2020, 12, 801 17 of 23
Polymers 2020, 12, x FOR PEER REVIEW 17 of 23
Figure 18. BHP versus log PV for different in-situ rheology at 5000 bbl/day in a homogeneous reservoir.
5.2. Layered Case
A basic heterogeneity case was investigated to observe the impact of high permeability streaks on the injection BHP compared to the homogeneous results. It is anticipated that high permeability layers can significantly enhance injectivity by lowering injection BHP. Nonetheless, we aim to find if heterogeneity can affect the distinctive signals of different in-situ rheology. The modified case is a layered reservoir with alternating high permeability (1000 mD) streaks (Figure 13). Figure 19 illustrates the BHP versus injection rate for the layered case. The trends of BHP responses are similar to the ones in homogeneous cases. This suggest that a similar method could be used for both homogenous and heterogeneous reservoirs. Besides, the signature on the BHP vs. log time is affected, and each rheology can be distinguished with the same characteristics observed in the homogenous case (Figure 20).
Figure 18. BHP versus log PV for different in-situ rheology at 5000 bbl/day in a homogeneous reservoir.
5.2. Layered Case
A basic heterogeneity case was investigated to observe the impact of high permeability streakson the injection BHP compared to the homogeneous results. It is anticipated that high permeabilitylayers can significantly enhance injectivity by lowering injection BHP. Nonetheless, we aim to findif heterogeneity can affect the distinctive signals of different in-situ rheology. The modified case is alayered reservoir with alternating high permeability (1000 mD) streaks (Figure 13). Figure 19 illustratesthe BHP versus injection rate for the layered case. The trends of BHP responses are similar to the onesin homogeneous cases. This suggest that a similar method could be used for both homogenous andheterogeneous reservoirs. Besides, the signature on the BHP vs. log time is affected, and each rheologycan be distinguished with the same characteristics observed in the homogenous case (Figure 20).

Polymers 2020, 12, 801 18 of 23
Polymers 2020, 12, x FOR PEER REVIEW 18 of 23
Figure 19. BHP versus injection rate for different in-situ rheology in the layered reservoir.
Figure 20. BHP versus log PV for different in-situ rheologies at 5000 bbl/day in the layered reservoir.
6. Conclusions
The findings presented in this study contribute to optimizing the design of polymer injectivity tests for enhanced oil recovery (EOR) polymer flooding projects. The main issue addressed was the
Figure 19. BHP versus injection rate for different in-situ rheology in the layered reservoir.
Polymers 2020, 12, x FOR PEER REVIEW 18 of 23
Figure 19. BHP versus injection rate for different in-situ rheology in the layered reservoir.
Figure 20. BHP versus log PV for different in-situ rheologies at 5000 bbl/day in the layered reservoir.
6. Conclusions
The findings presented in this study contribute to optimizing the design of polymer injectivity tests for enhanced oil recovery (EOR) polymer flooding projects. The main issue addressed was the
Figure 20. BHP versus log PV for different in-situ rheologies at 5000 bbl/day in the layered reservoir.

Polymers 2020, 12, 801 19 of 23
6. Conclusions
The findings presented in this study contribute to optimizing the design of polymer injectivitytests for enhanced oil recovery (EOR) polymer flooding projects. The main issue addressed was theimpact of polymer in-situ rheology in porous media on the injector’s BHP response, since BHP is themain—and sometimes the only—source of data available in field tests. We suggest from this study thatadapting a rate-stepped scheme in polymer injectivity tests is of a significant benefit in optimizing ourunderstanding of polymer in-situ rheology at reservoir conditions and hence optimizing the design ofpolymer injectivity tests based on each individual reservoir characteristics.
The main conclusions are based on two simulation approaches: (1) history matching the results ofa radial water and polymer flood lab experiments, (2) using generic up-scaled field-size model to testthe impact of different in-situ rheology on BHP.
The experiment results showed that it is possible to distinguish between water and polymer floodsbased on BHP pressure build-up time. Moreover, the experiment confirmed the ability to differentiatebetween different rheological regimes based on BHP pressure-build up time, where shear-thickeningbehavior stabilizes pressure quicker than shear thinning. Lab-scale simulation findings confirmed theinjection BHP as a robust tool for estimating in-situ polymer rheology in radial flow in porous media.
The field-scale simulation approach confirmed that BHP could be used to obtain informationabout in-situ rheology if rate variation is included in the procedure of field polymer injectivity tests.The rate-variation should include a minimum of three rate steps covering the whole range of velocitiesfrom low to high. Respective BHP readings then are used to determine the polymer rheology behavioras it propagates into the reservoir.
Besides the rate variation, it is important to assess the time the pressure needs to stabilize so it canbe representative of the rheology signal. The findings suggest that the time for pressure stabilization ata given injection rate, is slower for shear-thinning fluids, compared to Newtonian and shear-thickeningfluids. In addition, combined rheology exhibits a combination of shear thickening and shear-thinningbehaviors that can be detected from BHP vs. time. Although pressure stabilization is affected byviscosity mixing at the front and hence it is not achievable before at least 1 PV is injected, the resultsconfirmed that a minimum of 0.0001 PV could still be used to detect rheology signal. That being said,one can obtain information from a stepped-rate injectivity test only when comparing equal injectedPVs for each rate. This finding is highly subjective to the specific assumptions of the model, but it canbe used as a rough estimate to decide minimum injection duration at each rate step.
Furthermore, for heterogonous-layered reservoirs, it was found that the method is still applicable,despite the fact the rheological signal is noticeably reduced.
For future studies, we recommend investigating the impact of other near well bore effects such asskin, fractures, filtrate cake, etc. In addition, the impact of viscosity mixing needs to be quantified andfurther assessed in order to have better understanding of its impact on BHP response.
Author Contributions: M.A.A. and J.G.J.: Simulation work, results analysis, and manuscript writing. A.S.:Results analysis and discussion. S.M., A.A.S. and Ø.P.: Reviewing the paper and following up. All authors haveread and agreed to the published version of the manuscript.
Funding: This research received no external funding.
Acknowledgments: Mohamed Alzaabi acknowledges financial support from ADNOC for his PhD studies at theUniversity of Bergen, Norway. Arne Skauge recognizes support from Energi Simulation as the Energi SimulationIndustrial Research Chair in EOR. The research project appreciates support from PETROMAKS 2 program at theNorwegian Research Council through the Project Upscaling EOR.
Conflicts of Interest: The authors declare no conflict of interest.

Polymers 2020, 12, 801 20 of 23
Appendix APolymers 2020, 12, x FOR PEER REVIEW 20 of 23
Appendix A
Figure A1. Sensitivity of shear thinning curve to different n1 values.
Figure A2. Sensitivity of shear thinning curve to different λ1 values.
Figure A1. Sensitivity of shear thinning curve to different n1 values.
Polymers 2020, 12, x FOR PEER REVIEW 20 of 23
Appendix A
Figure A1. Sensitivity of shear thinning curve to different n1 values.
Figure A2. Sensitivity of shear thinning curve to different λ1 values. Figure A2. Sensitivity of shear thinning curve to different λ1 values.
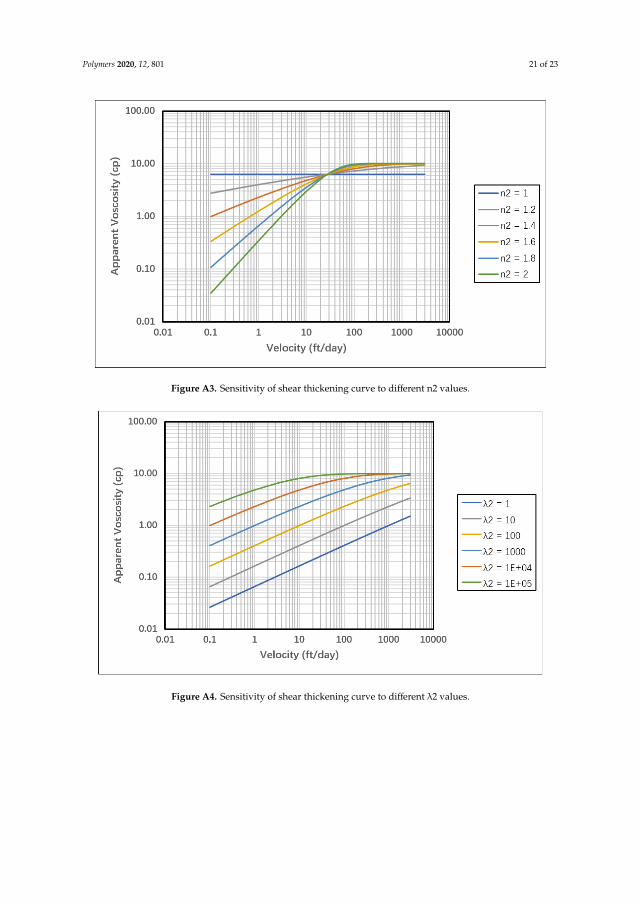
Polymers 2020, 12, 801 21 of 23
Polymers 2020, 12, x FOR PEER REVIEW 21 of 23
Figure A3. Sensitivity of shear thickening curve to different n2 values.
Figure A4. Sensitivity of shear thickening curve to different λ2 values.
Figure A3. Sensitivity of shear thickening curve to different n2 values.
Polymers 2020, 12, x FOR PEER REVIEW 21 of 23
Figure A3. Sensitivity of shear thickening curve to different n2 values.
Figure A4. Sensitivity of shear thickening curve to different λ2 values. Figure A4. Sensitivity of shear thickening curve to different λ2 values.

Polymers 2020, 12, 801 22 of 23
Polymers 2020, 12, x FOR PEER REVIEW 22 of 23
Figure A5. 2D maps of producer pattern sensitivity cases.
References
1. Pope, G.A. The Application of Fractional Flow Theory to Enhanced Oil Recovery. Soc. Pet. Eng. J. 1980, 20, doi:10.2118/7660-PA.
2. Masalmeh, S.; Hillgartner, H.; Al Mjeni, R.; Jing, X.D. Simultaneous Injection of Miscible Gas and Polymer (SIMGAP) to Improve Oil Recovery and Sweep Efficiency from Layered Carbonate Reservoirs. In Proceedings of the SPE EOR Conference at Oil & Gas West Asia, Muscat, Oman, 11–13 April 2010, doi:10.2118/129645-MS.
3. Sheng, J.J.; Leonhardt, B.; Azri, N. Status of Polymer-Flooding Technology. J. Can. Pet. Technol. 2015, 54, doi:10.2118/174541-PA.
4. Huh, C.; Pope, G.A. Residual Oil Saturation from Polymer Floods: Laboratory Measurements and Theoretical Interpretation. In Proceedings of the SPE Symposium on Improved Oil Recovery, Tulsa, OK, USA, 20–23 April 2008, doi:10.2118/113417-MS.
5. Skauge, A.; Zamani, N.; Gausdal Jacobsen, J.; Shaker Shiran, B.; Al-Shakry, B.; Skauge, T. Polymer Flow in Porous Media—Relevance to Enhanced Oil Recovery. Colloids Interfaces 2018, 2, doi:10.3390/colloids2030027.
6. Sorbie, K.S. Polymer-Improved Oil Recovery; Blackie and Son Ltd.: Glasgow, UK, 1991. 7. Skauge, T.; Skauge, A.; Salmo, I.C.; Ormehaug, P.A.; Al-Azri, N.; Wassing, L.M.; Glasbergen, G.; Van
Wunnik, J.N.; Masalmeh, S.K. Radial and Linear Polymer Flow—Influence on Injectivity. In Proceedings of the SPE Improved Oil Recovery Conference, Tulsa, OK, USA,11–13 April 2016, doi:10.2118/179694-MS.
8. Al-Shakry, B.; Skauge, T.; Shaker Shiran, B.; Skauge, A. Polymer Injectivity: Investigation of Mechanical Degradation of Enhanced Oil Recovery Polymers Using In-Situ Rheology. Energies 2019, 12, 49, doi:10.3390/en12010049.
9. Zeito, G.A. Three Dimensional Numerical Simulation of Polymer Flooding in Homogeneous and Heterogeneous Systems. In Proceedings of the Fall Meeting of the Society of Petroleum Engineers of AIME, Houston, TX, USA, 29 September–2 October 1968, doi:10.2118/2186-MS.
10. Bondor, P.L.; Hirasaki, G.J.; Tham, M.J. Mathematical Simulation of Polymer Flooding in Complex Reservoirs. SPE J. 1972, 12, 369–382, doi:10.2118/3524-PA.
11. Seright, R.S. The Effectsof Mechanical Degradation and Viscoelastic Behavior on Injectivity of Polyacrylamide Solutions. SPE J. 1983, 23, 475–485, doi:10.2118/9297-PA.
12. Lotfollahi, M.; Farajzadeh, R.; Delshad, M.; Al-Abri, A.-K.; Wassing, B.M.; Al-Mjeni, R.; Awan, K.; Bedrikovetsky, P. Mechanistic Simulation of Polymer Injectivity in Field Tests. Soc. Pet. Eng. J. 2016, 21, doi:10.2118/174665-PA.
Figure A5. 2D maps of producer pattern sensitivity cases.
References
1. Pope, G.A. The Application of Fractional Flow Theory to Enhanced Oil Recovery. Soc. Pet. Eng. J. 1980, 20.[CrossRef]
2. Masalmeh, S.; Hillgartner, H.; Al Mjeni, R.; Jing, X.D. Simultaneous Injection of Miscible Gas and Polymer(SIMGAP) to Improve Oil Recovery and Sweep Efficiency from Layered Carbonate Reservoirs. In Proceedingsof the SPE EOR Conference at Oil & Gas West Asia, Muscat, Oman, 11–13 April 2010. [CrossRef]
3. Sheng, J.J.; Leonhardt, B.; Azri, N. Status of Polymer-Flooding Technology. J. Can. Pet. Technol. 2015, 54.[CrossRef]
4. Huh, C.; Pope, G.A. Residual Oil Saturation from Polymer Floods: Laboratory Measurements and TheoreticalInterpretation. In Proceedings of the SPE Symposium on Improved Oil Recovery, Tulsa, OK, USA,20–23 April 2008. [CrossRef]
5. Skauge, A.; Zamani, N.; Gausdal Jacobsen, J.; Shaker Shiran, B.; Al-Shakry, B.; Skauge, T. Polymer Flow inPorous Media—Relevance to Enhanced Oil Recovery. Colloids Interfaces 2018, 2, 27. [CrossRef]
6. Sorbie, K.S. Polymer-Improved Oil Recovery; Blackie and Son Ltd.: Glasgow, UK, 1991.7. Skauge, T.; Skauge, A.; Salmo, I.C.; Ormehaug, P.A.; Al-Azri, N.; Wassing, L.M.; Glasbergen, G.; Van
Wunnik, J.N.; Masalmeh, S.K. Radial and Linear Polymer Flow—Influence on Injectivity. In Proceedings ofthe SPE Improved Oil Recovery Conference, Tulsa, OK, USA, 11–13 April 2016. [CrossRef]
8. Al-Shakry, B.; Skauge, T.; Shaker Shiran, B.; Skauge, A. Polymer Injectivity: Investigation of MechanicalDegradation of Enhanced Oil Recovery Polymers Using In-Situ Rheology. Energies 2019, 12, 49. [CrossRef]
9. Zeito, G.A. Three Dimensional Numerical Simulation of Polymer Flooding in Homogeneous andHeterogeneous Systems. In Proceedings of the Fall Meeting of the Society of Petroleum Engineers ofAIME, Houston, TX, USA, 29 September–2 October 1968. [CrossRef]
10. Bondor, P.L.; Hirasaki, G.J.; Tham, M.J. Mathematical Simulation of Polymer Flooding in Complex Reservoirs.SPE J. 1972, 12, 369–382. [CrossRef]
11. Seright, R.S. The Effectsof Mechanical Degradation and Viscoelastic Behavior on Injectivity of PolyacrylamideSolutions. SPE J. 1983, 23, 475–485. [CrossRef]
12. Lotfollahi, M.; Farajzadeh, R.; Delshad, M.; Al-Abri, A.-K.; Wassing, B.M.; Al-Mjeni, R.; Awan, K.;Bedrikovetsky, P. Mechanistic Simulation of Polymer Injectivity in Field Tests. Soc. Pet. Eng. J. 2016,21. [CrossRef]

Polymers 2020, 12, 801 23 of 23
13. Goudarzi, A.; Delshad, M.; Sepehrnoori, K. A Critical Assessment of Several Reservoir Simulators forModeling Chemical Enhanced Oil Recovery Processes. In Proceedings of the SPE Reservoir SimulationSymposium, The Woodlands, TX, USA, 18–20 February 2013. [CrossRef]
14. Gogarty, W.B. Mobility Control With Polymer Solutions. Soc. Pet. Eng. 1967. [CrossRef]15. Delshad, M.; Kim, D.H.; Magbagbeola, O.A.; Huh, C.; Pope, G.A.; Tarahhom, F. Mechanistic Interpretation
and Utilization of Viscoelastic Behavior of Polymer Solutions for Improved Polymer-Flood Efficiency.In Proceedings of the SPE Symposium on Improved Oil Recovery, Tulsa, OK, USA, 20–23 April 2008.[CrossRef]
© 2020 by the authors. Licensee MDPI, Basel, Switzerland. This article is an open accessarticle distributed under the terms and conditions of the Creative Commons Attribution(CC BY) license (http://creativecommons.org/licenses/by/4.0/).


Graphic design: Comm
unication Division, UiB / Print: Skipnes Komm
unikasjon AS
uib.no
ISBN: 9788230861585 (print)9788230840252 (PDF)


