Embed Size (px)
Citation preview

Seediscussions,stats,andauthorprofilesforthispublicationat:https://www.researchgate.net/publication/264857514
MechanicalDesignofaSelf-MooringAutonomousUnderwaterVehicle
ARTICLE
CITATION
1
READS
11
5AUTHORS,INCLUDING:
WayneL.Neu
VirginiaPolytechnicInstituteandStateUniv…
38PUBLICATIONS144CITATIONS
SEEPROFILE
CraigA.Woolsey
VirginiaPolytechnicInstituteandStateUniv…
111PUBLICATIONS766CITATIONS
SEEPROFILE
Availablefrom:WayneL.Neu
Retrievedon:03February2016
Mechanical Design of a Self-Mooring Autonomous UnderwaterVehicle
Robert C. Briggs
Thesis submitted to the Faculty of theVirginia Polytechnic Institute and State University
in partial fulfillment of the requirements for the degree of
Master of Sciencein
Aerospace Engineering
Wayne L. Neu, ChairDaniel J. StilwellCraig A. Woolsey
December 7, 2010Blacksburg, Virginia
Keywords: Autonomous Underwater Vehicle, Self Mooring, AUVCopyright 2010, Robert C. Briggs
Mechanical Design of a Self-Mooring Autonomous Underwater Vehicle
Robert C. Briggs
(ABSTRACT)
The Virginia Tech self-mooring autonomous underwater vehicle (AUV) is capable of mooringitself on the seafloor for extended periods of time. The AUV is intended to travel to a desiredmooring location, moor itself on the seafloor, and then release the mooring and return toa desired egress location. The AUV is designed to be an inexpensive sensor platform. TheAUV utilizes a false nose that doubles as an anchor. The anchor is neutrally buoyant whenattached to the AUV nose. When the vehicle moors it releases the false nose, which floodsthe anchor making it heavy, sinking both the anchor and AUV to the seafloor. At theend of the mooring time the vehicle releases the anchor line and travels to the recoverylocation. A prototype vehicle was constructed from a small-scale platform known as theVirginia Tech 475 AUV and used to test the self-mooring concept. The final self-mooringAUV was then constructed to perform the entire long duration mission. The final vehiclewas tested successfully for an abbreviated mission profile. This report covers the generaldesign elements of the self-mooring AUV, the detailed design of both the prototype and finalAUVs, and the results of successful field trials with both vehicles.
Acknowledgments
I would like to thank the entire Self-Mooring AUV team at Virginia Tech. Developingand designing the new AUV was a collaborative effort and would not have been possiblewithout everyone who was involved. First, Dr. Wayne Neu and Dr. Daniel Stilwell deservea great deal of thanks for organizing and advising the team. Thanks to Brian McCarterfor basically handling all the electronics of the AUV by himself. I would also like to thankTim Pratt and Chris Bright for their help with the mechanical design. Thanks to RichardDuelley for designing the propulsion system for the final AUV, as well as handling all theseal testing. Jason Mims also deserves a big thanks for his advice on design and his helpwith the structural analysis. All photos and figures are owned by the Autonomous Systemsand Control Laboratory at Virginia Tech.
iii
Contents
List of Symbols . . . . . . . . . . . . . . . . . . . . . . . . . . . . . . . . . . . . . x
List of Abbreviations . . . . . . . . . . . . . . . . . . . . . . . . . . . . . . . . . . xi
1 Introduction 1
1.1 Mission Profile . . . . . . . . . . . . . . . . . . . . . . . . . . . . . . . . . . 2
1.2 Design Approach and Team Structure . . . . . . . . . . . . . . . . . . . . . . 2
2 Conceptual Design 4
2.1 Anchor Attachment . . . . . . . . . . . . . . . . . . . . . . . . . . . . . . . . 4
2.2 Galvanic Release . . . . . . . . . . . . . . . . . . . . . . . . . . . . . . . . . 5
2.3 Anchor Sizing . . . . . . . . . . . . . . . . . . . . . . . . . . . . . . . . . . . 5
2.4 Feasibility Study . . . . . . . . . . . . . . . . . . . . . . . . . . . . . . . . . 9
2.4.1 Results . . . . . . . . . . . . . . . . . . . . . . . . . . . . . . . . . . . 10
3 Prototype Vehicle 11
3.1 Payload Integration . . . . . . . . . . . . . . . . . . . . . . . . . . . . . . . . 11
3.2 Anchor Design . . . . . . . . . . . . . . . . . . . . . . . . . . . . . . . . . . . 12
3.3 Nose Modifications . . . . . . . . . . . . . . . . . . . . . . . . . . . . . . . . 12
3.4 Prototype Testing . . . . . . . . . . . . . . . . . . . . . . . . . . . . . . . . . 14
3.4.1 Dive Testing . . . . . . . . . . . . . . . . . . . . . . . . . . . . . . . . 14
3.4.2 Full Systems Test . . . . . . . . . . . . . . . . . . . . . . . . . . . . . 15
4 Final Vehicle 17
iv

4.1 Overall Design . . . . . . . . . . . . . . . . . . . . . . . . . . . . . . . . . . . 17
4.1.1 Configuration . . . . . . . . . . . . . . . . . . . . . . . . . . . . . . . 17
4.1.2 Hydrodynamic Design . . . . . . . . . . . . . . . . . . . . . . . . . . 18
4.1.3 Overall Sizing and Units . . . . . . . . . . . . . . . . . . . . . . . . . 19
4.1.4 Tolerances . . . . . . . . . . . . . . . . . . . . . . . . . . . . . . . . . 20
4.1.5 O-Ring Design . . . . . . . . . . . . . . . . . . . . . . . . . . . . . . 20
4.1.6 Corrosion Resistance . . . . . . . . . . . . . . . . . . . . . . . . . . . 22
4.2 Tail Design . . . . . . . . . . . . . . . . . . . . . . . . . . . . . . . . . . . . 22
4.2.1 Fin Design . . . . . . . . . . . . . . . . . . . . . . . . . . . . . . . . . 23
4.2.2 Propulsion System . . . . . . . . . . . . . . . . . . . . . . . . . . . . 23
4.2.3 Electronics and Motor Chassis . . . . . . . . . . . . . . . . . . . . . . 25
4.3 Nose Design . . . . . . . . . . . . . . . . . . . . . . . . . . . . . . . . . . . . 25
4.3.1 Air System Design . . . . . . . . . . . . . . . . . . . . . . . . . . . . 25
4.3.2 Galvanic Release . . . . . . . . . . . . . . . . . . . . . . . . . . . . . 26
4.3.3 External Antennas and Connections . . . . . . . . . . . . . . . . . . . 26
4.4 Tube Design . . . . . . . . . . . . . . . . . . . . . . . . . . . . . . . . . . . . 27
4.4.1 Rib Spacing and Sizing . . . . . . . . . . . . . . . . . . . . . . . . . . 27
4.4.2 Sail Design . . . . . . . . . . . . . . . . . . . . . . . . . . . . . . . . 29
4.4.3 Breakaway Bulkheads . . . . . . . . . . . . . . . . . . . . . . . . . . . 31
4.5 Anchor Design . . . . . . . . . . . . . . . . . . . . . . . . . . . . . . . . . . . 31
4.5.1 Shape and Layout . . . . . . . . . . . . . . . . . . . . . . . . . . . . . 31
4.5.2 Weight and Balance . . . . . . . . . . . . . . . . . . . . . . . . . . . 32
4.5.3 Mooring System . . . . . . . . . . . . . . . . . . . . . . . . . . . . . . 33
4.5.4 Vacuum System . . . . . . . . . . . . . . . . . . . . . . . . . . . . . . 33
5 Testing 35
5.1 Control Testing . . . . . . . . . . . . . . . . . . . . . . . . . . . . . . . . . . 35
5.2 Full Mission Testing . . . . . . . . . . . . . . . . . . . . . . . . . . . . . . . 35
v

Bibliography 38
vi
List of Figures
1.1 VT self-mooring AUV during testing off Panama City Beach, Florida. . . . . 1
1.2 Schematic of mooring mission profile. (not to scale). . . . . . . . . . . . . . . 2
1.3 Virginia Tech 475 AUV. . . . . . . . . . . . . . . . . . . . . . . . . . . . . . 3
2.1 Four AUV configurations during proposed mission. . . . . . . . . . . . . . . 4
2.2 Sketch of side drift during descent for a two current case. . . . . . . . . . . . 6
2.3 Assumed anchor shape. . . . . . . . . . . . . . . . . . . . . . . . . . . . . . . 7
3.1 Prototype self-mooring AUV in both ingress (a) and egress (b) configurations. 11
3.2 Prototype Anchor. . . . . . . . . . . . . . . . . . . . . . . . . . . . . . . . . 12
3.3 Internal components of the prototype vacuum system. . . . . . . . . . . . . . 13
3.4 Prototype galvanic release. . . . . . . . . . . . . . . . . . . . . . . . . . . . . 14
3.5 Simulated vs. actual descent during the 60 ft. dive test. . . . . . . . . . . . . 15
3.6 Initial deployment of mooring line shortly after anchor release (left) and AUVin the moored configuration (right). . . . . . . . . . . . . . . . . . . . . . . . 16
3.7 Navigation track from full system test. . . . . . . . . . . . . . . . . . . . . . 16
4.1 Final self-mooring AUV in both ingress (a) and egress (b) configurations. . . 17
4.2 Final AUV Shape. . . . . . . . . . . . . . . . . . . . . . . . . . . . . . . . . 19
4.3 Piston Seal Dimensions. . . . . . . . . . . . . . . . . . . . . . . . . . . . . . 21
4.4 Face Seal Dimensions. . . . . . . . . . . . . . . . . . . . . . . . . . . . . . . 21
4.5 CFD analysis of rudder fins before modification. . . . . . . . . . . . . . . . . 24
4.6 Final AUV Propeller. . . . . . . . . . . . . . . . . . . . . . . . . . . . . . . . 24
vii
4.7 Final galvanic release (left) and detail of interconnect system (right). . . . . 26
4.8 Final AUV Fairing . . . . . . . . . . . . . . . . . . . . . . . . . . . . . . . . 27
4.9 Dimensions and stress conventions of tube stress analysis. . . . . . . . . . . . 28
4.10 Final version of the sail . . . . . . . . . . . . . . . . . . . . . . . . . . . . . . 30
4.11 Final AUV Breakaway Bulkhead. . . . . . . . . . . . . . . . . . . . . . . . . 31
4.12 Final Anchor. . . . . . . . . . . . . . . . . . . . . . . . . . . . . . . . . . . . 32
4.13 Final anchor structure. . . . . . . . . . . . . . . . . . . . . . . . . . . . . . . 32
4.14 Mooring system for final anchor. . . . . . . . . . . . . . . . . . . . . . . . . . 33
5.1 Commanded and measured yaw (left), depth (right) and pitch (bottom) duringtesting. . . . . . . . . . . . . . . . . . . . . . . . . . . . . . . . . . . . . . . . 36
5.2 Pitch (left) and depth (right) during descent. . . . . . . . . . . . . . . . . . . 36
5.3 Pitch (left) and depth (right) during ascent. . . . . . . . . . . . . . . . . . . 37
viii

List of Tables
2.1 Estimated dimensions of self-mooring AUV . . . . . . . . . . . . . . . . . . . 10
3.1 Simulated vs. Actual Descent Results . . . . . . . . . . . . . . . . . . . . . . 15
ix

List of Symbols
A : cross-section area
b : span
C : length of straight sides on anchor
c : chord
Cd : coefficient of drag
Cf : coefficient of friction
D : depth
d : diameter
e : energy
η : efficiency
FF : form factor
Fd : drag force
� : length
∇ : displaced volume
ν : water viscosity or Poisson’s Ratio
P : pressure
p : power
q : external pressure
R : CEP Radius
r : radius
Re : Reynold’s number
ρ : density
SF : safety factor
Swet : wetted surface area
σ : normal stress
T : time
t : thickness
Tnaca : airfoil thickness fraction
V : volume
v : velocity
W : weight
x : longitudinal position
y : vertical position
x

List of Abbreviations
AUV : autonomous underwater vehicle
AHRS : attitude heading reference system
CB : center of buoyancy
CEP : circular error probable
CFD : computational fluid dynamics
CG : center of gravity
CPU : central processing unit
FEM : finite element method
GPS : global positioning system
ID : inner diameter
LCB : longitudinal CB location
LCG : longitudinal CG location
LED : light emitting diode
MATLAB : matrix laboratory (software)
NACA : National Advisory Committee forAeronautics
NPT : national pipe thread
OD : outer diameter
PSU : power supply unit
RF : radio frequency
RPM : rotations per minute
xi
Chapter 1
Introduction
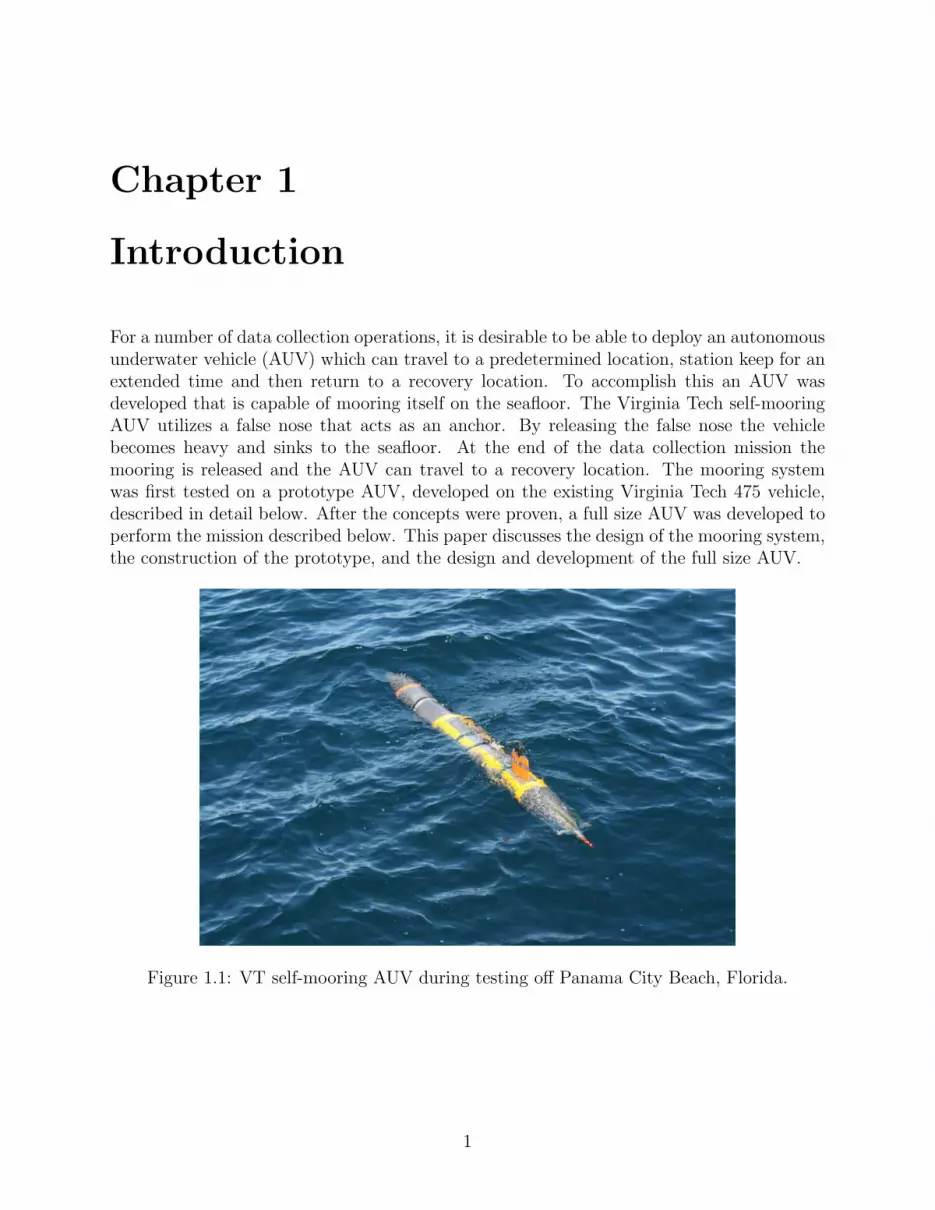
For a number of data collection operations, it is desirable to be able to deploy an autonomousunderwater vehicle (AUV) which can travel to a predetermined location, station keep for anextended time and then return to a recovery location. To accomplish this an AUV wasdeveloped that is capable of mooring itself on the seafloor. The Virginia Tech self-mooringAUV utilizes a false nose that acts as an anchor. By releasing the false nose the vehiclebecomes heavy and sinks to the seafloor. At the end of the data collection mission themooring is released and the AUV can travel to a recovery location. The mooring systemwas first tested on a prototype AUV, developed on the existing Virginia Tech 475 vehicle,described in detail below. After the concepts were proven, a full size AUV was developed toperform the mission described below. This paper discusses the design of the mooring system,the construction of the prototype, and the design and development of the full size AUV.
Figure 1.1: VT self-mooring AUV during testing off Panama City Beach, Florida.
1
2
1.1 Mission Profile
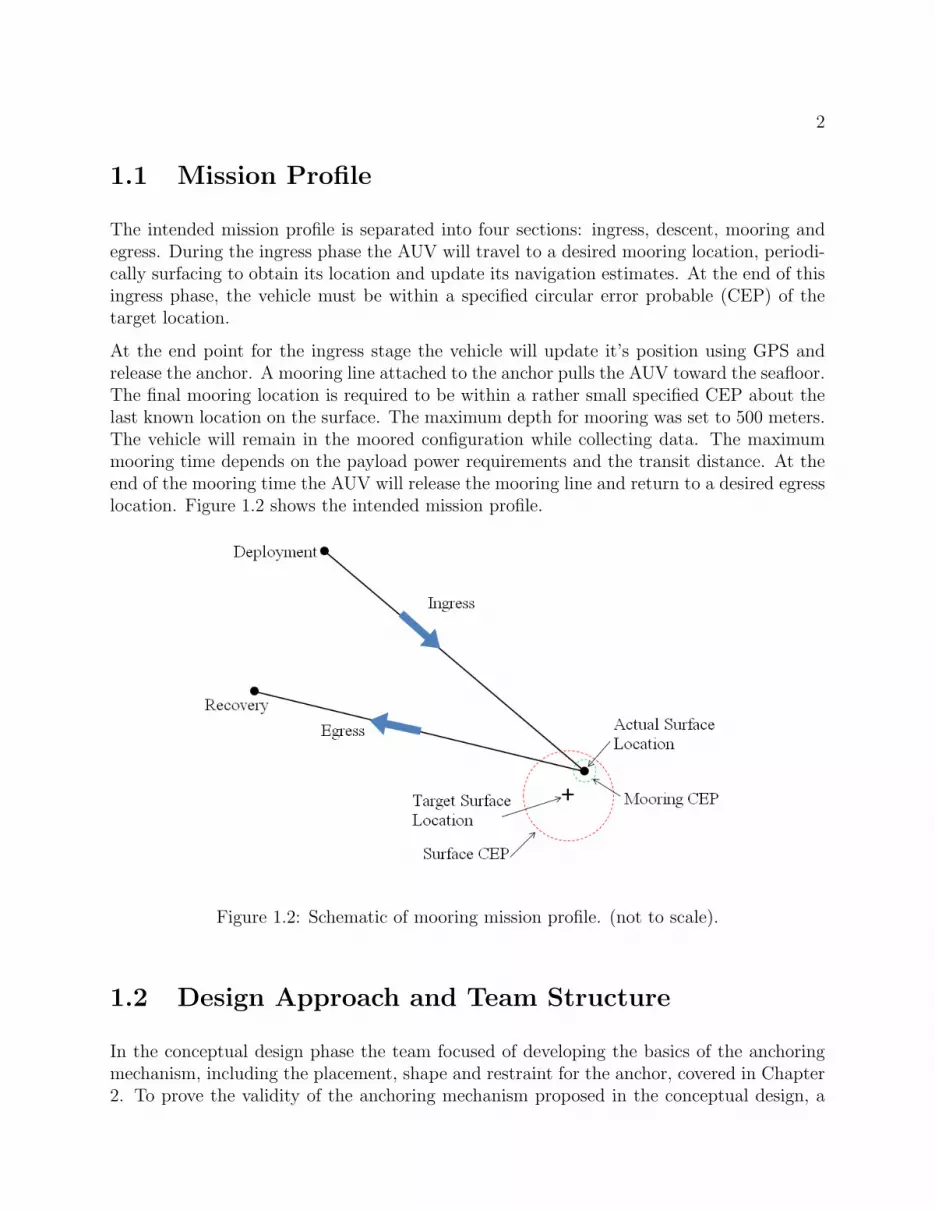
The intended mission profile is separated into four sections: ingress, descent, mooring andegress. During the ingress phase the AUV will travel to a desired mooring location, periodi-cally surfacing to obtain its location and update its navigation estimates. At the end of thisingress phase, the vehicle must be within a specified circular error probable (CEP) of thetarget location.
At the end point for the ingress stage the vehicle will update it’s position using GPS andrelease the anchor. A mooring line attached to the anchor pulls the AUV toward the seafloor.The final mooring location is required to be within a rather small specified CEP about thelast known location on the surface. The maximum depth for mooring was set to 500 meters.The vehicle will remain in the moored configuration while collecting data. The maximummooring time depends on the payload power requirements and the transit distance. At theend of the mooring time the AUV will release the mooring line and return to a desired egresslocation. Figure 1.2 shows the intended mission profile.
Figure 1.2: Schematic of mooring mission profile. (not to scale).
1.2 Design Approach and Team Structure
In the conceptual design phase the team focused of developing the basics of the anchoringmechanism, including the placement, shape and restraint for the anchor, covered in Chapter2. To prove the validity of the anchoring mechanism proposed in the conceptual design, a
3
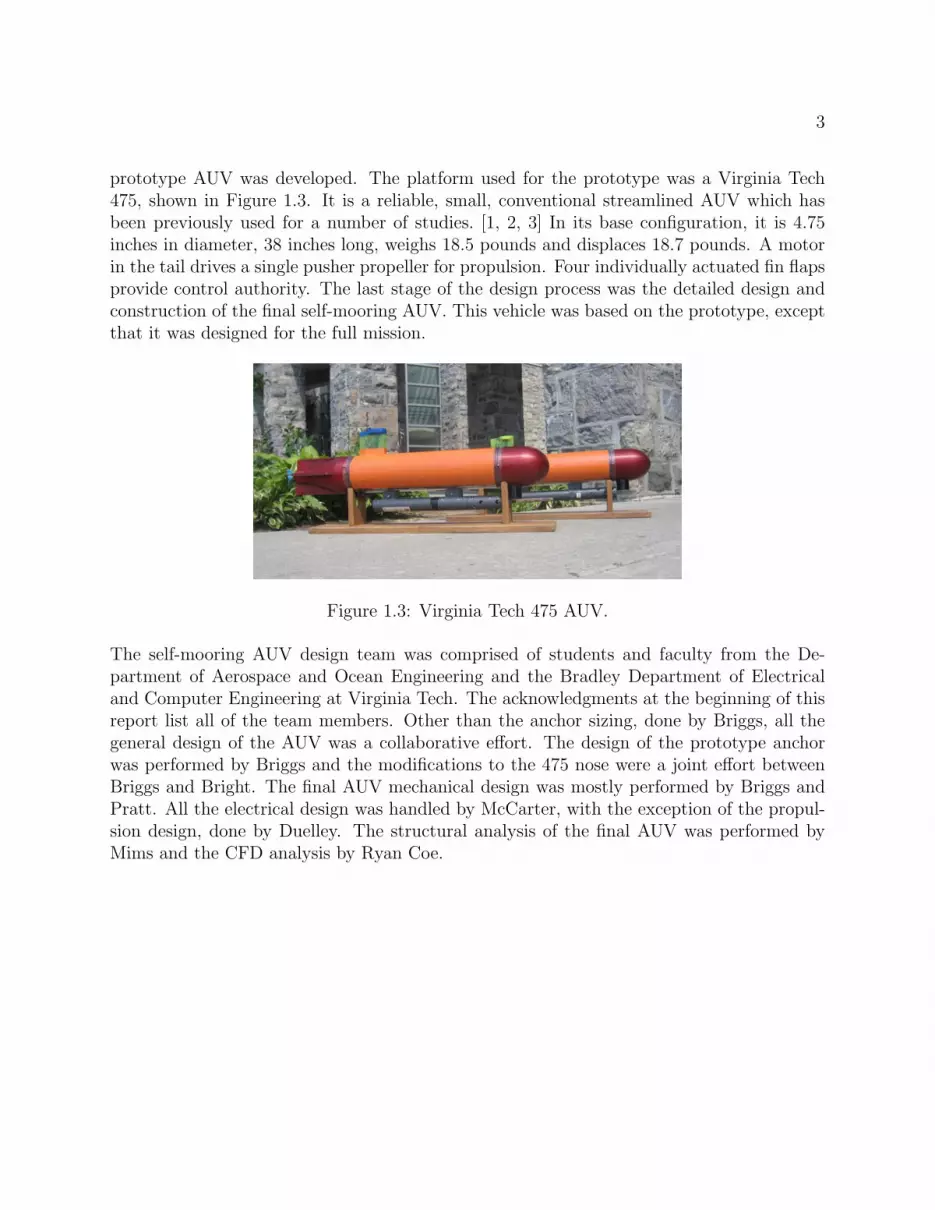
prototype AUV was developed. The platform used for the prototype was a Virginia Tech475, shown in Figure 1.3. It is a reliable, small, conventional streamlined AUV which hasbeen previously used for a number of studies. [1, 2, 3] In its base configuration, it is 4.75inches in diameter, 38 inches long, weighs 18.5 pounds and displaces 18.7 pounds. A motorin the tail drives a single pusher propeller for propulsion. Four individually actuated fin flapsprovide control authority. The last stage of the design process was the detailed design andconstruction of the final self-mooring AUV. This vehicle was based on the prototype, exceptthat it was designed for the full mission.
Figure 1.3: Virginia Tech 475 AUV.
The self-mooring AUV design team was comprised of students and faculty from the De-partment of Aerospace and Ocean Engineering and the Bradley Department of Electricaland Computer Engineering at Virginia Tech. The acknowledgments at the beginning of thisreport list all of the team members. Other than the anchor sizing, done by Briggs, all thegeneral design of the AUV was a collaborative effort. The design of the prototype anchorwas performed by Briggs and the modifications to the 475 nose were a joint effort betweenBriggs and Bright. The final AUV mechanical design was mostly performed by Briggs andPratt. All the electrical design was handled by McCarter, with the exception of the propul-sion design, done by Duelley. The structural analysis of the final AUV was performed byMims and the CFD analysis by Ryan Coe.

Chapter 2
Conceptual Design
The design of the mooring system focused on developing a method that would allow thevehicle to quickly descend, would provide a hydrodynamic and balanced vehicle in all con-figurations, and be reliable through multiple uses and long mission times. As described in1.1, the AUV acquires a GPS location at the surface and then releases the anchor. Sincecurrents may push the AUV away from the specified CEP during descent, the anchor mustbe designed to allow the AUV to descend very quickly. In addition the AUV should be hy-drodynamic with and without the anchor. It was decided that the best way to address theseissues was to make the anchor a false nose that attaches to the true AUV nose. Adding theanchor in this manner lengthens the vehicle, but does not affect the hydrodynamic shape,allowing for an efficient vehicle with the anchor attached. When the anchor is released itwill pull the AUV nose down during descent, minimizing drag and increasing the speed ofdescent. Figure 2.1 shows the four configurations during the mission.
Figure 2.1: Four AUV configurations during proposed mission.
2.1 Anchor Attachment
Two concepts were proposed for attaching the anchor to the nose. One concept was to drawa vacuum inside of the anchor. The pressure differential with the surroundings then forces
4
5
the anchor to stay on the nose. This concept is simple and requires very little mechanicalhardware. The concern with this method is securing the anchor adequately while still havingit separate from the seal easily and fall off when released.
The second concept was a mechanically fastened anchor. The anchor would have a threadedrod that protrudes out the back. This rod is inserted into a hole in the nose and through anexternal-rotor electric motor. By spinning the motor one way it would pull the anchor ontothe nose and seal. Turning the motor the other way would push the anchor off. By sizingthe threaded rod correctly it can be assured the anchor will break the seal when released.
Due to the simplicity of the system, the vacuum attached anchor was chosen. Both theprototype and final vehicles were outfitted with this system and it proved reliable.
2.2 Galvanic Release
When the mooring phase of the mission is over the AUV must release the mooring line. Thisis done with a galvanic release installed on the nose of the AUV. The galvanic release consistsof two loops of stainless steel wire, an anode and a cathode. The mooring line is attachedto the anode. If a properly polarized voltage difference is applied between the anode andthe cathode while the vehicle is in salt water the resulting current will rapidly corrode theanode. [4] After a few minutes the wire will break and the vehicle will be released from theanchor. This method of release proved to be simple and robust.
2.3 Anchor Sizing
Since there is no requirement to moor the AUV in a region of strong bottom currents, thegrip of the anchor on the bottom was not a concern. Rather, the anchor size was determinedby setting the terminal velocity of the anchor-vehicle system during descent. Figure 2.2shows the descent profile for a case where the current is split into two separate values. Fromthe surface to a depth of D1, the current is equal to vcur,1. From D1 to depth D2, at theseafloor, the current is vcur,2. As the vehicle dives the currents will push it away from thesurface location, shown by the solid line in Figure 2.2. The vertical velocity of the AUVmust be sufficient that it will reach the seafloor in no more time than it takes it to travellaterally a distance equal to the CEP radius, R. This vertical velocity is the required terminalvelocity, approximated by Equation 2.1. For anchor sizing the worst case scenario, where thecurrents are at their maximum values and are acting in the same direction, is considered.For this study the maximum current values were set to vcur,1 = 2 knots and vcur,2 = 0.5knots, transiting at D1 = 30 meters. If the vehicle is assume to reach its terminal velocity

6
immediately upon beginning its descent, a consideration of travel times yields,
vterminal =vcur,1D1 + vcur,2 (D2 −D1)
R(2.1)
Figure 2.2: Sketch of side drift during descent for a two current case.
Since the submerged weight of the anchor is much greater than that of the submergedegress vehicle it can be assumed that during the descent the two bodies are separated by afew meters (the length of the mooring line), enabling the drag of each body to be treatedseparately. The anchor is assumed to be shaped like a cylinder with a half sphere front andblunt back, shown in Figure 2.3. This assumption is true for the prototype and was a closeenough approximation for the final vehicle. This shape has a coefficient of drag, Cd,anchor,which is very nearly 0.2 for fineness ratios between 2 and 10. [5] The reference area for thisdrag coefficient is the cross-sectional area, A = πr2. Thus the drag on the anchor is,
Fd,anchor =1
2ρv2ACd,anchor (2.2)
The drag on the AUV (Fd,vehicle) is separated into two parts: the main body and the sail.The body drag is calculated by the corrected form factor approach. [5] First the coefficient offriction, Cf,body, is calculated as a function of velocity, v, body length, �, and the kinematicviscosity of water, ν. The friction coefficient used is the 1957 ITTC line. [6]
Re� =v�
ν(2.3)
Cf,body =0.075
(log10 Re� − 2.0)2(2.4)

7
Figure 2.3: Assumed anchor shape.
An appropriate form factor is chosen for the vehicle’s shape. Since the prototype will be amodified 475 vehicle and the final vehicle will be based on the 475, the chosen form factoris a cylinder with hemispherical ends. The form factor, FF , is a function of body length, �,and diameter, d.
FF = 2.643 + 1.5
(d
�
)1.5
+ 7
(d
�
)3
(2.5)
The coefficient of drag, Cd,body, is obtained by multiplying the coefficient of friction, Cf,body,by the form factor, FF , and, since the reference area for the coefficient of friction is the totalwetted surface area, Swet, and for the coefficient of drag is the cross-sectional area, A, theratio of these areas.
Cd,body = Cf,bodySwet
AFF (2.6)
Further employing the shape approximation of a cylinder with hemispherical ends, the arearatio is reduced to
Swet
A= 4
�
d(2.7)
The drag force on the body is then
Fd,body =1
2ρv2ACd,body (2.8)
The sail drag is calculated by the general airfoil approach. [5] The coefficient of friction,Cf,sail, is calculated as in Equation 2.4, except the Reynolds number, Rec, is referenced tothe airfoil chord, c.
Rec =vc
ν(2.9)
Cf,sail =0.075
(log10 Rec − 2.0)2(2.10)
8
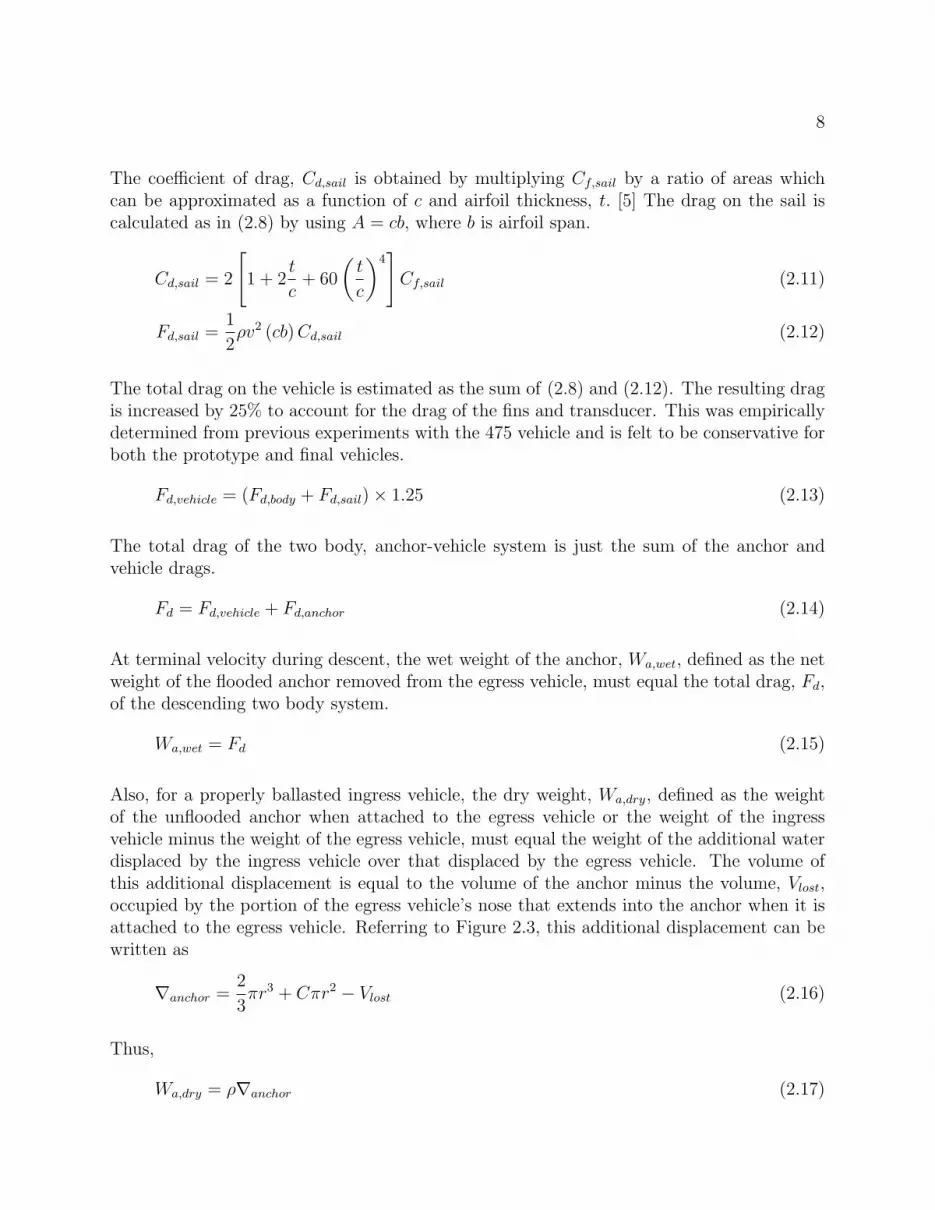
The coefficient of drag, Cd,sail is obtained by multiplying Cf,sail by a ratio of areas whichcan be approximated as a function of c and airfoil thickness, t. [5] The drag on the sail iscalculated as in (2.8) by using A = cb, where b is airfoil span.
Cd,sail = 2
[1 + 2
t
c+ 60
(t
c
)4]Cf,sail (2.11)
Fd,sail =1
2ρv2 (cb)Cd,sail (2.12)
The total drag on the vehicle is estimated as the sum of (2.8) and (2.12). The resulting dragis increased by 25% to account for the drag of the fins and transducer. This was empiricallydetermined from previous experiments with the 475 vehicle and is felt to be conservative forboth the prototype and final vehicles.
Fd,vehicle = (Fd,body + Fd,sail)× 1.25 (2.13)
The total drag of the two body, anchor-vehicle system is just the sum of the anchor andvehicle drags.
Fd = Fd,vehicle + Fd,anchor (2.14)
At terminal velocity during descent, the wet weight of the anchor, Wa,wet, defined as the netweight of the flooded anchor removed from the egress vehicle, must equal the total drag, Fd,of the descending two body system.
Wa,wet = Fd (2.15)
Also, for a properly ballasted ingress vehicle, the dry weight, Wa,dry, defined as the weightof the unflooded anchor when attached to the egress vehicle or the weight of the ingressvehicle minus the weight of the egress vehicle, must equal the weight of the additional waterdisplaced by the ingress vehicle over that displaced by the egress vehicle. The volume ofthis additional displacement is equal to the volume of the anchor minus the volume, Vlost,occupied by the portion of the egress vehicle’s nose that extends into the anchor when it isattached to the egress vehicle. Referring to Figure 2.3, this additional displacement can bewritten as
∇anchor =2
3πr3 + Cπr2 − Vlost (2.16)
Thus,
Wa,dry = ρ∇anchor (2.17)
9
Further, for proper trim, the longitudinal center of gravity (LCG) must coincide with thelongitudinal center of buoyancy (LCB) for both the egress and ingress vehicles. Assumingthe egress vehicle is properly trimmed, the addition of the anchor must shift the LCG andLCB by equal amounts. This means that the LCG of the anchor mass must coincide withthe center of volume of the additional displacement, ∇anchor. Further, if the anchor is to fallvertically during descent, its center of gravity must be located on its axis of rotation.
Proper anchor design then requires adjustment of the length, C, and the anchor mass dis-tribution to simultaneously satisfy Equations 2.15 and 2.17 as well as proper placement ofthe anchor’s center of gravity.
2.4 Feasibility Study
After the general design was selected a feasibility study was done to calculate a range ofpossible dimensions for the final vehicle. This showed what size vehicle would be needed tomeet the mission requirements. The first step in the feasibility study was to estimate thebatteries needed for a given vehicle size. An egress vehicle would then be found and usedto estimate the size of the anchor. Knowing this the properties of the ingress vehicle wouldbe calculated. This process was put into a MATLAB program and iterated until a solutionwas found for a variety of diameters.
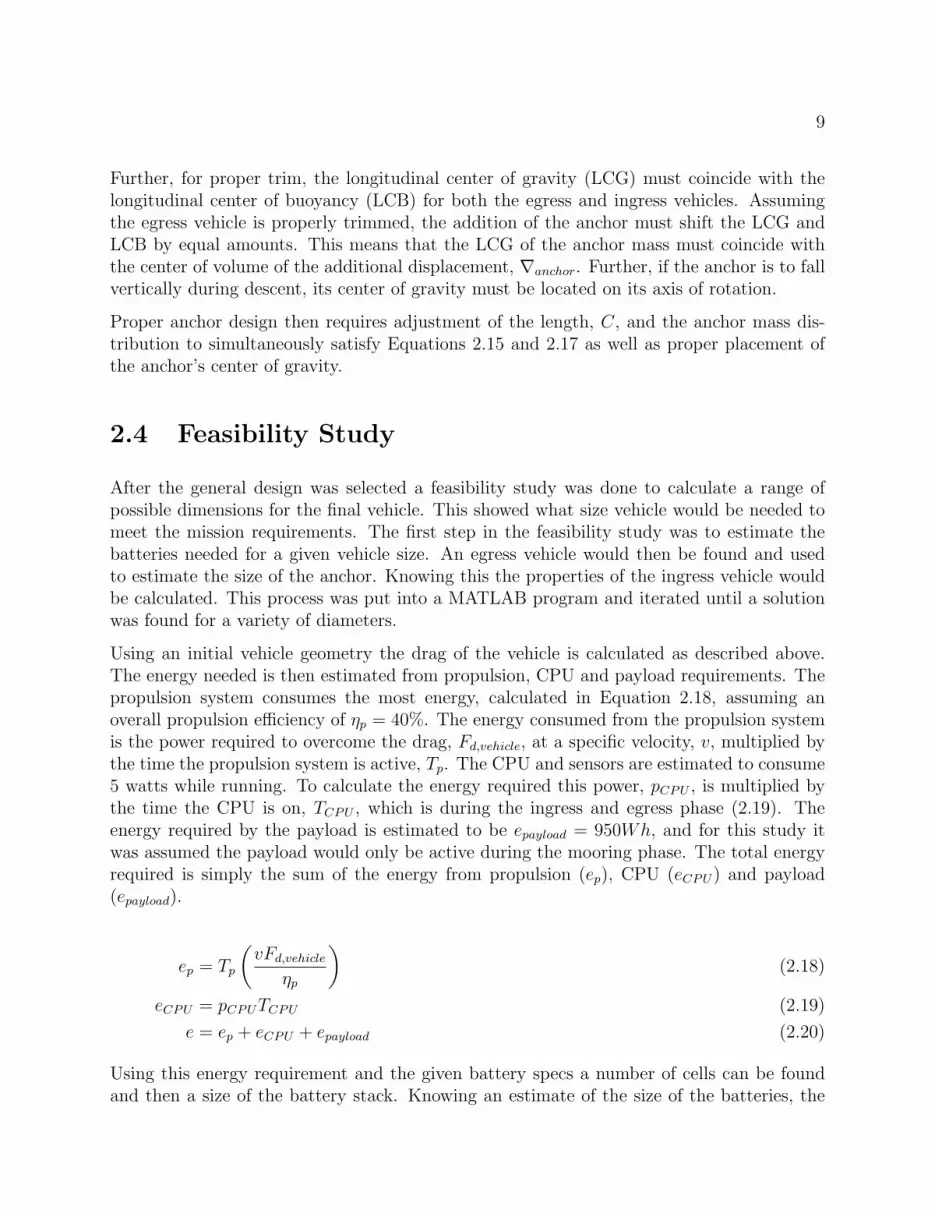
Using an initial vehicle geometry the drag of the vehicle is calculated as described above.The energy needed is then estimated from propulsion, CPU and payload requirements. Thepropulsion system consumes the most energy, calculated in Equation 2.18, assuming anoverall propulsion efficiency of ηp = 40%. The energy consumed from the propulsion systemis the power required to overcome the drag, Fd,vehicle, at a specific velocity, v, multiplied bythe time the propulsion system is active, Tp. The CPU and sensors are estimated to consume5 watts while running. To calculate the energy required this power, pCPU , is multiplied bythe time the CPU is on, TCPU , which is during the ingress and egress phase (2.19). Theenergy required by the payload is estimated to be epayload = 950Wh, and for this study itwas assumed the payload would only be active during the mooring phase. The total energyrequired is simply the sum of the energy from propulsion (ep), CPU (eCPU) and payload(epayload).
ep = Tp
(vFd,vehicle
ηp
)(2.18)
eCPU = pCPUTCPU (2.19)
e = ep + eCPU + epayload (2.20)
Using this energy requirement and the given battery specs a number of cells can be foundand then a size of the battery stack. Knowing an estimate of the size of the batteries, the
10
CPU, the required sensors and hardware an egress vehicle size and weight is calculated. Thisinformation can be used to calculate the anchor size, as above.
Lastly the egress drag, mass and size is calculated. If the calculated vehicle is too heavy,length is added to the vehicle to increase the buoyancy. If the vehicle is too light, mass isadded. This process is iterated until a solution is found.
2.4.1 Results
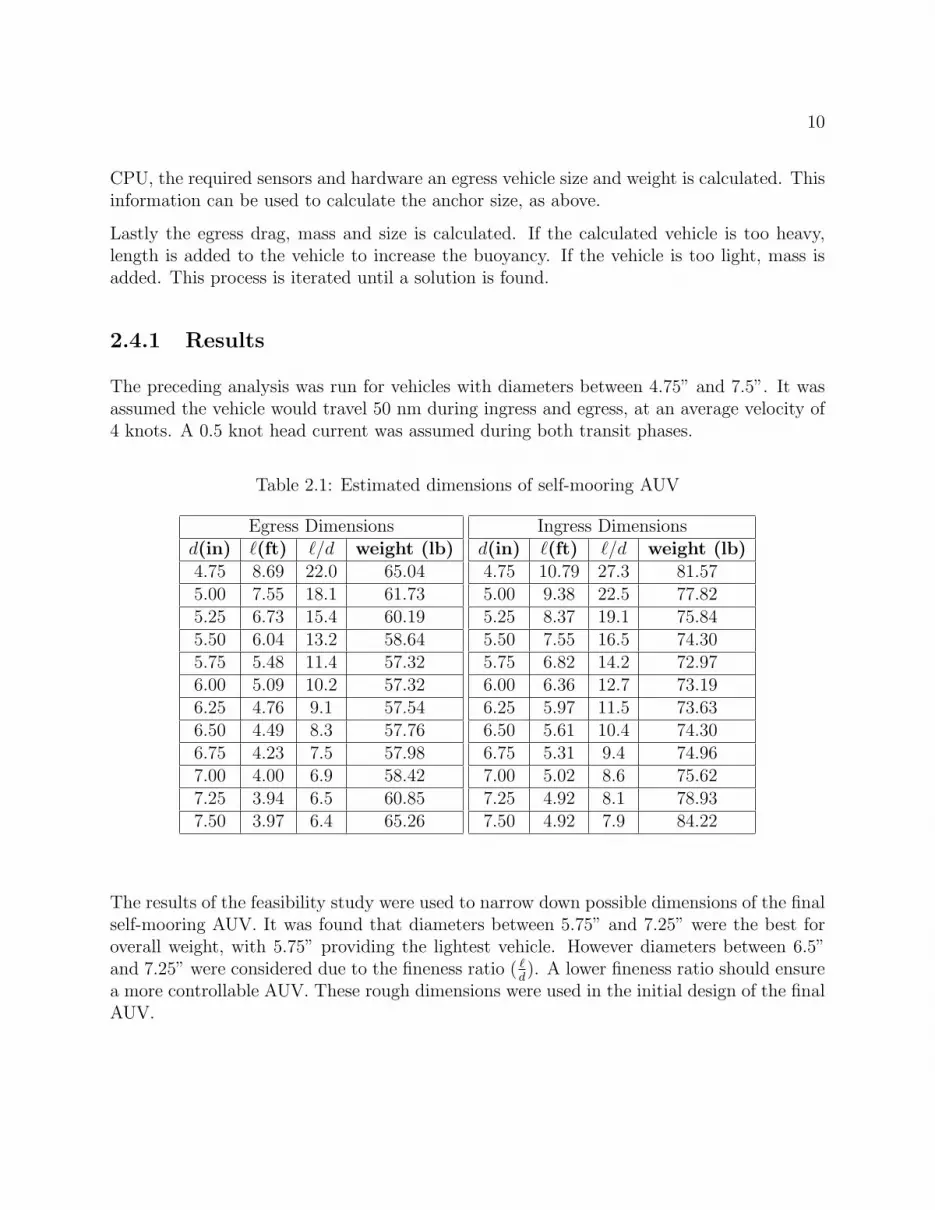
The preceding analysis was run for vehicles with diameters between 4.75” and 7.5”. It wasassumed the vehicle would travel 50 nm during ingress and egress, at an average velocity of4 knots. A 0.5 knot head current was assumed during both transit phases.
Table 2.1: Estimated dimensions of self-mooring AUV
Egress Dimensionsd(in) �(ft) �/d weight (lb)4.75 8.69 22.0 65.045.00 7.55 18.1 61.735.25 6.73 15.4 60.195.50 6.04 13.2 58.645.75 5.48 11.4 57.326.00 5.09 10.2 57.326.25 4.76 9.1 57.546.50 4.49 8.3 57.766.75 4.23 7.5 57.987.00 4.00 6.9 58.427.25 3.94 6.5 60.857.50 3.97 6.4 65.26
Ingress Dimensionsd(in) �(ft) �/d weight (lb)4.75 10.79 27.3 81.575.00 9.38 22.5 77.825.25 8.37 19.1 75.845.50 7.55 16.5 74.305.75 6.82 14.2 72.976.00 6.36 12.7 73.196.25 5.97 11.5 73.636.50 5.61 10.4 74.306.75 5.31 9.4 74.967.00 5.02 8.6 75.627.25 4.92 8.1 78.937.50 4.92 7.9 84.22
The results of the feasibility study were used to narrow down possible dimensions of the finalself-mooring AUV. It was found that diameters between 5.75” and 7.25” were the best foroverall weight, with 5.75” providing the lightest vehicle. However diameters between 6.5”and 7.25” were considered due to the fineness ratio ( �
d). A lower fineness ratio should ensure
a more controllable AUV. These rough dimensions were used in the initial design of the finalAUV.
Chapter 3
Prototype Vehicle
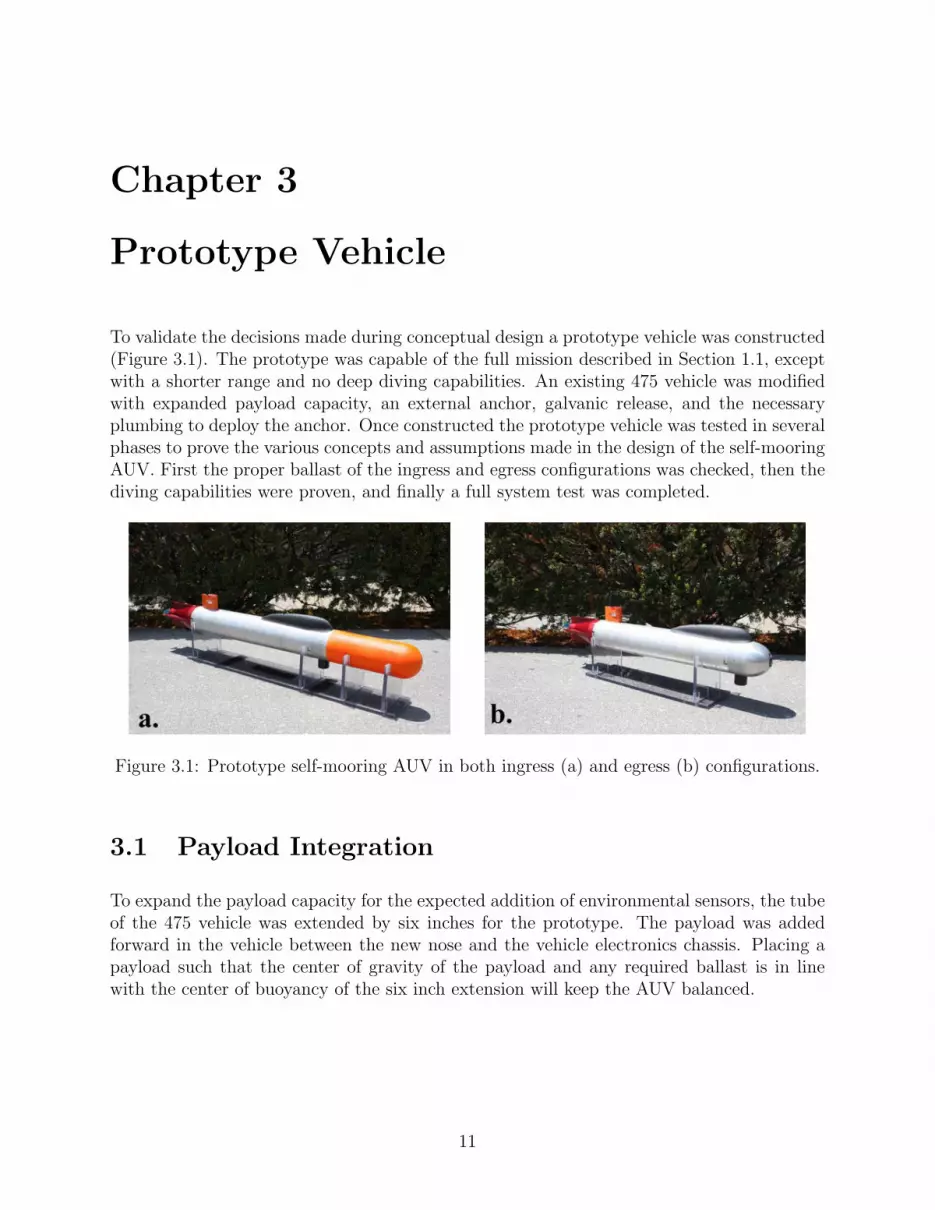
To validate the decisions made during conceptual design a prototype vehicle was constructed(Figure 3.1). The prototype was capable of the full mission described in Section 1.1, exceptwith a shorter range and no deep diving capabilities. An existing 475 vehicle was modifiedwith expanded payload capacity, an external anchor, galvanic release, and the necessaryplumbing to deploy the anchor. Once constructed the prototype vehicle was tested in severalphases to prove the various concepts and assumptions made in the design of the self-mooringAUV. First the proper ballast of the ingress and egress configurations was checked, then thediving capabilities were proven, and finally a full system test was completed.
Figure 3.1: Prototype self-mooring AUV in both ingress (a) and egress (b) configurations.
3.1 Payload Integration
To expand the payload capacity for the expected addition of environmental sensors, the tubeof the 475 vehicle was extended by six inches for the prototype. The payload was addedforward in the vehicle between the new nose and the vehicle electronics chassis. Placing apayload such that the center of gravity of the payload and any required ballast is in linewith the center of buoyancy of the six inch extension will keep the AUV balanced.
11
12
3.2 Anchor Design
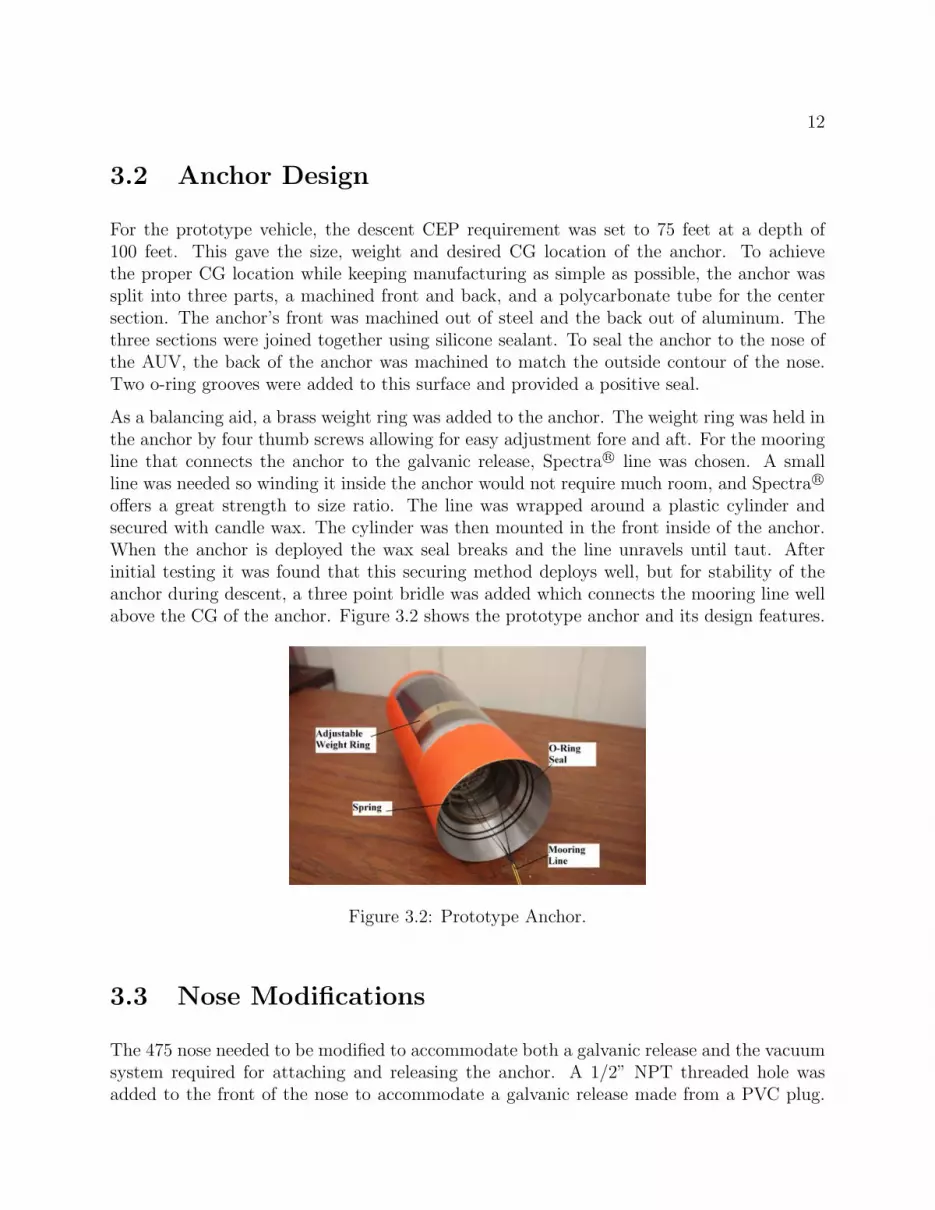
For the prototype vehicle, the descent CEP requirement was set to 75 feet at a depth of100 feet. This gave the size, weight and desired CG location of the anchor. To achievethe proper CG location while keeping manufacturing as simple as possible, the anchor wassplit into three parts, a machined front and back, and a polycarbonate tube for the centersection. The anchor’s front was machined out of steel and the back out of aluminum. Thethree sections were joined together using silicone sealant. To seal the anchor to the nose ofthe AUV, the back of the anchor was machined to match the outside contour of the nose.Two o-ring grooves were added to this surface and provided a positive seal.
As a balancing aid, a brass weight ring was added to the anchor. The weight ring was held inthe anchor by four thumb screws allowing for easy adjustment fore and aft. For the mooringline that connects the anchor to the galvanic release, Spectra R© line was chosen. A smallline was needed so winding it inside the anchor would not require much room, and Spectra R©
offers a great strength to size ratio. The line was wrapped around a plastic cylinder andsecured with candle wax. The cylinder was then mounted in the front inside of the anchor.When the anchor is deployed the wax seal breaks and the line unravels until taut. Afterinitial testing it was found that this securing method deploys well, but for stability of theanchor during descent, a three point bridle was added which connects the mooring line wellabove the CG of the anchor. Figure 3.2 shows the prototype anchor and its design features.
Figure 3.2: Prototype Anchor.
3.3 Nose Modifications
The 475 nose needed to be modified to accommodate both a galvanic release and the vacuumsystem required for attaching and releasing the anchor. A 1/2” NPT threaded hole wasadded to the front of the nose to accommodate a galvanic release made from a PVC plug.
13
The vacuum system relied on an off-the-shelf servo actuated valve used for hobby aircraft.This valve was placed inside the nose and connected to an extra pressure port placed onthe front of the nose, above the NPT hole. The other side of the valve was connected toa quick-connect tube fitting placed on the top of the nose. This allowed a vacuum to bepulled in the anchor via the quick-connect fitting. Once a vacuum was established the valvewas closed. When releasing the anchor the valve was open, pulling air and/or water in fromoutside the vehicle and releasing the vacuum.
Early anchor dive testing proved this method was not sufficient. It was found that the valverestricted the flow into the anchor causing the vehicle to sit in place for over a minute waitingfor the anchor to fall off. This would allow the vehicle too much time to drift off target. Inaddition if the anchor pulls in water and becomes heavy the vehicle could start sinking beforethe anchor was released. This could result in the vehicle gliding horizontally a significantdistance before the anchor released. To reduce the anchor release time on the surface, it wasdecided to increase the diameter of the tubing and valve forming the vacuum system. Inaddition, a carbon dioxide canister was connected to the exterior vacuum port with flexibletubing. The vacuum release could now be accomplished quickly and without weight changeby discharging the compressed CO2 into the anchor.
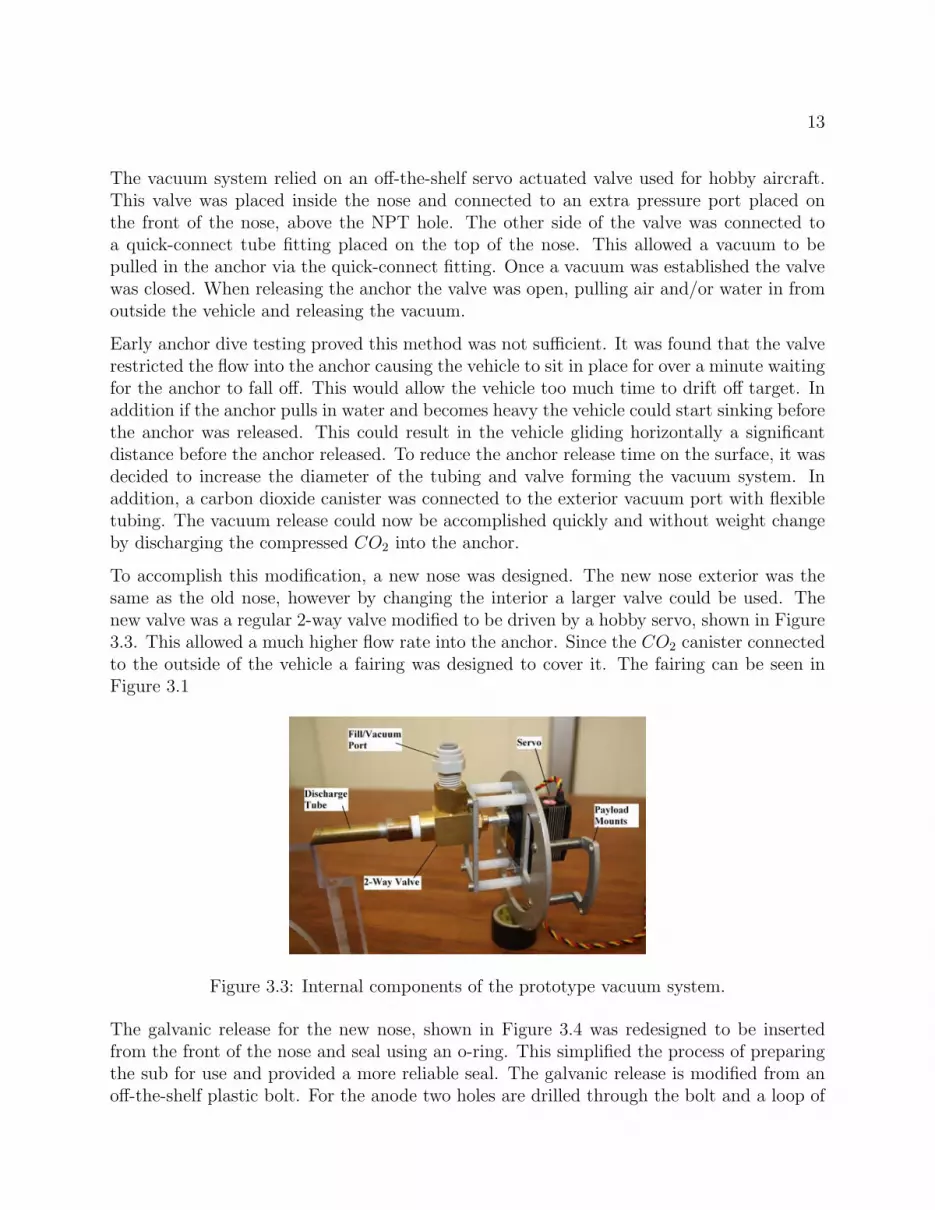
To accomplish this modification, a new nose was designed. The new nose exterior was thesame as the old nose, however by changing the interior a larger valve could be used. Thenew valve was a regular 2-way valve modified to be driven by a hobby servo, shown in Figure3.3. This allowed a much higher flow rate into the anchor. Since the CO2 canister connectedto the outside of the vehicle a fairing was designed to cover it. The fairing can be seen inFigure 3.1
Figure 3.3: Internal components of the prototype vacuum system.
The galvanic release for the new nose, shown in Figure 3.4 was redesigned to be insertedfrom the front of the nose and seal using an o-ring. This simplified the process of preparingthe sub for use and provided a more reliable seal. The galvanic release is modified from anoff-the-shelf plastic bolt. For the anode two holes are drilled through the bolt and a loop of
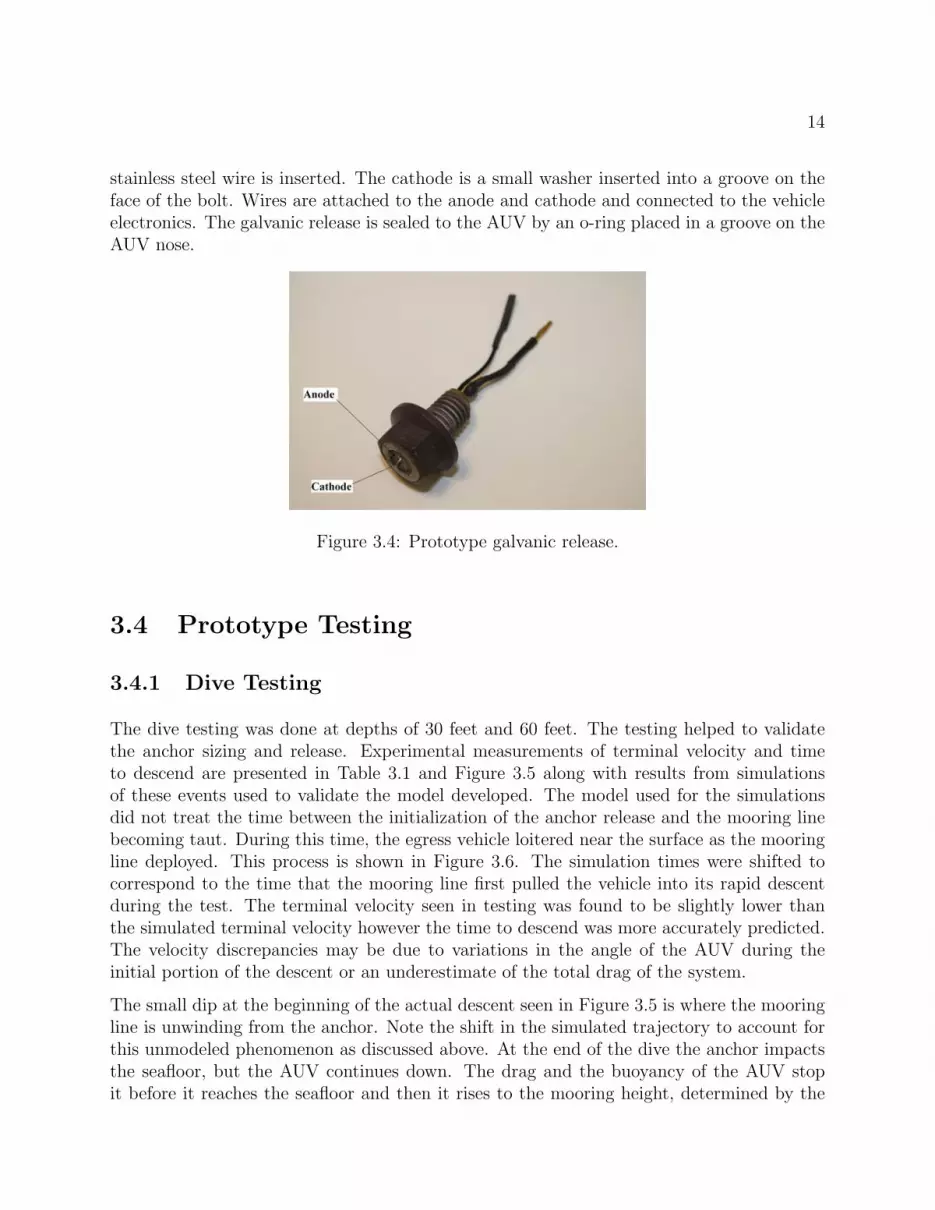
14
stainless steel wire is inserted. The cathode is a small washer inserted into a groove on theface of the bolt. Wires are attached to the anode and cathode and connected to the vehicleelectronics. The galvanic release is sealed to the AUV by an o-ring placed in a groove on theAUV nose.
Figure 3.4: Prototype galvanic release.
3.4 Prototype Testing
3.4.1 Dive Testing
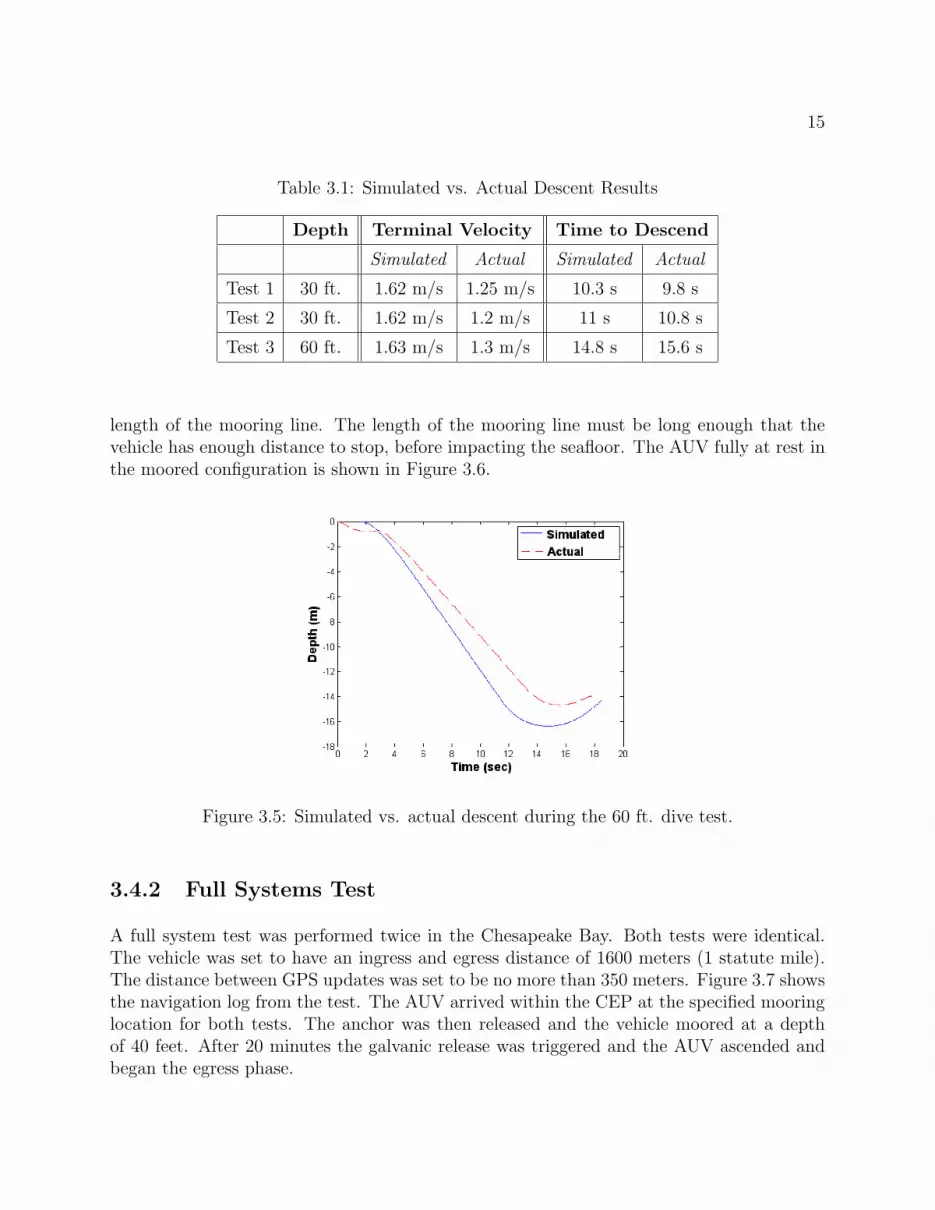
The dive testing was done at depths of 30 feet and 60 feet. The testing helped to validatethe anchor sizing and release. Experimental measurements of terminal velocity and timeto descend are presented in Table 3.1 and Figure 3.5 along with results from simulationsof these events used to validate the model developed. The model used for the simulationsdid not treat the time between the initialization of the anchor release and the mooring linebecoming taut. During this time, the egress vehicle loitered near the surface as the mooringline deployed. This process is shown in Figure 3.6. The simulation times were shifted tocorrespond to the time that the mooring line first pulled the vehicle into its rapid descentduring the test. The terminal velocity seen in testing was found to be slightly lower thanthe simulated terminal velocity however the time to descend was more accurately predicted.The velocity discrepancies may be due to variations in the angle of the AUV during theinitial portion of the descent or an underestimate of the total drag of the system.
The small dip at the beginning of the actual descent seen in Figure 3.5 is where the mooringline is unwinding from the anchor. Note the shift in the simulated trajectory to account forthis unmodeled phenomenon as discussed above. At the end of the dive the anchor impactsthe seafloor, but the AUV continues down. The drag and the buoyancy of the AUV stopit before it reaches the seafloor and then it rises to the mooring height, determined by the
15
Table 3.1: Simulated vs. Actual Descent Results
Depth Terminal Velocity Time to Descend
Simulated Actual Simulated Actual
Test 1 30 ft. 1.62 m/s 1.25 m/s 10.3 s 9.8 s
Test 2 30 ft. 1.62 m/s 1.2 m/s 11 s 10.8 s
Test 3 60 ft. 1.63 m/s 1.3 m/s 14.8 s 15.6 s
length of the mooring line. The length of the mooring line must be long enough that thevehicle has enough distance to stop, before impacting the seafloor. The AUV fully at rest inthe moored configuration is shown in Figure 3.6.
Figure 3.5: Simulated vs. actual descent during the 60 ft. dive test.
3.4.2 Full Systems Test
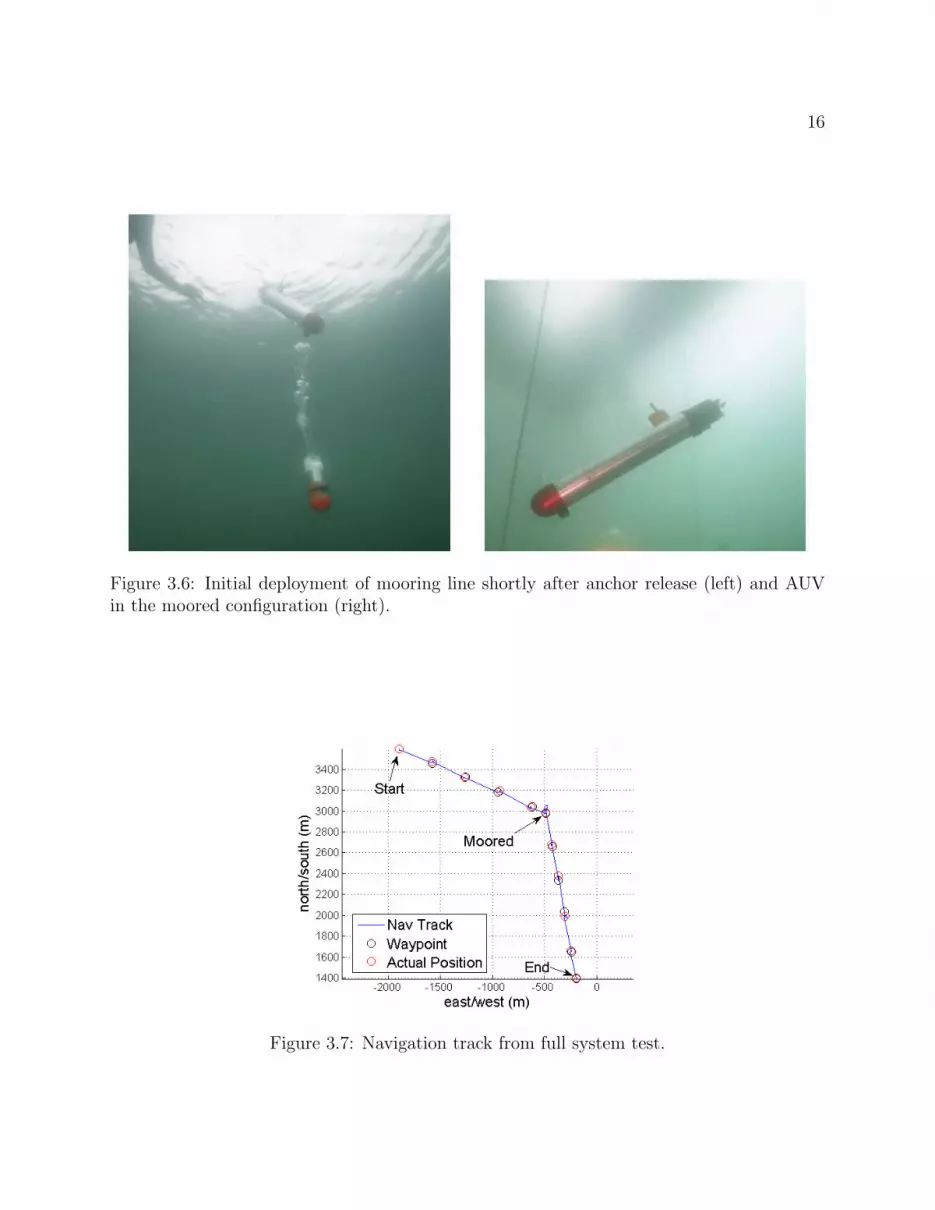
A full system test was performed twice in the Chesapeake Bay. Both tests were identical.The vehicle was set to have an ingress and egress distance of 1600 meters (1 statute mile).The distance between GPS updates was set to be no more than 350 meters. Figure 3.7 showsthe navigation log from the test. The AUV arrived within the CEP at the specified mooringlocation for both tests. The anchor was then released and the vehicle moored at a depthof 40 feet. After 20 minutes the galvanic release was triggered and the AUV ascended andbegan the egress phase.
16
Figure 3.6: Initial deployment of mooring line shortly after anchor release (left) and AUVin the moored configuration (right).
Figure 3.7: Navigation track from full system test.

Chapter 4
Final Vehicle
4.1 Overall Design
After the initial design concepts were proven on the prototype, a full size final vehicle wasdesigned. This vehicle is capable of the full 100 nautical mile mission and is rated to 500meters depth. The design of the vehicle is based on the prototype vehicle and the 475 vehicle.The final self-mooring AUV is shown in Figure 4.1.
Figure 4.1: Final self-mooring AUV in both ingress (a) and egress (b) configurations.
4.1.1 Configuration
The final self-mooring AUV was designed with the intention to utilize the platform for usesbeyond the mooring mission. This meant the design would need to be expandable withthe option to add or remove hardware. One way to ensure this was to place all the AUVhardware into the tail. This allows the tail to essentially be a self contained AUV, minuscommunication antennas and sensors. Thus the tube and nose could be changed for differentmissions and attached to the same tail. This decision left the nose and tube open for payloadand batteries.
17
18
4.1.2 Hydrodynamic Design
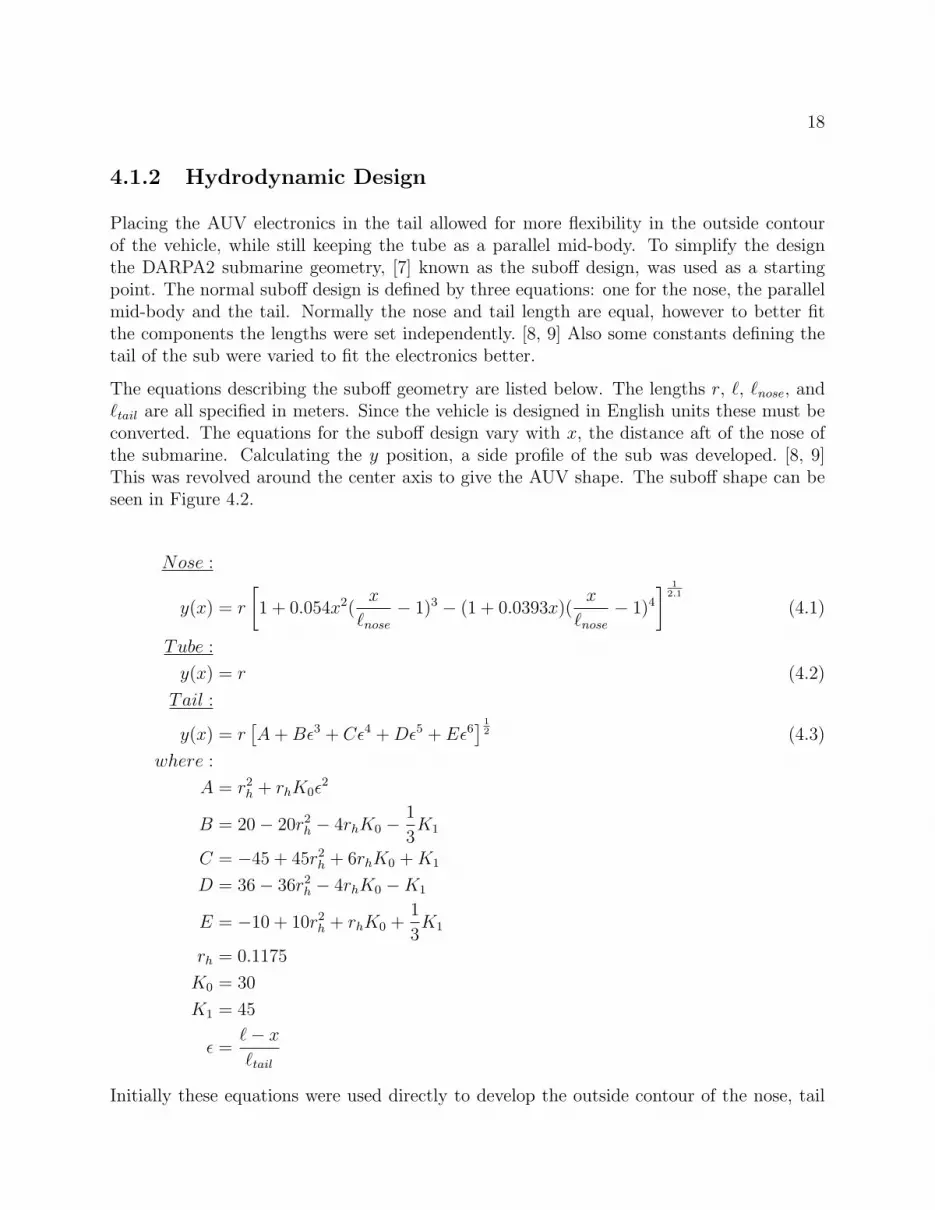
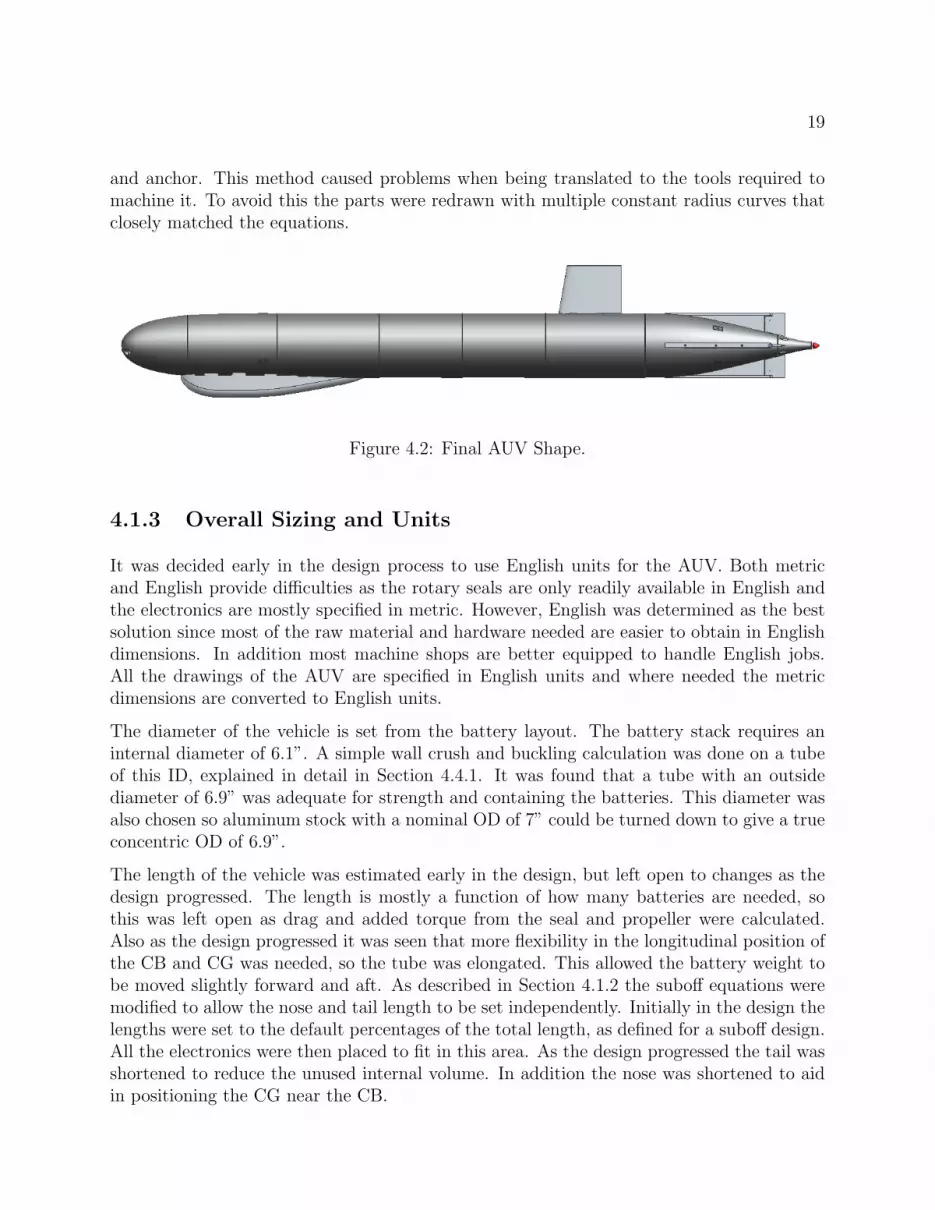
Placing the AUV electronics in the tail allowed for more flexibility in the outside contourof the vehicle, while still keeping the tube as a parallel mid-body. To simplify the designthe DARPA2 submarine geometry, [7] known as the suboff design, was used as a startingpoint. The normal suboff design is defined by three equations: one for the nose, the parallelmid-body and the tail. Normally the nose and tail length are equal, however to better fitthe components the lengths were set independently. [8, 9] Also some constants defining thetail of the sub were varied to fit the electronics better.
The equations describing the suboff geometry are listed below. The lengths r, �, �nose, and�tail are all specified in meters. Since the vehicle is designed in English units these must beconverted. The equations for the suboff design vary with x, the distance aft of the nose ofthe submarine. Calculating the y position, a side profile of the sub was developed. [8, 9]This was revolved around the center axis to give the AUV shape. The suboff shape can beseen in Figure 4.2.
Nose :
y(x) = r
[1 + 0.054x2(
x
�nose− 1)3 − (1 + 0.0393x)(
x
�nose− 1)4
] 12.1
(4.1)
Tube :
y(x) = r (4.2)
Tail :
y(x) = r[A+ Bε3 + Cε4 +Dε5 + Eε6
] 12 (4.3)
where :
A = r2h + rhK0ε2
B = 20− 20r2h − 4rhK0 − 1
3K1
C = −45 + 45r2h + 6rhK0 +K1
D = 36− 36r2h − 4rhK0 −K1
E = −10 + 10r2h + rhK0 +1
3K1
rh = 0.1175
K0 = 30
K1 = 45
ε =�− x
�tail
Initially these equations were used directly to develop the outside contour of the nose, tail
19
and anchor. This method caused problems when being translated to the tools required tomachine it. To avoid this the parts were redrawn with multiple constant radius curves thatclosely matched the equations.
Figure 4.2: Final AUV Shape.
4.1.3 Overall Sizing and Units
It was decided early in the design process to use English units for the AUV. Both metricand English provide difficulties as the rotary seals are only readily available in English andthe electronics are mostly specified in metric. However, English was determined as the bestsolution since most of the raw material and hardware needed are easier to obtain in Englishdimensions. In addition most machine shops are better equipped to handle English jobs.All the drawings of the AUV are specified in English units and where needed the metricdimensions are converted to English units.
The diameter of the vehicle is set from the battery layout. The battery stack requires aninternal diameter of 6.1”. A simple wall crush and buckling calculation was done on a tubeof this ID, explained in detail in Section 4.4.1. It was found that a tube with an outsidediameter of 6.9” was adequate for strength and containing the batteries. This diameter wasalso chosen so aluminum stock with a nominal OD of 7” could be turned down to give a trueconcentric OD of 6.9”.
The length of the vehicle was estimated early in the design, but left open to changes as thedesign progressed. The length is mostly a function of how many batteries are needed, sothis was left open as drag and added torque from the seal and propeller were calculated.Also as the design progressed it was seen that more flexibility in the longitudinal position ofthe CB and CG was needed, so the tube was elongated. This allowed the battery weight tobe moved slightly forward and aft. As described in Section 4.1.2 the suboff equations weremodified to allow the nose and tail length to be set independently. Initially in the design thelengths were set to the default percentages of the total length, as defined for a suboff design.All the electronics were then placed to fit in this area. As the design progressed the tail wasshortened to reduce the unused internal volume. In addition the nose was shortened to aidin positioning the CG near the CB.
20
4.1.4 Tolerances
All dimensions on the vehicle are held to a tolerance of 0.003” unless specified otherwise.Most tolerances on the vehicle are not critical, however all the sealing surfaces are requiredto be held at a tighter tolerance. These tolerances were specified by the seal manufacturersand added to the part drawings. [10] In addition the bearings for the control surfaces andmain shaft required a tighter tolerance.
4.1.5 O-Ring Design
O-Rings are used for all the static seals on the vehicle. O-rings provide a simple and reliablesealing method. In addition they require very little structure and mechanics to implement,keeping the weight of the AUV down. Two styles of o-ring seals are used. The first is themale piston design; where an o-ring is placed in a gland on the male part, which is insertedinto the female part. The o-ring seals against the inner diameter of the female part and theouter diameter of the male part. This sealing method is used for all the connections betweenthe body sections, the sail, the galvanic release, and the discharge tube. The second style ofseal is a face seal; where an o-ring is sandwiched between a gland on one part and a flat wallon another part. This sealing method is used for the depth sensor and the transducers. [10]The use of a piston seal is favorable over a face seal, since the o-ring stays in place betterduring installation due to being stretched over the male part.
Piston Seal Sizing
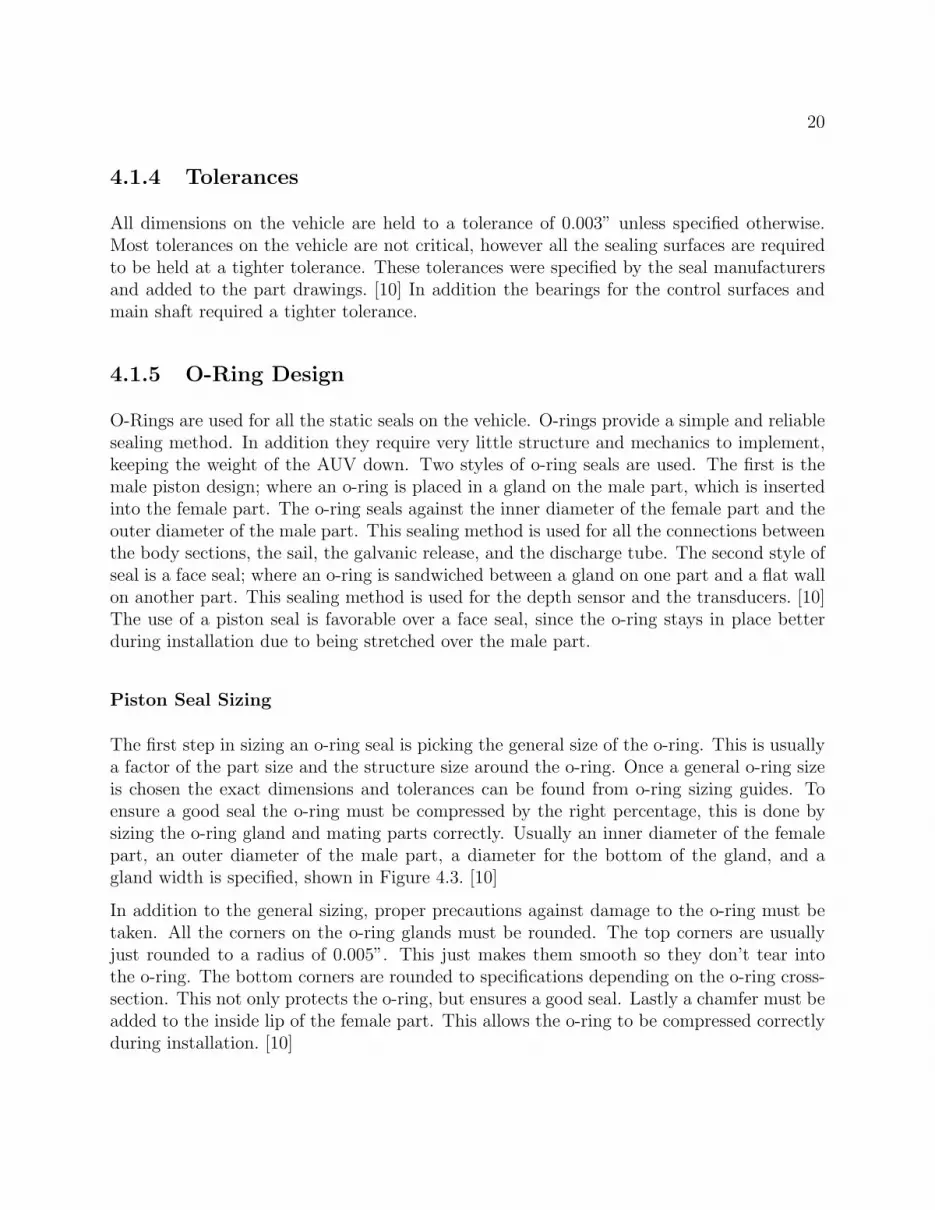
The first step in sizing an o-ring seal is picking the general size of the o-ring. This is usuallya factor of the part size and the structure size around the o-ring. Once a general o-ring sizeis chosen the exact dimensions and tolerances can be found from o-ring sizing guides. Toensure a good seal the o-ring must be compressed by the right percentage, this is done bysizing the o-ring gland and mating parts correctly. Usually an inner diameter of the femalepart, an outer diameter of the male part, a diameter for the bottom of the gland, and agland width is specified, shown in Figure 4.3. [10]
In addition to the general sizing, proper precautions against damage to the o-ring must betaken. All the corners on the o-ring glands must be rounded. The top corners are usuallyjust rounded to a radius of 0.005”. This just makes them smooth so they don’t tear intothe o-ring. The bottom corners are rounded to specifications depending on the o-ring cross-section. This not only protects the o-ring, but ensures a good seal. Lastly a chamfer must beadded to the inside lip of the female part. This allows the o-ring to be compressed correctlyduring installation. [10]
21
Figure 4.3: Piston Seal Dimensions.
Face Seal Sizing
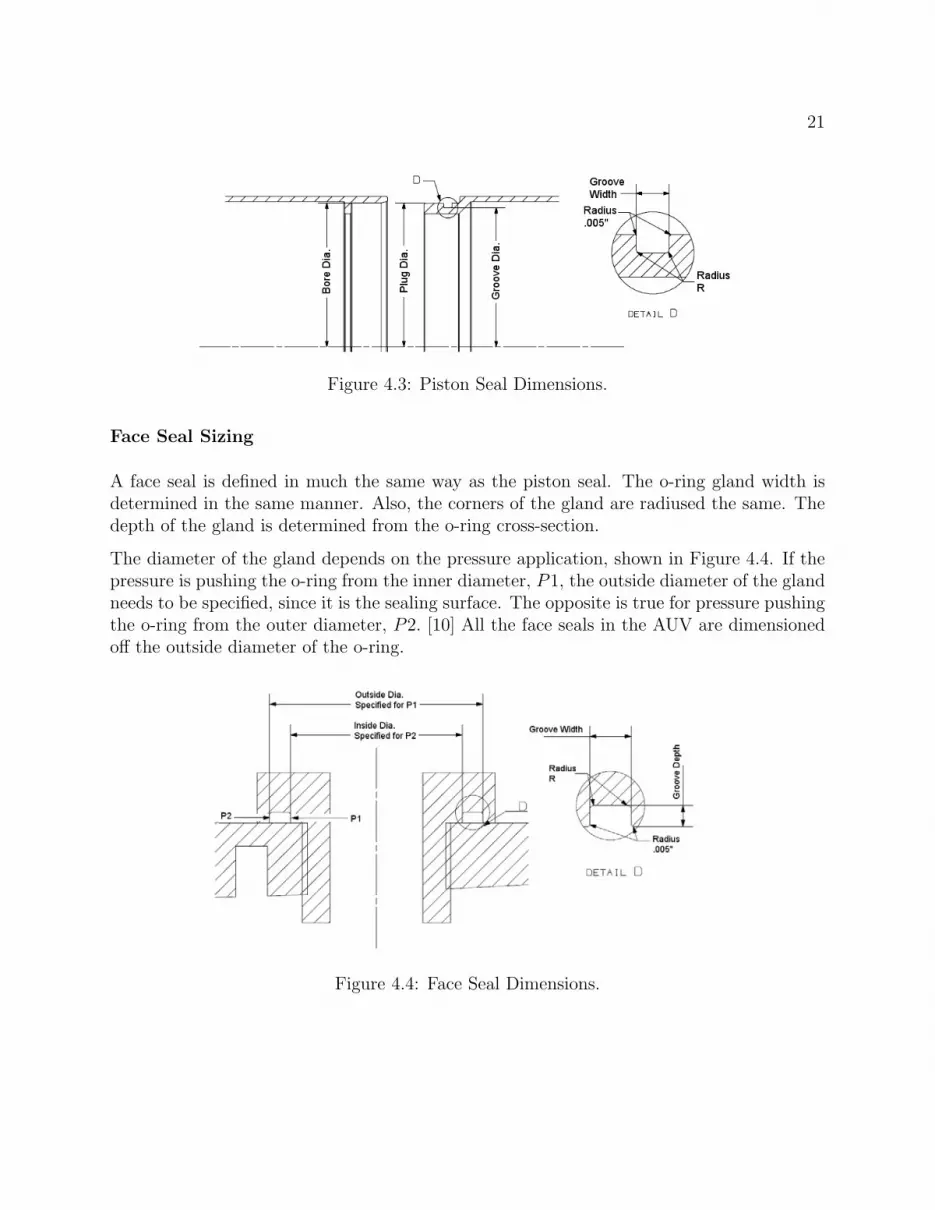
A face seal is defined in much the same way as the piston seal. The o-ring gland width isdetermined in the same manner. Also, the corners of the gland are radiused the same. Thedepth of the gland is determined from the o-ring cross-section.
The diameter of the gland depends on the pressure application, shown in Figure 4.4. If thepressure is pushing the o-ring from the inner diameter, P1, the outside diameter of the glandneeds to be specified, since it is the sealing surface. The opposite is true for pressure pushingthe o-ring from the outer diameter, P2. [10] All the face seals in the AUV are dimensionedoff the outside diameter of the o-ring.
Figure 4.4: Face Seal Dimensions.

22
4.1.6 Corrosion Resistance
Corrosion on the AUV is caused by an electrochemical reaction between the metal of theAUV hull and the salt water surrounding it. All metal surfaces have imperfections whichcauses small voltage differences across the material. If this material is submerged in saltwater an ion current is produced between the positive region (anode) and negative region(cathode) of the material. If left in the salt water for an extended period of time materialwill be removed from the anode. As material is removed the properties of the material willchange and new anodes and cathodes will be formed. The result will be corrosion across theAUV. [4]
This process of corrosion will occur for a single metal, but if two different metals are incontact the corrosion will occur much more rapidly, due to higher voltage differences. [4] Mostcomponents connected to the hull were designed with aluminum or plastic where possible.This proved difficult with the tail strake and fairing screws, as plastic was too ductile andaluminum screws were not available in the correct size. This could be fixed with a slightredesign of screw location. For the depth sensor a plastic isolation plug was used, describedin Section 4.3.3.
To address the small imperfections in the aluminum of the AUV hull, all exposed metal wasanodized with a type 3 hard coat. This provides excellent scratch resistance and isolatesthe aluminum from the salt water. The default material color for type 3 anodizing is adark gray. Due to time constraints colored anodizing was not considered. All tolerancesapply after anodizing, and since the anodizing process adds material, the parts need to bemachined smaller than specified. During manufacturing it was found that maintaining thetolerances in holes on the vehicle was difficult. To address this all the toleranced holes onthe vehicle (discharge tube, galvanic release, sail, control surface seals, and main shaft seals)were left bare metal. A method of maintaining tolerances in these locations will need to befound to avoid all corrosion issues.
The last preventative measure for corrosion is cathodic protection. Seven small zinc plates(three on the nose and four on the tail) are attached to the nose and tail of the vehicle withstainless steel screws. The zinc plates purposely create a voltage difference and act as theanodes. [4] This way during the mission the sacrificial plates will corrode before the AUVhull. To ensure electrical connection between the hull and the anode a small external toothwasher is placed between them. To reduce the drag they are all recessed into pockets on thehull.
4.2 Tail Design
The overall tail design is based on the 475 vehicle. The main tail is made of two pieces:a machined cone like structure that houses the electronics and a small tail cone that hold
23
the seals and bearings for the main motor shaft. The tail cone is essential because it allowsaccess the the flap-servo connections. For stability and control there are four static finsand four movable fins placed around the tail at 90 degree increments. As described abovethe tail houses all the essential AUV hardware other than the communication antennas andsensors. This includes the CPU, the power supply, the inertial sensor, all the communicationmodems, and the motor and servos.
4.2.1 Fin Design
Both the static fins and movable flaps are designed to fit within the 6.9 inch diameter vehicleand are manufactured from cast plastic. This reduces the weight of the components and forlarge production quantities, will reduce the cost. The static fins are attached to the tail bythree screws that thread into blind holes on the tail. These screws were originally intendedto be plastic, however they proved to be too weak and were replaced with stainless steel.
Making the flaps out of plastic enabled them to have a complicated cross-section. The flapsare NACA 0009 airfoils with the trailing edge removed to ease manufacturing. [11] Equation4.4 defines the NACA profile of the flap, where c is the chord and Tnaca is the thicknessfraction or the NACA number divided by 100. [12] The flaps are designed to slide over an1/8” shaft and attach via a set screw. This allows the servos on the inside of the tail to drivethe control surfaces. A small spring seal is used to seal where the shaft penetrates the hull.A bearing below the seal and a bearing placed in the static fin hold the shaft in place.
y(x) = Tnaca
0.2c[0.2969
√xc− 0.126
(xc
)− 0.3516(xc
)2+ 0.2843
(xc
)3 − 0.1015(xc
)4](4.4)
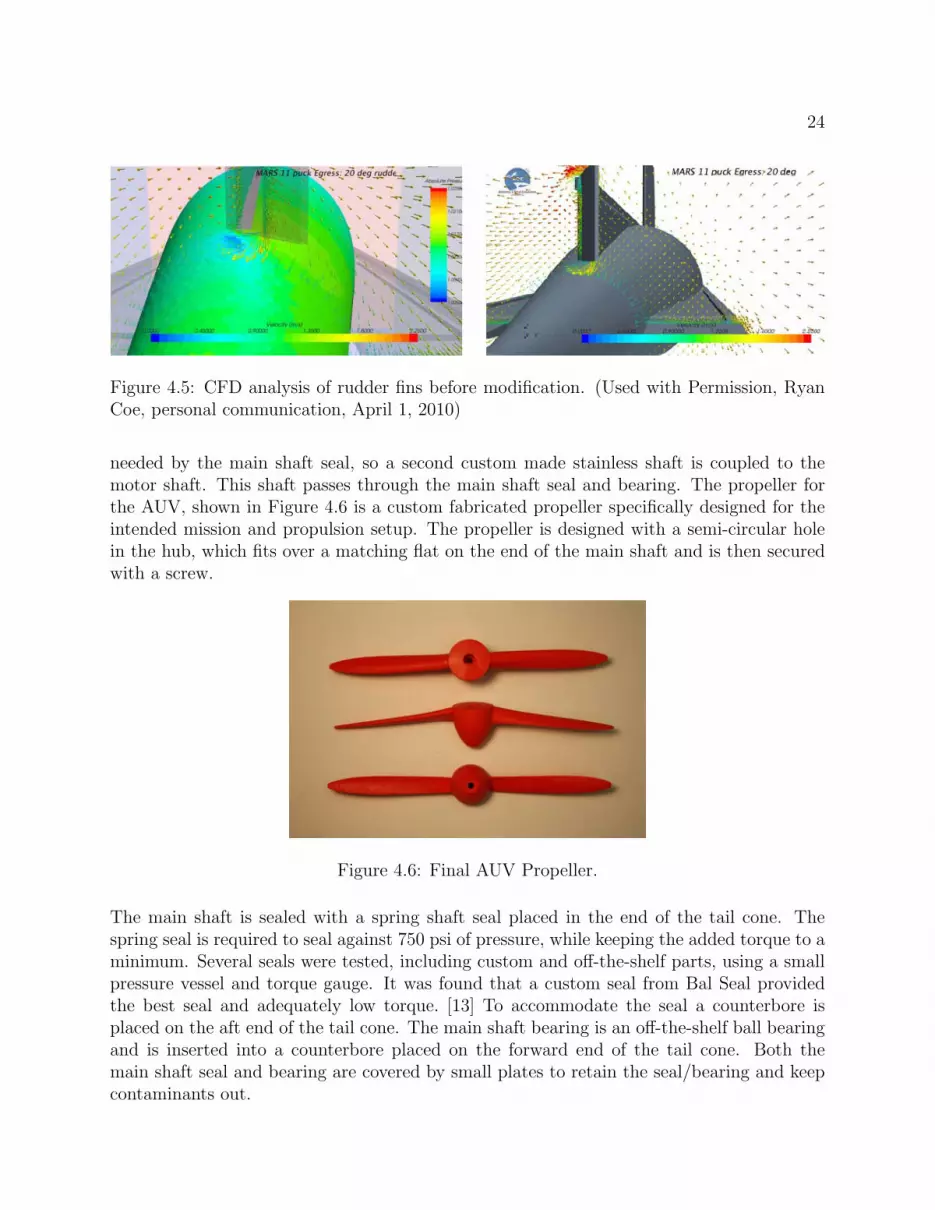
The first iteration of the movable flap called for a straight bottom edge, leaving a gap betweenthe hull and flap. CFD analysis, shown in Figure 4.5 was performed on the flaps and showedthat a significant portion of the flow was being routed through this gap when the controlsurface was actuated. By removing this gap the control surfaces could be more effective,resulting in smaller deflections and less induced drag. The bottom of the flaps was redrawnto follow the contour of the tail.
4.2.2 Propulsion System
The propulsion system for the final AUV was designed to use one of two motors from Neu-Motors. The system is designed to work with either the 1521-10.5Y or 1925-3Y. The 1925motor provides slightly better efficiency (4%) and less weight. Both motors will be testedto decide on a final configuration. [13] The motors were ordered with a custom motor shaftto extend the shaft past the servo basket. The motor shaft is not held to the tolerances
24
Figure 4.5: CFD analysis of rudder fins before modification. (Used with Permission, RyanCoe, personal communication, April 1, 2010)
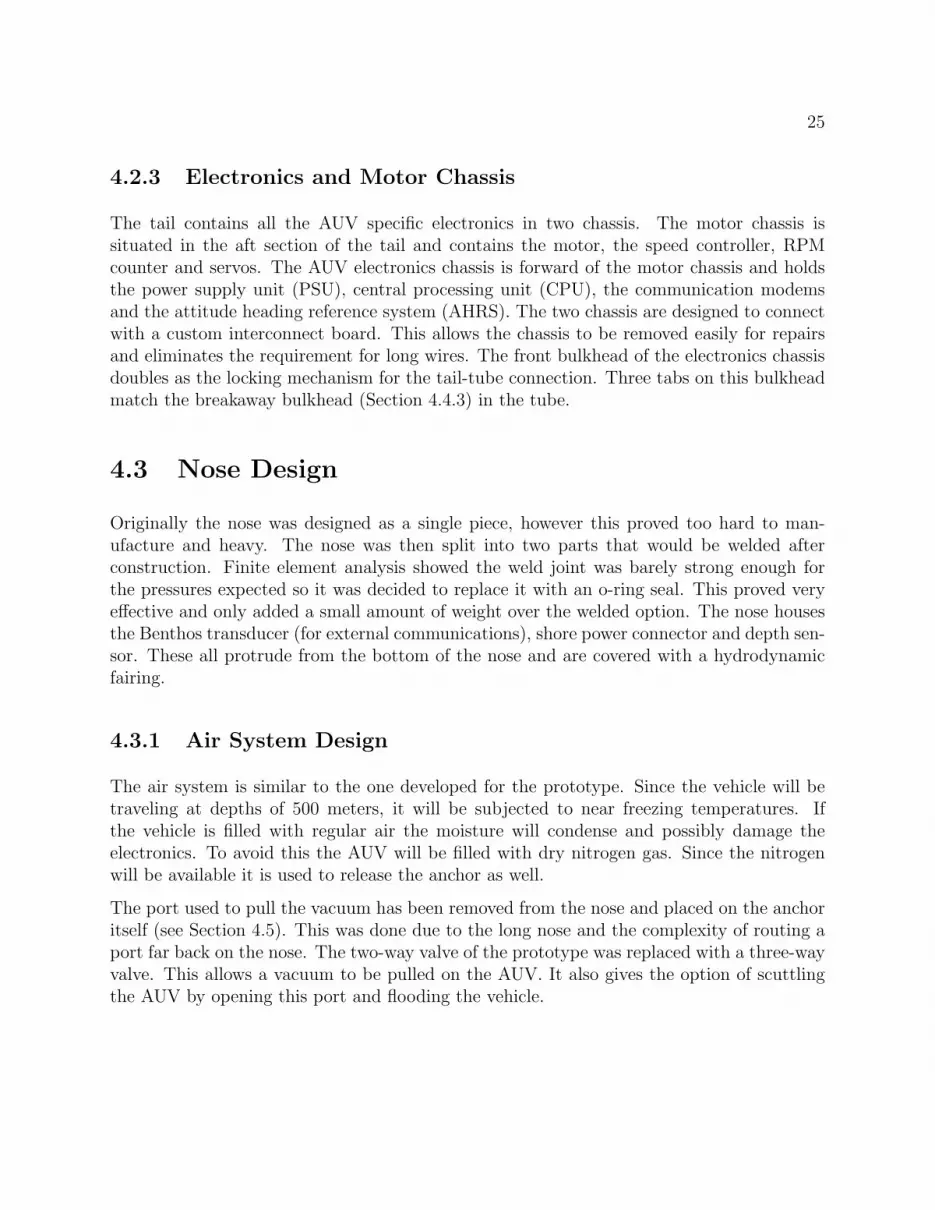
needed by the main shaft seal, so a second custom made stainless shaft is coupled to themotor shaft. This shaft passes through the main shaft seal and bearing. The propeller forthe AUV, shown in Figure 4.6 is a custom fabricated propeller specifically designed for theintended mission and propulsion setup. The propeller is designed with a semi-circular holein the hub, which fits over a matching flat on the end of the main shaft and is then securedwith a screw.
Figure 4.6: Final AUV Propeller.
The main shaft is sealed with a spring shaft seal placed in the end of the tail cone. Thespring seal is required to seal against 750 psi of pressure, while keeping the added torque to aminimum. Several seals were tested, including custom and off-the-shelf parts, using a smallpressure vessel and torque gauge. It was found that a custom seal from Bal Seal providedthe best seal and adequately low torque. [13] To accommodate the seal a counterbore isplaced on the aft end of the tail cone. The main shaft bearing is an off-the-shelf ball bearingand is inserted into a counterbore placed on the forward end of the tail cone. Both themain shaft seal and bearing are covered by small plates to retain the seal/bearing and keepcontaminants out.
25
4.2.3 Electronics and Motor Chassis
The tail contains all the AUV specific electronics in two chassis. The motor chassis issituated in the aft section of the tail and contains the motor, the speed controller, RPMcounter and servos. The AUV electronics chassis is forward of the motor chassis and holdsthe power supply unit (PSU), central processing unit (CPU), the communication modemsand the attitude heading reference system (AHRS). The two chassis are designed to connectwith a custom interconnect board. This allows the chassis to be removed easily for repairsand eliminates the requirement for long wires. The front bulkhead of the electronics chassisdoubles as the locking mechanism for the tail-tube connection. Three tabs on this bulkheadmatch the breakaway bulkhead (Section 4.4.3) in the tube.
4.3 Nose Design
Originally the nose was designed as a single piece, however this proved too hard to man-ufacture and heavy. The nose was then split into two parts that would be welded afterconstruction. Finite element analysis showed the weld joint was barely strong enough forthe pressures expected so it was decided to replace it with an o-ring seal. This proved veryeffective and only added a small amount of weight over the welded option. The nose housesthe Benthos transducer (for external communications), shore power connector and depth sen-sor. These all protrude from the bottom of the nose and are covered with a hydrodynamicfairing.
4.3.1 Air System Design
The air system is similar to the one developed for the prototype. Since the vehicle will betraveling at depths of 500 meters, it will be subjected to near freezing temperatures. Ifthe vehicle is filled with regular air the moisture will condense and possibly damage theelectronics. To avoid this the AUV will be filled with dry nitrogen gas. Since the nitrogenwill be available it is used to release the anchor as well.
The port used to pull the vacuum has been removed from the nose and placed on the anchoritself (see Section 4.5). This was done due to the long nose and the complexity of routing aport far back on the nose. The two-way valve of the prototype was replaced with a three-wayvalve. This allows a vacuum to be pulled on the AUV. It also gives the option of scuttlingthe AUV by opening this port and flooding the vehicle.
26
4.3.2 Galvanic Release
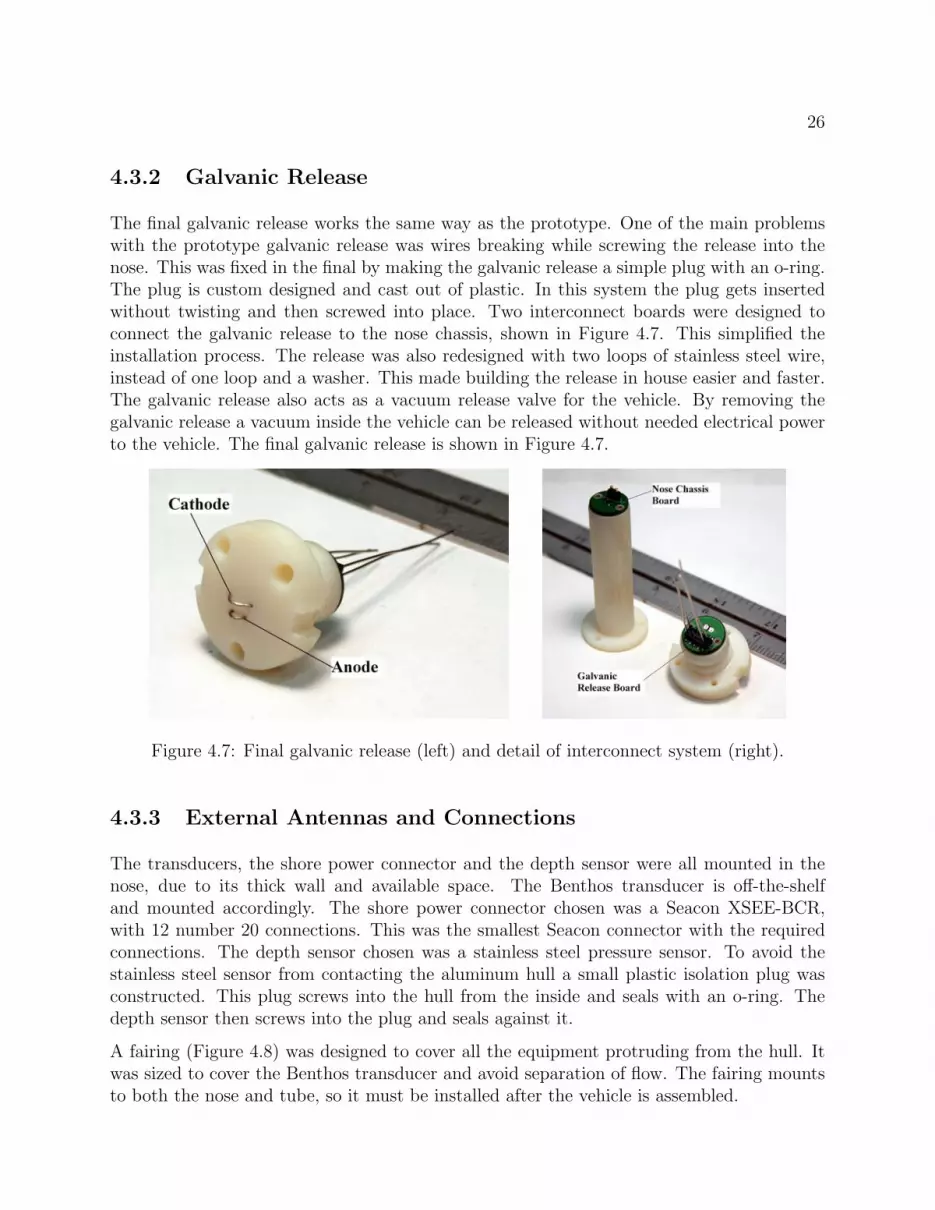
The final galvanic release works the same way as the prototype. One of the main problemswith the prototype galvanic release was wires breaking while screwing the release into thenose. This was fixed in the final by making the galvanic release a simple plug with an o-ring.The plug is custom designed and cast out of plastic. In this system the plug gets insertedwithout twisting and then screwed into place. Two interconnect boards were designed toconnect the galvanic release to the nose chassis, shown in Figure 4.7. This simplified theinstallation process. The release was also redesigned with two loops of stainless steel wire,instead of one loop and a washer. This made building the release in house easier and faster.The galvanic release also acts as a vacuum release valve for the vehicle. By removing thegalvanic release a vacuum inside the vehicle can be released without needed electrical powerto the vehicle. The final galvanic release is shown in Figure 4.7.
Figure 4.7: Final galvanic release (left) and detail of interconnect system (right).
4.3.3 External Antennas and Connections
The transducers, the shore power connector and the depth sensor were all mounted in thenose, due to its thick wall and available space. The Benthos transducer is off-the-shelfand mounted accordingly. The shore power connector chosen was a Seacon XSEE-BCR,with 12 number 20 connections. This was the smallest Seacon connector with the requiredconnections. The depth sensor chosen was a stainless steel pressure sensor. To avoid thestainless steel sensor from contacting the aluminum hull a small plastic isolation plug wasconstructed. This plug screws into the hull from the inside and seals with an o-ring. Thedepth sensor then screws into the plug and seals against it.
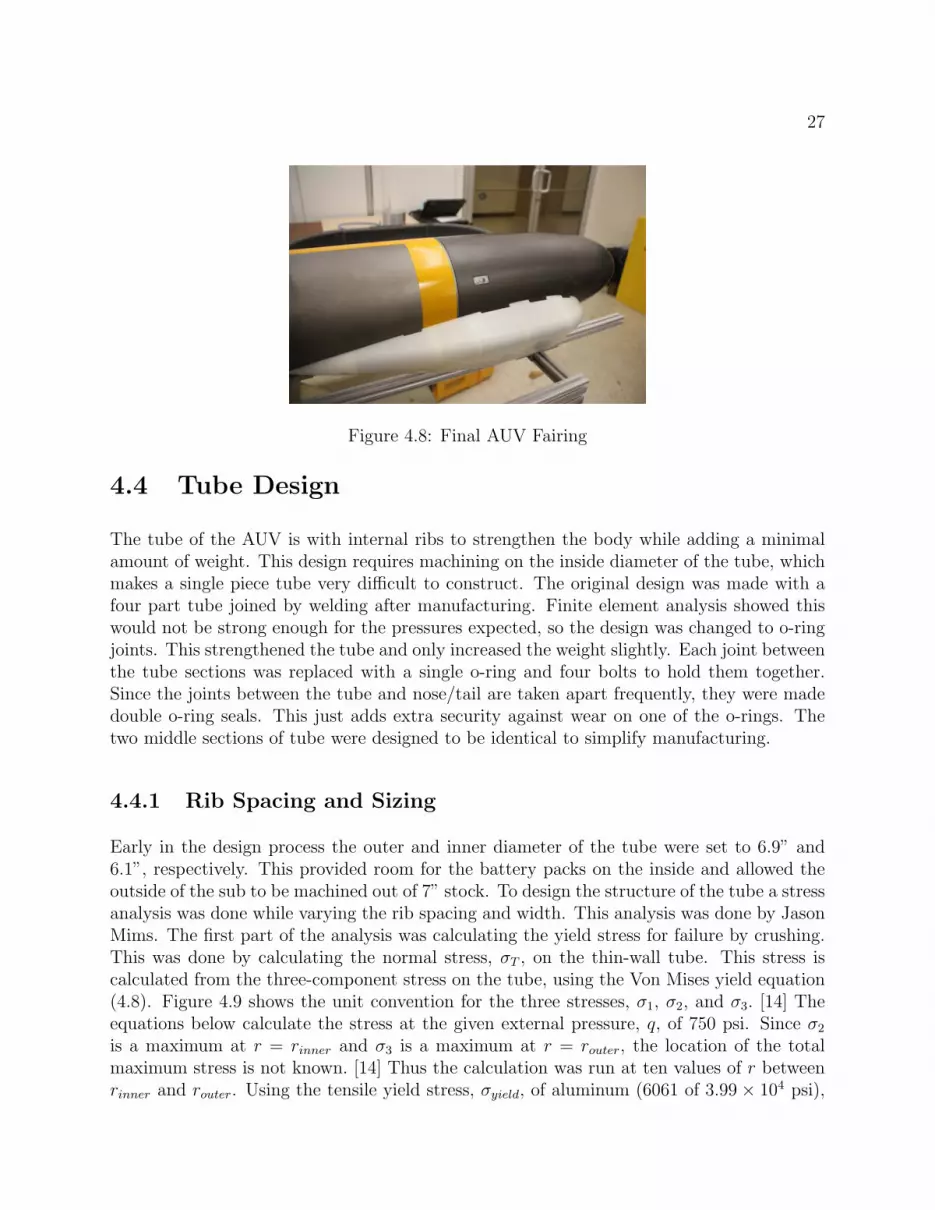
A fairing (Figure 4.8) was designed to cover all the equipment protruding from the hull. Itwas sized to cover the Benthos transducer and avoid separation of flow. The fairing mountsto both the nose and tube, so it must be installed after the vehicle is assembled.
27
Figure 4.8: Final AUV Fairing
4.4 Tube Design
The tube of the AUV is with internal ribs to strengthen the body while adding a minimalamount of weight. This design requires machining on the inside diameter of the tube, whichmakes a single piece tube very difficult to construct. The original design was made with afour part tube joined by welding after manufacturing. Finite element analysis showed thiswould not be strong enough for the pressures expected, so the design was changed to o-ringjoints. This strengthened the tube and only increased the weight slightly. Each joint betweenthe tube sections was replaced with a single o-ring and four bolts to hold them together.Since the joints between the tube and nose/tail are taken apart frequently, they were madedouble o-ring seals. This just adds extra security against wear on one of the o-rings. Thetwo middle sections of tube were designed to be identical to simplify manufacturing.
4.4.1 Rib Spacing and Sizing
Early in the design process the outer and inner diameter of the tube were set to 6.9” and6.1”, respectively. This provided room for the battery packs on the inside and allowed theoutside of the sub to be machined out of 7” stock. To design the structure of the tube a stressanalysis was done while varying the rib spacing and width. This analysis was done by JasonMims. The first part of the analysis was calculating the yield stress for failure by crushing.This was done by calculating the normal stress, σT , on the thin-wall tube. This stress iscalculated from the three-component stress on the tube, using the Von Mises yield equation(4.8). Figure 4.9 shows the unit convention for the three stresses, σ1, σ2, and σ3. [14] Theequations below calculate the stress at the given external pressure, q, of 750 psi. Since σ2
is a maximum at r = rinner and σ3 is a maximum at r = router, the location of the totalmaximum stress is not known. [14] Thus the calculation was run at ten values of r betweenrinner and router. Using the tensile yield stress, σyield, of aluminum (6061 of 3.99× 10⁴ psi),

28
Figure 4.9: Dimensions and stress conventions of tube stress analysis.
the safety factor of the tube can be found.
σ1 =−qr2outer
r2outer − r2inner(4.5)
σ2 =−qr2outer(r
2inner + r2)
r2(r2outer − r2inner)(4.6)
σ3 =−qr2outer(r
2 − r2inner)
r2(r2outer − r2inner)(4.7)
σ2T = (σ2
1 + σ22 + σ2
3)− σ1σ2 − σ2σ3 − σ1σ3 (4.8)
SFcrush =σyield
σT
(4.9)
The second part of the analysis is finding the external pressure at which elastic bucklingoccurs, q′, calculated in Equation 4.10. [14] To calculate q′ the Young’s modulus, E, andthe Poisson’s ratio, ν, of the material is needed. Equation 4.10 also requires the numberof lobes formed by the tube during buckling. The normal way to account for this is thecalculate q′ for 2 ≤ n ≤ 10, and use the minimum value of q′. From experimental resultsthe recommended critical pressure, Pcrit, occurs at 80 percent of the minimum q′ value. [14]The safety factor for failure by buckling is calculated using Pcrit and the expected externalpressure, q.
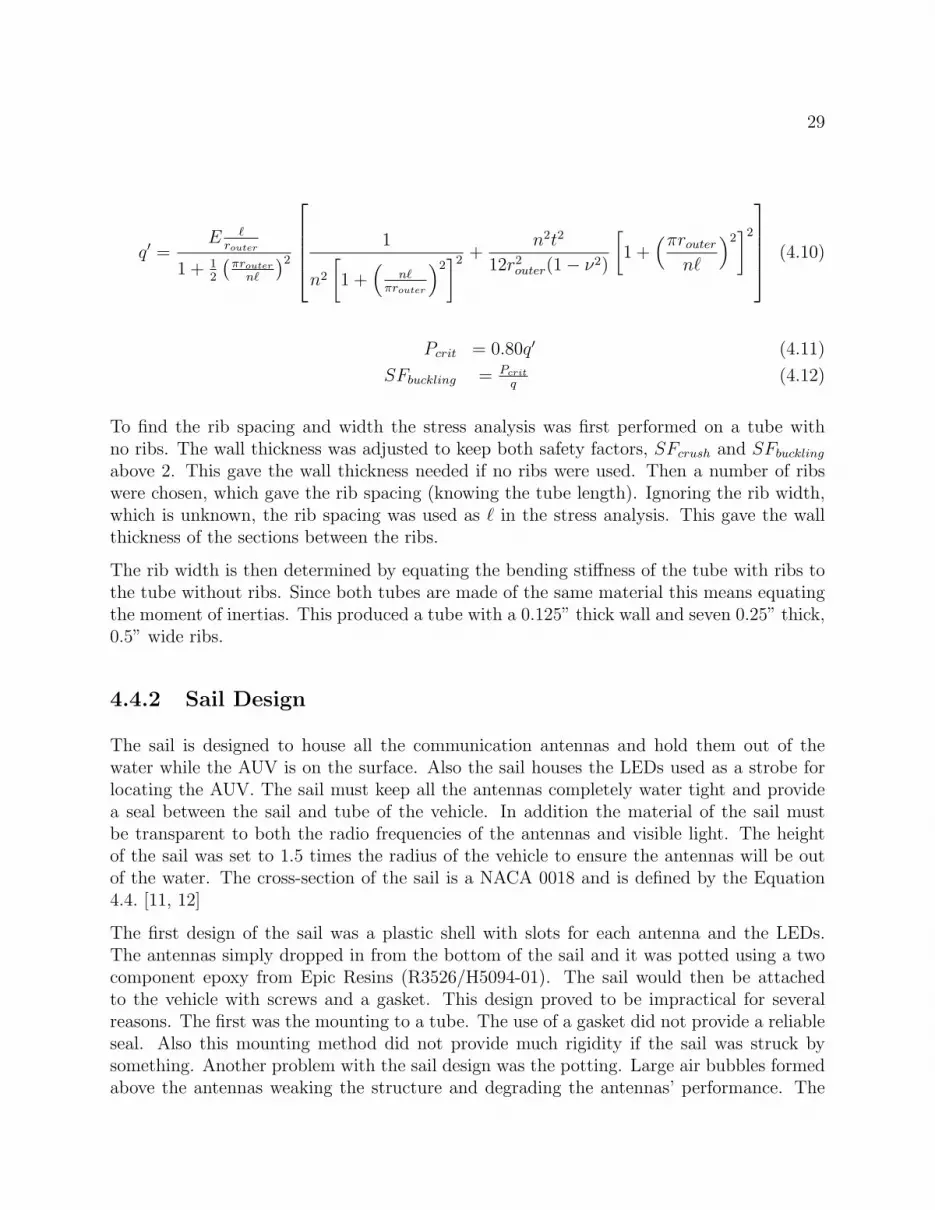
29
q′ =E �
router
1 + 12
(πrouter
n�
)2⎡⎢⎢⎢⎣ 1
n2
[1 +
(n�
πrouter
)2]2 +
n2t2
12r2outer(1− ν2)
[1 +
(πroutern�
)2]2⎤⎥⎥⎥⎦ (4.10)
Pcrit = 0.80q′ (4.11)
SFbuckling = Pcrit
q(4.12)
To find the rib spacing and width the stress analysis was first performed on a tube withno ribs. The wall thickness was adjusted to keep both safety factors, SFcrush and SFbuckling
above 2. This gave the wall thickness needed if no ribs were used. Then a number of ribswere chosen, which gave the rib spacing (knowing the tube length). Ignoring the rib width,which is unknown, the rib spacing was used as � in the stress analysis. This gave the wallthickness of the sections between the ribs.
The rib width is then determined by equating the bending stiffness of the tube with ribs tothe tube without ribs. Since both tubes are made of the same material this means equatingthe moment of inertias. This produced a tube with a 0.125” thick wall and seven 0.25” thick,0.5” wide ribs.
4.4.2 Sail Design
The sail is designed to house all the communication antennas and hold them out of thewater while the AUV is on the surface. Also the sail houses the LEDs used as a strobe forlocating the AUV. The sail must keep all the antennas completely water tight and providea seal between the sail and tube of the vehicle. In addition the material of the sail mustbe transparent to both the radio frequencies of the antennas and visible light. The heightof the sail was set to 1.5 times the radius of the vehicle to ensure the antennas will be outof the water. The cross-section of the sail is a NACA 0018 and is defined by the Equation4.4. [11, 12]
The first design of the sail was a plastic shell with slots for each antenna and the LEDs.The antennas simply dropped in from the bottom of the sail and it was potted using a twocomponent epoxy from Epic Resins (R3526/H5094-01). The sail would then be attachedto the vehicle with screws and a gasket. This design proved to be impractical for severalreasons. The first was the mounting to a tube. The use of a gasket did not provide a reliableseal. Also this mounting method did not provide much rigidity if the sail was struck bysomething. Another problem with the sail design was the potting. Large air bubbles formedabove the antennas weaking the structure and degrading the antennas’ performance. The
30
first sail potted showed deformation due to the heat produced by the epoxy. The epoxyused for the potting compound has a cure time of 30-40 minutes, which makes the epoxytemperature rise significantly.
The second design fixed the mounting issue by replacing the gasket with a custom bolt. Thisbolt held the sail to the tube mechanically while providing a seal with an o-ring. This provedto be a much more durable and reliable seal. The middle rib on the back tube section waslengthened to accommodate the o-ring seat for the bolt. The sail was thickened all around toprevent deforming and decrease the effect air bubbles would have on the structural integrity.Lastly the antennas were mounted to an internal structure that slid into the sail. This madeinstalling the antennas easier and allowed the potting compound to be poured before insertingthe antennas. Pouring the potting compound in first prevents air from being trapped abovethe antennas.
In addition the potting compound was changed to Ultraclear 438. This epoxy had a longercuring time (overnight), which reduced the heat produced during curing. An ice bath duringcuring was used with the old Epic Resins epoxy, which helped reduce air bubbles, but thenew potting compound proved sufficient without the need for an ice bath. The potting ofthe sail was performed in a vacuum chamber to degas the epoxy. This pulls the air out ofthe epoxy, reducing the number of air bubbles. To facilitate this the shell of the sail wasdesigned to allow paths around the antennas for the air bubbles.
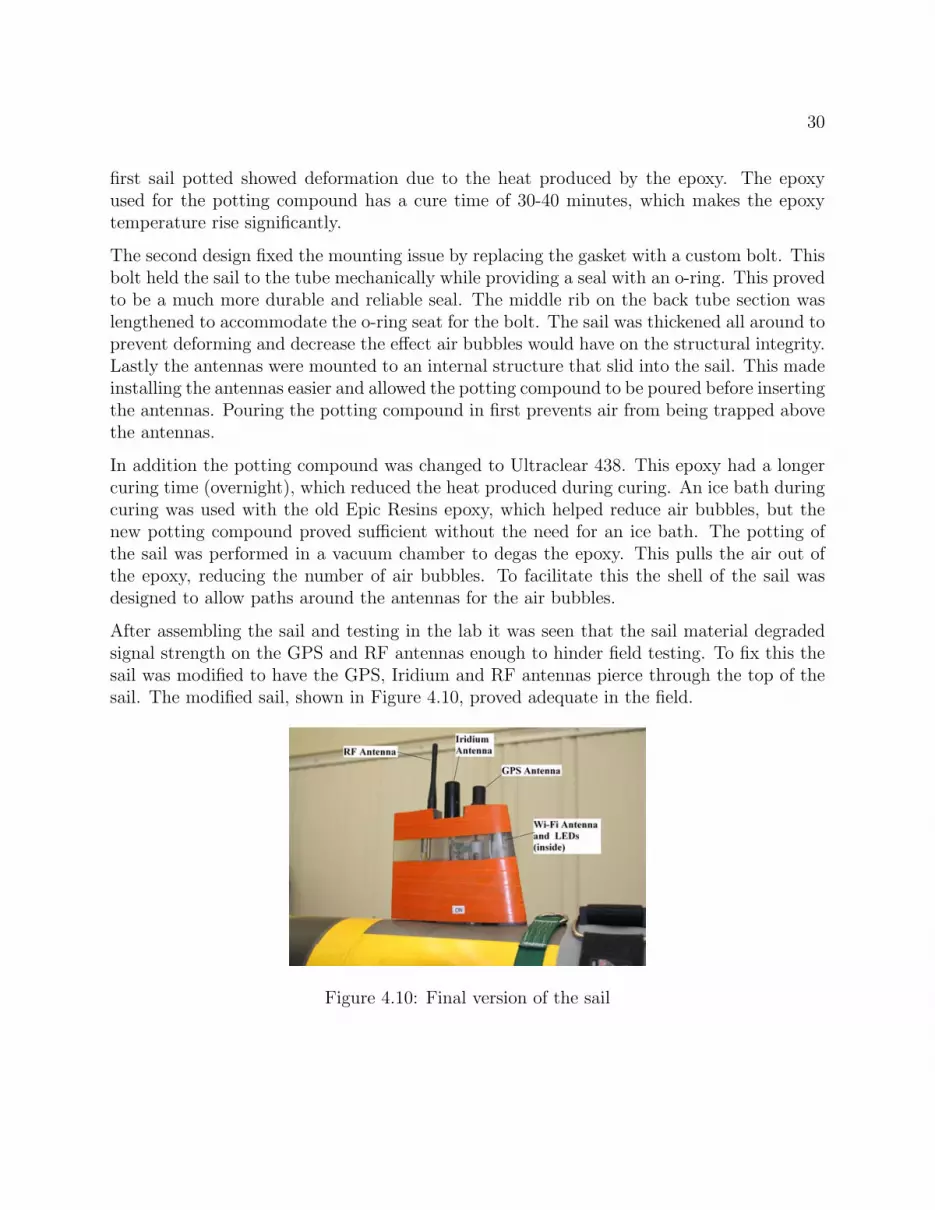
After assembling the sail and testing in the lab it was seen that the sail material degradedsignal strength on the GPS and RF antennas enough to hinder field testing. To fix this thesail was modified to have the GPS, Iridium and RF antennas pierce through the top of thesail. The modified sail, shown in Figure 4.10, proved adequate in the field.
Figure 4.10: Final version of the sail
31
4.4.3 Breakaway Bulkheads
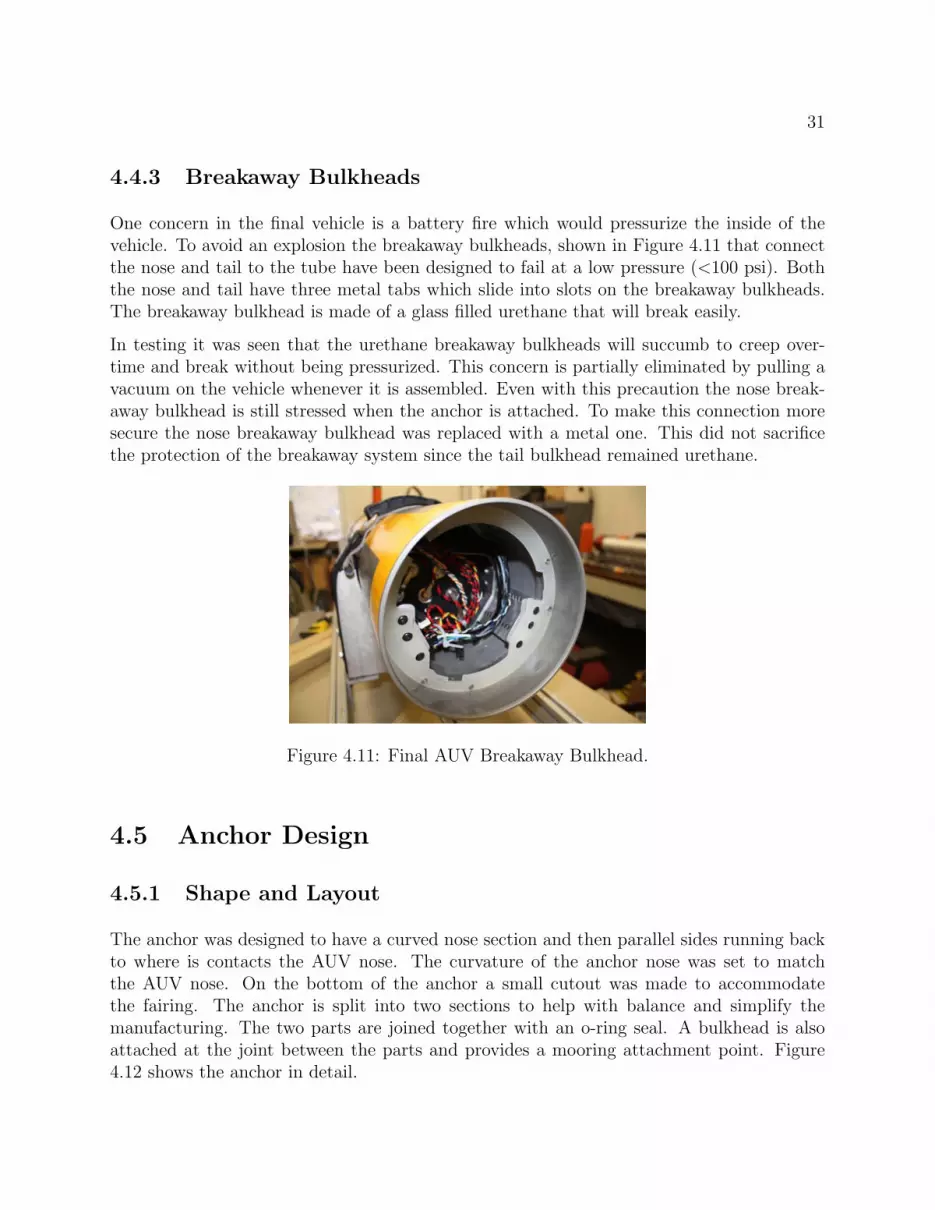
One concern in the final vehicle is a battery fire which would pressurize the inside of thevehicle. To avoid an explosion the breakaway bulkheads, shown in Figure 4.11 that connectthe nose and tail to the tube have been designed to fail at a low pressure (<100 psi). Boththe nose and tail have three metal tabs which slide into slots on the breakaway bulkheads.The breakaway bulkhead is made of a glass filled urethane that will break easily.
In testing it was seen that the urethane breakaway bulkheads will succumb to creep over-time and break without being pressurized. This concern is partially eliminated by pulling avacuum on the vehicle whenever it is assembled. Even with this precaution the nose break-away bulkhead is still stressed when the anchor is attached. To make this connection moresecure the nose breakaway bulkhead was replaced with a metal one. This did not sacrificethe protection of the breakaway system since the tail bulkhead remained urethane.
Figure 4.11: Final AUV Breakaway Bulkhead.
4.5 Anchor Design
4.5.1 Shape and Layout
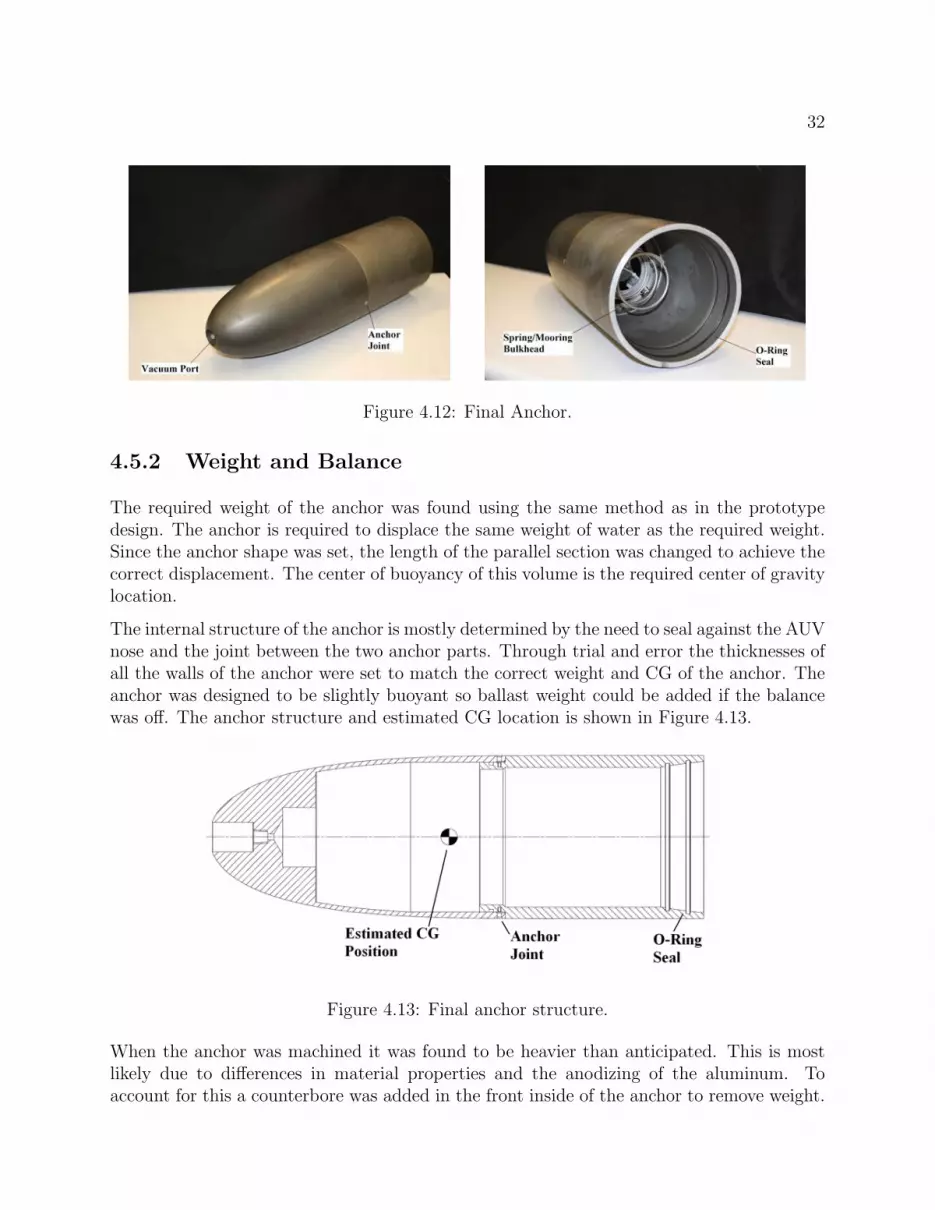
The anchor was designed to have a curved nose section and then parallel sides running backto where is contacts the AUV nose. The curvature of the anchor nose was set to matchthe AUV nose. On the bottom of the anchor a small cutout was made to accommodatethe fairing. The anchor is split into two sections to help with balance and simplify themanufacturing. The two parts are joined together with an o-ring seal. A bulkhead is alsoattached at the joint between the parts and provides a mooring attachment point. Figure4.12 shows the anchor in detail.
32
Figure 4.12: Final Anchor.
4.5.2 Weight and Balance
The required weight of the anchor was found using the same method as in the prototypedesign. The anchor is required to displace the same weight of water as the required weight.Since the anchor shape was set, the length of the parallel section was changed to achieve thecorrect displacement. The center of buoyancy of this volume is the required center of gravitylocation.
The internal structure of the anchor is mostly determined by the need to seal against the AUVnose and the joint between the two anchor parts. Through trial and error the thicknesses ofall the walls of the anchor were set to match the correct weight and CG of the anchor. Theanchor was designed to be slightly buoyant so ballast weight could be added if the balancewas off. The anchor structure and estimated CG location is shown in Figure 4.13.
Figure 4.13: Final anchor structure.
When the anchor was machined it was found to be heavier than anticipated. This is mostlikely due to differences in material properties and the anodizing of the aluminum. Toaccount for this a counterbore was added in the front inside of the anchor to remove weight.
33
Since the CG-CB separation cannot change, weight was removed by machining down theback lip of the anchor.
4.5.3 Mooring System
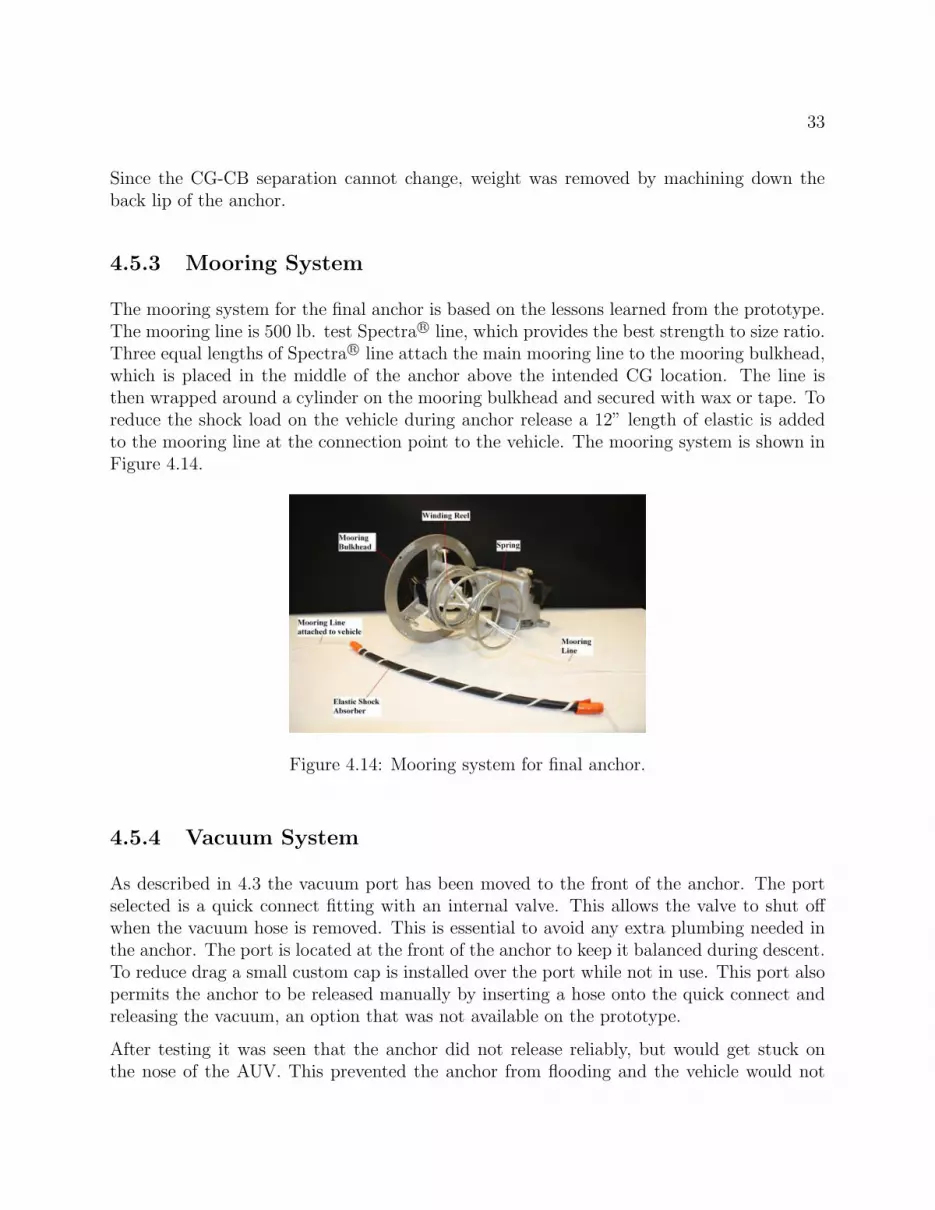
The mooring system for the final anchor is based on the lessons learned from the prototype.The mooring line is 500 lb. test SpectraR© line, which provides the best strength to size ratio.Three equal lengths of Spectra R© line attach the main mooring line to the mooring bulkhead,which is placed in the middle of the anchor above the intended CG location. The line isthen wrapped around a cylinder on the mooring bulkhead and secured with wax or tape. Toreduce the shock load on the vehicle during anchor release a 12” length of elastic is addedto the mooring line at the connection point to the vehicle. The mooring system is shown inFigure 4.14.
Figure 4.14: Mooring system for final anchor.
4.5.4 Vacuum System
As described in 4.3 the vacuum port has been moved to the front of the anchor. The portselected is a quick connect fitting with an internal valve. This allows the valve to shut offwhen the vacuum hose is removed. This is essential to avoid any extra plumbing needed inthe anchor. The port is located at the front of the anchor to keep it balanced during descent.To reduce drag a small custom cap is installed over the port while not in use. This port alsopermits the anchor to be released manually by inserting a hose onto the quick connect andreleasing the vacuum, an option that was not available on the prototype.
After testing it was seen that the anchor did not release reliably, but would get stuck onthe nose of the AUV. This prevented the anchor from flooding and the vehicle would not
34
descend. To fix this a spring was added to the anchor and attached to the mooring bulkhead.The spring was sized to be compressed when the anchor was attached to the AUV.
Chapter 5
Testing
5.1 Control Testing
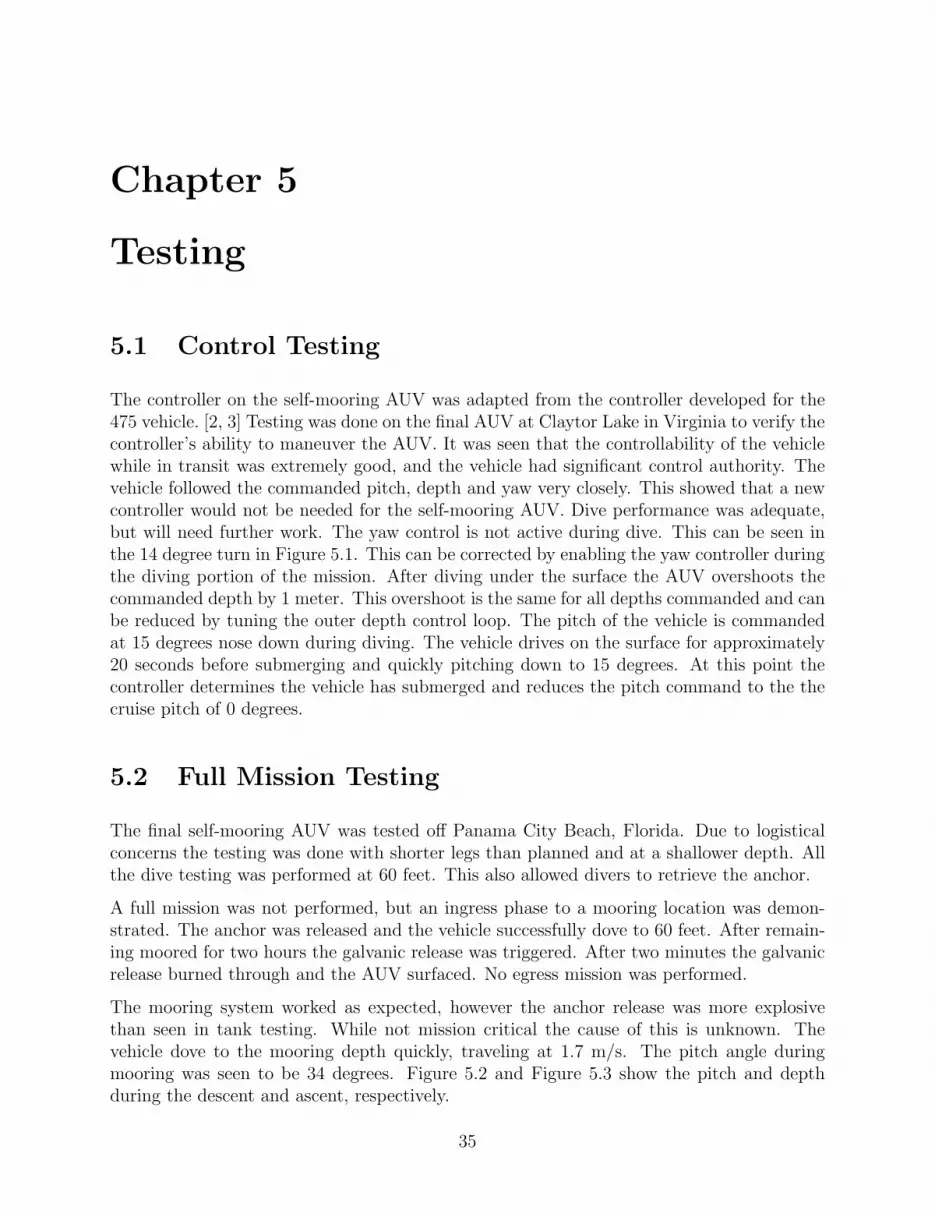
The controller on the self-mooring AUV was adapted from the controller developed for the475 vehicle. [2, 3] Testing was done on the final AUV at Claytor Lake in Virginia to verify thecontroller’s ability to maneuver the AUV. It was seen that the controllability of the vehiclewhile in transit was extremely good, and the vehicle had significant control authority. Thevehicle followed the commanded pitch, depth and yaw very closely. This showed that a newcontroller would not be needed for the self-mooring AUV. Dive performance was adequate,but will need further work. The yaw control is not active during dive. This can be seen inthe 14 degree turn in Figure 5.1. This can be corrected by enabling the yaw controller duringthe diving portion of the mission. After diving under the surface the AUV overshoots thecommanded depth by 1 meter. This overshoot is the same for all depths commanded and canbe reduced by tuning the outer depth control loop. The pitch of the vehicle is commandedat 15 degrees nose down during diving. The vehicle drives on the surface for approximately20 seconds before submerging and quickly pitching down to 15 degrees. At this point thecontroller determines the vehicle has submerged and reduces the pitch command to the thecruise pitch of 0 degrees.
5.2 Full Mission Testing
The final self-mooring AUV was tested off Panama City Beach, Florida. Due to logisticalconcerns the testing was done with shorter legs than planned and at a shallower depth. Allthe dive testing was performed at 60 feet. This also allowed divers to retrieve the anchor.
A full mission was not performed, but an ingress phase to a mooring location was demon-strated. The anchor was released and the vehicle successfully dove to 60 feet. After remain-ing moored for two hours the galvanic release was triggered. After two minutes the galvanicrelease burned through and the AUV surfaced. No egress mission was performed.
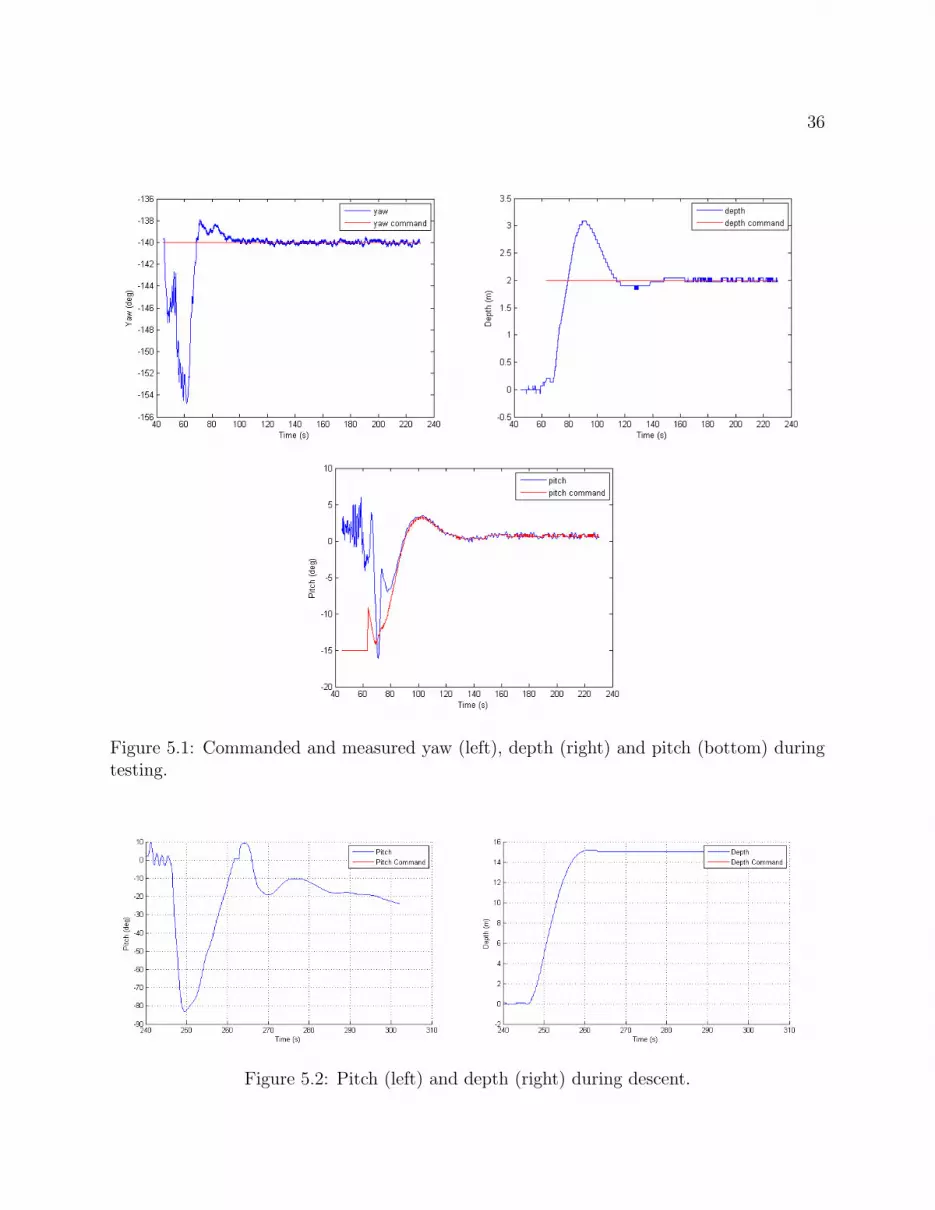
The mooring system worked as expected, however the anchor release was more explosivethan seen in tank testing. While not mission critical the cause of this is unknown. Thevehicle dove to the mooring depth quickly, traveling at 1.7 m/s. The pitch angle duringmooring was seen to be 34 degrees. Figure 5.2 and Figure 5.3 show the pitch and depthduring the descent and ascent, respectively.
35
36
Figure 5.1: Commanded and measured yaw (left), depth (right) and pitch (bottom) duringtesting.
Figure 5.2: Pitch (left) and depth (right) during descent.
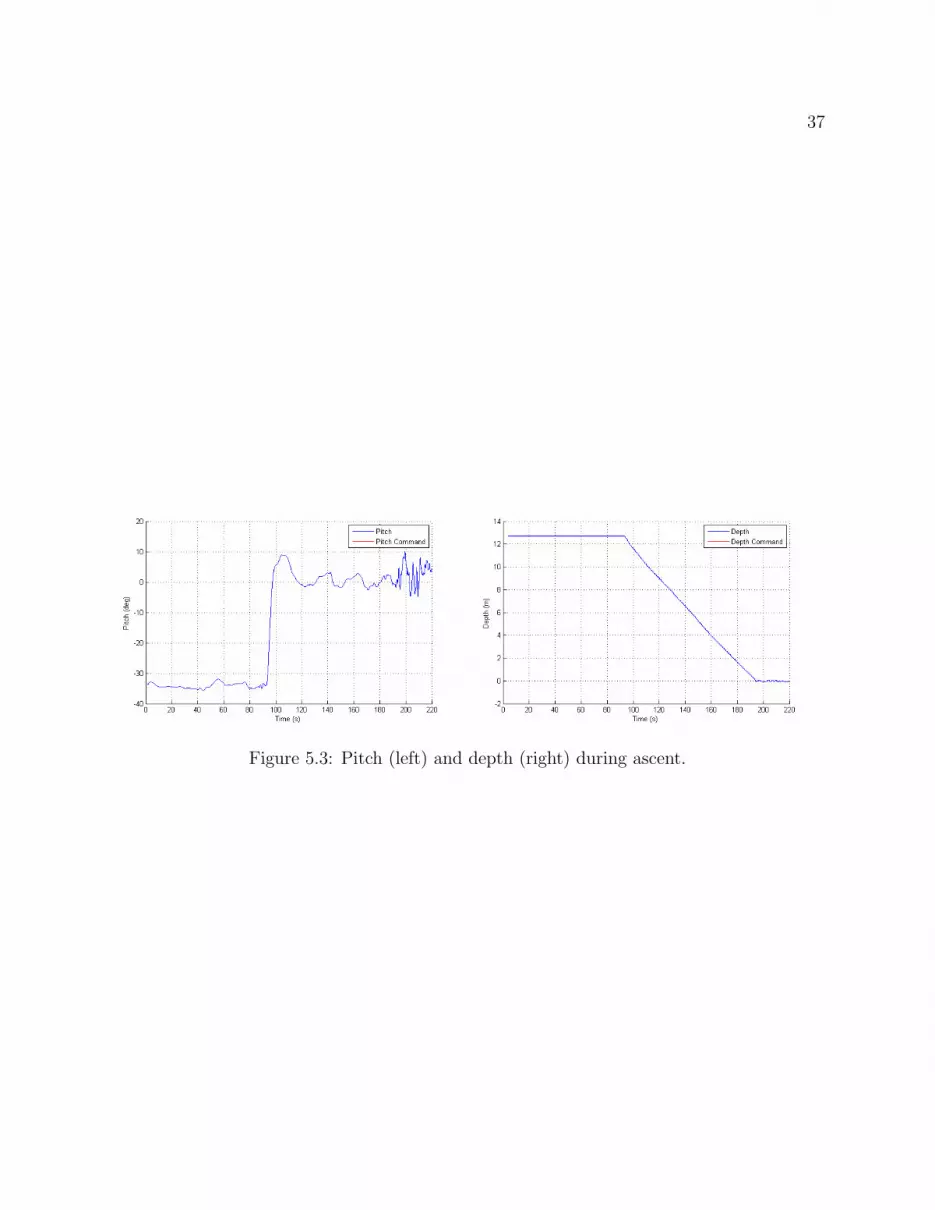
37
Figure 5.3: Pitch (left) and depth (right) during ascent.

Bibliography
[1] Gadre, A.S., D.K. Maczka, D. Spinello, B.R. McCarter, D.J. Stilwell, W.L. Neu, M.J.Roan, J.B. Hennage. Cooperative localization of an acoustic source using towed hy-drophone arrays, in Proc. IEEE Workshop on Autonomous Underwater Vehicles, WoodsHole, MA, 2008.
[2] Petrich, J., W.L. Neu, and D.J. Stilwell. Identification of a simplified AUV pitch axismodel for control design: Theory and experiments. In OCEANS 2007, Proceedings ofMTS/IEEE, Vancover, BC, Canada, 2007.
[3] Petrich, J., and D.J. Stilwell. Model simplification for AUV pitch-axis control design,in Journal of Ocean Engineering, 37(7): 638652, 2010.
[4] Sackinger, William, Causes and Prevention of Marine Corrosion, Marine Advisory Bul-letin No. 10, University of Alaska, Fairbanks, Alaska, 1980.
[5] Hoerner, S.F., Fluid-Dynamic Drag, Hoerner Fluid Dynamics, Bakersfield, CA, 1992.
[6] ITTC (1957), Proc. 8th ITTC, Madrid, Spain, published by Canal de ExperienciasHidrodinamicas, El Pardo, Madrid.
[7] Groves, N.C., T. Huang, M. Chang. Geometric Characteristics of DARPA Suboff Mod-els, David Taylor Research Center, Bethesda, MD, 1989.
[8] Granlund, K., Steady and Unsteady Maneuvering Forces and Moments on Slender Bod-ies, Doctoral dissertation, Virginia Polytechnic Institute and State University, Blacks-burg, Virginia, 2009.
[9] Whitfield, C., Steady and Unsteady Force and Moment Data on a DARPA2 Subma-rine, Masters thesis, Virginia Polytechnic Institute and State University, Blacksburg,Virginia, 1999.
[10] “Parker O-Ring Handbook.”, Parker Hannifin Corporation, Cleveland, OH, 2007.
[11] Jacobs, E.N., K.E. Ward, R.M. Pinkerton. The characteristics of 78 related airfoil sec-tions from tests in the variable-density wind tunnel, National Advisory Committee forAeronautics Report No. 460, 1935.
38

39
[12] Moran, J., An Introduction to Theoretical and Computational Aerodynamics, DoverPublications, Inc., Mineola, NY, 2003.
[13] Duelley, R., Autonomous Underwater Vehicle Propulsion Design, Masters thesis, Vir-ginia Polytechnic Institute and State University, Blacksburg, Virginia, 2010.
[14] Young, W.C., Roark’s Formulas for Stress & Strain, McGraw-Hill, Inc., New York, NY,1989.


