Embed Size (px)
Citation preview

2068 Biophysical Journal Volume 104 May 2013 2068–2076
Measuring Shape-Dependent Looping Probability of DNA
Tung T. Le and Harold D. Kim*School of Physics, Georgia Institute of Technology, Atlanta, Georgia
ABSTRACT Recently, several studies have shown that short doubled-stranded DNA (dsDNA) loops more readily than thewormlike chain model predicts. In most of these experiments, the intrinsic bendedness of dsDNA, which in theory can dramat-ically influence looping dynamics, was either avoided or unaccounted for. To investigate the effect of the shape of dsDNA onlooping dynamics, we characterized the shapes of several synthetic dsDNA molecules of equal length but different sequencesusing gel electrophoresis. We then measured their looping rates using a FRET (Forster resonance energy transfer)-based assayand extracted the looping probability density known as the J factor (jM). We also used, for comparison, several dinucleotideangular parameter sets derived from the observed electrophoretic mobility to compute the jM predicted by the wormlike chainmodel. Although we found a strong correlation between curvature and jM, the measured jM was higher than most dinucleotidemodel predictions. This result suggests that it is difficult to reconcile the looping probability with the observed gel mobility withinthe wormlike chain model and underscores the importance of determining the intrinsic shape of dsDNA for proper theoreticalanalysis.
INTRODUCTION
DNA is arguably one of the most important molecules in sci-ence (1). Besides its biological importance as a carrier of thegenetic code, it has become a versatile molecular buildingblock for self-assembly of submicron structures. Therefore,understanding the mechanical properties of DNA is offundamental importance in basic sciences and engineeringapplications. Although the typical double-stranded DNA(dsDNA) structure is portrayed as a double helix, dsDNAcan be intrinsically curved, and can bend, twist, stretch,and/or melt due to thermal fluctuations. Despite thiscomplexity, mechanical properties of DNA at large lengthscales can be well described by the wormlike chain model.According to this model, thermal energy on average bendsdsDNA through an angle of one radian over ~50 nm(~147 bp), which is known as the persistence length. There-fore, loop formation of a 147-bp-long dsDNAwhich requires2p bending over one persistence length would be rare.
However, looping of dsDNA on this length scale oftenplays an important role in biology (2), for example, in pack-aged DNA of bacterial viruses (3), transcription-factormediated DNA looping (4), and winding of DNA in nucle-osomes (5). Understanding dsDNA looping at small lengthscales demands a more detailed and thorough examinationof local structural aberrations, which would be averagedout over large length scales. These aberrations can stemfrom static variations in mechanical properties such as stiff-ness and curvature, or from dynamic defects in the doublehelical structure, such as kinks and bubbles. There mayalso exist unknown mechanisms that cause elastic behaviorof dsDNA at short length scales to deviate from the large-scale average behavior.
Submitted January 26, 2013, and accepted for publication March 18, 2013.
*Correspondence: [email protected]
Editor: Taekjip Ha.
� 2013 by the Biophysical Society
0006-3495/13/05/2068/9 $2.00
Spontaneous looping dynamics of dsDNA has been tradi-tionally measured by ligase-dependent cyclization (6). Inthis assay, dsDNA molecules with sticky (cohesive) endsare circularized or dimerized by DNA ligase. By comparingthe rates of circle and dimer formation, the looping effi-ciency can be quantified in terms of an effective molar con-centration of one end of the DNA in the vicinity of the otherend, which is known as the J factor (jM). Widom et al.showed that the jM of dsDNA shorter than the persistencelength was much higher than predicted by the wormlikechain model (7). Although this conclusion was questionabledue to the high ligase concentration used (8), several othergroups also reported that dsDNA loops more frequentlythan a wormlike chain when different methods are em-ployed (9–13). However, most of these kinetics studiesinvolved proteins that could affect mechanical propertiesof dsDNA due to their nonspecific binding (14,15). To over-come this issue, Vafabakhsh and Ha used a FRET-basedsingle-molecule assay to measure looping dynamics of shortdsDNA in the absence of proteins (16). They measured jM tobe a few orders of magnitude higher than the wormlikechain model prediction for <100-bp dsDNAs.
In most dsDNA looping studies, the jM-versus-lengthrelationship was used as the litmus test for the wormlikechain model. The intrinsic bendedness of dsDNA was usu-ally avoided or ignored, because permanent bendedness ofdsDNA can in principle lead to abnormally high jM at shortlength scales (17). Moreover, it is difficult to experimentallydetermine the exact shape of dsDNA in the ground state touse in jM calculation. This poses the question: to what extentdoes curvature affect the looping dynamics of dsDNA? Herewe designed several dsDNAs of equal length but differentshape and used a similar FRET-based assay to Vafabakhshand Ha (16) to measure their jM. To compute jM predictedby the wormlike chain model, we used the dinucleotide
http://dx.doi.org/10.1016/j.bpj.2013.03.029

Shape-Dependent Looping Probability of DNA 2069
chain model with angular parameters optimized by the gelelectrophoretic mobility of these dsDNAs. We showed thatmeasured jM values were higher than in silico predictionsin most cases. Our results suggest that mechanics of large-angle dsDNA bending cannot be reconciled with that ofsmall-angle dsDNA bending at least in the dinucleotidechain framework.
MATERIALS AND METHODS
Experimental Design
We used two kinds of sequences: repeating artificial sequences and nonrep-
eating genomic sequences. The repeating sequences were variations of
sequences chosen from a large-scale nucleosome occupancy study by
Kaplan et al. (18). All sequences, both artificial and genomic, were termi-
nated at each end with a common 18-bp-long adaptor sequence for subse-
quent polymerase chain reactions (PCRs). The repeating sequences were
commercially synthesized by GenScript (sequences are given in the Sup-
porting Material) and amplified using the following sets of primers synthe-
sized by IDT:
F1: /5Cy3/GGTAAATTCACCAACAACGAGCTCGAATG,
F10: /5Cy3/TAAATTCCTACAACAACGAGCTCGAATG,R1: GTGCCAGCAACAGATAGC,
F2: CAACAACGAGCTCGAATG,
R2: /5BioTEG/GAAACATAG/iCy5/GAATTTACCGTGCCAGCAAC
AGATAGC.
For time efficiency, we used the backbone-incorporated Cy5 as the FRET
acceptor instead of internally labeling a modified base with Cy5 in a sepa-
rate step. We performed two separate PCRs on each sequence, one with
primers F1 and R1 to integrate Cy3, and the other with primers F2 and
R2 to integrate Cy5 and biotin. The 10-base-long complementary regions
in F1 and R2 stabilize DNA in the looped state (shown in bold). The under-
lined A in primer F1 is a spacer that compensates for the internally linked
Cy5 (iCy5) on R2. We also used F10 with a shorter complementary region to
increase the number of looping events. To construct the dsDNA carrying the
FRET pair and biotin, we mixed the two PCR products with an excess
amount of Cy3-carrying strand (molar ratio 4:1) and allowed strand ex-
change by heating and cooling the sample (incubation at 98.5�C for
1.5 min, gradual cooling to 5�C with ramp rate of 0.1�C/s, and incubation
at 5�C for 2 h). More than 90% of surface-immobilized molecules carried
Cy5, as expected, and R50% of them carried a Cy3 partner as a result of
efficient strand exchange.
DNA electrophoresis
To measure curvature of dsDNA, we implemented polyacrylamide gel elec-
trophoresis, similar to previously published protocols (29.2:0.8 acryl/bis,
5% in TBE buffer, PH 8.4, run at 5–8 V/cm in 4�C) (19,20). We compared
the mobility of a DNA against the bands of a 1 kb DNA ladder (Fermentas)
and interpolated its apparent length. The apparent size of the DNA (R) was
defined as the ratio of its apparent length to its real length.
Optimizing helical parameters
We used the Levenberg-Marquardt nonlinear-least-squares algorithm in
MATLAB (The MathWorks, Natick, MA) to find helical parameters that
best predict the mobility of the seven artificial dsDNAs. We optimized 22
variables in total: 20 angular parameters corresponding to roll and tilt
angles for all 10 unique dinucleotides and two additional parameters
(a and b) for the linear relationship between the apparent size (R) and the
central dispersion (s2):R ¼ as2 þ b. We used 0.000156 and 0.97 as the
initial values of a and b, as in the publication by De Santis et al. (21),
and initialized the angular parameters based on seven different helical
parameter sets, termed BT (22), OZ (23), CD (24), AS (25), LB (26),
CHARMM27 (27), and PARMBSC0 (27). The twist angle was relatively
insensitive to this optimization and was thus kept fixed (21). The three-
dimensional dsDNA structure of a sequence was determined by the 30
angular variables, from which the central dispersion was calculated as
published (21).
Fluorescence microscopy and image acquisition
For single-molecule imaging, we used an objective-type total internal
reflection setup on a commercial microscope (IX81, Olympus, Melville,
NY), as described (28). For FRET measurement, Cy3 (donor) was excited
with a 532-nm laser (NT66-968, B&W Tek, Newark, DE). Cy5 (acceptor),
when mentioned, was directly excited with a 640-nm laser (CUBE 640-
30FP, Coherent, Santa Clara, CA). The donor and acceptor emissions
were split into two separate paths by a dichroic mirror (FF545/650-Di01-
25�36, Semrock, Rochester, NY). After passing through long-pass filters
(LM01-552 for donor emission, FF650-Di01 for acceptor emission;
Semrock), they were merged by the second dichroic mirror and projected
on two halves of an EMCCD (DU-897ECS0-# BV, Andor). The laser power
for Cy3 excitation was ~60 mW coming out of the objective. Binned images
(2�2) were acquired at 25 frames/s with 40-ms exposure using our in-house
software.
Glass slides and coverslips were cleaned according to a protocol of
20-min sonication in 10% Alconox, 10-min sonication in purified water,
15-min sonication in acetone, and 20-min sonication in 5 M KOH. Cleaned
slides and coverslips were stored in purified water for long-term use. For
single-molecule immobilization, both slides and coverslips were treated
with polyethylene glycol polymer mixture (1:80 w/w ratio of biotin-(poly-
ethylene glycol) PEG-silane, molecular weight 3400/mPEG-silane, molec-
ular weight 2000 (w/w), Laysan Bio, Arab, AL) in 0.1 M sodium
bicarbonate solution. After being rinsed with distilled water, they were
dried in open air and assembled into a flow cell with multiple channels
formed by double-stick tape. Immediately before each experiment, we in-
jected 10 ml of Neutravidin solution (100 mg/ml) into the channel and
waited for two minutes before washing with T50 buffer (10 mM Tris-
HCl, 50 mM NaCl, pH 7.0). DNA molecules were introduced at 50–100
pM for specific binding to the PEG-coated surface through Neutravidin-
biotin interaction. Based on our design, the presence of Cy3 on the surface
indicates the presence of Cy5 in the same molecule. The channel was finally
flushed with the imaging buffer, which contained an oxygen scavenging
system (100 mM PCD, 5 mM PCA, and 1 mM Trolox, slightly modified
from Aitken et al. (29)) and varying concentrations of NaCl (100–
500 mM). All measurements took place at room temperature (22�C).
Data analysis
The movies, captured as a series of 256 � 256 images, were processed by a
MATLAB code to generate single-molecule FRET traces and dwell-time
histograms. The FRET traces were filtered using a two-point sliding
average. A typical FRET histogram showed two peaks that corresponded
to the looped state (high FRET value) and the unlooped state (low FRET
value). Each histogram was fitted using a double Gaussian function, and
the intersection between the two Gaussian curves was used as a hard
threshold between the two states. Dwell times in each state were collected
from traces showing switching behaviors. For each DNA sequence, ~500
traces from multiple viewing fields were used to generate dwell-time
histograms.
In this study, we either reported the lifetimes of the unlooped and the
looped states, which are the normal mean dwell times measured in most
single-molecule studies, or the mean first looping time. The first looping
Biophysical Journal 104(9) 2068–2076
2070 Le and Kim
time is defined as the first passage time for an unlooped molecule to loop for
the first time based on the observed FRET signal. Thus, it can be measured
from molecules that exist in the unlooped state at the beginning of observa-
tion. For this measurement, we used molecules with a shorter, 7-bp comple-
mentary region so that the majority of the molecules were prepared in the
unlooped state (~99%). Molecules that were either missing one of the two
dyes or in the looped state (high FRET) at the beginning were discarded
from analysis. Molecules that underwent Cy3 or Cy5 photobleaching before
the first looping event were also discarded from analysis. Since the high-
FRET state with the 7-bp complementary region was very short-lived
(<1 s), Cy5 photobleaching was extremely rare. The typical photobleach-
ing lifetime of Cy3 in these experiments was ~30–40 min, which was sub-
stantially longer than all looping times measured in our study.
To obtain the lifetime of the unlooped state or the mean first looping
time, we plotted the number of molecules with both Cy3 and Cy5 that
survived in the unlooped state as a function of time. We then fitted this
decay curve using a double-exponential function with a base line:
NðtÞ ¼ NN þ Nf expð�kftÞ þ Ns expð�kstÞ. Although the reason for this
biphasic decay is not known, we suspect that molecules with small curva-
ture can bend either inward or outward to form a loop, which might lead
to double-exponential looping kinetics. In this equation, NN accounts for
the number of dysfunctional dsDNA molecules that are not able to
loop for unknown reasons. The mean first looping time was calculated as
hti ¼ Nf=ðkfðNfþNsÞÞ þ Ns=ðksðNfþNsÞÞ. The only difference between
the two was whether the dwells in the unlooped state were synchronized
on their unlooping transitions or not. The looping rate is defined as the in-
verse of the mean first looping time.
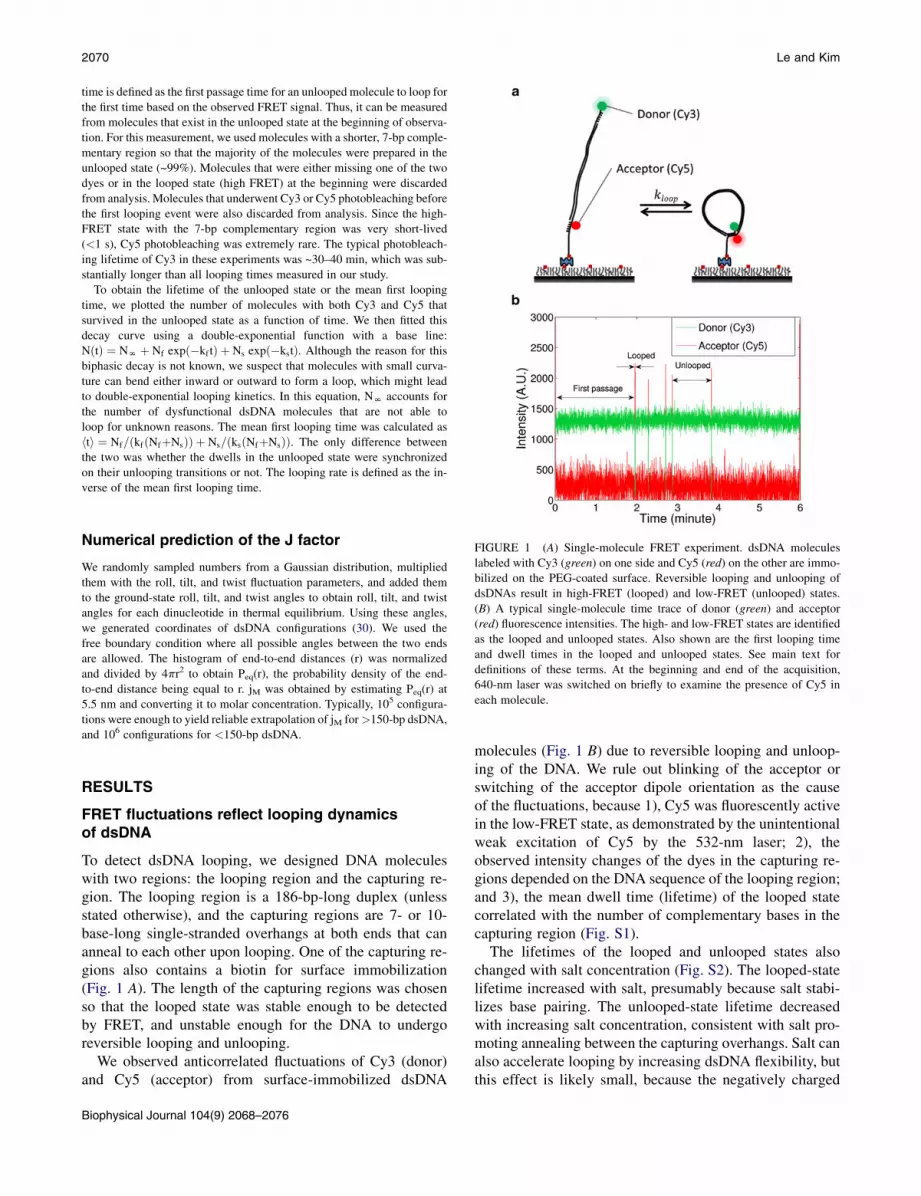
FIGURE 1 (A) Single-molecule FRET experiment. dsDNA molecules
labeled with Cy3 (green) on one side and Cy5 (red) on the other are immo-
bilized on the PEG-coated surface. Reversible looping and unlooping of
dsDNAs result in high-FRET (looped) and low-FRET (unlooped) states.
(B) A typical single-molecule time trace of donor (green) and acceptor
(red) fluorescence intensities. The high- and low-FRET states are identified
as the looped and unlooped states. Also shown are the first looping time
and dwell times in the looped and unlooped states. See main text for
definitions of these terms. At the beginning and end of the acquisition,
640-nm laser was switched on briefly to examine the presence of Cy5 in
each molecule.
Numerical prediction of the J factor
We randomly sampled numbers from a Gaussian distribution, multiplied
them with the roll, tilt, and twist fluctuation parameters, and added them
to the ground-state roll, tilt, and twist angles to obtain roll, tilt, and twist
angles for each dinucleotide in thermal equilibrium. Using these angles,
we generated coordinates of dsDNA configurations (30). We used the
free boundary condition where all possible angles between the two ends
are allowed. The histogram of end-to-end distances (r) was normalized
and divided by 4pr2 to obtain Peq(r), the probability density of the end-
to-end distance being equal to r. jM was obtained by estimating Peq(r) at
5.5 nm and converting it to molar concentration. Typically, 105 configura-
tions were enough to yield reliable extrapolation of jM for>150-bp dsDNA,
and 106 configurations for <150-bp dsDNA.
RESULTS
FRET fluctuations reflect looping dynamicsof dsDNA
To detect dsDNA looping, we designed DNA moleculeswith two regions: the looping region and the capturing re-gion. The looping region is a 186-bp-long duplex (unlessstated otherwise), and the capturing regions are 7- or 10-base-long single-stranded overhangs at both ends that cananneal to each other upon looping. One of the capturing re-gions also contains a biotin for surface immobilization(Fig. 1 A). The length of the capturing regions was chosenso that the looped state was stable enough to be detectedby FRET, and unstable enough for the DNA to undergoreversible looping and unlooping.
We observed anticorrelated fluctuations of Cy3 (donor)and Cy5 (acceptor) from surface-immobilized dsDNA
Biophysical Journal 104(9) 2068–2076
molecules (Fig. 1 B) due to reversible looping and unloop-ing of the DNA. We rule out blinking of the acceptor orswitching of the acceptor dipole orientation as the causeof the fluctuations, because 1), Cy5 was fluorescently activein the low-FRET state, as demonstrated by the unintentionalweak excitation of Cy5 by the 532-nm laser; 2), theobserved intensity changes of the dyes in the capturing re-gions depended on the DNA sequence of the looping region;and 3), the mean dwell time (lifetime) of the looped statecorrelated with the number of complementary bases in thecapturing region (Fig. S1).
The lifetimes of the looped and unlooped states alsochanged with salt concentration (Fig. S2). The looped-statelifetime increased with salt, presumably because salt stabi-lizes base pairing. The unlooped-state lifetime decreasedwith increasing salt concentration, consistent with salt pro-moting annealing between the capturing overhangs. Salt canalso accelerate looping by increasing dsDNA flexibility, butthis effect is likely small, because the negatively charged

Shape-Dependent Looping Probability of DNA 2071
phosphate groups are almost completely screened in therange of concentrations tested (145–505 mM NaCl)(31,32). We used 505 mM NaCl as the standard concentra-tion for all other experiments of this study.
We decreased the length of a dsDNAwhose sequence wasderived from the yeast genome from 186 to 102 bp andobserved a 20-fold increase in the unlooped-state lifetime(Fig. 2 A). We emphasize that even if we had assumedthat all molecules could loop eventually by fitting the decaycurves with a zero-baseline exponential function, the changein the looping rate between 102 bp and 186 bp would still be<20-fold. To confirm that the measured looping kineticswas not affected by the acquisition time, we increased theacquisition time from 15 min to 45 min and measured theunlooped-state lifetime of the 102bp dsDNA. As is evidentfrom Fig. S3, the decay curves are nearly indistinguishable.
In a ligation-based DNA cyclization assay that covalentlylinks the 50-end and the 30-end of a dsDNA, jM depends onthe probability that the helical phases of the two ends matcheach other. This dependence results in oscillation of jM as afunction of length, whose peak-to-peak change can be as
FIGURE 2 (A) Decay curves of the unlooped-state population as a func-
tion of length (gray, 102 bp; blue, 112 bp, red, 133 bp; green, 176 bp;
brown, 186 bp). The decay curves were fitted using a double-exponential
function with a fixed baseline extracted from the 186-bp data. (B) The
unlooped-state lifetime of the genomic sequence DNA measured over
one helical period. The small variation in the lifetime implies weak
torsional stress for the dsDNA in the looped state.
much as 100-fold at 180 bp according to the twisted worm-like chain model (33). To investigate whether our measuredlooping rate showed similar helical phase dependence, wemeasured looping rates of dsDNAs varying in length from176 bp to 186 bp. We found that the looping rate changedno more than 1.3 times over this one helical period (Fig. 2B). This result suggests that annealing between the twooverhangs might not require as strict a helical phase matchas ligation does in a cyclization assay.
Conversion of looping rate to jM
The relationship between the equilibrium probability distri-bution of chain conformations and looping kinetics wasgiven by Szabo et al. (34). According to this relationship,the mean first passage time between the two reactive termi-nal sites of a polymer chain is given by
t ¼ZL
a
dx�DðxÞPeqðxÞ
��1
0@ZL
x
dyPeqðyÞ1A
2
þ 1
kaPeqðaÞ; (1)
where Peq(r) is the equilibrium probability density of the
end-to-end distance being equal to r, L is the contour lengthof the polymer, D is the diffusion coefficient, and a is theinner boundary radius. ka reflects the trapping reactionbetween the two ends when r ¼ a. In the case of a perfectlyabsorbing boundary condition (ka/N), the second termvanishes.We estimated the upper limit of this mean first passagetime using an analytical expression of Peq(r) derived for awormlike chain (35). The diffusion coefficient is estimatedto be ~2.0 � 108 nm2/s by treating the overhangs as 10-base-long rigid rods in water (36). The boundary radius isassumed to be ~5 nm. Using these values, the first term ofEq. 1 is ~5.5 ms, which is 102- to 103-fold shorter thanour measured looping time. Other studies using moleculardynamics simulations or an analytical calculation alsoyielded a much shorter first passage time with efficient trap-ping (37–39). Therefore, the measured looping time likelyreflects the second term in Eq. 1, in which case the inverseof the mean first passage time is directly proportional toPeq(r). Moreover, if the measured looping time reflects thefirst term in the equation, we expect it to increase linearlywith viscosity. However, the looping time varied only1.2-fold between 4% and 30% glycerol, which indicatesthat the apparent looping is not diffusion-limited (data notshown).
jM is thus related to the mean first looping time (tloop) by
jMðaÞ ¼ PeqðaÞ4pa2
¼ 1
kað4pa2Þtloop : (2)
To extract jM, ka must be known. This parameter can be
measured from free diffusion of one sticky end with respectBiophysical Journal 104(9) 2068–2076

2072 Le and Kim
to the other in a volume V, where PeqðaÞ ¼ 4pa2=V.Substituting this in Eq. 1 and assuming that annealing isnot diffusion-limited, we obtain the annealing time (tanneal)
tannealz1
Nka
�4pa2
V
� : (3)
Here, we used the fact that in the presence of N sticky ends,
the annealing rate increases N-fold. Substituting ka fromEq. 3 into Eq. 2, we obtainjMðaÞ ¼ N
V
tannealtloop
¼ ctannealtloop
: (4)
Therefore, jM can be determined from three experimental
measurables: concentration of sticky ends (c), the loopingtime, and the annealing time.We realized this experiment by immobilizing the Cy5-containing single strand to the surface and introducing theCy3-containing single strand at 50 nM (Fig. S4 A). Anneal-ing of the Cy5 strand to the Cy3 strand resulted in detectableFRET bursts, and the first-order rate constant was measuredto be 0.455 0.04 � 106 M�1 s�1 in 505 mM NaCl (Fig. S4B). This value is comparable to the values reported by theHa group (0.78 5 0.07 � 106 M�1 s�1 in 1 M NaCl and0.265 0.04 � 106 M�1 s�1 in 10 mM Mg2þ) that were ob-tained from dimerization kinetics between dsDNAs (16).
FIGURE 3 (A) Polyacrylamide gel electrophoresis pattern of synthetic
DNAs. From left to right, the lanes contain 1 kb marker, sequence 4,
sequence 3, sequence 3-1, sequence 3-2, sequence 2, sequence 2-1,
sequence 1, and 1 kb marker. The exact sequences of these dsDNAs are
given in the Supporting Material. (B) The relationship between the un-
looped-state lifetime and the apparent size.
More curved molecules loop faster
Although measuring the length dependence of jM has beenused as the litmus test for the wormlike behavior, the inter-pretation of the result is nontrivial for a couple of reasons.First, changing the length changes not only the bendingenergy, but also the twisting energy, required for looping.Second, curvature can be introduced locally when basepairsare added. Therefore, we kept the length of dsDNAs thesame while varying the curvature in a global, predictablemanner. To build curved DNA molecules, we concatenateda 10-mer sequence multiple times, with a random nucleotideinserted every 20 bases. As a result, the 10-mer sequencerepeats itself every helical repeat (10.5 bp), and the staticcurvature, or bendedness, of the 10-mer, if there is any,will add up constructively. We designed four such repeatingsequences, termed sequences 1–4. Sequences 1–3 are moresimilar to each other than they are to sequence 4. Sequence 2and 4 were chosen from a previous study by Kaplan et al.(18) and are supposed to possess opposite nucleosome affin-ity. We also designed three extra sequences with locally per-turbed curvature: 1), we changed G to T in the two central10-mers of sequence 3 (sequence 3-1); 2), we changed Gto T in the terminal 10-mers of sequence 3 (sequence3-2); and 3), we truncated the central 10-mer of sequence2 by half to make an S-shaped molecule with an inflectionpoint (sequence 2-1).
Biophysical Journal 104(9) 2068–2076
We checked overall curvature of these dsDNAs by poly-acrylamide gel electrophoresis. The order of apparent size(R) for sequences 1–4 was 1> 2> 4> 3 (Fig. 3 A). Amongthe sequence 3 variants, the apparent size was 3-2> 3-1> 3.The S-shaped molecule exhibited an apparent size between2 and 4. Empirically, a curved dsDNA migrates moreslowly than a straight dsDNA (19,25). Therefore, we couldconclude that sequence 1 is the most curved, and thatsequence 3 is the straightest. We measured looping kineticsof these dsDNAs, and found an anticorrelation between theapparent size and the unlooped-state lifetime (Fig. 3 B). Thestrong anticorrelation among the repeat sequences suggeststhat the deflection angle increases monotonically in theorder 3 / 4 / 2 / 1 without exceeding 2p. Despitelocally perturbed curvature, other sequences also followedthe anticorrelation between apparent size and loopingtime, although the S-shaped molecule (sequence 2-1) devi-ated notably from the overall trend.
Estimating helical parameters from gel mobility
A curved dsDNA costs less bending energy to loop than astraight one and thus has a higher jM. To compare jM betweendifferent dsDNAs, one must know their intrinsic shape.Koo and Crothers obtained a relationship between the deflec-tion angle of a dsDNA and its apparent size on a gel (19).However, the absolute deflection angle of a referencedsDNAwas determined from its jM according to the worm-like chain model. Since we wanted to test the wormlike
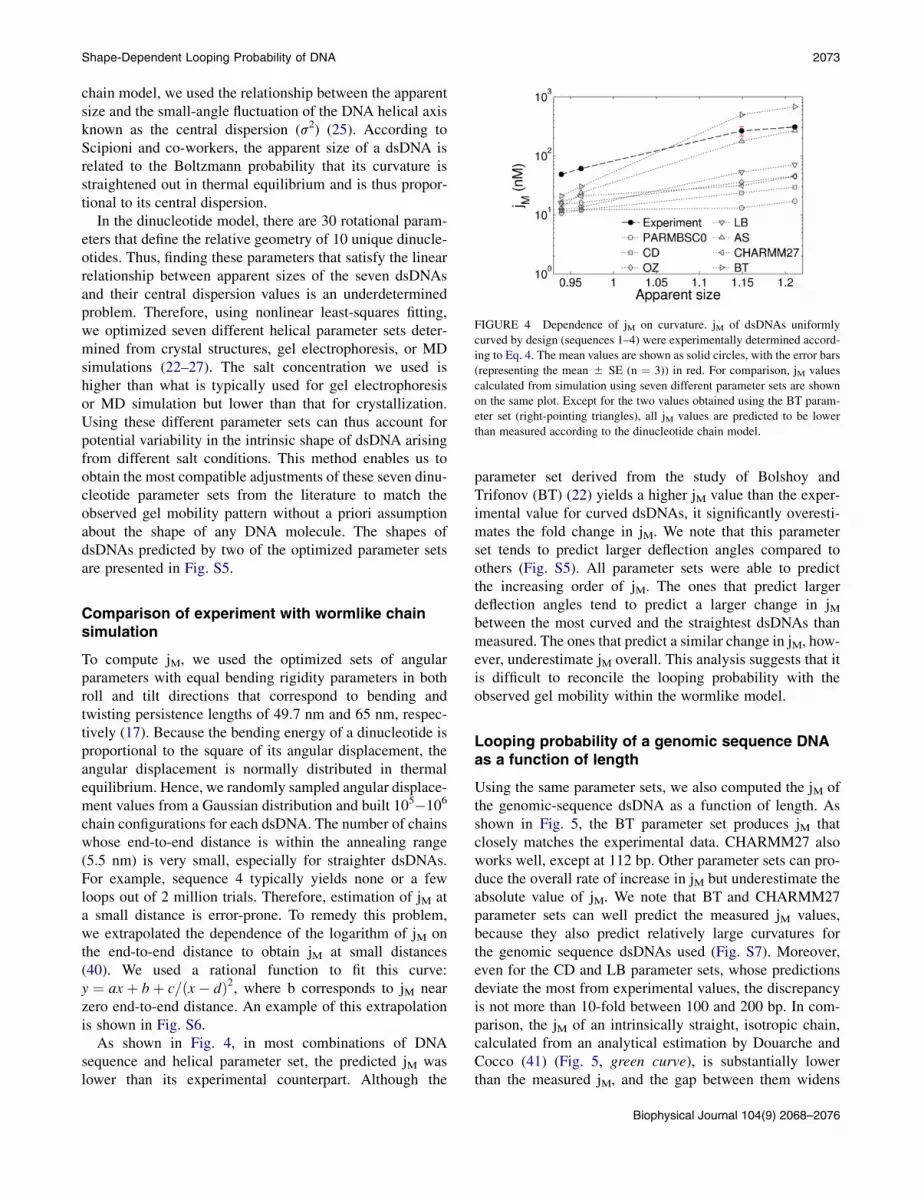
FIGURE 4 Dependence of jM on curvature. jM of dsDNAs uniformly
curved by design (sequences 1–4) were experimentally determined accord-
ing to Eq. 4. The mean values are shown as solid circles, with the error bars
(representing the mean 5 SE (n ¼ 3)) in red. For comparison, jM values
calculated from simulation using seven different parameter sets are shown
on the same plot. Except for the two values obtained using the BT param-
eter set (right-pointing triangles), all jM values are predicted to be lower
than measured according to the dinucleotide chain model.
Shape-Dependent Looping Probability of DNA 2073
chain model, we used the relationship between the apparentsize and the small-angle fluctuation of the DNA helical axisknown as the central dispersion (s2) (25). According toScipioni and co-workers, the apparent size of a dsDNA isrelated to the Boltzmann probability that its curvature isstraightened out in thermal equilibrium and is thus propor-tional to its central dispersion.
In the dinucleotide model, there are 30 rotational param-eters that define the relative geometry of 10 unique dinucle-otides. Thus, finding these parameters that satisfy the linearrelationship between apparent sizes of the seven dsDNAsand their central dispersion values is an underdeterminedproblem. Therefore, using nonlinear least-squares fitting,we optimized seven different helical parameter sets deter-mined from crystal structures, gel electrophoresis, or MDsimulations (22–27). The salt concentration we used ishigher than what is typically used for gel electrophoresisor MD simulation but lower than that for crystallization.Using these different parameter sets can thus account forpotential variability in the intrinsic shape of dsDNA arisingfrom different salt conditions. This method enables us toobtain the most compatible adjustments of these seven dinu-cleotide parameter sets from the literature to match theobserved gel mobility pattern without a priori assumptionabout the shape of any DNA molecule. The shapes ofdsDNAs predicted by two of the optimized parameter setsare presented in Fig. S5.
Comparison of experiment with wormlike chainsimulation
To compute jM, we used the optimized sets of angularparameters with equal bending rigidity parameters in bothroll and tilt directions that correspond to bending andtwisting persistence lengths of 49.7 nm and 65 nm, respec-tively (17). Because the bending energy of a dinucleotide isproportional to the square of its angular displacement, theangular displacement is normally distributed in thermalequilibrium. Hence, we randomly sampled angular displace-ment values from a Gaussian distribution and built 105�106
chain configurations for each dsDNA. The number of chainswhose end-to-end distance is within the annealing range(5.5 nm) is very small, especially for straighter dsDNAs.For example, sequence 4 typically yields none or a fewloops out of 2 million trials. Therefore, estimation of jM ata small distance is error-prone. To remedy this problem,we extrapolated the dependence of the logarithm of jM onthe end-to-end distance to obtain jM at small distances(40). We used a rational function to fit this curve:y ¼ ax þ bþ c=ðx � dÞ2, where b corresponds to jM nearzero end-to-end distance. An example of this extrapolationis shown in Fig. S6.
As shown in Fig. 4, in most combinations of DNAsequence and helical parameter set, the predicted jM waslower than its experimental counterpart. Although the
parameter set derived from the study of Bolshoy andTrifonov (BT) (22) yields a higher jM value than the exper-imental value for curved dsDNAs, it significantly overesti-mates the fold change in jM. We note that this parameterset tends to predict larger deflection angles compared toothers (Fig. S5). All parameter sets were able to predictthe increasing order of jM. The ones that predict largerdeflection angles tend to predict a larger change in jMbetween the most curved and the straightest dsDNAs thanmeasured. The ones that predict a similar change in jM, how-ever, underestimate jM overall. This analysis suggests that itis difficult to reconcile the looping probability with theobserved gel mobility within the wormlike model.
Looping probability of a genomic sequence DNAas a function of length
Using the same parameter sets, we also computed the jM ofthe genomic-sequence dsDNA as a function of length. Asshown in Fig. 5, the BT parameter set produces jM thatclosely matches the experimental data. CHARMM27 alsoworks well, except at 112 bp. Other parameter sets can pro-duce the overall rate of increase in jM but underestimate theabsolute value of jM. We note that BT and CHARMM27parameter sets can well predict the measured jM values,because they also predict relatively large curvatures forthe genomic sequence dsDNAs used (Fig. S7). Moreover,even for the CD and LB parameter sets, whose predictionsdeviate the most from experimental values, the discrepancyis not more than 10-fold between 100 and 200 bp. In com-parison, the jM of an intrinsically straight, isotropic chain,calculated from an analytical estimation by Douarche andCocco (41) (Fig. 5, green curve), is substantially lowerthan the measured jM, and the gap between them widens
Biophysical Journal 104(9) 2068–2076

FIGURE 5 Dependence of jM on length. jM of the genomic sequence
dsDNAs with varying length (sequences 102, 112, 133, 176, and 186)
were experimentally determined according to Eq. 4. The mean values of
three independent measurements are shown as solid spheres, with the error
bars (representing the mean5 SE) shown in red. For comparison, jM values
calculated from simulation using seven different parameter sets are shown
on the same plot. Most jM values are predicted to be lower than measured
according to the dinucleotide chain model. The green curve represents jM of
a uniform, isotropic wormlike chain calculated from an analytical estima-
tion by Douarche and Cocco (42) with the constraint of a 5.5-nm end-to-
end distance.
2074 Le and Kim
as length decreases. This result shows that the measuredlength dependence of jM alone can be explained by theworm like chain model with a proper choice of dinucleotideparameters.
DISCUSSION
In summary, we studied looping kinetics of dsDNA of<200 bp using single-molecule FRET. The measured firstlooping times were much longer than the estimated firstdiffusive encounter time between the ends of the dsDNA,which allowed us to extract the equilibrium looping proba-bility density, jM, from the looping rate. jM increased withcurvature and decreased with length, as expected. Wecomputed the jM using helical parameter sets consistentwith the observed gel mobility and found that it was lowerthan the measured jM in most cases. We also demonstratethat it is difficult to test the wormlike chain model of dsDNAwith jM versus length measurement alone, as some param-eter sets could reproduce the measured jM between 100and 200 bp. Hence, we propose the experimental compari-son between gel mobility and looping probability of dsDNAat a fixed length as a powerful alternative approach to testconsistency of the wormlike chain model.
In a ligase-based DNA cyclization assay, jM is defined asthe concentration of monomers that results in the same frac-tion of dimers and circles in equilibrium, and it can be esti-mated from the transient first-order rates of circle and dimerformation (42). However, this measured jM is sensitive to theligase concentration used and can be overestimated, aspointed out by Du et al. (8). Furthermore, nonspecific bind-ing of DNA ligase to DNA can also affect jM (14). In
Biophysical Journal 104(9) 2068–2076
contrast, our FRET-based looping assay, similar to that ofVafabakhsh and Ha (16), is free from these concerns, andtherefore can become a reliable alternative to measuredsDNA looping dynamics.
In this study, we used the mean first looping time (tloop)for theoretical comparison, for two reasons. First, Eq. 1 for-mulates looping kinetics in terms of the mean first passagetime by averaging the first passage time over the unsynchro-nized initial end-to-end distribution of a polymer (34).Second, using the mean first looping time (tloop) insteadof the unlooped-state lifetime reduces the risk of overesti-mating the frequency of rare events. For example, a routinedwell-time analysis includes events that are observed duringthe finite acquisition time only; it excludes slow events thatcould have been observed had the acquisition time beenlonger. Also, a long exposure to laser illumination requiredto capture rare events can elevate the sample temperature,thus accelerating the apparent looping rate.
The computation of jM by simulation requires geometricconstraints for the looped state. In a ligation-based DNAcyclization assay, jM exhibits length-dependent oscillation,indicative of torsional stress involved in covalent loopclosure. This helical phase dependence was also observedin other single-molecule dsDNA looping studies (16,43).However, we did not observe such oscillation in the loopingrate over a 10-bp window. We note two main differencesbetween our study and those studies (16,43). First, ourdsDNAs are slightly longer, and therefore, the amplitudeof jM oscillation is expected to be smaller according to thetwisted wormlike chain model. Second, our dsDNA has agap of a few bases between opposite ends of one strand inthe looped state, which prevents proper stacking of basesaround it. In any case, because of the lack of helical phasedependence, we applied end proximity as the only constraintfor jM calculation.
In this study, dsDNAwas attached to the surface through aterminal base. This raises the question of how the surfaceattachment would affect jM. According to our simulation,the jM of a dsDNA terminally anchored to the surface islower than that of a dsDNA free in solution (to be addressedin a future publication). Therefore, the jM values we reporthere should be taken as low estimates, implying that thediscrepancy in jM between a real dsDNA and a wormlikechain might be even larger. Another potential concernwith this FRET-based assay is the presence of dye labelsin the capturing region, which can interfere with cyclization.We stress that jM was extracted by dividing the apparentcyclization rate by the rate of annealing between the twosticky ends, which was measured independently of looping.Therefore, the effect of dyes on cyclization, if any, is effec-tively normalized out by this procedure.
Our experimental finding that intrinsic curvature ofdsDNA has a dominant effect on its looping probabilityseems to be at odds with a previous study by Vologodskaiaand Vologodskii (44). There, it was reported that intrinsic
Shape-Dependent Looping Probability of DNA 2075
curvature has only a minor impact on cyclization. We pointout that the lambda DNA used in that study does not have arepeating sequence feature that can give rise to a consistentdirection of bendedness. Such randomized curvature doesnot lead to a dramatic increase in looping probability, asillustrated by the S-shaped dsDNA used in our study.Although the S-shaped dsDNA is highly curved, jM is notrelatively high, because the two halves of the molecule arecurved in opposite directions.
Our results demonstrate that it is difficult to reconcile theenergetics of small-angle dsDNA bending with that of large-angle or sharp bending. The angular parameters derivedbased on gel mobility of mildly curved dsDNAs are optimalfor describing small-angle bending, and we show that theyunderestimate jM that describes sharp bending. In gel elec-trophoresis, the gel network can be thought of as a free-energy barrier that limits movement of curved dsDNA. Inthis simple thermodynamic model, gel mobility can be theo-retically interpreted as the probability of a curved dsDNA tobe straightened (25). If the curvature of a dsDNA is rela-tively small, its mobility can be shown to be linearly propor-tional to the central dispersion of the dsDNA. The dsDNAmolecules we used in this study show apparent sizes wellwithin the range where the linear relationship is experimen-tally valid (25). If the curvature is too large, the moleculecan entangle with the gel network in a complicated fashionand fail to obey the linear relationship. In this case, inferringthe intrinsic shape of dsDNA from the absolute electropho-retic mobility may require more detailed theoretical models(45–47).
Our result is in qualitative agreement with a subelasticchain model where the bending energy of dsDNA has aless than quadratic dependence on the bending angle(48). The most discussed mechanism for subelastic dsDNAis the formation of defects such as kinks and bubbles inthe dsDNA structure (49). However, the existence ofstable kinks or bubbles in dsDNAs as long as 190 bp isvery unlikely at the high salt concentrations we used (8).Another mechanism that does not require bubble formationcomes from a recent molecular dynamics study (50). Inthat study, the authors proposed that counterions preferen-tially congregate on the concave side of the sharply bentdsDNA, and therefore, the free-energy cost of bendingdsDNA increases linearly with bending angle at largebending angles. It is also possible that the dinucleotidechain model fails at large bending angles because near-est-neighbor effects become significant (51). Furtherstudies on the effect of salt, temperature, and sequenceon dsDNA looping will help elucidate the mechanism ofextreme dsDNA flexibility.
SUPPORTING MATERIAL
Seven figures are available at http://www.biophysj.org/biophysj/
supplemental/S0006-3495(13)00368-8.
We are especially grateful to Dr. Taekjip Ha for sharing his unpublished
manuscript. We thank Dr. Stephen Harvey, Dr. Yongli Zhang, and Dr.
Huan-Xiang Zhou for useful discussions. We thank James Waters for crit-
ical reading of the manuscript and providing preliminary data for the sur-
face effect.
REFERENCES
1. Seeman, N. C. 2010. Nanomaterials based on DNA. Annu. Rev.Biochem. 79:65–87.
2. Garcia, H. G., P. Grayson, ., P. A. Wiggins. 2007. Biological conse-quences of tightly bent DNA: the other life of a macromolecular celeb-rity. Biopolymers. 85:115–130.
3. Baker, T. S., N. H. Olson, and S. D. Fuller. 1999. Adding the thirddimension to virus life cycles: three-dimensional reconstruction oficosahedral viruses from cryo-electron micrographs. Microbiol. Mol.Biol. Rev. 63:862–922.
4. Bond, L. M., J. P. Peters,., L. J. Maher, 3rd. 2010. Gene repression byminimal lac loops in vivo. Nucleic Acids Res. 38:8072–8082.
5. Andrews, A. J., and K. Luger. 2011. Nucleosome structure(s) and sta-bility: variations on a theme. Annu. Rev. Biophys. 40:99–117.
6. Shore, D., J. Langowski, and R. L. Baldwin. 1981. DNA flexibilitystudied by covalent closure of short fragments into circles. Proc.Natl. Acad. Sci. USA. 78:4833–4837.
7. Cloutier, T. E., and J. Widom. 2004. Spontaneous sharp bending ofdouble-stranded DNA. Mol. Cell. 14:355–362.
8. Du, Q., C. Smith, ., A. Vologodskii. 2005. Cyclization of short DNAfragments and bending fluctuations of the double helix. Proc. Natl.Acad. Sci. USA. 102:5397–5402.
9. Cloutier, T. E., and J. Widom. 2005. DNA twisting flexibility and theformation of sharply looped protein-DNA complexes. Proc. Natl.Acad. Sci. USA. 102:3645–3650.
10. Wiggins, P. A., T. van der Heijden, ., P. C. Nelson. 2006. High flex-ibility of DNA on short length scales probed by atomic force micro-scopy. Nat. Nanotechnol. 1:137–141.
11. Yuan, C., E. Rhoades, ., L. A. Archer. 2006. Spontaneous sharpbending of DNA: role of melting bubbles. Nucleic Acids Res.34:4554–4560.
12. Yuan, C., H. Chen, ., L. A. Archer. 2008. DNA bending stiffness onsmall length scales. Phys. Rev. Lett. 100:018102.
13. Han, L., H. G. Garcia, ., R. Phillips. 2009. Concentration and lengthdependence of DNA looping in transcriptional regulation. PLoS ONE.4:e5621.
14. Yuan, C., X. W. Lou, ., L. A. Archer. 2007. T4 DNA ligase is morethan an effective trap of cyclized dsDNA. Nucleic Acids Res.35:5294–5302.
15. Manzo, C., C. Zurla,., L. Finzi. 2012. The effect of nonspecific bind-ing of lambda repressor on DNA looping dynamics. Biophys. J.103:1753–1761.
16. Vafabakhsh, R., and T. Ha. 2012. Extreme bendability of DNA less than100 base pairs long revealed by single-molecule cyclization. Science.337:1097–1101.
17. Czapla, L., D. Swigon, and W. K. Olson. 2006. Sequence-dependenteffects in the cyclization of short DNA. J. Chem. Theory Comput.2:685–695.
18. Kaplan, N., I. K. Moore, ., E. Segal. 2009. The DNA-encoded nucle-osome organization of a eukaryotic genome. Nature. 458:362–366.
19. Koo, H. S., and D. M. Crothers. 1988. Calibration of DNA curvatureand a unified description of sequence-directed bending. Proc. Natl.Acad. Sci. USA. 85:1763–1767.
20. Prosseda, G., A. Mazzola, ., B. Colonna. 2010. A temperature-induced narrow DNA curvature range sustains the maximum activityof a bacterial promoter in vitro. Biochemistry. 49:2778–2785.
Biophysical Journal 104(9) 2068–2076

2076 Le and Kim
21. De Santis, P., A. Palleschi, ., A. Scipioni. 1990. Validity of the near-est-neighbor approximation in the evaluation of the electrophoreticmanifestations of DNA curvature. Biochemistry. 29:9269–9273.
22. Bolshoy, A., P. McNamara, ., E. N. Trifonov. 1991. Curved DNAwithout A-A: experimental estimation of all 16 DNA wedge angles.Proc. Natl. Acad. Sci. USA. 88:2312–2316.
23. Olson, W. K., A. A. Gorin, ., V. B. Zhurkin. 1998. DNA sequence-dependent deformability deduced from protein-DNA crystal com-plexes. Proc. Natl. Acad. Sci. USA. 95:11163–11168.
24. Calladine, C. R., H. R. Drew, andM. J. McCall. 1988. The intrinsic cur-vature of DNA in solution. J. Mol. Biol. 201:127–137.
25. Anselmi, C., P. De Santis,., A. Scipioni. 2002. From the sequence tothe superstructural properties of DNAs. Biophys. Chem. 95:23–47.
26. Liu, Y., and D. L. Beveridge. 2001. A refined prediction method for gelretardation of DNA oligonucleotides from dinucleotide step parame-ters: reconciliation of DNA bending models with crystal structuredata. J. Biomol. Struct. Dyn. 18:505–526.
27. Perez, A., F. Lankas, ., M. Orozco. 2008. Towards a moleculardynamics consensus view of B-DNA flexibility. Nucleic Acids Res.36:2379–2394.
28. Friedman, L. J., J. Chung, and J. Gelles. 2006. Viewing dynamicassembly of molecular complexes by multi-wavelength single-mole-cule fluorescence. Biophys. J. 91:1023–1031.
29. Aitken, C. E., R. A. Marshall, and J. D. Puglisi. 2008. An oxygen scav-enging system for improvement of dye stability in single-moleculefluorescence experiments. Biophys. J. 94:1826–1835.
30. Zhang, Y., and D. M. Crothers. 2003. Statistical mechanics ofsequence-dependent circular DNA and its application for DNA cycliza-tion. Biophys. J. 84:136–153.
31. Baumann, C. G., S. B. Smith,., C. Bustamante. 1997. Ionic effects onthe elasticity of single DNA molecules. Proc. Natl. Acad. Sci. USA.94:6185–6190.
32. Guo, Z., C. H. Taubes, ., U. Mohanty. 2008. DNA on a tube: electro-static contribution to stiffness. J. Phys. Chem. B. 112:16163–16169.
33. Shimada, J., and H. Yamakawa. 1984. Ring-closure probabilitiesfor twisted wormlike chains. Application to DNA. Macromolecules.17:689–698.
34. Szabo, A., K. Schulten, and Z. Schulten. 1980. First passage timeapproach to diffusion controlled reactions. J. Chem. Phys. 72:4350–4357.
35. Wilhelm, J., and E. Frey. 1996. Radial distribution function of semi-flexible polymers. Phys. Rev. Lett. 77:2581–2584.
36. Nkodo, A. E., J. M. Garnier, ., G. W. Slater. 2001. Diffusion coeffi-cient of DNA molecules during free solution electrophoresis. Electro-phoresis. 22:2424–2432.
Biophysical Journal 104(9) 2068–2076
37. Podtelezhnikov, A. A., and A. V. Vologodskii. 2000. Dynamics of smallloops in DNA molecules. Macromolecules. 33:2767–2771.
38. Jun, S., J. Bechhoefer, and B.-Y. Ha. 2003. Diffusion-limited loop for-mation of semiflexible polymers: Kramers theory and the intertwinedtime scales of chain relaxation and closing. Europhys. Lett. 64:420–426 (EPL).
39. Hyeon, C., and D. Thirumalai. 2006. Kinetics of interior loop forma-tion in semiflexible chains. J. Chem. Phys. 124:104905, 104905–104914.
40. Hagerman, P. J. 1985. Analysis of the ring-closure probabilities ofisotropic wormlike chains: application to duplex DNA. Biopolymers.24:1881–1897.
41. Douarche, N., and S. Cocco. 2005. Protein-mediated DNA loops:effects of protein bridge size and kinks. Phys. Rev. E Stat. Nonlin.Soft Matter Phys. 72:061902.
42. Taylor, W. H., and P. J. Hagerman. 1990. Application of the method ofphage T4 DNA ligase-catalyzed ring-closure to the study of DNAstructure. II. NaCl-dependence of DNA flexibility and helical repeat.J. Mol. Biol. 212:363–376.
43. Laurens, N., D. A. Rusling, ., G. J. Wuite. 2012. DNA looping byFokI: the impact of twisting and bending rigidity on protein-inducedlooping dynamics. Nucleic Acids Res. 40:4988–4997.
44. Vologodskaia, M., and A. Vologodskii. 2002. Contribution of theintrinsic curvature to measured DNA persistence length. J. Mol. Biol.317:205–213.
45. Haran, T. E., I. Cohen, ., U. Mohanty. 2003. Dynamics of curvedDNA molecules: prediction and experiment. J. Am. Chem. Soc.125:11160–11161.
46. Haran, T. E., I. Cohen,., U. Mohanty. 2004. Characteristics of migra-tion patterns of DNA oligomers in gels and the relationship to the ques-tion of intrinsic DNA bending. J. Am. Chem. Soc. 126:2372–2377.
47. Haran, T. E., and U. Mohanty. 2009. The unique structure of A-tractsand intrinsic DNA bending. Q. Rev. Biophys. 42:41–81.
48. Wiggins, P. A., and P. C. Nelson. 2006. Generalized theory of semiflex-ible polymers. Phys. Rev. E Stat. Nonlin. Soft Matter Phys. 73:031906.
49. Yan, J., and J. F. Marko. 2004. Localized single-stranded bubble mech-anism for cyclization of short double helix DNA. Phys. Rev. Lett.93:108108.
50. Spiriti, J., H. Kamberaj, ., A. van der Vaart. 2012. DNA bendingthrough large angles is aided by ionic screening. J. Chem. TheoryComput. 8:2145–2156.
51. Lavery, R., K. Zakrzewska, ., J. Sponer. 2010. A systematic molecu-lar dynamics study of nearest-neighbor effects on base pair and basepair step conformations and fluctuations in B-DNA. Nucleic AcidsRes. 38:299–313.


