Embed Size (px)
Citation preview
University of Northern Colorado University of Northern Colorado
Scholarship & Creative Works @ Digital UNC Scholarship & Creative Works @ Digital UNC
Capstones & Scholarly Projects Student Research
5-2019
Measuring Impact Noise with Smartphone Apps Measuring Impact Noise with Smartphone Apps
Jacob Page Leons
Follow this and additional works at: https://digscholarship.unco.edu/capstones
Recommended Citation Recommended Citation Leons, Jacob Page, "Measuring Impact Noise with Smartphone Apps" (2019). Capstones & Scholarly Projects. 53. https://digscholarship.unco.edu/capstones/53
This Text is brought to you for free and open access by the Student Research at Scholarship & Creative Works @ Digital UNC. It has been accepted for inclusion in Capstones & Scholarly Projects by an authorized administrator of Scholarship & Creative Works @ Digital UNC. For more information, please contact [email protected].

© 2019
JACOB PAGE LEONS
ALL RIGHTS RESERVED
UNIVERSITY OF NORTHERN COLORADO
Greeley, Colorado
The Graduate School
MEASURING IMPACT NOISE WITH
SMARTPHONE APPS
A Capstone Research Project Submitted in Partial Fulfillment
of the Requirements for the Degree of
Doctor of Audiology
Jacob Page Leons
College of Natural and Health Sciences
School of Human Sciences
Audiology and Speech-Language
May 2019
This Capstone Project by: Jacob Page Leons
Entitled: Measuring Impact Noise with Smartphone Apps
has been approved as meeting the requirement for the Degree of Doctor of Audiology in
College of Natural and Health Sciences in the Department of Audiology and Speech-
Language Sciences, Program of Audiology.
Accepted by the Capstone Research Committee
Deanna K. Meinke, Ph.D., Co-Research Advisor
Donald S. Finan, Ph.D., Co-Research Advisor
Gregory Flamme, Ph.D., Committee Member
Accepted by the Graduate School
Linda L. Black, Ed.D.
Associate Provost and Dean
Graduate School and International Admissions
Research and Sponsored Projects
iii
ABSTRACT
Leons, Jacob Page Measuring impulse noise with smartphone apps. Unpublished Doctor
of Audiology Capstone, University of Northern Colorado, 2019.
The ability of smartphone apps to measure impact noise has not been evaluated.
This study was designed to explore the feasibility of using smartphone apps as a means to
evaluate impact noise levels in industrial settings. Impact noise was generated by
dropping a 4 Kg shotput onto a .5” thick steel plate at heights ranging from 6.5 to 102
cm. Two iPhones and two Android phones were tested with three apps each using both
the phone’s built-in microphone and an external microphone. Sound level measurements
of each drop were simultaneously recorded by a calibrated smartphone and a gold
standard system capable of accurately measuring high intensity impact noise. These
experimentally grouped datapoints (phone/app) were analyzed to determine if any
smartphone/app/microphone could measure impact noise to within ±2dB SPL of the gold
standard system. The results of this study showed that none of the three Android apps
tested could measure impact noise with any meaningful degree of accuracy. The absolute
mean differences for measurements recorded with Android devices ranged from 29.5 to
53.4 dB SPL. Measurements recorded with iPhones were closer than Android devices to
gold standard measurements, with absolute mean differences ranging from 0.3 to 43.1 dB
using the internal mic and 0.5 to 44.8 dB with the external mic. Measurements from the
SoundMeter iOS app were closest to the gold standard, with absolute mean differences of
from 0.5 to 4.8 dB.
iv
The data recorded using Android phones to measure impact noise in this study
indicated that even with an external microphone and proper calibration, Android
smartphones and apps are unable to measure impact noise with any degree of accuracy
and should not be relied upon to make any decisions regarding occupational impact noise
exposure. iOS phones more closely approximated the performance of the gold standard
measurements. The SoundMeter app with the iMM-6 external microphone coupled to
either the iPhone 6 or iPhone Se approximated the performance of a calibrated Type II
sound level meter and would be the preferred instrument combination for impact noise
field measurement up to 142 dB peak SPL.
v
ACKNOWLEDGEMENTS
To my family
To my friends
To my research committee,
vi
TABLE OF CONTENTS
CHAPTER
I. INTRODUCTION ………………………………………………..…..
Statement of the Problem
1
II. REVIEW OF THE LITERATURE ………………………………..….
Impulse and Impact Noise
Occupational Hearing Loss Prevention
Noise Exposure Measurement in the Workplace
Noise Measurement with Smartphones and Tablet Apps
Study Rationale
4
III. METHODS ………………………………………………………..….
Experimental Setup
Data Collection
25
IV. RESULTS ………………………………………………..………..….
External Microphone Performance
Internal Versus External Microphone Performance
Descriptive Statistics
32
V. DISCUSSION ……………………………………………………..…
Experimental Setup Condition Following Testing
Implications for Field Measurement
Limitations
Future Study
Summary
54
REFERENCES ……………………………………………………………..……..
58
APPENDIX
A: Octave Script Created by Dr. Donald Finan………………...……..………
62
vii
LIST OF TABLES
Table
1. iOS Apps Tested…………………….……………..………………...…..… 19
2. Android Apps Tested …………………………………………………...…. 19
3. Drop Height and Decibels Produced…………………………………....…. 30
4. Difference in Mean SPL iOS Phones Internal Mic and Gold
Standard (dB)…………………………………………………..……….
33
5. Difference in Mean SPL Android Phones Internal Mic and Gold
Standard (dB)……………………………………..…………………….
35
6. Difference in Mean SPL iOS Phones External Mic and Gold
Standard (dB)…………………………………………………..……….
38
7. Difference in Mean SPL Android Phones External Mic and Gold
Standard (dB)……………………………………………………..…….
40
8. Difference in Mean Peak dB SPL iPhone 6……………………..…..……. 43
9. Difference in Mean Peak dB SPL iPhone Se………………………..……. 46
10. Difference in Mean Peak dB SPL Samsung Amp II………….……..……. 47
11. Difference in Mean Peak dB SPL Sony Xperia Z3 Comp………………... 49
12. Peak dB SPL Difference Between iOS Phones and Gold Standard…..…... 51
13. Peak dB SPL Difference Between Android Phones and Gold
Standard…………………………………………………………..…….
53
viii
LIST OF FIGURES
Figure
1. Sound Level Meter Signal Processing Chain………………………………... 5
2. Experimental Setup………………………………………………………….. 29
3. Difference in Mean Between iPhone 6 Internal Mic and Gold Standard…… 34
4. Difference in Mean Between iPhone Se Internal Mic and Gold Standard….. 34
5. Difference in Mean Between Samsung Amp II Internal Mic and Gold
Standard…………………………………………………………………..
36
6. Difference in Mean Between Sony Xperia Z3 Internal Mic and Gold
Standard…………………………………………………………………..
36
7. Difference in Mean Between iPhone 6 External Mic and Gold Standard...… 38
8. Difference in Mean Between iPhone Se External Mic and Gold Standard..... 39
9. Difference in Mean Between Samsung Amp II External Mic and Gold
Standard…………………………………………………………………..
40
10. Difference in Mean Between Sony Xperia Z3 External Mic and Gold
Standard…………………………………………………………………..
41
11. Comparison of Internal and External Mic Performance iPhone 6…………... 44
12. Comparison of Internal and External Mic Performance iPhone Se…………. 45
13. Comparison of Internal and External Mic Performance Samsung Amp II….. 48
14. Comparison of Internal and External Mic Performance Sony Xperia Z3…… 50
15. Mean Error of iOS Phones from Gold Standard…………………………….. 52
16. Mean Error of Android Phones from Gold Standard………………………... 53
ix
ABBREVIATIONS
ABR acoustic brainstem response
BPS beats per second
CSL Computerized Speech Lab
dB decibel(s)
Lavg average level
Leq level equivalent
MEMS microelectromechanical systems
MSHA Mine Safety and Health Administration
NIHL noise induced hearing loss
NIOSH National Institute for Occupational Safety and Health
OSHA Occupational Safety and Health Administration
PEL permissible noise exposure level
PPE personal protective equipment
PTS permanent threshold shift
SPL sound pressure level
SLM sound level meter
TTS temporary threshold shift
TWA time weighted average
VA Veterans Administration
1
CHAPTER I
STATEMENT OF THE PROBLEM
An estimated 22 million civilian workers are exposed to hazardous levels of noise
(Roberts, Kardous, Neitzel, 2016). Government agencies such as the Occupational Safety
and Health Administration (OSHA) and the National Institute for Occupational Safety
and Health (NIOSH) have been created to help ensure the safety of workers by
establishing guidelines for and enforcing safe exposures to workplace hazards. These
agencies regulate or recommend exposure limits for a number of different occupational
hazards including noise.
Impact noise can be defined as the sound produced by the collision of masses,
followed by the vibration of those masses (Flamme & Murphy, in press). Measuring
impulse and impact noise is difficult and requires specialized equipment because of the
high amplitude and short duration of the signal (Rasmussen, Flamme, Stewart, Meinke, &
Lankford, 2009). Impact noise can have peak sound pressure levels in excess of 140 dB
SPL and last only milliseconds, depending on the physical properties and force involved
in the collision.
Impact noise affects the inner ear differently than continuous noise, often causing
mechanical damage to tissue (Fu, 2011). In addition to amplitude, impact noise repetition
rate is an important mechanism in contributing to cochlear damage. Even at relatively
2
low amplitude levels (107 dB SPL), repetition rates faster than .5 per second cause
significantly more temporary threshold shifts.
Workers in the United States are subject to environmental noise monitoring in an
effort to minimize risk of occupational noise-induced hearing loss. Limits set for time
weighted average and maximum noise dose percentage inaccurately incorporate impact
noise; however both the OSHA and the NIOSH require or suggest that impact/impulse
noise be integrated into noise exposure measurements of workers (Kardous, Willson, &
Murphy, 2005).
Many workers are exposed to high-level impact noise. Workers in the
manufacturing sector work in close proximity to machines that stamp, hammer, and shape
metal parts. Other machines drop metal parts into metal bins or create impact noise
during normal operation. All these sources combined to cause nearly 18,000 workplace
hearing injuries in 2010 (National Institute for Occupational Safety and Health [NIOSH],
2010). Workers in the mining industry must work around conveyer belts, rock drills, rock
smashers, and other equipment. It is not surprising that 80% of miners suffer material
hearing impairment by the time they retire (NIOSH, 2015b). Construction workers are
also at risk of developing noise-induced hearing loss; in a study by Kerr, McCullagh,
Savik, & Dvorak (2003), 53% of the 147 construction laborers tested had hearing
thresholds at 4 kHz worse than 25 dB HL.
Most sound level meters and noise dosimeters are not only expensive to purchase,
but also require complex proprietary software to evaluate results. Smartphones have
become extremely common in the U.S. and around the world. Many computer application
developers have created “apps” for smartphones that are capable of measuring
3
environmental noise to varying degrees of accuracy. This project aimed to determine the
ability of calibrated smartphone apps to accurately measure impact noise in a laboratory
setting. Outcomes from this research may inform health and safety personnel interested in
utilizing lower cost and more accessible technology for noise exposure measurements in
the workplaces.
The following research questions were asked:
Q1 What are the differences in peak sound pressure level for impact noise when
measured with the internal microphone of a calibrated smartphone device
using sound level meter apps versus a gold-standard laboratory sound
measurement system?
Q2 What are the differences in peak sound pressure level for impact noise when
measured with an external microphone coupled to the calibrated smartphone
device using sound measurement apps and the gold-standard laboratory
equipment?
Q3 What are the differences in peak sound pressure level for impact noise when
measured with the internal microphone of the calibrated smartphone device
as compared to an external microphone?
4
CHAPTER II
REVIEW OF THE LITERATURE
Noise-induced hearing loss (NIHL) is caused by exposure to hazardous noise
levels. In the United States, over 22 million civilian workers are exposed to hazardous
levels of noise (Roberts et al., 2016). In the military, the most common injuries to service
members are caused by excessive noise exposure. In 2013, the U. S. Department of
Veterans Affairs (VA) reported over 2.1 million veterans living with service-connected
hearing loss and/or tinnitus and nearly 1.4 million receiving financial benefits as a result
(Department of Veterans Affairs [VA], 2013). These numbers are slightly higher than
2009 when the VA recognized 1.2 million cases and paid over 1.1 billion dollars in
compensation (Government Accountability Office Report to Congressional Committees,
2011). The risk of NIHL from continuous noise is increased when the worker is also
exposed to high-level impact or impulse noise.
Impulse and Impact Noise
Hamernik and Hsueh (1991) defined impulse noise as “a noise transient that arises
as the result of a sudden release of energy (most often electrical or chemical) into the
atmosphere” (p. 189). The authors differentiate impulse noise from impact noise, noting
that impact noise is caused by mechanical interactions and the waveform will be different
depending on the physical characteristics of the materials, and that impact noise generally
has a peak SPL under 140 dB. The National Institute for Occupational Safety and Health
5
does not differentiate between impulse and impact noise, simply defining impulsive noise
as “characterized by a sharp rise and rapid decay in sound levels and is less than 1 sec in
duration” (NIOSH, 1998, p. xiii).
Noise Measurement
A sound level meter (SLM) is a device commonly used to measure sound
amplitude, frequency composition, and other acoustical parameters. In order to record or
measure a sound, the acoustic signal must first be changed into a signal that can be
quantified and manipulated. The first piece of equipment in this step is the microphone.
Inside the microphone, a diaphragm vibrates as a result of the interaction with the
physical sound wave. This movement creates a tiny electrical signal analogous to the
sound wave. This signal is too small to process and is boosted by a preamplifier. After
this step, the now-amplified signal moves through a series of circuitry that processes the
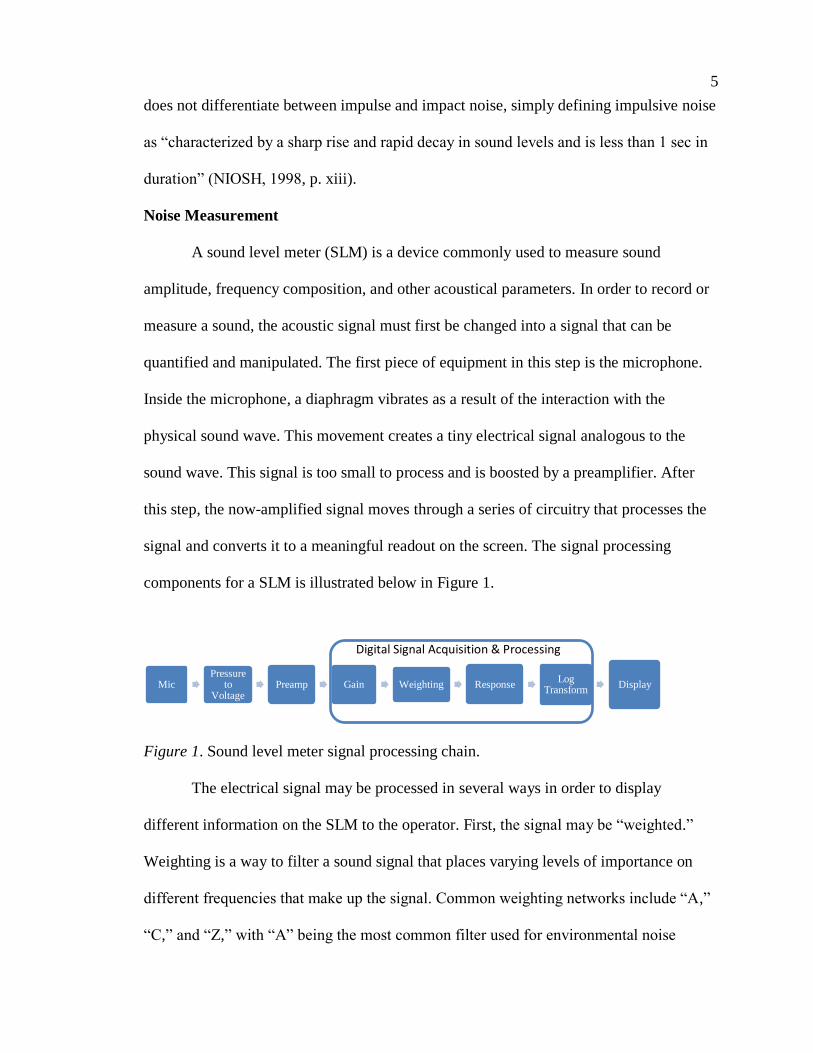
signal and converts it to a meaningful readout on the screen. The signal processing
components for a SLM is illustrated below in Figure 1.
Figure 1. Sound level meter signal processing chain.
The electrical signal may be processed in several ways in order to display
different information on the SLM to the operator. First, the signal may be “weighted.”
Weighting is a way to filter a sound signal that places varying levels of importance on
different frequencies that make up the signal. Common weighting networks include “A,”
“C,” and “Z,” with “A” being the most common filter used for environmental noise
MicPressure
to Voltage
Preamp Gain Weighting ResponseLog
TransformDisplay
Digital Signal Acquisition & Processing
6
monitoring. A-weighting is “said to be best for the frequency response of the human ear:
when a sound dosimeter is set to A-weighting, it responds to the frequency components
of sound much like your ear responds” (Occupational Safety and Health Administration
[OSHA], 2013, Loudness and Weighting Networks, para. 2). With A-weighting, very low
frequency components in the signal are attenuated and more emphasis is placed at
frequencies where the human ear is most sensitive (around 1-4 kHz).
Another way a SLM processes sound is in terms of “response time.” The SLM is
programmed with a “time constant,” or window in which the meter averages its readings.
The time constant can be “fast,” with a time constant of 125 milliseconds, or “slow,” with
a time constant of 1 second (OSHA 2013). Typically, for continuous noise, exposure
measurements are made with the meter set to “slow” response.
This signal can be further analyzed by a process known as “integration” where the
total sound exposure over a given period of time is accounted for and displayed as a
sound exposure level (SEL). This SEL is used in calculations for occupational noise
compliance standards discussed in detail in the section Noise Exposure Measurement in
the Workplace.
Impulse and Impact Noise
Measurement
Rasmussen et al. (2009) described the techniques and equipment required to
accurately measure high-level impulse noise from recreational firearms. The authors
reported that microphone sensitivity is an important variable when measuring impulse
noise. An inverse relationship exists between sensitivity and peak signal handling
capability; the less sensitive the microphone, the greater the sound pressure level it can
accurately represent. Because firearm impulse noise contains very high frequency
7
components, the transducer must be small in relation to the physical wavelength of the
individual frequencies. Microphone orientation to sound source is another important
variable. If the microphone is pointed directly towards the source, it will cause diffraction
of the sound waves. If perpendicular, diffraction is minimized, but higher frequency
measurements may be inaccurate due to interactions of physical wavelength of sound and
microphone diaphragm diameter. Common microphone diameters range from 1” to 1/8,”
and Rasmussen et al. chose the 1/8” size to minimize this effect and measure higher peak
levels. The authors also reported that the maximum signal amplitude that can be
accurately measured by a system is partially dependent on the maximum voltage the
preamplifier can handle. The input voltage to the preamplifier dictates this maximum and
if the voltage is too high, the system will be overloaded.
Meinke et al. (2016) compared sound pressure level readings from five
commercial SLMs equipped with 1/8” microphones against readings obtained with a
gold-standard laboratory test system and processed via MATLAB to determine how
accurately SLMs measured impulse noise from a firearm. The SLMs were placed at
different distances from the weapon that corresponded to 130, 140, 150, 160, and 170 dB
peak SPL as confirmed by the laboratory apparatus. The five commercially available
sound level meters were unable to accurately measure impulse noise at or above ~150 dB
SPL. The error at 170 dB was ~17 dB for all five sound level meters tested, and the
displayed reading often did not match the AC value output delivered by the SLM,
possibly indicating errors in response time or log transfer function or circuit voltage
limitations. Simply adding a “better” (1/8 inch) microphone does not necessarily increase
8
the maximum measurement range and does not improve the accuracy of high-level
impulse sound measurement for commercial sound level meters.
Laboratory Impulse Noise Source
An acoustic shock tube is a device that enables researchers to create high
amplitude shockwaves in the confines of a laboratory test environment. The acoustic
shock tube has a number of advantages over firearms or explosives for this purpose. The
use of firearms and explosives requires a large parcel of vacant land appropriate for
setting off detonations, highly trained technicians to handle the explosive, and numerous
other safety precautions and bureaucratic red tape that make testing cumbersome
(NIOSH, 2013). The shock tube uses a cylinder or compressed air separated from another
open cylinder at atmospheric pressure by a thin polyurethane or metal membrane. When
the membrane is punctured, the rapid release of the pressurized gas causes a shockwave
whose amplitude can be calibrated by adjusting the thickness of the partition used.
Impact Noise and Sources
Flamme and Murphy (in press) defined impact noise as “produced by collision of
masses, followed by free vibration of those masses”. The authors also noted that
compared to impulse noise, impact noise generally lasts longer, has lower peak levels,
and has more low-frequency energy.
Akay (1978) described the five basic mechanisms that create impact sound. The
first is “air ejection.” As two objects rapidly come together, the air between them is
compressed and forcefully ejected. This process is reversed as the objects rebound after
collision and create another pressure pulse when air rushes in to fill the vacuum created
as the two objects separate. The second mechanism described by Akay is “rigid body
9
radiation.” He defined this as a “pressure disturbance generated in an acoustic medium by
the acceleration of an object” (p. 978). As two objects collide, the rapid acceleration
causes sound waves to radiate from them. The third mechanism is “radiation due to rapid
surface deformations” (p. 979). A sound pressure peak is created when two objects
collide, and one is deformed. This peak is a discrete waveform and can be distinguished
from the sound waves caused by the collision of masses. The fourth mechanism is termed
“pseudo-steady state radiation” (p. 979). This can be thought of as the excess energy left
over after the collision between objects is converted to mechanical work. In industrial
settings, this energy is absorbed by manufacturing machinery and causes it to vibrate.
The fifth mechanism is “radiation from material fracture” (p. 979). This is noise caused
by material fracturing, and its intensity depends on how rapidly the material fractures. It
does not appear that a standardized means of creating and measuring impact noise in the
laboratory has been developed or implemented to date.
Occupational Hearing Loss Prevention
Today various government agencies regulate employees’ exposure to hazardous
noise by monitoring employee noise exposure and hearing acuity, establishing criteria for
wearing personal protective equipment (PPE), mandating hearing conservation training,
and ensuring employer compliance with record-keeping regulations. One of the key roles
employers play in these programs is monitoring noise levels in the workplace. Traditional
SLMs and noise dosimeters are expensive, and the use of smartphone or computer tablet
“apps” may be a viable way to survey the workplace or act as a stand-in for more
expensive equipment, especially in developing countries (Roberts et al., 2016).
10
United States Occupations with
High Rates of Hearing Loss
According to NIOSH, approximately 16 million Americans work in the
manufacturing sector, producing everything from food and beverages to transportation
equipment and chemicals (NIOSH, 2010). Hearing loss accounted for 17,700 of the
59,100 cases of workplace injuries reported to OSHA, making it the most commonly
recorded work-related illness for the sector (NIOSH, 2010). Occupational hearing loss
caused by exposure to manufacturing equipment is a preventable illness and could be
significantly reduced if OSHA regulations, and ideally, NIOSH best-practice guidelines
(NIOSH, 1998) are followed.
Hammer forging is the process of shaping metal that has been heated with blows
from a hammer or die. This process is used to create a variety of manufactured goods like
jewelry, knives, and firearm components. Pal Singh and Bhardwaj (2013) conducted a
survey of 572 randomly selected workers in hammer forging plants in India and used
both pure tone audiometry testing and environmental noise measurements to determine if
worker PPE use and job type influenced audiometric findings. The authors discovered
that depending on where the workers were located in the plant, noise doses ranged from
95% to over 800% using OSHA 5 dB exchange rate. The two tasks associated with the
highest decibel levels, forger and furnace job taker, had A-weighted Leq value of 105.1
and 103.3 dBA, respectively. Pure tone audiometry results showed that over 90% of
workers had hearing thresholds worse than 25 dB hearing level (HL) in both ears at all
frequencies tested (500 Hz to 8K Hz). The authors contributed the abnormally high
prevalence of NIHL to the fact that 85% of employees work longer than average work
11
weeks (50-60 hours) and the majority reported seldom or never wearing hearing
protection.
Mining is another industry with a high occurrence of NIHL. Mining is such a
dangerous occupation that another separate government agency, the Mine Safety and
Health Administration (MSHA), was created to govern its work environment and
procedures. The NIOSH reported that people employed in the mining industry suffer the
highest prevalence of hazardous noise exposure of all major industry with 25% of
workers having a hearing problem and 80% suffering hearing impairment by retirement
age (NIOSH, 2015a). Miners are exposed to a hazardous noise from a number of different
sources, including conveyer systems, roof bolting machines, and scrubber fans (NIOSH,
2015b). A report by McBride (2004) noted the estimated noise exposure of several
different types of mining equipment. Average dBA levels ranged from 88 (cutting
machines) to 117 (pneumatic percussion tools). He also noted that many types of
equipment emitted multiple hazards; hand drills, in particular, have impact noise from the
drill bit, impulse noise from the exhaust, and strong vibrations from the body of the drill.
Another study by Kitcher, Ocansey, and Tumpi (2012) examined NIHL in miners in the
African country of Ghana. The authors discovered that workers in the stone crushing
plant and mechanic shop were exposed to the highest noise levels (99.6 and 98.6 dBA,
respectively) and the prevalence of NIHL was 33.6%.
Construction industry workers are also at elevated risk for developing
occupational NIHL. Because construction workers have a wide scope of jobsite
responsibilities, they have the potential to be exposed to several impact noise hazards in
one day, ranging from chipping concrete with a jackhammer to pneumatic nail guns.
12
Another variable is phase of construction. Neitzel, Seixas, Camp, & Yost (1999)
discovered that while TWAs did not vary significantly by specific job title in construction
workers, the phase of construction did play a significant role. Construction workers
involved in the “structural stage” of a construction project exceeded the NIOSH
recommended exposure level (TWA of 85 dBA) in over 90% of samples. In a study by
Kerr et al. (2003), 53% of the 147 construction laborers tested had hearing thresholds at 4
kHz worse than 25 dB HL, indicating NIHL.
Hearing Loss from Impact Noise
Impact and impulse noise have long been known to have a more detrimental
effect on hearing than equal levels of steady state noise (Schwetz, Hloch, & Schewczik,
1979; Hamernik, Turrentine, Roberto, Salvi, & Henderson, 1984). Henderson,
Subramaniam, Gratton, & Saunders (1991) explored how impact noise effected both
temporary and permanent threshold shifts in chinchillas. Thresholds were established in
healthy subjects using acoustic brainstem response (ABR). After establishing this
baseline, the test subjects were grouped and subjected to impact noise of 107, 113, 125,
or 137 dBA. In addition to amplitude, the rate of stimulation was either 4 beats per
second (BPS), 1 BPS, or ¼ BPS of electronically synthesized impact noise. Thresholds
were retested again immediately after exposure and then again, every 5 days until 30 days
passed in order to establish both temporary threshold shift (TTS) and permanent
threshold shift (PTS) values. The authors discovered that TTSs were present at all levels
and stimulation rates, but the severity of the shift varied between test groups until
exposure levels reached 125 dBA and became stable across groups. Permanent threshold
shift results were similar to TTS with respect to variability across groups until exposure
13
levels reached 131 dBA. The authors also demonstrated that PTS increased as stimulation
rate increased until exposure levels reached 131 dBA. Above this level, PTS values were
severe and independent of rate.
In addition to temporary and permanent threshold shifts, impulse/impact noise
causes mechanical damage to inner ear structures not seen in long-term continuous noise
exposures. Specifically, outer hair cells may become separated from each other, fall over,
or break (Fu, 2011). In addition to hair cell damage, the tectorial membrane may be torn,
and structural support cells can be damaged. Imaging from a chinchilla subjected to 4
kHz tone at 110 dBA revealed that the four rows of outer hair cells on the area of
maximal displacement of the cochlea had been completely destroyed. The researchers
discovered that a smooth layer of scar tissue replaced the damaged area and the sensory
cells required to sense sound had completely vanished (Fu, 2011).
Noise Exposure Measurement in the Workplace
Noise exposure in the workplace can be measured using noise-dosimetry, which is
especially useful for mobile workers. When using noise dosimeters, the sound level in
any environment must exceed the “threshold” to be averaged into any reading. The
OSHA sets the threshold at 80 dBA for noise measurements used for determining the
need for hearing conservation programs (OSHA, 2013). Sound exposure levels may be
quantified in a few different ways that either represent exposure as a percentage dose or
as an averaged level in decibels. Two common measurement parameters are time
weighted average (TWA) and average level (Lavg) or level equivalent (Leq).
Time weighted average is defined as “a constant sound level lasting 8 hours that
would result in the equivalent sound energy as the noise that was sampled. The TWA
14
calculation always averages the sampled sound over an eight-hour period” (OSHA, 2013,
Appendix A, Glossary). Therefore, TWA can be thought of simply as the average noise
level over the course of eight hours and is represented as a decibel number. Averaging
sound exposure over an eight-hour period is a useful means to monitor workers who may
be exposed to varying levels of sound throughout the work day, possibly moving from
one duty to another. It is also important to note that TWA measurements are all
normalized to an eight-hour period. Noise exposure sampling of less than eight hours
may incorrectly estimate eight-hour exposures depending on the averaging approach
implemented in the noise dosimeter algorithm for accounting for the time not sampled.
For longer shifts (>eight hours), the full-shift noise exposure must be normalized to an
eight-hour TWA. Workers whose noise exposure exceeds 85 dBA TWA are required to
be included in a hearing conservation program per OSHA (1983).
Another way to report noise exposure is Lavg. This is “the average sound level
measured over the run time of the measurement” using a 5-dB exchange rate to integrate
the sound levels over time (OSHA, 2013, Appendix A, Glossary). The Lavg and the
TWA will be equivalent when the sample time is eight hours. In cases of shorter or
longer sample times, the values will differ. When sound levels are integrated over time
using the 3-dB exchange rate recommended by NIOSH, the metric is referenced as level
equivalent or Leq.
Other concepts to understand when measuring sound for workplace safety are
“exchange rate” and “dose.” Exchange rate is defined as “the increase or decrease in
decibels corresponding to twice (or half) the nose dose” (OSHA, 2013, Appendix A,
Glossary). Dose is defined as “a dose reading of 100% is the maximum allowable
15
exposure to accumulated noise” (OSHA, 2013, Appendix A, Glossary). The OSHA uses
an exchange rate of 5 dB and sets the 100% dose at 90 dBA, so reducing the TWA to 85
would yield a dose of 50%, and increasing it to 95 would result in a dose of 200%. The
NIOSH uses an exchange rate of 3 dB and sets the 100% dose at 85 dBA, so reducing the
TWA to 82 would yield a dose of 50%, and increasing it to 88 dBA would result in a
dose of 200% (NIOSH, 1998, P xiii).
As mentioned previously, one common way to measure hazardous sound
exposure in the workplace is to use a device called a noise dosimeter. This device
measures varying noise levels occurring over time in the environment and converts it to
TWA that can be used to ensure worker exposure does not exceed OSHA/NIOSH
suggested maximums. The OSHA specifies that the permissible noise exposure level
(PEL) sampling should include all sounds from 90 dBA and above, and impact/impulse
noise and sets a maximum ceiling limit of 115 dBA measured using a slow response with
a peak sound pressure level limit of 140 dB (OSHA, 1983). The OSHA also utilizes an
“action level,” where if the TWA is greater than 85 dBA, employees must be a part of a
hearing conservation program, undergo training, and complete annual hearing tests. The
NIOSH recommends integrating all sounds from 80 to 140 dBA using a 3-dB exchange
rate. The NIOSH recommended that exposure limit criterion is 85 dBA for 100% dose
and did not specify a ceiling level (NIOSH, 1998).
National Institute for Occupational Safety
and Health Versus Occupational
Safety Health Administration
The National Institute for Occupational Safety and Health is the scientific agency
responsible for developing criteria for safe occupational exposures to workplace hazards.
16
The NIOSH best practice guidelines recommend that employers monitor work
environments where workers may be exposed to sound levels over 85 dBA (NIOSH,
1998). The NIOSH makes recommendations to employers, but does not have the
authority to enforce them. Another government agency, OSHA, actually enforces laws
related to workplace safety including noise exposure. The OSHA standards are slightly
more liberal than NIOSH recommendations across the board. In addition to the different
exchange rates discussed earlier, the two agencies set different values for permissible
exposure limit (PEL). The OSHA uses a TWA of 90, and the limit for NIOSH (termed
recommended exposure limit) is 85. These seeming small differences add up quickly; an
85 dBA TWA is a 100% dose for NIOSH, but only a 50% dose for OSHA; a 91 dBA
TWA is a 400% dose for NIOSH, but a 115% dose for OSHA. The stricter NIOSH
standards for allowable noise exposure reduce the risk of developing NHL over a 40-year
working career by 50% (NIOSH, 1998) and are used by most regulatory agencies around
the world. Both NIOSH and OSHA limit the maximum peak level exposure to 140 dB
SPL.
Approaches to Manage
Occupational Noise
Exposure
The NIOSH has established a hierarchy of controls that apply to not only noise
exposure, but also to all environmental safety hazards an employee may face (NIOSH,
2015a). The hierarchy consists of five methods to minimize employee exposure to
hazards including elimination, substitution, engineering controls, administrative controls,
and PPE. The controls are ranked from most effective (elimination) to least effective
(PPE) and are meant to be implemented in that order. An example of elimination would
17
be to remove a piece of equipment with high sound pressure levels from a mining
operation. While this would be the most effective course of action, it is often impossible
for an existing operation. Substitution would entail replacing the equipment that is
causing the hazard with another that does not and is also an effective option, but may be
financially or logistically impossible to accomplish. An example of engineering controls
would be to make modifications to an existing piece of equipment that would reduce
exposure by either minimizing the level of noise created or insulating the employee from
the noise. Administrative controls rely on changing how manpower is allocated to a task.
These controls are commonly used when excessive exposure levels cannot be controlled
by other more effective methods. An example would be to rotate crew members to
different stations over the course of a shift to minimize exposure to a particularly loud
task. The least effective, but most commonly used, exposure control is requiring
employees to wear PPE while working. This approach is least effective because of the
variability in the fit of hearing protectors, and the effectiveness of the strategy relies upon
worker behavior which can be influenced by a number of factors.
Noise Dosimetry and Impact Noise
Kardous et al. (2005) examined noise dosimeter effectiveness for measuring
impulse noise and found the devices are limited by several technical issues. Specifically,
the microphone response above 3 kHz is poor, and the microphones are unable to
measure peak sound pressure levels greater than ~146 dB. Another difficulty the authors
pointed out was the conversion of impulse noise to time weighted average. The current
NIOSH equation for dose is D = [C1/T1+C2/T2+ . . . +CN/TN], where CN is the total time
of exposure at a specified level and TN is the exposure duration that would expect to
18
cause harm. The value for TN is determined by measuring the sound in the “slow”
response time setting, causing a significantly lower value than the actual peak sound
pressure level. When the values for TN (2.2 seconds) and CN (456 milliseconds) are
entered into the equation, the result is a contribution of only approx. 0.02-0.03%. So,
because the duration of an impulse/impact sound is so short, a worker could safely be
exposed to 5000 gunshots according to the NIOSH equation. For these reasons, the
authors found dosimeters entirely unsuitable for measuring exposure to impulse noise.
The contribution of impact noise to the overall noise exposure may also be
underestimated due to the same issues related to slow response and may be limited,
depending on the spectral characteristics of the impact noise source, especially if A-
weighting is applied to the measurement.
Another tool commonly used to measure noise is the sound level meter. This
device measures sound pressure in the atmosphere and displays sound pressure level in
decibels (dB SPL), rather than TWA or dose. Sound level meters are useful for measuring
individual noise sources, evaluating hearing protective devices’ suitability, and aiding in
the analysis of noise sources for possible noise control (OSHA, 2013). Sound level
meters are broken into two basic types, depending on accuracy: Type 1 is used for
precision field measurements and have an accuracy of ±1 dBA, and Type 2 is used for
general measurements with a tolerance of ±2 dBA (OSHA, 2013).
Noise Measurement with Smartphones and Tablet Apps
Numerous sound level meter apps are available for download for free or for a
small cost. The apps are available for different operating systems, and each is designed
with different features and capabilities. Table 1 and Table 2 provide a summary of
19
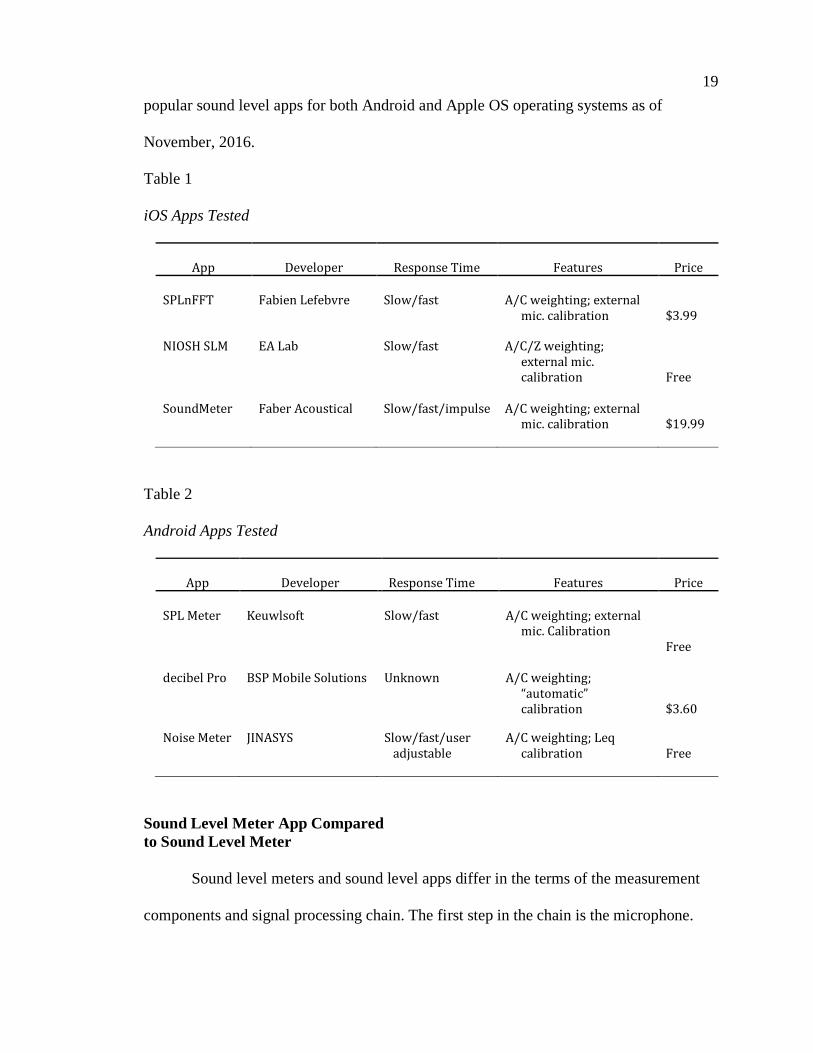
popular sound level apps for both Android and Apple OS operating systems as of
November, 2016.
Table 1
iOS Apps Tested
App
Developer
Response Time
Features
Price
SPLnFFT
Fabien Lefebvre
Slow/fast
A/C weighting; external
mic. calibration
$3.99
NIOSH SLM EA Lab Slow/fast A/C/Z weighting; external mic. calibration
Free
SoundMeter Faber Acoustical Slow/fast/impulse A/C weighting; external
mic. calibration $19.99
Table 2
Android Apps Tested
App
Developer
Response Time
Features
Price
SPL Meter
Keuwlsoft
Slow/fast
A/C weighting; external
mic. Calibration
Free
decibel Pro BSP Mobile Solutions Unknown A/C weighting; “automatic” calibration
$3.60
Noise Meter JINASYS Slow/fast/user adjustable
A/C weighting; Leq calibration
Free
Sound Level Meter App Compared
to Sound Level Meter
Sound level meters and sound level apps differ in the terms of the measurement
components and signal processing chain. The first step in the chain is the microphone.
20
Smartphone microphones are primarily intended to detect sound sources close to the mic
(the user’s voice) and not environmental sounds around the user. While this increases the
clarity of the signal for the person on the other end of the line, it may limit the ability of
an app to measure sounds accurately. Most cell phone manufacturers today use a
microelectromechanical systems (MEMS) class microphone that can accurately capture
sounds from 30 dB SPL to 130 dB SPL and has a flat frequency response (Kardous &
Shaw, 2014). Unfortunately, there are many companies manufacturing MEMS
microphones (Knowles, AAC, Goertek, and BSE, to name a few), and cell phone
companies do not disclose which one or ones they use in each phone. This makes it
nearly impossible to know the exact specifications for the microphone and whether
recording errors are caused by the hardware or software. When the signal arrives at the
microphone, a tiny electrical voltage is created. The amplitude of this signal is dependent
on the amplitude of the signal and the sensitivity of the microphone. This is another
possible opportunity for error to occur, and since the microphone sensitivity is unknown,
it may be difficult to analyze. The voltage created by the microphone is analogous to the
original signal and must be converted to a digital signal so that it can be manipulated by
the app’s software. The app manipulates the response time, weighting and decibel
conversion using digital filters not disclosed by the software developers (Nast, Speer, &
Le Prell, 2014). The proprietary processing of this digital signal is probably different for
each app and is yet another opportunity for error to occur. This processed digital signal is
then displayed on the screen.
21
Accuracy of Sound Level
Meter Apps
Kardous and Shaw (2014) examined the ability of smart devices to measure
continuous sound using only the built-in microphone. The authors tested a number of
smartphones and tablets manufactured by Apple, Samsung, HTC, and Motorola.
Inclusion criteria for the applications tested were: ability to report A-weighted and
unweighted sound levels, slow or fast response time setting, and 3 or 5 dB exchange rate,
and ability to display both equivalent continuous average sound level or time weighted
average. The authors tested 10 Apple apps that met the criteria. None of the apps
available for the Android operating system met all inclusion criteria, but the authors
selected four that were closest. The authors did not go into specific about detail on how
each app failed to meet inclusion criteria. Sound level measurements were taken in the
sound field using pink noise starting at 65 dBA and increasing to 95 dBA in 5 dB steps.
The value reported by the smart device was compared to a calibrated Type 1 SLM. The
results showed that some apps were very accurate. Three of the iOS apps (SPLnFFT,
NoiSee, and SoundMeter) were within ±2 dB of the reference value for A-weighted
sound levels. The researchers also noted that Android apps were generally unsatisfactory
for measuring sound due to the wide variance in values reported from the same app
across different devices and the fact that Android devices are manufactured by many
different companies and there was no consistency in the hardware components.
Roberts et al. (2016) extended the 2014 study by Kardous and Shaw (2014) and
added external microphones to the experimental design. The researchers selected the
three apps that gave the best performance from the 2014 Kardous and Shaw study and
chose to use only Apple branded iOS products because of the more uniform hardware and
22
tighter controls placed on the Apple operating system compared to Android devices. In
addition to the iPhone 4, 4S, and 5 used in the previous study, the authors used three 5th
generation iPods. Two external microphones were used, the iMM-6 manufactured by
Dayton Audio (Springboro, Ohio) and the i436 manufactured by MicW (Beijing, China).
The authors conducted two experiments. The first was designed to evaluate the variability
of the external mic while measuring noise levels in the same type of device running the
same app. Pink noise was generated in a sound-treated chamber, and measurements were
taken in the same manner as the 2014 study at levels from 60 to 100 dBA in 5 dB steps.
This experiment revealed that when measurements are taken by the same type of device
using the same app and same microphone, the data will be similar, but not necessarily
accurate in comparison to the ±2 dB required of a type II SLM. Some device/app/mic
combinations were more accurate than others, and to complicate things further, the noise
level sometimes influenced the accuracy of the measurement. The authors discovered that
when the iMM-6 microphone was used, the mean difference between sound meter app
measurements and the reference mic was 0 at all noise levels from 70-100 dBA. The
SPLnFFT app was the next most accurate, with a mean difference on 1-2.1 dB over the
same range. NoiSee was also accurate, with mean differences from .1 to .7 dB up to the
95 dB level, but when noise reached the 100 dBA level, mean difference rose to 4.3 dBA.
Kardous, Shaw, and Murphy (2016) noted that different generations of
smartphone devices use different microphone hardware and software depending on the
current operating system. The second experiment was designed to show if using an
external mic would compensate for this and allow different versions of smartphones to
make accurate measurements once an external mic was attached. When the internal
23
microphone was used, sound level readings could be off by as much as 25 dBA. When
the external mic was used, the differences reported were less than 1 dBA. Despite the
promising improvement when using the external microphones, the authors noted that
there are still hurtles to using smart devices to monitor noise levels, including the
necessity to calibrate the app before accurate measurements can be made and inconsistent
software and hardware updates. It is also noteworthy that these studies limited the
measurements to continuous sound levels between 65 dB and 95 dB SPL and microphone
performance when measuring sound levels below or above these limits is unknown.
Nast et al. (2014) tested five apps that ranged in cost from free to over $10 in an
iPhone 4S using the phone’s microphone compared to a calibrated Type I sound level
meter. The authors placed each device in a sound isolation chamber and presented
narrow-band noise in the sound field centered at frequencies of 250, 500, 1000, 2000,
4000, and 8000 Hz at intensities of 50, 70, and 85 dB HL. Following calibration with a
type I SLM, sound level measurements were taken every 10 seconds with the
smartphones, and the average of 10 samples were recorded for each narrow-band
frequency. The researcher took measurements with the app set to both A-weighting and
C-weighting. The smartphones were unable to measure low noise levels (~ 0 dB HL) due
to high internal noise generated by the phone and elevated ambient noise levels in the test
room. Most smartphone apps measured C-weighted sounds more accurately than A-
weighted sounds, and most apps underestimated the actual sound level, especially at 85
dB HL and above. The authors do not recommend the use of SLM apps to monitor
workplace noise unless correctly calibrated.
24
Study Rationale
While there are a number of studies in which the authors examined the accuracy
of smartphone devices and apps to measure constant noise, there are none that examine
the performance of smartphones using internal and external microphones to measure
impact noise in a laboratory setting. In addition, no study has been performed that
examined the effect of using an external microphone in an Android device. The use of an
external microphone may overcome the hardware limitations mentioned by previous
authors and expand the availability of reliable environmental noise monitoring equipment
to a larger number of workplaces, especially those in developing countries.
25
CHAPTER III
METHODS
This study borrowed from previous studies with respect to experimental setup.
Hardware positioning, data collection, and statistical analysis was similar to that of Nast
et al. (2014), Rasmussen et al. (2009), and Roberts et al. (2016).
Experimental Setup
Instrumentation
Sound field measurements were conducted in a lab. Instrumentation used for data
collection consisted of a gold standard system capable of measuring sound levels with a
high degree of accuracy, and the smartphones were evaluated.
Gold standard system. The gold standard system consisted of the Computerized
Speech Lab (Pentax Medical) system (CSL) employing a G.R.A.S. Sound and Vibration
1/4” type 46BD combination microphone and preamplifier. Sampling rate was set at
100,000 Hz, and16-bit quantization was used. Acoustic waveforms recorded by the CSL
system were saved as individual .wav files and analyzed with a custom script written for
GNU Octave 4.2.1 software. The peak SPL level was obtained from the Octave script
output and served as the reference. These reference values were compared to individual
measurements gathered from the smartphones for accuracy.
Smartphones, apps, and microphone. Test phones consisted of two iOS
operating system phones (Apple iPhone 6S and iPhone 7) and two Android operating
26
system phones (Samsung Galaxy Amp 2 and Sony Xperia Z3 Compact). Three
applications were tested for each operating system. Two of the three apps selected for
iOS performed well in previous studies (Kardous et al., 2014; Nast et al., 2014); they
were SPLnFFT (Fabien Lefebvre) and SoundMeter (Faber Acoustical, LLC). The third
iOS application tested was NIOSH SLM (EA Lab). Although Android devices/apps were
reported to exhibit inadequate performance in the literature, three apps stood out as
having more features and were selected for this study. They were SPL Meter
(Keuwlsoft), decibel Pro (BSP Mobile Solutions), and Noise Meter (JINASYS).
Measurements were recorded using both the phone’s built-in microphone and an iMM-6
Calibrated Measurement Microphone manufactured by Dayton Audio (Springboro,
Ohio).
Calibration
The CSL system was calibrated by recording a 114 dB calibration tone from a
G.R.A.S. Sound and Vibration Pistonphone Type 42AA. After this tone was recorded, a
1.5 second duration section from the middle of the recording where the waveform was
most stable was extracted using Audacity 2.2.2 software. This extracted waveform
section was saved for use as a calibration signal applied during waveform analysis via a
custom GNU Octave script (Appendix A).
Applications were calibrated by adjusting displayed readings to match a calibrated
Larson Davis System 824 Type I sound level meter. The calibration signal consisted of
white noise presented at 80 dB SPL generated by the Audacity software from a laptop
computer connected to an Acoustic Research Powered Partner 570 speaker. Calibration
was completed in a manner that would maximize accuracy of readings and attempt to
27
mitigate measurement errors caused by app limitations. Each smartphone was placed on a
microphone stand 1 meter from the speaker, and the displayed dB level was adjusted to
within ± 1 dB of the Type I SLM reading inside a sound treated booth. Microphones were
in a grazing orientation to the source. Each smart phone and app combination was
calibrated separately for internal and external microphone test conditions prior to impact
sound level measurements. Immediately following calibration, the microphone stand with
the smartphone still in place was moved to the experimental setup, and data collection for
that smartphone/app combination was completed. This process was identical for each
combination tested, with the exception of the “SPL Meter” app for Android devices. This
app had multiple calibration levels, and calibration levels of 60 and 80 dB SPL
unweighted were selected to provide a range of inputs. Calibration was not attempted for
this app above 80 dB SPL. All phones were calibrated and tested in either “Z” or “None”
weighted conditions, with either “impulse” or “fast” time constant selected, depending on
application capabilities.
Impact Noise Source
Impact noise was generated by dropping a 4 Kg cast iron shotput onto a horizontal
½” thick A-36 grade diamond plate piece of steel resting on concrete blocks. The plate
was oriented with the diamond plate facing down so that the shotput impacted the smooth
side of the plate. Drop height was adjusted from high to low, or low to high, depending
on where the shelf was located following completion of the smartphone/app/mic prior to
it.
Drop height was controlled by raising and lowering a shelf that supported the
shotput. The shelf was supported by hanging brackets that moved up and down on shelf
28
tracks secured to a piece of plywood. The shelf tracks allowed a drop height range of
from 6.5 to 102 centimeters in 1.5-centimeter increments. This range was divided into 31
numbered levels to allow the shelf to be easily and consistently adjusted during data
acquisition.
The release mechanism consisted of a 10” long piece of 6” dimeter PVC oriented
at a shallow angle. An 1/8” diameter stick was inserted horizontally to retain the shotput
approximately 2.5 cm from the lip of the pipe. To release the shotput, the stick was
quickly removed. Due to the shallow slope of the ramp (~5º), the gate was completely
removed before the shotput began any forward motion, eliminating the possibility of the
gate interfering with the shotput on release and ensuring it fell in a consistent and
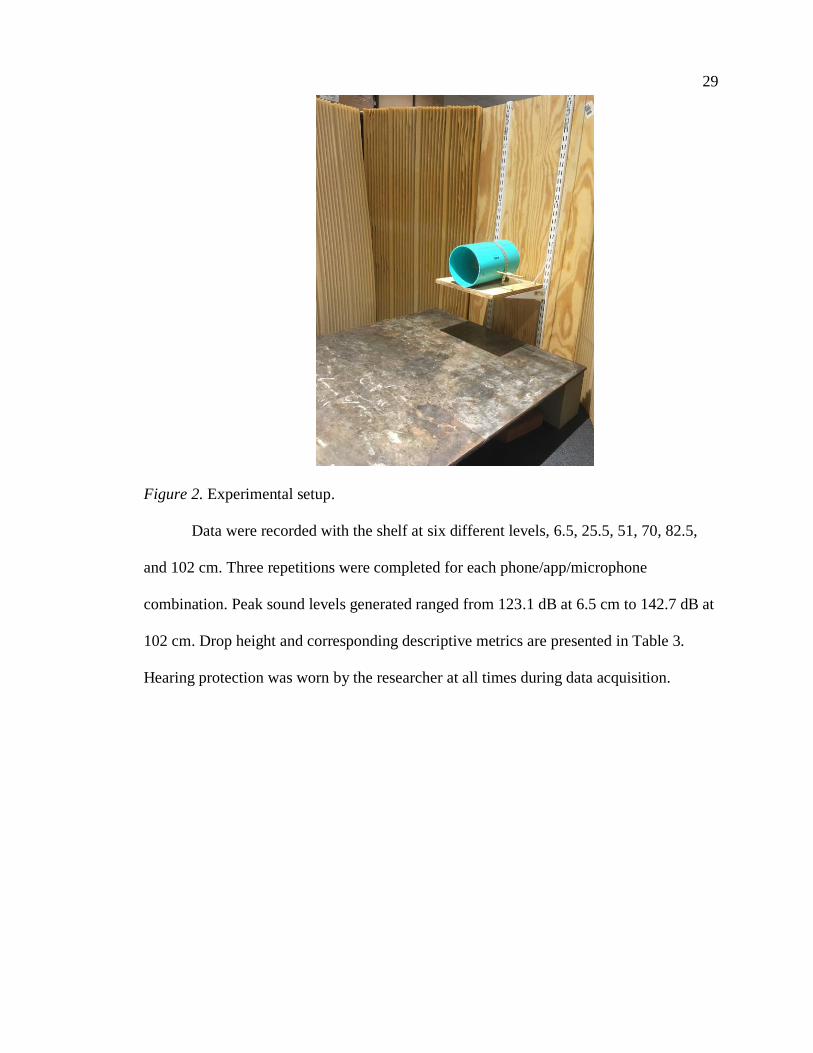
repeatable manner. Figure 2 displays the experimental setup with steel plate, release
mechanism, acoustic foam, and height adjustment visible.
29
Figure 2. Experimental setup.
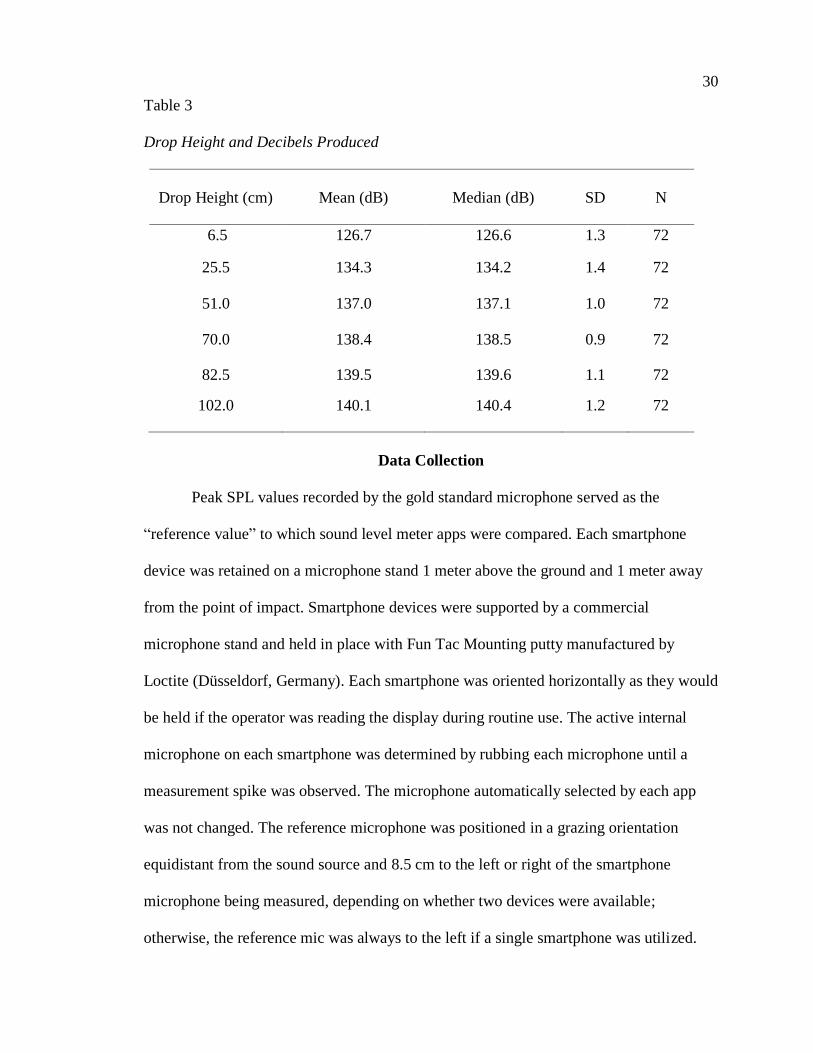
Data were recorded with the shelf at six different levels, 6.5, 25.5, 51, 70, 82.5,
and 102 cm. Three repetitions were completed for each phone/app/microphone
combination. Peak sound levels generated ranged from 123.1 dB at 6.5 cm to 142.7 dB at
102 cm. Drop height and corresponding descriptive metrics are presented in Table 3.
Hearing protection was worn by the researcher at all times during data acquisition.
30
Table 3
Drop Height and Decibels Produced
Drop Height (cm)
Mean (dB)
Median (dB)
SD
N
6.5 126.7 126.6 1.3 72
25.5 134.3 134.2 1.4 72
51.0 137.0 137.1 1.0 72
70.0 138.4 138.5 0.9 72
82.5 139.5 139.6 1.1 72
102.0 140.1 140.4 1.2 72
Data Collection
Peak SPL values recorded by the gold standard microphone served as the
“reference value” to which sound level meter apps were compared. Each smartphone
device was retained on a microphone stand 1 meter above the ground and 1 meter away
from the point of impact. Smartphone devices were supported by a commercial
microphone stand and held in place with Fun Tac Mounting putty manufactured by
Loctite (Düsseldorf, Germany). Each smartphone was oriented horizontally as they would
be held if the operator was reading the display during routine use. The active internal
microphone on each smartphone was determined by rubbing each microphone until a
measurement spike was observed. The microphone automatically selected by each app
was not changed. The reference microphone was positioned in a grazing orientation
equidistant from the sound source and 8.5 cm to the left or right of the smartphone
microphone being measured, depending on whether two devices were available;
otherwise, the reference mic was always to the left if a single smartphone was utilized.
31
When two smartphones were available for testing at the same time, they were measured
simultaneously in an effort to increase efficiency of data collection.
Each smartphone was measured during three trials at each shotput drop height
using each smartphone/microphone/app combination. Each of the four smartphones
contributed 108 measurements for a total of 432 smartphone data points. Each of the
smartphone data points had a corresponding gold standard measurement, bringing the
grand total to 864 data points.
Descriptive Statistics
The mean difference between the CSL system measurements and smartphone
measurements was calculated for every combination of dB level, app, and microphone. A
mean difference of zero would indicate perfect agreement between the two, and the larger
the mean difference, the poorer agreement. Negative values indicated measurement was a
lower intensity than the reference system. Data were summarized by device, app, and
microphone used.
32
CHAPTER IV
RESULTS
A total of 435 data points was recorded during the data collection portion of the
study. Three samples were erroneously recorded with the reference microphone out of the
correct position following smartphone calibration and were immediately purged.
Therefore, a total of 432 valid samples was collected and analyzed.
The mean differences between smartphone internal microphone measurements
and gold standard measurements were compared to determine if smartphone
measurements were within ±2 dB of gold standard values. The only phone/app
combination to meet this criterion was the Apple iPhone Se using the SoundMeter app at
low drop heights. Overall, measurements collected with iPhones were closer to gold
standard values than measurements from Android devices, and detailed outcomes are
provided below.
iPhone Internal Microphone
Measurements
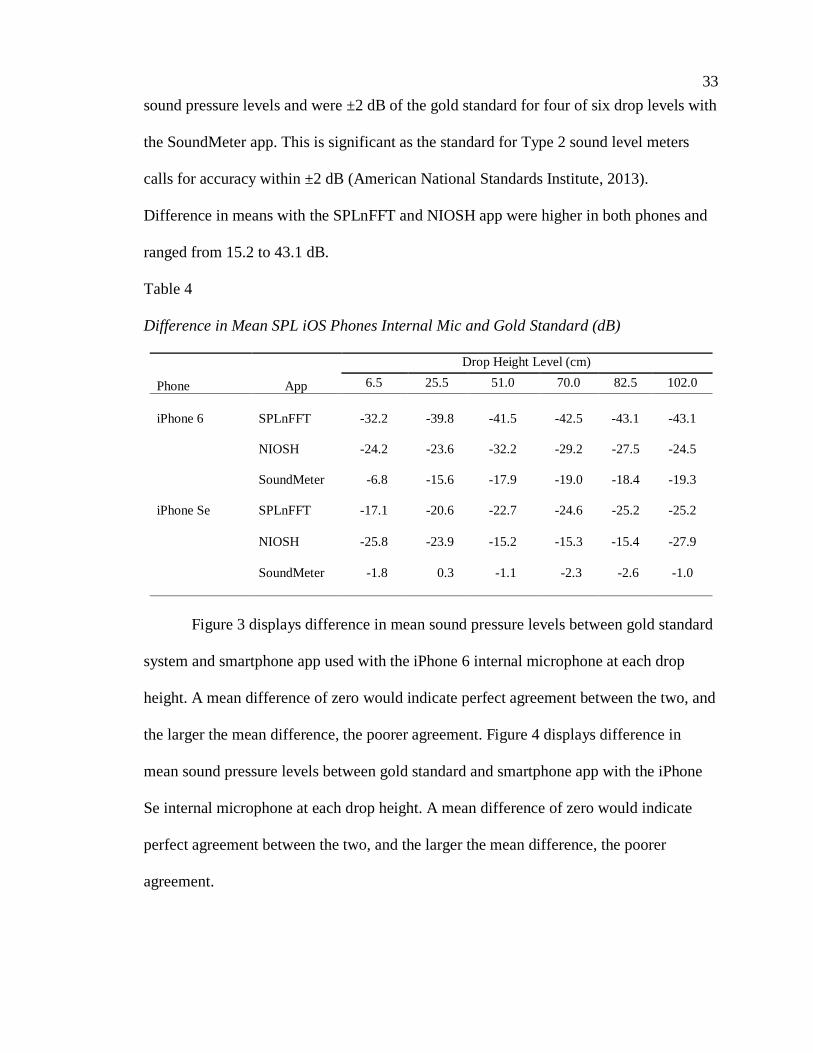
iPhone internal microphone measurements are presented in Table 4. Mean
differences in peak SPL were generally between 1 and 40 dB, depending on application.
The lowest mean difference recorded for the iPhone 6 was with the SoundMeter app at
the lowest drop level (6.5 cm). iPhone 6 internal mic measurements are presented in
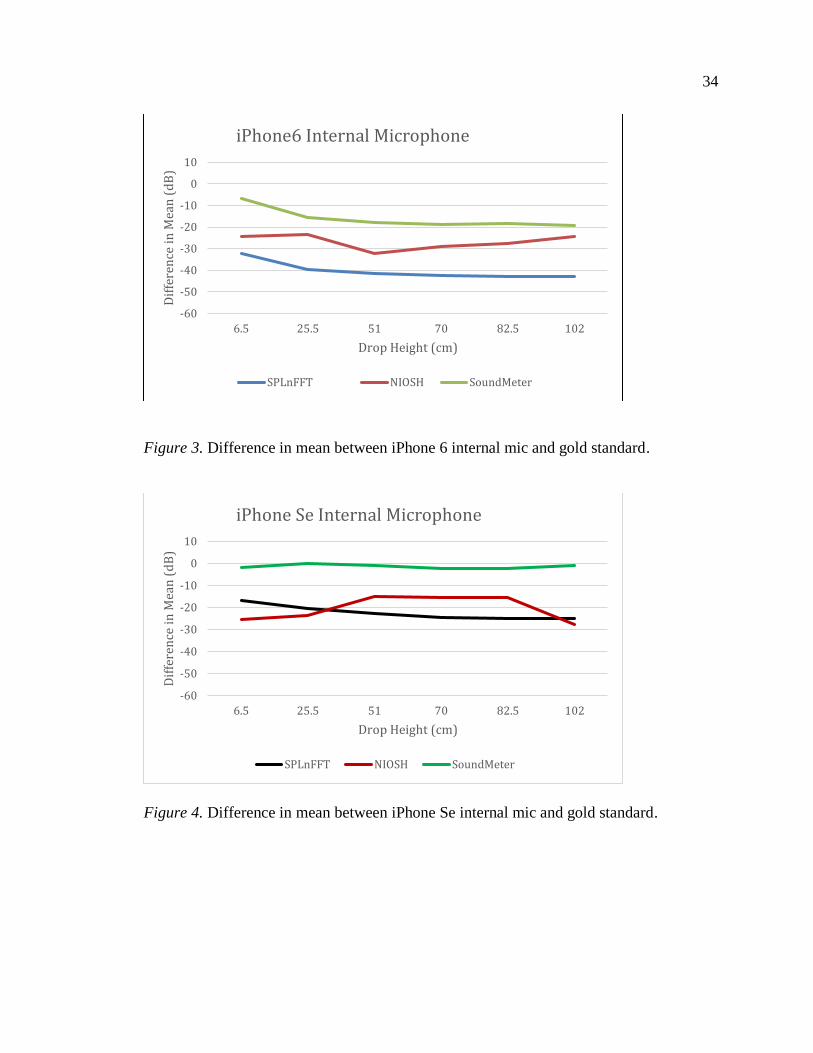
Figure 3. Measurements from the iPhone Se had smaller differences between mean peak
33
sound pressure levels and were ±2 dB of the gold standard for four of six drop levels with
the SoundMeter app. This is significant as the standard for Type 2 sound level meters
calls for accuracy within ±2 dB (American National Standards Institute, 2013).
Difference in means with the SPLnFFT and NIOSH app were higher in both phones and
ranged from 15.2 to 43.1 dB.
Table 4
Difference in Mean SPL iOS Phones Internal Mic and Gold Standard (dB)
Phone App
Drop Height Level (cm)
6.5 25.5 51.0 70.0 82.5 102.0
iPhone 6 SPLnFFT -32.2 -39.8 -41.5 -42.5 -43.1 -43.1
NIOSH -24.2 -23.6 -32.2 -29.2 -27.5 -24.5
SoundMeter -6.8 -15.6 -17.9 -19.0 -18.4 -19.3
iPhone Se SPLnFFT -17.1 -20.6 -22.7 -24.6 -25.2 -25.2
NIOSH -25.8 -23.9 -15.2 -15.3 -15.4 -27.9
SoundMeter -1.8 0.3 -1.1 -2.3 -2.6 -1.0
Figure 3 displays difference in mean sound pressure levels between gold standard
system and smartphone app used with the iPhone 6 internal microphone at each drop
height. A mean difference of zero would indicate perfect agreement between the two, and
the larger the mean difference, the poorer agreement. Figure 4 displays difference in
mean sound pressure levels between gold standard and smartphone app with the iPhone
Se internal microphone at each drop height. A mean difference of zero would indicate
perfect agreement between the two, and the larger the mean difference, the poorer
agreement.
34
Figure 3. Difference in mean between iPhone 6 internal mic and gold standard.
Figure 4. Difference in mean between iPhone Se internal mic and gold standard.
-60
-50
-40
-30
-20
-10
0
10
6.5 25.5 51 70 82.5 102
Dif
fere
nce
in
Mea
n (
dB
)
Drop Height (cm)
iPhone6 Internal Microphone
SPLnFFT NIOSH SoundMeter
-60
-50
-40
-30
-20
-10
0
10
6.5 25.5 51 70 82.5 102
Dif
fere
nce
in
Mea
n (
dB
)
Drop Height (cm)
iPhone Se Internal Microphone
SPLnFFT NIOSH SoundMeter
35
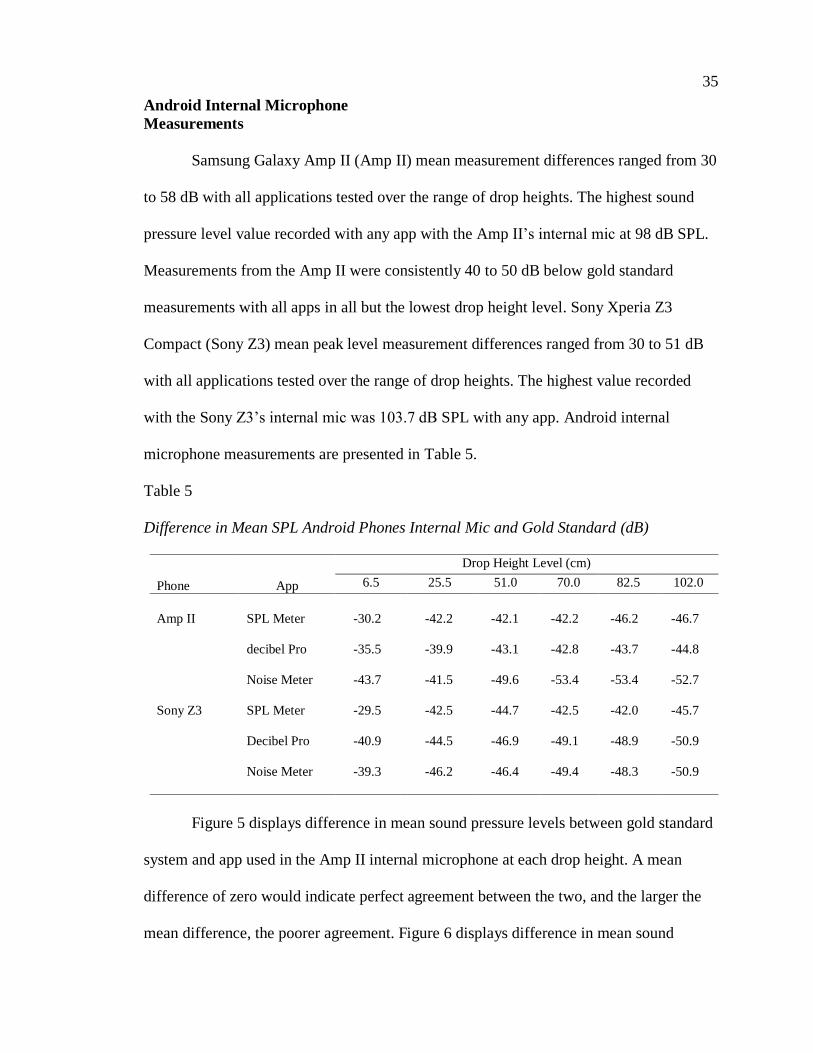
Android Internal Microphone
Measurements
Samsung Galaxy Amp II (Amp II) mean measurement differences ranged from 30
to 58 dB with all applications tested over the range of drop heights. The highest sound
pressure level value recorded with any app with the Amp II’s internal mic at 98 dB SPL.
Measurements from the Amp II were consistently 40 to 50 dB below gold standard
measurements with all apps in all but the lowest drop height level. Sony Xperia Z3
Compact (Sony Z3) mean peak level measurement differences ranged from 30 to 51 dB
with all applications tested over the range of drop heights. The highest value recorded
with the Sony Z3’s internal mic was 103.7 dB SPL with any app. Android internal
microphone measurements are presented in Table 5.
Table 5
Difference in Mean SPL Android Phones Internal Mic and Gold Standard (dB)
Phone App
Drop Height Level (cm)
6.5 25.5 51.0 70.0 82.5 102.0
Amp II SPL Meter -30.2 -42.2 -42.1 -42.2 -46.2 -46.7
decibel Pro -35.5 -39.9 -43.1 -42.8 -43.7 -44.8
Noise Meter -43.7 -41.5 -49.6 -53.4 -53.4 -52.7
Sony Z3 SPL Meter -29.5 -42.5 -44.7 -42.5 -42.0 -45.7
Decibel Pro -40.9 -44.5 -46.9 -49.1 -48.9 -50.9
Noise Meter -39.3 -46.2 -46.4 -49.4 -48.3 -50.9
Figure 5 displays difference in mean sound pressure levels between gold standard
system and app used in the Amp II internal microphone at each drop height. A mean
difference of zero would indicate perfect agreement between the two, and the larger the
mean difference, the poorer agreement. Figure 6 displays difference in mean sound
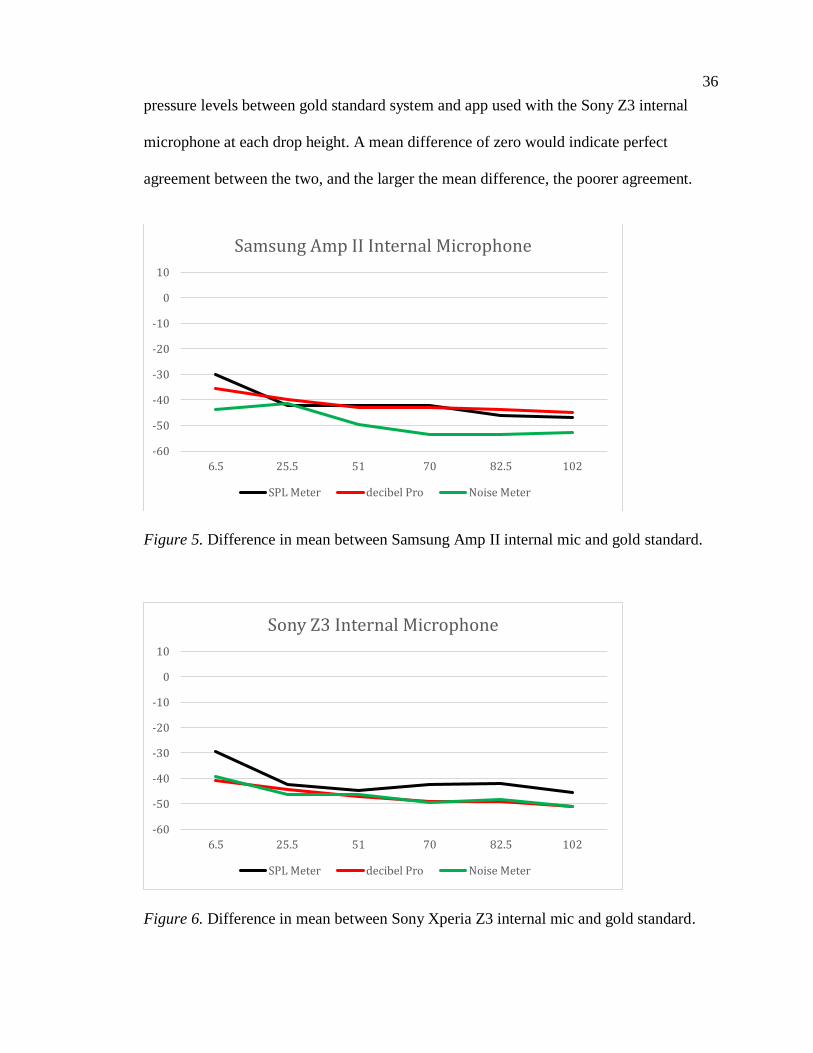
36
pressure levels between gold standard system and app used with the Sony Z3 internal
microphone at each drop height. A mean difference of zero would indicate perfect
agreement between the two, and the larger the mean difference, the poorer agreement.
Figure 5. Difference in mean between Samsung Amp II internal mic and gold standard.
Figure 6. Difference in mean between Sony Xperia Z3 internal mic and gold standard.
-60
-50
-40
-30
-20
-10
0
10
6.5 25.5 51 70 82.5 102
Samsung Amp II Internal Microphone
SPL Meter decibel Pro Noise Meter
-60
-50
-40
-30
-20
-10
0
10
6.5 25.5 51 70 82.5 102
Sony Z3 Internal Microphone
SPL Meter decibel Pro Noise Meter
37
External Microphone Performance
The mean sound pressure level differences between smartphone external
measurements and gold standard system measurements were compared. Again,
measurements collected with iPhones were closer to gold standard values than
measurements from Android devices.
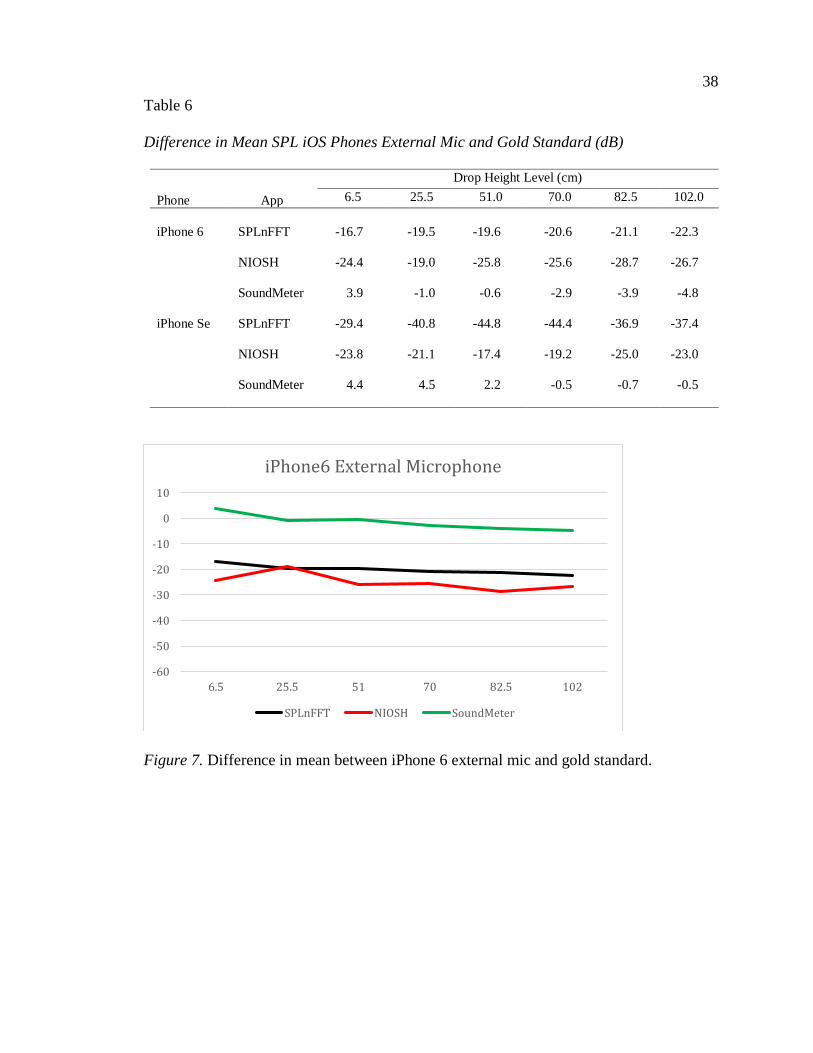
iPhone External Microphone
Measurements
iPhone external microphone measurements are presented in Table 6. Mean sound
pressure level differences ranged from 44.8 dB to less than 1 dB, depending on
application and microphone used. The lowest mean sound pressure differences recorded
for both the iPhone 6 and iPhone Se with the external microphone were recorded with the
SoundMeter app and ranged from 0.6 to 4 dB for the former, and 0.5 to 5.5 dB for the
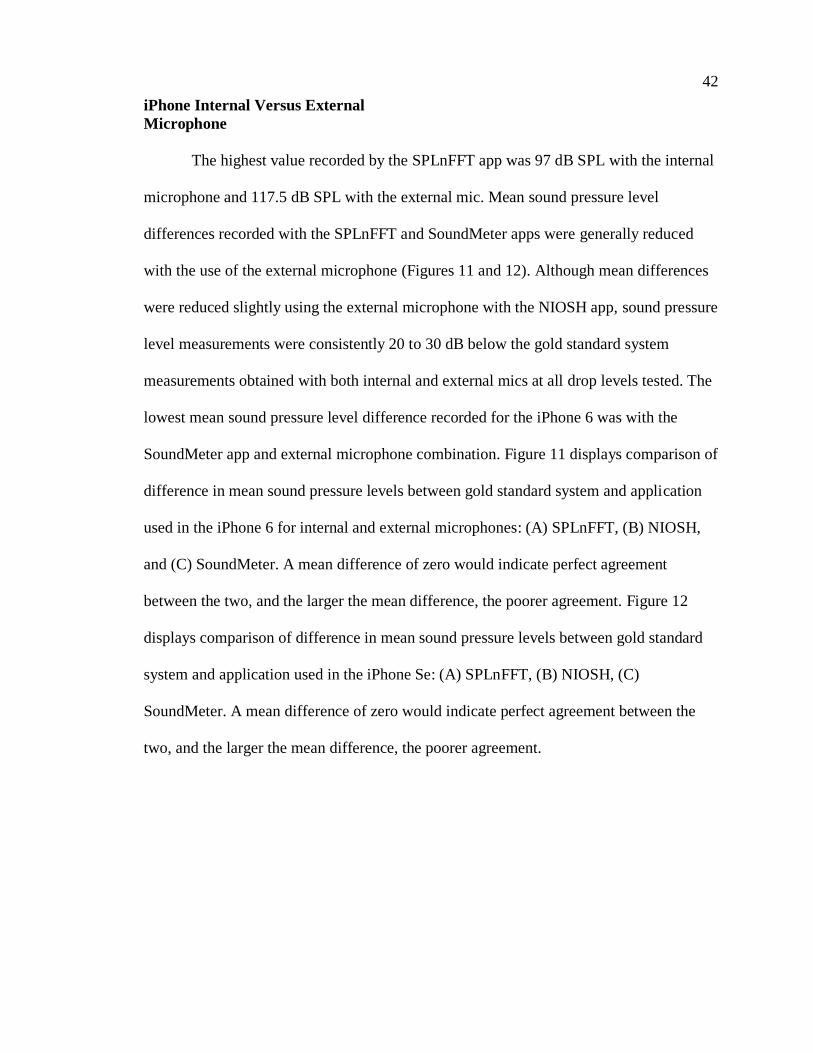
latter. Figure 7 displays difference in mean sound pressure levels between gold standard
system and app used in the iPhone 6 with the iMM-6 external microphone at each drop
height. A mean difference of zero would indicate perfect agreement between the two, and
the larger the mean difference, the poorer agreement. Figure 8 displays difference in
mean sound pressure levels between gold standard system and app used in the iPhone Se
with the iMM-6 external microphone at each drop height. A mean difference of zero
would indicate perfect agreement between the two, and the larger the mean difference,
the poorer agreement.
38
Table 6
Difference in Mean SPL iOS Phones External Mic and Gold Standard (dB)
Phone App
Drop Height Level (cm)
6.5 25.5 51.0 70.0 82.5 102.0
iPhone 6
SPLnFFT
-16.7
-19.5
-19.6
-20.6
-21.1
-22.3
NIOSH -24.4 -19.0 -25.8 -25.6 -28.7 -26.7
SoundMeter 3.9 -1.0 -0.6 -2.9 -3.9 -4.8
iPhone Se SPLnFFT -29.4 -40.8 -44.8 -44.4 -36.9 -37.4
NIOSH -23.8 -21.1 -17.4 -19.2 -25.0 -23.0
SoundMeter 4.4 4.5 2.2 -0.5 -0.7 -0.5
Figure 7. Difference in mean between iPhone 6 external mic and gold standard.
-60
-50
-40
-30
-20
-10
0
10
6.5 25.5 51 70 82.5 102
iPhone6 External Microphone
SPLnFFT NIOSH SoundMeter
39
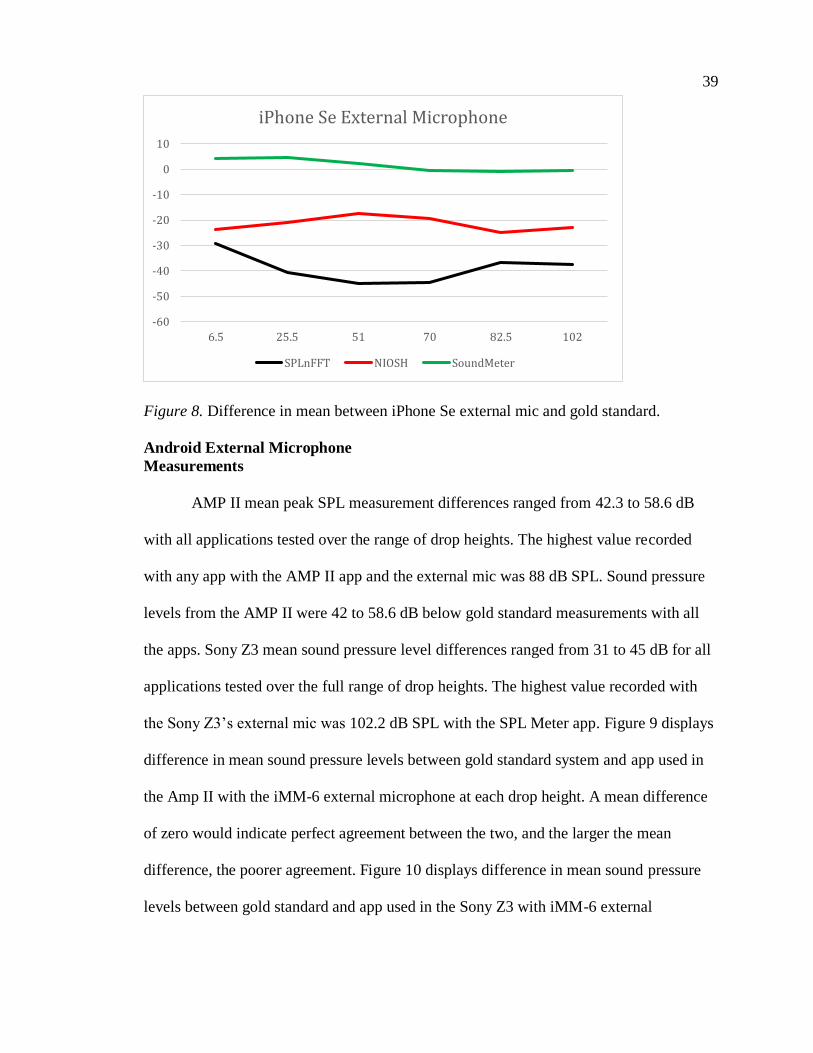
Figure 8. Difference in mean between iPhone Se external mic and gold standard.
Android External Microphone
Measurements
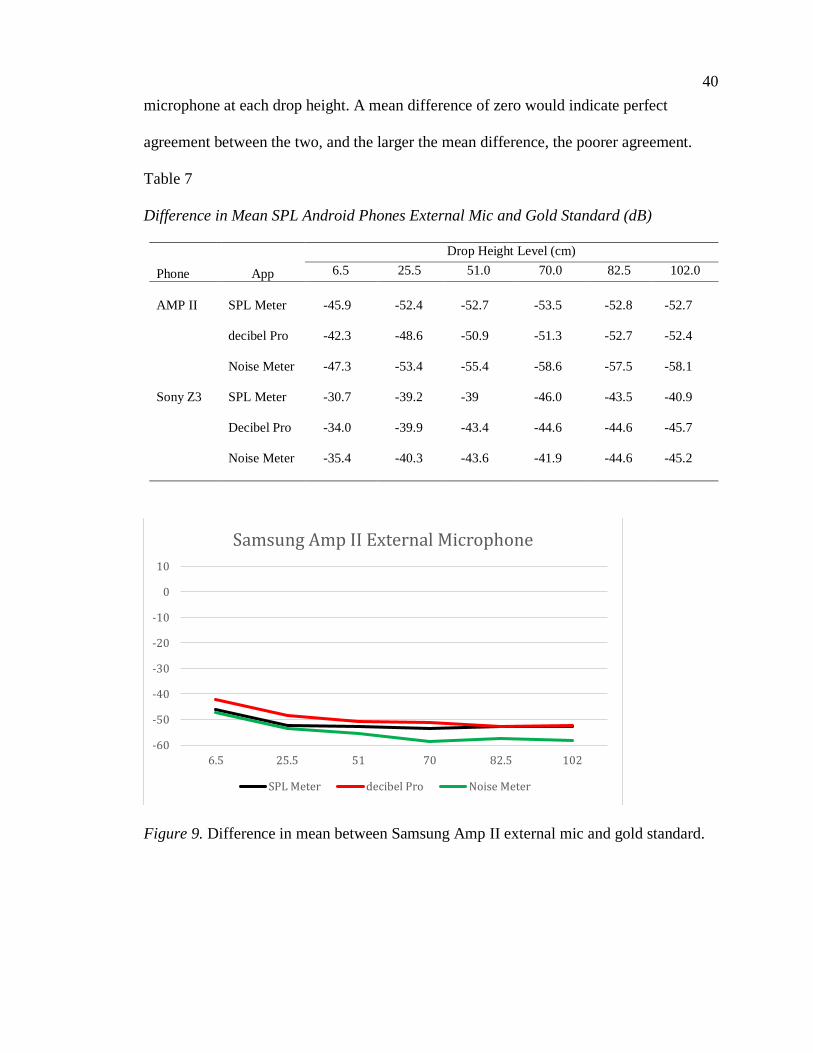
AMP II mean peak SPL measurement differences ranged from 42.3 to 58.6 dB
with all applications tested over the range of drop heights. The highest value recorded
with any app with the AMP II app and the external mic was 88 dB SPL. Sound pressure
levels from the AMP II were 42 to 58.6 dB below gold standard measurements with all
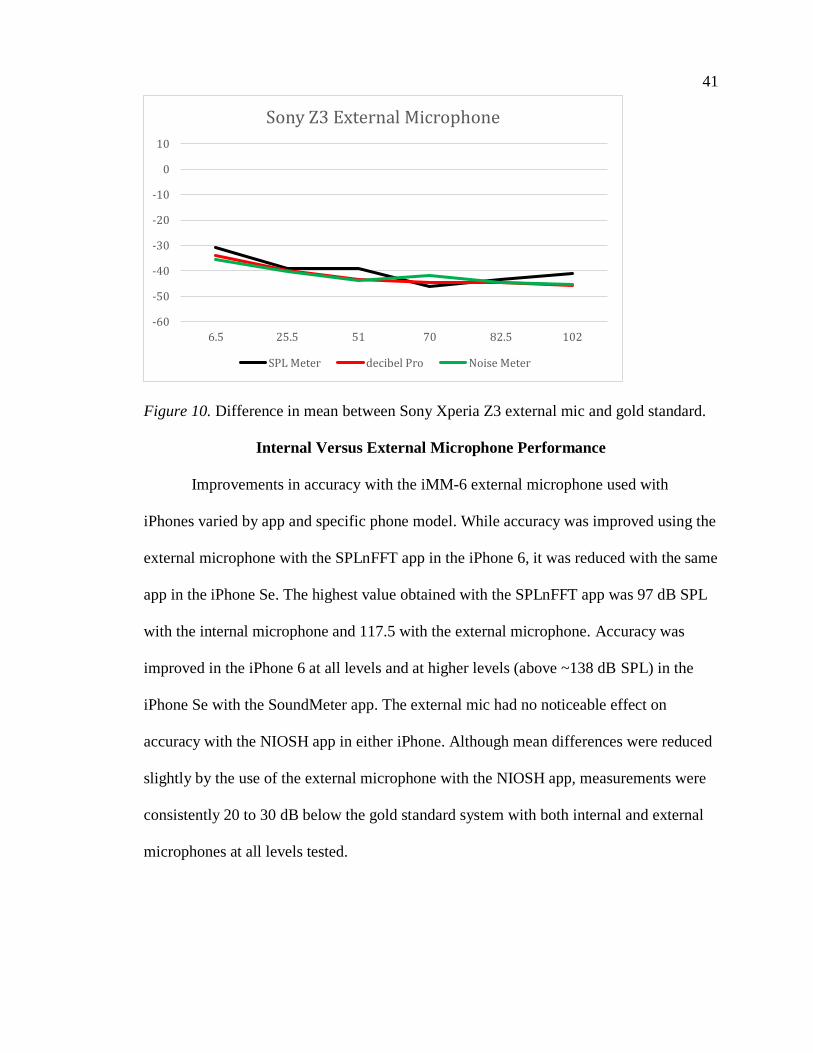
the apps. Sony Z3 mean sound pressure level differences ranged from 31 to 45 dB for all
applications tested over the full range of drop heights. The highest value recorded with
the Sony Z3’s external mic was 102.2 dB SPL with the SPL Meter app. Figure 9 displays
difference in mean sound pressure levels between gold standard system and app used in
the Amp II with the iMM-6 external microphone at each drop height. A mean difference
of zero would indicate perfect agreement between the two, and the larger the mean
difference, the poorer agreement. Figure 10 displays difference in mean sound pressure
levels between gold standard and app used in the Sony Z3 with iMM-6 external
-60
-50
-40
-30
-20
-10
0
10
6.5 25.5 51 70 82.5 102
iPhone Se External Microphone
SPLnFFT NIOSH SoundMeter
40
microphone at each drop height. A mean difference of zero would indicate perfect
agreement between the two, and the larger the mean difference, the poorer agreement.
Table 7
Difference in Mean SPL Android Phones External Mic and Gold Standard (dB)
Phone App
Drop Height Level (cm)
6.5 25.5 51.0 70.0 82.5 102.0
AMP II
SPL Meter
-45.9
-52.4
-52.7
-53.5
-52.8
-52.7
decibel Pro -42.3 -48.6 -50.9 -51.3 -52.7 -52.4
Noise Meter -47.3 -53.4 -55.4 -58.6 -57.5 -58.1
Sony Z3 SPL Meter -30.7 -39.2 -39 -46.0 -43.5 -40.9
Decibel Pro -34.0 -39.9 -43.4 -44.6 -44.6 -45.7
Noise Meter -35.4 -40.3 -43.6 -41.9 -44.6 -45.2
Figure 9. Difference in mean between Samsung Amp II external mic and gold standard.
-60
-50
-40
-30
-20
-10
0
10
6.5 25.5 51 70 82.5 102
Samsung Amp II External Microphone
SPL Meter decibel Pro Noise Meter
41
Figure 10. Difference in mean between Sony Xperia Z3 external mic and gold standard.
Internal Versus External Microphone Performance
Improvements in accuracy with the iMM-6 external microphone used with
iPhones varied by app and specific phone model. While accuracy was improved using the
external microphone with the SPLnFFT app in the iPhone 6, it was reduced with the same
app in the iPhone Se. The highest value obtained with the SPLnFFT app was 97 dB SPL
with the internal microphone and 117.5 with the external microphone. Accuracy was
improved in the iPhone 6 at all levels and at higher levels (above ~138 dB SPL) in the
iPhone Se with the SoundMeter app. The external mic had no noticeable effect on
accuracy with the NIOSH app in either iPhone. Although mean differences were reduced
slightly by the use of the external microphone with the NIOSH app, measurements were
consistently 20 to 30 dB below the gold standard system with both internal and external
microphones at all levels tested.
-60
-50
-40
-30
-20
-10
0
10
6.5 25.5 51 70 82.5 102
Sony Z3 External Microphone
SPL Meter decibel Pro Noise Meter
42
iPhone Internal Versus External
Microphone
The highest value recorded by the SPLnFFT app was 97 dB SPL with the internal
microphone and 117.5 dB SPL with the external mic. Mean sound pressure level
differences recorded with the SPLnFFT and SoundMeter apps were generally reduced
with the use of the external microphone (Figures 11 and 12). Although mean differences
were reduced slightly using the external microphone with the NIOSH app, sound pressure
level measurements were consistently 20 to 30 dB below the gold standard system
measurements obtained with both internal and external mics at all drop levels tested. The
lowest mean sound pressure level difference recorded for the iPhone 6 was with the
SoundMeter app and external microphone combination. Figure 11 displays comparison of
difference in mean sound pressure levels between gold standard system and application
used in the iPhone 6 for internal and external microphones: (A) SPLnFFT, (B) NIOSH,
and (C) SoundMeter. A mean difference of zero would indicate perfect agreement
between the two, and the larger the mean difference, the poorer agreement. Figure 12
displays comparison of difference in mean sound pressure levels between gold standard
system and application used in the iPhone Se: (A) SPLnFFT, (B) NIOSH, (C)
SoundMeter. A mean difference of zero would indicate perfect agreement between the
two, and the larger the mean difference, the poorer agreement.
43
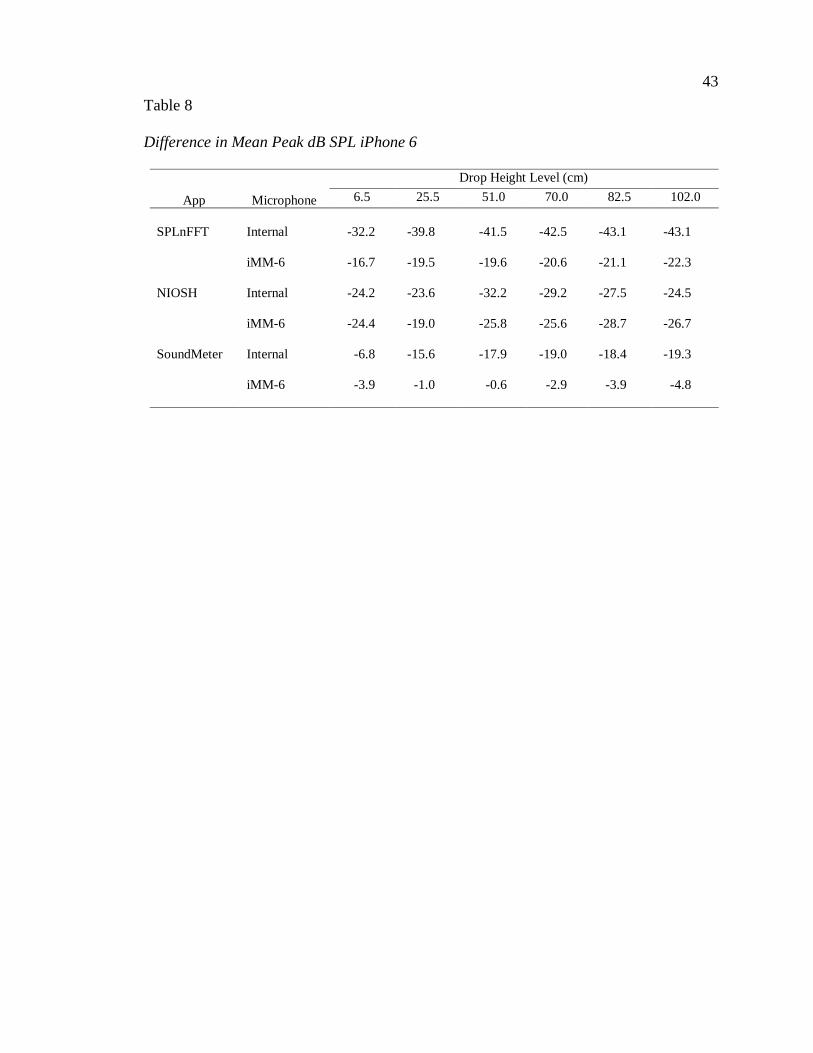
Table 8
Difference in Mean Peak dB SPL iPhone 6
App Microphone
Drop Height Level (cm)
6.5 25.5 51.0 70.0 82.5 102.0
SPLnFFT
Internal
-32.2
-39.8
-41.5
-42.5
-43.1
-43.1
iMM-6 -16.7 -19.5 -19.6 -20.6 -21.1 -22.3
NIOSH Internal -24.2 -23.6 -32.2 -29.2 -27.5 -24.5
iMM-6 -24.4 -19.0 -25.8 -25.6 -28.7 -26.7
SoundMeter Internal -6.8 -15.6 -17.9 -19.0 -18.4 -19.3
iMM-6 -3.9 -1.0 -0.6 -2.9 -3.9 -4.8
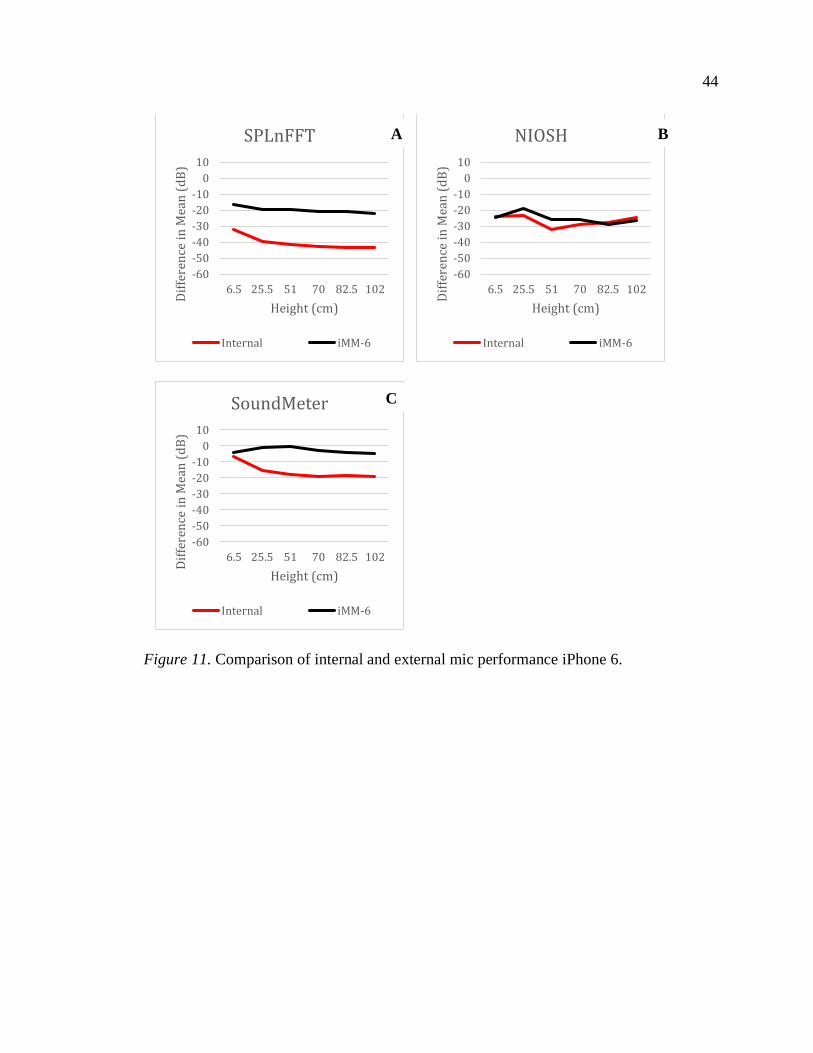
44
Figure 11. Comparison of internal and external mic performance iPhone 6.
-60
-50
-40
-30
-20
-10
0
10
6.5 25.5 51 70 82.5 102
Dif
fere
nce
in
Mea
n (
dB
)
Height (cm)
SPLnFFT
Internal iMM-6
-60
-50
-40
-30
-20
-10
0
10
6.5 25.5 51 70 82.5 102
Dif
fere
nce
in
Mea
n (
dB
)
Height (cm)
NIOSH
Internal iMM-6
-60
-50
-40
-30
-20
-10
0
10
6.5 25.5 51 70 82.5 102
Dif
fere
nce
in
Mea
n (
dB
)
Height (cm)
SoundMeter
Internal iMM-6
A B
C
45
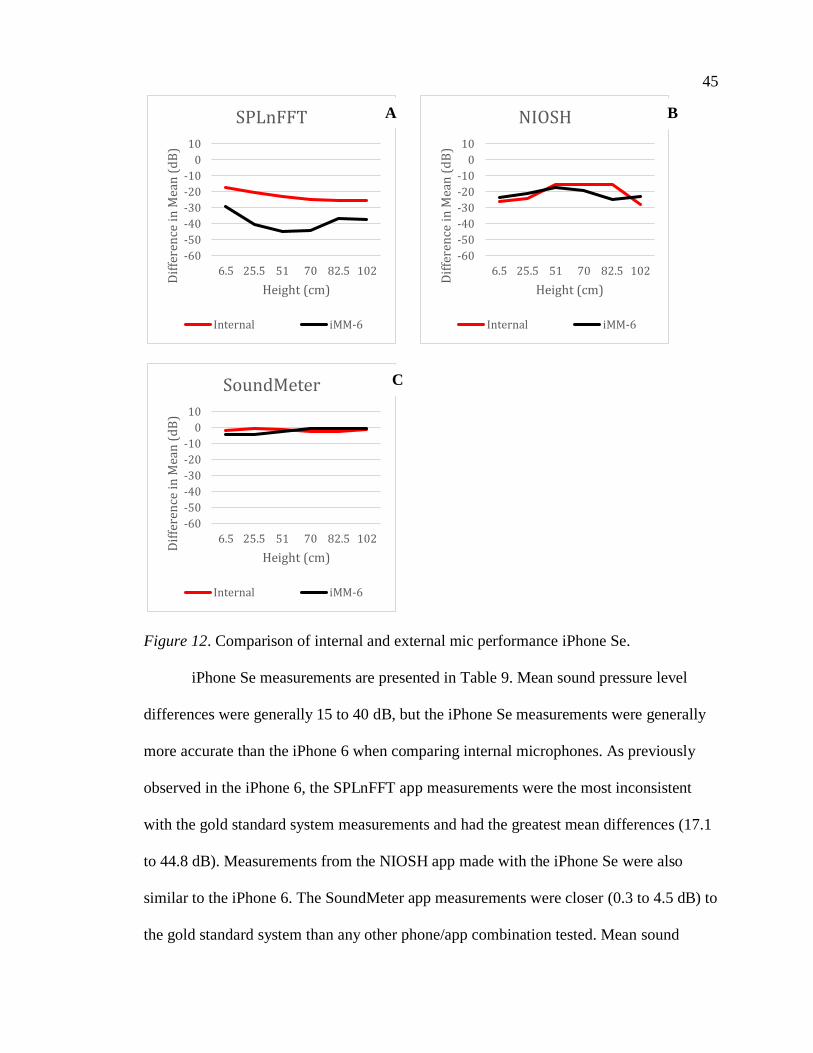
Figure 12. Comparison of internal and external mic performance iPhone Se.
iPhone Se measurements are presented in Table 9. Mean sound pressure level
differences were generally 15 to 40 dB, but the iPhone Se measurements were generally
more accurate than the iPhone 6 when comparing internal microphones. As previously
observed in the iPhone 6, the SPLnFFT app measurements were the most inconsistent
with the gold standard system measurements and had the greatest mean differences (17.1
to 44.8 dB). Measurements from the NIOSH app made with the iPhone Se were also
similar to the iPhone 6. The SoundMeter app measurements were closer (0.3 to 4.5 dB) to
the gold standard system than any other phone/app combination tested. Mean sound
-60
-50
-40
-30
-20
-10
0
10
6.5 25.5 51 70 82.5 102
Dif
fere
nce
in
Mea
n (
dB
)
Height (cm)
SPLnFFT
Internal iMM-6
-60
-50
-40
-30
-20
-10
0
10
6.5 25.5 51 70 82.5 102
Dif
fere
nce
in
Mea
n (
dB
)
Height (cm)
NIOSH
Internal iMM-6
-60
-50
-40
-30
-20
-10
0
10
6.5 25.5 51 70 82.5 102
Dif
fere
nce
in
Mea
n (
dB
)
Height (cm)
SoundMeter
Internal iMM-6
C
B A
46
pressure level differences were within 3 dB with the internal mic and 4.5 dB with the
external iMM-6 mic.
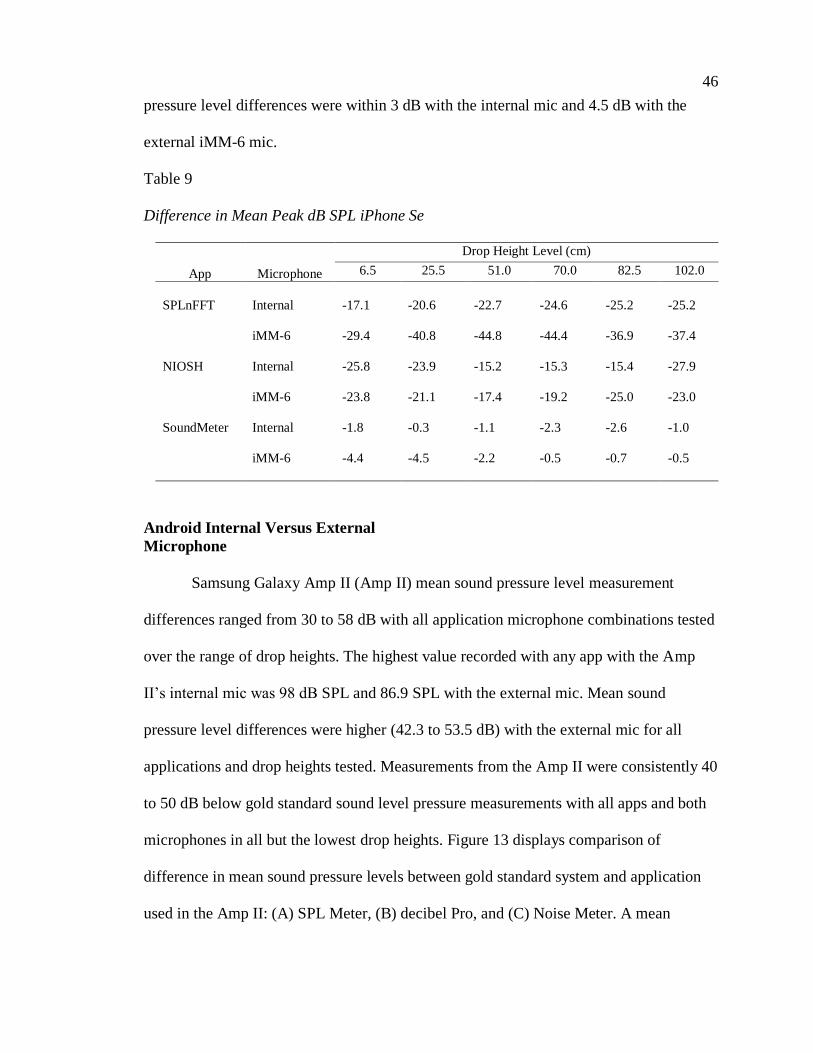
Table 9
Difference in Mean Peak dB SPL iPhone Se
App Microphone
Drop Height Level (cm)
6.5 25.5 51.0 70.0 82.5 102.0
SPLnFFT
Internal
-17.1
-20.6
-22.7
-24.6
-25.2
-25.2
iMM-6 -29.4 -40.8 -44.8 -44.4 -36.9 -37.4
NIOSH Internal -25.8 -23.9 -15.2 -15.3 -15.4 -27.9
iMM-6 -23.8 -21.1 -17.4 -19.2 -25.0 -23.0
SoundMeter Internal -1.8 -0.3 -1.1 -2.3 -2.6 -1.0
iMM-6 -4.4 -4.5 -2.2 -0.5 -0.7 -0.5
Android Internal Versus External
Microphone
Samsung Galaxy Amp II (Amp II) mean sound pressure level measurement
differences ranged from 30 to 58 dB with all application microphone combinations tested
over the range of drop heights. The highest value recorded with any app with the Amp
II’s internal mic was 98 dB SPL and 86.9 SPL with the external mic. Mean sound
pressure level differences were higher (42.3 to 53.5 dB) with the external mic for all
applications and drop heights tested. Measurements from the Amp II were consistently 40
to 50 dB below gold standard sound level pressure measurements with all apps and both
microphones in all but the lowest drop heights. Figure 13 displays comparison of
difference in mean sound pressure levels between gold standard system and application
used in the Amp II: (A) SPL Meter, (B) decibel Pro, and (C) Noise Meter. A mean
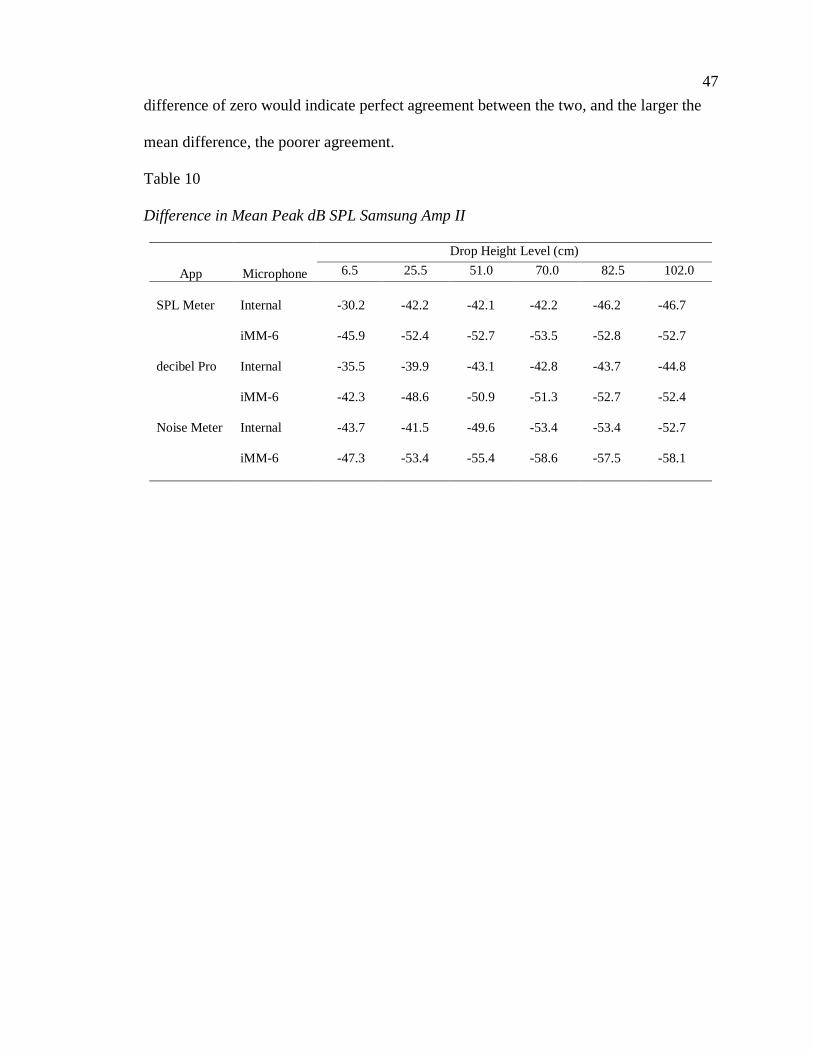
47
difference of zero would indicate perfect agreement between the two, and the larger the
mean difference, the poorer agreement.
Table 10
Difference in Mean Peak dB SPL Samsung Amp II
App Microphone
Drop Height Level (cm)
6.5 25.5 51.0 70.0 82.5 102.0
SPL Meter
Internal
-30.2
-42.2
-42.1
-42.2
-46.2
-46.7
iMM-6 -45.9 -52.4 -52.7 -53.5 -52.8 -52.7
decibel Pro Internal -35.5 -39.9 -43.1 -42.8 -43.7 -44.8
iMM-6 -42.3 -48.6 -50.9 -51.3 -52.7 -52.4
Noise Meter Internal -43.7 -41.5 -49.6 -53.4 -53.4 -52.7
iMM-6 -47.3 -53.4 -55.4 -58.6 -57.5 -58.1
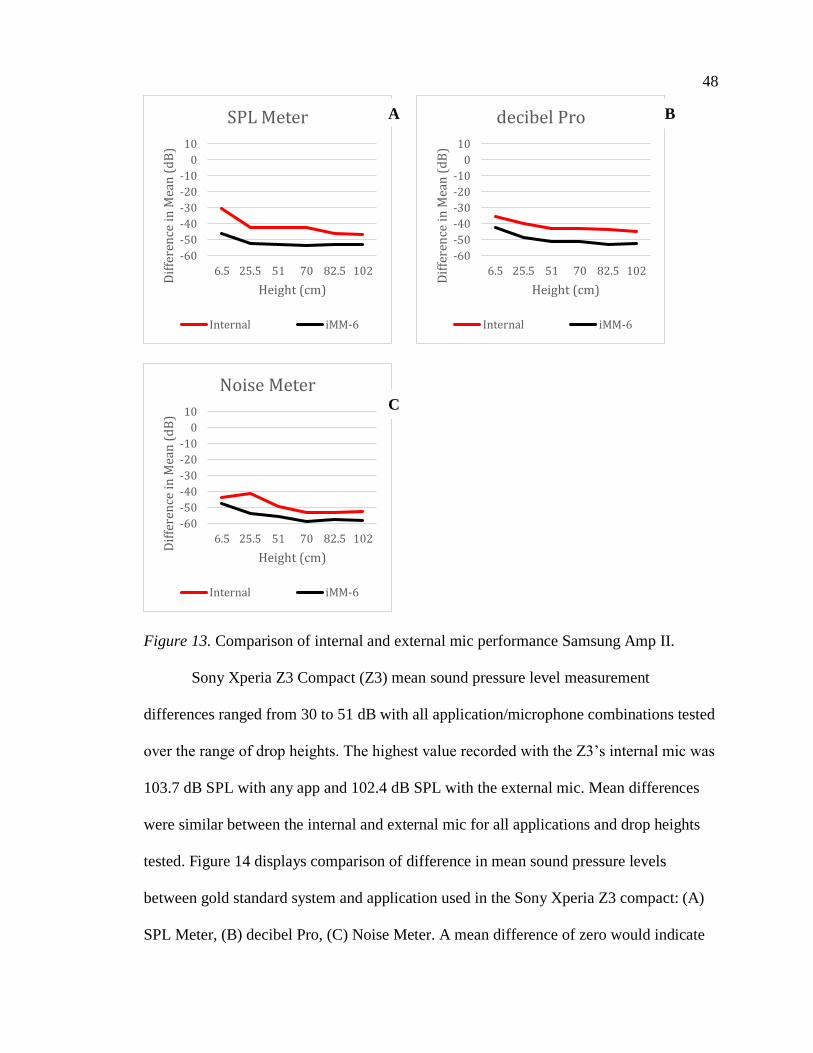
48
Figure 13. Comparison of internal and external mic performance Samsung Amp II.
Sony Xperia Z3 Compact (Z3) mean sound pressure level measurement
differences ranged from 30 to 51 dB with all application/microphone combinations tested
over the range of drop heights. The highest value recorded with the Z3’s internal mic was
103.7 dB SPL with any app and 102.4 dB SPL with the external mic. Mean differences
were similar between the internal and external mic for all applications and drop heights
tested. Figure 14 displays comparison of difference in mean sound pressure levels
between gold standard system and application used in the Sony Xperia Z3 compact: (A)
SPL Meter, (B) decibel Pro, (C) Noise Meter. A mean difference of zero would indicate
-60
-50
-40
-30
-20
-10
0
10
6.5 25.5 51 70 82.5 102
Dif
fere
nce
in
Mea
n (
dB
)
Height (cm)
SPL Meter
Internal iMM-6
-60
-50
-40
-30
-20
-10
0
10
6.5 25.5 51 70 82.5 102
Dif
fere
nce
in
Mea
n (
dB
)
Height (cm)
decibel Pro
Internal iMM-6
-60
-50
-40
-30
-20
-10
0
10
6.5 25.5 51 70 82.5 102
Dif
fere
nce
in
Mea
n (
dB
)
Height (cm)
Noise Meter
Internal iMM-6
C
B A
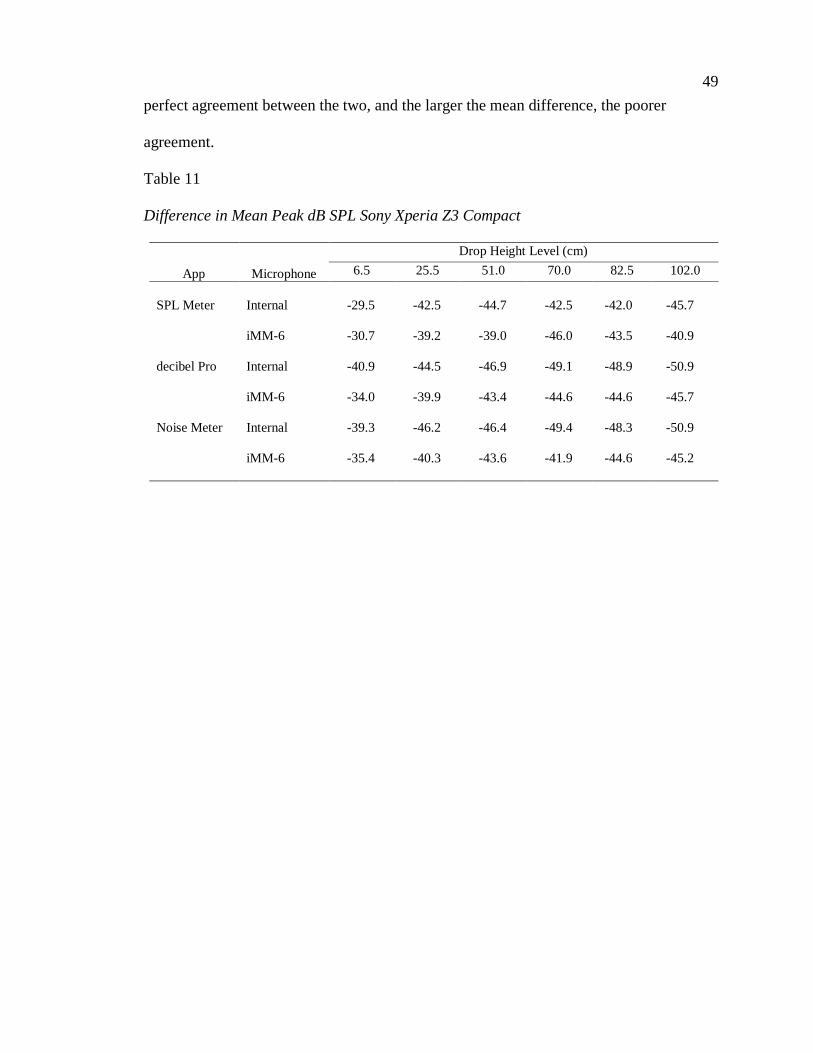
49
perfect agreement between the two, and the larger the mean difference, the poorer
agreement.
Table 11
Difference in Mean Peak dB SPL Sony Xperia Z3 Compact
App Microphone
Drop Height Level (cm)
6.5 25.5 51.0 70.0 82.5 102.0
SPL Meter
Internal
-29.5
-42.5
-44.7
-42.5
-42.0
-45.7
iMM-6 -30.7 -39.2 -39.0 -46.0 -43.5 -40.9
decibel Pro Internal -40.9 -44.5 -46.9 -49.1 -48.9 -50.9
iMM-6 -34.0 -39.9 -43.4 -44.6 -44.6 -45.7
Noise Meter Internal -39.3 -46.2 -46.4 -49.4 -48.3 -50.9
iMM-6 -35.4 -40.3 -43.6 -41.9 -44.6 -45.2
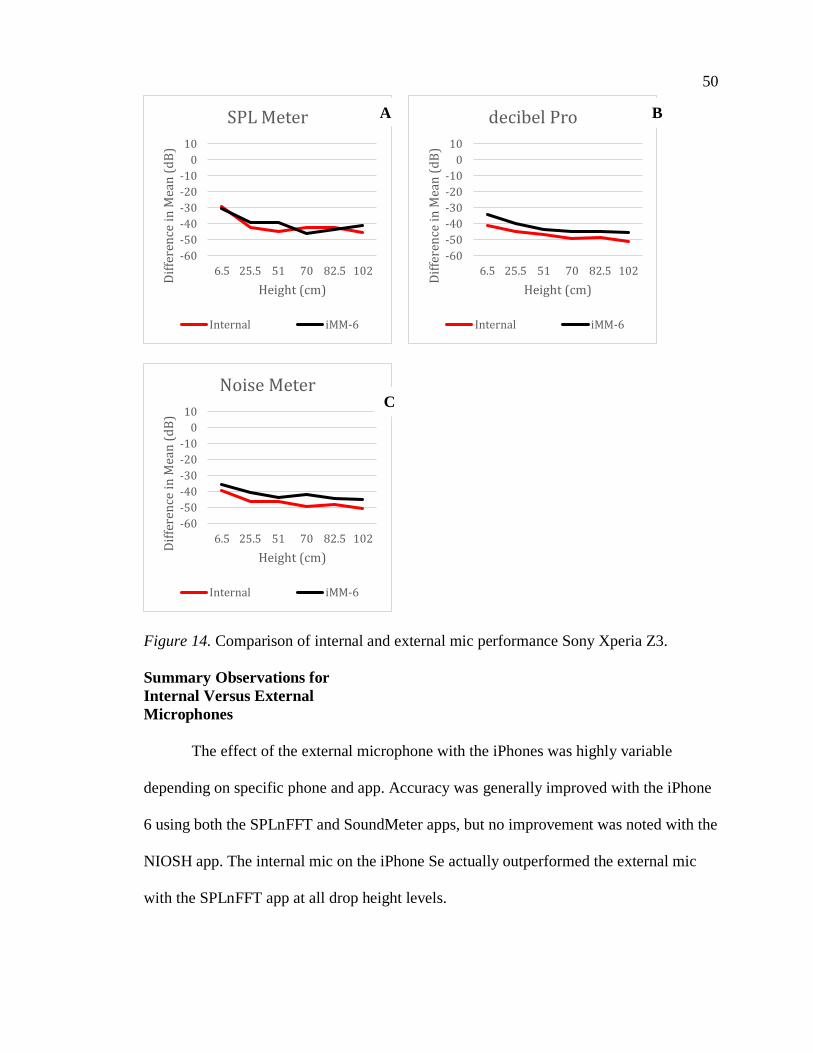
50
Figure 14. Comparison of internal and external mic performance Sony Xperia Z3.
Summary Observations for
Internal Versus External
Microphones
The effect of the external microphone with the iPhones was highly variable
depending on specific phone and app. Accuracy was generally improved with the iPhone
6 using both the SPLnFFT and SoundMeter apps, but no improvement was noted with the
NIOSH app. The internal mic on the iPhone Se actually outperformed the external mic
with the SPLnFFT app at all drop height levels.
-60
-50
-40
-30
-20
-10
0
10
6.5 25.5 51 70 82.5 102
Dif
fere
nce
in
Mea
n (
dB
)
Height (cm)
SPL Meter
Internal iMM-6
-60
-50
-40
-30
-20
-10
0
10
6.5 25.5 51 70 82.5 102
Dif
fere
nce
in
Mea
n (
dB
)
Height (cm)
decibel Pro
Internal iMM-6
-60
-50
-40
-30
-20
-10
0
10
6.5 25.5 51 70 82.5 102
Dif
fere
nce
in
Mea
n (
dB
)
Height (cm)
Noise Meter
Internal iMM-6
C
B A
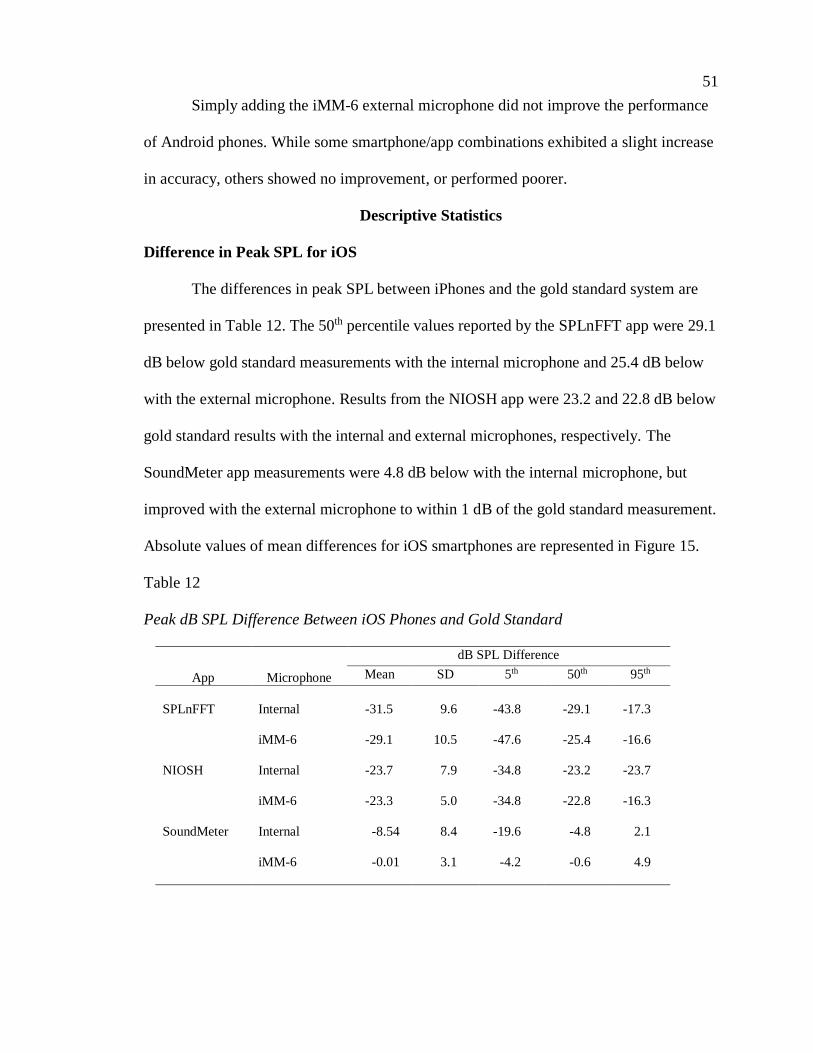
51
Simply adding the iMM-6 external microphone did not improve the performance
of Android phones. While some smartphone/app combinations exhibited a slight increase
in accuracy, others showed no improvement, or performed poorer.
Descriptive Statistics
Difference in Peak SPL for iOS
The differences in peak SPL between iPhones and the gold standard system are
presented in Table 12. The 50th percentile values reported by the SPLnFFT app were 29.1
dB below gold standard measurements with the internal microphone and 25.4 dB below
with the external microphone. Results from the NIOSH app were 23.2 and 22.8 dB below
gold standard results with the internal and external microphones, respectively. The
SoundMeter app measurements were 4.8 dB below with the internal microphone, but
improved with the external microphone to within 1 dB of the gold standard measurement.
Absolute values of mean differences for iOS smartphones are represented in Figure 15.
Table 12
Peak dB SPL Difference Between iOS Phones and Gold Standard
App Microphone
dB SPL Difference
Mean SD 5th 50th 95th
SPLnFFT
Internal
-31.5
9.6
-43.8
-29.1
-17.3
iMM-6 -29.1 10.5 -47.6 -25.4 -16.6
NIOSH Internal -23.7 7.9 -34.8 -23.2 -23.7
iMM-6 -23.3 5.0 -34.8 -22.8 -16.3
SoundMeter Internal -8.54 8.4 -19.6 -4.8 2.1
iMM-6 -0.01 3.1 -4.2 -0.6 4.9
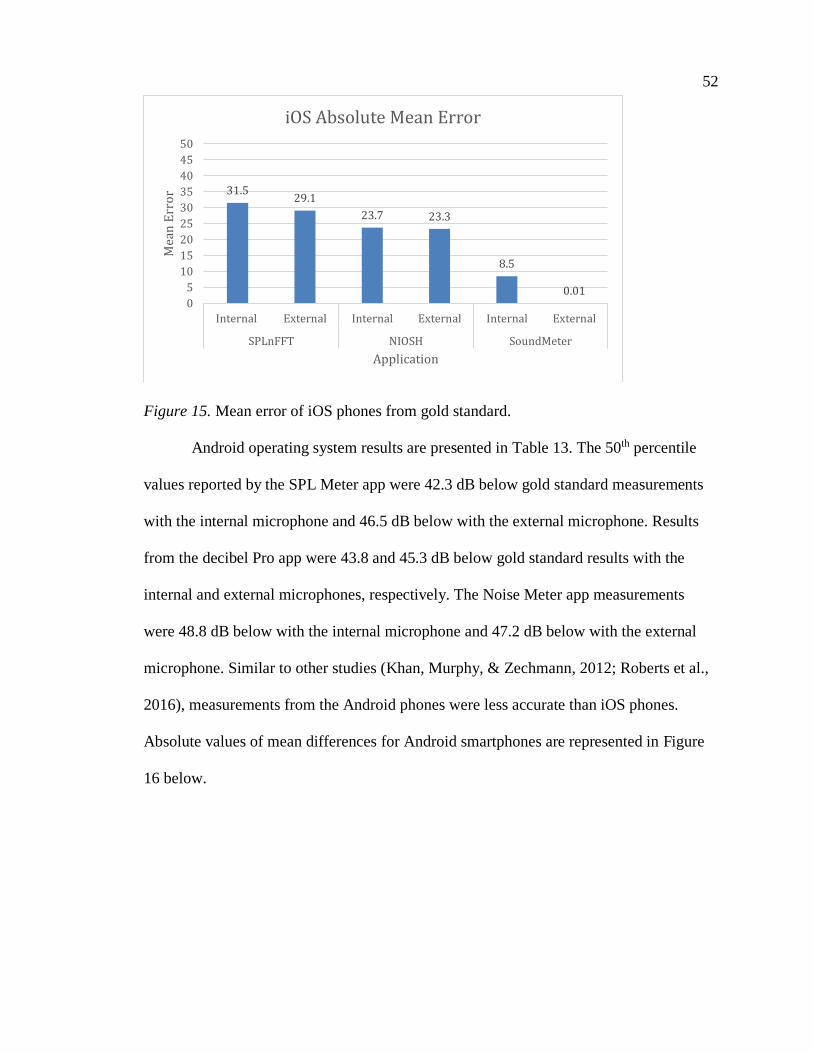
52
Figure 15. Mean error of iOS phones from gold standard.
Android operating system results are presented in Table 13. The 50th percentile
values reported by the SPL Meter app were 42.3 dB below gold standard measurements
with the internal microphone and 46.5 dB below with the external microphone. Results
from the decibel Pro app were 43.8 and 45.3 dB below gold standard results with the
internal and external microphones, respectively. The Noise Meter app measurements
were 48.8 dB below with the internal microphone and 47.2 dB below with the external
microphone. Similar to other studies (Khan, Murphy, & Zechmann, 2012; Roberts et al.,
2016), measurements from the Android phones were less accurate than iOS phones.
Absolute values of mean differences for Android smartphones are represented in Figure
16 below.
31.529.1
23.7 23.3
8.5
0.010
5
10
15
20
25
30
35
40
45
50
Internal External Internal External Internal External
SPLnFFT NIOSH SoundMeter
Mea
n E
rro
r
Application
iOS Absolute Mean Error
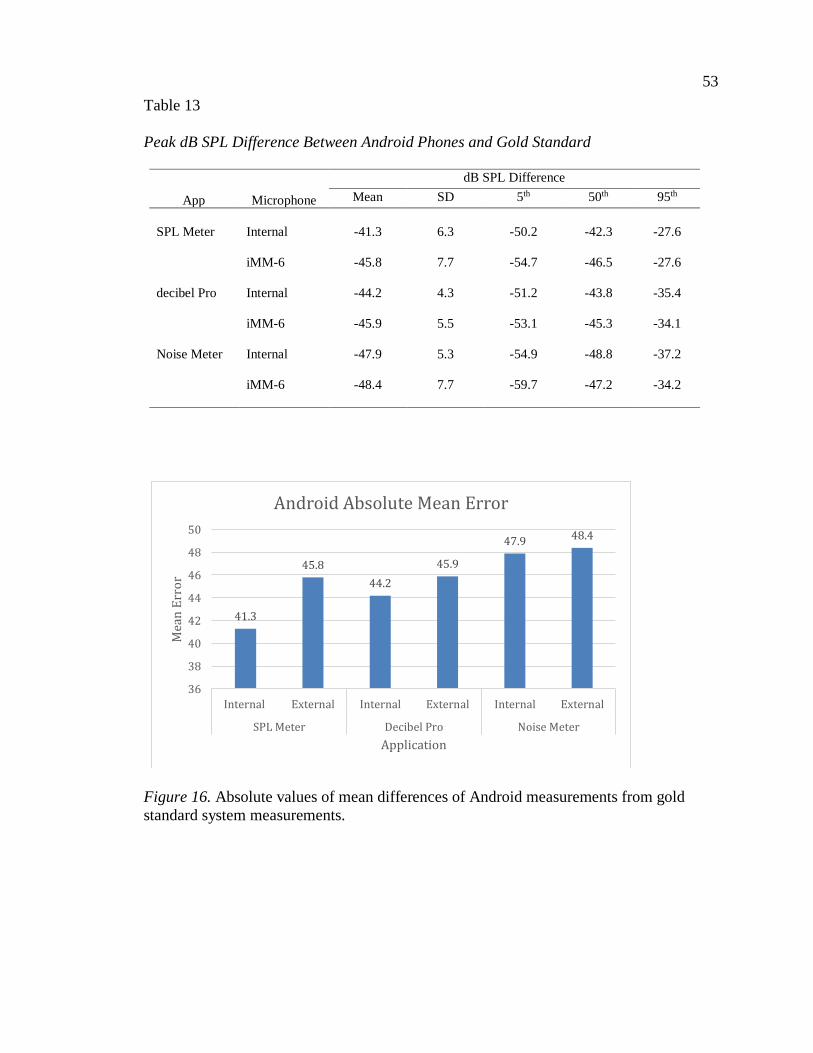
53
Table 13
Peak dB SPL Difference Between Android Phones and Gold Standard
App Microphone
dB SPL Difference
Mean SD 5th 50th 95th
SPL Meter
Internal
-41.3
6.3
-50.2
-42.3
-27.6
iMM-6 -45.8 7.7 -54.7 -46.5 -27.6
decibel Pro Internal -44.2 4.3 -51.2 -43.8 -35.4
iMM-6 -45.9 5.5 -53.1 -45.3 -34.1
Noise Meter Internal -47.9 5.3 -54.9 -48.8 -37.2
iMM-6 -48.4 7.7 -59.7 -47.2 -34.2
Figure 16. Absolute values of mean differences of Android measurements from gold
standard system measurements.
41.3
45.8
44.2
45.9
47.9 48.4
36
38
40
42
44
46
48
50
Internal External Internal External Internal External
SPL Meter Decibel Pro Noise Meter
Mea
n E
rro
r
Application
Android Absolute Mean Error
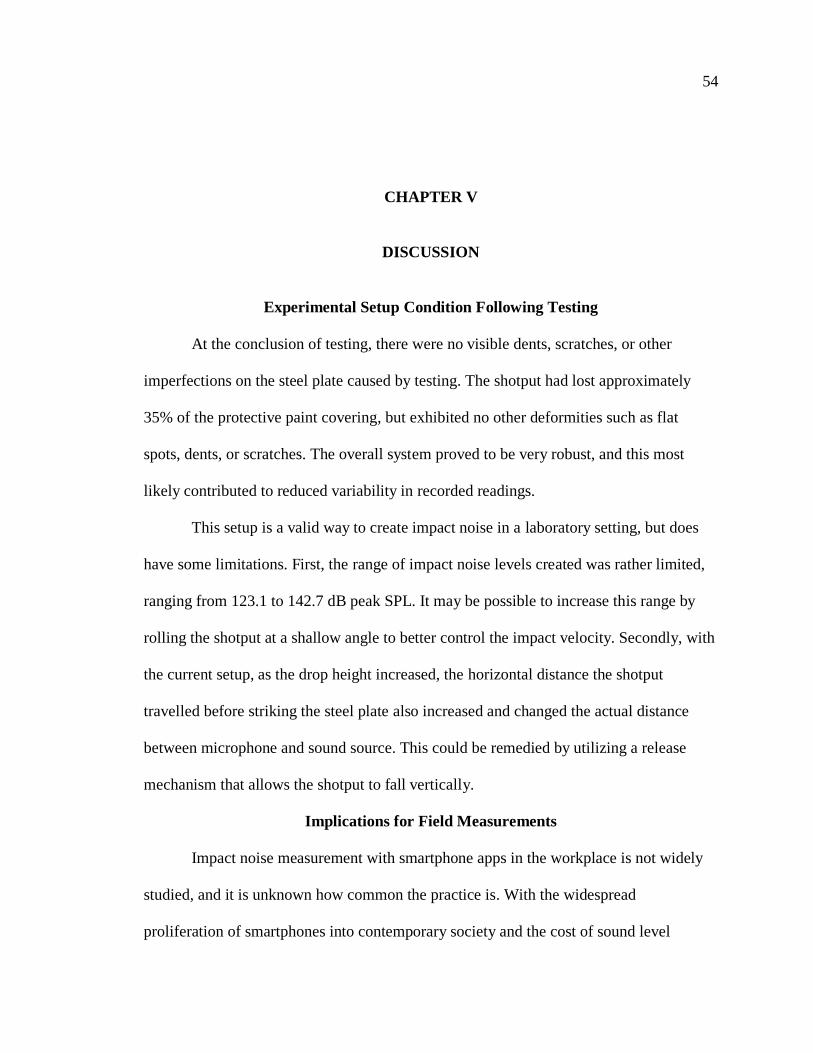
54
CHAPTER V
DISCUSSION
Experimental Setup Condition Following Testing
At the conclusion of testing, there were no visible dents, scratches, or other
imperfections on the steel plate caused by testing. The shotput had lost approximately
35% of the protective paint covering, but exhibited no other deformities such as flat
spots, dents, or scratches. The overall system proved to be very robust, and this most
likely contributed to reduced variability in recorded readings.
This setup is a valid way to create impact noise in a laboratory setting, but does
have some limitations. First, the range of impact noise levels created was rather limited,
ranging from 123.1 to 142.7 dB peak SPL. It may be possible to increase this range by
rolling the shotput at a shallow angle to better control the impact velocity. Secondly, with
the current setup, as the drop height increased, the horizontal distance the shotput
travelled before striking the steel plate also increased and changed the actual distance
between microphone and sound source. This could be remedied by utilizing a release
mechanism that allows the shotput to fall vertically.
Implications for Field Measurements
Impact noise measurement with smartphone apps in the workplace is not widely
studied, and it is unknown how common the practice is. With the widespread
proliferation of smartphones into contemporary society and the cost of sound level
55
meters, it is reasonable to assume this it is a relatively common occurrence. As
demonstrated by earlier studies, certain smartphone/app combinations can be used to
measure pink noise (Roberts et al., 2016) and pure tones (Nast et al., 2014) with a degree
of accuracy similar to a type II sound level meter.
There are a number of possible causes for the measurement errors observed. In the
case of the Android phones, the app developers are tasked with designing an app that
must work across a broad range of phone manufacturers who happen to use the Android
operating system. The individual smartphone models will have a variety of different
hardware (microphones, preamplifiers, etc.) that may interact with the software
differently. Another possible limitation for the Android operating system is the low cost
of apps relative to iOS apps. Many of these apps are either free or 99 cents, whereas the
top performing iOS app in this study cost $19.99.
Smartphone microphones are not necessarily designed to measure high-level
impact noise. The specifications and physical properties of a microphone purpose build to
measure speech signals in close proximity to the microphone may make it difficult or
impossible to accurately measure high-amplitude impact or impulse noise.
Limitations
The sample size of one device per manufacturer model, one external microphone,
and six evaluated apps is small. While this study was designed to draw from a broad
range of popular smartphones, there is the possibility that one of the devices selected
exhibited performance outside of norms for that manufacturer or model.
This study was designed to emulate how an untrained individual may use a
smartphone to take readings in field conditions. The values displayed on the screen do
56
not necessarily demonstrate the app’s capability to measure impact noise. This point can
be best illustrated by the NIOSH app, which has a two-part instantaneous level readout.
The main readout is a numerical value, and below it is a digital bar that represents
changes in sound amplitude, but does not have a corresponding numerical value
associated with it. During some recordings, this bar would rapidly increase to a high
level, but the numerical value displayed would be significantly smaller. This may indicate
that the app was measuring the impact more accurately than the displayed numerical
value. Perhaps the numerical display was using a longer time constant, fast, while the bar
used the selected, shorter time constant, impulse.
Future Study
A larger sample size of smartphones, apps, and microphones would be beneficial.
A four-way interaction could be used to evaluate the effect of amplitude, smartphone,
app, and microphone to determine if measurement errors are the result of amplitude
clipping, peak limiting, or some other means.
The experimental design could be further analyzed to determine if the impact
noise created in this study is analogous to real-world impact noise in industries such as
hammer forging, metal parts stamping, mining, etc. If so, this setup could serve as a
small, convenient, repeatable source of impact noise for the study of hearing protective
devices or noise mitigation in a laboratory setting.
Summary
This study demonstrated that those wishing to use a smartphone to measure
impact noise should consider using only iOS phones, preferably with an external
microphone. The only app that approximated the performance of a type II SLM was the
57
SoundMeter app combined with the iMM-6 external microphone. Even if the user
employs this combination, they must be aware that measurements could be wildly
inaccurate without proper calibration. Using either iOS smartphone with the SoundMeter
app, accurately measuring impact noise up 142 dB SPL is possible if the smartphone is
properly calibrated.
58
REFERENCES
Akay, A. (1978). A review of impact noise. Journal of the Acoustical Society of America
64(4), 977-987. doi:10.1121/1.2773928
American National Standards Institute. (2013). Electroacoustics sound level meters part
1 specifications. Retrieved from American National Standards Institute:
https://webstore.ansi.org/RecordDetail.aspx?sku=IEC+61672-
1+Ed.+2.0+b%3a2013
Flamme, G., & Murphy, W. (in press). Brief sounds. In F. M. Berger (Ed.), Noise
manual: 6th edition. Washington, DC: American Industrial Hygiene Association
Fu, B. (2011). Noise induced structural damage to the cochlea. In C. G. Le Prell, D.
Henderson, R. Fay, & A. Popper (Eds.), Noise induced hearing loss: Scientific
advances (pp. 57-86). New York: Springer Press.
Government Accountability Office Report to Congressional Committees. (2011).
Hearing loss prevention: Improvements to DOD hearing conservation programs
could lead to better outcomes (GAO-11-114). Retrieved from
http://www.gao.gov/new.items/d11114.pdf
Hamernik, R. P., & Hsueh, K. D. (1991). Impulse noise: Some definitions, physical
acoustics and other considerations. Journal of the Acoustical Society of America,
90(1), 189-196. doi:10.1121/1.401287
59
Hamernik, R. P., Turrentine, G., Roberto, M., Salvi, R., Henderson, D. (1984).
Anatomical correlates of impulse noise-induced mechanical damage in the
cochlea. Hearing Research, 13(3), 229-247. doi:10.1016/0378-5955(84)90077-7
Henderson, D., Subramaniam, M., Gratton, M. A., & Saunders, S. S. (1991). Impact
noise: the importance of level, duration, and repetition rate. The Journal of the
Acoustical Society of America, 89(3), 1350-1357. doi:101121/1.400658
Kardous, C. A., & Shaw, P. B. (2014). Evaluation of smartphone sound measurement
applications. Acoustical Society of America, 135(4), EL186-EL192.
doi:10.1121/1.4865269
Kardous, C. A., Shaw, P. B., & Murphy, W. J. (2016). Evaluation of smartphone sound
measurement applications using external microphones—A follow-up study.
Journal of the Acoustical Society of America 139(4), 2036.
doi:10.1121/1.4950017
Kardous, C. A., Willson, R. D., & Murphy, W. J. (2005). Noise dosimeter for monitoring
exposure to impulse noise. Applied Acoustics, 66(8), 974-985.
doi:10.1016/j.apacoust.2004.11.007
Kerr, M. J., McCullagh, M., Savik, K., & Dvorak, L. A. (2003). Perceived and measured
hearing ability in construction laborers and farmers. American Journal of
Industrial Medicine, 44(4), 437-437. doi:10.1002/ajim.10286
Khan, A., Murphy, W. J., & Zechmann, E. L. (2012). Design and construction of an
acoustic shock tube for generating high-level impulses to test hearing protection
devices (EPHB 350-12a). Retrieved from
http://198.246.124.22//niosh/surveyreports/pdfs/350-12a.pdf
60
Kitcher, E. D., Ocansey, G., & Tumpi, D. A. (2012). Early occupational hearing loss of
workers in a stone crushing industry: Our experience in a developing country.
Noise and Health 14(57), 68-71. doi:10.4103/1463-1741.95134
McBride, D. I. (2004). Noise-induced hearing loss and hearing conservation in mining.
Occupational Medicine 54(5), 290-296. doi:10.1093/occmed/kqh075
Meinke, D. K., Flamme, G. A., Murphy, W. J. (2016). Measuring gunshots with
commercial sound level meters. NHCA Spectrum 33(01). 26
Nast, D. R., Speer, W. S., & Le Prell, C. G. (2014). Sound level measurements using
smartphone “apps”: Useful or inaccurate? Noise & Health, 16(72). 251-256.
doi:10.4103/1463-1741.140495
National Institute for Occupational Safety and Health. (1998). Criteria for recommended
standard: Occupational noise exposure. Retrieved from
https://www.cdc.gov/niosh/docs/98-126/pdfs/98-126.pdf National Institute for
Occupational Safety and Health
National Institute for Occupational Safety and Health. (2010). Occupationally-induced
hearing loss, employers and employees need your help (2010-136). Retrieved
from https://www.cdc.gov/niosh/docs/2010-136/pdfs/2010-136.pdf
National Institute for Occupational Safety and Health. (2015a, July 18). Workplace safety
and health topics: Hierarchy of controls. Retrieved from
https://www.cdc.gov/niosh/topics/hierarchy/
National Institute for Occupational Safety and Health. (2015b, September, 21). Mining
topic: Hearing loss prevention overview. Retrieved from
http://www.cdc.gov/niosh/mining/topics/HearingLossPreventionOverview.html
61
Neitzel, R., Seixas, N., Camp, J., & Yost, M. (1999). An assessment of occupational
noise exposures in four construction trades. American Industrial Hygiene
Association Journal 60(6), 807-817. doi:10.1202/0002-
8894(1999)060<0807:aaoone>2.0.co;2
Occupational Safety and Health Administration. (1983) Code of federal regulations. 29
CFR 1910.95. Occupational noise exposure; Hearing conservation amendment;
Final rule, effective 8 March 1983. Retrieved from https://www.osha.gov/laws-
regs/regulations/standardnumber/1910/1910.95 Occupational Safety and Health
Administration
Occupational Safety and Health Administration. (2013). OSHA technical manual (TED
01-00-015 [TED 1-0.15A]). Retrieved from
https://www.osha.gov/enforcement/directives/ted-01-00-015-5 Occupational
Safety and Health Administration
Pal Singh, L., & Bhardwaj, A. (2013). Occupational noise-induced hearing loss in Indian
steel industry workers: An exploratory study. Human Factors 55(2), 411-424.
doi:10.1177/0018720812457175
Rasmussen, P., Flamme. G., Stewart. M., Meinke. D., Lankford. J. (2009). Measuring
recreational firearm noise. Sound and Vibration 43(8), 14-18.
doi:10.1121/1.3384002
Roberts, B., Kardous, C. A, Neitzel, R. (2016). Improving the accuracy of smart devices
to measure noise exposure. Journal of Occupational and Environmental Hygiene
13(11), 840-846. doi:10.1080/15459624.2016.1183014
62
Schwetz, F., Hloch, T., & Schewczik, R. (1979). Experimental exposure to impulse noise
in the especially pathogenic impact frequency range. Acta Oto-Laryngologica,
87(3-7), 264-266. doi:10.3109/00016487909126418
U. S. Department of Veterans Affairs. (2013). FY 2013 annual benefits Report--
Compensation section (SECURED). Retrieved from
https://www.benefits.va.gov/REPORTS/abr/ABR-Combined-FY13-09262014.pdf
U. S. Department of Veterans Affairs
63
APPENDIX A
OCTAVE SCRIPT CREATED BY
DR. DONALD FINAN
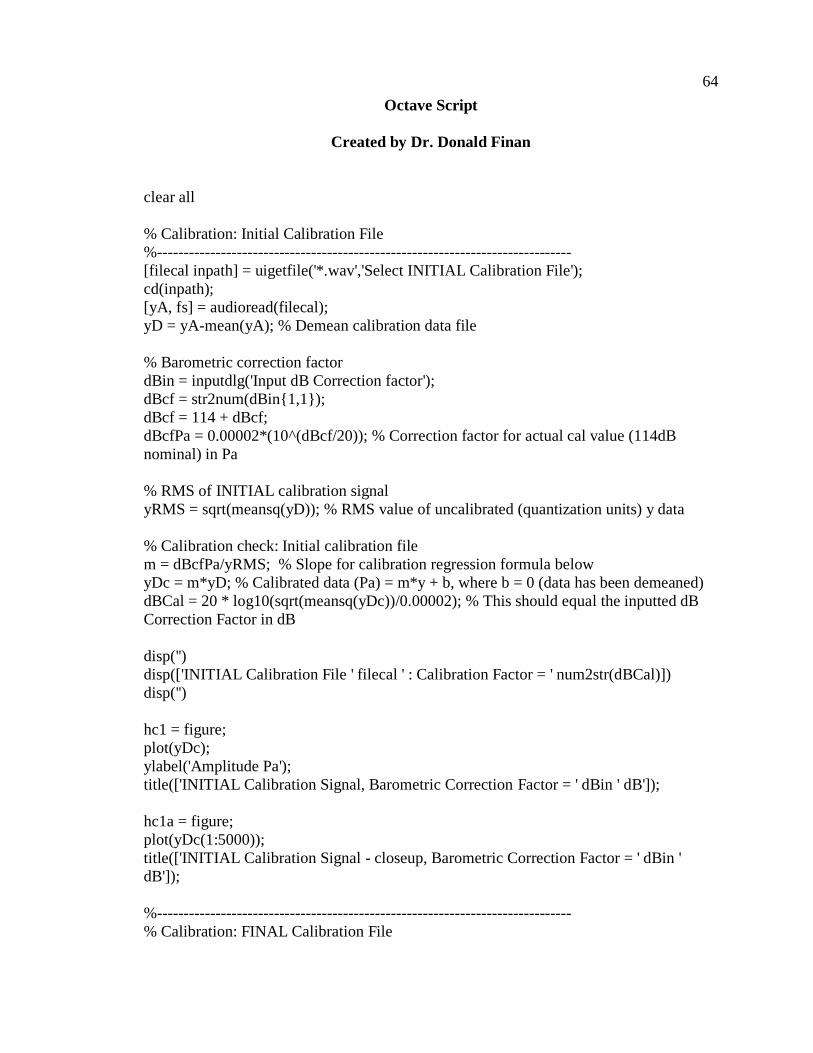
64
Octave Script
Created by Dr. Donald Finan
clear all
% Calibration: Initial Calibration File
%------------------------------------------------------------------------------
[filecal inpath] = uigetfile('*.wav','Select INITIAL Calibration File');
cd(inpath);
[yA, fs] = audioread(filecal);
yD = yA-mean(yA); % Demean calibration data file
% Barometric correction factor
dBin = inputdlg('Input dB Correction factor');
dBcf = str2num(dBin{1,1});
dBcf = 114 + dBcf;
dBcfPa = 0.00002*(10^(dBcf/20)); % Correction factor for actual cal value (114dB
nominal) in Pa
% RMS of INITIAL calibration signal
yRMS = sqrt(meansq(yD)); % RMS value of uncalibrated (quantization units) y data
% Calibration check: Initial calibration file
m = dBcfPa/yRMS; % Slope for calibration regression formula below
yDc = m*yD; % Calibrated data (Pa) = m*y + b, where b = 0 (data has been demeaned)
dBCal = 20 * log10(sqrt(meansq(yDc))/0.00002); % This should equal the inputted dB
Correction Factor in dB
disp('')
disp(['INITIAL Calibration File ' filecal ' : Calibration Factor = ' num2str(dBCal)])
disp('')
hc1 = figure;
plot(yDc);
ylabel('Amplitude Pa');
title(['INITIAL Calibration Signal, Barometric Correction Factor = ' dBin ' dB']);
hc1a = figure;
plot(yDc(1:5000));
title(['INITIAL Calibration Signal - closeup, Barometric Correction Factor = ' dBin '
dB']);
%------------------------------------------------------------------------------
% Calibration: FINAL Calibration File
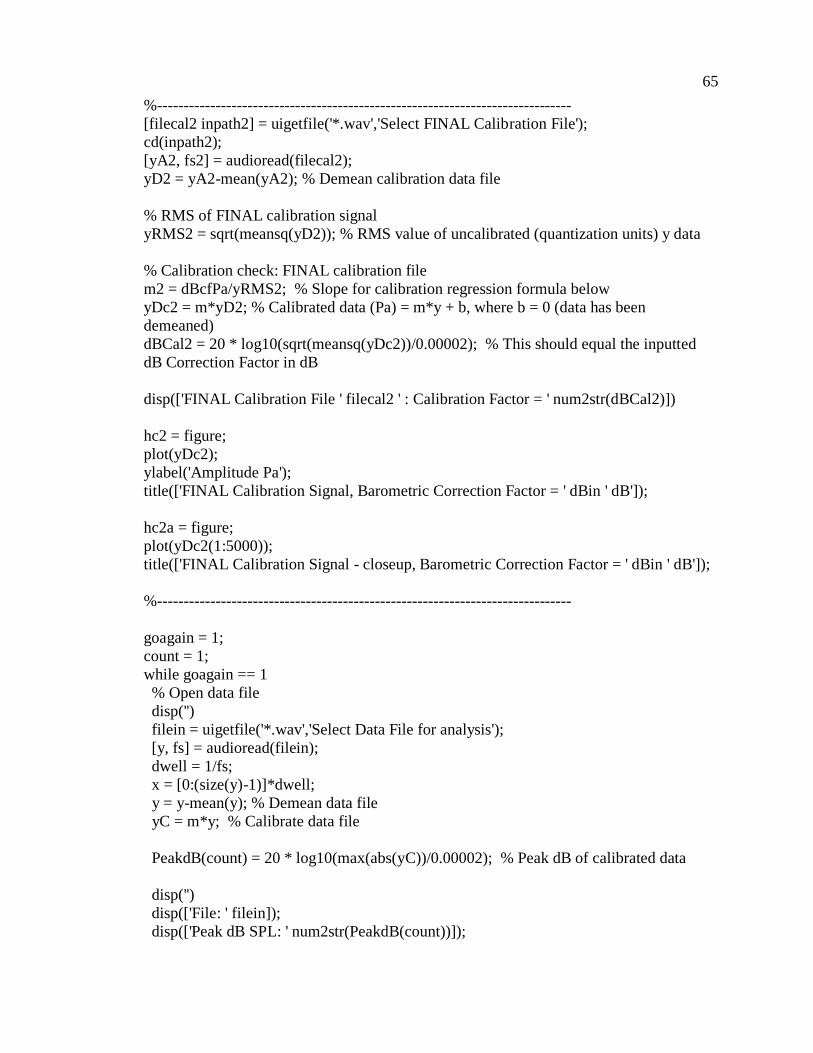
65
%------------------------------------------------------------------------------
[filecal2 inpath2] = uigetfile('*.wav','Select FINAL Calibration File');
cd(inpath2);
[yA2, fs2] = audioread(filecal2);
yD2 = yA2-mean(yA2); % Demean calibration data file
% RMS of FINAL calibration signal
yRMS2 = sqrt(meansq(yD2)); % RMS value of uncalibrated (quantization units) y data
% Calibration check: FINAL calibration file
m2 = dBcfPa/yRMS2; % Slope for calibration regression formula below
yDc2 = m*yD2; % Calibrated data (Pa) = m*y + b, where b = 0 (data has been
demeaned)
dBCal2 = 20 * log10(sqrt(meansq(yDc2))/0.00002); % This should equal the inputted
dB Correction Factor in dB
disp(['FINAL Calibration File ' filecal2 ' : Calibration Factor = ' num2str(dBCal2)])
hc2 = figure;
plot(yDc2);
ylabel('Amplitude Pa');
title(['FINAL Calibration Signal, Barometric Correction Factor = ' dBin ' dB']);
hc2a = figure;
plot(yDc2(1:5000));
title(['FINAL Calibration Signal - closeup, Barometric Correction Factor = ' dBin ' dB']);
%------------------------------------------------------------------------------
goagain = 1;
count = 1;
while goagain == 1
% Open data file
disp('')
filein = uigetfile('*.wav','Select Data File for analysis');
[y, fs] = audioread(filein);
dwell = 1/fs;
x = [0:(size(y)-1)]*dwell;
y = y-mean(y); % Demean data file
yC = m*y; % Calibrate data file
PeakdB(count) = 20 * log10(max(abs(yC))/0.00002); % Peak dB of calibrated data
disp('')
disp(['File: ' filein]);
disp(['Peak dB SPL: ' num2str(PeakdB(count))]);
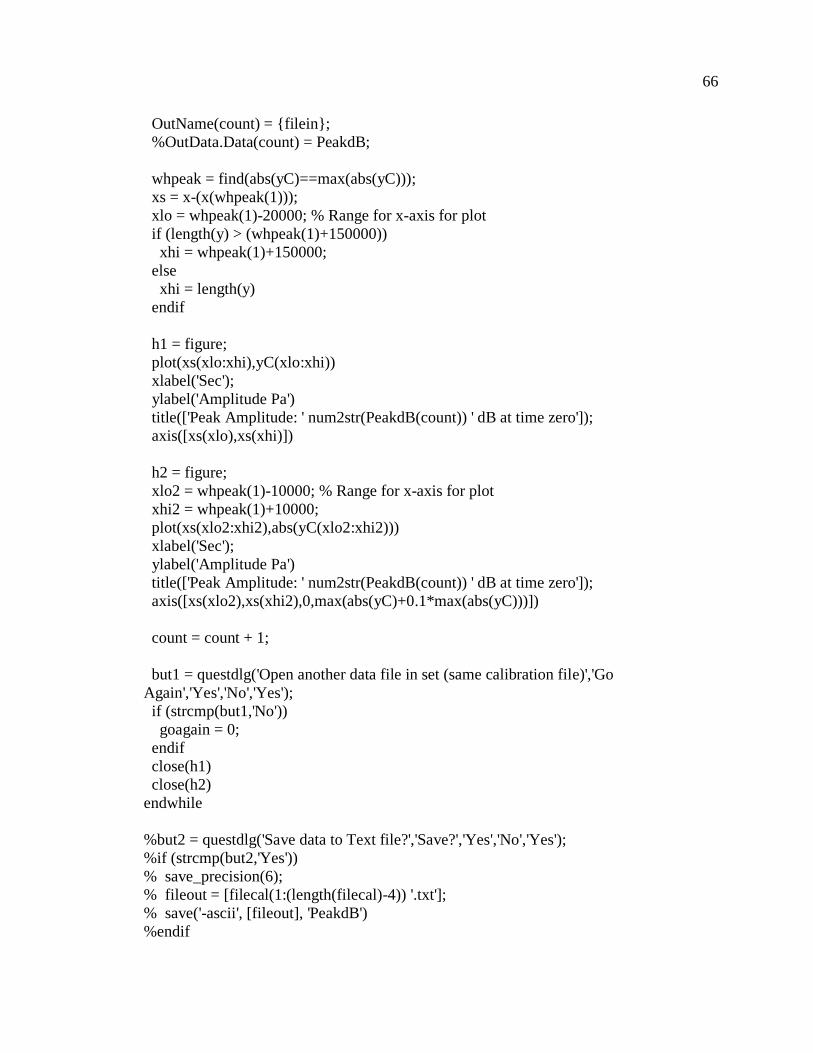
66
OutName(count) = {filein};
%OutData.Data(count) = PeakdB;
whpeak = find(abs(yC)==max(abs(yC)));
xs = x-(x(whpeak(1)));
xlo = whpeak(1)-20000; % Range for x-axis for plot
if (length(y) > (whpeak(1)+150000))
xhi = whpeak(1)+150000;
else
xhi = length(y)
endif
h1 = figure;
plot(xs(xlo:xhi),yC(xlo:xhi))
xlabel('Sec');
ylabel('Amplitude Pa')
title(['Peak Amplitude: ' num2str(PeakdB(count)) ' dB at time zero']);
axis([xs(xlo),xs(xhi)])
h2 = figure;
xlo2 = whpeak(1)-10000; % Range for x-axis for plot
xhi2 = whpeak(1)+10000;
plot(xs(xlo2:xhi2),abs(yC(xlo2:xhi2)))
xlabel('Sec');
ylabel('Amplitude Pa')
title(['Peak Amplitude: ' num2str(PeakdB(count)) ' dB at time zero']);
axis([xs(xlo2),xs(xhi2),0,max(abs(yC)+0.1*max(abs(yC)))])
count = count + 1;
but1 = questdlg('Open another data file in set (same calibration file)','Go
Again','Yes','No','Yes');
if (strcmp(but1,'No'))
goagain = 0;
endif
close(h1)
close(h2)
endwhile
%but2 = questdlg('Save data to Text file?','Save?','Yes','No','Yes');
%if (strcmp(but2,'Yes'))
% save_precision(6);
% fileout = [filecal(1:(length(filecal)-4)) '.txt'];
% save('-ascii', [fileout], 'PeakdB')
%endif


![Fusion Apps FSM Final[1]](https://img.dokumen.tips/doc/110x75/631e5e210ff042c6110c507c/fusion-apps-fsm-final1.jpg)


