Embed Size (px)
Citation preview
arX
iv:0
807.
2204
v4 [
hep-
ex]
27
May
200
9
Measurement of the Inclusive Jet Cross Section at the Fermilab Tevatron pp Collider
Using a Cone-Based Jet Algorithm
T. Aaltonen,24 J. Adelman,14 T. Akimoto,56 M.G. Albrow,18 B. Alvarez Gonzalez,12 S. Ameriou,44 D. Amidei,35
A. Anastassov,39 A. Annovi,20 J. Antos,15 G. Apollinari,18 A. Apresyan,49 T. Arisawa,58 A. Artikov,16
W. Ashmanskas,18 A. Attal,4 A. Aurisano,54 F. Azfar,43 P. Azzurris,47 W. Badgett,18 A. Barbaro-Galtieri,29
V.E. Barnes,49 B.A. Barnett,26 V. Bartsch,31 G. Bauer,33 P.-H. Beauchemin,34 F. Bedeschi,47 P. Bednar,15
D. Beecher,31 S. Behari,26 G. Bellettiniq,47 J. Bellinger,60 D. Benjamin,17 A. Beretvas,18 J. Beringer,29 A. Bhatti,51
M. Binkley,18 D. Bisellou,44 I. Bizjak,31 R.E. Blair,2 C. Blocker,7 B. Blumenfeld,26 A. Bocci,17 A. Bodek,50
V. Boisvert,50 G. Bolla,49 D. Bortoletto,49 J. Boudreau,48 A. Boveia,11 B. Brau,11 A. Bridgeman,25 L. Brigliadori,44
C. Bromberg,36 E. Brubaker,14 J. Budagov,16 H.S. Budd,50 S. Budd,25 K. Burkett,18 G. Busettou,44 P. Busseyx,22
A. Buzatu,34 K. L. Byrum,2 S. Cabrerap,17 C. Calancha,32 M. Campanelli,36 M. Campbell,35 F. Canelli,18
A. Canepa,46 D. Carlsmith,60 R. Carosi,47 S. Carrilloj,19 S. Carron,34 B. Casal,12 M. Casarsa,18 A. Castrot,6
P. Catastinir,47 D. Cauzw,55 V. Cavalierer,47 M. Cavalli-Sforza,4 A. Cerri,29 L. Cerriton,31 S.H. Chang,28
Y.C. Chen,1 M. Chertok,8 G. Chiarelli,47 G. Chlachidze,18 F. Chlebana,18 K. Cho,28 D. Chokheli,16 J.P. Chou,23
G. Choudalakis,33 S.H. Chuang,53 K. Chung,13 W.H. Chung,60 Y.S. Chung,50 C.I. Ciobanu,45 M.A. Cioccir,47
A. Clark,21 D. Clark,7 G. Compostella,44 M.E. Convery,18 J. Conway,8 K. Copic,35 M. Cordelli,20 G. Cortianau,44
D.J. Cox,8 F. Crescioliq,47 C. Cuenca Almenarp,8 J. Cuevasm,12 R. Culbertson,18 J.C. Cully,35 D. Dagenhart,18
M. Datta,18 T. Davies,22 P. de Barbaro,50 S. De Cecco,52 A. Deisher,29 G. De Lorenzo,4 M. Dell’Orsoq,47
C. Deluca,4 L. Demortier,51 J. Deng,17 M. Deninno,6 P.F. Derwent,18 G.P. di Giovanni,45 C. Dionisiv,52
B. Di Ruzzaw,55 J.R. Dittmann,5 M. D’Onofrio,4 S. Donatiq,47 P. Dong,9 J. Donini,44 T. Dorigo,44 S. Dube,53
J. Efron,40 A. Elagin,54 R. Erbacher,8 D. Errede,25 S. Errede,25 R. Eusebi,18 H.C. Fang,29 S. Farrington,43
W.T. Fedorko,14 R.G. Feild,61 M. Feindt,27 J.P. Fernandez,32 C. Ferrazzas,47 R. Field,19 G. Flanagan,49 R. Forrest,8
M. Franklin,23 J.C. Freeman,18 I. Furic,19 M. Gallinaro,52 J. Galyardt,13 F. Garberson,11 J.E. Garcia,47
A.F. Garfinkel,49 K. Genser,18 H. Gerberich,25 D. Gerdes,35 A. Gessler,27 S. Giaguv,52 V. Giakoumopoulou,3
P. Giannetti,47 K. Gibson,48 J.L. Gimmell,50 C.M. Ginsburg,18 N. Giokaris,3 M. Giordaniw,55 P. Giromini,20
M. Giuntaq,47 G. Giurgiu,26 V. Glagolev,16 D. Glenzinski,18 M. Gold,38 N. Goldschmidt,19 A. Golossanov,18
G. Gomez,12 G. Gomez-Ceballos,33 M. Goncharov,54 O. Gonzalez,32 I. Gorelov,38 A.T. Goshaw,17 K. Goulianos,51
A. Greseleu,44 S. Grinstein,23 C. Grosso-Pilcher,14 R.C. Group,18 U. Grundler,25 J. Guimaraes da Costa,23
Z. Gunay-Unalan,36 C. Haber,29 K. Hahn,33 S.R. Hahn,18 E. Halkiadakis,53 B.-Y. Han,50 J.Y. Han,50 R. Handler,60
F. Happacher,20 K. Hara,56 D. Hare,53 M. Hare,57 S. Harper,43 R.F. Harr,59 R.M. Harris,18 M. Hartz,48
K. Hatakeyama,51 J. Hauser,9 C. Hays,43 M. Heck,27 A. Heijboer,46 B. Heinemann,29 J. Heinrich,46 C. Henderson,33
M. Herndon,60 J. Heuser,27 S. Hewamanage,5 D. Hidas,17 C.S. Hillc,11 D. Hirschbuehl,27 A. Hocker,18 S. Hou,1
M. Houlden,30 S.-C. Hsu,10 B.T. Huffman,43 R.E. Hughes,40 U. Husemann,61 J. Huston,36 J. Incandela,11
G. Introzzi,47 M. Ioriv,52 A. Ivanov,8 E. James,18 B. Jayatilaka,17 E.J. Jeon,28 M.K. Jha,6 S. Jindariani,18
W. Johnson,8 M. Jones,49 K.K. Joo,28 S.Y. Jun,13 J.E. Jung,28 T.R. Junk,18 T. Kamon,54 D. Kar,19 P.E. Karchin,59
Y. Kato,42 R. Kephart,18 J. Keung,46 V. Khotilovich,54 B. Kilminster,40 D.H. Kim,28 H.S. Kim,28 J.E. Kim,28
M.J. Kim,20 S.B. Kim,28 S.H. Kim,56 Y.K. Kim,14 N. Kimura,56 L. Kirsch,7 S. Klimenko,19 B. Knuteson,33
B.R. Ko,17 S.A. Koay,11 K. Kondo,58 D.J. Kong,28 J. Konigsberg,19 A. Korytov,19 A.V. Kotwal,17 M. Kreps,27
J. Kroll,46 D. Krop,14 N. Krumnack,5 M. Kruse,17 V. Krutelyov,11 T. Kubo,56 T. Kuhr,27 N.P. Kulkarni,59
M. Kurata,56 Y. Kusakabe,58 S. Kwang,14 A.T. Laasanen,49 S. Lami,47 S. Lammel,18 M. Lancaster,31 R.L. Lander,8
K. Lannon,40 A. Lath,53 G. Latinor,47 I. Lazzizzerau,44 T. LeCompte,2 E. Lee,54 S.W. Leeo,54 S. Leone,47
J.D. Lewis,18 C.S. Lin,29 J. Linacre,43 M. Lindgren,18 E. Lipeles,10 A. Lister,8 D.O. Litvintsev,18 C. Liu,48
T. Liu,18 N.S. Lockyer,46 A. Loginov,61 M. Loretiu,44 L. Lovas,15 R.-S. Lu,1 D. Lucchesiu,44 J. Lueck,27
C. Luciv,52 P. Lujan,29 P. Lukens,18 G. Lungu,51 L. Lyons,43 J. Lys,29 R. Lysak,15 E. Lytken,49 P. Mack,27
D. MacQueen,34 R. Madrak,18 K. Maeshima,18 K. Makhoul,33 T. Maki,24 P. Maksimovic,26 S. Malde,43
S. Malik,31 G. Manca,30 A. Manousakis-Katsikakis,3 F. Margaroli,49 C. Marino,27 C.P. Marino,25 A. Martin,61
V. Martini,22 M. Martınez,4 R. Martınez-Balların,32 T. Maruyama,56 P. Mastrandrea,52 T. Masubuchi,56
M.E. Mattson,59 P. Mazzanti,6 K.S. McFarland,50 P. McIntyre,54 R. McNultyh,30 A. Mehta,30 P. Mehtala,24
A. Menzione,47 P. Merkel,49 C. Mesropian,51 T. Miao,18 N. Miladinovic,7 R. Miller,36 C. Mills,23 M. Milnik,27
A. Mitra,1 G. Mitselmakher,19 H. Miyake,56 N. Moggi,6 C.S. Moon,28 R. Moore,18 M.J. Morelloq,47 J. Morlok,27
P. Movilla Fernandez,18 J. Mulmenstadt,29 A. Mukherjee,18 Th. Muller,27 R. Mumford,26 P. Murat,18
M. Mussinit,6 J. Nachtman,18 Y. Nagai,56 A. Nagano,56 J. Naganoma,58 K. Nakamura,56 I. Nakano,41
2
A. Napier,57 V. Necula,17 C. Neu,46 M.S. Neubauer,25 J. Nielsene,29 L. Nodulman,2 M. Norman,10
O. Norniella,25 E. Nurse,31 L. Oakes,43 S.H. Oh,17 Y.D. Oh,28 I. Oksuzian,19 T. Okusawa,42 R. Orava,24
K. Osterberg,24 S. Pagan Grisou,44 C. Pagliarone,47 E. Palencia,18 V. Papadimitriou,18 A. Papaikonomou,27
A.A. Paramonov,14 B. Parks,40 S. Pashapour,34 J. Patrick,18 G. Paulettaw,55 M. Paulini,13 C. Paus,33 D.E. Pellett,8
A. Penzo,55 T.J. Phillips,17 G. Piacentino,47 E. Pianori,46 L. Pinera,19 K. Pitts,25 C. Plager,9 L. Pondrom,60
O. Poukhov∗,16 N. Pounder,43 F. Prakoshyn,16 A. Pronko,18 J. Proudfoot,2 F. Ptohosg,18 E. Pueschel,13
G. Punziq,47 J. Pursley,60 J. Rademackerc,43 A. Rahaman,48 V. Ramakrishnan,60 N. Ranjan,49 I. Redondo,32
B. Reisert,18 V. Rekovic,38 P. Renton,43 M. Rescigno,52 S. Richter,27 F. Rimondit,6 L. Ristori,47 A. Robson,22
T. Rodrigo,12 T. Rodriguez,46 E. Rogers,25 S. Rolli,57 R. Roser,18 M. Rossi,55 R. Rossin,11 P. Roy,34 A. Ruiz,12
J. Russ,13 V. Rusu,18 H. Saarikko,24 A. Safonov,54 W.K. Sakumoto,50 O. Salto,4 L. Santiw,55 S. Sarkarv,52
L. Sartori,47 K. Sato,18 A. Savoy-Navarro,45 T. Scheidle,27 P. Schlabach,18 A. Schmidt,27 E.E. Schmidt,18
M.A. Schmidt,14 M.P. Schmidt†,61 M. Schmitt,39 T. Schwarz,8 L. Scodellaro,12 A.L. Scott,11 A. Scribanor,47
F. Scuri,47 A. Sedov,49 S. Seidel,38 Y. Seiya,42 A. Semenov,16 L. Sexton-Kennedy,18 A. Sfyrla,21 S.Z. Shalhout,59
T. Shears,30 P.F. Shepard,48 D. Sherman,23 M. Shimojimal,56 S. Shiraishi,14 M. Shochet,14 Y. Shon,60 I. Shreyber,37
A. Sidoti,47 P. Sinervo,34 A. Sisakyan,16 A.J. Slaughter,18 J. Slaunwhite,40 K. Sliwa,57 J.R. Smith,8 F.D. Snider,18
R. Snihur,34 A. Soha,8 S. Somalwar,53 V. Sorin,36 J. Spalding,18 T. Spreitzer,34 P. Squillaciotir,47
M. Stanitzki,61 R. St. Denis,22 B. Stelzer,9 O. Stelzer-Chilton,43 D. Stentz,39 J. Strologas,38 D. Stuart,11
J.S. Suh,28 A. Sukhanov,19 I. Suslov,16 T. Suzuki,56 A. Taffardd,25 R. Takashima,41 Y. Takeuchi,56 R. Tanaka,41
M. Tecchio,35 P.K. Teng,1 K. Terashi,51 J. Thomf ,18 A.S. Thompson,22 G.A. Thompson,25 E. Thomson,46
P. Tipton,61 V. Tiwari,13 S. Tkaczyk,18 D. Toback,54 S. Tokar,15 K. Tollefson,36 T. Tomura,56 D. Tonelli,18
S. Torre,20 D. Torretta,18 P. Totarow,55 S. Tourneur,45 Y. Tu,46 N. Turinir,47 F. Ukegawa,56 S. Vallecorsa,21
N. van Remortela,24 A. Varganov,35 E. Vatagas,47 F. Vazquezj ,19 G. Velev,18 C. Vellidis,3 V. Veszpremi,49
M. Vidal,32 R. Vidal,18 I. Vila,12 R. Vilar,12 T. Vine,31 M. Vogel,38 I. Volobouevo,29 G. Volpiq,47 F. Wurthwein,10
P. Wagner,2 R.G. Wagner,2 R.L. Wagner,18 J. Wagner-Kuhr,27 W. Wagner,27 T. Wakisaka,42 R. Wallny,9
S.M. Wang,1 A. Warburton,34 D. Waters,31 M. Weinberger,54 W.C. Wester III,18 B. Whitehouse,57 D. Whitesond,46
A.B. Wicklund,2 E. Wicklund,18 G. Williams,34 H.H. Williams,46 P. Wilson,18 B.L. Winer,40 P. Wittichf ,18
S. Wolbers,18 C. Wolfe,14 T. Wright,35 X. Wu,21 S.M. Wynne,30 A. Yagil,10 K. Yamamoto,42 J. Yamaoka,53
U.K. Yangk,14 Y.C. Yang,28 W.M. Yao,29 G.P. Yeh,18 J. Yoh,18 K. Yorita,14 T. Yoshida,42 G.B. Yu,50 I. Yu,28
S.S. Yu,18 J.C. Yun,18 L. Zanellov,52 A. Zanetti,55 I. Zaw,23 X. Zhang,25 Y. Zhengb,9 and S. Zucchellit6
(CDF Collaboration‡)1Institute of Physics, Academia Sinica, Taipei, Taiwan 11529, Republic of China
2Argonne National Laboratory, Argonne, Illinois 604393University of Athens, 157 71 Athens, Greece
4Institut de Fisica d’Altes Energies, Universitat Autonoma de Barcelona, E-08193, Bellaterra (Barcelona), Spain5Baylor University, Waco, Texas 76798
6Istituto Nazionale di Fisica Nucleare Bologna, tUniversity of Bologna, I-40127 Bologna, Italy7Brandeis University, Waltham, Massachusetts 02254
8University of California, Davis, Davis, California 956169University of California, Los Angeles, Los Angeles, California 90024
10University of California, San Diego, La Jolla, California 9209311University of California, Santa Barbara, Santa Barbara, California 93106
12Instituto de Fisica de Cantabria, CSIC-University of Cantabria, 39005 Santander, Spain13Carnegie Mellon University, Pittsburgh, PA 15213
14Enrico Fermi Institute, University of Chicago, Chicago, Illinois 6063715Comenius University, 842 48 Bratislava, Slovakia; Institute of Experimental Physics, 040 01 Kosice, Slovakia
16Joint Institute for Nuclear Research, RU-141980 Dubna, Russia17Duke University, Durham, North Carolina 27708
18Fermi National Accelerator Laboratory, Batavia, Illinois 6051019University of Florida, Gainesville, Florida 32611
20Laboratori Nazionali di Frascati, Istituto Nazionale di Fisica Nucleare, I-00044 Frascati, Italy21University of Geneva, CH-1211 Geneva 4, Switzerland
22Glasgow University, Glasgow G12 8QQ, United Kingdom23Harvard University, Cambridge, Massachusetts 02138
24Division of High Energy Physics, Department of Physics,University of Helsinki and Helsinki Institute of Physics, FIN-00014, Helsinki, Finland
25University of Illinois, Urbana, Illinois 6180126The Johns Hopkins University, Baltimore, Maryland 21218
27Institut fur Experimentelle Kernphysik, Universitat Karlsruhe, 76128 Karlsruhe, Germany
3
28Center for High Energy Physics: Kyungpook National University,Daegu 702-701, Korea; Seoul National University, Seoul 151-742,
Korea; Sungkyunkwan University, Suwon 440-746,Korea; Korea Institute of Science and Technology Information, Daejeon,305-806, Korea; Chonnam National University, Gwangju, 500-757, Korea
29Ernest Orlando Lawrence Berkeley National Laboratory, Berkeley, California 9472030University of Liverpool, Liverpool L69 7ZE, United Kingdom
31University College London, London WC1E 6BT, United Kingdom32Centro de Investigaciones Energeticas Medioambientales y Tecnologicas, E-28040 Madrid, Spain
33Massachusetts Institute of Technology, Cambridge, Massachusetts 0213934Institute of Particle Physics: McGill University, Montreal,
Canada H3A 2T8; and University of Toronto, Toronto, Canada M5S 1A735University of Michigan, Ann Arbor, Michigan 48109
36Michigan State University, East Lansing, Michigan 4882437Institution for Theoretical and Experimental Physics, ITEP, Moscow 117259, Russia
38University of New Mexico, Albuquerque, New Mexico 8713139Northwestern University, Evanston, Illinois 6020840The Ohio State University, Columbus, Ohio 43210
41Okayama University, Okayama 700-8530, Japan42Osaka City University, Osaka 588, Japan
43University of Oxford, Oxford OX1 3RH, United Kingdom44Istituto Nazionale di Fisica Nucleare, Sezione di Padova-Trento, uUniversity of Padova, I-35131 Padova, Italy
45LPNHE, Universite Pierre et Marie Curie/IN2P3-CNRS, UMR7585, Paris, F-75252 France46University of Pennsylvania, Philadelphia, Pennsylvania 19104
47Istituto Nazionale di Fisica Nucleare Pisa, qUniversity of Pisa,rUniversity of Siena and sScuola Normale Superiore, I-56127 Pisa, Italy
48University of Pittsburgh, Pittsburgh, Pennsylvania 1526049Purdue University, West Lafayette, Indiana 47907
50University of Rochester, Rochester, New York 1462751The Rockefeller University, New York, New York 10021
52Istituto Nazionale di Fisica Nucleare, Sezione di Roma 1,vSapienza Universita di Roma, I-00185 Roma, Italy53Rutgers University, Piscataway, New Jersey 08855
54Texas A&M University, College Station, Texas 7784355Istituto Nazionale di Fisica Nucleare Trieste/ Udine, wUniversity of Trieste/ Udine, Italy
56University of Tsukuba, Tsukuba, Ibaraki 305, Japan57Tufts University, Medford, Massachusetts 02155
58Waseda University, Tokyo 169, Japan59Wayne State University, Detroit, Michigan 48201
60University of Wisconsin, Madison, Wisconsin 5370661Yale University, New Haven, Connecticut 06520
(Dated: May 27, 2009)
We present a measurement of the inclusive jet cross section in pp collisions at√
s = 1.96 TeV basedon data collected by the CDF II detector with an integrated luminosity of 1.13 fb−1 [1]. The mea-surement was made using the cone-based Midpoint jet clustering algorithm in the rapidity region of|y| < 2.1. The results are consistent with next-to-leading-order perturbative QCD predictions basedon recent parton distribution functions (PDFs), and are expected to provide increased precision inPDFs at high parton momentum fraction x. The results are also compared to the recent inclusivejet cross section measurement using the kT jet clustering algorithm, and we find that the ratio ofthe cross sections measured with the two algorithms is in agreement with theoretical expectationsover a large range of jet transverse momentum and rapidity.
PACS numbers: 13.87.Ce, 12.38.Qk, 13.85.Ni
∗Deceased†Deceased‡With visitors from aUniversiteit Antwerpen, B-2610 Antwerp,Belgium, bChinese Academy of Sciences, Beijing 100864, China,cUniversity of Bristol, Bristol BS8 1TL, United Kingdom,
dUniversity of California Irvine, Irvine, CA 92697, eUniversity ofCalifornia Santa Cruz, Santa Cruz, CA 95064, f Cornell Univer-sity, Ithaca, NY 14853, gUniversity of Cyprus, Nicosia CY-1678,Cyprus, hUniversity College Dublin, Dublin 4, Ireland, iUniversityof Edinburgh, Edinburgh EH9 3JZ, United Kingdom, jUniversidad
4
I. INTRODUCTION
The measurement of the differential inclusive jet crosssection at the Fermilab Tevatron probes the highest mo-mentum transfers in particle collisions currently attain-able in any accelerator experiment, and thus is poten-tially sensitive to new physics such as quark substruc-ture [2, 3]. The measurement also provides a direct testof predictions of perturbative quantum chromodynamics(pQCD) [4, 5, 6]. The inclusive jet cross section measure-ments at Tevatron Run II [7, 8, 9, 10] cover up to 600GeV/c in jet transverse momentum pT [11], and rangeover more than eight orders of magnitude in differentialcross section. Comparisons of the measured cross sectionwith pQCD predictions provide constraints on the par-ton distribution function (PDF) of the (anti)proton, inparticular at high momentum fraction x (x & 0.3) wherethe gluon distribution is poorly constrained [12]. Fur-ther constraints on the gluon distribution at high x willcontribute to reduced uncertainties on theoretical predic-tions of many interesting physics processes both for ex-periments at the Tevatron and for future experiments atthe Large Hadron Collider (LHC). One example is tt pro-duction at the Tevatron for which the dominant PDF un-certainty arises from the uncertainty in the high-x gluondistribution. In addition, searches for new physics be-yond the standard model at high pT such as quark sub-structure require precise knowledge of PDFs at high x.
Jets are defined by algorithms which cluster togetherobjects such as energies measured in calorimeter towers,particles, or partons. Jet clustering relies on the associ-ation of objects based either on proximity in coordinatespace (as in cone algorithms) or in momentum space (asin kT algorithms) [13, 14, 15, 16]. The CDF Collabo-ration recently published a measurement of the inclusivejet cross section in the rapidity region 0.1 < |y| < 0.7 [11]using a cone-based jet clustering algorithm [17] based on0.39 fb−1 of the Run II data [7]. This paper presentsan updated measurement based on 1.13 fb−1 with thekinematic range extended up to |y| = 2.1, and compar-isons with next-to-leading-order (NLO) pQCD predic-tions based on recent PDFs of the proton [12, 18]. Theextension of the rapidity range significantly increases thekinematic reach in x−Q space, where Q denotes the mo-mentum transfer, and helps to further constrain the pro-ton PDFs. The D0 Collaboration also recently reported ameasurement of the inclusive jet cross section using 0.70fb−1 of data in the rapidity region |y| < 2.4 [10].
Similar measurements of the inclusive jet cross sec-
Iberoamericana, Mexico D.F., Mexico, kUniversity of Manchester,Manchester M13 9PL, England, lNagasaki Institute of Applied Sci-ence, Nagasaki, Japan, mUniversity de Oviedo, E-33007 Oviedo,Spain, nQueen Mary, University of London, London, E1 4NS, Eng-land, oTexas Tech University, Lubbock, TX 79409, pIFIC(CSIC-Universitat de Valencia), 46071 Valencia, Spain, xRoyal Society ofEdinburgh/Scottish Executive Support Research Fellow,
tion have been made by the CDF Collaboration in RunII using the kT jet clustering algorithm [19] in the re-gion of 0.1 < |y| < 0.7 [8] and later in the region up to|y| = 2.1 [9]. The kT algorithm has been used successfullyat e+e− and e±p collider experiments; however, the conealgorithms have been used traditionally at hadron col-lider experiments, mainly due to the associated simplicityin constructing corrections for the underlying event andfor multiple interactions in the same bunch crossing [13].It is worth noting that previous measurements made atthe Tevatron in Run I using a cone algorithm and kT
algorithm showed only marginal agreement [20, 21].The rest of this paper proceeds as follows: Section II
describes the CDF detector components most relevantto this analysis. The details of the jet clustering algo-rithm and the data sample used in this measurement arepresented in Secs. III and IV. Section V explains themethods used to correct the CDF data for all detectoreffects, so that the measured cross section may be di-rectly compared to theoretical predictions. The eventsamples from Monte Carlo (MC) event generators andCDF detector simulation that are used to derive thesecorrections are also discussed in this section. Systematicuncertainties in the cross section measurement are dis-cussed in Sec. VI. Section VII discusses NLO pQCD pre-dictions on the inclusive jet cross sections, and Sec. VIIIpresents the measured cross sections and comparisons tothose predictions. In Sec. IX the measured cross sectionsare also compared to the recent measurement using thekT jet clustering algorithm [9], and in Sec. X conclusionsare presented.
II. THE CDF II DETECTOR
The CDF II detector, shown schematically in Fig. 1,is described in detail elsewhere [22]. Here, those compo-nents that are relevant to this measurement are brieflydescribed. The central detector consists of a silicon ver-tex detector (SVXII) [23] and intermediate silicon lay-ers (ISL) [24], covering the radial ranges of 1.5 − 11 cmand 19 − 30 cm, respectively. They are located inside acylindrical open-cell drift chamber [25] of 96 layers orga-nized in 8 superlayers with alternating structures of axialand ±2◦ stereo readout within a radial range between 40and 137 cm. The tracking system is located inside asuperconducting solenoid magnet which provides an ax-ial 1.4 T magnetic field. Surrounding the magnet coilare projective-tower-geometry sampling calorimeters tomeasure the energy of interacting particles.
The central calorimeter covers the region of |η| < 1.1and is divided into two halves at |η| = 0. It con-sists of 48 modules, segmented into towers of granu-larity ∆η × ∆φ ≈ 0.1 × 0.26. The central electro-magnetic calorimeter (CEM) [26, 27] consists of lead-scintillator with a depth of about 18 radiation lengths;the central hadron calorimeter (CHA) [28] consists ofiron-scintillator with a depth of approximately 4.7 in-
5
teraction lengths. The energy resolution of the CEMfor electrons is σ(ET )/ET = 13.5%/
√
ET (GeV) ⊕ 1.5%,while the energy resolution of the CHA for charged pi-ons that do not interact in the CEM is σ(ET )/ET =
50%/√
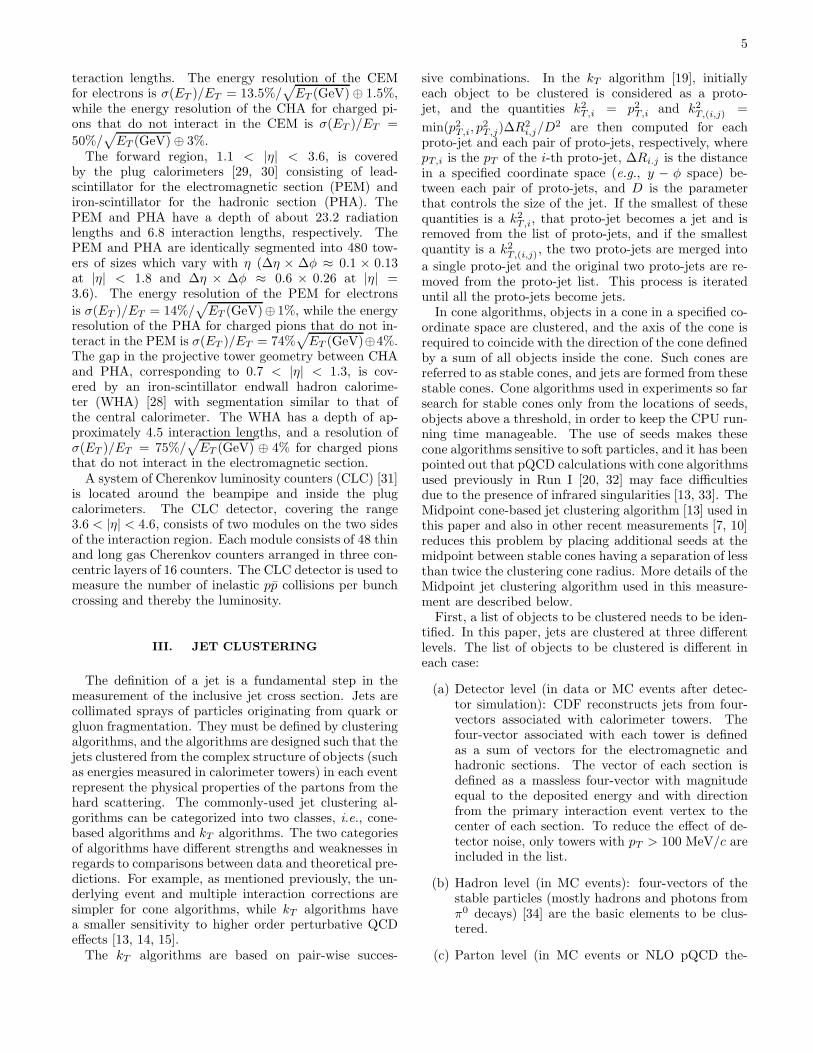
ET (GeV) ⊕ 3%.The forward region, 1.1 < |η| < 3.6, is covered
by the plug calorimeters [29, 30] consisting of lead-scintillator for the electromagnetic section (PEM) andiron-scintillator for the hadronic section (PHA). ThePEM and PHA have a depth of about 23.2 radiationlengths and 6.8 interaction lengths, respectively. ThePEM and PHA are identically segmented into 480 tow-ers of sizes which vary with η (∆η × ∆φ ≈ 0.1 × 0.13at |η| < 1.8 and ∆η × ∆φ ≈ 0.6 × 0.26 at |η| =3.6). The energy resolution of the PEM for electrons
is σ(ET )/ET = 14%/√
ET (GeV)⊕ 1%, while the energyresolution of the PHA for charged pions that do not in-teract in the PEM is σ(ET )/ET = 74%
√
ET (GeV)⊕4%.The gap in the projective tower geometry between CHAand PHA, corresponding to 0.7 < |η| < 1.3, is cov-ered by an iron-scintillator endwall hadron calorime-ter (WHA) [28] with segmentation similar to that ofthe central calorimeter. The WHA has a depth of ap-proximately 4.5 interaction lengths, and a resolution ofσ(ET )/ET = 75%/
√
ET (GeV) ⊕ 4% for charged pionsthat do not interact in the electromagnetic section.
A system of Cherenkov luminosity counters (CLC) [31]is located around the beampipe and inside the plugcalorimeters. The CLC detector, covering the range3.6 < |η| < 4.6, consists of two modules on the two sidesof the interaction region. Each module consists of 48 thinand long gas Cherenkov counters arranged in three con-centric layers of 16 counters. The CLC detector is used tomeasure the number of inelastic pp collisions per bunchcrossing and thereby the luminosity.
III. JET CLUSTERING
The definition of a jet is a fundamental step in themeasurement of the inclusive jet cross section. Jets arecollimated sprays of particles originating from quark orgluon fragmentation. They must be defined by clusteringalgorithms, and the algorithms are designed such that thejets clustered from the complex structure of objects (suchas energies measured in calorimeter towers) in each eventrepresent the physical properties of the partons from thehard scattering. The commonly-used jet clustering al-gorithms can be categorized into two classes, i.e., cone-based algorithms and kT algorithms. The two categoriesof algorithms have different strengths and weaknesses inregards to comparisons between data and theoretical pre-dictions. For example, as mentioned previously, the un-derlying event and multiple interaction corrections aresimpler for cone algorithms, while kT algorithms havea smaller sensitivity to higher order perturbative QCDeffects [13, 14, 15].
The kT algorithms are based on pair-wise succes-
sive combinations. In the kT algorithm [19], initiallyeach object to be clustered is considered as a proto-jet, and the quantities k2
T,i = p2T,i and k2
T,(i,j) =
min(p2T,i, p
2T,j)∆R2
i,j/D2 are then computed for eachproto-jet and each pair of proto-jets, respectively, wherepT,i is the pT of the i-th proto-jet, ∆Ri.j is the distancein a specified coordinate space (e.g., y − φ space) be-tween each pair of proto-jets, and D is the parameterthat controls the size of the jet. If the smallest of thesequantities is a k2
T,i, that proto-jet becomes a jet and isremoved from the list of proto-jets, and if the smallestquantity is a k2
T,(i,j), the two proto-jets are merged into
a single proto-jet and the original two proto-jets are re-moved from the proto-jet list. This process is iterateduntil all the proto-jets become jets.
In cone algorithms, objects in a cone in a specified co-ordinate space are clustered, and the axis of the cone isrequired to coincide with the direction of the cone definedby a sum of all objects inside the cone. Such cones arereferred to as stable cones, and jets are formed from thesestable cones. Cone algorithms used in experiments so farsearch for stable cones only from the locations of seeds,objects above a threshold, in order to keep the CPU run-ning time manageable. The use of seeds makes thesecone algorithms sensitive to soft particles, and it has beenpointed out that pQCD calculations with cone algorithmsused previously in Run I [20, 32] may face difficultiesdue to the presence of infrared singularities [13, 33]. TheMidpoint cone-based jet clustering algorithm [13] used inthis paper and also in other recent measurements [7, 10]reduces this problem by placing additional seeds at themidpoint between stable cones having a separation of lessthan twice the clustering cone radius. More details of theMidpoint jet clustering algorithm used in this measure-ment are described below.
First, a list of objects to be clustered needs to be iden-tified. In this paper, jets are clustered at three differentlevels. The list of objects to be clustered is different ineach case:
(a) Detector level (in data or MC events after detec-tor simulation): CDF reconstructs jets from four-vectors associated with calorimeter towers. Thefour-vector associated with each tower is definedas a sum of vectors for the electromagnetic andhadronic sections. The vector of each section isdefined as a massless four-vector with magnitudeequal to the deposited energy and with directionfrom the primary interaction event vertex to thecenter of each section. To reduce the effect of de-tector noise, only towers with pT > 100 MeV/c areincluded in the list.
(b) Hadron level (in MC events): four-vectors of thestable particles (mostly hadrons and photons fromπ0 decays) [34] are the basic elements to be clus-tered.
(c) Parton level (in MC events or NLO pQCD the-
6
ory): four-vectors of partons are used to formparton-level jets. In MC events, the partons be-fore hadronization are used, and in the pQCD the-ory, the partons after all QCD radiation are used.There are at most three partons in the list in theNLO pQCD theory used in this paper.
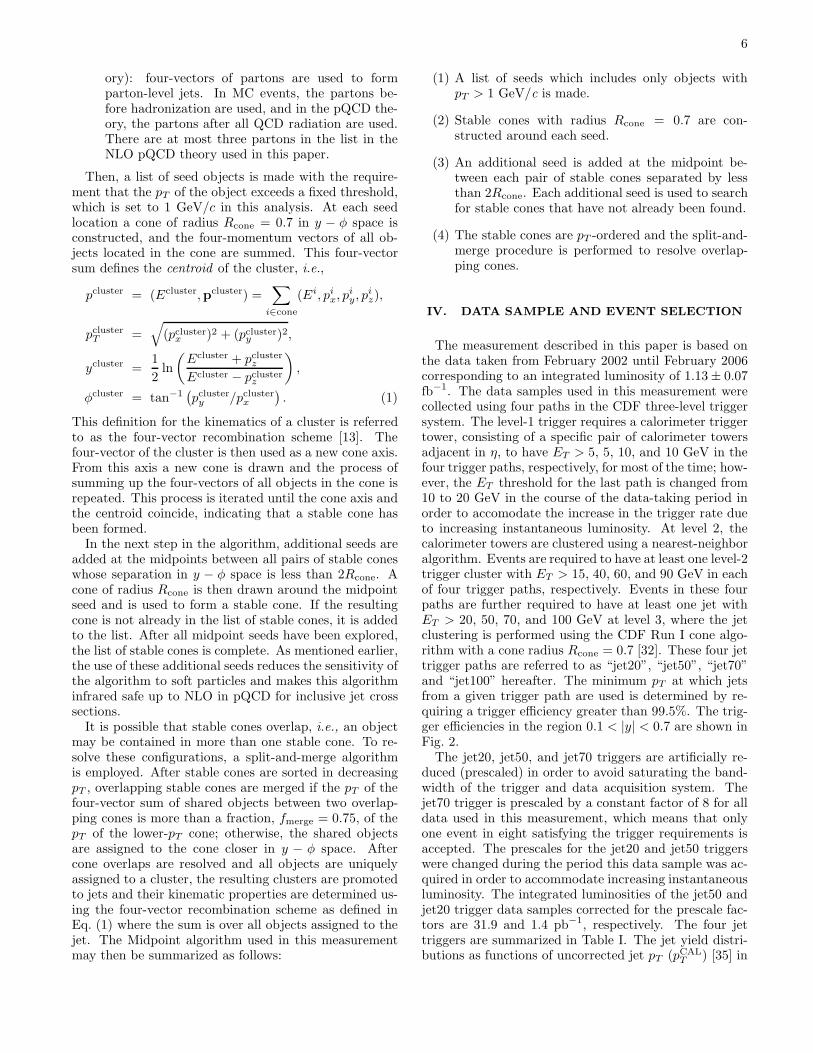
Then, a list of seed objects is made with the require-ment that the pT of the object exceeds a fixed threshold,which is set to 1 GeV/c in this analysis. At each seedlocation a cone of radius Rcone = 0.7 in y − φ space isconstructed, and the four-momentum vectors of all ob-jects located in the cone are summed. This four-vectorsum defines the centroid of the cluster, i.e.,
pcluster = (Ecluster,pcluster) =∑
i∈cone
(Ei, pix, pi
y, piz),
pclusterT =
√
(pclusterx )2 + (pcluster
y )2,
ycluster =1
2ln
(
Ecluster + pclusterz
Ecluster − pclusterz
)
,
φcluster = tan−1(
pclustery /pcluster
x
)
. (1)
This definition for the kinematics of a cluster is referredto as the four-vector recombination scheme [13]. Thefour-vector of the cluster is then used as a new cone axis.From this axis a new cone is drawn and the process ofsumming up the four-vectors of all objects in the cone isrepeated. This process is iterated until the cone axis andthe centroid coincide, indicating that a stable cone hasbeen formed.
In the next step in the algorithm, additional seeds areadded at the midpoints between all pairs of stable coneswhose separation in y − φ space is less than 2Rcone. Acone of radius Rcone is then drawn around the midpointseed and is used to form a stable cone. If the resultingcone is not already in the list of stable cones, it is addedto the list. After all midpoint seeds have been explored,the list of stable cones is complete. As mentioned earlier,the use of these additional seeds reduces the sensitivity ofthe algorithm to soft particles and makes this algorithminfrared safe up to NLO in pQCD for inclusive jet crosssections.
It is possible that stable cones overlap, i.e., an objectmay be contained in more than one stable cone. To re-solve these configurations, a split-and-merge algorithmis employed. After stable cones are sorted in decreasingpT , overlapping stable cones are merged if the pT of thefour-vector sum of shared objects between two overlap-ping cones is more than a fraction, fmerge = 0.75, of thepT of the lower-pT cone; otherwise, the shared objectsare assigned to the cone closer in y − φ space. Aftercone overlaps are resolved and all objects are uniquelyassigned to a cluster, the resulting clusters are promotedto jets and their kinematic properties are determined us-ing the four-vector recombination scheme as defined inEq. (1) where the sum is over all objects assigned to thejet. The Midpoint algorithm used in this measurementmay then be summarized as follows:
(1) A list of seeds which includes only objects withpT > 1 GeV/c is made.
(2) Stable cones with radius Rcone = 0.7 are con-structed around each seed.
(3) An additional seed is added at the midpoint be-tween each pair of stable cones separated by lessthan 2Rcone. Each additional seed is used to searchfor stable cones that have not already been found.
(4) The stable cones are pT -ordered and the split-and-merge procedure is performed to resolve overlap-ping cones.
IV. DATA SAMPLE AND EVENT SELECTION
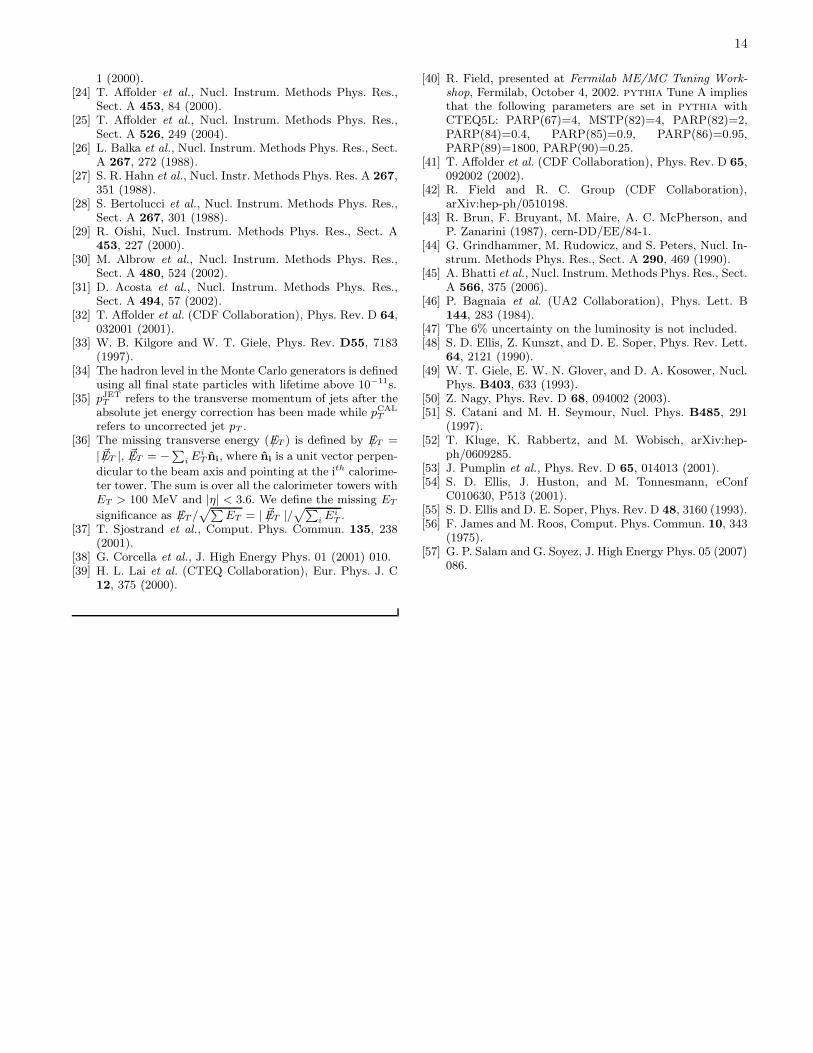
The measurement described in this paper is based onthe data taken from February 2002 until February 2006corresponding to an integrated luminosity of 1.13 ± 0.07fb−1. The data samples used in this measurement werecollected using four paths in the CDF three-level triggersystem. The level-1 trigger requires a calorimeter triggertower, consisting of a specific pair of calorimeter towersadjacent in η, to have ET > 5, 5, 10, and 10 GeV in thefour trigger paths, respectively, for most of the time; how-ever, the ET threshold for the last path is changed from10 to 20 GeV in the course of the data-taking period inorder to accomodate the increase in the trigger rate dueto increasing instantaneous luminosity. At level 2, thecalorimeter towers are clustered using a nearest-neighboralgorithm. Events are required to have at least one level-2trigger cluster with ET > 15, 40, 60, and 90 GeV in eachof four trigger paths, respectively. Events in these fourpaths are further required to have at least one jet withET > 20, 50, 70, and 100 GeV at level 3, where the jetclustering is performed using the CDF Run I cone algo-rithm with a cone radius Rcone = 0.7 [32]. These four jettrigger paths are referred to as “jet20”, “jet50”, “jet70”and “jet100” hereafter. The minimum pT at which jetsfrom a given trigger path are used is determined by re-quiring a trigger efficiency greater than 99.5%. The trig-ger efficiencies in the region 0.1 < |y| < 0.7 are shown inFig. 2.
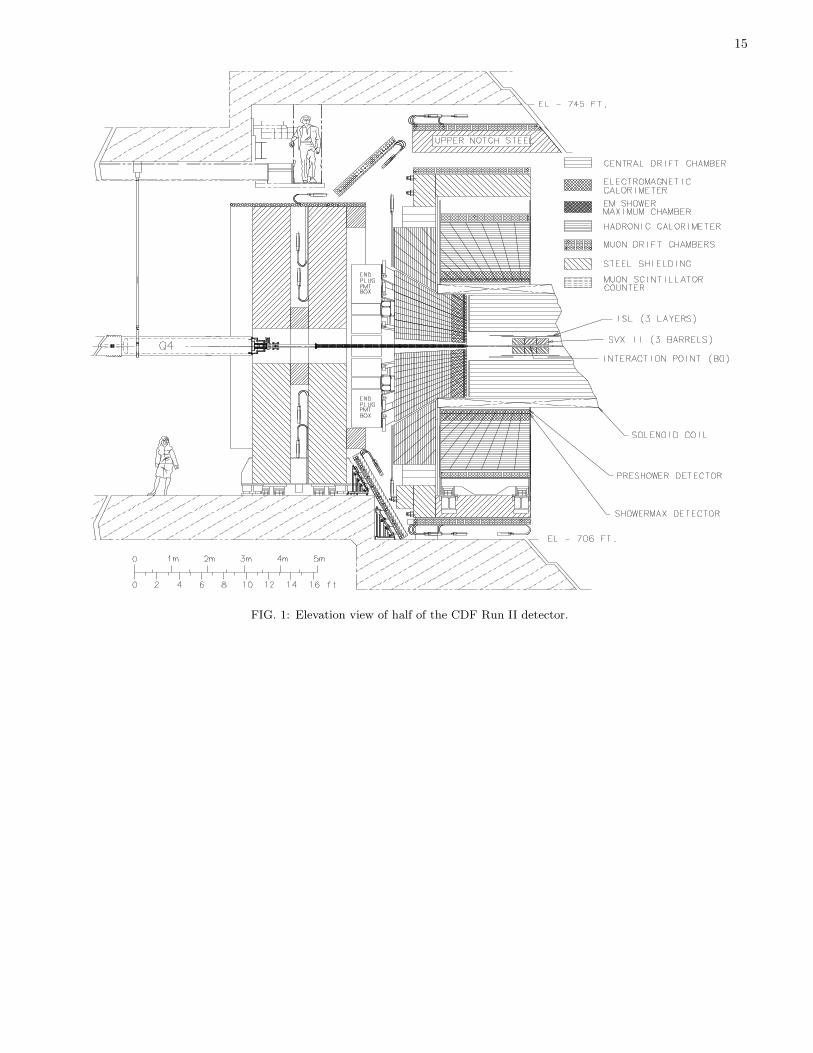
The jet20, jet50, and jet70 triggers are artificially re-duced (prescaled) in order to avoid saturating the band-width of the trigger and data acquisition system. Thejet70 trigger is prescaled by a constant factor of 8 for alldata used in this measurement, which means that onlyone event in eight satisfying the trigger requirements isaccepted. The prescales for the jet20 and jet50 triggerswere changed during the period this data sample was ac-quired in order to accommodate increasing instantaneousluminosity. The integrated luminosities of the jet50 andjet20 trigger data samples corrected for the prescale fac-tors are 31.9 and 1.4 pb−1, respectively. The four jettriggers are summarized in Table I. The jet yield distri-butions as functions of uncorrected jet pT (pCAL
T ) [35] in
7
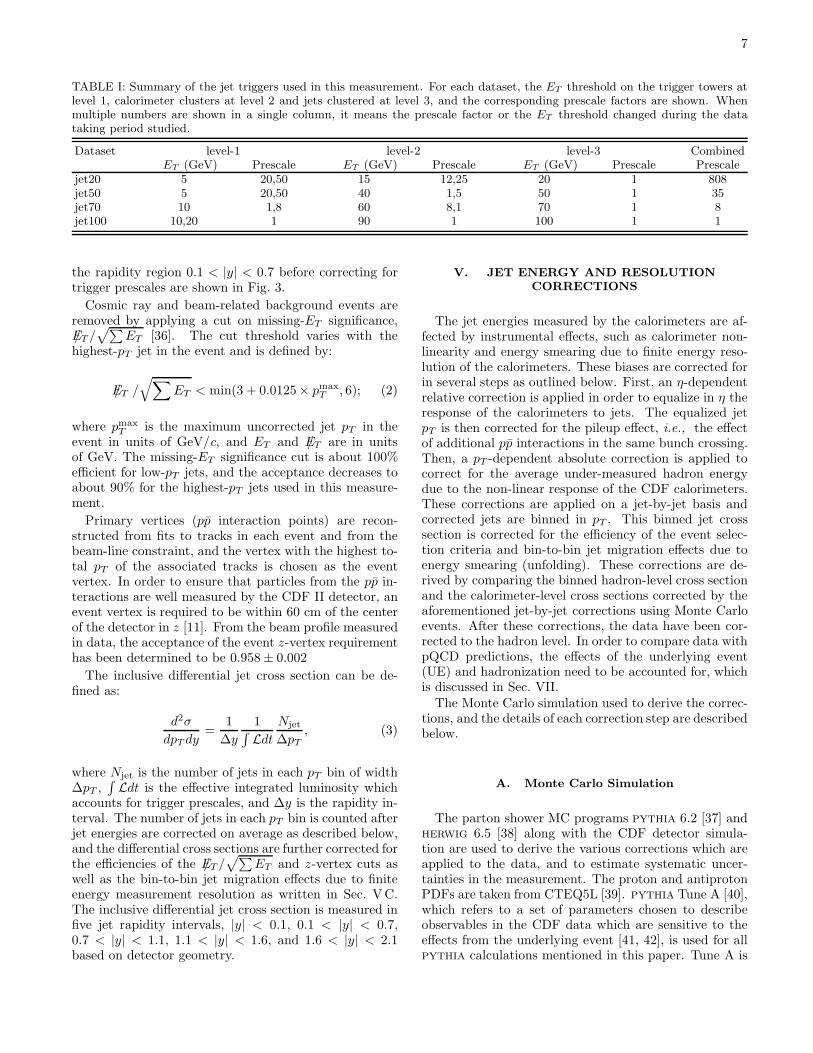
TABLE I: Summary of the jet triggers used in this measurement. For each dataset, the ET threshold on the trigger towers atlevel 1, calorimeter clusters at level 2 and jets clustered at level 3, and the corresponding prescale factors are shown. Whenmultiple numbers are shown in a single column, it means the prescale factor or the ET threshold changed during the datataking period studied.
Dataset level-1 level-2 level-3 CombinedET (GeV) Prescale ET (GeV) Prescale ET (GeV) Prescale Prescale
jet20 5 20,50 15 12,25 20 1 808jet50 5 20,50 40 1,5 50 1 35jet70 10 1,8 60 8,1 70 1 8jet100 10,20 1 90 1 100 1 1
the rapidity region 0.1 < |y| < 0.7 before correcting fortrigger prescales are shown in Fig. 3.
Cosmic ray and beam-related background events areremoved by applying a cut on missing-ET significance,E/T /
√
∑
ET [36]. The cut threshold varies with thehighest-pT jet in the event and is defined by:
E/T /√
∑
ET < min(3 + 0.0125× pmaxT , 6); (2)
where pmaxT is the maximum uncorrected jet pT in the
event in units of GeV/c, and ET and E/T are in unitsof GeV. The missing-ET significance cut is about 100%efficient for low-pT jets, and the acceptance decreases toabout 90% for the highest-pT jets used in this measure-ment.
Primary vertices (pp interaction points) are recon-structed from fits to tracks in each event and from thebeam-line constraint, and the vertex with the highest to-tal pT of the associated tracks is chosen as the eventvertex. In order to ensure that particles from the pp in-teractions are well measured by the CDF II detector, anevent vertex is required to be within 60 cm of the centerof the detector in z [11]. From the beam profile measuredin data, the acceptance of the event z-vertex requirementhas been determined to be 0.958 ± 0.002
The inclusive differential jet cross section can be de-fined as:
d2σ
dpT dy=
1
∆y
1∫
Ldt
Njet
∆pT
, (3)
where Njet is the number of jets in each pT bin of width∆pT ,
∫
Ldt is the effective integrated luminosity whichaccounts for trigger prescales, and ∆y is the rapidity in-terval. The number of jets in each pT bin is counted afterjet energies are corrected on average as described below,and the differential cross sections are further corrected forthe efficiencies of the E/T /
√
∑
ET and z-vertex cuts aswell as the bin-to-bin jet migration effects due to finiteenergy measurement resolution as written in Sec. VC.The inclusive differential jet cross section is measured infive jet rapidity intervals, |y| < 0.1, 0.1 < |y| < 0.7,0.7 < |y| < 1.1, 1.1 < |y| < 1.6, and 1.6 < |y| < 2.1based on detector geometry.
V. JET ENERGY AND RESOLUTION
CORRECTIONS
The jet energies measured by the calorimeters are af-fected by instrumental effects, such as calorimeter non-linearity and energy smearing due to finite energy reso-lution of the calorimeters. These biases are corrected forin several steps as outlined below. First, an η-dependentrelative correction is applied in order to equalize in η theresponse of the calorimeters to jets. The equalized jetpT is then corrected for the pileup effect, i.e., the effectof additional pp interactions in the same bunch crossing.Then, a pT -dependent absolute correction is applied tocorrect for the average under-measured hadron energydue to the non-linear response of the CDF calorimeters.These corrections are applied on a jet-by-jet basis andcorrected jets are binned in pT . This binned jet crosssection is corrected for the efficiency of the event selec-tion criteria and bin-to-bin jet migration effects due toenergy smearing (unfolding). These corrections are de-rived by comparing the binned hadron-level cross sectionand the calorimeter-level cross sections corrected by theaforementioned jet-by-jet corrections using Monte Carloevents. After these corrections, the data have been cor-rected to the hadron level. In order to compare data withpQCD predictions, the effects of the underlying event(UE) and hadronization need to be accounted for, whichis discussed in Sec. VII.
The Monte Carlo simulation used to derive the correc-tions, and the details of each correction step are describedbelow.
A. Monte Carlo Simulation
The parton shower MC programs pythia 6.2 [37] andherwig 6.5 [38] along with the CDF detector simula-tion are used to derive the various corrections which areapplied to the data, and to estimate systematic uncer-tainties in the measurement. The proton and antiprotonPDFs are taken from CTEQ5L [39]. pythia Tune A [40],which refers to a set of parameters chosen to describeobservables in the CDF data which are sensitive to theeffects from the underlying event [41, 42], is used for allpythia calculations mentioned in this paper. Tune A is
8
especially important for the UE correction discussed inSec. VII.
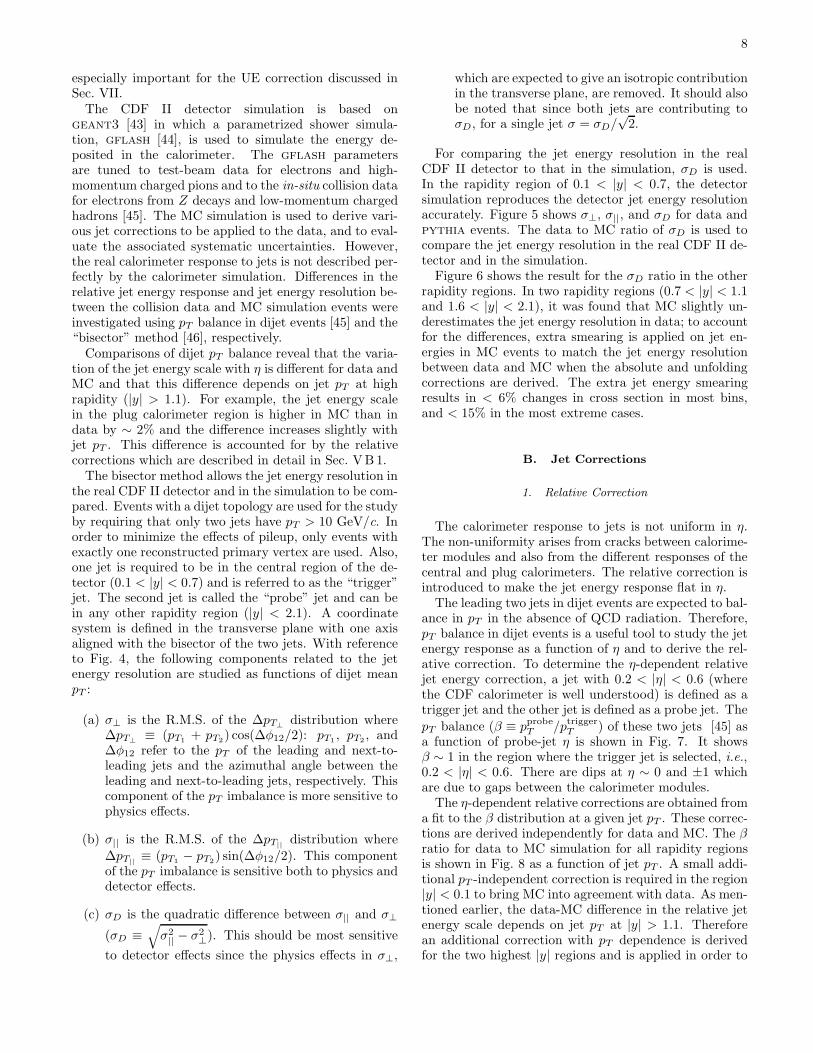
The CDF II detector simulation is based ongeant3 [43] in which a parametrized shower simula-tion, gflash [44], is used to simulate the energy de-posited in the calorimeter. The gflash parametersare tuned to test-beam data for electrons and high-momentum charged pions and to the in-situ collision datafor electrons from Z decays and low-momentum chargedhadrons [45]. The MC simulation is used to derive vari-ous jet corrections to be applied to the data, and to eval-uate the associated systematic uncertainties. However,the real calorimeter response to jets is not described per-fectly by the calorimeter simulation. Differences in therelative jet energy response and jet energy resolution be-tween the collision data and MC simulation events wereinvestigated using pT balance in dijet events [45] and the“bisector” method [46], respectively.
Comparisons of dijet pT balance reveal that the varia-tion of the jet energy scale with η is different for data andMC and that this difference depends on jet pT at highrapidity (|y| > 1.1). For example, the jet energy scalein the plug calorimeter region is higher in MC than indata by ∼ 2% and the difference increases slightly withjet pT . This difference is accounted for by the relativecorrections which are described in detail in Sec. VB 1.
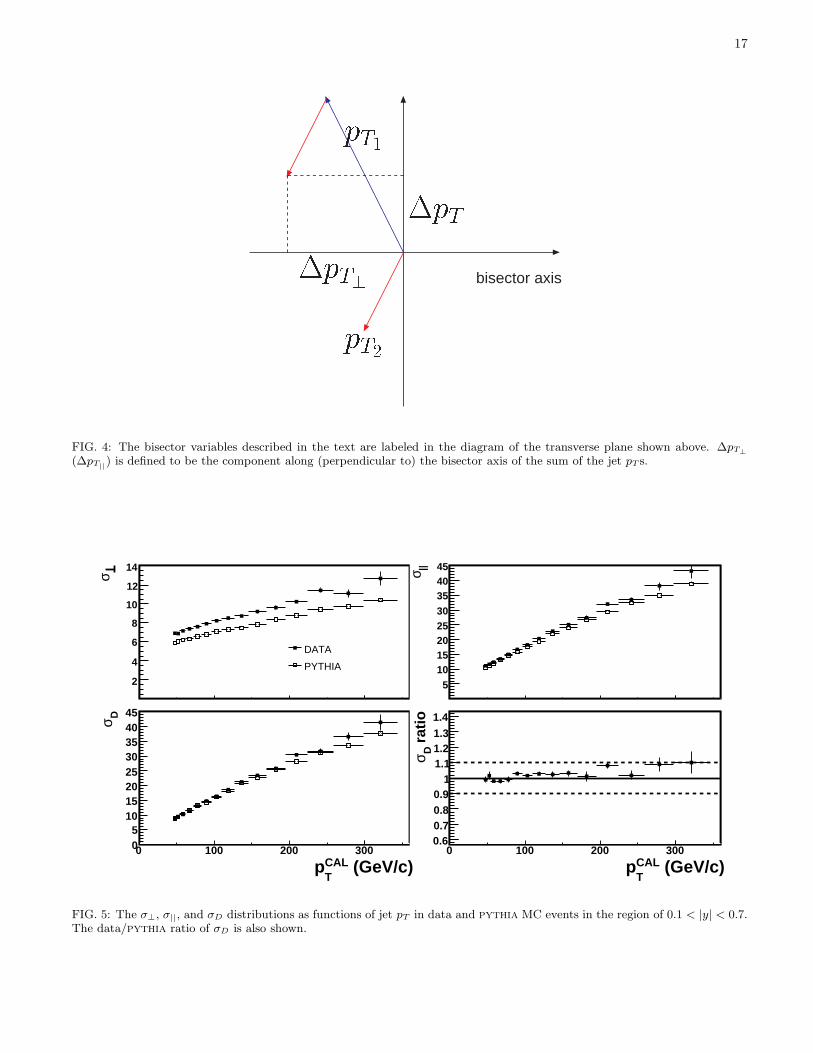
The bisector method allows the jet energy resolution inthe real CDF II detector and in the simulation to be com-pared. Events with a dijet topology are used for the studyby requiring that only two jets have pT > 10 GeV/c. Inorder to minimize the effects of pileup, only events withexactly one reconstructed primary vertex are used. Also,one jet is required to be in the central region of the de-tector (0.1 < |y| < 0.7) and is referred to as the “trigger”jet. The second jet is called the “probe” jet and can bein any other rapidity region (|y| < 2.1). A coordinatesystem is defined in the transverse plane with one axisaligned with the bisector of the two jets. With referenceto Fig. 4, the following components related to the jetenergy resolution are studied as functions of dijet meanpT :
(a) σ⊥ is the R.M.S. of the ∆pT⊥distribution where
∆pT⊥≡ (pT1
+ pT2) cos(∆φ12/2): pT1
, pT2, and
∆φ12 refer to the pT of the leading and next-to-leading jets and the azimuthal angle between theleading and next-to-leading jets, respectively. Thiscomponent of the pT imbalance is more sensitive tophysics effects.
(b) σ|| is the R.M.S. of the ∆pT||distribution where
∆pT||≡ (pT1
− pT2) sin(∆φ12/2). This component
of the pT imbalance is sensitive both to physics anddetector effects.
(c) σD is the quadratic difference between σ|| and σ⊥
(σD ≡√
σ2|| − σ2
⊥). This should be most sensitive
to detector effects since the physics effects in σ⊥,
which are expected to give an isotropic contributionin the transverse plane, are removed. It should alsobe noted that since both jets are contributing toσD, for a single jet σ = σD/
√2.
For comparing the jet energy resolution in the realCDF II detector to that in the simulation, σD is used.In the rapidity region of 0.1 < |y| < 0.7, the detectorsimulation reproduces the detector jet energy resolutionaccurately. Figure 5 shows σ⊥, σ||, and σD for data andpythia events. The data to MC ratio of σD is used tocompare the jet energy resolution in the real CDF II de-tector and in the simulation.
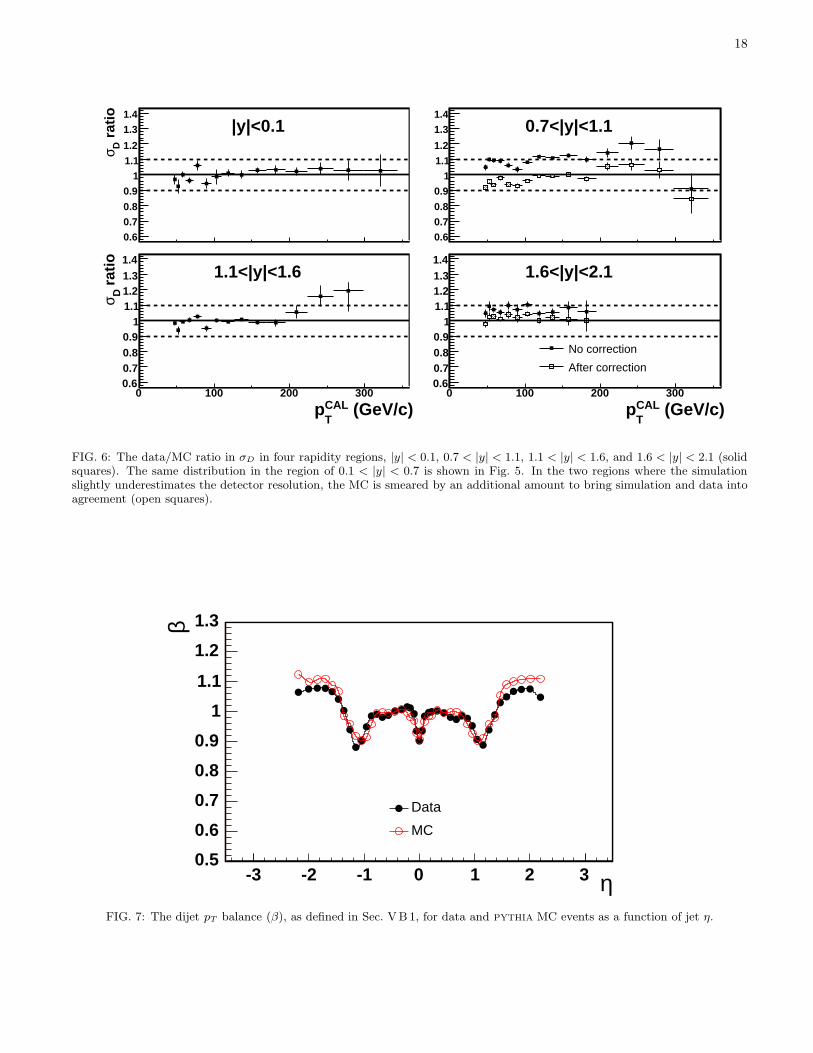
Figure 6 shows the result for the σD ratio in the otherrapidity regions. In two rapidity regions (0.7 < |y| < 1.1and 1.6 < |y| < 2.1), it was found that MC slightly un-derestimates the jet energy resolution in data; to accountfor the differences, extra smearing is applied on jet en-ergies in MC events to match the jet energy resolutionbetween data and MC when the absolute and unfoldingcorrections are derived. The extra jet energy smearingresults in < 6% changes in cross section in most bins,and < 15% in the most extreme cases.
B. Jet Corrections
1. Relative Correction
The calorimeter response to jets is not uniform in η.The non-uniformity arises from cracks between calorime-ter modules and also from the different responses of thecentral and plug calorimeters. The relative correction isintroduced to make the jet energy response flat in η.
The leading two jets in dijet events are expected to bal-ance in pT in the absence of QCD radiation. Therefore,pT balance in dijet events is a useful tool to study the jetenergy response as a function of η and to derive the rel-ative correction. To determine the η-dependent relativejet energy correction, a jet with 0.2 < |η| < 0.6 (wherethe CDF calorimeter is well understood) is defined as atrigger jet and the other jet is defined as a probe jet. The
pT balance (β ≡ pprobeT /ptrigger
T ) of these two jets [45] asa function of probe-jet η is shown in Fig. 7. It showsβ ∼ 1 in the region where the trigger jet is selected, i.e.,0.2 < |η| < 0.6. There are dips at η ∼ 0 and ±1 whichare due to gaps between the calorimeter modules.
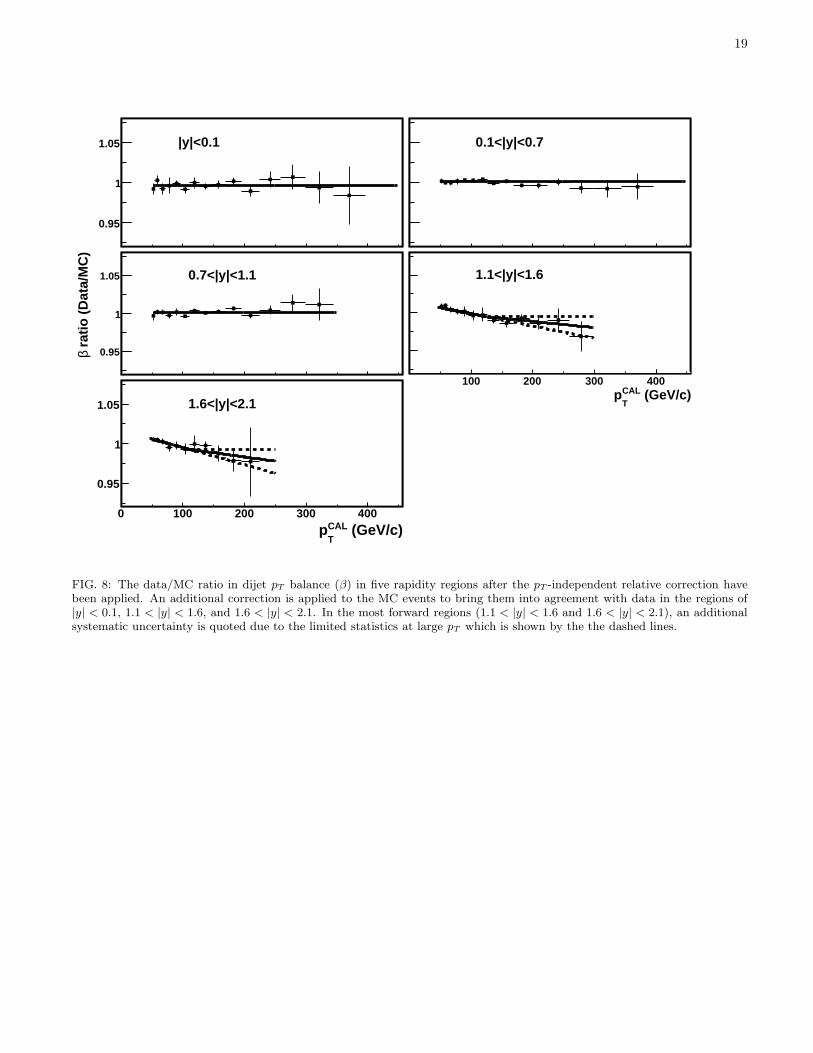
The η-dependent relative corrections are obtained froma fit to the β distribution at a given jet pT . These correc-tions are derived independently for data and MC. The βratio for data to MC simulation for all rapidity regionsis shown in Fig. 8 as a function of jet pT . A small addi-tional pT -independent correction is required in the region|y| < 0.1 to bring MC into agreement with data. As men-tioned earlier, the data-MC difference in the relative jetenergy scale depends on jet pT at |y| > 1.1. Thereforean additional correction with pT dependence is derivedfor the two highest |y| regions and is applied in order to
9
match MC to data at any jet pT . Due to lack of statis-tics at high pT mainly in data, the uncertainty associatedwith this correction increases with increasing jet pT as in-dicated by the dashed lines in Fig. 8.
2. Pileup Correction
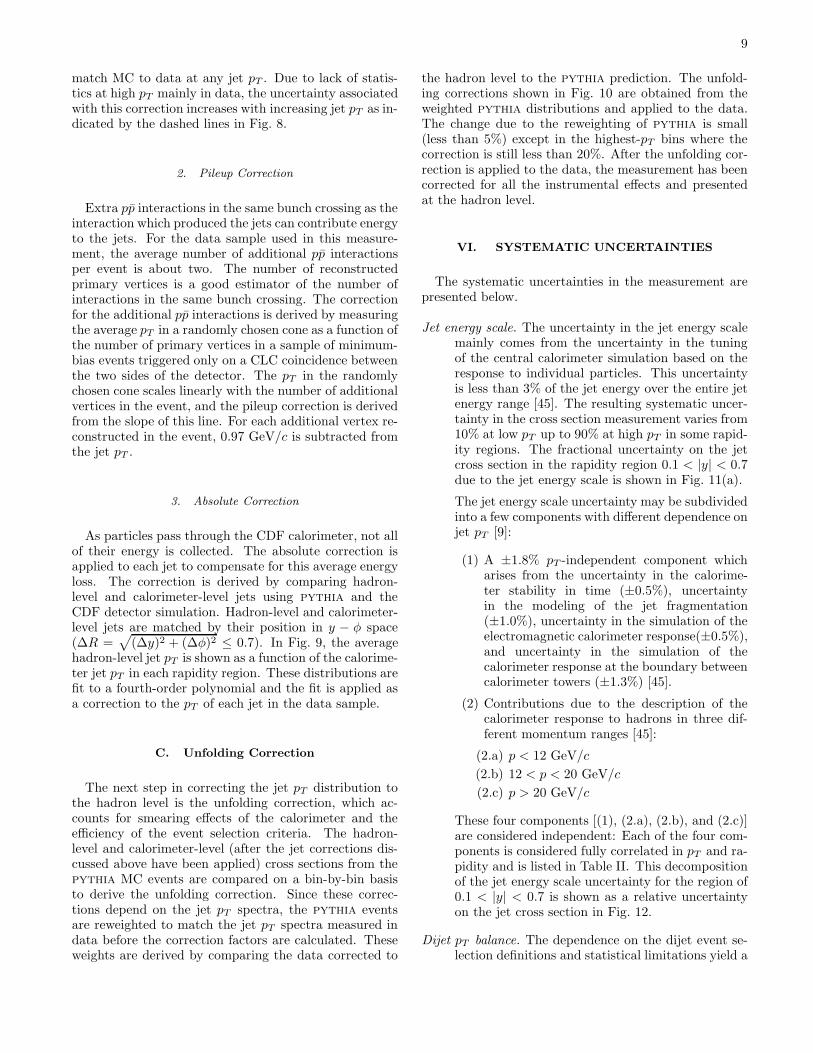
Extra pp interactions in the same bunch crossing as theinteraction which produced the jets can contribute energyto the jets. For the data sample used in this measure-ment, the average number of additional pp interactionsper event is about two. The number of reconstructedprimary vertices is a good estimator of the number ofinteractions in the same bunch crossing. The correctionfor the additional pp interactions is derived by measuringthe average pT in a randomly chosen cone as a function ofthe number of primary vertices in a sample of minimum-bias events triggered only on a CLC coincidence betweenthe two sides of the detector. The pT in the randomlychosen cone scales linearly with the number of additionalvertices in the event, and the pileup correction is derivedfrom the slope of this line. For each additional vertex re-constructed in the event, 0.97 GeV/c is subtracted fromthe jet pT .
3. Absolute Correction
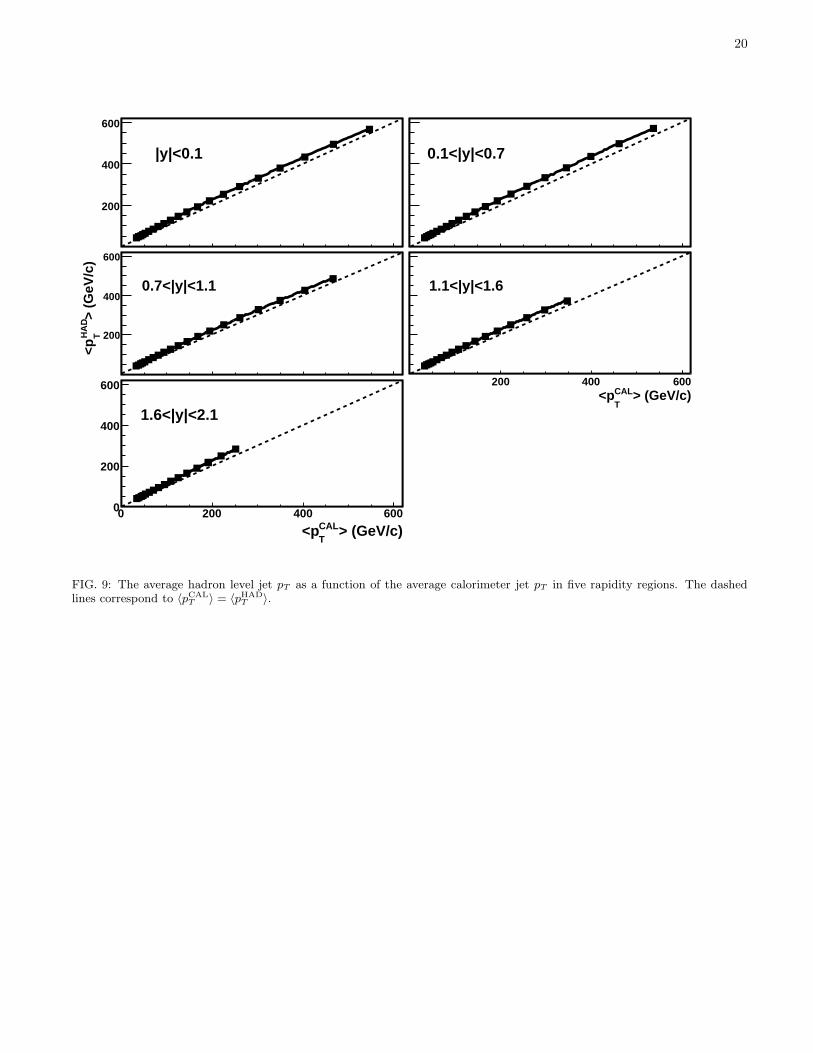
As particles pass through the CDF calorimeter, not allof their energy is collected. The absolute correction isapplied to each jet to compensate for this average energyloss. The correction is derived by comparing hadron-level and calorimeter-level jets using pythia and theCDF detector simulation. Hadron-level and calorimeter-level jets are matched by their position in y − φ space(∆R =
√
(∆y)2 + (∆φ)2 ≤ 0.7). In Fig. 9, the averagehadron-level jet pT is shown as a function of the calorime-ter jet pT in each rapidity region. These distributions arefit to a fourth-order polynomial and the fit is applied asa correction to the pT of each jet in the data sample.
C. Unfolding Correction
The next step in correcting the jet pT distribution tothe hadron level is the unfolding correction, which ac-counts for smearing effects of the calorimeter and theefficiency of the event selection criteria. The hadron-level and calorimeter-level (after the jet corrections dis-cussed above have been applied) cross sections from thepythia MC events are compared on a bin-by-bin basisto derive the unfolding correction. Since these correc-tions depend on the jet pT spectra, the pythia eventsare reweighted to match the jet pT spectra measured indata before the correction factors are calculated. Theseweights are derived by comparing the data corrected to
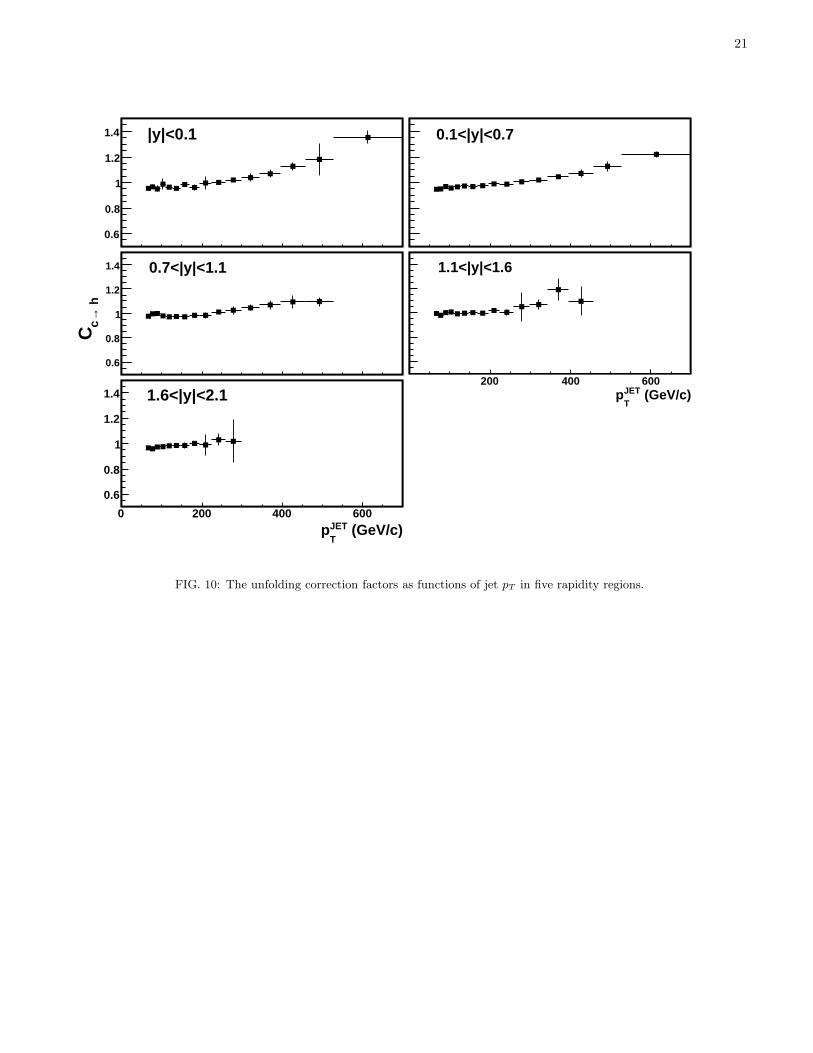
the hadron level to the pythia prediction. The unfold-ing corrections shown in Fig. 10 are obtained from theweighted pythia distributions and applied to the data.The change due to the reweighting of pythia is small(less than 5%) except in the highest-pT bins where thecorrection is still less than 20%. After the unfolding cor-rection is applied to the data, the measurement has beencorrected for all the instrumental effects and presentedat the hadron level.
VI. SYSTEMATIC UNCERTAINTIES
The systematic uncertainties in the measurement arepresented below.
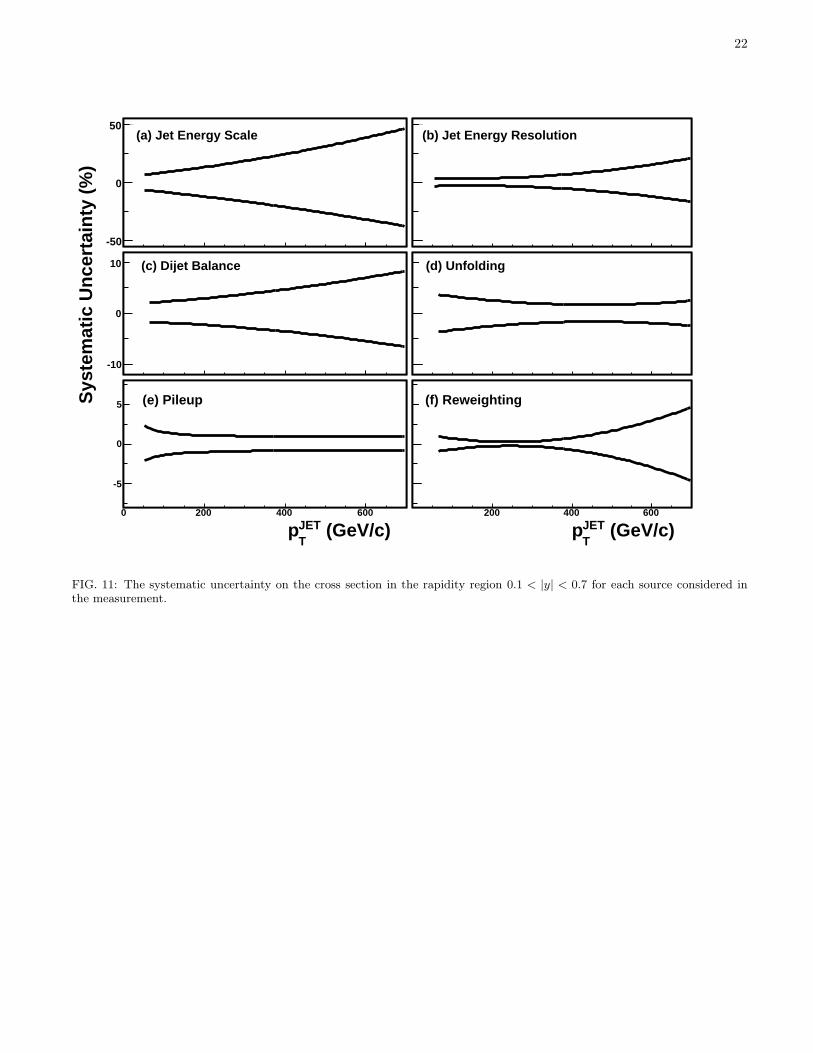
Jet energy scale. The uncertainty in the jet energy scalemainly comes from the uncertainty in the tuningof the central calorimeter simulation based on theresponse to individual particles. This uncertaintyis less than 3% of the jet energy over the entire jetenergy range [45]. The resulting systematic uncer-tainty in the cross section measurement varies from10% at low pT up to 90% at high pT in some rapid-ity regions. The fractional uncertainty on the jetcross section in the rapidity region 0.1 < |y| < 0.7due to the jet energy scale is shown in Fig. 11(a).
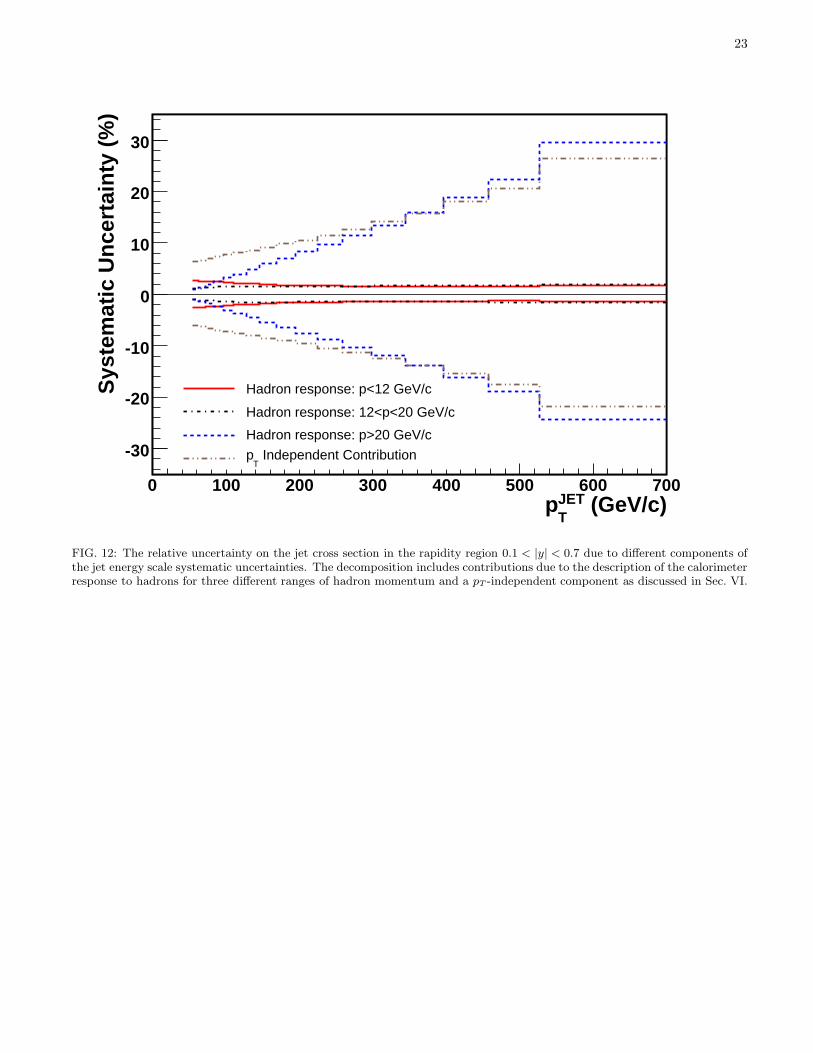
The jet energy scale uncertainty may be subdividedinto a few components with different dependence onjet pT [9]:
(1) A ±1.8% pT -independent component whicharises from the uncertainty in the calorime-ter stability in time (±0.5%), uncertaintyin the modeling of the jet fragmentation(±1.0%), uncertainty in the simulation of theelectromagnetic calorimeter response(±0.5%),and uncertainty in the simulation of thecalorimeter response at the boundary betweencalorimeter towers (±1.3%) [45].
(2) Contributions due to the description of thecalorimeter response to hadrons in three dif-ferent momentum ranges [45]:
(2.a) p < 12 GeV/c
(2.b) 12 < p < 20 GeV/c
(2.c) p > 20 GeV/c
These four components [(1), (2.a), (2.b), and (2.c)]are considered independent: Each of the four com-ponents is considered fully correlated in pT and ra-pidity and is listed in Table II. This decompositionof the jet energy scale uncertainty for the region of0.1 < |y| < 0.7 is shown as a relative uncertaintyon the jet cross section in Fig. 12.
Dijet pT balance. The dependence on the dijet event se-lection definitions and statistical limitations yield a
10
0.5% uncertainty in the relative jet energy correc-tion in all rapidity regions. In addition, at high pT
there is a pT -dependent uncertainty on the correc-tion in the higher rapidity regions (|y| > 1.1) due tolow statistics. This uncertainty is considered cor-related over pT but uncorrelated across differentrapidity regions. The fractional uncertainty on thecross section in the region of 0.1 < |y| < 0.7 due tothis dijet balance systematic uncertainty is shownin Fig. 11(c).
Pileup correction. The pileup correction is obtained fromminimum-bias data, and the systematic uncer-tainty is determined so that it covers variationsfrom a set of validation measurements. Measure-ments of the pileup correction from dijet, photon-jet, and W → eν events result in variations of lessthan 30% and this is taken as the size of the sys-tematic uncertainty. This uncertainty results in lessthan 3% uncertainty in the cross section measure-ment. This uncertainty is considered fully corre-lated in pT and rapidity. The fractional uncertaintyon the cross section in the region of 0.1 < |y| < 0.7due to the pileup systematic uncertainty is shownin Fig. 11(e).
Unfolding and pT -spectra. The difference between thepythia and herwig predictions is taken as thesystematic uncertainty on the unfolding correction,as they have different fragmentation models. Thefractional uncertainty on the cross section in theregion of 0.1 < |y| < 0.7 due to the jet unfold-ing systematic uncertainty is shown in Fig. 11(d).This uncertainty is considered fully correlated inpT and rapidity. As mentioned in Sec. V, pythia
events are reweighted when the unfolding correc-tions are determined so that the jet pT spectrumagrees with what is observed in data. The uncer-tainty in the unfolding correction due to the de-pendence on the jet pT spectra is taken conserva-tively from the change in the unfolding correctionswith and without reweighting pythia events. Thisreweighting is done independently in each rapid-ity region; therefore, the uncertainty is consideredcorrelated over pT but uncorrelated across differentrapidity regions. The fractional uncertainty on thecross section in the rapidity region 0.1 < |y| < 0.7due to reweighting is shown in Fig. 11(f).
Jet energy resolution. Due to the sharply falling spec-trum of the inclusive jet cross section, any imper-fect modeling of the jet energy smearing in the de-tector simulation will affect the derived unfoldingcorrection. The calorimeter-level jets in the pythia
events have been smeared by an extra amount suchthat σD as defined in the bisector method changesby 10%. The effect of this extra smearing on the jetdifferential cross section is taken as the systematicuncertainty due to resolution. The jet resolution
differences between data and MC events vary withrapidity and the corrections are performed inde-pendently in five rapidity regions; therefore, thisuncertainty is considered correlated over pT butuncorrelated across different rapidity regions. Thefractional uncertainty on the cross section in the ra-pidity region 0.1 < |y| < 0.7 due to the jet energyresolution is shown in Fig. 11(b).
Luminosity. There is a 6% uncertainty in normalizationdue to the luminosity measurement [31]. This un-certainty is considered fully correlated in pT andrapidity.
The total systematic uncertainty on the hadron-leveljet cross section for each jet rapidity region is shown inFig. 13 [47]. The systematic uncertainties on the mea-sured cross section from each source for each rapidityregion are given in Tables III-VII.
VII. THEORETICAL PREDICTIONS
Perturbative QCD calculations for the inclusive jetcross sections in hadron-hadron collisions have been per-formed so far only up to next-to-leading order, and theirpredictions are provided at the parton level [48, 49, 50,51] in which the final state is comprised of only two orthree partons. Our measurement is compared with pre-dictions from fastNLO [52] which are based on the nlo-
jet++ [50, 51] program. CTEQ6.1M [12] is used for theparton distribution functions (PDFs). The renormaliza-tion and factorization scales (µR and µF ) are chosen tobe the transverse momentum of the jet divided by two,which is the same as that used in the global QCD analy-ses [12, 18] to determine the PDFs. Using µR = µF = pjet
T
gives up to 10% smaller predictions in the cross section.The uncertainties on the predictions due to PDF are es-timated by using the 40 CTEQ6.1M error PDFs [12, 53],and the MRST2004 PDF [18] is also used to obtain a pre-diction. In order to account for the splitting and mergingstep of the Midpoint jet clustering algorithm when clus-tering partons after the parton shower or particles afterhadronization [54], a parameter Rsep [55] with a valueof 1.3 is used for the Midpoint algorithm at the NLOparton level. Two partons are clustered into a single jetif they are within Rcone of the jet centroid and withinRcone × Rsep of each other. An Rsep value of 2.0 (i.e.,the Midpoint algorithm without Rsep) yields < 5% largercross sections for NLO pQCD predictions.
As mentioned earlier, NLO pQCD calculations providepredictions not at the hadron level, to which the data arecorrected, but at the parton level, i.e., they do not ac-count for the underlying event and hadronization effects.In order to compare the data corrected to the hadronlevel with predictions for jets clustered from partons asobtained from NLO pQCD calculations, such effects mustbe accounted for. The underlying event contributes en-ergy to the jet cone that is not associated with the hard
11
scattering event, i.e., energy from collisions of other par-tons in the proton and antiproton. Hadronization maycause particles originating from partons whose trajecto-ries lie inside the jet cone to go outside of the jet cone.The effect of hard gluon emission outside the jet coneis already accounted for in NLO pQCD predictions, andthus it is not included in the corrections discussed below.
The bin-by-bin parton-to-hadron-level (Cp→h) correc-tions are obtained by applying the Midpoint clusteringalgorithm to the hadron-level and to the parton-leveloutputs of the pythia Tune A dijet Monte Carlo sam-ples, generated with and without an underlying event.The samples without the underlying event were gener-ated by turning off multiple parton interactions (MPIs).The parton-to-hadron-level correction increases the NLOpQCD cross section predictions by about 10% at low pT
and is negligible at high pT as shown in Fig. 14.The uncertainty on the parton-to-hadron-level correc-
tion is estimated from the difference in the predictionsfor this correction from herwig and pythia. herwig
does not include MPIs in its underlying event model, andinstead relies on initial state radiation (ISR) and beamremnants to populate the underlying event. The differ-ence between herwig and pythia is conservatively takenfor this systematic uncertainty, and this uncertainty isrepresented by the shaded bands in Fig. 14.
VIII. RESULTS
The measured inclusive differential jet cross sections atthe hadron level are shown in Fig. 15, and Tables VIII-XII show the lists of the measured cross sections foreach jet pT and rapidity bin together with the statis-tical and total systematic uncertainties, and parton-to-hadron-level correction factors. The ratios of the mea-sured cross sections to the NLO pQCD predictions fromfastNLO (corrected to the hadron level) based on theCTEQ6.1M PDF are shown in Fig. 16 together with thetheoretical uncertainties due to PDF. The measured in-clusive jet cross sections tend to be lower but still inagreement with the NLO pQCD predictions within theexperimental and theoretical uncertainties.
To quantify the comparisons, a procedure based on theχ2 defined as:
χ2 =
nbin∑
i=1
[σdatai − σtheory
i ]2
[(δσdata−stati )2 + (δσtheory−stat
i )2]+
nsyst∑
j=1
s2j ,
(4)
σtheoryi = σtheory
i,0 +
nsyst∑
j=1
sj × δσsysti,j (5)
is used where σdatai and δσdata−stat
i are the measuredcross section and its statistical uncertainty in the i-th
data point, and σtheoryi and σtheory−stat
i are the corre-sponding theoretical prediction and its statistical uncer-
tainty. The σtheoryi may be shifted from the nominal
theoretical prediction for the i-th data point, σtheoryi,0 , as
shown in Eq. (5), where δσsysti,j is the systematic uncer-
tainty in the i-th data point due to the j-th systematicuncertainty and sj is the standard deviation in the j-thsystematic uncertainty. The first sum in Eq. (4) is carriedout over all data points, and the second sum in Eq. (4)and the sum in Eq. (5) are over all independent sourcesof the systematic uncertainties. These systematic shiftssj are chosen to minimize the χ2 defined above usingthe minuit program [56]. This χ2 definition is basicallythe same as those used in the previous CDF inclusive jetcross section measurements [9, 32], and this χ2 is equiv-alent to the one calculated using the covariance matrixtechnique.
In the χ2 calculation, the systematic uncertainties dueto jet energy scale (four independent contributions), lu-minosity, pileup, and unfolding are treated as correlatedacross all data points in pT and rapidity. The uncer-tainties from dijet pT balance, jet energy resolution, andpT spectra are treated as correlated over pT in a rapid-ity region but are uncorrelated across different rapidityregions, as discussed in Sec. VI. As for the theoreticaluncertainty, the uncertainty on Cp→h is considered asfully correlated across all data points, however the PDFand scale uncertainties are not considered. This χ2 testyields the probabilities of 71, 91, 23, 69 and 91% whenit is performed separately in the five rapidity regions of|y| < 0.1, 0.1 < |y| < 0.7, 0.7 < |y| < 1.1, 1.1 < |y| < 1.6,and 1.6 < |y| < 2.1. The global χ2 test which is per-formed simultaneously on all the data points in all fiverapidity regions yields the reduced χ2, χ2/n.d.f. = 94/72corresponding to a probability of 4%.
As shown in Fig. 16, the experimental uncertainties inthe measurement are comparable or somewhat smallerthan the PDF uncertainties on the theoretical predic-tions, especially in higher |y| regions, and thus this mea-surement will lead to useful constraints on PDFs when itis included in QCD global fits.
While this measurement was underway, a new cone-based jet clustering algorithm, called SISCone [57], wasproposed which is a seedless algorithm and thus infraredsafe to all orders in pQCD. We have studied the impactof using the SISCone algorithm instead of the Midpointalgorithm in Appendix A and found that the ratio ofthe measured cross section over theoretical predictionswould change by only ∼1%. Therefore, both algorithmswill yield similar data-theory comparisons and lead to asimilar PDF parametrization when the measurement isincluded in QCD global fits.
IX. COMPARISON WITH THE
MEASUREMENT USING kT CLUSTERING
ALGORITHM
As mentioned in Sec. I, the CDF collaboration has re-cently made a measurement of the inclusive jet cross sec-tion using the kT jet clustering algorithm [9]. In this
12
section, our measurement is compared with the resultsobtained with the kT algorithm with D = 0.7 by takingthe ratio of the cross sections from the two measurementsand comparing it with theoretical predictions. In orderto make a useful comparison, the correlations betweenthe statistical and systematic uncertainties were studiedand are presented below.
A. Statistical Correlation
The datasets used in the two measurements have about90% overlap, and even in the same events the Midpointand kT algorithms may lead to a different set of jetsand thus populate different pT bins which are treatedas statistically independent. In order to study the sta-tistical correlation between the two measurements, bothkT and Midpoint jet clustering algorithms are applied inevents used in both measurements and if the resultingjets from both algorithms are matched in y − φ spacewithin R < 0.7 and fall into the same jet pT and rapiditybin, those jets are treated as correlated, otherwise theyare considered uncorrelated. This was done for the datapoints for which events from the jet100 and jet70 trig-gers are used. The situation is more complicated for datapoints from jet20 and jet50 triggers where prescale fac-tors were changed during the data taking period. Thus,the statistical uncertainties are treated as uncorrelated inthe two measurements for data points for which the jet20and jet50 trigger events are used. It should be noted thatthe statistics are high in these triggers and the statisti-cal uncertainties are small compared with the systematicuncertainties.
B. Systematic Correlation
The systematic uncertainties arising from the jet en-ergy scale, unfolding correction, and underlying eventmodeling were determined with the same methods inthe two measurements, and thus these uncertainties aretreated as fully correlated between the two measure-ments, i.e., the systematic uncertainties are canceled inthe ratio of the two measurements.
In this analysis, the pileup correction is determined bymeasuring the average pT in a randomly chosen cone as afunction of the number of primary vertices in minimum-bias data as discussed in Sec. V. However, a differentmethod is used in the measurement using the kT al-gorithm [9], and thus uncertainties arising from pileupcorrections are treated as uncorrelated. The details ofη-dependent jet corrections are also compared and it isconcluded that this uncertainty is also uncorrelated.
The correction for the jet pT resolution and the as-sociated systematic uncertainties between the two mea-surements are determined in a similar way in the twomeasurements but the size of the correction was foundto be different. The jet pT resolution difference between
data and MC events is measured in dijet events withthird-jet pT <10 GeV/c in order to use dijet events witha clear back-to-back structure, and this dijet event se-lection is not equivalent when jets are clustered by thekT algorithm and by the Midpoint algorithm. In ad-dition, the jet resolution correction is sensitive to theprocedure of applying the η-dependent relative jet cor-rection. By varying the dijet selection requirement andthe η-dependent jet correction procedure, 35% of the sizeof the jet pT resolution uncertainty is found to be uncor-related between the two measurements.
C. Results
The ratio of the cross section measured with the kT al-gorithm to that with the Midpoint algorithm is shown inFig. 17. This ratio of the NLO pQCD predictions as givenby fastNLO (corrected to the hadron level) and the ratiofrom pythia are also included. It should be noted thatthe rapidity region where the agreement is only marginal(0.7 < |y| < 1.1) corresponds to the crack between thecentral and plug calorimeters. In the other regions, goodagreement is observed over a large range of rapidity andpT . This agreement means that both algorithms observesimilar systematic trends when compared to NLO pQCDpredictions and favor the same PDF parametrization. Inaddition, the agreement between the data, pythia, andNLO pQCD predictions for these ratios provide strongevidence that these clustering algorithms are behavingin a consistent way when clustering particles at the par-ton, hadron, and calorimeter-tower (detector) levels.
X. CONCLUSIONS
A measurement has been presented of the inclusivejet cross section for jets clustered by the Midpoint jet-finding algorithm using 1.13 fb−1 of data collected bythe CDF experiment. The measured cross sections tendto be lower than the central NLO pQCD predictions,but they are still consistent when systematic uncertain-ties are taken into account. Similar trends are also ob-served in the recent results from CDF using the kT algo-rithm [9] and from D0 using the Midpoint algorithm [10].In the forward regions, the measurement precision is bet-ter than current PDF uncertainties. When included inQCD global fits this will provide further constraints onPDFs, especially the gluon distributions at high x. Sincethe measured cross sections tend to be lower than the cen-tral NLO pQCD predictions, the inclusion of this mea-surement to QCD global fits will lead to somewhat re-duced gluon densities at high x. The results are alsocompared to the recent measurement of the inclusive jetcross section using the kT jet clustering algorithm [9], andit is found that the ratios of the cross sections measuredwith the two algorithms are in reasonable agreement withtheoretical expectations.
13
Acknowledgments
We thank the Fermilab staff and the technical staffs ofthe participating institutions for their vital contributions.This work was supported by the U.S. Department of En-ergy and National Science Foundation; the Italian Isti-tuto Nazionale di Fisica Nucleare; the Ministry of Educa-tion, Culture, Sports, Science and Technology of Japan;the Natural Sciences and Engineering Research Councilof Canada; the National Science Council of the Repub-lic of China; the Swiss National Science Foundation; theA.P. Sloan Foundation; the Bundesministerium fur Bil-dung und Forschung, Germany; the Korean Science andEngineering Foundation and the Korean Research Foun-dation; the Science and Technology Facilities Council andthe Royal Society, UK; the Institut National de PhysiqueNucleaire et Physique des Particules/CNRS; the RussianFoundation for Basic Research; the Ministerio de Edu-cacion y Ciencia and Programa Consolider-Ingenio 2010,Spain; the Slovak R&D Agency; and the Academy ofFinland.
APPENDIX A: SEEDLESS INFRARED-SAFE
CONE ALGORITHM
Recently, a cone algorithm (SISCone) has been pro-posed which is a seedless algorithm and thus infrared
safe to all orders in pQCD [57]. One of the main prob-lems with the use of a seedless cone algorithm has beenits slow speed with respect to the seeded cone algorithms(such as the Midpoint algorithm); however, the SISConealgorithm has a speed comparable to the seeded cone al-gorithms. We have studied the differences in the inclusivejet cross section between the Midpoint algorithm usedin this paper and the SISCone algorithm using pythia
Monte Carlo samples. Studies with the pythia sam-ples generated with the Tune A parameters show that,at the hadron level, the SISCone algorithm yields theinclusive jet cross section lower than the Midpoint algo-rithm by ∼ 5% at low pT and ∼ 2% in the highest pT
bins independent of jet rapidities; however, the pythia
samples generated without multiple parton interactionsshow that the parton-level inclusive jet cross section isconsistent between the Midpoint algorithm and SISConealgorithm to better than 1%, if the same cone radius andthe same merging fraction fmerge are used for both algo-rithms [14]. Therefore, although the inclusive jet crosssection measured at the hadron level will decrease byup to ∼ 5% with the SISCone algorithm, the changewill be compensated by the parton-to-hadron-level cor-rections applied to the NLO pQCD predictions, and thus,the comparisons between the measured cross section andNLO pQCD predictions will essentially be the same.
[1] Figures 13, 15–17 and Tables VI and VIII–XII were cor-rected in May, 2009. In prior versions, Table VI had thecolumns for the systematic uncertainties from the un-folding correction, pT -spectra modeling, and jet energyresolution modeling mislabeled, and the final set of un-folding corrections did not propagate into Figs. 15–17and Tables VIII–XII. Miscalculations in error propaga-tion were also corrected which affected Figs. 13, 15–17and Tables VIII–XII. It should be noted that the com-parisons of data and theoretical predictions presented inSec. VIII used the correct numbers and thus the conclu-sions of the paper were not affected by these corrections.
[2] E. J. Eichten, K. D. Lane, and M. E. Peskin, Phys. Rev.Lett. 50, 811 (1983).
[3] K. Lane, arXiv:hep-ph/9605257.[4] D. J. Gross and F. Wilczek, Phys. Rev. D 8, 3633 (1973).[5] H. Fritzsch, M. Gell-Mann, and H. Leutwyler, Phys. Lett.
B 47, 365 (1973).[6] R. K. Ellis, W. J. Stirling and B. R. Webber, Camb.
Monogr. Part. Phys. Nucl. Phys. Cosmol. 8, 1 (1996).[7] A. Abulencia et al. (CDF Collaboration), Phys. Rev. D
74, 071103 (2006).[8] A. Abulencia et al. (CDF Collaboration), Phys. Rev.
Lett. 96, 122001 (2006).[9] A. Abulencia et al. (CDF Collaboration), Phys. Rev. D
75, 092006 (2007).[10] V. M. Abazov et al. (D0 Collaboration), Phys. Rev. Lett.
101, 062001 (2008).[11] We use a cylindrical coordinate system with the z coor-
dinate along the proton beam direction and the originat the center of the detector, the azimuthal angle φ, andthe polar angle θ usually expressed through the pseudo-rapidity η = − ln tan(θ/2). The rapidity y is defined asy = 1/2 ln((E + pz)/(E − pz)) where E denotes the en-ergy and pz is the momentum component along z. Thetransverse energy and transverse momentum are given byET = E sin(θ) and pT = p sin(θ) where p is the magni-tude of the momentum vector.
[12] D. Stump et al., J. High Energy Phys. 10 (2003) 046.[13] G. C. Blazey et al., arXiv:hep-ex/0005012.[14] S. D. Ellis et al., Prog. Part. Nucl. Phys. 60, 484 (2008).[15] C. Buttar et al., arXiv:0803.0678.[16] M. G. Albrow et al., arXiv:hep-ph/0610012.[17] In the previous CDF measurement [7], an additional step
called the “Search Cone” was included in the Midpointalgorithm. This step is removed in this measurement asrecommended by the TeV4LHC QCD Working Group.For further discussions, see Ref. [16].
[18] A. D. Martin, R. G. Roberts, W. J. Stirling, and R. S.Thorne, Phys. Lett. B 604, 61 (2004).
[19] S. D. Ellis and D. E. Soper, Phys. Rev. D 48, 3160 (1993).[20] B. Abbott et al. (D0 Collaboration), Phys. Rev. Lett. 82,
2451 (1999).[21] B. Abbott et al. (D0 Collaboration), Phys. Lett. B 525,
221 (2002).[22] D. Acosta et al. (CDF Collaboration), Phys. Rev. D 71,
052003 (2005).[23] A. Sill, Nucl. Instrum. Methods Phys. Res., Sect. A 447,
14
1 (2000).[24] T. Affolder et al., Nucl. Instrum. Methods Phys. Res.,
Sect. A 453, 84 (2000).[25] T. Affolder et al., Nucl. Instrum. Methods Phys. Res.,
Sect. A 526, 249 (2004).[26] L. Balka et al., Nucl. Instrum. Methods Phys. Res., Sect.
A 267, 272 (1988).[27] S. R. Hahn et al., Nucl. Instr. Methods Phys. Res. A 267,
351 (1988).[28] S. Bertolucci et al., Nucl. Instrum. Methods Phys. Res.,
Sect. A 267, 301 (1988).[29] R. Oishi, Nucl. Instrum. Methods Phys. Res., Sect. A
453, 227 (2000).[30] M. Albrow et al., Nucl. Instrum. Methods Phys. Res.,
Sect. A 480, 524 (2002).[31] D. Acosta et al., Nucl. Instrum. Methods Phys. Res.,
Sect. A 494, 57 (2002).[32] T. Affolder et al. (CDF Collaboration), Phys. Rev. D 64,
032001 (2001).[33] W. B. Kilgore and W. T. Giele, Phys. Rev. D55, 7183
(1997).[34] The hadron level in the Monte Carlo generators is defined
using all final state particles with lifetime above 10−11s.[35] pJET
T refers to the transverse momentum of jets after theabsolute jet energy correction has been made while pCAL
T
refers to uncorrected jet pT .[36] The missing transverse energy (E/T ) is defined by E/T =
| ~E/T |, ~E/T = −P
iEi
T ni, where ni is a unit vector perpen-
dicular to the beam axis and pointing at the ith calorime-ter tower. The sum is over all the calorimeter towers withET > 100 MeV and |η| < 3.6. We define the missing ET
significance as E/T /p
P
ET = | ~E/T |/p
P
iEi
T .[37] T. Sjostrand et al., Comput. Phys. Commun. 135, 238
(2001).[38] G. Corcella et al., J. High Energy Phys. 01 (2001) 010.[39] H. L. Lai et al. (CTEQ Collaboration), Eur. Phys. J. C
12, 375 (2000).
[40] R. Field, presented at Fermilab ME/MC Tuning Work-shop, Fermilab, October 4, 2002. pythia Tune A impliesthat the following parameters are set in pythia withCTEQ5L: PARP(67)=4, MSTP(82)=4, PARP(82)=2,PARP(84)=0.4, PARP(85)=0.9, PARP(86)=0.95,PARP(89)=1800, PARP(90)=0.25.
[41] T. Affolder et al. (CDF Collaboration), Phys. Rev. D 65,092002 (2002).
[42] R. Field and R. C. Group (CDF Collaboration),arXiv:hep-ph/0510198.
[43] R. Brun, F. Bruyant, M. Maire, A. C. McPherson, andP. Zanarini (1987), cern-DD/EE/84-1.
[44] G. Grindhammer, M. Rudowicz, and S. Peters, Nucl. In-strum. Methods Phys. Res., Sect. A 290, 469 (1990).
[45] A. Bhatti et al., Nucl. Instrum. Methods Phys. Res., Sect.A 566, 375 (2006).
[46] P. Bagnaia et al. (UA2 Collaboration), Phys. Lett. B144, 283 (1984).
[47] The 6% uncertainty on the luminosity is not included.[48] S. D. Ellis, Z. Kunszt, and D. E. Soper, Phys. Rev. Lett.
64, 2121 (1990).[49] W. T. Giele, E. W. N. Glover, and D. A. Kosower, Nucl.
Phys. B403, 633 (1993).[50] Z. Nagy, Phys. Rev. D 68, 094002 (2003).[51] S. Catani and M. H. Seymour, Nucl. Phys. B485, 291
(1997).[52] T. Kluge, K. Rabbertz, and M. Wobisch, arXiv:hep-
ph/0609285.[53] J. Pumplin et al., Phys. Rev. D 65, 014013 (2001).[54] S. D. Ellis, J. Huston, and M. Tonnesmann, eConf
C010630, P513 (2001).[55] S. D. Ellis and D. E. Soper, Phys. Rev. D 48, 3160 (1993).[56] F. James and M. Roos, Comput. Phys. Commun. 10, 343
(1975).[57] G. P. Salam and G. Soyez, J. High Energy Phys. 05 (2007)
086.
15
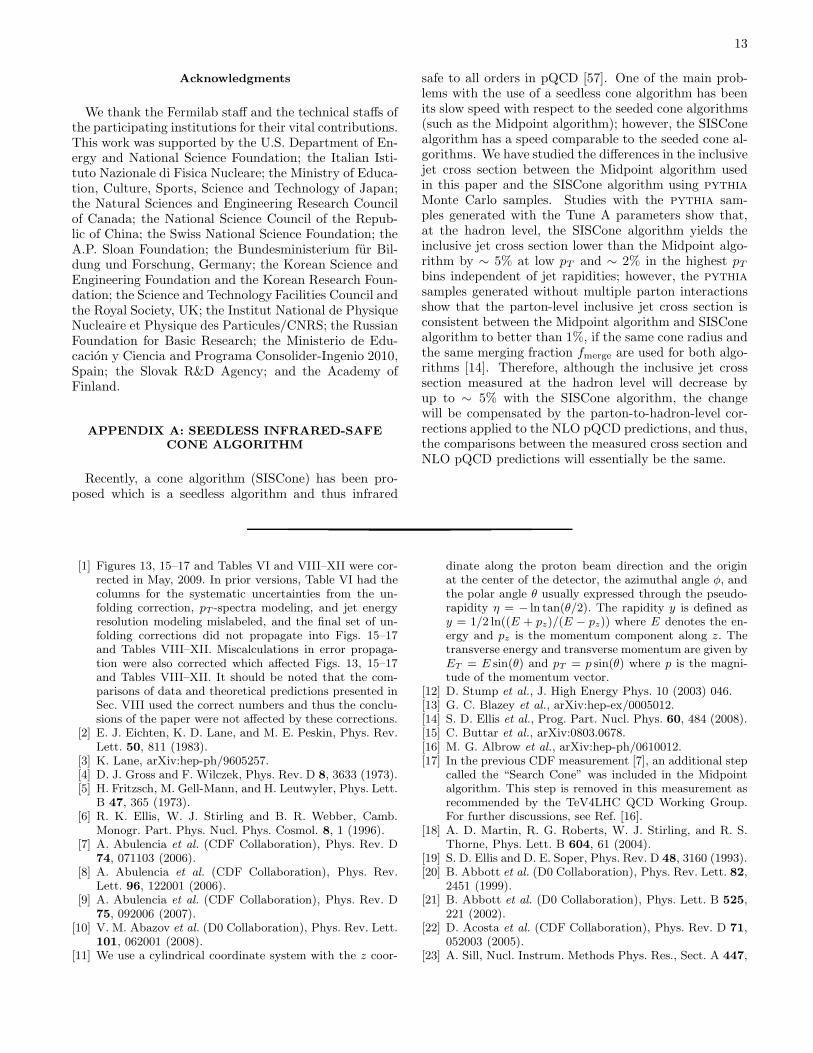
FIG. 1: Elevation view of half of the CDF Run II detector.
16
(GeV/c)JETT
p0 50 100 150 200 250 300
Tri
gg
er E
ffic
ien
cy
0.2
0.4
0.6
0.8
1
Jet 20
Jet 50
Jet 70
Jet 100
0.1<|y|<0.7
FIG. 2: Jet trigger efficiencies as functions of jet pT for four trigger paths in the rapidity region 0.1 < |y| < 0.7. The jet pT
measured by the calorimeters is corrected as described in Sec. V in these distributions.
(GeV/c)CALT
p0 100 200 300 400 500 600 700
Nu
mb
er o
f Je
ts
1
10
210
310
410
510
610
710
810
910
1010
Jet20 (prescale=808)Jet50 (prescale=35)Jet70 (prescale=8)Jet100 (prescale=1)
0.1<|y|<0.7
Midpoint (R=0.7)-1
L=1.13 fb∫
FIG. 3: Jet yield distributions as functions of jet pT for four trigger paths in the rapidity region 0.1 < |y| < 0.7 with nocorrection for trigger prescales.
17
bisector axis
pT1pT2
�pTjj�pT?
1
FIG. 4: The bisector variables described in the text are labeled in the diagram of the transverse plane shown above. ∆pT⊥
(∆pT||) is defined to be the component along (perpendicular to) the bisector axis of the sum of the jet pT s.
σ
2
4
6
8
10
12
14
DATA
PYTHIA
||σ
5
1015202530
354045
0 100 200 300
Dσ
05
1015202530354045
0 100 200 300
rat
ioDσ
0.60.70.80.9
11.11.21.31.4
(GeV/c)CALT
p (GeV/c)CALT
p
FIG. 5: The σ⊥, σ||, and σD distributions as functions of jet pT in data and pythia MC events in the region of 0.1 < |y| < 0.7.The data/pythia ratio of σD is also shown.
18
rat
ioDσ
0.6
0.7
0.8
0.9
1
1.1
1.2
1.3
1.4|y|<0.1
0.6
0.7
0.8
0.9
1
1.1
1.2
1.3
1.40.7<|y|<1.1
0 100 200 300
rat
ioDσ
0.60.70.80.9
11.11.21.31.4
1.1<|y|<1.6
0 100 200 3000.60.70.80.9
11.11.21.31.4
No correction
After correction
1.6<|y|<2.1
(GeV/c)CALT
p (GeV/c)CALT
p
FIG. 6: The data/MC ratio in σD in four rapidity regions, |y| < 0.1, 0.7 < |y| < 1.1, 1.1 < |y| < 1.6, and 1.6 < |y| < 2.1 (solidsquares). The same distribution in the region of 0.1 < |y| < 0.7 is shown in Fig. 5. In the two regions where the simulationslightly underestimates the detector resolution, the MC is smeared by an additional amount to bring simulation and data intoagreement (open squares).
η-3 -2 -1 0 1 2 3
β
0.5
0.6
0.7
0.8
0.9
1
1.1
1.2
1.3
Data
MC
FIG. 7: The dijet pT balance (β), as defined in Sec. VB1, for data and pythia MC events as a function of jet η.
19
0.95
1
1.05 |y|<0.1 0.1<|y|<0.7
rat
io (
Dat
a/M
C)
β 0.95
1
1.05 0.7<|y|<1.1
(GeV/c)CALT
p100 200 300 400
1.1<|y|<1.6
(GeV/c)CALT
p0 100 200 300 400
0.95
1
1.05 1.6<|y|<2.1
FIG. 8: The data/MC ratio in dijet pT balance (β) in five rapidity regions after the pT -independent relative correction havebeen applied. An additional correction is applied to the MC events to bring them into agreement with data in the regions of|y| < 0.1, 1.1 < |y| < 1.6, and 1.6 < |y| < 2.1. In the most forward regions (1.1 < |y| < 1.6 and 1.6 < |y| < 2.1), an additionalsystematic uncertainty is quoted due to the limited statistics at large pT which is shown by the the dashed lines.
20
200
400
600
|y|<0.1 0.1<|y|<0.7
> (G
eV/c
)
HA
DT
<p
200
400
600
0.7<|y|<1.1
> (GeV/c)CAL
T<p
200 400 600
1.1<|y|<1.6
> (GeV/c)CALT
<p0 200 400 6000
200
400
600
1.6<|y|<2.1
FIG. 9: The average hadron level jet pT as a function of the average calorimeter jet pT in five rapidity regions. The dashedlines correspond to 〈pCAL
T 〉 = 〈pHADT 〉.
21
0.6
0.8
1
1.2
1.4 |y|<0.1 0.1<|y|<0.7
h
→cC
0.6
0.8
1
1.2
1.4 0.7<|y|<1.1
(GeV/c)JETT
p200 400 600
1.1<|y|<1.6
(GeV/c)JETT
p0 200 400 600
0.6
0.8
1
1.2
1.4 1.6<|y|<2.1
FIG. 10: The unfolding correction factors as functions of jet pT in five rapidity regions.
22
-50
0
50(a) Jet Energy Scale (b) Jet Energy Resolution
-10
0
10 (c) Dijet Balance (d) Unfolding
0 200 400 600
-5
0
5 (e) Pileup
200 400 600
(f) ReweightingSys
tem
atic
Un
cert
ain
ty (
%)
(GeV/c)JETT
p (GeV/c)JETT
p
FIG. 11: The systematic uncertainty on the cross section in the rapidity region 0.1 < |y| < 0.7 for each source considered inthe measurement.
23
(GeV/c)JETT
p0 100 200 300 400 500 600 700
Sys
tem
atic
Un
cert
ain
ty (
%)
-30
-20
-10
0
10
20
30
Hadron response: p<12 GeV/c
Hadron response: 12<p<20 GeV/c
Hadron response: p>20 GeV/c
Independent ContributionT
p
FIG. 12: The relative uncertainty on the jet cross section in the rapidity region 0.1 < |y| < 0.7 due to different components ofthe jet energy scale systematic uncertainties. The decomposition includes contributions due to the description of the calorimeterresponse to hadrons for three different ranges of hadron momentum and a pT -independent component as discussed in Sec. VI.
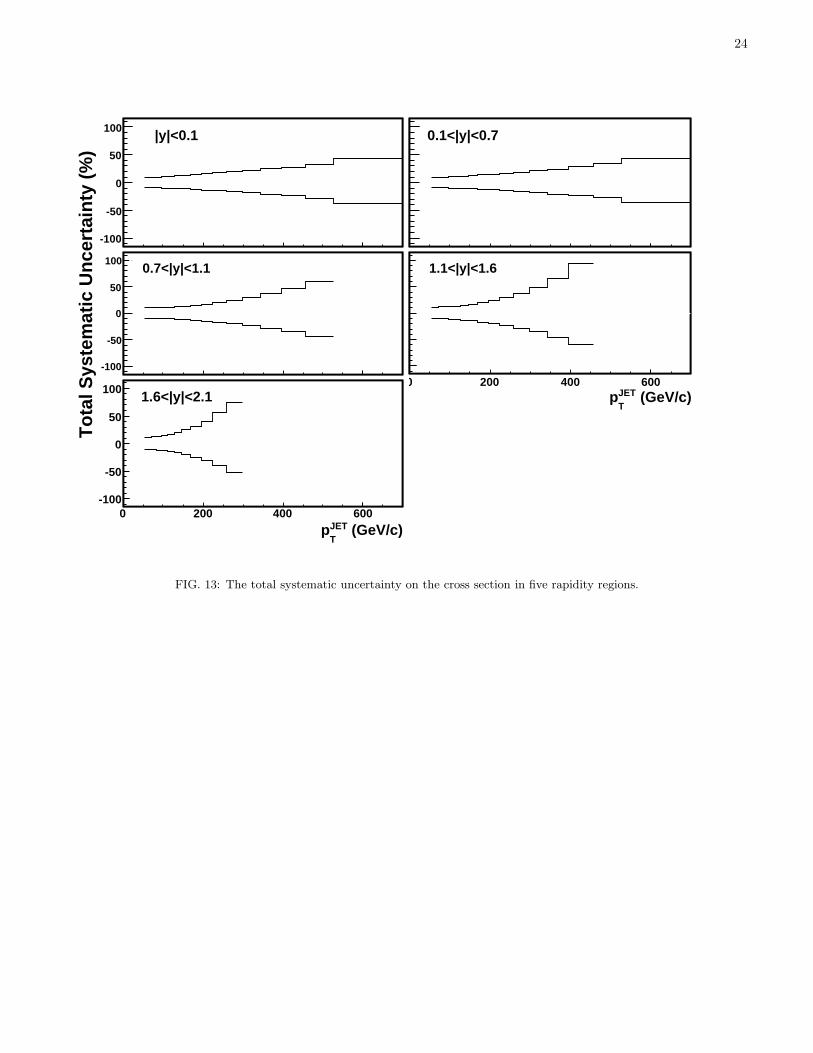
24
0 200 400 600-100
-50
0
50
100 |y|<0.1
0 200 400 600-100
-50
0
50
100 0.1<|y|<0.7
0 200 400 600-100
-50
0
50
1000.7<|y|<1.1
(GeV/c)JETT
p0 200 400 600
-100
-50
0
50
100 1.1<|y|<1.6
(GeV/c)JETT
p0 200 400 600
-100
-50
0
50
100 1.6<|y|<2.1
To
tal S
yste
mat
ic U
nce
rtai
nty
(%
)
FIG. 13: The total systematic uncertainty on the cross section in five rapidity regions.
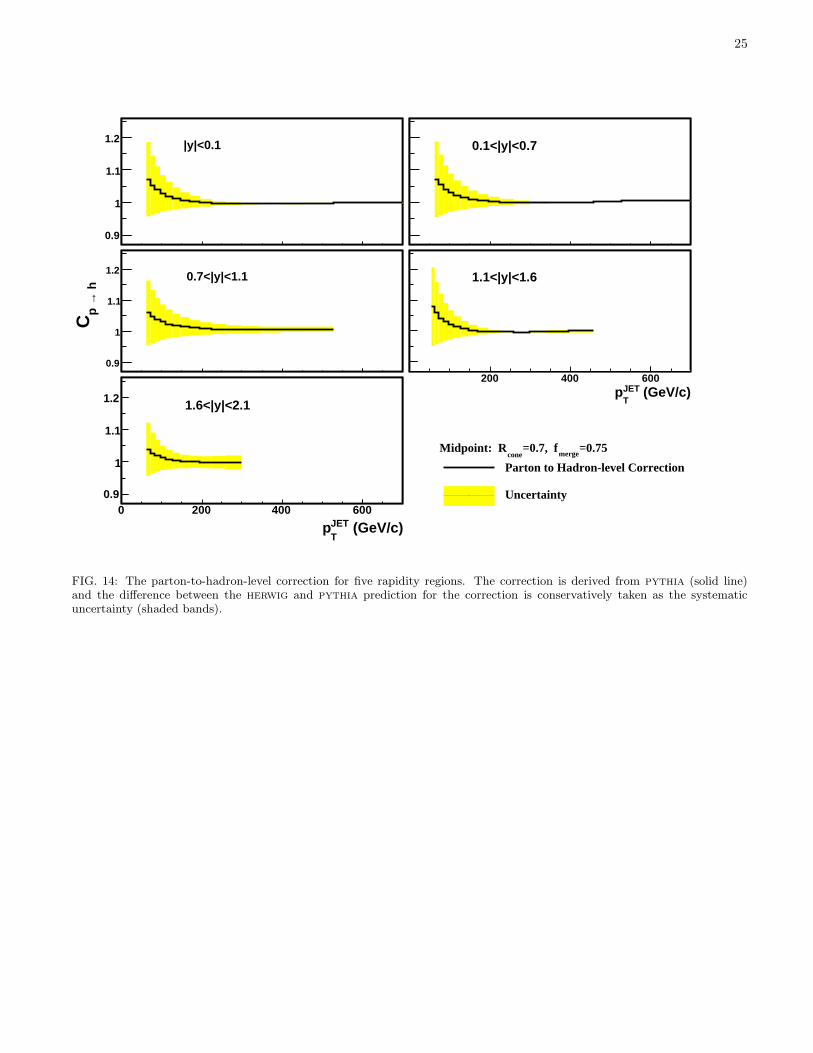
25
0.9
1
1.1
1.2 |y|<0.1 0.1<|y|<0.7
h
→p
C
0.9
1
1.1
1.2 0.7<|y|<1.1
(GeV/c)JETT
p200 400 600
1.1<|y|<1.6
(GeV/c)JETT
p0 200 400 600
0.9
1
1.1
1.2 1.6<|y|<2.1
=0.75 merge
=0.7, fcone
Midpoint: R
Parton to Hadron-level Correction
Uncertainty
FIG. 14: The parton-to-hadron-level correction for five rapidity regions. The correction is derived from pythia (solid line)and the difference between the herwig and pythia prediction for the correction is conservatively taken as the systematicuncertainty (shaded bands).
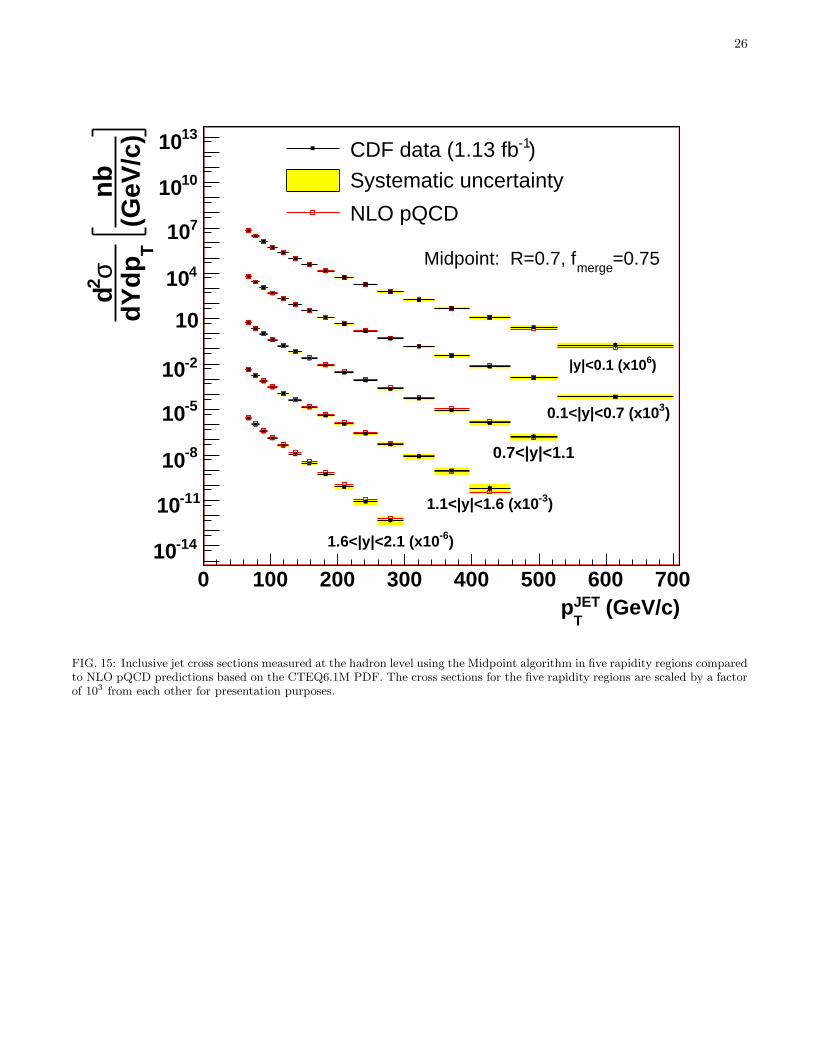
26
(GeV/c)JETT
p0 100 200 300 400 500 600 700
(GeV
/c)
nb
T
dY
dpσ2 d
-1410
-1110
-810
-510
-210
10
410
710
1010
1310
)6|y|<0.1 (x10
)30.1<|y|<0.7 (x10
0.7<|y|<1.1
)-31.1<|y|<1.6 (x10
)-61.6<|y|<2.1 (x10
=0.75merge
Midpoint: R=0.7, f
)-1CDF data (1.13 fb
Systematic uncertainty
NLO pQCD
FIG. 15: Inclusive jet cross sections measured at the hadron level using the Midpoint algorithm in five rapidity regions comparedto NLO pQCD predictions based on the CTEQ6.1M PDF. The cross sections for the five rapidity regions are scaled by a factorof 103 from each other for presentation purposes.
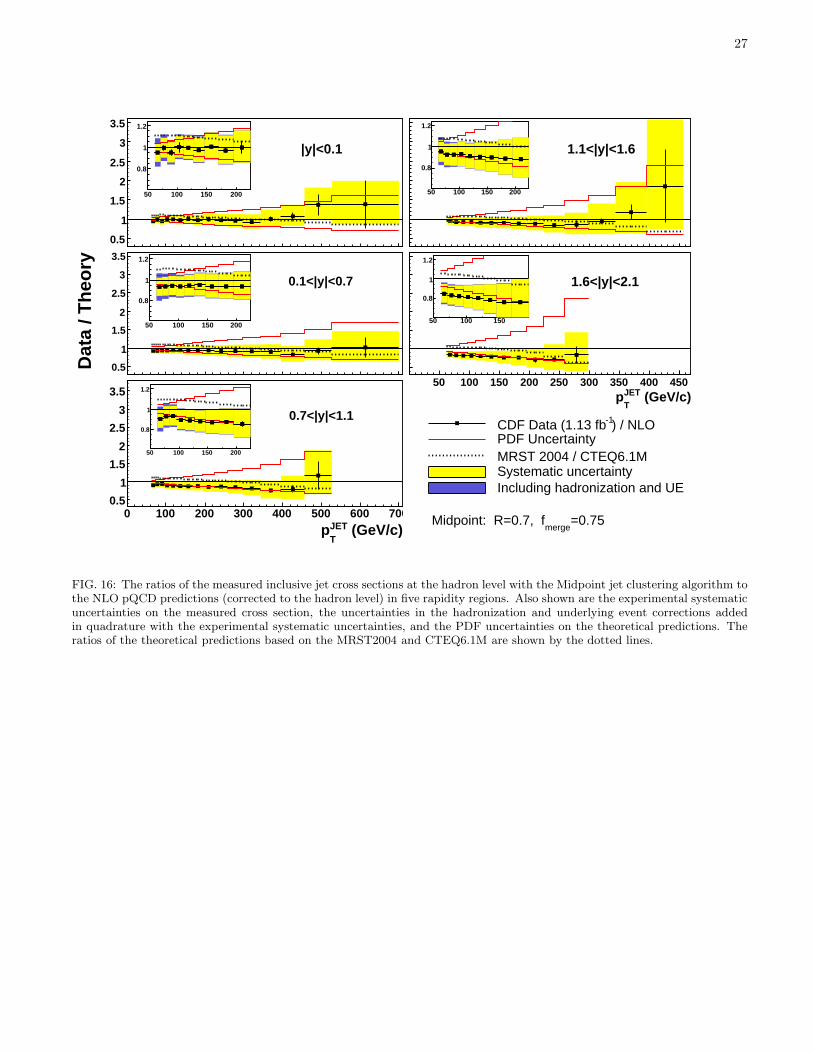
27
0.5
1
1.5
2
2.5
3
3.5
|y|<0.1
50 100 150 200
0.8
1
1.2
0.5
1
1.5
2
2.5
3
3.5
1.1<|y|<1.6
50 100 150 200
0.8
1
1.2
0 100 200 300 400 500 600 700
Dat
a / T
heo
ry
0.5
1
1.5
2
2.5
3
3.5
0.1<|y|<0.7
50 100 150 200
0.8
1
1.2
(GeV/c)JETT
p50 100 150 200 250 300 350 400 450
0.5
1
1.5
2
2.5
3
3.5
1.6<|y|<2.1
50 100 150
0.8
1
1.2
(GeV/c)JETT
p0 100 200 300 400 500 600 700
0.5
1
1.5
2
2.5
3
3.5
0.7<|y|<1.1
50 100 150 200
0.8
1
1.2
) / NLO-1CDF Data (1.13 fbPDF UncertaintyMRST 2004 / CTEQ6.1MSystematic uncertaintyIncluding hadronization and UE
=0.75merge
Midpoint: R=0.7, f
FIG. 16: The ratios of the measured inclusive jet cross sections at the hadron level with the Midpoint jet clustering algorithm tothe NLO pQCD predictions (corrected to the hadron level) in five rapidity regions. Also shown are the experimental systematicuncertainties on the measured cross section, the uncertainties in the hadronization and underlying event corrections addedin quadrature with the experimental systematic uncertainties, and the PDF uncertainties on the theoretical predictions. Theratios of the theoretical predictions based on the MRST2004 and CTEQ6.1M are shown by the dotted lines.
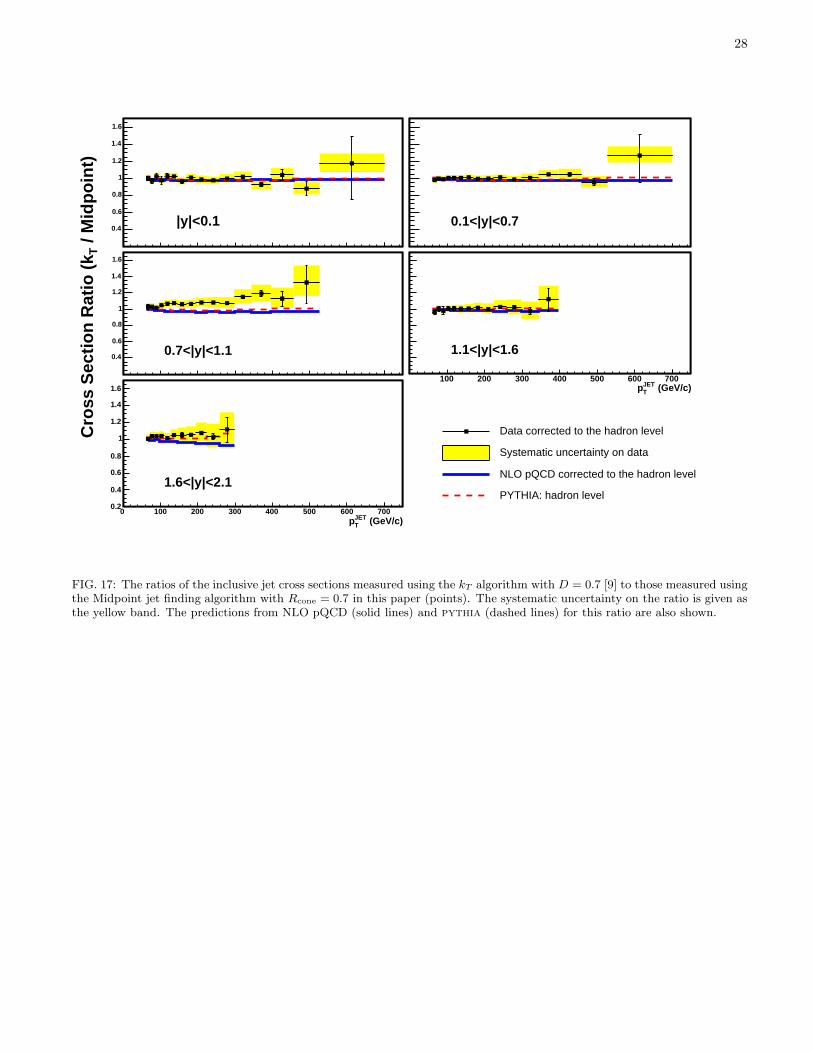
28
0.4
0.6
0.8
1
1.2
1.4
1.6
|y|<0.1 0.1<|y|<0.7
0.4
0.6
0.8
1
1.2
1.4
1.6
0.7<|y|<1.1
(GeV/c)JETTp
100 200 300 400 500 600 700
1.1<|y|<1.6
(GeV/c)JETTp
0 100 200 300 400 500 600 7000.2
0.4
0.6
0.8
1
1.2
1.4
1.6
1.6<|y|<2.1
Data corrected to the hadron level
Systematic uncertainty on data
NLO pQCD corrected to the hadron level
PYTHIA: hadron level
/ M
idp
oin
t)T
Cro
ss S
ecti
on
Rat
io (
k
FIG. 17: The ratios of the inclusive jet cross sections measured using the kT algorithm with D = 0.7 [9] to those measured usingthe Midpoint jet finding algorithm with Rcone = 0.7 in this paper (points). The systematic uncertainty on the ratio is given asthe yellow band. The predictions from NLO pQCD (solid lines) and pythia (dashed lines) for this ratio are also shown.
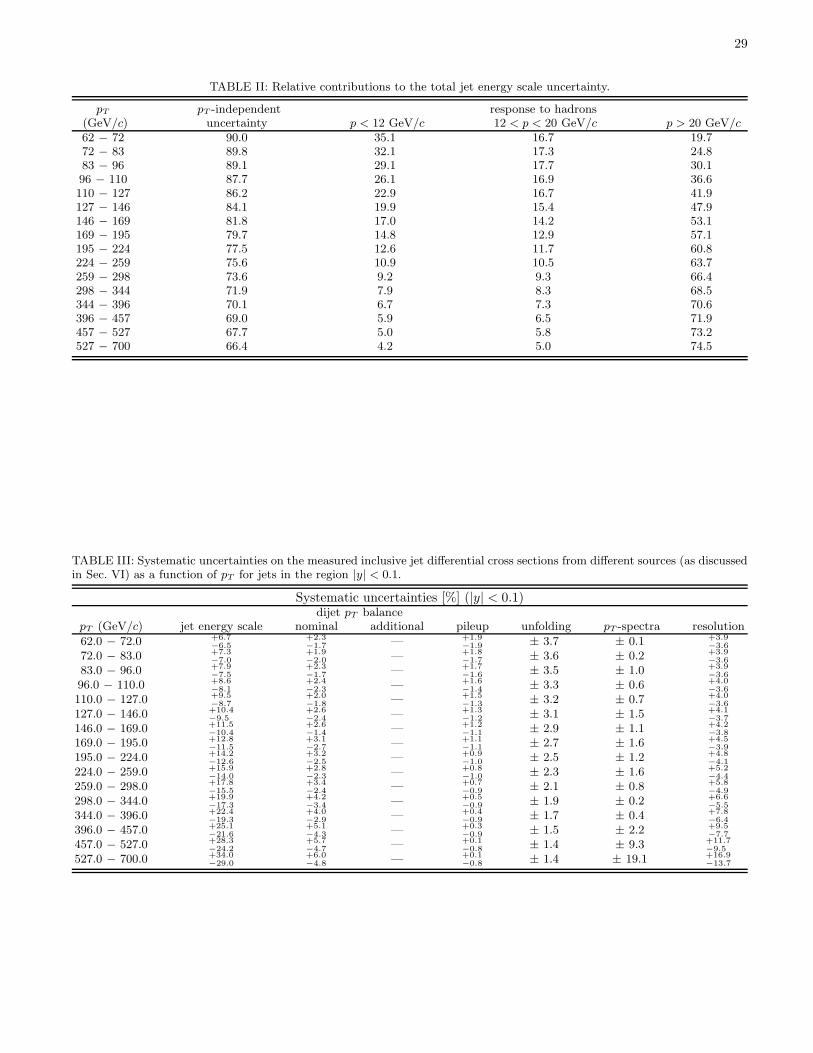
29
TABLE II: Relative contributions to the total jet energy scale uncertainty.
pT pT -independent response to hadrons(GeV/c) uncertainty p < 12 GeV/c 12 < p < 20 GeV/c p > 20 GeV/c62 − 72 90.0 35.1 16.7 19.772 − 83 89.8 32.1 17.3 24.883 − 96 89.1 29.1 17.7 30.196 − 110 87.7 26.1 16.9 36.6110 − 127 86.2 22.9 16.7 41.9127 − 146 84.1 19.9 15.4 47.9146 − 169 81.8 17.0 14.2 53.1169 − 195 79.7 14.8 12.9 57.1195 − 224 77.5 12.6 11.7 60.8224 − 259 75.6 10.9 10.5 63.7259 − 298 73.6 9.2 9.3 66.4298 − 344 71.9 7.9 8.3 68.5344 − 396 70.1 6.7 7.3 70.6396 − 457 69.0 5.9 6.5 71.9457 − 527 67.7 5.0 5.8 73.2527 − 700 66.4 4.2 5.0 74.5
TABLE III: Systematic uncertainties on the measured inclusive jet differential cross sections from different sources (as discussedin Sec. VI) as a function of pT for jets in the region |y| < 0.1.
Systematic uncertainties [%] (|y| < 0.1)dijet pT balance
pT (GeV/c) jet energy scale nominal additional pileup unfolding pT -spectra resolution
62.0 − 72.0 +6.7−6.5
+2.3−1.7 — +1.9
−1.9 ± 3.7 ± 0.1 +3.9−3.6
72.0 − 83.0 +7.3−7.0
+1.9−2.0 — +1.8
−1.7 ± 3.6 ± 0.2 +3.9−3.6
83.0 − 96.0 +7.9−7.5
+2.3−1.7 — +1.7
−1.6 ± 3.5 ± 1.0 +3.9−3.6
96.0 − 110.0 +8.6−8.1
+2.4−2.3 — +1.6
−1.4 ± 3.3 ± 0.6 +4.0−3.6
110.0 − 127.0 +9.5−8.7
+2.0−1.8 — +1.5
−1.3 ± 3.2 ± 0.7 +4.0−3.6
127.0 − 146.0 +10.4−9.5
+2.6−2.4 — +1.3
−1.2 ± 3.1 ± 1.5 +4.1−3.7
146.0 − 169.0 +11.5−10.4
+2.6−1.4 — +1.2
−1.1 ± 2.9 ± 1.1 +4.2−3.8
169.0 − 195.0 +12.8−11.5
+3.1−2.7 — +1.1
−1.1 ± 2.7 ± 1.6 +4.5−3.9
195.0 − 224.0 +14.2−12.6
+3.2−2.5 — +0.9
−1.0 ± 2.5 ± 1.2 +4.8−4.1
224.0 − 259.0 +15.9−14.0
+2.8−2.3 — +0.8
−1.0 ± 2.3 ± 1.6 +5.2−4.4
259.0 − 298.0 +17.8−15.5
+3.4−2.4 — +0.7
−0.9 ± 2.1 ± 0.8 +5.8−4.9
298.0 − 344.0 +19.9−17.3
+4.2−3.4 — +0.5
−0.9 ± 1.9 ± 0.2 +6.6−5.5
344.0 − 396.0 +22.4−19.3
+4.0−2.9 — +0.4
−0.9 ± 1.7 ± 0.4 +7.8−6.4
396.0 − 457.0 +25.1−21.6
+5.1−4.3 — +0.3
−0.9 ± 1.5 ± 2.2 +9.5−7.7
457.0 − 527.0 +28.3−24.2
+5.7−4.7 — +0.1
−0.8 ± 1.4 ± 9.3 +11.7−9.5
527.0 − 700.0 +34.0−29.0
+6.0−4.8 — +0.1
−0.8 ± 1.4 ± 19.1 +16.9−13.7
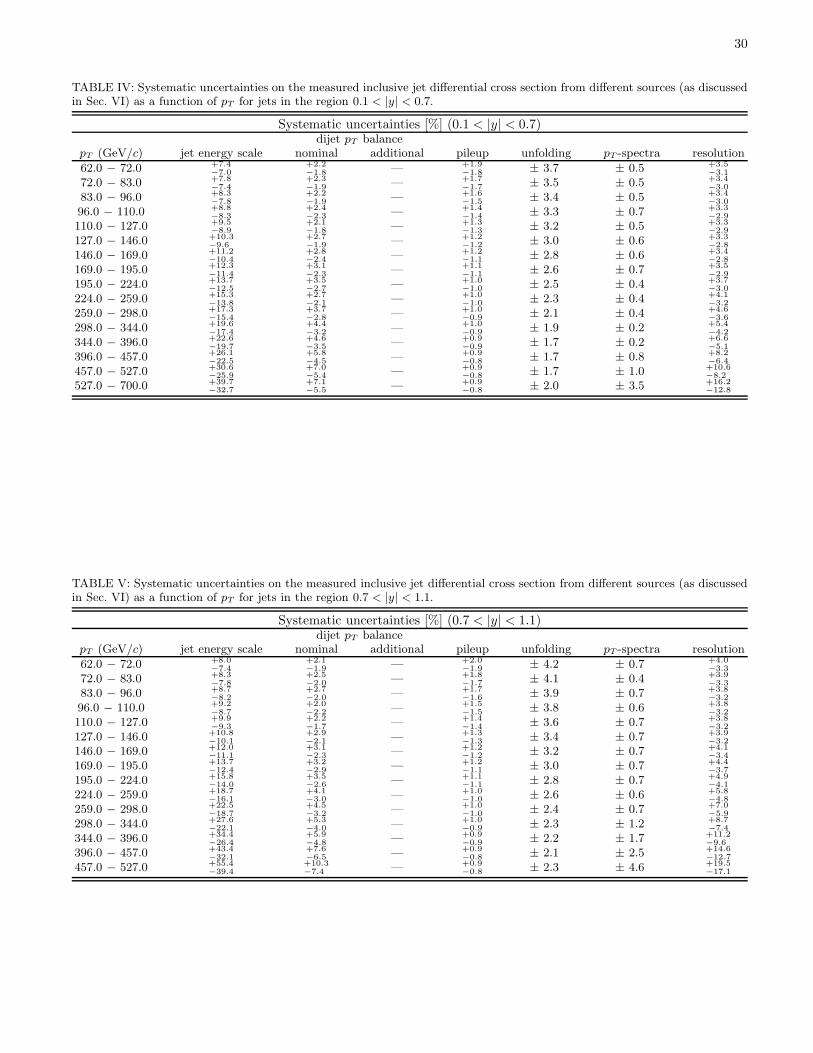
30
TABLE IV: Systematic uncertainties on the measured inclusive jet differential cross section from different sources (as discussedin Sec. VI) as a function of pT for jets in the region 0.1 < |y| < 0.7.
Systematic uncertainties [%] (0.1 < |y| < 0.7)dijet pT balance
pT (GeV/c) jet energy scale nominal additional pileup unfolding pT -spectra resolution
62.0 − 72.0 +7.4−7.0
+2.2−1.8 — +1.9
−1.8 ± 3.7 ± 0.5 +3.5−3.1
72.0 − 83.0 +7.8−7.4
+2.3−1.9 — +1.7
−1.7 ± 3.5 ± 0.5 +3.4−3.0
83.0 − 96.0 +8.3−7.8
+2.2−1.9 — +1.6
−1.5 ± 3.4 ± 0.5 +3.4−3.0
96.0 − 110.0 +8.8−8.3
+2.4−2.3 — +1.4
−1.4 ± 3.3 ± 0.7 +3.3−2.9
110.0 − 127.0 +9.5−8.9
+2.1−1.8 — +1.3
−1.3 ± 3.2 ± 0.5 +3.3−2.9
127.0 − 146.0 +10.3−9.6
+2.7−1.9 — +1.2
−1.2 ± 3.0 ± 0.6 +3.3−2.8
146.0 − 169.0 +11.2−10.4
+2.8−2.4 — +1.2
−1.1 ± 2.8 ± 0.6 +3.4−2.8
169.0 − 195.0 +12.3−11.4
+3.1−2.3 — +1.1
−1.1 ± 2.6 ± 0.7 +3.5−2.9
195.0 − 224.0 +13.7−12.5
+3.5−2.7 — +1.0
−1.0 ± 2.5 ± 0.4 +3.7−3.0
224.0 − 259.0 +15.3−13.8
+2.7−2.1 — +1.0
−1.0 ± 2.3 ± 0.4 +4.1−3.2
259.0 − 298.0 +17.3−15.4
+3.7−2.8 — +1.0
−0.9 ± 2.1 ± 0.4 +4.6−3.6
298.0 − 344.0 +19.6−17.4
+4.4−3.2 — +1.0
−0.9 ± 1.9 ± 0.2 +5.4−4.2
344.0 − 396.0 +22.6−19.7
+4.6−3.5 — +0.9
−0.9 ± 1.7 ± 0.2 +6.6−5.1
396.0 − 457.0 +26.1−22.5
+5.8−4.5 — +0.9
−0.8 ± 1.7 ± 0.8 +8.2−6.4
457.0 − 527.0 +30.6−25.9
+7.0−5.4 — +0.9
−0.8 ± 1.7 ± 1.0 +10.6−8.2
527.0 − 700.0 +39.7−32.7
+7.1−5.5 — +0.9
−0.8 ± 2.0 ± 3.5 +16.2−12.8
TABLE V: Systematic uncertainties on the measured inclusive jet differential cross section from different sources (as discussedin Sec. VI) as a function of pT for jets in the region 0.7 < |y| < 1.1.
Systematic uncertainties [%] (0.7 < |y| < 1.1)dijet pT balance
pT (GeV/c) jet energy scale nominal additional pileup unfolding pT -spectra resolution
62.0 − 72.0 +8.0−7.4
+2.1−1.9 — +2.0
−1.9 ± 4.2 ± 0.7 +4.0−3.3
72.0 − 83.0 +8.3−7.8
+2.5−2.0 — +1.8
−1.7 ± 4.1 ± 0.4 +3.9−3.3
83.0 − 96.0 +8.7−8.2
+2.7−2.0 — +1.7
−1.6 ± 3.9 ± 0.7 +3.8−3.2
96.0 − 110.0 +9.2−8.7
+2.0−2.2 — +1.5
−1.5 ± 3.8 ± 0.6 +3.8−3.2
110.0 − 127.0 +9.9−9.3
+2.2−1.7 — +1.4
−1.4 ± 3.6 ± 0.7 +3.8−3.2
127.0 − 146.0 +10.8−10.1
+2.9−2.1 — +1.3
−1.3 ± 3.4 ± 0.7 +3.9−3.2
146.0 − 169.0 +12.0−11.1
+3.1−2.3 — +1.2
−1.2 ± 3.2 ± 0.7 +4.1−3.4
169.0 − 195.0 +13.7−12.4
+3.2−2.9 — +1.2
−1.1 ± 3.0 ± 0.7 +4.4−3.7
195.0 − 224.0 +15.8−14.0
+3.5−2.6 — +1.1
−1.1 ± 2.8 ± 0.7 +4.9−4.1
224.0 − 259.0 +18.7−16.1
+4.1−3.0 — +1.0
−1.0 ± 2.6 ± 0.6 +5.8−4.8
259.0 − 298.0 +22.5−18.7
+4.5−3.2 — +1.0
−1.0 ± 2.4 ± 0.7 +7.0−5.9
298.0 − 344.0 +27.6−22.1
+5.3−4.0 — +1.0
−0.9 ± 2.3 ± 1.2 +8.7−7.4
344.0 − 396.0 +34.4−26.4
+5.9−4.8 — +0.9
−0.9 ± 2.2 ± 1.7 +11.2−9.6
396.0 − 457.0 +43.4−32.1
+7.6−6.5 — +0.9
−0.8 ± 2.1 ± 2.5 +14.6−12.7
457.0 − 527.0 +55.4−39.4
+10.3−7.4 — +0.9
−0.8 ± 2.3 ± 4.6 +19.5−17.1
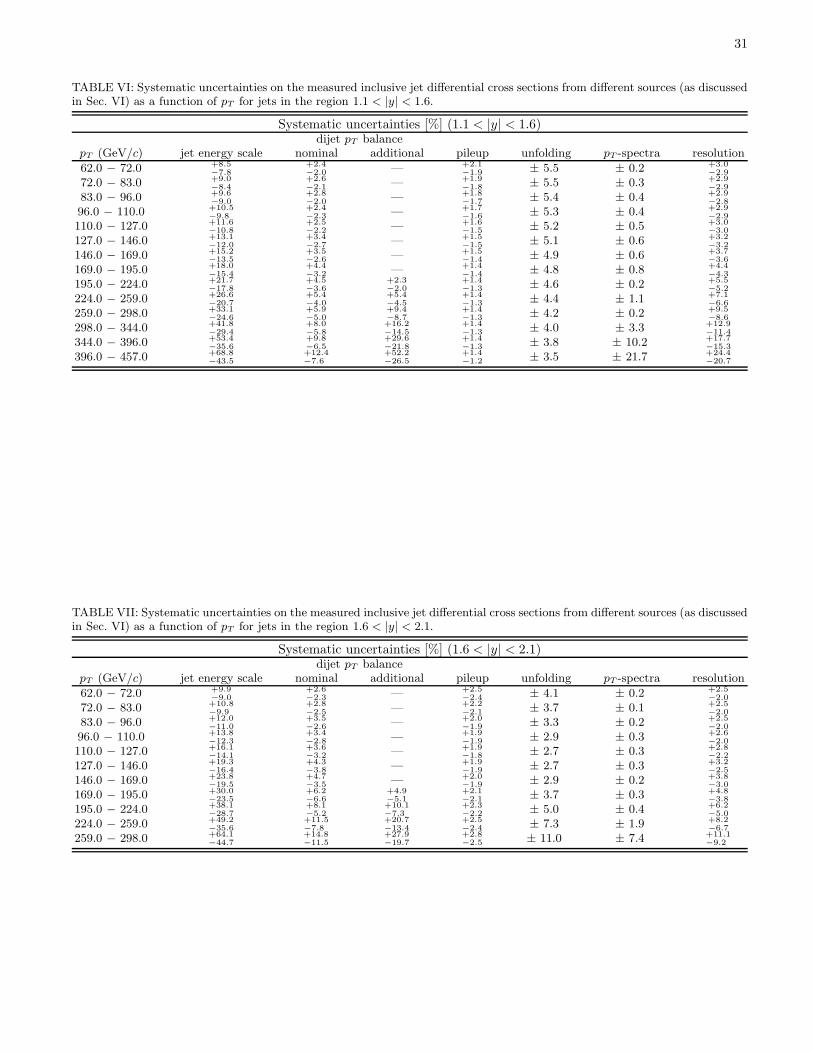
31
TABLE VI: Systematic uncertainties on the measured inclusive jet differential cross sections from different sources (as discussedin Sec. VI) as a function of pT for jets in the region 1.1 < |y| < 1.6.
Systematic uncertainties [%] (1.1 < |y| < 1.6)dijet pT balance
pT (GeV/c) jet energy scale nominal additional pileup unfolding pT -spectra resolution
62.0 − 72.0 +8.5−7.8
+2.4−2.0 — +2.1
−1.9 ± 5.5 ± 0.2 +3.0−2.9
72.0 − 83.0 +9.0−8.4
+2.6−2.1 — +1.9
−1.8 ± 5.5 ± 0.3 +2.9−2.9
83.0 − 96.0 +9.6−9.0
+2.8−2.0 — +1.8
−1.7 ± 5.4 ± 0.4 +2.9−2.8
96.0 − 110.0 +10.5−9.8
+2.4−2.3 — +1.7
−1.6 ± 5.3 ± 0.4 +2.9−2.9
110.0 − 127.0 +11.6−10.8
+2.5−2.2 — +1.6
−1.5 ± 5.2 ± 0.5 +3.0−3.0
127.0 − 146.0 +13.1−12.0
+3.4−2.7 — +1.5
−1.5 ± 5.1 ± 0.6 +3.2−3.2
146.0 − 169.0 +15.2−13.5
+3.5−2.6 — +1.5
−1.4 ± 4.9 ± 0.6 +3.7−3.6
169.0 − 195.0 +18.0−15.4
+4.4−3.2 — +1.4
−1.4 ± 4.8 ± 0.8 +4.4−4.3
195.0 − 224.0 +21.7−17.8
+4.5−3.6
+2.3−2.0
+1.4−1.3 ± 4.6 ± 0.2 +5.5
−5.2
224.0 − 259.0 +26.6−20.7
+5.4−4.0
+5.4−4.5
+1.4−1.3 ± 4.4 ± 1.1 +7.1
−6.6
259.0 − 298.0 +33.1−24.6
+5.9−5.0
+9.4−8.7
+1.4−1.3 ± 4.2 ± 0.2 +9.5
−8.6
298.0 − 344.0 +41.8−29.4
+8.0−5.8
+16.2−14.5
+1.4−1.3 ± 4.0 ± 3.3 +12.9
−11.4
344.0 − 396.0 +53.4−35.6
+9.8−6.5
+29.6−21.8
+1.4−1.3 ± 3.8 ± 10.2 +17.7
−15.3
396.0 − 457.0 +68.8−43.5
+12.4−7.6
+52.2−26.5
+1.4−1.2 ± 3.5 ± 21.7 +24.4
−20.7
TABLE VII: Systematic uncertainties on the measured inclusive jet differential cross sections from different sources (as discussedin Sec. VI) as a function of pT for jets in the region 1.6 < |y| < 2.1.
Systematic uncertainties [%] (1.6 < |y| < 2.1)dijet pT balance
pT (GeV/c) jet energy scale nominal additional pileup unfolding pT -spectra resolution
62.0 − 72.0 +9.9−9.0
+2.6−2.3 — +2.5
−2.4 ± 4.1 ± 0.2 +2.5−2.0
72.0 − 83.0 +10.8−9.9
+2.8−2.5 — +2.2
−2.1 ± 3.7 ± 0.1 +2.5−2.0
83.0 − 96.0 +12.0−11.0
+3.5−2.6 — +2.0
−1.9 ± 3.3 ± 0.2 +2.5−2.0
96.0 − 110.0 +13.8−12.3
+3.4−2.8 — +1.9
−1.9 ± 2.9 ± 0.3 +2.6−2.0
110.0 − 127.0 +16.1−14.1
+3.6−3.2 — +1.9
−1.8 ± 2.7 ± 0.3 +2.8−2.2
127.0 − 146.0 +19.3−16.4
+4.3−3.8 — +1.9
−1.9 ± 2.7 ± 0.3 +3.2−2.5
146.0 − 169.0 +23.8−19.5
+4.7−3.5 — +2.0
−1.9 ± 2.9 ± 0.2 +3.8−3.0
169.0 − 195.0 +30.0−23.5
+6.2−6.6
+4.9−5.1
+2.1−2.1 ± 3.7 ± 0.3 +4.8
−3.8
195.0 − 224.0 +38.1−28.7
+8.1−5.2
+10.1−7.3
+2.3−2.2 ± 5.0 ± 0.4 +6.2
−5.0
224.0 − 259.0 +49.2−35.6
+11.5−7.8
+20.7−13.4
+2.5−2.4 ± 7.3 ± 1.9 +8.2
−6.7
259.0 − 298.0 +64.1−44.7
+14.8−11.5
+27.9−19.7
+2.8−2.5 ± 11.0 ± 7.4 +11.1
−9.2
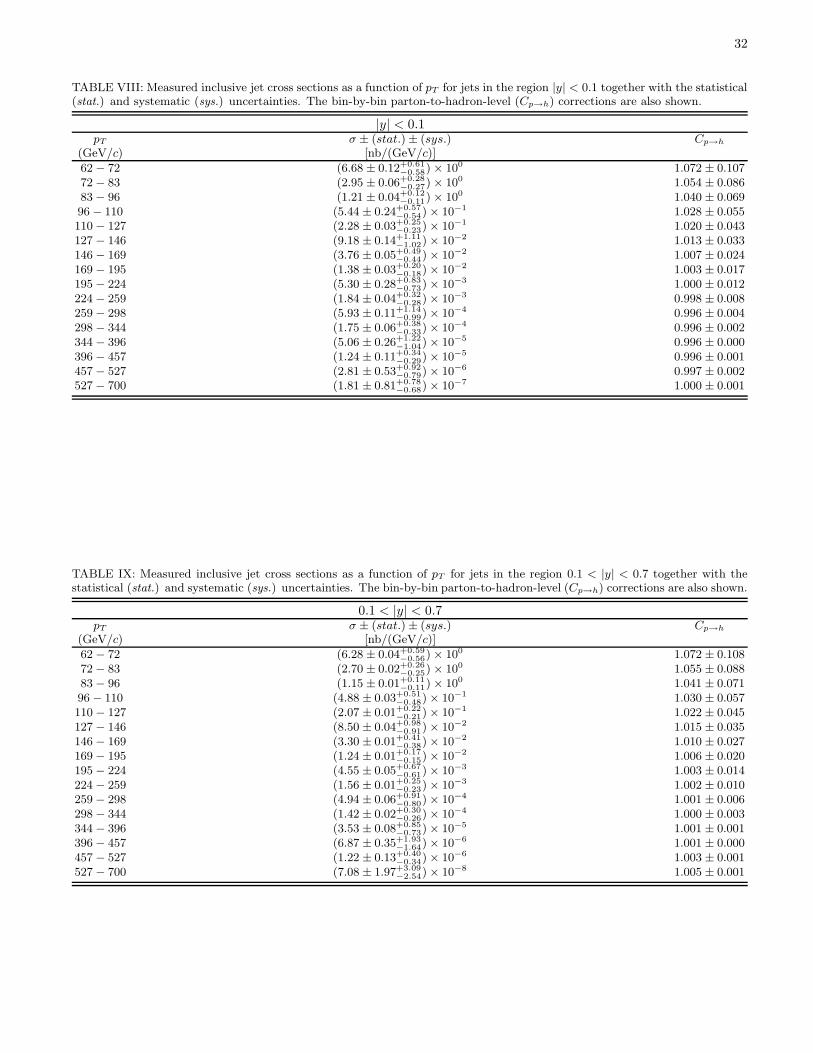
32
TABLE VIII: Measured inclusive jet cross sections as a function of pT for jets in the region |y| < 0.1 together with the statistical(stat.) and systematic (sys.) uncertainties. The bin-by-bin parton-to-hadron-level (Cp→h) corrections are also shown.
|y| < 0.1pT σ ± (stat.) ± (sys.) Cp→h
(GeV/c) [nb/(GeV/c)]
62 − 72 (6.68 ± 0.12+0.61−0.58) × 100 1.072 ± 0.107
72 − 83 (2.95 ± 0.06+0.28−0.27) × 100 1.054 ± 0.086
83 − 96 (1.21 ± 0.04+0.12−0.11) × 100 1.040 ± 0.069
96 − 110 (5.44 ± 0.24+0.57−0.54) × 10−1 1.028 ± 0.055
110 − 127 (2.28 ± 0.03+0.25−0.23) × 10−1 1.020 ± 0.043
127 − 146 (9.18 ± 0.14+1.11−1.02) × 10−2 1.013 ± 0.033
146 − 169 (3.76 ± 0.05+0.49−0.44) × 10−2 1.007 ± 0.024
169 − 195 (1.38 ± 0.03+0.20−0.18) × 10−2 1.003 ± 0.017
195 − 224 (5.30 ± 0.28+0.83−0.73) × 10−3 1.000 ± 0.012
224 − 259 (1.84 ± 0.04+0.32−0.28) × 10−3 0.998 ± 0.008
259 − 298 (5.93 ± 0.11+1.14−0.99) × 10−4 0.996 ± 0.004
298 − 344 (1.75 ± 0.06+0.38−0.33) × 10−4 0.996 ± 0.002
344 − 396 (5.06 ± 0.26+1.22−1.04) × 10−5 0.996 ± 0.000
396 − 457 (1.24 ± 0.11+0.34−0.29) × 10−5 0.996 ± 0.001
457 − 527 (2.81 ± 0.53+0.92−0.79) × 10−6 0.997 ± 0.002
527 − 700 (1.81 ± 0.81+0.78−0.68) × 10−7 1.000 ± 0.001
TABLE IX: Measured inclusive jet cross sections as a function of pT for jets in the region 0.1 < |y| < 0.7 together with thestatistical (stat.) and systematic (sys.) uncertainties. The bin-by-bin parton-to-hadron-level (Cp→h) corrections are also shown.
0.1 < |y| < 0.7pT σ ± (stat.) ± (sys.) Cp→h
(GeV/c) [nb/(GeV/c)]
62 − 72 (6.28 ± 0.04+0.59−0.56) × 100 1.072 ± 0.108
72 − 83 (2.70 ± 0.02+0.26−0.25) × 100 1.055 ± 0.088
83 − 96 (1.15 ± 0.01+0.11−0.11) × 100 1.041 ± 0.071
96 − 110 (4.88 ± 0.03+0.51−0.48) × 10−1 1.030 ± 0.057
110 − 127 (2.07 ± 0.01+0.22−0.21) × 10−1 1.022 ± 0.045
127 − 146 (8.50 ± 0.04+0.98−0.91) × 10−2 1.015 ± 0.035
146 − 169 (3.30 ± 0.01+0.41−0.38) × 10−2 1.010 ± 0.027
169 − 195 (1.24 ± 0.01+0.17−0.15) × 10−2 1.006 ± 0.020
195 − 224 (4.55 ± 0.05+0.67−0.61) × 10−3 1.003 ± 0.014
224 − 259 (1.56 ± 0.01+0.25−0.23) × 10−3 1.002 ± 0.010
259 − 298 (4.94 ± 0.06+0.91−0.80) × 10−4 1.001 ± 0.006
298 − 344 (1.42 ± 0.02+0.30−0.26) × 10−4 1.000 ± 0.003
344 − 396 (3.53 ± 0.08+0.85−0.73) × 10−5 1.001 ± 0.001
396 − 457 (6.87 ± 0.35+1.93−1.64) × 10−6 1.001 ± 0.000
457 − 527 (1.22 ± 0.13+0.40−0.34) × 10−6 1.003 ± 0.001
527 − 700 (7.08 ± 1.97+3.09−2.54) × 10−8 1.005 ± 0.001
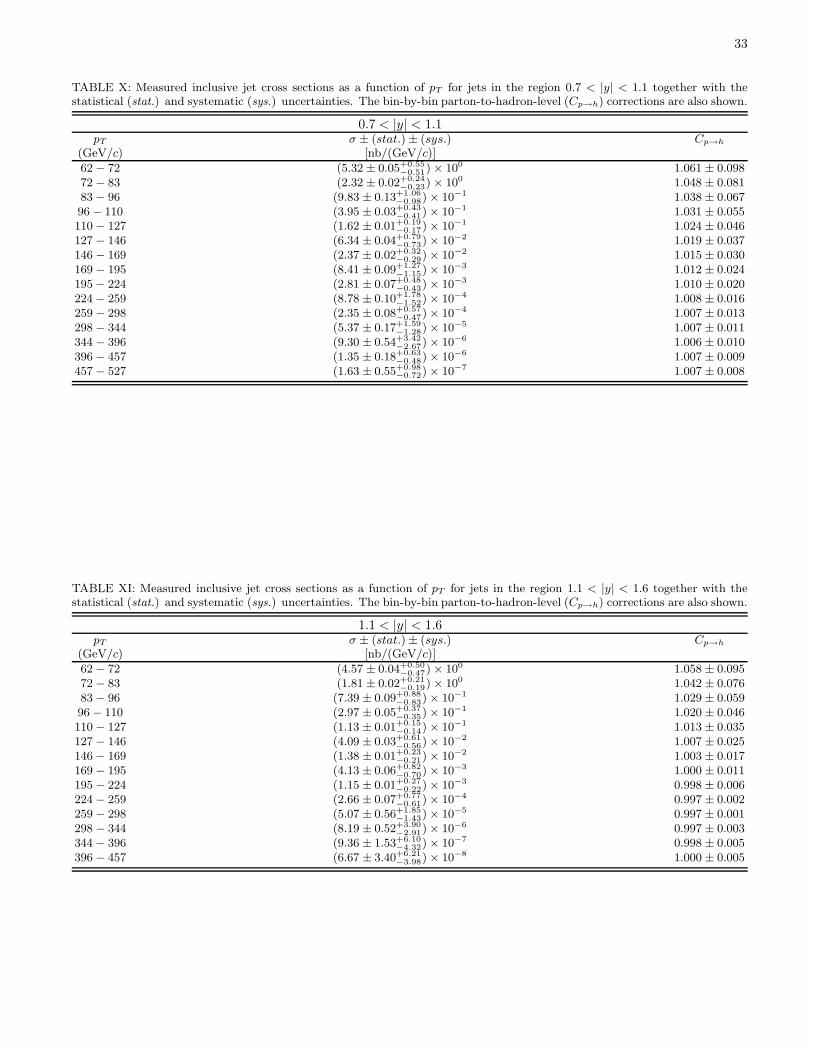
33
TABLE X: Measured inclusive jet cross sections as a function of pT for jets in the region 0.7 < |y| < 1.1 together with thestatistical (stat.) and systematic (sys.) uncertainties. The bin-by-bin parton-to-hadron-level (Cp→h) corrections are also shown.
0.7 < |y| < 1.1pT σ ± (stat.) ± (sys.) Cp→h
(GeV/c) [nb/(GeV/c)]
62 − 72 (5.32 ± 0.05+0.55−0.51) × 100 1.061 ± 0.098
72 − 83 (2.32 ± 0.02+0.24−0.23) × 100 1.048 ± 0.081
83 − 96 (9.83 ± 0.13+1.06−0.98) × 10−1 1.038 ± 0.067
96 − 110 (3.95 ± 0.03+0.43−0.41) × 10−1 1.031 ± 0.055
110 − 127 (1.62 ± 0.01+0.19−0.17) × 10−1 1.024 ± 0.046
127 − 146 (6.34 ± 0.04+0.79−0.73) × 10−2 1.019 ± 0.037
146 − 169 (2.37 ± 0.02+0.32−0.29) × 10−2 1.015 ± 0.030
169 − 195 (8.41 ± 0.09+1.27−1.15) × 10−3 1.012 ± 0.024
195 − 224 (2.81 ± 0.07+0.48−0.43) × 10−3 1.010 ± 0.020
224 − 259 (8.78 ± 0.10+1.78−1.52) × 10−4 1.008 ± 0.016
259 − 298 (2.35 ± 0.08+0.57−0.47) × 10−4 1.007 ± 0.013
298 − 344 (5.37 ± 0.17+1.59−1.28) × 10−5 1.007 ± 0.011
344 − 396 (9.30 ± 0.54+3.42−2.67) × 10−6 1.006 ± 0.010
396 − 457 (1.35 ± 0.18+0.63−0.48) × 10−6 1.007 ± 0.009
457 − 527 (1.63 ± 0.55+0.98−0.72) × 10−7 1.007 ± 0.008
TABLE XI: Measured inclusive jet cross sections as a function of pT for jets in the region 1.1 < |y| < 1.6 together with thestatistical (stat.) and systematic (sys.) uncertainties. The bin-by-bin parton-to-hadron-level (Cp→h) corrections are also shown.
1.1 < |y| < 1.6pT σ ± (stat.) ± (sys.) Cp→h
(GeV/c) [nb/(GeV/c)]
62 − 72 (4.57 ± 0.04+0.50−0.47) × 100 1.058 ± 0.095
72 − 83 (1.81 ± 0.02+0.21−0.19) × 100 1.042 ± 0.076
83 − 96 (7.39 ± 0.09+0.88−0.83) × 10−1 1.029 ± 0.059
96 − 110 (2.97 ± 0.05+0.37−0.35) × 10−1 1.020 ± 0.046
110 − 127 (1.13 ± 0.01+0.15−0.14) × 10−1 1.013 ± 0.035
127 − 146 (4.09 ± 0.03+0.61−0.56) × 10−2 1.007 ± 0.025
146 − 169 (1.38 ± 0.01+0.23−0.21) × 10−2 1.003 ± 0.017
169 − 195 (4.13 ± 0.06+0.82−0.70) × 10−3 1.000 ± 0.011
195 − 224 (1.15 ± 0.01+0.27−0.22) × 10−3 0.998 ± 0.006
224 − 259 (2.66 ± 0.07+0.77−0.61) × 10−4 0.997 ± 0.002
259 − 298 (5.07 ± 0.56+1.85−1.43) × 10−5 0.997 ± 0.001
298 − 344 (8.19 ± 0.52+3.90−2.91) × 10−6 0.997 ± 0.003
344 − 396 (9.36 ± 1.53+6.10−4.32) × 10−7 0.998 ± 0.005
396 − 457 (6.67 ± 3.40+6.21−3.98) × 10−8 1.000 ± 0.005
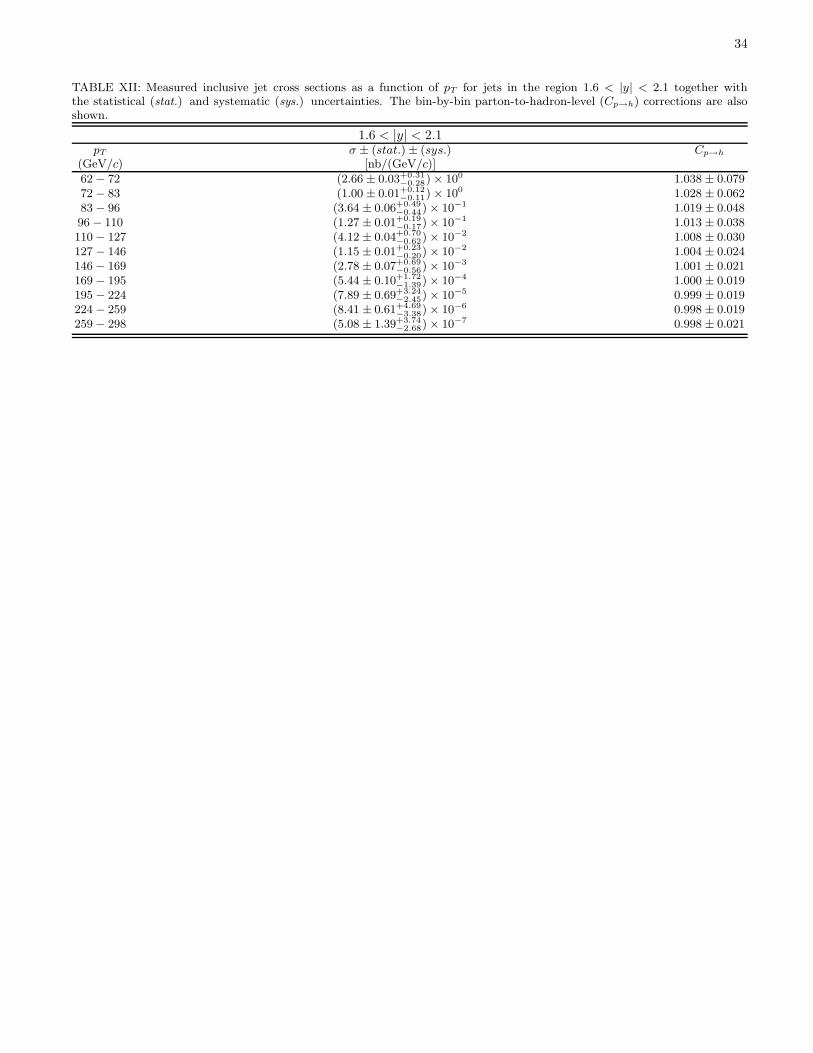
34
TABLE XII: Measured inclusive jet cross sections as a function of pT for jets in the region 1.6 < |y| < 2.1 together withthe statistical (stat.) and systematic (sys.) uncertainties. The bin-by-bin parton-to-hadron-level (Cp→h) corrections are alsoshown.
1.6 < |y| < 2.1pT σ ± (stat.) ± (sys.) Cp→h
(GeV/c) [nb/(GeV/c)]
62 − 72 (2.66 ± 0.03+0.31−0.28) × 100 1.038 ± 0.079
72 − 83 (1.00 ± 0.01+0.12−0.11) × 100 1.028 ± 0.062
83 − 96 (3.64 ± 0.06+0.49−0.44) × 10−1 1.019 ± 0.048
96 − 110 (1.27 ± 0.01+0.19−0.17) × 10−1 1.013 ± 0.038
110 − 127 (4.12 ± 0.04+0.70−0.62) × 10−2 1.008 ± 0.030
127 − 146 (1.15 ± 0.01+0.23−0.20) × 10−2 1.004 ± 0.024
146 − 169 (2.78 ± 0.07+0.69−0.56) × 10−3 1.001 ± 0.021
169 − 195 (5.44 ± 0.10+1.72−1.39) × 10−4 1.000 ± 0.019
195 − 224 (7.89 ± 0.69+3.24−2.45) × 10−5 0.999 ± 0.019
224 − 259 (8.41 ± 0.61+4.69−3.38) × 10−6 0.998 ± 0.019
259 − 298 (5.08 ± 1.39+3.74−2.68) × 10−7 0.998 ± 0.021


