Embed Size (px)
Citation preview

arX
iv:h
ep-e
x/02
0508
1v1
23
May
200
2
DESY–02–072
May 2002
Measurement of proton-dissociative
diffractive photoproduction of vector mesons
at large momentum transfer at HERA
ZEUS Collaboration
Abstract
Diffractive photoproduction of vector mesons, γp → V Y , where Y is a proton-
dissociative system, has been measured in e+p interactions with the ZEUS de-
tector at HERA using an integrated luminosity of 25 pb−1. The differential cross
section, dσ/dt, is presented for −t < 12 GeV2, where t is the square of the
four-momentum transferred to the vector meson. The data span the range in
photon-proton centre-of-mass energy, W , from 80 GeV to 120 GeV. The t distri-
butions are well fit by a power law, dσ/dt ∝ (−t)−n. The slope of the Pomeron
trajectory, measured from the W dependence of the ρ0 and φ cross sections in
bins of t, is consistent with zero. The ratios dσγp→φY /dt to dσγp→ρ0Y /dt and
dσγp→J/ψY /dt to dσγp→ρ0Y /dt increase with increasing −t. Decay-angle analyses
for ρ0, φ and J/ψ mesons have been carried out. For the ρ0 and φ mesons,
contributions from single and double helicity flip are observed. The results are
compared to expectations of theoretical models.

The ZEUS Collaboration
S. Chekanov, D. Krakauer, S. Magill, B. Musgrave, J. Repond, R. Yoshida
Argonne National Laboratory, Argonne, Illinois 60439-4815 n
M.C.K. Mattingly
Andrews University, Berrien Springs, Michigan 49104-0380
P. Antonioli, G. Bari, M. Basile, L. Bellagamba, D. Boscherini, A. Bruni, G. Bruni,
G. Cara Romeo, L. Cifarelli, F. Cindolo, A. Contin, M. Corradi, S. De Pasquale, P. Giusti,
G. Iacobucci, G. Levi, A. Margotti, R. Nania, F. Palmonari, A. Pesci, G. Sartorelli,
A. Zichichi
University and INFN Bologna, Bologna, Italy e
G. Aghuzumtsyan, D. Bartsch, I. Brock, J. Crittenden1, S. Goers, H. Hartmann, E. Hilger,
P. Irrgang, H.-P. Jakob, A. Kappes, U.F. Katz2, R. Kerger3, O. Kind, E. Paul, J. Rautenberg4,
R. Renner, H. Schnurbusch, A. Stifutkin, J. Tandler, K.C. Voss, A. Weber
Physikalisches Institut der Universitat Bonn, Bonn, Germany b
D.S. Bailey5, N.H. Brook5, J.E. Cole, B. Foster, G.P. Heath, H.F. Heath, S. Robins,
E. Rodrigues6, J. Scott, R.J. Tapper, M. Wing
H.H. Wills Physics Laboratory, University of Bristol, Bristol, United Kingdom m
M. Capua, A. Mastroberardino, M. Schioppa, G. Susinno
Calabria University, Physics Department and INFN, Cosenza, Italy e
J.Y. Kim, Y.K. Kim, J.H. Lee, I.T. Lim, M.Y. Pac7
Chonnam National University, Kwangju, Korea g
A. Caldwell, M. Helbich, X. Liu, B. Mellado, S. Paganis, W.B. Schmidke, F. Sciulli
Nevis Laboratories, Columbia University, Irvington on Hudson, New York 10027 o
J. Chwastowski, A. Eskreys, J. Figiel, K. Olkiewicz, K. Piotrzkowski8, M.B. Przybycien9,
P. Stopa, L. Zawiejski
Institute of Nuclear Physics, Cracow, Poland i
L. Adamczyk, B. Bednarek, I. Grabowska-Bold, K. Jelen, D. Kisielewska, A.M. Kowal,
M. Kowal, T. Kowalski, B. Mindur, M. Przybycien, E. Rulikowska-Zarebska, L. Suszycki,
D. Szuba, J. Szuba10
Faculty of Physics and Nuclear Techniques, University of Mining and Metallurgy, Cracow,
Poland p
A. Kotanski11, W. S lominski12
Department of Physics, Jagellonian University, Cracow, Poland
I

L.A.T. Bauerdick13, U. Behrens, K. Borras, V. Chiochia, D. Dannheim, M. Derrick14,
G. Drews, J. Fourletova, A. Fox-Murphy, U. Fricke, A. Geiser, F. Goebel15, P. Gottlicher16,
O. Gutsche, T. Haas, W. Hain, G.F. Hartner, S. Hillert, U. Kotz, H. Kowalski17, H. Labes,
D. Lelas, B. Lohr, R. Mankel, M. Martınez13, M. Moritz, D. Notz, I.-A. Pellmann,
M.C. Petrucci, A. Polini, A. Raval, U. Schneekloth, F. Selonke18, B. Surrow19, H. Wes-
soleck, R. Wichmann20, G. Wolf, C. Youngman, W. Zeuner
Deutsches Elektronen-Synchrotron DESY, Hamburg, Germany
A. Lopez-Duran Viani21, A. Meyer, S. Schlenstedt
DESY Zeuthen, Zeuthen, Germany
G. Barbagli, E. Gallo, C. Genta, P. G. Pelfer
University and INFN, Florence, Italy e
A. Bamberger, A. Benen, N. Coppola, H. Raach
Fakultat fur Physik der Universitat Freiburg i.Br., Freiburg i.Br., Germany b
M. Bell, P.J. Bussey, A.T. Doyle, C. Glasman, S. Hanlon, S.W. Lee, A. Lupi, G.J. Mc-
Cance, D.H. Saxon, I.O. Skillicorn
Department of Physics and Astronomy, University of Glasgow, Glasgow, United King-
dom m
I. Gialas
Department of Engineering in Management and Finance, Univ. of Aegean, Greece
B. Bodmann, T. Carli, U. Holm, K. Klimek22, N. Krumnack, E. Lohrmann, M. Milite,
H. Salehi, S. Stonjek23, K. Wick, A. Ziegler, Ar. Ziegler
Hamburg University, Institute of Exp. Physics, Hamburg, Germany b
C. Collins-Tooth, C. Foudas, R. Goncalo6, K.R. Long, F. Metlica, D.B. Miller, A.D. Tap-
per, R. Walker
Imperial College London, High Energy Nuclear Physics Group, London, United King-
dom m
P. Cloth, D. Filges
Forschungszentrum Julich, Institut fur Kernphysik, Julich, Germany
M. Kuze, K. Nagano, K. Tokushuku24, S. Yamada, Y. Yamazaki
Institute of Particle and Nuclear Studies, KEK, Tsukuba, Japan f
A.N. Barakbaev, E.G. Boos, N.S. Pokrovskiy, B.O. Zhautykov
Institute of Physics and Technology of Ministry of Education and Science of Kazakhstan,
Almaty, Kazakhstan
H. Lim, D. Son
Kyungpook National University, Taegu, Korea g
II

F. Barreiro, O. Gonzalez, L. Labarga, J. del Peso, I. Redondo25, J. Terron, M. Vazquez
Departamento de Fısica Teorica, Universidad Autonoma Madrid,Madrid, Spain l
M. Barbi, A. Bertolin, F. Corriveau, A. Ochs, S. Padhi, D.G. Stairs, M. St-Laurent
Department of Physics, McGill University, Montreal, Quebec, Canada H3A 2T8 a
T. Tsurugai
Meiji Gakuin University, Faculty of General Education, Yokohama, Japan
A. Antonov, V. Bashkirov26, P. Danilov, B.A. Dolgoshein, D. Gladkov, V. Sosnovtsev,
S. Suchkov
Moscow Engineering Physics Institute, Moscow, Russia j
R.K. Dementiev, P.F. Ermolov, Yu.A. Golubkov, I.I. Katkov, L.A. Khein, I.A. Korzhav-
ina, V.A. Kuzmin, B.B. Levchenko, O.Yu. Lukina, A.S. Proskuryakov, L.M. Shcheglova,
N.N. Vlasov, S.A. Zotkin
Moscow State University, Institute of Nuclear Physics, Moscow, Russia k
C. Bokel, J. Engelen, S. Grijpink, E. Koffeman, P. Kooijman, E. Maddox, A. Pellegrino,
S. Schagen, E. Tassi, H. Tiecke, N. Tuning, J.J. Velthuis, L. Wiggers, E. de Wolf
NIKHEF and University of Amsterdam, Amsterdam, Netherlands h
N. Brummer, B. Bylsma, L.S. Durkin, J. Gilmore, C.M. Ginsburg, C.L. Kim, T.Y. Ling
Physics Department, Ohio State University, Columbus, Ohio 43210 n
S. Boogert, A.M. Cooper-Sarkar, R.C.E. Devenish, J. Ferrando, G. Grzelak, T. Mat-
sushita, M. Rigby, O. Ruske27, M.R. Sutton, R. Walczak
Department of Physics, University of Oxford, Oxford United Kingdom m
R. Brugnera, R. Carlin, F. Dal Corso, S. Dusini, A. Garfagnini, S. Limentani, A. Longhin,
A. Parenti, M. Posocco, L. Stanco, M. Turcato
Dipartimento di Fisica dell’ Universita and INFN, Padova, Italy e
E.A. Heaphy, B.Y. Oh, P.R.B. Saull28, J.J. Whitmore29
Department of Physics, Pennsylvania State University, University Park, Pennsylvania
16802 o
Y. Iga
Polytechnic University, Sagamihara, Japan f
G. D’Agostini, G. Marini, A. Nigro
Dipartimento di Fisica, Universita ’La Sapienza’ and INFN, Rome, Italy e
C. Cormack, J.C. Hart, N.A. McCubbin
Rutherford Appleton Laboratory, Chilton, Didcot, Oxon, United Kingdom m
III

C. Heusch
University of California, Santa Cruz, California 95064 n
I.H. Park
Seoul National University, Seoul, Korea
N. Pavel
Fachbereich Physik der Universitat-Gesamthochschule Siegen, Germany
H. Abramowicz, S. Dagan, A. Gabareen, S. Kananov, A. Kreisel, A. Levy
Raymond and Beverly Sackler Faculty of Exact Sciences, School of Physics, Tel-Aviv
University, Tel-Aviv, Israel d
T. Abe, T. Fusayasu, T. Kohno, K. Umemori, T. Yamashita
Department of Physics, University of Tokyo, Tokyo, Japan f
R. Hamatsu, T. Hirose18, M. Inuzuka, S. Kitamura30, K. Matsuzawa, T. Nishimura
Tokyo Metropolitan University, Deptartment of Physics, Tokyo, Japan f
M. Arneodo31, N. Cartiglia, R. Cirio, M. Costa, M.I. Ferrero, S. Maselli, V. Monaco,
C. Peroni, M. Ruspa, R. Sacchi, A. Solano, A. Staiano
Universita di Torino, Dipartimento di Fisica Sperimentale and INFN, Torino, Italy e
R. Galea, T. Koop, G.M. Levman, J.F. Martin, A. Mirea, A. Sabetfakhri
Department of Physics, University of Toronto, Toronto, Ontario, Canada M5S 1A7 a
J.M. Butterworth, C. Gwenlan, R. Hall-Wilton, T.W. Jones, J.B. Lane, M.S. Lightwood,
J.H. Loizides32, B.J. West
Physics and Astronomy Department, University College London, London, United King-
dom m
J. Ciborowski33, R. Ciesielski34, R.J. Nowak, J.M. Pawlak, B. Smalska35, J. Sztuk36,
T. Tymieniecka37, A. Ukleja37, J. Ukleja, J.A. Zakrzewski, A.F. Zarnecki
Warsaw University, Institute of Experimental Physics, Warsaw, Poland q
M. Adamus, P. Plucinski
Institute for Nuclear Studies, Warsaw, Poland q
Y. Eisenberg, L.K. Gladilin38, D. Hochman, U. Karshon
Department of Particle Physics, Weizmann Institute, Rehovot, Israel c
D. Kcira, S. Lammers, L. Li, D.D. Reeder, A.A. Savin, W.H. Smith
Department of Physics, University of Wisconsin, Madison, Wisconsin 53706 n
A. Deshpande, S. Dhawan, V.W. Hughes, P.B. Straub
Department of Physics, Yale University, New Haven, Connecticut 06520-8121 n
S. Bhadra, C.D. Catterall, S. Fourletov, S. Menary, M. Soares, J. Standage
Department of Physics, York University, Ontario, Canada M3J 1P3 a
IV

1 now at Cornell University, Ithaca/NY, USA2 on leave of absence at University of Erlangen-Nurnberg, Germany3 now at Ministere de la Culture, de L’Enseignement Superieur et de la Recherche, Lux-
embourg4 supported by the GIF, contract I-523-13.7/975 PPARC Advanced fellow6 supported by the Portuguese Foundation for Science and Technology (FCT)7 now at Dongshin University, Naju, Korea8 now at Universite Catholique de Louvain, Louvain-la-Neuve/Belgium9 now at Northwestern Univ., Evanston/IL, USA
10 partly supported by the Israel Science Foundation and the Israel Ministry of Science11 supported by the Polish State Committee for Scientific Research, grant no. 2 P03B
0932212 member of Dept. of Computer Science, supported by the Polish State Committee for
Sci. Res., grant no. 2 P03B 0611613 now at Fermilab, Batavia/IL, USA14 on leave from Argonne National Laboratory, USA15 now at Max-Planck-Institut fur Physik, Munchen/Germany16 now at DESY group FEB17 on leave of absence at Columbia Univ., Nevis Labs., N.Y./USA18 retired19 now at Brookhaven National Lab., Upton/NY, USA20 now at Mobilcom AG, Rendsburg-Budelsdorf, Germany21 now at Deutsche Borse Systems AG, Frankfurt/Main, Germany22 supported by the Polish State Committee for Scientific Research, grant no. 5 P03B
0872023 supported by NIKHEF, Amsterdam/NL24 also at University of Tokyo25 now at LPNHE Ecole Polytechnique, Paris, France26 now at Loma Linda University, Loma Linda, CA, USA27 now at IBM Global Services, Frankfurt/Main, Germany28 now at National Research Council, Ottawa/Canada29 on leave of absence at The National Science Foundation, Arlington, VA/USA30 present address: Tokyo Metropolitan University of Health Sciences, Tokyo 116-8551,
Japan31 also at Universita del Piemonte Orientale, Novara, Italy32 supported by Argonne National Laboratory, USA33 also at Lodz University, Poland34 supported by the Polish State Committee for Scientific Research, grant no. 2 P03B
V

0722235 supported by the Polish State Committee for Scientific Research, grant no. 2 P03B
0021936 Lodz University, Poland37 sup. by Pol. State Com. for Scien. Res., 5 P03B 09820 and by Germ. Fed. Min. for
Edu. and Research (BMBF), POL 01/04338 on leave from MSU, partly supported by University of Wisconsin via the U.S.-Israel BSF
VI

a supported by the Natural Sciences and Engineering Research Council of
Canada (NSERC)b supported by the German Federal Ministry for Education and Research
(BMBF), under contract numbers HZ1GUA 2, HZ1GUB 0, HZ1PDA 5,
HZ1VFA 5c supported by the MINERVA Gesellschaft fur Forschung GmbH, the Israel Sci-
ence Foundation, the U.S.-Israel Binational Science Foundation, the Israel Min-
istry of Science and the Benozyio Center for High Energy Physicsd supported by the German-Israeli Foundation, the Israel Science Foundation,
and by the Israel Ministry of Sciencee supported by the Italian National Institute for Nuclear Physics (INFN)f supported by the Japanese Ministry of Education, Science and Culture (the
Monbusho) and its grants for Scientific Researchg supported by the Korean Ministry of Education and Korea Science and Engi-
neering Foundationh supported by the Netherlands Foundation for Research on Matter (FOM)i supported by the Polish State Committee for Scientific Research, grant no.
620/E-77/SPUB-M/DESY/P-03/DZ 247/2000-2002j partially supported by the German Federal Ministry for Education and Re-
search (BMBF)k supported by the Fund for Fundamental Research of Russian Ministry for
Science and Education and by the German Federal Ministry for Education
and Research (BMBF)l supported by the Spanish Ministry of Education and Science through funds
provided by CICYTm supported by the Particle Physics and Astronomy Research Council, UKn supported by the US Department of Energyo supported by the US National Science Foundationp supported by the Polish State Committee for Scientific Research, grant no.
112/E-356/SPUB-M/DESY/P-03/DZ 301/2000-2002, 2 P03B 13922q supported by the Polish State Committee for Scientific Research, grant no.
115/E-343/SPUB-M/DESY/P-03/DZ 121/2001-2002, 2 P03B 07022
VII

1 Introduction
Studies of the elastic production of vector mesons in electron-proton interactions [1] show
that at large Q2, the exchanged-photon virtuality, or at high vector-meson mass, the cross
section increases with energy faster than is observed in hadron-hadron interactions [2,3].
The latter increase is well described by Regge theory [4]. Although the energy dependence
of vector-meson production in ep interactions can be described by models based on Regge
phenomenology [5] and the vector dominance model (VDM) [6], it can also be explained
by models based on perturbative QCD (pQCD) [7,8]. In this case, it is related to the rise
of the gluon density in the proton as x decreases, where x is the Bjorken scaling variable.
In pQCD models, a perturbative (hard) scale can be provided by either a high Q2 or a
large meson mass. It is also predicted [9] that, in diffractive dissociation of hadrons, the
squared four-momentum transfer, t, may serve as a hard scale.
The subject of this paper is vector-meson (V ) photoproduction at high −t, which is dom-
inated by the proton-dissociative reaction, γp→ V Y , where Y is the dissociated hadronic
system. The data cover the photon-proton centre-of-mass energy range 80 < W < 120
GeV and extend from −t = 1.1 GeV2 up to −t = 12 GeV2 for the ρ0, to 7 GeV2 for the φ
and to 6.5 GeV2 for the J/ψ meson. The vector mesons were identified via their decays to
two oppositely charged particles: ρ0 → π+π−, φ→ K+K−, and J/ψ → l+l−(e+e−, µ+µ−).
2 Theoretical approaches
2.1 The Regge model
In Regge theory, diffractive processes are assumed to proceed through the exchange of the
Pomeron trajectory. The vector dominance model, schematically indicated in Fig. 1(a),
together with Regge theory, gives the following form for the double-differential cross
section for the reaction γp→ V Y :
d2σγp→V Y
dM2Y dt
= f(t)1
W 2
(
W 2
M2Y
)2α(t)−1
(M2Y )α(0)−1, (1)
where MY is the mass of the diffractively produced hadronic state, Y .
Assuming a linear form for the Pomeron trajectory, α(t) = α(0) + α′t, fits [10, 11] to
the elastic photoproduction of ρ0, φ and J/ψ mesons in the range −t < 1.5 GeV2 gave
α(0) = 1.096 ± 0.021 and α′ = 0.125 ± 0.038 GeV−2 for the ρ0, α(0) = 1.081 ± 0.010 and
α′ = 0.158 ± 0.028 GeV−2 for the φ, and α(0) = 1.200 ± 0.009+0.004−0.010 and α′ = 0.115 ±
0.018+0.008−0.015 GeV−2 for the J/ψ meson. These values may be compared to α(0) = 1.08 [2],
1

α(0) = 1.096 [3] and α′ = 0.25 GeV−2 [2], obtained from fits to hadron-scattering data at
−t < 0.5 GeV2. These numbers indicate that the Pomeron trajectory is not universal. In
fact, it has been suggested [12] that, in the production of vector mesons, an anomalous
Regge trajectory exchange, with α(0) ≈ 1 and α′ ≈ 0, gives a dominant contribution to
the differential cross section at large −t.
2.2 pQCD models
In models based on pQCD [13–18], the reaction γp → V Y is viewed as a sequence of
three successive processes, illustrated in Figs. 1(b) and 1(c): the photon fluctuates into a
qq pair; the qq pair scatters off a single parton in the proton by the exchange of a colour
singlet; the scattered qq pair becomes a vector meson and the struck parton and the proton
remnant fragment into a system of hadrons. The probability of the photon fluctuating
into a qq pair is parameterised by the photon wave-function. Many models assume that
the interaction of the qq pair with a parton in the proton is mediated in the lowest order
by the exchange of two gluons [13, 15, 17, 18]. The exchange of the gluon ladder has
also been computed [13, 14, 16, 18] in the leading logarithm approximation (LLA). The
transition of a qq pair into a meson is, however, a non-perturbative phenomenon that
must be parameterised by the meson wave-function derived from lattice calculations and
sum rules.
In the perturbative regime, the cross section for the process γp→ V Y is given by
d2σγp→V Y
dtdx= g(x,−t)dσγg→V g
dt+
∑
(q(x,−t) + q(x,−t))dσγq→V q
dt, (2)
where x is the fraction of the proton momentum carried by the struck parton and g(x,−t),q(x,−t) and q(x,−t) are the gluon, quark and antiquark density functions, respectively.
The cross section for the production of a vector meson through the interaction with a
gluon (Fig. 1(c)) is about five times larger than through the interaction with a quark
(Fig. 1(b)). At low x, therefore, the process γp → V Y should be dominated by the
reaction in which a gluon from the proton is struck.
In the two-gluon approximation, the cross section of Eq. (2) does not depend on W for
any given t, i.e. α′ = 0. In the LLA, this cross section has a power-law dependence on
W , although α′ is expected to be small, α′ . 0.1 GeV−2 for −t & 1 GeV2 [16], decreasing
with increasing −t and reaching zero at asymptotically large −t values.
A previous ZEUS publication [10] showed that dσ/dt for the γp → ρ0Y and γp → φY
processes were larger than those obtained by perturbative calculations performed in the
two-gluon approximation [15]. These calculations have been further developed by Ivanov
et al. [17], who proposed that a large contribution would arise from qq fluctuations in a
2

chiral-odd spin configuration. In this case, the quark mass appearing in the γV coupling
is interpreted as a current quark mass, and therefore the quark mass in the light-meson
wave-function is neglected. In such an approximation, dσ/dt for ρ0 and φ mesons should
have the same shape for −t & 1 GeV2. In addition, the cross sections should exhibit a
power-law dependence on t, dσ/dt ∝ (−t)−n; for x > 0.01, the exponent n ≈ 3.8 can be
estimated from the Ivanov et al. calculation [17] for a fixed value of the strong coupling
constant, αs, or n ≈ 4.8 using the leading-order form for αs(−t) [19].
In another two-gluon calculation, that of Forshaw and Ryskin [13], the quark mass ap-
pearing in the γV coupling is interpreted as the constituent quark mass. Such models
predict a dip in dσ/dt at −t ≈M2V , where MV is the meson mass.
A LLA BFKL [20] calculation has been carried out by Bartels et al. [16] for heavy mesons.
The results are expanded in terms of ln (xW 2/W 20 ), where W 2
0 = M2V − t is assumed. This
model predicts that dσ/dt ∝ (−t)−n, where n is a function of the ratio −t/M2V . For
the t range covered by the J/ψ analysis of this paper, an average value of n ≈ 1.8 is
predicted for a fixed value of αs. The previous ZEUS measurement of the γp → J/ψY
cross section [10] shows that the prediction of this model, using αs = 0.2, agrees well with
the data. However, the uncertainties due to the choice of αs and the W0 scale are large.
In a recent paper, Forshaw and Poludniowski [18] have extended the BFKL models of
Forshaw and Ryskin [13] and Bartels et al. [16], and have given cross sections for the ρ0,
φ and J/ψ mesons. In this model, which uses a fixed value for αs, a delta-function meson
wave-function was used and the quark mass appearing in the γV coupling was assumed
to be the constituent quark mass for all three mesons.
2.3 Helicity structure and cross-section ratios
The hypothesis of s-channel helicity conservation (SCHC) [21] for vector-meson produc-
tion states that the helicity of the final-state meson will be equal to that of the initial
photon. Studies of the elastic photoproduction of light vector mesons at low −t [1] show
that SCHC holds in these soft diffractive processes.
In VDM, the cross section for vector-meson production is proportional to the product of
the coupling of the photon to the vector meson and the meson-proton scattering cross
section. The γ → V coupling depends on the meson leptonic width, ΓV→e+e−, which
depends on the meson mass, the quark assignment and the wave-function. The SU(4)
prediction, which ignores the differences in the masses and the wave-functions of the
mesons, is that the ratio of the production cross sections for vector mesons will be
ρ0 : ω : φ : J/ψ = 1 : 1/9 : 2/9 : 8/9. (3)
3

In pQCD, the helicity of the final-state meson and the cross-section ratios are sensitive
to the photon polarisation and the meson wave-function. In the trivial case of a meson
wave-function given by a delta function, which is a good approximation for heavy vector
mesons, the helicity of the final-state vector meson is equal to that of the initial photon,
and thus SCHC will hold. In this case, the cross-section for transverse photons is given by
dσ/dt ∝M3V ΓV→e+e− [13,16,18]. Based on the measured values of MV and ΓV→e+e− [22],
the ratio of the photoproduction cross sections for various vector mesons at asymptotic
values of −t becomes
ρ0 : ω : φ : J/ψ = 1 : (0.8 × 1/9) : (2.1 × 2/9) : (56 × 8/9), (4)
which is significantly higher than the SU(4) prediction of Eq. (3) for the φ and J/ψ meson.
A wave-function more appropriate for the light mesons [15, 17] leads to the production
of mesons in the helicity-0 state by transverse photons and therefore to a violation of
SCHC. The ratios of the production cross sections for mesons in the helicity-±1 states
by transverse photons are equal to those of Eq. (4). The production of mesons in the
helicity-0 state by transverse photons, which is expected to be dominant at large −t, is
given by dσ/dt ∝ MV ΓV→e+e− rather than M3V ΓV→e+e− mentioned earlier. In this case,
the ratios of the photoproduction cross sections at large −t should be
ρ0 : ω : φ : J/ψ = 1 : (0.8 × 1/9) : (1.2 × 2/9) : (3.5 × 8/9), (5)
which lie between the values of Eqs. (3) and (4).
3 Experimental set-up
The measurements were performed with the ZEUS detector at the HERA ep collider.
The data, corresponding to an integrated luminosity of 25.0 ± 0.4 pb−1, were collected
in 1996 and 1997, when HERA operated with a proton-beam energy of 820 GeV and a
positron-beam energy of 27.5 GeV.
A detailed description of the ZEUS detector can be found elsewhere [23]. A brief outline
of the components that are most relevant for this analysis is given below.
Charged particles are tracked in the central tracking detector (CTD) [24], which oper-
ates in a magnetic field of 1.43 T provided by a thin superconducting coil. The CTD
consists of 72 cylindrical drift chamber layers, organized in 9 superlayers covering the
4

polar-angle1 region 15◦ < θ < 164◦. The transverse-momentum resolution for full-length
tracks is σ(pT )/pT = 0.0058pT ⊕ 0.0065 ⊕ 0.0014/pT , with pT in GeV.
The high-resolution uranium–scintillator calorimeter (CAL) [25] consists of three parts:
the forward (FCAL), the barrel (BCAL) and the rear (RCAL) calorimeters. Each part
is subdivided transversely into towers and longitudinally into one electromagnetic sec-
tion (EMC) and either one (in RCAL) or two (in BCAL and FCAL) hadronic sections
(HAC). The smallest subdivision of the calorimeter is called a cell. The CAL energy res-
olutions, as measured under test-beam conditions, are σ(E)/E = 0.18/√E for electrons
and σ(E)/E = 0.35/√E for hadrons (E in GeV).
A proton-remnant tagger (PRT1) [26] was used to tag events in which the proton dissoci-
ates. It consists of two layers of scintillation counters at Z = 5.15 m. The pseudorapidity
range covered by the PRT1 is 4.3 < η < 5.8.
The photoproduction tagger (PT) [10] is a small electromagnetic calorimeter located close
to the beam-pipe at Z = −44 m. It detects positrons of energy between 21 and 26 GeV
scattered under very small angles (less than a few mrads). The positron measured in the
PT is used to tag photoproduction events with a photon-beam energy in the 1.5–6.5 GeV
range.
The luminosity is determined from the rate of the Bethe-Heitler bremsstrahlung process
e+p → e+γp, where the high-energy photon is detected in a lead-scintillator calorimeter
(LUMI) located at Z = −107 m in the HERA tunnel [27].
4 Kinematics and decay distributions
Figure 1(d) shows a diagram of the reaction
e(k)p(P ) → e(k′)V (v)Y (P ′),
where V is a ρ0, φ, or J/ψ meson and k, k′, P , P ′ and v are the four-momenta of the
incident positron, scattered positron, incident proton, diffractively produced state Y and
vector meson, respectively. The kinematic variables used to describe proton-dissociative
vector-meson production are:
1 The ZEUS coordinate system is a right-handed Cartesian system, with the Z axis pointing in the
proton beam direction, referred to as the “forward direction”, and the X axis pointing left towards
the centre of HERA. The coordinate origin is at the nominal interaction point. The pseudorapidity
is defined as η = − ln(
tan θ2
)
, where the polar angle, θ, is measured with respect to the proton beam
direction.
5

• Q2 = −q2 = −(k− k′)2, the negative of the squared four-momentum of the exchanged
photon;
• y = (P · q)/(P · k), the fraction of the positron energy transferred to the photon in the
rest frame of the initial-state proton;
• W 2 = (q + P )2, the squared centre-of-mass energy of the photon-proton system;
• t = (P − P ′)2 = (v − q)2, the squared four-momentum exchanged at the hadronic
vertex;
• x, the fraction of the proton’s momentum carried by the scattered parton. Assuming
that the exchanged object in the photon-proton scattering couples to a single massless
parton in the proton
x =−(P ′ − P )2
2P (P ′ − P )= −t/(M2
Y −M2p − t), (6)
where Mp is the mass of the proton and M2Y = (P ′)2 is the squared mass of the
diffractively produced state, Y .
The angles used are shown in Fig. 2 and are:
• Φ, the angle, in the photon-proton centre-of-mass frame, between the positron-scattering
plane and the V -production plane. The latter contains the momentum vectors of the
virtual photon and the vector meson;
• θh and ϕh, the polar and azimuthal angles of the positively charged decay particle in
the V helicity frame. The helicity frame is the rest frame of the meson with the meson
direction in the photon-proton centre-of-mass frame taken as the quantisation axis.
The polar angle, θh, is defined as the angle between the direction of the positively
charged decay particle and the quantisation axis. The azimuthal angle, ϕh, is the
angle between the decay plane and the V -production plane.
Only the momentum vectors of the meson decay products were measured. The momen-
tum of the scattered positron (and hence Q2), the angle Φ, and the mass MY were not
measured.
In the tagged photoproduction events, Q2 ranges from Q2min ≈ 10−9 GeV2 up to Q2
max ≈0.02 GeV2, with a median Q2 of approximately 7 × 10⁻⁶ GeV2 [10]. The value of Q2 was
neglected in the reconstruction of the other kinematic variables.
The variables W and t can be expressed as [10]
W 2 ≈ 2Ep(E − pZ) and t ≈ −p2T ,
6

where Ep is the incoming proton energy and E is the energy, pZ is the longitudinal
momentum and pT is the transverse momentum of the produced vector meson in the
laboratory frame.
Since Φ is not measured, the three-dimensional angular distribution was averaged over
this angle, so that the ±1 photon-helicity states are not distinguished. The normalised
two-dimensional angular distribution can then be written in terms of spin density matrix
elements as
1
σ
d2σ
d cos θhdϕh=
3
4π
{
1
2(1 ∓ r04
00) ± 1
2(3r04
00 − 1) cos2 θh
∓√
2Re[r0410] sin 2θh cosϕh ∓ r04
1−1 sin2 θh cos 2ϕh
}
, (7)
where the upper (lower) signs are for the V decay to spin-0 (spin-1/2) particles. Integra-
tion over θh or ϕh produces the one-dimensional distributions
dσ
d cos θh∝ 1 ∓ r04
00 ± (3r0400 − 1) cos2 θh (8)
and
dσ
dϕh∝ 1 ∓ r04
1−1 cos 2ϕh. (9)
Since Q2 is very small for this study, the contribution from photons in the helicity-0 state
is negligible. In this case, the matrix elements are related to the helicity amplitudes,
TλV λγ, as follows [28]:
r0400 ≈ T 2
01
T 201 + T 2
11 + T 2−11
, r0410 ≈ 1
2
(T11T⋆01) + (T−11T
⋆01)
T 201 + T 2
11 + T 2−11
, r041−1 ≈
1
2
(T11T⋆−11) + (T−11T
⋆11)
T 201 + T 2
11 + T 2−11
,
(10)
where T11 is the helicity non-flip amplitude, T01 is the helicity single-flip amplitude and
T−11 is the helicity double-flip amplitude. If SCHC holds, only the T11 amplitude is
non-zero and therefore r0400, r04
10 and r041−1 should all be zero.
5 Event selection
Events were selected online with a three-level trigger system [23]. The selection of the
reaction ep→ eV Y at large values of −t required:
• at the first trigger level:
– a minimum energy deposit of 1 GeV in the PT;
7

– at least one track candidate in the CTD.
In addition, the following cuts were applied to further reduce the backgrounds from
random coincidences between some activity in the CTD and a detected positron in
the PT:
– an upper limit of 1 GeV on the energy deposited in the LUMI photon detector. This
requirement suppresses bremsstrahlung events and rejects hard QED radiation;
– at least 0.5 GeV of energy deposit in the EMC section of the RCAL. This cut
rejects proton-gas events. However, it also reduces the acceptance for ep → eV Y
events and therefore was used only when necessary;
• at the second trigger level:
– CAL timing consistent with an ep collision;
– not more than three tracks in the CTD;
• at the third trigger level:
– exactly two tracks in the CTD pointing to a common vertex within −60 < Z <
60 cm;
– the transverse momentum of at least one track candidate greater than 0.8 GeV.
This cut efficiently selects events with large values of −t.
After the event reconstruction, the following requirements were imposed:
• an interaction vertex within −40 < Z < 40 cm and a transverse distance within 0.7 cm
of the nominal interaction point (IP);
• exactly two tracks with opposite charges, each associated with the reconstructed event
vertex, and each with pseudorapidity |η| < 2.1 and transverse momentum greater than
150 MeV for the ρ0, 400 MeV for the φ, and 500 MeV for the J/ψ candidates;
• energy deposits in the CAL (excluding FCAL cells with η > 2.1), not associated with
tracks, smaller than 250 MeV. This cut rejects events with an additional particle not
associated with either the vector meson or the proton-dissociative system.
In addition, −t > 1.1 GeV2 and 80 < W < 120 GeV were required to select a kinematic
region of high acceptance. The final number of events, after all selection cuts, was 21414
for 0.55 < Mππ < 1.3 GeV, 2407 for 0.99 < MKK < 1.06 GeV and 214 for 2.7 < Mll <
3.2 GeV.
6 Monte Carlo simulation and acceptance calculation
8

6.1 Monte Carlo simulation
The EPSOFT [29] Monte Carlo (MC) generator was used for the simulation of the reaction
γp→ V Y . The particular version [30] used here had an improved simulation of the final-
state particle multiplicity. The DIFFVM [31] MC generator was used for systematic
checks. In these generators, γp interactions are simulated assuming the exchange of
a colourless object. The cross-section d2σγp→V Y /(dtdM2Y ) was parameterised using an
exponential t distribution and a 1/M2Y distribution; SCHC was also assumed. Because
the MC samples thus generated did not give a sufficiently good description of the data,
they were reweighted as described in the next section. The only difference between the
EPSOFT and DIFFVM generators that is relevant for this analysis is the fragmentation
scheme of system Y :
• in EPSOFT, the exchanged object is assumed to couple to the whole proton (Fig. 1(a)),
which subsequently fragments into a state Y . The particle multiplicities and the
transverse momenta of the hadrons in Y are simulated using parameterisations of
pp data [32], while the longitudinal momenta are generated with a uniform rapidity
distribution;
• in DIFFVM, the exchanged object couples to a single quark (Fig. 1(b)) in the proton.
The fraction of the proton’s momentum carried by the struck quark is given by Eq. (6).
The struck quark and the diquark remnant are colour-connected and are fragmented
into the final-state Y by the JETSET7.3 [33] program.
As pointed out in Section 2.2, pQCD models predict that the process γp → V Y is
dominated by the reaction involving a gluon (Fig. 1(c)) from the proton. This process
was implemented as an option in DIFFVM. In the following sections, the DIFFVM sample
where this option was selected is called DIFFVMg, while the DIFFVM sample in which
the proton emits a quark is called DIFFVMq.
The response of the ZEUS detector to generated particles was simulated using a pro-
gram based on GEANT3.13 [34]. The generated events were processed through the same
selection and reconstruction procedures as the data.
6.2 Modelling of the dissociative-system Y
The FCAL energy distributions are sensitive to the fragmentation schemes of the system
Y as well as to the shape of the generated MY distribution. The latter was reweighted
with a function (1/M2Y )β(t)−1 to have the effective dependence
dσγp→V Y
dM2Y
∝(
1
M2Y
)β(t)
. (11)
9

The exponent β(t) was chosen so as to reproduce the measured energy distributions in
the FCAL for the ρ0 data sample: β(t) = 0.93e0.11t for EPSOFT and β(t) = 0.67e−0.1t
for DIFFVMg. These parameterisations are also valid for the φ and J/ψ mesons. The
comparisons between the data and the MC simulations are displayed in Fig. 3 for several
t ranges and for the three mesons. The agreement is satisfactory for DIFFVMg and
EPSOFT but not for DIFFVMq (shown only for the ρ0 in Fig. 3). This observation is
consistent with the pQCD expectation that the photoproduction of vector mesons with
proton dissociation at low x is dominated by the reaction in which a gluon from the
proton couples to the vector meson. The DIFFVMg samples were used for systematic
checks since the results do not change significantly when the mixture of DIFFVMq and
DIFFVMg expected in Eq. (2) was used.
6.3 Acceptance corrections
The overall acceptance is the product of the PT acceptance and that of the main detec-
tor. The geometric acceptance of the PT was evaluated with a program that uses the
HERA beam-transport matrices to track the positron through the HERA beamline. The
simulation was tuned so as to reproduce the tagging efficiency of the PT for Bethe-Heitler
events, ep → eγp, triggered by a photon measured in the LUMI photon detector. This
procedure was described previously [10]. The variations of the position and tilt of the
positron beam at the IP observed during data taking [35] were also simulated.
The efficiency for photoproduction events was determined using the geometric acceptance
of the PT and events were generated according to the equivalent-photon approxima-
tion [36]. The photoproduction tagging efficiency, calculated as a function of the positron
energy, Ee′ , is shown in Fig. 4. The range 80 < W < 120 GeV was chosen so that the
systematic uncertainty of the tagging efficiency, shown by the shaded area, does not dom-
inate the total systematic uncertainty. For the kinematic range used in this analysis, the
cross-section-weighted PT acceptance averages 80 ± 6% 2.
The decay-angle distributions at the generator level were iteratively reweighted according
to Eq. (7) using the spin density matrix elements found in this study (see Section 9.6)
The spin density matrix elements for the ρ0 and φ mesons were assumed to be linear
functions of t; SCHC was assumed for the J/ψ meson. The generated t distributions were
reweighted with a function eP (t), where P (t) is a polynomial, to reproduce those observed
in the data. The resulting simulation agrees reasonably well with the data, as shown
in Fig. 5.
2 For these data, the PT was shifted closer to the positron beam, yielding a higher tagging efficiency
than in the previous ZEUS measurement [10].
10

Acceptance corrections evaluated on the basis of the reweighted EPSOFT sample, which
gives the best description of the data, were calculated separately for each bin of any given
variable.
On average, 6% of ep → eV Y events were rejected by the trigger due to accidental coin-
cidence with bremsstrahlung photons in the LUMI calorimeter. This effect was corrected
for in the analysis.
7 Backgrounds
The dominant background sources, common to all channels, came from the double-
dissociative, γp → XY , and non-diffractive, γp → anything, processes. Additional back-
grounds contributing to individual channels are non-resonant π+π− production for the ρ0
sample, ρ0 production for the φ sample, and inelastic Bethe-Heitler production of e+e−
and µ+µ− pairs for the J/ψ sample. These backgrounds were statistically subtracted
using the fits to the invariant-mass distributions described in Section 9.2.
The contribution of elastic vector-meson production (γp→ V p) to the data was estimated
from the fraction of events, F , with a signal in one of the PRT1 counters above a threshold
corresponding to the signal of a minimum-ionising particle. For elastic vector-meson pro-
duction, such energy deposits are absent. A comparison of the EPSOFT prediction with
the measured values of F shows that the contribution from the elastic process decreases
from about 0.2 at −t = 1.2 GeV2 to about 0.05 at −t = 3.0 GeV2. The precision with
which this background is known is 0.01 for the ρ0, 0.03 for the φ and 0.1 for the J/ψ
meson. This background was statistically subtracted bin by bin. For −t > 3 GeV2, the
contamination from the elastic reaction was consistent with zero and was neglected.
The contributions from the ω and φ mesons (decaying to π+π−π0) in the ρ0-candidate
sample were estimated using a MC simulation and the cross-section ratio given by the
SU(4) prediction of 1/9 for ω/ρ0 and the results of this analysis for φ/ρ0 (see Section 9.4).
This background was less than 3%. The contribution from the ψ′ meson (decaying to
J/ψ+ neutrals) in the J/ψ candidate sample was less than 3%. These backgrounds
contribute to the overall normalisation uncertainty.
8 Systematic uncertainties
The overall systematic uncertainties in the cross sections and density matrix elements in
each bin were obtained by summing in quadrature the uncertainties listed below:
• event selection:
11
– the selection cuts, described in Section 5, were varied within the resolutions of the
cut variables;
– a different procedure to associate CTD tracks and CAL objects was used.
The effect on the cross sections was less than ±10%, and less than ±0.03 in the spin
density matrix elements;
• signal extraction:
– the parameterisations of the signal shape were changed from the functional forms
to the MC expectations;
– the ranges of the Mππ, MKK and Mll mass distributions used in the fit procedure
described in Section 9.2 were varied by their resolutions.
This resulted in changes of less than ±10% in the cross sections and less than ±0.01
in the spin density matrix elements;
• modelling of the dissociative-system Y :
– β(t) in Eq. (11) was changed to β(t) = (0.93 ± 0.07)e(0.11±0.06)t for the ρ0, β(t) =
(0.93± 0.17)e(0.19±0.17)t for the φ and β(t) = 0.73± 0.37 for the J/ψ meson. These
ranges were chosen to maintain a satisfactory agreement between the measured
FCAL energy distributions and the EPSOFT simulation;
– the fragmentation scheme of the system Y was changed by using DIFFVMg instead
of EPSOFT for the acceptance corrections;
– M2Y −M2
p − t was used instead of M2Y [37] in Eq. (11);
– the 1/M2Y dependence was reweighted to agree with the pQCD prediction of
Eq. (2) 3.
The resulting uncertainty in the cross sections, coming mainly from the β(t) variation,
was less than ±20%. All checks in this class change the generated MY distribution.
Therefore, to avoid double counting, the maximum deviation from the nominal value
was taken as the total systematic uncertainty of this class of systematic check. Since
the MC simulation assumes factorisation of the proton and meson vertices, these
systematic checks result in no changes to the spin density matrix elements;
• reweighting of the other MC distributions in EPSOFT:
– the θh and ϕh distributions were reweighted according to the SCHC predictions
for the ρ0 and φ mesons. For the J/ψ, the values r0400 = 0.13 or r04
1−1 = ±0.2 were
used, corresponding to one standard deviation from the SCHC values, as discussed
in Section 9.6;
3 The GRV98 [19] parton densities were used, but the results do not change when other parameterisations
are selected.
12
– the t and W distributions were reweighted by a power-law function of t and W ,
respectively, whilst maintaining satisfactory agreement between the data and the
MC distributions.
These modifications to the analysis procedure lead to changes in the cross section of
less than 7% and less than ±0.01 in the spin density matrix elements;
• calorimeter trigger efficiency:
– the EMC RCAL trigger efficiency was varied within its uncertainty, as determined
from subsamples of events triggered without the requirement of an energy deposit
in the EMC section of the RCAL.
This resulted in changes to the cross sections of less than ±5% and variations in the
spin density matrix elements of up to ±0.01;
• normalisation uncertainty:
– PT acceptance; the systematic uncertainty related to the PT acceptance was eval-
uated by varying the inputs to the MC simulation. The energy scale for photons
measured in the LUMI detector was changed by ±50 MeV [27], the horizontal
position of the PT by ±0.3mm, and the average position of the IP by ±0.1mm.
These variations correspond to the systematic uncertainties, as calculated from
the Bethe-Heitler event sample, discussed in Section 6.3. The effect on the cross
sections was ±6%;
– tracking-trigger efficiency; the uncertainty on the CTD trigger efficiency was esti-
mated from an independently triggered data sample and corresponds to an uncer-
tainty on the cross section of ±4%;
– PRT1 acceptance; the systematic uncertainty related to the PRT1 acceptance was
estimated from the difference between the fraction of events with a signal in the
PRT1 in the data and in the EPSOFT simulation in the region of large −t, where
the elastic contribution is expected to be negligible. This resulted in a systematic
uncertainty of ±3% in the cross sections. This value was also used in the low −tregion;
– other uncertainties; backgrounds from the ω and φ mesons in the ρ0 sample and
from the ψ′ meson in the J/ψ sample (−3%), as discussed in Section 7 ; QED
radiation (±2%) [10]; measurement of the integrated luminosity (±1.8%) [27];
The overall normalisation uncertainty of ±10% was the sum in quadrature of the above
uncertainties. This uncertainty does not affect the spin density matrix elements.
13

9 Results
Although MY (and hence x) was not measured, the trigger and offline selection restricted
MY to be . 25 GeV, which corresponds to 0.005 . x < 1 at −t = 2 GeV2 and 0.03 . x < 1
at −t = 10 GeV2. To facilitate the comparison of the data with the pQCD predictions,
the cross sections presented in the following sections were evaluated in the fixed x range
0.01 < x < 1, which approximately corresponds to the x range covered by the data at the
average t of this analysis.
9.1 Cross-section determination
The differential cross-section dσγp→V Y /dξ for the photoproduction process γp→ V Y was
obtained from the cross section measured for the reaction ep → eV Y in each bin of the
variable ξ(= t, ϕ, cos θh) as
dσγp→V Y
dξ=
dσep→eV Y
dξ
1
Φγ=
NV
∆ξ · L · Φγ · BV,
where Φγ is the effective photon flux [36], NV is the background-corrected and acceptance-
corrected number of vector mesons in the range ∆ξ, extracted using the fits described
in Section 9.2, L is the integrated luminosity and BV is the branching ratio of the vector-
meson decay channel. The cross sections for ρ0 production were integrated over the range
2Mπ < Mππ < Mρ + 5Γρ.
9.2 Mass distributions
The ππ, KK, and ll mass spectra for two representative t ranges, together with the results
of the fits discussed below, are shown in Fig. 6.
The acceptance-corrected ππ mass spectra for the ρ0-candidate sample were fitted in the
range 0.55 < Mππ < 1.3 GeV using the Soding parameterisation [38]:
dσ
dMππ
= A2ρ0
∣
∣
∣
∣
∣
√
MππMρ0Γρ0
M2ππ −M2
ρ0 + iMρ0Γρ0+B/Aρ0
∣
∣
∣
∣
∣
2
+ fPS(Mππ), (12)
where B is the non-resonant amplitude (taken to be constant and real), Aρ0 is the normal-
isation of the resonant amplitude, Mρ0 is the ρ0 mass and Γρ0 is the momentum-dependent
ρ0 width [39]. The additional term fPS = APS(1 + 1.5Mππ) [10] was used to account for
residual background from the non-diffractive γp→ anything and the diffractive γp→ XY
processes. The χ2/ndf for all the fits is satisfactory. The ratio |B/Aρ0| decreases from
14

0.13 ± 0.02 GeV−1/2 at −t = 1.3 GeV2 to 0.05 ± 0.03 GeV−1/2 at −t = 2.3 GeV2 and is
consistent with zero above −t = 2.5 GeV2. The background contribution in the range
0.6 < Mππ < 1.3 GeV, given by the integral of the function fPS, increases from about
8 ± 2% at −t = 1.3 GeV2 to 17 ± 4% at −t = 2.7 GeV2 and is consistent with 15% above
−t = 3.2 GeV2.
The detector efficiency does not vary over the region of the φ and J/ψ peaks. The φ and
J/ψ signals were, therefore, extracted from the uncorrected mass spectra. The KK mass
spectra for the sample of φ candidates were fitted in the range 0.99 < MKK < 1.15 GeV
with the sum of a Breit-Wigner function convoluted with a Gaussian resolution function
for the signal, and the function (MKK−2MK)δ for the background. The χ2/ndf for all the
fits is satisfactory. The background contribution in the range 0.99 < MKK < 1.06 GeV
decreases from 25 ± 2% at −t = 1.3 GeV2 to 3 ± 2% above −t = 4 GeV2.
The ll mass spectra for the J/ψ candidate sample in the dilepton-invariant-mass range
2.6 < Mll < 3.4 GeV were fitted with the sum of a Gaussian (for the muon decay channel),
a bremsstrahlung function convoluted with a Gaussian (for the electron decay channel),
and a background term linear in Mll. No muon or electron identification was performed;
the relative contributions of muon and electron pairs were taken from the MC simulation.
The electron mass4 was used in calculating Mll. The χ2/ndf for all the fits is satisfactory.
The background contribution in the range 2.7 < Mll < 3.2 GeV is 25±2%, approximately
independent of the t range under study.
Since the backgrounds depend on t, W , cos θh and ϕh, each of the results presented in the
following sections was obtained by repeating the fits to the invariant mass distributions
in each kinematic bin.
9.3 Measurement of dσγp→V Y /dt
Tables 1 - 3 and Fig. 7 show the differential cross sections for the ρ0, φ and J/ψ mesons
obtained from the present data together with results obtained in the ZEUS 1995 [10]
study of the lower −t region. In that analysis, the cross section was determined for
M2Y /W
2 < 0.01. In the kinematic region −t ≈ 1 GeV2 and W ≈ 100 GeV, this limit
is numerically equivalent to that used in the present study, so that the results may be
directly compared. The two measurements are consistent in the region of overlap.
The cross sections are well described by a power-law dependence, as expected for a hard
production mechanism [9]. A fit to the present data with the function A · (−t)−n gives
n = 3.21 ± 0.04(stat.)±0.15(syst.) for the ρ0, n = 2.7 ± 0.1(stat.)±0.2(syst.) for the φ,
and n = 1.7 ± 0.2(stat.)±0.3(syst.) for the J/ψ meson.
4 The results do not change when the muon mass is used.
15

The measured values of n for the ρ0 and φ mesons are significantly smaller than the lower
limit n ≈ 3.8 predicted by Ivanov et al. [17]. The value of n for the J/ψ meson agrees
with the Bartels et al. [16] BFKL prediction of 1.8. The BFKL prediction of Forshaw
and Poludniowski [18], for the most natural choice of αs = 0.2 and W 20 = M2
V , gives
χ2/ndf = 0.5 for all three mesons and is shown in Fig. 8. These measurements establish
that perturbative QCD calculations are able to describe the large −t regime. The dip at
−t ≈ M2V predicted by the two-gluon exchange model of Forshaw and Ryskin [13] is not
seen [18] in the data for light mesons, indicating that this model is not applicable in the
−t ≈M2V region.
Note that n depends slightly on the x range used in the cross-section definition both in
the experiment and in the theory. Hence the values quoted in this paper apply only to
the cross section integrated over x > 0.01.
9.4 Ratios of cross sections
The cross-section ratios
rφ ≡ dσγp→φY
dt/
dσγp→ρ0Y
dt
and
rJ/ψ ≡ dσγp→J/ψY
dt/
dσγp→ρ0Y
dt
are shown in Tables 4 and 5 and in Fig. 9, together with the values given in Eqs. (3), (4)
and (5). A clear increase of rφ and rJ/ψ with increasing −t is observed.
The dependence of rφ and rJ/ψ on t suggests that the production mechanism may become
flavour independent at larger −t values than covered in this analysis. In the framework
of pQCD, this observation supports the hypothesis that the quark mass appearing in the
γV coupling should be the constituent quark mass, since, in this case, the asymptotic
value of rφ should be reached at −t ≫ M2ρ0 ,M
2φ. If the quark mass is interpreted as the
current quark mass, rφ is expected to approach its asymptotic value at much smaller −tvalues.
The cross-section ratios given in Eq. (5), expected for the production of mesons in the
helicity-0 state by transverse photons at large t [15, 17], are the same as those expected
from pQCD for the elastic production of mesons in the helicity-0 state by longitudinal
photons at large Q2 [8, 40]. The cross-section ratios for production of mesons in the
helicity-±1 states are expected to be larger than those for production of mesons in the
helicity-0 state. Figure 10 compares the t and Q2 dependences of the ratios for the
16

proton-dissociative and for the elastic process, respectively; rφ lies systematically above
σγ∗p→φp/σγ∗p→ρ0p [41, 42] but is compatible within the experimental uncertainties, while
rJ/ψ for −t > 3 GeV2 is about a factor of five larger than σγ∗p→J/ψp/σγ∗p→ρ0p for Q2 >
3 GeV2 as measured by ZEUS [43] and H1 [44, 45] 5. The helicity analysis, described in
Section 9.6, shows that the production of mesons in the helicity-±1 states dominates in
the large −t region.
9.5 The slope of the Pomeron trajectory
The cross section given by Eq. (1), integrated over MY , can be expressed as
dσγp→V Y
dt= F (t)W 4α(t)−4,
where F (t) is a function of t only. Assuming a linear form for the Pomeron trajectory
implies
dσγp→V Y
dt= F (t)W 4α(0)+4α′t−4 = F (t)G(W )W 4α′t, (13)
where G(W ) is a function of W only.
The absolute W dependence, and hence α(t), cannot be measured using the present data
because of the large anti-correlated systematic uncertainties of the PT acceptance as a
function of W . However, these uncertainties do not affect the measurement of the relative
changes of the W dependence as a function of t, which are sensitive to α′. The slope of the
Pomeron trajectory for the ρ0 meson was obtained by fitting the form given by Eq. (13) to
the measured cross sections using threeW times six t bins. A two-dimensional fit gave α′ =
−0.02± 0.05(stat.)+0.04−0.08(syst.) GeV−2 with χ2/ndf = 4.6/9. A similar fit for the φ meson,
performed in three W times five t bins, gave α′ = −0.06 ± 0.12(stat.)+0.05−0.09(syst.) GeV−2
with χ2/ndf = 3.4/7. There were insufficient data to perform a similar analysis on the
J/ψ sample.
The consistency of the α′ values with zero implies that the W dependence does not vary
with t, and vice versa. This conclusion is manifest when looking at the W dependence of
the ratio of differential cross sections
dσ(W )dt
dσ(W )dt
|t=t0∝W 4α′(t−t0),
shown in Figs. 11 and 12. Values of −t0 = 1.3 GeV2 were chosen for the ρ0 and −t0 =
1.5 GeV2 for the φ case.
5 The J/ψ data from H1 have been scaled from W = 90 GeV to W = 75 GeV and the ρ0 data calculated
at the same Q2 values using a fit of the form (Q2 +M2
ρ0)−n [46]
17

Figure 13 compares the values of α′ measured in this analysis with those obtained at
lower −t. For both ρ0 and φ mesons, the values of α′ for −t > 1.3 GeV2 are smaller
than the value α′ = 0.25 GeV−2 characteristic of soft hadronic processes at −t < 0.5 GeV2
and also below the values α′ = 0.125 ± 0.038 GeV−2, α′ = 0.158 ± 0.028 GeV−2 and
α′ = 0.113 ± 0.018 GeV−2 obtained for −t < 1.5 GeV2, from fits [10, 11] to the elastic
photoproduction of ρ0, φ and J/ψ mesons, respectively. This observation indicates that
α′ decreases with increasing −t. The small values of α′ obtained in this analysis are
consistent with the flatness of the Pomeron trajectory observed by UA8 [47] at large −tand with the expectation of the anomalous Regge exchange model by Kochelev et al. [12].
They are also consistent with the expectation of α′ = 0 characteristic of the two-gluon-
exchange models [13,15,17,18] and the expectation of α′ . 0.1 GeV−2 of the BFKL model
of Bartels et al. [16].
9.6 Decay angular distributions
The r0400 and r04
1−1 spin density matrix elements for the ρ0, φ, and J/ψ were obtained by
fitting Eqs. (8) and (9) to the background-subtracted and acceptance-corrected data in
several t ranges. The t ranges and the results of the fits are given in Tables 6, 7 and
8. As an example, Fig. 14 shows the cos θh and ϕh distributions with the results of the
fits in the highest −t bin used in the helicity analysis for each of the three mesons. The
flat ϕh distribution shown by the dashed line disagrees (χ2/ndf = 42/7) with the ρ0
data, indicating a violation of SCHC. The parameter Re[r0410] for the ρ0 and φ mesons was
determined using a two-dimensional fit of Eq. (7) in three and two t intervals, respectively.
The results of the fits are summarised in Tables 6 and 7. The above results were also
confirmed by a decay-angle analysis [48] performed in the transversity frame 6. There
were insufficient data to perform a two-dimensional fit for the J/ψ meson.
The fitted values of r0400, Re[r04
10], and r041−1 for the ρ0 meson are displayed in Fig. 15. The
results are consistent with the ZEUS 1995 [10] measurements in the overlap region. The
small values of r0400 indicate that the probability to produce ρ0 mesons in the helicity-0
state from a photon in the helicity-±1 states is 4 ± 5% at −t = 3.35 GeV2 and 9 ± 6%
at −t = 5.67 GeV2. However, the non-zero value of Re[r0410] indicates a helicity single-flip
contribution at the level of a few percent. The finite negative values of r041−1 show clear
evidence for a helicity-double-flip contribution.
The measurements for the φ meson, shown in Fig. 16, display similar features to those
for the ρ0 meson, although with a smaller statistical significance. The values of r0400 and
6 The spin-quantisation axis in the transversity frame is chosen along the normal to the meson production
frame.
18

r041−1 for the J/ψ meson, shown in Fig. 17, are consistent with the SCHC hypothesis.
Although the BFKL calculation of Forshaw and Poludniowski [18] successfully describes
the cross sections for all three mesons, it is not in accord with the observation of SCHC
violation. This calculation forces SCHC by using a delta-function for the meson wave-
function.
If a more appropriate meson wave-function for the light mesons is used, the helicity of the
final-state meson will depend on the modelling of the photon fluctuation into a qq pair.
Within perturbation theory, a photon can only split into a qq pair in a chiral-even spin
configuration. If, in addition, the quark appearing in the γV coupling is interpreted as a
current quark, as assumed by Ginzburg and Ivanov [15], real photons will produce light
mesons only in the helicity-0 state because of the chiral nature of the perturbative coupling
in the massless limit. Not only does this model not agree with the cross section [10],
but it is also ruled out by the helicity data. Ivanov et al. [17] have proposed that a
large contribution of light mesons produced in the helicity-±1 states could arise from
qq fluctuations in a chiral-odd spin configuration. This model fails to describe the cross
section and does not quantitatively describe the helicity structure.
10 Summary
Diffractive photoproduction of ρ0, φ and J/ψ mesons with proton dissociation has been
measured in the ZEUS detector at HERA using data at W ≈ 100 GeV for −t values up to
12 GeV2. Expressing the differential cross section as a power-law, dσγp→V Y /dt ∝ (−t)−n,
yields a value for n that decreases with increasing mass of the meson. The resulting expo-
nents are: 3.21± 0.04(stat.)±0.15(syst.) for ρ0 production; 2.7± 0.1(stat.)±0.2(syst.) for
φ production; and 1.7± 0.2(stat.)±0.3(syst.) for J/ψ production. The BFKL calculation
of Bartels et al. [16] agrees with the J/ψ data. An extension of this model by Forshaw
and Poludniowski [18] is able to describe the data for all three mesons.
The cross-section ratios for the φ and J/ψ with respect to the ρ as a function of t in-
crease with −t. In the context of pQCD, this observation suggests that the production
mechanism may become flavour independent at larger −t values than those covered in
this analysis.
The decay-angle analysis for the ρ0 and φ mesons indicates that the SCHC hypothesis
does not hold, since both single and double helicity-flip contributions are observed. No
available pQCD calculation is able to describe this result quantitatively.
The effective slope of the Pomeron trajectory, α′, was determined by studying the relative
changes of the W dependence of the cross-section as a function of t for the ρ0 and φ
19

mesons. The slopes are α′ = −0.02 ± 0.05(stat.)+0.04−0.08(syst.) GeV−2 for the ρ0 meson and
α′ = −0.06±0.12(stat.)+0.05−0.09(syst.) GeV−2 for the φ meson. These values are lower than the
value characteristic of low −t hadronic scattering (α′ = 0.25 GeV−2) and lower than those
obtained in elastic vector-meson photoproduction at HERA at lower −t [10, 11]. They
are in agreement with pQCD expectations [16,17] and are consistent with the flatness of
the Pomeron trajectory at large −t observed by UA8 [47]. These results imply that large
values of −t can provide a suitable hard scale for perturbative QCD calculations.
11 Acknowledgments
We thank the DESY directorate for their strong support and encouragement. The re-
markable achievements of the HERA machine group were essential for the successful
completion of this work and are gratefully acknowledged. We are grateful for the support
of the DESY computing and network services. The design, construction and installation
of the ZEUS detector has been made possible by the efforts and ingenuity of many people
from DESY and the home institutes who are not listed as authors. We are grateful to
J.R. Forshaw and G. Poludniowski for providing the results of their calculation and to
J. Bartels and D.Yu Ivanov for useful discussion.
20

References
[1] J.A. Crittenden, Exclusive Production of Neutral Vector Mesons at the
Electron-Proton Collider HERA, Springer Tracts in Modern Physics, Vol. 140.
Springer, Berlin, Germany, 1997;
H. Abramowicz and A. Caldwell, Rev. Mod. Phys. 71, 1275 (1999).
[2] A. Donnachie and P.V. Landshoff, Nucl. Phys. B 231, 189 (1984).
[3] J.R. Cudell, K. Kang and S.K. Kim, Phys. Lett. B 395, 311 (1997).
[4] P.D.B. Collins, An Introduction to Regge Theory and High Energy Physics.
Cambridge University Press, 1977.
[5] A. Donnachie and P.V. Landshoff, Phys. Lett. B 470, 243 (1999);
A. Donnachie and P.V. Landshoff, Phys. Lett. B 478, 146 (2000);
E. Martynov, E. Predazzi and A. Prokudin, Preprint hep-ph/0112242, 2001. Subm.
to Eur. Phys. J.
[6] J.J. Sakurai, Ann. Phys. 11, 1 (1960);
J.J. Sakurai, Phys. Rev. Lett. 22, 981 (1969).
[7] M.G. Ryskin, Z. Phys. C 57, 89 (1993).
[8] S.J. Brodsky et al., Phys. Rev. D 50, 3134 (1994).
[9] L. Frankfurt and M. Strikman, Phys. Rev. Lett. 63, 1914 (1989);
A.H. Mueller and W.K. Tang, Phys. Lett. B 284, 123 (1992).
[10] ZEUS Coll., J. Breitweg et al., Eur. Phys. J. C 14, 213 (2000).
[11] ZEUS Coll., S. Chekanov et al., Preprint DESY-02-008 (hep-ex-0201043), DESY,
2002. Subm. to Eur. Phys. J.
[12] N.I. Kochelev et al., Nucl. Phys. Proc. Suppl. 99 A, 24 (2001).
[13] J.R. Forshaw and M.G. Ryskin, Z. Phys. C 68, 137 (1995).
[14] D.Yu. Ivanov, Phys. Rev. D 53, 3564 (1996).
[15] I.F. Ginzburg and D.Yu. Ivanov, Phys. Rev. D 54, 5523 (1996).
[16] J. Bartels et al., Phys. Lett. B 375, 301 (1996).
[17] D.Yu. Ivanov et al., Phys. Lett. B 478, 101 (2000). Erratum in
Phys. Lett. B 498, 295 (2001).
[18] J.R Forshaw and G. Poludniowski, Preprint hep-ph/0107068, 2001.
[19] M. Gluck, E. Reya and A. Vogt, Eur. Phys. J. C 5, 461 (1998).
21

[20] E.A. Kuraev, L.N. Lipatov and V.S. Fadin, Sov. Phys. JETP 45, 199 (1977);
Ya.Ya. Balitskii and L.N. Lipatov, Sov. J. Nucl. Phys. 28, 822 (1978).
[21] F.J. Gilman et al., Phys. Lett. B 31, 387 (1970).
[22] Particle Data Group, D.E. Groom et al., Eur. Phys. J. C 15, 1 (2000).
[23] ZEUS Coll., U. Holm (ed.), The ZEUS Detector. Status Report (unpublished),
DESY (1993), available on http://www-zeus.desy.de/bluebook/bluebook.html.
[24] N. Harnew et al., Nucl. Inst. Meth. A 279, 290 (1989);
B. Foster et al., Nucl. Phys. Proc. Suppl. B 32, 181 (1993);
B. Foster et al., Nucl. Inst. Meth. A 338, 254 (1994).
[25] M. Derrick et al., Nucl. Inst. Meth. A 309, 77 (1991);
A. Andresen et al., Nucl. Inst. Meth. A 309, 101 (1991);
A. Caldwell et al., Nucl. Inst. Meth. A 321, 356 (1992);
A. Bernstein et al., Nucl. Inst. Meth. A 336, 23 (1993).
[26] ZEUS Coll., J. Breitweg et al., Z. Phys. C 75, 421 (1997).
[27] J. Andruszkow et al., Acta Phys. Pol. B 32, 2025 (2001).
[28] K. Schilling and G. Wolf, Nucl. Phys. B 61, 381 (1973).
[29] M. Kasprzak, Inclusive Properties of Diffractive and Non-diffractive
Photoproduction at HERA. Ph.D. Thesis, Warsaw University, Warsaw, Poland,
Report DESY F35D-96-16, DESY, 1996.
[30] L. Adamczyk, Vector Meson Photoproduction at Large Momentum Transfer at
HERA. Ph.D. Thesis, University of Mining and Metallurgy, Cracow, Poland,
Report DESY-THESIS-1999-045, DESY, 1999.
[31] B. List and A. Mastroberardino, Proc. Workshop on Monte Carlo Generators for
HERA Physics, p. 396. DESY, Hamburg, Germany (1999). Also in preprint
DESY-PROC-1999-02, available on http://www.desy.de/~heramc/.
[32] R.L. Cool et al., Phys. Rev. Lett. 48, 1451 (1982);
R. Hagedorn, Riv. Nuovo Cim. 6, 1 (1984).
[33] T. Sjostrand, Comp. Phys. Comm. 82, 74 (1994).
[34] R. Brun et al., geant3, Technical Report CERN-DD/EE/84-1, CERN, 1987.
[35] K.H. Klimek, Cross Section Measurement of Vector Meson Quasi-Photoproduction
at High Four-Momentum Transfer Using the ZEUS Detector at the HERA Collider.
Ph.D. Thesis, Institute of Nuclear Physics, Cracow, Poland, Report
DESY-THESIS-2001-053, DESY, 2001.
[36] V.M. Budnev et al., Phys. Rep. 15C, 181 (1974).
22

[37] D.P. Roy and R.G. Roberts, Nucl. Phys. B 77, 240 (1974).
[38] P. Soding, Phys. Lett. 19, 702 (1966).
[39] J.D. Jackson, Nuovo Cimento 34, 1644 (1964).
[40] H. Abramowicz, L. Frankfurt and M. Strikman, Surv. High Energy Phys.
11, 51 (1997).
[41] H1 Coll., C. Adloff et al., Phys. Lett. B 483, 360 (2000).
[42] ZEUS Coll., J. Breitweg et al., Phys. Lett. B 487, 273 (2000).
[43] ZEUS Coll., J. Breitweg et al., Eur. Phys. J. C 6, 603 (1999).
[44] H1 Coll., C. Adloff et al., Eur. Phys. J. C 13, 371 (2000).
[45] H1 Coll., C. Adloff et al., Eur. Phys. J. C 10, 373 (1999).
[46] A.B. Meyer, private communication.
[47] UA8 Coll., A. Brandt et al., Nucl. Phys. B 514, 3 (1998).
[48] A. Kowal, Helicity Analysis of Vector Mesons Produced in Proton-dissociative
Diffractive Photoproduction at Large Momentum Transfer at HERA. Ph.D. Thesis,
University of Mining and Metallurgy, Cracow, Poland, 2002. Unpublished.
[49] ZEUS Coll., M. Derrick et al., Phys. Lett. B 377, 259 (1996).
[50] ZEUS Coll., M. Derrick et al., Phys. Lett. B 380, 220 (1996).
[51] ZEUS Coll., J. Breitweg et al., Z. Phys. C 75, 215 (1997).
23

ZEUS 1996-97 γp→ ρ0Y
−t range 〈−t〉 dσ/d|t|( GeV2) ( GeV2) (nb/GeV2)
1.20-1.50 1.33 163 ± 6 +14−19
+7−12
1.50-2.00 1.71 80.1 ± 2.5 +5.5−8.5
+2.0−8.5
2.00-2.50 2.22 36.9 ± 1.4 +3.4−2.8
+0.4−2.6
2.50-3.00 2.72 17.5 ± 0.9 +1.3−1.5
+0.1−1.7
3.00-3.50 3.23 10.7 ± 0.7 +0.8−0.7
+0.3−1.2
3.50-4.00 3.73 6.98 ± 0.59 +0.81−0.41
+0.39−0.97
4.00-5.00 4.43 3.39 ± 0.27 +0.78−0.50
+0.23−0.57
5.00-6.85 5.75 1.41 ± 0.15 +0.35−0.49
+0.20−0.25
6.85-10.0 8.04 0.46 ± 0.07 +0.17−0.22
+0.08−0.13
Table 1: The differential cross section, dσγp→ρ0Y /d|t|, for x > 0.01 and 80 < W <120 GeV . The first uncertainty is the statistical, the second the systematic and thelast is due to the modelling of the proton-dissociation process. The normalisationuncertainty of 10% is not included.
ZEUS 1996-97 γp→ φY
−t range 〈−t〉 dσ/d|t|)( GeV2) ( GeV2) (nb/GeV2)
1.20-1.55 1.36 19.2 ± 1.1 +2.5−2.1
+1.0−1.7
1.55-1.90 1.71 12.4 ± 0.7 +1.8−1.1
+0.3−0.9
1.90-2.30 2.08 7.43 ± 0.53 +0.68−0.72
+0.30−0.41
2.30-2.70 2.48 4.63 ± 0.40 +0.49−0.43
+0.17−0.08
2.70-3.20 2.93 2.55 ± 0.26 +0.30−0.29
+0.15−0.08
3.20-3.80 3.47 1.55 ± 0.20 +0.33−0.25
+0.13−0.07
3.80-4.80 4.24 0.89 ± 0.18 +0.31−0.14
+0.13−0.07
4.80-6.50 5.53 0.36 ± 0.08 +0.09−0.12
+0.10−0.06
Table 2: The differential cross section, dσγp→φY /d|t|, for x > 0.01 and 80 < W <120 GeV . The first uncertainty is the statistical, the second the systematic and thelast is due to the modelling of the proton-dissociation process. The normalisationuncertainty of 10% is not included.
24

ZEUS 1996-97 γp→ J/ψY
−t range 〈−t〉 dσ/d|t|( GeV2) ( GeV2) (nb/GeV2)
1.20-1.50 1.34 16.0 ± 2.4 +1.6−3.4
+1.6−4.8
1.50-2.00 1.74 9.5 ± 1.5 +1.4−1.4
+0.3−1.2
2.00-2.50 2.24 8.3 ± 1.5 +1.6−1.6
+0.3−2.4
2.50-3.25 2.84 4.98 ± 0.95 +0.89−0.90
+0.38−0.63
3.25-4.50 3.81 2.5 ± 0.6 +0.8−1.0
+0.4−0.4
4.50-6.50 5.37 1.33 ± 0.45 +0.80−0.41
+0.16−0.39
Table 3: The differential cross section, dσγp→J/ψY /d|t|, for x > 0.01 and80 < W < 120 GeV . The first uncertainty is the statistical, the second the sys-tematic and the last is due to the modelling of the proton-dissociation process. Thenormalisation uncertainty of 10% is not included.
ZEUS 1996-97
−t range 〈−t〉 dσdt
(γp→ φY )/dσdt
(γp→ ρ0Y )
1.20-1.55 1.35 0.124 ± 0.008 +0.020−0.012
+0.014−0.013
1.55-1.90 1.71 0.156 ± 0.011 +0.023−0.010
+0.014−0.013
1.90-2.30 2.08 0.176 ± 0.015 +0.021−0.017
+0.011−0.010
2.30-2.70 2.48 0.167 ± 0.016 +0.013−0.013
+0.006−0.006
2.70-3.20 2.93 0.185 ± 0.021 +0.014−0.034
+0.013−0.013
3.20-3.80 3.47 0.189 ± 0.027 +0.020−0.038
+0.021−0.020
3.80-4.80 4.23 0.223 ± 0.047 +0.057−0.042
+0.034−0.033
4.80-6.50 5.49 0.225 ± 0.052 +0.055−0.060
+0.055−0.052
Table 4: The ratio of the differential cross sections, dσ/dt, for φ to ρ0 proton-dissociative photoproduction for x > 0.01 and 80 < W < 120 GeV . The firstuncertainty is the statistical, the second the systematic and the last is due to themodelling of the proton-dissociation process.
25

ZEUS 1996-97
−t range 〈−t〉 dσdt
(γp→ J/ψY )/dσdt
(γp→ ρ0Y )
1.20-1.50 1.33 0.099 ± 0.015 +0.021−0.019
+0.010−0.007
1.50-2.00 1.71 0.119 ± 0.019 +0.027−0.017
+0.007−0.007
2.00-2.50 2.22 0.226 ± 0.042 +0.056−0.037
+0.005−0.008
2.50-3.25 2.82 0.325 ± 0.063 +0.020−0.059
+0.013−0.018
3.25-4.50 3.75 0.409 ± 0.097 +0.078−0.121
+0.038−0.046
4.50-6.50 5.28 0.72 ± 0.25 +0.20−0.22
+0.11−0.15
Table 5: The ratio of the differential cross sections, dσ/dt, for J/ψ to ρ0 proton-dissociative photoproduction for x > 0.01 and 80 < W < 120 GeV . The firstuncertainty is the statistical, the second the systematic and the last is due to themodelling of the proton-dissociation process.
ZEUS 1996-97 γp→ ρ0Y
−t range 〈−t〉 r0400 Re [r04
10] r041−1
(GeV2) (GeV2)
1.1–1.7 1.34 0.022±0.015+0.016−0.018 0.054±0.012+0.017
−0.010 -0.143±0.014+0.023−0.031
1.7–2.9 2.14 0.042±0.017+0.018−0.021 0.045±0.013+0.016
−0.010 -0.158±0.017+0.020−0.022
2.9–4.0 3.35 0.037±0.034+0.032−0.036 -0.129±0.032+0.023
−0.050
4.0–12 5.67 0.090±0.049+0.035−0.040 -0.252±0.047+0.044
−0.023
2.9–12 4.38 0.047±0.020+0.009−0.017
Table 6: The spin density matrix elements for γp→ ρ0Y for 80 < W < 120 GeV .The first uncertainty is the statistical and the second the systematic.
ZEUS 1996-97 γp→ φY
−t range 〈−t〉 r0400 Re [r04
10] r041−1
(GeV2) (GeV2)
1.2–1.7 1.42 0.080±0.028+0.020−0.026 0.053±0.021+0.019
−0.024 0.008±0.033+0.011−0.039
1.7–3.0 2.20 0.066±0.025+0.034−0.021 -0.085±0.032+0.023
−0.028
3.0–7.0 4.03 -0.020±0.035+0.034−0.018 -0.108±0.058+0.053
−0.030
1.7–7.0 2.72 0.057±0.018+0.013−0.007
Table 7: The spin density matrix elements for γp→ φY for 80 < W < 120 GeV .The first uncertainty is the statistical and the second the systematic.
26

ZEUS 1996-97 γp→ J/ψY
−t range 〈−t〉 r0400 r04
1−1
(GeV2) (GeV2)
1.1–1.8 1.42 -0.28±0.26+0.28−0.08 0.10±0.15+0.16
−0.03
1.8–6.5 3.01 0.22±0.30+0.38−0.11 -0.11±0.16+0.06
−0.04
Table 8: The spin density matrix elements for γp → J/ψY for 80 < W <120 GeV . The first uncertainty is the statistical and the second the systematic.
27

p
γ V
Y
p
γ V
Y
p
γ V
Y
e(k) e(k )/
γ*(q)
V(v)
q+
q-
MV}
MY}p(P) Y(P )
/
t
Figure 1: (a) γp → V Y scattering in the VDM model. The photon fluctuatesinto a vector meson, which then scatters off the proton and the proton breaks up.(b,c) Example of γp → V Y scattering in pQCD models. The photon fluctuatesinto a qq pair, which then scatters off a single quark (b) or gluon (c) in the protonby the exchange of two gluons or a gluon ladder. The scattered qq pair becomes avector meson. The struck parton and the proton remnant fragment into a systemof hadrons. (d) Schematic diagram of proton-dissociative vector-meson productionin ep interactions, ep→ eV Y .
28

γ
γ
*
+
-
e
e
V production planepositron scattering plane V decay plane
Y
V
q
q
V helicity frame
p cm frameγp cm frame
p
Φ
ϕh
θh
Figure 2: Illustration of the angles used to analyse the helicity states of a vectormeson (for a decay into two particles, V → q+q−).
29

ZEUS
even
tsev
ents
even
ts
EFCAL (GeV)
1.2 < −t < 1.5 GeV 2
EPSOFTDIFFVMgDIFFVMq
ZEUS 1996-97γ p → ρ Y
1.5 < −t < 3 GeV 2 3 < −t < 10 GeV 2
(a) (b) (c)
EFCAL (GeV)
1.2 < −t < 1.7 GeV 2
ZEUS 1996-97γ p → φ Y
1.7 < −t < 2.7 GeV 2 2.7 < −t < 6.5 GeV 2
(d) (e) (f)
EFCAL (GeV) EFCAL (GeV)
1.2 < −t < 2 GeV 2 2 < −t < 6.5 GeV 2
(g) (h)
ZEUS 1996-97γ p → J/ψ Y
0
500
1000
1500
2000
2500
20 40 60 800
500
1000
1500
2000
20 40 60 800
100
200
300
400
20 40 60 80
0
50
100
150
200
20 40 600
50
100
150
20 40 600
20
40
60
20 40 60
0
10
20
30
20 40 600
5
10
15
20
20 40 60
Figure 3: The distributions of the FCAL energy for: (a,b,c) ρ0; (d,e,f) φ; (g,h)J/ψ candidate samples in different −t regions. The symbols represent the data andthe histograms indicate the results of the simulation using EPSOFT (solid line),DIFFVMg (dashed lines) and DIFFVMq (dotted lines shown only for the ρ0). Theshaded bands represent the size of the correlated uncertainties due to the modellingof the proton dissociation in EPSOFT.
30

120 8090130 110 100❘ ❘❘ ❘❘ ❘
❘ ❘ ❘ ❘ ❘ ❘ ❘
ZEUS
Tag
ging
acc
epta
nce
W (GeV)
(a)
(b)
scattered positron energy (GeV)
0.1
0.2
0.3
0.4
0.5
0.6
0.7
0.8
0.9
1
1.1
-0.5
-0.25
0
0.25
0.5
22 22.5 23 23.5 24 24.5 25 25.5 26
Figure 4: The photoproduction tagging acceptance as a function of the energyof the scattered positron calculated using simulated events generated according tothe equivalent-photon approximation in the Q2 < 0.02 GeV 2 range. The shadedband represents the relative systematic uncertainty of the tagging acceptance. Thedashed lines indicate the kinematic region used in this analysis.
31

even
tsev
ents
even
tsev
ents
EPSOFTZEUS 1996-97γ p → ρ Y
ZEUS 1996-97γ p → φ Y
ZEUS 1996-97γ p → J/ψ Y
ZEUS (a) (b) (c)
−t (GeV 2)
(d) (e) (f)
cosθh
(g) (h) (i)
(j) (k) (l)
W (GeV)
11010 210 310 4
5 101
10
10 2
10 3
2 4 61
10
10 2
2 4 6
0
500
1000
1500
2000
-1 0 10
50
100
150
200
-1 0 10
20
40
60
-1 0 1
0
500
1000
1500
2000
0 2.5 50
50
100
150
0 2.5 50
20
40
0 2.5 5
0
1000
2000
3000
100 1500
100
200
300
100 1500
20
40
60
100 150
Figure 5: Comparison between the data and the EPSOFT MC (histograms) eventsfor: (a,b,c) −t; (d,e,f) cos θh; (g,h,i) ϕh; (j,k,l) W , after all selection cuts (exceptthe cut on W in the case of W distributions). The MC is normalised to the data.The dashed lines (j,k,l) indicate the cuts on W applied to select the final eventsample. The systematic uncertainties due to the tagging acceptance are relevant inthe case of W distributions and are shown as the shaded bands. The three columnsrefer to the ρ0, φ, and J/ψ samples, as indicated.
32

ZEUS
dσ/d
Mπ
π (nb
/GeV
)ev
ents
/10
MeV
eve
nts/
25 M
eV
ZEUS 1996-97γ p → ρ Y
1.2 < −t < 1.5 GeV 2 (a) 4 < −t < 5 GeV 2 (b)
Mππ (GeV) Mππ (GeV)
1.2 < −t < 1.55 GeV 2 (c) 4.8 < −t < 6.5 GeV 2 (d)
ZEUS 1996-97γ p → φ Y
MKK (GeV) MKK (GeV)
ZEUS 1996-97
γ p → J/ψ Y
1.2 < −t < 1.65 GeV 2 (e) 2.5 < −t < 6.5 GeV 2 (f)
M (GeV) M (GeV) llll
0
100
200
0.6 0.8 1 1.20
5
10
15
0.6 0.8 1 1.2
0
100
200
300
400
1 1.05 1.1 1.150
10
20
1 1.05 1.1 1.15
0
5
10
15
2.6 2.8 3 3.2 3.40
5
10
15
2.6 2.8 3 3.2 3.4
Figure 6: (a,b) The differential cross-section dσ/dMππ for the ρ0 sample. (c,d)The MKK mass distributions for the φ sample. (e,f) The Mll mass distributionsfor the J/ψ sample. The symbols are the data for representative t ranges and thesolid curves indicate the result of the fits discussed in the text. The dashed curvesshow the background contributions.
33
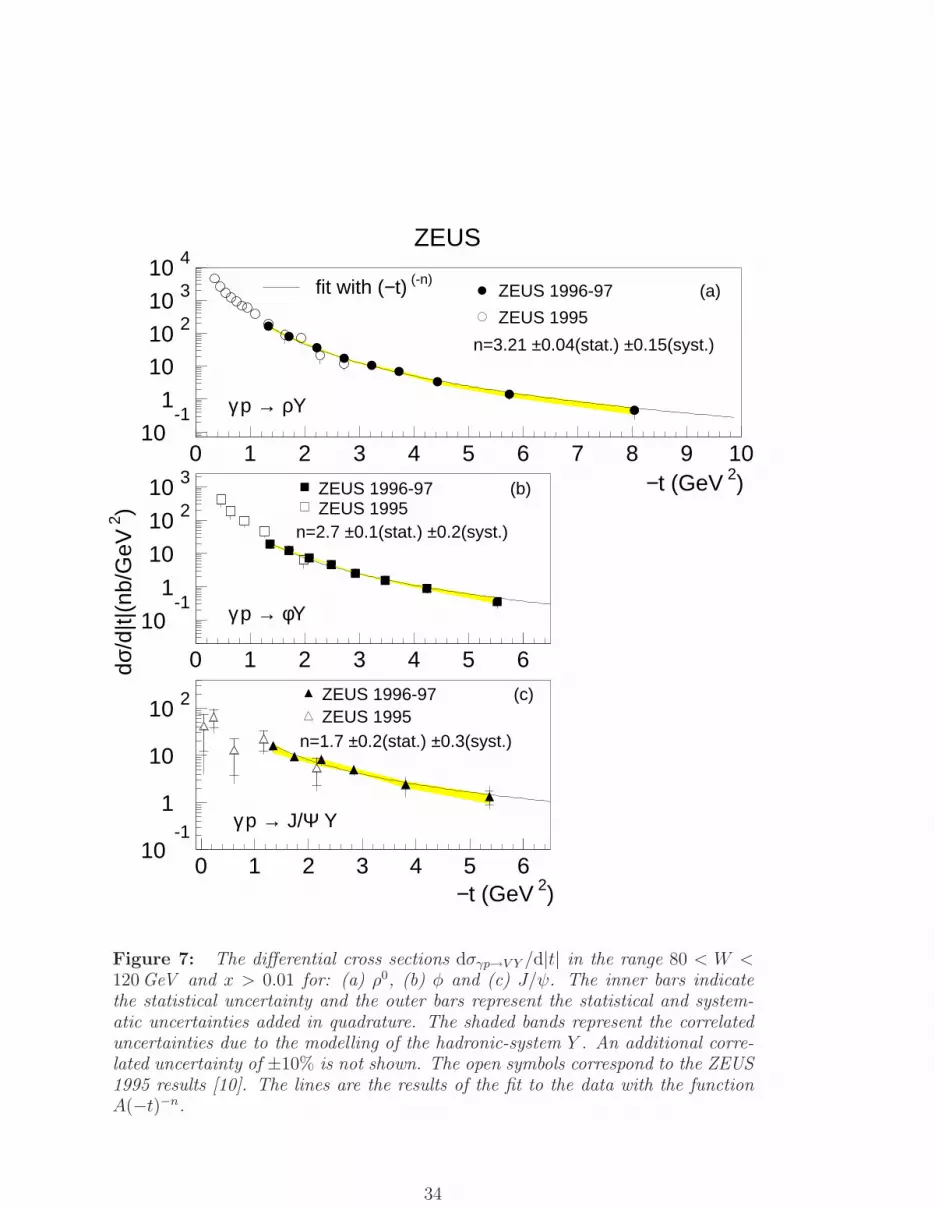
ZEUS
ZEUS 1996-97 (a)
ZEUS 1995
fit with (−t) (-n)
γ p → ρY
n=3.21 ±0.04(stat.) ±0.15(syst.)
−t (GeV 2)ZEUS 1996-97 (b)ZEUS 1995
γ p → φY
n=2.7 ±0.1(stat.) ±0.2(syst.)
ZEUS 1996-97 (c)ZEUS 1995
γ p → J/Ψ Y
n=1.7 ±0.2(stat.) ±0.3(syst.)
−t (GeV 2)
dσ/d
|t|(n
b/G
eV 2
)
10-1
1
10
10 210 310 4
0 1 2 3 4 5 6 7 8 9 10
10-1
1
10
10 210 3
0 1 2 3 4 5 6
10-1
1
10
10 2
0 1 2 3 4 5 6
Figure 7: The differential cross sections dσγp→V Y /d|t| in the range 80 < W <120 GeV and x > 0.01 for: (a) ρ0, (b) φ and (c) J/ψ. The inner bars indicatethe statistical uncertainty and the outer bars represent the statistical and system-atic uncertainties added in quadrature. The shaded bands represent the correlateduncertainties due to the modelling of the hadronic-system Y . An additional corre-lated uncertainty of ±10% is not shown. The open symbols correspond to the ZEUS1995 results [10]. The lines are the results of the fit to the data with the functionA(−t)−n.
34

ZEUS
ZEUS 1996-97 (a)
ForshawPoludniowski
γ p → ρY
−t (GeV 2)ZEUS 1996-97 (b)
γ p → φY
γ p → J/Ψ Y
dσ/d
|t| (
nb/G
eV 2
)
−t (GeV 2)
ZEUS 1996-97 (c)
10-1
1
10
10 2
10 3
0 1 2 3 4 5 6 7 8 9 10
10-1
1
10
10 2
0 1 2 3 4 5 6
10-1
1
10
0 1 2 3 4 5 6
Figure 8: The differential cross sections dσγp→V Y /d|t| for: (a) ρ0, (b) φ, and(c) J/ψ photoproduction in the range 80 < W < 120 GeV and x > 0.01. Thesolid curves show a pQCD calculation [18]. The inner bars indicate the statisticaluncertainty and the outer bars represent the statistical and systematic uncertaintiesadded in quadrature. The shaded bands represent the size of the correlated uncer-tainties due to the modelling of the hadronic-system Y. An additional correlateduncertainty of ±10% is not shown.
35

0.050.1
0.150.2
0.250.3
0.350.4
0.45
0 1 2 3 4 5 6 7
ZEUS
ZEUS 1996-97ZEUS 1995
(a)
2/9
1.2 2/9 ×
2.1 2/9 ×
/
σ γ p
φ
Yd
→
dt
σ γ
p
ρY
d→
dt /
σ
γ p
J/
ψY
d→
dt
σ
γ p
ρY
d→
dt
(b)
8/9
3.5 8/9 ×
56 8/9 ×
−t (GeV 2)
10-4
10-3
10-2
10-1
1
10
0 1 2 3 4 5 6 7
0
0.2
0.4
0.6
0.8
1
1 1.5 2 2.5 3 3.5 4 4.5 5 5.5 6
Figure 9: (a) The ratio of the cross sections dσγp→V Y /dt for φ to ρ0 photoproduc-tion. (b) The ratio of the cross sections dσγp→V Y /dt for J/ψ to ρ0 photoproduction.The inset shows this ratio on a linear scale. The inner bars indicate the statisticaluncertainty, the outer bars represent the statistical and systematic uncertaintiesadded in quadrature. The shaded bands represent the size of the correlated un-certainties due to the modelling of the dissociative system, Y . The dashed linescorrespond to the SU(4) predictions, while the dotted and dashed-dotted correspondto the pQCD values given by Eqs. (4) and (5), respectively. The open circles arethe ZEUS 1995 results [10].
36

ZEUS
σ φ / σ
ρσ J/
ψ /
σ ρ
2/91.2 2/9 ×
2.1 2/9 ×
Proton dissoc. vs. −t Elastic vs. Q2
H1ZEUS
ZEUS 1996-97ZEUS 1995
8/9
3.5 8/9 ×
56 8/9 ×
−t or Q 2 (GeV 2)
(b)
(a)
0
0.1
0.2
0.3
0.4
0.5
0 5 10 15
10-3
10-2
10-1
1
10
0 10 20 30
Figure 10: (a) The ratio of the φ to ρ0 cross sections as a function of −t orQ2. The φ/ρ0 results as a function of −t for proton-dissociative photoproductionfrom this analysis are shown with solid circles and those from the ZEUS 1995 [10]measurement with the solid squares. The shaded bands represent the size of the cor-related uncertainties due to the modelling of the dissociative system, Y . Open tri-angles at Q2 ≈ 0 GeV 2 [49], Q2 = 7 GeV 2 [42] and Q2 = 12.3 GeV 2 [50] representthe φ/ρ0 ratio of the elastic cross sections as a function of Q2 from ZEUS, while theopen squares represent those from H1 [41]. (b) The ratio of the J/ψ to ρ0 cross sec-tions as a function of −t or Q2. The same convention for symbols as for φ/ρ0 ratiois used. Open triangles at Q2 ≈ 0 GeV 2 [51] and Q2 = 3.5, 13 GeV 2 [43] representthe ZEUS measurements, while the open squares represent those of H1 [44,45]. Thedashed lines correspond to the SU(4) predictions, while the dotted and dashed-dottedcorrespond to the pQCD values given by Eqs. (4) and (5), respectively.
37

ZEUS
dσ dt /
dσ dt
t =
−1.
3 G
eV 2
ZEUS 1996-97γ p → ρY
W 4 α (t+1.3 GeV )2/
α/ = −0.02±0.05(stat.)+0.04(syst.)α/ = −0.02±0.05(stat.)−0.08
W (GeV)
−t = 1.7 GeV 2
−t = 2.3 GeV 2
−t = 3.0 GeV 2
−t = 4.1 GeV 2
−t = 6.2 GeV 2
10-3
10-2
10-1
1
80 85 90 95 100 105 110 115 120
Figure 11: The ratios of ρ0 production cross sections, dσdt/dσ
dt|t=t0, for −t0 = 1.3
GeV2, as a function of W in five t intervals. The lines represent the result of thefit with Eq. (13). The inner bars indicate the statistical uncertainty and the outerbars represent the statistical and systematic uncertainties added in quadrature.
38

−t = 2.2 GeV 2
−t = 3.1 GeV 2
−t = 4.1 GeV 2
−t = 5.5 GeV 2
(×0.5)
W (GeV)
ZEUS 1996-97
γ p → φ Y W 4 α (t+1.5 GeV )2/
α/ = −0.06±0.12(stat.)+0.05(syst.)α/ = −0.06±0.12(stat.)−0.09
ZEUS
dσ dtdσ dt
t = −
1.5
GeV
2 /
10-3
10-2
10-1
80 85 90 95 100 105 110 115 120
Figure 12: The ratios of φ production cross sections dσdt/dσ
dt|t=t0, for −t0 = 1.5
GeV2, as a function of W in four t intervals. The lines represent the result of thefit with Eq. (13). The inner bars indicate the statistical uncertainty and the outerbars represent the statistical and systematic uncertainties added in quadrature.
39

ZEUS
−t (GeV 2)
α (G
eV−2
)/
α = 0.25 GeV−2/
γ p → ρ0 p ZEUS (0 < −t < 0.5 GeV 2)
γ p → ρ0 p ZEUS+H1+OMEGA (0 < −t < 0.95 GeV 2)
γ p → φ p ZEUS+low energy exp. (0 < −t < 1.4 GeV 2)
γ p → J/ψ p ZEUS (0 < −t < 1.34 GeV 2)
γ p → ρ0 Y ZEUS (1.3 < −t < 6.2 GeV 2)
γ p → φ Y ZEUS (1.3 < −t < 5.5 GeV 2)
-0.2
-0.1
0
0.1
0.2
0.3
0.4
0.5
0 1 2 3 4 5 6
Figure 13: Comparison of results on α′ for vector-meson production. The resultfor the proton-dissociative photoproduction from this analysis are shown with solidsymbols and those for elastic photoproduction with the open symbols. The valueof α′ = 0.25 GeV −2 is characteristic of soft hadronic processes. The horizontalbars correspond to the −t range in which α′ is measured. The vertical inner barsindicate the statistical uncertainty and the outer bars represent the statistical andsystematic uncertainties added in quadrature.
40

0
0.1
0.2
0.3
0.4
-1 -0.5 0 0.5 1
1/N
dN
/dco
sθh
(a)ZEUS 1996-97γ p → ρ0 Y
SCHC
4 < -t < 12 GeV2
ZEUS fit
ZEUS
0
0.1
0.2
0.3
0 2 4 61/
N d
N/d
h
(b)4 < -t < 12 GeV2
0
0.1
0.2
0.3
0.4
-1 -0.5 0 0.5 1
1/N
dN
/dco
sθh
ZEUS 1996-97γ p → φ Y
3 < -t < 7 GeV2
(c)
0
0.1
0.2
0.3
0 2 4 6
1/N
dN
/dh
(d)3 < -t < 7 GeV2
0
0.2
0.4
0.6
-0.5 0 0.5cosθh
1/N
dN
/dco
sθh
(e)ZEUS 1996-97γ p → J/ψ Y
1.8 < -t < 6.5 GeV2
0
0.1
0.2
0.3
0.4
0 2 4 6h
1/N
dN
/dh
(f)1.8 < -t < 6.5 GeV2
Figure 14: The normalised background-subtracted and acceptance-corrected cos θhand ϕh distributions for proton-dissociative photoproduction of: (a,b) ρ0, (c,d) φand (e,f) J/ψ. The symbols represent the data and the solid curves the result ofthe fits with Eqs. (8) and (9). The dashed curves are the SCHC predictions.
41

-0.2
0
0.2
0.4
0 1 2 3 4 5 6 7
ZEUS
r0 4
0 0
(a)ZEUS 1995
ZEUS 1996-97
γ p → ρ0 Y
SCHC
-0.1
0
0.1
0.2
0 1 2 3 4 5 6 7
Re[
r0 4
1 0
]
(b)
-0.25
0
0.25
0 1 2 3 4 5 6 7
-t (GeV2)
r0 4
1-1
(c)
Figure 15: The fitted values of (a) r0400, (b) Re[r04
10] and (c) r041−1 for proton-
dissociative ρ0 photoproduction as a function of −t. The inner bars indicate thestatistical uncertainty and the outer bars represent the statistical and systematicuncertainties added in quadrature. The open circles correspond to the ZEUS 1995results [10]. The SCHC prediction is shown as the dashed line.
42

-0.2
0
0.2
0 1 2 3 4 5 6
ZEUS
r0 4
0 0
(a)ZEUS 1996-97
γ p → φ Y
SCHC
-0.1
0
0.1
0.2
0 1 2 3 4 5 6
Re[
r0 4
1 0
]
(b)
-0.2
0
0 1 2 3 4 5 6
-t (GeV2)
r0 4
1-1
(c)
Figure 16: The fitted values of (a) r0400, (b) Re[r04
10] and (c) r041−1 for proton-
dissociative φ meson photoproduction as a function of −t. The inner bars indicatethe statistical uncertainty and the outer bars represent the statistical and systematicuncertainties added in quadrature. The SCHC prediction is shown as the dashedline.
43

-0.75-0.5
-0.250
0.250.5
0.75
0 0.5 1 1.5 2 2.5 3 3.5 4
ZEUS
r0 4
0 0
(a)ZEUS 1996-97
γ p → J/ψ Y
SCHC
-0.4
-0.2
0
0.2
0.4
0 0.5 1 1.5 2 2.5 3 3.5 4
-t (GeV2)
r0 4
1-1
(b)
Figure 17: The fitted values of (a) r0400 and (b) r04
1−1 for proton-dissociative J/ψmeson photoproduction as a function of −t. The inner bars indicate the statisticaluncertainty and the outer bars represent the statistical and systematic uncertaintiesadded in quadrature. The SCHC prediction is shown as the dashed line.
44


