Embed Size (px)
Citation preview
Market opportunities on Circular Economy in MexicoCommissioned by the Netherlands Enterprise Agency
1
Market Opportunities on Circular
Economy in Mexico
ABRIL 2019
Circular Economy Mission|Misión Economía Circular Unión Europea-México
2
The purpose of this study is to identify business opportunities for EU companies in key Circular Economy
sectors in Mexico, notably in the fields of: waste management, waste water and waste energy. This
study was presented in the Circular Economy Mission held in Mexico City from the 24th to the 26th of
April.
DISCLAIMER This publication was produced with the financial support of the European Union. Its contents are the
sole responsibility of IDOM and CEDDET and do not necessarily reflect the views of the European Union.
All rights reserved
This document is property of the Delegation of the European Union to Mexico and cannot be released,
or further disseminated, without the express and written approval of the Delegation of the European
Union to Mexico.
3
Contenido
1. EXECUTIVE SUMMARY ........................................................................................................... 7
2. INTRODUCTION ................................................................................................................... 12
2.1. TRENDS IN CIRCULAR ECONOMY ........................................................................ 14
2.1.1. TRENDS IN INITIATIVES .................................................................................................. 14
2.1.2. TRENDS IN TECHNOLOGY AND BUSINESS MODELS ...................................................... 15
2.2. COUNTRY AND CONTEXT OVERVIEW .................................................................. 17
2.3. SOCIO-ECONOMIC CONTEXT ............................................................................... 17
2.4. OVERVIEW OF THE CIRCULAR ECONOMY IN MEXICO ......................................... 19
2.5. PRODUCTION AND CONSUMPTION PATTERNS IN MEXICO ................................ 21
2.6. MARKET TRENDS ................................................................................................. 23
2.7. REGULATORY FRAMEWORK AND PUBLIC PROGRAMMES SUPPORTING CE INITIATIVES
26
2.7.1. WASTE COLLECTION, GOVERNANCE AND REGULATIONS ............................................. 27
2.7.2. LANDFILL OPERATION AND SOLID WASTE VALORISATION ........................................... 28
2.7.3. LACK OF FISCAL OPPORTUNITIES .................................................................................. 28
2.7.4. THE FRAGMENTED MARKET .......................................................................................... 29
2.7.5. LACK OF ACCEPTANCE ................................................................................................... 30
3. SECTOR ANALYSIS ................................................................................................................ 31
3.1. SECTOR ANALYSIS SOLID WASTE MANAGEMENT ............................................... 31
3.1.1. SECTOR OVERVIEW: MEXICO ........................................................................................ 31
3.1.2. MARKET OVERVIEW ...................................................................................................... 39
3.1.3. CONCLUSIONS AND RECOMMENDATIONS ................................................................... 45
3.2. SECTOR ANALYSIS WASTEWATER TREATMENT AND REUSE ............................... 47
3.2.1. SECTOR OVERVIEW MEXICO ......................................................................................... 48
3.2.2. MARKET OVERVIEW ...................................................................................................... 51
3.2.3. CONCLUSIONS AND RECOMMENDATIONS ................................................................... 59
3.3. WASTE TO ENERGY SECTOR ANALYSIS ................................................................ 61
3.3.1. SECTOR OVERVIEW: MEXICO ........................................................................................ 61
3.3.2. MARKET OVERVIEW ...................................................................................................... 72
3.3.3. CONCLUSIONS AND RECOMMENDATIONS ................................................................... 77
4. ENTRY PHASE AND FINANCIAL INSTRUMENTS AVAILABLE ................................................. 79
4.1. NATIONAL FUNDING AND PROGRAMMES .......................................................... 79
4.2. INTERNATIONAL FUNDING AND PROGRAMMES ................................................ 81
5. CONCLUSIONS ..................................................................................................................... 83
6. REFERENCES ........................................................................................................................ 85
ANNEXES ...................................................................................................................................... 90
4
Annex I: Solid Waste Management Sector Trends, Legislation, Policy and the Enabling
Environment. .................................................................................................................. 90
6.1.1. Sector Technologies and Trends ................................................................................... 90
The Enabling Environment in Solid Waste Management ............................................. 104
6.1.2. Policy and Legislation .................................................................................................. 104
6.1.3. Cultural and Social aspects to consider ....................................................................... 107
6.1.4. Key events/fairs/conferences ...................................................................................... 111
6.1.5. Existing reports/information for further reading ........................................................ 111
Annex II: Wastewater Management Sector Trends, Legislation, Policy and the Enabling
Environment. ................................................................................................................ 121
6.1.6. Sector technologies and trends ................................................................................... 125
6.1.7. The enabling environment .......................................................................................... 126
6.1.8. Market overview ......................................................................................................... 133
6.1.9. Key events and conferences ........................................................................................ 141
6.1.10. Existing reports/information for further reading ................................................ 143
6.1.11. List of potential partners ..................................................................................... 143
6.1.12. Companies and clusters involved in private water sector in Mexico .................. 145
6.1.13. Research and academic institutions involved in Mexican water sector ............. 147
Annex III: Waste to Energy Sector Trends, Legislation, Policy and the Enabling Environment.
149
6.1.14. Sector Overview: International ........................................................................... 149
6.1.15. Renewable energies – Latin American context ................................................... 151
6.1.16. The Enabling Environment .................................................................................. 152
Policy and Legislation ............................................................................................................. 152
6.1.17. Governance ......................................................................................................... 155
6.1.18. Cultural and Social Aspects ................................................................................. 157
6.1.19. SWOT Analysis ..................................................................................................... 158
Annex IV: Success Stories ............................................................................................. 161
6.1.20. Success stories in wastewater management ...................................................... 163
6.1.21. Success stories in waste to energy ...................................................................... 165
Annex V: Market Opportunities in Circular Economy in Mexico (PPT) ........................ 167
5
Index of Figures Figure 1. The conceptual diagram of the Circular Economy as proposed by the European Commission ............................................................................................................................................................... 13 Figure 2. Mexico’s trading partners (authors own elaboration, data from OECD)................................. 18 Figure 3. The largest Green Roof in Latin America, on the INFONAVIT National Workers’ Housing Fund Institute (photo credit: The Mazatlan post) ........................................................................................... 21 Figure 4. Percentage of Mexico’s total manufacturing of the World’s total. Authors own elaboration data taken from Perez (2015). ....................................................................................................................... 24 Figure 5. Municipal solid waste generation in the world Source: (Waste Atlas, 2019) .......................... 31 Figure 6. Waste generation by region in Mexico Source: (SEMARNAT, 2018) ....................................... 32 Figure 7. Average composition of MSW in Mexico Source: Elaborated by authors with data from (Salas Casasola, Islas Cortés, & Caballero Castrillo, 2016) & (INECC, 2012) ..................................................... 33 Figure 8. Materials that compose the Recyclable fraction of MSW in Mexico Source: Elaborated by authors with data from (INECC, 2012) ................................................................................................... 33 Figure 9. Regional composition of MSW in Mexico Source: Elaborated by authors with data from (INECC, 2012) ...................................................................................................................................................... 34 Figure 10. Ranking of mixed and selective collection in Mexico Source: Elaborated by authors with information of (SEMARNAT, 2018) ........................................................................................................ 35 Figure 11. Prevailing collection systems in Mexico Source: Elaborated by authors with data from (INEGI, 2018) ...................................................................................................................................................... 36 Figure 12. Contribution of Informal recycling sector to the recovery of MSW in Mexico Source: Elaborated by authors with data from (INEGI, 2018) & rates from (INECC, 2012) ................................ 36 Figure 13. Final destination of MSW in Mexico Source: Elaborated by authors with data from (INEGI, 2018) & rates from (INECC, 2012) ......................................................................................................... 37 Figure 14. Management strategy for hazardous waste in Mexico Source: (SEMARNAT, 2018) ............ 39 Figure 15. Distribution of water stress in Mexico (Source: GWI) ........................................................... 49 Figure 16. Future projection of water demand for agricultural, industrial and municipal uses ............. 50 Figure 17: Biogas installed capacity and output for Mexico. [Source: SENER, 2016] ............................. 64 Figure 18: Distribution of biogas electricity-producing landfills in Mexico showing the private companies involved in each project. [Source: GIZ, 2018] ........................................................................................ 66 Figure 19. High Potential Scenario for obtaining used cooking oils and animal fats for biodiesel, [Source: REMBIO, data from SIAP and INEGI] ...................................................................................................... 67 Figure 20, Installed capacity and electrical generation from sugarcane bagasse, 2005-2015 (MW,GWh); [Source: SENER, 2016] ........................................................................................................................... 69 Figure 21, Bagasse capacity and generation of power electricity, 2015 (MW,GWh); [Source: SENER, 2016] ...................................................................................................................................................... 70 Figure 22: Expected Installed capacity and electrical generation from Bioenergy, 2016-2030 (MW,GWh); [Source: SENER, 2016] ........................................................................................................................... 73 Figure 23, Biodiesel Mexican market share evolution (millions of m3 and %); [Source: SENER, 2015] .. 74 Figure 24 Autonomous Refuse Truck by Volvo ...................................................................................... 91 Figure 25 Sorting robot: Recycler by ZenRobotics ................................................................................. 92 Figure 26 RecycleNation by Electronic Recyclers International, Inc. ..................................................... 93 Figure 27 3D Printer ProtoCycler ........................................................................................................... 94 Figure 28. Main markets of eWaste in LATA .......................................................................................... 99 Figure 29. Structure and entities involved in Mexican water sector .................................................... 121 Figure 30. Number of companies involved in different activities within the water sector (based on data from DENUE, http://www3.inegi.org.mx/sistemas/mapa/denue/) ..................................................... 134 Figure 31. SWOT analysis scheme for circular economy related to wastewater treatment in Mexico 139 Figure 32. International installed capacity per technology [Source: International Renewable Agency IRENA] .................................................................................................................................................. 151
6
Index of Tables Table 1. Indicators of Mexico’s achievement to SDG 12 on Sustainable Production and Consumption (modified from SDG index) .................................................................................................................... 21 Table 2. Main types and data on special handling waste in Mexico ...................................................... 38 Table 3: Criteria used to describe the situation of the different waste management technologies ...... 40 Table 4: Level of implementation of the technologies involved in different treatment processes........ 41 Table 5. Classification criteria used for level of need of the different technologies .............................. 42 Table 6 Market needs in terms of innovation/technology/solutions ..................................................... 42 Table 7: Mexico`s indicator results for SDG 6 ........................................................................................ 47 Table 8: General indicators of wastewater management in Mexico ..................................................... 51 Table 9. Capital and operational expenditure in water sector for the period 2013-2020 ..................... 52 Table 10: Criteria used to describe the situation of the different wastewater technologies ................. 54 Table 11: Level of implementation of the technologies involved in different treatment processes ..... 54 Table 12: Percentage of use for wastewater treatment technologies in Mexico ................................. 56 Table 13. Level of need of primary treatment technologies .................................................................. 57 Table 14. Level of need of secondary treatment technologies .............................................................. 57 Table 15. Level of need of tertiary treatment technologies .................................................................. 58 Table 16. Energy potential for different biomass residues. [Source: REMBIO, 2016] ............................ 62 Table 17: Criteria used to describe the situation of the different WTE technologies. ........................... 63 Table 18: Level of implementation of the technologies involved in different WTE processes. ............. 63 Table 19. Biodiesel commercial plants, Source: [SAGARPA, 2015] ........................................................ 68 Table 20: Processing technologies for solid biofuels; Source: [Shankar Tumuluru, et al. 2010] ............ 70 Table 21: Solid biofuel processing companies in Mexico; [Source: REMBIO] ........................................ 72 Table 22: Level of need for different WTE technologies. ....................................................................... 74 Table 23: Cogeneration capacity in Mexico. [Source: SENER-GIZ, 2017] ............................................... 77 Table 24: Programs and relevant projects in Waste Management ...................................................... 107 Table 25:List of companies, potential clients or partners, as well as clusters or sector associations .. 112 Table 26: Main financial sources related to water management in Mexico ........................................ 125 Table 27: Regulation framework applicable to the water sector in Mexico ........................................ 126 Table 28: Main entities involved in water management in Mexico ..................................................... 130 Table 29. Main companies working in the water sector in Mexico ...................................................... 134 Table 30. Main International conferences and expositions within the water sector ........................... 141 Table 31. List of potential partners and sectors where they operate .................................................. 143 Table 32. Global overview of renewable energy capacity and generation of electricity [Source: IRENA] ............................................................................................................................................................. 150 Table 33. Mexican legal framework ..................................................................................................... 152 Table 34. Mexican governance context ............................................................................................... 155
7
1. EXECUTIVE SUMMARY
Current Situation in Mexico
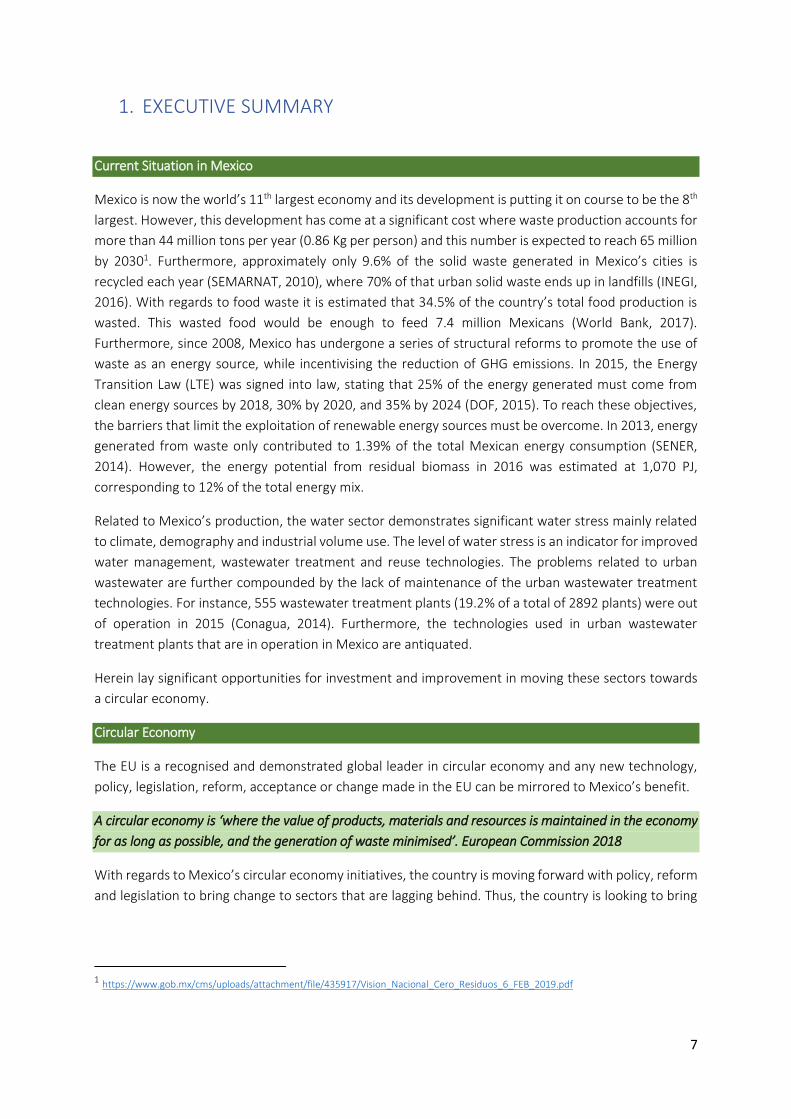
Mexico is now the world’s 11th largest economy and its development is putting it on course to be the 8th
largest. However, this development has come at a significant cost where waste production accounts for
more than 44 million tons per year (0.86 Kg per person) and this number is expected to reach 65 million
by 20301. Furthermore, approximately only 9.6% of the solid waste generated in Mexico’s cities is
recycled each year (SEMARNAT, 2010), where 70% of that urban solid waste ends up in landfills (INEGI,
2016). With regards to food waste it is estimated that 34.5% of the country’s total food production is
wasted. This wasted food would be enough to feed 7.4 million Mexicans (World Bank, 2017).
Furthermore, since 2008, Mexico has undergone a series of structural reforms to promote the use of
waste as an energy source, while incentivising the reduction of GHG emissions. In 2015, the Energy
Transition Law (LTE) was signed into law, stating that 25% of the energy generated must come from
clean energy sources by 2018, 30% by 2020, and 35% by 2024 (DOF, 2015). To reach these objectives,
the barriers that limit the exploitation of renewable energy sources must be overcome. In 2013, energy
generated from waste only contributed to 1.39% of the total Mexican energy consumption (SENER,
2014). However, the energy potential from residual biomass in 2016 was estimated at 1,070 PJ,
corresponding to 12% of the total energy mix.
Related to Mexico’s production, the water sector demonstrates significant water stress mainly related
to climate, demography and industrial volume use. The level of water stress is an indicator for improved
water management, wastewater treatment and reuse technologies. The problems related to urban
wastewater are further compounded by the lack of maintenance of the urban wastewater treatment
technologies. For instance, 555 wastewater treatment plants (19.2% of a total of 2892 plants) were out
of operation in 2015 (Conagua, 2014). Furthermore, the technologies used in urban wastewater
treatment plants that are in operation in Mexico are antiquated.
Herein lay significant opportunities for investment and improvement in moving these sectors towards
a circular economy.
Circular Economy
The EU is a recognised and demonstrated global leader in circular economy and any new technology,
policy, legislation, reform, acceptance or change made in the EU can be mirrored to Mexico’s benefit.
A circular economy is ‘where the value of products, materials and resources is maintained in the economy
for as long as possible, and the generation of waste minimised’. European Commission 2018
With regards to Mexico’s circular economy initiatives, the country is moving forward with policy, reform
and legislation to bring change to sectors that are lagging behind. Thus, the country is looking to bring
1 https://www.gob.mx/cms/uploads/attachment/file/435917/Vision_Nacional_Cero_Residuos_6_FEB_2019.pdf
8
the circular economy concept to Mexican industries to bring about change, as these current initiatives
show:
✓ Pacto por México: Reforms related to trade openness, foreign direct investment, integration into global value chains, and innovation incentives, these have also boosted exports, notably within the car and truck industries.
✓ National Programs for the Prevention and Integral Management of Waste: seeks to promote the valorisation of waste and to minimise the impact on the environment and particularly to human health.
✓ Energy Transition Law: regulates sustainable electricity use. ✓ National Vision Towards Sustainable Management: Zero Waste: includes the following guiding
principles: Sustainable Development; Circular Economy; Commitment to Corruption and Transparency in Public Management; Attend to Vulnerable Populations Including Social Justice; Reduce Risk and Impacts in Health and the Environment; Social Welfare and Inequality Reduction.
Following these reforms, Mexico’s productivity growth has recently picked up in sectors that have
benefitted from the structural reforms, namely: energy (electricity, oil and gas), financial, manufacturing
and the telecom sectors.
Reform Opportunities
There are however still significant opportunities for sector reform to take place in Mexico. For secondary
raw materials markets to work a series of changes need to take place in the way policy makers view and
regulate waste. Without these changes, it remains a complex challenge to drive recycling standards and
to give confidence to designers of secondary raw materials. This need was first recognised in 2011 by
the EU Resource Efficiency Roadmap. Secondary raw material markets need to provide the same
services as those currently operational for primary raw materials. Secondary raw material markets
therefore need reforms in:
✓ buying and selling materials; ✓ price transparency;
There are three sectors in Mexico that present considerable business opportunities to bring the sectors
in line with the circular economy initiative which can be aided by EU businesses:
(i) Solid Waste management; (ii) Wastewater; (iii) Waste to energy.
Business Opportunities in Solid Waste Management
Key Message
There are 1,643 open dump sites in Mexico, however, only 25% of that waste is available for valorisation.
Therefore, there is a need for technology implementation specifically in management, collection, sorting,
and recycling. This presents a significant market for European companies, specifically within the
municipal waste equipment market. Mexico in 2009 had a waste equipment market of 806 million Euros,
in 2019 this is expected to be around 1300 million Euros, which is then expected to grow at 6% to 2025.
9
Business Opportunities in Solid Waste
✓ There is a need for information generation and collection of municipal solid waste as it suffers from difficulties in integrating data between national and local levels, as well as between countries; this is due to the lack of harmonization of waste generation and management indicators
✓ There exists an opportunity for introducing sorting lines in Mexico where the materials are identified by using automated systems which sort and separate the waste then store and condition it for recycling or valorisation
✓ E-waste is now the fastest-growing waste stream in Mexico representing 2.52kg/hab/year, this is a waste stream that is currently not well managed in Mexico.
✓ Approximately one third of the total food produced for human consumption –equivalent to 1.3 billion tonnes– is lost or wasted annually, this presents an opportunity to improve food waste management in Mexico.
✓ The volume of Construction and Demolition waste is increasing and reached 6.5 million tones anually in Mexico.
✓ In Mexico, 5% of all tyres are recycled, 2% are used for energy generation, 2% are disposed in authorized collection centres and the remaining 91% are abandoned or used without control.
Technology trends and opportunities
✓ Management: New technologies are required for Integrated Waste Management Data Systems ✓ Storage: There is a need for special containers for automated load; Bins hidden in street furniture;
Smart containers and Eco-points ✓ Handling technologies required: Shredders, crushers, chippers; pulpers; pelleting and briquetting
including high compaction balers ✓ Collection: There is a need for data systems for garbage trucks with automated front, rear and side
loading systems; mini rear loaders and multi-compartment vehicles ✓ Sorting and recovery: Technologies for optical multiplexer sorting systems; sorting systems by
density; magnetic separation systems; trommels and screens and Conveyors are required. ✓ Plastic Waste needs: Mechanical recycling lines; Chemical recycling systems; Up-cycling
technologies ✓ Construction and Demolish waste: Integrated recycling lines and equipment: Crushers, Screens and
stackers ✓ Economic Waste: Integrated e-waste management from collection, process and recycling schemes ✓ Tyre waste: Opportunity for upcycling to produce asphalt paviment, running tracks and urban
furniture.
Business Opportunities in Wastewater Treatment
Key Message:
Increased water stress coupled with antiquated urban wastewater systems and Mexico’s international
commitments presents a significant opportunity for EU companies. Furthermore industrial wastewater
treatment for reuse with nutrient recovery is an untapped market in Mexico. The wastewater market in
Mexico has shifted to the upgrading of plants that are currently not in operation, which will require
private sector involvement. Most of these opportunities will materialise as service contracts resulting in
capex opportunities of around 2 billion € in the utilities sector and around 600 million € in the industrial
wastewater treatment sector.
10
Business Opportunities in Wastewater
✓ EU Companies will increasingly find opportunities in the growing industrial wastewater sector. Contracts here have a lower value than in the municipal sector but there is a higher frequency of projects. Specifically, specialised SMEs could find value in this sector.
✓ Technologies in the industrial wastewater treatment sector will focus on Membrane Bioreactors and technologies for material recovery as Mexico looks to upgrade antiquated plants.
✓ The highest potential for implementation of new technologies is found in tertiary treatment processes. This also includes technologies related to nutrient recovery and energy generation.
✓ It is expected that wastewater networks will also be a major focus of investment in the future in order to connect communities to existing wastewater treatment plants
✓ National planning coupled with international commitments sets an objective to treat all the wastewater by the year 2030. This ambitious objective will result in an increase in the number of projects in this sector and result in related market opportunities
✓ The situation of the wastewater sector in recent years has shown some uncertainty in the development of regulations due to social and political pressure. This point needs to be considered when establishing market strategies that must adapt to national regulation.
Business Opportunities in Waste to Energy
Key Message
The waste to energy sector can be considered virgin territory in Mexico, a country where successful, large
scale projects are scarce. Mexico will require 95 billion Euro investments over the next 15 years for power-
related infrastructure projects. Of this, 81% would be required for generation projects, 11% for
transmission projects, and 8% for distribution projects. The Secretaria de Energía (SENER) estimates that
about 137 generation units, totalling 15,814 MW (nearly 16 GW), will need to be retired. This means
Mexico will need to add 56 GW of new capacity between now and 2031. The target is to make clean
energy account for 38.2% of its total power generation by 2031.
Business Opportunities in Waste to Energy
✓ FIBRAs (Real Estate Investment Funds), has changed the Industrial Park development trend by offering retrofitting opportunities with localized portfolios of Waste to Energy solutions.
✓ Wastewater: The anaerobic treatment of wastewater in Mexico has proven to be successful in both municipal and industrial sectors, and this area is the most mature of all biogas subsectors in Mexico, however significant opportunity still abounds by bringing other wastewater treatment plants in line with this trend.
✓ Combustion of dehydrated residual sludge: Currently there are no cases in Mexico where the combustion potential of this residue is utilized. Landfills are still a preferred method of disposal for dehydrated residual sludge, mainly due to the lack of experienced service providers rather than other market barriers.
✓ Agricultural (Meat and Dairy farms): biogas plants are seen to be profitable if they possess good design, quality equipment, and good practices in operations are implemented. Key technological and operational improvements can make these projects financially attractive for farmers with access to financing and government subsidies.
✓ The Food and Beverage Industry: In collaboration with the Danish Energy Agency, SENER is expected to release a complete biogas potential characterization. This will make it easier to perform preliminary feasibility studies of biogas projects that deal with the digestion or co-digestion of these substrates that are abundantly found in Mexico.
11
✓ Organic Fractions: Still requires validation projects that necessitates the involvement of international consultants with successful track records. Mexico has 36 municipalities which have a population of over 500,000 in which large scale food waste biogas plants can be implemented (INEGI).
✓ Municipal Landfill: In 2015, there were only 8 landfills with a total installed capacity of 34MW that was generated from biogas. This means that there are at least 252 landfills in which biogas generation projects can be implemented.
Conclusions
There are three main sectors in Mexico that present significant opportunities in bringing the sectors
towards the circular economy concept, these are: Solid Waste Management; Wastewater Treatment
and Waste to Energy. The solid waste management sector has two main areas that present
opportunities: Municipal Solid Waste and Special Handling Waste. It is estimated that bringing the
Mexican solid waste market to a more circular economy has a potential worth of 1,172 million Euros
per year. In terms of the Special Handling Waste, for instance the electronic waste represents a potential
of 1 billion Euro market value that could be recovered each year through introducing circular solutions.
Furthermore, the increasing building materials recycling and reuse activities will require an investment
of up to 180 million Euro per year to scale up the number of CDW recovery plants in the main 10 cities
in Mexico.
Keeping pace with the significant consumption and production in Mexico, the water sector
demonstrates significant water stress mainly related to climate, demography and industrial volume use.
A lower level of water stress is a good indicator to show improved water management, wastewater
treatment and reuse. The wastewater treatment sector has a potential market opportunity size for
circular solutions of around 1,644 million Euro for CAPEX related investment in wastewater treatment.
Most of this increase is related to wastewater networks, whereas an increase in sludge management is
lower in absolute values and capex is approximately constant for wastewater treatment plants.
Operational expenses also show a steady increasing trend with the opportunities more significant for
industrial uses (20.6%, from 1,035.3€ million to 1,249.2€ million) than for wastewater utilities (8.3%,
from 731.8€ million to 792.3€ million).
Indeed, it is within the wastewater treatment sector that significant opportunities arise in waste to
energy production for both biogas and combustion technologies. However, to date, there is no record
of a WWTP that is transferring its dried sludge to industrial facilities to be used in co-combustion
processes. Furthermore, in the waste to energy sector, biodiesel infrastructure investment
opportunities are estimated at 845 Million Euro from years 2018 to 2036.
12
2. INTRODUCTION
For many years the global economic model has been based on a linear model of production. This model
can be summarised as the: take-make-use-dispose model, where resources are converted to products
that are destroyed at the end of their life. However, the linear model is also characterised by driving
down natural resources, increasing the emissions of greenhouse gases, generating vast amounts of
plastic waste which all result in significant environment damage. It is precisely this economic model that
is no longer compatible with economic advancement. The circular economy model, on the other hand,
converts waste into new resources that implements a sustainable system of creation - use - reuse. This
model results in a paradigm shift that is encouraging companies to completely reconsider their
production strategies and processes while obtaining new markets.
The first industrial revolution was built around low-cost primary raw materials and the innovation and
skills to exploit them through mechanisation in the late 18th century. The early 20th century saw
industrialising countries move through the second industrial revolution when they built their industrial
base and wealth through mass production using those raw materials. Such countries have maintained
that position with falling raw material prices and increases in labour productivity for nearly a hundred
years. During that time, they have built an economy with massive raw material supplies embedded into
the infrastructure and the goods and commodities their communities use. The same model has survived
as OECD countries have offshored manufacturing (largely driven by lower labour and manufacturing
costs) to the new economies such as China, India, Brazil, Vietnam and Bangladesh who are all growing
strongly. As a consequence, the global community has seen a growing scramble for the globe’s
resources, which is not sustainable.
It was in 1972 that a report from the Club of Rome2 stressed the idea of the limits to the continuous
increase of material wellbeing and expressed the limits to the extent with which humans can exhaust
the natural environment. Within this context, the need emerged to investigate a new economic model
to face the challenges of the availability of the resources coupled with environmental protection, there
within came the proposal of an innovative economic model: Circular Economy (CE). The current
understanding of the Circular Economy and its practical applications to economic systems evolved to
incorporate different features and contributions from a variety of concepts sharing the idea of closed
loops. Some of the relevant theoretical influences are cradle-to-cradle, laws of ecology, looped and
performance economy, regenerative design, industrial ecology, biomimicry and blue economy
(Ghisellini, Cialani and Ulgiati, 2016). The concept was proposed as an alternative to the negative effects
caused by the linear economy model, in which the (re)design of the production systems at a variety of
levels coupled with value retention in the production chains as well as during the life cycle of the
resources, materials and products is key. This often leads to new and intensely connected recycling and
reuse patterns, mostly of a cyclical nature and leading to value creation that is mutually dependent3
2 The Club of Rome is an organisation of individuals who share a common concern for the future of humanity and strive to make a difference. The members are notable scientists, economists, businessmen and businesswomen, high level civil servants and former heads of state from around the world. The mission is to promote understanding of the global challenges facing humanity and to propose solutions through scientific analysis, communication and advocacy.
3European Commission (2018), Organising for the circular economy (2018).
13
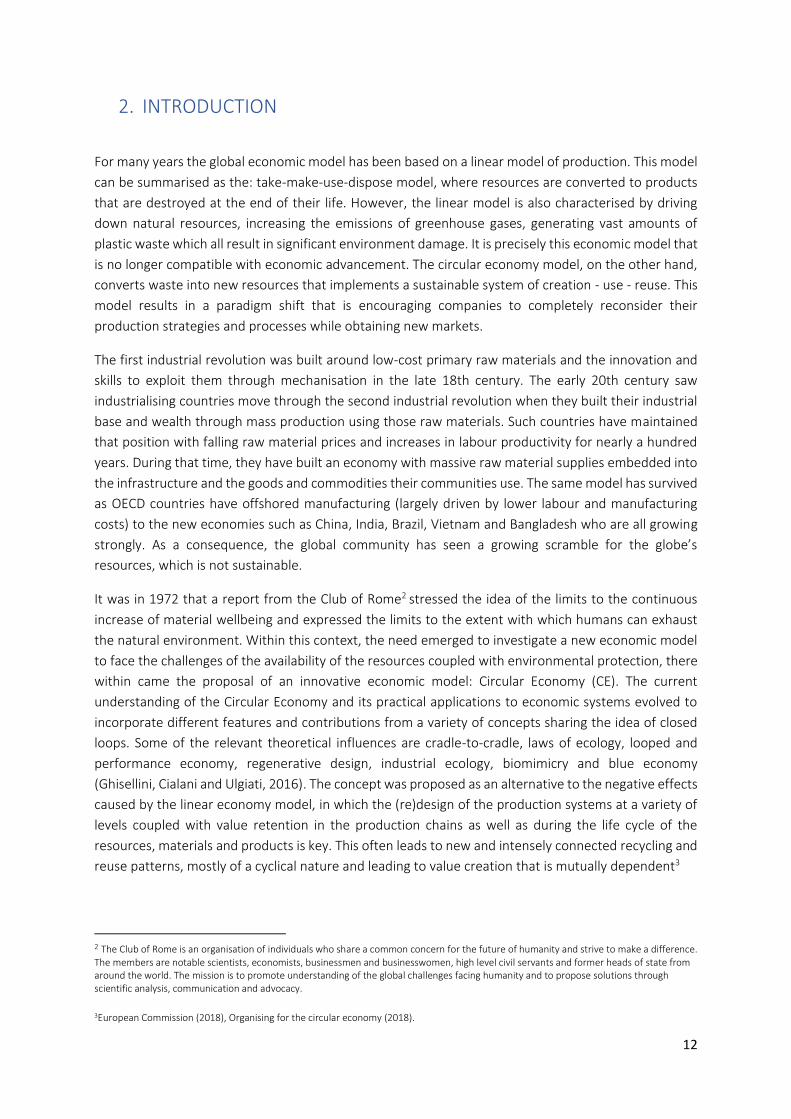
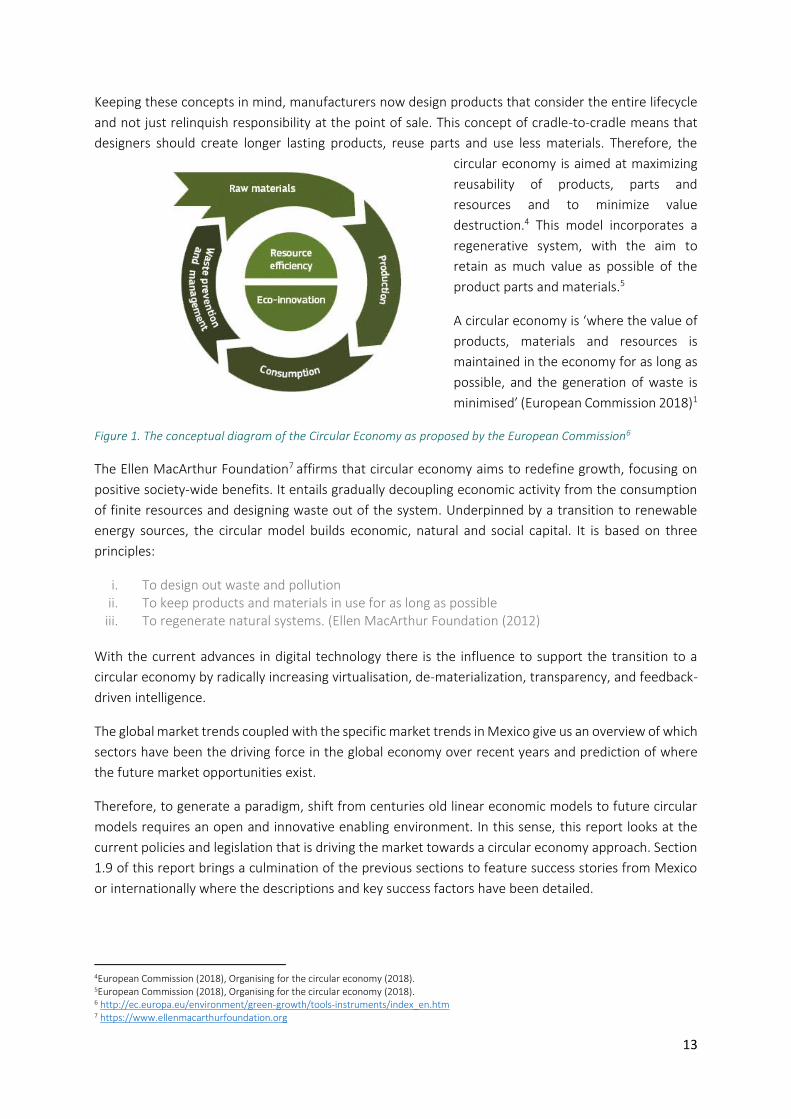
Keeping these concepts in mind, manufacturers now design products that consider the entire lifecycle
and not just relinquish responsibility at the point of sale. This concept of cradle-to-cradle means that
designers should create longer lasting products, reuse parts and use less materials. Therefore, the
circular economy is aimed at maximizing
reusability of products, parts and
resources and to minimize value
destruction.4 This model incorporates a
regenerative system, with the aim to
retain as much value as possible of the
product parts and materials.5
A circular economy is ‘where the value of
products, materials and resources is
maintained in the economy for as long as
possible, and the generation of waste is
minimised’ (European Commission 2018)1
Figure 1. The conceptual diagram of the Circular Economy as proposed by the European Commission6
The Ellen MacArthur Foundation7 affirms that circular economy aims to redefine growth, focusing on
positive society-wide benefits. It entails gradually decoupling economic activity from the consumption
of finite resources and designing waste out of the system. Underpinned by a transition to renewable
energy sources, the circular model builds economic, natural and social capital. It is based on three
principles:
i. To design out waste and pollution ii. To keep products and materials in use for as long as possible iii. To regenerate natural systems. (Ellen MacArthur Foundation (2012)
With the current advances in digital technology there is the influence to support the transition to a
circular economy by radically increasing virtualisation, de-materialization, transparency, and feedback-
driven intelligence.
The global market trends coupled with the specific market trends in Mexico give us an overview of which
sectors have been the driving force in the global economy over recent years and prediction of where
the future market opportunities exist.
Therefore, to generate a paradigm, shift from centuries old linear economic models to future circular
models requires an open and innovative enabling environment. In this sense, this report looks at the
current policies and legislation that is driving the market towards a circular economy approach. Section
1.9 of this report brings a culmination of the previous sections to feature success stories from Mexico
or internationally where the descriptions and key success factors have been detailed.
4European Commission (2018), Organising for the circular economy (2018). 5European Commission (2018), Organising for the circular economy (2018). 6 http://ec.europa.eu/environment/green-growth/tools-instruments/index_en.htm 7 https://www.ellenmacarthurfoundation.org
14
Within the circular economy approach and framework, section 2 of this report takes a deep dive into
three main sectors where the greatest potential exists to foster a paradigm shift into the circular
economy model that will bring positive economic and environmental impacts. These three sectors are:
(iv) Solid Waste management; (v) Wastewater; (vi) Waste to energy.
Finally, in chapter 4 financial instruments that are currently available both internationally and nationally
are detailed to aid both European and Mexican businesses to identify the best financing opportunities
to work together to bring about this paradigm shift.
2.1. TRENDS IN CIRCULAR ECONOMY
According to the International Solid Waste Association report, the annual material cost saving
opportunity at EU level for a “transition scenario” is €300 to 340 billion per annum and for an “advanced
scenario” €460 – 590 billion or a recurring 3-3.9% of 2010 EU GDP, for the materials used in the circular
economy processes8. The UN Global Compact study9 on the views of CEO’s on Sustainability in the
Mining and Metals sector shows that the concept of the circular economy has taken hold quickly among
CEOs focused on innovation and the potential of new business models. With a potential €1 trillion
opportunity in transitioning to the circular economy, companies are recognising that preservation
makes as much economic sense as it does environmental. It is thus evident that transforming to a
circular economy is economically beneficial, however trends within different initiatives give us an idea
of where the best economic opportunities lie within the circular economy paradigm shift.
2.1.1. TRENDS IN INITIATIVES
On 4 March 2019, the European Commission adopted a comprehensive report on the implementation
of the Circular Economy Action Plan10. The report presents the main achievements under the Action
Plan and sketches out future challenges to shaping the EU economy and paving the way towards a
climate-neutral, circular economy where pressure on natural and freshwater resources as well as
ecosystems is minimised.
The Action Plan establishes a concrete programme of action, with measures covering the whole product cycle: from production and consumption to waste management and the market for secondary raw materials and a revised legislative proposal on waste. The proposed actions will contribute to "closing the loop" of product lifecycles through greater recycling and re-use, and to bring benefits for both the environment and the economy. Further to the Action Plan, there are European legislations and strategies such as the revised legislative
framework on waste that entered into force in July 2018. The framework sets clear targets for the
reduction of waste and establishes an ambitious long-term path for waste management and recycling.
Additionally, the Europe-wide EU Strategy for Plastics in the Circular Economy includes the way plastics
and plastic products are designed, produced, used and recycled. The EU has set the target that by 2030,
all plastic packaging should be recyclable. To achieve this ambitious aim, the strategy foresees actions
to improve the economics and quality of plastic recycling; to curb plastic waste and littering and to drive
8 https://www.iswa.org/fileadmin/galleries/Task_Forces/Task_Force_Report_1_02.pdf 9 https://www.accenture.com/us-en/insight-un-global-compact-ceo-study 10 http://ec.europa.eu/environment/circular-economy/index_en.htm
15
investments and innovation. To reduce plastics into the environment, the Commission has also adopted
a new proposal on Port Reception Facilities, to tackle sea-based marine litter and published a report on
the impact for the use of oxo-degradable plastic, including oxo-degradable plastic carrier bags, on the
environment.
Moreover, the EU put forward the EU Strategy for Plastics in the Circular Economy to reduce the impact
of certain plastic products on the environment. The Strategy proposes different measures for specific
items made of single use plastics considering consumer behaviour as well as consumer needs and
opportunities for businesses. When alternatives are clearly available – both single use and multi-use
plastic bags – market restrictions are then proposed. Other measures include appropriate labelling,
awareness raising, voluntary actions, and the establishment of Extended Producer Responsibility
schemes that would also cover the costs for the clean-up of litter.
In terms of raw materials, the European Commission has produced a vision on the use of Critical Raw Materials (CRMs) and the circular economy that highlights the potential to make use of the 27 critical materials in the EU economy more circular. This vision report provides key data sources, suggests several best practices and identifies options for further action, to ensure a coherent and effective EU approach to CRMs in the context of the transition to a circular economy.
When considering the circularity of the water cycle, the European Commission has put forward a proposal for a Regulation on minimum requirements for water reuse - the proposal is setting the minimum requirement to boost the efficient, safe and cost-effective reuse of water for irrigation -and thus delivering the Circular Economy Action Plan.
In monitoring the achievement of these circular economy initiatives at European level, the European
Commission in 2018 produced the Monitoring Framework on progress towards a circular economy at
EU and national level. It is composed of a set of ten key indicators which cover each phase – i.e.
production, consumption, waste management and secondary raw materials – as well as economic
aspects – investments and jobs - and innovation. They have also produced an interactive website
following the progress of these initiatives: https://ec.europa.eu/eurostat/web/circular-
economy/indicators/monitoring-framework.
2.1.2. TRENDS IN TECHNOLOGY AND BUSINESS MODELS
The above-mentioned trends to change to a circular economy, are affected by the rapid pace of
technological innovation. The Report on the Next Manufacturing Revolution11 considers that the OECD
countries are entering the next major manufacturing revolution in what they call “Circular Resource
Flows”. According to the World Economic Forum12 supply chains are the key unit of implementation
that will drive the technological trends in the circular economy. Analysing the most advanced business
cases confirms that a supply chain management approach that balances the forward and reverse loops
and ensures uniform materials quality is critical to maximising resource productivity globally. For
instance, advanced tracking and treatment technologies is a key innovation point that can boost the
efficiency of both forward and reverse logistics.
11 http://www.nextmanufacturingrevolution.org/wp-content/uploads/2013/09/Next-Manufacturing-Revolution-full-report.pdf 12 http://reports.weforum.org/toward-the-circular-economy-accelerating-the-scale-up-across-global-supply-chains/executive-summary/
16
A 2018 report by The Warren Centre on The Circular Economy: Global Trends and Future Challenges13
identifies current global trends towards a circular economy for industrial systems, products and
consumers. The report identified three (3) main technological trends in circular economy: (i)
Partnerships (covered in section 1.1.2), (ii) Industrial design reform and (iii) New Business Models.
Industrial design reform
Currently, industrial design is characterised by planned obsolescence and bespoke and unique parts that
make replacement difficult. Extending product lives will result in a decline in revenue for suppliers.
However, manufacturers could learn from other industries such as music, television or even private
transport that are moving towards a subscription-based service. Subscription based services provide a
better business model to apply the circular economy processes and concepts. For a product designed
with recycled materials to be financially viable, a steady supply of that recycled material is required. The
kind of recycling infrastructure that would provide industrial volumes of secondary raw material are rare
throughout the world and require significant technical development and supportive legislative
advances. For continued benefits in the long term, circular economy concepts need to be taught in
industrial design courses and to be taken up from the very start of the product design.14
Business Models
Increasingly business models for consumer products have been shifting from a product-based system
to a product service system (PSS). A product-based system involves firms selling discrete goods to the
consumer, incentivising manufacturers and marketers to create more products to sell to more buyers
to make more profit. This has been the traditional business model for consumer products and has been
entrenched by technological constraints, force of habit and the need for individuals to have control and
ownership over objects. Alternatively, in a PSS, a firm does not sell a product but rather a fulfilment of
a need, and the product is merely a channel for satisfying consumer needs. This is seen in ridesharing
services like: Uber (Global), GoGet15 (Australia) OBike16 (Singapore), and even for shared office spaces
(e.g. SC Trade Centre17 in Spain). These business models prioritise access over ownership and takes
advantage of the idle capacity of these goods.
13 https://thewarrencentre.org.au/publications/circular-economy/ 14 The Warren Centre (2019), The circular economy (2019) 15 https://www.goget.com.au 16 https://www.o.bike 17 http://sctradecenter.es/web/
17
2.2. COUNTRY AND CONTEXT OVERVIEW
The current study brings a focus on the market opportunities in Mexico in relation to Circular Economy
solutions in the solid waste, wastewater and waste to energy sectors. The shift towards a circular
economic model comes at a good time for the Mexican economy as a recent economic survey by the
OECD in 2017, showed that the Mexican economy is seen as resilient with recent indicators suggesting
that there is further growth ahead18. Given that the external economic environment is turbulent, with
the global economy remaining in a low-growth environment coupled with weak global trade and
investment, innovation in these 3 major sectors in Mexico will be vital to secure future economic, social
and environmental sustainability. Specific challenges to the Mexican economy include collapsing oil
prices, which reduced government receipts and led to cutbacks in energy sector investments, as well as
the sharply depreciating Mexican peso following market expectations of US Federal Reserve tightening
and rising global policy uncertainty. However, despite these shocks, performance is good, supported by
domestic demand. The structural reforms related to waste and water are supporting economic growth.
The OECD further elaborates that output growth in Mexico is projected to accelerate modestly to 2.1
and 2.3 % in 2018 and 2019, respectively, and to then gradually converge to just under 3% over the
medium term as uncertainty subsides and the economy reaps the full benefits of the implemented
structural reforms. Inflation is expected to converge toward the Bank of Mexico’s 3% target in the
second half of 2019. The main risks to the outlook include weaker-than-projected global growth,
renewed volatility in global financial markets, and global trade-related uncertainty.
Private consumption continued to be the main driver of growth on the demand side, including on the
back of real wage growth turning positive in the first half of 2018. Oil production, which had declined to
1.9 million barrels per day (bpd) by the end-2017, from 2.6 million bpd five years earlier, had shown no
sign of a trend reversal by mid-2018, as large investments in extraction are progressing slowly. With the
elections behind Mexico, as well as the trilateral US-Mexico-Canada Agreement (USMCA) on trade,
these past uncertainty factors should fade, helping to support a further, albeit moderate, rebound in
investment. Weakness in the currency and asset markets in advance of the July Presidential election
had been more than reversed by early August, with the incoming administration’s economic team
signalling its commitment to prudent fiscal and monetary policies implying continued adherence to the
Fiscal Responsibility framework as well as the principle of Central Bank independence.
2.3. SOCIO-ECONOMIC CONTEXT
According to the OECDs How is Life in Mexico19, relative to other OECD countries, Mexico has a mixed
performance across the different well-being dimensions. The employment rate in Mexico of 61% in
2017, is below the OECD average (67%), but the long-term unemployment rate was close to zero, one
of the lowest levels in the OECD countries. Housing conditions are below the OECD average for all three
indicators, and the average life expectancy at birth (75 years in 2015) is 5 years below the OECD average.
Mexico has the highest homicide rate, with 18 homicides per 100 000 people in 2016. Mexico also ranks
low in terms of education and skills but is in the top tier of OECD countries in terms of life satisfaction
However, following the general elections in 2018 a new political landscape is shaping up in Mexico. The
new President, Lopez Obrador, has promised to reduce corruption and crime, and boost social spending
18 https://www.oecd.org/eco/surveys/Mexico-2017-OECD-economic-survey-overview.pdf 19 https://www.oecd.org/statistics/Better-Life-Initiative-country-note-Mexico.pdf
18
and public investment, while maintaining fiscal cautiousness. The incoming administration will inherit
an economy with very strong fundamentals and policy frameworks that has exhibited resilience in the
face of a complex external environment. Nevertheless, since the crisis of 2009, Mexico has observed a
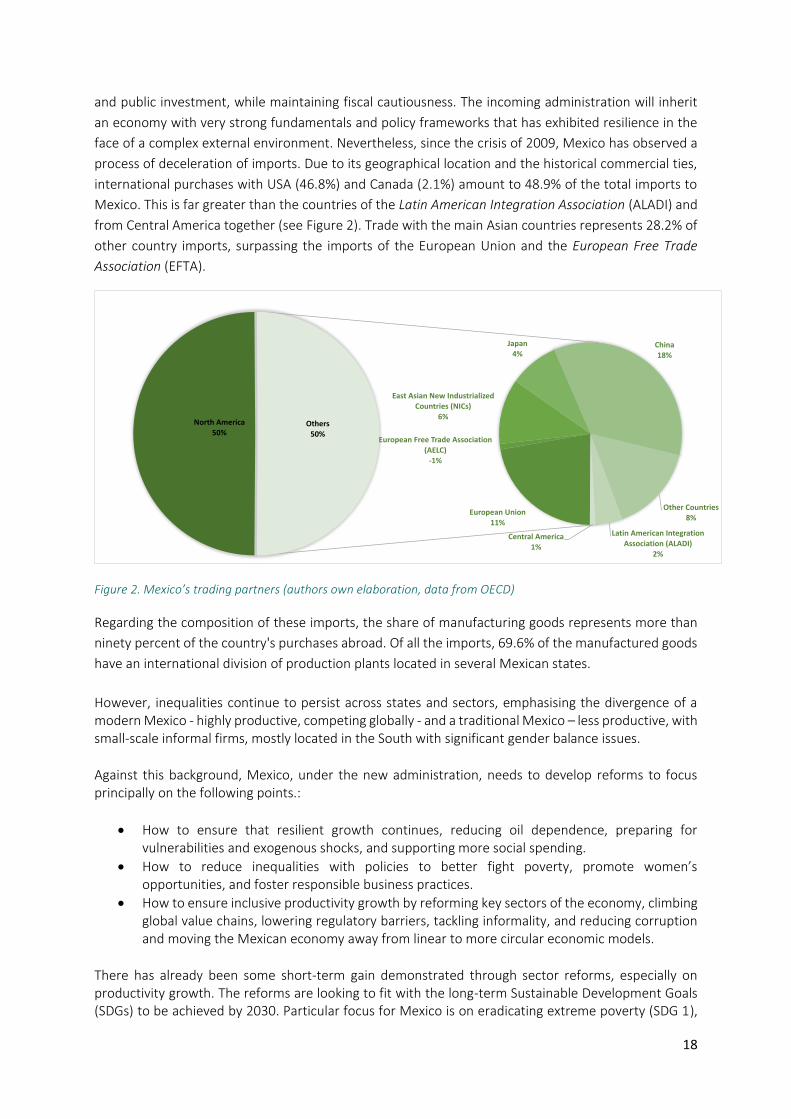
process of deceleration of imports. Due to its geographical location and the historical commercial ties,
international purchases with USA (46.8%) and Canada (2.1%) amount to 48.9% of the total imports to
Mexico. This is far greater than the countries of the Latin American Integration Association (ALADI) and
from Central America together (see Figure 2). Trade with the main Asian countries represents 28.2% of
other country imports, surpassing the imports of the European Union and the European Free Trade
Association (EFTA).
Figure 2. Mexico’s trading partners (authors own elaboration, data from OECD)
Regarding the composition of these imports, the share of manufacturing goods represents more than
ninety percent of the country's purchases abroad. Of all the imports, 69.6% of the manufactured goods
have an international division of production plants located in several Mexican states.
However, inequalities continue to persist across states and sectors, emphasising the divergence of a modern Mexico - highly productive, competing globally - and a traditional Mexico – less productive, with small-scale informal firms, mostly located in the South with significant gender balance issues.
Against this background, Mexico, under the new administration, needs to develop reforms to focus principally on the following points.:
• How to ensure that resilient growth continues, reducing oil dependence, preparing for vulnerabilities and exogenous shocks, and supporting more social spending.
• How to reduce inequalities with policies to better fight poverty, promote women’s opportunities, and foster responsible business practices.
• How to ensure inclusive productivity growth by reforming key sectors of the economy, climbing global value chains, lowering regulatory barriers, tackling informality, and reducing corruption and moving the Mexican economy away from linear to more circular economic models.
There has already been some short-term gain demonstrated through sector reforms, especially on productivity growth. The reforms are looking to fit with the long-term Sustainable Development Goals (SDGs) to be achieved by 2030. Particular focus for Mexico is on eradicating extreme poverty (SDG 1),
North America
50%
European Union11%
European Free Trade Association
(AELC)
-1%
East Asian New Industrialized
Countries (NICs)
6%
Japan
4%China
18%
Other Countries
8%
Latin American Integration Association (ALADI)
2%
Central America
1%
Others50%
19
raising female participation (SDG 5), improving access to water and sanitation (SDG 6), improving affordable and clean energy (SDG 7), improving economic opportunities (SDG 8), reducing income inequality (SDG 10), and encouraging more responsible business practices (SDG 12).
2.4. OVERVIEW OF THE CIRCULAR ECONOMY IN MEXICO
Mexico in 2011 was stated as being far away from having any semblance of a circular economy, and it
was thought, at the time, that the effort in many sectors of Mexican society to transform into a circular
economy would not be forthcoming (Gottesfeld and Durand, 2011). It was mentioned in 2011 that this
transition to a circular economy would require changes in recycling and reuse of waste; changes in
production and consumption, and in the institutional systems surrounding production and
consumption, such as in legislation, education, knowledge transfer, environmental awareness and
entrepreneurial cultures.
The production of waste in Mexico is particularly worrisome. It generates more than 44 million tons of
waste per year and this number is expected to reach 65 million by the year 203020. Given that a linear
economic model in this sense would be wholly unsustainable, the Mexican government put forward a
regulatory framework and public policy instruments, such as the National Programs for the Prevention
and Integral Management of Waste, which seeks to promote the valorisation of waste and to minimise
the impact on the environment and particularly to human health. Similarly, Mexico has international
obligations through its signed corresponding international agreements to manage waste and chemical
substances as a global priority, thus complementing the integral management at the national level.
However, it was not until January of this year (2019) that Mexico put forward a vision document National
Vision Towards Sustainable Management: Zero Waste. Within this document a roadmap was laid down
on how Mexico could move towards a circular economy, it specifies the formulation and
implementation of public policies, as well as the execution of instruments, programs and plans, to
strengthen the management of waste in the country.
This document puts forward 6 guiding principles:
1. Sustainable Development. To consider the integrity of the development of the country, with economic, social and environmental
aspects.
2. Circular Economy. To establish the grounding and to develop the mechanisms and instruments to implement a circular
economy approach that strengthens the sustainable management of materials, with a zero-waste
vision.
3. Commitment to Corruption and Transparency in Public Management. To prevent and avoid irregularities in the provision and collection of waste services.
4. Attend to Vulnerable Populations Including Social Justice.
20 https://www.gob.mx/cms/uploads/attachment/file/435917/Vision_Nacional_Cero_Residuos_6_FEB_2019.pdf
20
To provide training and services to isolated populations with few inhabitants. Formation of cooperatives
and work groups to collaborate in the collection, accumulation and management of waste.
5. Reduce Risk and Impacts in Health and the Environment. To avoid the proliferation of diseases and harmful effects on health due to the inadequate management
of waste, as well as the risk and impacts on the environment.
6. Social Welfare and Inequality Reduction. To expand service coverage and serve communities under 10 thousand inhabitants. Establish
coordination and follow-up mechanisms to achieve harmonization and articulation with programs and
policies related to gender equality.
Following these guiding principles, the document has put forward a roadmap towards zero waste where
the integral management of waste includes hazardous waste, urban solid waste, wastewater and special
waste. The scope of this document is primarily focused on solid waste, considering the biggest issue
facing Mexico in terms of waste is the size and number of open dump sites and sanitary landfills.
Furthermore, solid waste has given rise to the formation of contaminated sites or open dumpsites
where there is proliferation of informality, and space for irregularities in waste management to exist
which are significant barriers to implement a circular economy model. To reduce the risk of exposure to
waste in landfills, this document directs the action to the flows and processes of classification, collection,
transport, transfer, reuse, recycling, storage and recovery into new valorised materials and energy. The
vision is to bring forward these concepts to allow for the gradual reduction of solid waste and to reduce
and finally close solid waste landfill sites.
The Roadmap includes the following 6 main goals:
1. A thorough diagnosis of the infrastructure, capacity, market and management of waste in the country.
2. The closure of final disposal destinations (open dumps and landfills) that do not comply with the regulations.
3. To design the platform of technical assistance and finance for the management of waste in all Mexican states.
4. The creation, adoption and operation of models for the sustainable management of waste. 5. To transform open dumps into material banks and to create markets for recycled raw materials,
promoting the remanufacturing and recycling industry. 6. To eliminate food waste and to take advantage of the organic and energetic potential of the
waste.
The response from the public sector in providing a vision for a circular economy in Mexico has in many
regards already been met by the private sector as they see a market niche and an economic gain in
moving towards a circular economy. Currently, Veolia - a world leading European company in water,
waste and energy management – has developed innovative processes to create access, preserve and
reuse natural resources and thus respond to emerging needs globally. It has various projects based on
the circular economy, in Europe, specifically in Brussels, where bioplastics are produced from
wastewater; at the regional level, in Chile, they recover the copper from the sedimentation tanks.
21
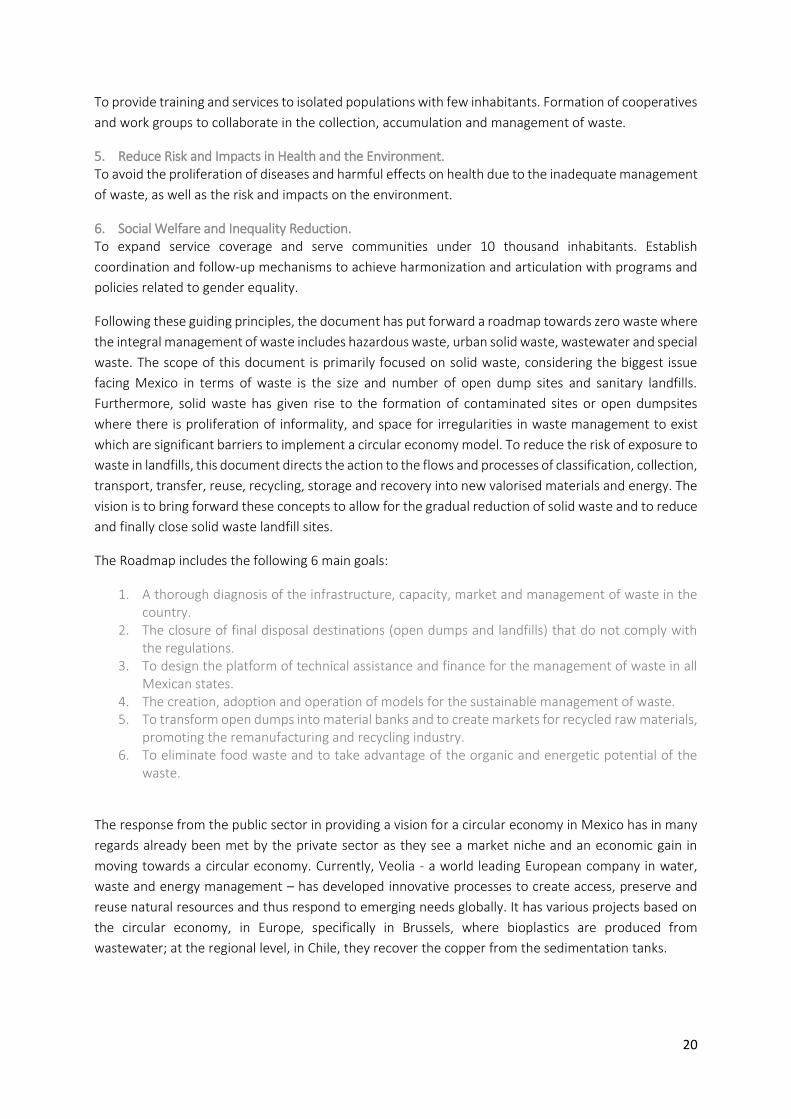
Another example of circular solutions that are using private sector initiatives is the case of the largest
green roof in Latin America, located in Mexico City, with an area of 2,270 square meters and more than
125 different species of vegetation. The budget for this initiative was 9.8 million pesos (0.2 million Euros)
with the instillation following the
guidelines and implementing Swiss
technology based on the usage of
polymers and geotextiles. The polymer
undergoes a thermofusion process with
heat, it is attached to the floor and
sealed completely. This plastic is
accompanied by geotextiles and
geodren, a technique that stores water
long enough, so the plants and
vegetation can take the essential
nutrients.
Figure 3. The largest Green Roof in Latin America, on the INFONAVIT National Workers’ Housing Fund Institute
(photo credit: The Mazatlan post)
2.5. PRODUCTION AND CONSUMPTION PATTERNS IN MEXICO
The production and consumption patterns that govern the globe, present serious contradictions and
challenges in the logic of sustainable development and specifically within the framework of the so-called
"green economy". To achieve a paradigm shift, the 2030 Agenda for Sustainable Development21
proposes in its Goal 12 to promote the efficient use of resources and energy; build infrastructures that
do not harm the environment; improve access to basic services; and the creation of well-paid ecological
jobs with good working conditions. Clearly the elaboration of the Sustainable Development Goals
represents an advance, but where economic growth is governed by the consumption of fossil fuels make
the viability of achieving Goal 12 difficult.
Mexico’s performance on the progress of SDG Goal 12 on ensuring sustainable consumption and
production patterns is estimated according to data from the SDG Index and Dashboards Report 2017
(Sachs et al., 2017). Table 1 shows Mexico’s position in the global ranking of sustainable production and
consumption which has a ranking of 74,2 meaning that Mexico is 74,2% of the way to completing all
indicators within the SDG12. ¡Error! No se encuentra el origen de la referencia.
Table 1. Indicators of Mexico’s achievement to SDG 12 on Sustainable Production and Consumption (modified from SDG index)
E-waste 8.2 kg/capita
Wastewater treated 45.6 %
Production-based SO2 emissions 16 kg/capita
Net imported SO2 emissions -1.3 kg/capita
Nitrogen production footprint 27.8 kg/capita
Net imported emissions of reactive nitrogen 34.4 kg/capita
21 https://www.un.org/sustainabledevelopment/development-agenda/
22
Non-recycled municipal solid waste 1.3 kg/person/day
As can be noted in table 1, Mexico has made important advances to promote sustainable consumption
and production, however progress in terms of transforming the systems into circular processes has been
very limited. For instance, Mexico is the country with the fifth highest use of cardboard and paper
secondary fibres. In 2017, only 0.77% of the federal budget for administrative materials and official
documents and articles was spent on sustainable purchases. Furthermore, only approximately 9.6% of
the 44 million tons of solid waste generated in Mexico’s cities is recycled each year (SEMARNAT, 2010),
where 70% of that urban solid waste ends up in landfills (INEGI, 2016). With regards to food waste it is
estimated that 34.5% of the country’s total food production is wasted (over 20 million pounds of
foodstuffs). This wasted food would be enough to feed 7.4 million Mexicans (World Bank, 2017).
However, in terms of policy and legislation, Mexico is moving to change these unsustainable production
and consumption patterns. For instance, Mexico has legislation on the comprehensive management of
solid waste, solid waste management plans and decentralized Comprehensive Urban Solid Waste
Management Agencies. The National Chemical Substances Profile shows the country’s infrastructure for
the management of waste and other substances. The National Management Plan for Vehicles at the End
of their Useful Life and the analogous television collection program contribute to the proper
management of dangerous substances. There are also legislative reforms on public purchases that
include sustainability criteria, such as (1) modifications to Public Sector Acquisitions, on equality
between women and men, which incorporates gender equality provisions; and (2) the Energy Transition
Law, which regulates sustainable electricity use.
Furthermore, since November 2012, Mexico has a National Strategy for Sustainable Production and
Consumption. This strategy establishes the bases for stakeholders to consolidate integration actions at
a vertical and transversal level, to adopt patterns of production and consumption that are attached to
sustainability with a focus directed towards social benefit (SEMARNAT, 2013). The Strategy highlights
the importance of aligning sectoral policies towards a global dimension of sustainable development
through the coordination of efforts of the public and private sectors to create and implement policies
that catalyse the development of projects and that encourage the adoption of sustainable practices.
The Strategy guiding principles are intrinsic to the application of measures in order to serve as a guide
in the actions of social actors and decision makers, such as: quality of life; access to the information;
citizen participation; the gender perspective; the life cycle perspective of the products; the culture of
sustainability; the common but differentiated responsibility; the precautionary principle; inter and intra-
governmental coordination; and the reduction, reuse and recycling. All these aspects of the National
Strategy for Sustainable Production and Consumption go hand in hand with the concepts of a circular
economy.
However, the achievement of the National Strategy together with SDG 12 cannot be done in isolation
and needs to be considered in a sustainable manner. Looking at the sector sustainably indicates how
consumption and production are related. The production of an object requires the extraction of the
natural resources (raw material) with which it is going to be produced. Often it requires water, energy
23
and fuels that are combined with the object and the waste that is discarded. Its industrial development
generates emissions of greenhouse gases that generate global warming, and the final destination of the
product are sent to landfill. The complexity to achieve sustainable consumption and production
development lies in the interdependence of its causes and the trade-offs and synergies that occur
between the social environmental and economic systems. To align production and consumption in an
efficient approach is to do so through the concepts of a circular economy, which can be seen in three
basic parts: production, consumption and the surrounding support system. Each of these parts has its
own elements and characteristics, and the interaction of them determines the chances for Mexico to
transform its consumption and production patterns into a circular economy and its achievement of SDG
12.
2.6. MARKET TRENDS
According to a report by JP Morgan22, growth in the global economy is set to slow down slightly in 2019
with expectations of 2.9% growth. The U.S. economy is set to post a moderate 1.8% growth in 2019, as
fiscal, monetary and trade policies start to constrict. Recent disruptions in the euro area industry are
expected to fade and the region is forecast to grow to 1.7%, offsetting some of the moderation in U.S.
growth. China is facing a considerable challenge in sustaining growth at around 6% as it deals with
internal imbalances and external struggle. However, after a challenging 2018 many Emerging Market
economies are forecast to grow strongly in the second quarter of 2019. Latin America is the one region
with modestly faster activity forecast in 2019, as China is heavily contributing to the overall Emerging
Market slowdown.
Within the Emerging Market, Mexico is now the world’s 11th largest economy (in terms of GDP
measured at purchasing power parity). The country has gone through tremendous structural changes
over the past three decades. From an oil-dependent economy up to the early 1990s to a booming
manufacturing centre in the aftermath of NAFTA in the mid-1990s, Mexico is now increasingly becoming
an international trade hub. Given that the economy has been relatively stable over the past decades,
with an average growth of 2.6% in the past 10 years23, a report on the World in 2050 the BRICs and
beyond, indicates that Mexico is indeed projected to become the world’s 8th largest economy in 2050,
in front of Russia, the UK and France24.
Mexico’s geographical location favours economic development, as it is centrally located in-between
most of the world’s economic centres. The dependency on the American economy, however, makes the
Mexican economy vulnerable to changes in political relationships between the two countries, as well as
in fluctuations in the American economy. A diversification of the economic relationships of Mexico with
other parts of the world is therefore needed to ensure a sustained economic growth in the coming
decades.
Mexico is still predominantly a country of manufacturers, complemented with tourism, mining, agriculture, real estate and construction, while the financial and service sectors are gradually gaining importance in the national economy (Dielman, Hans, Martínez-Rodríguez, 2018). Industrial production and manufacturing predominantly hail from the famous Mexican maquiladoras. The greatest
22 https://www.jpmorgan.com/global/research/global-market-outlook-2019 23 http://www.oecd.org/dev/americas/LEO-2019-Chapter-1.pdf 24 https://espas.secure.europarl.europa.eu/orbis/sites/default/files/generated/document/en/World%20in%202050.pdf
24
concentration of these maquiladoras is found in the northern part of the country, with proximity to the US border.
The continued economic potential in Mexico is however hindered by important challenges in recent
years, such as high levels of poverty, extensive informality, low female participation rates, insufficient
educational achievement, financial exclusion, weak rule of law, and persistent levels of corruption and
crime. To address these problems, reforms including the Pacto por México, has led to notable progress
across a range of areas and has put Mexico at the forefront of reformers among OECD countries (OECD,
2015). These ambitious structural reforms coupled with sound macroeconomic policies have ensured
the resilience of the highly-open Mexican economy in the face of challenging global conditions.
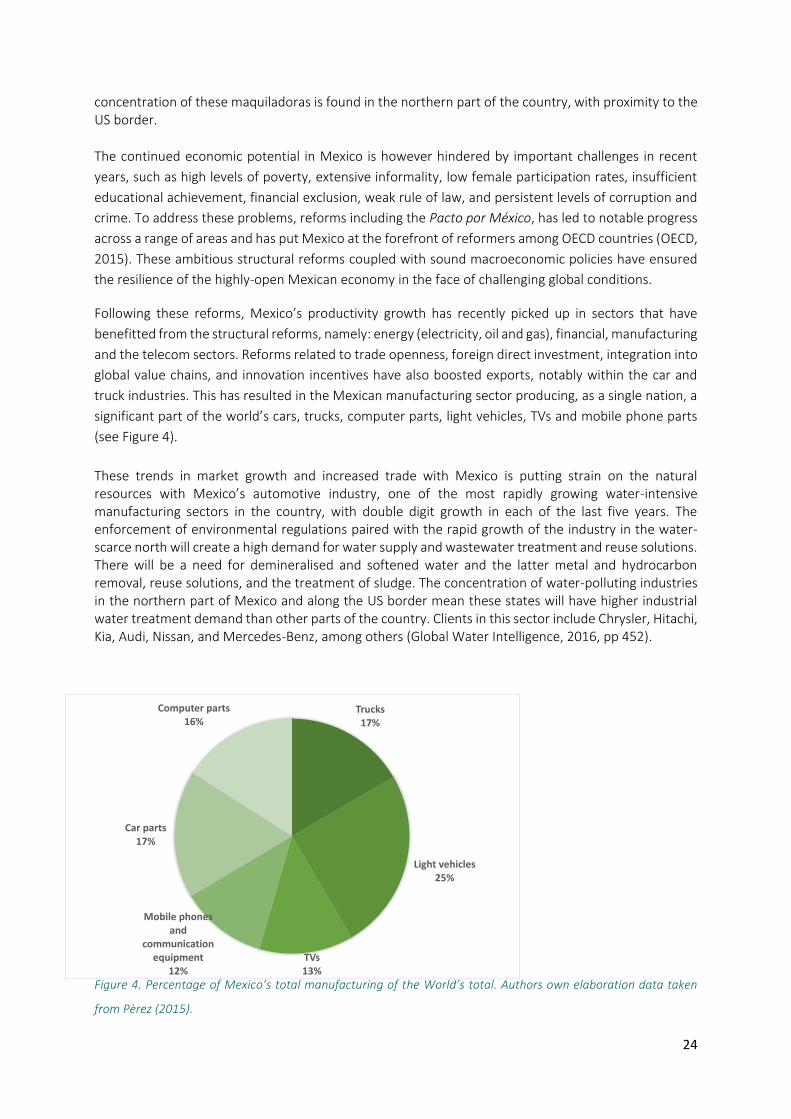
Following these reforms, Mexico’s productivity growth has recently picked up in sectors that have
benefitted from the structural reforms, namely: energy (electricity, oil and gas), financial, manufacturing
and the telecom sectors. Reforms related to trade openness, foreign direct investment, integration into
global value chains, and innovation incentives have also boosted exports, notably within the car and
truck industries. This has resulted in the Mexican manufacturing sector producing, as a single nation, a
significant part of the world’s cars, trucks, computer parts, light vehicles, TVs and mobile phone parts
(see Figure 4).
These trends in market growth and increased trade with Mexico is putting strain on the natural resources with Mexico’s automotive industry, one of the most rapidly growing water-intensive manufacturing sectors in the country, with double digit growth in each of the last five years. The enforcement of environmental regulations paired with the rapid growth of the industry in the water-scarce north will create a high demand for water supply and wastewater treatment and reuse solutions. There will be a need for demineralised and softened water and the latter metal and hydrocarbon removal, reuse solutions, and the treatment of sludge. The concentration of water-polluting industries in the northern part of Mexico and along the US border mean these states will have higher industrial water treatment demand than other parts of the country. Clients in this sector include Chrysler, Hitachi, Kia, Audi, Nissan, and Mercedes-Benz, among others (Global Water Intelligence, 2016, pp 452).
Figure 4. Percentage of Mexico’s total manufacturing of the World’s total. Authors own elaboration data taken
from Perez (2015).
Trucks17%
Light vehicles 25%
TVs 13%
Mobile phones and
communication equipment
12%
Car parts 17%
Computer parts 16%
25
Within the food and beverage sector opportunities exist for providers of advanced filtration methods such as reverse osmosis, micro-filtration, ultra-filtration, and UV disinfection, which are used to both purify the ingredient water and treat the wastewater. Clients in this sector include Coca Cola, Pepsi, Alpura, LaLa, and Jose Cuervo, among others (Global Water Intelligence, 2016, pp 471).
In 2014 a new energy reform measure opened up Mexico’s oil sector to private and foreign investors, whereas previously only the national oil company, Pemex, had exploration and production rights. One result of the reform is that Pemex can now form joint ventures (JVs) with private and foreign enterprises to invest in and manage critical areas of their operations, including exploration and production, logistics, and refining. Opportunities in upstream oil and gas are found in the treatment of produced water after oil separation and the implementation of enhanced oil recovery (EOR) methods. At the end of 2015 Pemex announced a multi-year $23 billion investment to upgrade existing refineries. Should the announced investment come to fruition, opportunities would be in solutions for cooling water production, boiler and process water and the treatment of hydrocarbon-contaminated wastewater. Advanced technologies such as demineralisation, ultrafiltration, membrane bioreactors, and reverse osmosis will be in demand (Global Water Intelligence, 2016, pp 471).
Within the wastewater market in Mexico the priority has shifted to the upgrading of plants that are currently not in operation (40% of all WWTPs), which will require private sector involvement. Authorities are currently structuring new programmes to bring in private sector expertise to improve the operational, technological, and financial capabilities of utilities. Most of these opportunities will materialise as service contracts (Global Water Intelligence, 2016). The main investment programme which has funded the majority of large WWTPs in Mexico is the Modernisation of Water Operating Organisations Program (PROMAGUA). Targeted towards municipalities of more than 50,000 inhabitants, the aim of PROMAGUA is to incentivise investment partnerships in water supply, sewage, and wastewater treatment projects. Depending on the private sector contribution, the programme grants funds to cover up to 50% of the initial investment for water supply, sanitation, and desalination projects. For projects related to improving the operational efficiency of the utilities, it will fund up to 40% of the investment. The priority will be in building WWTP for communities of less than 50,000 residents and investing in upgrades of out-of-date plants, as well as bringing into operation offline plants (Global Water Intelligence, 2016, pp 451).
Within the solid waste management sector, Mexico is not doing very well. While the country holds the number 2 position overall in the import of environmental technology from the USA, it is ranked only number 13 in imports of solid waste management technology. Waste management technology imported from the USA includes waste handling equipment, biogas capture technologies, sanitary landfill systems and sorting machines. There is however a growing interest in applying environmental technology in all sectors of the Mexican industry, mainly due to more stringent environmental legislation. This creates a demand that is largely satisfied through importing technology from other countries, mainly Europe and the USA, with the USA holding the largest stake in Mexico’s import of environmental technology. Export of environmental technology from the USA to Mexico has been growing rapidly in the past years. The US International Trade Administration talks about “an unprecedented investment in environmental infrastructure, that gave Mexico an upward mobility by improving two points in the world ranking in the Environmental Technologies Top Market Study”25.
The design and product specifications in the manufacturing and food and beverage industries predominately take place outside of Mexico in the headquarters of companies like Chevrolet, Volkswagen, Nissan, Dell, Nestle, Unilever, Danone or Heineken. All these companies however are present in Mexico and give guidance to the Mexican manufacturers on how to produce, manufacture and assemble their products according to their production specifications. Mexico is in this respect a
25 https://www.trade.gov/press/press-releases/2016/international-trade-administration-releases-reports-ranking-top-export-markets-052516.asp
26
follower of the international businesses operating in Mexico and will without any doubt follow when these companies opt to change the design of their products and production to fit circular economy processes and concepts. The overall economic situation in Mexico, and the trends for the future, shows a potentially positive transformation towards a circular economy. An important characteristic of the manufacturing sector is its international character, with perpetual flows of import and export in and out of Mexico. This can be seen as a potential for transformation process towards a circular economy.
2.7. REGULATORY FRAMEWORK AND PUBLIC PROGRAMMES SUPPORTING CE INITIATIVES
Mexico has 32 states, Mexico City recently being included, and has about 2454 municipalities. Its legal
system is based on the European, and especially French, system, with a division between the legislative,
executive and judicial branch. The legislative branch is comprised of a congress with a chamber of
deputies and chamber of senators. The executive branch – the president, ministers and their
administrative entities – are responsible for executing the laws enacted by the congress, and the judicial
branch has the function of interpreting the laws and resolving disputes. On the federal level, the key
administrative body responsible for environmental affairs is the Secretariat of the Environment and
Natural Resources (Secretaria de Medio Ambiente y Recursos Naturales, SEMARNAT). Many
environmental areas have special agencies with far-reaching authority to develop and execute politics,
such as the National Water Commission, the National Commission for Protected Natural Areas or the
National Institute of Ecology and Climate Change. Other areas are decentralised, such as the municipal
waste management that largely is the responsibility of local and municipal governments. The
differentiation and decentralisation of politics are seen as a positive development, but what is missing
is a proper coordination between different institutions and levels of government (Gasnier and Portales
2008).
Despite of the obvious flaws in the Mexican political/legislative framework, there are also positive developments to be mentioned. For some years now, Mexico has developed a National Development Plan (NDP) to drive developments in a certain direction with clear objectives and goals. The National Development Plan 2013– 2018 was launched in 2012.
The words environment, sustainability or circular economy are not found among the five key objectives, but they are present as objective 4.4, under the heading of prosperity. Objective 4.4 of the national plan aims at stimulating “green growth”, while the way to operationalise this is published in the “Sectorial programme for environment and natural recourses 2013–2018” (PROMARNAT), developed in parallel with the overall national plan.
The main law related to circular economy is the Fundamental Mexican Law, the 4th article of the Political
Constitution of Mexico indicates, among other rights, that each person has the right to a healthy
environment as part of personal development and wellness. It is the most important law in Mexico and
no other laws must be against the rights recognized there.
Another important reference in the Mexican framework of circular economy is the National Plan for the
government (2018-2024) which presents the action lines that federal government will implement
around economic, political and environmental protection. It is relevant because the funds and financial
resources of the government will be assigned according to this plan.
27
Recently the following laws are part of the body laws in Mexico to drive all actions related to circular
economy:
• General law to prevent and integrate waste management.
• National vision to sustainable management: zero waste.
• General law of climate change.
• Hydric National Program.
Also, the Federal congress is working on law initiatives to enhance the environmental system in Mexico,
some of them are related to circular economy topics as well as:
• Initiative to avoid plastic pollution of one unique use.
• Project of law to reform different norms of the General law to prevention and integral waste management.
• Initiative to modify the Protection to environmental law. Overview of the main challenges to the business opportunities in CE in Mexico
In chapter 2 of this document, we enter into the specific business opportunities in the solid waste,
wastewater and waste to energy markets where Mexican and European companies can join forces to
bring about positive changes, while making economic gains. However, there are several challenges or
potential barriers to enter into the market which we highlight in this section.
2.7.1. WASTE COLLECTION, GOVERNANCE AND REGULATIONS
Waste management in Mexico is regulated under the General Law for the Prevention and Integral
Management of Waste (LGPGIR). However, different authorities have control over the management of
different waste fractions. For instance, urban solid waste is managed by municipal authorities; special
handling waste is the responsibility of the state authorities meanwhile hazardous waste is controlled at
federal level. In this sense, the municipalities are responsible for the provision of the public service for
the: cleaning, collection, transfer, treatment and final disposal of waste where they have the budgetary
and social burden to manage their waste. However, municipalities only have the legal authority over the
solid urban waste and not over special handling waste or hazardous waste.
However, the municipalities’ problems are compounded by the community and human settlement
patterns, which are not specific to a precise area. For instance, there are communities that by their
expansion can be established in two or more municipalities. For this reason, the waste collection and
final disposal service must be shared as an urban basin with little authority over who is responsible for
the waste collection. Furthermore, there is inequality in the coverage of the collection and disposal
service at national level. Areas with a population greater than 10,000 inhabitants, have a service
coverage of up to 80% on average, meanwhile areas of less than 10,000 inhabitants, have a service
coverage only up to 23%26. On the other hand, there are 143 municipalities in Mexico that do not have
any service at all. In this sense, the southern region, made up of Veracruz, Guerrero, Oaxaca and
Chiapas, where there are more municipalities with a greater number of towns of less than 10,000
inhabitants, is the region with the lowest coverage (69%) of waste collection services.
26 https://www.gob.mx/cms/uploads/attachment/file/435917/Vision_Nacional_Cero_Residuos_6_FEB_2019.pdf
28
Furthermore, the global market for secondary raw materials is also affected by decisions covering
product regulations and economic regulations. In effect the Waste Industry and pioneering
manufacturers in Mexico and Europe are operating in a poor regulatory framework that does little to
support the recovery of secondary raw materials, one that generally stifles innovation. The problem of
market failure in the recovery of secondary raw materials is being recognised in Europe, but the global
nature of trade means wider solutions are needed. A new regulatory construct that moves from “waste”
to the idea “materials management” or “materials reuse” is required. Regulations therefore remain a
major barrier to circular economy progress. A regulatory framework is needed where materials have
similar management controls/incentives based on their risk potential rather than seeing them as a
waste. A clear lead in this regard can be taken from Europe where Sweden (best in class) is now at 0.7%
to landfill.
2.7.2. LANDFILL OPERATION AND SOLID WASTE VALORISATION
In relation to the final disposal services and landfill in Mexico, an INEGI report in 201027 listed 238
sanitary landfills in which 70% of the waste generated is available for reuse or valorisation. Meanwhile
out of a staggering 1,643 of the reported open dumps, only 25% of that waste is available for
valorisation; the rest (5%) is waste that can be recycled without valorisation.
The operation of landfills and dumps is reported as being inadequate and representing a risk to the
health of the population and the environment. The Contaminated Sites Computer System (SISCO)
(operated by SEMARNAT) identified that at least 277 final disposal sites (landfills or open dump sites)
present conditions similar to those of a contaminated site. Therefore, critical actions need to be
undertaken in terms of sanitation or remediation at each of these sites to mitigate the risk posed to
human and environmental health. The waste streams also need to be managed corrected to enable
create the conditions for circular economy processes to exist.
2.7.3. LACK OF FISCAL OPPORTUNITIES
Finance is clearly critical in any change process as significant as a change from a linear to a circular
economy. Since landfilling is still the predominant treatment route across Mexico and in virtue of the
increase of municipal waste amounts in future, substantial investments are required to deliver a circular
economy. A new financing approach to better tackle investment needs for this niche of projects in the
solid waste sector is needed in which partnerships are built with key manufacturing and retailing
industries. Although the Solid Waste sector is in a phase of growth that offers attractive opportunities
for private and public investment the instability in secondary raw material prices will not be overcome
without better partnerships with both suppliers of secondary raw materials and market users of the
outputs.
Any fiscal change with new financing options, needs to be supported by regulatory change. For instance,
if the use of primary raw materials is continually subsidized to a point where the economic advantage
of using secondary raw materials is cancelled out, this will not drive market forces to change to a circular
economy focus. Fiscal incentives are also required to ensure that business as usual for manufacturing
companies becomes the most expensive solution as the real price of externalities is factored into the
price of primary raw materials. There should be an aim that businesses in transition should face lower
overall taxes, whilst those that continue with linear business approaches be provided with fiscal
27 https://www.inegi.org.mx/temas/residuos/
29
incentives to change. Fiscal solutions in Europe have shown how landfill taxes drove change which has
been rapid and has inspired radical new solutions and the emergence of new technologies.
With such an approach, the waste industry can be the catalyst that makes it possible for manufacturers
and energy suppliers to use secondary raw materials as their main or substantive raw material
supplemented by primary raw materials. Once manufacturers and energy suppliers take the step change
it becomes powerful by putting the waste management industry at the centre of the change process.
2.7.4. THE FRAGMENTED MARKET
Across the EU the waste markets are fragmented. Coupled with the fractured methods of
implementation they have created further barriers in an industry that now routinely moves recovered
raw materials across global markets. In Europe financing institutions have been supporting
comprehensive solid waste management schemes including different kinds of technologies. This fact is
important as solutions found for the EUs fragmented markets will have wider relevance in Mexico. The
EU is a global leader in the circular economy and any acceptance or change made in the EU will more
than likely be mirrored by others including Mexico.
Further afield there is a current lack of international commodity markets for secondary raw materials.
For such markets to work a series of changes need to take place in the way policy makers view and
regulate waste. Without these changes, it remains a complex challenge to drive up recycling standards
in rapidly urbanizing countries and to give confidence to designers to specify secondary raw materials.
This was recognised in the original EU Resource Efficiency Roadmap.
Secondary raw material markets need to provide the same services as those currently operational for
primary raw materials. That is markets were participants can expect to:
• buy and sell materials;
• have price transparency;
In an OECD28 report prepared in 2006 they identified three potentially significant barriers and failures
in markets for recyclable materials:
• have built in systems to protect against price fluctuations and “futures” trading;
• have regulatory certainty; and
• have computerised data and information systems to underpin that market.
Quality standards are fundamental to any commodity market. For secondary raw materials, common
standards are needed that will work across Mexico and answer both regulatory (End of Waste) and
market (Quality Requirements) questions. No designer will use secondary raw materials unless the
properties of those materials are understood, the quality is guaranteed, and the supply chain is secure.
28 OECD, (2006) Improving Recycling Markets, ISBN 9264029575.
30
2.7.5. LACK OF ACCEPTANCE
Public acceptance is a key component for the feasibility of using technologies in the circular economy.
For instance, the public perception on the source of water and its end-use of recycled water is widely
noted to impact public acceptance. This refers to the emotional responses to the idea of using recycled
water, including “disgust” at the perception of the proximity to ‘waste’. This has been cited as a key
factor in the rejection of several reuse schemes globally. According to (Hartley, 2006) people are more
likely to accept reuse of water from their own home than from a public source. This relates principally
to what is called the “yuck factor”. Generally, acceptance is higher when human contact with water is
minimal. Application for industrial use therefore tends to be well accepted, which is the opposite to
domestic use (van Rensburg, 2016). This has been no more evident than the rejection from the farmers
in the Hidalgo municipal area. These farmers occupy the largest agricultural land in Mexico, where they
have been irrigating with untreated wastewater for decades. The new massive 50m3/second
wastewater treatment (the largest in the world, built in a single stage) was seen as an opportunity to
treat the wastewater and to give the treated water back to the farmers for irrigation. The farmers
rejected this water, forced the closure of the construction of the plant for over a year and created an
association called the “Black Water Defenders”. The reason they gave was that the water would contain
less nutrients and that would force them to buy fertilizers which would increase the cost of their
production. The lack of sensitization campaigns, education and capacity were the principle reasons to
blame for the farmers to reject this circular economy solution.
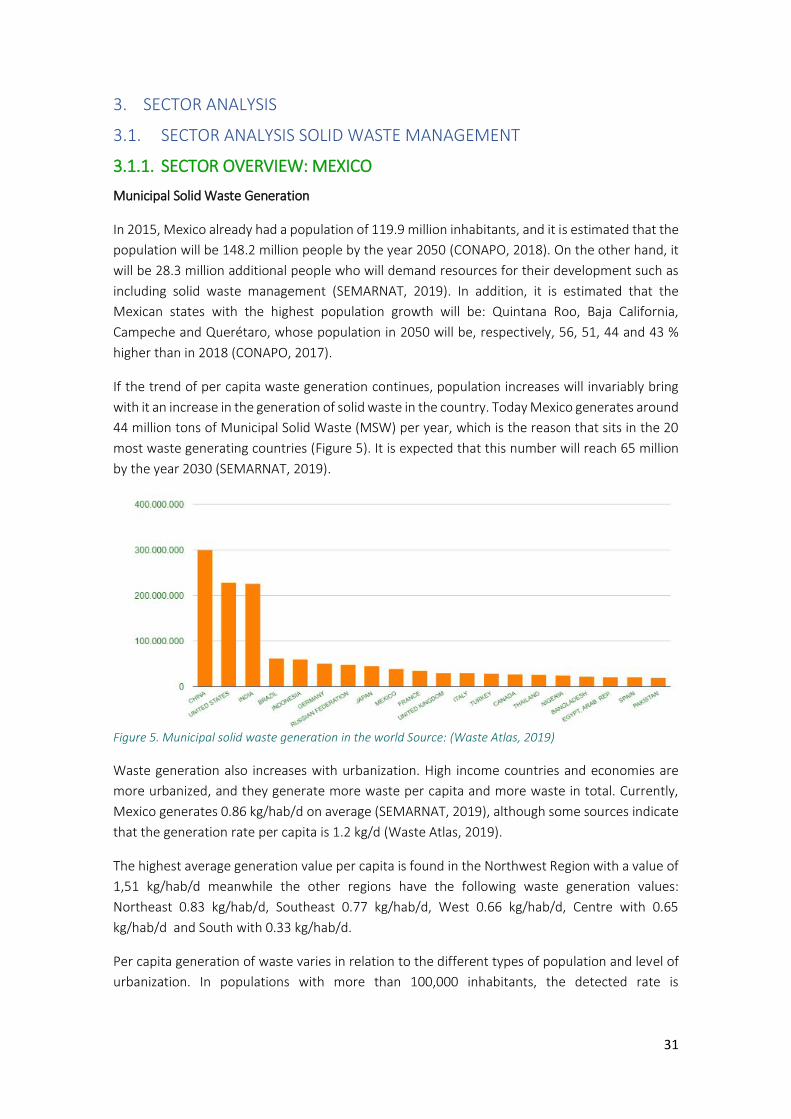
31
3. SECTOR ANALYSIS
3.1. SECTOR ANALYSIS SOLID WASTE MANAGEMENT
3.1.1. SECTOR OVERVIEW: MEXICO
Municipal Solid Waste Generation
In 2015, Mexico already had a population of 119.9 million inhabitants, and it is estimated that the
population will be 148.2 million people by the year 2050 (CONAPO, 2018). On the other hand, it
will be 28.3 million additional people who will demand resources for their development such as
including solid waste management (SEMARNAT, 2019). In addition, it is estimated that the
Mexican states with the highest population growth will be: Quintana Roo, Baja California,
Campeche and Querétaro, whose population in 2050 will be, respectively, 56, 51, 44 and 43 %
higher than in 2018 (CONAPO, 2017).
If the trend of per capita waste generation continues, population increases will invariably bring
with it an increase in the generation of solid waste in the country. Today Mexico generates around
44 million tons of Municipal Solid Waste (MSW) per year, which is the reason that sits in the 20
most waste generating countries (Figure 5). It is expected that this number will reach 65 million
by the year 2030 (SEMARNAT, 2019).
Figure 5. Municipal solid waste generation in the world Source: (Waste Atlas, 2019)
Waste generation also increases with urbanization. High income countries and economies are
more urbanized, and they generate more waste per capita and more waste in total. Currently,
Mexico generates 0.86 kg/hab/d on average (SEMARNAT, 2019), although some sources indicate
that the generation rate per capita is 1.2 kg/d (Waste Atlas, 2019).
The highest average generation value per capita is found in the Northwest Region with a value of
1,51 kg/hab/d meanwhile the other regions have the following waste generation values:
Northeast 0.83 kg/hab/d, Southeast 0.77 kg/hab/d, West 0.66 kg/hab/d, Centre with 0.65
kg/hab/d and South with 0.33 kg/hab/d.
Per capita generation of waste varies in relation to the different types of population and level of
urbanization. In populations with more than 100,000 inhabitants, the detected rate is
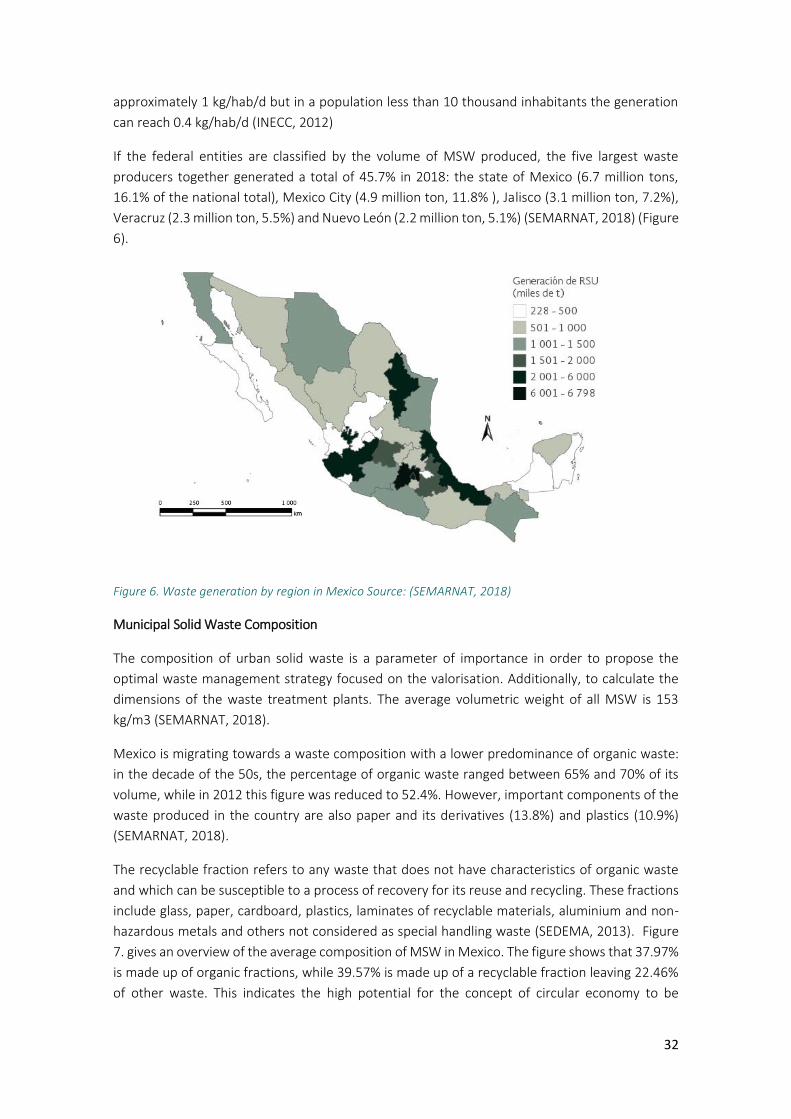
32
approximately 1 kg/hab/d but in a population less than 10 thousand inhabitants the generation
can reach 0.4 kg/hab/d (INECC, 2012)
If the federal entities are classified by the volume of MSW produced, the five largest waste
producers together generated a total of 45.7% in 2018: the state of Mexico (6.7 million tons,
16.1% of the national total), Mexico City (4.9 million ton, 11.8% ), Jalisco (3.1 million ton, 7.2%),
Veracruz (2.3 million ton, 5.5%) and Nuevo León (2.2 million ton, 5.1%) (SEMARNAT, 2018) (Figure
6).
Figure 6. Waste generation by region in Mexico Source: (SEMARNAT, 2018)
Municipal Solid Waste Composition
The composition of urban solid waste is a parameter of importance in order to propose the
optimal waste management strategy focused on the valorisation. Additionally, to calculate the
dimensions of the waste treatment plants. The average volumetric weight of all MSW is 153
kg/m3 (SEMARNAT, 2018).
Mexico is migrating towards a waste composition with a lower predominance of organic waste:
in the decade of the 50s, the percentage of organic waste ranged between 65% and 70% of its
volume, while in 2012 this figure was reduced to 52.4%. However, important components of the
waste produced in the country are also paper and its derivatives (13.8%) and plastics (10.9%)
(SEMARNAT, 2018).
The recyclable fraction refers to any waste that does not have characteristics of organic waste
and which can be susceptible to a process of recovery for its reuse and recycling. These fractions
include glass, paper, cardboard, plastics, laminates of recyclable materials, aluminium and non-
hazardous metals and others not considered as special handling waste (SEDEMA, 2013). Figure
7. gives an overview of the average composition of MSW in Mexico. The figure shows that 37.97%
is made up of organic fractions, while 39.57% is made up of a recyclable fraction leaving 22.46%
of other waste. This indicates the high potential for the concept of circular economy to be
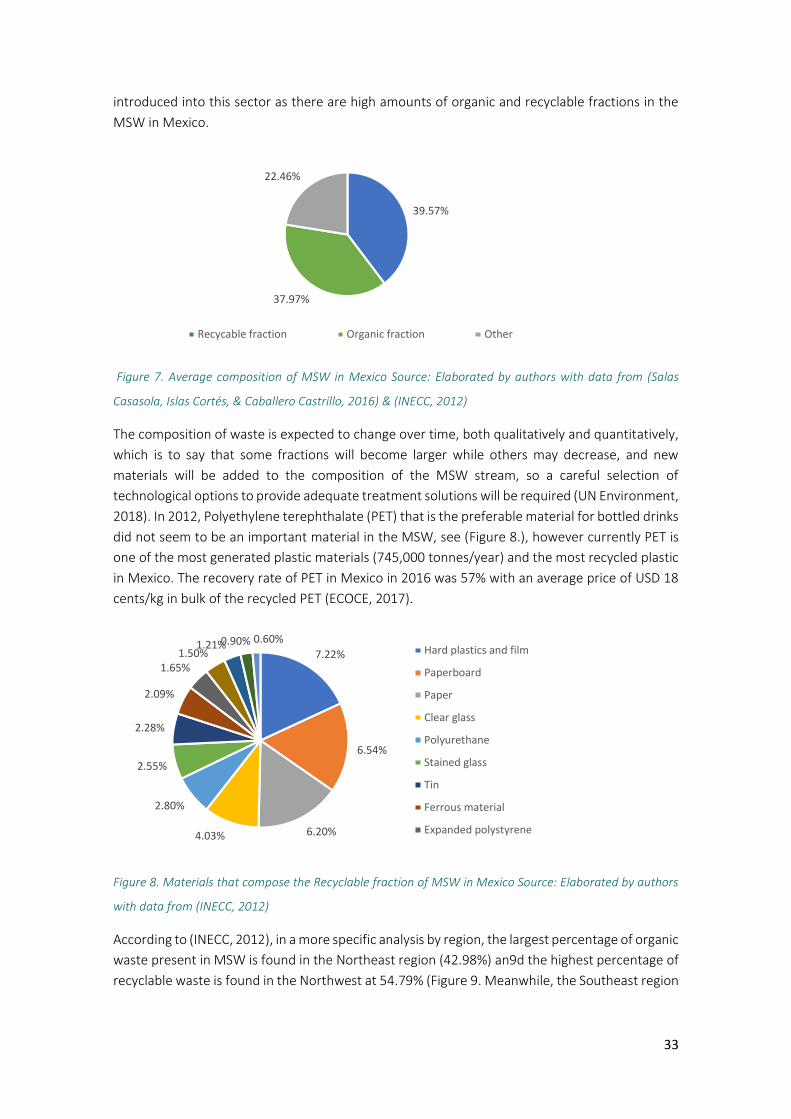
33
introduced into this sector as there are high amounts of organic and recyclable fractions in the
MSW in Mexico.
Figure 7. Average composition of MSW in Mexico Source: Elaborated by authors with data from (Salas
Casasola, Islas Cortés, & Caballero Castrillo, 2016) & (INECC, 2012)
The composition of waste is expected to change over time, both qualitatively and quantitatively,
which is to say that some fractions will become larger while others may decrease, and new
materials will be added to the composition of the MSW stream, so a careful selection of
technological options to provide adequate treatment solutions will be required (UN Environment,
2018). In 2012, Polyethylene terephthalate (PET) that is the preferable material for bottled drinks
did not seem to be an important material in the MSW, see (Figure 8.), however currently PET is
one of the most generated plastic materials (745,000 tonnes/year) and the most recycled plastic
in Mexico. The recovery rate of PET in Mexico in 2016 was 57% with an average price of USD 18
cents/kg in bulk of the recycled PET (ECOCE, 2017).
Figure 8. Materials that compose the Recyclable fraction of MSW in Mexico Source: Elaborated by authors
with data from (INECC, 2012)
According to (INECC, 2012), in a more specific analysis by region, the largest percentage of organic
waste present in MSW is found in the Northeast region (42.98%) an9d the highest percentage of
recyclable waste is found in the Northwest at 54.79% (Figure 9. Meanwhile, the Southeast region
39.57%
37.97%
22.46%
Recycable fraction Organic fraction Other
7.22%
6.54%
6.20%4.03%
2.80%
2.55%
2.28%
2.09%
1.65%1.50%
1.21%0.90% 0.60%Hard plastics and film
Paperboard
Paper
Clear glass
Polyurethane
Stained glass
Tin
Ferrous material
Expanded polystyrene
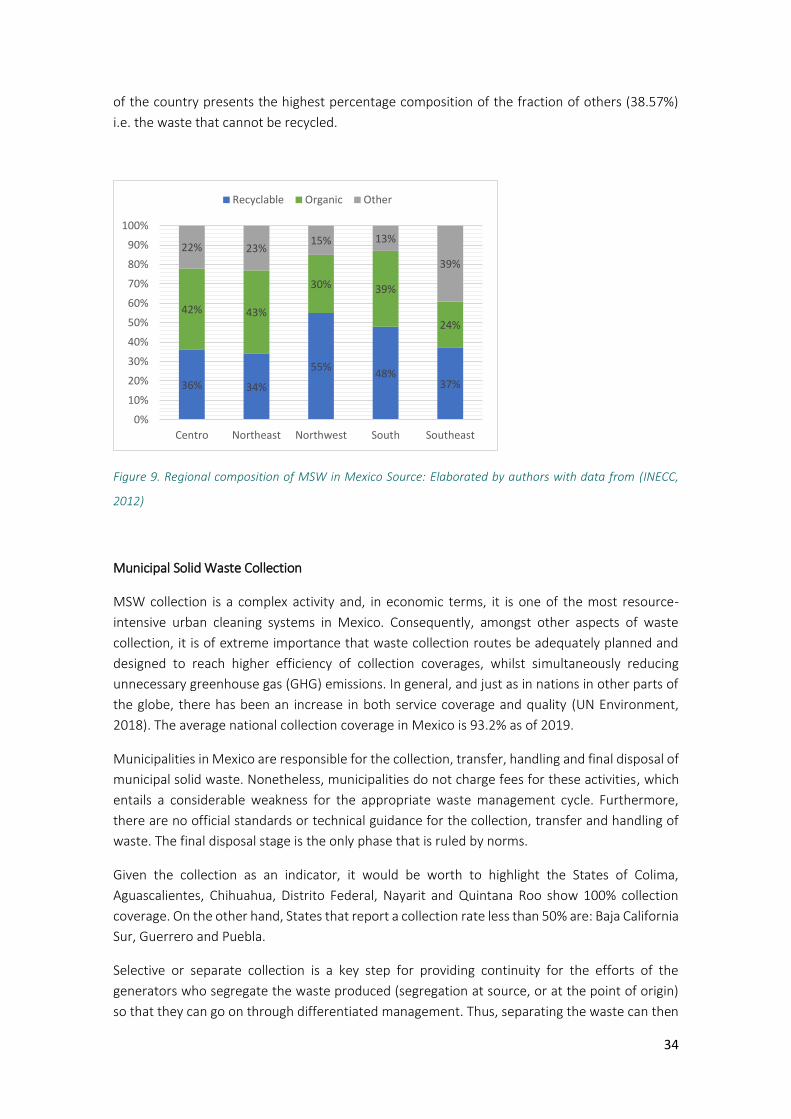
34
of the country presents the highest percentage composition of the fraction of others (38.57%)
i.e. the waste that cannot be recycled.
Figure 9. Regional composition of MSW in Mexico Source: Elaborated by authors with data from (INECC,
2012)
Municipal Solid Waste Collection
MSW collection is a complex activity and, in economic terms, it is one of the most resource-
intensive urban cleaning systems in Mexico. Consequently, amongst other aspects of waste
collection, it is of extreme importance that waste collection routes be adequately planned and
designed to reach higher efficiency of collection coverages, whilst simultaneously reducing
unnecessary greenhouse gas (GHG) emissions. In general, and just as in nations in other parts of
the globe, there has been an increase in both service coverage and quality (UN Environment,
2018). The average national collection coverage in Mexico is 93.2% as of 2019.
Municipalities in Mexico are responsible for the collection, transfer, handling and final disposal of
municipal solid waste. Nonetheless, municipalities do not charge fees for these activities, which
entails a considerable weakness for the appropriate waste management cycle. Furthermore,
there are no official standards or technical guidance for the collection, transfer and handling of
waste. The final disposal stage is the only phase that is ruled by norms.
Given the collection as an indicator, it would be worth to highlight the States of Colima,
Aguascalientes, Chihuahua, Distrito Federal, Nayarit and Quintana Roo show 100% collection
coverage. On the other hand, States that report a collection rate less than 50% are: Baja California
Sur, Guerrero and Puebla.
Selective or separate collection is a key step for providing continuity for the efforts of the
generators who segregate the waste produced (segregation at source, or at the point of origin)
so that they can go on through differentiated management. Thus, separating the waste can then
36% 34%
55%48%
37%
42% 43%
30% 39%
24%
22% 23%15% 13%
39%
0%
10%
20%
30%
40%
50%
60%
70%
80%
90%
100%
Centro Northeast Northwest South Southeast
Recyclable Organic Other
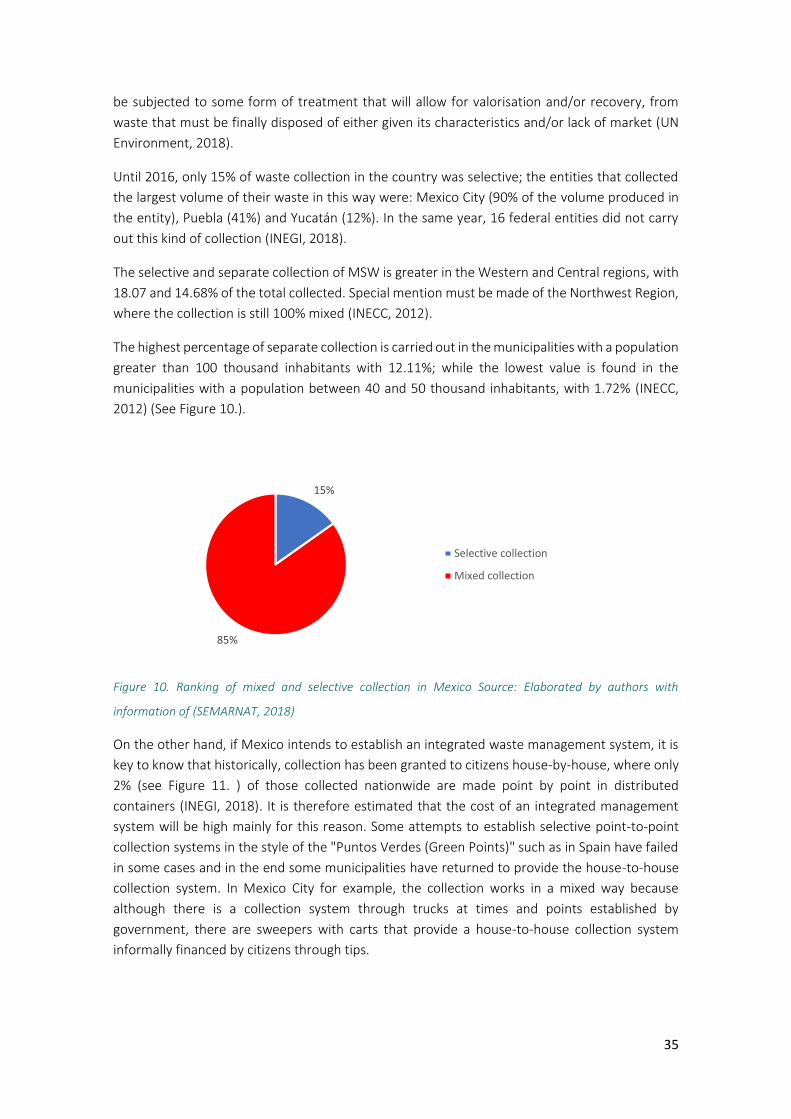
35
be subjected to some form of treatment that will allow for valorisation and/or recovery, from
waste that must be finally disposed of either given its characteristics and/or lack of market (UN
Environment, 2018).
Until 2016, only 15% of waste collection in the country was selective; the entities that collected
the largest volume of their waste in this way were: Mexico City (90% of the volume produced in
the entity), Puebla (41%) and Yucatán (12%). In the same year, 16 federal entities did not carry
out this kind of collection (INEGI, 2018).
The selective and separate collection of MSW is greater in the Western and Central regions, with
18.07 and 14.68% of the total collected. Special mention must be made of the Northwest Region,
where the collection is still 100% mixed (INECC, 2012).
The highest percentage of separate collection is carried out in the municipalities with a population
greater than 100 thousand inhabitants with 12.11%; while the lowest value is found in the
municipalities with a population between 40 and 50 thousand inhabitants, with 1.72% (INECC,
2012) (See Figure 10.).
Figure 10. Ranking of mixed and selective collection in Mexico Source: Elaborated by authors with
information of (SEMARNAT, 2018)
On the other hand, if Mexico intends to establish an integrated waste management system, it is
key to know that historically, collection has been granted to citizens house-by-house, where only
2% (see Figure 11. ) of those collected nationwide are made point by point in distributed
containers (INEGI, 2018). It is therefore estimated that the cost of an integrated management
system will be high mainly for this reason. Some attempts to establish selective point-to-point
collection systems in the style of the "Puntos Verdes (Green Points)" such as in Spain have failed
in some cases and in the end some municipalities have returned to provide the house-to-house
collection system. In Mexico City for example, the collection works in a mixed way because
although there is a collection system through trucks at times and points established by
government, there are sweepers with carts that provide a house-to-house collection system
informally financed by citizens through tips.
15%
85%
Selective collection
Mixed collection
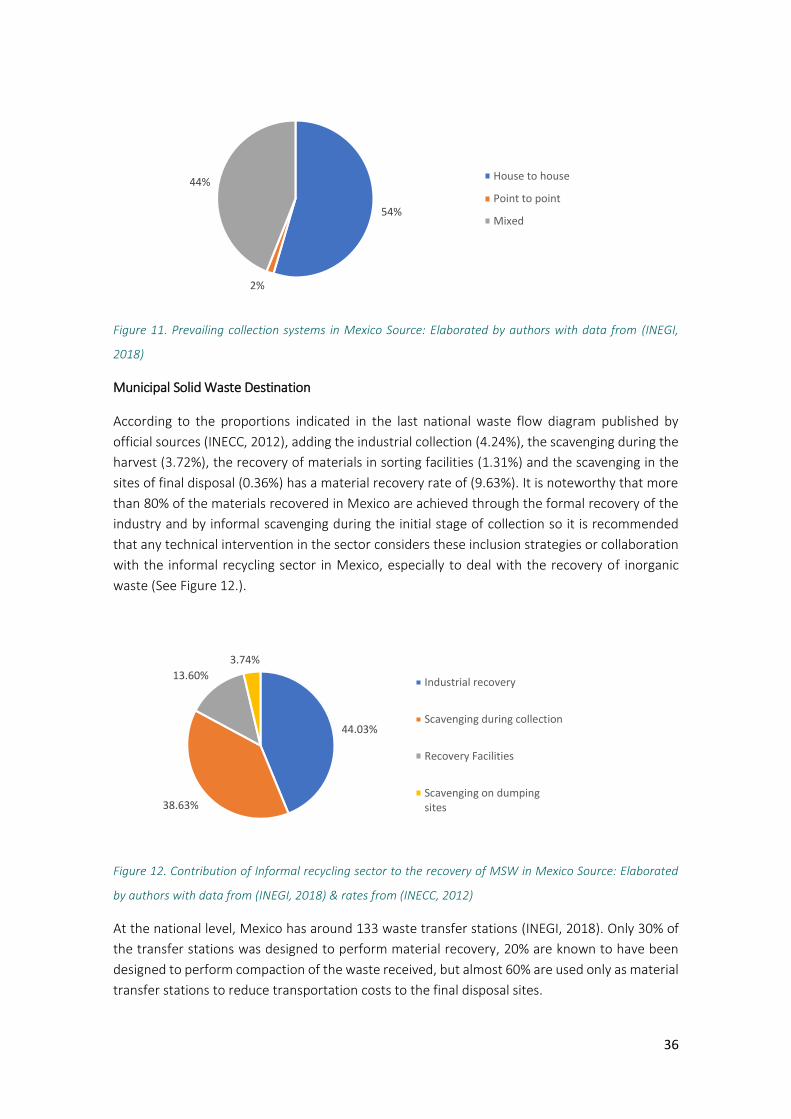
36
Figure 11. Prevailing collection systems in Mexico Source: Elaborated by authors with data from (INEGI,
2018)
Municipal Solid Waste Destination
According to the proportions indicated in the last national waste flow diagram published by
official sources (INECC, 2012), adding the industrial collection (4.24%), the scavenging during the
harvest (3.72%), the recovery of materials in sorting facilities (1.31%) and the scavenging in the
sites of final disposal (0.36%) has a material recovery rate of (9.63%). It is noteworthy that more
than 80% of the materials recovered in Mexico are achieved through the formal recovery of the
industry and by informal scavenging during the initial stage of collection so it is recommended
that any technical intervention in the sector considers these inclusion strategies or collaboration
with the informal recycling sector in Mexico, especially to deal with the recovery of inorganic
waste (See Figure 12.).
Figure 12. Contribution of Informal recycling sector to the recovery of MSW in Mexico Source: Elaborated
by authors with data from (INEGI, 2018) & rates from (INECC, 2012)
At the national level, Mexico has around 133 waste transfer stations (INEGI, 2018). Only 30% of
the transfer stations was designed to perform material recovery, 20% are known to have been
designed to perform compaction of the waste received, but almost 60% are used only as material
transfer stations to reduce transportation costs to the final disposal sites.
54%
2%
44%House to house
Point to point
Mixed
44.03%
38.63%
13.60%
3.74%
Industrial recovery
Scavenging during collection
Recovery Facilities
Scavenging on dumpingsites
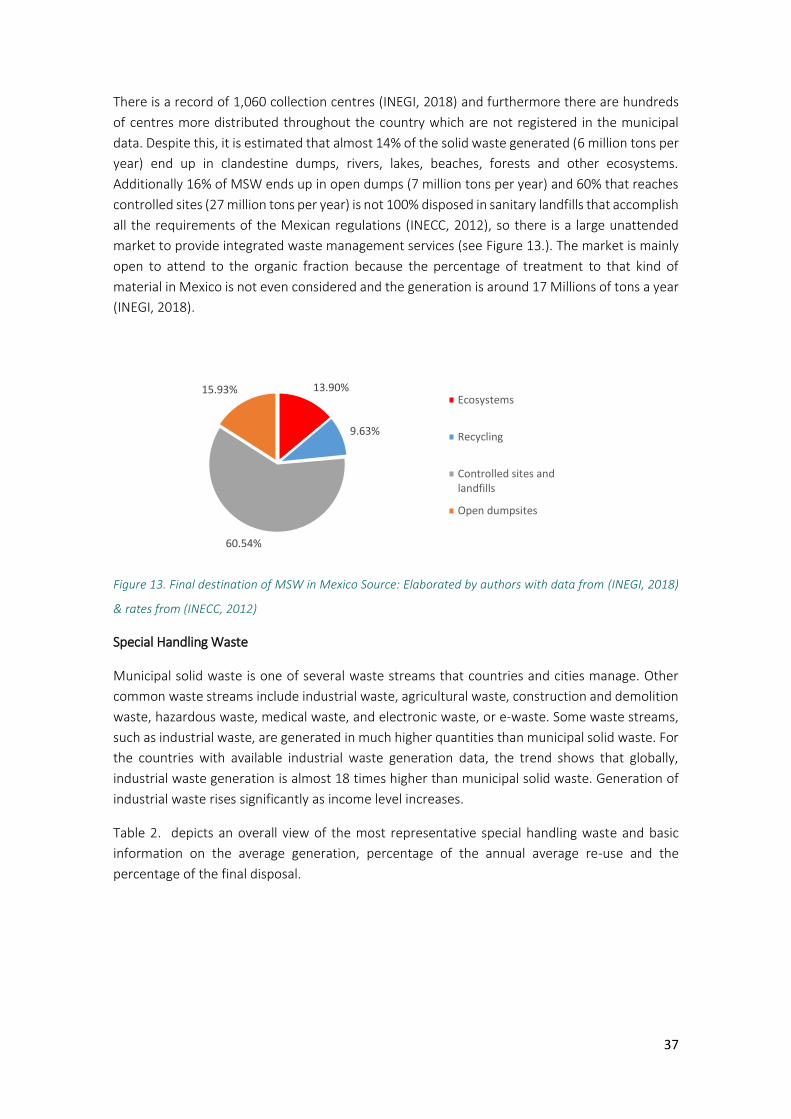
37
There is a record of 1,060 collection centres (INEGI, 2018) and furthermore there are hundreds
of centres more distributed throughout the country which are not registered in the municipal
data. Despite this, it is estimated that almost 14% of the solid waste generated (6 million tons per
year) end up in clandestine dumps, rivers, lakes, beaches, forests and other ecosystems.
Additionally 16% of MSW ends up in open dumps (7 million tons per year) and 60% that reaches
controlled sites (27 million tons per year) is not 100% disposed in sanitary landfills that accomplish
all the requirements of the Mexican regulations (INECC, 2012), so there is a large unattended
market to provide integrated waste management services (see Figure 13.). The market is mainly
open to attend to the organic fraction because the percentage of treatment to that kind of
material in Mexico is not even considered and the generation is around 17 Millions of tons a year
(INEGI, 2018).
Figure 13. Final destination of MSW in Mexico Source: Elaborated by authors with data from (INEGI, 2018)
& rates from (INECC, 2012)
Special Handling Waste
Municipal solid waste is one of several waste streams that countries and cities manage. Other
common waste streams include industrial waste, agricultural waste, construction and demolition
waste, hazardous waste, medical waste, and electronic waste, or e-waste. Some waste streams,
such as industrial waste, are generated in much higher quantities than municipal solid waste. For
the countries with available industrial waste generation data, the trend shows that globally,
industrial waste generation is almost 18 times higher than municipal solid waste. Generation of
industrial waste rises significantly as income level increases.
Table 2. depicts an overall view of the most representative special handling waste and basic
information on the average generation, percentage of the annual average re-use and the
percentage of the final disposal.
13.90%
9.63%
60.54%
15.93%Ecosystems
Recycling
Controlled sites andlandfills
Open dumpsites
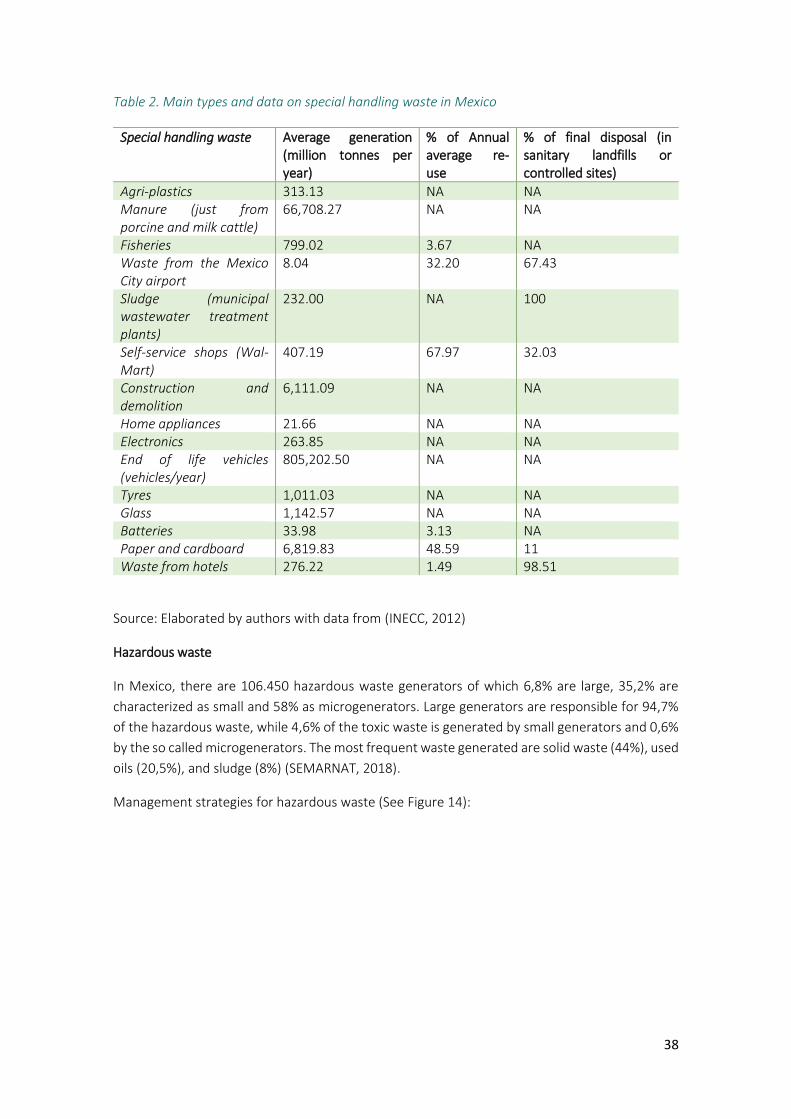
38
Table 2. Main types and data on special handling waste in Mexico
Special handling waste Average generation (million tonnes per year)
% of Annual average re-use
% of final disposal (in sanitary landfills or controlled sites)
Agri-plastics 313.13 NA NA Manure (just from porcine and milk cattle)
66,708.27 NA NA
Fisheries 799.02 3.67 NA Waste from the Mexico City airport
8.04 32.20 67.43
Sludge (municipal wastewater treatment plants)
232.00 NA 100
Self-service shops (Wal-Mart)
407.19 67.97 32.03
Construction and demolition
6,111.09 NA NA
Home appliances 21.66 NA NA Electronics 263.85 NA NA End of life vehicles (vehicles/year)
805,202.50 NA NA
Tyres 1,011.03 NA NA Glass 1,142.57 NA NA Batteries 33.98 3.13 NA Paper and cardboard 6,819.83 48.59 11 Waste from hotels 276.22 1.49 98.51
Source: Elaborated by authors with data from (INECC, 2012)
Hazardous waste
In Mexico, there are 106.450 hazardous waste generators of which 6,8% are large, 35,2% are
characterized as small and 58% as microgenerators. Large generators are responsible for 94,7%
of the hazardous waste, while 4,6% of the toxic waste is generated by small generators and 0,6%
by the so called microgenerators. The most frequent waste generated are solid waste (44%), used
oils (20,5%), and sludge (8%) (SEMARNAT, 2018).
Management strategies for hazardous waste (See Figure 14):
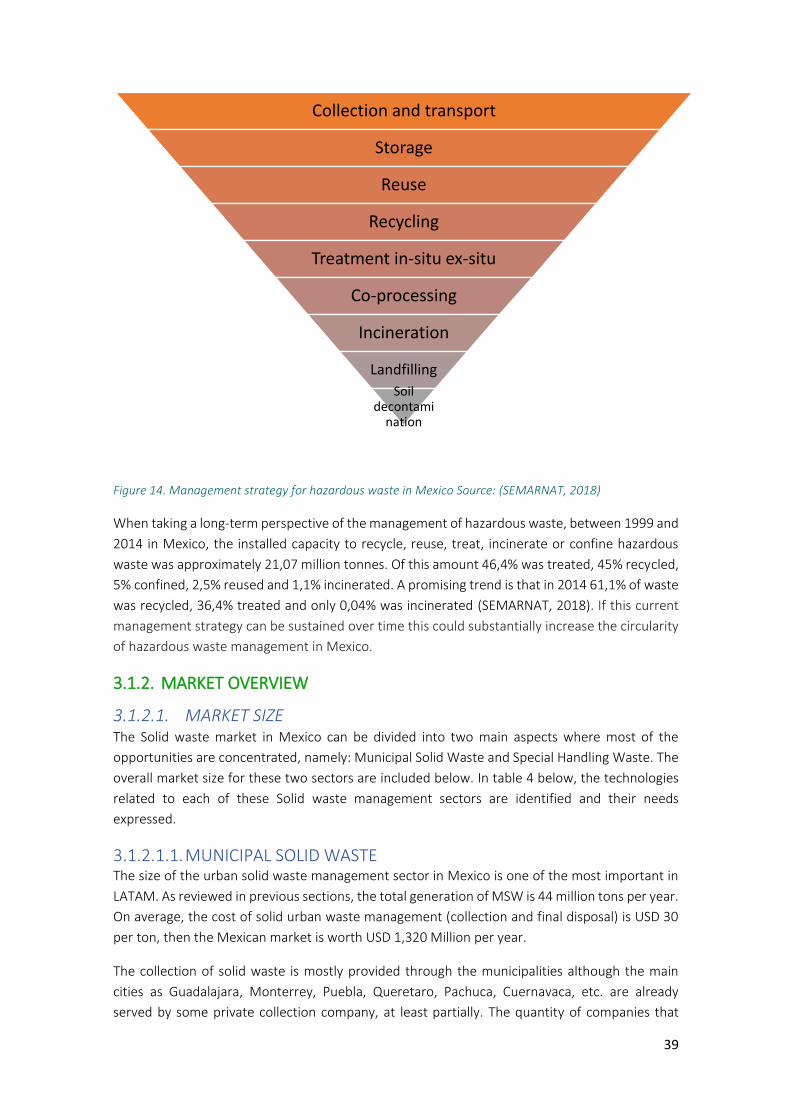
39
Figure 14. Management strategy for hazardous waste in Mexico Source: (SEMARNAT, 2018)
When taking a long-term perspective of the management of hazardous waste, between 1999 and
2014 in Mexico, the installed capacity to recycle, reuse, treat, incinerate or confine hazardous
waste was approximately 21,07 million tonnes. Of this amount 46,4% was treated, 45% recycled,
5% confined, 2,5% reused and 1,1% incinerated. A promising trend is that in 2014 61,1% of waste
was recycled, 36,4% treated and only 0,04% was incinerated (SEMARNAT, 2018). If this current
management strategy can be sustained over time this could substantially increase the circularity
of hazardous waste management in Mexico.
3.1.2. MARKET OVERVIEW
3.1.2.1. MARKET SIZE The Solid waste market in Mexico can be divided into two main aspects where most of the
opportunities are concentrated, namely: Municipal Solid Waste and Special Handling Waste. The
overall market size for these two sectors are included below. In table 4 below, the technologies
related to each of these Solid waste management sectors are identified and their needs
expressed.
3.1.2.1.1. MUNICIPAL SOLID WASTE The size of the urban solid waste management sector in Mexico is one of the most important in
LATAM. As reviewed in previous sections, the total generation of MSW is 44 million tons per year.
On average, the cost of solid urban waste management (collection and final disposal) is USD 30
per ton, then the Mexican market is worth USD 1,320 Million per year.
The collection of solid waste is mostly provided through the municipalities although the main
cities as Guadalajara, Monterrey, Puebla, Queretaro, Pachuca, Cuernavaca, etc. are already
served by some private collection company, at least partially. The quantity of companies that
Collection and transport
Storage
Reuse
Recycling
Treatment in-situ ex-situ
Co-processing
Incineration
Landfilling
Soil decontami
nation
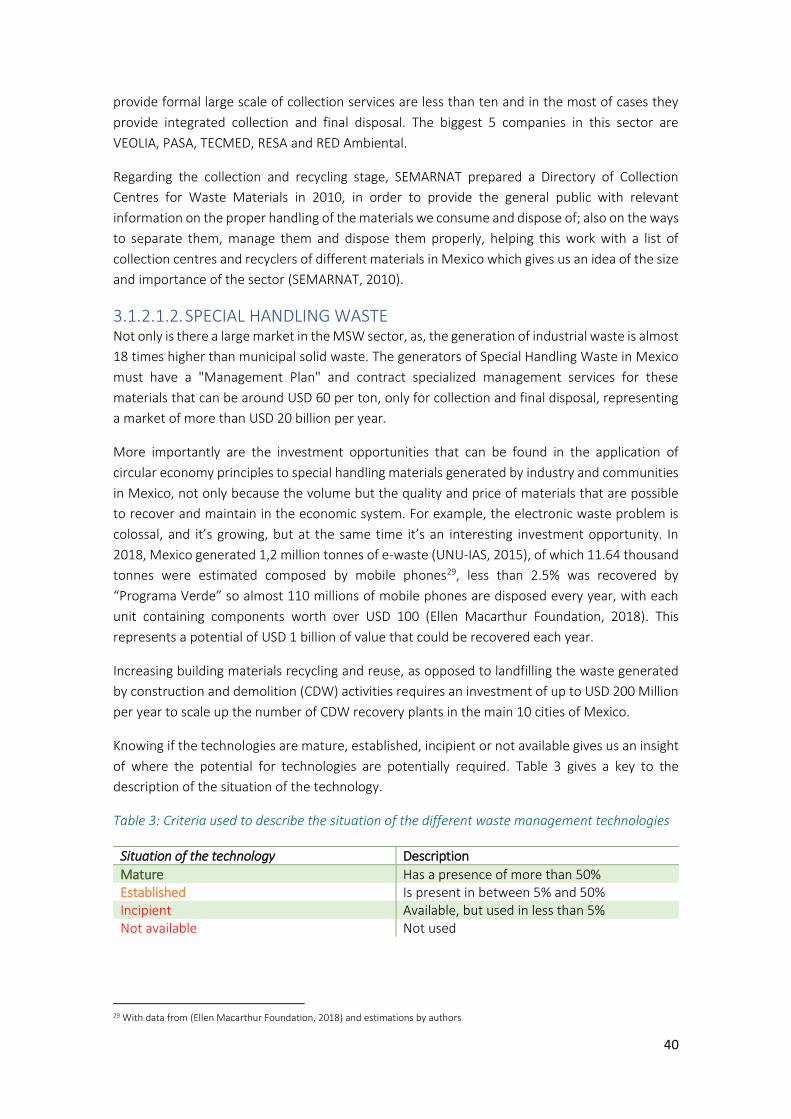
40
provide formal large scale of collection services are less than ten and in the most of cases they
provide integrated collection and final disposal. The biggest 5 companies in this sector are
VEOLIA, PASA, TECMED, RESA and RED Ambiental.
Regarding the collection and recycling stage, SEMARNAT prepared a Directory of Collection
Centres for Waste Materials in 2010, in order to provide the general public with relevant
information on the proper handling of the materials we consume and dispose of; also on the ways
to separate them, manage them and dispose them properly, helping this work with a list of
collection centres and recyclers of different materials in Mexico which gives us an idea of the size
and importance of the sector (SEMARNAT, 2010).
3.1.2.1.2. SPECIAL HANDLING WASTE Not only is there a large market in the MSW sector, as, the generation of industrial waste is almost
18 times higher than municipal solid waste. The generators of Special Handling Waste in Mexico
must have a "Management Plan" and contract specialized management services for these
materials that can be around USD 60 per ton, only for collection and final disposal, representing
a market of more than USD 20 billion per year.
More importantly are the investment opportunities that can be found in the application of
circular economy principles to special handling materials generated by industry and communities
in Mexico, not only because the volume but the quality and price of materials that are possible
to recover and maintain in the economic system. For example, the electronic waste problem is
colossal, and it’s growing, but at the same time it’s an interesting investment opportunity. In
2018, Mexico generated 1,2 million tonnes of e-waste (UNU-IAS, 2015), of which 11.64 thousand
tonnes were estimated composed by mobile phones29, less than 2.5% was recovered by
“Programa Verde” so almost 110 millions of mobile phones are disposed every year, with each
unit containing components worth over USD 100 (Ellen Macarthur Foundation, 2018). This
represents a potential of USD 1 billion of value that could be recovered each year.
Increasing building materials recycling and reuse, as opposed to landfilling the waste generated
by construction and demolition (CDW) activities requires an investment of up to USD 200 Million
per year to scale up the number of CDW recovery plants in the main 10 cities of Mexico.
Knowing if the technologies are mature, established, incipient or not available gives us an insight
of where the potential for technologies are potentially required. Table 3 gives a key to the
description of the situation of the technology.
Table 3: Criteria used to describe the situation of the different waste management technologies
Situation of the technology Description
Mature Has a presence of more than 50% Established Is present in between 5% and 50% Incipient Available, but used in less than 5% Not available Not used
29 With data from (Ellen Macarthur Foundation, 2018) and estimations by authors
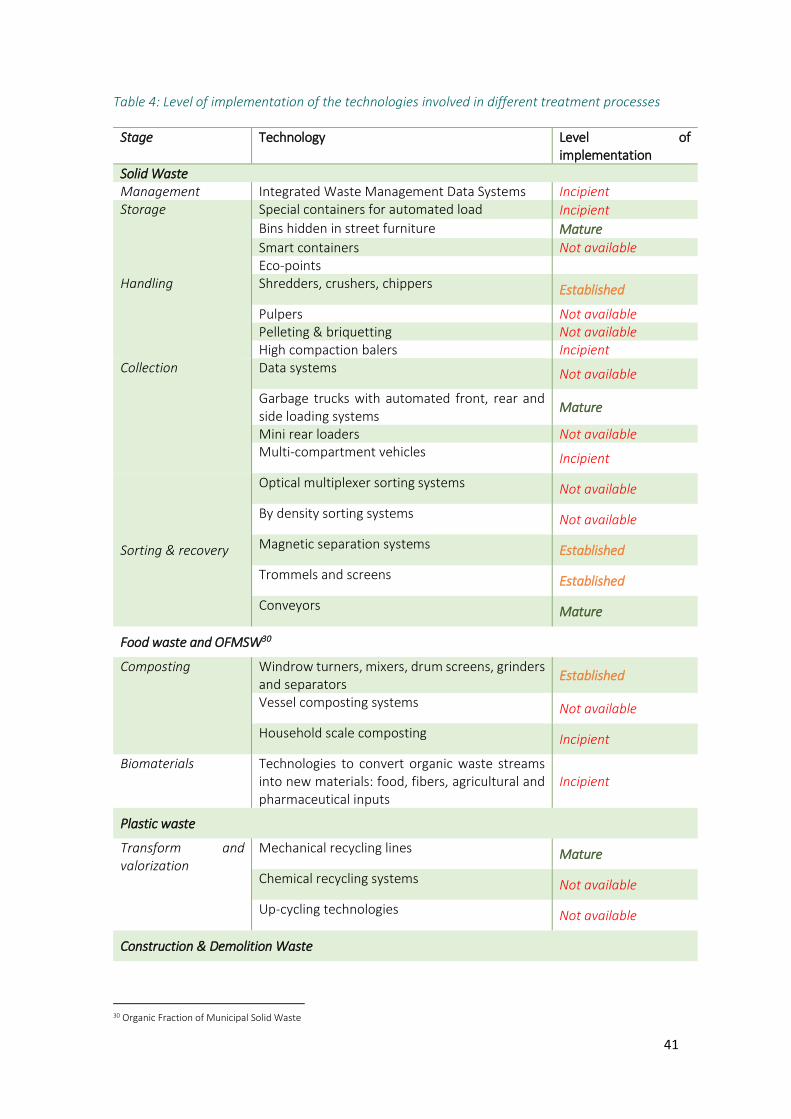
41
Table 4: Level of implementation of the technologies involved in different treatment processes
Stage Technology Level of implementation
Solid Waste Management Integrated Waste Management Data Systems Incipient Storage Special containers for automated load Incipient
Bins hidden in street furniture Mature
Smart containers Not available Eco-points
Handling Shredders, crushers, chippers Established
Pulpers Not available Pelleting & briquetting Not available High compaction balers Incipient
Collection Data systems Not available
Garbage trucks with automated front, rear and side loading systems
Mature
Mini rear loaders Not available Multi-compartment vehicles Incipient
Sorting & recovery
Optical multiplexer sorting systems Not available
By density sorting systems Not available
Magnetic separation systems Established
Trommels and screens Established
Conveyors Mature
Food waste and OFMSW30
Composting Windrow turners, mixers, drum screens, grinders and separators
Established
Vessel composting systems Not available
Household scale composting Incipient
Biomaterials Technologies to convert organic waste streams into new materials: food, fibers, agricultural and pharmaceutical inputs
Incipient
Plastic waste
Transform and valorization
Mechanical recycling lines Mature
Chemical recycling systems Not available
Up-cycling technologies Not available
Construction & Demolition Waste
30 Organic Fraction of Municipal Solid Waste
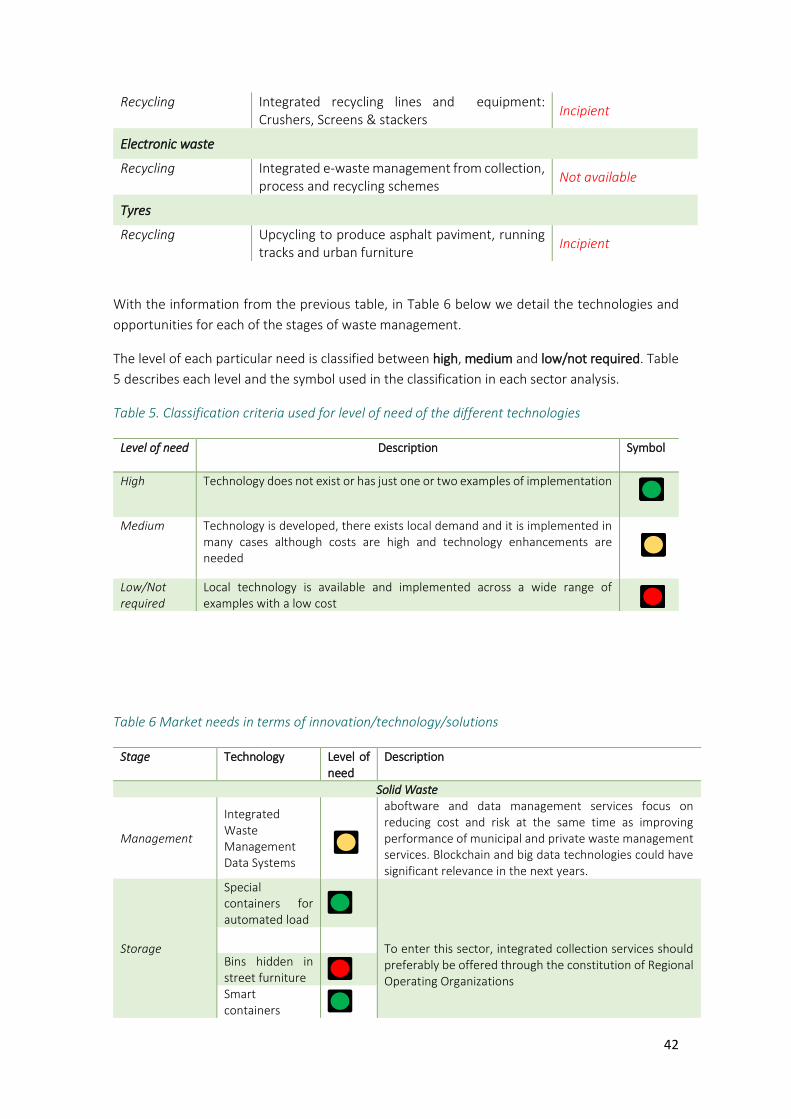
42
Recycling Integrated recycling lines and equipment: Crushers, Screens & stackers
Incipient
Electronic waste
Recycling Integrated e-waste management from collection, process and recycling schemes
Not available
Tyres
Recycling Upcycling to produce asphalt paviment, running tracks and urban furniture
Incipient
With the information from the previous table, in Table 6 below we detail the technologies and
opportunities for each of the stages of waste management.
The level of each particular need is classified between high, medium and low/not required. Table
5 describes each level and the symbol used in the classification in each sector analysis.
Table 5. Classification criteria used for level of need of the different technologies
Level of need Description Symbol
High Technology does not exist or has just one or two examples of implementation
Medium Technology is developed, there exists local demand and it is implemented in many cases although costs are high and technology enhancements are needed
Low/Not required
Local technology is available and implemented across a wide range of examples with a low cost
Table 6 Market needs in terms of innovation/technology/solutions
Stage Technology Level of need
Description
Solid Waste
Management
Integrated Waste Management Data Systems
aboftware and data management services focus on reducing cost and risk at the same time as improving performance of municipal and private waste management services. Blockchain and big data technologies could have significant relevance in the next years.
Storage
Special containers for automated load
To enter this sector, integrated collection services should preferably be offered through the constitution of Regional Operating Organizations
Bins hidden in street furniture
Smart containers
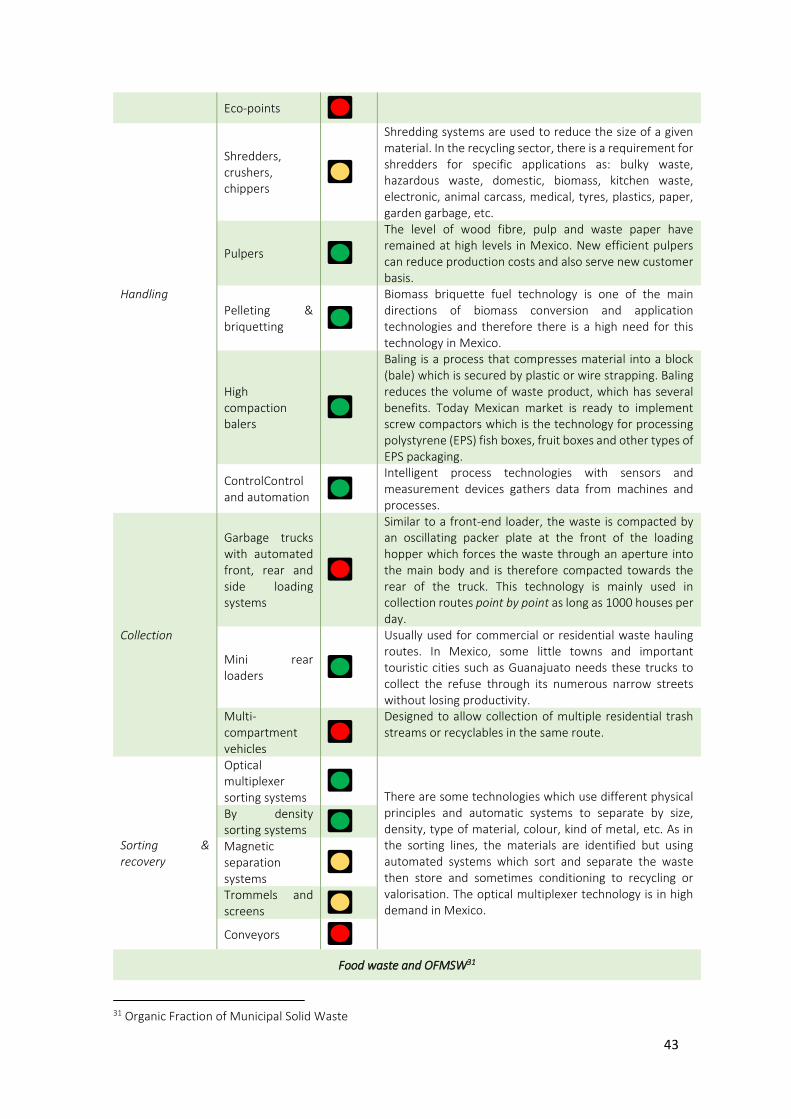
43
Eco-points
Handling
Shredders, crushers, chippers
Shredding systems are used to reduce the size of a given material. In the recycling sector, there is a requirement for shredders for specific applications as: bulky waste, hazardous waste, domestic, biomass, kitchen waste, electronic, animal carcass, medical, tyres, plastics, paper, garden garbage, etc.
Pulpers
The level of wood fibre, pulp and waste paper have remained at high levels in Mexico. New efficient pulpers can reduce production costs and also serve new customer basis.
Pelleting & briquetting
Biomass briquette fuel technology is one of the main directions of biomass conversion and application technologies and therefore there is a high need for this technology in Mexico.
High compaction balers
Baling is a process that compresses material into a block (bale) which is secured by plastic or wire strapping. Baling reduces the volume of waste product, which has several benefits. Today Mexican market is ready to implement screw compactors which is the technology for processing polystyrene (EPS) fish boxes, fruit boxes and other types of EPS packaging.
ControlControl and automation
Intelligent process technologies with sensors and measurement devices gathers data from machines and processes.
Collection
Garbage trucks with automated front, rear and side loading systems
Similar to a front-end loader, the waste is compacted by an oscillating packer plate at the front of the loading hopper which forces the waste through an aperture into the main body and is therefore compacted towards the rear of the truck. This technology is mainly used in collection routes point by point as long as 1000 houses per day.
Mini rear loaders
Usually used for commercial or residential waste hauling routes. In Mexico, some little towns and important touristic cities such as Guanajuato needs these trucks to collect the refuse through its numerous narrow streets without losing productivity.
Multi-compartment vehicles
Designed to allow collection of multiple residential trash streams or recyclables in the same route.
Sorting & recovery
Optical multiplexer sorting systems
There are some technologies which use different physical principles and automatic systems to separate by size, density, type of material, colour, kind of metal, etc. As in the sorting lines, the materials are identified but using automated systems which sort and separate the waste then store and sometimes conditioning to recycling or valorisation. The optical multiplexer technology is in high demand in Mexico.
By density sorting systems
Magnetic separation systems
Trommels and screens
Conveyors
Food waste and OFMSW31
31 Organic Fraction of Municipal Solid Waste
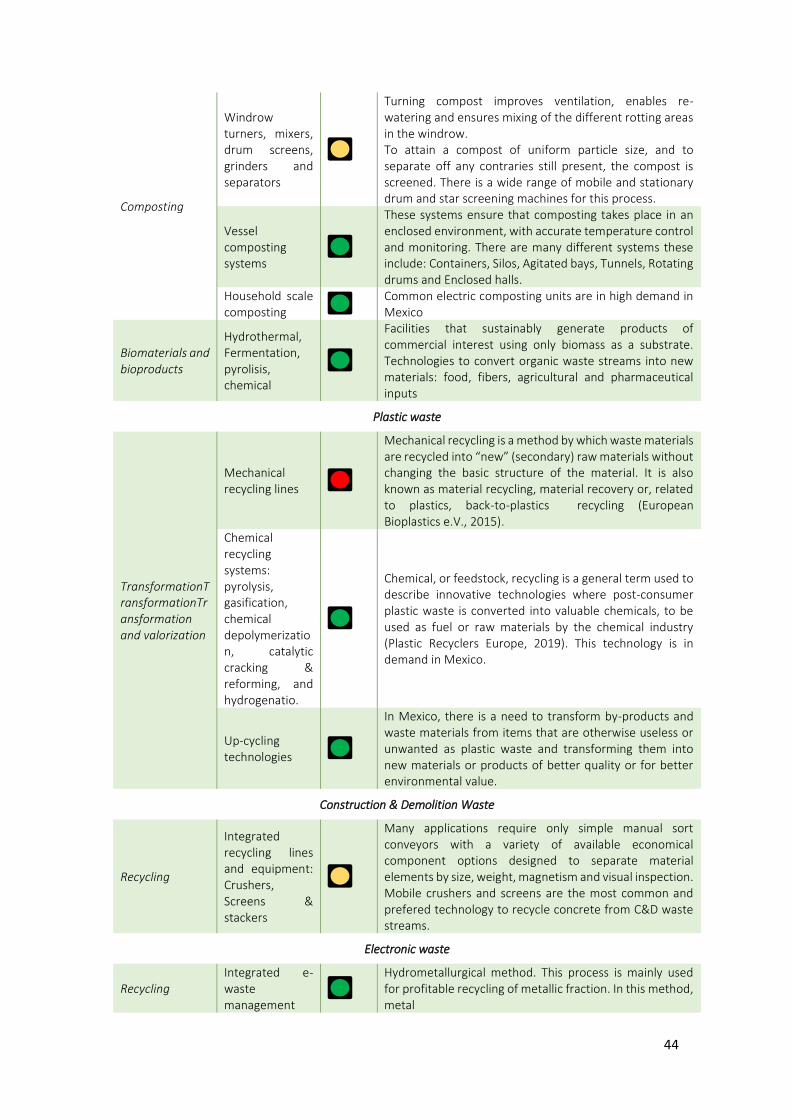
44
Composting
Windrow turners, mixers, drum screens, grinders and separators
Turning compost improves ventilation, enables re-watering and ensures mixing of the different rotting areas in the windrow. To attain a compost of uniform particle size, and to separate off any contraries still present, the compost is screened. There is a wide range of mobile and stationary drum and star screening machines for this process.
Vessel composting systems
These systems ensure that composting takes place in an enclosed environment, with accurate temperature control and monitoring. There are many different systems these include: Containers, Silos, Agitated bays, Tunnels, Rotating drums and Enclosed halls.
Household scale composting
Common electric composting units are in high demand in Mexico
Biomaterials and bioproducts
Hydrothermal, Fermentation, pyrolisis, chemical
Facilities that sustainably generate products of commercial interest using only biomass as a substrate. Technologies to convert organic waste streams into new materials: food, fibers, agricultural and pharmaceutical inputs
Plastic waste
TransformationTransformationTransformation and valorization
Mechanical recycling lines
Mechanical recycling is a method by which waste materials are recycled into “new” (secondary) raw materials without changing the basic structure of the material. It is also known as material recycling, material recovery or, related to plastics, back-to-plastics recycling (European Bioplastics e.V., 2015).
Chemical recycling systems: pyrolysis, gasification, chemical depolymerization, catalytic cracking & reforming, and hydrogenatio.
Chemical, or feedstock, recycling is a general term used to describe innovative technologies where post-consumer plastic waste is converted into valuable chemicals, to be used as fuel or raw materials by the chemical industry (Plastic Recyclers Europe, 2019). This technology is in demand in Mexico.
Up-cycling technologies
In Mexico, there is a need to transform by-products and waste materials from items that are otherwise useless or unwanted as plastic waste and transforming them into new materials or products of better quality or for better environmental value.
Construction & Demolition Waste
Recycling
Integrated recycling lines and equipment: Crushers, Screens & stackers
Many applications require only simple manual sort conveyors with a variety of available economical component options designed to separate material elements by size, weight, magnetism and visual inspection. Mobile crushers and screens are the most common and prefered technology to recycle concrete from C&D waste streams.
Electronic waste
Recycling Integrated e-waste management
Hydrometallurgical method. This process is mainly used for profitable recycling of metallic fraction. In this method, metal
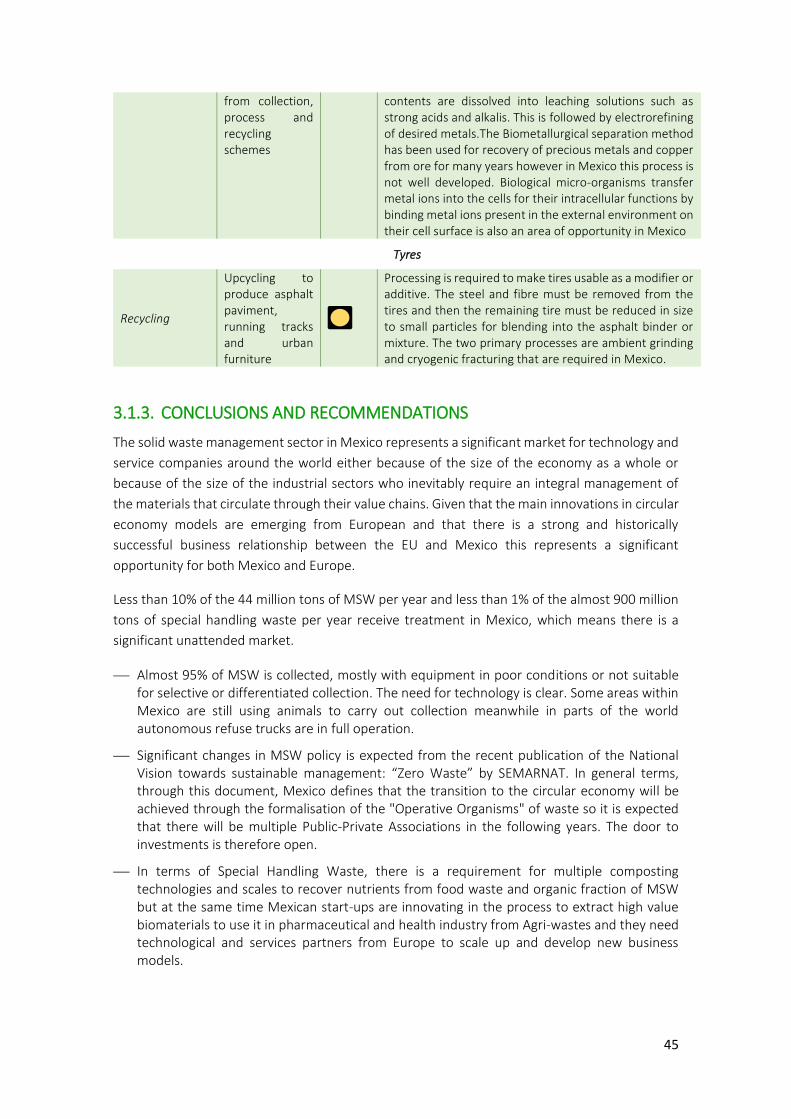
45
from collection, process and recycling schemes
contents are dissolved into leaching solutions such as strong acids and alkalis. This is followed by electrorefining of desired metals.The Biometallurgical separation method has been used for recovery of precious metals and copper from ore for many years however in Mexico this process is not well developed. Biological micro-organisms transfer metal ions into the cells for their intracellular functions by binding metal ions present in the external environment on their cell surface is also an area of opportunity in Mexico
Tyres
Recycling
Upcycling to produce asphalt paviment, running tracks and urban furniture
Processing is required to make tires usable as a modifier or additive. The steel and fibre must be removed from the tires and then the remaining tire must be reduced in size to small particles for blending into the asphalt binder or mixture. The two primary processes are ambient grinding and cryogenic fracturing that are required in Mexico.
3.1.3. CONCLUSIONS AND RECOMMENDATIONS
The solid waste management sector in Mexico represents a significant market for technology and
service companies around the world either because of the size of the economy as a whole or
because of the size of the industrial sectors who inevitably require an integral management of
the materials that circulate through their value chains. Given that the main innovations in circular
economy models are emerging from European and that there is a strong and historically
successful business relationship between the EU and Mexico this represents a significant
opportunity for both Mexico and Europe.
Less than 10% of the 44 million tons of MSW per year and less than 1% of the almost 900 million
tons of special handling waste per year receive treatment in Mexico, which means there is a
significant unattended market.
⎯ Almost 95% of MSW is collected, mostly with equipment in poor conditions or not suitable for selective or differentiated collection. The need for technology is clear. Some areas within Mexico are still using animals to carry out collection meanwhile in parts of the world autonomous refuse trucks are in full operation.
⎯ Significant changes in MSW policy is expected from the recent publication of the National Vision towards sustainable management: “Zero Waste” by SEMARNAT. In general terms, through this document, Mexico defines that the transition to the circular economy will be achieved through the formalisation of the "Operative Organisms" of waste so it is expected that there will be multiple Public-Private Associations in the following years. The door to investments is therefore open.
⎯ In terms of Special Handling Waste, there is a requirement for multiple composting technologies and scales to recover nutrients from food waste and organic fraction of MSW but at the same time Mexican start-ups are innovating in the process to extract high value biomaterials to use it in pharmaceutical and health industry from Agri-wastes and they need technological and services partners from Europe to scale up and develop new business models.
46
⎯ The volume of C&D waste is also sharply increasing, reflecting the pace of infrastructure development across Mexico. The latest report from SEMARNAT indicates that 6.5 million tones of C&D waste is produced annually in Mexico.
⎯ E-waste is now the fastest-growing waste stream in the world. Sobering, only 20% of global e-waste is formally recycled the remaining 80% is often incinerated or dumped in landfills. The Mexican national average generation of this type of waste in 2006 was of 263,849 tonnes, which represented a per capita generation of 2.52kg/hab/year. The number of mobile devices in the Mexican market has increased from 14 million in 2000 to 107 million until the first semester of 2016. This growth has raised concerns amongst mobile phone operators, device manufacturers and consumers for the adequate disposal of devices and accessories.
⎯ There are 28,900 million tyres disposed of every year in Mexico. The Mexican tyre market is very peculiar due to the proximity to the US and its close connection to the used automobile market. Aside from producing and importing new tyres, Mexico imports from the US used tyres to be used on vehicles in Mexico (1,065,000 units in 2012; 3.7 % of the national market), furthermore it also imports used tyres for rethreading (1,082,000 in 2012).
⎯ Currently, in Mexico, 5% of tyres are recycled, 2% are used for energy generation, 2% are disposed in authorized collection centres and the remaining 91% are abandoned or used without control.
Finally, Mexico in 2009 had a waste equipment market of 806 Million Euros, in 2019 this is
expected to be around 1300M Euros and then it is expected to grow at 6% to 2025.
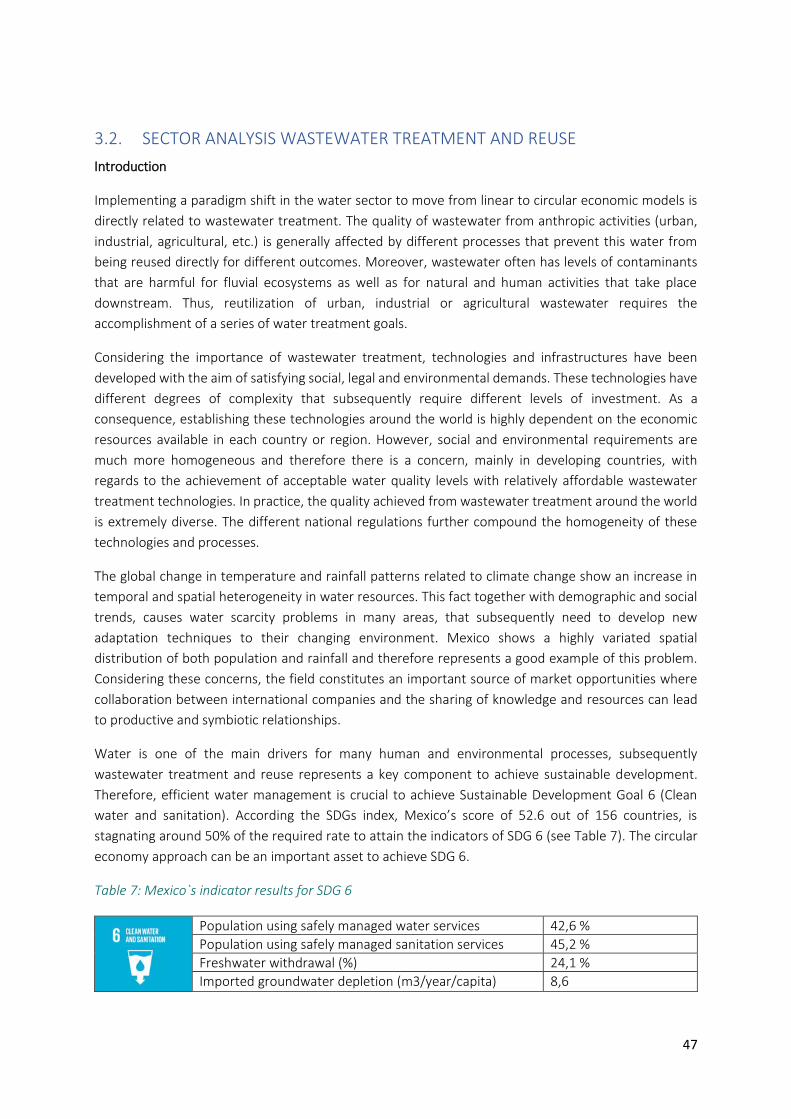
47
3.2. SECTOR ANALYSIS WASTEWATER TREATMENT AND REUSE
Introduction
Implementing a paradigm shift in the water sector to move from linear to circular economic models is
directly related to wastewater treatment. The quality of wastewater from anthropic activities (urban,
industrial, agricultural, etc.) is generally affected by different processes that prevent this water from
being reused directly for different outcomes. Moreover, wastewater often has levels of contaminants
that are harmful for fluvial ecosystems as well as for natural and human activities that take place
downstream. Thus, reutilization of urban, industrial or agricultural wastewater requires the
accomplishment of a series of water treatment goals.
Considering the importance of wastewater treatment, technologies and infrastructures have been
developed with the aim of satisfying social, legal and environmental demands. These technologies have
different degrees of complexity that subsequently require different levels of investment. As a
consequence, establishing these technologies around the world is highly dependent on the economic
resources available in each country or region. However, social and environmental requirements are
much more homogeneous and therefore there is a concern, mainly in developing countries, with
regards to the achievement of acceptable water quality levels with relatively affordable wastewater
treatment technologies. In practice, the quality achieved from wastewater treatment around the world
is extremely diverse. The different national regulations further compound the homogeneity of these
technologies and processes.
The global change in temperature and rainfall patterns related to climate change show an increase in
temporal and spatial heterogeneity in water resources. This fact together with demographic and social
trends, causes water scarcity problems in many areas, that subsequently need to develop new
adaptation techniques to their changing environment. Mexico shows a highly variated spatial
distribution of both population and rainfall and therefore represents a good example of this problem.
Considering these concerns, the field constitutes an important source of market opportunities where
collaboration between international companies and the sharing of knowledge and resources can lead
to productive and symbiotic relationships.
Water is one of the main drivers for many human and environmental processes, subsequently
wastewater treatment and reuse represents a key component to achieve sustainable development.
Therefore, efficient water management is crucial to achieve Sustainable Development Goal 6 (Clean
water and sanitation). According the SDGs index, Mexico’s score of 52.6 out of 156 countries, is
stagnating around 50% of the required rate to attain the indicators of SDG 6 (see Table 7). The circular
economy approach can be an important asset to achieve SDG 6.
Table 7: Mexico`s indicator results for SDG 6
Population using safely managed water services 42,6 %
Population using safely managed sanitation services 45,2 %
Freshwater withdrawal (%) 24,1 %
Imported groundwater depletion (m3/year/capita) 8,6
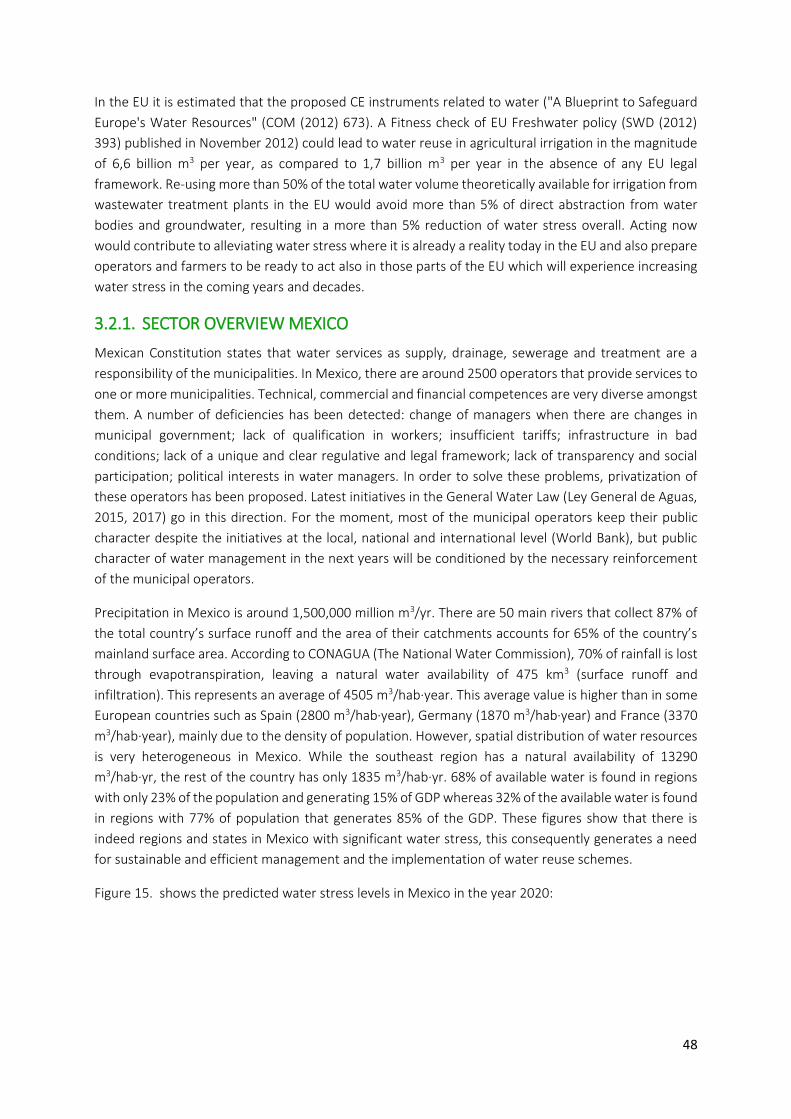
48
In the EU it is estimated that the proposed CE instruments related to water ("A Blueprint to Safeguard
Europe's Water Resources" (COM (2012) 673). A Fitness check of EU Freshwater policy (SWD (2012)
393) published in November 2012) could lead to water reuse in agricultural irrigation in the magnitude
of 6,6 billion m3 per year, as compared to 1,7 billion m3 per year in the absence of any EU legal
framework. Re-using more than 50% of the total water volume theoretically available for irrigation from
wastewater treatment plants in the EU would avoid more than 5% of direct abstraction from water
bodies and groundwater, resulting in a more than 5% reduction of water stress overall. Acting now
would contribute to alleviating water stress where it is already a reality today in the EU and also prepare
operators and farmers to be ready to act also in those parts of the EU which will experience increasing
water stress in the coming years and decades.
3.2.1. SECTOR OVERVIEW MEXICO
Mexican Constitution states that water services as supply, drainage, sewerage and treatment are a
responsibility of the municipalities. In Mexico, there are around 2500 operators that provide services to
one or more municipalities. Technical, commercial and financial competences are very diverse amongst
them. A number of deficiencies has been detected: change of managers when there are changes in
municipal government; lack of qualification in workers; insufficient tariffs; infrastructure in bad
conditions; lack of a unique and clear regulative and legal framework; lack of transparency and social
participation; political interests in water managers. In order to solve these problems, privatization of
these operators has been proposed. Latest initiatives in the General Water Law (Ley General de Aguas,
2015, 2017) go in this direction. For the moment, most of the municipal operators keep their public
character despite the initiatives at the local, national and international level (World Bank), but public
character of water management in the next years will be conditioned by the necessary reinforcement
of the municipal operators.
Precipitation in Mexico is around 1,500,000 million m3/yr. There are 50 main rivers that collect 87% of
the total country’s surface runoff and the area of their catchments accounts for 65% of the country’s
mainland surface area. According to CONAGUA (The National Water Commission), 70% of rainfall is lost
through evapotranspiration, leaving a natural water availability of 475 km3 (surface runoff and
infiltration). This represents an average of 4505 m3/hab·year. This average value is higher than in some
European countries such as Spain (2800 m3/hab·year), Germany (1870 m3/hab·year) and France (3370
m3/hab·year), mainly due to the density of population. However, spatial distribution of water resources
is very heterogeneous in Mexico. While the southeast region has a natural availability of 13290
m3/hab·yr, the rest of the country has only 1835 m3/hab·yr. 68% of available water is found in regions
with only 23% of the population and generating 15% of GDP whereas 32% of the available water is found
in regions with 77% of population that generates 85% of the GDP. These figures show that there is
indeed regions and states in Mexico with significant water stress, this consequently generates a need
for sustainable and efficient management and the implementation of water reuse schemes.
Figure 15. shows the predicted water stress levels in Mexico in the year 2020:
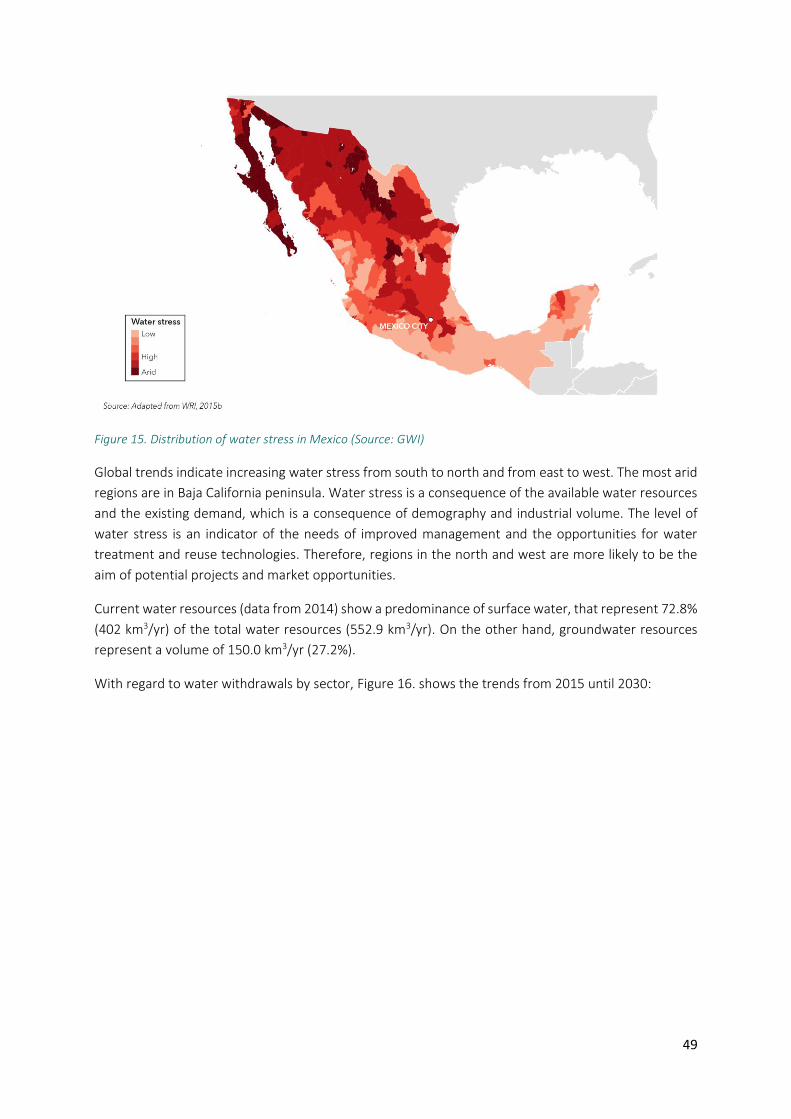
49
Figure 15. Distribution of water stress in Mexico (Source: GWI)
Global trends indicate increasing water stress from south to north and from east to west. The most arid
regions are in Baja California peninsula. Water stress is a consequence of the available water resources
and the existing demand, which is a consequence of demography and industrial volume. The level of
water stress is an indicator of the needs of improved management and the opportunities for water
treatment and reuse technologies. Therefore, regions in the north and west are more likely to be the
aim of potential projects and market opportunities.
Current water resources (data from 2014) show a predominance of surface water, that represent 72.8%
(402 km3/yr) of the total water resources (552.9 km3/yr). On the other hand, groundwater resources
represent a volume of 150.0 km3/yr (27.2%).
With regard to water withdrawals by sector, Figure 16. shows the trends from 2015 until 2030:
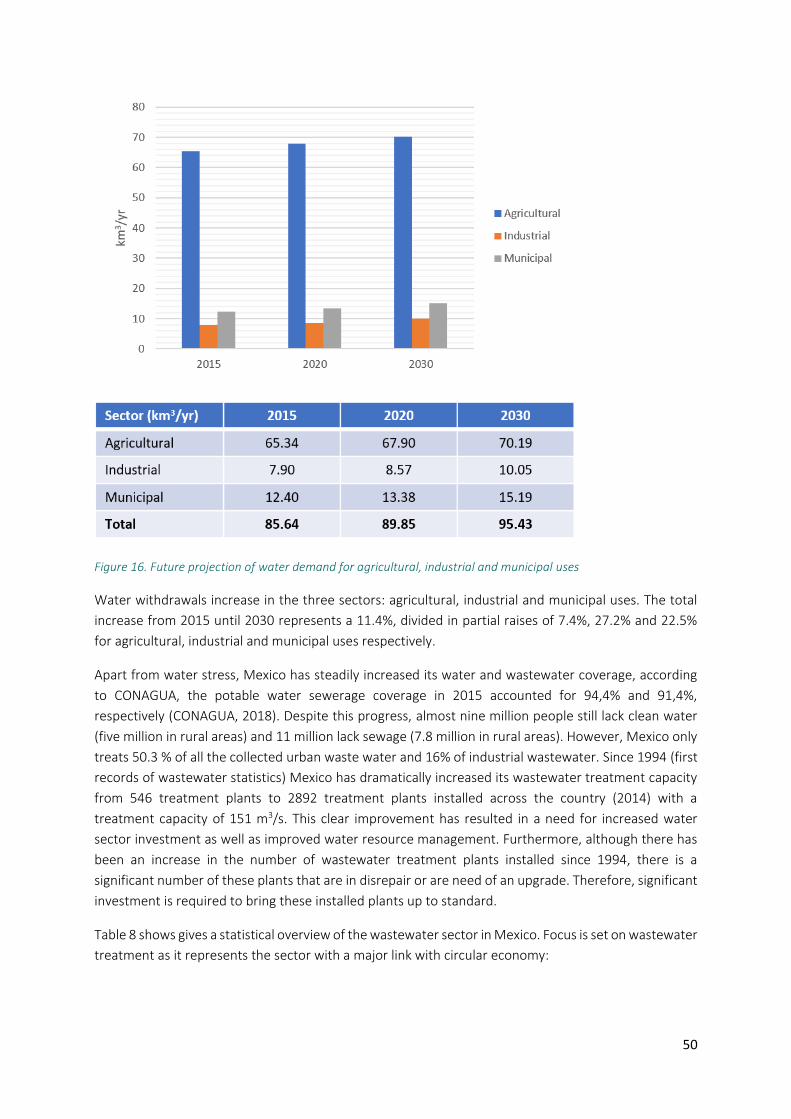
50
Figure 16. Future projection of water demand for agricultural, industrial and municipal uses
Water withdrawals increase in the three sectors: agricultural, industrial and municipal uses. The total
increase from 2015 until 2030 represents a 11.4%, divided in partial raises of 7.4%, 27.2% and 22.5%
for agricultural, industrial and municipal uses respectively.
Apart from water stress, Mexico has steadily increased its water and wastewater coverage, according
to CONAGUA, the potable water sewerage coverage in 2015 accounted for 94,4% and 91,4%,
respectively (CONAGUA, 2018). Despite this progress, almost nine million people still lack clean water
(five million in rural areas) and 11 million lack sewage (7.8 million in rural areas). However, Mexico only
treats 50.3 % of all the collected urban waste water and 16% of industrial wastewater. Since 1994 (first
records of wastewater statistics) Mexico has dramatically increased its wastewater treatment capacity
from 546 treatment plants to 2892 treatment plants installed across the country (2014) with a
treatment capacity of 151 m3/s. This clear improvement has resulted in a need for increased water
sector investment as well as improved water resource management. Furthermore, although there has
been an increase in the number of wastewater treatment plants installed since 1994, there is a
significant number of these plants that are in disrepair or are need of an upgrade. Therefore, significant
investment is required to bring these installed plants up to standard.
Table 8 shows gives a statistical overview of the wastewater sector in Mexico. Focus is set on wastewater
treatment as it represents the sector with a major link with circular economy:
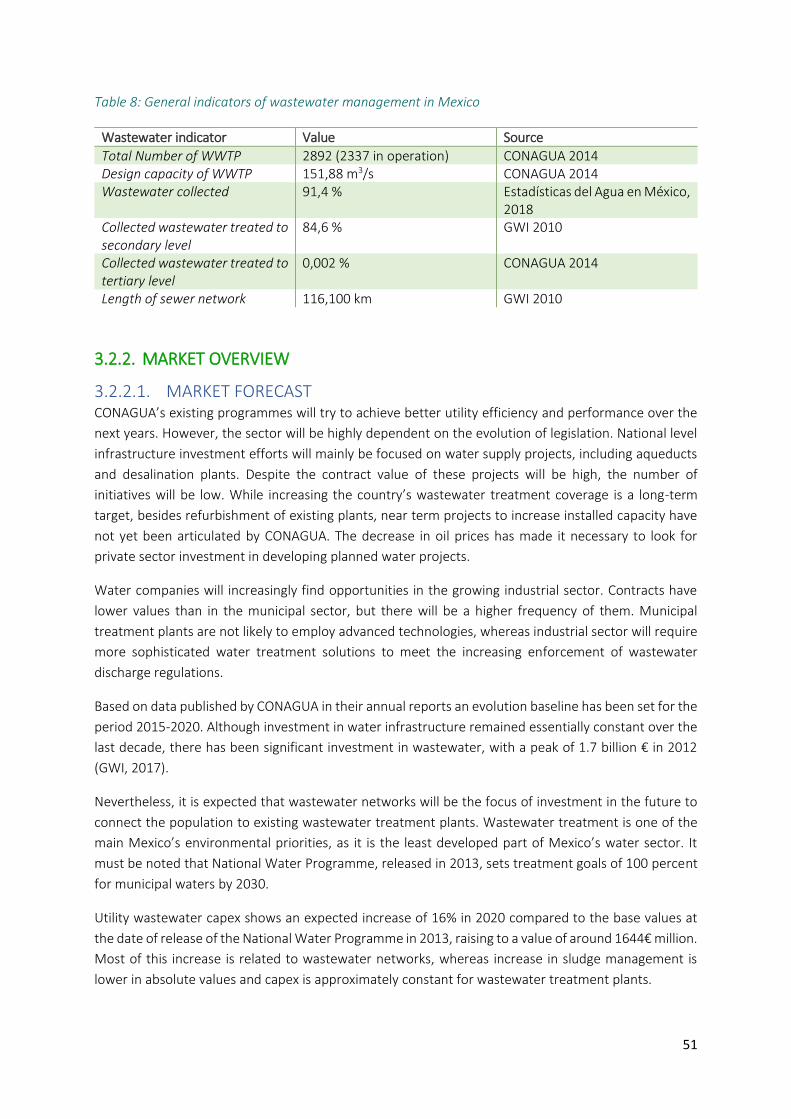
51
Table 8: General indicators of wastewater management in Mexico
Wastewater indicator Value Source
Total Number of WWTP 2892 (2337 in operation) CONAGUA 2014 Design capacity of WWTP 151,88 m3/s CONAGUA 2014 Wastewater collected 91,4 % Estadísticas del Agua en México,
2018 Collected wastewater treated to secondary level
84,6 % GWI 2010
Collected wastewater treated to tertiary level
0,002 % CONAGUA 2014
Length of sewer network 116,100 km GWI 2010
3.2.2. MARKET OVERVIEW
3.2.2.1. MARKET FORECAST CONAGUA’s existing programmes will try to achieve better utility efficiency and performance over the
next years. However, the sector will be highly dependent on the evolution of legislation. National level
infrastructure investment efforts will mainly be focused on water supply projects, including aqueducts
and desalination plants. Despite the contract value of these projects will be high, the number of
initiatives will be low. While increasing the country’s wastewater treatment coverage is a long-term
target, besides refurbishment of existing plants, near term projects to increase installed capacity have
not yet been articulated by CONAGUA. The decrease in oil prices has made it necessary to look for
private sector investment in developing planned water projects.
Water companies will increasingly find opportunities in the growing industrial sector. Contracts have
lower values than in the municipal sector, but there will be a higher frequency of them. Municipal
treatment plants are not likely to employ advanced technologies, whereas industrial sector will require
more sophisticated water treatment solutions to meet the increasing enforcement of wastewater
discharge regulations.
Based on data published by CONAGUA in their annual reports an evolution baseline has been set for the
period 2015-2020. Although investment in water infrastructure remained essentially constant over the
last decade, there has been significant investment in wastewater, with a peak of 1.7 billion € in 2012
(GWI, 2017).
Nevertheless, it is expected that wastewater networks will be the focus of investment in the future to
connect the population to existing wastewater treatment plants. Wastewater treatment is one of the
main Mexico’s environmental priorities, as it is the least developed part of Mexico’s water sector. It
must be noted that National Water Programme, released in 2013, sets treatment goals of 100 percent
for municipal waters by 2030.
Utility wastewater capex shows an expected increase of 16% in 2020 compared to the base values at
the date of release of the National Water Programme in 2013, raising to a value of around 1644€ million.
Most of this increase is related to wastewater networks, whereas increase in sludge management is
lower in absolute values and capex is approximately constant for wastewater treatment plants.
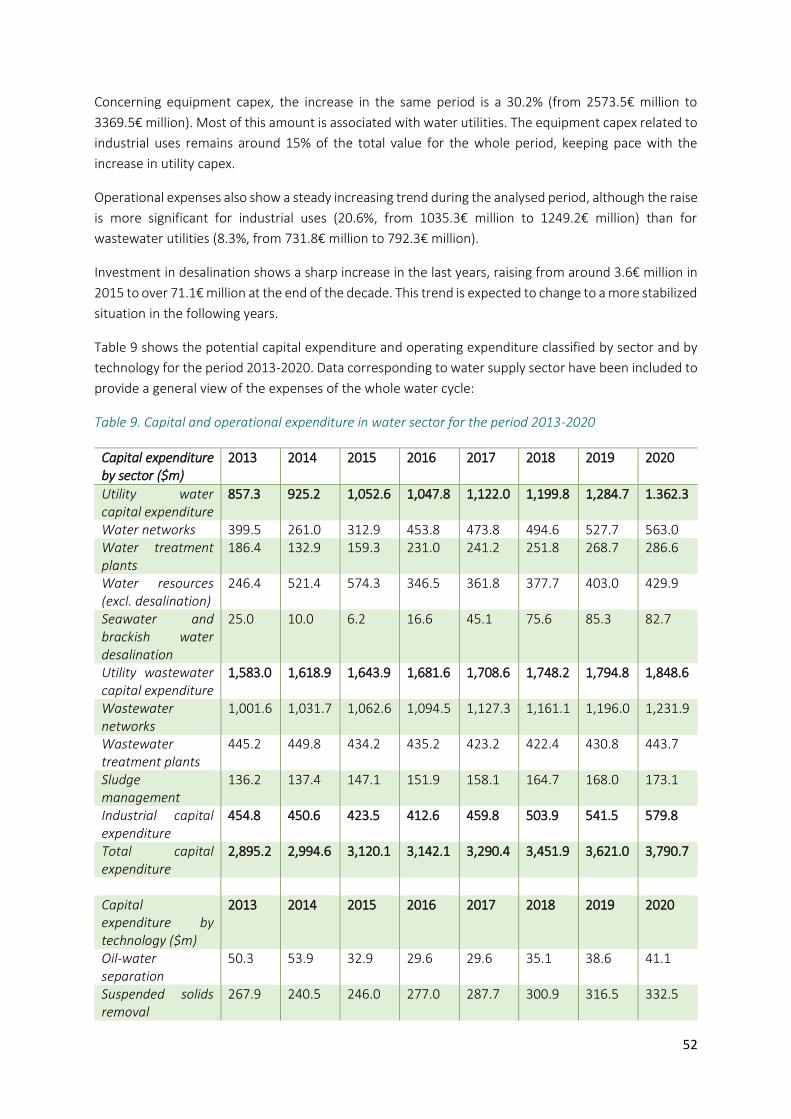
52
Concerning equipment capex, the increase in the same period is a 30.2% (from 2573.5€ million to
3369.5€ million). Most of this amount is associated with water utilities. The equipment capex related to
industrial uses remains around 15% of the total value for the whole period, keeping pace with the
increase in utility capex.
Operational expenses also show a steady increasing trend during the analysed period, although the raise
is more significant for industrial uses (20.6%, from 1035.3€ million to 1249.2€ million) than for
wastewater utilities (8.3%, from 731.8€ million to 792.3€ million).
Investment in desalination shows a sharp increase in the last years, raising from around 3.6€ million in
2015 to over 71.1€ million at the end of the decade. This trend is expected to change to a more stabilized
situation in the following years.
Table 9 shows the potential capital expenditure and operating expenditure classified by sector and by
technology for the period 2013-2020. Data corresponding to water supply sector have been included to
provide a general view of the expenses of the whole water cycle:
Table 9. Capital and operational expenditure in water sector for the period 2013-2020
Capital expenditure by sector ($m)
2013 2014 2015 2016 2017 2018 2019 2020
Utility water capital expenditure
857.3 925.2 1,052.6 1,047.8 1,122.0 1,199.8 1,284.7 1.362.3
Water networks 399.5 261.0 312.9 453.8 473.8 494.6 527.7 563.0 Water treatment plants
186.4 132.9 159.3 231.0 241.2 251.8 268.7 286.6
Water resources (excl. desalination)
246.4 521.4 574.3 346.5 361.8 377.7 403.0 429.9
Seawater and brackish water desalination
25.0 10.0 6.2 16.6 45.1 75.6 85.3 82.7
Utility wastewater capital expenditure
1,583.0 1,618.9 1,643.9 1,681.6 1,708.6 1,748.2 1,794.8 1,848.6
Wastewater networks
1,001.6 1,031.7 1,062.6 1,094.5 1,127.3 1,161.1 1,196.0 1,231.9
Wastewater treatment plants
445.2 449.8 434.2 435.2 423.2 422.4 430.8 443.7
Sludge management
136.2 137.4 147.1 151.9 158.1 164.7 168.0 173.1
Industrial capital expenditure
454.8 450.6 423.5 412.6 459.8 503.9 541.5 579.8
Total capital expenditure
2,895.2 2,994.6 3,120.1 3,142.1 3,290.4 3,451.9 3,621.0 3,790.7
Capital expenditure by technology ($m)
2013 2014 2015 2016 2017 2018 2019 2020
Oil-water separation
50.3 53.9 32.9 29.6 29.6 35.1 38.6 41.1
Suspended solids removal
267.9 240.5 246.0 277.0 287.7 300.9 316.5 332.5
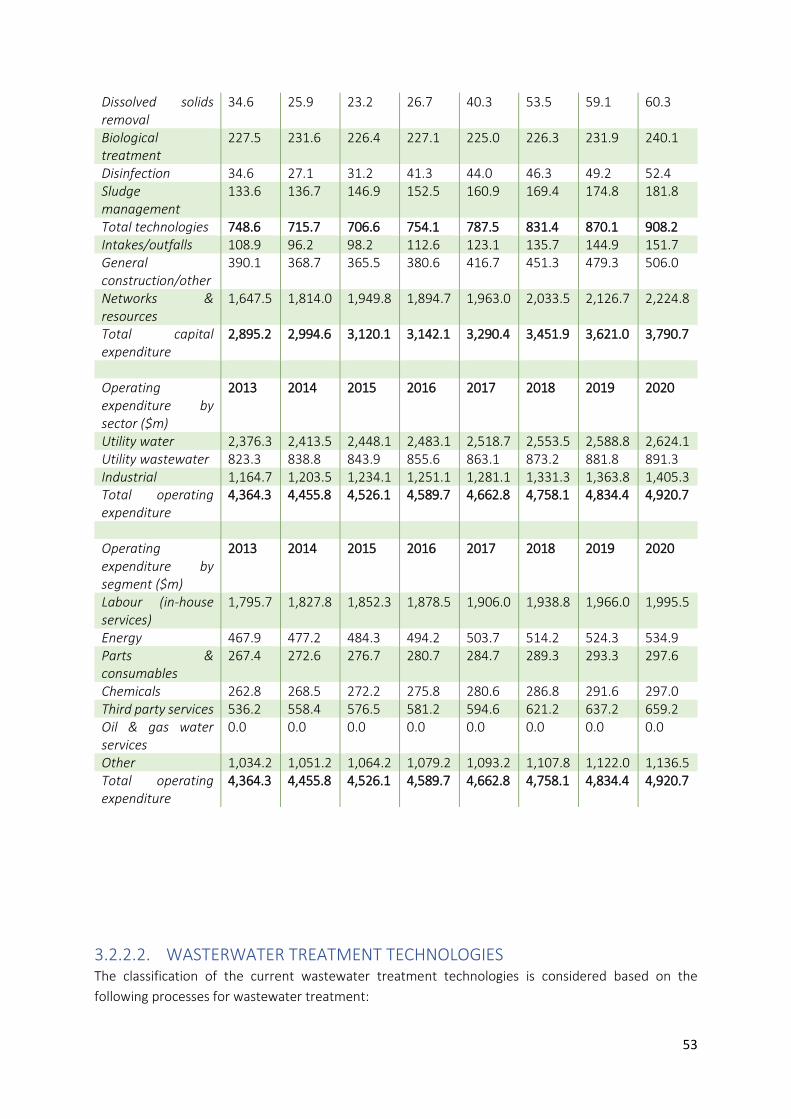
53
Dissolved solids removal
34.6 25.9 23.2 26.7 40.3 53.5 59.1 60.3
Biological treatment
227.5 231.6 226.4 227.1 225.0 226.3 231.9 240.1
Disinfection 34.6 27.1 31.2 41.3 44.0 46.3 49.2 52.4 Sludge management
133.6 136.7 146.9 152.5 160.9 169.4 174.8 181.8
Total technologies 748.6 715.7 706.6 754.1 787.5 831.4 870.1 908.2 Intakes/outfalls 108.9 96.2 98.2 112.6 123.1 135.7 144.9 151.7 General construction/other
390.1 368.7 365.5 380.6 416.7 451.3 479.3 506.0
Networks & resources
1,647.5 1,814.0 1,949.8 1,894.7 1,963.0 2,033.5 2,126.7 2,224.8
Total capital expenditure
2,895.2 2,994.6 3,120.1 3,142.1 3,290.4 3,451.9 3,621.0 3,790.7
Operating expenditure by sector ($m)
2013 2014 2015 2016 2017 2018 2019 2020
Utility water 2,376.3 2,413.5 2,448.1 2,483.1 2,518.7 2,553.5 2,588.8 2,624.1 Utility wastewater 823.3 838.8 843.9 855.6 863.1 873.2 881.8 891.3 Industrial 1,164.7 1,203.5 1,234.1 1,251.1 1,281.1 1,331.3 1,363.8 1,405.3 Total operating expenditure
4,364.3 4,455.8 4,526.1 4,589.7 4,662.8 4,758.1 4,834.4 4,920.7
Operating expenditure by segment ($m)
2013 2014 2015 2016 2017 2018 2019 2020
Labour (in-house services)
1,795.7 1,827.8 1,852.3 1,878.5 1,906.0 1,938.8 1,966.0 1,995.5
Energy 467.9 477.2 484.3 494.2 503.7 514.2 524.3 534.9 Parts & consumables
267.4 272.6 276.7 280.7 284.7 289.3 293.3 297.6
Chemicals 262.8 268.5 272.2 275.8 280.6 286.8 291.6 297.0 Third party services 536.2 558.4 576.5 581.2 594.6 621.2 637.2 659.2 Oil & gas water services
0.0 0.0 0.0 0.0 0.0 0.0 0.0 0.0
Other 1,034.2 1,051.2 1,064.2 1,079.2 1,093.2 1,107.8 1,122.0 1,136.5 Total operating expenditure
4,364.3 4,455.8 4,526.1 4,589.7 4,662.8 4,758.1 4,834.4 4,920.7
3.2.2.2. WASTERWATER TREATMENT TECHNOLOGIES The classification of the current wastewater treatment technologies is considered based on the
following processes for wastewater treatment:
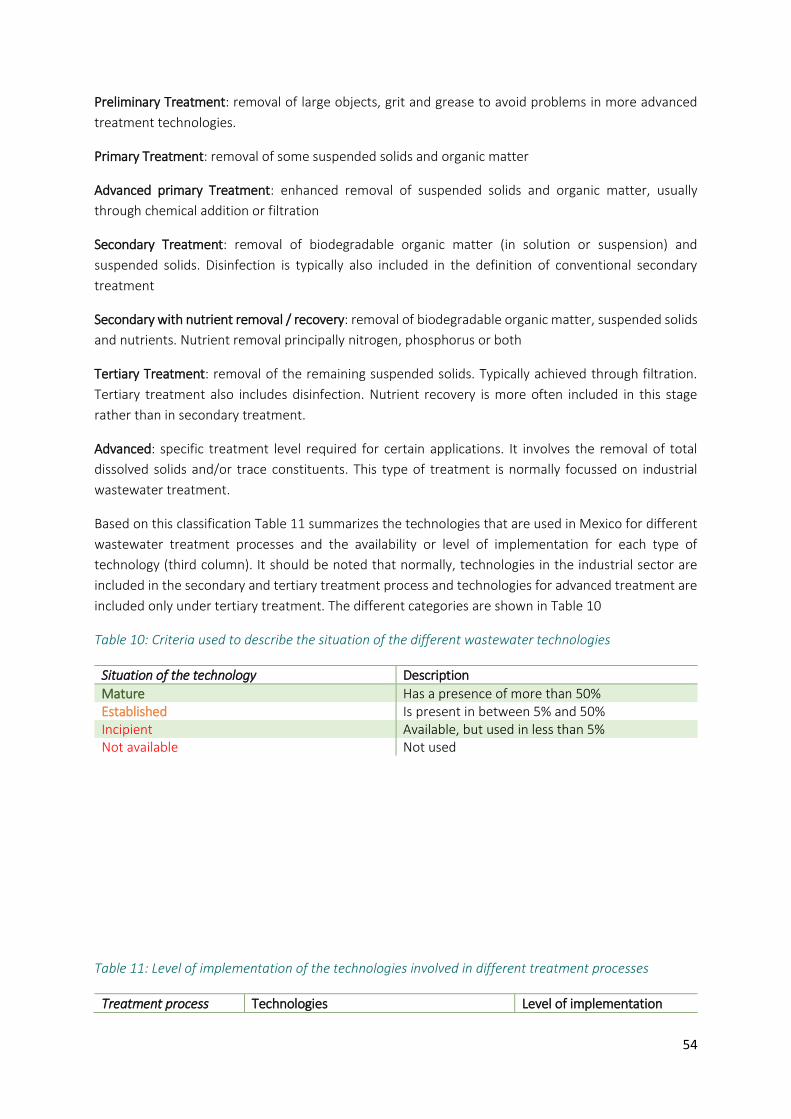
54
Preliminary Treatment: removal of large objects, grit and grease to avoid problems in more advanced
treatment technologies.
Primary Treatment: removal of some suspended solids and organic matter
Advanced primary Treatment: enhanced removal of suspended solids and organic matter, usually
through chemical addition or filtration
Secondary Treatment: removal of biodegradable organic matter (in solution or suspension) and
suspended solids. Disinfection is typically also included in the definition of conventional secondary
treatment
Secondary with nutrient removal / recovery: removal of biodegradable organic matter, suspended solids
and nutrients. Nutrient removal principally nitrogen, phosphorus or both
Tertiary Treatment: removal of the remaining suspended solids. Typically achieved through filtration.
Tertiary treatment also includes disinfection. Nutrient recovery is more often included in this stage
rather than in secondary treatment.
Advanced: specific treatment level required for certain applications. It involves the removal of total
dissolved solids and/or trace constituents. This type of treatment is normally focussed on industrial
wastewater treatment.
Based on this classification Table 11 summarizes the technologies that are used in Mexico for different
wastewater treatment processes and the availability or level of implementation for each type of
technology (third column). It should be noted that normally, technologies in the industrial sector are
included in the secondary and tertiary treatment process and technologies for advanced treatment are
included only under tertiary treatment. The different categories are shown in Table 10
Table 10: Criteria used to describe the situation of the different wastewater technologies
Situation of the technology Description
Mature Has a presence of more than 50% Established Is present in between 5% and 50% Incipient Available, but used in less than 5% Not available Not used
Table 11: Level of implementation of the technologies involved in different treatment processes
Treatment process Technologies Level of implementation
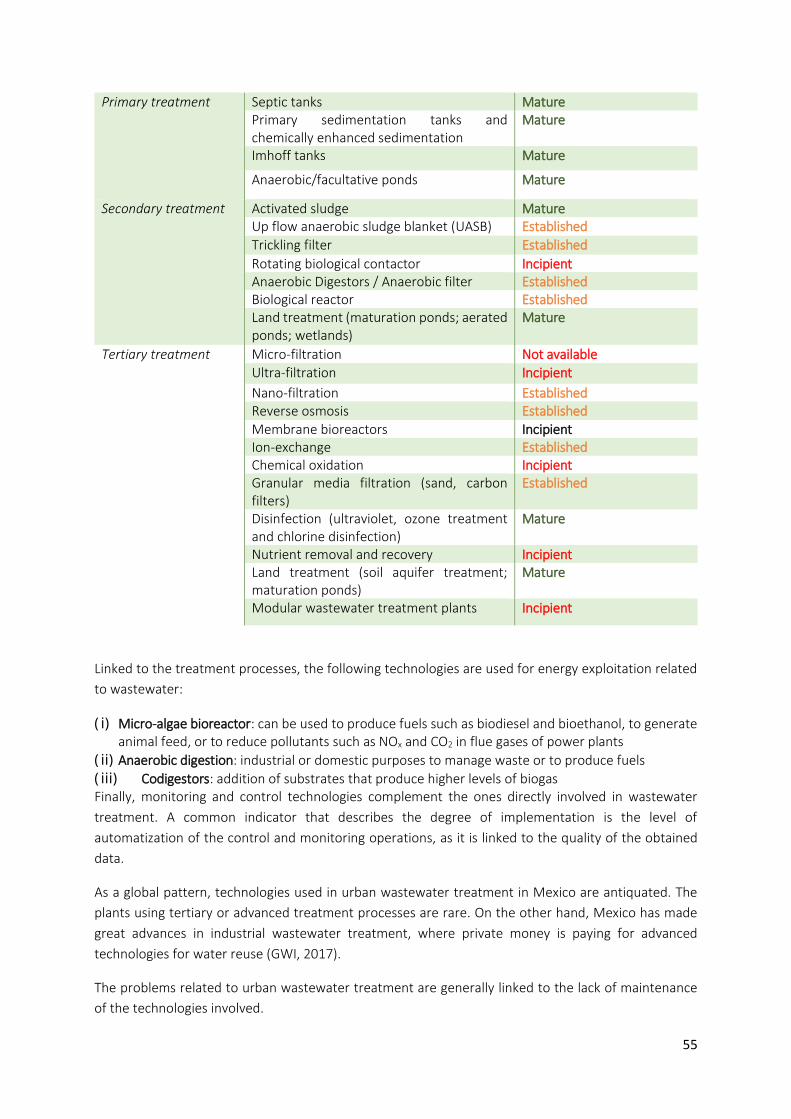
55
Primary treatment Septic tanks Mature Primary sedimentation tanks and chemically enhanced sedimentation
Mature
Imhoff tanks Mature
Anaerobic/facultative ponds Mature
Secondary treatment Activated sludge Mature Up flow anaerobic sludge blanket (UASB) Established
Trickling filter Established
Rotating biological contactor Incipient Anaerobic Digestors / Anaerobic filter Established Biological reactor Established Land treatment (maturation ponds; aerated ponds; wetlands)
Mature
Tertiary treatment Micro-filtration Not available
Ultra-filtration Incipient
Nano-filtration Established Reverse osmosis Established Membrane bioreactors Incipient Ion-exchange Established Chemical oxidation Incipient Granular media filtration (sand, carbon filters)
Established
Disinfection (ultraviolet, ozone treatment and chlorine disinfection)
Mature
Nutrient removal and recovery Incipient Land treatment (soil aquifer treatment; maturation ponds)
Mature
Modular wastewater treatment plants Incipient
Linked to the treatment processes, the following technologies are used for energy exploitation related
to wastewater:
(i) Micro-algae bioreactor: can be used to produce fuels such as biodiesel and bioethanol, to generate animal feed, or to reduce pollutants such as NOx and CO2 in flue gases of power plants
(ii) Anaerobic digestion: industrial or domestic purposes to manage waste or to produce fuels
(iii) Codigestors: addition of substrates that produce higher levels of biogas Finally, monitoring and control technologies complement the ones directly involved in wastewater
treatment. A common indicator that describes the degree of implementation is the level of
automatization of the control and monitoring operations, as it is linked to the quality of the obtained
data.
As a global pattern, technologies used in urban wastewater treatment in Mexico are antiquated. The
plants using tertiary or advanced treatment processes are rare. On the other hand, Mexico has made
great advances in industrial wastewater treatment, where private money is paying for advanced
technologies for water reuse (GWI, 2017).
The problems related to urban wastewater treatment are generally linked to the lack of maintenance
of the technologies involved.
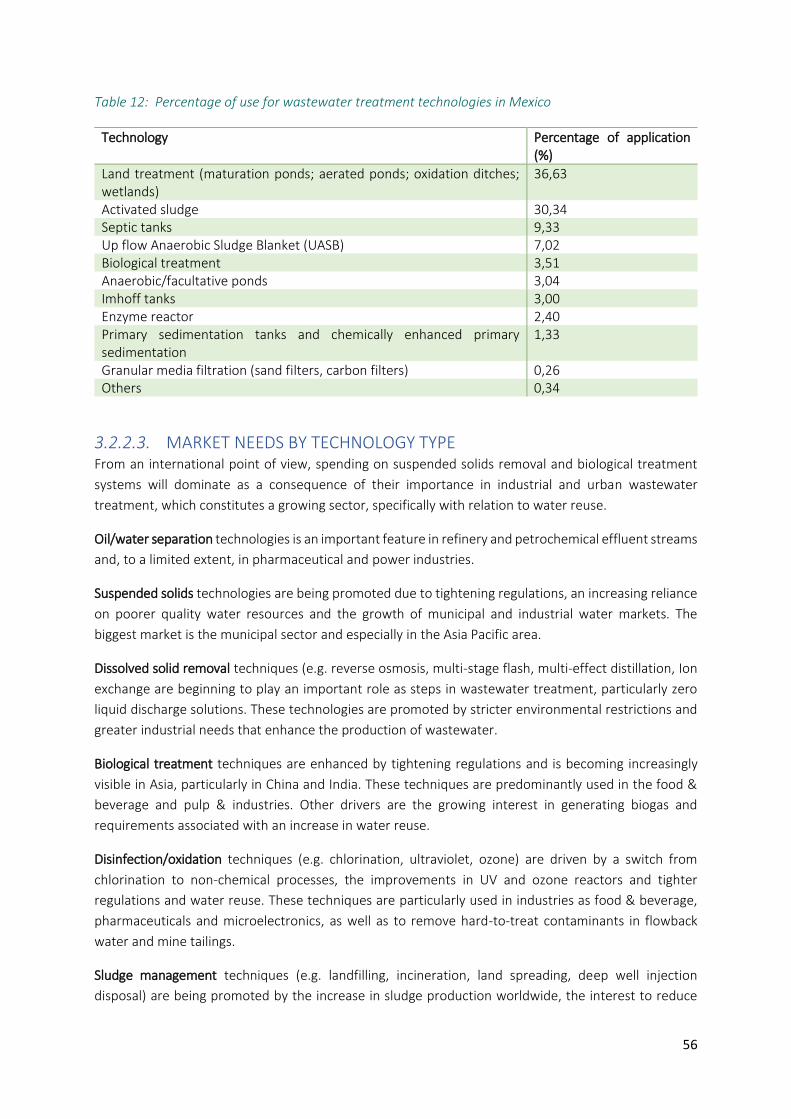
56
Table 12: Percentage of use for wastewater treatment technologies in Mexico
Technology Percentage of application (%)
Land treatment (maturation ponds; aerated ponds; oxidation ditches; wetlands)
36,63
Activated sludge 30,34 Septic tanks 9,33 Up flow Anaerobic Sludge Blanket (UASB) 7,02 Biological treatment 3,51 Anaerobic/facultative ponds 3,04 Imhoff tanks 3,00 Enzyme reactor 2,40 Primary sedimentation tanks and chemically enhanced primary sedimentation
1,33
Granular media filtration (sand filters, carbon filters) 0,26 Others 0,34
3.2.2.3. MARKET NEEDS BY TECHNOLOGY TYPE From an international point of view, spending on suspended solids removal and biological treatment
systems will dominate as a consequence of their importance in industrial and urban wastewater
treatment, which constitutes a growing sector, specifically with relation to water reuse.
Oil/water separation technologies is an important feature in refinery and petrochemical effluent streams
and, to a limited extent, in pharmaceutical and power industries.
Suspended solids technologies are being promoted due to tightening regulations, an increasing reliance
on poorer quality water resources and the growth of municipal and industrial water markets. The
biggest market is the municipal sector and especially in the Asia Pacific area.
Dissolved solid removal techniques (e.g. reverse osmosis, multi-stage flash, multi-effect distillation, Ion
exchange are beginning to play an important role as steps in wastewater treatment, particularly zero
liquid discharge solutions. These technologies are promoted by stricter environmental restrictions and
greater industrial needs that enhance the production of wastewater.
Biological treatment techniques are enhanced by tightening regulations and is becoming increasingly
visible in Asia, particularly in China and India. These techniques are predominantly used in the food &
beverage and pulp & industries. Other drivers are the growing interest in generating biogas and
requirements associated with an increase in water reuse.
Disinfection/oxidation techniques (e.g. chlorination, ultraviolet, ozone) are driven by a switch from
chlorination to non-chemical processes, the improvements in UV and ozone reactors and tighter
regulations and water reuse. These techniques are particularly used in industries as food & beverage,
pharmaceuticals and microelectronics, as well as to remove hard-to-treat contaminants in flowback
water and mine tailings.
Sludge management techniques (e.g. landfilling, incineration, land spreading, deep well injection
disposal) are being promoted by the increase in sludge production worldwide, the interest to reduce
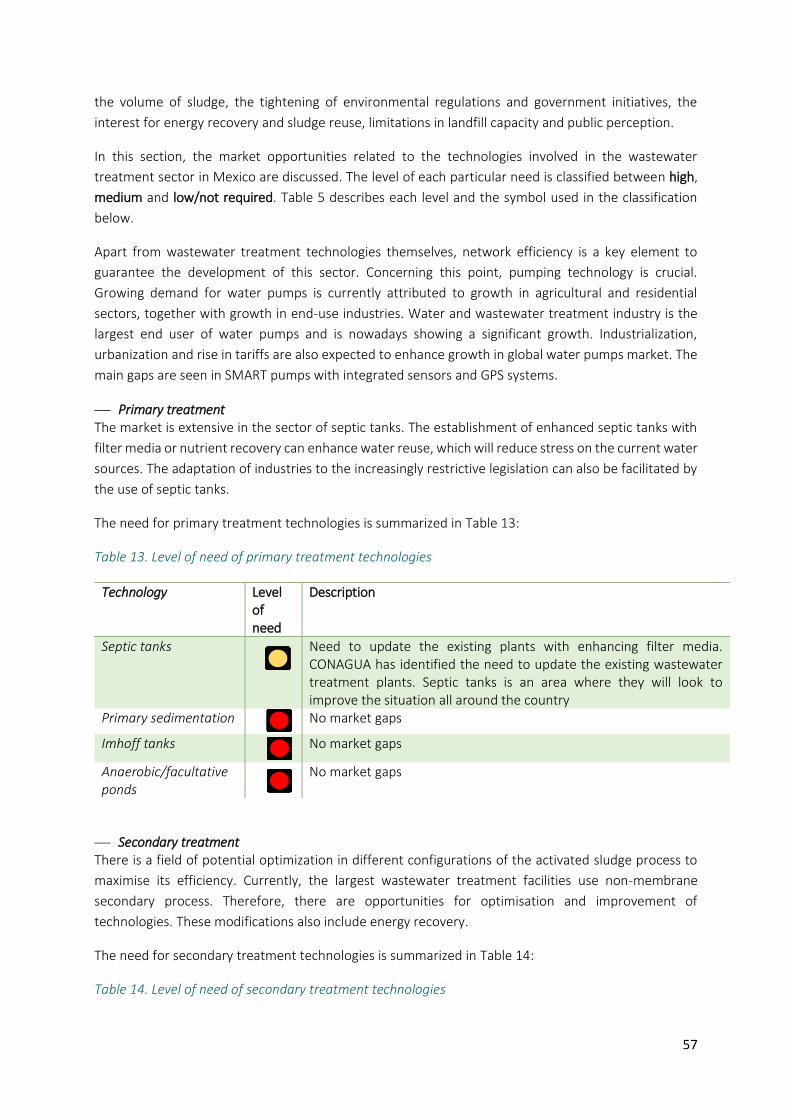
57
the volume of sludge, the tightening of environmental regulations and government initiatives, the
interest for energy recovery and sludge reuse, limitations in landfill capacity and public perception.
In this section, the market opportunities related to the technologies involved in the wastewater
treatment sector in Mexico are discussed. The level of each particular need is classified between high,
medium and low/not required. Table 5 describes each level and the symbol used in the classification
below.
Apart from wastewater treatment technologies themselves, network efficiency is a key element to
guarantee the development of this sector. Concerning this point, pumping technology is crucial.
Growing demand for water pumps is currently attributed to growth in agricultural and residential
sectors, together with growth in end-use industries. Water and wastewater treatment industry is the
largest end user of water pumps and is nowadays showing a significant growth. Industrialization,
urbanization and rise in tariffs are also expected to enhance growth in global water pumps market. The
main gaps are seen in SMART pumps with integrated sensors and GPS systems.
⎯ Primary treatment The market is extensive in the sector of septic tanks. The establishment of enhanced septic tanks with
filter media or nutrient recovery can enhance water reuse, which will reduce stress on the current water
sources. The adaptation of industries to the increasingly restrictive legislation can also be facilitated by
the use of septic tanks.
The need for primary treatment technologies is summarized in Table 13:
Table 13. Level of need of primary treatment technologies
Technology Level of need
Description
Septic tanks
Need to update the existing plants with enhancing filter media. CONAGUA has identified the need to update the existing wastewater treatment plants. Septic tanks is an area where they will look to improve the situation all around the country
Primary sedimentation
No market gaps
Imhoff tanks
No market gaps
Anaerobic/facultative ponds
No market gaps
⎯ Secondary treatment There is a field of potential optimization in different configurations of the activated sludge process to
maximise its efficiency. Currently, the largest wastewater treatment facilities use non-membrane
secondary process. Therefore, there are opportunities for optimisation and improvement of
technologies. These modifications also include energy recovery.
The need for secondary treatment technologies is summarized in Table 14:
Table 14. Level of need of secondary treatment technologies
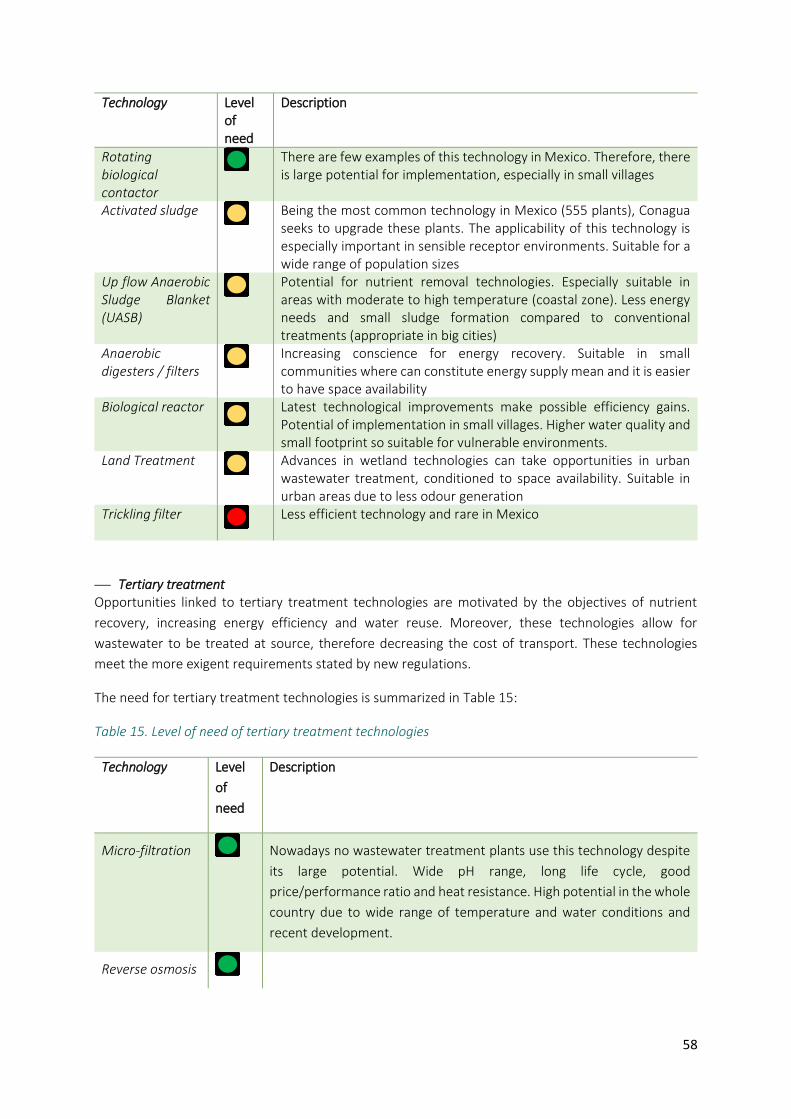
58
Technology Level of need
Description
Rotating biological contactor
There are few examples of this technology in Mexico. Therefore, there is large potential for implementation, especially in small villages
Activated sludge
Being the most common technology in Mexico (555 plants), Conagua seeks to upgrade these plants. The applicability of this technology is especially important in sensible receptor environments. Suitable for a wide range of population sizes
Up flow Anaerobic Sludge Blanket (UASB)
Potential for nutrient removal technologies. Especially suitable in areas with moderate to high temperature (coastal zone). Less energy needs and small sludge formation compared to conventional treatments (appropriate in big cities)
Anaerobic digesters / filters
Increasing conscience for energy recovery. Suitable in small communities where can constitute energy supply mean and it is easier to have space availability
Biological reactor
Latest technological improvements make possible efficiency gains. Potential of implementation in small villages. Higher water quality and small footprint so suitable for vulnerable environments.
Land Treatment
Advances in wetland technologies can take opportunities in urban wastewater treatment, conditioned to space availability. Suitable in urban areas due to less odour generation
Trickling filter
Less efficient technology and rare in Mexico
⎯ Tertiary treatment Opportunities linked to tertiary treatment technologies are motivated by the objectives of nutrient
recovery, increasing energy efficiency and water reuse. Moreover, these technologies allow for
wastewater to be treated at source, therefore decreasing the cost of transport. These technologies
meet the more exigent requirements stated by new regulations.
The need for tertiary treatment technologies is summarized in Table 15:
Table 15. Level of need of tertiary treatment technologies
Technology Level
of
need
Description
Micro-filtration
Nowadays no wastewater treatment plants use this technology despite
its large potential. Wide pH range, long life cycle, good
price/performance ratio and heat resistance. High potential in the whole
country due to wide range of temperature and water conditions and
recent development.
Reverse osmosis
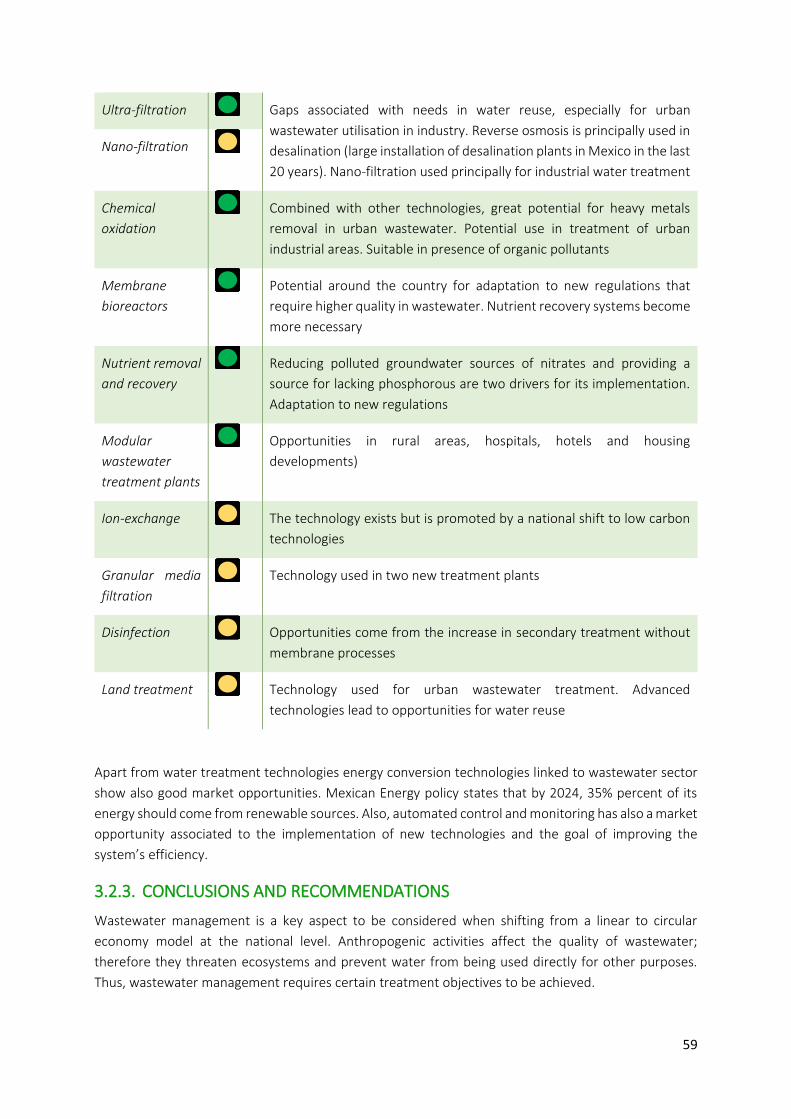
59
Ultra-filtration
Gaps associated with needs in water reuse, especially for urban
wastewater utilisation in industry. Reverse osmosis is principally used in
desalination (large installation of desalination plants in Mexico in the last
20 years). Nano-filtration used principally for industrial water treatment
Nano-filtration
Chemical
oxidation
Combined with other technologies, great potential for heavy metals
removal in urban wastewater. Potential use in treatment of urban
industrial areas. Suitable in presence of organic pollutants
Membrane
bioreactors
Potential around the country for adaptation to new regulations that
require higher quality in wastewater. Nutrient recovery systems become
more necessary
Nutrient removal
and recovery
Reducing polluted groundwater sources of nitrates and providing a
source for lacking phosphorous are two drivers for its implementation.
Adaptation to new regulations
Modular
wastewater
treatment plants
Opportunities in rural areas, hospitals, hotels and housing
developments)
Ion-exchange
The technology exists but is promoted by a national shift to low carbon
technologies
Granular media
filtration
Technology used in two new treatment plants
Disinfection
Opportunities come from the increase in secondary treatment without
membrane processes
Land treatment
Technology used for urban wastewater treatment. Advanced
technologies lead to opportunities for water reuse
Apart from water treatment technologies energy conversion technologies linked to wastewater sector
show also good market opportunities. Mexican Energy policy states that by 2024, 35% percent of its
energy should come from renewable sources. Also, automated control and monitoring has also a market
opportunity associated to the implementation of new technologies and the goal of improving the
system’s efficiency.
3.2.3. CONCLUSIONS AND RECOMMENDATIONS
Wastewater management is a key aspect to be considered when shifting from a linear to circular
economy model at the national level. Anthropogenic activities affect the quality of wastewater;
therefore they threaten ecosystems and prevent water from being used directly for other purposes.
Thus, wastewater management requires certain treatment objectives to be achieved.
60
The water sector in Mexico is overseen by the governmental institution CONAGUA, which establishes
the guidelines and planning that concerns the water infrastructures and regulations. Despite the
improvement in recent years, work is still to be done especially considering a demographic evolution
which shows an increase in population in some specific areas. Within this framework we provide an
insight into the market opportunities that can be the origin of relationships of collaboration between
European and Mexican companies. The main points related to market opportunities in the wastewater
sector are summarized as:
⎯ Demographic evolution shows a progressive increase of population in urban areas, therefore making necessary an adaptation of wastewater treatment procedures
⎯ Climate patterns in Mexico show a great spatial heterogeneity. Water stress is higher in the northern and western regions, therefore becoming areas with high potential for new treatment and reuse initiatives and projects
⎯ SEMARNAT (Secretaría de Medio Ambiente y Recursos Naturales) and its dependent institution CONAGUA (Comisión Nacional del Agua) are the organisms responsible of launching tenders and adjudicating winning proposals and funding wastewater projects in Mexico. Therefore, these will be the main institutions to liaise with for European entities looking to work in Mexico.
⎯ Companies will increasingly find opportunities in the growing industrial sector. Contracts here have a lower value than in the municipal sector but there is a higher frequency of projects.
⎯ Wastewater treatment plants in Mexico do not typically use advanced technologies but more sophisticated water treatment solutions will be needed to meet the increasing enforcement of wastewater discharge regulations
⎯ It is expected that wastewater networks will be the focus of investment in the future to connect the population to existing wastewater treatment plants
⎯ The highest potential for implementation of new technologies is found in tertiary treatment processes
⎯ National planning sets an objective to treat all the wastewater by the year 2030. This ambitious objective should reinforce the number of projects in this sector and related market opportunities
⎯ The situation of the sector in recent years has shown some uncertainty in the development of regulations due to social and political pressure. This point needs to be considered when establishing market strategies that must adapt to national regulation
61
3.3. WASTE TO ENERGY SECTOR ANALYSIS
Introduction
The transformation of waste into energy, whether it is thermal or electrical, is increasingly becoming a
part of municipal, state, national and regional systemic approaches. On the one hand, it increases
resource efficiency and diminishes the need for external fuel sources, and on the other, it adds
profitability to waste management infrastructure, which can be expensive and difficult to execute by
governments alone, especially those in developing economies who spend a larger portion of their
budget on such investments as well as O&M (World Bank, 2018). All potential waste to energy
interventions should be looked at in terms of long term and short-term business opportunities as there
could be potential for the waste to be transferred into another added value produced which does not
undermine local supply.
The sourcing of waste that can be utilized for energy generation is quite varied, for example the
following have been identified as areas for potential energy sources.
1. Municipal solid waste (organic and inorganic)
2. Industrial
3. Electronic
4. Construction and demolition
5. Agricultural and agribusiness (of vegetable and animal origin)
6. Food industry oils and fats
7. Domestic, industrial and municipal wastewater
8. Gaseous losses
9. Energy losses due to inefficiencies in power generation or transformation
Therefore, the methods for transforming these above-mentioned wastes to energy vary significantly in
complexity, GHG emissions (a high price to pay when considered part of a renewable energy matrix),
and the potential return on investment. Nevertheless, this sector analysis focuses on providing valuable
insight into the existing opportunities in Mexico for Original Equipment Manufacturers (OEMs), project
developers, technical advisors, as well as funding partners, given the current market conditions.
Special attention is focussed on the sectors which have been identified by previous studies as those with
the most promising outlook, such as agricultural solid waste, MSW (including food waste), wastewater
treatment, and waste heat recovery for cogeneration. (GIZ, 2016; SENER, 2014)
3.3.1. SECTOR OVERVIEW: MEXICO
Since 2008, Mexico has undergone a series of structural reforms to promote the use of waste as an
energy source, while incentivising the reduction of GHG emissions. The Energy Transition Law (LTE)
signed in 2015, stated that 25% of the energy generated must come from clean energy sources by 2018,
30% by 2020, and 35% by 2024 (DOF, 2015). To reach these objectives, the barriers that limit the
exploitation of renewable energy sources must be overcome. In 2013, energy generated from waste
only contributed to 1.39% of the total Mexican energy consumption (SENER, 2014). However, the
energy potential from residual biomass in 2016 was estimated at 1,070 PJ, corresponding to 12% of the
total energy mix (Table 16)
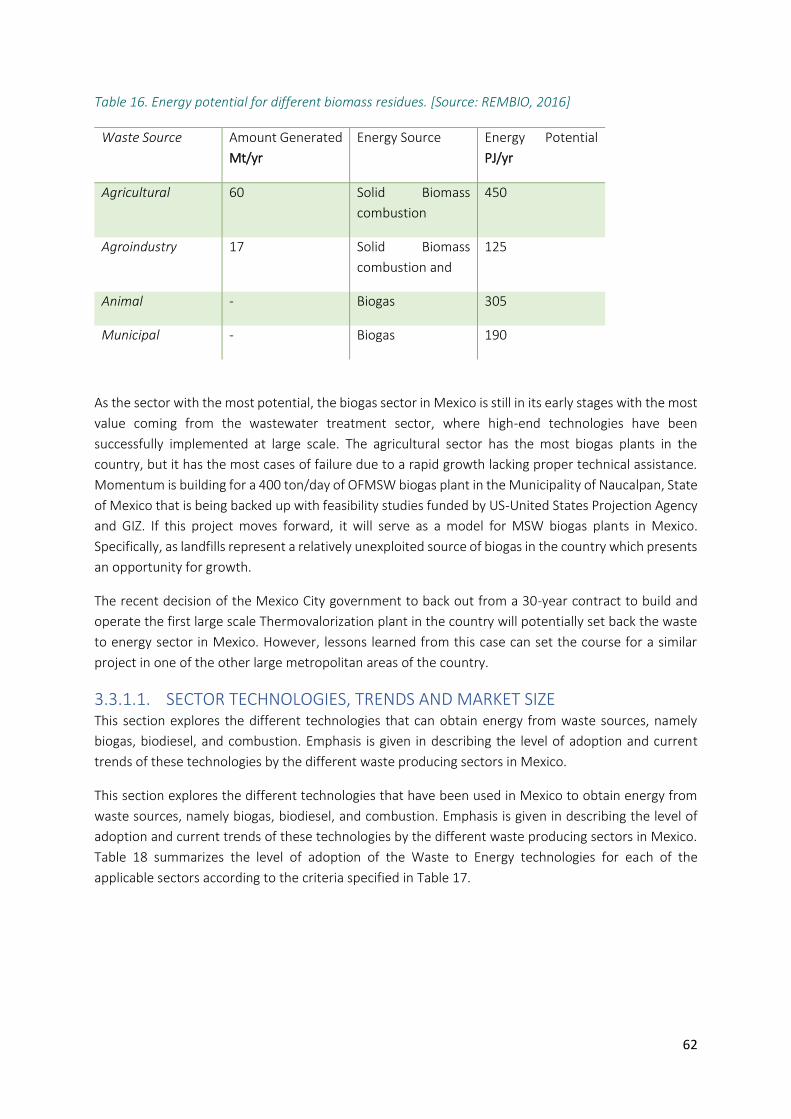
62
Table 16. Energy potential for different biomass residues. [Source: REMBIO, 2016]
Waste Source Amount Generated
Mt/yr
Energy Source Energy Potential
PJ/yr
Agricultural 60 Solid Biomass
combustion
450
Agroindustry 17 Solid Biomass
combustion and
125
Animal - Biogas 305
Municipal - Biogas 190
As the sector with the most potential, the biogas sector in Mexico is still in its early stages with the most
value coming from the wastewater treatment sector, where high-end technologies have been
successfully implemented at large scale. The agricultural sector has the most biogas plants in the
country, but it has the most cases of failure due to a rapid growth lacking proper technical assistance.
Momentum is building for a 400 ton/day of OFMSW biogas plant in the Municipality of Naucalpan, State
of Mexico that is being backed up with feasibility studies funded by US-United States Projection Agency
and GIZ. If this project moves forward, it will serve as a model for MSW biogas plants in Mexico.
Specifically, as landfills represent a relatively unexploited source of biogas in the country which presents
an opportunity for growth.
The recent decision of the Mexico City government to back out from a 30-year contract to build and
operate the first large scale Thermovalorization plant in the country will potentially set back the waste
to energy sector in Mexico. However, lessons learned from this case can set the course for a similar
project in one of the other large metropolitan areas of the country.
3.3.1.1. SECTOR TECHNOLOGIES, TRENDS AND MARKET SIZE This section explores the different technologies that can obtain energy from waste sources, namely
biogas, biodiesel, and combustion. Emphasis is given in describing the level of adoption and current
trends of these technologies by the different waste producing sectors in Mexico.
This section explores the different technologies that have been used in Mexico to obtain energy from
waste sources, namely biogas, biodiesel, and combustion. Emphasis is given in describing the level of
adoption and current trends of these technologies by the different waste producing sectors in Mexico.
Table 18 summarizes the level of adoption of the Waste to Energy technologies for each of the
applicable sectors according to the criteria specified in Table 17.
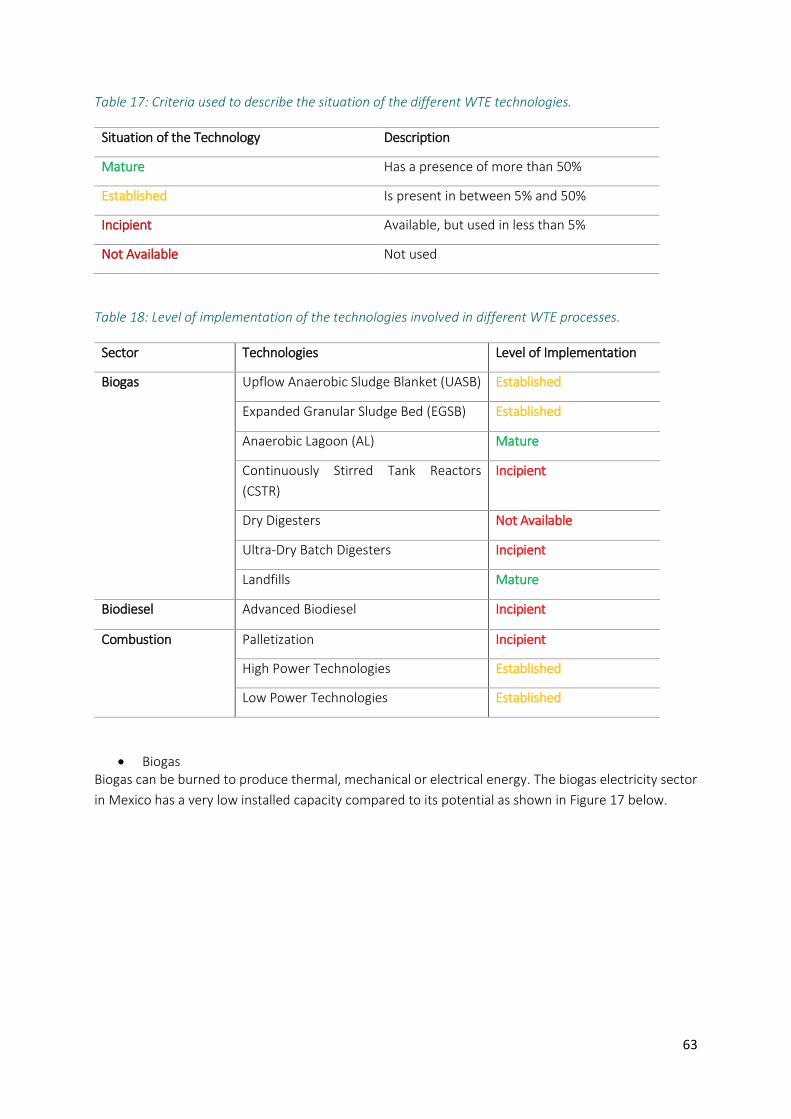
63
Table 17: Criteria used to describe the situation of the different WTE technologies.
Situation of the Technology Description
Mature Has a presence of more than 50%
Established Is present in between 5% and 50%
Incipient Available, but used in less than 5%
Not Available Not used
Table 18: Level of implementation of the technologies involved in different WTE processes.
Sector Technologies Level of Implementation
Biogas Upflow Anaerobic Sludge Blanket (UASB) Established
Expanded Granular Sludge Bed (EGSB) Established
Anaerobic Lagoon (AL) Mature
Continuously Stirred Tank Reactors
(CSTR)
Incipient
Dry Digesters Not Available
Ultra-Dry Batch Digesters Incipient
Landfills Mature
Biodiesel Advanced Biodiesel Incipient
Combustion Palletization Incipient
High Power Technologies Established
Low Power Technologies Established
• Biogas Biogas can be burned to produce thermal, mechanical or electrical energy. The biogas electricity sector
in Mexico has a very low installed capacity compared to its potential as shown in Figure 17 below.
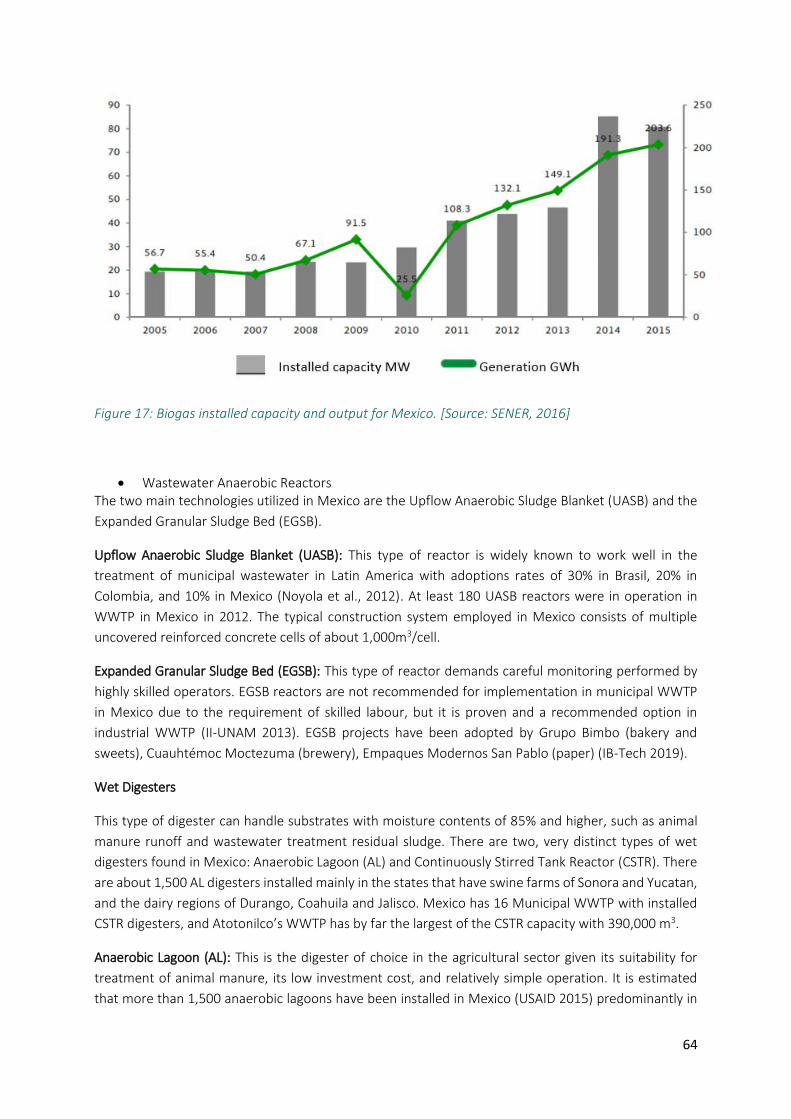
64
Figure 17: Biogas installed capacity and output for Mexico. [Source: SENER, 2016]
• Wastewater Anaerobic Reactors The two main technologies utilized in Mexico are the Upflow Anaerobic Sludge Blanket (UASB) and the
Expanded Granular Sludge Bed (EGSB).
Upflow Anaerobic Sludge Blanket (UASB): This type of reactor is widely known to work well in the
treatment of municipal wastewater in Latin America with adoptions rates of 30% in Brasil, 20% in
Colombia, and 10% in Mexico (Noyola et al., 2012). At least 180 UASB reactors were in operation in
WWTP in Mexico in 2012. The typical construction system employed in Mexico consists of multiple
uncovered reinforced concrete cells of about 1,000m3/cell.
Expanded Granular Sludge Bed (EGSB): This type of reactor demands careful monitoring performed by
highly skilled operators. EGSB reactors are not recommended for implementation in municipal WWTP
in Mexico due to the requirement of skilled labour, but it is proven and a recommended option in
industrial WWTP (II-UNAM 2013). EGSB projects have been adopted by Grupo Bimbo (bakery and
sweets), Cuauhtémoc Moctezuma (brewery), Empaques Modernos San Pablo (paper) (IB-Tech 2019).
Wet Digesters
This type of digester can handle substrates with moisture contents of 85% and higher, such as animal
manure runoff and wastewater treatment residual sludge. There are two, very distinct types of wet
digesters found in Mexico: Anaerobic Lagoon (AL) and Continuously Stirred Tank Reactor (CSTR). There
are about 1,500 AL digesters installed mainly in the states that have swine farms of Sonora and Yucatan,
and the dairy regions of Durango, Coahuila and Jalisco. Mexico has 16 Municipal WWTP with installed
CSTR digesters, and Atotonilco’s WWTP has by far the largest of the CSTR capacity with 390,000 m3.
Anaerobic Lagoon (AL): This is the digester of choice in the agricultural sector given its suitability for
treatment of animal manure, its low investment cost, and relatively simple operation. It is estimated
that more than 1,500 anaerobic lagoons have been installed in Mexico (USAID 2015) predominantly in
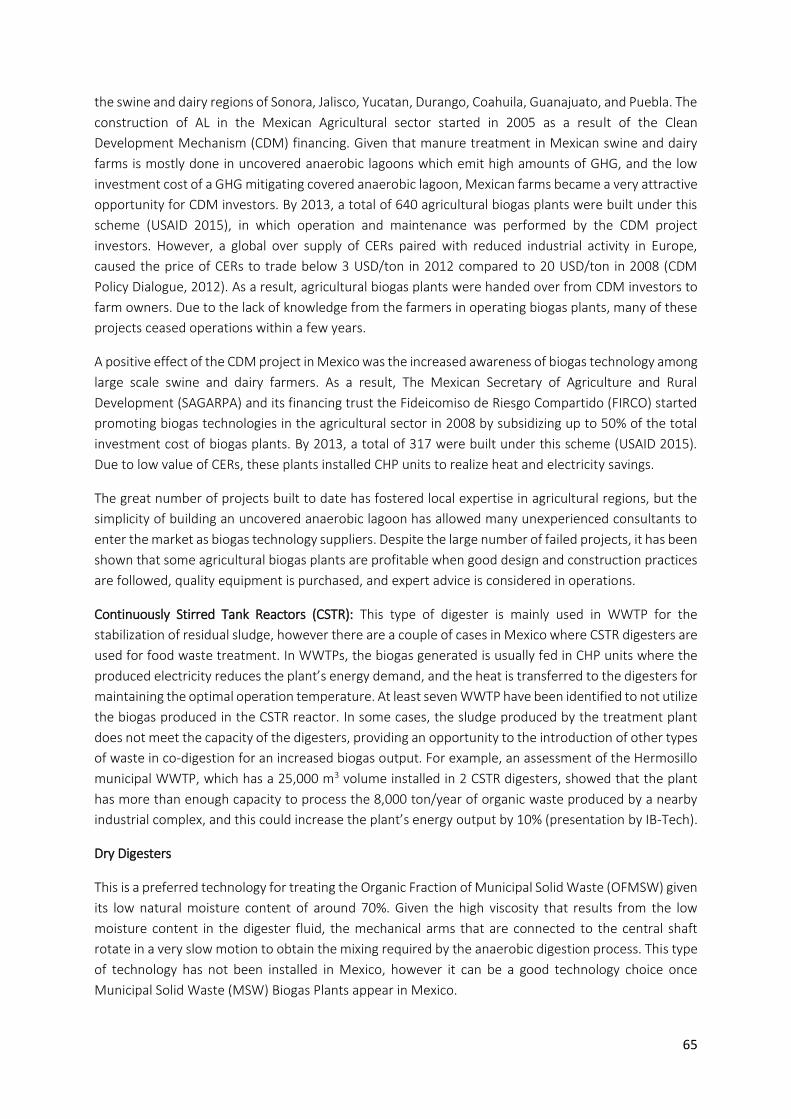
65
the swine and dairy regions of Sonora, Jalisco, Yucatan, Durango, Coahuila, Guanajuato, and Puebla. The
construction of AL in the Mexican Agricultural sector started in 2005 as a result of the Clean
Development Mechanism (CDM) financing. Given that manure treatment in Mexican swine and dairy
farms is mostly done in uncovered anaerobic lagoons which emit high amounts of GHG, and the low
investment cost of a GHG mitigating covered anaerobic lagoon, Mexican farms became a very attractive
opportunity for CDM investors. By 2013, a total of 640 agricultural biogas plants were built under this
scheme (USAID 2015), in which operation and maintenance was performed by the CDM project
investors. However, a global over supply of CERs paired with reduced industrial activity in Europe,
caused the price of CERs to trade below 3 USD/ton in 2012 compared to 20 USD/ton in 2008 (CDM
Policy Dialogue, 2012). As a result, agricultural biogas plants were handed over from CDM investors to
farm owners. Due to the lack of knowledge from the farmers in operating biogas plants, many of these
projects ceased operations within a few years.
A positive effect of the CDM project in Mexico was the increased awareness of biogas technology among
large scale swine and dairy farmers. As a result, The Mexican Secretary of Agriculture and Rural
Development (SAGARPA) and its financing trust the Fideicomiso de Riesgo Compartido (FIRCO) started
promoting biogas technologies in the agricultural sector in 2008 by subsidizing up to 50% of the total
investment cost of biogas plants. By 2013, a total of 317 were built under this scheme (USAID 2015).
Due to low value of CERs, these plants installed CHP units to realize heat and electricity savings.
The great number of projects built to date has fostered local expertise in agricultural regions, but the
simplicity of building an uncovered anaerobic lagoon has allowed many unexperienced consultants to
enter the market as biogas technology suppliers. Despite the large number of failed projects, it has been
shown that some agricultural biogas plants are profitable when good design and construction practices
are followed, quality equipment is purchased, and expert advice is considered in operations.
Continuously Stirred Tank Reactors (CSTR): This type of digester is mainly used in WWTP for the
stabilization of residual sludge, however there are a couple of cases in Mexico where CSTR digesters are
used for food waste treatment. In WWTPs, the biogas generated is usually fed in CHP units where the
produced electricity reduces the plant’s energy demand, and the heat is transferred to the digesters for
maintaining the optimal operation temperature. At least seven WWTP have been identified to not utilize
the biogas produced in the CSTR reactor. In some cases, the sludge produced by the treatment plant
does not meet the capacity of the digesters, providing an opportunity to the introduction of other types
of waste in co-digestion for an increased biogas output. For example, an assessment of the Hermosillo
municipal WWTP, which has a 25,000 m3 volume installed in 2 CSTR digesters, showed that the plant
has more than enough capacity to process the 8,000 ton/year of organic waste produced by a nearby
industrial complex, and this could increase the plant’s energy output by 10% (presentation by IB-Tech).
Dry Digesters
This is a preferred technology for treating the Organic Fraction of Municipal Solid Waste (OFMSW) given
its low natural moisture content of around 70%. Given the high viscosity that results from the low
moisture content in the digester fluid, the mechanical arms that are connected to the central shaft
rotate in a very slow motion to obtain the mixing required by the anaerobic digestion process. This type
of technology has not been installed in Mexico, however it can be a good technology choice once
Municipal Solid Waste (MSW) Biogas Plants appear in Mexico.
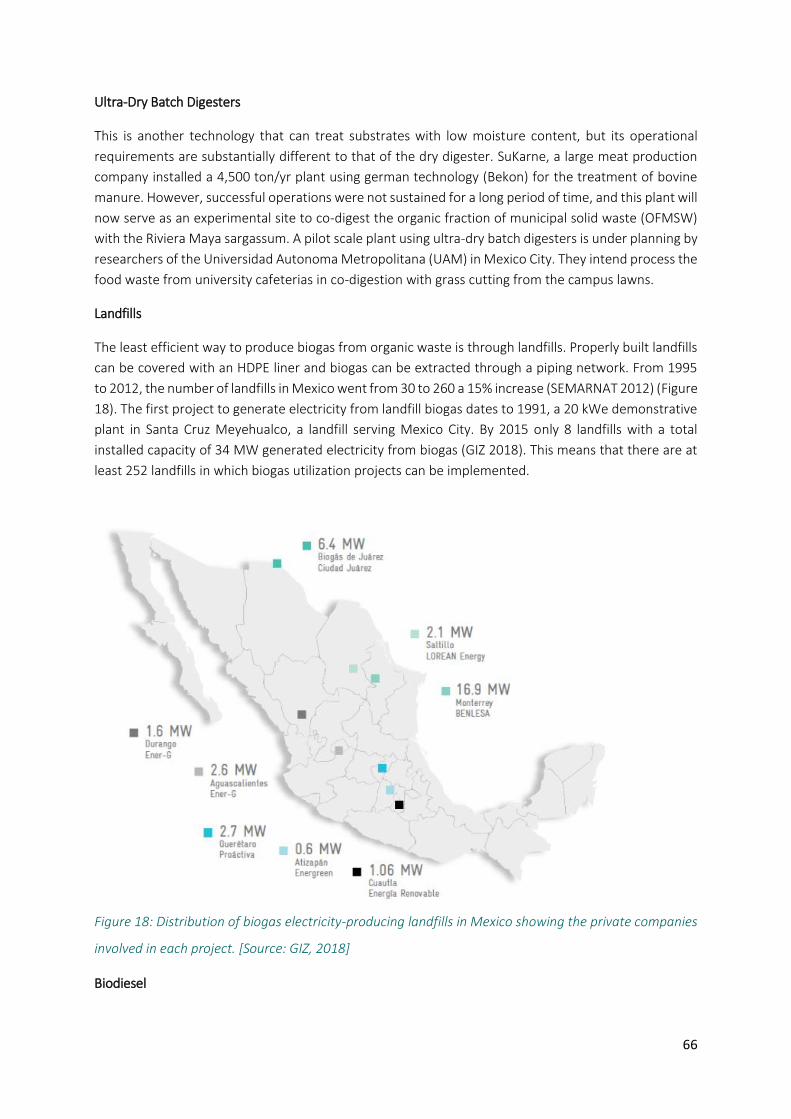
66
Ultra-Dry Batch Digesters
This is another technology that can treat substrates with low moisture content, but its operational
requirements are substantially different to that of the dry digester. SuKarne, a large meat production
company installed a 4,500 ton/yr plant using german technology (Bekon) for the treatment of bovine
manure. However, successful operations were not sustained for a long period of time, and this plant will
now serve as an experimental site to co-digest the organic fraction of municipal solid waste (OFMSW)
with the Riviera Maya sargassum. A pilot scale plant using ultra-dry batch digesters is under planning by
researchers of the Universidad Autonoma Metropolitana (UAM) in Mexico City. They intend process the
food waste from university cafeterias in co-digestion with grass cutting from the campus lawns.
Landfills
The least efficient way to produce biogas from organic waste is through landfills. Properly built landfills
can be covered with an HDPE liner and biogas can be extracted through a piping network. From 1995
to 2012, the number of landfills in Mexico went from 30 to 260 a 15% increase (SEMARNAT 2012) (Figure
18). The first project to generate electricity from landfill biogas dates to 1991, a 20 kWe demonstrative
plant in Santa Cruz Meyehualco, a landfill serving Mexico City. By 2015 only 8 landfills with a total
installed capacity of 34 MW generated electricity from biogas (GIZ 2018). This means that there are at
least 252 landfills in which biogas utilization projects can be implemented.
Figure 18: Distribution of biogas electricity-producing landfills in Mexico showing the private companies
involved in each project. [Source: GIZ, 2018]
Biodiesel
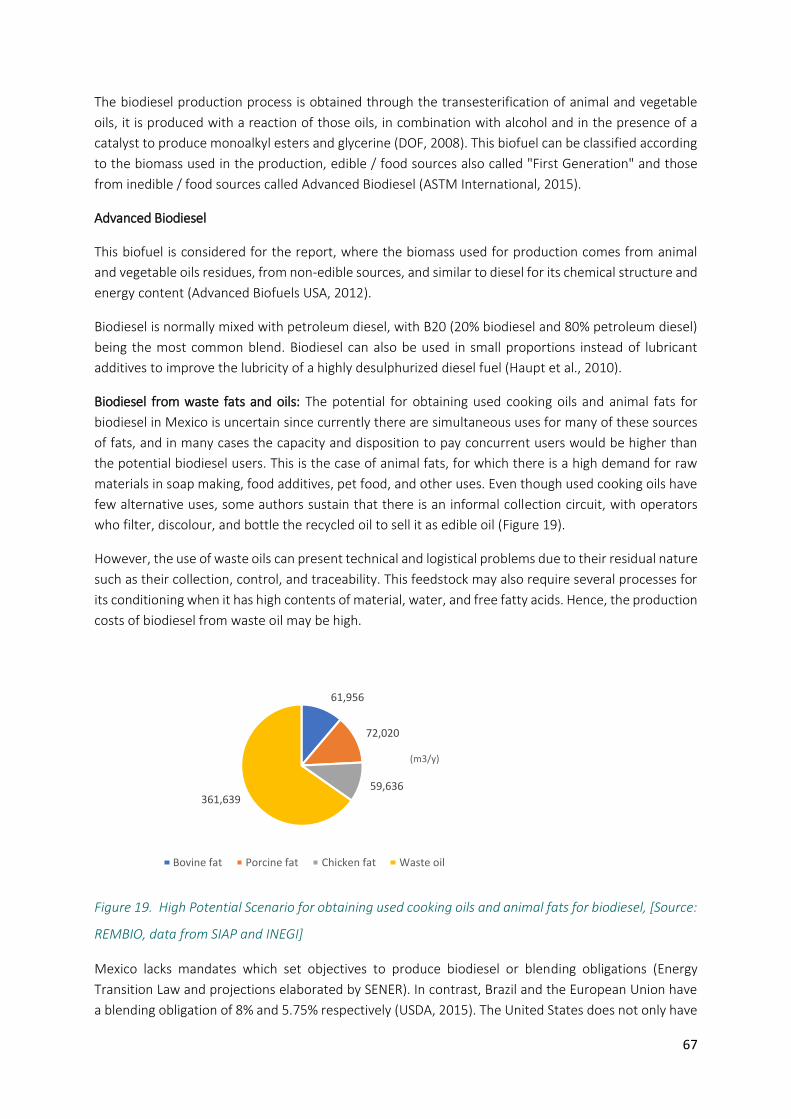
67
The biodiesel production process is obtained through the transesterification of animal and vegetable
oils, it is produced with a reaction of those oils, in combination with alcohol and in the presence of a
catalyst to produce monoalkyl esters and glycerine (DOF, 2008). This biofuel can be classified according
to the biomass used in the production, edible / food sources also called "First Generation" and those
from inedible / food sources called Advanced Biodiesel (ASTM International, 2015).
Advanced Biodiesel
This biofuel is considered for the report, where the biomass used for production comes from animal
and vegetable oils residues, from non-edible sources, and similar to diesel for its chemical structure and
energy content (Advanced Biofuels USA, 2012).
Biodiesel is normally mixed with petroleum diesel, with B20 (20% biodiesel and 80% petroleum diesel)
being the most common blend. Biodiesel can also be used in small proportions instead of lubricant
additives to improve the lubricity of a highly desulphurized diesel fuel (Haupt et al., 2010).
Biodiesel from waste fats and oils: The potential for obtaining used cooking oils and animal fats for
biodiesel in Mexico is uncertain since currently there are simultaneous uses for many of these sources
of fats, and in many cases the capacity and disposition to pay concurrent users would be higher than
the potential biodiesel users. This is the case of animal fats, for which there is a high demand for raw
materials in soap making, food additives, pet food, and other uses. Even though used cooking oils have
few alternative uses, some authors sustain that there is an informal collection circuit, with operators
who filter, discolour, and bottle the recycled oil to sell it as edible oil (Figure 19).
However, the use of waste oils can present technical and logistical problems due to their residual nature
such as their collection, control, and traceability. This feedstock may also require several processes for
its conditioning when it has high contents of material, water, and free fatty acids. Hence, the production
costs of biodiesel from waste oil may be high.
Figure 19. High Potential Scenario for obtaining used cooking oils and animal fats for biodiesel, [Source:
REMBIO, data from SIAP and INEGI]
Mexico lacks mandates which set objectives to produce biodiesel or blending obligations (Energy
Transition Law and projections elaborated by SENER). In contrast, Brazil and the European Union have
a blending obligation of 8% and 5.75% respectively (USDA, 2015). The United States does not only have
61,956
72,020
59,636 361,639
(m3/y)
Bovine fat Porcine fat Chicken fat Waste oil
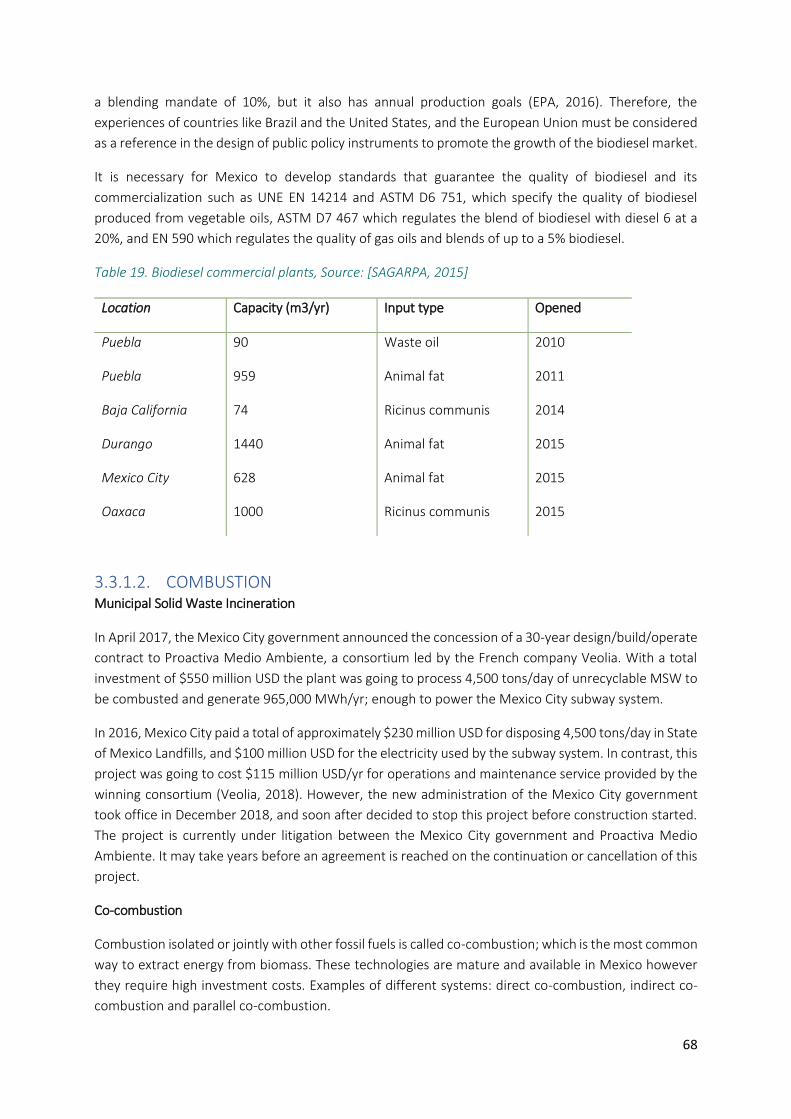
68
a blending mandate of 10%, but it also has annual production goals (EPA, 2016). Therefore, the
experiences of countries like Brazil and the United States, and the European Union must be considered
as a reference in the design of public policy instruments to promote the growth of the biodiesel market.
It is necessary for Mexico to develop standards that guarantee the quality of biodiesel and its
commercialization such as UNE EN 14214 and ASTM D6 751, which specify the quality of biodiesel
produced from vegetable oils, ASTM D7 467 which regulates the blend of biodiesel with diesel 6 at a
20%, and EN 590 which regulates the quality of gas oils and blends of up to a 5% biodiesel.
Table 19. Biodiesel commercial plants, Source: [SAGARPA, 2015]
Location Capacity (m3/yr) Input type Opened
Puebla 90 Waste oil 2010
Puebla 959 Animal fat 2011
Baja California 74 Ricinus communis 2014
Durango 1440 Animal fat 2015
Mexico City 628 Animal fat 2015
Oaxaca 1000 Ricinus communis 2015
3.3.1.2. COMBUSTION Municipal Solid Waste Incineration
In April 2017, the Mexico City government announced the concession of a 30-year design/build/operate
contract to Proactiva Medio Ambiente, a consortium led by the French company Veolia. With a total
investment of $550 million USD the plant was going to process 4,500 tons/day of unrecyclable MSW to
be combusted and generate 965,000 MWh/yr; enough to power the Mexico City subway system.
In 2016, Mexico City paid a total of approximately $230 million USD for disposing 4,500 tons/day in State
of Mexico Landfills, and $100 million USD for the electricity used by the subway system. In contrast, this
project was going to cost $115 million USD/yr for operations and maintenance service provided by the
winning consortium (Veolia, 2018). However, the new administration of the Mexico City government
took office in December 2018, and soon after decided to stop this project before construction started.
The project is currently under litigation between the Mexico City government and Proactiva Medio
Ambiente. It may take years before an agreement is reached on the continuation or cancellation of this
project.
Co-combustion
Combustion isolated or jointly with other fossil fuels is called co-combustion; which is the most common
way to extract energy from biomass. These technologies are mature and available in Mexico however
they require high investment costs. Examples of different systems: direct co-combustion, indirect co-
combustion and parallel co-combustion.
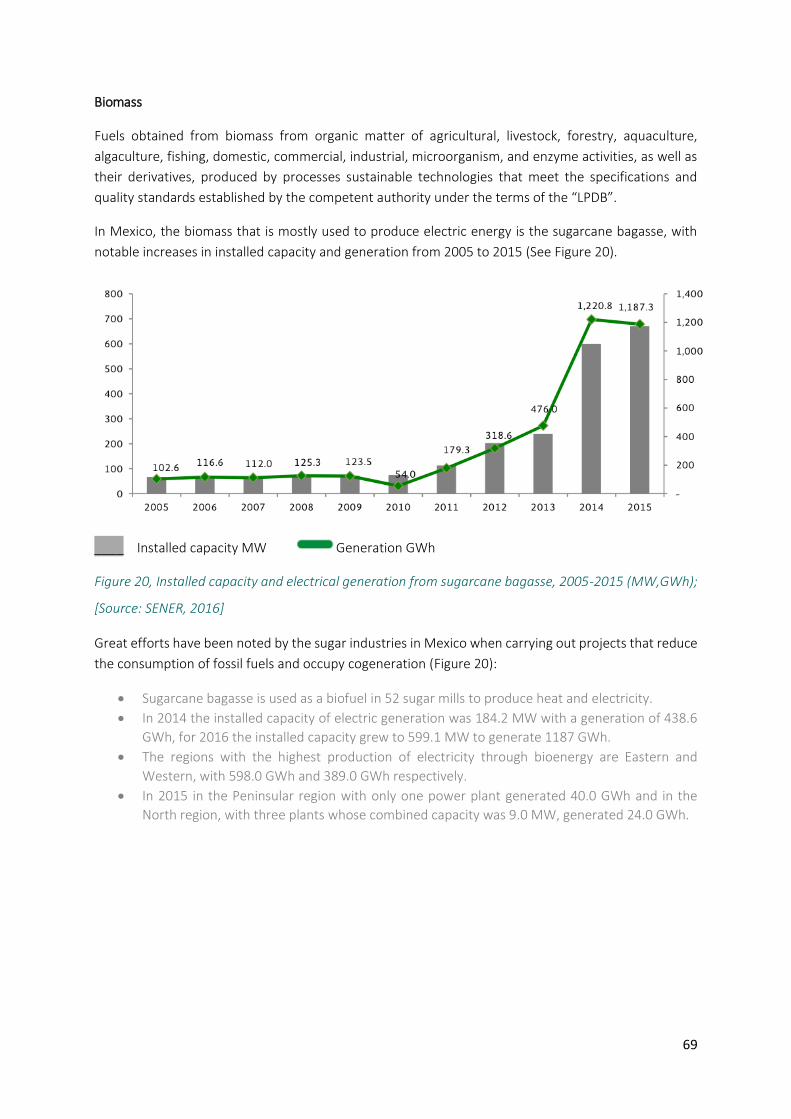
69
Biomass
Fuels obtained from biomass from organic matter of agricultural, livestock, forestry, aquaculture,
algaculture, fishing, domestic, commercial, industrial, microorganism, and enzyme activities, as well as
their derivatives, produced by processes sustainable technologies that meet the specifications and
quality standards established by the competent authority under the terms of the “LPDB”.
In Mexico, the biomass that is mostly used to produce electric energy is the sugarcane bagasse, with
notable increases in installed capacity and generation from 2005 to 2015 (See Figure 20).
____ Installed capacity MW Generation GWh
Figure 20, Installed capacity and electrical generation from sugarcane bagasse, 2005-2015 (MW,GWh);
[Source: SENER, 2016]
Great efforts have been noted by the sugar industries in Mexico when carrying out projects that reduce
the consumption of fossil fuels and occupy cogeneration (Figure 20):
• Sugarcane bagasse is used as a biofuel in 52 sugar mills to produce heat and electricity.
• In 2014 the installed capacity of electric generation was 184.2 MW with a generation of 438.6
GWh, for 2016 the installed capacity grew to 599.1 MW to generate 1187 GWh.
• The regions with the highest production of electricity through bioenergy are Eastern and
Western, with 598.0 GWh and 389.0 GWh respectively.
• In 2015 in the Peninsular region with only one power plant generated 40.0 GWh and in the
North region, with three plants whose combined capacity was 9.0 MW, generated 24.0 GWh.
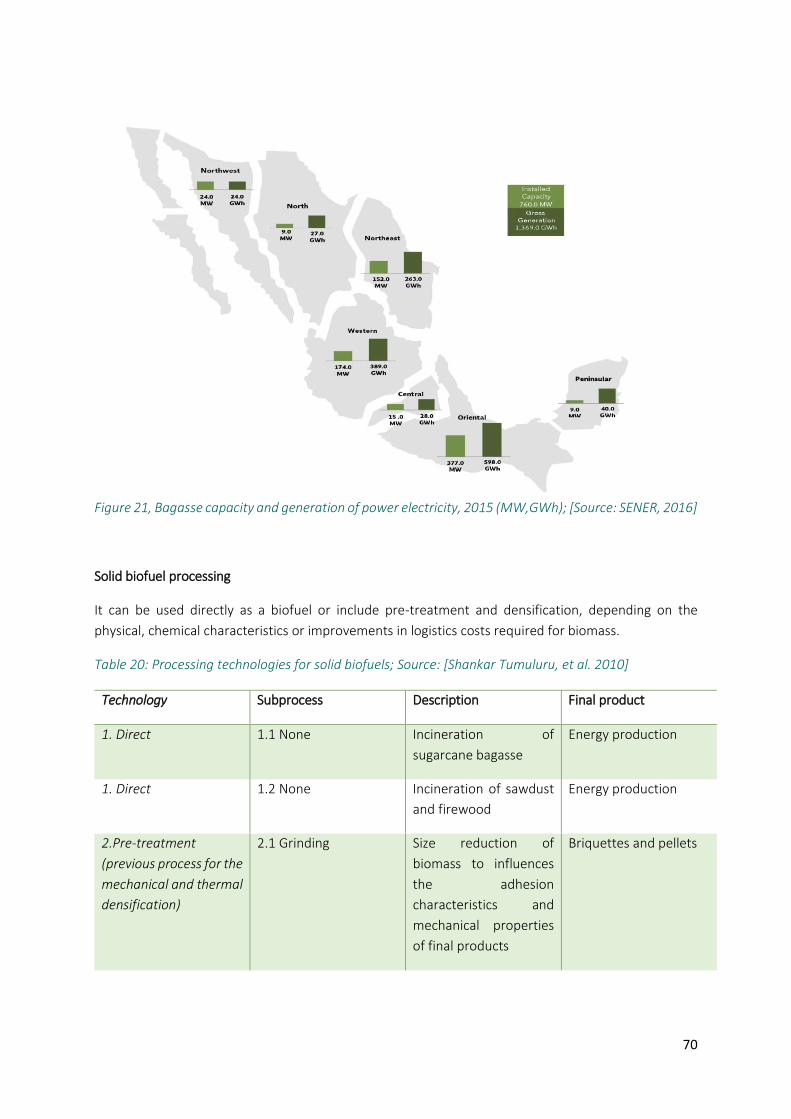
70
Figure 21, Bagasse capacity and generation of power electricity, 2015 (MW,GWh); [Source: SENER, 2016]
Solid biofuel processing
It can be used directly as a biofuel or include pre-treatment and densification, depending on the
physical, chemical characteristics or improvements in logistics costs required for biomass.
Table 20: Processing technologies for solid biofuels; Source: [Shankar Tumuluru, et al. 2010]
Technology Subprocess Description Final product
1. Direct 1.1 None Incineration of
sugarcane bagasse
Energy production
1. Direct 1.2 None Incineration of sawdust
and firewood
Energy production
2.Pre-treatment
(previous process for the
mechanical and thermal
densification)
2.1 Grinding Size reduction of
biomass to influences
the adhesion
characteristics and
mechanical properties
of final products
Briquettes and pellets
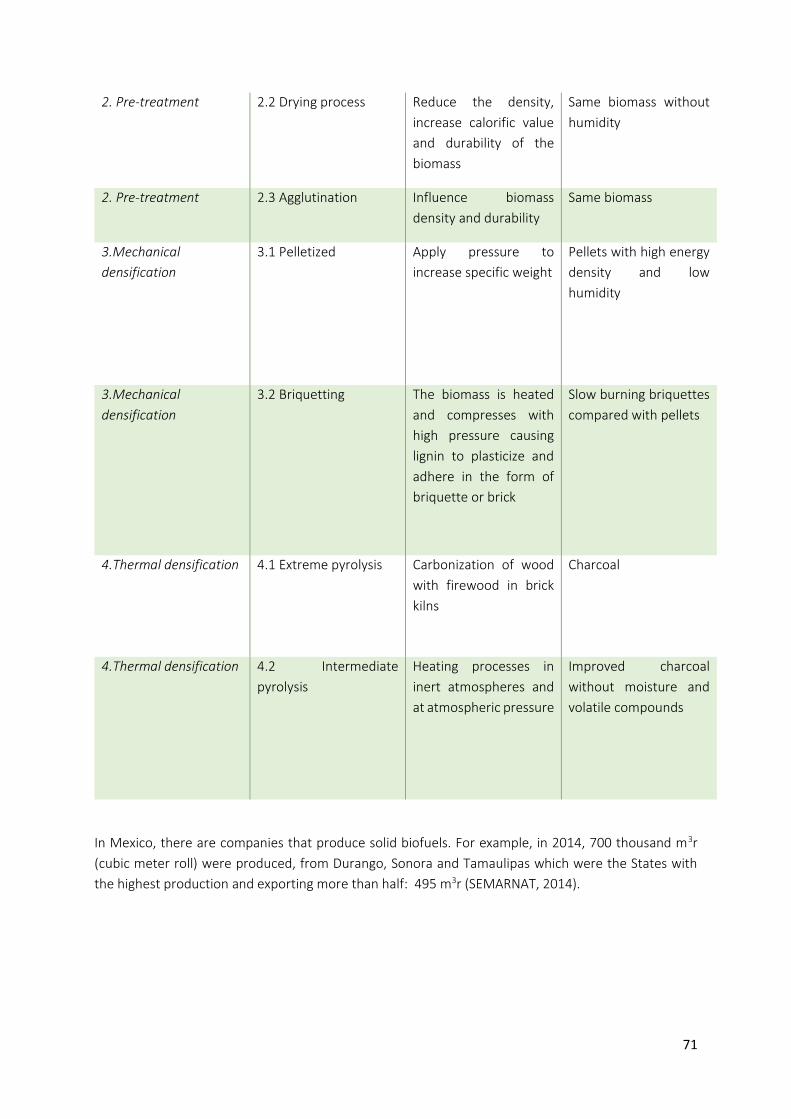
71
2. Pre-treatment 2.2 Drying process
Reduce the density,
increase calorific value
and durability of the
biomass
Same biomass without
humidity
2. Pre-treatment 2.3 Agglutination Influence biomass
density and durability
Same biomass
3.Mechanical
densification
3.1 Pelletized Apply pressure to
increase specific weight
Pellets with high energy
density and low
humidity
3.Mechanical
densification
3.2 Briquetting The biomass is heated
and compresses with
high pressure causing
lignin to plasticize and
adhere in the form of
briquette or brick
Slow burning briquettes
compared with pellets
4.Thermal densification 4.1 Extreme pyrolysis
Carbonization of wood
with firewood in brick
kilns
Charcoal
4.Thermal densification 4.2 Intermediate
pyrolysis
Heating processes in
inert atmospheres and
at atmospheric pressure
Improved charcoal
without moisture and
volatile compounds
In Mexico, there are companies that produce solid biofuels. For example, in 2014, 700 thousand m3r
(cubic meter roll) were produced, from Durango, Sonora and Tamaulipas which were the States with
the highest production and exporting more than half: 495 m3r (SEMARNAT, 2014).
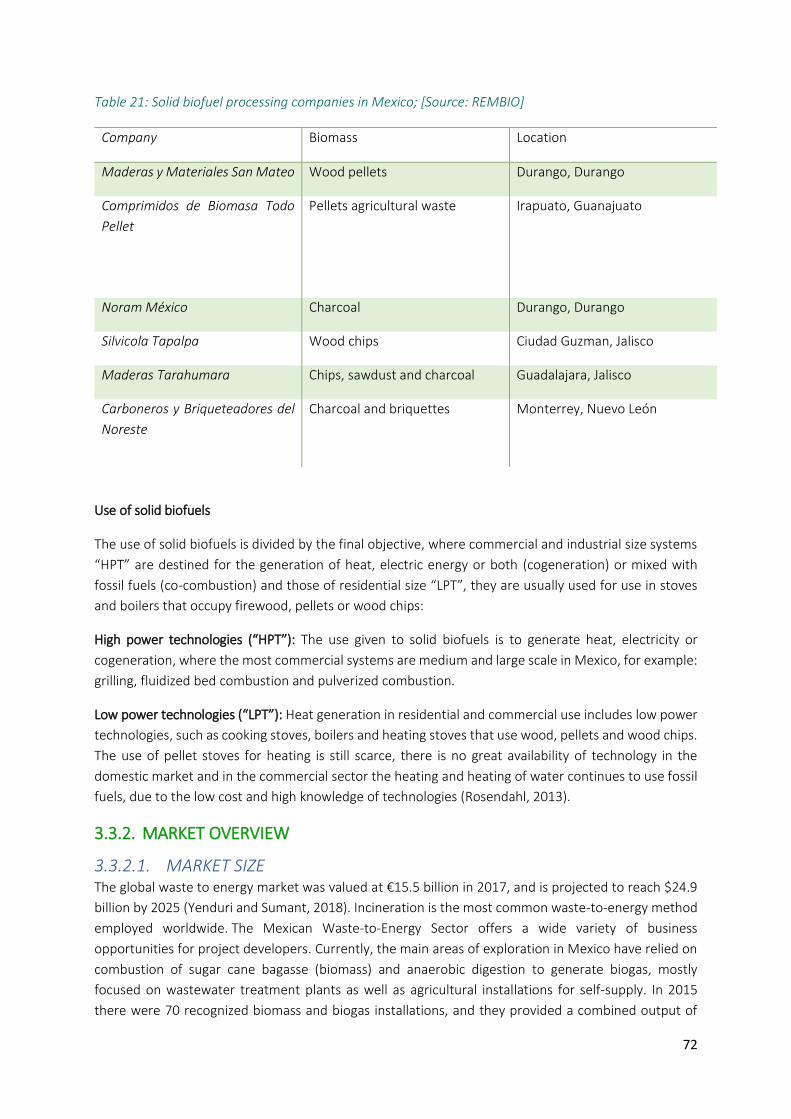
72
Table 21: Solid biofuel processing companies in Mexico; [Source: REMBIO]
Company Biomass Location
Maderas y Materiales San Mateo Wood pellets Durango, Durango
Comprimidos de Biomasa Todo
Pellet
Pellets agricultural waste
Irapuato, Guanajuato
Noram México Charcoal Durango, Durango
Silvicola Tapalpa Wood chips Ciudad Guzman, Jalisco
Maderas Tarahumara Chips, sawdust and charcoal Guadalajara, Jalisco
Carboneros y Briqueteadores del
Noreste
Charcoal and briquettes
Monterrey, Nuevo León
Use of solid biofuels
The use of solid biofuels is divided by the final objective, where commercial and industrial size systems
“HPT” are destined for the generation of heat, electric energy or both (cogeneration) or mixed with
fossil fuels (co-combustion) and those of residential size “LPT”, they are usually used for use in stoves
and boilers that occupy firewood, pellets or wood chips:
High power technologies (“HPT”): The use given to solid biofuels is to generate heat, electricity or
cogeneration, where the most commercial systems are medium and large scale in Mexico, for example:
grilling, fluidized bed combustion and pulverized combustion.
Low power technologies (“LPT”): Heat generation in residential and commercial use includes low power
technologies, such as cooking stoves, boilers and heating stoves that use wood, pellets and wood chips.
The use of pellet stoves for heating is still scarce, there is no great availability of technology in the
domestic market and in the commercial sector the heating and heating of water continues to use fossil
fuels, due to the low cost and high knowledge of technologies (Rosendahl, 2013).
3.3.2. MARKET OVERVIEW
3.3.2.1. MARKET SIZE The global waste to energy market was valued at €15.5 billion in 2017, and is projected to reach $24.9
billion by 2025 (Yenduri and Sumant, 2018). Incineration is the most common waste-to-energy method
employed worldwide. The Mexican Waste-to-Energy Sector offers a wide variety of business
opportunities for project developers. Currently, the main areas of exploration in Mexico have relied on
combustion of sugar cane bagasse (biomass) and anaerobic digestion to generate biogas, mostly
focused on wastewater treatment plants as well as agricultural installations for self-supply. In 2015
there were 70 recognized biomass and biogas installations, and they provided a combined output of
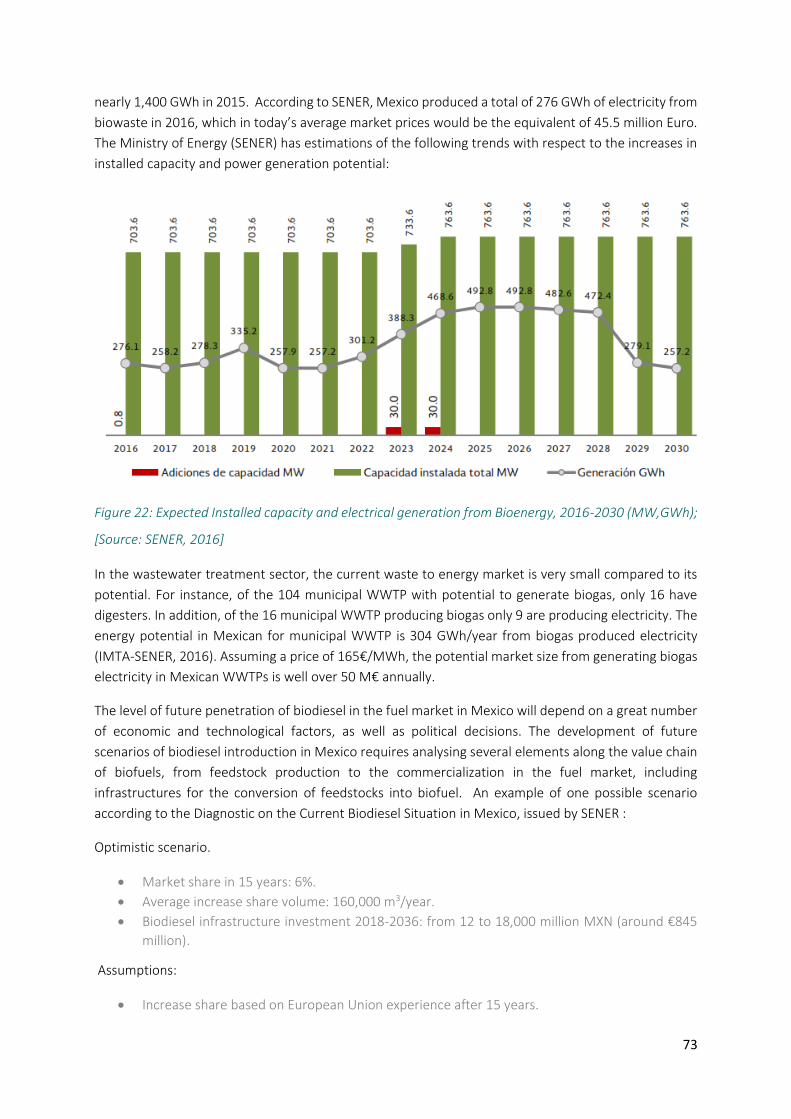
73
nearly 1,400 GWh in 2015. According to SENER, Mexico produced a total of 276 GWh of electricity from
biowaste in 2016, which in today’s average market prices would be the equivalent of 45.5 million Euro.
The Ministry of Energy (SENER) has estimations of the following trends with respect to the increases in
installed capacity and power generation potential:
Figure 22: Expected Installed capacity and electrical generation from Bioenergy, 2016-2030 (MW,GWh);
[Source: SENER, 2016]
In the wastewater treatment sector, the current waste to energy market is very small compared to its
potential. For instance, of the 104 municipal WWTP with potential to generate biogas, only 16 have
digesters. In addition, of the 16 municipal WWTP producing biogas only 9 are producing electricity. The
energy potential in Mexican for municipal WWTP is 304 GWh/year from biogas produced electricity
(IMTA-SENER, 2016). Assuming a price of 165€/MWh, the potential market size from generating biogas
electricity in Mexican WWTPs is well over 50 M€ annually.
The level of future penetration of biodiesel in the fuel market in Mexico will depend on a great number
of economic and technological factors, as well as political decisions. The development of future
scenarios of biodiesel introduction in Mexico requires analysing several elements along the value chain
of biofuels, from feedstock production to the commercialization in the fuel market, including
infrastructures for the conversion of feedstocks into biofuel. An example of one possible scenario
according to the Diagnostic on the Current Biodiesel Situation in Mexico, issued by SENER :
Optimistic scenario.
• Market share in 15 years: 6%.
• Average increase share volume: 160,000 m3/year.
• Biodiesel infrastructure investment 2018-2036: from 12 to 18,000 million MXN (around €845
million).
Assumptions:
• Increase share based on European Union experience after 15 years.
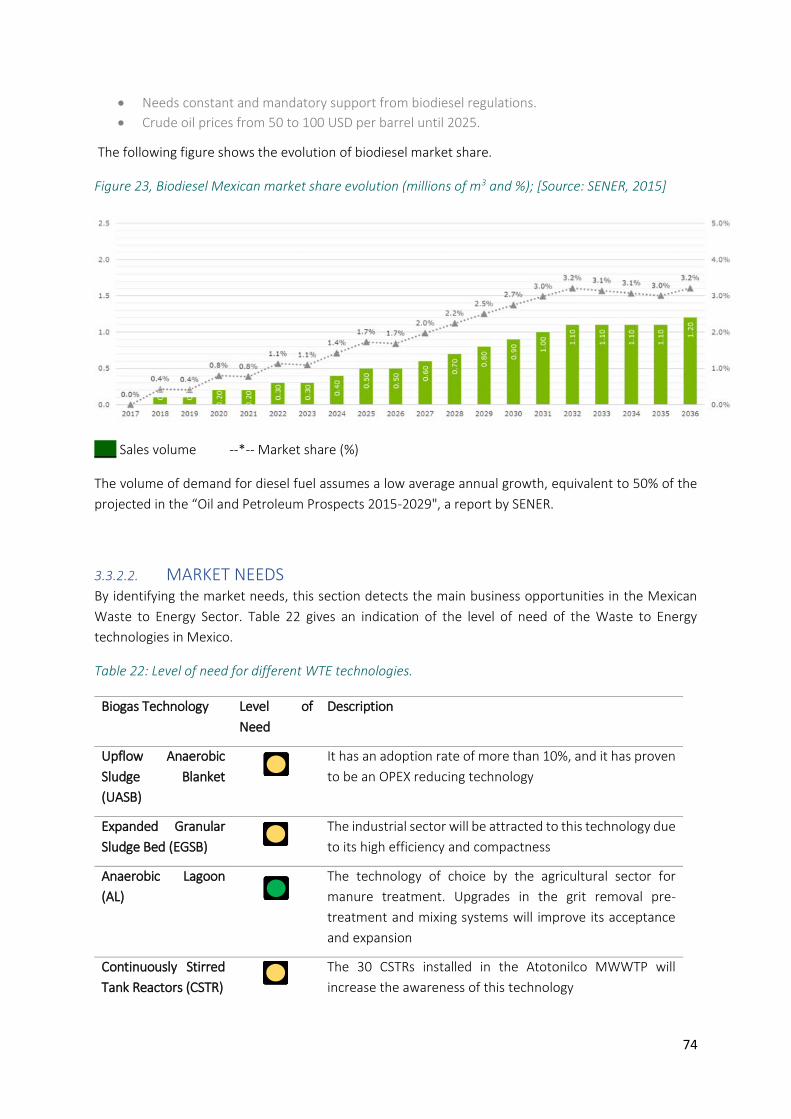
74
• Needs constant and mandatory support from biodiesel regulations.
• Crude oil prices from 50 to 100 USD per barrel until 2025.
The following figure shows the evolution of biodiesel market share.
Figure 23, Biodiesel Mexican market share evolution (millions of m3 and %); [Source: SENER, 2015]
___ Sales volume --*-- Market share (%)
The volume of demand for diesel fuel assumes a low average annual growth, equivalent to 50% of the
projected in the “Oil and Petroleum Prospects 2015-2029", a report by SENER.
3.3.2.2. MARKET NEEDS
By identifying the market needs, this section detects the main business opportunities in the Mexican
Waste to Energy Sector. Table 22 gives an indication of the level of need of the Waste to Energy
technologies in Mexico.
Table 22: Level of need for different WTE technologies.
Biogas Technology Level of
Need
Description
Upflow Anaerobic
Sludge Blanket
(UASB)
It has an adoption rate of more than 10%, and it has proven
to be an OPEX reducing technology
Expanded Granular
Sludge Bed (EGSB)
The industrial sector will be attracted to this technology due
to its high efficiency and compactness
Anaerobic Lagoon
(AL)
The technology of choice by the agricultural sector for
manure treatment. Upgrades in the grit removal pre-
treatment and mixing systems will improve its acceptance
and expansion
Continuously Stirred
Tank Reactors (CSTR)
The 30 CSTRs installed in the Atotonilco MWWTP will
increase the awareness of this technology
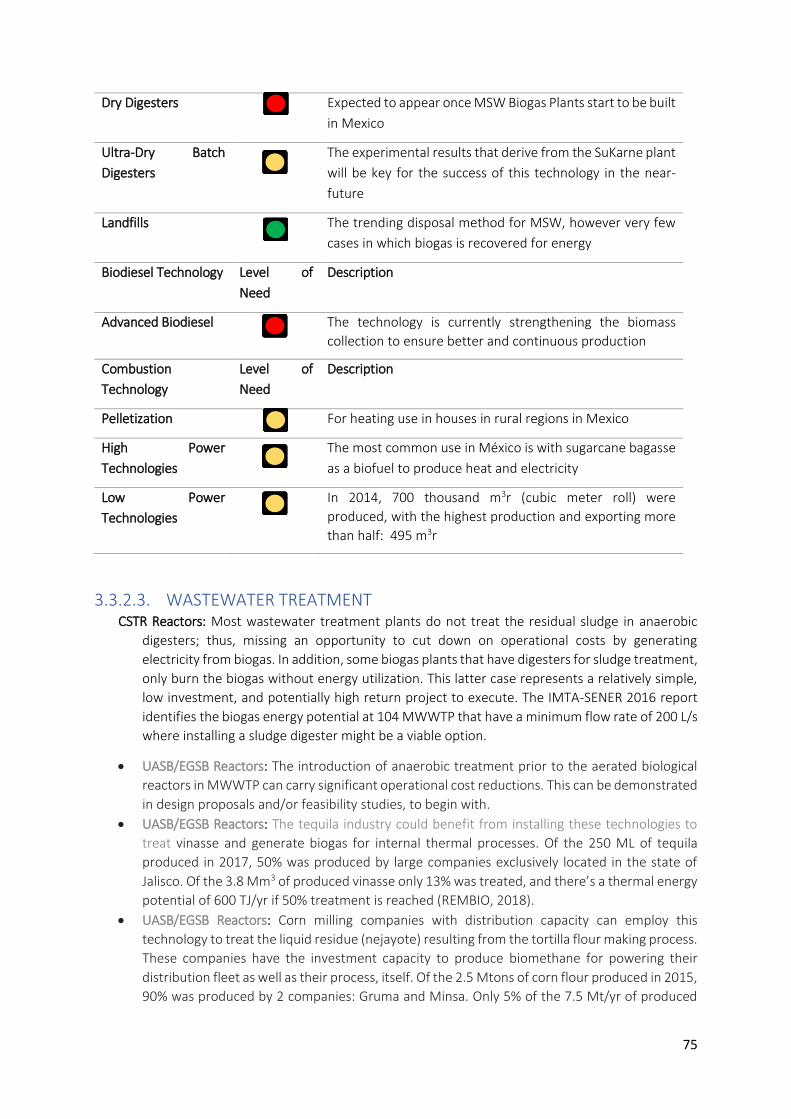
75
Dry Digesters
Expected to appear once MSW Biogas Plants start to be built
in Mexico
Ultra-Dry Batch
Digesters
The experimental results that derive from the SuKarne plant
will be key for the success of this technology in the near-
future
Landfills
The trending disposal method for MSW, however very few
cases in which biogas is recovered for energy
Biodiesel Technology Level of
Need
Description
Advanced Biodiesel
The technology is currently strengthening the biomass
collection to ensure better and continuous production
Combustion
Technology
Level of
Need
Description
Pelletization
For heating use in houses in rural regions in Mexico
High Power
Technologies
The most common use in México is with sugarcane bagasse
as a biofuel to produce heat and electricity
Low Power
Technologies
In 2014, 700 thousand m3r (cubic meter roll) were
produced, with the highest production and exporting more
than half: 495 m3r
3.3.2.3. WASTEWATER TREATMENT CSTR Reactors: Most wastewater treatment plants do not treat the residual sludge in anaerobic
digesters; thus, missing an opportunity to cut down on operational costs by generating
electricity from biogas. In addition, some biogas plants that have digesters for sludge treatment,
only burn the biogas without energy utilization. This latter case represents a relatively simple,
low investment, and potentially high return project to execute. The IMTA-SENER 2016 report
identifies the biogas energy potential at 104 MWWTP that have a minimum flow rate of 200 L/s
where installing a sludge digester might be a viable option.
• UASB/EGSB Reactors: The introduction of anaerobic treatment prior to the aerated biological
reactors in MWWTP can carry significant operational cost reductions. This can be demonstrated
in design proposals and/or feasibility studies, to begin with.
• UASB/EGSB Reactors: The tequila industry could benefit from installing these technologies to
treat vinasse and generate biogas for internal thermal processes. Of the 250 ML of tequila
produced in 2017, 50% was produced by large companies exclusively located in the state of
Jalisco. Of the 3.8 Mm3 of produced vinasse only 13% was treated, and there’s a thermal energy
potential of 600 TJ/yr if 50% treatment is reached (REMBIO, 2018).
• UASB/EGSB Reactors: Corn milling companies with distribution capacity can employ this
technology to treat the liquid residue (nejayote) resulting from the tortilla flour making process.
These companies have the investment capacity to produce biomethane for powering their
distribution fleet as well as their process, itself. Of the 2.5 Mtons of corn flour produced in 2015,
90% was produced by 2 companies: Gruma and Minsa. Only 5% of the 7.5 Mt/yr of produced
76
nejayote is treated, this represents a biogas thermal energy potential of 1PJ/yr if 50% treatment
is reached (REMBIO, 2018).
• Co-digestion: It is common for sludge treatment digesters to be overly-dimensioned in Mexican
industrial installations. This represents an opportunity to generate value to the business model
through the incorporation or increase of electricity production, by introducing nearby
generated organic waste in the oversized digesters in retrofits, or including them from the very
design of the industrial installations.
• Biomass Combustion: There are no cases in Mexico where the combustion potential of
dehydrated sludge is utilized. Landfills are still a preferred method of disposal for dehydrated
residual sludge, mainly due to lack of experienced service providers rather than other market
barriers.
3.3.2.4. AGRICULTURAL SOLID WASTE
• Improved AL or CSTR: Vertically integrated meat and dairy companies are well structured companies that produce a wide range of substrates and can utilize biogas for thermal, electricity and transportation purposes. In addition, they can utilize digestate to enhance forage crop fields, since they grow their own. These companies are characterized by their high investment capacity.
• Improved AL or CSTR: Large scale meat and dairy Farmers are fully aware of the potential of
biogas technology given that there are over 1,500 digesters installed in this type of farm.
However, most of these plants are poorly designed and operated. Key technological and
operational improvements can make these projects financially attractive for farmers with
access to financing and government subsidies.
• Biomass Combustion: Solid biofuels have an energetic potential of 472 PJ/year from agricultural
residues and 125 PJ/year from agroindustry residues. The combined use of wood chips with
residues of sugar cane in sugar mills (bagasse and straw) has an estimated cogeneration
capacity of 900 MWh. Sugarcane bagasse, corncobs, olotes, maguey bagasse, rice and peanut
husk, and coffee pulp among others have an estimated generation potential of between 100
and 125 PJ/year.
• Biomass Combustion: The agave bagasse can be properly treated for harvesting its combustion
potential. The thermal energy demand in the Tequila industry comes from agave cooking and
distillation traditionally using LPG and fuel oil. There’s a recent move towards CNG and bagasse
furnaces. A tequila distillery can supply 60% of its thermal energy demand form bagasse
combustion, 20% from vinasse biogas and 20% from CNG (REMBIO, 2018). Large scale
distilleries have high investment capacity.
3.3.2.5. MUNICIPAL SOLID WASTE • Biogas or Incineration Plants: The gas biofuel potential from MSW is estimated at 495 PJ/year.
There are no large biogas or incineration plants to treat MSW in Mexico, while there are 36
Municipalities with a population over 500,000 which generate enough waste to build a cost-
effective waste to energy plant. Momentum is building for a 400 ton/day of OFMSW biogas
plant in the Municipality of Naucalpan, State of Mexico that is being backed up with feasibility
studies funded by US-EPA and GIZ.
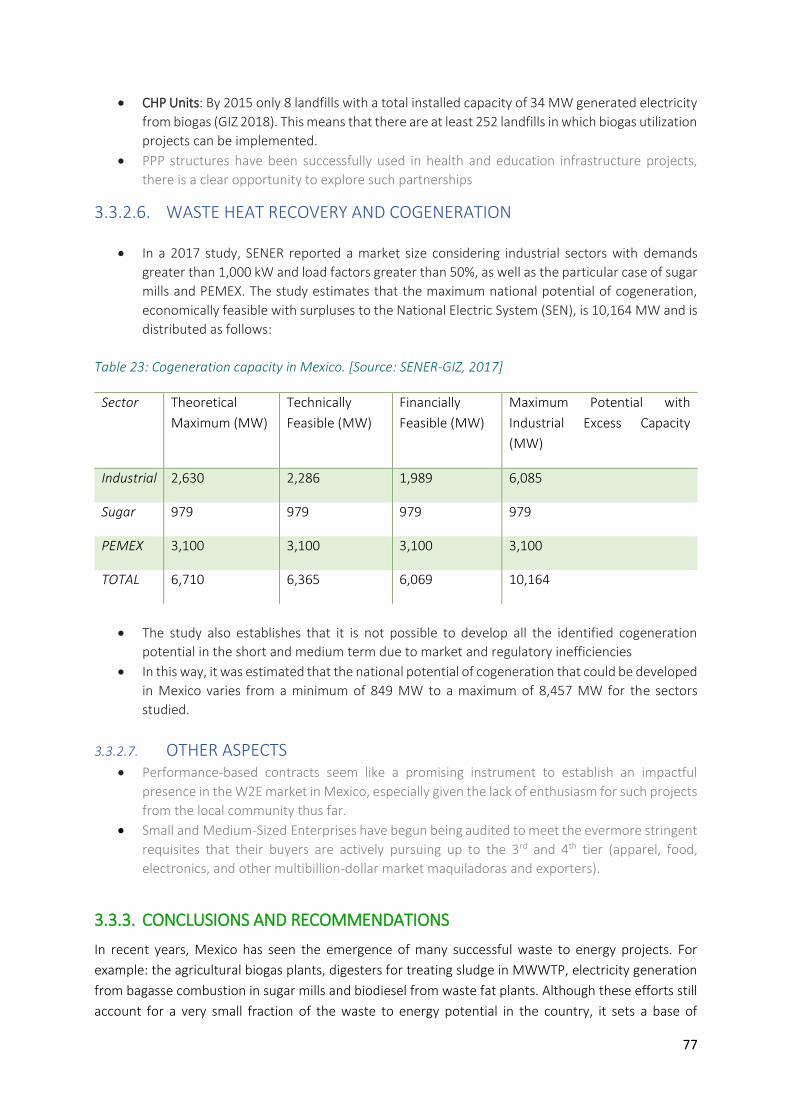
77
• CHP Units: By 2015 only 8 landfills with a total installed capacity of 34 MW generated electricity
from biogas (GIZ 2018). This means that there are at least 252 landfills in which biogas utilization
projects can be implemented.
• PPP structures have been successfully used in health and education infrastructure projects,
there is a clear opportunity to explore such partnerships
3.3.2.6. WASTE HEAT RECOVERY AND COGENERATION
• In a 2017 study, SENER reported a market size considering industrial sectors with demands
greater than 1,000 kW and load factors greater than 50%, as well as the particular case of sugar
mills and PEMEX. The study estimates that the maximum national potential of cogeneration,
economically feasible with surpluses to the National Electric System (SEN), is 10,164 MW and is
distributed as follows:
Table 23: Cogeneration capacity in Mexico. [Source: SENER-GIZ, 2017]
Sector Theoretical
Maximum (MW)
Technically
Feasible (MW)
Financially
Feasible (MW)
Maximum Potential with
Industrial Excess Capacity
(MW)
Industrial 2,630 2,286 1,989 6,085
Sugar 979 979 979 979
PEMEX 3,100 3,100 3,100 3,100
TOTAL 6,710 6,365 6,069 10,164
• The study also establishes that it is not possible to develop all the identified cogeneration
potential in the short and medium term due to market and regulatory inefficiencies
• In this way, it was estimated that the national potential of cogeneration that could be developed
in Mexico varies from a minimum of 849 MW to a maximum of 8,457 MW for the sectors
studied.
3.3.2.7. OTHER ASPECTS
• Performance-based contracts seem like a promising instrument to establish an impactful
presence in the W2E market in Mexico, especially given the lack of enthusiasm for such projects
from the local community thus far.
• Small and Medium-Sized Enterprises have begun being audited to meet the evermore stringent
requisites that their buyers are actively pursuing up to the 3rd and 4th tier (apparel, food,
electronics, and other multibillion-dollar market maquiladoras and exporters).
3.3.3. CONCLUSIONS AND RECOMMENDATIONS
In recent years, Mexico has seen the emergence of many successful waste to energy projects. For
example: the agricultural biogas plants, digesters for treating sludge in MWWTP, electricity generation
from bagasse combustion in sugar mills and biodiesel from waste fat plants. Although these efforts still
account for a very small fraction of the waste to energy potential in the country, it sets a base of
78
potential local partners (both private and public) with experience and vision of a more mature waste to
energy industry in Mexico. The inclusion of international state-of-the-art technologies and know-how
will be key for a bright future in the Mexican Waste to Energy Sector. This section summarizes the
relevant ideas to consider when looking for waste to energy business opportunities in Mexico.
⎯ The Municipal Wastewater Treatment sector offers business opportunities in both biogas and
combustion technologies. Starting with the 7 Municipal WWTP that produced biogas from sludge
treatment but are currently not recovering energy from it. Furthermore there are 104 Municipal
WWTP that generate enough sludge volume to justify the investment in a CSTR reactor for biogas
production. Besides, the over-sized sludge digesters present an opportunity to increase efficiency
by using nearby organic residues in co-digestion. Finally, there’s no record of a WWTP that is sending
its dried sludge to industrial facilities to be used in co-combustion processes.
⎯ The confirmation of the new wastewater discharge regulation (PROY-NOM-001-SEMARNAT-2017)
can open the gates for the increased demand of UASB and EGSB reactors for WWTP retrofits.
⎯ The tequila, corn milling, meat, and dairy sectors have very large companies that generate energy-
rich residues with both biogas and combustion potential that’s not being exploited.
⎯ There are at least 252 landfills in which biogas utilization projects are not being implemented.
⎯ The actions being taken by the Danish Energy Agency will facilitate the rapid assessment of biogas
projects based on both technical and financial data on local market dynamics like higher cost of
capital, lower tipping fees and a high degree of informality imply a relatively high barrier of entry.
Waste to Energy projects can quickly assist Mexico in meeting the ambitious GHG emission
reduction targets signed in Paris.
⎯ Real Estate Investment Trusts (or FIBRAS for their Spanish initials) have become a popular
instrument in Mexico that offer a good opportunity to explore that could bring multiple industrial
opportunities through a single channel.
79
4. ENTRY PHASE AND FINANCIAL INSTRUMENTS AVAILABLE With an understanding of the market, the opportunities that each of the sectors presents and the
barriers to those opportunities, this section gives insight into how European and Mexican business can
enter business together, through the funding mechanisms available and the programmes focused on
circular economy in Mexico.
4.1. NATIONAL FUNDING AND PROGRAMMES
The processes to access government programs vary depending on the type of support you want to
obtain, since the established requirements differ. The deadlines are also different, depending on
whether the person who wants to operate the project has the permits or is going to start the process.
However, there are certain steps and aspects that an organization looking to doing business within
circular economy in Mexico would need to consider:
✓ Firstly, identify the need for financing: the municipality or agent must clearly identify what is the
need to be financed in the circular economy process. Principally support requests are concentrated
on equipment and infrastructure for the collection and separation of waste.
✓ The need for financing: An organization looking to do business in Mexico should have prepared the
good for which the support is requested will be used, its operating characteristics, estimated costs
and operating mechanisms; for example, if it is a team, the minimum volume required for it to
operate, the training requirements for the type of technology, energy requirements etc.
✓ Accreditation of the property or the area where the works will be carried out: the property title
must be accounted for, failing that, a legal document certifying the ownership of the place where
the project is to be established or the property.
✓ Accreditation of current regulations: in the case of buildings, there must be an Environmental
Impact Evaluation (preventive or hazardous waste management).
✓ Preparation of an economic study for the project. This study must contain information that shows
that the project is economically viable and that the investment (support) requested allows
sustainable flows over time
✓ Processing permits with the CRE: for projects that intend to cogenerate, self-supply or sell energy,
a permit must be processed before the Energy Regulatory Commission (they may take a year from
the moment they are requested until the resolution).
✓ Bidding process of the project: when it comes to public procurement, the applicant (municipality or
state) is required to bid for the required service, which may be in the form of invitation or public,
depending on the amount required. Times vary, depending on the procurement legislation
established by each state or municipality.
✓ Reports (notice of completion of the work and closure of the project): during project financing
processes it is common to request progress reports, as well as the notice of completion of the work
and closure of the project with which it is carried out
80
Program for the Prevention and Integral Management of Waste-SEMARNAT
Objective: to promote the integrated management of solid urban waste and special waste in Mexico,
through the financing of studies or programs for the prevention and integral management and projects
to increase the installed capacity for the collection, use and adequate disposal of said waste.
Program of Environmental Strengthening of the Federative Entities-SEMARNAT
Objective: to contribute to the accomplishment of the goals related to the care of the environment and
those linked to sustainable development and green growth as a fundamental purpose of the
governments including integral waste management, environmental education, adaptation and
mitigation of the effects of climate change, as well as the reduction of greenhouse gases, and the use
of clean energy.
Fund for the Energy Transition and the Sustainable Use of Energy -FOTEASE- SENER
This Fund does not constitute a program of direct subsidies but contributes to finance programs and
projects focused on the following aspects: use and application of technologies for the use of renewable
and clean energy; promotion of energy efficiency and energy saving in different sectors: residential,
industrial, commercial, agricultural, among others.
Objective: to finance programs and projects focused on the following aspects:
a) Use and application of technologies for the use of renewable and clean energy.
b) Promotion of energy efficiency and energy saving in the different sectors (residential, industrial,
commercial, agricultural, among others).
c) Diversification of energy sources to carry out the energy transition in Mexico. d) Collection,
generation and diffusion of renewable and clean energy potential in Mexico.
HABITAT-SEDATU
Promotes and encourages works and actions (for example studies) that contribute to the sustainability,
conservation and improvement of the environment that imply the use of new technologies, that allow
to apply systems or devices of high energy efficiency, the recycling of materials, savings or a better use
of energy and water, among others.
Objective: to contribute to productive, competitive, inclusive and sustainable cities, which facilitate
mobility and raise the quality of life of its inhabitants by supporting strategies for the realization of
integral works of basic and complementary infrastructure that promote connectivity and accessibility;
as well as the provision of Community Development Centres where courses and workshops are offered
that address the integrity of the individual and the community.
Wastewater Treatment Program (PROTAR) -Conagua
Strengthens sanitation actions through the treatment of larger volumes of municipal wastewater, with
the purpose of reducing, preventing and / or controlling the contamination of the national water bodies
and supporting the water operators to comply with current regulations; in addition, it contributes to
improve the environmental and ecological status of the water bodies. PROTAR can finance projects for
the use of energy for wastewater.
81
Objective: to assign federal resources to the water operators, to design, build, expand, or rehabilitate
wastewater treatment plants, and thus increase the volume treated or to improve their treatment
processes.
4.2. INTERNATIONAL FUNDING AND PROGRAMMES
This section includes a list of the relevant funding programmes or initiatives that from an international
stand point are supporting investments of European organizations in Mexico.
France: Le Comite pour les Metaux Strategiques (COMES) seeks to strengthen the security of supply of
strategic metals. Its activities include work on specific recycling targets for strategic metals as part of
certain extended producer responsibility (EPR) schemes. The French agency ADEME also commissioned
and published a study on research and development priorities for the recycling of critical metals with a
focus on Mexico.
The Netherlands: A Government-wide Programme for a Circular Economy addresses critical mineral raw
materials by promoting their substitution, efficient use, re-use and recycling. The Ministry of Economic
Affairs has also commissioned the development of a “resource scanner”, a method and IT tool to map
out business risks.
H2020: Through the Horizon 2020 programme, the Commission is co-funding ERA-MIN 2 which is the
largest network of R&I funding organisations in the mineral resources field. It is a public-public
partnership of 21 research funding organisations from 11 Member States, two regions and five non-EU
countries. In February 2017, a joint call, “Raw materials for the sustainable development and the circular
economy”, was published, including a topic on design of products: efficient use or substitution of critical
materials in products and components, product durability, facilitation of recycling with a focus on
Mexico. There are two main call areas that focus on the circular economy and have Mexico as a priority
in the circular economy:
• Building a low-carbon, climate resilient future: climate action in support of the Paris Agreement”
• “Greening the economy in line with the Sustainable Development Goals (SDGs)”
Global Environmental Facility (GEF), managed through the UNDP, UNEP, WB, UNIDO, African
Development Bank, Asian Development Bank, European Bank for Reconstruction and Development, IDB,
and IFAD. It finances projects through donations or concessions. Any person or group can access it and
it finances project in the areas or climate change and environment. Mexico has 48 published projects,
16 of which are in climate change (http://www.thegef.org/gef/gef_country_prg/MX).
World Bank (WB) manages two Climate Investment Funds: Clean Technology Fund and Strategic Climate
Fund. Additionally, the IFI the affiliated World Bank institution directed to the private sector, has come
associated funds: Clean Technology Fund, Strategic Climate Fund, Carbon Alliances Fund, Forest Carbon
Partnership Facility and Support to the Development of Green Infrastructure. In Mexico this adds us to
USD 500 million authorized for projects that include energy efficiency and emissions reduction.
Inter-American Development Bank (IDB). The IDB group is made up of the Inter-American Development
Bank (IDB), the Inter-American Investment Corporation (IIC), and the Multilateral Investment Fund
(MIF). The IIC supports mainly SMEs and the MIF promotes the growth of the private sector through
donations and funding, with emphasis on micro enterprises. One quarter of the annual IDB loans for
82
2015 (almost USD 3.000 million) is directed to projects in the areas of climate change, energies,
renewables and environmental sustainability. The action lines for the IDB to combat climate change are:
North American Development Bank (NADBANK) established the Border Environment Infrastructure Fund
(BEIF) to manage the non-refundable resources given by the Agency for Environmental Protection of
the United States with the objective to finance the construction of municipality works to water, sewage
and water treatment in the border region between Mexico and the US. It only considers this type of
projects within a 100 Km strip to both sides of the border.
UK Prosperity Fund –Under this fund, annual call for bids are launched each year, under the modality of
grants. Prioritized areas include: support the implementation of the General Law on Climate Change
Waste Management and Recycling Green Funds: Channelling of private and/or public funding for
implementation of low carbon policies, Development of Green Banks, Renewable Finances
USAID – MLED. The MLED Program provides technical assistance to the Government of Mexico along 4
different efforts: 1. Design and implementation of a nationwide low-carbon development strategy, and
action plans against climate change at the state level; 2. Systems strengthening for measuring, reporting
and verification of greenhouse gas (GHG) emissions in Mexico, 3. Implementation of demonstration
projects harnessing clean energy, 4. Coordination of the Global Climate Change (GCC) USAID/Mexico, 5.
Promotion of financial analysis schemes for clean energy projects. The MLED launches annual calls for
grants to NGOs, academic and private sectors.
MEXICO Sustainable Energy Technologies Development for Climate Change, (funded by the World Bank),
which includes grants to private sector enterprises for (a) proof-of-concept stage development of ACE
(Advanced Clean Energy) technologies and (b) collaborative clean energy commercialization (CCEC)
targeting industry-academia collaboration for ACE technologies
European Investment Bank (EIB), Support to the direct foreign investment of the EU in Latin America.
Support to projects that include improvements for environment, including renewable energies, and
energy security from the EU. It finances projects up to EUR 5 million when it represents only up to 50%
of the total amount.
83
5. CONCLUSIONS Europe is the recognised global leader in the Circular Economy paradigm shift. Over the last few years,
a shift in legislation, reform, initiatives and public acceptance has placed Europe firmly as the global
authority in Circular Economy.
In stark contrast, Mexico, now the world’s 11th largest economy, is producing significant waste
production in a linear economy, accounting for more than 44 million tons per year (0.86 Kg per person),
this number is expected to reach 65 million by 203032. Furthermore, approximately only 9.6% of the
solid waste generated in Mexico’s cities is recycled each year (SEMARNAT, 2010), where 70% of that
urban solid waste ends up in landfills (INEGI, 2016). With regards to food waste it is estimated that
34.5% of the country’s total food production is wasted. This wasted food would be enough to feed 7.4
million Mexicans (World Bank, 2017).
It is within this solid waste management sector that two main areas of opportunities exist, namely:
Municipal Solid Waste and Special Handling Waste. It is estimated that bringing the Mexican solid waste
market to a more circular economy has a potential worth of 1,172 Million Euro per year. In terms of the
Special Handling Waste, for instance the electronic waste represents a potential of 1 billion Euro market
value that could be recovered each year through introducing circular solutions. Furthermore, the
increasing building materials recycling and reuse activities will require an investment of up to 180 Million
Euro per year to scale up the number of CDW recovery plants in the main 10 cities in Mexico.
Through introducing circular solutions Mexico’s performance on the progress of SDG Goal 12
(responsible production and consumption) should improve from its current position of 74,2% of the way
to completing all indicators within this SDG.
However, to keep pace with the significant consumption and production in Mexico, the water sector
demonstrates significant water stress mainly related to climate, demography and industrial volume use.
The level of water stress is an indicator for improved water management, wastewater treatment and
reuse technologies. The problems related to urban wastewater are further compounded by the lack of
maintenance of the urban wastewater treatment technologies. As a reference, 555 wastewater
treatment plants (19.2% of a total of 2892 plants) were out of operation in 2015 (Conagua, 2014).
Furthermore, the technologies used in urban wastewater treatment plants that are in operation in
Mexico are antiquated.
The wastewater treatment sector has a potential market opportunity size for circular solutions of
around 1644 million Euro for CAPEX related investment in wastewater treatment. Most of this increase
is related to wastewater networks, whereas an increase in sludge management is lower in absolute
values and capex is approximately constant for wastewater treatment plants. Operational expenses also
show a steady increasing trend with the opportunities more significant for industrial uses (20.6%, from
1035.3€ million to 1249.2€ million) than for wastewater utilities (8.3%, from 731.8€ million to 792.3€
million).
Indeed, it is within the wastewater treatment sector that significant opportunities arise for waste to
energy production in both biogas and combustion technologies. However, to date, there’s no record of
32 https://www.gob.mx/cms/uploads/attachment/file/435917/Vision_Nacional_Cero_Residuos_6_FEB_2019.pdf
84
a WWTP that is sending its dried sludge to industrial facilities to be used in co-combustion processes.
The waste to energy sector needs to take advantage of these opportunities as the Energy Transition Law
(LTE) states that 25% of the energy generated must come from clean energy sources by 2018, 30% by
2020, and 35% by 2024, therefore significant changes need to take place for this to be achieved. The
unique production sectors of tequila, corn milling, meat, and dairy sectors generate energy-rich residues
with both biogas and combustion potential that can be exploited. Biodiesel is also a potentially large
market for circular solutions in Mexico, where it is estimated that biodiesel infrastructure investment
from 2018 to 2036 can result in a market opportunity of 845 Million Euro.
Through collaboration, mirroring initiatives and following lighthouse case studies (specifically from the
private sector), both Mexican and European entities can benefit in moving Mexico to a more circular
economy. Herein lies a significant opportunity for investment and improvement in moving these sectors
towards a circular economy.
85
6. REFERENCES
Accenture, 2013. Caracterización del Sector Informal del Reciclaje en América Latina y El Caribe, s.l.:
IRR-BID Agua y Saneamiento-FOMIN-AVINA-Coca Cola.
Advanced Biofuels USA, 2012, What Are Advanced Biofuels? Part of a Truly Sustainable Renewable
Future!
ANATEL, 2019. Programa verde ANATEL. [Online]
Available at: http://anatel.org.mx/centros-de-acopio.php
ASTM International, 2015, ASTM D6751-15cel Standard Specification for Biodiesel Fuel Blend Stock
(B100) for Middle Distillate Fuels.
CDM Policy Dialogue, 2012, Report of the High-Level Panel.
CECED, 2017. Material flows of the Home Appliance Industry, s.l.: UNU-VIE SCYCLE.
Circle Economy, 2019. The circularity Gap Report, s.l.: Adessum Foundation.
CONAPO, 2017. Proyecciones de la Población de México y Entidades Federativas 2016-2050, Ciudad de
México: s.n.
CONAPO, 2018. Proyecciones de la población de México y de las entidades federativas 2016-2050,
México: Colegio de México.
Dielman, Hans, Martínez-Rodríguez, M.-C. (2018) ‘Potentials and Challenges for a Circular Economy in
Mexico’, Towards Zero Waste, pp. 9–24. doi: 10.1007/978-3-319-92931-6
DOF, 2008, Ley de promoción y desarrollo de los bioenergéticos.
DOF, 2015, Ley de Transicion Energetica. Diario Oficial de la Federacion, Mexico.
Diez J (2006) Political change and environmental policymaking in Mexico. Routledge, New York
ECOCE, 2017. ECOCE 15 años, Ciudad e México: Offset Santiago.
Ellen Macarthur Foundation, 2018. Circular consumer electrónics: An inicial exploration, s.l.: s.n.
Ellen Macarthur Fundation, 2018. New Plastics Economy Global Commitment, s.l.: s.n.
Ellen Macarthur Fundation, 2019. Cities and Circular Economy for Food, s.l.: s.n.
EPA, 2016, Final Renewable Fuel Standards for 2014, 2015 and 2016, and the Biomass-Based Diesel
Volume for 2017.
Ghisellini, P., Cialani, C. and Ulgiati, S. (2016) ‘A review on circular economy: The expected transition to
a balanced interplay of environmental and economic systems’, Journal of Cleaner Production. Elsevier
Ltd, 114, pp. 11–32. doi: 10.1016/j.jclepro.2015.09.007.
GIZ México (2018) Proyectos de Aprovechamiento Energético a partir de Residuos Urbanos en México.
86
Mexico City.
GIZ, 2016, Fuentes de recursos financieros para proyectos de aprovechamiento energetico de Residuos
Solidos Urbanos (RSU) y Residuos de Manejo Especial (RME) en Mexico
Global Water Intelligence (2016) Global Water Market 2017: Volume 1.
Gottesfeld, P. and Durand, K. (2011) ‘Lead Battery Recycling–Case Study Mexico’.
Goulding, C., 2018. 3Dprint.com. [Online]
Available at: https://3dprint.com/219206/plastic-recycling-3d-printing/
Guerra Diaz, E. (2017) ‘El abastecimiento responsable apuesta por la Economia Circular’, Ganar-Ganar.
Hartley, T. W. (2006) ‘Public perception and participation in water reuse’, Desalination. Elsevier, 187(1–
3), pp. 115–126. doi: 10.1016/J.DESAL.2005.04.072.
Haupt et al., 2010, Recommendations for a Mexican biodiesel standard and the infrastructure required
for its handling.
van Rensburg, P. (2016) ‘Overcoming global water reuse barriers: The Windhoek experience’,
International Journal of Water Resources Development, 32(4), pp. 622–636. doi:
10.1080/07900627.2015.1129319.
IB-Tech, 2019, http://ibtech.com.mx/nosotros/nuestros-clientes
II-UNAM, 2013, Selección de Tecnologías para el Tratamiento de Aguas Residuales Municipales.
IMTA-SENER, 2016, Revisión y actualización del potencial de biomasa para generación de energía
eléctrica a partir de plantas de tratamiento de aguas residuales presentado en el Inventario Nacional de
Energías Renovables (INERE).
IMTA-SENER, 2016, Revisión y actualización del potencial de biomasa para generación de energía
eléctrica a partir de plantas de tratamiento de aguas residuales presentado en el Inventario Nacional de
Energías Renovables (INERE).
INECC, 2012. Diagnóstico Básico para la Gestión Integral de los residuos, Ciudad de México: SEMARNAT.
INEGI, 2018. Censo Nacional de Gobiernos Municipales y Delegacionales 2017, Ciudad de México: SNIEG
Información de Interés Nacional.
International Resource Panel , 2019. Global Resources Outlook 2019 Summary for policymakers, Nairobi,
Kenya: UN Environment Programme.
IRR, 2013. Caracterización del sector informal del reciclaje en América Latina y El Caribe, Washington,
DC: IRR.
ISWA, 2015. Circular economy: Trends and emerging ideas, Vienna, Austria: ISWA Task Force on
Resource Management.
87
ISWA, 2015. Wasted Health: The tragic case of dumpsites, Vienna, Austria: Scientific and Technical
Commitee Work-Program 2014-2015.
ISWA, 2017. The impact of the 4th Industrial Revolution on the Waste Management Sector, Baltimore,
USA: D Waste.
McKinnon, D., Fazakerley, J. & Hultermans, R., 2017. Waste sorting plants – extracting value from waste,
Vienna, Austria, Vienna, Austria: ISWA.
Mavropoulus, A., Anthouli, A. & Tsakona, M., 2013. Mobile Applications & Waste Management:
Recyling, Personal Behavor, Logistics, s.l.: D-Waste.
Noyola et al., 2012, Typology of Municipal Wastewater Treatment Technologies in Latin America.
O'Neal, B., 2014. 3Dprint.com. [Online]
Available at: https://3dprint.com/31564/protocycler-indiegogo/
RecycleNation, 2019. [Online]
Available at: https://recyclenation.com/about/
REMBIO, 2006, La bioenergía en México. Un Catalizador del Desarrollo Sustentable.
REMBIO, 2016, Estado del Arte de la Bioenergía en México.
REMBIO, 2018, Situación Actual y Escenarios para el Desarrollo del Biogás en México hacia 2024 y 2030.
REMBIO, 2018, Situación Actual y Escenarios para el Desarrollo del Biogás en México hacia 2024 y 2030.
REMBIO, data from SIAP and INEGI.
Rosendahl, 2013, Biomass combustion, science, technology and engineering. Cambridge.
Schwab, K., 2015. Foreign Affairs. [Online]
Available at: https://www.foreignaffairs.com/articles/2015-12-12/fourth-industrial-revolution
Sachs, J. et al. (2017) ‘SDG Index and Dashboards Report 2017’, New York: Bertelsmann Stiftung and
Sustainable Development Solutions Network (SDSN).
SEMARNAT (2015) ‘Informe de Situacion de Medio Ambiente en Mexico’, Semarnat. doi:
10.1176/jnp.6.2.201.
Salas Casasola, I., Islas Cortés, I. & Caballero Castrillo, A., 2016. Fuentes de recursos financieros para
proyectos de aprovechamiento energético de residuos sólidos urbanos (RSU) y de Manejo Especial (RME)
en México, Ciudad de México: Programa ENRES, GIZ México.
SAGARPA, 2015, Dirección General de Fibras Naturales y Biocombustibles.
SEDEMA, 2013. NORMA AMBIENTAL PARA EL DISTRITO FEDERAL NADF-024-AMBT-2013, Ciudad de
México: Gobierno del Distrito Federal.
SEMARNAT, 2010. Directorio de Centros deAcopio de Materiales Provenientes de Residuos en México
2010, Ciudad de México: Festival Internacional de Reciclaje Creativo PEPENAFEST.
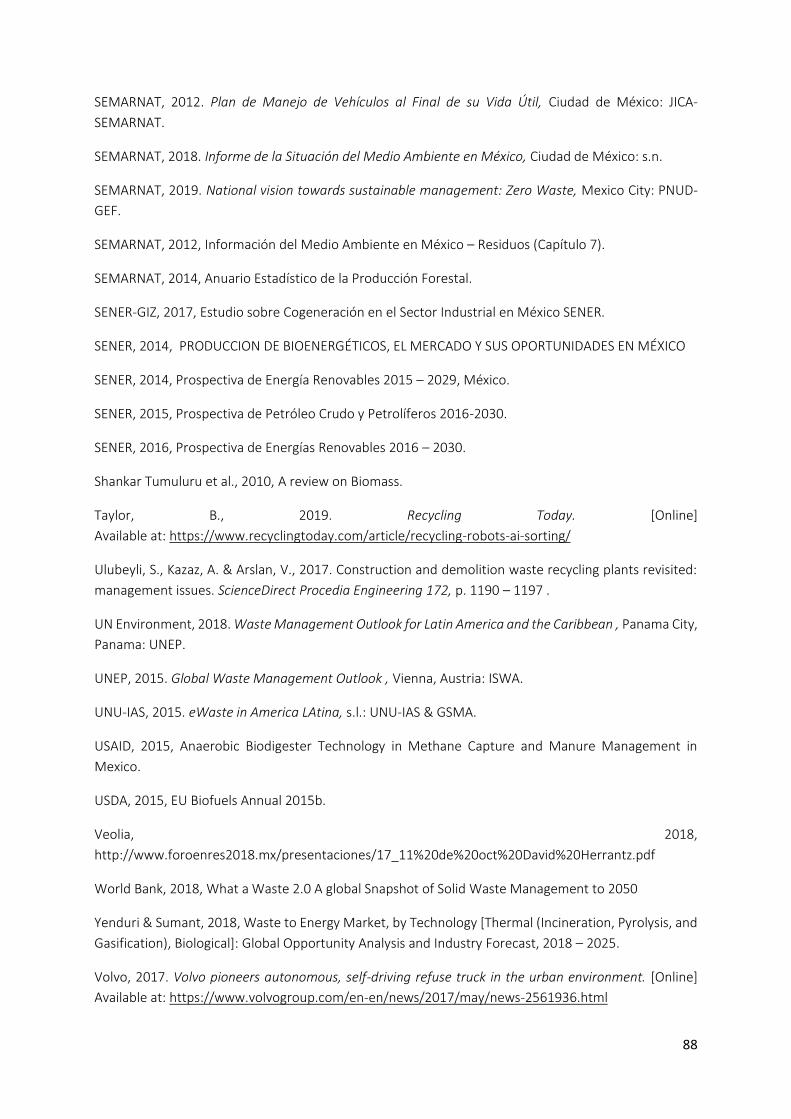
88
SEMARNAT, 2012. Plan de Manejo de Vehículos al Final de su Vida Útil, Ciudad de México: JICA-
SEMARNAT.
SEMARNAT, 2018. Informe de la Situación del Medio Ambiente en México, Ciudad de México: s.n.
SEMARNAT, 2019. National vision towards sustainable management: Zero Waste, Mexico City: PNUD-
GEF.
SEMARNAT, 2012, Información del Medio Ambiente en México – Residuos (Capítulo 7).
SEMARNAT, 2014, Anuario Estadístico de la Producción Forestal.
SENER-GIZ, 2017, Estudio sobre Cogeneracion en el Sector Industrial en Mexico SENER.
SENER, 2014, PRODUCCION DE BIOENERGETICOS, EL MERCADO Y SUS OPORTUNIDADES EN MEXICO
SENER, 2014, Prospectiva de Energía Renovables 2015 – 2029, México.
SENER, 2015, Prospectiva de Petróleo Crudo y Petrolíferos 2016-2030.
SENER, 2016, Prospectiva de Energías Renovables 2016 – 2030.
Shankar Tumuluru et al., 2010, A review on Biomass.
Taylor, B., 2019. Recycling Today. [Online]
Available at: https://www.recyclingtoday.com/article/recycling-robots-ai-sorting/
Ulubeyli, S., Kazaz, A. & Arslan, V., 2017. Construction and demolition waste recycling plants revisited:
management issues. ScienceDirect Procedia Engineering 172, p. 1190 – 1197 .
UN Environment, 2018. Waste Management Outlook for Latin America and the Caribbean , Panama City,
Panama: UNEP.
UNEP, 2015. Global Waste Management Outlook , Vienna, Austria: ISWA.
UNU-IAS, 2015. eWaste in America LAtina, s.l.: UNU-IAS & GSMA.
USAID, 2015, Anaerobic Biodigester Technology in Methane Capture and Manure Management in
Mexico.
USDA, 2015, EU Biofuels Annual 2015b.
Veolia, 2018,
http://www.foroenres2018.mx/presentaciones/17_11%20de%20oct%20David%20Herrantz.pdf
World Bank, 2018, What a Waste 2.0 A global Snapshot of Solid Waste Management to 2050
Yenduri & Sumant, 2018, Waste to Energy Market, by Technology [Thermal (Incineration, Pyrolysis, and
Gasification), Biological]: Global Opportunity Analysis and Industry Forecast, 2018 – 2025.
Volvo, 2017. Volvo pioneers autonomous, self-driving refuse truck in the urban environment. [Online]
Available at: https://www.volvogroup.com/en-en/news/2017/may/news-2561936.html

89
The World Bank Group (2018) ‘Wastewater : From Waste to Resource’, Waster Global Practice, pp. 1–
6.
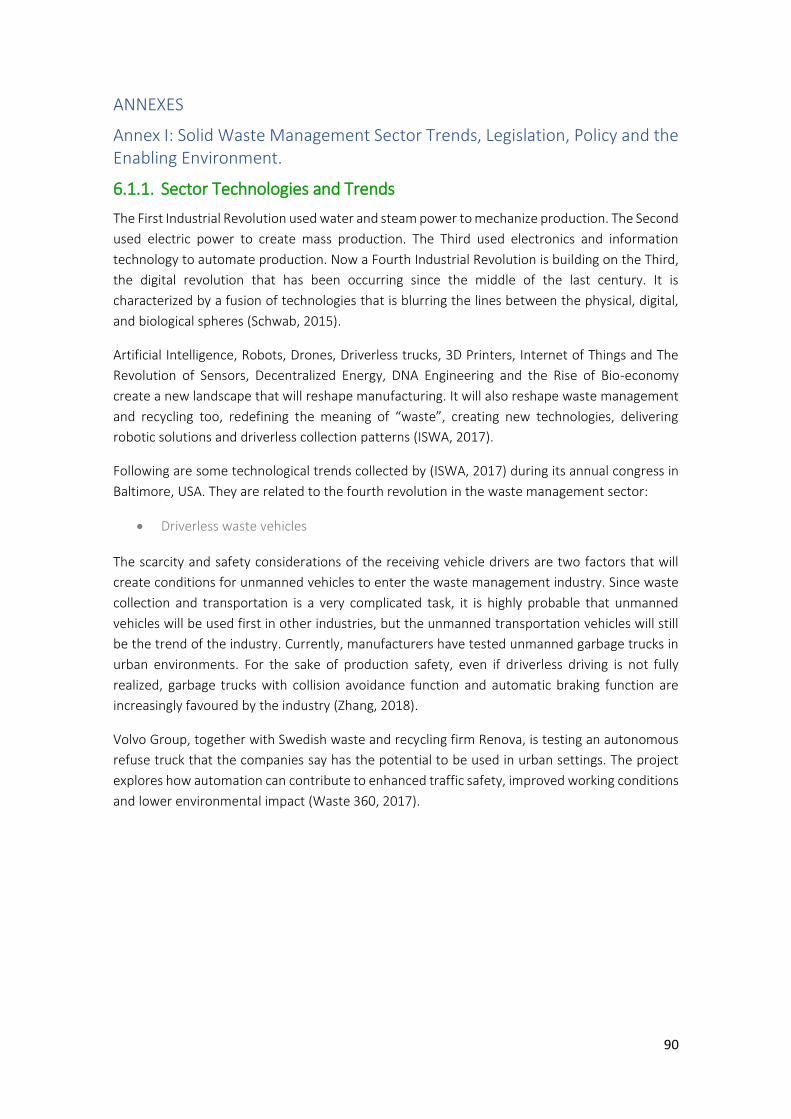
90
ANNEXES
Annex I: Solid Waste Management Sector Trends, Legislation, Policy and the Enabling Environment.
6.1.1. Sector Technologies and Trends
The First Industrial Revolution used water and steam power to mechanize production. The Second
used electric power to create mass production. The Third used electronics and information
technology to automate production. Now a Fourth Industrial Revolution is building on the Third,
the digital revolution that has been occurring since the middle of the last century. It is
characterized by a fusion of technologies that is blurring the lines between the physical, digital,
and biological spheres (Schwab, 2015).
Artificial Intelligence, Robots, Drones, Driverless trucks, 3D Printers, Internet of Things and The
Revolution of Sensors, Decentralized Energy, DNA Engineering and the Rise of Bio-economy
create a new landscape that will reshape manufacturing. It will also reshape waste management
and recycling too, redefining the meaning of “waste”, creating new technologies, delivering
robotic solutions and driverless collection patterns (ISWA, 2017).
Following are some technological trends collected by (ISWA, 2017) during its annual congress in
Baltimore, USA. They are related to the fourth revolution in the waste management sector:
• Driverless waste vehicles
The scarcity and safety considerations of the receiving vehicle drivers are two factors that will
create conditions for unmanned vehicles to enter the waste management industry. Since waste
collection and transportation is a very complicated task, it is highly probable that unmanned
vehicles will be used first in other industries, but the unmanned transportation vehicles will still
be the trend of the industry. Currently, manufacturers have tested unmanned garbage trucks in
urban environments. For the sake of production safety, even if driverless driving is not fully
realized, garbage trucks with collision avoidance function and automatic braking function are
increasingly favoured by the industry (Zhang, 2018).
Volvo Group, together with Swedish waste and recycling firm Renova, is testing an autonomous
refuse truck that the companies say has the potential to be used in urban settings. The project
explores how automation can contribute to enhanced traffic safety, improved working conditions
and lower environmental impact (Waste 360, 2017).
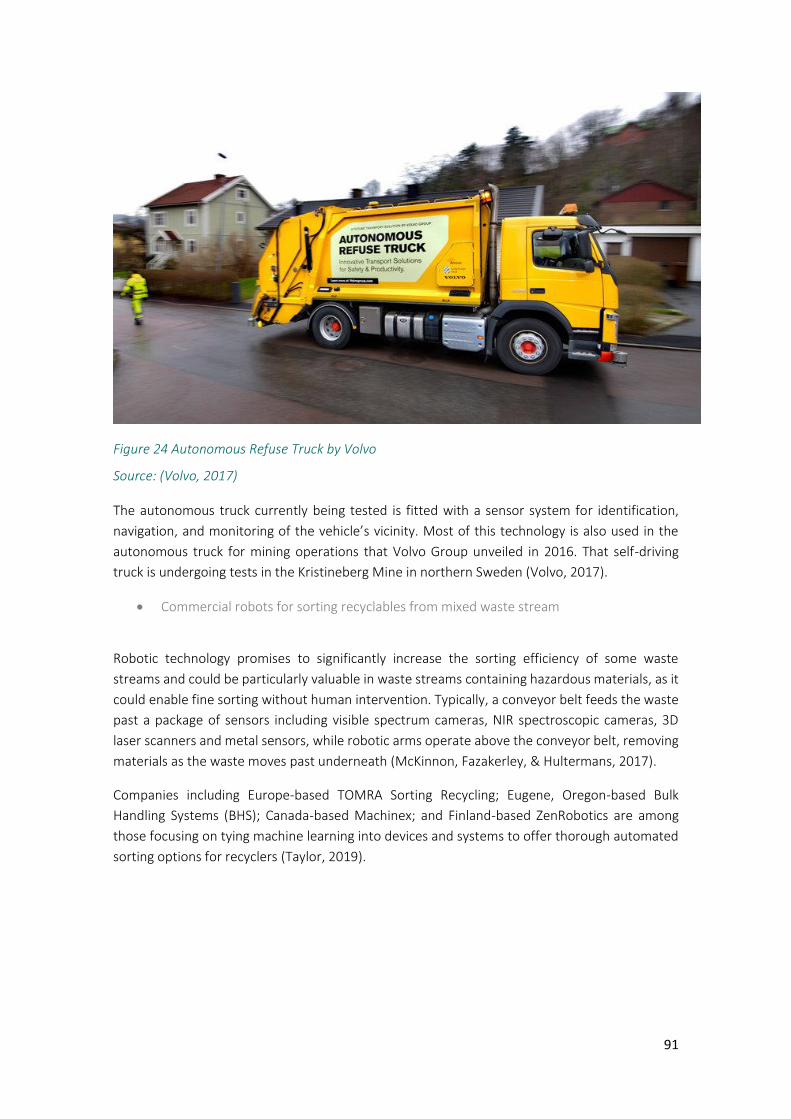
91
Figure 24 Autonomous Refuse Truck by Volvo
Source: (Volvo, 2017)
The autonomous truck currently being tested is fitted with a sensor system for identification,
navigation, and monitoring of the vehicle’s vicinity. Most of this technology is also used in the
autonomous truck for mining operations that Volvo Group unveiled in 2016. That self-driving
truck is undergoing tests in the Kristineberg Mine in northern Sweden (Volvo, 2017).
• Commercial robots for sorting recyclables from mixed waste stream
Robotic technology promises to significantly increase the sorting efficiency of some waste
streams and could be particularly valuable in waste streams containing hazardous materials, as it
could enable fine sorting without human intervention. Typically, a conveyor belt feeds the waste
past a package of sensors including visible spectrum cameras, NIR spectroscopic cameras, 3D
laser scanners and metal sensors, while robotic arms operate above the conveyor belt, removing
materials as the waste moves past underneath (McKinnon, Fazakerley, & Hultermans, 2017).
Companies including Europe-based TOMRA Sorting Recycling; Eugene, Oregon-based Bulk
Handling Systems (BHS); Canada-based Machinex; and Finland-based ZenRobotics are among
those focusing on tying machine learning into devices and systems to offer thorough automated
sorting options for recyclers (Taylor, 2019).
92
Figure 25 Sorting robot: Recycler by ZenRobotics
Source: (Taylor, 2019)
Companies such as BHS with its MaxAI systems, Machinex with its SamurAI line of sorting
machinery and ZenRobotics with its Recycler have all gained attention and investments from
recycling plant operators who have calculated that such advanced technology will yield a healthy
return on investment (ROI) (Taylor, 2019).
• Several platforms and mobile apps for recycling systems, including platforms for informal recyclers
Undoubtedly, “The future is mobile”. Nowadays, digital evolution and mobile developments are
carving a new era that affects human behaviour and global governance. Interconnectivity and
information flow through various types of modern means create new opportunities for
cooperation and ways to work. Waste management could not stay unaffected by these changes.
New potentials are arising for the sector, offering a novel field for innovation, changing the way
waste practices are applied. In this framework, mobile products and applications (further apps)
can become valuable tools for authorities, companies, civilians and other stakeholders,
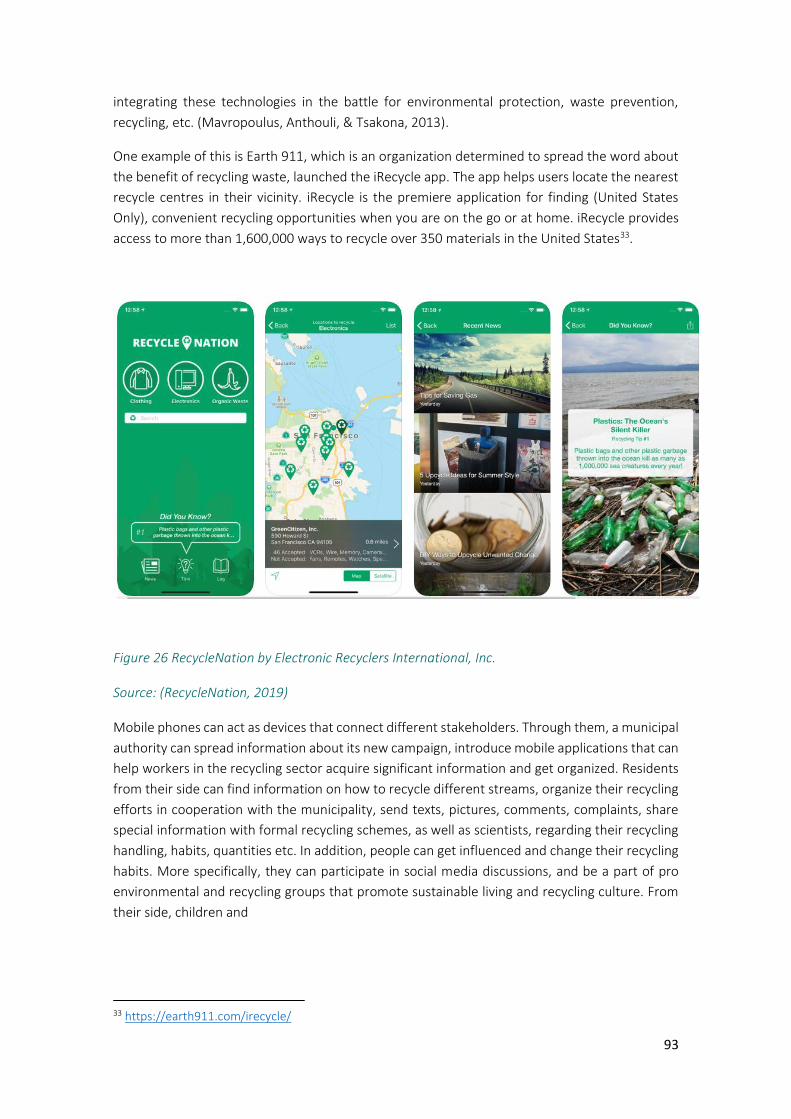
93
integrating these technologies in the battle for environmental protection, waste prevention,
recycling, etc. (Mavropoulus, Anthouli, & Tsakona, 2013).
One example of this is Earth 911, which is an organization determined to spread the word about
the benefit of recycling waste, launched the iRecycle app. The app helps users locate the nearest
recycle centres in their vicinity. iRecycle is the premiere application for finding (United States
Only), convenient recycling opportunities when you are on the go or at home. iRecycle provides
access to more than 1,600,000 ways to recycle over 350 materials in the United States33.
Figure 26 RecycleNation by Electronic Recyclers International, Inc.
Source: (RecycleNation, 2019)
Mobile phones can act as devices that connect different stakeholders. Through them, a municipal
authority can spread information about its new campaign, introduce mobile applications that can
help workers in the recycling sector acquire significant information and get organized. Residents
from their side can find information on how to recycle different streams, organize their recycling
efforts in cooperation with the municipality, send texts, pictures, comments, complaints, share
special information with formal recycling schemes, as well as scientists, regarding their recycling
handling, habits, quantities etc. In addition, people can get influenced and change their recycling
habits. More specifically, they can participate in social media discussions, and be a part of pro
environmental and recycling groups that promote sustainable living and recycling culture. From
their side, children and
33 https://earth911.com/irecycle/
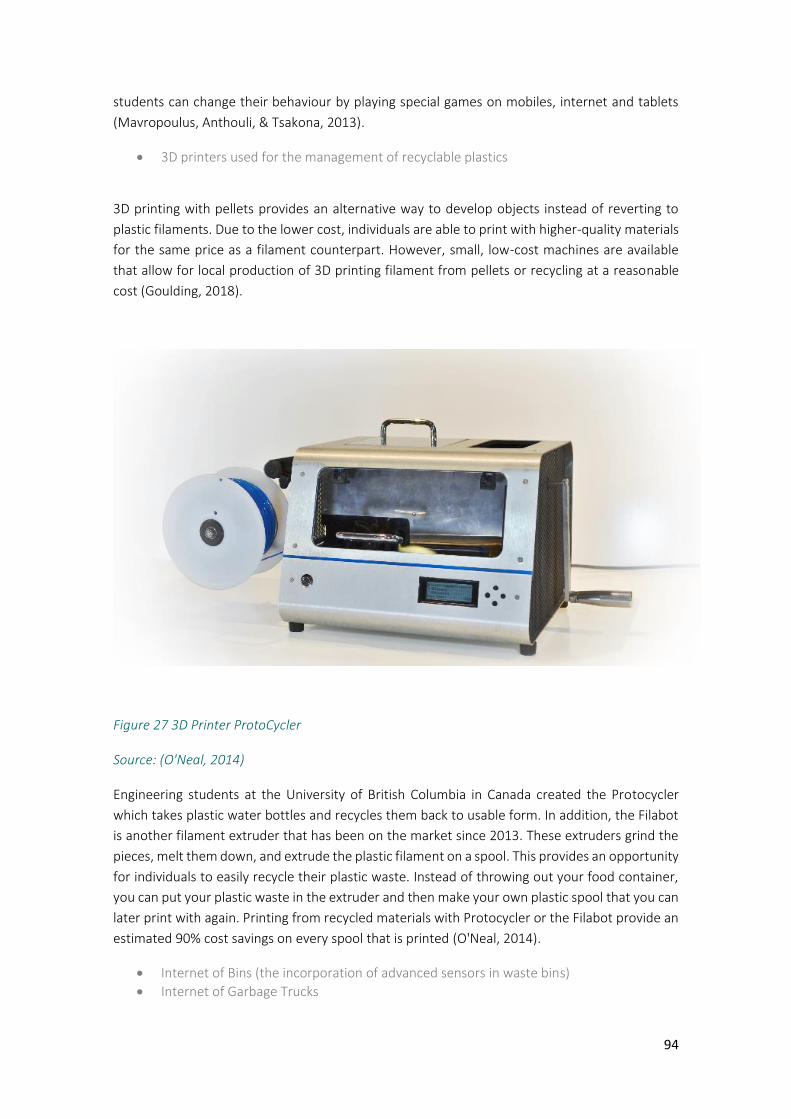
94
students can change their behaviour by playing special games on mobiles, internet and tablets
(Mavropoulus, Anthouli, & Tsakona, 2013).
• 3D printers used for the management of recyclable plastics
3D printing with pellets provides an alternative way to develop objects instead of reverting to
plastic filaments. Due to the lower cost, individuals are able to print with higher-quality materials
for the same price as a filament counterpart. However, small, low-cost machines are available
that allow for local production of 3D printing filament from pellets or recycling at a reasonable
cost (Goulding, 2018).
Figure 27 3D Printer ProtoCycler
Source: (O'Neal, 2014)
Engineering students at the University of British Columbia in Canada created the Protocycler
which takes plastic water bottles and recycles them back to usable form. In addition, the Filabot
is another filament extruder that has been on the market since 2013. These extruders grind the
pieces, melt them down, and extrude the plastic filament on a spool. This provides an opportunity
for individuals to easily recycle their plastic waste. Instead of throwing out your food container,
you can put your plastic waste in the extruder and then make your own plastic spool that you can
later print with again. Printing from recycled materials with Protocycler or the Filabot provide an
estimated 90% cost savings on every spool that is printed (O'Neal, 2014).
• Internet of Bins (the incorporation of advanced sensors in waste bins)
• Internet of Garbage Trucks
95
• Internet of Packaging is gradually considered a cornerstone of the shift towards a sustainable management of packaging recyclables.
• Turning food waste to proteins that are used to feed animals
• Chatbots dealing with waste management and recycling
The on-going industrial revolution represents a potential for substantial benefits in recycling and
waste management, because with the new cheap and energy efficient sensors, many industries
will have the possibility to follow closely all the life cycle of any item sold. This will allow product
designers to optimize the design, minimize useless functions and materials, prevent damages,
improve maintenance, and finally develop closed loops of clean materials. “Zero waste”
approaches for specific supply chains will become more realistic than ever. Reuse, recycling and
material recovery will become easier, from a technological point of view (ISWA, 2017).
Management Information on the generation and collection of municipal solid waste is generally available, but
there are difficulties to integrate data between national and local levels, as well as between
countries; this is due to the lack of harmonization of waste generation and management
indicators.
Formal information systems are increasing in cities but they are not universal. For example, in
Quito, Ecuador, La Empresa Metropolitana de Aseo (the Metropolitan Cleaning Company) has
developed a central data management system that tracks collection routes, generates reports on
service performance metrics, and allows citizens to report infractions of waste regulations. In
Japan, a central data system connects waste facilities around the country to a central national
waste information system. Measurements of toxins and emissions are reported in real time to
the central database. Any problems in equipment operations trigger automatic reports to the
plant operator so that emergencies can be addressed immediately (World Bank Group, 2018).
Therefore there is an an opportunity to upgrade the data management systems of Municipal Solid
Waste in Mexico in the public and private sector. The most important waste management
operator in Mexico is Promotora Ambiental (PASA).
Further information:
https://www.pasa.mx/
Storage, handling and collection Waste collection and associated transportation is often the costliest step in waste management,
and technology is extensively available to increase efficiency. Starting with the use of a geographic
information system, a city can optimize routing and minimize improper use of trucks.
Sensors can optimize routes and reduce unnecessary pickups. Dumpster sensors can signal how
full a dumpster is so that pickups can be made accordingly. Smart and solar-powered compactor
bins use solar power to compact waste to one-sixth of its original volume and can alert the
municipality or waste collector when a sensor detects that the bin is reaching capacity. In
locations with sufficient infrastructure, relevant geographical conditions, and ample financing,
alternative approaches are being used for waste collection.
96
Automation for waste collection vehicles ranges from the lifting of bins placed in the back of the
truck to mechanical side arms that automatically pick up standardized bins directly from
households.
These kinds of containers are equipped with coupling systems to be self-feeding by small
containers and then lifted by special forks trucks or roll-off trucks. The trend is to get the container
smarter fitting it up with sensors of quantity and quality of the content to process this information
in a software and optimizing the collection system. It can be included the eco-points that promote
the recycling culture through giving an incentive in exchange of specific materials.
Even more automated collection solutions are being tested. In a limited number of areas with
restricted transportation access or that are extremely dense, a more unusual approach could be
pneumatic waste collection.
Sorting and recovery There are some technologies which use different physical principles and automatic systems to
separate by size, density, type of material, colour, kind of metal, etc. As in the sorting lines, the
materials are identified but using automated systems which sort and separate the waste then
store and sometimes conditioning to recycling or valorisation.
Some of these technologies required in the recycling sector in Mexico are:
a. Optical multiplexer sorting systems
b. By density sorting systems
c. Magnetic separation systems
d. Trommels and screens
e. Conveyors
Food Waste and organics Approximately one third of the total food produced for human consumption –equivalent to 1.3
billion tonnes– is lost or wasted annually. In Mexico, losses can be found in different links of the
corresponding food value chain, for instance: 28 % occurs at production; 28 % at consumption,
22 % during handling and storage, 17 % in the market and during distribution and, finally, 6 %
during processing (UN Environment, 2018). Mexico losses reach 37 % of the food produced in the
country (approximately 30 thousand tonnes a day).
Composting
Cities can transform collected organic materials to drive regenerative peri-urban food production.
Currently in cities, the most common management processes for organic materials are
composting, anaerobic digestion, and wastewater treatment. The organic fertilisers resulting
from these processes include compost and biodigestate, which – when compliant with
regulations – can be returned to peri-urban farms to re-nurish soils and potentially increase yields
without putting crop quality or safety at risk. Compost and biodigestate both contain carbon and
97
nutrients. However, their properties vary due to their respective treatment processes, and the
type of organic materials from which they are made.
Innovation can make organic fertilisers easier to use and economically competitive with
conventional synthetic fertilisers. A number of companies such as Lystek Inc., Soil Food, Ostara,
and WISErg are demonstrating that such innovation is possible. Several interventions help
enhance the quality of organic fertilisers (Ellen Macarthur Fundation, 2019). For example, the
recycling and recovery company SUEZ produces compost enriched with calcium carbonate
extracted from sludge produced by a paper mill plant located in the southwest of France. Product
certification was achieved by local authorities. The plant produced 30,000 tonnes per year of
enhanced compost, sold via two main cooperatives at twice the value of traditional compost,
responding to the needs of local farmers to reduce soil acidity (Ellen Macarthur Fundation, 2019).
Digital Innovation
Digital platforms can play an important role in getting organic resources from where they are
produced to where they are needed. One such example is the partnership of Rochester Institute
of Technology with New York State to create an Organic Resource Locator, a web-based mapping
tool that provides state-wide information on organic production and utilisation. Similarly, SUEZ
has developed Organix, a digital marketplace for organic resources, that allows organic producers
to find the right and proximate solutions for their waste, for example to locate AD recovery
centres (Ellen Macarthur Fundation, 2019).
MATERIALS AND BIOENERGY
Biomaterial
3 examples of usage of food waste as a biomaterial is describe below:
• Ricehouse – transforming rice husks into high-performance construction materials for buildings
• Pigmento and Mancha – creating safe ‘organic’ dyes for textiles and other products from food by-products, such as coffee, saffron, and cabbage
• Peel Pioneers – turning chemicals from citrus peels into cosmetics and cleaning products
Further information:
https://www.ellenmacarthurfoundation.org/publications/cities-and-circular-economy-for-food
Plastic Waste Plastic waste and pollution have captured the attention of the public, governments, and
businesses around the world. The search for solutions has started, and there is growing
recognition that addressing the symptoms through clean-ups is not enough. A systemic shift
tackling the root causes is required: a transition towards a circular economy for plastic, in which
plastic never becomes waste (Ellen Macarthur Fundation, 2018). Therefore, there is now a huge
potential market for innovative technologies related to circularity of plastic.
98
The New Plastics Economy Global Commitment unites businesses, governments, and other
organizations behind a common vision and targets to address plastic waste and pollution at its
source. It is led by the Ellen MacArthur Foundation in collaboration with UN Environment.
Launched in October 2018, the Global Commitment already unites more than 350 organizations
on its common vision of a circular economy for plastics, keeping plastics in the economy and out
of the ocean.
For plastic packaging, specifically, this vision for a circular economy is defined by six
characteristics:
1. Elimination of problematic or unnecessary plastic packaging through redesign, innovation, and new delivery models is a priority
2. Reuse models are applied where relevant, reducing the need for single-use packaging 3. All plastic packaging is 100% reusable, recyclable, or compostable 4. All plastic packaging is reused, recycled, or composted in practice 5. The use of plastics is fully decoupled from the consumption of finite resources 6. All plastic packaging is free of hazardous chemicals, and the health, safety, and rights of
all people involved are respected
In Mexico, practically all the industry related to the production, use and handling of packaging
and plastic containers represented by ANIPAC, ANIQ, CONMEXICO and ECOCE has signed the
Global Pact for what investments and substantial changes are expected in the value chain,
especially taking into account of the trend of bans on plastics pursued by NGOs international as
GreenPeace and national.
Further information:
http://responsabilidad.anipac.com/economia-circular-2
Electrical Waste and electronic equipment Just like in the rest of the world, the production, consumption and disposal of electronic and
electrical devices have grown in the region and the country, which has led to the generation of a
growing volume of waste from these products at the end of their useful life. The progressive offer
of equipment and new electronic devices, as well as intensive advertising campaigns and more
convenient prices, coupled with a general improvement in purchasing power, have increased
consumption of these types of products, making this the fastest-growing waste stream
worldwide, due to the short lifespan of some of these products that are often not designed with
their potential for recycling in mind (UN Environment, 2018).
Electronic devices are made up of a series of components that contain toxic materials and
substances such as lead, cadmium, mercury, polychlorinated biphenyls (PCB), among others;
together with materials that once incinerated in inadequate conditions are forerunners of other
toxic substances such as dioxins and furans. This waste is generated from the improper disposal
of televisions, computers, media players, land line phones and mobile phones, displays, keypads,
game consoles, cables and chargers, hard disks, printers, scanners and faxes (UNU-IAS, 2015) .
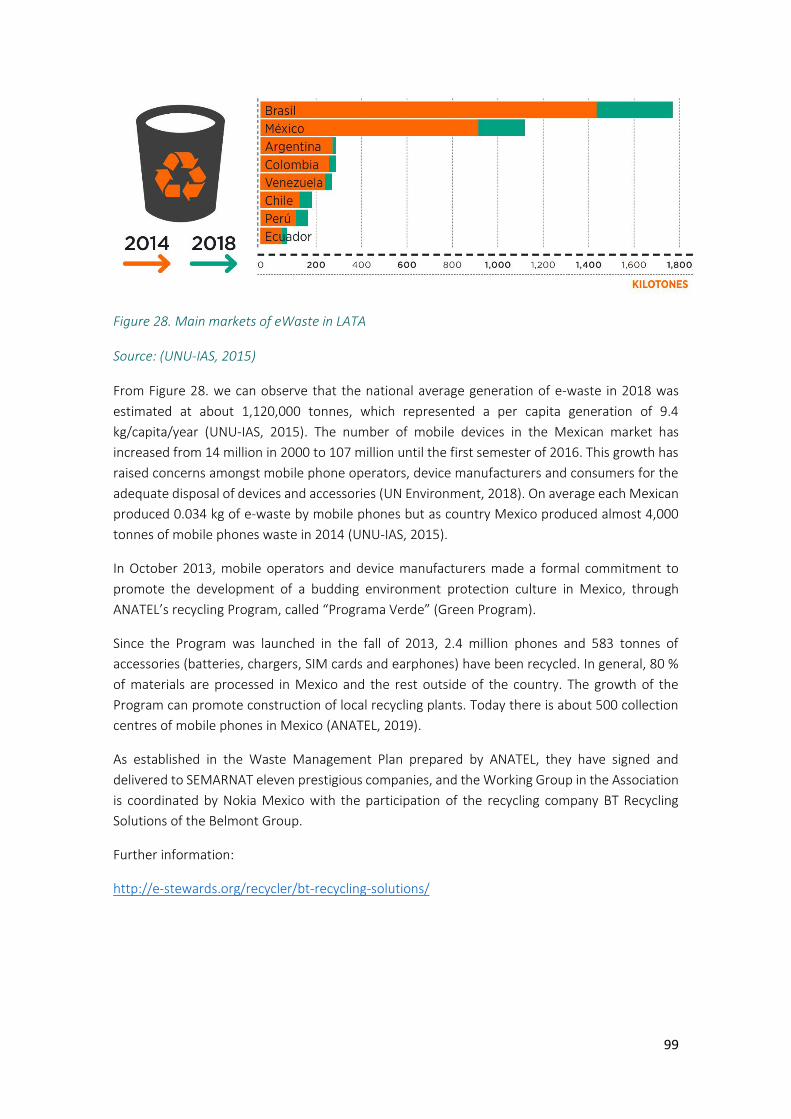
99
Figure 28. Main markets of eWaste in LATA
Source: (UNU-IAS, 2015)
From Figure 28. we can observe that the national average generation of e-waste in 2018 was
estimated at about 1,120,000 tonnes, which represented a per capita generation of 9.4
kg/capita/year (UNU-IAS, 2015). The number of mobile devices in the Mexican market has
increased from 14 million in 2000 to 107 million until the first semester of 2016. This growth has
raised concerns amongst mobile phone operators, device manufacturers and consumers for the
adequate disposal of devices and accessories (UN Environment, 2018). On average each Mexican
produced 0.034 kg of e-waste by mobile phones but as country Mexico produced almost 4,000
tonnes of mobile phones waste in 2014 (UNU-IAS, 2015).
In October 2013, mobile operators and device manufacturers made a formal commitment to
promote the development of a budding environment protection culture in Mexico, through
ANATEL’s recycling Program, called “Programa Verde” (Green Program).
Since the Program was launched in the fall of 2013, 2.4 million phones and 583 tonnes of
accessories (batteries, chargers, SIM cards and earphones) have been recycled. In general, 80 %
of materials are processed in Mexico and the rest outside of the country. The growth of the
Program can promote construction of local recycling plants. Today there is about 500 collection
centres of mobile phones in Mexico (ANATEL, 2019).
As established in the Waste Management Plan prepared by ANATEL, they have signed and
delivered to SEMARNAT eleven prestigious companies, and the Working Group in the Association
is coordinated by Nokia Mexico with the participation of the recycling company BT Recycling
Solutions of the Belmont Group.
Further information:
http://e-stewards.org/recycler/bt-recycling-solutions/
100
Construction and demolition waste (CDW) The CDW are leftover materials not used and generated both from the demolition activities
(debris) as well as from the construction of new buildings. This waste is made up of a series of
fragments of partitions, stone, concrete, mortars, wood, wires, rods and ceramics, mixed up with
dirt, granular materials and other components used in construction.
There are two types of the recycling plants: stationary and mobile. Stationary plants of which
capacities range from 100 to 350 ton/h usually adopt higher level technologies and are typically
provided with the sorting equipment for the separation of unwanted fractions. They are suitable
high areas, capable of producing a high quality of product, and efficient due to the production of
different recycled products of various grading. However, the initial investment of setting such a
plant can be very high. Mobile plants of which capacities can reach up to 100 ton/h treat smaller
quantities of CDW in temporary demolition worksites, deploy basic technologies, and typically
produce low grade recycling aggregates by in-situ recycling. They are economically feasible from
an amount of 5,000 to 6,000 ton/site. However, there are limited cleaning facilities in this type of
installation, and therefore, the recycled product is normally of low quality. In addition, such a
plant that is usually close to residential areas can cause high levels of dust and noise which can
be unacceptable. If the quantity of the area is lower than a certain amount, a transfer or collection
station of which capacity changes between 1-4 ton/h should also be located from an economic
point of view. Such centres do not physically recycle anything, but simply sort out or classify and
compact the materials and then send this to the recycling facilities. Rejected fluxes are only
hazardous and untreatable materials (e.g., tar, asbestos, resins, and adhesives) and wet sludge
carrying ultra-fine mixed particles (Ulubeyli, Kazaz, & Arslan, 2017).
For instance, in Mexico, "Concretos reciclados" is one of the places for this purpose. It is located
in the Iztapalapa delegation; It is a private recycling plant where only 3% of the waste generated
in the city is processed, although the plant has an operating capacity of 2,000 tons per day, that
is, close to 30%. It only handles concrete to produce aggregates such as gravels and sands.
The NADF-007-RNAT-2004 and the NTEA-011-SMA-RS-2008 policies establish the requirements
for the management of CDW in Mexico City and in the state of Mexico. Given the low reuse and
recycling percentages, technological opportunities are high for the installation of crushing plants
and selection of aggregates for their future use in construction or civil works.
Further information:
http://www.concretosreciclados.com.mx/
Home appliances waste Household appliances are universal and an integral part of our daily life. To produce and supply
these products, large amounts of raw materials are used every year, and the installed products
in homes represent even larger volumes of materials (CECED, 2017).
Waste from home appliances is made up, mostly, of materials that can be reused: iron, copper,
aluminium, lead, tin, plastics, epoxies, ceramics, etc. It should be noted that in Mexico it is a
101
common practice that when a device is no longer needed in a household, it is not immediately
transformed into waste, but is reused by other people with fewer resources close to the family
circle (INECC, 2012).
There is an opportunity to address the issues of reuse and recycling of home appliances by setting
up Integrated Management Systems from the manufacturer until the end consumer that are
responsible for the collection, transport, storage and recycling of a determined type of waste and
to monitor all operations and disposal sites. Another opportunity calls for the introduction of
liquid nitrogen installations in the treatment plants to separate the chlorofluorocarbon (CFC)
from refrigerators, apart from separators for ferric and non-ferric metals, polyurethane, oils, etc.
(CECED, 2017).
Further information:
https://www.applia-europe.eu/
End of life vehicles The end of life vehicles represents a significant problem in Mexico due to the fast-paced growth
in the current vehicle fleet, among which are included second hand vehicles coming from the
United States, and implicitly the imminent growth of this type of waste. The lifespan of vehicles
can vary from one country to the next, generally being shorter in developed countries than in
developing countries. By the end of this period, automobiles are wastes comprising a wide variety
of materials, such as various metals, plastics, glass, fluids, etc.
Because of their design and manufacture, they also include hazardous waste, such as lead-acid
batteries, lubricant oils, filters, explosive material from airbags, coolants, electronic circuits, etc.;
therefore, it is very important to have suitable management schemes for this waste stream. ELVs
have a high potential for recycling, because their average composition has the following general
characteristics (UN Environment, 2018):
• 68% ferrous metals
• 9% plastics (some chlorinated or with brominated flame retardants) • 8% non-ferrous metals • 6% glass and rubber
• 9% other materials (textiles, batteries, fluids, electric components, etc.)
In 2012 Mexico published its Plan de Manejo de Vehículos al Final de su Vida Útil (SEMARNAT,
2012), (Management plan for vehicles at the end of the useful life) which defines an ELVs as a
vehicle that meets some of the following conditions: it has been destroyed in a collision; it is
inoperable due to mechanical failures; its obsolescence makes it unaffordable to keep it working;
or was abandoned in a public place. The Management Plan is
only applicable to light vehicles (weighing under 3.5 tonnes), and its goals are:
• Avoiding environmental pollution generated by the inadequate management of this waste
102
• Achieving the maximum recovery per vehicle • Having a comprehensive management control system for ELVs, under the shared
responsibility amongst stakeholders’ scheme
The Plan reports the value of 837,000 vehicles for disposal for the year 2012. The ELVs generation
mechanisms in Mexico involve a specific element since it is next to the US, because, aside from
the new domestically produced and imported vehicles, the country also legally receives a
significant number of used automobiles (more than 10 years old) from the neighbouring country,
which in 2007 amounted to 1,221,144 units, and close to four million units between 2005 and
2010 (amongst the externalities inherent to this activity, it is estimated that “in the border cities
of the state of Baja California, more than 85 % of CO emissions are attributable to imported used
vehicles, whereas less than 15 % is attributable to national used vehicles”). In addition to this are
illegally imported used vehicles, for which no data are reported in the Management Plan. There
are ten companies authorized to destroy ELVs in the country, and 27 reception sites.
Further information:
http://www.semarnat.gob.mx/archivosanteriores/temas/residuos/vehiculos/Documents/plan-
manejo-vehiculos.pdf
Tyres Used tyres and their waste are a considerable environmental problem in Mexico. These tyres are
disposed in house courtyards, illegal landfills, public roads and public and private collection
centres, representing a “shelter” for pests, rodents and insects that are a source of diseases and
add to the additional risk for the environment and human health in case of a fire in the disposal
sites.
The National Association of Tyre Suppliers and Renewing Plants (ANDELLAC, in Spanish), the
National Association of Tyre Importers (ANILLAC, in Spanish) and the National Chamber of the
Coal Industry (CNIH) published in 2013 the Plan de manejo de neumáticos usados de desecho
[Management plan for used waste tyres], in accordance with the applicable Official Mexican
Standard.
According to the above Plan, 28,900 million tyres are disposed of every year in Mexico. The
Mexican tyre market is very peculiar in the region because of the proximity to the US and its close
connection to the used automobile market. Aside from producing and importing new tyres,
Mexico imports from the US used tyres to be placed in vehicles (1,065,000 units in 2012; 3.7 % of
the national market), and it also imports used tyres for rethreading (1,082,000 in 2012) (UN
Environment, 2018).
This has led to the creation of joint Programs for tackling these and other types of waste on both
sides of the 3,200-km border between the two countries. This two-country problem has resulted
in joint workshops and seminars, as well as in the documents Scrap Tires: Handbook on Recycling
Applications and Management for the U.S. and Mexico, and in the so called Propuesta de
Estrategia y Política Pública para el Manejo Integral de Llantas de Desecho en la Región Fronteriza
103
[Strategy and Public Policy Proposal for the Comprehensive Management of Waste Tires in the
Border Region]. As for the recovery and valorisation of out of border tires in Mexico, in 2011, 2.6
% of energy consumption in the cement industry came from using tires as replacement for
conventional fuel, which represents close to 8,360,000 tires used every year (UN Environment,
2018).
Currently, in Mexico, 5% of tyres is recycled, 2% is used for energy generations, 2% is disposed in
authorized collection centres and the remaining 91% is abandoned or used without control.
A recycling opportunity for used tyres, which is widely spread in Europe, is to use them as
alternative fuel in cement plants, given their high calorific value. Another opportunity is to recycle
them for asphalt pavement or for running tracks.
Further information:
http://reciclallantas.org.mx/anillac/index.html
104
The Enabling Environment in Solid Waste Management
6.1.2. Policy and Legislation
Legislation
The dispositions to regulation and control of the waste sector in Mexico are covered in the Constitution of Mexican United States, the General Law of Ecological Equilibrium and Environment Protection, the General Law for Prevention and Integral Management of Waste, the General Law of Health, Mexican Official Standards, Technical Standards and State Laws and its regulations, that currently constitutes the legal framework for Mexico in this field.
The Constitution of Mexican United States established an accord to article 115, fraction III, that
municipalities are in charge of the function and clean up services, collection, treatment and waste
final disposal, therefore municipalities are the legitimate authorities to carry out the provision of
cleaning services previously commented. Generally, this attribution is ratified for the State
Constitutions and supported by the State Law of Ecological Equilibrium and environmental
protection. This framework serves as a reference to establish the general guidelines for local
regulations and better governance and particularly of municipal sanitations regulations.
The General Law of Ecological Equilibrium and Environment Protection (LGEEPA for its acronym
in Spanish) gives attributions to the Federal Government in emission field of Mexican Official
Standards (NOM for its acronym in Spanish) applicable for all types of waste, plus it provides the
possibilities to agreeing with states the intervention regarding the control of low hazard waste.
Although the LGEEPA does not raise obligations for solid waste generators, since this is a matter
of states and municipalities, it empowers to environmental federal authority to establish
technical rules for storage, collections, transport, treatment and the final disposal of municipal
solid waste. Also, the LGEEPA raises the technical rules to prevent and control the effects that
over the environment could happen for the generation, storage, collection, transport, treatment
and final disposal of solid waste and no dangerous industrial waste.
The States, across its legislatures, has commissioned legislation in this field and have
administrative authorities, dependent on state civil service, to intervene the support of
competent municipal authorities, especially in matters relating to urban development. The
municipalities, through the council, issued regulations in the matter, in so far as the councillors
acts like activities supervisors; also having administrative institutions that attend directly to the
public service consisting of: street sweeping, collection, transport, treatment and final disposal of
solid waste.
Technical Policies • NOM-083-SEMARNAT-2003, It establishes the requirements for final disposal of
municipal and industrial solid waste while they are not considered as hazardous. It’s important to note that currently in Mexico, it is not obligatory to exploit the biogas produced
in landfills, even in this Official Regulation it is not specified technical security aspects or operating
parameters. SEMARNAT and PROFEPA are the institutions responsible for monitoring compliance
with this regulation.
105
• NOM-052-SEMARNAT-2005, It establishes the characteristics, procedures of identifying and classification of dangerous wastes.
Especially for energy recovery systems it is required to revise that there are some considered
hazardous waste with high calorific value as some of the classified in the "Listado 4", and there is
only one treatment approved for this material: incineration. It is important to check in NOM-054-
SEMARNAT-1993, the incompatibility between two or more hazardous waste.
• NOM-098-SEMARNAT-2002, establishes the operation specs and the maximum bounds of related pollutants.
In Mexico it is considered as “incineration” the gasification technology, pyrolysis and plasma,
when fuel products are subjected to combustion in an oxygen-rich environment. Fortunately, in
the recently publishes law (2014) “Ley de la Industria Electrica”, these technologies are classified
as Clean Energy, as long as they accomplish the requirements in toxic gas emissions.
• NOM-161-SEMARNAT-2011, It establishes the criteria to classify Special Management Waste and determines which are obligated to have a Management Plan.
This regulation is so far the most powerful tool to encourage the use of industrial and commercial
waste because it states the obligation to have a record of the quantity and characteristics of waste
generated; also begins to recognize that within the waste can be a great economic value which
needs appropriate processes to generate profitability in the management and not just costs.
This regulation is complemented by:
NOM-004-SEMARNAT-2002 which refers to sludge from water treatment plant and biosolids.
NOM-087-SEMARNAT-SAA1-2002, marking procedures for handling biological-infectious
hazardous waste.
• NOM-157-SEMARNAT-2009, It establishes the elements and procedures to implement management plans for mining waste.
Like the previous, NOM-161 this regulation is a milestone and is an important tool for low carbon
technologies in this industry that for every ton of product produced generate up to 10 times more
waste.
It is recommended that related to waste management permits consult the Ministry of
Environment: SEMARNAT.
Review the NOMs issued by the Ministry because in them the lists of municipal solid waste and
require special handling management plan, criteria, type of plan and the elements and
procedures to be taken into consideration to be placed.
If applying as a major and small generator of hazardous waste will need to obtain a registration
with SEMARNAT as a generator.
106
The largest generators of municipal solid waste and special management are required to register
with municipal authorities, establish management plans for the waste they generate large
volumes and subject to registration of competent authorities, if required to be changed or
updated.
Should be subject or liable to generate a plan for hazardous waste management, this should be
recorded before the SEMARNAT.
In both NOMs governing technologies or processes of recycling, treatment, incineration,
gasification, plasma, or other thermolysis is not issued, SEMARNAT may request the executive
service provider and develop a testing protocol project, provided that the technology or process
is innovative and there is no experience with it.
In case of an emergency related to the comprehensive management of waste should resort to
civil protection.
In the case of the generation of hazardous waste considered as infectious, SEMARNAT, together
with the Ministry of Health will issue official Mexican standards by which their management and
disposal is regulated.
Governance In Mexico, the waste management sector is organised according to three types of waste: (i)
municipal solid waste (MSW); (ii) special handling waste; and (iii) hazardous waste. Each type
accounts for a different value chain given the fact that the Public Administration is involved at
different levels in the management process. Firstly, municipalities are responsible for the
management of municipal solid waste, secondly, states are responsible special handling waste
and lastly federal authorities oversee hazardous waste. A telling feature of the Mexican system is
that the municipalities do not charge fees for the collection, treatment and disposal of waste,
which impairs a correct waste management. In addition, the only regulated phase in the whole
process is the final disposal.
Recently, the new vision for waste management in the country has been published and, in this
declaration, the following 6 Guiding Principles of the waste management policy are established:
• Sustainable development. Consider the integrity of the development of the country, with economic, social and environmental aspects.
• Circular economy. Establish the bases and develop the mechanisms and instruments to implement a circular economy approach that strengthens the sustainable management of materials, with a zero-waste vision.
• Fight against corruption and transparency in public management. Prevent and avoid discretion in the provision and collection of services.
• Attention to vulnerable populations and social justice. Provide training and service to isolated populations with few inhabitants. Training of cooperatives and work groups to collaborate in the collection, collection and management of waste.
• Reduce the risk and impacts on health and the environment. Avoid the proliferation of diseases and harmful effects on health due to the inadequate management of waste, as well as the risk and impacts on the environment.
• Social welfare and reduction of inequality. Expand service coverage and serve communities under 10 thousand inhabitants. Establish coordination and follow-up
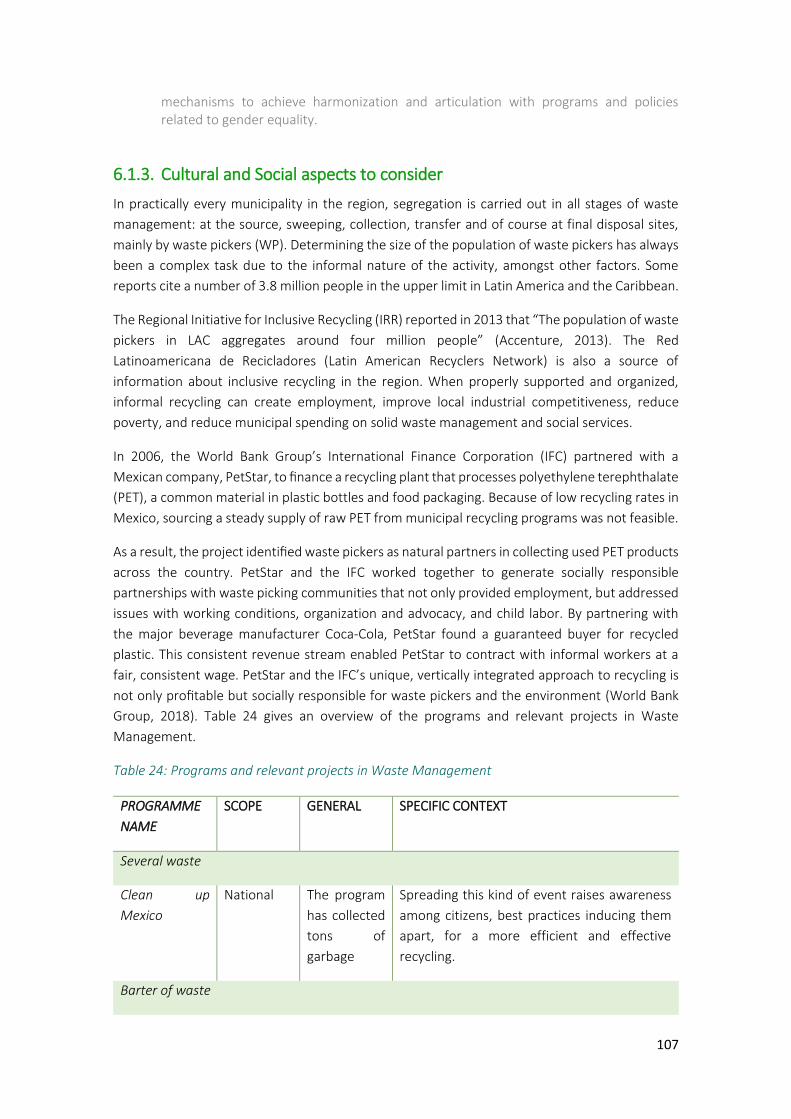
107
mechanisms to achieve harmonization and articulation with programs and policies related to gender equality.
6.1.3. Cultural and Social aspects to consider
In practically every municipality in the region, segregation is carried out in all stages of waste
management: at the source, sweeping, collection, transfer and of course at final disposal sites,
mainly by waste pickers (WP). Determining the size of the population of waste pickers has always
been a complex task due to the informal nature of the activity, amongst other factors. Some
reports cite a number of 3.8 million people in the upper limit in Latin America and the Caribbean.
The Regional Initiative for Inclusive Recycling (IRR) reported in 2013 that “The population of waste
pickers in LAC aggregates around four million people” (Accenture, 2013). The Red
Latinoamericana de Recicladores (Latin American Recyclers Network) is also a source of
information about inclusive recycling in the region. When properly supported and organized,
informal recycling can create employment, improve local industrial competitiveness, reduce
poverty, and reduce municipal spending on solid waste management and social services.
In 2006, the World Bank Group’s International Finance Corporation (IFC) partnered with a
Mexican company, PetStar, to finance a recycling plant that processes polyethylene terephthalate
(PET), a common material in plastic bottles and food packaging. Because of low recycling rates in
Mexico, sourcing a steady supply of raw PET from municipal recycling programs was not feasible.
As a result, the project identified waste pickers as natural partners in collecting used PET products
across the country. PetStar and the IFC worked together to generate socially responsible
partnerships with waste picking communities that not only provided employment, but addressed
issues with working conditions, organization and advocacy, and child labor. By partnering with
the major beverage manufacturer Coca-Cola, PetStar found a guaranteed buyer for recycled
plastic. This consistent revenue stream enabled PetStar to contract with informal workers at a
fair, consistent wage. PetStar and the IFC’s unique, vertically integrated approach to recycling is
not only profitable but socially responsible for waste pickers and the environment (World Bank
Group, 2018). Table 24 gives an overview of the programs and relevant projects in Waste
Management.
Table 24: Programs and relevant projects in Waste Management
PROGRAMME
NAME
SCOPE GENERAL SPECIFIC CONTEXT
Several waste
Clean up
Mexico
National The program
has collected
tons of
garbage
Spreading this kind of event raises awareness
among citizens, best practices inducing them
apart, for a more efficient and effective
recycling.
Barter of waste
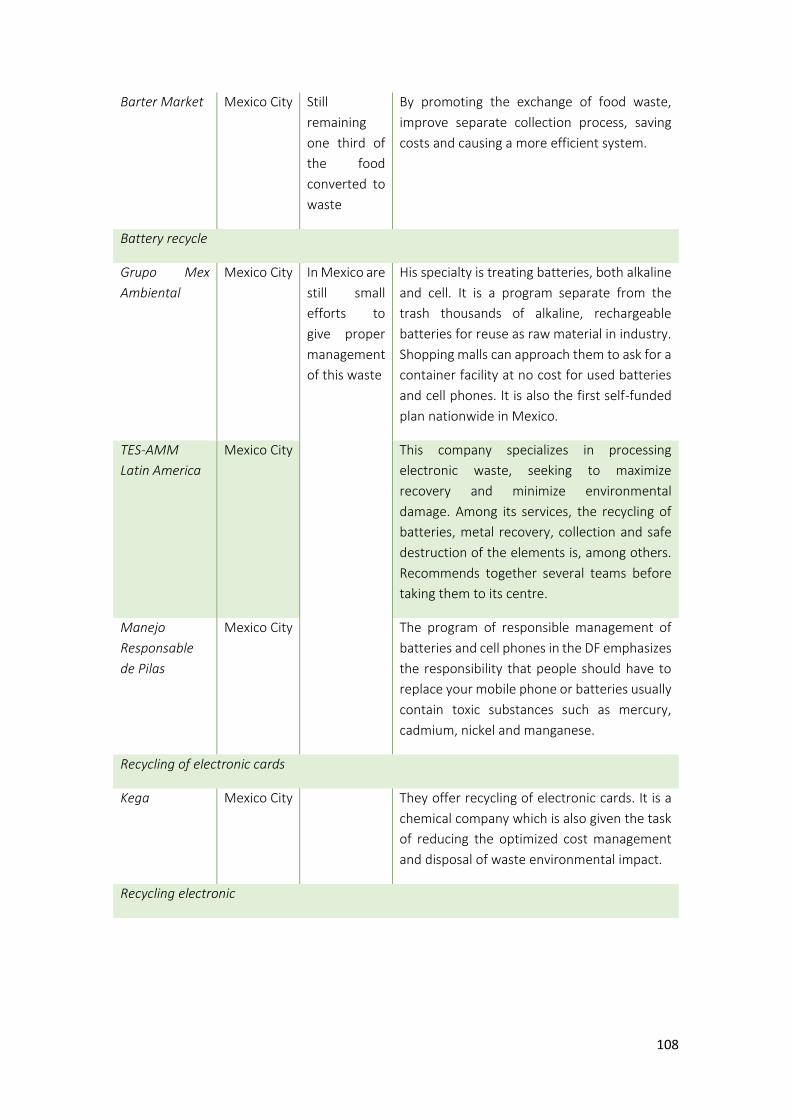
108
Barter Market Mexico City Still
remaining
one third of
the food
converted to
waste
By promoting the exchange of food waste,
improve separate collection process, saving
costs and causing a more efficient system.
Battery recycle
Grupo Mex
Ambiental
Mexico City In Mexico are
still small
efforts to
give proper
management
of this waste
His specialty is treating batteries, both alkaline
and cell. It is a program separate from the
trash thousands of alkaline, rechargeable
batteries for reuse as raw material in industry.
Shopping malls can approach them to ask for a
container facility at no cost for used batteries
and cell phones. It is also the first self-funded
plan nationwide in Mexico.
TES-AMM
Latin America
Mexico City This company specializes in processing
electronic waste, seeking to maximize
recovery and minimize environmental
damage. Among its services, the recycling of
batteries, metal recovery, collection and safe
destruction of the elements is, among others.
Recommends together several teams before
taking them to its centre.
Manejo
Responsable
de Pilas
Mexico City The program of responsible management of
batteries and cell phones in the DF emphasizes
the responsibility that people should have to
replace your mobile phone or batteries usually
contain toxic substances such as mercury,
cadmium, nickel and manganese.
Recycling of electronic cards
Kega Mexico City
They offer recycling of electronic cards. It is a
chemical company which is also given the task
of reducing the optimized cost management
and disposal of waste environmental impact.
Recycling electronic
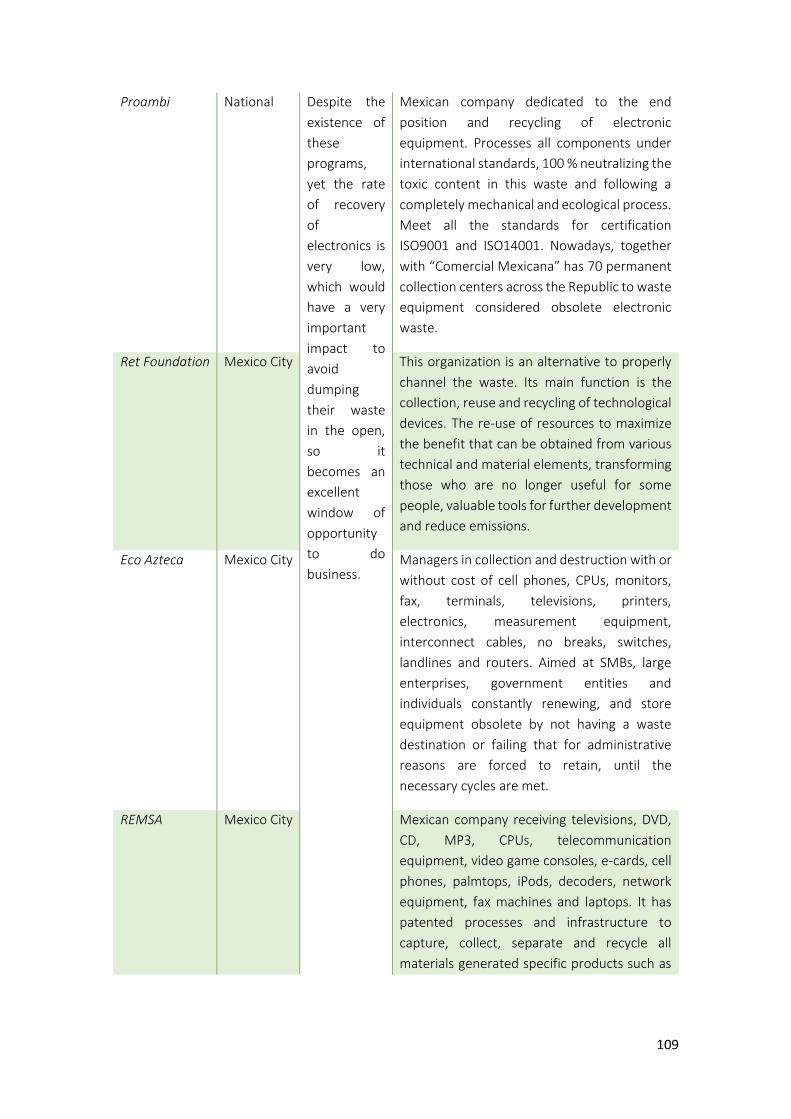
109
Proambi National Despite the
existence of
these
programs,
yet the rate
of recovery
of
electronics is
very low,
which would
have a very
important
impact to
avoid
dumping
their waste
in the open,
so it
becomes an
excellent
window of
opportunity
to do
business.
Mexican company dedicated to the end
position and recycling of electronic
equipment. Processes all components under
international standards, 100 % neutralizing the
toxic content in this waste and following a
completely mechanical and ecological process.
Meet all the standards for certification
ISO9001 and ISO14001. Nowadays, together
with “Comercial Mexicana” has 70 permanent
collection centers across the Republic to waste
equipment considered obsolete electronic
waste.
Ret Foundation Mexico City This organization is an alternative to properly
channel the waste. Its main function is the
collection, reuse and recycling of technological
devices. The re-use of resources to maximize
the benefit that can be obtained from various
technical and material elements, transforming
those who are no longer useful for some
people, valuable tools for further development
and reduce emissions.
Eco Azteca Mexico City Managers in collection and destruction with or
without cost of cell phones, CPUs, monitors,
fax, terminals, televisions, printers,
electronics, measurement equipment,
interconnect cables, no breaks, switches,
landlines and routers. Aimed at SMBs, large
enterprises, government entities and
individuals constantly renewing, and store
equipment obsolete by not having a waste
destination or failing that for administrative
reasons are forced to retain, until the
necessary cycles are met.
REMSA Mexico City Mexican company receiving televisions, DVD,
CD, MP3, CPUs, telecommunication
equipment, video game consoles, e-cards, cell
phones, palmtops, iPods, decoders, network
equipment, fax machines and laptops. It has
patented processes and infrastructure to
capture, collect, separate and recycle all
materials generated specific products such as
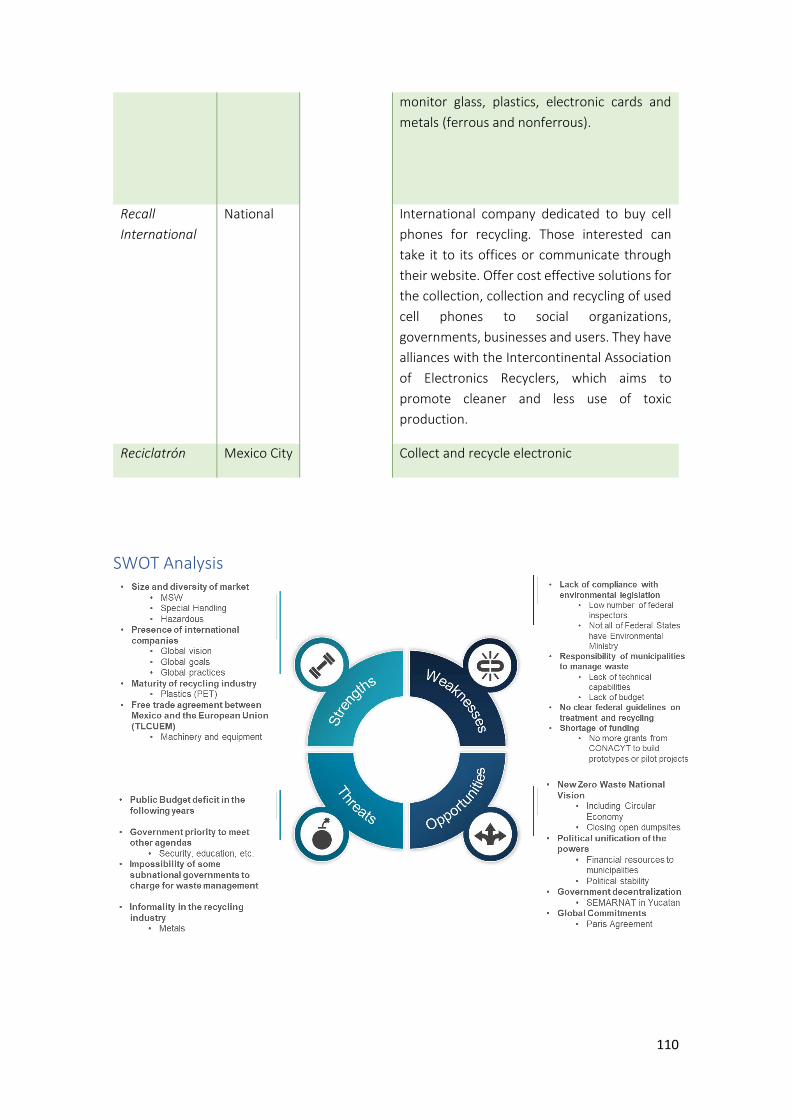
110
monitor glass, plastics, electronic cards and
metals (ferrous and nonferrous).
Recall
International
National International company dedicated to buy cell
phones for recycling. Those interested can
take it to its offices or communicate through
their website. Offer cost effective solutions for
the collection, collection and recycling of used
cell phones to social organizations,
governments, businesses and users. They have
alliances with the Intercontinental Association
of Electronics Recyclers, which aims to
promote cleaner and less use of toxic
production.
Reciclatrón Mexico City Collect and recycle electronic
SWOT Analysis
111
6.1.4. Key events/fairs/conferences
• http://www.residuosexpo.com/RE2018/es/
• https://www.thegreenexpo.com.mx/2018/es/
• https://expoenverdeser.com/
• https://www.earthxmexico.org/
6.1.5. Existing reports/information for further reading
It is highly recommended to review the results and publications of the recently completed ENRES
Program (Energy from waste) promoted by GIZ, SEMARNAT and SENER.
ENRES Program
1. Analysis of public policy instruments to stimulate the energy recovery of urban waste in Mexico
and proposals to improve and expand them
Download
2. Technical guide for the management and use of biogas in wastewater treatment plants
Download
3. Sources of financial resources available for energy use projects of urban solid waste and special
management in Mexico
Download
4. Potential for the energy recovery of urban waste in Mexico, through co-processing in cement
kilns
Download
5. Waste-to-Energy Options in Municipal Solid Waste Management
Download
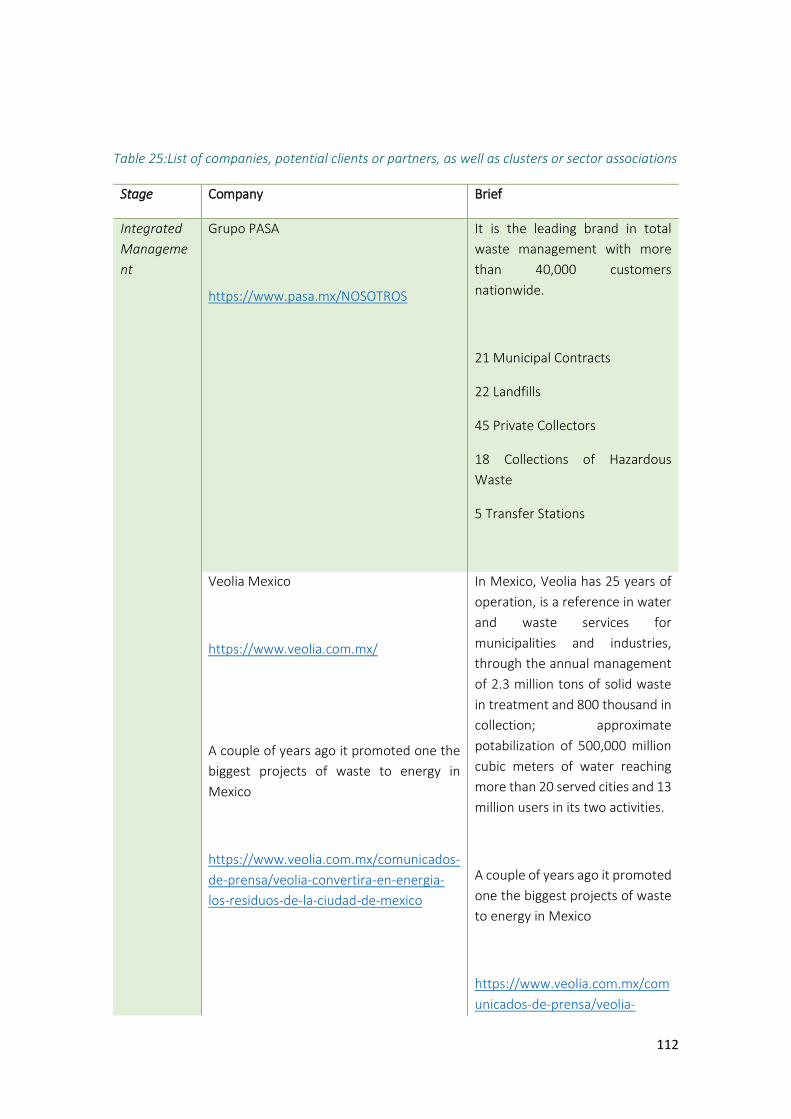
112
Table 25:List of companies, potential clients or partners, as well as clusters or sector associations
Stage Company Brief
Integrated
Manageme
nt
Grupo PASA
https://www.pasa.mx/NOSOTROS
It is the leading brand in total
waste management with more
than 40,000 customers
nationwide.
21 Municipal Contracts
22 Landfills
45 Private Collectors
18 Collections of Hazardous
Waste
5 Transfer Stations
Veolia Mexico
https://www.veolia.com.mx/
A couple of years ago it promoted one the
biggest projects of waste to energy in
Mexico
https://www.veolia.com.mx/comunicados-
de-prensa/veolia-convertira-en-energia-
los-residuos-de-la-ciudad-de-mexico
In Mexico, Veolia has 25 years of
operation, is a reference in water
and waste services for
municipalities and industries,
through the annual management
of 2.3 million tons of solid waste
in treatment and 800 thousand in
collection; approximate
potabilization of 500,000 million
cubic meters of water reaching
more than 20 served cities and 13
million users in its two activities.
A couple of years ago it promoted
one the biggest projects of waste
to energy in Mexico
https://www.veolia.com.mx/com
unicados-de-prensa/veolia-
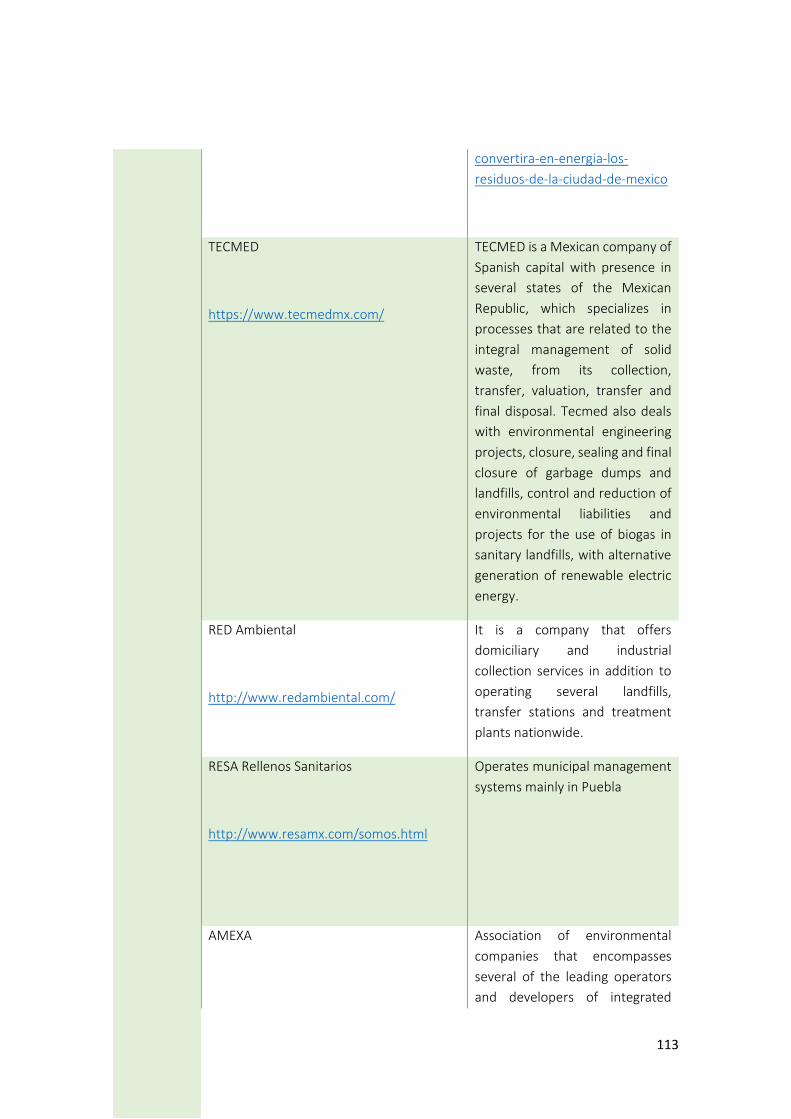
113
convertira-en-energia-los-
residuos-de-la-ciudad-de-mexico
TECMED
https://www.tecmedmx.com/
TECMED is a Mexican company of
Spanish capital with presence in
several states of the Mexican
Republic, which specializes in
processes that are related to the
integral management of solid
waste, from its collection,
transfer, valuation, transfer and
final disposal. Tecmed also deals
with environmental engineering
projects, closure, sealing and final
closure of garbage dumps and
landfills, control and reduction of
environmental liabilities and
projects for the use of biogas in
sanitary landfills, with alternative
generation of renewable electric
energy.
RED Ambiental
http://www.redambiental.com/
It is a company that offers
domiciliary and industrial
collection services in addition to
operating several landfills,
transfer stations and treatment
plants nationwide.
RESA Rellenos Sanitarios
http://www.resamx.com/somos.html
Operates municipal management
systems mainly in Puebla
AMEXA
Association of environmental
companies that encompasses
several of the leading operators
and developers of integrated
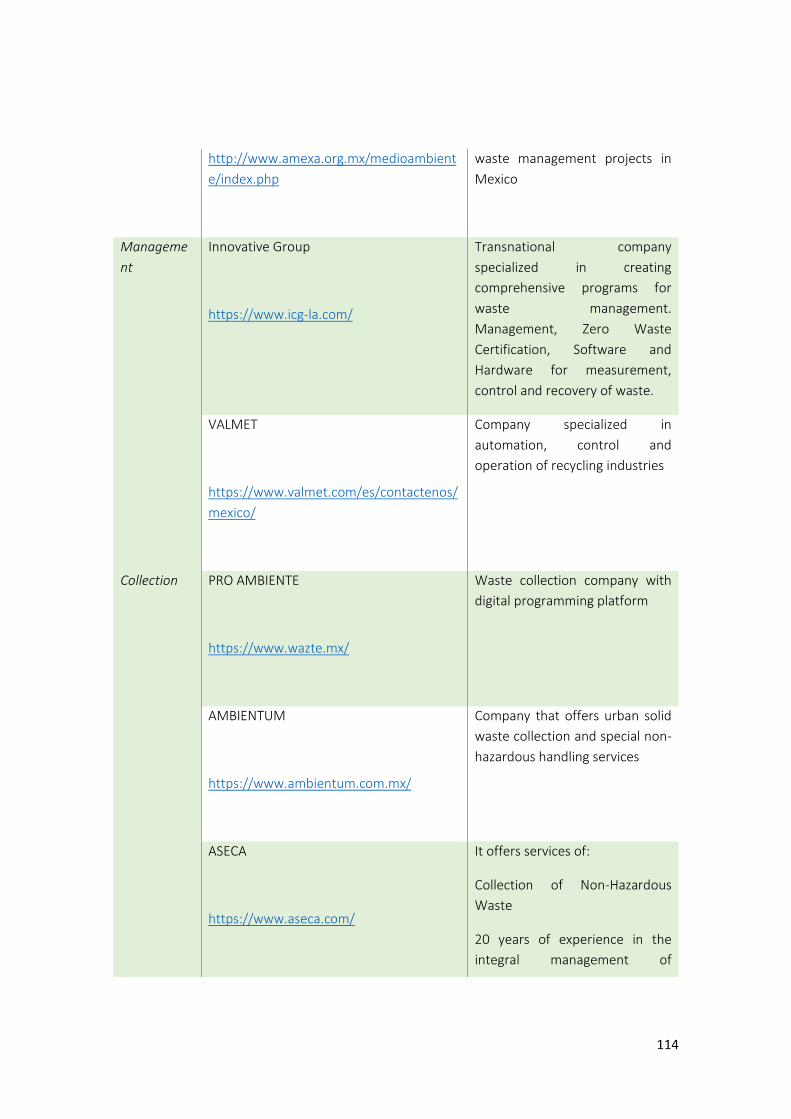
114
http://www.amexa.org.mx/medioambient
e/index.php
waste management projects in
Mexico
Manageme
nt
Innovative Group
https://www.icg-la.com/
Transnational company
specialized in creating
comprehensive programs for
waste management.
Management, Zero Waste
Certification, Software and
Hardware for measurement,
control and recovery of waste.
VALMET
https://www.valmet.com/es/contactenos/
mexico/
Company specialized in
automation, control and
operation of recycling industries
Collection PRO AMBIENTE
https://www.wazte.mx/
Waste collection company with
digital programming platform
AMBIENTUM
https://www.ambientum.com.mx/
Company that offers urban solid
waste collection and special non-
hazardous handling services
ASECA
https://www.aseca.com/
It offers services of:
Collection of Non-Hazardous
Waste
20 years of experience in the
integral management of
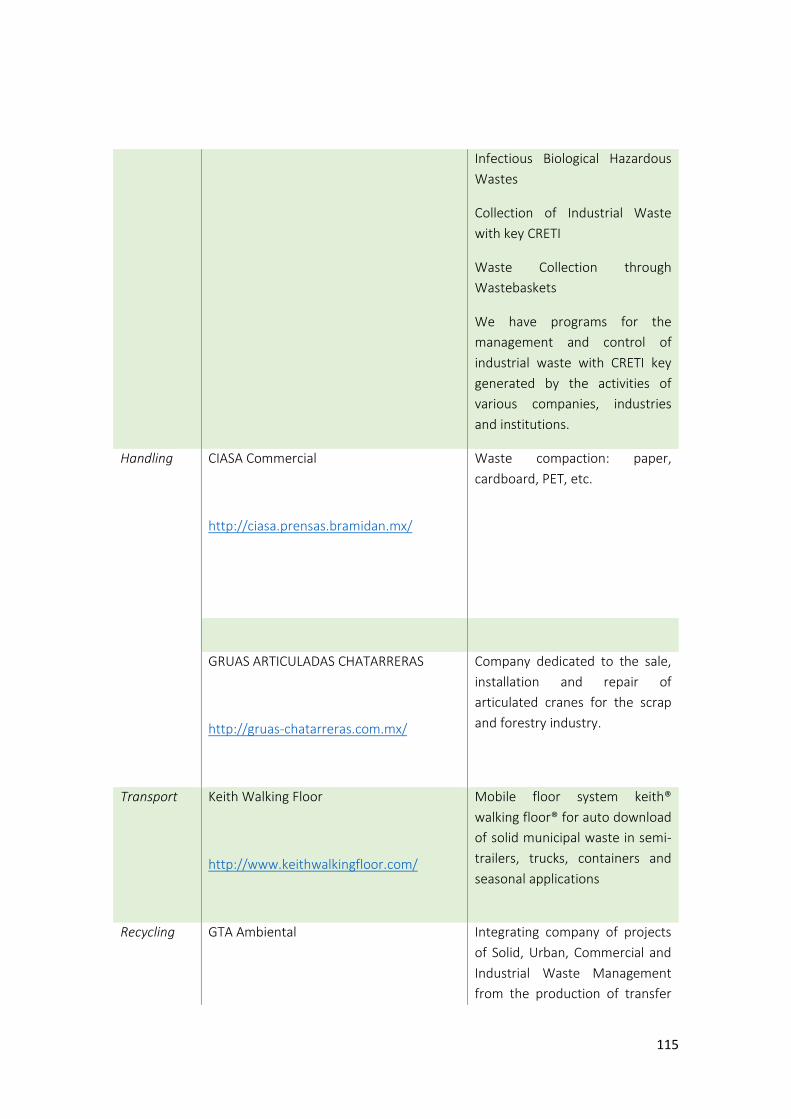
115
Infectious Biological Hazardous
Wastes
Collection of Industrial Waste
with key CRETI
Waste Collection through
Wastebaskets
We have programs for the
management and control of
industrial waste with CRETI key
generated by the activities of
various companies, industries
and institutions.
Handling CIASA Commercial
http://ciasa.prensas.bramidan.mx/
Waste compaction: paper,
cardboard, PET, etc.
GRUAS ARTICULADAS CHATARRERAS
http://gruas-chatarreras.com.mx/
Company dedicated to the sale,
installation and repair of
articulated cranes for the scrap
and forestry industry.
Transport Keith Walking Floor
http://www.keithwalkingfloor.com/
Mobile floor system keith®
walking floor® for auto download
of solid municipal waste in semi-
trailers, trucks, containers and
seasonal applications
Recycling GTA Ambiental
Integrating company of projects
of Solid, Urban, Commercial and
Industrial Waste Management
from the production of transfer
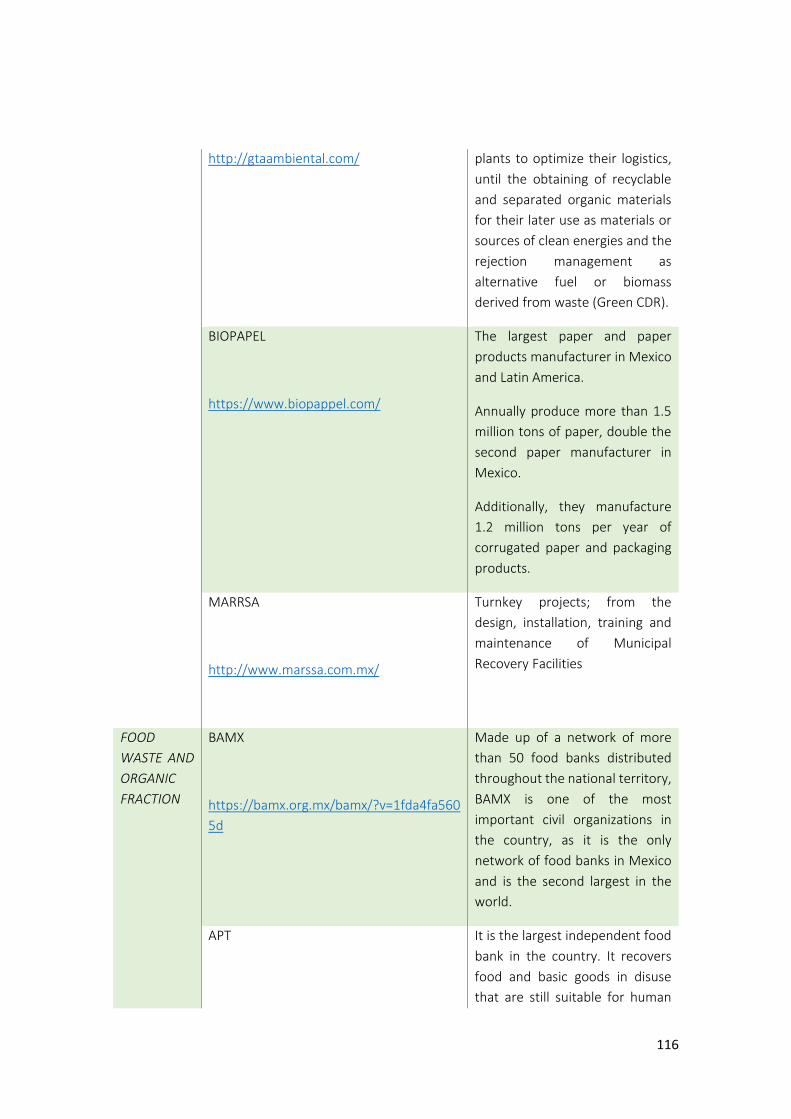
116
http://gtaambiental.com/ plants to optimize their logistics,
until the obtaining of recyclable
and separated organic materials
for their later use as materials or
sources of clean energies and the
rejection management as
alternative fuel or biomass
derived from waste (Green CDR).
BIOPAPEL
https://www.biopappel.com/
The largest paper and paper
products manufacturer in Mexico
and Latin America.
Annually produce more than 1.5
million tons of paper, double the
second paper manufacturer in
Mexico.
Additionally, they manufacture
1.2 million tons per year of
corrugated paper and packaging
products.
MARRSA
http://www.marssa.com.mx/
Turnkey projects; from the
design, installation, training and
maintenance of Municipal
Recovery Facilities
FOOD
WASTE AND
ORGANIC
FRACTION
BAMX
https://bamx.org.mx/bamx/?v=1fda4fa560
5d
Made up of a network of more
than 50 food banks distributed
throughout the national territory,
BAMX is one of the most
important civil organizations in
the country, as it is the only
network of food banks in Mexico
and is the second largest in the
world.
APT
It is the largest independent food
bank in the country. It recovers
food and basic goods in disuse
that are still suitable for human
117
https://www.apt.org.mx/
consumption and use, to deliver
them to people living in poverty.
ALDEA VERDE
https://www.aldeaverde.mx/
Leaders and national references
in the sector, with more than 70
compost and vermicomposting
plants assembled to date.
IBTECH
http://ibtech.com.mx/
IBTech® is a Mexican company
dedicated to the diagnosis,
design, construction, start-up and
operation of water conditioning
plants and wastewater
treatment, as well as biogas
generation plants and energy
from biomass.
SUEMA
www.suema.com.mx
It is an innovation agency focused
on the development of circular
economy projects in the organic
cycle and plastic cycle. They have
built the first urban biogas system
to treat organic waste produce in
public markets in Mexico City.
Plastic
Waste
PETSTAR
http://www.petstar.mx/
The PET recycling plant largest
food grade in the world
CPR
http://www.cprmex.net/
Founded in 2009, CPR MEX is
associated with VALGROUP,
which has been active in several
countries for more than 30 years
in the plastic products
transformation and marketing
market. The company specializes

118
in the manufacture of recycled
resins.
ECOCE
http://www.ecoce.org.mx/
It is an environmental civil
association created and
sponsored by the consumer
products industry. Leader in
environmental sustainability and
tool of Corporate Social
Responsibility (CSR) of our
associates, through the recovery
of packaging waste and packaging
of its products, for recycling in
Mexico. We are the first
organization in Mexico to
propose concrete actions on the
proper handling of packaging and
packaging waste.
ANIPAC
https://anipac.com/
It is an organization with greater
representation of the sector,
since it is present throughout the
supply chain: from producers and
distributors of raw materials,
recyclers, producers and
distributors of machinery and
equipment, and plastic
transformers in all its forms.
ANIQ
http://www.aniq.org.mx/webpublico/
It currently represents more than
95% of the private production of
chemicals in our country through
around 258 companies of
different sizes and activities
within the sector that are
voluntarily affiliated.
INBOPLAST
https://www.inboplast.com.mx/
Inboplast is an association of
industrial companies,
manufacturers of plastic bags and
plastic packaging, concerned and
occupied by the future of the
planet, which through the
119
continuous innovation of its
products, as well as the efficient
management of the natural
resources it employs, allows the
protection and maintenance of
the environment.
INDUPLASTIC
https://induplastic.com/
Company dedicated to the
recycling of all types of plastics
and the maquila
CONSTRUCT
ION &
DEMOLITIO
N WASTE
CONCRETOS RECICLADOS
http://www.concretosreciclados.com.mx/
es/index.php
Concretos Reciclados is a Mexican
company dedicated to the
recycling of construction waste,
founded in 2004.
CMIC
http://www.cmic.org/
The CMlC is a public, autonomous
institution with its own legal
personality and jurisdiction
throughout the territory of the
Mexican Republic that was
established on March 23, 1953
and currently has about 12
thousand members.
SUMe
http://sume.org.mx/
SUMe Sustainability for Mexico
A.C. is a nonprofit association
whose vision is to join efforts
towards a sustainable Mexico in
order to improve the quality of
life of all through joint actions and
wills. SUMe is officially the
Established Council for Mexico of
the World Green Building Council
(WGBC) and is recognized by the
US Green Building Council
(USGBC) as an Education Partner.
120
e-WASTE ANATEL
http://www.anatel.org.mx/
Currently ANATEL has 52
Associate members that
represent 90% of the added value
that the telecommunications
industry brings to the Mexican
economy.
CANIETI
http://www.canieti.org/
The National Chamber of the
Electronics Industry of
Telecommunications and
Information Technology has more
than 80 years of life in our
country, the Chamber is
integrated by more than 1000
affiliated companies throughout
Mexico
HOME
APPLIANCE
ANFAD
http://anfad.org.mx/
The ANFAD has 28 associated
companies, which are divided
into 7 representative sectors
nationwide. It is an organization
whose objective is to guarantee
the development of the industry
of domestic appliances
integrated by a General Assembly
of Associates and a Board of
Directors, constituted by the
most important representatives
of the various companies
belonging to the category.
Hazardous
waste
CIMARI
http://www.cimari.com.mx/
Company dedicated to the
handling, treatment and disposal
of hazardous waste
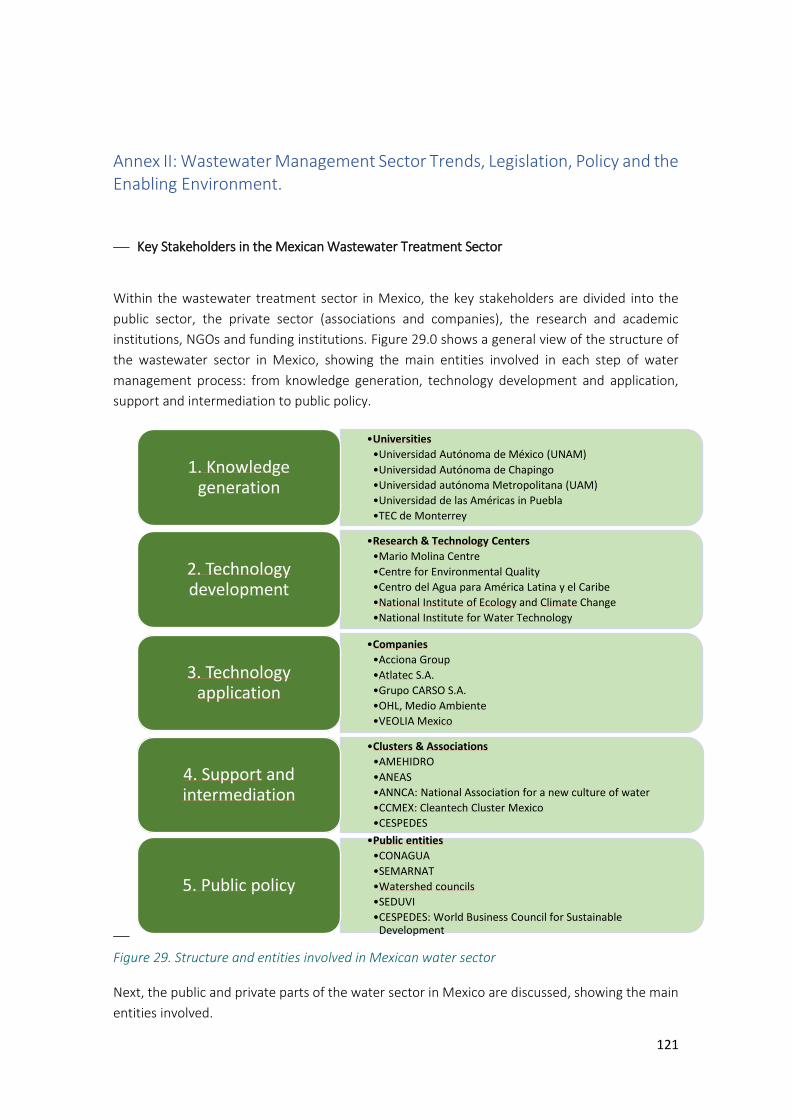
121
Annex II: Wastewater Management Sector Trends, Legislation, Policy and the Enabling Environment.
⎯ Key Stakeholders in the Mexican Wastewater Treatment Sector
Within the wastewater treatment sector in Mexico, the key stakeholders are divided into the
public sector, the private sector (associations and companies), the research and academic
institutions, NGOs and funding institutions. Figure 29.0 shows a general view of the structure of
the wastewater sector in Mexico, showing the main entities involved in each step of water
management process: from knowledge generation, technology development and application,
support and intermediation to public policy.
⎯
Figure 29. Structure and entities involved in Mexican water sector
Next, the public and private parts of the water sector in Mexico are discussed, showing the main
entities involved.
•Universities
•Universidad Autónoma de México (UNAM)
•Universidad Autónoma de Chapingo
•Universidad autónoma Metropolitana (UAM)
•Universidad de las Américas in Puebla
•TEC de Monterrey
1. Knowledgegeneration
•Research & Technology Centers
•Mario Molina Centre
•Centre for Environmental Quality
•Centro del Agua para América Latina y el Caribe
•National Institute of Ecology and Climate Change
•National Institute for Water Technology
2. Technologydevelopment
•Companies
•Acciona Group
•Atlatec S.A.
•Grupo CARSO S.A.
•OHL, Medio Ambiente
•VEOLIA Mexico
3. Technologyapplication
•Clusters & Associations
•AMEHIDRO
•ANEAS
•ANNCA: National Association for a new culture of water
•CCMEX: Cleantech Cluster Mexico
•CESPEDES
4. Support and intermediation
•Public entities
•CONAGUA
•SEMARNAT
•Watershed councils
•SEDUVI
•CESPEDES: World Business Council for Sustainable Development
5. Public policy
122
⎯ The Public sector Concerning the public part of the sector the following institutions are the key players involved in
the water public sector:
• Banks and funding institutions BANOBRAS: National Bank for Public Works
FIRA: Trust funds related to Agriculture
• Public authorities CONAGUA: National Commission for Water
SAGARPA: Ministry of Economy and Production, through the Secretaries of Agriculture, Livestock,
Fisheries and Food
SEDATU: Ministry for Land Planning and Development
SEMARNAT: Ministry of Environment and Natural Resources
SFNA: Undersecretary for Environmental Support and Regulations
SGPA: Undersecretary for Management of Environmental Conservation
SHCP: Ministry of Finance
SPPA: Undersecretary for Planning and Environmental Policy in SEMARNAT
• National institutions CENAPRED: National Disaster Prevention Centre
CONACYT: National Council for Science and Technology
CONANP: National Commission for Protected Areas
INE: National Ecology Institute
PROFEPA: State Attorney for the Protection of the Environment
For European entities looking to work in Mexico, CONAGUA would be the main institution to liaise
with, as it is the entity in charge of launching tenders and adjudicating winning proposals and
funding wastewater projects in Mexico. CONAGUA is subordinated to SEMARNAT, which is the
Secretary of Environment and Natural Resources. Its main functions include the development of
the national water policy; administering the rights for water use and wastewater discharge;
planning, irrigation and developing drainage systems; managing emergency and natural disasters
and managing investment in the water sector in Mexico. Also, there are international funding
agencies that fund water projects in Mexico (GIZ, World Bank, IDB, etc.)
Other public entities involved in water management in Mexico are the State Government and
Municipal Governments. State governments have responsibilities for planning, regulating,
123
developing infrastructure for water resources and, in some cases, directly providing water and
sanitation. Municipalities are responsible for providing water and, generally, sanitation services.
⎯ Private sector The water sector has several private institutions that play an important role in national water
management. They can be divided between individual companies and clusters or associations.
They are listed in Annex 2A. Many of these companies are Mexican (e.g. Atlatec, Controladora de
Operaciones e Infraestructura S.A.) but there is also a strong link with Spanish (e.g. Acciona, Sacyr)
and other European entities (Alfa Laval).
Companies are often associated in clusters or associations that operate jointly in the Mexican
water sector. Amongst them, AMEXA (Mexican Association for Environmental Companies) links
companies that provide services in different sectors to fight against environmental deterioration,
including projects related to the improvement of water management. CESPEDES is another
relevant companies’ cluster that develop public policies in terms of sustainability with a business
point of view. This association represents Mexican environmental sector in national and
international forums.
⎯ Research sector There is a series of academic institutions that focus, to some extent, in the water sector in Mexico.
The most important are listed in Annex 2B.
An example of world leading research is found in the work done by experts of UNAM (Universidad
Autónoma Metropolitana) in the Instituto de Ingeniería (Engineering Institute) related to water
reuse research some of it focused on increasing soil productivity (B. Jiménez Cisneros). Also, Tec
de Monterrey is known for its research concerning industrial wastewater treatment with specific
specialisation on membrane bioreactors. Moreover, this institution has developed several
systems for rainfall water gathering and reuse. Tec de Monterrey are also one of the founding
members of the “Centro de Agua para America Latina y el Caribe” (The Water Centre for Latin
America and the Caribbean) which is a centre known across Latin America for its training and
research on water resources research management and for specifically running the water
network in Latin America and the Caribbean.
⎯ Non-governmental organizations: The most important NGO working on water issues in Mexico is “Agua para Todos” (Water for
Everyone, http://aguaparatodos.org.mx/). This organization is focused on the protection of water
resources for Mexican citizens. It is formed by local associations, social organizations, trade
unions, farmers, human rights associations, local community systems, church communities,
students and researchers.
The following are other NGOs that operate, to some extent, in Mexican water sector. They are
presented subdivided by their associated main roles:
124
Sustainability and environment:
Mario Molina Center for Strategic Studies on Energy and the Environment
CTS EMBARQ Mexico: global initiative of the WRI Ross Centre for Sustainable Cities
AIDA: Interamerican Association for Environmental Defense
GREENPEACE: international NGO in Environment
I.A.P.: Environmental Groups’ Union
Environmental Studies Group
Foundation for Sustainable Development
Research
Fundar Analysis and Research Centre
CIDAC: centre for development research
IMCO: Mexican Institute for Competitiveness
Climate
LARCI: Latin America Regional Climate Initiative
Poverty and human rights
OXFAM: international NGO supporting climate change measures to reduce poverty
⎯ Funding institutions With regards to funding mechanisms, Table 26 gives a list of the main entities involved in financial
resources related to water management, operations and infrastructures in Mexico:
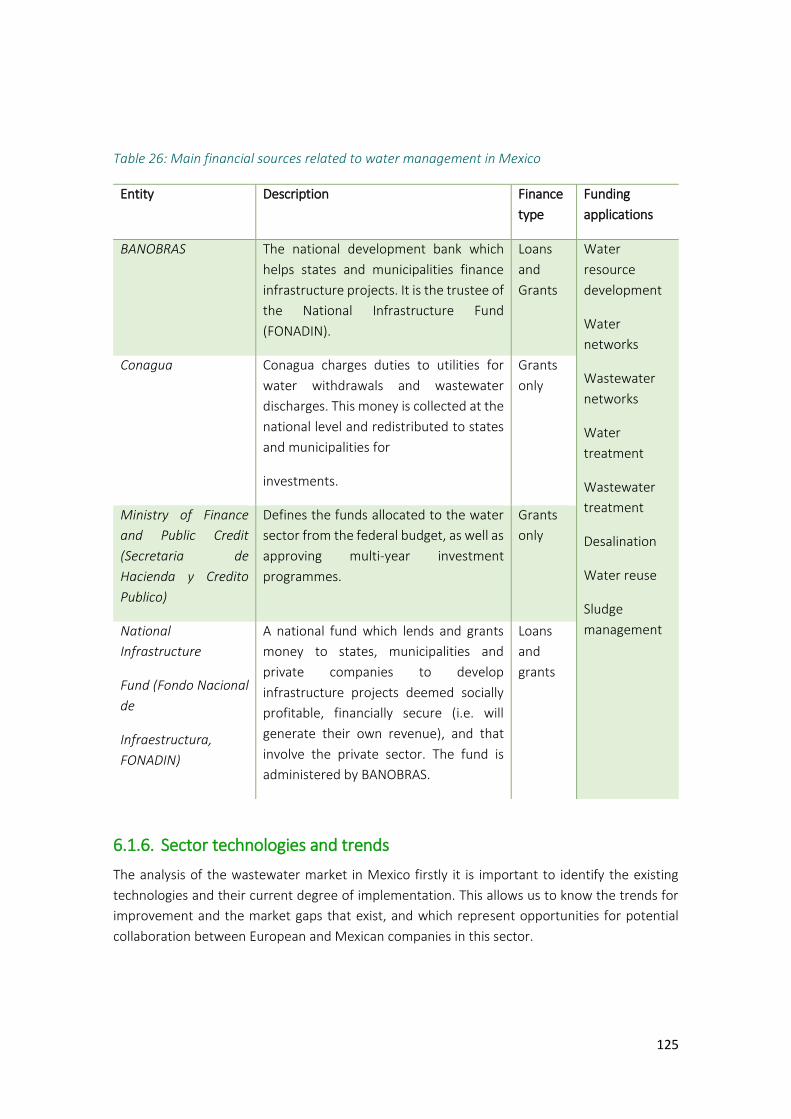
125
Table 26: Main financial sources related to water management in Mexico
Entity Description Finance
type
Funding
applications
BANOBRAS The national development bank which
helps states and municipalities finance
infrastructure projects. It is the trustee of
the National Infrastructure Fund
(FONADIN).
Loans
and
Grants
Water
resource
development
Water
networks
Wastewater
networks
Water
treatment
Wastewater
treatment
Desalination
Water reuse
Sludge
management
Conagua Conagua charges duties to utilities for
water withdrawals and wastewater
discharges. This money is collected at the
national level and redistributed to states
and municipalities for
investments.
Grants
only
Ministry of Finance
and Public Credit
(Secretaria de
Hacienda y Credito
Publico)
Defines the funds allocated to the water
sector from the federal budget, as well as
approving multi-year investment
programmes.
Grants
only
National
Infrastructure
Fund (Fondo Nacional
de
Infraestructura,
FONADIN)
A national fund which lends and grants
money to states, municipalities and
private companies to develop
infrastructure projects deemed socially
profitable, financially secure (i.e. will
generate their own revenue), and that
involve the private sector. The fund is
administered by BANOBRAS.
Loans
and
grants
6.1.6. Sector technologies and trends
The analysis of the wastewater market in Mexico firstly it is important to identify the existing
technologies and their current degree of implementation. This allows us to know the trends for
improvement and the market gaps that exist, and which represent opportunities for potential
collaboration between European and Mexican companies in this sector.
126
Sector trends Wastewater reuse is being increasingly considered by municipal water organisations and the
industrial sector to combat water scarcity. This will be an important market in the northern states,
because they have a higher population, they are hubs of manufacturing and industrial activity,
and have less water availability than in the south.
Being the largest wastewater treatment plant in the world, the recently built Atotonilco plant
represents a crucial element in the increase in the volume of wastewater reused in Mexico. The
plant provides service to 10.5 million of inhabitants and supply an irrigation area of 800.000 has.
The investment was 560 million euros.
Apart from this project, the state of San Luis Potosí recently announced plans to treat wastewater
to a level that can be reused in industrial and potable water supply. The El Morro plant is meant
to provide treatment for 90% of San Luís Potosí wastewater. Recent initiatives such as these
indicate a demand for reuse with advanced technology will be increasingly considered in the
future, therefore constituting an important market opportunity.
According to data from 2014, 106 of Mexico’s 653 national aquifers were in a state of over-
exploitation and 31 of the country’s coastal aquifers were under threat of saltwater intrusion. In
recent years, Conagua has carried out large-scale studies to assess the current state of the
aquifers. One of the main investments in groundwater protection in the coming years will be the
creation of a national aquifer database that will provide real-time data on withdrawal and
recharge rates, as well as the water quality of groundwater in different regions. The initiative is
called the Information System of Aquifer Extraction Volumes (SIEVA) and is designed to provide a
basis for relevant policies related to water rights, withdrawals and aquifer management.
Moreover, 2012 Mexican standard NMX-AA-159-SCFI-2012 was developed with the objective of
restoring the hydrologic balance and to determine ecological flows in watersheds. These aspects
represent a market opportunity for companies involved in the field of water monitoring.
6.1.7. The enabling environment
Policy and legislation Table 27 summarizes the main regulations applicable to the water sector in Mexico
Table 27: Regulation framework applicable to the water sector in Mexico
Document Description Policy areas Industries targeted
Mexican Law
of Public-
Private
Partnerships
(2012)
Establishes the legal
framework for
developing, procuring,
- -
127
and financing PPP
infrastructure projects in
all sectors.
NOM-004-
ECOL-2002
(2002)
Establishes maximum
allowed values for
pollutants in sludge,
according to different
uses.
Sludge
management
Utilities, upstream oil &
gas, refining &
petrochemicals, power
generation, mining, food &
beverage, pulp & paper,
textiles & tanneries,
pharmaceutical,
microelectronics, other
industries
NOM-003-
ECOL-1997
(1997)
Defines the maximum
level of pollutants allowed
in treated wastewater
(both municipal and
industrial) to be reused in
public services such as
green park and golf course
irrigation, artificial
recreational lakes, and car
wash services.
Water reuse Utilities
NOM-001-
ECOL-1996
(1996)
Defines the maximum
level of pollutants in
wastewater that can be
discharged into national
waters.
Wastewater
discharge
Utilities, upstream oil &
gas, refining &
petrochemicals, power
generation, mining, food &
beverage, pulp & paper,
textiles & tanneries,
pharmaceutical,
microelectronics, other
industries
NOM-002-
ECOL-1996
(1996)
Defines the types of
wastewater that can be
discharged into urban
drainage systems.
Wastewater
discharge
Utilities
NOM-127-
SSA1-1994
(1994)
Regulates the quality of
drinking water for human
consumption
Drinking water
quality
Utilities
128
National
Water Law of
1992 (1992
(revised
2004))
The main law governing
the management and
distribution of water in
the country, dictating
everything from quality
standards to private
sector participation.
Drinking water
quality,
wastewater
discharge, water
reuse,
environmental
water quality
Utilities, upstream oil &
gas, refining &
petrochemicals, power
generation, mining, food &
beverage, pulp & paper,
textiles & tanneries,
pharmaceutical,
microelectronics, other
industries
Federal Duties
Law (1981)
Federal law that
determines the amounts
of water abstraction
fees based on the
availability of water in
designated regions,
and which government
institution receives the
money.
- Utilities, upstream oil &
gas, refining &
petrochemicals, power
generation, mining, food &
beverage, pulp & paper,
textiles & tanneries,
pharmaceutical,
microelectronics, other
industries
Together with this general framework, the following points reflect the current trends concerning
water regulations in Mexico:
Enforcement of existing water regulations in industry: in terms of biological oxygen demand the
wastewater discharge of self-supplied industries is equivalent to the municipal wastewater
discharge of 300 million people. Industrial water treatment demand is higher in the north part of
the country and along the US border than in other parts of the country. The government has
taken a harder line with enforcement of existing environmental regulations, mainly as a means of
generating revenue. Therefore, companies are now being pressured to meet prevailing discharge
standards. This will enhance the adoption of more advanced water treatment technology and
water solutions that more adequately address the unique scenario of a given feedwater stream.
Increasingly the demand for advanced treatment will call for better design and operational
support.
2012 Public-Private Partnership Law: this law sets the stakes for a larger percentage of private
financing in public works projects. As such, this law will be the national level law that governs
public-private partnerships (PPPs) in the coming years, not only in the water sector but in all
infrastructure arenas.
New general water law: this law addresses the poor financial and technical capacities of state and
municipal organisations responsible for provision as the primary challenge of the sector. The
129
application of this law has been controversial and has gone through difficulties for its
implementation. It is designed to hold municipalities more accountable and will punish bad
practices and non-compliance. It is designed to depoliticise local water organisations. Conagua
hopes the law will indirectly lead to more concessions and more private sector contracts as the
municipal water organisations will turn to private sector expertise to become fully compliant, as
well as to resolve their outstanding debt.
The private sector is typically required to finance 30-50% of infrastructure costs, usually through
a combination of risk capital and finance. The most common public private partnerships model
used is Design-Build-Operate-Transfer (DBOOT). All or part of a project may be offered for tender.
Once an acquisition project has been identified, the public sector must choose between three
main tender models:
Direct acquisition: public body purchases directly from a supplier, showing examples of rival
companies’ offers to prove competitiveness. Usually used for small acquisitions of goods and
services
Invitation to tender: Public body invites a small number of companies (usually less than 6) to
tender offers for goods and services. Usually used for mid-level acquisitions or situations where
specific skills and experience is required and restricted to national companies.
Open tender: Public body invites tenders from all interested parties, sometimes restricted to
national companies but often including international enterprises. Usually used for the most
expensive infrastructure projects.
⎯ Water Agenda 2030 (Agenda del Agua 2030) Within the official documents that frame water management policies, the Agenda del Agua 2030,
establishes a series of lines of strategy for the following years. These strategies are key for market
evolution and opportunities for international collaboration and can be grouped in two areas:
i. To ensure that the different catchments of the country have a solid governance structure, with enough capacity to manage water resources in a sustainable way
o Consolidated catchment organisms in each of the big watersheds of the country o Operative catchment councils with capacity to concretize and carry out
agreements and strategies o Groundwater technical committees operating in overexploited aquifers, focused
on their rehabilitation o Associations of irrigation users in all districts with reinforced capacities to
improve and modernize their units of production o Organisms and water companies operating at high physical and commercial
efficiency levels ii. To ensure a better and more equilibrated distribution of competences in regulation and
supply of water and wastewater treatment services with responsibilities at the national, regional and municipal level to achieve a more equilibrated National System of Water Management
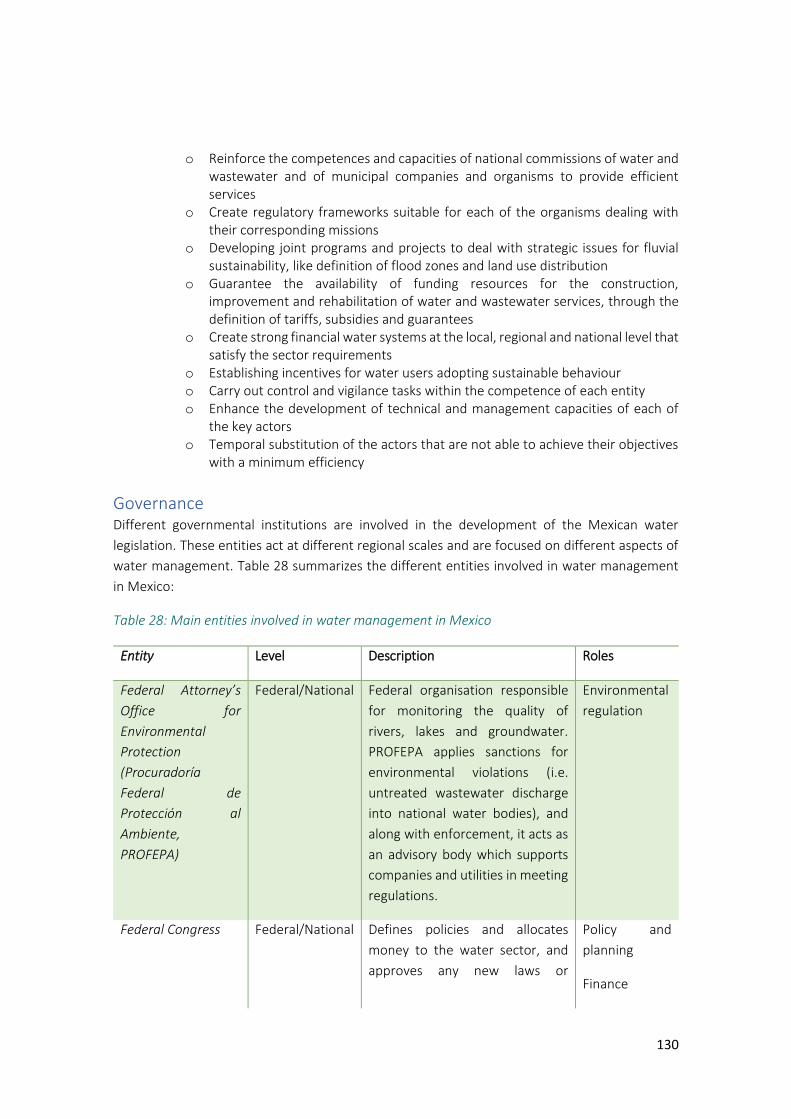
130
o Reinforce the competences and capacities of national commissions of water and wastewater and of municipal companies and organisms to provide efficient services
o Create regulatory frameworks suitable for each of the organisms dealing with their corresponding missions
o Developing joint programs and projects to deal with strategic issues for fluvial sustainability, like definition of flood zones and land use distribution
o Guarantee the availability of funding resources for the construction, improvement and rehabilitation of water and wastewater services, through the definition of tariffs, subsidies and guarantees
o Create strong financial water systems at the local, regional and national level that satisfy the sector requirements
o Establishing incentives for water users adopting sustainable behaviour o Carry out control and vigilance tasks within the competence of each entity o Enhance the development of technical and management capacities of each of
the key actors o Temporal substitution of the actors that are not able to achieve their objectives
with a minimum efficiency
Governance Different governmental institutions are involved in the development of the Mexican water
legislation. These entities act at different regional scales and are focused on different aspects of
water management. Table 28 summarizes the different entities involved in water management
in Mexico:
Table 28: Main entities involved in water management in Mexico
Entity Level Description Roles
Federal Attorney’s
Office for
Environmental
Protection
(Procuradoría
Federal de
Protección al
Ambiente,
PROFEPA)
Federal/National Federal organisation responsible
for monitoring the quality of
rivers, lakes and groundwater.
PROFEPA applies sanctions for
environmental violations (i.e.
untreated wastewater discharge
into national water bodies), and
along with enforcement, it acts as
an advisory body which supports
companies and utilities in meeting
regulations.
Environmental
regulation
Federal Congress Federal/National Defines policies and allocates
money to the water sector, and
approves any new laws or
Policy and
planning
Finance
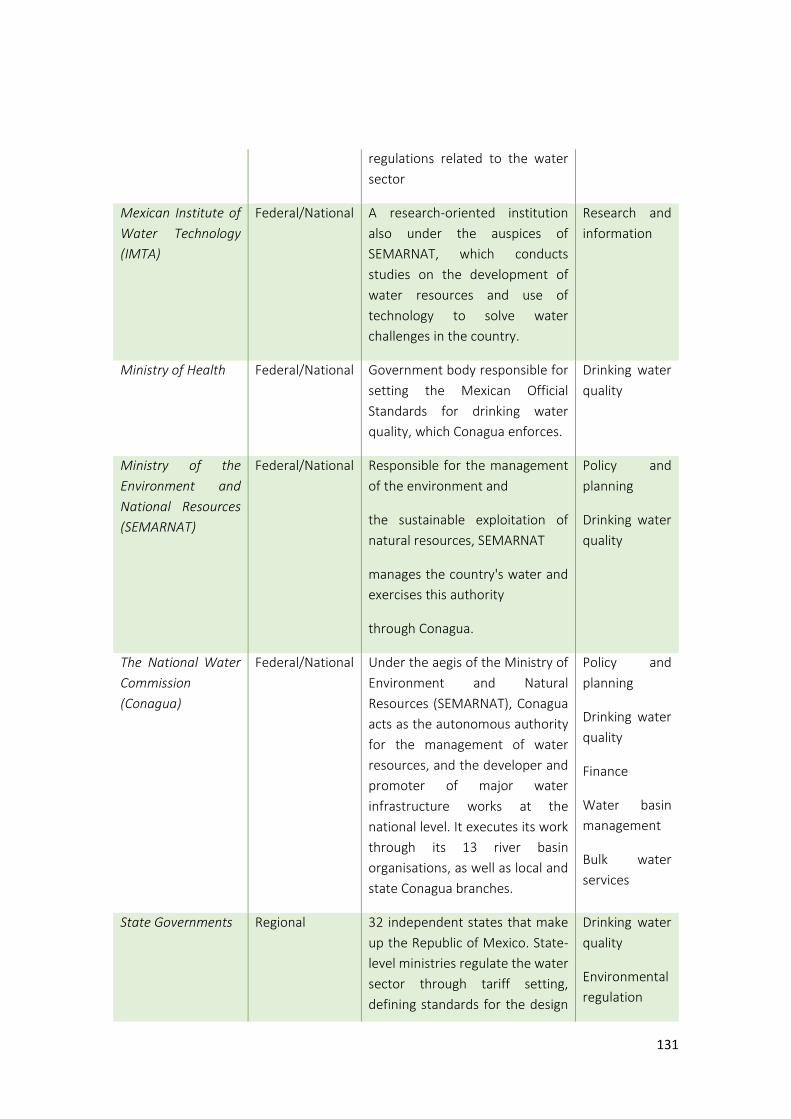
131
regulations related to the water
sector
Mexican Institute of
Water Technology
(IMTA)
Federal/National A research-oriented institution
also under the auspices of
SEMARNAT, which conducts
studies on the development of
water resources and use of
technology to solve water
challenges in the country.
Research and
information
Ministry of Health Federal/National Government body responsible for
setting the Mexican Official
Standards for drinking water
quality, which Conagua enforces.
Drinking water
quality
Ministry of the
Environment and
National Resources
(SEMARNAT)
Federal/National Responsible for the management
of the environment and
the sustainable exploitation of
natural resources, SEMARNAT
manages the country's water and
exercises this authority
through Conagua.
Policy and
planning
Drinking water
quality
The National Water
Commission
(Conagua)
Federal/National Under the aegis of the Ministry of
Environment and Natural
Resources (SEMARNAT), Conagua
acts as the autonomous authority
for the management of water
resources, and the developer and
promoter of major water
infrastructure works at the
national level. It executes its work
through its 13 river basin
organisations, as well as local and
state Conagua branches.
Policy and
planning
Drinking water
quality
Finance
Water basin
management
Bulk water
services
State Governments Regional 32 independent states that make
up the Republic of Mexico. State-
level ministries regulate the water
sector through tariff setting,
defining standards for the design
Drinking water
quality
Environmental
regulation
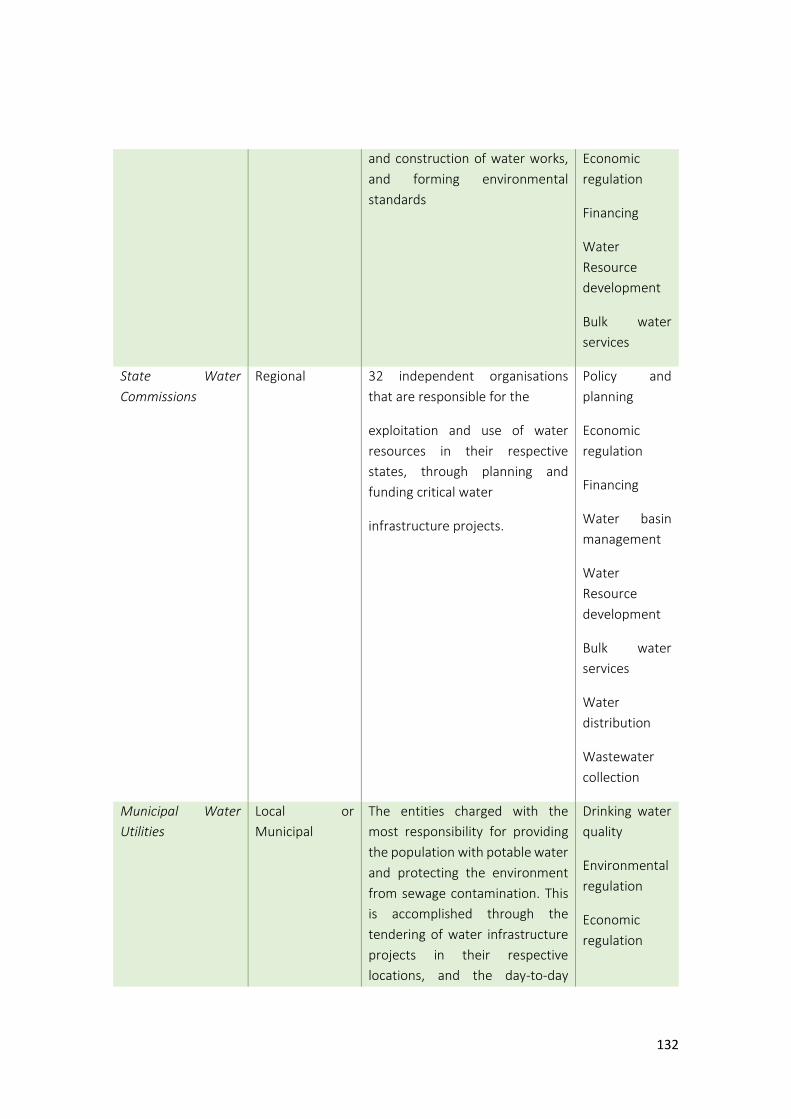
132
and construction of water works,
and forming environmental
standards
Economic
regulation
Financing
Water
Resource
development
Bulk water
services
State Water
Commissions
Regional 32 independent organisations
that are responsible for the
exploitation and use of water
resources in their respective
states, through planning and
funding critical water
infrastructure projects.
Policy and
planning
Economic
regulation
Financing
Water basin
management
Water
Resource
development
Bulk water
services
Water
distribution
Wastewater
collection
Municipal Water
Utilities
Local or
Municipal
The entities charged with the
most responsibility for providing
the population with potable water
and protecting the environment
from sewage contamination. This
is accomplished through the
tendering of water infrastructure
projects in their respective
locations, and the day-to-day
Drinking water
quality
Environmental
regulation
Economic
regulation

133
operation of urban water
networks.
Water
Resource
development
Water
distribution
Wastewater
collection
Wastewater
treatment
Drainage
Cultural and social aspects to consider Several questions arise related to social concern which should be considered when selecting
technologies for wastewater treatment infrastructures (UNAM, 2013). These points should be
taken into account by water managers as they can have an impact on project planning and
development:
⎯ Has the potentially affected population been consulted about the construction of the treatment plant?
⎯ Is the population aware of the need and advantages of a wastewater treatment plant?
⎯ Is there a scheme of citizen participation during the decision process as well as during tendering, construction and operation?
⎯ Will employees be from the local community?
⎯ Is there an education plan for the community (guided visits, museum, social service, other actions)?
⎯ Is there a training plan for employees?
⎯ Is there a response plan for emergencies?
6.1.8. Market overview
Market size The following sectors are considered as involved in the wastewater generation and treatment:
⎯ Wastewater collection, treatment and reuse
⎯ Construction works for wastewater collection, treatment, drainage and irrigation and reuse
⎯ Hidro-sanitary and gas installations
⎯ Architectural and engineering services Figure 30. shows the number of companies for each of these sectors in the different Mexican
states:
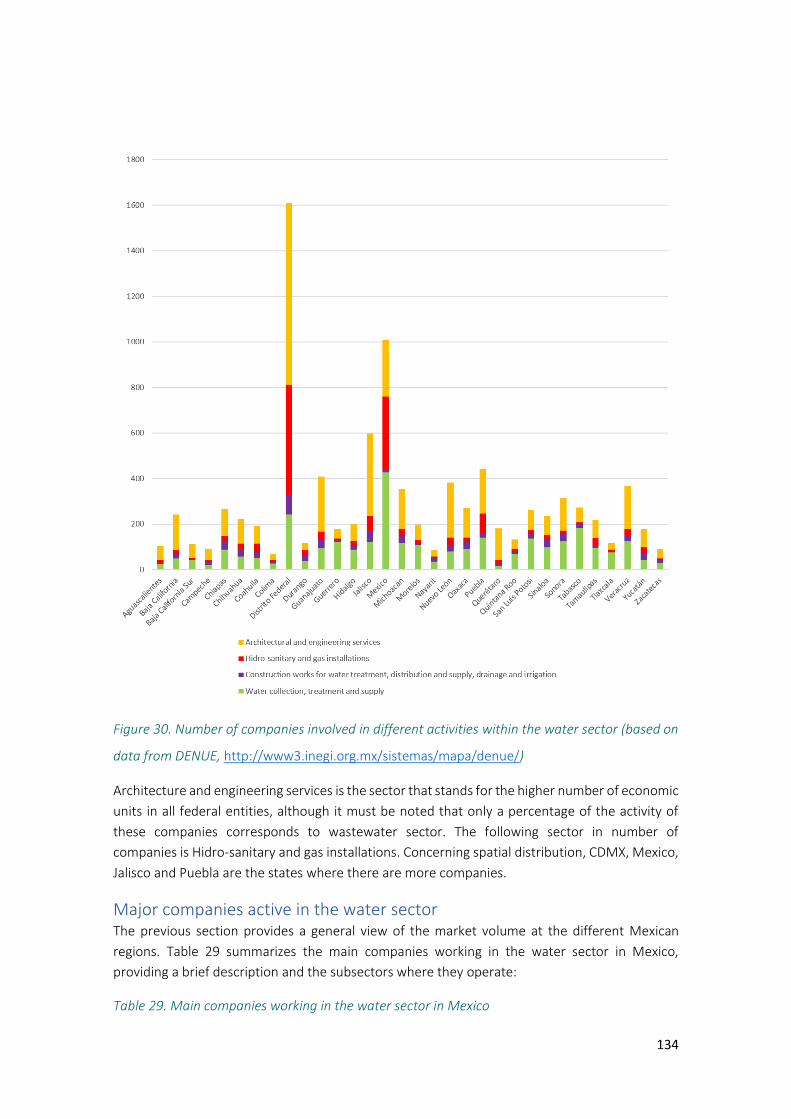
134
Figure 30. Number of companies involved in different activities within the water sector (based on
data from DENUE, http://www3.inegi.org.mx/sistemas/mapa/denue/)
Architecture and engineering services is the sector that stands for the higher number of economic
units in all federal entities, although it must be noted that only a percentage of the activity of
these companies corresponds to wastewater sector. The following sector in number of
companies is Hidro-sanitary and gas installations. Concerning spatial distribution, CDMX, Mexico,
Jalisco and Puebla are the states where there are more companies.
Major companies active in the water sector The previous section provides a general view of the market volume at the different Mexican
regions. Table 29 summarizes the main companies working in the water sector in Mexico,
providing a brief description and the subsectors where they operate:
Table 29. Main companies working in the water sector in Mexico
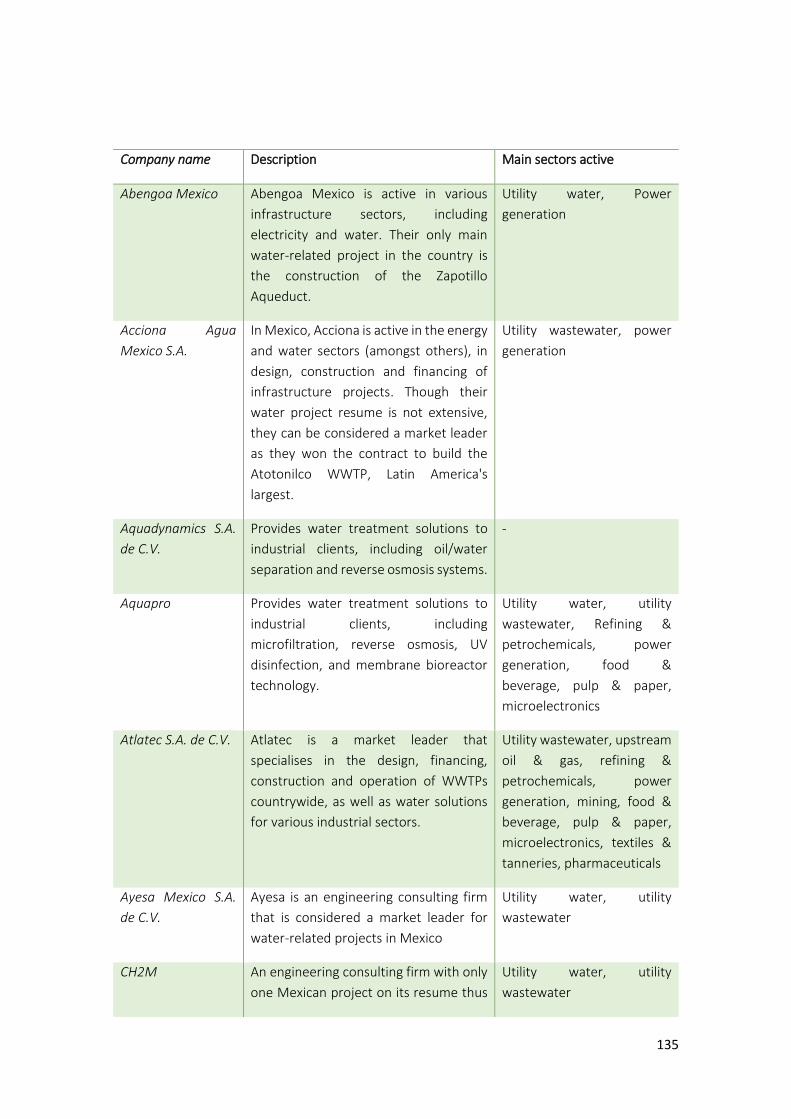
135
Company name Description Main sectors active
Abengoa Mexico Abengoa Mexico is active in various
infrastructure sectors, including
electricity and water. Their only main
water-related project in the country is
the construction of the Zapotillo
Aqueduct.
Utility water, Power
generation
Acciona Agua
Mexico S.A.
In Mexico, Acciona is active in the energy
and water sectors (amongst others), in
design, construction and financing of
infrastructure projects. Though their
water project resume is not extensive,
they can be considered a market leader
as they won the contract to build the
Atotonilco WWTP, Latin America's
largest.
Utility wastewater, power
generation
Aquadynamics S.A.
de C.V.
Provides water treatment solutions to
industrial clients, including oil/water
separation and reverse osmosis systems.
-
Aquapro Provides water treatment solutions to
industrial clients, including
microfiltration, reverse osmosis, UV
disinfection, and membrane bioreactor
technology.
Utility water, utility
wastewater, Refining &
petrochemicals, power
generation, food &
beverage, pulp & paper,
microelectronics
Atlatec S.A. de C.V. Atlatec is a market leader that
specialises in the design, financing,
construction and operation of WWTPs
countrywide, as well as water solutions
for various industrial sectors.
Utility wastewater, upstream
oil & gas, refining &
petrochemicals, power
generation, mining, food &
beverage, pulp & paper,
microelectronics, textiles &
tanneries, pharmaceuticals
Ayesa Mexico S.A.
de C.V.
Ayesa is an engineering consulting firm
that is considered a market leader for
water-related projects in Mexico
Utility water, utility
wastewater
CH2M An engineering consulting firm with only
one Mexican project on its resume thus
Utility water, utility
wastewater
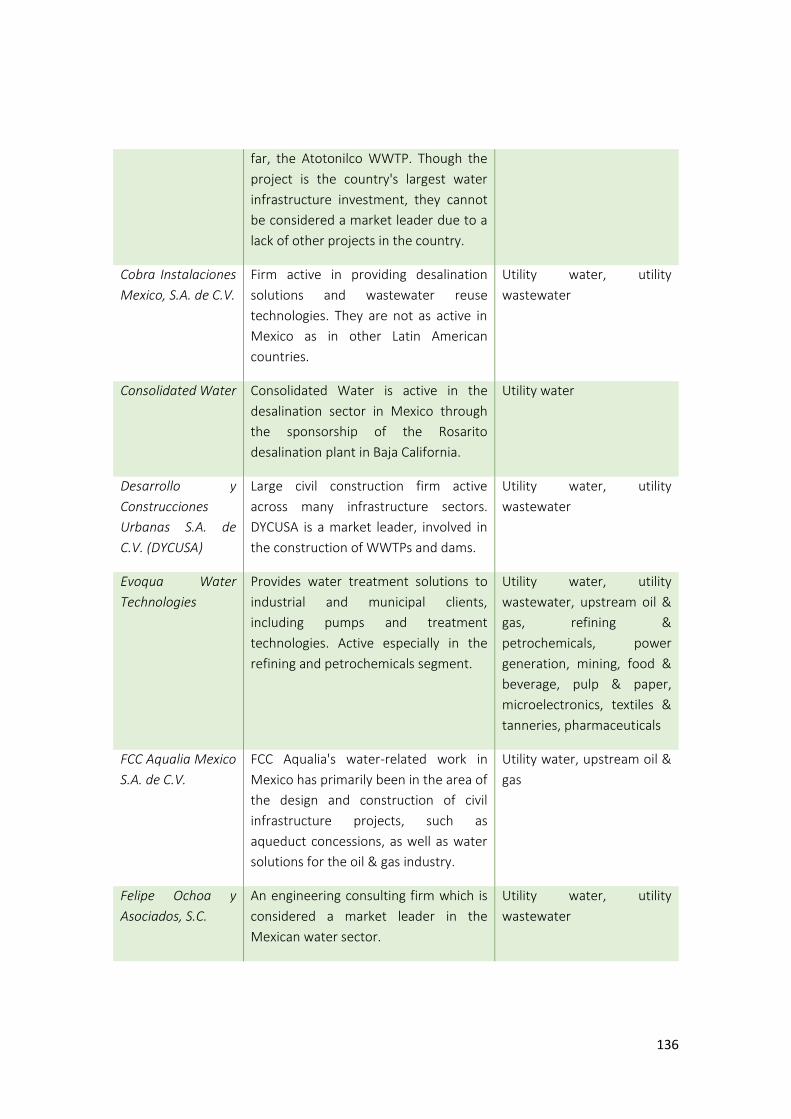
136
far, the Atotonilco WWTP. Though the
project is the country's largest water
infrastructure investment, they cannot
be considered a market leader due to a
lack of other projects in the country.
Cobra Instalaciones
Mexico, S.A. de C.V.
Firm active in providing desalination
solutions and wastewater reuse
technologies. They are not as active in
Mexico as in other Latin American
countries.
Utility water, utility
wastewater
Consolidated Water Consolidated Water is active in the
desalination sector in Mexico through
the sponsorship of the Rosarito
desalination plant in Baja California.
Utility water
Desarrollo y
Construcciones
Urbanas S.A. de
C.V. (DYCUSA)
Large civil construction firm active
across many infrastructure sectors.
DYCUSA is a market leader, involved in
the construction of WWTPs and dams.
Utility water, utility
wastewater
Evoqua Water
Technologies
Provides water treatment solutions to
industrial and municipal clients,
including pumps and treatment
technologies. Active especially in the
refining and petrochemicals segment.
Utility water, utility
wastewater, upstream oil &
gas, refining &
petrochemicals, power
generation, mining, food &
beverage, pulp & paper,
microelectronics, textiles &
tanneries, pharmaceuticals
FCC Aqualia Mexico
S.A. de C.V.
FCC Aqualia's water-related work in
Mexico has primarily been in the area of
the design and construction of civil
infrastructure projects, such as
aqueduct concessions, as well as water
solutions for the oil & gas industry.
Utility water, upstream oil &
gas
Felipe Ochoa y
Asociados, S.C.
An engineering consulting firm which is
considered a market leader in the
Mexican water sector.
Utility water, utility
wastewater

137
Fypasa
Construcciones S.A.
de C.V.
Fypasa is a market leader that specialises
in the design, financing, construction
and operation of WWTPs countrywide.
Utility water, utility
wastewater
GE Water & Process
Technologies
México
Provides water treatment solutions to
industrial and municipal clients. Market
leader in providing advanced
technologies to the industrial sector.
Utility water, upstream oil &
gas, refining &
petrochemicals, power
generation, mining, food &
beverage, microelectronics,
pharmaceuticals
Grupo Carson Grupo Carso is a conglomerate firm
active in sectors as diverse as industry,
media, infrastructure and
telecommunications. In the water sector
it acts as a general civil contractor of
large-scale water projects such as
aqueducts and WTPs.
Utility water, utility
wastewater
Grupo Hermes
Infraestructura,
S.A. de C.V.
Grupo Hermes is active in the water
sector as both a civil contractor and a
concessionaire.
Utility water, utility
wastewater
GS Inima México GS Inima is active in the desalination
sector in Mexico's Baja California
peninsula, through the design, building,
and operation of the Los Cabos (built)
and Ensenada (under construction)
desalination plants.
Utility water
Hi-Pro Ecológicos
S.A. de C.V.
Provides water treatment solutions to
industrial clients, particularly membrane
and membrane bioreactor solutions
Utility water, utility
wastewater, refining &
petrochemicals, mining,
food & beverage, pulp &
paper, textiles & tanneries
Impulsora del
Desarrollo y el
Empleo en América
Latina SAB de CV
(IDEAL)
Holding company which develops
human and physical capital for
infrastructure projects. IDEAL is part of
the consortium building the Atotonilco
WWTP.
Utility water, utility
wastewater
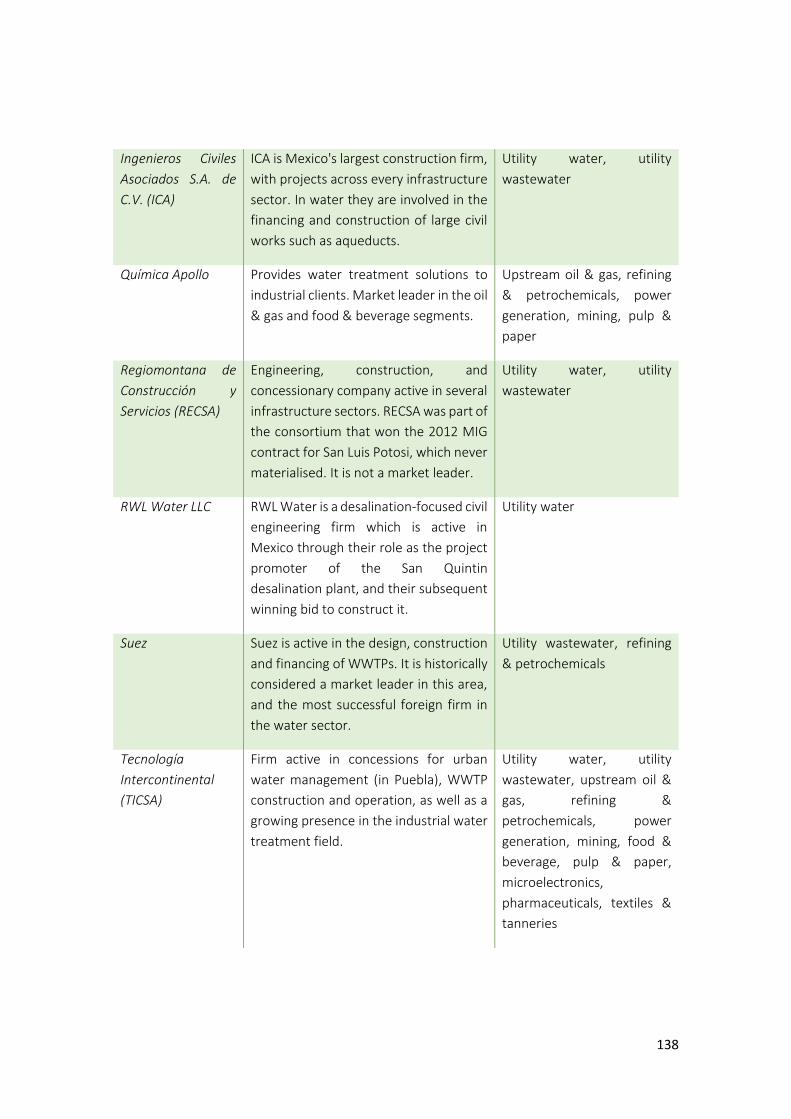
138
Ingenieros Civiles
Asociados S.A. de
C.V. (ICA)
ICA is Mexico's largest construction firm,
with projects across every infrastructure
sector. In water they are involved in the
financing and construction of large civil
works such as aqueducts.
Utility water, utility
wastewater
Química Apollo Provides water treatment solutions to
industrial clients. Market leader in the oil
& gas and food & beverage segments.
Upstream oil & gas, refining
& petrochemicals, power
generation, mining, pulp &
paper
Regiomontana de
Construcción y
Servicios (RECSA)
Engineering, construction, and
concessionary company active in several
infrastructure sectors. RECSA was part of
the consortium that won the 2012 MIG
contract for San Luis Potosi, which never
materialised. It is not a market leader.
Utility water, utility
wastewater
RWL Water LLC RWL Water is a desalination-focused civil
engineering firm which is active in
Mexico through their role as the project
promoter of the San Quintin
desalination plant, and their subsequent
winning bid to construct it.
Utility water
Suez Suez is active in the design, construction
and financing of WWTPs. It is historically
considered a market leader in this area,
and the most successful foreign firm in
the water sector.
Utility wastewater, refining
& petrochemicals
Tecnología
Intercontinental
(TICSA)
Firm active in concessions for urban
water management (in Puebla), WWTP
construction and operation, as well as a
growing presence in the industrial water
treatment field.
Utility water, utility
wastewater, upstream oil &
gas, refining &
petrochemicals, power
generation, mining, food &
beverage, pulp & paper,
microelectronics,
pharmaceuticals, textiles &
tanneries

139
⎯ CONAGUA investment PROMAGUA is a national program that channelizes resources from the National fund for
Infrastructures to address deficiencies in coverage or quality of water supply, sewerage or
wastewater treatment. In parallel, it creates incentives for the participation of the private sector.
PROMAGUA supports federal and municipal entities, mainly in towns with more than 50,000
inhabitants. This plan operates in two phases depending on the needs of the municipal entities
and provides up to 50% of the initial inversion depending on the case (www.fonadin.gob.mx).
SWOT Analysis The following sections summarize the strengths, weaknesses, opportunities and threats of the
implementation of circular economy in the wastewater sector.
Figure 31. SWOT analysis scheme for circular economy related to wastewater treatment in Mexico
Strengths
⎯ Increase of resources: the development of wastewater treatment and reuse of resources available for a large number of applications therefore minimizing the water stress, especially in the driest regions of the country
⎯ Technological improvements: Recent research works increase the feasibility of implementation of many wastewater treatment and reuse technologies
⎯ Low emissions: Some of the treatment processes (anaerobic, facultative and aerobic without airing) imply low energy consumption and low level of emissions
⎯ Weaknesses
⎯ Cost of implementation: some of wastewater treatment and reuse techniques require a significant cost for implementation
⎯ Space restrictions: land treatment technologies have space requirements that are not always easy to fulfil
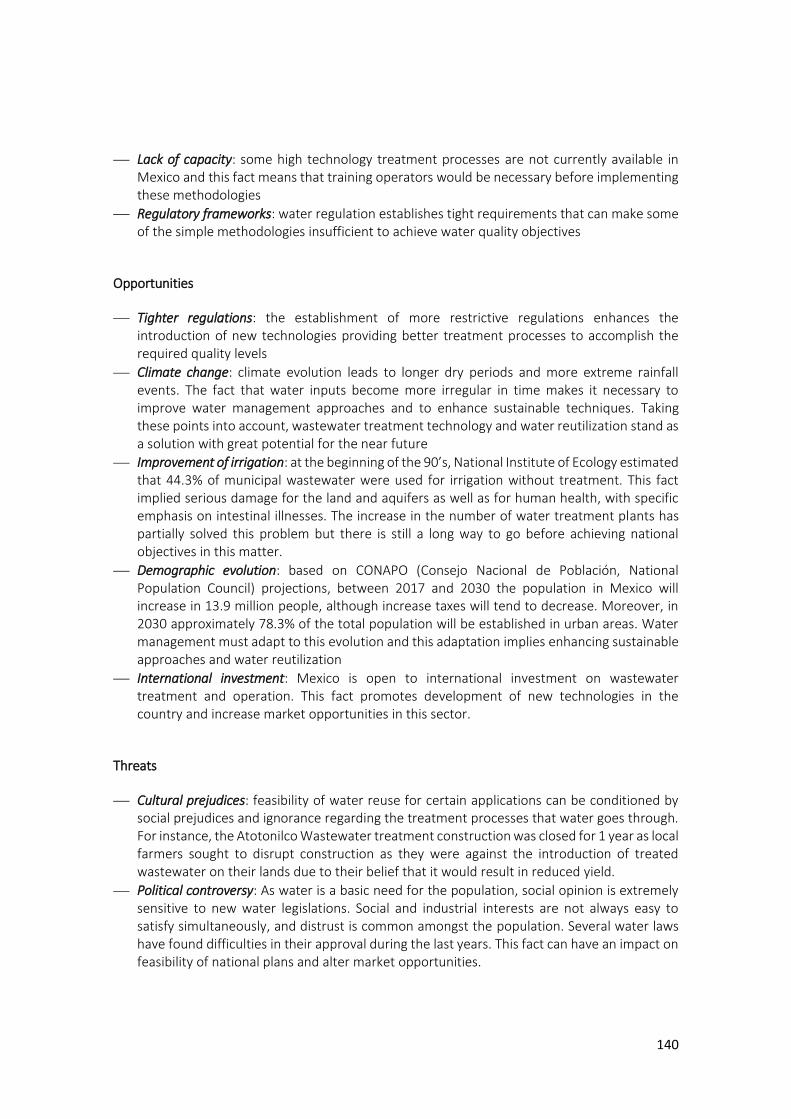
140
⎯ Lack of capacity: some high technology treatment processes are not currently available in Mexico and this fact means that training operators would be necessary before implementing these methodologies
⎯ Regulatory frameworks: water regulation establishes tight requirements that can make some of the simple methodologies insufficient to achieve water quality objectives
Opportunities
⎯ Tighter regulations: the establishment of more restrictive regulations enhances the introduction of new technologies providing better treatment processes to accomplish the required quality levels
⎯ Climate change: climate evolution leads to longer dry periods and more extreme rainfall events. The fact that water inputs become more irregular in time makes it necessary to improve water management approaches and to enhance sustainable techniques. Taking these points into account, wastewater treatment technology and water reutilization stand as a solution with great potential for the near future
⎯ Improvement of irrigation: at the beginning of the 90’s, National Institute of Ecology estimated that 44.3% of municipal wastewater were used for irrigation without treatment. This fact implied serious damage for the land and aquifers as well as for human health, with specific emphasis on intestinal illnesses. The increase in the number of water treatment plants has partially solved this problem but there is still a long way to go before achieving national objectives in this matter.
⎯ Demographic evolution: based on CONAPO (Consejo Nacional de Población, National Population Council) projections, between 2017 and 2030 the population in Mexico will increase in 13.9 million people, although increase taxes will tend to decrease. Moreover, in 2030 approximately 78.3% of the total population will be established in urban areas. Water management must adapt to this evolution and this adaptation implies enhancing sustainable approaches and water reutilization
⎯ International investment: Mexico is open to international investment on wastewater treatment and operation. This fact promotes development of new technologies in the country and increase market opportunities in this sector.
Threats
⎯ Cultural prejudices: feasibility of water reuse for certain applications can be conditioned by social prejudices and ignorance regarding the treatment processes that water goes through. For instance, the Atotonilco Wastewater treatment construction was closed for 1 year as local farmers sought to disrupt construction as they were against the introduction of treated wastewater on their lands due to their belief that it would result in reduced yield.
⎯ Political controversy: As water is a basic need for the population, social opinion is extremely sensitive to new water legislations. Social and industrial interests are not always easy to satisfy simultaneously, and distrust is common amongst the population. Several water laws have found difficulties in their approval during the last years. This fact can have an impact on feasibility of national plans and alter market opportunities.
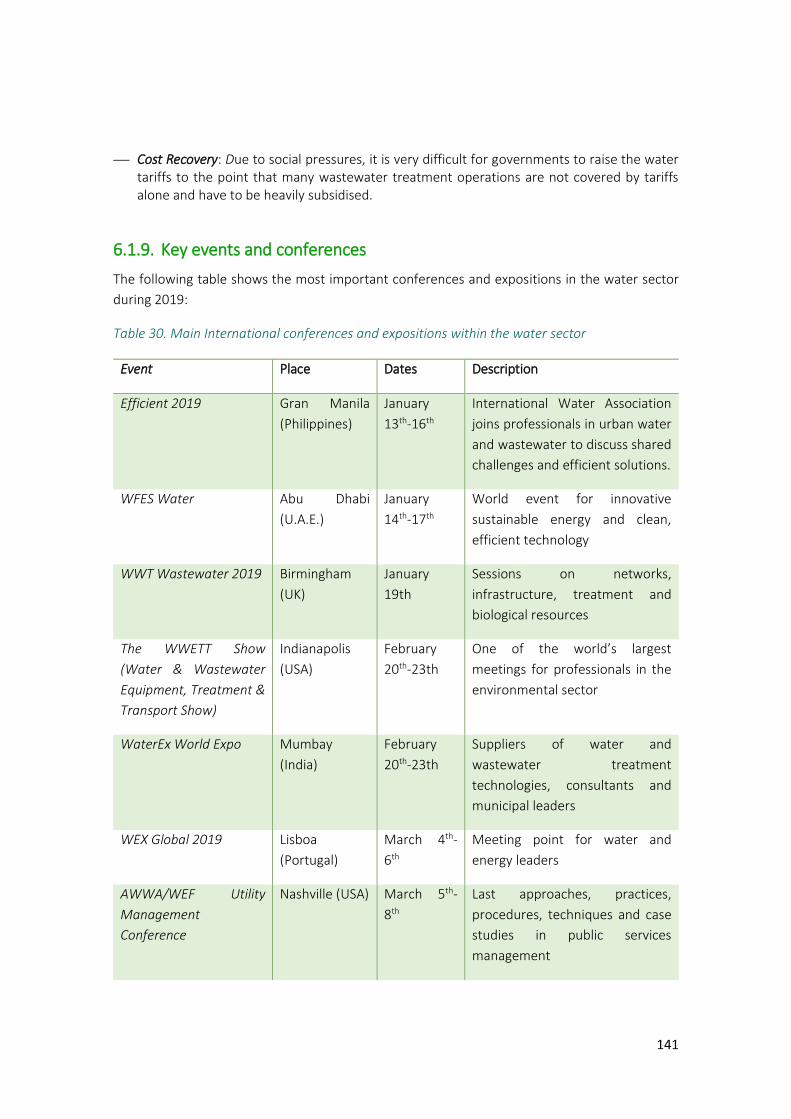
141
⎯ Cost Recovery: Due to social pressures, it is very difficult for governments to raise the water tariffs to the point that many wastewater treatment operations are not covered by tariffs alone and have to be heavily subsidised.
6.1.9. Key events and conferences
The following table shows the most important conferences and expositions in the water sector
during 2019:
Table 30. Main International conferences and expositions within the water sector
Event Place Dates Description
Efficient 2019 Gran Manila
(Philippines)
January
13th-16th
International Water Association
joins professionals in urban water
and wastewater to discuss shared
challenges and efficient solutions.
WFES Water Abu Dhabi
(U.A.E.)
January
14th-17th
World event for innovative
sustainable energy and clean,
efficient technology
WWT Wastewater 2019 Birmingham
(UK)
January
19th
Sessions on networks,
infrastructure, treatment and
biological resources
The WWETT Show
(Water & Wastewater
Equipment, Treatment &
Transport Show)
Indianapolis
(USA)
February
20th-23th
One of the world’s largest
meetings for professionals in the
environmental sector
WaterEx World Expo Mumbay
(India)
February
20th-23th
Suppliers of water and
wastewater treatment
technologies, consultants and
municipal leaders
WEX Global 2019 Lisboa
(Portugal)
March 4th-
6th
Meeting point for water and
energy leaders
AWWA/WEF Utility
Management
Conference
Nashville (USA) March 5th-
8th
Last approaches, practices,
procedures, techniques and case
studies in public services
management
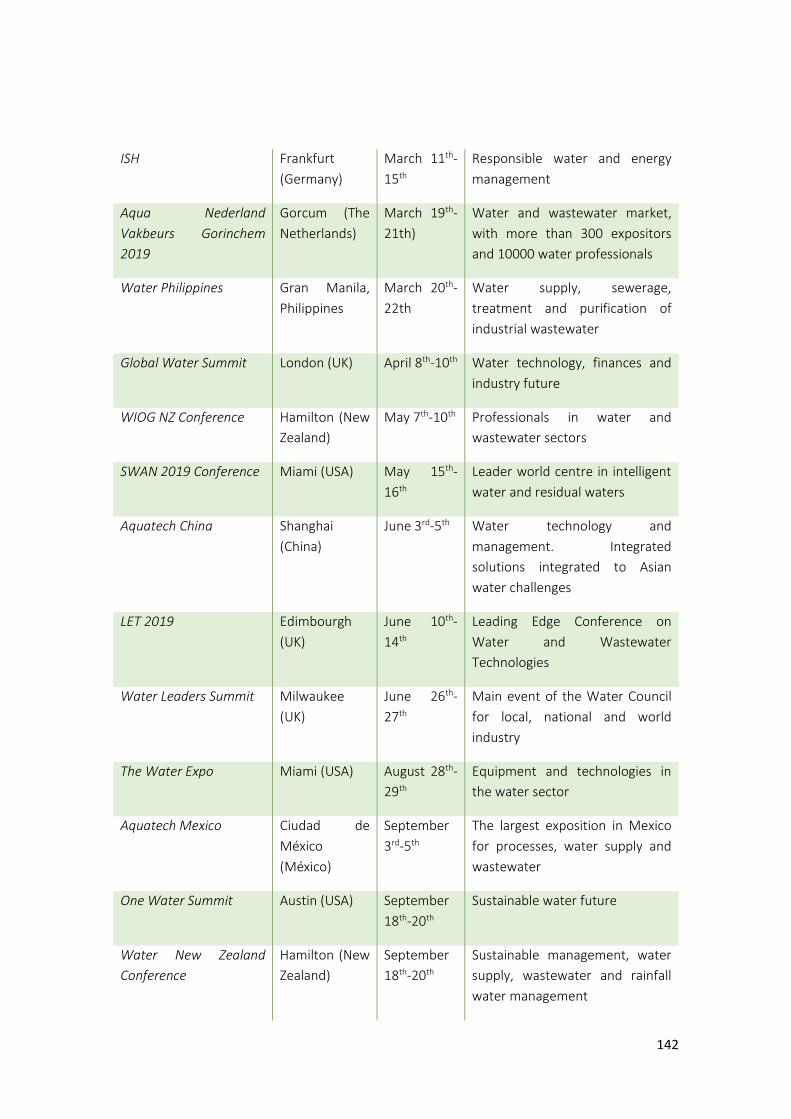
142
ISH Frankfurt
(Germany)
March 11th-
15th
Responsible water and energy
management
Aqua Nederland
Vakbeurs Gorinchem
2019
Gorcum (The
Netherlands)
March 19th-
21th)
Water and wastewater market,
with more than 300 expositors
and 10000 water professionals
Water Philippines Gran Manila,
Philippines
March 20th-
22th
Water supply, sewerage,
treatment and purification of
industrial wastewater
Global Water Summit London (UK) April 8th-10th Water technology, finances and
industry future
WIOG NZ Conference Hamilton (New
Zealand)
May 7th-10th Professionals in water and
wastewater sectors
SWAN 2019 Conference Miami (USA) May 15th-
16th
Leader world centre in intelligent
water and residual waters
Aquatech China Shanghai
(China)
June 3rd-5th Water technology and
management. Integrated
solutions integrated to Asian
water challenges
LET 2019 Edimbourgh
(UK)
June 10th-
14th
Leading Edge Conference on
Water and Wastewater
Technologies
Water Leaders Summit Milwaukee
(UK)
June 26th-
27th
Main event of the Water Council
for local, national and world
industry
The Water Expo Miami (USA) August 28th-
29th
Equipment and technologies in
the water sector
Aquatech Mexico Ciudad de
México
(México)
September
3rd-5th
The largest exposition in Mexico
for processes, water supply and
wastewater
One Water Summit Austin (USA) September
18th-20th
Sustainable water future
Water New Zealand
Conference
Hamilton (New
Zealand)
September
18th-20th
Sustainable management, water
supply, wastewater and rainfall
water management
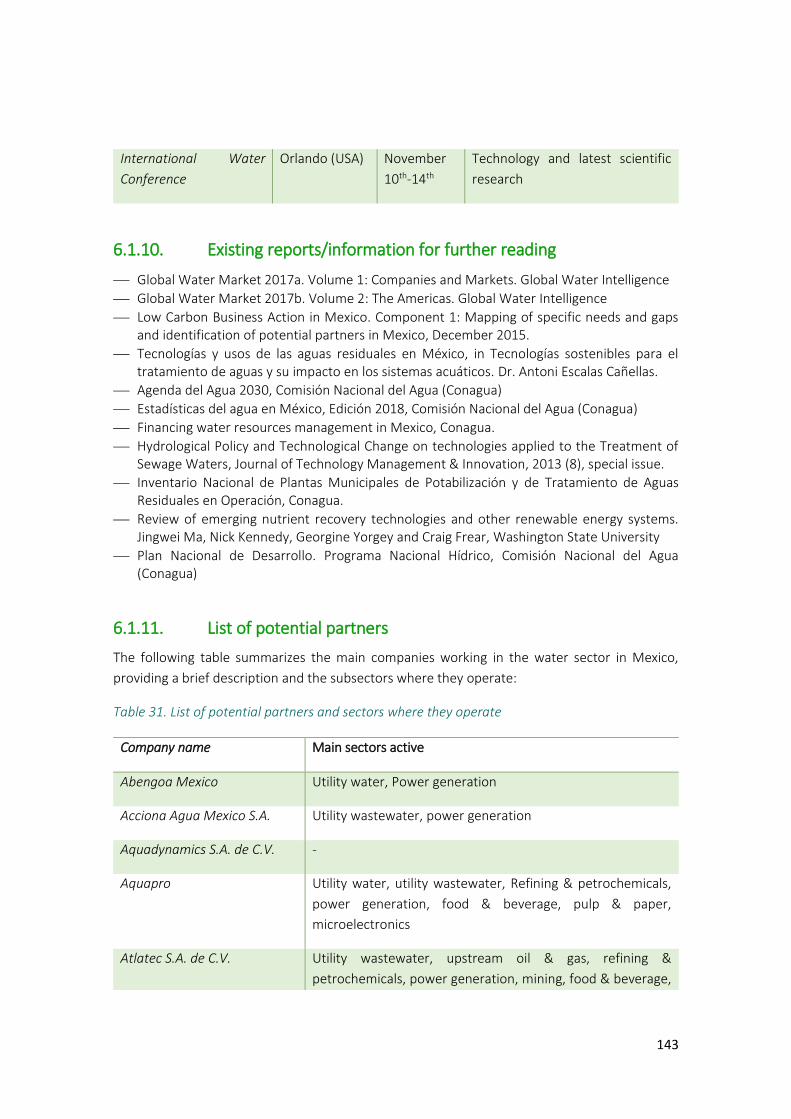
143
International Water
Conference
Orlando (USA) November
10th-14th
Technology and latest scientific
research
6.1.10. Existing reports/information for further reading
⎯ Global Water Market 2017a. Volume 1: Companies and Markets. Global Water Intelligence
⎯ Global Water Market 2017b. Volume 2: The Americas. Global Water Intelligence
⎯ Low Carbon Business Action in Mexico. Component 1: Mapping of specific needs and gaps and identification of potential partners in Mexico, December 2015.
⎯ Tecnologías y usos de las aguas residuales en México, in Tecnologías sostenibles para el tratamiento de aguas y su impacto en los sistemas acuáticos. Dr. Antoni Escalas Cañellas.
⎯ Agenda del Agua 2030, Comisión Nacional del Agua (Conagua)
⎯ Estadísticas del agua en México, Edición 2018, Comisión Nacional del Agua (Conagua)
⎯ Financing water resources management in Mexico, Conagua.
⎯ Hydrological Policy and Technological Change on technologies applied to the Treatment of Sewage Waters, Journal of Technology Management & Innovation, 2013 (8), special issue.
⎯ Inventario Nacional de Plantas Municipales de Potabilización y de Tratamiento de Aguas Residuales en Operación, Conagua.
⎯ Review of emerging nutrient recovery technologies and other renewable energy systems. Jingwei Ma, Nick Kennedy, Georgine Yorgey and Craig Frear, Washington State University
⎯ Plan Nacional de Desarrollo. Programa Nacional Hídrico, Comisión Nacional del Agua (Conagua)
6.1.11. List of potential partners
The following table summarizes the main companies working in the water sector in Mexico,
providing a brief description and the subsectors where they operate:
Table 31. List of potential partners and sectors where they operate
Company name Main sectors active
Abengoa Mexico Utility water, Power generation
Acciona Agua Mexico S.A. Utility wastewater, power generation
Aquadynamics S.A. de C.V. -
Aquapro Utility water, utility wastewater, Refining & petrochemicals,
power generation, food & beverage, pulp & paper,
microelectronics
Atlatec S.A. de C.V. Utility wastewater, upstream oil & gas, refining &
petrochemicals, power generation, mining, food & beverage,
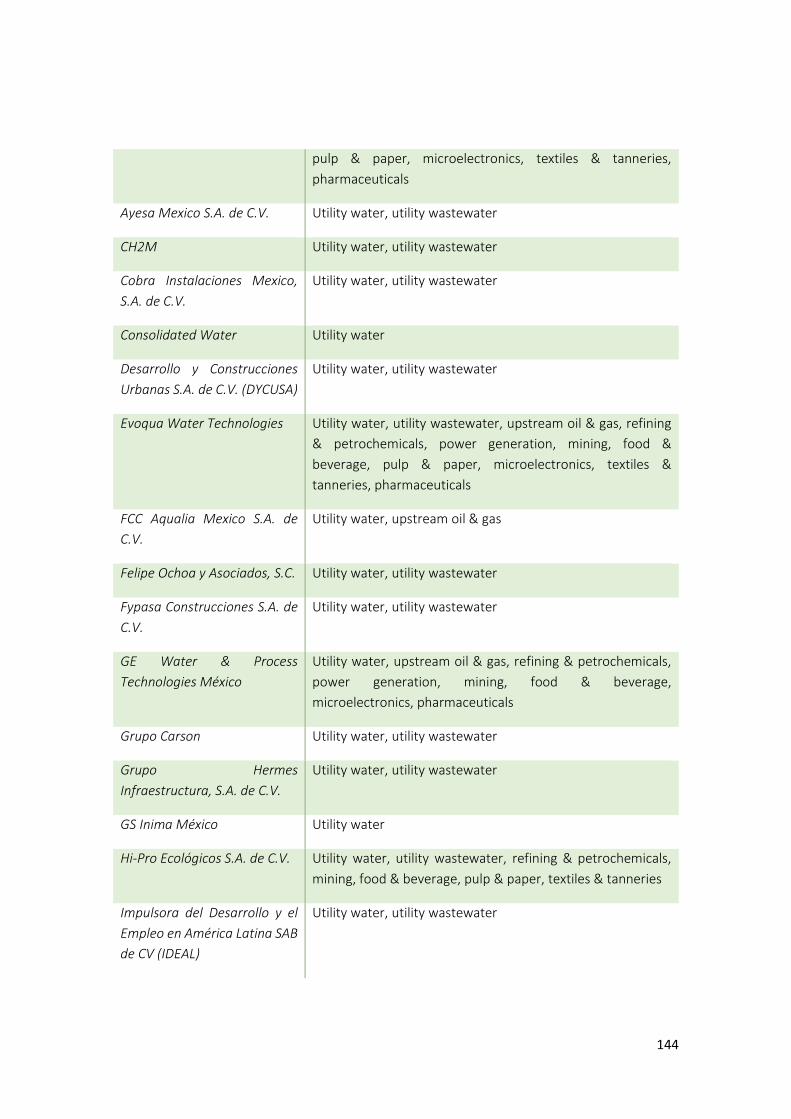
144
pulp & paper, microelectronics, textiles & tanneries,
pharmaceuticals
Ayesa Mexico S.A. de C.V. Utility water, utility wastewater
CH2M Utility water, utility wastewater
Cobra Instalaciones Mexico,
S.A. de C.V.
Utility water, utility wastewater
Consolidated Water Utility water
Desarrollo y Construcciones
Urbanas S.A. de C.V. (DYCUSA)
Utility water, utility wastewater
Evoqua Water Technologies Utility water, utility wastewater, upstream oil & gas, refining
& petrochemicals, power generation, mining, food &
beverage, pulp & paper, microelectronics, textiles &
tanneries, pharmaceuticals
FCC Aqualia Mexico S.A. de
C.V.
Utility water, upstream oil & gas
Felipe Ochoa y Asociados, S.C. Utility water, utility wastewater
Fypasa Construcciones S.A. de
C.V.
Utility water, utility wastewater
GE Water & Process
Technologies México
Utility water, upstream oil & gas, refining & petrochemicals,
power generation, mining, food & beverage,
microelectronics, pharmaceuticals
Grupo Carson Utility water, utility wastewater
Grupo Hermes
Infraestructura, S.A. de C.V.
Utility water, utility wastewater
GS Inima México Utility water
Hi-Pro Ecológicos S.A. de C.V. Utility water, utility wastewater, refining & petrochemicals,
mining, food & beverage, pulp & paper, textiles & tanneries
Impulsora del Desarrollo y el
Empleo en América Latina SAB
de CV (IDEAL)
Utility water, utility wastewater
145
Ingenieros Civiles Asociados
S.A. de C.V. (ICA)
Utility water, utility wastewater
Química Apollo Upstream oil & gas, refining & petrochemicals, power
generation, mining, pulp & paper
Regiomontana de
Construcción y Servicios
(RECSA)
Utility water, utility wastewater
RWL Water LLC Utility water
Suez Utility wastewater, refining & petrochemicals
Tecnología Intercontinental
(TICSA)
Utility water, utility wastewater, upstream oil & gas, refining
& petrochemicals, power generation, mining, food &
beverage, pulp & paper, microelectronics, pharmaceuticals,
textiles & tanneries
6.1.12. Companies and clusters involved in private water sector in
Mexico
The main companies involved in Mexican water sector are listed next:
Acciona Group S.A.: large Spanish Company that has an infrastructure business as well as
wastewater operations
Alfa Laval S.A.: Swedish company with its main business in heat exchangers, separators, pumps
and valves
Atlatec S.A.: Large Mexican company owned by Japanese companies Mitsui and Co. and Tokyo
Engineering Cooperation that has an infrastructure business and wastewater operations
C&C Ingeniería y Proyectos S.A.: Small wastewater and water engineering company with many
projects in the Mexican wastewater sector
Cobra Instalaciones México: large Spanish company that designs, constructs and operates potable
water and wastewater treatment plants
Controladora de Operaciones de Infraestructura S.A.: a large Mexican company that operates and
maintains drinking-water supply, conveyance, distribution, treatment and management systems
Fypasa Construcciones S.A.: Mexican company dedicated to design, construction and operation
of wastewater and potable water treatment plants
146
Grupo CARSO S.A.: large Mexican cooperation that designs builds and operates water and
wastewater treatment plants. Recently bought 50% share in Spanish company FCC (Fomento de
Construcciones y Contratas)
Grupo Casgo S.A.: large Mexican infrastructure company
Industrias del Agua de la Ciudad de México S.A.: large Mexican construction company for water
treatment Works, distribution and drainage
Isolux de México S.A.: large Spanish company for the construction, development and detailed
engineering, civil works, supply and installation of electromechanical equipment, electrical
installation projects, commissioning, maintenance for water and waste treatment plants
Marhnos S.A.: large Mexican construction and infrastructure company
OHL Medio Ambiente, Inima, S.A.U.: large Spanish company for the construction, maintenance
and operation of wastewater treatment plants
Proyectos y Desarrollos de Infraestructura, S.A.P.L.: large Mexican construction company
Grupo Proaqua S.A.: Mexican company dedicated to the construction of wastewater treatment
plants
Tecnología en Sistemas Ambientales S.A.: Mexican company for the design, construction,
operation, supervision, commissioning, equipment, operation, supervision, commissioning,
equipment, operation and maintenance of wastewater treatment plants
Sacyr México S.A.: large Spanish construction company
On the other hand, these are the most important entities amongst clusters and associations:
AMEHIDRO: Mexican Association for Hydroelectric power
AMEXA: Mexican Association for Environmental Companies
ANEAS: National Association of water operators and sewage companies
ANNCA: National Association for a new culture of water
CESPEDES: Mexican counterpart of the World Business Council for Sustainable Development and
belongs to the CEE (Coordinating Business Council)
CICESE: Ensenada Higher Education and Scientific Research Centre
CCMEX Cleantech Cluster México: environmental oriented cluster based in Puebla
CMP+: Mexican Cleaner Production Centre
COPARMEX: Mexican Confederation of Business Owners
147
IMAPP: Mexican Institute for Public-Private Associations
6.1.13. Research and academic institutions involved in Mexican water
sector
The main research institutions involved in Mexican water sector are listed next:
National Autonomous University of Mexico (UNAM)
TEC of Monterrey
Mexican Institute of Water Technology
Autonomous Metropolitan University (UAM)
La Salle University
Anáhuac Northern México University
National Polytechnic Institute
University of Guadalajara (UdG)
Nuevo León Autonomous University
San Nicolás de Hidalgo Michoacán University
Universidad Popular Autónoma del Estado de Puebla (UPAEP)
Endicott College
Research Centre – Centro de Investigación (CIDE)
College of México
Mario Molina Centre
University of the Americas in Puebla
Engineering Institute
Southern Frontier College
National Institute of Forestry, Crop and Livestock Research
The College of Postgraduates
Autonomous University of Chapingo

148
University of Veracruz
Environmental Information System
National Research and Environmental Capacity Centre
Centre for Environmental Quality
149
Annex III: Waste to Energy Sector Trends, Legislation, Policy and the Enabling Environment.
6.1.14. Sector Overview: International
There is a conceptual contradiction between the principles of Circular Economy, and the long-
term energy needs that have already resulted in over-dimensioned incineration facilities, for
example, without the long-term supply of waste guaranteed for the operation of such facilities.
The juxtaposition of an ever-increasing energy demand and the critical proportions of waste
generation will continue to accompany the increasing rates of urbanization the world is
undergoing, particularly the developing world, according to a World Bank urbanization report.
These pressures can put governments in a very uncomfortable position, being pushed to make
capital intensive decisions without an adequate strategic approach or the subject matter
expertise to consider the technical, financial and social risks tied to such investments, and the
implementation of the appropriate mitigation measures to ensure that waste to energy does not
become the standard solution, but rather a piece of the programmatic approach aimed at
reducing waste.
Considering solid waste and wastewater treatment as directly related to total waste generation
with energy potential, according to a 2018 World Bank report on global waste, the world
generates 0.74 kilograms of waste per capita per day, yet national waste generation rates
fluctuate widely from 0.11 to 4.54 kilograms per capita per day. Waste generation volumes are
generally correlated with income levels and urbanization rates.
Around 130 million tons of municipal solid waste (MSW) are combusted annually in over 600
waste-to-energy (WTE) facilities globally that produce electricity and steam for district heating
and recovered metals for recycling. Over the last five years, waste incineration in Europe has
generated between an average of 4% to 8% of the electricity and between an average of 10% to
15% of the continent’s domestic heat.
Advanced thermal technologies, like pyrolysis and gasification, and biochemical anaerobic
digestion systems are beginning to make their mark in the waste-to-energy sector and are
expected to increase their respective market shares because of global interest in integrated waste
management frameworks in urban areas. Scarcity of waste disposal sites coupled with growing
waste volumes and solid waste management challenges are generating a high degree of interest
in energy-from-waste systems among policy-makers, urban planners, entrepreneurs, utility
companies, etc.
2007 there were more than 600 WTE plants in 35 different countries, including large countries
such as China, and small ones such as Bermuda and other Caribbean islands. Some of the newest
projects are located in Asia. China is sponsoring a surge in waste-to-energy installations and has
plans to establish over 125 new waste-to-energy plants during the following decade.
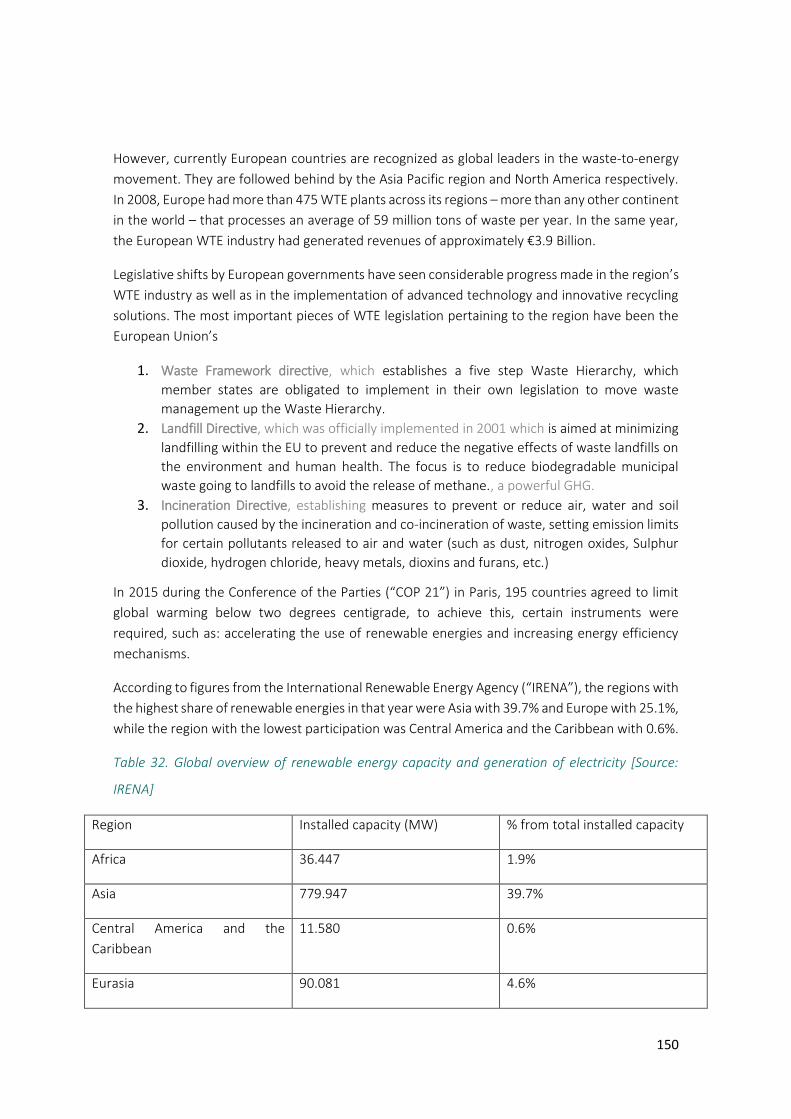
150
However, currently European countries are recognized as global leaders in the waste-to-energy
movement. They are followed behind by the Asia Pacific region and North America respectively.
In 2008, Europe had more than 475 WTE plants across its regions – more than any other continent
in the world – that processes an average of 59 million tons of waste per year. In the same year,
the European WTE industry had generated revenues of approximately €3.9 Billion.
Legislative shifts by European governments have seen considerable progress made in the region’s
WTE industry as well as in the implementation of advanced technology and innovative recycling
solutions. The most important pieces of WTE legislation pertaining to the region have been the
European Union’s
1. Waste Framework directive, which establishes a five step Waste Hierarchy, which
member states are obligated to implement in their own legislation to move waste
management up the Waste Hierarchy.
2. Landfill Directive, which was officially implemented in 2001 which is aimed at minimizing
landfilling within the EU to prevent and reduce the negative effects of waste landfills on
the environment and human health. The focus is to reduce biodegradable municipal
waste going to landfills to avoid the release of methane., a powerful GHG.
3. Incineration Directive, establishing measures to prevent or reduce air, water and soil
pollution caused by the incineration and co-incineration of waste, setting emission limits
for certain pollutants released to air and water (such as dust, nitrogen oxides, Sulphur
dioxide, hydrogen chloride, heavy metals, dioxins and furans, etc.)
In 2015 during the Conference of the Parties (“COP 21”) in Paris, 195 countries agreed to limit
global warming below two degrees centigrade, to achieve this, certain instruments were
required, such as: accelerating the use of renewable energies and increasing energy efficiency
mechanisms.
According to figures from the International Renewable Energy Agency (“IRENA”), the regions with
the highest share of renewable energies in that year were Asia with 39.7% and Europe with 25.1%,
while the region with the lowest participation was Central America and the Caribbean with 0.6%.
Table 32. Global overview of renewable energy capacity and generation of electricity [Source:
IRENA]
Region Installed capacity (MW) % from total installed capacity
Africa 36.447 1.9%
Asia 779.947 39.7%
Central America and the
Caribbean
11.580 0.6%
Eurasia 90.081 4.6%
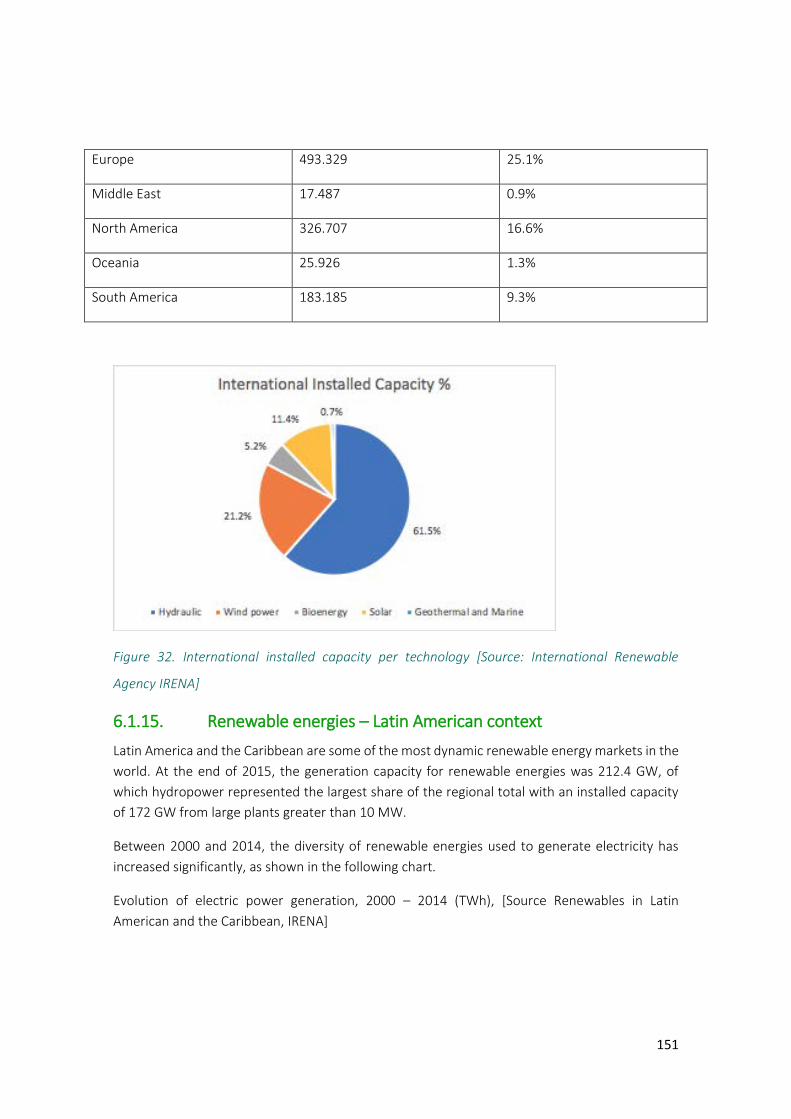
151
Europe 493.329 25.1%
Middle East 17.487 0.9%
North America 326.707 16.6%
Oceania 25.926 1.3%
South America 183.185 9.3%
Figure 32. International installed capacity per technology [Source: International Renewable
Agency IRENA]
6.1.15. Renewable energies – Latin American context
Latin America and the Caribbean are some of the most dynamic renewable energy markets in the
world. At the end of 2015, the generation capacity for renewable energies was 212.4 GW, of
which hydropower represented the largest share of the regional total with an installed capacity
of 172 GW from large plants greater than 10 MW.
Between 2000 and 2014, the diversity of renewable energies used to generate electricity has
increased significantly, as shown in the following chart.
Evolution of electric power generation, 2000 – 2014 (TWh), [Source Renewables in Latin
American and the Caribbean, IRENA]
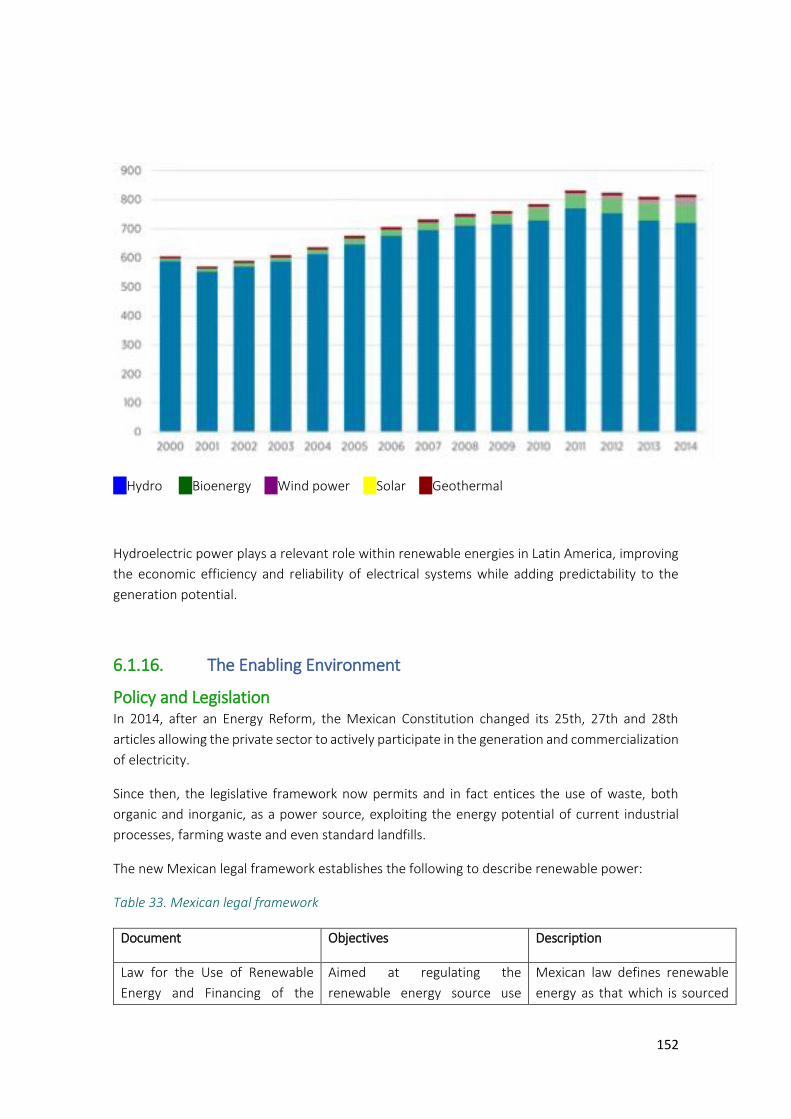
152
Hydro Bioenergy Wind power Solar Geothermal
Hydroelectric power plays a relevant role within renewable energies in Latin America, improving
the economic efficiency and reliability of electrical systems while adding predictability to the
generation potential.
6.1.16. The Enabling Environment
Policy and Legislation In 2014, after an Energy Reform, the Mexican Constitution changed its 25th, 27th and 28th
articles allowing the private sector to actively participate in the generation and commercialization
of electricity.
Since then, the legislative framework now permits and in fact entices the use of waste, both
organic and inorganic, as a power source, exploiting the energy potential of current industrial
processes, farming waste and even standard landfills.
The new Mexican legal framework establishes the following to describe renewable power:
Table 33. Mexican legal framework
Document Objectives Description
Law for the Use of Renewable
Energy and Financing of the
Aimed at regulating the
renewable energy source use
Mexican law defines renewable
energy as that which is sourced
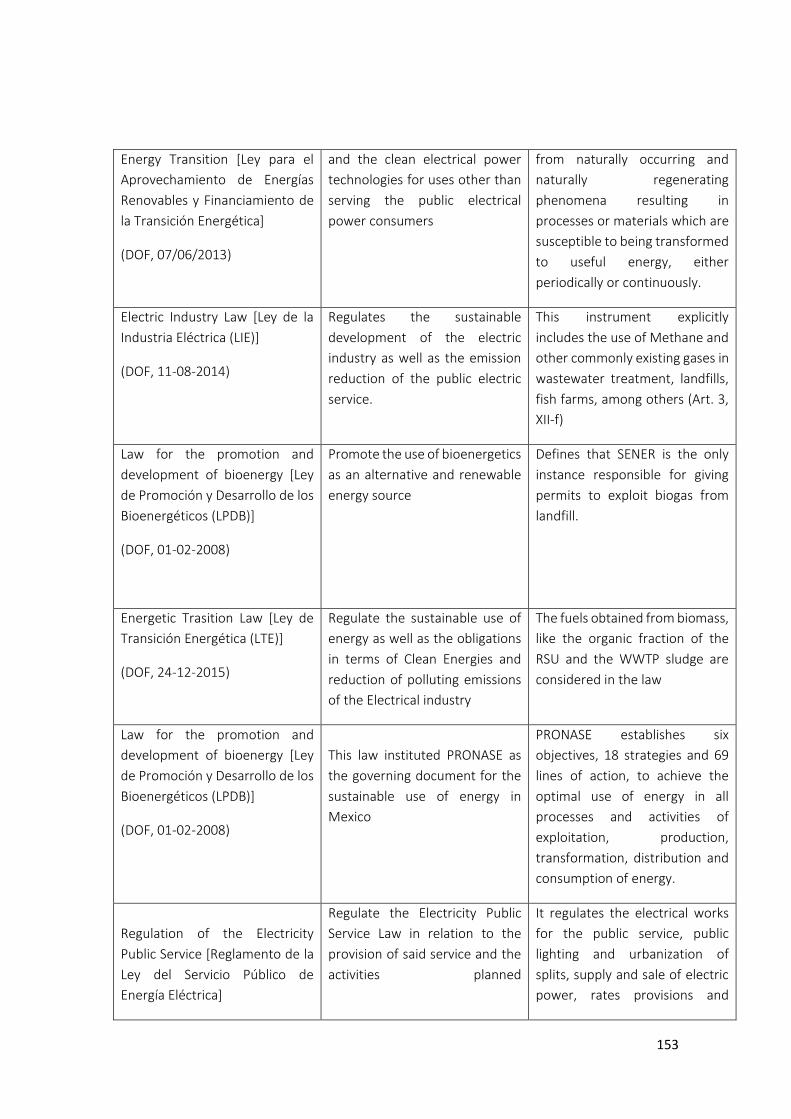
153
Energy Transition [Ley para el
Aprovechamiento de Energias
Renovables y Financiamiento de
la Transicion Energetica]
(DOF, 07/06/2013)
and the clean electrical power
technologies for uses other than
serving the public electrical
power consumers
from naturally occurring and
naturally regenerating
phenomena resulting in
processes or materials which are
susceptible to being transformed
to useful energy, either
periodically or continuously.
Electric Industry Law [Ley de la
Industria Electrica (LIE)]
(DOF, 11-08-2014)
Regulates the sustainable
development of the electric
industry as well as the emission
reduction of the public electric
service.
This instrument explicitly
includes the use of Methane and
other commonly existing gases in
wastewater treatment, landfills,
fish farms, among others (Art. 3,
XII-f)
Law for the promotion and
development of bioenergy [Ley
de Promocion y Desarrollo de los
Bioenergeticos (LPDB)]
(DOF, 01-02-2008)
Promote the use of bioenergetics
as an alternative and renewable
energy source
Defines that SENER is the only
instance responsible for giving
permits to exploit biogas from
landfill.
Energetic Trasition Law [Ley de
Transicion Energetica (LTE)]
(DOF, 24-12-2015)
Regulate the sustainable use of
energy as well as the obligations
in terms of Clean Energies and
reduction of polluting emissions
of the Electrical industry
The fuels obtained from biomass,
like the organic fraction of the
RSU and the WWTP sludge are
considered in the law
Law for the promotion and
development of bioenergy [Ley
de Promocion y Desarrollo de los
Bioenergeticos (LPDB)]
(DOF, 01-02-2008)
This law instituted PRONASE as
the governing document for the
sustainable use of energy in
Mexico
PRONASE establishes six
objectives, 18 strategies and 69
lines of action, to achieve the
optimal use of energy in all
processes and activities of
exploitation, production,
transformation, distribution and
consumption of energy.
Regulation of the Electricity
Public Service [Reglamento de la
Ley del Servicio Público de
Energía Eléctrica]
Regulate the Electricity Public
Service Law in relation to the
provision of said service and the
activities planned
It regulates the electrical works
for the public service, public
lighting and urbanization of
splits, supply and sale of electric
power, rates provisions and
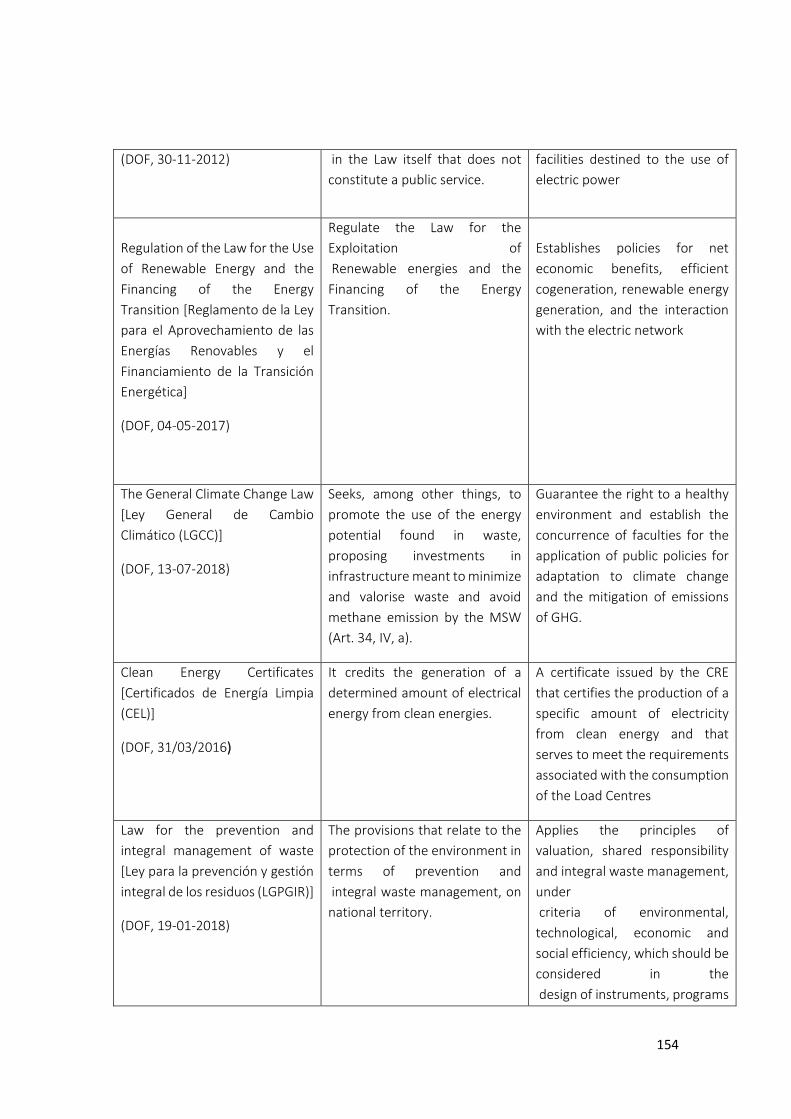
154
(DOF, 30-11-2012)
in the Law itself that does not
constitute a public service.
facilities destined to the use of
electric power
Regulation of the Law for the Use
of Renewable Energy and the
Financing of the Energy
Transition [Reglamento de la Ley
para el Aprovechamiento de las
Energías Renovables y el
Financiamiento de la Transición
Energética]
(DOF, 04-05-2017)
Regulate the Law for the
Exploitation of
Renewable energies and the
Financing of the Energy
Transition.
Establishes policies for net
economic benefits, efficient
cogeneration, renewable energy
generation, and the interaction
with the electric network
The General Climate Change Law
[Ley General de Cambio
Climatico (LGCC)]
(DOF, 13-07-2018)
Seeks, among other things, to
promote the use of the energy
potential found in waste,
proposing investments in
infrastructure meant to minimize
and valorise waste and avoid
methane emission by the MSW
(Art. 34, IV, a).
Guarantee the right to a healthy
environment and establish the
concurrence of faculties for the
application of public policies for
adaptation to climate change
and the mitigation of emissions
of GHG.
Clean Energy Certificates
[Certificados de Energia Limpia
(CEL)]
(DOF, 31/03/2016)
It credits the generation of a
determined amount of electrical
energy from clean energies.
A certificate issued by the CRE
that certifies the production of a
specific amount of electricity
from clean energy and that
serves to meet the requirements
associated with the consumption
of the Load Centres
Law for the prevention and
integral management of waste
[Ley para la prevención y gestión
integral de los residuos (LGPGIR)]
(DOF, 19-01-2018)
The provisions that relate to the
protection of the environment in
terms of prevention and
integral waste management, on
national territory.
Applies the principles of
valuation, shared responsibility
and integral waste management,
under
criteria of environmental,
technological, economic and
social efficiency, which should be
considered in the
design of instruments, programs
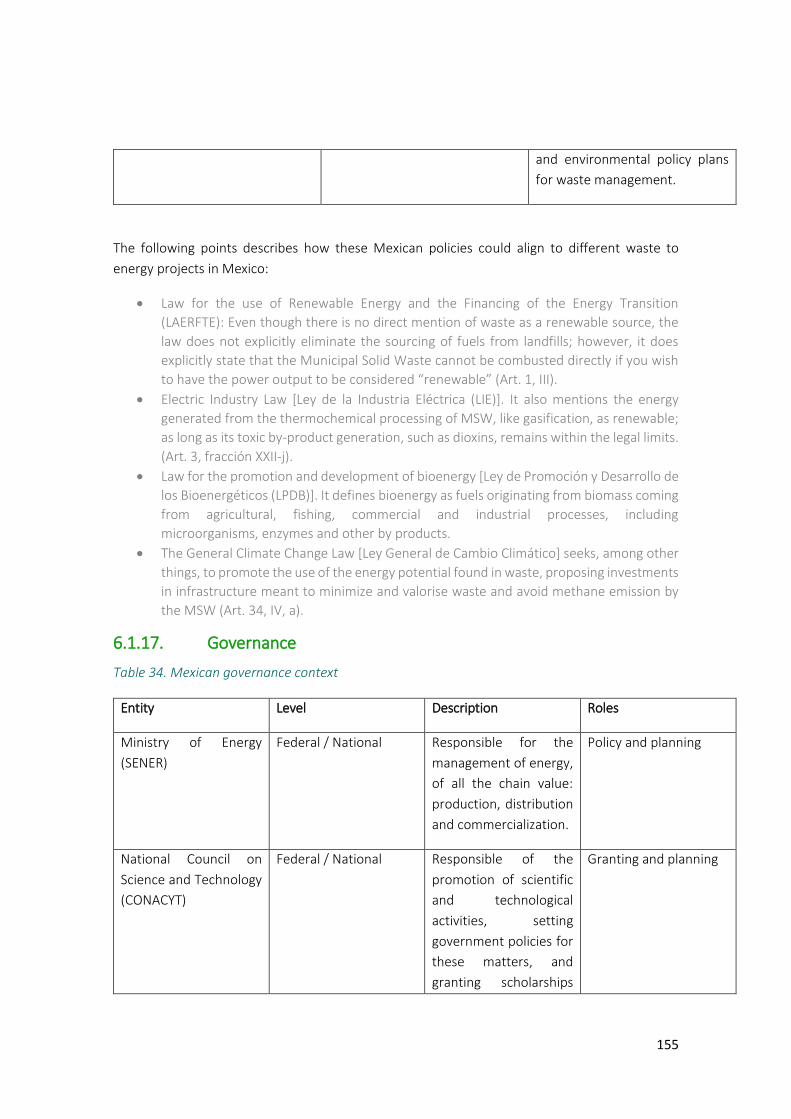
155
and environmental policy plans
for waste management.
The following points describes how these Mexican policies could align to different waste to
energy projects in Mexico:
• Law for the use of Renewable Energy and the Financing of the Energy Transition
(LAERFTE): Even though there is no direct mention of waste as a renewable source, the
law does not explicitly eliminate the sourcing of fuels from landfills; however, it does
explicitly state that the Municipal Solid Waste cannot be combusted directly if you wish
to have the power output to be considered “renewable” (Art. 1, III).
• Electric Industry Law [Ley de la Industria Electrica (LIE)]. It also mentions the energy
generated from the thermochemical processing of MSW, like gasification, as renewable;
as long as its toxic by-product generation, such as dioxins, remains within the legal limits.
(Art. 3, fraccion XXII-j).
• Law for the promotion and development of bioenergy [Ley de Promocion y Desarrollo de
los Bioenergeticos (LPDB)]. It defines bioenergy as fuels originating from biomass coming
from agricultural, fishing, commercial and industrial processes, including
microorganisms, enzymes and other by products.
• The General Climate Change Law [Ley General de Cambio Climatico] seeks, among other
things, to promote the use of the energy potential found in waste, proposing investments
in infrastructure meant to minimize and valorise waste and avoid methane emission by
the MSW (Art. 34, IV, a).
6.1.17. Governance
Table 34. Mexican governance context
Entity Level Description Roles
Ministry of Energy
(SENER)
Federal / National Responsible for the
management of energy,
of all the chain value:
production, distribution
and commercialization.
Policy and planning
National Council on
Science and Technology
(CONACYT)
Federal / National Responsible of the
promotion of scientific
and technological
activities, setting
government policies for
these matters, and
granting scholarships
Granting and planning
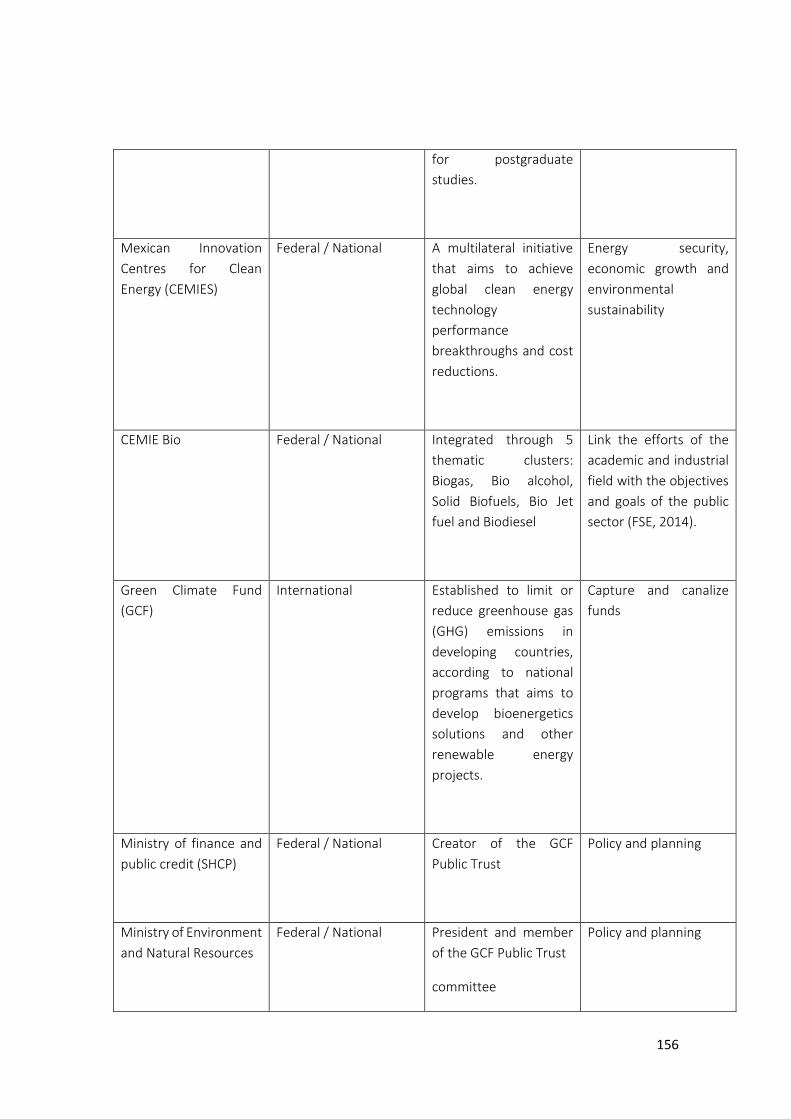
156
for postgraduate
studies.
Mexican Innovation
Centres for Clean
Energy (CEMIES)
Federal / National A multilateral initiative
that aims to achieve
global clean energy
technology
performance
breakthroughs and cost
reductions.
Energy security,
economic growth and
environmental
sustainability
CEMIE Bio Federal / National Integrated through 5
thematic clusters:
Biogas, Bio alcohol,
Solid Biofuels, Bio Jet
fuel and Biodiesel
Link the efforts of the
academic and industrial
field with the objectives
and goals of the public
sector (FSE, 2014).
Green Climate Fund
(GCF)
International Established to limit or
reduce greenhouse gas
(GHG) emissions in
developing countries,
according to national
programs that aims to
develop bioenergetics
solutions and other
renewable energy
projects.
Capture and canalize
funds
Ministry of finance and
public credit (SHCP)
Federal / National Creator of the GCF
Public Trust
Policy and planning
Ministry of Environment
and Natural Resources
Federal / National President and member
of the GCF Public Trust
committee
Policy and planning
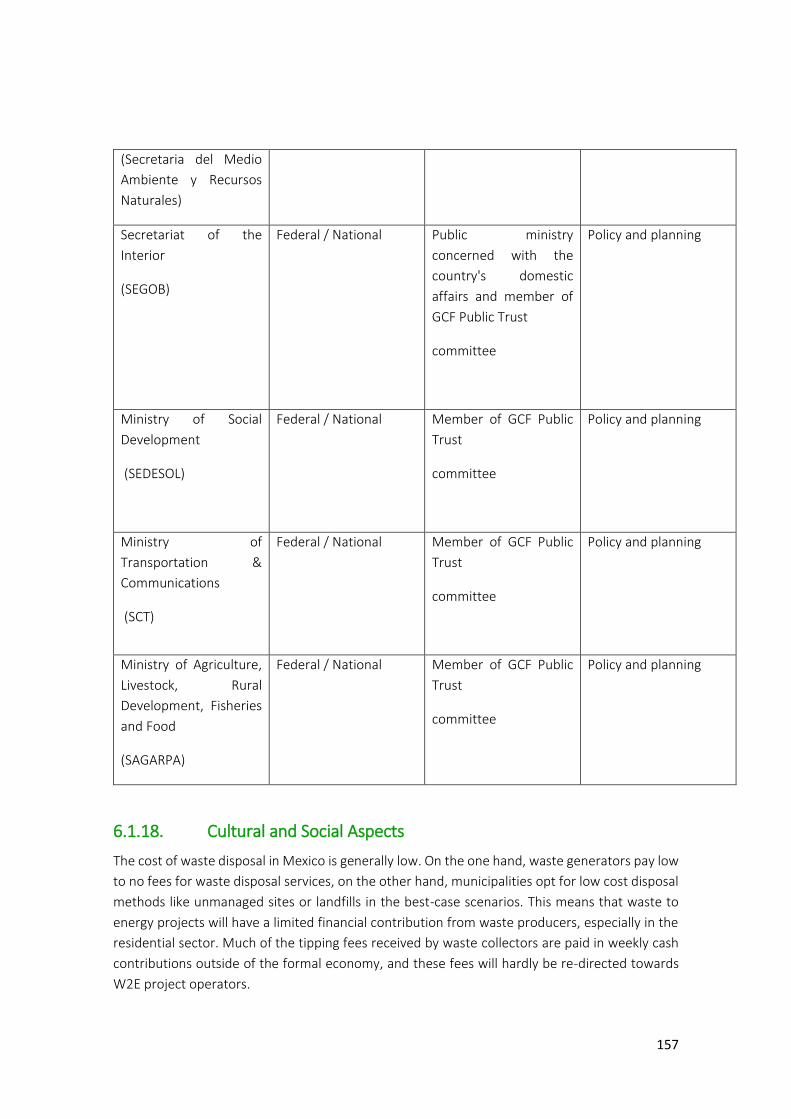
157
(Secretaria del Medio
Ambiente y Recursos
Naturales)
Secretariat of the
Interior
(SEGOB)
Federal / National Public ministry
concerned with the
country's domestic
affairs and member of
GCF Public Trust
committee
Policy and planning
Ministry of Social
Development
(SEDESOL)
Federal / National Member of GCF Public
Trust
committee
Policy and planning
Ministry of
Transportation &
Communications
(SCT)
Federal / National Member of GCF Public
Trust
committee
Policy and planning
Ministry of Agriculture,
Livestock, Rural
Development, Fisheries
and Food
(SAGARPA)
Federal / National Member of GCF Public
Trust
committee
Policy and planning
6.1.18. Cultural and Social Aspects
The cost of waste disposal in Mexico is generally low. On the one hand, waste generators pay low
to no fees for waste disposal services, on the other hand, municipalities opt for low cost disposal
methods like unmanaged sites or landfills in the best-case scenarios. This means that waste to
energy projects will have a limited financial contribution from waste producers, especially in the
residential sector. Much of the tipping fees received by waste collectors are paid in weekly cash
contributions outside of the formal economy, and these fees will hardly be re-directed towards
W2E project operators.
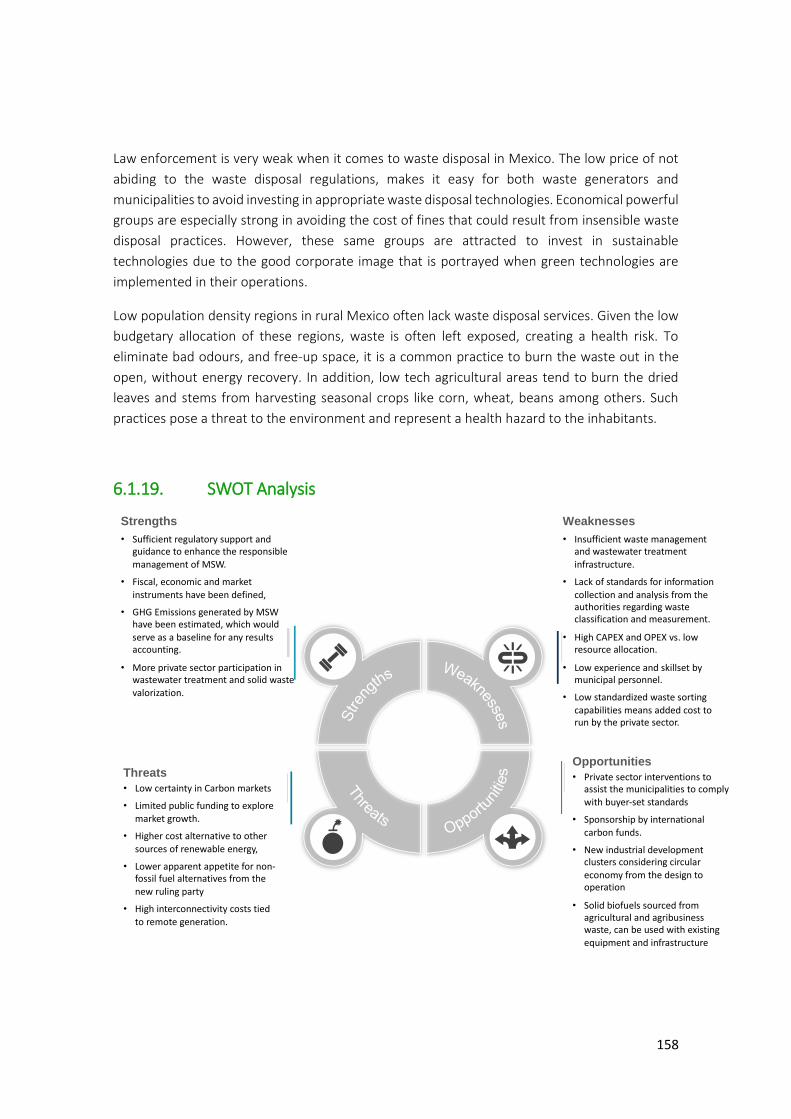
158
Law enforcement is very weak when it comes to waste disposal in Mexico. The low price of not
abiding to the waste disposal regulations, makes it easy for both waste generators and
municipalities to avoid investing in appropriate waste disposal technologies. Economical powerful
groups are especially strong in avoiding the cost of fines that could result from insensible waste
disposal practices. However, these same groups are attracted to invest in sustainable
technologies due to the good corporate image that is portrayed when green technologies are
implemented in their operations.
Low population density regions in rural Mexico often lack waste disposal services. Given the low
budgetary allocation of these regions, waste is often left exposed, creating a health risk. To
eliminate bad odours, and free-up space, it is a common practice to burn the waste out in the
open, without energy recovery. In addition, low tech agricultural areas tend to burn the dried
leaves and stems from harvesting seasonal crops like corn, wheat, beans among others. Such
practices pose a threat to the environment and represent a health hazard to the inhabitants.
6.1.19. SWOT Analysis
Weaknesses
• Insufficient waste management and wastewater treatment infrastructure.
• Lack of standards for information
collection and analysis from the authorities regarding waste classification and measurement.
• High CAPEX and OPEX vs. low resource allocation.
• Low experience and skillset by municipal personnel.
• Low standardized waste sorting
capabilities means added cost to run by the private sector.
Opportunities
• Private sector interventions to assist the municipalities to comply with buyer-set standards
• Sponsorship by international
carbon funds.
• New industrial development clusters considering circular economy from the design to operation
• Solid biofuels sourced from agricultural and agribusiness waste, can be used with existing equipment and infrastructure
Strengths
• Sufficient regulatory support and guidance to enhance the responsible management of MSW.
• Fiscal, economic and market
instruments have been defined,
• GHG Emissions generated by MSW have been estimated, which would serve as a baseline for any results accounting.
• More private sector participation in wastewater treatment and solid waste
valorization.
Threats
• Low certainty in Carbon markets
• Limited public funding to explore market growth.
• Higher cost alternative to other
sources of renewable energy,
• Lower apparent appetite for non-fossil fuel alternatives from the
new ruling party
• High interconnectivity costs tied
to remote generation.
159
Strengths
• Sufficient regulatory support and guidance to enhance the responsible management of
MSW.
• Fiscal, economic and market instruments have been defined, adding feasibility to new
project developments around the use of wastewater and MSW for power generation.
• Significant budgets have been programmatically allocated to enhance the national water
treatment infrastructure having allocated over $20MM USD over the last four years.
• GHG Emissions generated by MSW have been estimated, which would serve as a baseline
for any results accounting.
• More private sector participation in wastewater treatment and solid waste valorisation.
Weaknesses
• Insufficient waste management and wastewater treatment infrastructure.
• Lack of standards for information collection and analysis from the authorities regarding
waste classification and measurement.
• Some states have below 50% waste collection services, like Puebla, and Baja California
Sur.
• High CAPEX and OPEX vs. low resource allocation.
• Low experience and skillset by municipal personnel.
• Understaffed and underbudgeted environmental enforcement.
• Low standardized waste sorting capabilities means added cost to run by the private
sector.
• Higher cost of capital than in other regions and increased financial risk.
Opportunities
• Private sector interventions to assist the municipalities to comply with buyer-set
standards, and now audited to the third tier in the supply chain by both domestic and
foreign buyers.
• Sponsorship by international carbon funds.
• National Carbon funds.
• Commercialization of alternative fuels, such as CNG (Clean Natural Gas).
• Power self-generation to increase operational resilience; connected to grid to sell
oversupply.
• New industrial development clusters considering circular economy from the design and
need a dedicated service provider to assist with project diagnosis, engineering,
procurement and construction (EPC) of a technically sound solution, as well as the
financial products to make such solutions feasible.
• Unlike other renewable energy sources, solid biofuels sourced from agricultural and
agribusiness waste, can be used with existing equipment and infrastructure: the inclusion
of biomass pelletizing into existing thermoelectric generators, cogeneration for the sugar
cane industry, among others.
160
Threats
• Low certainty in Carbon markets
• Limited public funding to explore market growth.
• Higher cost alternative to other sources of renewable energy, if only the energetic benefit
is to be considered, not including the diminished GHG emissions from current standard
practices, and the revenue generated by the collection and treatment of the waste itself.
• Lower apparent appetite for non-fossil fuel alternatives from the new ruling party which
could make the incentives prefer traditional power sourcing in the short term.
• Higher cost of providing purified natural gas equivalent from waste processing than from
traditional sources due to biomass sourcing instability and other market inequalities.
• High interconnectivity costs tied to remote generation.
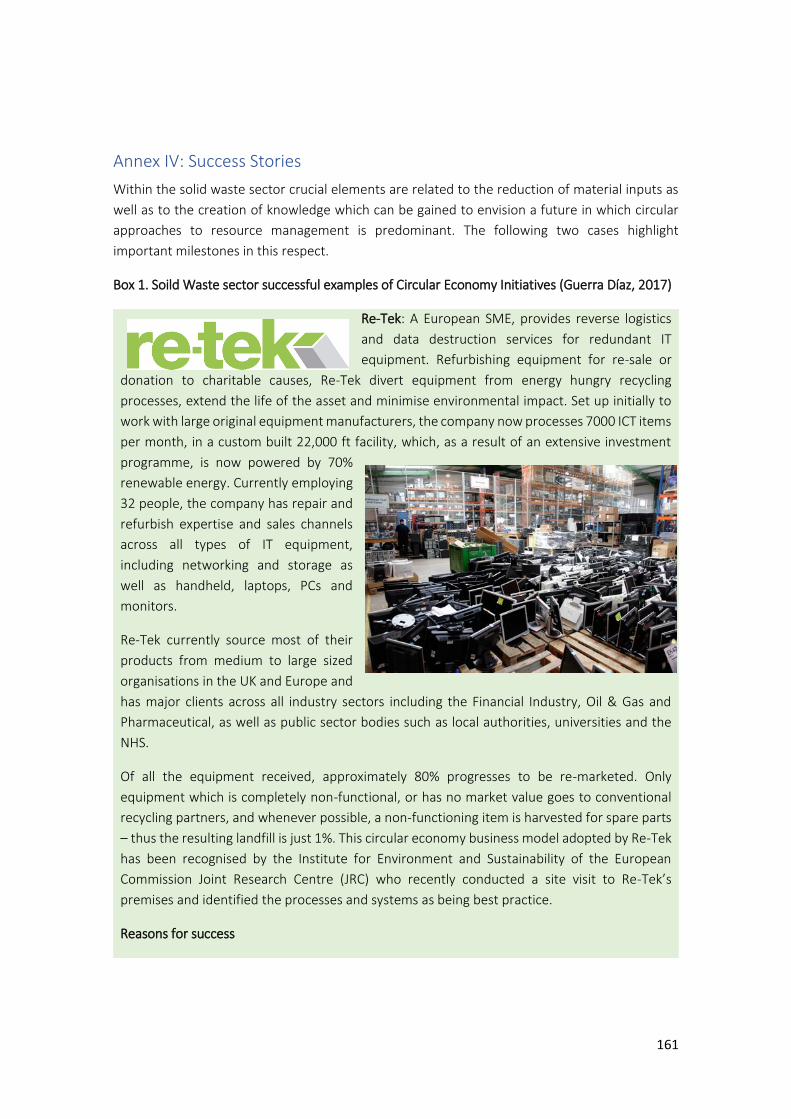
161
Annex IV: Success Stories
Within the solid waste sector crucial elements are related to the reduction of material inputs as
well as to the creation of knowledge which can be gained to envision a future in which circular
approaches to resource management is predominant. The following two cases highlight
important milestones in this respect.
Box 1. Soild Waste sector successful examples of Circular Economy Initiatives (Guerra Díaz, 2017)
Re-Tek: A European SME, provides reverse logistics
and data destruction services for redundant IT
equipment. Refurbishing equipment for re-sale or
donation to charitable causes, Re-Tek divert equipment from energy hungry recycling
processes, extend the life of the asset and minimise environmental impact. Set up initially to
work with large original equipment manufacturers, the company now processes 7000 ICT items
per month, in a custom built 22,000 ft facility, which, as a result of an extensive investment
programme, is now powered by 70%
renewable energy. Currently employing
32 people, the company has repair and
refurbish expertise and sales channels
across all types of IT equipment,
including networking and storage as
well as handheld, laptops, PCs and
monitors.
Re-Tek currently source most of their
products from medium to large sized
organisations in the UK and Europe and
has major clients across all industry sectors including the Financial Industry, Oil & Gas and
Pharmaceutical, as well as public sector bodies such as local authorities, universities and the
NHS.
Of all the equipment received, approximately 80% progresses to be re-marketed. Only
equipment which is completely non-functional, or has no market value goes to conventional
recycling partners, and whenever possible, a non-functioning item is harvested for spare parts
– thus the resulting landfill is just 1%. This circular economy business model adopted by Re-Tek
has been recognised by the Institute for Environment and Sustainability of the European
Commission Joint Research Centre (JRC) who recently conducted a site visit to Re-Tek’s
premises and identified the processes and systems as being best practice.
Reasons for success
162
✓ Culture of entrepreneurship within large industries that pave the way for smaller
industries and provide the private sector with lighthouse initiatives for other
industries.
✓ The change is led from an economic stand point with environmental gains seen as
secondary. This results in a substantial reduction in material input that is achieved
through these initiatives.
✓ Cradle to cradle management strategies are promoted throughout the entire company
so that all employees follow the circular economy approach.
Box 2. Generating and sharing knowledge innovation in circular economy
It is widely acknowledged that research and hence
innovation approaches are essential to foster
circular economy, and this is no different in the solid
waste management sector with a particular focus
on industry. A global initiative to bring research to
the forefront of circular solutions is the The
Greening of Industry platform, which is an
international network of professionals from
research, education, business, government and civil
society organizations that are focusing on the issues
of industrial development, environment and society that is dedicated to building a sustainable
future. The Greening of Industry Network brings together people of various backgrounds
(professionally and geographically) to meet, exchange ideas and develop strategies. With
coordinating offices in various countries (including Mexico), participants engage from more
than 50 countries to respond to the challenges of sustainable development. Through linked
conferences, publications and communications, the network creates new relationships, visions,
and practices for sustainability and circular solutions. Each year a high-level international
conference is held in Mexico with the participation of start-ups, large transnational business,
governments as well as researches with space to create alliances between the public and
private sectors and to promote circular approaches. These yearly events position Mexico
broadly within the circular economy movement.
Reasons for success
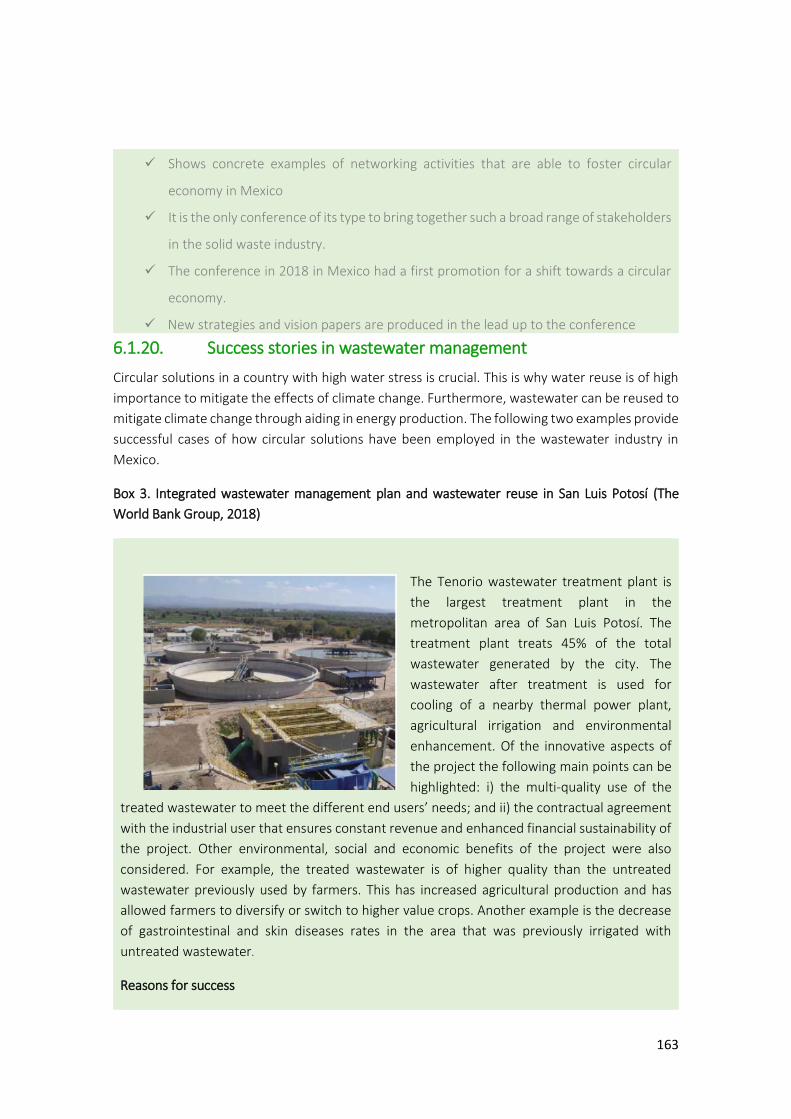
163
✓ Shows concrete examples of networking activities that are able to foster circular
economy in Mexico
✓ It is the only conference of its type to bring together such a broad range of stakeholders
in the solid waste industry.
✓ The conference in 2018 in Mexico had a first promotion for a shift towards a circular
economy.
✓ New strategies and vision papers are produced in the lead up to the conference
6.1.20. Success stories in wastewater management
Circular solutions in a country with high water stress is crucial. This is why water reuse is of high
importance to mitigate the effects of climate change. Furthermore, wastewater can be reused to
mitigate climate change through aiding in energy production. The following two examples provide
successful cases of how circular solutions have been employed in the wastewater industry in
Mexico.
Box 3. Integrated wastewater management plan and wastewater reuse in San Luis Potosí (The
World Bank Group, 2018)
The Tenorio wastewater treatment plant is
the largest treatment plant in the
metropolitan area of San Luis Potosí. The
treatment plant treats 45% of the total
wastewater generated by the city. The
wastewater after treatment is used for
cooling of a nearby thermal power plant,
agricultural irrigation and environmental
enhancement. Of the innovative aspects of
the project the following main points can be
highlighted: i) the multi-quality use of the
treated wastewater to meet the different end users’ needs; and ii) the contractual agreement
with the industrial user that ensures constant revenue and enhanced financial sustainability of
the project. Other environmental, social and economic benefits of the project were also
considered. For example, the treated wastewater is of higher quality than the untreated
wastewater previously used by farmers. This has increased agricultural production and has
allowed farmers to diversify or switch to higher value crops. Another example is the decrease
of gastrointestinal and skin diseases rates in the area that was previously irrigated with
untreated wastewater.
Reasons for success
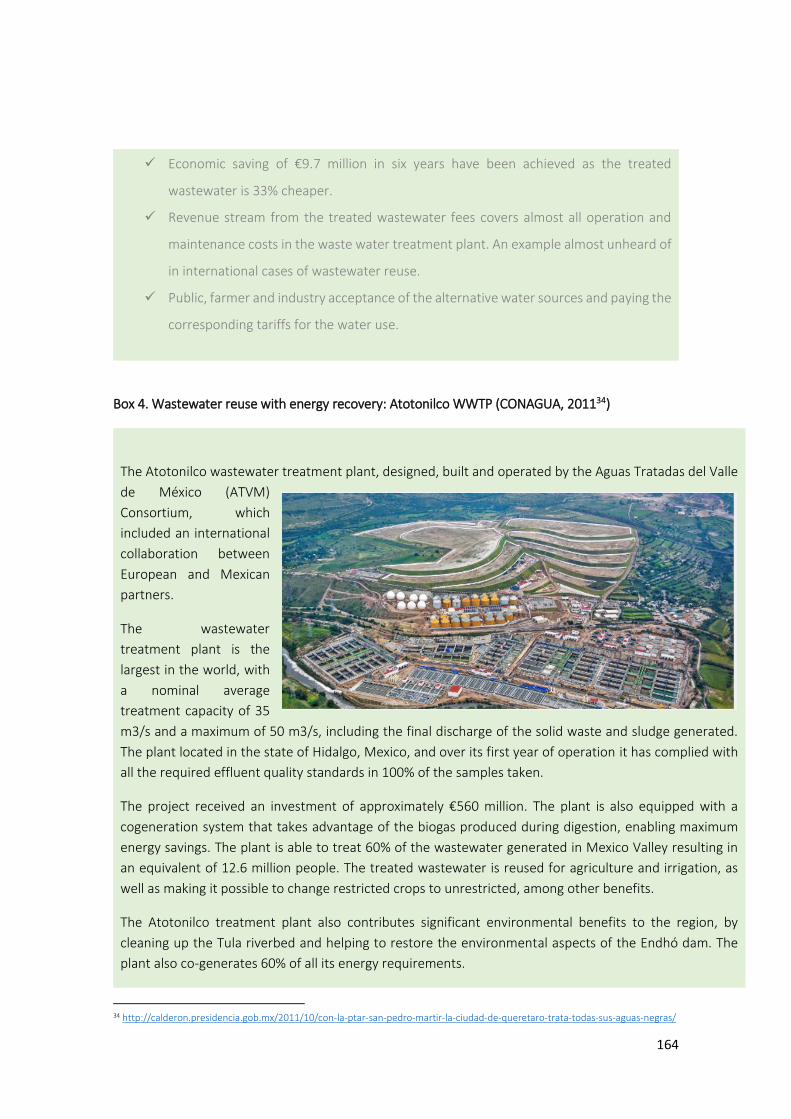
164
✓ Economic saving of €9.7 million in six years have been achieved as the treated
wastewater is 33% cheaper.
✓ Revenue stream from the treated wastewater fees covers almost all operation and
maintenance costs in the waste water treatment plant. An example almost unheard of
in international cases of wastewater reuse.
✓ Public, farmer and industry acceptance of the alternative water sources and paying the
corresponding tariffs for the water use.
Box 4. Wastewater reuse with energy recovery: Atotonilco WWTP (CONAGUA, 201134)
The Atotonilco wastewater treatment plant, designed, built and operated by the Aguas Tratadas del Valle
de México (ATVM)
Consortium, which
included an international
collaboration between
European and Mexican
partners.
The wastewater
treatment plant is the
largest in the world, with
a nominal average
treatment capacity of 35
m3/s and a maximum of 50 m3/s, including the final discharge of the solid waste and sludge generated.
The plant located in the state of Hidalgo, Mexico, and over its first year of operation it has complied with
all the required effluent quality standards in 100% of the samples taken.
The project received an investment of approximately €560 million. The plant is also equipped with a
cogeneration system that takes advantage of the biogas produced during digestion, enabling maximum
energy savings. The plant is able to treat 60% of the wastewater generated in Mexico Valley resulting in
an equivalent of 12.6 million people. The treated wastewater is reused for agriculture and irrigation, as
well as making it possible to change restricted crops to unrestricted, among other benefits.
The Atotonilco treatment plant also contributes significant environmental benefits to the region, by
cleaning up the Tula riverbed and helping to restore the environmental aspects of the Endhó dam. The
plant also co-generates 60% of all its energy requirements.
34 http://calderon.presidencia.gob.mx/2011/10/con-la-ptar-san-pedro-martir-la-ciudad-de-queretaro-trata-todas-sus-aguas-negras/
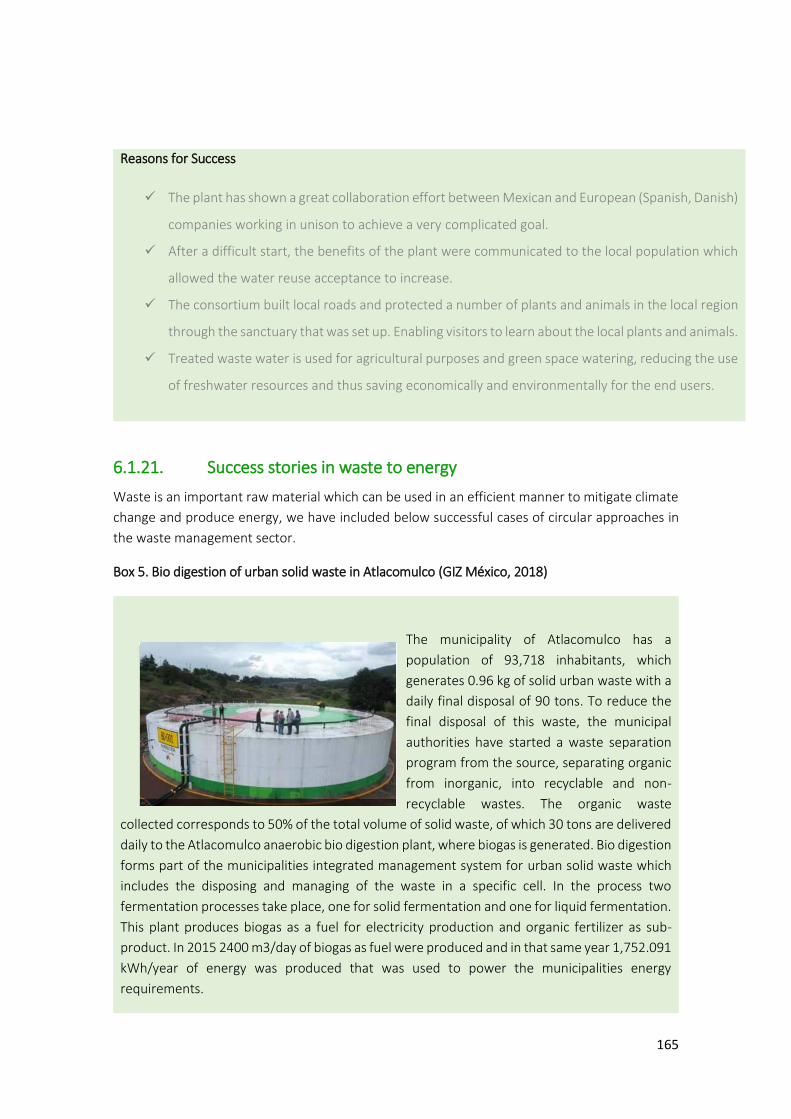
165
Reasons for Success
✓ The plant has shown a great collaboration effort between Mexican and European (Spanish, Danish)
companies working in unison to achieve a very complicated goal.
✓ After a difficult start, the benefits of the plant were communicated to the local population which
allowed the water reuse acceptance to increase.
✓ The consortium built local roads and protected a number of plants and animals in the local region
through the sanctuary that was set up. Enabling visitors to learn about the local plants and animals.
✓ Treated waste water is used for agricultural purposes and green space watering, reducing the use
of freshwater resources and thus saving economically and environmentally for the end users.
6.1.21. Success stories in waste to energy
Waste is an important raw material which can be used in an efficient manner to mitigate climate
change and produce energy, we have included below successful cases of circular approaches in
the waste management sector.
Box 5. Bio digestion of urban solid waste in Atlacomulco (GIZ México, 2018)
The municipality of Atlacomulco has a
population of 93,718 inhabitants, which
generates 0.96 kg of solid urban waste with a
daily final disposal of 90 tons. To reduce the
final disposal of this waste, the municipal
authorities have started a waste separation
program from the source, separating organic
from inorganic, into recyclable and non-
recyclable wastes. The organic waste
collected corresponds to 50% of the total volume of solid waste, of which 30 tons are delivered
daily to the Atlacomulco anaerobic bio digestion plant, where biogas is generated. Bio digestion
forms part of the municipalities integrated management system for urban solid waste which
includes the disposing and managing of the waste in a specific cell. In the process two
fermentation processes take place, one for solid fermentation and one for liquid fermentation.
This plant produces biogas as a fuel for electricity production and organic fertilizer as sub-
product. In 2015 2400 m3/day of biogas as fuel were produced and in that same year 1,752.091
kWh/year of energy was produced that was used to power the municipalities energy
requirements.
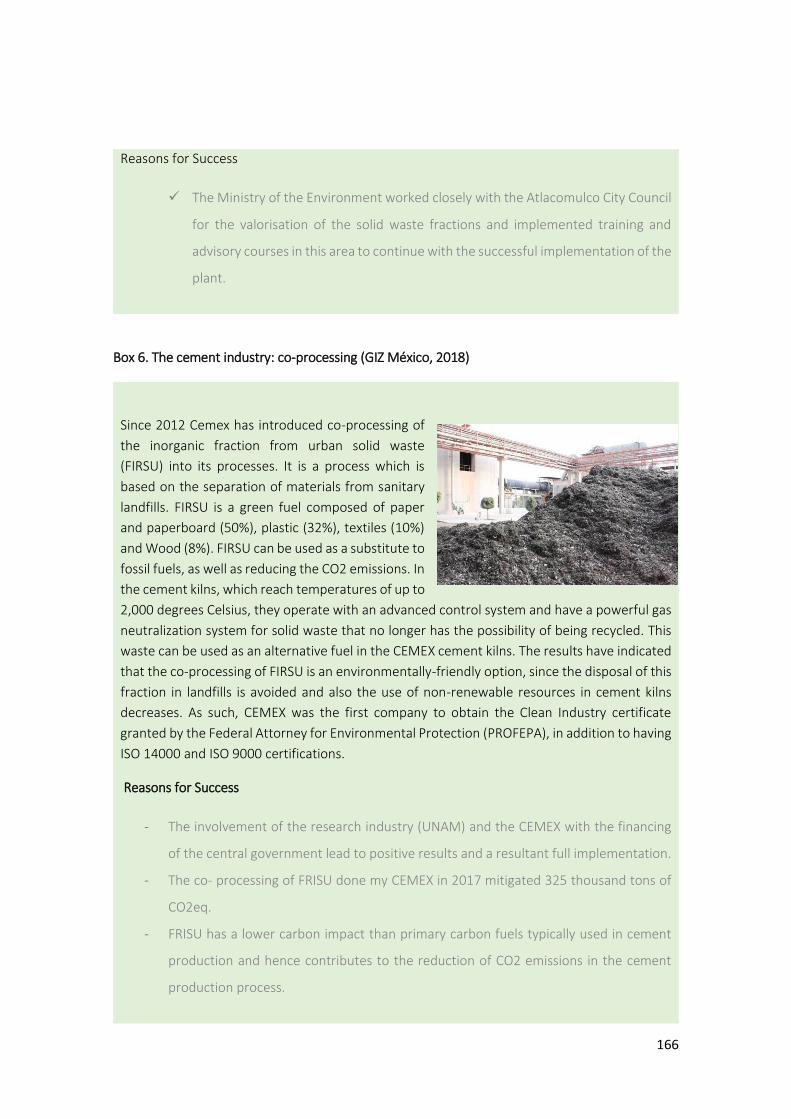
166
Reasons for Success
✓ The Ministry of the Environment worked closely with the Atlacomulco City Council
for the valorisation of the solid waste fractions and implemented training and
advisory courses in this area to continue with the successful implementation of the
plant.
Box 6. The cement industry: co-processing (GIZ México, 2018)
Since 2012 Cemex has introduced co-processing of
the inorganic fraction from urban solid waste
(FIRSU) into its processes. It is a process which is
based on the separation of materials from sanitary
landfills. FIRSU is a green fuel composed of paper
and paperboard (50%), plastic (32%), textiles (10%)
and Wood (8%). FIRSU can be used as a substitute to
fossil fuels, as well as reducing the CO2 emissions. In
the cement kilns, which reach temperatures of up to
2,000 degrees Celsius, they operate with an advanced control system and have a powerful gas
neutralization system for solid waste that no longer has the possibility of being recycled. This
waste can be used as an alternative fuel in the CEMEX cement kilns. The results have indicated
that the co-processing of FIRSU is an environmentally-friendly option, since the disposal of this
fraction in landfills is avoided and also the use of non-renewable resources in cement kilns
decreases. As such, CEMEX was the first company to obtain the Clean Industry certificate
granted by the Federal Attorney for Environmental Protection (PROFEPA), in addition to having
ISO 14000 and ISO 9000 certifications.
Reasons for Success
- The involvement of the research industry (UNAM) and the CEMEX with the financing
of the central government lead to positive results and a resultant full implementation.
- The co- processing of FRISU done my CEMEX in 2017 mitigated 325 thousand tons of
CO2eq.
- FRISU has a lower carbon impact than primary carbon fuels typically used in cement
production and hence contributes to the reduction of CO2 emissions in the cement
production process.
167
Annex V: Market Opportunities in Circular Economy in Mexico (PPT)
This is a publication of
Netherlands Enterprise Agency
Prinses Beatrixlaan 2
PO Box 93144 | 2509 AC The Hague
T +31 (0) 88 042 42 42
www.rvo.nl
This publication was commissioned by the ministry of Foreign Affairs.
© Netherlands Enterprise Agency | April 2021
Publicationnumber: RVO-085-2021/RP-INT
NL Enterprise Agency is a department of the Dutch ministry of Economic
Affairs and Climate Policy that implements government policy for
Agricultural, sustainability, innovation, and international business and
cooperation. NL Enterprise Agency is the contact point for businesses,
educational institutions and government bodies for information and advice,
financing, networking and regulatory matters.
Netherlands Enterprise Agency is part of the ministry of Economic Affairs and
Climate Policy.


