Embed Size (px)
Citation preview

March 4, 2020 Transmitted Via: Email ([email protected]) Ms. Holly Ross, Sr. Project Manager U.S. Army Corps of Engineers Savannah District - Regulatory Division 1104 N. Westover Blvd. Unit 9 Albany, Georgia 31707 Subject: Individual Permit Application
Twin Pines Minerals, LLC Saunders Demonstration Mine Saint George, Charlton County, GA USACE Project No.: SAS-2018-00554 TTL Project No.: 00180200804.00
Dear Ms. Ross, TTL, Inc. (TTL) respectfully submits this Individual Permit application package for impacts to waters of the United States associated with the proposed heavy minerals mine operation located near St. George, in Charlton County, Georgia. By signature of the Joint Application and Notification form enclosed, the applicant, Twin Pines Minerals, LLC designates and authorizes TTL to act as Agent on Twin Pine Mineral’s behalf in the processing of the permit application. TTL representatives look forward to working with you on this important permitting project. Sincerely,
TTL, Inc. Christopher Terrell Chris Stanford Cindy House-Pearson Project Professional Project Professional Vice President Enclosed: Joint Application Form
Individual Permit Application Package
2743-B Gunter Park Drive West Montgomery, AL 36109
334.244.0766www.TTLUSA.com


2743B Gunter Park Drive West| Montgomery, Alabama 36109 | Telephone 334.244.0766
INDIVIDUAL PERMIT APPLICATION FOR
SAUNDERS DEMONSTRATION MINE
SAINT GEORGE, CHARLTON COUNTY, GEORGIA (SAS-2018-00554)
Submitted to: Ms. Holly Ross, Project Manager
U.S. Army Corps of Engineers Savannah District - Regulatory Division
1104 N. Westover Blvd. Unit 9 Albany, Georgia 31707
Prepared by: TTL, Inc.
2743-B Gunter Park Drive West Montgomery, Alabama 36109
USACE Project No. SAS-2018-00554
TTL Project No. 000180200804
March 4, 2020

Twin Pines Minerals – Individual Permit Application Supplemental Information USACE Project No. SAS-2018-00554 March 4, 2020 TTL Project No. 000180200804 Page i
Mont M:\Projects\2018\000180200804.00 - Twin Pines Minerals Permitting Services\USACE Individual Permit App\Revisions to IP app\IP Application 03032020
TABLE OF CONTENTS
1.0 INTRODUCTION ................................................................................................. 1 2.0 PURPOSE AND NEED ........................................................................................ 5 3.0 HYDROGEOLOGY OF TRAIL RIDGE ................................................................... 7
3.1 Trail Ridge and Okefenokee Swamp Background ............................................................ 7
3.2 Subsurface Geology ............................................................................................................ 8
3.3 Hydraulic Properties and Data ......................................................................................... 10
3.4 Water Quality ..................................................................................................................... 17
3.5 Climate Data ...................................................................................................................... 19
3.6 Summary of Groundwater Models ................................................................................... 20
3.6.1 Three-Dimensional Groundwater Flow Models ..................................................... 21
3.6.2 Impact of a Moving Mine ........................................................................................ 23
3.6.3 Summary of Model Results .................................................................................... 25
3.7 Groundwater and Surface Water Quality Monitoring Plan ............................................. 26
3.7.1 Groundwater- and Surface-Water-Level Monitoring Plan ..................................... 26
3.7.2 Groundwater- and Surface-Water Quality Monitoring Plan .................................. 29
3.7.3 Reporting ................................................................................................................. 34
4.0 ALTERNATIVE ANALYSIS ................................................................................ 35 4.1. Alternatives Development Process .................................................................................. 35
4.2. Alternatives Screening Process ....................................................................................... 36
4.3 Evaluation of Potential Mining Methodologies ................................................................ 36
4.4 Alternatives Sites Eliminated from Further Consideration ............................................. 38
4.5 Alternatives Evaluated Further ........................................................................................... 41
4.5.1 Off-Site Alternatives .................................................................................................. 41
4.5.2 On-Site Alternatives: Saunders Tract ....................................................................... 41
5.0 AVOIDANCE AND MINIMIZATION ................................................................... 48 6.0 TYPES OF IMPACTS ....................................................................................... 49 7.0 MITIGATION PLAN .......................................................................................... 52 8.0 WATERS OF THE U.S. JURISDICTIONAL DETERMINATION ........................... 54 9.0 THREATENED AND ENDANGERED SPECIES ................................................ 55
9.1 Frosted flatwoods salamander ......................................................................................... 55
9.2 Striped newt ....................................................................................................................... 56
9.3 Gopher frog ........................................................................................................................ 56
9.4 Red-cockaded woodpecker ............................................................................................... 57

Twin Pines Minerals – Individual Permit Application Supplemental Information USACE Project No. SAS-2018-00554 March 4, 2020 TTL Project No. 000180200804 Page ii
Mont M:\Projects\2018\000180200804.00 - Twin Pines Minerals Permitting Services\USACE Individual Permit App\Revisions to IP app\IP Application 03032020
9.5 Florida hartwrightia ............................................................................................................ 57
9.6 Flooplain tickseed .............................................................................................................. 57
9.7 Purple honeycomb-head ................................................................................................... 57
9.8 Eastern indigo snake ......................................................................................................... 58
9.9 Gopher tortoise .................................................................................................................. 58
9.10 Other Special Concern Species ...................................................................................... 60
10.0 CULTURAL RESOURCES .............................................................................. 65 11.0 ADJACENT PROPERTY OWNERS ................................................................. 66 12.0 REFERENCES ............................................................................................... 67

Twin Pines Minerals – Individual Permit Application Supplemental Information USACE Project No. SAS-2018-00554 March 4, 2020 TTL Project No. 000180200804 Page iii
Mont M:\Projects\2018\000180200804.00 - Twin Pines Minerals Permitting Services\USACE Individual Permit App\Revisions to IP app\IP Application 03032020
TABLES Table 1 Variogram Models Used to Fit Experimental Indicator Variograms of Soil data Table 2 Horizontal Correlation Lengths Used in Variogram Models Table 3 Vertical Correlation Lengths Used in Variogram Models Table 4 Well Construction Summary Table Table 5 Slug and Bail Test Results Summary Table Table 6 Laboratory Results of Soil Samples Analyzed for Vertical Hydraulic Conductivity Table 7 Laboratory Results of Soil Samples Analyzed for Porosity Table 8 Summary of Grain-Size Distribution Analysis of Soil Samples Collected from Borings Table 9 Results of Bench-Scale Study Vertical Hydraulic Conductivity Testing of Post-
Processed Soils Compared to Undisturbed Sample PZ57D Table 10 Local Precipitation Summary Table Table 11 Staff Gauge Elevation Summary Table Table 12 Groundwater Elevation Summary Table Table 13 Water Budget Comparisons of the Pre-Mining and Post-Mining Models Table 14 Water Budget Comparison of the Pre-Mining and Post-Mining Models - Zone 1 Table 15 Water Budget Comparison of the Pre-Mining and Post-Mining Models - Zone 2 Table 16 Water-Quality Analytical List Table 17 Summary of Alternatives Analysis Table 18 Avoidance and Minimization Summary Table Table 19 Mitigation Bank Analysis for Permanent Impacts and Year 1 Table 20 Federal Status Species Potentially Occurring in Project Area Table 21 Other Special Concern Species Potentially Occurring in Project Area Table 22 Summary of Potential Impacts to Federal Status Species in Project Area FIGURES Figure 1 Location of the Proposed Saunders Demonstration Mine Figure 2 Heavy Mineral Deposits of SE Georgia & NE Florida Figure 3 Estimated Progression of Mining Figure 4 Conceptual Hydrogeologic Model Figure 5 Okefenokee Swamp Watershed Characteristics Figure 6 Soil Boring and Piezometer/Well Location Map Figure 7 Example West-To-East Profile Figure 8 Example North-To-South Profile Figure 9 Horizontal Variogram for Consolidated Sand Figure 10 Vertical Variogram for Consolidated Sand Figure 11 Probability (%) of Consolidated Sands Presence Figure 12 Probability (%) of Consolidated Sands Presence Figure 13 Probability (%) of Consolidated Sands Presence Figure 14 Pumping Well Location Map Figure 15 Pumping Well “A” Location Map Figure 16 Pumping Well “B” Location Map Figure 17 Hydraulic Conductivity (Bail Tests) Figure 18 Hydraulic Conductivity (Slug Tests) Figure 19 Slug Test Hydraulic Conductivity vs. Elevation Figure 20 Slug Test Normality Plot (Above 120 ft AMSL) Figure 21 Slug Test Normality Plot (Below 120 ft AMSL) Figure 22 Undisturbed (UD) Soil Boring Location Map Figure 23 Exploratory Boring Location Map Figure 24 Piezometer Location Map Figure 25 Soil Moisture Sampling Location Map

Twin Pines Minerals – Individual Permit Application Supplemental Information USACE Project No. SAS-2018-00554 March 4, 2020 TTL Project No. 000180200804 Page iv
Mont M:\Projects\2018\000180200804.00 - Twin Pines Minerals Permitting Services\USACE Individual Permit App\Revisions to IP app\IP Application 03032020
Figure 26 Undisturbed (UD) Soil Boing Location Map & Post-Mineral Process Paring Map Figure 27 Rain Gauge Location Map Figure 28 Staff Gauge Location Map Figure 29 Data Logger Equipped Piezometers & Observation Wells Figure 30 Rain Gauge Precipitation Data Figure 31 PZ-44 & SG-22 Hydrograph Figure 32 PZ-28S/D Hydrograph Figure 33 SG-06 Hydrograph Figure 34 SG-27 Hydrograph Figure 35 Average Groundwater Elevation Differences in Shallow & Deep Piezometer Pairs Figure 36 PZ-45S/D Hydrograph Figure 37 Potentiometric Surface Map of the Surficial Aquifer (January 26, 2019) Figure 38 Potentiometric Surface Map of the Surficial Aquifer (April 26, 2019) Figure 39 Potentiometric Surface Map of the Surficial Aquifer (July 26, 2019) Figure 40 Model Area Map Figure 41 Model Grid & Boundary Conditions Figure 42 Vertical Model Grid – North to South Figure 43 Vertical Model Grid – West to East Figure 44 Initial Model Horizontal Hydraulic Conductivity, Layer 4 Figure 45 Initial Model Horizontal Hydraulic Conductivity, Layer 8 Figure 46 Initial Model Horizontal Hydraulic Conductivity, Layer 12 Figure 47 Objective Function vs. Iteration Figure 48 Calculated vs. Observed Heads - Calibrated Figure 49 Calibrated Model Horizontal Hydraulic conductivity, Layer 4 Figure 50 Calibrated Model Horizontal Hydraulic conductivity, Layer 8 Figure 51 Calibrated Model Horizontal Hydraulic conductivity, Layer 12 Figure 52 Pre-Mining Model Potentiometric Surface Map Figure 53 Surface & Mining Base Digital Elevation Model Figure 54 Post-Mining Model Horizontal Hydraulic Conductivity, Layer 4 Figure 55 Post-Mining Model Horizontal Hydraulic Conductivity, Layer 8 Figure 56 Post-Mining Model Horizontal Hydraulic Conductivity, Layer 12 Figure 57 Post-Mining Model Potentiometric Surface Map Figure 58 Post-Mining Water Table Elevation Change Map Figure 59 Model Water Budget Zone Map Figure 60 Drawdown Due to the Moving Mine Figure 61 Existing Piezometer Location Map Figure 62 Existing Shallow “Wetlands” Piezometer Location Map Figure 63 Proposed Piezometer Location & Mining Timeline Map Figure 64 Predictive Drawdown Due to the Moving Mine Figure 65 Typical Piezometer Construction Detail Figure 66 Proposed Surface-Water Monitoring Locations Figure 67 Overall Saunders Tract Map Figure 68 Alternative 3 Relative to the Okefenokee Swamp Figure 69 Sensitive Features Map: Alternative 3 Figure 70 Alternative 4 Relative to the Okefenokee Swamp Figure 71 Sensitive Features Map: Alternative 4 Figure 72 Alternative 5 Relative to the Okefenokee Swamp Figure 73 Sensitive Features Map: Alternative 5 Figure 74 Historical Aerial Photograph (1970) Figure 75 Proposed Project Aquatic Feature Impact Areas Map Figure 76 Hydrologic Unit Code Map

Twin Pines Minerals – Individual Permit Application Supplemental Information USACE Project No. SAS-2018-00554 March 4, 2020 TTL Project No. 000180200804 Page v
Mont M:\Projects\2018\000180200804.00 - Twin Pines Minerals Permitting Services\USACE Individual Permit App\Revisions to IP app\IP Application 03032020
Figure 77 Threatened & Endangered Species Location Map Figure 78 Parrot Pitchplant Location Map Figure 79 Site Location & Real Estate Parcel Map APPENDICES Appendix A Data Files for Geostatistics Appendix B Variograms for Soil Types Appendix C Indicator-Kriged Maps Showing the Probability that a Soil Type is Present Appendix D Moving Mine Concept Appendix E Road Crossing Plan & Profile Appendix F SOP Worksheets Appendix G Waters of the US Delineation Reports and Verification Letters Appendix H Threatened & Endangered Species Reports Appendix I Cultural Resource Survey Reports

Twin Pines Minerals – Individual Permit Application Supplemental Information USACE Project No. SAS-2018-00554 March 4, 2020 TTL Project No. 000180200804 Page 1
Mont M:\Projects\2018\000180200804.00 - Twin Pines Minerals Permitting Services\USACE Individual Permit App\Revisions to IP app\IP Application 03032020
1.0 INTRODUCTION Twin Pines Minerals (TPM) proposes to mine heavy mineral sands (HMS) from a site located along Trail Ridge near Saint George, Charlton County, Georgia (Figure 1). On July 3, 2019, TPM prepared and submitted an Individual Permit Application package (USACE Project No.: SAS-2018-00554) to the U.S. Army Corps of Engineers, Savanah District Regulatory Division for impacts to waters of the US associated with the proposed development of 1,450.4 acres for a heavy minerals mine operation. This proposed mine was located near St. George, Charlton County, Georgia. This application was withdrawn on February 7, 2020. TPM now wishes to conduct a demonstration mining project for a reduced mining area of approximately 898 acres. This demonstration project has been selected and designed to demonstrate that heavy mineral sand (HMS) mining can be conducted in an environmentally responsible manner. The proposed demonstration project will be used to validate a previously completed groundwater model which predicted that mining will have a negligible impact on local groundwater resources, surface water resources, and the Okefenokee Swamp. Substantial studies have been conducted to determine site characteristics and evaluate potential impacts. The following summarizes these studies and their results. Heavy Minerals Economic heavy mineral assemblages located in the southeastern U.S. are formed as heavy minerals become concentrated through depositional processes which remove less dense, more erodible minerals from the sediment thus increasing the percentage of heavy minerals. Environments conducive to this type of preferential weathering and deposition include fluvial-deltaic, barrier island, and beach ridge sequences deposited on ancient and modern shorelines. Hamilton (1995) defines these heavy mineral deposits as “coastal placers” where eolian, wave, and tidal processes provide the mechanical reworking and deposition of sediment to concentrate zircon, ilmenite, rutile and other heavy minerals. In southeastern Georgia, seven coastlines (paleo and current) have been identified which contain heavy-mineral deposits. Trail Ridge is located on the oldest recognized paleo-shoreline, the Wicomico Shoreline (Figure 2). HMS deposits contain the primary ores of titanium dioxide (TiO2) for the pigment industry and zircon (ZrSiO2) used in refractory products. TiO2 is primarily obtained from mining and processing the minerals ilmenite, rutile, and leucoxene. Zircon is the main ore mineral for the elements zirconium (Zr) and hafnium (Hf) and approximately 97 percent of all zirconium is obtained from of zircon mined from HMS deposits. Proposed Mining Technique Twin Pines has developed a novel HMS mining technique using a dragline excavator and conveyor system for materials transport, and land-based permanent processing plants. This mining technique is different from conventional "wet mining", which utilizes a dredge and floating concentrator to mine and process heavy mineral-bearing sands. This technique will utilize an electrically powered dragline for mining which can efficiently move large quantities of material. After mining and processing, the tailings will be transported back to the open mine pit within five to seven days of excavation and the reclamation area will then be recontoured, covered with topsoil and revegetated. The operation is a continuous process and while the dragline is operating, backfilling of the cut is simultaneously occurring. It is estimated that it will require approximately six years to mine the entire 898-acre mining area (Figure 3).

Twin Pines Minerals – Individual Permit Application Supplemental Information USACE Project No. SAS-2018-00554 March 4, 2020 TTL Project No. 000180200804 Page 2
Mont M:\Projects\2018\000180200804.00 - Twin Pines Minerals Permitting Services\USACE Individual Permit App\Revisions to IP app\IP Application 03032020
Geology Soil cores reveal that the upper part of the Surficial Aquifer is heterogeneous, consisting mainly of unconsolidated sands interspersed with irregular, discontinuous zones of semi-consolidated to consolidated sands cemented by humate. Deeper within the Surficial Aquifer, unconsolidated sands are interbedded with discontinuous lenses of clayey sands, silty-clayey sands, and local clay units, likely derived from the underlying Hawthorn Group. Based on our studies, six subsurface units have been identified within the Surficial Aquifer in the study area. The Surficial Aquifer is the uppermost geologic unit in the area of the proposed mine. The Surficial Aquifer is underlain by the sediments of the Hawthorn Group. The Hawthorn Group is approximately 350 feet thick under Trail Ridge and consists of low-permeability, calcareous clays that effectively isolate the Surficial Aquifer from the deeper Floridian aquifer. Slug and Pumping Tests Slug tests conducted within the Surficial Aquifer are described in Holt et al. (2019a). To estimate the horizontal hydraulic conductivity of the Surficial Aquifer, slug and bail tests were performed in 24 piezometers within the project study area. Both methods produced similar estimates of hydraulic conductivity. Two pumping tests (wells PWA and PWB) conducted for the Surficial Aquifer are described in Holt et al. (2019a). The purpose of the pumping tests was to obtain transmissivity (T) and storage coefficient (S) data for the Surficial Aquifer beneath the site. For pumping test PWA, estimates of T and S from pumping well PWA data range from 1,490 ft2/day to 1,967 ft2/day and from 3.5 x 10⁻⁴ to 1.1 x 10⁻², respectively. For pumping test PWB, estimates of T and S from pumping well PWB data range from 530 ft2/day to 697 ft2/day and from 2.4 x 10⁻³ to 0.11, respectively. Precipitation Monitoring Details of precipitation monitoring are presented in Holt et al. (2019d, 2019e). Local precipitation data was collected from three rain gauges installed by Twin Pines personnel at the northern, central, and southern portions of the project study area. Rain gauge data collected from the project study area indicates that the greatest rainfall occurred during the months of December 2018 and July 2019 with monthly rainfall gauge totals of about 8 and 14 inches, respectively. An examination of the rain gauge data reveals that rainfall across the project study area varies spatially. Hydrographs show that groundwater levels respond quickly to distant rainfall events, even when the closest rain gauge shows no observed precipitation. These rapid responses reflect the high hydraulic conductivity of the Surficial Aquifer at Trail Ridge. Many observed surface water levels show a significant lag with precipitation data, suggesting that surface water levels in these areas are influenced by groundwater flow. Potentiometric Surface Maps Water elevation data collected on January 26, April 26, and July 26, 2019, was used to generate potentiometric surface maps of the Surficial Aquifer. Review of the potentiometric surface maps indicates that groundwater elevations at the site generally mimic land surface topography with groundwater flowing to the west and east of Trail Ridge. This indicates that Trail Ridge represents a hydrologic divide within the underlying Surficial Aquifer. Groundwater flow along the west side of Trail Ridge is to the west. Groundwater flow along the east side of Trail Ridge is to the east. Depths to groundwater in the shallow piezometers beneath the site generally range from just below land surface to about 5 feet below ground surface (bgs). The average groundwater velocity along the west and east sides of the ridge was approximately 0.24 ft/day and 0.32 ft/day, respectively, in July 2019. Water Quality Water quality sampling activities at the Twin Pines study area are described in Holt et al. (2019c). Precipitation provides most of the recharge for the Surficial Aquifer beneath the study area. As rainfall

Twin Pines Minerals – Individual Permit Application Supplemental Information USACE Project No. SAS-2018-00554 March 4, 2020 TTL Project No. 000180200804 Page 3
Mont M:\Projects\2018\000180200804.00 - Twin Pines Minerals Permitting Services\USACE Individual Permit App\Revisions to IP app\IP Application 03032020
infiltrates through the soil zone or sediments it is chemically altered through mineral dissolution, precipitation, cation exchange, oxidation reduction, anion exchange, and dissolution of organic molecules. Surface water on the property is dependent on precipitation for recharge, but appears to be in contact with groundwater (within low-lying areas of the site) during periods of seasonally high precipitation. TTL personnel collected groundwater samples from six piezometers and two surface water locations to evaluate background water quality data at the project site. Results of analyses are summarized in Holt et al. (2019c). Groundwater Models Holt et al. (2020) developed two types of groundwater models to evaluate the impact of the proposed Saunders Demonstration Mine on the hydrologic system underlying Trail Ridge: numerical models and analytical models. Two numerical models were developed using the U.S. Geological Survey (USGS) code MODFLOW-2005 to simulate three-dimensional, steady-state groundwater flow in the Surficial Aquifer at the study area. First, a model representing pre-mining conditions was created and calibrated to match observed water levels in piezometers and wells. The second model represents post-mining conditions and is based on the original calibrated model, except the calibrated hydraulic conductivity values of the aquifer within the mined zone were homogenized to represent the mine pit filled with spoil. The pre-mining and post-mining models were compared to evaluate changes in the groundwater discharge to the model boundaries (e.g., the swamps to the west and the groundwater system to the east). The models compare changes in the groundwater discharge to streams along Trail Ridge and changes in the water table position at the mine and near the Okefenokee swamp due to the proposed mining project. This comparison shows that the proposed mining activities will have negligible impact on the hydrologic system of Trail Ridge and the Okefenokee Swamp. The following conclusions were drawn from these modeling efforts: • Trail Ridge is a classic example of topographically-driven groundwater flow. It acts as a hydrologic
divide that separates the Okefenokee Swamp to the west from the Saint Mary’s River to the east. Rainfall on Trail Ridge provides water to the Surficial Aquifer. This groundwater recharge causes the water table to rise within a few feet of the ground surface along Trail Ridge, forming a hydrologic divide that mimics the topography. Because groundwater flow follows the elevation of the water table, Trail Ridge groundwater flows to the west, supplying water to the Okefenokee Swamp, and flows to the east, supplying water to springs and creeks.
• Proposed mining activities will have an insignificant impact on the groundwater and stream flow to the Okefenokee Swamp and the creeks and groundwater system to the east of Trail Ridge. A comparison of groundwater models of the pre-mining conditions and post-mining conditions show that changes to the groundwater discharge and stream discharge are minimal and insignificant.
• Mining activities will cause insignificant changes in the water table across most of the study area. Within the mine pit, the water table position will both increase and decrease due to the placement of homogenized sand spoil in the mine pit. At the Okefenokee Wildlife Refuge, the worst-case scenario models predict that the water table will decrease by no more than 0.0004 ft due to mining.
• Mining activities will not dewater the Okefenokee Swamp. The Okefenokee Swamp is 2.7 miles away from the closest part of the proposed mine footprint. The active mine pit will be small and filled within five to seven days of excavation. Analytical groundwater models of the moving mine pit show that water levels will recover to within four feet of their original position within 10 days following excavation and two feet of their original position within about 30 days. The perturbation of the water table caused by the moving mine pit will not affect the Okefenokee Swamp. The Trail Ridge hydrologic divide separating the Okefenokee Swamp to west from the Saint Mary’s River to the east will always be maintained.

Twin Pines Minerals – Individual Permit Application Supplemental Information USACE Project No. SAS-2018-00554 March 4, 2020 TTL Project No. 000180200804 Page 4
Mont M:\Projects\2018\000180200804.00 - Twin Pines Minerals Permitting Services\USACE Individual Permit App\Revisions to IP app\IP Application 03032020
Groundwater and Surface Water Quality Monitoring Plan A Groundwater/Surface Water Monitoring Plan has been designed to document monitoring activities to assess the impact or effect of proposed mining on hydrology along Trail Ridge and surrounding areas (including the Okefenokee Swamp) and verify the results of the groundwater models developed for the site. Groundwater/surface water-level monitoring activities are designed to:
• Monitor changes in groundwater levels due to precipitation, recharge, and runoff
• Characterize the response of surface water levels to precipitation and groundwater levels
• Allow the development of models relating precipitation to groundwater levels and recharge
• Identify changes in levels induced by the moving mine pit
• Quantify changes in post-mining water levels
• Provide water-level data to assist in mine reclamation activities These data will be used to verify current groundwater models and to support future revisions of the groundwater models. Groundwater/surface-water-quality monitoring activities will be conducted to:
• Establish baseline groundwater and surface water chemistry
• Monitor spatial and temporal changes in water chemistry due to mining activities
• Provide groundwater chemistry data for mine restoration activities Twin Pines estimates that it will take about six years to mine the entire 898 acres. Post-mining monitoring will be performed for a period equal to the period of mining, and will consist of the monitoring of water levels in the piezometers on a continuous basis. This monitoring will include a manual download of the pressure transducers once every two weeks during the post-mining period. Water-quality samples will be collected semi-annually for analysis of the constituents specified in the monitoring plan. Waters of the United States TTL performed a delineation of waters of the U.S. for the various tracts during a time period covering April 2018 to June 2019, identifying 1202.399 acres of wetlands and approximately 11,587 linear feet of stream channel within the project area. The preferred demonstration project proposes to impact 453.111 acres of wetland through mining. An additional 25.124 acres of wetland and 412 linear feet of stream are to be impacted as a result of site development Threatened & Endangered Species No federally listed threatened or endangered species will be impacted by the demonstration project. Three active gopher tortoise burrows have been identified within the mining footprint. During burrow camera surveys only one gopher tortoise was observed in this colony.

Twin Pines Minerals – Individual Permit Application Supplemental Information USACE Project No. SAS-2018-00554 March 4, 2020 TTL Project No. 000180200804 Page 5
Mont M:\Projects\2018\000180200804.00 - Twin Pines Minerals Permitting Services\USACE Individual Permit App\Revisions to IP app\IP Application 03032020
2.0 PURPOSE AND NEED The purpose of this demonstration project proposed by TPM is to gather data required to evaluate the groundwater hydrology model completed on the selected site (Section 3.0). This evaluation is necessary to demonstrate that heavy mineral sand (HMS) mining can be accomplished in an environmentally sensitive area with negligible impact to the site and surrounding resources. An additional purpose is to develop a high-quality HMS reserve to produce HMS concentrate products including titanium mineral concentrates and zircon concentrates to meet global demands in a safe, cost effective and environmentally sound manner. The TPM mining plan and the associated groundwater and surface water monitoring plan will be used to confirm the ability of HMS mining to be conducted within close proximity to sensitive environmental resources. As the economic locations for mining HMS within the United States are becoming scarce, it is vital that new mines be developed in such a manner as to minimize environmental impacts. TPM has completed extensive geologic and hydrogeologic evaluations of the Saunders Tract which culminated with the production of a groundwater hydrology model demonstrating that mining can be safely conducted within the demonstration area with negligible impact to the site, the surrounding area, and the Okefenokee Swamp. Small scale projects, such as the one proposed, that can demonstrate sound environmental practices for extracting heavy mineral resources in environmentally sensitive locations, represents good stewardship of the environment. HMS deposits contain the primary ores of titanium dioxide (TiO2) for the pigment industry and zircon (ZrSiO2) used in refractory products. TiO2 is primarily obtained from mining and processing the minerals ilmenite, rutile, and leucoxene. Leucoxene, not technically a mineral, is a higher quality derivative of ilmenite resulting from the preferential weathering and leaching of iron therefore increasing the TiO2 percentage to greater than 70 percent (Force, 1991). Zircon is recovered as a co-product from the processing of HMS deposits. Australia and China are the major global producers of HMS and the United States only accounts for about four percent of the total world production of titanium minerals; therefore, the United States “is heavily dependent on imports of titanium mineral concentrates to meet its domestic needs” (Final List of Critical Minerals, 2018). On December 20, 2017, President Trump issued Executive Order 13817, “A Federal Strategy to Ensure Secure and Reliable Supplies of Critical Minerals, directing the Secretary of the Interior to produce a list of critical minerals in order “to reduce the Nation's vulnerability to disruptions in the supply of critical minerals, which constitutes a strategic vulnerability for the security and prosperity of the United States.” On May 18, 2018 the Department of the Interior published the “Final List of Critical Minerals” within which included titanium and zirconium (Final List of Critical Minerals, 2018). This project will serve to decrease the United States dependence on foreign imports of critical mineral resources including titanium and zirconium as directed in Executive Order 13817. Titanium is considered a critical and strategic mineral because of the unique properties of both titanium metal and TiO2 pigment (Woodruff et. al, 2017). According to the USGS (2020), in 2019 the U.S. imported 93 percent of its titanium mineral concentrates with approximately 90 percent of titanium mineral concentrates consumed in the pigment industry. In powder form, TiO2 is a white pigment used in paints, paper, and plastics because it provides even whiteness, brightness, very high refractive index, and opacity (USGS 2018, USGS 2020). The remaining 10 percent was utilized for welding-rod coatings and manufacturing of carbides, chemicals, and titanium metal. “Titanium metal, derived from processing rutile, ilmenite, and (or) leucoxene is also used in spacecraft, guided missiles, jewelry, artificial joints, and heart pacemakers to name a few.” (van Gosen et. al, 2016). From 2018 to 2019 the domestic consumption of titanium mineral concentrates increased 16 percent (USGS, 2020).

Twin Pines Minerals – Individual Permit Application Supplemental Information USACE Project No. SAS-2018-00554 March 4, 2020 TTL Project No. 000180200804 Page 6
Mont M:\Projects\2018\000180200804.00 - Twin Pines Minerals Permitting Services\USACE Individual Permit App\Revisions to IP app\IP Application 03032020
Zircon is the main ore mineral for the elements zirconium (Zr) and hafnium (Hf) and approximately 97 percent of all zirconium is obtained from zircon mined from HMS deposits (Jones, 2017; ZIA, 2019). Zirconium and hafnium are metals that are widely used in the chemical and nuclear-reactor industries due to specific properties of the metals. Zircon mineral is highly refractive with a melting point of 2,550 degrees Celsius (°C) or greater and is commonly used for facings on foundry molds, and milled zircon is used in refractory paints for coating the surfaces of molds (Pirkle et. al, 2007; Jones et. al, 2017). Micronized zircon (zircon “flour”) offers high light reflectivity and thermal stability, and thus is used mostly in refractory products as an opacifier for glazes on ceramics such as tiles, and as foundry sands (Zircon Industry Association, 2019). The ceramic industry represents the most important market for zircon with approximately 85% of the total zircon used by the ceramic industry being used in tile production. Zircon can be used as a whiteness and opacity enhancer in ceramics and with respect to tiles, the whiteness of a tile increases with the zircon content. As a glaze, zircon results in increased resistance to abrasion and chemicals (ZIA, 2019). Other uses for zirconia include medical prosthesis devises, cutting tools, abrasives, high-stress manufacturing components (ball valves, bearings, thermal insulators, etc.), lead zirconate titanate (PZT) which is used in microwaves dielectrics, high voltage capacitors, microphones, sonars, mobile phone cameras, etc. (ZIA, 2019). At the beginning of 2019, titanium and zirconium mineral concentrates were only being mined from two locales within the U.S. – Starke, Florida by The Chemours Company (Chemours), and Nahunta, Georgia by Southern Ionics (now Chemours) (USGS, 2020). TPM is also recovering and producing zircon concentrates from previously mined tailings in Starke, Florida.

Twin Pines Minerals – Individual Permit Application Supplemental Information USACE Project No. SAS-2018-00554 March 4, 2020 TTL Project No. 000180200804 Page 7
Mont M:\Projects\2018\000180200804.00 - Twin Pines Minerals Permitting Services\USACE Individual Permit App\Revisions to IP app\IP Application 03032020
3.0 HYDROGEOLOGY OF TRAIL RIDGE 3.1 Trail Ridge and Okefenokee Swamp Background Trail Ridge Trail Ridge is a one mile-wide and 100-mile-long topographic ridge that separates the Okefenokee Basin and Swamp from the coastal plain of Georgia (Force and Rich, 1989) (Figure 1). It represents the crest of a former beach complex and was formed as inland sand dunes near the proposed Twin Pines Mine (e.g., Pirkle et al., 1993). The ridge is composed of fine-grained to medium-grained quartzose sand. In an 18-mile portion of its length in Florida, the sand throughout its thickness averages about four percent heavy minerals, which generally consist of ilmenite, zircon, rutile, staurolite, and aluminosilicates. (Force and Rich, 1989). The earliest geologic descriptions of Trail Ridge were entirely geomorphic. Cooke (1925, 1939) envisioned the ridge as a large Pleistocene marine sand spit that was attached to a mainland near Jesup, Georgia. (Cooke, 1925, plate Xb). Cooke believed that the sand body possibly was tilted northward after deposition and that the sand was partly eolian in origin. MacNeil (1950) extended this view to include the Okefenokee Swamp as a former lagoon behind a Trail Ridge marine shoreline and bar. In the 1970’s and 1980’s, numerous geologic publications about Trail Ridge were prepared by the Pirkle family and their colleagues. These publications primarily focused on the source and quantity of heavy mineral sands found within Trail Ridge and the depositional origin of Trail Ridge. E.C. Pirkle and others (1971) described a core through Trail Ridge, adjacent to the Florida-Georgia line. F.L. Pirkle (1975) compared grain sizes, heavy-mineral suites, and grain shapes among Trail Ridge sands and proposed possible source regions. E.C. Pirkle and others (1977) described the portion of the Trail Ridge deposit northwest of Highway 301 in Florida. F.L. Pirkle and Czel (1983) reported marine fossils of probable Pleistocene age at elevations of 39 to 49 meters (130 to 160 feet) in sands just west of and stratigraphically above a Georgia segment of the ridge. W.A. Pirkle and E.C. Pirkle (1984) and F.L. Pirkle (1984) summarized the evidence for a beach-ridge origin of Trail Ridge, the latter paper concluding that some grain-size characteristics of the deposit are consistent only with an eolian origin. Rich (1985) described the palynology of the peat bed, and Force and Garnar (1985) described eolian crossbedding of the ilmenite ore sand. The ridge is underlain by a shallow aquifer, locally known as the Surficial Aquifer, and forms a hydrologic divide between the Okefenokee swamplands to the west and the Saint Mary’s River to the east. At the Twin Pines project study area, Trail Ridge is a classic example of a topographically-driven hydrologic system as illustrated in the site conceptual model (Figure 4). The water table is shallow and mimics the ground surface. Much of the precipitation that falls on Trail Ridge is returned to the atmosphere by evaporation and transpiration. Precipitation that is not evaporated or transpired to the atmosphere infiltrates to recharge the Surficial Aquifer. Groundwater recharge on Trail Ridge causes the water table to mound close to the land surface. In the absence of recharge, water would flow from the Okefenokee Swamp in the west [where water levels are at an elevation of about 120 feet above mean sea level (amsl)] to the east (where water levels are at an elevation of 80 feet amsl) and the water table would linearly decline to the east. Groundwater mainly flows from the centerline of Trail Ridge to the west and to the east and small amounts of groundwater discharges to local streams, particularly on the eastern side of the study area. Along the western margin of the study area, groundwater flow provides water to the Okefenokee Swamp and related wetlands. On the eastern side, groundwater provides base flow to streams.

Twin Pines Minerals – Individual Permit Application Supplemental Information USACE Project No. SAS-2018-00554 March 4, 2020 TTL Project No. 000180200804 Page 8
Mont M:\Projects\2018\000180200804.00 - Twin Pines Minerals Permitting Services\USACE Individual Permit App\Revisions to IP app\IP Application 03032020
Okefenokee Swamp The Okefenokee Swamp is a 395,000-acre freshwater wetland. The swamp is one of the largest freshwater wetland complexes in the United States and a National Wildlife Refuge and designated wilderness area (Brook and Sun, 1987). Figure 5 indicates major characteristics such as uplands, stream drainage divides and the watershed of the Okefenokee. Formation of the wetland landscape began at least 650,000 years ago, as plant decay was delayed by continuous flooding, creating anerobic, acidic conditions favorable for peat production (Cohen 1973a). Elevations within the swamp range from 130 feet amsl on the northeast side to about 105 feet amsl on the southwest side. 3.2 Subsurface Geology The hydrology and geology of Trail Ridge in the study area has been extensively characterized (e.g., Holt et al., 2019a; 2019b; 2019c; 2019d, 2019e, 2019f, and 2019g). 387 exploratory borings were cored and described by TPM. 217 borings were completed and described by TTL including 86 piezometers installed in the Surficial Aquifer (Figure 6). Two deep pumping wells and 22 associated observation wells were drilled in the northern and southern portions of the study area. Soil cores reveal that the upper part of the Surficial Aquifer is heterogeneous, consisting mainly of unconsolidated sands interspersed with irregular, discontinuous zones of semi-consolidated to consolidated sands cemented by humate (Figures 7 and 8). Deeper within the Surficial Aquifer, unconsolidated sands are interbedded with discontinuous lenses of clayey sands, silty-clayey sands, and local clays units, likely derived from the underlying Hawthorn Group. Six subsurface units have been identified within the Surficial Aquifer in the study area; these units are briefly described below:
1) The majority of the sediment underlying Trail Ridge is part of an unconsolidated sand unit that generally consists of silty sands (SM) and well sorted sands (SP). Subsurface boring data collected from the project area indicates that this unit extends from land surface to the top of the Hawthorn Group sediments.
2) Semi-consolidated sands generally consist of fine- to medium-grained silty sands (SM) and well sorted sands (SP) and silty-clayey sand (SC-SM) with a color range from black to brown. The general characteristics of semi-consolidated sand unit includes sands that are moderately cohesive due to the presence of minor amounts of humate.
3) Consolidated black sands consist of fine- to medium-grained silty sands (SM) and well sorted sands (SP) and are generally described as black in color. These sands are cemented by humate.
4) Silty-clayey sands are black to brown to grey and generally consist of fine- to medium-grained sands with silt and less than five percent clay content. These sands are loosely cohesive due to the presence of small amounts of clay.
5) The clayey sand unit generally consists of fine- to medium-grained silty sands with clay content between 10 to 40 percent and ranges in color from yellow to brown to grey. The general characteristics of the clayey sand unit includes sands that are cohesive due to moderate clay content.
6) The clay unit at the site consists of silty clays, sandy clays, and fat clays and ranges in color from brown to grey to greenish grey closer to the Hawthorn Group. The clay layer is generally firmer and more compact than the surrounding sand units.
The Surficial Aquifer is underlain by the sediments of the Hawthorn Group. The Hawthorn Group is approximately 350 feet thick under Trail Ridge (e.g., Williams & Kuniansky, 2016) and consists of low-permeability, calcareous clays that effectively isolate the Surficial Aquifer from the deeper Floridian aquifer. Holt et al (2019g) generated 24 geologic cross sections depicting subsurface data across the project study area. The cross sections depict the soil/sediment matrix comprising the Surficial Aquifer beneath the project study area as generally being dominated by unconsolidated sand; however, heterogeneity

Twin Pines Minerals – Individual Permit Application Supplemental Information USACE Project No. SAS-2018-00554 March 4, 2020 TTL Project No. 000180200804 Page 9
Mont M:\Projects\2018\000180200804.00 - Twin Pines Minerals Permitting Services\USACE Individual Permit App\Revisions to IP app\IP Application 03032020
is present within the subsurface due to the presence of irregular zones of lower permeability semi-consolidated to consolidated sands and lenses of silty-clayey sands, clayey sands and clays. Of particular importance is the lateral continuity of the consolidated black sands, which can create local areas of lower permeability soil beneath the study area. Extensive drilling activities performed within and/or immediately adjacent to the proposed permit area indicated that the consolidated black sands are very discontinuous in the permit area and appear in irregular zones, not layers. Indicator geostatistics were used to examine the spatial continuity of soil types present within the Surficial Aquifer along Trail Ridge. Seven target soil types were identified for this analysis, including clay, consolidated sand, clayey sand, silty-clayey sand, semi-consolidated sand, unconsolidated sand, and unconsolidated humate-stained (black) sand. For each soil type, borehole data were transformed into indicator functions, with a value of 1 assigned where the target soil type is present and a value of 0 assigned where it is absent, e.g.,
1 Target soil present( )
0 Target soil absentI
=
x
where x is a location (coordinate) vector. Data files containing the transformed data are presented electronically in Appendix A. These data were then used to create experimental indicator variograms using Stanford Geostatistical Modeling Software (SGeMS) (Remy, 2005).
[ ]( )
2
1
1( ) ( ) ( )2 ( )
N
i ii
I IN
γ=
= + −h
h x h xh
(1)
where N(h) is the number of samples in lag interval h and I(x) is the indicator function. Because the soil data are statistically anisotropic, two horizontal variograms were estimated along the azimuths of the maximum and minimum correlation lengths, and one vertical variogram was calculated. These variograms were then fit using one of the three variogram models described in Table 1 to estimate correlation lengths for each soil type (Tables 2 and 3). In this case, the correlation length nominally represents the maximum distance that the presence or absence of the target soil type can be predicted from an observation of a target soil type in a borehole. Variograms for consolidated sand are shown in Figures 9 and 10, and all variograms are shown in Appendix B. Indicator variograms were used to indicator krige each of the soil types. Indicator kriging generates a map of the probability that a particular soil type is present (e.g., Journel, 1978). In areas far from borehole data, the probability that a soil type is present is represented by the fraction of that soil type observed in all boreholes. Indicator kriging was performed using a three-dimensional kriging algorithm provided in SGeMS (Remy, 2005). Indicator-kriged maps indicating the probability that consolidated sand is present at various elevations are shown in Figures 11 through 13, and probability maps for all soil types are presented in Appendix C. The maximum horizontal correlation lengths for all soil types are small (Table 2), ranging from 336 feet for clay and unconsolidated sand to 912 feet for silty-clayey sands, indicating that these units are horizontally very discontinuous. Vertical correlation lengths range from 7.2 feet for semi-consolidated sand to 36 feet for silty-clayey sand (Table 3). Humate-cemented consolidated sand has a maximum horizontal correlation length of 432 feet, a minimum horizontal correlation length of 240 feet, and a vertical correlation length of 18 feet; these short correlation lengths are consistent with a diagenetic origin for the humate cements. The probability maps for the humate-cemented consolidated sand (Figures 11 through 13) illustrate the discontinuity of these sands, particularly in the south-central part of the study area where boreholes are closely spaced.

Twin Pines Minerals – Individual Permit Application Supplemental Information USACE Project No. SAS-2018-00554 March 4, 2020 TTL Project No. 000180200804 Page 10
Mont M:\Projects\2018\000180200804.00 - Twin Pines Minerals Permitting Services\USACE Individual Permit App\Revisions to IP app\IP Application 03032020
3.3 Hydraulic Properties and Data Hydraulic property data obtained from the Surficial Aquifer and subsurface soil/sediments underlying the study area were collected to assist in the creation of groundwater models. A summary of the field and laboratory testing activities performed during the acquisition of hydraulic property data within the study area is listed below:
• Two 24-hour pumping tests along the crest of Trail Ridge and 24 slug and bail tests at piezometers across the project study area.
• Laboratory testing of soil/sediment samples collected across the project study area. • Installation of 23 staff gauges at surface water locations across the project study area. • Collection of local precipitation data from three rain gauges installed by Twin Pines personnel
at the northern, central, and southern portions of the project study area. • Deployment of 111 data loggers in select piezometers, observation wells, and staff gauge
locations.
Pumping Tests Pumping tests conducted for the Surficial Aquifer are described in Holt et al. (2019a) and are summarized here. TTL contracted with Hydro Geo Chem, Inc. (HGC) of Phoenix, Arizona for assistance in design, data collection for the two pumping tests, and analysis of the pumping test data. The purpose of the pumping tests was to obtain transmissivity (T) and storage coefficient (S) data for the Surficial Aquifer beneath the site. In December 2018, TTL subcontracted Partridge Well Drilling Company, Inc. (Partridge) of Jacksonville, Florida to install two pumping wells (PWA and PWB) within the project study area (Figure 14). The northernmost pumping well on the eastern crest of Trail Ridge was designated PWA and the southernmost well on the western crest of Trail Ridge was designated PWB. Each pumping well was installed to a depth of approximately 115 feet below ground surface (bgs). A TTL geologist was present during the drilling activities to describe soil samples and supervise well installations for PWA and PWB. During November 2018 through January 2019, Betts Environmental provided drilling services for the installation of 22 observations wells. Eleven observation wells were constructed adjacent to pumping wells PWA and PWB, respectively (Figures 15 and 16). Well construction characteristics of pumping and observation wells are listed on Table 4. For pumping test PWA, estimates of T and S from pumping well PWA data range from 1,490 ft2/day to 1,967 ft2/day and from 3.5 x 10⁻⁴ to 1.1 x 10⁻², respectively. Although estimates of T from observation well data range from approximately 1 ft2/day to 2,288 ft2/day, the majority of estimates are lower than for the pumping well and average 875 ft2/day. Estimates of S from observation well data range from approximately 1.6 x 10⁻⁵ to 1.7 x 10⁻²; estimates of horizontal hydraulic conductivity (Kh) range from <1 to 20 ft/day; estimates of vertical hydraulic conductivity (Kv) range from 0.06 ft/day to 1.8 ft/day; and estimates of aquitard Kv range from 2.4 x 10⁻⁶ ft/day to 0.75 ft/day. The lowest T of 1 ft2/day was derived from one interpretation of data from OWA-3D, where, due to non-uniqueness, T estimates from alternate interpretations ranged from 1 ft2/day to 1,700 ft2/day. For pumping test PWB, estimates of T and S from pumping well PWB data range from 530 ft2/day to 697 ft2/day and from 2.4 x 10⁻³ to 0.11, respectively. T estimates from the shallowest water table well data range from 5,455 ft2/day to 9,500 ft2/day. Excluding these estimates, observation well data yield T estimates ranging from approximately 53 ft2/day to 1,100 ft2/day; however, the majority of the estimates are lower than for the pumping well and average 432 ft2/day. Estimates of S from observation well data range from approximately 1 x 10⁻¹⁰ to 5 x 10⁻³; estimates of Kh range from <1

Twin Pines Minerals – Individual Permit Application Supplemental Information USACE Project No. SAS-2018-00554 March 4, 2020 TTL Project No. 000180200804 Page 11
Mont M:\Projects\2018\000180200804.00 - Twin Pines Minerals Permitting Services\USACE Individual Permit App\Revisions to IP app\IP Application 03032020
to 11 ft/day; estimates of Kv range from 8.6 x 10⁻⁵ ft/day to 1.5 ft/day; and estimates of aquitard Kv range from 1.1 x 10⁻⁶ ft/day to 0.3 ft/day. Slug Tests Slug tests conducted within the Surficial Aquifer are described in Holt et al. (2019a) and are summarized here. To estimate the horizontal hydraulic conductivity of the Surficial Aquifer, slug and bail tests were performed in the 24 piezometers within the project study area. Slug and bail tests were conducted by creating an instantaneous change in water level in the piezometer and recording the rate of groundwater recovery relative to the initial measured water level. The slug and bail tests were interpreted by HGC. Slug test data were analyzed using the Kansas Geological Survey (KGS) method (Hyder et al., 1994) and the Bouwer-Rice method (Bouwer and Rice, 1976). The results from the 24 slug and bail tests performed in the study area are shown in Table 5 and Figures 17 and 18. Both methods produced similar estimates of hydraulic conductivity. Hydraulic conductivities estimated using the KGS method range from 0.2 to 75.1 ft/day and average 12.2 ft/day. The Bouwer-Rice method yields a hydraulic conductivity range of 0.24 to 54.7 ft/day and an average of 13.5 ft/day. Estimates of aquifer specific storage from the KGS method range from 3.8 x 10⁻²⁰ to 2.2 x 10⁻³ 1/ft and average specific storage of 1.6 x 10⁻⁴ 1/ft. The averages of the hydraulic conductivity estimated from a slug test and corresponding bail test at each well show a distinct vertical pattern, with lower hydraulic conductivities found below an elevation of 120 feet amsl and much higher hydraulic conductivities found above 120 feet amsl (Figure 19). Holt et al. (2019) showed that the subsurface lithology is dominated by unconsolidated sands. They also found that humate-cemented sands are more common above 120 feet amsl and that silty-clayey sand, clayey sand, and clay are more common below 120 feet amsl. The vertical distribution of hydraulic conductivity estimated from slug tests reflects the occurrence of clays below 120 feet amsl. The data presented here suggest that there are two distributions of hydraulic conductivity: one for elevations above 120 feet amsl and another for elevations below 120 feet amsl. The log of the averaged (slug and bail) hydraulic conductivity for both the upper and lower elevations appears to be log normal for both types of estimates (KGS and Bouwer Rice). The geometric means for the upper elevations are 9.4 and 7.9 ft/day for hydraulic conductivities estimated using the KGS and Bouwer-Rice methods, respectively. In the lower elevations, the geometric means are 2.1 and 1.8 ft/day for the KGS and Bouwer-Rice methods, respectively. Figures 20 and 21 depict the normality plots for slug tests conducted above and below 120 feet amsl, respectively. Note: only the results for hydraulic conductivities for the KGS method are shown, as the results for hydraulic conductivities determined using the Bouwer-Rice method are similar. Laboratory Tests Laboratory tests of sediments and soils from the Surficial Aquifer are described in Holt et al. (2019f) and are summarized here. Soil/sediment samples were collected from borings drilled throughout the project study area and submitted for the following laboratory analyses:
• 53 Vertical hydraulic conductivity analysis (undisturbed samples) • 7 Vertical hydraulic conductivity analysis (remolded or disturbed samples) • 42 Porosity analysis

Twin Pines Minerals – Individual Permit Application Supplemental Information USACE Project No. SAS-2018-00554 March 4, 2020 TTL Project No. 000180200804 Page 12
Mont M:\Projects\2018\000180200804.00 - Twin Pines Minerals Permitting Services\USACE Individual Permit App\Revisions to IP app\IP Application 03032020
• 132 Grain-size distribution analysis • 3 Soil Moisture Retention Curve Analysis (various analysis) • Vertical hydraulic conductivity analysis of post-processed sands
Locations of borings utilized for soil/sediment sampling (i.e. UD borings, exploratory borings, and piezometers) are shown on Figures 22 through 24. Vertical Hydraulic Conductivity During drilling activities within the project study area, undisturbed and disturbed samples of soil/sediment were collected for vertical hydraulic conductivity (Kv) analysis. A total of 42 soil/sediment samples for Kv analysis were collected from UD borings using mud rotary drilling technique and operation of the Denison Sampler. The remainder of the soil/sediment samples for Kv analysis were collected using either a sonic or hollow-stem auger drill rig and stainless-steel Shelby tubes. The soil/sediment samples collected for Kv testing were transported by TTL courier to Bowser-Morner’s laboratory in Dayton, Ohio or TTL’s laboratories in Albany, Georgia or Tuscaloosa, Alabama for analyses. Results of the laboratory analyses indicated Kv values for samples of semi-consolidated to consolidated sands and clayey sands ranging from 1.70×10⁻⁸ to 6.30×10⁻² centimeters per second (cm/sec) (Table 6). Results of the laboratory analyses of unconsolidated sands samples indicated Kv values ranging from 2.07×10⁻⁷ to 3.90×10⁻⁴ cm/sec. The geometric mean of Kv values for undisturbed unconsolidated sands samples ranged from 1.30×10⁻⁵ to 4.30×10⁻⁴ cm/sec. For the modeling efforts, laboratory testing data could not be used to assign the soil-type hydraulic conductivity values because soil samples collected using a mud rotary drilling technique and operation of a Denison Sampler were contaminated by drilling muds, lowering the measured hydraulic conductivity (Holt et al., 2019f). The Kv values of three soil/sediment samples collected from the top of the Hawthorn Group ranged from 1.61×10⁻⁹ to 1.29×10⁻⁵ cm/sec. Two undisturbed samples of the humate-cemented, consolidated sand were collected using Shelby tube samplers. The Kv values of these samples were 2.70×10⁻⁸ cm/s (PZ59D, 20-22 feet bgs) and 3.47×10⁻⁷ cm/s (PZ57D, 25-27 feet bgs). Porosity and Grain-Size Distribution A total of 42 soil/sediment samples were submitted to Bowser-Morner’s off-site laboratory for porosity analysis. Results of the porosity analysis of these 42 soil/sediment samples indicated soil porosity values ranging from 30.1% to 43.7% (Table 7). A total of 125 soil/sediment samples were collected for grain-size distribution and analyzed by either Bowser-Morner’s or TTL’s off-site laboratory. Results of the grain-size distribution analysis of 125 soil/sediment samples indicated that the majority of the soil samples classified as predominantly sand with very little silts or clays (Table 8). Soil Moisture Retention Curves A total of three undisturbed soil samples were collected from the surface at three locations within or adjacent to the proposed permit area for soil moisture retention curve analysis (Figure 25). In addition, a full one-gallon Ziploc bag of loose material was collected from each location for remolded sample testing. The soil samples were submitted to Daniel B. Stephens & Associates, Inc (DB Stephens) in Albuquerque, New Mexico for the following laboratory analyses.

Twin Pines Minerals – Individual Permit Application Supplemental Information USACE Project No. SAS-2018-00554 March 4, 2020 TTL Project No. 000180200804 Page 13
Mont M:\Projects\2018\000180200804.00 - Twin Pines Minerals Permitting Services\USACE Individual Permit App\Revisions to IP app\IP Application 03032020
Soil Samples and Analytical Procedures
Sample ID Matrix Number of Samples
Summary of Test Performed
SS-ADK-01 Soil 1 Gravimetric Moisture Content Volume Measurement Method Constant Head Rigid Wall Hanging Column Pressure Plate Dew Point Potentiometer Relative Humidity Box Calculated Unsaturated Hydraulic Conductivity
SS-KEY-01 Soil 1
SS-TIA-01 Soil 1
A listing of methods used in performance of the above-referenced tests are listed below:
Tests Methods
Dry Bulk Density ASTM D 7263 Moisture Content ASTM D 7263, ASTM D 2216 Calculated Porosity ASTM D 7263 Saturated Hydraulic Conductivity:
ASTM D 5856 (modified apparatus)
Hanging Column Method ASTM D 6836 (modified apparatus) Pressure Plate Method ASTM D 6836 (modified apparatus) Water Potential Method ASTM D 6836 Relative Humidity Box Campbell, G. and G. Gee. 1986. Water Potential: Miscellaneous Methods. Chp.
25, pp. 631-632, in A. Klute (ed.), Methods of Soil Analysis. Part 1. American Society of Agronomy, Madison, WI; Karathanasis & Hajek. 1982. Quantitative Evaluation of Water Adsorption on Soil Clays. SSA Journal 46:1321-1325.
Moisture Retention Characteristics & Calculated Unsaturated Hydraulic Conductivity
ASTM D6836; van Genuchten, M.T. 1980. A closed-form equation for predicting the hydraulic conductivity of unsaturated soils. SSSAJ 44:892-898; van Genuchten, M.T., F.J. Leij, and S.R. Yates. 1991. The RETC code for quantifying the hydraulic functions of unsaturated soils. Robert S. Kerr Environmental Research Laboratory, Office of Research and Development, U.S. Environmental Protection Agency, Ada, Oklahoma. EPA/600/2091/065. December 1991.
The porosity in the soil samples ranged from 38.5% to 44.8%, and the saturated hydraulic conductivity varied from 2.0E-03 cm/s to 1.6E-02 cm/s in the undisturbed samples and 3.2E-04 to 1.1E-02 cm/s in the remolded samples. The van Genuchten (1980) parameters α and n are consistent with those of well-sorted to poorly-sorted sands.
Soil Physical Characteristics
Sample ID Porosity (-) Ks (cm/s) α (cm-1) n (-)
SS-ADK-01 (Undisturbed) 44.8 1.6E-02 0.0305 3.6589
SS-ADK-01 (Remolded) 39.8 1.1E-02 0.0370 2.9456
SS-KEY-01 (Undisturbed) 38.5 2.0E-03 0.0357 1.4480
SS-KEY-01 (Remolded) 39.9 1.9E-03 0.0188 1.6228
SS-T1A-01 (Undisturbed) 42.0 2.4E-03 0.0450 1.3213
SS-T1A-01 (Remolded) 40.1 3.2E-04 0.0236 1.4332

Twin Pines Minerals – Individual Permit Application Supplemental Information USACE Project No. SAS-2018-00554 March 4, 2020 TTL Project No. 000180200804 Page 14
Mont M:\Projects\2018\000180200804.00 - Twin Pines Minerals Permitting Services\USACE Individual Permit App\Revisions to IP app\IP Application 03032020
Vertical Hydraulic Conductivity Analysis of Post-Processed Sands TTL considered that the vertical hydraulic conductivity of sands returned to the mine pit during reclamation/restoration may need to be reduced to ensure that groundwater levels are appropriate for maintaining wetlands. Bench-scale studies were conducted to evaluate methods for decreasing the permeability of sands returned to the mining pit. TTL drilled 14 soil borings (UD borings) across the study area and collected bulk sand samples from ground surface to 50 feet below ground surface (bgs), which represents the proposed maximum mining depth. The bulk sand samples collected from 0 to 50 feet bgs were drummed by individual boring location and transported to Minerals Technologies, Inc. (MT) in Stark, Florida in order to process the material in a similar manner as the proposed mining extraction process (i.e. extraction of the humate, clays (or slime), and heavy minerals). The post-processed sands, minus humate, clays, and heavy minerals, were drummed and then transported to TTL’s office in Tuscaloosa, Alabama for Kv analysis. Once at TTL’s office the drums were paired as indicted on Figure 26 and the paired drums were combined to ensure that sufficient material was available for testing. Samples of the post-processed sand were collected from UD 338/25 and placed in a steel chamber that allowed for application of a load equal to approximately 4,500 pounds over 24-hours. Prior to the addition of bentonite, three simulated in-situ samples (UD 338/25 A, B, and C) were collected from the steel chamber using drive tubes for dry bulk density, moisture content, and Kv analysis. This process was repeated for the permeability testing of sand samples mixed with percentages of bentonite equal to 0.35% and 1.42%, respectively. Additionally, individual samples of sand were collected directly from the UD338/25 drum and mixed with the following percentages of bentonite: 5%, 7.5%, 10%, 12.5%, 15%, and 30%. After mixing, each sample was remolded and tested for vertical hydraulic conductivity. Bentonite used for testing was a Wyoming bentonite, high yield, high viscosity bentonite produced by Halliburton, Baroid Industrial Drilling Products. TTL also performed permeability tests on two undisturbed samples of black humate-cemented consolidated sand collected from borehole PZ57D. Permeability test results are provided in Table 9. Results of the bench-scale study that the Kv value of homogenized post-processed sand is approximately 1.0E-03 cm/sec. The study also indicated that a mixture of approximately 10% to 12.5% bentonite would be required to achieve a relative permeability similar to the results calculated for the black humate-cemented consolidated sand in the two samples from PZ57D (Table 9).

Twin Pines Minerals – Individual Permit Application Supplemental Information USACE Project No. SAS-2018-00554 March 4, 2020 TTL Project No. 000180200804 Page 15
Mont M:\Projects\2018\000180200804.00 - Twin Pines Minerals Permitting Services\USACE Individual Permit App\Revisions to IP app\IP Application 03032020
Groundwater, Surface Water, and Precipitation Monitoring Details of the groundwater, surface water, and precipitation monitoring are presented in Holt et al. (2019d, 2019e) and are summarized here. Field activities performed to collect local precipitation, surface water, and groundwater data at the site included the following:
• Collection of local precipitation data from three rain gauges installed by Twin Pines personnel at the northern, central, and southern portions of the project study area (Figure 27).
• Installation of 23 staff gauges at surface water locations across the project study area (Figure 28).
• Deployment of 111 data loggers in select piezometers and observation wells (Figure 29).
A summary of rain gauge data is listed in Table 10. Tabulations of surface water and groundwater elevation data at monitored locations are listed in Tables 11 and 12. The purpose of the above-referenced activities was to obtain water-elevation data that could be used to evaluate: (1) the response of groundwater and surface water to precipitation events, (2) groundwater and surface water interaction, (3) fluctuations of water elevations over time, and (4) groundwater flow direction and velocity. Between January and July, 2019, TTL installed In-Situ, Inc. Rugged Troll 200 non-vented data loggers equipped with a cable setup for direct-read at land surface in select piezometers, observation wells, and at each staff gauge monitoring location. Each data logger deployed was programmed to record groundwater elevation, water pressure, and temperature data at ten-minute intervals. Additionally, In-Situ, Inc. Rugged BaroTroll 200 data loggers were deployed at land surface across the site to measure and log barometric pressure and temperature. TTL personnel used a tablet and/or laptop to manually download Rugged Troll and BaroTroll data from each monitoring location. The In-Situ, Inc. BaroTroll 200 data and Win Situ 5/Baro Merge Software were used to automatically correct groundwater elevation data (recorded with the Rugged Troll 200) for barometric pressure changes. Rain Gauge Data Rain gauge data collected from the project study area (Figure 30) indicates that the greatest rainfall occurred during the months of December 2018 and July 2019 with monthly rainfall gauge totals of about 8 and 14 inches, respectively. Additionally, during the November 28, 2018 to October 16, 2019 rain gauge monitoring period, monthly rainfall totals varied from about 0.1-inch to over 2-inches in measurements recorded at the three rain gauges. This range of differences in rainfall between the three rain gauges is related to the size of the project study area and indicates variation in local weather patterns. For example, during site field activities, field personnel observed rainfall occurring on the north side of the study area while no rainfall was observed on the southern half of the study area. Hydrograph Data Data logger measurements were used to generate hydrographs for comparing daily groundwater and surface water elevations to precipitation data. As reported by Holt et al (2019e), hydrograph data indicates that depths to groundwater beneath the study area generally range from just below ground surface to five feet bgs; however, during periods of increased precipitation, the water levels in some piezometers were observed to temporarily rise above the top of the well casings. Groundwater and surface water elevations generally declined from January through June 2019 followed by a sharp increase during the month of July and a second decline from August to October, which correlates with

Twin Pines Minerals – Individual Permit Application Supplemental Information USACE Project No. SAS-2018-00554 March 4, 2020 TTL Project No. 000180200804 Page 16
Mont M:\Projects\2018\000180200804.00 - Twin Pines Minerals Permitting Services\USACE Individual Permit App\Revisions to IP app\IP Application 03032020
seasonal rainfall fluctuations at the site. During the January to June and August to October periods of decline of groundwater levels, surface water elevations also decreased and were dry at several staff gauge locations. The hydrograph data indicates that both groundwater and surface elevations showed similar response times to precipitation events at the site (Figure 31), which suggest that the infiltration rate was generally greater than the runoff rate at the monitored locations. Additionally, changes in groundwater elevations and time of response compared to precipitation data were generally the same in shallow and deep piezometer pairs (Figure 32). An examination of the rain gauge data reveals that rainfall across the project study area varies spatially. Hydrographs show that groundwater levels respond quickly to distant rainfall events, even when the closest rain gauge shows no observed precipitation. These rapid responses reflect the high hydraulic conductivity of the Surficial Aquifer at Trail Ridge. Many observed surface water levels show a significant lag with precipitation data, suggesting that surface water levels in these areas are influenced by groundwater flow (Figures 33 and 34). Hydrograph data from 8 of 12 shallow and deep piezometer pairs within or adjacent to the proposed permit area indicated generally less than a 0.5-foot separation in groundwater elevations between the deep and shallow piezometers (Figure 35). These eight piezometers are identified as PZ33D/S, PZ31D/S, PZ29D/S, PZ30D/S, PZ55D/S, PZ28D/S, PZ25D/S, and PZ27D/S. Hydrographs from the remaining three shallow and deep piezometer pairs PZ16D/S, PZ48D/S, PZ57D/S, and observation wells OWB1D/S/BS showed separation of groundwater elevations that ranged from 1 to 3 feet above mean sea level (amsl). The small separation between groundwater elevations in these shallow and deep piezometers/wells, as well as, similar response times to rain events indicates that permeability of subsurface soils within the majority of proposed permit area is generally homogenous. Groundwater elevations in deep piezometers PZ01D, PZ03D, PZ36D exhibited artesian conditions, with groundwater elevations that rose above those of their respective partner shallow piezometer. These three piezometers are located outside the proposed permit area, along the west-northwestern boundary of the project study area. Data collected from shallow and deep piezometer pairs PZ39D/S, PZ45D/S, PZ58D/S, and observation wells OWA1D/1S/1BS, located northeast of the proposed permit area, showed differences of groundwater elevations ranging from about 4 feet to 13 feet (Figure 36). The groundwater elevation differences in these shallow and deep piezometers/wells indicates that the permeability of subsurface soils northeast of the proposed permit area is likely more heterogeneous. Potentiometric Surface Maps Water elevation data collected on January 26, April 26, and July 26, 2019, was used to generate potentiometric surface maps of the Surficial Aquifer (Figures 37 through 39, respectively). Review of the potentiometric surface maps indicates that groundwater elevations at the site generally mimic land surface topography with groundwater flowing to the west and east of Trail Ridge. This indicates that Trail Ridge represents a hydrologic divide within the underlying Surficial Aquifer. Groundwater flow along the west side of Trail Ridge is to the west. Groundwater flow along the east side of Trail Ridge is to the east. Review of groundwater data indicates elevations beneath the site range from a high of about 174 feet amsl along the crest of Trail Ridge to 108 feet amsl along the east side of the project study area. Depths to groundwater in the shallow piezometers beneath the site generally range from just below land surface to about five feet bgs. Assuming steady groundwater flow, the Darcy flux and the groundwater velocity can be estimated by determining the hydraulic gradient along a streamline, averaging the hydraulic conductivity values determined from slug tests, and assuming an effective porosity (0.32 for medium sand; McWorter and Sunada, 1977; Yu et al, 1993). Four streamlines were selected from the July 2019 potentiometric surface map (Figure 39), the horizontal distance between select equipotentials was determined for each streamline, and the hydraulic gradient was determined. The resulting hydraulic gradients were

Twin Pines Minerals – Individual Permit Application Supplemental Information USACE Project No. SAS-2018-00554 March 4, 2020 TTL Project No. 000180200804 Page 17
Mont M:\Projects\2018\000180200804.00 - Twin Pines Minerals Permitting Services\USACE Individual Permit App\Revisions to IP app\IP Application 03032020
5.573×10⁻³ for the northwest streamline, 6.456×10⁻³ for the southwest streamline, 8.729×10⁻³ for the northeast streamline, and 6.066×10⁻³ for the southeast streamline. The average hydraulic conductivity from slug tests conducted in the permit area (south streamlines) was 10.3 feet per day (ft/day), and slug tests conducted in the northern part of the study area had an average hydraulic conductivity of 16.0 ft/day. The average groundwater velocity along the west and east sides of the ridge was approximately 0.24 ft/day and 0.32 ft/day, respectively, in July 2019. The average Darcy Flux along the west and east sides of the ridge was approximately 0.08 ft/day and 0.10 ft/day, respectively, in July 2019. 3.4 Water Quality Water quality sampling activities at the Twin Pines study area are described in Holt et al. (2019c) and are summarized here. Precipitation provides most of the recharge for the Surficial Aquifer beneath the study area. As rainfall infiltrates through the soil zone or sediments it is chemically altered through mineral dissolution, precipitation, cation exchange, oxidation reduction, anion exchange, and dissolution of organic molecules. Surface water on the property is dependent on precipitation for recharge, but appears to be in contact with groundwater (within low-lying areas of the site) during periods of seasonally high precipitation. Current land use at the site generally consist of industrial forestry operations and recreational hunting. Historical operations during the late 1800s and early 1900s included industrial forestry operations for the harvesting of resins and distillation of turpentine. An adjacent property owner reported that at least a portion of the study area was used as a cattle ranch in the last 50 years. Based on the historical land use at the site, groundwater and surface water samples were collected to evaluate baseline water quality data within the project study area. On April 25 and 26, 2019, TTL personnel collected groundwater samples from six piezometers and two surface water locations to evaluate background water quality data at the project site. The groundwater and surface water samples were shipped via FedEx overnight delivery to Xenco Laboratories (Xenco) in Norcross, Georgia for laboratory analysis. The groundwater and surface water samples were analyzed for the following parameters:
Groundwater and Surface Water Sampling Locations and Laboratory Analyses.
Sample ID Laboratory Analysis Method
Groundwater Samples PZ08 PZ14 PZ16S PZ28D PZ48S PZ43 Surface Water Samples SW1 (W) SW2 (E)
Alkalinity, Total (as CACO3) Alkalinity, Bicarbonate (as CACO3) Alkalinity, Carbonate (as CACO3)
SM2320B
Bromide, Chloride, Fluoride, Sulfate, Acetate, Formate
EPA 300
Isovaleric Acid Valeric Acid Isocaproic Acid Heptanoic Acid Butyric-Isobutyric Acid
Organic & Volatile Acids by HPLC
Total Dissolved Solids SM2540C
Total Organic Carbon SM5310C
Phosphorous, Total (as P) EPA 365.1

Twin Pines Minerals – Individual Permit Application Supplemental Information USACE Project No. SAS-2018-00554 March 4, 2020 TTL Project No. 000180200804 Page 18
Mont M:\Projects\2018\000180200804.00 - Twin Pines Minerals Permitting Services\USACE Individual Permit App\Revisions to IP app\IP Application 03032020
Groundwater and Surface Water Sampling Locations and Laboratory Analyses.
Sample ID Laboratory Analysis Method
Aluminum, Arsenic, Barium, Boron, Calcium, Copper, Iron, Magnesium, Manganese, Potassium, Selenium, Sodium, Titanium, Thorium, Uranium Zinc
SW-846 6020A
Mercury SW-846 7470A
Lithium, Silicon, Scandium 45, SW-846 6010C
Nitrogen, Ammonia (as N) EPA 350.1
Nitrogen, Total Kjeldahl (TKN) EPA 351.2
Nitrogen, Nitrate-Nitrite EPA 353.2
Field Measured Parameters: Temperature, pH, specific conductance, dissolved oxygen, oxidation-reduction potential, and turbidity
Groundwater Sample Data Field Parameters A summary of the field parameters measured in groundwater samples collected from the six piezometers are listed below.
Field Measurement Groundwater Samples
# of Measurements Median Average Range
Temperature (degrees oC) 6 20.9 20.8 20.0-21.4
pH (standard units) 6 4.35 4.35 4.11-4.89
Specific Conductance (µS/cm) 6 62.5 59.3 43-70
Oxidation Reduction Potential (mV) 6 279 270 221-310
Dissolved Oxygen (mg/L) 6 0.86 1.50 0.1-3.54 °C = degrees celcius mV = millivolts μS/cm = microsiemens per centimeter mg/L - milligrams per liter Laboratory Analytical Data Concentrations of detected constituents in groundwater samples were compared to groundwater protection standards. The groundwater protection standard consisted of USEPA Regional Screening Levels (RSLs) for tap water, and or the USEPA Maximum Contaminant Levels (MCLs) and Secondary MCLs for drinking water. Based on the results of the laboratory analysis of groundwater samples, the following exceedances of a groundwater protection standard were noted:
• Aluminum exceeded the EPA RSL for tap water of 2.00 mg/L in two of the six groundwater samples.
• Iron exceeded the Secondary MCL value for drinking water of 0.300 mg/L in all six groundwater samples; however, lower pH of the groundwater most likely mobilized iron in the aquifer matrix.
• Manganese exceeded the Secondary MCL value for drinking water of 0.050 mg/L in one of the six groundwater samples.

Twin Pines Minerals – Individual Permit Application Supplemental Information USACE Project No. SAS-2018-00554 March 4, 2020 TTL Project No. 000180200804 Page 19
Mont M:\Projects\2018\000180200804.00 - Twin Pines Minerals Permitting Services\USACE Individual Permit App\Revisions to IP app\IP Application 03032020
Surface Water Sample Data Field Parameters A summary of the field parameters measured in samples of surface water collected are listed below.
Constituent Surface Water Samples
# of Measurements Median Average Range
Temperature (degrees oC) 2 24.2 24.2 19.7-28.7
pH (standard units) 2 5.14 5.14 4.05-6.22
Specific Conductance (µS/cm) 2 240 240 87-392
Oxidation Reduction Potential (mV) 0 --- --- ---
Dissolved Oxygen (mg/L) 2 7.51 7.51 7.09-7.93 °C = degrees celcius mV = millivolts μS/cm = microsiemens per centimeter mg/L - milligrams per liter Laboratory Analytical Data Concentrations of detected constituents in surface water samples were compared to the Georgia Environmental Protection Division instream water quality standards (Rule 391-3-6-.03). Based on a review of the laboratory analytical data, the following constituents were detected in surface water samples; however, there are currently no instream water quality standards listed for these detected constituents.
• Chloride, sulfate, aluminum, barium, boron, calcium, iron, magnesium, manganese, potassium, strontium, total dissolved solids, total organic carbon, total phosphorus, ammonia (as N), and total kjeldahl nitrogen.
3.5 Climate Data Climate data were collected to support groundwater modeling efforts and are reported in Holt et al. (2019e) and are summarized here. Historical climate information for temperature, precipitation, and evapotranspiration were obtained from online resource databases from one government and two academic organizations. The table below summarizes source information of historical climate data compiled for this study.
Climate Data Source Information
Climate Values Years Compiled Dataset Title Data Source Data Source Affiliation
Temperature 1986 - 2017 Global Summary of the Month (GSOM)
National Centers for Environmental Information (NCEI)
National Oceanic and Atmospheric Administration (NOAA) Precipitation 1986 - 2017
Evapotranspiration 2003 - 2017
Evapotranspiration Data from Water Balance Calculator
Automated Environmental Monitoring Network Page (AEMN)
College of Agricultural and Environmental Sciences - University of Georgia (UGA)
Evapotranspiration Monthly Average
Florida Automated Weather Network (FAWN)
IFAS Extension – University of Florida

Twin Pines Minerals – Individual Permit Application Supplemental Information USACE Project No. SAS-2018-00554 March 4, 2020 TTL Project No. 000180200804 Page 20
Mont M:\Projects\2018\000180200804.00 - Twin Pines Minerals Permitting Services\USACE Individual Permit App\Revisions to IP app\IP Application 03032020
As reported by Holt et al (2019d), the estimated average temperature, precipitation, and evapotranspiration values were documented:
• The estimated average temperature at the project study area over a 32-year period is 68.60 degrees Fahrenheit,
• The estimated annual precipitation value at the project study area over the last 32-year period is 51.25 inches per year and,
• The estimated average total annual evapotranspiration value at the project study area over the last 15-year period is 39.50 inches per year.
3.6 Summary of Groundwater Models Holt et al. (2020) developed two types of groundwater models to evaluate the impact of the proposed Saunders Demonstration Mine on the hydrologic system underlying Trail Ridge: numerical models and analytical models. These groundwater models are summarized here. Two (2) numerical models were developed using the U.S. Geological Survey (USGS) code MODFLOW-2005 (Harbaugh, 2005) to simulate three-dimensional, steady-state groundwater flow in the Surficial Aquifer at the study area. First, a model representing pre-mining conditions was created and calibrated to match observed water levels in piezometers and wells. The second model represents post-mining conditions and is based on the original calibrated model, except the calibrated hydraulic conductivity values of the aquifer within the mined zone were homogenized to represent the mine pit filled with spoil. The pre-mining and post-mining models were compared to evaluate changes in the groundwater discharge to the model boundaries (e.g., the swamps to the west and the groundwater system to the east). The models compare changes in the groundwater discharge to streams along Trail Ridge and changes in the water table position at the mine and near the Okefenokee swamp due to the proposed mining project. This comparison shows that the proposed mining activities will have negligible impact on the hydrologic system of Trail Ridge and the Okefenokee Swamp. An analytical model was developed to evaluate drawdown in the Surficial Aquifer caused by the moving mine pit. The model shows that, even in a highly conservative (extreme) modeling scenario, perturbations in the water table due to the moving mine will quickly recover. For these models, Trail Ridge is conceptualized as a classic example of a topographically-driven hydrologic system as illustrated in the site conceptual model (Figure 4). The water table is shallow and mimics the ground surface (Figures 37 through 39). Much of the precipitation that falls on Trail Ridge is returned to the atmosphere by evaporation and transpiration. Precipitation that is not evaporated or transpired to the atmosphere infiltrates to recharge the Surficial Aquifer. Groundwater recharge on Trail Ridge causes the water table to mound close to the land surface. In the absence of recharge, water would flow from the Okefenokee Swamp in the west (where water levels are ~ 120 ft) to the east (where water levels are < 80 ft) and the water table would linearly decline to the east. Groundwater mainly flows from the centerline of Trail Ridge to the west and to the east and small amounts of groundwater discharges to local streams, particularly on the eastern side of the study area. Along the western margin of the study area, groundwater flow provides water to the Okefenokee Swamp and related wetlands. On the eastern side, groundwater provides base flow to streams. Soil cores reveal that the upper part of the Surficial Aquifer is heterogeneous, consisting mainly of unconsolidated sands interspersed with irregular, discontinuous zones of semi-consolidated to consolidated sands cemented by humate (see Section 3.2). Deeper within the Surficial Aquifer, unconsolidated sands are interbedded with discontinuous lenses of clayey sands, silty-clayey sands, and local clay units, likely derived from the underlying Hawthorn Group.

Twin Pines Minerals – Individual Permit Application Supplemental Information USACE Project No. SAS-2018-00554 March 4, 2020 TTL Project No. 000180200804 Page 21
Mont M:\Projects\2018\000180200804.00 - Twin Pines Minerals Permitting Services\USACE Individual Permit App\Revisions to IP app\IP Application 03032020
The Surficial Aquifer is underlain by the sediments of the Hawthorn Group. The Hawthorn Group is approximately 350 feet thick under Trail Ridge (e.g., Williams & Kuniansky, 2016) and consists of low-permeability, calcareous clays that effectively isolate the Surficial Aquifer from the deeper Floridian Aquifer. The hydraulic conductivity of three samples of the upper Hawthorn are 3.7×10⁻² feet per day (ft/d), 2.6×10⁻⁵ ft/d, and 4.5×10⁻⁵ ft/d (Holt et al., 2019f). 3.6.1 Three-Dimensional Groundwater Flow Models Three-dimensional groundwater flow models were developed for a broad region beyond the extent of site characterization activities for Twin Pines Mine (Figure 40). The east and west model boundaries were selected to approximately parallel Trail Ridge and encompass a significant part of the Okefenokee Wildlife Refuge. The northern and southern boundaries were extended beyond the limits of property tracts investigated by Twin Pines. These models numerically approximate solutions to the governing equation for steady-state flow in heterogeneous aquifers:
(2)
where h is the hydraulic head; Kh is the horizontal hydraulic conductivity; Kv is the vertical hydraulic conductivity; and x, y, and z are spatial coordinates. The solution of Equation 1 requires boundary conditions around the entire model domain. The USGS code MODFLOW-2005 (Harbaugh, 2005) was used to simulate steady-state groundwater flow in the model domain. MODFLOW-2005 uses an integrated-finite difference formulation to numerically approximate solutions to Equation 2, given a predetermined set of boundary conditions. Prior to simulating groundwater flow using MODFLOW-2005, the study area was subdivided into an orthogonal grid of cells and layers. In the horizontal plane, the study area was subdivided into 62 rows in the y-direction and 64 columns in the x-direction (Figure 41). 15 model layers were assigned. Because a deformed model grid was used, model layers vary in thickness from a minimum of 0.1 ft to a maximum of 10.0 ft (Figure 42 and 43). The top of the model is the land surface, and the base of the model is the top of the Hawthorn Group. Since simulations are at a steady state only one stress period, of length one (1) day, was required. No flow boundaries were assigned to the northern and southern edges of the model domain to approximate the position of streamlines (Figure 41). Along the western and eastern boundaries of the model domain, constant head (constant water table) boundaries were assigned, with the head values set to be at a depth of one (1) ft below the land surface, The base of the Surficial Aquifer is the low permeability Hawthorn Group (Holt et al., 2019b; 2019f, 2019g), and the lower boundary of the model is assigned to be a no-flow boundary. The top boundary of the model receives groundwater recharge, and an initial recharge rate of 4.54 inches per year (in/yr) was applied to the entire upper surface of the model domain. Streams flowing from Trail Ridge are typical gaining streams that derive some or all their flow from aquifer base flow (the aquifer discharges into the stream beds), and drain boundary conditions are assigned to the location of the major streams within the model domain. The spatial distribution of soil types is highly complex in the Surficial Aquifer, and units identified in adjacent boreholes are difficult to correlate. Because of these complications, it is not possible to identify unique stratigraphic units in the upper part of the Surficial Aquifer. Consequently, a geostatistical approach was used based on indicator kriging (e.g., Journel, 1978) to define the spatial variations in hydraulic conductivity within the Surficial Aquifer (see Section 3.2). Indicator variograms were created for each of the soil types and used in a three-dimensional indicator kriging algorithm (Remy, 2005). The resulting maps (Appendix C) show the probability that each of the soil types that were present in every model grid block. Please note that for the model, the unconsolidated humate-
0h h vh h hK K K
x x y y z z ∂ ∂ ∂ ∂ ∂ ∂ + + = ∂ ∂ ∂ ∂ ∂ ∂

Twin Pines Minerals – Individual Permit Application Supplemental Information USACE Project No. SAS-2018-00554 March 4, 2020 TTL Project No. 000180200804 Page 22
Mont M:\Projects\2018\000180200804.00 - Twin Pines Minerals Permitting Services\USACE Individual Permit App\Revisions to IP app\IP Application 03032020
stained (black) sand soil type referenced in Section 3.2 was combined with the unconsolidated sand soil type. For each grid block, the probabilities were normalized so that they summed to 1.0. These probabilities were used to determine the horizontal and vertical hydraulic conductivity for each grid block. The horizontal hydraulic conductivity was determined using an arithmetic mean of each of the soil type hydraulic conductivities, weighted by the probability that each soil type was present in the grid block. Similarly, the vertical hydraulic conductivity was determined using a probability-weighted harmonic mean. Hydraulic conductivity values for each soil type were selected (Table 1) to ensure that the vertical and horizontal hydraulic conductivity in grid blocks far from soil boring locations were consistent with those calculated from pumping tests and slug tests (Holt et al., 2019a), e.g., a horizontal hydraulic conductivity of 6.36×10⁻³ cm/s (18 ft/d) and a vertical hydraulic conductivity of 2.60×10⁻⁴ cm/s (0.74 ft/d), Example initial hydraulic conductivity values are shown for selected layers in Figures 44 through 46. Trial and error approaches were used to calibrate the recharge rate and the leakance per unit length for each reach of drains (representing streams). These parameters were systematically varied until the model produced maximum head values that were close to those observed in piezometers and wells. Following the trial and error calibrations, the program PEST (Doherty and Hunt, 2010) was used to automatically calibrate the hydraulic conductivity values. Average groundwater levels measured in piezometers and were used as calibration targets. A number of “soft” calibration targets were added to the calibration target data set to ensure that the water table approximated the land surface. At the location of these soft targets, the water table position was set to 2 feet below the land surface. The objective function (difference between observed and modeled heads) was minimized on the completion of 25 PEST iterations (Figure 47). Overall, the calibration procedure led to a good match between the calibration targets and modeled heads (Figure 48). The calibrated recharge rate of 2.8 in/yr produced head values near an elevation of 170 feet along the centerline of Trail Ridge. Final leakance per unit length values ranged from 0.001 – 0.1 ft/d for the drain boundaries representing streams. Higher leakance values were required for streams on the eastern side of the model domain. The hydraulic conductivity values for the model were calibrated using PEST; calibrated hydraulic conductivity fields for selected model layers are shown in Figures 49 through 51. Similar hydraulic conductivity patterns are found in all model layers, indicating that the hydraulic heads are not sensitive to vertical variations in hydraulic conductivity. In general, higher hydraulic conductivities were produced on the west and east model boundaries to accommodate the flux of water through a thinner aquifer. Higher hydraulic conductivities along the center of Trail Ridge flatten the water table. North-to-south oriented bands of lower hydraulic conductivity occur along the western and eastern flanks of Trail Ridge, maintaining the water table within a few feet of the land surface. The modeled pre-mining water table (Figure 52) resembles the potentiometric surface of the Surficial Aquifer on July 26, 2019 (Figure 39). The modeled water-table does not reproduce all of the topographic variability shown in the interpreted potentiometric surface map but does retain the overall pattern and shows the influence of the streams on the eastern side of the model domain. After the mining is completed, the mined volume will be filled with homogenized sand spoil. The elevation of the base of the proposed mining zone ranges from approximately 136 feet in the northwest part of the mined area to 111 ft in the southeast part of the mined area (Figure 53). For the purpose of this model, it is assumed that the final elevation of the bottom of the mine is 119 ft. Experiments conducted on homogenized sands from the Twin Pines Mine study area reveal that the hydraulic conductivity of the pit filling will be approximately 1.0E-03 cm/s (Holt et al., 2019f). The calibrated hydraulic conductivity values in all grid blocks above 119 ft within the mine footprint were replaced with a horizontal and vertical conductivity of 1.0×10⁻³ cm/s. Example horizontal hydraulic conductivity values for selected layers are shown in Figures 54 through 56. Within the mine footprint some of the horizontal hydraulic conductivity values are reduced; however, nearly all the vertical hydraulic conductivity values were increased.

Twin Pines Minerals – Individual Permit Application Supplemental Information USACE Project No. SAS-2018-00554 March 4, 2020 TTL Project No. 000180200804 Page 23
Mont M:\Projects\2018\000180200804.00 - Twin Pines Minerals Permitting Services\USACE Individual Permit App\Revisions to IP app\IP Application 03032020
The changes of hydraulic conductivity within the mine footprint produced only minor variations in the position of the water table (Figure 57). The differences are best revealed by subtracting the post-mining water table from the pre-mining water table (Figure 58). Across much of the model domain, water table changes are very small. In the vicinity of the proposed mine pit, water table elevations both increased and decreased as a result of mining activities. The water table rose over two feet in the western part of the mining area, and locally decreased by over one foot near the central part of the mining area. Within the eastern part of the mining area water level increases and decreases due to mining were less than one foot. These variations result from the groundwater flow system adjusting to a homogeneous block of sand spoil placed within the mine pit. Where the Okefenokee National Wildlife Refuge is closest to the mine footprint, the worst-case scenario models predict that the water table will decrease by no more than 0.0004 ft due to mining.
Table 13 presents a comparison of the water budgets for the pre-mining and post-mining models. Mining leads to a decrease of stream outflow (drains) across the entire model of 35 cubic feet per day (ft3/d) or 4.1E-04 cubic feet per second (cfs) and an equivalent increase in groundwater discharge at the constant head boundaries. Both models were subdivided into two zones following the topographic divide on Trail Ridge (Figure 59). Separate water budgets were determined for each zone in each model. For the eastern zone (Zone 1), Table 14 presents the water budget. The eastern zone experienced a decrease of 40 ft3/d of stream discharge and 300 ft3/d of discharge to the constant head boundaries due to mining. The western zone (Table 15), however, showed an increase of 4 ft3/d in stream discharge and 340 ft3/d of groundwater discharge due to mining. Based on these model results, the swamps to the west of the study area, including the Okefenokee Swamp, will receive a fractional increase in both stream and groundwater discharge due to the proposed mine. 3.6.2 Impact of a Moving Mine At the Twin Pines Mine, heavy mineral sands will be excavated from a moving pit that has a length of 500 feet, a width of 100 feet, and a maximum depth of 50 feet. Here we assume that the pit will advance at a rate of 100 ft/day (e.g., Holt et al., 2020) and the oldest part of the pit will be filled at the same rate, so the pit dimensions will change minimally over time. Some water contained within the excavated sands will be removed from the pit by the drag line. Much of the water within the excavated sands will, however, quickly drain from the excavated sand and infiltrate back into the aquifer. Furthermore, the sand spoil that is returned to the mine pit will also contain a significant amount of water. Some water will be lost to evaporation as the sand is transported on mobile conveyors to and from the processing facility, but the net loss of water from the pit area and the aquifer will be small. Below, we will consider the impact of an extreme case, where all the water in the excavated sands are removed from the aquifer. The extent of that drawdown in the Surficial Aquifer due to the removal of all water within the excavated sands can be quantified using an analytical solution for a moving, rectangular source of heat (e.g., Ling, 1973 and Tichy 1991). This solution can be adapted to simulate the drawdown effects from a moving mine pit, as the equations for heat flow and groundwater flow are identical. If we move with the center point of the mine pit, the heads will quickly drawdown, and the pattern of the drawdown will eventually stabilize or reach a steady state. The time required for the moving pit to reach steady state is given by (Hou and Komanduri, 2000)
220SSTt
SV= (3)

Twin Pines Minerals – Individual Permit Application Supplemental Information USACE Project No. SAS-2018-00554 March 4, 2020 TTL Project No. 000180200804 Page 24
Mont M:\Projects\2018\000180200804.00 - Twin Pines Minerals Permitting Services\USACE Individual Permit App\Revisions to IP app\IP Application 03032020
where S is the storage coefficient, V is the velocity of the pit, and T is the aquifer transmissivity. If we assume that V = 100 ft/d T = 1,500 ft/d S = 0.3 the drawdown due to the moving mine pit will reach a steady state in 10 days. The governing equation and boundary conditions for a moving rectangular sink of groundwater is
2 S V hhT x
∂∇ =∂
(4)
with boundary conditions
0, , , hz x L y W q Kz
∂= ≤ ≤ = −∂
(5)
0, , , 0hz x L y W Kz
∂= > > − =∂
(6)
2 2 20, , 0z x y z h≥ + + → ∞ → (7) where y and z spatial coordinates; x is a Lagrangian spatial coordinate that moves in the x-direction at V; L is the length of the pit; and W is the width of the pit. Figure 60 depicts the half-space geometry of the moving pit. Using the following non-dimensional terms
* * * *, y , z , h ,x y z hK SVLx PeL L L qL T
= = = = = (8)
the solution is (e.g., Ling, 1973)
{ }* * *'1 /
* *` *`*
1 /
exp ( ) / 21 W L
W L
Pe r x xh dy dx
rπ
+
− −
− − − = − (9)
with
* * *' 2 * *' 2 * 2( ) ( ) ( )r x x y y z= − + − + (10)
For our pit, L = 250 feet, W = 50 feet, and K = 13 ft/d. If we assume that a volume of 100 feet × 100 feet × 50 feet of sand is excavated per day, the porosity of the sand is 0.3, and all of the water contained within that pore space is removed with the sand, the volumetric discharge from the pit (Q) will be 150,000 ft3/d, and the Darcy flux (q) is equal to the volumetric discharge/area of the pit or q = 3 ft/d. Using these parameters in equations 8, 9, and 10, the steady-state drawdown to removing all of the water in the excavated sand is shown in Figure 60. In Figure 60, the origin is fixed at x = 0 and moving to the left at 100 ft/d. In this case, the x-coordinate of the moving origin can be related to time. The pit, and moving origin, moves to the left at a velocity of 100 ft/d; therefore, the drawdown

Twin Pines Minerals – Individual Permit Application Supplemental Information USACE Project No. SAS-2018-00554 March 4, 2020 TTL Project No. 000180200804 Page 25
Mont M:\Projects\2018\000180200804.00 - Twin Pines Minerals Permitting Services\USACE Individual Permit App\Revisions to IP app\IP Application 03032020
at an x-coordinate of 1,000 feet represents the drawdown 10 days after the moving mine pit has passed that location. In this unrealistic case, the drawdown recovers to about four feet of the original water table position after 10 days and between one foot and two feet after 20 days; this relationship holds true for pit velocities up to 200 ft/d. It is clear from this unrealistic example (the removal of all water within the excavated sand), that the water table around the moving mine pit will quickly recover to close to its original position and that mining activities will not dewater the Okefenokee Swamp. When superimposed on the existing water table, groundwater divides will continue to separate the moving pit from the Okefenokee to the west and the streams to the east. The Trail Ridge hydrologic divide separating the Okefenokee Swamp to west from the Saint Mary’s River to the east will always be maintained. 3.6.3 Summary of Model Results We draw the following conclusions from these modeling efforts: • Trail Ridge is a classic example of topographically-driven groundwater flow. It acts as a hydrologic
divide that separates the Okefenokee Swamp to the west from the Saint Mary’s River to the east. Rainfall on Trail Ridge provides water to the Surficial Aquifer. This groundwater recharge causes the water table to rise within a few feet of the ground surface along Trail Ridge, forming a hydrologic divide that mimics the topography. Because groundwater flow follows the elevation of the water table, Trail Ridge groundwater flows to the west, supplying water to the Okefenokee Swamp, and flows to the east, supplying water to springs and creeks.
• Proposed mining activities will have an insignificant impact on the groundwater and stream flow to the Okefenokee Swamp and the creeks and groundwater system to the east of Trail Ridge. A comparison of groundwater models of the pre-mining conditions and post-mining conditions show that changes to the groundwater discharge and stream discharge are minimal and insignificant.
• Mining activities will cause insignificant changes in the water table across most of the study area.
Within the mine pit, the water table position will both increase and decrease due to the placement of homogenized sand spoil in the mine pit. At the Okefenokee Wildlife Refuge, the worst-case scenario models predict that the water table will decrease by no more than 0.0004 ft due to mining.
• Mining activities will not dewater the Okefenokee Swamp. The Okefenokee Swamp is 2.7 miles away from the closest part of the proposed mine footprint. The active mine pit will be small and filled within five to seven days. Analytical groundwater models of the moving mine pit show that water levels will recover to within four feet of their original position within 10 days following excavation and two feet of their original position within about 30 days. The perturbation of the water table caused by the moving mine pit will not affect the Okefenokee Swamp. The Trail Ridge hydrologic divide separating the Okefenokee Swamp to west from the Saint Mary’s River to the east will always be maintained.

Twin Pines Minerals – Individual Permit Application Supplemental Information USACE Project No. SAS-2018-00554 March 4, 2020 TTL Project No. 000180200804 Page 26
Mont M:\Projects\2018\000180200804.00 - Twin Pines Minerals Permitting Services\USACE Individual Permit App\Revisions to IP app\IP Application 03032020
3.7 Groundwater and Surface Water Quality Monitoring Plan Purpose This Groundwater/Surface Water Monitoring Plan documents monitoring activities designed to assess the impact or effect of proposed mining on hydrology along Trail Ridge and surrounding areas (including the Okefenokee Swamp) and verify the results of the groundwater models developed for the site. Groundwater/surface water-level monitoring activities are designed to:
• Monitor changes in groundwater levels due to precipitation, recharge, and runoff • Characterize the response of surface water levels to precipitation and groundwater levels • Allow the development of models relating precipitation to groundwater levels and recharge • Identify changes in levels induced by the moving mine pit • Quantify changes in post-mining water levels • Provide water-level data to assist in mine reclamation activities
These data will be used to verify current groundwater models and to support future revisions of the groundwater models. Groundwater/surface-water-quality monitoring activities will be conducted to:
• Establish baseline groundwater and surface water chemistry • Monitor spatial and temporal changes in water chemistry due to mining activities • Provide groundwater chemistry data for mine restoration activities
In the following, the mining progression is reviewed, the groundwater and surface-water level monitoring plan is described, and the groundwater and surface water-quality monitoring plan is developed. Progression of Mining TPM estimates that it will take about six years to mine the entire 898-acre mine area. The Twin Pines Conceptual Mining Plan (CMP) estimates that mining will advance at a rate between 100 and 200 feet per day and average approximately 115 feet per day. The CMP is designed to allow for mining an approximate 100-foot wide by 500-foot long section to a maximum depth of 50 feet below land surface. Once the mined pit reaches a length of approximately 500 feet, processed sands will be returned to the pit as mining continues to advance. The CMP calls for mining to begin in the extreme southwest corner of the mine. The total length of each cut will be, on average, approximately 9,000 linear feet (average distance from the west boundary of the mine to the east boundary of the mine). Once mining reaches either the east or west limit of mining, the dragline will reverse its course and mine the next adjacent cut in the opposite direction. This east-west to west-east alternating mining will continue throughout the entire course of mining. 3.7.1 Groundwater- and Surface-Water-Level Monitoring Plan Current Groundwater and Surface-Water-Level Monitoring Currently, there are five piezometers (PZ-15, PZ-16S, PZ-16D, PZ-28S, and PZ-28D,) installed within the proposed mine footprint (Figure 61). There are an additional 19 piezometers located within 2,000 feet of the proposed mine footprint. In addition to the above-referenced monitoring points, 62 piezometers were installed within the larger project study area. Combined, each of these 86 piezometers are equipped with Rugged Troll pressure transducers and have been recording background groundwater-level data for a period of between six months and one year. These piezometers will continue to be monitored throughout the period of mining and during post mining.

Twin Pines Minerals – Individual Permit Application Supplemental Information USACE Project No. SAS-2018-00554 March 4, 2020 TTL Project No. 000180200804 Page 27
Mont M:\Projects\2018\000180200804.00 - Twin Pines Minerals Permitting Services\USACE Individual Permit App\Revisions to IP app\IP Application 03032020
An additional 100 shallow 1.5-foot deep piezometers were installed inside the proposed mine footprint to monitor groundwater levels within wetlands. These shallow “wetlands” piezometers are also equipped with Rugged Troll pressure transducers and will be monitored during pre-mining, active mining and post-mining periods (Figure 62). A total of 23 staff gauges were installed to evaluate surface water elevations across the project study area (Figure 28). Each staff gauge segment measures approximately 3.3 feet in length and is mounted to a metal fence post or pressure-treated wood post so that the base of the gauge was positioned at ground surface. TTL installed In-Situ, Inc. Rugged Troll 200 non-vented data logger/cable combinations at the 23 staff gauge locations across the project study area. The data loggers were installed at each staff gauge with the transducers tip positioned at the approximate ground surface. Each data logger/cable combination has been recording background surface-water-level data for a period of between six months and one year. These staff gauges will continue to be monitored throughout the period of mining and during post mining. Weather Stations TPM personnel installed three HOBO rain gauge data loggers at the site in November 2018. The three rain gauge locations (RG01, RG02, and RG03) were installed at the northern, central, and southern portions of the project study area (Figure 27). The data loggers for each rain gauge record the accumulation of precipitation in units of hundredths of an inch. Rain gauge data is manually downloaded in the field by TPM representatives on a monthly or bi-monthly basis. During the proposed course of mining, rain gauge data will continue to be manually downloaded in the field once every two weeks. Proposed Configuration of Piezometers As part of this monitoring plan, new piezometers will be installed within the mining footprint for the collection of groundwater data. Prior to the start of mining, a site grid will be established to assist in the placement of these new piezometers. Figure 63 shows the approximate locations of proposed piezometers within the mine footprint. A new piezometer will be installed approximately every 2,000 feet in an east-west direction and every 1,000 feet in the north-south direction. The spacing will provide five rows of piezometers (approximately 23 piezometers), covering an area of roughly 898 acres, or one piezometer every 39 acres. This spacing was developed to provide for monitoring of the predicted steady-state drawdowns due to the moving mine, which has an estimated cone of depression of approximately 1,000 feet wide and 2,000 feet long (Figure 64). The 23 new piezometers will be identified at MPZ-01 through MPZ-23. In addition to these 23 proposed piezometers, four existing piezometers (PZ30D, PZ14, PZ57D, and PZ44) located within 2,000 feet of the mine footprint will also be included in the monitoring program. Monitoring of these piezometers will be initiated prior to the start of mining. Piezometer Construction Each of the 23 new piezometers will be constructed to a depth of approximately 50 feet below land surface (bls) using a sonic drill rig (Figure 65). Fifty feet is the maximum depth of mining. During installation of the new piezometers, soil cores will be continuously collected and described by an on-site geologist. Boring and well construction logs will be prepared for each newly constructed piezometer. Each piezometer will be constructed with 40 feet of 0.010-inch slotted, 2-inch diameter, threaded-joint, schedule 40 PVC installed from a depth of 10 to 50 feet bls. From the top of the screen to approximate land surface will be cased with solid 2-inch diameter, schedule 40 PVC riser. The natural formation sand will be allowed to settle around the screen to provide a natural pack to a depth of approximately eight feet bls. A two-foot thick bentonite pellet seal will be placed above the top of the

Twin Pines Minerals – Individual Permit Application Supplemental Information USACE Project No. SAS-2018-00554 March 4, 2020 TTL Project No. 000180200804 Page 28
Mont M:\Projects\2018\000180200804.00 - Twin Pines Minerals Permitting Services\USACE Individual Permit App\Revisions to IP app\IP Application 03032020
natural filter sand. The remaining annular space above the bentonite seal will be grouted to land surface using a cement/bentonite grout. A metal, flush-mount, bolt-down, protective cover will be installed over the piezometer at land surface to include a 2-foot x 2-foot x 4-inch thick concrete pad. Each piezometer will be fitted with a Rugged Troll transducer in order to continuously monitor groundwater levels. Sequencing of Piezometer Installation Relative to Progression of Mining Once initiated, mining will advance at an estimated rate of about 115 feet per day and piezometers within the mine footprint will periodically be excavated and reinstalled during the mining progression. The general procedures for the removal and reinstallation piezometers is discussed below:
• Within one or two days of the advancing mine face reaching a piezometer, the transducer will be removed and the piezometer will subsequently be excavated by the advancing drag-line excavator,
• Within approximately five to seven days of mining, the open excavation pit will be backfilled with post-processed soils,
• Within five to ten days of backfilling the excavation, a replacement piezometer will be installed in the approximate location of above-referenced excavated piezometer and,
• The replacement piezometer will be fitted with the Rugged Troll transducer that was removed from the previous piezometer in order to continue monitoring of groundwater levels.
Using this approach for the removal and reinstallation of piezometers, will aid in maintaining the full complement of piezometers within the mine boundary. This same methodology will be applied for the excavation and reinstallation of the shallow “wetlands” piezometers. Proposed Surface-Water Monitoring Locations Nine surface water locations are proposed to be monitored in the same general manner as previously installed staff gauges. Six additional staff gauges will be installed and equipped with Rugged Troll pressure transducers. These locations are shown on Figure 66. Frequency of Water-Level Monitoring As previously stated, water levels will be recorded using Rugged Troll pressure transducers. The transducers will generally be programmed to record water-level measurements at the following intervals; however, the frequency of measurements may be changed as necessary during the life of the mine. Shallow “Wetland” Piezometers
• Transducers installed, in the shallow 1.5-foot-deep piezometers for monitoring water levels within existing wetlands, will record water-level measurements at 6-hour intervals.
Remaining Piezometers • Transducers installed, in the row of 50-foot-deep piezometers located within 1,000 feet of the
active excavation and within the mining footprint, will record water-level measurements at 10-minute intervals.
• Transducers installed, in the row of 50-foot-deep piezometers located greater than 1,000 feet from the active excavation but within the mining footprint, will record water-level measurements at one-hour intervals.
• Transducers installed, in the remaining piezometers outside of the mining footprint, will record water-level measurements at 6-hour intervals.

Twin Pines Minerals – Individual Permit Application Supplemental Information USACE Project No. SAS-2018-00554 March 4, 2020 TTL Project No. 000180200804 Page 29
Mont M:\Projects\2018\000180200804.00 - Twin Pines Minerals Permitting Services\USACE Individual Permit App\Revisions to IP app\IP Application 03032020
Surface Water Transducers • Transducers installed at staff gauges will record water-level measurements at 6-hour intervals.
Initially, transducer data will be downloaded twice per week to evaluate water levels within and adjacent to the proposed mine. The frequency of transducer data downloading may be adjusted as needed during the life of the mine. 3.7.2 Groundwater- and Surface-Water Quality Monitoring Plan Frequency of Groundwater/Surface-Water Quality Monitoring Water-quality samples will be collected once prior to the start of mining (background) from the 23 new piezometers, four existing piezometers, and nine surface-water locations. The monitoring locations are listed below:
• Newly installed piezometers (MPZ-01 through MPZ-23) (Figures 63), • Piezometers PZ30D, PZ14, PZ57D, and PZ44 (Figure 61), • Wetland Monitoring Points WSP-01 through WSP-03 (Figure 66) and, • Stream monitoring points MSW-01 though MSW-06 (Figure 66).
The following is a schedule for the frequency of water-quality sampling:
• One sampling event performed prior to initiation of mining. • Four quarterly monitoring events beginning three months after mining is initiated • Semi-annual sampling thereafter until the end of mining unless a notable change in water
quality occurs. • Semi-annual monitoring of post mining conditions for an estimated period of six years
(estimated duration of mining). Based on the results of water-quality data monitoring and the progression of the mine, the frequency of water-quality data sampling and number of monitoring locations may periodically be adjusted (i.e. increased or decreased) during the life of the mine. Post-Mining Monitoring Twin Pines estimates that it will take about six years to mine the entire 898 acres. Post- mining monitoring will be performed for a period equal to the period of mining, and will consist of the monitoring of water levels in the piezometers on a continuous basis. This monitoring will include a manual download of the pressure transducers once every quarter during the post-mining period. Water-quality samples will be collected semi-annually for analysis of the constituents specified in this monitoring plan. Water-Quality Sample Collection and Analysis of Data To ensure that water-quality samples are collected properly, a Sampling and Analysis Plan (SAP) has been prepared. The SAP addresses well preparation, sample collection, chain-of-custody, analytical procedures, and field and laboratory quality assurance/quality control (QA/QC). Groundwater sampling procedures, chain of custody, field parameter measurement, and field QA/QC will be performed in general accordance with the Region 4 US Environmental Protection Agency (EPA), Science and Ecosystem Support Division Operating Procedure, Groundwater Sampling (SESDPROC-301-R4), effective April 26, 2017. Surface water sampling procedures and field QA/QC will be performed in general accordance with the Region 4 US Environmental Protection Agency (EPA), Science and Ecosystem Support Division Operating Procedure, Surface Water Sampling (SESDPROC-

Twin Pines Minerals – Individual Permit Application Supplemental Information USACE Project No. SAS-2018-00554 March 4, 2020 TTL Project No. 000180200804 Page 30
Mont M:\Projects\2018\000180200804.00 - Twin Pines Minerals Permitting Services\USACE Individual Permit App\Revisions to IP app\IP Application 03032020
201-R4), effective December 16, 2016. Low-level mercury sampling will be performed in general accordance with EPA Method 1669. Sample Collection Procedures Equipment Decontamination Any reusable sampling equipment that may contact the interior of the piezometer, groundwater, or surface water will be decontaminated in the field immediately prior to use, or in the office/lab and protected using aluminum foil and/or plastic. For sampling events requiring non-dedicated sampling equipment, decontamination procedures will consist of rinsing the equipment once with distilled or deionized water, brushing the equipment with a phosphate free laboratory-quality detergent, and finally rinsing the equipment with distilled or deionized water. Water Level Measurement – (Piezometers Only) Prior to purging and sampling, water-level measurements will be made at each piezometer by utilizing a dedicated or portable water-level indicator, tape, or other suitable measuring device capable of achieving an accuracy of 0.01 foot. The depth to water in each piezometer will be measured on the same day and prior to purging. The measuring device will be used in accordance with the manufacturer's recommendations and/or directions. Measurements of the depth to water from the top of the piezometer casing will be to the nearest 0.01 foot, and the value will be recorded. Total depths will be measured at each piezometer and recorded. Piezometer Purging Prior to the collection of groundwater samples, each piezometer will be purged to ensure that fresh aquifer water is being sampled. Purging of each piezometer will be completed using either a peristaltic or electric submersible pump. Due to the depths of the proposed piezometers and the high groundwater tables at the site (i.e. excessive purge volumes), low-flow purging procedures may be utilized. During low-flow purging, the pump or tubing intake will be located within the screened interval and at a depth that will remain under water at all times. During low-flow purging:
• The pumping rate will be set at a speed that produces minimal and stable drawdown within the well,
• The pumping rate will be measured using a graduated cylinder or bucket and a stop watch, • The groundwater level, pumping rate, and field parameters (pH, temperature, specific
conductivity, dissolved oxygen, oxidation-reduction potential, and turbidity) will be monitored and recorded every 5 to 10 minutes (or as appropriate),
• The field parameters will be measured using a calibrated multi-parameter instrument and flow-through cell,
• Purging will be considered complete and sampling will begin when the field measured parameters have stabilized. Stabilization is considered complete when three consecutive readings are within the following limits: Turbidity – 10% for values greater than 10 NTU, Dissolved Oxygen – Varies no more than 0.2 mg/L or 10% saturation, Oxidation-Reduction Potential – Varies no more than 20 millivolts, Specific Conductance – Varies no more than 5%, pH – Varies no more 0.1 unit

Twin Pines Minerals – Individual Permit Application Supplemental Information USACE Project No. SAS-2018-00554 March 4, 2020 TTL Project No. 000180200804 Page 31
Mont M:\Projects\2018\000180200804.00 - Twin Pines Minerals Permitting Services\USACE Individual Permit App\Revisions to IP app\IP Application 03032020
Sample Collection and Preservation – Piezometers Groundwater sampling is the process of obtaining, containerizing, and preserving a groundwater sample after the purging process is complete. Appropriate devices to be used to collect groundwater samples from piezometers include: peristaltic or electric submersible pumps. Alternative sampling devices/methods may be utilized if the alternative device/method is approved for use in EPA field sampling guidance literature. During sample collection, each piezometer will be sampled with equipment and methodologies that minimize the potential for alteration or contamination of the sample and that are capable of obtaining a sample representative of the formation ground water. Care will be taken to avoid placing clean sampling equipment on the ground or on any contaminated surface. Additionally, personnel who contact sampling equipment that may contact the interior of the monitoring well or the ground water will wear new powderless latex or nitrile gloves. Gloves will be changed between sample locations to avoid cross-contamination. Field personnel responsible for sample collection will record, at a minimum, the following:
• Date, time and technician’s name • Piezometer number and well depth • Well casing material and inside diameter • Static water level prior to purging • Sampling equipment used • Volume of water purged prior to sampling • Sample container numbers, types, sizes, and preservatives • pH, specific conductance, dissolved oxygen, oxidation-reduction potential, and temperature of
water samples • Comments about sample color, odor, and unusual characteristics • Comments about weather conditions • Comments about accessibility and condition of well
Groundwater collected from each piezometer will be slowly discharged into laboratory provided sample containers of the appropriate size and type, and with the preservatives appropriate for the analytical tests required. The sample container will be labeled with the following information:
• Site name, • Collected date and time, • Sampler’s name, • Analysis required, and • Preservative, if any
The laboratory will specify the preservation methods based on knowledge of methods and procedures approved by the Georgia EPD or EPA.

Twin Pines Minerals – Individual Permit Application Supplemental Information USACE Project No. SAS-2018-00554 March 4, 2020 TTL Project No. 000180200804 Page 32
Mont M:\Projects\2018\000180200804.00 - Twin Pines Minerals Permitting Services\USACE Individual Permit App\Revisions to IP app\IP Application 03032020
Sample Collection and Preservation – Surface Water Surface water samples will be collected directly into the laboratory provided container from the surface water body or by decanting the water sample from a collection device such as an unpreserved laboratory provided plastic container. The field sampler will face upstream if there is a current and collect the sample without disturbing the bottom sediment. Alternative sampling devices/methods may be utilized if the alternative device/method is approved for use in EPA field sampling guidance literature. Water quality samples collected for low-level mercury analysis (EPA Method 1631E) will be collected in general accordance with EPA Method 1669. Each surface water sample will be sampled with equipment and methodologies that minimize the potential for alteration or contamination of the sample. Care will be taken to avoid placing clean sampling equipment on the ground or on any contaminated surface. Additionally, personnel who contact sampling equipment will wear new powderless latex or nitrile gloves. Gloves will be changed between sample locations to avoid cross-contamination. Field personnel responsible for sample collection will record, at a minimum, the following:
• Date, time and technician’s name • Sample location identifier • Sampling equipment used • Sample container numbers, types, sizes, and preservatives • pH, specific conductance, dissolved oxygen, oxidation-reduction potential, and temperature of
water samples • Comments about sample color, odor, and unusual characteristics • Comments about weather conditions • Comments about accessibility and condition of the sample locations
Surface water samples will be collected into laboratory provided sample containers of the appropriate size and type, and with the preservatives appropriate for the analytical tests required. The sample container will be labeled with the following information:
• Site name, • Collected date and time, • Sampler’s name, • Analysis required, and • Preservative, if any
The laboratory will specify the preservation methods based on knowledge of methods and procedures approved by the Georgia EPD or EPA. Sample Shipment Upon completion of sampling each piezometer and/or surface water monitoring point, each laboratory provided container will be sealed, labeled and placed in an iced cooler for preservation and transport to a Georgia EPD approved laboratory for analysis. Chain of custody forms will be completed in the field at the time of sampling of each well. Samples will be transported to the laboratory via courier or shipped for overnight delivery using FedEx or UPS delivery.

Twin Pines Minerals – Individual Permit Application Supplemental Information USACE Project No. SAS-2018-00554 March 4, 2020 TTL Project No. 000180200804 Page 33
Mont M:\Projects\2018\000180200804.00 - Twin Pines Minerals Permitting Services\USACE Individual Permit App\Revisions to IP app\IP Application 03032020
Laboratory Analysis Water-quality samples will be analyzed for the constituents listed below and specified in the Table 16. The analytical list may be revised during the life of the mine. Sampling will be conducted according to sufficiently sensitive test procedures (i.e., methods) approved under 40 CFR 136. pH Aluminum, Total Selenium, Total BOD5 Antimony, Total Silver, Total COD Arsenic, Total Tin, Total Color Cadmium, Total Titanium, Total Fluoride Chromium, Total Zinc, Total Nitrate-Nitrite Cobalt, Total Zirconium Nitrate Copper, Total Ammonia, Nitrogen Nitrite Iron, Total Total Kjeldahl Nitrogen Nitrogen, Total Organic (as N) Lead, Total Alkalinity, Total Oil & Grease Magnesium, Total Alkalinity, Bicarbonate Phosphorus (as P), Total Manganese, Total Alkalinity, Carbonate Sulfate (as SO4) Mercury, Total Total Hardness Sulfide Molybdenum, Total Total Cyanide Sulfite (as SO3) Nickel, Total Uranium Alfa, Total Radium, Total Thorium Beta, Total Radium 226, Total Quality Assurance and Quality Control A quality-assurance and quality-control program (QA/QC) will be part of the sampling protocol and a requirement of the laboratory chosen to provide analytical services. At a minimum, field QA/QC per sampling event will require the collection of an equipment-rinsate blank if equipment is field cleaned and re-used on-site. Additional QA/QC sampling such as field or trip blanks may also analyzed as deemed necessary. The laboratory QA/QC program will be a written program and will describe the accuracy and completeness of the laboratory data; the documentation of procedures for calibration and maintenance of laboratory equipment, for analysis of samples, for computing and validating test data, and for chain-of-custody control; and the control and security of all documentation. Laboratory QA/QC standards will be initiated with the receipt of samples and will be maintained throughout the record-keeping period. Chain-of-Custody Control The chain-of-custody program will allow tracing the possession of and the handling of individual samples from the time of field collection through the completion of laboratory analysis. Evaluation of Analytical Data Results of the field measured and analytical groundwater data will be tabulated for each monitoring event. The data will be analyzed for trends and compared to applicable groundwater protection and in-stream water quality standards. The purpose of the trend analysis will be to evaluate if concentrations are declining, remaining level or constant (no discernable change), or increasing.

Twin Pines Minerals – Individual Permit Application Supplemental Information USACE Project No. SAS-2018-00554 March 4, 2020 TTL Project No. 000180200804 Page 34
Mont M:\Projects\2018\000180200804.00 - Twin Pines Minerals Permitting Services\USACE Individual Permit App\Revisions to IP app\IP Application 03032020
3.7.3 Reporting A report summarizing mining activities and water-level and water-quality data will be prepared and submitted to the applicable regulatory authorities on a quarterly basis for the first year and on an annual basis thereafter. These reports will include groundwater contour maps, results of water-quality analysis for the period of monitoring and trend graphs of concentrations. Water-level and water-chemistry data will be evaluated to determine the success of initial mining operations and methods. Groundwater-level data will be compared with groundwater levels predicted by the groundwater models. Water-chemistry data will be evaluated against current groundwater and surface water quality standards.

Twin Pines Minerals – Individual Permit Application Supplemental Information USACE Project No. SAS-2018-00554 March 4, 2020 TTL Project No. 000180200804 Page 35
Mont M:\Projects\2018\000180200804.00 - Twin Pines Minerals Permitting Services\USACE Individual Permit App\Revisions to IP app\IP Application 03032020
4.0 ALTERNATIVE ANALYSIS Alternatives screening is also pertinent to Clean Water Act (CWA) 40 CFR Part 230 Section 404(b)(1) Guidelines for Specification of Disposal Sites for Dredged or Fill Material (404(b)(1) guidelines), which require the analysis of practicable alternatives to the proposed discharge. The 404(b)(1) guidelines define a practicable alternative as one that is “available and capable of being done after taking into consideration cost, existing technology, and logistics in light of overall project purposes” (40 CFR Part 230.10(a)(2)).
According to USACE's National Environmental Policy Act (NEPA) Implementation Procedures for the Regulatory Program (33 CFR Part 325, Appendix B); the alternatives analysis should be thorough enough to use for both the NEPA review and the 404(b)(1) guidelines analysis.
4.1. Alternatives Development Process In order to effectively evaluate reasonable alternatives, site screening criteria were established and applied during the initial site selection process. If an option clearly did not meet one of the test-screening criteria, it was eliminated from further consideration, and did not proceed to the subsequent screening tests. These initial criteria include: 1 – that the alternative meets the purpose and need of the demonstration project
a) The purpose of the demonstration project is to demonstrate that HMS mining can be conducted in an environmentally sensitive area with negligible impacts to the site and surrounding resources and to develop a high-quality HMS reserve to produce HMS concentrate products including titanium mineral concentrates and zircon concentrates to meet global demands in a safe, cost effective and environmentally sound manner.
2 – that the alternative be reasonable and practical from both a technological and economic standpoint
a) The property must be available for purchase or lease. b) For the demonstration project to be economically reasonable the minimum heavy
mineral concentration per cut must average greater than 1.5% economic heavy minerals (ilmenite, leucoxene, rutile, zircon)
3 – that the alternative must be located within the Atlantic Coastal Plain physiographic region in southeast Georgia or northeast Florida
a) HMS are commonly found in beach/shallow offshore and fluvial/alluvial depositional environments. In the U.S., these HMS deposits are primarily located within the Atlantic Coastal Plain (Hou et. al, 2016; Pirkle et. al, 2013, Woodruff et. al, 2018).
4 – the alternative must be accessible to rail
a) Without adequate rail access, material would require transportation over greater distances or would require the construction of a rail which would ultimately increase onsite impacts. Without the construction of a rail, the cost of handling/transporting of material would increase as a result.
5 – that the alternative minimizes impacts to sensitive features including:
a) water resources including wetlands, streams, and floodplains, b) threatened and endangered species, c) cultural resources, and d) protected natural areas including the Okefenokee Swamp National Wildlife Refuge.

Twin Pines Minerals – Individual Permit Application Supplemental Information USACE Project No. SAS-2018-00554 March 4, 2020 TTL Project No. 000180200804 Page 36
Mont M:\Projects\2018\000180200804.00 - Twin Pines Minerals Permitting Services\USACE Individual Permit App\Revisions to IP app\IP Application 03032020
4.2. Alternatives Screening Process Pirkle et. al. (2013) identifies several known heavy mineral reserves within southeast Georgia and northeast Florida (Figure 2). These known deposits were evaluated on the established criteria. Alternative mining methodologies were also evaluated to determine the most responsible mining methodology for a demonstration project (Section 4.3). Additional alternative sites were evaluated. Those alternatives are briefly discussed in Section 4.4. The possible alternative sites were narrowed to include: three potential mining locations, two alternate sites within the preferred project location, and a no action alternative (Section 4.5). The depositional mechanisms for heavy mineral deposits are vital to understanding the locations in which they are found in economic concentrations. Economic heavy mineral assemblages located in the southeastern U.S. are formed as heavy minerals become concentrated through depositional processes which remove less dense, more erodible minerals from the sediment thus increasing the percentage of heavy minerals. Environments conducive to this type of preferential weathering and deposition include fluvial-deltaic, barrier island, and beach ridge sequences deposited on ancient and modern shorelines (Pirkle et. al., 2013). Hamilton (1995) defines these heavy mineral deposits as “coastal placers” where eolian, wave, and tidal processes provide the mechanical reworking and deposition of sediment to concentrate zircon, ilmenite, rutile and other economic heavy minerals (Jones et. al, 2017). HMS deposits that are being discovered, evaluated, and exploited are smaller and lower grade than those historically mined as many of the more accessible and concentrated HMS deposits are no longer accessible as a result of previous mining, environmental concerns, or regulations associated with mining activities, particularly in southeast Georgia and northeastern Florida (Pirkle et. al., 2007). These prospective areas for HMS deposits in the Atlantic Coastal Plain occur near the modern shores or on barrier islands and much of the modern coastal areas are covered by infrastructure or are otherwise protected lands. As mining moves into more environmentally sensitive areas, it is imperative that mining be conducted in a responsible way manner that is protective of our natural resources. In southeastern Georgia, seven coastlines (paleo and current) have been identified which contain heavy-mineral deposits (Hails and Hoyt, 1969; Pirkle et. al., 2013). Trail Ridge is located on the oldest recognized paleo-shoreline, the Wicomico Shoreline (Figure 2). These ridges align with heavy mineral deposits noted by Force (1991) within the “Jacksonville district.” The Jacksonville district is further refined by Force into deposits, notably the Trail Ridge deposit and the Green Cove Springs deposit. Other heavy mineral deposits located within the Jacksonville district are discussed by Pirkle et. al. (2007) and include the Lulaton, Folkston, Boulogne, Arlington, and Mineral City (Ponte Vedre) ore bodies (Figure 2). Cumberland Island and Amelia Island are noted as modern beaches where heavy mineral accumulation is also currently occurring (Force, 1991). Older Pleistocene deposits contain more mature heavy mineral suites than younger ridges with relative increases of titanium-bearing minerals and zircon due to leaching of iron from ilmenite and decreasing amounts of monazite and other less stable minerals such as epidote, amphiboles, and staurolite as they tend to weather more rapidly and are generally less abundant. (Kellam et. al., 1991). As a result, the TiO2 content of ilmenite is higher in Trail Ridge than other ridges (Pirkle, 2005). 4.3 Evaluation of Potential Mining Methodologies Heavy mineral sands are typically mined by one of two methods in the Southeastern United States. One method is using mobile (truck/shovel) equipment, the other uses a dredge. Due to the sensitive environmental landscape of the Saunders Tract, TPM evaluated whether mining could be conducted in a more environmentally responsible manner than that of traditional HMS mining methods (dredging

Twin Pines Minerals – Individual Permit Application Supplemental Information USACE Project No. SAS-2018-00554 March 4, 2020 TTL Project No. 000180200804 Page 37
Mont M:\Projects\2018\000180200804.00 - Twin Pines Minerals Permitting Services\USACE Individual Permit App\Revisions to IP app\IP Application 03032020
or truck/shovel) which are common in the Atlantic Coastal Plain. In the Ukraine, HMS reserves are known to have been mined via dragline operation. TPM evaluated the possibility of utilizing a mobile dragline and conveyor system which would allow for more efficient extraction of mineral resources at depth, minimize the impact to groundwater, and decrease the time between mining activities and beginning reclamation activities.
Truck & Shovel Mining Truck and shovel operations in these areas typically mine down to a depth of 20 feet below the existing ground surface. The excavation takes place in two approximately 10 feet lifts. Shallow groundwater levels are common in these sands deposits where heavy minerals are found. Groundwater levels in this area range from the ground surface to depths of approximately five feet below the ground surface. With the shallow groundwater levels, dewatering is required for the truck/shovel method. Dewatering is achieved by excavating ‘rim’ ditches around three sides of the mining block to channel the water to a central sump area where the water is pumped from the excavation. The rim ditch is excavated down to the reach of the excavator, approximately 10 feet. This will dewater the pit for the first lift, then the ditch is extended to an elevation just slightly lower than the planned pit bottom elevation. Each pit area is actively dewatered for approximately 30 days before moving to another mining location.
The excavated material is hauled in articulated trucks to a site where the material is screened and passed through a trommel to remove any remaining organics or oversize material. The ore is then mixed with water to produce a slurry and pumped to the Wet Concentration Plant (WCP) where the heavy minerals are separated from the quartz sand and slimes (fine clay/silt size material). The quartz and slimes are then slurried and pumped back to an open pit in preparation for reclamation. The tailings are allowed to build up 10 to 12 feet above the original ground surface. This allows the tailings to dry and the water seeps back into the open pit. As the tailings dry and are able to be worked with a dozer, they are pushed backed into remaining open portion of the pit. Allowing the tailings to dewater by gravity adds time and prolongs the reclamation efforts. Typically, it is 12 to 18 months after the pit is mined before the reclamation process is completed. Once the tailings are able to support the tracked equipment, the reclamation process starts. The first step in the reclamation process is to slope/grade the tailings to the original topographic contours. Once the site is graded, the stockpiled topsoil is replaced. Then the site is prepped for pine plantation. Due to the nature of a truck shovel operation, there could be more than 300 acres of disturbed/unreclaimed ground at any one time.
Floating Dredge Mining Another method of moving materials in a sand formation is that of a floating dredge. A dredge is composed of a floating platform with a suction/cutter head. At a dredge operation, the site prep, clearing and grubbing, etc. is the same as that for a truck and shovel HMS mine. In the southeastern U.S., dredges used to mine minerals sands are typically used to mine deposits down to a depth of 40-50 feet below the ground surface. The dredge(s) is sized to match the capacity of the WCP and the dimensions of the sand deposit. In this area, dredges are usually capable of moving 800-2000 tons of material per hour. Typical dredge pits for mineral sands mine in this area are 600 feet wide. However, sometimes two pits are mined simultaneously for a pit width of 1200 feet. Pit advancement is dependent on width and depth, but is generally approximately five feet per day. On average, 190-220 acres are mined per year. As the material is mined, it is slurried to the WCP which also floats and is located at the back side of the pit. The WCP in this operation functions the same as that in a truck shovel. After the heavy minerals are separated, the tailings (quartz sand and slimes) are sprayed and discharged from the back of the

Twin Pines Minerals – Individual Permit Application Supplemental Information USACE Project No. SAS-2018-00554 March 4, 2020 TTL Project No. 000180200804 Page 38
Mont M:\Projects\2018\000180200804.00 - Twin Pines Minerals Permitting Services\USACE Individual Permit App\Revisions to IP app\IP Application 03032020
WCP and redeposited back in the pit. As the water drains from the tailings, mobile equipment is used to spread and contour the tailings to the approximate original topography. Due to the humate, process water quality can be a problem. In some cases, it can be necessary to use additional settling ponds outside the pit to further clarify the water. This allows the humate and fines to settle out of solution after which, the water is pumped back for use in the wet concentration plant. These humate ponds typically take longer to reclaim because the humate retains that moisture, making it difficult to put heavy equipment on the surface during reclamation. Reclamation associated with a dredge operation is, on average, completed 18-30 months after mining is completed. Some areas might have up to 600 acres of unreclaimed land at any one time. Reclamation timelines can be tied to the individual property lease requirements, as well as state regulations. No dewatering is required in a dredge operation, therefore there are typically no significant changes in the groundwater table as a result of pumping. However, if the mineralized zone extends below the depth of the dredge’s capability, the water level in the pit is pumped down and lowered. This allows for mining to greater depths with the same equipment. Usually the lowering of the pond level would only extend the mining depth a few feet and is generally done on a temporary basis. Furthermore, large ponds required to float the dredge increase water loss to evaporation and alter groundwater flow directions by mounding groundwater beneath the pond. Dragline Mining There are multiple benefits for using the Dragline/Conveyor mining method. In general, a dragline is a more efficient method for moving bulk material where long mining cuts and pits can be utilized. Employing elongated cuts allows for simultaneous mining the mineral sands and tailings placement to occur in the same pit. This process will allow reclamation to occur at a faster rate as backfilling and rough grading may occur up to +/-500 feet behind the dragline dig face. This should allow reclamation to begin within days of mining, where typical methods take several months to greater than a year.
Use of this mining method will also minimize water loss and maximize water recovery/recycling through the use of dewatering screens and cyclones. When compared to dredge mining of mineral sands, this method will allow for more water recovery whereas a dredge loses water to evaporation as process water is sprayed back into the pit from the back side of the wet concentration plant. In TPM’s process, the recycled process water quality is improved as they will be separating the humate in the process and burying it in the open pit below the quartz sand tailings. This technique will eliminate the need for separate humate deposition ponds which take extended lengths of time to dry and “set up” to support for equipment to reclamation.
Due to the noted concerns with dredging and dry mining, TPM is proposing to conduct a demonstration project to show the efficiency and minimal environmental effects of the proposed dragline mining methodology. The TPM demonstration project location was selected as the most practical location furthest from the Okefenokee National Wildlife Refuge with the least amount of environmental impacts. 4.4 Alternatives Sites Eliminated from Further Consideration Green Cove Springs Orebody The Green Cove Springs orebody is located north of the town of Palatka, Florida and south of the town of Green Cove Springs, Florida. Black Creek limits the northern extension of the deposit and a karst depression and erosion by the St. Johns River restricts the southern extension (Pirkle et. al., 2007). Mining of this orebody began in 1972 and continued until 2006. Following the cessation of mining, Iluka Resources, Inc. began processing tailings of the previously mined material until it was

Twin Pines Minerals – Individual Permit Application Supplemental Information USACE Project No. SAS-2018-00554 March 4, 2020 TTL Project No. 000180200804 Page 39
Mont M:\Projects\2018\000180200804.00 - Twin Pines Minerals Permitting Services\USACE Individual Permit App\Revisions to IP app\IP Application 03032020
decommissioned in 2009 (NRC, 2018, United States Nuclear Regulatory Commission Iluka Resources, Inc., retrieved February 18, 2020, available at: nrc.gov/info-finder-decommissioning/complex/iluka-resources.html). This orebody is no longer economically viable to mine as the resource has been exhausted; therefore, it is inappropriate for a demonstration project. Trail Ridge and Highland/Maxville Orebodies The Trail Ridge orebody represents the largest known heavy mineral orebody in the southeastern U.S. (Pirkle et. al, 1991) and is located along the southern extent of Trail Ridge extending from town of Starke, Florida following Trail Ridge north towards the town of MacClenny, Florida. This deposit has been mined since 1949 and is currently being mined by Chemours (formerly DuPont). As Chemours is actively mining this orebody and owns the majority of the land, it is not economically feasible for TPM to lease or purchase the remainder of this deposit; therefore, it is not practical for a demonstration project. Mission Deposit The Mission deposit is located northeast of the town of Folkston, Georgia and is currently being mined by the Chemours Company (previously Southern Ionics Minerals). The Mission deposit is located on the Penholoway Shoreline and generally consists of three major mineralized zones with minimal overburden. The heavy minerals are predominately highly altered ilmenite, with moderate amounts of zircon, rutile, and leucoxene (Pirkle et. al, 2007). As this deposit is being exploited by Chemours, this deposit is not considered a practical demonstration mining alternative. Buffalo Ridge Deposit The Buffalo Ridge deposit is located west of the Mission Deposit and east of Trail Ridge approximately 11 miles south of Nahunta, Georgia. The heavy mineral assemblage contains approximately 14% rutile, 12% zircon, and 44% ilmenite plus leucoxene. Pirkle et. al (2007) describe the deposit as five mineralized zones that varies in length from 945 to 2,195 meters, in width from 125 to 300 meters, and in thickness from 0.8 to 4.5 meters. Overburden thickness extends to 2.3 meters. Due to the limited extent of the resource and the thickness of overburden this deposit is not currently economical to mine; therefore, this site is not practical for a demonstration project. Boulougne Orebody The Boulogne orebody, located in northeastern Florida, south of the town of Boulogne, has also been developed. Located on the Penholoway Formation, the Boulogne orebody was mined from 1974 to 1979 by the Humphreys Mining Company. The northern portion of the deposit is now developed with houses and the southern unmined portion contains shallow deposits with an average depth of 3.6 meters (~12 feet); therefore, limiting the economic viability of any potential mine (Pirkle et. al, 2007). Due to limited heavy mineral resources remaining in this orebody, it is not currently economical to mine and in not feasible for a demonstration mining project. Yulee Deposit The Yulee deposit, located east and north of Yulee, Florida, is part of the Pamlico barrier island complex. The heavy mineral deposits are in narrow north-south trending ridges that are irregular in shape and have been identified as “Crandall Ridge,” “Bells Ridge,” “Haven Road Ridge,”, and “Chester Road Ridge” (Pirkle et. al., 2007). This deposit has been evaluated numerous times including from 1970 to 1971 by Humphreys Mining Company, 1986 by E.I. du Pont de Nemours & Co., and in 2002 by Iluka Resources, Inc. and has an estimated heavy mineral percentage of approximately three percent. However, the reserve contains a high percentage of non-economic heavy minerals with estimates ranging from 22% to 54% non-economic minerals within the heavy mineral suite (Pirkle et. al., 2007). Additionally, Chester Road Ridge and Haven Road Ridge are now developed with residential neighborhoods and therefore unavailable for mining. Based on the reserve area and volume (0.97 km2
& 3,492 m3) estimated by Iluka in 2002, the Crandall Ridge reserve is too small for economic mining.

Twin Pines Minerals – Individual Permit Application Supplemental Information USACE Project No. SAS-2018-00554 March 4, 2020 TTL Project No. 000180200804 Page 40
Mont M:\Projects\2018\000180200804.00 - Twin Pines Minerals Permitting Services\USACE Individual Permit App\Revisions to IP app\IP Application 03032020
Due to the high percentage of non-economic heavy minerals and the limited size of the available reserve, it is currently not economical to mine and is therefore not practical for a demonstration project. Lulaton Orebody The Lulaton Orebody is located just west of the town of Lulaton, Georgia on the Penholoway Formation. This orebody was mined by Iluka Resources, Inc. from 2004 until 2006 (Pirkle et. al, 2007). This orebody is no longer economically viable to mine, as the resources have been exhausted, making it unsuitable as a viable demonstration project. Altama Deposit The Altama heavy-mineral deposits are located in eastern Glynn County, Georgia, northwest of Brunswick, in north–south-trending dune ridges of quartz sand that accumulated along a Pamlico shoreline (Figure 2) (Pirkle et. al., 2007). The titanium minerals ilmenite (average 60% TiO2), rutile, and leucoxene constitute 63% of the total heavy minerals, and zircon accounts for almost 11%. In 1985, DuPont conducted a detailed evaluation of the main Altama deposit and estimated that approximately 2.34 million metric tons of heavy minerals including approximately 227,000 metric tons of zircon may be within the deposit (Pirkle et. al., 2007). More recently, Iluka Resources, Inc. re-evaluated the Altama deposit and in 2003 purchased acreage that they planned to mine. However, in 2006, Iluka sold a portion of the property to the Glynn County Development Authority after they were denied a mining permit because of community opposition (Starr, 2006). The southern extent of the deposit has since been developed by commercial and residential properties. Due to the sale of the property to the local development authority and development of the southern portion of the deposit, the Altama deposit was not considered a practical alternative, and thus is not a reasonable location for a demonstration mining project. Folkston Orebody The Folkston orebody is located approximately 2.5 miles north of the St. Mary’s River in Charlton County, near the town of Folkston, Georgia. 80% of the Folkston deposit was mined between 1965 and 1974 and can be considered both economically and geologically depleted (Elsner, 1997). Pirkle et. al. (2007) reiterates this by stating that this orebody has been mined out and is no longer viable. Since this deposit is not economical to mine, it was not considered a practical alternative for the demonstration mining project. Amelia A/B/C Deposit The Amelia deposit consists of two separate blocks of heavy mineral concentrated sands, a northern tract (Amelia A & Amelia B) located west/southwest of Jesup, Wayne County, Georgia, and a southern tract (Amelia C) located southeast of Screven, Wayne County, Georgia. According to Pirkle et al.(1993b) the mineable sediments containing heavy-mineral concentrations in the Amelia A and B tract average 5.2 meters in thickness containing an average of approximately 2.5% heavy minerals by weight. Mineable sediments with heavy-mineral concentrations in Amelia C average 6.7 meters in thickness and contain an average of approximately 2.3% heavy minerals. (Pirkle et. al., 2007). Approximately 60% of the heavy mineral is composed of titanium minerals with highly altered ilmenite, and more than 13% zircon Pirkle et. al, 2007). This deposit is being mined by Chemours; it is unavailable for lease or purchase by TPM and therefore not a practical alternative for a demonstration project. Folkston West The Folkston West deposit is approximately 9,000 acres located west of the town of Folkston, Georgia and east of the Okefenokee National Wildlife Refuge along Trail Ridge. Titanium minerals compose about 51% of the total heavy minerals and zircon accounts for approximately 13%; the ore-grade sediments contain very small percentages of non-economic heavy minerals (Pirkle et. al., 1993). In 2003, Dupont Company donated approximately 16,000 acres including the entire Folkston West

Twin Pines Minerals – Individual Permit Application Supplemental Information USACE Project No. SAS-2018-00554 March 4, 2020 TTL Project No. 000180200804 Page 41
Mont M:\Projects\2018\000180200804.00 - Twin Pines Minerals Permitting Services\USACE Individual Permit App\Revisions to IP app\IP Application 03032020
reserve to The Conservation Fund and relinquished mining rights (Seabrook, 2003; Pirkle et. al., 2007). The Folkston West deposit is protected and was not considered for further evaluation as an alternative or demonstration project location. Toledo Tract The Toledo Tract is located immediately north of the Saunders Tract and east of the Okefenokee Swamp, along Trail Ridge. The Toledo Tract is approximately 30,637 acres with an average orebody thickness of 9.4 meters, and no overburden (Pirkle et. al, 2007). The deposit is estimated to contain approximately 19.2 million metric tons of heavy minerals (Pirkle et. al, 2007). TPM contacted Toledo Manufacturing Company, owner of the Toledo Tract, regarding potential mineral exploration and subsequent lease or purchase of the property. Toledo Manufacturing Company indicated that the property was not currently available for lease or purchase and thus is not a practical location for a demonstration mining project. 4.5 Alternatives Evaluated Further 4.5.1 Off-Site Alternatives Alternative 1: Confidential Site 1 Confidential Site 1 (CS 1) is located in Brantley County, Georgia along Trail Ridge and is greater than 1,000 acres in size. CS 1 is located more than three miles from the Okefenokee National Wildlife Refuge. The site is located adjacent to a historically known heavy mineral reserve. TPM evaluated the CS 1 property through exploration drilling and heavy mineral percentages averaged less than %. As this property did not have the required economic heavy mineral percentage, it was not considered a viable, practical demonstration project location. Since this property was not economical to mine, it was not evaluated for cultural or environmental resources. Alternative 2: Confidential Site 2 Confidential Site 2 (CS 2) was evaluated by TPM through exploration drilling. The CS 2 property was not economical to mine at this time; therefore, it was not considered a practical alternative for a demonstration project. CS 2 was not evaluated for cultural or environmental resources.
4.5.2 On-Site Alternatives: Saunders Tract The Saunders Tract is located approximately four miles west of the town of St. George, Georgia. The deposit extends from Highway 94 north along Trail Ridge to the Toledo deposit (Pirkle et. al., 2007). The Saunders Tract is comprised of five individual properties: the Adirondack Tract, the Keystone Tract, the TIAA Tract, the Dallas Police & Fire Tract, and the Loncala Tract (Figure 67). Drilling conducted by Dupont in 1977 and again in 1994 identified an HMS concentration averaging 2.17% with no overburden. At the time, the Saunders deposit was thought to be “lost” due to multiple property owners of the individual tracts (Pirkle et. al., 2007). Beginning in 2018, TPM began a more extensive mineral exploration of the Saunders Tract. Results of TPM’s exploration revealed economic concentrations of heavy minerals along the crest and western flank of Trail Ridge up to a depth of approximately 70 feet below land surface. Alternative 3: Loncala Tract Alternative 3 consists of mining an alternative location within the Saunders Tract, the Loncala Tract. The site is an approximately 1,012-acre area depicted on the USGS 7.5-minute Topographic Maps of Moniac, Georgia and Saint George, Georgia (Figure 68). The center of the site is located near latitude

Twin Pines Minerals – Individual Permit Application Supplemental Information USACE Project No. SAS-2018-00554 March 4, 2020 TTL Project No. 000180200804 Page 42
Mont M:\Projects\2018\000180200804.00 - Twin Pines Minerals Permitting Services\USACE Individual Permit App\Revisions to IP app\IP Application 03032020
30.576162 and longitude -82.128950 and the site elevation ranges from approximately 120 to 175 feet above mean sea level. The western boundary follows a portion of Swamp Perimeter Road and, Trail Ridge Road is located along the eastern portion of the site. The site has historically been used for silvicultural activities. The primary sources of hydrology for the site are on-site rainfall and surface water flow. The site is located approximately 0.5 mile east of the eastern boundary of the Okefenokee National Wildlife Refuge. The proposed mining boundary for Alternative 3 is located 0.75 mile from the Okefenokee National Wildlife Refuge property boundary (Figure 69) TPM began exploratory drilling of Alternative 3 in February 2018 and determined that the Tract is comprised of suitable reserves of heavy mineral sands containing the target minerals suitable for mining. The heavy mineral sands underlying the site average approximately % economic heavy mineral concentration. Aquatic features located within Alternative 3 are summarized below.
Feature Area (ac) Length (lf)
Wetland 405.387 ---
Intermittent Stream 0.337 3,020
Open Water 0.340 ---
Alternative 3 contains two tributaries located within the northwestern portion of the site. Stream S2 flows into Stream S1, which flows offsite westward towards the Okefenokee National Wildlife Refuge. One open water (OW1) totaling 0.34 acre occurs within the site. The observed open water appears to be an excavated feature that is adjacent to Wetland D. Alternative 3 would result in impacts to approximately 292.209 acres of wetlands and 1,160 linear feet of stream. These estimated impacts do not include impacts associated with processing facilities, attendant features, or road improvements that would be required to operate on the property. In order to efficiently transport HMS concentrate products from the Loncala tract, approximately 3.5 miles of railroad would need to be constructed or significant road improvements would be required to handle the significant increase in heavy truck traffic. Due to the distance of rail access, constructing a rail road to access the property is not currently economically feasible for a demonstration project. Sensitive species that were identified on the Loncala Tract and would be potentially impacted include the American black bear, gopher tortoise and gopher frog. In a survey completed April 2-4, 2019, TTL and Altamaha Environmental Consulting identified 62 gopher tortoise burrows. During a camera survey of the burrows, also completed April 2-4, 2019, 29 tortoises were identified over four separate colonies. Furthermore, three burrows contained gopher frogs. All of the identified burrows are located within Alternative 3’s area and would require relocation. The Phase I Cultural Resources Survey completed by TerraXplorations, Inc. (TerraX) revealed the presence of one cultural resource site (9CR120) recommended as potentially eligible for the National Register of Historic Places (NRHP) inclusion under Criterion D. Additionally, the NRHP status of another cultural resource is listed as unknown as this site was unable to be fully tested due to the site extending outside of the project limits. However, the investigated portion of the site was determined to lack significant data potential and thus no further archaeological work was recommended within the project area. TerraX recommended that until this site could be fully defined and evaluated, the overall NRHP eligibility status should remain as unknown. For site 9CR120 avoidance or further testing

Twin Pines Minerals – Individual Permit Application Supplemental Information USACE Project No. SAS-2018-00554 March 4, 2020 TTL Project No. 000180200804 Page 43
Mont M:\Projects\2018\000180200804.00 - Twin Pines Minerals Permitting Services\USACE Individual Permit App\Revisions to IP app\IP Application 03032020
was recommended. If avoidance is not possible, TerraX recommended Phase II testing be conducted prior to any ground disturbing activities in order to better evaluate the NRHP eligibility status of this site. Locations of sensitive features on Alternative 3 are depicted on Figure 69. Alternative 4: Keystone Tract Layout 1 Alternative 4 consists of the originally proposed layout submitted in the July 3, 2019 Twin Pines Minerals Individual Permit application. The center of the site is located near latitude 30.524900 and longitude -82.124198. Alternative 4 consists of a combination of dragline and excavator/dozer trap mining at the proposed project site. Mining at the site would be accomplished utilizing dragline mining for the majority of the site and the truck/shovel method would be utilized due to the shallower depth of mineral resource on the TIAA mining block (Figure 70). The northern boundary of the Alternative 4 site is located approximately 2.7 miles southeast from the nearest boundary of the Okefenokee Swamp National Wildlife Refuge, providing a substantial buffer of protection for this sensitive resource. Alternative 4 contains suitable reserves of heavy mineral sands containing the target minerals suitable for mining. The heavy mineral sands underlying the site are comprised of an average of % concentration of the economically viable heavy minerals. The Alternative 4 review area, consists of 2,405.1 acres with a proposed mining area of 1,268.4 acres, an additional 182 acres would be developed to support the mining and mineral processing operations. Alternative 4 is located along a railroad; however, access spurs to the rail would need to be constructed. In Alternative 4, dry processing facilities, office facilities, and storage facilities would be located south of the mining operation between Highway 94 and the railroad. Alternative 4 contains numerous forested, shrub-scrub, and herbaceous wetlands as well as ephemeral, intermittent, and perennial streams. Stream impacts would occur within partially unstable channels that have been historically impacted by silvicultural activities and stable intermittent streams located in mature forested riparian corridors. The table below summarizes the quantities of aquatic resources for the Alternative 4 project area.
Feature Area (ac) Length (lf)
Wetland 1,194.437 ---
Stream 1.010 11,587
Open Water --- ---
Alternative 4 provides habitat for the federal candidate, state listed threatened gopher tortoise and federal candidate, state listed rare gopher frog. In a survey completed April 2-4, 2019, TTL and Altamaha Environmental Consulting identified 62 gopher tortoise burrows. During a camera survey of the burrows completed April 2-4, 2019, 29 tortoises were identified over four separate colonies. Furthermore, three burrows contained gopher frogs. Gopher tortoise and gopher frog would be relocated. With the implementation of these mitigation measures, Alternative 4 is not expected to have an effect on these species. A cultural resource survey identified a total of 16 archaeological locations within the extent of the permit area. These included seven isolated finds and nine archaeological sites. Of these sites, five are the remains of early-to-middle-twentieth century domestic assemblages. None of the sites were recommended as eligible for NRHP inclusion and isolated finds are, by their nature, ineligible for NRHP inclusion. One resource located outside of the permit area boundary is recommended as potentially

Twin Pines Minerals – Individual Permit Application Supplemental Information USACE Project No. SAS-2018-00554 March 4, 2020 TTL Project No. 000180200804 Page 44
Mont M:\Projects\2018\000180200804.00 - Twin Pines Minerals Permitting Services\USACE Individual Permit App\Revisions to IP app\IP Application 03032020
eligible for NRHP inclusion under Criterion C. This resource is a mid-century ranch home constructed in 1950. Though currently abandoned, the integrity of the structure is intact and its architecture is significant as a representative example of a mid-twentieth century ranch house. The cultural resource survey recommended avoidance of this property. Additionally, the house is currently located near an existing chip mill and railroad tracks and is currently exposed to heavy audible effects. Due to avoidance measures the historic resource will not suffer adverse visual and audible effects as a result of the proposed mining operations. Locations of sensitive features on the Alternative 4 are depicted on Figure 71. Alternative 5: Keystone Tract Layout 2 (Preferred) Alternative 5 consists of the originally proposed layout submitted in the July 3, 2019 Twin Pines Minerals Individual Permit application. The center of the site is located near latitude 30.524900 and longitude -82.119090. Alternative 5 consists solely of dragline mining at the proposed project site. The northern boundary of the Alternative 5 site is located approximately 2.7 miles southeast from the nearest boundary of the Okefenokee Swamp National Wildlife Refuge, providing a substantial buffer of protection for this sensitive resource (Figure 72). Alternative 5 contains suitable reserves of heavy mineral sands containing the target minerals suitable for mining. The heavy mineral sands underlying the site are comprised of an average of % concentration of the economically viable heavy minerals. The Alternative 5 review area is the same review area as Alternative 4 and consists of 2,405.1 acres. However, the proposed mining area has been substantially reduced to 898 acres, an additional 143.7 acres would be utilized to support the mining and mineral processing operations. In Alternative 5, dry processing facilities, office facilities, and storage facilities would be located at the recently vacant chip mill facility located approximately one mile east of Trail Ridge Road. Heavy truck access would be facilitated by the construction of an internal haul road from the on-site wet processing plant to the dry processing plant at the “chip mill.” This road is proposed to be constructed along existing roadways where possible, thus minimizing impacts to aquatic features. The chip mill facility is located along the railroad with existing spurs on the property, no additional construction would be required for rail access. Two deep water wells will be located east of the mining operation on the Adirondack Tract. These wells will be drilled into the Floridan Aquifer to supply make-up water to the wet-processing plant as needed. These wells will be constructed in uplands and water will be transported to the wet plant via eight-inch high-density polyethylene (HDPE) pipe. The corridor for the piping is proposed as to avoid crossing wetlands or known gopher tortoise burrow locations and to utilize existing roadways where feasible. Alternative 5 contains numerous forested, shrub-scrub, and herbaceous wetlands as well as portions of intermittent streams. Stream impacts would primarily occur within partially unstable channels that have been historically impacted by agricultural/silvicultural activities. The table below summarizes the quantities of aquatic resources for the project area.
Feature Area (ac) Length (lf)
Wetland 1,202.399 --- Stream 1.010 11,587
Open Water --- ---

Twin Pines Minerals – Individual Permit Application Supplemental Information USACE Project No. SAS-2018-00554 March 4, 2020 TTL Project No. 000180200804 Page 45
Mont M:\Projects\2018\000180200804.00 - Twin Pines Minerals Permitting Services\USACE Individual Permit App\Revisions to IP app\IP Application 03032020
Alternative 5 provides habitat for one (federal candidate, state listed threatened) gopher tortoise which would be relocated prior to mining. With the implementation of these mitigation measures, Alternative 5 is not expected to have an effect on these species. A cultural resource survey identified a total of 16 archaeological locations within the extent of the permit area. These included seven isolated finds and nine archaeological sites. Of these sites, five are the remains of early-to-middle-twentieth century domestic assemblages. None of the sites were recommended as eligible for NRHP inclusion and isolated finds are, by their nature, ineligible for NRHP inclusion. One resource located outside of the permit area boundary is recommended as potentially eligible for NRHP inclusion under Criterion C. This resource is a mid-century ranch home constructed in 1950. Though currently abandoned, the integrity of the structure is intact and its architecture is significant as a representative example of a mid-twentieth century ranch house. The cultural resource survey recommended avoidance of this property. Additionally, the house is currently located near the existing chip mill and railroad tracks and is currently exposed to heavy audible effects. Due to avoidance measures the historic resource will not suffer adverse visual and audible effects as a result of the proposed mining operations. Locations of sensitive features on Alternative 5 are depicted on Figure 73. Alternative 5: Mining Activities and Progression of Mining The following is an outline of TPM’s Conceptual Mining Plan (CMP). The sequence of mining activities is described in this section. This outline is generalized and may require modification once mining begins and field logistics are established. At the current time, below is the best estimate of the anticipated processes and progression of mining. The mining concept proposed by TPM is an innovative approach that will utilize a dragline to remove the HMS and an overland conveyor to transport the material to the processing plant. The TPM CMP is designed to allow for mining of an approximate 100-foot wide pit to a maximum depth of 50 feet below the land surface. Prior to mining, clearing for the Feed conveyor will be completed along a 50-foot corridor along the north section of this initial area. Once clearing for the feed conveyor is completed, clearing for the Tails conveyor and berm to the south will be performed. This tails/berm corridor clearing will extend approximately 150-170 feet north to south. After the clearing for the tailings conveyor corridor is completed, clearing for the mining corridor will be started. The first step in the mining process will be rough clearing of the mining corridor ahead of the dragline. This corridor will be approximately 450 feet north to south which will allow for mining of three pits before relocating the feed/tailings conveyors. This corridor will be cleared immediately ahead of the dragline. This clearing will extend +/-500 feet ahead of the mining and progress as the dragline advances. The clearing of this 450-foot north to south corridor is required to facilitate the advancement of the apron feeder and mobile conveyors as mining progresses to the east in this initial pit. The initial clearing for all three corridors (feed, tails/berm and mine pit corridor) will extend an approximate distance of 650-670 feet north to south. Once clearing for the conveyors is completed, both the feed and tailings conveyors will be constructed for the entire length of pit to near the eastern boundary of the mine area, where they will turn to the north towards the wet concentration plant, located near the northeastern portion of the proposed mining area.

Twin Pines Minerals – Individual Permit Application Supplemental Information USACE Project No. SAS-2018-00554 March 4, 2020 TTL Project No. 000180200804 Page 46
Mont M:\Projects\2018\000180200804.00 - Twin Pines Minerals Permitting Services\USACE Individual Permit App\Revisions to IP app\IP Application 03032020
Topsoil removal for the active pit will occur in approximately 500-1000 feet sections ahead of the dragline. The topsoil will be pushed up and windrowed just north of the pit being mined. Topsoil removal will advance as needed to stay ahead of the mining. As stated previously, the mining will advance in 100-foot wide pits. TPM estimates that mining will advance at a rate between 100 and 200 feet per day and average approximately 115 feet per day. Mining will begin in the extreme southwest corner of the permit area and advance to the east. The total length of each cut will be, on average 9,000 feet (average distance from west boundary of the mine to the east boundary). Once mining reaches either the west or east limit of mining, the dragline will reverse its course and mine the next cut in the opposite direction. The east-west to west-east alternation of mining will continue throughout the entire course of mining, overall advancing to the north. The dragline will excavate the HMS from the mine pits and place material on the apron feeder. The apron feeder plus two shorter conveyors, oriented north-south will move the HMS to the feed conveyor. As the dragline advances east and the HMS are processed at the wet concentration plant, tailings (sand, slimes and humate) are transported back to the mined pit along the tailings conveyor. Once the open pit reaches approximately 500 feet, the tailings will be placed into the open pit and graded to the approximate original topography. After this initial 500 feet of pit is excavated and tailings are being placed back in the pit, the operation should reach a “steady state” where the HMS removal is roughly equal to the tailings placement and only leaving approximately 500 feet of pit open at any one time. TPM refers to this concept as a “moving mine” (Appendix D). Once an area has been mined, backfilled, and graded, the topsoil will be redistributed back on to the newly graded area. Once the topsoil has been replaced, revegetation will follow as soon as practical for the species to be planted. Alternative 6: No Action Alternative The No Action Alternative would be to allow the site to remain in its current land use and condition. This alternative does not meet the projects purpose and need of the project to demonstrate that HMS mining can be conducted in an environmentally sensitive area with negligible impacts to the site and surrounding resources nor a high-quality HMS reserve to produce HMS concentrate products. The Saunders Tract is currently managed for industrial forest resources. Implementation of the No Action Alternative would entail the continued active industrial logging and unsustainable forestry practices. The industrial logging of the site is, in and of itself, a degradative use of the property. Google Earth and historic aerial images dating back to 1970 (Figure 74) show continuous historic industrial forestry activity on the site. The prior ownership of the site has not practiced sustainable forestry. None of the tracts (Loncala Tract, Keystone Tract, Adirondack Tract, nor TIAA Tract) have been certified as sustainable forestry by the Sustainable Forestry Initiative (SFI). This on-the-ground evidence indicating that the site has been severely and negatively impacted by industrial forestry activity through intensive mechanical disturbance and herbicide use (site prep and release/mid-rotation) as observed by:
• >18” beds (in most drier areas, in all low-lying areas including wetland ecotones and entire area of shallow wetlands, some beds are >3 feet)
• Windrows/piles
• Lack of stumps and stump holes
• Low plant diversity, vegetation dominated by ‘weedy’ old field species (e.g. Andropgon virginicus, Rubus sp., etc.)

Twin Pines Minerals – Individual Permit Application Supplemental Information USACE Project No. SAS-2018-00554 March 4, 2020 TTL Project No. 000180200804 Page 47
Mont M:\Projects\2018\000180200804.00 - Twin Pines Minerals Permitting Services\USACE Individual Permit App\Revisions to IP app\IP Application 03032020
There are many peer-reviewed studies on the effects of mechanical and chemical treatments on vegetation. Many of these studies are inconclusive, funded by forest industry, and focus on species richness (including ruderals and exotics) with no attention to species composition. Miller et. al. (2009) found that preserving biodiversity in managed forests is possible with “judicious, targeted use of forest chemicals”. However, the study states that “…there are tradeoffs between intensity of silvicultural practices and potential terrestrial biodiversity. The extreme form of intensive management is the agricultural model, i.e., site preparation and subsequent vegetation control that eliminates most vegetation except for crop trees, resulting in a highly productive stand from a wood production standpoint, but with limited ecological value.” A 2004 study found that “Current site-preparation techniques rely on herbicide combinations (‘tank mixes’ that affect a broad spectrum of plants), often coupled with mechanical treatments and >1 years post-planting application to enhance the spectrum and duration of vegetation control. This near-total control of associated vegetation at establishment and more rapid pine canopy closure, coupled with shortened and repeated rotations, likely will affect plant diversity…” Short rotations allow less time for herbaceous establishment before canopy closure which results in less seed rain and depletion of the seed bank (Miller and Miller, 2004). Mechanical site prep is correlated with high mid-story density which suppresses the herbaceous layer. Chemical site prep is correlated with low understory species richness and high mid-story density. Additionally, agricultural history (repeated soil disturbance and herbicide application) has a strong influence on vegetation structure and composition (Hedman et al, 2000). Chemical and physical soil disturbances cause changes in the ectomycorrhizal fungal assemblage that likely have significant and lasting ecological impacts (Jones, et al, 2003). Additionally, a study looked at the use of herbicides used to establish longleaf pine stand. The rates of application were less than what is typically used by forest industry. Species richness was similar to reference sites, but composition included more ruderal and old-field species less emblematic of high-quality sites (Addlington et al, 2012). Implementation of Alternative 6 will result in the continuation of these destructive industrial forestry practices on the site. Table 17 provides a summary of the completed alternatives analysis.

Twin Pines Minerals – Individual Permit Application Supplemental Information USACE Project No. SAS-2018-00554 March 4, 2020 TTL Project No. 000180200804 Page 48
Mont M:\Projects\2018\000180200804.00 - Twin Pines Minerals Permitting Services\USACE Individual Permit App\Revisions to IP app\IP Application 03032020
5.0 AVOIDANCE AND MINIMIZATION In an effort to avoid and minimize impacts to aquatic resources and threatened/endangered species, TPM and TTL developed a site layout by first placing priority on these sensitive features during site layout planning. Impacts to some aquatic resources were avoided by locating the project’s facilities away from the higher quality wetlands. Permanent roadways that required crossing wetlands were located where the crossing was the shortest, avoiding impacts to larger wetlands areas. Culverts are proposed at these wetland crossings in order to minimize the damming effect of the roadway and maintain surface flow out of and into offsite wetlands and streams. The dry processing, shipping, and office facilities were relocated from south of the Keystone property between Highway 94 and the railroad, to a vacant but developed industrial site (the chip mill site). This not only avoided additional impacts to wetlands but also significantly reduced the number of gopher tortoise that will require relocation (six to one) and eliminated impacts to gopher frogs. The proposed mining footprint has been reduced to the minimum size necessary to provide an adequate demonstration that dragline mining of HMS can be conducted in an environmentally responsible manner and provide economic viability for the project and long-term success of the site restoration. The development of dragline mining methodology by TPM for mining HMS also minimizes impacts by reducing the length of time for land disturbance activities in a given area and decreasing the time to begin reclamation activities. Mining via dragline minimizes water loss through evaporation (dredge), and significantly reduces the need to dewater (truck and shovel). Water within the processing plant is able to be recycled due to the humates being removed from the process water early in processing. Using a dragline eliminates the need for separate humate deposition ponds. In addition to purchasing mitigation credits and in order to minimize the temporal loss of wetland function on-site, TPM is proposing to reconstruct the mined wetlands. A Reclamation Plan will be provided at a later date. Appendix D provides the general design of the proposed mining activity including plan and profile drawings. Table 18 provides a summary of the on-site alternatives that were evaluated to minimize impacts to sensitive features.

Twin Pines Minerals – Individual Permit Application Supplemental Information USACE Project No. SAS-2018-00554 March 4, 2020 TTL Project No. 000180200804 Page 49
Mont M:\Projects\2018\000180200804.00 - Twin Pines Minerals Permitting Services\USACE Individual Permit App\Revisions to IP app\IP Application 03032020
6.0 TYPES OF IMPACTS The current design for the proposed project would impact waters of the U.S. by dragline mining and subsequent placement of approximately 33,182,677 cubic yards of fill material in wetlands, and streams, as well as the construction of the associated facilities and roads which would involve the placement of fill material in wetlands and streams. The impacts to wetlands from the mining activities are considered permanent for the purposes of mitigation due to the unknown, long-term timeline associated with restoring previously mined areas. However, the mined area will be reclaimed with the excavated material and, once minerals are extracted, restored. Restoring wetlands will minimize the temporal loss of wetland function and provide data to demonstrate the time necessary to complete wetland restoration activities after HMS mining. Mitigation for impacts will be provided through the purchase of wetland and stream credits from an approved commercial mitigation bank, because of this and the proposed reclamation activities there will be no net loss of waters of the U.S. in these areas. Associated infrastructure facilities of the mine that will be constructed will result in permanent impacts to waters of the U.S. Stream SB will be permanently impacted by the placement of a culvert and associated outfall protection in an existing low-water road crossing, detailed drawings for the culverted locations and cross-sections are included in Appendix E. The waters proposed to be impacted include wetlands and intermittent streams. The streams are generally part of the tributary system of the St. Mary’s River. On-site aquatic features and proposed impacts are shown on Figure 75. The review area contains approximately 1,202.399 acres of wetlands and approximately 11,587 linear feet of stream channel. Aquatic resources quantities, proposed impacts, and mining summary are provided in the tables below. All activities will be performed in a manner to minimize turbidity in the stream.
Proposed Mining Summary by Property
Property Mining Method
Total Area to be mined (ac)
Mining Depth
Total Wetland to be Mined
(ac)
Total Upland to be Mined
(ac) TIAA Dragline 233.315 25 83.511 149.804
Keystone Dragline 644.566 50 369.60 294.966
TOTAL 897.881 453.111 444.77
The following table provides a summary of the proposed mining volumes by property area.
Proposed Mining Volume Summary
Property Total Volume to be Mined Total Wetland to Be Mined
Cubic feet Cubic yards Cubic feet Cubic yards
TIAA 254,080,050 ± 9,410,372 ± 90,943,484 3,368,277
Keystone 1,447,424,750 ± 53,608,324 ± 804,988,801 29,814,400
TOTAL 1,701,504,800 ± 63,410,372 ± 895,932,285 33,182,677
There will be no oils or other pollutants released from the proposed activities which will reach the stream.

Twin Pines Minerals – Individual Permit Application Supplemental Information USACE Project No. SAS-2018-00554 March 4, 2020 TTL Project No. 000180200804 Page 50
Mont M:\Projects\2018\000180200804.00 - Twin Pines Minerals Permitting Services\USACE Individual Permit App\Revisions to IP app\IP Application 03032020
All work performed during construction will be done in a manner to prevent interference with any legitimate water uses.
Proposed Mining Wetland Impact Summary by Year
YEAR 1 YEAR 2 YEAR 3 YEAR 4 YEAR 5 YEAR 6
ID AREA
(Acres) ID
AREA (Acre)
ID AREA
(Acres) ID
AREA (Acres)
ID AREA
(Acres) ID
AREA (Acres)
WA1 4.947 WH1 0.084 WN1 3.619 WU1 15.485 WAB1 27.497 WAH 0.376
WB1 9.588 WI1 20.476 WO1 1.285 WV 11.088 WAC 21.851 WAI 3.992
WC 19.152 WJ 1.419 WP1 0.530 WW 6.936 WAD 8.927 WAJ 19.691 WD 25.132 WK 0.081 WQ 0.507 WX 12.960 WAE 1.116 WE 3.945 WL 21.134 WR 46.530 WY 10.171 WAF 24.490 WF 15.090 WM 47.133 WS 29.754 WZ 13.915 WAG 1.002 WG 0.756 WT 1.135 WAA 21.317
Total Year
1 78.61
Total Year
2 90.327
Total Year
3 83.36
Total Year
4 91.872
Total Year
5 84.883
Total Year
6 24.059
Total Mining Impacts = 453.111 acres
1 Wetland area is located on the TIAA property tract.
Proposed Infrastructure Wetland Impact Summary
Property Wetland ID Permanent Impacted
Area (ac) Adirondack Area 10 (WA) 0.225 Adirondack Area 8 (WE) 2.184 Adirondack Area 17 (WA) 0.645 Adirondack Area 18 (WA) 0.093 Keystone Area 4 (WAH) 0.037 Keystone Area 5 (WAI) 0.060 Keystone Area 6 (WAJ) 0.618 Keystone Area 7 (WAA) 4.176 Keystone Area 9 (WS) 5.027 Keystone Area 11 (WB) 1.367 Keystone Area 12 (WF) 0.041 Keystone Area 13 (WC) 0.920 Keystone Area 14 (WE) 2.378 Keystone Area 15 (WD) 3.450 Keystone Area 16 (WK) 2.438
TIAA Area 1 (WA) 0.330 TIAA Area 2 (WN) 0.359 TIAA Area 3 (WU) 0.776
TOTAL 25.124

Twin Pines Minerals – Individual Permit Application Supplemental Information USACE Project No. SAS-2018-00554 March 4, 2020 TTL Project No. 000180200804 Page 51
Mont M:\Projects\2018\000180200804.00 - Twin Pines Minerals Permitting Services\USACE Individual Permit App\Revisions to IP app\IP Application 03032020
Proposed Stream Impact Summary
Total
Permanent Impacts
Property Stream
ID Classification
Length (LF)
Area (AC)
Length (LF)
Area (AC)
Keystone SA Intermittent 297 0.020 297 0.020 Adirondack SB Intermittent 3,257 0.265 115 0.008
TOTAL 3,554 0.285 412 0.028

Twin Pines Minerals – Individual Permit Application Supplemental Information USACE Project No. SAS-2018-00554 March 4, 2020 TTL Project No. 000180200804 Page 52
Mont M:\Projects\2018\000180200804.00 - Twin Pines Minerals Permitting Services\USACE Individual Permit App\Revisions to IP app\IP Application 03032020
7.0 MITIGATION PLAN Mitigation for permanent impacts will be provided through the purchase of wetland and stream credits from an approved commercial mitigation bank. The Savannah District, US Army Corps of Engineers Regulatory Guidelines to Evaluate Proposed Mitigation Bank Credit Purchases in the State of Georgia was utilized when identifying the appropriate mitigation bank. This analysis is provided below. Using the 2018 Department of the Army Savannah District Corps of Engineers Standard Operating Procedure (SOP), the Qualitative Resource Assessments for Adverse Impact were utilized. SOP worksheets are included in Appendix F. The Qualitative Worksheets for Wetland and Stream Adverse Impacts were utilized to determine the total quantity of wetland and stream credits to be purchased as summarized below. The wetland and stream credits required for the impacts will be purchased prior to the initiation of the associated activities. Prior to the start of construction, the applicant would purchase the required number of credits for the permanent infrastructure impacts as well as the impacts for the first year of mining (Year 1). The initial purchase would be for 553.36 depressional wetland grandfathered credits and 2,225 stream credits. Upon completion of the first year of mining, the applicant would purchase the required credits for Year 2 prior to commencing further mining. The mitigation for the impacts would continue in a phased manner each year, prior to the start of mining.
The project is located in the St. Mary’s Primary Service Area (PSA) and in the 03070204 8-digit Hydrologic Unit Code (Figure 76). There are three banks located in the PSA with non-tidal wetland credits. The Musket Bay Mitigation Bank currently has sufficient credits available for purchase for the initial start of construction that includes the permanent infrastructure and mining year 1 impacts. The other banks do not have sufficient credits on their own. Therefore, wetland credits will be purchased from Musket Bay Mitigation Bank or from a combination of banks that have credits available. There is also one bank, the Satilla River Mitigation Bank, that is within the tertiary service area. There are no banks with stream credits that service the 03070204 8-digit Hydrologic Unit Code. The Patriots Pride Mitigation Bank is within the secondary service area. Additional information and analyses are provided in the Table 19.
Mitigation Credits Required by Year
Impact Type
Depressional Wetland Stream
Acres of Impact Grandfathered
Credits Required Acres of Impact
Grandfathered
Credits Required
Infrastructure 25.12 119.92 0.028 2,225
Mining Year 1 78.61 433.44 0.000 0
Mining Year 2 90.33 541.92 0.000 0
Mining Year 3 83.36 396.32 0.000 0
Mining Year 4 91.87 489.28 0.000 0
Mining Year 5 84.88 405.44 0.000 0
Mining Year 6 24.06 143.60 0.000 0
TOTAL 478.23 2,529.92 0.028 2,225

Twin Pines Minerals – Individual Permit Application Supplemental Information USACE Project No. SAS-2018-00554 March 4, 2020 TTL Project No. 000180200804 Page 53
Mont M:\Projects\2018\000180200804.00 - Twin Pines Minerals Permitting Services\USACE Individual Permit App\Revisions to IP app\IP Application 03032020
In general, reclamation will consist of returning the site to approximate preconstruction contours and elevations, replacement of the stockpiled topsoil and revegetation. The general processes are described below:
• Prior to mining the top 6 inches of topsoil will be removed and stockpiled nearby. • The mined material will be returned to the mined area and restored to approximate pre-
construction contours and elevations. • The stockpiled topsoil will be replaced. • The area will be revegetated with the appropriate native vegetation.
The Reclamation Plan detailing the activities that will take place will be submitted at a later date.

Twin Pines Minerals – Individual Permit Application Supplemental Information USACE Project No. SAS-2018-00554 March 4, 2020 TTL Project No. 000180200804 Page 54
Mont M:\Projects\2018\000180200804.00 - Twin Pines Minerals Permitting Services\USACE Individual Permit App\Revisions to IP app\IP Application 03032020
8.0 WATERS OF THE U.S. JURISDICTIONAL DETERMINATION
During the TPM due diligence process, TTL performed a delineation of waters of the U.S. for the various tracts during a time period covering April 2018 – June 2019. A report of findings along with a request for a jurisdictional determination for the Keystone and Loncala Tracts was submitted to the USACE and on November 27 and 28, 2018. A site visit was conducted with USACE representatives to review the delineated areas. A verification letter was received December 18, 2018. On July 3, 2019, waters of the U.S delineation reports were submitted for approximately 551 acres of the Adirondack Tract and 1,143 acres of the TIAA Tract. The USACE reviewed the delineation areas for these tracts from October 21-25, 2019 and provided a verification letter on January 24, 2020. Following receipt of the verification letter for the Adirondack and TIAA Tracts, TTL contacted the USACE regarding the identification of wetlands crossing historic roads. As these roads were in place prior to Clean Water Act regulation and are actively maintained, they do not meet the criteria for consideration as a wetland. The USACE agreed with this determination and directed TTL to remove wetlands that had been indicated on historic roads. Edits to the wetland features have been included with this application. TTL completed a desktop review of aquatic features for the proposed haul road east of the Adirondack Tract and the former chip mill areas utilizing available topographic maps, aerial photography, the USFWS National Wetland Inventory (NWI) mapper, the Natural Resources Conservation Service (NRCS) web soil survey and local experience. Copies of each of the waters of the U.S. delineation reports and the received verification letters are included in Appendix G.

Twin Pines Minerals – Individual Permit Application Supplemental Information USACE Project No. SAS-2018-00554 March 4, 2020 TTL Project No. 000180200804 Page 55
Mont M:\Projects\2018\000180200804.00 - Twin Pines Minerals Permitting Services\USACE Individual Permit App\Revisions to IP app\IP Application 03032020
9.0 THREATENED AND ENDANGERED SPECIES
Project site-specific reviews on the USFWS Information for Planning and Consultation (IPaC) website identified three federally-listed species and one federal candidate species (Consultation Codes:04EG1000-2020-SLI-1378 Event Code:04EG1000-2020-E-02535) (Appendix H). Consultations with state agencies in the preliminary planning process resulted in additional species of concern being added to the list of targeted species for review at the proposed site. TTL personnel Christopher Terrell and Christopher Stanford initially performed a habitat characterization site reconnaissance to observe the presence of or the habitat of the targeted species. Where suitable habitat was identified, targeted surveys were conducted. The results of the targeted species surveys are described in detail in the following reports included in Appendix H: “2018-2019 Survey for Protected Amphibians/Reptiles on the Twin Pines Site, Charlton County, Georgia,” “2019 Survey for Rare, Threatened, and Endangered Plants” and, “Results of Eastern Indigo Snake Surveys on the Twin Pines Site, Charlton County, Georgia: Year 2.” The federal status species of concern identified by the resource agencies (with IPaC species highlighted in bold) and field findings are summarized in the table below. Results of the review of available data, habitat characterization and focused field surveys for sensitive species are presented in Tables 20 and 21. Table 22 provides a summary of the potential impacts of the project to federal status species.
One federal candidate species, the gopher tortoise, will be impacted by the project due to mining activities. Mitigation measures to reduce this impact include pre-construction surveys to scope burrows and the relocation of the species. Based on the implementation of these conservation measures, the proposed project is not expected to have a significant effect on threatened and endangered species. 9.1 Frosted flatwoods salamander Potential breeding pond habitats for this species (isolated depressional wetlands forested with pond cypress (Taxodium ascendens), black gum (Nyssa biflora), slash pine (Pinus elliottii), and myrtle-leaved holly (Ilex myrtifolia) were visited in December, 2018. Each wetland (25 total) was evaluated as to its potential suitability for the frosted flatwoods salamander based on a ranking system developed by Palis (2002). For each wetland; the hydrology, fire history, presence/absence of graminaceous vegetation within the pond basin (including Carex, Rhynchospora, Eriocaulon, Xyris, Panicum spp.) as well as the condition of pine uplands (e.g., fire history, integrity of ground cover, soil type and disturbance) surrounding the wetland was considered. Pine uplands on-site, although underlain by hydric-to-mesic flatwoods soils that historically may have supported the specific pine savannah habitats required by flatwoods salamanders (Palis 1996, 1997; USFWS 1999; Jensen and Stevenson 2008); are grossly degraded from commercial forestry operations (e.g., bedding) that date to the 1970s. Today, these uplands no longer support intact ground vegetation (e.g., wiregrass, Aristida stricta). Similarly, isolated wetlands on-site are also in poor condition due to bedding, ditching, historic fire suppression and other disturbances. A total of 12 survey ponds were sampled from February 27 – March 9, 2019. The surveys included 17.25 person-hours dip netting and 175 trap-nights. No frosted flatwoods salamander larvae were found. On these surveys, 2 species of salamanders, 6 species of anurans, 9 species of fishes, and 4 species of snakes were captured. During the same period frosted flatwoods salamander larvae were found on Fort Stewart, Georgia, indicating the species bred at this site during the fall-winter of 2018-2019 (Chris Coppola, U.S. Fish and Wildlife Service, pers. Comm., 2019).

Twin Pines Minerals – Individual Permit Application Supplemental Information USACE Project No. SAS-2018-00554 March 4, 2020 TTL Project No. 000180200804 Page 56
Mont M:\Projects\2018\000180200804.00 - Twin Pines Minerals Permitting Services\USACE Individual Permit App\Revisions to IP app\IP Application 03032020
The disappearance of the frosted flatwoods salamander from Chesser Island and Okefenokee National Wildlife refuge lands is most likely attributed to anthropogenic disturbances the region suffered prior to being acquired by the U.S. Fish and Wildlife Service (Jensen 1995). Large-scale declines and extirpations of frosted flatwoods salamanders have been attributed to habitat loss and degradation from commercial forestry practices (Means et al. 1996, Palis 1997). In fact, the impetus, in part, for the federal listing of the species in 1999 was widespread loss of habitat due to silviculture (USFWS 1999). It is probable that the inability to document frosted flatwoods salamanders as well as two easily sampled frog species typical of pine flatwoods habitats on the site (the southern chorus frog (Pseudacris nigrita) and ornate chorus frog (Pseudacris ornata) is due to their extirpation, historically, from habitat changes caused by forestry operations. The uplands on the site – although in some areas underlain by hydric-to-mesic flatwoods soils that historically may have supported the specific pine savannah habitats required by frosted flatwoods salamanders− are, as detailed above, grossly degraded from commercial forestry operations that (based on a review of aerial photographs) date at least to the early 1970s. Today, these uplands no longer support intact ground vegetation (e.g., wiregrass, Aristida stricta) as is typical of habitat still occupied by this species. The proposed project is not likely to have an effect on the frosted flatwoods salamander. 9.2 Striped newt Until recently, the striped newt was considered a candidate for federal listing under the Endangered Species Act. In December 2018, the U.S. Fish and Wildlife Service determined that federal listing is not warranted at this time. This amphibian is known to have declined and disappeared from portions of its historic range on Trail Ridge, near the Okefenokee National Wildlife Refuge, due to commercial forestry operations (Dodd and LaClaire 1993, Farmer et al. 2017). Sampling for striped newt adults/larvae at the same 10 wetland sites using the same dipnet and minnow trap survey methods as detailed above for the frosted flatwoods salamander was performed during February-March 2019. Dipnet and minnow trap surveys of 12 isolated wetlands on-site did not document the striped newt. Naturally-functioning longleaf pine−wiregrass sandhills, the preferred habitat for transformed examples of this newt, are lacking on-site. Due to the profound habitat changes and perturbations from commercial forestry practices (see section 8.1 Frosted Flatwoods Salamander above), it is unlikely that the species persists on the site, if in fact it was ever present. The proposed project is not likely to have an effect on the striped newt. 9.3 Gopher frog Gopher frog tadpoles were sampled at the same 10 wetland sites using the same dipnet and minnow trap survey methods as detailed above for the frosted flatwoods salamander (also during February-March 2019). In December 2018, this species was documented from a site on the Keystone Tract, finding an adult female gopher frog in a juvenile gopher tortoise burrow. Gopher frog was recorded during gopher tortoise burrow scoping surveys (conducted spring 2019). Single-opening funnel traps made of aluminum screening were placed at active gopher tortoise burrows in an effort to capture gopher frogs that emerge during the night (traps were set at a minimum of six active burrows, for two consecutive nights, at all tortoise colonies on-site that contained eight or more tortoise burrows).

Twin Pines Minerals – Individual Permit Application Supplemental Information USACE Project No. SAS-2018-00554 March 4, 2020 TTL Project No. 000180200804 Page 57
Mont M:\Projects\2018\000180200804.00 - Twin Pines Minerals Permitting Services\USACE Individual Permit App\Revisions to IP app\IP Application 03032020
The gopher frog, state-listed as Rare by the Georgia Department of Natural Resources, was documented on the site, including observations for the Adirondack, Keystone, and Loncala tracts. A total of six gopher frogs were observed, including three adults seen in gopher tortoise burrows during indigo snake surveys or gopher tortoise surveys and three adults observed in tortoise burrows while scoping burrows with the burrow camera. Two frogs were captured and voucher photographs were taken of these specimens. Dates and specific location information for these records are provided in the “2018-2019 Survey for Protected Amphibians/Reptiles on the Twin Pines Site, Charlton County, Georgia” report in Appendix H. Dipnet and minnow trap surveys of 12 isolated wetlands conducted on-site during February-March 2019 did not document egg masses or tadpoles of the gopher frog. An isolated wetland surveyed in March 2019 (A-04; 30.525379°N, 82.09925° W), dry when revisited on 23 April 2019, is a potential breeding pond for the gopher frog. A small cypress pond, converted in part into a borrow pit and located offsite and just south of the Keystone Tract (30.51613°N, 82.11790°W), may be a breeding site used by gopher frogs. Efforts to locate gopher frog choruses, egg masses, and tadpoles in 2019 were unsuccessful, including during site visits conducted in mid-late December 2019, following heavy rains. Prior to construction, all gopher tortoise burrows will be camera scoped to determine the occupancy status of the burrow. Occupied burrows will be trapped and gopher frog along with gopher tortoise will be captured, then relocated to an area identified in coordination with Georgia DNR. No gopher frogs have been located within the proposed impact area (Alternative 5). A map of known gopher frog locations is provided as Figure 77. 9.4 Red-cockaded woodpecker Red-cockaded woodpecker are residents of the Okefenokee National Wildlife Refuge and identified by a resource agency as possibly using the proposed project site for foraging. Suitable habitat consists of well-drained, sandy areas dominated by old-growth, longleaf pine communities with sparse mid-story vegetation and dense diverse herbaceous groundcover. Pine trees must be of sufficient size and spatial distribution to be inhabited by red-cockaded woodpeckers. Due to the site’s current use as a commercial forestry operation, this habitat does not exist within the review area. No red-cockaded woodpeckers, cavity trees, or sign were observed during field reconnaissance nor during any of the field work. The proposed project is not likely to have an effect on the red-cockaded woodpecker. 9.5 Florida hartwrightia This plant flowers from September to November. Targeted surveys were conducted from October 7 to October 14, 2019. The species was not identified on the site. 9.6 Flooplain tickseed This plant flowers from August to November. Suitable habitat for this species may not occur in the project review area. Targeted surveys were conducted from October 7 to October 14, 2019. The species was not identified on the site. 9.7 Purple honeycomb-head This plant flowers from August to October. Habitat for this species includes wet savannas and pitcher plant bogs. Targeted surveys were conducted from October 7 to October 14, 2019. The species was not identified on the site.

Twin Pines Minerals – Individual Permit Application Supplemental Information USACE Project No. SAS-2018-00554 March 4, 2020 TTL Project No. 000180200804 Page 58
Mont M:\Projects\2018\000180200804.00 - Twin Pines Minerals Permitting Services\USACE Individual Permit App\Revisions to IP app\IP Application 03032020
9.8 Eastern indigo snake The soil types present at the project site indicate that suitable habitat may be present for the eastern indigo snake and the gopher tortoise. Surveys for indigo snakes overwintering in gopher tortoise burrows were conducted following visual encounter survey methods that are effective for this species in the southern Georgia portion of its range (Stevenson et al. 2003, Bauder et al. 2017). Specifically, all active/inactive tortoise burrows (n=118) were visited on three dates between December 2018 -March 2019 in an effort to locate basking snakes and shed skins; burrows with fresh snake tracks were examined with a tortoise burrow camera (to look for snakes inside burrows). Additionally, all active/inactive tortoise burrows were scoped with a burrow camera (in late March or April/May) in an effort to document burrow commensals, including indigo snakes. No eastern indigo snakes or eastern indigo snake shed skins were found during visual encounter surveys, and no fresh snake tracks were located at burrows. A single pygmy rattlesnake (Sistrurus miliarius), the shed skin of an eastern coachwhip (Coluber flagellum) and two observations of gopher frogs (Rana capito) were observed during the surveys. In addition to the above visual encounter surveys, all active/inactive gopher tortoise burrows on-site were visited on 2-4 April 2019. As part of a tortoise survey, most subadult-and-adult-sized burrows were scoped with a tortoise burrow camera at this time (see section 9.9 gopher tortoise below). No indigo snakes or shed skins were found during this effort. On three dates from November 19 to December 18, 2019, additional surveys for indigo snakes were conducted. No eastern indigo snakes or eastern indigo snake shed skins were found by visual encounter surveys at the site, and no fresh snake tracks were located at burrows. A single pygmy rattlesnake (Sistrurus miliarius) and the shed skin of a Florida pinesnake (Pituophis melanoleucus) were observed. A map of indigo snake survey areas and gopher tortoise burrow locations is provided in Appendix H. The indigo snake is an extremely vagile species that often moves between upland and wetland habitats in search of food (Stevenson et al. 2010, Breininger et al. 2011). Individual snakes studied in southern Georgia had large home ranges, for some large males up to 3,500 acres in size (Hyslop et al. 2014). A lack of indigo snake observations during focused surveys doesn’t demonstrate that the species is never present or transient on the site (even if the species doesn’t winter on-site it is possible that snakes from adjacent tracts, if present that is, may occasionally visit the site to forage. However, there are no recent credible sightings known for the property. The proposed project is not likely to have an effect on the eastern indigo snake. 9.9 Gopher tortoise Suitable habitat for gopher tortoise is present in the review area. Open canopy pine forests with abundant herbaceous understory are the preferred habitat for gopher tortoises and this habitat was present within the review area. Only one area within the proposed project alternative was identified during surveys to contained gopher tortoise burrows (Figure 77; Appendix H). Other gopher tortoise colonies have been avoided. From pedestrian surveys, all gopher tortoise burrows were located and each individual burrow classified as “active” or “inactive” (based on presence or absence of fresh tracks, respectively). Also, each burrow was classified as that of an “adult”, “subadult”, or “juvenile” tortoise (based on burrow width). Gopher tortoise burrow widths were classified as follows: juvenile burrows are 0-7.85 cm in width; subadult burrows 7.86-25.7 cm wide; adult burrows are 25.8+ cm wide (these widths correspond to carapace lengths of 0-12 cm, 12.1-24 cm, and 24+ cm, respectively). Note: 19 burrows that were less than 14 cm in burrow width were not scoped because of their small size; however, they

Twin Pines Minerals – Individual Permit Application Supplemental Information USACE Project No. SAS-2018-00554 March 4, 2020 TTL Project No. 000180200804 Page 59
Mont M:\Projects\2018\000180200804.00 - Twin Pines Minerals Permitting Services\USACE Individual Permit App\Revisions to IP app\IP Application 03032020
were closely examined using a mirror or flashlight and in doing so we observed tortoises in 5 of these burrows; we scoped all remaining burrows. A total of 118 active/inactive tortoise burrows comprised of 59 adult burrows, 9 subadult burrows, and 26 juvenile burrows were identified during the surveys. In an effort to determine burrow occupancy in Spring 2019, a tortoise burrow camera was used to scope all adult/subadult burrows. (Juvenile burrows were assumed to be occupied by tortoises if fresh tracks were present). These activities assisted in developing a very precise estimate of just how many gopher tortoises are present on-site.

Twin Pines Minerals – Individual Permit Application Supplemental Information USACE Project No. SAS-2018-00554 March 4, 2020 TTL Project No. 000180200804 Page 60
Mont M:\Projects\2018\000180200804.00 - Twin Pines Minerals Permitting Services\USACE Individual Permit App\Revisions to IP app\IP Application 03032020
On the site, the sandy, well-drained environments that support gopher tortoises have historically been site-prepped and bedded and are now in planted pine, usually slash pine. Tortoises are not especially common or widespread on the site, occurring only in four to five fairly small and discrete areas of sandy, open-canopied plantation habitat; individual tortoise colonies support ca. 10-15 adult tortoises, or less. With the burrow camera (or using flashlights/mirrors), we observed gopher tortoises in 23 adult-sized burrows, 11 subadult-sized burrows, and in one juvenile-sized burrow. For another four active adult-sized burrows, 11 active subadult-sized burrows, and two active juvenile burrows, we could not determine conclusively whether or not the burrow was in fact occupied by a tortoise. Tortoise survey data is provided in Appendix H. A map of gopher tortoise locations is provided as Figure 77. Based on the limits of the proposed demonstration project, approximately three active adult burrows were identified within the preferred project footprint. During the camera survey only one gopher tortoise was observed in the on-site burrows. Conservation measures include avoidance, translocation and /or habitat management to reduce the adverse impacts and potentially benefit the gopher tortoise population. Gopher tortoise burrows will be avoided to the maximum extent practicable at the site. For the gopher tortoise burrows that cannot be avoided, a translocation project will be conducted for the gopher tortoise in these areas. Prior to construction, all gopher tortoise burrows will be camera scoped to determine the occupancy status of the burrow. Occupied burrows will be trapped and captured gopher tortoise will be relocated to an area identified in coordination with Georgia DNR; should, over the course of the project, the gopher tortoise achieve federal listing status coordination will also occur with the USFWS. The applicant has successfully trapped and relocated gopher tortoise for its mining operation in Starke, Florida. The applicant, through its consultant, successfully obtained permits to capture by using bucket traps, live traps, hand shovel and backhoe excavation of tortoise burrows. The animals were relocated to a donor site by non-harmful means. The permit was obtained through the Florida Fish and Wildlife Commission, Division of Habitat and Species Conservation. Additionally, the gopher tortoise has successfully recolonized areas that were previously mined for heavy mineral sands. With the implementation of these mitigation measures, the proposed project is not likely to have an effect on the gopher tortoise. 9.10 Other Special Concern Species As previously stated, consultations with state agencies in the preliminary planning process resulted in additional species of concern being added to the list of targeted species for review at the proposed site. These species do not have federal status but were identified by various resource agencies as being species of special concern. Results of the review of available data, habitat characterization and focused field surveys for other special concern species are presented Table 21. Bald eagle Juvenile bald eagles and non-nesting adults can be seen throughout Georgia, but known nesting activity is concentrated mostly along the coast and near major rivers, wetlands, and reservoirs in the southern and central parts of the state. Like other members of the "fish eagle" group, bald eagles almost always nest near open water. Bald eagles have not been observed on the site. Habitat for bald eagle does not occur on site. The proposed project is not likely to have an effect on the bald eagle.

Twin Pines Minerals – Individual Permit Application Supplemental Information USACE Project No. SAS-2018-00554 March 4, 2020 TTL Project No. 000180200804 Page 61
Mont M:\Projects\2018\000180200804.00 - Twin Pines Minerals Permitting Services\USACE Individual Permit App\Revisions to IP app\IP Application 03032020
Bachman’s sparrow Habitat for this species consists of open pine or oak woods; old fields; brushy areas, young large grassy pine regeneration areas. The state-listed Bachman’s sparrow (Peucaea aestivalis) was documented from one location on-site and from a second location just east of the site boundary during the herpetological surveys in April of 2019. This species may utilize the site for foraging. Based on the short-term nature of the majority of the impacts of the project and the poor quality of the existing habitat on site, the proposed project is not likely to have an effect on the Bachman’s sparrow. Red face top minnow Habitat for this species includes stream margins, backwaters, pools, marshes, and wetlands, often associated with aquatic vegetation. Habitat for this species occurs on the project site. This species was identified on site. Savannah milkweed 5Habitat for this species consists of pine flatwoods and prairies. Habitat for this species occurs on the project site. Nine individuals were identified during the field survey. Dwarf pawpaw Habitat for this species consists of flatwoods and wet savannas. Habitat for this species occurs on the project site. Six populations of this species were identified on site. There were 413 individuals identified during the field survey. Florida orange-grass Habitat for this species consists of moist pine barrens. Habitat for this species is present on site. This species was not identified on site. Green-fly orchid This species is epiphytic especially on Magnolia grandiflora, Quercus virginiana, and Taxodium spp.in blackwater river swamps and mesic hardwood hammocks. Habitat for this species is present on site. This species was not identified on site. Southern umbrella-sedge Habitat for this species consists of pineland depressions, and wet savannas with Toxicodendron vernix. Habitat for this species is present on the project site. Populations of this species were identified on the project site. There were 206 individuals identified during the field survey. Florida milk-pea Habitat for this species consists of pine flatwoods. This plant is a herbaceous vine that can reach 3 feet in length. It tends to stay prostrate and trailing but will climb if given a support. Habitat for this species is present on the project site. This species was not identified on site. Chapman's skeleton grass Habitat for this species consists of calcareous glades and relict prairies with dryish clay loam soils. It also grows in sandy pine barrens and sites inhabited by dwarf palmetto, Serenoa repens. Habitat for this species is present on the project site. This species was not identified on the site. Narrowleaf water-willow Habitat for this species consists of roadside ditches, often with Hartwrightia in shallow sloughs and wet savannas. It is emergent in shallow water wetlands. Habitat for this species is present on the project site. This species was not identified on the site.

Twin Pines Minerals – Individual Permit Application Supplemental Information USACE Project No. SAS-2018-00554 March 4, 2020 TTL Project No. 000180200804 Page 62
Mont M:\Projects\2018\000180200804.00 - Twin Pines Minerals Permitting Services\USACE Individual Permit App\Revisions to IP app\IP Application 03032020
Southern bog-button Habitat for this species consists of flatwoods. Habitat for this species is present on the project site. This species was not identified on the site. Pond spice Habitat for this species consists of cypress ponds, and swamp margins. Habitat for this species is present on the project site. This species was not identified on the site. Odorless bayberry abitat consists of bayheads, titi swamps, moist to wet pinelands. Habitat for this species is present of the project site. This species was not identified on the site. Palafoxia Habitat for this species consists of sandy pine oak scrub. Habitat for this species is present on the project site. This species was not identified on the site. Arrow arum Habitat for this species consists of swamps, wet hammocks on pristine sphagnum mats. This species is relatively common in the Piedmont area of Georgia, but lesser known in the coastal plain. Habitat for this species is present on the project site. This species was not identified on the site. Pennyroyal Habitat for this species consists of myrtle oak scrub. Habitat for this species is present on the project site. This species was not identified on the site. Chapman’s fringed orchid Habitat for this species consists of wet savannas, wet pine flatwoods, hillside seeps, and wet roadsides. Habitat for this species is present of the project site. This species was not identified on the site. Yellow fringeless orchid Habitat for this species consists of wet savannas and pitcher plant bogs. Habitat for this species is present of the project site. This species was not identified on the site. Wild coco Habitat for this species consists of grassy savannas, palmetto barrens and longleaf pine grasslands. Habitat for this species is present on the project site. This species was not identified on the site. Chapman oak Habitat for this species consists of sand ridges, dunes, and oak-pine scrub. Habitat for this species is present on the project site. This species was identified on the project site. A total of 4 individuals were identified during the field survey. Nuttall meadowbeauty Habitat for this species consists of pine flatwoods and bogs. Habitat for this species is present on the project site. This species was identified on the project site. There were 253 individuals identified during the field survey. Fernald's beakrush Habitat for this species consists of sandy, peaty pond margins and depressions. Habitat for this species is present on the project site. This species was not identified on the site.

Twin Pines Minerals – Individual Permit Application Supplemental Information USACE Project No. SAS-2018-00554 March 4, 2020 TTL Project No. 000180200804 Page 63
Mont M:\Projects\2018\000180200804.00 - Twin Pines Minerals Permitting Services\USACE Individual Permit App\Revisions to IP app\IP Application 03032020
Hooded pitcherplant Habitat for this species consists of wet savannas and pitcherplant bogs. Habitat for this species is present on the project site. This species was identified on the proposed project site. A total of 78 individuals were identified during the field survey. Parrot pitcherplant Habitat for this species consists of wet savannas and pitcherplant bogs. Habitat for this species is present on the project site. This species was identified on the proposed project site. A total of 8 individuals were identified during the field survey. One plant was identified within the proposed impact area, as shown on Figure 78. White sunnybell Habitat for this species consists of wet savannas. Habitat for this species is present on the project site. This species was not identified on the site. Sandhill skullcap Habitat for this species consists of sandy scrub. Habitat for this species is present on the project site. This species was not identified on the site. Florida ladies-tresses Habitat for this species consists of wet savannas, and mowed grassy openings in the Okefenokee area. Habitat for this species is present on the project site. This species was not identified on the site. Wireleaf dropseed Habitat for this species consists of longleaf pine-wiregrass savannas and pitcherplant bogs. Habitat for this species is present on the project site. This species was not identified on the site. Stokes aster Habitat for this species consists of coastal plains, bogs, pine savanna, and open woodlands. Habitat for this species is present on the project site. This species was not identified on the site. Sprawling goats’ rue Habitat for this species consists of dry sandy scrub. Habitat for this species is present on the project site. This species was not identified on site. Bartram's air-plant This plant is epiphytic in bay swamps, freshwater tidal swamps; beech-magnolia bluff forests. Habitat for this species is present on the project site. Populations of this plant were identified on the project site. A total of 29 individuals were identified during the field survey. Diverse-leaf crownbeard Habitat for this species consists of sandy peat in fire-maintained savannahs or in open stands of slash pine-palmetto flatwoods where wiregrass dominates. Habitat for this species is present on the project site. This species was not identified on site. Black Bear Most of the South Georgia bear habitat is slash pine (Pinus elliottii) flatwoods, lowland mixed hardwoods, cypress/gum wetlands, and emergent freshwater prairie. The core of the range is a contiguous area of protected public lands totaling 666,107 acres including Dixon Memorial State Forest (and WMA) and Okefenokee NWR in Georgia, and Osceola National Forest and John Bethea State Forest in Florida. Most of the perimeter of the core area is industrial forest land which is managed

Twin Pines Minerals – Individual Permit Application Supplemental Information USACE Project No. SAS-2018-00554 March 4, 2020 TTL Project No. 000180200804 Page 64
Mont M:\Projects\2018\000180200804.00 - Twin Pines Minerals Permitting Services\USACE Individual Permit App\Revisions to IP app\IP Application 03032020
with intensive pine site preparation and short timber rotations. Most (97%) of the diet of the South Georgia population bears was of plant origin, with the top 3 food items being black gum, saw palmetto, and acorns. Home ranges of adult female bears were in areas with disproportionately high loblolly bay (Gordonia lasianthus) and gum-bay-cypress (Taxodium spp.) vegetation associations (Dobey et al. 2005). Although Dobey et al.’s (2005) analyses did not rank pine associations highly, 57% of the summer diet of bears was comprised of food items found almost exclusively in pine (i.e., huckleberry, blueberry, bitter gallberry) or bears to have access to all life requisites, they need to be located within the home range of the bear. The mean annual home-range size for females in the South Georgia population was 13,813 acres and they expanded their home ranges during years of poor black gum production (Dobey et al. 2005). The expansion was most apparent between autumn 1998 and 1999 when the average home-range size for females increased from 3,583 acres to 19,373 acres and included a larger proportion of upland areas open to hunting (Dobey et al. 2005). Male home-range size was 84,708 acres (Dobey et al. 2005). Black bear was identified on the Loncala tract (Alternate 3). The proposed project is not likely to have an effect on black bear.

Twin Pines Minerals – Individual Permit Application Supplemental Information USACE Project No. SAS-2018-00554 March 4, 2020 TTL Project No. 000180200804 Page 65
Mont M:\Projects\2018\000180200804.00 - Twin Pines Minerals Permitting Services\USACE Individual Permit App\Revisions to IP app\IP Application 03032020
10.0 CULTURAL RESOURCES
A desktop and subsequent Phase I Cultural Resources Survey was conducted for the Keystone review area by TerraX (report dated October 26, 2018). Phase I investigations of this property led to the discovery of six archaeological sites and four isolated finds. Based on the results of the field investigation, none of these resources were considered significant, having been heavily impacted by numerous years of repeated pine cultivation activities. All six archaeological sites were recommended ineligible for NRHP inclusion under Criterion D based on their lack of integrity. As no significant cultural resources will be impacted by the proposed mining operation, TerraX recommended clearance for the project. An additional Phase I Cultural Resources Survey for the Adirondack tract was conducted by TerraX (report dated May 31, 2019). The Phase I investigation of this property led to the identification of one archaeological site and two isolated finds. The single archaeological site and both isolated finds date to the early-to-middle twentieth century. Neither the single archaeological site nor the isolated finds are recommended as eligible for NRHP inclusion under Criterion D. An architectural survey identified six resources within view of the proposed project area. Of these six, only one, is recommended as potentially eligible for NRHP inclusion under Criterion C. This resource is a mid-century ranch home constructed in 1950. Though currently abandoned, the integrity of the structure is intact and its architecture is significant as a representative example of a mid-twentieth century ranch house. TerraX recommends avoidance of this property, and notes that it may suffer adverse visual and audible effects as a result of the proposed mining operations. However, the house is currently located near an existing chip mill and railroad tracks and is currently exposed to heavy audible effects. The house will not be impacted by the project directly. An additional Phase I Cultural Resources Survey for the TIAA tract was conducted by TerraX (report dated June 16, 2019. As a summary of findings of this survey, three archaeological sites and one isolated find were discovered. TerraX recommended that the sites be considered ineligible for NRHP inclusion under Criterion D and isolated finds, by their nature, are not eligible for NRHP inclusion. Based on the findings of the survey, no further cultural resources studies were recommended for the proposed project area. The proposed project is not expected to significantly impact cultural resources. Copies of the Phase I Cultural Resources Survey reports are provided in Appendix I.

Twin Pines Minerals – Individual Permit Application Supplemental Information USACE Project No. SAS-2018-00554 March 4, 2020 TTL Project No. 000180200804 Page 66
Mont M:\Projects\2018\000180200804.00 - Twin Pines Minerals Permitting Services\USACE Individual Permit App\Revisions to IP app\IP Application 03032020
11.0 ADJACENT PROPERTY OWNERS
The adjacent property owners are depicted on Figure 79 and summarized in the table below.
Map ID
PIN OWNER ADDRESS
1 36001 TIAA TIMBERLANDS, LLC 1500 S FIRST AVE, STE 1150, PORTLAND, OR
97201
2 59001002 TRAIL RIDGE LAND, LLC 2100 SOUTHBRIDGE PKWY, BIRMINGHAM, AL
35209
3 58001 TRAIL RIDGE LAND, LLC 2100 SOUTHBRIDGE PKWY, BIRMINGHAM, AL 35209
4 84001 JOHN, VERNON GOWEN 315 AGNES ROAD, FOLKSTON, GA 31537
5 61002 W L OLIVER/CHARLTON,
LLC P.O. BOX 161139, MOBILE, AL 36616
6 60009 TRAIL RIDGE LAND, LLC 2100 SOUTHBRIDGE PKWY, BIRMINGHAM, AL
35209
7 60003 CHARLTON COUNTY
FORREST FOLKSTON, GA 31537
8 60007 WALTER & DEBRA
SCHEIDERER 8024 HWY 94, ST GEORGE, GA, 31562
9 60006 RANDAL DUKES 8208 HWY 94, ST GEORGE, GA 31562
10 60004 FINLEY W WOLFE 8242 HWY 94, ST GEORGE, GA 31562
11 60004001 KIRK W WOLFE 8296 HWY 94, ST GEORGE, GA 31562
12 60005 ERNST HARDEN SUITE 107, JACKSONVILLE, FL 32211
13 84003001 FRED & MARLENE
WINECOFF 8422 HWY 94, ST GEORGE, GA 31562
14 84003 SHARON BELL & ELI L. PADGETT
10624 HILLSIDE DR, MACCLENNY, FL 32063
15 84003002 SHARON BELL & ELI L.
PADGETT 10624 HILLSIDE DR, MACCLENNY, FL 32063
16 84002001 SIDNEY E & RODNEY
BELL P.O. BOX 173, ST GEORGE, GA 31562
17 84002002 SHARON BELL & ELI L.
PADGETT 10624 HILLSIDE DR, MCCLENNY, FL 32063

Twin Pines Minerals – Individual Permit Application Supplemental Information USACE Project No. SAS-2018-00554 March 4, 2020 TTL Project No. 000180200804 Page 67
Mont M:\Projects\2018\000180200804.00 - Twin Pines Minerals Permitting Services\USACE Individual Permit App\Revisions to IP app\IP Application 03032020
12.0 REFERENCES
Bauder, J.M., Stevenson, D.J., Sutherland, C.S., and Jenkins, C.L., 2017, Occupancy of potential overwintering habitat on protected lands by two imperiled snake species in the Coastal Plain of the southeastern United States; Journal of Herpetology, 51(1), p. 73-88.
Bouwer, H. and Rice, R.C., 1976, A slug test method for determining hydraulic conductivity of
unconfined aquifer with completely or partially penetrating wells: Water Resources Research, vol. 12, no. 3, p. 423-428.
Breininger, D.R., Bolt, M.R., Legare, M.L., Drese, J.H., and Stolen, E.D., 2011, Factors
influencing home-range sizes of eastern indigo snakes in central Florida; Journal of Herpetology, 45(4), p. 484−490.
Brook, G.A. and Sun, C.H., 1987, Hydrological simulation of Okefenokee Swamp upland
watersheds using a distributed model: Southern Geographer, vol. 27, no. 2, p. 71-89. Cohen, A.D., 1973, Possible influence of subpeat topography and sediment type on the
development of the Okefenokee swamp march complex of Georgia: SE Geologist, vol.15, p. 141-151.
Cooke, CF.W., 1925(a), Physical geography of Georgia: Georgia Geological Survey, Bulletin
42, p. 29. Cooke, CF.W., 1925(b), The coastal plain, in Physical geography of Georgia: Georgia
Geological Survey Bulletin 42, p. 19-57. Cooke, C.W., 1939, Scenery of Florida in interpreted by a geologist: Florida Geol. Survey
Bulletin 17, p. 118. Dobey, Steven, Masters, D.V., Scheick, B.K., Clark, J.D., Pelton, M.R., Sunquist, M.E., 2005,
Ecology of Florida Black Bears in the Okefenokee‐Osceola Ecosystem. Wildlife Monographs, 158, p. 1 – 41.
Dodd Jr., C.K., and LaClaire, L.V., 1995, Biogeography and status of the striped newt
(Notophthalmus perstriatus) in Georgia, USA: Herpetological Natural History, 3(1), p. 37−46.
Doherty, J.E., and Hunt, R.J., 2010, Approaches to Highly Parameterized Inversion—A Guide
to Using PEST for Groundwater-Model Calibration, U.S. Geological Survey Scientific Investigations Report 2010–5169, p. 59.
Elsner, H., 1997, Economic Geology of the Heavy Mineral Placer Deposits in Northeastern
Florida: Open File Report No. 71, Florida Geological Survey

Twin Pines Minerals – Individual Permit Application Supplemental Information USACE Project No. SAS-2018-00554 March 4, 2020 TTL Project No. 000180200804 Page 68
Mont M:\Projects\2018\000180200804.00 - Twin Pines Minerals Permitting Services\USACE Individual Permit App\Revisions to IP app\IP Application 03032020
Farmer, A.L., Enge, K.M., Jensen, J.B., Stevenson, D.J., and Smith, L.L., 2017, A range-wide assessment of the status and distribution of the striped newt (Notophthalmus perstriatus). Herpetological Conservation and Biology, 12(3), p. 585−598.
Force, E.R., and Garnar, T.E., 1985, High-angel aeolian crossbedding at Trail Ridge, Florida:
Industrial Minerals, August, p. 55-59. Force, E.R., and Rich, F.R., 1989, Geologic Evolution of the Trail Ridge Eolian Heavy-Mineral
Sand and Underlying Peat, Northern Florida: U.S. Geological Survey Professional Paper 1499.
Hails, J.R., Hoyt, J.H., 1969, An appraisal of the lower Atlantic Coastal Plain of Georgia (U.S.A.).
Transactions of the Institute of British Geographers: 46, p. 53-68. Harbaugh, A.W., 2005, MODFLOW-2005, The U.S. Geological Survey Modular Ground-Water
Model -- The Ground-Water Flow Process: U.S. Geological Survey Techniques and Methods 6-A16.
Hedman, C.W., Grace, S.L., and King, S.E., 2000, Vegetation composition and structure of
southern coastal plain pine forests: An ecological comparison: Forest Ecology and Management, 134, p. 233–247.
Holt, R.M., Tanner, J.M., Smith, J.R., Patton, A.C., Lepchitz, Z.B., 2019(a), Hydrogeological
Field Characterization at Twin Pines Mine, prepared for Twin Pines Minerals LLC by TTL Incorporated, Tuscaloosa Alabama.
Holt, R.M., Tanner, J.M., Smith, J.R., Patton, A.C., Lepchitz, Z.B., 2019(b), Geologic
Characterization at Twin Pines Mine, prepared for Twin Pines Minerals LLC by TTL Incorporated, Tuscaloosa Alabama.
Holt, R.M., Tanner, J.M., Smith, J.R., Patton, A.C., Lepchitz, Z.B., 2019(c), Water Quality Data
at Twin Pines Mine, prepared for Twin Pines Minerals LLC by TTL Incorporated, Tuscaloosa Alabama.
Holt, R.M., Tanner, J.M., Smith, J.R., Patton, A.C., Lepchitz, Z.B., 2019(d), Climate Data at
Twin Pines Mine, prepared for Twin Pines Minerals LLC by TTL Incorporated, Tuscaloosa Alabama.
Holt, R.M., Tanner, J.M., Smith, J.R., Patton, A.C., Lepchitz, Z.B., 2019(e), Local
Groundwater/Surface Water Hydrology at Twin Pines Mine, prepared for Twin Pines Minerals LLC by TTL Incorporated, Tuscaloosa Alabama.
Holt, R.M., Tanner, J.M., Smith, J.R., Patton, A.C., Lepchitz, Z.B., 2019(f), Laboratory Testing
at Twin Pines Mine, prepared for Twin Pines Minerals LLC by TTL Incorporated, Tuscaloosa Alabama.

Twin Pines Minerals – Individual Permit Application Supplemental Information USACE Project No. SAS-2018-00554 March 4, 2020 TTL Project No. 000180200804 Page 69
Mont M:\Projects\2018\000180200804.00 - Twin Pines Minerals Permitting Services\USACE Individual Permit App\Revisions to IP app\IP Application 03032020
Holt, R.M., Tanner, J.M., Smith, J.R., Patton, A.C., Lepchitz, Z.B., 2019(g), Subsurface Lithology of the Surficial Aquifer at Twin Pines Mine, prepared for Twin Pines Minerals LLC by TTL Incorporated, Tuscaloosa Alabama.
Holt, R.M., Tanner, J.M., Smith, J.R., Patton, A.C., Lepchitz, Z.B., 2020, Impact of the
Proposed Twin Pines Mine on the Trail Ridge Hydrologic System, prepared for Twin Pines Minerals LLC by TTL Incorporated, Tuscaloosa Alabama
Hou, B., Keeling, J., and Van Gosen, B.S., 2016, Geological Exploration Models of Beach Placer
Deposits, Integrated from Case-Studies of Southern Australia. Ore Geology Reviews. Doi: 10.1016/j.oregeorev.2016.07.016.
Hou, Z. B., Komanduri, R., 2000, General Solutions for Stationary/Moving Plane Heat Source
Problems in Manufacturing and Tribology, International Journal of Heat and Mass Transfer, v. 43, p. 1679-1698.
Hyder, Z., Butler, J.J., Jr., McElwee, C.D., and Liu, W., 1994, Slug test in partially penetrating
wells: Water Resources Research, vol. 30, no. 11, p. 2945-2957. Hyslop, N.L., Meyer, J.M., Cooper, R.J., and Stevenson, D.J., 2014, Effects of body size and sex
of Drymarchon couperi (Eastern Indigo Snake) on habitat use, movements, and home range size in Georgia: Journal of Wildlife Management, 78, (1), p. 1–11.
Jensen, J.B., 1995, Survey of potential habitat on Okefenokee National Wildlife Refuge for
Ambystoma cingulatum, Rana capito, and Notophthalmus perstriatus. Report to the U.S. Fish and Wildlife Service.
Jones, M.D., Durall, D.M., and Cairney, J.W.G., 2003, Ectomycorrhizal fungal communities in
young forest stands regenerating after clearcut logging: New Phytologist, 157, p. 399 – 422. Doi: 10.1046/j.1469-8137.2003.00698.x.
Jones, J.V., III, Piatak, N.M., and Bedinger, G.M., 2017, Zirconium and hafnium, chap. V of
Schulz, K.J., DeYoung, J.H., Jr., Seal, R.R., II, and Bradley, D.C., eds., Critical mineral resources of the United States—Economic and environmental geology and prospects for future supply: U.S. Geological Survey Professional Paper 1802, p. V1–V26, https://doi.org/10.3133/pp1802V.
Journel, A. G., Huijbregts, Ch. J., 1978, Mining Geostatistics, Academic Press Limited, San
Diego. Kellam, Jeffery, A., M. Mallary, and M.K. Laney, 1991, Heavy Mineral Bearing Sands from the
Wicomico to the Princess Anne Paleobarrier Complexes along the Georgia Coastal Plain: Department of Natural Resources, Environmental Protection Division, Georgia Geological Survey, Bulletin 111.
Ling, F. F., 1973, Surface Mechanics, Wiley and Sons, New York.

Twin Pines Minerals – Individual Permit Application Supplemental Information USACE Project No. SAS-2018-00554 March 4, 2020 TTL Project No. 000180200804 Page 70
Mont M:\Projects\2018\000180200804.00 - Twin Pines Minerals Permitting Services\USACE Individual Permit App\Revisions to IP app\IP Application 03032020
MacNeil, F.S., 1950, Pleistocene shorelines in Florida and Georgia: U.S. Geological Survey, Professional Paper 221, p. 95-107.
McWhorter, D.B. and Sunada, D.K., 1977, Ground-water Hydrology and Hydraulics: Ann
Arbor, Water Resources Publications, p. 1-290. Means, D. B, Palis, J. G., and Baggett, M., 1996, Effects of slash pine silviculture on a Florida
population of flatwoods salamander: Conservation Biology, 10, p. 426–437. Miller, J.D., Safford, H.D., Crimmins, M. and Thode, A.E., 2009, Quantitative Evidence for
Increasing Forest Fire Severity in the Sierra Nevada and Southern Cascade Mountains, California and Nevada, USA. Ecosystems, DOI:10.1007/s10021-008-9201-9.
Miller, K.V. and Miller, J.H., 2004, Forestry herbicide influences on biodiversity and wildlife
habitat in southern forests: Wildlife Society Bulletin, 32(4), p.1049-1060. National Science and Technology Council, Subcommittee on Critical and Strategic Mineral
Supply Chains, Committee on Environment, Natural Resources, and Sustainability, 2018, Assessment of Critical Minerals: Updated Application of Screening Methodology.
Palis, J.G., 1997, Distribution, habitat, and status of the flatwoods salamander (Ambystoma
cingulatum) in Florida, USA: Herpetological Natural History, 5, p. 53–65. Palis, J.G., 2002, Distribution of potential habitat for the federally threatened flatwoods
salamander (Ambystoma cingulatum) on Fort Stewart, Georgia. Unpublished report submitted to the Fort Stewart Fish and Wildlife Management Branch, Fort Stewart, GA.
Pirkle, E.C., Pirkle, W.A., Yoho, W.H., 1977, The Highland heavy-mineral sand deposit on Trail
Ridge in northern peninsular Florida: Florida Bur. Geology Rept., Inv.84, p. 50. Pirkle, F.L., 1975, Evaluation of possible source regions of Trail Ridge sands: Southeastern
Geology, vol. 17, p. 93-144. Pirkle, F.L., 1984, Environment of deposition of Trail Ridge sediments as determined from
factor analysis: p. 629-650 in Cohen , A.D., Casagrande, D.J., Andrejko, M.J., and Best G.R. (eds), The Okefenokee Swamp: Its Natural History, Geology, and Geochemistry, Los Alamos, New Mexico, Wetlands Survey.
Pirkle, F.L., and Czel, L.J., 1983, Marine fossils from region of Trail Ridge, a Georgia-Florida
landform: Southeastern Geology, vol. 24, p. 31-38. Pirkle, F.L., Pirkle, E.C., Reynolds, J.G., Pirkle, W.A., Henry, J.A., and Rice, W.J., 1993, The
Folkston West and Amelia Heavy Mineral Deposits of Trail Ridge, Southeastern Georgia, Economic Geology, vol. 88, p. 961-971.
Pirkle, F.L., Pirkle W.A., and Pirkle, E.C., 2007, Heavy-Mineral Sands of the Atlantic and Gulf
Coastal Plains, USA: Developments in Sedimentology, vol 58, p. 1145-1232.

Twin Pines Minerals – Individual Permit Application Supplemental Information USACE Project No. SAS-2018-00554 March 4, 2020 TTL Project No. 000180200804 Page 71
Mont M:\Projects\2018\000180200804.00 - Twin Pines Minerals Permitting Services\USACE Individual Permit App\Revisions to IP app\IP Application 03032020
Pirkle, F.L., Pirkle, W.A., Pirkle, E.C., Pirkle, D.L., 2005, Heavy mineral mining in the Atlantic Coastal Plain of Florida and Georgia and the chemical and physical characteristics of the deposits. in Akser, M., Elder, J. (Eds.), 2005 Heavy Minerals Conference Proceedings: Society for Mining, Metallurgy, and Exploration, Inc., p. 7–18.
Pirkle, F.L.; Pirkle, W.A., and Rich, F.J., 2013, Heavy-mineral mining in the Atlantic Coastal
Plain and what deposit locations tell us about ancient shorelines. In: Kana, T.; Michel, J., and Voulgaris, G. (eds.), Proceedings, Symposium in Applied Coastal Geomorphology to Honor Miles O. Hayes, Journal of Coastal Research, Special Issue No. 69, 154–175. Coconut Creek (Florida), ISSN 0749-0208.
Pirkle, W.A. and Pirkle E.C., 1984, Physiographic features and field relations of Trial Ridge in
northern Florida and southeaster Georgia: p. 613-628 in Cohen, A.D., Casagrande, D.J., Andrejko, M.J. and Best, G.R. (eds.), The Okefenokee Swamp: Its natural history, geology, and geochemistry, Los Alamos, New Mexico, Wetland Survey.
Remy N., 2005, S-GeMS: The Stanford Geostatistical Modeling Software: A Tool for New
Algorithms Development. In: Leuangthong O., Deutsch C.V. (eds) Geostatistics Banff 2004. Quantitative Geology and Geostatistics, vol 14. Springer, Dordrecht.
Rich, F.J., 1985, Palynology and paleoecology of a lignitic peat from Trail Ridge, Florida:
Florida Bur. Geology inf. Circ. 100, p. 15. Seabrook, C., 2003, 16,000-acre gift to Okefenokee Swamp DuPont donation ‘‘retires’’
mining rights. The Atlanta Journal-Constitution, August 27. Starr, M., 2006, Big land, bigger future. The Brunswick News. November 2.
https://thebrunswicknews.com/news/local_news/big-land-bigger-future/article_4b554a57-8ecc-5eec-89cb-cae185752402.html.
Stevenson, D.J., 2010., Results of eastern indigo snake (Drymarchon couperi) surveys
conducted at Okefenokee National Wildlife Refuge, Charlton County, Georgia. Unpublished report to Okefenokee National Wildlife Refuge. 8 pp. + appendices.
Stevenson, D.J., Bolt, M.R., Smith, D.J., Enge, K.M., Hyslop, N.L., Norton, T.M., and Dyer, K.J.,
2010, Prey records for the Eastern Indigo Snake (Drymarchon couperi). Southeastern Naturalist, 9, (1), p. 1–18.
Stevenson, D.J., Dyer, K.J., and Willis-Stevenson, B.A., 2003, Survey and monitoring of the
eastern indigo snake in Georgia. Southeastern Naturalist, 2, p. 393-408. Stevenson, D.J., Enge, K.M., Carlile, L., Dyer, K.J., Norton, T.M., Hyslop, N.L., and Kiltie, R.A.,
2009, An Eastern Indigo Snake (Drymarchon couperi) mark-recapture study in southeastern Georgia. Herpetological Conservation and Biology, 4, (1), p. 30–42.
Stevenson, D.J., Jensen, J.B., Schlimm, E.A., and Moore, M., 2015, The distribution, habitat
use, activity, and status of the Spotted Turtle (Clemmys guttata) in Georgia. Chelonian Conservation and Biology, 14, (2), p. 136–142.

Twin Pines Minerals – Individual Permit Application Supplemental Information USACE Project No. SAS-2018-00554 March 4, 2020 TTL Project No. 000180200804 Page 72
Mont M:\Projects\2018\000180200804.00 - Twin Pines Minerals Permitting Services\USACE Individual Permit App\Revisions to IP app\IP Application 03032020
Tichy, J. A., 1991, Closed-Form Expression for Temperature in a Semi-Infinite Solid due to a
Fast-Moving Surface Heat Source, Journal of Tribology, v. 133, p. 828-831. U. S. Department of the Interior, 2018, Final list of critical minerals 2018: Federal Register,
vol (83), no. 97, p. 23295-23296. U. S. Department of the Interior, 2017, A Federal Strategy to Ensure Secure and Reliable
Supplies of Critical Minerals: Executive Order 13817, 82 Federal Register 60835. U. S. Geological Survey (USGS), 2020, Mineral commodity summaries 2020: U.S. Geological
Survey, 200p. https://doi.org/10.3133/mcs2020. van Genuchten, M.Th., 1980, A closed-form equation for predicting the hydraulic conductivity
of unsaturated soils: Soil Science Society of America Journal. vol. 44, p. 892-898. Van Gosen, B.S., Fey, D.L., Shah, A.K., Verplanck, P.L., and Hoefen, T.M, 2014, Deposit
model for heavy-mineral sands in coastal environments: U.S. Geological Survey Scientific Investigations Report 2010–5070–L, 51 p., http://dx.doi.org/10.3133/sir20105070L.
Williams, L.J., and Kuniansky, E.L., 2016, Revised Hydrogeologic Framework of the Floridan
Aquifer System in Florida and Parts of Georgia, Alabama, and South Carolina: U.S.G.S, Professional Paper 1807, Version 1.1.
Woodruff, L.G., Bedinger, G.M., and Piatak, N.M., 2017, Titanium, chap. T In: Schulz, K.J.,
DeYoung, J.H., Jr., Seal, R.R., II, and Bradley, D.C., eds., Critical mineral resources of the United States—Economic and environmental geology and prospects for future supply: U.S. Geological Survey Professional Paper 1802, p. T1–T23, https://doi.org/10.3133/pp1802T.
Yu, C., Loureiro, C., Cheng, J.J., Jones, L.G., Want, Y.Y., Chia, Y.P., and Faillace, E., 1993,
Data Collection Handbook to Support Modeling the Impacts of Radioactive Material in Soil: Argonne National Lan, UDDOE Office of Science (SC), Basic Energy Sciences (BES)-(SC-22).
Zircon Industry Association (ZFA), 2019, Technical handbook on zirconium and zirconium
compounds 2019. 139p. zircon-association.org.

TABLES

Type Formula
Exponential
( ) ( )2 2 1 exp 3n aγ σ σ = + − − h h
Gaussian
( ) ( )22 2 21 exp 3n aγ σ σ = + − −
h h
Spherical
( )
32 2
2 2
3 12 2n
n
aa a
a
σ σγ
σ σ
+ − ≤ = + >
h hh
h
h
Table 1. Variogram models used to fit experimental indicator variograms of soil data, where h is the separation distance, 2σ is the spatially-correlated variance of the indicator function, 2
nσ is the uncorrelated component of the variance of the indicator function, and a is the correlation length.

Soil Type Variogram Model Variance Nugget
Variance
Maximum
Horizontal
Correlation
Length
(ft)
Minimum
Horizontal
Correlation
Length
(ft)
Azimuth of
Maximum
Correlation
Length
Silty Clayey Sand (SC-SM) Gaussian 0.095 0 912 384 30
Clayey Sand (SC) Gaussian 0.080 0 432 380 90
Consolidated Sand Gaussian 0.052 0 432 240 90
Semi-Consolidated Sand Spherical 0.120 0 624 144 60
Unconsolidated Black Sand Exponential 0.013 0 432 96 120
Unconsolidated Sand Exponential 0.243 0 336 240 45
Clay Gaussian 0.040 0 336 240 60
Soil Type Variogram Model Variance Nugget
Variance
Vertical
Correlation
Length
(ft)
Silty Clayey Sand (SC-SM)Spherical and
Exponential
0.032 and
0.030 36 and 8
Clayey Sand (SC) Spherical 0.0723 0 33.6
Consolidated Sand Exponential 0.053 0.01 18
Semi-Consolidated Sand Exponential 0.084 0 7.2
Unconsolidated Black Sand Spherical 0.0132 0 9.6
Unconsolidated Sand Exponential 0.243 0 15.6
Clay Exponential 0.04 0 20.4
Notes:
The azimuth of the minimum horizontal correlation length is 90 degrees from the azimuth of the maximum horizontal correlation
length.
Table 3. Vertical Correlation Lengths Used in Variogram Models; Twin Pines Mine Project; St.
George, Charlton County, Georgia. TTL Project No. 000180200804.00
Table 2. Horizontal Correlation Lengths Used in Variogram Models; Twin Pines Mine Project; St. George, Charlton County,
Georgia. TTL Project No. 000180200804.00

Well I.D.Installation Start
DateScreened Interval
(feet bgs 1)
Natural Fill Sand Pack(feet bgs)
Bentonite Plug(feet bgs)
Portland Cement Grout(feet bgs)
Construction Depth of Piezometer(feet bgs)
Total Boring Depth(feet bgs)
OWA1S 11/9/2018 35-25 35-22 22-20 20-0.5 35 35OWA1D 11/9/2018 90-80 90-76 76-74 74-0 90 90
OWA1BS 12/11/2018 12-2 12-1 1-0.5 -- 12 12OWA2S 11/14/2018 35-25 35-22 22-20 20-0.5 35 35OWA2D 11/13/2018 90-80 90-76 76-74 74-0 90 90
OWA2BS 12/7/2018 12-2 12-1 1-0.5 -- 12 12OWA3BS 1/30/2019 12-7 12-0 -- -- 12 12OWA4BS 1/30/2019 12-7 12-0 -- -- 12 12OWA5BS 1/30/2019 12-7 12-0 -- -- 12 12
PWA 12/20/2018 115-55 115-45 45-40 40-0 115 115OWB1S 11/27/2018 35-25 35-22 22-20 20-0.5 35 35OWB1D 11/27/2018 90-80 90-76 76-74 74-0 90 90
OWB1BS 12/7/2018 12-2 12-1 1-0.5 -- 12 12OWB2S 1130/18 35-25 35-22 22-20 20-0.5 35 35OWB2D 11/28/2018 90-80 90-76 76-74 74-0 90 90
OWB2BS 12/7/2018 12-2 12-1 1-0.5 -- 12 12OWB3S 12/5/2018 35-25 35-22 22-20 20-0.5 35 35OWB3D 12/5/2018 90-80 90-76 76-74 74-0 90 90
OWB3BS 1/30/2019 12-7 12-0 -- -- 12 12OWB4BS 1/30/2019 12-7 12-0 -- -- 12 12OWB5BS 1/30/2019 12-7 12-0 -- -- 12 12
PWB 12/10/2018 115-55 115-45 45-40 40-0 115 115
3 Undisturbed sample borings converted to piezometers for downhole geophysical survey
Table 4. Well Construction Summary Table; Hydrologic Field Characteristics at Twin Pines Mine; Twin Pines Minerals, LLC; St. George, Charlton County, Georgia. TTL Project No. 000180200804.00
Pumping & Observation Wells
1 Below ground surface2 Not applicable or missing data

Bouwer-RiceMethod
Kh(ft/d)
Ss(1/ft)
Kh(ft/d)
PZ01S Bail 664792.9515 213145.725 123.04 14.0 4.0 13.5 119.04 109.54 1.24E+00 3.30E-05 9.82E-01
PZ01S Slug 664792.9515 213145.725 123.04 14.0 4.0 13.5 119.04 109.54 1.65E+00 2.60E-06 1.14E+00
PZ04 Bail 663720.3298 205447.0841 123.89 14.0 4.0 13.5 119.89 110.39 1.99E+00 4.40E-05 1.66E+00
PZ04 Slug 663720.3298 205447.0841 123.89 14.0 4.0 13.5 119.89 110.39 1.74E+00 1.67E-03 1.38E+00
PZ06 Bail 662436.2138 201256.8347 124.26 14.0 4.0 13.5 120.26 110.76 3.71E+00 2.41E-05 2.95E+00
PZ06 Slug 662436.2138 201256.8347 124.26 14.0 4.0 13.5 120.26 110.76 3.51E+00 1.26E-04 2.22E+00
PZ10 Bail 667689.3258 206292.4778 145.97 25.0 15.0 24.5 130.97 121.47 3.91E+00 1.11E-03 3.91E+00
PZ10 Slug 667689.3258 206292.4778 145.97 25.0 15.0 24.5 130.97 121.47 6.39E+00 5.49E-05 4.22E+00
PZ13 Bail 668652.4560 196413.6877 157.63 30.0 20.0 29.5 137.63 128.13 5.16E+01 1.61E-12 3.91E+01
PZ13 Slug 668652.4560 196413.6877 157.63 30.0 20.0 29.5 137.63 128.13 5.24E+01 1.61E-1239.8 (middle time)
12.0 (late time)
PZ16S Bail 668683.7808 189192.1062 160.42 20.0 10.0 19.5 150.42 140.92 4.10E+01 3.34E-05 3.41E+01
PZ16S Slug 668683.7808 189192.1062 160.42 20.0 10.0 19.5 150.42 140.92 3.99E+01 5.09E-05 2.94E+01
PZ17D Bail 670005.1448 212015.6518 161.01 45.0 35.0 44.5 126.01 116.51 4.14E+01 8.55E-13 3.44E+01
PZ17D Slug 670005.1448 212015.6518 161.01 45.0 35.0 44.5 126.01 116.51 4.27E+01 8.55E-13 2.95E+01
PZ20D Bail 670360.6665 205134.8784 168.46 40.0 30.0 39.5 138.46 128.96 1.84E+01 8.18E-06 1.53E+01
PZ20D Slug 670360.6665 205134.8784 168.46 40.0 30.0 39.5 138.46 128.96 1.84E+01 2.17E-04 1.53E+01
PZ24 Bail 672562.2118 196807.9532 169.54 20.0 10.0 19.5 159.54 150.04 1.48E+01 2.19E-05 1.18E+01
PZ24 Slug 672562.2118 196807.9532 169.54 20.0 10.0 19.5 159.54 150.04 4.40E+01 3.19E-06 3.05E+01
PZ28D Bail 672470.6111 191101.7018 173.99 30.0 20.0 29.5 153.99 144.49 2.34E+00 6.99E-05 2.04E+00
PZ29D Bail 667975.5644 193583.6283 153.88 50.0 40 49.5 113.88 104.38 1.45E+00 1.32E-04 1.45E+00
PZ29D Slug 667975.5644 193583.6283 153.88 50.0 40 49.5 113.88 104.38 1.25E+00 2.28E-04 1.19E+00
PZ29S Bail 667981.0292 193588.0244 154.035 19.0 9.0 18.5 145.04 135.54 8.23E+00 7.00E-06 6.24E+00
PZ29S Slug 667981.0292 193588.0244 154.035 19.0 9.0 18.5 145.04 135.54 5.44E+00 5.13E-04 5.70E+00
PZ30D Bail 666484.959 189997.8257 138.02 50.0 40.0 49.5 98.02 88.52 1.09E+00 1.14E-05 9.89E-01
PZ30D Slug 666484.959 189997.8257 138.02 50.0 40.0 49.5 98.02 88.52 1.38E+00 2.23E-05 1.21E+00
PZ30S Bail 666491.4469 190004.5697 137.65 10.0 5.0 9.5 132.65 128.15 8.68E-01 1.07E-05 6.86E-01
PZ30S Slug 666491.4469 190004.5697 137.65 10.0 5.0 9.5 132.65 128.15 1.09E+00 1.97E-16 1.43E+00
PZ31D Bail 665327.2418 192381.7249 135.90 50.0 40.0 49.5 95.90 86.40 1.57E+00 5.94E-05 1.50E+00
PZ31D Slug 665327.2418 192381.7249 135.90 50.0 40.0 49.5 95.90 86.40 1.98E+00 1.22E-04 1.98E+00
PZ31S Bail 665331.907 192374.4898 135.92 12.0 7.0 11.5 128.92 124.42 1.42E+00 2.69E-05 1.08E+00
PZ31S Slug 665331.907 192374.4898 135.92 12.0 7.0 11.5 128.92 124.42 1.36E+00 2.34E-06 1.03E+00
PZ33D Bail 661249.6461 192704.3174 123.91 50.5 41.0 50.5 82.91 73.41 2.77E+00 8.22E-06 1.75E+00
PZ33D Slug 661249.6461 192704.3174 123.91 50.5 41.0 50.5 82.91 73.41 2.23E+00 2.55E-05 1.48E+00
PZ33S Bail 661258.6777 192703.2169 123.73 13.0 7.0 11.5 116.73 112.23 2.66E+00 5.85E-06 1.93E+00
PZ33S Slug 661258.6777 192703.2169 123.73 13.0 7.0 11.5 116.73 112.23 2.63E+00 7.72E-06 1.99E+00
PZ55D Bail 663504.9654 187429.6642 174.92 50.0 40.0 49.5 134.92 125.42 2.03E+01 1.16E-05 1.85E+01
PZ55D Slug 663504.9654 187429.6642 174.92 50.0 40.0 49.5 134.92 125.42 2.20E+01 6.23E-05 2.10E+01
PZ55S Bail 671858.651 188474.3774 174.83 20.0 14.0 19.5 160.83 155.33 9.46E-01 1.40E-06 7.18E-01
PZ55S Slug 671858.651 188474.3774 174.83 20.0 14.0 19.5 160.83 155.33 2.40E-01 1.63E-05 1.99E-01
PZ57D Bail 675314.5224 192314.0733 165.89 50.0 39.0 48.5 126.89 117.39 5.47E+01 3.79E-20 6.58E+01
PZ57D Slug 675314.5224 192314.0733 165.89 50.0 39.0 48.5 126.89 117.39 3.59E+01 2.03E-04 7.51E+01
PZ57S Bail 675311.1832 192310.6915 165.68 14.0 9.0 13.5 156.68 152.18 6.77E+00 6.37E-05 5.38E+00
PZ57S Slug 675311.1832 192310.6915 165.68 14.0 9.0 13.5 156.68 152.18 7.26E+00 5.75E-05 5.78E+00
PZ58D Bail 676850.4859 196491.6367 139.98 50.0 40.0 49.5 99.98 90.48 5.10E+00 2.24E-04 5.10E+00
PZ58D Slug 676850.4859 196491.6367 139.98 50.0 40.0 49.5 99.98 90.48 3.55E+00 2.18E-03 5.38E+00
PZ58S Bail 676849.7667 196495.5787 140.02 15.0 10.0 14.5 130.02 125.52 2.66E+01 7.87E-05 2.11E+01
PZ58S Slug 676849.7667 196495.5787 140.02 15.0 10.0 14.5 130.02 125.52 2.42E+01 8.67E-05 1.92E+01
Bouwer-Rice = Unconfined Bouwer-Rice solution method in Aqtesolv™
ft/d = feet per day
Kh = hydraulic conductivity
KGS = Unconfined KGS solution method in Aqtesolv™
Ss = specific storage
ft bgs = feet below ground surface
ft amsl = feet above mean sea level
Table 5. Slug and Bail Test Results Summary Table; Hydrologic Field Characteristics at Twin Pines Mine; Twin Pines Minerals, LLC; St. George, Charlton County, Georgia. TTL Project No. 000180200804.00
SampleLocation
Type Test
Easting Northing Top of Casing
Elevation(ft. amsl)
Well Depth(ft. bgs)
Screen Depth Top
(ft. bgs)
Screen Depth
Bottom(ft. bgs)
Screen Depth
Top(ft. amsl)
Screen Depth
Bottom(ft. amsl)
KGSMethod
Page 1 of 1

SampleIdentifier
Northing Easting Land Surface
Elevation(ft. amsl)
Sample Depth
Top(ft. bgs)
Sample Depth
Bottom(ft. bgs)
Sample Elevation
Top(ft. amsl)
Sample Elevation Bottom
(ft. amsl)
USCS Vertical Hydraulic
Conductivity (Kv)
(cm/sec)
Undisturbed/Remolded?
Laboratory Sample Notes
UD10 208093.3130 666408.7486 131.70 13 15 118.70 116.70 SP-SM 1.30E-04 Undisturbed Unconsolidated SandUD10 208093.3130 666408.7486 131.70 28 30 103.70 101.70 SP 2.00E-05 Undisturbed Unconsolidated SandUD10 208093.3130 666408.7486 131.70 43 45 88.70 86.70 SP-SM 1.90E-05 Undisturbed Unconsolidated SandUD25 190488.7166 668975.1185 165.49 15 17 150.49 148.49 SP-SM 1.40E-05 Undisturbed Semi-Consolidated SandUD25 190488.7166 668975.1185 165.49 30 32 135.49 133.49 SP 8.20E-05 Undisturbed Unconsolidated SandUD25 190488.7166 668975.1185 165.49 43 45 122.49 120.49 SP 1.40E-06 Undisturbed Unconsolidated SandUD34 200408.2230 671582.2720 170.29 13 15 157.29 155.29 SP-SM 1.00E-05 Undisturbed Consolidated SandUD34 200408.2230 671582.2720 170.29 28 29 142.29 141.29 SP 7.80E-07 Undisturbed Unconsolidated SandUD34 200408.2230 671582.2720 170.29 48 50 122.29 120.29 SP 4.40E-07 Undisturbed Semi-consolidated SandUD43 190542.5306 678135.6130 148.55 13 15 135.55 133.55 SP 7.00E-06 Undisturbed Unconsolidated SandUD43 190542.5306 678135.6130 148.55 30 32 118.55 116.55 SP-SM 3.80E-06 Undisturbed Unconsolidated SandUD43 190542.5306 678135.6130 148.55 43 45 105.55 103.55 SC 1.70E-08 Undisturbed Clayey SandUD51 197065.1026 674174.9889 165.00 13 15 152.00 150.00 SP-SM 5.20E-06 Undisturbed Semi-Consolidated Sand (Black)UD51 197065.1026 674174.9889 165.00 28 30 137.00 135.00 SP-SM 7.60E-06 Undisturbed Unconsolidated SandUD51 197065.1026 674174.9889 165.00 43 45 122.00 120.00 SP 6.90E-05 Undisturbed Unconsolidated SandUD65 202093.9328 675684.2974 166.76 17 19 149.76 147.76 SP 2.80E-04 Undisturbed Semi-ConsolidatedUD65 202093.9328 675684.2974 166.76 28 30 138.76 136.76 SP 1.10E-04 Undisturbed Unconsolidated SandUD65 202093.9328 675684.2974 166.76 43 45 123.76 121.76 SP 6.30E-02 Remolded Consolidated - Sity-Clay SandUD67 203551.9396 672306.1274 172.06 17 19 155.06 153.06 SP-SM 1.40E-04 Undisturbed Semi-Consolidated SandUD67 203551.9396 672306.1274 172.06 28 30 144.06 142.06 SP 2.90E-04 Undisturbed Unconsolidated SandUD67 203551.9396 672306.1274 172.06 43 45 129.06 127.06 SP 4.10E-06 Undisturbed Unconsolidated SandUD93 211493.3310 668617.5144 150.25 13 15 137.25 135.25 SP 6.50E-07 Undisturbed Consolidated SandUD93 211493.3310 668617.5144 150.25 28 30 122.25 120.25 SP-SM 2.40E-05 Undisturbed Unconsolidated SandUD93 211493.3310 668617.5144 150.25 43 45 107.25 105.25 SP 2.80E-05 Undisturbed Unconsolidated Sand
UD126 202917.1019 666640.3662 140.22 13 15 127.22 125.22 SP-SM 8.30E-05 Undisturbed Consolidated SandUD126 202917.1019 666640.3662 140.22 28 30 112.22 110.22 SP 1.00E-05 Undisturbed Unconsolidated SandUD126 202917.1019 666640.3662 140.22 43 45 97.22 95.22 SP-SM 9.30E-07 Undisturbed Clayey Sand mixed w/ Fat ClayUD128 199193.1410 667712.6820 150.52 13 15 137.52 135.52 SP 9.50E-05 Undisturbed Semi-Consolidated SandUD128 199193.1410 667712.6820 150.52 30 32 120.52 118.52 SP-SM 2.20E-06 Undisturbed Unconsolidated SandUD128 199193.1410 667712.6820 150.52 43 45 107.52 105.52 SP 1.70E-04 Undisturbed Unconsolidated SandUD179 207884.9971 670857.1818 166.08 13 15 153.08 151.08 SP 2.10E-06 Undisturbed Semi-Consolidated SandUD179 207884.9971 670857.1818 166.08 28 30 138.08 136.08 SP 3.90E-04 Undisturbed Unconsolidated SandUD179 207884.9971 670857.1818 166.08 43 45 123.08 121.08 SP 2.00E-07 Undisturbed Unconsolidated SandUD231 196158.7390 669687.5038 167.53 13 15 154.53 152.53 SP-SM 2.70E-06 Undisturbed Unconsolidated SandUD231 196158.7390 669687.5038 167.53 30 32 137.53 135.53 SP-SM 6.00E-06 Undisturbed Unconsolidated SandUD231 196158.7390 669687.5038 167.53 43 45 124.53 122.53 SP-SM 1.90E-05 Undisturbed Semi-consolidated Sand
Table 6: Laboratory Results of Soil Samples Analyzed for Vertical Hydraulic Conductivity; Twin Pines Minerals, LLC; St. George, Charlton County, Georgia. TTL Project No. 000180200804.00
Bowser-Morner, Inc.
Bowser-Morner, Inc.
Bowser-Morner, Inc.
Bowser-Morner, Inc.
Bowser-Morner, Inc.
Bowser-Morner, Inc.
Bowser-Morner, Inc.
Bowser-Morner, Inc.
Bowser-Morner, Inc.
Bowser-Morner, Inc.
Bowser-Morner, Inc.
Bowser-Morner, Inc.
Page 1 of 2

SampleIdentifier
Northing Easting Land Surface
Elevation(ft. amsl)
Sample Depth
Top(ft. bgs)
Sample Depth
Bottom(ft. bgs)
Sample Elevation
Top(ft. amsl)
Sample Elevation Bottom
(ft. amsl)
USCS Vertical Hydraulic
Conductivity (Kv)
(cm/sec)
Undisturbed/Remolded?
Laboratory Sample NotesTable 6: Laboratory Results of Soil Samples Analyzed for Vertical Hydraulic Conductivity; Twin Pines Minerals, LLC; St. George, Charlton County, Georgia. TTL Project No. 000180200804.00
UD238 192952.8585 674171.2238 168.31 13 15 155.31 153.31 SP-SM 1.00E-04 Undisturbed Unconsolidated SandUD238 192952.8585 674171.2238 168.31 28 30 140.31 138.31 SP 3.30E-04 Undisturbed Unconsolidated SandUD238 192952.8585 674171.2238 168.31 43 45 125.31 123.31 SP 1.20E-04 Undisturbed Unconsolidated SandUD338 191127.7310 672504.6590 173.56 13 15 160.56 158.56 SP-SM 2.60E-06 Undisturbed Semi-Consolidated SandUD338 191127.7310 672504.6590 173.56 28 30 145.56 143.56 SP-SM 2.20E-05 Undisturbed Unconsolidated SandUD338 191127.7310 672504.6590 173.56 43 45 130.56 128.56 SP 9.20E-05 Undisturbed Unconsolidated SandEB03 206290.6294 667706.7987 145.44 92.5 94 52.94 51.44 CH 1.61E-09 Undisturbed TTL, Inc. ClayEB06 198366.9546 672066.9668 171.50 120 122 51.50 49.50 CL 1.29E-05 Undisturbed TTL, Inc. ClayEB08 191112.0239 672464.5741 173.68 130 133 43.68 40.68 CH 9.29E-09 Undisturbed TTL, Inc. ClayEB16 198336.5709 677166.6458 140.28 12 12.5 128.28 127.78 SP 9.60E-02 Remolded Unconsolidated SandEB16 198336.5709 677166.6458 140.28 15.5 17 124.78 123.28 SM 1.80E-04 Disturbed Consolidated SandEB16 198336.5709 677166.6458 140.28 25.5 26 114.78 114.28 SM 2.30E-02 Remolded Unconsolidated SandEB16 198336.5709 677166.6458 140.28 34.5 36 105.78 104.28 SP 1.90E-02 Remolded Unconsolidated SandEB16 198336.5709 677166.6458 140.28 44.5 46 95.78 94.28 SP 2.40E-02 Remolded Unconsolidated SandEB16 198336.5709 677166.6458 140.28 86 90 54.28 50.28 CH 1.30E-08 Disturbed Clay
PZ57D 192314.0733 675314.5224 165.62 20 22 145.62 143.62 SM 2.70E-08 Undisturbed Consolidated SandPZ57D 192314.0733 675314.5224 165.62 25 27 140.62 138.62 SM 3.40E-07 Undisturbed Consolidated SandUD25R NS NS NS 3 5 NS NS SP-SM 3.20E-04 Undisturbed Unconsolidated SandUD25R NS NS NS 10 12 NS NS SP 2.30E-04 Undisturbed Unconsolidated SandUD43R NS NS NS 5 7 NS NS SP 6.20E-04 Undisturbed Unconsolidated SandUD43R NS NS NS 10 12 NS NS SP 4.50E-04 Undisturbed Unconsolidated Sand
UD238R NS NS NS 6 8 NS NS SP 8.50E-04 Undisturbed Unconsolidated SandUD238R NS NS NS 10 12 NS NS SP 4.00E-04 Undisturbed Unconsolidated SandUD338R NS NS NS 9 11 NS NS SP 3.00E-04 Undisturbed TTL, Inc. Unconsolidated Sand
Notes: ft bgs = feet blow ground surface USCS = Unified Soil Classification System NS = Not surveyed; borings performed within 5-10 feet of original UD boringft. amsl = feet above mean sea level cm/sec = centimeters per second
Bowser-Morner, Inc.
Bowser-Morner, Inc.
TTL, Inc.
TTL, Inc.
TTL, Inc.
TTL, Inc.
TTL, Inc.
Page 2 of 2

SampleIdentifier
Northing Easting Land Surface
Elevation(ft. amsl)
Sample Depth Top
(ft. bgs)
Sample Depth
Bottom(ft. bgs)
Sample Elevation
Top(ft. amsl)
Sample Elevation Bottom
(ft. amsl)
USCS Porosity Sample Notes
UD10 208093.3130 666408.7486 131.70 13 15 118.70 116.70 SP-SM 36.7% Unconsolidated SandUD10 208093.3130 666408.7486 131.70 28 30 103.70 101.70 SP 38.7% Unconsolidated SandUD10 208093.3130 666408.7486 131.70 43 45 88.70 86.70 SP-SM 35.5% Unconsolidated SandUD25 190488.7166 668975.1185 165.49 15 17 150.49 148.49 SP-SM 43.7% Semi-Consolidated SandUD25 190488.7166 668975.1185 165.49 30 32 135.49 133.49 SP 41.6% Unconsolidated SandUD25 190488.7166 668975.1185 165.49 43 45 122.49 120.49 SP 35.0% Unconsolidated SandUD34 200408.2230 671582.2720 170.29 13 15 157.29 155.29 SP-SM 32.9% Consolidated SandUD34 200408.2230 671582.2720 170.29 28 29 142.29 141.29 SP 42.0% Unconsolidated SandUD34 200408.2230 671582.2720 170.29 48 50 122.29 120.29 SP 40.8% Semi-consolidated SandUD43 190542.5306 678135.6130 148.55 13 15 135.55 133.55 SP 39.6% Unconsolidated SandUD43 190542.5306 678135.6130 148.55 30 32 118.55 116.55 SP-SM 36.6% Unconsolidated SandUD43 190542.5306 678135.6130 148.55 43 45 105.55 103.55 SC 35.2% Clayey SandUD51 197065.1026 674174.9889 165.00 13 15 152.00 150.00 SP-SM 33.8% Semi-Consolidated Sand (Black)UD51 197065.1026 674174.9889 165.00 28 30 137.00 135.00 SP-SM 39.1% Unconsolidated SandUD51 197065.1026 674174.9889 165.00 43 45 122.00 120.00 SP 32.0% Unconsolidated SandUD65 202093.9328 675684.2974 166.76 17 19 149.76 147.76 SP 40.0% Semi-ConsolidatedUD65 202093.9328 675684.2974 166.76 28 30 138.76 136.76 SP 37.7% Unconsolidated SandUD65 202093.9328 675684.2974 166.76 43 45 123.76 121.76 SP 36.5% Consolidated - Sity-Clay SandUD67 203551.9396 672306.1274 172.06 17 19 155.06 153.06 SP-SM 33.1% Semi-Consolidated SandUD67 203551.9396 672306.1274 172.06 28 30 144.06 142.06 SP 39.8% Unconsolidated SandUD67 203551.9396 672306.1274 172.06 43 45 129.06 127.06 SP 31.7% Unconsolidated SandUD93 211493.3310 668617.5144 150.25 13 15 137.25 135.25 SP 37.7% Consolidated SandUD93 211493.3310 668617.5144 150.25 28 30 122.25 120.25 SP-SM 33.7% Unconsolidated SandUD93 211493.3310 668617.5144 150.25 43 45 107.25 105.25 SP 35.5% Unconsolidated Sand
UD126 202917.1019 666640.3662 140.22 13 15 127.22 125.22 SP-SM 31.3% Consolidated SandUD126 202917.1019 666640.3662 140.22 28 30 112.22 110.22 SP 31.3% Unconsolidated SandUD126 202917.1019 666640.3662 140.22 43 45 97.22 95.22 SP-SM 33.0% Clayey Sand mixed w/ Fat ClayUD128 199193.1410 667712.6820 150.52 13 15 137.52 135.52 SP 37.5% Semi-Consolidated SandUD128 199193.1410 667712.6820 150.52 30 32 120.52 118.52 SP-SM 39.1% Unconsolidated SandUD128 199193.1410 667712.6820 150.52 43 45 107.52 105.52 SP 36.0% Unconsolidated SandUD179 207884.9971 670857.1818 166.08 13 15 153.08 151.08 SP 38.5% Semi-Consolidated SandUD179 207884.9971 670857.1818 166.08 28 30 138.08 136.08 SP 34.6% Unconsolidated SandUD179 207884.9971 670857.1818 166.08 43 45 123.08 121.08 SP 34.4% Unconsolidated Sand
Table 7: Laboratory Results of Soil Samples Analzyzed for Porosity; Twin Pines Minerals, LLC; St. George, Charlton County, Georgia. TTL Project No. 000180200804.00
Page 1 of 2

SampleIdentifier
Northing Easting Land Surface
Elevation(ft. amsl)
Sample Depth Top
(ft. bgs)
Sample Depth
Bottom(ft. bgs)
Sample Elevation
Top(ft. amsl)
Sample Elevation Bottom
(ft. amsl)
USCS Porosity Sample NotesTable 7: Laboratory Results of Soil Samples Analzyzed for Porosity; Twin Pines Minerals, LLC; St. George, Charlton County, Georgia. TTL Project No. 000180200804.00
UD231 196158.7390 669687.5038 167.53 13 15 154.53 152.53 SP-SM 37.1% Unconsolidated SandUD231 196158.7390 669687.5038 167.53 30 32 137.53 135.53 SP-SM 30.1% Unconsolidated SandUD231 196158.7390 669687.5038 167.53 43 45 124.53 122.53 SP-SM 35.4% Semi-consolidated SandUD238 192952.8585 674171.2238 168.31 13 15 155.31 153.31 SP-SM 33.5% Unconsolidated SandUD238 192952.8585 674171.2238 168.31 28 30 140.31 138.31 SP 35.9% Unconsolidated SandUD238 192952.8585 674171.2238 168.31 43 45 125.31 123.31 SP 33.2% Unconsolidated SandUD338 191127.7310 672504.6590 173.56 13 15 160.56 158.56 SP-SM 33.9% Semi-Consolidated SandUD338 191127.7310 672504.6590 173.56 28 30 145.56 143.56 SP-SM 37.0% Unconsolidated SandUD338 191127.7310 672504.6590 173.56 43 45 130.56 128.56 SP 35.3% Unconsolidated Sand
Notes: ft bgs = feet blow ground surface USCS = Unified Soil Classification Systemft. amsl = feet above mean sea level
Page 2 of 2

SampleIdentifier
Northing Easting Land Surface Elevation(ft. amsl)
Sample Depth Top
(ft. bgs)
Sample Depth
Bottom(ft. bgs)
Sample Elevation
Top(ft. amsl)
Sample Elevation Bottom
(ft. amsl)
GradationPercent
Sand
GradationPercentSilt/Clay
PZ01S 213145.7250 664792.9515 122.98 6 9 116.98 113.98 84.9 15.1PZ01S 213145.7250 664792.9515 122.98 12.5 20 110.48 102.98 95.0 5.0PZ02 209988.5659 664881.4667 126.02 4 10 122.02 116.02 90.3 9.7PZ02 209988.5659 664881.4667 126.02 17.5 20 108.52 106.02 95.8 4.2
PZ03S 208020.1141 665029.0251 123.77 3 7 120.77 116.77 88.9 11.1PZ03S 208020.1141 665029.0251 123.77 18 20 105.77 103.77 92.5 7.5PZ03D 208027.2407 665032.2313 123.50 7 12 116.50 111.50 49.5 50.5PZ03D 208027.2407 665032.2313 123.50 36 50 87.50 73.50 48.9 51.1PZ04 205447.0841 663720.3298 123.94 6 11 117.94 112.94 92.0 8.0PZ04 205447.0841 663720.3298 123.94 15 20 108.94 103.94 96.1 3.9PZ05 202705.7568 662571.7449 124.62 5 11 119.62 113.62 69.2 30.8PZ05 202705.7568 662571.7449 124.62 15 20 109.62 104.62 90.1 9.9PZ06 201256.8347 662436.2138 124.39 7.5 8 116.89 116.39 94.8 5.2PZ06 201256.8347 662436.2138 124.39 14 20 110.39 104.39 78.8 21.2PZ07 199410.2734 662371.7196 123.08 5 7 118.08 116.08 85.3 14.7PZ07 199410.2734 662371.7196 123.08 9 20 114.08 103.08 93.2 6.8PZ08 197508.9048 664403.2655 130.19 5 6.5 125.19 123.69 85.1 14.9PZ08 197508.9048 664403.2655 130.19 15 20 115.19 110.19 92.5 7.5PZ09 210549.7044 666674.5353 135.39 7 10 128.39 125.39 91.8 8.2PZ09 210549.7044 666674.5353 135.39 27 30 108.39 105.39 95.4 4.6PZ10 206292.4778 667689.3258 145.72 5 8 140.72 137.72 93.2 6.8PZ10 206292.4778 667689.3258 145.72 28 30 117.72 115.72 92.4 7.6PZ11 201281.0529 667407.6724 147.48 8 13 139.48 134.48 92.0 8.0PZ11 201281.0529 667407.6724 147.48 13 19 134.48 128.48 98.3 1.7
PZ12S 199119.7966 666484.6179 138.16 5 9 133.16 129.16 77.6 22.4PZ12S 199119.7966 666484.6179 138.16 19 20 119.16 118.16 92.0 8.0PZ12D 199125.8047 666484.2013 137.52 9 19 128.52 118.52 49.2 50.8PZ12D 199125.8047 666484.2013 137.52 26 40 111.52 97.52 47.3 52.7PZ13 196413.6877 668652.4560 157.47 5 20 152.47 137.47 90.3 9.7PZ13 196413.6877 668652.4560 157.47 27 28 130.47 129.47 93.4 6.6PZ14 193936.6051 669743.4272 167.32 3 9 164.32 158.32 95.8 4.2PZ14 193936.6051 669743.4272 167.32 27 30 140.32 137.32 97.2 2.8PZ15 192000.6802 669433.9007 166.95 4 5.5 162.95 161.45 92.9 7.1PZ15 192000.6802 669433.9007 166.95 6 9 160.95 157.95 84.9 15.1PZ15 192000.6802 669433.9007 166.95 9 12 157.95 154.95 48.4 51.6PZ15 192000.6802 669433.9007 166.95 12.5 20 154.45 146.95 95.0 5.0PZ15 192000.6802 669433.9007 166.95 28 29 138.95 137.95 98.5 1.5
PZ16S 189192.1062 668683.7808 160.60 5 8 155.60 152.60 90.2 9.8PZ16S 189192.1062 668683.7808 160.60 18 20 142.60 140.60 98.0 2.0PZ16D 189193.4656 668689.3844 160.43 10 19 150.43 141.43 48.0 52.0PZ16D 189193.4656 668689.3844 160.43 41 42.5 119.43 117.93 48.0 52.0PZ17S 212018.9084 669994.2076 161.58 9 10 152.58 151.58 48.7 51.3PZ17D 212015.6518 670005.1448 160.89 8 10 152.89 150.89 97.4 2.6PZ17D 212015.6518 670005.1448 160.89 40 45 120.89 115.89 99.2 0.8PZ18 210112.6384 670419.4050 164.38 13 18 151.38 146.38 97.0 3.0PZ18 210112.6384 670419.4050 164.38 18 20 146.38 144.38 91.2 8.8PZ19 207234.6924 670845.9142 169.57 6 13 163.57 156.57 98.2 1.8PZ19 207234.6924 670845.9142 169.57 13 18 156.57 151.57 95.5 4.5
PZ20D 205134.8784 670360.6665 168.43 7 16 161.43 152.43 97.4 2.6PZ20D 205134.8784 670360.6665 168.43 33 40 135.43 128.43 98.1 1.9PZ21 203215.0202 670383.6651 164.61 3 5 161.61 159.61 91.1 8.9PZ21 203215.0202 670383.6651 164.61 6 17 158.61 147.61 93.0 7.0
PZ22S 200359.9896 671694.6840 170.17 9 10 161.17 160.17 48.2 51.8
Table 8 : Summary of Grain-Size Distribution Analysis of Soil Samples Collected from Borings; Twin Pines Minerals, LLC; St. George, Charlton County, Georgia. TTL Project No. 000180200804.00
Page 1 of 3

SampleIdentifier
Northing Easting Land Surface Elevation(ft. amsl)
Sample Depth Top
(ft. bgs)
Sample Depth
Bottom(ft. bgs)
Sample Elevation
Top(ft. amsl)
Sample Elevation Bottom
(ft. amsl)
GradationPercent
Sand
GradationPercentSilt/Clay
Table 8 : Summary of Grain-Size Distribution Analysis of Soil Samples Collected from Borings; Twin Pines Minerals, LLC; St. George, Charlton County, Georgia. TTL Project No. 000180200804.00
PZ22D 200357.7075 671700.7149 170.54 18 23 152.54 147.54 95.3 4.7PZ22D 200357.7075 671700.7149 170.54 35 38 135.54 132.54 98.9 1.1PZ23 198353.0813 672071.4617 169.31 12.5 15 156.81 154.31 46.3 53.7PZ24 196807.9532 672562.2118 169.44 6 7 163.44 162.44 95.2 4.8PZ24 196807.9532 672562.2118 169.44 10 18 159.44 151.44 93.2 6.8
PZ25S 194061.9564 673383.9824 169.99 3 5 166.99 164.99 94.9 5.1PZ25S 194061.9564 673383.9824 169.99 13 19 156.99 150.99 95.8 4.2PZ25D 194070.0069 673381.4148 169.68 9 11 160.68 158.68 48.9 51.1PZ25D 194070.0069 673381.4148 169.68 28.5 29 141.18 140.68 47.3 52.7PZ26 190199.0854 675725.3696 168.99 0 6 168.99 162.99 93.0 7.0PZ26 190199.0854 675725.3696 168.99 13.5 20 155.49 148.99 92.9 7.1
PZ27S 188607.1176 676385.2376 168.02 9 10 159.02 158.02 47.9 52.1PZ27D 188607.9571 676394.0349 168.01 8 13 160.01 155.01 96.1 3.9PZ27D 188607.9571 676394.0349 168.01 24 30 144.01 138.01 97.5 2.5PZ28D 191101.7018 672470.6111 174.13 9 19 165.13 155.13 89.3 10.7PZ28D 191101.7018 672470.6111 174.13 27 30 147.13 144.13 74.0 26.0PZ38 205467.2108 672734.7122 171.69 6 7 165.69 164.69 48.0 52.0
PZ39D 203579.2608 672985.6825 171.84 19 20 152.84 151.84 46.7 53.3PZ39D 203579.2608 672985.6825 171.84 77 79 94.84 92.84 51.0 49.0PZ40 200660.5583 673966.9078 169.48 14 15 155.48 154.48 50.4 49.6PZ43 191206.1308 676493.9937 161.68 5.5 18 156.18 143.68 50.7 49.3
PZ45D 202715.5700 675525.2030 166.58 18 22 148.58 144.58 49.9 50.1PZ45D 202715.5700 675525.2030 166.58 49 49.5 117.58 117.08 50.9 49.1PZ45S 202723.2096 675524.3128 166.64 6.5 7 160.14 159.64 50.5 49.5PZ46 198343.7772 677166.5936 139.98 4 10 135.98 129.98 45.5 54.5PZ47 193012.6975 678365.3361 138.30 13 15 125.30 123.30 49.8 50.2PZ49 205324.4574 677820.5368 142.97 13.5 15 129.47 127.97 48.4 51.6PZ50 202797.9514 678800.9975 127.64 12 13 115.64 114.64 48.9 51.1PZ53 199168.3109 681563.2307 111.31 5 8 106.31 103.31 48.3 51.7PZ53 199168.3109 681563.2307 111.31 7 10 104.31 101.31 48.8 51.2UD10 208093.3130 666408.7486 131.70 13 15 118.70 116.70 93.6 6.4UD10 208093.3130 666408.7486 131.70 28 30 103.70 101.70 95.6 4.4UD10 208093.3130 666408.7486 131.70 43 45 88.70 86.70 94.7 5.3UD25 190488.7166 668975.1185 165.49 15 17 150.49 148.49 93.8 6.2UD25 190488.7166 668975.1185 165.49 30 32 135.49 133.49 96.1 3.9UD25 190488.7166 668975.1185 165.49 43 45 122.49 120.49 95.3 4.7UD34 200408.2230 671582.2720 170.29 13 15 157.29 155.29 92.3 7.7UD34 200408.2230 671582.2720 170.29 28 29 142.29 141.29 96.7 3.3UD34 200408.2230 671582.2720 170.29 48 50 122.29 120.29 95.8 4.2UD43 190542.5306 678135.6130 148.55 13 15 135.55 133.55 96.1 3.9UD43 190542.5306 678135.6130 148.55 30 32 118.55 116.55 93.9 6.1UD43 190542.5306 678135.6130 148.55 43 45 105.55 103.55 73.8 26.2UD51 197065.1026 674174.9889 165.00 13 15 152.00 150.00 92.7 7.3UD51 197065.1026 674174.9889 165.00 28 30 137.00 135.00 93.4 6.6UD51 197065.1026 674174.9889 165.00 43 45 122.00 120.00 98.5 1.5UD65 202093.9328 675684.2974 166.76 17 19 149.76 147.76 97.5 2.5
UD65 202093.9328 675684.2974 166.76 28 30 138.76 136.76 98.3 1.7
UD65 202093.9328 675684.2974 166.76 43 45 123.76 121.76 98.7 1.3UD67 203551.9396 672306.1274 172.06 17 19 155.06 153.06 92.4 5.4UD67 203551.9396 672306.1274 172.06 28 30 144.06 142.06 96.3 2.3UD67 203551.9396 672306.1274 172.06 43 45 129.06 127.06 97.0 2.8UD93 211493.3310 668617.5144 150.25 13 15 137.25 135.25 95.5 4.5UD93 211493.3310 668617.5144 150.25 28 30 122.25 120.25 94.3 5.7UD93 211493.3310 668617.5144 150.25 43 45 107.25 105.25 97.6 2.4
Page 2 of 3

SampleIdentifier
Northing Easting Land Surface Elevation(ft. amsl)
Sample Depth Top
(ft. bgs)
Sample Depth
Bottom(ft. bgs)
Sample Elevation
Top(ft. amsl)
Sample Elevation Bottom
(ft. amsl)
GradationPercent
Sand
GradationPercentSilt/Clay
Table 8 : Summary of Grain-Size Distribution Analysis of Soil Samples Collected from Borings; Twin Pines Minerals, LLC; St. George, Charlton County, Georgia. TTL Project No. 000180200804.00
UD126 202917.1019 666640.3662 140.22 13 15 127.22 125.22 92.3 7.7UD126 202917.1019 666640.3662 140.22 28 30 112.22 110.22 96.8 3.2UD126 202917.1019 666640.3662 140.22 43 45 97.22 95.22 90.5 9.5UD128 199193.1410 667712.6820 150.52 13 15 137.52 135.52 96.7 3.3UD128 199193.1410 667712.6820 150.52 30 32 120.52 118.52 89.5 10.5UD128 199193.1410 667712.6820 150.52 43 45 107.52 105.52 96.8 3.2UD179 207884.9971 670857.1818 166.08 13 15 153.08 151.08 98.0 2.0UD179 207884.9971 670857.1818 166.08 28 30 138.08 136.08 96.0 4.0UD179 207884.9971 670857.1818 166.08 43 45 123.08 121.08 95.9 4.1UD231 196158.7390 669687.5038 167.53 13 15 154.53 152.53 94.3 5.7UD231 196158.7390 669687.5038 167.53 30 32 137.53 135.53 93.6 6.4UD231 196158.7390 669687.5038 167.53 43 45 124.53 122.53 92.5 7.5UD238 192952.8585 674171.2238 168.31 13 15 155.31 153.31 94.9 5.1UD238 192952.8585 674171.2238 168.31 28 30 140.31 138.31 96.4 3.6UD238 192952.8585 674171.2238 168.31 43 45 125.31 123.31 97.1 2.9UD338 191127.7310 672504.6590 173.56 13 15 160.56 158.56 94.5 5.5UD338 191127.7310 672504.6590 173.56 28 30 145.56 143.56 94.5 5.5UD338 191127.7310 672504.6590 173.56 43 45 130.56 128.56 96.9 3.1UD25R NS NS NS 3 5 NS NS 91.4 8.6UD25R NS NS NS 10 12 NS NS 96.8 3.2UD43R NS NS NS 5 7 NS NS 96.6 3.4UD43R NS NS NS 10 12 NS NS 99.0 1.0
UD238R NS NS NS 6 8 NS NS 98.3 1.7UD238R NS NS NS 10 12 NS NS 98.7 1.4UD338R NS NS NS 9 11 NS NS 96.2 3.8Notes: ft bgs = feet below ground surface
ft amsl = feet above mean sea levelNS = Not surveyed; borings performed within 5-10 feet of original UD boring
Page 3 of 3

Sample IdentifierBentonite
Addition (%)Hydraulic Conductivity
(cm/sec)Sample Type
ASTMMethod
UD338/25-A 0% bentonite 1.1 X 10⁻³ Simulated In Situ D 5084
UD338/25-B 0% bentonite 1.1 X 10⁻³ Simulated In Situ D 5084
UD338/25-C 0% bentonite 7.2 X 10⁻⁴ Simulated In Situ D 5084
UD338/25-A 0.35% bentonite to sand 7.0 X 10⁻⁴ Simulated In Situ D 5084
UD338/25-B 0.35% bentonite to sand 5.6 X 10⁻⁴ Simulated In Situ D 5084
UD338/25-C 0.35% bentonite to sand 1.2 X 10⁻³ Simulated In Situ D 5084
UD338/25-A 1.42% bentonite to sand 1.7 X 10⁻³ Simulated In Situ D 5084
UD338/25-B 1.42% bentonite to sand 1.6 X 10⁻³ Simulated In Situ D 5084
UD338/25-C 1.42% bentonite to sand 1.5 X 10⁻³ Simulated In Situ D 5084
UD338/25 5% bentonite to sand 5.7 X 10⁻⁶ Remolded D 5084
UD338/25 7.5% bentonite to sand 2.0 X 10⁻⁶ Remolded D 5084
UD338/25 10% bentonite to sand 3.0 X 10⁻⁷ Remolded D 5084
UD338/25 10% bentonite to sand 6.8 X 10⁻⁷ Remolded D 5084
UD338/25 12.5% bentonite to sand 1.0 X 10⁻⁸ Remolded D 5084
UD338/25 15% bentonite to sand 5.8 X 10⁻⁹ Remolded D 5084
UD338/25 15% bentonite to sand 5.0 X 10⁻⁹ Remolded D 5084
UD338/25 30% bentonite to sand 2.7 X 10⁻⁹ Remolded D 5084
UD338/25 30% bentonite to sand 2.0 X 10⁻⁹ Remolded D 5084
PZ57D (20’-22’) Black Sand 0% bentonite 2.7 X 10⁻⁸ Undisturbed D 5084
PZ57D (25'-27’) Black Sand 0% bentonite 3.4 X 10⁻⁷ Undisturbed D 5084
Table 9. Results of Bench-Scale Study Vertical Hydraulic Conductivity Testing of Post-Processed Soils Compared to Undisturbed Sample PZ57D. Hydrogeology of the Twin Pines Project Area; Twin Pines Minerals, LLC; St. George, Charlton County, Georgia. TTL Project No. 000180200804.00
Notes: cm/sec = centimeters per second
Undisturbed Soil Sample PZ57 - Consolidated Black Sand
Post-Processed Sand Sample UD338/25

RG01 RG02 RG03
09/21/18 ---2 0.20 0.04
09/22/18 --- --- ---
09/23/18 --- --- ---
09/24/18 0.01 0.09 0.13
09/25/18 --- --- 0.01
09/26/18 --- --- ---
09/27/18 0.01 --- ---
09/28/18 0.33 0.83 1.73
09/29/18 --- --- 0.01
09/30/18 --- --- ---
Total Monthly 0.35 1.12 1.92
10/01/18 0.42 0.01 ---
10/02/18 --- --- ---
10/03/18 --- --- ---
10/04/18 --- --- ---
10/05/18 --- --- ---
10/06/18 --- --- ---
10/07/18 0.02 0.02 ---
10/08/18 0.31 0.08 0.06
10/09/18 0.52 0.55 0.32
10/10/18 0.21 0.24 0.35
10/11/18 --- --- ---
10/12/18 --- --- ---
10/13/18 --- --- ---
10/14/18 --- --- ---
10/15/18 --- --- ---
10/16/18 --- ---
10/17/18 --- 0.01 ---
10/18/18 --- --- ---
10/19/18 --- --- ---
10/20/18 0.07 0.04 0.02
10/21/18 --- --- ---
10/22/18 --- --- ---
10/23/18 0.02 0.01 ---
10/24/18 --- --- ---
10/25/18 0.01 0.01 0.03
10/26/18 0.10 0.09 0.15
10/27/18 --- --- ---
10/28/18 --- --- ---
10/29/18 --- --- ---
10/30/18 --- --- ---
10/31/18 --- --- ---
Total Monthly 1.68 1.06 0.93
Date
Daily Cumulative Precipitation (in.)1
Table 10. Local Precipitation Summary Table; Local Groundwater/Surface Water Hydrology At Twin Pines Mine; Twin Pines Minerals, LLC; St. George, Charlton County, Georgia. TTL Project No. 000180200804.00
Page 1 of 13

RG01 RG02 RG03Date
Daily Cumulative Precipitation (in.)1
Table 10. Local Precipitation Summary Table; Local Groundwater/Surface Water Hydrology At Twin Pines Mine; Twin Pines Minerals, LLC; St. George, Charlton County, Georgia. TTL Project No. 000180200804.00
11/01/18 0.09 0.12 0.10
11/02/18 0.45 0.30 0.37
11/03/18 --- --- ---
11/04/18 0.71 0.52 0.89
11/05/18 0.09 0.07 0.13
11/06/18 --- 0.01 ---
11/07/18 --- ---
11/08/18 --- ---
11/09/18 --- ---
11/10/18 --- ---
11/11/18 --- ---
11/12/18 --- ---
11/13/18 --- ---
11/14/18 --- ---
11/15/18 --- ---
11/16/18 --- ---
11/17/18 --- ---
11/18/18 --- ---
11/19/18 --- ---
11/20/18 --- ---
11/21/18 --- ---
11/22/18 --- ---
11/23/18 --- ---
11/24/18 --- ---
11/25/18 --- ---
11/26/18 --- ---
11/27/18 --- ---
11/28/18 --- ---
11/29/18 --- ---
11/30/18 --- ---
Total Monthly 1.34 1.02 1.49
No
Prec
ipita
tion
Dat
a fr
om 1
1/0
7/1
8 to
02
/18
/19
(RG
01
Des
troy
ed)
Page 2 of 13

RG01 RG02 RG03Date
Daily Cumulative Precipitation (in.)1
Table 10. Local Precipitation Summary Table; Local Groundwater/Surface Water Hydrology At Twin Pines Mine; Twin Pines Minerals, LLC; St. George, Charlton County, Georgia. TTL Project No. 000180200804.00
12/01/18 0.74 0.74
12/02/18 0.30 0.19
12/03/18 0.66 0.86
12/04/18 --- ---
12/05/18 --- ---
12/06/18 --- ---
12/07/18 --- ---
12/08/18 --- ---
12/09/18 1.26 1.23
12/10/18 0.01 0.01
12/11/18 --- ---
12/12/18 --- ---
12/13/18 --- ---
12/14/18 1.96 2.23
12/15/18 0.13 0.20
12/16/18 --- ---
12/17/18 --- ---
12/18/18 --- ---
12/19/18 --- ---
12/20/18 0.60 0.74
12/21/18 0.04 0.02
12/22/18 --- ---
12/23/18 --- ---
12/24/18 --- ---
12/25/18 --- ---
12/26/18 --- ---
12/27/18 --- ---
12/28/18 0.51 1.24
12/29/18 0.11 0.33
12/30/18 0.01 0.01
12/31/18 --- ---
Total Monthly No Data 6.33 7.80
No
Prec
ipita
tion
Dat
a fr
om 1
1/0
7/1
8 to
02
/18
/19
(RG
01
Des
troy
ed)
Page 3 of 13

RG01 RG02 RG03Date
Daily Cumulative Precipitation (in.)1
Table 10. Local Precipitation Summary Table; Local Groundwater/Surface Water Hydrology At Twin Pines Mine; Twin Pines Minerals, LLC; St. George, Charlton County, Georgia. TTL Project No. 000180200804.00
01/01/19 --- ---
01/02/19 --- ---
01/03/19 0.01 0.05
01/04/19 0.48 0.62
01/05/19 --- ---
01/06/19 --- ---
01/07/19 --- ---
01/08/19 --- ---
01/09/19 --- ---
01/10/19 --- ---
01/11/19 --- ---
01/12/19 --- ---
01/13/19 0.05 0.10
01/14/19 --- ---
01/15/19 --- ---
01/16/19 --- ---
01/17/19 --- ---
01/18/19 --- ---
01/19/19 --- ---
01/20/19 0.53 0.81
01/21/19 --- ---
01/22/19 --- ---
01/23/19 --- ---
01/24/19 1.86 2.20
01/25/19 --- ---
01/26/19 --- ---
01/27/19 0.58 0.67
01/28/19 0.23 0.27
01/29/19 --- ---
01/30/19 --- ---
01/31/19 --- ---
Total Monthly No Data 3.74 4.72
No
Prec
ipita
tion
Dat
a fr
om 1
1/0
7/1
8 to
02
/18
/19
(RG
01
Des
troy
ed)
Page 4 of 13

RG01 RG02 RG03Date
Daily Cumulative Precipitation (in.)1
Table 10. Local Precipitation Summary Table; Local Groundwater/Surface Water Hydrology At Twin Pines Mine; Twin Pines Minerals, LLC; St. George, Charlton County, Georgia. TTL Project No. 000180200804.00
02/01/19 0.01 0.01
02/02/19 0.08 0.09
02/03/19 0.53 0.95
02/04/19 --- ---
02/05/19 --- ---
02/06/19 --- ---
02/07/19 --- ---
02/08/19 --- ---
02/09/19 --- ---
02/10/19 --- ---
02/11/19 0.05 0.05
02/12/19 0.07 0.26
02/13/19 0.15 0.13
02/14/19 --- ---
02/15/19 --- ---
02/16/19 --- ---
02/17/19 --- ---
02/18/19 --- ---
02/19/19 0.05 0.06 0.04
02/20/19 --- --- ---
02/21/19 --- --- ---
02/22/19 --- --- ---
02/23/19 --- --- ---
02/24/19 0.26 --- ---
02/25/19 --- --- ---
02/26/19 --- --- ---
02/27/19 0.25 --- ---
02/28/19 0.02 --- ---
Total Monthly 0.58 0.95 1.53
No
Prec
ipita
tion
Dat
a fr
om 1
1/0
7/1
8 to
02
/18
/19
(RG
01
Des
troy
ed)
Page 5 of 13

RG01 RG02 RG03Date
Daily Cumulative Precipitation (in.)1
Table 10. Local Precipitation Summary Table; Local Groundwater/Surface Water Hydrology At Twin Pines Mine; Twin Pines Minerals, LLC; St. George, Charlton County, Georgia. TTL Project No. 000180200804.00
03/01/19 0.59 --- ---
03/02/19 0.25 --- ---
03/03/19 0.32 --- ---
03/04/19 --- --- ---
03/05/19 0.28 --- ---
03/06/19 --- --- ---
03/07/19 --- --- ---
03/08/19 --- --- ---
03/09/19 --- --- ---
03/10/19 --- --- ---
03/11/19 0.24 --- ---
03/12/19 0.01 --- ---
03/13/19 --- --- ---
03/14/19 --- --- ---
03/15/19 --- --- ---
03/16/19 --- --- ---
03/17/19 0.03 --- ---
03/18/19 --- --- ---
03/19/19 --- --- ---
03/20/19 --- --- ---
03/21/19 --- --- ---
03/22/19 --- --- ---
03/23/19 --- --- ---
03/24/19 --- --- ---
03/25/19 --- --- ---
03/26/19 0.08 0.05 0.02
03/27/19 0.14 0.15 0.16
03/28/19 --- --- ---
03/29/19 --- --- ---
03/30/19 --- --- ---
03/31/19 0.04 0.06 0.10
Total Monthly 1.98 0.26 0.28
Page 6 of 13

RG01 RG02 RG03Date
Daily Cumulative Precipitation (in.)1
Table 10. Local Precipitation Summary Table; Local Groundwater/Surface Water Hydrology At Twin Pines Mine; Twin Pines Minerals, LLC; St. George, Charlton County, Georgia. TTL Project No. 000180200804.00
04/01/19 0.42 0.45 0.25
04/02/19 0.31 0.35 0.35
04/03/19 --- --- ---
04/04/19 --- --- ---
04/05/19 0.57 0.63 0.65
04/06/19 --- --- ---
04/07/19 --- --- ---
04/08/19 0.03 --- 0.10
04/09/19 0.01 0.02 0.11
04/10/19 --- --- ---
04/11/19 --- --- ---
04/12/19 --- --- 0.06
04/13/19 --- ---
04/14/19 0.16 0.10 0.10
04/15/19 --- --- ---
04/16/19 --- --- ---
04/17/19 --- --- ---
04/18/19 --- --- ---
04/19/19 0.82 0.58 0.47
04/20/19 --- --- ---
04/21/19 --- --- ---
04/22/19 --- --- ---
04/23/19 --- --- ---
04/24/19 --- --- ---
04/25/19 --- --- ---
04/26/19 0.29 0.31 0.22
04/27/19 --- --- ---
04/28/19 --- --- ---
04/29/19 --- --- ---
04/30/19 --- --- ---
Total Monthly 2.61 2.44 2.31
Page 7 of 13

RG01 RG02 RG03Date
Daily Cumulative Precipitation (in.)1
Table 10. Local Precipitation Summary Table; Local Groundwater/Surface Water Hydrology At Twin Pines Mine; Twin Pines Minerals, LLC; St. George, Charlton County, Georgia. TTL Project No. 000180200804.00
05/01/19 --- --- ---
05/02/19 0.09 --- ---
05/03/19 0.07 0.04 0.42
05/04/19 0.29 --- 0.01
05/05/19 1.23 0.95 1.07
05/06/19 0.01 0.01 ---
05/07/19 --- --- ---
05/08/19 --- --- ---
05/09/19 --- --- ---
05/10/19 --- --- ---
05/11/19 --- --- ---
05/12/19 0.03 0.01 0.02
05/13/19 --- --- 0.39
05/14/19 0.01 --- ---
05/15/19 --- --- ---
05/16/19 --- --- ---
05/17/19 --- --- ---
05/18/19 --- --- ---
05/19/19 --- --- ---
05/20/19 --- --- ---
05/21/19 --- --- ---
05/22/19 --- --- ---
05/23/19 --- --- ---
05/24/19 --- --- ---
05/25/19 --- --- ---
05/26/19 --- --- ---
05/27/19 --- --- ---
05/28/19 --- --- ---
05/29/19 --- --- ---
05/30/19 --- --- ---
05/31/19 --- --- ---
Total Monthly 1.73 1.01 1.91
Page 8 of 13

RG01 RG02 RG03Date
Daily Cumulative Precipitation (in.)1
Table 10. Local Precipitation Summary Table; Local Groundwater/Surface Water Hydrology At Twin Pines Mine; Twin Pines Minerals, LLC; St. George, Charlton County, Georgia. TTL Project No. 000180200804.00
06/01/19 --- --- ---
06/02/19 --- --- ---
06/03/19 --- --- ---
06/04/19 --- 0.09 ---
06/05/19 --- --- 0.34
06/06/19 --- --- ---
06/07/19 0.01 --- 0.01
06/08/19 0.23 0.28 0.14
06/09/19 --- --- 0.01
06/10/19 0.39 0.12 ---
06/11/19 0.18 0.45 0.53
06/12/19 0.36 0.38 0.30
06/13/19 0.02 0.08 0.01
06/14/19 --- --- ---
06/15/19 --- --- ---
06/16/19 --- 0.31 ---
06/17/19 --- --- ---
06/18/19 0.22 0.07 0.02
06/19/19 0.45 0.38 0.34
06/20/19 0.67 0.86 0.63
06/21/19 0.01 0.01 ---
06/22/19 0.02 --- ---
06/23/19 0.01 --- ---
06/24/19 --- --- ---
06/25/19 --- --- ---
06/26/19 --- --- ---
06/27/19 --- --- 0.01
06/28/19 --- --- ---
06/29/19 1.23 1.65 1.21
06/30/19 0.01 --- ---
Total Monthly 3.81 4.68 3.55
Page 9 of 13

RG01 RG02 RG03Date
Daily Cumulative Precipitation (in.)1
Table 10. Local Precipitation Summary Table; Local Groundwater/Surface Water Hydrology At Twin Pines Mine; Twin Pines Minerals, LLC; St. George, Charlton County, Georgia. TTL Project No. 000180200804.00
07/01/19 --- --- ---
07/02/19 0.06 0.03 0.07
07/03/19 --- --- ---
07/04/19 0.62 0.44 0.18
07/05/19 0.26 0.54 0.20
07/06/19 1.74 2.18 1.42
07/07/19 0.19 0.37 0.29
07/08/19 0.46 1.59 1.02
07/09/19 --- --- ---
07/10/19 1.00 1.01 0.91
07/11/19 0.28 0.86 0.72
07/12/19 2.52 1.82 2.11
07/13/19 0.02 --- 0.01
07/14/19 --- --- ---
07/15/19 --- --- ---
07/16/19 --- --- ---
07/17/19 1.68 1.29 0.58
07/18/19 --- --- ---
07/19/19 0.18 0.23 0.50
07/20/19 1.22 0.46 0.67
07/21/19 0.27 0.17 0.52
07/22/19 --- --- ---
07/23/19 0.12 0.04 0.02
07/24/19 0.78 1.05 0.52
07/25/19 --- 0.01 ---
07/26/19 --- --- 0.01
07/27/19 --- 1.44 0.53
07/28/19 --- 0.82 1.38
07/29/19 --- --- ---
07/30/19 --- --- ---
07/31/19 --- --- ---
Total Monthly 11.40 14.35 11.66
Page 10 of 13

RG01 RG02 RG03Date
Daily Cumulative Precipitation (in.)1
Table 10. Local Precipitation Summary Table; Local Groundwater/Surface Water Hydrology At Twin Pines Mine; Twin Pines Minerals, LLC; St. George, Charlton County, Georgia. TTL Project No. 000180200804.00
08/01/19 --- --- ---
08/02/19 --- --- ---
08/03/19 0.35 --- 0.01
08/04/19 --- --- ---
08/05/19 0.15 0.48 0.12
08/06/19 --- --- ---
08/07/19 --- --- ---
08/08/19 --- --- ---
08/09/19 --- --- ---
08/10/19 0.16 0.08 0.01
08/11/19 0.04 0.04 0.72
08/12/19 --- --- 0.01
08/13/19 --- --- ---
08/14/19 0.29 0.52 0.64
08/15/19 0.21 0.62 1.11
08/16/19 --- ---
08/17/19 0.33 0.43 0.53
08/18/19 0.03 0.19
08/19/19 --- ---
08/20/19 --- 0.26
08/21/19 --- ---
08/22/19 --- ---
08/23/19 --- ---
08/24/19 --- ---
08/25/19 0.18 ---
08/26/19 0.07 0.06
08/27/19 0.01 0.45
08/28/19 --- ---
08/29/19 --- ---
08/30/19 0.11 ---
08/31/19 0.69 0.16
Total Monthly 2.62 2.17 4.27
No
Prec
ipita
tion
Dat
a fr
om 0
8/1
8/1
9 to
1
0/1
6/1
9 (t
rans
duce
r da
ta c
orru
pted
)
Page 11 of 13

RG01 RG02 RG03Date
Daily Cumulative Precipitation (in.)1
Table 10. Local Precipitation Summary Table; Local Groundwater/Surface Water Hydrology At Twin Pines Mine; Twin Pines Minerals, LLC; St. George, Charlton County, Georgia. TTL Project No. 000180200804.00
09/01/19 0.01 ---
09/02/19 0.15 0.02
09/03/19 0.06 ---
09/04/19 0.07 0.09
09/05/19 --- ---
09/06/19 --- ---
09/07/19 --- ---
09/08/19 --- ---
09/09/19 --- ---
09/10/19 --- ---
09/11/19 --- ---
09/12/19 0.02 0.52
09/13/19 --- ---
09/14/19 --- ---
09/15/19 0.03 0.04
09/16/19 --- ---
09/17/19 --- ---
09/18/19 --- ---
09/19/19 --- ---
09/20/19 --- ---
09/21/19 --- ---
09/22/19 --- ---
09/23/19 --- ---
09/24/19 --- ---
09/25/19 --- ---
09/26/19 --- ---
09/27/19 --- ---
09/28/19 --- ---
09/29/19 --- ---
09/30/19 --- ---
Total Monthly 0.34 No Data 0.67
No
Prec
ipita
tion
Dat
a fr
om 0
8/1
8/1
9 to
10
/16
/19
(tra
nsdu
cer
data
cor
rupt
ed)
Page 12 of 13

RG01 RG02 RG03Date
Daily Cumulative Precipitation (in.)1
Table 10. Local Precipitation Summary Table; Local Groundwater/Surface Water Hydrology At Twin Pines Mine; Twin Pines Minerals, LLC; St. George, Charlton County, Georgia. TTL Project No. 000180200804.00
10/01/19 0.01 ---
10/02/19 --- ---
10/03/19 --- ---
10/04/19 --- ---
10/05/19 --- ---
10/06/19 0.03 0.01
10/07/19 2.01 2.01
10/08/19 --- 0.01
10/09/19 --- ---
10/10/19 --- ---
10/11/19 --- ---
10/12/19 --- ---
10/13/19 --- ---
10/14/19 --- ---
10/15/19 0.10 ---
10/16/19 0.12 ---Total Monthly 2.27 No Data 2.03
No
Prec
ipita
tion
Dat
a fr
om 0
8/1
8/1
9 to
10
/16
/19
(t
rans
duce
r da
ta c
orru
pted
)
1 in. = inches2 --- = No Precipitation
Page 13 of 13

WELL ID Northing EastingDate of
Measurement
Water Level Elevation(ft. AMSL)
SG01 190060.1533 675353.0374 1/26/2019 170.03
2/26/2019 169.87
3/26/2019 169.70
4/26/2019 DRY
5/26/2019 169.09
6/26/2019 169.08
7/26/2019 170.06
8/26/2019 169.75
9/26/2019 DRY
SG02 194170.4613 673292.0111 3/26/2019 DRY
4/26/2019 DRY
5/26/2019 DRY
6/26/2019 DRY
7/26/2019 169.01
8/26/2019 DRY
9/26/2019 DRY
SG03 195831.1963 671005.9187 2/26/2019 DRY
3/26/2019 NO DATA
4/26/2019 NO DATA
5/26/2019 DRY
6/26/2019 DRY
7/26/2019 170.80
8/26/2019 DRY
9/26/2019 DRY
SG04 203312.6721 670258.9505 1/26/2019 163.54
2/26/2019 163.45
3/26/2019 163.19
4/26/2019 163.21
5/26/2019 163.16
6/26/2019 163.08
7/26/2019 163.42
8/26/2019 162.97
9/26/2019 DRY
Table 11. Staff Gauge Elevation Summary Table; Local Groundwater/Surface Water Hydrology at Twin Pines Mine; Twin Pines Minerals, LLC; St. George, Charlton County, Georgia. TTL Project No. 000180200804.00
Page 1 of 6

WELL ID Northing EastingDate of
Measurement
Water Level Elevation(ft. AMSL)
Table 11. Staff Gauge Elevation Summary Table; Local Groundwater/Surface Water Hydrology at Twin Pines Mine; Twin Pines Minerals, LLC; St. George, Charlton County, Georgia. TTL Project No. 000180200804.00
SG05 207341.2463 670317.5041 1/26/2019 162.10
2/26/2019 DRY
3/26/2019 DRY
4/26/2019 DRY
5/26/2019 DRY
6/26/2019 DRY
7/26/2019 161.75
8/26/2019 DRY
9/26/2019 DRY
SG06 213217.3710 664858.0050 1/26/2019 122.89
2/26/2019 122.59
3/26/2019 122.24
4/26/2019 121.86
5/26/2019 120.61
6/26/2019 119.73
7/26/2019 122.72
8/26/2019 121.30
9/26/2019 119.52
SG07 208304.7741 665040.0182 1/26/2019 121.82
2/26/2019 121.68
3/26/2019 121.51
4/26/2019 121.55
5/26/2019 DRY
6/26/2019 DRY
7/26/2019 121.87
8/26/2019 121.24
9/26/2019 DRY
SG08 202479.9185 662783.8356 2/26/2019 Data Lost
3/26/2019 Data Lost
4/26/2019 Data Lost
5/26/2019 Data Lost
6/26/2019 Data Lost
7/26/2019 124.75
8/26/2019 DRY
9/26/2019 DRY
Page 2 of 6

WELL ID Northing EastingDate of
Measurement
Water Level Elevation(ft. AMSL)
Table 11. Staff Gauge Elevation Summary Table; Local Groundwater/Surface Water Hydrology at Twin Pines Mine; Twin Pines Minerals, LLC; St. George, Charlton County, Georgia. TTL Project No. 000180200804.00
SG09 203743.3543 665882.4745 1/26/2019 135.27
2/26/2019 134.85
3/26/2019 DRY
4/26/2019 DRY
5/26/2019 DRY
6/26/2019 134.71
7/26/2019 135.32
8/26/2019 DRY
9/26/2019 DRY
SG10 200660.2535 666577.4581 2/26/2019 139.86
3/26/2019 DRY
4/26/2019 DRY
5/26/2019 139.91
6/26/2019 139.89
7/26/2019 140.33
8/26/2019 DRY
9/26/2019 DRY
SG11 198442.8366 662889.7644 2/26/2019 Data Lost
3/26/2019 Data Lost
4/26/2019 Data Lost
5/26/2019 Data Lost
6/26/2019 Data Lost
7/26/2019 Test Reset
8/26/2019 120.67
9/26/2019 DRY
SG12 191752.2030 670193.4861 3/26/2019 DRY
4/26/2019 DRY
5/26/2019 DRY
6/26/2019 DRY
7/26/2019 170.38
8/26/2019 DRY
9/26/2019 DRY
Page 3 of 6

WELL ID Northing EastingDate of
Measurement
Water Level Elevation(ft. AMSL)
Table 11. Staff Gauge Elevation Summary Table; Local Groundwater/Surface Water Hydrology at Twin Pines Mine; Twin Pines Minerals, LLC; St. George, Charlton County, Georgia. TTL Project No. 000180200804.00
SG20 200805.0365 673471.1511 1/26/2019 170.32
2/26/2019 170.19
3/26/2019 170.01
4/26/2019 169.53
5/26/2019 169.62
6/26/2019 169.60
7/26/2019 170.50
8/26/2019 169.75
9/26/2019 169.43
SG21 198431.5982 677192.9153 1/26/2019 136.01
2/26/2019 135.96
3/26/2019 135.97
4/26/2019 135.95
5/26/2019 DRY
6/26/2019 DRY
7/26/2019 136.15
8/26/2019 135.88
9/26/2019 DRY
SG22 189578.3083 677892.6959 1/26/2019 152.13
2/26/2019 151.83
3/26/2019 151.33
4/26/2019 150.98
5/26/2019 150.57
6/26/2019 150.54
7/26/2019 152.06
8/26/2019 151.68
9/26/2019 150.39
SG23 202266.8562 681949.5614 1/26/2019 107.34
2/26/2019 106.87
3/26/2019 106.77
4/26/2019 107.01
5/26/2019 105.47
6/26/2019 105.76
7/26/2019 107.36
8/26/2019 106.77
9/26/2019 106.08
Page 4 of 6

WELL ID Northing EastingDate of
Measurement
Water Level Elevation(ft. AMSL)
Table 11. Staff Gauge Elevation Summary Table; Local Groundwater/Surface Water Hydrology at Twin Pines Mine; Twin Pines Minerals, LLC; St. George, Charlton County, Georgia. TTL Project No. 000180200804.00
SG24 197574.4045 681962.1716 5/26/2019 93.71
6/26/2019 93.69
7/26/2019 94.58
8/26/2019 93.72
9/26/2019 DRY
SG25 196293.4142 681520.1068 5/26/2019 DRY
6/26/2019 DRY
7/26/2019 97.71
8/26/2019 DRY
9/26/2019 DRY
SG26 194274.1234 680987.7320 1/26/2019 99.95
2/26/2019 99.67
3/26/2019 99.53
4/26/2019 99.33
5/26/2019 DRY
6/26/2019 DRY
7/26/2019 99.53
8/26/2019 DRY
9/26/2019 DRY
SG27 190408.5483 680028.7130 5/26/2019 132.57
6/26/2019 132.50
7/26/2019 133.39
8/26/2019 132.69
9/26/2019 132.53
SG28 200427.6280 687397.7131 5/26/2019 66.62
6/26/2019 66.82
7/26/2019 68.03
8/26/2019 67.72
9/26/2019 67.15
SG29 200571.7839 687446.5409 5/26/2019 DRY
6/26/2019 DRY
7/26/2019 67.77
8/26/2019 67.41
9/26/2019 DRY
Page 5 of 6

WELL ID Northing EastingDate of
Measurement
Water Level Elevation(ft. AMSL)
Table 11. Staff Gauge Elevation Summary Table; Local Groundwater/Surface Water Hydrology at Twin Pines Mine; Twin Pines Minerals, LLC; St. George, Charlton County, Georgia. TTL Project No. 000180200804.00
SG30 200814.9364 687457.3495 5/26/2019 DRY
6/26/2019 DRY
7/26/2019 69.92
8/26/2019 69.489/26/2019 DRY
ft. AMSL = feet above mean sea level
Page 6 of 6

WELL ID Northing EastingTop of Casing
Elevation(ft. AMSL)
Date of Measurement
Depth to Water (ft bgs)
Water Level Elevation(ft. AMSL)
PZ01D 213150.6852 664800.7444 123.10 1/26/2019 -0.50 123.60
2/26/2019 -0.68 123.78
3/26/2019 -0.56 123.66
4/26/2019 -0.48 123.58
5/26/2019 0.91 122.19
6/26/2019 1.39 121.71
7/26/2019 -0.60 123.70
8/26/2019 0.34 122.76
9/26/2019 1.90 121.21
PZ01S 213145.7250 664792.9515 123.04 1/26/2019 0.20 122.84
2/26/2019 0.61 122.43
3/26/2019 1.38 121.66
4/26/2019 1.64 121.40
5/26/2019 3.25 119.79
6/26/2019 4.00 119.04
7/26/2019 0.19 122.85
8/26/2019 2.63 120.41
9/26/2019 4.36 118.68
PZ02 209988.5659 664881.4667 126.03 1/26/2019 -0.06 126.09
2/26/2019 0.76 125.27
3/26/2019 1.42 124.61
4/26/2019 1.39 124.64
5/26/2019 2.85 123.18
6/26/2019 3.21 122.82
7/26/2019 -0.08 126.11
8/26/2019 2.37 123.66
9/26/2019 3.83 122.20
PZ03D 208027.2407 665032.2313 123.56 1/26/2019 -1.32 124.88
2/26/2019 -0.54 124.10
3/26/2019 -0.38 123.94
4/26/2019 -0.17 123.73
5/26/2019 1.22 122.34
6/26/2019 1.52 122.04
7/26/2019 -0.55 124.11
8/26/2019 0.48 123.08
9/26/2019 2.04 121.52
PZ03S 208020.1141 665029.0251 123.80 1/26/2019 0.61 123.19
2/26/2019 1.04 122.76
3/26/2019 1.77 122.03
4/26/2019 1.68 122.12
5/26/2019 3.35 120.45
6/26/2019 3.33 120.47
7/26/2019 0.55 123.25
8/26/2019 2.48 121.32
9/26/2019 3.94 119.86
Table 12. Groundwater Elevation Summary Table; Local Groundwater/Surface Water Hydrology at Twin Pines Mine; Twin Pines Minerals, LLC; St. George, Charlton County, Georgia. TTL Project No. 000180200804.00
Page 1 of 14

WELL ID Northing EastingTop of Casing
Elevation(ft. AMSL)
Date of Measurement
Depth to Water (ft bgs)
Water Level Elevation(ft. AMSL)
Table 12. Groundwater Elevation Summary Table; Local Groundwater/Surface Water Hydrology at Twin Pines Mine; Twin Pines Minerals, LLC; St. George, Charlton County, Georgia. TTL Project No. 000180200804.00
PZ04 205447.0841 663720.3298 123.89 1/26/2019 1.16 122.73
2/26/2019 1.84 122.05
3/26/2019 2.74 121.15
4/26/2019 3.01 120.88
5/26/2019 4.57 119.33
6/26/2019 5.19 118.70
7/26/2019 1.41 122.48
8/26/2019 3.51 120.38
9/26/2019 5.30 118.59
PZ05 202705.7568 662571.7449 124.37 1/26/2019 0.95 123.42
2/26/2019 1.38 122.99
3/26/2019 2.44 121.93
4/26/2019 2.89 121.48
5/26/2019 4.56 119.82
6/26/2019 5.45 118.92
7/26/2019 1.07 123.30
8/26/2019 3.01 121.36
9/26/2019 4.95 119.42
PZ06 201256.8347 662436.2138 124.26 1/26/2019 0.20 124.06
2/26/2019 1.11 123.16
3/26/2019 1.88 122.38
4/26/2019 2.14 122.12
5/26/2019 3.73 120.53
6/26/2019 4.53 119.74
7/26/2019 0.53 123.74
8/26/2019 2.30 121.96
9/26/2019 4.03 120.23
PZ07 199410.2734 662371.7196 123.41 1/26/2019 -0.20 123.61
2/26/2019 0.70 122.71
3/26/2019 1.34 122.07
4/26/2019 1.97 121.44
5/26/2019 3.65 119.76
6/26/2019 4.61 118.80
7/26/2019 -0.24 123.65
8/26/2019 1.45 121.96
9/26/2019 3.45 119.96
PZ08 197508.9048 664403.2655 130.08 1/26/2019 0.59 129.49
2/26/2019 1.42 128.67
3/26/2019 2.04 128.04
4/26/2019 2.70 127.39
5/26/2019 4.22 125.86
6/26/2019 4.79 125.29
7/26/2019 0.56 129.52
8/26/2019 2.15 127.93
9/26/2019 4.06 126.02
Page 2 of 14

WELL ID Northing EastingTop of Casing
Elevation(ft. AMSL)
Date of Measurement
Depth to Water (ft bgs)
Water Level Elevation(ft. AMSL)
Table 12. Groundwater Elevation Summary Table; Local Groundwater/Surface Water Hydrology at Twin Pines Mine; Twin Pines Minerals, LLC; St. George, Charlton County, Georgia. TTL Project No. 000180200804.00
PZ09 210549.7044 666674.5353 135.06 1/26/2019 0.36 134.702/26/2019 0.93 134.133/26/2019 1.43 133.634/26/2019 1.28 133.78
5/26/2019 2.69 132.37
6/26/2019 2.87 132.19
7/26/2019 0.39 134.67
8/26/2019 2.41 132.65
9/26/2019 3.53 131.53
PZ10 206292.4778 667689.3258 145.97 1/26/2019 0.77 145.20
2/26/2019 1.32 144.65
3/26/2019 2.09 143.88
4/26/2019 2.11 143.86
5/26/2019 3.49 142.48
6/26/2019 3.92 142.05
7/26/2019 0.74 145.23
8/26/2019 2.65 143.32
9/26/2019 3.88 142.09
PZ11 201281.0529 667407.6724 148.10 1/26/2019 1.21 146.89
2/26/2019 2.07 146.04
3/26/2019 2.46 145.64
4/26/2019 2.51 145.59
5/26/2019 3.73 144.37
6/26/2019 4.21 143.89
7/26/2019 1.16 146.94
8/26/2019 2.53 145.57
9/26/2019 3.94 144.16
PZ12D 199125.8047 666484.2013 138.18 1/26/2019 -0.09 138.27
2/26/2019 0.30 137.89
3/26/2019 1.13 137.05
4/26/2019 1.22 136.96
5/26/2019 3.11 135.07
6/26/2019 2.93 135.25
7/26/2019 -0.09 138.27
8/26/2019 1.69 136.50
9/26/2019 3.22 134.96
PZ12S 199119.7966 666484.6179 138.00 1/26/2019 -0.27 138.27
2/26/2019 0.18 137.82
3/26/2019 1.00 137.00
4/26/2019 1.10 136.90
5/26/2019 2.93 135.07
6/26/2019 2.77 135.23
7/26/2019 -0.29 138.29
8/26/2019 1.55 136.45
9/26/2019 3.04 134.96
Page 3 of 14

WELL ID Northing EastingTop of Casing
Elevation(ft. AMSL)
Date of Measurement
Depth to Water (ft bgs)
Water Level Elevation(ft. AMSL)
Table 12. Groundwater Elevation Summary Table; Local Groundwater/Surface Water Hydrology at Twin Pines Mine; Twin Pines Minerals, LLC; St. George, Charlton County, Georgia. TTL Project No. 000180200804.00
PZ13 196413.6877 668652.4560 157.63 1/26/2019 0.82 156.81
2/26/2019 1.77 155.86
3/26/2019 2.13 155.51
4/26/2019 2.54 155.09
5/26/2019 3.71 153.92
6/26/2019 3.96 153.67
7/26/2019 0.76 156.87
8/26/2019 2.21 155.42
9/26/2019 3.68 153.95
PZ14 193936.6051 669743.4272 167.66 1/26/2019 0.17 167.49
2/26/2019 0.86 166.80
3/26/2019 1.32 166.35
4/26/2019 1.97 165.69
5/26/2019 3.13 164.53
6/26/2019 3.62 164.04
7/26/2019 0.68 166.98
8/26/2019 1.89 165.77
9/26/2019 3.06 164.60
PZ15 192000.6802 669433.9007 166.84 1/26/2019 1.24 165.60
2/26/2019 1.83 165.01
3/26/2019 1.96 164.88
4/26/2019 2.26 164.58
5/26/2019 3.37 163.47
6/26/2019 3.56 163.28
7/26/2019 1.37 165.47
8/26/2019 2.16 164.68
9/26/2019 3.20 163.64
PZ16D 189193.4656 668689.3844 160.41 1/26/2019 3.11 157.30
2/26/2019 3.71 156.70
3/26/2019 4.19 156.22
4/26/2019 4.97 155.44
5/26/2019 6.04 154.37
6/26/2019 6.82 153.59
7/26/2019 4.01 156.40
8/26/2019 5.01 155.40
9/26/2019 6.02 154.39
PZ16S 189192.1062 668683.7808 160.42 1/26/2019 0.80 159.62
2/26/2019 1.63 158.79
3/26/2019 2.02 158.40
4/26/2019 2.99 157.43
5/26/2019 4.02 156.40
6/26/2019 5.01 155.41
7/26/2019 2.18 158.24
8/26/2019 3.09 157.33
9/26/2019 4.02 156.40
Page 4 of 14

WELL ID Northing EastingTop of Casing
Elevation(ft. AMSL)
Date of Measurement
Depth to Water (ft bgs)
Water Level Elevation(ft. AMSL)
Table 12. Groundwater Elevation Summary Table; Local Groundwater/Surface Water Hydrology at Twin Pines Mine; Twin Pines Minerals, LLC; St. George, Charlton County, Georgia. TTL Project No. 000180200804.00
PZ17D 212015.6518 670005.1448 161.01 1/26/2019 3.13 157.89
2/26/2019 3.79 157.22
3/26/2019 4.19 156.82
4/26/2019 4.53 156.48
5/26/2019 5.46 155.55
6/26/2019 6.13 154.88
7/26/2019 3.54 157.47
8/26/2019 5.14 155.87
9/26/2019 6.23 154.78
PZ17S 212018.9084 669994.2076 161.75 1/26/2019 1.13 160.62
2/26/2019 2.00 159.75
3/26/2019 2.34 159.41
4/26/2019 2.60 159.15
5/26/2019 3.03 158.72
6/26/2019 3.74 158.01
7/26/2019 1.19 160.56
8/26/2019 3.10 158.65
9/26/2019 4.06 157.70
PZ18 210112.6384 670419.4050 164.26 1/26/2019 0.66 163.60
2/26/2019 1.72 162.54
3/26/2019 2.30 161.96
4/26/2019 2.80 161.46
5/26/2019 3.50 160.76
6/26/2019 4.21 160.05
7/26/2019 1.30 162.96
8/26/2019 3.08 161.18
9/26/2019 4.08 160.18
PZ19 207234.6924 670845.9142 169.87 1/26/2019 1.54 168.33
2/26/2019 2.39 167.48
3/26/2019 2.82 167.05
4/26/2019 3.33 166.54
5/26/2019 3.96 165.91
6/26/2019 4.66 165.21
7/26/2019 1.56 168.31
8/26/2019 3.13 166.74
9/26/2019 4.21 165.66
PZ20D 205134.8784 670360.6665 168.46 1/26/2019 2.04 166.422/26/2019 2.84 165.623/26/2019 3.29 165.174/26/2019 3.86 164.60
5/26/2019 4.77 163.69
6/26/2019 5.65 162.81
7/26/2019 2.18 166.28
8/26/2019 3.52 164.94
9/26/2019 4.82 163.64
Page 5 of 14

WELL ID Northing EastingTop of Casing
Elevation(ft. AMSL)
Date of Measurement
Depth to Water (ft bgs)
Water Level Elevation(ft. AMSL)
Table 12. Groundwater Elevation Summary Table; Local Groundwater/Surface Water Hydrology at Twin Pines Mine; Twin Pines Minerals, LLC; St. George, Charlton County, Georgia. TTL Project No. 000180200804.00
PZ20S 205140.4640 670362.1990 168.33 1/26/2019 1.68 166.66
2/26/2019 2.45 165.88
3/26/2019 2.90 165.43
4/26/2019 3.45 164.88
5/26/2019 4.25 164.08
6/26/2019 5.20 163.13
7/26/2019 1.71 166.62
8/26/2019 3.10 165.23
9/26/2019 4.35 163.98
PZ21 203215.0202 670383.6651 164.90 1/26/2019 0.07 164.83
2/26/2019 0.52 164.38
3/26/2019 1.03 163.87
4/26/2019 0.92 163.98
5/26/2019 2.37 162.53
6/26/2019 2.78 162.12
7/26/2019 0.12 164.78
8/26/2019 1.19 163.71
9/26/2019 2.46 162.44
PZ22D 200357.7075 671700.7149 170.48 1/26/2019 1.18 169.30
2/26/2019 1.75 168.73
3/26/2019 2.25 168.23
4/26/2019 2.49 167.99
5/26/2019 4.18 166.30
6/26/2019 4.48 166.00
7/26/2019 1.24 169.24
8/26/2019 2.21 168.27
9/26/2019 3.90 166.58
PZ22S 200359.9896 671694.6840 170.18 1/26/2019 0.50 169.68
2/26/2019 1.31 168.87
3/26/2019 1.79 168.39
4/26/2019 1.91 168.27
5/26/2019 3.31 166.87
6/26/2019 3.70 166.48
7/26/2019 0.39 169.79
8/26/2019 1.81 168.37
9/26/2019 3.27 166.91
PZ23 198353.0813 672071.4617 169.44 1/26/2019 0.02 169.42
2/26/2019 0.87 168.57
3/26/2019 1.34 168.10
4/26/2019 1.45 167.99
5/26/2019 2.86 166.58
6/26/2019 2.96 166.48
7/26/2019 -0.10 169.54
8/26/2019 1.24 168.20
9/26/2019 2.71 166.73
Page 6 of 14

WELL ID Northing EastingTop of Casing
Elevation(ft. AMSL)
Date of Measurement
Depth to Water (ft bgs)
Water Level Elevation(ft. AMSL)
Table 12. Groundwater Elevation Summary Table; Local Groundwater/Surface Water Hydrology at Twin Pines Mine; Twin Pines Minerals, LLC; St. George, Charlton County, Georgia. TTL Project No. 000180200804.00
PZ24 196807.9532 672562.2118 169.54 1/26/2019 0.44 169.10
2/26/2019 0.74 168.80
3/26/2019 1.27 168.27
4/26/2019 1.54 168.00
5/26/2019 3.00 166.54
6/26/2019 3.26 166.28
7/26/2019 0.38 169.16
8/26/2019 1.37 168.17
9/26/2019 2.59 166.95
PZ25D 194070.0069 673381.4148 169.65 1/26/2019 0.45 169.20
2/26/2019 0.94 168.71
3/26/2019 1.42 168.23
4/26/2019 2.01 167.64
5/26/2019 3.14 166.51
6/26/2019 3.65 166.01
7/26/2019 0.57 169.08
8/26/2019 1.48 168.17
9/26/2019 2.79 166.86
PZ25S 194061.9564 673383.9824 169.61 1/26/2019 0.40 169.21
2/26/2019 1.03 168.58
3/26/2019 1.45 168.16
4/26/2019 1.95 167.66
5/26/2019 3.14 166.47
6/26/2019 3.64 165.97
7/26/2019 0.75 168.86
8/26/2019 1.70 167.91
9/26/2019 2.92 166.70
PZ26 190199.0854 675725.3696 169.22 1/26/2019 0.24 168.98
2/26/2019 1.32 167.90
3/26/2019 1.68 167.54
4/26/2019 2.25 166.97
5/26/2019 3.28 165.95
6/26/2019 3.80 165.42
7/26/2019 0.80 168.42
8/26/2019 1.60 167.62
9/26/2019 3.04 166.18
PZ27D 188607.9571 676394.0349 168.06 1/26/2019 1.03 167.03
2/26/2019 1.40 166.66
3/26/2019 1.76 166.30
4/26/2019 2.18 165.89
5/26/2019 3.27 164.79
6/26/2019 3.52 164.54
7/26/2019 0.97 167.09
8/26/2019 1.69 166.37
9/26/2019 3.06 165.00
Page 7 of 14

WELL ID Northing EastingTop of Casing
Elevation(ft. AMSL)
Date of Measurement
Depth to Water (ft bgs)
Water Level Elevation(ft. AMSL)
Table 12. Groundwater Elevation Summary Table; Local Groundwater/Surface Water Hydrology at Twin Pines Mine; Twin Pines Minerals, LLC; St. George, Charlton County, Georgia. TTL Project No. 000180200804.00
PZ27S 188607.1176 676385.2376 168.17 3/26/2019 2.04 166.13
4/26/2019 2.34 165.83
5/26/2019 3.01 165.16
6/26/2019 3.35 164.82
7/26/2019 0.71 167.46
8/26/2019 1.78 166.39
9/26/2019 2.88 165.29
PZ28D 191101.7018 672470.6111 173.99 1/26/2019 0.69 173.30
2/26/2019 1.25 172.74
3/26/2019 1.66 172.33
4/26/2019 2.21 171.78
5/26/2019 3.50 170.49
6/26/2019 3.93 170.06
7/26/2019 0.87 173.12
8/26/2019 1.62 172.37
9/26/2019 2.99 171.00
PZ28S 191103.4804 672457.8838 173.92 1/26/2019 0.46 173.462/26/2019 0.99 172.933/26/2019 1.46 172.464/26/2019 1.84 172.08
5/26/2019 3.21 170.71
6/26/2019 3.63 170.29
7/26/2019 0.62 173.30
8/26/2019 1.43 172.49
9/26/2019 2.75 171.17
PZ29D 193584.1783 667976.3949 153.88 7/26/2019 0.97 152.91
8/26/2019 2.40 151.48
9/26/2019 3.41 150.47
PZ29S 193588.7986 667981.8218 154.04 7/26/2019 0.75 153.30
8/26/2019 2.05 151.99
9/26/2019 2.97 151.07
PZ30D 189999.1411 666485.7096 138.02 7/26/2019 1.19 136.83
8/26/2019 2.43 135.59
9/26/2019 3.81 134.21
PZ30S 190003.9590 666490.5901 137.65 7/26/2019 0.53 137.12
8/26/2019 1.86 135.79
9/26/2019 3.35 134.30
PZ31D 192380.6325 665328.1184 135.90 7/26/2019 1.57 134.33
8/26/2019 3.10 132.80
9/26/2019 4.37 131.53
Page 8 of 14

WELL ID Northing EastingTop of Casing
Elevation(ft. AMSL)
Date of Measurement
Depth to Water (ft bgs)
Water Level Elevation(ft. AMSL)
Table 12. Groundwater Elevation Summary Table; Local Groundwater/Surface Water Hydrology at Twin Pines Mine; Twin Pines Minerals, LLC; St. George, Charlton County, Georgia. TTL Project No. 000180200804.00
PZ31S 192375.7463 665331.2438 135.92 7/26/2019 1.68 134.24
8/26/2019 3.20 132.72
9/26/2019 4.48 131.44
PZ32D 195456.4215 666039.5426 139.68 7/26/2019 0.49 139.19
8/26/2019 1.87 137.81
9/26/2019 3.27 136.41
PZ32S 195456.5519 666034.4581 139.94 7/26/2019 0.58 139.36
8/26/2019 2.04 137.90
9/26/2019 3.42 136.52
PZ33D 192704.3676 661250.7016 123.91 7/26/2019 1.65 122.26
8/26/2019 2.91 121.00
9/26/2019 4.54 119.37
PZ33S 192703.1100 661257.2218 123.73 7/26/2019 1.48 122.25
8/26/2019 2.41 121.32
9/26/2019 3.72 120.01
PZ34D 196728.9345 662454.0647 124.48 7/26/2019 1.54 122.94
8/26/2019 3.08 121.40
9/26/2019 4.78 119.70
PZ34S 196727.7956 662451.0040 124.39 7/26/2019 1.26 123.13
8/26/2019 2.54 121.85
9/26/2019 4.36 120.03
PZ35D 197877.5722 658754.8806 119.17 7/26/2019 1.24 117.93
8/26/2019 2.52 116.66
9/26/2019 4.52 114.65
PZ35S 197876.8198 658750.6567 119.17 7/26/2019 1.34 117.83
8/26/2019 2.38 116.79
9/26/2019 3.90 115.27
PZ36D 200011.2104 658943.3970 119.18 7/26/2019 0.40 118.78
8/26/2019 1.50 117.68
9/26/2019 3.73 115.45
PZ36S 200011.8629 658939.5260 118.83 7/26/2019 0.77 118.06
8/26/2019 1.82 117.02
9/26/2019 3.74 115.10
Page 9 of 14

WELL ID Northing EastingTop of Casing
Elevation(ft. AMSL)
Date of Measurement
Depth to Water (ft bgs)
Water Level Elevation(ft. AMSL)
Table 12. Groundwater Elevation Summary Table; Local Groundwater/Surface Water Hydrology at Twin Pines Mine; Twin Pines Minerals, LLC; St. George, Charlton County, Georgia. TTL Project No. 000180200804.00
PZ38 205467.2108 672734.7122 171.93 3/26/2019 2.48 169.45
4/26/2019 2.90 169.03
5/26/2019 3.69 168.24
6/26/2019 4.50 167.43
7/26/2019 0.88 171.05
8/26/2019 2.22 169.71
9/26/2019 3.60 168.33
PZ39D 203579.2608 672985.6825 171.81 7/26/2019 14.45 157.36
8/26/2019 14.54 157.27
9/26/2019 15.69 156.13
PZ39S 203576.2324 672993.8948 171.94 5/26/2019 3.14 168.80
6/26/2019 3.73 168.21
7/26/2019 0.08 171.86
8/26/2019 1.20 170.74
9/26/2019 2.87 169.07
PZ40 200660.5583 673966.9078 169.70 1/26/2019 0.32 169.38
2/26/2019 0.94 168.76
3/26/2019 1.47 168.23
4/26/2019 1.74 167.96
5/26/2019 2.97 166.73
6/26/2019 3.35 166.36
7/26/2019 -0.01 169.71
8/26/2019 1.02 168.68
9/26/2019 2.48 167.22
PZ41 197293.3643 674605.3516 161.19 8/26/2019 0.76 160.43
9/26/2019 1.92 159.27
PZ42 194351.8655 675527.4483 147.46 1/26/2019 0.33 147.14
2/26/2019 1.13 146.34
3/26/2019 1.60 145.86
4/26/2019 2.44 145.02
5/26/2019 3.70 143.77
6/26/2019 3.99 143.48
7/26/2019 0.34 147.12
8/26/2019 1.62 145.84
9/26/2019 3.17 144.29
Page 10 of 14

WELL ID Northing EastingTop of Casing
Elevation(ft. AMSL)
Date of Measurement
Depth to Water (ft bgs)
Water Level Elevation(ft. AMSL)
Table 12. Groundwater Elevation Summary Table; Local Groundwater/Surface Water Hydrology at Twin Pines Mine; Twin Pines Minerals, LLC; St. George, Charlton County, Georgia. TTL Project No. 000180200804.00
PZ43 191206.1308 676493.9937 161.88 1/26/2019 0.28 161.60
2/26/2019 0.94 160.94
3/26/2019 1.34 160.54
4/26/2019 1.98 159.90
5/26/2019 2.99 158.89
6/26/2019 3.55 158.33
7/26/2019 0.19 161.69
8/26/2019 0.84 161.04
9/26/2019 2.35 159.53
PZ44 189175.0361 678021.3317 154.07 1/26/2019 0.56 153.51
2/26/2019 1.39 152.68
3/26/2019 1.85 152.22
4/26/2019 2.26 151.81
5/26/2019 3.09 150.98
6/26/2019 3.29 150.78
7/26/2019 0.60 153.47
8/26/2019 1.58 152.49
9/26/2019 3.03 151.04
PZ45D 202715.5700 675525.2030 166.67 2/26/2019 7.03 159.64
3/26/2019 7.64 159.03
4/26/2019 8.11 158.56
5/26/2019 9.02 157.65
6/26/2019 9.30 157.37
7/26/2019 6.48 160.19
8/26/2019 6.99 159.68
9/26/2019 8.43 158.24
PZ45S 202723.2096 675524.3128 166.72 1/26/2019 0.77 165.95
2/26/2019 1.52 165.20
3/26/2019 1.94 164.78
4/26/2019 2.22 164.50
5/26/2019 3.03 163.69
6/26/2019 3.57 163.15
7/26/2019 0.55 166.17
8/26/2019 1.61 165.11
9/26/2019 3.03 163.69
PZ46 198343.7772 677166.5936 139.99 1/26/2019 1.82 138.17
2/26/2019 2.13 137.86
3/26/2019 2.56 137.43
4/26/2019 2.89 137.10
5/26/2019 3.64 136.35
6/26/2019 3.44 136.56
7/26/2019 1.71 138.28
8/26/2019 2.44 137.55
9/26/2019 3.39 136.60
Page 11 of 14

WELL ID Northing EastingTop of Casing
Elevation(ft. AMSL)
Date of Measurement
Depth to Water (ft bgs)
Water Level Elevation(ft. AMSL)
Table 12. Groundwater Elevation Summary Table; Local Groundwater/Surface Water Hydrology at Twin Pines Mine; Twin Pines Minerals, LLC; St. George, Charlton County, Georgia. TTL Project No. 000180200804.00
PZ47 193012.6975 678365.3361 138.47 1/26/2019 0.59 137.88
2/26/2019 1.63 136.84
3/26/2019 1.93 136.54
4/26/2019 2.72 135.75
5/26/2019 3.54 134.93
6/26/2019 4.18 134.29
7/26/2019 2.26 136.21
8/26/2019 2.26 136.21
9/26/2019 3.71 134.76
PZ48D 191310.9390 680202.8388 132.78 5/26/2019 4.82 127.96
6/26/2019 5.04 127.74
7/26/2019 3.10 129.68
8/26/2019 3.64 129.14
9/26/2019 4.84 127.94
PZ48S 191305.7477 680199.1634 133.20 1/26/2019 0.91 132.292/26/2019 1.98 131.223/26/2019 2.32 130.884/26/2019 3.17 130.03
5/26/2019 4.37 128.83
6/26/2019 4.88 128.32
7/26/2019 2.07 131.13
8/26/2019 2.64 130.56
9/26/2019 4.39 128.81
PZ49 205324.4574 677820.5368 143.01 3/26/2019 1.32 141.69
4/26/2019 1.37 141.64
5/26/2019 2.30 140.71
6/26/2019 2.40 140.61
7/26/2019 0.28 142.73
8/26/2019 1.04 141.97
9/26/2019 2.44 140.57
PZ50 202797.9514 678800.9975 127.87 1/26/2019 0.75 127.12
2/26/2019 1.39 126.48
3/26/2019 2.36 125.51
4/26/2019 2.66 125.21
5/26/2019 3.90 123.97
6/26/2019 3.96 123.91
7/26/2019 0.45 127.42
8/26/2019 1.90 125.97
9/26/2019 3.47 124.40
PZ51D 195571.6636 680184.1086 115.73 1/26/2019 2.00 113.73
2/26/2019 2.78 112.95
3/26/2019 3.14 112.59
4/26/2019 3.62 112.11
5/26/2019 4.44 111.29
6/26/2019 4.23 111.50
7/26/2019 2.05 113.69
8/26/2019 2.85 112.88
9/26/2019 4.12 111.61
Page 12 of 14

WELL ID Northing EastingTop of Casing
Elevation(ft. AMSL)
Date of Measurement
Depth to Water (ft bgs)
Water Level Elevation(ft. AMSL)
Table 12. Groundwater Elevation Summary Table; Local Groundwater/Surface Water Hydrology at Twin Pines Mine; Twin Pines Minerals, LLC; St. George, Charlton County, Georgia. TTL Project No. 000180200804.00
PZ51S 195570.9997 680176.5664 115.84 1/26/2019 0.86 114.98
2/26/2019 1.65 114.19
3/26/2019 1.98 113.864/26/2019 2.53 113.31
5/26/2019 3.22 112.62
6/26/2019 3.11 112.73
7/26/2019 0.92 114.92
8/26/2019 1.69 114.16
9/26/2019 2.96 112.88
PZ52 201953.0060 681598.5839 111.44 1/26/2019 0.84 110.60
2/26/2019 1.17 110.27
3/26/2019 1.92 109.52
4/26/2019 2.16 109.28
5/26/2019 3.10 108.34
6/26/2019 2.92 108.52
7/26/2019 1.10 110.34
8/26/2019 1.81 109.63
9/26/2019 3.20 108.24
PZ53 199168.3109 681563.2307 111.51 1/26/2019 0.91 110.60
2/26/2019 1.37 110.14
3/26/2019 1.71 109.80
4/26/2019 1.92 109.59
5/26/2019 2.65 108.86
6/26/2019 2.45 109.06
7/26/2019 0.73 110.78
8/26/2019 1.52 109.99
9/26/2019 2.68 108.83
PZ55D 188479.2448 671856.4725 174.92 7/26/2019 0.81 174.11
8/26/2019 1.28 173.64
9/26/2019 3.07 171.86
PZ55S 188475.6036 671858.3517 174.83 7/26/2019 0.82 174.02
8/26/2019 1.56 173.27
9/26/2019 2.83 172.00
PZ56D 195754.4210 670661.0392 171.58 7/26/2019 1.18 170.40
8/26/2019 2.33 169.25
9/26/2019 3.69 167.89
PZ56S 195749.4737 670660.2256 171.50 7/26/2019 0.78 170.72
8/26/2019 2.15 169.36
9/26/2019 3.43 168.07
PZ57D 192314.5030 675315.4839 165.89 7/26/2019 3.64 162.25
8/26/2019 4.25 161.64
9/26/2019 5.52 160.37
Page 13 of 14

WELL ID Northing EastingTop of Casing
Elevation(ft. AMSL)
Date of Measurement
Depth to Water (ft bgs)
Water Level Elevation(ft. AMSL)
Table 12. Groundwater Elevation Summary Table; Local Groundwater/Surface Water Hydrology at Twin Pines Mine; Twin Pines Minerals, LLC; St. George, Charlton County, Georgia. TTL Project No. 000180200804.00
PZ57S 192311.1446 675312.2756 165.68 7/26/2019 0.43 165.25
8/26/2019 1.18 164.50
9/26/2019 2.38 163.31
PZ58D 196490.4671 676850.3236 139.98 7/26/2019 5.14 134.84
8/26/2019 5.50 134.48
9/26/2019 6.73 133.25
PZ58S 196494.4807 676849.6803 140.02 7/26/2019 0.59 139.43
8/26/2019 1.56 138.46
9/26/2019 2.90 137.12
OWA1BS 203877.7018 673147.0579 172.16 7/26/2019 -0.21 172.37
8/26/2019 1.18 170.98
9/26/2019 2.59 169.57
OWA1S 203876.5647 673154.3973 172.12 7/26/2019 0.02 172.10
8/26/2019 1.38 170.74
9/26/2019 2.84 169.28
OWA1D 203876.5738 673162.9290 172.23 7/26/2019 8.64 163.59
8/26/2019 9.11 163.12
9/26/2019 10.46 161.77
OWB1BS 191480.2903 670459.5027 172.38 7/26/2019 0.87 171.51
8/26/2019 1.63 170.75
9/26/2019 2.86 169.52
OWB1S 191476.4642 670468.6448 172.43 7/26/2019 1.95 170.48
8/26/2019 2.58 169.85
9/26/2019 3.77 168.66
OWB1D 191475.4850 670475.2055 172.49 7/26/2019 3.87 168.62
8/26/2019 4.29 168.209/26/2019 5.52 166.97
ft. bgs = feet below ground surface
ft. AMSL = feet above mean sea level
Negative depth to water values indicate artesian conditions
Page 14 of 14

In Out In Out In Out
Storage* 0.00 0.00 0.00 0.00 0.00 0.00
Constant Head* 0.00 572,079.38 0.00 572,114.56 0.00 -35.19
Drains* 0.00 40,802.34 0.00 40,767.18 0.00 35.17
Recharge** 612,881.69 0.00 612,881.69 0.00 0.00 0.00
Total 612,881.69 612,881.72 612,881.69 612,881.75 0.00 -0.02
In Out In Out In Out
Constant Head* 0.00 249,000.00 0.00 248,700.00 0.00 300.00
Drains* 0.00 29,670.00 0.00 29,630.00 0.00 40.00
Recharge** 276,900.00 0.00 276,900.00 0.00 0.00 0.00
Zone 2 to 1 74,254.00 0.00 72,518.00 0.00 1,736.00 0.00
Zone 1 to 2 0.00 72,489.00 0.00 71,092.00 0.00 1,397.00
* Cumulative Volume (ft3)
** Rates for time step (ft3/day)
In Out In Out In Out
Constant Head* 0.00 323,080.00 0.00 323,420.00 0.00 -340.00
Drains* 0.00 11,133.00 0.00 11,137.00 0.00 -4.00
Recharge** 335,980.00 0.00 335,980.00 0.00 0.00 0.00
Zone 2 to 1 0.00 74,254.00 0.00 72,518.00 0.00 1,736.00
Zone 1 to 2 72,489.00 0.00 71,092.00 0.00 1,397.00 0.00
* Cumulative Volume (ft3)
** Rates for time step (ft3/day)
Table 15. Water Budget Comparison of the Pre-Mining and Post-Mining Models - Zone 2
SourcePre-Mining Post-Mining Differences
Table 14. Water Budget Comparison of the Pre-Mining and Post-Mining Models - Zone 1
SourcePre-Mining Post-Mining Differences
** Rates for time step (ft3/day)
Table 13. Water Budget Comparisons of the Pre-Mining and Post-Mining Models
SourcePre-Mining Post-Mining Difference
* Cumulative Volume (ft3)

Analyte Method
BOD5 5210 B-2011COD H8000Total Organic Carbon 5310C-2011Total Suspended Solids SM2540DColor 2120 F-2011Bromide 300.0Fluoride 300.0Nitrate-Nitrite 300.0Nitrate 300.0Nitrite 300.0Total Kjeldahl Nitrogen 351.2Ammonia, Nitrogen 350.1Oil & Grease 1664Phosphorus (as P), total 200.7Sulfate (as SO4) 300.0Sulfide 4500SSulfite (as SO3) 4500-SO3Aluminum, total 200.8Antimony, total 200.8Arsenic, total 200.8Barium, total 200.8Beryllium, total 200.8Boron, total 200.8Cadmium, total 200.8Chromium, total 200.8Cobalt, total 200.8Copper, total 200.8Iron, total 200.8Lead, total 200.8Magnesium, total 200.8Manganese, total 200.8Mercury, total 245.1 or 1631EMolybdenum, total 200.8Nickel, total 200.8Selenium, total 200.8Silver, total 200.8Thallium, total 200.8Thorium, total 200.8Tin, total 200.8Titanium, total 200.8Uranium total 200.8Zinc, total 200.8Zirconium, total 200.8Alkalinity, Total SM2320BAlkalinity, Bicarbonate SM2320BAlkalinity, Carbonate SM2320BTotal Hardness SM2340BTotal cyanide 335.4Alpha, Total 900.0Beta, Total 900.0Radium, Total 903.1Radium 226, Total 904.0
pH Field MeasuredTemperature Field MeasuredSpecific Conductance Field MeasuredOxidation-Reduction Potential Field MeasuredDissolved Oxygen Field Measured
Table 16. Water-Quality Analytical List; Proposed Twin Pines Mine.

Alternative 1
(CS 1)
Alternative 2
(CS 2)
Alternative 3
(Loncala Tract)
Alternative 4
(Keystone Tract:
Layout 1)
Alternative 5
(Keystone Tract:
Layout 2)
Alternative 6 (No
Action Alternative)
>3.0 miles >3.0 miles 0.5 miles 2.7 miles 2.7 miles NA
Aquatic
ResourcesWetland Not evaluated Not evaluated 405.11 ac 1,194.437 ac 1,202.399 ac NA
On-Site Stream Not evaluated Not evaluated 3,020 lf 11,587 lf 11,587 lf NA
Open
WaterNot evaluated Not evaluated 0.34 ac 0 ac 0 ac NA
Not evaluated Not evaluated
Yes – one
potentially eligible
site; one unknown
effect
Yes – one
potentially eligible
site off-site property
Yes – one
potentially eligible
site off-site property
No effect
Not evaluated Not evaluated
No effect with
mitigation
measures
No effect with
mitigation
measures
No effect with
mitigation
measures
No effect
No No Yes Yes Yes No
Yes Yes Yes Yes Yes NA
No No Yes Yes Yes No
Effect on T&E Species
Economic Feasibility
(Mining cuts avg 1.5%
HMS)Available for
Lease/Purchase
Practicable
Table 17: Summary of Alternatives Analysis
Off-Site Alternative On-Site Alternatives: Saunders Tract
Factor
Distance from
Okefenokee Swamp
Cultural Resources

Mining Infrastructure Mining Infrastructure Mining Infrastructure
Wetland
(ac)405.387 287.537 4.672 1,194.44 522.134 65.131 1,202.40 453.111 25.124
Stream
(lf/ac)
3,020 /
0.337 0 1,160 / 0.106
11,587 /
1.0100 8,781 / 0.692
11,587 /
1.0100 412 / 0.020
Open
Water (ac)0.34 ac 0 0 0 0 0 0 0 0
Distance from
Okefenokee Swamp0.5 miles 2.7 miles 2.7 miles
Table 18: Avoidance and Minimization Summary Table
Factor Alternative 3 (Loncala Tract)Alternative 4 (Keystone Tract:
Layout 1)
Alternative 5 (Keystone Tract:
Layout 2)
Distance from Rail 3.5 milesOn-site but would need to be
constructedOn-site, currently in place
Aquatic
Resources
On-site
Impacted
On-site
Impacted
LEDPA NO NO YES
On-site
Impacted
Cultural Resources
One potentially NRHP eligible site within
proposed mining area; one
undetermined eligible site adjacent to
mining area
One potentially NRHP eligible off-site
property. Property will be avoided
One potentially NRHP eligible off-site
property
Threatened &
Endangered Species
Summary
(within proposed
impact footprint)
29 gopher tortoise, 3 gopher frogs, not
surveyed for listed plants
6 gopher tortoise, 2 gopher frogs, 0
federally listed plants, 3 state listed
threatened parrot pitcher plants
1 gopher tortoise, 0 gopher frogs, 0
federally listed plants, 1 state listed
threatened parrot pitcher plant

Resource Category Service Area; HUCDistance to Impact
SiteCredits Needed
PSA
3070204
PSA;
3070204
Sufficient Credits
Available
Recommended for
Use
PSA;
3070204
PSA;
3070204
PSA;
3070204
PSA;
3070203
PSA;
3070106
Table 19. Mitigation Bank Analysis for Permanent Impacts and Year 1 of Mining
Wetland 38 miles Not by itself no
Patriots Pride Mitigation Bank
Stream 122 miles yes yes
Offerman Mitigation Bank
Wetland 59 miles Not by itself yes
Satilla River Mitigation Bank
Wetland 60 miles Not by itself yes
Musket Bay Mitigation Bank
Wetland 51 miles yes yes
Stream -- 2,225
MITIGATION BANK DATA
Hog Creek Mitigation Bank
RESOURCE ANALYSIS
IMPACT SITE DATA
Freshwater Wetland -- 553.36

Federal
Status
Frosted flatwoods salamander
(Ambystoma cingulatum)
Striped Newt Previous Candidate
(Notophthalmus perstriatus)(listing determined “not
warranted” 12/19/2018)
Gopher frog
(Lithobates capito)
Red-cockaded woodpecker
(Picoides borealis)
Florida hartwrightia
(Hartwrightia floridana)
Floodplain tickseed
(Coreopsis integrifolia)
Purple Honeycomb-head
(Balduina atropurpurea
Eastern indigo snake
(Drymarchon corais couperi)
Gopher tortoise
(Gopherus polyphemus)
* Candidate species are not provided protection under the ESA.
Table 20: Federal Status Species Potentially Occurring in Project Area
Group Name Supporting Habitat in or near the Site
Amphibians
ThreatenedHabitat on site is too degraded to support.
Species not observed.
Habitat not observed. Species not observed.
Candidate*Habitat is present on site. A total of 6 individuals
observed.
Birds ThreatenedHabitat not observed. Species not observed. May
forage on site.
Under ReviewHabitat is present on site. Species not identified
on site.
Under ReviewHabitat is present on site. Species not identified
on site.
Reptiles
ThreatenedHabitat observed on site. No individuals
observed. May forage on site.
Candidate* Habitat, burrows and individuals observed.
Flowering
PlantsUnder Review
Habitat is present on site. Species not identified
on site.

Group Name State Status Supporting Habitat in or near the Site
Bald eagle
(Haliaeetus leucocephalus)
Bachman’s sparrow
(Peucaea aestivalis )
Red face top minnow
(Fundulus rubifrons )
Savannah milkweed
(Asclepias pedicellata )
Dwarf pawpaw
(Asimina pygmea )
Florida orange-grass
(Ctenium floridanum )
Green-fly orchid
(Epidendrum magnoliae )
Southern umbrella-sedge
(Fuirena scirpoidea )
Florida milk-pea
(Galactia floridana )
Chapman's skeleton grass
(Gymnopogon chapmanianus )
Narrowleaf water-willow
(Justicia angusta )
Southern bog-button
(Lachnocaulon beyrichianum )
Pond spice
(Litsea aestivalis )
Odorless bayberry
(Morella inodora )
Palafoxia
(Palafoxia integrifolia )
Arrow arum
(Peltandra sagittifolia )
Pennyroyal
(Piloblephis rigida )
Chapman’s fringed orchid
(Platanthera chapmanii )
Yellow fringeless orchid
(Platanthera integra )
Wild coco
(Pteroglossaspis ecristata )
Chapman oak
(Quercus chapmanii )
Nuttall meadowbeauty
(Rhexia nutallia )
Fernald's beakrush
(Rhynchospora fernaldii )
NoneHabitat is present. Individuals are abundant and
widespread on site.
Flowering
Plants
Table 21: Other Special Concern Species Potentially Occurring in Project Area
Birds
Threatened Habitat not observed. Species not known to occur on-site.
Rare Habitat is present. Observed on site in two locations.
Fish None Habitat is present. Observed on site.
None Habitat is present. Observed on site.
None Habitat is present. Was not identified on site.
Unusual Habitat is present. Was not identified on site.
NoneHabitat is present. Individuals are abundant and
widespread on site.
None Habitat is present. Was not identified on site.
None Habitat is present. Was not identified on site.
None Habitat is present. Was not identified on site.
None Habitat is present. Was not identified on site.
Rare Habitat is present. Was not identified on site.
Threatened Habitat is present. Was not identified on site.
None Habitat is present. Was not identified on site.
None Habitat is present. Was not identified on site.
None Habitat is present. Was not identified on site.
None Habitat is present. Was not identified on site.
None Habitat is present. Was not identified on site.
Threatened Habitat not present. Was not identified on site.
None Habitat is present. Individuals observed on site.
NoneHabitat is present. Individuals are abundant and
widespread on site.
None Habitat is present. Was not identified on site.

Group Name State Status Supporting Habitat in or near the Site
Hooded pitcherplant
(Sarracenia minor var. minor )
Parrot pitcherplant
(Sarracenia psittacine )
White sunnybell
(Schoenolirion albiflorum )
S Sandhill skullcap
(Scutellaria arenicola )
Florida ladies-tresses
(Spiranthes floridana )
Wireleaf dropseed
(Sporobolus teretifolius )
Stokes aster
(Stokesia laevis )
Sprawling goats’ rue
(Tephrosia chrysophylla )
Bartram's air-plant
(Tillandsia bartramii )
Diverse-leaf crownbeard
(Verbesina heterophylla )
Black bear
(Ursus americanus floridanus )
Spotted Turtle
(Clemmys guttata )
Southern hog-nosed snake
(Heterodon simus )
Black swampsnake
(Liodytes pygaea )
Mimic glass lizard
(Ophisaurus mimicus )
Florida pine snake
(Pituophis melanoleucus )
None Habitat is present. Was not identified on site.
Unusual Habitat is present. Individuals observed on site.
Threatened Habitat is present. Individuals observed on site.
None Habitat is present. Was not identified on site.
None Habitat is present on site. Individuals observed on site.
None Habitat is present. Was not identified on site.
Mammals NoneHabitat is present. Individuals not observed on site.
Individuals observed on Alternate 3 site.
Reptiles
UnusualExtremely limited habitat is present on site. Individuals not
observed on site.
ThreatenedExtremely limited habitat is present on site. Individuals not
observed on site.
Table 21 (cont'd): Other Special Concern Species Potentially Occurring in Project Area
Flowering
Plants
None Habitat is present on site. Individuals observed on site.
RareExtremely limited habitat is present on site. Individuals not
observed on site.
None Habitat is present. Was not identified on site.
None Habitat is present. Was not identified on site.
None Habitat is present. Individuals observed on site.
None Habitat is present. Was not identified on site.
None Habitat is present. Was not identified on site.

Federal
Status
Frosted flatwoods salamander
(Ambystoma cingulatum)
Gopher frog
(Lithobates capito)
Red-cockaded woodpecker
(Picoides borealis)
Florida hartwrightia
(Hartwrightia floridana )
Flooplain tickseed
(Coreopsis integrifolia )
Purple Honeycomb-head
(Balduina atropurpurea)
Eastern indigo snake
(Drymarchon corais couperi)
Gopher tortoise
(Gopherus polyphemus)
Group NameSupporting Habitat
in or near the Site
Effects to Species
from Project
Mitigation Measures
Proposed to Avoid
Adverse Effect
C*
Habitat is present on
site. A total of 6
individuals observed.
Occupied habitat is
within impact area.
One individual
identified.
Pre-Construction
Surveys to scope
burrows and relocate
species.
Birds T
Habitat not observed.
Species not
observed. May forage
on site.
No effect anticipated.No mitigation
measures proposed.
Amphibians
T
Habitat on site is too
degraded to support.
Species not
observed.
No effect anticipated.No mitigation
measures proposed.
C*
Under
Review
Habitat is present on
site. Species not
observed.
No effect anticipated.No mitigation
measures proposed.
Under
Review
Habitat is present on
site. Species not
observed.
No effect anticipated.No mitigation
measures proposed.
T = Threatened; C = Candidate
Habitat, burrows and
individuals observed.
Burrows in impact
area.
Pre-Construction
Surveys to scope
burrows and relocate
species.
Table 22. Summary of Potential Impacts to Federal Status Species in Project Area
Flowering
Plants
* Candidate species are not provided protection under the ESA.
Under
Review
Habitat is present on
site. Species not
observed.
No effect anticipated.No mitigation
measures proposed.
Reptiles
T
Habitat observed on
site. No individuals
observed. May forage
on site.
No effect anticipated.
Pre-Construction
Surveys to scope
burrows and relocate
species.

FIGURES

St. Marys River
Suwanee River OkefenokeeNationalWildlifeRefuge
Twin Pines MineralsProposed Permit Area
Saltilla River
F L O R I D A
G E O R G I ASITE
Service Layer Credits: © OpenStreetMap (and) contributors, CC-BY-SANational Geographic, Esri, Garmin, HERE, UNEP-WCMC, USGS, NASA,ESA, METI, NRCAN, GEBCO, NOAA, increment P Corp.
DRAWN BY: DEKCHECKED BY: CMS
DRAWING DATE: 2/28/2020REVISION DATE: N/A
TTL JOB NO.: 000180200804.00
APPROX. SCALE:
³0 100,000Feet
1 in = 100,000 ft
FIGURE 1: LOCATION OF THE PROPOSED SAUNDERS DEMONSTRATION MINETWIN PINES MINERALS
ST. GEORGE, CHARLTON COUNTY, GEORGIAINSET BASEMAP: Open Street Map; BASEMAP: National Geographic World Map (See Service Layer Credits).

FIGURE 2: HEAVY MINERALS OF SE GEORGIA & NE FLORIDA CMS
2/21/2020
Source: Pirkle, Pirkle & Rich, 2013.

Mineral Separation Plant& Shipping Area
Road For Material Transport
Floridan AquiferPumping Well #1
Floridan AquiferPumping Well #2
Wet Processing Plant
North Boundaryw/ 10' Buffer
West Boundaryw/ 20' Buffer
Highway 94 Buffer& Construction Berm
Pumping Well Access& Pipeline Corridor
Initial Location ofTails Conveyor forExcavation Fill
Initial Location ofFeed Conveyor forMaterial Transport
Year 6
Year 5
Year 4
Year 3
Year 2
Year 1
DRAWN BY: DEKCHECKED BY: CMS
DRAWING DATE: 2/28/2020REVISION DATE: N/A
TTL JOB NO.: 000180200804.00
APPROX. SCALE:
SITE LEGENDProposed Mining Area (898± AC)Proposed Permit Area (1,041.7± AC)Proposed Wet Processing Plant Site Plan
Year 1Year 2Year 3
Year 4Year 5Year 6
³
0 1,800Feet
1 in = 1,800 ft
FIGURE 3: ESTIMATED PROGRESSION OF MININGTWIN PINES MINERALS
ST. GEORGE, CHARLTON COUNTY, GEORGIABASEMAP: DigitalGlobe, 3/24/2018 (0.46 m Resolution).

FIGURE 4: CONCEPTUAL HYDROGEOLOGIC MODEL JRS
2/28/2020

FIGURE 5: OKEFENOKEE SWAMP WATERSHED CHARACTERISTICS JRS
2/28/2020

ST. GEORGE, CHARLTON COUNTY, GEORGIA
AA
A
A
A
AAAA
AA
A
A A
A
A
A
AA
A
A
AA
A
A
AA A
A
A
A
A
A
A
A
A
AA
A
A
A
A
AA
A
A
A
A
A
AA
A
A
A
A
A
A
A
A
A
A
A
A
A
A
A
AA
A
A
A
A
A
AA
A
A
A
A
A
AA
AA
A
AA
A A
AA
A
A A
A
A
A A A
A
A
A
A
A
A
A
A
A
A
A
A
A
AA
A
A
AA
A
A AA
AA
A
A
A
A AAA
AAAA
A
AA
AA AAAA A
AA AA AA
AA A
AAAAA
AAAAAAAA
AA A AAA
A
AA
A A
A
A
A AA
AA
AA
AA
A
AAAAA
A AA
A
A
AAA
AAAA
AAA
A
A
AA A A
A A
A A
A
A
A
A
AA
A
AA
A
A
A
A
A
A
A
A
A
A
A
AA
A
AA
A
AA
A
A
A
A
AAAA
A
A
AA
AA
A
AAA
A
AAAAAA
AAA
AA
A
AA
A A
AA
A
AA
AA
A
AAA
A A
A
AA
A
A AAA
A
A A A AA A A A A
A
A
AAA
AAAA
A
AA A
A AA
AA
A A AA
A
AAA
AA
A
A
A
A
AAAA
AAAA
A A A AA
A
A AA
A
A
AAA
A
AA
AA
AAA
A AA
A
A
A
AAAAA
DD
D
DD
D
DDD
DDDD
DD
D
DD
DDD
D
D
D
DD
D
D
D
DD
D
DD
DD
DD
D
DDDDDDD
DDD
DDDD
DD
D
DD
DDD
DDD
DDD
D
DDD
A
A
D
D
D
D
D
D
D
D
D
D
D D
D
D
@A@A
@A
@A@A
@A
@A
@A
@A
@A
@A
@A
@A
@A@A
@A
@A
@A
@A@A
@A@A
@A
@A
@A@A
@A
@A@A
@A
@A
@A@A
@A
@A@A
@A@A
@A@A
@A@A
@A@A
@A@A
@A@A
@A@A
@A@A
@A@A
@A@A
@A
@A@A
@A
@A
@A
@A
@A
@A@A
@A
@A
@A@A
@A
@A
@A@A
@A
@A
@A@A
@A@A
@A@A
@A@A
@A@A
D
DD
D
D
D
A
A
A
A
A
A
A
A
A
A
A
A
A
A A
A
Trail R
idge
Trail R
idge
OKEFENOKEENATIONAL
WILDLIFE REFUGE
TIAA Tract
Adirondack Tract
Loncala Tract
KeystoneTract
Dallas Police& Fire Tract
115
110105 90 85
145 130
120
95
160
150
13513012
5120
155140
145140
135
135
130
115105
120110
140130
145
135
145
14016
5
160
170
165
160155
15014514
0
135
130
130
120
135
130
125120
115
135130
155
140
135
160
150
145
160
120
155
150
110
165135
130
115170
170 170
170
170
120
80
120
80
80
DRAWN BY: DEKCHECKED BY: JRS
DRAWING DATE: 2/28/2020REVISION DATE: N/A
TTL JOB NO.: 000180200804.00
APPROX. SCALE:
SITE LEGENDProposed Permit Area (1,041.7± AC)Proposed Mining Area (898± AC)Project Study AreaOkefenokee Nat. Wildlife RefugeProperty Parcel BoundaryUSACE Verified StreamsUSCAE Verified Wetland
0 4,000Feet
1 in = 4,000 ft
FIGURE 6: SOIL BORING & PIEZOMETER/WELL LOCATION MAPTWIN PINES MINERALS
³BORING LEGEND
A EB BoringA OW EB BoringD PB Boring@A PiezometerD Undisturbed Soil BoringA Pumping WellD TIAA Soil BoringA Client Boring

FIGURE 7: EXAMPLE WEST-TO-EAST PROFILE JRS
2/28/2020

FIGURE 8: EXAMPLE NORTH-TO-SOUTH PROFILE JRS
2/28/2020

FIGURE 9: HORIZONTAL VARIOGRAM FOR CONSOLIDATED SAND RMH
2/28/2020
(A) Maximum Correlation Length 432 Feet at Azimuth 90 degrees (B) Minimum Correlation Length 240 Feet at Azimuth 0 degrees.Variance = 0.052, Nugget Variance = 0. Fit with Gaussian Variogram Model.

FIGURE 10: VERTICAL VARIOGRAM FOR CONSOLIDATED SAND RMH
2/28/2020
Maximum Correlation Length = 18 Feet, Variance = 0.053, Nugget Variance = 0.01. Fit with Exponential Variogram Model.

OKEFENOKEENATIONAL
WILDLIFE REFUGE
DRAWN BY: DEKCHECKED BY: RMH
DRAWING DATE: 2/28/2020REVISION DATE: N/A
TTL JOB NO.: 000180200804.00
APPROX. SCALE:
LEGENDModel BoundaryEstimated Mining DraglinesProposed Mining AreasProject Permit AreaOkefenokee National Wildlife Refuge
³
0 5,000Feet
1 in = 5,000 ft
FIGURE 11: PROBABILITY (%) OF CONSOLIDATED SAND PRESENCEBOTTOM OF 10 FOOT LAYER = 139' (EXPECTED VALUE = 5.54%)TWIN PINES MINERALS
ST GEORGE CHARLTON COUNTY GEORGIA. , ,

OKEFENOKEENATIONAL
WILDLIFE REFUGE
DRAWN BY: DEKCHECKED BY: RMH
DRAWING DATE: 2/28/2020REVISION DATE: N/A
TTL JOB NO.: 000180200804.00
APPROX. SCALE:
LEGENDModel BoundaryEstimated Mining DraglinesProposed Mining AreasProject Permit AreaOkefenokee National Wildlife Refuge
³
0 5,000Feet
1 in = 5,000 ft
FIGURE 12: PROBABILITY (%) OF CONSOLIDATED SAND PRESENCEBOTTOM OF 10 FOOT LAYER = 99' (EXPECTED VALUE = 5.54%)TWIN PINES MINERALS
ST GEORGE CHARLTON COUNTY GEORGIA. , ,
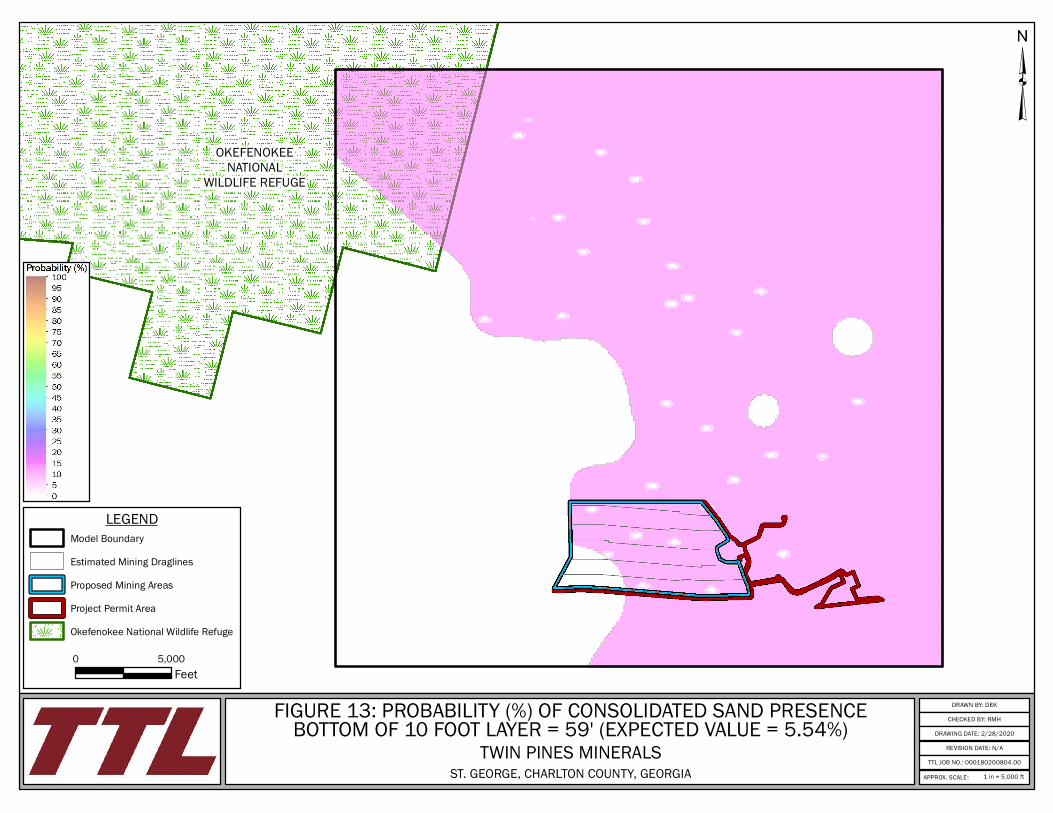
OKEFENOKEENATIONAL
WILDLIFE REFUGE
DRAWN BY: DEKCHECKED BY: RMH
DRAWING DATE: 2/28/2020REVISION DATE: N/A
TTL JOB NO.: 000180200804.00
APPROX. SCALE:
LEGENDModel BoundaryEstimated Mining DraglinesProposed Mining AreasProject Permit AreaOkefenokee National Wildlife Refuge
³
0 5,000Feet
1 in = 5,000 ft
FIGURE 13: PROBABILITY (%) OF CONSOLIDATED SAND PRESENCEBOTTOM OF 10 FOOT LAYER = 59' (EXPECTED VALUE = 5.54%)TWIN PINES MINERALS
ST GEORGE CHARLTON COUNTY GEORGIA. , ,

A
A
Trail R
idge
Trail R
idge
OKEFENOKEENATIONAL
WILDLIFE REFUGE
TIAA Tract
AdirondackTract
Loncala Tract
KeystoneTract
Dallas Police& Fire Tract
PWA
PWB
115
110105 90 85
155150
145
140
120
16015
014514
013
012512
0
155
135
145140
135
135
130
115105
120110
140130
145
135
145
14016
5
160
170
165
160155
15014514
0
130
120
130
115
115105
135130
125120
110
13513
0
135
130
160
135
130
95
160
120
155
130
150
135
165135
130
170
170
165
170
170
170
170
145
120
110
80
120
80
80
DRAWN BY: DEKCHECKED BY: JRS
DRAWING DATE: 2/28/2020REVISION DATE: N/A
TTL JOB NO.: 000180200804.00
APPROX. SCALE:
SITE LEGENDA Pumping Well (2)
Proposed Permit Area (1,041.7± AC)Proposed Mining Area (898± AC)Project Study AreaOkefenokee Nat. Wildlife RefugeProperty Parcel BoundaryUSACE Verified StreamsUSCAE Verified Wetland
0 4,000Feet
1 in = 4,000 ft
FIGURE 14: PUMPING WELL LOCATION MAPTWIN PINES MINERALS
ST GEORGE CHARLTON COUNTY GEORGIA. , ,
³

@A@A @A
@A@A@A
@A@A
@A
@A
@A
@A
APWAOWA1S
OWA1BS OWA1D
OWA2S
OWA2BSOWA2D
OWA3S/PZ39SOWA3D/PZ39D
OWA3BSOWA4BS
OWA5BS
OWA EB
DRAWN BY: DEKCHECKED BY: JRS
DRAWING DATE: 2/28/2020REVISION DATE: N/A
TTL JOB NO.: 000180200804.00
APPROX. SCALE:
SITE LEGENDA Pumping Well "A"@A Observation Well
50 ft Radius100 ft Radius300 ft Radius
³
0 100Feet
1 in = 100 ft
A
A
TIAA Tract
AdirondackTract
LoncalaTract
KeystoneTract
Dallas Police& Fire Tract
PWA
PWB
INSET LEGENDA Pumping Well (2)
Proposed Permit AreaProject Study AreaProposed Mining AreaOkefenokee Nat. Wildlife RefugeProperty Parcel Boundary
FIGURE 15: PUMPING WELL "A" LOCATION MAPTWIN PINES MINERALS
ST. GEORGE, CHARLTON COUNTY, GEORGIA

@A@A @A
@A
@A@A
@A@A
@A@A
@A
@A
A
PWB
OWB1SOWB1BS
OWB1D
OWB2S
OWB2BSOWB2D
OWB3SOWB3D
OWB3BSOWB4BS
OWB5BS
OWB EB
DRAWN BY: DEKCHECKED BY: JRS
DRAWING DATE: 2/28/2020REVISION DATE: N/A
TTL JOB NO.: 000180200804.00
APPROX. SCALE:
SITE LEGENDA Pumping Well "B"@A Observation Well
50 ft Radius100 ft Radius300 ft Radius
³
0 100Feet
1 in = 100 ft
A
A
TIAA Tract
AdirondackTract
LoncalaTract
KeystoneTract
Dallas Police& Fire Tract
PWA
PWB
INSET LEGENDA Pumping Well (2)
Proposed Permit AreaProject Study AreaProposed Mining AreaOkefenokee Nat. Wildlife RefugeProperty Parcel Boundary
FIGURE 16: PUMPING WELL "B" LOCATION MAPTWIN PINES MINERALS
ST. GEORGE, CHARLTON COUNTY, GEORGIA

@A
@A
@A
@A
@A
@A
@A
@A
@A
@A
@A@A
@A@A
@A@A@A@A
@A@A
@A@A
@A@A
ID PZ01SWD = 14TS = 119.04BS = 109.54K1 = 1.24e+00K2 = 9.82e-01
ID PZ04WD = 14TS = 119.89BS = 110.39K1 = 1.99e+00K2 = 1.66e+00
ID PZ06WD = 14TS = 120.26BS = 110.76K1 = 3.71e+00K2 = 2.95e+00
ID PZ10WD = 25TS = 130.97BS = 121.47K1 = 3.91e+00K2 = 3.91e+00
ID PZ13WD = 30TS = 137.63BS = 128.13K1 = 5.16e+01K2 = 3.91e+01
ID PZ16SWD = 20
TS = 150.42BS = 140.92
K1 = 4.10e+01K2 = 3.41e+01
ID PZ17DWD = 45TS = 126.01BS = 116.51K1 = 4.14e+01K2 = 3.44e+01
ID PZ20DWD = 40
TS = 138.46BS = 128.96
K1 = 1.84e+01K2 = 1.53e+01
ID PZ24WD = 20TS = 159.54BS = 150.04K1 = 1.48e+01K2 = 1.18e+01
ID PZ28DWD = 30TS = 153.99BS = 144.49K1 = 2.34e+00K2 = 2.04e+00
ID PZ29DWD = 50
TS = 113.88BS = 104.38
K1 = 1.45e+00K2 = 1.45e+00 ID PZ29S
WD = 19TS = 145.03BS = 135.53K1 = 8.23e+00K2 = 6.24e+00
ID PZ30DWD = 50
TS = 98.02BS = 88.52
K1 = 1.09e+00K2 = 9.89e-01
ID PZ30SWD = 10
TS = 132.65BS = 128.15
K1 = 8.68e-01K2 = 6.86e-01
ID PZ31DWD = 50
TS = 95.9BS = 86.4
K1 = 1.57e+00K2 = 1.50e+00
ID PZ31SWD = 12
TS = 128.92BS = 124.42
K1 = 1.42e+00K2 = 1.08e+00
ID PZ33DWD = 50.5TS = 82.91BS = 73.41
K1 = 2.77e+00K2 = 1.75e+00
ID PZ33SWD = 13
TS = 116.73BS = 112.23
K1 = 2.66e+00K2 = 1.93e+00
ID PZ55DWD = 50
TS = 134.92BS = 125.42
K1 = 2.03e+01K2 = 1.85e+01
ID PZ55SWD = 20
TS = 160.83BS = 155.33
K1 = 9.46e-01K2 = 7.18e-01
ID PZ57DWD = 50TS = 126.89BS = 117.39K1 = 5.47e+01K2 = 6.58e+01
ID PZ57SWD = 14
TS = 156.68BS = 152.18
K1 = 6.77e+00K2 = 5.38e+00
ID PZ58DWD = 50TS = 99.98BS = 90.48K1 = 5.10e+00K2 = 5.10e+00
ID PZ58SWD = 15
TS = 130.02BS = 125.52
K1 = 2.66e+01K2 = 2.11e+01
Trail R
idge
Trail R
idge
OKEFENOKEENATIONAL
WILDLIFE REFUGE
TIAA Tract
AdirondackTract
Loncala Tract
KeystoneTract
Dallas Police& Fire Tract
115
110105 90 85
145
140
130
160 155
120
95
160
150
145
140
13012
5120
145140
135
135
130
115105
120110
135
130
140
120
145
14016
5
160
155
145
170
165
130
120
130
115
115105
110
135
130
150
135125
155
135
160
155
160
135
130
150
135
130
170
170
165
170
170
170
135
130
120
110
80
80
80
DRAWN BY: DEKCHECKED BY: JRS
DRAWING DATE: 2/28/2020REVISION DATE: N/A
TTL JOB NO.: 000180200804.00
APPROX. SCALE:
SITE LEGEND@A Well Location
Proposed Permit Area (1,041.7± AC)Proposed Mining Area (898± AC)Project Study AreaOkefenokee Nat. Wildlife RefugeProperty Parcel BoundaryUSACE Verified StreamsUSCAE Verified Wetland
0 4,000Feet
1 in = 4,000 ft
FIGURE 17: HYDRAULIC CONDUCTIVITY (BAIL TESTS)TWIN PINES MINERALS
ST GEORGE CHARLTON COUNTY GEORGIA. , ,
Key:ft = feet, amsl = above mean sea levelID = Piezometer IDWD = Well Depth (ft)TS = Top of Screen (ft amsl)BS = Bottom of Screen (ft amsl)K1 = Hydraulic Conductivity [KGS Solution (ft/day)]K2 = Hydraulic Conductivity [Bouwer-Rice Solution (ft/day)]
³

@A
@A
@A
@A
@A@A
@A
@A
@A
@A
@A@A
@A@A
@A@A@A@A
@A@A
@A@A
@A@A
ID PZ01SWD = 14TS = 119.04BS = 109.54K1 = 1.65e+00K2 = 1.14e+00
ID PZ04WD = 14TS = 119.89BS = 110.39K1 = 1.74e+00K2 = 1.38e+00
ID PZ06WD = 14TS = 120.26BS = 110.76K1 = 3.51e+00K2 = 2.22e+00
ID PZ10WD = 25TS = 130.97BS = 121.47K1 = 6.39e+00K2 = 4.22e+00
ID PZ13WD = 30TS = 137.63BS = 128.13K1 = 5.24e+01K2 = 3.98e+01
ID PZ13WD = 30
TS = 137.63BS = 128.13
K1 = 5.24e+01K2 = 1.20e+01
ID PZ16SWD = 20
TS = 150.42BS = 140.92
K1 = 3.99e+01K2 = 2.94e+01
ID PZ17DWD = 45TS = 126.01BS = 116.51K1 = 4.27e+01K2 = 2.95e+01
ID PZ20DWD = 40
TS = 138.46BS = 128.96
K1 = 1.84e+01K2 = 1.53e+01
ID PZ24WD = 20TS = 159.54BS = 150.04K1 = 4.40e+01K2 = 3.05e+01
ID PZ29DWD = 50
TS = 113.88BS = 104.38
K1 = 1.25e+00K2 = 1.19e+00 ID PZ29S
WD = 19TS = 145.03BS = 135.53K1 = 5.44e+00K2 = 5.70e+00
ID PZ30DWD = 50
TS = 98.02BS = 88.52
K1 = 1.38e+00K2 = 1.21e+00
ID PZ30SWD = 10
TS = 132.65BS = 128.15
K1 = 1.08e+00K2 = 1.43e+00
ID PZ31DWD = 50
TS = 95.9BS = 86.4
K1 = 1.98e+00K2 = 1.98e+00
ID PZ31SWD = 12
TS = 128.92BS = 124.42
K1 = 1.36e+00K2 = 1.03e+00
ID PZ33DWD = 50.5TS = 82.91BS = 73.41
K1 = 2.23e+00K2 = 1.48e+00
ID PZ33SWD = 13
TS = 116.73BS = 112.23
K1 = 2.63e+00K2 = 1.99e+00
ID PZ55DWD = 50TS = 134.92BS = 125.42K1 = 2.20e+01K2 = 2.10e+01
ID PZ55SWD = 20
TS = 160.83BS = 155.33
K1 = 2.40e-01K2 = 1.99e-01
ID PZ57DWD = 50TS = 126.89BS = 117.39K1 = 3.59e+01K2 = 7.51e+01ID PZ57S
WD = 14TS = 156.68BS = 152.18
K1 = 7.26e+00K2 = 5.78e+00
ID PZ58DWD = 50TS = 99.98BS = 90.48K1 = 3.55e+00K2 = 5.38e+00
ID PZ58SWD = 15TS = 130.02BS = 125.52K1 = 2.42e+01K2 = 1.92e+01
Trail R
idge
Trail R
idge
OKEFENOKEENATIONAL
WILDLIFE REFUGE
TIAA Tract
AdirondackTract
Loncala Tract
KeystoneTract
Dallas Police& Fire Tract
115
110105 90 85
145
140
130
160 155
120
95
155
14514
0135
160
130125
145140
135
135
130
115105
120110
135
130
140
120
145
14016
5
160
165160
170 155
130
120
130
115
115105
110
135
130
150
135
150
120 160 145
155
150
130
150
130
130
170
170
165
170
170
170
170
135
130
130
120
110
80
80
80
DRAWN BY: DEKCHECKED BY: JRS
DRAWING DATE: 2/28/2020REVISION DATE: N/A
TTL JOB NO.: 000180200804.00
APPROX. SCALE:
SITE LEGEND@A Well Location
Proposed Permit Area (1,041.7± AC)Proposed Mining Area (898± AC)Project Study AreaOkefenokee Nat. Wildlife RefugeProperty Parcel BoundaryUSACE Verified StreamsUSCAE Verified Wetland
0 4,000Feet
1 in = 4,000 ft
FIGURE 18: HYDRAULIC CONDUCTIVITY (SLUG TESTS)TWIN PINES MINERALS
ST GEORGE CHARLTON COUNTY GEORGIA. , ,
Key:ft = feet, amsl = above mean sea levelID = Piezometer IDWD = Well Depth (ft)TS = Top of Screen (ft amsl)BS = Bottom of Screen (ft amsl)K1 = Hydraulic Conductivity [KGS Solution (ft/day)]K2 = Hydraulic Conductivity [Bouwer-Rice Solution (ft/day)]
³

FIGURE 19: SLUG TEST HYDRAULIC CONDUCTIVITY V. ELEVATION JRS
2/28/2020

FIGURE 20: SLUG TEST NORMALITY PLOT (ABOVE 120 FT AMSL) JRS
2/28/2020

FIGURE 21: SLUG TEST NORMALITY PLOT (BELOW 120 FT AMSL) JRS
2/28/2020

D
D
D
D
D
D
D
D
D
D
D D
D
D
Trail R
idge
Trail R
idge
OKEFENOKEENATIONAL
WILDLIFE REFUGE
TIAA Tract
AdirondackTract
Loncala Tract
KeystoneTract
Dallas Police& Fire Tract
UD238
UD51
UD67
UD65
UD179
UD93
UD10
UD126
UD128
UD231
UD25 UD43
UD34
UD338
115
110105 90 85
155150
145
140
120
16015
014514
013
012512
0
155
135
145140
135
135
130
115105
120110
140130
145
135
145
14016
5
160
165160
170 155
15014514
0
130
120
130
115
115105
135130
125120
110
175
170
13513
0
135
130
160
135
130
95
160
120
155
130
150
135
165135
130
170
165
170
170
170
170
145
120
110
80
120
80
80
DRAWN BY: DEKCHECKED BY: JRS
DRAWING DATE: 2/28/2020REVISION DATE: N/A
TTL JOB NO.: 000180200804.00
APPROX. SCALE:
SITE LEGENDD Undisturbed Soil Boring (14)
Proposed Permit Area (1,041.7± AC)Proposed Mining Area (898± AC)Project Study AreaOkefenokee Nat. Wildlife RefugeProperty Parcel BoundaryUSACE Verified StreamsUSCAE Verified Wetland
0 4,000Feet
1 in = 4,000 ft
FIGURE 22: UNDISTURBED (UD) SOIL BORING LOCATION MAPTWIN PINES MINERALS
ST GEORGE CHARLTON COUNTY GEORGIA. , ,
³

D
DD
D
D
D
A
A
A
A
A
A
A
A
A
A
A
A
A
A A
A
Trail R
idge
Trail R
idge
OKEFENOKEENATIONAL
WILDLIFE REFUGE
TIAA Tract
AdirondackTract
Loncala Tract
KeystoneTract
Dallas Police& Fire Tract
PB05
PB06 PB07
PB08
PB09
PB10
EB01
EB02
EB03
EB04
EB05
EB06
EB07
EB08
EB13
EB14
EB15
EB16 EB17
EB18
115
110105 90 85
155150
145 140135
125
120
95
16015
014514
013
012512
0
155
135
145140
135
135
130
115105
120110
140130
145
135
145
14016
5
160
170
165
160155
15014514
0
130
120
130
115
115105
135130
110
175
170
13513
0
135
130
160
130
160
120
155
130
150
135
165135
130
120
170
165
170
170
170
170
145
120
110
80
120
80
80
OWA EB
OWB EB
DRAWN BY: DEKCHECKED BY: JRS
DRAWING DATE: 2/28/2020REVISION DATE: N/A
TTL JOB NO.: 000180200804.00
APPROX. SCALE:
SITE LEGENDA EB Boring (16)A OW EB Boring (2)D PB Boring (6)
Proposed Permit Area (1,041.7± AC)Proposed Mining Area (898± AC)Project Study AreaOkefenokee Nat. Wildlife RefugeProperty Parcel BoundaryUSACE Verified StreamsUSCAE Verified Wetland
0 4,000Feet
1 in = 4,000 ft
FIGURE 23: EXPLORATORY BORING LOCATION MAPTWIN PINES MINERALS
ST GEORGE CHARLTON COUNTY GEORGIA. , ,
³

@A@A
@A
@A@A
@A
@A
@A
@A
@A
@A
@A
@A
@A@A
@A
@A
@A
@A@A
@A@A
@A
@A
@A@A
@A
@A@A
@A
@A
@A@A
@A
@A@A
@A@A
@A@A
@A@A
@A@A
@A@A
@A@A
@A@A
@A@A
@A@A
@A@A
@A
@A@A
@A
@A
@A
@A
@A
@A@A
@A
@A
@A@A
@A
@A
@A@A
@A
@A
@A@A
@A@A
@A@A
@A@A
@A@A
Trail R
idge
Trail R
idge
OKEFENOKEENATIONAL
WILDLIFE REFUGE
TIAA Tract
AdirondackTract
Loncala Tract
KeystoneTract
Dallas Police& Fire Tract
PZ01D/S
PZ02
PZ03D/S
PZ04
PZ05
PZ06
PZ07
PZ08
PZ09
PZ10
PZ11
PZ12D/S
PZ13
PZ14
PZ15
PZ16D/S
PZ17D/S
PZ18
PZ19
PZ20D/S
PZ21
PZ22D/S
PZ23
PZ24
PZ25D/S
PZ26
PZ27D/S
PZ28D/S
PZ29D/S
PZ30D/S
PZ31D/S
PZ32D/S
PZ33D/S
PZ34D/S
PZ35D/S
PZ36D/S
PZ37D/S
PZ38
PZ39D/S
PZ40
PZ41
PZ42
PZ43
PZ44
PZ45D/S
PZ46
PZ47
PZ48D/S
PZ49
PZ50
PZ51D/S
PZ52
PZ53
PZ54D/S
PZ55D/S
PZ56D/S
PZ57D/S
PZ58D/S
115
110105 90 85
145
140
130
160 155
120
9516015
5
14514
0135
150
130
145140
135
135
130
115105
120110
140130
14513
5
145
14016
5
160
170
165
160155
15014514
0
135
130
130
120
115105
135130
125
120
115
135
130
150
125
120
160
120
155
150
165
135
170
170 170
170
170
170
145
130125
120
110
80
120
80
80
DRAWN BY: DEKCHECKED BY: JRS
DRAWING DATE: 2/28/2020REVISION DATE: N/A
TTL JOB NO.: 000180200804.00
APPROX. SCALE:
SITE LEGEND@A Piezometer (86)
Proposed Permit Area (1,041.7± AC)Proposed Mining Area (898± AC)Project Study AreaOkefenokee Nat. Wildlife RefugeProperty Parcel BoundaryUSACE Verified StreamsUSCAE Verified Wetland
0 4,000Feet
1 in = 4,000 ft
FIGURE 24: PIEZOMETER LOCATION MAPTWIN PINES MINERALS
ST GEORGE CHARLTON COUNTY GEORGIA. , ,
³

!.
!.!.
Trail R
idge
Trail R
idge
OKEFENOKEENATIONAL
WILDLIFE REFUGE
TIAA Tract
AdirondackTract
Loncala Tract
KeystoneTract
Dallas Police& Fire Tract
115
110105 90 85
145140
135
150 130
160 155
120
95
16015
014514
013
012512
0
155
135
145140
135
135
130
115105
120110
140130
145
135
145
14016
5
160
170
165
160155
15014514
0
130
120
130
115
115105
135130
125120
110
175
170
13513
0
135
130
160
120
155
130
150
135
165135
130
170
165
170
170
170
170
145
120
110
80
120
80
80
SS-ADK-01SS-Key-01SS-TIA-01
DRAWN BY: DEKCHECKED BY: JRS
DRAWING DATE: 2/28/2020REVISION DATE: N/A
TTL JOB NO.: 000180200804.00
APPROX. SCALE:
SITE LEGEND!. Soil Sample Location (3)
Proposed Permit Area (1,041.7± AC)Proposed Mining Area (898± AC)Project Study AreaOkefenokee Nat. Wildlife RefugeProperty Parcel BoundaryUSACE Verified StreamsUSCAE Verified Wetland
0 4,000Feet
1 in = 4,000 ft
FIGURE 25: SOIL MOISTURE SAMPLING LOCATION MAPTWIN PINES MINERALS
ST GEORGE CHARLTON COUNTY GEORGIA. , ,
³

D
D
D
D
D
D
D
D
D
D
D D
D
D
Trail R
idge
Trail R
idge
OKEFENOKEENATIONAL
WILDLIFE REFUGE
TIAA Tract
AdirondackTract
LoncalaTract
Keystone Tract
Dallas Police& Fire Tract
UD238
UD51
UD67
UD65
UD179
UD93
UD10
UD126
UD128
UD231
UD25 UD43
UD34
UD338
115
110105 90 85
145 130
155150 140
135
125
120
95
15515
0145
135
120
160140
145140
135
135
130
115105
120110
140130
145
135
145
14016
5
160
165160
170 155
15014514
0
135
130
130
120
130
115
115105
135130
110
175
170
13513
0
135
130
160
130
125
160
120
155
150
165135
130
120
170
165
170
170
170
170
145
120
110
80
120
80
80
DRAWN BY: DEKCHECKED BY: JRS
DRAWING DATE: 2/28/2020REVISION DATE: N/A
TTL JOB NO.: 000180200804.00
APPROX. SCALE:
SITE LEGENDD Undisturbed Soil Boring (14)
UD Boring PairingProposed Permit Area (1,041.7± AC)Proposed Mining Area (898± AC)Project Study AreaOkefenokee Nat. Wildlife RefugeProperty Parcel BoundaryUSACE Verified StreamsUSCAE Verified Wetland
0 4,000Feet
1 in = 4,000 ft
³
FIGURE 26: UNDISTURBED (UD) SOIL BORING LOCATION& POST-MINERAL PROCESS PAIRING MAP
TWIN PINES MINERALSST. GEORGE, CHARLTON COUNTY, GEORGIA

!.
!.
!.
Trail R
idge
Trail R
idge
OKEFENOKEENATIONAL
WILDLIFE REFUGE
TIAA Tract
AdirondackTract
Loncala Tract
KeystoneTract
Dallas Police& Fire Tract
RG01
RG02
RG03
115
110105 90 85
155150
145
140
120
16015
014514
0135
130
125
120
145140
135
135
130
115105
120110
140130
145
135
145
14016
5
160
170
165
160155
15014514
0
130
120
130
115
115105
135130
125120
110
175
170
13513
0
135
130
160
135
130
95
155
160
120
155
130
150
135
165135
130
170
165
170
170
170
170
145
120
110
80
120
80
80
DRAWN BY: DEKCHECKED BY: JRS
DRAWING DATE: 2/28/2020REVISION DATE: N/A
TTL JOB NO.: 000180200804.00
APPROX. SCALE:
SITE LEGEND!. Rain Gauge (3)
Proposed Permit Area (1,041.7± AC)Proposed Mining Area (898± AC)Project Study AreaOkefenokee Nat. Wildlife RefugeProperty Parcel BoundaryUSACE Verified StreamsUSCAE Verified Wetland
0 4,000Feet
1 in = 4,000 ft
FIGURE 27: RAIN GAUGE LOCATION MAPTWIN PINES MINERALS
ST GEORGE CHARLTON COUNTY GEORGIA. , ,
³

#A
#A
#A
#A
#A
#A
#A
#A
#A
#A
#A
#A
#A
#A
#A
#A
#A
#A
#A
#A#A#A
#A
Trail R
idge
Trail R
idge
OKEFENOKEENATIONAL
WILDLIFE REFUGE
TIAA Tract
AdirondackTract
Loncala Tract
KeystoneTract
DallasPolice
& Fire Tract
SG01
SG02
SG03
SG04
SG05SG07
SG08
SG09
SG10
SG11
SG12
SG20
SG21
SG22
SG23
SG24
SG25
SG26
SG27
SG28 SG29SG30
SG06
115
110105 90 85
155150
145
140
120
16015
014514
013
012512
0
155135
145140
135
135
130
115105
120110
140130
145
135
145
14016
5
160
170
165
160155
15014514
0
130
120
115105
135130
125120
115
13513
0
135
130
160
135
130
95
160
120
155
130
150
135
165135
170 170
170
170
170
145
130
120
110
80
120
80
80
DRAWN BY: DEKCHECKED BY: JRS
DRAWING DATE: 2/28/2020REVISION DATE: N/A
TTL JOB NO.: 000180200804.00
APPROX. SCALE:
SITE LEGENDStaff Gauge Location#A Stream#A Wetland
Proposed Permit Area (1,041.7± AC)Proposed Mining Area (898± AC)Project Study AreaOkefenokee Nat. Wildlife RefugeProperty Parcel BoundaryUSACE Verified StreamsUSCAE Verified Wetland
0 4,000Feet
1 in = 4,000 ft
FIGURE 28: STAFF GAUGE LOCATION MAPTWIN PINES MINERALS
ST GEORGE CHARLTON COUNTY GEORGIA. , ,
³

A
A
A
A
A
A
A
A
A
A
A
A
A
A
A
A
A
A
A
A
A
A
A
A
A
A
A
A
A
A
A
A
A
A
A
A
A
A
A
A
A
A
A
A
A
A
A
A
A
A
A
A
A
A
A
A
A
A
Trail R
idge
Trail R
idge
OKEFENOKEENATIONAL
WILDLIFE REFUGE
TIAA Tract
AdirondackTract
Loncala Tract
Keystone Tract
Dallas Police& Fire Tract
PZ01D/S
PZ02
PZ03D/S
PZ04
PZ05
PZ06
PZ07
PZ08
PZ09
PZ10
PZ11
PZ12D/S
PZ13
PZ14
PZ15
PZ16D/S
PZ17D/S
PZ18
PZ19
PZ20D/S
PZ21
PZ22D/S
PZ23
PZ24
PZ25D/S
PZ26
PZ27D/S
PZ28D/S
PZ29D/S
PZ30D/S
PZ31D/S
PZ32D/S
PZ33D/S
PZ34D/S
PZ35D/S
PZ36D/S
PZ38
PZ39D/S
PZ40
PZ41
PZ42
PZ43
PZ44
PZ45D/S
PZ46
PZ47
PZ48D/S
PZ49
PZ50
PZ51D/S
PZ52
PZ53
PZ55D/S
PZ56D/S
PZ57D/S
PZ58D/S
OWA1D/S
OWB1D/S
115
110105 90 85
145
140
130
160 155
120
9516015
5
14514
0135
150
130
145140
135
135
130
115105
120110
140130
14513
5
145
14016
5
160
170
165
160155
15014514
0
135
130
130
120
115105
135130
125
120
115
135
130
150
125
120
160
120
155
150
165135
135
170
170 170
170
170
170
145
130
125
120
110
80
80
80
DRAWN BY: DEKCHECKED BY: JRS
DRAWING DATE: 2/28/2020REVISION DATE: N/A
TTL JOB NO.: 000180200804.00
APPROX. SCALE:
SITE LEGENDA PZ & OW w/ Dataloggers (58)
Proposed Permit Area (1,041.7± AC)Proposed Mining Area (898± AC)Project Study AreaOkefenokee Nat. Wildlife RefugeProperty Parcel BoundaryUSACE Verified StreamsUSCAE Verified Wetland
0 4,000Feet
1 in = 4,000 ft
FIGURE 29: DATA LOGGER EQUIPPED PIEZOMETERS & OBSERVATION WELLSTWIN PINES MINERALS
ST GEORGE CHARLTON COUNTY GEORGIA. , ,
³

FIGURE 30: Rain Gauge Precipitation Data JRS
2/28/2020

FIGURE 31: PZ-44 & SG-22 HYDROGRAPH JRS
2/28/2020

FIGURE 32: PZ-28S/D HYDROGRAPH JRS
2/28/2020

FIGURE 33: SG-06 HYDROGRAPH JRS
2/28/2020

FIGURE 34: SG-27 HYDROGRAPH JRS
2/28/2020

A
A
A
A
A
A
A
A
A
A
A
A
A
A
A
A
A
A
A
A
A
A
A
A
A
A
A
A
Trail R
idge
Trail R
idge
OKEFENOKEENATIONAL
WILDLIFE REFUGE
TIAA Tract
AdirondackTract
Loncala Tract
KeystoneTract
Dallas Police& Fire Tract
115
110105 90 85
155150
145 140135
125
120
95
15514
514013
5
160
150
130
125
145140
135
135
130
115105
120110
140130
145
135
145
14016
5
160
170
165
160155
15014514
0
135
130
135
120
13513
0
115
160
130
120
160
120
155
150
115
165135
135
120
170
170
165
170
170
170
170
145
135
130
130
120
80
120
80
80
PZ01+1.86
PZ03+1.54
PZ12+0.01
PZ16-2.00
PZ17-2.87
PZ20-0.29
PZ22-0.37
PZ25+0.12
PZ27-0.17
PZ28-0.20
PZ29-0.50
PZ30-0.30
PZ31+0.11
PZ32-0.10
PZ33-0.33
PZ34-0.34
PZ35-0.23
PZ36+0.57
PZ39-13.67
PZ45-5.85
PZ48-1.01
PZ51-1.19
PZ55+0.02
PZ56-0.18
PZ57-3.02
PZ58-4.24
OWA1-8.08
OWB1-2.72
DRAWN BY: DEKCHECKED BY: JRS
DRAWING DATE: 2/28/2020REVISION DATE: N/A
TTL JOB NO.: 000180200804.00
APPROX. SCALE:
SITE LEGENDA Shallow/Deep Piezometer (28)
Proposed Permit Area (1,041.7± AC)Proposed Mining Area (898± AC)Project Study AreaOkefenokee Nat. Wildlife RefugeProperty Parcel BoundaryUSACE Verified StreamsUSCAE Verified Wetland
0 4,000Feet
1 in = 4,000 ft
³
FIGURE 35: AVERAGE GROUNDWATER ELEVATION DIFFERENCESIN SHALLOW & DEEP PIEZOMETER PAIRS
TWIN PINES MINERALSST GEORGE CHARLTON COUNTY GEORGIA. , ,
PZ03+1.54
Identifier & Average GroundwaterElevation Difference betweenShallow/Deep Piezometer Pair (in feet)

FIGURE 36: PZ-45S/D HYDROGRAPH JRS
2/28/2020

A
A
A
A
A
A
A
A
A
A
A
A
A
A
A
A
A
A
A
A
A
A
A
A
A
A
A
A
A
A
A
A
A
A
A
A
A
A
A
A
A
A
A
A
?̀
?̀
?̀
?̀
?̀
?̀
?̀
?̀
?̀
?̀
?̀
?̀
?̀
?̀
?̀
?̀
?̀
Trail R
idge
Trail R
idge
OKEFENOKEENATIONAL
WILDLIFE REFUGE
TIAA Tract
Adirondack Tract
Loncala Tract
KeystoneTract
Dallas Police& Fire Tract
165
155
145
140
135
130 120
110105
90
160155
145140
135130
120115
105
95
16015
014514
0
135130
145140
135
15014514
0130
135
115
145
140
135
125
130
125
13513
0
135
130
120
85
80
110
155
125
160
105
165
160
160
155
150
135
170 170
170
170
170
165
150
145
135
130
135
120
120
120
120
110
110
120
120
80
80
PZ01D/S122.84
PZ02126.09
PZ03D/S123.19
PZ04122.73
PZ05123.42
PZ06124.06
PZ07123.61
PZ08129.49
PZ09134.70
PZ10145.20
PZ11146.89
PZ12D/S138.27
PZ13156.81
PZ14167.49
PZ15165.60
PZ16D/S159.62
PZ17D/S160.62
PZ18163.60
PZ19168.33
PZ20D/S166.66
PZ21164.83
PZ22D/S169.68
PZ23169.42
PZ24169.10
PZ25D/S169.21
PZ26168.98
PZ27D/S166.13
PZ28D/S173.46
PZ38
PZ39D/S
PZ40169.38
PZ41
PZ42147.14
PZ43161.60
PZ44153.51
PZ45D/S165.95
PZ46138.17
PZ47137.88
PZ48D/S132.29
PZ49
PZ50127.12
PZ51D/S114.98
PZ52110.60
PZ53110.60
SG01170.03
SG02
SG03
SG04163.54
SG05162.10
SG07121.82
SG08
SG09135.27
SG10
SG11
SG12
SG20170.32
SG21136.01
SG22152.13
SG23107.34
SG2699.95
SG06122.89
125 115
150145
160155
160 155
115
155
155
150
145
14014
0
135
135
130
130
125
120
100
165165
165
165
165
160
165
155
150
145
145
145
145
140
140
140
140135
135
135
130
130
125
125
120
110
110
105
DRAWN BY: DEKCHECKED BY: JRS
DRAWING DATE: 2/28/2020REVISION DATE: N/A
TTL JOB NO.: 000180200804.00
APPROX. SCALE:
SITE LEGENDA Piezometer?̀ Staff Gauge
Groundwater Flow DirectionGroundwater ContourProposed Permit Area (1,041.7± AC)Proposed Mining Area (898± AC)Project Study AreaOkefenokee Nat. Wildlife RefugeProperty Parcel BoundaryUSACE Verified StreamsUSCAE Verified Wetland
0 4,000Feet
1 in = 4,000 ft
³
FIGURE 37: POTENTIOMETRIC SURFACE MAP OF THE SURFICIAL AQUIFER(JANUARY 26, 2019)TWIN PINES MINERALS
ST GEORGE CHARLTON COUNTY GEORGIA. , ,
Note: Piezometers PZ29D/S, PZ30D/S, P31D/S,PZ32D/S, PZ33D/S, PZ34D/S, PZ35D/S, PZ36D/S,PZ37D/S, PZ54D/S, PZ55D/S, PZ56D/S, PZ57D/S,and PZ58D/S and staff gauges SG24, SG25, SG27,SG28, SG29, SG30 not installed until May 2019.

A
A
A
A
A
A
A
A
A
A
A
A
A
A
A
A
A
A
A
A
A
A
A
A
A
A
A
A
A
A
A
A
A
A
A
A
A
A
A
A
A
A
A
A
?̀
?̀
?̀
?̀
?̀
?̀
?̀
?̀
?̀
?̀
?̀
?̀
?̀
?̀
?̀
?̀
?̀
Trail R
idge
Trail R
idge
OKEFENOKEENATIONAL
WILDLIFE REFUGE
TIAA Tract
Adirondack Tract
Loncala Tract
KeystoneTract
Dallas Police& Fire Tract
165
155
145
140
135
130 120
110105
90
160155
145140
135130
120115
105
95
16015
014514
0
135130
145140
135
115
15014514
0130
145
140
160
13513
0
120
170
135
130
85
80
110
155
125
160
135
135
130
135
165
160 155
150
120120
170 170
170
170
170
165
145
135135
120
120
120
80
120
80PZ01D/S121.40
PZ02124.64
PZ03D/S122.12
PZ04120.88
PZ05121.48
PZ06122.12
PZ07121.44
PZ08127.39
PZ09133.78
PZ10143.86
PZ11145.59
PZ12D/S136.90
PZ13155.09
PZ14165.69
PZ15164.58
PZ16D/S157.43
PZ17D/S159.15
PZ18161.46
PZ19166.54
PZ20D/S164.88
PZ21163.98
PZ22D/S168.27
PZ23167.99
PZ24168.00
PZ25D/S167.66
PZ26166.97
PZ27D/S165.83
PZ28D/S172.08
PZ38169.03
PZ39D/S
PZ40167.96
PZ41
PZ42145.02
PZ43159.90
PZ44151.81
PZ45D/S164.50
PZ46137.10
PZ47135.75
PZ48D/S130.03
PZ49141.64
PZ50125.21
PZ51D/S113.31
PZ52109.28
PZ53109.59
SG01
SG02
SG03
SG04163.21
SG05
SG07121.55
SG08
SG09
SG10
SG11
SG12
SG20169.53
SG21135.95
SG22150.98
SG23107.01
SG2699.32
SG06121.86
125
150
150
140
110
165
155
150
120115
150
125
155
15515
0
145
150
125
120
165
165
165
160
160
160
155
150
150
145
145
140
140
135
135
135
135
130
130
130
130
130
125
115
115
110
105
DRAWN BY: DEKCHECKED BY: JRS
DRAWING DATE: 2/28/2020REVISION DATE: N/A
TTL JOB NO.: 000180200804.00
APPROX. SCALE:
SITE LEGENDA Piezometer?̀ Staff Gauge
Groundwater Flow DirectionGroundwater ContourProposed Permit Area (1,041.7± AC)Proposed Mining Area (898± AC)Project Study AreaOkefenokee Nat. Wildlife RefugeProperty Parcel BoundaryUSACE Verified StreamsUSCAE Verified Wetland
0 4,000Feet
1 in = 4,000 ft
³
FIGURE 38: POTENTIOMETRIC SURFACE MAP OF THE SURFICIAL AQUIFER(APRIL 26, 2019)
TWIN PINES MINERALSST GEORGE CHARLTON COUNTY GEORGIA. , ,
Note: Piezometers PZ29D/S, PZ30D/S, P31D/S,PZ32D/S, PZ33D/S, PZ34D/S, PZ35D/S, PZ36D/S,PZ37D/S, PZ54D/S, PZ55D/S, PZ56D/S, PZ57D/S,and PZ58D/S and staff gauges SG24, SG25, SG27,SG28, SG29, SG30 not installed until May 2019.

AA
A
AA
A
A
A
A
A
A
A
A
AA
A
A
A
AA
AA
A
A
AA
A
AA
A
A
AA
A
AA
AA
AA
AA
AA
AA
AA
AA
AA
AA
AA
A
AA
A
A
A
A
A
AA
A
A
AA
A
A
AA
A
A
AA
AA
AA
AA
AA
?̀
?̀
?̀
?̀
?̀
?̀
?̀
?̀
?̀
?̀
?̀
?̀
?̀
?̀
?̀
?̀
?̀
?̀
?̀
?̀?̀?̀
?̀
PZ01D/S122.85
PZ02126.11
PZ03D/S123.25
PZ04122.48
PZ05123.30
PZ06123.74
PZ07123.65
PZ08129.52
PZ09134.67
PZ10145.23
PZ11146.94
PZ12D/S138.29
PZ13156.87
PZ14166.97
PZ15165.47
PZ16D/S158.24
PZ17D/S160.56
PZ18162.96
PZ19168.31
PZ20D/S166.62
PZ21164.78
PZ22D/S169.79
PZ23169.54
PZ24169.16
PZ25D/S168.86
PZ26168.42
PZ27D/S167.46
PZ28D/S173.30
PZ29D/S153.30
PZ30D/S137.12
PZ31D/S134.24
PZ32D/S139.36
PZ33D/S122.25
PZ34D/S123.13
PZ35D/S117.83
PZ36D/S118.06
PZ37D/S
PZ38171.05
PZ39D/S171.86
PZ40169.71
PZ41
PZ42147.12
PZ43161.69
PZ44153.47
PZ45D/S166.17
PZ46138.28
PZ47136.21
PZ48D/S131.13
PZ49142.73
PZ50127.42
PZ51D/S114.92
PZ52110.34
PZ53110.78
PZ54D/S
PZ55D/S174.02
PZ56D/S170.72
PZ57D/S165.25
SG01170.06
SG04163.42
SG05161.75
SG07121.87
SG08124.75
SG09135.32
SG10140.33
SG11
SG12170.38
SG20170.50
SG21136.15
SG22152.06
SG23107.36
SG2494.58
SG2597.71
SG2699.53
SG27133.39
SG2868.03
SG2967.77
SG3069.62
SG06122.72
PZ58D/S139.43
SG02169.01
SG03170.80
Trail R
idge
Trail R
idge
OKEFENOKEENATIONAL
WILDLIFE REFUGE
TIAA Tract
AdirondackTract
Loncala Tract
KeystoneTract
Dallas Police& Fire Tract
165
155
145
140
135
130 120
110105
90
160155
145140
135130
120115
155
14514
0
130125
145140
135
15014013
5
160 155
150 145
145
135
130
125
105
105
175
170
170
170
130
125
85
80
80
95
165
160
150
160
135165
135
135
120
170 170 160
150
145
140
135
135
130
130
130
120
120
120
120
120
115
115
110
80
130
105
80
70
125
115
95
100
95
165
165
155150
145
145140
125
120
95
75
130
155
150
145
135
130
130
125
125
120
120
125
120
110
100 75
165
165165
160
160
160
15515
516
0
150
145
145
145
140
140
13513
5
135
135
140
135
130
130
120
115
110
110
105
105
90
90
85
85
8.729e-03
6.066e-03
6.456e-03
5.573e-03
DRAWN BY: DEKCHECKED BY: JRS
DRAWING DATE: 2/28/2020REVISION DATE: N/A
TTL JOB NO.: 000180200804.00
APPROX. SCALE:
SITE LEGENDA Piezometer?̀ Staff Gauge
Groundwater Flow DirectionGroundwater ContourHydraulic Gradient LineProposed Permit Area (1,041.7± AC)Proposed Mining Area (898± AC)Project Study AreaOkefenokee Nat. Wildlife RefugeProperty Parcel BoundaryUSACE Verified StreamsUSCAE Verified Wetland
0 4,000Feet
1 in = 4,000 ft
³
FIGURE 39: POTENTIOMETRIC SURFACE MAP OF THE SURFICIAL AQUIFER(JULY 26, 2019)
TWIN PINES MINERALSST GEORGE CHARLTON COUNTY GEORGIA. , ,

OKEFENOKEENATIONAL
WILDLIFE REFUGE
Trail R
idge
Trail R
idge
TIAA Tract
AdirondackTract
Loncala Tract
KeystoneTract
Dallas Police& Fire Tract
170
130 120 11
5
135 125
95
16516
0
105
100
85 80
70
110
90
155
140
145140135
130
150
125
120
100
120
115
115
110
115105
80
75
175
170
150
14575
65
11095
70
115
120
75
60
170
120DRAWN BY: DEK
CHECKED BY: RMHDRAWING DATE: 2/28/2020
REVISION DATE: N/ATTL JOB NO.: 000180200804.00
APPROX. SCALE:
LEGENDProject Study AreaProject Permit AreaProposed Mining AreaOkefenokee National Wildlife RefugeModel BoundaryAdirondack TractDallas Police & Fire TractKeystone TractLoncala TractTIAA Tract
³
0 5,000Feet
1 in = 5,000 ft
FIGURE 40: MODEL AREA MAPTWIN PINES MINERALS
ST. GEORGE, CHARLTON COUNTY, GEORGIA

OKEFENOKEENATIONAL
WILDLIFE REFUGE
CONS
TANT
HEAD
BOUN
DARY CONSTA NTHEADBOUND ARY
NO FLOW BOUNDARY
NO FLOW BOUNDARY
170
130 120 11
5
135 125
95
165
140
110
145
100
90
150
105
85
8065
155145
140135
150130
125
120
120
100
115
110
115105
80
75
175
170
160
70
11095
75
115
120
75
60
170
120DRAWN BY: DEK
CHECKED BY: RMHDRAWING DATE: 2/28/2020
REVISION DATE: N/ATTL JOB NO.: 000180200804.00
APPROX. SCALE:
LEGENDProject Permit AreaProposed Mining AreaOkefenokee National Wildlife RefugeModel BoundaryModel CellNo Flow BoundaryConstant Head BoundaryDrain Boundaries
³
0 5,000Feet
1 in = 5,000 ft
FIGURE 41: MODEL GRID & BOUNDARY CONDITIONSTWIN PINES MINERALS
ST. GEORGE, CHARLTON COUNTY, GEORGIA

Colum
n1
Colum
n31
Colum
n64
170
165
150
125 105 85
155
145140
130120
110
95
160 135
90
80
115100
14013513012
5
175
170
120
115
75
145
125
70
130
115
80
75
75
75
170
165
130
120
120
120
70120
120
120
DRAWN BY: DEKCHECKED BY: RMH
DRAWING DATE: 2/28/2020REVISION DATE: N/A
TTL JOB NO.: 000180200804.00
APPROX. SCALE:
LEGENDProject Permit AreaProposed Mining AreaOkefenokee National Wildlife RefugeModel BoundaryModel GridDisplayed Grid Column
³
0 7,000Feet
1 in = 7,000 ft
FIGURE 42: VERTICAL MODEL GRID - NORTH TO SOUTHTWIN PINES MINERALS
ST. GEORGE, CHARLTON COUNTY, GEORGIA
Column 1
Column 31
Column 64
south north
south north
south north

Row 20
Row 50
170
165
150
125 105 85
155
145140
130120
110
95
160 135
90
80
115100
14013513012
5
175
170
120
115
75
145
125
70
130
115
80
75
75
75
170
165
130
120
120
120
70120
120
120
DRAWN BY: DEKCHECKED BY: RMH
DRAWING DATE: 2/28/2020REVISION DATE: N/A
TTL JOB NO.: 000180200804.00
APPROX. SCALE:
LEGENDProject Permit AreaProposed Mining AreaOkefenokee National Wildlife RefugeModel BoundaryModel GridDisplayed Grid Column
³
0 7,000Feet
1 in = 7,000 ft
FIGURE 43: VERTICAL MODEL GRID - WEST TO EASTTWIN PINES MINERALS
ST. GEORGE, CHARLTON COUNTY, GEORGIA
Row 20
Row 50
west east
west east

OKEFENOKEENATIONAL
WILDLIFE REFUGE
130 125
120 105 95
135 110
100
140
115
85
150 90 80
170160
14514
0
130
15013
5
155
125
65 55
80
75120
115
7570
165
145
75
70
120
60
120
70
175
170
170
115 120
80120
DRAWN BY: DEKCHECKED BY: RMH
DRAWING DATE: 2/28/2020REVISION DATE: N/A
TTL JOB NO.: 000180200804.00
APPROX. SCALE:
LEGENDProject Permit AreaProposed Mining AreaOkefenokee National Wildlife RefugeModel Boundary
Hydraulic Conductivity (ft/s)<0.010<0.009<0.008<0.007<0.006<0.005<0.004<0.003<0.002
³
0 5,000Feet
1 in = 5,000 ft
FIGURE 44: INITIAL MODEL HORIZONTAL HYDRAULIC CONDUCTIVITYLAYER 4TWIN PINES MINERALS
ST GEORGE CHARLTON COUNTY GEORGIA. , ,

OKEFENOKEENATIONAL
WILDLIFE REFUGE
130 125
120 105 95
135 110
100
140
115
85
150 90 80
170160
14514
0
130
15013
5
155
125
65 55
80
75120
115
7570
165
145
75
70
120
60
120
70
175
170
170
115 120
80120
DRAWN BY: DEKCHECKED BY: RMH
DRAWING DATE: 2/28/2020REVISION DATE: N/A
TTL JOB NO.: 000180200804.00
APPROX. SCALE:
LEGENDProject Permit AreaProposed Mining AreaOkefenokee National Wildlife RefugeModel Boundary
Hydraulic Conductivity (ft/s)<0.010<0.009<0.008<0.007<0.006<0.005<0.004<0.003<0.002
³
0 5,000Feet
1 in = 5,000 ft
FIGURE 45: INITIAL MODEL HORIZONTAL HYDRAULIC CONDUCTIVITYLAYER 8TWIN PINES MINERALS
ST GEORGE CHARLTON COUNTY GEORGIA. , ,

OKEFENOKEENATIONAL
WILDLIFE REFUGE
130 125
120 105 95
135 110
100
140
115
85
150 90 80
170160
14514
0
130
15013
5
155
125
65 55
80
75120
115
7570
165
145
75
70
120
60
120
70
175
170
170
115 120
80120
DRAWN BY: DEKCHECKED BY: RMH
DRAWING DATE: 2/28/2020REVISION DATE: N/A
TTL JOB NO.: 000180200804.00
APPROX. SCALE:
LEGENDProject Permit AreaProposed Mining AreaOkefenokee National Wildlife RefugeModel Boundary
Hydraulic Conductivity (ft/s)<0.010<0.009<0.008<0.007<0.006<0.005<0.004<0.003<0.002
³
0 5,000Feet
1 in = 5,000 ft
FIGURE 46: INITIAL MODEL HORIZONTAL HYDRAULIC CONDUCTIVITYLAYER 12TWIN PINES MINERALS
ST GEORGE CHARLTON COUNTY GEORGIA. , ,

FIGURE 47: OBJECTIVE FUNCTION VS. ITERATION RMH
2/28/2020

FIGURE 48: CALCULATED VS. OBSERVED HEADS - CALIBRATED RMH
2/28/2020

OKEFENOKEENATIONAL
WILDLIFE REFUGE
130 125
120 105 95
135 110
100
140
115
85
150 90 80
170160
14514
0
130
15013
5
155
125
65 55
80
75120
115
7570
165
145
75
70
120
60
120
70
175
170
170
115 120
80120
DRAWN BY: DEKCHECKED BY: RMH
DRAWING DATE: 2/28/2020REVISION DATE: N/A
TTL JOB NO.: 000180200804.00
APPROX. SCALE:
LEGENDProject Permit AreaProposed Mining AreaOkefenokee National Wildlife RefugeModel Boundary
Hydraulic Conductivity (ft/s)<10e1<10e0<10e-1<10e-2<10e-3<10e-4
³
0 5,000Feet
1 in = 5,000 ft
FIGURE 49: CALIBRATED MODEL HORIZONTAL HYDRAULIC CONDUCTIVITYLAYER 4TWIN PINES MINERALS
ST GEORGE CHARLTON COUNTY GEORGIA. , ,

OKEFENOKEENATIONAL
WILDLIFE REFUGE
130 125
120 105 95
135 110
100
140
115
85
150 90 80
170160
14514
0
130
15013
5
155
125
65 55
80
75120
115
7570
165
145
75
70
120
60
120
70
175
170
170
115 120
80120
DRAWN BY: DEKCHECKED BY: RMH
DRAWING DATE: 2/28/2020REVISION DATE: N/A
TTL JOB NO.: 000180200804.00
APPROX. SCALE:
LEGENDProject Permit AreaProposed Mining AreaOkefenokee National Wildlife RefugeModel Boundary
Hydraulic Conductivity (ft/s)<10e1<10e0<10e-1<10e-2<10e-3<10e-4
³
0 5,000Feet
1 in = 5,000 ft
FIGURE 50: CALIBRATED MODEL HORIZONTAL HYDRAULIC CONDUCTIVITYLAYER 8TWIN PINES MINERALS
ST GEORGE CHARLTON COUNTY GEORGIA. , ,

OKEFENOKEENATIONAL
WILDLIFE REFUGE
130 125
120 105 95
135 110
100
140
115
85
150 90 80
170160
14514
0
130
15013
5
155
125
65 55
80
75120
115
7570
165
145
75
70
120
60
120
70
175
170
170
115 120
80120
DRAWN BY: DEKCHECKED BY: RMH
DRAWING DATE: 2/28/2020REVISION DATE: N/A
TTL JOB NO.: 000180200804.00
APPROX. SCALE:
LEGENDProject Permit AreaProposed Mining AreaOkefenokee National Wildlife RefugeModel Boundary
Hydraulic Conductivity (ft/s)<10e1<10e0<10e-1<10e-2<10e-3<10e-4
³
0 5,000Feet
1 in = 5,000 ft
FIGURE 51: CALIBRATED MODEL HORIZONTAL HYDRAULIC CONDUCTIVITYLAYER 12TWIN PINES MINERALS
ST GEORGE CHARLTON COUNTY GEORGIA. , ,

OKEFENOKEENATIONAL
WILDLIFE REFUGE
130
115
95
135 120
100 85
140
125
110
90 75
145
105
80
155145
140135
150130
125120
120
100
170
165 160
80
75
115
110
115105
150
110
95
75
70
115
120
65
60
175
170
170
120
70
175
165160
145135
130125
120
115
155150
130
125
155
140
145
140
110
105
100
95 90
170
170
170
17015
0
135
90
90
DRAWN BY: DEKCHECKED BY: RMH
DRAWING DATE: 2/28/2020REVISION DATE: N/A
TTL JOB NO.: 000180200804.00
APPROX. SCALE:
LEGENDProject Study AreaProject Permit AreaProposed Mining AreaOkefenokee National Wildlife RefugeModel BoundaryGroundwater Potentiometric Surface(5 ft. Contour Interval)
³
0 5,000Feet
1 in = 5,000 ft
FIGURE 52: PRE-MINING MODEL POTENTIOMETRIC SURFACE MAPTWIN PINES MINERALS
ST. GEORGE, CHARLTON COUNTY, GEORGIA

OKEFENOKEENATIONAL
WILDLIFE REFUGE
DRAWN BY: DEKCHECKED BY: RMH
DRAWING DATE: 2/28/2020REVISION DATE: N/A
TTL JOB NO.: 000180200804.00
APPROX. SCALE:
LEGENDProject Study AreaProject Permit AreaProposed Mining AreaOkefenokee National Wildlife RefugeModel Boundary
Digital Elevation Model180 ft
60 ft
³
0 5,000Feet
1 in = 5,000 ft
FIGURE 53: SURFACE & MINING BASE DIGITAL ELEVATION MODELTWIN PINES MINERALS
ST. GEORGE, CHARLTON COUNTY, GEORGIA

OKEFENOKEENATIONAL
WILDLIFE REFUGE
130 125
120 105 95
135 110
100
140
115
85
150 90 80
170160
14514
0
130
15013
5
155
125
65 55
80
75120
115
7570
165
145
75
70
120
60
120
70
175
170
170
115 120
80120
DRAWN BY: DEKCHECKED BY: RMH
DRAWING DATE: 2/28/2020REVISION DATE: N/A
TTL JOB NO.: 000180200804.00
APPROX. SCALE:
LEGENDProject Permit AreaProposed Mining AreaOkefenokee National Wildlife RefugeModel Boundary
Hydraulic Conductivity (ft/s)<10e1<10e0<10e-1<10e-2<10e-3<10e-4
³
0 5,000Feet
1 in = 5,000 ft
FIGURE 54: POST-MINING MODEL HORIZONTAL HYDRAULIC CONDUCTIVITYLAYER 4TWIN PINES MINERALS
ST GEORGE CHARLTON COUNTY GEORGIA. , ,

OKEFENOKEENATIONAL
WILDLIFE REFUGE
130 125
120 105 95
135 110
100
140
115
85
150 90 80
170160
14514
0
130
15013
5
155
125
65 55
80
75120
115
7570
165
145
75
70
120
60
120
70
175
170
170
115 120
80120
DRAWN BY: DEKCHECKED BY: RMH
DRAWING DATE: 2/28/2020REVISION DATE: N/A
TTL JOB NO.: 000180200804.00
APPROX. SCALE:
LEGENDProject Permit AreaProposed Mining AreaOkefenokee National Wildlife RefugeModel Boundary
Hydraulic Conductivity (ft/s)<10e1<10e0<10e-1<10e-2<10e-3<10e-4
³
0 5,000Feet
1 in = 5,000 ft
FIGURE 55: POST-MINING MODEL HORIZONTAL HYDRAULIC CONDUCTIVITYLAYER 8TWIN PINES MINERALS
ST GEORGE CHARLTON COUNTY GEORGIA. , ,

OKEFENOKEENATIONAL
WILDLIFE REFUGE
130 125
120 105 95
135 110
100
140
115
85
150 90 80
170160
14514
0
130
15013
5
155
125
65 55
80
75120
115
7570
165
145
75
70
120
60
120
70
175
170
170
115 120
80120
DRAWN BY: DEKCHECKED BY: RMH
DRAWING DATE: 2/28/2020REVISION DATE: N/A
TTL JOB NO.: 000180200804.00
APPROX. SCALE:
LEGENDProject Permit AreaProposed Mining AreaOkefenokee National Wildlife RefugeModel Boundary
Hydraulic Conductivity (ft/s)<10e1<10e0<10e-1<10e-2<10e-3<10e-4
³
0 5,000Feet
1 in = 5,000 ft
FIGURE 56: POST-MINING MODEL HORIZONTAL HYDRAULIC CONDUCTIVITYLAYER 12TWIN PINES MINERALS
ST GEORGE CHARLTON COUNTY GEORGIA. , ,

OKEFENOKEENATIONAL
WILDLIFE REFUGE
130 125
120 105 95
135
115100
90
155
140
8580
14514
0
130
15013
5
170160
80 75
165
120
115
7570
145
150
110
125
120
75
7065
60
120
70
175
170
170
115 120
55
120
80
165160
155
155150
145135
130125
110
100
135
130
125
120
115
175
145
140140
105
95
90
170
170
170
150
90
90
DRAWN BY: DEKCHECKED BY: RMH
DRAWING DATE: 2/28/2020REVISION DATE: N/A
TTL JOB NO.: 000180200804.00
APPROX. SCALE:
LEGENDProject Permit AreaProposed Mining AreaOkefenokee National Wildlife RefugeModel BoundaryGroundwater Potentiometric Surface(5 ft. Contour Interval)
³
0 5,000Feet
1 in = 5,000 ft
FIGURE 57: POST-MINING MODEL POTENTIOMETRIC SURFACE MAPTWIN PINES MINERALS
ST. GEORGE, CHARLTON COUNTY, GEORGIA

OKEFENOKEENATIONAL
WILDLIFE REFUGE
125120
115
130
110
95
90 85 80
145
135
150
105
155
140
14514
0
150
135
130
125
165160
80
75
175
115
7570
100
120
120
75
7065
60
55
170
70
170
170
115 120
120
120
80-0.000
1
-0.00
1
-0.01-0.
1
-0.5-10.001
0.000
1
0.1
0.01 1.51
-0.1
-0.00
001
0.00001
0.5
2-0.1
-0.00001
DRAWN BY: DEKCHECKED BY: RMH
DRAWING DATE: 2/28/2020REVISION DATE: N/A
TTL JOB NO.: 000180200804.00
APPROX. SCALE:
LEGENDProject Permit AreaProposed Mining AreaOkefenokee National WildlifeRefugeModel Boundary
Water Table Elevation Change (ft)(Post-Mining minus Pre-Mining)
-1-0.5-0.1-0.01-0.001-0.0001-0.0000100.000010.00010.0010.010.10.511.52
³
0 5,000Feet
1 in = 5,000 ft
FIGURE 58: POST-MINING WATER TABLE ELEVATION CHANGE MAPTWIN PINES MINERALS
ST. GEORGE, CHARLTON COUNTY, GEORGIA

OKEFENOKEENATIONAL
WILDLIFE REFUGE
130
100
95
105
85 80
70170 16
5
120115
110
135
125
140
90
155
145
145140135
130
150
125
120
100
120
115
115
110
115105
80
75
175
170
160
15075
65
11095
70
115
120
75
60
170
120
Zone 2Zone 1
DRAWN BY: DEKCHECKED BY: RMH
DRAWING DATE: 2/28/2020REVISION DATE: N/A
TTL JOB NO.: 000180200804.00
APPROX. SCALE:
LEGENDProject Permit AreaProposed Mining AreaOkefenokee National Wildlife RefugeModel BoundaryGridZone 1Zone 2
³
0 5,000Feet
1 in = 5,000 ft
FIGURE 59: MODEL WATER BUDGET ZONE MAPTWIN PINES MINERALS
ST. GEORGE, CHARLTON COUNTY, GEORGIA

FIGURE 60: DRAWDOWN DUE TO THE MOVING MINE
• The zone of drawdown moves 100 ft/d in the x-direction
• Recovery is fast behind the pit, with drawdown decreasing to > -2 ft in less than 20 days
• When superimposed on the existing water table, groundwater divides will separate the moving pit from the Okefenokee to the west and the streams to the east
Drawdown Profiles through the Origin
Drawdown Due to a Moving Rectangular Pit
RMH
2/28/2020

@A
@A
@A@A
@A@A
@A
@A@A
@A@A
@A@A
@A@A
@A@A
@A@A
@A
@A
@A
@A
@A@A
@A@A
@A@A
@A@A
Trail R
idge
Hwy 94Hwy 94
TIAA Tract
AdirondackTract
KeystoneTract
Dallas Police& Fire Tract
PZ14
PZ15
PZ16D/S
PZ25D/S
PZ26
PZ27D/S
PZ28D/S
PZ29D/S
PZ30D/S
PZ31D/S
PZ32D/S
PZ42
PZ43
PZ44
PZ47
PZ54D/S
PZ55D/S
PZ56D/S
PZ57D/S
165
160
155
150
145
140135
130125
120
115
16015
515014
5
140
135
165
16015
5
170
140
150140
135
130
170
165
175
170
170
165
165
160
145
140
135130
13513
0
175
170
140
135
135130
110
165
130
145
170
175
160
145
170
170
170
170
160
155
150
150
135
175
175
170
170
170
170
170
165 160
155
DRAWN BY: DEKCHECKED BY: JMT
DRAWING DATE: 2/28/2020REVISION DATE: N/A
TTL JOB NO.: 000180200804.00
APPROX. SCALE:
SITE LEGEND@A Existing Piezometer Location
Proposed Mining Area2,000' Mining Area BufferProperty Parcel Boundary
USCAE Verified WetlandUSACE Verified Stream
³
0 1,500Feet
1 in = 1,500 ft
FIGURE 61: EXISTING PIEZOMETER LOCATION MAPTWIN PINES MINERALS
ST GEORGE CHARLTON COUNTY GEORGIA. , ,BASEMAP: DigitalGlobe, 3/24/2018 (0.46 m Resolution).

@A
@A
@A
@A
@A
@A
@A
@A
@A
@A
@A
@A
@A
@A
@A
@A
@A
@A@A
@A
@A
@A
@A
@A
@A
@A@A
@A
@A
@A
@A
@A@A
@A
@A
@A@A
@A
@A
@A
@A @A@A
@A @A @A
@A
@A
@A
@A
@A
@A
@A
@A
@A
@A
@A
@A
@A
@A
@A@A
@A@A
@A
@A
@A
@A
@A
@A
@A
@A@A
@A
@A
@A
@A@A
@A
@A
@A
@A
@A
@A
@A
@A
@A
@A @A @A
@A
@A@A
@A
@A
@A
@A
@A
@A@A
A-1
A-2
A-3
A-4A-5
A-6A-7
A-8
B-1
B-2
B-3B-4
B-5B-6
B-7
B-8
B-9
C-9 C-10C-11
C-12C-13
C-14C-15 C-16
C-17C-18
C-19
C-20 C-21
C-22
C-23 C-24C-25
C-26
C-27 C-28
C-29C-30
D-38E-18
E-19E-20
E-21 E-22 E-23
E-24
E-25E-26
E-27E-28
E-29
E-30
E-31
E-32
E-33E-34
E-35
E-36
E-37
E-38 E-39
E-40E-41
E-42
E-43E-44
E-45E-46
E-47
F-39
G-1 G-2
G-3
H-1
I-1
I-2 I-3
I-4
I-5
I-6
J-1
J-2
J-3
J-4
K-1
K-2
L-1
L-2L-3
L-4
L-5L-6
L-7L-8
L-9
L-10
L-11
L-12L-14
DRAWN BY: DEKCHECKED BY: JMT
DRAWING DATE: 2/28/2020REVISION DATE: N/A
TTL JOB NO.: 000180200804.00
APPROX. SCALE:
SITE LEGENDProposed Mining AreaUSACE Verified WetlandUSACE Verified Stream
@A Shallow Piezometer Location
³
0 1,000Feet
1 in = 1,000 ft
FIGURE 62: EXISTING SHALLOW "WETLANDS" PIEZOMETER LOCATION MAPTWIN PINES MINERALS
ST. GEORGE, CHARLTON COUNTY, GEORGIABASEMAP: DigitalGlobe, 3/24/2018 (0.46 m Resolution).

@A @A @A@A
@A
@A @A @A@A
@A
@A @A @A@A
@A @A @A@A
@A
@A @A @A@A
@A
@A
@A@A
@A@A
@A
@A@A
@A@A
@A@A
@A@A
@A
@A@A
@A@A
PZ14
PZ15
PZ16D/S
PZ25D/S
PZ26
PZ27D/S
PZ28D/S
PZ29D/S
PZ30D/S
PZ43
PZ55D/S
PZ57D/S
MPZ-01 MPZ-03MPZ-05
MPZ-07MPZ-09
MPZ-11 MPZ-13
MPZ-15 MPZ-17
MPZ-19
MPZ-21MPZ-23
MPZ-02MPZ-04
MPZ-06 MPZ-08
MPZ-10
MPZ-12MPZ-14
MPZ-16MPZ-18
MPZ-20 MPZ-22
DRAWN BY: DEKCHECKED BY: JMT
DRAWING DATE: 2/28/2020REVISION DATE: N/A
TTL JOB NO.: 000180200804.00
APPROX. SCALE:
SITE LEGENDProposed Mining AreaUSACE Verified WetlandUSACE Verified Stream
Year 1Year 2Year 3
Year 4Year 5Year 6
@A Existing Piezometer Location
@A Proposed Piezometer Location
³
0 1,000Feet
1 in = 1,000 ft
FIGURE 63: PROPOSED PIEZOMETER LOCATION & MINING TIMELINE MAPTWIN PINES MINERALS
ST. GEORGE, CHARLTON COUNTY, GEORGIABASEMAP: DigitalGlobe, 3/24/2018 (0.46 m Resolution).

FIGURE 64: PREDICTIVE DRAWDOWN DUE TO THE MOVING MINE JMT
2/28/2020
1,000’
1,000’
2,000’

FIGURE 65: TYPICAL PIEZOMETER CONSTRUCTION DETAIL JMT
2/28/2020
GENERALIZED GROUNDWATER
ELEVATION
8’
(DEPTH 10’ to 50’)
NATURAL
(DEPTH 50’)
(DEPTH 51’)
10’
CONCRETE PAD (2’ x 2’ x 4”)
RUGGED TROLL PRESSURE TRANSDUCER
NOT TO SCALE
PVC CAP

@A
@A
@A
@A
@A
@A
@A
@A
@A
Okefenokee NationalWildlife Refuge
WSP-BG01
WSP-BG02WSP-BG03
MSW-1
MSW-2
MSW-3
MSW-4
MSW-5
MSW-6
DRAWN BY: DEKCHECKED BY: JMT
DRAWING DATE: 2/28/2020REVISION DATE: N/A
TTL JOB NO.: 000180200804.00
APPROX. SCALE:
SITE LEGENDProposed Mining AreaProposed Permit AreaOkefenokee National Wildlife RefugeUSACE Verified WetlandUSACE Verified StreamDrain Boundaries
@A Surface Water Sample
@A Wetland Sample
³
0 4,000Feet
1 in = 4,000 ft
FIGURE 66: PROPOSED SURFACE WATER MONITORING LOCATION MAPTWIN PINES MINERALS
ST. GEORGE, CHARLTON COUNTY, GEORGIABASEMAP: DigitalGlobe, 3/24/2018 (0.46 m Resolution).

OKEFENOKEENATIONAL
WILDLIFE REFUGE
TIAA Tract
AdirondackTract
Loncala Tract
KeystoneTract
Dallas Police& Fire Tract
DRAWN BY: DEKCHECKED BY: CMS
DRAWING DATE: 2/28/2020REVISION DATE: N/A
TTL JOB NO.: 000180200804.00
APPROX. SCALE:
LEGENDSaunders TractOkefenokee National Wildlife RefugeAdirondack TractDallas Police & Fire TractKeystone TractLoncala TractTIAA TractUSGS Topographic Quadrangle Boundary
³
0 5,000Feet
1 in = 5,000 ft
GEORGIA COUNTIES
SITE
CHARLTON CO.
FIGURE 67: OVERALL SAUNDERS TRACT MAPTWIN PINES MINERALS
ST. GEORGE, CHARLTON COUNTY, GEORGIABASEMAP: USGS 7.5 Minute Quadrangle Map, Florida & Georgia, (West) Moniac 2017 (10-ft Contour Interval), (East) Saint George 2017 (5-ft Contour Interval).
Moniac GA St George GAModified from:Pirkle et al., 2007

OKEFENOKEENATIONAL
WILDLIFE REFUGE
Loncala Tract
DRAWN BY: DEKCHECKED BY: CMS
DRAWING DATE: 2/28/2020REVISION DATE: N/A
TTL JOB NO.: 000180200804.00
APPROX. SCALE:
LEGENDSaunders TractLoncala TractOkefenokee National Wildlife RefugeUSGS Topographic Quadrangle Boundary
³
0 2,000Feet
1 in = 2,000 ft
FIGURE 68: LONCALA TRACT RELATIVE TO THE OKEFENOKEE SWAMPTWIN PINES MINERALS
ST. GEORGE, CHARLTON COUNTY, GEORGIABASEMAP: USGS 7.5 Minute Quadrangle Map, Florida & Georgia, (West) Moniac 2017 (10-ft Contour Interval), (East) Saint George 2017 (5-ft Contour Interval).
Moniac GA St George GA

0.8± mi.OKEFENOKEENATIONAL
WILDLIFE REFUGE
DRAWN BY: DEKCHECKED BY: CMS
DRAWING DATE: 2/28/2020REVISION DATE: N/A
TTL JOB NO.: 000180200804.00 APPROX. SCALE:
SITE LEGENDLoncala Property Boundary (1,012.8± AC)Proposed Mining Area (762.3± AC)Okefenokee Nat. Wildlife RefugeUSACE Verified Wetland (405.387± AC)USACE Verified Intermittent Stream (3,020± LF)(1,160± LF Impacted Stream)
Wetland Impact AreasInfrastructure (4.672± AC)Mining (287.537± AC)Avoided Open Water (0.337± AC)Avoided Wetlands (113.178± AC)Avoided Intermittent Stream (1,860± LF)Archaeological Site Boundary (9CR120)Gopher Frog Location
Gopher Tortoise Burrow LocationActiveInactive
³
0 1,200Feet
1 in = 1,200 ft
FIGURE 69: SENSITIVE FEATURES MAP: ALTERNATIVE 3TWIN PINES MINERALS
ST. GEORGE, CHARLTON COUNTY, GEORGIABASEMAP: DigitalGlobe, 3/24/2018 (0.46 m Resolution).

Trail R
idge
Trail R
idge
OKEFENOKEENATIONAL
WILDLIFE REFUGE
2.7± mi
TIAA Tract
AdirondackTract
Loncala Tract
KeystoneTract
Dallas Police& Fire Tract
DRAWN BY: DEKCHECKED BY: CMS
DRAWING DATE: 2/28/2020REVISION DATE: N/A
TTL JOB NO.: 000180200804.00
APPROX. SCALE:
LEGENDProject Study AreaProject Permit Area (2,405.1± AC)Proposed Mining Area (1,268.4± AC)Okefenokee National Wildlife RefugeAdirondack TractDallas Police & Fire TractKeystone TractLoncala TractTIAA TractUSGS Topographic Quadrangle Boundary
³
0 4,000Feet
1 in = 4,000 ft
GEORGIA COUNTIES
SITE
CHARLTON CO.
FIGURE 70: ALTERNATIVE 4 RELATIVE TO THE OKEFENOKEE SWAMPTWIN PINES MINERALS
ST. GEORGE, CHARLTON COUNTY, GEORGIABASEMAP: USGS 7.5 Minute Quadrangle Map, Florida & Georgia, (West) Moniac 2017 (10-ft Contour Interval), (East) Saint George 2017 (5-ft Contour Interval).
Moniac GA St George GA

_̂
DRAWN BY: DEKCHECKED BY: CMS
DRAWING DATE: 2/28/2020REVISION DATE: N/A
TTL JOB NO.: 000180200804.00 APPROX. SCALE:
SITE LEGENDProposed Permit Area (2,405.1± AC)Proposed Mining Area (1,268.4± AC)USACE Verified Wetland (1,194.437± AC)
USACE Verified Streams (11,587± LF)Ephermeral (412± LF Impacted)Intermittent (8,369± LF Impacted)Perennial (No Impacts)
Wetland Impact AreasInfrastructure (67.374± AC)Mining (522.134± AC)Avoided Wetlands (604.929± AC)
Avoided StreamsIntermittent Stream (2,419± LF)Perennial Stream (387± LF)
_̂ Historic ResourceState Threatened Plant Species LocationGopher Frog Location
Gopher Tortoise Burrow LocationActiveInactive
³
0 2,500Feet
1 in = 2,500 ft
FIGURE 71: SENSITIVE FEATURES MAP: ALTERNATIVE 4TWIN PINES MINERALS
ST. GEORGE, CHARLTON COUNTY, GEORGIABASEMAP: DigitalGlobe, 3/24/2018 (0.46 m Resolution).

Trail R
idge
Trail R
idge
OKEFENOKEENATIONAL
WILDLIFE REFUGE
2.7± mi
TIAA Tract
AdirondackTract
Loncala Tract
KeystoneTract
Dallas Police& Fire Tract
DRAWN BY: DEKCHECKED BY: CMS
DRAWING DATE: 2/28/2020REVISION DATE: N/A
TTL JOB NO.: 000180200804.00
APPROX. SCALE:
LEGENDProject Study AreaProject Permit Area (1,041.7± AC)Proposed Mining Area (898± AC)Okefenokee National Wildlife RefugeAdirondack TractDallas Police & Fire TractKeystone TractLoncala TractTIAA TractUSGS Topographic Quadrangle Boundary
³
0 4,000Feet
1 in = 4,000 ft
GEORGIA COUNTIES
SITE
CHARLTON CO.
FIGURE 72: ALTERNATIVE 5 RELATIVE TO THE OKEFENOKEE SWAMPTWIN PINES MINERALS
ST. GEORGE, CHARLTON COUNTY, GEORGIABASEMAP: USGS 7.5 Minute Quadrangle Map, Florida & Georgia, (West) Moniac 2017 (10-ft Contour Interval), (East) Saint George 2017 (5-ft Contour Interval).
Moniac GA St George GA

_̂
DRAWN BY: DEKCHECKED BY: CMS
DRAWING DATE: 2/28/2020REVISION DATE: N/A
TTL JOB NO.: 000180200804.00
APPROX. SCALE:
SITE LEGENDAlternative Permit Area (2,405.1± AC)Proposed Permit Area (1,041.7± AC)Proposed Mining Area (900± AC)USACE Verified Wetland (1,194.437± AC)
USACE Verified StreamEphermeral Stream (412± LF)Intermittent Stream (10,788± LF)Perennial Stream (387± LF)
Avoided Wetlands (724.164± AC)Avoided Streams
Ephermeral Stream (412± LF)Intermittent Stream (10,363± LF)Perennial Stream (387± LF)
_̂ Historic ResourceState Threatened Plant Species LocationGopher Frog Location
Gopher Tortoise Burrow LocationActiveInactive
³
0 2,700Feet
1 in = 2,700 ft
FIGURE 73: SENSITIVE FEATURES MAP: ALTERNATIVE 5TWIN PINES MINERALS
ST GEORGE CHARLTON COUNTY GEORGIA. , ,BASEMAP: DigitalGlobe, 3/24/2018 (0.46 m Resolution).
NOTE: See Figure 72 for aquatic feature impacts.

DRAWN BY: DEKCHECKED BY: CMS
DRAWING DATE: 2/28/2020REVISION DATE: N/A
TTL JOB NO.: 000180200804.00
APPROX. SCALE:
SITE LEGENDProposed Mining Area (900± AC)Proposed Permit Area (1,041.7± AC)
USACE Verified StreamEphermeral StreamIntermittent StreamPerennial StreamUSACE Verified Wetland
³
0 1,700Feet
1 in = 1,700 ft
FIGURE 74: HISTORICAL AERIAL PHOTOGRAPH (1970)TWIN PINES MINERALS
ST GEORGE CHARLTON COUNTY GEORGIA. , ,BASEMAP: USGS Single Frame Photo SWDG00030130, SWDG00010127, SWDG00010128, SWDG00010124, SWDG00030131,
SWDG00010050, and SWDG00010126. Image dates January 8, 1970 & January 23, 1970.

Year 6
Year 5
Year 4
Year 3
Year 2
Year 1WAWA
WG
WE
WDWC
WB
WF
WHWM
WJWI
WKWL
WN WSWR
WQWO WP
WT
WU
WZWAA
WX
WV
WWWY
WABWAF
WAGWAC
WAE
WAD
WAHWAJWAI
1
111314
46
7
16
5
10
8
2
3
9
1215
17
18
SA
SB
Existing Road To Be UsedNo Additional Impacts
DRAWN BY: DEKCHECKED BY: CMS
DRAWING DATE: 2/28/2020REVISION DATE: N/A
TTL JOB NO.: 000180200804.00
APPROX. SCALE:
SITE LEGENDProposed Mining Area (898± AC)Proposed Permit Area (1,041.7± AC)USACE Verified WetlandUSACE Verified StreamProposed Plant Site Plan
Year 1 (78.610± AC Impacts)Year 2 (90.327± AC Impacts)Year 3 (83.360± AC Impacts)
Year 4 (91.872± AC Impacts)Year 5 (84.883± AC Impacts)Year 6 (24.059± AC Impacts)
³
0 1,500Feet
1 in = 1,500 ft
FIGURE 75: PROPOSED PROJECT AQUATIC FEATURE IMPACT AREAS MAPTWIN PINES MINERALS
ST GEORGE CHARLTON COUNTY GEORGIA. , ,BASEMAP: DigitalGlobe, 3/24/2018 (0.46 m Resolution).
ID AREA (AC) ID AREA (AC) ID AREA (AC) ID AREA (AC) ID AREA (AC) ID AREA (AC)WA1 4.947 WH1 0.084 WN1 3.619 WU1 15.485 WAB1 27.497 WAH 0.376WB1 9.588 WI1 20.476 WO1 1.285 WV 11.088 WAC 21.851 WAI 3.992WC 19.152 WJ 1.419 WP1 0.530 WW 6.936 WAD 8.927 WAJ 19.691WD 25.132 WK 0.081 WQ 0.507 WX 12.960 WAE 1.116WE 3.945 WL 21.134 WR 46.530 WY 10.171 WAF 24.490WF 15.090 WM 47.133 WS 29.754 WZ 13.915 WAG 1.002WG 0.756 WT 1.135 WAA 21.317
1 Wetland area is located on the TIAA property tract.TOTAL = 453.111± AC
PROPOSED MINING WETLAND IMPACTSYEAR 1 YEAR 2 YEAR 3 YEAR 4 YEAR 5 YEAR 6
ID AREA (AC) ID AREA (AC) ID AREA (AC)1a 0.330 7 4.176 13 0.9202a 0.359 8 2.184 14 2.3783a 0.776 9 5.027 15 3.4504a 0.037 10 0.225 16 2.4385 0.060 11 1.367 17 0.6456 0.618 12 0.041 18 0.093
a Wetland area located on TIAA property tract.TOTAL = 25.124± AC
PROPOSED INFRASTRUCTURE WETLAND IMPACTS
ID LENGTH (FT) AREA (AC)SA 297 0.020SB 115 0.008
PROPOSED STREAM IMPACTS
NOTE: All streams are verified as intermittent.TOTAL = 412± LF, 0.028± AC

030702040301 030702040602
Service Layer Credits: Sources: Esri, HERE, Garmin, USGS, Intermap,INCREMENT P, NRCan, Esri Japan, METI, Esri China (Hong Kong), EsriKorea, Esri (Thailand), NGCC, (c) OpenStreetMap contributors, and the GISUser Community
DRAWN BY: DEKCHECKED BY: CMS
DRAWING DATE: 2/28/2020REVISION DATE: N/A
TTL JOB NO.: 000180200804.00
APPROX. SCALE:
SITE LEGENDProposed Permit Area (990± AC)HUC12 (Level 6)HUC10 (Level 5)HUC8 (Level 4)
³
0 50,000Feet
1 in = 50,000 ft
FIGURE 76: HYDROLOGIC UNIT CODE (HUC) MAPTWIN PINES MINERALS
ST. GEORGE, CHARLTON COUNTY, GEORGIABASEMAP: ESRI World Street Map (See Service Layer Credits).
LEVEL HUC NAMEREGION 1 03 South Atlantic-Gulf RegionSUBREGION 2 0307 Altamaha-St. MarysBASIN 3 030702 St. Marys-SatillaSUBBASIN 4 03070204 St. MarysWATERSHED (W) 5 0307020403 North Prong St. Marys RiverWATERSHED (E) 5 0307020406 Middle St. Marys RiverSUBWATERSHED (W) 6 030702040301 Soldiers Camp IslandSUBWATERSHED (E) 6 030702040602 Boone Creek
Boone CreekSoldiers Camp Island

OKEFENOKEENATIONAL
WILDLIFE REFUGE
TIAA TractAdirondack
Tract
LoncalaTract
KeystoneTract
Dallas Police& Fire Tract
DRAWN BY: DEKCHECKED BY: CMS
DRAWING DATE: 2/28/2020REVISION DATE: N/A
TTL JOB NO.: 000180200804.00
APPROX. SCALE: See Panels
0 8,000Feet
Trail Ridge Rd
Boon
e Rd
T-Mod
el Trail Ridge Rd
I-94I-94
Line Break
0 400Feet
0 1,750Feet
0 1,500Feet
³LONCALA TRACT
ADIRONDACK TRACTKEYSTONE TRACT
FIGURE 77: THREATENED & ENDANGERED SPECIES LOCATION MAPTWIN PINES MINERALS
ST GEORGE CHARLTON COUNTY GEORGIA. , ,BASEMAP: DigitalGlobe, 3/24/2018 (0.46 m Resolution).
SITE LEGENDProject Study AreaProposed Permit AreaProposed Mining AreaMining Year DemarkationOkefenokee Nat. Wildlife RefugeAdirondack TractDallas Police & Fire TractKeystone TractLoncala TractTIAA TractGopher Frog Location
Gopher Tortoise Burrow LocationActiveInactive

OKEFENOKEENATIONAL
WILDLIFE REFUGE
TIAA TractAdirondack
Tract
LoncalaTract
KeystoneTract
Dallas Police& Fire Tract
DRAWN BY: DEKCHECKED BY: CMS
DRAWING DATE: 2/28/2020REVISION DATE: N/A
TTL JOB NO.: 000180200804.00
APPROX. SCALE: See Panels
0 8,000Feet
Highway 94
0 500Feet
0 500Feet
0 500Feet
³TIAA TRACT
ADIRONDACK TRACTKEYSTONE TRACT
FIGURE 78: PARROT PITCHERPLANT LOCATION MAPTWIN PINES MINERALS
ST GEORGE CHARLTON COUNTY GEORGIA. , ,BASEMAP: DigitalGlobe, 3/24/2018 (0.46 m Resolution).
SITE LEGENDState Threatened Plant Species LocationProject Study AreaProposed Permit AreaProposed Mining AreaMining Year DemarkationOkefenokee Nat. Wildlife RefugeAdirondack TractDallas Police & Fire TractKeystone TractLoncala TractTIAA Tract

12
14
14
14
14 16
4
4
5
5
17
11109
13
158
1
1 32
66
6
7
DRAWN BY: DEKCHECKED BY: CMS
DRAWING DATE: 2/28/2020REVISION DATE: N/A
TTL JOB NO.: 000180200804.00
APPROX. SCALE:
SITE LEGENDProposed Permit AreaProposed Mining AreaAdjacent Parcels
³
0 2,000Feet
1 in = 2,000 ft
FIGURE 79: SITE LOCATION & REAL ESTATE PARCEL MAPTWIN PINES MINERALS
ST GEORGE CHARLTON COUNTY GEORGIA. , ,BASEMAP: DigitalGlobe, 3/24/2018 (0.46 m Resolution).
LABEL PIN OWNER ADDRESS LABEL PIN OWNER ADDRESS1 0036001 TIAA TIMBERLANDS, LLC 1500 S FIRST AVE, STE 1150, PORTLAND, OR 97201 10 0060004 FINLEY W WOLFE 8242 HWY 94, ST GEORGE, GA 315622 0059001002 TRAIL RIDGE LAND, LLC 2100 SOUTHBRIDGE PKWY, BIRMINGHAM, AL 35209 11 0060004001 KIRK W WOLFE 8296 HWY 94, ST GEORGE, GA 315623 0058001 TRAIL RIDGE LAND, LLC 2100 SOUTHBRIDGE PKWY, BIRMINGHAM, AL 35209 12 0060005 ERNST HARDEN SUITE 107, JACKSONVILLE, FL 322114 0084001 JOHN, VERNON GOWEN 315 AGNES ROAD, FOLKSTON, GA 31537 13 0084003001 FRED & MARLENE WINECOFF 8422 HWY 94, ST GEORGE, GA 315625 0061002 W L OLIVER/CHARLTON, LLC P.O. BPX 161139, MOBILE, AL 36616 14 0084003 SHARON BELL & ELI L. PADGETT 10624 HILLSIDE DR, MACCLENNY, FL 320636 0060009 TRAIL RIDGE LAND, LLC 2100 SOUTHBRIDGE PKWY, BIRMINGHAM, AL 35209 15 0084003002 SHARON BELL & ELI L. PADGETT 10624 HILLSIDE DR, MACCLENNY, FL 320637 0060003 CHARLTON COUNTY FORREST FOLKSTON, GA 31537 16 0084002001 SIDNEY E & RODNEY BELL P.O. BOX 173, ST GEORGE, GA 315628 0060007 WALTER & DEBRA SCHEIDERER 8024 HWY 94, ST GEORGE, GA, 31562 17 0084002002 SHARON BELL & ELI L. PADGETT 10624 HILLSIDE DR, MCCLENNY, FL 320639 0060006 RANDAL DUKES 8208 HWY 94, ST GEORGE, GA 31562


