Embed Size (px)
Citation preview
children
Article
Making a Decision between Acute Appendicitis andAcute Gastroenteritis
Yi-Ting Lu 1, Po-Cheng Chen 2,3 , Ying-Hsien Huang 1,4 and Fu-Chen Huang 1,4,*1 Department of Pediatrics, Kaohsiung Chang Gung Memorial Hospital, Kaohsiung 833, Taiwan;
[email protected] (Y.-T.L.); [email protected] (Y.-H.H.)2 Department of Physical Medicine and Rehabilitation, Kaohsiung Chang Gung Memorial Hospital,
Kaohsiung 833, Taiwan; [email protected] Department of Public Health, College of Medicine, National Cheng Kung University, Tainan 701, Taiwan4 Department of Pediatrics, College of Medicine, Chang Gung University, Taoyuan 333, Taiwan* Correspondence: [email protected]; Tel.: +886-7-7317123 (ext. 8724)
Received: 9 September 2020; Accepted: 6 October 2020; Published: 11 October 2020�����������������
Abstract: Acute appendicitis is one of the most common pediatric abdominal emergencies. Earlydiagnosis is vital for a positive outcome. However, it may initially present with diarrhea and vomiting,mimicking acute gastroenteritis, thus delaying prompt surgery. Differentiating appendicitis fromgastroenteritis in a timely manner poses a challenge. Therefore, we aim to investigate the predictorsthat help distinguish acute appendicitis from acute gastroenteritis. We conducted a retrospectivecase-control study, evaluating children admitted due to abdominal pain with diarrhea. Subjectswere divided into two groups according to the final diagnoses: acute appendicitis and acutegastroenteritis. We adopted multiple logistic regression analysis and the area under the receiveroperating characteristic curve to identify independent predictors of acute appendicitis and selectthe best model. A total of 32 patients diagnosed with appendicitis and 82 patients with gastroenteritiswere enrolled. Five independent predictors of acute appendicitis included vomiting, right lowerquadrant (RLQ) pain, stool occult blood (OB), white blood cell (WBC) count, and C-reactive protein(CRP). The revised combined model exhibited a higher degree of discrimination and outperformedthe pediatric appendicitis score (PAS) model. In conclusion, our study was proved to be helpful forassessing cases with abdominal pain and diarrhea in order to more accurately distinguish appendicitisfrom gastroenteritis in children in a timely manner.
Keywords: acute appendicitis; gastroenteritis; abdominal pain; diarrhea
1. Introduction
Acute appendicitis in children is the most common acute surgical condition but remains a difficultdiagnosis for clinicians. In children, it has a higher perforation rate than in adults and may present withcomplicated diseases in up to 40% of cases [1]. Early diagnosis is vital to improve outcomes and avoidcomplications such as appendiceal perforation, abscess formation, and postoperative complications.
Pediatric appendicitis score (PAS) has generally been utilized to diagnose appendicitis in childrenwith abdominal pain [2]. However, many cases receive a score that signifies intermediate risk (a PASscore of 4–6), encouraging clinicians to seek surgical consultation or advanced diagnostic imaging [3].
In clinical practice, acute appendicitis sometimes mimics acute gastroenteritis. Since entericinfections can cause appendicitis, diarrhea may be an initial manifestation, which makes gastroenteritisthe assumed diagnosis [4–7]. The major factor in the delayed diagnosis of acute appendicitis is suspectedgastroenteritis, which thus delays timely surgery [8]. However, differentiating acute appendicitis andacute gastroenteritis in the early stage still poses a challenge for clinicians.
Children 2020, 7, 176; doi:10.3390/children7100176 www.mdpi.com/journal/children
Children 2020, 7, 176 2 of 11
This study investigates clinical characteristics, laboratory data, and image studies betweencases with acute appendicitis mimicking gastroenteritis and those with gastroenteritis mimickingappendicitis. The purpose of this study is to identify the clinical predictors that may assist physiciansin distinguishing acute appendicitis from acute gastroenteritis in children.
2. Materials and Methods
2.1. Study Population
A retrospective case-control study was conducted in the Department of Pediatrics, KaohsiungChang Gung Memorial Hospital (KCGMH), Kaohsiung, Taiwan from 1 January 2015 to 30 April 2020.KCGMH is a teaching medical center in southern Taiwan that provides primary to tertiary care forchildren younger than 18 years of age. Taiwan National Health Insurance (NHI) covers more than 99%of Taiwan citizens and pays out every prescribing medicine, clinic visit, admission, and surgery.
2.2. Enrolment Criteria
The enrolment criteria were as follows: children <18 years old, who were admitted due toabdominal pain with diarrhea and/or vomiting, and final diagnoses were acute appendicitis or acutegastroenteritis. Other diagnoses were excluded. Subjects were divided into two groups accordingto their final diagnosis: acute appendicitis (group 1) and acute gastroenteritis (group 0). Acuteappendicitis was diagnosed according to clinical presentation, radiographic study, surgical report, andpathology. Patients came from the emergency department and ordinary wards in KCGMH.
2.3. Clinical Covariates
Age and sex were confirmed by the NHI database, and baseline characteristics were collected.Data were retrieved from validated hospital discharge, outpatient visit, emergency department,and laboratory documents. These include diagnoses of acute gastroenteritis, infectious colitis, acuteappendicitis, and ruptured appendix. We gathered data related to clinical symptoms and signs, physicalexamination, laboratory data, abdominal sonography, abdominal computed tomography (CT) reports,and operation records. Furthermore, we evaluated potential parameters for differentiating acuteappendicitis from gastroenteritis. Potential clinical predictors included (1) clinical symptoms and signs,such as the duration of fever, abdominal pain and diarrhea, presence of vomiting, diarrhea frequency,the pattern and location of abdominal pain, and the characteristic of bowel sounds; (2) laboratoryfindings, such as leukocyte count, differential count (segment %, lymphocyte %, and eosinophil %),hemoglobin level, platelet count (PLT), C-reactive protein (CRP), aspartate aminotransferase (AST),alanine aminotransferase (ALT), presence of occult blood (OB) or pus in the stool, and stool culture;and (3) image findings, such as abdominal sonography and abdominal CT.
2.4. Statistical Analysis
In descriptive statistics, demographic characteristics were presented as either mean ± standarddeviation for continuous variables or count numbers for categorical variables. Differences in variablesbetween the appendicitis group and the gastroenteritis group were compared using independentMann–Whitney U test for continuous variables and chi-square test or Fisher’s exact test for categoricalvariables. We adopted the Benjamini–Hochberg method [9] to control the false discovery rate ofmultiple testing in our study. For statistically different variables between two groups, we performedmultivariable stepwise logistic regression for clinical variables and laboratory variables to separatelydevelop a clinical predictive model and a laboratory predictive model. Finally, we combined the clinicaland laboratory predictive models to create a combined predictive model using multivariable stepwiselogistic regression. The criteria used in the model selection methods for stepwise regression appliedthe Akaike’s information criteria [10–12]. Receiver operating characteristic (ROC) analysis was usedto calculate the area under the curve (AUC) of each significant predictor in the combined predictive
Children 2020, 7, 176 3 of 11
model. After the initial combined model was obtained by the stepwise logistic regression, we gaveeach predictor an assigned point value to calculate the revised combined model score. Furthermore,we compared the AUC of the combined predictive model with that of the predictive model usingPAS. A two-tailed p-value less than 0.05 was considered statistically significant. Statistical analyseswere performed in SAS software, Version 9.4 of the SAS System for Windows (SAS Institute Inc., SASCampus Drive, Cary, North Carolina 27513, USA).
2.5. Ethics Statement
Ethical approval for this study was granted by the Institutional Review Board of Chang GungMemorial Hospital (Kaohsiung, Taiwan) (No. 202000311B0). We retrieved patient lists fromthe electronic database and retrospectively reviewed medical information from medical records.The need for consent was waived due to the retrospective nature of the project and the anonymousanalysis of data.
3. Result
3.1. Demographics and Clinical Characteristics
During the study period, 114 cases (63% male) were identified. Thirty-two cases were diagnosedwith appendicitis (group 1), and 82 cases were diagnosed with gastroenteritis (group 0). In group0, the mean ± standard deviation of age was 10.47 ± 3.85 years. In group 1, the mean ± standarddeviation of the age was 8.88 ± 4.51 years.
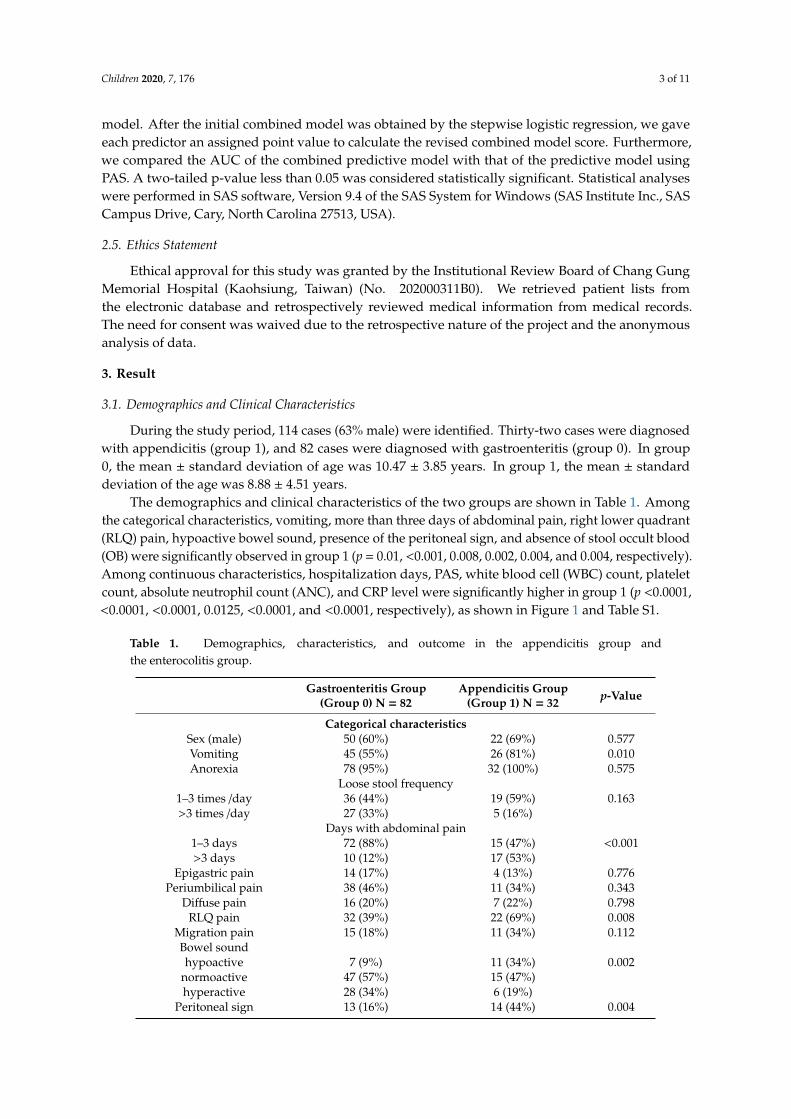
The demographics and clinical characteristics of the two groups are shown in Table 1. Amongthe categorical characteristics, vomiting, more than three days of abdominal pain, right lower quadrant(RLQ) pain, hypoactive bowel sound, presence of the peritoneal sign, and absence of stool occult blood(OB) were significantly observed in group 1 (p = 0.01, <0.001, 0.008, 0.002, 0.004, and 0.004, respectively).Among continuous characteristics, hospitalization days, PAS, white blood cell (WBC) count, plateletcount, absolute neutrophil count (ANC), and CRP level were significantly higher in group 1 (p <0.0001,<0.0001, <0.0001, 0.0125, <0.0001, and <0.0001, respectively), as shown in Figure 1 and Table S1.
Table 1. Demographics, characteristics, and outcome in the appendicitis group andthe enterocolitis group.
Gastroenteritis Group(Group 0) N = 82
Appendicitis Group(Group 1) N = 32 p-Value
Categorical characteristicsSex (male) 50 (60%) 22 (69%) 0.577Vomiting 45 (55%) 26 (81%) 0.010Anorexia 78 (95%) 32 (100%) 0.575
Loose stool frequency1–3 times /day 36 (44%) 19 (59%) 0.163>3 times /day 27 (33%) 5 (16%)
Days with abdominal pain1–3 days 72 (88%) 15 (47%) <0.001>3 days 10 (12%) 17 (53%)
Epigastric pain 14 (17%) 4 (13%) 0.776Periumbilical pain 38 (46%) 11 (34%) 0.343
Diffuse pain 16 (20%) 7 (22%) 0.798RLQ pain 32 (39%) 22 (69%) 0.008
Migration pain 15 (18%) 11 (34%) 0.112Bowel soundhypoactive 7 (9%) 11 (34%) 0.002
normoactive 47 (57%) 15 (47%)hyperactive 28 (34%) 6 (19%)
Peritoneal sign 13 (16%) 14 (44%) 0.004
Children 2020, 7, 176 4 of 11
Table 1. Cont.
Gastroenteritis Group(Group 0) N = 82
Appendicitis Group(Group 1) N = 32 p-Value
Stool OB positive 22 (27%) 1 (3%) 0.004Stool pus positive 16 (20%) 2 (6%) 0.094
Stool culture positive 28 (34%) 1 (3%) <0.001Continuous characteristics
Age 10.46 ± 3.85 8.88 ± 4.51 0.059Hospitalization days 5.06 ± 1.84 8.69 ± 4.08 <0.001Fever duration (days) 1.87 ± 1.33 2.56 ± 2.33 0.267
Diarrhea days 1.76 ± 1.47 1.78 ± 2.11 0.52PAS 4.93 ± 1.93 7.13 ± 1.58 <0.0001
Data are presented as mean value ± SD for continuous variables and the number and percentage of patients. RLQpain = right lower quadrant; PAS = pediatric appendicitis score; OB = occult blood.
Children 2020, 7, x FOR PEER REVIEW 4 of 11
hyperactive 28 (34%) 6 (19%)
Peritoneal sign 13 (16%) 14 (44%) 0.004 Stool OB positive 22 (27%) 1 (3%) 0.004 Stool pus positive 16 (20%) 2 (6%) 0.094
Stool culture positive 28 (34%) 1 (3%) <0.001 Continuous characteristics
Age 10.46 ± 3.85 8.88 ± 4.51 0.059 Hospitalization days 5.06 ± 1.84 8.69 ± 4.08 <0.001 Fever duration (days) 1.87 ± 1.33 2.56 ± 2.33 0.267
Diarrhea days 1.76 ± 1.47 1.78 ± 2.11 0.52 PAS 4.93 ± 1.93 7.13 ± 1.58 <0.0001
Data are presented as mean value ± SD for continuous variables and the number and percentage of patients. RLQ pain = right lower quadrant; PAS = pediatric appendicitis score; OB = occult blood.
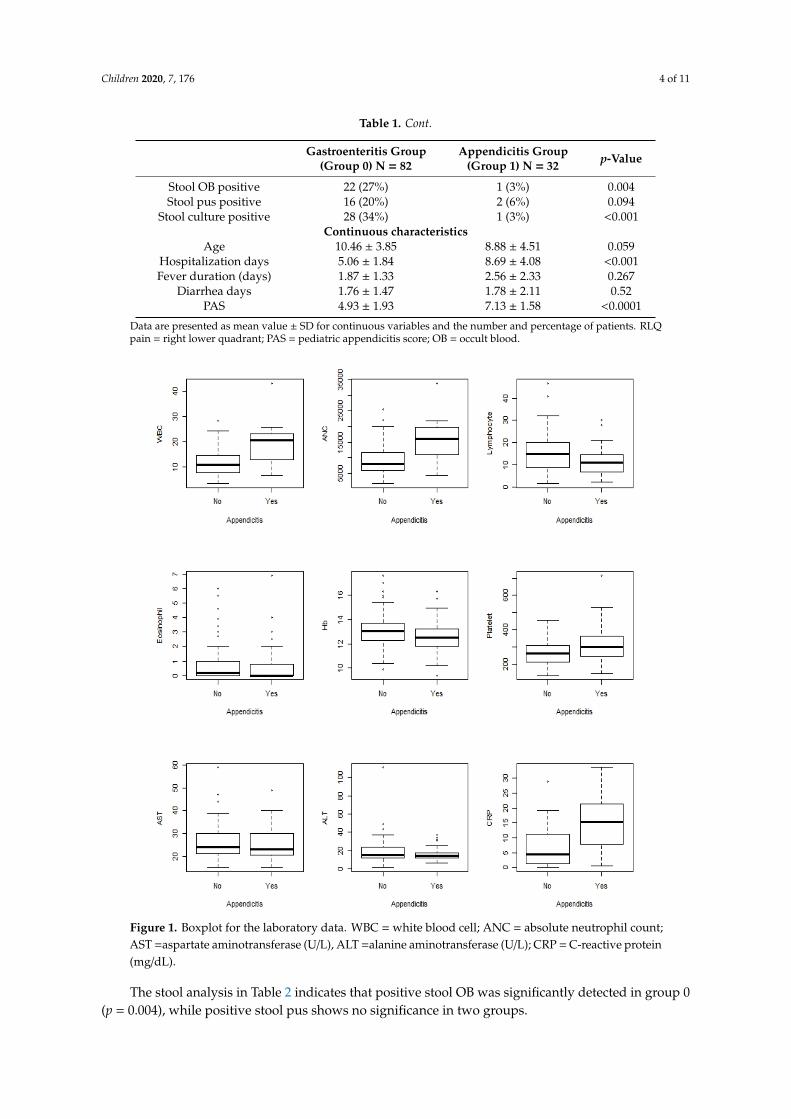
Figure 1. Boxplot for the laboratory data. WBC = white blood cell; ANC = absolute neutrophil count; AST =aspartate aminotransferase (U/L), ALT =alanine aminotransferase (U/L); CRP = C-reactive protein (mg/dL).
The stool analysis in Table 2 indicates that positive stool OB was significantly detected in group 0 (p = 0.004), while positive stool pus shows no significance in two groups.
Figure 1. Boxplot for the laboratory data. WBC = white blood cell; ANC = absolute neutrophil count;AST =aspartate aminotransferase (U/L), ALT =alanine aminotransferase (U/L); CRP = C-reactive protein(mg/dL).
The stool analysis in Table 2 indicates that positive stool OB was significantly detected in group 0(p = 0.004), while positive stool pus shows no significance in two groups.
Children 2020, 7, 176 5 of 11
Table 2. The stool analysis between the two groups.
Gastroenteritis Group(Group 0) N = 82
Appendicitis Group(Group 1) N = 32 p-Value
Stool OBnegative 60 31 0.004positive 22 1
Stool pusnegative 66 30 0.094positive 16 2
In patients with gastroenteritis, the stool culture of 15 (18%) patients yielded Campylobacter jejuni,six patients (7%) yielded Salmonella species, five patients (6%) yielded Rotavirus, and one patient (1%)yielded Norovirus. The rate of positive stool cultures was 34%. Negative stool culture was recorded inall patients of the appendicitis group.
3.2. Multivariable Stepwise Logistic Regression of Predictors for Acute Appendicitis
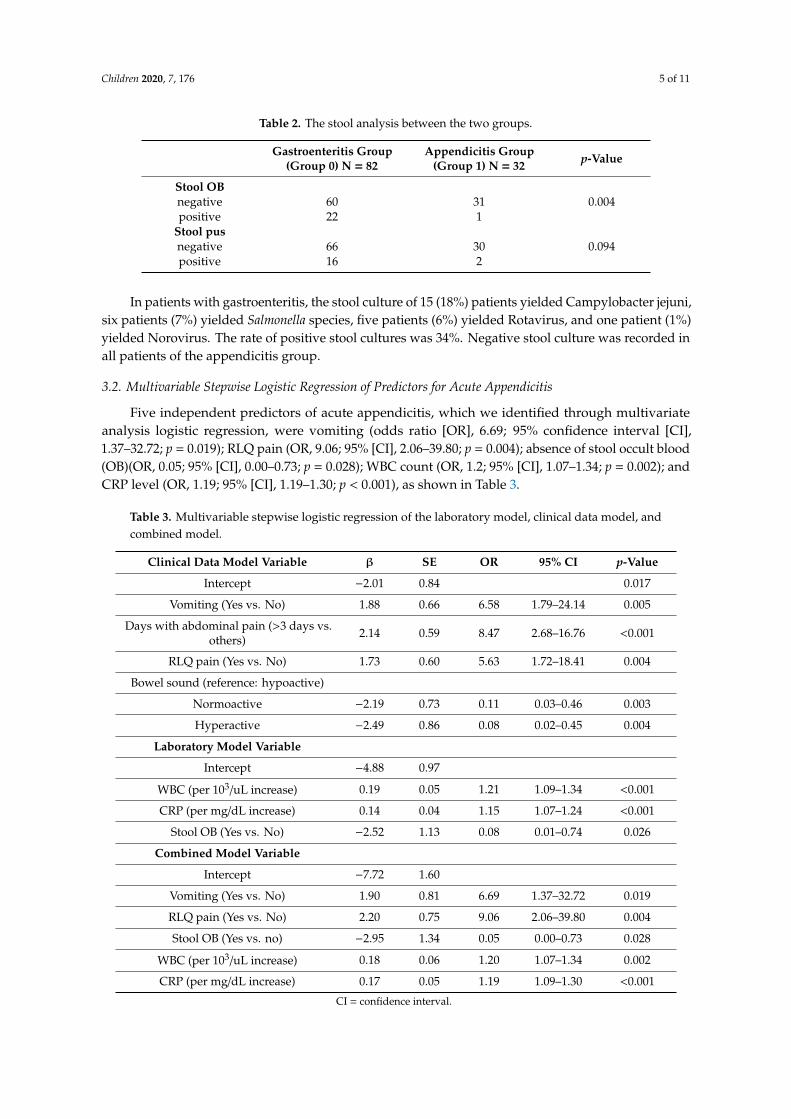
Five independent predictors of acute appendicitis, which we identified through multivariateanalysis logistic regression, were vomiting (odds ratio [OR], 6.69; 95% confidence interval [CI],1.37–32.72; p = 0.019); RLQ pain (OR, 9.06; 95% [CI], 2.06–39.80; p = 0.004); absence of stool occult blood(OB)(OR, 0.05; 95% [CI], 0.00–0.73; p = 0.028); WBC count (OR, 1.2; 95% [CI], 1.07–1.34; p = 0.002); andCRP level (OR, 1.19; 95% [CI], 1.19–1.30; p < 0.001), as shown in Table 3.
Table 3. Multivariable stepwise logistic regression of the laboratory model, clinical data model, andcombined model.
Clinical Data Model Variable β SE OR 95% CI p-Value
Intercept −2.01 0.84 0.017
Vomiting (Yes vs. No) 1.88 0.66 6.58 1.79–24.14 0.005
Days with abdominal pain (>3 days vs.others) 2.14 0.59 8.47 2.68–16.76 <0.001
RLQ pain (Yes vs. No) 1.73 0.60 5.63 1.72–18.41 0.004
Bowel sound (reference: hypoactive)
Normoactive −2.19 0.73 0.11 0.03–0.46 0.003
Hyperactive −2.49 0.86 0.08 0.02–0.45 0.004
Laboratory Model Variable
Intercept −4.88 0.97
WBC (per 103/uL increase) 0.19 0.05 1.21 1.09–1.34 <0.001
CRP (per mg/dL increase) 0.14 0.04 1.15 1.07–1.24 <0.001
Stool OB (Yes vs. No) −2.52 1.13 0.08 0.01–0.74 0.026
Combined Model Variable
Intercept −7.72 1.60
Vomiting (Yes vs. No) 1.90 0.81 6.69 1.37–32.72 0.019
RLQ pain (Yes vs. No) 2.20 0.75 9.06 2.06–39.80 0.004
Stool OB (Yes vs. no) −2.95 1.34 0.05 0.00–0.73 0.028
WBC (per 103/uL increase) 0.18 0.06 1.20 1.07–1.34 0.002
CRP (per mg/dL increase) 0.17 0.05 1.19 1.09–1.30 <0.001
CI = confidence interval.
Children 2020, 7, 176 6 of 11
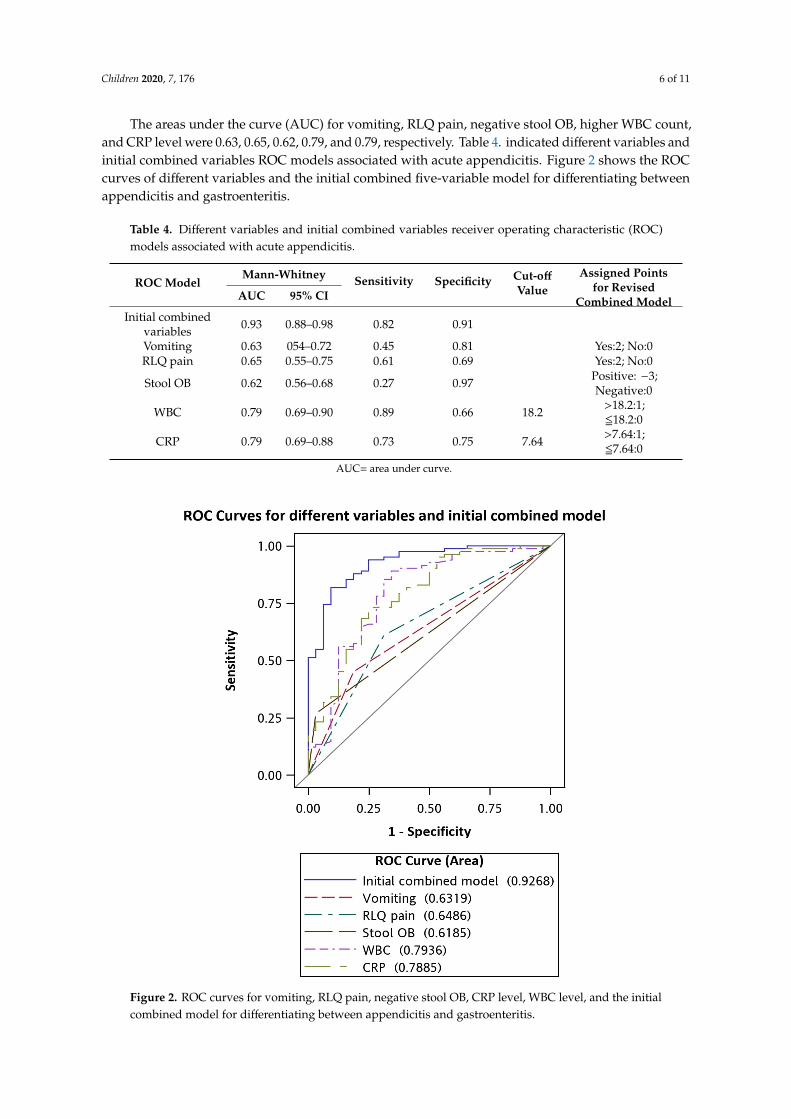
The areas under the curve (AUC) for vomiting, RLQ pain, negative stool OB, higher WBC count,and CRP level were 0.63, 0.65, 0.62, 0.79, and 0.79, respectively. Table 4. indicated different variables andinitial combined variables ROC models associated with acute appendicitis. Figure 2 shows the ROCcurves of different variables and the initial combined five-variable model for differentiating betweenappendicitis and gastroenteritis.
Table 4. Different variables and initial combined variables receiver operating characteristic (ROC)models associated with acute appendicitis.
ROC ModelMann-Whitney Sensitivity Specificity Cut-off
ValueAssigned Points
for RevisedCombined ModelAUC 95% CI
Initial combinedvariables 0.93 0.88–0.98 0.82 0.91
Vomiting 0.63 054–0.72 0.45 0.81 Yes:2; No:0RLQ pain 0.65 0.55–0.75 0.61 0.69 Yes:2; No:0
Stool OB 0.62 0.56–0.68 0.27 0.97 Positive: −3;Negative:0
WBC 0.79 0.69–0.90 0.89 0.66 18.2 >18.2:1;518.2:0
CRP 0.79 0.69–0.88 0.73 0.75 7.64 >7.64:1;57.64:0
AUC= area under curve.
Children 2020, 7, x FOR PEER REVIEW 6 of 11
Table 4. Different variables and initial combined variables receiver operating characteristic (ROC) models associated with acute appendicitis.
ROC Model Mann-
Whitney Sensitivity Specificity Cut-off Value
Assigned Points for Revised Combined Model
AUC 95% CI Initial combined
variables 0.93 0.88–0.98 0.82 0.91
Vomiting 0.63 054–0.72 0.45 0.81 Yes:2; No:0 RLQ pain 0.65 0.55–0.75 0.61 0.69 Yes:2; No:0 Stool OB 0.62 0.56–0.68 0.27 0.97 Positive: –3; Negative:0
WBC 0.79 0.69–0.90 0.89 0.66 18.2 >18.2:1; ≦18.2:0
CRP 0.79 0.69–0.88 0.73 0.75 7.64 >7.64:1; ≦7.64:0
AUC= area under curve.
Figure 2. ROC curves for vomiting, RLQ pain, negative stool OB, CRP level, WBC level, and the initial combined model for differentiating between appendicitis and gastroenteritis.
Table 5 and Table 6 show that our revised combined model compromises these five variables with assigned point value to calculate the score. In our revised model, vomiting and RLQ pain were
Figure 2. ROC curves for vomiting, RLQ pain, negative stool OB, CRP level, WBC level, and the initialcombined model for differentiating between appendicitis and gastroenteritis.
Children 2020, 7, 176 7 of 11
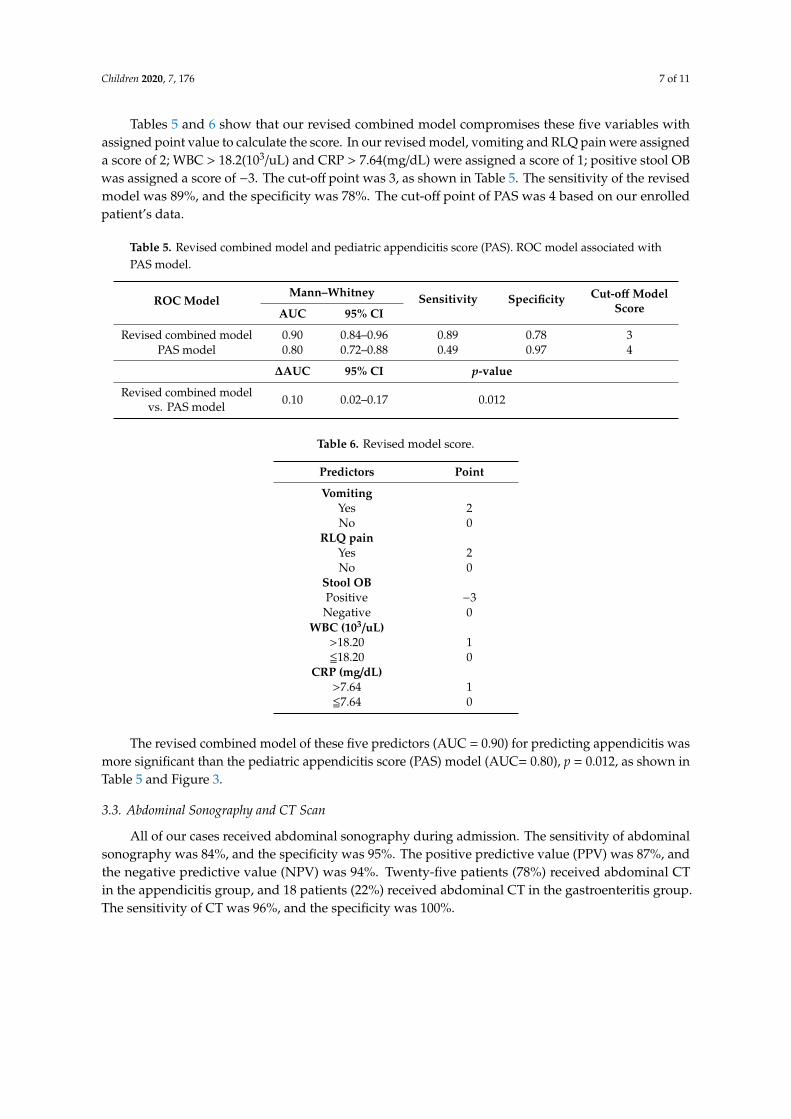
Tables 5 and 6 show that our revised combined model compromises these five variables withassigned point value to calculate the score. In our revised model, vomiting and RLQ pain were assigneda score of 2; WBC > 18.2(103/uL) and CRP > 7.64(mg/dL) were assigned a score of 1; positive stool OBwas assigned a score of −3. The cut-off point was 3, as shown in Table 5. The sensitivity of the revisedmodel was 89%, and the specificity was 78%. The cut-off point of PAS was 4 based on our enrolledpatient’s data.
Table 5. Revised combined model and pediatric appendicitis score (PAS). ROC model associated withPAS model.
ROC ModelMann–Whitney Sensitivity Specificity Cut-off Model
ScoreAUC 95% CI
Revised combined model 0.90 0.84–0.96 0.89 0.78 3PAS model 0.80 0.72–0.88 0.49 0.97 4
∆AUC 95% CI p-value
Revised combined modelvs. PAS model 0.10 0.02–0.17 0.012
Table 6. Revised model score.
Predictors Point
VomitingYes 2No 0
RLQ painYes 2No 0
Stool OBPositive −3
Negative 0WBC (103/uL)
>18.20 1518.20 0
CRP (mg/dL)>7.64 157.64 0
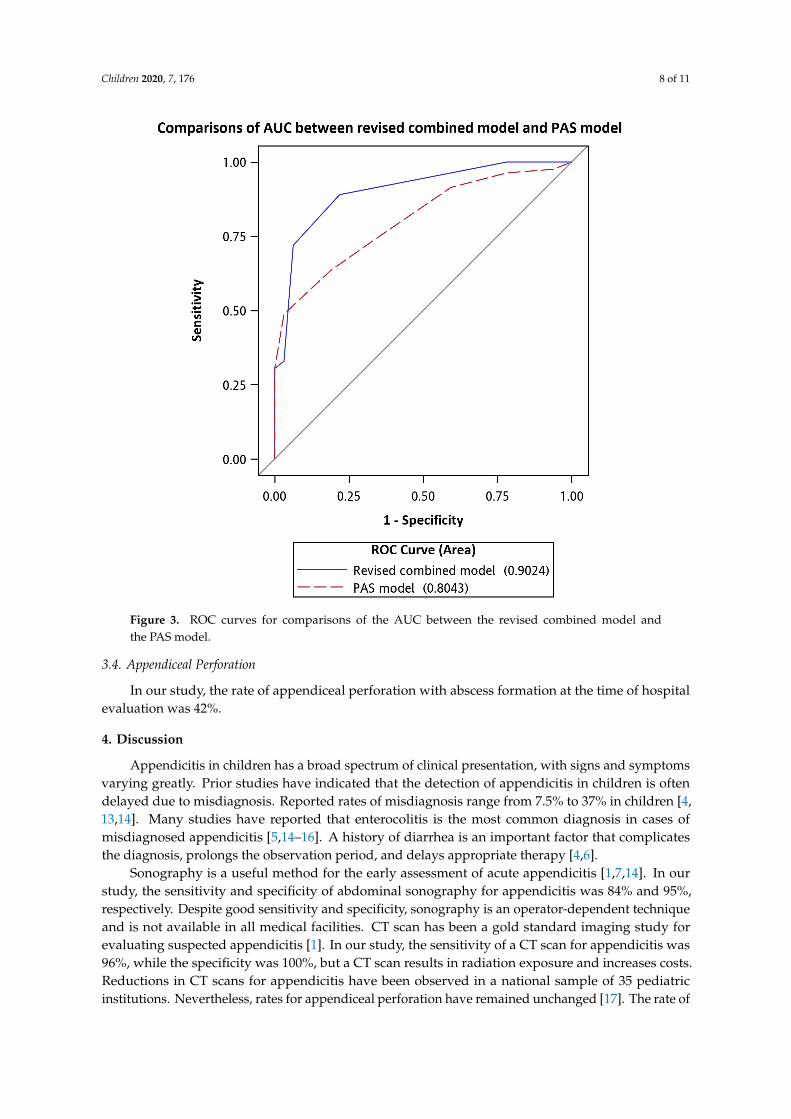
The revised combined model of these five predictors (AUC = 0.90) for predicting appendicitis wasmore significant than the pediatric appendicitis score (PAS) model (AUC= 0.80), p = 0.012, as shown inTable 5 and Figure 3.
3.3. Abdominal Sonography and CT Scan
All of our cases received abdominal sonography during admission. The sensitivity of abdominalsonography was 84%, and the specificity was 95%. The positive predictive value (PPV) was 87%, andthe negative predictive value (NPV) was 94%. Twenty-five patients (78%) received abdominal CTin the appendicitis group, and 18 patients (22%) received abdominal CT in the gastroenteritis group.The sensitivity of CT was 96%, and the specificity was 100%.
Children 2020, 7, 176 8 of 11Children 2020, 7, x FOR PEER REVIEW 8 of 11
Figure 3. ROC curves for comparisons of the AUC between the revised combined model and the PAS model.
4. Discussion Appendicitis in children has a broad spectrum of clinical presentation, with signs and symptoms
varying greatly. Prior studies have indicated that the detection of appendicitis in children is often delayed due to misdiagnosis. Reported rates of misdiagnosis range from 7.5% to 37% in children [4,13,14]. Many studies have reported that enterocolitis is the most common diagnosis in cases of misdiagnosed appendicitis [5,14–16]. A history of diarrhea is an important factor that complicates the diagnosis, prolongs the observation period, and delays appropriate therapy [4,6].
Sonography is a useful method for the early assessment of acute appendicitis [1,7,14]. In our study, the sensitivity and specificity of abdominal sonography for appendicitis was 84% and 95%, respectively. Despite good sensitivity and specificity, sonography is an operator-dependent technique and is not available in all medical facilities. CT scan has been a gold standard imaging study for evaluating suspected appendicitis [1]. In our study, the sensitivity of a CT scan for appendicitis was 96%, while the specificity was 100%, but a CT scan results in radiation exposure and increases costs. Reductions in CT scans for appendicitis have been observed in a national sample of 35 pediatric institutions. Nevertheless, rates for appendiceal perforation have remained unchanged [17]. The rate of appendiceal perforation in our study was as high as 42%. Therefore, we need other practical predictors for clinical assessment.
In clinical presentations, vomiting and RLQ pain were independently significant in our study. Vomiting is a common feature of gastrointestinal upset but is not specific to acute gastritis [18]. However, profuse vomiting may indicate ileus and the development of generalized peritonitis after perforation [19]. On the other hand, previous studies indicated that the presence of RLQ tenderness
Figure 3. ROC curves for comparisons of the AUC between the revised combined model andthe PAS model.
3.4. Appendiceal Perforation
In our study, the rate of appendiceal perforation with abscess formation at the time of hospitalevaluation was 42%.
4. Discussion
Appendicitis in children has a broad spectrum of clinical presentation, with signs and symptomsvarying greatly. Prior studies have indicated that the detection of appendicitis in children is oftendelayed due to misdiagnosis. Reported rates of misdiagnosis range from 7.5% to 37% in children [4,13,14]. Many studies have reported that enterocolitis is the most common diagnosis in cases ofmisdiagnosed appendicitis [5,14–16]. A history of diarrhea is an important factor that complicatesthe diagnosis, prolongs the observation period, and delays appropriate therapy [4,6].
Sonography is a useful method for the early assessment of acute appendicitis [1,7,14]. In ourstudy, the sensitivity and specificity of abdominal sonography for appendicitis was 84% and 95%,respectively. Despite good sensitivity and specificity, sonography is an operator-dependent techniqueand is not available in all medical facilities. CT scan has been a gold standard imaging study forevaluating suspected appendicitis [1]. In our study, the sensitivity of a CT scan for appendicitis was96%, while the specificity was 100%, but a CT scan results in radiation exposure and increases costs.Reductions in CT scans for appendicitis have been observed in a national sample of 35 pediatricinstitutions. Nevertheless, rates for appendiceal perforation have remained unchanged [17]. The rate of
Children 2020, 7, 176 9 of 11
appendiceal perforation in our study was as high as 42%. Therefore, we need other practical predictorsfor clinical assessment.
In clinical presentations, vomiting and RLQ pain were independently significant in our study.Vomiting is a common feature of gastrointestinal upset but is not specific to acute gastritis [18].However, profuse vomiting may indicate ileus and the development of generalized peritonitis afterperforation [19]. On the other hand, previous studies indicated that the presence of RLQ tendernessis probably the most sensitive physical finding in early appendicitis [20]. In PAS, RLQ pain is alsoa single diagnostic variable with a score of 2 (one of the highest-score factors in the score system). Sinceappendicitis has a broad spectrum of clinical presentation, we then integrated five predictors (vomiting,RLQ pain, negative stool OB, higher CRP level, and higher WBC level) into a revised combinedmodel. This revised combined model exhibited a high degree of discriminating acute appendicitisamong patients with abdominal pain and symptoms of gastroenteritis. Furthermore, it outperformedthe PAS model.
PAS is a weighted clinical scoring system with eight clinical features for accessing abdominalpain and diagnosing appendicitis in pediatric patients [2]. This score combines history, physical,and laboratory data to assist in the diagnosis. Migration of pain, anorexia, vomiting, fever >38 ◦C,leukocytosis and polymorphonuclear neutrophilia were each assigned a score of 1; RLQ pain andcough/percussion/hopping tenderness were each assigned a score of 2. A total score of >6 may becompatible with the diagnosis of appendicitis. However, the patients we enrolled in the study allsuffered from abdominal pain and symptoms mimicking gastroenteritis, resulting in a different cut-off
score of PAS (4) from previous studies.In laboratory examinations, the absence of stool OB is an independent predictor for appendicitis
in this study. Diarrhea accompanying appendicitis is usually culture-negative and is limited tothe release of small amounts of loose stool without blood or mucus rather than the copious amounts ofstool in enteritis [21]. In contrast, bacterial colitis often results in inflammatory-type diarrhea that ischaracterized by bloody, purulent, and mucoid stool [6]. This study also demonstrated that the WBCcount and CRP level can be helpful in diagnosing appendicitis [22]. The sensitivity of combining bothWBC counts and CRP levels was extremely high in children with acute appendicitis [23,24], while WBCcounts or CRP alone did not aid in the diagnosis because normal values of both WBC and CRP werevery rare in pediatric acute appendicitis. On the other hand, some studies have suggested that CRPmay be more sensitive than WBC in detecting appendiceal perforation [25–27]. In fact, the diagnosticaccuracy of WBC counts and CRP levels depends on the cutoff values and time from onset of symptomsto diagnosis [22]. It can explain our combined model has more diagnostic accuracy than the PASscore model.
This study has several limitations. First, this is a single-center study, and the identified predictorsmay not be able to be generalized to other institutions or countries. Second, the sample size wasrelatively small, and some potential predictors may not have been included in this study. Third, wedid not perform model validation because of the inadequate sample sizes; therefore, further research iswarranted for validation in order to accomplish better clinical application.
In conclusion, this study is the first to identify the clinical predictors of acute appendicitis inchildren with gastroenteritis-like presentation. If a child initially presents with abdominal pain andsymptoms mimicking gastroenteritis, accompanied with RLQ pain, an absence of stool OB, and higherWBC count and CRP level, a diagnosis of acute appendicitis would be more accurate. In our revisedscore system, a total of score >3 indicated a high probability of acute appendicitis. It may impact clinicalcare and substantially decrease the use of unnecessary CT scans in gastroenteritis patients. Our studyassists clinical physicians in distinguishing acute appendicitis from acute gastroenteritis, enabling anearly and precise diagnosis that can improve outcomes and may further prevent complications.
Supplementary Materials: The following are available online at http://www.mdpi.com/2227-9067/7/10/176/s1,Table S1: Laboratory data in the appendicitis group and the gastroenteritis group.
Children 2020, 7, 176 10 of 11
Author Contributions: Conceptualization, Y.-T.L. and F.-C.H.: data curation, Y.-T.L. and P.-C.C.; formal analysis,Y.-T.L. and P.-C.C.; Investigation, Y.-T.L.; Visualization, Y.-T.L. and P.-C.C.; Writing–original draft, Y.-T.L.;Methodology, P.-C.C.; Writing–review and editing, P.-C.C. and F.-C.H.; project administration, Y.-H.H. and F.-C.H.;Supervision, F.-C.H. All authors have read and agreed to the published version of the manuscript.
Acknowledgments: We would like to thank the Biostatistics Center, Kaohsiung Chang Gung Memorial Hospital,for its statistical work. The study was supported by grants from Chang Gung Memorial Hospital.
Funding: This research received no external funding.
Conflicts of Interest: The authors declare no conflict of interest.
References
1. Kliegman, R.M.; Geme, J.S. Nelson Textbook of Pediatrics, 21st ed.; Elsevier: Philadelphia, PA, USA, 2011.2. Samuel, M. Pediatric appendicitis score. J. Pediatr. Surg. 2002, 37, 877–881. [CrossRef] [PubMed]3. Bhatt, M.; Joseph, L.; Ducharme, F.M.; Dougherty, G.; McGillivray, D. Prospective validation of the pediatric
appendicitis score in a Canadian pediatric emergency department. Acad. Emerg. Med. 2009, 16, 591–596.[CrossRef]
4. Rothrock, S.G.; Skeoch, G.; Rush, J.J.; Johnson, N.E. Clinical features of misdiagnosed appendicitis in children.Ann. Emerg. Med. 1991, 20, 45–50. [CrossRef]
5. Rusnak, R.A.; Borer, J.M.; Fastow, J.S. Misdiagnosis of acute appendicitis: Common features discovered incases after litigation. Am. J. Emerg. Med. 1994, 12, 397–402. [CrossRef]
6. Horwitz, J.R.; Gursoy, M.; Jaksic, T.; Lally, K.P. Importance of diarrhea as a presenting symptom of appendicitisin very young children. Am. J. Surg. 1997, 173, 80–82. [CrossRef]
7. Tarantino, L.; Giorgio, A.; de Stefano, G.; Scala, V.; Esposito, F.; Liorre, G.; Farella, N.; Ferraioli, G. Acuteappendicitis mimicking infectious enteritis: Diagnostic value of sonography. J. Ultrasound Med. 2003, 22,945–950. [CrossRef]
8. Cappendijk, V.C.; Hazebroek, F.W. The impact of diagnostic delay on the course of acute appendicitis. Arch.Dis. Child. 2000, 83, 64–66. [CrossRef]
9. Benjamini, Y.; Hochberg, Y. Controlling the false discovery rate: A practical and powerful approach tomultiple testing. J. R. Stat. Soc. Ser. B Methodol. 1995, 57, 289–300.
10. Akaike, H. Likelihood of a Model and Information Criteria. J. Econom. 1981, 16, 3–14. [CrossRef]11. Darlington, R.B. Multiple regression in psychological research and practice. Psychol. Bull. 1968, 69, 161–182.
[CrossRef]12. Judge, G.G.; Griffiths, W.E.; Hill, R.C.; Lütkepohl, H.; Lee, T.-C. The Theory and Practice of Econometrics, 2nd
ed.; John Wiley & Sons: New York, NY, USA, 1985.13. Reynolds, S.L. Missed appendicitis in a pediatric emergency department. Pediatr. Emerg. Care 1993, 9, 1–3.
[CrossRef] [PubMed]14. Chang, Y.J.; Chao, H.C.; Kong, M.S.; Hsia, S.H.; Yan, D.C. Misdiagnosed acute appendicitis in children in
the emergency department. Chang. Gung Med. J. 2010, 33, 551–557. [PubMed]15. McCollough, M.; Sharieff, G.Q. Abdominal pain in children. Pediatr. Clin. N. Am. 2006, 53, 107–137.
[CrossRef] [PubMed]16. D’Agostino, J. Common abdominal emergencies in children. Emerg. Med. Clin. N. Am. 2002, 20, 139–153.
[CrossRef]17. Bachur, R.G.; Levy, J.A.; Callahan, M.J.; Rangel, S.J.; Monuteaux, M.C. Effect of Reduction in the Use of
Computed Tomography on Clinical Outcomes of Appendicitis. JAMA Pediatr. 2015, 169, 755–760. [CrossRef][PubMed]
18. Davenport, M. Acute abdomen pain in children. BMJ 1996, 312, 498–501. [CrossRef]19. Humes, D.J.; Simpson, J. Acute appendicitis. BMJ 2006, 333, 530–534. [CrossRef]20. Colvin, J.M.; Bachur, R.; Kharbanda, A. The presentation of appendicitis in preadolescent children. Pediatr.
Emerg. Care 2007, 23, 849–855. [CrossRef]21. Papaconstantinou, H.T.; Thomas, J.S. Bacterial colitis. Clin. Colon Rectal Surg. 2007, 20, 18–27. [CrossRef]22. Beltran, M.A.; Almonacid, J.; Vicencio, A.; Gutierrez, J.; Cruces, K.S.; Cumsille, M.A. Predictive value of white
blood cell count and C-reactive protein in children with appendicitis. J. Pediatr. Surg. 2007, 42, 1208–1214.[CrossRef]
Children 2020, 7, 176 11 of 11
23. Kim, E.; Subhas, G.; Mittal, V.K.; Golladay, E.S. C-reactive protein estimation does not improve accuracy inthe diagnosis of acute appendicitis in pediatric patients. Int. J. Surg. 2009, 7, 74–77. [CrossRef] [PubMed]
24. Stefanutti, G.; Ghirardo, V.; Gamba, P. Inflammatory markers for acute appendicitis in children: Are theyhelpful? J. Pediatr. Surg. 2007, 42, 773–776. [CrossRef] [PubMed]
25. Dado, G.; Anania, G.; Baccarani, U.; Marcotti, E.; Donini, A.; Risaliti, A.; Pasqualucci, A.; Bresadola, F.Application of a clinical score for the diagnosis of acute appendicitis in childhood: A retrospective analysisof 197 patients. J. Pediatr. Surg. 2000, 35, 1320–1322. [CrossRef] [PubMed]
26. Rothrock, S.G.; Pagane, J. Acute appendicitis in children: Emergency department diagnosis and management.Ann. Emerg. Med. 2000, 36, 39–51. [CrossRef] [PubMed]
27. Okamoto, T.; Sano, K.; Ogasahara, K. Receiver-operating characteristic analysis of leukocyte counts andserum C-reactive protein levels in children with advanced appendicitis. Surg. Today 2006, 36, 515–518.[CrossRef] [PubMed]
© 2020 by the authors. Licensee MDPI, Basel, Switzerland. This article is an open accessarticle distributed under the terms and conditions of the Creative Commons Attribution(CC BY) license (http://creativecommons.org/licenses/by/4.0/).