Embed Size (px)
Citation preview

Magnetoimpedance dependence on width in Co66.5Fe3.5Si12.0B18.0amorphous alloy ribbonsL. González-Legarreta, V. M. Prida, B. Hernando, M. Ipatov, V. Zhukova et al. Citation: J. Appl. Phys. 113, 053905 (2013); doi: 10.1063/1.4790480 View online: http://dx.doi.org/10.1063/1.4790480 View Table of Contents: http://jap.aip.org/resource/1/JAPIAU/v113/i5 Published by the American Institute of Physics. Related ArticlesTheory of magnetoelectric effect in multilayer nanocomposites on a substrate: Static bending-mode response AIP Advances 3, 022103 (2013) Giant magnetocaloric and barocaloric effects in R5Si2Ge2 (R=Tb, Gd) J. Appl. Phys. 113, 033910 (2013) Effect of mechanical strain on magnetic properties of flexible exchange biased FeGa/IrMn heterostructures Appl. Phys. Lett. 102, 022412 (2013) Direct measurements of field-induced strain at magnetoelectric interfaces by grazing incidence x-ray diffraction Appl. Phys. Lett. 102, 011601 (2013) Alternating domains with uniaxial and biaxial magnetic anisotropy in epitaxial Fe films on BaTiO3 Appl. Phys. Lett. 101, 262405 (2012) Additional information on J. Appl. Phys.Journal Homepage: http://jap.aip.org/ Journal Information: http://jap.aip.org/about/about_the_journal Top downloads: http://jap.aip.org/features/most_downloaded Information for Authors: http://jap.aip.org/authors

Magnetoimpedance dependence on width in Co66.5Fe3.5Si12.0B18.0 amorphousalloy ribbons
L. Gonz�alez-Legarreta,1 V. M. Prida,1 B. Hernando,1 M. Ipatov,2 V. Zhukova,2
A. P. Zhukov,2,3 and J. Gonz�alez2,a)
1Departamento de F�ısica, Facultad de Ciencias, Universidad de Oviedo, Calvo Sotelo s/n, 33007 Oviedo,Spain2Departamento F�ısica de Materiales, Facultad de Qu�ımica, UPV, 1072, 20080 San Sebasti�an, Spain3IKERBASQUE Foundation, Bilbao, Spain
(Received 29 November 2012; accepted 22 January 2013; published online 5 February 2013)
The magnetoimpedance (MI) response of near-zero magnetostriction Co-based amorphous ribbons
with different width ranging from 0.35 mm to 0.90 mm was investigated in the frequency range of
10 MHz–3.5 GHz. It was found that the wider ribbon displays the softer magnetic behavior and
larger magnetoimpedance. MI response is characterized by two symmetrical peaks corresponding at
the two opposite directions of applied magnetic field. The value of magnetic field at the peaks of MI
should be assigned to the anisotropy field. Frequency dependencies of anisotropy field for the range
500–1000 MHz could be understood in the framework of skin penetration effect in the ribbons
except to that of lowest width (0.35 mm) where the ferromagnetic resonance phenomenon could be
predominant at this frequency range. Ferromagnetic resonance was detected in all samples, and for
magnetic fields above 4 kA/m the square of resonance frequency quadratically fits vs. the applied
field. Given the saturation magnetization, both the anisotropy field and the Land�e factor have been
determined. VC 2013 American Institute of Physics. [http://dx.doi.org/10.1063/1.4790480]
I. INTRODUCTION
From the discovery of the giant magnetoimpedance
(GMI) effect in 1994 by Panina and Mohri1 and Beach and
Berkowitz2 in non-magnetostrictive soft magnetic amor-
phous wires (diameter around 120 lm), there has been an
intensively research activity owing to the promising and,
even, real technological applications based in the GMI phe-
nomenon.3,4 Such scientific research has dealt with several
aspects concerning the intrinsic magnetotransport properties
(i.e., frequency range, intensity of the effect, magnetic field
to observe possible maximum, noise, etc.) as well as those
related with microstructural (mainly amorphous or nanocrys-
talline) or geometrical character (as has been mentioned, ini-
tially wire, but GMI has been reported in glass-coated
microwire,5,6 ribbon,7 micro-patterned ribbon,8 multilayers9)
and, therefore, GMI is actually opening a new branch of
research combining the micromagnetics of soft magnets with
the classical electrodynamics. Obviously, the different geom-
etry leads to some differences in the GMI response like the
range of frequency or the magnetic field dependence of the
impedance curve with one or two peaks, or it could be rele-
vant the shape of the peak, etc.
In addition, the demand on the new magnetic sensors
requires, among other factors, the reduction of dimension of
the device that affects, of course, to the sensing element. In
this sense, it must be mentioned that the last strong tendency
in miniaturization of the magnetic sensing elements has
resulted in the development of the thinner wires produced by
the Taylor–Ulitovsky method5 (1–30 lm in diameter).
Accordingly, we have recently focused the attention in the
research of GMI effect in a very thin amorphous ribbon
which could result attractive for future applications in
micro-sensors either due to low dimensions or by the relative
low-cost fabrication of these amorphous ribbons.10 Since
GMI effect is associated with the sensitivity of the circular/
transverse component of the magnetic susceptibility to the
external magnetic field, it is reasonable to investigate the
effect of the ribbon width on the magnetoimpedance (MI)
effect, since this parameter affects drastically to the trans-
verse magnetoelastic anisotropy arising from the internal
stresses developed during the fabrication process. In this
work, we present magnetoimpedance results obtained in a
nearly zero magnetostrictive Co-rich amorphous alloy ribbon
fabricated with different width values by rapid quenching
(single-roller technique) and, consequently, with different
transverse susceptibility.
II. EXPERIMENTAL DETAILS
Amorphous ribbons of nominal composition Co66.5Fe3.5
Si12.0B18.0 (saturation magnetostriction of the order of
kS��0.1� 10�6) were fabricated by the melt-spinning
technique using a Fe wheel. The ribbons were cast in a 10�3
mbar vacuum and with different (0.35, 0.60, 0.70, and
0.90 mm) width, around 20 lm thick. Hysteresis loops were
measured in 4 cm long samples. The impedance, Z, of as-cast
1 cm long samples with different widths (values have been
mentioned above) was measured with a network analyzer at
moderate frequencies 10–100 MHz and at high frequencies
1.0–3.5 GHz, as described elsewhere.6 Z of ribbon samples
was determined with a N5230A vector network analyzer
through reflection coefficient measurement. The analyser
output power was �10 dBm that corresponds to 1.4 mA driv-
ing current.
a)Author to whom correspondence should be addressed. Electronic mail:
0021-8979/2013/113(5)/053905/6/$30.00 VC 2013 American Institute of Physics113, 053905-1
JOURNAL OF APPLIED PHYSICS 113, 053905 (2013)

An external magnetic field up to 15 kA/m can be applied
along the longitudinal direction of the ribbon. Hysteresis
loops have been measured at 112 Hz using the technique
described elsewhere.4,5 Either hysteresis loops and/or MI
response, Z(H,f), of nearly zero magnetostrictive Co66.5Fe3.5
Si12.0B18.0 amorphous ribbons obtained with different widths
by quenching exhibit a distinctive behaviour.
III. EXPERIMENTAL RESULTS AND THEIRDISCUSSION
The resulting hysteresis loops of ribbons were measured
along the ribbon axis at a low frequency (112 Hz) being dis-
played in Fig. 1(a). The saturation magnetization, Ms, is
found to be in the range 470–510 kA/m for all ribbons,
meanwhile for the 0.90 width sample the lowest coercivity
of 5.5 A/m is detected, which is a half lower than the respec-
tive value for the other ribbons as can be observed in Fig.
1(b). Also the remanence is lower for the wider ribbon. From
the knee area just before to the approach magnetic saturation,
as is indicated in Fig. 1(b) by the arrow, a value of the effec-
tive anisotropy field of 17.1 A/m was estimated which is an
average over the whole sample being the dominant contribu-
tion the corresponding to the bulk ribbon. Coercive and ani-
sotropy fields within the 0.5% accuracy for all ribbons were
determined. Amorphous materials have a small effective ani-
sotropy and a soft magnetic behaviour is observed due to the
scaling down of the local anisotropy, as is described by the
random anisotropy model (RAM).11,12 This can be recog-
nized in all studied samples although when the width dimin-
ishes the magnetization reversal takes place in a wider range
of magnetic field values, involving more rotations, and
showing an increase in both the coercivity and the anisotropy
effective field. These features could be related to a less ani-
sotropy easy axis dispersion for the less wide samples, being
the magnetization more strongly constrained by the orienta-
tion of the local anisotropy and as a consequence the satura-
tion of magnetization is harder to achieve. Therefore, the
ribbon produced with the larger value of width presents the
softer magnetic behaviour.
3D variation of the electrical impedance, Z(H,f), with Hthe applied magnetic field, f, the frequency (10–1000 MHz)
of the ac electrical current flowing along the ribbon with dif-
ferent width, 0.35, 0.60, 0.70, and 0.90 mm, respectively, is
shown in Figs. 2(a)–2(d). It can be seen that the two-peak
behaviour (symmetrically with respect to H) emerges more
clearly as increasing the frequency. The value of H corre-
sponding to the peaks (Z maximum value) is linked to the
FIG. 1. Normalized hysteresis loops at 112 Hz meas-
ured parallel to the ribbon axis (a), and positive part of
the hysteresis loops (b), of four Co66.5Fe3.5Si12.0B18.0
ribbons with different widths. Arrows indicate the ani-
sotropy field for each sample.
053905-2 Gonz�alez-Legarreta et al. J. Appl. Phys. 113, 053905 (2013)
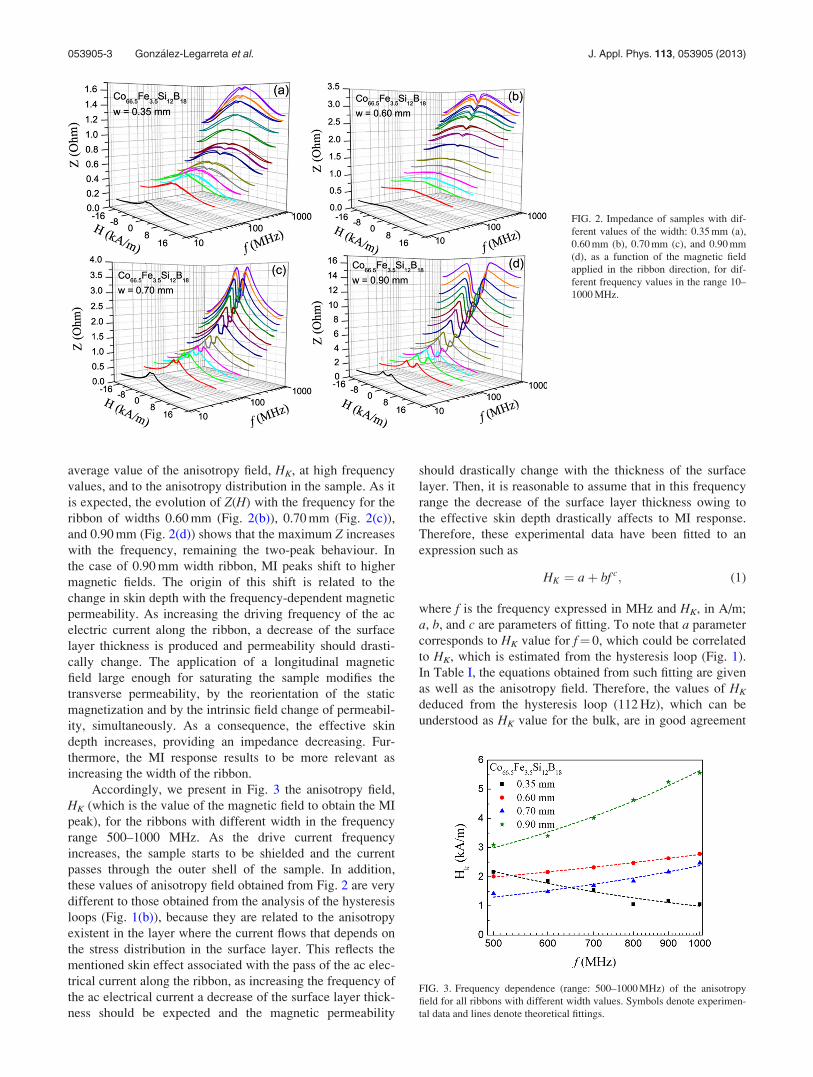
average value of the anisotropy field, HK, at high frequency
values, and to the anisotropy distribution in the sample. As it
is expected, the evolution of Z(H) with the frequency for the
ribbon of widths 0.60 mm (Fig. 2(b)), 0.70 mm (Fig. 2(c)),
and 0.90 mm (Fig. 2(d)) shows that the maximum Z increases
with the frequency, remaining the two-peak behaviour. In
the case of 0.90 mm width ribbon, MI peaks shift to higher
magnetic fields. The origin of this shift is related to the
change in skin depth with the frequency-dependent magnetic
permeability. As increasing the driving frequency of the ac
electric current along the ribbon, a decrease of the surface
layer thickness is produced and permeability should drasti-
cally change. The application of a longitudinal magnetic
field large enough for saturating the sample modifies the
transverse permeability, by the reorientation of the static
magnetization and by the intrinsic field change of permeabil-
ity, simultaneously. As a consequence, the effective skin
depth increases, providing an impedance decreasing. Fur-
thermore, the MI response results to be more relevant as
increasing the width of the ribbon.
Accordingly, we present in Fig. 3 the anisotropy field,
HK (which is the value of the magnetic field to obtain the MI
peak), for the ribbons with different width in the frequency
range 500–1000 MHz. As the drive current frequency
increases, the sample starts to be shielded and the current
passes through the outer shell of the sample. In addition,
these values of anisotropy field obtained from Fig. 2 are very
different to those obtained from the analysis of the hysteresis
loops (Fig. 1(b)), because they are related to the anisotropy
existent in the layer where the current flows that depends on
the stress distribution in the surface layer. This reflects the
mentioned skin effect associated with the pass of the ac elec-
trical current along the ribbon, as increasing the frequency of
the ac electrical current a decrease of the surface layer thick-
ness should be expected and the magnetic permeability
should drastically change with the thickness of the surface
layer. Then, it is reasonable to assume that in this frequency
range the decrease of the surface layer thickness owing to
the effective skin depth drastically affects to MI response.
Therefore, these experimental data have been fitted to an
expression such as
HK ¼ aþ bf c; (1)
where f is the frequency expressed in MHz and HK, in A/m;
a, b, and c are parameters of fitting. To note that a parameter
corresponds to HK value for f¼ 0, which could be correlated
to HK, which is estimated from the hysteresis loop (Fig. 1).
In Table I, the equations obtained from such fitting are given
as well as the anisotropy field. Therefore, the values of HK
deduced from the hysteresis loop (112 Hz), which can be
understood as HK value for the bulk, are in good agreement
FIG. 2. Impedance of samples with dif-
ferent values of the width: 0.35 mm (a),
0.60 mm (b), 0.70 mm (c), and 0.90 mm
(d), as a function of the magnetic field
applied in the ribbon direction, for dif-
ferent frequency values in the range 10–
1000 MHz.
FIG. 3. Frequency dependence (range: 500–1000 MHz) of the anisotropy
field for all ribbons with different width values. Symbols denote experimen-
tal data and lines denote theoretical fittings.
053905-3 Gonz�alez-Legarreta et al. J. Appl. Phys. 113, 053905 (2013)

with those deduced from Eq. (1) in all ribbons except to rib-
bon with smallest width value (0.35 mm) with a clear differ-
ent tendency of HK with f. This behaviour rather different
could be related to the influence of the shape anisotropy for
this ribbon. When the ribbon width is decreasing, the edge
roughness could worsen the MI effect. Certainly, the cross
section of this smallest width ribbon is still quite large as
comparing to that of microribbons,8 and glass-coated micro-
wires where a linear dependence of HK with the square of
the frequency was reported in the range of 0.5–15 GHz (Ref.
13) indicating that the reduction of cross section changes the
mentioned tendency to appear the ferromagnetic resonance
phenomenon. In fact, the frequency dependence of HK for
the ribbon of 0.35 mm width in the range of 1.0–3.0 GHz
showed in Fig. 4 leads to a different behaviour comparing
with the low frequency range of Fig. 3. Now, from the fitting
can be also obtained a value at f¼ 0 similar to that deduced
from the hysteresis loop. Concerning the results of c expo-
nent, it must be indicated that the increases with the width
samples could be understood in terms of complex mecha-
nisms of the magnetization process, which at this high fre-
quency range are connected mainly to spin rotations.14
On the other hand, at higher frequencies (1–3.5 GHz),
the MI effect is displayed in Fig. 5 for all studied ribbons. It
shows a significant increase of all the ribbons impedance but
the Z(f,H) behaviour is rather different for each sample. In
general, in the low field region, that is, for applied fields
below HK, the impedance change should be attributed to the
magnetization reorientation.15 At higher magnetic fields,
when the ribbon is close to magnetic saturation, the magnet-
ization reorientation no longer has much influence, being the
MI response essentially governed by the field variation of
the magnetic permeability, with ferromagnetic resonance
signature at high field. The large transverse permeability at
resonance strongly decreases the effective skin depth and the
impedance, Z, increases. As can be observed, there are Zpeaks at the resonance frequency for each value of the
applied static field, H. They become broader and diverge
from the centre of each curve as the frequency increases
remarking the ferromagnetic resonance contribution to the
impedance. As shown in Fig. 6(a), the resonance frequencies
f satisfy rather well the Kittel resonance condition for a uni-
axial thin film magnetized along the plane, which can also be
applied to the ribbons, and can be written as16,17
f 2 ¼ ðc2lo2=4p2Þ½ðH þ HKÞðH þ HK þMsÞ�; (2)
where c is the gyromagnetic ratio of an electron. With re-
spective saturation magnetization, Ms, determined from the
hysteresis loops measurements, the experimental results for
the high field data can be quadratic fitted with an anisotropy
field HK¼ 38.7 6 0.2 A/m and a Land�e splitting factor
g¼ 2.08 6 0.02 for the 0.35 mm width ribbon (Ms¼ 510 kA/
m). For the 0.60 mm sample (Ms¼ 470 kA/m), HK¼ 28.8
6 0.3 A/m and g¼ 2.01 6 0.01. In the case of the 0.70 mm
width ribbon (Ms¼ 490 kA/m), HK¼ 13.6 6 0.2 A/m and
g¼ 2.14 6 0.03, being HK¼ 12.2 6 0.2 A/m and g¼ 2.08
6 0.02 for the wider ribbon (Ms¼ 480 kA/m). Consequently,
obtained magnetic anisotropy field values are in good agree-
ment with HK values for the bulk alloys estimated from the
hysteresis loops, as can be seen in Fig. 1(b). In the low field
range, and considering that the saturating magnetic field of
these nearly zero magnetostrictive amorphous ribbons is
much lower than their saturation magnetization, (H þ HK)� Ms, Eq. (2) simplifies to
f 2 ¼ ðc2lo2=4p2Þ½ðH þ HKÞMs�: (3)
However, the linear fit holds only for static field values
stronger than HK in each sample as is presented in Fig. 6(b).
Moreover, for the narrower ribbon the slope is negative. Lin-
ear fits do not match the behaviour of the square resonance
frequency in the low field region. Deviations at applied fields
low 3 kA/m can be observed for all the samples that could be
ascribed to the specific anisotropy easy axis dispersion in
both strength and direction present in each ribbon. Other
source of this behaviour may be the inhomogeneity of Ms
through the cross section of the sample. MI-related phenom-
ena take place only in a thin outer layer of the ribbon, where
permeability inhomogeneity and surfaces defects may occur,
whereas hysteresis loop measurements provided average val-
ues of Ms and HK over the whole sample.
TABLE I. Fitting equations for the anisotropy field as a function of the frequency in the range 500–1000 MHz of several ribbons with different width.
Ribbon width (mm) Fitting equation Hk (112 Hz) (fitting) (A/m) Hk (112 Hz) (hysteresis loop) (A/m)
0.35 Hk¼ (39.2 6 0.6)þ (3.3 6 0.3)� 106�f (�1.18 6 0.16) … 38.2
0.60 Hk¼ (35.6 6 0.3)þ (98 6 8)�f (0.482 6 0.013) 36.8 36.0
0.70 Hk¼ (25.9 6 0.4)þ (5 6 3)�f (0.90 6 0.10) 25.9 26.0
0.90 Hk¼ (16.8 6 0.2)þ (10 6 3)�f (0.92 6 0.05) 16.8 17.1
FIG. 4. Frequency dependence (range: 1000–3000 MHz) of the anisotropy
field for the ribbon with 0.35 mm width. Symbols denote experimental data
and the line denotes the theoretical fitting.
053905-4 Gonz�alez-Legarreta et al. J. Appl. Phys. 113, 053905 (2013)

The results concerning the frequency dependence of the
anisotropy field in the range 500–1000 MHz in the ribbons
with different width indicate that the exponent c should be
further explored in order to control their magentoimpedance
response in a wide frequency range.
IV. CONCLUSIONS
Magnetoimpedance response of Co66.5Fe3.5Si12.0B18.0
amorphous alloy ribbons results to be very sensitive to the
width ribbon as a consequence of the average process of the
random distribution of magnetic moments through the width
dimension affecting drastically to the soft magnetic charac-
ter. Two-peak behaviour of the GMI effect is observed in all
studied ribbons, appearing the sharper peaks for a width
equal to 0.70 mm although the effect is enhanced as increas-
ing the value of the ribbon width in all frequency range (10–
3500 MHz). This behaviour is explained in terms of the skin
depth penetration and the dispersion of easy axes through the
ribbon thickness. The possibility about tuning the GMI two
peaks with both the applied magnetic field and the drive fre-
quency with different widths has been analyzed. Research
activities involving induced anisotropies with stress anneal-
ing treatment and/or by depositing an antiferromagnetic
layer on the ribbon surface are in progress.
ACKNOWLEDGMENTS
This work has been supported by Spanish MICINN under
projects MAT2009-13108-C02-01 and MAT2010-18914 and
by EU ERA-NET programme under project “SoMaMicSens”
(MANUNET-2010-Basque-3). Authors from UPV/EHU
acknowledge the financial support from the Department of
Industry of the Basque Government (Programme SAIO-
TEK2011, Projects: S-PE11UN013 and S- PE11UN087). FPI
grant is acknowledged by L.G.-L. Technical and human sup-
port provided by SGIker (UPV/EHU, MICINN, GV/EJ,
ERDF and ESF) is gratefully acknowledged.
1L. V. Panina and K. Mohri, Appl. Phys. Lett. 65, 1189 (1994).2R. S. Beach and A. E. Berkowitz, Appl. Phys. Lett. 64, 3652 (1994).3L. Kraus, M. V�azquez, and M. Knobel, in Giant Magnetoimpedance,
edited by K. H. J. Buschow (North-Holland, Amsterdam, 2003), Vol. 15.4V. Zhukova, A. Chizhik, A. Zhukov, A. Torcunov, V. Larin, and J.
Gonz�alez, IEEE Trans. Magn. 38, 3090 (2002).
FIG. 5. Impedance of samples with dif-
ferent values of the width: 0.35 mm (a),
0.60 mm (b), 0.70 mm (c), and 0.90 mm
(d), as a function of the magnetic field
applied in the ribbon direction, for fre-
quencies ranging from 1.25 GHz up to
3.5 GHz.
FIG. 6. Square of resonance frequency
as a function of the resonance field for
ribbons with different width. A quadratic
fit of the high field data was done (a),
and a linear fit was used for the low field
data (b). Symbols denote experimental
data and lines denote theoretical fits.
053905-5 Gonz�alez-Legarreta et al. J. Appl. Phys. 113, 053905 (2013)

5A. Zhukov, J. Gonz�alez, J. M. Blanco, M. V�azquez, and V. Larin, J. Mater.
Res. 15, 2107 (2000).6M. Ipatov, V. Zhukova, J. Gonzalez, and A. Zhukov, Appl. Phys. Lett. 97,
252507 (2010).7B. Hernando, M. L. Sanchez, V. M. Prida, M. Tejedor, and M. V�azquez,
J. Appl. Phys. 90, 4783 (2001).8L. Chen, Y. Zhou, C. Lei, Z.-M. Zhou, and W. Ding, J. Phys. D: Appl.
Phys. 42, 145005 (2009).9C. Garc�ıa, J. M. Flores, P. Vargas, and C. A. Ross, Appl. Phys. Lett. 96,
232501 (2010).10L. Gonz�alez, J. Bonastre, T. S�anchez, J. D. Santos, M. L. S�anchez, A.
Chizhik, L. Dom�ınguez, M. Ipatov, V. Zhukova, A. Zhukov, J. Gonz�alez,
J. J. Su~nol, and B. Hernando, IEEE Trans. Magn. 48, 4375 (2012).
11R. Alben, J. J. Becker, and M. C. Chi, J. Appl. Phys. 49, 1653 (1978).12G. Herzer, in NATO Science Series II: Mathematics, Physics and Chemis-
try, edited by B. Idzikowsky, P. Svec, and M. Miglierini (Kluwer Aca-
demic, Dordrecht, 2005), Vol. 184.13H. Garc�ıa-Miquel, M. J. Esbr�ı, J. M. Andr�es, J. M. Garc�ıa, J. M. Garc�ıa-
Beneytez, and M. V�azquez, IEEE Trans. Magn. 37, 561 (2001).14K. L. Garc�ıa and R. Valenzuela, J. Non-Cryst. Solids 287, 313 (2001).15P. Ciureanu, L. G. C. Melo, D. Seddaoui, D. M�enard, and A. Yelon,
J. Appl. Phys. 102, 073908 (2007).16P. Ciureanu, M. Britel, D. M�enard, C. Akyel, A. Yelon, M. Rouabhi, and
R. W. Cochrane, J. Magn. Magn. Mater. 196–197, 391 (1999).17L. Kraus, M. V�azquez, G. Infante, G. Badini-Confalonieri, and J. Torrej�on,
Appl. Phys. Lett. 94, 062505 (2009).
053905-6 Gonz�alez-Legarreta et al. J. Appl. Phys. 113, 053905 (2013)


