Embed Size (px)
Citation preview
Page 1 of 31
6 Dec 2017
Wilfred Yuen
(852) 2235 7131
Trading data
52-Week Range (HK$)
3 Mth Avg Daily Vol (m)
No of Shares (m)
Market Cap (HK$m)
Major Shareholders (%)
Auditors
Result Due
3.95/5.80
19.5
3,321
16,506
LIU Dian Bo (45.7%)
CITIC PE (5.9%)
E&Y
FY17: Mar
Company description
Founded in 1994, Luye Pharmaceutical engaged in
development, production, marketing and selling of
pharmaceutical products in oncology,
cardiovascular system, metabolism and CNS. The
company is headquartered in Yantai (Shandong
province, China) and was listed on Hong Kong
Stock Exchange in Jul 2014.
Price chart
Source: Bloomberg
0.0
2.0
4.0
6.0
8.0
10.0
Oct-15 Apr-16 Oct-16 Apr-17 Oct-17
Improved pipeline story + business development
Rating Buy Initiation
Target Price HK$6.10
Current price
HK$4.97 Upside +23%
Improved pipeline story + business development We initiate coverage on Luye with a Buy rating and target price of HK$6.10. The stock is currently trading at 14x FY18E P/E, representing a discount of 35% vs. peers’ average of 21x. While near-term revenues/earnings headwinds are reflected in the large discount from a P/E multiple perspective, we believe this view under-appreciates Luye’s pipeline optionality and business development, which provides a strong valuation argument. Our rNPV analysis indicates the valuation of its key pipeline assets amounted to RMB2.7bn (HK$0.95/share) vs. current biz at RMB14.0bn (HK$4.95/share). Moreover, Luye has been active in the business development front with recent acquisitions of Acino and rights to LY01008 and LY06006, which represent a mix of accretive and R&D deals. We expect the company to further diversifying its reliance on its key asset, Lipusu (paclitaxel liposome) and remain active in exploring acquisitions with a focus on commercial-stage CNS assets or R&D assets in oncology.
Pipeline events in 2018 are critical We believe the following two pipeline events are critical for Luye, i) Phase II readouts for LY03005 (Ansofaxine) in 2Q18, ii) NDA submission for LY03004 (Risperidone microsphere) in 3Q18, in the sense that any positive progress could have a meaningful implication for Luye P&L in FY18/19E. For LY03005, the company expects positive results from Phase II study in 2Q18 and is in talks with some pharma MNCs to license out its global rights (ex-China). For LY03004, the company expects to complete stability test for the first production facility (M1) by year-end, and is currently undergoing trial production for another production facility (M2), after which consistency tests between M1 and M2 will be conducted. NDA submission is expected in 3Q18. The annual production capacities for M1 and M2 are 50,000 vials and 0.8 million vials, respectively.
We model Lipusu to peak at RMB1.4bn in 2017 We have taken a more cautious approach (vs. mgmt and street consensus) to forecasting Lipusu franchise (which represents ~40% of FY17E revenues): We assume Lipusu to peak at RMB1.4bn in FY17E, after which we model a declining trajectory due to i) policy risk (the company exited NDRL price negotiation for Lipusu in Jul 2017), ii) increasing competition from Abraxane (protein-bound paclitaxel) and its generics, and iii) patent expiration in 2020.
Valuation and Risks Luye is trading at 15.7x/13.9x FY17E/FY18E P/E. Our NPV-based target price of HK$6.10 implies 17.1x FY18E P/E. Risks include i) higher than expected policy and competition risks on Lipusu, ii) pipeline risk, and iii) integration risk.
RMB mn FY15A FY16A FY17E FY18E FY19E
Revenue 2,563 2,918 3,559 3,765 3,972
Net profit 755 892 896 996 1,038
EPS (RMB) 0.23 0.27 0.27 0.30 0.32
P/E (x) 18.6 15.7 15.7 13.9 13.4
Sources: Company, CIRL estimates
Luye Pharma (2186 HK)
China Puti
Page 2 of 31
Improved pipeline story + business development
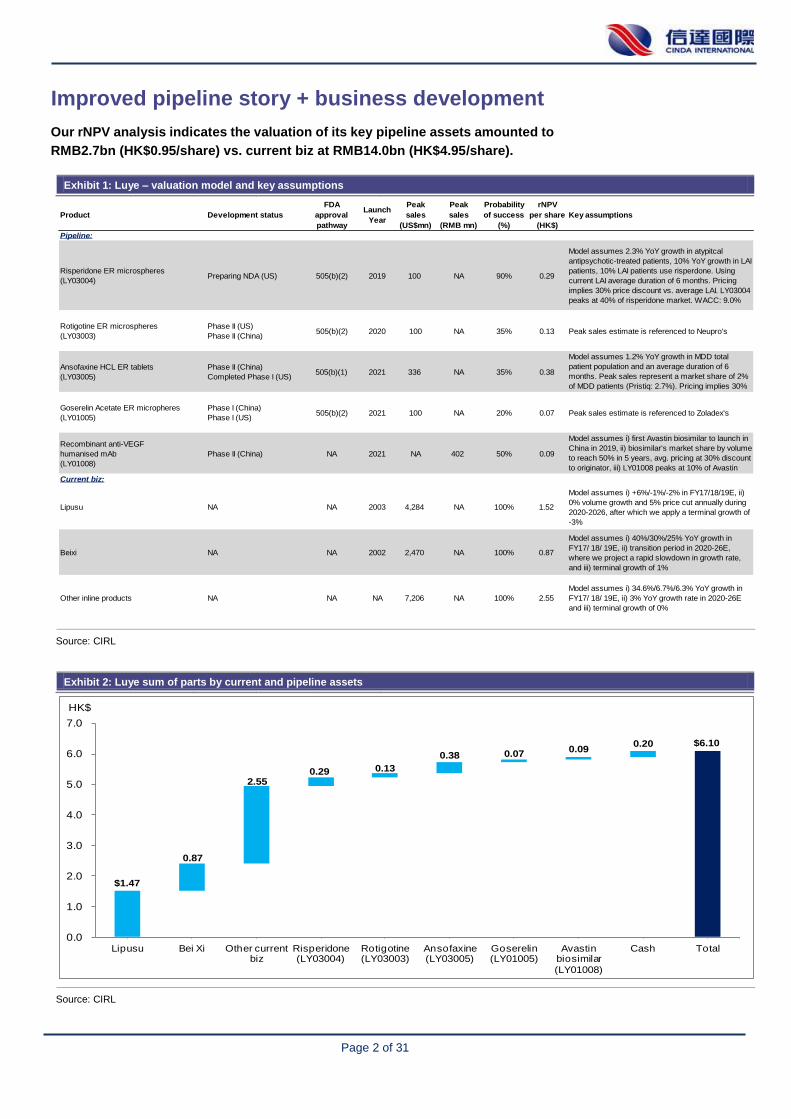
Our rNPV analysis indicates the valuation of its key pipeline assets amounted to
RMB2.7bn (HK$0.95/share) vs. current biz at RMB14.0bn (HK$4.95/share).
Exhibit 1: Luye – valuation model and key assumptions
Source: CIRL
Exhibit 2: Luye sum of parts by current and pipeline assets
Source: CIRL
Product Development status
FDA
approval
pathway
Launch
Year
Peak
sales
(US$mn)
Peak
sales
(RMB mn)
Probability
of success
(%)
rNPV
per share
(HK$)
Key assumptions
Pipeline:
Risperidone ER microspheres
(LY03004)Preparing NDA (US) 505(b)(2) 2019 100 NA 90% 0.29
Model assumes 2.3% YoY growth in atypitcal
antipsychotic-treated patients, 10% YoY growth in LAI
patients, 10% LAI patients use risperdone. Using
current LAI average duration of 6 months. Pricing
implies 30% price discount vs. average LAI. LY03004
peaks at 40% of risperidone market. WACC: 9.0%
Rotigotine ER microspheres
(LY03003)
Phase II (US)
Phase II (China)505(b)(2) 2020 100 NA 35% 0.13 Peak sales estimate is referenced to Neupro's
Ansofaxine HCL ER tablets
(LY03005)
Phase II (China)
Completed Phase I (US)505(b)(1) 2021 336 NA 35% 0.38
Model assumes 1.2% YoY growth in MDD total
patient population and an average duration of 6
months. Peak sales represent a market share of 2%
of MDD patients (Pristiq: 2.7%). Pricing implies 30%
discount to Pristiq
Goserelin Acetate ER micropheres
(LY01005)
Phase I (China)
Phase I (US)505(b)(2) 2021 100 NA 20% 0.07 Peak sales estimate is referenced to Zoladex's
Recombinant anti-VEGF
humanised mAb
(LY01008)
Phase II (China) NA 2021 NA 402 50% 0.09
Model assumes i) first Avastin biosimilar to launch in
China in 2019, ii) biosimilar's market share by volume
to reach 50% in 5 years, avg. pricing at 30% discount
to originator, iii) LY01008 peaks at 10% of Avastin
biosimilar marketCurrent biz:
Lipusu NA NA 2003 4,284 NA 100% 1.52
Model assumes i) +6%/-1%/-2% in FY17/18/19E, ii)
0% volume growth and 5% price cut annually during
2020-2026, after which we apply a terminal growth of
-3%
Beixi NA NA 2002 2,470 NA 100% 0.87
Model assumes i) 40%/30%/25% YoY growth in
FY17/ 18/ 19E, ii) transition period in 2020-26E,
where we project a rapid slowdown in growth rate,
and iii) terminal growth of 1%
Other inline products NA NA NA 7,206 NA 100% 2.55
Model assumes i) 34.6%/6.7%/6.3% YoY growth in
FY17/ 18/ 19E, ii) 3% YoY growth rate in 2020-26E
and iii) terminal growth of 0%
$6.10
$1.47
0.87
2.55 0.29 0.13
0.38 0.07 0.09
0.20
0.0
1.0
2.0
3.0
4.0
5.0
6.0
7.0
Lipusu Bei Xi Other current biz
Risperidone (LY03004)
Rotigotine (LY03003)
Ansofaxine (LY03005)
Goserelin (LY01005)
Avastin biosimilar
(LY01008)
Cash Total
HK$
Page 3 of 31
Risperidone extended release microspheres for injection (LY03004)
Risperidone extended release microspheres for injection (LY03004) is risperidone
formulated as extended-release microspheres for intramuscular injection for the
treatment of schizophrenia and bipolar disorder. Risperidone was originally marketed
as Risperdal by Janssen Pharmaceuticals in the US in 1993, and the long-acting
injectable formulation of risperidone, namely Risperdal Consta (administered once
every two weeks vs. daily for oral Risperdal) was launched in 2001.
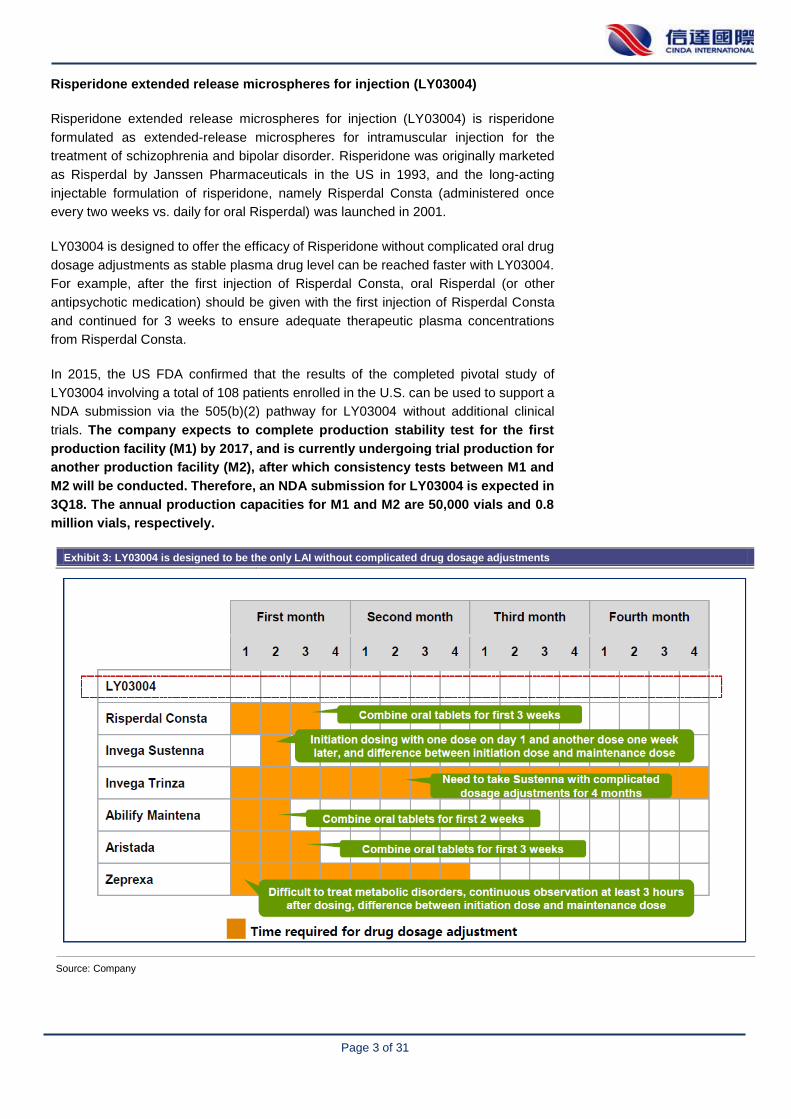
LY03004 is designed to offer the efficacy of Risperidone without complicated oral drug
dosage adjustments as stable plasma drug level can be reached faster with LY03004.
For example, after the first injection of Risperdal Consta, oral Risperdal (or other
antipsychotic medication) should be given with the first injection of Risperdal Consta
and continued for 3 weeks to ensure adequate therapeutic plasma concentrations
from Risperdal Consta.
In 2015, the US FDA confirmed that the results of the completed pivotal study of
LY03004 involving a total of 108 patients enrolled in the U.S. can be used to support a
NDA submission via the 505(b)(2) pathway for LY03004 without additional clinical
trials. The company expects to complete production stability test for the first
production facility (M1) by 2017, and is currently undergoing trial production for
another production facility (M2), after which consistency tests between M1 and
M2 will be conducted. Therefore, an NDA submission for LY03004 is expected in
3Q18. The annual production capacities for M1 and M2 are 50,000 vials and 0.8
million vials, respectively.
Exhibit 3: LY03004 is designed to be the only LAI without complicated drug dosage adjustments
Source: Company
Page 4 of 31
Ansofaxine Hydrochloride Extended-release Tablets (LY03005)
LY03005 is a novel serotonin-norepinephrine-dopamine reuptake inhibitor (SNDRI), or
triple reuptake inhibitor (TRI), that simultaneously acts as a reuptake inhibitor for three
major neurotransmitters involved in depression: serotonin (5-HT), norepinephrine (NE)
and dopamine (DA). There are currently no SNDRIs on the market. SNDRIs are
developed as an extension of selective serotonin reuptake inhibitors (SSRIs) and
serotonin-norepinephrine reuptake inhibitors (SNRIs), where the additional
dopaminergic action attempts to create medications with broader efficacy and a more
rapid onset of action.
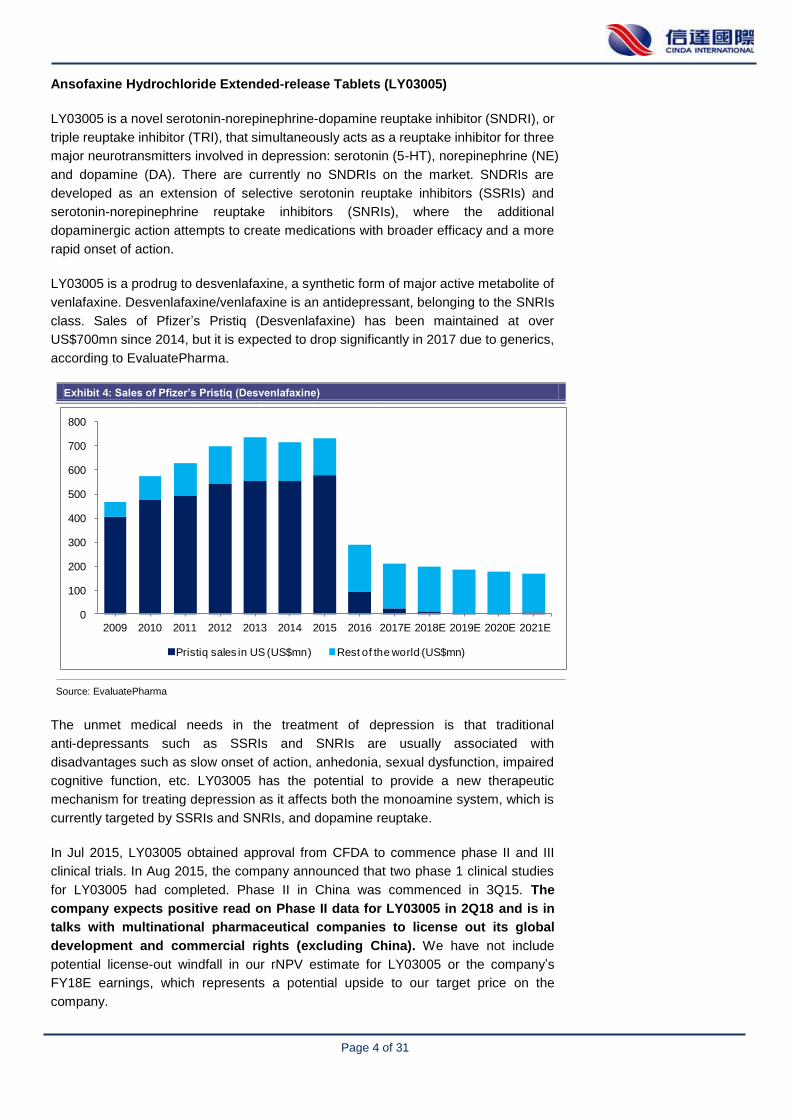
LY03005 is a prodrug to desvenlafaxine, a synthetic form of major active metabolite of
venlafaxine. Desvenlafaxine/venlafaxine is an antidepressant, belonging to the SNRIs
class. Sales of Pfizer’s Pristiq (Desvenlafaxine) has been maintained at over
US$700mn since 2014, but it is expected to drop significantly in 2017 due to generics,
according to EvaluatePharma.
Exhibit 4: Sales of Pfizer’s Pristiq (Desvenlafaxine)
Source: EvaluatePharma
The unmet medical needs in the treatment of depression is that traditional
anti-depressants such as SSRIs and SNRIs are usually associated with
disadvantages such as slow onset of action, anhedonia, sexual dysfunction, impaired
cognitive function, etc. LY03005 has the potential to provide a new therapeutic
mechanism for treating depression as it affects both the monoamine system, which is
currently targeted by SSRIs and SNRIs, and dopamine reuptake.
In Jul 2015, LY03005 obtained approval from CFDA to commence phase II and III
clinical trials. In Aug 2015, the company announced that two phase 1 clinical studies
for LY03005 had completed. Phase II in China was commenced in 3Q15. The
company expects positive read on Phase II data for LY03005 in 2Q18 and is in
talks with multinational pharmaceutical companies to license out its global
development and commercial rights (excluding China). We have not include
potential license-out windfall in our rNPV estimate for LY03005 or the company’s
FY18E earnings, which represents a potential upside to our target price on the
company.
0
100
200
300
400
500
600
700
800
2009 2010 2011 2012 2013 2014 2015 2016 2017E 2018E 2019E 2020E 2021E
Pristiq sales in US (US$mn) Rest of the world (US$mn)
Page 5 of 31
Rotigotine ER microspheres depot for injection (LY03003)
LY03003 is an extended-release microsphere formulation of rotigotine (a dopamine
agonist) that is designed to produce long-term continuous dopamine stimulation for
the treatment of Parkinson’s. It is designed to be administered once-weekly to improve
patient compliance vs. UCB’s once-daily Rotigotine Transdermal Patch System,
namely Neupro.
In Dec 2015, the company announced that the phase 1 clinical studies in US for
LY03003 were completed, which demonstrated that LY03003 was well tolerated and
produced good pharmacokinetic profile after a single injection and multiple injections
within a diversified dose range.
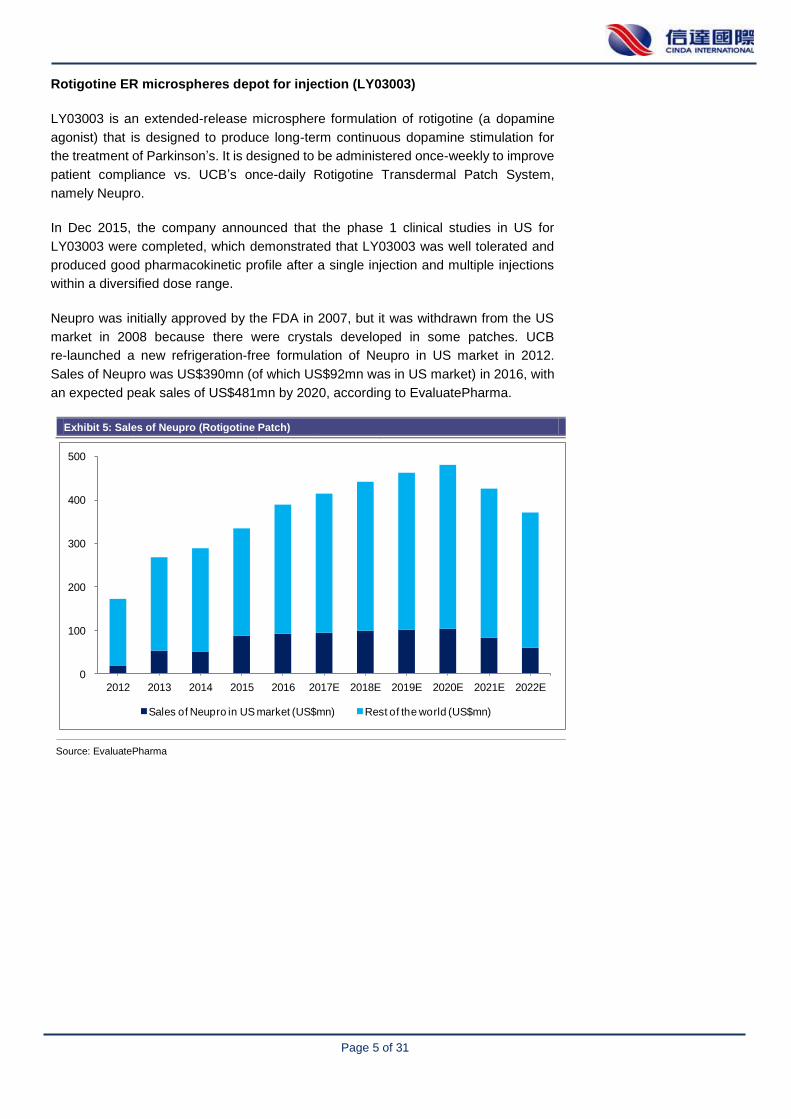
Neupro was initially approved by the FDA in 2007, but it was withdrawn from the US
market in 2008 because there were crystals developed in some patches. UCB
re-launched a new refrigeration-free formulation of Neupro in US market in 2012.
Sales of Neupro was US$390mn (of which US$92mn was in US market) in 2016, with
an expected peak sales of US$481mn by 2020, according to EvaluatePharma.
Exhibit 5: Sales of Neupro (Rotigotine Patch)
Source: EvaluatePharma
0
100
200
300
400
500
2012 2013 2014 2015 2016 2017E 2018E 2019E 2020E 2021E 2022E
Sales of Neupro in US market (US$mn) Rest of the world (US$mn)
Page 6 of 31
Goserelin Acetate Extended-release Microspheres for Injection (LY01005)
LY01005 is a monthly extended release microspheres for intramuscular formulation of
goserelin acetate, a gonadotropin-releasing hormone (GnRH) agonist. Goserelin
acetate was first approved in the US in 1989 and was commercialised by AstraZeneca
under the brand name of Zoladex. There are two other molecules in this class, namely
Decapeptyl (triptorelin) and Lupron (leuproelin), and a related product, GnRH
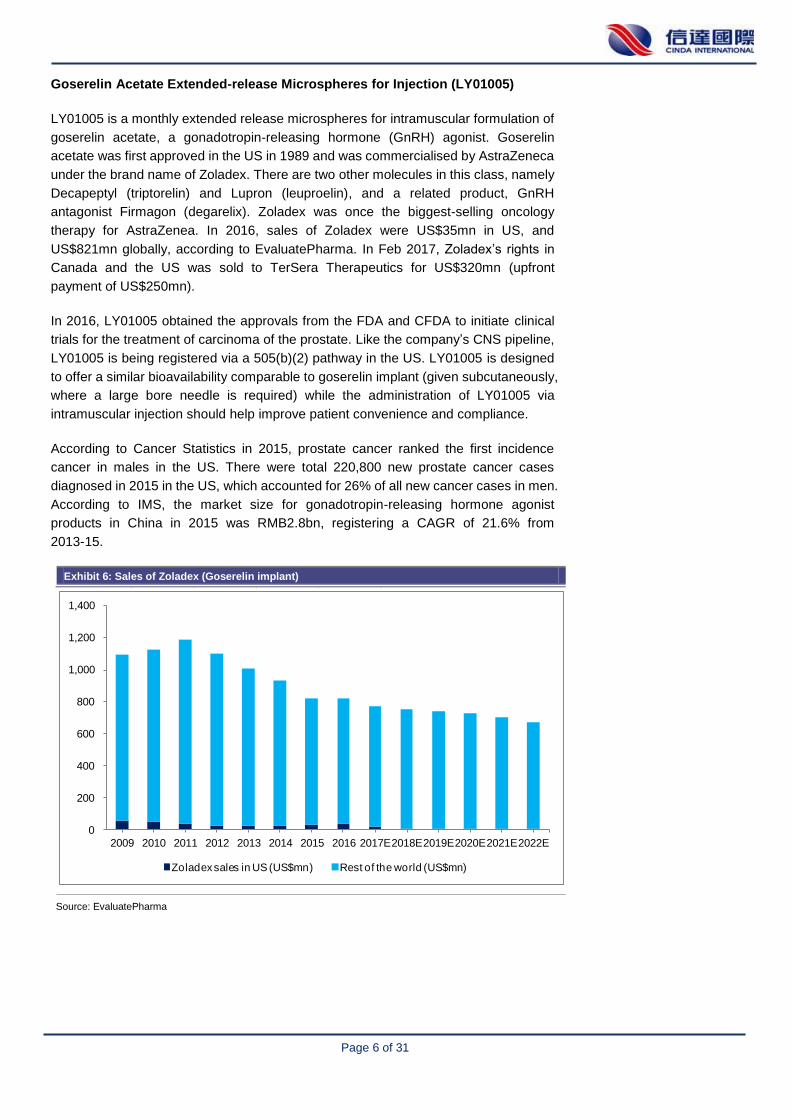
antagonist Firmagon (degarelix). Zoladex was once the biggest-selling oncology
therapy for AstraZenea. In 2016, sales of Zoladex were US$35mn in US, and
US$821mn globally, according to EvaluatePharma. In Feb 2017, Zoladex’s rights in
Canada and the US was sold to TerSera Therapeutics for US$320mn (upfront
payment of US$250mn).
In 2016, LY01005 obtained the approvals from the FDA and CFDA to initiate clinical
trials for the treatment of carcinoma of the prostate. Like the company’s CNS pipeline,
LY01005 is being registered via a 505(b)(2) pathway in the US. LY01005 is designed
to offer a similar bioavailability comparable to goserelin implant (given subcutaneously,
where a large bore needle is required) while the administration of LY01005 via
intramuscular injection should help improve patient convenience and compliance.
According to Cancer Statistics in 2015, prostate cancer ranked the first incidence
cancer in males in the US. There were total 220,800 new prostate cancer cases
diagnosed in 2015 in the US, which accounted for 26% of all new cancer cases in men.
According to IMS, the market size for gonadotropin-releasing hormone agonist
products in China in 2015 was RMB2.8bn, registering a CAGR of 21.6% from
2013-15.
Exhibit 6: Sales of Zoladex (Goserelin implant)
Source: EvaluatePharma
0
200
400
600
800
1,000
1,200
1,400
2009 2010 2011 2012 2013 2014 2015 2016 2017E2018E2019E2020E2021E2022E
Zoladex sales in US (US$mn) Rest of the world (US$mn)
Page 7 of 31
LY01008 (Avastin biosimilar)
LY01008 is a biosimilar of Roche’s Avastin (bevacizumab, a recombinant anti-VEGF
humanized monoclonal antibody), indicated for colorectal cancer or non-small cell
lung cancer (NSCLC). LY01008 entered into Phase III clinical trial in China in Nov
2017. The company expects to lunch LY01008 in 2021.
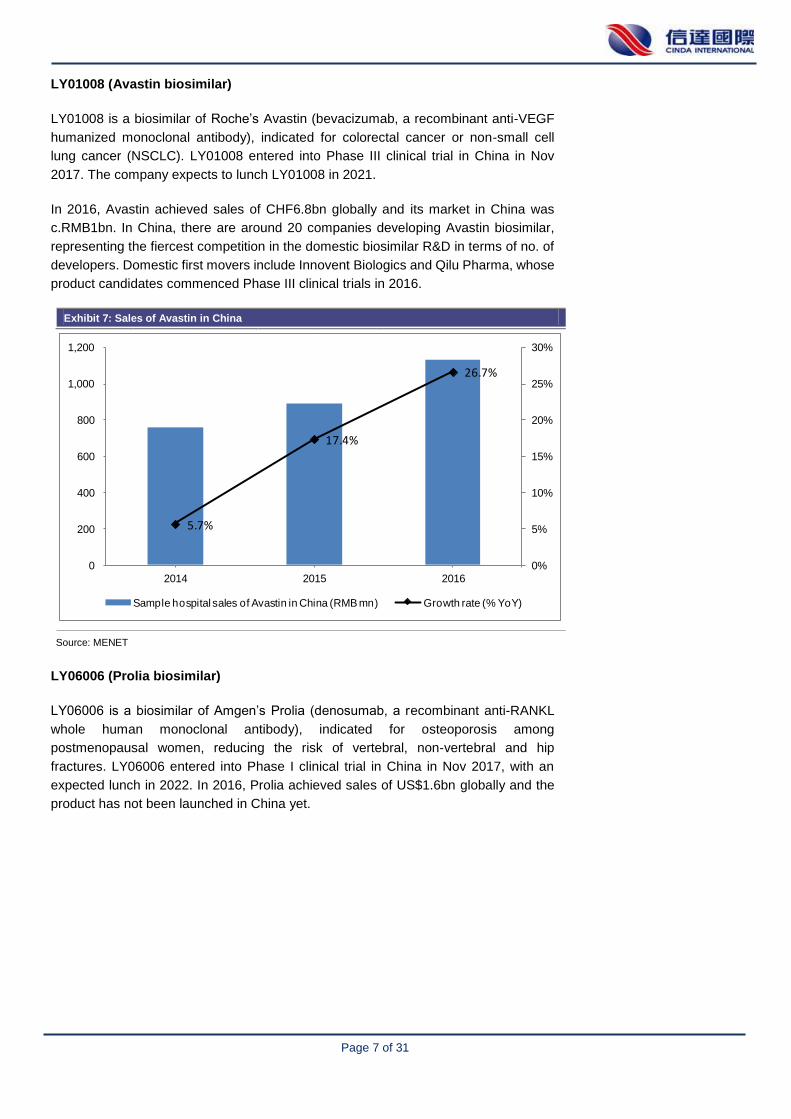
In 2016, Avastin achieved sales of CHF6.8bn globally and its market in China was
c.RMB1bn. In China, there are around 20 companies developing Avastin biosimilar,
representing the fiercest competition in the domestic biosimilar R&D in terms of no. of
developers. Domestic first movers include Innovent Biologics and Qilu Pharma, whose
product candidates commenced Phase III clinical trials in 2016.
Exhibit 7: Sales of Avastin in China
Source: MENET
LY06006 (Prolia biosimilar)
LY06006 is a biosimilar of Amgen’s Prolia (denosumab, a recombinant anti-RANKL
whole human monoclonal antibody), indicated for osteoporosis among
postmenopausal women, reducing the risk of vertebral, non-vertebral and hip
fractures. LY06006 entered into Phase I clinical trial in China in Nov 2017, with an
expected lunch in 2022. In 2016, Prolia achieved sales of US$1.6bn globally and the
product has not been launched in China yet.
5.7%
17.4%
26.7%
0%
5%
10%
15%
20%
25%
30%
0
200
400
600
800
1,000
1,200
2014 2015 2016
Sample hospital sales of Avastin in China (RMB mn) Growth rate (% YoY)
Page 8 of 31
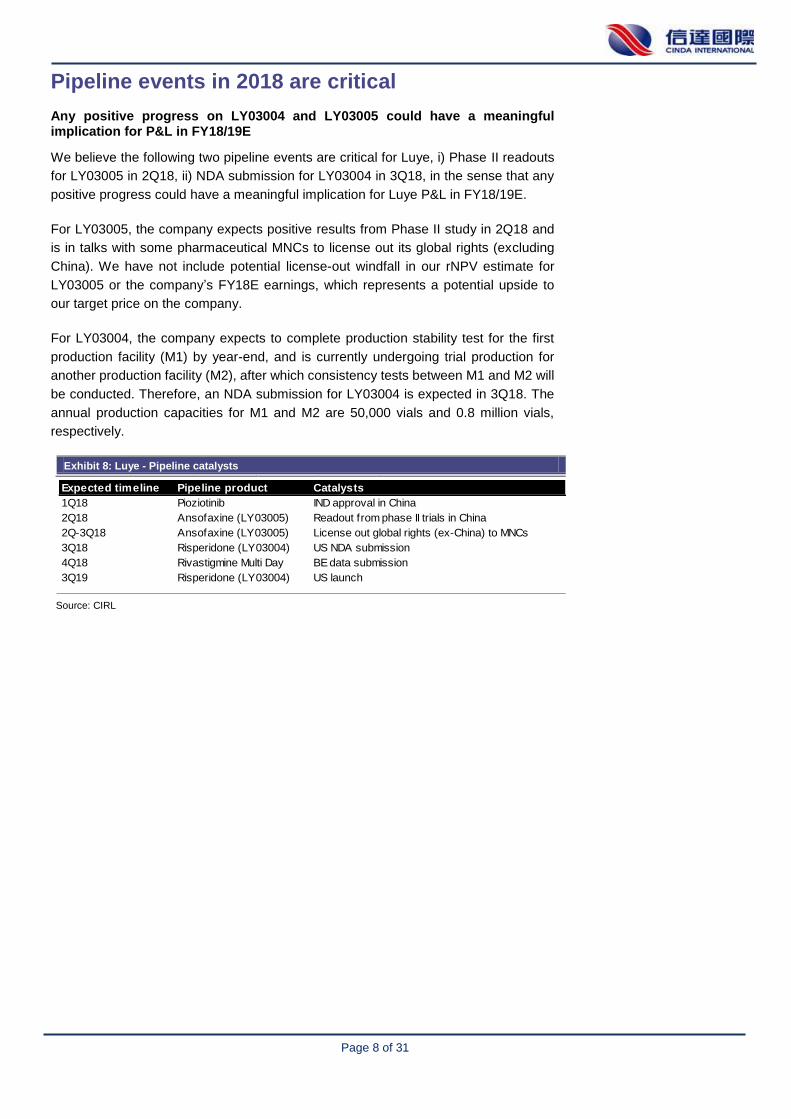
Pipeline events in 2018 are critical
Any positive progress on LY03004 and LY03005 could have a meaningful implication for P&L in FY18/19E
We believe the following two pipeline events are critical for Luye, i) Phase II readouts
for LY03005 in 2Q18, ii) NDA submission for LY03004 in 3Q18, in the sense that any
positive progress could have a meaningful implication for Luye P&L in FY18/19E.
For LY03005, the company expects positive results from Phase II study in 2Q18 and
is in talks with some pharmaceutical MNCs to license out its global rights (excluding
China). We have not include potential license-out windfall in our rNPV estimate for
LY03005 or the company’s FY18E earnings, which represents a potential upside to
our target price on the company.
For LY03004, the company expects to complete production stability test for the first
production facility (M1) by year-end, and is currently undergoing trial production for
another production facility (M2), after which consistency tests between M1 and M2 will
be conducted. Therefore, an NDA submission for LY03004 is expected in 3Q18. The
annual production capacities for M1 and M2 are 50,000 vials and 0.8 million vials,
respectively.
Exhibit 8: Luye - Pipeline catalysts
Source: CIRL
Expected timeline Pipeline product Catalysts
1Q18 Pioziotinib IND approval in China
2Q18 Ansofaxine (LY03005) Readout from phase II trials in China
2Q-3Q18 Ansofaxine (LY03005) License out global rights (ex-China) to MNCs
3Q18 Risperidone (LY03004) US NDA submission
4Q18 Rivastigmine Multi Day BE data submission
3Q19 Risperidone (LY03004) US launch
Page 9 of 31
We model Lipusu to peak at RMB1.4bn in 2017
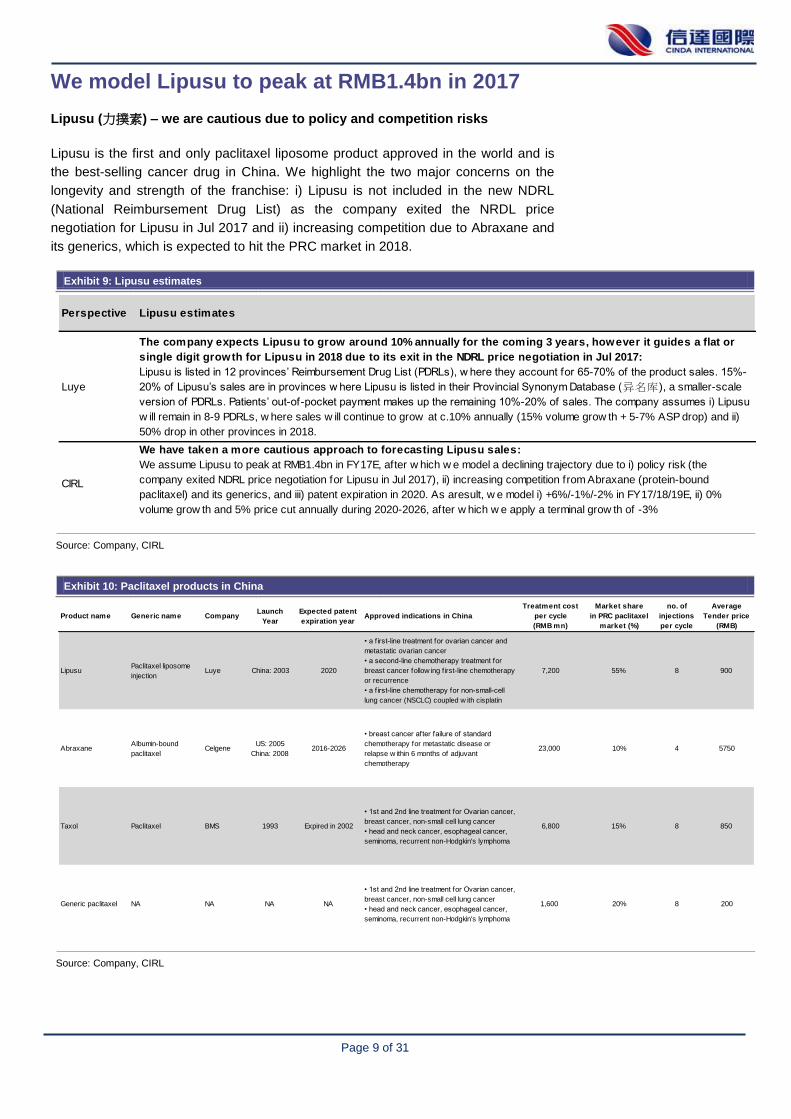
Lipusu (力撲素) – we are cautious due to policy and competition risks
Lipusu is the first and only paclitaxel liposome product approved in the world and is
the best-selling cancer drug in China. We highlight the two major concerns on the
longevity and strength of the franchise: i) Lipusu is not included in the new NDRL
(National Reimbursement Drug List) as the company exited the NRDL price
negotiation for Lipusu in Jul 2017 and ii) increasing competition due to Abraxane and
its generics, which is expected to hit the PRC market in 2018.
Exhibit 9: Lipusu estimates
Source: Company, CIRL
Exhibit 10: Paclitaxel products in China
Source: Company, CIRL
Perspective Lipusu estimates
Luye
The company expects Lipusu to grow around 10% annually for the coming 3 years, however it guides a flat or
single digit growth for Lipusu in 2018 due to its exit in the NDRL price negotiation in Jul 2017:
Lipusu is listed in 12 provinces’ Reimbursement Drug List (PDRLs), w here they account for 65-70% of the product sales. 15%-
20% of Lipusu’s sales are in provinces w here Lipusu is listed in their Provincial Synonym Database (异名库), a smaller-scale
version of PDRLs. Patients’ out-of-pocket payment makes up the remaining 10%-20% of sales. The company assumes i) Lipusu
w ill remain in 8-9 PDRLs, w here sales w ill continue to grow at c.10% annually (15% volume grow th + 5-7% ASP drop) and ii)
50% drop in other provinces in 2018.
CIRL
We have taken a more cautious approach to forecasting Lipusu sales:
We assume Lipusu to peak at RMB1.4bn in FY17E, after w hich w e model a declining trajectory due to i) policy risk (the
company exited NDRL price negotiation for Lipusu in Jul 2017), ii) increasing competition from Abraxane (protein-bound
paclitaxel) and its generics, and iii) patent expiration in 2020. As aresult, w e model i) +6%/-1%/-2% in FY17/18/19E, ii) 0%
volume grow th and 5% price cut annually during 2020-2026, after w hich w e apply a terminal grow th of -3%
Product name Generic name CompanyLaunch
Year
Expected patent
expiration yearApproved indications in China
Treatment cost
per cycle
(RMB mn)
Market share
in PRC paclitaxel
market (%)
no. of
injections
per cycle
Average
Tender price
(RMB)
LipusuPaclitaxel liposome
injectionLuye China: 2003 2020
• a f irst-line treatment for ovarian cancer and
metastatic ovarian cancer
• a second-line chemotherapy treatment for
breast cancer follow ing f irst-line chemotherapy
or recurrence
• a f irst-line chemotherapy for non-small-cell
lung cancer (NSCLC) coupled w ith cisplatin
7,200 55% 8 900
AbraxaneAlbumin-bound
paclitaxelCelgene
US: 2005
China: 20082016-2026
• breast cancer after failure of standard
chemotherapy for metastatic disease or
relapse w ithin 6 months of adjuvant
chemotherapy
23,000 10% 4 5750
Taxol Paclitaxel BMS 1993 Expired in 2002
• 1st and 2nd line treatment for Ovarian cancer,
breast cancer, non-small cell lung cancer
• head and neck cancer, esophageal cancer,
seminoma, recurrent non-Hodgkin's lymphoma
6,800 15% 8 850
Generic paclitaxel NA NA NA NA
• 1st and 2nd line treatment for Ovarian cancer,
breast cancer, non-small cell lung cancer
• head and neck cancer, esophageal cancer,
seminoma, recurrent non-Hodgkin's lymphoma
1,600 20% 8 200
Page 10 of 31
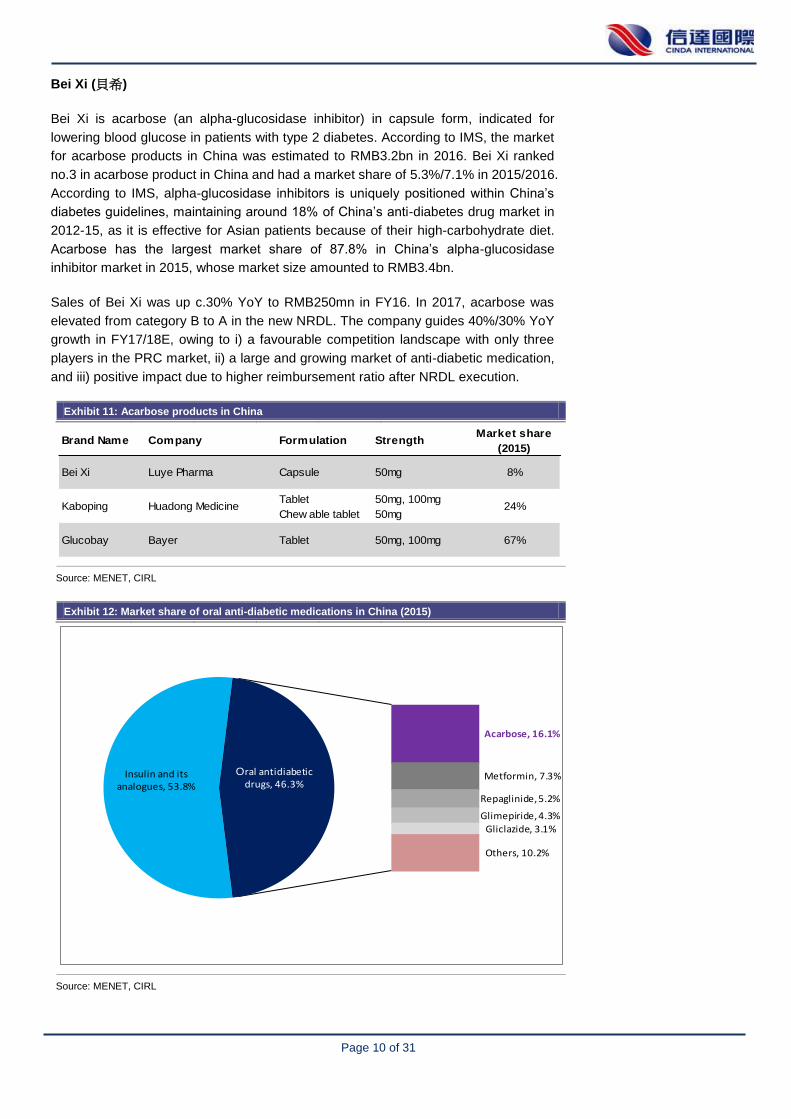
Bei Xi (貝希)
Bei Xi is acarbose (an alpha-glucosidase inhibitor) in capsule form, indicated for
lowering blood glucose in patients with type 2 diabetes. According to IMS, the market
for acarbose products in China was estimated to RMB3.2bn in 2016. Bei Xi ranked
no.3 in acarbose product in China and had a market share of 5.3%/7.1% in 2015/2016.
According to IMS, alpha-glucosidase inhibitors is uniquely positioned within China’s
diabetes guidelines, maintaining around 18% of China’s anti-diabetes drug market in
2012-15, as it is effective for Asian patients because of their high-carbohydrate diet.
Acarbose has the largest market share of 87.8% in China’s alpha-glucosidase
inhibitor market in 2015, whose market size amounted to RMB3.4bn.
Sales of Bei Xi was up c.30% YoY to RMB250mn in FY16. In 2017, acarbose was
elevated from category B to A in the new NRDL. The company guides 40%/30% YoY
growth in FY17/18E, owing to i) a favourable competition landscape with only three
players in the PRC market, ii) a large and growing market of anti-diabetic medication,
and iii) positive impact due to higher reimbursement ratio after NRDL execution.
Exhibit 11: Acarbose products in China
Source: MENET, CIRL
Exhibit 12: Market share of oral anti-diabetic medications in China (2015)
Source: MENET, CIRL
Brand Name Company Formulation StrengthMarket share
(2015)
Bei Xi Luye Pharma Capsule 50mg 8%
Kaboping Huadong MedicineTablet
Chew able tablet
50mg, 100mg
50mg24%
Glucobay Bayer Tablet 50mg, 100mg 67%
Insulin and its analogues, 53.8%
Acarbose, 16.1%
Metformin, 7.3%
Repaglinide, 5.2%
Glimepiride, 4.3%
Gliclazide, 3.1%
Others, 10.2%
Oral antidiabetic drugs, 46.3%
Page 11 of 31
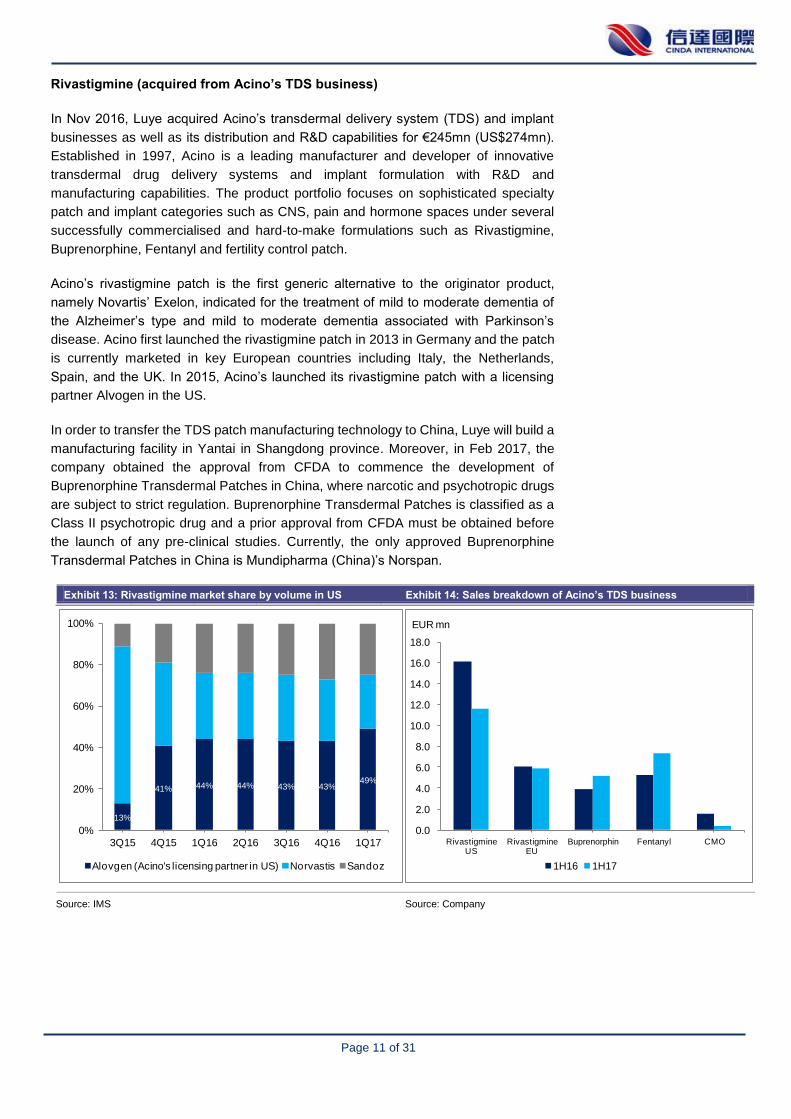
Rivastigmine (acquired from Acino’s TDS business)
In Nov 2016, Luye acquired Acino’s transdermal delivery system (TDS) and implant
businesses as well as its distribution and R&D capabilities for €245mn (US$274mn).
Established in 1997, Acino is a leading manufacturer and developer of innovative
transdermal drug delivery systems and implant formulation with R&D and
manufacturing capabilities. The product portfolio focuses on sophisticated specialty
patch and implant categories such as CNS, pain and hormone spaces under several
successfully commercialised and hard-to-make formulations such as Rivastigmine,
Buprenorphine, Fentanyl and fertility control patch.
Acino’s rivastigmine patch is the first generic alternative to the originator product,
namely Novartis’ Exelon, indicated for the treatment of mild to moderate dementia of
the Alzheimer’s type and mild to moderate dementia associated with Parkinson’s
disease. Acino first launched the rivastigmine patch in 2013 in Germany and the patch
is currently marketed in key European countries including Italy, the Netherlands,
Spain, and the UK. In 2015, Acino’s launched its rivastigmine patch with a licensing
partner Alvogen in the US.
In order to transfer the TDS patch manufacturing technology to China, Luye will build a
manufacturing facility in Yantai in Shangdong province. Moreover, in Feb 2017, the
company obtained the approval from CFDA to commence the development of
Buprenorphine Transdermal Patches in China, where narcotic and psychotropic drugs
are subject to strict regulation. Buprenorphine Transdermal Patches is classified as a
Class II psychotropic drug and a prior approval from CFDA must be obtained before
the launch of any pre-clinical studies. Currently, the only approved Buprenorphine
Transdermal Patches in China is Mundipharma (China)’s Norspan.
Exhibit 13: Rivastigmine market share by volume in US Exhibit 14: Sales breakdown of Acino’s TDS business
Source: IMS Source: Company
13%
41% 44% 44% 43% 43%49%
0%
20%
40%
60%
80%
100%
3Q15 4Q15 1Q16 2Q16 3Q16 4Q16 1Q17
Alovgen (Acino's licensing partner in US) Norvastis Sandoz
0.0
2.0
4.0
6.0
8.0
10.0
12.0
14.0
16.0
18.0
Rivastigmine US
Rivastigmine EU
Buprenorphin Fentanyl CMO
EUR mn
1H16 1H17
Page 12 of 31
Valuation
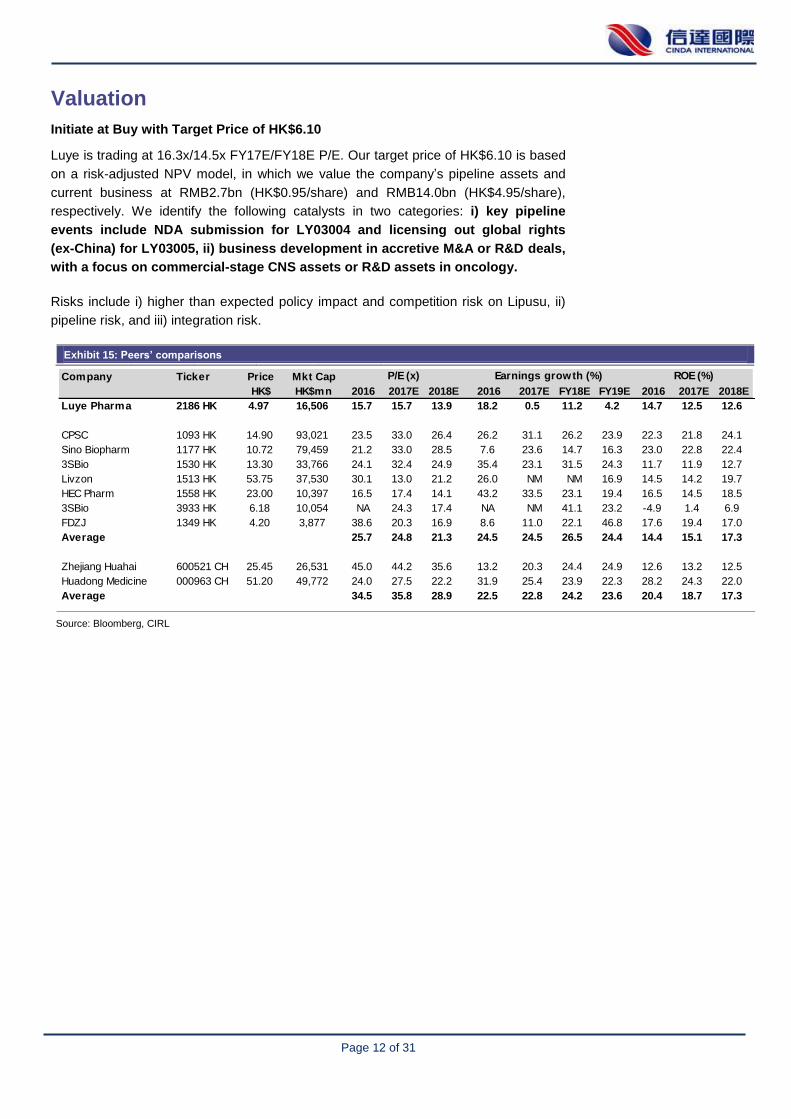
Initiate at Buy with Target Price of HK$6.10
Luye is trading at 16.3x/14.5x FY17E/FY18E P/E. Our target price of HK$6.10 is based
on a risk-adjusted NPV model, in which we value the company’s pipeline assets and
current business at RMB2.7bn (HK$0.95/share) and RMB14.0bn (HK$4.95/share),
respectively. We identify the following catalysts in two categories: i) key pipeline
events include NDA submission for LY03004 and licensing out global rights
(ex-China) for LY03005, ii) business development in accretive M&A or R&D deals,
with a focus on commercial-stage CNS assets or R&D assets in oncology.
Risks include i) higher than expected policy impact and competition risk on Lipusu, ii)
pipeline risk, and iii) integration risk.
Exhibit 15: Peers’ comparisons
Exhibit 1:
Source: Bloomberg, CIRL
Company Ticker Price Mkt Cap
HK$ HK$mn 2016 2017E 2018E 2016 2017E FY18E FY19E 2016 2017E 2018E
Luye Pharma 2186 HK 4.97 16,506 15.7 15.7 13.9 18.2 0.5 11.2 4.2 14.7 12.5 12.6
CPSC 1093 HK 14.90 93,021 23.5 33.0 26.4 26.2 31.1 26.2 23.9 22.3 21.8 24.1
Sino Biopharm 1177 HK 10.72 79,459 21.2 33.0 28.5 7.6 23.6 14.7 16.3 23.0 22.8 22.4
3SBio 1530 HK 13.30 33,766 24.1 32.4 24.9 35.4 23.1 31.5 24.3 11.7 11.9 12.7
Livzon 1513 HK 53.75 37,530 30.1 13.0 21.2 26.0 NM NM 16.9 14.5 14.2 19.7
HEC Pharm 1558 HK 23.00 10,397 16.5 17.4 14.1 43.2 33.5 23.1 19.4 16.5 14.5 18.5
3SBio 3933 HK 6.18 10,054 NA 24.3 17.4 NA NM 41.1 23.2 -4.9 1.4 6.9
FDZJ 1349 HK 4.20 3,877 38.6 20.3 16.9 8.6 11.0 22.1 46.8 17.6 19.4 17.0
Average 25.7 24.8 21.3 24.5 24.5 26.5 24.4 14.4 15.1 17.3
Zhejiang Huahai 600521 CH 25.45 26,531 45.0 44.2 35.6 13.2 20.3 24.4 24.9 12.6 13.2 12.5
Huadong Medicine 000963 CH 51.20 49,772 24.0 27.5 22.2 31.9 25.4 23.9 22.3 28.2 24.3 22.0
Average 34.5 35.8 28.9 22.5 22.8 24.2 23.6 20.4 18.7 17.3
P/E (x) Earnings growth (%) ROE (%)
Page 13 of 31
Financials
Revenue
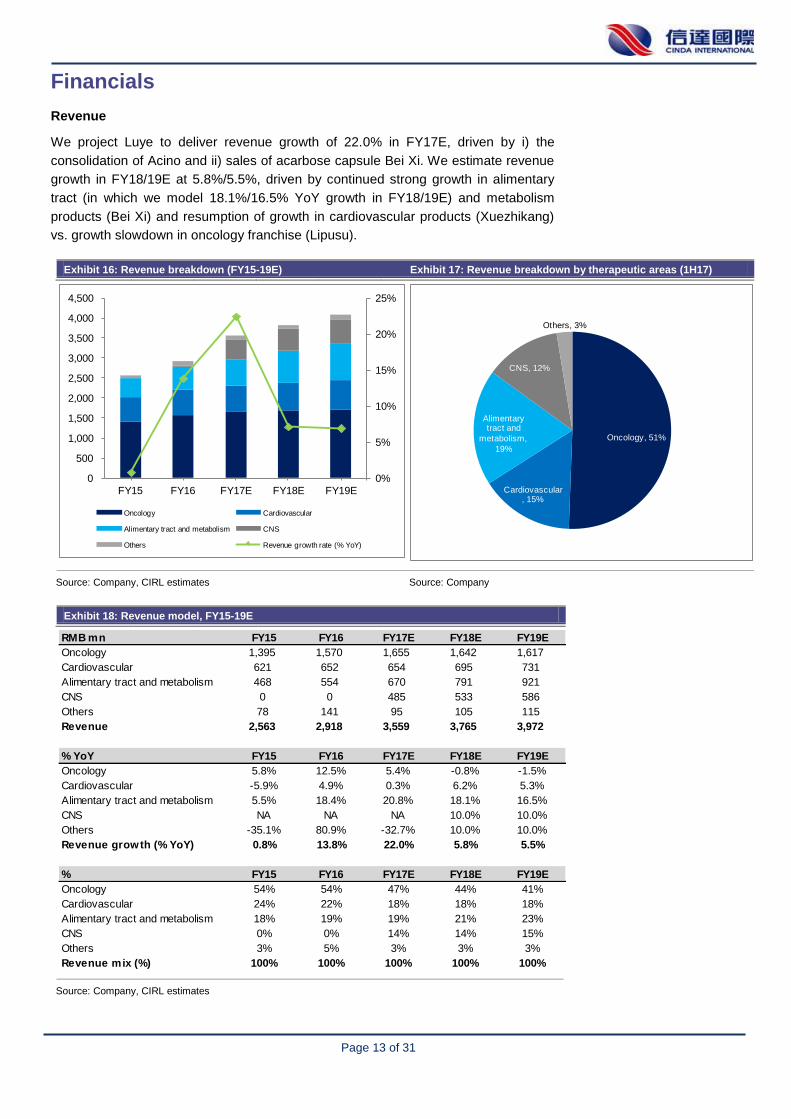
We project Luye to deliver revenue growth of 22.0% in FY17E, driven by i) the
consolidation of Acino and ii) sales of acarbose capsule Bei Xi. We estimate revenue
growth in FY18/19E at 5.8%/5.5%, driven by continued strong growth in alimentary
tract (in which we model 18.1%/16.5% YoY growth in FY18/19E) and metabolism
products (Bei Xi) and resumption of growth in cardiovascular products (Xuezhikang)
vs. growth slowdown in oncology franchise (Lipusu).
Exhibit 16: Revenue breakdown (FY15-19E) Exhibit 17: Revenue breakdown by therapeutic areas (1H17)
Source: Company, CIRL estimates Source: Company
Exhibit 18: Revenue model, FY15-19E
Source: Company, CIRL estimates
0%
5%
10%
15%
20%
25%
0
500
1,000
1,500
2,000
2,500
3,000
3,500
4,000
4,500
FY15 FY16 FY17E FY18E FY19E
Oncology Cardiovascular
Alimentary tract and metabolism CNS
Others Revenue growth rate (% YoY)
Oncology, 51%
Cardiovascular , 15%
Alimentary tract and
metabolism,
19%
CNS, 12%
Others, 3%
RMB mn FY15 FY16 FY17E FY18E FY19E
Oncology 1,395 1,570 1,655 1,642 1,617
Cardiovascular 621 652 654 695 731
Alimentary tract and metabolism 468 554 670 791 921
CNS 0 0 485 533 586
Others 78 141 95 105 115
Revenue 2,563 2,918 3,559 3,765 3,972
% YoY FY15 FY16 FY17E FY18E FY19E
Oncology 5.8% 12.5% 5.4% -0.8% -1.5%
Cardiovascular -5.9% 4.9% 0.3% 6.2% 5.3%
Alimentary tract and metabolism 5.5% 18.4% 20.8% 18.1% 16.5%
CNS NA NA NA 10.0% 10.0%
Others -35.1% 80.9% -32.7% 10.0% 10.0%
Revenue growth (% YoY) 0.8% 13.8% 22.0% 5.8% 5.5%
% FY15 FY16 FY17E FY18E FY19E
Oncology 54% 54% 47% 44% 41%
Cardiovascular 24% 22% 18% 18% 18%
Alimentary tract and metabolism 18% 19% 19% 21% 23%
CNS 0% 0% 14% 14% 15%
Others 3% 5% 3% 3% 3%
Revenue mix (%) 100% 100% 100% 100% 100%
Page 14 of 31
Margin analysis, SG&A ratio, R&D expenses
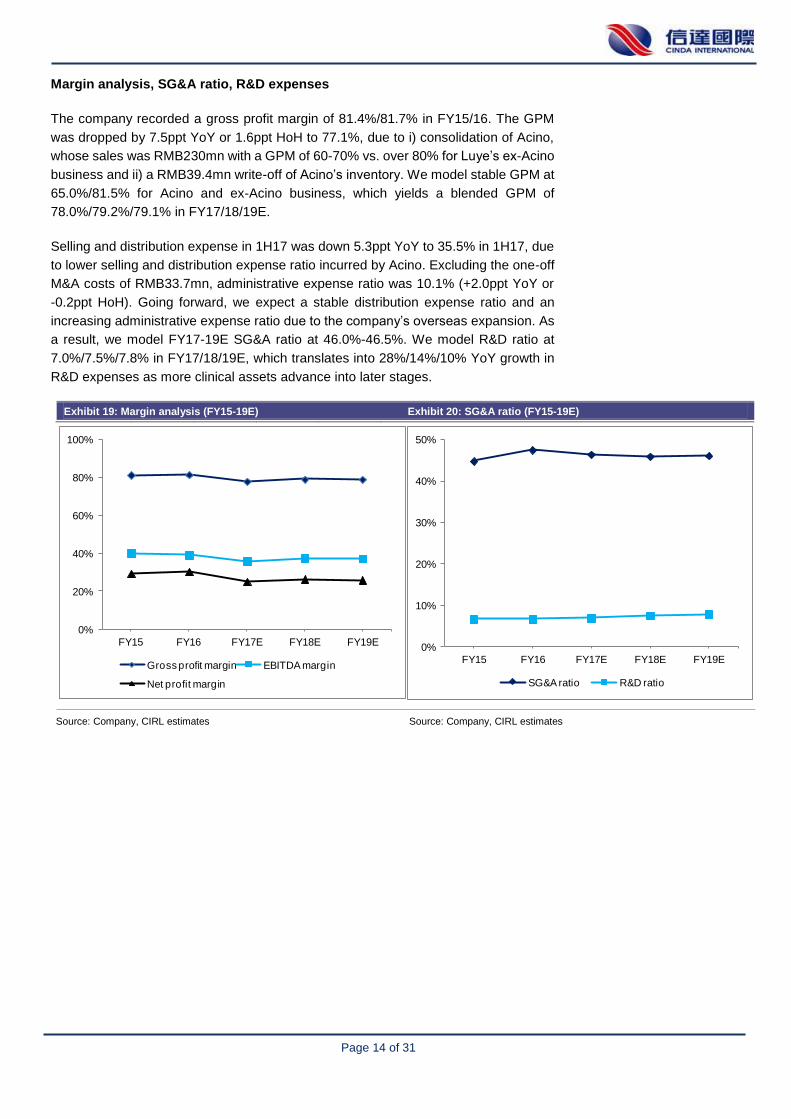
The company recorded a gross profit margin of 81.4%/81.7% in FY15/16. The GPM
was dropped by 7.5ppt YoY or 1.6ppt HoH to 77.1%, due to i) consolidation of Acino,
whose sales was RMB230mn with a GPM of 60-70% vs. over 80% for Luye’s ex-Acino
business and ii) a RMB39.4mn write-off of Acino’s inventory. We model stable GPM at
65.0%/81.5% for Acino and ex-Acino business, which yields a blended GPM of
78.0%/79.2%/79.1% in FY17/18/19E.
Selling and distribution expense in 1H17 was down 5.3ppt YoY to 35.5% in 1H17, due
to lower selling and distribution expense ratio incurred by Acino. Excluding the one-off
M&A costs of RMB33.7mn, administrative expense ratio was 10.1% (+2.0ppt YoY or
-0.2ppt HoH). Going forward, we expect a stable distribution expense ratio and an
increasing administrative expense ratio due to the company’s overseas expansion. As
a result, we model FY17-19E SG&A ratio at 46.0%-46.5%. We model R&D ratio at
7.0%/7.5%/7.8% in FY17/18/19E, which translates into 28%/14%/10% YoY growth in
R&D expenses as more clinical assets advance into later stages.
Exhibit 19: Margin analysis (FY15-19E) Exhibit 20: SG&A ratio (FY15-19E)
Exhibit 2:
Source: Company, CIRL estimates Source: Company, CIRL estimates
0%
20%
40%
60%
80%
100%
FY15 FY16 FY17E FY18E FY19E
Gross profit margin EBITDA margin
Net profit margin
0%
10%
20%
30%
40%
50%
FY15 FY16 FY17E FY18E FY19E
SG&A ratio R&D ratio
Page 15 of 31
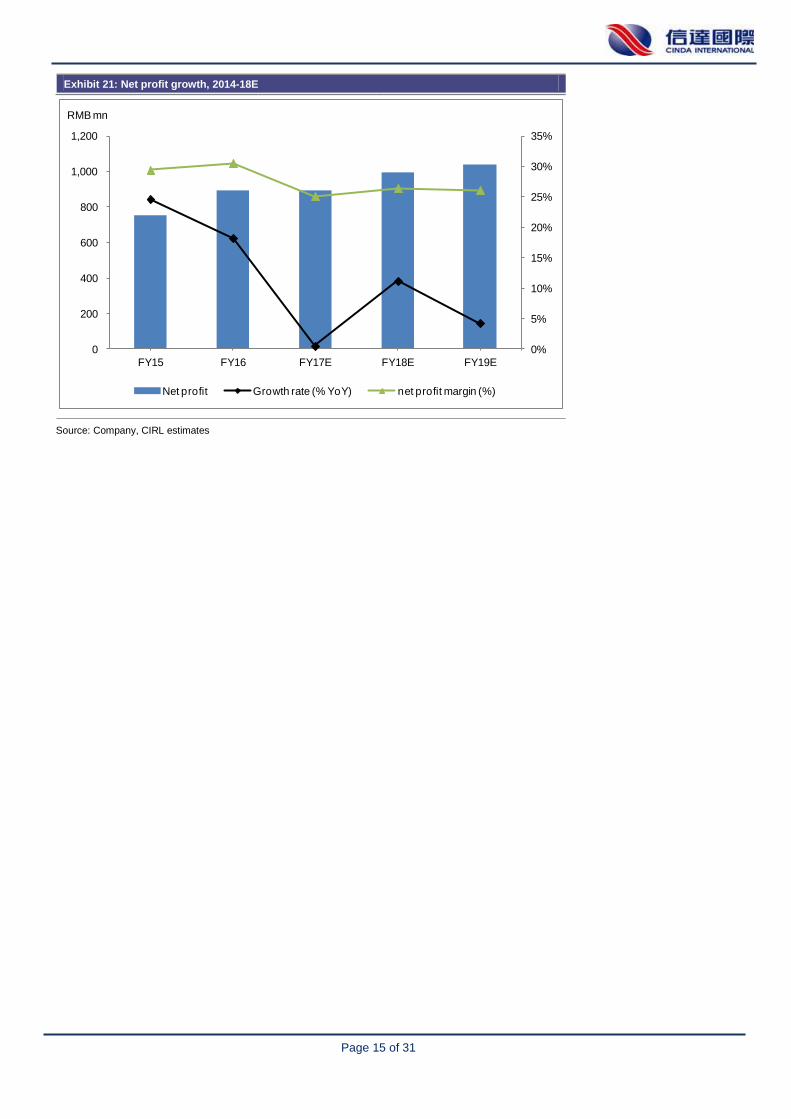
Exhibit 21: Net profit growth, 2014-18E
Source: Company, CIRL estimates
0%
5%
10%
15%
20%
25%
30%
35%
0
200
400
600
800
1,000
1,200
FY15 FY16 FY17E FY18E FY19E
RMB mn
Net profit Growth rate (% YoY) net profit margin (%)
Page 16 of 31
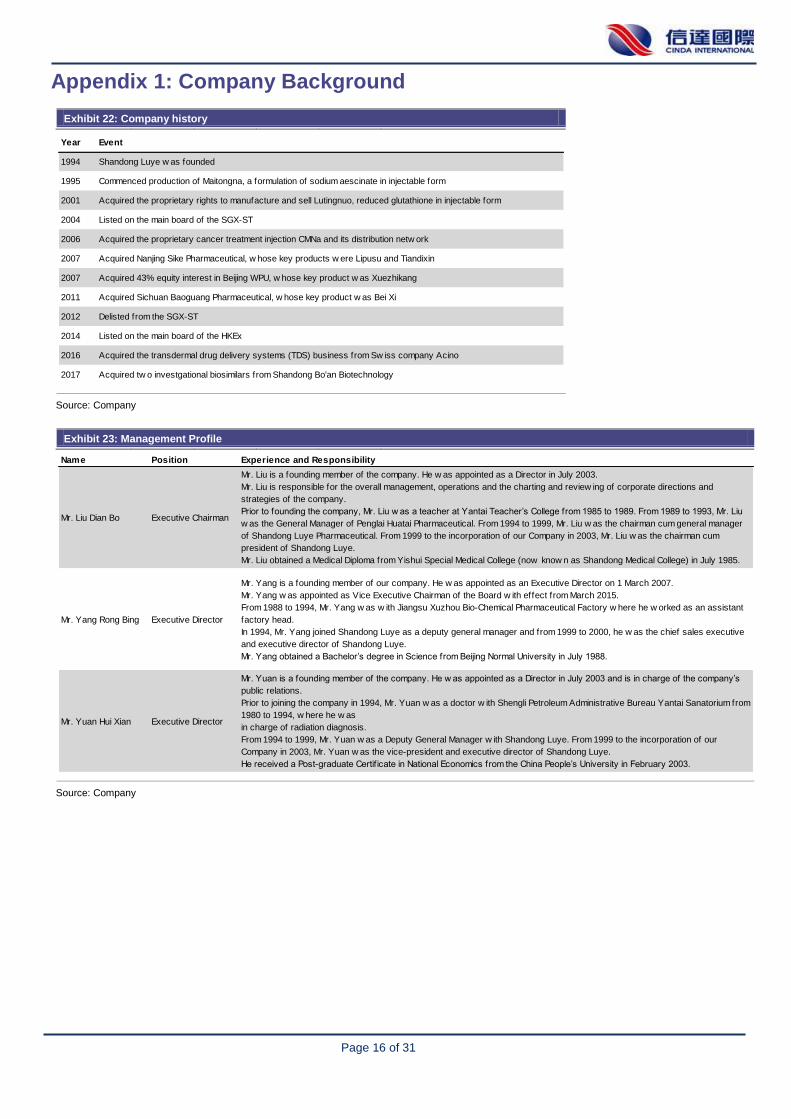
Appendix 1: Company Background
Exhibit 22: Company history
Source: Company
Exhibit 23: Management Profile
Source: Company
Year Event
1994 Shandong Luye w as founded
1995 Commenced production of Maitongna, a formulation of sodium aescinate in injectable form
2001 Acquired the proprietary rights to manufacture and sell Lutingnuo, reduced glutathione in injectable form
2004 Listed on the main board of the SGX-ST
2006 Acquired the proprietary cancer treatment injection CMNa and its distribution netw ork
2007 Acquired Nanjing Sike Pharmaceutical, w hose key products w ere Lipusu and Tiandixin
2007 Acquired 43% equity interest in Beijing WPU, w hose key product w as Xuezhikang
2011 Acquired Sichuan Baoguang Pharmaceutical, w hose key product w as Bei Xi
2012 Delisted from the SGX-ST
2014 Listed on the main board of the HKEx
2016 Acquired the transdermal drug delivery systems (TDS) business from Sw iss company Acino
2017 Acquired tw o investgational biosimilars from Shandong Bo'an Biotechnology
Name Position Experience and Responsibility
Mr. Liu Dian Bo Executive Chairman
Mr. Liu is a founding member of the company. He w as appointed as a Director in July 2003.
Mr. Liu is responsible for the overall management, operations and the charting and review ing of corporate directions and
strategies of the company.
Prior to founding the company, Mr. Liu w as a teacher at Yantai Teacher’s College from 1985 to 1989. From 1989 to 1993, Mr. Liu
w as the General Manager of Penglai Huatai Pharmaceutical. From 1994 to 1999, Mr. Liu w as the chairman cum general manager
of Shandong Luye Pharmaceutical. From 1999 to the incorporation of our Company in 2003, Mr. Liu w as the chairman cum
president of Shandong Luye.
Mr. Liu obtained a Medical Diploma from Yishui Special Medical College (now know n as Shandong Medical College) in July 1985.
Mr. Yang Rong Bing Executive Director
Mr. Yang is a founding member of our company. He w as appointed as an Executive Director on 1 March 2007.
Mr. Yang w as appointed as Vice Executive Chairman of the Board w ith effect from March 2015.
From 1988 to 1994, Mr. Yang w as w ith Jiangsu Xuzhou Bio-Chemical Pharmaceutical Factory w here he w orked as an assistant
factory head.
In 1994, Mr. Yang joined Shandong Luye as a deputy general manager and from 1999 to 2000, he w as the chief sales executive
and executive director of Shandong Luye.
Mr. Yang obtained a Bachelor’s degree in Science from Beijing Normal University in July 1988.
Mr. Yuan Hui Xian Executive Director
Mr. Yuan is a founding member of the company. He w as appointed as a Director in July 2003 and is in charge of the company’s
public relations.
Prior to joining the company in 1994, Mr. Yuan w as a doctor w ith Shengli Petroleum Administrative Bureau Yantai Sanatorium from
1980 to 1994, w here he w as
in charge of radiation diagnosis.
From 1994 to 1999, Mr. Yuan w as a Deputy General Manager w ith Shandong Luye. From 1999 to the incorporation of our
Company in 2003, Mr. Yuan w as the vice-president and executive director of Shandong Luye.
He received a Post-graduate Certif icate in National Economics from the China People’s University in February 2003.
Page 17 of 31
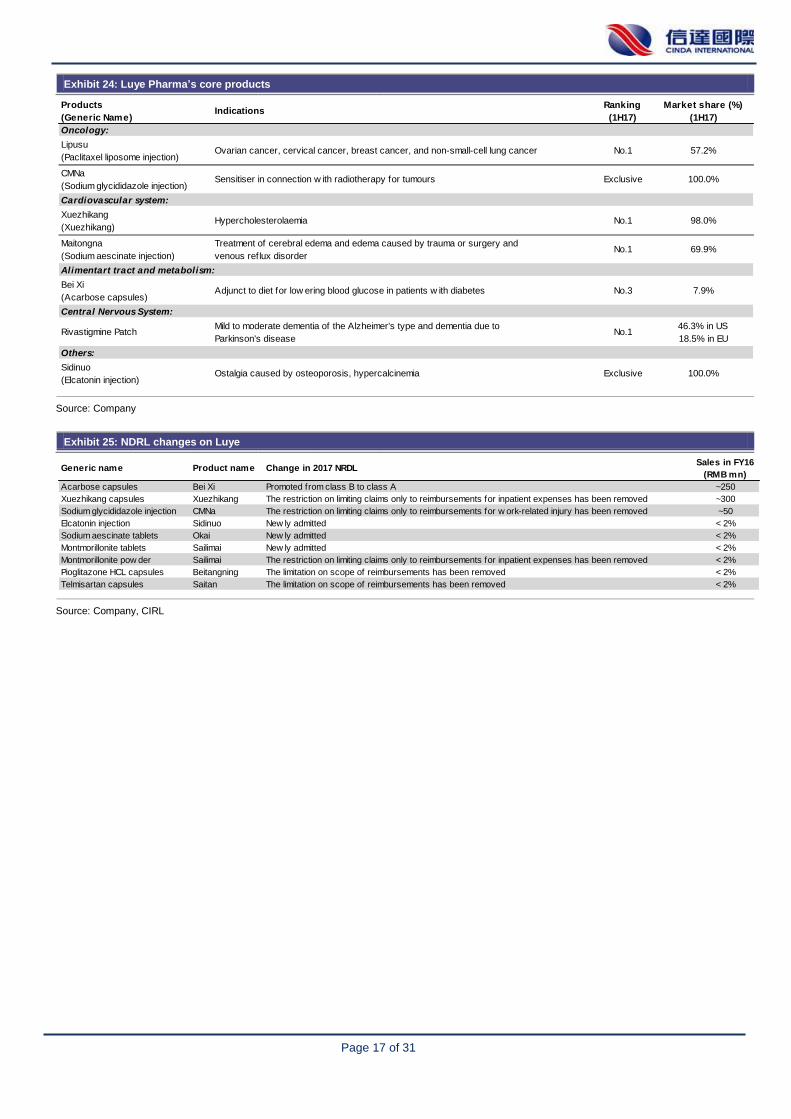
Exhibit 24: Luye Pharma’s core products
Source: Company
Exhibit 25: NDRL changes on Luye
Source: Company, CIRL
Products
(Generic Name)Indications
Ranking
(1H17)
Market share (%)
(1H17)
Oncology:
Lipusu
(Paclitaxel liposome injection)Ovarian cancer, cervical cancer, breast cancer, and non-small-cell lung cancer No.1 57.2%
CMNa
(Sodium glycididazole injection)Sensitiser in connection w ith radiotherapy for tumours Exclusive 100.0%
Cardiovascular system:
Xuezhikang
(Xuezhikang)Hypercholesterolaemia No.1 98.0%
Maitongna
(Sodium aescinate injection)
Treatment of cerebral edema and edema caused by trauma or surgery and
venous reflux disorderNo.1 69.9%
Alimentart tract and metabolism:
Bei Xi
(Acarbose capsules)Adjunct to diet for low ering blood glucose in patients w ith diabetes No.3 7.9%
Central Nervous System:
Rivastigmine PatchMild to moderate dementia of the Alzheimer's type and dementia due to
Parkinson's diseaseNo.1
46.3% in US
18.5% in EU
Others:
Sidinuo
(Elcatonin injection)Ostalgia caused by osteoporosis, hypercalcinemia Exclusive 100.0%
Generic name Product name Change in 2017 NRDLSales in FY16
(RMB mn)
Acarbose capsules Bei Xi Promoted from class B to class A ~250
Xuezhikang capsules Xuezhikang The restriction on limiting claims only to reimbursements for inpatient expenses has been removed ~300
Sodium glycididazole injection CMNa The restriction on limiting claims only to reimbursements for w ork-related injury has been removed ~50
Elcatonin injection Sidinuo New ly admitted < 2%
Sodium aescinate tablets Okai New ly admitted < 2%
Montmorillonite tablets Sailimai New ly admitted < 2%
Montmorillonite pow der Sailimai The restriction on limiting claims only to reimbursements for inpatient expenses has been removed < 2%
Pioglitazone HCL capsules Beitangning The limitation on scope of reimbursements has been removed < 2%
Telmisartan capsules Saitan The limitation on scope of reimbursements has been removed < 2%
Page 18 of 31
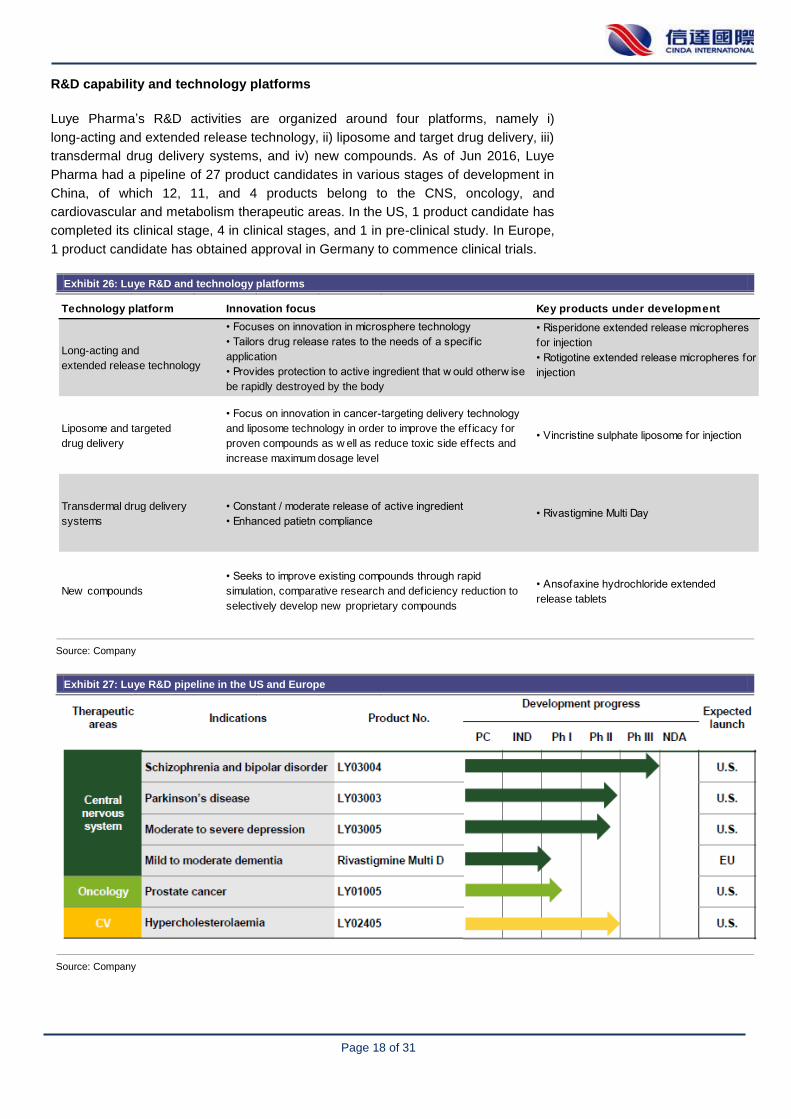
R&D capability and technology platforms
Luye Pharma’s R&D activities are organized around four platforms, namely i)
long-acting and extended release technology, ii) liposome and target drug delivery, iii)
transdermal drug delivery systems, and iv) new compounds. As of Jun 2016, Luye
Pharma had a pipeline of 27 product candidates in various stages of development in
China, of which 12, 11, and 4 products belong to the CNS, oncology, and
cardiovascular and metabolism therapeutic areas. In the US, 1 product candidate has
completed its clinical stage, 4 in clinical stages, and 1 in pre-clinical study. In Europe,
1 product candidate has obtained approval in Germany to commence clinical trials.
Exhibit 26: Luye R&D and technology platforms
Source: Company
Exhibit 27: Luye R&D pipeline in the US and Europe
Source: Company
Technology platform Innovation focus Key products under development
Long-acting and
extended release technology
• Focuses on innovation in microsphere technology
• Tailors drug release rates to the needs of a specif ic
application
• Provides protection to active ingredient that w ould otherw ise
be rapidly destroyed by the body
• Reduces the frequency of administration
• Risperidone extended release micropheres
for injection
• Rotigotine extended release micropheres for
injection
Liposome and targeted
drug delivery
• Focus on innovation in cancer-targeting delivery technology
and liposome technology in order to improve the eff icacy for
proven compounds as w ell as reduce toxic side effects and
increase maximum dosage level
• Vincristine sulphate liposome for injection
Transdermal drug delivery
systems
• Constant / moderate release of active ingredient
• Enhanced patietn compliance• Rivastigmine Multi Day
New compounds
• Seeks to improve existing compounds through rapid
simulation, comparative research and deficiency reduction to
selectively develop new proprietary compounds
• Ansofaxine hydrochloride extended
release tablets
Page 19 of 31
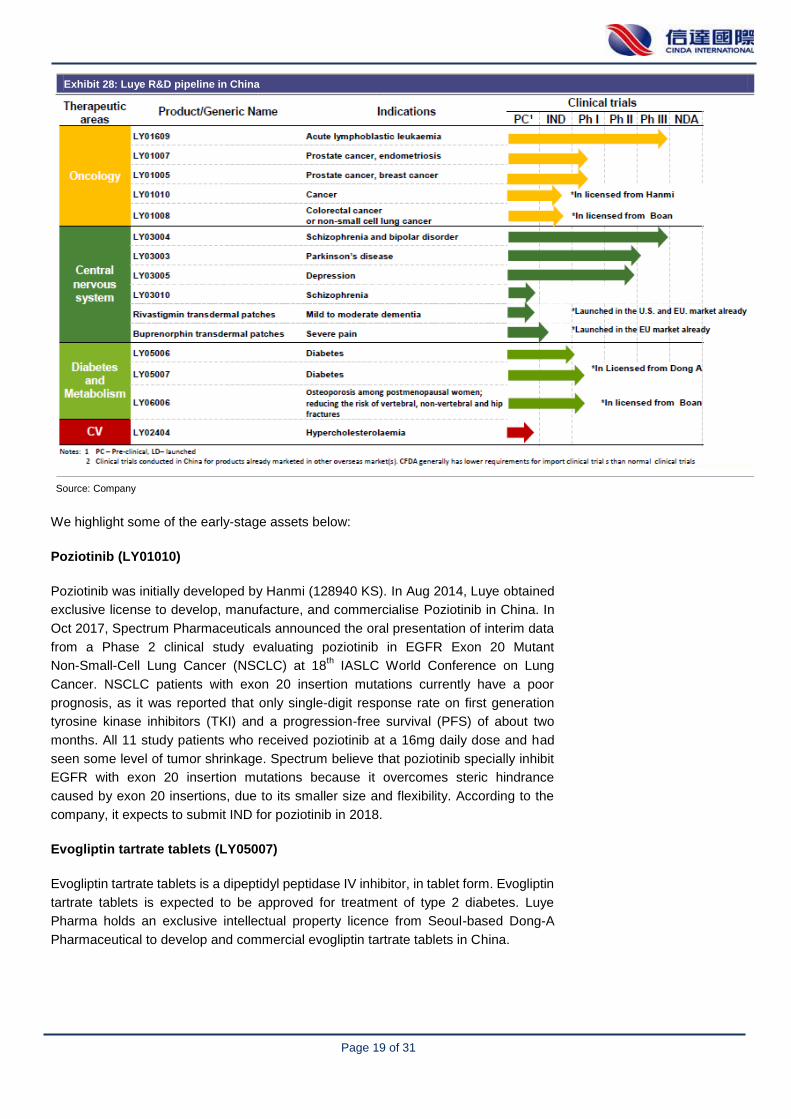
Exhibit 28: Luye R&D pipeline in China
Source: Company
We highlight some of the early-stage assets below:
Poziotinib (LY01010)
Poziotinib was initially developed by Hanmi (128940 KS). In Aug 2014, Luye obtained
exclusive license to develop, manufacture, and commercialise Poziotinib in China. In
Oct 2017, Spectrum Pharmaceuticals announced the oral presentation of interim data
from a Phase 2 clinical study evaluating poziotinib in EGFR Exon 20 Mutant
Non-Small-Cell Lung Cancer (NSCLC) at 18th IASLC World Conference on Lung
Cancer. NSCLC patients with exon 20 insertion mutations currently have a poor
prognosis, as it was reported that only single-digit response rate on first generation
tyrosine kinase inhibitors (TKI) and a progression-free survival (PFS) of about two
months. All 11 study patients who received poziotinib at a 16mg daily dose and had
seen some level of tumor shrinkage. Spectrum believe that poziotinib specially inhibit
EGFR with exon 20 insertion mutations because it overcomes steric hindrance
caused by exon 20 insertions, due to its smaller size and flexibility. According to the
company, it expects to submit IND for poziotinib in 2018.
Evogliptin tartrate tablets (LY05007)
Evogliptin tartrate tablets is a dipeptidyl peptidase IV inhibitor, in tablet form. Evogliptin
tartrate tablets is expected to be approved for treatment of type 2 diabetes. Luye
Pharma holds an exclusive intellectual property licence from Seoul-based Dong-A
Pharmaceutical to develop and commercial evogliptin tartrate tablets in China.
Page 20 of 31
Levetiracetam extended release tablet
In Sep 2011, Luye Pharma obtained an exclusive agency and distribution rights from
Lotus Pharma (1795 TT) to sell levetiracetam extended release tablet in PRC.
Levetiracetam extended release tablet is applicable to epilepsy patients who are over
sixteen as an adjunctive therapy for their partial seizures. In Oct 2011, Lotus Pharma
obtained regulatory approval for launching levetiracetam extended release tablet in
Taiwan. Currently, no products of levetiracetam extended release tablet have been
launched in China.
According to ‘‘Clinical Practice Guidelines: Epilepsy Volume’’ (2007), the lifetime
prevalence of epilepsy is between 0.4% and 0.7% in China. Active epilepsy
prevalence is 0.46% with an annual incidence rate of approximately 30 per 100,000
patients. Accordingly, there are approximately 6 million active epilepsy patients in
China with approximately 0.4 million new epilepsy patients each year. According to
IMS Health Incorporated, the market size for epilepsy treatment products in China was
approximately RMB1.8 billion in 2014, and grew at a compound annual growth rate of
24.5% from 2011 to 2014.
Page 21 of 31
Appendix 2: The global CNS market
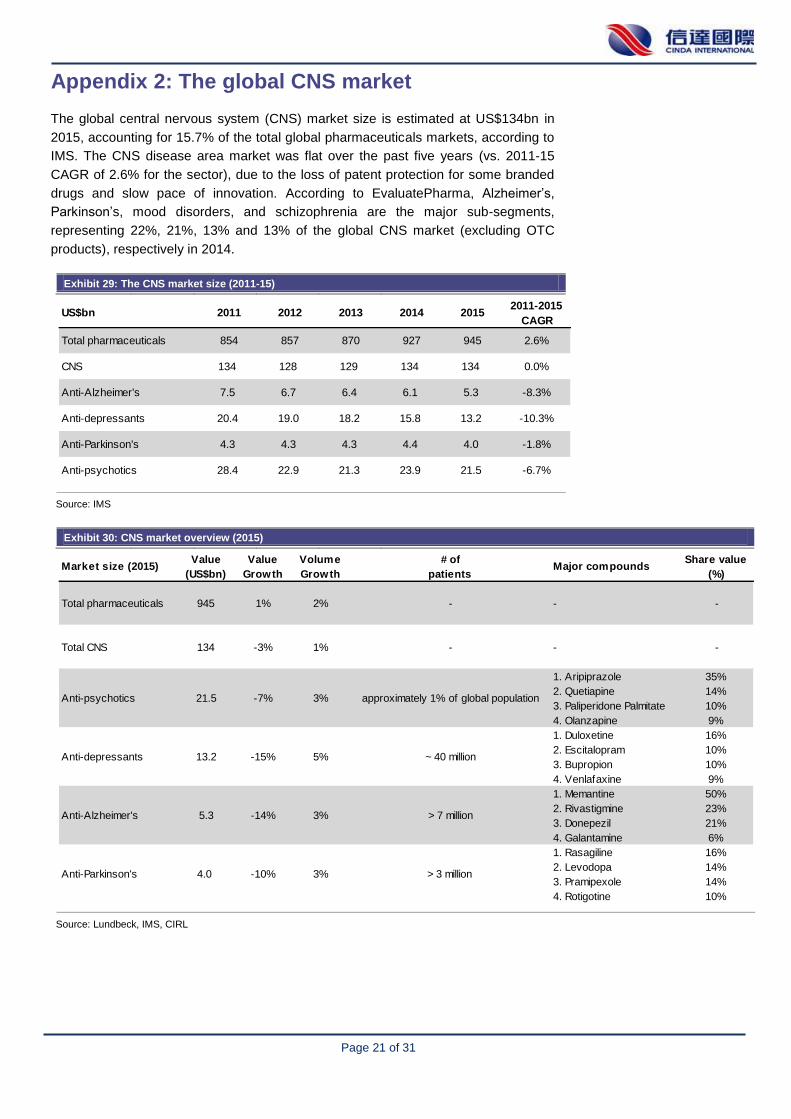
The global central nervous system (CNS) market size is estimated at US$134bn in
2015, accounting for 15.7% of the total global pharmaceuticals markets, according to
IMS. The CNS disease area market was flat over the past five years (vs. 2011-15
CAGR of 2.6% for the sector), due to the loss of patent protection for some branded
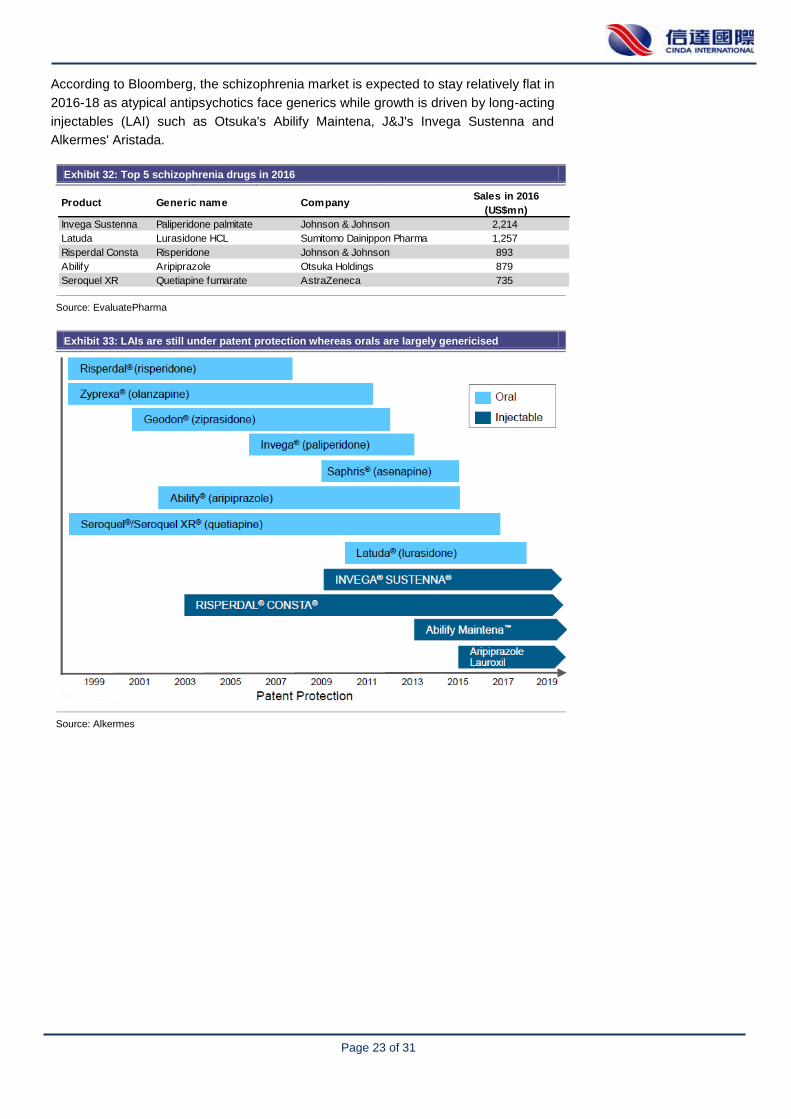
drugs and slow pace of innovation. According to EvaluatePharma, Alzheimer’s,
Parkinson’s, mood disorders, and schizophrenia are the major sub-segments,
representing 22%, 21%, 13% and 13% of the global CNS market (excluding OTC
products), respectively in 2014.
Exhibit 29: The CNS market size (2011-15)
Source: IMS
Exhibit 30: CNS market overview (2015)
Exhibit 3:
Source: Lundbeck, IMS, CIRL
US$bn 2011 2012 2013 2014 20152011-2015
CAGR
Total pharmaceuticals 854 857 870 927 945 2.6%
CNS 134 128 129 134 134 0.0%
Anti-Alzheimer's 7.5 6.7 6.4 6.1 5.3 -8.3%
Anti-depressants 20.4 19.0 18.2 15.8 13.2 -10.3%
Anti-Parkinson's 4.3 4.3 4.3 4.4 4.0 -1.8%
Anti-psychotics 28.4 22.9 21.3 23.9 21.5 -6.7%
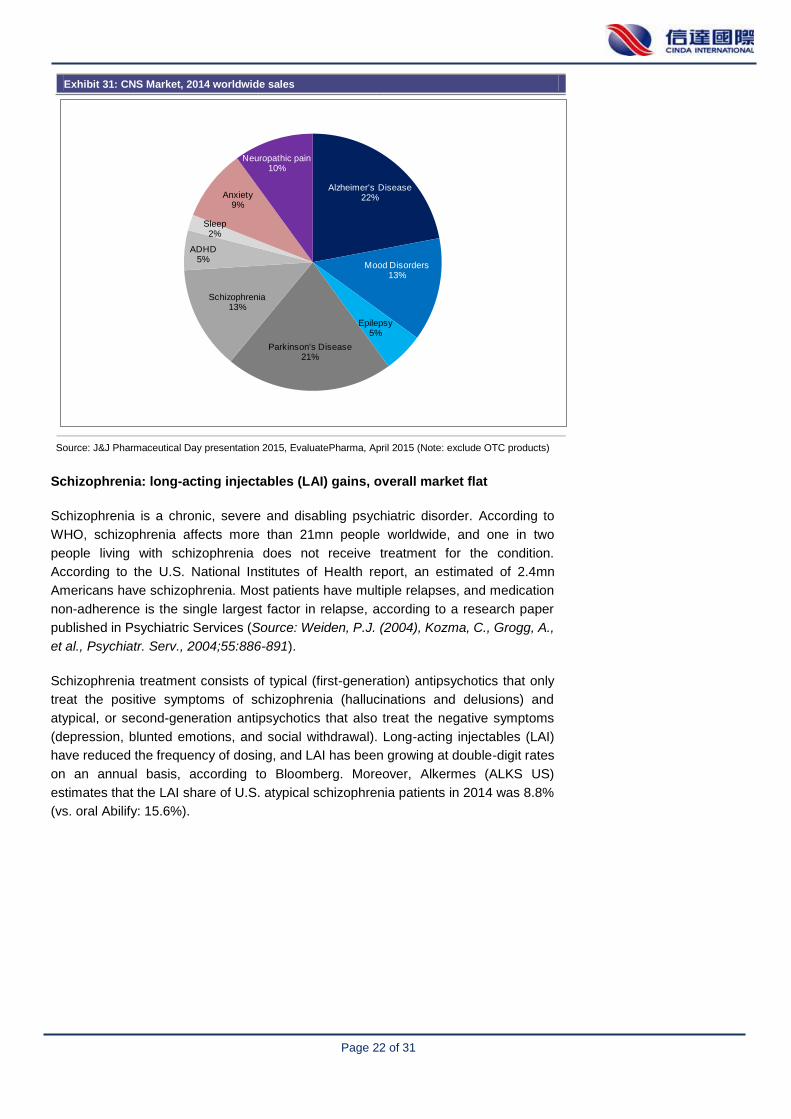
Market size (2015)Value
(US$bn)
Value
Growth
Volume
Growth
# of
patientsMajor compounds
Share value
(%)
Total pharmaceuticals 945 1% 2% - - -
Total CNS 134 -3% 1% - - -
Anti-psychotics 21.5 -7% 3% approximately 1% of global population
1. Aripiprazole
2. Quetiapine
3. Paliperidone Palmitate
4. Olanzapine
35%
14%
10%
9%
Anti-depressants 13.2 -15% 5% ~ 40 million
1. Duloxetine
2. Escitalopram
3. Bupropion
4. Venlafaxine
16%
10%
10%
9%
Anti-Alzheimer's 5.3 -14% 3% > 7 million
1. Memantine
2. Rivastigmine
3. Donepezil
4. Galantamine
50%
23%
21%
6%
Anti-Parkinson's 4.0 -10% 3% > 3 million
1. Rasagiline
2. Levodopa
3. Pramipexole
4. Rotigotine
16%
14%
14%
10%
Page 22 of 31
Exhibit 31: CNS Market, 2014 worldwide sales
Source: J&J Pharmaceutical Day presentation 2015, EvaluatePharma, April 2015 (Note: exclude OTC products)
Schizophrenia: long-acting injectables (LAI) gains, overall market flat
Schizophrenia is a chronic, severe and disabling psychiatric disorder. According to
WHO, schizophrenia affects more than 21mn people worldwide, and one in two
people living with schizophrenia does not receive treatment for the condition.
According to the U.S. National Institutes of Health report, an estimated of 2.4mn
Americans have schizophrenia. Most patients have multiple relapses, and medication
non-adherence is the single largest factor in relapse, according to a research paper
published in Psychiatric Services (Source: Weiden, P.J. (2004), Kozma, C., Grogg, A.,
et al., Psychiatr. Serv., 2004;55:886-891).
Schizophrenia treatment consists of typical (first-generation) antipsychotics that only
treat the positive symptoms of schizophrenia (hallucinations and delusions) and
atypical, or second-generation antipsychotics that also treat the negative symptoms
(depression, blunted emotions, and social withdrawal). Long-acting injectables (LAI)
have reduced the frequency of dosing, and LAI has been growing at double-digit rates
on an annual basis, according to Bloomberg. Moreover, Alkermes (ALKS US)
estimates that the LAI share of U.S. atypical schizophrenia patients in 2014 was 8.8%
(vs. oral Abilify: 15.6%).
Alzheimer's Disease22%
Mood Disorders13%
Epilepsy5%
Parkinson's Disease21%
Schizophrenia13%
ADHD5%
Sleep2%
Anxiety9%
Neuropathic pain10%
Page 23 of 31
According to Bloomberg, the schizophrenia market is expected to stay relatively flat in
2016-18 as atypical antipsychotics face generics while growth is driven by long-acting
injectables (LAI) such as Otsuka's Abilify Maintena, J&J's Invega Sustenna and
Alkermes' Aristada.
Exhibit 32: Top 5 schizophrenia drugs in 2016
Source: EvaluatePharma
Exhibit 33: LAIs are still under patent protection whereas orals are largely genericised
Source: Alkermes
Product Generic name CompanySales in 2016
(US$mn)
Invega Sustenna Paliperidone palmitate Johnson & Johnson 2,214
Latuda Lurasidone HCL Sumitomo Dainippon Pharma 1,257
Risperdal Consta Risperidone Johnson & Johnson 893
Abilify Aripiprazole Otsuka Holdings 879
Seroquel XR Quetiapine fumarate AstraZeneca 735
Page 24 of 31
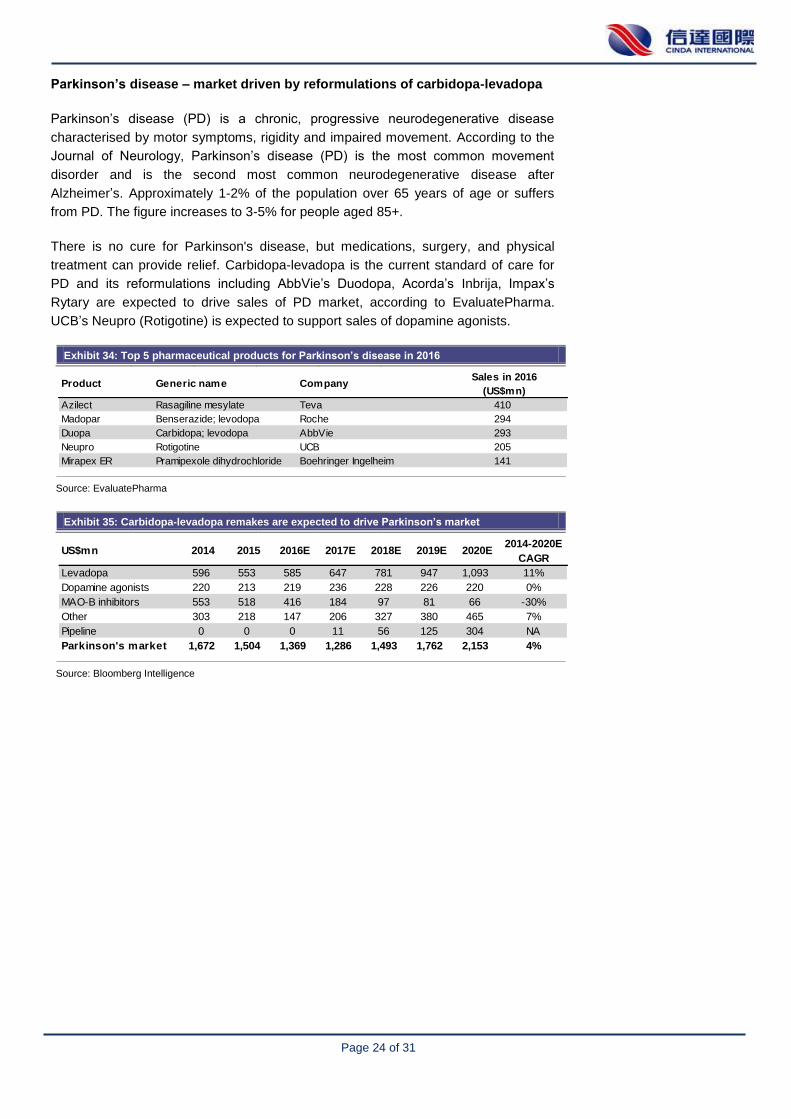
Parkinson’s disease – market driven by reformulations of carbidopa-levadopa
Parkinson’s disease (PD) is a chronic, progressive neurodegenerative disease
characterised by motor symptoms, rigidity and impaired movement. According to the
Journal of Neurology, Parkinson’s disease (PD) is the most common movement
disorder and is the second most common neurodegenerative disease after
Alzheimer’s. Approximately 1-2% of the population over 65 years of age or suffers
from PD. The figure increases to 3-5% for people aged 85+.
There is no cure for Parkinson's disease, but medications, surgery, and physical
treatment can provide relief. Carbidopa-levadopa is the current standard of care for
PD and its reformulations including AbbVie’s Duodopa, Acorda’s Inbrija, Impax’s
Rytary are expected to drive sales of PD market, according to EvaluatePharma.
UCB’s Neupro (Rotigotine) is expected to support sales of dopamine agonists.
Exhibit 34: Top 5 pharmaceutical products for Parkinson’s disease in 2016
Source: EvaluatePharma
Exhibit 35: Carbidopa-levadopa remakes are expected to drive Parkinson’s market
Source: Bloomberg Intelligence
Product Generic name CompanySales in 2016
(US$mn)
Azilect Rasagiline mesylate Teva 410
Madopar Benserazide; levodopa Roche 294
Duopa Carbidopa; levodopa AbbVie 293
Neupro Rotigotine UCB 205
Mirapex ER Pramipexole dihydrochloride Boehringer Ingelheim 141
US$mn 2014 2015 2016E 2017E 2018E 2019E 2020E2014-2020E
CAGR
Levadopa 596 553 585 647 781 947 1,093 11%
Dopamine agonists 220 213 219 236 228 226 220 0%
MAO-B inhibitors 553 518 416 184 97 81 66 -30%
Other 303 218 147 206 327 380 465 7%
Pipeline 0 0 0 11 56 125 304 NA
Parkinson's market 1,672 1,504 1,369 1,286 1,493 1,762 2,153 4%
Page 25 of 31
Alzheimer’s – a symptomatic drug market of ~US$5bn
Alzheimer’s is the most common cause of dementia, which is one of the major causes
of disability and dependency among older people. According to WHO, around 48
million people have dementia worldwide and there are 7.7 million new cases every
year.
Current treatments for Alzheimer’s are symptomatic only. Acetylcholinesterase
inhibitors (AChEIs) such as Eisai/Pfizer’s Aricept and Novartis’ Exelon and memantine
are the most currently available drug therapies. Competition from generics has eroded
sales of cholinesterase inhibitor class after their combined sales reached US$5.3bn in
2009, according to EvaluatePharma. Development-stage drugs such as Biogen’s
aducanumab, Merck’s verubecestat, and Eisai’s Elenbecestat are disease-modifying
therapies (DMT) and are expected to drive the Alzheimer’s market, according to
EvaluatePharma. Moreover, Decision Resources estimates that AChEIs will continue
to capture 70% total patient share across all AD subpopulation in 2023 as they will
remain the foundation of treatment, aided in part by “growing generic availability”.
Exhibit 36: Top 5 pharmaceutical products for Alzheimer’s disease in 2016
Source: EvaluatePharma
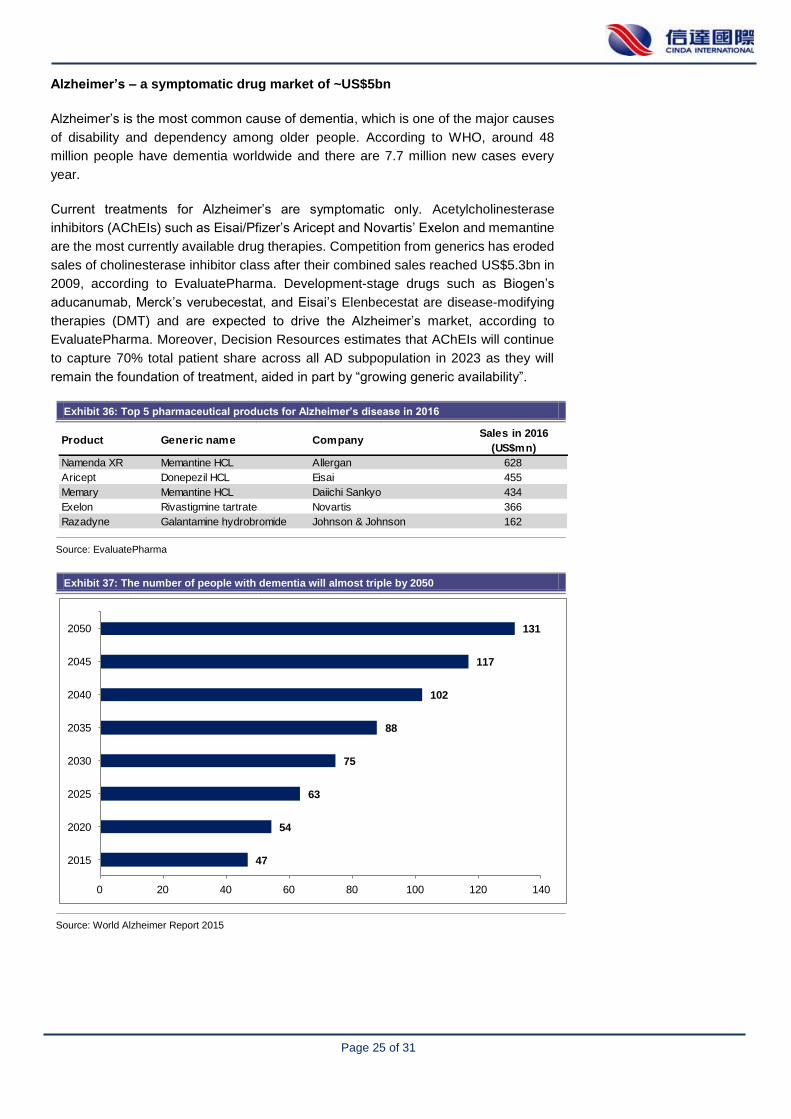
Exhibit 37: The number of people with dementia will almost triple by 2050
Source: World Alzheimer Report 2015
Product Generic name CompanySales in 2016
(US$mn)
Namenda XR Memantine HCL Allergan 628
Aricept Donepezil HCL Eisai 455
Memary Memantine HCL Daiichi Sankyo 434
Exelon Rivastigmine tartrate Novartis 366
Razadyne Galantamine hydrobromide Johnson & Johnson 162
47
54
63
75
88
102
117
131
0 20 40 60 80 100 120 140
2015
2020
2025
2030
2035
2040
2045
2050
Page 26 of 31
Depression
Depression is a serious medical condition associated with symptoms including
cognitive impairment, melancholy, loss of energy, and suicidal thoughts. According to
WHO, there are around 400 million people of all age worldwide suffering from
depression.
Current approaches and unmet needs: Major classes of antidepressants include
selective serotonin reuptake inhibitors (SSRIs), serotonin-norepinephrine reuptake
inhibitors (SNRIs), norepinephrine and dopamine reuptake inhibitors (NDRIs), atypical
antidepressants, tricyclic antidepressants, and monoamine oxidase inhibitors (MAOIs).
The onset of effect with many antidepressants is 4 to 8 weeks and it is estimated that
c.30% of major depression patients fail multiple antidepressants and have treatment
resistant depression (source: Patient Prefer Adherence, 2012; 6: 369–388). As a
result, developing therapeutics with a faster onset of effect with high remission rates is
the main focus in clinical research.
Exhibit 38: Top 5 pharmaceutical products for depression in 2016
Source: EvaluatePharma
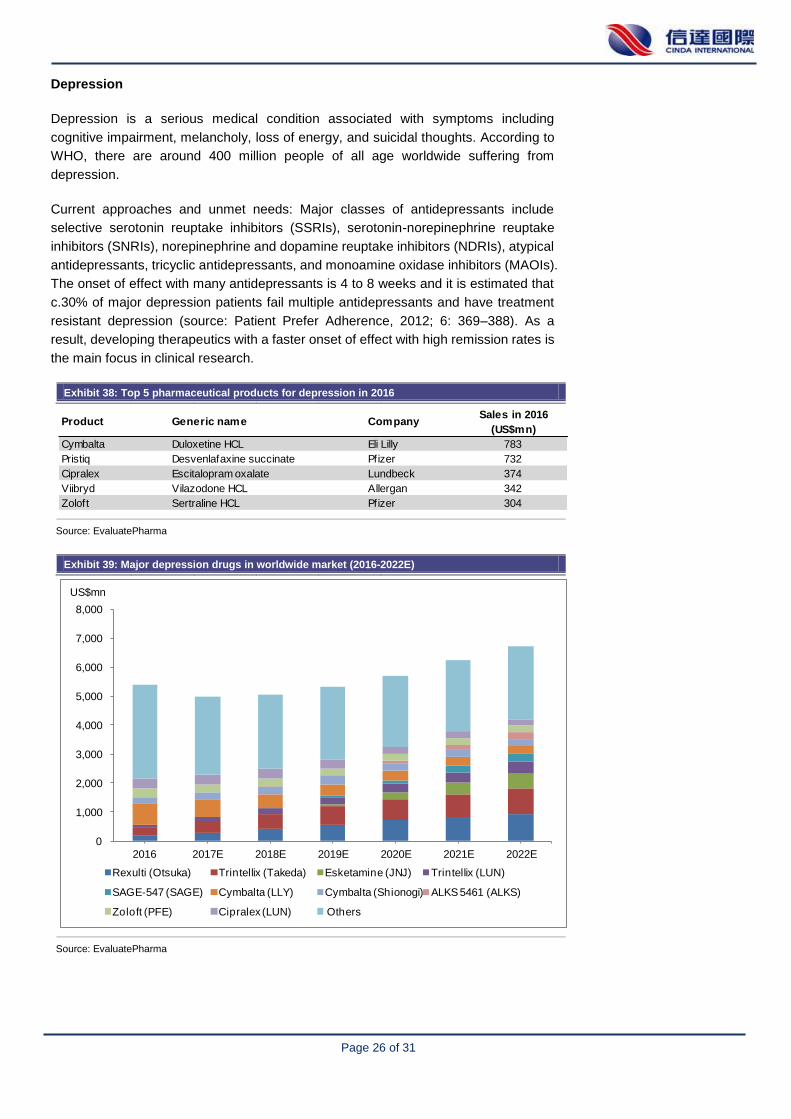
Exhibit 39: Major depression drugs in worldwide market (2016-2022E)
Source: EvaluatePharma
Product Generic name CompanySales in 2016
(US$mn)
Cymbalta Duloxetine HCL Eli Lilly 783
Pristiq Desvenlafaxine succinate Pfizer 732
Cipralex Escitalopram oxalate Lundbeck 374
Viibryd Vilazodone HCL Allergan 342
Zoloft Sertraline HCL Pfizer 304
0
1,000
2,000
3,000
4,000
5,000
6,000
7,000
8,000
2016 2017E 2018E 2019E 2020E 2021E 2022E
US$mn
Rexulti (Otsuka) Trintellix (Takeda) Esketamine (JNJ) Trintellix (LUN)
SAGE-547 (SAGE) Cymbalta (LLY) Cymbalta (Shionogi) ALKS 5461 (ALKS)
Zoloft (PFE) Cipralex (LUN) Others
Page 27 of 31
Appendix 3: 505(b)(2) pathway
The 505(b)(2) new drug application (NDA) is one of three US FDA drug approval
pathways. The pathway was created by the Hatch-Waxman Act of 1984, and 505(b)(2)
refers to a section of the Federal Food, Drug, and Comestic Act. This provision
expressly permits FDA to rely, for approval of an NDA, on data not developed by the
applicant.
The 505(b)(2) pathway can be viewed as a hybrid between a full NDA and an ANDA
(Abbreviated New Drug Application), with the following potential benefits: i) relatively
low risk due to previous drug approval, ii) lower costs and shorter development time
due to fewer studies, and iii) eligible for exclusivity protection (such as orphan drug
exclusivity for 7 years and new chemical entity exclusivity for 5 years).
Exhibit 40: FDA regulator pathways at a glance
Exhibit 4:
Source: FDA, Cinda
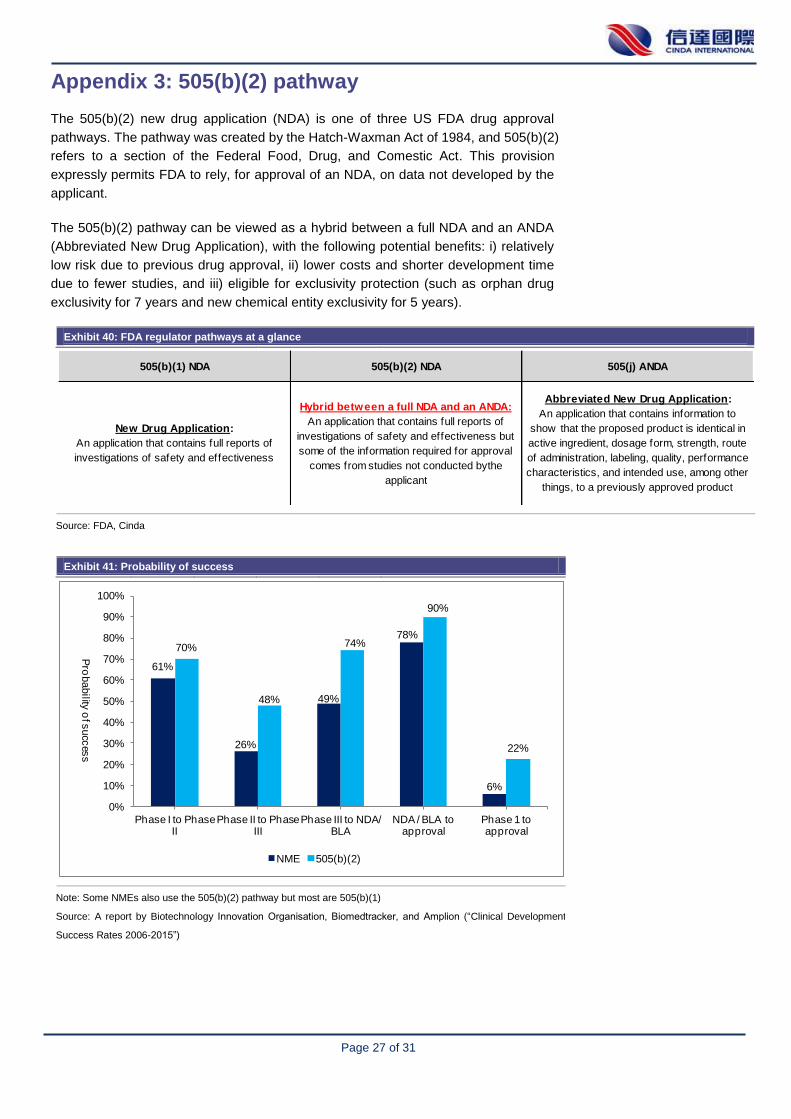
Exhibit 41: Probability of success
Note: Some NMEs also use the 505(b)(2) pathway but most are 505(b)(1)
Source: A report by Biotechnology Innovation Organisation, Biomedtracker, and Amplion (“Clinical Development
Success Rates 2006-2015”)
505(b)(1) NDA 505(b)(2) NDA 505(j) ANDA
New Drug Application:
An application that contains full reports of
investigations of safety and effectiveness
Hybrid between a full NDA and an ANDA:
An application that contains full reports of
investigations of safety and effectiveness but
some of the information required for approval
comes from studies not conducted bythe
applicant
Abbreviated New Drug Application:
An application that contains information to
show that the proposed product is identical in
active ingredient, dosage form, strength, route
of administration, labeling, quality, performance
characteristics, and intended use, among other
things, to a previously approved product
61%
26%
49%
78%
6%
70%
48%
74%
90%
22%
0%
10%
20%
30%
40%
50%
60%
70%
80%
90%
100%
Phase I to Phase II
Phase II to Phase III
Phase III to NDA/ BLA
NDA / BLA to approval
Phase 1 to approval
NME 505(b)(2)
Pro
bability
of s
ucc
ess
Page 28 of 31
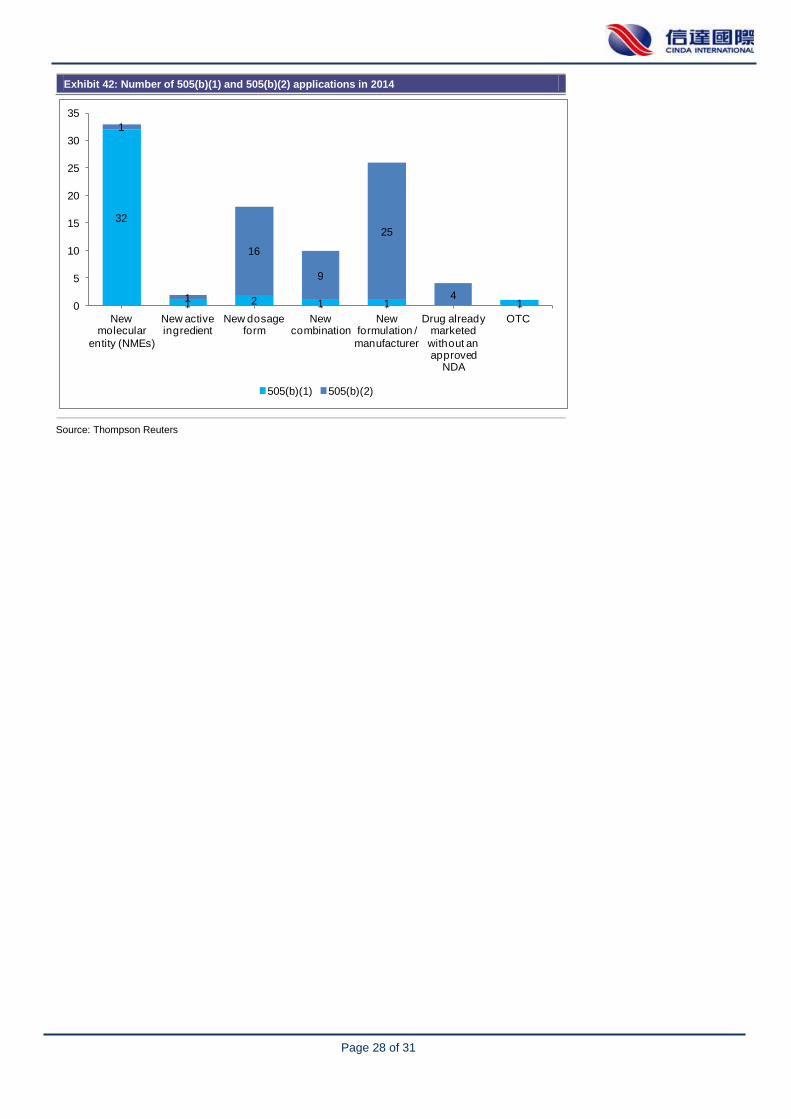
Exhibit 42: Number of 505(b)(1) and 505(b)(2) applications in 2014
Source: Thompson Reuters
32
1 2 1 1 1
1
1
16
9
25
40
5
10
15
20
25
30
35
New molecular
entity (NMEs)
New active ingredient
New dosage form
New combination
New formulation /
manufacturer
Drug already marketed
without an approved
NDA
OTC
505(b)(1) 505(b)(2)
Page 29 of 31
Risk Factors
Policy and competition risk on Lipusu
Lipusu accounted for c.45% of the company’s total revenue in 2015 and 2016,
respectively. There are two major concerns on the product’s sales: i) Lipusu is not
included in the new NDRL (National Reimbursement Drug List) as the company exited
the NRDL price negotiation in Jul 2017 and ii) increasing competition due to generic
Abraxane, which is expected to be launched in China in 2018. We have taken a more
conservative approach (vs. management and street consensus) in our forecast and
model. Higher than expected policy impact and competitions from Abraxane generics
may cause the company’s revenue and profitability to decline.
Pipeline risks
The long-term competitiveness hinges on a company’s pipeline and its ability to
develop and commercialise new biotechnology and other pharmaceutical products.
There are risks of failure to meet safety, efficacy or other standards during the R&D
process, or the failure to obtain necessary regulatory approvals, including CFDA and
FDA on time or at all. Competition risks and rapidly changing market demand would
make commercialisation efforts more complex and less certain.
Integration risks relating to recent M&As
There are integration risks that the company may not be able to integrate acquired
subsidiaries such as Acino to achieve expected synergies and to fulfill the purposes of
acquisitions.
Page 30 of 31
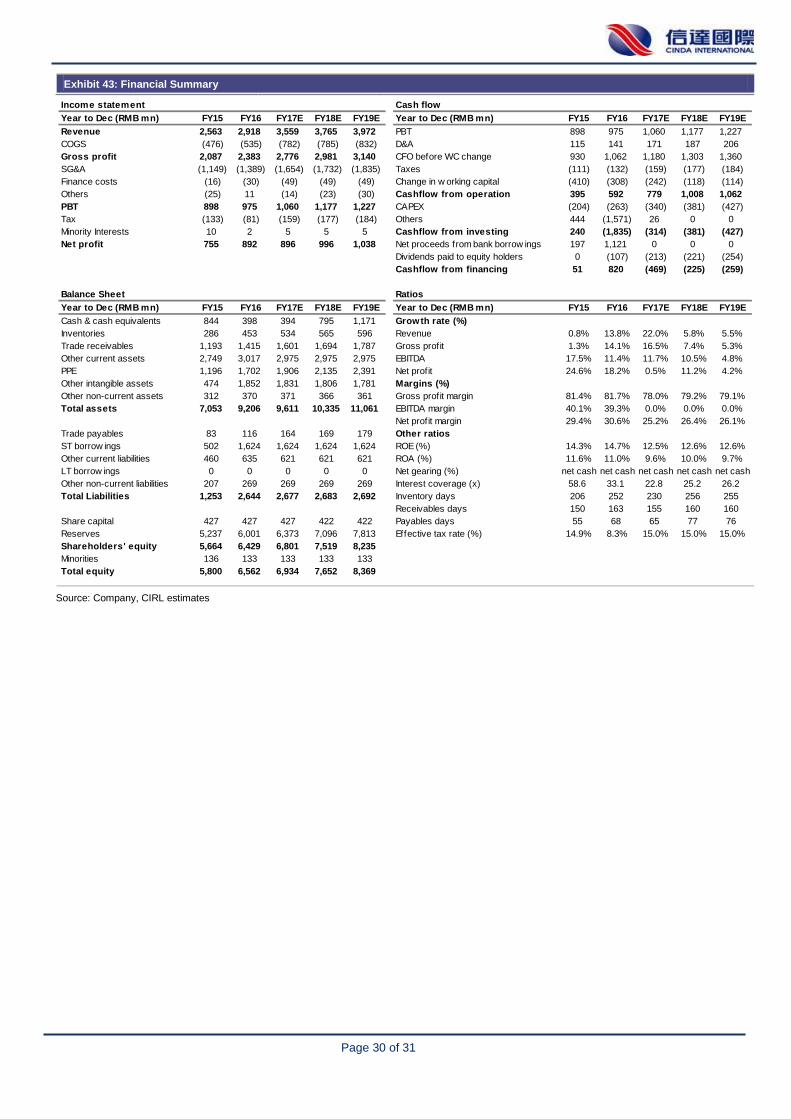
Exhibit 43: Financial Summary
Source: Company, CIRL estimates
Income statement Cash flow
Year to Dec (RMB mn) FY15 FY16 FY17E FY18E FY19E Year to Dec (RMB mn) FY15 FY16 FY17E FY18E FY19E
Revenue 2,563 2,918 3,559 3,765 3,972 PBT 898 975 1,060 1,177 1,227
COGS (476) (535) (782) (785) (832) D&A 115 141 171 187 206
Gross profit 2,087 2,383 2,776 2,981 3,140 CFO before WC change 930 1,062 1,180 1,303 1,360
SG&A (1,149) (1,389) (1,654) (1,732) (1,835) Taxes (111) (132) (159) (177) (184)
Finance costs (16) (30) (49) (49) (49) Change in w orking capital (410) (308) (242) (118) (114)
Others (25) 11 (14) (23) (30) Cashflow from operation 395 592 779 1,008 1,062
PBT 898 975 1,060 1,177 1,227 CAPEX (204) (263) (340) (381) (427)
Tax (133) (81) (159) (177) (184) Others 444 (1,571) 26 0 0
Minority Interests 10 2 5 5 5 Cashflow from investing 240 (1,835) (314) (381) (427)
Net profit 755 892 896 996 1,038 Net proceeds from bank borrow ings 197 1,121 0 0 0
Dividends paid to equity holders 0 (107) (213) (221) (254)
Cashflow from financing 51 820 (469) (225) (259)
Balance Sheet Ratios
Year to Dec (RMB mn) FY15 FY16 FY17E FY18E FY19E Year to Dec (RMB mn) FY15 FY16 FY17E FY18E FY19E
Cash & cash equivalents 844 398 394 795 1,171 Growth rate (%)
Inventories 286 453 534 565 596 Revenue 0.8% 13.8% 22.0% 5.8% 5.5%
Trade receivables 1,193 1,415 1,601 1,694 1,787 Gross profit 1.3% 14.1% 16.5% 7.4% 5.3%
Other current assets 2,749 3,017 2,975 2,975 2,975 EBITDA 17.5% 11.4% 11.7% 10.5% 4.8%
PPE 1,196 1,702 1,906 2,135 2,391 Net profit 24.6% 18.2% 0.5% 11.2% 4.2%
Other intangible assets 474 1,852 1,831 1,806 1,781 Margins (%)
Other non-current assets 312 370 371 366 361 Gross profit margin 81.4% 81.7% 78.0% 79.2% 79.1%
Total assets 7,053 9,206 9,611 10,335 11,061 EBITDA margin 40.1% 39.3% 0.0% 0.0% 0.0%
Net profit margin 29.4% 30.6% 25.2% 26.4% 26.1%
Trade payables 83 116 164 169 179 Other ratios
ST borrow ings 502 1,624 1,624 1,624 1,624 ROE (%) 14.3% 14.7% 12.5% 12.6% 12.6%
Other current liabilities 460 635 621 621 621 ROA (%) 11.6% 11.0% 9.6% 10.0% 9.7%
LT borrow ings 0 0 0 0 0 Net gearing (%) net cash net cash net cash net cash net cash
Other non-current liabilities 207 269 269 269 269 Interest coverage (x) 58.6 33.1 22.8 25.2 26.2
Total Liabilities 1,253 2,644 2,677 2,683 2,692 Inventory days 206 252 230 256 255
Receivables days 150 163 155 160 160
Share capital 427 427 427 422 422 Payables days 55 68 65 77 76
Reserves 5,237 6,001 6,373 7,096 7,813 Effective tax rate (%) 14.9% 8.3% 15.0% 15.0% 15.0%
Shareholders' equity 5,664 6,429 6,801 7,519 8,235
Minorities 136 133 133 133 133
Total equity 5,800 6,562 6,934 7,652 8,369
Page 31 of 31
Rating Policy
Rating Definition
Stock Rating Buy Outperform HSI by 15%
Neutral Between -15% ~ 15% of the HSI
Sell Underperform HSI by -15%
Sector Rating Accumulate Outperform HSI by 10%
Neutral Between -10% ~ 10% of the HSI
Reduce Underperform HSI by -10%
Analysts List
Hayman Chiu Research Director (852) 2235 7677 [email protected]
Kenneth Li Senior Research Analyst (852) 2235 7619 [email protected]
Lewis Pang Senior Research Analyst (852) 2235 7847 [email protected]
Wilfred Yuen Research Analyst (852) 2235 7131 [email protected]
Chloe Chan Research Analyst (852) 2235 7170 [email protected]
Johnny Yum Research Assistant (852) 2235 7617 [email protected]
Analyst Certification
I, Wilfred Yuen hereby certify that all of the views expressed in this report accurately reflect my personal views about
the subject company or companies and its or their securities. I also certify that no part of my compensation was / were,
is / are or will be directly or indirectly, related to the specific recommendations or views expressed in this report / note.
Disclaimer
This report has been prepared by the Cinda International Research Limited. Although the information and opinions
contained in this report have been compiled or arrived at from sources believed to be reliable, Cinda International
cannot and does not warrant the accuracy or completeness of any such information and analysis. The report should not
be regarded by recipients as a substitute for the exercise of their own judgment. Recipients should understand and
comprehend the investment objectives and its related risks, and where necessary consult their own financial advisers
prior to any investment decision. The report may contain some forward-looking estimates and forecasts derived from
the assumptions of the future political and economic conditions with inherently unpredictable and mutable situation, so
uncertainty may contain. Any opinions expressed in this report are subject to change without notice. The report is
published solely for information purposes, it does not constitute any advertisement and should not be construed as an
offer to buy or sell securities. Cinda International will not accept any liability whatsoever for any direct or consequential
loss arising from any use of the materials contained in this report. This document is for the use of intended recipients
only, the whole or a part of this report should not be reproduced to others.


