Embed Size (px)
Citation preview
California State University, San Bernardino California State University, San Bernardino
CSUSB ScholarWorks CSUSB ScholarWorks
Electronic Theses, Projects, and Dissertations Office of Graduate Studies
3-2014
Los Angeles County's Criminal Street Gangs: Does Violence Roll Los Angeles County's Criminal Street Gangs: Does Violence Roll
Downhill? Downhill?
Jasmin B. Randle California State University - San Bernardino
Follow this and additional works at: https://scholarworks.lib.csusb.edu/etd
Part of the Criminology Commons, Criminology and Criminal Justice Commons, Other Public Affairs,
Public Policy and Public Administration Commons, Policy Design, Analysis, and Evaluation Commons, and
the Social Control, Law, Crime, and Deviance Commons
Recommended Citation Recommended Citation Randle, Jasmin B., "Los Angeles County's Criminal Street Gangs: Does Violence Roll Downhill?" (2014). Electronic Theses, Projects, and Dissertations. 10. https://scholarworks.lib.csusb.edu/etd/10
This Thesis is brought to you for free and open access by the Office of Graduate Studies at CSUSB ScholarWorks. It has been accepted for inclusion in Electronic Theses, Projects, and Dissertations by an authorized administrator of CSUSB ScholarWorks. For more information, please contact [email protected].
LOS ANGELES COUNTY’S CRIMINAL STREET GANGS:
DOES VIOLENCE ROLL DOWNHILL?
______________________
A Thesis
Presented to the
Faculty of
California State University,
San Bernardino
______________________
In Partial Fulfillment
of the Requirements for the Degree
Master of Arts
in
Criminal Justice
______________________
by
Jasmin Brianne Randle
March 2014
LOS ANGELES COUNTY’S CRIMINAL STREET GANGS:
DOES VIOLENCE ROLL DOWNHILL?
_____________________
A Thesis
Presented to the
Faculty of
California State University,
San Bernardino
_____________________
by
Jasmin Brianne Randle
March 2014
Approved by:
Gisela Bichler, Committee Chair, Criminal Justice
Andrea Schoepfer, Committee Chair
Stephen Tibbetts, Committee Chair

© 2014 Jasmin Brianne Randle
iii
ABSTRACT
According to the 2011 National Gang Threat Assessment created by the
Federal Bureau of Investigation, there are more than 33,000 gangs in the United
States, cited as being responsible for nearly 48% of the violent crime in the
country. Using information drawn from gang-related court cases, this study
examines the nature of inter- and intra-gang violence occurring between January
1, 2002-December 31, 2011. An innovative application of network analysis will be
used to hone in on rivalries, the existence of possible hierarchy, and the
relational and structural characteristics of Blood and Crip gangs in Los Angeles
County. Results show that the majority of gang-on-gang violence originates and
targets individuals in the city of Los Angeles. Furthermore, more than two-thirds
of the violence committed at the hands of Blood and Crip gangs is upon
individuals that are not affiliated with a gang. Strategies are offered on how to
improve the effectiveness of existing community-based policing or hot-spot
policing in areas known to have violent gang-related incidents (Los Angeles City).
Furthermore, the implementation of programs designed to assist and deter the
formation and proliferation of gangs will result in less gang violence and therefore
more time to be spent on creating law enforcement strategies aimed at quelling
the more troublesome gang rivalries.
iv
TABLE OF CONTENTS
ABSTRACT ........................................................................................................... iii
LIST OF TABLES ................................................................................................. vi
LIST OF FIGURES ............................................................................................... vii
CHAPTER ONE: INTRODUCTION
The Problem ............................................................................................... 1
CHAPTER TWO: LITERATURE REVIEW
Gang Violence ............................................................................................ 5
General Context of Gang Violence and Prevention ................................... 5
Gang Violence in California and Los Angeles County ................................ 8
Bloods and Crips ........................................................................................ 9
Characteristics of Rivalry Violence ........................................................... 11
Using Social Network Analysis ................................................................. 14
Research Questions ................................................................................. 17
CHAPTER THREE: METHODOLOGY
Case Generation ...................................................................................... 19
Network Generator and Network Description ........................................... 20
Variables .................................................................................................. 21
Attributes ........................................................................................ 21
Structural Position .......................................................................... 22
Analytic Strategy ............................................................................ 24
Methodological Limitations ....................................................................... 26
v
CHAPTER FOUR: RESULTS
Introduction ............................................................................................... 28
Research Question One ................................................................ 28
Research Question Two ................................................................ 30
Research Question Three ............................................................. 34
Research Question Four ............................................................... 37
CHAPTER FIVE: DISCUSSION
Introduction ............................................................................................... 44
Research Question One ................................................................ 44
Research Question Two ................................................................ 50
Research Question Three ............................................................. 53
Research Question Four ............................................................... 55
Conclusion ..................................................................................... 57
APPENDIX: COMPLETE DESCRIPTIVE VARIABLES ...................................... 62
REFERENCES .................................................................................................... 64
vi
LIST OF TABLES
Table 1. Association between Defendant and Victim Gang Affiliation ................. 28
Table 2. Top Five Gang Subsets per Affiliation in Entire Network (Indegree Centrality) .............................................................................................. 32
Table 3. Top Five Gang Subsets per Affiliation in Entire Network (Outdegree Centrality) .............................................................................................. 32
Table 4. Number of Blood and Crip Subsets Involved in Violence in Each City ........................................................................................................ 36
Table 5. Top Five Offending Gang Subsets Controlling for Non-Gang Individuals (Outdegree Centrality) ......................................................... 37
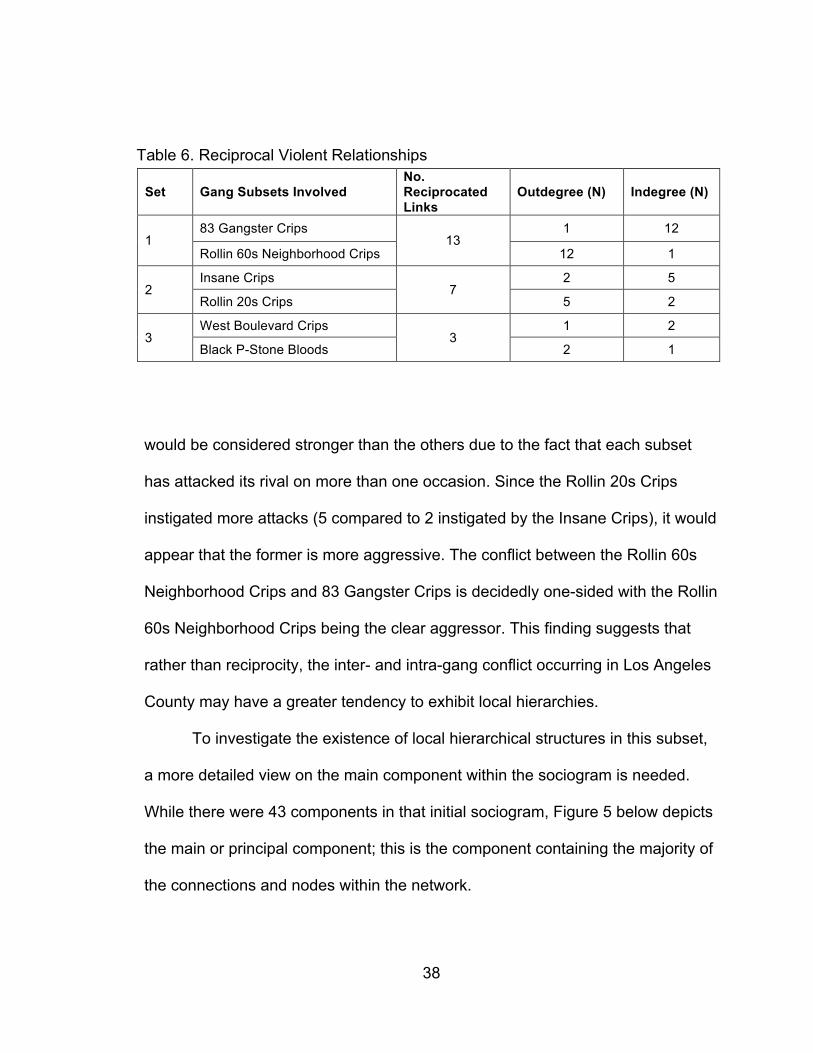
Table 6. Reciprocal Violent Relationships .......................................................... 38
Table 7. Effectiveness of Los Angeles City Gang Injunctions ............................. 46
Table 8. Subsets with Subsets: Leading to Misrepresentation of Data ............... 58
vii
LIST OF FIGURES Figure 1. Depiction of Violence among Blood and Crip Gangs in Los Angeles County .................................................................................................. 30
Figure 2. Depiction of Violence among Blood and Crip Gangs in Los Angeles County (Outdegree Centrality Statistic) ................................................ 31
Figure 3. Offending Subsets with Outdegree Centrality ...................................... 33
Figure 4. Subset Location to Subset Location with Outdegree Centrality ........... 34
Figure 5. Subset Initiated Patterns of Violence ................................................... 40
Figure 6. Triad Census: Two-Star Formations .................................................... 41
1
CHAPTER ONE
INTRODUCTION
The Problem
The presence of gang members in the United States in 2011 has
increased about 40% since 2009. In 2009, the Federal Bureau of Investigation
suggest that there are 1.4 million gang members nation-wide. This number
includes members from street gangs, outlawed motorcycle gangs, and prison
gangs (FBI, 2012). The National Gang Intelligence Center indicates that the 40%
increase since 2009 has been attributed to the significant increases in gang
membership in Arizona, California, and Illinois.
As the number of gang members increase it appears that the frequency
and number of crimes follows the same trend. It has been reported that gangs
are responsible for more than 48% of the violent crime that occurs in the country,
most of which occurs in major cities and suburban areas. And, trend research
indicates that violent crime caused by gangs in Los Angeles County has
increased by 12.4% from 2003 to 2005, accounting for 57% of the Los Angeles
City’s 515 homicides in 2005 (Winton, 2005). While many criminal street gangs
are involved to some degree in the trafficking of illegal drugs and prostitution,
criminal enterprise does not appear to be the sole impetus of inter-gang violence.
For instance, while Bellair and McNulty (2009) indicate that gang members who
sell drugs are significantly more violent than gang members that don’t sell drugs;
2
Houston and Anglin (1995) show that less than 5% of the inter-gang-related
deaths in Los Angeles, California were related to drug trafficking. This apparent
contradiction raises questions about perconceived notions about violent inter-
gang rivalry.
This thesis examines inter- and intra-gang violence between Blood and
Crip subsets in Los Angeles County, California. Four specific research questions
are answered: (1) is gang violence more apt to be directed upon a known or
suspected gang member as opposed to non-gang members; (2) between the
Bloods and Crips, which gang affiliation, and more specifically, subset tends to
be more dominant, attacking others more than they are victimized; (3) are violent
altercations among Blood and Crip subsets more apt to occur when the subsets
“represent” or lay claim upon the same neighborhood, and (4) do these gangs
exhibit structural differences in reciprocity and local heirarchy?
A directed network was constructed from information that was derived
from violent crime occurring in Los Angeles County between 2002-2011. In total,
284 prosecuted cases satisfied the selection criteria: crime occurred in LA
County and at least one of the defendants belonged to a Blood or Crip subset.
Three key variables were extracted from court documents: defendants gang
affiliation (if any), the victim’s gang affiliation (if any), and the location in which
each gang subset identifies as their “territory”. The origin of the violence was
coded as the defendant’s gang subset and the recipient was the victim. Up to
four defendants and two victims were linked in each case. This violent crime
3
network includes 625 links, connecting 439 offenders (includes defendant and
accomplices) and 384 victims.
The results of this study showed that more often than not, the victim of the
violence between Blood and Crip subsets in Los Angeles County did not identify
with a gang. Specifically, in less than one-third of the cases, the victim identified
with a gang. Additionally, as expected and described in previous research, the
violence between gang subsets seemed to be directly related to the rivalries
between the two subsets (Tita and Radil, 2011). In other words, the violence was
more apt to occur when subsets shared the same territory which was proven by
the immense amount of violence between subsets that represented Los Angeles
City. While not as prominent, the same held true in regards to gang subsets in
Inglewood and Compton. The existence of reciprocity and heirarchy in the
network was also present among several subsets. The reciprocity in violence
between gang subsets was not as pronounced as was expected, nonetheless
there were a few sets of dyads that follow that trend. In regards to heirarchy
within the network, two gangs seem to offend quite a lot more than their
counterparts. The Rollin 60s Neighborhood Crips and the Black P-Stone Bloods,
both representing Los Angeles City, are significantly more responsible for the
offending within the network than they are victimized. Further detailed in the
results section will describe the main difference between the offending of these
two powerhouses.
4
Upon detailing the results, policy implications and a discussion on the best
course of methods to combat gang violence is presented. The discussion takes
into consideration previous attempts to resolve inter-gang conflict, and offers
suggestions on how to fine-tune existing policy to generate more efficient ways to
handle gang violence in Los Angeles County. Other than an ill-conceived attempt
of fighting violence by increasing patrol units, it is suggested that community-
based policing or hot-spot policing would be more beneficial after determining the
areas in which gang-related crime is more apt to take place.
This research intends to fill gaps in knowledge about the structure of
violent gang activity amongst two entrenched and public gang rivals in Los
Angeles in order to delve more directly into the structure of conflict, particularly in
relation to reciprocated attacks and local hierarchies of violence.
5
CHAPTER TWO
LITERATURE REVIEW
Gang Violence
Gang violence has been a problem in the United States, dating as far back
as the late 1700s. According to the National Gang Intelligence Center, it is
estimated that there are nearly 1 million active gang members in the United
States as of 2009 (Hegemann, Smith, Barbaro, Bertozzi, Reid, and Tita, 2011).
As gangs continue to increase, the occurrence of violent activity, often attributed
to involvement in criminal enterprise, appears to increase as well. Despite a
plethora of research, violence continues to increase with no immediate answer or
solution in sight.
General Context of Gang Violence and Prevention
Homicide is the leading cause of death in the United States. In 2003, the
Center for Disease Center (CDC) reported that homicide ranked 20th for Whites,
6th for African Americans, 7th for Latinos, 11th for Native Americans, and 14th for
Asians and Pacific Islanders in regards to the leading cause of death (Robinson,
Boscardin, George, Teklehaimanot, Heslin, and Bluthenthal, 2009). While street
gang homicides account for less than half of all homicide incidents in
metropolitan cities, street gang violence still acts as the major contributor to the
alarmingly high homicide rate. Statistics show that between 1994 and 1995,
6
gang-related homicides accounted for more than 45% of the overall homicides
(Robinson et al., 2009).
Robinson et al. (2009) identified that the majority of gang-related violence
occur during what can be described as retaliatory situations. The “perception of
‘threat’ by groups” is described as a major cause of gang violence. Because
street gangs are territorial, the violence that occurs on the “stomping grounds” of
certain gang subsets is likely to be labeled as gang-related violence. Robinson et
al. (2009) referenced a study conducted in St. Louis, Missouri in 1999, which
provided information that indicates gang violence is a direct result of the activities
and intrinsic behaviors that occur from the spatial distribution of turf rivalries,
rather than the common belief that gang violence is attributed to social and
economic characteristics. In other words, gang-related homicides are best
described as a result of the gang rivalries rather than the social and economic
characteristics of the area.
There have been efforts to thwart the formation and proliferation of
criminal street gangs. Efforts have included prevention programs such as Barrios
Unidos, Homeboy Industries in East Los Angeles, and Community Self-
Development Institute. These prevention programs contain mentors that assist in
working with the troubled youth, provide education, tattoo removal, and job
referrals, just to name a few (Rodriguez, 2005). In addition to the communities
efforts to assist in gang prevention, legislature and law enforcement have
7
implemented practices and laws to deter the formation and the perpetuation of
criminal activity of gangs as well.
In 2005, the “Gangbusters” bill was passed. The bill enhanced the
consequences of gang-related activities. It modified several gang-related violent
offenses into federal crimes, imposed mandatory sentences of 10 years to life,
expanded the reach of the death penalty and allowed 16 and 17-year old gang
members to be prosecuted as adults for federal crimes. Even as far back as
1988, with the implementation of the STEP Act, legislation have been putting
forth effort to deter the formation of gangs and the engagement of criminal
activity. The STEP Act allows prosecutors the ability to impose greater sentence
enhancements on individuals involved in criminal activity if it is found that they fit
the three criteria necessary to label them as gang members.
The three criteria established in the STEP Act is: “(1) the group must be
an ongoing association of three or more persons sharing a common name
or common identifying sign or symbol; (2) one of the group’s primary
activities must be the commission of one of the specified predicate
offenses; and (3) the group’s members must ‘engage in or have engaged
in a pattern of criminal gang activity.’” (Jones, 2011)
So while there have been attempts to prevent the formation of new gangs and
deter the criminal activity of already existing gangs, it would appear that such
attempts have not had the desired impact as gangs continue to grow from 600
8
street gangs in California in 1986 to nearly 1,400 street gangs in Los Angeles
County alone in 2000 (Jones, 2011; McCarty, 2001).
Gang Violence in California and Los Angeles County
The United States Census of Population and Housing (2000) identified
Los Angeles County as the largest county in the United States in terms of
population, acting as resident to more than 9.5 million people and one of the
largest counties in terms of land area, garnering more than 4,000 square miles
(Robinson et al., 2009). According to the CDC, homicide is the second leading
cause of death for individuals between the ages of 15 and 24. The CDC has
determined five cities that have high rates of gang murders; three of which are
located in California (Oakland, Long Beach, and Los Angeles) (Weiss, 2012).
Furthermore, it was found that in Los Angeles the deaths of those between the
ages of 15 and 24 were gang-related deaths 61% of the time; in Long Beach the
same holds true for 70% of the deaths (Weiss, 2012). While it is not clearly
stated what the CDC defines as “gang-related”, one would assume that it
includes deaths in which the offender was a gang member. The CDC is not the
only organization that has recognized gang violence as a growing problem. The
California Department of Justice published “Homicide in California 2007”, in
which indicates that the majority of male homicides (37.5%) are gang related.
Additionally, homicide victims between 5 and 17 years of age (57.7%) and
9
between 18 and 29 years of age (47.2%) are killed as a result of gang or drug
related activity (Violence Policy Center, 2009).
In Los Angeles County gangs have become known as quite a large
contributor to the violent crime in the area. According to the Los Angeles County
District Attorney’s Office, there are more than 1,400 criminal street gangs that
exist in the county. Street gangs are territorial, making it quite difficult for 1,400
gangs to coexist peacefully. Gang-related homicide and assault may be
increasing due to heightened competition for limited resources or criminal
enterprise opportunity. Some criminologists attribute much of the increase in
gang violence to the fact that veteran gang members are beginning to be
released on parole or have maxed out their sentences, therefore adding to the
already present danger on the streets. According to the California Department of
Corrections, there are 100,000 gang members that are currently incarcerated; yet
they are being released at a rate of 3,000 a month. As senior gang members
return to their neighborhoods, disputes over leadership are inevitable (McCarthy,
2005).
Bloods and Crips
The current study will focus on the violence between two of the most well-
known, predominantly African American street gangs rivals: the Bloods and the
Crips. There have been multiple stories surrounding the creation of the two
notorious Los Angeles street gangs. Stories range from troubled urban youth
10
“looking for fun” to young African Americans looking for family ties after being
disenfranchised and excluded from what were known as white organizations,
such as the boy scouts. These gangs and their intense rivalry originated in Los
Angeles in the late 1960s and early 1970s. Since then the gangs have branched
out, with subsets claiming multiple areas and the rivalry becoming stronger and
more pronounced. According to Gangs in America’s Communities, there was a
1994 survey that estimated that there are more than 1,100 gangs in 115 cities
throughout the nation with “Blood” or “Crips” in their name (Howell, 2012, p.13).
As the Crips and Bloods became larger, the subsets became more
prevalent. Territory began to hold quite a bit of weight in regards to the increase
in power and respect. It came to a point in which Bloods were no longer fighting
against only Crips, rather they were fighting amongst one another as well. Bloods
attacked Bloods and Crips victimized Crips. It has become evident that the group
cliques and brotherhood that was created to unite African Americans and provide
a familial bond later became the same institution responsible for taking the
greatest number of African American lives in regards to death and incarceration.
Howell quotes Alonso (2004), “as white clubs began to fade from the scene,
eventually the black clubs, which were first organized as protectors of the
community, began to engage in conflicts with other black clubs. Black gang
activity soon represented a significant proportion of gang incidents” (2012, p. 18).
The Crips and the Bloods are the two largest predominately African American
gangs in Los Angeles County, claiming multiple territories, represented by

11
various subsets. As the formation of gangs increase, the likelihood of violence
also increases due to the inevitable confrontation regarding territory and respect
(Howell, 2012, p. 18). While some studies examined the prevalence of violence
in relation to gang presence (Robinson et al., 2009) other studies sought to
determine the impact of geography on gang rivalries (Tita and Radil, 2011).
Characteristics of Rivalry Violence
In 2011, Tita and Radil examined the nature of gang violence in
Hollenbeck, a neighborhood in Los Angeles, known for violent gang rivalries (Tita
& Radil, 521, 2011). This study, consisting of 29 criminally active street gangs,
found that neighboring groups were not solely responsible for the violent crime
levels; rather, violent gang rivalries involved groups claiming turf in
noncontiguous areas (Tita & Radil, 2011). Contradictory to most studies,
neighboring areas do not have as much of an effect on crime statistics as
hypothesized. Results showed that gang rivalries had a greater contribution
towards gang violence than geographic proximity. Furthermore, the impact of
rivalries extended beyond the simple contiguity of neighboring areas. Tita and
Radil recognized two consistent findings: (1) young urban minority males tend to
be the subpopulation at the greatest risk of homicide victimization and (2)
homicides tend to follow a pattern of non-randomization of spatial concentration,
showing that areas that have similar occurrences of violence tend to cluster
(2011). The latter of the two findings coincide with research conducted by
12
Brantingham et al. (2012), which show that inter-gang violence is concentrated in
what can be described as “hot spots” that are located between the two competing
gangs.
Brantingham, Tita, Short and Reid (2012) extended research of territorial
behaviors of street gangs by postulating that the conflict and competition
between rival gangs generates territories within the neighborhoods in which
gangs reside. Brantingham et al. (2012) used information about inter-gang
violence that occurred among 13 street gangs in the Hollenbeck Policing Division
in Los Angeles County. The 13 of the 29 street gangs from the Hollenbeck
Policing Division were representative of the gangs that claimed territory within
Boyle Heights. The authors’ intent was to examine the Lotka-Volterra competition
model (Gilpin and Ayala, 1973) and determine how different factors affect the
outcomes of competitive interactions. The Lotka-Volterra competition model
suggests that two species (gangs in this case) with similar characteristics should
have a territorial boundary, which is equal in distance from each gang’s set
space (Brantingham et al., 2012).
The 1,126 events that occurred during the period of this study were
examined to determine if the event took place in the territory belonging to the
focal gangs (1 of the 13 gangs residing in Boyle Heights) or that belonging to the
rival gang. Results were equivalent to the theoretical perspective of Lotka-
Volterra (1920), in that the violent crimes occurring among gangs tend to occur
along the predicted boundary between the two gangs. These results show that
13
violent crime in Hollenbeck acts as a predictor of boundaries through the
competition between gangs (Brantingham et al., 2012). The results of this study
suggest that the competition of inter-gang interactions does well to determine the
territories in which gangs tend to frequent. Information such as this can be used
as an tool for departments when assigning beats to officers. Los Angeles County
acts as residence to over 1,000 gangs and the Lotka-Volterra competition model
would do well in assisting to decrease the criminal activities of gangs.
Robinson et al. (2009) conducted a study in Los Angeles County in which
was designed to determine the impact of gang rivalries on a community in
reference to homicide rates when controlling for other factors that are known to
influence homicide rates. They hypothesized that communities in Los Angeles
County that have a higher density of nearby potential rival gangs would also have
a greater number of homicides. The study was representative of 255 out of the
289 zip codes in Los Angeles County (the study excluded the zip codes with low
populations and vast university campuses in which had their own zip codes) and
was comprised of 98.9% of the entire population of Los Angeles County in 2000
and 98.9% of all homicide victims in the country during the time period of the
study. Robinson et al. (2009) used the eight Service Planning Areas (SPA)
identified by the county in an effort to easily identify the different areas. Results
showed that of the 10,880 individuals killed during the time period of the study,
the area identified as the South SPA accounted for the majority of the homicides
(40 per 100,000 persons). The results suggest that areas with higher
14
concentration of street gangs were a direct result of the elevated levels of
homicides. Furthermore, the study showed that zip codes that contained more
than 10 street gangs in a 2-mile radius of that particular zip’s center accounted
for 40% of all the homicides in Los Angeles County. The victims represented in
that 40% was representative of 16% of the County’s entire population (Robinson
et al., 2009).
Using Social Network Analysis
The use of social network analysis allows for the detailed examination of
the relationship between objects or categories. According to Wasserman and
Faust (1994), there are several principles that clearly separate social network
research from other research approaches. Social network theory assumes that
the actors and the relationships between the actors within the dataset are
interdependent as opposed to independent. Additionally, the relationships
created between the actors act as channels for the contiguous flow of
information, action, or material. When a network is based upon the individual, the
network structure can act as an opportunity for further expansion of the individual
or as a constraint and lack of expansion for an individual. Finally, social network
theory argues that the relationships created between these actors constrain or
shape the behavior of actors in the network (Wasserman and Faust, 1994, 3-4).
As mentioned earlier, social network analysis does not use the same
principles as other research methods. Wasserman and Faust (1994) provide the
15
example of analyzing why a county would choose to invest in one non-profit
organization over another. A standard approach to this inquiry would consist of
sampling a portion of the population of corporations interested in non-profits and
then measuring certain characteristics of each corporation. In the standard
method, it is assumed that each corporation is independent and therefore has no
impact on one another. On the contrary, when using social network analysis, it is
believed that each corporation has a relationship with one another, such as the
possible relationship between board members or business ventures, therefore
having an effect on the overall decision as to which non-profit organization one
would choose to invest in (Wasserman and Faust, 1994, 7).
There are several methods available to use when analyzing a group using
social network analysis. Among these methods are sociocentric networks (full),
snowball networks, egocentric network with alter connections, and egocentric
networks without the focus of alter connections, just to name a few. The main
difference between these four above-mentioned methods is the amount of detail
that is gathered on each actor (ego and alter) and the number of links that the
research uses to expand the relationship. The sociocentric method is known for
its focus on the quantification of relationships between people within a defined
group (i.e., gang members in a gang subset). Sociocentric networks look to
discover structural patterns within a dataset that may not have otherwise been
noticed. In using this method, the researcher collects information about each
actors’ (gang members) ties with other actors. This method uses the entire
16
population as opposed to a sample of the population (Hanneman and Riddle,
2005). In this study events are used to generate information about offenders
(egos) linked to victim(s) or alters.
Once relational information is collected on the actors, a measured network
must be generated. Links between interdependent actors can be valued
indicating the number of interactions or strength of the tie or the links could be
binary. Binary ties identify whether the relation is simply absent or present, which
is a dichotomous code. These links may also be directional if one set of actors is
sending or imposing something on another. Deciding between these options is in
part based on the research question.
A study conducted by Maoz, Terris, Kuperman, and Talmund (2007)
utilized social network analysis to determine the relationship of international
relations to direct relations (i.e. “the enemy of my enemy” and “the enemy of my
friend” to “my friend” and “my enemy”). This particular study is large scale. In this
study it is assumed that states/countries that shared common enemies would be
allies and therefore, not fight one another. As an example, if France disliked
Germany and the United States also disliked Germany, then it would be
assumed that France and the United States are allies and therefore will not fight
each other. However, such a premise can be applied on a smaller scale to
cliques and gangs.
Maoz et al. (2007) used the terms of “Balanced Relationships” and
“Imbalanced Relationships” in a network analysis to determine the likelihood of
17
the initial hypothesis being correct based upon prior history of enemies and
allies. A balanced relationship in a triad is defined as “wherein we can infer the
relationship in a dyad given information about the relationship about the two
other dyads”. So, if state a likes state b and state b likes state c, then it would be
assumed that state a and state c would also be allies. If the relationship of the
dyad does not follow this pattern, it is defined as an imbalanced relationship. The
study conducted by Maoz et al. (2007) used a dataset in which represented the
actual rivalries between states over the last 186 years in order to determine the
validity of the hypothesis posed earlier.
Results both favored and discredited the initial hypothesis. Results
showed that international interactions used in this dataset showed a significant
amount of imbalanced relationships. It was shown that states that have the same
allies and enemies were likely to be both allies and enemies at the same time.
While this study did not result in a complete acceptance of the original
hypothesis, it was able to show that social network analysis can be used to
examine the relational ties and connections between enemies.
Research Questions
The current research will examine inter- and intra-gang violence
committed by Blood and Crip subsets within Los Angeles County to determine
whether such violence is more likely to occur when the rival gangs share a
neighborhood. Specifically, the research questions this study will answer are: (1)
18
is gang violence more apt to be directed upon a known or suspected gang
member as opposed to non-gang members; (2) between the Bloods and Crips,
which gang affiliation, and more specifically, subset tends to be more dominant,
attacking others more than they are victimized; (3) are violent altercations among
Blood and Crip subsets more apt to occur when the subsets “represent” or lay
claim upon the same neighborhood, and (4) do these gangs exhibit structural
differences in reciprocity and local hierarchy?
In addressing these questions, results may make it possible to better
predict gang violence, thereby improving the likely success of intervention
strategies. Capturing the inter- and intra-gang nature of violent attacks will reveal
the structural characteristics of group rivalry that will help law enforcement gauge
where the problem areas are. While research studies of gang violence primarily
focus on the overall violence of all gang in a particular area, few studies have
focused on two major rivals with a particular interest on territorial boundaries and
the use of violence that is popularly assumed to stem from conflict arising from
criminal enterprise.
19
CHAPTER THREE
METHODOLOGY
Case Generation
This study uses data generated from publicly available sources.
Information was retrieved from California court cases in which the defendant was
a suspected or known Blood or Crip gang member that was arrested and
prosecuted for a violent crime. For the purpose of this study, a violent crime
includes assault with a deadly weapon, attempted homicide and homicide.
The first step in generating a list of eligible cases required developing a
current list of active subsets of the Bloods and Crips. Several sources were used.
The Los Angeles County Street Gangs website was used to create an initial list
of the active Blood gangs and Crips gangs in Los Angeles, California. Then,
Detective Daniel Milchovich of the Inglewood Police Department and Detective
Keith Chaffin of the Hawthorne Police Department provided a list of active Blood
and Crip subsets within their respective jurisdictions. The subsets provided by
the detectives were amalgamated with the initial list. This triangulating process
ensured that only current, active subsets were included.
After the list was compiled, each gang subset was searched on
LexisNexis, an electronic library that provides federal and state cases and
statutes, including U.S. Supreme Court decisions. The cases that were selected
for use in this study were those in which the offender belonged to a gang that is
20
representative of the Bloods or Crips and the violent event occurred in Los
Angeles County between January 1st, 2002 and December 31st, 2011 (a period of
10 years). While the search did not exclude females from the research, few
female offenders were uncovered; thus, the results can only be construed to
apply to male gang members. Additionally, this study only included offenders that
were tried as adults; juveniles were excluded from this study due to the lack of
detailed information provided by Lexis Nexis in juvenile cases. This search
protocol uncovered 284 cases, which generated 439 offenders (includes
defendant and accomplices) and 384 victims.
Network Generator and Network Description
A network was generated to model inter- and intra-gang violence by
aggregating events to the subset associated to each offender and accomplice to
the victim. There are cases in which the parties to the violence are not
associated with a gang. For the purpose of the dataset and to provide an
accurate depiction of the network, the non-gang affiliation will be replaced with
the victims’ names. However, the name will not be visible in the sociogram. This
strategy has been used previously to ensure that all non-gang members are not
treated as a single group as this would bias the centrality statistics generated
(see Malm et al., 2011). The software used to create the networks and calculate
the statistics to be presented in this study is NetDraw and UCInet. This network
is a directed, valued network linking multiple sets of dyads to one another. In
21
other words, the link (acting as a violent event) between a set of nodes (acting as
the gang affiliation, subset, or location) has a specific direction. In all cases, the
linkage originates with the defendant and ends with the victim. The link between
the sets of nodes is weighted in the sense that the greater the frequency of
connections between the two nodes, the thicker the visual representation of the
link will be.
Variables
Attributes
All attributes of individuals (otherwise referred to as independent variables
in conventional research methodology) were extracted from the information
provided in the court cases. Attributes include: gang affiliation of the defendants,
accomplices, and victims, the detailed subsets associated with each person, and
the location in which is determined to be the “home territory” of the gang subset.
A detailed explanation of each attribute follows.
Gang Affiliation. Gang affiliation for offenders (the defendant prosecuted
and the accomplices) and victims identifies the gang that each individual belongs
to. Gang affiliation is coded as a multinomial variable with four categories to
identify with: Blood, Crip, neither or non-gang. Bloods are coded as “0”, Crips as
“1”, Non-Gang as “2”, and Neither as “3”.
Gang Subset. Gang subset is also a multinomial variable distinguishing
the subset to which the individual is reported to identify with. In total, there are 38
22
Blood subsets, 109 Crip subsets, and 10 subsets with no Blood or Crip
connection.
City. The geography variable is indicative of the location (city) in which the
gang subsets (defendant’s, accomplices’, and victims’) report to be the territory in
which they lay claim to. The city is a multinomial variable as well; fifteen cities are
included in this study: Altadena, Antelope Valley, Athens, Carson, Compton,
Florence, Gardena, Hawthorne, Inglewood, Long Beach, Los Angeles, Lynwood,
Pasadena, Pomona, and Santa Monica.
Structural Position
Centrality. The degree centrality statistic is used to determine the
positional importance of specific subsets and cities in the network of inter-group
violent activity. Degree centrality is an actor-based statistic that captures the
number of links that each actor possesses. As mentioned above, the links
(connections or relationships) between the nodes are directed; meaning that the
offender’s subset “extends a relation” by attacking the other group (victim). This
means that two different types of degree centrality can be calculated; the
indegree and outdegree centrality. The difference between the two is that the
indegree centrality statistic provides the number of links that have been directed
toward any particular node, whereas the outdegree centrality statistic is the
number of links that the node directs to others. As used here, high outdegree
centrality scores indicate that the subgroup in question initiates more attacks
than others; whereas, subsets with high indegree centrality are victimized more
23
often and/or by more groups. Since violence may occur within a group among
subset members, reflexive ties capture intra-group violence.
Hierarchical and Reciprocal Violence. Reciprocity occurs when the node,
(e.g. victim gang subset in this network), in a particular dyad later becomes the
ego (offender gang subset) in another dyad. The Black P-Stone Bloods and the
Rollin’ 30’s Crips are rivals. In an effort to provide an example of reciprocity, if a
member of the Black P-Stone Bloods committed a violent act against a member
of the Rollin’ 30’s Crips (making the Black P-Stone Bloods the ego and Rollin’
30’s Crips the alter), the Rollin’ 30’s Crips would make it a point to later victimize
the Black P-Stone Bloods as a form of revenge, which would indicate that the
relationship is reciprocal.
Dominant relationships can be identified by comparing the outdegree
centrality statistic and the indegree centrality statistic of one node amongst the
others in the network. Such an examination will show which subsets are
offending more often than they are being attacked, therefore showing dominance
in the network. While that is one way to determine dominance within a network,
an alternative method would be to examine the transitivity of the nodes within the
network. Transitive ties include the existence of two-star formations that will
highlight the presence of local hierarchies within the network. Transitive ties will
be discussed in further detail later in this chapter and in the Discussion. The
perception of power can be viewed one of two ways, through the entire network
of 625 links or through the network of gang-affiliates only (205 links). Dependent
24
upon which way it is looked upon, the power in regards to the frequency of
offending is deceptive.
Analytic Strategy
The method used to test each of the aforementioned research questions is
dependent upon the questions. While most of these questions can be addressed
with simple contingency tables and analysis of variance, network analytic
techniques allow for a more precise examination of the origin of the violent
activity and as well as offering a mechanism to study the problem as a whole. A
contingency table, also known as a cross tabulation table, is used to display the
frequency distribution of nominal and ordinal variables.
Research questions 1 and 2 will be answered by constructing a
contingency table. To address research question 1, the contingency table using
variables “offender gang affiliation” and “victim gang affiliation” will show whether
the victims of gang violence also identify with a gang. Research question 2 will
examine the direction of violence committed by Blood subsets versus Crip
subsets using outdegree centrality. A network sociogram can be used to provide
a visual showing which subset is more violent and towards what group of
individuals (gang vs. non-gang).
The third research question examines the geographic pattern of violence
using a directed network constructed by linking the city associated with the home
turf of the defendants’ gang subset to the city associated with the victims’
claimed gang territory. As an example, if an individual that identifies with the
25
Black P-Stones attack the an individual that identifies with the Carver Park
Compton Crips there will be a link between Los Angeles City and Compton; as
the Black P-Stones represent Los Angeles and Carver Park Compton Crips
represent Compton. Since both the offender and victim must be associated with
a gang to be included in this analysis, only 205 links are included here. These
ties represent the total number of gang-on-gang violent incidents (non-gang
victims are excluded from this analysis). Again, in- and outdegree centrality
identify the recipients and exporters of violence. Reflexive ties are indicative of
within city conflict. A sociogram helps to illustrate what the statistics tell us; the
sociogram visually identifies the city in which the violence is originated and the
city in which the violence is subjected upon in regards to the territory each gang
subsets represents. The third research question will provide the greatest detail
and information towards creating policy implications and possible changes in
policing habits within Los Angeles County because it does well to address the
problem areas in terms of gang-on-gang violence.
The final research question regarding the presence of a hierarchical and
reciprocal relationship is examined three ways. First, a network sociogram
provides a visualization of which gangs are most involved, as both victims and
offenders, the existence of gang rivalries and violence that stem from them, and
the occurrence and organization of gang hierarchy upon all the gang subsets in
Los Angeles County. In examining the existence of a hierarchical relationship,
the sociogram constructed will look to highlight gang subsets that tend to offend
26
in a significantly greater manner than they are victimized. Second, cases of
reciprocity will also be identified. Finally, the presence of two-star formations,
also known as potential transitive triads, will be tabulated. Two-star formations
expose the local hierarchies that may be overshadowed by the larger picture.
Two-star formations are formed in multiple ways, which will be discussed in
greater detail in the final chapter of this thesis.
Combined, these analytic strategies will provide information as to which
gang subset is the most responsible for causing crime, which subsets and cities
appear to have the greatest control and most frequent violent acts within the
entire network, the frequency of revenge violence, and the overall pattern of gang
violence occurring in Los Angeles County between Bloods and Crips.
Methodological Limitations
As mentioned earlier, the data collected for this study was provided by a
very credible source, therefore making the validity and reliability of the data quite
solid. However, because of the disparities present in the way in which court
reporters dictate information, the information gathered by officers and detectives,
and the information given by the defendants and the victims, the maximum
amount of data that could have been collected for this study was not achieved. It
could be the possibility that some instances of gang affiliation were not clearly
defined, therefore not allowing 100% accuracy within the data represented on
Lexis Nexis. Also addressed earlier, juvenile cases and female defendants are
27
not present in this study due to the lack of detailed information and the
nonexistence of such cases in Lexis Nexis, respectively. So while the data that is
currently used in this study is valid and reliable, it is also limited. However, once
presented with the findings of the current data, it may be obvious, that even with
greater inclusion, the results would still appear to be the same. The specific
limitations associated with each research question are examined in greater detail
in the discussion chapter.
28
CHAPTER FOUR
RESULTS
Introduction
The current study sought to provide additional knowledge to the ongoing
violence between gangs; specifically, Blood and Crip gangs in Los Angeles
County. The intention is for the results to yield additional policy implications that
may help to deter gang violence in the future. This study uses social network
analysis to provide an alternative visual amongst the common use of tables and
bar graphs. For the simplicity in the presentation of these results, each research
questions will be addressed separately in this chapter.
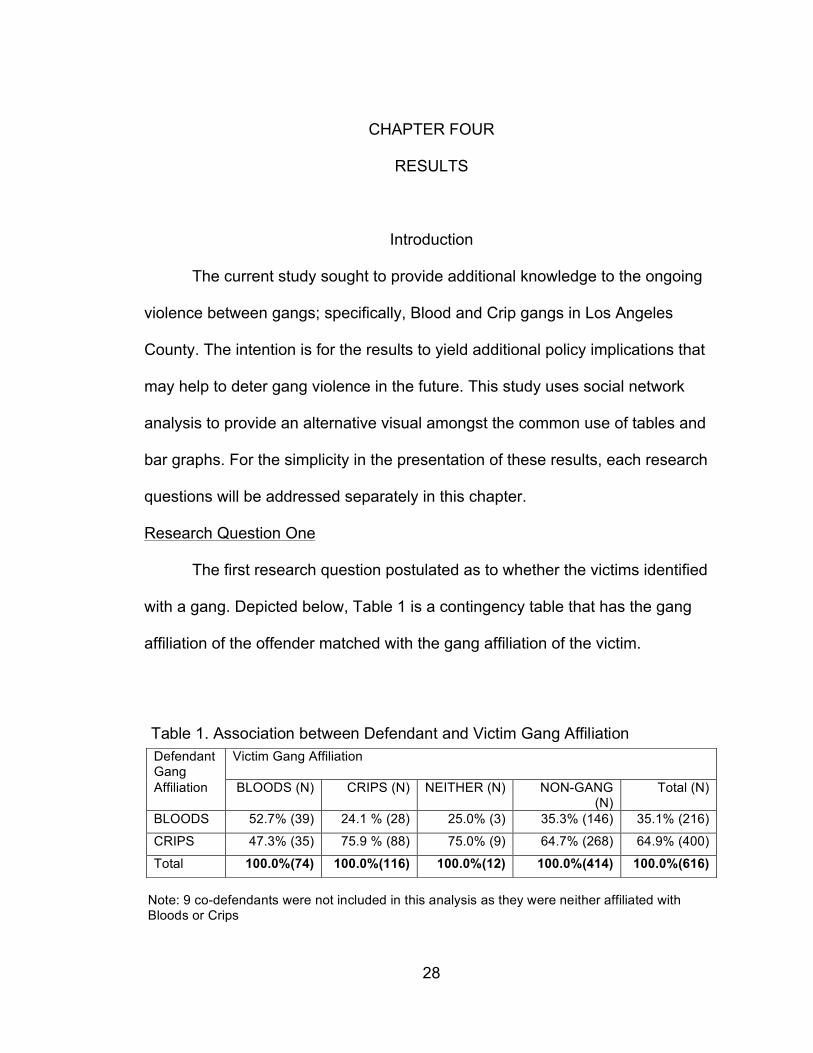
Research Question One
The first research question postulated as to whether the victims identified
with a gang. Depicted below, Table 1 is a contingency table that has the gang
affiliation of the offender matched with the gang affiliation of the victim.
Defendant Gang
Victim Gang Affiliation
Affiliation BLOODS (N) CRIPS (N) NEITHER (N) NON-GANG (N)
Total (N)
BLOODS 52.7% (39) 24.1 % (28) 25.0% (3) 35.3% (146) 35.1% (216)
CRIPS 47.3% (35) 75.9 % (88) 75.0% (9) 64.7% (268) 64.9% (400)
Total 100.0%(74) 100.0%(116) 100.0%(12) 100.0%(414) 100.0%(616)
Note: 9 co-defendants were not included in this analysis as they were neither affiliated with Bloods or Crips
Table 1. Association between Defendant and Victim Gang Affiliation
29
Including all offender-victim dyads (625 links between all possible
offenders and victims), reveals that only 33% of victimizations (206 links)
involved victims whom identified with a gang. Comparing victims from the Bloods
versus the Crips, it is clear that intra-group violence predominates among the
both gangs. Among non-gang victimizations, a much greater percent of non-gang
victims were attached by Crips (64.7%) than Bloods (35.3%). It should be noted
that some of these non-gang related victimization incidents can be intentional
(gang initiation or intimidation tactics) while others may be unintentional (bad
intelligence or inaccurate aim). This is not identifiable from the information
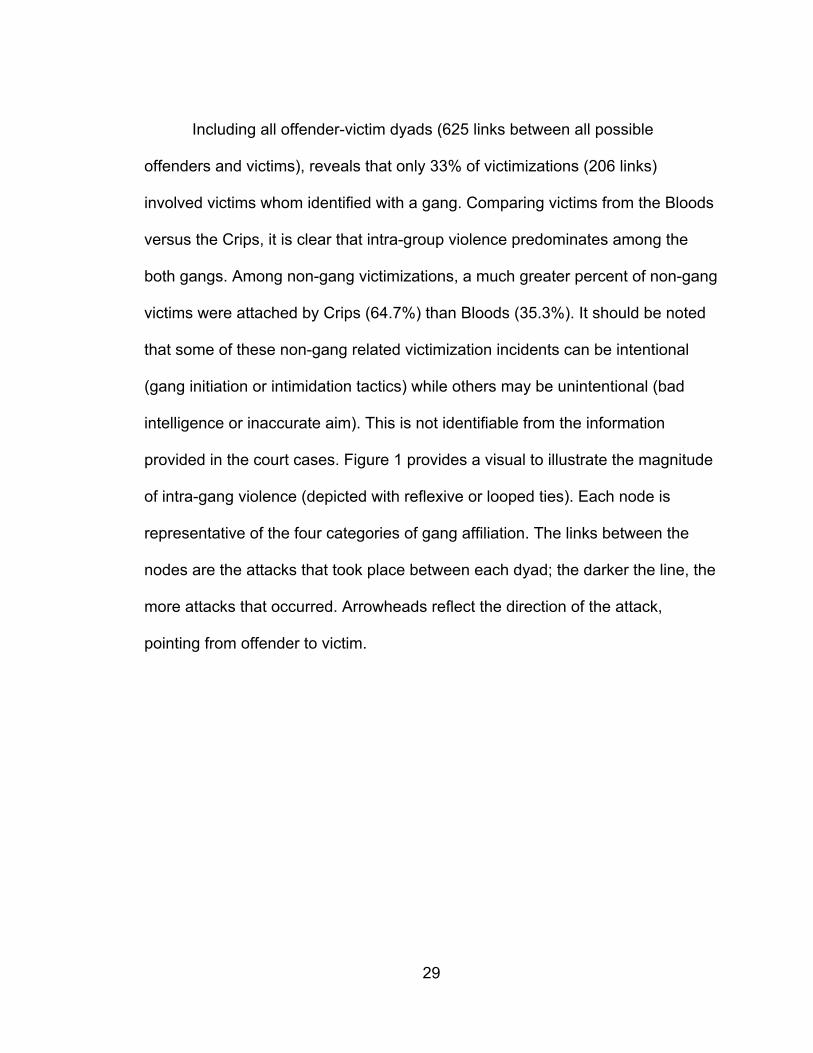
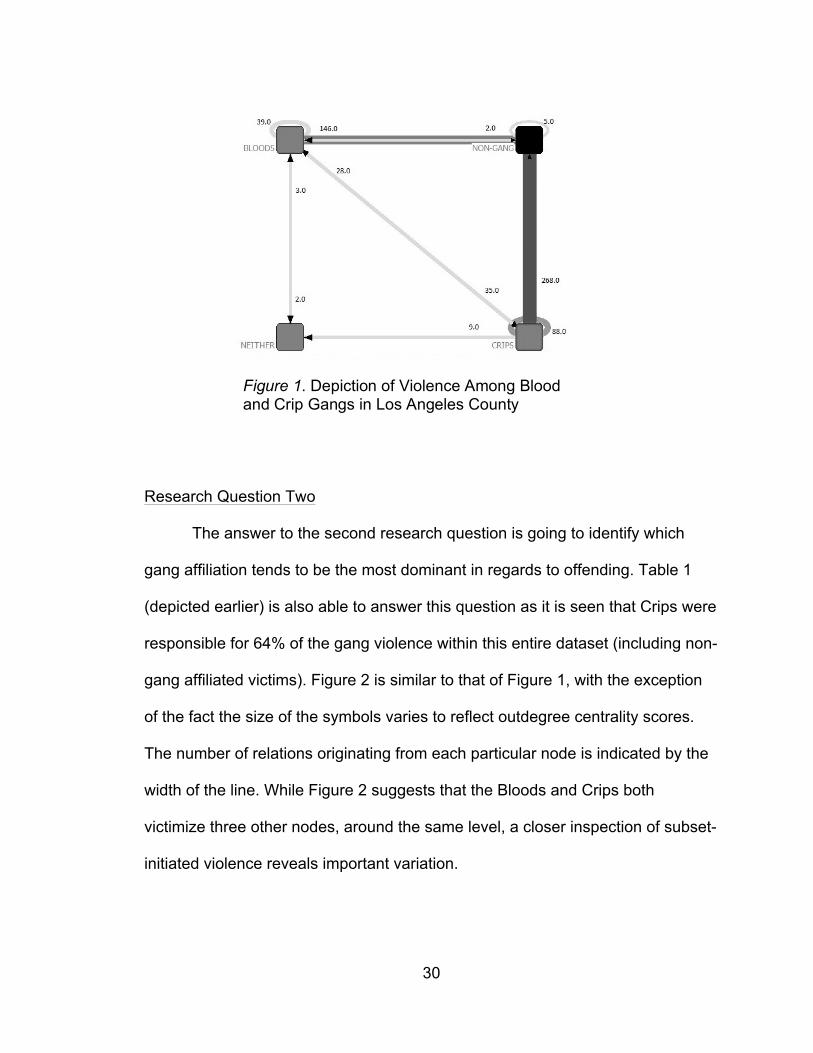
provided in the court cases. Figure 1 provides a visual to illustrate the magnitude
of intra-gang violence (depicted with reflexive or looped ties). Each node is
representative of the four categories of gang affiliation. The links between the
nodes are the attacks that took place between each dyad; the darker the line, the
more attacks that occurred. Arrowheads reflect the direction of the attack,
pointing from offender to victim.
30
Research Question Two
The answer to the second research question is going to identify which
gang affiliation tends to be the most dominant in regards to offending. Table 1
(depicted earlier) is also able to answer this question as it is seen that Crips were
responsible for 64% of the gang violence within this entire dataset (including non-
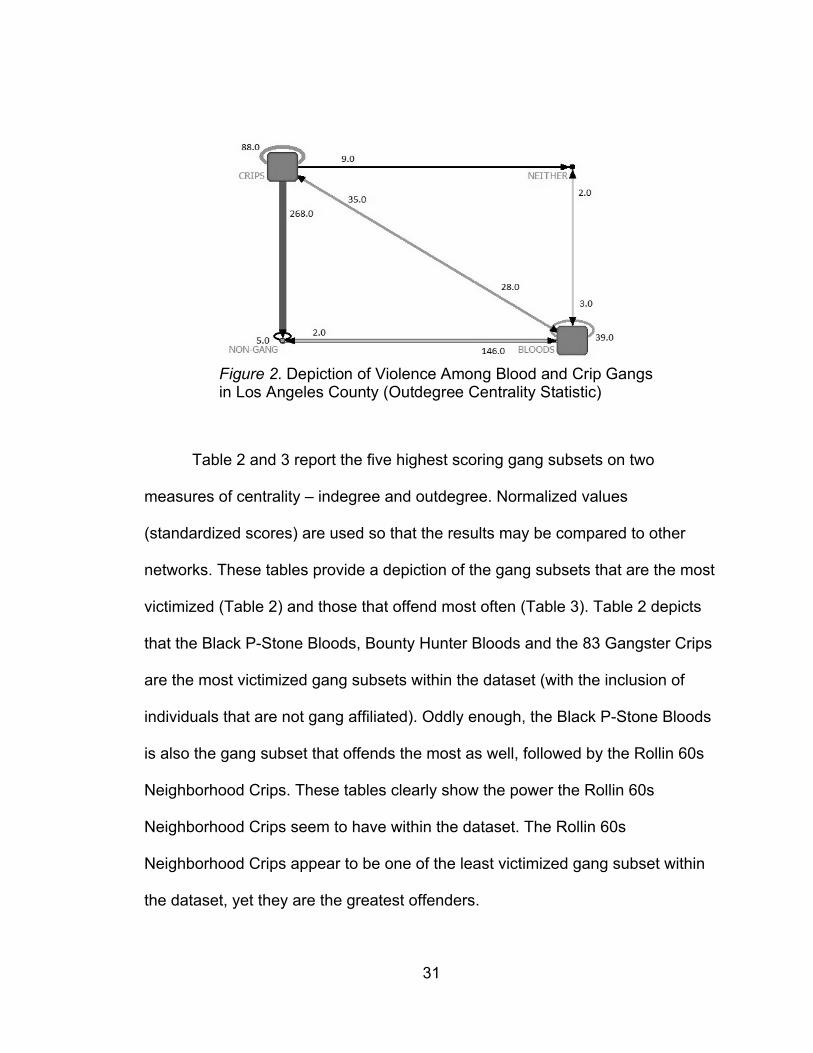
gang affiliated victims). Figure 2 is similar to that of Figure 1, with the exception
of the fact the size of the symbols varies to reflect outdegree centrality scores.
The number of relations originating from each particular node is indicated by the
width of the line. While Figure 2 suggests that the Bloods and Crips both
victimize three other nodes, around the same level, a closer inspection of subset-
initiated violence reveals important variation.
Figure 1. Depiction of Violence Among Blood and Crip Gangs in Los Angeles County
31
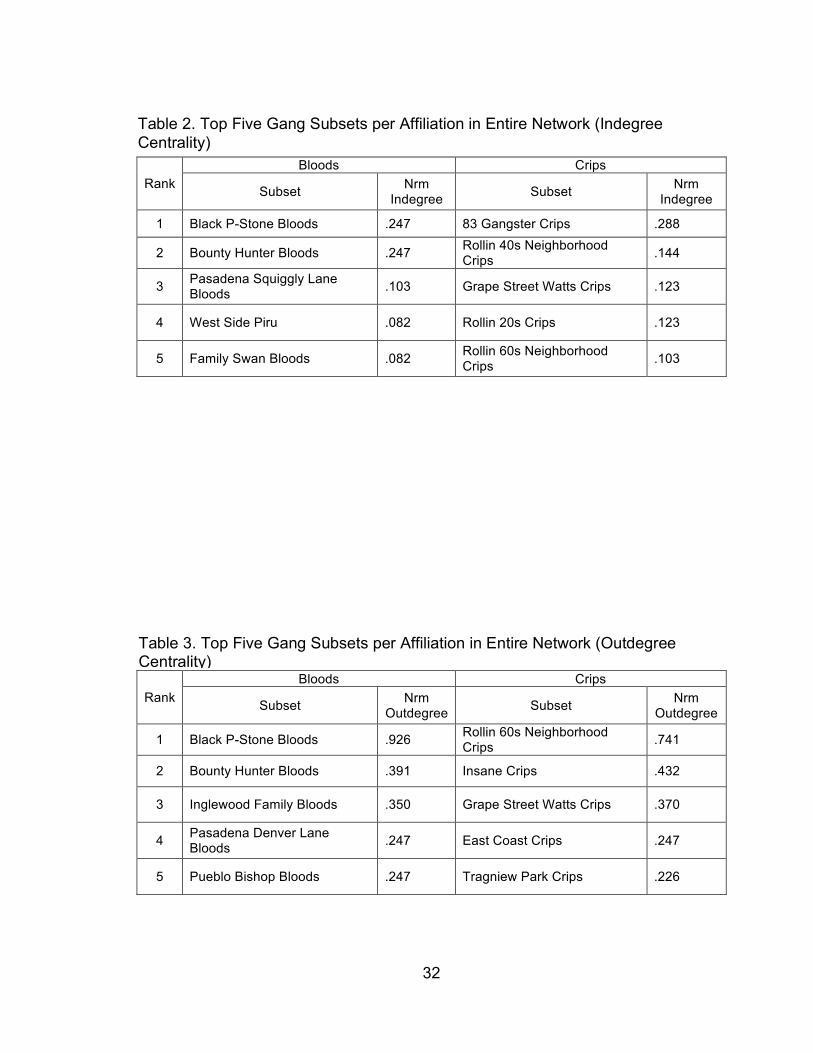
Table 2 and 3 report the five highest scoring gang subsets on two
measures of centrality – indegree and outdegree. Normalized values
(standardized scores) are used so that the results may be compared to other
networks. These tables provide a depiction of the gang subsets that are the most
victimized (Table 2) and those that offend most often (Table 3). Table 2 depicts
that the Black P-Stone Bloods, Bounty Hunter Bloods and the 83 Gangster Crips
are the most victimized gang subsets within the dataset (with the inclusion of
individuals that are not gang affiliated). Oddly enough, the Black P-Stone Bloods
is also the gang subset that offends the most as well, followed by the Rollin 60s
Neighborhood Crips. These tables clearly show the power the Rollin 60s
Neighborhood Crips seem to have within the dataset. The Rollin 60s
Neighborhood Crips appear to be one of the least victimized gang subset within
the dataset, yet they are the greatest offenders.
Figure 2. Depiction of Violence Among Blood and Crip Gangs in Los Angeles County (Outdegree Centrality Statistic)
32
Rank Bloods Crips
Subset Nrm Indegree Subset Nrm
Indegree
1 Black P-Stone Bloods .247 83 Gangster Crips .288
2 Bounty Hunter Bloods .247 Rollin 40s Neighborhood Crips .144
3 Pasadena Squiggly Lane Bloods .103 Grape Street Watts Crips .123
4 West Side Piru .082 Rollin 20s Crips .123
5 Family Swan Bloods .082 Rollin 60s Neighborhood Crips .103
Rank Bloods Crips
Subset Nrm Outdegree Subset Nrm
Outdegree
1 Black P-Stone Bloods .926 Rollin 60s Neighborhood Crips .741
2 Bounty Hunter Bloods .391 Insane Crips .432
3 Inglewood Family Bloods .350 Grape Street Watts Crips .370
4 Pasadena Denver Lane Bloods .247 East Coast Crips .247
5 Pueblo Bishop Bloods .247 Tragniew Park Crips .226
Table 2. Top Five Gang Subsets per Affiliation in Entire Network (Indegree Centrality)
Table 3. Top Five Gang Subsets per Affiliation in Entire Network (Outdegree Centrality)
33
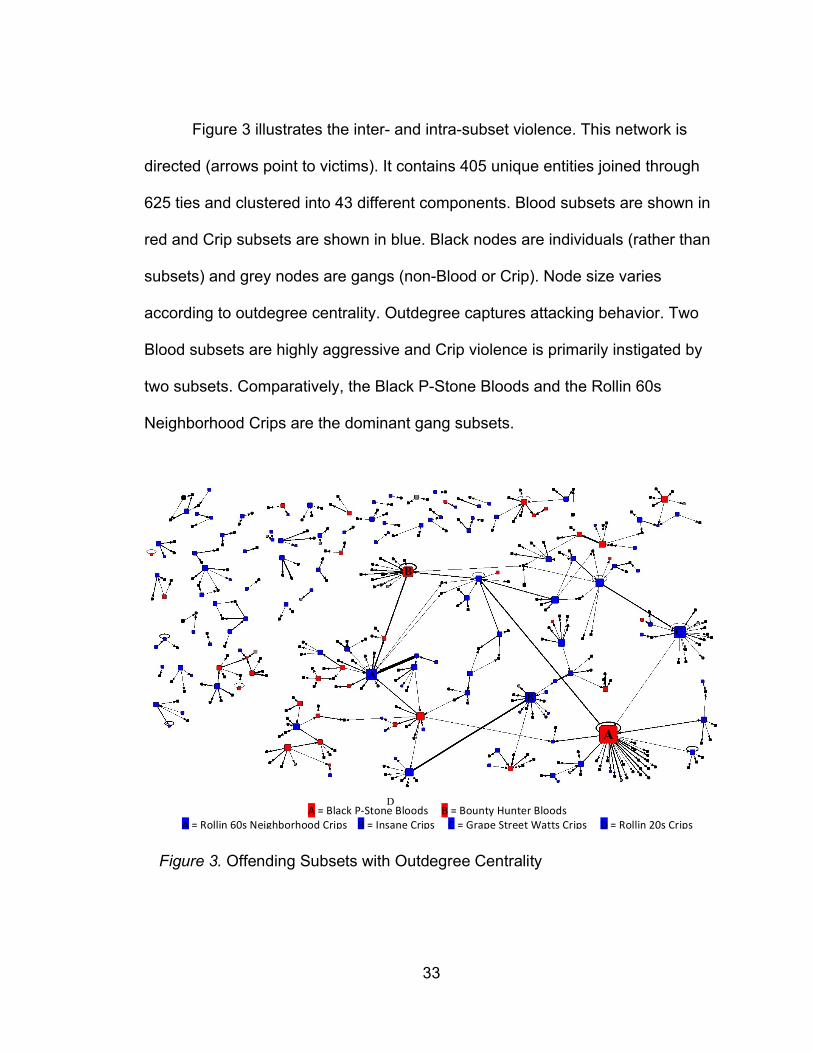
Figure 3 illustrates the inter- and intra-subset violence. This network is
directed (arrows point to victims). It contains 405 unique entities joined through
625 ties and clustered into 43 different components. Blood subsets are shown in
red and Crip subsets are shown in blue. Black nodes are individuals (rather than
subsets) and grey nodes are gangs (non-Blood or Crip). Node size varies
according to outdegree centrality. Outdegree captures attacking behavior. Two
Blood subsets are highly aggressive and Crip violence is primarily instigated by
two subsets. Comparatively, the Black P-Stone Bloods and the Rollin 60s
Neighborhood Crips are the dominant gang subsets.
A
B
A
B
C
Figure 3. Offending Subsets with Outdegree Centrality
A = Black P-‐Stone Bloods B = Bounty Hunter Bloods A = Rollin 60s Neighborhood Crips B = Insane Crips C = Grape Street Watts Crips D = Rollin 20s Crips
D
34
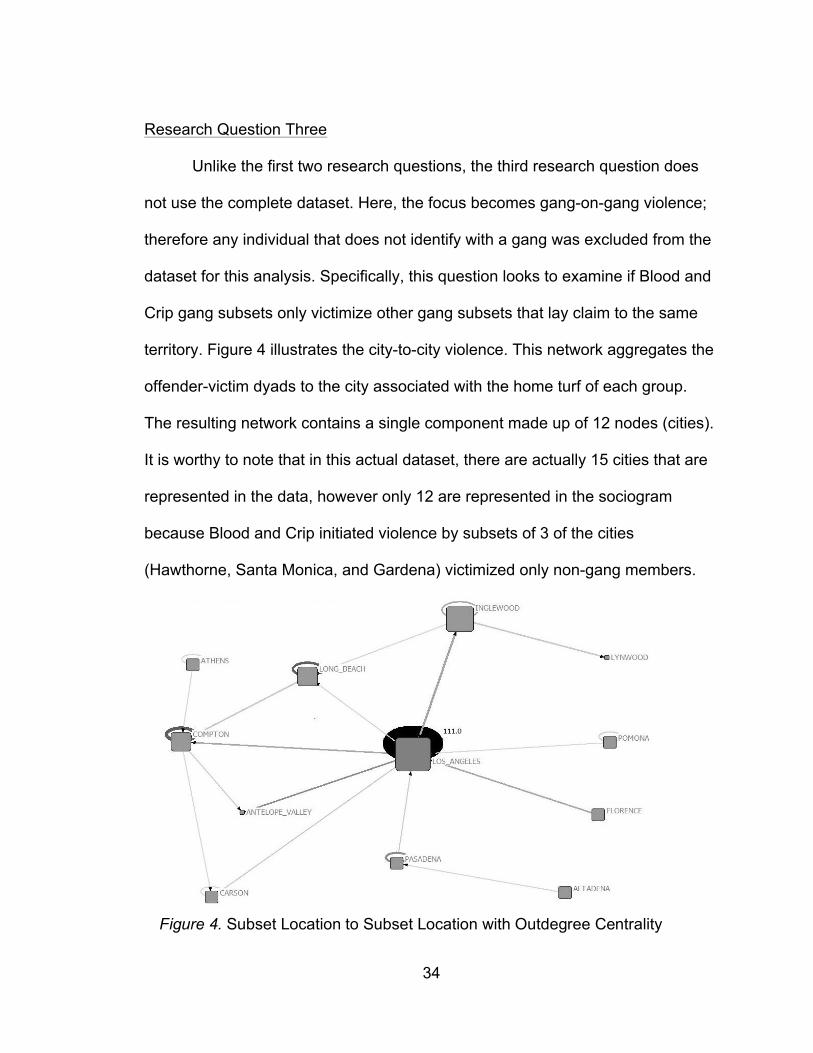
Research Question Three
Unlike the first two research questions, the third research question does
not use the complete dataset. Here, the focus becomes gang-on-gang violence;
therefore any individual that does not identify with a gang was excluded from the
dataset for this analysis. Specifically, this question looks to examine if Blood and
Crip gang subsets only victimize other gang subsets that lay claim to the same
territory. Figure 4 illustrates the city-to-city violence. This network aggregates the
offender-victim dyads to the city associated with the home turf of each group.
The resulting network contains a single component made up of 12 nodes (cities).
It is worthy to note that in this actual dataset, there are actually 15 cities that are
represented in the data, however only 12 are represented in the sociogram
because Blood and Crip initiated violence by subsets of 3 of the cities
(Hawthorne, Santa Monica, and Gardena) victimized only non-gang members.
Figure 4. Subset Location to Subset Location with Outdegree Centrality
35
Figure 4 includes 33% of the dataset (206 links). Like previous figures, the
outdegree centrality statistic is depicted. The most important link is emphasized
by the thickness of the line wrapping around the node of Los Angeles. As
indicated by the weighted link, 111 links (attacks) of the total 206 attacks
represented in this dataset originate and end in Los Angles City. This indicates
that more than half of the violence occurring between gang subsets in Los
Angeles County happens in the city of Los Angeles. Ties between cities indicate
the direction of exported violence: while Compton, Long Beach and Inglewood
have the tendency to produce problems, it is evident that the main problem lies in
the city of Los Angeles.
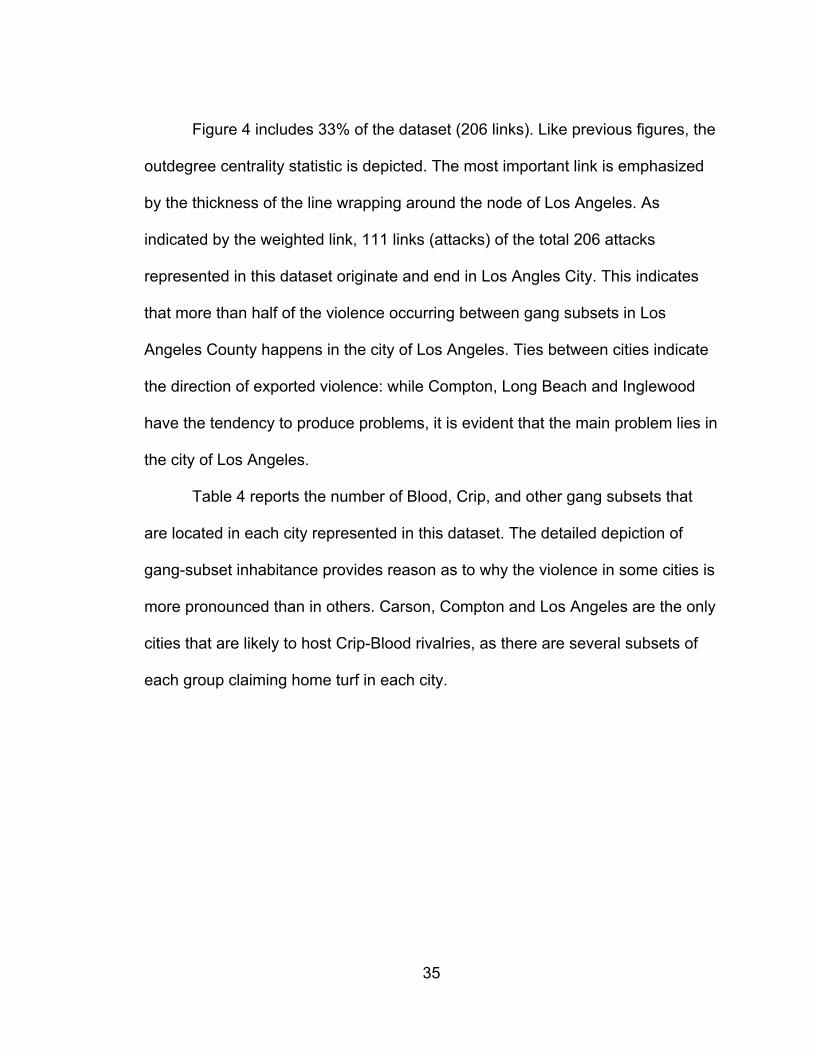
Table 4 reports the number of Blood, Crip, and other gang subsets that
are located in each city represented in this dataset. The detailed depiction of
gang-subset inhabitance provides reason as to why the violence in some cities is
more pronounced than in others. Carson, Compton and Los Angeles are the only
cities that are likely to host Crip-Blood rivalries, as there are several subsets of
each group claiming home turf in each city.
36
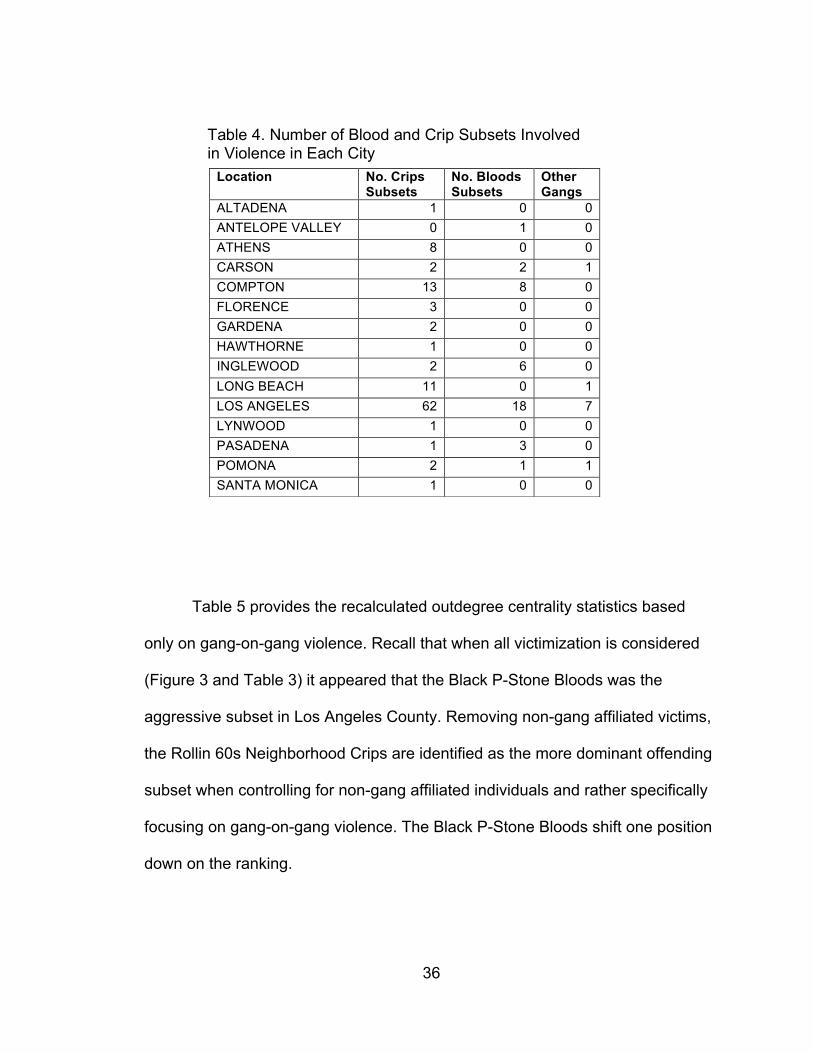
Table 5 provides the recalculated outdegree centrality statistics based
only on gang-on-gang violence. Recall that when all victimization is considered
(Figure 3 and Table 3) it appeared that the Black P-Stone Bloods was the
aggressive subset in Los Angeles County. Removing non-gang affiliated victims,
the Rollin 60s Neighborhood Crips are identified as the more dominant offending
subset when controlling for non-gang affiliated individuals and rather specifically
focusing on gang-on-gang violence. The Black P-Stone Bloods shift one position
down on the ranking.
Location No. Crips Subsets
No. Bloods Subsets
Other Gangs
ALTADENA 1 0 0 ANTELOPE VALLEY 0 1 0 ATHENS 8 0 0 CARSON 2 2 1 COMPTON 13 8 0 FLORENCE 3 0 0 GARDENA 2 0 0 HAWTHORNE 1 0 0 INGLEWOOD 2 6 0 LONG BEACH 11 0 1 LOS ANGELES 62 18 7 LYNWOOD 1 0 0 PASADENA 1 3 0 POMONA 2 1 1 SANTA MONICA 1 0 0
Table 4. Number of Blood and Crip Subsets Involved in Violence in Each City
37
The difference made when controlling for non-gang affiliated victims is
quite large. Not only did it alter the outdegree centrality for the most dominant
gang in the subset, but it also altered the top 5 offending gang subsets of both
the Bloods and Crips in comparison to what was shown in Table 3.
Research Question Four
The final research question investigates the hierarchical structure and
reciprocity of violent attacks. Table 6 displays the sets of dyads that were
identified as reciprocal sets in UCINet.
Three sets of reciprocal dyads are identified in Table 6. In this dataset,
there are a few more reciprocal relationships, however the aforementioned three
were worthy of attention due to the frequency of violence that occurs between the
sets. Specifically, the Insane Crips and the Rollin 20s Crips have a rivalry that
Rank Bloods Crips
Subset Nrm Outdegree Subset Nrm
Outdegree
1 Black P-Stone Bloods 1.016 Rollin 60s Neighborhood Crips 1.423
2 Inglewood Family Bloods .474 Insane Crips .745
3 Fruit Town Pirus .407 Rollin 40s Neighborhood Crips .474
4 Bounty Hunter Bloods .339 East Coast Crips .474
5 Crenshaw Mafia Gangster Bloods .271 Acacia Block Crips .271
Table 5. Top Five Offending Gang Subsets Controlling for Non-Gang Individuals (Outdegree Centrality)
38
would be considered stronger than the others due to the fact that each subset
has attacked its rival on more than one occasion. Since the Rollin 20s Crips
instigated more attacks (5 compared to 2 instigated by the Insane Crips), it would
appear that the former is more aggressive. The conflict between the Rollin 60s
Neighborhood Crips and 83 Gangster Crips is decidedly one-sided with the Rollin
60s Neighborhood Crips being the clear aggressor. This finding suggests that
rather than reciprocity, the inter- and intra-gang conflict occurring in Los Angeles
County may have a greater tendency to exhibit local hierarchies.
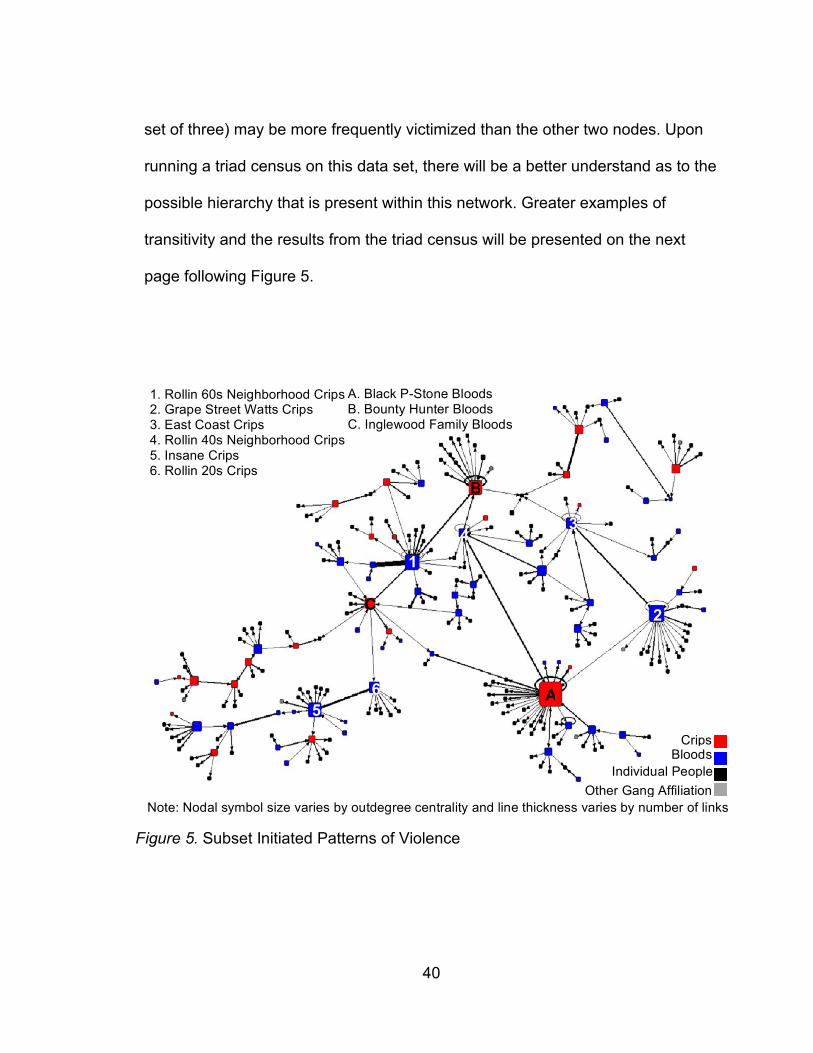
To investigate the existence of local hierarchical structures in this subset,
a more detailed view on the main component within the sociogram is needed.
While there were 43 components in that initial sociogram, Figure 5 below depicts
the main or principal component; this is the component containing the majority of
the connections and nodes within the network.
Set Gang Subsets Involved No. Reciprocated Links
Outdegree (N) Indegree (N)
1 83 Gangster Crips
13 1 12
Rollin 60s Neighborhood Crips 12 1
2 Insane Crips
7 2 5
Rollin 20s Crips 5 2
3 West Boulevard Crips
3 1 2
Black P-Stone Bloods 2 1
Table 6. Reciprocal Violent Relationships
39
Two patterns predominate, suggesting the presence of local hierarchies.
First, there appears to be many chain-like formations among gang subsets where
one subset victimizes another, who in turns attacks a third group. Second, there
are many two-star formations where a group attacks two other groups or
alternatively, two subsets attack the same victim. Combined, these patterns
suggest that within local circles, some groups are more dominant than others.
Given the lack of reciprocated ties, the idea of gang rivalries being equivalent
conflicts is not supported. The presence of the two-star formations among
multiple triads is representative of potential transitive triads. Transitive triads are
described by Holland and Leinhardt (1975) as a set of three nodes in which each
node is connected to one another by at least one link. Potential transitive ties,
ties in which two nodes are connected by at least one link; therefore providing
the possibility of the third link connecting all three nodes, provide a glimpse into
what can possibly be a hierarchical structure in the making as offending
increases and the links between nodes become more pronounced. To be more
specific, a triad in which has two out of three links between three nodes is
actually described as a “two star” or two-path triad and such a triad gives the
impression that there may be one node amongst the three that may have more
influential power within the network. In this case, it may be assumed that one
node of the set of three is responsibility for offending on a greater occasion than
the other two nodes. However, because this is a directed network, that notion
can work in the opposite manner as well. That is to say that one node (out of the
40
set of three) may be more frequently victimized than the other two nodes. Upon
running a triad census on this data set, there will be a better understand as to the
possible hierarchy that is present within this network. Greater examples of
transitivity and the results from the triad census will be presented on the next
page following Figure 5.
Figure 5. Subset Initiated Patterns of Violence
A
B
C
1
2
3 4
5 6
Crips Bloods
Individual People Other Gang Affiliation
dddd
A. Black P-Stone Bloods B. Bounty Hunter Bloods C. Inglewood Family Bloods
1. Rollin 60s Neighborhood Crips 2. Grape Street Watts Crips 3. East Coast Crips 4. Rollin 40s Neighborhood Crips 5. Insane Crips 6. Rollin 20s Crips
Note: Nodal symbol size varies by outdegree centrality and line thickness varies by number of links
41
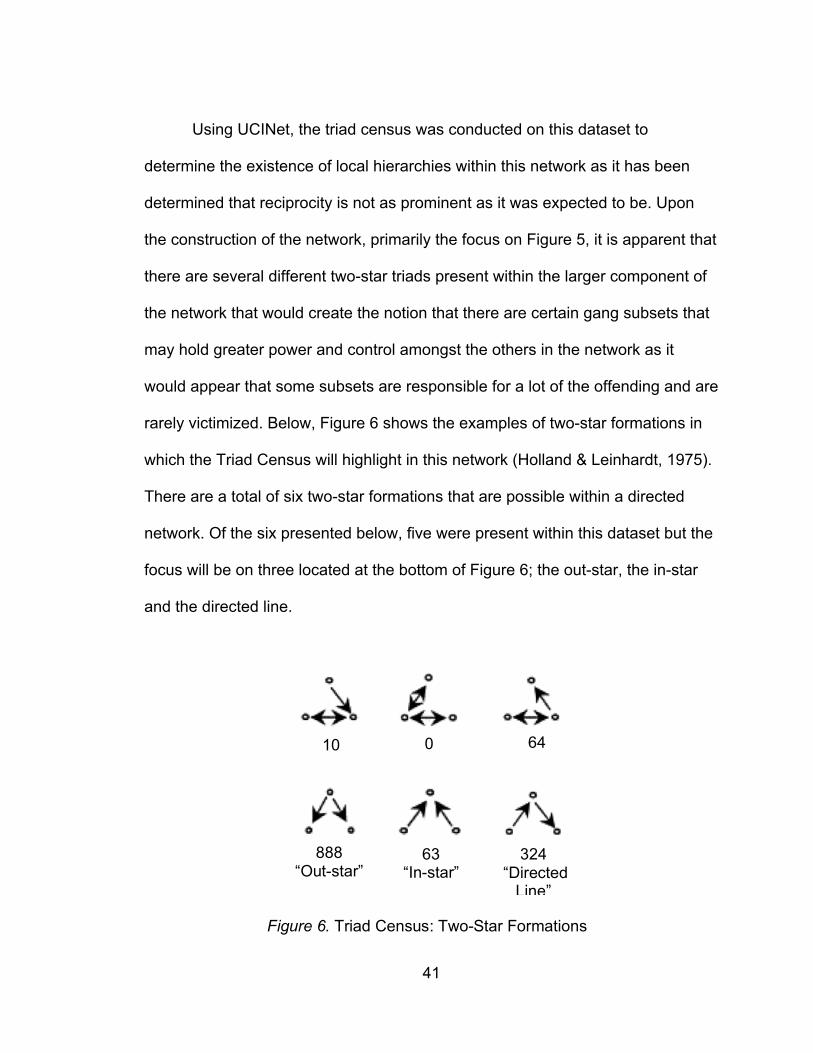
Using UCINet, the triad census was conducted on this dataset to
determine the existence of local hierarchies within this network as it has been
determined that reciprocity is not as prominent as it was expected to be. Upon
the construction of the network, primarily the focus on Figure 5, it is apparent that
there are several different two-star triads present within the larger component of
the network that would create the notion that there are certain gang subsets that
may hold greater power and control amongst the others in the network as it
would appear that some subsets are responsible for a lot of the offending and are
rarely victimized. Below, Figure 6 shows the examples of two-star formations in
which the Triad Census will highlight in this network (Holland & Leinhardt, 1975).
There are a total of six two-star formations that are possible within a directed
network. Of the six presented below, five were present within this dataset but the
focus will be on three located at the bottom of Figure 6; the out-star, the in-star
and the directed line.
10
0
64
888 “Out-star”
63 “In-star”
324 “Directed
Line”
Figure 6. Triad Census: Two-Star Formations
42
The numbers beneath each triad is representing the number of occasions
in which that particular type of triad was present in the network. As mentioned
earlier, the focus will be on the three sets of triads at the bottom of Figure 6. The
triad known as out-star is present when one node attacks two other nodes and is
not attacked by either in return. The in-star triad formation is present when two
nodes attack one node and the victimized node does not offend in either
direction. And lastly, the triad labeled as directed line is when one node attacks a
second node, and the second node attacks a third node. In this study, the out-
star triad formation is present 888 times, the in-star triad formation is present 63
times and the directed line triad formation is present 324 times. The triad census
does not identify each example of the triad formations, but it is evident by Figure
5 that the gang triad of the Bounty Hunter Bloods, the Rollin 40s Neighborhood
Crips and the Rollin 60s Neighborhood Crips is a prime example of an in-star
triad as it would appear that the Rollin 40s and Rollin 60s Neighborhood Crips
are both attacking the Bounty Hunter Bloods, but the Bounty Hunter Bloods are
not attacking either in return. An example of an out-star triad formation is the
Rollin 40s Neighborhood Crips offending the Black P-Stone Bloods and the
Bounty Hunter Bloods. And an example of the direct line triad is when the East
Coast Crips victimize the Grape Street Watts Crips and then the Grape Street
Watts Crips victimize the Black P-Stone Bloods.
43
The overwhelming presence of two-star triads in this dataset would
indicate that there is a local hierarchy among certain gang subsets as it is seen
that some subsets victimize multiple individuals or gangs, but do not get
victimized in return. It would appear that Los Angeles County contain gang
subsets that hold the majority of the power and therefore instill the greatest fears
in non-gang individuals and their gang counterparts.
44
CHAPTER FIVE
DISCUSSION
Introduction
Gang violence in Los Angeles County has been an ongoing problem.
Policies have been created and implemented in order to combat, deter and
punish the violence and the proliferation of gang activity. However, it would
appear that previous and current initiatives are not as effective as many would
hope which is evident by the ever-increasing presence of gang subsets growing
from 600 street gang in California in 1986 to nearly 1,400 street gangs in Los
Angeles County in 2000. The purpose behind this study was to provide policy
makers and law enforcement agencies an alternative view of the violence that is
being perpetuated by Blood and Crip gangs in Los Angeles County. Similar to the
way in which the results were presented in this thesis, this discussion section will
address each research question separately in order to consider the unique policy
implications accruing from each analysis.
Research Question One
Results show that more than two-thirds of the gang violence committed by
Blood and Crips members in Los Angeles County during the ten-year period
victimized individuals whom did not identify with a gang. The article written by
Weiss (2012) addressed earlier in this thesis indicated that 61% and 70% of the
deaths of individuals between the ages of 15 and 24 in Los Angeles City and
45
Long Beach, respectively, were gang-related. In combining that research with the
research done in this thesis, it can be generalized that nearly 40% and 50% of
the violence in these two cities were directed upon victims that were not affiliated
with any gang. Violence against non-gang affiliated victims increase fear within
the neighborhood where the attack occurs and fosters fear and unease more
broadly in the region. While the presence of law enforcement has the ability to
decrease the frequency of violence and deter the occurrence of gang related
criminal activity, there are other solutions that have been implemented that may
need to be revisited and altered in order to serve a better purpose for the safety
of the innocent individuals in the community.
A gang injunction is “a court order that prohibits gang members and
associates from engaging in specified behaviors within specifically designated
geographical boundaries” (Caldwell, 2010). The first gang injunction was
imposed in 1987 in the City of Los Angeles against the Playboy Gangster Crips.
A recent census of gang injunctions shows that there are 43 permanent
injunctions against 71 gangs in the city of Los Angeles alone (Caldwell, 2010).
Arguments against the use of injunctions posit that these civil restrictions are
served in a manner in which assumes guilt prior to providing proof, while
arguments in support of injunctions posit that they restrict public association
among gang members that intimidates other community members and
engenders further criminal activity (Felson, 2006). In reference to the results of
this study, it would appear that the effectiveness of injunctions should be
46
revisited so as to ensure that the most active groups are targeted; the groups
targeted must present a problem to the community now. There are currently 17
Blood and Crip gang subsets in the City of Los Angeles that have been served
with gang injunctions; included but not limited to Black P-Stone Bloods (as of
2005), Rollin 60s Neighborhood Crips (as of 2003), Grape Street Crips (as of
2005), and Bounty Hunter Bloods (as of 2003) (Gang Injunctions, 2013). Two of
the four mentioned subsets are responsible for the greatest amount of offending
in regards to the Bloods and Crips subsets in this study.
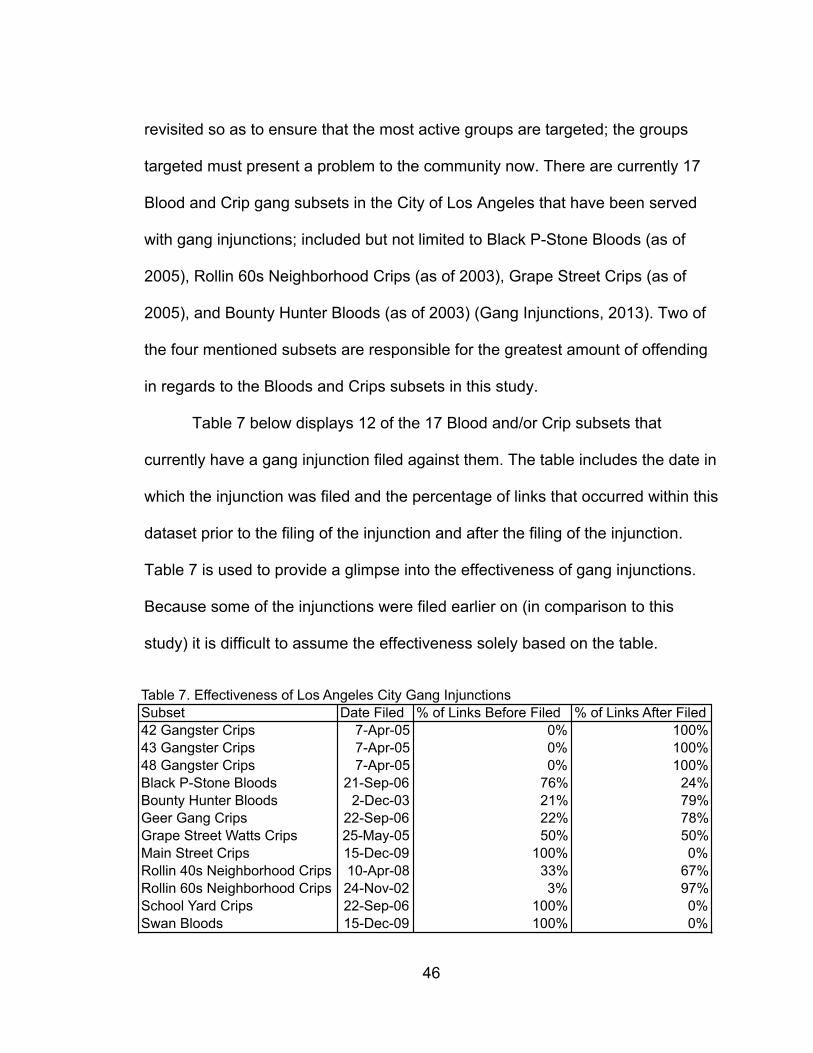
Table 7 below displays 12 of the 17 Blood and/or Crip subsets that
currently have a gang injunction filed against them. The table includes the date in
which the injunction was filed and the percentage of links that occurred within this
dataset prior to the filing of the injunction and after the filing of the injunction.
Table 7 is used to provide a glimpse into the effectiveness of gang injunctions.
Because some of the injunctions were filed earlier on (in comparison to this
study) it is difficult to assume the effectiveness solely based on the table.
Subset Date Filed % of Links Before Filed % of Links After Filed42 Gangster Crips 7-Apr-05 0% 100%43 Gangster Crips 7-Apr-05 0% 100%48 Gangster Crips 7-Apr-05 0% 100%Black P-Stone Bloods 21-Sep-06 76% 24%Bounty Hunter Bloods 2-Dec-03 21% 79%Geer Gang Crips 22-Sep-06 22% 78%Grape Street Watts Crips 25-May-05 50% 50%Main Street Crips 15-Dec-09 100% 0%Rollin 40s Neighborhood Crips 10-Apr-08 33% 67%Rollin 60s Neighborhood Crips 24-Nov-02 3% 97%School Yard Crips 22-Sep-06 100% 0%Swan Bloods 15-Dec-09 100% 0%
Table 7. Effectiveness of Los Angeles City Gang Injunctions
47
According to the table, it would appear that the gang injunctions had quite
a positive effect on the deterrence of criminal activity among the Black P-Stone
Bloods, as 76% of the events took place prior to the filing of the gang injunction
while only 24% of the events occurred after the gang injunction was filed.
Nonetheless, the same cannot be said for the Rollin 40s Neighborhood Crips in
which had 33% of the events occur prior to the gang injunction and 66% after the
gang injunction. It would appear that the deterrent premise of a gang injunction
did not have the same effect on the activity of the Rollin 40s Neighborhood Crips
as it did the Black P-Stone Bloods. It can be said that the number of events
increased after the gang injunction because officers became more focused on
the criminal activities of this gang and therefore increased the level of patrol,
resulting in a greater number of arrests. Unfortunately, the exact rhyme and
reason as to the trends of arrests is not able to be determined simply from this
data. Expanding the resources in which data is retrieved may do well in
determining this in future research.
Since gang violence committed by these subsets is still a problem in Los
Angeles one might conclude that the injunctions are failing. However, it is
equally, if not more likely the case, that the high number of prosecuted cases
indicates the opposite; that the gang injunction is working. Greater effort is
extended to monitor the activities of these groups and thus, their criminal
behavior is identified more readily and the associated supporting intelligence
gathering apparatus provides sufficient information upon which to launch
48
successful prosecutions. In other words, the cases that were identified in Lexis
Nexis may have been the result of the implementation of the injunction, therefore
creating the increase in arrests of these particular gang subsets.
Additionally, it may be assumed that the creation of gang injunctions and
the increase of law enforcement successes in the crack down on the criminal
activity of gangs may indirectly perpetuate the cycle. As gang subsets fall under
the hold of a gang injunction, individuals may branch from the larger gang to
create yet another subset in order to continue their criminal activity without being
under the scope of law enforcement. As an example, the West Side Crips
(founded in 1971), one of the largest Crip gangs in Los Angeles County had
members that branched out and created their own subset under the umbrella of
West Side Crips. 83 Gangster Crips is a smaller subset of West Side Crips and is
also one of the subsets identified in the research question regarding reciprocal
violent relationships within the dataset. To fully understand how the injunctions
are affecting gang activity more detail is needed than was collected in the current
study.
The details and the specifics of each case examined were limited; with so
many cases examined, it was difficult to investigate the factors leading up to the
arrest. Consequently, it would be wise for future research to look into the purpose
of the arrests made by contacting the arresting officers identified in the case
study to determine whether it was an opportunistic arrest or an arrest that was
pursued due to the issuance of the injunction. Due to the large number of non-
49
gang affiliated victims, it would be prudent to look into the effectiveness of the
police injunctions that are currently in place. Further research into injunctions,
their effectiveness, and the patrol resources that are put into current injunctions
may assist in the reduction of gang violence, specifically violence against non-
gang affiliated individuals.
A second consideration is that these results might be distorted due to the
enhanced penalties associated with being a known gang member (Jones, 2011;
McCarty, 2001). It is plausible that the number of the non-gang member
victimizations was inflated. Moreover, it is not possible to tell whether the non-
gang victims were actually part of a new or emerging group that had yet to come
to the attention of law enforcement. Further, some victims may have been in the
early stages of joining the gang when they were assaulted/murdered; to join a
gang, pledges are often forced to become involved in a violent altercation which
may end badly for them (they are victimized) or the individual proves themselves
(surviving and thus becoming the defendant). In some contexts, being a
defendant in a homicide case that targeted a rival (though unknown gang
member) or a general community member (to instill fear in the local area) may
constitute a heroic act in the eyes of the group.
Since it is unclear as to the motive of the attack and nature of interactions
between victim and offender leading up to the incident, little can be concluded at
this juncture. However, one implication raised by this analysis is that greater
effort is needed to ensure that CalGangs (California DOJ, 2013) and other gang
50
intelligence data gathering systems contain current, as well as historical
information (knowing who recently left a gang is also important). Given that 66%
of the people victimized were not known to be part of a gang, it is reasonable to
assert that it may be time to overhaul the CalGangs system. If a significant
number of gang members are able to avoid the enhanced penalties by masking
their role within local gang activity, then the system is fundamentally flawed and
in need of reengineering.
To test this possibility, future research must delve deeper into the avenues
in which the data is retrieved. Extracting data from one source is not exhaustive
and leaves room for an extensive amount of information left uncovered. Not only
must future research expand on the number of resources, rather the researcher
must also ensure the reliability of the resource, as it is conceivable that the
source in which the information is obtained may be out of date or inaccurate.
Similar to the earlier mentioned idea of gang subsets that branch from beneath
larger gangs, it would behoove law enforcement agencies to detail the existence,
formation and “birth” of gang subsets and gang members in order to maintain
accurate information that will provide for a better tracking system.
Research Question Two
The violence between Bloods and Crips has been present since the
1960s. As time passes, the number of subsets appears to increase and the
existence of all these splinter groups may have weakened the rivalry between
Bloods and Crips. According to Table 5 and Figure 5 it is apparent that some
51
gang subsets garner more attention than others in regards to their contribution to
the gang violence occurring in Los Angeles County. While there are more Crips
subsets (70%) in this dataset than there are Bloods subsets (24%), each gang
affiliation had a particular subset that stood out above all others as an instigator
of violence. The Rollin 60s Neighborhood Crips and the Black P-Stone Bloods
were the dominating subsets; victimizing many others yet not being on the
receiving end (low reciprocation of violence). Overall, the Crips were a greater
dominating force that the Bloods. Nonetheless, certain subsets in within the
Bloods also did well in representing Los Angeles County in regards to
contributing to the gang violence.
As mentioned throughout this thesis, the occurrence of gang violence
often stems from the rivalries present among surrounding neighborhoods.
Strategies to prevent the gang violence amongst Bloods and Crips are often
suggested but not always carried out and fewer still have been evaluated with
rigorous studies. The Gangbusters bill that was established in 2005 that was
mentioned in the second chapter is an excellent example of implemented ideas
and legislation that was posed to thwart the criminal activity and formation of
gangs. However, there appears to be a substantial lack in statistical evidence
showing that the creation of the Gangbusters bill in 2005 has proven to be an
effective way to combat inter- and intra-gang violence. Several years ago, the
Los Angeles Police Department partnered with community leaders and residents
to create the Community Safety Partnership, in which the main goal was to
52
decrease the gang violence in Los Angeles City (Watts specifically) and increase
the community efficacy between residents and officers (Buntin, 2013). The
necessity of cooperation between community residents and city police will
attribute to the omnipresent watchful guardianship of the streets of Los Angeles.
In order to assist in the prevention of the Black P-Stone Bloods and the Rollin
60s Neighborhood Crips victimization among individuals within the community, I
believe the programs that were instituted to curtail these problems need to be
revisited, as it would appear that the successes of these programs are not
evident. The increase of deterring tactics (Gangbusters bill) will only be as
effective as the effort to ensure its proper implementation.
Due to the fact that Lexis Nexis does not clearly identify the criteria
necessary to be included in the system archive, there is a possibility that there
are events and cases that occurred yet that were not captured during the process
of data retrieval in this study. Furthermore, it would appear that all cases that are
present in Lexis Nexis are cases that went to trial before the appearance of a
judge and appears to exclude cases in which may have been settled outside of
the courtroom. With that being said, to expand the present study, it would be
suggested that in the future, data should be gathered from a greater number of
sources; those that are even more reliable and can provide additional cases and
information that may be lacking in Lexis Nexis. Interviewing and working
alongside detectives and police officers that work in the cities known for greater
53
gang violence may allow for uncovering subsets that may have been looked over
while only using data that was present in Lexis Nexis.
Research Question Three
As mentioned in the literature review, a study conducted in St. Louis in
1999 stated that gang violence is a direct result of the activities and intrinsic
behaviors that occur from the spatial distribution of turf rivalries (Robinson et al.,
2009). In other words, gang violence is directly impacted by the altercations that
are likely to occur in locations in which are shared or act as a border between
two gang rivalries. The results presented here support this premise. As an
example, Figure 4 and Table 6 provide a clear, distinctive focus on the frequency
of gang violence amongst subsets that share the same neighborhood. Figure 4
details the cities in which each defendant subset within the data claimed as their
territory. In the majority of the data, it was shown that the most violence was
delivered by and inflicted upon gang subsets representing the City of Los
Angeles. Furthermore, Table 6 illustrates the top three reciprocated dyads in the
data set; showing that both gang subsets that are represented in each dyad are
from the same city, proving further that rivalries within city limits seem to be a
strong trend.
An article written in 1992 titled 8-Trey Crips Have Chilling Crime Record,
detailed the criminal history of the 83 Gangster Crips representing the City of Los
Angeles (Sahagun and Chavez, 1992). In the article, the rivalry between the 83
Gangster Crips and the Rollin 60s Neighborhood Crips is described as a rivalry
54
that has been active for at least 7 years. This current study is representative of
the time period of January 2002 to December of 2011. It is clear that the rivalry
between the 83 Gangster Crips and the Rollin 60s Neighborhood Crips is still in
existence more than 25 years later as this dyad is one of the top three in
reference to reciprocating relationships in regards to gang violence. The results
that were presented in regards to research question three falls directly in line with
the examination of the Lotka-Volterra model addressed in the study of gang
violence in Boyle Heights (Brantingham et al., 2012). Brantingham et al. (2012)
provided similar results showing the likelihood of gang violence occurring in the
area in which would be considered as a boundary line between two gang,
therefore acting as a predictor of violence amongst gangs. The impact that gang
rivalry and adjacent locations have on the occurrence of gang violence must be a
policing priority and should be a consideration when drawing up patrol beats and
assigning coverage, developing gang injunctions and pinpointing problem areas.
The data in this study illuminates 13 events that occurred between the 83
Gangster Crips and the Rollin 60s Neighborhood Crips during this time period.
However, one would likely assume that during this ten-year period, there were
more instances of violence between these long-standing rivals. Future research
should extend on the area of data collection to other sources in order to capture
other events occurring between these rivals that are not published in Lexis Nexis.
The collection of greater material may provide for a reason or mitigating
55
circumstance as to why the rivalry continues which can in turn lead to a way to
deter the violence and possibly create a truce or cease fire between the subsets.
Research Question Four
The structure of the network created from this study shows the existence
of reciprocated relationships between subsets and a slight hierarchical
relationship amongst the network. Specifically, there were three sets of dyads
that were identified within the network as reciprocal pairs: (1) 83 Gangster Crips
and Rollin 60s Neighborhood Crips, (2) Insane Crips and Rollin 20s Crips, and
(3) West Boulevard Crips and Black P-Stone Bloods. Upon identifying the three
dyads, it is clear that both subsets within each dyad were at one point an
offender as well as a victim of violence. According to an article written by Nate
Berg (2012) of The Atlantic Cities, gang-related homicides tend to differ across
varying cities, but some characteristics remain the same: (1) they tend to involve
firearms, (2) occur in public places, (3) victimize males between 15 and 19 and
(4) often revolve around retaliation. The fact that it has been identified that gang-
related violence is often based on retaliation, it proved beneficial to research the
existence and frequency of reciprocated violence amongst Blood and Crip gangs
in Los Angeles County.
Furthermore, as mentioned in the discussion of the first research question,
the gangs that are identified in reciprocated relationships are also identified as
gangs that are currently under gang injunctions in Los Angeles City. The 83
Gangster Crips, the Rollin 60s Neighborhood Crips and the Black P-Stone
56
Bloods each currently have a gang injunction in place. Additionally, the Insane
Crips of Long Beach are also under gang injunction in the city of Long Beach as
of 2003. Not present on the list of gang injunction is the Rollin 20s Crips. If it is
assumed that there is a positive relationship between the existence of a gang
injunction and that of the increase in the number of arrests amongst these
subsets, it would behoove law enforcement to focus on the relationship between
the Insane Crips and Rollin 20s Crips of Long Beach with the intent to file a gang
injunction against the Rollin 20s Crips as well.
Upon establishing the fact that several of these gang injunctions were
imposed nearly a decade ago, it would be interesting to see the difference or
impact of such an injunction after the implementation. As the scope of this study
does not cover cases prior to 2002, it would be interesting to determine if the
filing of gang injunctions is effective in regards to the decrease in gang violence.
An additional solution would be that of an agreement between two gang rivalries,
similar to the Cease Fire Agreement that was drafted in 1992 amongst the
Bloods and Crips. The effectiveness of this agreement would need to be further
researched as well.
In regards to the presence of a hierarchy in the network, it would appear
that the Black P-Stone Bloods and the Rollin 60s Neighborhood Crips have the
greatest influence in violence amongst this network. Both gang subsets are
representative of the city of Los Angeles and are no greater than five-miles away
from one another. The increase in resources and patrol units in this area would
57
provide the necessary increase in police presence to assist in the deterrence of
gang violence. However, such a solution does not provide a prevention policy
rather only a way to deal with it after the fact. To determine a manner in which to
address the violence involving the Black P-Stone Bloods and the Rollin 60s
Neighborhood Crips proactively, it would be wise to focus only on the violent
activities amongst these two gang subsets, possibly discovering a correlation
between the subsets and their rivals and/or victims on a greater scale than what
was able to be provided in this thesis due to the overwhelming amount of data
analyzed and the limited number of resources used to extract the data.
Conclusion
As mentioned several times in the Discussion Chapter of this study, the
primary limitation to take into consideration is the possibility of misrepresented
data in regards to the way in which gang subset names are recorded in the court
cases. In an effort to provide an example, there are instances in which a certain
gang subset has additional subsets and therefore the inconsistency of specifying
each subset can lead to a misrepresentation of violence of one subset over
others. Table 8 below illustrates a select few Crip subsets that have additional
subsets beneath the main subset umbrella that, if mislabeled, can slightly
construe the representation of the data. In this study, the East Coast Crips were
represented as offenders in 45 links; however, in 12 links (27% of East Coast
Crips activity), a neighborhood or specific set of East Coast Crips is not specified
in the court cases of these particular 12 links.
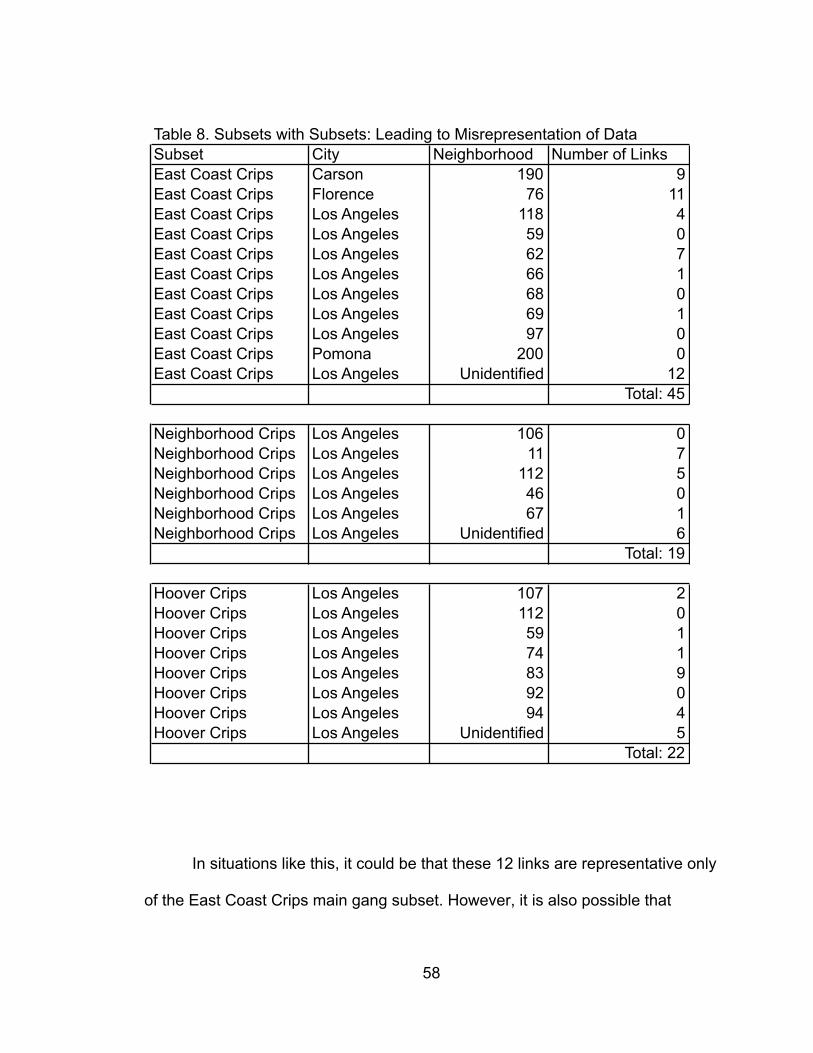
58
In situations like this, it could be that these 12 links are representative only
of the East Coast Crips main gang subset. However, it is also possible that
Subset City Neighborhood Number of LinksEast Coast Crips Carson 190 9East Coast Crips Florence 76 11East Coast Crips Los Angeles 118 4East Coast Crips Los Angeles 59 0East Coast Crips Los Angeles 62 7East Coast Crips Los Angeles 66 1East Coast Crips Los Angeles 68 0East Coast Crips Los Angeles 69 1East Coast Crips Los Angeles 97 0East Coast Crips Pomona 200 0East Coast Crips Los Angeles Unidentified 12
Total: 45
Neighborhood Crips Los Angeles 106 0Neighborhood Crips Los Angeles 11 7Neighborhood Crips Los Angeles 112 5Neighborhood Crips Los Angeles 46 0Neighborhood Crips Los Angeles 67 1Neighborhood Crips Los Angeles Unidentified 6
Total: 19
Hoover Crips Los Angeles 107 2Hoover Crips Los Angeles 112 0Hoover Crips Los Angeles 59 1Hoover Crips Los Angeles 74 1Hoover Crips Los Angeles 83 9Hoover Crips Los Angeles 92 0Hoover Crips Los Angeles 94 4Hoover Crips Los Angeles Unidentified 5
Total: 22
Table 8. Subsets with Subsets: Leading to Misrepresentation of Data

59
some, if not all of these 12 links are representative of a smaller neighborhood or
specific set, therefore under-representing the violence caused by a smaller
subset and over-representing the violence caused by the larger subset. The
same holds true in regards to the Neighborhood Crips and the Hoover Crips, also
represented in Table 8.
Despite the slight limitations that the detailing of subsets can cause, the
main gang subsets that are responsible for most of the offending within this study
are not the gang subsets that may be misrepresented because of the lack of
detail in regards to street territory. As clearly identified, there are three major
dyads that have a history of reciprocal violence dating back years prior to this
study. Furthermore, also identified in this study is the omnipresent structure of
local hierarchies in regards to offending among the gang subsets in Los Angeles
County. The two-star formations that were uncovered in this network are
representative of the notion that there appears to be a less than “sporadic”
structure amongst the gang violence in Los Angeles County. It would appear that
quite a bit of the violence is caused by dominant gang subsets and the
victimization often falls upon individuals that are not gang-related. It is important
to highlight that two gang subsets appear in both the presence of reciprocal
violence as well as play an active role in offending among the local hierarchies in
the area. The Black P-Stone Bloods and the Rollin 60s Neighborhood Crips
make a strong impression in this network, an impression that should be
considered in regards to policy implications. The activity of the Black P-Stone
60
Bloods and the Rollin 60s Neighborhood Crips should also be scrutinized in
regards to the targets of their violence. The network shows that more often than
not, both of these gang subsets are victimizing individuals that are not known to
be gang members. The direction of gang violence would cause for speculation as
to why these subsets seek after non-gang affiliates. The victimization of
community members that do not belong to a gang may be a method to instill fear,
and therefore respect of the subsets. Where on the contrary, violence amongst
subsets may be a fight for resources that may provide for a financial gain. The
scope of this thesis does not allow for the answer to such questions, rather an
idea as to what future research can expand on.
As opposed to simply increasing the patrol in the areas in which
troublesome gangs frequent, it may behoove law enforcement agencies to
proactively discontinue the feud that is going on amongst the dyads in which the
Black P-Stone Bloods and the Rollin 60s Neighborhood Crips are involved in.
Similar to the Cease Fire Agreement that was posed in 1992 between the Bloods
and Crips as a whole, it may be more beneficial to focus on a smaller aspect of
the gang violence amongst Bloods and Crips and branch out as time progresses
and the effects of such a policy is noticed.
Lastly, while the Black P-Stone Bloods is a gang that is noted as
committing acts of reciprocal violence, it would actually appear that most of the
violence committed by Black P-Stone Bloods are against individuals that do not
belong to a gang, which instills a greater fear in the community as it would
61
appear that the gang does not necessarily care whom they harm. With that
realization, law enforcement agencies should put a greater focus on the areas in
which the Black P-Stone Bloods represent as well as educate the community in a
manner in which they are able to protect themselves and be aware of their
surroundings, therefore lessening the fear and rather encouraging and increasing
their ability to be more observant, which can in turn assist law enforcement.
To further expand on the value of this study, it would be wise to include
other popular Los Angeles County gang subsets, such as those that may account
for the other demographics in the County (Asian and Hispanic street gangs), as it
has been identified that Hispanics are the majority of the gang-related victims in
Long Beach and Los Angeles (Berg, 2012). There is a known lack of social
efficacy between races in Los Angeles County (in regards to street gangs), which
can also attribute to several incidents of gang violence between the inter-racial
gang subsets in Los Angeles County. Such a feat would be difficult to endure, as
the number of cases and subsets would certainly rise above 284 cases and 158
Bloods and Crips subsets that were identified in Lexis Nexis during this time
period.

62
APPENDIX
COMPLETE DESCRIPTIVE VARIABLES
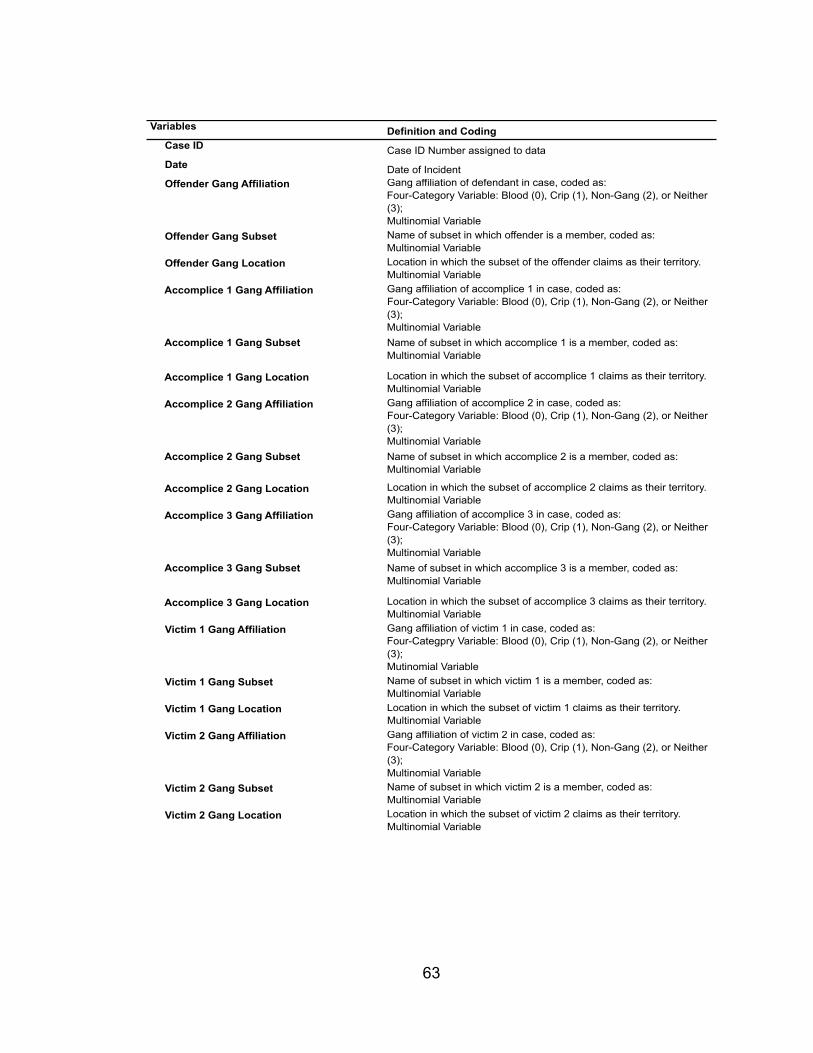
63
Variables Definition and Coding Case ID Case ID Number assigned to data Date Date of Incident Offender Gang Affiliation Gang affiliation of defendant in case, coded as:
Four-Category Variable: Blood (0), Crip (1), Non-Gang (2), or Neither (3);Multinomial Variable
Offender Gang Subset Name of subset in which offender is a member, coded as:Multinomial Variable
Offender Gang Location Location in which the subset of the offender claims as their territory.Multinomial Variable
Accomplice 1 Gang Affiliation Gang affiliation of accomplice 1 in case, coded as:Four-Category Variable: Blood (0), Crip (1), Non-Gang (2), or Neither (3);Multinomial Variable
Accomplice 1 Gang Subset Name of subset in which accomplice 1 is a member, coded as:Multinomial Variable
Accomplice 1 Gang Location Location in which the subset of accomplice 1 claims as their territory.Multinomial Variable
Accomplice 2 Gang Affiliation Gang affiliation of accomplice 2 in case, coded as:Four-Category Variable: Blood (0), Crip (1), Non-Gang (2), or Neither (3);Multinomial Variable
Accomplice 2 Gang Subset Name of subset in which accomplice 2 is a member, coded as:Multinomial Variable
Accomplice 2 Gang Location Location in which the subset of accomplice 2 claims as their territory.Multinomial Variable
Accomplice 3 Gang Affiliation Gang affiliation of accomplice 3 in case, coded as:Four-Category Variable: Blood (0), Crip (1), Non-Gang (2), or Neither (3);Multinomial Variable
Accomplice 3 Gang Subset Name of subset in which accomplice 3 is a member, coded as:Multinomial Variable
Accomplice 3 Gang Location Location in which the subset of accomplice 3 claims as their territory.Multinomial Variable
Victim 1 Gang Affiliation Gang affiliation of victim 1 in case, coded as:Four-Categpry Variable: Blood (0), Crip (1), Non-Gang (2), or Neither (3);Mutinomial Variable
Victim 1 Gang Subset Name of subset in which victim 1 is a member, coded as:Multinomial Variable
Victim 1 Gang Location Location in which the subset of victim 1 claims as their territory.Multinomial Variable
Victim 2 Gang Affiliation Gang affiliation of victim 2 in case, coded as:Four-Category Variable: Blood (0), Crip (1), Non-Gang (2), or Neither (3);Multinomial Variable
Victim 2 Gang Subset Name of subset in which victim 2 is a member, coded as:Multinomial Variable
Victim 2 Gang Location Location in which the subset of victim 2 claims as their territory.Multinomial Variable
64
REFERENCES
Bellair, P. E., & McNulty, T. L. (2009). Gang membership, drug selling, and
violence in neighborhood context. JQ: Justice Quarterly, 26(4), 644-669.
doi:10.1080/07418820802593394
Berg, N. (2012, January 31). The 5 U.S. cities with the worst gang violence.
Retrieved October 24, 2013, from The Atlantic Cities website:
http://www.theatlanticcities.com/neighborhoods/2012/01/5-us-cities-worst-
gang-violence/1095/
Brantingham, P., Tita, G. E., Short, M. B., & Reid, S. E. (2012). The ecology of
gang territorial boundaries. Criminology, 50(3), 851-885.
doi:10.1111/j.1745-9125.2012.00281.x
Buntin, J. (2013, July 10). What does it take to stop Crips and Bloods from killing
each other? New York Times. Retrieved from
http://www.nytimes.com/2013/07/14/magazine/what-does-it-take-to-stop-
crips-and-bloods-from-killing-each-other.html?pagewanted=1&_r=1
Caldwell, B. (2010). Criminalizing day-to-day life: A socio-legal critique of gang
injunctions. American Journal Of Criminal Law, 37(3), 241-290.
CalGang [Fact sheet]. (2013). Retrieved November 7, 2013, from State of
California: Department of Justice website: http://oag.ca.gov/calgang
Federal Bureau of Investigation. 2011 National gang threat assessment –
emerging trends. (2011). Retrieved November, 2012, from
65
http://www.fbi.gov/stats-services/publications/2011-national-gang-threat-
assessment/2011-national-gang-threat-assessment#Endnotes
Felson, M. (2006). Crime and nature. Thousand Oaks, CA: Sage.
Gang Injunctions [Fact sheet]. (2013). Retrieved October 24, 2013, from Los
Angeles City Attorney website: http://www.atty.lacity.org/index.htm
Gilpin, M. E., & Ayala, F. J. (1973). Global models of growth and competition.
Proceedings of the National Academy of Sciences of the United States of
America, 70(12), 3590-3593.
Hanneman, R. A., & Riddle, M. (2005). Introduction to social network methods.
Riverside, CA: University of California, Riverside.
Hegemann, R. A., Smith, L. M., Barbaro, A. T., Bertozzi, A. L., Reid, S. E., & Tita,
G. E. (2011). Geographical influences of an emerging network of gang
rivalries. Physica A, 390(21/22), 3894-3914.
doi:10.1016/j.physa.2011.05.040
Holland, P. W., & Leinhardt, S. (1976). The statistical analysis of local structure in
social networks. Sociological Methodology, 1-45.
Houston, H., and Anglin, D. (1995). The epidemic of gang-related homicides in
Los Angeles County from 1979 through 1994. JAMA. Journal of the
American Medical Association, 274(13). 1031.
Howell, J. C. (2012). Gangs in America's communities. Thousand Oaks, CA:
Sage Publications.
66
Mackun, P., & Wilson, S. (2011, March). Population distribution and change:
2000 to 2010 [Fact sheet]. Retrieved November, 2012, from U.S. Census
website: http://www.census.gov/prod/cen2010/briefs/c2010br-01.pdf
Malm, A., Bichler, G., & Nash, R. (2011). Co-Offending between criminal
enterprise groups. Global Crime, 12(2), 112-128.
Maoz, Z., Terris, L. G., Kuperman, R. D., & Talmud, I. (2007). What is the enemy
of my enemy? Causes and consequences of imbalanced international
relations, 1816–2001. Journal Of Politics, 69(1), 100-115.
doi:10.1111/j.1468-2508.2007.00497.x
McCarthy, T. (2005, June 13). L.A. gangs are back. TIME Magazine.
Robinson, P. L., Boscardin, W., George, S. M., Teklehaimanot, S., Heslin, K. C.,
& Bluthenthal, R. N. (2009). The effect of urban street gang densities on
small area homicide incidence in a large metropolitan county, 1994–2002.
Journal Of Urban Health, 86(4), 511-523. doi:10.1007/s11524-009-9343-x
Sahagun, L., & Chavez, S. (1992, May 13). 8-Trey Crips have chilling crime
record. Los Angeles Times, Collections. Retrieved from
http://articles.latimes.com/1992-05-13/news/mn-1663_1_hoover-crip-
gang-member
Sugarmann, J., & Diaz, T. (2009, February). Youth gang violence and gangs:
data collection in California. Retrieved November, 2012, from Violence
Policy Center website: http://www.vpc.org/studies/CAgang.pd
67
Tita, G., & Radil, S. (2011). Spatializing the social networks of gangs to explore
patterns of violence. Journal Of Quantitative Criminology, 27(4), 521-545.
doi:10.1007/s10940-011-9136-8
Wasserman, S., & Faust, K. (1994). Social network analysis: methods and
applications. New York, NY: Cambridge University Press.
Weiss, K. (2012, January 31). California gang violence is public health threat
[Blog post]. Retrieved from California HealthCare Foundation website:
http://centerforhealthreporting.org/blog/california-gang-violence-public-
health-threat769
Winton, R. (2005, May 13). L.A. home turf for hundreds of neighborhood criminal
groups. Los Angeles Times, Local.


