Embed Size (px)
Citation preview

agriculture
Article
Longitudinal Axial Flow Rice Thresher PerformanceOptimization Using the Taguchi Technique
Mohamed Anwer Abdeen 1,2 , Abouelnadar Elsayed Salem 1,3 and Guozhong Zhang 1,*
�����������������
Citation: Abdeen, M.A.; Salem, A.E.;
Zhang, G. Longitudinal Axial Flow
Rice Thresher Performance
Optimization Using the Taguchi
Technique. Agriculture 2021, 11, 88.
https://doi.org/10.3390/agriculture
11020088
Received: 24 November 2020
Accepted: 18 January 2021
Published: 20 January 2021
Publisher’s Note: MDPI stays neutral
with regard to jurisdictional claims in
published maps and institutional affil-
iations.
Copyright: © 2021 by the authors.
Licensee MDPI, Basel, Switzerland.
This article is an open access article
distributed under the terms and
conditions of the Creative Commons
Attribution (CC BY) license (https://
creativecommons.org/licenses/by/
4.0/).
1 College of Engineering, Huazhong Agricultural University, Wuhan 430070, China;[email protected] (M.A.A.); [email protected] (A.E.S.)
2 Agricultural Engineering Department, Zagazig University, Zagazig 44519, Egypt3 Desert Research Center, Mataria 11753, Egypt* Correspondence: [email protected]
Abstract: Combine harvesters are widely used worldwide in harvesting many crops, and they havemany functions that cover the entire harvesting process, such as cutting, threshing, separating, andcleaning. The threshing drum is the core working device of the combine harvester and plays aninfluential role in rice threshing efficiency, threshing power requirement, and seed loss. In this study,two structures of rice threshers (conical-shaped and cylindrical-shaped) were tested and evaluatedfor performance under different thresher rotating speeds of 1100, 1300, and 1500 rpm and differentfeeding rates of 0.8, 1.1, and 1.4 kg/s. The experiment was designed using the Taguchi method, andthe obtained results were evaluated using the same technique. The thresher structure and operatingparameters were assessed and optimized with reference to threshing efficiency, required power, andproductivity. The obtained results revealed that increasing thresher rotating speed and the feedingrate positively related to threshing efficiency, power, and productivity. The highest efficiency of 98%and the maximum productivity of 0.64 kg/s were obtained using the conical-shaped thresher undera 1500 rpm rotating speed and a feed rate of 1.4 kg/s, whereas the minimum required power of5.45 kW was obtained using the conical thresher under a rotating speed of 1100 rpm and a feed rateof 0.8 kg/s.
Keywords: rice threshing; rice combine; longitudinal axial flow thresher; Taguchi method
1. Introduction
Rice is the second most important cereal after wheal, which together supply 95% ofthe world’s population’s whole staple food [1].
China is the biggest grain producer globally, with a planting area of 94,370.8 km2 andaccounting for 21.98% of the world’s grain production [2].
The grain harvester is the most essential piece of agricultural machinery that improvesharvesting efficiency and reduces labor costs [3–6].
Combine harvesters are widely used worldwide to harvest different crops underdifferent environmental and operating conditions. They have many functions such ascutting, threshing, separating, cleaning, and sometimes storing crops.
Many small, medium, and giant threshers have existed for a long time, but becauseof their low performance compared to traditional threshing methods, they have neverbeen adapted to a significant extent. Some of these threshers are hand-held, and others arepedal-operated [7].
Threshing is considered one of the most vital crop processing operations for separatinggrains from the ears and preparing them for the market [8].
Threshing is the process of separating the edible part of the cereal grain from the chaffthat surrounds it, and it is done after harvesting the crop and before winnowing it [9].
The simplest threshing system is picking up rice stalks and trampling the paniclesunderfoot or beating them against a hard surface such as a rack, threshing board, or tub [10].
Agriculture 2021, 11, 88. https://doi.org/10.3390/agriculture11020088 https://www.mdpi.com/journal/agriculture
Agriculture 2021, 11, 88 2 of 14
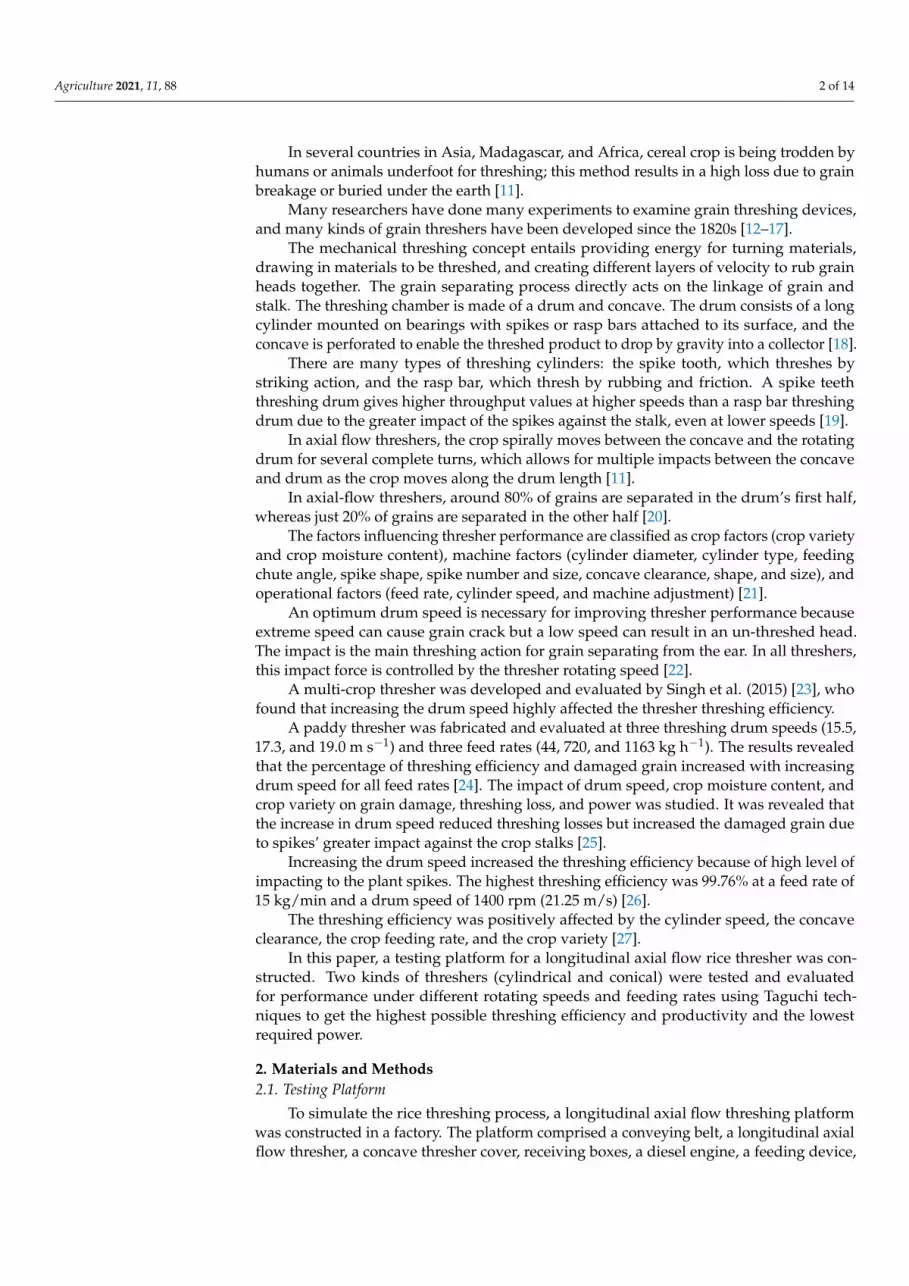
In several countries in Asia, Madagascar, and Africa, cereal crop is being trodden byhumans or animals underfoot for threshing; this method results in a high loss due to grainbreakage or buried under the earth [11].
Many researchers have done many experiments to examine grain threshing devices,and many kinds of grain threshers have been developed since the 1820s [12–17].
The mechanical threshing concept entails providing energy for turning materials,drawing in materials to be threshed, and creating different layers of velocity to rub grainheads together. The grain separating process directly acts on the linkage of grain andstalk. The threshing chamber is made of a drum and concave. The drum consists of a longcylinder mounted on bearings with spikes or rasp bars attached to its surface, and theconcave is perforated to enable the threshed product to drop by gravity into a collector [18].
There are many types of threshing cylinders: the spike tooth, which threshes bystriking action, and the rasp bar, which thresh by rubbing and friction. A spike teeththreshing drum gives higher throughput values at higher speeds than a rasp bar threshingdrum due to the greater impact of the spikes against the stalk, even at lower speeds [19].
In axial flow threshers, the crop spirally moves between the concave and the rotatingdrum for several complete turns, which allows for multiple impacts between the concaveand drum as the crop moves along the drum length [11].
In axial-flow threshers, around 80% of grains are separated in the drum’s first half,whereas just 20% of grains are separated in the other half [20].
The factors influencing thresher performance are classified as crop factors (crop varietyand crop moisture content), machine factors (cylinder diameter, cylinder type, feedingchute angle, spike shape, spike number and size, concave clearance, shape, and size), andoperational factors (feed rate, cylinder speed, and machine adjustment) [21].
An optimum drum speed is necessary for improving thresher performance becauseextreme speed can cause grain crack but a low speed can result in an un-threshed head.The impact is the main threshing action for grain separating from the ear. In all threshers,this impact force is controlled by the thresher rotating speed [22].
A multi-crop thresher was developed and evaluated by Singh et al. (2015) [23], whofound that increasing the drum speed highly affected the thresher threshing efficiency.
A paddy thresher was fabricated and evaluated at three threshing drum speeds (15.5,17.3, and 19.0 m s−1) and three feed rates (44, 720, and 1163 kg h−1). The results revealedthat the percentage of threshing efficiency and damaged grain increased with increasingdrum speed for all feed rates [24]. The impact of drum speed, crop moisture content, andcrop variety on grain damage, threshing loss, and power was studied. It was revealed thatthe increase in drum speed reduced threshing losses but increased the damaged grain dueto spikes’ greater impact against the crop stalks [25].
Increasing the drum speed increased the threshing efficiency because of high level ofimpacting to the plant spikes. The highest threshing efficiency was 99.76% at a feed rate of15 kg/min and a drum speed of 1400 rpm (21.25 m/s) [26].
The threshing efficiency was positively affected by the cylinder speed, the concaveclearance, the crop feeding rate, and the crop variety [27].
In this paper, a testing platform for a longitudinal axial flow rice thresher was con-structed. Two kinds of threshers (cylindrical and conical) were tested and evaluatedfor performance under different rotating speeds and feeding rates using Taguchi tech-niques to get the highest possible threshing efficiency and productivity and the lowestrequired power.
2. Materials and Methods2.1. Testing Platform
To simulate the rice threshing process, a longitudinal axial flow threshing platformwas constructed in a factory. The platform comprised a conveying belt, a longitudinal axialflow thresher, a concave thresher cover, receiving boxes, a diesel engine, a feeding device,

Agriculture 2021, 11, 88 3 of 14
a frequency convertor, an electric motor, and a torque sensor. The platform is shown inFigure 1, and the characteristics of it are shown in Table 1.
Agriculture 2021, 11, x FOR PEER REVIEW 3 of 14
2. Materials and Methods
2.1. Testing Platform
To simulate the rice threshing process, a longitudinal axial flow threshing platform
was constructed in a factory. The platform comprised a conveying belt, a longitudinal
axial flow thresher, a concave thresher cover, receiving boxes, a diesel engine, a feeding
device, a frequency convertor, an electric motor, and a torque sensor. The platform is
shown in Figure 1, and the characteristics of it are shown in Table 1.
Figure 1. Testing platform.
Table 1. Characteristics of the platform.
Part Parameters Value
platform
Length 3700 mm
Width 1460 mm
Height 1540 mm
Thresher
Length 1360 mm
Diameter 370 mm
No. of threshing bars 6
No. of threshing teeth 87
Tooth height 50–70 mm
Tooth diameter 20 mm
Distance between two adjacent teeth 80 mm
Concave
Length 1000 mm
Wrap angle 180°
Meshing size 20 × 36.6 mm
Clearance 20 mm
Top cover Deflector helical angle 24–30°
The gap between the two deflectors 160°
Feeding auger
Length 193 mm
Front diameter 230 mm
rear diameter 270 mm
The conveying mechanism composed of a rotating belt with dimensions of 6 × 0.5 m,
and it was driven by an electric motor. Its speed was controlled using a frequency con-
verter. It was used to transport rice to the feeding auger, which consisted of a rotating
auger and a rotating chain with steel bars. The power was conveyed from the diesel en-
Figure 1. Testing platform.
Table 1. Characteristics of the platform.
Part Parameters Value
platformLength 3700 mm
Width 1460 mm
Height 1540 mm
Thresher
Length 1360 mm
Diameter 370 mm
No. of threshing bars 6
No. of threshing teeth 87
Tooth height 50–70 mm
Tooth diameter 20 mm
Distance between two adjacent teeth 80 mm
Concave
Length 1000 mm
Wrap angle 180◦
Meshing size 20 × 36.6 mm
Clearance 20 mm
Top coverDeflector helical angle 24–30◦
The gap between the two deflectors 160◦
Feeding auger
Length 193 mm
Front diameter 230 mm
rear diameter 270 mm
The conveying mechanism composed of a rotating belt with dimensions of 6 × 0.5 m,and it was driven by an electric motor. Its speed was controlled using a frequency converter.It was used to transport rice to the feeding auger, which consisted of a rotating auger and arotating chain with steel bars. The power was conveyed from the diesel engine to the augerusing a belt and pulley. Its function was to feed the rice from the conveying mechanism tothe threshing unit.

Agriculture 2021, 11, 88 4 of 14
The threshing unit consisted of a longitudinal axial flow thresher with spike teeth,a thresher cover with helical blades, and a stationary concave. The thresher composedof 6 bars with spike teeth, and the rotational speed was conveyed from the engine tothe thresher using a pulley and belt. Two kinds of thresher structures (cylindrical andconical), and three thresher rotating speeds of (1100, 1300, and 1500 rpm) were tested forthe experiment. The threshers are shown in Figure 2.
Agriculture 2021, 11, x FOR PEER REVIEW 4 of 14
gine to the auger using a belt and pulley. Its function was to feed the rice from the con-
veying mechanism to the threshing unit.
The threshing unit consisted of a longitudinal axial flow thresher with spike teeth, a
thresher cover with helical blades, and a stationary concave. The thresher composed of 6
bars with spike teeth, and the rotational speed was conveyed from the engine to the
thresher using a pulley and belt. Two kinds of thresher structures (cylindrical and coni-
cal), and three thresher rotating speeds of (1100, 1300, and 1500 rpm) were tested for the
experiment. The threshers are shown in Figure 2.
(a)
(b)
Figure 2. Longitudinal axial flow threshers: (a) Conical thresher and (b) cylindrical thresher.
2.2. Torque Sensor
The torque sensor (Figure 3) was installed on the thresher shaft to measure thresher
rotating speed, threshing torque, and required power. The torque sensor’s measuring
range was 0–10000 N.m and 0–12000 rpm.
Figure 3. Torque sensor.
2.3. Testing Instruments
An TD 1001 electronic digital balance with an accuracy of 0.01 g produced by the
Chengdu Cheng Sheng tools group company, LTD; an Sdh-1202 rapid halogen moisture
Figure 2. Longitudinal axial flow threshers: (a) Conical thresher and (b) cylindrical thresher.
2.2. Torque Sensor
The torque sensor (Figure 3) was installed on the thresher shaft to measure thresherrotating speed, threshing torque, and required power. The torque sensor’s measuring rangewas 0–10,000 N.m and 0–12,000 rpm.
Agriculture 2021, 11, x FOR PEER REVIEW 4 of 14
gine to the auger using a belt and pulley. Its function was to feed the rice from the con-
veying mechanism to the threshing unit.
The threshing unit consisted of a longitudinal axial flow thresher with spike teeth, a
thresher cover with helical blades, and a stationary concave. The thresher composed of 6
bars with spike teeth, and the rotational speed was conveyed from the engine to the
thresher using a pulley and belt. Two kinds of thresher structures (cylindrical and coni-
cal), and three thresher rotating speeds of (1100, 1300, and 1500 rpm) were tested for the
experiment. The threshers are shown in Figure 2.
(a)
(b)
Figure 2. Longitudinal axial flow threshers: (a) Conical thresher and (b) cylindrical thresher.
2.2. Torque Sensor
The torque sensor (Figure 3) was installed on the thresher shaft to measure thresher
rotating speed, threshing torque, and required power. The torque sensor’s measuring
range was 0–10000 N.m and 0–12000 rpm.
Figure 3. Torque sensor.
2.3. Testing Instruments
An TD 1001 electronic digital balance with an accuracy of 0.01 g produced by the
Chengdu Cheng Sheng tools group company, LTD; an Sdh-1202 rapid halogen moisture
Figure 3. Torque sensor.
2.3. Testing Instruments
An TD 1001 electronic digital balance with an accuracy of 0.01 g produced by theChengdu Cheng Sheng tools group company, LTD; an Sdh-1202 rapid halogen moisturemeter produced by the same instruments company, LTD; a TMS-PRO type texture analyzerproduced by the FTC USA company; an MB45 moisture meter produced by the OHAUS

Agriculture 2021, 11, 88 5 of 14
USA company; an electronic digital display Vernier caliper; a tape; scissors; some sealingbags; a tachometer; and a frequency converter were used for the test.
2.4. Rice Cultivar
The Huanghuazhan rice variety was used for the experiment. It was planted in a fieldat Huazhong agricultural university, Wuhan, China. The planting method was artificialtransplanting. Manual harvesting was used, with a stubble height of about 150 mm, andthen the rice was transported to the university factory for testing.
Each rice stem was subjected to a three-point bending test and a shearing test using theTMS-PRO type texture analyzer at the engineering college’s agricultural equipment laboratory,as shown in Figure 4. The properties of rice stalks and grains are shown in Table 2.
Agriculture 2021, 11, x FOR PEER REVIEW 5 of 14
meter produced by the same instruments company, LTD; a TMS-PRO type texture ana-
lyzer produced by the FTC USA company; an MB45 moisture meter produced by the
OHAUS USA company; an electronic digital display Vernier caliper; a tape; scissors;
some sealing bags; a tachometer; and a frequency converter were used for the test.
2.4. Rice Cultivar
The Huanghuazhan rice variety was used for the experiment. It was planted in a
field at Huazhong agricultural university, Wuhan, China. The planting method was arti-
ficial transplanting. Manual harvesting was used, with a stubble height of about 150 mm,
and then the rice was transported to the university factory for testing.
Each rice stem was subjected to a three-point bending test and a shearing test using
the TMS-PRO type texture analyzer at the engineering college’s agricultural equipment
laboratory, as shown in Figure 4. The properties of rice stalks and grains are shown in
Table 2.
Bending test Shearing test
Figure 4. Bending and shearing test.
Table 2. Rice stalks and grain properties.
Properties Value
Average Grain Length; mm 9.75
Average Grain Width; mm 2.75
Average Grain Thickness; mm 2.02
Grain Moisture Content; % 13.32
1000 Grains Weight; g 30.43
Average Stalk Length; mm 964.08
Stalk Moisture Content; % 63.21
Max Shearing Force; N 249.6
Max Bending Force; N 9
2.5. Taguchi Method and Experiment Design
The Taguchi method is used widely in engineering analysis. It is a dominant design
that reduces the number of tests and minimizes the effects of factors that cannot be con-
trolled [28,29]. It uses a loss function to calculate the deviation between the desired val-
ues and the experimental values. This loss function is converted into a signal–noise (S/N)
ratio [29,30].
The S/N ratio can be divided into three categories given by Equations (1)–(3) [31]:
The nominal is the best:
𝑆
𝑁= 10 log
ӯ
𝑠𝑦2 (1)
Figure 4. Bending and shearing test.
Table 2. Rice stalks and grain properties.
Properties Value
Average Grain Length; mm 9.75
Average Grain Width; mm 2.75
Average Grain Thickness; mm 2.02
Grain Moisture Content; % 13.32
1000 Grains Weight; g 30.43
Average Stalk Length; mm 964.08
Stalk Moisture Content; % 63.21
Max Shearing Force; N 249.6
Max Bending Force; N 9
2.5. Taguchi Method and Experiment Design
The Taguchi method is used widely in engineering analysis. It is a dominant designthat reduces the number of tests and minimizes the effects of factors that cannot be con-trolled [28,29]. It uses a loss function to calculate the deviation between the desired valuesand the experimental values. This loss function is converted into a signal–noise (S/N)ratio [29,30].
The S/N ratio can be divided into three categories given by Equations (1)–(3) [31]:The nominal is the best:
SN
= 10 logys2
y(1)
The lower is better:

Agriculture 2021, 11, 88 6 of 14
SN
= −10 log1n(∑ y2
)(2)
The higher is better:SN
= − log1n
(∑
1y2
)(3)
where y is the average of observed data, s2y is the variation of y, n is the number of
observations, and y is the observed data or each type of the characteristics.
2.5.1. Threshing Parameters and Their Levels
For the test, we used the cylindrical and conical types of threshers (A); three rotationalspeeds (B) of 1100, 1300, and 1500 rpm; and three feeding rates (C) of 0.8, 1.1, and 1.4 kg/s,as shown in Table 3.
Table 3. Threshing parameters levels.
Parameters Symbol Level 1 Level 2 Level 3
Thresher type (T) A Cylindrical ConicalThresher rotating speed (N), rpm B 1100 1300 1500
Feeding rate (F), Kg/s C 0.8 1.1 1.4
2.5.2. Taguchi Full Factorial Design L18 (21 × 32)
In this study, the Taguchi method was used to assess threshing performance and tocompare two threshers’ structures (cylindrical and conical). Taguchi’s L18 arrangementwas used for experimenting. To determine the optimal threshing conditions and the bestoperating parameters, the S/N ratio was calculated. The lower is better was used todetermine the S/N ratio for power requirement, and the higher is better was used forefficiency and productivity. The experiment results and S/N ratios are shown in Table 4.
Table 4. The results of experiment and the signal–noise (S/N) ratios.
No ThresherType
ThresherSpeed
FeedingRate
ThreshingEfficiency
S/NEfficiency Productivity S/N
Productivity Power S/NPower
1 Cylindrical 1100 0.8 96.98 39.73 0.27 −11.37 6.20 −15.85
2 Cylindrical 1100 1.1 97.77 39.80 0.30 −10.46 8.27 −18.35
3 Cylindrical 1100 1.4 98.16 39.84 0.35 −9.12 10.37 −20.32
4 Cylindrical 1300 0.8 97.07 39.74 0.33 −9.63 6.31 −16.00
5 Cylindrical 1300 1.1 97.96 39.82 0.38 −8.40 8.96 −19.05
6 Cylindrical 1300 1.4 98.28 39.85 0.39 −8.18 10.43 −20.37
7 Cylindrical 1500 0.8 97.40 39.77 0.40 −7.96 6.57 −16.35
8 Cylindrical 1500 1.1 98.05 39.83 0.45 −6.94 9.04 −19.12
9 Cylindrical 1500 1.4 98.41 39.86 0.51 −5.85 10.63 −20.53
10 Conical 1100 0.8 97.21 39.75 0.33 −9.63 5.45 −14.73
11 Conical 1100 1.1 97.90 39.82 0.38 −8.40 7.22 −17.17
12 Conical 1100 1.4 98.21 39.84 0.39 −8.18 10.06 −20.05
13 Conical 1300 0.8 97.48 39.78 0.38 −8.40 5.89 −15.40
14 Conical 1300 1.1 98.09 39.83 0.42 −7.54 7.66 −17.68
15 Conical 1300 1.4 98.34 39.85 0.44 −7.13 10.22 −20.19
16 Conical 1500 0.8 97.92 39.82 0.48 −6.38 6.44 −16.18
17 Conical 1500 1.1 98.15 39.84 0.59 −4.58 8.90 −18.99
18 Conical 1500 1.4 98.60 39.88 0.64 −3.88 10.30 −20.26

Agriculture 2021, 11, 88 7 of 14
2.6. Testing Procedure
The platform of the thresher was established in the factory. The conveyor belt’s totallength was 6 m, the first meter was left empty, and the rice straw was evenly spread on thelast 5 m to ensure that it would be fed at a stable speed. The conveyor belt’s speed was keptto 1 m/s, and different feeding rates of 0.8, 1.1, and 1.4 kg/s were tested. The drum speedswere 1100, 1300, and 1500 rpm. After the experiment, the rice grains were collected fromthe boxes under the concave and from the straw outlet, cleaned using a cleaning machine,and then weighed to measure the threshing efficiency and productivity. Additionally, therequired power was measured using the torque sensor mounted on the thresher shaft.
2.7. Threshing Performance Indicators
Performance evaluation is a scientific method of ascertaining the working conditionsof a system’s main components to establish how the components contribute to the system’soverall efficiency [32].
The criteria for evaluating threshing mechanisms’ performance include threshingefficiency, grain loss, grain damage, output capacity, cleaning efficiency, and power require-ment [33].
The crop’s feed rate into the thresher and operating parameters such as drum speedsignificantly affected the threshing performance [34].
2.7.1. Threshing Efficiency
Threshing efficiency is the ratio between the mass of threshed grains received fromthresher outlets and the total grain input per time unit expressed in percentage [25].
It was calculated regarding the following equation:
TE = weight of threshed seed (g)/total weight of seed (g) × 100
2.7.2. Thresher Productivity
The throughput of a thresher is the mass of materials passing through the thresher pertime unit [35].
Throughput = total weight of seed/threshing time
2.7.3. Power Requirement
The required power was calculated after analyzing the obtained data from thetorque sensor.
3. Results and Analysis3.1. Taguchi Technique Analysis3.1.1. Analysis of the Signal-to-Noise (S/N) Ratio
Threshing efficiency, power, and productivity were measured using Taguchi tech-niques, and the optimization of the control factors was provided by signal-to-noise ratiosusing the Minitab software. The lowest value of power was effective on threshing per-formance enhancing, so the lower is better equation was used to determine its S/N ratio.Additionally, the highest values of threshing efficiency and productivity were very effec-tive on threshing performance, so the higher is better was used. The values of the S/Nratios are shown in Tables 5–7 and show the optimal levels of control factors for optimalthreshing efficiency, power, and productivity. These levels are also shown in graph formsin Figures 5–7.
The optimum level for each control factor was found regarding the highest S/Nratio in the levels of that control factor. The levels of the factors giving the best efficiencyand productivity were specified as A2B3C3. This means that the optimum efficiency andproductivity were obtained using the conical shaped thresher (A2), a rotating speed of1500 (B3), and a feed rate of 1.8 (C3). On the other hand, the lowest power requirement wasobtained with a thresher type (A2), at rotating speed (B1), and feeding rate (C1).
Agriculture 2021, 11, 88 8 of 14
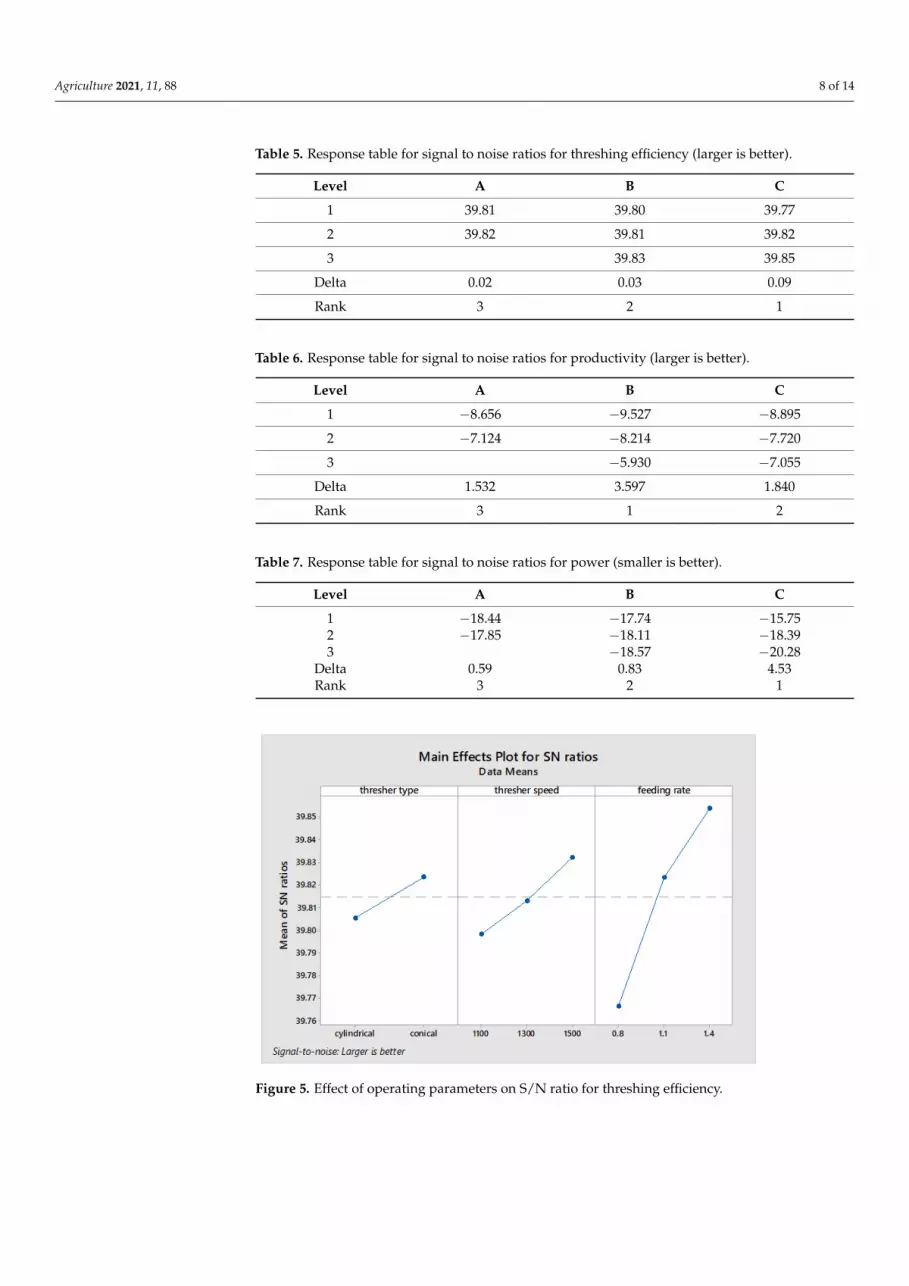
Table 5. Response table for signal to noise ratios for threshing efficiency (larger is better).
Level A B C
1 39.81 39.80 39.77
2 39.82 39.81 39.82
3 39.83 39.85
Delta 0.02 0.03 0.09
Rank 3 2 1
Table 6. Response table for signal to noise ratios for productivity (larger is better).
Level A B C
1 −8.656 −9.527 −8.895
2 −7.124 −8.214 −7.720
3 −5.930 −7.055
Delta 1.532 3.597 1.840
Rank 3 1 2
Table 7. Response table for signal to noise ratios for power (smaller is better).
Level A B C
1 −18.44 −17.74 −15.752 −17.85 −18.11 −18.393 −18.57 −20.28
Delta 0.59 0.83 4.53Rank 3 2 1
Agriculture 2021, 11, x FOR PEER REVIEW 8 of 14
and productivity were specified as A2B3C3. This means that the optimum efficiency and
productivity were obtained using the conical shaped thresher (A2), a rotating speed of
1500 (B3), and a feed rate of 1.8 (C3). On the other hand, the lowest power requirement
was obtained with a thresher type (A2), at rotating speed (B1), and feeding rate (C1).
Table 5. Response table for signal to noise ratios for threshing efficiency (larger is better).
Level A B C
1 39.81 39.80 39.77
2 39.82 39.81 39.82
3
39.83 39.85
Delta 0.02 0.03 0.09
Rank 3 2 1
Figure 5. Effect of operating parameters on S/N ratio for threshing efficiency.
Table 6. Response table for signal to noise ratios for productivity (larger is better).
Level A B C
1 −8.656 −9.527 −8.895
2 −7.124 −8.214 −7.720
3
−5.930 −7.055
Delta 1.532 3.597 1.840
Rank 3 1 2
Figure 5. Effect of operating parameters on S/N ratio for threshing efficiency.

Agriculture 2021, 11, 88 9 of 14Agriculture 2021, 11, x FOR PEER REVIEW 9 of 14
Figure 6. Effect of operating parameters on S/N ratio for productivity.
Table 7. Response table for signal to noise ratios for power (smaller is better).
Level A B C
1 −18.44 −17.74 −15.75
2 −17.85 −18.11 −18.39
3
−18.57 −20.28
Delta 0.59 0.83 4.53
Rank 3 2 1
Figure 7. Effect of operating parameters on S/N ratio for power.
3.1.2. Analysis of Variance
ANOVA was used to determine the individual interaction of all of the control fac-
tors in the test. In this study, ANOVA was used to analyze the effects of thresher type,
rotating speeds, and feeding rates on threshing performance. The ANOVA results are
shown in Tables 7–9. This analysis was carried out at a 5% significance level and a 95%
confidence level. The last column of the table shows the percentage value of each pa-
rameter contribution, which indicates the degree of influence on threshing performance.
According to Table 8, the percent contributions of the A, B, and C factors on the
threshing efficiency were found to be 4.87, 11.63, and 79%, respectively. Thus, the most
important factor affecting the threshing efficiency was feeding rate.
Table 8. ANOVA for threshing efficiency.
Figure 6. Effect of operating parameters on S/N ratio for productivity.
Agriculture 2021, 11, x FOR PEER REVIEW 9 of 14
Figure 6. Effect of operating parameters on S/N ratio for productivity.
Table 7. Response table for signal to noise ratios for power (smaller is better).
Level A B C
1 −18.44 −17.74 −15.75
2 −17.85 −18.11 −18.39
3
−18.57 −20.28
Delta 0.59 0.83 4.53
Rank 3 2 1
Figure 7. Effect of operating parameters on S/N ratio for power.
3.1.2. Analysis of Variance
ANOVA was used to determine the individual interaction of all of the control fac-
tors in the test. In this study, ANOVA was used to analyze the effects of thresher type,
rotating speeds, and feeding rates on threshing performance. The ANOVA results are
shown in Tables 7–9. This analysis was carried out at a 5% significance level and a 95%
confidence level. The last column of the table shows the percentage value of each pa-
rameter contribution, which indicates the degree of influence on threshing performance.
According to Table 8, the percent contributions of the A, B, and C factors on the
threshing efficiency were found to be 4.87, 11.63, and 79%, respectively. Thus, the most
important factor affecting the threshing efficiency was feeding rate.
Table 8. ANOVA for threshing efficiency.
Figure 7. Effect of operating parameters on S/N ratio for power.
3.1.2. Analysis of Variance
ANOVA was used to determine the individual interaction of all of the control fac-tors in the test. In this study, ANOVA was used to analyze the effects of thresher type,rotating speeds, and feeding rates on threshing performance. The ANOVA results areshown in Tables 7–9. This analysis was carried out at a 5% significance level and a 95%confidence level. The last column of the table shows the percentage value of each parametercontribution, which indicates the degree of influence on threshing performance.
According to Table 8, the percent contributions of the A, B, and C factors on thethreshing efficiency were found to be 4.87, 11.63, and 79%, respectively. Thus, the mostimportant factor affecting the threshing efficiency was feeding rate.

Agriculture 2021, 11, 88 10 of 14
Table 8. ANOVA for threshing efficiency.
Source DF Adj SS Adj MS F-Value p-Value ContributionRate (%)
Thresher Type (A) 1 0.1860 0.18600 12.99 0.004 4.87
Thresher Speed (B) 2 0.4440 0.22200 15.50 0.000 11.63
Feeding Rate (C) 2 3.0160 1.50799 105.29 0.000 79.00
Error 12 0.1719 0.01432 4.50
Total 17 3.8178 100.00
Table 9. ANOVA for productivity.
Source DF Adj SS Adj MS F-Value p-Value ContributionRate (%)
Thresher Type (A) 1 0.024939 0.024939 33.25 0.000 16.16
Thresher Speed (B) 2 0.096544 0.048272 64.36 0.000 62.54
Feeding Rate (C) 2 0.023878 0.011939 15.92 0.000 15.47
Error 12 0.009000 0.000750 5.83
Total 17 0.154361 100.00
Referring to Table 9, the percent contributions of the A, B, and C factors in produc-tivity were 16.16, 62.54, and 15.47%, respectively. Thus, the most effective factor on theproductivity was thresher speed.
Regarding Table 10, the contributions percentage of the A, B, and C factors on thepower were 2.11, 2.74, and 93.05%. Thus, the most effective factor was the feeding rate.
Table 10. ANOVA for power.
Source DF Adj SS Adj MS F-Value p-Value ContributionRate (%)
Thresher Type (A) 1 1.196 1.1961 12.04 0.005 2.11
Thresher Speed (B) 2 1.555 0.7776 7.83 0.007 2.74
Feeding Rate (C) 2 52.752 26.3761 265.61 0.000 93.05
Error 12 1.192 0.0993 2.10
Total 17 56.695 100.00
3.2. Results Evaluation and Discussion
After the test was carried out, and after the collected data were analyzed according toTaguchi techniques, some graphs were drawn using the Origin software in order to assurethe former obtained results.
3.2.1. Effect of Feed Rate on Threshing Efficiency under Different Rotating Speeds for theCylindrical and Conical Thresher
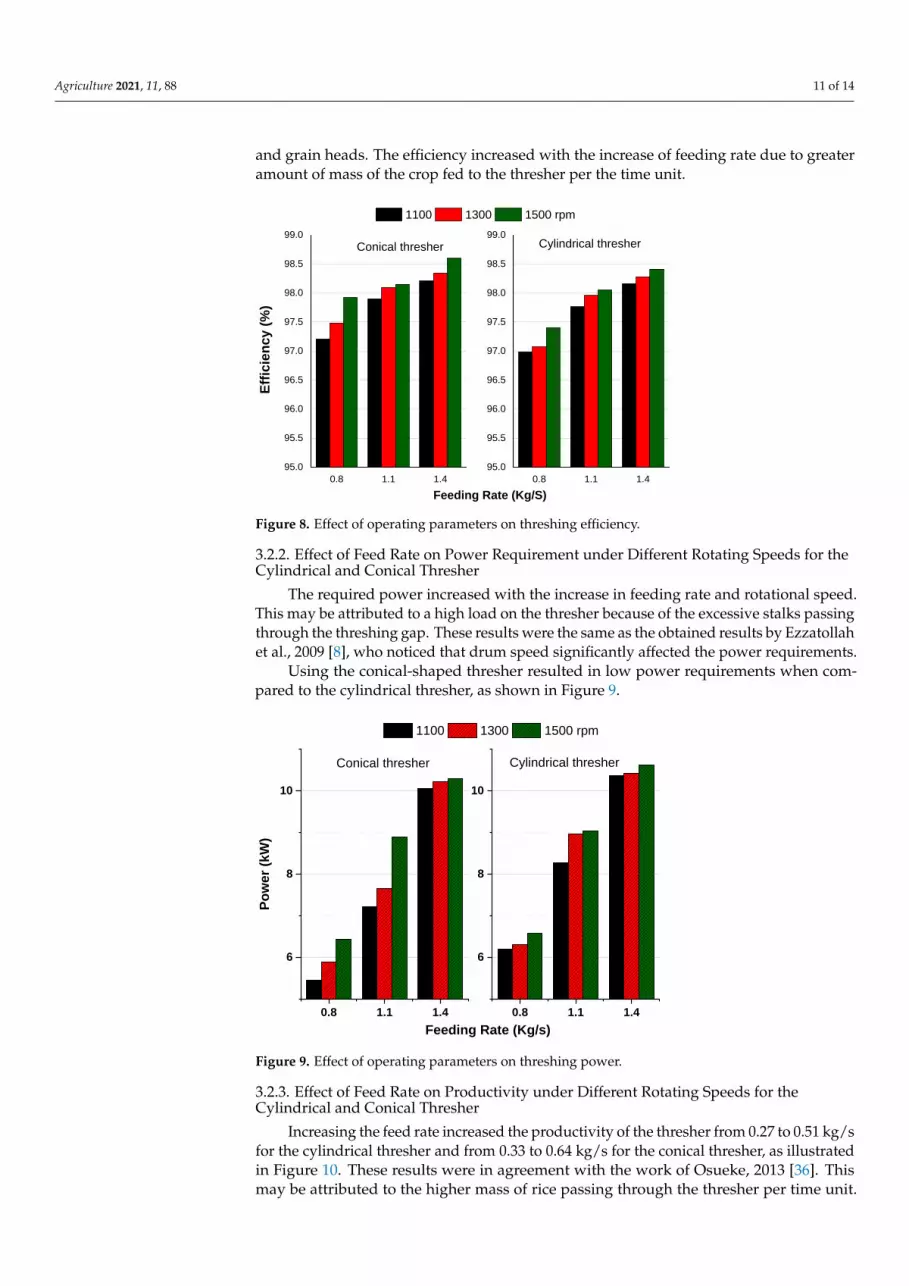
It was concluded that increasing the thresher’s feeding rate and rotating speed in-creased the threshing efficiency from 96.98% to 98.41% for the cylindrical thresher andfrom 97.21 to 98.6% for the conical thresher, as shown in Figure 8. These results were inagreement with the results of Osueke, 2013 [36], and Ahuja et al., 2017 [37]. The increasein threshing efficiency with drum speed could be attributed to the high frequency of colli-sions and impacts between spikes and grain heads, resulting in more grain threshing andseparating, and it could also be attributed to the increased friction between the concave
Agriculture 2021, 11, 88 11 of 14
and grain heads. The efficiency increased with the increase of feeding rate due to greateramount of mass of the crop fed to the thresher per the time unit.
Agriculture 2021, 11, x FOR PEER REVIEW 11 of 14
Figure 8. Effect of operating parameters on threshing efficiency.
3.2.2. Effect of Feed Rate on Power Requirement under Different Rotating Speeds for the
Cylindrical and Conical Thresher
The required power increased with the increase in feeding rate and rotational
speed. This may be attributed to a high load on the thresher because of the excessive
stalks passing through the threshing gap. These results were the same as the obtained
results by Ezzatollah et al., 2009 [8], who noticed that drum speed significantly affected
the power requirements.
Using the conical-shaped thresher resulted in low power requirements when com-
pared to the cylindrical thresher, as shown in Figure 9.
Figure 9. Effect of operating parameters on threshing power.
3.2.3. Effect of Feed Rate on Productivity under Different Rotating Speeds for the Cylin-
drical and Conical Thresher
Increasing the feed rate increased the productivity of the thresher from 0.27 to 0.51
kg/s for the cylindrical thresher and from 0.33 to 0.64 kg/s for the conical thresher, as il-
lustrated in Figure 10. These results were in agreement with the work of Osueke, 2013
[36]. This may be attributed to the higher mass of rice passing through the thresher per
time unit. Additionally, the increase of the rotational speed increased productivity be-
cause the higher speed resulted in a low threshing time, which increased the threshed
0.8 1.1 1.4
95.0
95.5
96.0
96.5
97.0
97.5
98.0
98.5
99.0
Conical thresher
1100 1300 1500 rpm
Eff
icie
nc
y (
%)
0.8 1.1 1.4
95.0
95.5
96.0
96.5
97.0
97.5
98.0
98.5
99.0Cylindrical thresher
Feeding Rate (Kg/S)
0.8 1.1 1.4
6
8
10
Conical thresher
Po
we
r (k
W)
0.8 1.1 1.4
6
8
10
Cylindrical thresher
Feeding Rate (Kg/s)
1100 1300 1500 rpm
Figure 8. Effect of operating parameters on threshing efficiency.
3.2.2. Effect of Feed Rate on Power Requirement under Different Rotating Speeds for theCylindrical and Conical Thresher
The required power increased with the increase in feeding rate and rotational speed.This may be attributed to a high load on the thresher because of the excessive stalks passingthrough the threshing gap. These results were the same as the obtained results by Ezzatollahet al., 2009 [8], who noticed that drum speed significantly affected the power requirements.
Using the conical-shaped thresher resulted in low power requirements when com-pared to the cylindrical thresher, as shown in Figure 9.
Agriculture 2021, 11, x FOR PEER REVIEW 11 of 14
Figure 8. Effect of operating parameters on threshing efficiency.
3.2.2. Effect of Feed Rate on Power Requirement under Different Rotating Speeds for the
Cylindrical and Conical Thresher
The required power increased with the increase in feeding rate and rotational
speed. This may be attributed to a high load on the thresher because of the excessive
stalks passing through the threshing gap. These results were the same as the obtained
results by Ezzatollah et al., 2009 [8], who noticed that drum speed significantly affected
the power requirements.
Using the conical-shaped thresher resulted in low power requirements when com-
pared to the cylindrical thresher, as shown in Figure 9.
Figure 9. Effect of operating parameters on threshing power.
3.2.3. Effect of Feed Rate on Productivity under Different Rotating Speeds for the Cylin-
drical and Conical Thresher
Increasing the feed rate increased the productivity of the thresher from 0.27 to 0.51
kg/s for the cylindrical thresher and from 0.33 to 0.64 kg/s for the conical thresher, as il-
lustrated in Figure 10. These results were in agreement with the work of Osueke, 2013
[36]. This may be attributed to the higher mass of rice passing through the thresher per
time unit. Additionally, the increase of the rotational speed increased productivity be-
cause the higher speed resulted in a low threshing time, which increased the threshed
0.8 1.1 1.4
95.0
95.5
96.0
96.5
97.0
97.5
98.0
98.5
99.0
Conical thresher
1100 1300 1500 rpm
Eff
icie
nc
y (
%)
0.8 1.1 1.4
95.0
95.5
96.0
96.5
97.0
97.5
98.0
98.5
99.0Cylindrical thresher
Feeding Rate (Kg/S)
0.8 1.1 1.4
6
8
10
Conical thresher
Po
we
r (k
W)
0.8 1.1 1.4
6
8
10
Cylindrical thresher
Feeding Rate (Kg/s)
1100 1300 1500 rpm
Figure 9. Effect of operating parameters on threshing power.
3.2.3. Effect of Feed Rate on Productivity under Different Rotating Speeds for theCylindrical and Conical Thresher
Increasing the feed rate increased the productivity of the thresher from 0.27 to 0.51 kg/sfor the cylindrical thresher and from 0.33 to 0.64 kg/s for the conical thresher, as illustratedin Figure 10. These results were in agreement with the work of Osueke, 2013 [36]. Thismay be attributed to the higher mass of rice passing through the thresher per time unit.

Agriculture 2021, 11, 88 12 of 14
Additionally, the increase of the rotational speed increased productivity because the higherspeed resulted in a low threshing time, which increased the threshed crop per the time unit.The conical thresher gave a higher productivity than the cylindrical thresher.
Agriculture 2021, 11, x FOR PEER REVIEW 12 of 14
crop per the time unit. The conical thresher gave a higher productivity than the cylin-
drical thresher.
Figure 10. Effect of operating parameters on threshing productivity.
4. Conclusions
1. In this paper, two thresher structures were tested and evaluated for performance
under different operating parameters such as thresher speed and feeding rate. The
Taguchi technique was used to reduce the testing time and number and to analyze
the data for experimental variable optimization The obtained results revealed that
increasing the feed rate and rotating speed positively correlated with threshing effi-
ciency, productivity, and power requirements.
2. The highest threshing efficiency and highest productivity of 98.6% and 0.64 kg/s,
respectively, were achieved using the conical thresher under a rotating speed of 1500
rpm and a feeding rate of 1.4 kg/s.
3. The lowest required power of 5.45 kW was obtained using the conical thresher un-
der a rotational speed of 1100 rpm and a feeding rate of 0.8 kg/s.
4. It was concluded that the conical thresher was more effective than the cylindrical
thresher because it achieved a higher efficiency, a higher productivity, and a lower
power requirement.
5. This research provides a new method for assessing rice thresher performance and
presents a new threshing drum structure that will be more efficient for rice threshing
with a combine harvester.
Author Contributions: Conceptualization, M.A.A. and Z.G.; methodology, M.A.A.; software,
M.A.A.; validation, M.A.A., Z.G., and A.E.S.; formal analysis, M.A.A.; investigation, M.A.A.; re-
sources, M.A.A.; data curation, Z.G.; writing—original draft preparation, M.A.A.; writing—review
and editing, M.A.A.; visualization, M.A.A.; supervision, Z.G.; project administration, M.A.A.;
funding acquisition, Z.G. All authors have read and agreed to the published version of the manu-
script.
Funding: This research was financially supported by the National Key Research and Development
Program of China (Technological Innovation of Regenerated Rice Mechanization in the North of
the Middle and Lower Reaches of the Yangtze River, 2017YFD0301404-05); and the Fundamental
Research Funds for the Central Universities (2662018PY038).
Institutional Review Board Statement: Not applicable.
Informed Consent Statement: Not applicable.
Data Availability Statement: The data presented in this study are available on demand from the
first author at ([email protected]).
0.8 1.1 1.4
0.0
0.2
0.4
0.6
0.8p
rod
ucti
vit
y, kg
/s
1100 1300 1500 rpm
0.8 1.1 1.4
0.0
0.2
0.4
0.6
0.8
Feeding Rate (Kg/s)
Cylindrical thresherConical thresher
Figure 10. Effect of operating parameters on threshing productivity.
4. Conclusions
1. In this paper, two thresher structures were tested and evaluated for performanceunder different operating parameters such as thresher speed and feeding rate. TheTaguchi technique was used to reduce the testing time and number and to analyzethe data for experimental variable optimization. The obtained results revealed thatincreasing the feed rate and rotating speed positively correlated with threshing effi-ciency, productivity, and power requirements.
2. The highest threshing efficiency and highest productivity of 98.6% and 0.64 kg/s, respec-tively, were achieved using the conical thresher under a rotating speed of 1500 rpm anda feeding rate of 1.4 kg/s.
3. The lowest required power of 5.45 kW was obtained using the conical thresher undera rotational speed of 1100 rpm and a feeding rate of 0.8 kg/s.
4. It was concluded that the conical thresher was more effective than the cylindricalthresher because it achieved a higher efficiency, a higher productivity, and a lowerpower requirement.
5. This research provides a new method for assessing rice thresher performance andpresents a new threshing drum structure that will be more efficient for rice threshingwith a combine harvester.
Author Contributions: Conceptualization, M.A.A. and G.Z.; methodology, M.A.A.; software, M.A.A.;validation, M.A.A., G.Z., and A.E.S.; formal analysis, M.A.A.; investigation, M.A.A.; resources,M.A.A.; data curation, G.Z.; writing—original draft preparation, M.A.A.; writing—review andediting, M.A.A.; visualization, M.A.A.; supervision, G.Z.; project administration, M.A.A.; fundingacquisition, G.Z. All authors have read and agreed to the published version of the manuscript.
Funding: This research was financially supported by the National Key Research and DevelopmentProgram of China (Technological Innovation of Regenerated Rice Mechanization in the North ofthe Middle and Lower Reaches of the Yangtze River, 2017YFD0301404-05); and the FundamentalResearch Funds for the Central Universities (2662018PY038).
Institutional Review Board Statement: Not applicable.
Informed Consent Statement: Not applicable.
Agriculture 2021, 11, 88 13 of 14
Data Availability Statement: The data presented in this study are available on demand from thefirst author at ([email protected]).
Acknowledgments: G.Z. and National Key Research and Development Program of China (Techno-logical Innovation of Regenerated Rice Mechanization in the North of the Middle and Lower Reachesof the Yangtze River, 2017YFD0301404-05); and the Fundamental Research Funds for the CentralUniversities (2662018PY038).
Conflicts of Interest: Authors declare no conflict of interest.
References1. Center American Trends Panel. The forecast of world agricultural supply and demand forecast for February. World Agric. 2017, 4,
215–219.2. Callaway, E.J.N. The birth of rice. Nature 2014, 514, S58. [CrossRef] [PubMed]3. Qi, W. Impacts of nitrogen and zeolite managements on yield and physicochemical properties of rice grain. Int. J. Agric. Biol. Eng.
2016, 9, 93–100.4. Cerquitelli, T.J.E.P. Predicting large scale fine grain energy consumption. Energy Proc. 2017, 111, 1079–1088. [CrossRef]5. Zami, M.A. Performance evaluation of the BRRI reaper and Chinese reaper compared to manual harvesting of rice (Oryza sativa L.).
Agriculturists 2014, 12, 142–150. [CrossRef]6. Unakıtan, G.; Aydın, B.E.J. A comparison of energy use efficiency and economic analysis of wheat and sunflower production in
Turkey: A case study in Thrace Region. Energy 2018, 149, 279–285. [CrossRef]7. Chabrol, D. The Technical Centre for Agricultural and Rural Cooperation. ACP-EU Lome 1996, 6, 12–15.8. Ezzatollah, A.A.-A.; Yousef, A.-G.; Saeid, A. Study of Performance Parameters of Threshing Unit in a Single Plant Thresher.
Ardabil 2009, 4, 92–96.9. Asundep, N.N. Determinants of access to antenatal care and birth outcomes in Kumasi, Ghana. J. Epid. Glob. Health 2013, 3,
279–288. [CrossRef]10. Olayanju, T. An assessment of the status of small rice threshers in Nigeria. J. Nat. Sci. Eng. Technol. 2009, 8, 84–94.11. Azouma, O.Y. Design of throw-in type rice thresher for small scale farmers. Indian J. Sci. Tehnol. 2009, 2, 10–14. [CrossRef]12. Gbabo, A.; Gana, I.M.; Amoto, M.S. Design, fabrication and testing of a millet thresher. Net J. Agric. Sci. 2013, 1, 100–106.13. Singh, B.; Linvill, D.E. Determining the effect of pod and grain moisture content on threshing loss and damage of navy beans.
Trans. ASAE 1977, 20, 226–0227. [CrossRef]14. Ndirika, V.J. A mathematical model for predicting output capacity of selected stationary spike-tooth grain threshers. Appl. Eng.
Agric. 2006, 22, 195–200. [CrossRef]15. Gang, W. Design of variable screw pitch rib snapping roller and residue cutter for corn harvesters. Int. J. Agric. Biol. Eng. 2016, 9,
27–34.16. Li, H. CFD–DEM simulation of material motion in air-and-screen cleaning device. Comp. Electron. Agric. 2012, 88, 111–119.
[CrossRef]17. Li, Y. Development and application of mechanized maize harvesters. Int. J. Agric. Biol. Eng. 2016, 9, 15–28.18. Tang, Z.; Li, Y.; Xu, L. Design and optimization for length of longitudinal-flow threshing cylinder of combine harvester. Trans.
Chin. Sci. Agric. Eng. 2014, 30, 28–34.19. Addo, A. Effect of different threshing cylinders on soybean quality. J. Sci. Tehnol. 2004, 24, 121–125. [CrossRef]20. Alizadeh, M.R.; Bagheri, I. Field performance evaluation of different rice threshing methods. Int. J. Nat. Sci. Eng. 2009, 3, 139–143.21. Osueke, C.O. Frictional impact modeling of a cereal thresher. Am. J. Eng. Appl. Sci. 2011, 4, 405–412. [CrossRef]22. Khazaei, J. Force Requirement for Pulling off Chickpea Pods as Well as Fracture Resistance of Chickpea Pods and Grains. Ph.D.
Thesis, Tehran University, Tehran, Iran, 2003.23. Singh, K. Development and evaluation of multi millet thresher. J. Appl. Nat. Sci. 2015, 7, 939–948. [CrossRef]24. Azhar Saeed, M. Testing and evaluation of hold-on paddy thresher. Agric. Mech. Asia Africa 1995, 26, 47.25. Asli-Ardeh, E.A.; Abbaspour-Gilandeh, Y. Investigation of the effective factors on threshing loss, damaged grains percent and
material other than grain to grain ratio on an auto head feed threshing unit. Am. J. Agric. Biol. Sci. 2008, 3, 699–705.26. El-Haddad, W.Z. A simplified design and performance study of threshing and winnowing machine suitable for sample holdings.
Master’s Thesis, University Egypt, Tanta, Egypt, 2000.27. Helmy, M.; Yousef, I.; Badawy, M.A. Performance evaluation of some sunflower threshers. Egypt J. Agric. Res. 2000, 78, 959–975.28. Palanikumar, K.J.M. Experimental investigation and optimisation in drilling of GFRP composites. Measurement 2011, 44, 2138–2148.
[CrossRef]29. Asiltürk, I.; Akkus, H. Determining the effect of cutting parameters on surface roughness in hard turning using the Taguchi
method. Measurement 2011, 44, 1697–1704. [CrossRef]30. Köksoy, O.; Muluk, F.Z. Solution to the taguchiâs problem with correlated responses. Gazi Univ. J. Sci. 2004, 17, 59–70.31. Shetty, R.; Pai, R.B.; Rao, S.S.; Nayak, R. Taguchi’s technique in machining of metal matrix composites. J. Braz. Soc. Mech. Sci. Eng.
2009, 31, 12–20. [CrossRef]32. Chukwu, O. Performance evaluation of locally manufactured rice threshers in Niger state. J. Eng. Appl. Sci. 2008, 3, 602–606.

Agriculture 2021, 11, 88 14 of 14
33. Behera, B.K. Development and testing of a power-operated wheat thresher. Agric. Mech. Asia Africa Lat. Am. Jpn. 1990, 21, 15–21.34. Špokas, L.; Steponavicius, D.; Petkevicius, S. Impact of technological parameters of threshing apparatus on grain damage. Agron.
Res. 2008, 6, 367–376.35. Ndirika, V.I.O. Modeling the Performance of Selected Stationary Grain Threshers. Ph.D. Thesis, Department of Agricultural
Engineering Ahmadu, Bello University, Zaria, Nigeria, 1997.36. Osueke, E.C.O. Study of the influence of crop, machine and operating parameters on performance of cereal threshers. Int. J. Eng.
Res. Dev. 2014, 7, 1–9.37. Ahuja, M.; Dogra, B.; Narang, M.K.; Dogra, R. Development and evaluation of axial flow paddy thresher equipped with feeder
chain type mechanical feeding system. Curr. J. Appl. Sci. Technol. 2017, 23, 1–10. [CrossRef]


