Embed Size (px)
Citation preview
ACPD11, 19089–19111, 2011
Long-termtropospheric trend
of octafluoro-cyclobutane
D. E. Oram et al.
Title Page
Abstract Introduction
Conclusions References
Tables Figures
J I
J I
Back Close
Full Screen / Esc
Printer-friendly Version
Interactive Discussion
Discussion
Paper
|D
iscussionP
aper|
Discussion
Paper
|D
iscussionP
aper|
Atmos. Chem. Phys. Discuss., 11, 19089–19111, 2011www.atmos-chem-phys-discuss.net/11/19089/2011/doi:10.5194/acpd-11-19089-2011© Author(s) 2011. CC Attribution 3.0 License.
AtmosphericChemistry
and PhysicsDiscussions
This discussion paper is/has been under review for the journal Atmospheric Chemistryand Physics (ACP). Please refer to the corresponding final paper in ACP if available.
Long-term tropospheric trend ofoctafluorocyclobutane (c-C4F8 orPFC-318)D. E. Oram1, F. S. Mani2, J. C. Laube2, M. J. Newland2, C. E. Reeves1,W. T. Sturges2, S. A. Penkett2, C. A. M. Brenninkmeijer3, T. Rockmann4, andP. J. Fraser5
1National Centre for Atmospheric Science, School of Environmental Sciences, University ofEast Anglia, Norwich, UK2School of Environmental Sciences, University of East Anglia, Norwich, UK3Max Planck Institute for Chemistry, Air Chemistry Division, Mainz, Germany4Institute for Marine and Atmospheric Research, Utrecht University, Utrecht, The Netherlands5Centre for Australian Weather and Climate Research/CSIRO Marine and AtmosphericResearch, Aspendale, Australia
Received: 18 May 2011 – Accepted: 2 June 2011 – Published: 4 July 2011
Correspondence to: D. E. Oram ([email protected])
Published by Copernicus Publications on behalf of the European Geosciences Union.
19089
ACPD11, 19089–19111, 2011
Long-termtropospheric trend
of octafluoro-cyclobutane
D. E. Oram et al.
Title Page
Abstract Introduction
Conclusions References
Tables Figures
J I
J I
Back Close
Full Screen / Esc
Printer-friendly Version
Interactive Discussion
Discussion
Paper
|D
iscussionP
aper|
Discussion
Paper
|D
iscussionP
aper|
Abstract
Air samples collected at Cape Grim, Tasmania between 1978 and 2008 and duringa series of more recent aircraft sampling programmes have been analysed to deter-mine the atmospheric abundance and trend of octafluorocyclobutane (c-C4F8 or PFC-318). c-C4F8 has an atmospheric lifetime in excess of 3000 yr and a global warm-5
ing potential (GWP) of 10 300 (100 yr time horizon), making it one of the most potentgreenhouse gases detected in the atmosphere to date. The abundance of c-C4F8 inthe Southern Hemisphere has risen from 0.35 ppt in 1978 to 1.2 ppt in 2010, and iscurrently increasing at a rate of around 0.03 ppt yr−1. It is the third most abundant per-fluorocarbon (PFC) in the present day atmosphere, behind CF4 (∼ 75 ppt) and C2F610
(∼4 ppt). The origin of c-C4F8 is unclear. Using a 2-D global model to derive top-downglobal emissions based on the Cape Grim measurements yields a recent (2007) emis-sion rate of around 1.1 Gg yr−1 and a cumulative emission up to and including 2007 of38.1 Gg. Emissions reported on the EDGAR emissions database for the period 1986–2005 represent less than 1 % of the top-down emissions for the same period, which15
suggests there is a large unaccounted for source of this compound. It is also apparentthat the magnitude of this source has varied considerably over the past 30 yr, decliningsharply in the late 1980s before increasing again in the mid-1990s.
1 Introduction
Owing to a combination of long atmospheric lifetimes and strong absorption bands in20
the infrared, fully fluorinated hydrocarbons (perfluorocarbons or PFCs) are among themost potent greenhouse gases known, with global warming potentials three or fourorders of magnitude greater than that of CO2 (Forster et al., 2007). Being harmless tostratospheric ozone, PFCs were not included in the Montreal Protocol and no formalinternational restrictions have been placed on their production and/or consumption.25
More recently however the PFCs have been included in the suite of gases covered bythe Kyoto Protocol.
19090
ACPD11, 19089–19111, 2011
Long-termtropospheric trend
of octafluoro-cyclobutane
D. E. Oram et al.
Title Page
Abstract Introduction
Conclusions References
Tables Figures
J I
J I
Back Close
Full Screen / Esc
Printer-friendly Version
Interactive Discussion
Discussion
Paper
|D
iscussionP
aper|
Discussion
Paper
|D
iscussionP
aper|
The most abundant PFC in the atmosphere is CF4. The first atmospheric measure-ments were reported in the late 1970s (Rasmussen et al., 1979) and it has a currenttropospheric abundance in the region of 75 ppt (Khalil et al., 2003; Worton et al., 2007;Muhle et al., 2010). Other identified PFCs include C2F6, first reported by Penkett et al.(1981), C3F8 (Culbertson et al., 2000) and c-C4F8 (Oram et al., 1999; Sturges et al.,5
2000). The present-day abundances of these compounds are much lower than CF4,being typically in the range of a few ppt or less (Khalil et al., 2003; Culbertson et al.,2004; Worton et al., 2007; Muhle et al., 2010; Saito et al., 2010). However, atmosphericlevels of all three minor PFCs have been reported as increasing in recent years, as isthat of CF4.10
Historically the primary anthropogenic source of PFCs to the atmosphere has beenthe aluminium industry, which is known to release CF4 and C2F6 during the electrolyticreduction of aluminium oxide to aluminium. More recently PFCs have found increasingusage in the electronics industry, where they are used in the manufacture of semicon-ductors (plasma etching, chamber cleaning, etc.). Recent studies of air trapped in ice15
cores and polar firn have revealed that CF4 has a natural background of around 35ppt, approximately half of its present day abundance (Harnisch et al., 1996; Wortonet al., 2008; Muhle et al., 2010). Harnisch and Eisenhauer (1998) found evidence forthe slow release of CF4 from rocks containing natural fluorites and have suggested thatdegassing from the Earth’s crust could sustain this natural background, although the20
annual natural source is miniscule relative to present day anthropogenic sources.Long term trends of CF4, C2F6 and C3F8 have been reported in the recent literature
(Muhle et al., 2010) but there remains little information on another PFC, octafluoro-cyclobutane (c-C4F8, or PFC-318). In common with other perfluorinated compounds,c-C4F8 is resistant to the common atmospheric degradation mechanisms, resulting in25
an estimated lifetime of 3200 yr (Ravishankara et al., 1993). Furthermore, it is a stronggreenhouse gas with GWPs of 7310, 10 300 and 14 700 for 20-yr, 100-yr and 500-yrtime horizons respectively (Forster et al., 2007), making it one of the most potent green-house gases to be identified in the atmosphere to date. Saito et al. (2010) recently re-
19091
ACPD11, 19089–19111, 2011
Long-termtropospheric trend
of octafluoro-cyclobutane
D. E. Oram et al.
Title Page
Abstract Introduction
Conclusions References
Tables Figures
J I
J I
Back Close
Full Screen / Esc
Printer-friendly Version
Interactive Discussion
Discussion
Paper
|D
iscussionP
aper|
Discussion
Paper
|D
iscussionP
aper|
ported measurements of c-C4F8 from two Japanese sites in the Northern Hemisphereover the period 2006–2009. Mean baseline mixing ratios of 1.33 pptv and 1.22 pptvwere observed at Hateruma Island (24.1◦ N, 123.8◦ E) and Cape Ochiishi (43.1◦ N,145.3◦ E), respectively, with corresponding growth rates of 0.02 and 0.01 pptv yr−1.
Here we report observations of c-C4F8 between 1978 and 2008 from a long term5
measurement programme at Cape Grim, Tasmania. These data are complementedby more recent measurements in the upper troposphere and lower stratosphere fromsamples collected by the CARIBIC and Geophysica aircraft. The long-term southernhemispheric trend is used to derive a top-down global emission scenario using a 2-Datmospheric model. The model-derived emissions are compared with those reported10
to the EDGAR database.
2 Experimental
A total of 110 air samples from Cape Grim, Tasmania (41◦ S, 145◦ E) have been anal-ysed for their c-C4F8 content. The majority of samples since 1994 have been collecteddirectly into 3-l electropolished (Rasmussen) or Silcosteel-treated stainless steel can-15
isters (Restek Corp.) at a pressure of ∼ 3 bar using a diaphragm pump (KNF). Prior to1994, the samples analysed were sub samples of the parent Cape Grim air archive.Details of the archive and the sampling techniques have been reported elsewhere (Lan-genfelds et al., 1996; Oram et al., 1995; Fraser et al., 1999). Trace gas data (CFC-11,-12, -113, CH3CCl3, and CH4) obtained from the archive show the same concentra-20
tions and long term trends as in-situ measurements at Cape Grim for the same species(Cunnold et al., 1994; Prinn et al., 1995), indicating that the archive contains represen-tative samples of background air and, importantly, that these species can be storedwithout significant changes in their concentration. The archive has been used to re-construct the past atmospheric history of halons (Fraser et al., 1999); HCFCs -141b25
(CH3CFCl2) and -142b (CH3CF2Cl) (Oram et al., 1995); HCFC-22 (CHClF2) (Milleret al., 1997); HFC-134a (CF3CH2F) (Oram et al., 1996); CF4, C2F6 and C3F8 (Muhle
19092
ACPD11, 19089–19111, 2011
Long-termtropospheric trend
of octafluoro-cyclobutane
D. E. Oram et al.
Title Page
Abstract Introduction
Conclusions References
Tables Figures
J I
J I
Back Close
Full Screen / Esc
Printer-friendly Version
Interactive Discussion
Discussion
Paper
|D
iscussionP
aper|
Discussion
Paper
|D
iscussionP
aper|
et al., 2010) and SF6 (Maiss et al., 1996). Being highly inert and with similar propertiesto other long-lived halocarbons, we are confident of the stability of c-C4F8 in the archivesamples.
Prior to analysis, the Cape Grim samples (∼ 200 ml) were pre-concentrated usinga stainless steel manifold. After drying, by passing through magnesium perchlorate,5
condensables were trapped in an evacuated, 100×3 mm OD stainless steel sampleloop filled with 100 µm glass beads, held in liquid argon (−186 ◦C). The bulk of the airpassed into an evacuated stainless steel flask (∼ 800 ml), where the pressure change,and hence sample volume, was measured with a capacitance manometer (EdwardsBarocel). The magnesium perchlorate trap was shown to have no effect on the mea-10
sured c-C4F8 concentrations.Up until 2006 all samples were analysed using a double-focussing, tri-sector mass
spectrometer (V.G. Autospec) coupled to the outlet of a Hewlett Packard 5890A gaschromatograph. The mass spectrometer was operated in electron ionisation, selectedion mode at a resolution of ∼ 2000. c-C4F8 was monitored at m/z 130.992, which15
corresponds to the C3F+5 ion, the most abundant ion in the mass spectrum. Various
halocarbons, including c-C4F8 (retention time ∼10.4 min), were separated on a KCl-passivated alumina PLOT column (50 m×0.53 mm, Chrompack), with helium carriergas (2 ml min−1) and a temperature program of −10 ◦C (2 min) rising to 180 ◦C, at a rateof 15 ◦C min−1. Full details of the method can be found in Fraser et al. (1999). Since20
2006 samples have been analysed using a similar method but with an updated GC-MS (Waters Autospec Premier) and a slightly modified pre-concentration procedure.The post 2006 procedures are described in detail by Laube et al. (2010a), but the mainchanges are in the method of pre-concentration, which now incorporates a Hayesep D-packed stainless steel sample loop at −78 ◦C, and the chromatographic column (Agilent25
30 m×0.32 mm GS-GasPro). A selection of pre-2006 samples (∼ 300 ml) have beenreanalysed with this system to confirm the absence of systematic differences. Compar-isons of 6 samples covering the period 1999–2005 showed agreement to within 3 %,with no significant bias.
19093
ACPD11, 19089–19111, 2011
Long-termtropospheric trend
of octafluoro-cyclobutane
D. E. Oram et al.
Title Page
Abstract Introduction
Conclusions References
Tables Figures
J I
J I
Back Close
Full Screen / Esc
Printer-friendly Version
Interactive Discussion
Discussion
Paper
|D
iscussionP
aper|
Discussion
Paper
|D
iscussionP
aper|
The mean precision of 2–3 replicate analyses, bracketed by working standard sam-ples to correct for instrumental drift, was 0.8 %, based on the pre and post 2006 meth-ods. Blank tests were performed by analysing 200–300 ml of purified helium (the carriergas). c-C4F8 was below the detection limit (DL<0.01 ppt) in these blank tests.
The working standard used to calibrate the pre-2006 c-C4F8 data was a northern5
hemispheric air sample collected at Niwot Ridge, Colorado, USA, contained in anAculife-treated, aluminium cylinder (ALM-39753) at an initial pressure of 1.3×10⁴ kPa(supplied by J. Elkins, NOAA-ESRL, Boulder, Colorado, USA). A different working stan-dard, also from NOAA, was used for the post 2006 analyses (AAL-071170). The con-centration of c-C4F8 in this second working standard (1.55±0.04 ppt) was determined10
by three repeated comparisons to primary standards prepared using a two stage, staticdilution technique described recently in Laube et al. (2010a). The stated purity of thec-C4F8 used for the dilutions was 99 % (Fluorochem Ltd. UK) and the absence of im-purities was confirmed by performing a mass scan over the range 47–200 amu. Threeseparate dilutions in the region of 6–14 ppt were prepared using CF2Cl2 (CFC-12, 16–15
30 ppt) as an internal reference. The CF2Cl2 mixing ratio assigned to the workingstandard from these dilutions was within 4.6 % of the value assigned by NOAA (2001scale). The concentration of c-C4F8 in the original working standard (ALM-39753;0.91±0.03 ppt) was determined by repeat comparisons to AAL-071170. The UEA cal-ibration is based on volumetric dilutions and therefore generates standards on a pptv20
scale. To convert to a dry air mole fraction scale (ppt) the UEA scale has been cor-rected for non ideal gas behaviour. As described in Laube et al. (2010a) the correctionunder the reduced pressures of the initial dilution step is actually very small, in the caseof c-C4F8 being less than 0.2 %, based on the virial coefficients reported by (Douslinet al., 1959). The linearity of the pre-concentration and analytical system was tested by25
pre-concentrating different volumes of the working standard (between 50 and 300 ml)and found to be linear within 1.2 %. The total uncertainty of the UEA calibration scalefor c-C4F8 is estimated to be 7 %, which is slightly higher than that reported for HFC-227ea (<5 %, Laube et al., 2010a) due to the higher uncertainty of the CFC-12 internal
19094
ACPD11, 19089–19111, 2011
Long-termtropospheric trend
of octafluoro-cyclobutane
D. E. Oram et al.
Title Page
Abstract Introduction
Conclusions References
Tables Figures
J I
J I
Back Close
Full Screen / Esc
Printer-friendly Version
Interactive Discussion
Discussion
Paper
|D
iscussionP
aper|
Discussion
Paper
|D
iscussionP
aper|
standard (4.6 % for c-C4F8 dilutions, 1.3 % for HFC-227ea dilutions).The new calibration scale replaces an earlier scale which was used to calibrate pre-
viously reported measurements of c-C4F8 from UEA (Oram, 1999; Sturges et al., 2000;Montzka and Fraser, 2003). These earlier numbers must be reduced by 19.6 % to placethem on the current scale.5
2.1 Aircraft measurements
Samples from two aircraft programmes have also been analysed for c-C4F8. Two recentflights of the CARIBIC aircraft (Lufthansa Airbus 340; http://www.caribic-atmospheric.com) between Germany and South Africa were analysed using the GasPro col-umn/Autospec Premier combination. A total of 34 samples were analysed from flights10
on 27–29 October 2009 (21 samples, Flights 290 and 291) and 14–15 November 2010(13 samples, Flight 317). One sample was found to be contaminated and rejected.CARIBIC whole air samples are collected in 2.7 l glass vessels at pressures of around4 bar. Full details of the CARIBIC instrument package and sampling methods can befound in Brenninkmeijer et al. (2007).15
Samples collected during two earlier flights of the CARIBIC aircraft have also beenanalysed for c-C4F8. 20 samples from flights on 5 June (9 samples, Flight 5) and 7August (11 samples, Flight 7) 1998 were analysed using the original instrument andalumina PLOT column. These Northern Hemisphere flights between Germany andSri Lanka occurred during phase 1 of the CARIBIC project (LTU airlines, Boeing 767),20
which had a smaller instrument package and a different whole air sampler (see Bren-ninkmeijer et al., 1999 for details). At this time air samples were collected at high pres-sure (∼ 17 bar) into 21-l stainless steel cylinders, with aliquots being transferred intosmaller (2.5 l) electropolished SS canisters (3–4 bar) for subsequent halocarbon anal-ysis. The lack of variability in the data and excellent agreement with the Cape Grim25
measurements (see below) confirms the reliability of the sampling and sub-samplingtechniques.
19095
ACPD11, 19089–19111, 2011
Long-termtropospheric trend
of octafluoro-cyclobutane
D. E. Oram et al.
Title Page
Abstract Introduction
Conclusions References
Tables Figures
J I
J I
Back Close
Full Screen / Esc
Printer-friendly Version
Interactive Discussion
Discussion
Paper
|D
iscussionP
aper|
Discussion
Paper
|D
iscussionP
aper|
Finally 99 samples, collected during several northern hemispheric flights of the highaltitude M55 Geophysica research aircraft during October–November 2009 and Jan-uary 2010, have also been analysed for their c-C4F8 content. These lower stratosphericsamples (10–20 km altitude) were collected in 2.5 l, electropolished stainless steel can-isters at a pressure of 3–4 bar and analysed with the GasPro-Autospec Q combination.5
Two samples were found to be contaminated and were rejected from the subsequentdata analysis. Details of the Geophysica sampling system can be found in Kaiser et al.(2006). Again, the lack of variability in the data and excellent agreement with the CapeGrim measurements confirms the reliability of the sampling technique.
3 Results10
3.1 Cape Grim
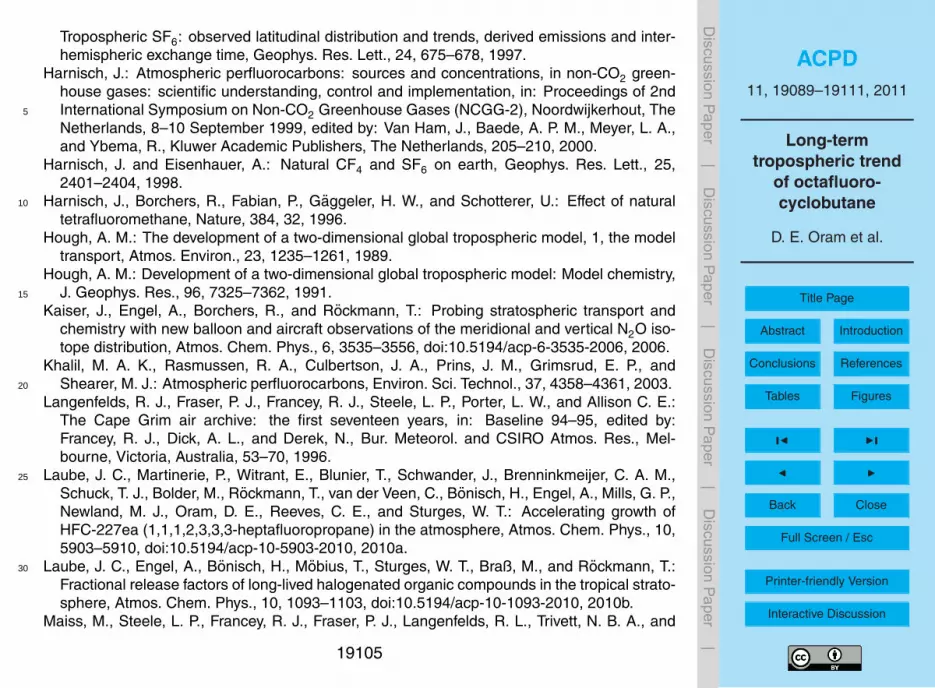
Figure 1 shows the changing abundance of c-C4F8 at Cape Grim over the period1978–2008. Background levels have increased from around 0.35 ppt in 1978 toaround 1.1 pptv in mid-2008. The growth rate of c-C4F8 has fluctuated over this30 yr period, slowing considerably during the early 1990s, but increasing again since15
1996. A linear fit through the 2003–2008 data (R2 = 0.91) yields a growth rate of0.030±0.002 ppt yr−1, or 2.7 % yr−1 based on the mean 2008 mixing ratio of 1.12 ppt.This is significantly higher than the 0.016±0.001 ppt yr−1 seen between 1990 and 2002(R2 =0.806).
In absolute terms the Cape Grim data compares well with recently reported values20
from the Northern Hemisphere. Saito et al (2010) reported a mean baseline mix-ing ratio of 1.22 pptv at Cape Ochiishi (43.1◦ N, 145.3◦ E) for the period August 2006–September 2009, and a slightly higher mean of 1.33 pptv at Hateruma Island (24.1◦ N,123.8◦ E), a site more impacted by emissions from East Asia. However, the reportedgrowth rates of 0.01 pptv yr−1 and 0.02 pptv yr−1 for Ochiishi and Hateruma respectively25
are significantly lower than those measured at Cape Grim. It should be noted that the
19096
ACPD11, 19089–19111, 2011
Long-termtropospheric trend
of octafluoro-cyclobutane
D. E. Oram et al.
Title Page
Abstract Introduction
Conclusions References
Tables Figures
J I
J I
Back Close
Full Screen / Esc
Printer-friendly Version
Interactive Discussion
Discussion
Paper
|D
iscussionP
aper|
Discussion
Paper
|D
iscussionP
aper|
Saito et al. measurements are reported on a volume mixing ratio scale, which is notdirectly comparable to dry air mole fraction unless the correction for non-ideal gas be-haviour has been applied. Any correction factor is however likely to be quite small, andwill not account for the observed difference in growth rates.
3.2 Global emission estimates5
We use the long-term c-C4F8 dataset from Cape Grim to derive top-down emissionestimates by means of a 2-D global chemistry-transport model. The model grid isdivided into 24 equal area, zonally-averaged bands and has 12 vertical layers of 2 kmdepth. The model has been described elsewhere (Hough 1989, 1991) and has recentlybeen used to study the temporal behaviour and global distribution of halons (Fraser10
et al., 1999; Reeves et al., 2005) and HFC-227ea (Laube et al., 2010a). The latitudinaldistribution of emissions is based on a function of industrial activity such that 95 %of emissions are in the Northern Hemisphere, primarily from mid-latitudes (Reeveset al., 2005). Under these conditions the model’s transport scheme has been shownto reproduce the observed global distributions of CFC-11 and CFC-12 (Reeves et al.,15
2005). For c-C4F8, using an atmospheric lifetime of 3200 yr (Forster et al., 2007), theemissions into the model were varied until the predicted concentrations matched theCape Grim observations.
The model was initialised with a Cape Grim starting mixing ratio of 0.275 ppt andannual emissions into the model began in 1976. It is important to note that emissions20
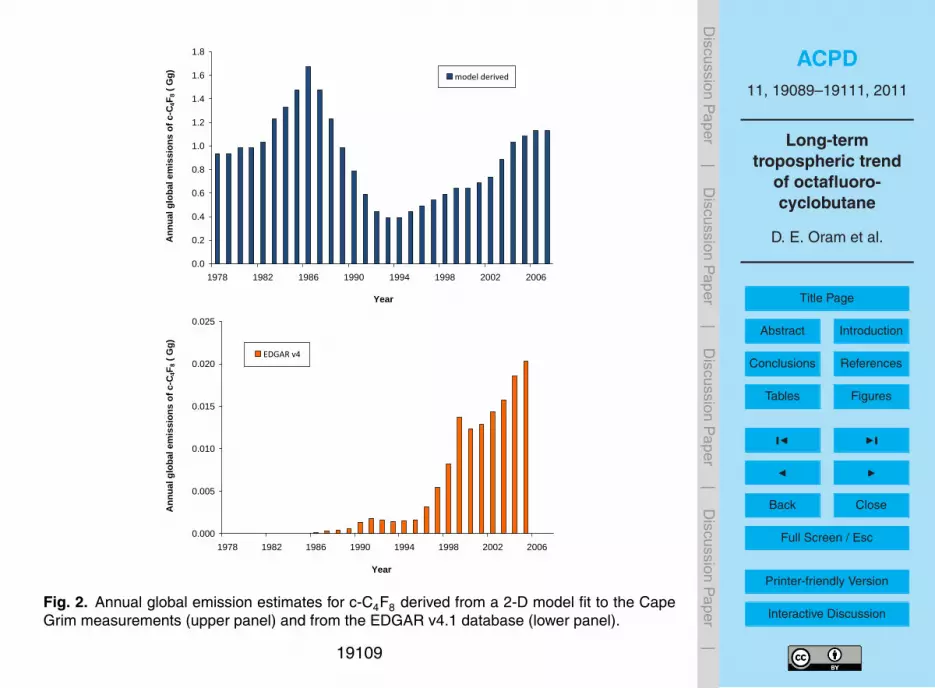
into the mid-latitudes of the Northern Hemisphere will take about 1 yr to impact on ob-served mixing ratios in the Southern Hemisphere. The emission scenario shown inFig. 2 is the one that made the modelled mixing ratios closely follow the Cape Grimmeasurements (Fig. 1, red line). The cumulative emissions required to generate aninitial 0.275 ppt at Cape Grim were 9.3 Gg. The model-derived emissions were around25
0.9 Gg yr−1 in 1978 and grew steadily during the early 1980s reaching a maximum rateof 1.7 Gg yr−1 in 1986. After 1987, the inferred emissions of c-C4F8 had to declinerapidly in order to match the decline in growth seen in the observed mixing ratios at
19097
ACPD11, 19089–19111, 2011
Long-termtropospheric trend
of octafluoro-cyclobutane
D. E. Oram et al.
Title Page
Abstract Introduction
Conclusions References
Tables Figures
J I
J I
Back Close
Full Screen / Esc
Printer-friendly Version
Interactive Discussion
Discussion
Paper
|D
iscussionP
aper|
Discussion
Paper
|D
iscussionP
aper|
Cape Grim, such that by 1993 they had dropped to just 0.4 Gg yr−1. After 1994 mod-elled emissions increased slightly, followed by a more significant increase between2000 and 2004. The most recent observations (2005–2008) suggest emissions mayhave levelled off at around 1.1 Gg yr−1. The model-derived mixing ratio of c-C4F8 in thelatitudinal band of Cape Ochiishi (43.1◦ N) for mid-2008 is 1.22 ppt, which compares5
well with the 2006–2009 average of 1.22 pptv reported by Saito et al. (2010).Cumulative global emissions of c-C4F8 up until the end of 2007 are calculated to be
38.1 Gg, which is equivalent to a 100 yr GWP-weighted emission of 0.39 billion tonnesof CO2 (0.39 Pg). Also shown in Fig. 1 are the predicted mixing ratios at Cape Grimderived from a +10 % and −10 % change in the input emissions. Clearly the majority10
of measurements lie well within these boundaries.It is possible to compare the model-derived emissions with those published on the
EDGAR v4.1 database (EDGAR, 2009). EDGAR emissions are derived from figuresreported by individual producers and from national inventories submitted to the UN-FCCC (United Nations Framework Convention on Climate Change) by countries that15
are party to the Kyoto Protocol. EDGAR emissions are available for the period 1986–2005 and are also shown in Fig. 2. Reported emissions have clearly increased overthis period, particularly since 1995, but the magnitude of these emissions is well be-low those derived here from observations, suggesting a large missing source of c-C4F8.Cumulative emissions between 1986 and 2005 from EDGAR amount to 0.14 Gg, which20
is less than 1 % of the 15.7 Gg derived from the Cape Grim measurements over thesame period. Based on measurements at Cape Ochiishi and Hateruma Island be-tween 2006 and 2009, Saito et al. (2010) estimated c-C4F8 emissions from East Asiato be 0.56 Gg yr−1, with China being responsible for around 70 % of the total. Globalemissions over the same period were estimated to be 0.6±0.2 Gg yr−1, implying that25
the East Asia region (China, Japan, North Korea, South Korea and Taiwan) is responsi-ble for ∼93 % of global emissions. The global emission estimates of Saito et al. (2010)are somewhat lower than those derived from the Cape Grim data for the same period(1.1 Gg yr−1). This can be largely explained by the fact that the Saito et al. estimates
19098
ACPD11, 19089–19111, 2011
Long-termtropospheric trend
of octafluoro-cyclobutane
D. E. Oram et al.
Title Page
Abstract Introduction
Conclusions References
Tables Figures
J I
J I
Back Close
Full Screen / Esc
Printer-friendly Version
Interactive Discussion
Discussion
Paper
|D
iscussionP
aper|
Discussion
Paper
|D
iscussionP
aper|
were based on observed growth rates of between 0.01 and 0.02 ppt yr−1, which arelower than the Cape Grim trend of 0.030±0.002 ppt yr−1. However, if our estimatedglobal emissions are correct it would imply that emissions from China and East Asiaare only responsible for around 50 %, which is closer to the figure of ∼30 % which wasreported by EDGAR v4 (China, Korea, Japan, Taiwan) for the year 2005.5
From the observed trend at Cape Grim and the corresponding model-derived emis-sion scenario, it is evident that emissions of c-C4F8 have varied considerably over thepast 30 yr. Indeed, the behaviour of c-C4F8 is rather unusual when compared to thebehaviour of other halocarbons. The decline seen between 1986 and 1993 is difficultto explain. It precedes the similar decline seen in CFC emissions by several years10
(CFC-11 and 12 emissions peaked in 1988, CFC-113 in 1989), although there is noreason to expect a link between CFC production and c-C4F8 emissions, and c-C4F8 isnot controlled by the Montreal Protocol.
It is possible that c-C4F8 is released along with CF4 and C2F6 during the productionof aluminium although, to the best of our knowledge, c-C4F8 has not been reported in15
studies of emissions from the aluminium industry. Furthermore the trends in c-C4F8emissions do not necessarily match well those of CF4. From long term troposphericmeasurements in both hemispheres Muhle et al. (2010) derived an emission scenariothat saw CF4 emissions peak in 1980 before declining gradually during the 1980s andthen more rapidly after 1990. From the modelling study reported here, emissions of20
c-C4F8 increased during the early 1980s reaching a peak in 1986 before a fairly rapiddecline between 1987 and 1993.
Known uses of c-C4F8 include the semiconductor industry, for example in plasmaetching and chamber cleaning, and also in the production of optical fibres. It has alsofound some use in refrigerant blends (e.g. R405a) and in fire extinguishers and aerosol25
sprays. c-C4F8 has also been used as a tracer in tracer release experiments, althoughit is highly unlikely to have been used in significantly large quantities. c-C4F8 can beformed by the dimerisation of tetrafluoroethene (C2F4; Harnisch, 2000) and conse-quently could be released as a by-product during the manufacture of fluoropolymers. It
19099
ACPD11, 19089–19111, 2011
Long-termtropospheric trend
of octafluoro-cyclobutane
D. E. Oram et al.
Title Page
Abstract Introduction
Conclusions References
Tables Figures
J I
J I
Back Close
Full Screen / Esc
Printer-friendly Version
Interactive Discussion
Discussion
Paper
|D
iscussionP
aper|
Discussion
Paper
|D
iscussionP
aper|
has also been suggested that the combustion or thermal desorption of polytetraflu-oroethene (PTFE) and other fluoropolymers could account for some of the c-C4F8found in the atmosphere (Morisaki, 1978; Harnisch, 2000). Finally, a significant natu-ral source of c-C4F8 can be ruled out as our own recent measurements in deep polarsnow (firn air) show no detectable c-C4F8 in air representative of the atmosphere in the5
1940s (Mani, 2010).
3.3 Upper tropospheric measurements
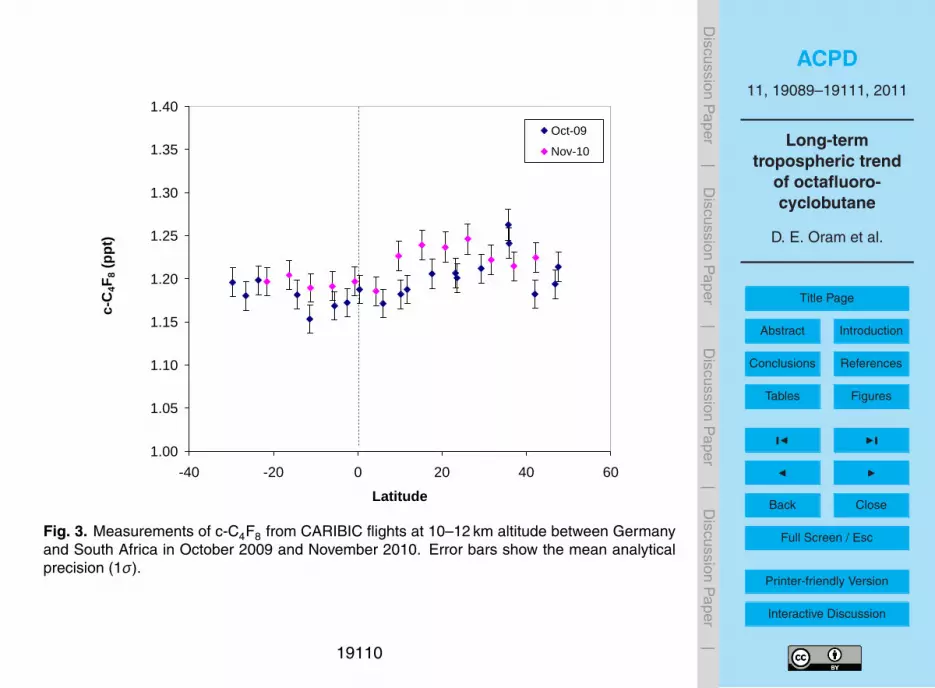
Information on the latitudinal distribution of c-C4F8 can be obtained from a selectionof samples collected during recent CARIBIC flights between Germany (Frankfurt) andSouth Africa. Figure 3 shows the measurements from flights carried out in October10
2009 (to Cape Town) and November 2010 (to Johannesburg). The flight routes wereessentially north to south, being confined to the longitude range 5◦–30◦ E. With the ex-ception of the most northerly sample in November 2010 (altitude 8.6 km), all sampleswere collected at altitudes between 10 and 12 km (250–200 hPa). Based on measuredozone and model-derived potential vorticity (O3 < 100 ppb, PV< 3), none of the sam-15
ples were significantly affected by mixing with stratospheric air, so are representative ofmid-upper tropospheric air. Back trajectories show that, with the exception of samplescollected in the region of the ITCZ, the intercepted air in both hemispheres is typicallywesterly, originating over the Atlantic and beyond. Both flights reveal a small interhemi-spheric ratio, with mean concentrations higher in the Northern Hemisphere by 2.1 %20
and 1.5 % in 2009 and 2010, respectively. This is consistent with continuing moder-ate emissions of a long-lived compound primarily from mid-latitudes of the NorthernHemisphere. The mean southern hemispheric concentrations of 1.18±0.02 ppt and1.20±0.01 ppt in October 2009 and November 2010 show how c-C4F8 has continuedto grow since the end of the Cape Grim record in June 2008 (see Fig. 1). The mean NH25
concentrations of 1.20±0.02 ppt (October 2009) and 1.22±0.02 ppt (November 2010)are in reasonable agreement with the 2006–2009 average of 1.22 reported by Saitoet al. (2010) at Cape Ochiishi.
19100
ACPD11, 19089–19111, 2011
Long-termtropospheric trend
of octafluoro-cyclobutane
D. E. Oram et al.
Title Page
Abstract Introduction
Conclusions References
Tables Figures
J I
J I
Back Close
Full Screen / Esc
Printer-friendly Version
Interactive Discussion
Discussion
Paper
|D
iscussionP
aper|
Discussion
Paper
|D
iscussionP
aper|
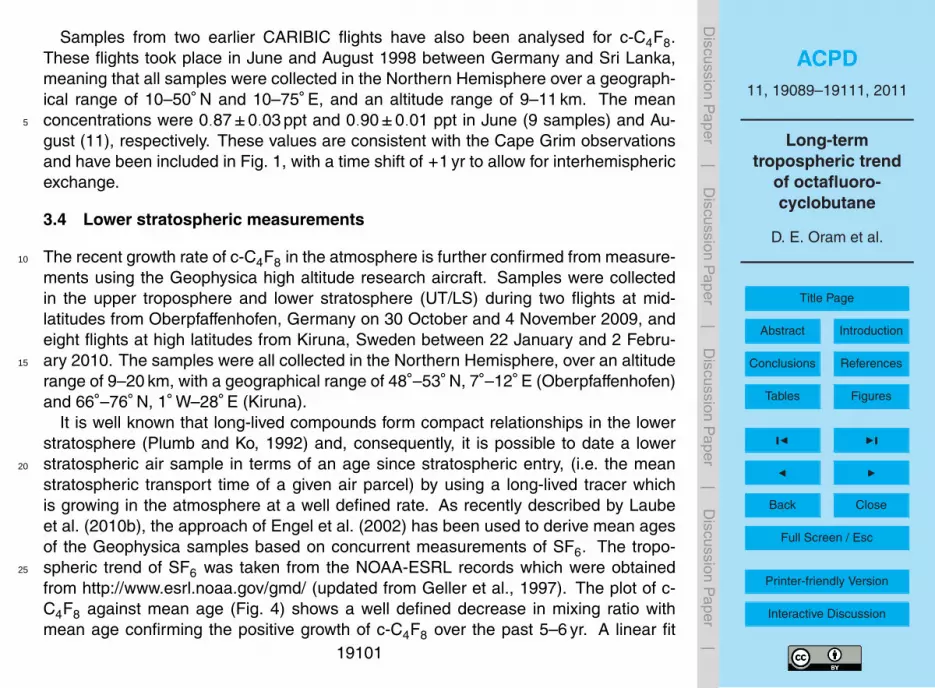
Samples from two earlier CARIBIC flights have also been analysed for c-C4F8.These flights took place in June and August 1998 between Germany and Sri Lanka,meaning that all samples were collected in the Northern Hemisphere over a geograph-ical range of 10–50◦ N and 10–75◦ E, and an altitude range of 9–11 km. The meanconcentrations were 0.87±0.03 ppt and 0.90±0.01 ppt in June (9 samples) and Au-5
gust (11), respectively. These values are consistent with the Cape Grim observationsand have been included in Fig. 1, with a time shift of +1 yr to allow for interhemisphericexchange.
3.4 Lower stratospheric measurements
The recent growth rate of c-C4F8 in the atmosphere is further confirmed from measure-10
ments using the Geophysica high altitude research aircraft. Samples were collectedin the upper troposphere and lower stratosphere (UT/LS) during two flights at mid-latitudes from Oberpfaffenhofen, Germany on 30 October and 4 November 2009, andeight flights at high latitudes from Kiruna, Sweden between 22 January and 2 Febru-ary 2010. The samples were all collected in the Northern Hemisphere, over an altitude15
range of 9–20 km, with a geographical range of 48◦–53◦ N, 7◦–12◦ E (Oberpfaffenhofen)and 66◦–76◦ N, 1◦ W–28◦ E (Kiruna).
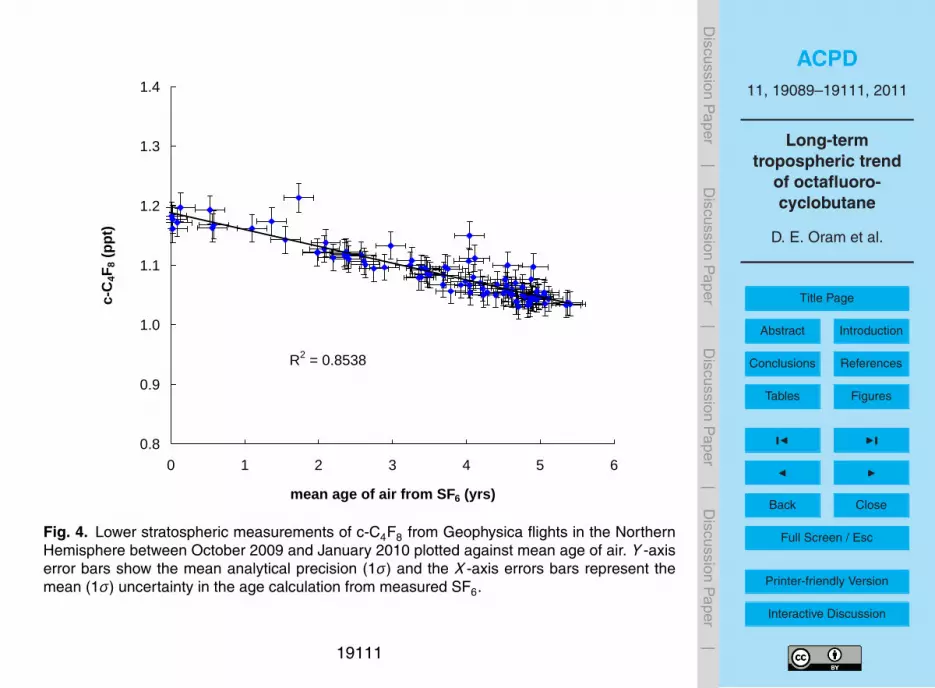
It is well known that long-lived compounds form compact relationships in the lowerstratosphere (Plumb and Ko, 1992) and, consequently, it is possible to date a lowerstratospheric air sample in terms of an age since stratospheric entry, (i.e. the mean20
stratospheric transport time of a given air parcel) by using a long-lived tracer whichis growing in the atmosphere at a well defined rate. As recently described by Laubeet al. (2010b), the approach of Engel et al. (2002) has been used to derive mean agesof the Geophysica samples based on concurrent measurements of SF6. The tropo-spheric trend of SF6 was taken from the NOAA-ESRL records which were obtained25
from http://www.esrl.noaa.gov/gmd/ (updated from Geller et al., 1997). The plot of c-C4F8 against mean age (Fig. 4) shows a well defined decrease in mixing ratio withmean age confirming the positive growth of c-C4F8 over the past 5–6 yr. A linear fit
19101
ACPD11, 19089–19111, 2011
Long-termtropospheric trend
of octafluoro-cyclobutane
D. E. Oram et al.
Title Page
Abstract Introduction
Conclusions References
Tables Figures
J I
J I
Back Close
Full Screen / Esc
Printer-friendly Version
Interactive Discussion
Discussion
Paper
|D
iscussionP
aper|
Discussion
Paper
|D
iscussionP
aper|
to the data (R2 = 0.854) yields a mean growth rate of 0.028±0.001 ppt yr−1, which issimilar to the southern hemispheric growth rate of 0.030±0.002 ppt yr−1 derived fromthe Cape Grim record (2003–2008). This also confirms the very long lifetime of c-C4F8as there is no evidence for a significant sink reaction in the lower stratosphere. Themean upper tropospheric concentration of 1.18±0.02 ppt (derived from samples with5
mean age less than 0.15 yr) is similar to the CARIBIC northern hemispheric means of1.20±0.02 ppt and 1.22±0.02 ppt in October 2009 and November 2010, respectively.
4 Summary and conclusions
Long-term observations from Cape Grim together with recent aircraft measurements inthe upper troposphere and lower stratosphere reveal the continuing accumulation of c-10
C4F8 in the remote atmosphere. The current (2010) abundance of c-C4F8 is ∼ 1.2 pptand is growing at 0.03 ppt yr−1. Model calculations suggest that global emissions ofc-C4F8 have increased in recent years after a steady decline in the late 1980s andearly 1990s. Current emission rates are estimated to be of the order of 1.1 Gg yr−1.Cumulative emissions up to and including 2007 are 38.1 Gg, which is equivalent to15
a 100 yr GWP-weighted emission of 0.39 billion tonnes of CO2. To put this in context, itis similar to the total annual anthropogenic emissions of CO2 from the UK (0.47 billiontonnes in 2009; DECC, 2011). Comparison with bottom up emissions from the EDGARv4 database reveals a large discrepancy, with reported emissions accounting for lessthan 1 % of those required to match the Cape Grim measurements. There is clearly20
a large missing, or unreported, source of this potent greenhouse gas, and it has beenspeculated that this could be from the manufacture or incineration of fluoropolymerssuch as PTFE. Further research is required to identify this missing source of c-C4F8 sothat accurate data can be reported to the UNFCCC and other relevant agencies.
19102
ACPD11, 19089–19111, 2011
Long-termtropospheric trend
of octafluoro-cyclobutane
D. E. Oram et al.
Title Page
Abstract Introduction
Conclusions References
Tables Figures
J I
J I
Back Close
Full Screen / Esc
Printer-friendly Version
Interactive Discussion
Discussion
Paper
|D
iscussionP
aper|
Discussion
Paper
|D
iscussionP
aper|
Acknowledgement. The UEA Cape Grim and CARIBIC programmes are currently supportedby the UK NERC National Centre for Atmospheric Science. The Cape Grim programmehas previously received funding from the former UK Government Department of Environ-ment (GA/4/2/57). The CARIBIC programme has previously received funding from UK NERC(NER/T/S/2000/01040 and GST/02/2218) and the European Union (EVK2-GT2001-00101).5
Further funding came from NERC award NE/F021194/1). The Geophysica flights were fundedby the European Space Agency, the Forschungszentrum Julich and the EU RECONCILEproject (226365-FP7-2008-1). F. Mani acknowledges an EU Marie Curie studentship (MEST-CT-2004-514159). J. Laube is funded by a UK NERC Fellowship (NE/F015585/1). We areindebted to G. Mills, P. Begley and S. Humphrey for technical support and would like to thank10
the CARIBIC and Geophysica teams and those at CSIRO involved in the long-term operationof the Cape Grim station.
References
Brenninkmeijer, C.A.M., Crutzen, P.J., Fischer, H., Gsten, H., Hans, W., Heinrich, G., Heintzen-berg, J., Hermann, M., Immelmann, T., Kersting, D., Maiss, M., Nolle, M., Pitscheider, A.,15
Pohlkamp, H., Scharffe, D., Specht, K.; and Wiedensohler, A.: CARIBIC-Civil Aircraft forglobal measurement of trace gases and aerosols in the tropopause region, J. Atmos. OceanicTechnol., 16, 1373–1383, 1999.
Brenninkmeijer, C. A. M., Crutzen, P., Boumard, F., Dauer, T., Dix, B., Ebinghaus, R., Filippi, D.,Fischer, H., Franke, H., Frieß, U., Heintzenberg, J., Helleis, F., Hermann, M., Kock, H. H.,20
Koeppel, C., Lelieveld, J., Leuenberger, M., Martinsson, B. G., Miemczyk, S., Moret, H. P.,Nguyen, H. N., Nyfeler, P., Oram, D., O’Sullivan, D., Penkett, S., Platt, U., Pupek, M., Ra-monet, M., Randa, B., Reichelt, M., Rhee, T. S., Rohwer, J., Rosenfeld, K., Scharffe, D.,Schlager, H., Schumann, U., Slemr, F., Sprung, D., Stock, P., Thaler, R., Valentino, F., vanVelthoven, P., Waibel, A., Wandel, A., Waschitschek, K., Wiedensohler, A., Xueref-Remy, I.,25
Zahn, A., Zech, U., and Ziereis, H.: Civil Aircraft for the regular investigation of the atmo-sphere based on an instrumented container: The new CARIBIC system, Atmos. Chem.Phys., 7, 4953–4976, doi:10.5194/acp-7-4953-2007, 2007.
Culbertson, J. A., Prins, J. M., and Grimsrud, E. P.: Improvements in the detection and analysis
19103
ACPD11, 19089–19111, 2011
Long-termtropospheric trend
of octafluoro-cyclobutane
D. E. Oram et al.
Title Page
Abstract Introduction
Conclusions References
Tables Figures
J I
J I
Back Close
Full Screen / Esc
Printer-friendly Version
Interactive Discussion
Discussion
Paper
|D
iscussionP
aper|
Discussion
Paper
|D
iscussionP
aper|
of CF3-containing compounds in the background atmosphere using gas chromatography-high resolution mass spectrometry, J. Chromatogr., 903, 261–265, 2000.
Culbertson, J. A., Prins, J. M., Grimsrud, E. P., Rasmussen, R. A., Khalil, M. A. K., andShearer, M. J.: Observed trends for CF3-containing compounds in background air at CapeMeares, Oregon, Point Barrow, Alaska and Palmer Station, Antarctica, Chemosphere, 55,5
1109–1119, 2004.Cunnold, D., Fraser, P. J., Weiss, R. F., Prinn, R. G., Simmonds, P. G., Miller, B. R., Alyea, F. N.,
and Crawford, A. J.: Global trends and annual releases of CCl3F and CCl2F2 estimated fromALE/GAGE and other measurements from July 1978 to June 1991, J. Geophys. Res., 99,1107–1126, 1994.10
DECC: UK Department of Energy and Climate Change, Statistical release for 2009, availableat: http://www.decc.gov.uk/, last acces: March 2011, February 2011.
Douslin, D. R., Moore, R. T., and Waddington, G.: The pressure-volume-temperature propertiesof perfluorocyclobutane: equations of state, virial coefficients and intermolecular potentialenergy functions, J. Phys. Chem., 63, 1959–1966, 1959.15
EDGAR: European Commission, Joint Research Centre (JRC)/Netherlands Environmental As-sessment Agency (PBL). Emission Database for Global Atmospheric Research (EDGAR),release version 4.0., available at: http://edgar.jrc.ec.europa.eu, last access: March 2011,2009.
Engel A., Strunk, M., Muller, M., Haase, H.-P., Poss, C., Levin, I., and Schmidt, U.: Tem-20
poral development of total chlorine in the high-latitude stratosphere based on referencedistributions of mean age derived from CO2 and SF6, J. Geophys. Res., 107(D12), 4136,doi:10.1029/2001JD000584, 2002.
Fraser, P. J., Oram, D. E., Reeves, C. E., Penkett, S. A., and McCulloch, A.: Southern hemi-spheric halon trends (1978–1998) and global halon emissions, J. Geophys. Res., 104,25
15985–15999, 1999.Forster, P., Ramaswamy, V., Artaxo, P., Berntsen, T., Betts, R., Fahey, D.W., Haywood, J., Lean,
J., Lowe, D. C., Myhre, G., Nganga, J., Prinn, R., Raga, G., Schulz, M., and Van Dorland, R.:Changes in Atmospheric Constituents and in Radiative Forcing, in: Climate Change 2007:The Physical Science Basis, Contribution of Working Group I to the Fourth Assessment30
Report of the Intergovernmental Panel on Climate Change, Cambridge University Press,Cambridge, UK and New York, USA, 2007.
Geller, L. S., Elkins, J. W., Lobert, J. M., Clarke, A. D., Hurst, D. F. Butler, J. H., and Myers, R. C.:
19104
ACPD11, 19089–19111, 2011
Long-termtropospheric trend
of octafluoro-cyclobutane
D. E. Oram et al.
Title Page
Abstract Introduction
Conclusions References
Tables Figures
J I
J I
Back Close
Full Screen / Esc
Printer-friendly Version
Interactive Discussion
Discussion
Paper
|D
iscussionP
aper|
Discussion
Paper
|D
iscussionP
aper|
Tropospheric SF6: observed latitudinal distribution and trends, derived emissions and inter-hemispheric exchange time, Geophys. Res. Lett., 24, 675–678, 1997.
Harnisch, J.: Atmospheric perfluorocarbons: sources and concentrations, in non-CO2 green-house gases: scientific understanding, control and implementation, in: Proceedings of 2ndInternational Symposium on Non-CO2 Greenhouse Gases (NCGG-2), Noordwijkerhout, The5
Netherlands, 8–10 September 1999, edited by: Van Ham, J., Baede, A. P. M., Meyer, L. A.,and Ybema, R., Kluwer Academic Publishers, The Netherlands, 205–210, 2000.
Harnisch, J. and Eisenhauer, A.: Natural CF4 and SF6 on earth, Geophys. Res. Lett., 25,2401–2404, 1998.
Harnisch, J., Borchers, R., Fabian, P., Gaggeler, H. W., and Schotterer, U.: Effect of natural10
tetrafluoromethane, Nature, 384, 32, 1996.Hough, A. M.: The development of a two-dimensional global tropospheric model, 1, the model
transport, Atmos. Environ., 23, 1235–1261, 1989.Hough, A. M.: Development of a two-dimensional global tropospheric model: Model chemistry,
J. Geophys. Res., 96, 7325–7362, 1991.15
Kaiser, J., Engel, A., Borchers, R., and Rockmann, T.: Probing stratospheric transport andchemistry with new balloon and aircraft observations of the meridional and vertical N2O iso-tope distribution, Atmos. Chem. Phys., 6, 3535–3556, doi:10.5194/acp-6-3535-2006, 2006.
Khalil, M. A. K., Rasmussen, R. A., Culbertson, J. A., Prins, J. M., Grimsrud, E. P., andShearer, M. J.: Atmospheric perfluorocarbons, Environ. Sci. Technol., 37, 4358–4361, 2003.20
Langenfelds, R. J., Fraser, P. J., Francey, R. J., Steele, L. P., Porter, L. W., and Allison C. E.:The Cape Grim air archive: the first seventeen years, in: Baseline 94–95, edited by:Francey, R. J., Dick, A. L., and Derek, N., Bur. Meteorol. and CSIRO Atmos. Res., Mel-bourne, Victoria, Australia, 53–70, 1996.
Laube, J. C., Martinerie, P., Witrant, E., Blunier, T., Schwander, J., Brenninkmeijer, C. A. M.,25
Schuck, T. J., Bolder, M., Rockmann, T., van der Veen, C., Bonisch, H., Engel, A., Mills, G. P.,Newland, M. J., Oram, D. E., Reeves, C. E., and Sturges, W. T.: Accelerating growth ofHFC-227ea (1,1,1,2,3,3,3-heptafluoropropane) in the atmosphere, Atmos. Chem. Phys., 10,5903–5910, doi:10.5194/acp-10-5903-2010, 2010a.
Laube, J. C., Engel, A., Bonisch, H., Mobius, T., Sturges, W. T., Braß, M., and Rockmann, T.:30
Fractional release factors of long-lived halogenated organic compounds in the tropical strato-sphere, Atmos. Chem. Phys., 10, 1093–1103, doi:10.5194/acp-10-1093-2010, 2010b.
Maiss, M., Steele, L. P., Francey, R. J., Fraser, P. J., Langenfelds, R. L., Trivett, N. B. A., and
19105
ACPD11, 19089–19111, 2011
Long-termtropospheric trend
of octafluoro-cyclobutane
D. E. Oram et al.
Title Page
Abstract Introduction
Conclusions References
Tables Figures
J I
J I
Back Close
Full Screen / Esc
Printer-friendly Version
Interactive Discussion
Discussion
Paper
|D
iscussionP
aper|
Discussion
Paper
|D
iscussionP
aper|
Levin, I.: Sulfur hexafluoride – a powerful new atmospheric tracer, Atmos. Environ., 30,1621–1629, 1996.
Mani, F.: Measurements of δ15N of nitrogen gas and composition of trace gases in air from firnand ice cores, Ph.D. Thesis, University of East Anglia, Norwich, UK, 2010.
Miller, B., Huang, J., Weiss, R., Prinn, R., and Fraser, P.: Atmospheric trend and lifetime of5
chlorodifluoromethane (HCFC-22) and the global tropospheric OH concentration, J. Geo-phys. Res., 103, 13237–13248, 1998.
Morisaki, S.: Simultaneous thermogravimetry-mass spectrometry and pyrolysis-gas chro-matography of fluorocarbon polymers, Thermochim. Acta, 25, 171–183, 1978.
Montzka, S. A. and Fraser, P. J. (Lead Authors): Controlled substances and other source10
gases, Chapt. 1, in: Scientific Assessment of Stratospheric Ozone Depletion: 2002, GlobalOzone Research and Monitoring Project, Report No. 47, World meteorological Organisation,Geneva, 2003.
Muhle, J., Ganesan, A. L., Miller, B. R., Salameh, P. K., Harth, C. M., Greally, B. R., Rigby, M.,Porter, L. W., Steele, L. P., Trudinger, C. M., Krummel, P. B., O’Doherty, S., Fraser, P. J.,15
Simmonds, P. G., Prinn, R. G., and Weiss, R. F.: Perfluorocarbons in the global atmo-sphere: tetrafluoromethane, hexafluoroethane, and octafluoropropane, Atmos. Chem. Phys.,10, 5145–5164, doi:10.5194/acp-10-5145-2010, 2010.
Oram, D. E.: Trends of long-lived anthropogenic halocarbons in the Southern Hemisphere andmodel calculations of global emissions, Ph.D. Thesis, University of East Anglia, Norwich, UK,20
1999.Oram, D. E., Reeves, C. E., Fraser, P. J., and Penkett, S. A.: Measurements of HCFC-142b and
HCFC-141b in the Cape Grim air archive: 1978–1993, Geophys. Res. Lett., 22, 2741–2744,1995.
Oram, D. E., Reeves, C. E., Sturges, W. T., Penkett, S. A., Fraser, P. J., and Langenfelds, R. L.:25
Recent tropospheric growth rate and distribution of HFC-134a (CF3CH2F), Geophys. Res.Lett., 23, 1949–1952, 1996.
Oram, D. E., Sturges, W. T., Penkett, S. A., McCulloch, A., and Fraser, P. J.: Growth of fluoroform(CHF3, HFC-23) in the background atmosphere, Geophys. Res. Lett., 25, 35–38, 1998.
Penkett, S. A., Prosser, N. J. D., Rasmussen, R. A., and Khalil, M. A. K.: Atmospheric mea-30
surements of CF4 and other fluorocarbons containing the CF3 grouping, J. Geophys. Res.,86, 5172–5178, 1981.
Plumb, R. A. and Ko, M. K. W.: Interrelationships between mixing ratios of long-lived
19106
ACPD11, 19089–19111, 2011
Long-termtropospheric trend
of octafluoro-cyclobutane
D. E. Oram et al.
Title Page
Abstract Introduction
Conclusions References
Tables Figures
J I
J I
Back Close
Full Screen / Esc
Printer-friendly Version
Interactive Discussion
Discussion
Paper
|D
iscussionP
aper|
Discussion
Paper
|D
iscussionP
aper|
stratospheric constituents, J. Geophys. Res., 97, 10145–10156, 1992.Prinn, R. G., Weiss, R. F., Miller, B. R., Huang, J., Alyea, F. N., Cunnold, D. M., Fraser, P. J.,
Hartley, D. E., and Simmonds, P. G.: Atmospheric trends and lifetime of trichloroethane andglobal average hydroxyl radical concentrations based on 1978–1994 ALE/GAGE measure-ments, Science, 269, 187–192, 1995.5
Rasmussen, R. A., Penkett, S. A., and Prosser, N. J. D.: Measurement of carbon tetrafluoridein the atmosphere, Nature, 277, 549–551, 1979.
Reeves, C. E., Sturges, W. T., Sturrock, G. A., Preston, K., Oram, D. E., Schwander, J., Mul-vaney, R., Barnola, J.-M., and Chappellaz, J.: Trends of halon gases in polar firn air: implica-tions for their emission distributions, Atmos. Chem. Phys., 5, 2055–2064, doi:10.5194/acp-10
5-2055-2005, 2005.Saito, T., Yokouchi, Y., Stohl, A., Taguchi, S., and Mukai, H.: Large emissions of perfluoro-
carbons in East Asia deduced from continuous atmospheric measurements, Environ. Sci.Technol., 44, 4089–4095, 2010.
Sturges, W. T., Oram, D. E., Penkett, S. A., Fraser, P. J., and Engel, A., Long-lived halogenated15
compounds in the stratosphere, in: Proceedings of 2nd International Symposium on Non-CO2 Greenhouse Gases (NCGG-2), Noordwijkerhout, The Netherlands, 8–10 September1999, edited by: Van Ham, J., Baede, A. P. M., Meyer, L. A., and Ybema, R., Kluwer Aca-demic Publishers, The Netherlands, 239–240, 2000.
Worton, D. R., Sturges, W. T., Gohar, L. K., Shine, K. P., Martinerie, P., Oram, D. E.,20
Humphrey, S. P., Begley, P., Barnola, J.-M., Schwander, J., and Mulvaney, R.: Atmospherictrends and radiative forcings of CF4 and C2F6 inferred from firn air, Environ. Sci. Technol.,41, 2184–2189, doi:10.1021/es061710t, 2007.
19107
ACPD11, 19089–19111, 2011
Long-termtropospheric trend
of octafluoro-cyclobutane
D. E. Oram et al.
Title Page
Abstract Introduction
Conclusions References
Tables Figures
J I
J I
Back Close
Full Screen / Esc
Printer-friendly Version
Interactive Discussion
Discussion
Paper
|D
iscussionP
aper|
Discussion
Paper
|D
iscussionP
aper|
0.0
0.2
0.4
0.6
0.8
1.0
1.2
1.4
1978 1982 1986 1990 1994 1998 2002 2006 2010
Year
c-C
4F8 (
ppt)
Cape Grim obsCape Grim modelledModelled + /-10%CARIBIC
Fig. 1. Measured and modelled c-C4F8 in the Southern Hemisphere over the period 1978–2010. Blue diamonds are individual samples collected at Cape Grim, Tasmania (41◦ S); opendiamonds are mean mole fractions (with ±1σ) from CARIBIC flights in 1998, 2009 and 2010.The 1998 CARIBIC samples are from the Northern Hemisphere and have been shifted by+1 yr to allow for interhemispheric mixing. The 2009 and 2010 CARIBIC data are southernhemispheric samples only. For clarity the uncertainty of the individual Cape Grim data points(mean precision=0.8 %) have been omitted. The red line represents the model-derived molefractions, with the dashed lines showing the effect of a ±10 % change on the modelled emis-sions.
19108
ACPD11, 19089–19111, 2011
Long-termtropospheric trend
of octafluoro-cyclobutane
D. E. Oram et al.
Title Page
Abstract Introduction
Conclusions References
Tables Figures
J I
J I
Back Close
Full Screen / Esc
Printer-friendly Version
Interactive Discussion
Discussion
Paper
|D
iscussionP
aper|
Discussion
Paper
|D
iscussionP
aper|
0.0
0.2
0.4
0.6
0.8
1.0
1.2
1.4
1.6
1.8
1978 1982 1986 1990 1994 1998 2002 2006
Year
Ann
ual g
loba
l em
issi
ons
of c
-C4F
8 ( G
g) model derived
0.000
0.005
0.010
0.015
0.020
0.025
1978 1982 1986 1990 1994 1998 2002 2006
Year
Ann
ual g
loba
l em
issi
ons
of c
-C4F
8 ( G
g)
EDGAR v4
Fig. 2. Annual global emission estimates for c-C4F8 derived from a 2-D model fit to the CapeGrim measurements (upper panel) and from the EDGAR v4.1 database (lower panel).
19109
ACPD11, 19089–19111, 2011
Long-termtropospheric trend
of octafluoro-cyclobutane
D. E. Oram et al.
Title Page
Abstract Introduction
Conclusions References
Tables Figures
J I
J I
Back Close
Full Screen / Esc
Printer-friendly Version
Interactive Discussion
Discussion
Paper
|D
iscussionP
aper|
Discussion
Paper
|D
iscussionP
aper|
1.00
1.05
1.10
1.15
1.20
1.25
1.30
1.35
1.40
-40 -20 0 20 40 60
Latitude
c-C
4F8 (
ppt)
Oct-09
Nov-10
Fig. 3. Measurements of c-C4F8 from CARIBIC flights at 10–12 km altitude between Germanyand South Africa in October 2009 and November 2010. Error bars show the mean analyticalprecision (1σ).
19110
ACPD11, 19089–19111, 2011
Long-termtropospheric trend
of octafluoro-cyclobutane
D. E. Oram et al.
Title Page
Abstract Introduction
Conclusions References
Tables Figures
J I
J I
Back Close
Full Screen / Esc
Printer-friendly Version
Interactive Discussion
Discussion
Paper
|D
iscussionP
aper|
Discussion
Paper
|D
iscussionP
aper|
R2 = 0.8538
0.8
0.9
1.0
1.1
1.2
1.3
1.4
0 1 2 3 4 5 6
mean age of air from SF6 (yrs)
c-C
4F8 (
ppt)
Fig. 4. Lower stratospheric measurements of c-C4F8 from Geophysica flights in the NorthernHemisphere between October 2009 and January 2010 plotted against mean age of air. Y -axiserror bars show the mean analytical precision (1σ) and the X -axis errors bars represent themean (1σ) uncertainty in the age calculation from measured SF6.
19111


![Mayenite supergroup, part III: Fluormayenite, Ca\u003cSUB\u003e12\u003c/SUB\u003eAl\u003cSUB\u003e14\u003c/SUB\u003eO\u003cSUB\u003e32\u003c/SUB\u003e[〈\u003cSUB\u003e4\u003c/SUB\u003eF\u003cSUB\u003e2\u003c/SUB\u003e],](https://img.dokumen.tips/doc/110x75/634059325328aff1b103eb6f/mayenite-supergroup-part-iii-fluormayenite-cau003csubu003e12u003csubu003ealu003csubu003e14u003csubu003eou003csubu003e32u003csubu003eu003csubu003e4u003csubu003efu003csubu003e2u003csubu003e.jpg)


