Embed Size (px)
Citation preview
http://ajs.sagepub.com/Medicine
The American Journal of Sports
http://ajs.sagepub.com/content/early/2014/06/16/0363546514536682The online version of this article can be found at:
DOI: 10.1177/0363546514536682
published online June 16, 2014Am J Sports MedNorbert P. Südkamp and Philipp Niemeyer
Gian M. Salzmann, Benjamin Erdle, Stella Porichis, Markus Uhl, Nadir Ghanem, Hagen Schmal, David Kubosch,Implantation: Cartilage Ultrastructure Is Not Correlated to Clinical or Qualitative MRI Outcome
Long-term T2 and Qualitative MRI Morphology After First-Generation Knee Autologous Chondrocyte
Published by:
http://www.sagepublications.com
On behalf of:
American Orthopaedic Society for Sports Medicine
can be found at:The American Journal of Sports MedicineAdditional services and information for
P<PPublished online June 16, 2014 in advance of the print journal.
http://ajs.sagepub.com/cgi/alertsEmail Alerts:
http://ajs.sagepub.com/subscriptionsSubscriptions:
http://www.sagepub.com/journalsReprints.navReprints:
http://www.sagepub.com/journalsPermissions.navPermissions:
What is This?
- Jun 16, 2014OnlineFirst Version of Record >>
at Aerzte-Bibliothek on June 16, 2014ajs.sagepub.comDownloaded from at Aerzte-Bibliothek on June 16, 2014ajs.sagepub.comDownloaded from
Long-term T2 and QualitativeMRI Morphology After First-GenerationKnee Autologous Chondrocyte Implantation
Cartilage Ultrastructure Is Not Correlated toClinical or Qualitative MRI Outcome
Gian M. Salzmann,*y MD, Benjamin Erdle,y MD, Stella Porichis,y MD, Markus Uhl,z MD, PhD,Nadir Ghanem,§ MD, Hagen Schmal,y MD, PhD, David Kubosch,y MD, PhD,Norbert P. Sudkamp,y MD, PhD, and Philipp Niemeyer,y MD, PhDInvestigation performed at Freiburg University Hospital, Freiburg, Germany,and Institute of Diagnostic Radiology, St Josefskrankenhaus, Freiburg, Germany
Background: There are several reports on long-term clinical outcomes after autologous chondrocyte implantation (ACI) for kneecartilage defect treatment. Few published articles have evaluated defect quality using quantitative magnetic resonance (MR)imaging techniques.
Purpose: To evaluate clinical outcomes and the quality of repair tissue (RT) after first-generation periosteum-covered ACI (ACI-P)using qualitative MR outcomes and T2-weighted relaxation times.
Study Design: Case series; Level of evidence, 4.
Methods: All patients (n = 86) who underwent knee joint ACI-P (from 1997 through 2001) with a postoperative follow-up of at least10 years were invited for clinical and MR evaluation. Clinical outcomes analysis included pre- and postoperative Lysholm andnumeric analog scale (NAS) for pain (10 = worst, 0 = best). Radiographic analysis included postoperative T2-weighted mappingof the RT, RT-associated regions, and healthy control cartilage; MOCART (magnetic resonance observation of cartilage repairtissue) score; a modified Knee Osteoarthritis Scoring System (mKOSS; 0 = best, 15 = worst) score; as well as numeric gradingfor subjective RT and whole knee joint evaluation (1 = best, 6 = worst).
Results: A total of 70 patients (45 male, 25 female; mean age, 33.3 6 10.2 years; 81% follow-up rate) with 82 defects were avail-able for follow-up at an average 10.9 6 1.1 years postoperatively, with MR analysis for 59 patients with 71 transplant sites (aver-age defect size, 6.5 6 4.0 cm2). Final Lysholm (71.0 6 17.4) and NAS (7.2 6 1.9) scores improved significantly when comparedwith preoperative scores (Lysholm: 42.0 6 22.5; NAS: 2.1 6 2.1; P\ .01 for both). Average transplant T2 was 35.2 6 11.3 ms andthereby significantly lower (P = .005) when compared to the intraknee healthy femur T2 (39.7 6 6.8 ms). The MOCART was 44.9 6
23.6 and mKOSS was 4.8 6 3.2. RT subjective grading was 3.3 6 1.4, while it was 2.3 6 0.7 for whole joint evaluation. The RT T2significantly correlated with postoperative NAS (P = .04; r = –0.28); it also correlated with the healthy femur T2 (P = .004; r = 0.4).The MOCART significantly correlated with the mKOSS (P \ .001).
Conclusion: The MRI outcome is imperfect in this collective of patients. There is only weak correlation of quantitative imagingdata and clinical function. Qualitative imaging data are much better correlated to functional outcomes.
Keywords: cartilage; chondrocyte; autologous chondrocyte implantation; knee; chondrocyte transplantation; magnetic reso-nance; T2 mapping; repair tissue
Final repair tissue (RT) quality can be considered one of themajor objective outcome parameters after autologous chon-drocyte implantation (ACI)9 at the knee joint.30 It is currently
unclear whether there is a direct relationship between RTquality and clinical outcomes.10,12 Intra-articular jointhomeostasis may be closely connected to the integrity andhealth of the previously implanted cells, which are designedto treat significant articular cartilage deficiencies to preventosteoarthritis and potentially stabilize joint degeneration.3
Quantitative magnetic resonance imaging (MRI) hasemerged as a noninvasive way to monitor RT after
The American Journal of Sports Medicine, Vol. XX, No. XDOI: 10.1177/0363546514536682� 2014 The Author(s)
1
AJSM PreView, published on June 16, 2014 as doi:10.1177/0363546514536682
at Aerzte-Bibliothek on June 16, 2014ajs.sagepub.comDownloaded from
implantation. The body of literature reporting on MRI quali-tative morphology as well as transplant ultrastructure afterACI is constantly increasing, but the majority of reports uti-lize short-term results. Cartilage T2-weighted mapping isnow an accepted, noninvasive biomarker/imaging tool toquantify cartilage ultrastructure with information on colla-gen structure and water content without requiring poten-tially dangerous contrast agents.2 Long-term data afterperiosteum-covered ACI (ACI-P) using delayed gadolinium-enhanced MRI of cartilage (dGEMRIC) has been reported,39
while radiographic outcomes concentrating on T2-weightedmapping have not been presented. The primary aim of thestudy was to report 10-year outcomes on T2 relaxation timesof the resulting RT and surrounding cartilage correlating toclinical outcomes after first-generation ACI for treatment ofsymptomatic knee joint cartilage lesions.
MATERIALS AND METHODS
The study was approved by the local ethical committee(EK 8-10) and registered in the German Clinical Trials Reg-ister (DRKS00003353). Clinical results of the same collectiveof patients have been published elsewhere27; the purpose ofthis report was to focus on the description of the MRI-radiographic outcome. The clinical investigation was per-formed by an independent investigator (S.P.); the radiologicevaluation was performed by an independent blinded (tothe clinical data) radiologist (N.G.) with years of experiencein MR-based musculoskeletal imaging and a specialty inknee joint cartilage evaluation.21 Neither investigator wasinvolved in patient treatment. All patients (n = 86) whounderwent ACI-P for treatment of symptomatic knee jointcartilage defects between January 1997 through January2001 at our institution were included. Indications, operativeinterventions, as well as postoperative rehabilitation resultsare given in our previous study.27 All available study partic-ipants underwent clinical knee joint examination as well asMRI of the index knee. The modified Lysholm22 score anda numeric analog scale (NAS) for pain (0 for no pain, 10 formaximal imaginable pain) were used to assess the clinicaloutcome at the time of MR examination.
The MR images were obtained with a 1.5-T MRI scanner(Avanto, Siemens) with a dedicated 8-channel knee coil. Thefollowing sequences were utilized: fast spin-echo protondensity weighted (repetition time/echo time [TR/TE],2810/31 ms) in coronal and sagittal planes; fast spin-echoproton density weighted with spectral fat saturation(TR/TE, 3370/36 ms) in transversal, coronal, and sagittalplanes; and fast spin-echo T2 weighted with spectral fat sat-uration (TR/TE, 5880/60 ms) in sagittal plane. The spatial
resolution in plane was 320 3 320 to 384 3 384 pixels ina field of view of 100 3 138 mm. T2 maps were calculatedfrom data obtained with a multiple spin-echo sequencewith the following parameters: slice thickness, 3 mm;matrix, 256 3 256; field of view, 100 mm; TR, 1600 ms;and TE, 13.9 ms; with 2 averages. A colored T2-weightedmap was calculated automatically using the manufacturer’sstandard software tool. For assessment of T2 relaxation,regions of interest (ROIs) were drawn manually by the mus-culoskeletal radiologist and one orthopaedic surgeon (B.E.)in consensus.
The ROIs were selected in weightbearing areas at an ori-entation perpendicular to the magnetic field in the cases ofcartilage repair at the femoral condyles or parallel to themagnetic field in cases of retropatellar cartilage repair.ROIs covering full-thickness cartilage were positionedaccording to a previous nomenclature33 to give informationon not only the RT area but also the interfacing, adjacent,opposing, and control cartilage regions; ROIs were placed(only in this collective of patients, no healthy controls) inthe cartilage RT, the immediate edges of the cartilage RT(interface regions), the adjacent regions of the cartilage RT(the cartilage flanking the immediate margins, 4 mm ante-rior and 4 mm posterior), the opposing (tibial) cartilage ofthe cartilage RT (this was done only for femur ACI patients),healthy femoral (control) cartilage (HC), and healthy tibialcartilage. Regions of healthy control femoral and tibial carti-lage were chosen to ensure equal size when compared withthe RT area. Among patellar and trochlear lesions, whichwere measured on axial images, no opposing cartilage wasmeasured. No ROI has been placed in a cartilage regionangulated between 40� and 70� to the magnetic field.
The MOCART (magnetic resonance observation of carti-lage RT) score was applied for qualitative RT assessmentand calculated as previously described.23 A customizedarthritis score, which was inspired by the original KneeOsteoarthritis Scoring System (KOSS),19 was applied forwhole joint evaluation with an emphasis on global degener-ation (modified KOSS [mKOSS]). The original KOSS scoreis subdivided into 12 items, including a cartilage defect andosteochondrosis dissecans analysis, which is not relevantfor postoperative ACI patients. The modified score there-fore included the evaluation of osteophytes (yes 1, no 0),subchondral cysts (yes 1, no 0), bone marrow edema atRT site (yes 1, no 0), bone marrow edema at other sites(yes 1, no 0), each medial and lateral meniscus evaluation(intact 0, small tear 1, large tear 2, subtotal loss 3, absent4), effusion (yes 1, no 0), baker cyst (yes 1, no 0), andappearance of other cartilage than RT (abnormal 1, normal0), resulting in a best outcome of 0 points and worst 15points. Finally, a summarizing intentionally subjective
*Address correspondence to Gian M. Salzmann, MD, Department of Orthopedic Surgery and Traumatology, Freiburg University Hospital, HugstetterStrasse 55, D-79095 Freiburg, Germany (e-mail: [email protected]).
yDepartment of Orthopaedic and Trauma Surgery, University Medical Center, Albert-Ludwigs University Freiburg, Freiburg, Germany.zInstitute of Diagnostic Radiology, St Josefskrankenhaus, Freiburg, Germany.§Diagnostic Imaging Center, Singen, Germany.
G.M.S. and B.E. contributed equally to this study.One or more of the authors has declared the following potential conflict of interest or source of funding: The study was supported by a grant of the
Deutsche Arthrose-Hilfe eV.
2 Salzmann et al The American Journal of Sports Medicine
at Aerzte-Bibliothek on June 16, 2014ajs.sagepub.comDownloaded from
numeric grade (1 best, 6 worst) was given for evaluation ofthe RT as well as the knee joint as a whole.
Statistical Analysis
Statistical analysis was performed using the software pack-age SPSS v 20 (IBM SPSS Statistics). All data were testedfor normal distribution using the Kolmogorov-Smirnov test.Afterward, data were compared using t tests or Mann-Whitney U and Wilcoxon signed-rank tests. For comparisonof specific T2 values compared with HC, the Wilcoxon testwas used. Group data were compared using 1-way analysisof variance or Kruskal-Wallis analysis. Differences betweencohorts of patients and defect locations were evaluated usinga 1-way analysis of variance test for all parametric data, suchas the Lysholm score. Correlations were performed usingSpearman correlation coefficient (r). After chi-square test todefine independence, linear regression analysis was done toanalyze the effects of patient and/or defect characteristics.All statistical tests were 2-sided unless otherwise stated,and descriptive results are demonstrated as the mean 6
SD. The significance level was defined at P\ .05 for all tests.
RESULTS
Patient and defect characteristics as well as clinical out-comes have been previously reported in specific detail.27
Briefly, 70 patients were available for follow-up (25 female,45 male; mean age at time of ACI, 33.3 6 10.2 years; meanbody mass index, 26.3 6 5.2; 81% follow-up rate) with 82defects and an average postoperative interval of 10.9 6
1.1 years. The average defect size was 6.5 6 4.0 cm2 forthe 58 patients with single treated lesions and 12 with dou-ble lesions (medial/lateral condyle, 29/13; trochlea/patella, 2/14; double, 12). Among 20 patients, concomitant surgerywas performed at time of ACI (5 ACL reconstructions, 2high tibial osteotomies, 13 other). A total of 44 patients
had undergone previous surgery, while 24 of this grouphad a defect-associated cartilage type procedure previously.Lysholm scores increased from 42.0 6 22.5 before interven-tion to 71.0 6 17.4 at final follow-up (P \ .01); NAS scoresimproved significantly when compared with preoperatively(2.1 6 2.1 vs 7.2 6 1.9, respectively; P \ .01).
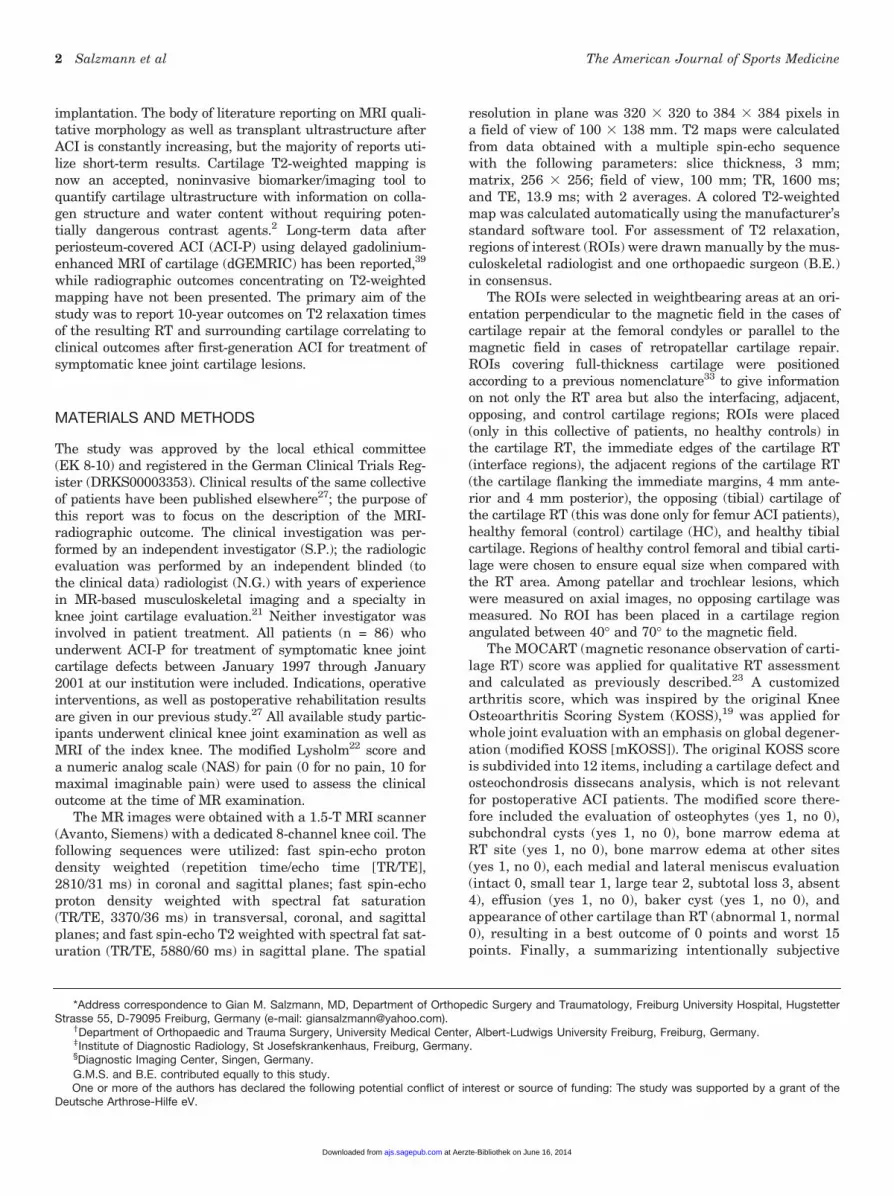
Complete MRI evaluation was available for 59 patientswith 71 transplant sites. All T2 measured regions of interestare reported in Table 1. Average transplant T2 was 35.2 6
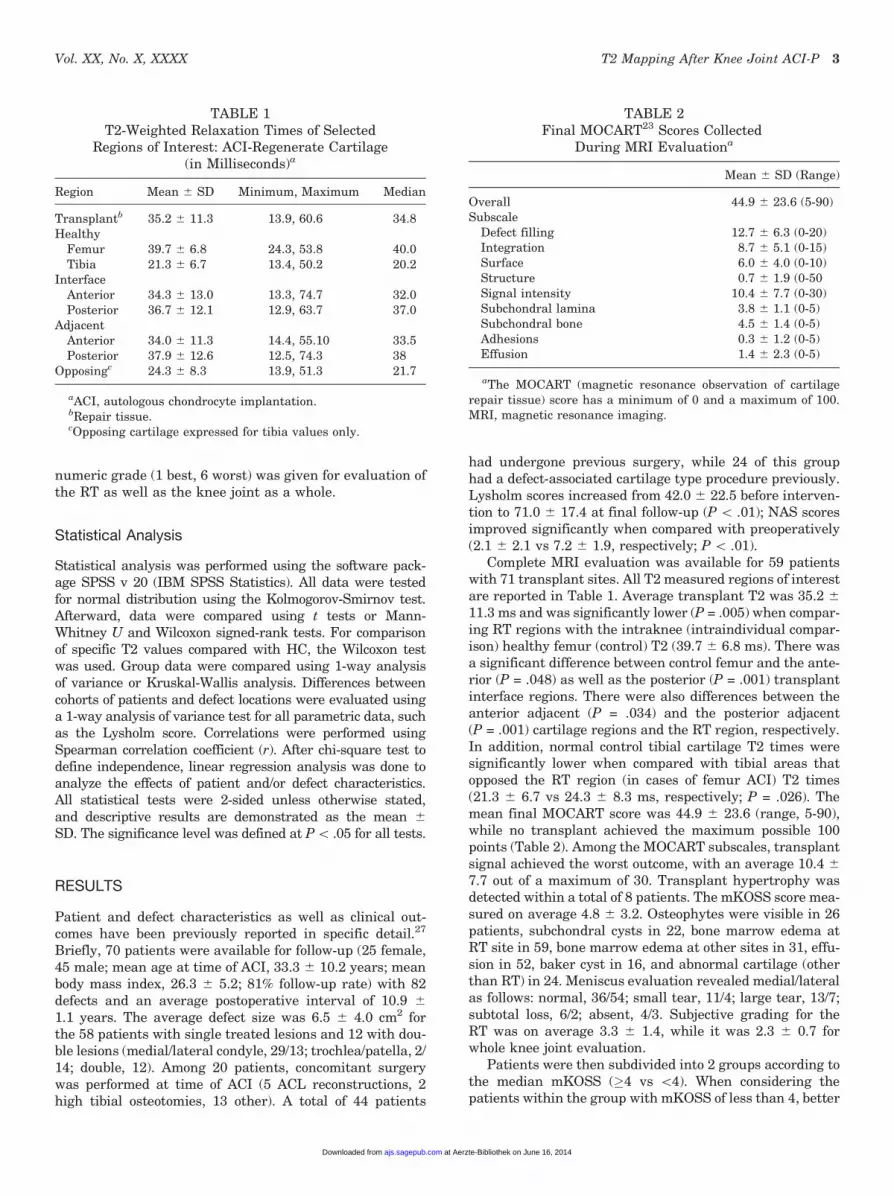
11.3 ms and was significantly lower (P = .005) when compar-ing RT regions with the intraknee (intraindividual compar-ison) healthy femur (control) T2 (39.7 6 6.8 ms). There wasa significant difference between control femur and the ante-rior (P = .048) as well as the posterior (P = .001) transplantinterface regions. There were also differences between theanterior adjacent (P = .034) and the posterior adjacent(P = .001) cartilage regions and the RT region, respectively.In addition, normal control tibial cartilage T2 times weresignificantly lower when compared with tibial areas thatopposed the RT region (in cases of femur ACI) T2 times(21.3 6 6.7 vs 24.3 6 8.3 ms, respectively; P = .026). Themean final MOCART score was 44.9 6 23.6 (range, 5-90),while no transplant achieved the maximum possible 100points (Table 2). Among the MOCART subscales, transplantsignal achieved the worst outcome, with an average 10.4 6
7.7 out of a maximum of 30. Transplant hypertrophy wasdetected within a total of 8 patients. The mKOSS score mea-sured on average 4.8 6 3.2. Osteophytes were visible in 26patients, subchondral cysts in 22, bone marrow edema atRT site in 59, bone marrow edema at other sites in 31, effu-sion in 52, baker cyst in 16, and abnormal cartilage (otherthan RT) in 24. Meniscus evaluation revealed medial/lateralas follows: normal, 36/54; small tear, 11/4; large tear, 13/7;subtotal loss, 6/2; absent, 4/3. Subjective grading for theRT was on average 3.3 6 1.4, while it was 2.3 6 0.7 forwhole knee joint evaluation.
Patients were then subdivided into 2 groups according tothe median mKOSS (�4 vs \4). When considering thepatients within the group with mKOSS of less than 4, better
TABLE 1T2-Weighted Relaxation Times of Selected
Regions of Interest: ACI-Regenerate Cartilage(in Milliseconds)a
Region Mean 6 SD Minimum, Maximum Median
Transplantb 35.2 6 11.3 13.9, 60.6 34.8Healthy
Femur 39.7 6 6.8 24.3, 53.8 40.0Tibia 21.3 6 6.7 13.4, 50.2 20.2
InterfaceAnterior 34.3 6 13.0 13.3, 74.7 32.0Posterior 36.7 6 12.1 12.9, 63.7 37.0
AdjacentAnterior 34.0 6 11.3 14.4, 55.10 33.5Posterior 37.9 6 12.6 12.5, 74.3 38
Opposingc 24.3 6 8.3 13.9, 51.3 21.7
aACI, autologous chondrocyte implantation.bRepair tissue.cOpposing cartilage expressed for tibia values only.
TABLE 2Final MOCART23 Scores Collected
During MRI Evaluationa
Mean 6 SD (Range)
Overall 44.9 6 23.6 (5-90)Subscale
Defect filling 12.7 6 6.3 (0-20)Integration 8.7 6 5.1 (0-15)Surface 6.0 6 4.0 (0-10)Structure 0.7 6 1.9 (0-50Signal intensity 10.4 6 7.7 (0-30)Subchondral lamina 3.8 6 1.1 (0-5)Subchondral bone 4.5 6 1.4 (0-5)Adhesions 0.3 6 1.2 (0-5)Effusion 1.4 6 2.3 (0-5)
aThe MOCART (magnetic resonance observation of cartilagerepair tissue) score has a minimum of 0 and a maximum of 100.MRI, magnetic resonance imaging.
Vol. XX, No. X, XXXX T2 Mapping After Knee Joint ACI-P 3
at Aerzte-Bibliothek on June 16, 2014ajs.sagepub.comDownloaded from
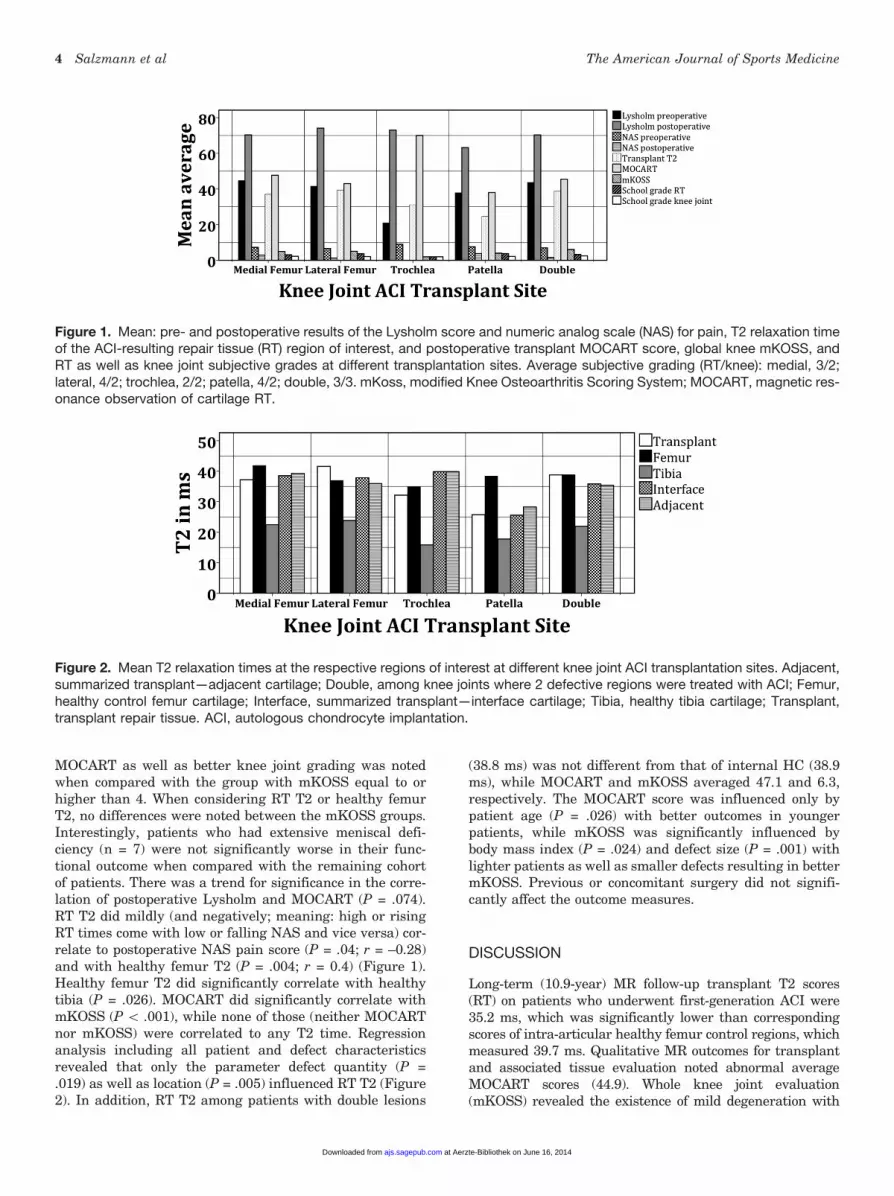
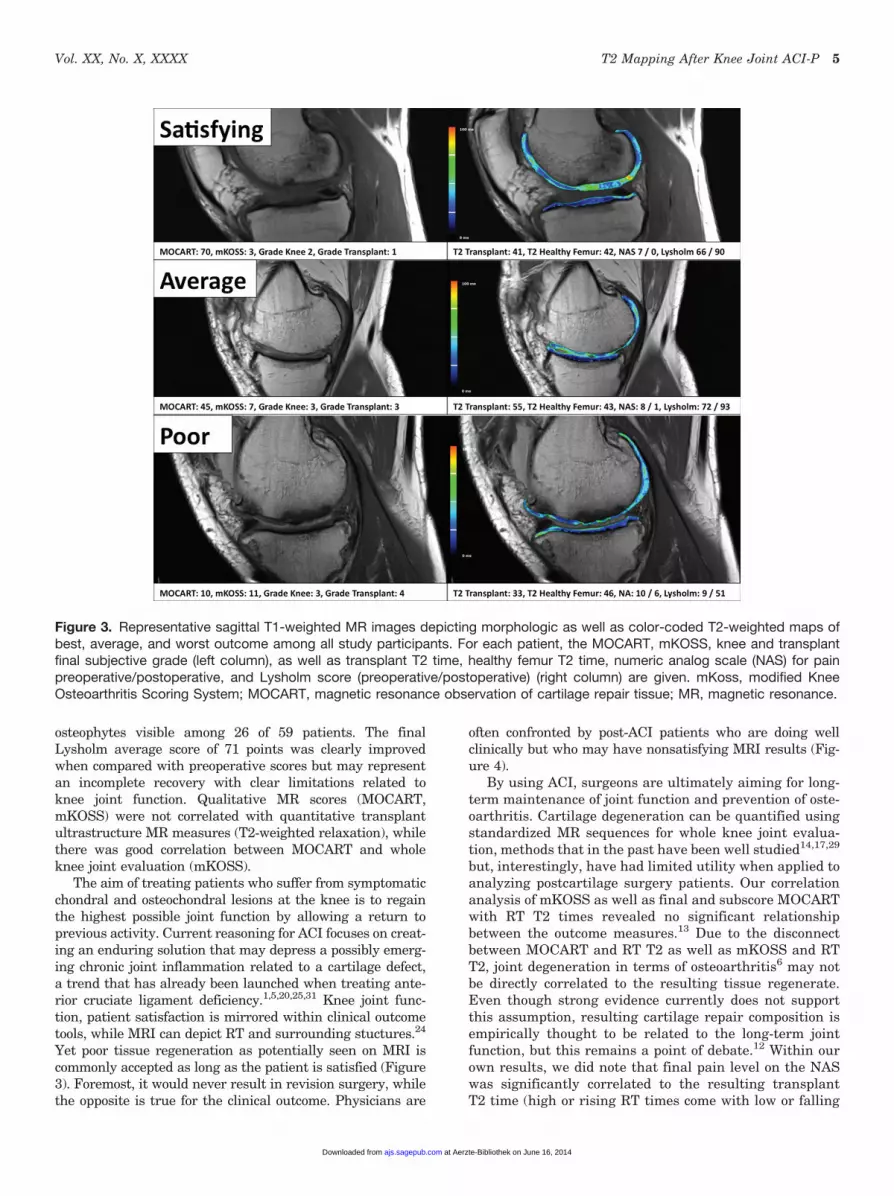
MOCART as well as better knee joint grading was notedwhen compared with the group with mKOSS equal to orhigher than 4. When considering RT T2 or healthy femurT2, no differences were noted between the mKOSS groups.Interestingly, patients who had extensive meniscal defi-ciency (n = 7) were not significantly worse in their func-tional outcome when compared with the remaining cohortof patients. There was a trend for significance in the corre-lation of postoperative Lysholm and MOCART (P = .074).RT T2 did mildly (and negatively; meaning: high or risingRT times come with low or falling NAS and vice versa) cor-relate to postoperative NAS pain score (P = .04; r = –0.28)and with healthy femur T2 (P = .004; r = 0.4) (Figure 1).Healthy femur T2 did significantly correlate with healthytibia (P = .026). MOCART did significantly correlate withmKOSS (P \ .001), while none of those (neither MOCARTnor mKOSS) were correlated to any T2 time. Regressionanalysis including all patient and defect characteristicsrevealed that only the parameter defect quantity (P =.019) as well as location (P = .005) influenced RT T2 (Figure2). In addition, RT T2 among patients with double lesions
(38.8 ms) was not different from that of internal HC (38.9ms), while MOCART and mKOSS averaged 47.1 and 6.3,respectively. The MOCART score was influenced only bypatient age (P = .026) with better outcomes in youngerpatients, while mKOSS was significantly influenced bybody mass index (P = .024) and defect size (P = .001) withlighter patients as well as smaller defects resulting in bettermKOSS. Previous or concomitant surgery did not signifi-cantly affect the outcome measures.
DISCUSSION
Long-term (10.9-year) MR follow-up transplant T2 scores(RT) on patients who underwent first-generation ACI were35.2 ms, which was significantly lower than correspondingscores of intra-articular healthy femur control regions, whichmeasured 39.7 ms. Qualitative MR outcomes for transplantand associated tissue evaluation noted abnormal averageMOCART scores (44.9). Whole knee joint evaluation(mKOSS) revealed the existence of mild degeneration with
Figure 1. Mean: pre- and postoperative results of the Lysholm score and numeric analog scale (NAS) for pain, T2 relaxation timeof the ACI-resulting repair tissue (RT) region of interest, and postoperative transplant MOCART score, global knee mKOSS, andRT as well as knee joint subjective grades at different transplantation sites. Average subjective grading (RT/knee): medial, 3/2;lateral, 4/2; trochlea, 2/2; patella, 4/2; double, 3/3. mKoss, modified Knee Osteoarthritis Scoring System; MOCART, magnetic res-onance observation of cartilage RT.
Figure 2. Mean T2 relaxation times at the respective regions of interest at different knee joint ACI transplantation sites. Adjacent,summarized transplant—adjacent cartilage; Double, among knee joints where 2 defective regions were treated with ACI; Femur,healthy control femur cartilage; Interface, summarized transplant—interface cartilage; Tibia, healthy tibia cartilage; Transplant,transplant repair tissue. ACI, autologous chondrocyte implantation.
4 Salzmann et al The American Journal of Sports Medicine
at Aerzte-Bibliothek on June 16, 2014ajs.sagepub.comDownloaded from
osteophytes visible among 26 of 59 patients. The finalLysholm average score of 71 points was clearly improvedwhen compared with preoperative scores but may representan incomplete recovery with clear limitations related toknee joint function. Qualitative MR scores (MOCART,mKOSS) were not correlated with quantitative transplantultrastructure MR measures (T2-weighted relaxation), whilethere was good correlation between MOCART and wholeknee joint evaluation (mKOSS).
The aim of treating patients who suffer from symptomaticchondral and osteochondral lesions at the knee is to regainthe highest possible joint function by allowing a return toprevious activity. Current reasoning for ACI focuses on creat-ing an enduring solution that may depress a possibly emerg-ing chronic joint inflammation related to a cartilage defect,a trend that has already been launched when treating ante-rior cruciate ligament deficiency.1,5,20,25,31 Knee joint func-tion, patient satisfaction is mirrored within clinical outcometools, while MRI can depict RT and surrounding stuctures.24
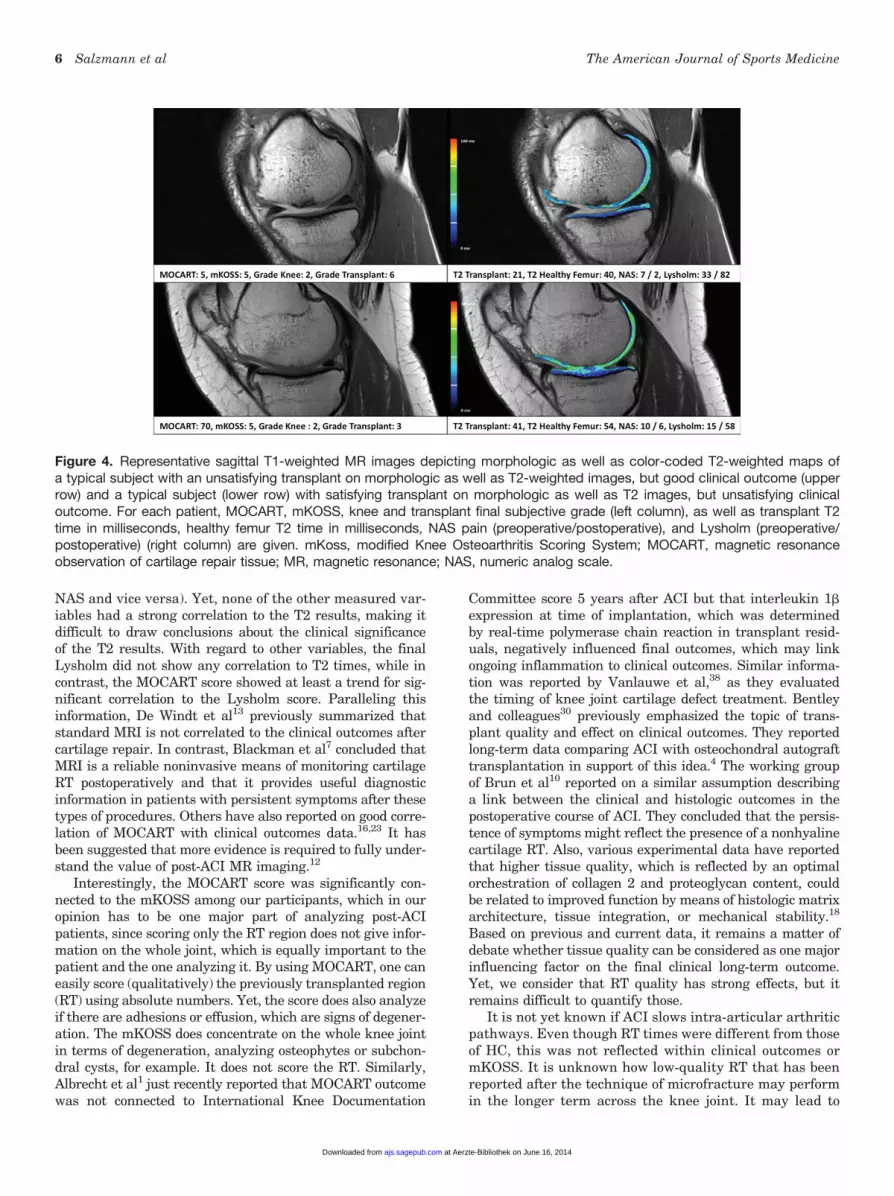
Yet poor tissue regeneration as potentially seen on MRI iscommonly accepted as long as the patient is satisfied (Figure3). Foremost, it would never result in revision surgery, whilethe opposite is true for the clinical outcome. Physicians are
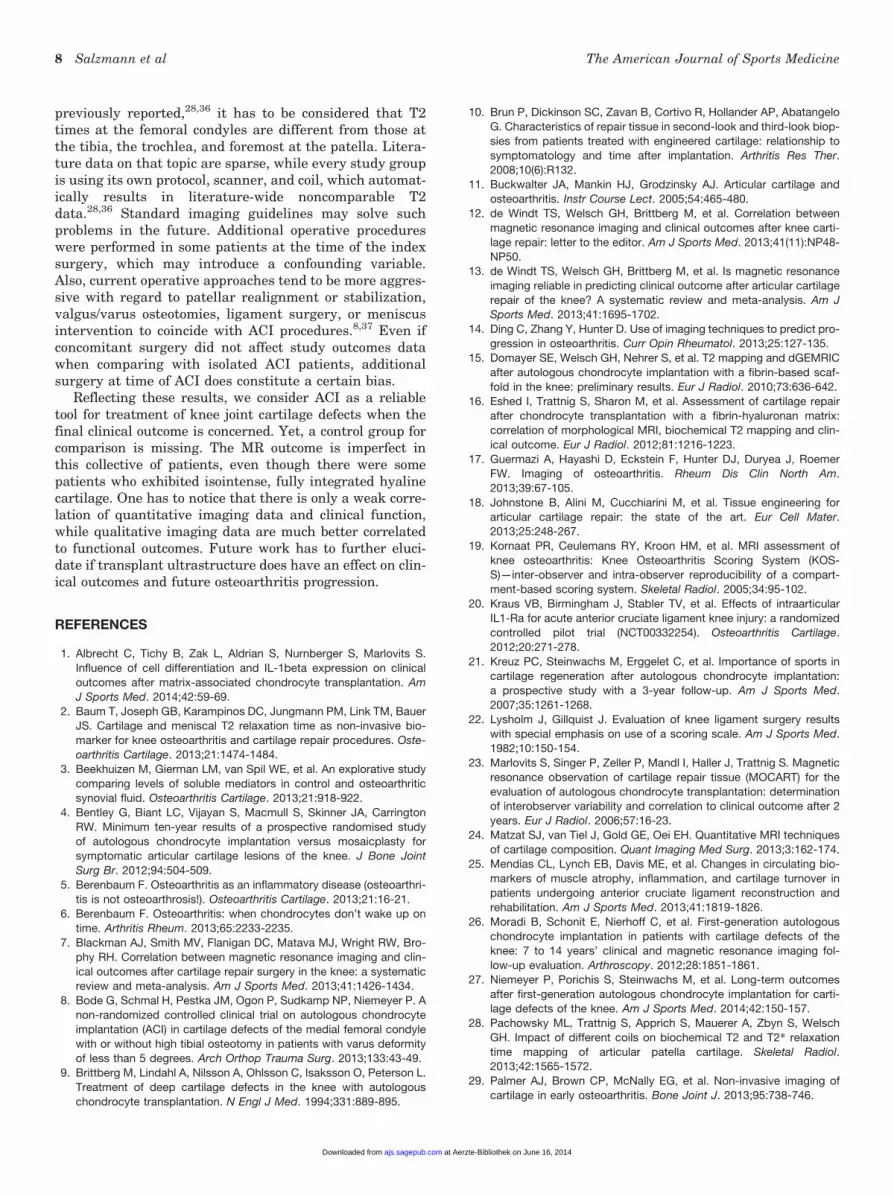
often confronted by post-ACI patients who are doing wellclinically but who may have nonsatisfying MRI results (Fig-ure 4).
By using ACI, surgeons are ultimately aiming for long-term maintenance of joint function and prevention of oste-oarthritis. Cartilage degeneration can be quantified usingstandardized MR sequences for whole knee joint evalua-tion, methods that in the past have been well studied14,17,29
but, interestingly, have had limited utility when applied toanalyzing postcartilage surgery patients. Our correlationanalysis of mKOSS as well as final and subscore MOCARTwith RT T2 times revealed no significant relationshipbetween the outcome measures.13 Due to the disconnectbetween MOCART and RT T2 as well as mKOSS and RTT2, joint degeneration in terms of osteoarthritis6 may notbe directly correlated to the resulting tissue regenerate.Even though strong evidence currently does not supportthis assumption, resulting cartilage repair composition isempirically thought to be related to the long-term jointfunction, but this remains a point of debate.12 Within ourown results, we did note that final pain level on the NASwas significantly correlated to the resulting transplantT2 time (high or rising RT times come with low or falling
Figure 3. Representative sagittal T1-weighted MR images depicting morphologic as well as color-coded T2-weighted maps ofbest, average, and worst outcome among all study participants. For each patient, the MOCART, mKOSS, knee and transplantfinal subjective grade (left column), as well as transplant T2 time, healthy femur T2 time, numeric analog scale (NAS) for painpreoperative/postoperative, and Lysholm score (preoperative/postoperative) (right column) are given. mKoss, modified KneeOsteoarthritis Scoring System; MOCART, magnetic resonance observation of cartilage repair tissue; MR, magnetic resonance.
Vol. XX, No. X, XXXX T2 Mapping After Knee Joint ACI-P 5
at Aerzte-Bibliothek on June 16, 2014ajs.sagepub.comDownloaded from
NAS and vice versa). Yet, none of the other measured var-iables had a strong correlation to the T2 results, making itdifficult to draw conclusions about the clinical significanceof the T2 results. With regard to other variables, the finalLysholm did not show any correlation to T2 times, while incontrast, the MOCART score showed at least a trend for sig-nificant correlation to the Lysholm score. Paralleling thisinformation, De Windt et al13 previously summarized thatstandard MRI is not correlated to the clinical outcomes aftercartilage repair. In contrast, Blackman et al7 concluded thatMRI is a reliable noninvasive means of monitoring cartilageRT postoperatively and that it provides useful diagnosticinformation in patients with persistent symptoms after thesetypes of procedures. Others have also reported on good corre-lation of MOCART with clinical outcomes data.16,23 It hasbeen suggested that more evidence is required to fully under-stand the value of post-ACI MR imaging.12
Interestingly, the MOCART score was significantly con-nected to the mKOSS among our participants, which in ouropinion has to be one major part of analyzing post-ACIpatients, since scoring only the RT region does not give infor-mation on the whole joint, which is equally important to thepatient and the one analyzing it. By using MOCART, one caneasily score (qualitatively) the previously transplanted region(RT) using absolute numbers. Yet, the score does also analyzeif there are adhesions or effusion, which are signs of degener-ation. The mKOSS does concentrate on the whole knee jointin terms of degeneration, analyzing osteophytes or subchon-dral cysts, for example. It does not score the RT. Similarly,Albrecht et al1 just recently reported that MOCART outcomewas not connected to International Knee Documentation
Committee score 5 years after ACI but that interleukin 1b
expression at time of implantation, which was determinedby real-time polymerase chain reaction in transplant resid-uals, negatively influenced final outcomes, which may linkongoing inflammation to clinical outcomes. Similar informa-tion was reported by Vanlauwe et al,38 as they evaluatedthe timing of knee joint cartilage defect treatment. Bentleyand colleagues30 previously emphasized the topic of trans-plant quality and effect on clinical outcomes. They reportedlong-term data comparing ACI with osteochondral autografttransplantation in support of this idea.4 The working groupof Brun et al10 reported on a similar assumption describinga link between the clinical and histologic outcomes in thepostoperative course of ACI. They concluded that the persis-tence of symptoms might reflect the presence of a nonhyalinecartilage RT. Also, various experimental data have reportedthat higher tissue quality, which is reflected by an optimalorchestration of collagen 2 and proteoglycan content, couldbe related to improved function by means of histologic matrixarchitecture, tissue integration, or mechanical stability.18
Based on previous and current data, it remains a matter ofdebate whether tissue quality can be considered as one majorinfluencing factor on the final clinical long-term outcome.Yet, we consider that RT quality has strong effects, but itremains difficult to quantify those.
It is not yet known if ACI slows intra-articular arthriticpathways. Even though RT times were different from thoseof HC, this was not reflected within clinical outcomes ormKOSS. It is unknown how low-quality RT that has beenreported after the technique of microfracture may performin the longer term across the knee joint. It may lead to
Figure 4. Representative sagittal T1-weighted MR images depicting morphologic as well as color-coded T2-weighted maps ofa typical subject with an unsatisfying transplant on morphologic as well as T2-weighted images, but good clinical outcome (upperrow) and a typical subject (lower row) with satisfying transplant on morphologic as well as T2 images, but unsatisfying clinicaloutcome. For each patient, MOCART, mKOSS, knee and transplant final subjective grade (left column), as well as transplant T2time in milliseconds, healthy femur T2 time in milliseconds, NAS pain (preoperative/postoperative), and Lysholm (preoperative/postoperative) (right column) are given. mKoss, modified Knee Osteoarthritis Scoring System; MOCART, magnetic resonanceobservation of cartilage repair tissue; MR, magnetic resonance; NAS, numeric analog scale.
6 Salzmann et al The American Journal of Sports Medicine
at Aerzte-Bibliothek on June 16, 2014ajs.sagepub.comDownloaded from

chronic destructive inflammation, as emphasized byBuckwalter et al.11 It furthermore may be the reasonwhy ACI-treated patients do fine for long periods eventhough MR appearance has to be declared not satisfying.In a sense, one can speculate that the mild T2 differencesas presented here (4.5 ms) between transplanted and con-trol ROI may not be paramount to joint homeostasis andthat larger distinctions may be necessary to cause a truefailure or advanced arthritis. The initial impact causingthe cartilage defect and/or long periods with existing jointsurface defects without coverage may represent the majorinjury and initiator of osteoarthritis rather than purelyhyaline cartilage defect repair.42 Without control groups,the effect of ACI on such pathogenesis may remain elusive.Accordingly, mKOSS values in this population did reflectthe existence of a mild global degeneration that, underphysiologic conditions, should not occur in 43-year-olds.When isolating patients who had T2 times as close as61 ms (38.7-40.7; n = 6; data not shown in Results section)to the healthy femur and thus considering physiologic car-tilage ultrastructure at T2, we realized that for these casesthere was an average Lysholm score of 68 (a worse clinicaloutcome compared with the score of the remaining collec-tive, 71), a MOCART of 50 (higher in comparison withthe remaining collective score of 44.9, and therefore a bet-ter qualitative MR score), and a mKOSS of 4.5 (less in com-parison with remaining collective score of 4.8, andtherefore a better degeneration MR score). A healthy-appearing T2 time does not result in a much improvedLysholm or different MR scoring (MOCART, mKOSS) incomparison with the remaining collective. Thus, one hasto bear in mind that weightbearing entails a certain topol-ogy within each knee joint, which has been reportedbefore32,34 and which can complicate result interpretation.
T2 mapping is required for water content and, conse-quently, for indirect assessment of collagen orientation.The current alternative MR technique (dGEMRIC) ismainly being required for indirect proteoglycan content.For the most part, hyaline cartilage is composed of water,collagen 2 (15%-20% of weight), and proteoglycans (3%-10% of weight). On first view, T2-weighted mapping seemsto be an optimal tool for reflection of these contents. Still,one has to consider that other quantitative imaging modal-ities are equally appropriate to reflect knee joint functionafter ACI. However, Vasiliadis et al39 did, paralleling ourdata, describe no correlation between the dGEMRIC valuesand KOOS outcomes in their long-term ACI study. Whenmore closely looking at RT T2 times, we found comparabletrends as such have been reported. Regarding postopera-tive matrix-assisted ACI (MACT) and osteochondral auto-graft transplantation patients as well as T2 mapping andMOCART analysis, it was found that T2 values afterMACT ranged from 35 to 57 ms (mean 6 SD, 46.8 6 8.6ms) and were significantly lower (P = .048) when comparedwith intrajoint HC T2 values (mean 6 SD, 52.5 6 7.9 ms).Related to the fact that different MR scanners and imageacquisition techniques were used, values cannot totallybe compared but have the same trend.33 This suggeststhat T2 and dGEMRIC are both limited in their clinicalapplicability when evaluating long-term post-ACI patients.
Stelzeneder and colleagues35 previously reported encour-aging results 1 year after arthroscopy-assisted ACI witha final MOCART of 71 and no significant difference inT2*-weighted tissue evaluation between the RT and HC.Eshed et al16 reported 17-month post-ACI data with 71points on the MOCART score. Comparable with our data,T2 values were significantly different between the healthyand RT cartilage, but RT had higher values than HC.Welsch et al40 reported 24-month data after 2 ACI productswith MOCART scores above 70 for both products used inthat study. Furthermore, there was no difference betweencontrol HC and RT with longer T2 among transplantedareas when comparing with reference cartilage. Such earlypostoperative reports are encouraging but stand in contrastto our longer term follow-up. The same author compared theLysholm and MOCART with T2 measurements for theirability to assess differences between cartilage RT aftermicrofracture and MACT. While no differences betweenmicrofracture and MACT patients were observed by theLysholm and MOCART scores, T2 measurements werelower in the cartilage RT of patients after microfracturecompared with those after MACT.41 This information doesclearly parallel our assumption that higher tissue quality,as one can expect after ACI,30 will perform better duringpostsurgical MR review. Moradi et al26 published long-term data after ACI-P among a group of 23 subjects.When analyzing the MOCART score, the group revealeda defect fill of just about 50%. The final average score wasnot given by the authors. Interestingly, it was discoveredthat patients with less than 50% filling of the defect pre-sented with clinical symptoms, including persistent painand recurrent swelling with lower clinical scores. The MRdata did correlate with the Tegner score, although notwith the other functional outcome measures.
This study has several limitations. First of all, it is ret-rospective in nature, even though Lysholm and NAS val-ues were collected preoperatively. The parameter ofsymptom duration is missing because the majority ofpatients analyzed could not provide accurate symptomduration from over 10 years ago and this informationwas incomplete in the patient charts. We were unable toreliably obtain preoperative MRIs because of a protractedtime course and the fact that many patients had imagingat a referral institution. Not every patient consented toMR follow-up. Quantitative imaging was limited to T2-weighted maps only and did not involve invasive contrastagents (to realize dGEMRIC) for study evaluation becausedoing so would violate our ethical policies. T1rho andsodium imaging are not yet considered standard at ourinstitution. We placed the ROIs full thickness into the car-tilage and did not divide the defects into deep and superfi-cial, which resulted in a lack of analysis concerning T2variation along the cartilage depth. However, anatomiccartilage contains 4 different layers, and thus dividinginto just the deep and the superficial parts (as others rou-tinely do15) does not represent the true anatomy. The T2relaxation times were indeed related to healthy appearingcartilage within each respective joint for intrapatient com-parison. However, a clear definition of what can bedeclared as physiologic T2 is missing. As already
Vol. XX, No. X, XXXX T2 Mapping After Knee Joint ACI-P 7
at Aerzte-Bibliothek on June 16, 2014ajs.sagepub.comDownloaded from
previously reported,28,36 it has to be considered that T2times at the femoral condyles are different from those atthe tibia, the trochlea, and foremost at the patella. Litera-ture data on that topic are sparse, while every study groupis using its own protocol, scanner, and coil, which automat-ically results in literature-wide noncomparable T2data.28,36 Standard imaging guidelines may solve suchproblems in the future. Additional operative procedureswere performed in some patients at the time of the indexsurgery, which may introduce a confounding variable.Also, current operative approaches tend to be more aggres-sive with regard to patellar realignment or stabilization,valgus/varus osteotomies, ligament surgery, or meniscusintervention to coincide with ACI procedures.8,37 Even ifconcomitant surgery did not affect study outcomes datawhen comparing with isolated ACI patients, additionalsurgery at time of ACI does constitute a certain bias.
Reflecting these results, we consider ACI as a reliabletool for treatment of knee joint cartilage defects when thefinal clinical outcome is concerned. Yet, a control group forcomparison is missing. The MR outcome is imperfect inthis collective of patients, even though there were somepatients who exhibited isointense, fully integrated hyalinecartilage. One has to notice that there is only a weak corre-lation of quantitative imaging data and clinical function,while qualitative imaging data are much better correlatedto functional outcomes. Future work has to further eluci-date if transplant ultrastructure does have an effect on clin-ical outcomes and future osteoarthritis progression.
REFERENCES
1. Albrecht C, Tichy B, Zak L, Aldrian S, Nurnberger S, Marlovits S.
Influence of cell differentiation and IL-1beta expression on clinical
outcomes after matrix-associated chondrocyte transplantation. Am
J Sports Med. 2014;42:59-69.
2. Baum T, Joseph GB, Karampinos DC, Jungmann PM, Link TM, Bauer
JS. Cartilage and meniscal T2 relaxation time as non-invasive bio-
marker for knee osteoarthritis and cartilage repair procedures. Oste-
oarthritis Cartilage. 2013;21:1474-1484.
3. Beekhuizen M, Gierman LM, van Spil WE, et al. An explorative study
comparing levels of soluble mediators in control and osteoarthritic
synovial fluid. Osteoarthritis Cartilage. 2013;21:918-922.
4. Bentley G, Biant LC, Vijayan S, Macmull S, Skinner JA, Carrington
RW. Minimum ten-year results of a prospective randomised study
of autologous chondrocyte implantation versus mosaicplasty for
symptomatic articular cartilage lesions of the knee. J Bone Joint
Surg Br. 2012;94:504-509.
5. Berenbaum F. Osteoarthritis as an inflammatory disease (osteoarthri-
tis is not osteoarthrosis!). Osteoarthritis Cartilage. 2013;21:16-21.
6. Berenbaum F. Osteoarthritis: when chondrocytes don’t wake up on
time. Arthritis Rheum. 2013;65:2233-2235.
7. Blackman AJ, Smith MV, Flanigan DC, Matava MJ, Wright RW, Bro-
phy RH. Correlation between magnetic resonance imaging and clin-
ical outcomes after cartilage repair surgery in the knee: a systematic
review and meta-analysis. Am J Sports Med. 2013;41:1426-1434.
8. Bode G, Schmal H, Pestka JM, Ogon P, Sudkamp NP, Niemeyer P. A
non-randomized controlled clinical trial on autologous chondrocyte
implantation (ACI) in cartilage defects of the medial femoral condyle
with or without high tibial osteotomy in patients with varus deformity
of less than 5 degrees. Arch Orthop Trauma Surg. 2013;133:43-49.
9. Brittberg M, Lindahl A, Nilsson A, Ohlsson C, Isaksson O, Peterson L.
Treatment of deep cartilage defects in the knee with autologous
chondrocyte transplantation. N Engl J Med. 1994;331:889-895.
10. Brun P, Dickinson SC, Zavan B, Cortivo R, Hollander AP, Abatangelo
G. Characteristics of repair tissue in second-look and third-look biop-
sies from patients treated with engineered cartilage: relationship to
symptomatology and time after implantation. Arthritis Res Ther.
2008;10(6):R132.
11. Buckwalter JA, Mankin HJ, Grodzinsky AJ. Articular cartilage and
osteoarthritis. Instr Course Lect. 2005;54:465-480.
12. de Windt TS, Welsch GH, Brittberg M, et al. Correlation between
magnetic resonance imaging and clinical outcomes after knee carti-
lage repair: letter to the editor. Am J Sports Med. 2013;41(11):NP48-
NP50.
13. de Windt TS, Welsch GH, Brittberg M, et al. Is magnetic resonance
imaging reliable in predicting clinical outcome after articular cartilage
repair of the knee? A systematic review and meta-analysis. Am J
Sports Med. 2013;41:1695-1702.
14. Ding C, Zhang Y, Hunter D. Use of imaging techniques to predict pro-
gression in osteoarthritis. Curr Opin Rheumatol. 2013;25:127-135.
15. Domayer SE, Welsch GH, Nehrer S, et al. T2 mapping and dGEMRIC
after autologous chondrocyte implantation with a fibrin-based scaf-
fold in the knee: preliminary results. Eur J Radiol. 2010;73:636-642.
16. Eshed I, Trattnig S, Sharon M, et al. Assessment of cartilage repair
after chondrocyte transplantation with a fibrin-hyaluronan matrix:
correlation of morphological MRI, biochemical T2 mapping and clin-
ical outcome. Eur J Radiol. 2012;81:1216-1223.
17. Guermazi A, Hayashi D, Eckstein F, Hunter DJ, Duryea J, Roemer
FW. Imaging of osteoarthritis. Rheum Dis Clin North Am.
2013;39:67-105.
18. Johnstone B, Alini M, Cucchiarini M, et al. Tissue engineering for
articular cartilage repair: the state of the art. Eur Cell Mater.
2013;25:248-267.
19. Kornaat PR, Ceulemans RY, Kroon HM, et al. MRI assessment of
knee osteoarthritis: Knee Osteoarthritis Scoring System (KOS-
S)—inter-observer and intra-observer reproducibility of a compart-
ment-based scoring system. Skeletal Radiol. 2005;34:95-102.
20. Kraus VB, Birmingham J, Stabler TV, et al. Effects of intraarticular
IL1-Ra for acute anterior cruciate ligament knee injury: a randomized
controlled pilot trial (NCT00332254). Osteoarthritis Cartilage.
2012;20:271-278.
21. Kreuz PC, Steinwachs M, Erggelet C, et al. Importance of sports in
cartilage regeneration after autologous chondrocyte implantation:
a prospective study with a 3-year follow-up. Am J Sports Med.
2007;35:1261-1268.
22. Lysholm J, Gillquist J. Evaluation of knee ligament surgery results
with special emphasis on use of a scoring scale. Am J Sports Med.
1982;10:150-154.
23. Marlovits S, Singer P, Zeller P, Mandl I, Haller J, Trattnig S. Magnetic
resonance observation of cartilage repair tissue (MOCART) for the
evaluation of autologous chondrocyte transplantation: determination
of interobserver variability and correlation to clinical outcome after 2
years. Eur J Radiol. 2006;57:16-23.
24. Matzat SJ, van Tiel J, Gold GE, Oei EH. Quantitative MRI techniques
of cartilage composition. Quant Imaging Med Surg. 2013;3:162-174.
25. Mendias CL, Lynch EB, Davis ME, et al. Changes in circulating bio-
markers of muscle atrophy, inflammation, and cartilage turnover in
patients undergoing anterior cruciate ligament reconstruction and
rehabilitation. Am J Sports Med. 2013;41:1819-1826.
26. Moradi B, Schonit E, Nierhoff C, et al. First-generation autologous
chondrocyte implantation in patients with cartilage defects of the
knee: 7 to 14 years’ clinical and magnetic resonance imaging fol-
low-up evaluation. Arthroscopy. 2012;28:1851-1861.
27. Niemeyer P, Porichis S, Steinwachs M, et al. Long-term outcomes
after first-generation autologous chondrocyte implantation for carti-
lage defects of the knee. Am J Sports Med. 2014;42:150-157.
28. Pachowsky ML, Trattnig S, Apprich S, Mauerer A, Zbyn S, Welsch
GH. Impact of different coils on biochemical T2 and T2* relaxation
time mapping of articular patella cartilage. Skeletal Radiol.
2013;42:1565-1572.
29. Palmer AJ, Brown CP, McNally EG, et al. Non-invasive imaging of
cartilage in early osteoarthritis. Bone Joint J. 2013;95:738-746.
8 Salzmann et al The American Journal of Sports Medicine
at Aerzte-Bibliothek on June 16, 2014ajs.sagepub.comDownloaded from
30. Perera JR, Gikas PD, Bentley G. The present state of treatments for
articular cartilage defects in the knee. Ann R Coll Surg Engl.
2012;94:381-387.
31. Rotter N, Ung F, Roy AK, et al. Role for interleukin 1alpha in the inhi-
bition of chondrogenesis in autologous implants using polyglycolic
acid-polylactic acid scaffolds. Tissue Eng. 2005;11:192-200.
32. Salzmann GM, Buchberger MS, Stoddart MJ, et al. Varying regional
topology within knee articular chondrocytes under simulated in vivo
conditions. Tissue Eng Part A. 2011;17:451-461.
33. Salzmann GM, Paul J, Bauer JS, et al. T2 assessment and clinical
outcome following autologous matrix-assisted chondrocyte and
osteochondral autograft transplantation. Osteoarthritis Cartilage.
2009;17:1576-1582.
34. Shiomi T, Nishii T, Nakata K, et al. Three-dimensional topographical
variation of femoral cartilage T2 in healthy volunteer knees. Skeletal
Radiol. 2013;42:363-370.
35. Stelzeneder D, Shetty AA, Kim SJ, et al. Repair tissue quality after
arthroscopic autologous collagen-induced chondrogenesis (ACIC)
assessed via T2* mapping. Skeletal Radiol. 2013;42:1657-1664.
36. Surowiec RK, Lucas EP, Ho CP. Quantitative MRI in the evaluation of
articular cartilage health: reproducibility and variability with a focus
on T2 mapping [published online October 30, 2013]. Knee Surg
Sports Traumatol Arthrosc. doi: 10.1007/s00167-013-2714-6
37. Trinh TQ, Harris JD, Siston RA, Flanigan DC. Improved outcomes
with combined autologous chondrocyte implantation and
patellofemoral osteotomy versus isolated autologous chondrocyte
implantation. Arthroscopy. 2013;29:566-574.
38. Vanlauwe J, Saris DB, Victor J, Almqvist KF, Bellemans J, Luyten FP.
Five-year outcome of characterized chondrocyte implantation versus
microfracture for symptomatic cartilage defects of the knee: early
treatment matters. Am J Sports Med. 2011;39:2566-2574.
39. Vasiliadis HS, Danielson B, Ljungberg M, McKeon B, Lindahl A,
Peterson L. Autologous chondrocyte implantation in cartilage lesions
of the knee: long-term evaluation with magnetic resonance imaging
and delayed gadolinium-enhanced magnetic resonance imaging
technique. Am J Sports Med. 2010;38:943-949.
40. Welsch GH, Mamisch TC, Zak L, et al. Evaluation of cartilage repair
tissue after matrix-associated autologous chondrocyte transplanta-
tion using a hyaluronic-based or a collagen-based scaffold with mor-
phological MOCART scoring and biochemical T2 mapping:
preliminary results. Am J Sports Med. 2010;38:934-942.
41. Welsch GH, Trattnig S, Domayer S, Marlovits S, White LM, Mamisch
TC. Multimodal approach in the use of clinical scoring, morphological
MRI and biochemical T2-mapping and diffusion-weighted imaging in
their ability to assess differences between cartilage repair tissue after
microfracture therapy and matrix-associated autologous chondro-
cyte transplantation: a pilot study. Osteoarthritis Cartilage.
2009;17:1219-1227.
42. Zamli Z, Sharif M. Chondrocyte apoptosis: a cause or consequence
of osteoarthritis? Int J Rheum Dis. 2011;14:159-166.
For reprints and permission queries, please visit SAGE’s Web site at http://www.sagepub.com/journalsPermissions.nav
Vol. XX, No. X, XXXX T2 Mapping After Knee Joint ACI-P 9
at Aerzte-Bibliothek on June 16, 2014ajs.sagepub.comDownloaded from


