Embed Size (px)
Citation preview
Journal of Neuroscience Methods xxx (2005) xxx–xxx
Long-term spinal reflex studies in awake behaving mice
Jonathan S. Carpa,b,∗, Ann M. Tennissena, Xiang Yang Chena,b,Gerwin Schalka, Jonathan R. Wolpawa,b
a Wadsworth Center, New York State Department of Health, PO Box 509, Albany, NY 12201-0509, USAb Department of Biomedical Sciences, SUNY at Albany, Albany, NY 12201, USA
Received 22 December 2004; received in revised form 5 May 2005; accepted 10 May 2005
Abstract
The increasing availability of genetic variants of mice has facilitated studies of the roles of specific molecules in specific behaviors.The contributions of such studies could be strengthened and extended by correlation with detailed information on the patterns of motorcommands throughout the course of specific behaviors in freely moving animals. Previously reported methodologies for long-term recordingof electromyographic activity (EMG) in mice using implanted electrodes were designed for intermittent, but not continuous operation. Thisreport describes the fabrication, implantation, and utilization of fine wire electrodes for continuous long-term recordings of spontaneous andn rocnemiusm for 59–144d ording for2 ponse, andd MR size.S feasibilityo©
K
1
rsdgitbcbgu
ingctiv-essrally87;
4addi-rvethe
ntal
enicch-;to
0d
0
erve-evoked EMG in mice. Six mice were implanted with a tibial nerve cuff electrode and EMG electrodes in soleus and gastuscles. Wires exited through a skin button and traveled through an armored cable to an electrical commutator. In mice implantedays, ongoing EMG was monitored continuously (i.e., 24 h/day, 7 days/week) by computer for 18–92 days (total intermittent rec5–130 days). When the ongoing EMG criteria were met, the computer applied the nerve stimulus, recorded the evoked EMG resetermined the size of the M-response (MR) and the H-reflex (HR). It continually adjusted stimulation intensity to maintain a stabletable recordings of ongoing EMG, MR, and HR were obtained typically 3 weeks after implantation. This study demonstrates thef long-term continuous EMG recordings in mice for addressing a variety of neurophysiological and behavioral issues.2005 Elsevier B.V. All rights reserved.
eywords:Electromyography; Implanted electrodes; Spinal cord; Monosynaptic
. Introduction
Identification of the sites and mechanisms of the neu-onal plasticity underlying learning and memory requirestudy of animals during the acquisition and maintenance ofefined behaviors. Acute studies require anesthetized or sur-ically reduced preparations, which are incapable of express-
ng the behavior of interest and/or afford periods of studyoo brief to capture the time course of gradually evolvingehaviors. These factors limit the utility of acute studies inonnecting specific mechanisms of plasticity with specificehaviors. More complete information can be gleaned andreater insight achieved when behavior is studied contin-ously in unrestrained animals. Chronic recording of elec-
∗ Corresponding author. Tel.: +1 518 486 4911; fax: +1 518 486 4910.E-mail address:[email protected] (J.S. Carp).
tromyographic activity (EMG) and nerve stimulation usimplanted electrodes can provide information on motor aity in awake freely moving animals. The reduction in strand other perturbations permits recording during natuoccurring motor (Belanger et al., 1996; Fortier et al., 19Hoffer et al., 1987; Leblond et al., 2003), respiratory (Treleaseet al., 1982), sexual (Affanni et al., 2001; Miura et al., 2001),and gastrointestinal (Atobe et al., 1980; Dwinell et al., 199)behaviors in rats, cats, primates, and other species. Intion, the ability to repeatedly or continuously stimulate neand/or record muscle activity for extended periods insame animal permits powerful within-subject experimedesigns.
The continuing development of new mutant and transgmice provides powerful tools for exploration of the meanisms underlying memory and learning (Morgan, 2003Vaillend et al., 2002). Such tools are ideally suited
165-0270/$ – see front matter © 2005 Elsevier B.V. All rights reserved.oi:10.1016/j.jneumeth.2005.05.012
NSM-3974; No. of Pages 1
2 J.S. Carp et al. / Journal of Neuroscience Methods xxx (2005) xxx–xxx
establishing links between specific behaviors and molecu-lar mechanisms. Application of these tools to chronic stud-ies has been limited by the lack of continuous recordingmethodologies in mice. Implantation and data transmissionhardware used in earlier studies involving chronic nervestimulation and/or EMG recordings in mice were designedfor brief epochs of stimulation and/or recording at periodicintervals with the mice disconnected between recording ses-sions (Leblond et al., 2003; Milner and Hoffer, 1987; Valatx,1971; Warren et al., 1998). Development of very lightweightnerve cuffs, wires, and tethers to permit long-term continuous(i.e., 24 h/day, 7 days/week) instrumentation of the animalswould greatly facilitate joint application of these two power-ful methodologies.
Continuous chronic stimulation and recording technologyhas been an essential tool in our laboratory’s study of learningand memory in the spinal cord using an H-reflex (HR) operantconditioning paradigm (Wolpaw and Tennissen, 2001). Orig-inally developed in non-human primate (Wolpaw, 1987) andsubsequently transferred to rats (Chen and Wolpaw, 1994,1995) and humans (Wolf and Segal, 1990), HR conditioning
is associated with altered motoneuron excitability and otherspinal cord plasticity. Exploring the mechanisms underly-ing HR conditioning using genetic variants (which are notwidely available in rats) would require transferring our HRconditioning paradigm to mice. As the first step in estab-lishing the HR conditioning paradigm in mice, this reportdescribes methodology for construction and implantation ofEMG electrodes and a stimulating nerve cuff in the mouse.It also demonstrates the feasibility of continuous long-termrecording of spontaneous and stimulus-evoked EMG. Por-tions of this study have been reported previously (Carp et al.,2004).
2. Materials and methods
2.1. Implant and tether assembly
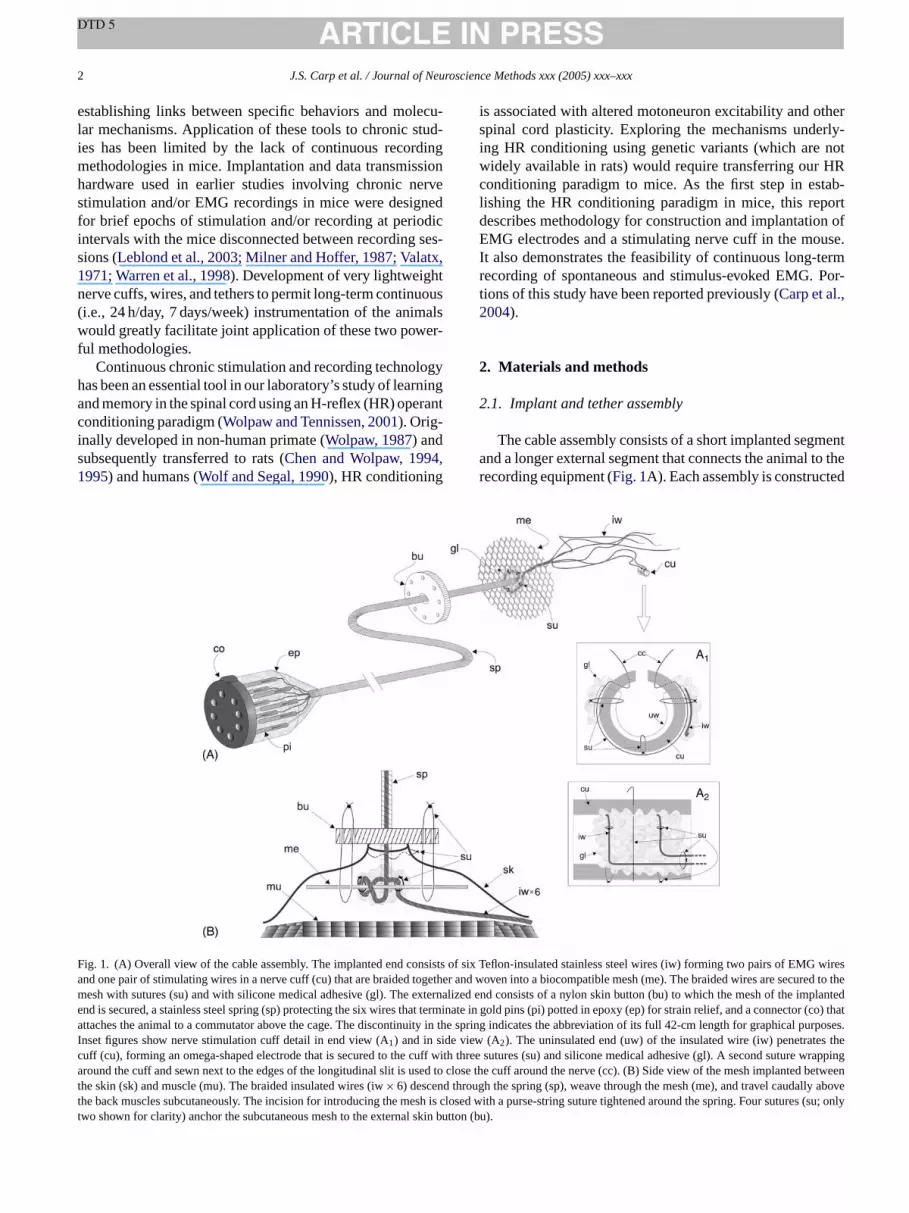
The cable assembly consists of a short implanted segmentand a longer external segment that connects the animal to therecording equipment (Fig. 1A). Each assembly is constructed
FameaIcattt
ig. 1. (A) Overall view of the cable assembly. The implanted end consists ond one pair of stimulating wires in a nerve cuff (cu) that are braided togetheesh with sutures (su) and with silicone medical adhesive (gl). The externand is secured, a stainless steel spring (sp) protecting the six wires that termttaches the animal to a commutator above the cage. The discontinuity in th
nset figures show nerve stimulation cuff detail in end view (A1) and in side vieuff (cu), forming an omega-shaped electrode that is secured to the cuff withround the cuff and sewn next to the edges of the longitudinal slit is used to c
he skin (sk) and muscle (mu). The braided insulated wires (iw× 6) descend throhe back muscles subcutaneously. The incision for introducing the mesh is cwo shown for clarity) anchor the subcutaneous mesh to the external skin bu
f six Teflon-insulated stainless steel wires (iw) forming two pairs of EMG wiresr and woven into a biocompatible mesh (me). The braided wires are secured to thelized end consists of a nylon skin button (bu) to which the mesh of the implantedinate in gold pins (pi) potted in epoxy (ep) for strain relief, and a connector (co) thate spring indicates the abbreviation of its full 42-cm length for graphical purposes.w (A2). The uninsulated end (uw) of the insulated wire (iw) penetrates the
three sutures (su) and silicone medical adhesive (gl). A second suture wrappinglose the cuff around the nerve (cc). (B) Side view of the mesh implanted between
ugh the spring (sp), weave through the mesh (me), and travel caudally abovelosed with a purse-string suture tightened around the spring. Four sutures (su; onlytton (bu).
J.S. Carp et al. / Journal of Neuroscience Methods xxx (2005) xxx–xxx 3
from six 42-cm-long multistranded (7× 50 ga) stainless steelTeflon-insulated wires (AS828, Cooner Wire, Chatsworth,CA) braided together except for the final 2–3 cm at eitherend. A 10 cm length at one end of the braided wires (i.e.,the implanted end) is inserted through a 12 mm diameter cir-cle of polyester mesh (Mersilene, Ethicon, Somerville, NJ).The wires are then woven in and out in a spiral pattern to exit atthe center of the mesh (Fig. 1A; also in side view inFig. 1B).The wires are secured by suturing them to the mesh with 6/0nylon and gluing them in place with medical adhesive (Silas-tic, Dow Corning, Midland, MI). Four of the six wires aredesignated for recording electromyographic activity (EMG),and the two other wires are used for the stimulation cuff.
To construct the stimulation cuff (Fig. 1A, with enlargedviews in insets A1 and A2), two wires are trimmed by 1 cm,stripped of 8 mm of insulation, and twisted individually tostiffen each wire and remove frayed ends. The cuff is formedfrom a 3-mm length of silicone rubber tubing (1.65 mmo.d.× 0.76 mm i.d.; PAT04, Allied Biomedical). Each wireis introduced into the cuff through a 30-ga needle insertedperpendicular to the side of the cuff 1 mm in from either endand across the top of the tube lumen. After removing the nee-dle, each wire is formed into an omega shape by pressingthe wire along the contour of the tube lumen such that thetwo loops are parallel to each other, 1 mm apart. The wireportions external to the cuff are folded down onto the cuff’ss nter-n silka eachs glet adsa cesss f ist ands s, thec s int ck oft wo2 ff tof rve.
them rarilya uresa 30-c ng( thes endt them sher( lesa mblyf
ctore intos VA).T ngth
of the wires and is crimped into the same type of connector.The uncrimped ends of the seven connectors are slid onto thepins of an 8-position circular transistor socket and soldered.The connector end of the cable is then potted in epoxy fromthe wired side of the circular socket to the first 5 mm of thespring to protect the fine wires and prevent the cable fromtwisting when the animal moves about its cage.
The portion of the cable assembly directly attached to themouse (i.e., nerve cuff, wires, mesh, and skin button) weighs0.12 g. The entire cable assembly weighs about 3.5 g, butthis load is largely supported by the recording hardware fromwhich it is suspended. Based on the horizontal load vectorwhen the mouse maximally deflects its cable plus implantand slack cable weight, we estimate the maximum load expe-rienced by the animal to be≤0.9 g.
2.2. Animals and preparation
Mice (Swiss Webster, male, 9–13 weeks) are eachimplanted with a nerve cuff on the right tibial nerve, a pairof recording electrodes in the right soleus muscle (SOL), anda pair of recording electrodes in the gastrocnemius muscles(GAS; one wire in the medial head and one wire in the lateralhead) to record spontaneous EMG and evoked responses. Allanimal procedures are in accordance with the Guide for theCare and Use of Laboratory Animals of the Institute of Lab-o ces,N ash-i andW theC
d foru -t /kga ed tom gicali eni-c h an righth ain-t t heatf ellyo urings
areasf righth andt aseda ora-t sitesa
anda ime-t sixw dert ision
urface parallel to the inside loops. For each wire, the ial and external portions are sutured together with 7/0cross the tubing adjacent to the wire’s entry point onide of the cuff. Each cuff wire is then bent at a right ano travel along the long axis of the cuff. The two wire lere sutured to the cuff at a point 0.5 mm from the end. Extripped wire protruding from the other side of the cufrimmed and all external wires and sutures are insulatedecured with medical adhesive. After the adhesive cureuff is slit longitudinally along one side between the gaphe electrodes. A 7/0 nylon suture is sewn around the bahe cuff at its midpoint through each of the slit edges. T-cm lengths of suture are left protruding beyond the cu
acilitate application and closure of the cuff around the neThe ends of the >30-cm lengths of wire emerging from
esh (i.e., the connector end of the assembly) are tempottached to a thin stainless steel wire with 7/0 nylon sutnd cyanoacrylate glue, and carefully pulled through am-long× 1.5 mm o.d.× 1.0 mm i.d. stainless steel spri0.25 mm wire diameter). After detaching the guide wire,pring is secured to the mesh by spiraling the cut springhrough the holes in the mesh and gluing it in place withedical adhesive. A skin button made from a nylon wa
8.7 mm o.d., 2.6 mm i.d.) with eight 0.4-mm diameter horound its perimeter is then threaded onto the cable asse
rom the connector end.The wires extending beyond the spring at the conne
nd are trimmed to about 1 cm, stripped, and crimpedmall gold connectors (E363-0, Plastics One, Roanoke,he free end of the spring is straightened to match the le
ratory Animal Resources, Commission on Life Scienational Research Council (National Academy Press, W
ngton, DC, 1996), and Department of Health, Educationelfare (DHEW) Publ. No. 0309-05377-3, “Guide forare and Use of Laboratory Animals.”Surgical procedures are modified from those describe
se in rats (Chen and Wolpaw, 1994, 1995). Mice are aneshetized with a mixture of ketamine and xylazine (120 mgnd 8 mg/kg i.p., respectively) supplemented as needaintain deep surgical anesthesia. Additional pre-sur
njections include glycopyrrolate (0.02 mg/kg i.p.) and pillin G (10,000 units/kg i.p.). The head is secured witose clamp and tooth plate, and medical tapes hold theindlimb in an extended position. Body temperature is m
ained by a heating pad under the animal and by radianrom a lamp above the animal. A thin layer of petroleum jn the eyes covered with gauze prevents desiccation durgery.
Aseptic techniques are used throughout surgery. Theor incision (i.e., the dorsal and lateral aspects of theindlimb and the midline of the upper back) are shaved
he skin is cleaned with 70% ethanol and an iodine-bntiseptic solution (Xenodine, Veterinary Products Lab
ories, Phoenix, AZ). The areas surrounding the incisionre covered with sterile drapes.
A 5 mm long incision is made at the nape of the neckpurse-string suture is installed loosely around its per
er for later use. This incision permits introduction ofires from the implanted end of the cable, which travel un
he skin above the back and thigh to emerge at the inc

4 J.S. Carp et al. / Journal of Neuroscience Methods xxx (2005) xxx–xxx
exposing the lower half of the back of the right thigh. Foreliciting the H-reflex, the tibial nerve is exposed, carefullyisolated from the sural and peroneal nerves, and encircled bythe silicone rubber nerve cuff just proximal to the GAS. Forrecording EMG, the ends of the four stainless steel electrodesare stripped of insulation, twisted, inserted into a 30-ga nee-dle, and bent to form a hook; they are then inserted in pairs inthe medial and lateral GAS (3–4 mm stripped length) and inthe SOL (2–3 mm stripped length). After electrode implan-tation, the subcutaneous incision is closed with 7/0 nylonsutures. All wires are sutured to muscle fascia about 1–2 cmrostral to their implantation sites to provide strain relief and tominimize the pressure exerted by the wires on the overlyingskin. The incision area is flushed with saline and 1–2 dropsof a long acting local anesthetic (bupivacaine, 0.25%) areapplied to the incised tissue. The skin incision is closed withtissue adhesive (Nexaband, Closure Medical Corp., Raleigh,NC) and painted with nitrofurazone ointment.
At the cable exit site, four 6/0 nylon sutures are used tosecure the mesh by which the wires are anchored to the skin.This is accomplished by inserting a 25-ga needle throughskin, mesh, and then skin again. After introducing a suturethrough the needle, the needle is removed, leaving the suturein place. The process is repeated for the other three sutures.The exit site is flushed with sterile saline and instilled with1–2 drops of the local anesthetic. The skin incision at then oundt ges.E holesi f theb sivet
erol,3 Thec base(s nearc ini-m cage.T mingt ec ectora cages nsistso ledo cen-t uredt ouset alt
ost-s nedb note ent( arem nal-
gesia (acetaminophen at 20 mg per 100 ml drinking water)whenever necessary. Mice showing signs of dehydration(e.g., weight loss, skin tenting) receive saline s.c.
2.3. Data collection and analysis
Once mice exhibit normal feeding, grooming, and locomo-tor behaviors, the fluid swivel atop the cage is replaced witha low-torque electrical commutator (SL-88-10, DragonflyR&D, Ridgeley, WV). The wires connect via the commu-tator to amplifiers (gain = 1000, bandwidth 10–3000 Hz) andan isolated stimulator.
Data are collected using PC-based multifunction boards(National Instruments, Austin, TX). The software system fordata acquisition and analysis (ELIZAN 3.0, based on priorversions used for controlling monkey and rat experiments(Chen and Wolpaw, 1995; Wolpaw and Herchenroder, 1990))was written in-house (G.S.) to run the online experimen-tal protocol and provide offline analysis capabilities. Onemultifunction board is dedicated to each animal. The onlinesoftware controls nerve stimulation and gathers EMG signalsfrom the animals continuously (i.e., 24 h/day, 7 days/week).Cage and animal maintenance require only brief interrup-tion of data collection. Data are stored using the open-sourcedatabase mySQL. Additional components permit offlineextraction of data from individual trials or averaging of dataf ionc col-l d upt rm cteda
bso-l ingE .6 s,t s theb rves ther1 vokedr s thea MR)i ter-v dea MGe nimali re-m ude,d rgetv theM just-i MRv R ismd thodw pli-t five
ape of the neck is closed with a purse-string suture arhe spring. Nitrofurazone is applied to the incised skin edach pair of four suture ends is passed through adjacent
n the skin button and tied to secure the mesh to the skin oack. The knots were then lightly coated with tissue adhe
o prevent slippage.After surgery, the mouse receives an analgesic (Dem
mg/kg i.p.) and is transferred to a recovery cage.ustom-built cages are 30.5 cm high on an octagonal16–17 cm between opposing sides; 209–243 cm2 floorpace). Compared to standard rectangular cages, theircular footprint and increased height-to-width ratio mizes cable slack when the mouse is in the center of thehe cage is placed on a thermostatically regulated war
able to maintain the litter at 30–32◦C for 3–4 h. Because thable is permanently attached to the mouse (i.e., no connt the skin button), a fluid bearing positioned atop theupports the connector end of the cable. The bearing cof a buoyant inner ring floating in a slightly larger water-filuter ring. The cable passes through a hollow tube in the
er of the outer ring to attach to a mating connector seco the center of the inner ring. This device permits the mo turn freely with its attached tether in its cage with minimorque demands.
Each mouse receives penicillin G on days 2 and 4 purgery. For the first two post-surgery days, chow softey soaking in water is placed in each cage. Mice that doat either wet or dry chow receive a nutritional supplemNutri-Cal, Evsco Pharmaceuticals, Buena, NJ). Miceonitored for signs of stress or discomfort, and receive a
-
or any period from any animal while online data collectontinues. In its present configuration, each animal’s dataection system supports up to two stimulus channels ano 16 EMG channels at sampling rates≥10 kHz/channel foultiple animals. The amount of data that can be collend stored is limited only by available hard drive space.
Each online data acquisition system monitors the aute value of the ongoing EMG 24 h/day. When the ongoMG remains within an operator-defined range for 3.0–3
he computer stores the most recent 50 ms (defined aackground EMG (bEMG) interval), delivers a tibial netimulus, and continues to collect and store EMG for ano00 ms. The data stored in the database for each eesponse defines a single trial. The computer calculateverage absolute value of the EMG in the M-response (
nterval (typically 1–3 ms post-stimulus) and the HR inal (typically 4–6 ms post-stimulus). Time intervals inclupproximately 90% of the center of the MR and HR Envelopes (see examples of time ranges used in one a
n inset ofFig. 2). The computer then increments or decents the D/A converter that controls the stimulus amplitepending on whether the MR is below or above a taalue. This provides feedback control over the size ofR, such that the computer regulates the MR size by ad
ng stimulus intensity. Typically, we selected a targetalue corresponding to a stimulation level at which the Haximal (see below). The average MR amplitude± standardeviation (S.D.) produced by this feedback-control meas 26± 15% (range, 16–48%) of the maximum MR am
ude (determined in four animals from the average of the
J.S. Carp et al. / Journal of Neuroscience Methods xxx (2005) xxx–xxx 5
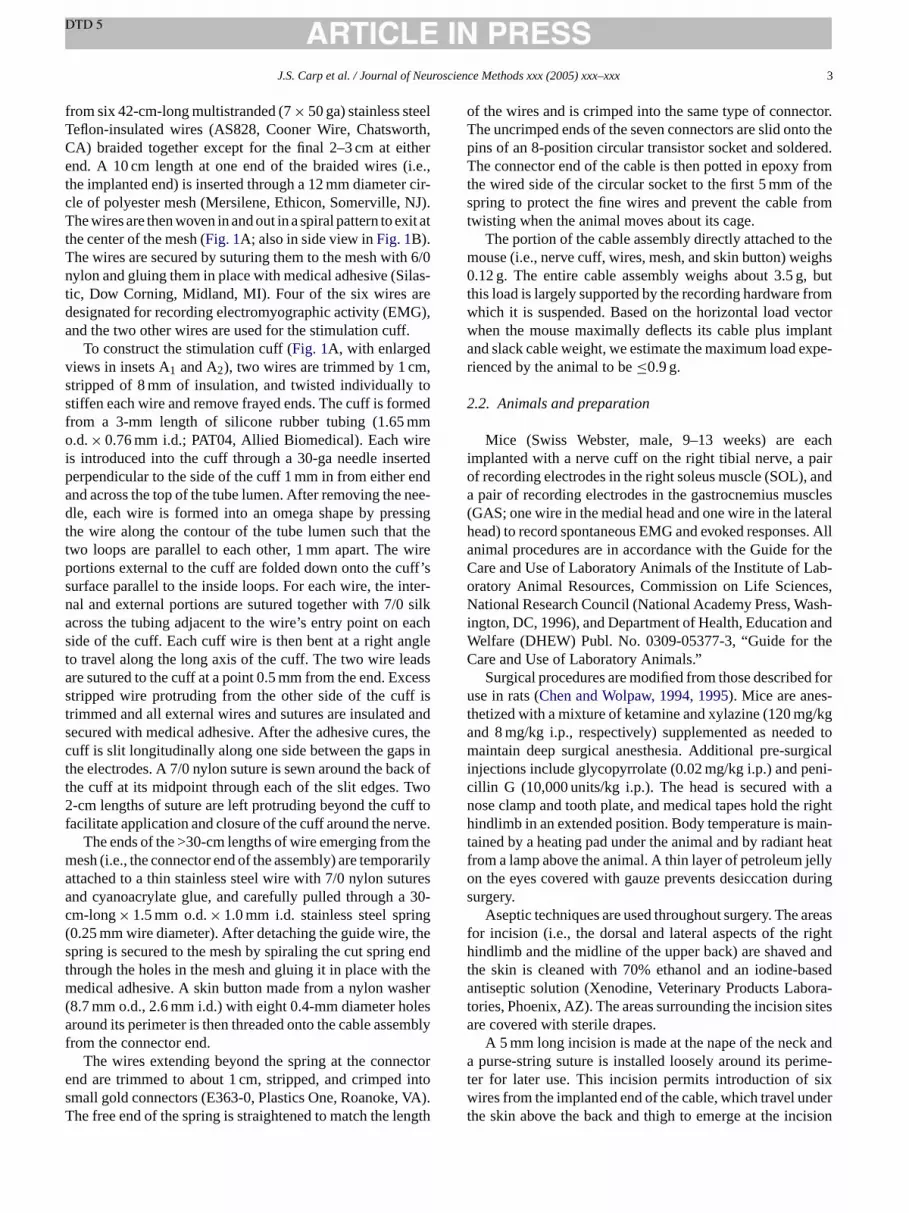
Fig. 2. Relationship between stimulus intensity and MR (filled circles) andHR (open circles) in SOL of one mouse. MR and HR values calculatedfrom 286 trials elicited over a wide range of stimulus intensities. The datawere sorted by stimulus intensity, binned into 11 equal-sized groups, and theassociated average MR and HR plotted as a function of stimulus intensity(in multiples of MR threshold). See text for further details. The inset figureshows the average of the absolute value (equivalent to full-wave rectification)of the EMG during the evoked response for the stimulus intensity at which theHR was maximal. The MR and HR intervals are indicated by the black barsbelow the evoked potential waveform. The onset of stimulation is indicatedby the arrowhead. Calibration: 1 ms, 100�V.
largest responses in the MR interval to supramaximal stim-ulation). The range of ongoing EMG levels during whichevoked responses were recorded in this study was large, lim-ited only to require at least a minimal level of activity (i.e., toavoid eliciting trials with very low or indeterminate levels ofmotoneuron pool activation) and to exclude values exceedingthe targeted average amplitude in the MR interval (i.e., to pre-vent the computer from unnecessarily reducing the stimulusstrength).
For each trial, the average absolute value of the EMG isdetermined within the bEMG, MR, and HR intervals. Theaverage MR size is calculated as the difference between theaverage absolute value of the EMG within the MR intervaland the bEMG interval. The average HR size is calculatedas the difference between the average absolute value of theEMG within the HR interval and the bEMG interval.
Empirical evaluation of different stimulus polarities, dura-tions (0.04–0.5 ms), and intensities determines the combina-tion that elicits the largest HR. In four animals, this procedurewas automated by taking advantage of the computer’s controlover stimulus intensity to achieve a target MR. The stimulusintensity is set temporarily to a just-subthreshold value andthe MR target is set to a supramaximal value. A series of a fewhundred trials are then collected while the computer gradu-ally increases the stimulus amplitude in its attempt to elicit anMR at the target value.Fig. 2illustrates typical input–outputr d theH tim-u eaka -linea HRiw
3. Results
3.1. Recovery from surgery
The purpose of this study was to develop methodology inunanesthetized, unrestrained mice for performing continuous(i.e., 24 h/day, 7 days/week) recording of spontaneous EMGand to elicit and record the HR. Towards this end, we haveimplanted each of six mice with a tibial nerve cuff and GASand SOL EMG electrodes. All animals recovered quicklyfrom surgery, exhibiting normal behaviors (e.g., grooming,locomotion, rearing, and climbing the bars of its food hopperwith all four limbs) within 24 h. No motor impairment wasobserved during quadrupedal stance or locomotion. However,immediately after surgery, two of the six animals did notappear to support their body weight fully with the operatedhindlimb during rearing and climbing. This deficit disap-peared within 1 week after surgery.
The mice weighed 36–59 g at time of surgery. Body weightdecreased between 2 and 7% within the first 4 days aftersurgery. Body weight stabilized within 10 days in four mice;in the two remaining mice, it stabilized at 16–18% below pre-surgery weight after 4–6 weeks. After body weight stabilized,it increased again in all six mice. One mouse irreparably dam-aged its skin button and implanted wires, and was euthanized60 days after surgery.
3
fters andf eda (i.e.,< dayv ingf fters se forf micee frome an 34d ing at icec ).
of3 dian7 ningaa al’sl rval(
sed( thev al-u eanH
elationships between stimulus intensity and the MR anR for one animal. The HR increases with increasing slus intensity up to the MR threshold, but reaches its pnd eventually disappears with increasing MR size. Offnalysis determined the MR value at which the maximum
s elicited (see evoked response illustrated in inset ofFig. 2),hich was then used as the target value for the MR.
.2. Daily HR recording
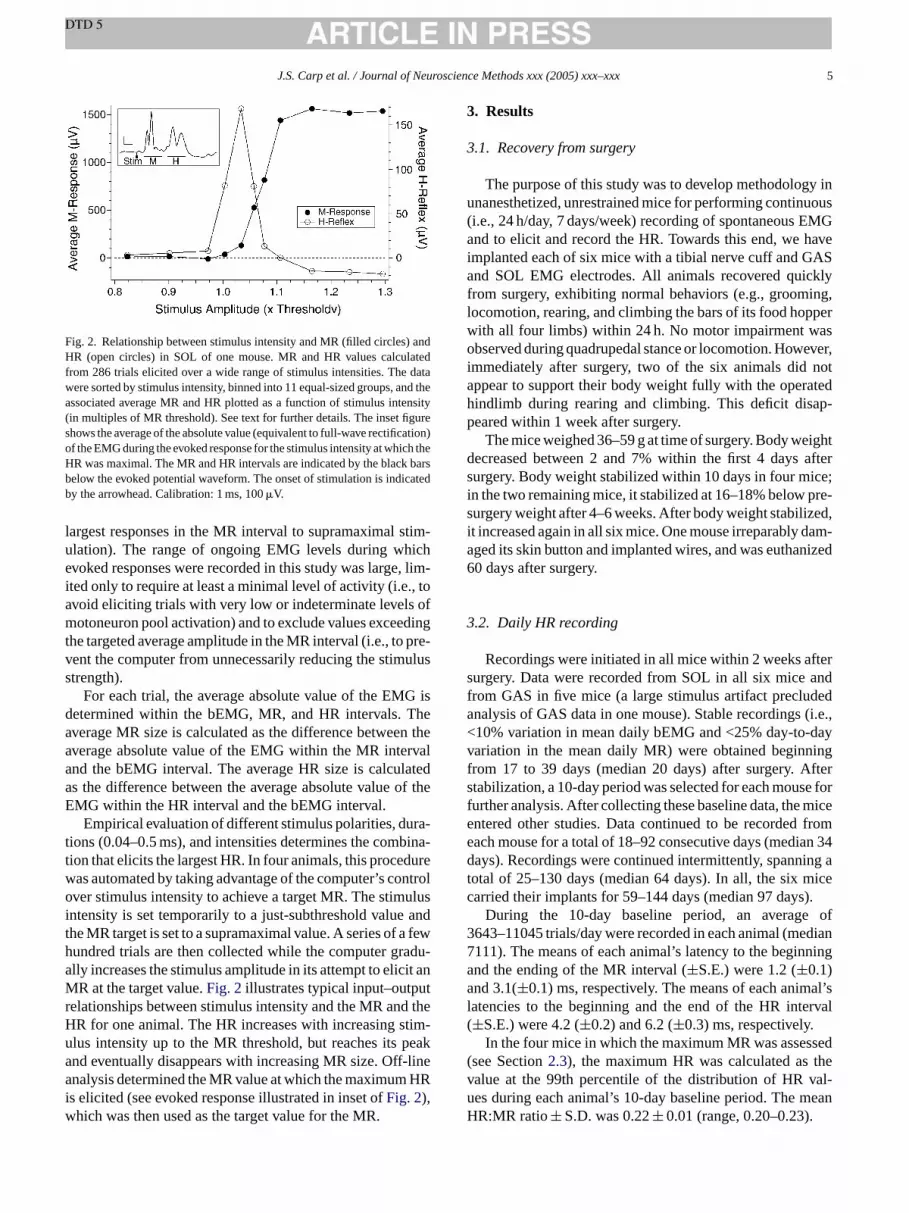
Recordings were initiated in all mice within 2 weeks aurgery. Data were recorded from SOL in all six micerom GAS in five mice (a large stimulus artifact precludnalysis of GAS data in one mouse). Stable recordings10% variation in mean daily bEMG and <25% day-to-ariation in the mean daily MR) were obtained beginnrom 17 to 39 days (median 20 days) after surgery. Atabilization, a 10-day period was selected for each mouurther analysis. After collecting these baseline data, thentered other studies. Data continued to be recordedach mouse for a total of 18–92 consecutive days (mediays). Recordings were continued intermittently, spann
otal of 25–130 days (median 64 days). In all, the six married their implants for 59–144 days (median 97 days
During the 10-day baseline period, an average643–11045 trials/day were recorded in each animal (me111). The means of each animal’s latency to the beginnd the ending of the MR interval (±S.E.) were 1.2 (±0.1)nd 3.1(±0.1) ms, respectively. The means of each anim
atencies to the beginning and the end of the HR inte±S.E.) were 4.2 (±0.2) and 6.2 (±0.3) ms, respectively.
In the four mice in which the maximum MR was assessee Section2.3), the maximum HR was calculated asalue at the 99th percentile of the distribution of HR ves during each animal’s 10-day baseline period. The mR:MR ratio± S.D. was 0.22± 0.01 (range, 0.20–0.23).
6 J.S. Carp et al. / Journal of Neuroscience Methods xxx (2005) xxx–xxx
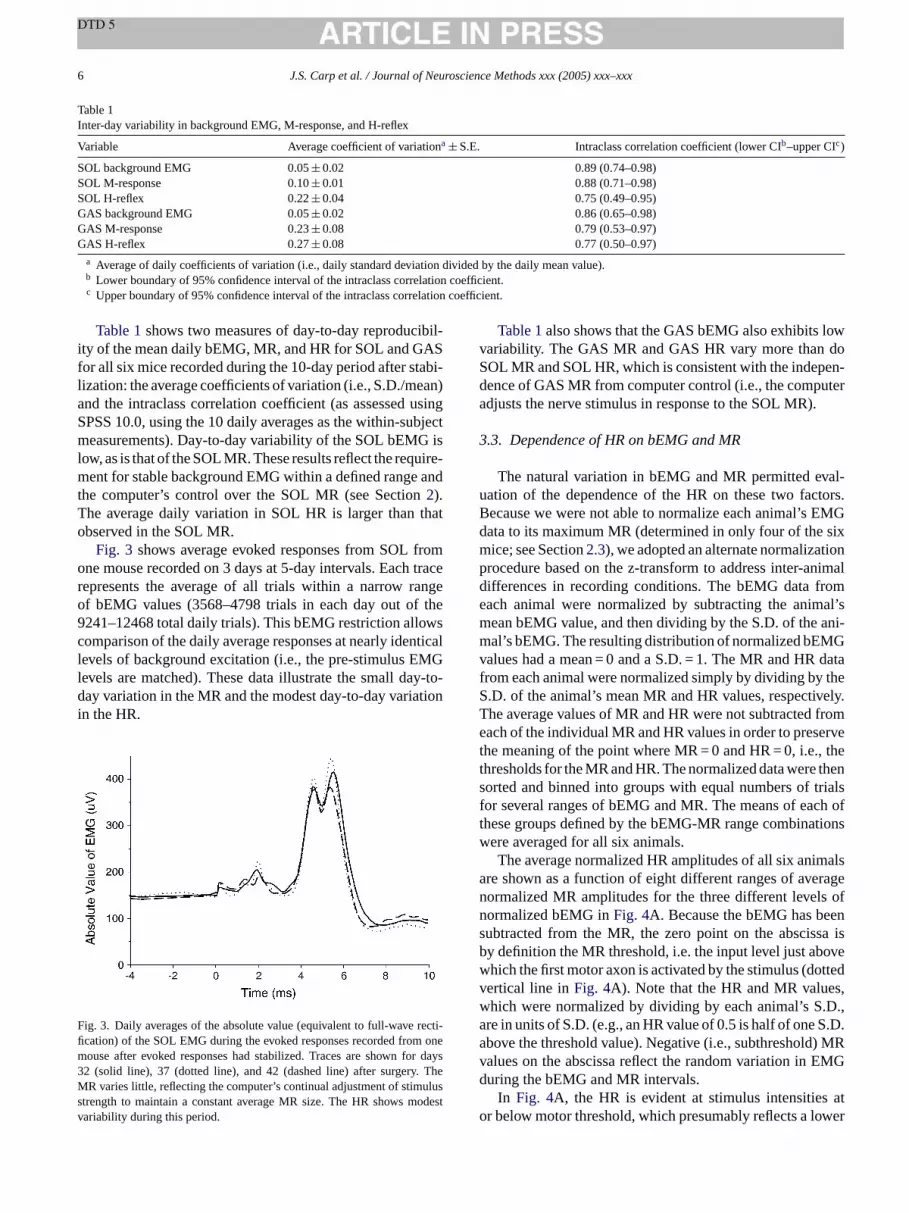
Table 1Inter-day variability in background EMG, M-response, and H-reflex
Variable Average coefficient of variationa ± S.E. Intraclass correlation coefficient (lower CIb–upper CIc)
SOL background EMG 0.05± 0.02 0.89 (0.74–0.98)SOL M-response 0.10± 0.01 0.88 (0.71–0.98)SOL H-reflex 0.22± 0.04 0.75 (0.49–0.95)GAS background EMG 0.05± 0.02 0.86 (0.65–0.98)GAS M-response 0.23± 0.08 0.79 (0.53–0.97)GAS H-reflex 0.27± 0.08 0.77 (0.50–0.97)
a Average of daily coefficients of variation (i.e., daily standard deviation divided by the daily mean value).b Lower boundary of 95% confidence interval of the intraclass correlation coefficient.c Upper boundary of 95% confidence interval of the intraclass correlation coefficient.
Table 1shows two measures of day-to-day reproducibil-ity of the mean daily bEMG, MR, and HR for SOL and GASfor all six mice recorded during the 10-day period after stabi-lization: the average coefficients of variation (i.e., S.D./mean)and the intraclass correlation coefficient (as assessed usingSPSS 10.0, using the 10 daily averages as the within-subjectmeasurements). Day-to-day variability of the SOL bEMG islow, as is that of the SOL MR. These results reflect the require-ment for stable background EMG within a defined range andthe computer’s control over the SOL MR (see Section2).The average daily variation in SOL HR is larger than thatobserved in the SOL MR.
Fig. 3 shows average evoked responses from SOL fromone mouse recorded on 3 days at 5-day intervals. Each tracerepresents the average of all trials within a narrow rangeof bEMG values (3568–4798 trials in each day out of the9241–12468 total daily trials). This bEMG restriction allowscomparison of the daily average responses at nearly identicallevels of background excitation (i.e., the pre-stimulus EMGlevels are matched). These data illustrate the small day-to-day variation in the MR and the modest day-to-day variationin the HR.
F recti-fi onem r days3 TheM uluss odestv
Table 1also shows that the GAS bEMG also exhibits lowvariability. The GAS MR and GAS HR vary more than doSOL MR and SOL HR, which is consistent with the indepen-dence of GAS MR from computer control (i.e., the computeradjusts the nerve stimulus in response to the SOL MR).
3.3. Dependence of HR on bEMG and MR
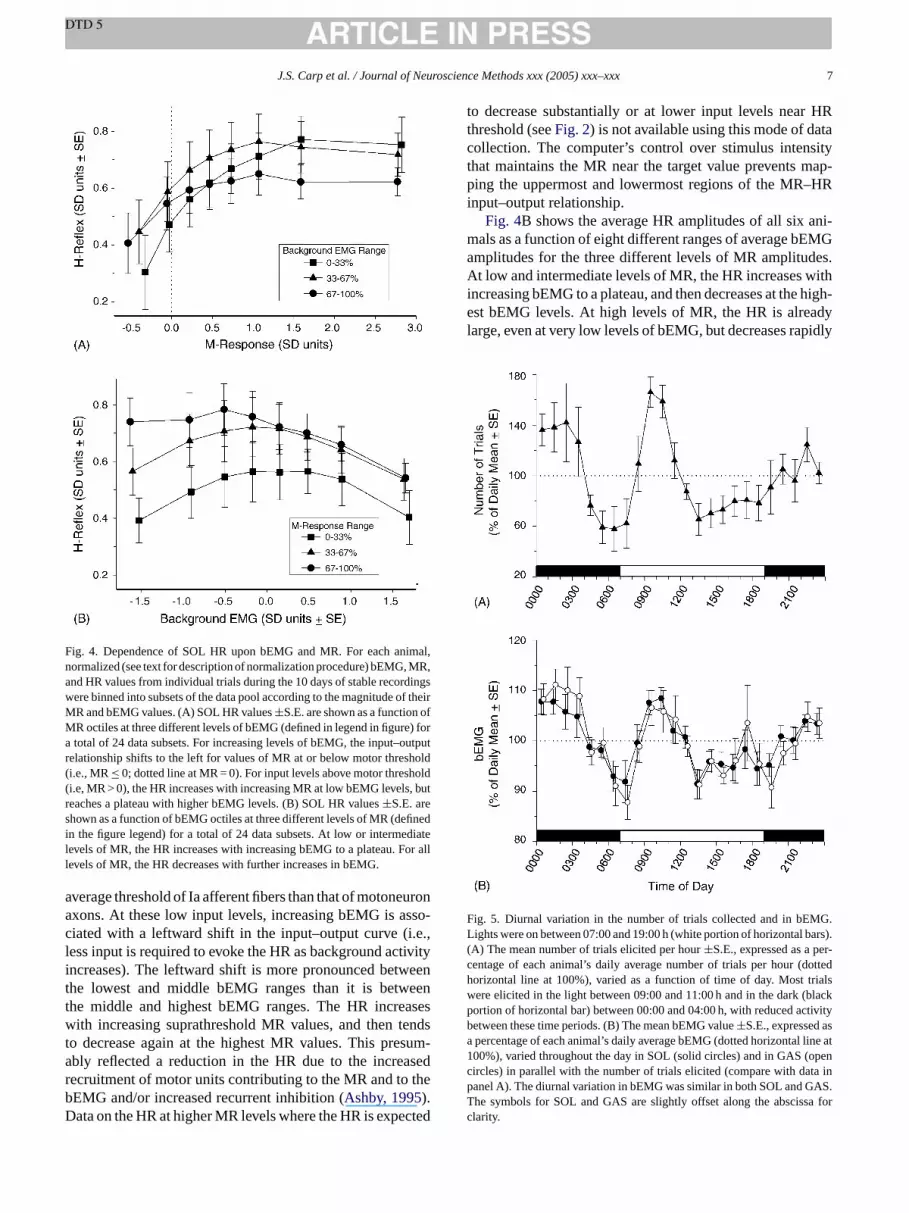
The natural variation in bEMG and MR permitted eval-uation of the dependence of the HR on these two factors.Because we were not able to normalize each animal’s EMGdata to its maximum MR (determined in only four of the sixmice; see Section2.3), we adopted an alternate normalizationprocedure based on the z-transform to address inter-animaldifferences in recording conditions. The bEMG data fromeach animal were normalized by subtracting the animal’smean bEMG value, and then dividing by the S.D. of the ani-mal’s bEMG. The resulting distribution of normalized bEMGvalues had a mean = 0 and a S.D. = 1. The MR and HR datafrom each animal were normalized simply by dividing by theS.D. of the animal’s mean MR and HR values, respectively.The average values of MR and HR were not subtracted fromeach of the individual MR and HR values in order to preservethe meaning of the point where MR = 0 and HR = 0, i.e., thethresholds for the MR and HR. The normalized data were thensorted and binned into groups with equal numbers of trialsf h oft tionsw
alsa ragen s ofn ens sa isb ovew ttedv s,w .D.,a .D.a ) MRv MGd
ato wer
ig. 3. Daily averages of the absolute value (equivalent to full-wavecation) of the SOL EMG during the evoked responses recorded fromouse after evoked responses had stabilized. Traces are shown fo2 (solid line), 37 (dotted line), and 42 (dashed line) after surgery.R varies little, reflecting the computer’s continual adjustment of stim
trength to maintain a constant average MR size. The HR shows mariability during this period.
or several ranges of bEMG and MR. The means of eachese groups defined by the bEMG-MR range combinaere averaged for all six animals.The average normalized HR amplitudes of all six anim
re shown as a function of eight different ranges of aveormalized MR amplitudes for the three different levelormalized bEMG inFig. 4A. Because the bEMG has beubtracted from the MR, the zero point on the abscisy definition the MR threshold, i.e. the input level just abhich the first motor axon is activated by the stimulus (doertical line inFig. 4A). Note that the HR and MR valuehich were normalized by dividing by each animal’s Sre in units of S.D. (e.g., an HR value of 0.5 is half of one Sbove the threshold value). Negative (i.e., subthresholdalues on the abscissa reflect the random variation in Euring the bEMG and MR intervals.
In Fig. 4A, the HR is evident at stimulus intensitiesr below motor threshold, which presumably reflects a lo
J.S. Carp et al. / Journal of Neuroscience Methods xxx (2005) xxx–xxx 7
Fig. 4. Dependence of SOL HR upon bEMG and MR. For each animal,normalized (see text for description of normalization procedure) bEMG, MR,and HR values from individual trials during the 10 days of stable recordingswere binned into subsets of the data pool according to the magnitude of theirMR and bEMG values. (A) SOL HR values±S.E. are shown as a function ofMR octiles at three different levels of bEMG (defined in legend in figure) fora total of 24 data subsets. For increasing levels of bEMG, the input–outputrelationship shifts to the left for values of MR at or below motor threshold(i.e., MR≤ 0; dotted line at MR = 0). For input levels above motor threshold(i.e, MR > 0), the HR increases with increasing MR at low bEMG levels, butreaches a plateau with higher bEMG levels. (B) SOL HR values±S.E. areshown as a function of bEMG octiles at three different levels of MR (definedin the figure legend) for a total of 24 data subsets. At low or intermediatelevels of MR, the HR increases with increasing bEMG to a plateau. For alllevels of MR, the HR decreases with further increases in bEMG.
average threshold of Ia afferent fibers than that of motoneuronaxons. At these low input levels, increasing bEMG is asso-ciated with a leftward shift in the input–output curve (i.e.,less input is required to evoke the HR as background activityincreases). The leftward shift is more pronounced betweenthe lowest and middle bEMG ranges than it is betweenthe middle and highest bEMG ranges. The HR increaseswith increasing suprathreshold MR values, and then tendsto decrease again at the highest MR values. This presum-ably reflected a reduction in the HR due to the increasedrecruitment of motor units contributing to the MR and to thebEMG and/or increased recurrent inhibition (Ashby, 1995).Data on the HR at higher MR levels where the HR is expected
to decrease substantially or at lower input levels near HRthreshold (seeFig. 2) is not available using this mode of datacollection. The computer’s control over stimulus intensitythat maintains the MR near the target value prevents map-ping the uppermost and lowermost regions of the MR–HRinput–output relationship.
Fig. 4B shows the average HR amplitudes of all six ani-mals as a function of eight different ranges of average bEMGamplitudes for the three different levels of MR amplitudes.At low and intermediate levels of MR, the HR increases withincreasing bEMG to a plateau, and then decreases at the high-est bEMG levels. At high levels of MR, the HR is alreadylarge, even at very low levels of bEMG, but decreases rapidly
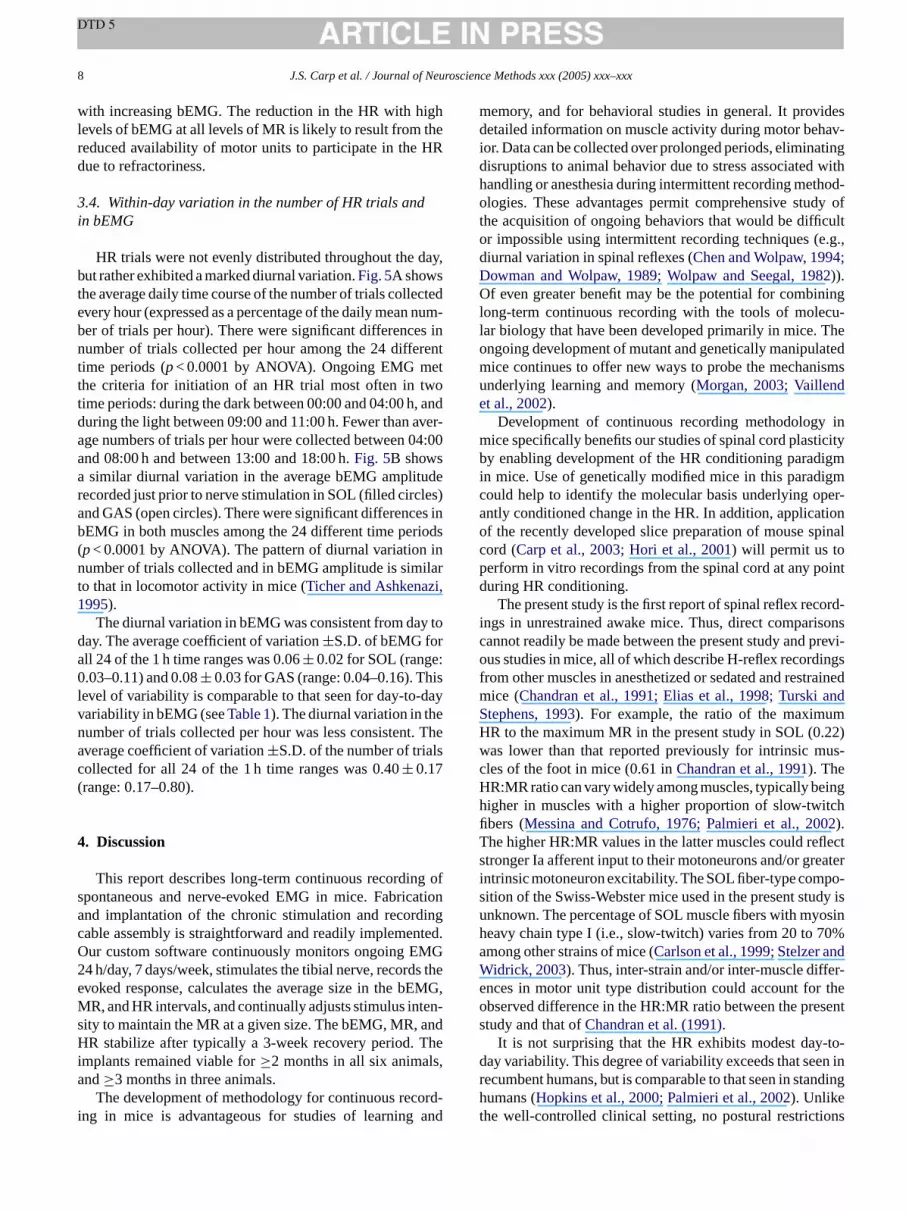
Fig. 5. Diurnal variation in the number of trials collected and in bEMG.Lights were on between 07:00 and 19:00 h (white portion of horizontal bars).(A) The mean number of trials elicited per hour±S.E., expressed as a per-centage of each animal’s daily average number of trials per hour (dottedhorizontal line at 100%), varied as a function of time of day. Most trialswere elicited in the light between 09:00 and 11:00 h and in the dark (blackportion of horizontal bar) between 00:00 and 04:00 h, with reduced activitybetween these time periods. (B) The mean bEMG value±S.E., expressed asa percentage of each animal’s daily average bEMG (dotted horizontal line at100%), varied throughout the day in SOL (solid circles) and in GAS (opencircles) in parallel with the number of trials elicited (compare with data inpanel A). The diurnal variation in bEMG was similar in both SOL and GAS.The symbols for SOL and GAS are slightly offset along the abscissa forclarity.
8 J.S. Carp et al. / Journal of Neuroscience Methods xxx (2005) xxx–xxx
with increasing bEMG. The reduction in the HR with highlevels of bEMG at all levels of MR is likely to result from thereduced availability of motor units to participate in the HRdue to refractoriness.
3.4. Within-day variation in the number of HR trials andin bEMG
HR trials were not evenly distributed throughout the day,but rather exhibited a marked diurnal variation.Fig. 5A showsthe average daily time course of the number of trials collectedevery hour (expressed as a percentage of the daily mean num-ber of trials per hour). There were significant differences innumber of trials collected per hour among the 24 differenttime periods (p< 0.0001 by ANOVA). Ongoing EMG metthe criteria for initiation of an HR trial most often in twotime periods: during the dark between 00:00 and 04:00 h, andduring the light between 09:00 and 11:00 h. Fewer than aver-age numbers of trials per hour were collected between 04:00and 08:00 h and between 13:00 and 18:00 h.Fig. 5B showsa similar diurnal variation in the average bEMG amplituderecorded just prior to nerve stimulation in SOL (filled circles)and GAS (open circles). There were significant differences inbEMG in both muscles among the 24 different time periods(p< 0.0001 by ANOVA). The pattern of diurnal variation innumber of trials collected and in bEMG amplitude is similart i,1
y toda :0 isl dayv en . Thea lsc(
4
g ofs ationa ingc ted.O MG2 s thee EMG,M ten-s andH hei s,a
ord-i and
memory, and for behavioral studies in general. It providesdetailed information on muscle activity during motor behav-ior. Data can be collected over prolonged periods, eliminatingdisruptions to animal behavior due to stress associated withhandling or anesthesia during intermittent recording method-ologies. These advantages permit comprehensive study ofthe acquisition of ongoing behaviors that would be difficultor impossible using intermittent recording techniques (e.g.,diurnal variation in spinal reflexes (Chen and Wolpaw, 1994;Dowman and Wolpaw, 1989; Wolpaw and Seegal, 1982)).Of even greater benefit may be the potential for combininglong-term continuous recording with the tools of molecu-lar biology that have been developed primarily in mice. Theongoing development of mutant and genetically manipulatedmice continues to offer new ways to probe the mechanismsunderlying learning and memory (Morgan, 2003; Vaillendet al., 2002).
Development of continuous recording methodology inmice specifically benefits our studies of spinal cord plasticityby enabling development of the HR conditioning paradigmin mice. Use of genetically modified mice in this paradigmcould help to identify the molecular basis underlying oper-antly conditioned change in the HR. In addition, applicationof the recently developed slice preparation of mouse spinalcord (Carp et al., 2003; Hori et al., 2001) will permit us toperform in vitro recordings from the spinal cord at any pointd
ord-i isonsc previ-o ingsf rainedm andS mH 22)w us-cH ingh tchfi 2T flects eateri po-s dy isu osinh 0%a ndW er-e theo sents
-to-d n inr ndinght ons
o that in locomotor activity in mice (Ticher and Ashkenaz995).
The diurnal variation in bEMG was consistent from daay. The average coefficient of variation±S.D. of bEMG forll 24 of the 1 h time ranges was 0.06± 0.02 for SOL (range.03–0.11) and 0.08± 0.03 for GAS (range: 0.04–0.16). Th
evel of variability is comparable to that seen for day-to-ariability in bEMG (seeTable 1). The diurnal variation in thumber of trials collected per hour was less consistentverage coefficient of variation±S.D. of the number of triaollected for all 24 of the 1 h time ranges was 0.40± 0.17range: 0.17–0.80).
. Discussion
This report describes long-term continuous recordinpontaneous and nerve-evoked EMG in mice. Fabricnd implantation of the chronic stimulation and recordable assembly is straightforward and readily implemenur custom software continuously monitors ongoing E4 h/day, 7 days/week, stimulates the tibial nerve, recordvoked response, calculates the average size in the bR, and HR intervals, and continually adjusts stimulus in
ity to maintain the MR at a given size. The bEMG, MR,R stabilize after typically a 3-week recovery period. T
mplants remained viable for≥2 months in all six animalnd≥3 months in three animals.
The development of methodology for continuous recng in mice is advantageous for studies of learning
uring HR conditioning.The present study is the first report of spinal reflex rec
ngs in unrestrained awake mice. Thus, direct comparannot readily be made between the present study andus studies in mice, all of which describe H-reflex record
rom other muscles in anesthetized or sedated and restice (Chandran et al., 1991; Elias et al., 1998; Turskitephens, 1993). For example, the ratio of the maximuR to the maximum MR in the present study in SOL (0.as lower than that reported previously for intrinsic mles of the foot in mice (0.61 inChandran et al., 1991). TheR:MR ratio can vary widely among muscles, typically beigher in muscles with a higher proportion of slow-twibers (Messina and Cotrufo, 1976; Palmieri et al., 200).he higher HR:MR values in the latter muscles could retronger Ia afferent input to their motoneurons and/or grntrinsic motoneuron excitability. The SOL fiber-type comition of the Swiss-Webster mice used in the present stunknown. The percentage of SOL muscle fibers with myeavy chain type I (i.e., slow-twitch) varies from 20 to 7mong other strains of mice (Carlson et al., 1999; Stelzer aidrick, 2003). Thus, inter-strain and/or inter-muscle diff
nces in motor unit type distribution could account forbserved difference in the HR:MR ratio between the pretudy and that ofChandran et al. (1991).
It is not surprising that the HR exhibits modest dayay variability. This degree of variability exceeds that seeecumbent humans, but is comparable to that seen in staumans (Hopkins et al., 2000; Palmieri et al., 2002). Unlike
he well-controlled clinical setting, no postural restricti
J.S. Carp et al. / Journal of Neuroscience Methods xxx (2005) xxx–xxx 9
are placed on the animal during recording other that thoseresulting indirectly from the limitations imposed on ongo-ing EMG. The HR variability is evident even with on-linecomputer control of data collection and stimulus intensityand off-line matching of bEMG and MR values. This pre-sumably reflects variation in the supraspinal control overpre-motoneuronal elements (e.g., presynaptic inhibition ofafferent input to spinal motoneurons (Capaday, 1997)) orover intrinsic motoneuron properties that affect reflex gain(e.g., neuromodulator-dependent persistent currents (Leeet al., 2003)).
The input–output relationship of the SOL HR is compara-ble to that observed in other species. HR size varies not onlywith input magnitude (as assessed by MR size or stimulusamplitude), but is highly dependent upon the level of ongoingEMG (as assessed by the prestimulus bEMG level). Similardependencies of the HR on bEMG have been demonstratedin humans (Verrier, 1985). The ability to record continuouslyover many days in an unrestrained behaving animal facili-tates evaluation of the relative contributions of changes innet synaptic drive to motoneurons. With additional implantedelectrodes, it may also be possible to evaluate other determi-nants of the HR such as presynaptic inhibition.
Unlike experimental designs in which the tether isremoved from a connector on the mouse between record-ing sessions (Leblond et al., 2003; Milner and Hoffer, 1987;V ea t allt veryl nec-t byt ht oft diall om-p caged eedst rotec-t nestg tatorw dyh fromo e, Airfl thet ght),w fluidb r tor
studya om-m withs tur-i rquer
me-t on-n ent.
This has facilitated chronic EMG recordings in many specieslarger than mice (Herzog et al., 1993; Kramer and Kinter,2003; Marques and Dutourne, 1977; Winter and Quanbury,1975), but the need to implant a power source (usually abattery) along with transmission and/or receiving hardwarelimits its use in small animals to short duration recordings.Telemetry has been performed with mice for acquisition ofEEG, heart rate, blood pressure, and/or temperature data(Ishii et al., 1996; Kramer and Kinter, 2003), but not withhigher bandwidth signals such as EMG and/or those requir-ing nerve stimulation.
In summary, the data show the feasibility of continuouslong-term EMG recording and HR study in mice. Develop-ment of this methodology will permit us to transfer the HRconditioning paradigm to mice. Thus, the mouse may providean important new model for defining the spinal cord plasticityassociated with HR operant conditioning.
Acknowledgements
The authors thank Dr. Dennis McFarland for his thought-ful comments on this manuscript. We also thank Dr. MichaelCallahan for advice on skin button design and application,Ms. Lu Chen for advice on cable construction, Mr. ScottP dataa 189(
R
A ringslow
A na in
A altion63.
B read-tion.
C ystem–18.
C RNAload-
C ord-No.
y for
C dultgramoci-
C bility
C es
alatx, 1971; Warren et al., 1998), in our experiments thnimal is connected to the data acquisition system a
imes. The implanted portion of the cable assembly isight, due in part to the absence of an intermediate conor. Most of the weight of the cable is directly supportedhe commutator. The mouse only experiences the weighe unsupported slack cable (typically <2 cm) and any raoad when located away from the center of the cage. Cared to standard rectangular cages, the near-circularesign minimizes the slack in the cable that the animal n
o access all parts of its cage. The mass of the cable’s pive stainless steel spring was minimized by using the fiauge wire that was stiff enough to rotate the commuithout twisting itself. The commutator used in this stuas a lower torque requirement than any other devicether sources that we have assessed (e.g., Plastics Onyte Electronics). In order to achieve a further reduction inorque requirement (and thus further reduce spring weie are developing a commutator that incorporates theearing used here for maintaining cable integrity prioecording.
The outbred Swiss-Webster mice used in the presentre substantially larger than many of the inbred strains conly used for genetic manipulations. Future studies
maller or less robust strains may require further miniazation of the cable assembly and/or reduction in the toequirements of the commutator.
The alternative to hardwired data transmission is telery, which removes the requirement for any physical cection between the animal and the recording equipm
-
arsons for graphics, and Mr. Nicholas Schwartz fornalysis. This work was supported by NIH grants NS22JRW) and HD36020 (XYC).
eferences
ffanni JM, Cervino CO, Marcos HJ. Absence of penile erections duparadoxical sleep. Peculiar penile events during wakefulness andwave sleep in the armadillo. J Sleep Res 2001;10:219–28.
shby P. Some spinal mechanisms of negative motor phenomehumans. Adv Neurol 1995;67:305–20.
tobe Y, Akagi M, Nishi K. Validity of long-term recordings of electricactivity of the stomach by chronically implanted monopolar sucelectrodes in the conscious dog. Gastroent Japon 1980;15:452–
elanger M, Drew T, Provencher J, Rossignol S. A comparison of tmill locomotion in adult cats before and after spinal transecJ Neurophysiol 1996;76:471–91.
apaday C. Neurophysiological methods for studies of the motor sin freely moving human subjects. J Neurosci Meth 1997;74:201
arlson CJ, Booth FW, Gordon SE. Skeletal muscle myostatin mexpression is fiber-type specific and increases during hindlimb uning. Am J Physiol 1999;277:R601–6.
arp JS, Tennissen AM, Chen XY, Wolpaw JR. Chronic H-reflex recing in mice: methods development and normative data. Program417.5, Abstract Viewer/Itinerary Planner, Washington, DC: SocietNeuroscience, 2004. Online.
arp JS, Tennissen AM, Wolpaw JR. Intracellular recording from amouse spinal motoneurons in vitro: methods development. ProNo. 496.15, Abstract Viewer/Itinerary Planner. Washington, DC: Sety for Neuroscience, 2003.
handran AP, Oda K, Shibasaki H. Changes in motoneuron excitaduring postnatal life in the mouse. Brain Dev 1991;13:180–3.
hen XY, Wolpaw JR. Circadian rhythm in rat H-reflex. Brain R1994;648:167–70.
10 J.S. Carp et al. / Journal of Neuroscience Methods xxx (2005) xxx–xxx
Chen XY, Wolpaw JR. Operant conditioning of H-reflex in freely movingrats. J Neurophysiol 1995;73:411–5.
Dowman R, Wolpaw JR. Diurnal rhythms in primate spinal reflexes andaccompanying cortical somatosensory evoked potentials. Electroen-cephalogr Clin Neurophysiol 1989;72:69–80.
Dwinell MB, Bass P, Oaks JA. Intestinal myoelectric alterations in ratschronically infected with the tapewormHymenolepis diminuta. Am JPhysiol 1994;267:G851–8.
Elias KA, Cronin MJ, Stewart TA, Carlsen RC. Peripheral neuropathy intransgenic diabetic mice: restoration of C-fiber function with humanrecombinant nerve growth factor. Diabetes 1998;47:1637–42.
Fortier PA, Smith AM, Rossignol S. Locomotor deficits in the mutantmouse, Lurcher. Exp Brain Res 1987;66:271–86.
Herzog W, Stano A, Leonard TR. Telemetry system to record force andEMG from cat ankle extensor and tibialis anterior muscles. J Biomech1993;26:1463–71.
Hoffer JA, Sugano N, Loeb GE, Marks WB, O’Donovan MJ, Pratt CA.Cat hindlimb motoneurons during locomotion. II. Normal activity pat-terns. J Neurophysiol 1987;57:530–53.
Hopkins JT, Ingersoll CD, Cordova ML, Edwards JE. Intrasession andintersession reliability of the soleus H-reflex in supine and standingpositions. Electromyogr Clin Neurophysiol 2000;40:89–94.
Hori N, Tan Y, Strominger NL, Carpenter DO. Intracellular activity of ratspinal cord motoneurons in slices. J Neurosci Meth 2001;112:185–91.
Ishii K, Kuwahara M, Tsubone H, Sugano S. The telemetric monitoringof heart rate, locomotor activity, and body temperature in mice andvoles (Microtus arvalis) during ambient temperature changes. LabAnim 1996;30:7–12.
Kramer K, Kinter LB. Evaluation and applications of radiotelemetry insmall laboratory animals. Physiol Genomics 2003;13:197–205.
Leblond H, L’Esperance M, Orsal D, Rossignol S. Treadmill locomotion
L driticvo. J
M term
M ha-slow
M ord-987;
Miura T, Kondo Y, Akimoto M, Sakuma Y. Electromyography ofmale rat perineal musculature during copulatory behavior. Urol Int2001;67:240–5.
Morgan D. Learning and memory deficits in APP transgenic mouse mod-els of amyloid deposition. Neurochem Res 2003;28:1029–34.
Palmieri RM, Hoffman MA, Ingersoll CD. Intersession reliability forH-reflex measurements arising from the soleus, peroneal, and tibialisanterior musculature. Int J Neurosci 2002;112:841–50.
Stelzer JE, Widrick JJ. Effect of hindlimb suspension on the functionalproperties of slow and fast soleus fibers from three strains of mice.J Appl Physiol 2003;95:2425–33.
Ticher A, Ashkenazi IE. Compound structure of rodents activity rhythm.Physiol Behav 1995;57:37–40.
Trelease RB, Sieck GC, Harper RM. A new technique for acute andchronic recording of crural diaphragm EMG in cats. Electroen-cephalogr Clin Neurophysiol 1982;53:459–62.
Turski L, Stephens DN. Effect of the beta-carboline abecarnil on spinalreflexes in mice and on muscle tone in genetically spastic rats: a com-parison with diazepam. J Pharmacol Exp Ther 1993;267: 1215–20.
Vaillend C, Rampon C, Davis S, Laroche S. Gene control of synapticplasticity and memory formation: implications for diseases and ther-apeutic strategies. Curr Mol Med 2002;2:613–28.
Valatx JL. Long-term recording of cerebral, muscular and ocular electricactivities in mice. C R Seances Soc Biol Fil 1971;165:112–5.
Verrier MC. Alterations in H reflex magnitude by variations inbaseline EMG excitability. Electroencephalogr Clin Neurophysiol1985;60:492–9.
Warren GL, Ingalls CP, Armstrong RB. A stimulating nerve cuff forchronic in vivo measurements of torque produced about the ankle inthe mouse. J Appl Physiol 1998;84:2171–6.
Winter DA, Quanbury AQ. Multichannel biotelemetry systems for useed
W ons
W flex.
W eely
W rain
W y in
in the intact and spinal mouse. J Neurosci 2003;23:11411–9.ee RH, Kuo JJ, Jiang MC, Heckman CJ. Influence of active den
currents on input-output processing in spinal motoneurons in viNeurophysiol 2003;89:27–39.
arques M, Dutourne B. Implantable telemetry system for long-EMG. Biotelemetry 1977;4:28–33.
essina C, Cotrufo R. Different excitability of type 1 and type 2 alpmotoneurons. The recruitment curve of H- and M-responses inand fast muscles of rabbits. J Neurol Sci 1976;28:57–63.
ilner TE, Hoffer JA. Long-term peripheral nerve and muscle recings from normal and dystrophic mice. J Neurosci Meth 119:37–45.
in EMG studies, particularly in locomotion. Am J Phys M1975;54:142–7.
olf SL, Segal RL. Conditioning of the spinal stretch reflex: implicatifor rehabilitation. Phys Ther 1990;70:652–6.
olpaw JR. Operant conditioning of primate spinal reflexes: the H-reJ Neurophysiol 1987;57:443–59.
olpaw JR, Herchenroder PA. Operant conditioning of H-reflex in frmoving monkeys. J Neurosci Meth 1990;31:145–52.
olpaw JR, Seegal RF. Diurnal rhythm in the spinal stretch reflex. BRes 1982;244:365–9.
olpaw JR, Tennissen AM. Activity-dependent spinal cord plasticithealth and disease. Ann Rev Neurosci 2001;24:807–43.


