Embed Size (px)
Citation preview


INFORMATION MODELLING AND KNOWLEDGE
BASES XVIII

Frontiers in Artificial Intelligence and
Applications
FAIA covers all aspects of theoretical and applied artificial intelligence research in the form of
monographs, doctoral dissertations, textbooks, handbooks and proceedings volumes. The FAIA
series contains several sub-series, including “Information Modelling and Knowledge Bases” and
“Knowledge-Based Intelligent Engineering Systems”. It also includes the biennial ECAI, the
European Conference on Artificial Intelligence, proceedings volumes, and other ECCAI – the
European Coordinating Committee on Artificial Intelligence – sponsored publications. An
editorial panel of internationally well-known scholars is appointed to provide a high quality
selection.
Series Editors:
J. Breuker, R. Dieng-Kuntz, N. Guarino, J.N. Kok, J. Liu, R. López de Mántaras,
R. Mizoguchi, M. Musen and N. Zhong
Volume 154
Recently published in this series
Vol. 153. Y. Vogiazou, Design for Emergence – Collaborative Social Play with Online and
Location-Based Media
Vol. 152. T.M. van Engers (Ed.), Legal Knowledge and Information Systems – JURIX 2006:
The Nineteenth Annual Conference
Vol. 151. R. Mizoguchi et al. (Eds.), Learning by Effective Utilization of Technologies:
Facilitating Intercultural Understanding
Vol. 150. B. Bennett and C. Fellbaum (Eds.), Formal Ontology in Information Systems –
Proceedings of the Fourth International Conference (FOIS 2006)
Vol. 149. X.F. Zha and R.J. Howlett (Eds.), Integrated Intelligent Systems for Engineering
Design
Vol. 148. K. Kersting, An Inductive Logic Programming Approach to Statistical Relational
Learning
Vol. 147. H. Fujita and M. Mejri (Eds.), New Trends in Software Methodologies, Tools and
Techniques – Proceedings of the fifth SoMeT_06
Vol. 146. M. Polit et al. (Eds.), Artificial Intelligence Research and Development
Vol. 145. A.J. Knobbe, Multi-Relational Data Mining
Vol. 144. P.E. Dunne and T.J.M. Bench-Capon (Eds.), Computational Models of Argument –
Proceedings of COMMA 2006
Vol. 143. P. Ghodous et al. (Eds.), Leading the Web in Concurrent Engineering – Next
Generation Concurrent Engineering
Vol. 142. L. Penserini et al. (Eds.), STAIRS 2006 – Proceedings of the Third Starting AI
Researchers’ Symposium
ISSN 0922-6389

Information Modelling and
Knowledge Bases XVIII
Edited by
Marie Duží
VSB-Technical University Ostrava, Czech Republic
Hannu Jaakkola
Tampere University of Technology, Finland
Yasushi Kiyoki
Keio University, Japan
and
Hannu Kangassalo
University of Tampere, Finland
Amsterdam • Berlin • Oxford • Tokyo • Washington, DC

© 2007 The authors and IOS Press.
All rights reserved. No part of this book may be reproduced, stored in a retrieval system,
or transmitted, in any form or by any means, without prior written permission from the publisher.
ISBN 978-1-58603-710-9
Library of Congress Control Number: 2006939923
Publisher
IOS Press
Nieuwe Hemweg 6B
1013 BG Amsterdam
Netherlands
fax: +31 20 687 0019
e-mail: [email protected]
Distributor in the UK and Ireland Distributor in the USA and Canada
Gazelle Books Services Ltd. IOS Press, Inc.
White Cross Mills 4502 Rachael Manor Drive
Hightown Fairfax, VA 22032
Lancaster LA1 4XS USA
United Kingdom fax: +1 703 323 3668
fax: +44 1524 63232 e-mail: [email protected]
e-mail: [email protected]
LEGAL NOTICE
The publisher is not responsible for the use which might be made of the following information.
PRINTED IN THE NETHERLANDS

Information Modelling and Knowledge Bases XVIII v
M. Duží et al. (Eds.)
IOS Press, 2007
© 2007 The authors and IOS Press. All rights reserved.
Preface
In the last decades information modelling and knowledge bases have become hot topics
not only in academic communities related to information systems and computer science
but also in business areas where information technology is applied.
The 16th European-Japanese Conference on Information Modelling and Knowledge
Bases EJC 2006 continues the series of events that originally started as a co-operation
between Japan and Finland as far back as the late 1980’s. Later (1991) the geographical
scope of these conferences expanded to cover all of Europe as well as countries outside
Europe other than Japan.
The EJC conferences constitute a world-wide research forum for the exchange of
scientific results and experiences achieved in computer science and other related disci-
plines using innovative methods and progressive approaches. In this way a platform has
been established drawing together researches as well as practitioners dealing with in-
formation modelling and knowledge bases. Thus the main topics of the EJC conferences
target the variety of themes in the domain of information modelling, conceptual analysis,
design and specification of information systems, ontologies, software engineering,
knowledge and process management, data and knowledge bases. We also aim at ap-
plying new progressive theories. To this end much attention is being paid also to theo-
retical disciplines including cognitive science, artificial intelligence, logic, linguistics
and analytical philosophy.
In order to achieve the EJC targets, an international programme committee selected
13 full papers, 5 short papers, 2 position papers and 8 poster papers in the course of a
rigorous reviewing process including 33 submissions. The selected papers cover many
areas of information modelling, namely theory of concepts, database semantics,
knowledge representation, software engineering, WWW information management,
context-based information retrieval, ontological technology, image databases, temporal
and spatial databases, document data management, process management, and many
others.
The conference would not have been a success without the effort of many people
and organizations.
In the Programme Committee, 27 reputable researchers devoted a good deal of ef-
fort to the review process in order to select the best papers and create the EJC 2006
programme. We are very grateful to them. Professors Yasushi Kiyoki and Hannu Kan-
gassalo were acting as co-chairs of the programme committee. The VSB-Technical
University Ostrava, Czech Republic, promoted the conference in its capacity as organ-
iser, and professor Marie Duží acted as conference leader. Her team took care of various
practical aspects necessary for the smooth running of the conference. Professor Hannu
Jaakkola and his team took care both of general organizational things necessary for

vi
running the annual conference series and of arranging the conference proceedings in the
form of a book to be printed by IOS Press Amsterdam. We gratefully appreciate the
efforts of everyone who lent a helping hand.
We are convinced that the conference will prove to be productive and fruitful toward
advancing the research and application of information modelling and knowledge bases.
The Editors
Marie Duží
Hannu Jaakkola
Yasushi Kiyoki
Hannu Kangassalo

vii
Programme Committee
Co-chairs:
Yasushi Kiyoki, Keio University, Japan
Hannu Kangassalo, University of Tampere, Finland
Members:
Mina Akaishi, University of Tokyo, Japan
Pierre-Jean Charrel, Université Toulouse 2, France
Xing Chen, Kanagawa Institute of Technology, Japan
Marie Duží, VSB-Technical University Ostrava, Czech Republic
Yutaka Funyu, Iwate Prefectural University, Japan
Hele-Mai Haav, Institute of Cybernetics, Estonia
Anneli Heimbürger, Tampere University of Technology, Finland
Jaak Henno,Tallinn Technical University, Estonia
Yoshihide Hosokawa, Nagoya Institute of Technology, Japan
Hannu Jaakkola, Tampere University of Technology, Pori, Finland
Eiji Kawaguchi, EJC Steering Committee, Japan
Tommi Mikkonen, Tampere University of Technology, Finland
Tapio Niemi, University of Tampere, Finland
Jørgen Fischer Nilsson, Denmark Technical University, Denmark
Koichi Nozaki, Nagasaki University, Japan
Hideyasu Sasaki, Ritsumeikan University, Japan
Bernhard Thalheim, Kiel University, Germany
Takehiro Tokuda, Tokyo Institute of Technology, Japan
Benkt Wangler, Skövde University, Sweden
Jeffery Xu Yu, Chinese University of Hong Kong, Honk Kong
Organizing Committee
Marie Duží, VSB-Technical University Ostrava, Czech Republic (Co-Chair)
Hannu Jaakkola, Tampere University of Technology, Pori, Finland (Co-Chair)
Eiji Kawaguchi, (Steering Committee member)
Daniela Ďuráková (Local Arrangement Chair), VSB-Technical University Ostrava,
Czech Republic
Petr Gajdoš (Local Arrangement), VSB-Technical University Ostrava, Czech Republic
Ulla Nevanranta (Publication), Tampere University of Technology, Pori, Finland
Steering Committee
Hannu Kangassalo, Programme Committee Co-chair, University of Tampere, Finland
Hannu Jaakkola, Organizing Committee Co-chair, Tampere University of Technology,
Pori, Finland
Jaak Henno,Tallinn Technical University, Estonia
Eiji Kawaguchi, Japan
Setsuo Ohsuga (Honorary member), Japan
Marie Duží, VSB-Technical University Ostrava, Czech Republic
Yasushi Kiyoki, Keio University, Japan

viii
Additional Reviewers
Lena Aggestam, University of Skövde, Sweden
Gunar Fiedler, Kiel University, Germany
Takayuki Fukatani, Tokyo Institute of Technology, Japan
Gabriel Pui Cheong Fung, Chinese University of Hong Kong, Hong Kong
Tomoya Noro, Tokyo Institute of Technology, Japan
Jun Sasaki, Iwate Prefectural University, Japan
Vaclav Snasel, VSB-Technical University Ostrava, Czech Republic
Tetsuya Suzuki, Tokyo Institute of Technology, Japan
Shao Xiao, Tokyo Institute of Technology, Japan
Tae Yoneda, Iwate Prefectural University, Japan

ix
Contents
Preface v
Marie Duží, Hannu Jaakkola, Yasushi Kiyoki and Hannu Kangassalo
Committees vii
Additional Reviewers viii
On Agility of Formal Specification 1
Tommi Mikkonen and Risto Pitkänen
Ontological Queries Supporting Decision Process in KaSeA System 17
Krzysztof Goczyła, Aleksander Waloszek, Wojciech Waloszek,
Teresa Zawadzka and Michał Zawadzki
The Conceptual Framework to User-Oriented Content Management 30
Bernhard Thalheim
A Model of Digital Contents Access Control System Using Steganographic
Information Hiding Scheme 50
Eiji Kawaguchi, Michiro Maeta, Hideki Noda and Koichi Nozaki
An Application of Semantic Information Retrieval System for International
Relations 62
Shiori Sasaki, Yasushi Kiyoki and Hiroyasu Akutsu
Emergence of Names and Compositionality 80
Jaak Henno
Treating Quantifiers in Database Semantics 100
Jae-Woong Choe and Roland Hausser
Semantic Associative Search and Space Integration Methods Applied to
Semantic Metrics for Multiple Medical Fields 120
Yasushi Kiyoki and Minoru Kawamoto
Time Contexts in Document-Driven Projects on the Web: From Time-Sensitive
Links Towards an Ontology of Time 136
Anneli Heimbürger, Jari Multisilta and Kai Ojansuu
EL Description Logics with Aggregation of User Preference Concepts 154
Peter Vojtáš
Towards an Abstraction Ontology 166
Mauri Leppänen
A Causality Computation Retrieval Method with Context Dependent Dynamics
and Causal-Route Search Functions 186
Kosuke Takano and Yasushi Kiyoki
x
A Method of Automatic Metadata Extraction Corresponding to the Impression
by Sound of the Words 206
Hidenori Homma, Takafumi Nakanishi and Takashi Kitagawa
Business Process Modeling 223
Ivo Vondrák
Logic and Artificial Intelligence for Multi-Agent Systems 236
Marie Duží, Daniela Ďuráková, Pavel Děrgel, Petr Gajdoš and
Jaroslav Müller
A Visual and Semantic Image Retrieval Method Based on Similarity Computing
with Query-Context Recognition 245
Xing Chen and Yasushi Kiyoki
Information Systems Development in the Age of Multimedia Web Systems 253
Benkt Wangler and Alexander Backlund
NATO C3 Architectures and Difficulties of Application in National Environment 261
Ladislav Burita and Vojtech Ondryhal
Mining International Academic Conference Programs on the Web 269
Tomoya Noro, Hidenori Negishi and Takehiro Tokuda
Towards Automatic Detection of Potentially Important International
Events/Phenomena from News Articles at Mostly Domestic News Sites 277
Pham Van Hai, Takahiro Aoyagi, Tomoya Noro and Takehiro Tokuda
ROC Curves for the CART Algorithm in STATISTICA Data Miner 285
Bohumil Jakoubek
Development of Designed Q-R Code 290
Jun Sasaki, Hiroaki Shimomukai, Tae Yoneda and Yutaka Funyu
Process and Logic Approaches in the Intelligent Agents Behavior 295
Michal Radecký and Petr Gajdoš
Human Expert Modelling Using Numerical Linear Algebra: A Heavy Industry
Case Study 301
Pavel Praks, Jindřich Černohorský and Radim Briš
Computer Aided Support for Content Management Development 306
Antti Lehtinen and Airi Salminen
Ontology Based Text Annotation – OnTeA 311
Michal Laclavik, Martin Seleng, Emil Gatial, Zoltan Balogh and
Ladislav Hluchy
An Implementation Method for Semantic Document Search with Dynamic
Relevance Routing by Hierarchical and Causal Relationships for Psychiatry 316
Yukiko Sone, Naofumi Yoshida and Yasushi Kiyoki
Author Index 321

On Agility of Formal Specification
Tommi MIKKONEN and Risto PITKANENInstitute of Software Systems, Tampere University of Technology
P.O. Box 553, FIN-33101 Tampere, Finland
[email protected], risto.pitkanen @tut.fi
Abstract
Agile software development approaches have gained interest by leveraging goalssuch as small initial investment, incremental development, and rapid feedback. Incontrast, application of formal specification methods has typically implied extensiveinitial investment, relatively fixed requirements on top of which a formalization canbe established, and relatively slow feedback due to the effort needed for formal mod-eling. In this paper, we challenge this view of formal methods, and describe how theagile software development approach can be applied with formal methods. We backthe discussion on formal method DisCo, which has been intended as a formalizationtool for a programmer rather than for a mathematician. Towards the end of the paper,we also give a small example where agility is demonstrated.Keywords: Agile software development, formal methods
1 Introduction
Agile approaches to software engineering have been gaining more and more foothold inindustrial software engineering by focusing on what is known to work. For instance, it iscommonsense that iterations are good, so in agile development one uses iteration in termsof minutes and hours instead of months and years [4]. At the same time, all work that isnot directly driving specification, design, or implementation should be minimized, whichunleashes the talent of the developers to productive work.
In contrast to agility, formal specification methods have been aiming at a model of asystem composed in terms of a formalism before actually building the system. Obviously,this means that engineering effort is invested in the system prior to its actual construction.The claim is that once the model is built, the most difficult problems will be solved inadvance, thus enabling faster development once moving to actual software development.In practice, however, constant changes in requirements, which are common, obviouslyharden the design of a long-living formal model. This in turn further slows down thedevelopment. Furthermore, the design of the formal model is often considered slow,cumbersome, and tiring.
In this paper, we consider carrying out a formal analysis, verification, validation, andcode generation in the spirit of agile software engineering. In other words, we discusshow to perform rigorous software development while adhering to principles of agility.We also discuss how well such an approach suits already established formalisms such as
M. Duží et al. (Eds.)Information Modelling and Knowledge Bases XVIII
IOS Press, 2007© 2007 The authors and IOS Press. All rights reserved.
1
DisCo [24, 14], which uses TLA (Temporal Logic of Actions, [16]) as the underlyinglogic.
The rest of this paper is structured as follows. Section 2 discusses agility and for-mal methods in general. The purpose is to identify common incompatibilities of theapproaches. Section 3 introduces the DisCo approach, and compares its design driverswith agile software engineering approaches. Section 4 demonstrates the approach with asimple yet real-life example. Then, Section 5 discusses related work, and Section 6 finallyconcludes the paper.
2 Agility and Formal Methods
In this section, we introduce the principles of agile development, and reflect them againstformal methods. Towards the end of the section, we discuss the common properties offormalisms that need reconsideration when aiming at agility.
2.1 Fundamentals of Agile Development
In [4], Beck introduces a list of principles of agile development. The following list in-cludes the statements that imply requirements to tools and methods that are used1.
Small initial investment — Tight budget forces one to focus on the essentials.
Incremental change — Big changes made all at once just don’t work. Any problemis solved with a series of the smallest changes that make the difference.
Concrete experiments — Every time you make a decision and you don’t test it, thereis some probability that the decision is wrong.
Rapid feedback — Psychology teaches that the time between an action and its feed-back is critical to learning. Therefore, it is important to get feedback, interpret it,and put the results back to the system.
Automate testing — If testing takes place automatically, humans can preserve theirtime for more valuable work.
Embracing change — The best strategy is that one preserves the most options whileactually solving the most pressing problem.
Travel light — The artifacts one should maintain should be few, simple, and valu-able. Furthermore, one should benefit from them in full.
In the following, we discuss these simple principles and reflect them to the propertiesof commonly used formal methods.
1In addition to tools and methods, Beck also implies a certain mindset in some of the items that he lists.We have removed such items to focus on technical aspects.
T. Mikkonen and R. Pitkänen / On Agility of Formal Specification2
2.2 Formal Methods and Agility
Perhaps the most well-established expectation of a formal approach is that it requires alot of initial investment to use one, which contrasts the principles of agility. In order toachieve anything that can be formally treated, a model of the system (or a part of it) mustbe composed in terms of a formalism. Often, only after a complete formalisation, onecan verify some properties of the model provided that adequate tools and techniques forformal verification are available in the first place.
Many formalisms include a notion of incremental refinement. However, these refine-ments are based on a common assumption that an abstract description of all the functionsis available initially, and it is the purpose of the specification to refine abstract functionsinto an implementable form. Agile approaches have a different view of incrementality:one should address the different functions of the system, which different increments im-plement.
In formal methods, concrete experiments may be difficult to compose before a formalmodel of the system is available. Given only a partial specification, it is possible thatsome parts of the system are overlooked, which can invalidate the mathematical model.As increments address implementation details of fully specified functions, concrete ex-periments require the specification of full functionality, i.e., they can only be conductedafter the initial investment. Therefore, reasoning takes place at a relatively low level ofabstraction, which requires the developer to define the details first before advancing toconcrete proofs.
In order to get quality feedback regarding a formal model, type checkers and othersimilar tools can be used. Furthermore, the use of a theorem prover or model checker ispossible, which do produce precise feedback, but again only after the initial investment.Unlike partially-implemented code, a partially-done proof is worthless. There can be noguarantee that the property one is trying to prove actually is provable. Getting feedbackfrom customers or end users is often hard because of the inherent difficulties with readingand understanding mathematical notations.
Change and optionality is something that is not too clearly addressed in commonlyused formalisms. The reason is that modularity in formalisms does not directly reflectthe principles of modularity needed for change and optionality in programming but plainlogic. Therefore, improved facilities are necessary for agile formal modeling in this re-spect. In practice, this is not so much about what formal methods offer but on scoping ofspecifications and the methodology that guides the use of a formalism.
Finally, the artifacts of the specification should be light and simple. However, formalmodels are often overly complex, and it may be hard to determine what the value ofdifferent elements is. Partly this is due to the flexibility of mathematical denotations, andpartly due to indirect mapping of mathematical constructs to software units that wouldeasily lend themselves for practical software engineering.
2.3 Improving Agility in Formal Methods
Based on the above, we consider that one of the most important improvements for formalmethods is the introduction of functional rather than traditional refinement based incre-ments. By functional we mean the separation of high-level concerns similarly to e.g.program slices [23] or projections [15], both of which have been considered as power-
T. Mikkonen and R. Pitkänen / On Agility of Formal Specification 3
ful mechanisms of abstraction. This gives specifications an aspect-oriented flavor [7, 8]in the sense that systems are designed one behavioral concern at a time. Furthermore,mixin layers of Smaragdakis and Batory bear similar characteristics [22]. In essence, weshould formally model the problem in an abstract fashion, not its programming-level im-plementation. This creates a meaning for each increment, as requested in [3]. In fact,specifications could then be composed such that the meaning is defined in terms of aninvariant in a declarative fashion, and an operational specification is given to define theactual behavior. Still, the formal meaning of refinement as a transformation that preservesall properties of interest shoud be retained.
Using such increments requires that we also consider the abstractions of the behavior,changing the focus from programming level to the effect that different atomic operationshave in the context of the problem. Each increment then introduces its atomic operationsin terms of which the system runs. This liberates the developer from only defining behav-iors with more program-level details in them in terms of features, thus creating a basis formeaningful increments in the sense of programming [11].
When increments are available, it is possible to shift the focus to supporting the useof functional increments with tools that enable animation and code generation even forpartially described systems in order to test systems as soon as possible. This then givesimmediate feedback to developers, and also allows studying of a particular detail of asystem in isolation when necessary, resulting in intermediate feedback.
To make formal specification techniques more available to all developers, specifica-tions should be built using relatively simple elements that can be reflected to the con-struction of software systems rather than plain mathematics. This makes the gap betweenformal modeling and coding diminish. Together with the appropriate tools, a programmer-friendly formal specification language makes the formal specification workflow essen-tially similar to programming, which leads to many of the principles of agility becomingadaptable.
Finally, the link between a specification and its implementation should be at leastsemi-automatic, and establishable after every increment of the specification level. Thisreduces the need for re-formulating the previously formulated, i.e., writing programminglanguage code whose effects have already been specified using a formal specificationlanguage.
3 Agile Elements In DisCo
In this section, we discuss how agile elements have been considered in the design ofthe DisCo method [24, 14]. Some of the properties are a result of a concious choice inlanguage design, some others reflect the capability of tool designers, and, in fact, some ofthe properties have been obtained accidentally.
3.1 Overview of DisCo
DisCo is a state-based formal method that has its formal basis defined in terms of thetemporal logic of actions, TLA [16]. All DisCo specifications are composed in termsof classes and joint actions. Classes are instantiated as objects, whose instance variables
T. Mikkonen and R. Pitkänen / On Agility of Formal Specification4
constitute state variables. Variables can be of basic types (integer, boolean, state machine),references to objects, or sets or sequences of any of the above.
The level of abstraction is raised above traditional object-oriented design by usingso-called joint actions (or simply actions) instead of methods for specifying behavior.Actions are patterns of change for some set of participating objects. Actions are atomic,and they are executed nondeterministically in an interleaving fashion, which allows anyexecution of a system to be interpreted as a sequence of changes in state variables. Interms of conventional object-oriented specification, actions are much closer to use casesthan methods, but they are specified precisely enough to allow formal analysis and exe-cution.
In addition to classes and actions, it is possible to give invariants that formalize therelation between some state variables. Proof techniques of TLA can be used for showingthat the invariant holds. On the one hand, this provides an option to compose proofs forsome crucial properties of the system. On the other hand, and even more importantly, weconsider that it is the invariants that must be used as the basis for selecting the scope fora certain system. In other words, one should first find an invariant that characterizes theproperties of the system, and only then continue to compose the rest of the system. Thismakes invariants as the part of the system that define what has been bound, and the partsthat are not fixed by the given invariants can be used for flexibility.
Obviously, as any system of reasonable size contains several slices (or projections)that define a meaningful invariant, one should use a methodology that allows developersto advance in increments. We will next discuss this.
3.2 Methodology
From a practical perspective, the most obvious result of invariant-based development isthat in DisCo there is a well-defined purpose for different increments. Provided withthe meaning, developers can experiment with different solutions, and, moreover, studyan individual design choice in isolation yet in its necessary context, which includes therequired assumptions about environment.
The way we have defined increments is that safety properties are always preservedby construction. However, additional considerations are needed for liveness. For practi-cal purposes, this means that whenever increments are added, the underlying incrementscannot be broken in the sense that behaviors that were disallowed earlier would now be al-lowed. However, it is necessary to check that old desired executions remain valid, becausenew extensions may have introduced additional restrictions on actions.
As a side-effect of the above preservation of properties, one can define parts thatcan be defined later. This is in line with the open-closed principle of object-orienteddevelopment in the sense that already given increments are closed for modifications butopen for extension [17]. In other words, the parts that have not been explicitly fixedrepresent flexibility in different increments. For instance, it is common that in abstractDisCo specifications messages are simply presented by an empty class. Later incrementsthen introduce structure of the message, and even further increments are used for actualcontents, thus making the message class “grow” in increments. From the perspective ofagile development, this realizes embracing change in the most formal sense; the specifierknows explicitly if a new feature can be implemented on top of an existing collection ofincrements, or require interventions in the internals of the increments.
T. Mikkonen and R. Pitkänen / On Agility of Formal Specification 5
3.3 Tool Support
When composing DisCo specifications, a compiler is used for checking specification syn-tax [2]. The compiler essentially opens the specification hierarchy into a flat form, whichis represented using an intermediate language.
The intermediate language can be used for different purposes. The most obvious useis the validation of specification by transforming it again to a form that can be animated.The user can select an action for execution by clicking it with mouse and by selectingsuitable participants. It is also possible to run the specification without user intervention,in which case the action to be executed next is chosen arbitrarily. In addition, it is possibleto record a sequence of an execution, and rerun that later on. This, however, is sensitive torefinements, because addition of new variables or action participants can cause problems.
The value of animation should not be underestimated. It brings the specification tolife even for non-technical and non-formalists. In specification sessions, where domainexperts have been observing the animation of a DisCo specification, questions like “Whatwill happen if the other action is executed?” have frequently been asked, even if it thedomain expert herself rather than the user of the DisCo tool that should know the answer[18]. We take this as a piece of evidence on the role of animation as a source of immediatefeedback even for the customer of the project.
In one sense, the core of a formal model is the proofs it enables. The way we have ad-vocated this is DisCo is to focus on projections that lend themselves for relatively simpleproofs. Then, by aggregating the proofs of individual increments, more complex invari-ants can be achieved. In other words, a purpose for individual increments is supposed interms of invariants as already discussed [13]. In the scope of DisCo, both model checking[1] and computer-aided proofs [12] have been studied.
In addition to animation and proofs, code generation has been studied. As all-purposecompilation experiments have turned to be overly general for practical purposes, we haveadopted an approach where generation is performed for a certain domain. Currently,the most mature approach is TransCo, which is a web environment specific intermediatelanguage for augmenting DisCo specifications with information that enables their trans-formation into J2EE applications [20].
3.4 Summary
Application of the principles of agile development need not be restricted to the program-ming level. In fact, most principles are meaningful also in a specification-level context.For example, concrete experiments can be carried out with executable formal specifica-tions as well as with code. Rapid feedback does not have to mean feedback obtainedusing a working implementation, but any kind of rapid feedback, obtained for example byanimating or verifying a model that has been refined with a small increment.
Figure 1 summarizes how DisCo reflects the principles of agility that were listed under2.1.
One principle usually associated with agile software production is writing unit testsbefore writing the code (e.g. Beck [4]). Because development phases that precede pro-gramming are very light or nonexistent, unit tests can actually be seen as substitutes fora rigorous specification. The problem with such an approach is that the “specification”depends heavily on implementation-level constructs, and often has to be formulated in te-
T. Mikkonen and R. Pitkänen / On Agility of Formal Specification6
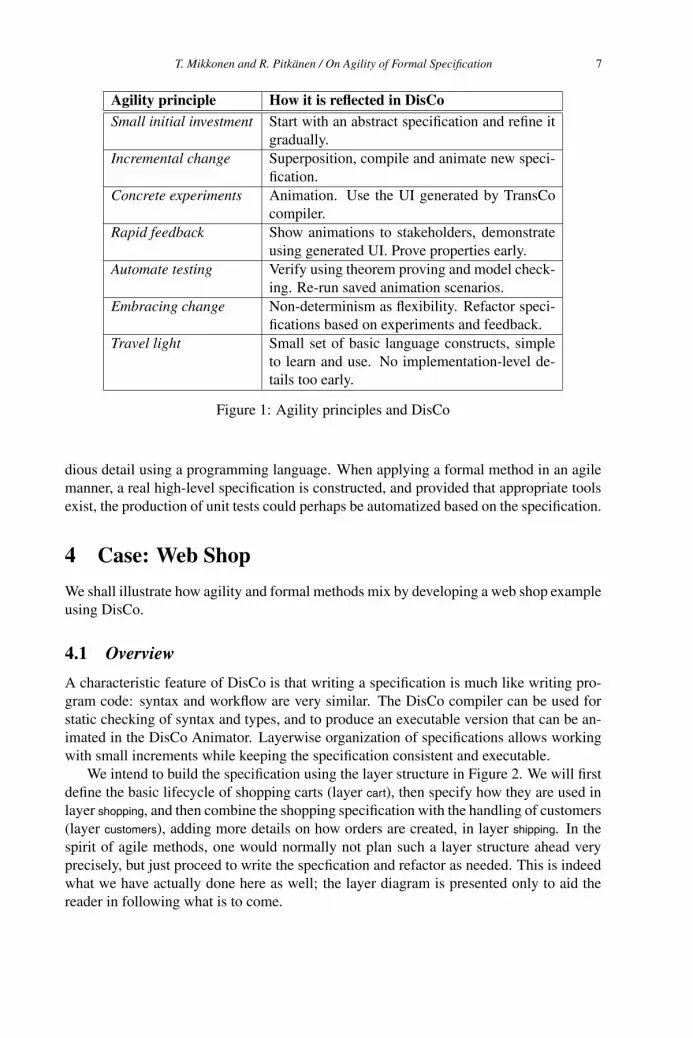
Agility principle How it is reflected in DisCoSmall initial investment Start with an abstract specification and refine it
gradually.Incremental change Superposition, compile and animate new speci-
fication.Concrete experiments Animation. Use the UI generated by TransCo
compiler.Rapid feedback Show animations to stakeholders, demonstrate
using generated UI. Prove properties early.Automate testing Verify using theorem proving and model check-
ing. Re-run saved animation scenarios.Embracing change Non-determinism as flexibility. Refactor speci-
fications based on experiments and feedback.Travel light Small set of basic language constructs, simple
to learn and use. No implementation-level de-tails too early.
Figure 1: Agility principles and DisCo
dious detail using a programming language. When applying a formal method in an agilemanner, a real high-level specification is constructed, and provided that appropriate toolsexist, the production of unit tests could perhaps be automatized based on the specification.
4 Case: Web Shop
We shall illustrate how agility and formal methods mix by developing a web shop exampleusing DisCo.
4.1 Overview
A characteristic feature of DisCo is that writing a specification is much like writing pro-gram code: syntax and workflow are very similar. The DisCo compiler can be used forstatic checking of syntax and types, and to produce an executable version that can be an-imated in the DisCo Animator. Layerwise organization of specifications allows workingwith small increments while keeping the specification consistent and executable.
We intend to build the specification using the layer structure in Figure 2. We will firstdefine the basic lifecycle of shopping carts (layer cart), then specify how they are used inlayer shopping, and then combine the shopping specification with the handling of customers(layer customers), adding more details on how orders are created, in layer shipping. In thespirit of agile methods, one would normally not plan such a layer structure ahead veryprecisely, but just proceed to write the specfication and refactor as needed. This is indeedwhat we have actually done here as well; the layer diagram is presented only to aid thereader in following what is to come.
T. Mikkonen and R. Pitkänen / On Agility of Formal Specification 7

refines
cart customers
shopping
shipping
Figure 2: Web shop layers.
4.2 Shopping Carts
The web shop is a shopping cart based application. Carts are created, used, and finallyremoved. A timeout is specified: a cart is to be removed if it isn’t used for a while. Thefollowing DisCo layer formalizes this behavior:
layer cart is
We need a constant representing the time period after which an unused shopping cartwill be removed:
constant TIMEOUT: time;
Class Cart represents the shopping cart itself. At this level of abstraction, it only con-tains two time variables that are used for formulating real-time requirements:
dynamic class Cart isremove dl: time;last used at : time;
end;
Assertions often used to explicitly formulate intended invariants, but as DisCo speci-fications are operational, ultimately they are to be honored by the actions. In this case weexpress using assertion timeout honored that a cart may never exist that has not been usedduring the period specified by the constant TIMEOUT:
assert timeout honored isc : Cart :: Omega = c.last used at + TIMEOUT;
The timeout behavior is implemented inside actions using the operational real-timeconstructs of DisCo. There is a real-valued global clock2 and an implicit parameter now
that is passed to each action. The value of now is nondeterministically set to some value, where is a global multiset of deadlines that can be manipulated
by deadline set and reset statements. The value of is implicitly assigned as the newvalue of in the action, but now direct manipulation of or is allowed. This resultsin a real time execution semantics where time grows monotonically in actions, but cannever proceed beyond the minimum deadline in set .
Actions create cart, use cart and remove cart set and reset the deadline and the last used at
variable appropriately:action create cart(new c: Cart) iswhen do
c.remove dl @ TIMEOUTc. last used at now;
end;
2Referring to explicitly in actions is prohibited (but it can be used in assertions).
T. Mikkonen and R. Pitkänen / On Agility of Formal Specification8
action use cart(c : Cart) iswhen do
c.remove dl @ c.remove dl @ TIMEOUTc. last used at now;
end;
action remove cart(c: Cart) iswhen do
c.remove dl @ delete c;end;
end;
In addition to a list of participants and parameters, an action comprises a guard expres-sion (beginning with when), and a body that is essentially a parallel multiple assignment.An action is enabled whenever a combination of participants and parameters can be foundsuch that the guard evaluates to true. Any enabled action can be executed.
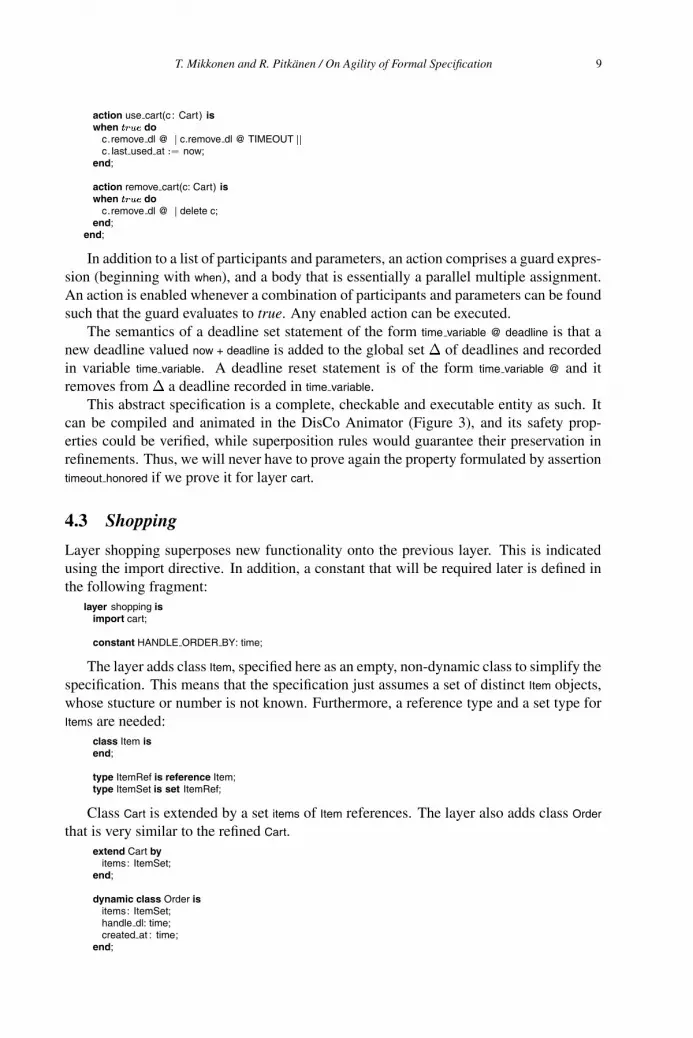
The semantics of a deadline set statement of the form time variable @ deadline is that anew deadline valued now + deadline is added to the global set of deadlines and recordedin variable time variable. A deadline reset statement is of the form time variable @ and itremoves from a deadline recorded in time variable.
This abstract specification is a complete, checkable and executable entity as such. Itcan be compiled and animated in the DisCo Animator (Figure 3), and its safety prop-erties could be verified, while superposition rules would guarantee their preservation inrefinements. Thus, we will never have to prove again the property formulated by assertiontimeout honored if we prove it for layer cart.
4.3 Shopping
Layer shopping superposes new functionality onto the previous layer. This is indicatedusing the import directive. In addition, a constant that will be required later is defined inthe following fragment:
layer shopping isimport cart;
constant HANDLE ORDER BY: time;
The layer adds class Item, specified here as an empty, non-dynamic class to simplify thespecification. This means that the specification just assumes a set of distinct Item objects,whose stucture or number is not known. Furthermore, a reference type and a set type forItems are needed:
class Item isend;
type ItemRef is reference Item;type ItemSet is set ItemRef;
Class Cart is extended by a set items of Item references. The layer also adds class Order
that is very similar to the refined Cart.extend Cart by
items: ItemSet;end;
dynamic class Order isitems: ItemSet;handle dl: time;created at : time;
end;
T. Mikkonen and R. Pitkänen / On Agility of Formal Specification 9
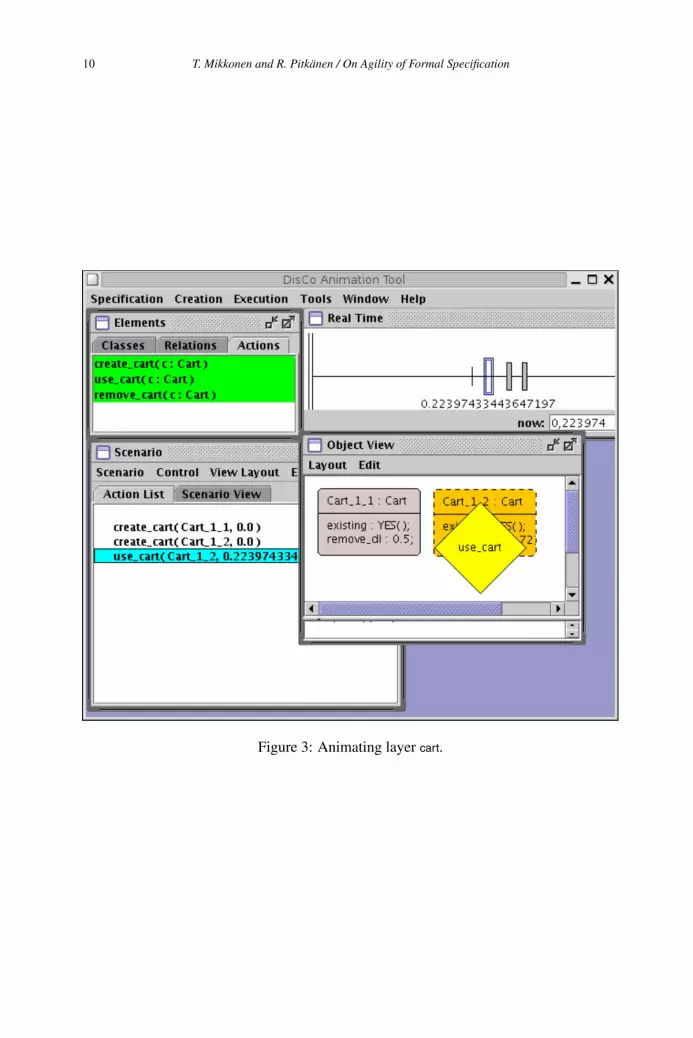
Figure 3: Animating layer cart.
T. Mikkonen and R. Pitkänen / On Agility of Formal Specification10
Assertion orders handled in time formulates a property for orders that is analogous toassertion timeout honored for shopping carts:
assert orders handled in time is o: Order ::Omega = o.created at + HANDLE ORDER BY;
Actions add to cart and and remove from cart are refinements of use cart:refined add to cart(item: Item; cart : Cart) of
use cart(cart ) iswhen ... item not in cart . items do
...cart . items cart . items + item ;
end;
refined remove from cart(item: Item; cart : Cart) ofuse cart(cart ) is
when ... item in cart . items do...cart . items cart . items item ;
end;
In DisCo the ellipsis refers to the corresponding part of the refined action, i.e. bothrefined versions also have the effects of the base action.
Action order is a refinement of remove cart that copies the contents of the cart to a newOrder object and sets a deadline for handling the order. Action cart timeout refines remove cart
in such a way that an actual timeout will take place exactly when the timeout period haspassed:
refined order(new o: Order; c: Cart) of remove cart(c) iswhen ... do
...o.items c.itemsc.itemso.handle dl @ HANDLE ORDER BYo.created at now;
end;
refined cart timeout(c : Cart) of remove cart(c) iswhen ... now = c.remove dl do
...end;
At this level of abstraction, handle order just removes the deadline set for handling thisorder and deletes the order.
action handle order(o: Order) iswhen do
o.handle dl @ delete o;end;
end;
This concludes the shopping layer.
4.4 Rest of the Specification
We only give a short verbal description of the rest of the specification. Layer customers isindependent of the above layers. It defines creating, removing and altering objects thatrepresent entries in the customer database of our web shop. Layer shipping combines theindependent specification branches, most notably requiring customers to participate inplacing orders. There are two refinements of the ordering action, one of which is also arefinement of the customer creation action, thus effectively specifying a use case where anew customer places an order, at the same time registering in the web shop system. Theother ordering action represents a use case where a returning customer places an order.
T. Mikkonen and R. Pitkänen / On Agility of Formal Specification 11
4.5 TransCo
At the specification level, DisCo can be used much like a programming language is usedat the implementation level. The workflow and tools are quite similar, with the additionof facilities for formal verification. However, to form a complete agile development cy-cle, some systematic means of deriving an implementation of a DisCo specification isrequired. Such a means has been described in [20, 21]: the TransCo language.
TransCo is an extension of DisCo that allows refining a specification to a form thatcan be easily compiled to an actual implementation in a particular domain. As discussedin [19], elements of a particular architectural style have been embedded in the TransColanguage, which allows a straightforward mapping to an implementation utilizing some ofthe current technologies for implementating business logic of enterprise systems. Thereis a prototype compiler that can produce Enterprise JavaBeans code from TransCo.
TransCo is used for partitioning a DisCo specification into components with well-defined interfaces, augmenting classes and actions with information about object lookups,control flow, and other issues not specified at the DisCo level.
An example component created based on our web shop specification is the following:component cart management of shipping is
constant TIMEOUT: integer := 30;
class implementation Item isprimary attribute number: integer;
end;
type ItemSet is set Item;
class implementation Cart isprimary attribute id : integer ;attribute items: ItemSet;
end;
interface default istransaction create cart () : Cart
c : new Cart;of shipping.create cart (c)is
schedule cart timeout(c) at TIMEOUT;return c;
end;
transaction add to cart(item: Item; cart : Cart)of shipping.add to cart(item, cart )is
when item not in cart.items;cart . items := cart . items + item ;reschedule cart timeout(cart) at TIMEOUT;
end;
transaction remove from cart(item: Item; cart : Cart)of shipping.remove from cart(item, cart)is
when item in cart.items;cart . items := cart . items item ;reschedule cart timeout(cart) at TIMEOUT;
end;end default;
transaction cart timeout(c: Cart)of cart timeout(c)is
c.items := ;delete c;
end;end;
T. Mikkonen and R. Pitkänen / On Agility of Formal Specification12
Without getting into the details we observe that the actions are implemented usingtransactions (hence the name TransCo for ‘‘Transactional Components”), and timeoutsare implemented using scheduling statements. There are many other facilities of TransCothat are not illustrated by this example, related e.g. to looking up objects in a database-query-like manner. In short, TransCo reflects the facilities provided by enterprise comput-ing business logic tier technologies such as EJB, Microsoft COM+, and CORBA Compo-nent Model.
While a TransCo refinement of a DisCo model is quite verbose and often roughly asas long as the original specification, it adds somewhat less information than it seems to.The verbosity is mainly due to the rudimentary tools available at this time; the TransCocompiler cannot deduce details based on the original DisCo specification, but everythinghas to be repeated and rephrased. An interactive tool could perhaps remove the need for anexplicit TransCo-like language altogether; the supplementary information could be giveninteractively to a code generator that would produce an implementation directly from aDisCo model.
4.6 Generating an Implementation
The TransCo compiler, described in [20], is able to generate an EJB implementation,database-related scripts, and a simple form-based web interface. Agility is thus preserved,as a rudimentary form of a complete application is generated from the specification of justthe business logic part, allowing developers to experiment with the implementation rightaway.
5 Related Work
Agile practices in conjunction with formal methods do not seem to have been the sub-ject of much research. Eleftherakis and Cowling [6] describe XFun, an agile formal de-velopment methodology that adopts the Unified Process [10]. They mention automaticanimation and discuss change management, but they do not reflect their method againstagility principles explicitly. Unlike DisCo, the approach is based on a traditional systemdecomposition and does not as such support functional increments.
Berner et al. [5] discuss XFM, an extreme formal method for capturing and verifyinga formal model based on requirements stated in a natural language. Their method is essen-tially to incrementally build the formal model, building a model for one property at a time,and model checking for the property and all previously incorporated properties. They usefinite automata for modeling and linear time temporal logic for expressing properties. Themodeling language does not directly support incrementality, but incrementality is more ofa property of the process associated with XFM.
6 Discussion
We conclude that existing formal methods can be used in an agile fashion. We howeverargue that agility is not that much about the properties of formal methods as such but on
T. Mikkonen and R. Pitkänen / On Agility of Formal Specification 13

the methodology that guides their use that should be agile. In the scope of DisCo, thefollowing properties proved themselves essential:
Simple enough mechanism for composing formal specifications.
Modularity that enables structuring of the problem, not its solution.
Tools for animation and analysis of increments that have been composed.
Tools for code generation to enable a rapid overall development cycle.
Early industrial feedback on using the approach is in line with our conclusions [9].Animation is praised as the best part of the approach, but, on the other hand, it wouldget overly complex without the ability to restrict the scope of individual specificationswith layers. Furthermore, the fact that animation provides feedback as soon as the sys-tem is completed is an important factor. At the time of conducting the industrial study,no support for automatic code generation was available, and in any case the domain ofthe experiment would have been different. Hence, no results are available on its actualimportance.
To conclude, the identified items that are important for agile formal modeling are notDisCo specific, but can be met with several formal methods, assuming that associated de-velopment facilities are provided. Therefore, the problem is not to introduce agile formalmethods, but to teach ourselves to use those that already exist in an agile fashion, togetherwith associated tools.
References
[1] T. Aaltonen, M. Katara, and R. Pitkanen. Verifying real-time joint action specifica-tions using timed automata. In Y. Feng, D. Notkin, and M.-C. Gaudel, editors, 16thWorld Computer Congress 2000, Proceedings of Conference on Software: Theoryand Practice, pages 516–525, Beijing, China, Aug. 2000. IFIP, Publishing House ofElectronics Industry and International Federation for Information Processing.
[2] T. Aaltonen, M. Katara, and R. Pitkanen. DisCo toolset – the new generation. Jour-nal of Universal Computer Science, 7(1):3–18, 2001. http://www.jucs.org.
[3] S. Ambler. Agile Modeling: Effective Practices for Extreme Programming and theUnified Process. Wiley Computer Publishing, 2002.
[4] K. Beck. Extreme Programming Explained: Embrace Change. Addison-Wesley,1999.
[5] D. Berner, S. Suhaib, and S. Shukla. Xfm: Extreme formal modeling for captur-ing formal specification into abstract model. Technical Report 2003-08, FERMAT,2003.
[6] G. Eleftherakis and A. J. Cowling. An agile formal development methodology. InProceedings of the 1st South-East European Workshop on Formal Methods, pages36–47, Thessaloniki, Greece, Nov. 2003.
T. Mikkonen and R. Pitkänen / On Agility of Formal Specification14
[7] T. Elrad, R. E. Filman, and A. Bader. Aspect-oriented programming. Communica-tions of the ACM, 44(10):29–32, October 2001.
[8] R. E. Filman, T. Elrad, S. Clarke, and M. Aksit. Aspect-Oriented Software Develop-ment. Addison–Wesley, 2004.
[9] S. Isojarvi. DisCo and Nokia: Experiences of DisCo with modeling real-time systemin multiprocessor environment. FMEIndSem’97, Otaniemi, Finland, February 20,1997.
[10] I. Jacobson, G. Booch, and J. Rumbaugh. The Unified Software Development Pro-cess. Addison-Wesley, 1999.
[11] J. Jokinen, H.-M. Jarvinen, and T. Mikkonen. Incremental introduction of behaviorswith static software architecture. Computer Standards and Interfaces, 25(3), 2003.
[12] P. Kellomaki. Verification of reactive systems using DisCo and PVS. In J. Fitzgerald,C. B. Jones, and P. Lucas, editors, FME’97: Industrial Applications and Strength-ened Foundations of Formal Methods, number 1313 in Lecture Notes in ComputerScience, pages 589–604. Springer–Verlag, 1997.
[13] P. Kellomaki. Verification-friendly specification of distributed systems. In Y. Feng,D. Notkin, and M.-C. Gaudel, editors, 16th World Computer Congress 2000, Pro-ceedings of Conference on Software: Theory and Practice, pages 480–483, Beijing,China, Aug. 2000. IFIP, Publishing House of Electronics Industry and InternationalFederation for Information Processing.
[14] R. Kurki-Suonio. A Practical Theory of Reactive Systems — Incremental Modelingof Dynamic Behaviors. Springer, 2005.
[15] S. S. Lam and A. U. Shankar. Protocol verification via projections. IEEE Transac-tions on Software Engineering, 10(4):325–342, July 1984.
[16] L. Lamport. The temporal logic of actions. ACM Transactions on ProgrammingLanguages and Systems, 16(3):872–923, 1994.
[17] B. Meyer. Object-Oriented Software Construction. Prentice-Hall, 1994.
[18] T. Mikkonen. Experiences on developing and using a tool support for formal spec-ification. In J.-P. Rosen and A. Strohmeier, editors, Proceedings of the 8th Interna-tional Conference on Reliable Software Technologies — Ada-Europe 2003, number1906 in Lecture Notes in Computer Science, pages 297–308. Springer–Verlag, 2003.
[19] T. Mikkonen, R. Pitkanen, and M. Pussinen. On the role of architectural style inmodel-driven development. In F. Oquendo, B. Warboys, and R. Morrison, editors,Software Architecture — Proceedings of the First European Workshop on SoftwareArchitecture, number 3047 in Lecture Notes in Computer Science, pages 74–87.Springer-Verlag, 2004.
T. Mikkonen and R. Pitkänen / On Agility of Formal Specification 15

[20] R. Pitkanen. A specification-driven approach for development of enterprise systems.In K. Koskimies, J. Lilius, I. Porres, and K. Østerbye, editors, Proceedings of the11th Nordic Workshop on Programming and Software Development Tools and Tech-niques, pages 74–87. TUCS General Publication 34, Turku Centre for ComputerScience, Aug. 2004.
[21] R. Pitkanen. Tools and Techniques for Specification-Driven Software Development.PhD thesis, Tampere University of Technology, 2006.
[22] Y. Smaragdakis and D. Batory. Mixin layers: An object-oriented implementationtechnique for refinements and collaboration-based designs. ACM Transactions onSoftware Engineering and Methodology, 11(2):215–255, 2002.
[23] M. Weiser. Programmers use slices when debugging. Communications of the ACM,25(7):446–452, July 1982.
[24] DisCo WWW site. At http://disco.cs.tut.fi on the World Wide Web.
T. Mikkonen and R. Pitkänen / On Agility of Formal Specification16
Ontological Queries Supporting Decision
Process in KaSeA� System
Krzysztof GOCZYŁA, Aleksander WALOSZEK, Wojciech WALOSZEK, Teresa ZAWADZKA, Michał ZAWADZKI
Gdańsk University of Technology, Faculty of Electronics, Telecommunications and Informatics,
Department of Software Engineering, ul. G. Narutowicza 11/12, 80-952 Gdańsk, Poland
Abstract. With development of knowledge bases (KB) there appeared expert systems that use KBs to support them in decision making process. Decision Support Systems, that are the subject of the paper, communicate with knowledge bases by populating them with known facts and receiving newly inferred knowledge. However there exist situations when a DSS receives ambiguous response from knowledge base and needs to know what additional information is missing and is required to give a precise response. The paper focuses on a communication between a DSS and a knowledge base especially in the scope of getting the missing information. The special type of inference performed over a Description Logics ontology to solve the problem, the corresponding query and implementation issues are described.
Introduction
While the computer science and related technologies develop and become more popular, computers are entering our everyday live. We use intelligent cookers, dishwashers and washing machines. Even such a thing as a mobile phone has a small computer inside. But there is also another domain where computers help (or try to help) people. There are emerging so-called expert systems which are designed to act as an automated expert in specified domain: basing on some rules embedded they “know” how to control other systems. An example of such a system can be an ABS system in our cars. There also exist a special kind of expert system – Decision Support System. Some of them also use a Knowledge Base for inferring new knowledge from known facts.
The authors of this paper personally experienced that communication of a Decision Support System with a Knowledge Base can be a very complicated and sometimes confusing task, especially in large software systems. This paper tries to summarize their experience gained in the course of development of PIPS project [1], [2]. PIPS (Personal Information Platform for life and Heath Services, www.pips.eu.org) is a 6th European Union Framework Programme integrated project whose main goal is to create a Web infrastructure to support health care and promote healthy life style among European communities. The heart of PIPS are two activities related to development of the
� Work partially sponsored by the 6. Framework Programme of European Union, Contract No. IST-507019-PIPS
M. Duží et al. (Eds.)Information Modelling and Knowledge Bases XVIII
IOS Press, 2007© 2007 The authors and IOS Press. All rights reserved.
17
“intelligent” part of PIPS that consists of the Decision Support Subsystem (DSS) and the Knowledge Management Subsystem (KMS).
In this paper, we concentrate on the Knowledge Management Subsystem of PIPS and communication issues of DSS active components (agents) with KMS. The reason for that is that the authors of this paper were assigned a task of design and development of KMS that should: (1) deliver trustworthy and dependable knowledge base covering broad range of knowledge on health and healthy lifestyle, (2) offer an efficient, scalable, flexible, distributed platform for managing knowledge base and ontologies, (3) be compliant with the Semantic Web [3] emerging standards.
The paper is organized as follows: In the first section we describe the motivation – the problems in gathering knowledge from KMS by DSS agents. The second section presents the solution we developed to overcome the problems introduced in the previous section. The implementation of proposed solution is described in Section 3. That section also provides a brief introduction to Knowledge Cartography algorithm [4] [5] – a new algorithm for reasoning over Description Logics (DL) ontologies [6]. In Section 4 we present the related work. Section 5 concludes the paper.
1. Motivations
Basics assumptions and background that are behind the both subsystems of PIPS (KMS and DSS) have been addressed in [1]. To summarize briefly: DSS consists of a set of agents that are responsible for interaction with users (doctors, patient, or other citizens), and a database that contains, among others, information about patients (clinical records) in the form of so-called virtual egos. To fulfill the users’ demands or queries, or to react on some events concerning patients reported by tele-medicine devices, some DSS agents (called Knowledge Discovery Agents, KDAs) communicate with the PIPS Knowledge Base (KB) managed by the KMS. In the Knowledge Base, the KMS stores relevant knowledge in the form of ontologies [7], general ones or dedicated to PIPS. An essential part of the KMS is the KaSeA System that is able to perform reasoning over the ontologies to infer new knowledge from stored facts and axioms. The knowledge is sent from KaSeA to the KDAs on demand, through a specialized interface and is further used by DSS to take appropriate decisions.
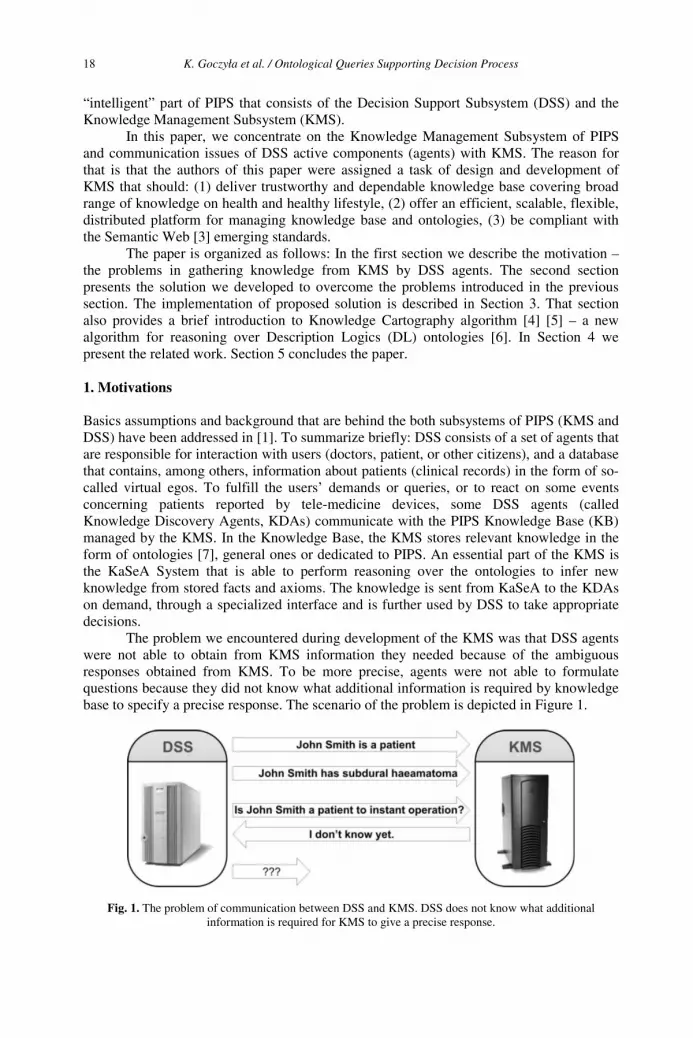
The problem we encountered during development of the KMS was that DSS agents were not able to obtain from KMS information they needed because of the ambiguous responses obtained from KMS. To be more precise, agents were not able to formulate questions because they did not know what additional information is required by knowledge base to specify a precise response. The scenario of the problem is depicted in Figure 1.
Fig. 1. The problem of communication between DSS and KMS. DSS does not know what additional information is required for KMS to give a precise response.
K. Goczyła et al. / Ontological Queries Supporting Decision Process18
On the left hand side there are DSS agents and on the right hand side there is KMS. DSS agents communicate with KMS to obtain information they need. Let us take a medical example from the figure. There exist two possible types of therapy: conservative and surgical. Moreover, in some situations the patient may require instant surgical therapy (i.e. immediate operation) . Suppose that DSS wants to know, whether John Smith is a patient to instant operation. Firstly, it tells KMS that John Smith is a patient. Another information passed to KMS is that the examination of computer tomography indicated subdural haeamatoma. Then DSS asks the question. The KMS tries to answer the given question basing on the information it gathered from DSS and the medical knowledge described in an appropriate ontology. Unfortunately, the information it received from DSS is insufficient to unambiguously state whether John Smith requires instant operation, so such response is returned to DSS. The problem is that DSS may not know what additional information is required for KMS to give the needed, precise response. The essence of the problem is that KMS knows what information it needs, but the DSS does not know this information and how to ask for it. A way of solving this problem is described in the following sections.
2. The solution
These motivations led us to the development of new DIG [8] queries realized as DIGUT [9] queries. Section 2.1 presents the queries developed especially to meet requirements put by DSS Agents, needed in the above described decision making process. When the queries were designed and implemented, the other partner of PIPS project: San Raffaele del Monte Tabor Foundation has developed a top level ontology especially designed to support decision making processes. This framework was slightly modified and extended and is presented in Section 2.2. Section 2.3 presents the brain injuries ontology based on the top level ontology. Section 2.4 presents the concrete application of the new DIGUT queries and the presented framework in the scenario of decision making process in the diagnosis of brain injuries.
2.1 New DIGUT queries in the decision making process
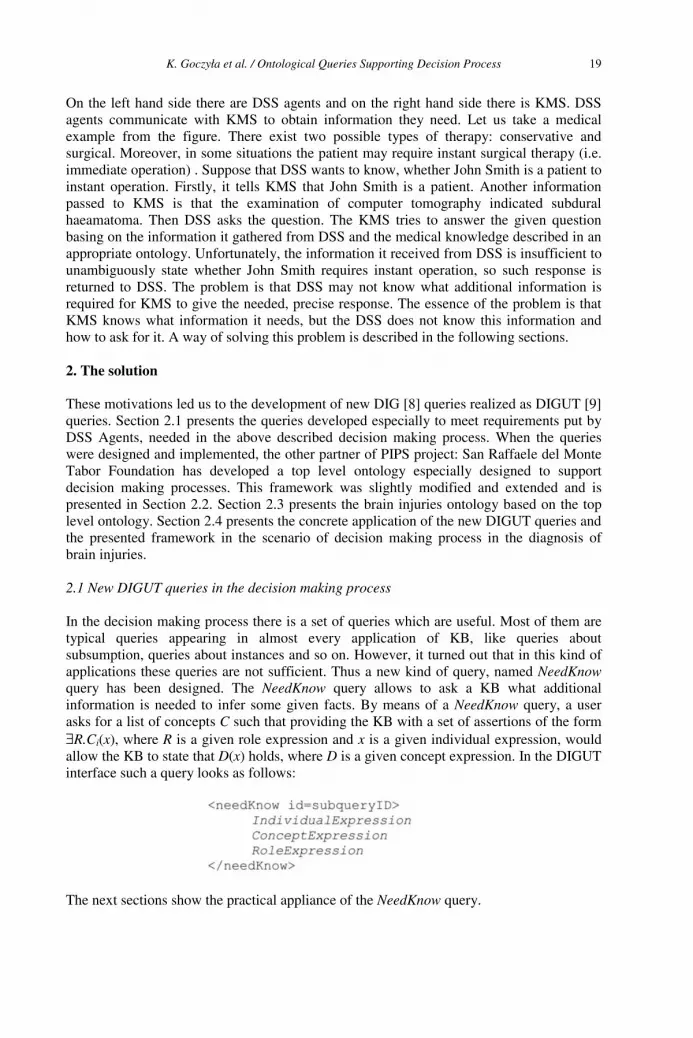
In the decision making process there is a set of queries which are useful. Most of them are typical queries appearing in almost every application of KB, like queries about subsumption, queries about instances and so on. However, it turned out that in this kind of applications these queries are not sufficient. Thus a new kind of query, named NeedKnowquery has been designed. The NeedKnow query allows to ask a KB what additional information is needed to infer some given facts. By means of a NeedKnow query, a user asks for a list of concepts C such that providing the KB with a set of assertions of the form ∃R.Ci(x), where R is a given role expression and x is a given individual expression, would allow the KB to state that D(x) holds, where D is a given concept expression. In the DIGUT interface such a query looks as follows:
The next sections show the practical appliance of the NeedKnow query.
K. Goczyła et al. / Ontological Queries Supporting Decision Process 19
2.2 The top level ontology
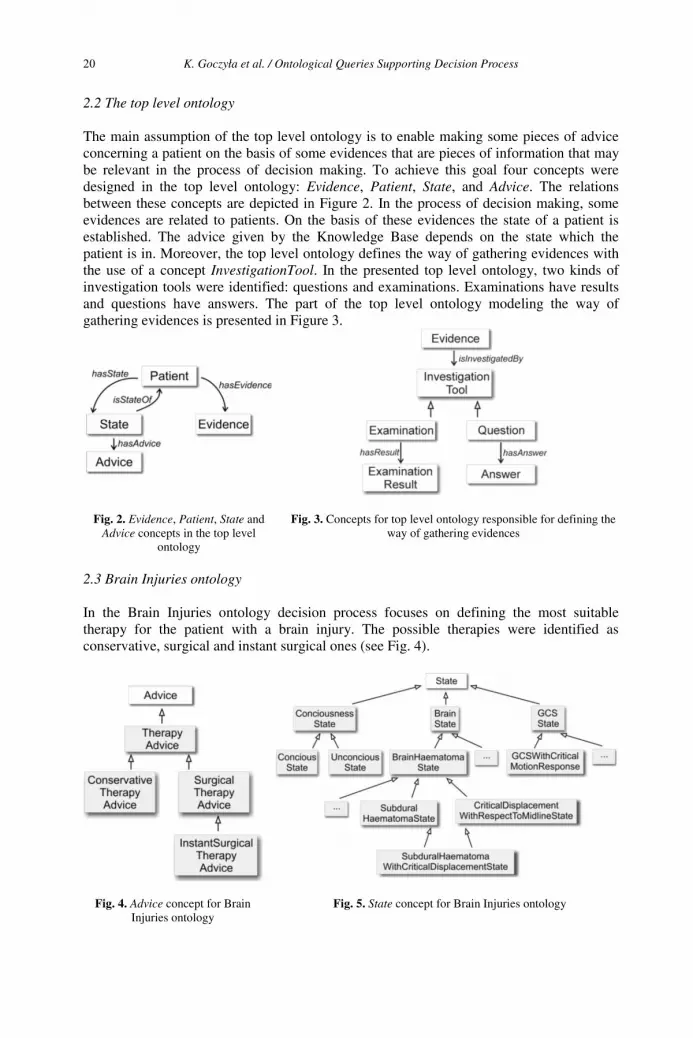
The main assumption of the top level ontology is to enable making some pieces of advice concerning a patient on the basis of some evidences that are pieces of information that may be relevant in the process of decision making. To achieve this goal four concepts were designed in the top level ontology: Evidence, Patient, State, and Advice. The relations between these concepts are depicted in Figure 2. In the process of decision making, some evidences are related to patients. On the basis of these evidences the state of a patient is established. The advice given by the Knowledge Base depends on the state which the patient is in. Moreover, the top level ontology defines the way of gathering evidences with the use of a concept InvestigationTool. In the presented top level ontology, two kinds of investigation tools were identified: questions and examinations. Examinations have results and questions have answers. The part of the top level ontology modeling the way of gathering evidences is presented in Figure 3.
Fig. 2. Evidence, Patient, State and Advice concepts in the top level
ontology
Fig. 3. Concepts for top level ontology responsible for defining the way of gathering evidences
2.3 Brain Injuries ontology
In the Brain Injuries ontology decision process focuses on defining the most suitable therapy for the patient with a brain injury. The possible therapies were identified as conservative, surgical and instant surgical ones (see Fig. 4).
Fig. 4. Advice concept for Brain Injuries ontology
Fig. 5. State concept for Brain Injuries ontology
K. Goczyła et al. / Ontological Queries Supporting Decision Process20

Other parts of Brain Injuries ontology presented in this section are shown in fragments. Only these parts of Brain Injuries ontology that are necessary to show the idea of building the ontology conforming to the presented framework and that are necessary to build the scenario are here discussed. The entire Brain Injuries ontology is available in DIGUT at [10] and OWL at [11]. We show how the rest of the top level ontology concepts are modeled in the Brain Injuries ontology. Figure 5 presents the State concept. Our special interest encompasses BrainState concept which describes the state of brain of a patient injured. The two important subconcepts of BrainHaematoma, subsumed by BrainState, are also identified, these are SubduralHaematoma and CriticalDisplacementWithRespectTo-MidlineState. Figure 6 presents Patient concept. The hierarchy of the Patient concept is very similar to that defined for the State concept. Intuitively, PatientWithBrainHaematomais a patient who has brain haematoma, PatientWithSubduralHaematoma is a patient who has brain subdural haematoma, and so on. The last of the four previously defined concepts is the Evidence concept. In Figure 7 two kinds of evidence are depicted: the evidence that the patient has subdural haematoma and the evidence that the patient has critical displacement with respect to midline.
Fig. 6. Patient concept for Brain Injuries ontology Fig. 7. Evidence concept for Brain Injuries ontology
The last two concepts defined in the top level ontology, which are necessary to present the scenario, are Examination and ExaminationResult. Within the Examination concept there is defined only one subconcept: ExaminationOfCT denoting computer tomography of head (see Fig. 8). The structure of examination results is presented in Figure 9.
Fig. 8. Examination concept for Brain Injuries ontology
Fig. 9. ExaminationResult concept for Brain Injuries ontology
K. Goczyła et al. / Ontological Queries Supporting Decision Process 21
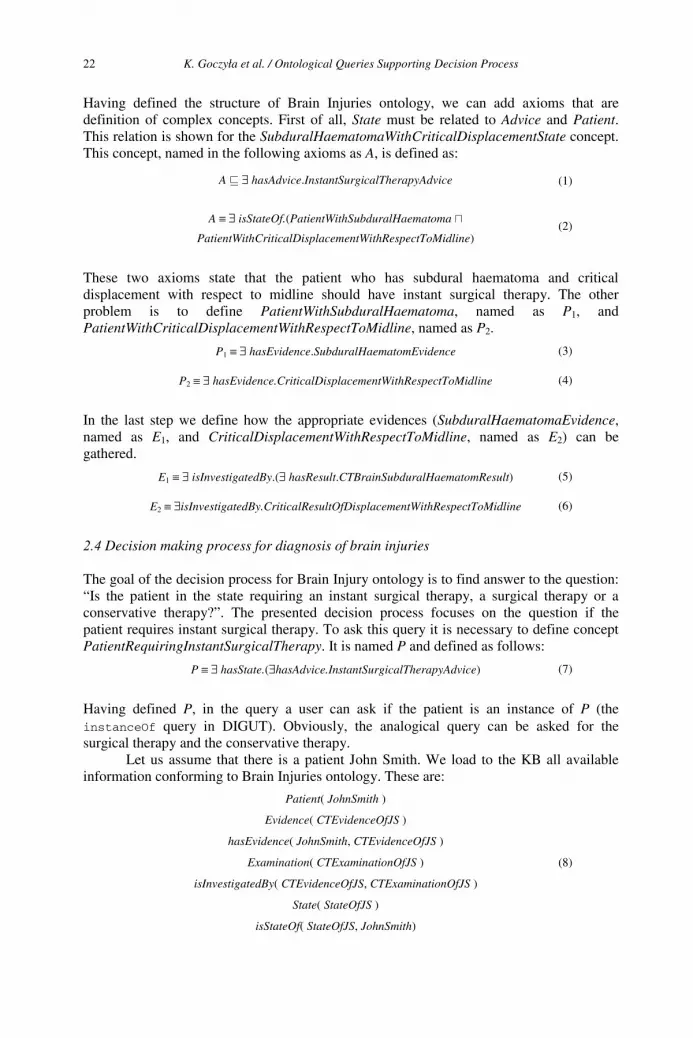
Having defined the structure of Brain Injuries ontology, we can add axioms that are definition of complex concepts. First of all, State must be related to Advice and Patient.This relation is shown for the SubduralHaematomaWithCriticalDisplacementState concept. This concept, named in the following axioms as A, is defined as:
A � ∃ hasAdvice.InstantSurgicalTherapyAdvice (1)
A ≡ ∃ isStateOf.(PatientWithSubduralHaematoma �PatientWithCriticalDisplacementWithRespectToMidline)
(2)
These two axioms state that the patient who has subdural haematoma and critical displacement with respect to midline should have instant surgical therapy. The other problem is to define PatientWithSubduralHaematoma, named as P1, and PatientWithCriticalDisplacementWithRespectToMidline, named as P2.
P1 ≡ ∃ hasEvidence.SubduralHaematomEvidence (3)
P2 ≡ ∃ hasEvidence.CriticalDisplacementWithRespectToMidline (4)
In the last step we define how the appropriate evidences (SubduralHaematomaEvidence,named as E1, and CriticalDisplacementWithRespectToMidline, named as E2) can be gathered.
E1 ≡ ∃ isInvestigatedBy.(∃ hasResult.CTBrainSubduralHaematomResult) (5)
E2 ≡ ∃isInvestigatedBy.CriticalResultOfDisplacementWithRespectToMidline (6)
The goal of the decision process for Brain Injury ontology is to find answer to the question: “Is the patient in the state requiring an instant surgical therapy, a surgical therapy or a conservative therapy?”. The presented decision process focuses on the question if the patient requires instant surgical therapy. To ask this query it is necessary to define concept PatientRequiringInstantSurgicalTherapy. It is named P and defined as follows:
P ≡ ∃ hasState.(∃hasAdvice.InstantSurgicalTherapyAdvice) (7)
Having defined P, in the query a user can ask if the patient is an instance of P (the instanceOf query in DIGUT). Obviously, the analogical query can be asked for the surgical therapy and the conservative therapy. Let us assume that there is a patient John Smith. We load to the KB all available information conforming to Brain Injuries ontology. These are:
Patient( JohnSmith )
Evidence( CTEvidenceOfJS )
hasEvidence( JohnSmith, CTEvidenceOfJS )
Examination( CTExaminationOfJS )
isInvestigatedBy( CTEvidenceOfJS, CTExaminationOfJS )
State( StateOfJS )
isStateOf( StateOfJS, JohnSmith)
(8)
2.4 Decision making process for diagnosis of brain injuries
K. Goczyła et al. / Ontological Queries Supporting Decision Process22
After inserting these assertions to the KB, everything what can be said about John Smith is the fact that he is a patient, has some state and evidence. Moreover, the evidence is investigated by the examination of computer tomography of head. However, the result of this examination is not known. After some time the result of computer tomography is known and provided. The result indicates that John Smith has subdural haematoma.
hasResult( CTExaminationOfJS, indCTBrainSubduralHaeamatomaResult ) (9)
where indCTBrainSubduralHaematomaResult is an instance of CTBrainSubdural-HaematomaResult. Now, the healthcare professional asks if John Smith should have the instant surgical therapy. The process of inference carried out by the KB is as follows:
- On the basis of (5) the KB knows that CTEvidenceOfJS is an instance of a SubduralHaematomaEvidence.
- On the basis of (3) the KB also knows that John Smith is a PatientWithSubduralHaematoma.
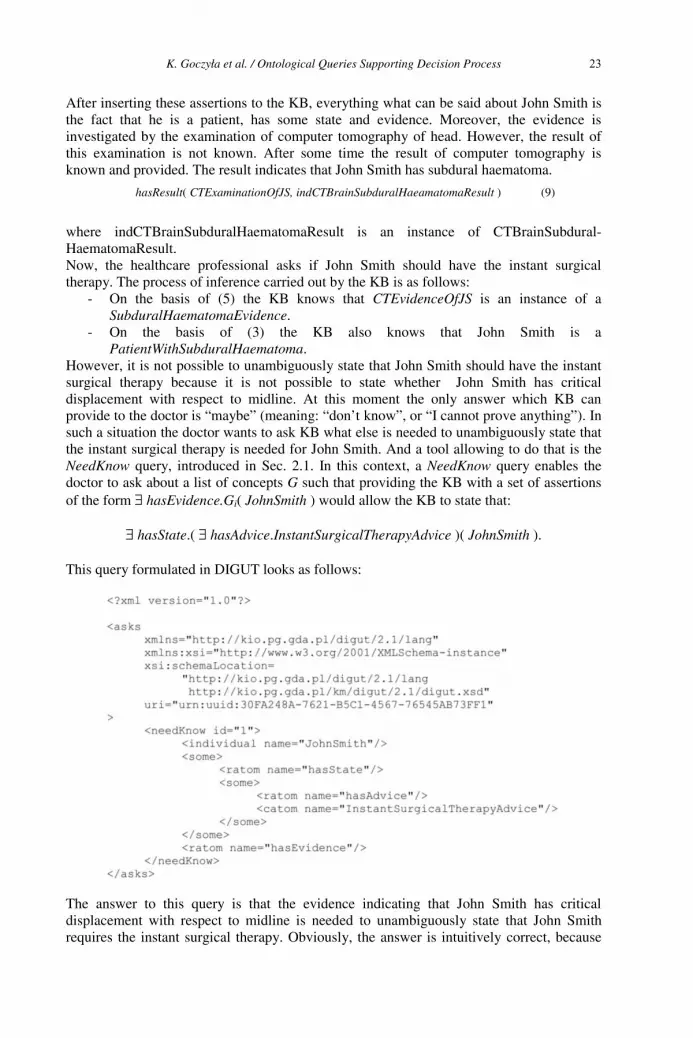
However, it is not possible to unambiguously state that John Smith should have the instant surgical therapy because it is not possible to state whether John Smith has critical displacement with respect to midline. At this moment the only answer which KB can provide to the doctor is “maybe” (meaning: “don’t know”, or “I cannot prove anything”). In such a situation the doctor wants to ask KB what else is needed to unambiguously state that the instant surgical therapy is needed for John Smith. And a tool allowing to do that is the NeedKnow query, introduced in Sec. 2.1. In this context, a NeedKnow query enables the doctor to ask about a list of concepts G such that providing the KB with a set of assertions of the form ∃ hasEvidence.Gi( JohnSmith ) would allow the KB to state that:
∃ hasState.( ∃ hasAdvice.InstantSurgicalTherapyAdvice )( JohnSmith ).
This query formulated in DIGUT looks as follows:
The answer to this query is that the evidence indicating that John Smith has critical displacement with respect to midline is needed to unambiguously state that John Smith requires the instant surgical therapy. Obviously, the answer is intuitively correct, because
K. Goczyła et al. / Ontological Queries Supporting Decision Process 23
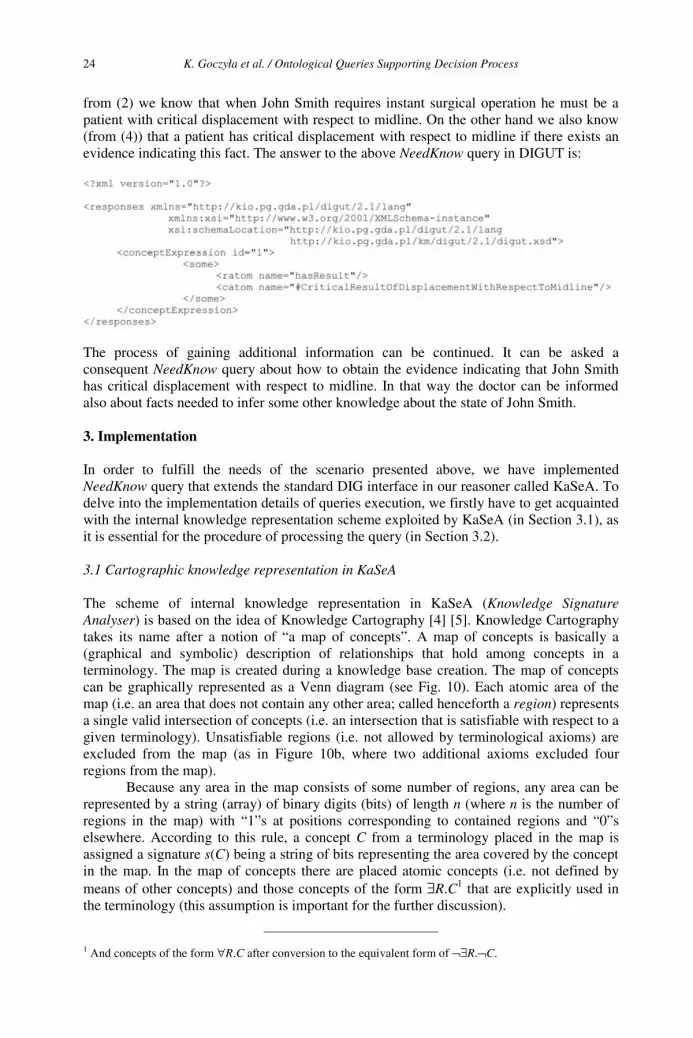
from (2) we know that when John Smith requires instant surgical operation he must be a patient with critical displacement with respect to midline. On the other hand we also know (from (4)) that a patient has critical displacement with respect to midline if there exists an evidence indicating this fact. The answer to the above NeedKnow query in DIGUT is:
The process of gaining additional information can be continued. It can be asked a consequent NeedKnow query about how to obtain the evidence indicating that John Smith has critical displacement with respect to midline. In that way the doctor can be informed also about facts needed to infer some other knowledge about the state of John Smith.
3. Implementation
In order to fulfill the needs of the scenario presented above, we have implemented NeedKnow query that extends the standard DIG interface in our reasoner called KaSeA. To delve into the implementation details of queries execution, we firstly have to get acquainted with the internal knowledge representation scheme exploited by KaSeA (in Section 3.1), as it is essential for the procedure of processing the query (in Section 3.2).
3.1 Cartographic knowledge representation in KaSeA
The scheme of internal knowledge representation in KaSeA (Knowledge Signature Analyser) is based on the idea of Knowledge Cartography [4] [5]. Knowledge Cartography takes its name after a notion of “a map of concepts”. A map of concepts is basically a (graphical and symbolic) description of relationships that hold among concepts in a terminology. The map is created during a knowledge base creation. The map of concepts can be graphically represented as a Venn diagram (see Fig. 10). Each atomic area of the map (i.e. an area that does not contain any other area; called henceforth a region) represents a single valid intersection of concepts (i.e. an intersection that is satisfiable with respect to a given terminology). Unsatisfiable regions (i.e. not allowed by terminological axioms) are excluded from the map (as in Figure 10b, where two additional axioms excluded four regions from the map).
Because any area in the map consists of some number of regions, any area can be represented by a string (array) of binary digits (bits) of length n (where n is the number of regions in the map) with “1”s at positions corresponding to contained regions and “0”s elsewhere. According to this rule, a concept C from a terminology placed in the map is assigned a signature s(C) being a string of bits representing the area covered by the concept in the map. In the map of concepts there are placed atomic concepts (i.e. not defined by means of other concepts) and those concepts of the form ∃R.C1 that are explicitly used in the terminology (this assumption is important for the further discussion).
1 And concepts of the form ∀R.C after conversion to the equivalent form of ¬∃R.¬C.
K. Goczyła et al. / Ontological Queries Supporting Decision Process24
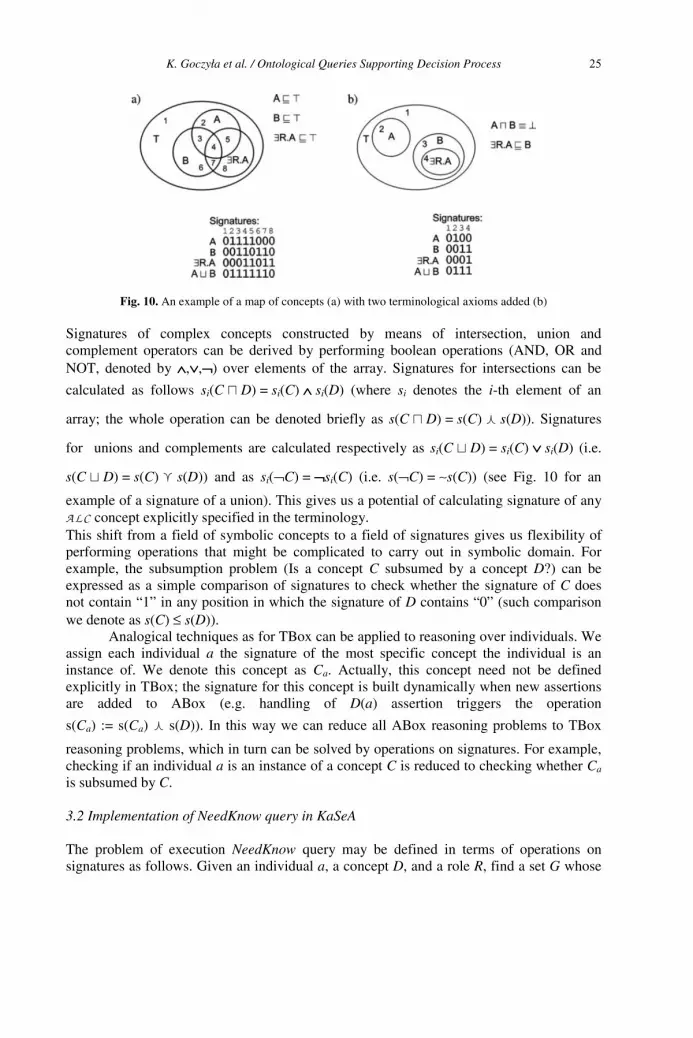
Fig. 10. An example of a map of concepts (a) with two terminological axioms added (b)
Signatures of complex concepts constructed by means of intersection, union and complement operators can be derived by performing boolean operations (AND, OR and NOT, denoted by ∧∧∧∧,∨∨∨∨,¬¬¬¬) over elements of the array. Signatures for intersections can be
calculated as follows si(C � D) = si(C) ∧∧∧∧ si(D) (where si denotes the i-th element of an
array; the whole operation can be denoted briefly as s(C � D) = s(C) � s(D)). Signatures
for unions and complements are calculated respectively as si(C � D) = si(C) ∨∨∨∨ si(D) (i.e.
s(C � D) = s(C) � s(D)) and as si(¬C) = ¬¬¬¬si(C) (i.e. s(¬C) = ∼s(C)) (see Fig. 10 for an
example of a signature of a union). This gives us a potential of calculating signature of any ALC concept explicitly specified in the terminology. This shift from a field of symbolic concepts to a field of signatures gives us flexibility of performing operations that might be complicated to carry out in symbolic domain. For example, the subsumption problem (Is a concept C subsumed by a concept D?) can be expressed as a simple comparison of signatures to check whether the signature of C does not contain “1” in any position in which the signature of D contains “0” (such comparison we denote as s(C) ≤ s(D)).
Analogical techniques as for TBox can be applied to reasoning over individuals. We assign each individual a the signature of the most specific concept the individual is an instance of. We denote this concept as Ca. Actually, this concept need not be defined explicitly in TBox; the signature for this concept is built dynamically when new assertions are added to ABox (e.g. handling of D(a) assertion triggers the operation
s(Ca) := s(Ca) � s(D)). In this way we can reduce all ABox reasoning problems to TBox
reasoning problems, which in turn can be solved by operations on signatures. For example, checking if an individual a is an instance of a concept C is reduced to checking whether Ca
is subsumed by C.
3.2 Implementation of NeedKnow query in KaSeA
The problem of execution NeedKnow query may be defined in terms of operations on signatures as follows. Given an individual a, a concept D, and a role R, find a set G whose
K. Goczyła et al. / Ontological Queries Supporting Decision Process 25
elements are sets G1, G2, …, where each Gi is of the form {∃R.C1, ∃R.C2, …} and satisfies the following conditions2:
s(Ca) � s(∃R.C1) � s(∃R.C2) � … ≤ s(D) for any ∃R.Cj ∈ Gi (10)
s(Ca) � s(∃R.C1) � s(∃R.C2) � … ≠ {0}n for any ∃R.Cj ∈ Gi,
(n is the size of signature)(11)
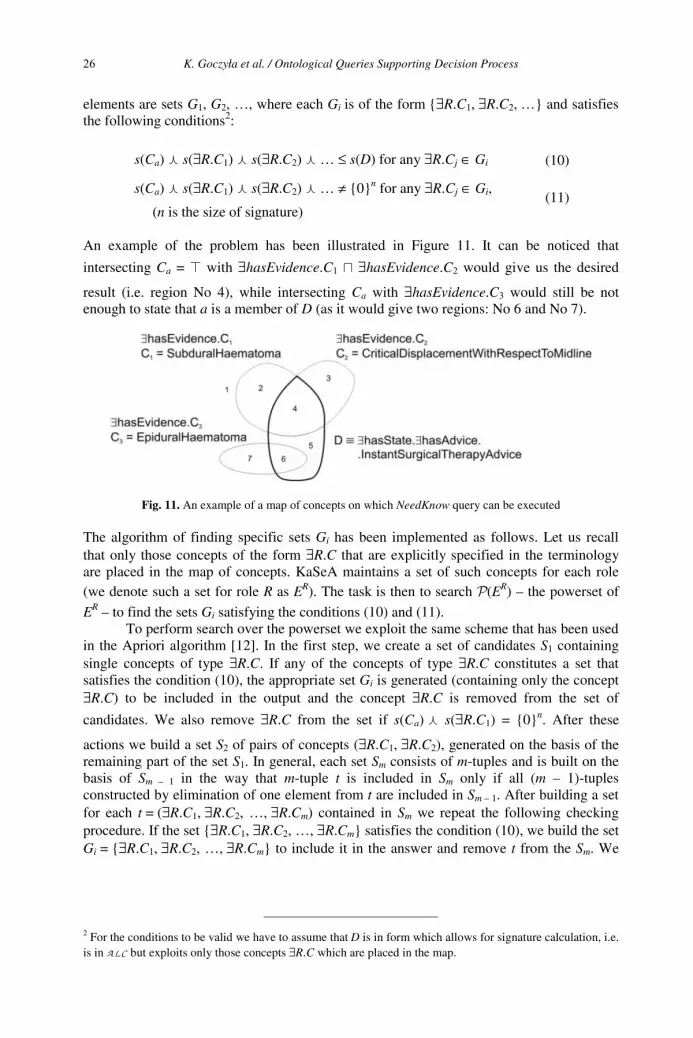
An example of the problem has been illustrated in Figure 11. It can be noticed that
intersecting Ca = � with ∃hasEvidence.C1 � ∃hasEvidence.C2 would give us the desired
result (i.e. region No 4), while intersecting Ca with ∃hasEvidence.C3 would still be not enough to state that a is a member of D (as it would give two regions: No 6 and No 7).
Fig. 11. An example of a map of concepts on which NeedKnow query can be executed
The algorithm of finding specific sets Gi has been implemented as follows. Let us recall that only those concepts of the form ∃R.C that are explicitly specified in the terminology are placed in the map of concepts. KaSeA maintains a set of such concepts for each role (we denote such a set for role R as ER). The task is then to search P(ER) – the powerset of
ER – to find the sets Gi satisfying the conditions (10) and (11). To perform search over the powerset we exploit the same scheme that has been used
in the Apriori algorithm [12]. In the first step, we create a set of candidates S1 containing single concepts of type ∃R.C. If any of the concepts of type ∃R.C constitutes a set that satisfies the condition (10), the appropriate set Gi is generated (containing only the concept ∃R.C) to be included in the output and the concept ∃R.C is removed from the set of
candidates. We also remove ∃R.C from the set if s(Ca) � s(∃R.C1) = {0}n. After these
actions we build a set S2 of pairs of concepts (∃R.C1, ∃R.C2), generated on the basis of the remaining part of the set S1. In general, each set Sm consists of m-tuples and is built on the basis of Sm – 1 in the way that m-tuple t is included in Sm only if all (m – 1)-tuples constructed by elimination of one element from t are included in Sm – 1. After building a set for each t = (∃R.C1, ∃R.C2, …, ∃R.Cm) contained in Sm we repeat the following checking procedure. If the set {∃R.C1, ∃R.C2, …, ∃R.Cm} satisfies the condition (10), we build the set Gi = {∃R.C1, ∃R.C2, …, ∃R.Cm} to include it in the answer and remove t from the Sm. We
2 For the conditions to be valid we have to assume that D is in form which allows for signature calculation, i.e. is in ALC but exploits only those concepts ∃R.C which are placed in the map.
K. Goczyła et al. / Ontological Queries Supporting Decision Process26
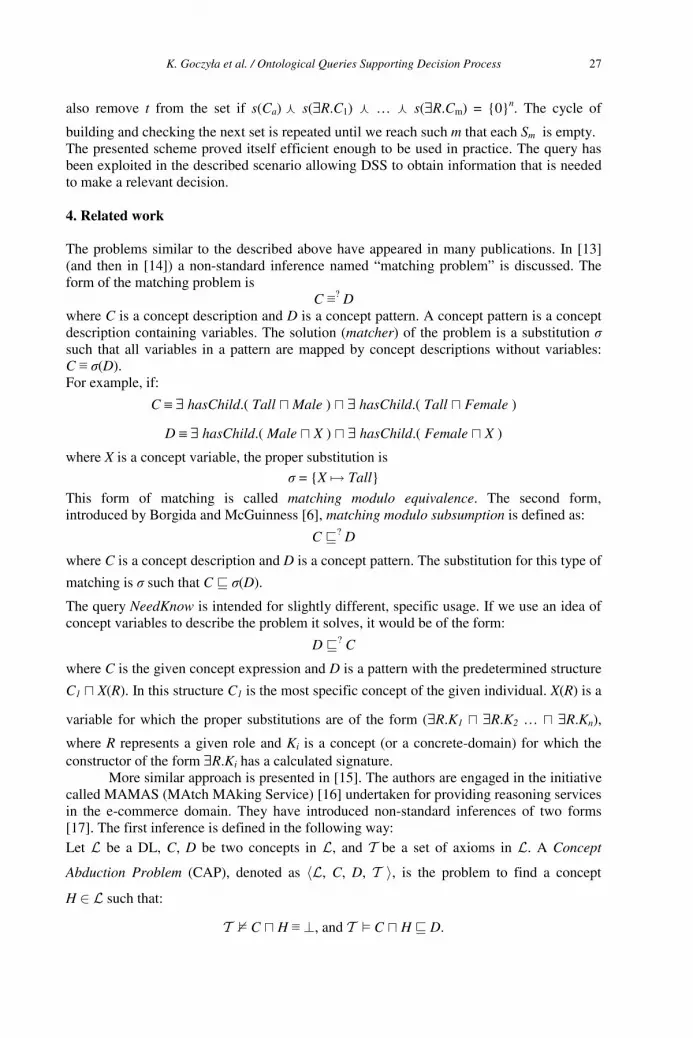
also remove t from the set if s(Ca) � s(∃R.C1) � … � s(∃R.Cm) = {0}n. The cycle of
building and checking the next set is repeated until we reach such m that each Sm is empty. The presented scheme proved itself efficient enough to be used in practice. The query has been exploited in the described scenario allowing DSS to obtain information that is needed to make a relevant decision.
4. Related work
The problems similar to the described above have appeared in many publications. In [13] (and then in [14]) a non-standard inference named “matching problem” is discussed. The form of the matching problem is
C ≡? Dwhere C is a concept description and D is a concept pattern. A concept pattern is a concept description containing variables. The solution (matcher) of the problem is a substitution σsuch that all variables in a pattern are mapped by concept descriptions without variables: C ≡ σ(D).For example, if:
C ≡ ∃ hasChild.( Tall �Male ) � ∃ hasChild.( Tall � Female )
D ≡ ∃ hasChild.( Male � X ) � ∃ hasChild.( Female � X )
where X is a concept variable, the proper substitution is
σ = {X� Tall}
This form of matching is called matching modulo equivalence. The second form, introduced by Borgida and McGuinness [6], matching modulo subsumption is defined as:
C �? D
where C is a concept description and D is a concept pattern. The substitution for this type of
matching is σ such that C � σ(D).
The query NeedKnow is intended for slightly different, specific usage. If we use an idea of concept variables to describe the problem it solves, it would be of the form:
D �? C
where C is the given concept expression and D is a pattern with the predetermined structure
C1 � X(R). In this structure C1 is the most specific concept of the given individual. X(R) is a
variable for which the proper substitutions are of the form (∃R.K1 � ∃R.K2 … � ∃R.Kn),
where R represents a given role and Ki is a concept (or a concrete-domain) for which the constructor of the form ∃R.Ki has a calculated signature.
More similar approach is presented in [15]. The authors are engaged in the initiative called MAMAS (MAtch MAking Service) [16] undertaken for providing reasoning services in the e-commerce domain. They have introduced non-standard inferences of two forms [17]. The first inference is defined in the following way: Let L be a DL, C, D be two concepts in L, and T be a set of axioms in L. A Concept
Abduction Problem (CAP), denoted as ⟨L, C, D, T ⟩, is the problem to find a concept
H ∈ L such that:
T � C � H ≡ ⊥, and T � C � H � D.
K. Goczyła et al. / Ontological Queries Supporting Decision Process 27
The definition of the second inference is as follows: Let C, D be two concepts in ALN, and T be a set of axioms in ALN, where both C and D
are satisfiable in T. A Concept Contraction Problem (CCP), denoted as ⟨C, D, T ⟩, is the
problem to find a pair of concepts ⟨G, K⟩ (both in ALN) such that T � C ≡ G � K, and K �D is satisfiable in T. We call K a contraction of C according to D and T.
The authors have extended DIG language creating MaMaS DIG Interface [18] and providing it with many new features. Among others there are two new requests <abduce>and <contract>. Both allow to realize the new non-standard inferences.
Those kinds of inferences are very helpful in tasks concerning e.g. searching for purchase offers fitting a customer needs or in determining a customer profile. The query NeedKnow is expected to be used in more specific conditions. Hypothesis H has the
predetermined form of (∃R.K1 � ∃R.K2 … � ∃R.Kn), where R represents a given role and Ki
is a concept or a concrete-domain for which the constructor of the form ∃R.Ki has a calculated signature. It is obvious that developing all these language extensions has the same reason—to allow non-standard inferences which supply a user with information helpful in making decisions. However the query NeedKnow is concentrated on individuals whereas both abduction and contraction problems concern concepts.
5. Summary
The presented paper describes new tools which can be used to support decision process carried out on the basis of knowledge stored in ontologies. The tools encompass NeedKnowquery and the top level ontology in which the decision, or in other words advice, is modeled explicitly. The other presented solution to the problem is implementation of NeedKnow query in KaSeA system. This implementation is based on the Cartographic Representation of knowledge and reveals that realization of such tasks using Cartographic Representation is quite straightforward. We hope that some related features that take origin from the above matching problems will be accessible in next versions of KaSeA system. It is worth stressing that the solution presented in this paper has its practical validation in PIPS project, where the ideas were approved for use.
References
[1] Goczyła K. Grabowska T. Waloszek W. Zawadzki M.: Problematyka zarządzania wiedzą w systemach typu e-health. W: Software Engineering – New Challenges . Eds. J. Górski, A. Wardziński. Warszawa: WNT 2004, pp. 357-371 (in Polish).
[2] Goczyła K., Grabowska T., Waloszek W., Zawadzki M.: Inference Mechanisms for Knowledge Management System in E-health Environment, In: „Software Engineering: Evolution and Emerging Technologies”, Eds. K. Zieliński, and T. Szmuc, IOS Press, Series: „Frontiers in Artificial Intelligence and Applications”, 2005, pp. 418-423.
[3] Semantic Web Initiatives, http://www.semantic-web.org/ [4] Goczyła K., Grabowska T., Waloszek W., Zawadzki M. The Cartographer
Algorithm for Processing and Querying Description Logics Ontologies. LNAI 3528: Advances in Web Intelligence, Third International Atlantic Web Intelligence Conference, Springer 2005. pp. 163-169.
K. Goczyła et al. / Ontological Queries Supporting Decision Process28

[5] Goczyła K., Grabowska T., Waloszek W., Zawadzki M.: The Knowledge Cartography – A new approach to reasoning over Description Logics ontologies.In: Proc. of SOFSEM 2006, 32nd International Conference on Current Trends in Theory and Practice of Computer Science, (accepted for publication).
[6] Baader F. A., McGuiness D. L., Nardi D., Patel-Schneider P. F.: The Description Logic Handbook: Theory, implementation, and applications, Cambridge University Press, 2003.
[7] Staab S., Studer R.: Handbook on Ontologies. International Handbooks on Information Systems Springer 2004.
[8] Bechhofer S.: The DIG Description Logic Interface: DIG/1.1, University of Manchester, February 7, 2003.
[9] DIGUT Interface Version 1.3. KMG@GUT Technical Report, 2005, available at http://km.pg.gda.pl/km/digut/1.3/DIGUT_Interface_1.3.pdf
[10] Brain Injuries ontology in DIGUT format, available at: http://km.pg.gda.pl/km/ontologies/BrainInjuries/BrainInjuries_2.0.digut
[11] Brain Injuries ontology in OWL format, available at: http://km.pg.gda.pl/km/ontologies/BrainInjuries/BrainInjuries_2.0.owl
[12] Wittem I. H., Frank E.: Data Mining. Practical Machine Learning Tools and Techniques with Java Implementations. Morgan Kaufmann Publisher 2000.
[13] Baader F. and Küsters R.: Matching Concept Descriptions with Existential Restrictions. In Proceedings of the Seventh International Conference on Principles of Knowledge Representation and Reasoning (KR2000).
[14] Baader F. A., McGuiness D. L., Nardi D., Patel-Schneider P. F.: The Description Logic Handbook: Theory, implementation, and applications, Cambridge University Press, 2003.
[15] Di Noia T., Di Sciascio E., Donini F. M., Mongiello M.: Abductive Matchmaking using Description Logics. Proceedings of Eighteenth International Joint Conference on Artificial Intelligence IJCAI-03, pp. 337 – 342 - Aug. 2003
[16] MAtch MAking Service available at see http://sisinflab.poliba.it/MAMAS-tng [17] Colucci S., Di Noia T., Di Sciascio E., Donini F. M., Mongiello M.: A Uniform
Tableaux-Based Approach to Concept Abduction and Contraction in ALN. In Proceedings of the 2004 International Workshop on Description Logics (DL2004), Whistler, British Columbia, Canada, June 6-8, 2004.
[18] Extended MaMaS1 DIG Description Logic Interface 1.1, available at: http://sisinflab.poliba.it/MAMAS-tng/DIG1.1MaMaS.pdf
K. Goczyła et al. / Ontological Queries Supporting Decision Process 29
The Conceptual Framework To
User-Oriented Content ManagementBernhard Thalheim
Christian-Albrechts-University Kiel, Computer Science Institute, 24098 Kiel, [email protected]
Abstract
Content and content management have become buzzwords. They are still heavily overloaded,not well understood or defined and heavily misused. Moreover, the user dimension is notyet incorporated. We develop an approach that is based on separation of concern: syntaxdimension and content, semantics dimension and concepts, pragmatics dimension and topics,and finally referent or user dimension and memes. This separation of concern may increasethe complexity of handling. We show, however, that a sophisticated handling of different kindof data at each dimension and a mapping facility between the dimensions provides a basisfor a user-oriented content management system. This separation of concern and the specialmapping procedure allows to derive content management systems that satisfy the needs ofuser communities.
1 Web Content Management
Content management, simply stated, is the process of sharing information vital to an organi-
zation. Likewise, intranet content management involves sharing information using the private
computer networks and associated software of intranets (or extranets) as a primary commu-
nication tool [Boi01, SS03]. In today’s “information society,” where the total quantity of data
and the pace of communication continue to increase, the goal of effective content manage-
ment continues to gain importance.
Content management became vital within the web information systems context. A wide
variety of systems claim to be a web content management system (CMS), e.g., CacheWare,
ConnectSite.com ASP, ContentPlanner, Coremedia, Corevue, Documentum, DynaBase, E-
Grail web management platform Ektron, eKeeper, ECOMS, Eprise, Gauss, Imparto Web
Marketing Suite, Intervwowren, IntraNet Solutions, iDB Browsinform, iMakeNews.com,
Midgard, NCompass, OnDisplay, SiteC, SiteDriver, SiteGeneral, SiteManager, SiteMerger,
SiteStation, Stage2Live, Vignette, Website ASP, etc. There are surveys [Jou05] that keep lists
of CMS. Roughly we may classify CMS into website CMS, enterprise CMS, advanced docu-
ment management systems, and extranet CMS. This large variety of systems has a number of
properties in common: generation, delivery and storage of complex structured objects; rights
management; service management in distributed environment; customer management; update
and quality management; context dependent delivery depending on the user, the HCI, and the
actual systems situation.
M. Duží et al. (Eds.)Information Modelling and Knowledge Bases XVIII
IOS Press, 2007© 2007 The authors and IOS Press. All rights reserved.
30

The content of a CMS is a most value asset. Content must be updated frequently to keep
user coming back and to succeed in their tasks. Thus, a content management system supports
production of content while automating some of the frequent operational tasks.
CMS and web CMS specifically support a variety of tasks:
Managing web assets: Content comes from a variety of sources including both file assets,
database assets, assets from legacy systems or from syndication services. Content may
be stored in both XML and databases. CMS can automate meta data creation and storage
which enables companies to organize content and improve customer searches.
Workflow: Most CMS provide a user interface for managing tasks such as email notification
and approval. Tasks can be manually initiated or automated. Changes are tracked and their
history is stored.
Templates: Templates are designed for either entering content or for presentation. Templates
may contain templates.
Source control and versioning: Since data and the generated content changes and older
content may be still in use, CMS also provide source code management capabilities such
as versioning, merging changes, and identifying conflict resolution.
Deployment and delivery services: CMS offer content deployment solutions, automated
archival and expiration services, runtime delivery services, and performance improvement
tools based on caching approaches.
Management of distribution and adaptation: Content is extracted from several sources,
is integrated and may be delivered to a large variety of customers.
Therefore, we claim that CMS must
• integrate extraction, preparation, transformation, storage/load and delivery of complex
structured objects,
• support workflows and tasks,
• be based on service systems, and
• deliver content objects to users on demand and profile, at the right moment, and within
the right format and size.
Content is complex and may become ready-to-use information. Information is related to the
users dimension. Information as processed by humans, is data perceived or noticed, selected
and organized by its receiver, because of his subjective human interests, originating from his
instincts, feelings, experience, intuition, common sense, values, beliefs, personal knowledge,
or wisdom simultaneously processed by his cognitive and mental processes, and seamlessly
integrated in his recallable knowledge. CMS are information systems that support extraction,
storage and delivery of complex information. Thus, we claim that content specification must
use specification of structuring, functionality, distribution, and interactivity. The co-design
approach [Tha00, Tha03] presented in this paper may be used for specification of content
structure and of content workflow.
This broad list of requirements, targets, dreams for content management has not yet been
supported by any implementation and may lead into the same dead end as high-targeting AI
B. Thalheim / The Conceptual Framework to User-Oriented Content Management 31
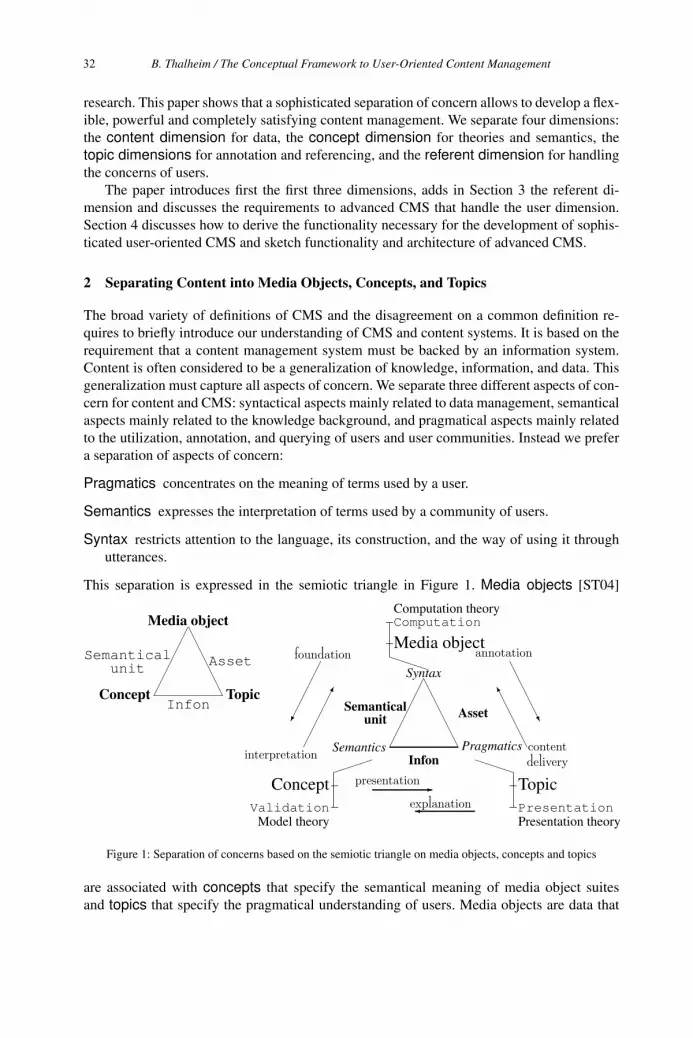
research. This paper shows that a sophisticated separation of concern allows to develop a flex-
ible, powerful and completely satisfying content management. We separate four dimensions:
the content dimension for data, the concept dimension for theories and semantics, the
topic dimensions for annotation and referencing, and the referent dimension for handling
the concerns of users.
The paper introduces first the first three dimensions, adds in Section 3 the referent di-
mension and discusses the requirements to advanced CMS that handle the user dimension.
Section 4 discusses how to derive the functionality necessary for the development of sophis-
ticated user-oriented CMS and sketch functionality and architecture of advanced CMS.
2 Separating Content into Media Objects, Concepts, and Topics
The broad variety of definitions of CMS and the disagreement on a common definition re-
quires to briefly introduce our understanding of CMS and content systems. It is based on the
requirement that a content management system must be backed by an information system.
Content is often considered to be a generalization of knowledge, information, and data. This
generalization must capture all aspects of concern. We separate three different aspects of con-
cern for content and CMS: syntactical aspects mainly related to data management, semantical
aspects mainly related to the knowledge background, and pragmatical aspects mainly related
to the utilization, annotation, and querying of users and user communities. Instead we prefer
a separation of aspects of concern:
Pragmatics concentrates on the meaning of terms used by a user.
Semantics expresses the interpretation of terms used by a community of users.
Syntax restricts attention to the language, its construction, and the way of using it through
utterances.
This separation is expressed in the semiotic triangle in Figure 1. Media objects [ST04]
Semantics Pragmatics
Syntax
Media object
Computation
Concept
Validation
Topic
PresentationPresentation theory
Computation theory
Model theory
Infon
Semanticalunit Asset
�
interpretation
�
foundation
�presentation
�explanation
�
contentdelivery
�
annotation
Concept Topic
Media object
Semanticalunit Asset
Infon
Figure 1: Separation of concerns based on the semiotic triangle on media objects, concepts and topics
are associated with concepts that specify the semantical meaning of media object suites
and topics that specify the pragmatical understanding of users. Media objects are data that
B. Thalheim / The Conceptual Framework to User-Oriented Content Management32
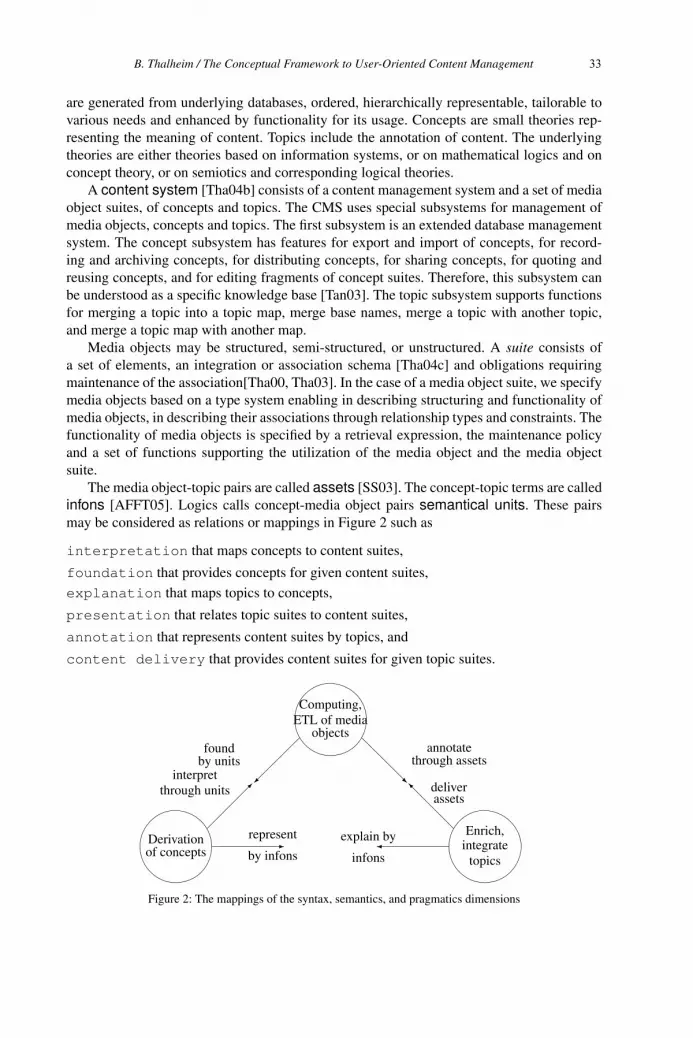
are generated from underlying databases, ordered, hierarchically representable, tailorable to
various needs and enhanced by functionality for its usage. Concepts are small theories rep-
resenting the meaning of content. Topics include the annotation of content. The underlying
theories are either theories based on information systems, or on mathematical logics and on
concept theory, or on semiotics and corresponding logical theories.
A content system [Tha04b] consists of a content management system and a set of media
object suites, of concepts and topics. The CMS uses special subsystems for management of
media objects, concepts and topics. The first subsystem is an extended database management
system. The concept subsystem has features for export and import of concepts, for record-
ing and archiving concepts, for distributing concepts, for sharing concepts, for quoting and
reusing concepts, and for editing fragments of concept suites. Therefore, this subsystem can
be understood as a specific knowledge base [Tan03]. The topic subsystem supports functions
for merging a topic into a topic map, merge base names, merge a topic with another topic,
and merge a topic map with another map.
Media objects may be structured, semi-structured, or unstructured. A suite consists of
a set of elements, an integration or association schema [Tha04c] and obligations requiring
maintenance of the association[Tha00, Tha03]. In the case of a media object suite, we specify
media objects based on a type system enabling in describing structuring and functionality of
media objects, in describing their associations through relationship types and constraints. The
functionality of media objects is specified by a retrieval expression, the maintenance policy
and a set of functions supporting the utilization of the media object and the media object
suite.
The media object-topic pairs are called assets [SS03]. The concept-topic terms are called
infons [AFFT05]. Logics calls concept-media object pairs semantical units. These pairs
may be considered as relations or mappings in Figure 2 such as
interpretation that maps concepts to content suites,
foundation that provides concepts for given content suites,
explanation that maps topics to concepts,
presentation that relates topic suites to content suites,
annotation that represents content suites by topics, and
content delivery that provides content suites for given topic suites.
Enrich,integrate
topics
�
�
deliverassets
explain by
infons
Derivationof concepts
�
interpretthrough units
represent
by infons
Computing,ETL of media
objects
�
foundby units
annotatethrough assets
Figure 2: The mappings of the syntax, semantics, and pragmatics dimensions
B. Thalheim / The Conceptual Framework to User-Oriented Content Management 33
Media object suites are presented by possible databases, i.e. the data world. The rep-
resentations may very depending on the model used. Concept worlds are represented by
theory worlds. The modeling world depends on the logical theory used for the representa-
tion. Topics are used to represent the user world. Topic suites may be represented by ontolo-
gies, taxonomies, dictionaries, or glossaries. They are used for communication among users.
Therefore, topics are based on a vocabulary a users group has agreed upon. Media object
management is based on a database and computation environment. Concept management is
based on model theory. Topic management uses a presentation, visualization, and language
environment.
The functionality necessary for each dimension is based on engines that have been devel-
oped in the past:
database and data warehouse system which handle basic data, derived complex data,
extract, transform, and load (ETL) data from one database system to the other one,
AI and theorem proving systems that enable in deriving new pieces of concepts and that
support handling of small logical theories, and
topic or ontology engines which are based on XML technology, name spaces, linking fa-
cilities.
The mappings interpretation, foundation, explanation, presentation,
annotation, and (content) delivery can be developed using classical Discrete
Mathematics or database theory [Tha00]. The concept-media object query facility in [TV02]
shows that delivery can be based on the product of explanation and interpretat-ion. The association between media objects and concepts can be defined through queries
added to each concept triple C [FT04]
(meta information, intension specification, extension)
and the media type schema defined on a database schema S and query q defining the content
depending on a database state.
Topics T are described by the triple
(user community, topic description, topic population)
for a given user community (or cultural context based on a population that serves as typical
examples for the given topic. The topic description is given by
(topicRef, subjectIdentity, scope, baseName, association, roles, member, parameters).
Topics are given by an ortho-normalized language [OS96], a glossary, a thesaurus, or an on-
tology. A glossary is a collection of textual glosses or of specialized terms with their mean-
ings. A thesaurus1 is a list of subject headings or descriptors about a particular field together
with their synonyms usually with a cross-reference system for use in the organization of a col-
lection of documents for reference and retrieval. The word ‘ontology’ is heavily overloaded
in the computer engineering area and, thus, not used here.
The annotationmay be similarly to [TV02] defined through the product of foundationand presentation. This kind of derived definition of the mapping provides a content in-dependence since the concepts need not to be changed whenever the underlying database or
media object base is going to be changed.
1A typical thesaurus is the dictionary developed by wikipedia community groups. The entries in wikipedia
are agreed within a certain community but neither validated nor integrated into a common theory.
B. Thalheim / The Conceptual Framework to User-Oriented Content Management34
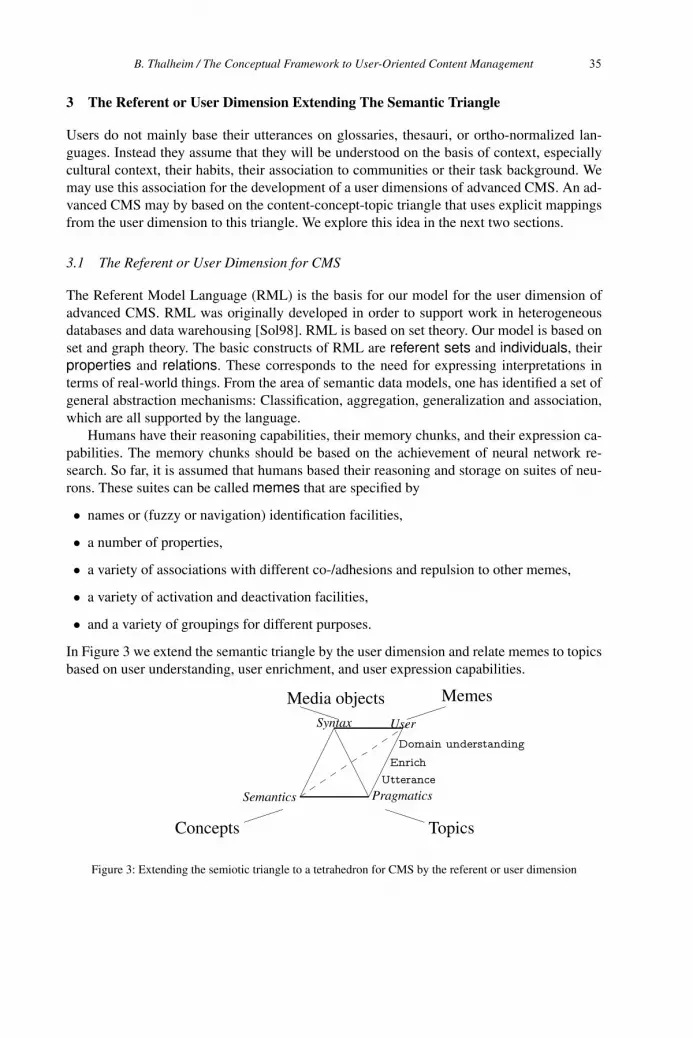
3 The Referent or User Dimension Extending The Semantic Triangle
Users do not mainly base their utterances on glossaries, thesauri, or ortho-normalized lan-
guages. Instead they assume that they will be understood on the basis of context, especially
cultural context, their habits, their association to communities or their task background. We
may use this association for the development of a user dimensions of advanced CMS. An ad-
vanced CMS may by based on the content-concept-topic triangle that uses explicit mappings
from the user dimension to this triangle. We explore this idea in the next two sections.
3.1 The Referent or User Dimension for CMS
The Referent Model Language (RML) is the basis for our model for the user dimension of
advanced CMS. RML was originally developed in order to support work in heterogeneous
databases and data warehousing [Sol98]. RML is based on set theory. Our model is based on
set and graph theory. The basic constructs of RML are referent sets and individuals, their
properties and relations. These corresponds to the need for expressing interpretations in
terms of real-world things. From the area of semantic data models, one has identified a set of
general abstraction mechanisms: Classification, aggregation, generalization and association,
which are all supported by the language.
Humans have their reasoning capabilities, their memory chunks, and their expression ca-
pabilities. The memory chunks should be based on the achievement of neural network re-
search. So far, it is assumed that humans based their reasoning and storage on suites of neu-
rons. These suites can be called memes that are specified by
• names or (fuzzy or navigation) identification facilities,
• a number of properties,
• a variety of associations with different co-/adhesions and repulsion to other memes,
• a variety of activation and deactivation facilities,
• and a variety of groupings for different purposes.
In Figure 3 we extend the semantic triangle by the user dimension and relate memes to topics
based on user understanding, user enrichment, and user expression capabilities.
Semantics Pragmatics
Syntax
Media objects
Concepts Topics
User
Memes
Domain understanding
Enrich
Utterance
Figure 3: Extending the semiotic triangle to a tetrahedron for CMS by the referent or user dimension
B. Thalheim / The Conceptual Framework to User-Oriented Content Management 35
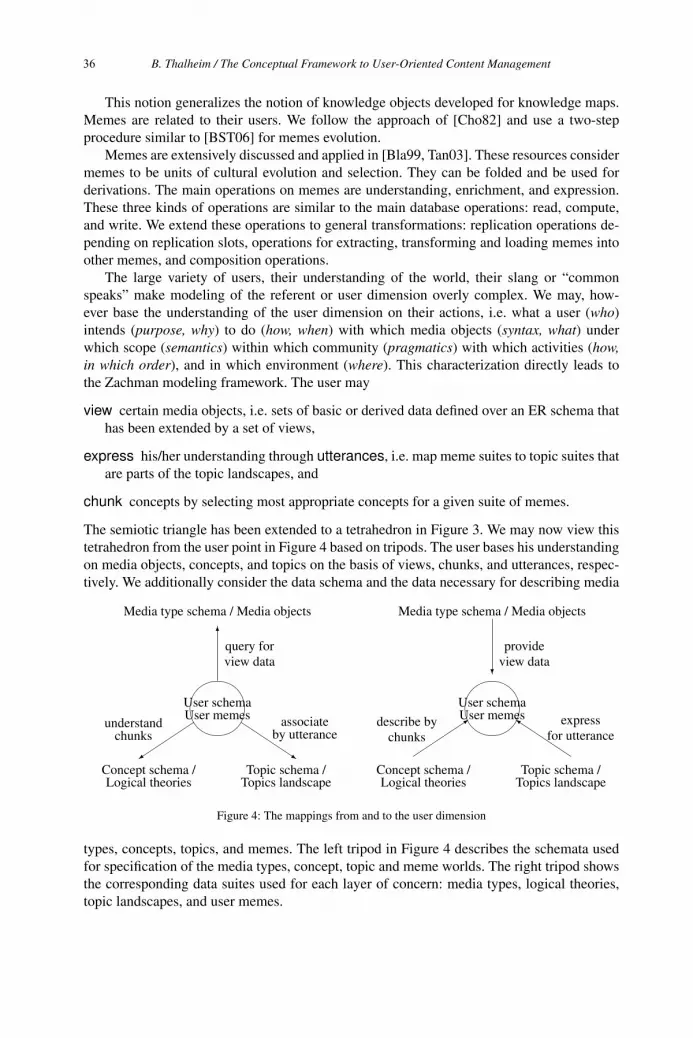
This notion generalizes the notion of knowledge objects developed for knowledge maps.
Memes are related to their users. We follow the approach of [Cho82] and use a two-step
procedure similar to [BST06] for memes evolution.
Memes are extensively discussed and applied in [Bla99, Tan03]. These resources consider
memes to be units of cultural evolution and selection. They can be folded and be used for
derivations. The main operations on memes are understanding, enrichment, and expression.
These three kinds of operations are similar to the main database operations: read, compute,
and write. We extend these operations to general transformations: replication operations de-
pending on replication slots, operations for extracting, transforming and loading memes into
other memes, and composition operations.
The large variety of users, their understanding of the world, their slang or “common
speaks” make modeling of the referent or user dimension overly complex. We may, how-
ever base the understanding of the user dimension on their actions, i.e. what a user (who)
intends (purpose, why) to do (how, when) with which media objects (syntax, what) under
which scope (semantics) within which community (pragmatics) with which activities (how,in which order), and in which environment (where). This characterization directly leads to
the Zachman modeling framework. The user may
view certain media objects, i.e. sets of basic or derived data defined over an ER schema that
has been extended by a set of views,
express his/her understanding through utterances, i.e. map meme suites to topic suites that
are parts of the topic landscapes, and
chunk concepts by selecting most appropriate concepts for a given suite of memes.
The semiotic triangle has been extended to a tetrahedron in Figure 3. We may now view this
tetrahedron from the user point in Figure 4 based on tripods. The user bases his understanding
on media objects, concepts, and topics on the basis of views, chunks, and utterances, respec-
tively. We additionally consider the data schema and the data necessary for describing media
User schemaUser memes
�
�
Media type schema / Media objects
Concept schema /Logical theories
Topic schema /Topics landscape
query forview data
associateby utterance
understandchunks
User schemaUser memes�
�
�
Media type schema / Media objects
Concept schema /Logical theories
Topic schema /Topics landscape
provideview data
expressfor utterance
describe bychunks
Figure 4: The mappings from and to the user dimension
types, concepts, topics, and memes. The left tripod in Figure 4 describes the schemata used
for specification of the media types, concept, topic and meme worlds. The right tripod shows
the corresponding data suites used for each layer of concern: media types, logical theories,
topic landscapes, and user memes.
B. Thalheim / The Conceptual Framework to User-Oriented Content Management36
3.2 Brain-Pattern, Memes, and Information
We use a notion of information that is better fitted to the needs of information systems and
of CMS. It bases the existence of information for a user on this users abilities for perception
(1), abilities for selection (2), the interests (3), the knowledge obtained so far (4), and abilities
for integration (5). This notion nicely corresponds to different uses of information as noted
in [Tan03]: generation, externalization, recording, protection, communication, distribution,
sharing, referencing, editing, search, analysis, management, and annihilation. This notion of
information does not directly lead to a definition similar to the definition of information based
on the entropy information or of information based on the logical and derivational power. It
is, however, user-centered.
So far no commonly accepted theory of meme structures of the brain has been proposed.
Classically memes have been considered as structures that are encoded within a gene or a
suite of genes. We may, however, consider also dynamic memes that allow a change over the
lifespan of a human organism. To develop this, we use biochemistry [RPZ06] and introduce
the brain-pattern (b-pattern) that consist of a suite of neurons. B-pattern may be stable or
instable. Their formation, transformation, and removal requires energy. Therefore, stability
and transformation is based on minimal energy consumption. Additionally, b-pattern have
their compositionality and replication that is characterized by
• the general ability for composition or replication, e.g., characteristics describing when
composition may appear,
• the general properties required for composition or replication, e.g. the free slot property
describing whether composition may take place for a part of the b-pattern and the support
for agglomeration,
• the topological and geometrical properties including distance and relative location, and
• the ad-/cohesion and repulsion within a suite and to other suites.
Repulsion and cohesion allow to describe the energy that is needed for composition. Replica-
tion of b-pattern is based on folding donors. Given two memes xDy and x′Dy′ with a donor.
Then the memes may be crossed at the donor to xDy′ and/or x′Dy. Crossing may lead to the
death of one of the results if the energy level is too low. A specific kind of crossing is the
linked transformation of a meme to a background meme.
Using b-pattern we may now characterize the meme as a suite of b-pattern that is enhanced
by activation facilities. These facilities support building, removal, and change of memes. Typ-
ical activation facilities are based on stimulants such as positive or negative emotions, good
or bad practices (for keeping, refining or checking), and requests for change or replacement
(delete, store in the background and link, insert, update). Stimulants are usually increasing or
decreasing the energy level. Requests for change are often based on imposing some stress to
memes. If the energy level becomes too low for a meme then this meme is lost or forgotten.
This process can also be explicitly described by deactivation mechanisms.
Memes can be accessed by pattern matching or by navigation. Pattern matching is based
on overlay structures that might be applied. The access to a meme may lead to a change of
pattern (control memes), to invocation of replication or composition (collector memes), or to
orchestration of a new set of b-pattern (information meme). Navigation is based on a number
of different facets [Tha00]. We may now combine composition, replication and query func-
tions to complex functions that represent the users ability for deduction, induction, abduction,
B. Thalheim / The Conceptual Framework to User-Oriented Content Management 37
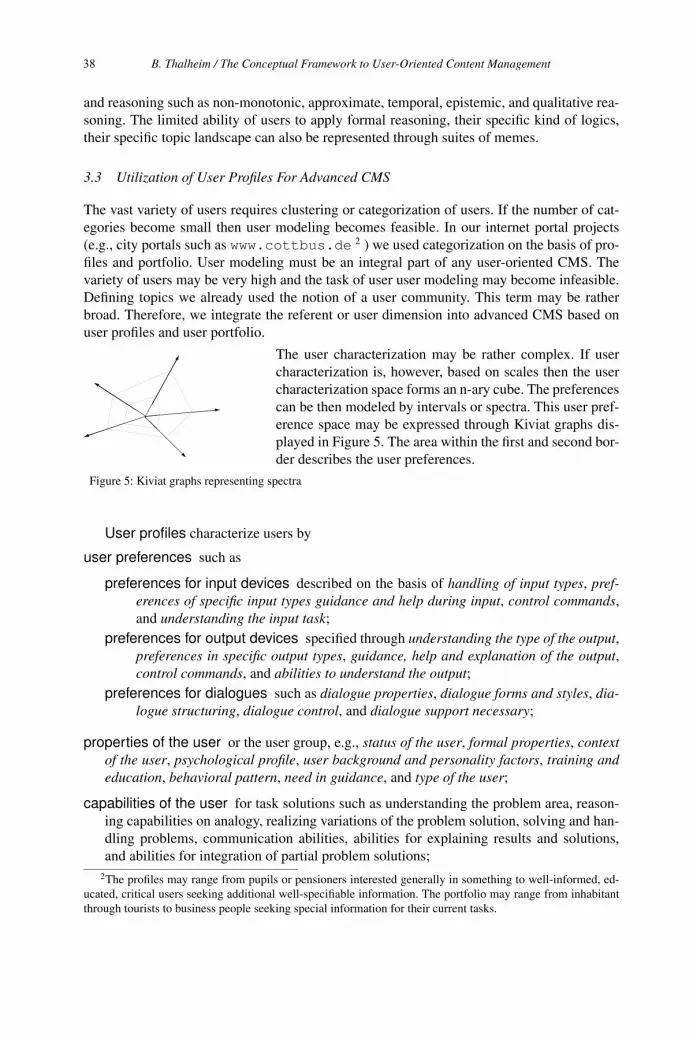
and reasoning such as non-monotonic, approximate, temporal, epistemic, and qualitative rea-
soning. The limited ability of users to apply formal reasoning, their specific kind of logics,
their specific topic landscape can also be represented through suites of memes.
3.3 Utilization of User Profiles For Advanced CMS
The vast variety of users requires clustering or categorization of users. If the number of cat-
egories become small then user modeling becomes feasible. In our internet portal projects
(e.g., city portals such as www.cottbus.de 2 ) we used categorization on the basis of pro-
files and portfolio. User modeling must be an integral part of any user-oriented CMS. The
variety of users may be very high and the task of user user modeling may become infeasible.
Defining topics we already used the notion of a user community. This term may be rather
broad. Therefore, we integrate the referent or user dimension into advanced CMS based on
user profiles and user portfolio.
Figure 5: Kiviat graphs representing spectra
The user characterization may be rather complex. If user
characterization is, however, based on scales then the user
characterization space forms an n-ary cube. The preferences
can be then modeled by intervals or spectra. This user pref-
erence space may be expressed through Kiviat graphs dis-
played in Figure 5. The area within the first and second bor-
der describes the user preferences.
User profiles characterize users by
user preferences such as
preferences for input devices described on the basis of handling of input types, pref-erences of specific input types guidance and help during input, control commands,
and understanding the input task;
preferences for output devices specified through understanding the type of the output,preferences in specific output types, guidance, help and explanation of the output,control commands, and abilities to understand the output;
preferences for dialogues such as dialogue properties, dialogue forms and styles, dia-logue structuring, dialogue control, and dialogue support necessary;
properties of the user or the user group, e.g., status of the user, formal properties, contextof the user, psychological profile, user background and personality factors, training andeducation, behavioral pattern, need in guidance, and type of the user;
capabilities of the user for task solutions such as understanding the problem area, reason-
ing capabilities on analogy, realizing variations of the problem solution, solving and han-
dling problems, communication abilities, abilities for explaining results and solutions,
and abilities for integration of partial problem solutions;
2The profiles may range from pupils or pensioners interested generally in something to well-informed, ed-
ucated, critical users seeking additional well-specifiable information. The portfolio may range from inhabitant
through tourists to business people seeking special information for their current tasks.
B. Thalheim / The Conceptual Framework to User-Oriented Content Management38
knowledge of the user, e.g., application knowledge depending on application type, appli-
cation domain, application structuring, and application functions;
privacy restrictions users apply to partners, to general public, or to specific content;
task knowledge, especially task expertise and task experience;
system knowledge depending on the systems to be explored and used.
This user characterization seems to be very complex at the first glance. We may, how-
ever, restrict our specification of user characteristics to linearly ordered domain types. For
instance, type of users may be ‘casual user’, ‘novice user’, ‘knowledgeable intermittent user’
and ‘expert user’ thus forming a scale.
We extend for this purpose the view definition by parameters that provide the flexibility
for meeting the user characteristics. In the next Section we explore how this facility may be
implemented.
3.4 Natural Language Foundation For User Portfolio
A portfolio consists of
• a specification of tasks,
• a specification of the context [ST05] of the actor,
• a specification of rights, prohibition, and obligations,
• a specification of the role of actors3, and
• execution models for fulfilling the requirements including priorities and time and resource
restrictions.
The task is given by [Pae00]
• a specification of current and target states,
• a characterization of goals of the task,
• a number of operations that might be used to achieve the task,
• a metrics for evaluation of distance from the target state and the progress of completion,
• a characterization of knowledge necessary for completing the task, and
• a set of control frames characteristically used for completion of the task.
The workflow of a task completion may be specified through UML activity diagrams or Site-
Lang scenario [ST05].
Now the portfolio for users can be given by a set of parameterized views. Using this
facility we meet the requirements of users in a flexible form. The next section is, thus, devoted
to the conceptual development of the framework for the mapping functions.
User express their questions, their update requirements, and their input or deletion on the
basis of natural language utterances relating memes to topics, their understanding of chunks
3Actors are abstractions of groups of users that have the same intention and share goals.
B. Thalheim / The Conceptual Framework to User-Oriented Content Management 39
of logical theories and their views on the media objects. The development of user function-
ality may be based on the narrative expressibility of users. This expressibility is based on
natural languages. In Indo-European languages verbs express activities. Activities of users
may be characterized by verbs of action [Hau00] such as buy, learn, and inform, ergative
verbs such as escape, process verbs such as fall asleep (ingressive verbs) and wither (regres-
sive processes) and verbs describing a state such as sleep or have.
For modeling activities of users of advanced CMS we are concentrating on the first and
last groups. Within these groups we distinguish with [Kun92]
(1) verbs describing what takes place,
(2) verbs of increasing properties of states,
(3) verbs of coincidence/differentiation,
(4) verbs of communication,
(5) verbs of argumentation,
(6) verbs of agreement,
(7) verbs of chairing,
(8) verbs of collaboration,
(9) verbs of sensuous observation,
(10) verbs of nutrition, and
(11) verbs of cleaning.
The first eight groups are relevant for CMS and may be used for functionality development.
The functionality of advanced CMS may be based on discourse types known from con-
versation theory:
Actions: The partner is requested to do something.
Clarification: The semantics of a partial topic map is becoming specialized and derived.
Decision: The partners agree on next steps to be taken.
Orientation: An orientation for the next actions of the partner is provided.
We can, thus specify a CMS portfolio of the user by and algebraic expression of SiteLang
with the basic portfolio elements given by
Tasks to be completed by the user,
Context of the user within the portfolio,
Rights, obligations, and prohibitions for the given step,
Discourse types such as action, clarification, decision, or orientation,
Excution model to be applied for the user step.
B. Thalheim / The Conceptual Framework to User-Oriented Content Management40
3.5 Handling The Vast Variety of Usage Invocations
Modeling of the referent dimension is currently considered one of the most difficult tasks or
often considered to be infeasible. The complex behavior of the user may be modeled through
the story space [ST05] that describes portfolio under consideration and supports adaptation to
users. Based on the approach developed in this section we are able to overcome this problem
by
collecting the actual profiles and portfolio of current users depending on the actual usage,
integrating the actual usage into the usage star that consists of a combined profile and a suite
of interrelated portfolios, and
assembling the topic landscape based on usage stars by associating the user memes to those
topics that correspond to user communities which work on tasks that are related to tasks
within the usage star and that are supporting users of the profile that is valid for the current
user and collected within the usage star.
Given a user u. The user u has a profile or a number of profiles which can be combined
through nesting4 into CurrProfile(u). Furthermore, given a set CurrPortfolio(u) of cur-
rent portfolio of this user. We may now use the star type UsageStar(u) [Tha04a] that com-
bine the common properties and tasks of the user u and the portfolios.
For instance, a user Thalheim that currently works on conference paper evaluation of pa-
pers p1, ..., pk (decision), seeks for information on authors a1, ..., al (clarification), requests
for papers on topics t1, ..., tm (orientation), compares the paper results with results r1, ..., rn
(orientation), uses an email system (actions) etc. and uses the profile of an informed Linux
user in a high speed environment. This usage star may be now associated to the combined
topic landscape that contains t1, ..., tm together with their related topics of distance less than
3, the search interfaces of engines accessible in his current environment or paid on the basis
of his profile. The topic landscape is explained through concepts c1, ..., co and associated with
the media objects for paper evaluation, with the media objects that are related to the papers
of the authors or on the topics of interest.
3.6 Approaches for Coping With User Understanding and Abilities
Classically, reasoning of users is associated with deduction that is based on first-order predi-
cate logics. This approach is far too strict. For this reason we develop a more flexible approach
to user reasoning. Reasoning of users can be characterized by their specific abilities to relate
memes to each other. Reasoning might depend on the knowledge, experience, capabilities of
users to reason.
So, the first step consists of the development of an adequate logics that may be different
of the one of classical logics usually forced to be used:
• Users use denotations for representing their observations and belief on the reality. These
denotations can be mapped to variables. The signification (intension and comprehension)
4Depending on the profile specification we may assume that the current profiles of a user are given by a set
of ER objects that may be combined into a complex nested object. The operations developed for advanced ER
models (e.g., join, product, unnest, nest, rename, difference, set operations [Tha00]) may be used to define the
profile combination operations.
B. Thalheim / The Conceptual Framework to User-Oriented Content Management 41
and the meaning (reference, etendue) of these variables may vary depending on the user
world and the user memes we are considering.
• The logical connectives ¬,∧,∨ and the quantifiers ∀, ∀timecontext,∃ and their logical conse-
quences (e.g., α ∧ β |= β |= β ∨ γ) may be different depending on the scope of the user
world and their memes.
• Identity, existence and identification vary in users world.
• Classical predicates such as <,>, =,≤,≥ may neither be complete nor transitive. The
predicate �= may be transitive or anti-symmetric.
• Implication may be understood in a large variety. We may distinguish between material
implication, weak implication, strong implication, and logical implication.
• Reasoning of users may be based on closed-world or open-world assumptions.
• User may use qualitative reasoning instead of logical reasoning.
• Compositionality of connectives may only be partially accepted. We cannot assume in
general validity of {α, β} |= α ∧ β.
• Users, user schemata and user memes may be represented in many-dimensional spaces.
For instance, users may use some understanding of space and time. In some cases these
dimensions can be modeled by geometric or topological structures.
• Understanding and reasoning of users is context-dependent. Applications often require
adaptation of processing context, e.g. to actual environments such as client, server, and
channel currently in use, to users rights, roles, obligations, and prohibitions, to content
required for the current portfolio for the current user, to actual user with preferences, to
level of task completion depending on the user, and to users completion history.
• Utterance of users may be recursively constructed. User may use metaphors and other
rhetorical figures which meaning cannot be reconstructed based on the structure of the
utterance.
• Usage of memes may depend on the context, on the auditory, on the purpose and other
environmental parameters.
This variety may be considered to be the playground of logicians.
At the same time, users may base their reasoning on a variety of approaches. Classically,
main logical reasoning procedures are based on the three main reasoning facilities developed
for logics:
Exact reasoning by deduction uses derivation rules such as the modus ponens∀x(P (x) =⇒ Q(x)), P (a)
Q(a)for forward deduction and derivation of new formulas or for back-
ward deduction, i.e tracking back from the proof goal to axioms.
Reasoning based on induction uses a background theory B and observational data D with
the limitation B �|= D. It is based on such for a formula α that is consistent with the data
(B ∪ D �|= ¬α) and explains the data (B ∪ {α} |= D).
B. Thalheim / The Conceptual Framework to User-Oriented Content Management42

Abductive reasoning allow to derive explanations E within a set of hypotheses H (E ⊆ H)
for observations O on the basis of a logical theory Σ, i.e. we seek for a set E through
which a user may explain the observations Σ∪E |= O. We may require that the set Σ∪Eis consistent. Rules such as the pseudo modus ponens
∀x(P (x) =⇒ Q(x)), Q(a)P (a)
or the modus
tollens(α =⇒ β), β=0
α=0may be used.
In reality, however, users base their reasoning on other approaches:
Non-monotonous reasoning supports reconsideration and revision of conclusions drawn be-
fore whenever observations are changing or the belief of the user is under change. In some
case the change is only applied depending on the context of the utterance currently under
consideration.
Approximative reasoning is used whenever fuzzy, uncertain, or unsafe statement, aggrega-
tions or conclusions, or their combinations or accumulations are used. We may map such
reasoning facilities to point-wise reasoning based on certainty factor methods, Bayes,
or many-valued logics, to interval-based logics such as Dempster-Shafer logics or to
distribution-based logics such as the logic of possibilities or plausibility logics.
Temporal reasoning of users is based on their understanding of modality and time.
Epistemic reasoning allows to bind the user understanding to the current user and to handle
at the same time reasoning facilities of groups of users.
Qualitative reasoning supports the utilization of abstractions and reasoning for abstractions.
At the same time, users are used to partial inconsistencies. The classical approach is to use
para-consistent logics. We prefer to extend the theory of knowledge islands [BC95].
The extension is based on quasi-classical logics [BH95]. They support derivation of con-
clusions in the context of inconsistencies. They use the reasoning facilities sketched above
and additionally natural deduction based on the Gentzen calculus. This logics support the
unambiguous identification of each derived formula. This identification is compositional, i.e.
two derived formulas are identified by the union of their identifications. So, the user sees the
effect or impact of the conclusions drawn. A knowledge island of a user is a maximal con-
sistent set of users memes. Users may use a number of knowledge islands at the same time.
Conclusions are only drawn within the knowledge island.
At the same time, we characterize the languages we use for representation of memes and
for reasoning based on memes by different layers of adequacy:
Epistemic adequacy characterizes the expressive strength of the language used.
Heuristic adequacy uses a complexity characterization for checking whether a derivation
procedure is feasible and can be applied or whether it should not be applied.
Ergonomic adequacy considers whether a user can easily understand the reasoning facilities
and their results.
Cognitive adequacy associates derivations with the users ability to understand the conclu-
sions drawn.
Users reasoning abilities are characterized by their
B. Thalheim / The Conceptual Framework to User-Oriented Content Management 43
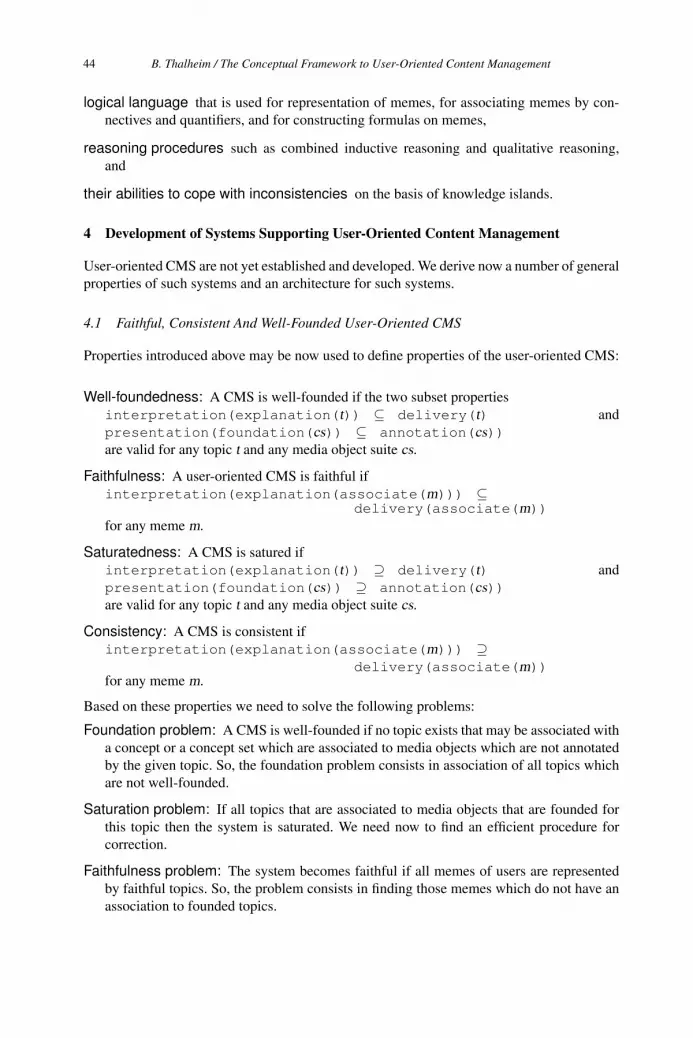
logical language that is used for representation of memes, for associating memes by con-
nectives and quantifiers, and for constructing formulas on memes,
reasoning procedures such as combined inductive reasoning and qualitative reasoning,
and
their abilities to cope with inconsistencies on the basis of knowledge islands.
4 Development of Systems Supporting User-Oriented Content Management
User-oriented CMS are not yet established and developed. We derive now a number of general
properties of such systems and an architecture for such systems.
4.1 Faithful, Consistent And Well-Founded User-Oriented CMS
Properties introduced above may be now used to define properties of the user-oriented CMS:
Well-foundedness: A CMS is well-founded if the two subset properties
interpretation(explanation(t)) ⊆ delivery(t) and
presentation(foundation(cs)) ⊆ annotation(cs))are valid for any topic t and any media object suite cs.
Faithfulness: A user-oriented CMS is faithful if
interpretation(explanation(associate(m))) ⊆delivery(associate(m))
for any meme m.
Saturatedness: A CMS is satured if
interpretation(explanation(t)) ⊇ delivery(t) and
presentation(foundation(cs)) ⊇ annotation(cs))are valid for any topic t and any media object suite cs.
Consistency: A CMS is consistent if
interpretation(explanation(associate(m))) ⊇delivery(associate(m))
for any meme m.
Based on these properties we need to solve the following problems:
Foundation problem: A CMS is well-founded if no topic exists that may be associated with
a concept or a concept set which are associated to media objects which are not annotated
by the given topic. So, the foundation problem consists in association of all topics which
are not well-founded.
Saturation problem: If all topics that are associated to media objects that are founded for
this topic then the system is saturated. We need now to find an efficient procedure for
correction.
Faithfulness problem: The system becomes faithful if all memes of users are represented
by faithful topics. So, the problem consists in finding those memes which do not have an
association to founded topics.
B. Thalheim / The Conceptual Framework to User-Oriented Content Management44
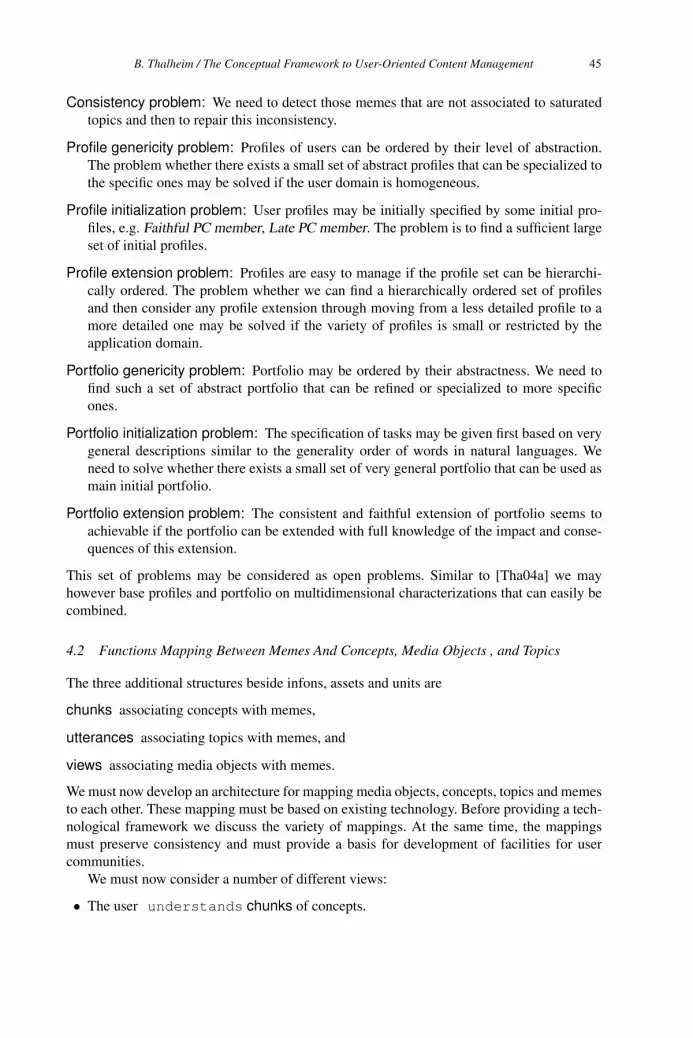
Consistency problem: We need to detect those memes that are not associated to saturated
topics and then to repair this inconsistency.
Profile genericity problem: Profiles of users can be ordered by their level of abstraction.
The problem whether there exists a small set of abstract profiles that can be specialized to
the specific ones may be solved if the user domain is homogeneous.
Profile initialization problem: User profiles may be initially specified by some initial pro-
files, e.g. Faithful PC member, Late PC member. The problem is to find a sufficient large
set of initial profiles.
Profile extension problem: Profiles are easy to manage if the profile set can be hierarchi-
cally ordered. The problem whether we can find a hierarchically ordered set of profiles
and then consider any profile extension through moving from a less detailed profile to a
more detailed one may be solved if the variety of profiles is small or restricted by the
application domain.
Portfolio genericity problem: Portfolio may be ordered by their abstractness. We need to
find such a set of abstract portfolio that can be refined or specialized to more specific
ones.
Portfolio initialization problem: The specification of tasks may be given first based on very
general descriptions similar to the generality order of words in natural languages. We
need to solve whether there exists a small set of very general portfolio that can be used as
main initial portfolio.
Portfolio extension problem: The consistent and faithful extension of portfolio seems to
achievable if the portfolio can be extended with full knowledge of the impact and conse-
quences of this extension.
This set of problems may be considered as open problems. Similar to [Tha04a] we may
however base profiles and portfolio on multidimensional characterizations that can easily be
combined.
4.2 Functions Mapping Between Memes And Concepts, Media Objects , and Topics
The three additional structures beside infons, assets and units are
chunks associating concepts with memes,
utterances associating topics with memes, and
views associating media objects with memes.
We must now develop an architecture for mapping media objects, concepts, topics and memes
to each other. These mapping must be based on existing technology. Before providing a tech-
nological framework we discuss the variety of mappings. At the same time, the mappings
must preserve consistency and must provide a basis for development of facilities for user
communities.
We must now consider a number of different views:
• The user understands chunks of concepts.
B. Thalheim / The Conceptual Framework to User-Oriented Content Management 45
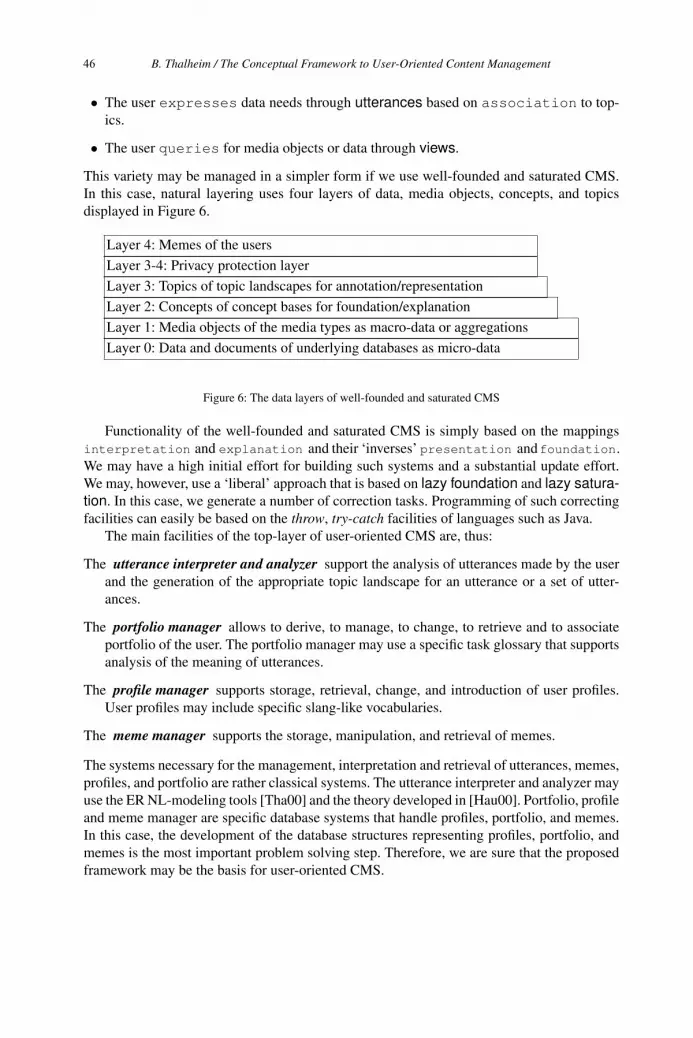
• The user expresses data needs through utterances based on association to top-
ics.
• The user queries for media objects or data through views.
This variety may be managed in a simpler form if we use well-founded and saturated CMS.
In this case, natural layering uses four layers of data, media objects, concepts, and topics
displayed in Figure 6.
Layer 0: Data and documents of underlying databases as micro-data
Layer 1: Media objects of the media types as macro-data or aggregations
Layer 2: Concepts of concept bases for foundation/explanation
Layer 3: Topics of topic landscapes for annotation/representation
Layer 3-4: Privacy protection layer
Layer 4: Memes of the users
Figure 6: The data layers of well-founded and saturated CMS
Functionality of the well-founded and saturated CMS is simply based on the mappings
interpretation and explanation and their ‘inverses’ presentation andfoundation.
We may have a high initial effort for building such systems and a substantial update effort.
We may, however, use a ‘liberal’ approach that is based on lazy foundation and lazy satura-tion. In this case, we generate a number of correction tasks. Programming of such correcting
facilities can easily be based on the throw, try-catch facilities of languages such as Java.
The main facilities of the top-layer of user-oriented CMS are, thus:
The utterance interpreter and analyzer support the analysis of utterances made by the user
and the generation of the appropriate topic landscape for an utterance or a set of utter-
ances.
The portfolio manager allows to derive, to manage, to change, to retrieve and to associate
portfolio of the user. The portfolio manager may use a specific task glossary that supports
analysis of the meaning of utterances.
The profile manager supports storage, retrieval, change, and introduction of user profiles.
User profiles may include specific slang-like vocabularies.
The meme manager supports the storage, manipulation, and retrieval of memes.
The systems necessary for the management, interpretation and retrieval of utterances, memes,
profiles, and portfolio are rather classical systems. The utterance interpreter and analyzer may
use the ER NL-modeling tools [Tha00] and the theory developed in [Hau00]. Portfolio, profile
and meme manager are specific database systems that handle profiles, portfolio, and memes.
In this case, the development of the database structures representing profiles, portfolio, and
memes is the most important problem solving step. Therefore, we are sure that the proposed
framework may be the basis for user-oriented CMS.
B. Thalheim / The Conceptual Framework to User-Oriented Content Management46
4.3 Proposing An Architecture Of A User-Oriented CMS
The broad variety of definitions of CMS and the disagreement on a common definition re-
quires to briefly introduce our understanding of content management systems and content
systems. It is based on the requirement that a content management system must be backed by
an information system.
We may envision the general architecture of a user-oriented CMS. It consists of a content
management system that uses a web playout system as shown in Figure 7. The architecture is
based on the proposal of [FT04] for content management systems and the proposal of [ST05]
for web information systems. The first proposal used the 2-layer architecture of content man-
agement that are defined over database systems by adding content services with content struc-
turing and content functionality. A content management system, thus, consists of an informa-
tion system extended by facilities for management of content suites. The second proposal has
defined web information systems through a playout facility with containers for adapted con-
tent delivery to the web playout system that uses an explicit specification of the story space.
Our new proposal generalizes an architecture to information system that has successfully
been applied in more than 30 projects resulting in huge or very large information-intensive
websites and in more than 100 projects aiming in building large information systems.
Media TypeManagement System
(Pragmatics)
Static IC
Structure
(Pragmatics)
Dynamic IC
Processes
FunctionalityStructure
Container
Structuring Functionality
Media typesService
Web Playout System
Story Space
Scenarios
ActorsStories
Context
Concept Management System
Topic Management System
User Management System
Profilemanager
Portfoliomanager
Association generator /Natural language engine
Topicmanager
Asset manager /Infon representer
Communitymanager
Conceptmanager
Unit manager /Infon representer
Derivationengine
Mediaobjectbase
��
�
Data-base
�� Conceptbase
��
Topicland-scape
��
� �
Figure 7: Proposal for an architecture of user-oriented content management systems
This CMS is now extended by a concept management system that supports reasoning on
concepts and management of infons and units. The topic management system is an extension
of the system discussed in [TV02] and supports infons and assets. The user management
system supports user adaptation, user management, profile and portfolio management.
The architecture neatly integrates the conceptions for content and the user worlds. Infor-
mation is then representable either by the pair (meme, concepts) or by the pair (meme, topics
landscape) or by the pair (meme, media objects) or finally by the pair (meme, content).
B. Thalheim / The Conceptual Framework to User-Oriented Content Management 47

5 Conclusion
This paper does not target to develop the ultimate solution for all user-oriented CMS. We
developed a framework that allows to manage user-oriented CMS by
separating concerns in dimensions for data, logical foundations and representational (topic)
worlds,
handling each of the dimensions separately by providing sophisticated functionality for
the dimension,
adding the user worlds through explicit representation of their understandings, and
mapping facilities between the syntax, semantics, pragmatics and referent dimension.
This framework has already been partially used in our web information systems projects. The
project DigiCult (www.museen-sh.de) that already contains a CMS, a web playout system
and a topic management system is currently extended by a user management system. Within
this project we are now experimenting with the proposed framework to user-oriented CMS.
The proposed separation between the syntactical and semantical dimensions has led to the
integration of sophisticated derivational facilities into classical content management systems.
The separation between the syntactical and pragmatical dimension has already intensionally
been used in a number of commercial CMS. The separation between the semantical and prag-
matical dimensions intensionally led on the basis of AI research. The integration of the refer-
ent dimension was a dream over decades for database and information systems development.
Despite the Scandinavian school of conceptual modeling and a number of Japanese groups
working within the 5th generation project and in the Meme Media Laboratory of Hokkaido
University, the user dimension has been neglected in research. This paper provides a uniform
and feasible framework for user-oriented content management.
Acknowledgement. The author is thankful to N. Lukashev (Lomonossov University Moscov)
for discussions and the explanation of (bio)chemical foundations behind [RPZ06].
References
[AFFT05] S. S. Al-Fedaghi, G. Fiedler, and B. Thalheim. Privacy enhanced information systems. In EJC’05,
2005.
[BC95] L. Botelho and H. Coelho. Agents that rationalize their decisions. In Victor Lesser, editor, Proceed-ings of the First International Conference on Multi–Agent Systems. MIT Press, 1995.
[BH95] P. Besnard and A. Hunter. Quasi-classical logic: Non-trivializable classical reasoning from incosis-
tent information. In Symbolic and Quantitative Approaches to Reasoning and Uncertainty, pages
44–51, 1995.
[Bla99] S. Blackmore. The Meme Machine. Oxford University Press, Oxford, 1999.
[Boi01] B. Boiko. Content Management Bible. Wiley, Indianapolis, 2001.
[BST06] A. Bienemann, K.-D. Schewe, and B. Thalheim. Generalizing model driven architectures to gov-
ernment and binding genericity. In ER’06, 2006.
[Cho82] N. Chomsky. Some concepts and consequences of the theory of government and binding. MIT Press,
1982.
B. Thalheim / The Conceptual Framework to User-Oriented Content Management48

[FT04] G. Fiedler and B. Thalheim. Towards linguistic foundations of content management. In Springer,
editor, NLDB’2004, LNCS 3136, pages 348–353, 2004.
[Hau00] R. Hausser. Foundations of computational linguistics. Springer, Berlin, 2000. in German.
[Jou05] Intranet Journal. Content management system survey. http://www.intranetjournal.com/tools/km.shtml,
Nov. 2005.
[Kun92] J. Kunze. Generating verb fields. In Proc. KONVENS, Informatik Aktuell, pages 268–277. Springer,
1992. in German.
[OS96] E. Ortner and B. Schienmann. Normative language approach - a framework for understanding.
LNCS 1157, pages 261–276, Cottbus, Germany, Oct. 7 - 10, 1996, 1996. Springer, Berlin.
[Pae00] B. Paech. Aufgabenorientierte Softwareentwicklung. Springer, Berlin, 2000.
[RPZ06] E.V. Radchenko, V.A. Palyulin, and N.S. Zefirov. Local molecular parameters in quantitative
structure-activity analysis. Russian Chemical Journal, L(2):76–85, 2006.
[Sol98] A. Solvberg. Data and what they refer to. In P.P. Chen et. al, editor, Conceptual modeling: Historicalpersepectives and future trends, number 1565 in LNCS. Springer, 1998.
[SS03] J.W. Schmidt and H.-W. Sehring. Conceptual content modeling and management - the rationale of
an asset language. In Proc. PSI’03, LNCS , Springer, 2003, 2003.
[ST04] K.-D. Schewe and B. Thalheim. Structural media types in the development of data-intensive web
information systems. In W. Rahayu D. Taniar, editor, Web Information Systems, pages 34–70. IDEA
Group, 2004.
[ST05] K.-D. Schewe and B. Thalheim. Conceptual modelling of web information systems. Data andKnowledge Engineering, 54:147–188, 2005.
[Tan03] Y. Tanaka. Meme media and meme market architectures: Knowledge media for editing, distributing,and managing intellectual resources. J. Wiley, Hoboken, 2003.
[Tha00] B. Thalheim. Entity-relationship modeling – Foundations of database technology. Springer, Berlin,
2000.
[Tha03] B. Thalheim. Informationssystem-Entwicklung - Die integrierte Entwicklung der Strukturierung,
Funktionalitat, Verteilung und Interaktivitat von großen Informationssystemen. Preprint I-2003-15,
Cottbus Tech, Computer Science Institut, BTU Cottbus, 21. 9. 2003 2003.
[Tha04a] B. Thalheim. Application development based on database components. In Y. Kiyoki H. Jaakkola,
editor, EJC’2004, Information Modeling and Knowledge Bases XVI. IOS Press, 2004.
[Tha04b] B. Thalheim. The co-design framework to content specification. In W. Abramowicz, editor,
BIS’2004, pages 326–351. IEEE Press, 2004.
[Tha04c] B. Thalheim. Codesign of structuring, functionality, distribution and interactivity. In APCCM’2004,
volume 31, pages 3–12. Australian Computer Science Comm., 2004.
[TV02] B. Thalheim and V. Vestenicky. An intelligent query generator. In EJC’2002, volume Information
Modelling and Knowledge Bases XIV, pages 135–141, 2002.
Remark: Our main aim has been the development of a general theory of content management. We used the co-
design framework [Tha03] to content management. We restrict thus the bibliography only to those references
which are necessary for this paper. An extensive bibliography on relevant literature in this field can be found in
[Tha00].
B. Thalheim / The Conceptual Framework to User-Oriented Content Management 49
A Model of Digital Contents Access Control System Using Steganographic Information Hiding Scheme
Eiji Kawaguchi*1) Michiro Maeta*2) Hideki Noda*3) and Koichi Nozaki*4)
*1) KIT Senior Academy (E-Mail: )*2) Hitachi Government & Public Corporation System Engineering, Ltd. *3) Kyushu Institute of Technology *4) Nagasaki University
Abstract In the present paper we propose a model for a steganography-based digital contents access control system. It is suited for digital content creators who store their digital works in their computers and want to distribute them over the Internet where they make a complete local access control to their works. We have developed a prototype system for Windows and tested its basic performance. It worked well from a technical point of view. The novel point is that the creators don’t need to send their works to the content users. They only send keys to extract the digital works out of the image data that the users have downloaded from the creator’s home page. We are convinced that this model will serve as a new content distribution scheme for content creators in the Internet age for today and tomorrow.
1. Introduction Digital contents are created by photographers, graphic designers, illustrators, animation cartoonists, musicians, movie producers, and more. Moreover, we can say that novelists, poets, news reporters, engineers, researchers and professors are all digital content creators because they create some type of digital content by using computers. The created contents are in some cases printed out on a paper surface to make a newspaper or a book, in other cases they are put into CD disks to make music albums. Also, they are often broadcast on TV either in a free or charged manner. These are traditional styles of content distribution.
Traditional content distribution systems had many “intermediate aspects” along with the delivering steps, e.g., book publishers are responsible for price and copyright handlings, record companies for selecting musicians and sales promotions, and TV codes for keeping ethics standard of the shows. In those traditional frameworks the content creators could stay away from sales management, copyright handling, cost-cutting campaigns, and project managing. All these works were taken care of by the respective sectors involved in the content distribution process.
In the Internet age today and tomorrow, everyone can be a content creator because everyone can produce some types of digital content by computers. But still there are professional content-creators. Most of the professional-created contents will be distributed in a traditional manner. Some other professional-created and many non-professional-created contents may be directly transferred from the creator to the content-user (e.g., from a novel author to a reader) over the Internet. In this case, the creator must first publicize the information about the content. A creator will do this by uploading such information onto his “home page.” However, he cannot upload the content data there, because if once uploaded, everyone can download it free. But, it is not the situation the content creator wants to be in. He wants to have some new Internet distribution method that implements a safe uploading and downloading. The most important point is, the creator wants
M. Duží et al. (Eds.)Information Modelling and Knowledge Bases XVIII
IOS Press, 2007© 2007 The authors and IOS Press. All rights reserved.
50

to exclusively control the content distribution by himself. There is no such system available as of today.
The difference between the traditional and a new content distribution control, i.e., content access control, is the following. In a traditional method, controls are set equal for everyone. For example, if someone wants to buy a digital poster from a shop, the price is the same for everyone. The copyright terms are the same. The license expiration term, if ever, will be the same. All the controls are beyond the reach of the content creator, and he cannot respond to the users’ requests one by one in a flexible manner. The new method that we are proposing is very different. A creator needs two types of data. One is the content data itself; the other is the information data that informs the public what types of contents are where. We call the latter data “introduction-data” of the content. The introduction-data should be placed on the Internet, but the content data should not be there in a visible manner. The two type of data are different in the role, but they must be associated with each other. The important point is that the content creator is the only person who can control access to the digital contents he created. Of course he must have his own home page from where he can distribute his contents to the public.
One practical embodiment of the new method is to embed the content data, as well as some access-link information, in the introduction-data according to a steganographic embedding method that uses “Access keys.” We show the new system in this article. The organization of the rest of the paper is as follows.
In Section 2 we provide the basic idea and describe its merit. A brief introduction to steganography is given in Section 3. We illustrate an example system in Section 4 and show the operation scheme. We have developed a prototype system which is explained in Section 5. Several experimental results are described in Section 6. We have discussions and conclusions in the last two sections, 7 and 8.
2. Digital contents embedded in the Home Page images One typical example of the introduction-data is an html file having text and images located on a content-creator’s Web server. Actually, it is the content creator’s home page. The creator will proclaim that he has created novel contents (digital works), e.g., digital photo-works that are distributable on request with some charge. He will explain each piece of the photo work by an attractive caption. Then, he will say “Please contact me if you are interested. The e-mail address is here.” The home page has several images that are relatively large in size. We call such images “home page images.” All of them are downloadable from the page. But, none of the photo-works themselves are visible there. Only the thumbnails can be found.
In fact, most of his photo-works are included in his home page images in an invisible manner, i.e., embedded in the images according to a steganography using access keys. This is the reason why “relatively large” images are needed in the home page. In the thumbnail images, on the other hand, the access-link information to the actual location of the large digital works is embedded one by one. A viewer of the home page, if interested, will contact the creator directly. The creator will tell him that each piece of work is extractable from the home page images by using an “extracting program” and an “access key.” Extracting a piece of work may be charged according to the value of the piece. In that case the creator will send a key only and charge for the key, because the digital works are already uploaded on the home page for everyone to download, and the work is hidden in an embedded manner. The embedding program will be provided from a software developer as a software product. Creators will buy and use it. The extracting program, on the other hand, will appear on a website as a free program.
The merits of this content distribution scheme are as follows.
E. Kawaguchi et al. / A Model of Digital Contents Access Control System 51
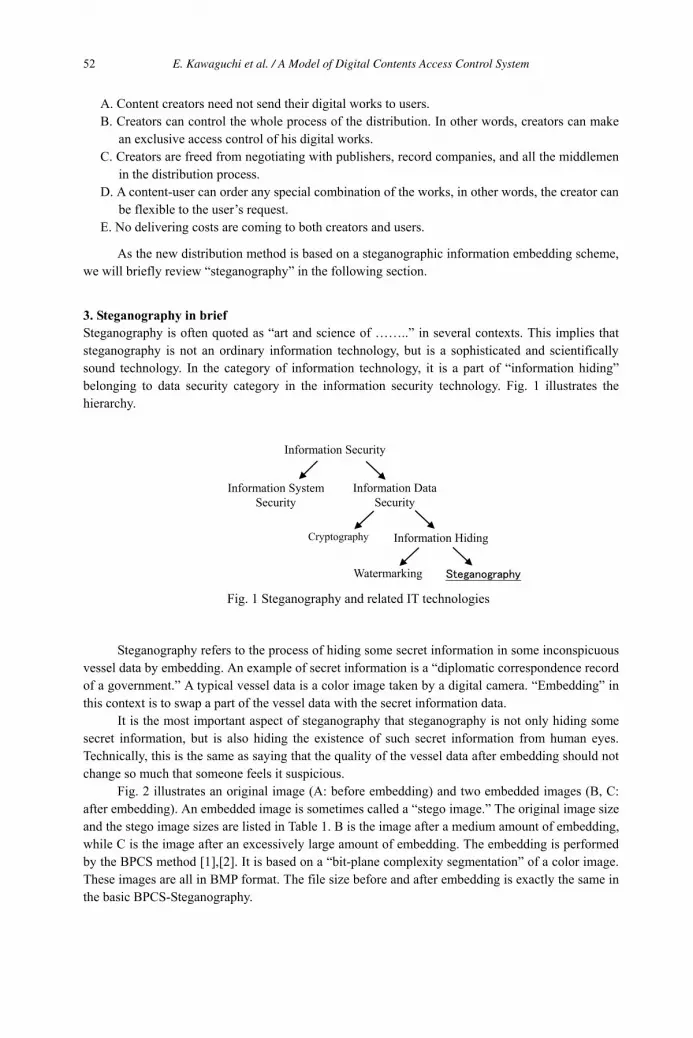
A. Content creators need not send their digital works to users. B. Creators can control the whole process of the distribution. In other words, creators can make
an exclusive access control of his digital works. C. Creators are freed from negotiating with publishers, record companies, and all the middlemen
in the distribution process. D. A content-user can order any special combination of the works, in other words, the creator can
be flexible to the user’s request. E. No delivering costs are coming to both creators and users.
As the new distribution method is based on a steganographic information embedding scheme, we will briefly review “steganography” in the following section.
3. Steganography in brief Steganography is often quoted as “art and science of ……..” in several contexts. This implies that steganography is not an ordinary information technology, but is a sophisticated and scientifically sound technology. In the category of information technology, it is a part of “information hiding” belonging to data security category in the information security technology. Fig. 1 illustrates the hierarchy.
Steganography refers to the process of hiding some secret information in some inconspicuous vessel data by embedding. An example of secret information is a “diplomatic correspondence record of a government.” A typical vessel data is a color image taken by a digital camera. “Embedding” in this context is to swap a part of the vessel data with the secret information data.
It is the most important aspect of steganography that steganography is not only hiding some secret information, but is also hiding the existence of such secret information from human eyes. Technically, this is the same as saying that the quality of the vessel data after embedding should not change so much that someone feels it suspicious.
Fig. 2 illustrates an original image (A: before embedding) and two embedded images (B, C: after embedding). An embedded image is sometimes called a “stego image.” The original image size and the stego image sizes are listed in Table 1. B is the image after a medium amount of embedding, while C is the image after an excessively large amount of embedding. The embedding is performed by the BPCS method [1],[2]. It is based on a “bit-plane complexity segmentation” of a color image. These images are all in BMP format. The file size before and after embedding is exactly the same in the basic BPCS-Steganography.
Information Security
Information System Security
Information Data Security
Information Hiding
Watermarking
Cryptography
Fig. 1 Steganography and related IT technologies
E. Kawaguchi et al. / A Model of Digital Contents Access Control System52

A (original) B (embedded, medium) C (embedded, excessive)
A’ (Upper-left part of A) B’ (Upper-left part of B) C’ (Upper-left part of C)
Images A B C
Image size (in BMP format) 376 KB 376 KB 376 KB Embedded text file size
(Compressed size) 328 KB
(106 KB)657 KB
(225 KB) Formal 0.87 1.75 Embedding
Ratio Theoretical 0.28 0.60
In the BPCS method, embedding is executed after compressing the embedding file in a lossless manner. It is a well-known fact that most text data can be compressed by 1/3 of its original size by using the ZIP or LHA algorithm. “Compressed size” in Table 1 shows such high compression. The Formal Embedding Ratio is calculated by the embedded text file size (328KB and 657KB) divided by the image size (376KB). The Theoretical Embedding Ratio is determined by the compressed size (106KB and 225KB) divided by the image size (376KB).
The difference between A and C is obvious. We see some artifacts in image C. Especially, its upper-left portion is obviously deteriorated by embedding (see C’). This was caused by an excessive embedding. It is difficult, however, to find any difference between A and B. This is because the embedding amount was almost half of that in case C.
The general properties of BPCS-Steganography are as follows.
1. Embedding capacity is very large; in other words, the quality degradation is very small. 2. Embedding/Extracting operation is fast. 3. Embedded data is fragile. 4. The details of the embedding algorithm have varieties. 5. The vessel image and the embedded data are inseparable.
Programmers can make a steganography program in many different ways. For example, it is possible to make a BPCS-Steganography program in such a way that it can embed one single file in one embedding operation. It is also possible to make it a multiple-file embedding program. Moreover, it is not very difficult to make a BPCS-program that can make a folder-and-file mixed embedding in one embedding operation. Each embedding can be done by using an embedding key. We call it an “Access Key” because access to the embedded data can be possible only by extracting it from the embedded vessel data by using a specific extracting program and a key.
Fig. 2 An original image and embedded images
Table 1 Vessel image and embedded text files
E. Kawaguchi et al. / A Model of Digital Contents Access Control System 53
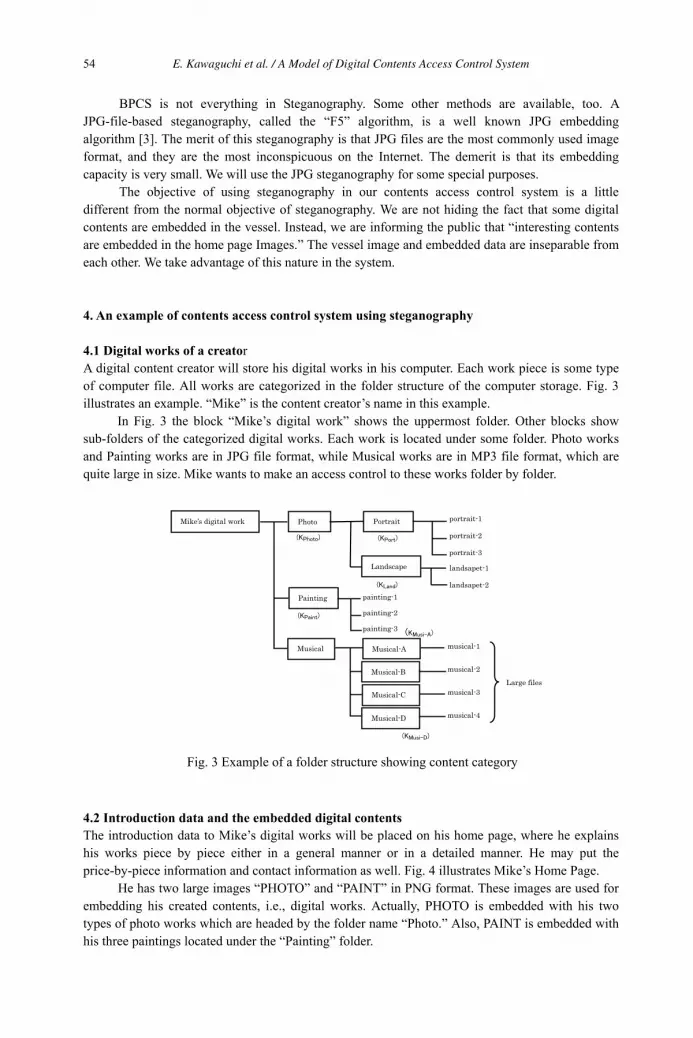
BPCS is not everything in Steganography. Some other methods are available, too. A JPG-file-based steganography, called the “F5” algorithm, is a well known JPG embedding algorithm [3]. The merit of this steganography is that JPG files are the most commonly used image format, and they are the most inconspicuous on the Internet. The demerit is that its embedding capacity is very small. We will use the JPG steganography for some special purposes.
The objective of using steganography in our contents access control system is a little different from the normal objective of steganography. We are not hiding the fact that some digital contents are embedded in the vessel. Instead, we are informing the public that “interesting contents are embedded in the home page Images.” The vessel image and embedded data are inseparable from each other. We take advantage of this nature in the system.
4. An example of contents access control system using steganography
4.1 Digital works of a creatorA digital content creator will store his digital works in his computer. Each work piece is some type of computer file. All works are categorized in the folder structure of the computer storage. Fig. 3 illustrates an example. “Mike” is the content creator’s name in this example.
In Fig. 3 the block “Mike’s digital work” shows the uppermost folder. Other blocks show sub-folders of the categorized digital works. Each work is located under some folder. Photo works and Painting works are in JPG file format, while Musical works are in MP3 file format, which are quite large in size. Mike wants to make an access control to these works folder by folder.
4.2 Introduction data and the embedded digital contentsThe introduction data to Mike’s digital works will be placed on his home page, where he explains his works piece by piece either in a general manner or in a detailed manner. He may put the price-by-piece information and contact information as well. Fig. 4 illustrates Mike’s Home Page.
He has two large images “PHOTO” and “PAINT” in PNG format. These images are used for embedding his created contents, i.e., digital works. Actually, PHOTO is embedded with his two types of photo works which are headed by the folder name “Photo.” Also, PAINT is embedded with his three paintings located under the “Painting” folder.
Fig. 3 Example of a folder structure showing content category
Mike’s digital work
Painting painting-1
painting-2
painting-3
Photo
Landscape landsapet-1
landsapet-2
Portrait portrait-1
portrait-2
portrait-3
Musical Musical-A
Musical-B
Musical-C
Musical-D
Large files
musical-1
musical-2
musical-3
musical-4
E. Kawaguchi et al. / A Model of Digital Contents Access Control System54
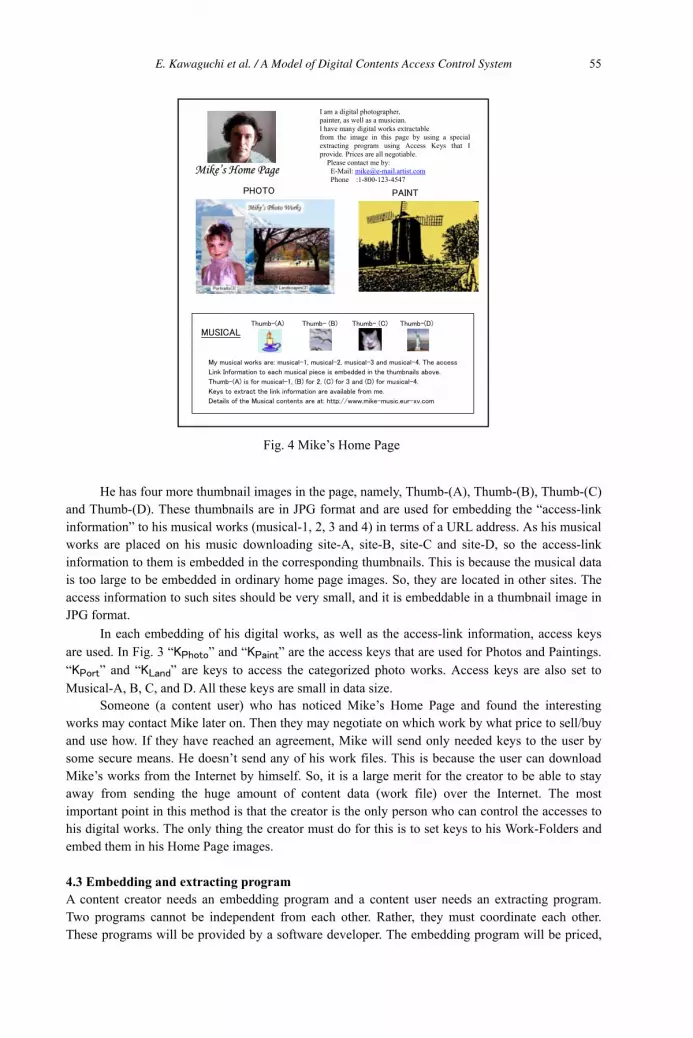
He has four more thumbnail images in the page, namely, Thumb-(A), Thumb-(B), Thumb-(C) and Thumb-(D). These thumbnails are in JPG format and are used for embedding the “access-link information” to his musical works (musical-1, 2, 3 and 4) in terms of a URL address. As his musical works are placed on his music downloading site-A, site-B, site-C and site-D, so the access-link information to them is embedded in the corresponding thumbnails. This is because the musical data is too large to be embedded in ordinary home page images. So, they are located in other sites. The access information to such sites should be very small, and it is embeddable in a thumbnail image in JPG format.
In each embedding of his digital works, as well as the access-link information, access keys are used. In Fig. 3 “ ” and “ ” are the access keys that are used for Photos and Paintings. “ ” and “ ” are keys to access the categorized photo works. Access keys are also set to Musical-A, B, C, and D. All these keys are small in data size.
Someone (a content user) who has noticed Mike’s Home Page and found the interesting works may contact Mike later on. Then they may negotiate on which work by what price to sell/buy and use how. If they have reached an agreement, Mike will send only needed keys to the user by some secure means. He doesn’t send any of his work files. This is because the user can download Mike’s works from the Internet by himself. So, it is a large merit for the creator to be able to stay away from sending the huge amount of content data (work file) over the Internet. The most important point in this method is that the creator is the only person who can control the accesses to his digital works. The only thing the creator must do for this is to set keys to his Work-Folders and embed them in his Home Page images.
4.3 Embedding and extracting program A content creator needs an embedding program and a content user needs an extracting program. Two programs cannot be independent from each other. Rather, they must coordinate each other. These programs will be provided by a software developer. The embedding program will be priced,
Mike’s Home Page
I am a digital photographer, painter, as well as a musician. I have many digital works extractable from the image in this page by using a special extracting program using Access Keys that I provide. Prices are all negotiable.
Please contact me by: E-Mail: [email protected] Phone :1-800-123-4547
Fig. 4 Mike’s Home Page
E. Kawaguchi et al. / A Model of Digital Contents Access Control System 55
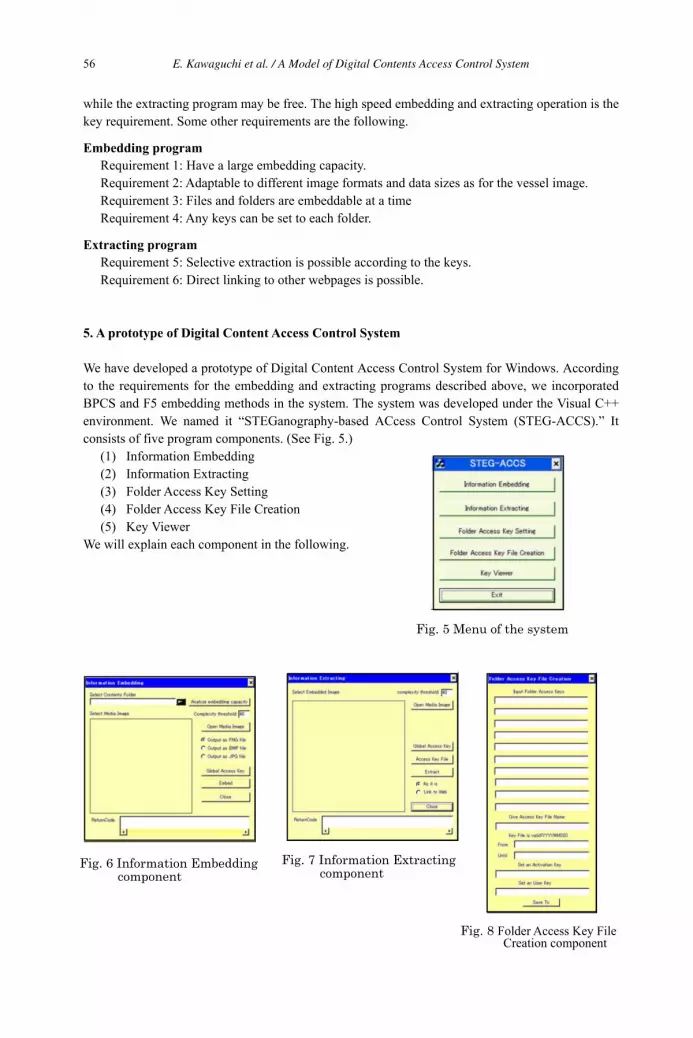
while the extracting program may be free. The high speed embedding and extracting operation is the key requirement. Some other requirements are the following.
Embedding program Requirement 1: Have a large embedding capacity. Requirement 2: Adaptable to different image formats and data sizes as for the vessel image. Requirement 3: Files and folders are embeddable at a time Requirement 4: Any keys can be set to each folder.
Extracting program Requirement 5: Selective extraction is possible according to the keys. Requirement 6: Direct linking to other webpages is possible.
5. A prototype of Digital Content Access Control System
We have developed a prototype of Digital Content Access Control System for Windows. According to the requirements for the embedding and extracting programs described above, we incorporated BPCS and F5 embedding methods in the system. The system was developed under the Visual C++ environment. We named it “STEGanography-based ACcess Control System (STEG-ACCS).” It consists of five program components. (See Fig. 5.)
(1) Information Embedding (2) Information Extracting (3) Folder Access Key Setting (4) Folder Access Key File Creation (5) Key Viewer
We will explain each component in the following.
Fig. 5 Menu of the system
Fig. 6 Information Embedding component
Fig. 8 Folder Access Key FileCreation component
Fig. 7 Information Extractingcomponent
E. Kawaguchi et al. / A Model of Digital Contents Access Control System56

5.1 Information embedding component Content-embedding is executed by the Information Embedding component shown in Fig. 6. The acceptable file types for the vessel image are BMP, PNG, and JPG. They must be in a RGB color format. The image size must be equal to or larger than 128 128 and less than or equal to 3,200 3,200 pixels. For BMP and PNG images the BPCS-embedding method is used, and for JPG images the F5 algorithm is used. The embedding data must be a folder-structure having several files and folders. One special case is having an “index.html” file right under the topmost folder. In this case the extracting program operates in a special manner. “Global Access Key” is the key to access (i.e., extract) the topmost folder. The “complexity threshold value” is a very important parameter in BPCS. It balances the embedding capacity and the image quality [2].
The output image format, i.e., the stego image format, is selected from among BMP, PNG, and JPG files. The BMP and PNG embedding schemes are exactly the same. The only difference is that a BMP stego file is not compressed after embedding, while a PNG stego file is the compressed version of the BMP output in a lossless manner. Therefore, the BMP and PNG embedding capacities are the same, and are calculable before embedding if the complexity-threshold value is provided. The threshold value can be set at any value ranging from 0 to 55. However, the default complexity threshold was set to 40. In the JPG case the embedding capacity is not calculable before embedding. In most JPG embedding the capacity falls to around 10% of the vessel image.
5.2 Information extracting component The information extracting component of the system is illustrated in Fig. 7. This component extracts the embedded data, i.e., files and folders, out of the given stego image in BMP, PNG, and JPG file formats.
The Global Access Key must be given in the same way as it was given for embedding. A Folder Access Key File (see Sec. 5.3) is a set of Folder Access Keys provided by the content creator. It makes “selective folder extraction” possible. It must be input to the system to start the extracting operation. The complexity threshold value must be given in exactly same way as it was given for embedding. The extraction mode is either “As it is” or “Link to Web.” As-it-is mode extracts the embedded data just as it was when embedded. Link-to-Web mode operates differently. In this mode, if the program finds an “index.html” file right under the top-folder, then after extracting, the program will start running that index.html file instantly. This operation can lead the system user (someone who runs the extracting program) to the WWW world directly without starting a Web browser manually. This operation can seamlessly link the content users to a special content location that is owned by the content creator, or by someone who embedded the content.
5.3 Folder Access Key setting and Folder Access Key File Creation componentsThe content data and Folder Access Key that are placed under one folder are embedded altogether in a home page image in an embedding operation. When extracting, each embedded folder is examined whether the folder should be extracted or not. This is done by matching the Folder Access Key that was embedded and the keys in the Folder Access Key File that are input by the content user. If the keys match, the folder is extracted (i.e., the contents there are extracted).
STEG-ACCS is designed for a creator to set arbitrary access keys to arbitrary content folders in his computer. For example, Mike has set , , , , , etc. to folders in Fig. 3. This key setting is done using a program component “Folder Access Key Setting” which is illustrated in Fig.5. A Folder Access Key is just a file name (can be an empty file).
When the creator sends the access keys to a content user, the keys should be scrambled to make them unreadable. The “Folder Access Key File Creation” component is implemented to do so. It combines and scrambles a set of keys and creates a Folder Access Key File. The content creator
E. Kawaguchi et al. / A Model of Digital Contents Access Control System 57
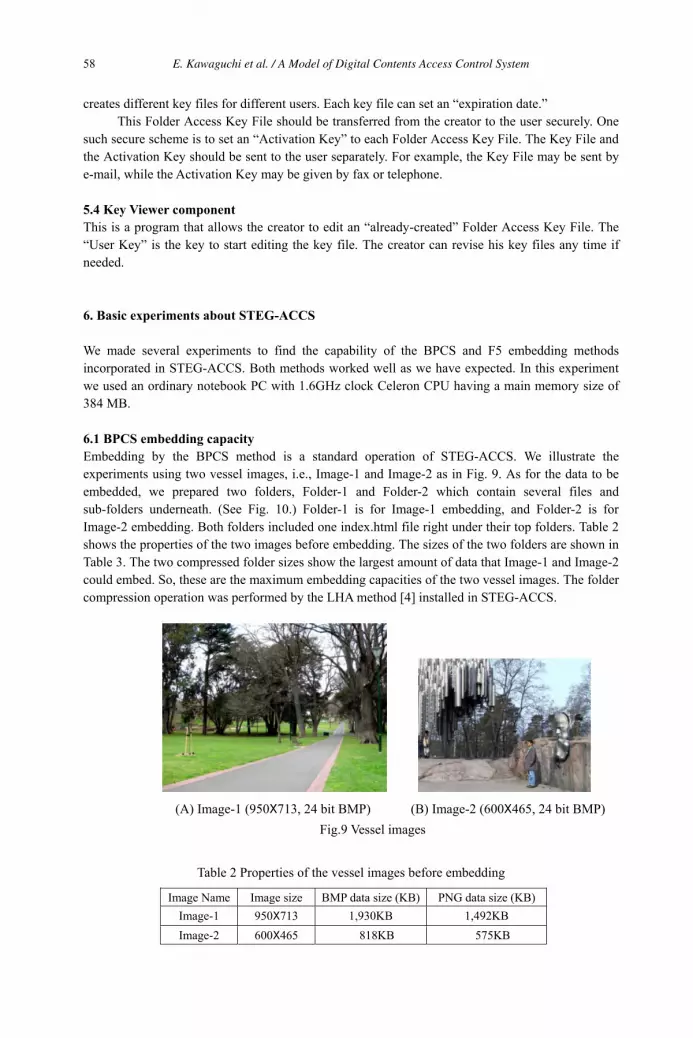
creates different key files for different users. Each key file can set an “expiration date.” This Folder Access Key File should be transferred from the creator to the user securely. One
such secure scheme is to set an “Activation Key” to each Folder Access Key File. The Key File and the Activation Key should be sent to the user separately. For example, the Key File may be sent by e-mail, while the Activation Key may be given by fax or telephone.
5.4 Key Viewer componentThis is a program that allows the creator to edit an “already-created” Folder Access Key File. The “User Key” is the key to start editing the key file. The creator can revise his key files any time if needed.
6. Basic experiments about STEG-ACCS
We made several experiments to find the capability of the BPCS and F5 embedding methods incorporated in STEG-ACCS. Both methods worked well as we have expected. In this experiment we used an ordinary notebook PC with 1.6GHz clock Celeron CPU having a main memory size of 384 MB.
6.1 BPCS embedding capacity Embedding by the BPCS method is a standard operation of STEG-ACCS. We illustrate the experiments using two vessel images, i.e., Image-1 and Image-2 as in Fig. 9. As for the data to be embedded, we prepared two folders, Folder-1 and Folder-2 which contain several files and sub-folders underneath. (See Fig. 10.) Folder-1 is for Image-1 embedding, and Folder-2 is for Image-2 embedding. Both folders included one index.html file right under their top folders. Table 2 shows the properties of the two images before embedding. The sizes of the two folders are shown in Table 3. The two compressed folder sizes show the largest amount of data that Image-1 and Image-2 could embed. So, these are the maximum embedding capacities of the two vessel images. The folder compression operation was performed by the LHA method [4] installed in STEG-ACCS.
(A) Image-1 (950 713, 24 bit BMP) (B) Image-2 (600 465, 24 bit BMP)
Image Name Image size BMP data size (KB) PNG data size (KB) Image-1 950 713 1,930KB 1,492KB Image-2 600 465 818KB 575KB
Fig.9 Vessel images
Table 2 Properties of the vessel images before embedding
E. Kawaguchi et al. / A Model of Digital Contents Access Control System58
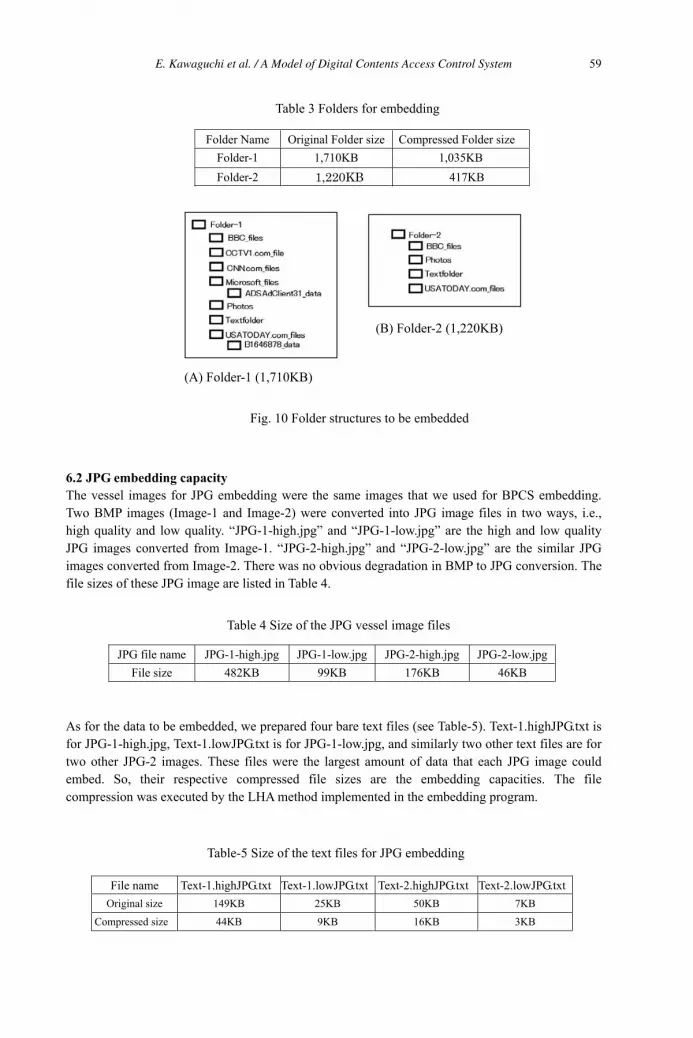
Folder Name Original Folder size Compressed Folder size Folder-1 1,710KB 1,035KB Folder-2 1,220KB 417KB
6.2 JPG embedding capacity The vessel images for JPG embedding were the same images that we used for BPCS embedding. Two BMP images (Image-1 and Image-2) were converted into JPG image files in two ways, i.e., high quality and low quality. “JPG-1-high.jpg” and “JPG-1-low.jpg” are the high and low quality JPG images converted from Image-1. “JPG-2-high.jpg” and “JPG-2-low.jpg” are the similar JPG images converted from Image-2. There was no obvious degradation in BMP to JPG conversion. The file sizes of these JPG image are listed in Table 4.
JPG file name JPG-1-high.jpg JPG-1-low.jpg JPG-2-high.jpg JPG-2-low.jpg File size 482KB 99KB 176KB 46KB
As for the data to be embedded, we prepared four bare text files (see Table-5). Text-1.highJPG.txt is for JPG-1-high.jpg, Text-1.lowJPG.txt is for JPG-1-low.jpg, and similarly two other text files are for two other JPG-2 images. These files were the largest amount of data that each JPG image could embed. So, their respective compressed file sizes are the embedding capacities. The file compression was executed by the LHA method implemented in the embedding program.
File name Text-1.highJPG.txt Text-1.lowJPG.txt Text-2.highJPG.txt Text-2.lowJPG.txt Original size 149KB 25KB 50KB 7KB
Compressed size 44KB 9KB 16KB 3KB
Fig. 10 Folder structures to be embedded
(A) Folder-1 (1,710KB)
(B) Folder-2 (1,220KB)
Table 3 Folders for embedding
Table 4 Size of the JPG vessel image files
Table-5 Size of the text files for JPG embedding
E. Kawaguchi et al. / A Model of Digital Contents Access Control System 59
6.3 From prototype system to practical system We confirmed that STEG-ACCS works very well from an embedding and extracting point of view. The idea of “folder access key setting” is very unique in this system because the content-creators will store their digital works under several folders in a categorized manner. They may want folder-by-folder access control within their content server. So, this access control scheme will fit their requirements.
However, we need more real life experiments to study the practical problems. There may be some unexpected inconveniences occurring to this prototype system. We believe we can overcome such practical problems by step-by-step improvement, and finally we can build a useful system in a near future.
7. Discussions The proposed system employs a steganographic scheme to embed content data in other vessel data to make them invisible. This is to protect the content data from being stolen from the creator’s content storage site, i.e., his home page server.
However, someone may raise a question “Why steganography? There are some other techniques to make them invisible. Cryptography may be better.”
Yes, it is possible to utilize cryptography to implement this kind of contents access control system. But, nonetheless, we think our system is better.
The merits of a steganography-based system are summarized in the following.
(1) Content identification by associative images In a steganography-based system it is easy to select a vessel image for a home page image that can easily remind the creator of the embedded content. For example, in Fig. 4, portrait works and landscape works are embedded in a “portrait-like and landscape-like” image, and painting works are embedded in a “painting-like” image. Therefore, not only by file-name, but also by the content-associative image file, the content creator can keep a good arrangement of his digital works in his home page. Moreover, he can add some text information on the home page image directly. While, in a cryptography system, contents are invisible and the content identification is made only by the file-name. It may cause some trouble.
(2) Portability of the content When a creator wants to move some content to a new page on the Webpage, he can do so just by carrying the content-embedded images file from the old page to a new page. That is, the content portability is very good.
While in a cryptography-based system, he will have to refer the “content-directory” by file-names. It could take some extra time to recover the content organization as it was. We can conclude that a steganography-based system is generally better in terms of content portability than a cryptography-based one.
(3) Variety in folder access key combinations In a steganography-based system, the embedding operation is done only once, because contents are placed under some top folder in his content server. If he has several top folders he may embed each top folder one by one. If requested by a content user, he can easily make appropriate combinations of folder access keys according to the user’s request just by collecting the relevant access keys and combining them to create one single access key file. He doesn’t need to change any part of the extraction program.
While in a cryptography-based system, when he wants to make special key combinations, he may need to change some part of the “decrypting program.” However, it is a little inconvenient.
E. Kawaguchi et al. / A Model of Digital Contents Access Control System60
By taking the merits mentioned above into account, we conclude that a steganography-based system is better than a cryptography-based one for most content creators today and tomorrow.
8. Conclusions We proposed a model of a Digital Contents Access Control System based on a steganographic information embedding scheme. This is a system most suited for digital content creators who want to make a complete access control system to his digital works according to his own policy. This is entirely different from traditional content distribution systems. Also, this is a new application of steganography which has previously been simply regarded as an information hiding technology. We have made a prototype system and conducted several embedding experiments. We combined two embedding algorithms, namely BPCS and F5, into one STEG-ACCS. We are very satisfied with its basic performance and we are convinced that this system provides a new solution to digital content creators’ problem of how to distribute their works by themselves. Also, we discussed the merit of a steganography-based system over a cryptography-based system, and pointed out several advantages of our system. We hope someone will put this system into real use.
AcknowledgementThe authors acknowledge their thanks to Dr. Richard O. Eason for his constructive advice to improve the paper.
References
[1] Eiji Kawaguchi and Michiharu Niimi, “Modeling Digital Image into Informative and Noise-Like Regions by Complexity Measure”, in Information Modelling and Knowledge Bases IX, pp.255-265, 1998.
[2] Eiji Kawaguchi and Richard O. Eason, “Principle and applications of BPCS-Steganography”, Proceedings of SPIE: Multimedia Systems and Applications Vol.3528, pp.464-473, November1-6, 1998
[3] Andreas Westfield, “F5 – A steganographic algorithm: High capacity despite better Steganalysis.” Lecture Note on Computer Science 2137, pp.289-302, 2001.
[4] http://www.csdinc.co.jp/archiver/lib/main-e.html http://www2.nsknet.or.jp/~micco/english/unlha32_e.htm
E. Kawaguchi et al. / A Model of Digital Contents Access Control System 61
An application of Semantic Information Retrieval System for
International Relations *Shiori SASAKI, ** Yasushi KIYOKI, ***Hiroyasu AKUTSU *Graduate School of Media and Governance, Keio University
** Faculty of Environmental Information, Keio University ***The Okazaki Institute
*, **5322 Endo, Fujisawa-shi, Kanagawa, JAPAN ***1-15-16 Toranomon, Minato-ku, Tokyo, JAPAN
[email protected], [email protected], [email protected]
Abstract. In this paper, we present an implementation method of a semantic information retrieval system using specialized and general knowledge and its application for the field of International Relations (IR). To realize our system, we apply the Semantic Associative Search Method to the system. The Semantic Associative Search Method makes it possible to compute semantic relationships between words and documents according to a given context dynamically. The important features of our system are distilled to the three points: 1) a user can obtain and analyze IR-related documents by using general words even if the user does not have special knowledge of IR, 2) a user can analyze both time-varying and source-specific semantics of IR-related documents, 3) a user can acquire IR-related information that maintains relevancies to IR expertise. This new semantic retrieval environment for IR field is realized by creating a semantic vector space where document data with metadata of both technical terms and general words can be mapped, and also by applying a learning system to the IR document database, which can adapt retrieval results to individual context and improve accuracy of the database. To verify the feasibility and the practical effectiveness of our system, we performed qualitative and quantitative experiments with the evaluation by IR experts.
1 Introduction One of the most important issues for researchers of a specific field of social science is how to extract appropriate information from enormous document data related to the field according to their concerns and viewpoints as well as their knowledge. In this paper, we present an information retrieval system for International Relations using the Semantic Associative Search Method [1][2][3] and a learning system with Semantic Spectrum Analyzer [4]. In this method, the acquisition of information is performed by semantic computations so that researchers can search and analyze the documents from various information resources according to their own contexts and points of view dynamically.
International Relations (IR) is a study area of the social science, which treats all interactions between state-based actors such as states, governments, social groups, corporations and individuals. The subjects of research range from history of diplomacy, security study, political economy, international law, conflict resolution, global environmental problems and problem of natural resources to science and technology. Because IR is an interdisciplinary and heterogeneous area of study, it is essential to analyze the related information not only with relevancy to IR expertise but also from various angles dynamically.
On the other hands, a large number of information resources related to IR or World Politics are distributed in the world-wide network environment, such as official announcements of governments or international organizations, policy statements, parliamentary papers, press briefings, activity reports of NGO and announcements in the form of informal talks of politicians. In this environment, one of the most important issues for researchers of international relations or world politics is how to extract appropriate
M. Duží et al. (Eds.)Information Modelling and Knowledge Bases XVIII
IOS Press, 2007© 2007 The authors and IOS Press. All rights reserved.
62
information according to their concerns and viewpoints. However, it is difficult to obtain the documents accompanied by the interpretation of the meaning and semantics of the word and data because general search engines including the category retrieval in WWW adopt a simple pattern-matching method.
It is also difficult for researchers of IR to analyze the semantic content in documents multilaterally and dynamically because existing methods in this field such as the Content Analysis [5][6][7] and the Cognitive Map [8][9] are knowledge discovery based mainly on the static character of documents. The Content Analysis and the Cognitive Map have been applied to the analyses of the cognition, attitude or images to another country of the policy makers and public opinion through published documents, such as newspapers, party organs, speeches, statements, exchange documents and letters. Though these methods are considered to be valuable and quantitative methods in political science traditionally, these methods cannot measure semantic relations between words included in document groups and semantic relations between documents automatically. Mostly because these methods were developed when there was only a limited number of published documents, these methods are premised on the situation that researchers code every sentence in a document by hand.
Therefore, there is a real need for a system with semantic computation machinery which enables to extract and obtain significant information from enormous multiple document data in current situation. In this paper, we propose an implementation method of a semantic information retrieval system for IR by applying the Semantic Associative Search Method because it enables to compute semantic relationships between words and documents according to a given context dynamically.
The important features of our system are distilled to the three points: 1) a user can obtain and analyze IR-related documents by using general words even if the user does not have special knowledge of IR, 2) a user can analyze both time-varying and source-specific semantics of IR-related documents, 3) a user can acquire IR-related information that maintains relevancies to IR expertise. This new semantic retrieval environment is realized by creating a semantic space where document data represented as metadata of both technical terms and general words can be mapped, and applying a learning system with Semantic Spectrum Analyzer which can adapt retrieval results to individual context and improve accuracy of the document database. In the Semantic Associative Search applied to the system, it might happen that the document data with the most correlated to a query are not selected. By modifying the document data to be defined as appropriate expression, the system can adapt retrieval results to individual context and improve accuracy of the document database.
We have described the current challenges in document analysis in IR field as background of our study and our basic motivation to construct the Semantic Information Retrieval System for IR in this section. We present a basic framework of our information retrieval system in the next section. In Section 3, we review the outline of the Semantic Associative Search [1][2][3] and the learning system with a Semantic Spectrum Analyzer [4]. In Section 4, we present actual system implementation according to a semantic space creation method by using specialized and general knowledge [10][11]. In Section 5, we present several experimental results to verify practical effectiveness of our system as an application and examine the value of the system in the field of IR.
2 Semantic Information Retrieval System for International Relations Figure 1 shows an overview of a Semantic Information Retrieval System for IR. This system has mainly 6 functions. (1) Document Collector:
A user (a researcher of IR field) issues a set of keywords according to his/her own concern or topics. Then, the Document Collector collects various documents related to the keywords by pattern matching from multiple document resources on the Internet, such as news archives, official governmental website or other external databases.
S. Sasaki et al. / An Application of Semantic Information Retrieval System 63
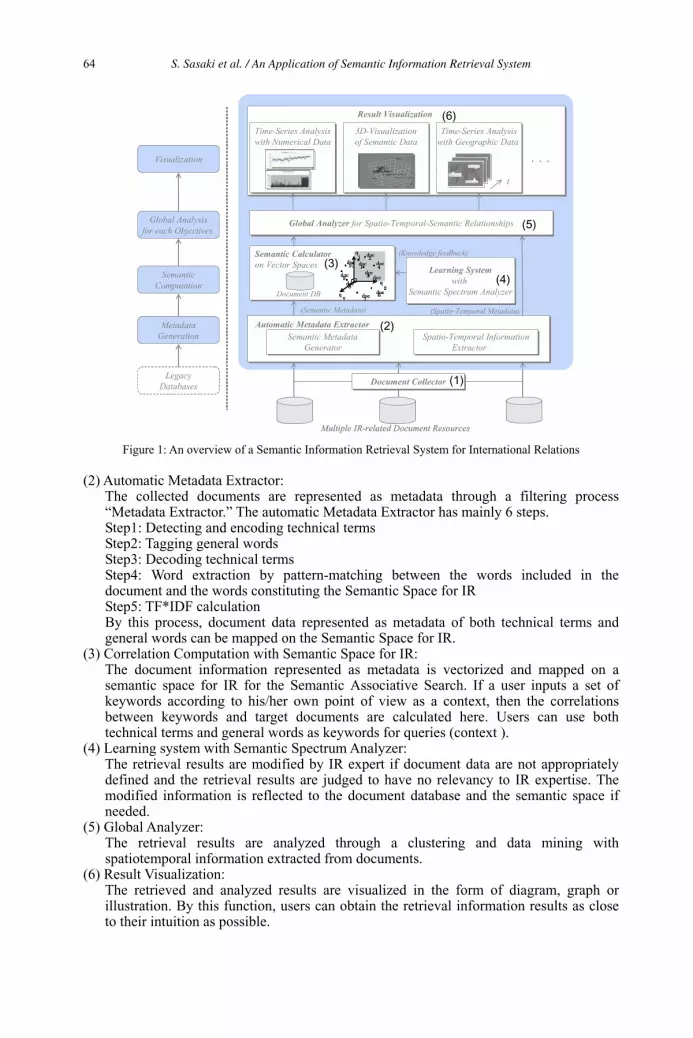
(Spatio-Temporal Metadata)
Time-Series Analysiswith Geographic Data Time-Series Analysis
with Geographic Data 3D-Visualizationof Semantic Data3D-Visualizationof Semantic Data
Time-Series Analysiswith Numerical DataTime-Series Analysiswith Numerical Data
Semantic Calculator
on Vector SpacesSemantic Calculator
on Vector Spaces
(Semantic Metadata)
Visualization
Global Analysisfor each Objectives
SemanticComputation
MetadataGeneration
LegacyDatabases
t
Global Analyzer for Spatio-Temporal-Semantic RelationshipsGlobal Analyzer for Spatio-Temporal-Semantic Relationships
(2)
(3)
(4) (5)
(5)
(6)
Multiple IR-related Document Resources
Semantic MetadataGenerator
Semantic MetadataGenerator
Spatio-Temporal InformationExtractor
Spatio-Temporal InformationExtractor
Automatic Metadata Extractor
Learning System
with Semantic Spectrum Analyzer
Learning System
with Semantic Spectrum Analyzer
(Knowledge feedback)
Document CollectorDocument Collector (1)
(2)
(4)
Result Visualization
Document DB
q1
q2
q v
doc2doc
doc7doc
doc10
doc8
doc9 doc5doc3
doc1 4
6
q1
q2
q v
q1
q2
q v
doc2doc
doc7doc
doc10
doc8
doc9 doc5doc3
doc1 4
6
doc2doc
doc7doc
doc10
doc8
doc9 doc5doc3
doc1 4
6
Figure 1: An overview of a Semantic Information Retrieval System for International Relations
(2) Automatic Metadata Extractor: The collected documents are represented as metadata through a filtering process “Metadata Extractor.” The automatic Metadata Extractor has mainly 6 steps. Step1: Detecting and encoding technical terms Step2: Tagging general words Step3: Decoding technical terms Step4: Word extraction by pattern-matching between the words included in the document and the words constituting the Semantic Space for IR Step5: TF*IDF calculation By this process, document data represented as metadata of both technical terms and general words can be mapped on the Semantic Space for IR.
(3) Correlation Computation with Semantic Space for IR: The document information represented as metadata is vectorized and mapped on a semantic space for IR for the Semantic Associative Search. If a user inputs a set of keywords according to his/her own point of view as a context, then the correlations between keywords and target documents are calculated here. Users can use both technical terms and general words as keywords for queries (context ).
(4) Learning system with Semantic Spectrum Analyzer: The retrieval results are modified by IR expert if document data are not appropriately defined and the retrieval results are judged to have no relevancy to IR expertise. The modified information is reflected to the document database and the semantic space if needed.
(5) Global Analyzer: The retrieval results are analyzed through a clustering and data mining with spatiotemporal information extracted from documents.
(6) Result Visualization: The retrieved and analyzed results are visualized in the form of diagram, graph or illustration. By this function, users can obtain the retrieval information results as close to their intuition as possible.
S. Sasaki et al. / An Application of Semantic Information Retrieval System64
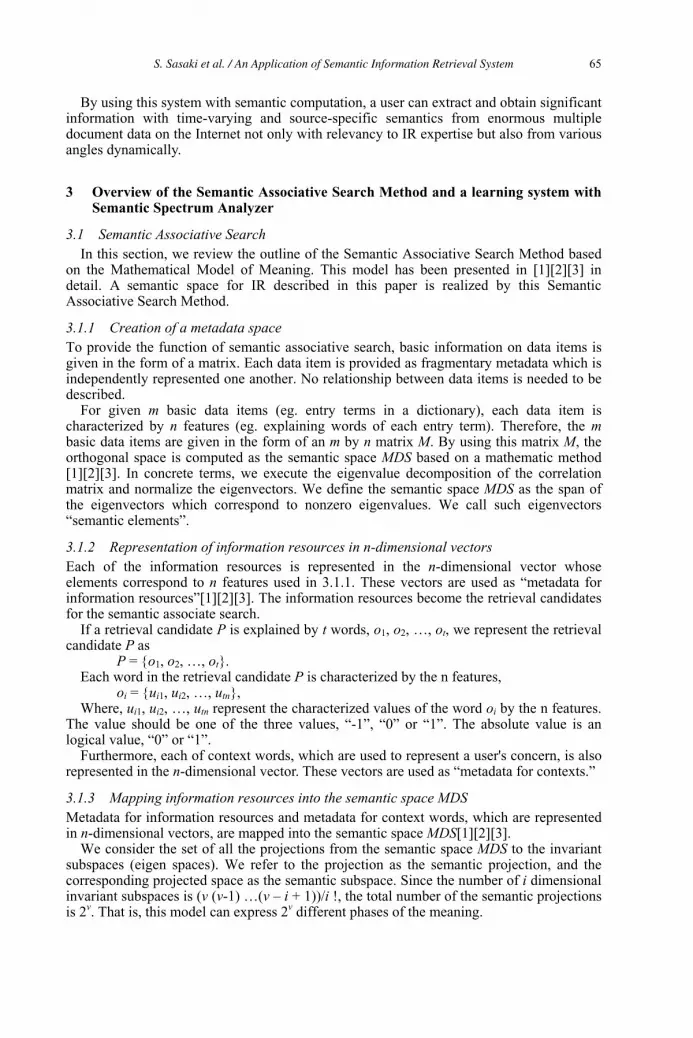
By using this system with semantic computation, a user can extract and obtain significant information with time-varying and source-specific semantics from enormous multiple document data on the Internet not only with relevancy to IR expertise but also from various angles dynamically.
3 Overview of the Semantic Associative Search Method and a learning system with Semantic Spectrum Analyzer
3.1 Semantic Associative Search In this section, we review the outline of the Semantic Associative Search Method based
on the Mathematical Model of Meaning. This model has been presented in [1][2][3] in detail. A semantic space for IR described in this paper is realized by this Semantic Associative Search Method.
3.1.1 Creation of a metadata space To provide the function of semantic associative search, basic information on data items is given in the form of a matrix. Each data item is provided as fragmentary metadata which is independently represented one another. No relationship between data items is needed to be described.
For given m basic data items (eg. entry terms in a dictionary), each data item is characterized by n features (eg. explaining words of each entry term). Therefore, the mbasic data items are given in the form of an m by n matrix M. By using this matrix M, the orthogonal space is computed as the semantic space MDS based on a mathematic method [1][2][3]. In concrete terms, we execute the eigenvalue decomposition of the correlation matrix and normalize the eigenvectors. We define the semantic space MDS as the span of the eigenvectors which correspond to nonzero eigenvalues. We call such eigenvectors “semantic elements”.
3.1.2 Representation of information resources in n-dimensional vectors Each of the information resources is represented in the n-dimensional vector whose elements correspond to n features used in 3.1.1. These vectors are used as “metadata for information resources”[1][2][3]. The information resources become the retrieval candidates for the semantic associate search.
If a retrieval candidate P is explained by t words, o1, o2, …, ot, we represent the retrieval candidate P as
P = {o1, o2, …, ot}. Each word in the retrieval candidate P is characterized by the n features,
oi = {ui1, ui2, …, utn},Where, ui1, ui2, …, utn represent the characterized values of the word oi by the n features.
The value should be one of the three values, “-1”, “0” or “1”. The absolute value is an logical value, “0” or “1”.
Furthermore, each of context words, which are used to represent a user's concern, is also represented in the n-dimensional vector. These vectors are used as “metadata for contexts.”
3.1.3 Mapping information resources into the semantic space MDS Metadata for information resources and metadata for context words, which are represented in n-dimensional vectors, are mapped into the semantic space MDS[1][2][3].
We consider the set of all the projections from the semantic space MDS to the invariant subspaces (eigen spaces). We refer to the projection as the semantic projection, and the corresponding projected space as the semantic subspace. Since the number of i dimensional invariant subspaces is (v (v-1) …(v – i + 1))/i !, the total number of the semantic projections is 2v. That is, this model can express 2v different phases of the meaning.
S. Sasaki et al. / An Application of Semantic Information Retrieval System 65
3.1.4 Semantic associative search: When a set of keywords (context words) and retrieval candidates are given, the mostly related information resource to the given context is extracted from a set of metadata items for information resources in MDS.
Suppose a sequence sl of l words (context words) which determines the context is given. We have constructed an operator Sp to determine the semantic projection according to the context.
We call the operator a semantic operator Sp[1][2][3].(a) First we map the l context words in databases to the semantic space MDS. This
mathematically means that we execute the Fourier expansion of the sequence sl in MDS and seek the Fourier coefficients of the words with respect to the semantic elements. This corresponds to seeking the correlation between each context word of sl
and each semantic element. (b) Then we sum up the values of the Fourier coefficients for each semantic element. This
corresponds to finding the correlation between the sequence sl and each semantic element. Since we have v semantic elements, we can constitute a v dimensional vector. We call the vector normalized in the infinity norm the semantic center of the sequence sl.
(c) If the sum obtained in (b) for a semantic element is greater than a given threshold ,we employ the semantic element to form the projected semantic subspace. We define the semantic projection by the sum of such projections.
This operator automatically selects the semantic subspace which is highly correlated with the sequence sl of the l context words which determines the context.
This model makes dynamic semantic interpretation possible. In this model, the ”meaning” is the selection of the semantic subspace, namely, the selection of the semantic projection and the “interpretation” is the best approximation in the selected subspace.
3.2 Learning System with Semantic Spectrum Analyzer In Semantic Associative Search, it might happen that the media data with the most correlated to a query are not selected. This phenomenon happens when the media data with the most correlated meaning to a query is not located in the correct location in the semantic space. It is caused when media data are not appropriately defined in the original data matrix.
In a multimedia database environment, metadata of retrieval candidate data might not be defined as appropriate semantic expression vectors in initial definitions. Therefore, a learning system which modifies the retrieval candidates to be defined as appropriate expression is needed essentially.
The followings are the processes of the leaning system which have been presented in [4] in detail.
3.2.1 Learning Processes for Vectors Expressing Media Data The target retrieval candidate data “T” which must be the most correlated to the query “a” is specified by the user.
In the computations of correlations between a query and each retrieval candidate data, the learning processes are applied when the retrieval candidate data “T” is not the most correlated to the query. The query “a” and the retrieval candidate data “T” are located in the semantic space.
In the learning processes, the retrieval candidate data “T” is modified toward the query “a” by changing (reversing) value of each element (feature) so as to make the data “T” is the most correlated to the query “a”. As the constraint in this learning, the change of location of “T” in the semantic space is minimized. This constraint is introduced to minimize the influence of learning in the semantic space.
S. Sasaki et al. / An Application of Semantic Information Retrieval System66

3.2.2 Learning Algorithm The leaning algorithm consists of the following steps.
Step-1: When a set of context words represented as a context vector is given, a semantic subspace is selected. Then, in the selected semantic subspace, each vector representing each of retrieval candidate data is mapped into the selected subspace. And norms of those retrieval candidate data representing correlations are computed, and those retrieval candidate data are ranked according to correlations in the descending order. Step-2: If the target retrieval candidate data “T”, which should be within the top ranking, is not ranked in the appropriate ranking position, the learning process is performed. As Figure 3, a table for the learning process is shown to the user. (This table represents the vector of the target retrieval candidate data “T”, and each feature of the vector is shown. The value of a feature is “-1”, “0”, or “1”. This table shows the new correlation values as norm when the user indicates to change (reverse) the value (“0 1”, “1 0”, “-1 0”,“0 -1”) of each feature, and also shows the new ranking position of “T” if the change (reverse) of the value is actually applied to the feature. That is, this table shows the influence of changing the feature value to the correlation of “T” to the query. When the change (reverse) of some feature value in the vector of “T” is indicated by the user, a new modified vector Ti is registered, to be mapped onto the semantic space. Step-3: The norm of the modified vector of “T” is computed, and retrieval candidate data are ranked again according to new correlations in the descending order. The new ranking position is checked by the user. If the new ranking position is not still appropriate to “T”, Steps 2 and 3 are performed repeatedly. If the new ranking position is appropriate to “T”, the current vector of “T” is fixed and registered, and the learning process is terminated.
4 Implementation of the Semantic Information Retrieval System for International Relations
4.1 Creation of a semantic space for IR Generally, documents related to IR such as policy statements and news articles include not only IR technical terms but also general words. Therefore, we need a semantic space where document data represented as metadata of both technical terms and general words can be projected. Furthermore, to retrieve and analyze IR related documents by using general words even if a user doesn’t have knowledge of IR, the basic technical terms and general words must be related appropriately in the semantic space. For these purposes, we have been proposed a space creation method using specialized knowledge and general knowledge in [10][11].
Figure 2 shows the structure of data matrix for creating a semantic space for IR. T-Mr is a metadata matrix which shows the “relation” between IR technical terms. For
given k basic technical terms (wT-1, wT-2, ..., wT-k), each term is characterized by m relatedfeature words (fr-1, fr-2, ..., fr-m), which correspond to primitive technical terms. On the other hand, G-Md is a metadata matrix which represents the “definition” of basic general words. For given l basic general words (wG-1, wG-2, ..., wG-l), each word is characterized by ndefining feature words (fd-1, fd-2, ..., fd-n), which correspond to primitive general words. To create an integrated matrix TG-Mrd, part G-Mr and part T-Md must be added to T-Mr and G-Md . The Part G-Mr is a partial matrix which represents the “relation” between basic general terms and related feature words of IR technical terms, and the part T-Md is a partial matrix which represents the “definition” of basic technical terms by defining feature words of general words. For a realization, here we referred to the Dictionary of International Relations [12]
(hereinafter called “IR-Dic”) that is widely used in the study of International Relations, and to the Longman Dictionary of Contemporary English [13] (hereinafter called “Longman-Dic”) as the general dictionary. The process of the realization has been presented in [6] in detail.
S. Sasaki et al. / An Application of Semantic Information Retrieval System 67
4.1.1 Creation of basic IR matrix To create T-Mr, we referred to the IR-Dic. The IR-Dic explains 716 technical terms by their definitions, sources, history, and relevance with other technical terms. Every 716 term of data items is extracted as basic technical term (wT), and only the related technical terms are
Figure 2: Structure of data matrix for the space creation
extracted as related feature words (fr) from the explanatory note of each item. Then, each basic technical term is characterized by the related feature words. “1” is set to a related feature word which appears as a positive sense in the explanation, “-1” as a negative sense, and “0” as no relation. For example, for the term “arms control,” the value 1 is set to the related feature words such as “crisis management”, “deterrence”, “disarmament”, “Cold War”, “non-proliferation”, “security regime” etc..
Through this process, the IR basic matrix T-Mr is created. It is 712 * 712 matrix consisting of 712 basic words and 712 feature words, and represents the “relation” between the basic technical terms and the related feature words. Then, the created space (hereinafter called “basic IR space”) based on this matrix consists of 710 dimensional vectors.
4.1.2 Integration of the basic IR matrix and the general words matrix To create G-Md, we referred to the Longman-Dic that explains about 56,000 general words by about 2,000 basic words. We selected 2,115 basic words as both general basic words (wG) and defining feature word (fd). Then, 2115 * 2115 matrix is created, which represent the definitions of general words in the Longman-Dic.
Next, we create part G-Mr and part T-Md to compound matrix T-Mr and matrix G-Md,Step 1: Relating the general words to the technical terms
For the creation of part G-Mr l general basic words (wG-1, wG-2, ..., w G-l) are characterized by m related feature (fr-1, fr-2, ..., fr-m). For example, the basic general word "arms" is characterized by the related feature words of IR technical terms such as "arms control", "arms race" and "arms sales". This characterization is checked by the specialists of IR according to their knowledge. Step2: Defining the technical terms by the general words
For the creation of part T-Md, k basic technical terms (wT-1, wT-2, ..., wT-k) are characterized by n defining feature words(fd -1, fd -2, ..., fd-n). As an example, the basic IR
S. Sasaki et al. / An Application of Semantic Information Retrieval System68
term "arms control" is characterized by the defining feature words such as "arms", "control", "reduce", “remove", "weapon", and "threat". When there was a word which was not extracted as the defining feature words from the IR-Dic, we looked up the word in the Longman-Dic and extracted the verb and the noun from the explanation. Step 3: Adding other words to the vertical elements
Words, which exist in neither matrix T-Mr nor matrix G-Md but appear frequently in the document groups, are added to the vertical elements as basic words, and characterized by both defining and related feature words. For example, important words such as "democracy", "economy" and "policy", which exist in neither basic IR terms nor basic general words but frequently appear in IR-related documents, were added to the vertical elements and characterized by the related and defining feature words. We referred the Longman-Dic and the IR-Dic for this process. By these processes, the new integrated matrix TG-Mrd was created. The matrix has
2,115+712 basic words in the vertical elements and 2,861 feature words in the horizontal elements. The created orthogonal image space based on the matrix (hereinafter called the “Semantic Space for IR”) consists of 2,846 dimensional vectors.
By using this Semantic Space for IR, it is possible to retrieve documents related to IR include not only IR technical terms but also general words. And also it is possible to retrieve and analyze IR-related documents by using general words even if a user does not have knowledge of IR. We consider these points help both researchers and students to study document analysis in IR field.
4.2 Metadata Extraction To retrieve highly-specialized information from various and enormous information resources automatically, it is necessary to extract metadata from document data appropriately and precisely. Especially, technical terms are often complex words so that tagging process needs careful preparations.
The function of Metadata Extraction of this system is equipped with the following filtering process.
Step1: By using a list of synonymous words, every synonym of technical terms is detected and encoded. For example, “United Nations”, “U.N.” and “UN” are all encoded such as “YYY701”.
Step2: Other general words in conjugation and plural form are reverted to the original form by tagging method.
Step3: By using a reversed list of synonymous words used in Step 1, every encoded technical term is decoded to the form of “metadata for information resources” in 3.1.3. For example, “United Nations”, “U.N.” and “UN” encoded as “YYY701” in Step1 is decoded as “united-nations” in the form of basic technical words constituting the created semantic space for IR.
Step4: Words included in the document are extracted by pattern-matching between the words constituting the semantic space for IR.
Step5: Term frequency (TF), document frequency (DF) and TF*IDF are calculated. Words which have TF*IDF value greater than a given threshold are employed as metadata for a retrieval candidate.
By these processes, each document data is represented as metadata of both IR technical terms and general words and mapped into the semantic space for IR.
4.3 Learning System for retrieval candidates and modifying semantic space By using the learning system explained in 3.2, we can modify the target document database and also the semantic space maintaining relevancies with IR expertise if needed. An example of leaning process is presented in Section 5.
4.4 AnalyzerAnalytical functions and Visualization are very useful and effective for practical use of information retrieval.
S. Sasaki et al. / An Application of Semantic Information Retrieval System 69
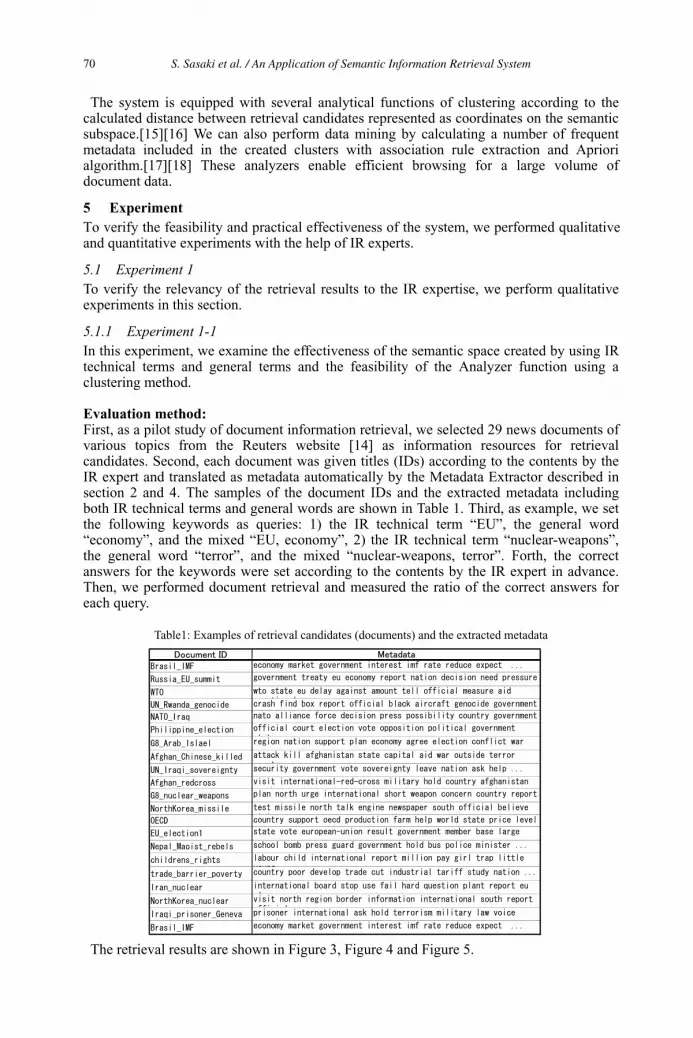
The system is equipped with several analytical functions of clustering according to the calculated distance between retrieval candidates represented as coordinates on the semantic subspace.[15][16] We can also perform data mining by calculating a number of frequent metadata included in the created clusters with association rule extraction and Apriori algorithm.[17][18] These analyzers enable efficient browsing for a large volume of document data.
5 ExperimentTo verify the feasibility and practical effectiveness of the system, we performed qualitative and quantitative experiments with the help of IR experts.
5.1 Experiment 1 To verify the relevancy of the retrieval results to the IR expertise, we perform qualitative experiments in this section.
5.1.1 Experiment 1-1 In this experiment, we examine the effectiveness of the semantic space created by using IR technical terms and general terms and the feasibility of the Analyzer function using a clustering method.
Evaluation method: First, as a pilot study of document information retrieval, we selected 29 news documents of various topics from the Reuters website [14] as information resources for retrieval candidates. Second, each document was given titles (IDs) according to the contents by the IR expert and translated as metadata automatically by the Metadata Extractor described in section 2 and 4. The samples of the document IDs and the extracted metadata including both IR technical terms and general words are shown in Table 1. Third, as example, we set the following keywords as queries: 1) the IR technical term “EU”, the general word “economy”, and the mixed “EU, economy”, 2) the IR technical term “nuclear-weapons”, the general word “terror”, and the mixed “nuclear-weapons, terror”. Forth, the correct answers for the keywords were set according to the contents by the IR expert in advance. Then, we performed document retrieval and measured the ratio of the correct answers for each query.
Table1: Examples of retrieval candidates (documents) and the extracted metadata
The retrieval results are shown in Figure 3, Figure 4 and Figure 5.
S. Sasaki et al. / An Application of Semantic Information Retrieval System70
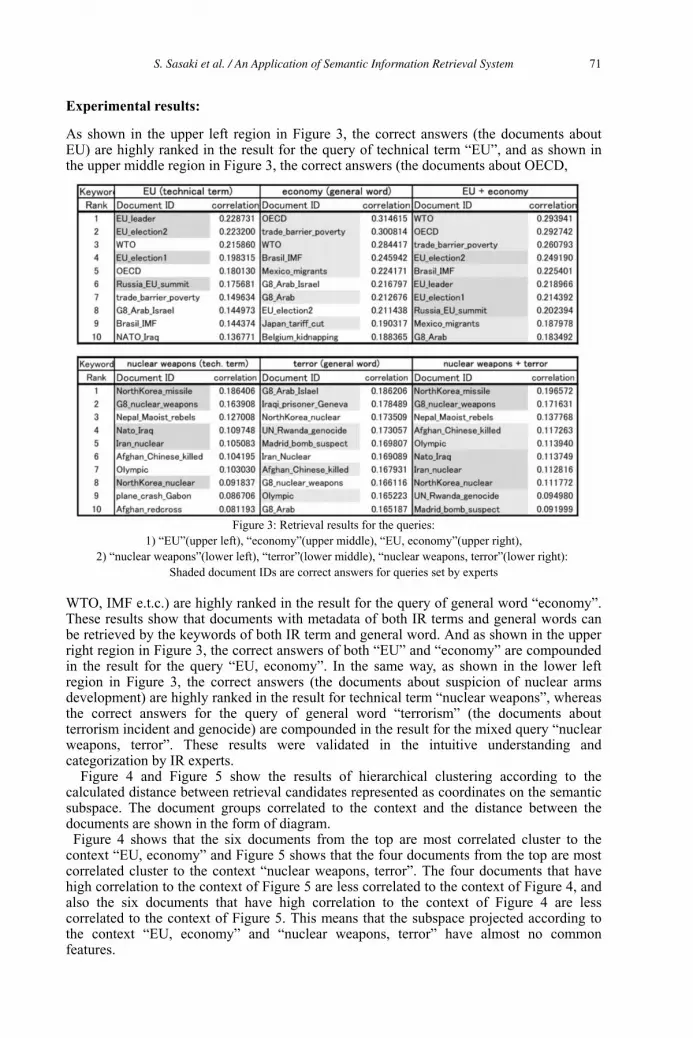
Experimental results:
s about “EU”, and as shown in
Figure 3: Retrieval results for the queries:
1) “EU”(upper left), “economy”(upper middle), “EU, economy”(upper right),
2) “nuclear weapons”(lower left), “terror”(lower middle), “nuclear weapons, terror”(lower right):
Shaded document IDs are correct answers for queries set by experts
WTO, IMF e.t.c.) are highly ranked in the result for the query of general word “economy”. These results show that documents with metadata of both IR terms and general words can be retrieved by the keywords of both IR term and general word. And as shown in the upper right region in Figure 3, the correct answers of both “EU” and “economy” are compounded in the result for the query “EU, economy”. In the same way, as shown in the lower left region in Figure 3, the correct answers (the documents about suspicion of nuclear arms development) are highly ranked in the result for technical term “nuclear weapons”, whereas the correct answers for the query of general word “terrorism” (the documents about terrorism incident and genocide) are compounded in the result for the mixed query “nuclear weapons, terror”. These results were validated in the intuitive understanding and categorization by IR experts.
Figure 4 and Figure 5 show the results of hierarchical clustering according to the calculated distance between retrieval candidates represented as coordinates on the semantic subspace. The document groups correlated to the context and the distance between the documents are shown in the form of diagram. Figure 4 shows that the six documents from the top are most correlated cluster to the context “EU, economy” and Figure 5 shows that the four documents from the top are most correlated cluster to the context “nuclear weapons, terror”. The four documents that have high correlation to the context of Figure 5 are less correlated to the context of Figure 4, and also the six documents that have high correlation to the context of Figure 4 are less correlated to the context of Figure 5. This means that the subspace projected according to the context “EU, economy” and “nuclear weapons, terror” have almost no common features.
As shown in the upper left region in Figure 3, the correct answers (the documentEU) are highly ranked in the result for the query of technical termthe upper middle region in Figure 3, the correct answers (the documents about OECD,
S. Sasaki et al. / An Application of Semantic Information Retrieval System 71

The form of diagram is intuitive and effective for researchers of social science. If the retrieval candidates are documents from various resources, it could be possible to detect which group of resources publishes similar documents.
EU_election1
EU_election2
EU_leader
Russia_EU_summit
WTO
NATO_Iraq
Afghan_Chinese_killedG8_arab_islael
OECDtrade_barrier_povertyBrasil_IMF
G8_nuclear_weaponsNorthKorea_missileNorthKorea_nuclear
Belgium_kidnapping
OlympicUN_Rwanda_genocideplane_crash_GabonJapan_tariff_cutchildrens_rights
Iran_nuclearMexico_migrantsUN_Iraqi_sovereigntyG8_arab
Madrid_bomb_suspectPhilippine_electionIraqi_prisoner_genevaNepal_maoist_rebelsAfghan_redcross
28 24 20 16 12 8 4 028 24 20 16 12 8 4 0
correlation0.834617
0.297786
0.298652
0.297786
0.312984
0.395222
0.5174880.689807
0.231786
Number of cluster
Figure 4: Clustering result for the context “EU, economy”
28 24 20 16 12 8 4 0
0.290610
0.237072
correlation0.646482
0.336721
0.376081
0.162619
0.2189
0.159822
0.288054
0.336721
G8_nuclear_weaponsNorthKorea_nuclear
Iran_nuclear
NATO_Iraq
Japan_tariff_cutplane_crash_Gabon
Mexico_migrantsNorthKorea_missile
Belgium_kidnappingUN_Rwanda_genocideOlympicchildrens_rights
Madrid_bomb_suspectBrasil_imfAfghan_redcross
Afghan_Chinese_killedNepal_maoist_rebels
G8_arab_islael
Iraqi_prisoner_geneva
UN_Iraqi_sovereigntyG8_arab
EU_election1
EU_leader
Philippine_electionEU_election2
Russia_EU_summit
trade_barrier_povertyWTO
OECD
Number of cluster 28 24 20 16 12 8 4 028 24 20 16 12 8 4 0
0.290610
0.237072
correlation0.646482
0.336721
0.376081
0.162619
0.2189
0.159822
0.288054
0.336721
G8_nuclear_weaponsNorthKorea_nuclear
Iran_nuclear
NATO_Iraq
Japan_tariff_cutplane_crash_Gabon
Mexico_migrantsNorthKorea_missile
Belgium_kidnappingUN_Rwanda_genocideOlympicchildrens_rights
Madrid_bomb_suspectBrasil_imfAfghan_redcross
Afghan_Chinese_killedNepal_maoist_rebels
G8_arab_islael
Iraqi_prisoner_geneva
UN_Iraqi_sovereigntyG8_arab
EU_election1
EU_leader
Philippine_electionEU_election2
Russia_EU_summit
trade_barrier_povertyWTO
OECD
Number of cluster
Figure 5: Clustering result for the context “nuclear weapons, terror”
S. Sasaki et al. / An Application of Semantic Information Retrieval System72
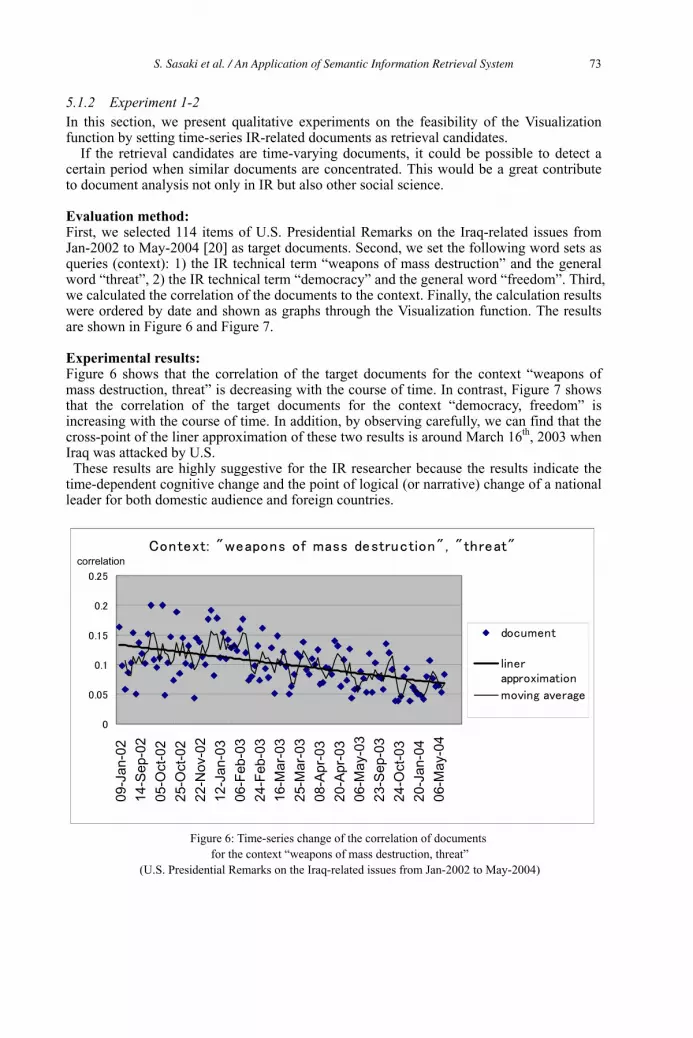
5.1.2 Experiment 1-2 In this section, we present qualitative experiments on the feasibility of the Visualization function by setting time-series IR-related documents as retrieval candidates.
If the retrieval candidates are time-varying documents, it could be possible to detect a certain period when similar documents are concentrated. This would be a great contribute to document analysis not only in IR but also other social science.
Evaluation method: First, we selected 114 items of U.S. Presidential Remarks on the Iraq-related issues from Jan-2002 to May-2004 [20] as target documents. Second, we set the following word sets as queries (context): 1) the IR technical term “weapons of mass destruction” and the general word “threat”, 2) the IR technical term “democracy” and the general word “freedom”. Third, we calculated the correlation of the documents to the context. Finally, the calculation results were ordered by date and shown as graphs through the Visualization function. The results are shown in Figure 6 and Figure 7.
Experimental results: Figure 6 shows that the correlation of the target documents for the context “weapons of mass destruction, threat” is decreasing with the course of time. In contrast, Figure 7 shows that the correlation of the target documents for the context “democracy, freedom” is increasing with the course of time. In addition, by observing carefully, we can find that the cross-point of the liner approximation of these two results is around March 16th, 2003 when Iraq was attacked by U.S. These results are highly suggestive for the IR researcher because the results indicate the time-dependent cognitive change and the point of logical (or narrative) change of a national leader for both domestic audience and foreign countries.
Figure 6: Time-series change of the correlation of documents
(U.S. Presiden o May-2004)
09
-Ja
n-0
2
14-S
ep-0
2
05
-Oct-
02
25
-Oct-
02
22-N
ov-0
2
12
-Ja
n-0
3
06
-Feb
-03
24
-Feb
-03
16-M
ar-
03
25-M
ar-
03
08
-Apr-
03
20
-Apr-
03
06-M
ay-0
3
23-S
ep-0
3
24
-Oct-
03
20
-Ja
n-0
4
06-M
ay-0
4
correlation
09
-Ja
n-0
2
14-S
ep-0
2
05
-Oct-
02
25
-Oct-
02
22-N
ov-0
2
12
-Ja
n-0
3
06
-Feb
-03
24
-Feb
-03
16-M
ar-
03
25-M
ar-
03
08
-Apr-
03
20
-Apr-
03
06-M
ay-0
3
23-S
ep-0
3
24
-Oct-
03
20
-Ja
n-0
4
06-M
ay-0
4
09
-Ja
n-0
2
14-S
ep-0
2
05
-Oct-
02
25
-Oct-
02
22-N
ov-0
2
12
-Ja
n-0
3
06
-Feb
-03
24
-Feb
-03
16-M
ar-
03
25-M
ar-
03
08
-Apr-
03
20
-Apr-
03
06-M
ay-0
3
23-S
ep-0
3
24
-Oct-
03
20
-Ja
n-0
4
06-M
ay-0
4
correlation
for the context “weapons of mass destruction, threat”
tial Remarks on the Iraq-related issues from Jan-2002 t
S. Sasaki et al. / An Application of Semantic Information Retrieval System 73
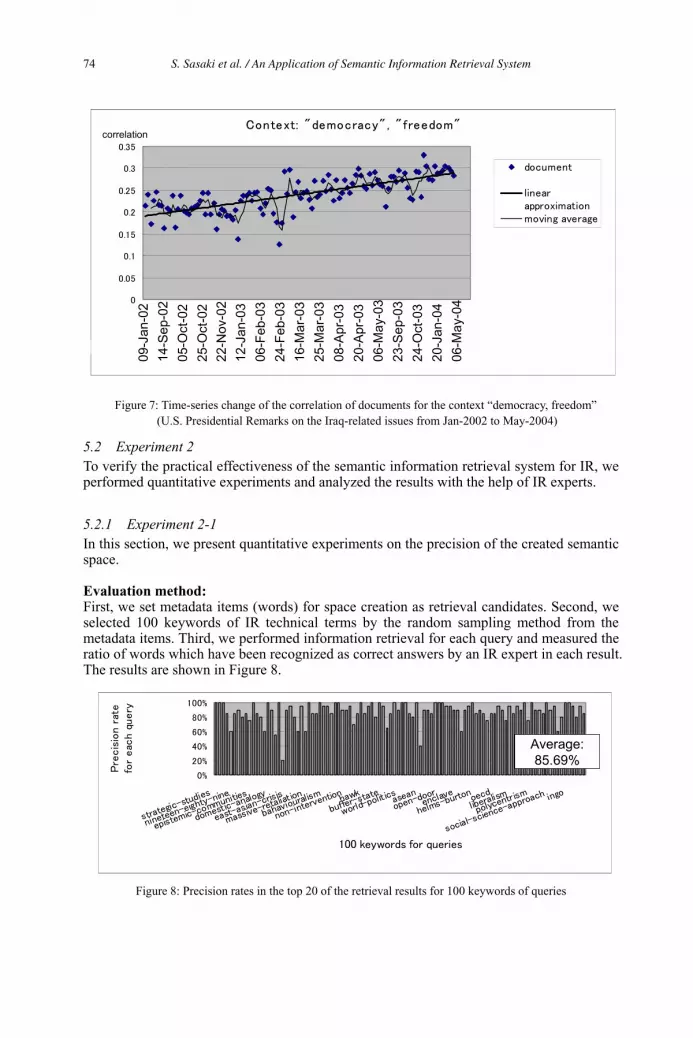
09
-Jan
-02
14
-Se
p-0
2
05-O
ct-
02
25-O
ct-
02
22-N
ov-0
2
12
-Jan
-03
06
-Feb
-03
24
-Feb
-03
16
-Ma
r-0
3
25
-Ma
r-0
3
08
-Ap
r-0
3
20
-Ap
r-0
3
06-M
ay-0
3
23
-Se
p-0
3
24-O
ct-
03
20
-Jan
-04
06-M
ay-0
4
correlation09
-Jan
-02
14
-Se
p-0
2
05-O
ct-
02
25-O
ct-
02
22-N
ov-0
2
12
-Jan
-03
06
-Feb
-03
24
-Feb
-03
16
-Ma
r-0
3
25
-Ma
r-0
3
08
-Ap
r-0
3
20
-Ap
r-0
3
06-M
ay-0
3
23
-Se
p-0
3
24-O
ct-
03
20
-Jan
-04
06-M
ay-0
4
09
-Jan
-02
14
-Se
p-0
2
05-O
ct-
02
25-O
ct-
02
22-N
ov-0
2
12
-Jan
-03
06
-Feb
-03
24
-Feb
-03
16
-Ma
r-0
3
25
-Ma
r-0
3
08
-Ap
r-0
3
20
-Ap
r-0
3
06-M
ay-0
3
23
-Se
p-0
3
24-O
ct-
03
20
-Jan
-04
06-M
ay-0
4
correlation
Figure 7: Time-series change of the correlation of documents for the context “democracy, freedom”
(U.S. Presidential Remarks on the Iraq-related issues from Jan-2002 to May-2004)
5.2 Experiment 2 To verify the practical effectiveness of the semantic information retrieval system for IR, we performed quantitative experiments and analyzed the results with the help of IR experts.
5.2.1 Experiment 2-1 In this section, we present quantitative experiments on the precision of the created semantic space.
Evaluation method: First, we set metadata items (words) for space creation as retrieval candidates. Second, we selected 100 keywords of IR technical terms by the random sampling method from the metadata items. Third, we performed information retrieval for each query and measured the ratio of words which have been recognized as correct answers by an IR expert in each result. The results are shown in Figure 8.
Average:
85.69%
Average:
85.69%
Figure 8: Precision rates in the top 20 of the retrieval results for 100 keywords of queries
S. Sasaki et al. / An Application of Semantic Information Retrieval System74
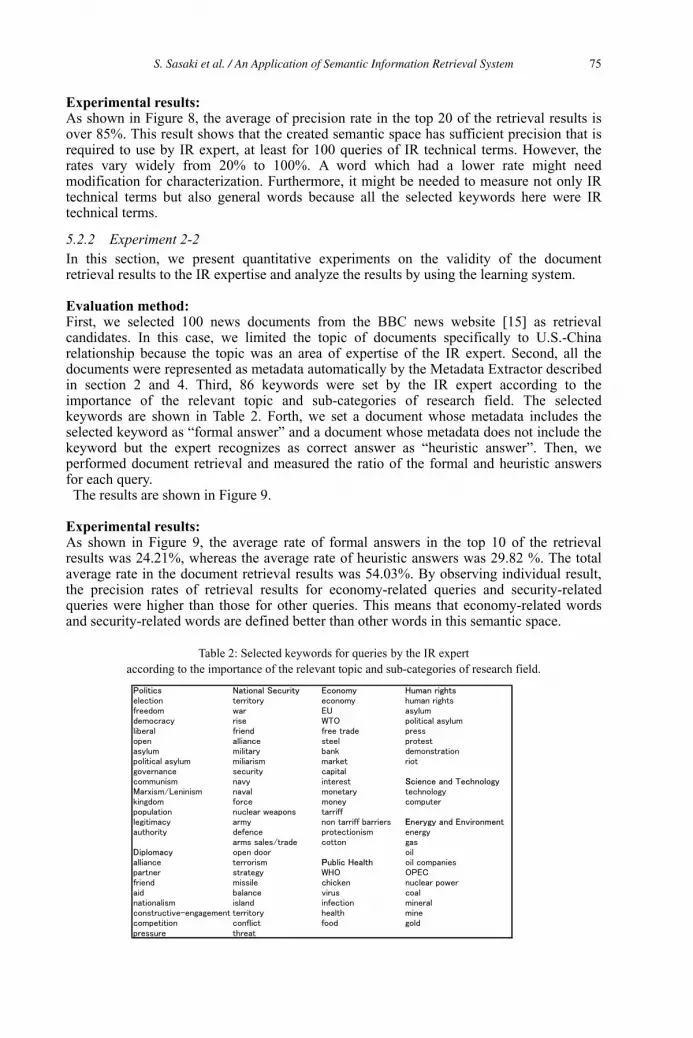
Experimental results: As shown in Figure 8, the average of precision rate in the top 20 of the retrieval results is over 85%. This result shows that the created semantic space has sufficient precision that is required to use by IR expert, at least for 100 queries of IR technical terms. However, the rates vary widely from 20% to 100%. A word which had a lower rate might need modification for characterization. Furthermore, it might be needed to measure not only IR technical terms but also general words because all the selected keywords here were IR technical terms.
5.2.2 Experiment 2-2 In this section, we present quantitative experiments on the validity of the document retrieval results to the IR expertise and analyze the results by using the learning system.
Evaluation method: First, we selected 100 news documents from the BBC news website [15] as retrieval candidates. In this case, we limited the topic of documents specifically to U.S.-China relationship because the topic was an area of expertise of the IR expert. Second, all the documents were represented as metadata automatically by the Metadata Extractor described in section 2 and 4. Third, 86 keywords were set by the IR expert according to the importance of the relevant topic and sub-categories of research field. The selected keywords are shown in Table 2. Forth, we set a document whose metadata includes the selected keyword as “formal answer” and a document whose metadata does not include the keyword but the expert recognizes as correct answer as “heuristic answer”. Then, we performed document retrieval and measured the ratio of the formal and heuristic answers for each query. The results are shown in Figure 9.
Experimental results: As shown in Figure 9, the average rate of formal answers in the top 10 of the retrieval results was 24.21%, whereas the average rate of heuristic answers was 29.82 %. The total average rate in the document retrieval results was 54.03%. By observing individual result, the precision rates of retrieval results for economy-related queries and security-related queries were higher than those for other queries. This means that economy-related words and security-related words are defined better than other words in this semantic space.
Table 2: Selected keywords for queries by the IR expert
according to the importance of the relevant topic and sub-categories of research field.
S. Sasaki et al. / An Application of Semantic Information Retrieval System 75

Figure 9: The ratio of formal and heuristic answers in the top 10 for 86 queries (average rate)
To analyze the retrieval results in details, we picked up the retrieval result for a query “alliance”. In the result, the document “4092646” is ranked in the 2nd in the ranking. The document is one of the heuristic answers because it does not have the keyword “alliance” in the metadata.
Figure 10 shows important information of the semantic elements of the original vector of the document “4092646” in the subspace projected according to the keyword of query “alliance”. The highly correlated feature to the document “4092646” and the metadata of the document related to the feature are shown.
We can find that the feature “multipolarity” contributes to the query “alliance” and the metadata of the document “defence” is related to “multipolarity”. That the reason why this document can be ranked highly in the ranking though it has not the keyword “alliance” itself in the metadata. This means that if the target documents do not have a query word itself in the metadata, you can retrieve the correlated document appropriately if the document has a feature highly correlated to the query word. We consider this is a case in point of knowledge discovering.
the related metadata (“defence”) of the document “4092646” for the query word “alliance”
5.2.3 Experiment 2-3 In this section, we present a pilot experiment on the effectiveness of the learning system for IR document database.
Evaluation method: In this experiment, we set the keyword "strategy" as a query, and analyzed the retrieval result by using the learning system with Semantic Spectrum Analyzer. The retrieval result before learning is shown as a ranking list in Figure 11 and Figure 12. As Figure 11 and Figure 12 show, the document "4537417" was ranked in ranking 2nd, but
it was not formal correct answer. The IR expert also considered that the document is less related to the context (query) "strategy" than other correct answers because it is about human rights, and it should be ranked down in the retrieval result.
Figure 10: Highly correlated feature (“multipolarity”) and
S. Sasaki et al. / An Application of Semantic Information Retrieval System76

Experimental results Figure 13 shows the semantic information of the original vector of the document "4537417" in the subspace projected according to the keyword of query "strategy". The highly correlated feature to the document “4537417” and the metadata of the document related to the feature are shown. By observing this information, we can find that the feature “opponent” contributes to increase the correlation to the query word “strategy” because the document has the related word “opinion” in the metadata. This indicate that the correlation of the document to the query “strategy” will be decreased if the value of the feature “opponent” is changed from “1” to “0”.
Figure 11: Retrieval result for
the query “strategy” before learning process
2. 4537417.txt (0.2666) opposition party offensive praise charm relation favour trip matter independence democracy wisdom divide peaceful ability willing talk world moment either invite eye guest opinion watch joint recognize together principle improve accept person important though effort past recently play election island back show meeting side refuse head home across group visit part hold end tell
#skilful action purpose1 #fight war #plan #political opponent #power fact #need capability do2 #have quality order1 time1 country1 period state1 not #offer receive willing give1 take1 good1 consider #side one1 ready1 #act state international-relations sovereignty person autonomy as1 live1 people1 make1 word1 #think #true position1 #favour#experience short1 goals surround1 earth1 #use everyone prevent try1 oppose #very #sense ago strong space1 ask #social mind1 see1 come1 example #choice course1 #judge regard2 #express #human body land1 #equal colonialism piece1 great1 before2 acceptable balance-of-power game1 occasion1 strength base1 hard2 again #better #water opposed physical1 effect1 bring rather system matter2 #influence lot1 #quiet #govern know1 character #difference value1 #possible area rights #vote member cold-war #compete liberalism base2 #belief calm1 #decide #elect #nation hear accept #likely official2 issue-area actor dependence self-determination third-world representative2 actual #wise isolationism family alternative-world-futures region good-governance world-government personal1 world-health-organization suggest public-opinion falkland-islands authority interdependence state-centrism world-law gathering #opposite world-public-opinion world-trade-organization reasoning world-politics carter-doctrine johnson-doctrine eisenhower-doctrine brezhnev-doctrine nixon-doctrine monroe-doctrine destaing-doctrine reagan-doctrine wilson-doctrine calvo-doctrine truman-doctrine gorbachev-doctrine clinton-doctrine lately world-society sub-system diplomacy #peace womp free-world new-world-order world-bank-group territory spillover decolonization
(the Shaded document IDs are correct
answers)
Figure 12: Metadata (upper part) and
the related features (lower part) of the document “4537417”
By using the interface to a user who is responsible for the learning process (expert), we can find the new correlation values when the user indicates to change (reverse) the value (“0 to 1”, “1 to 0”, “-1 to 0”, “0 to -1”) of each feature, and the new ranking position of the document if the change (reverse) of the value is actually applied to the feature. In this case, it is suggested that new ranking position is the 5th if the value of the feature “opponent” is changed from “1” to “0”.
Figure 13: Highly correlated feature (“opponent”) and
the related metadata (“opinion”) of the document “4535417” for the query “strategy”
We also performed the leaning process on the document “4595405” in the 6th, then the ranking was changed and the document “4595405” was ranked in the 10th as Figure 14 shows.
These results show that we can adapt the document database to the expertise of a certain field if the learning processes are repeatedly performed with the help of experts of the filed.
S. Sasaki et al. / An Application of Semantic Information Retrieval System 77

Figure 14: Modified retrieval result for the query “strategy” after learning process
(The shaded document IDs are correct answers)
5.2.4 Experiment 2-4 In this section, we present quantitative experiment on the effectiveness of the learning system for IR document database and examine how much the degree of precision was elevated.
Evaluation Method: First, we set the retrieval results in the Experiment 2-1 as target of learning. After the leaning processes are performed repeatedly, we recalculated the ratio of the formal and heuristic answers for each query.
The results are shown in Figure 15.
Experimental Results The average rate of formal answers in the top 10 increased from 24.21% to 36.24%, whereas the average rate of heuristic answers increased from 29.82% to 35.98%. The total average rate in the document retrieval results increased from 54.03% to 72.22%.
Figure 15: The ratio of formal and heuristic answers in the top 10 of the retrieval results
for 86 queries (average rate) after learning process
6 ConclusionIn this paper, we have presented a Semantic Information Retrieval System for International Relations and performed qualitative and quantitative experiments with the help of IR experts to verify the feasibility and the practical effectiveness of the system. This system enables users to obtain and analyze IR-related documents by using general words even if the user does not have special knowledge of IR, to analyze both time-varying and source-specific semantics of IR-related documents, and to acquire IR-related information that maintains relevancies with IR expertise. The Semantic Associative Search Method applied to the system makes it possible to compute semantic relationships between words and documents according to a given context dynamically, and a learning system with Semantic Spectrum Analyzer enables to adapt retrieval results to individual context and improve accuracy of the document database.
S. Sasaki et al. / An Application of Semantic Information Retrieval System78

As future work, we design an algorithm to detect a certain period when semantically similar documents are concentrated or a group of resources which publish semantically similar documents automatically. We also apply the clustering and data mining methods to analysis of time-varying documents and documents from various resources. This work could be a great contribute to analysis of various actors’ cognitive change and institution-specific behavior not only in International Relations but also in other study field of social science.
References [1] Kitagawa, T. and Kiyoki, Y.: The mathematical model of meaning and its application to multidatabase
systems, Proceedings of 3rd IEEE International Workshop on Research Issues on Data Engineering Interoperability in Multidatabase Systems, April 1993, 130-135.
[2] Kiyoki, Y. Kitagawa, T. and Hayama, T.: A metadatabase system for semantic image search by a mathematical model of meaning, ACM SIGMOD Record, Vol. 23, No. 4, 1994, 34-41.
[3] Kiyoki, Y., Kitagawa, T. and Hitomi, Y.: A fundamental framework for realizing semantic interoperability in a multidatabase environment, Journal of Integrated Computer-Aided Engineering, Vol.2, No.1, Jan. 1995, 3-20.
[4] Kiyoki, Y., Chen, X. and Ohashi, H.: A Semantic Spectrum Analyzer for Realizing Semantic Learning in a Semantic Associative Search Space, Information Modeliing and Knowledge Bases, (to appear) Vol. XVII, IOS Press, (accepted, 18 pages), June, 2006.
[5] Holsti and Robert C. North: Comparative Data from Content Analysis: Perception of History and Economic Variables in the 1914 Crisis, Richard L. Merritt and Stein Rokkan eds., Comparing Nations: The Use of Quantitative Data in Cross-National Research, 1966, pp.169-190.
[6] Dina A. Zinnes: A comparison of Hostile Behavior of Decision-Makers in Simulated historical Data, World Politics 18, 1966, pp474-502.
[7] Ole R. Holsti: Content Analysis, Gardner Lindzey and Elliot Aronson eds., The Handbook of Social Psychology, 1968, pp.596-632.
[8] Robert Axelrod ed., The Structure of Decision: The Cognitive Maps of Political Elites, Princeton U. P., 1976.
[9] Christer Jonsson ed., Cognitive Dynamics and International Politics, London: Frances Printer, 1982.
[10] Sasaki, S., Kiyoki, Y. and Yakushiji T..: Semantic Space Creation and Associative Search Methods for Document Databases of International Relations, Proceedings of the 7th IASTED International Conference on Internet and Multi- media Systems and Applications, August 2003, 399-405.
[11] Sasaki, S. and Kiyoki, Y.: Space Creation and Evaluation Method using Specialized and General Knowledge for Semantic Associative Search, IEEE International Symposium on Applications and the Internet (SAINT 2005) - the International Workshop on Cyberspace Technologies and Societies (IWCTS 2005), pp.434-437, IEEE Computer Society Press. (Feb. 2005).
[12] Evans, Graham and Newnham, Jeffrey, Dictionary of International Relations (Penguin Books, 1998).
[13]Longman Dictionary of Contemporary English (Longman, 1987).
[14] Reuters.com: http://www.reuters.com/
[15] Yoshida N., Kiyoki Y. and Kitagawa T., An Implementation Method of a Media Information Retrieval System with Semantic Associative Search Functions, Transactions of Information Processing Society of Japan, Vol.39, No.4, pp.911-922, 1998.
[16] Yoshida N., Zushi T., Kiyoki Y., Kitagawa T., A Context Dependent Dynamic Clustering and Semantic Data Mining Method for Document Data, Information Processing Society of Japan Transactions on Databases, Vol. 41, No. SIG 1 (TOD5), pp. 127-139, 2000.
[17] Agrawal, R., Imielinski, T., Swami, A.: Mining Association Rules betwen Sets of Items in Large Databases, Proc. of ACM SIGMOD, pp. 207-216, 1993.
[18] Agrawal, R., and Srilant, R.: Fast Algorithms for Mining Association Rules, Proc. of the 20th
International Conference on Very Large Data Bases, pp. 487-489, 1994.
[19] BBC News: http://news.bbc.co.uk/
[20] http://usinfo.state.gov/
S. Sasaki et al. / An Application of Semantic Information Retrieval System 79
Emergence of Names and Compositionality
Jaak HENNO Tallinn Technical University, Tallinn 19086, Estonia
Abstract. Here is presented an algebraic model of emergence of natural language, which defines language as the limit of a communication process in a society of agents. The heterogeneous model consists of semantic algebra Obj created by the set of attributes (elementary perceptions) and syntactic algebra L. Objects are compositional, determined by their attributes and sub-objects. Every agent amaintains its own language , which is developed in the communication process using a meaning morphism , the speech morphism
and a naming function , where is a set of names (subjective attributes, ). The model is investigated using computer modelling (language game). In the communication process agents add new words to their languages (at the beginning all and improve their meaning and speech functions using inference and disambiguation of semantics when objects are presented in different contexts. At the first stage of language creation agents use grounded messages (the message's object is included, e.g. pointed at), but on later stages they can also use ungrounded messages. Communication allows errors and several random features. If in the process of sending-receiving messages agents understanding of each other improves, i.e. error rate in recreating message's object decreases, then at the limit they create common language. It is shown, how compositionality (structure) in semantic domain creates elementary compositionality (structured denotations) also in the language. Compositionality of denotations follows from a very simple algorithm of agent's behaviour and does not require any pre-defined word categories or syntactic rules.
aL L
a a
:a am L Obj:asp Obj L :an Obj N aN
a aN L
)aL
Introduction
Computational modelling of emergence of language has become a quite popular topic in the last decade (for overview, see e.g. [1], [2], [3]). Most often has been considered emergence of protolanguage, i.e. language consisting of unconnected words, but in recent years there have appeared also papers where emergence of syntax (e.g. [4], [5], [6], [7]) is investigated.
The main method used in these papers is the so called "word games"[8], where agents are sending and receiving messages: pairs [object, word], where word denotes external object. Usually these objects either do not have any semantic structure or have very simple fixed structure (e.g. predicates used in [4]: "run<dog>", "eat<dog, meat>" or “who did what to whom”-phrases in [9]). This is the so-called “pre-lexical” state of learning of 10-15 months old children, where words are context-bound, produced only in very limited and specific situations and this creates only protolanguage[10] - a communication system with no structure (syntax), which is considered to be a precursor of modern human syntactical language.
In experimental models presented in these papers compositionality (structure) is usually handled using pre-defined, structured syntactic rules providing an explicit information for constructing meaning (e.g. "word order rules" in [4]) or assuming already existing knowledge and meaning transfer (language) structures. The appearance of this
M. Duží et al. (Eds.)Information Modelling and Knowledge Bases XVIII
IOS Press, 2007© 2007 The authors and IOS Press. All rights reserved.
80
knowledge and/or structures is not explained or is attributed to mysterious innate Language Acquisition Device (Universal Grammar) introduced by Chomsky [11] (for an overview see e.g. [12]).
By now we have already more-or-less understood how protolanguage or language with fixed structural depth can emerge. When depth and complexity of phrases are fixed beforehand (typical for robot experiments, e.g. [13]), the language is finite, i.e. only a finite structure consisting of separate expressions is considered. But the most striking feature of human language is our ability to create and understand infinite number of however complex (deep) language constructs.
Considering single words or expressions with fixed structure in messages is unnatural. We can not perceive properties (attributes) of external world separately: e.g. how to demonstrate attributes "big", "round", "red" without objects, which have these properties? But if these properties are demonstrated using some objects, then how to show that we are speaking just about size, shape or color, when the object has both these properties and many more? Showing to learner (child, robot) a red cube and saying just one word: "cube" puts learner into a very difficult situation, since learner sees many features of the object (cube): its shape, its color, its size etc and presented word "cube" leaves totally open, which of the properties of the cube the word should denote: the shape, the color, the size or something else – maybe the ground under the cube (ambiguity of pointing was discussed already in [14]). And if learner has already guessed, that objects can have names, then maybe the produced word denotes name? But names aren't even visible, can't be perceived, i.e. the produced word can denote some ideal property, which learner has itself yet invent. Word games with one word or expression with fixed structure does not help learning vocabulary in real-word situations; words in presented expression should describe several, all or at least the most important of the perceivable properties (attributes) of the real-word object. And in order to be able to construct however complex expressions word game should include also names ("apple", "table" etc). Gentner [15] studied vocabularies of children and found that all children had more object names than any other kind of words, thus names should also be included as a special kind of mental attributes.
The most distinguishing feature of human language is its compositionality: the meaning of a complex expression is determined by its structure and the meanings of its constituents, so that we can create and understand expressions, which we have not created or heard before. The definition is intuitively understandable, but closer inspection reveals several problems: what exactly is "meaning" and what means "is determined"?
Meanings are structured entities, which are composed from simple perceptions. Meanings are also names, which we use to consider these entities (collections of perceptions) as one whole. We perceive properties, attributes of real-word objects, so e.g. a meaning can be a collection of attributes "red round eatable sweet", but the same meaning can be also expressed as "sweet apple". Here "apple" is also an attribute, but this attribute is not perceived, it is a subjective attribute, name, created by users of the language. The set of objects includes also however complex (deep) structured entities which are (hierarchically) composed from simpler sub-entities and perceptions, e.g. a meaning could be denoted in ordinary language as "big blue car passed us quickly" – the whole event is considered as one structured perception, i.e. one object.
The word of "meanings" (semantics) consists of simple, elementary perceptions ("red", "round" - attributes of real-word objects), names of objects ("apple", "table") and more complex, hierarchically structured objects. The complex objects are constructed from simpler objects ("red apple is on the black table", "big car passed us") using operations ("is on", "passed", i.e. verbs), which create from simple objects more complex ones, i.e. the semantic domain is a (partial) algebra. The classification and characterization of these cognitive operations is intensively studied (see e.g. [16]), but and until now there does not
J. Henno / Emergence of Names and Compositionality 81
exist any commonly accepted system (for an example see e.g. Schank's primitive ACT's classification system [17]). Therefore here all semantic operations are generalized to one semantic constructor operation.
"Understanding", getting the meaning of a language phrase is a projection (homomorphism) from language phrases to semantic objects. The compositionality of language is a reflection of compositionality of the real word. Montague [18] presented a mathematical description of compositionality: compositionality is a homomorphism from language's expressions (denotations) to the meanings of those expressions. This allows analyzing meanings of a static, established language. But this one-way – from language expressions to meanings – mapping is not sufficient, when language is considered as a dynamic phenomen, especially when the language's emergence is considered. In the process of language creation (emergence) new language's expressions are created by speakers. If somebody wants to express something, but does not yet have a word for it, then the only way is to create a new word. And this happens often even when there is already a word to denote something – language speakers invent constantly new words and expressions. Therefore to analyze emergence of language also an mapping (homomorphism) in other direction is needed - from meanings to denotations of these meanings: speech. These two mappings are not exact inverses of each other, especially when language is created, emerges. Children language acquisition studies have shown, that children understand much more words than they actually use: "…what children say ...is a quite imperfect measure of what they know"[19], i.e. their meaning function is much better defined than their speech function.
The structure of environment creates structure and compositionality also in the denotations. The process depends on speech and meaning homomorphisms, which create from the hierarchical (compositional) structure of real-word objects (objects of the semantic algebra) similar hierarchical (compositional) structure also in denotations. The most important ability needed for creation of complex compositional expressions is ability to perform embedding, superposition of expressions and meanings [20]: "A proper lingua ex machina would be a language machine capable of nesting phrases and clauses inside one another". Similar idea was expressed lately also by Chomsky [21]: "Faculty of Language in the Narrow sense... only includes recursion and is the only uniquely human component of the faculty of language".
Here is presented an algebraic model (improvement of [22], [23]), which allows defining natural language and considering its emergence in a collection of communicating agents in precise mathematical terms. The model consists of two parts (algebras) – the algebra of objects (semantic algebra) and the syntactic algebra (denotations of semantic objects, i.e. language). Objects are defined by attributes and sub-objects; in messages these attributes are described by words from the speaker vocabulary. The communication act allows is errors and randomness: when composing a message, sender selects for his message (randomly) only several of object's attributes and/or sub-objects - we do not see things the same way and do not consider important the same features of an object. This random selection of information corresponds to ambiguity of pointing – receiver has to decide, which properties of the communication object are described in the message and does not know, what the words denote (which attributes or sub-objects). Agents can create names for objects (a subjective, unperceivable attribute); names can be used in messages. Ability to name objects is essential prerequisite for creating more and more complex syntactic structures, i.e. for the compositionality of the language. Structure (compositionality) of objects creates similar compositional structure also denotations of these objects without any pre-defined rules.
The emerging system of denotations is functionally equivalent to a language – it allows agents to communicate. But its syntactic structure (expressed only using one
J. Henno / Emergence of Names and Compositionality82
syntactic constructor) is very primitive, so this system of denotations can be considered as the "deep structure" [24] of a language.
1. Algebraic Model
1.1 The Semantic Algebra
The model is a heterogeneous structure ,{ , }Obj L Ag , where Obj is the semantic algebra of objects, Ag is the set of agents, L is the syntactic algebra (language) of agent
Ag .Semantic algebra Obj is generated by a finite set 1, 2 1 2 1 2{ ,..., , ,..., , ,...}a a b b c cA of
attributes.Elements of the set A can be interpreted as elementary senses, elementary
perceptions (attributes of real-word objects), i.e. things like "green", "flat", "sweet" etc. An object is described as an (unordered) list of attributes. These elementary senses can be combined to form bigger objects, using the semantic operator [ ] (in order to simplify presentation, only one semantic operator is used here). The semantic constructor [ ] allows to create from elementary attributes and already existing objects however complex objects with hierarchical structure, e.g. ["round", "red", "sweet",...] may be an apple, [["round", "red", "sweet"], "on", ["flat", "rectangular", "hard", "black"]] may be an object, which could be described as "red apple on a black table" and ["moves", ["blue", "car"], "quickly"] can be interpreted as an object "blue car moves quickly". The number of arguments of the operator [] is not fixed and depends on the set of arguments; the operator [ ] is partial, i.e. for some collection of arguments it can't be applied. Here are considered only binary attributes, i.e. they are either present in an object or not.
Elements O of the semantic algebra Obj, their depth d(O), size and the set of sub-objects sub(O) are defined recursively:
( )sz O
1. every a A belongs to Obj, d(a) = 0, ( ) { }sub O a , ( ) 1sz a ;
2. if , , then (sometimes) also 1 2, ,..., nO O O Obj 0n 1[ ,..., ]nO O Obj ,,1([ ,..., ]) max( ( )) 1n ii
d O O d O 1 1([ ,..., ]) ( ) {[ ,..., ]}n iisub O O sub O O On ,
1([ ,..., ]) ( ) 1n ii
sz O O sz O
Partial order on algebra Obj is introduced by: 1O O2 iff ;, i.e. from are deleted all subtrees which belong to , but
in both sets search starts from subtrees with minimal depth; the distance of = .
1 2( ) ( )sub O sub O
2 1 2 1[ ( )\ ( )O O sub O sub O ]
j
2O 1O
1 2( , )d O O 2 1 1 2( ) ( )sz O O sz O OFrom the above definition can be created important sub-cases: 2.1 for every , always 1 2, ,..., nO O O Obj 0n 1[ ,..., ]nO O Ob
i.e. Obj is the free algebra (a context-free language) with the set of generators A and one n-ary operation [ ] for every ;0n
2.2 application of the semantic constructor [ ] could be described by a context-free (context-sensitive) grammar, so that Obj would be also a context-free (context-sensitive) language.
J. Henno / Emergence of Names and Compositionality 83
1.2 The Syntactic Algebra
The syntactic algebra L is a free algebra, generated by the (potentially infinite) set of symbols (which are called words), using a syntactic
constructor operator, which is also denoted [ ] (the same notation as in the semantic algebra, but these operators are different, they act on different sets); elements w (which are called denotations) of the algebra
1 2{ , ,...}W w w .1 2, ,..w w
L , their depth d(w) and the set of subwords sub(w) are defined the same way as for the semantic algebra:
for all we have ,w W w L ( ) 0d w , sub(w)={w};if , then also 1,..., nw w L 1[ ,..., ]nw w L , d w1( ,..., ) max( ( )) 1n ii
w d w
n
,
.1 1([ ,..., ]) ( ) {[ ,..., ]}n iisub w w sub w w w
Definitions for partial order on the set of denotations and symmetric difference of denotations are similar with those used in the semantic algebra.
The algebra L (a free algebra) contains all possible language expressions. In the process agents get from here expressions, what they need to improve their language.
1.3 Agents, Languages, Meaning and Speech
Let Ag is the set of agents. Subsets of the semantic algebra L are called languages. Every agent Ag has its own language .L L
At the beginning of the simulation process all languages L are empty, but gradually agents add to their languages denotations, which describe objects from the semantic algebra Obj.
For every agent Ag there are three mappings (many-to-many partial homomorphisms):
the meaning mapping: ;:am L Objthe speech mapping: :sp Obj L ;the naming function: , O O( )n O N bj .Names are similar to attributes of objects, but they are subjective, "invisible"
attributes (not perceived, but created!); , . Denote N A = WN = N A = A - the extended set of attributes. Every agent creates their own names, names for the same object are different for different agents and they can not have any information about names created by others. But when agents exchange messages, they send also denotations for names and so denotations for names will become the same for all agents (more or less).
The meaning and speech mappings are defined gradually (in the process of communication) in such a way, that they do not increase depth (create noise), i.e. they have properties:
1. if for a O , i.e. O( ) 0d O Obj A , then also , i.e. and
( ( )) 0ad sp O ( )asp O W
1 1[ ,..., ] [ ( ),..., ( )]a n a asp O O sp O sp On
- denotation of an attribute or name is always a single word (does not contain the constructor [ ]) and denotation of a structured object is among the set of all denotations, which can be constructed from denotations of sub-objects ;
1[ ,..., ]nO O
1,..., nO OFunctions m , sp are partial and many-to-many, i.e. they may give to several
denotations the same meaning and several meanings the same denotation. However, it is required that when an agent creates a new word for some attribute from A (i.e. attribute or
J. Henno / Emergence of Names and Compositionality84
name), then this word should be different from all words which are already in his language. Using the above properties it is easy to prove by induction on depth, that always:
( ( ))sp m w w- if an agent a considers all meanings of a denotation and speaks about all of them,
then he/she creates the denotation (and possibly some other denotations); ( ( ))m sp O O
- if an agent a speaks about some object O , then meaning (for him) of the created denotation is a sub-object of the object O , i.e. agent understand what it says and reveals in its speech (partial) truth about the object.
1.4 Communication
Agents are able to communicate – send and receive messages; they all participate with equal probability as senders and receivers of messages (in the computational model were considered also other possibilities).
A message is always about some object O (message's object), , i.e. the message's object has some structure. Message is grounded, if the object O is a part of the message (this is equivalent to pointing). At the beginning agents exchange only grounded messages, but when they have already some common understanding (language), they can use also ungrounded messages, where the object is not indicated (this corresponds to the fact, that most of the words what we know and use are not taught to us - we have learned them from context, picked them up from conversations, from read texts etc [
Obj ( ) 0d O
25],[26] etc).
Communication is not error-prone. Different people see the same object different ways and select (consider important) only some features (attributes and sub-objects) of the message's object; besides, they can use about the same object (attribute) different words (the speech function is many-valued).
Language is created (emerges) in the process of exchanging messages (language game). The first part of the process (language game with grounded messages) consists of following steps:
1. An object , (message's object) and two agents (senderand receiver) are selected randomly; since the object O can be presented as
;
O Obj ( ) 0d O 1 2,A A Ag( ) 0d O
1[ ,..., ]nO O O2. Sender selects randomly a subset 1A 1 1[ ,..., ] [ ,..., ]i imO O O O On of sub-objects or
attributes, which he wants to include in the message, every sub-object is included with probability
iO
attrp (if 1attrp , then all sub-objects are included; if , the message will be empty); he may (a random decision with probability ) also add the name
0attrp
nmp
1( )n O O ; 3. Agent creates a message, using his speech function :
; receiver gets the (grounded) message = ,
1A 1sp
1 1 1 1 1 1([ ,..., ]) [ ,..., ] [ ( ),..., ( )]i im m i imsp O O w w sp O sp O 2A
1,[ ,..., ]mO w w 1 1[ ,..., ],[ ,..., ]n mO O w w 1m n .4. The receiver constructs a partial many-to-many mapping 2A 2 1( ) { ,..., }j nm w O O ,
j=1,…,m, and adds the constructed part to his meaning function , i.e. updates his data structure.
2 2:m L Obj
The process is repeated and after some number of steps various tests are made.
J. Henno / Emergence of Names and Compositionality 85

In the second part (when agents have already learned some objects and words) the game continues with non-grounded messages, i.e. messages do not contain the object.
1.5 Language
The process creates a language, if it converges, i.e. the rate of errors (receiver does not recognize the message's object) becomes with growth of the number of messages smaller and smaller, i.e.
1 2 1 2( , )( ) lim(#( ( ( )) )/ )n
a a Ag O Obj m sp O O n 0 (*)
Here n is the number of communication acts and is the part of communication acts, where receiver did not understand the sender , i.e. for the meaning of the received (ungrounded) message was not the message's object O.
1 2#( ( ( )) )/m sp O O n
2a 1a 2a
2( )sp OUsually by the word "language" is understood a set of strings. To agree with this
tradition, we could define this (emerging) language by { ( ) | ,an
L sp O O Obj a A }g
The often-cited result by Gold [27] that even context-free languages are not learnable in the limit is not relevant in our setting. Gold's theorem considers passive learning (guessing) from provided examples of fixed (constant) language. Here all agents are active creators of the language; every one of them participates in the creation of the emerging language. Thus even if application of the semantic constructor [ ] were described in 3.1, 3.2 by whatever context-free or context-sensitive grammar (i.e. the semantic algebra would be a context-free or context-sensitive language) and in message-creation rules 6.2 probabilities , , (then the emerging language would be isomorphic to the semantic algebra, i.e. would also be context-free or context-sensitive) it still does not follow, that the language could not be learned, i.e. the limit (*) would not exist. Some support to convergence is provided by the result that the class of probabilistic context-free languages is learnable in the limit [
1attrp 0nmp
28]– since communication objects are selected randomly, the set of messages is a probabilistic language.
Because of many random elements of the model (structure of the semantic algebra, probabilities , ) it is not clear, whether the process converges (i.e. describes anything). Behaviour of the model was investigated using computer modelling.
attrp nmp
2. Computational Model
2.1 Agent's Data Structures and the Algorithm
In the following are described essential features of the computational model which was used to investigate properties of the process.
Agents maintain vocabulary, which has very simple structure: for every object and name agent keeps a list of words, which are possible denotations of this
attribute or name, i.e. they were used in messages, where they could denote this attribute or name. With every word in such a list is stored also its use count – how many times the word has been used to denote (probably) this attribute. This list is the base for its speech functions: when agent needs a word for an attribute or name, he selects from this list a word, which he considers suitable. Usually this was the word with highest use count and if there are yet no words for some attribute or name, agent “invented” a new word, but some
O Obj
J. Henno / Emergence of Names and Compositionality86
other tactics of word selection were also considered, e.g. agents can sometimes “stick” to their “own” word (what they invented earlier), use the latest added word etc [29]. When the use count of words grows, words with considerably lower use count are deleted ("forgotten") so that lists do not grow unbounded.
Another data structure of agents is list of (already known) objects together with the name (the name given by the agent) of the object – this is the data structure of the naming function. Agent's total memory is linear in the size of the semantic algebra Obj.
2.2 Communication Act
In order to create/learn words for objects and attributes, agents exchange messages. A communication act consists of:
- selecting a speaker (sender) and receiver; usually they were selected randomly, but “teaching” (when sender and receiver were fixed) and some hierarchical communication systems were also considered [29];
- selecting (randomly) a communication object (structured, i.e. with depth > 0); - speaker creates message, describing some of the sub-objects (attributes) and name
of the communication object; attributes are included with probability (every attribute was tested for inclusion separately, if for a generated for this attribute random number p, then the attribute was included), name – with probability (these probabilities were parameters of tests);
0attrp
attrp p
nmp
- message receiver gets the created by speaker description of the communication object - unordered list of words, which in sender’s language describes some of object’s attributes and (possibly) it's name and the communication object is “pointed”, i.e. he also receives the communication object as a unordered list of attributes (a grounded message);
- receiver uses the received message to modify/improve its vocabulary (learn). The emergence of language depends on the structure of the semantic domain Obj.
Objects were generated by random selection of attributes; maximal size of objects (upper bound on number of attributes in an object) was a varied parameter; the number of attributes was from 2 to 8, maximal depth – 4 (experiment becomes very slow with greater depth). Since messages possibly do not contain words for all object attributes, at the beginning objects were mutually disjunctive, i.e. no object (as a set of attributes) could be a subset of some other object, but this property did not have any observable influence and was later dropped. The algebra Obj should separate all objects. This means that the indiscernibility relation [30] on the set of objects Obj defined by
O O n
1
iff 1 1 1( )( [ ,..., ])( { ,..., } { ,..., })n nO Obj O O O O O O O O Oshould be trivial, i.e. for all objects there should be a context, which separates them – an object, where only one of them is a proper sub-object. This condition was later also weakened to cover only attributes – if two different structured objects belong to the same indiscernibility class (i.e. they are always used together as a sub-objects), then they still could be separated since their own structure is different.
,O O
2.3 The Learning Algorithm
The crucial part of the process described above is step 4: after receiving a (grounded) message , m n , how the receiver constructs corresponding semantic mapping
1 1[ ,..., ],[ ,..., ]n mO O w w
2 1( ) { ,..., }im w O On , i=1,…,m. Several strategies could be used, but
J. Henno / Emergence of Names and Compositionality 87
most useful (converges best) seems to be the following (disambiguition using different contexts)
In the first part of the process, when grounded messages are used, the algorithm for the mapping function 2m is following:
1. Agent adds to the set also the name of the object ; if this object already is listed in his list of names, he uses the name created earlier, if not, invents a new name for this object; let nm be the added name.
1{ ,..., }nO O 1[ ,..., ]nO O
2. Agent separates from the set of received words the known words, i.e. words , which already are present in the vocabulary list of some object
1{ ,..., }mw w
kw jO ,j=1,…,n+1; use counts of these words in corresponding lists are increased and the objects jO are removed from the set (words for them have been already found).
1{ ,..., , }nO O nm
3. The "known" words (i.e. words, which were removed in step 1.) are also removed from word lists of all objects O which do not occur in the message, i.e.
- it is assumed, that all words in the message denote objects or the name nm .
1{ ,..., , }nO O O nm
1,..., nO O4. Let , and , l1{ ,..., }kv v k m 1{ ,..., }lP P n be the remaining words and objects.
Since there is no additional information available (what means what), every word is mapped to every object iv jO , i.e.
2 1 1 1 1({ ,..., } { ,..., } { ,..., } { ,..., }k l km v v P P v v P Pl (direct product) and all words , i=1,…,k are added to word lists of objects iv jP , j=1,…,l.
In the second part (messages without object) the algorithm is different: 1. Agent separates from the set of received words the known words, i.e.
words , which already are present in the vocabulary list of some object 1{ ,..., }mw w
kw jO(whatever object) and selects for every word the most probable meanings, e.g. objects, which have in their lists with highest use count; he also collects all named objects O , i.e. objects, whose name (some of them) occur in the message;
kw
kw
2. named objects O found in the step 1 are tested – whether they contain other objects jO as sub-objects (objects have hierarchical structure, so the test is as for subtrees);
3. if some suitable O was found (i.e. the message contained the name of and other words of the message denoted sub-objects of O ), the object is selected as the meaning of the message and use counts of words, which denoted its sub-objects are increased (in lists of these sub-objects); if no suitable O were found, a new object is stored in receiver's list of objects with all objects
OO
jO as sub-objects of the new object.
2.4 An Example
This simple example shows first steps in development of common vocabulary. In the example are used three objects [2, 4], [2, 3], [3, 1, 4] over the set of four attributes {1,2,3,4}. At the beginning all vocabularies and agent's lists of objects are empty.
J. Henno / Emergence of Names and Compositionality88
1. Agent 1 creates a message about the first object; the first argument of the predicate "speak" is speaker's name, the second - communication object, the third: created message (the simulation program was written in Prolog and ? is the Prolog prompt):
?- speak(1,[2,4],M).M = [a4_1, a2_1, a101_1] Here word a4_1 denotes attribute 4, word a2_1 - attribute 2 and a10_1 is the name
of the object [2,4] in agent's vocabulary (agent 1 "invented" all those words).Agent 2 receives the message (the first argument is receiver's name, the second -
communication object and the third - received message): message(2,[2,4],[a4_1, a2_1, a101_1]). After processing the language of agent 2 becomes: [2, [[a101_1, 1], [a2_1, 1], [a4_1, 1]]] [101, [[a101_1, 1], [a2_1, 1], [a4_1, 1]]] [4, [[a101_1, 1], [a2_1, 1], [a4_1, 1]]]
i.e. agent 2 added in his vocabulary all received words as denotations for both attributes 2,4, and also as possible denotations for the name 101, which he "invented" for the received object [2,4]; his list of external objects is now [[101, [2, 4]]].
Suppose next agent 2 receives a message about object [2,3]:message(2,[2,3],[a2_1, a102_1]).
(speaker has left out word for attribute 3).This message already simplifies the vocabulary of agent 2, which becomes: [102, [[a102_1, 1]]] [2, [[a4_1, 1], [a2_1, 2], [a101_1, 1]]] [3, [[a102_1, 1]]] [101, [[a4_1, 1], [a101_1, 1]]] [4, [[a4_1, 1], [a101_1, 1]]]
i.e. agent 2 could remove the word a2_1 from lists of denotations of attributes 101and 4.
If agent 2 is next asked, what means a test message [a3_1, a2_1, a102_1] (he is receiving only a message without the object), he can correctly calculate the communication object:
message_object(2, [a3_1, a2_1, a102_1],O). O = [3, 2]
- but he has even not received earlier the full description of the object - the attribute 3 was not described in the earlier message describing this object.
More, he/it is also capable of retrieving the correct object if only the name of the object is passed to him:
message_object(2,[a101_1],O).O = [4, 2]
3. Emergence of Common Vocabulary and Understanding
3.1 Measured Parameters
The process of emergence of common vocabulary was investigated using several parameters:
- for how many attributes and objects agents already have a word, how many words are there in their lists, how are their use frequencies distributed (at the end frequency of one, one word, the "right" one, will be much higher than frequencies of all the others);
J. Henno / Emergence of Names and Compositionality 89
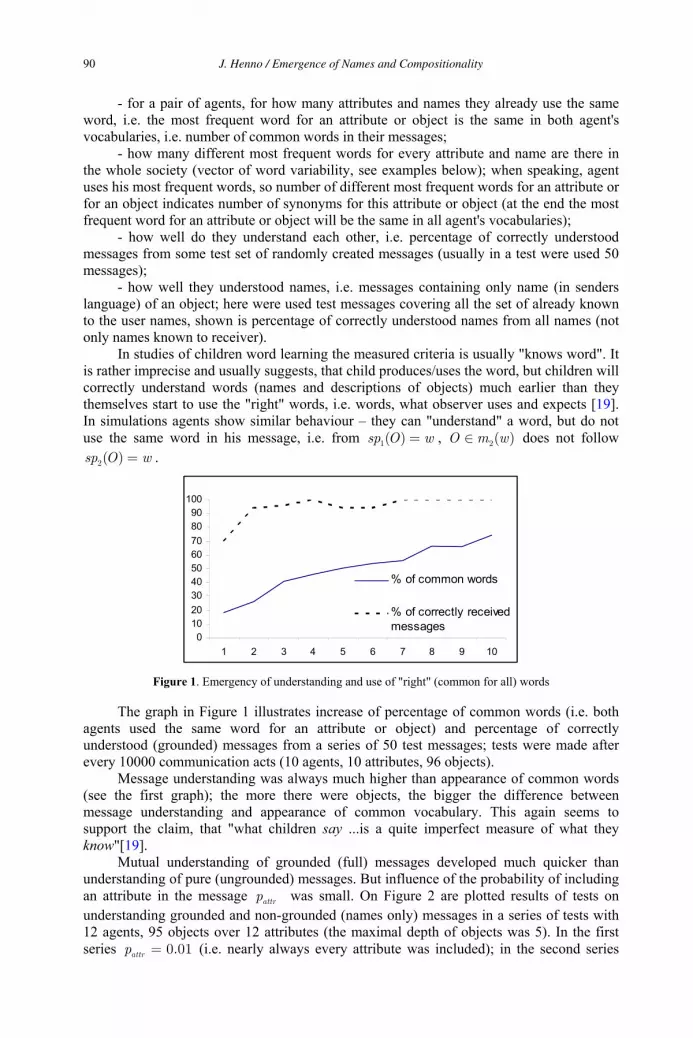
- for a pair of agents, for how many attributes and names they already use the same word, i.e. the most frequent word for an attribute or object is the same in both agent's vocabularies, i.e. number of common words in their messages;
- how many different most frequent words for every attribute and name are there in the whole society (vector of word variability, see examples below); when speaking, agent uses his most frequent words, so number of different most frequent words for an attribute or for an object indicates number of synonyms for this attribute or object (at the end the most frequent word for an attribute or object will be the same in all agent's vocabularies);
- how well do they understand each other, i.e. percentage of correctly understood messages from some test set of randomly created messages (usually in a test were used 50 messages);
- how well they understood names, i.e. messages containing only name (in senders language) of an object; here were used test messages covering all the set of already known to the user names, shown is percentage of correctly understood names from all names (not only names known to receiver).
In studies of children word learning the measured criteria is usually "knows word". It is rather imprecise and usually suggests, that child produces/uses the word, but children will correctly understand words (names and descriptions of objects) much earlier than they themselves start to use the "right" words, i.e. words, what observer uses and expects [19].In simulations agents show similar behaviour – they can "understand" a word, but do not use the same word in his message, i.e. from , does not follow
.1( )sp O w 2( )O m w
2( )sp O w
0102030405060708090
100
1 2 3 4 5 6 7 8 9 10
% of common words
% of correctly receivedmessages
Figure 1. Emergency of understanding and use of "right" (common for all) words
The graph in Figure 1 illustrates increase of percentage of common words (i.e. both agents used the same word for an attribute or object) and percentage of correctly understood (grounded) messages from a series of 50 test messages; tests were made after every 10000 communication acts (10 agents, 10 attributes, 96 objects).
Message understanding was always much higher than appearance of common words (see the first graph); the more there were objects, the bigger the difference between message understanding and appearance of common vocabulary. This again seems to support the claim, that "what children say ...is a quite imperfect measure of what they know"[19].
Mutual understanding of grounded (full) messages developed much quicker than understanding of pure (ungrounded) messages. But influence of the probability of including an attribute in the message was small. On Figure 2 are plotted results of tests on understanding grounded and non-grounded (names only) messages in a series of tests with 12 agents, 95 objects over 12 attributes (the maximal depth of objects was 5). In the first series (i.e. nearly always every attribute was included); in the second series
attrp
0.01attrp
J. Henno / Emergence of Names and Compositionality90
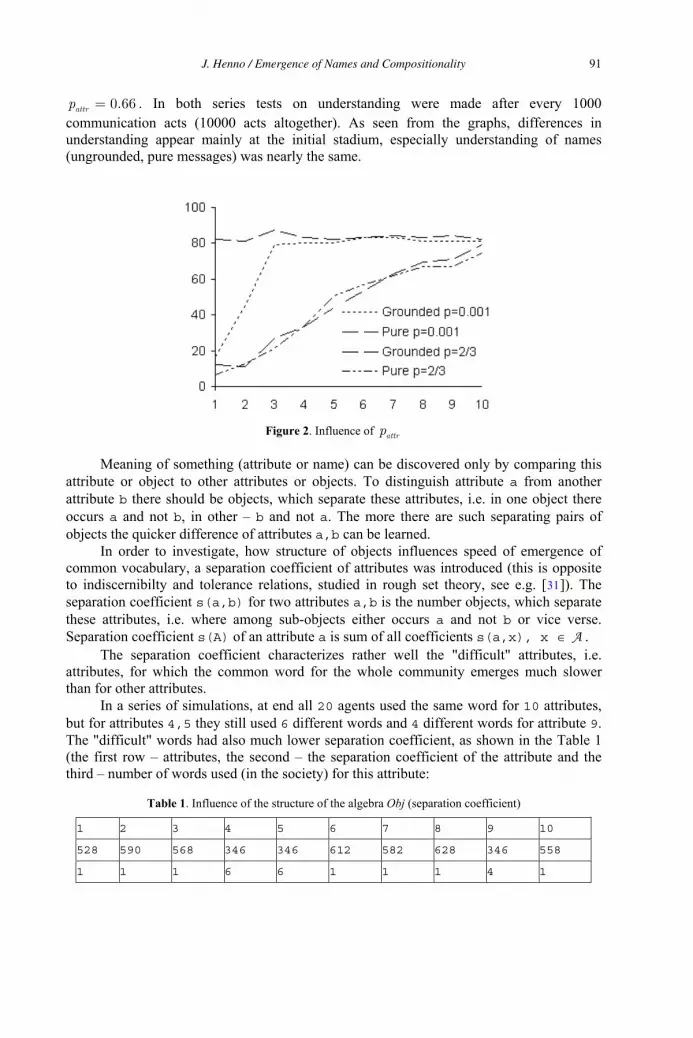
0.66attrp . In both series tests on understanding were made after every 1000 communication acts (10000 acts altogether). As seen from the graphs, differences in understanding appear mainly at the initial stadium, especially understanding of names (ungrounded, pure messages) was nearly the same.
Figure 2. Influence of attrp
Meaning of something (attribute or name) can be discovered only by comparing this attribute or object to other attributes or objects. To distinguish attribute a from another attribute b there should be objects, which separate these attributes, i.e. in one object there occurs a and not b, in other – b and not a. The more there are such separating pairs of objects the quicker difference of attributes a,b can be learned.
In order to investigate, how structure of objects influences speed of emergence of common vocabulary, a separation coefficient of attributes was introduced (this is opposite to indiscernibilty and tolerance relations, studied in rough set theory, see e.g. [31]). The separation coefficient s(a,b) for two attributes a,b is the number objects, which separate these attributes, i.e. where among sub-objects either occurs a and not b or vice verse. Separation coefficient s(A) of an attribute a is sum of all coefficients s(a,x), x A .
The separation coefficient characterizes rather well the "difficult" attributes, i.e. attributes, for which the common word for the whole community emerges much slower than for other attributes.
In a series of simulations, at end all 20 agents used the same word for 10 attributes, but for attributes 4,5 they still used 6 different words and 4 different words for attribute 9.The "difficult" words had also much lower separation coefficient, as shown in the Table 1 (the first row – attributes, the second – the separation coefficient of the attribute and the third – number of words used (in the society) for this attribute:
Table 1. Influence of the structure of the algebra Obj (separation coefficient)
1 2 3 4 5 6 7 8 9 10
528 590 568 346 346 612 582 628 346 558
1 1 1 6 6 1 1 1 4 1
J. Henno / Emergence of Names and Compositionality 91
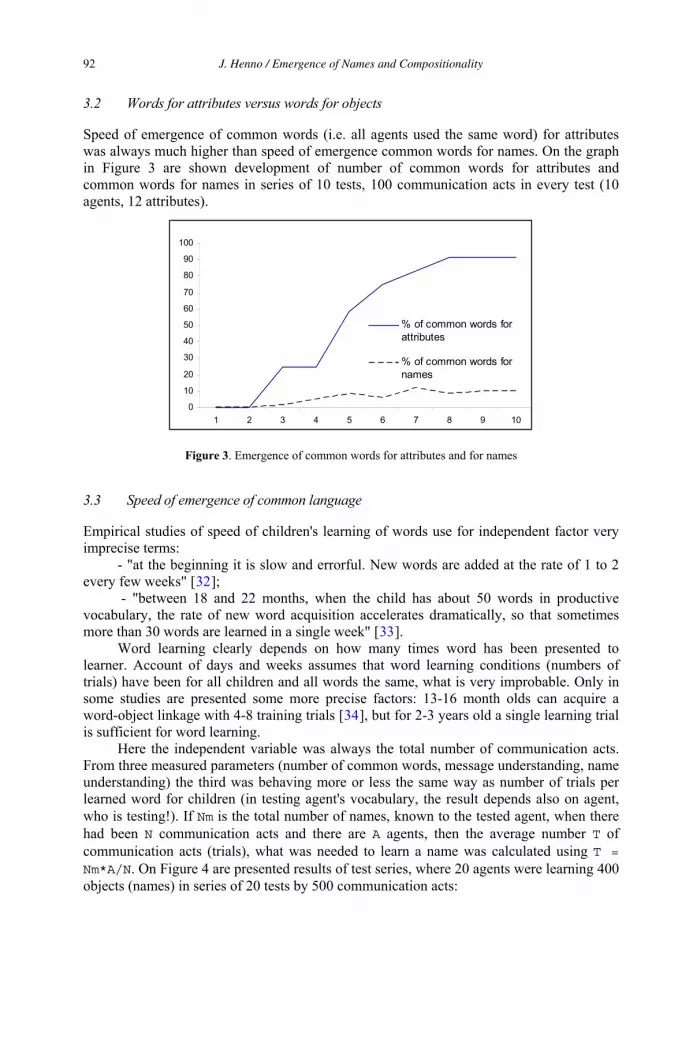
3.2 Words for attributes versus words for objects
Speed of emergence of common words (i.e. all agents used the same word) for attributes was always much higher than speed of emergence common words for names. On the graph in Figure 3 are shown development of number of common words for attributes and common words for names in series of 10 tests, 100 communication acts in every test (10 agents, 12 attributes).
0
10
20
30
40
50
60
70
80
90
100
1 2 3 4 5 6 7 8 9 10
% of common words forattributes
% of common words fornames
Figure 3. Emergence of common words for attributes and for names
3.3 Speed of emergence of common language
Empirical studies of speed of children's learning of words use for independent factor very imprecise terms:
- "at the beginning it is slow and errorful. New words are added at the rate of 1 to 2 every few weeks" [32];
- "between 18 and 22 months, when the child has about 50 words in productive vocabulary, the rate of new word acquisition accelerates dramatically, so that sometimes more than 30 words are learned in a single week" [33].
Word learning clearly depends on how many times word has been presented to learner. Account of days and weeks assumes that word learning conditions (numbers of trials) have been for all children and all words the same, what is very improbable. Only in some studies are presented some more precise factors: 13-16 month olds can acquire a word-object linkage with 4-8 training trials [34], but for 2-3 years old a single learning trial is sufficient for word learning.
Here the independent variable was always the total number of communication acts. From three measured parameters (number of common words, message understanding, name understanding) the third was behaving more or less the same way as number of trials per learned word for children (in testing agent's vocabulary, the result depends also on agent, who is testing!). If Nm is the total number of names, known to the tested agent, when there had been N communication acts and there are A agents, then the average number T of communication acts (trials), what was needed to learn a name was calculated using T = Nm*A/N. On Figure 4 are presented results of test series, where 20 agents were learning 400 objects (names) in series of 20 tests by 500 communication acts:
J. Henno / Emergence of Names and Compositionality92
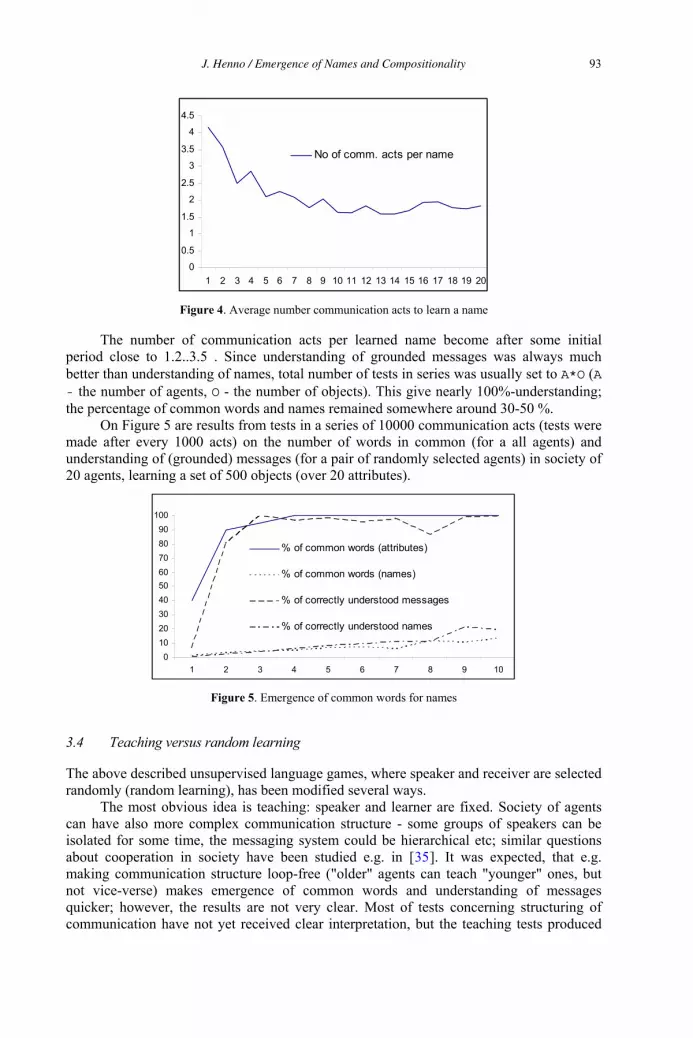
0
0.5
1
1.5
2
2.5
3
3.5
4
4.5
1 2 3 4 5 6 7 8 9 10 11 12 13 14 15 16 17 18 19 20
No of comm. acts per name
Figure 4. Average number communication acts to learn a name
The number of communication acts per learned name become after some initial period close to 1.2..3.5 . Since understanding of grounded messages was always much better than understanding of names, total number of tests in series was usually set to A*O (A- the number of agents, O - the number of objects). This give nearly 100%-understanding; the percentage of common words and names remained somewhere around 30-50 %.
On Figure 5 are results from tests in a series of 10000 communication acts (tests were made after every 1000 acts) on the number of words in common (for a all agents) and understanding of (grounded) messages (for a pair of randomly selected agents) in society of 20 agents, learning a set of 500 objects (over 20 attributes).
0102030405060708090
100
1 2 3 4 5 6 7 8 9 10
% of common words (attributes)
% of common words (names)
% of correctly understood messages
% of correctly understood names
Figure 5. Emergence of common words for names
3.4 Teaching versus random learning
The above described unsupervised language games, where speaker and receiver are selectedrandomly (random learning), has been modified several ways.
The most obvious idea is teaching: speaker and learner are fixed. Society of agents can have also more complex communication structure - some groups of speakers can be isolated for some time, the messaging system could be hierarchical etc; similar questions about cooperation in society have been studied e.g. in [35]. It was expected, that e.g. making communication structure loop-free ("older" agents can teach "younger" ones, but not vice-verse) makes emergence of common words and understanding of messages quicker; however, the results are not very clear. Most of tests concerning structuring of communication have not yet received clear interpretation, but the teaching tests produced
J. Henno / Emergence of Names and Compositionality 93
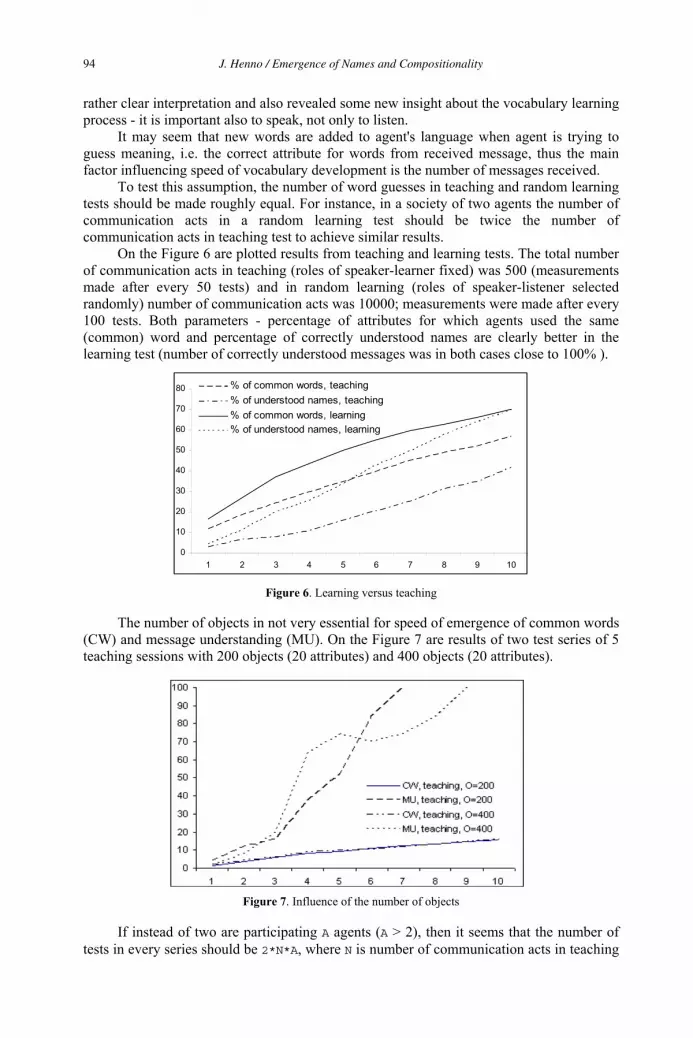
rather clear interpretation and also revealed some new insight about the vocabulary learning process - it is important also to speak, not only to listen.
It may seem that new words are added to agent's language when agent is trying to guess meaning, i.e. the correct attribute for words from received message, thus the main factor influencing speed of vocabulary development is the number of messages received.
To test this assumption, the number of word guesses in teaching and random learning tests should be made roughly equal. For instance, in a society of two agents the number of communication acts in a random learning test should be twice the number of communication acts in teaching test to achieve similar results.
On the Figure 6 are plotted results from teaching and learning tests. The total number of communication acts in teaching (roles of speaker-learner fixed) was 500 (measurements made after every 50 tests) and in random learning (roles of speaker-listener selected randomly) number of communication acts was 10000; measurements were made after every 100 tests. Both parameters - percentage of attributes for which agents used the same (common) word and percentage of correctly understood names are clearly better in the learning test (number of correctly understood messages was in both cases close to 100% ).
0
10
20
30
40
50
60
70
80
1 2 3 4 5 6 7 8 9 10
% of common words, teaching% of understood names, teaching% of common words, learning% of understood names, learning
Figure 6. Learning versus teaching
The number of objects in not very essential for speed of emergence of common words (CW) and message understanding (MU). On the Figure 7 are results of two test series of 5 teaching sessions with 200 objects (20 attributes) and 400 objects (20 attributes).
Figure 7. Influence of the number of objects
If instead of two are participating A agents (A > 2), then it seems that the number of tests in every series should be 2*N*A, where N is number of communication acts in teaching
J. Henno / Emergence of Names and Compositionality94

series, i.e. if in teaching series were sent altogether 50 messages, then in learning test (using the same set of objects) with 20 agents should be 20000 messages; however, the percentage of attributes with common words becomes nearly the same already with 10000 messages, as seen on the Figure 8.
0102030405060708090
100
1 2 3 4 5 6 7 8 9 10
CW, teaching, K=5MU, teaching, K=5CW, learning, Ag=20, K=1000MU, learning, Ag=20, K=1000
Figure 8. Influence of the number of objects
050
100150200
250300350400450
1 2 3 4 5 6 7 8 9 10
teaching,K=50
learning,K=100
Figure 9. The speed of learning names
Random learning (compared to teaching) was much more efficient especially for learning names.
On Figure 9 is plotted number of correctly understood names for two agents in a teaching and random learning tests using a set of 500 objects over 20 attributes. In teaching measuring was conducted after every 50 messages, in random learning – after every 100 messages.
Results about message understanding are not so easy to interprete (see above), but still clearly indicate, that speaking also develops agent's vocabulary. When agent is speaking about new (unknown to him earlier) object, he adds its name to his list of names and new (earlier unknown to him) attributes together with invented by him words for these attributes into his vocabulary and sends these words to "wide world". Now there is a chance that he will get a message containing these (already known to him) words; otherwise (if he did not speak) he always receives totally unknown words. Additional structure of his knowledge created in speaking will help him in consecutive listening/learning acts.
3.5 Self-Learning
Most of the words what we know and use are not taught to us. We have learned them from context - picked them up from conversations, from read texts etc [25],[26].
J. Henno / Emergence of Names and Compositionality 95
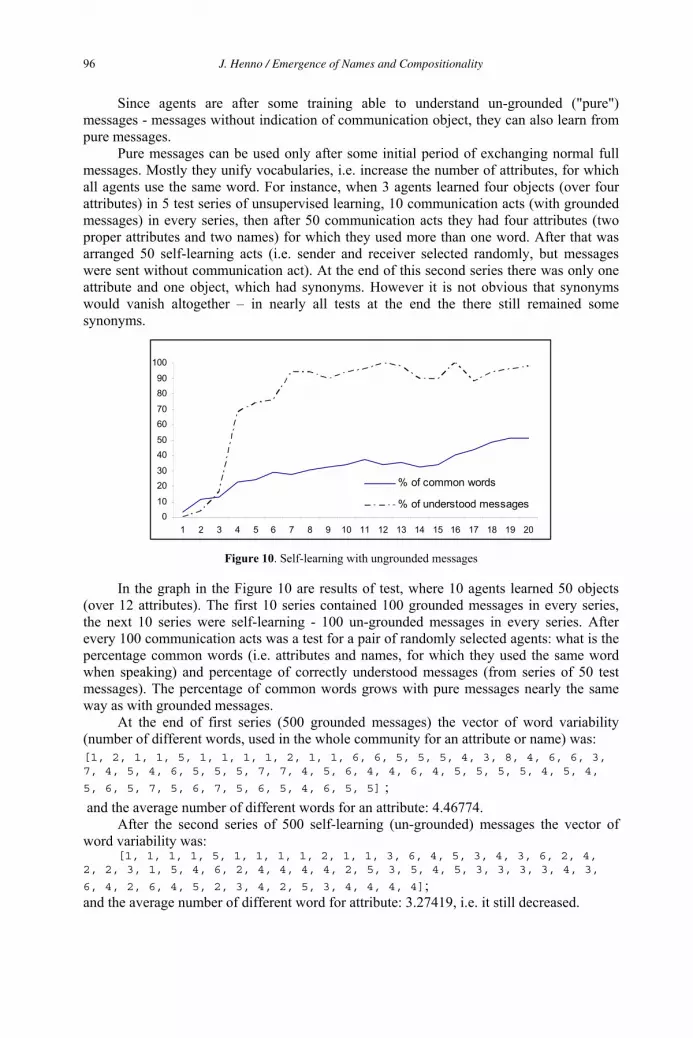
Since agents are after some training able to understand un-grounded ("pure") messages - messages without indication of communication object, they can also learn from pure messages.
Pure messages can be used only after some initial period of exchanging normal full messages. Mostly they unify vocabularies, i.e. increase the number of attributes, for which all agents use the same word. For instance, when 3 agents learned four objects (over four attributes) in 5 test series of unsupervised learning, 10 communication acts (with grounded messages) in every series, then after 50 communication acts they had four attributes (two proper attributes and two names) for which they used more than one word. After that was arranged 50 self-learning acts (i.e. sender and receiver selected randomly, but messages were sent without communication act). At the end of this second series there was only one attribute and one object, which had synonyms. However it is not obvious that synonyms would vanish altogether – in nearly all tests at the end the there still remained some synonyms.
010
2030
4050
6070
8090
100
1 2 3 4 5 6 7 8 9 10 11 12 13 14 15 16 17 18 19 20
% of common words
% of understood messages
Figure 10. Self-learning with ungrounded messages
In the graph in the Figure 10 are results of test, where 10 agents learned 50 objects (over 12 attributes). The first 10 series contained 100 grounded messages in every series, the next 10 series were self-learning - 100 un-grounded messages in every series. After every 100 communication acts was a test for a pair of randomly selected agents: what is the percentage common words (i.e. attributes and names, for which they used the same word when speaking) and percentage of correctly understood messages (from series of 50 test messages). The percentage of common words grows with pure messages nearly the same way as with grounded messages.
At the end of first series (500 grounded messages) the vector of word variability (number of different words, used in the whole community for an attribute or name) was: [1, 2, 1, 1, 5, 1, 1, 1, 1, 2, 1, 1, 6, 6, 5, 5, 5, 4, 3, 8, 4, 6, 6, 3, 7, 4, 5, 4, 6, 5, 5, 5, 7, 7, 4, 5, 6, 4, 4, 6, 4, 5, 5, 5, 5, 4, 5, 4,
5, 6, 5, 7, 5, 6, 7, 5, 6, 5, 4, 6, 5, 5] ; and the average number of different words for an attribute: 4.46774.
After the second series of 500 self-learning (un-grounded) messages the vector of word variability was:
[1, 1, 1, 1, 5, 1, 1, 1, 1, 2, 1, 1, 3, 6, 4, 5, 3, 4, 3, 6, 2, 4, 2, 2, 3, 1, 5, 4, 6, 2, 4, 4, 4, 4, 2, 5, 3, 5, 4, 5, 3, 3, 3, 3, 4, 3,
6, 4, 2, 6, 4, 5, 2, 3, 4, 2, 5, 3, 4, 4, 4, 4];and the average number of different word for attribute: 3.27419, i.e. it still decreased.
J. Henno / Emergence of Names and Compositionality96
3.6 Vocabulary spurt
Many specialists in child learning claim, that at about 16 months of age, or when a child learns about 50 words children word learning sharply accelerates [33]; this is called word burst, word spurt, vocabulary burst, naming explosion, word explosion etc (but some studies indicate, that many children do not have sharp changes in speed of word learning [19], [31]). It is not clear, what actually means "learn a word", since children (and agents) know much more words than they use in messages. In this experiment the main criteria used for investigation of the development of vocabulary were the number of words in common and % of correctly understood messages about randomly selected objects. While the number of words in common changed all the time more or less the same way, the percentage of correctly understood messages really increased sharply after some initial period of learning. Such an acceleration of correctly understood messages can be seen on several presented above graphs, thus agents also had some kind of " vocabulary burst".
4. Conclusions
Here was presented a precise mathematical model for investigating emergence of language and interactions between syntax and semantics, described as semantic and syntactic algebras. To Montague-type semantics (the meaning homomorphism from the language expressions to semantic algebra) was added inverse mapping (speech) from semantic algebra to language expressions. These mappings are individual to every agent which participates in development of the common language. At the beginning of the process languages of all agents are empty. When agents send and receive messages about objects in semantic domain, they add new words to their languages and delete, "forget" rarely-used words. Their understanding of each other improves and a new language emerges in the society.
Semantic objects are compositional, created from already existing objects and elementary attributes. This hierarchical structure is reflected also in the denotations of the emerging language. To allow more economical representations, agents can substitute the full representation of an object (tree of attributes) with a name for this object. Names are "inner", subjective attributes of semantic objects; however, in communications agents use words for names and these words become common for all agents denotations of objects, the same ways as denotations of attributes become common in the society.
Without proper understanding of use of naming and emergence of compositionality - how natural language learned to handle structured real-world (semantic) objects it seems to be impossible to understand emergence of syntax – syntax is just a means to express semantic structure, syntactical constructs were invented to express real-word structures, i.e. they reflect compositionality in real world.
The presented framework was tested in a computational model (i.e. executed) and it demonstrated emergence of compositional system of denotations. Several questions and problems remain; several features can be implemented differently etc. Because of complexity of the process of emergence of language and the syntax the "real" model has yet to be invented – from humans it took several hundred million years – but hopefully presented here model gives some new insight to builders of similar models and this time we can do better.
The problem of language and especially syntax emergence is interesting and important not only theoretically. Natural language systems (machine translation, natural language databases, general natural language understanding systems etc) have been studied and programmed from the very appearance of electronic computers, for ca 50 years by now,
J. Henno / Emergence of Names and Compositionality 97
but computers still do not understand natural language. It seems more and more difficult to believe in success of natural language systems with built-in semantics. The best-known system of this type – Cyc – has been developed for 21 years (using milliards of dollars) and it is still not working. Natural language is a dynamic system, which is constantly changing (emerging), new words, new meanings of old words etc appear all the time. There is no such thing as ONE (e.g. english) language – everyone has his/her own language and understanding of meanings and they are not exactly the same. But these differences are introduced also to natural language systems with built-in semantics – they reflect (fixed) understanding of their creators at the moment of their creation; e.g. the two biggest upper-level ontologies, SUMO and Cyc together generate contradictions, i.e. they do not have any model – how should computers in the semantic web use them? Computers can be useful and understand natural language in semantic web or in whatever application only if they are capable to learn the language, i.e. if they can constantly create their own language, and for this we need algorithms, which are developed considering the emergence of natural language.
References:
[1] Christiansen, M.; Kirby, S. Eds. (2003) Language Evolution. Oxford University Press: New York. [2] E. Brisoe (Ed.) (2002) Linguistic Evolution through Language Acquisition: Formal and Computational Models, Cambridge University Press, Cambridge [3] Andrew D. M. Smith (2002) Evolving Communication through the Inference of Meaning. University of Edinburgh, September 2003. pp 1-418 [4] Gong, T., Minett, J. W., Ke, J., Holland, J. H., and Wang, W. S-Y. (2005) Coevolution of lexicon and syntax from a simulation perspective. Complexity, 10(6), pp 50-62. [5] Griffiths, T. L. and Kalish, M. L. (2005) A Bayesian view of language evolution by iterated learning. In Proceedings of the 27th Annual Conference of the Cognitive Science Society. [6] Brighton, H. (2002) Compositional Syntax from Cultural Transmission. Artificial Life, 8(1):25--54. [7] Kirby, S. (2002), Learning, bottlenecks and the evolution of recursive syntax. In E. Briscoe (ed.), Linguistic evolution through language acquisition: Formal and computational models. Cambridge: Cambridge University Press, 173–203 [8] L. Steels, P. Vogt, Grounding adaptive language games in robotic agents. In: I. Harvey and P. Husbands, editors, ECAL97. Cambridge, MA: MIT Press. [9] Simon Kirby. Learning, bottlenecks and the evolution of recursive syntax. In Ted Briscoe (ed), Linguisitic Evolution through Language Acquisition: Formal and Computational Models. Cambridge University Press, 1999.[10] Bickerton, D. How protolanguage became language. In Chris Knight, James R. Hurford and Michael Studdert-Kennedy, editors, The Evolutionary Emergence of Language: Social Function and the Origins of Linguistic Form. Cambridge: Cambridge University Press, 2000 [11] Chomsky, N. Language and Mind. New York: Harcourt, Brace and World, 1968 [12] Briscoe, E. J. (2000). Grammatical acquisition: Inductive bias and coevolution of language and the language acquisition device. Language, 76(2), 245–296. [13] P. Vogt, Anchoring of semiotic symbols, Robotics and Autonomous Systems 43 (2) (2003) 109–120. [14] Quine, W. V. Word and Object. MIT Press: Cambridge, MA, 1960. [15] Gentner, D. Why are nouns learned before verbs: Linguistic relativity versus natural partitioning. In S.A. Kuczaj II (Ed.), Language development, Vol. 2: Language, thought and culture. Hillsdale, NJ: Erlbaum, 1982. [16] Greer, M. J., van Casteren, M., McLellan, S. A., Moss, H. E., Rodd, J., Rogers, T. T., & Tyler, L. K. (2001). The emergence of semantic categories from distributed featural representations. In J. D. Moore & K. Stenning (Eds.), Proceedings of the 23rd Annual Conference of the Cognitive Science Society, London, UK: Lawrence Erlbaum Associates, pp. 358-363. [17] Roger C. Schank (1972). Conceptual Dependency: {A} Theory of Natural Language Understanding, Cognitive Psychology, (3)4, pp 532-631
J. Henno / Emergence of Names and Compositionality98
[18] Montague, R. (1970) ‘Universal Grammar.’ In R. Thomason ed., Formal Philosophy. New Haven : Yale University Press, 1974, pp 222–246 [19] Bloom, P. Myths of word learning. In D.G. Hall & S.R. Waxman (Eds.) Weaving a lexicon, Cambridge, MA: MIT Press [20] William H. Calvin and Derek Bickerton, Lingua ex Machina: Reconciling Darwin and Chomsky with the human brain. MIT Press, 2000 [21] M. D. Hauser, Noam Chomsky, W. T. Fitch. (2002) The Faculty of Language: What Is It, Who Has It, and How Did It Evolve? [22] Henno, J. Emergence of names and compositionality. Yashushi Kiyoki, Hannu Jangassalo, Marie Duži (eds). Proceedings of the 16th European - Japanese Conference on Information Modelling and Knowledge Bases, (EJC2006), pp 78-97, ISBN 80-248-1023-9[23] Henno, J. Mathematical Model of Natural Languages. ICCC 2006 2006 IEEE International Conference on Computational Cybernetics, Tallinn, Estonia August 20-22, 2006, Proceedings, pp 275-281, ISBN 1-4244-0072-4 [24] Schank, R. C. 1975. Conceptual information processing. Amsterdam: North-Holland Publishing Co. [25] Sternberg, R.J. (1987). Most vocabulary is learned from context. In M.G. McKeown & M.E. Curtis (Eds.) The nature of vocabulary acquisition. Hillsdale, NJ: Erlbaum. [26] Nagy, W.E. & Herman, P.A. (1987). Breadth and depth of vocabulary knowledge: implications for acquisition and instruction. In M.G. McKeown & M.E. Curtis (Eds.) The nature of vocabulary acquisition. Hillsdale, NJ: Erlbaum [27] Gold, E. M. Language Identification to the Limit. Information and Contral, 10:447-474, 1967 [28] Angluin, D.. Identifying languages from stochastic examples. Technical Report YALEU/ DCS/RR-614, Yale University, Dept. of Computer Science, New Haven, CT, 1988 [29] Henno, J.. Emergence of communication and creation of common vocabulary in multi-agent environment. Proceedings of the 12th European-Japanese Conference on Information Modelling and Knowledge Bases. Krippen, Swiss Saxony, Germany. May 27-30, 2002, pp 229-233 [30] E. Orlowska. Logic of indiscernibility relations. In A. Skowron, editor, 5th Symposium on Computation Theory, pages 177--186. LNCS 208, Springer-Verlag, 1984 [31]Jennifer Ganger, Michael R. Brent. Reexamining the Vocabulary Spurt. Developmental Psychology2004, Vol. 40, No. 4, 621–632 [32] Gerskoff-Stove,L. and Smith, L.B. (1997). A curvi-line trend in naming errors as a function of early vocabulary growth. Cognitive Psychology, 34:37-71 [33] Dromi, E. (1987). Early lexical development. Cambridge: Cambridge University Press.. [34] Bird, K-R. E., & Chapman, R.S. (1998). Partial representation and phonological selectivity in the comprehension of 13- to 16- month olds. First Language, 18, 105-127. [35] Jung-Kyoo Choi. Play Locally, Learn Globally: The Structural Basis of Cooperation. Santa Fe Institute Working Papers, 2002, http://www.santafe.edu/sfi/publications/Working-Papers/02-12-066.pdf
J. Henno / Emergence of Names and Compositionality 99
Treating Quantifiers in Database Semantics
Jae-Woong CHOE Roland HAUSSERKorea University Universität Erlangen-NürnbergDept. of Linguistics Abt. Computerlinguistik (CLUE)[email protected] [email protected]
Abstract
This paper analyzes the syntactic and semantic structure of noun phrases in English andKorean, using the time-linear derivations of Database Semantics. In comparison withPredicate Calculus, which handles the semantics of determiners like some and all at thehighest level of the logical syntax, Database Semantics takes the alternative approach ofspecifying their semantics as atomic values in the feature structures representing nounphrases. This not only avoids well-known difficulties of the classical approach, suchas unwanted scope ambiguities (Copestake et al. 2001) and problems binding certainvariables (Geach 1969, Kamp & Reyle 1993), but also opens the way to concentrate onimportant linguistic aspects of complex noun phrases, namely agreement in English, andthe alternative word orders and the rather free distribution of case markers inside the NPin Korean. Given that the internal structure of Japanese NPs is very similar to that ofKorean, we believe that our analysis can be easily extended to include Japanese as well.
1 Interpretation of Quantifiers in Predicate Calculus
Since Russell’s 1905 celebrated analysis of definite descriptions in terms of predicate calcu-lus, the most widely used semantic interpretation of determiners like the, all, some, every,several, and the numerals one, two, three, etc., is by means of the familiar quantifiers and
. Consider the following example:
1.1 PREDICATE CALCULUS ANALYSIS OF All girls sleep
x [girl(x) sleep(x)]
The interpretation of such a formula is defined with respect to a model and a variable assign-ment. Following Montague (1974), the model @ is defined as a tuple (A,F), where A is a setof individuals, e.g., {a0, a1, a2, a3}, and F is an assignment function which assigns to everyone-place predicate in the formal language an element of 2A (i.e., the power set of A) as aninterpretation (and accordingly for two-place predicates, etc.). For example, F(girl) might bedefined in @ as {a1, a2} and F(sleep) as {a0, a2}. This means that a1 and a2 in the model aregirls, while a0 and a2 are sleeping.
The dependence of the truth-value of the formula on the actual definition of the model isrepresented by Montague as follows:
M. Duží et al. (Eds.)Information Modelling and Knowledge Bases XVIII
IOS Press, 2007© 2007 The authors and IOS Press. All rights reserved.
100
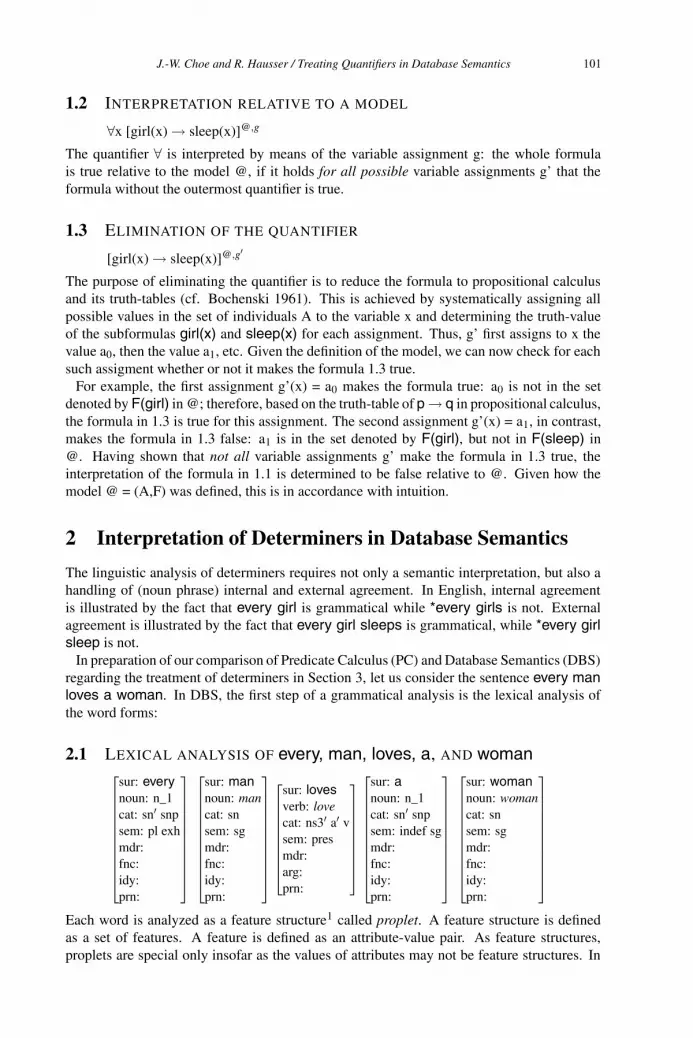
1.2 INTERPRETATION RELATIVE TO A MODEL
x [girl(x) sleep(x)]@,g
The quantifier is interpreted by means of the variable assignment g: the whole formulais true relative to the model @, if it holds for all possible variable assignments g’ that theformula without the outermost quantifier is true.
1.3 ELIMINATION OF THE QUANTIFIER
[girl(x) sleep(x)]@,g
The purpose of eliminating the quantifier is to reduce the formula to propositional calculusand its truth-tables (cf. Bochenski 1961). This is achieved by systematically assigning allpossible values in the set of individuals A to the variable x and determining the truth-valueof the subformulas girl(x) and sleep(x) for each assignment. Thus, g’ first assigns to x thevalue a0, then the value a1, etc. Given the definition of the model, we can now check for eachsuch assigment whether or not it makes the formula 1.3 true.
For example, the first assignment g’(x) = a0 makes the formula true: a0 is not in the setdenoted by F(girl) in @; therefore, based on the truth-table of p q in propositional calculus,the formula in 1.3 is true for this assignment. The second assignment g’(x) = a1, in contrast,makes the formula in 1.3 false: a1 is in the set denoted by F(girl), but not in F(sleep) in@. Having shown that not all variable assignments g’ make the formula in 1.3 true, theinterpretation of the formula in 1.1 is determined to be false relative to @. Given how themodel @ = (A,F) was defined, this is in accordance with intuition.
2 Interpretation of Determiners in Database Semantics
The linguistic analysis of determiners requires not only a semantic interpretation, but also ahandling of (noun phrase) internal and external agreement. In English, internal agreementis illustrated by the fact that every girl is grammatical while *every girls is not. Externalagreement is illustrated by the fact that every girl sleeps is grammatical, while *every girlsleep is not.
In preparation of our comparison of Predicate Calculus (PC) and Database Semantics (DBS)regarding the treatment of determiners in Section 3, let us consider the sentence every manloves a woman. In DBS, the first step of a grammatical analysis is the lexical analysis ofthe word forms:
2.1 LEXICAL ANALYSIS OF every, man, loves, a, AND woman⎡⎢⎢⎢⎢⎢⎢⎢⎢⎢⎢⎣
sur: everynoun: n_1cat: sn snpsem: pl exhmdr:fnc:idy:prn:
⎤⎥⎥⎥⎥⎥⎥⎥⎥⎥⎥⎦
⎡⎢⎢⎢⎢⎢⎢⎢⎢⎢⎢⎣
sur: mannoun: mancat: snsem: sgmdr:fnc:idy:prn:
⎤⎥⎥⎥⎥⎥⎥⎥⎥⎥⎥⎦
⎡⎢⎢⎢⎢⎢⎢⎢⎢⎣
sur: lovesverb: lovecat: ns3 a vsem: presmdr:arg:prn:
⎤⎥⎥⎥⎥⎥⎥⎥⎥⎦
⎡⎢⎢⎢⎢⎢⎢⎢⎢⎢⎢⎣
sur: anoun: n_1cat: sn snpsem: indef sgmdr:fnc:idy:prn:
⎤⎥⎥⎥⎥⎥⎥⎥⎥⎥⎥⎦
⎡⎢⎢⎢⎢⎢⎢⎢⎢⎢⎢⎣
sur: womannoun: womancat: snsem: sgmdr:fnc:idy:prn:
⎤⎥⎥⎥⎥⎥⎥⎥⎥⎥⎥⎦
Each word is analyzed as a feature structure1 called proplet. A feature structure is definedas a set of features. A feature is defined as an attribute-value pair. As feature structures,proplets are special only insofar as the values of attributes may not be feature structures. In
J.-W. Choe and R. Hausser / Treating Quantifiers in Database Semantics 101
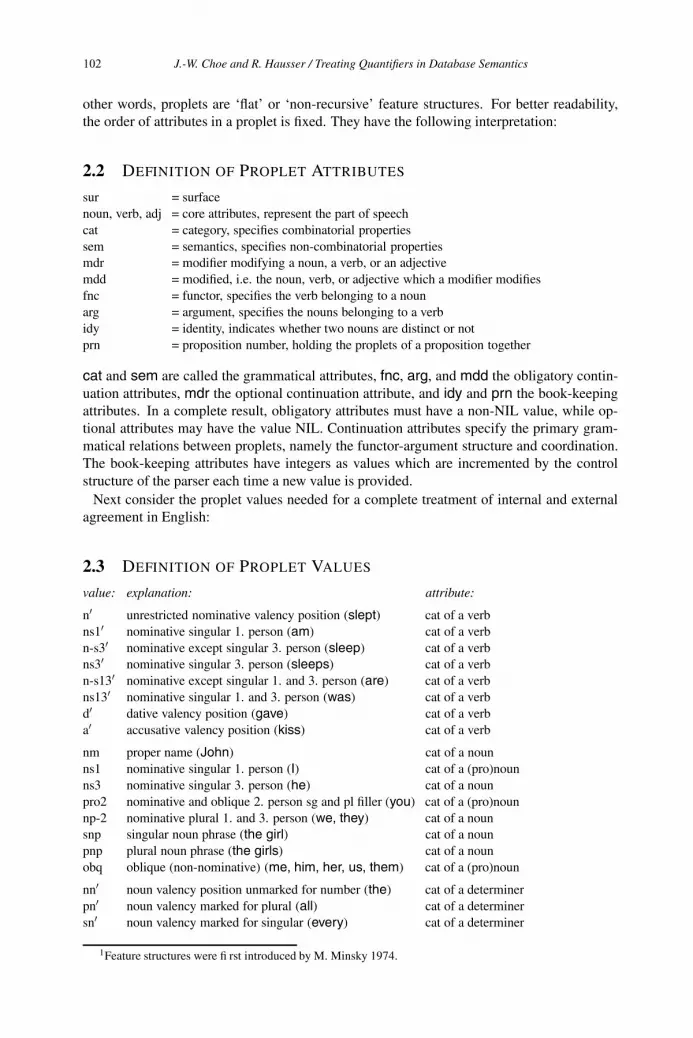
other words, proplets are ‘flat’ or ‘non-recursive’ feature structures. For better readability,the order of attributes in a proplet is fixed. They have the following interpretation:
2.2 DEFINITION OF PROPLET ATTRIBUTES
sur = surfacenoun, verb, adj = core attributes, represent the part of speechcat = category, specifies combinatorial propertiessem = semantics, specifies non-combinatorial propertiesmdr = modifier modifying a noun, a verb, or an adjectivemdd = modified, i.e. the noun, verb, or adjective which a modifier modifiesfnc = functor, specifies the verb belonging to a nounarg = argument, specifies the nouns belonging to a verbidy = identity, indicates whether two nouns are distinct or notprn = proposition number, holding the proplets of a proposition together
cat and sem are called the grammatical attributes, fnc, arg, and mdd the obligatory contin-uation attributes, mdr the optional continuation attribute, and idy and prn the book-keepingattributes. In a complete result, obligatory attributes must have a non-NIL value, while op-tional attributes may have the value NIL. Continuation attributes specify the primary gram-matical relations between proplets, namely the functor-argument structure and coordination.The book-keeping attributes have integers as values which are incremented by the controlstructure of the parser each time a new value is provided.
Next consider the proplet values needed for a complete treatment of internal and externalagreement in English:
2.3 DEFINITION OF PROPLET VALUES
value: explanation: attribute:
n unrestricted nominative valency position (slept) cat of a verbns1 nominative singular 1. person (am) cat of a verbn-s3 nominative except singular 3. person (sleep) cat of a verbns3 nominative singular 3. person (sleeps) cat of a verbn-s13 nominative except singular 1. and 3. person (are) cat of a verbns13 nominative singular 1. and 3. person (was) cat of a verbd dative valency position (gave) cat of a verba accusative valency position (kiss) cat of a verb
nm proper name (John) cat of a nounns1 nominative singular 1. person (I) cat of a (pro)nounns3 nominative singular 3. person (he) cat of a nounpro2 nominative and oblique 2. person sg and pl filler (you) cat of a (pro)nounnp-2 nominative plural 1. and 3. person (we, they) cat of a nounsnp singular noun phrase (the girl) cat of a nounpnp plural noun phrase (the girls) cat of a nounobq oblique (non-nominative) (me, him, her, us, them) cat of a (pro)noun
nn noun valency position unmarked for number (the) cat of a determinerpn noun valency marked for plural (all) cat of a determinersn noun valency marked for singular (every) cat of a determiner
1Feature structures were fi rst introduced by M. Minsky 1974.
J.-W. Choe and R. Hausser / Treating Quantifiers in Database Semantics102
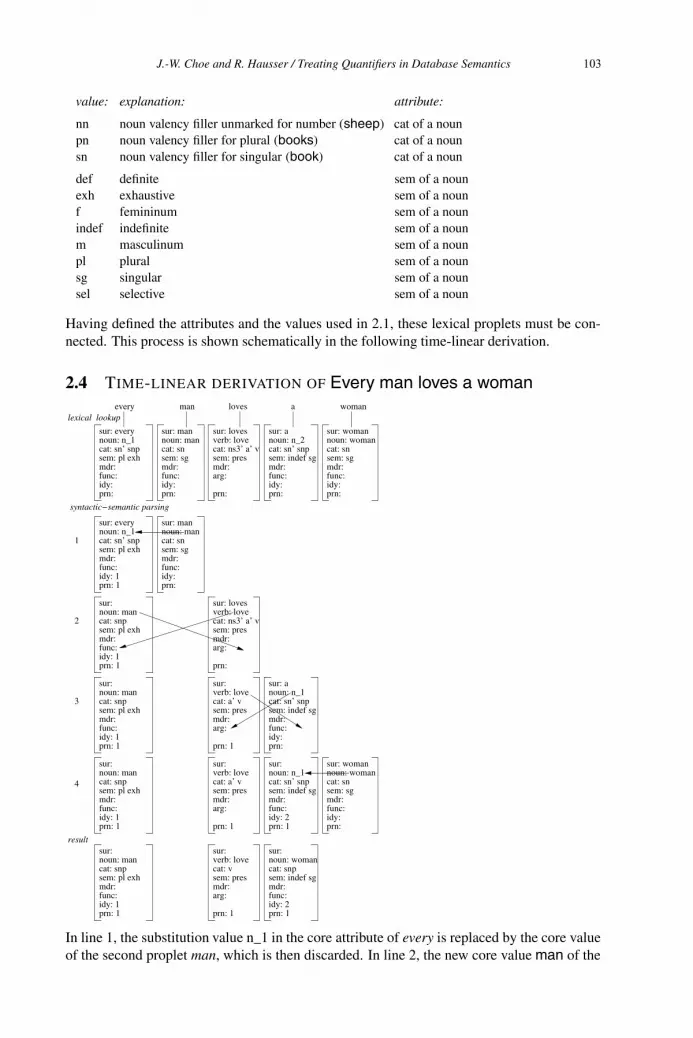
value: explanation: attribute:
nn noun valency filler unmarked for number (sheep) cat of a nounpn noun valency filler for plural (books) cat of a nounsn noun valency filler for singular (book) cat of a noun
def definite sem of a nounexh exhaustive sem of a nounf femininum sem of a nounindef indefinite sem of a nounm masculinum sem of a nounpl plural sem of a nounsg singular sem of a nounsel selective sem of a noun
Having defined the attributes and the values used in 2.1, these lexical proplets must be con-nected. This process is shown schematically in the following time-linear derivation.
2.4 TIME-LINEAR DERIVATION OF Every man loves a woman
prn: prn:
sur: everynoun: n_1cat: sn’ snpsem: pl exhmdr:func:idy:
sur: man
cat: snsem: sg
idy:
mdr:func:
noun: man
sur: everynoun: n_1cat: sn’ snpsem: pl exhmdr:func:
prn: 1idy: 1
prn:
sur: lovesverb: lovecat: ns3’ a’ vsem: presmdr:arg:
prn:
sur: lovesverb: lovecat: ns3’ a’ vsem: presmdr:arg:
sem: pl exhmdr:func:
prn: 1idy: 1
sur:noun: mancat: snp
prn:
cat: snsem: sg
idy:
mdr:func:
sur: womannoun: woman
loves aevery man
prn:
sur: man
cat: snsem: sg
idy:
mdr:func:
noun: man
woman
prn:
cat: sn’ snp
mdr:func:idy:
sem: indef sg
sur: a
sem: pl exhmdr:func:
prn: 1idy: 1
sur:noun: mancat: snp
verb: love
sem: presmdr:arg:
prn: 1
mdr:func:
sem: indef sg
prn: 1idy: 2
noun: woman
sem: pl exhmdr:func:
prn: 1idy: 1
sur:noun: mancat: snp
verb: love
sem: presmdr:arg:
cat: a’ v
prn: 1 prn:
noun: n_1cat: sn’ snp
mdr:func:idy:
sem: indef sg
sur: a
prn:
cat: snsem: sg
idy:
mdr:func:
sur: womannoun: woman
sem: pl exhmdr:func:
prn: 1idy: 1
sur:noun: mancat: snp
verb: love
sem: presmdr:arg:
cat: a’ v
prn: 1
noun: n_1cat: sn’ snp
mdr:func:
sem: indef sg
prn: 1idy: 2
sur:
sur: sur:
sur: sur:
cat: v cat: snp
lexical lookup
syntactic−semantic parsing
result
3
1
2
4
noun: n_2
In line 1, the substitution value n_1 in the core attribute of every is replaced by the core valueof the second proplet man, which is then discarded. In line 2, the new core value man of the
J.-W. Choe and R. Hausser / Treating Quantifiers in Database Semantics 103
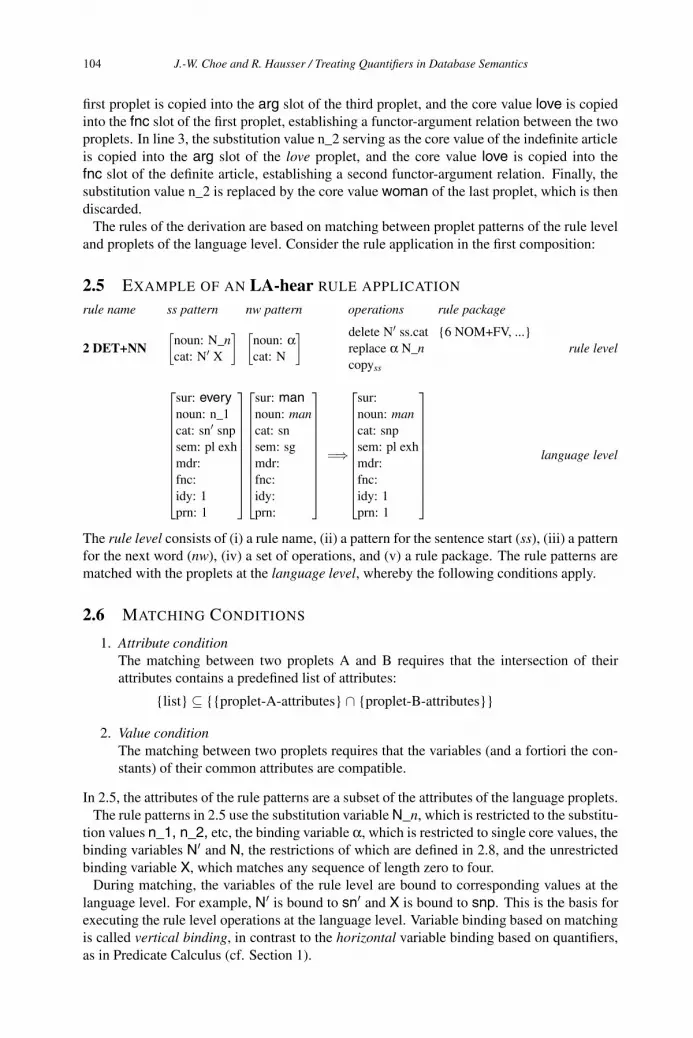
first proplet is copied into the arg slot of the third proplet, and the core value love is copiedinto the fnc slot of the first proplet, establishing a functor-argument relation between the twoproplets. In line 3, the substitution value n_2 serving as the core value of the indefinite articleis copied into the arg slot of the love proplet, and the core value love is copied into thefnc slot of the definite article, establishing a second functor-argument relation. Finally, thesubstitution value n_2 is replaced by the core value woman of the last proplet, which is thendiscarded.
The rules of the derivation are based on matching between proplet patterns of the rule leveland proplets of the language level. Consider the rule application in the first composition:
2.5 EXAMPLE OF AN LA-hear RULE APPLICATION
rule name ss pattern nw pattern operations rule package
2 DET+NN[
noun: N_ncat: N X
] [noun: αcat: N
] delete N ss.catreplace α N_ncopyss
{6 NOM+FV, ...}rule level
⎡⎢⎢⎢⎢⎢⎢⎢⎢⎢⎢⎣
sur: everynoun: n_1cat: sn snpsem: pl exhmdr:fnc:idy: 1prn: 1
⎤⎥⎥⎥⎥⎥⎥⎥⎥⎥⎥⎦
⎡⎢⎢⎢⎢⎢⎢⎢⎢⎢⎢⎣
sur: mannoun: mancat: snsem: sgmdr:fnc:idy:prn:
⎤⎥⎥⎥⎥⎥⎥⎥⎥⎥⎥⎦
=
⎡⎢⎢⎢⎢⎢⎢⎢⎢⎢⎢⎣
sur:noun: mancat: snpsem: pl exhmdr:fnc:idy: 1prn: 1
⎤⎥⎥⎥⎥⎥⎥⎥⎥⎥⎥⎦
language level
The rule level consists of (i) a rule name, (ii) a pattern for the sentence start (ss), (iii) a patternfor the next word (nw), (iv) a set of operations, and (v) a rule package. The rule patterns arematched with the proplets at the language level, whereby the following conditions apply.
2.6 MATCHING CONDITIONS
1. Attribute conditionThe matching between two proplets A and B requires that the intersection of theirattributes contains a predefined list of attributes:
{list} {{proplet-A-attributes} {proplet-B-attributes}}
2. Value conditionThe matching between two proplets requires that the variables (and a fortiori the con-stants) of their common attributes are compatible.
In 2.5, the attributes of the rule patterns are a subset of the attributes of the language proplets.The rule patterns in 2.5 use the substitution variable N_n, which is restricted to the substitu-
tion values n_1, n_2, etc, the binding variable α, which is restricted to single core values, thebinding variables N and N, the restrictions of which are defined in 2.8, and the unrestrictedbinding variable X, which matches any sequence of length zero to four.
During matching, the variables of the rule level are bound to corresponding values at thelanguage level. For example, N is bound to sn and X is bound to snp. This is the basis forexecuting the rule level operations at the language level. Variable binding based on matchingis called vertical binding, in contrast to the horizontal variable binding based on quantifiers,as in Predicate Calculus (cf. Section 1).
J.-W. Choe and R. Hausser / Treating Quantifiers in Database Semantics104
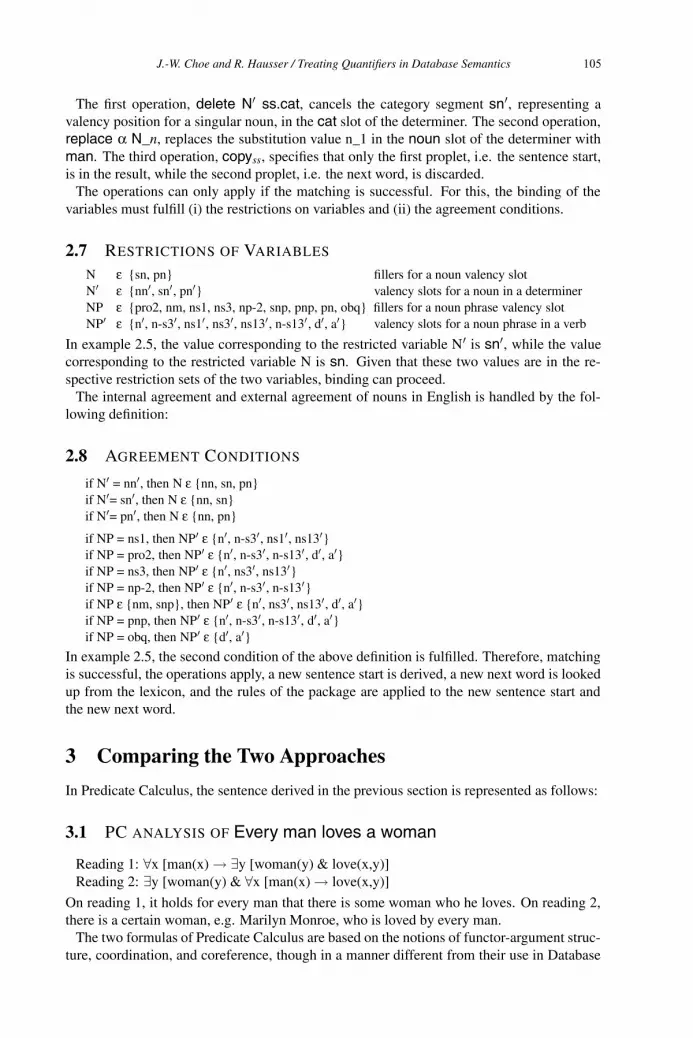
The first operation, delete N ss.cat, cancels the category segment sn , representing avalency position for a singular noun, in the cat slot of the determiner. The second operation,replace α N_n, replaces the substitution value n_1 in the noun slot of the determiner withman. The third operation, copyss, specifies that only the first proplet, i.e. the sentence start,is in the result, while the second proplet, i.e. the next word, is discarded.
The operations can only apply if the matching is successful. For this, the binding of thevariables must fulfill (i) the restrictions on variables and (ii) the agreement conditions.
2.7 RESTRICTIONS OF VARIABLES
N ε {sn, pn} fillers for a noun valency slotN ε {nn , sn , pn } valency slots for a noun in a determinerNP ε {pro2, nm, ns1, ns3, np-2, snp, pnp, pn, obq} fillers for a noun phrase valency slotNP ε {n , n-s3 , ns1 , ns3 , ns13 , n-s13 , d , a } valency slots for a noun phrase in a verb
In example 2.5, the value corresponding to the restricted variable N is sn , while the valuecorresponding to the restricted variable N is sn. Given that these two values are in the re-spective restriction sets of the two variables, binding can proceed.
The internal agreement and external agreement of nouns in English is handled by the fol-lowing definition:
2.8 AGREEMENT CONDITIONS
if N = nn , then N ε {nn, sn, pn}if N = sn , then N ε {nn, sn}if N = pn , then N ε {nn, pn}
if NP = ns1, then NP ε {n , n-s3 , ns1 , ns13 }if NP = pro2, then NP ε {n , n-s3 , n-s13 , d , a }if NP = ns3, then NP ε {n , ns3 , ns13 }if NP = np-2, then NP ε {n , n-s3 , n-s13 }if NP ε {nm, snp}, then NP ε {n , ns3 , ns13 , d , a }if NP = pnp, then NP ε {n , n-s3 , n-s13 , d , a }if NP = obq, then NP ε {d , a }
In example 2.5, the second condition of the above definition is fulfilled. Therefore, matchingis successful, the operations apply, a new sentence start is derived, a new next word is lookedup from the lexicon, and the rules of the package are applied to the new sentence start andthe new next word.
3 Comparing the Two Approaches
In Predicate Calculus, the sentence derived in the previous section is represented as follows:
3.1 PC ANALYSIS OF Every man loves a woman
Reading 1: x [man(x) y [woman(y) & love(x,y)]Reading 2: y [woman(y) & x [man(x) love(x,y)]
On reading 1, it holds for every man that there is some woman who he loves. On reading 2,there is a certain woman, e.g. Marilyn Monroe, who is loved by every man.
The two formulas of Predicate Calculus are based on the notions of functor-argument struc-ture, coordination, and coreference, though in a manner different from their use in Database
J.-W. Choe and R. Hausser / Treating Quantifiers in Database Semantics 105
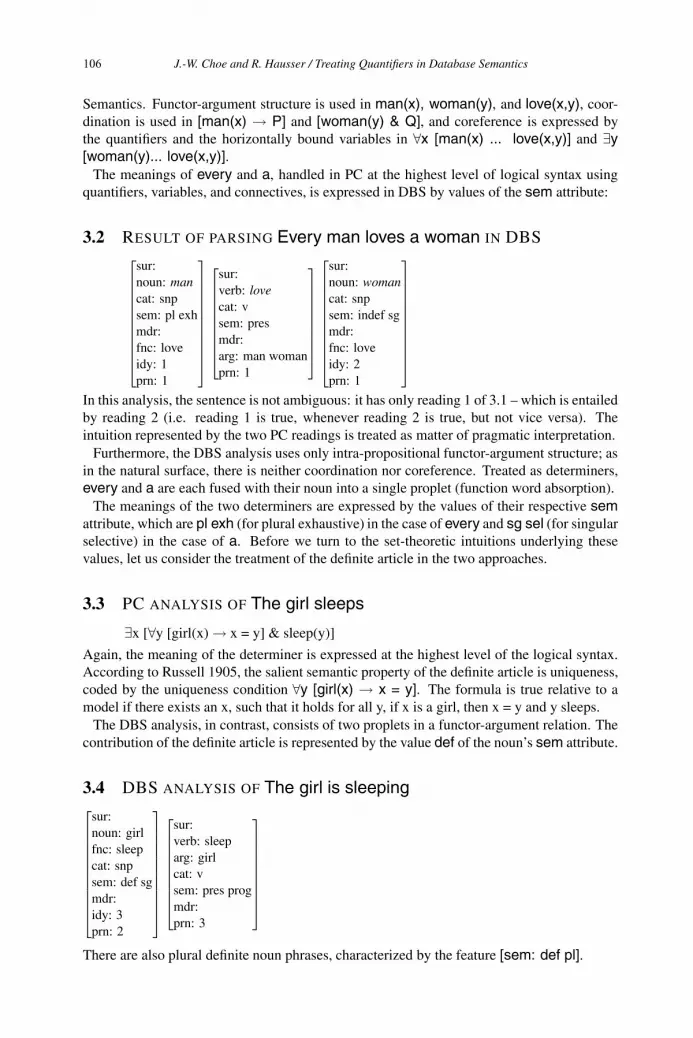
Semantics. Functor-argument structure is used in man(x), woman(y), and love(x,y), coor-dination is used in [man(x) P] and [woman(y) & Q], and coreference is expressed bythe quantifiers and the horizontally bound variables in x [man(x) ... love(x,y)] and y[woman(y)... love(x,y)].
The meanings of every and a, handled in PC at the highest level of logical syntax usingquantifiers, variables, and connectives, is expressed in DBS by values of the sem attribute:
3.2 RESULT OF PARSING Every man loves a woman IN DBS⎡⎢⎢⎢⎢⎢⎢⎢⎢⎢⎢⎣
sur:noun: mancat: snpsem: pl exhmdr:fnc: loveidy: 1prn: 1
⎤⎥⎥⎥⎥⎥⎥⎥⎥⎥⎥⎦
⎡⎢⎢⎢⎢⎢⎢⎢⎢⎣
sur:verb: lovecat: vsem: presmdr:arg: man womanprn: 1
⎤⎥⎥⎥⎥⎥⎥⎥⎥⎦
⎡⎢⎢⎢⎢⎢⎢⎢⎢⎢⎢⎣
sur:noun: womancat: snpsem: indef sgmdr:fnc: loveidy: 2prn: 1
⎤⎥⎥⎥⎥⎥⎥⎥⎥⎥⎥⎦
In this analysis, the sentence is not ambiguous: it has only reading 1 of 3.1 – which is entailedby reading 2 (i.e. reading 1 is true, whenever reading 2 is true, but not vice versa). Theintuition represented by the two PC readings is treated as matter of pragmatic interpretation.
Furthermore, the DBS analysis uses only intra-propositional functor-argument structure; asin the natural surface, there is neither coordination nor coreference. Treated as determiners,every and a are each fused with their noun into a single proplet (function word absorption).
The meanings of the two determiners are expressed by the values of their respective semattribute, which are pl exh (for plural exhaustive) in the case of every and sg sel (for singularselective) in the case of a. Before we turn to the set-theoretic intuitions underlying thesevalues, let us consider the treatment of the definite article in the two approaches.
3.3 PC ANALYSIS OF The girl sleeps
x [ y [girl(x) x = y] & sleep(y)]
Again, the meaning of the determiner is expressed at the highest level of the logical syntax.According to Russell 1905, the salient semantic property of the definite article is uniqueness,coded by the uniqueness condition y [girl(x) x = y]. The formula is true relative to amodel if there exists an x, such that it holds for all y, if x is a girl, then x = y and y sleeps.
The DBS analysis, in contrast, consists of two proplets in a functor-argument relation. Thecontribution of the definite article is represented by the value def of the noun’s sem attribute.
3.4 DBS ANALYSIS OF The girl is sleeping⎡⎢⎢⎢⎢⎢⎢⎢⎢⎢⎢⎣
sur:noun: girlfnc: sleepcat: snpsem: def sgmdr:idy: 3prn: 2
⎤⎥⎥⎥⎥⎥⎥⎥⎥⎥⎥⎦
⎡⎢⎢⎢⎢⎢⎢⎢⎢⎣
sur:verb: sleeparg: girlcat: vsem: pres progmdr:prn: 3
⎤⎥⎥⎥⎥⎥⎥⎥⎥⎦
There are also plural definite noun phrases, characterized by the feature [sem: def pl].
J.-W. Choe and R. Hausser / Treating Quantifiers in Database Semantics106
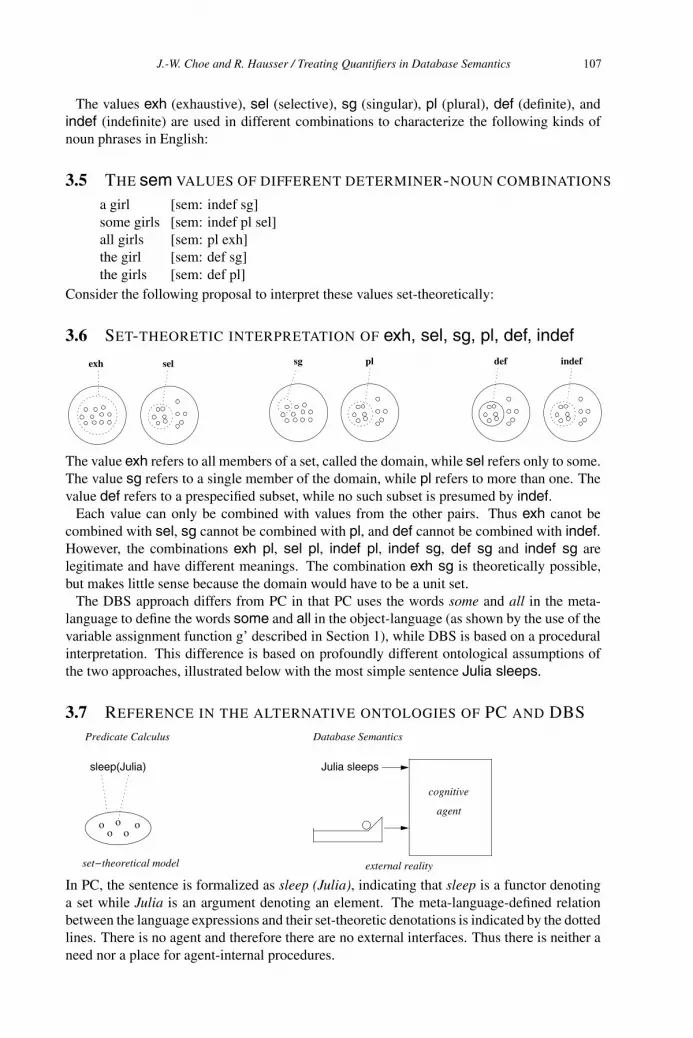
The values exh (exhaustive), sel (selective), sg (singular), pl (plural), def (definite), andindef (indefinite) are used in different combinations to characterize the following kinds ofnoun phrases in English:
3.5 THE sem VALUES OF DIFFERENT DETERMINER-NOUN COMBINATIONS
a girl [sem: indef sg]some girls [sem: indef pl sel]all girls [sem: pl exh]the girl [sem: def sg]the girls [sem: def pl]
Consider the following proposal to interpret these values set-theoretically:
3.6 SET-THEORETIC INTERPRETATION OF exh, sel, sg, pl, def, indefsg pl def indefexh sel
The value exh refers to all members of a set, called the domain, while sel refers only to some.The value sg refers to a single member of the domain, while pl refers to more than one. Thevalue def refers to a prespecified subset, while no such subset is presumed by indef.
Each value can only be combined with values from the other pairs. Thus exh canot becombined with sel, sg cannot be combined with pl, and def cannot be combined with indef.However, the combinations exh pl, sel pl, indef pl, indef sg, def sg and indef sg arelegitimate and have different meanings. The combination exh sg is theoretically possible,but makes little sense because the domain would have to be a unit set.
The DBS approach differs from PC in that PC uses the words some and all in the meta-language to define the words some and all in the object-language (as shown by the use of thevariable assignment function g’ described in Section 1), while DBS is based on a proceduralinterpretation. This difference is based on profoundly different ontological assumptions ofthe two approaches, illustrated below with the most simple sentence Julia sleeps.
3.7 REFERENCE IN THE ALTERNATIVE ONTOLOGIES OF PC AND DBS
Julia sleeps
Database Semantics
external reality
cognitive
agent
Predicate Calculus
set−theoretical model
ooo o
o
sleep(Julia)
In PC, the sentence is formalized as sleep (Julia), indicating that sleep is a functor denotinga set while Julia is an argument denoting an element. The meta-language-defined relationbetween the language expressions and their set-theoretic denotations is indicated by the dottedlines. There is no agent and therefore there are no external interfaces. Thus there is neither aneed nor a place for agent-internal procedures.
J.-W. Choe and R. Hausser / Treating Quantifiers in Database Semantics 107
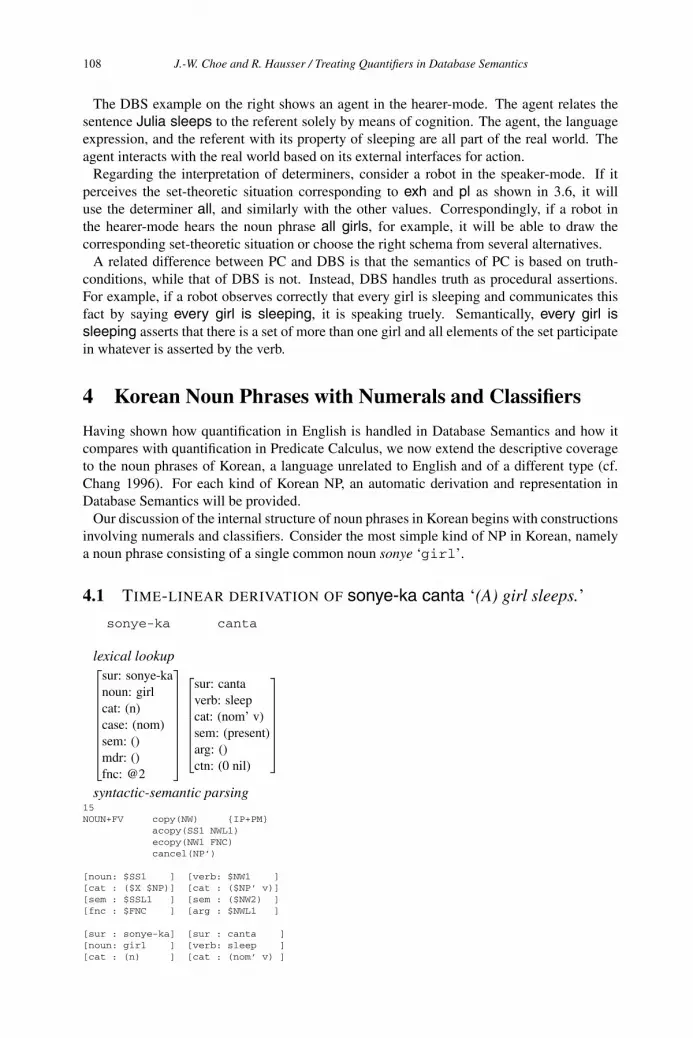
The DBS example on the right shows an agent in the hearer-mode. The agent relates thesentence Julia sleeps to the referent solely by means of cognition. The agent, the languageexpression, and the referent with its property of sleeping are all part of the real world. Theagent interacts with the real world based on its external interfaces for action.
Regarding the interpretation of determiners, consider a robot in the speaker-mode. If itperceives the set-theoretic situation corresponding to exh and pl as shown in 3.6, it willuse the determiner all, and similarly with the other values. Correspondingly, if a robot inthe hearer-mode hears the noun phrase all girls, for example, it will be able to draw thecorresponding set-theoretic situation or choose the right schema from several alternatives.
A related difference between PC and DBS is that the semantics of PC is based on truth-conditions, while that of DBS is not. Instead, DBS handles truth as procedural assertions.For example, if a robot observes correctly that every girl is sleeping and communicates thisfact by saying every girl is sleeping, it is speaking truely. Semantically, every girl issleeping asserts that there is a set of more than one girl and all elements of the set participatein whatever is asserted by the verb.
4 Korean Noun Phrases with Numerals and Classifiers
Having shown how quantification in English is handled in Database Semantics and how itcompares with quantification in Predicate Calculus, we now extend the descriptive coverageto the noun phrases of Korean, a language unrelated to English and of a different type (cf.Chang 1996). For each kind of Korean NP, an automatic derivation and representation inDatabase Semantics will be provided.
Our discussion of the internal structure of noun phrases in Korean begins with constructionsinvolving numerals and classifiers. Consider the most simple kind of NP in Korean, namelya noun phrase consisting of a single common noun sonye ‘girl’.
4.1 TIME-LINEAR DERIVATION OF sonye-ka canta ‘(A) girl sleeps.’
sonye-ka canta
lexical lookup⎡⎢⎢⎢⎢⎢⎢⎢⎢⎣
sur: sonye-kanoun: girlcat: (n)case: (nom)sem: ()mdr: ()fnc: @2
⎤⎥⎥⎥⎥⎥⎥⎥⎥⎦
⎡⎢⎢⎢⎢⎢⎢⎣
sur: cantaverb: sleepcat: (nom’ v)sem: (present)arg: ()ctn: (0 nil)
⎤⎥⎥⎥⎥⎥⎥⎦
syntactic-semantic parsing15NOUN+FV copy(NW) {IP+PM}
acopy(SS1 NWL1)ecopy(NW1 FNC)cancel(NP’)
[noun: $SS1 ] [verb: $NW1 ][cat : ($X $NP)] [cat : ($NP’ v)][sem : $SSL1 ] [sem : ($NW2) ][fnc : $FNC ] [arg : $NWL1 ]
[sur : sonye-ka] [sur : canta ][noun: girl ] [verb: sleep ][cat : (n) ] [cat : (nom’ v) ]
J.-W. Choe and R. Hausser / Treating Quantifiers in Database Semantics108
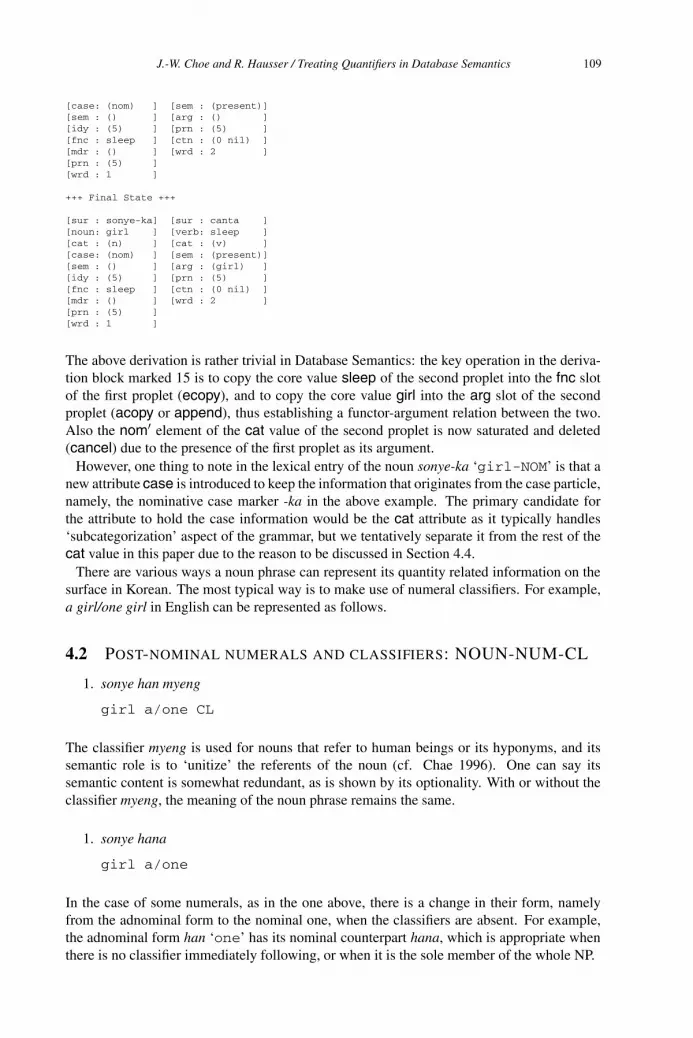
[case: (nom) ] [sem : (present)][sem : () ] [arg : () ][idy : (5) ] [prn : (5) ][fnc : sleep ] [ctn : (0 nil) ][mdr : () ] [wrd : 2 ][prn : (5) ][wrd : 1 ]
+++ Final State +++
[sur : sonye-ka] [sur : canta ][noun: girl ] [verb: sleep ][cat : (n) ] [cat : (v) ][case: (nom) ] [sem : (present)][sem : () ] [arg : (girl) ][idy : (5) ] [prn : (5) ][fnc : sleep ] [ctn : (0 nil) ][mdr : () ] [wrd : 2 ][prn : (5) ][wrd : 1 ]
The above derivation is rather trivial in Database Semantics: the key operation in the deriva-tion block marked 15 is to copy the core value sleep of the second proplet into the fnc slotof the first proplet (ecopy), and to copy the core value girl into the arg slot of the secondproplet (acopy or append), thus establishing a functor-argument relation between the two.Also the nom element of the cat value of the second proplet is now saturated and deleted(cancel) due to the presence of the first proplet as its argument.
However, one thing to note in the lexical entry of the noun sonye-ka ‘girl-NOM’ is that anew attribute case is introduced to keep the information that originates from the case particle,namely, the nominative case marker -ka in the above example. The primary candidate forthe attribute to hold the case information would be the cat attribute as it typically handles‘subcategorization’ aspect of the grammar, but we tentatively separate it from the rest of thecat value in this paper due to the reason to be discussed in Section 4.4.
There are various ways a noun phrase can represent its quantity related information on thesurface in Korean. The most typical way is to make use of numeral classifiers. For example,a girl/one girl in English can be represented as follows.
4.2 POST-NOMINAL NUMERALS AND CLASSIFIERS: NOUN-NUM-CL
1. sonye han myeng
girl a/one CL
The classifier myeng is used for nouns that refer to human beings or its hyponyms, and itssemantic role is to ‘unitize’ the referents of the noun (cf. Chae 1996). One can say itssemantic content is somewhat redundant, as is shown by its optionality. With or without theclassifier myeng, the meaning of the noun phrase remains the same.
1. sonye hana
girl a/one
In the case of some numerals, as in the one above, there is a change in their form, namelyfrom the adnominal form to the nominal one, when the classifiers are absent. For example,the adnominal form han ‘one’ has its nominal counterpart hana, which is appropriate whenthere is no classifier immediately following, or when it is the sole member of the whole NP.
J.-W. Choe and R. Hausser / Treating Quantifiers in Database Semantics 109

An interesting complication to this construction2 is that some case-markers like the nomi-native -ka(/-i) and accusative -lul(/-ul) can attach either to the host noun or the classifier,3 orto both. Given that the classifier itself is optional, there would be up to six possible variantsof the construction.4
1. sonye-ka han myeng
girl-NOM one CL
2. sonye han myeng-i
girl one CL-NOM
3. sonye-ka han myeng-i
girl-NOM one CL-NOM
4. sonye-ka hana
girl-NOM a/one
5. sonye hana-ka
girl a/one-NOM
6. sonye-ka hana-ka
girl-NOM a/one-NOM
Then the eight possible variations can be summarized as follows:
4.3 PATTERNS OF POST-NOMINAL NUMERALS AND CLASSIFIERS
1. NOUN case) NUM CL case)
2. NOUN case) NUM case)
Note that the case marker can attach virtually to any element in the NP structure. Whicheverelement the case marker attaches to, its value should be copied to the proplet that remains tobe included in the resulting representation. If we were to keep the information as part of thecat value, then linking it to the surface position of the case marker would get complicated,and that is why we introduce a separate attribute case. Since the case marker can attach toNOUN, CL, or NUM when it appears in a nominal position, all their proplets will have thecase attribute in the lexicon.
Now the question is how we can deal with these various Korean quantificational construc-tions in the framework of Database Semantics. The first issue would be whether we should
2There are some issues concerning the constituency of the above expressions, that is, whether each expres-sion forms a single constituent or not at the syntactic level, as the second part of the expression, namely, numeral+ classifi er han myeng can sometimes ‘float’ from its host noun sonye-ka thus allowing an intervening elementin between. We will not touch on the issue here, but for further discussion see Sohn 1999, Kang 2002, andreferences cited therein.
3Another point to note is that while distribution and use of classifi ers are largely the same in Korean andJapanese, one major difference is that in Japanese case markers cannot attach to the classifi ers (cf. Miyagawa1989).
4Yet another optionality, though not to be discussed in this paper, is attested by the plural marker -tul. Inthe examples given above, -tul can optionally attach to the noun sonye ‘girl’, thus making the total number ofvariants twelve.
J.-W. Choe and R. Hausser / Treating Quantifiers in Database Semantics110
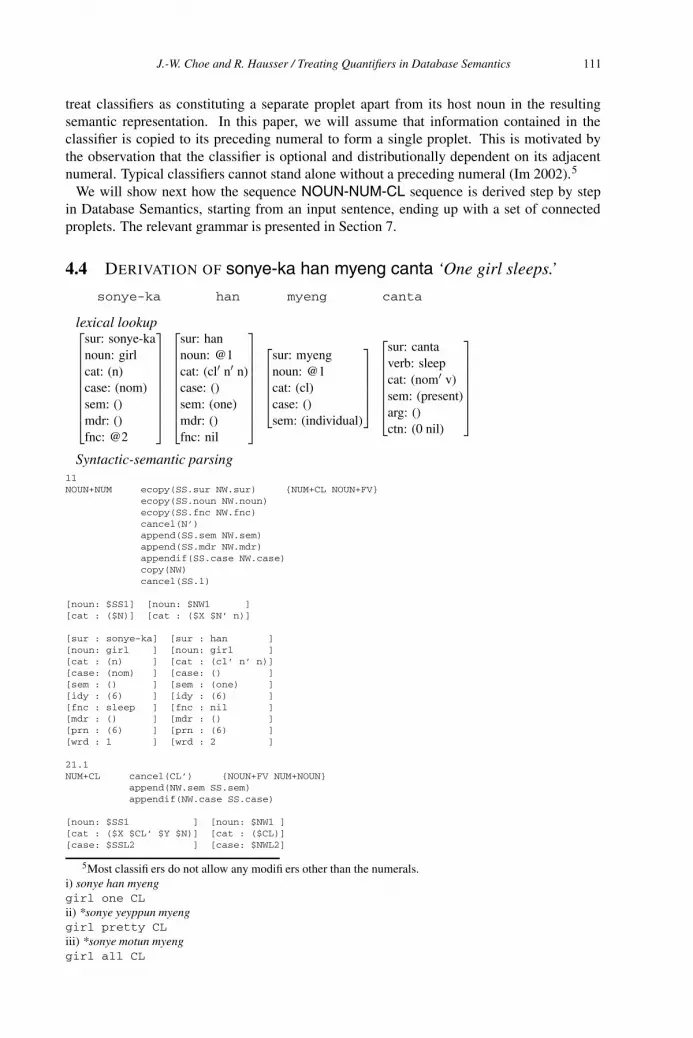
treat classifiers as constituting a separate proplet apart from its host noun in the resultingsemantic representation. In this paper, we will assume that information contained in theclassifier is copied to its preceding numeral to form a single proplet. This is motivated bythe observation that the classifier is optional and distributionally dependent on its adjacentnumeral. Typical classifiers cannot stand alone without a preceding numeral (Im 2002).5
We will show next how the sequence NOUN-NUM-CL sequence is derived step by stepin Database Semantics, starting from an input sentence, ending up with a set of connectedproplets. The relevant grammar is presented in Section 7.
4.4 DERIVATION OF sonye-ka han myeng canta ‘One girl sleeps.’
sonye-ka han myeng canta
lexical lookup⎡⎢⎢⎢⎢⎢⎢⎢⎢⎣
sur: sonye-kanoun: girlcat: (n)case: (nom)sem: ()mdr: ()fnc: @2
⎤⎥⎥⎥⎥⎥⎥⎥⎥⎦
⎡⎢⎢⎢⎢⎢⎢⎢⎢⎣
sur: hannoun: @1cat: (cl n n)case: ()sem: (one)mdr: ()fnc: nil
⎤⎥⎥⎥⎥⎥⎥⎥⎥⎦
⎡⎢⎢⎢⎢⎣
sur: myengnoun: @1cat: (cl)case: ()sem: (individual)
⎤⎥⎥⎥⎥⎦
⎡⎢⎢⎢⎢⎢⎢⎣
sur: cantaverb: sleepcat: (nom v)sem: (present)arg: ()ctn: (0 nil)
⎤⎥⎥⎥⎥⎥⎥⎦
Syntactic-semantic parsing11NOUN+NUM ecopy(SS.sur NW.sur) {NUM+CL NOUN+FV}
ecopy(SS.noun NW.noun)ecopy(SS.fnc NW.fnc)cancel(N’)append(SS.sem NW.sem)append(SS.mdr NW.mdr)appendif(SS.case NW.case)copy(NW)cancel(SS.1)
[noun: $SS1] [noun: $NW1 ][cat : ($N)] [cat : ($X $N’ n)]
[sur : sonye-ka] [sur : han ][noun: girl ] [noun: girl ][cat : (n) ] [cat : (cl’ n’ n)][case: (nom) ] [case: () ][sem : () ] [sem : (one) ][idy : (6) ] [idy : (6) ][fnc : sleep ] [fnc : nil ][mdr : () ] [mdr : () ][prn : (6) ] [prn : (6) ][wrd : 1 ] [wrd : 2 ]
21.1NUM+CL cancel(CL’) {NOUN+FV NUM+NOUN}
append(NW.sem SS.sem)appendif(NW.case SS.case)
[noun: $SS1 ] [noun: $NW1 ][cat : ($X $CL’ $Y $N)] [cat : ($CL)][case: $SSL2 ] [case: $NWL2]
5Most classifi ers do not allow any modifi ers other than the numerals.i) sonye han myenggirl one CLii) *sonye yeyppun myenggirl pretty CLiii) *sonye motun myenggirl all CL
J.-W. Choe and R. Hausser / Treating Quantifiers in Database Semantics 111
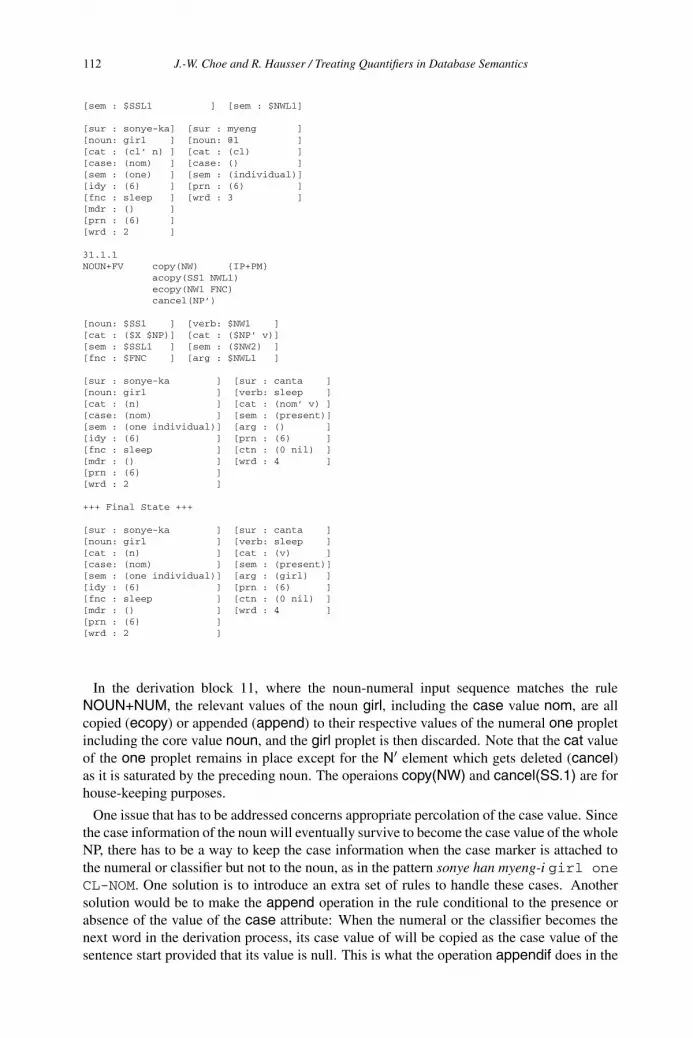
[sem : $SSL1 ] [sem : $NWL1]
[sur : sonye-ka] [sur : myeng ][noun: girl ] [noun: @1 ][cat : (cl’ n) ] [cat : (cl) ][case: (nom) ] [case: () ][sem : (one) ] [sem : (individual)][idy : (6) ] [prn : (6) ][fnc : sleep ] [wrd : 3 ][mdr : () ][prn : (6) ][wrd : 2 ]
31.1.1NOUN+FV copy(NW) {IP+PM}
acopy(SS1 NWL1)ecopy(NW1 FNC)cancel(NP’)
[noun: $SS1 ] [verb: $NW1 ][cat : ($X $NP)] [cat : ($NP’ v)][sem : $SSL1 ] [sem : ($NW2) ][fnc : $FNC ] [arg : $NWL1 ]
[sur : sonye-ka ] [sur : canta ][noun: girl ] [verb: sleep ][cat : (n) ] [cat : (nom’ v) ][case: (nom) ] [sem : (present)][sem : (one individual)] [arg : () ][idy : (6) ] [prn : (6) ][fnc : sleep ] [ctn : (0 nil) ][mdr : () ] [wrd : 4 ][prn : (6) ][wrd : 2 ]
+++ Final State +++
[sur : sonye-ka ] [sur : canta ][noun: girl ] [verb: sleep ][cat : (n) ] [cat : (v) ][case: (nom) ] [sem : (present)][sem : (one individual)] [arg : (girl) ][idy : (6) ] [prn : (6) ][fnc : sleep ] [ctn : (0 nil) ][mdr : () ] [wrd : 4 ][prn : (6) ][wrd : 2 ]
In the derivation block 11, where the noun-numeral input sequence matches the ruleNOUN+NUM, the relevant values of the noun girl, including the case value nom, are allcopied (ecopy) or appended (append) to their respective values of the numeral one propletincluding the core value noun, and the girl proplet is then discarded. Note that the cat valueof the one proplet remains in place except for the N element which gets deleted (cancel)as it is saturated by the preceding noun. The operaions copy(NW) and cancel(SS.1) are forhouse-keeping purposes.
One issue that has to be addressed concerns appropriate percolation of the case value. Sincethe case information of the noun will eventually survive to become the case value of the wholeNP, there has to be a way to keep the case information when the case marker is attached tothe numeral or classifier but not to the noun, as in the pattern sonye han myeng-i girl oneCL-NOM. One solution is to introduce an extra set of rules to handle these cases. Anothersolution would be to make the append operation in the rule conditional to the presence orabsence of the value of the case attribute: When the numeral or the classifier becomes thenext word in the derivation process, its case value of will be copied as the case value of thesentence start provided that its value is null. This is what the operation appendif does in the
J.-W. Choe and R. Hausser / Treating Quantifiers in Database Semantics112

above derivation.6
In block 21.1, the relevant information is copied from the new next word, the classifiermyeng, to the sentence start resulting from the previous composition. The key value to becopied is the sem value, individual, which is added to the sem value of the sentence start.Here the cancellation of the relevant element of the cat value also occurs. The rest of theparsing are the same as before, the completed noun phrase combining with the verb.
Returnting to the possible patterns of quantificational NPs in Korean, even the noun is notalways required in an NP. For example, an NP can consist of a NUM sequence only.
4.5 RESULT OF PARSING hana-ka canta ‘One sleeps.’⎡⎢⎢⎢⎢⎢⎢⎢⎢⎢⎢⎢⎢⎣
sur : hana-kanoun: @1cat : (n n)case: (nom)mdr : ()sem : (one)fnc : sleepwrd : 1prn : (1)
⎤⎥⎥⎥⎥⎥⎥⎥⎥⎥⎥⎥⎥⎦
⎡⎢⎢⎢⎢⎢⎢⎢⎢⎢⎢⎣
sur : cantaverb: sleepcat : (v)sem : (present)arg : (@1)ctn : (0 nil)wrd : 2prn : (1)
⎤⎥⎥⎥⎥⎥⎥⎥⎥⎥⎥⎦
The sentence does not seem specific enough to be counted as an independent proposition, butthere is no doubt that one comes across such kind of utterances rather frequently in everydaylife. We can assume that the rest of the information to make the sentence concrete enoughwill come from the discourse, and the unsaturated element of the cat value of the one propletwill eventually be cancelled or linked to some salient discourse referent through inference.
5 Prenominal Numerals in Korean
So far we have considered cases of quantificational NP in Korean where the numeral fol-lows the related noun. But the numerals can precede the noun as well – with or without anintervening classifier.
5.1 PRENOMINAL NUMERALS AND CLASSIFIERS: NUM-CL-NOUN
1. han myeng sonye
one CL girl
2. han sonye
one girl
When the classifier precedes the noun, its case relation to the noun becomes more restrictedand allows only a genitive case marker as its suffix.
1. han myeng-ui sonye
one CL-GEN girl
Therefore, there will be all six variants of the prenominal numeral/classifier constructionfor noun phrases in Korean.
6However, allowing a rule operation to be sensitive to the context could cause some undesirable complicationin the whole system, so this might require some further investigation.
J.-W. Choe and R. Hausser / Treating Quantifiers in Database Semantics 113
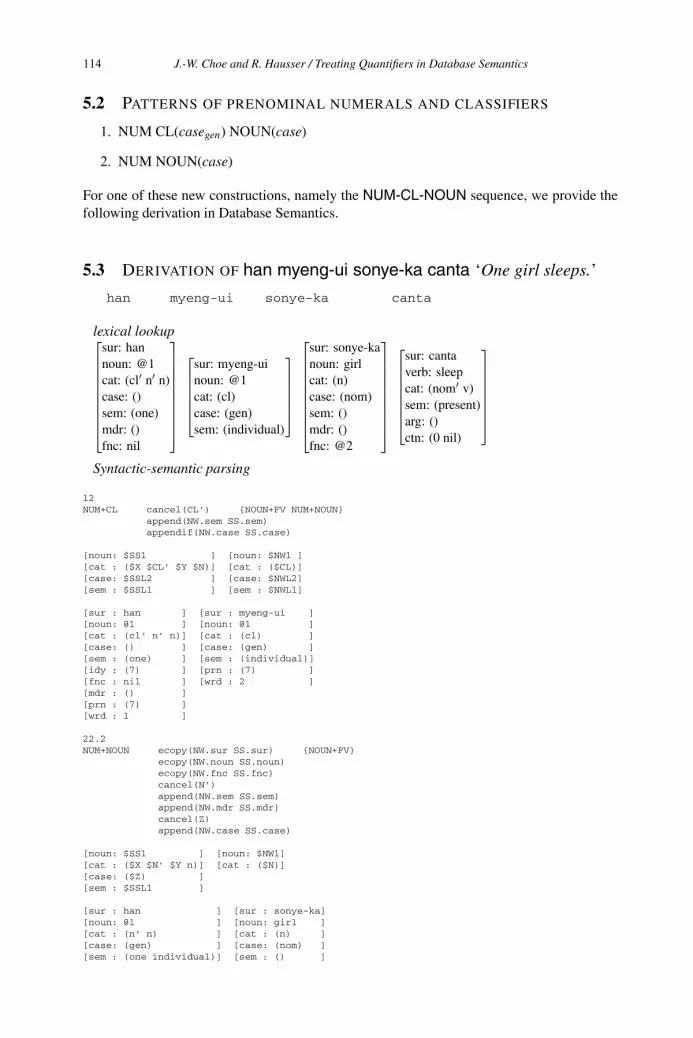
5.2 PATTERNS OF PRENOMINAL NUMERALS AND CLASSIFIERS
1. NUM CL(casegen) NOUN(case)
2. NUM NOUN(case)
For one of these new constructions, namely the NUM-CL-NOUN sequence, we provide thefollowing derivation in Database Semantics.
5.3 DERIVATION OF han myeng-ui sonye-ka canta ‘One girl sleeps.’
han myeng-ui sonye-ka canta
lexical lookup⎡⎢⎢⎢⎢⎢⎢⎢⎢⎣
sur: hannoun: @1cat: (cl n n)case: ()sem: (one)mdr: ()fnc: nil
⎤⎥⎥⎥⎥⎥⎥⎥⎥⎦
⎡⎢⎢⎢⎢⎣
sur: myeng-uinoun: @1cat: (cl)case: (gen)sem: (individual)
⎤⎥⎥⎥⎥⎦
⎡⎢⎢⎢⎢⎢⎢⎢⎢⎣
sur: sonye-kanoun: girlcat: (n)case: (nom)sem: ()mdr: ()fnc: @2
⎤⎥⎥⎥⎥⎥⎥⎥⎥⎦
⎡⎢⎢⎢⎢⎢⎢⎣
sur: cantaverb: sleepcat: (nom v)sem: (present)arg: ()ctn: (0 nil)
⎤⎥⎥⎥⎥⎥⎥⎦
Syntactic-semantic parsing
12NUM+CL cancel(CL’) {NOUN+FV NUM+NOUN}
append(NW.sem SS.sem)appendif(NW.case SS.case)
[noun: $SS1 ] [noun: $NW1 ][cat : ($X $CL’ $Y $N)] [cat : ($CL)][case: $SSL2 ] [case: $NWL2][sem : $SSL1 ] [sem : $NWL1]
[sur : han ] [sur : myeng-ui ][noun: @1 ] [noun: @1 ][cat : (cl’ n’ n)] [cat : (cl) ][case: () ] [case: (gen) ][sem : (one) ] [sem : (individual)][idy : (7) ] [prn : (7) ][fnc : nil ] [wrd : 2 ][mdr : () ][prn : (7) ][wrd : 1 ]
22.2NUM+NOUN ecopy(NW.sur SS.sur) {NOUN+FV}
ecopy(NW.noun SS.noun)ecopy(NW.fnc SS.fnc)cancel(N’)append(NW.sem SS.sem)append(NW.mdr SS.mdr)cancel(Z)append(NW.case SS.case)
[noun: $SS1 ] [noun: $NW1][cat : ($X $N’ $Y n)] [cat : ($N)][case: ($Z) ][sem : $SSL1 ]
[sur : han ] [sur : sonye-ka][noun: @1 ] [noun: girl ][cat : (n’ n) ] [cat : (n) ][case: (gen) ] [case: (nom) ][sem : (one individual)] [sem : () ]
J.-W. Choe and R. Hausser / Treating Quantifiers in Database Semantics114
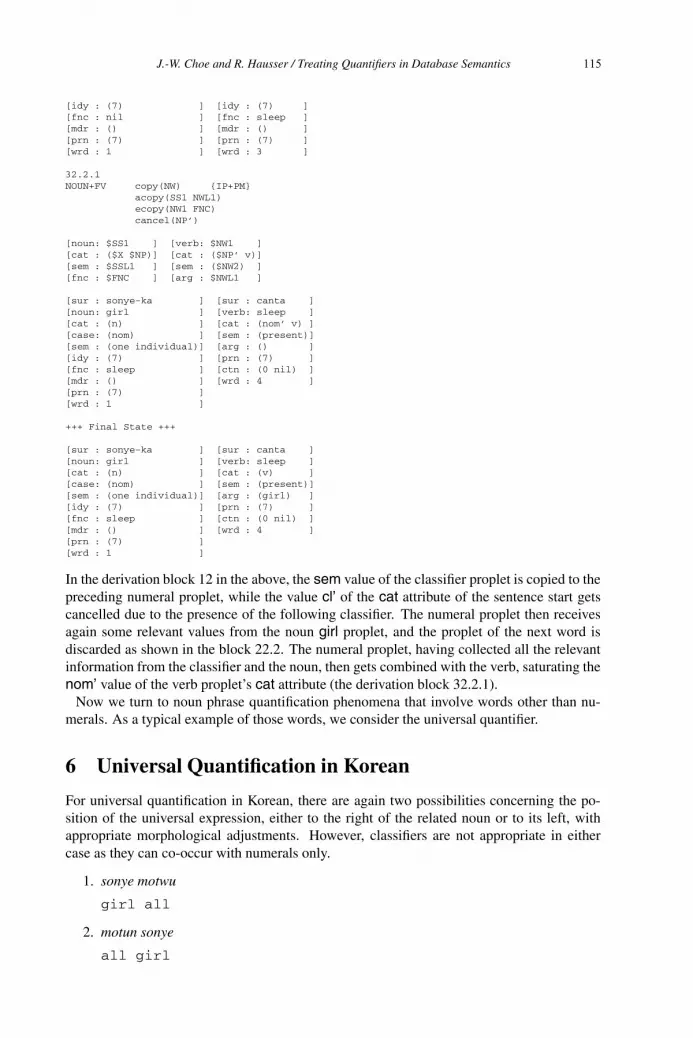
[idy : (7) ] [idy : (7) ][fnc : nil ] [fnc : sleep ][mdr : () ] [mdr : () ][prn : (7) ] [prn : (7) ][wrd : 1 ] [wrd : 3 ]
32.2.1NOUN+FV copy(NW) {IP+PM}
acopy(SS1 NWL1)ecopy(NW1 FNC)cancel(NP’)
[noun: $SS1 ] [verb: $NW1 ][cat : ($X $NP)] [cat : ($NP’ v)][sem : $SSL1 ] [sem : ($NW2) ][fnc : $FNC ] [arg : $NWL1 ]
[sur : sonye-ka ] [sur : canta ][noun: girl ] [verb: sleep ][cat : (n) ] [cat : (nom’ v) ][case: (nom) ] [sem : (present)][sem : (one individual)] [arg : () ][idy : (7) ] [prn : (7) ][fnc : sleep ] [ctn : (0 nil) ][mdr : () ] [wrd : 4 ][prn : (7) ][wrd : 1 ]
+++ Final State +++
[sur : sonye-ka ] [sur : canta ][noun: girl ] [verb: sleep ][cat : (n) ] [cat : (v) ][case: (nom) ] [sem : (present)][sem : (one individual)] [arg : (girl) ][idy : (7) ] [prn : (7) ][fnc : sleep ] [ctn : (0 nil) ][mdr : () ] [wrd : 4 ][prn : (7) ][wrd : 1 ]
In the derivation block 12 in the above, the sem value of the classifier proplet is copied to thepreceding numeral proplet, while the value cl’ of the cat attribute of the sentence start getscancelled due to the presence of the following classifier. The numeral proplet then receivesagain some relevant values from the noun girl proplet, and the proplet of the next word isdiscarded as shown in the block 22.2. The numeral proplet, having collected all the relevantinformation from the classifier and the noun, then gets combined with the verb, saturating thenom’ value of the verb proplet’s cat attribute (the derivation block 32.2.1).
Now we turn to noun phrase quantification phenomena that involve words other than nu-merals. As a typical example of those words, we consider the universal quantifier.
6 Universal Quantification in Korean
For universal quantification in Korean, there are again two possibilities concerning the po-sition of the universal expression, either to the right of the related noun or to its left, withappropriate morphological adjustments. However, classifiers are not appropriate in eithercase as they can co-occur with numerals only.
1. sonye motwu
girl all
2. motun sonye
all girl
J.-W. Choe and R. Hausser / Treating Quantifiers in Database Semantics 115
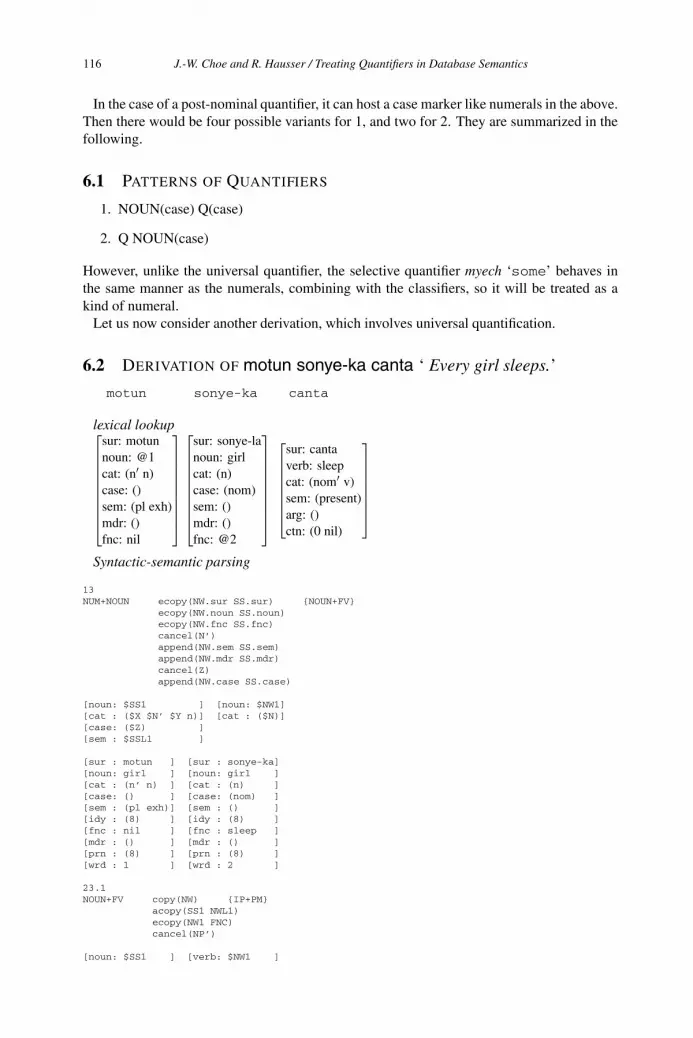
In the case of a post-nominal quantifier, it can host a case marker like numerals in the above.Then there would be four possible variants for 1, and two for 2. They are summarized in thefollowing.
6.1 PATTERNS OF QUANTIFIERS
1. NOUN(case) Q(case)
2. Q NOUN(case)
However, unlike the universal quantifier, the selective quantifier myech ‘some’ behaves inthe same manner as the numerals, combining with the classifiers, so it will be treated as akind of numeral.
Let us now consider another derivation, which involves universal quantification.
6.2 DERIVATION OF motun sonye-ka canta ‘ Every girl sleeps.’
motun sonye-ka canta
lexical lookup⎡⎢⎢⎢⎢⎢⎢⎢⎢⎣
sur: motunnoun: @1cat: (n n)case: ()sem: (pl exh)mdr: ()fnc: nil
⎤⎥⎥⎥⎥⎥⎥⎥⎥⎦
⎡⎢⎢⎢⎢⎢⎢⎢⎢⎣
sur: sonye-lanoun: girlcat: (n)case: (nom)sem: ()mdr: ()fnc: @2
⎤⎥⎥⎥⎥⎥⎥⎥⎥⎦
⎡⎢⎢⎢⎢⎢⎢⎣
sur: cantaverb: sleepcat: (nom v)sem: (present)arg: ()ctn: (0 nil)
⎤⎥⎥⎥⎥⎥⎥⎦
Syntactic-semantic parsing
13NUM+NOUN ecopy(NW.sur SS.sur) {NOUN+FV}
ecopy(NW.noun SS.noun)ecopy(NW.fnc SS.fnc)cancel(N’)append(NW.sem SS.sem)append(NW.mdr SS.mdr)cancel(Z)append(NW.case SS.case)
[noun: $SS1 ] [noun: $NW1][cat : ($X $N’ $Y n)] [cat : ($N)][case: ($Z) ][sem : $SSL1 ]
[sur : motun ] [sur : sonye-ka][noun: girl ] [noun: girl ][cat : (n’ n) ] [cat : (n) ][case: () ] [case: (nom) ][sem : (pl exh)] [sem : () ][idy : (8) ] [idy : (8) ][fnc : nil ] [fnc : sleep ][mdr : () ] [mdr : () ][prn : (8) ] [prn : (8) ][wrd : 1 ] [wrd : 2 ]
23.1NOUN+FV copy(NW) {IP+PM}
acopy(SS1 NWL1)ecopy(NW1 FNC)cancel(NP’)
[noun: $SS1 ] [verb: $NW1 ]
J.-W. Choe and R. Hausser / Treating Quantifiers in Database Semantics116
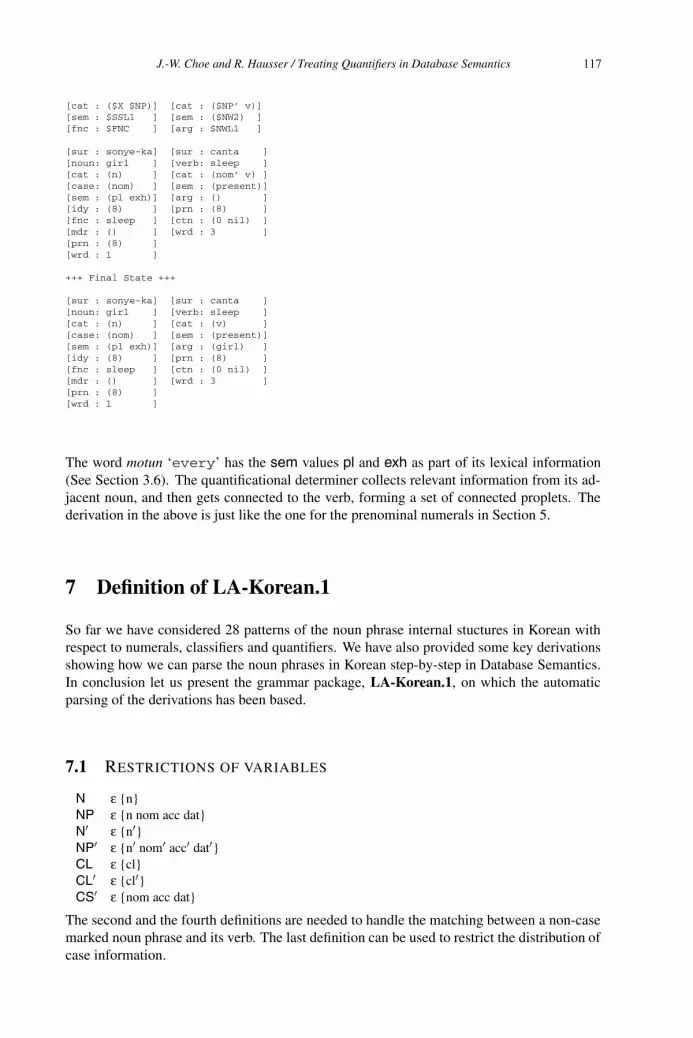
[cat : ($X $NP)] [cat : ($NP’ v)][sem : $SSL1 ] [sem : ($NW2) ][fnc : $FNC ] [arg : $NWL1 ]
[sur : sonye-ka] [sur : canta ][noun: girl ] [verb: sleep ][cat : (n) ] [cat : (nom’ v) ][case: (nom) ] [sem : (present)][sem : (pl exh)] [arg : () ][idy : (8) ] [prn : (8) ][fnc : sleep ] [ctn : (0 nil) ][mdr : () ] [wrd : 3 ][prn : (8) ][wrd : 1 ]
+++ Final State +++
[sur : sonye-ka] [sur : canta ][noun: girl ] [verb: sleep ][cat : (n) ] [cat : (v) ][case: (nom) ] [sem : (present)][sem : (pl exh)] [arg : (girl) ][idy : (8) ] [prn : (8) ][fnc : sleep ] [ctn : (0 nil) ][mdr : () ] [wrd : 3 ][prn : (8) ][wrd : 1 ]
The word motun ‘every’ has the sem values pl and exh as part of its lexical information(See Section 3.6). The quantificational determiner collects relevant information from its ad-jacent noun, and then gets connected to the verb, forming a set of connected proplets. Thederivation in the above is just like the one for the prenominal numerals in Section 5.
7 Definition of LA-Korean.1
So far we have considered 28 patterns of the noun phrase internal stuctures in Korean withrespect to numerals, classifiers and quantifiers. We have also provided some key derivationsshowing how we can parse the noun phrases in Korean step-by-step in Database Semantics.In conclusion let us present the grammar package, LA-Korean.1, on which the automaticparsing of the derivations has been based.
7.1 RESTRICTIONS OF VARIABLES
N ε {n}NP ε {n nom acc dat}N ε {n }NP ε {n nom acc dat }CL ε {cl}CL ε {cl }CS ε {nom acc dat}
The second and the fourth definitions are needed to handle the matching between a non-casemarked noun phrase and its verb. The last definition can be used to restrict the distribution ofcase information.
J.-W. Choe and R. Hausser / Treating Quantifiers in Database Semantics 117
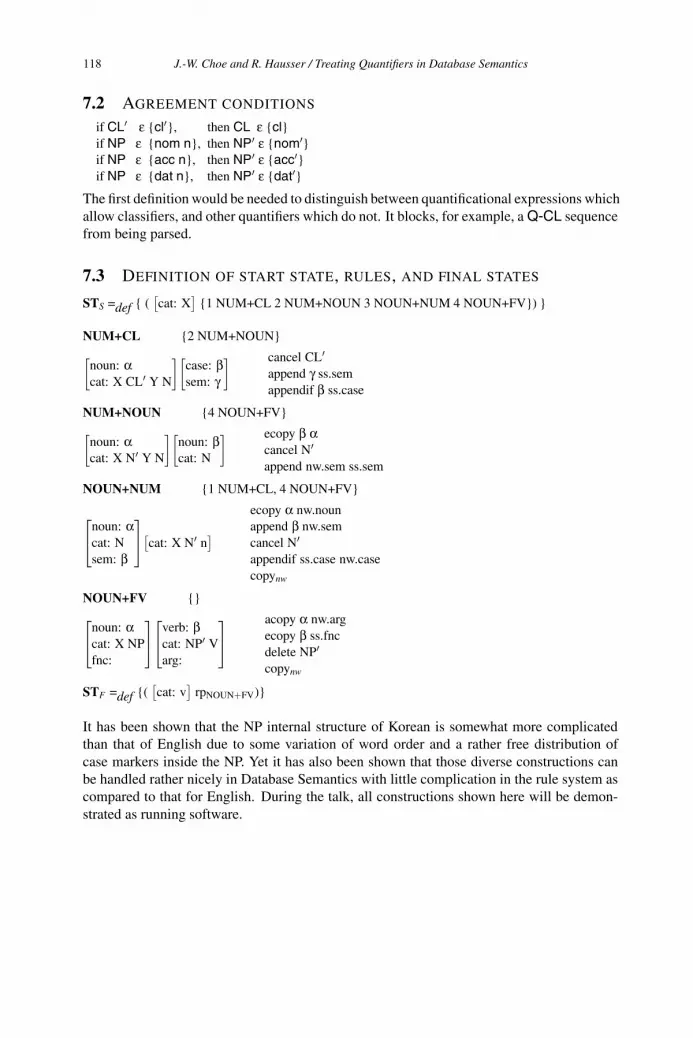
7.2 AGREEMENT CONDITIONS
if CL ε {cl }, then CL ε {cl}if NP ε {nom n}, then NP ε {nom }if NP ε {acc n}, then NP ε {acc }if NP ε {dat n}, then NP ε {dat }
The first definition would be needed to distinguish between quantificational expressions whichallow classifiers, and other quantifiers which do not. It blocks, for example, a Q-CL sequencefrom being parsed.
7.3 DEFINITION OF START STATE, RULES, AND FINAL STATES
STS =def { ([cat: X
]{1 NUM+CL 2 NUM+NOUN 3 NOUN+NUM 4 NOUN+FV}) }
NUM+CL {2 NUM+NOUN}
[noun: αcat: X CL Y N
][case: βsem: γ
] cancel CLappend γ ss.semappendif β ss.case
NUM+NOUN {4 NOUN+FV}
[noun: αcat: X N Y N
][noun: βcat: N
] ecopy β αcancel Nappend nw.sem ss.sem
NOUN+NUM {1 NUM+CL, 4 NOUN+FV}
⎡⎣noun: α
cat: Nsem: β
⎤⎦[
cat: X N n]
ecopy α nw.nounappend β nw.semcancel Nappendif ss.case nw.casecopynw
NOUN+FV {}
⎡⎣noun: α
cat: X NPfnc:
⎤⎦⎡⎣verb: β
cat: NP Varg:
⎤⎦
acopy α nw.argecopy β ss.fncdelete NPcopynw
STF =def {([cat: v
]rpNOUN FV)}
It has been shown that the NP internal structure of Korean is somewhat more complicatedthan that of English due to some variation of word order and a rather free distribution ofcase markers inside the NP. Yet it has also been shown that those diverse constructions canbe handled rather nicely in Database Semantics with little complication in the rule system ascompared to that for English. During the talk, all constructions shown here will be demon-strated as running software.
J.-W. Choe and R. Hausser / Treating Quantifiers in Database Semantics118
Bibliography
Bochenski, I. (1961) A History of Formal Logic, University of Notre Dame Press.
Chae, Wan (1996) “The meaning and function of Korean classifiers,” Chindanhakbo 70. [inKorean]
Chang, Suk-Jin (1996) Korean, John Benjamins Publishing Company.
Copestake, A., D. Flickinger, C. Pollard, & I. Sag (2001) “Minimal Recursion Semantics: AnIntroduction,” Language & Computation, Vol. 1 - No. 3:1–47, Hermes Science Publication.
Geach, P.T. (1969) “Quine’s Syntactical Insights,” in Davidson & Hintikka (eds.).
Hausser, R. (1999) Foundations of Computational Linguistics, 2nd ed. 2001, Berlin–NewYork: Springer-Verlag.
Hausser, R. (2006) A Computational Model of Natural Language Communication, Berlin–New York: Springer-Verlag.
Im, Hong-bin (2002) The Depth of Korean Grammar III, Taehak-sa. [in Korean]
Kamp, J.A.W. & U. Reyle (1993) From Discourse to Logic, Kluwer, Dordrecht.
Kang, Beom-mo (2002) “Categories and meanings of Korean floating quantifiers with somereference to Japanese,” Journal of East Asian Linguistics, 11, Kluwer Academic Publishers.
Montague, R. (1974) Formal Philosophy, Yale U. Press, New Haven.
Minsky, M. (1974) “A Framework for Representing Knowledge,” Techreport 306, ArtificialIntelligence Laboratory, MIT. Republished in Brachman et al. (eds.) 1989 Readings inKnowledge Representation.
Miyagawa, Shigeru (1989) Structure and Case Marking in Japanese, Academic Press, NewYork.
Russell, B. (1905) “On Denoting” Mind 14:479–493.
Sohn, Ho-Min (1999) The Korean language, The Cambridge University Press.
J.-W. Choe and R. Hausser / Treating Quantifiers in Database Semantics 119
Semantic Associative Search and Space Integration Methods Applied to Semantic
Metrics for Multiple Medical Fields
Yasushi KIYOKI* and Minoru KAWAMOTO*
*Department of Environmental Information, Keio University Fujisawa, Kanagawa 252-8520, Japan
[email protected], [email protected]
Abstract Semantic associative search and semantic space integration are promising and significant functions for obtaining appropriate and significant information resources in multimedia database and knowledge base environments. Semantic space creation and integration for semantic associative search are essentially important for realizing advanced semantic associative search environments and synergy effects among different domain fields. This paper presents implementation and application of our semantic associative search and semantic space integration methods to actual medical fields. This implementation realizes a domain-specific semantic associative search and semantic space integration by referring to domain-specific encyclopedias. This paper also shows the feasibility and applicability of the semantic associative search environment with integration of those medical fields. Several experimental results are shown to clarify the feasibility and applicability of the semantic associative search environment in actual medical fields.
1. Introduction
Semantic associative search is recognized as a promising and important function for obtaining appropriate and significant information resources in multimedia database and knowledge base environments. Semantic space creation for semantic associative search is one of the most essential processes for realizing semantic associative search environments [3,4,10,13].
In current information societies, it is essentially important to realize logical and semantic associative search environments for various scientific and social areas [1,2,6,11,12,13]. In this background, we have designed a meta-level knowledge base system with a new semantic associative search method based on the Mathematical Model of Meaning(MMM) [4,5,6]. This method makes it possible to obtain information resources semantically related to queries from multimedia databases with semantic spaces for various natural and social scientific areas. In this method, the acquisition of information resources in multimedia databases is performed by semantic computations on semantic spaces. When a keyword with context words explaining the keyword is given as a query, context-dependent interpretation for the keyword is performed, and the related information to the meaning of the keyword is obtained according to the given context. Context-dependent interpretation means that information included in multimedia databases is extracted by specifying a keyword with context words explaining the keyword itself.
In this method, it is not necessary to know concrete representations of information resources in multimedia databases. It is possible to submit queries for information acquisition to multimedia databases by using keywords and context words which are independent of individual database contents. The most important feature of this method is
M. Duží et al. (Eds.)Information Modelling and Knowledge Bases XVIII
IOS Press, 2007© 2007 The authors and IOS Press. All rights reserved.
120

that information resources in multimedia databases are mapped onto an orthogonal semantic space and extracted by an intelligent semantic associative search mechanism with metrics[4,5,6]. This method realizes the computational machinery for recognizing the meaning of a keyword according to a context (context words) and obtaining the semantically related information resources to the keyword in the given context.
We have implemented a meta-level knowledge base system with a semantic associative search function realizing this method[4]. In this system, we have also designed and implemented another significant method for of semantic space integration (SSI) for heterogeneous fields[20]. Semantic space integration for semantic associative search is essentially important for realizing synergy effects among different domain fields. The SSI method makes it possible to integrate semantic spaces with the interpretation of meanings by using common concepts (common terms) for matrices of heterogeneous fields. This method realizes information acquisition from viewpoints related to semantically integrated fields. The integrated semantic space realizes to extract synergy effects between independent fields. For example, in the integrated medical space, information resources, such as medical documents, including contents related to both of those independent medical fields, high correlation values can be obtained. The advantage of the space integration typically appears in extracting those relevant information resources with high correlation values only in the integrated space.
In the SSI method, it is assumed that common concepts (common terms) between heterogeneous fields are detected in advance before applying this method to the semantic associative search spaces corresponding to those fields. It is assumed that the semantic equivalence and similarity between terms in different fields are recognized by using our mathematical model of meaning (MMM) or the concept of ontology[1,10,13]. In [20], we have also presented an implementation method for applying our integration method to semantic associative search spaces.
In this paper, we apply this meta-level knowledge base system to two medical fields, in order to semantically integrate and obtain those information resources based on various semantic relationships between those fields. A lot of medical documents exist in wide area networks. As each document has different semantics, it is difficult to choose and access appropriate medical documents for obtaining significant medical knowledge. Those databases from the medical fields include the same kind of information, and one of the objectives of this application is to provide a significant semantic associative search environment for obtaining medical information resources which are semantically related to those fields.
In this paper, we present implementation and application of a semantic associative search and semantic space integration methods (MMM and SSI) to various medical fields. This implementation realizes a domain-specific semantic associative search and semantic space integration by referring to a medical textbook(encyclopedia) [19] which describes not only word definitions but also word explanations in specialized medical fields. In the creation of a domain-specific semantic space, an appropriate feature word set should be defined sufficiently to express the domain field. There are two requirements of encyclopedias and dictionaries for automatic generation of semantic search spaces:
(1) Each entry word is described by focusing attention on definitions of words themselves.
(2) Each entry word is defined by a fixed set of feature words that are primitive essences of the domain-specific field.
In this implementation, medical semantic spaces are created by referring to medical encyclopedias. We have created two semantic spaces from medical encyclopedias, where each entry word description contains not only words definitions but also word explanations.
Y. Kiyoki and M. Kawamoto / Semantic Associative Search and Space Integration Methods 121
In this paper, we also show several experimental results to clarify the feasibility and applicability of the semantic associative search and space integration methods in two actual medical fields.
2. The Outline of Semantic Associative Search and Semantic Space Integration Methods
2.1 Semantic Associative Search Method
In this section, the outline of our semantic associative search method based on the Mathematical Model of Meaning(MMM) is briefly reviewed. This model has been presented in [4,5,6] in detail.
The semantic associative search method is used to extract information resources corresponding to the words, which represent the “user's query” (“searcher’s query” or “query context”) and data contents. Each information resource is mapped in the orthogonal semantic space. This space is referred to as “orthogonal metadata space” or “semantic space.” The mathematical model of meaning gives The mathematical model of meaning gives the machinery for creating orthogonal semantic space and dynamically searching the associated information according to a given context.
For searching appropriate information resources, context words that represent the user’s query (query context) and data contents are given as the context. According to these context words, a semantic subspace is selected dynamically. Then, the most related information resource to the context is extracted in the semantic subspace.
Metadata items are classified into three different kinds. The first kind of data items is used for the creation of a semantic space, which is used as a search space for semantic associative search. These data items are referred to as “data items for space creation.” The second kind of metadata items is used as the metadata items of the information resources, which are the candidates for semantic associative data retrieval. These metadata items are referred to as “metadata for information resources.” The third kind of metadata items is used as the context words, which represent user's query (query context). These metadata items are referred to as “metadata for contexts.” The basic functions and metadata structures are summarized as follows:
(1) Creation of metadata space: To provide the function of semantic associative search, basic information on m data items (“data-items for space creation”) is given in the form of a matrix. Each data item is provided as fragmentary metadata which is independently represented one another. No relationship between data items is needed to be described. The information of each data item is represented by its features. The m basic data items are given in the form of an m by n matrix M. For given m basic data items, each data item is characterized by n features. By using this matrix M, the orthogonal space is computed as the metadata space MDS.
(2) Representation of information resources in n-dimensional vectors: Each of the information resources is represented in the n-dimensional vector whose elements correspond to n features used in (1). These vectors are used as “metadata for information resources.” The information resources become the candidates for the semantic associate search in this model. Furthermore, each of context words, which are used to represent the user’s impression and data contents in semantic information retrieval, is also represented in the n-dimensional vector. These vectors are used as “metadata for contexts.”
(3) Mapping information resources into the metadata space MDS:
Y. Kiyoki and M. Kawamoto / Semantic Associative Search and Space Integration Methods122
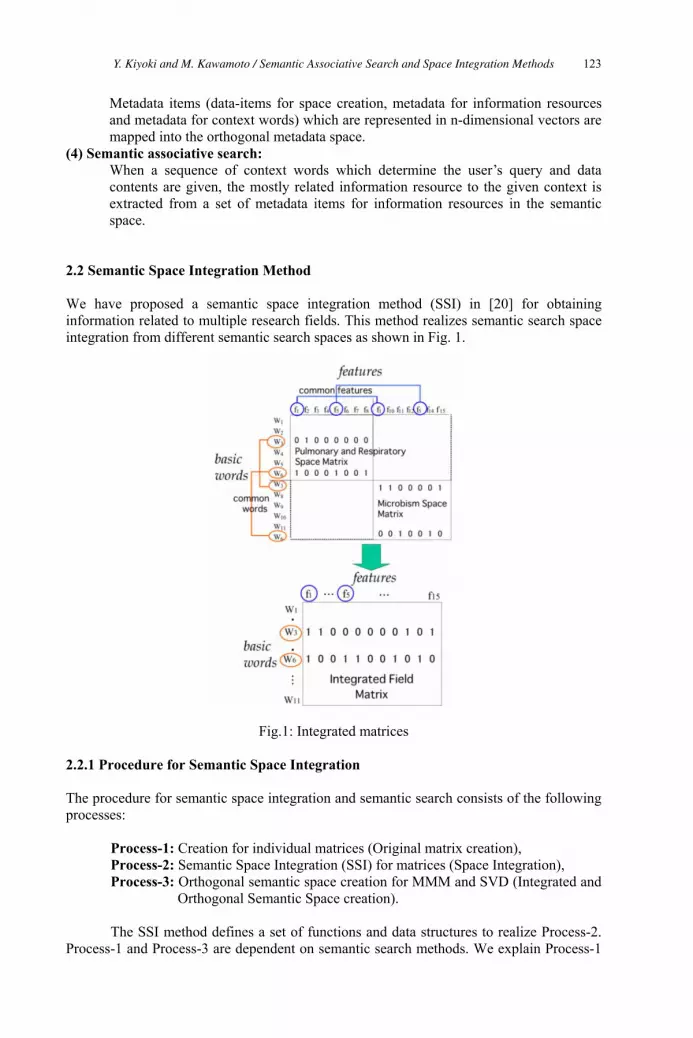
Metadata items (data-items for space creation, metadata for information resources and metadata for context words) which are represented in n-dimensional vectors are mapped into the orthogonal metadata space.
(4) Semantic associative search: When a sequence of context words which determine the user’s query and data contents are given, the mostly related information resource to the given context is extracted from a set of metadata items for information resources in the semantic space.
2.2 Semantic Space Integration Method
We have proposed a semantic space integration method (SSI) in [20] for obtaining information related to multiple research fields. This method realizes semantic search space integration from different semantic search spaces as shown in Fig. 1.
Fig.1: Integrated matrices
2.2.1 Procedure for Semantic Space Integration
The procedure for semantic space integration and semantic search consists of the following processes:
Process-1: Creation for individual matrices (Original matrix creation), Process-2: Semantic Space Integration (SSI) for matrices (Space Integration), Process-3: Orthogonal semantic space creation for MMM and SVD (Integrated and
Orthogonal Semantic Space creation).
The SSI method defines a set of functions and data structures to realize Process-2. Process-1 and Process-3 are dependent on semantic search methods. We explain Process-1
Y. Kiyoki and M. Kawamoto / Semantic Associative Search and Space Integration Methods 123
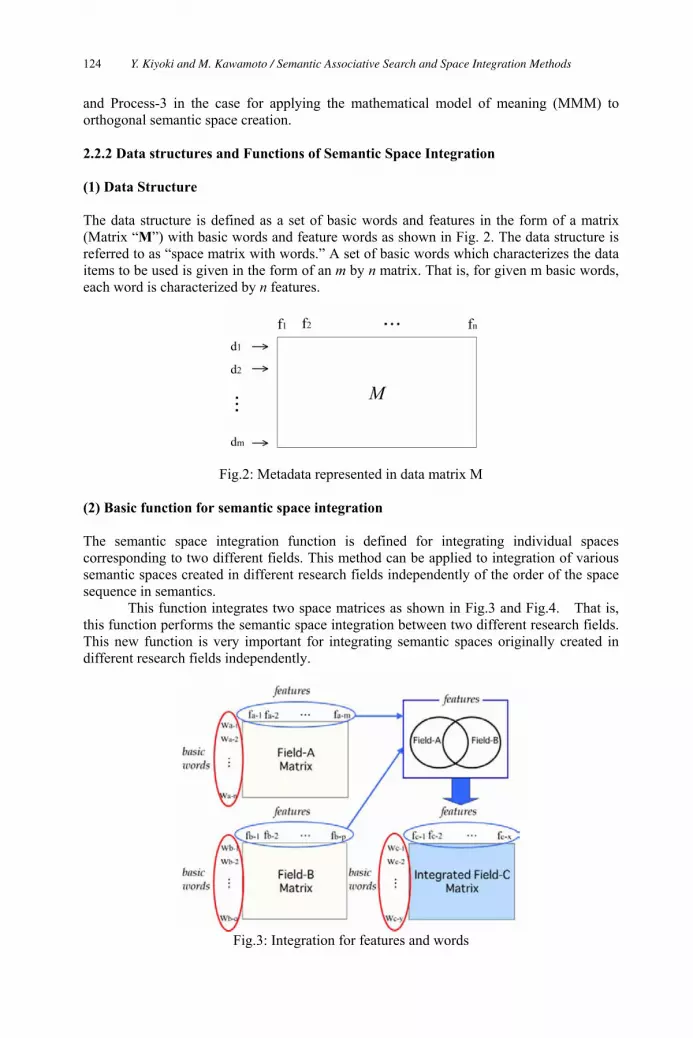
and Process-3 in the case for applying the mathematical model of meaning (MMM) to orthogonal semantic space creation.
2.2.2 Data structures and Functions of Semantic Space Integration
(1) Data Structure
The data structure is defined as a set of basic words and features in the form of a matrix (Matrix “M”) with basic words and feature words as shown in Fig. 2. The data structure is referred to as “space matrix with words.” A set of basic words which characterizes the data items to be used is given in the form of an m by n matrix. That is, for given m basic words, each word is characterized by n features.
Fig.2: Metadata represented in data matrix M
(2) Basic function for semantic space integration
The semantic space integration function is defined for integrating individual spaces corresponding to two different fields. This method can be applied to integration of various semantic spaces created in different research fields independently of the order of the space sequence in semantics.
This function integrates two space matrices as shown in Fig.3 and Fig.4. That is, this function performs the semantic space integration between two different research fields. This new function is very important for integrating semantic spaces originally created in different research fields independently.
Fig.3: Integration for features and words
Y. Kiyoki and M. Kawamoto / Semantic Associative Search and Space Integration Methods124
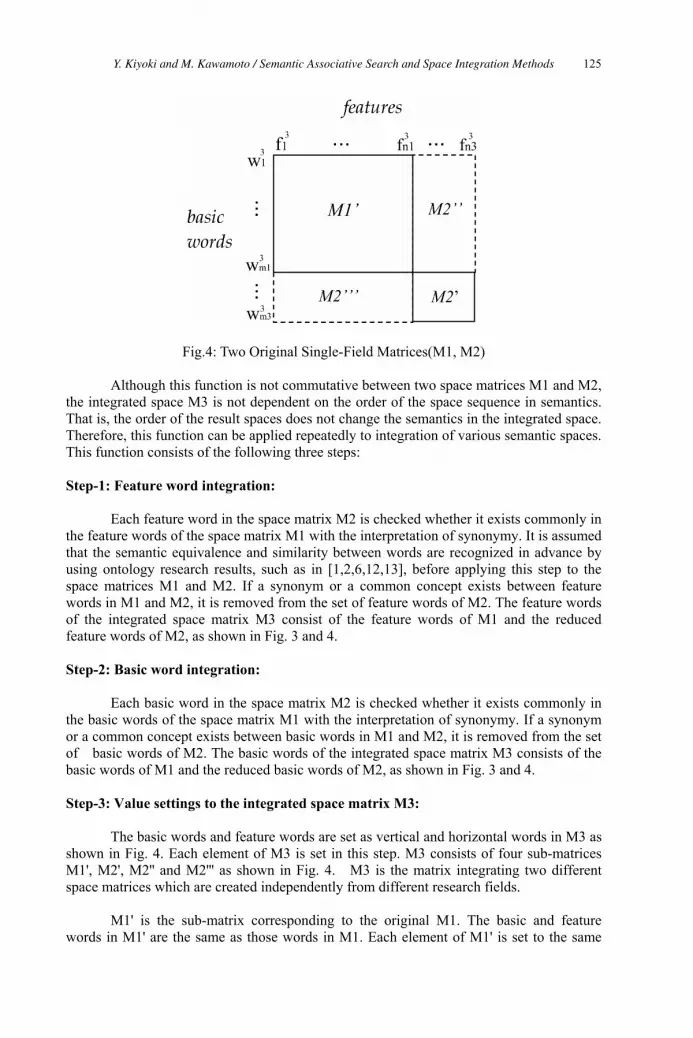
Fig.4: Two Original Single-Field Matrices(M1, M2)
Although this function is not commutative between two space matrices M1 and M2, the integrated space M3 is not dependent on the order of the space sequence in semantics. That is, the order of the result spaces does not change the semantics in the integrated space. Therefore, this function can be applied repeatedly to integration of various semantic spaces. This function consists of the following three steps:
Step-1: Feature word integration:
Each feature word in the space matrix M2 is checked whether it exists commonly in the feature words of the space matrix M1 with the interpretation of synonymy. It is assumed that the semantic equivalence and similarity between words are recognized in advance by using ontology research results, such as in [1,2,6,12,13], before applying this step to the space matrices M1 and M2. If a synonym or a common concept exists between feature words in M1 and M2, it is removed from the set of feature words of M2. The feature words of the integrated space matrix M3 consist of the feature words of M1 and the reduced feature words of M2, as shown in Fig. 3 and 4.
Step-2: Basic word integration:
Each basic word in the space matrix M2 is checked whether it exists commonly in the basic words of the space matrix M1 with the interpretation of synonymy. If a synonym or a common concept exists between basic words in M1 and M2, it is removed from the set of basic words of M2. The basic words of the integrated space matrix M3 consists of the basic words of M1 and the reduced basic words of M2, as shown in Fig. 3 and 4.
Step-3: Value settings to the integrated space matrix M3:
The basic words and feature words are set as vertical and horizontal words in M3 as shown in Fig. 4. Each element of M3 is set in this step. M3 consists of four sub-matrices M1', M2', M2'' and M2''' as shown in Fig. 4. M3 is the matrix integrating two different space matrices which are created independently from different research fields.
M1' is the sub-matrix corresponding to the original M1. The basic and feature words in M1' are the same as those words in M1. Each element of M1' is set to the same
Y. Kiyoki and M. Kawamoto / Semantic Associative Search and Space Integration Methods 125
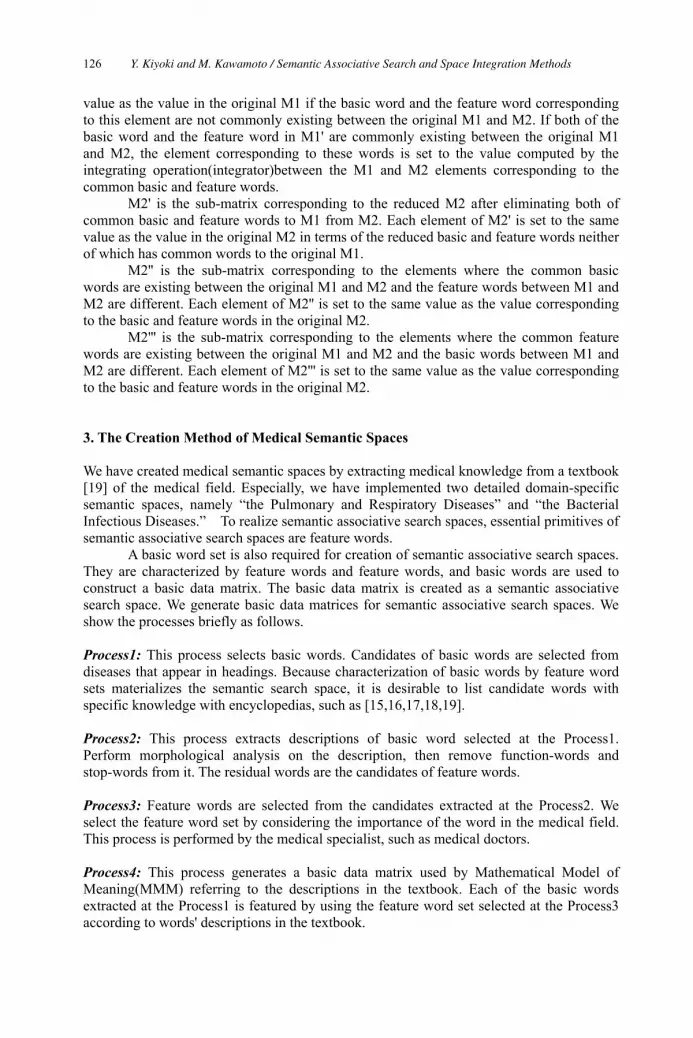
value as the value in the original M1 if the basic word and the feature word corresponding to this element are not commonly existing between the original M1 and M2. If both of the basic word and the feature word in M1' are commonly existing between the original M1 and M2, the element corresponding to these words is set to the value computed by the integrating operation(integrator)between the M1 and M2 elements corresponding to the common basic and feature words.
M2' is the sub-matrix corresponding to the reduced M2 after eliminating both of common basic and feature words to M1 from M2. Each element of M2' is set to the same value as the value in the original M2 in terms of the reduced basic and feature words neither of which has common words to the original M1.
M2'' is the sub-matrix corresponding to the elements where the common basic words are existing between the original M1 and M2 and the feature words between M1 and M2 are different. Each element of M2'' is set to the same value as the value corresponding to the basic and feature words in the original M2.
M2''' is the sub-matrix corresponding to the elements where the common feature words are existing between the original M1 and M2 and the basic words between M1 and M2 are different. Each element of M2''' is set to the same value as the value corresponding to the basic and feature words in the original M2.
3. The Creation Method of Medical Semantic Spaces
We have created medical semantic spaces by extracting medical knowledge from a textbook [19] of the medical field. Especially, we have implemented two detailed domain-specific semantic spaces, namely “the Pulmonary and Respiratory Diseases” and “the Bacterial Infectious Diseases.” To realize semantic associative search spaces, essential primitives of semantic associative search spaces are feature words.
A basic word set is also required for creation of semantic associative search spaces. They are characterized by feature words and feature words, and basic words are used to construct a basic data matrix. The basic data matrix is created as a semantic associative search space. We generate basic data matrices for semantic associative search spaces. We show the processes briefly as follows.
Process1: This process selects basic words. Candidates of basic words are selected from diseases that appear in headings. Because characterization of basic words by feature word sets materializes the semantic search space, it is desirable to list candidate words with specific knowledge with encyclopedias, such as [15,16,17,18,19].
Process2: This process extracts descriptions of basic word selected at the Process1. Perform morphological analysis on the description, then remove function-words and stop-words from it. The residual words are the candidates of feature words.
Process3: Feature words are selected from the candidates extracted at the Process2. We select the feature word set by considering the importance of the word in the medical field. This process is performed by the medical specialist, such as medical doctors.
Process4: This process generates a basic data matrix used by Mathematical Model of Meaning(MMM) referring to the descriptions in the textbook. Each of the basic words extracted at the Process1 is featured by using the feature word set selected at the Process3 according to words' descriptions in the textbook.
Y. Kiyoki and M. Kawamoto / Semantic Associative Search and Space Integration Methods126
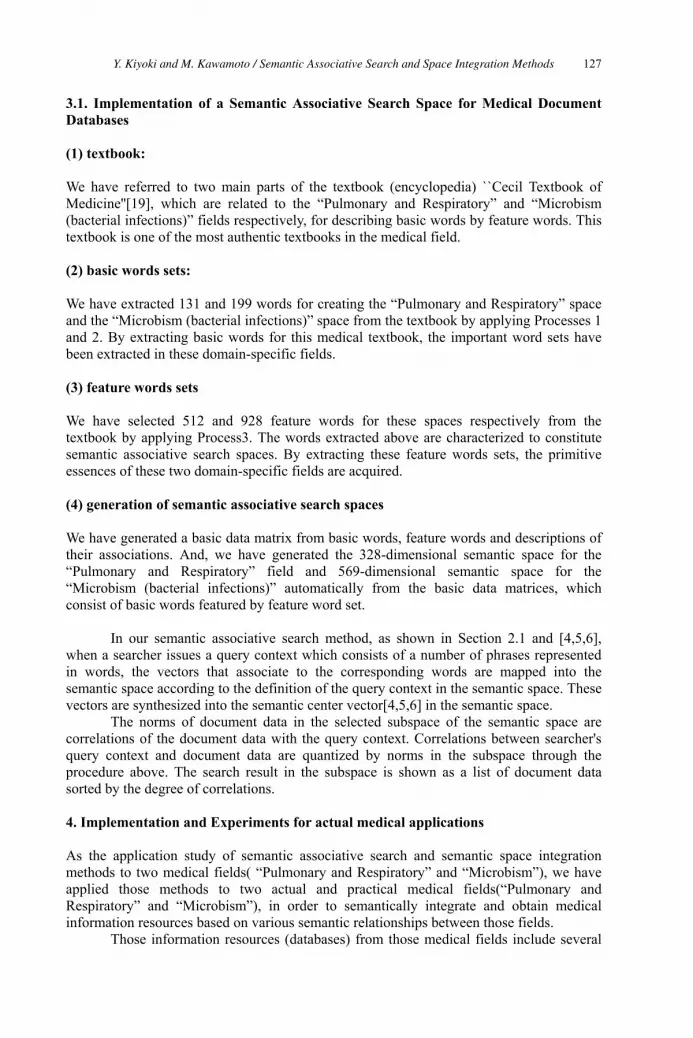
3.1. Implementation of a Semantic Associative Search Space for Medical Document Databases
(1) textbook:
We have referred to two main parts of the textbook (encyclopedia) ``Cecil Textbook of Medicine''[19], which are related to the “Pulmonary and Respiratory” and “Microbism (bacterial infections)” fields respectively, for describing basic words by feature words. This textbook is one of the most authentic textbooks in the medical field.
(2) basic words sets:
We have extracted 131 and 199 words for creating the “Pulmonary and Respiratory” space and the “Microbism (bacterial infections)” space from the textbook by applying Processes 1 and 2. By extracting basic words for this medical textbook, the important word sets have been extracted in these domain-specific fields.
(3) feature words sets
We have selected 512 and 928 feature words for these spaces respectively from the textbook by applying Process3. The words extracted above are characterized to constitute semantic associative search spaces. By extracting these feature words sets, the primitive essences of these two domain-specific fields are acquired.
(4) generation of semantic associative search spaces
We have generated a basic data matrix from basic words, feature words and descriptions of their associations. And, we have generated the 328-dimensional semantic space for the “Pulmonary and Respiratory” field and 569-dimensional semantic space for the “Microbism (bacterial infections)” automatically from the basic data matrices, which consist of basic words featured by feature word set.
In our semantic associative search method, as shown in Section 2.1 and [4,5,6], when a searcher issues a query context which consists of a number of phrases represented in words, the vectors that associate to the corresponding words are mapped into the semantic space according to the definition of the query context in the semantic space. These vectors are synthesized into the semantic center vector[4,5,6] in the semantic space.
The norms of document data in the selected subspace of the semantic space are correlations of the document data with the query context. Correlations between searcher's query context and document data are quantized by norms in the subspace through the procedure above. The search result in the subspace is shown as a list of document data sorted by the degree of correlations.
4. Implementation and Experiments for actual medical applications
As the application study of semantic associative search and semantic space integration methods to two medical fields( “Pulmonary and Respiratory” and “Microbism”), we have applied those methods to two actual and practical medical fields(“Pulmonary and Respiratory” and “Microbism”), in order to semantically integrate and obtain medical information resources based on various semantic relationships between those fields.
Those information resources (databases) from those medical fields include several
Y. Kiyoki and M. Kawamoto / Semantic Associative Search and Space Integration Methods 127
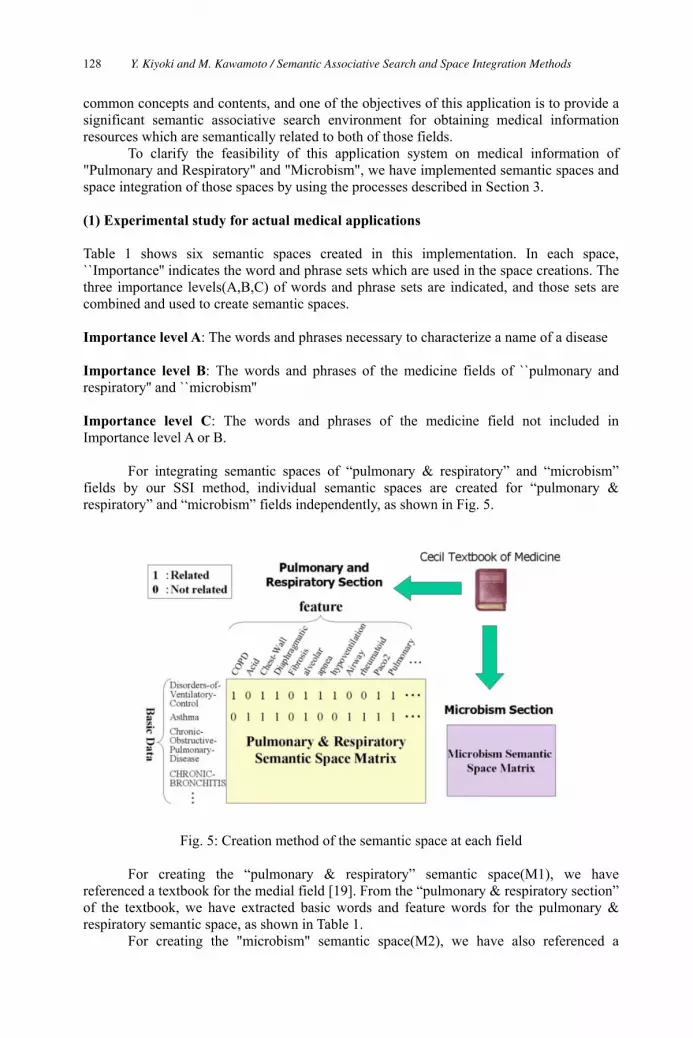
common concepts and contents, and one of the objectives of this application is to provide a significant semantic associative search environment for obtaining medical information resources which are semantically related to both of those fields.
To clarify the feasibility of this application system on medical information of "Pulmonary and Respiratory" and "Microbism", we have implemented semantic spaces and space integration of those spaces by using the processes described in Section 3.
(1) Experimental study for actual medical applications
Table 1 shows six semantic spaces created in this implementation. In each space, ``Importance'' indicates the word and phrase sets which are used in the space creations. The three importance levels(A,B,C) of words and phrase sets are indicated, and those sets are combined and used to create semantic spaces.
Importance level A: The words and phrases necessary to characterize a name of a disease
Importance level B: The words and phrases of the medicine fields of ``pulmonary and respiratory'' and ``microbism''
Importance level C: The words and phrases of the medicine field not included in Importance level A or B.
For integrating semantic spaces of “pulmonary & respiratory” and “microbism” fields by our SSI method, individual semantic spaces are created for “pulmonary & respiratory” and “microbism” fields independently, as shown in Fig. 5.
Fig. 5: Creation method of the semantic space at each field
For creating the “pulmonary & respiratory” semantic space(M1), we have referenced a textbook for the medial field [19]. From the “pulmonary & respiratory section” of the textbook, we have extracted basic words and feature words for the pulmonary & respiratory semantic space, as shown in Table 1.
For creating the "microbism" semantic space(M2), we have also referenced a
Y. Kiyoki and M. Kawamoto / Semantic Associative Search and Space Integration Methods128

textbook for the medical field[19] and extracted basic words and feature words from the "microbism section" of the textbook for the microbism semantic space. By applying the SSI method to "pulmonary & respiratory" semantic space(M1) and "microbism" semantic space(M2), we have created an integrated semantic space(M3) combining both of "pulmonary & respiratory" (M1) and "microbism"(M2) spaces.
Three semantic spaces(M1, M2 and M3) have been created for searching and retrieving medical documents semantically related to "pulmonary & respiratory", "microbism" and both of "pulmonary & respiratory" and "microbism". Each semantic space is independently used for searching those documents.
1) the pulmonary & respiratory semantic space for retrieving pulmonary & respiratory documents as the space matrix M1 in SSI.
2) the microbism semantic space for retrieving microbism documents as the space matrix M2 in SSI.
3) the integrated pulmonary & respiratory-microbism semantic space for retrieving pulmonary & respiratory and/or microbism documents as the space matrix M3 in SSI.
Our semantic space integration method(SSI) is applied to create the integrated pulmonary & respiratory-microbism semantic space (M3) from the space matrices M1 and M2. We have implemented our semantic space integration method by developing the programs in Perl programming language and the Java application.
Table 1: Semantic spaces
Importance Number of feature
Number of words
Spacedimension
Pulmonary and Respiratorysemantic space A+B 512 131 328
Pulmonary and Respiratorysemantic space A+B+C 854 131 576
Microbism semantic space A+B 928 199 569Microbism semantic space A+B+C 1470 199 928Integrated semantic space A+B 1361 330 737Integrated semantic space A+B+C 2101 330 1500
common duplication words A+B 79 0common duplication words A+B+C 223 0
As retrieval candidate documents for the pulmonary & respiratory semantic space, we have divided the pulmonary & respiratory section of the medical textbook[19] into 132 pieces in each name of a disease and mapped these 132 documents into the space. As retrieval candidate documents for the microbism semantic space, we have divided the microbism section of the medical textbook [19] into 199 pieces in each name of a disease and mapped these 199 documents into the space. We have also mapped those 331 documents into the integrated pulmonary & respiratory-microbism semantic space.
For mapping each of those documents into semantic spaces, we created a vector for each document by extracting a set of metadata from the document in the medical textbook [19]. Several metadata sets are shown in Table 2 as examples.
Y. Kiyoki and M. Kawamoto / Semantic Associative Search and Space Integration Methods 129

Table 2: Examples of metadata
(2) Experimental results
We have performed several experiments to clarify the feasibility of the application system on medical information of “Pulmonary and Respiratory” and “Microbism.” The objective of these experiments is to evaluate the effectiveness and applicability of our system to the actual medical information resources.
Table 3: Search context
Context Field SEPTIC-EMBOLISM Pulmonary and respiratory ENDOCARDITIS Microbism
Table 4: Evaluation point
Point Adjudication 5 Exact 43 Possible 21 Not related
Tables 5 and 6 typically show the advantage of our semantic space integration method.
In these tables, the “ID” is a document identifier(Document ID: “b-I” represents a “Microbism” document, and “l-j” represents a “Pulmonary and Respiratory” document). And, the “norm” is a semantic correlation value between a query (context, shown in Table 3) and each document in semantic computation, and the “point” is an evaluation value which indicates a score of precision (1: lowest and 5: highest, as shown in Table 4) evaluated by medical specialists (medical doctors) in “Pulmonary and Respiratory” and “Microbism” fields.
Document-ID Metadata
b1meningitis, Endocarditis, Bone, endemic, Diarrhea, antibiotic-therapy, Toxin, purulent, immunity, macrophage, virus
b2 Antibiotics, LOSs, malaise, streptococcus, Bone, infiltrate, Diarrhea, outbreaks, nosocomial, Trauma, antibiotic-therapy
b3 Skin, bacteria, culture, Strains, Diarrhea, Trauma, purulent, animal, virus, immunocompromised, febrile
l1alveolar, obstruction, lung, cor-pulmonale, cardiopulmonary, dyspnea, arterial-blood-gas, Diaphragmatic, hyperventilation, Paco2, respiratory-center
l2Pulmonary, dyspnea, alveolar, ventilation, ventilatory, Chest-Wall, cor-pulmonale, cardiopulmonary, hypoxia, arterial-blood-gas, hyperventilation
l3Pulmonary, lung, obstruction, respiratory, Paco2, parenchymal-lung-disease, ventilatory, sleep-apnea, obstructive-apnea, respiratory-failure, obstructive
Y. Kiyoki and M. Kawamoto / Semantic Associative Search and Space Integration Methods130

The main advantage of our method is that it realizes the acquisitions of the documents which are related to two or more independent fields, but are not selected in each single semantic space because they do not have high correlation to each single field.
Table 5 shows the retrieval results to the context(query) “ENDOCARDITIS.”
Table 5: Experimental results (context : ENDOCARDITIS)
context ENDOCARDITIS space Integrated space Microbism space Importance level A+B+C A+B A+B+C A+B rank ID norm point ID norm point ID norm point ID norm point
1 b101 0.3975 2 b40 0.4087 5 b40 0.275 5 b40 0.5140 52 b174 0.3818 1 b52 0.2821 5 b39 0.244 4 b150 0.3776 33 b40 0.3103 5 b51 0.2649 4 b174 0.218 1 b39 0.3722 44 b149 0.3103 2 b14 0.2635 1 b59 0.212 1 b147 0.3711 15 b167 0.2694 1 b150 0.2531 3 b14 0.186 1 b14 0.3133 16 b133 0.2493 1 b147 0.2489 1 b150 0.182 3 b52 0.3084 57 b163 0.2483 3 b39 0.2429 4 b90 0.182 1 b169 0.3072 38 b166 0.2483 3 b174 0.2369 1 b57 0.167 1 b174 0.3069 19 b31 0.2428 4 b12 0.2334 4 b147 0.167 1 b161 0.2991 1
10 b169 0.2374 3 b161 0.2308 1 b88 0.165 3 b172 0.2970 111 b39 0.2342 4 l49 0.2272 1 b24 0.164 2 b34 0.2947 112 b88 0.2322 3 l30 0.2270 3 b38 0.163 2 b64 0.2944 113 b161 0.2303 1 b175 0.2266 1 b132 0.162 1 b57 0.2894 114 b11 0.2246 3 b163 0.2262 3 b69 0.162 5 b33 0.2799 115 b151 0.2226 1 b115 0.2254 2 b142 0.162 1 b148 0.2799 216 l50 0.2181 1 l94 0.2252 1 b11 0.159 3 b126 0.2793 217 b104 0.2173 1 b41 0.2235 3 b25 0.158 1 b163 0.2762 318 l85 0.2153 3 b178 0.2231 4 b176 0.158 1 b69 0.2723 519 b197 0.2152 2 b191 0.2229 3 b33 0.157 1 b141 0.2694 120 b24 0.2127 2 b181 0.2227 4 b163 0.156 3 b165 0.2672 1
In this experiment shown in Table 5, we evaluate the quality of retrieval results in the integrated semantic space(M3) created by our semantic space integration method, in comparing with retrieval results in the single semantic space of “microbism” (M1). For this query (context), the integrated space can also realize the extraction of more documents with high scores(high points) than those in the single space.
This result shows that we can obtain relevant documents(b52, b51, b12, b178, b181, b31) in the integrated space more than those in the single space. As those documents include contents related to both "Pulmonary and Respiratory" and "Microbism" fields, high correlation values can be obtained in the integrated space, but not in the single space of "Microbism" fields. The advantage of the space integration typically appears in extracting those relevant documents with these high correlation values only in the integrated space.The integrated semantic space realizes to extract synergy effects between independent fields.
Furthermore, Table 5 indicates that the highly relevant documents ranked in the "Microbism" search space are also highly ranked in the integrated spaces. The integrated semantic space has ability for keeping field independency, that is, for field-specific queries, documents related to the original field can be extracted sharply.
Y. Kiyoki and M. Kawamoto / Semantic Associative Search and Space Integration Methods 131
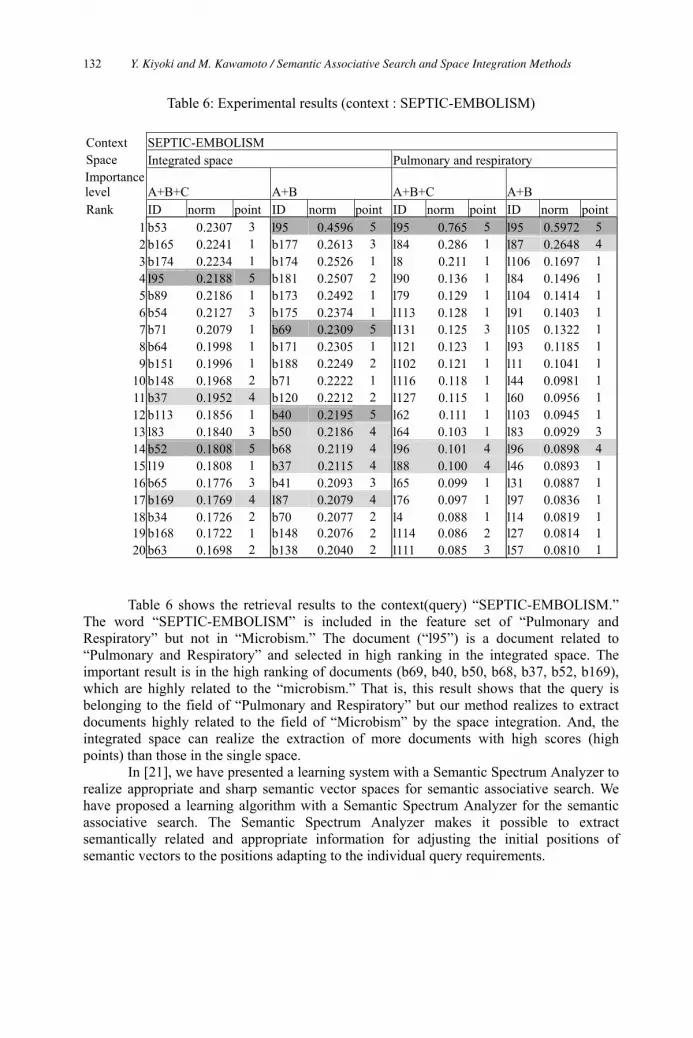
Table 6: Experimental results (context : SEPTIC-EMBOLISM)
Context SEPTIC-EMBOLISM Space Integrated space Pulmonary and respiratory Importance level A+B+C A+B A+B+C A+B Rank ID norm point ID norm point ID norm point ID norm point
1 b53 0.2307 3 l95 0.4596 5 l95 0.765 5 l95 0.5972 52 b165 0.2241 1 b177 0.2613 3 l84 0.286 1 l87 0.2648 43 b174 0.2234 1 b174 0.2526 1 l8 0.211 1 l106 0.1697 14 l95 0.2188 5 b181 0.2507 2 l90 0.136 1 l84 0.1496 15 b89 0.2186 1 b173 0.2492 1 l79 0.129 1 l104 0.1414 16 b54 0.2127 3 b175 0.2374 1 l113 0.128 1 l91 0.1403 17 b71 0.2079 1 b69 0.2309 5 l131 0.125 3 l105 0.1322 18 b64 0.1998 1 b171 0.2305 1 l121 0.123 1 l93 0.1185 19 b151 0.1996 1 b188 0.2249 2 l102 0.121 1 l11 0.1041 1
10 b148 0.1968 2 b71 0.2222 1 l116 0.118 1 l44 0.0981 111 b37 0.1952 4 b120 0.2212 2 l127 0.115 1 l60 0.0956 112 b113 0.1856 1 b40 0.2195 5 l62 0.111 1 l103 0.0945 113 l83 0.1840 3 b50 0.2186 4 l64 0.103 1 l83 0.0929 314 b52 0.1808 5 b68 0.2119 4 l96 0.101 4 l96 0.0898 415 l19 0.1808 1 b37 0.2115 4 l88 0.100 4 l46 0.0893 116 b65 0.1776 3 b41 0.2093 3 l65 0.099 1 l31 0.0887 117 b169 0.1769 4 l87 0.2079 4 l76 0.097 1 l97 0.0836 118 b34 0.1726 2 b70 0.2077 2 l4 0.088 1 l14 0.0819 119 b168 0.1722 1 b148 0.2076 2 l114 0.086 2 l27 0.0814 1 20 b63 0.1698 2 b138 0.2040 2 l111 0.085 3 l57 0.0810 1
Table 6 shows the retrieval results to the context(query) “SEPTIC-EMBOLISM.” The word “SEPTIC-EMBOLISM” is included in the feature set of “Pulmonary and Respiratory” but not in “Microbism.” The document (“l95”) is a document related to “Pulmonary and Respiratory” and selected in high ranking in the integrated space. The important result is in the high ranking of documents (b69, b40, b50, b68, b37, b52, b169), which are highly related to the “microbism.” That is, this result shows that the query is belonging to the field of “Pulmonary and Respiratory” but our method realizes to extract documents highly related to the field of “Microbism” by the space integration. And, the integrated space can realize the extraction of more documents with high scores (high points) than those in the single space.
In [21], we have presented a learning system with a Semantic Spectrum Analyzer to realize appropriate and sharp semantic vector spaces for semantic associative search. We have proposed a learning algorithm with a Semantic Spectrum Analyzer for the semantic associative search. The Semantic Spectrum Analyzer makes it possible to extract semantically related and appropriate information for adjusting the initial positions of semantic vectors to the positions adapting to the individual query requirements.
Y. Kiyoki and M. Kawamoto / Semantic Associative Search and Space Integration Methods132
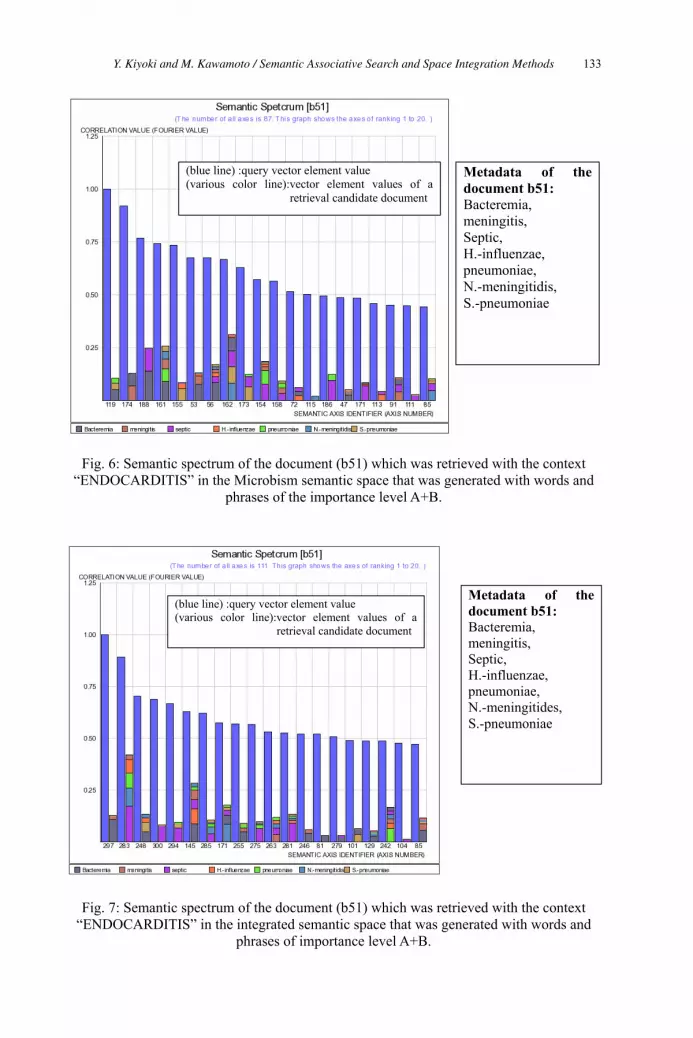
Fig. 6: Semantic spectrum of the document (b51) which was retrieved with the context “ENDOCARDITIS” in the Microbism semantic space that was generated with words and
phrases of the importance level A+B.
Fig. 7: Semantic spectrum of the document (b51) which was retrieved with the context “ENDOCARDITIS” in the integrated semantic space that was generated with words and
phrases of importance level A+B.
Metadata of the document b51: Bacteremia, meningitis, Septic,H.-influenzae,pneumoniae, N.-meningitidis, S.-pneumoniae
Metadata of the document b51: Bacteremia, meningitis, Septic,H.-influenzae,pneumoniae, N.-meningitides, S.-pneumoniae
(blue line) :query vector element value (various color line):vector element values of a
retrieval candidate document
(blue line) :query vector element value (various color line):vector element values of a
retrieval candidate document
Y. Kiyoki and M. Kawamoto / Semantic Associative Search and Space Integration Methods 133
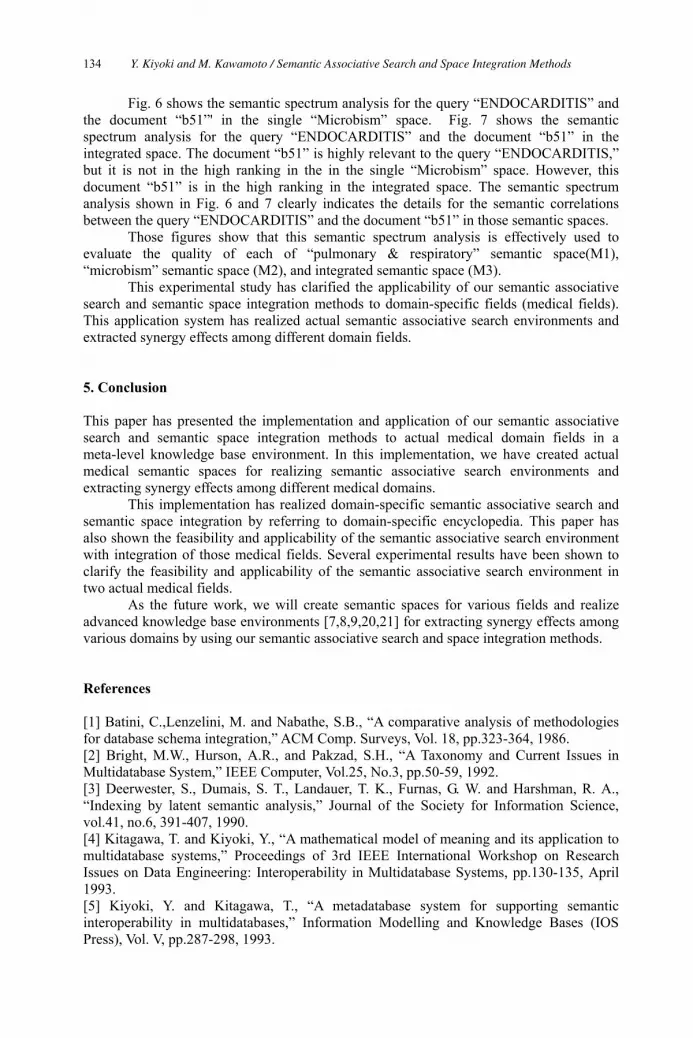
Fig. 6 shows the semantic spectrum analysis for the query “ENDOCARDITIS” and the document “b51”' in the single “Microbism” space. Fig. 7 shows the semantic spectrum analysis for the query “ENDOCARDITIS” and the document “b51” in the integrated space. The document “b51” is highly relevant to the query “ENDOCARDITIS,” but it is not in the high ranking in the in the single “Microbism” space. However, this document “b51” is in the high ranking in the integrated space. The semantic spectrum analysis shown in Fig. 6 and 7 clearly indicates the details for the semantic correlations between the query “ENDOCARDITIS” and the document “b51” in those semantic spaces.
Those figures show that this semantic spectrum analysis is effectively used to evaluate the quality of each of “pulmonary & respiratory” semantic space(M1), “microbism” semantic space (M2), and integrated semantic space (M3).
This experimental study has clarified the applicability of our semantic associative search and semantic space integration methods to domain-specific fields (medical fields). This application system has realized actual semantic associative search environments and extracted synergy effects among different domain fields.
5. Conclusion
This paper has presented the implementation and application of our semantic associative search and semantic space integration methods to actual medical domain fields in a meta-level knowledge base environment. In this implementation, we have created actual medical semantic spaces for realizing semantic associative search environments and extracting synergy effects among different medical domains.
This implementation has realized domain-specific semantic associative search and semantic space integration by referring to domain-specific encyclopedia. This paper has also shown the feasibility and applicability of the semantic associative search environment with integration of those medical fields. Several experimental results have been shown to clarify the feasibility and applicability of the semantic associative search environment in two actual medical fields.
As the future work, we will create semantic spaces for various fields and realize advanced knowledge base environments [7,8,9,20,21] for extracting synergy effects among various domains by using our semantic associative search and space integration methods.
References
[1] Batini, C.,Lenzelini, M. and Nabathe, S.B., “A comparative analysis of methodologies for database schema integration,” ACM Comp. Surveys, Vol. 18, pp.323-364, 1986. [2] Bright, M.W., Hurson, A.R., and Pakzad, S.H., “A Taxonomy and Current Issues in Multidatabase System,” IEEE Computer, Vol.25, No.3, pp.50-59, 1992. [3] Deerwester, S., Dumais, S. T., Landauer, T. K., Furnas, G. W. and Harshman, R. A., “Indexing by latent semantic analysis,” Journal of the Society for Information Science, vol.41, no.6, 391-407, 1990. [4] Kitagawa, T. and Kiyoki, Y., “A mathematical model of meaning and its application to multidatabase systems,” Proceedings of 3rd IEEE International Workshop on Research Issues on Data Engineering: Interoperability in Multidatabase Systems, pp.130-135, April 1993.[5] Kiyoki, Y. and Kitagawa, T., “A metadatabase system for supporting semantic interoperability in multidatabases,” Information Modelling and Knowledge Bases (IOS Press), Vol. V, pp.287-298, 1993.
Y. Kiyoki and M. Kawamoto / Semantic Associative Search and Space Integration Methods134
[6] Kiyoki, Y., Kitagawa, T. and Hitomi, Y., “A fundamental framework for realizing semantic interoperability in a multidatabase environment,” Journal of Integrated Computer-Aided Engineering, Vol.2, No.1(Special Issue on Multidatabase and Interoperable Systems), pp.3-20, John Wiley & Sons, Jan. 1995. [7] Kiyoki, Y., Kitagawa, T. and Miyahara, T., “A fast algorithm of semantic associative search for databases and knowledge bases,” Information Modelling and Knowledge Bases (IOS Press), Vol. VII, 4.1-4.16, 1995. [8] Kiyoki, Y., Kitagawa, T. and Kurata, K., “An Adaptive Learning Mechanism for Semantic Associative Search in Databases and Knowledge Bases,” Information Modelling and Knowledge Bases (IOS Press), Vol. VIII, May 1996. [9] Kiyoki, Y., Kitagawa, T. and Hayama, T., “A metadatabase system for semantic image search by a mathematical model of meaning,” ACM SIGMOD Record, Vol.23, No. 4, pp.34-41, Dec. 1994. [10] Kolodner, J.L., “Retrieval and organizational strategies in conceptual memory: a computer model,” Lawrence Erlbaum Associates, 1984. [11] Krikelis, A., Weems C.C., “Associative processing and processors,” IEEE Computer, Vol.27, No. 11, pp.12-17, Nov. 1994. [12] Potter J.L., “Associative Computing,” Frontiers of Computer Science Series, Plenumn, 1992.[13] Sheth, A. and Larson, J.A., “Federated database systems for managing distributed, heterogeneous, and autonomous databases,” ACM Computing Surveys, Vol.22, No.3, pp.183-236, 1990. [14] Kiyoki, Y. and Kitagawa, T., “A semantic associative search method for knowledge acquisition,” Information Modelling and Knowledge Bases (IOS Press), Vol. VI, pp.121-130, 1995. [15] “Stedman's Electronic Medical Dictionary VERSION 5.0,” Lippincott Williams and Wilkins, A Wolters Kluwer Company, 2000 [16] “Fifteenth Edition Harrison's Principles of Internal Medicine CD-ROM VERSION 1.0,” McGraw-Hill, 2001 [17] “Longman Dictionary of Contemporary English,” Longman, 1987. [18] Ogden, C.K., “The General Basic English Dictionary,” Evans Brothers Limited, 1940. [19] “Cecil Textbook of Medicine 22nd CD-ROM edition” W.B. Saunders Company, December 19, 2003 [20] Kiyoki, Y. and Ishihara, S., ``A Semantic Search Space Integration Method for Meta-level Knowledge Acquisition from Heterogeneous Databases,’’ Information Modelling and Knowledge Bases (IOS Press), Vol. 14, pp.86-103, May 2002. [21] Kiyoki, Y. , Chen, X. and Ohashi, H. : "A Semantic Spectrum Analyzer for Realizing Semantic Learning in a Semantic Associative Search Space," 15th European - Japanese Conference on Information Modelling and Knowledge Bases, pp. 93-110 , (June, 2005).
Y. Kiyoki and M. Kawamoto / Semantic Associative Search and Space Integration Methods 135

Time Contexts in Document-Driven Projects on the Web: From Time-Sensitive Links
towards an Ontology of Time
Anneli HEIMBÜRGER, Jari MULTISILTA and Kai OJANSUU Tampere University of Technology, Pori, Advanced Multimedia Center
P.O. Box 300, FI – 28101 Pori, Finland [email protected], [email protected], [email protected]
Abstract. Time is the core resource of a project. A project combines human and non-human resources together into a temporary organization that aims to achieve a specified objective. A project has a temporal structure of its own, with related operations and deliverables that also are functions of time. In knowledge-intensive organizations, more and more projects are distributed, document-driven processes with parallel phases and tasks. Change management between parallel phases and tasks with associated documents has become one of the core functions in distributed project management. In our paper, we present a framework for time contexts in distributed project management environments, particularly from a project manager’s point of view. In document-driven projects, document life-cycles, the statuses of documents, temporal relations between documents, all define the document logistics of a project and describe the overall temporal structure of a project. We analyze the life-cycles of project documents with related time statuses and temporal relations between different documents. We apply time-sensitive links to illustrate the temporal characteristics of project documents and to construct time-based navigation support through the life-cycles and temporal relations of the project documents in single and simple project environments. Our approach is designed to be applied especially to the analysis phase of document logistics from a time-based project management point of view before an organization selects and implements a commercial or customized distributed project management system. We extend our approach to more complex, multi-project environments. We discuss an ontology of time, and Topic Maps as a means of analyzing, deriving and managing time rule sets separated from project document space. The focus of our approach is on knowledge-intensive organizations, on Web-based document-centric projects and on solutions based on W3C Recommendations.
1. Introduction
Distributed project management systems (DPMS) on the Web play an important role in project execution between different organizations - particularly when inter- and intra-organizational projects involve geographically dispersed teams in different time zones. Such systems provide a virtual project workspace for communication, information interchange, creation of knowledge, document and knowledge management and monitoring the progress of the project. Within given access rights, the virtual project workspace and tools are available to all project partners. The use of distributed and mobile technologies allows project teams and project managers to work both in the office and on the move. The new ways of working enabled by mobile technologies are often characterized in terms of access to corporate information and communication with people - anytime, anywhere [7, 16, 17, 24]. Distribution and mobility provide new challenges when the roles of users,
M. Duží et al. (Eds.)Information Modelling and Knowledge Bases XVIII
IOS Press, 2007© 2007 The authors and IOS Press. All rights reserved.
136
contexts and related documents, as well as technological requirement specifications for document logistics and project management systems, are defined. Nor should the role of national culture in the management of large-scale international projects be underestimated [17, 19, 21].
In a context-sensitive framework for distributed project management three basic layers can be identified. The resource layer, on the bottom, consists of all the project information resources available on the Internet, extranet and/or intranet environments. The context sensitive layer, in the middle, includes methods and tools for selective information retrieval, use and dissemination based on knowledge creation and management technologies and context-sensitive computing. The top layer, for users anywhere and anytime, provides context-dependent access and navigation services to relevant information.
From the vantage points of project managers, several context classes can be identified such as individual users and their roles, project teams and tasks, geographical dispersion and time. Context classes are not totally separate but are also partially overlapping. However each of them provides an interesting viewpoint of the project. Effective time-based project management can decrease project lead-times and thus results in economical benefits with increased competitiveness. Special attention should be paid to analyzing life-cycles of project documents and developing monitoring services and tools for project managers both in single project and in multi-project environments.
In order to develop time-sensitive monitoring methods, tools and services for project managers in document-driven projects, a deeper understanding of the time contexts and temporal structures of the project and associated documents is needed. Time-based project management in distributed environments fundamentally means the management of information flows – in our case study document flows - across interfaces between tasks and the passing of work flows smoothly from one task and resource to the next one [9, 10]. In knowledge-intensive organizations, more and more projects are distributed and document-driven processes with parallel phases and tasks. Change management between parallel phases, tasks and document flows has become one of the core functions in distributed project management (Figure 1). In document-driven projects, document life-cycles, document statuses, temporal relations between phases, tasks and documents define the document logistics of the project and describe the overall temporal structure of the project.
Our paper makes the following contribution. Initially, we introduce a framework for time contexts in distributed project management environments, particularly from a project manager’s point of view. Secondly, we present an analysis of temporality as related to project documents. We apply time-sensitive links [11, 12, 13] to construct temporal structures in the analysis phase of document logistics in organizations and to support time-based navigation through the life-cycles of project documents in single project environments. Thirdly, we extend our approach to multi-project environments. We discuss an ontology of time for analyzing and deriving the temporal structures of documents in multi-project environments. We also discuss the implementation of a time ontology by means of Topic Maps as one possibility [22]. The focus of our approach is on knowledge-intensive organizations and on document-driven projects.
The remainder of the paper is organized as follows. In Section 2, as a synthesis of related work, we present a temporal framework for time contexts in distributed project environments. In Section 3, we introduce life-cycles of and temporal relations between project documents and we present an example of their implementations to the document logistics analysis phase in single project environments. In Section 4, we discuss multi-project environments and the possibility of applying a time ontology approach to construct temporal structures for project documents. Section 5 is reserved for conclusions and issues needing further research.
A. Heimbürger et al. / Time Contexts in Document-Driven Projects on the Web 137

(A) In serial document logistics the main direction of the information flow is from left to right. The project is milestone driven.
Project Delivery Time
Documents related to Task 3
Documents related to Task 2
Documents related to Task 1
(B) In parallel document logistics the main direction of the information flow is both from bottom-up and from top-down. The project is change driven and change management is one of the most essential monitoring operations of the project progress.
Documents related to Task N
Time
Project Delivery Time
Documents related to Task 2
Documents related to Task 3
Time
Documents related to Task 1
Documents related to Task N
Change Management
Figure 1. From serial to parallel document logistics
2. Related Work: Time Contexts in Distributed Projects
A project can be defined as a combination of human and non-human resources pulled together into a temporary organization for achieving a specified purpose [30]. The project manager is the chief executive of this temporary organization. In addition to temporal structures of the projects and temporal relations between project phases, tasks and documents, there are other time contexts which a project manager has to face.
Time attitudes include cultural, organizational, group specific and personal issues. Despite globalization, many temporal habits, calendars and clocks coexist [28]. Calendars and clocks differ in many ways. Examples are [20]:
the beginning and end of an interval - such as a year
the length of the interval
A. Heimbürger et al. / Time Contexts in Document-Driven Projects on the Web138

the measuring unit of the interval
the method of synchronization with the solar year. Hence, even when a person is located in a different country he/she may celebrate the New Year on the day it is celebrated in that person’s country of origin. While a project’s events may be marked on the Gregorian calendar, many social, personal and even professional events may be marked on or driven by a local calendar. Monochronic cultures differ from polychronic cultures in that the former encourage a highly structured, time-ordered approach to life and the latter a more flexible, indirect approach, based more upon personal relationships than scheduled commitments [27].
A project manager has to optimize harmonizing with the local time contexts [4, 26]. However, he/she can’t compromise on the overall goals of the project. At a more fundamental level the project schedule is simply another calendar that is particular to that project. It may be implemented by means of UTC (Coordinated Universal Time), which is a standard time common to every place in the world [31]. The UTC-based calendar can coexist with other local calendars by adapting to them with minimum conflict, by including the events of local calendars and by working around them as additional constraints.
Anacona et al. [2] introduced the concept of temporal zones in organizations. Three different zones can be identified: short-term time zones, medium-term zones and long-term zones. Temporal zones applied to distributed project environments reflect activities that share the same temporal parameters, such as pace, time horizon and cycle.
Computer system failures are examples of trouble-shooting situations related to the technical resources of a project, and they have effects of their own on project scheduling. Natural phenomena and social conditions can be anticipated to some extent. However, they can have critical follow-ups to a project’s lead time. A new invention is an example of a totally unplanned temporal issue that a project manager may have to face, and therefore may result in re-estimation of the realization of the whole project.
One of the essential design issues of DPMS for document-driven projects has been the reduction of project lead-times. A layer model of distributed project management integrates key disciplines for designing, executing, analyzing and understanding document-driven processes in project operations [9, 10]. The model usually consists of four main layers: a document management layer, a communication layer, a project operations layer and a business performance layer. The business performance layer implements tools for document processing across the whole project workspace according to a company’s given strategy. The project operations layer provides tools for general management issues. The communication layer implements tools for keeping project members informed about what other members are doing and thus increases project transparency and information transfer. The document management layer constitutes the repository and management tools for project deliverables which reflects the created knowledge of the project.
Takeuchi [29] pointed out one of the fundamental differences between Western project managers and Asian project managers, and the difference between the concept of knowledge management and knowledge creation. Western managers emphasize the importance of explicit knowledge whereas, for instance, Japanese intellectual tradition places a strong emphasis on tacit knowledge, seeing the explicit knowledge as being just the tip of the iceberg. The distinction between explicit and tacit knowledge is the key to understanding the differences between the Western and Asian approaches to knowledge. For tacit knowledge to be communicated and shared within a project organization, it has to be converted into words, drawings or numbers that everyone can understand. It is precisely during the time that this kind of conversation and conversion process takes place – from tacit to explicit – that project- and task-specific and more widely organizational knowledge is created [29].
A. Heimbürger et al. / Time Contexts in Document-Driven Projects on the Web 139
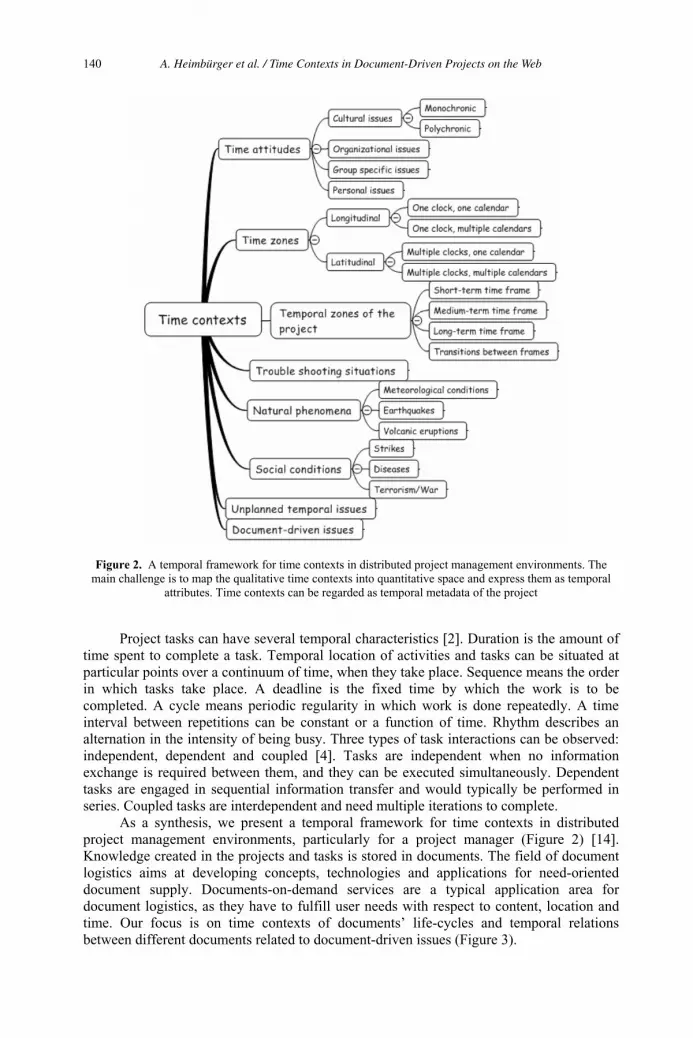
Figure 2. A temporal framework for time contexts in distributed project management environments. The main challenge is to map the qualitative time contexts into quantitative space and express them as temporal
attributes. Time contexts can be regarded as temporal metadata of the project
Project tasks can have several temporal characteristics [2]. Duration is the amount of time spent to complete a task. Temporal location of activities and tasks can be situated at particular points over a continuum of time, when they take place. Sequence means the order in which tasks take place. A deadline is the fixed time by which the work is to be completed. A cycle means periodic regularity in which work is done repeatedly. A time interval between repetitions can be constant or a function of time. Rhythm describes an alternation in the intensity of being busy. Three types of task interactions can be observed: independent, dependent and coupled [4]. Tasks are independent when no information exchange is required between them, and they can be executed simultaneously. Dependent tasks are engaged in sequential information transfer and would typically be performed in series. Coupled tasks are interdependent and need multiple iterations to complete.
As a synthesis, we present a temporal framework for time contexts in distributed project management environments, particularly for a project manager (Figure 2) [14]. Knowledge created in the projects and tasks is stored in documents. The field of document logistics aims at developing concepts, technologies and applications for need-oriented document supply. Documents-on-demand services are a typical application area for document logistics, as they have to fulfill user needs with respect to content, location and time. Our focus is on time contexts of documents’ life-cycles and temporal relations between different documents related to document-driven issues (Figure 3).
A. Heimbürger et al. / Time Contexts in Document-Driven Projects on the Web140
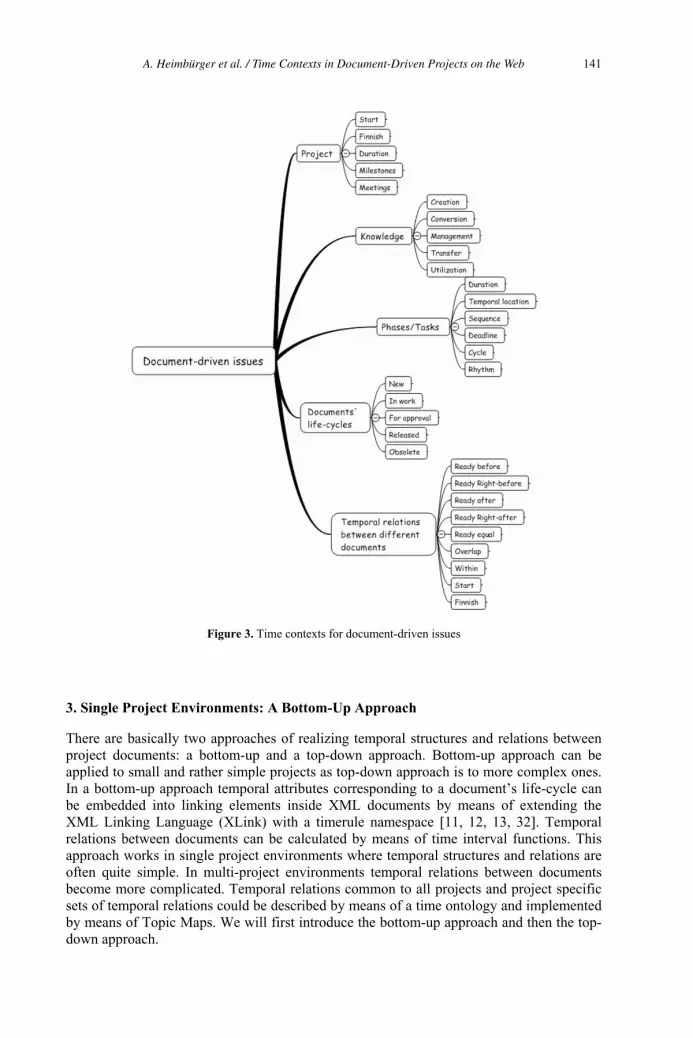
Figure 3. Time contexts for document-driven issues
3. Single Project Environments: A Bottom-Up Approach
There are basically two approaches of realizing temporal structures and relations between project documents: a bottom-up and a top-down approach. Bottom-up approach can be applied to small and rather simple projects as top-down approach is to more complex ones. In a bottom-up approach temporal attributes corresponding to a document’s life-cycle can be embedded into linking elements inside XML documents by means of extending the XML Linking Language (XLink) with a timerule namespace [11, 12, 13, 32]. Temporal relations between documents can be calculated by means of time interval functions. This approach works in single project environments where temporal structures and relations are often quite simple. In multi-project environments temporal relations between documents become more complicated. Temporal relations common to all projects and project specific sets of temporal relations could be described by means of a time ontology and implemented by means of Topic Maps. We will first introduce the bottom-up approach and then the top-down approach.
A. Heimbürger et al. / Time Contexts in Document-Driven Projects on the Web 141
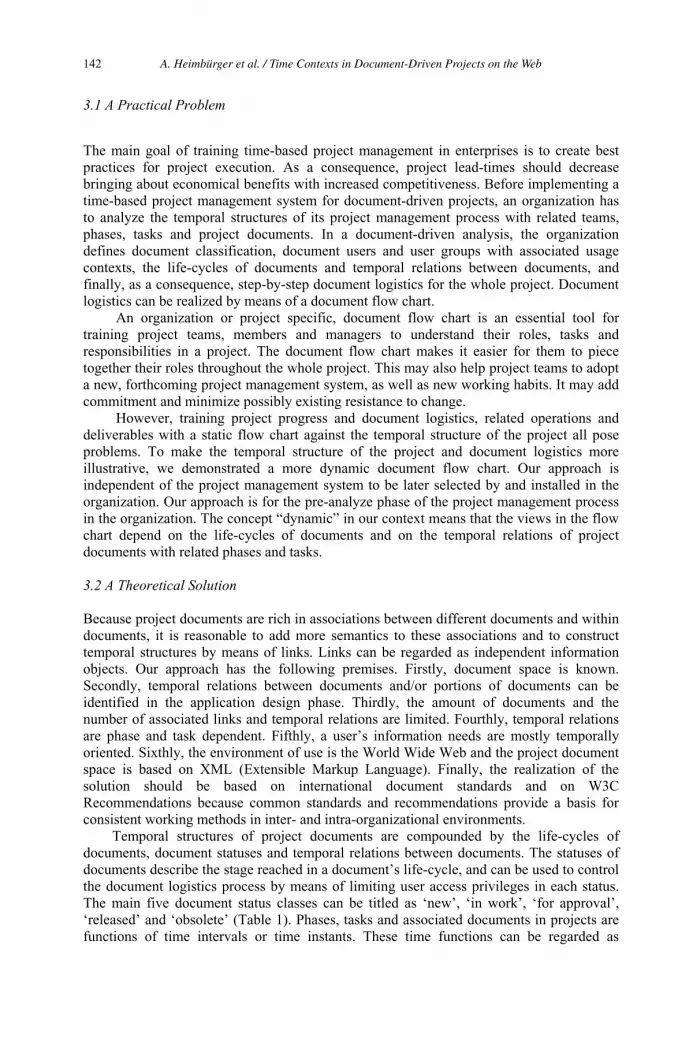
3.1 A Practical Problem
The main goal of training time-based project management in enterprises is to create best practices for project execution. As a consequence, project lead-times should decrease bringing about economical benefits with increased competitiveness. Before implementing a time-based project management system for document-driven projects, an organization has to analyze the temporal structures of its project management process with related teams, phases, tasks and project documents. In a document-driven analysis, the organization defines document classification, document users and user groups with associated usage contexts, the life-cycles of documents and temporal relations between documents, and finally, as a consequence, step-by-step document logistics for the whole project. Document logistics can be realized by means of a document flow chart.
An organization or project specific, document flow chart is an essential tool for training project teams, members and managers to understand their roles, tasks and responsibilities in a project. The document flow chart makes it easier for them to piece together their roles throughout the whole project. This may also help project teams to adopt a new, forthcoming project management system, as well as new working habits. It may add commitment and minimize possibly existing resistance to change.
However, training project progress and document logistics, related operations and deliverables with a static flow chart against the temporal structure of the project all pose problems. To make the temporal structure of the project and document logistics more illustrative, we demonstrated a more dynamic document flow chart. Our approach is independent of the project management system to be later selected by and installed in the organization. Our approach is for the pre-analyze phase of the project management process in the organization. The concept “dynamic” in our context means that the views in the flow chart depend on the life-cycles of documents and on the temporal relations of project documents with related phases and tasks.
3.2 A Theoretical Solution
Because project documents are rich in associations between different documents and within documents, it is reasonable to add more semantics to these associations and to construct temporal structures by means of links. Links can be regarded as independent information objects. Our approach has the following premises. Firstly, document space is known. Secondly, temporal relations between documents and/or portions of documents can be identified in the application design phase. Thirdly, the amount of documents and the number of associated links and temporal relations are limited. Fourthly, temporal relations are phase and task dependent. Fifthly, a user’s information needs are mostly temporally oriented. Sixthly, the environment of use is the World Wide Web and the project document space is based on XML (Extensible Markup Language). Finally, the realization of the solution should be based on international document standards and on W3C Recommendations because common standards and recommendations provide a basis for consistent working methods in inter- and intra-organizational environments.
Temporal structures of project documents are compounded by the life-cycles of documents, document statuses and temporal relations between documents. The statuses of documents describe the stage reached in a document’s life-cycle, and can be used to control the document logistics process by means of limiting user access privileges in each status. The main five document status classes can be titled as ‘new’, ‘in work’, ‘for approval’, ‘released’ and ‘obsolete’ (Table 1). Phases, tasks and associated documents in projects are functions of time intervals or time instants. These time functions can be regarded as
A. Heimbürger et al. / Time Contexts in Document-Driven Projects on the Web142
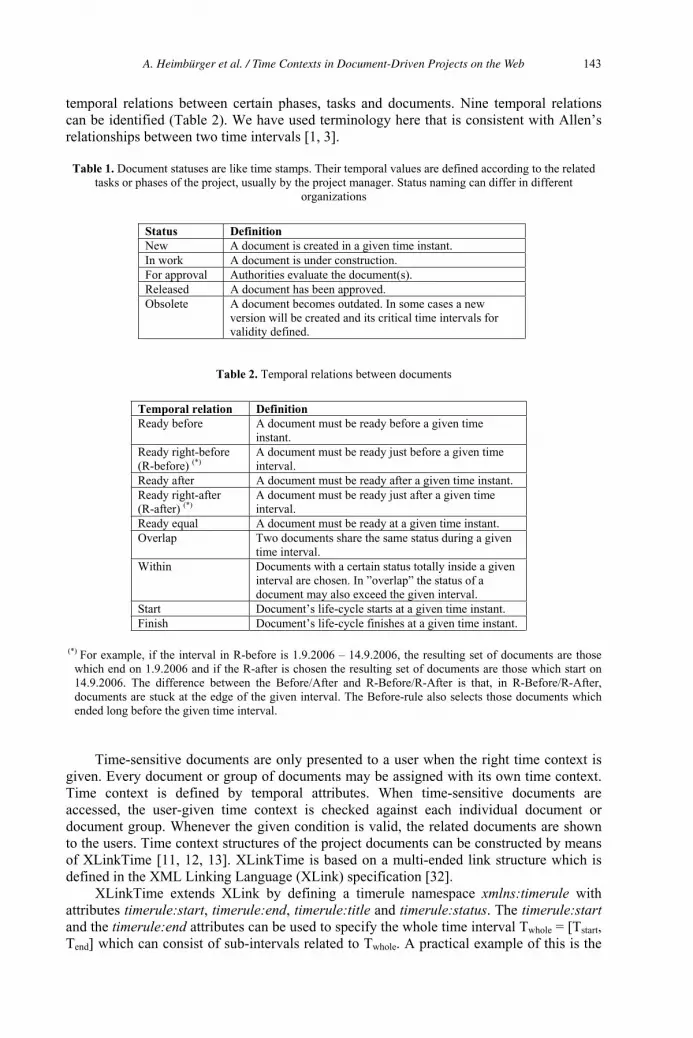
temporal relations between certain phases, tasks and documents. Nine temporal relations can be identified (Table 2). We have used terminology here that is consistent with Allen’s relationships between two time intervals [1, 3].
Table 1. Document statuses are like time stamps. Their temporal values are defined according to the related tasks or phases of the project, usually by the project manager. Status naming can differ in different
organizations
Status Definition New A document is created in a given time instant. In work A document is under construction. For approval Authorities evaluate the document(s). Released A document has been approved. Obsolete A document becomes outdated. In some cases a new
version will be created and its critical time intervals for validity defined.
Table 2. Temporal relations between documents
Temporal relation Definition Ready before A document must be ready before a given time
instant.Ready right-before (R-before) (*)
A document must be ready just before a given time interval.
Ready after A document must be ready after a given time instant. Ready right-after (R-after) (*)
A document must be ready just after a given time interval.
Ready equal A document must be ready at a given time instant. Overlap Two documents share the same status during a given
time interval. Within Documents with a certain status totally inside a given
interval are chosen. In ”overlap” the status of a document may also exceed the given interval.
Start Document’s life-cycle starts at a given time instant. Finish Document’s life-cycle finishes at a given time instant.
(*) For example, if the interval in R-before is 1.9.2006 – 14.9.2006, the resulting set of documents are those which end on 1.9.2006 and if the R-after is chosen the resulting set of documents are those which start on 14.9.2006. The difference between the Before/After and R-Before/R-After is that, in R-Before/R-After, documents are stuck at the edge of the given interval. The Before-rule also selects those documents which ended long before the given time interval.
Time-sensitive documents are only presented to a user when the right time context is given. Every document or group of documents may be assigned with its own time context. Time context is defined by temporal attributes. When time-sensitive documents are accessed, the user-given time context is checked against each individual document or document group. Whenever the given condition is valid, the related documents are shown to the users. Time context structures of the project documents can be constructed by means of XLinkTime [11, 12, 13]. XLinkTime is based on a multi-ended link structure which is defined in the XML Linking Language (XLink) specification [32].
XLinkTime extends XLink by defining a timerule namespace xmlns:timerule with attributes timerule:start, timerule:end, timerule:title and timerule:status. The timerule:startand the timerule:end attributes can be used to specify the whole time interval Twhole = [Tstart,Tend] which can consist of sub-intervals related to Twhole. A practical example of this is the
A. Heimbürger et al. / Time Contexts in Document-Driven Projects on the Web 143

whole schedule of a project and sub-schedules inside the project. The timerule:start and the timerule:end attributes are used with an attribute in the XLink namespace called type with a value of “extended” i.e. xlink:type=”extended”. An example is:
<project xmlns:timerule="http://www.tut.fi/amc/2005/05/timerule" xmlns:xlink="http://www.w3.org/1999/xlink" xlink:type="extended" timerule:start="StartMonth StartDay StartYear" timerule:end="EndMonth EndDay EndYear">….</project>
Inside xlink:type=”extended” there can be n time-sensitive links. They are defined by an attribute in the XLink namespace called type with a value of “locator” i.e. ”xlink:type=”locator”. An example is:
<remote xlink:type="locator" xlink:title="Title of a link" xlink:href="file.html" timerule:start="StartMonth StartDay StartYear" timerule:end="StartMonth StartDay StartYear" />
With a timerule:status attribute one document can be split into parts according to the sub-life-cycles of the document. We use “new”, “in work”, “for approval”, “released” and “obsolete” as examples for status names. A timerule:title attribute can be used for human-readable purposes. For example, with timerule:title=”The Third Checking Point of the Project” the corresponding text string will be shown to a user. To summarise, an xlink:type="extended” can include timerule:start and timerule:end attributes, and an xlink:type=”locator” can include timerule:start, timerule:end, timerule:title and timerule:status attributes.
3.3 An Example of Implementation
The temporal relations between two documents X and Y and corresponding functions implemented with JavaScript are given in Table 3. The functions include two time objects, startTime and endTime. The value of the date in the number of milliseconds is returned by the getTime method since the 1st of January 1970, and which is defined as 00:00:00.
Table 3. Temporal relations and corresponding functions between two documents
Relations Functions and inverse functionsX before Y function before(x,y)
{ return ( x.endTime.getTime() ) < ( y.startTime.getTime() ); } Inverse: function nbefore(x,y) { return !before(x,y); }
X equals Y function equal(x,y){ return ((x.startTime.getTime()) == (y.startTime.getTime())) && ((x.endTime.getTime()) == (y.endTime.getTime())); } Inverse: function nequal(x,y) { return !equal(x,y); }
X meets Y function meets(x,y){ return (x.endTime.getTime()) == (y.startTime.getTime()); } Inverse: function nmeets(x,y) { return !meets(x,y); }
X overlaps Y function overlaps(x,y){ return ( (x.startTime.getTime()) <= (y.endTime.getTime()) ) && ( (x.endTime.getTime()) >= (y.startTime.getTime())); } Inverse: function noverlaps(x,y) { return !overlaps(x,y); }
X during Y function during(x,y){ return ( (x.startTime.getTime()) >= (y.startTime.getTime()) ) && ( (x.endTime.getTime()) <= (y.endTime.getTime())); } Inverse: function nduring(x,y) { return !during(x,y); }
X starts with Y function starts(x,y){ return (x.startTime.getTime()) == (y.startTime.getTime()); } Inverse: function nstarts(x,y) { return !starts(x,y); }
X ends with Y function ends(x,y) { return (x.endTime.getTime()) == (y.endTime.getTime()); } Inverse: function nfinishes(x,y) { return !finishes(x,y); }
A. Heimbürger et al. / Time Contexts in Document-Driven Projects on the Web144
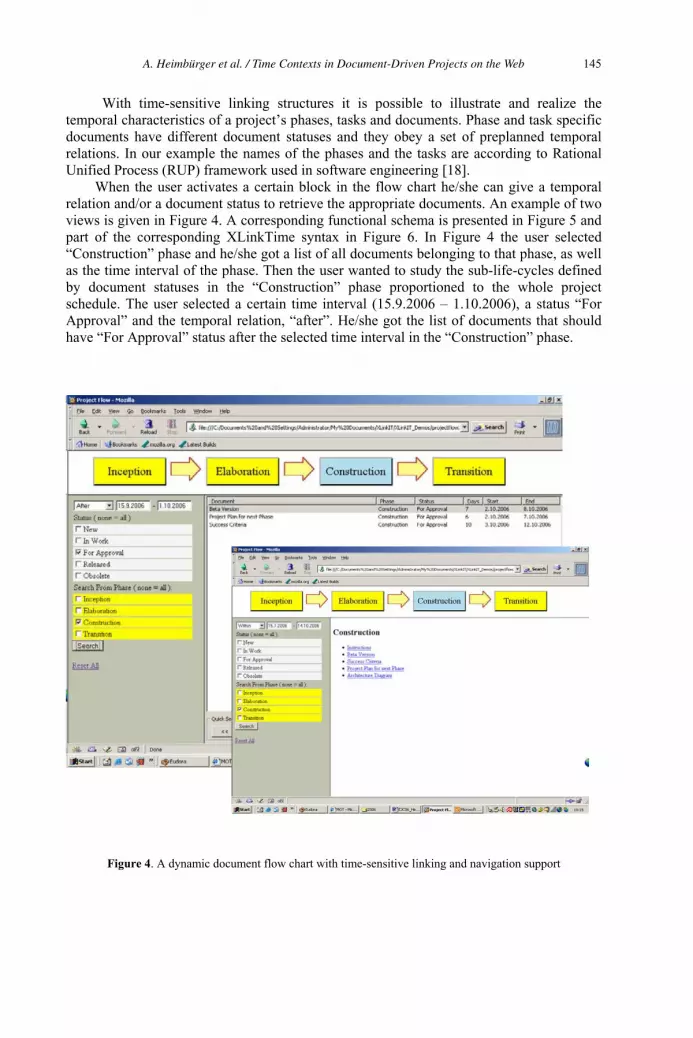
With time-sensitive linking structures it is possible to illustrate and realize the temporal characteristics of a project’s phases, tasks and documents. Phase and task specific documents have different document statuses and they obey a set of preplanned temporal relations. In our example the names of the phases and the tasks are according to Rational Unified Process (RUP) framework used in software engineering [18].
When the user activates a certain block in the flow chart he/she can give a temporal relation and/or a document status to retrieve the appropriate documents. An example of two views is given in Figure 4. A corresponding functional schema is presented in Figure 5 and part of the corresponding XLinkTime syntax in Figure 6. In Figure 4 the user selected “Construction” phase and he/she got a list of all documents belonging to that phase, as well as the time interval of the phase. Then the user wanted to study the sub-life-cycles defined by document statuses in the “Construction” phase proportioned to the whole project schedule. The user selected a certain time interval (15.9.2006 – 1.10.2006), a status “For Approval” and the temporal relation, “after”. He/she got the list of documents that should have “For Approval” status after the selected time interval in the “Construction” phase.
Figure 4. A dynamic document flow chart with time-sensitive linking and navigation support
A. Heimbürger et al. / Time Contexts in Document-Driven Projects on the Web 145

Search Frame
inception.xml
elaboration.xml
construction.xml
transition.xml
commonstyle.xsl
XLinkTime data
XLinkTime data is parsed
and transfered
to JavaScript environmentXLinkTime Collection
Search Results
XUL
User's search action
Figure 5. Functional schema of the document flow chart
******************************************************************************** Filename: construction.xml Description: XLinkTime links for "Construction" phase
<?xml version="1.0" encoding="ISO-8859-1"?> <?xml-stylesheet type="text/xsl" href="commonstyle.xml" ?>
<project xmlns:timerule="http://www.tut.fi/amc/2005/05/timerule" xmlns:xlink=http://www.w3.org/1999/xlink xlink:label="Construction" xlink:type="extended" timerule:start="July, 15 2006" timerule:end="Oct, 14 2006">
<local xlink:type="resource" xlink:title="Construction" xlink:label="Phase 3"/>
<remote xlink:type="locator" xlink:label="Construction" xlink:title="Constructing a Beta Version" xlink:href="construction/beta.xml" timerule:status="new" timerule:start="Jul, 15 2006" timerule:end="Jul, 24 2006" />
<remote xlink:type="locator" xlink:label="Construction" xlink:title="Constructing a Beta Version" xlink:href="construction/beta.xml" timerule:status="inWork" timerule:start="Jul, 24 2006" timerule:end="Oct, 2 2006" />
<remote xlink:type="locator" xlink:label="Construction" xlink:title="Constructing a Beta Version" xlink:href="construction/beta.xml" timerule:status="forApproval" timerule:start="Oct, 2 2006" timerule:end="Oct, 8 2006" />
<remote xlink:type="locator" xlink:label="Construction" xlink:title="Constructing a Beta Version" xlink:href="construction/beta.xml" timerule:status="released" timerule:start="Oct, 8 2006" timerule:end="Oct, 14 2006" />
</project>********************************************************************************
Figure 6. A part of the XLinkTime syntax of the Construction phase. The syntax describes the life-cycle of the Beta Version document
A. Heimbürger et al. / Time Contexts in Document-Driven Projects on the Web146
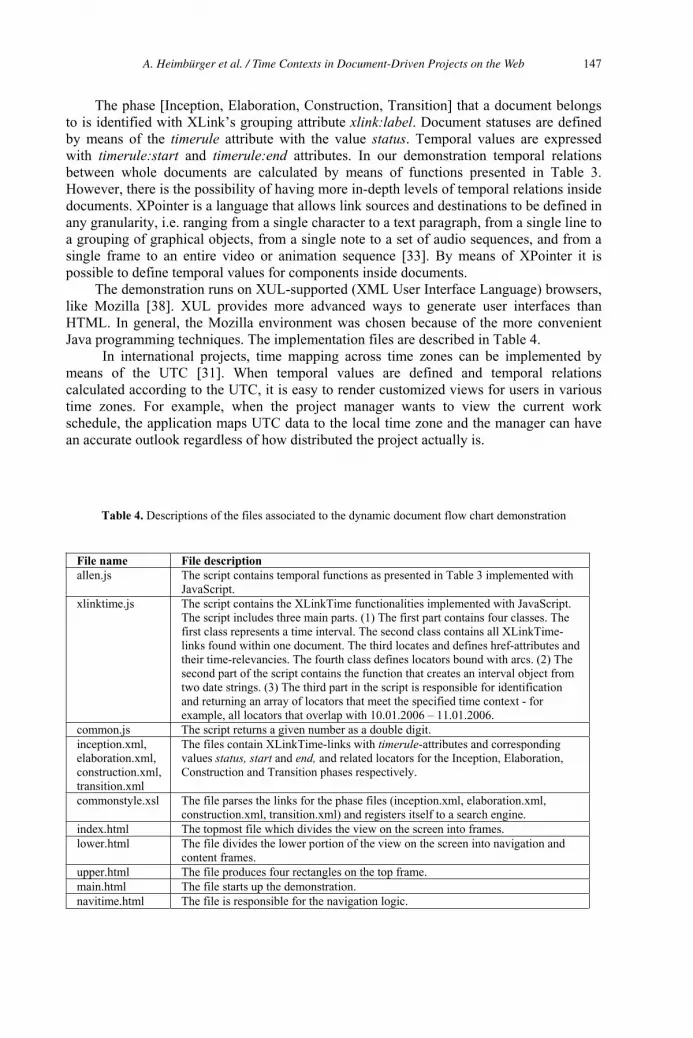
The phase [Inception, Elaboration, Construction, Transition] that a document belongs to is identified with XLink’s grouping attribute xlink:label. Document statuses are defined by means of the timerule attribute with the value status. Temporal values are expressed with timerule:start and timerule:end attributes. In our demonstration temporal relations between whole documents are calculated by means of functions presented in Table 3. However, there is the possibility of having more in-depth levels of temporal relations inside documents. XPointer is a language that allows link sources and destinations to be defined in any granularity, i.e. ranging from a single character to a text paragraph, from a single line to a grouping of graphical objects, from a single note to a set of audio sequences, and from a single frame to an entire video or animation sequence [33]. By means of XPointer it is possible to define temporal values for components inside documents.
The demonstration runs on XUL-supported (XML User Interface Language) browsers, like Mozilla [38]. XUL provides more advanced ways to generate user interfaces than HTML. In general, the Mozilla environment was chosen because of the more convenient Java programming techniques. The implementation files are described in Table 4.
In international projects, time mapping across time zones can be implemented by means of the UTC [31]. When temporal values are defined and temporal relations calculated according to the UTC, it is easy to render customized views for users in various time zones. For example, when the project manager wants to view the current work schedule, the application maps UTC data to the local time zone and the manager can have an accurate outlook regardless of how distributed the project actually is.
Table 4. Descriptions of the files associated to the dynamic document flow chart demonstration
File name File description allen.js The script contains temporal functions as presented in Table 3 implemented with
JavaScript. xlinktime.js The script contains the XLinkTime functionalities implemented with JavaScript.
The script includes three main parts. (1) The first part contains four classes. The first class represents a time interval. The second class contains all XLinkTime-links found within one document. The third locates and defines href-attributes and their time-relevancies. The fourth class defines locators bound with arcs. (2) The second part of the script contains the function that creates an interval object from two date strings. (3) The third part in the script is responsible for identification and returning an array of locators that meet the specified time context - for example, all locators that overlap with 10.01.2006 – 11.01.2006.
common.js The script returns a given number as a double digit. inception.xml, elaboration.xml, construction.xml,transition.xml
The files contain XLinkTime-links with timerule-attributes and corresponding values status, start and end, and related locators for the Inception, Elaboration, Construction and Transition phases respectively.
commonstyle.xsl The file parses the links for the phase files (inception.xml, elaboration.xml, construction.xml, transition.xml) and registers itself to a search engine.
index.html The topmost file which divides the view on the screen into frames. lower.html The file divides the lower portion of the view on the screen into navigation and
content frames. upper.html The file produces four rectangles on the top frame. main.html The file starts up the demonstration. navitime.html The file is responsible for the navigation logic.
A. Heimbürger et al. / Time Contexts in Document-Driven Projects on the Web 147

4. Multi-Project Environments: A Top-Down Approach
4.1 A Practical Problem
In multi-project environments there are multiple interdependencies across time. From a macro perspective, an organization should have an inventory of all projects under way at any given time, as well as aids to plan and control resources [5, 23, 25]. Such knowledge is to be automatically generated at regular intervals, such as in weekly, monthly and bi-monthly reports, but also on demand whenever needed. Project repositories to store knowledge from past projects also help to manage lessons learned. Such repositories form a base for organizational memory.
According to the project typology [6], as illustrated in Figure 7, a distributed project can be divided into two main categories: single projects and multiple projects. Furthermore, multiple projects can be divided into multiple traditional projects, multiple co-located projects, multiple distributed projects with discrete locations and finally, multiple distributed projects with shared locations. The more complex the distributed project typology is, the more complex are the temporal structures of the projects and associated document logistics. Also the amount of documents and the number of links between documents increase significantly. The bottom-up approach does not work anymore in multi-project environments. More versatile solutions are needed.
Multiple distributed projects with shared locations
Multiple traditional projects
Multiple co-located projects
Multiple distributed projects with discrete locations
Distributed project
Figure 7. Distributed project management typology
4.2 A Theoretical Solution
A practical example of the top-down approach is a multi-project management environment in an enterprise that carries out and is responsible for many projects at the same time. The top-down approach could be applied to describe both project specific temporal structures and general temporal structures common to many projects. Figure 8 illustrates a case where the time rule space is separated from the document space. Document space consists of project documents and time rule space of temporal structures of the projects and temporal relations between the phases, tasks and documents of the projects.
An ontology of time and Topic Maps are two interesting methods of realizing the top-down approach. Ontology includes (a) entities, (b) the relationships between entities, (c) the properties and property values of entities, (d) the functions and processes involving the entities and (e) constraints on and rules about the entities [8]. Ontologies can be classified according to two dimensions: their level of detail and their level of dependence on a particular task or point of view [8]. The second dimension is especially interesting
A. Heimbürger et al. / Time Contexts in Document-Driven Projects on the Web148
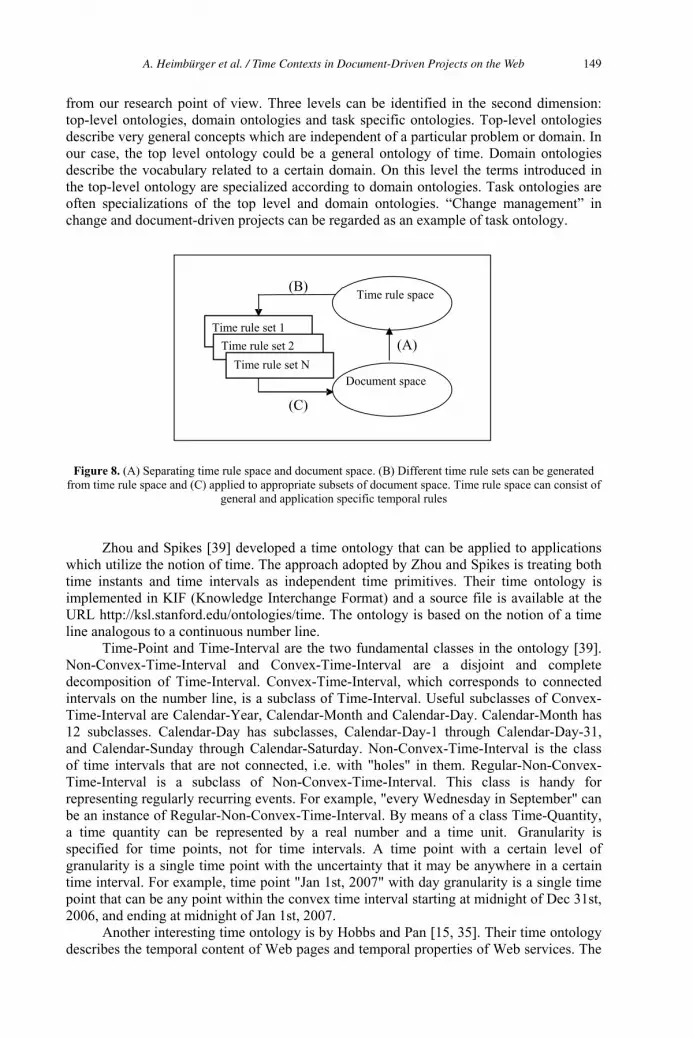
from our research point of view. Three levels can be identified in the second dimension: top-level ontologies, domain ontologies and task specific ontologies. Top-level ontologies describe very general concepts which are independent of a particular problem or domain. In our case, the top level ontology could be a general ontology of time. Domain ontologies describe the vocabulary related to a certain domain. On this level the terms introduced in the top-level ontology are specialized according to domain ontologies. Task ontologies are often specializations of the top level and domain ontologies. “Change management” in change and document-driven projects can be regarded as an example of task ontology.
Time rule set 1
Time rule set 2
Time rule set N
(C)
(B)
(A)
Document space
Time rule space
Figure 8. (A) Separating time rule space and document space. (B) Different time rule sets can be generated from time rule space and (C) applied to appropriate subsets of document space. Time rule space can consist of
general and application specific temporal rules
Zhou and Spikes [39] developed a time ontology that can be applied to applications which utilize the notion of time. The approach adopted by Zhou and Spikes is treating both time instants and time intervals as independent time primitives. Their time ontology is implemented in KIF (Knowledge Interchange Format) and a source file is available at the URL http://ksl.stanford.edu/ontologies/time. The ontology is based on the notion of a time line analogous to a continuous number line.
Time-Point and Time-Interval are the two fundamental classes in the ontology [39]. Non-Convex-Time-Interval and Convex-Time-Interval are a disjoint and complete decomposition of Time-Interval. Convex-Time-Interval, which corresponds to connected intervals on the number line, is a subclass of Time-Interval. Useful subclasses of Convex-Time-Interval are Calendar-Year, Calendar-Month and Calendar-Day. Calendar-Month has 12 subclasses. Calendar-Day has subclasses, Calendar-Day-1 through Calendar-Day-31, and Calendar-Sunday through Calendar-Saturday. Non-Convex-Time-Interval is the class of time intervals that are not connected, i.e. with "holes" in them. Regular-Non-Convex-Time-Interval is a subclass of Non-Convex-Time-Interval. This class is handy for representing regularly recurring events. For example, "every Wednesday in September" can be an instance of Regular-Non-Convex-Time-Interval. By means of a class Time-Quantity, a time quantity can be represented by a real number and a time unit. Granularity is specified for time points, not for time intervals. A time point with a certain level of granularity is a single time point with the uncertainty that it may be anywhere in a certain time interval. For example, time point "Jan 1st, 2007" with day granularity is a single time point that can be any point within the convex time interval starting at midnight of Dec 31st, 2006, and ending at midnight of Jan 1st, 2007.
Another interesting time ontology is by Hobbs and Pan [15, 35]. Their time ontology describes the temporal content of Web pages and temporal properties of Web services. The
A. Heimbürger et al. / Time Contexts in Document-Driven Projects on the Web 149
ontology covers topological properties of instants and interval, measures of duration and the meanings of clock and calendar terms.
4.3 Towards an Implementation
With topic maps an associative information structure, which is located outside that information, can be created [14]. The core of the XML Topic Maps (XTM) 1.0 specification is formed of topics, which represent the subjects the topic map is about [22, 37]. Topics can be grouped into classes called topic types. A topic may be linked to one or more information resources that are relevant to the topic. Such resources are called occurrences of the topic. Topics can be related through associations expressing given semantics. Just as topic and occurrences can be grouped according to type, so can associations between topics also be grouped according to their type. Each topic that participates in an association plays a role in that association called the association role. Topic associations are completely independent of information resources. The same topic map can be overlaid on different information repositories such as on different project document spaces. Different topic maps can be overlaid on the same information repository to provide different views to users. An example of this would be views according to different time rule sets as illustrated in Figure 8.
The ontology-driven topic maps approach offers several major advantages [22]. Producing the ontology first from which to generate the topic map separates the ontological design from the XTM implementation details. As versioning of the XTM specification occurs, if the ontology for a given topic map remains unchanged, then only the mapping from the ontology language to the XTM specification need to be updated.
Because ontologies and topic maps are the results of significant investments it is reasonable to avoid the efforts of building knowledge from scratch on domains for which considerable knowledge representation work has already been done. Existing ontologies have usually been tested and used for various applications. Ontologies are built using languages focused on knowledge representation, whereas topic maps are artefacts created specifically to organize Web resources. It is advisable to leave the actual implementation to the topic map, allowing the conceptualization to be specified by the ontology.
5. Conclusions
Time is an essential resource of a project. Human and non-human resources are combined in a project together into a temporary organization that aims to achieve a specified objective. In our paper, we have identified several time contexts related to project management. Time contexts are partially qualitative and partially quantitative. A challenge for a long term research is to develop functions by means of which we could map the qualitative time contexts into quantitative space and express them as temporal attributes. Time contexts can be regarded as temporal metadata of the project. In our paper we have concentrated on quantitative time contexts of document-driven issues.
The project, with related operations and deliverables that are functions of time, has a temporal structure of its own. In knowledge-intensive organizations, more and more projects are distributed and document-driven processes with parallel phases and tasks. Change management between parallel phases and tasks has become one of the core functions in distributed project management. In document-driven projects, document life-cycles, document statuses, temporal relations between phases, tasks and documents define the document logistics of the project and describe the overall temporal structure of the project.
A. Heimbürger et al. / Time Contexts in Document-Driven Projects on the Web150
In our paper we presented a framework for time contexts in distributed project management environments particularly from a project manager’s point of view. We introduced the granularity levels of project documents’ life-cycles i.e. document statuses, and temporal relations between different documents. Document life-cycles and related statuses are like time stamps. Their temporal values are defined according to the related tasks or phases of the project, usually by the project manager and a client. In some projects these are quite fixed and in some projects there can be more temporal tolerance.
We applied time-sensitive links, as a bottom-up approach, for single project environments to illustrate the temporal characteristics of project documents and to construct time-based navigation support through life-cycles and temporal relations of documents. Our approach is designed to be applied especially to the analysis phase of document logistics from a time-based point of view before an organization selects and implements a commercial or customized distributed project management system.
We extended our approach to multi-project environments. We discussed an ontology of time and Topic Maps as means of realizing a top-down approach that separates time rule space from project document space. The focus of our approach was on knowledge-intensive organizations and on document-centric projects.
The problem with XLinkTime has been with its formal representation. The main reason is that the XLink is based on the “xmlns:xlink=”http://www.w3.org/1999/xlink”namespace, i.e. elements that serve as links in XML documents are identified by means of a type-attribute defined in the XLink namespace. A DTD (Document Type Definition) defines the structure of an XML document with a list of legal elements. The XLink specification only gives a non-normative, general level DTD. The DTD makes invalid all XLink constructs for which the specification does not specify behavior. Only constructs that have XLink-defined meaning are allowed, and no other vocabularies are mixed in, since DTDs do not work well with namespaces. However, the XLink Version 1.1, which is the W3C Working Draft dated on the 28th of April 2005, also introduces a non-normative sample XML Schema and a sample RELAX NG Grammar for XLink [36]. These could provide new possibilities for more formal representations for XLink and related extensions such as XLinkTime, and would be the first challenging issue for further research. The general trend in developing XLink language is to explicitly reserve the XLink namespace for attributes defined in the XLink Recommendation and to prohibit developers from using new attributes in the XLink namespace [34]. Such use would create interoperability problems. New namespaces should be reserved for new attributes as we have done in the XLinkTime construction.
The second challenging issue for further research is a time ontology approach. With this approach, time ontology is an explicit artifact distinct from the project documents. Identifying ontological levels and deriving appropriate time rule sets are interesting research topics. The two existing ontologies of time will need more in-depth analysis from a distributed project management point of view. There are several essential questions. Could one or the other be selected to serve as a general time ontology, or is there a need for integration or for supplement? The mapping process from time ontology to Topic Maps and the possibilities of the XML Query as a query language are the third challenge of future work - in a practical sense.
Acknowledgements
We express our deep thanks to the National Technology Agency of Finland (Tekes) and to Kronodoc Inc. for funding our project.
A. Heimbürger et al. / Time Contexts in Document-Driven Projects on the Web 151

References
[1] Allen, J. F. 1991. Time and Time Again: The Many Ways to Represent Time. International Journal of Intelligent Systems, Vol. 6, No. 4, pp. 341 – 355.
[2] Ancona, D. G., Okhuysen, G. A. and Perlow, L. A. 2001. Taking Time to Integrate Temporal Research. Academy of Management Review, Vol. 26, No. 4, pp. 512 – 529.
[3] Berztiss, A. T. 2002. Time in Modelling. In: Kangassalo, H., Jaakkola, H., Kawaguchi, E. and Welzer, T. (Eds.). Frontiers in Artificial Intelligence and Applications, Vol 73, Information Modelling and Knowledge Bases XIII. Amsterdam: IOS Press. Pp. 184 – 200.
[4] Chen, C.-H., Ling, S. F. and Chen, W. 2003. Project Scheduling for Collaborative Product Development Using Design Structure Matrix (DSM). International Journal of Project Management, Vol. 21, No. 4, pp. 291 – 299.
[5] Desouza, K. C. and Evaristo, J. R. 2004. Managing Knowledge in Distributed Projects. Communications of the ACM, Vol. 47, No. 4, pp. 87 – 91.
[6] Evaristo, J. R. and van Fenema, P. C. 1999. A Typology of Project Management: Emergence and Evolution of New Forms. International Journal of Project Management, Vol. 17, No. 5, pp. 275 – 281.
[7] Gorlenko, L. and Merrick, R. 2003. No Wires Attached: Usability in the Connected Mobile World. IBM Systems Journal, Vol. 42, No. 4, pp. 639 – 651.
[8] Guarino, N. 1997. Semantic Matching: Formal Ontological Distinctions for Information Organization, Extraction, and Integration. In: Information Extraction (Pazienza, M. T. Ed.). A Multidisciplinary Approach to an Emerging Information Technology. Berlin: Springer-Verlag. Pp. 139 -170.
[9] Hameri, A.-P. and Heikkilä, J. 2002. Improving Efficiency: Time-critical Interfacing of Project Tasks. International Journal of Project Management, Vol. 20, No. 2, pp. 143 – 153.
[10] Hameri, A.-P. and Nihtilä, J. 1997. Distributed New Product Development Project based on Internet and World-Wide Web: A Case Study. The Journal of Product Innovation Management, Vol. 14, No. 2 pp. 77 – 87.
[11] Heimbürger, A. 2003. Modelling Time-Sensitive Linking Mechanisms. In: Jaakkola, H., Kangassalo, H, Kawaguchi, E. and Thalheim, B. (Eds.). Frontiers in Artificial Intelligence and Applications, Vol. 94, Information Modelling and Knowledge Bases XIV. Amsterdam: IOS Press. Pp. 26 - 42.
[12] Heimbürger, A. 2005. It’s time to link! Developing Time-Sensitive Linking Structures for the Web. Tampere University of Technology, Publication 547. 196 p.
[13] Heimbürger, A. 2005. Time-Sensitive Relationship Management in Technical Manuals. Case: Maintenance Schedules. In: Kangassalo, H., Wangler, B., Kiyoki, Y. and Jaakkola, H. (Eds.) Frontiers in Artificial Intelligence and Applications Vol. 121, Information Modelling and Knowledge Bases XVI. Amsterdam: IOS Press. Pp. 152 – 169.
[14] Heimbürger, A., Multisilta, J. and Ojansuu, K. 2005. Time Contexts in Distributed Projects: Towards an Interdisciplinary Temporal Framework. Fifth International and Interdisciplinary Conference on Modeling and Using Context (CONTEXT-05), Paris, France, July 5 - 8, 2005. Technical Report LIP 2005/007 of the Laboratoire d'Informatique de Paris 6. Pp. 55 – 59.
[15] Hobbs, J. R. and Pan, F. 2004. An Ontology of Time for the Semantic Web. ACM Transactions on Asian Language Processing (TALIP): Special Issue on Temporal Information Processing, Vol. 3, No. 1, pp. 66 - 85.
[16] Ikuko, N. 1999. Harmony as Efficiency. Is “Just-In-Time” a Product of Japanese Uniqueness? Time and Society, Vol. 8, No. 1, pp. 119 – 140.
[17] Jaafari, A. 2005. Project Management in 21st Century. Project Perspectives, Vol. 27, No. 1, pp. 34 – 41. [18] Jacobson, I., Booch, G. and Rumbaugh, J. 1999. The Unified Software Development Process. Boston:
Addison-Wesley. 463 p. [19] Karppinen-Shetta, M. 1996. Cultural Analysis of Working Time in Japan and Finland. Society and
Leisure, Vol. 19, No. 1, pp. 151 – 167. [20] Lippincott, K., Eco, U. and Gombrich, E. H. 1999. The Story of Time. London: Merrell Holberton
Publishers. 304 p. [21] Mäkilouko, M. 2005. Multicultural Project Leadership. Project Perspectives, Vol. 27, No. 1, pp. 16 –
19.[22] Park, J. and Hunting, S. 2003. XML Topic Maps. Creating and Using Topic Maps for the Web. Boston:
Addison-Wesley. 605 p. [23] Patanakul, P. and Milosevic, D. 2005. Multiple-Project Managers. What Competencies do You Need.
Project Perspectives, Vol. 27, No. 1, pp. 28 – 33. [24] Perry, M., O’Hara, K., Sellen, A., Brown, B. and Harper, R. 2001. Dealing with Mobility:
Understanding Access Anytime, Anywhere. ACM Transactions on Computer-Human Interaction, Vol. 8, No. 4, pp. 323 – 347.
A. Heimbürger et al. / Time Contexts in Document-Driven Projects on the Web152
[25] Pillai, A. S., Joshi, A. and Rao, K. S. 2002. Performance Measurement of R&D Projects in a Multi-project, Concurrent Engineering Environment. International Journal of Project Management, Vol. 20, No. 2, pp. 165 – 177.
[26] Ramaprasad, A. and Prakash, A. N. 2003. Emergent Project Management: How Foreign Managers can Leverage Local Knowledge. International Journal of Project Management, Vol. 21, No 3, pp. 199 – 205.
[27] Shimada, S. 1995. Social Time and Modernity in Japan: An Exploration of Concepts and Cultural Comparison. Time and Society, Vol. 4, No. 2, pp. 251 – 260.
[28] Shore, B. and Cross, B. J. 2005. Exploring the Role of National Culture in the Management of Large-Scale International Science Projects. International Journal of Project Management, Vol. 23, No. 1, pp. 55 – 64.
[29] Takeuchi, H. 2001. Towards a Universal Management Concept of Knowledge. In: Nonaka, I. and Teece, D. J. (Eds.). Managing Industrial Knowledge. Creation, Transfer and Utilization. London: SAGE Publications. Pp. 315 – 329.
[30] Turner, J. R. and Müller, R. 2003. On the Nature of the Project as a Temporary Organisation. International Journal of Project Management, Vol 21, No. 1, pp. 1 – 8.
[31] W3C 1998. The World Wide Web Consortium: Date and Time Formats (referred 1.12.2005), <URL: http://www.w3.org/TR/NOTE-datetime/>.
[32] W3C. 2001. The World Wide Web Consortium: XML Linking Language (XLink) Version 1.0 W3C Recommendation 27 June 2001 (referred 1.12.2005), <URL: http://www.w3.org/TR/xlink/>.
[33] W3C 2003. The World Wide Web Consortium XPointer Framework W3C Recommendation 25 March 2003 (referred 22.11.2005), <URI: http://www.w3.org/TR/xptr-framework/>.
[34] W3C 2005a. The World Wide Web Consortium: Extending XLink 1.0 W3C Working Group Note 27 January 2005 (referred 13.12.2005), <URL: http://www.w3.org/TR/xlink10-ext/>.
[35] W3C 2005b. The World Wide Web Consortium: Time Ontology in OWL. W3C Editor’s Draft 20 September 2005 (referred 1.12.2005), <URL: http://www.isi.edu/~pan/SWBP/time-ontology-note/time-ontology-note.html/>.
[36] W3C 2005c. The World Wide Web Consortium: XML Linking Language (XLink) Version 1.1 W3C Working Draft 28 April 2005 (referred 13.12.2005), <URI: http://www.w3.org/TR/2005/WD-xlink11-20050428>.
[37] XTM TopicMaps.Org. 2001. XML Topic Maps (XTM) 1.0. TopicMaps.Org Specification (referred 8.12.2005), <URI: http://www.topicmaps.org/xtm/1.0/>.
[38] XUL 2005. XulPlanet. XML User Interface Language (XUL) (referred 13.12.2005), <URL: http://www.xulplanet.com/>.
[39] Zhou, Q. and Fikes, R. 2002. A reusable time ontology (referred 13.12.2005), <URL: http://www. ksl.stanford.edu/KSL_Abstracts/KSL-00-01.html/>.
A. Heimbürger et al. / Time Contexts in Document-Driven Projects on the Web 153
EL description logics with aggregation of userpreference concepts
Dept. Software Eng., School Comp. Sci., Fac. Math. Phys., Charles Univ. Pragueand
Inst.Comp.Sci., Czech Acad.Sci., Prague
Abstract. We consider querying containing several vague concepts ofuser’s preferences (with preference scale T ), which is quite typical in se-mantic web. These particular preferences need to be combined to get anoverall ordering of results. We propose T − EL@ - a description logic al-lowing existential restrictions, crisp roles, T -fuzzy concepts and T -fuzzycombining functions @. We discuss problems of consistency, subsump-tion and the instance problem. We show some results on polynomialcomplexity of this problem. We conclude with a sketch of an embeddingof T − EL@ into a sort of classical EL logic with concrete domain.
Keywords: Description logic, crisp role, existential restrictions, fuzzy con-cept, fuzzy aggregation operator, user preference query, instance problem
1 Introduction and motivation
In the semantic web context, information has to be retrieved, processed, shared,reused and aligned in an automatic way by software agents. In [23] authorsdescribe experience with applications in the semantic web, which have shownthat these operations are rarely a matter of true or false, but rather proceduresthat require degree of relatedness, similarity or ranking. Similar motivation ledto development of fuzzy description logic for the semantic web in [25].
Exact constraints of a query often lead to empty or too many answers. Usingfuzzy atomic concepts, we can better express gradualism of user preferences.
Another source of fuzziness referred in the literature are uncertain, vague val-ues. Here we share our opinion with that of [10] when describing fuzzy attributetype 1 - ” these are represented as usual attributes because they do not allowfuzzy values. Nevertheless, information is stored in the fuzzy background knowl-edge base about the nature or context of them. They are classical attributesthat admit fuzzy processing.” This coincides with our viewpoint here, informa-tion on the web (though vague or imprecise) is interpreted by a user query. Aweb resource creator often cannot asign a degree of fuzziness, because this oftendepends on user preference and context.
In what follows, we use usual notation from description logic (see [2]).1 Email: [email protected], Partially supported by Czech projects MSM
0021620838, 1ET100300419 and 1ET100300517
1Peter Vojtas
M. Duží et al. (Eds.)Information Modelling and Knowledge Bases XVIII
IOS Press, 2007© 2007 The authors and IOS Press. All rights reserved.
154
1.1 Example
As a motivation example, imagine a user U looking for a hotel which is close to abeach, cheap and has a new building. Here (user dependent) fuzzy concepts canexpress users preferences cheap U, close U and new U (the syntax is not fuzzy,fuzziness comes with interpretations).
These fuzzy concepts can express particular constraints over crisp roles rep-resenting extensional data
cheap hotel U ≡ ∃hotel price.cheap U
close beach U ≡ ∃distance to beach.close U
new hotel U ≡ ∃year of construction.new U
In our approach we model preferences by linearly ordered set of preferencedegrees T extending classical truth values
0 = false = ⊥ = worst ∈ T
and1 = true = � = best ∈ T
Hence, all questions which classical (two valued) description logic answers yes/nowe expect answer from T . Typical representatives of preference (classification)degrees are school grades, stars of hotels or T = [0, 1].
In our model role instances remain yes/no
hotel price(h1, 1000)
and concepts have instances graded, e.g. our atomic concepts
cheap U(1000) = 0.75
give overall score
cheap hotel U(h1) = 0.75
i.e. the same degree as of being cheap for user U. This is the effect of usingcrisp roles - it substantially simplifies our model in comparison with full fuzzydescription logic. With similar argument and data, we can get remaining valuesof hotel, where p is a degree of a hotel price being cheap, d degree of closedistance and n is the novelty degree.
P. Vojtáš / EL Description Logics with Aggregation of User Preference Concepts 155
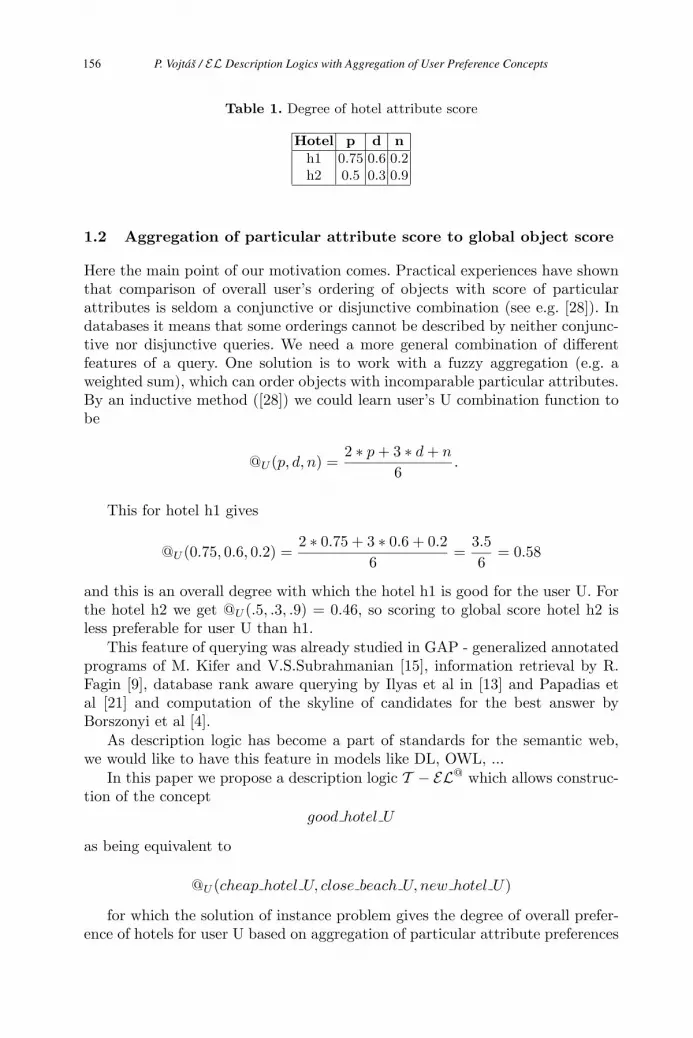
Table 1. Degree of hotel attribute score
Hotel p d n
h1 0.75 0.6 0.2h2 0.5 0.3 0.9
1.2 Aggregation of particular attribute score to global object score
Here the main point of our motivation comes. Practical experiences have shownthat comparison of overall user’s ordering of objects with score of particularattributes is seldom a conjunctive or disjunctive combination (see e.g. [28]). Indatabases it means that some orderings cannot be described by neither conjunc-tive nor disjunctive queries. We need a more general combination of differentfeatures of a query. One solution is to work with a fuzzy aggregation (e.g. aweighted sum), which can order objects with incomparable particular attributes.By an inductive method ([28]) we could learn user’s U combination function tobe
@U (p, d, n) =2 ∗ p + 3 ∗ d + n
6.
This for hotel h1 gives
@U (0.75, 0.6, 0.2) =2 ∗ 0.75 + 3 ∗ 0.6 + 0.2
6=
3.56
= 0.58
and this is an overall degree with which the hotel h1 is good for the user U. Forthe hotel h2 we get @U (.5, .3, .9) = 0.46, so scoring to global score hotel h2 isless preferable for user U than h1.
This feature of querying was already studied in GAP - generalized annotatedprograms of M. Kifer and V.S.Subrahmanian [15], information retrieval by R.Fagin [9], database rank aware querying by Ilyas et al in [13] and Papadias etal [21] and computation of the skyline of candidates for the best answer byBorszonyi et al [4].
As description logic has become a part of standards for the semantic web,we would like to have this feature in models like DL, OWL, ...
In this paper we propose a description logic T − EL@ which allows construc-tion of the concept
good hotel U
as being equivalent to
@U (cheap hotel U, close beach U, new hotel U)
for which the solution of instance problem gives the degree of overall prefer-ence of hotels for user U based on aggregation of particular attribute preferences
P. Vojtáš / EL Description Logics with Aggregation of User Preference Concepts156
good hotel U(h1) = 0.58
and
good hotel U(h2) = 0.46
The paper is organized as follows: first we describe the syntax and semanticsof description logic T − EL@. Further we discuss DL problems of satisfaction,consistency, subsumption and the instance problem. We show some results onpolynomial complexity of this problem. We continue with a sketch of an em-bedding of T − EL@ into a sort of classical EL logic with concrete domain. Weconclude with some observations, comparison and plans for future research.
2 Description logic T − EL@
In this section we introduce a description logic which in some parameters (e.g.crisp roles, without negations) is a weakening of fuzzy description logic of U.Straccia [24], [25] and in some parameters is a strengthening (aggregations).Moreover we use only existential restrictions which have surprisingly great ex-pressive power wrt. applications ([2], [17]). We loose the ability to describe fuzzi-ness in roles (e.g. uncertainty in values) but we gain combining of particular userpreferences to a global score. Intended meaning is that complex concepts describeuser query and atomic concepts play the role of selection conditions (similarlyas in WHERE expressions in an SQL query).
Note that we do not have negation in our logic because we are convincedthat negations have-to-be/can-be hidden in atomic concepts (similarly as SQLselection conditions are usually closed on negation).
2.1 Syntax of T − EL@
Our alphabet consists of (mutually disjoint) sets NC of concepts names contain-ing �, NR role names, NI instance names and constructors containing ∃ and afinite set C of combination functions with arity function ar : C −→ {n ∈ N : n ≥2}.
Concept descriptions in T − EL@ are formed according to the following syn-tax rules
C −→ �|A|@(C1, . . . , Cn)|∃r.C
2.2 Interpretations of T − EL@
Our description logic T − EL@ has interpretations parameterized by an orderedset of truth values with aggregations. Let T = {T,≤, {@•
T : @ ∈ C}}, (T ,≤,�T )is an upper complete semilattice which contains bottom element 0T for truth
P. Vojtáš / EL Description Logics with Aggregation of User Preference Concepts 157

value expressions and @•T : T ar(@) −→ T lattice totally continuous functions
(hence order preserving).A T -interpretations a pair I =
⟨ΔI , •I
⟩, with nonempty domain ΔI and
interpretation of language elementsaI ∈ ΔI , for a ∈ NI (with unique name assumption)AI : ΔI −→ T , for A ∈ NC (fuzzy concept)rI ⊆ ΔI × ΔI , for r ∈ NR (crisp role)The T -interpretation I extends to arbitrary T − EL@ concepts by(@(C1, . . . , Cn))I(x) = @•(CI
1 (x), . . . , CIn (x))
and(∃r.C)I(x) = sup{CI(y) : (x, y) ∈ rI}Note that interpretation of existential restrictions is a special case of the
fuzzy by [24], assuming his fuzzy connective is a t-norm ∗ fulfilling ∗(�T , t) = t.
2.3 TBox and Abox in T − EL@
All problems and questions of classical description logic which end with yes-noanswer are in fuzzy logic subject to answers with a certain degree - in our casefrom T . We can formulate a yes-no problem with a threshold (e.g. true withdegree 1 or degree at least 0.5) or as a v-problem (variable-problem) to find bestdegree true in all models (see e.g. [24], [25] or analogy in fuzzy logic programming[29]).
An equivalence problem C ≡ D asks whether in all interpretations I isCI = DI similarly a subsumption problem C � D questions CI(x) ≤ DI(x)for all x ∈ ΔI . Here in the ≤ is hidden the question whether the truth value ofa many valued implication CI(x) −→ DI(x) equals �I for all x ∈ ΔI . For theformulation of v-equivalence and v-subsumption we have to specify which manyvalued implication we mean (this is out of the scope of our paper).
Similarly the (v-)satisfiability of a concept has several variants of formulation.Following U. Straccia [24] we have to define ABox expressions using thresh-
olds. For an t ∈ T , a ∈ NI and C an T − EL@ concept 〈a : C ≥ t〉 is a T -ABoxexpression. As far as we have only crisp roles, role assertions are as in any DL,see [2].
An T -ABox is a finite set A of T -ABox expressions. A fuzzy interpretationI is a model of A if it satisfies all assertions, especially if CI(aI) ≥ t.
2.4 Formulation of the instance problem of T − EL@
An individual a is an instance (for t ∈ T a t-instance) of C with respect to a T -ABox A if for all interpretations I which are model of A we have CI(aI) = �I ,or ≥ t. A t ∈ T is a correct answer to a v-instance problem ? − a : C wrt Aif CI(aI) ≥ t in all models of A and t is the greatest such element of T (if alloperations involved are left continuous, such an element always exists, see [29]).
P. Vojtáš / EL Description Logics with Aggregation of User Preference Concepts158
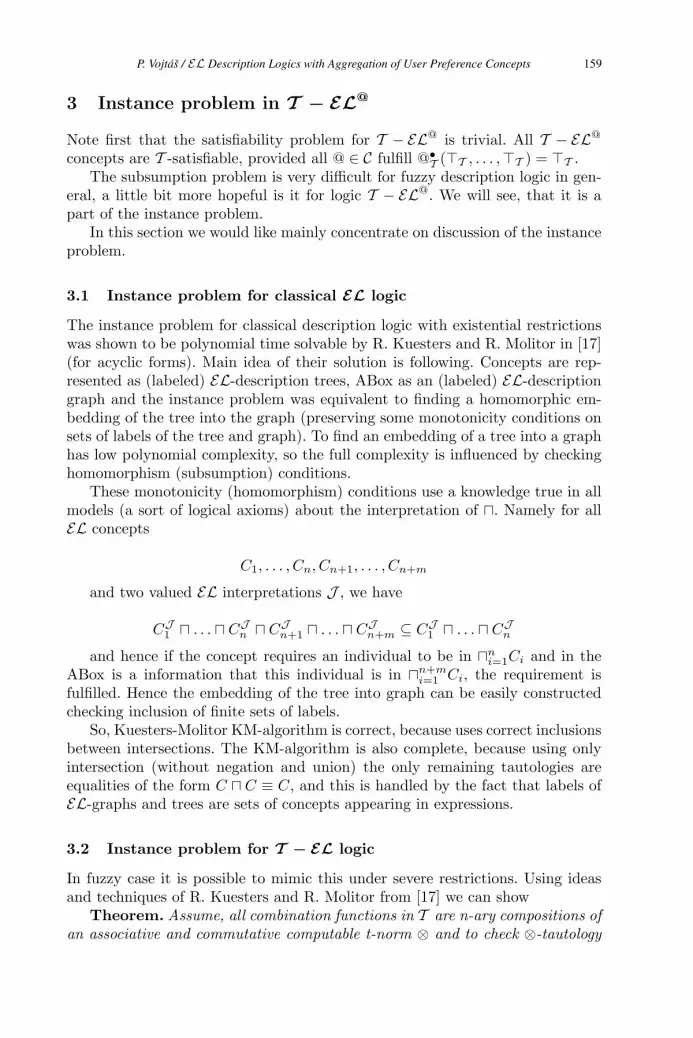
3 Instance problem in T − EL@
Note first that the satisfiability problem for T − EL@ is trivial. All T − EL@
concepts are T -satisfiable, provided all @ ∈ C fulfill @•T (�T , . . . ,�T ) = �T .
The subsumption problem is very difficult for fuzzy description logic in gen-eral, a little bit more hopeful is it for logic T − EL@. We will see, that it is apart of the instance problem.
In this section we would like mainly concentrate on discussion of the instanceproblem.
3.1 Instance problem for classical EL logic
The instance problem for classical description logic with existential restrictionswas shown to be polynomial time solvable by R. Kuesters and R. Molitor in [17](for acyclic forms). Main idea of their solution is following. Concepts are rep-resented as (labeled) EL-description trees, ABox as an (labeled) EL-descriptiongraph and the instance problem was equivalent to finding a homomorphic em-bedding of the tree into the graph (preserving some monotonicity conditions onsets of labels of the tree and graph). To find an embedding of a tree into a graphhas low polynomial complexity, so the full complexity is influenced by checkinghomomorphism (subsumption) conditions.
These monotonicity (homomorphism) conditions use a knowledge true in allmodels (a sort of logical axioms) about the interpretation of �. Namely for allEL concepts
C1, . . . , Cn, Cn+1, . . . , Cn+m
and two valued EL interpretations J , we have
CJ1 � . . . � CJ
n � CJn+1 � . . . � CJ
n+m ⊆ CJ1 � . . . � CJ
n
and hence if the concept requires an individual to be in �ni=1Ci and in the
ABox is a information that this individual is in �n+mi=1 Ci, the requirement is
fulfilled. Hence the embedding of the tree into graph can be easily constructedchecking inclusion of finite sets of labels.
So, Kuesters-Molitor KM-algorithm is correct, because uses correct inclusionsbetween intersections. The KM-algorithm is also complete, because using onlyintersection (without negation and union) the only remaining tautologies areequalities of the form C � C ≡ C, and this is handled by the fact that labels ofEL-graphs and trees are sets of concepts appearing in expressions.
3.2 Instance problem for T − EL logic
In fuzzy case it is possible to mimic this under severe restrictions. Using ideasand techniques of R. Kuesters and R. Molitor from [17] we can show
Theorem. Assume, all combination functions in T are n-ary compositions ofan associative and commutative computable t-norm ⊗ and to check ⊗-tautology
P. Vojtáš / EL Description Logics with Aggregation of User Preference Concepts 159
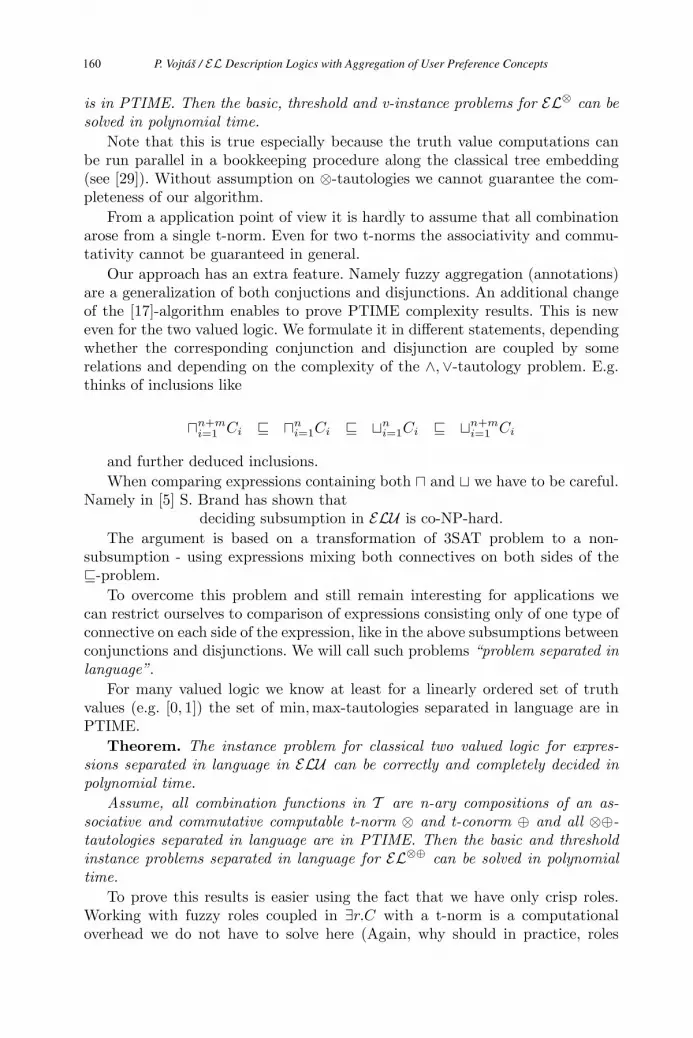
is in PTIME. Then the basic, threshold and v-instance problems for EL⊗ can besolved in polynomial time.
Note that this is true especially because the truth value computations canbe run parallel in a bookkeeping procedure along the classical tree embedding(see [29]). Without assumption on ⊗-tautologies we cannot guarantee the com-pleteness of our algorithm.
From a application point of view it is hardly to assume that all combinationarose from a single t-norm. Even for two t-norms the associativity and commu-tativity cannot be guaranteed in general.
Our approach has an extra feature. Namely fuzzy aggregation (annotations)are a generalization of both conjuctions and disjunctions. An additional changeof the [17]-algorithm enables to prove PTIME complexity results. This is neweven for the two valued logic. We formulate it in different statements, dependingwhether the corresponding conjunction and disjunction are coupled by somerelations and depending on the complexity of the ∧,∨-tautology problem. E.g.thinks of inclusions like
�n+mi=1 Ci � �n
i=1Ci � �ni=1Ci � �n+m
i=1 Ci
and further deduced inclusions.When comparing expressions containing both � and � we have to be careful.
Namely in [5] S. Brand has shown thatdeciding subsumption in ELU is co-NP-hard.
The argument is based on a transformation of 3SAT problem to a non-subsumption - using expressions mixing both connectives on both sides of the�-problem.
To overcome this problem and still remain interesting for applications wecan restrict ourselves to comparison of expressions consisting only of one type ofconnective on each side of the expression, like in the above subsumptions betweenconjunctions and disjunctions. We will call such problems “problem separated inlanguage”.
For many valued logic we know at least for a linearly ordered set of truthvalues (e.g. [0, 1]) the set of min,max-tautologies separated in language are inPTIME.
Theorem. The instance problem for classical two valued logic for expres-sions separated in language in ELU can be correctly and completely decided inpolynomial time.
Assume, all combination functions in T are n-ary compositions of an as-sociative and commutative computable t-norm ⊗ and t-conorm ⊕ and all ⊗⊕-tautologies separated in language are in PTIME. Then the basic and thresholdinstance problems separated in language for EL⊗⊕ can be solved in polynomialtime.
To prove this results is easier using the fact that we have only crisp roles.Working with fuzzy roles coupled in ∃r.C with a t-norm is a computationaloverhead we do not have to solve here (Again, why should in practice, roles
P. Vojtáš / EL Description Logics with Aggregation of User Preference Concepts160
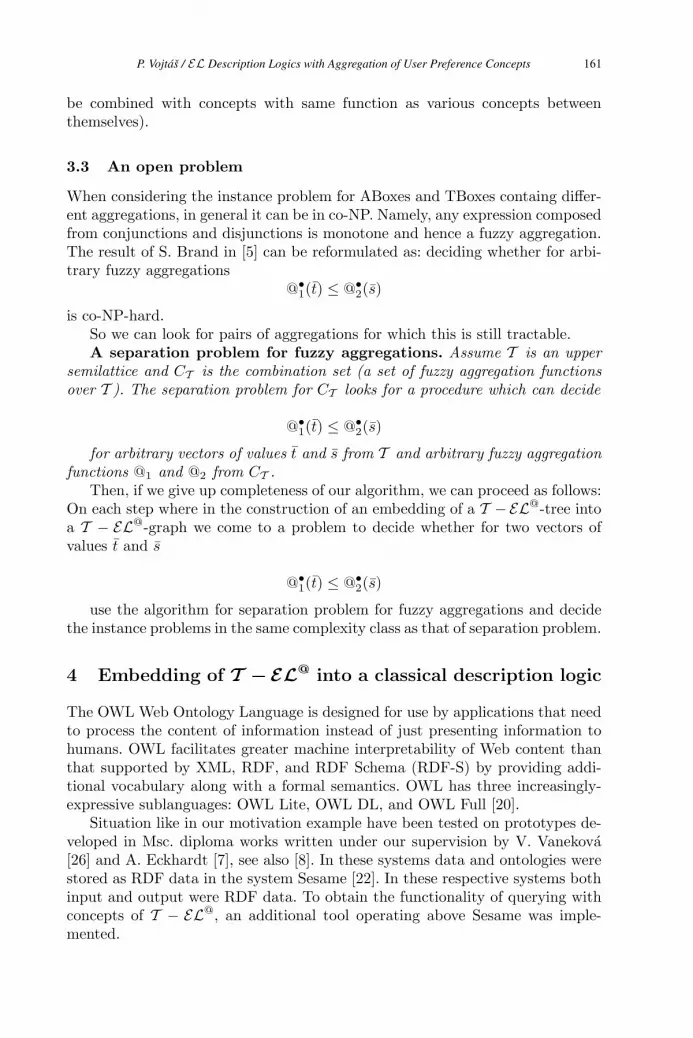
be combined with concepts with same function as various concepts betweenthemselves).
3.3 An open problem
When considering the instance problem for ABoxes and TBoxes containg differ-ent aggregations, in general it can be in co-NP. Namely, any expression composedfrom conjunctions and disjunctions is monotone and hence a fuzzy aggregation.The result of S. Brand in [5] can be reformulated as: deciding whether for arbi-trary fuzzy aggregations
@•1(t) ≤ @•
2(s)
is co-NP-hard.So we can look for pairs of aggregations for which this is still tractable.A separation problem for fuzzy aggregations. Assume T is an upper
semilattice and CT is the combination set (a set of fuzzy aggregation functionsover T ). The separation problem for CT looks for a procedure which can decide
@•1(t) ≤ @•
2(s)
for arbitrary vectors of values t and s from T and arbitrary fuzzy aggregationfunctions @1 and @2 from CT .
Then, if we give up completeness of our algorithm, we can proceed as follows:On each step where in the construction of an embedding of a T −EL@-tree intoa T − EL@-graph we come to a problem to decide whether for two vectors ofvalues t and s
@•1(t) ≤ @•
2(s)
use the algorithm for separation problem for fuzzy aggregations and decidethe instance problems in the same complexity class as that of separation problem.
4 Embedding of T − EL@ into a classical description logic
The OWL Web Ontology Language is designed for use by applications that needto process the content of information instead of just presenting information tohumans. OWL facilitates greater machine interpretability of Web content thanthat supported by XML, RDF, and RDF Schema (RDF-S) by providing addi-tional vocabulary along with a formal semantics. OWL has three increasingly-expressive sublanguages: OWL Lite, OWL DL, and OWL Full [20].
Situation like in our motivation example have been tested on prototypes de-veloped in Msc. diploma works written under our supervision by V. Vanekova[26] and A. Eckhardt [7], see also [8]. In these systems data and ontologies werestored as RDF data in the system Sesame [22]. In these respective systems bothinput and output were RDF data. To obtain the functionality of querying withconcepts of T − EL@, an additional tool operating above Sesame was imple-mented.
P. Vojtáš / EL Description Logics with Aggregation of User Preference Concepts 161
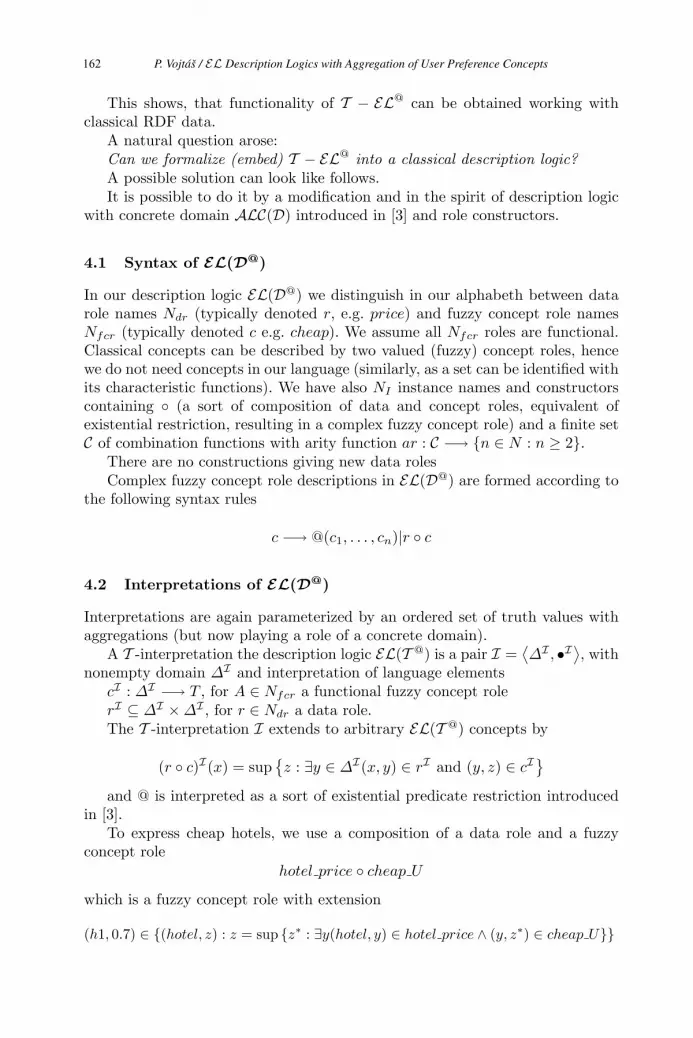
This shows, that functionality of T − EL@ can be obtained working withclassical RDF data.
A natural question arose:Can we formalize (embed) T − EL@ into a classical description logic?A possible solution can look like follows.It is possible to do it by a modification and in the spirit of description logic
with concrete domain ALC(D) introduced in [3] and role constructors.
4.1 Syntax of EL(D@)
In our description logic EL(D@) we distinguish in our alphabeth between datarole names Ndr (typically denoted r, e.g. price) and fuzzy concept role namesNfcr (typically denoted c e.g. cheap). We assume all Nfcr roles are functional.Classical concepts can be described by two valued (fuzzy) concept roles, hencewe do not need concepts in our language (similarly, as a set can be identified withits characteristic functions). We have also NI instance names and constructorscontaining ◦ (a sort of composition of data and concept roles, equivalent ofexistential restriction, resulting in a complex fuzzy concept role) and a finite setC of combination functions with arity function ar : C −→ {n ∈ N : n ≥ 2}.
There are no constructions giving new data rolesComplex fuzzy concept role descriptions in EL(D@) are formed according to
the following syntax rules
c −→ @(c1, . . . , cn)|r ◦ c
4.2 Interpretations of EL(D@)
Interpretations are again parameterized by an ordered set of truth values withaggregations (but now playing a role of a concrete domain).
A T -interpretation the description logic EL(T @) is a pair I =⟨ΔI , •I
⟩, with
nonempty domain ΔI and interpretation of language elementscI : ΔI −→ T , for A ∈ Nfcr a functional fuzzy concept rolerI ⊆ ΔI × ΔI , for r ∈ Ndr a data role.The T -interpretation I extends to arbitrary EL(T @) concepts by
(r ◦ c)I(x) = sup{z : ∃y ∈ ΔI(x, y) ∈ rI and (y, z) ∈ cI
}and @ is interpreted as a sort of existential predicate restriction introduced
in [3].To express cheap hotels, we use a composition of a data role and a fuzzy
concept rolehotel price ◦ cheap U
which is a fuzzy concept role with extension
(h1, 0.7) ∈ {(hotel, z) : z = sup {z∗ : ∃y(hotel, y) ∈ hotel price ∧ (y, z∗) ∈ cheap U}}
P. Vojtáš / EL Description Logics with Aggregation of User Preference Concepts162
so, similarly as above
cheap hotel U ≡ hotel price ◦ cheap U
and further with close beach U and new hotel U .A TBox axiom in EL(T @) can look like
good hotel U ≡ @U (cheap hotel U, close beach U, new hotel U)hence same as in the fuzzy case, just the semantics is different and the fuzzi-
ness is hidden in the concrete domain (similarly as fuzzy databases can be em-bedded in classical just adding one additional attribute and some conditions).
It is not a goal of this paper to develop EL(D@)further. These considerationsshow that both description logics mentioned in this paper have impact on webmodeling language and could be embedded into (some extension) of OWL (forsome other see [6]).
5 Conclusions
Despite successful standardization efforts by the W3C, there are still numerousdifferent ontology representation languages being used and for practical appli-cations we even need these. P. Hitzler, R. Studer and Y. Sure in [12] argue foran OWL subset known as DLP-Description logic programs to be used in ap-plications. Let us we mention that our description logic T − EL@ has the DLPpart of semantics equivalent to a DLP part of a variant of generalized annotatedprograms of [15], for details see [16].
The realm of instance problem with aggregations changes dramatically if weallow noncyclic constructions. In this case we can even get undecidable problem(using the [15] result on non-continuity of the production operator for restrictedsemantics of GAP programs).
In future we would like to apply these results on projects from network se-curity (see [14]) and job market system (see [19] and [18]).
Of course, we can shift discussed problem to the rule based system above ourknowledge base ([27], [11]). It is a question of decision, which task can/should bedone in a preprocessing stage in a DL and which in the time of a query. Furtherresults indicate that it suffices to work with a universal set of fuzzy conceptsand aggregation (fixed for a set of users with similar profile), check consistencyand satisfaction degree and then the query answering (in a rule based systemor query engine) can concentrate on finding the best answer - a resource withhighest degree of user preferences, which is the ultimate goal of the semanticweb.
It is a future work to study EL(D@) in the realm of classical description logicwith concrete domains.
References
1. DLPs Description Logic Programs http://km.aifb.uni-karlsruhe.de/projects/logic/
P. Vojtáš / EL Description Logics with Aggregation of User Preference Concepts 163

2. F. Baader, D. Calvanese, D.L. McGuinness, D. Nardi, P.F. Patel-Schneider, eds.Description Logic Handbook, Cambridge University Press, 2002
3. F. Baader, R. Kuesters, F. Wolter. Extensions to Description Logic. In [2], 219-2614. S. Borzsonyi, D. Kossmann, and K. Stocker. The Skyline Operator. In Proc. ICDE,
Heidelberg, Germany, Apr. 2001, pages 421-4305. S. Brandt. Polynomial Time Reasoning in a Description Logic with Existential
Restrictions, GCI Axioms, and What Else? In R. Lopez de Mantaras et al. eds. InProc. ECAI-2004, pp. 298-302. IOS Press, 2004
6. Paulo C. G. Costa, Kathryn B. Laskey, Kenneth J. Laskey, Michael Pool eds.URSW - Uncertainty Reasoning for the Semantic Web, an ISWC 2005 workshop,http://ite.gmu.edu/ klaskey/URSW Proceedings.pdf
7. A. Eckhardt. Metody pro nalezenı nejlepsı odpovedi s r˚uznymi uzivatelskymipreferencemi (Methods for finding best answers with various user preferences),MSc. diploma work Charles University Prague (in Czech), 2006
8. A. Eckhardt, P. Vojas. User and group preference for search of top-k web resources.Technical report KSI MFF UK Praha, 2006, 10 pages
9. R. Fagin, Combining fuzzy information from multiple systems, J. Comput. SystemSci. 58, 1999, 83-99
10. J. Galindo, A. Urrutia, M. Piatini. Fuzzy Databases. Idea GP, Hershey 200611. E. Sanchez ed. FUZZY LOGIC AND THE SEMANTIC WEB, Capturing Intelli-
gence Series, 1, Elsevier 200612. Pascal Hitzler, Rudi Studer, and York Sure, Description Logic Programs: A Prac-
tical Choice For the Modeling of Ontologies. In FOMI’05, see [1]13. I. F. Ilyas, R. Shah, W. G. Aref, J. S. Vitter, A. K. Elmagarmid. Rank-aware query
optimization. In SIGMOD 2004, ACM 2004, 203 - 21414. E. Jencusova, J. Jirasek: Formal Methods of Analysis of Security Protocols, Tatra
Mt. Math. Publ. 25 (2002), p. 1-1015. M. Kifer, V. S. Subrahmanian, ”Theory of generalized annotated logic program-
ming and its applications”, J. Logic Programming, 12 (1992) pp 335–36716. S. Krajci, R. Lencses, P. Vojtas, A comparison of fuzzy and annotated logic pro-
gramming, Fuzzy Sets and Systems, 144, 173-192 (2004)17. R. Kuesters, R. Molitor. Approximating most specific concepts in description logic
with existential restrictions. In KI 2001, F. Baader, G. Brewka, T. Eiter eds. LNAI2174, 33-47
18. Laclavik M., Gatial E., Balogh Z., Habala O., Nguyen G., Hluchy L.: ExperienceManagement Based on Text Notes (EMBET) In: Proc. of eChallenges 2005 Con-ference, Edited by Paul Cunnigham and Miriam Cunnigham; IOS Press, pp.261-268
19. P. Navrat, M. Bielikova, V. Rozinajova. Methods and Tools for Acquiring andPresenting Information and Knowledge in the Web. In CompSysTech 2005, Varna2005
20. OWL Web Ontology Language http://www.w3.org/TR/owl-features/21. D. Papadias, Y. Tao, G. Fu, B. Seeger. Progressive skyline computation in database
systems. ACM Transactions on Database Systems, 30(2005) 41 - 8222. Sesame http://www.openrdf.com23. G. Stoilos, G. Stamou, V. Tzouvaras, J. Pan, I. Horrocks. The Fuzzy Description
Logic f-SHIN. In [6], 67–7624. Straccia, U.: Reasoning within fuzzy description logics. Journal of Artificial Intel-
ligence and Research 14 (2001) 137-16625. Straccia, U.: Towards a Fuzzy Description Logic for the Semantic Web (Preliminary
Report) - 2nd European Semantic Web Conference (ESWC-05)
P. Vojtáš / EL Description Logics with Aggregation of User Preference Concepts164

26. V. Vanekova. Dopytovanie nad RDF datami s uzıvatelskou preferenciou (Queryingover RDF data with user preference), MSc. diploma work University of P. J. SafarikKosice (in Slovak), 2006
27. P. Vojtas . Fuzzy Logic Aggregation for Semantic Web Search for the Best Answer,in [11], 341-159
28. P. Vojtas, T. Horvath, S. Krajci, R. Lencses, An ILP model for a monotone gradedclassification problem, Kybernetika 40(3), 317-332 (2004).
29. P. Vojtas, Fuzzy logic programming, Fuzzy Sets and Systems, 124(3), 361-370(2001)
P. Vojtáš / EL Description Logics with Aggregation of User Preference Concepts 165

Towards an Abstraction Ontology
Mauri LEPPÄNEN Department of Computer Science and Information Systems
P.O. Box 35 (Agora), FI-40014 University of Jyväskylä, Finland [email protected]
Abstract Abstraction is commonly recognized as ubiquitous mechanism in human action. Conceptions about principles, concepts and constructs of abstraction are, however, quite vague and divergent in the literature. This paper proposes an ontology for abstraction, composed of two inter-related parts. The first-order abstraction defines concept things, called primary things, and their abstraction-based relationships. The second-order abstraction, also known as predicate abstraction, involves predicates that characterize primary things. The ontology covers four basic abstraction principles: classification, generalization, composition, and grouping. For each of them, key concepts and structural rules are defined and predicate derivation is discussed. The ontology is also described in meta models in a UML-based ontology representation language. We believe that the abstraction ontology can promote the achievement of a shared understanding of abstraction principles and constructs. Predicate abstraction can also be used as a foundation on which more sound systems of perspectives and viewpoints for database design and information systems development can be built.
Introduction
Conceiving is a complex process that human beings carry out by epistemological methods to organize their knowledge. Doing this, some abstraction is unconsciously applied to suppress details of particular things and to emphasize those features that are pertinent to the problem at hand. Besides to organize knowledge, abstraction is a fundamental means to produce new knowledge as well. To take a full advantage of abstraction requires that concepts and principles underlying it are made explicit and deployed consciously. Abstraction is widely discussed in the PL, SE, DB, AI and IS literature (e.g. [54, 55, 37, 8, 31, 67, 36, 53, 28, 32, 68, 40, 41, 39, 18, 65]). Unfortunately, the discussion has brought out insights that are, to a considerable extent, vague and confusing. First, different terms are used to refer to abstraction principles and constructs. For instance, the terms ‘aggregation’ (e.g. [54, 55, 18]), ‘whole-part relation’ (e.g. [3]), and ‘meronumic relation’ (e.g. [46]) are often used interchangeably. Likewise, ‘set membership’ (e.g. [15]), ‘association’ (e.g. [10, 48, 18]), ‘partitioning’, and ‘cover aggregation’ [52] are used to refer to a kind of relationship between an element and a group/set. Second, different ways to categorize and define abstraction principles are presented. Goldstein et al. [18] combine classification and generalization through the term ‘inclusion abstraction’. Third, there are divergent views on what conceptual mechanisms are included in abstraction. Mylopoulos [41], for instance, considers contextualization, materialization, parameterization, and normalization to be instances of abstraction mechanisms. Ralyté et al. [49] regard abstraction as the reverse principle to instantiation and consider specialization/generalization and aggregation/ decomposition to be separate from abstraction. What have been said above are only a few examples from that large variety of conceptions that are prevailing in these fields. What is
M. Duží et al. (Eds.)Information Modelling and Knowledge Bases XVIII
IOS Press, 2007© 2007 The authors and IOS Press. All rights reserved.
166
clearly needed is to have a general framework which could facilitate the specification and sharing of a common understanding of abstraction in all its varieties. Ontologies are commonly used to present consensual knowledge in a generic way to be reused and shared across fields and by groups of people (cf. [14]). An ontology is a kind of framework unifying different viewpoints, thus functioning in a way like a lingua-franga [13]. We define an ontology to mean an explicit specification of a conceptualization of some part of reality that is of interest [20, 21]. A specification can be presented in the form of a vocabulary, a taxonomy, a thesaurus, a conceptual framework, or a theory. A conceptual framework is composed of concepts, relationships, and rules for combining concepts (cf. [59]). The purpose of our study is to present consensual knowledge about abstraction as an ontology in the form of a conceptual framework, combining philosophical and semiotic standpoints. We argue that an ontologial framework can help establish a holistic view of the broad range of abstraction and enables the formulation and elaboration of a consistent and coherent set of essential concepts and constructs of abstraction. The ontology provides a vocabulary with explicit definitions. In addition, to enhance the clarity and preciseness of the ontology, we deploy a UML-based [4] ontology representation language to describe our ontology in meta models. The meta models specify the concepts, relationships, and rules for combining concepts. We have preferred the UML language [4], rather than some special ontology representation language (e.g. CLEO, LINGO, DAML+OIL), because it has a very large and rapidly expanding user community, it has an intrinsic mechanism for defining extensions for specific domains, and it is supported by widely adopted CASE tools which are more accessible than current ontology engineering tools (e.g. Ontolingua, Protégé). Our UML-based language for ontology representation is a slight variant of a sub-set of features of the UML class diagram. Our suggestion for an abstract ontology is not intended to be a complete ontology, but to be later enhanced and formalized. To our knowledge, there is no explicitly defined ontology concerning abstraction so far. Most of the presentations in the literature provide conceptual and formal specifications of some specific abstraction principle(s), such as generalization, aggregation or grouping. There are also some studies that apply an ontological approach to specify and classify relationships, but they do not conceptualize abstraction. An instance of these is the ontology of Ullrich et al. [61] for classifying verb phrases to capture their semantics. There are also a number of top-level ontologies, or foundational ontologies (e.g. Cyc, SUO, GUM, SENSUS, BFO, etc.), which conceptualize reality by elementary abstraction constructs. These ontologies are quite large including many other issues, not only abstraction, and they are presented in a way which makes it difficult to recognize and utilize abstraction constructs in them. We have made an extensive analysis of the literature on abstraction. Due to the scarcity of space, we are not able to present results from the analysis but to give only some examples of different conceptions found in the analysis. The study is organized as follows. First, we define basic concepts that are needed to establish the abstraction ontology. Second, we define two main categories of abstraction: first-order abstraction and second-order abstraction. Third, we specify four basic principles of the first-order abstraction. Fourth, we derive the principles and constructs of the second-order abstraction from those presented above. The study ends with a summary and discussions.
1. Basic Concepts
Reality is anything that exists, has existed or will (possible) exist. A thing means any phenomenon in the physical or subjective reality. In the subjective reality things are
M. Leppänen / Towards an Abstraction Ontology 167
characterized with one or more properties. A property also is a thing. A characterized thingis a thing that is characterized by at least one property. Things may be related to other things through relationships. A relationship is a thing that relates two or more characterized things together, each one associated with one property characterizing the role of that thing within that relationship (cf. [15]). A role is a property that reflects a position the thing holds, or a function the thing conducts, in the relationship. Because a relationship is a thing, relationships between relationships can also be recognized. The human mind produces a variety of subjective conceptions from the same thing in the physical reality, depending on the point of view adopted. To put it more precisely, we say that every thing has many properties, and to adopt a point of view is to consider some of these properties relevant. Using a point of view, some things and some properties of the thing(s) are selected because they are more relevant than the others. When a statement is made from that point of view, then the reasons for the statement are just selected properties (cf. [25]). Applying a point of view leads to a more or less limited or "predefined" conception of certain things and their properties in reality. To derive and relate the views, a framework is commonly deployed. A framework is a thing that guides a human being to select the points of view that are the most appropriate for the case or the problem at hand. A framework can be intuitive or formally established, vague or rigid. An example of the rigid
According to the semiotic framework [44], there are three kinds of things: concept things, sign things, and referent things. Concepts are mental things, words of mind [25]. They are basic epistemological components of human knowledge. A referent is a thing in reality to which a concept refers. It can be a physical thing, a process, an event, Wonderland that Alice visited, or the like. A sign or a symbol is any thing, which can stand for something else. It is a representation of a concept expressed in a symbolic or iconic language. Our world is full of things that are used as signs: words, pictures, facial expressions, body postures, films, traffic lights, etc. Here, we mainly consider verbal representations. A sign signifies or designates a concept. A concept refers to a referent. A sign stands for a referent, but it is not directly associated with a referent because a sign may have several meanings leading to different referents. The intension or comprehension of a concept consists of all its concept predicates, shortly predicates. Predicates are concepts, which are used to characterize the (original) concept (cf. [25]). They are properties of things referred by the concept. The predicates determine the applicability of the concept. For instance, the concept Animal is a predicate of the concept Cat. An intension makes up an idea, and none of its constituent parts can be removed without destroying the idea (cf. [2]). The extension of a concept is the set of all (referent) things to which the intension of the concept applies. Those things exist, have existed in the past, or will possibly exist in the future. The population of a concept is the set of the existing (referent) things to which the intension of the concept applies. For some concept, one corner of the meaning triangle [44] may be absent. The concepts with no referent things are called abstract concepts. The other concepts are called concreteconcepts. The concepts, which can only refer to one thing, are called individual concepts, or particulars. The concepts referring to many things are generic concepts, or universals. In the fields of conceptual modelling, information systems, and knowledge engineering, a generic concept is called a type concept, or shortly a type. Elements in the extension of a type are instances.
frameworks is the semiotic framework.
M. Leppänen / Towards an Abstraction Ontology168
2. Abstraction Categories
Abstraction is not an easy concept to pin down. It means different things to different people and tends to be used in an incantatory rather than a scientific manner. The term comes from Latin and means a withdrawal, or a removal. It is used to mean abstraction from unnecessary details, abstraction from the “how” to the “what”, abstraction from instance-level to type-level, and so on. On the other hand, abstraction is deployed to refer to a mental process, or to a principle for, or to a result from, that process. In this study, abstraction is defined to be the principle by which irrelevant things are ignored and the things relevant to understanding some problem of interest are uncovered. Abstraction is used to manage the complexity, thus implying that some information is always lost. If this is not the case, then there is no abstraction, just a transformation. The principle inverse to abstraction is called concretizing. Abstraction can be performed in many ways, as the following examples show. Instead of looking at individual persons (John, Mary, and Paul), the attention can be focussed on persons in general, or more specifically, on systems analysts and system designers in which roles John, Mary and Paul are acting. Likewise, a machine with its functionalities may be of interest, and not its components. For a discussion a labor union with its properties can be more relevant than persons as its members. These cases exemplify abstraction, which concerns things in different meanings: e.g. as types, subtypes, wholes, and groups. This kind of abstraction that concerns concept things and their abstraction-based relationships is called the first-order abstraction. On the other hand, there are cases in which only some properties of the things are of interest. For instance, what a customer wants to know about a machine may be related to its functional properties only. Characteristics related to its electrical wiring and other physical features are irrelevant. Likewise, one may be concerned with the financial status of a person. For someone else, physical skills a person possesses are more relevant. Mental health is an example about still another aspect abstracted from a large variety of properties related to a person. Essential to all these cases is that abstraction here concerns predicates of a given thing (a machine or a person). The process of abstraction is guided by a specific criterion. In the case of a machine, the criterion is related to independence from the physical structure. The cases of a person illustrate specific criteria related to finance, physics or healthy. The abstraction, which mainly concerns predicates of the concept things, is called the predicate abstraction, or the second-order abstraction. Predicate abstraction is important in database design and information systems development where complexity is reduced by the use of perspectives or viewpoints (e.g. [27, 60, 16, 29, 33]). These are rooted on abstraction levels that are related to one another by relationships of predicate abstraction. The main abstraction categories, the first-order abstraction and the predicate abstraction, are closely intertwined. As will be shown later, the predicate abstraction mostly behaves like the first-order abstraction, except that it operates with the predicates, or the so-called secondary things. Furthermore, these main categories of abstraction will be shown to be un-orthogonal. In the following we define four main principles of the first-order abstraction. They are: classification, composition, generalization and grouping. All these principles are semantically irreducible modeling primitives helping us conceive reality more clearly. To provide a proper understanding of the abstraction principles, it is necessary to specify their structural properties in an explicit way. To meet this requirement, our specifications cover basic concepts and constructs, structural rules and derivation of predicates for each kind of principle. Defining the semantics of the abstraction principles completely would require the
M. Leppänen / Towards an Abstraction Ontology 169
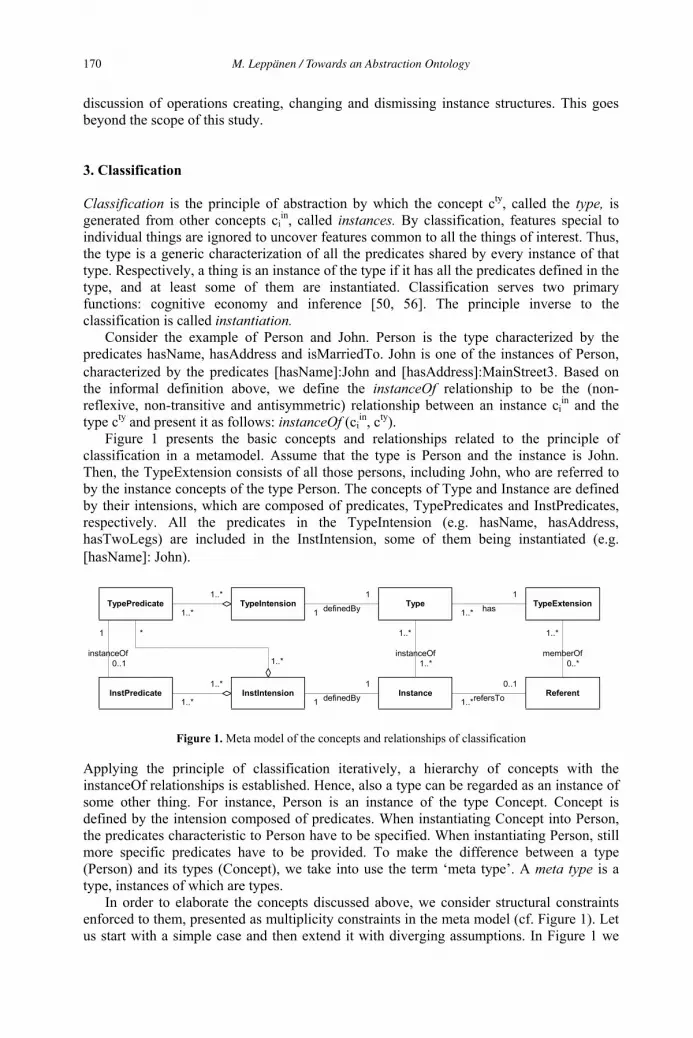
discussion of operations creating, changing and dismissing instance structures. This goes beyond the scope of this study.
3. Classification
Classification is the principle of abstraction by which the concept cty, called the type, is generated from other concepts ci
in, called instances. By classification, features special to individual things are ignored to uncover features common to all the things of interest. Thus, the type is a generic characterization of all the predicates shared by every instance of that type. Respectively, a thing is an instance of the type if it has all the predicates defined in the type, and at least some of them are instantiated. Classification serves two primary functions: cognitive economy and inference [50, 56]. The principle inverse to the classification is called instantiation. Consider the example of Person and John. Person is the type characterized by the predicates hasName, hasAddress and isMarriedTo. John is one of the instances of Person, characterized by the predicates hasName :John and hasAddress :MainStreet3. Based on the informal definition above, we define the instanceOf relationship to be the (non-reflexive, non-transitive and antisymmetric) relationship between an instance ci
in and the type cty and present it as follows: instanceOf (ci
in, cty). Figure 1 presents the basic concepts and relationships related to the principle of classification in a metamodel. Assume that the type is Person and the instance is John. Then, the TypeExtension consists of all those persons, including John, who are referred to by the instance concepts of the type Person. The concepts of Type and Instance are defined by their intensions, which are composed of predicates, TypePredicates and InstPredicates, respectively. All the predicates in the TypeIntension (e.g. hasName, hasAddress, hasTwoLegs) are included in the InstIntension, some of them being instantiated (e.g. hasName : John).
TypePredicate
ReferentInstanceInstIntensionInstPredicate
TypeExtensionTypeTypeIntension
1
0..1instanceOf
1..*
1..*instanceOf
1..*
1
has
1..*
0..1
refersTo
1..*
1..*
1..*
*
1
1
definedBy
1..*
0..*memberOf
1
1
definedBy1..*
1..*
Figure 1. Meta model of the concepts and relationships of classification
Applying the principle of classification iteratively, a hierarchy of concepts with the instanceOf relationships is established. Hence, also a type can be regarded as an instance of some other thing. For instance, Person is an instance of the type Concept. Concept is defined by the intension composed of predicates. When instantiating Concept into Person, the predicates characteristic to Person have to be specified. When instantiating Person, still more specific predicates have to be provided. To make the difference between a type (Person) and its types (Concept), we take into use the term ‘meta type’. A meta type is a type, instances of which are types. In order to elaborate the concepts discussed above, we consider structural constraints enforced to them, presented as multiplicity constraints in the meta model (cf. Figure 1). Let us start with a simple case and then extend it with diverging assumptions. In Figure 1 we
M. Leppänen / Towards an Abstraction Ontology170
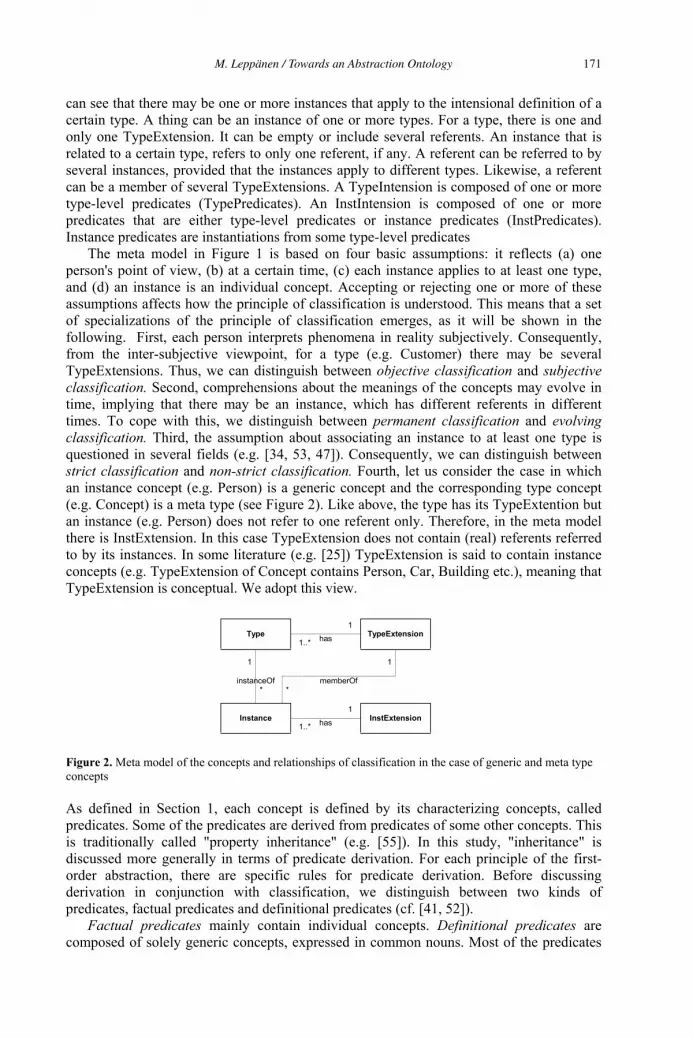
can see that there may be one or more instances that apply to the intensional definition of a certain type. A thing can be an instance of one or more types. For a type, there is one and only one TypeExtension. It can be empty or include several referents. An instance that is related to a certain type, refers to only one referent, if any. A referent can be referred to by several instances, provided that the instances apply to different types. Likewise, a referent can be a member of several TypeExtensions. A TypeIntension is composed of one or more type-level predicates (TypePredicates). An InstIntension is composed of one or more predicates that are either type-level predicates or instance predicates (InstPredicates). Instance predicates are instantiations from some type-level predicates The meta model in Figure 1 is based on four basic assumptions: it reflects (a) one person's point of view, (b) at a certain time, (c) each instance applies to at least one type, and (d) an instance is an individual concept. Accepting or rejecting one or more of these assumptions affects how the principle of classification is understood. This means that a set of specializations of the principle of classification emerges, as it will be shown in the following. First, each person interprets phenomena in reality subjectively. Consequently, from the inter-subjective viewpoint, for a type (e.g. Customer) there may be several TypeExtensions. Thus, we can distinguish between objective classification and subjectiveclassification. Second, comprehensions about the meanings of the concepts may evolve in time, implying that there may be an instance, which has different referents in different times. To cope with this, we distinguish between permanent classification and evolvingclassification. Third, the assumption about associating an instance to at least one type is questioned in several fields (e.g. [34, 53, 47]). Consequently, we can distinguish between strict classification and non-strict classification. Fourth, let us consider the case in which an instance concept (e.g. Person) is a generic concept and the corresponding type concept (e.g. Concept) is a meta type (see Figure 2). Like above, the type has its TypeExtention but an instance (e.g. Person) does not refer to one referent only. Therefore, in the meta model there is InstExtension. In this case TypeExtension does not contain (real) referents referred to by its instances. In some literature (e.g. [25]) TypeExtension is said to contain instance concepts (e.g. TypeExtension of Concept contains Person, Car, Building etc.), meaning that TypeExtension is conceptual. We adopt this view.
Type
InstExtensionInstance
TypeExtension1..*
1
has
1
*instanceOf
*
1
memberOf
1..*
1
has
Figure 2. Meta model of the concepts and relationships of classification in the case of generic and meta type concepts
As defined in Section 1, each concept is defined by its characterizing concepts, called predicates. Some of the predicates are derived from predicates of some other concepts. This is traditionally called "property inheritance" (e.g. [55]). In this study, "inheritance" is discussed more generally in terms of predicate derivation. For each principle of the first-order abstraction, there are specific rules for predicate derivation. Before discussing derivation in conjunction with classification, we distinguish between two kinds of predicates, factual predicates and definitional predicates (cf. [41, 52]). Factual predicates mainly contain individual concepts. Definitional predicates are composed of solely generic concepts, expressed in common nouns. Most of the predicates
M. Leppänen / Towards an Abstraction Ontology 171
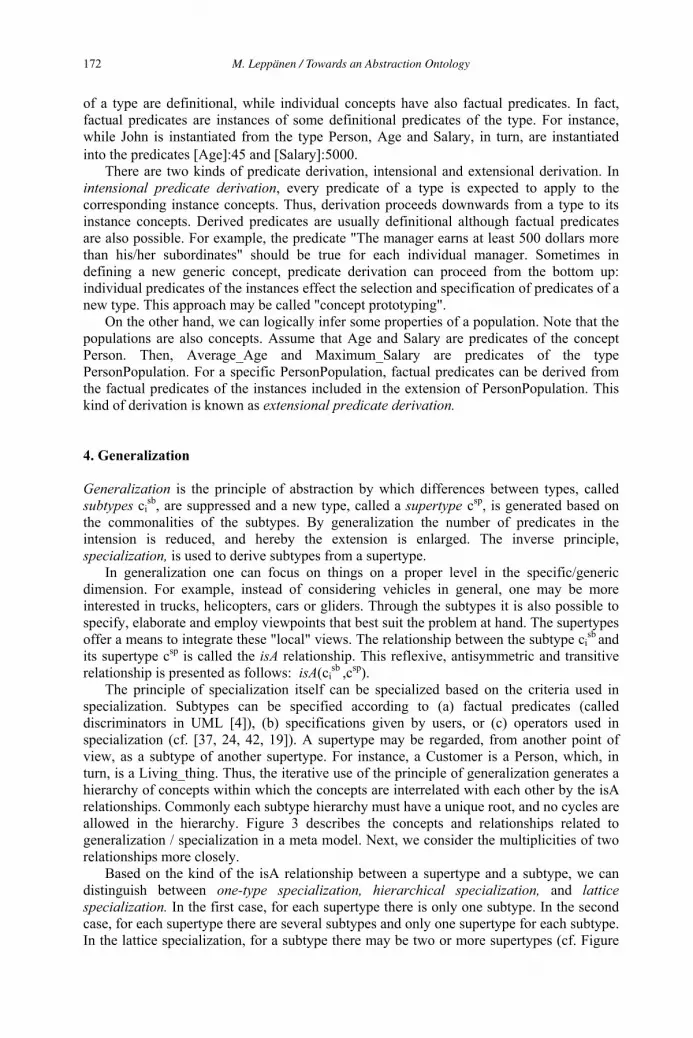
of a type are definitional, while individual concepts have also factual predicates. In fact, factual predicates are instances of some definitional predicates of the type. For instance, while John is instantiated from the type Person, Age and Salary, in turn, are instantiated into the predicates Age :45 and Salary :5000. There are two kinds of predicate derivation, intensional and extensional derivation. In intensional predicate derivation, every predicate of a type is expected to apply to the corresponding instance concepts. Thus, derivation proceeds downwards from a type to its instance concepts. Derived predicates are usually definitional although factual predicates are also possible. For example, the predicate "The manager earns at least 500 dollars more than his/her subordinates" should be true for each individual manager. Sometimes in defining a new generic concept, predicate derivation can proceed from the bottom up: individual predicates of the instances effect the selection and specification of predicates of a new type. This approach may be called "concept prototyping". On the other hand, we can logically infer some properties of a population. Note that the populations are also concepts. Assume that Age and Salary are predicates of the concept Person. Then, Average_Age and Maximum_Salary are predicates of the type PersonPopulation. For a specific PersonPopulation, factual predicates can be derived from the factual predicates of the instances included in the extension of PersonPopulation. This kind of derivation is known as extensional predicate derivation.
4. Generalization
Generalization is the principle of abstraction by which differences between types, called subtypes ci
sb, are suppressed and a new type, called a supertype csp, is generated based on the commonalities of the subtypes. By generalization the number of predicates in the intension is reduced, and hereby the extension is enlarged. The inverse principle, specialization, is used to derive subtypes from a supertype. In generalization one can focus on things on a proper level in the specific/generic dimension. For example, instead of considering vehicles in general, one may be more interested in trucks, helicopters, cars or gliders. Through the subtypes it is also possible to specify, elaborate and employ viewpoints that best suit the problem at hand. The supertypes offer a means to integrate these "local" views. The relationship between the subtype ci
sb andits supertype csp is called the isA relationship. This reflexive, antisymmetric and transitive relationship is presented as follows: isA(ci
sb ,csp). The principle of specialization itself can be specialized based on the criteria used in specialization. Subtypes can be specified according to (a) factual predicates (called discriminators in UML [4]), (b) specifications given by users, or (c) operators used in specialization (cf. [37, 24, 42, 19]). A supertype may be regarded, from another point of view, as a subtype of another supertype. For instance, a Customer is a Person, which, in turn, is a Living_thing. Thus, the iterative use of the principle of generalization generates a hierarchy of concepts within which the concepts are interrelated with each other by the isA relationships. Commonly each subtype hierarchy must have a unique root, and no cycles are allowed in the hierarchy. Figure 3 describes the concepts and relationships related to generalization / specialization in a meta model. Next, we consider the multiplicities of two relationships more closely. Based on the kind of the isA relationship between a supertype and a subtype, we can distinguish between one-type specialization, hierarchical specialization, and latticespecialization. In the first case, for each supertype there is only one subtype. In the second case, for each supertype there are several subtypes and only one supertype for each subtype. In the lattice specialization, for a subtype there may be two or more supertypes (cf. Figure
M. Leppänen / Towards an Abstraction Ontology172
3). Based on the multiplicity of the equalsTo relationship between a SPReferent and a SBReferent, we can distinguish between total specialization and partial specialization. In total specialization, for each SPReferent there is always one SBReferent (e.g. Hourly_Employee or Salaried_Employee). In partial specialization, there may be SPReferents for which there exist no SBReferents (e.g. a Person can be a Secretary, a Technician, an Engineer, or some non-specified professional). Based on whether the extensions of the subtypes overlap or not, we can distinguish between overlappingspecialization and disjoint specialization.
SPPredicate
SBExtensionSubtypeSBIntensionSBPredicate
SPExtensionSupertypeSPIntension
1..*
1..*isA
1..*
1
has
1..*
1
refersTo
1..*
1..*
1
1
definedBy
*
1..*
memberOf1
1
definedBy1..*
1..*
SPReferent
SBReferent
*
1..*
memberOf
1
0..*equalsTo
Figure 3. Meta model of the concepts and relationships of generalization
The way the predicates are derived in conjunction with generalization depends on the form of the generalization structure. Here, we first discuss predicate derivation in the hierarchical specialization and then describe it in conjunction with the lattice specialization. The predicate derivation, originally introduced as property inheritance in the artificial intelligence [8], refers to the principle by which all the predicates of a supertype are passed on to all of its subtypes. Thus, since Name is a predicate of Person, it also applies to Engineer, Secretary and Trucker. Likewise, the definitional predicate "a person can be married to one person only at a time" implicitly obliges the instances of every subtype of Person. The intensional definitions of subtypes can be further particularized by the predicates that are specific for the subtypes. So, the intensional predicate derivation proceeds from the top to the bottom. Extensional predicate derivation in conjunction with generalization occurs such as in classification. There are three basic forms of predicate derivation, known as strict derivation, default derivation, and exceptional derivation. In strict derivation, the isA relationship implies that a subtype necessarily inherits all the predicates of the supertype, without any exception. In reality exceptions do always appear. A way to manage them is to take derivation as a default, and allow some of the predicates of the supertype to be overridden. This is called default derivation (cf. [7, 41]). A special case of this is the way in which a predicate is refined during derivation. For example, a predicate of Person is "age is between 0 and 120". A student is a person but its predicate is "age is between 18 and 60". Another way to prepare for exceptions is to explicitly specify the exception types as the special kinds of types ([42, 6]). This is called exceptional derivation. For the lattice specialization, the derivation principles presented above are refined by special rules. The most common form of predicate derivation here is multiple derivation (cf. [64]), which provides a mechanism to derive predicates from multiple higher-level supertypes (cf. [48]) applying special derivation strategies. By the AND-strategy, a subtype inherits all the predicates of each supertype (e.g. Amphibious_Vehicle vs. Land_Vehicle and Sea_Vehicle). In the OR-strategy the predicates of only one supertype are inherited by a subtype (e.g. Owner vs. Person and Company).
M. Leppänen / Towards an Abstraction Ontology 173
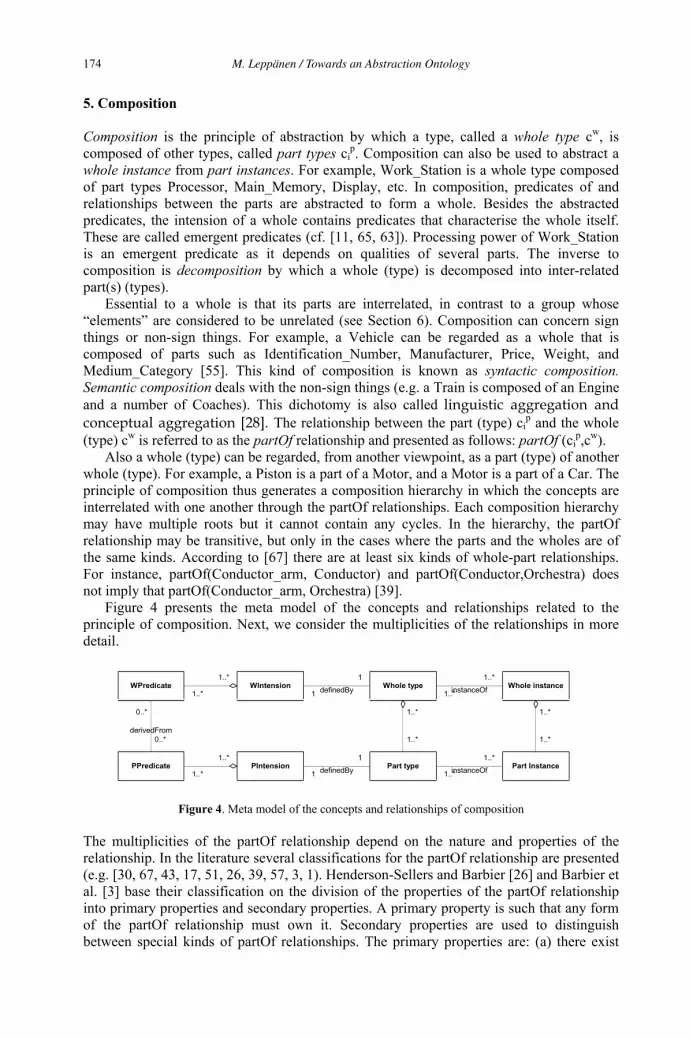
5. Composition
Composition is the principle of abstraction by which a type, called a whole type cw, is composed of other types, called part types ci
p. Composition can also be used to abstract a whole instance from part instances. For example, Work_Station is a whole type composed of part types Processor, Main_Memory, Display, etc. In composition, predicates of and relationships between the parts are abstracted to form a whole. Besides the abstracted predicates, the intension of a whole contains predicates that characterise the whole itself. These are called emergent predicates (cf. [11, 65, 63]). Processing power of Work_Station is an emergent predicate as it depends on qualities of several parts. The inverse to composition is decomposition by which a whole (type) is decomposed into inter-related part(s) (types). Essential to a whole is that its parts are interrelated, in contrast to a group whose “elements” are considered to be unrelated (see Section 6). Composition can concern sign things or non-sign things. For example, a Vehicle can be regarded as a whole that is composed of parts such as Identification_Number, Manufacturer, Price, Weight, and Medium_Category [55]. This kind of composition is known as syntactic composition.Semantic composition deals with the non-sign things (e.g. a Train is composed of an Engine and a number of Coaches). This dichotomy is also called linguistic aggregation and conceptual aggregation [28]. The relationship between the part (type) ci
p and the whole (type) cw is referred to as the partOf relationship and presented as follows: partOf (ci
p,cw). Also a whole (type) can be regarded, from another viewpoint, as a part (type) of another whole (type). For example, a Piston is a part of a Motor, and a Motor is a part of a Car. The principle of composition thus generates a composition hierarchy in which the concepts are interrelated with one another through the partOf relationships. Each composition hierarchy may have multiple roots but it cannot contain any cycles. In the hierarchy, the partOf relationship may be transitive, but only in the cases where the parts and the wholes are of the same kinds. According to [67] there are at least six kinds of whole-part relationships. For instance, partOf(Conductor_arm, Conductor) and partOf(Conductor,Orchestra) does not imply that partOf(Conductor_arm, Orchestra) [39]. Figure 4 presents the meta model of the concepts and relationships related to the principle of composition. Next, we consider the multiplicities of the relationships in more detail.
WPredicate
Part InstancePart typePIntensionPPredicate
Whole instanceWhole typeWIntension
0..*
0..*derivedFrom
1..*
1..*
instanceOf
1..*
1..*
instanceOf
1..*
1..*
1
1
definedBy
1
1
definedBy1..*
1..*
1..*
1..*
1..*
1..*
Figure 4. Meta model of the concepts and relationships of composition
The multiplicities of the partOf relationship depend on the nature and properties of the relationship. In the literature several classifications for the partOf relationship are presented (e.g. [30, 67, 43, 17, 51, 26, 39, 57, 3, 1). Henderson-Sellers and Barbier [26] and Barbier et al. [3] base their classification on the division of the properties of the partOf relationship into primary properties and secondary properties. A primary property is such that any form of the partOf relationship must own it. Secondary properties are used to distinguish between special kinds of partOf relationships. The primary properties are: (a) there exist
M. Leppänen / Towards an Abstraction Ontology174
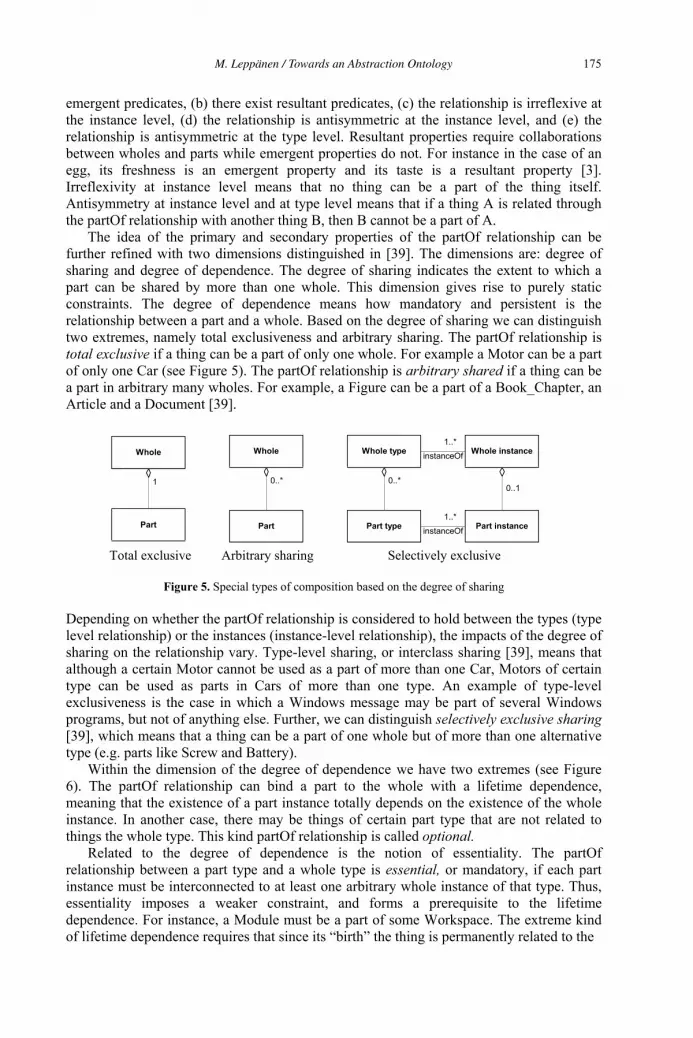
emergent predicates, (b) there exist resultant predicates, (c) the relationship is irreflexive at the instance level, (d) the relationship is antisymmetric at the instance level, and (e) the relationship is antisymmetric at the type level. Resultant properties require collaborations between wholes and parts while emergent properties do not. For instance in the case of an egg, its freshness is an emergent property and its taste is a resultant property [3]. Irreflexivity at instance level means that no thing can be a part of the thing itself. Antisymmetry at instance level and at type level means that if a thing A is related through the partOf relationship with another thing B, then B cannot be a part of A. The idea of the primary and secondary properties of the partOf relationship can be further refined with two dimensions distinguished in [39]. The dimensions are: degree of sharing and degree of dependence. The degree of sharing indicates the extent to which a part can be shared by more than one whole. This dimension gives rise to purely static constraints. The degree of dependence means how mandatory and persistent is the relationship between a part and a whole. Based on the degree of sharing we can distinguish two extremes, namely total exclusiveness and arbitrary sharing. The partOf relationship is total exclusive if a thing can be a part of only one whole. For example a Motor can be a part of only one Car (see Figure 5). The partOf relationship is arbitrary shared if a thing can be a part in arbitrary many wholes. For example, a Figure can be a part of a Book_Chapter, an Article and a Document [39].
Whole
Part Part
Whole Whole type Whole instance
Part type Part instance1..*
instanceOf
1 0..* 0..*0..1
1..*
instanceOf
Total exclusive Arbitrary sharing Selectively exclusive
Figure 5. Special types of composition based on the degree of sharing
Depending on whether the partOf relationship is considered to hold between the types (type level relationship) or the instances (instance-level relationship), the impacts of the degree of sharing on the relationship vary. Type-level sharing, or interclass sharing [39], means that although a certain Motor cannot be used as a part of more than one Car, Motors of certain type can be used as parts in Cars of more than one type. An example of type-level exclusiveness is the case in which a Windows message may be part of several Windows programs, but not of anything else. Further, we can distinguish selectively exclusive sharing[39], which means that a thing can be a part of one whole but of more than one alternative type (e.g. parts like Screw and Battery). Within the dimension of the degree of dependence we have two extremes (see Figure 6). The partOf relationship can bind a part to the whole with a lifetime dependence, meaning that the existence of a part instance totally depends on the existence of the whole instance. In another case, there may be things of certain part type that are not related to things the whole type. This kind partOf relationship is called optional. Related to the degree of dependence is the notion of essentiality. The partOf relationship between a part type and a whole type is essential, or mandatory, if each part instance must be interconnected to at least one arbitrary whole instance of that type. Thus, essentiality imposes a weaker constraint, and forms a prerequisite to the lifetime dependence. For instance, a Module must be a part of some Workspace. The extreme kind of lifetime dependence requires that since its “birth” the thing is permanently related to the
M. Leppänen / Towards an Abstraction Ontology 175

Part instance
Whole instance
1..1
Part type
Whole type
1..1
Whole instance
Part instance
1..*
Whole type
Part type
1..*
Whole instance
Part instance
0..1
Optional Essential Immutable Homogeneous Heterogeneous
Figure 6. Special types of composition based on the degree of dependence, or alternatively on the variety of parts
whole (cf.the composition relationship in UML [4]). This kind of relationship is called immutable [39]. Until now, we have considered the kinds of partOf relationships from the viewpoint of a part. Similar treatment can be made from the viewpoint of a whole. Hence, we can recognize the following kinds of wholes. A homogeneous whole is a thing that is composed of things of one part type (e.g. a Puzzle). A heterogeneous whole is a thing that is composed of things of several part types (e.g. a Train). A single-part whole is a thing that contains only one thing of a certain part type (e.g. a Train with one Engine). A multi-partwhole is a thing that contains several things of a certain part type. A flexible-structure whole is a thing in which parts of some part type may be missing (e.g. a Room without Windows). A fixed-structure whole is a thing, which must be composed of one or more parts of all the defined part types (e.g. a Train with an Engine and at least one Coach). Predicate derivation within the composition hierarchy is not as common as in conjunction with generalization. Values of quantitative predicates of non-sign things can increase or decrease when going upwards in the hierarchy (e.g. the weight of a whole is the sum of the weights of the parts). This kind of predicate is monotonically increasing (cf. [36]). An example of semantic derivation rules is the one declaring that the Name of a Family is determined according to the Name of the Mother or Father (cf. [58]). Also intensional predicate derivation is suggested in the literature (e.g. [9]), especially in conjunction with sign things. But in the most cases the real essence of predicate derivation is here misunderstood. For instance, Brodie [9] argues that "each property of a constituent (i.e. a part) becomes a constituent property of the aggregate”. If this would be the case, there would be no abstraction. Unfortunately, it is not possible here to discuss these issues further.
6. Grouping
Grouping is the principle of abstraction by which a concept, called a group type cg, isgenerated from other concepts, called member types ci
m. Grouping, also referred to as set membership (e.g. [15]), association (e.g. [18]) and cover aggregation (e.g. [52]), can also be used to abstract a group instance from member instances. By grouping, a group (type) as a unity is examined rather than its members (member types) and the features of members (member types) are abstracted away to obtain the essentials of the group (type). The principle inverse to grouping is called individualization by which a member (type) is distinguished from a group (type) for a more detailed consideration. Examples of groups are a Labor_Union whose members are Employees, and a School containing Departments. Essential to grouping is that the members of a group are of one type (in the most cases), and members are not inter-related within a group. The relationship between the member (type)
M. Leppänen / Towards an Abstraction Ontology176
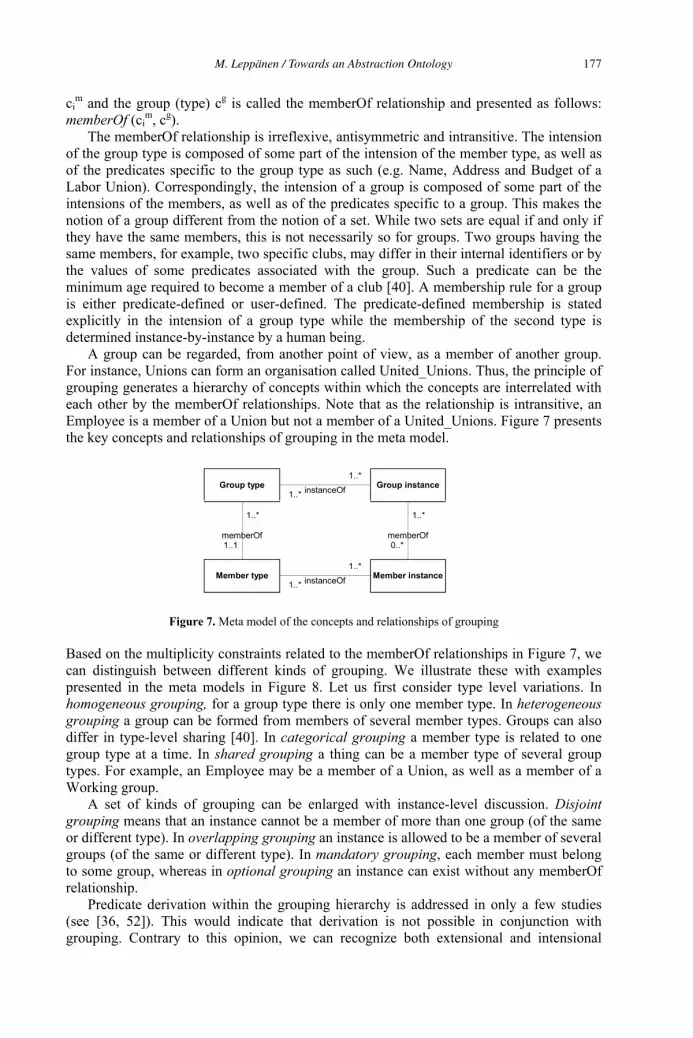
cim and the group (type) cg is called the memberOf relationship and presented as follows:
memberOf (cim g
The memberOf relationship is irreflexive, antisymmetric and intransitive. The intension of the group type is composed of some part of the intension of the member type, as well as of the predicates specific to the group type as such (e.g. Name, Address and Budget of a Labor Union). Correspondingly, the intension of a group is composed of some part of the intensions of the members, as well as of the predicates specific to a group. This makes the notion of a group different from the notion of a set. While two sets are equal if and only if they have the same members, this is not necessarily so for groups. Two groups having the same members, for example, two specific clubs, may differ in their internal identifiers or by the values of some predicates associated with the group. Such a predicate can be the minimum age required to become a member of a club [40]. A membership rule for a group is either predicate-defined or user-defined. The predicate-defined membership is stated explicitly in the intension of a group type while the membership of the second type is determined instance-by-instance by a human being. A group can be regarded, from another point of view, as a member of another group. For instance, Unions can form an organisation called United_Unions. Thus, the principle of grouping generates a hierarchy of concepts within which the concepts are interrelated with each other by the memberOf relationships. Note that as the relationship is intransitive, an Employee is a member of a Union but not a member of a United_Unions. Figure 7 presents the key concepts and relationships of grouping in the meta model.
Group type Group instance
Member type Member instance
1..*
1..*
instanceOf
0..*
1..*
memberOf
1..*
1..*
instanceOf
1..1
1..*
memberOf
Figure 7. Meta model of the concepts and relationships of grouping
Based on the multiplicity constraints related to the memberOf relationships in Figure 7, we can distinguish between different kinds of grouping. We illustrate these with examples presented in the meta models in Figure 8. Let us first consider type level variations. In homogeneous grouping, for a group type there is only one member type. In heterogeneousgrouping a group can be formed from members of several member types. Groups can also differ in type-level sharing [40]. In categorical grouping a member type is related to one group type at a time. In shared grouping a thing can be a member type of several group types. For example, an Employee may be a member of a Union, as well as a member of a Working group. A set of kinds of grouping can be enlarged with instance-level discussion. Disjointgrouping means that an instance cannot be a member of more than one group (of the same or different type). In overlapping grouping an instance is allowed to be a member of several groups (of the same or different type). In mandatory grouping, each member must belong to some group, whereas in optional grouping an instance can exist without any memberOf relationship. Predicate derivation within the grouping hierarchy is addressed in only a few studies (see [36, 52]). This would indicate that derivation is not possible in conjunction with grouping. Contrary to this opinion, we can recognize both extensional and intensional
, c ).
M. Leppänen / Towards an Abstraction Ontology 177
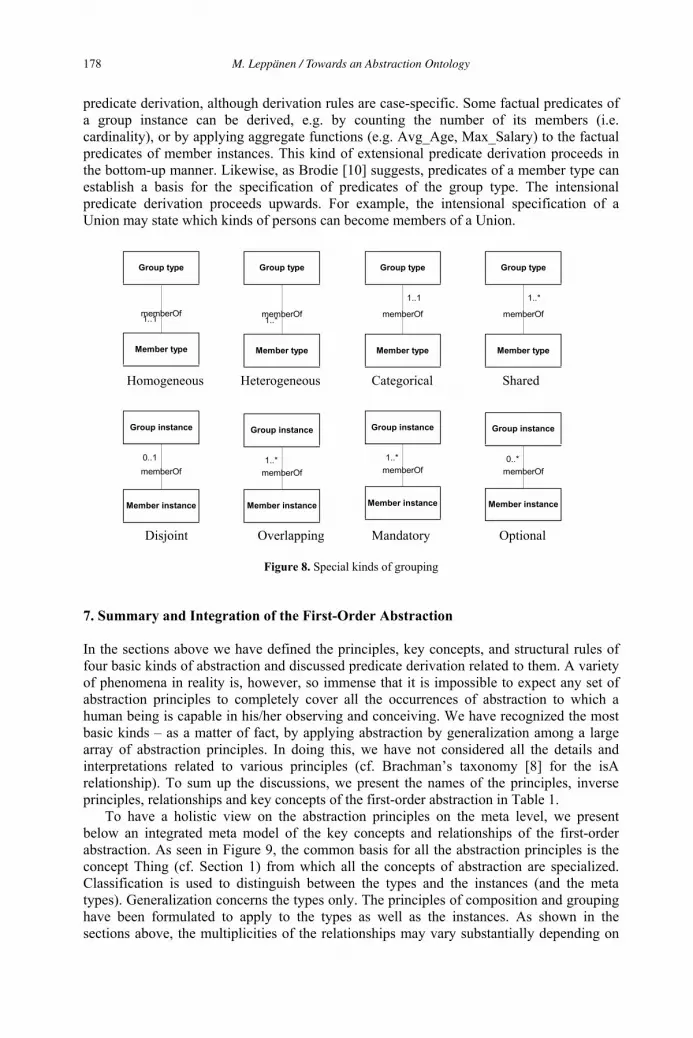
predicate derivation, although derivation rules are case-specific. Some factual predicates of a group instance can be derived, e.g. by counting the number of its members (i.e. cardinality), or by applying aggregate functions (e.g. Avg_Age, Max_Salary) to the factual predicates of member instances. This kind of extensional predicate derivation proceeds in the bottom-up manner. Likewise, as Brodie [10] suggests, predicates of a member type can establish a basis for the specification of predicates of the group type. The intensional predicate derivation proceeds upwards. For example, the intensional specification of a Union may state which kinds of persons can become members of a Union.
1..1memberOf
Group type
Member type Member type
Group type
1..*memberOf
Group type Group type
Member type Member type
1..1
memberOf
1..*
memberOf
Homogeneous Heterogeneous Categorical Shared
Member instance
Group instance
Member instance
Group instance
0..*memberOf
Group instance
Member instance
Group instance
Member instance
1..*memberOf
0..1memberOf
1..*memberOf
Disjoint Overlapping Mandatory Optional
Figure 8. Special kinds of grouping
7. Summary and Integration of the First-Order Abstraction
In the sections above we have defined the principles, key concepts, and structural rules of four basic kinds of abstraction and discussed predicate derivation related to them. A variety of phenomena in reality is, however, so immense that it is impossible to expect any set of abstraction principles to completely cover all the occurrences of abstraction to which a human being is capable in his/her observing and conceiving. We have recognized the most basic kinds – as a matter of fact, by applying abstraction by generalization among a large array of abstraction principles. In doing this, we have not considered all the details and interpretations related to various principles (cf. Brachman’s taxonomy [8] for the isA relationship). To sum up the discussions, we present the names of the principles, inverse principles, relationships and key concepts of the first-order abstraction in Table 1. To have a holistic view on the abstraction principles on the meta level, we present below an integrated meta model of the key concepts and relationships of the first-order abstraction. As seen in Figure 9, the common basis for all the abstraction principles is the concept Thing (cf. Section 1) from which all the concepts of abstraction are specialized. Classification is used to distinguish between the types and the instances (and the meta types). Generalization concerns the types only. The principles of composition and grouping have been formulated to apply to the types as well as the instances. As shown in the sections above, the multiplicities of the relationships may vary substantially depending on
M. Leppänen / Towards an Abstraction Ontology178
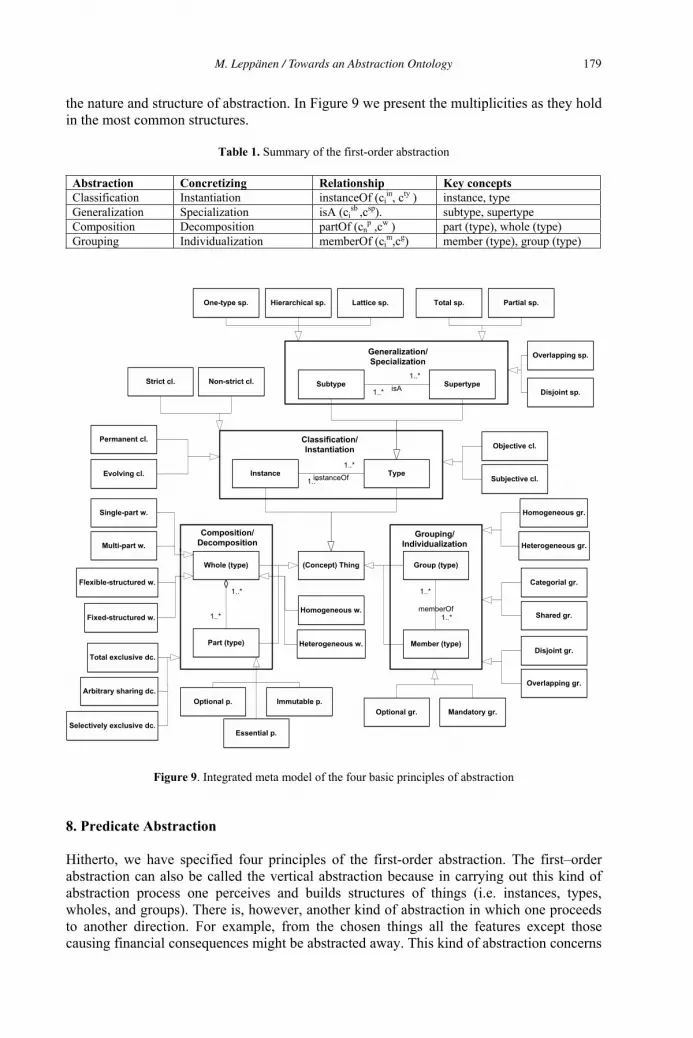
the nature and structure of abstraction. In Figure 9 we present the multiplicities as they hold in the most common structures.
Table 1. Summary of the first-order abstraction
Abstraction Concretizing Relationship Key concepts Classification Instantiation instanceOf (ci
in, cty ) instance, type Generalization Specialization isA (ci
sb ,csp). subtype, supertype Composition Decomposition partOf (cn
p ,cw ) part (type), whole (type) Grouping Individualization memberOf (ci
m,cg) member (type), group (type)
TypeInstance
SupertypeSubtype
Whole (type)
1..*
1..*
instanceOf
1..*
1..*memberOf
Part (type)
Group (type)
Member (type)
(Concept) Thing
1..*
1..*
isA
1..*
1..*Categorial gr.
Disjoint gr.
Overlapping gr.
Mandatory gr.Optional gr.
Heterogeneous w.
Homogeneous w.
Multi-part w.
Total exclusive dc.
Arbitrary sharing dc.
Selectively exclusive dc.
Non-strict cl.Strict cl.
Permanent cl.
Evolving cl.
Homogeneous gr.
Heterogeneous gr.
One-type sp. Hierarchical sp. Lattice sp. Total sp. Partial sp.
Overlapping sp.
Disjoint sp.
Optional p.
Essential p.
Single-part w.
Immutable p.
Flexible-structured w.
Fixed-structured w.
Grouping/Individualization
Composition/Decomposition
Generalization/Specialization
Classification/Instantiation
Shared gr.
Objective cl.
Subjective cl.
Figure 9. Integrated meta model of the four basic principles of abstraction
8. Predicate Abstraction
Hitherto, we have specified four principles of the first-order abstraction. The first–order abstraction can also be called the vertical abstraction because in carrying out this kind of abstraction process one perceives and builds structures of things (i.e. instances, types, wholes, and groups). There is, however, another kind of abstraction in which one proceeds to another direction. For example, from the chosen things all the features except those causing financial consequences might be abstracted away. This kind of abstraction concerns
M. Leppänen / Towards an Abstraction Ontology 179
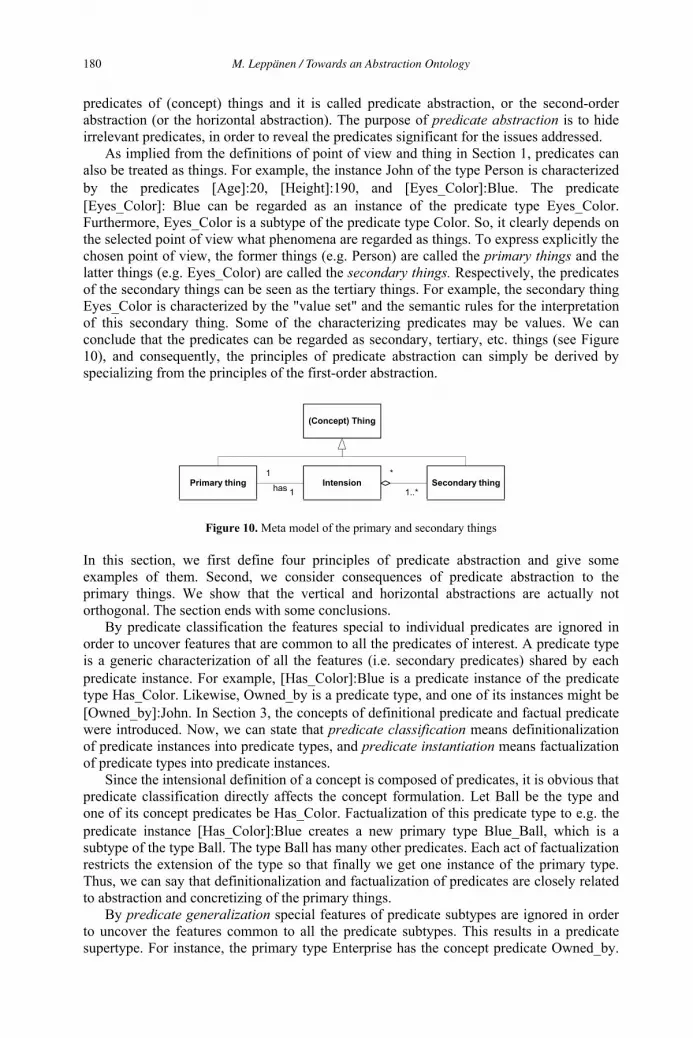
predicates of (concept) things and it is called predicate abstraction, or the second-order abstraction (or the horizontal abstraction). The purpose of predicate abstraction is to hide irrelevant predicates, in order to reveal the predicates significant for the issues addressed. As implied from the definitions of point of view and thing in Section 1, predicates can also be treated as things. For example, the instance John of the type Person is characterized by the predicates Age :20, Height :190, and Eyes_Color :Blue. The predicate Eyes_Color : Blue can be regarded as an instance of the predicate type Eyes_Color.
Furthermore, Eyes_Color is a subtype of the predicate type Color. So, it clearly depends on the selected point of view what phenomena are regarded as things. To express explicitly the chosen point of view, the former things (e.g. Person) are called the primary things and the latter things (e.g. Eyes_Color) are called the secondary things. Respectively, the predicates of the secondary things can be seen as the tertiary things. For example, the secondary thing Eyes_Color is characterized by the "value set" and the semantic rules for the interpretation of this secondary thing. Some of the characterizing predicates may be values. We can conclude that the predicates can be regarded as secondary, tertiary, etc. things (see Figure 10), and consequently, the principles of predicate abstraction can simply be derived by specializing from the principles of the first-order abstraction.
Primary thing Secondary thingIntension1..*
*
1
1
has
(Concept) Thing
Figure 10. Meta model of the primary and secondary things
In this section, we first define four principles of predicate abstraction and give some examples of them. Second, we consider consequences of predicate abstraction to the primary things. We show that the vertical and horizontal abstractions are actually not orthogonal. The section ends with some conclusions. By predicate classification the features special to individual predicates are ignored in order to uncover features that are common to all the predicates of interest. A predicate type is a generic characterization of all the features (i.e. secondary predicates) shared by each predicate instance. For example, Has_Color :Blue is a predicate instance of the predicate type Has_Color. Likewise, Owned_by is a predicate type, and one of its instances might be Owned_by :John. In Section 3, the concepts of definitional predicate and factual predicate
were introduced. Now, we can state that predicate classification means definitionalization of predicate instances into predicate types, and predicate instantiation means factualization of predicate types into predicate instances. Since the intensional definition of a concept is composed of predicates, it is obvious that predicate classification directly affects the concept formulation. Let Ball be the type and one of its concept predicates be Has_Color. Factualization of this predicate type to e.g. the predicate instance Has_Color :Blue creates a new primary type Blue_Ball, which is a subtype of the type Ball. The type Ball has many other predicates. Each act of factualization restricts the extension of the type so that finally we get one instance of the primary type. Thus, we can say that definitionalization and factualization of predicates are closely related to abstraction and concretizing of the primary things. By predicate generalization special features of predicate subtypes are ignored in order to uncover the features common to all the predicate subtypes. This results in a predicate supertype. For instance, the primary type Enterprise has the concept predicate Owned_by.
M. Leppänen / Towards an Abstraction Ontology180
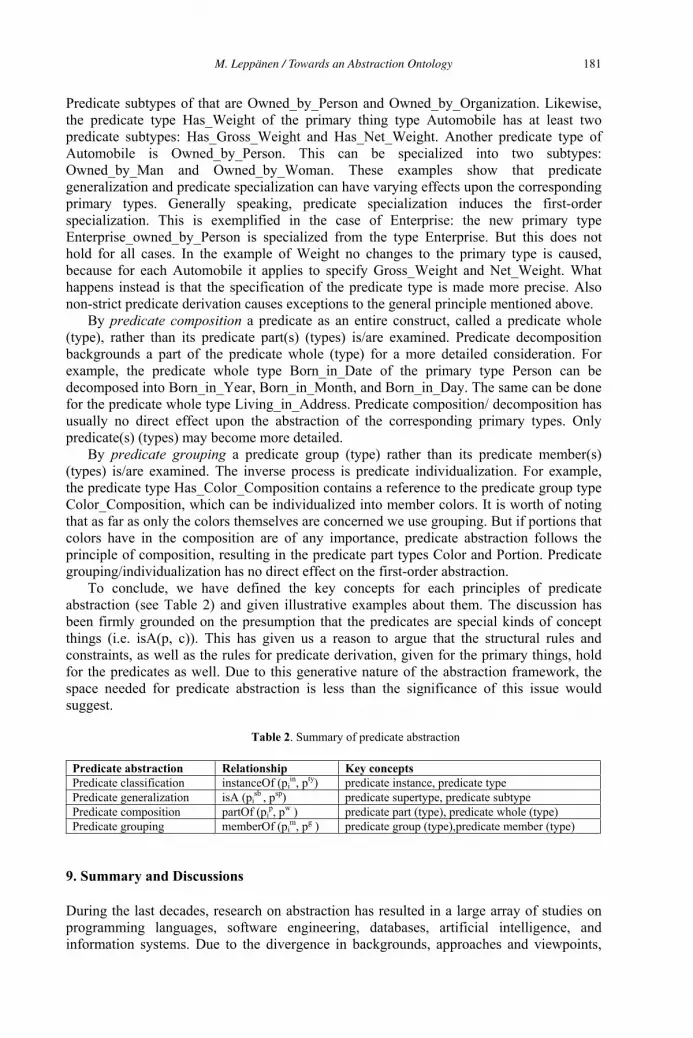
Predicate subtypes of that are Owned_by_Person and Owned_by_Organization. Likewise, the predicate type Has_Weight of the primary thing type Automobile has at least two predicate subtypes: Has_Gross_Weight and Has_Net_Weight. Another predicate type of Automobile is Owned_by_Person. This can be specialized into two subtypes: Owned_by_Man and Owned_by_Woman. These examples show that predicate generalization and predicate specialization can have varying effects upon the corresponding primary types. Generally speaking, predicate specialization induces the first-order specialization. This is exemplified in the case of Enterprise: the new primary type Enterprise_owned_by_Person is specialized from the type Enterprise. But this does not hold for all cases. In the example of Weight no changes to the primary type is caused, because for each Automobile it applies to specify Gross_Weight and Net_Weight. What happens instead is that the specification of the predicate type is made more precise. Also non-strict predicate derivation causes exceptions to the general principle mentioned above. By predicate composition a predicate as an entire construct, called a predicate whole (type), rather than its predicate part(s) (types) is/are examined. Predicate decomposition backgrounds a part of the predicate whole (type) for a more detailed consideration. For example, the predicate whole type Born_in_Date of the primary type Person can be decomposed into Born_in_Year, Born_in_Month, and Born_in_Day. The same can be done for the predicate whole type Living_in_Address. Predicate composition/ decomposition has usually no direct effect upon the abstraction of the corresponding primary types. Only predicate(s) (types) may become more detailed. By predicate grouping a predicate group (type) rather than its predicate member(s) (types) is/are examined. The inverse process is predicate individualization. For example, the predicate type Has_Color_Composition contains a reference to the predicate group type Color_Composition, which can be individualized into member colors. It is worth of noting that as far as only the colors themselves are concerned we use grouping. But if portions that colors have in the composition are of any importance, predicate abstraction follows the principle of composition, resulting in the predicate part types Color and Portion. Predicate grouping/individualization has no direct effect on the first-order abstraction. To conclude, we have defined the key concepts for each principles of predicate abstraction (see Table 2) and given illustrative examples about them. The discussion has been firmly grounded on the presumption that the predicates are special kinds of concept things (i.e. isA(p, c)). This has given us a reason to argue that the structural rules and constraints, as well as the rules for predicate derivation, given for the primary things, hold for the predicates as well. Due to this generative nature of the abstraction framework, the space needed for predicate abstraction is less than the significance of this issue would suggest.
Table 2. Summary of predicate abstraction
Predicate abstraction Relationship Key concepts Predicate classification instanceOf (pi
in, pty) predicate instance, predicate type Predicate generalization isA (pi
sb , psp) predicate supertype, predicate subtype Predicate composition partOf (pi
p, pw ) predicate part (type), predicate whole (type) Predicate grouping memberOf (pi
m, pg ) predicate group (type),predicate member (type)
9. Summary and Discussions
During the last decades, research on abstraction has resulted in a large array of studies on programming languages, software engineering, databases, artificial intelligence, and information systems. Due to the divergence in backgrounds, approaches and viewpoints,
M. Leppänen / Towards an Abstraction Ontology 181
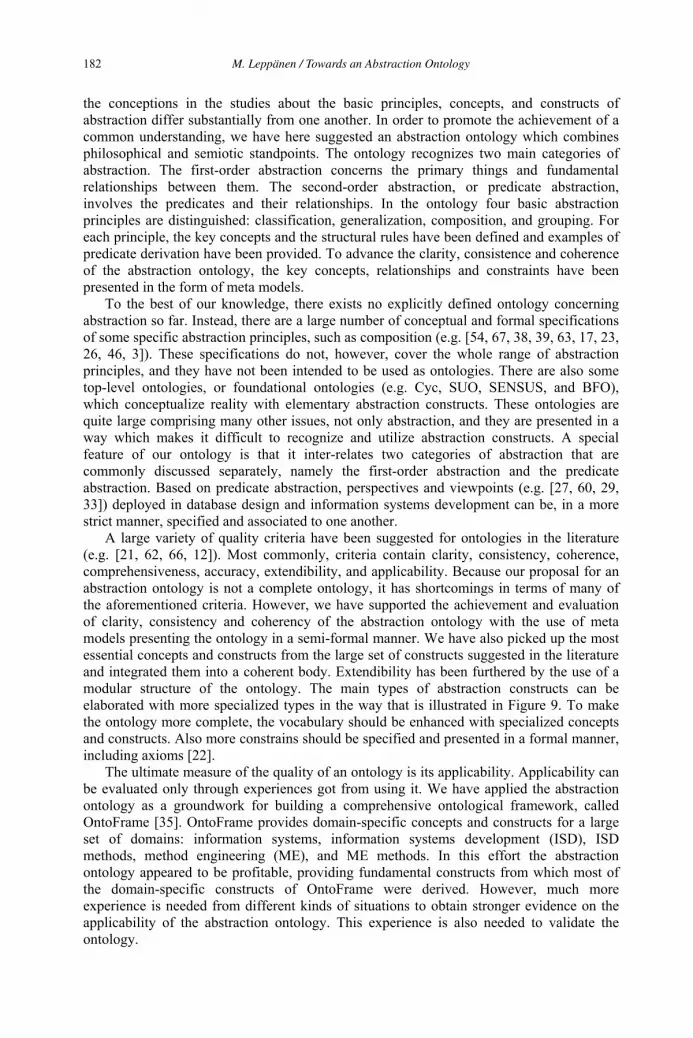
the conceptions in the studies about the basic principles, concepts, and constructs of abstraction differ substantially from one another. In order to promote the achievement of a common understanding, we have here suggested an abstraction ontology which combines philosophical and semiotic standpoints. The ontology recognizes two main categories of abstraction. The first-order abstraction concerns the primary things and fundamental relationships between them. The second-order abstraction, or predicate abstraction, involves the predicates and their relationships. In the ontology four basic abstraction principles are distinguished: classification, generalization, composition, and grouping. For each principle, the key concepts and the structural rules have been defined and examples of predicate derivation have been provided. To advance the clarity, consistence and coherence of the abstraction ontology, the key concepts, relationships and constraints have been presented in the form of meta models. To the best of our knowledge, there exists no explicitly defined ontology concerning abstraction so far. Instead, there are a large number of conceptual and formal specifications of some specific abstraction principles, such as composition (e.g. [54, 67, 38, 39, 63, 17, 23, 26, 46, 3]). These specifications do not, however, cover the whole range of abstraction principles, and they have not been intended to be used as ontologies. There are also some top-level ontologies, or foundational ontologies (e.g. Cyc, SUO, SENSUS, and BFO), which conceptualize reality with elementary abstraction constructs. These ontologies are quite large comprising many other issues, not only abstraction, and they are presented in a way which makes it difficult to recognize and utilize abstraction constructs. A special feature of our ontology is that it inter-relates two categories of abstraction that are commonly discussed separately, namely the first-order abstraction and the predicate abstraction. Based on predicate abstraction, perspectives and viewpoints (e.g. [27, 60, 29, 33]) deployed in database design and information systems development can be, in a more strict manner, specified and associated to one another. A large variety of quality criteria have been suggested for ontologies in the literature (e.g. [21, 62, 66, 12]). Most commonly, criteria contain clarity, consistency, coherence, comprehensiveness, accuracy, extendibility, and applicability. Because our proposal for an abstraction ontology is not a complete ontology, it has shortcomings in terms of many of the aforementioned criteria. However, we have supported the achievement and evaluation of clarity, consistency and coherency of the abstraction ontology with the use of meta models presenting the ontology in a semi-formal manner. We have also picked up the most essential concepts and constructs from the large set of constructs suggested in the literature and integrated them into a coherent body. Extendibility has been furthered by the use of a modular structure of the ontology. The main types of abstraction constructs can be elaborated with more specialized types in the way that is illustrated in Figure 9. To make the ontology more complete, the vocabulary should be enhanced with specialized concepts and constructs. Also more constrains should be specified and presented in a formal manner, including axioms [22]. The ultimate measure of the quality of an ontology is its applicability. Applicability can be evaluated only through experiences got from using it. We have applied the abstraction ontology as a groundwork for building a comprehensive ontological framework, called OntoFrame [35]. OntoFrame provides domain-specific concepts and constructs for a large set of domains: information systems, information systems development (ISD), ISD methods, method engineering (ME), and ME methods. In this effort the abstraction ontology appeared to be profitable, providing fundamental constructs from which most of the domain-specific constructs of OntoFrame were derived. However, much more experience is needed from different kinds of situations to obtain stronger evidence on the applicability of the abstraction ontology. This experience is also needed to validate the ontology.
M. Leppänen / Towards an Abstraction Ontology182
It could be argued that it is unrealistic to even try to merge conceptions about abstraction developed in different fields, considering how long the traditions and how established the viewpoints in each of these divergent fields are. We argue that holistic ontologies like ours can provide an arena for beneficial discussions and good opportunities for approaching to a shared conceptualization. This is worth trying, considering how fundamental the concepts and constructs of abstraction are for human action, as well as for scientific work. We believe that our abstraction ontology is of benefit in the comparison and assessment of principles, concepts and terms presented in different fields, in teaching fundamentals of abstraction for students, and in the elaboration of more specialized concepts and constructs of abstraction. The paper already at present provides a large set of references to relevant literature and compares conceptions presented in it. In the future our purpose is to extend this literature survey into an in-depth comparative analysis. In addition we aim to enhance the vocabulary of the ontology with more specialized concepts and constructs and specify a set of core rules with formal axioms.
References
[1] Albert, M., Pelechano, V., Fons, J., Ruiz, M. & Pastor, O. 2003. Implementing UML association, aggregation, and composition. A particular interpretation based on a multidimensional framework. In J. Eder & M. Missikoff (Eds.) Proc. of the 15th Int. Conf. on Advanced Information Systems Engineering (CAiSE 2003). LNCS 2681, Springer, 143-157.
[2] Arnauld, A. 1964. The art of thinking: Port-Royal Logic. Translated by J. Dickoff & P. James. New York: Bobbs-Merrill.
[3] Barbier, F. & Henderson-Sellers, B. 2001. The whole-part relationship in object modeling: a definition in c01Or. Information and Software Technology, Vol. 43, No.1, 19-39.
[4] Booch, G., Rumbaugh, J. & Jacobson I. 1999. The Unified Modeling Language – user guide, Addison-Wesley.
[5] Borgida, A. 1985. Features of languages for the development of information systems at the conceptual level. IEEE Software, Vol. 2, No. 1, 63-72.
[6] Borgida, A. 1988. Modelling class hierarchies with contradictions. In Proc. of SIGMOD Conference,434-443.
[7] Borgida, A., Mylopoulos, J. & Wong, H. 1984. Generalization / specialization. In M. Brodie, J. Mylopoulos & J. Schmidt (Eds.) On Conceptual Modelling, Berlin: Springer-Verlag, 87-114.
[8] Brachman, R. 1983. What IS-A is and isn’t: an analysis of taxonomic links of semantic networks. IEEE Computer, Vol. 16, No. 10, 30-36.
[9] Brodie, M. 1978. The application of data types to databases, Bericht Nr. 51, Fachbereich für Informatik, Universität Hamburg.
[10] Brodie, M. 1981. Association: a database abstraction. In P. Chen (Ed.) Entity-relationship Approach to Information Modelling and Analysis, Amsterdam: North-Holland, 583-608.
[11] Bunge, M. 1977. Treatise on basic philosophy, Vol. 3: Ontology I: The furniture of the world. Dortrecht: D. Reidel Publishing Company.
[12] Burton-Jones, A., Storey, V., Sugumaran, V. & Ahluwalia, P. 2005. A semiotic metric suite for assessing the quality of ontologies. Data & Knowledge Engineering, Vol. 55, No. 1, 84-102.
[13] Chandrasekaran, B., Josephson, J. & Benjamins, R. 1999. What are ontologies, and why do we need them? IEEE Intelligent Systems, Vol.14, No. 1, 20-26.
[14] Corcho, O., Fernandez-Lopez, M. & Gomez-Perez, A. 2003. Methodologies, tools and languages for building ontologies. Where is their meeting point? Data & Knowledge Engineering, Vol. 46, No. 1, 41-64.
[15] Falkenberg, E:, Hesse, W., Lindgreen, P., Nilsson, B., Oei, J. L. H., Rolland, C., Stamper, R., van Asche, F., Verrijn-Stuart, A. & Voss, K. 1998. A framework of information system concepts, The FRISCO Report (Web edition), IFIP.
[16] Freeman, M. & Layzell, P. 1994. A meta-model of information systems to support reverse engineering. Information and Software Technology, Vol. 36, No. 5, 283-294.
[17] Gerstl, P. & Pribbenow, S. 1996. A conceptual theory of part-whole relations and its applications. Data & Knowledge Engineering, Vol. 20, No. 2, 305-322.
[18] Goldstein, R. & Storey, V. 1999. Data abstraction: Why and how? Data & Knowledge Engineering, Vol. 29, No. 3, 293-311.
M. Leppänen / Towards an Abstraction Ontology 183
[19] Gomez, C. & Olive A. 2002. Evolving partitions in conceptual schemas in the UML. In A. Banks Pidduck, J. Mylopoulos, C. Woo & T. Ozsu (Eds.) Proc. of the 14th Int. Conf. on Advanced Information Systems Engineering (CAiSE’2002), Toronto, Springer, 467-483.
[20] Gruber, T. 1993. A translation approach to portable ontology specification. Knowledge Acquisition, Vol. 5, No. 2, 119-220.
[21] Gruber, T. 1995. Towards principles for the design of ontologies used for knowledge sharing. International Journal of Human-Coputer Studies, Vol. 43, No. 5/6, 907-928.
[22] Guarino, N., Carrara, M. & Giaretta, P. 1995. Ontologies and knowledge bases: towards a terminological clarification. In: N. Mars (Ed.) Towards Very Large Knowledge Bases, Knowledge Building and Knowledge Sharing, Amsterdam: IOS Press, 25-32.
[23] Guarino, N., Pribbenow, S. & Vieu, L. 1996. Modeling parts and wholes. Data and Knowledge Engineering, Special Issue, Vol. 20, No. 3, 257-258
[24] Hammer, M. & McLeod, D. 1981. Database description with SDM: a semantic database model. ACMTrans. on Database Systems, Vol. 6, No. 3, 351-386.
[25] Hautamäki, A. 1986. Points of views and their logical analysis. Acta Philosophica Fennica, Vol. 41, Helsinki
[26] Henderson-Sellers, B. & Barbier, F. 1999. What is this thing called aggregation. In: Proc. of TOOLS EUROPE’99, IEEE Computer Society Press, Silver Spring, MD, 236-250.
[27] Iivari, J. 1989. Levels of abstraction as a conceptual framework for an information system. In E. Falkenberg & P. Lindgren (Eds.) Information System Concepts: An In-Depth Analysis, North–Holland, 323-352.
[28] Iivari, J. 1992. Relationships, aggregations and complex objects. In S. Ohsuga, H. Kangassalo, H. Jaakkola, K. Hori & N. Yonezaki (Eds.) Proc. of European-Japanese Conference Information Modelling and Knowledge Bases III: Foundations, Theory, and Applications. Fujiyoshida, Amsterdam: IOS Press, 141-159.
[29] ISO/IEC 1996. Information Technology – Open Distributed Processing - Reference Model: Overview, 10746-1.
[30] Kangassalo, H. 1982. On the concept of concept in a conceptual schema, In: Kangassalo H. (Ed.), Proceedings of the First Scandinavian Research Seminar on Information Modelling and Data Base Modelling, Acta Universitatis Tamperensis, Ser. B., Vol. 17, University of Tampere, Finland, 129-172.
[31] Kangassalo, H. 1983. On the semantics of data abstraction. Report of Department of Mathematical Sciences A 116, University of Tampere, Finland.
[32] Kangassalo, H. 1993. COMIC: A system and methodology for conceptual modeling and information construction. Data & Knowledge Engineering, Vol. 9, No. 3, 287-319.
[33] Kruchten, P. 2000. The Rational Unified Process: An introduction, Reading: Addison-Wesley. [34] Liberman, H., Stein, A. & Ungar, D. 1988. Of types and prototypes: the treaty of Orlando. In OOPSLA
’87 Addendum to the Proceedings. Special Issue of SIGPLAN Notices, Vol. 23, No. 5, 43-44. [35] Leppänen, M. 2005. An ontological framework and a methodical skeleton for method engineering. Ph.D
thesis, Jyväskylä Studies in Computing 52, University of Jyväskylä, Finland. [36] Mattos, N. 1988. Abstraction concept: the basis for data and knowledge modeling. In C. Batini (Ed.)
Proc. of the 7th Int. Conf. on Entity-Relationship Approach, Amsterdam: North-Holland, 331-350. [37] McLeod, D. & King, R. 1980. Applying a semantic database model. In P. Chen (Ed.) Entity-Relationship
Approach to Systems Analysis and Design, Amsterdam: North-Holland, 193-210. [38] Motschnig-Pitrik, R. 1993. The semantics of parts versus aggregates in data/knowledge modeling. In C.
Rolland, F. Bodard & C. Cauvet (Eds.) Proc. of the 5th Int. Conf. on Advanced Information Systems Enginering (CAiSE’93), Paris, France, LNCS 685, Springer, 352-373.
[39] Motschnig-Pitrik, R. & Kaasboll, J. 1999. Part-Whole relationship categories and their application in object-oriented analysis. IEEE Trans. on Knowledge and Data Engineering, Vol. 11, No. 5, 779-797.
[40] Motschnig-Pitrik, R. & Storey, V. 1995. Modelling of set membership: the notion and the issues. Data & Knowledge Engineering, Vol. 16, No. 2, 147-185.
[41] Mylopoulos, J. 1998. Information modelling in the time of the revolution. Information Systems, Vol. 23, No.3/4, 127-155.
[42] Mylopoulos, J., Berstein, P. & Wong, H. 1980. A language facility for designing database-intensive applications. ACM Trans. on Database Systems, Vol. 5, No. 2, 185-207.
[43] Odell, J. 1994. Six different kinds of compositions. Journal of Object-Oriented Programming, Vol. 7, No. 8, 10-15.
[44] Ogden, C. & Richards I. 1923. The meaning of meaning. London: Kegan Paul. [45] Olive, A. 2002. Representation of generic relationship types in conceptual modelling. In A. Banks
Pidduck, J. Mylopoulos, C. Woo & T. Ozsu (Eds.) Proc. of the 14th Int. Conf. on Advanced Information Systems Engineering (CAiSE’2002), Toronto, Springer, 675-691.
[46] Opdahl, A., Henderson-Sellers, B. & Barbier, F. 2001. Ontological analysis of whole-part relationships in OO-models. Information and Software Technology, Vol. 43, No. 6, 387-399.
M. Leppänen / Towards an Abstraction Ontology184
[47] Parsons, J. & Wand, Y. 1997. Choosing classes in conceptual modeling. Comm. of the ACM, Vol. 40, No. 6, 63-69.
[48] Peckham, J. & Maryanski, F. 1988. Semantic data models. ACM Computing Surveys, Vol. 20, No. 3, 153-189.
[49] Ralyté, J., Deneckere, R. & Rolland, C. 2003. Towards a generic model for situational method engineering. In J. Eder & M. Missikoff (Eds.) Proc. of the 15th Int. Conf. on Advanced Information Systems Enginering (CAiSE’03), Klagenfurt/Velden, Austria, LNCS 2681, Springer-Verlag, 95-110.
[50] Rosch, E. 1978. Principles of categorization. In E. Rosch & B. Lloyd (Eds.) Cognition and Categorization. Hillsdale, NJ: Erlbaum, 27-48.
[51] Saksena, M., France, R. & Larrondo-Petric, M. 1998. A characterization of aggregation. In Proc. of 5th Int. Conf. on Object-Oriented Information Systems (OOIS’98), Berlin: Springer, 11-19.
[52] Schrefl, M., Tjoa, A. & Wagner, R. 1984. Comparison-criteria for semantic data models. In Proc. of Int. Conf. on Data Engineering (ICDE 1984), 120-125.
[53] Sciore, E. 1989. Object specialization. ACM Trans. on Information Systems, Vol. 7, No. 2, 103-122. [54] Smith, J. & Smith, D. 1977. Database abstraction: aggregation. Comm. of the ACM, Vol. 20, No. 6, 405-
413. [55] Smith, J. & Smith, D. 1977. Database abstraction: aggregation and generalization. ACM Transanctions
on Database Systems, Vol. 2, No. 2, 105-133. [56] Smith, W. 1988. Concepts and thoughts. In R. Sternberg & E. Smith (Eds.) The Psychology of Human
Thought. Cambridge: Cambridge University Press. [57] Snoek, M. & Dedene, G. 2001. Core modeling concepts to define aggregation. L’Objet Software,
Databases, Networks, Vol. 7, No. 1. [58] Stamper, R. 1978 Aspects of data semantics: names, species and complex physical objects. In G. Bracchi
& P. Lockemann (Eds.) Information Systems Methodology. Berlin: Springer-Verlag, 291-306. [59] Sugumaran, V. & Storey V. 2002. Ontologies for conceptual modeling: their creation, use, and
management. Data & Knowledge Engineering, Vol. 42, No. 3, 251-271. [60] Swede van, V. & van Vliet, J. 1993. A flexible framework for contingent information systems modeling.
Information and Software Technology, Vol. 35, No. 9, 530-548. [61] Ullrich, H., Purao, S. & Storey, V. 2001. An ontology for classifying the semantics of relationships in
database design. In M. Bouzeghoub, Z. Kedad & E. Metais (Eds.) Proc. of 5th International Conference on Applications of Natural Language to Information Ssystems (NLDB 2000), LNCS 1959, Springer, 91-102.
[62] Uschold, M. 1996. Building ontologies: towards a unified methodology. In Proc. of 16th Annual Conf. of the British Computer Society Specialist Group on Expert Systems. Cambridge, UK.
[63] Varzi, A. 1996. Parts, wholes, and part-whole relations: The prospects of mereotopology. Data & Knowledge Engineering, Vol. 20, No. 3, 259-286.
[64] Wagner, G. 1988. Implementing abstraction hierarchies. In C. Batini (Ed.) Proc. of the 7th Int. Conf. on Entity-Relationship Approach. Amsterdam: North-Holland, 267-300.
[65] Wand, Y., Storey, V. & Weber, R. 1999. An ontological analysis of the relationship construct in conceptual modeling. ACM Trans on. Database Systems, Vol. 24, No. 4, 494-528.
[66] Weinberger, H., Te’eni, D. & Frank, A. 2003. Ontologies of organizational memory as a basis for evaluation. In Proc. of the 11th European Conf. of Information Systems, Naples, Italy, 2003.
[67] Winston, M., Chaffin, R. & Hermann, D. 1987. A taxonomy of part-whole relations. Cognitive Science,Vol. 11, No. 4, 417-444.
[68] Yang, O., Halper, M., Geller, J. & Perl, Y. 1994. The OODB ownership relationship. In D. Patel, Y. Sun & S. Patel (Eds.) Proc. of Conf. on Object-Oriented Information Systems (OOIS’94), Berlin: Springer-Verlag, 278-291.
M. Leppänen / Towards an Abstraction Ontology 185
A Causality Computation Retrieval Method withContext Dependent Dynamics and
Causal-Route Search FunctionsKosuke TAKANO† and Yasushi KIYOKI‡
† Graduate School of Media and Governance, Keio University‡ Faculty of Environmental Information, Keio University5322 Endo, Fujisawa-shi, Kanagawa 252-8520, Japan
{kos, kiyoki}@sfc.keio.ac.jp
Abstract. In this paper, we present causality computation methods and its applica-
tion of a semantic associative search. We propose two essential methods for causality
search, which are a causality computation method with context dependent dynamics
and a causality route search method. The causality computation method with context
dependent dynamics makes it possible to retrieve documents describing causal events
in the context that specifies each situation of occurrent events. The causality route
search method realizes to search respectively set of documents related to each genera-
tion of causal events from query events. We define three types of vector for each event
data, that is, cause vector, effect vector and cause-effect vector that are characterized
respectively with cause, effect and “cause and effect” event data. Applying a set of
these vectors, our search method makes it possible to retrieve respectively “the docu-
ment data describing cause events” and “the document data describing effect events”
according to the context specified. Also, for realizing a causality route search, we
construct query that represent sequential generations of causal events from a query
event. Using the query constructed, we can retrieve documents about each generation
of causal events. We have implemented a search system for an aerospace engineering
field and clarified the effectiveness and the feasibility of our search method by several
experiments.
1 Introduction
In advanced computer and database environments, organizations are increasingly generatinga large amount of document data. These document data are stored and managed in databasesto support common ownership. In the research area of information retrieval and databasesystems, it is obvious that search methods on vector space models are effective to extractappropriate document data according to searchers’ various objectives. [1, 3, 5, 9]
Conventional search methods on vector space models have not dealt with metrical spacesto compute causal relationship, but metrical spaces to compute semantic equivalence or sim-ilarity among documents or terms. In SMART system [9, 10] and Latent Semantic Indexing(LSI) [3], queries and documents are represented as vector data based on term frequency ofthe documents. SMART system and LSI compute static relationships of semantic equiva-lence or similarity among queries and documents by inner product or cosine measure[1] inorder to extract documents that correlate with the queries. The Mathematical Model of Mean-ing (MMM) [6, 7] provides metrics on a vector space with a context recognition function tocompute the semantic equivalence and similarity on the vector space so that users can retrievedocument data that are semantically closed to the contexts given by users. However, it is not
M. Duží et al. (Eds.)Information Modelling and Knowledge Bases XVIII
IOS Press, 2007© 2007 The authors and IOS Press. All rights reserved.
186
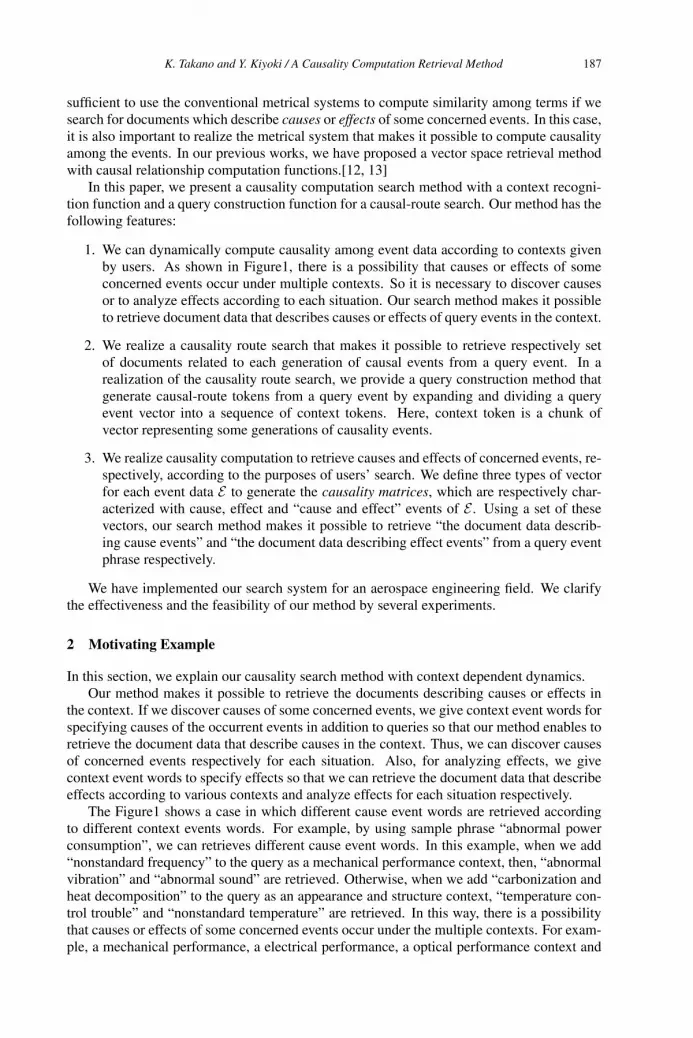
sufficient to use the conventional metrical systems to compute similarity among terms if wesearch for documents which describe causes or effects of some concerned events. In this case,it is also important to realize the metrical system that makes it possible to compute causalityamong the events. In our previous works, we have proposed a vector space retrieval methodwith causal relationship computation functions.[12, 13]
In this paper, we present a causality computation search method with a context recogni-tion function and a query construction function for a causal-route search. Our method has thefollowing features:
1. We can dynamically compute causality among event data according to contexts givenby users. As shown in Figure1, there is a possibility that causes or effects of someconcerned events occur under multiple contexts. So it is necessary to discover causesor to analyze effects according to each situation. Our search method makes it possibleto retrieve document data that describes causes or effects of query events in the context.
2. We realize a causality route search that makes it possible to retrieve respectively setof documents related to each generation of causal events from a query event. In arealization of the causality route search, we provide a query construction method thatgenerate causal-route tokens from a query event by expanding and dividing a queryevent vector into a sequence of context tokens. Here, context token is a chunk ofvector representing some generations of causality events.
3. We realize causality computation to retrieve causes and effects of concerned events, re-spectively, according to the purposes of users’ search. We define three types of vectorfor each event data E to generate the causality matrices, which are respectively char-acterized with cause, effect and “cause and effect” events of E . Using a set of thesevectors, our search method makes it possible to retrieve “the document data describ-ing cause events” and “the document data describing effect events” from a query eventphrase respectively.
We have implemented our search system for an aerospace engineering field. We clarifythe effectiveness and the feasibility of our method by several experiments.
2 Motivating Example
In this section, we explain our causality search method with context dependent dynamics.Our method makes it possible to retrieve the documents describing causes or effects in
the context. If we discover causes of some concerned events, we give context event words forspecifying causes of the occurrent events in addition to queries so that our method enables toretrieve the document data that describe causes in the context. Thus, we can discover causesof concerned events respectively for each situation. Also, for analyzing effects, we givecontext event words to specify effects so that we can retrieve the document data that describeeffects according to various contexts and analyze effects for each situation respectively.
The Figure1 shows a case in which different cause event words are retrieved accordingto different context events words. For example, by using sample phrase “abnormal powerconsumption”, we can retrieves different cause event words. In this example, when we add“nonstandard frequency” to the query as a mechanical performance context, then, “abnormalvibration” and “abnormal sound” are retrieved. Otherwise, when we add “carbonization andheat decomposition” to the query as an appearance and structure context, “temperature con-trol trouble” and “nonstandard temperature” are retrieved. In this way, there is a possibilitythat causes or effects of some concerned events occur under the multiple contexts. For exam-ple, a mechanical performance, a electrical performance, a optical performance context and
K. Takano and Y. Kiyoki / A Causality Computation Retrieval Method 187
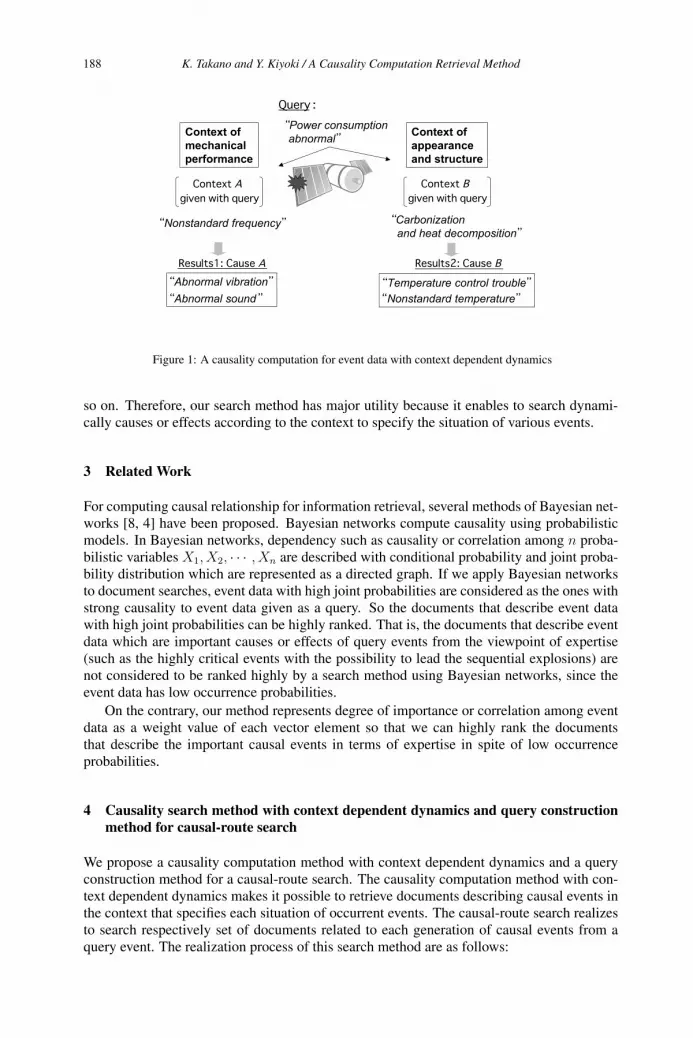
���������� ���
�������
����������������� �����������
������������� �����
���������
��� ��� �
����� ���
���������
��� � ���
������������
�����������
����������������
������������ �������
��� ����������������������
Figure 1: A causality computation for event data with context dependent dynamics
so on. Therefore, our search method has major utility because it enables to search dynami-cally causes or effects according to the context to specify the situation of various events.
3 Related Work
For computing causal relationship for information retrieval, several methods of Bayesian net-works [8, 4] have been proposed. Bayesian networks compute causality using probabilisticmodels. In Bayesian networks, dependency such as causality or correlation among n proba-bilistic variables X1, X2, · · · , Xn are described with conditional probability and joint proba-bility distribution which are represented as a directed graph. If we apply Bayesian networksto document searches, event data with high joint probabilities are considered as the ones withstrong causality to event data given as a query. So the documents that describe event datawith high joint probabilities can be highly ranked. That is, the documents that describe eventdata which are important causes or effects of query events from the viewpoint of expertise(such as the highly critical events with the possibility to lead the sequential explosions) arenot considered to be ranked highly by a search method using Bayesian networks, since theevent data has low occurrence probabilities.
On the contrary, our method represents degree of importance or correlation among eventdata as a weight value of each vector element so that we can highly rank the documentsthat describe the important causal events in terms of expertise in spite of low occurrenceprobabilities.
4 Causality search method with context dependent dynamics and query constructionmethod for causal-route search
We propose a causality computation method with context dependent dynamics and a queryconstruction method for a causal-route search. The causality computation method with con-text dependent dynamics makes it possible to retrieve documents describing causal events inthe context that specifies each situation of occurrent events. The causal-route search realizesto search respectively set of documents related to each generation of causal events from aquery event. The realization process of this search method are as follows:
K. Takano and Y. Kiyoki / A Causality Computation Retrieval Method188
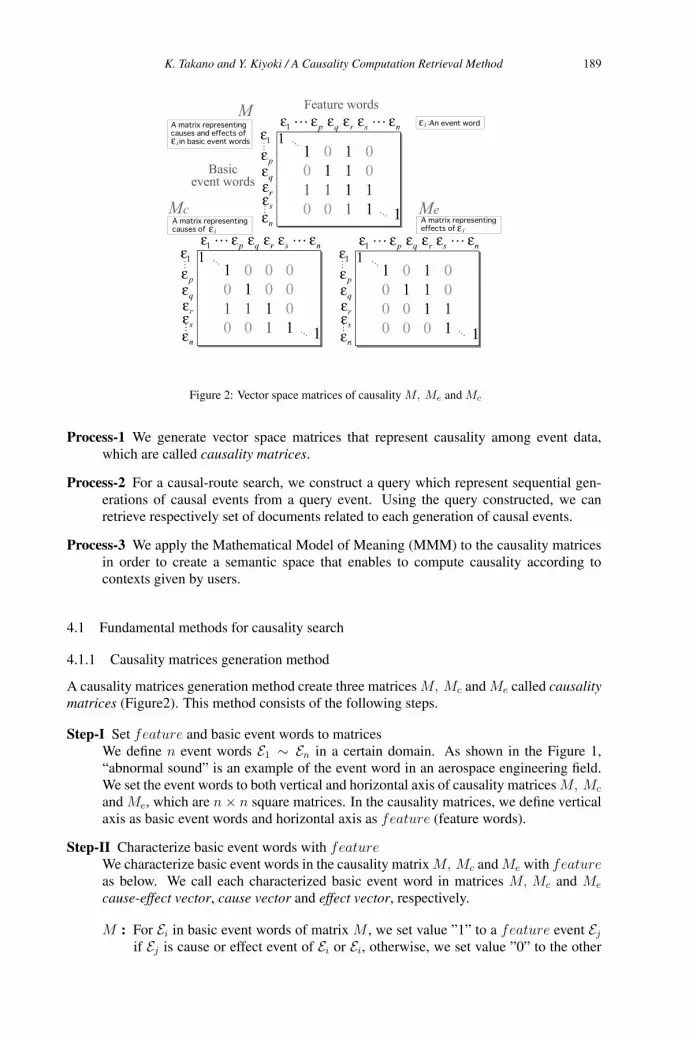
1
1
1
� �
�
��
Figure 2: Vector space matrices of causality M, Me and Mc
Process-1 We generate vector space matrices that represent causality among event data,which are called causality matrices.
Process-2 For a causal-route search, we construct a query which represent sequential gen-erations of causal events from a query event. Using the query constructed, we canretrieve respectively set of documents related to each generation of causal events.
Process-3 We apply the Mathematical Model of Meaning (MMM) to the causality matricesin order to create a semantic space that enables to compute causality according tocontexts given by users.
4.1 Fundamental methods for causality search
4.1.1 Causality matrices generation method
A causality matrices generation method create three matrices M, Mc and Me called causalitymatrices (Figure2). This method consists of the following steps.
Step-I Set feature and basic event words to matricesWe define n event words E1 ∼ En in a certain domain. As shown in the Figure 1,“abnormal sound” is an example of the event word in an aerospace engineering field.We set the event words to both vertical and horizontal axis of causality matrices M, Mc
and Me, which are n × n square matrices. In the causality matrices, we define verticalaxis as basic event words and horizontal axis as feature (feature words).
Step-II Characterize basic event words with featureWe characterize basic event words in the causality matrix M, Mc and Me with featureas below. We call each characterized basic event word in matrices M, Mc and Me
cause-effect vector, cause vector and effect vector, respectively.
M : For Ei in basic event words of matrix M , we set value ”1” to a feature event Ej
if Ej is cause or effect event of Ei or Ei, otherwise, we set value ”0” to the other
K. Takano and Y. Kiyoki / A Causality Computation Retrieval Method 189

��� ���� ��� ���� �� ���
Figure 3: Combinations of the vector space matrices
feature event Ek. Through these operations for all event words Ei in basic eventwords, it is accomplished to generate matrix M .
Mc: In the same way, for all basic event words Ei of matrix Mc, we set value ”1” to afeature event Ej if Ej is cause event of Ei or Ei, otherwise, we set value ”0” tothe other feature event Ek. Thus we create the matrix Mc.
Me: In the same way, for all basic event words Ei of matrix Me, we set value ”1” to afeature event Ej if Ej is effect event of Ei or Ei, otherwise, we set value ”0” tothe other feature event Ek. Thus we create the matrix Me.
4.1.2 Query and target data vectorization methods
We describe methods for vectorizing query and target data in the causality matrices describedin section4.1.1. Here, let query words be Q which consists of set of event words E in basicevent words of the causality matrix Mc,Me and M . In event words Q, let K be set of eventwords for occurrent events and CT be set of event words for a context to specify the situation.Hereinafter we call K keyword and CT context word. Also let target data (attached set of Eas metadata) be P .
To vectorize query words Q and target data P , we configure three sets of causality matri-ces (V S1,V S2 and V S3) (Figure 3) as metadata matrices for generating query and target datavectors. Let vector transformation functions be Vc, Ve and V which transform each eventword into cause vector, effect vector and cause-effect vector from the causality matricesMc,Me and M ,
Vc : Ei �−→ eci
Ve : Ei �−→ eei
V : Ei �−→ ei
(i = 1 · · ·n)
One of a set of causality matrices is selected from three sets of causality matrices V S1 ∼V S3 according to searchers’ purposes as follows.
1. A search for causes of concerned events.Set of causality matrices V S1(Mc,Me) is configured as metadata matrices for generat-
K. Takano and Y. Kiyoki / A Causality Computation Retrieval Method190
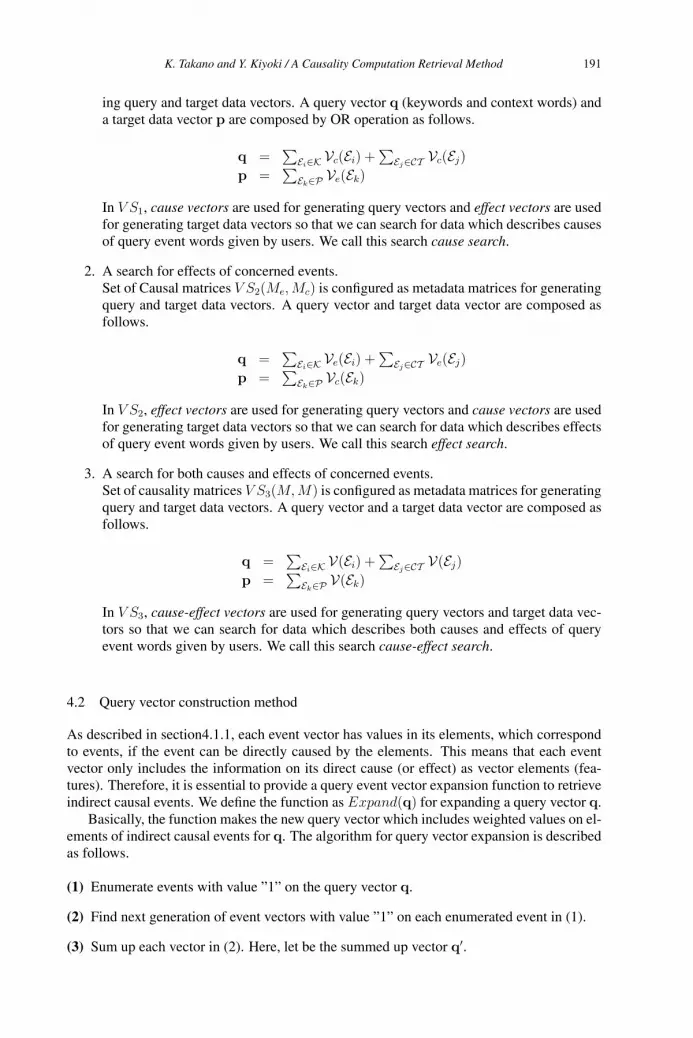
ing query and target data vectors. A query vector q (keywords and context words) anda target data vector p are composed by OR operation as follows.
q =∑
Ei∈K Vc(Ei) +∑
Ej∈CT Vc(Ej)
p =∑
Ek∈P Ve(Ek)
In V S1, cause vectors are used for generating query vectors and effect vectors are usedfor generating target data vectors so that we can search for data which describes causesof query event words given by users. We call this search cause search.
2. A search for effects of concerned events.Set of Causal matrices V S2(Me,Mc) is configured as metadata matrices for generatingquery and target data vectors. A query vector and target data vector are composed asfollows.
q =∑
Ei∈K Ve(Ei) +∑
Ej∈CT Ve(Ej)
p =∑
Ek∈P Vc(Ek)
In V S2, effect vectors are used for generating query vectors and cause vectors are usedfor generating target data vectors so that we can search for data which describes effectsof query event words given by users. We call this search effect search.
3. A search for both causes and effects of concerned events.Set of causality matrices V S3(M,M) is configured as metadata matrices for generatingquery and target data vectors. A query vector and a target data vector are composed asfollows.
q =∑
Ei∈K V(Ei) +∑
Ej∈CT V(Ej)
p =∑
Ek∈P V(Ek)
In V S3, cause-effect vectors are used for generating query vectors and target data vec-tors so that we can search for data which describes both causes and effects of queryevent words given by users. We call this search cause-effect search.
4.2 Query vector construction method
As described in section4.1.1, each event vector has values in its elements, which correspondto events, if the event can be directly caused by the elements. This means that each eventvector only includes the information on its direct cause (or effect) as vector elements (fea-tures). Therefore, it is essential to provide a query event vector expansion function to retrieveindirect causal events. We define the function as Expand(q) for expanding a query vector q.
Basically, the function makes the new query vector which includes weighted values on el-ements of indirect causal events for q. The algorithm for query vector expansion is describedas follows.
(1) Enumerate events with value ”1” on the query vector q.
(2) Find next generation of event vectors with value ”1” on each enumerated event in (1).
(3) Sum up each vector in (2). Here, let be the summed up vector q′.
K. Takano and Y. Kiyoki / A Causality Computation Retrieval Method 191
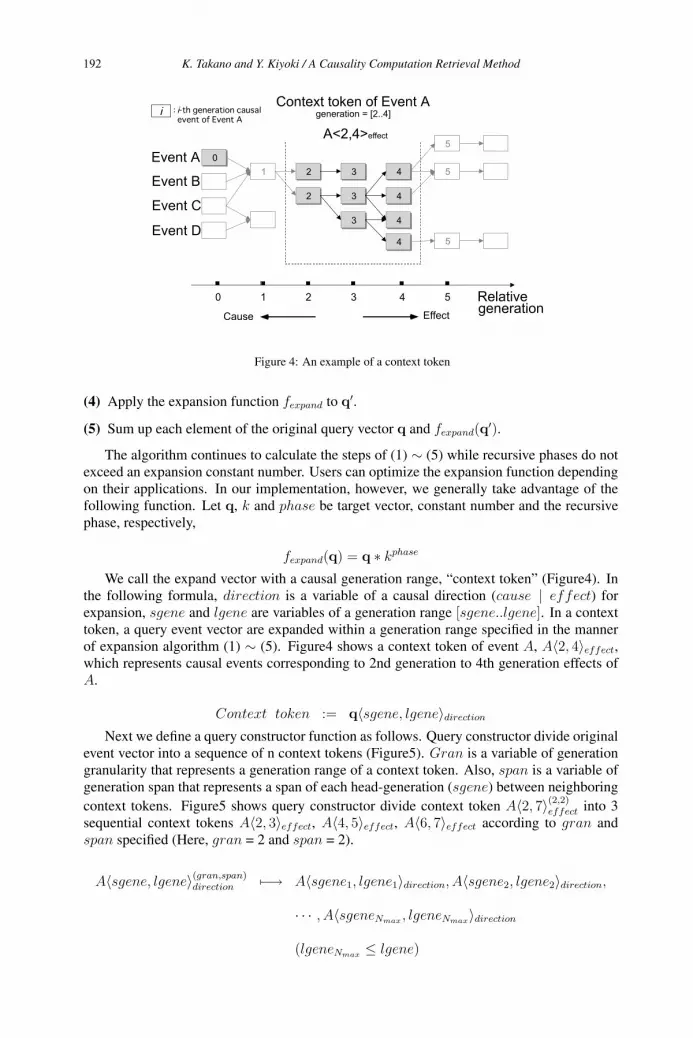
���������
� ��
��
��
��
��
��
�
�
�
�������
�������
�������
�������
���������������������
� � � �
������������������
��������� �
!�"�����
�#�$�%������
Figure 4: An example of a context token
(4) Apply the expansion function fexpand to q′.
(5) Sum up each element of the original query vector q and fexpand(q′).
The algorithm continues to calculate the steps of (1) ∼ (5) while recursive phases do notexceed an expansion constant number. Users can optimize the expansion function dependingon their applications. In our implementation, however, we generally take advantage of thefollowing function. Let q, k and phase be target vector, constant number and the recursivephase, respectively,
fexpand(q) = q ∗ kphase
We call the expand vector with a causal generation range, “context token” (Figure4). Inthe following formula, direction is a variable of a causal direction (cause | effect) forexpansion, sgene and lgene are variables of a generation range [sgene..lgene]. In a contexttoken, a query event vector are expanded within a generation range specified in the mannerof expansion algorithm (1) ∼ (5). Figure4 shows a context token of event A, A〈2, 4〉effect,which represents causal events corresponding to 2nd generation to 4th generation effects ofA.
Context token := q〈sgene, lgene〉direction
Next we define a query constructor function as follows. Query constructor divide originalevent vector into a sequence of n context tokens (Figure5). Gran is a variable of generationgranularity that represents a generation range of a context token. Also, span is a variable ofgeneration span that represents a span of each head-generation (sgene) between neighboring
context tokens. Figure5 shows query constructor divide context token A〈2, 7〉(2,2)effect into 3
sequential context tokens A〈2, 3〉effect, A〈4, 5〉effect, A〈6, 7〉effect according to gran andspan specified (Here, gran = 2 and span = 2).
A〈sgene, lgene〉(gran,span)direction �−→ A〈sgene1, lgene1〉direction, A〈sgene2, lgene2〉direction,
· · · , A〈sgeneNmax , lgeneNmax〉direction
(lgeneNmax ≤ lgene)
K. Takano and Y. Kiyoki / A Causality Computation Retrieval Method192
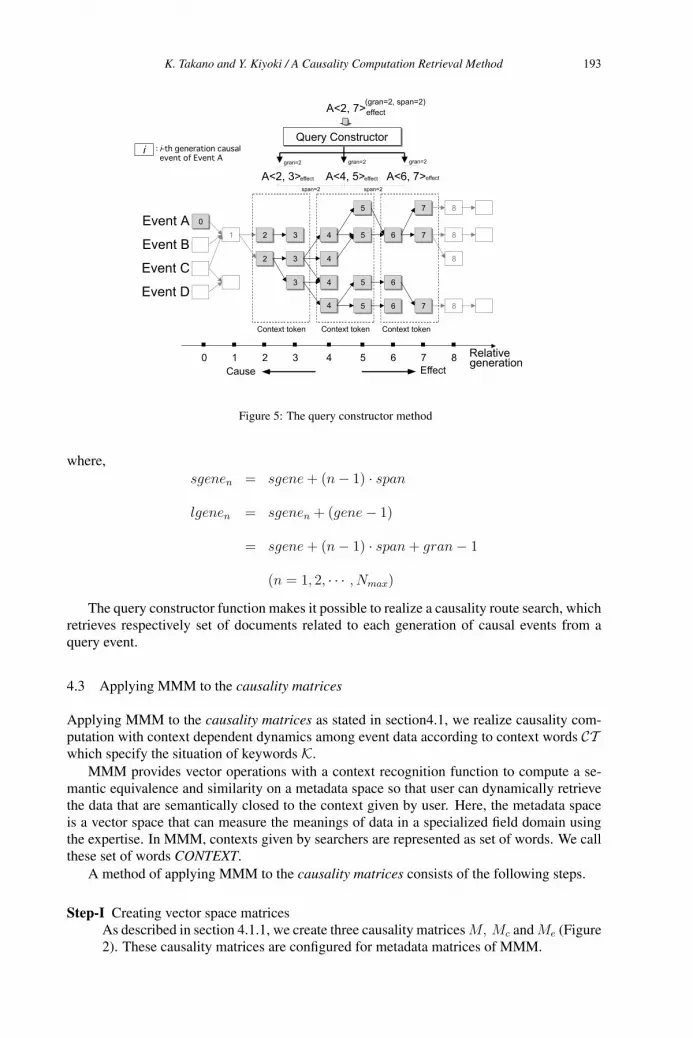
���������
� ��
��
��
��
��
��
��
��
��
�������
�������
�������
�������
� � � �
&&
&&
''
''
''
(
(
(
�� &&
(
& ' (
�#�$� % �#�$��% �#&$�'%
�#�$�'%)������$� *����+
����������� ����������� �����������
,���-��� ������,���-��� ������
��������� �
!�"�����
������
������ ������ ������
������������������
*���� *����
Figure 5: The query constructor method
where,
sgenen = sgene + (n − 1) · span
lgenen = sgenen + (gene − 1)
= sgene + (n − 1) · span + gran − 1
(n = 1, 2, · · · , Nmax)
The query constructor function makes it possible to realize a causality route search, whichretrieves respectively set of documents related to each generation of causal events from aquery event.
4.3 Applying MMM to the causality matrices
Applying MMM to the causality matrices as stated in section4.1, we realize causality com-putation with context dependent dynamics among event data according to context words CTwhich specify the situation of keywords K.
MMM provides vector operations with a context recognition function to compute a se-mantic equivalence and similarity on a metadata space so that user can dynamically retrievethe data that are semantically closed to the context given by user. Here, the metadata spaceis a vector space that can measure the meanings of data in a specialized field domain usingthe expertise. In MMM, contexts given by searchers are represented as set of words. We callthese set of words CONTEXT.
A method of applying MMM to the causality matrices consists of the following steps.
Step-I Creating vector space matricesAs described in section 4.1.1, we create three causality matrices M, Mc and Me (Figure2). These causality matrices are configured for metadata matrices of MMM.
K. Takano and Y. Kiyoki / A Causality Computation Retrieval Method 193
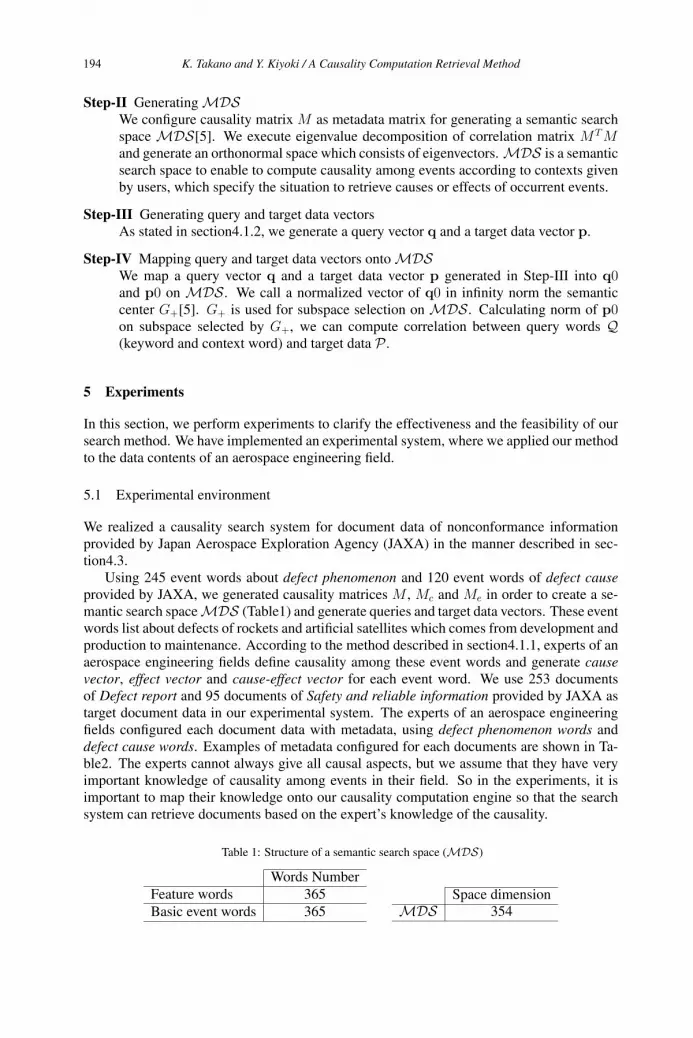
Step-II Generating MDSWe configure causality matrix M as metadata matrix for generating a semantic searchspace MDS[5]. We execute eigenvalue decomposition of correlation matrix MT Mand generate an orthonormal space which consists of eigenvectors. MDS is a semanticsearch space to enable to compute causality among events according to contexts givenby users, which specify the situation to retrieve causes or effects of occurrent events.
Step-III Generating query and target data vectorsAs stated in section4.1.2, we generate a query vector q and a target data vector p.
Step-IV Mapping query and target data vectors onto MDSWe map a query vector q and a target data vector p generated in Step-III into q0and p0 on MDS . We call a normalized vector of q0 in infinity norm the semanticcenter G+[5]. G+ is used for subspace selection on MDS . Calculating norm of p0on subspace selected by G+, we can compute correlation between query words Q(keyword and context word) and target data P .
5 Experiments
In this section, we perform experiments to clarify the effectiveness and the feasibility of oursearch method. We have implemented an experimental system, where we applied our methodto the data contents of an aerospace engineering field.
5.1 Experimental environment
We realized a causality search system for document data of nonconformance informationprovided by Japan Aerospace Exploration Agency (JAXA) in the manner described in sec-tion4.3.
Using 245 event words about defect phenomenon and 120 event words of defect causeprovided by JAXA, we generated causality matrices M , Mc and Me in order to create a se-mantic search space MDS (Table1) and generate queries and target data vectors. These eventwords list about defects of rockets and artificial satellites which comes from development andproduction to maintenance. According to the method described in section4.1.1, experts of anaerospace engineering fields define causality among these event words and generate causevector, effect vector and cause-effect vector for each event word. We use 253 documentsof Defect report and 95 documents of Safety and reliable information provided by JAXA astarget document data in our experimental system. The experts of an aerospace engineeringfields configured each document data with metadata, using defect phenomenon words anddefect cause words. Examples of metadata configured for each documents are shown in Ta-ble2. The experts cannot always give all causal aspects, but we assume that they have veryimportant knowledge of causality among events in their field. So in the experiments, it isimportant to map their knowledge onto our causality computation engine so that the searchsystem can retrieve documents based on the expert’s knowledge of the causality.
Table 1: Structure of a semantic search space (MDS)
Words Number
Feature words 365
Basic event words 365
Space dimensionMDS 354
K. Takano and Y. Kiyoki / A Causality Computation Retrieval Method194
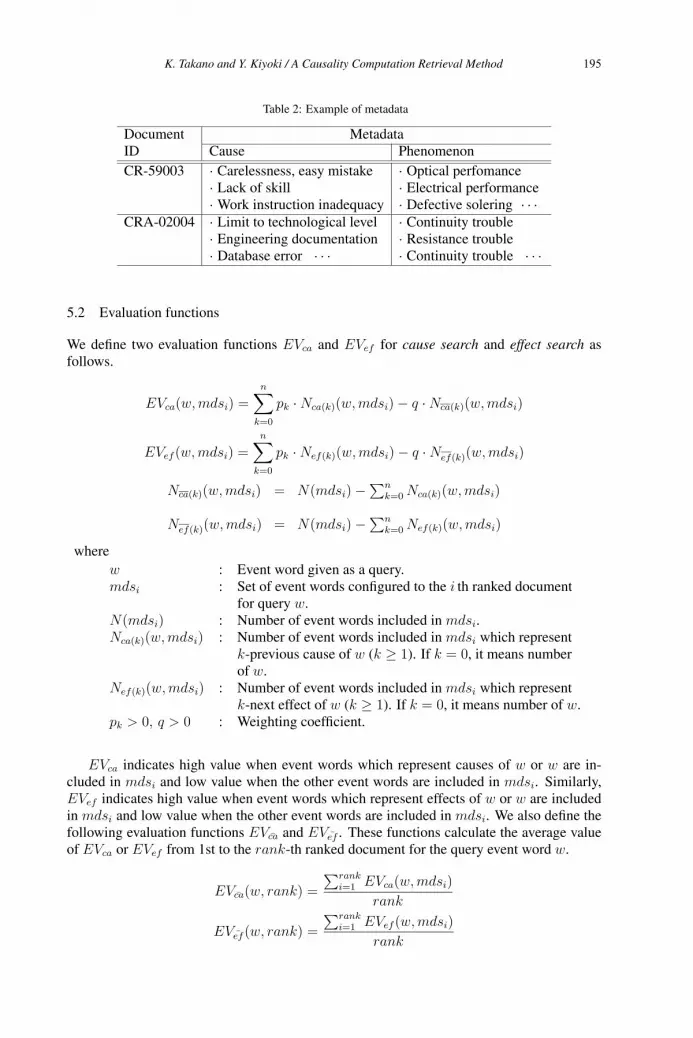
Table 2: Example of metadata
Document MetadataID Cause Phenomenon
CR-59003 · Carelessness, easy mistake · Optical perfomance· Lack of skill · Electrical performance· Work instruction inadequacy · Defective solering · · ·
CRA-02004 · Limit to technological level · Continuity trouble· Engineering documentation · Resistance trouble· Database error · · · · Continuity trouble · · ·
5.2 Evaluation functions
We define two evaluation functions EVca and EVef for cause search and effect search asfollows.
EVca(w,mdsi) =n∑
k=0
pk · Nca(k)(w,mdsi) − q · Nca(k)(w,mdsi)
EVef (w,mdsi) =n∑
k=0
pk · Nef(k)(w,mdsi) − q · Nef(k)(w,mdsi)
Nca(k)(w,mdsi) = N(mdsi) −∑n
k=0 Nca(k)(w,mdsi)
Nef(k)(w,mdsi) = N(mdsi) −∑n
k=0 Nef(k)(w,mdsi)
where
w : Event word given as a query.mdsi : Set of event words configured to the i th ranked document
for query w.N(mdsi) : Number of event words included in mdsi.Nca(k)(w,mdsi) : Number of event words included in mdsi which represent
k-previous cause of w (k ≥ 1). If k = 0, it means numberof w.
Nef(k)(w,mdsi) : Number of event words included in mdsi which representk-next effect of w (k ≥ 1). If k = 0, it means number of w.
pk > 0, q > 0 : Weighting coefficient.
EVca indicates high value when event words which represent causes of w or w are in-cluded in mdsi and low value when the other event words are included in mdsi. Similarly,EVef indicates high value when event words which represent effects of w or w are includedin mdsi and low value when the other event words are included in mdsi. We also define thefollowing evaluation functions EVca and EVef . These functions calculate the average valueof EVca or EVef from 1st to the rank-th ranked document for the query event word w.
EVca(w, rank) =
∑ranki=1 EVca(w,mdsi)
rank
EVef (w, rank) =
∑ranki=1 EVef (w,mdsi)
rank
K. Takano and Y. Kiyoki / A Causality Computation Retrieval Method 195
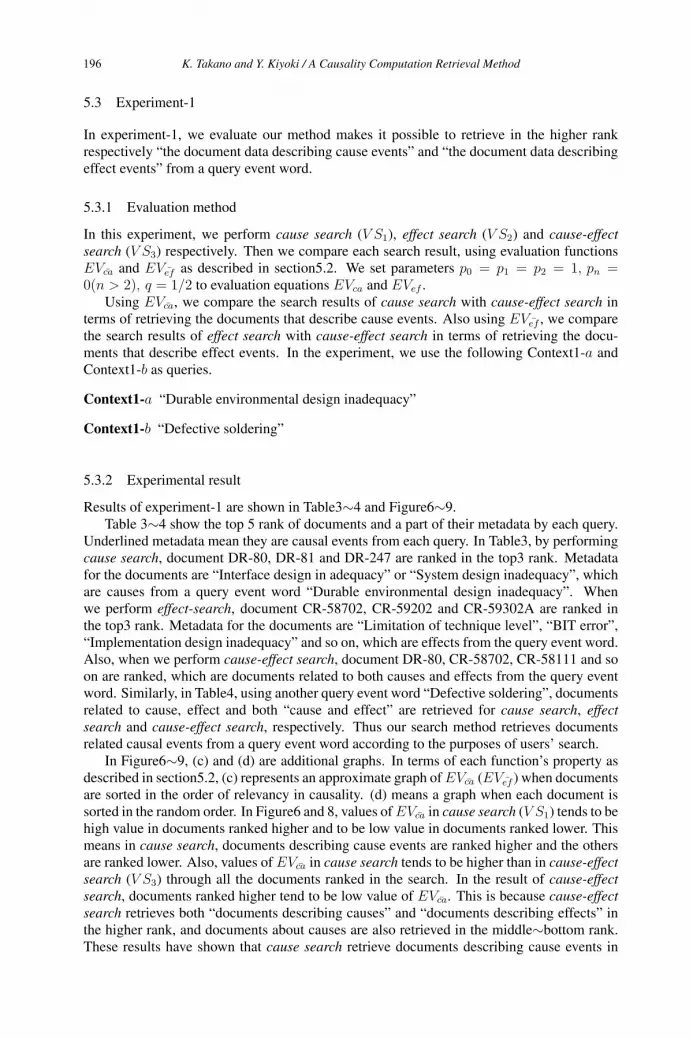
5.3 Experiment-1
In experiment-1, we evaluate our method makes it possible to retrieve in the higher rankrespectively “the document data describing cause events” and “the document data describingeffect events” from a query event word.
5.3.1 Evaluation method
In this experiment, we perform cause search (V S1), effect search (V S2) and cause-effectsearch (V S3) respectively. Then we compare each search result, using evaluation functionsEVca and EVef as described in section5.2. We set parameters p0 = p1 = p2 = 1, pn =0(n > 2), q = 1/2 to evaluation equations EVca and EVef .
Using EVca, we compare the search results of cause search with cause-effect search interms of retrieving the documents that describe cause events. Also using EVef , we comparethe search results of effect search with cause-effect search in terms of retrieving the docu-ments that describe effect events. In the experiment, we use the following Context1-a andContext1-b as queries.
Context1-a “Durable environmental design inadequacy”
Context1-b “Defective soldering”
5.3.2 Experimental result
Results of experiment-1 are shown in Table3∼4 and Figure6∼9.Table 3∼4 show the top 5 rank of documents and a part of their metadata by each query.
Underlined metadata mean they are causal events from each query. In Table3, by performingcause search, document DR-80, DR-81 and DR-247 are ranked in the top3 rank. Metadatafor the documents are “Interface design in adequacy” or “System design inadequacy”, whichare causes from a query event word “Durable environmental design inadequacy”. Whenwe perform effect-search, document CR-58702, CR-59202 and CR-59302A are ranked inthe top3 rank. Metadata for the documents are “Limitation of technique level”, “BIT error”,“Implementation design inadequacy” and so on, which are effects from the query event word.Also, when we perform cause-effect search, document DR-80, CR-58702, CR-58111 and soon are ranked, which are documents related to both causes and effects from the query eventword. Similarly, in Table4, using another query event word “Defective soldering”, documentsrelated to cause, effect and both “cause and effect” are retrieved for cause search, effectsearch and cause-effect search, respectively. Thus our search method retrieves documentsrelated causal events from a query event word according to the purposes of users’ search.
In Figure6∼9, (c) and (d) are additional graphs. In terms of each function’s property asdescribed in section5.2, (c) represents an approximate graph of EVca (EVef ) when documentsare sorted in the order of relevancy in causality. (d) means a graph when each document issorted in the random order. In Figure6 and 8, values of EVca in cause search (V S1) tends to behigh value in documents ranked higher and to be low value in documents ranked lower. Thismeans in cause search, documents describing cause events are ranked higher and the othersare ranked lower. Also, values of EVca in cause search tends to be higher than in cause-effectsearch (V S3) through all the documents ranked in the search. In the result of cause-effectsearch, documents ranked higher tend to be low value of EVca. This is because cause-effectsearch retrieves both “documents describing causes” and “documents describing effects” inthe higher rank, and documents about causes are also retrieved in the middle∼bottom rank.These results have shown that cause search retrieve documents describing cause events in
K. Takano and Y. Kiyoki / A Causality Computation Retrieval Method196

Figure 6: The result (1) of Experiment-1
Figure 7: The result (2) of Experiment-1
K. Takano and Y. Kiyoki / A Causality Computation Retrieval Method 197
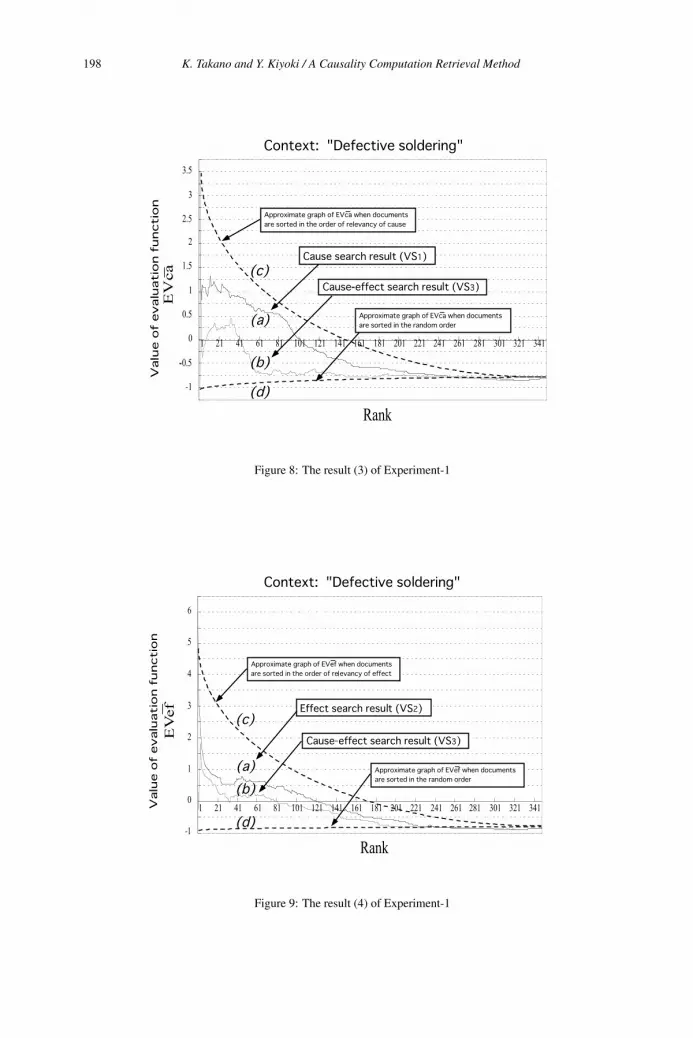
Figure 8: The result (3) of Experiment-1
Figure 9: The result (4) of Experiment-1
K. Takano and Y. Kiyoki / A Causality Computation Retrieval Method198
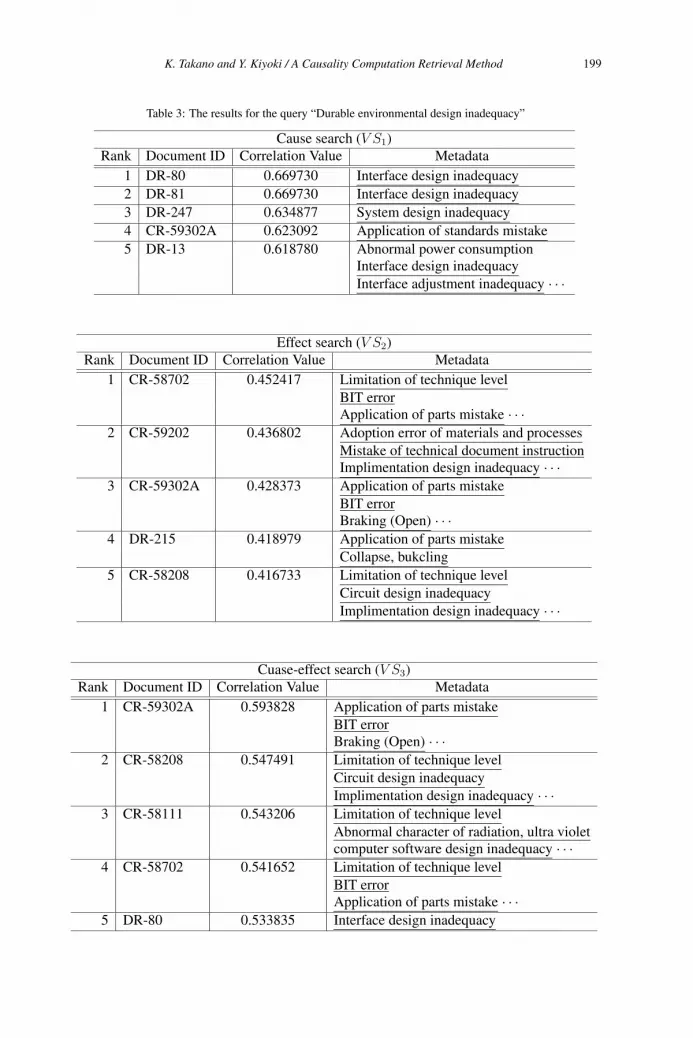
Table 3: The results for the query “Durable environmental design inadequacy”
Cause search (V S1)
Rank Document ID Correlation Value Metadata
1 DR-80 0.669730 Interface design inadequacy
2 DR-81 0.669730 Interface design inadequacy
3 DR-247 0.634877 System design inadequacy
4 CR-59302A 0.623092 Application of standards mistake
5 DR-13 0.618780 Abnormal power consumptionInterface design inadequacy
Interface adjustment inadequacy · · ·
Effect search (V S2)
Rank Document ID Correlation Value Metadata
1 CR-58702 0.452417 Limitation of technique level
BIT errorApplication of parts mistake · · ·
2 CR-59202 0.436802 Adoption error of materials and processes
Mistake of technical document instructionImplimentation design inadequacy · · ·
3 CR-59302A 0.428373 Application of parts mistake
BIT errorBraking (Open) · · ·
4 DR-215 0.418979 Application of parts mistake
Collapse, bukcling
5 CR-58208 0.416733 Limitation of technique level
Circuit design inadequacy
Implimentation design inadequacy · · ·
Cuase-effect search (V S3)
Rank Document ID Correlation Value Metadata
1 CR-59302A 0.593828 Application of parts mistake
BIT errorBraking (Open) · · ·
2 CR-58208 0.547491 Limitation of technique level
Circuit design inadequacy
Implimentation design inadequacy · · ·3 CR-58111 0.543206 Limitation of technique level
Abnormal character of radiation, ultra violetcomputer software design inadequacy · · ·
4 CR-58702 0.541652 Limitation of technique level
BIT errorApplication of parts mistake · · ·
5 DR-80 0.533835 Interface design inadequacy
K. Takano and Y. Kiyoki / A Causality Computation Retrieval Method 199
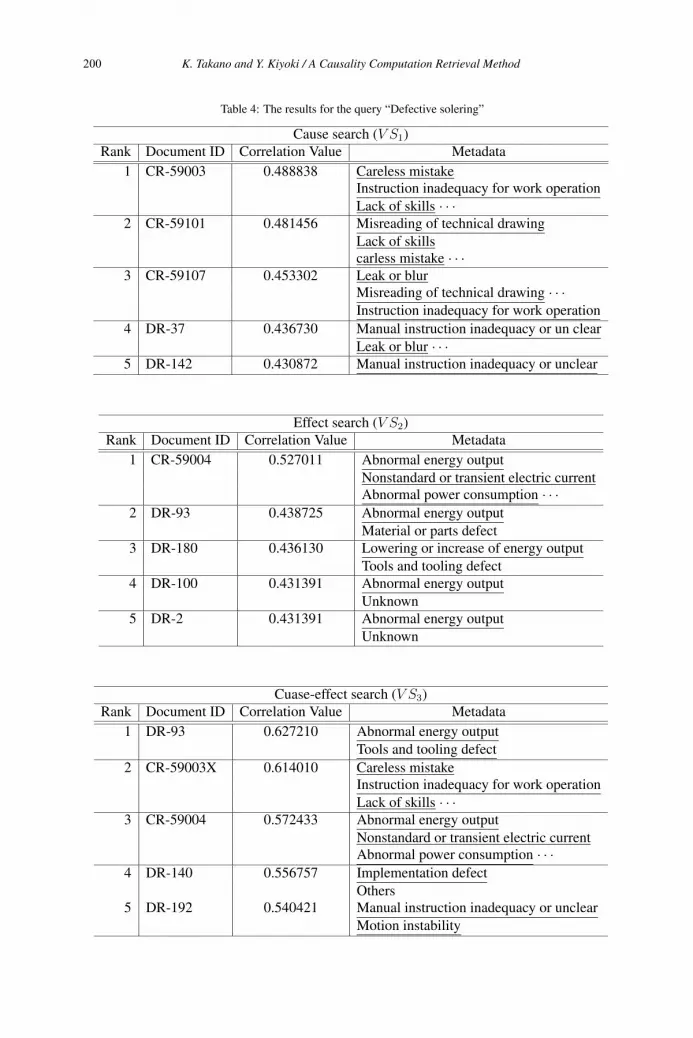
Table 4: The results for the query “Defective solering”
Cause search (V S1)
Rank Document ID Correlation Value Metadata
1 CR-59003 0.488838 Careless mistakeInstruction inadequacy for work operation
Lack of skills · · ·2 CR-59101 0.481456 Misreading of technical drawing
Lack of skillscarless mistake · · ·
3 CR-59107 0.453302 Leak or blurMisreading of technical drawing · · ·Instruction inadequacy for work operation
4 DR-37 0.436730 Manual instruction inadequacy or un clear
Leak or blur · · ·5 DR-142 0.430872 Manual instruction inadequacy or unclear
Effect search (V S2)
Rank Document ID Correlation Value Metadata
1 CR-59004 0.527011 Abnormal energy output
Nonstandard or transient electric currentAbnormal power consumption · · ·
2 DR-93 0.438725 Abnormal energy output
Material or parts defect
3 DR-180 0.436130 Lowering or increase of energy output
Tools and tooling defect
4 DR-100 0.431391 Abnormal energy output
Unknown
5 DR-2 0.431391 Abnormal energy output
Unknown
Cuase-effect search (V S3)
Rank Document ID Correlation Value Metadata
1 DR-93 0.627210 Abnormal energy output
Tools and tooling defect
2 CR-59003X 0.614010 Careless mistakeInstruction inadequacy for work operation
Lack of skills · · ·3 CR-59004 0.572433 Abnormal energy output
Nonstandard or transient electric currentAbnormal power consumption · · ·
4 DR-140 0.556757 Implementation defect
Others5 DR-192 0.540421 Manual instruction inadequacy or unclear
Motion instability
K. Takano and Y. Kiyoki / A Causality Computation Retrieval Method200
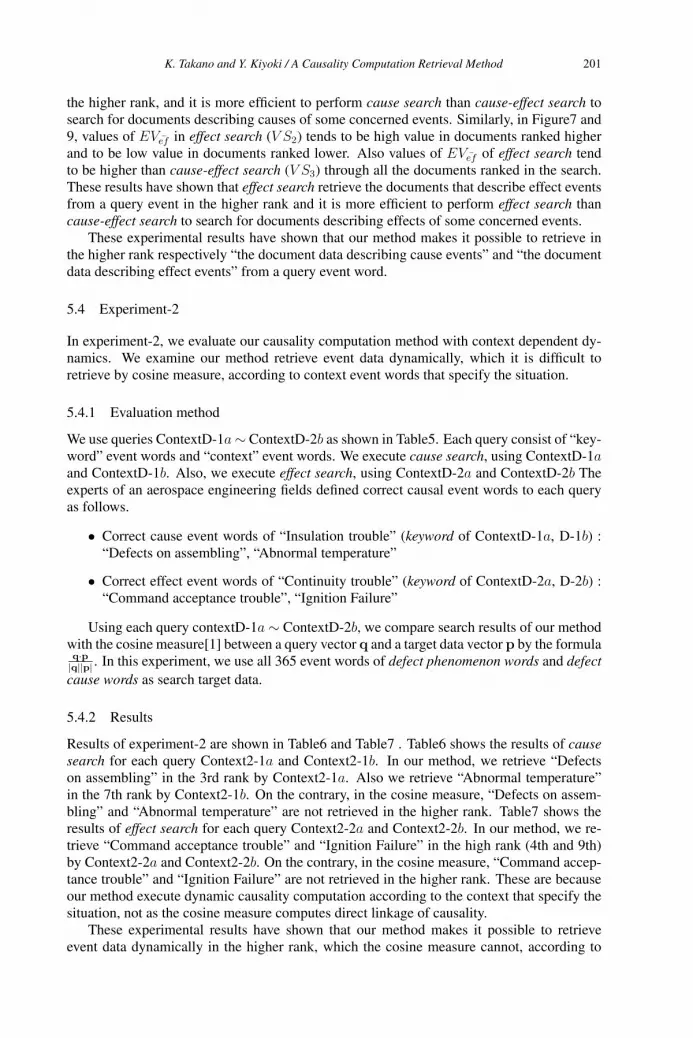
the higher rank, and it is more efficient to perform cause search than cause-effect search tosearch for documents describing causes of some concerned events. Similarly, in Figure7 and9, values of EVef in effect search (V S2) tends to be high value in documents ranked higherand to be low value in documents ranked lower. Also values of EVef of effect search tendto be higher than cause-effect search (V S3) through all the documents ranked in the search.These results have shown that effect search retrieve the documents that describe effect eventsfrom a query event in the higher rank and it is more efficient to perform effect search thancause-effect search to search for documents describing effects of some concerned events.
These experimental results have shown that our method makes it possible to retrieve inthe higher rank respectively “the document data describing cause events” and “the documentdata describing effect events” from a query event word.
5.4 Experiment-2
In experiment-2, we evaluate our causality computation method with context dependent dy-namics. We examine our method retrieve event data dynamically, which it is difficult toretrieve by cosine measure, according to context event words that specify the situation.
5.4.1 Evaluation method
We use queries ContextD-1a ∼ ContextD-2b as shown in Table5. Each query consist of “key-word” event words and “context” event words. We execute cause search, using ContextD-1aand ContextD-1b. Also, we execute effect search, using ContextD-2a and ContextD-2b Theexperts of an aerospace engineering fields defined correct causal event words to each queryas follows.
• Correct cause event words of “Insulation trouble” (keyword of ContextD-1a, D-1b) :“Defects on assembling”, “Abnormal temperature”
• Correct effect event words of “Continuity trouble” (keyword of ContextD-2a, D-2b) :“Command acceptance trouble”, “Ignition Failure”
Using each query contextD-1a ∼ ContextD-2b, we compare search results of our methodwith the cosine measure[1] between a query vector q and a target data vector p by the formulaq·p|q||p| . In this experiment, we use all 365 event words of defect phenomenon words and defectcause words as search target data.
5.4.2 Results
Results of experiment-2 are shown in Table6 and Table7 . Table6 shows the results of causesearch for each query Context2-1a and Context2-1b. In our method, we retrieve “Defectson assembling” in the 3rd rank by Context2-1a. Also we retrieve “Abnormal temperature”in the 7th rank by Context2-1b. On the contrary, in the cosine measure, “Defects on assem-bling” and “Abnormal temperature” are not retrieved in the higher rank. Table7 shows theresults of effect search for each query Context2-2a and Context2-2b. In our method, we re-trieve “Command acceptance trouble” and “Ignition Failure” in the high rank (4th and 9th)by Context2-2a and Context2-2b. On the contrary, in the cosine measure, “Command accep-tance trouble” and “Ignition Failure” are not retrieved in the higher rank. These are becauseour method execute dynamic causality computation according to the context that specify thesituation, not as the cosine measure computes direct linkage of causality.
These experimental results have shown that our method makes it possible to retrieveevent data dynamically in the higher rank, which the cosine measure cannot, according to
K. Takano and Y. Kiyoki / A Causality Computation Retrieval Method 201
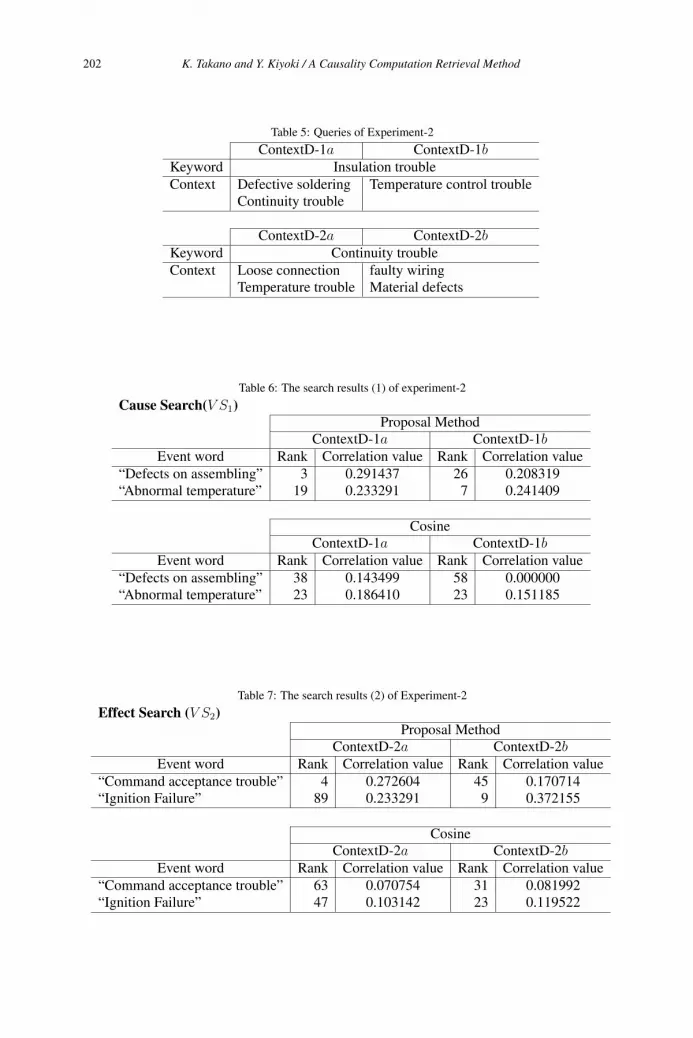
Table 5: Queries of Experiment-2
ContextD-1a ContextD-1bKeyword Insulation trouble
Context Defective soldering Temperature control troubleContinuity trouble
ContextD-2a ContextD-2bKeyword Continuity trouble
Context Loose connection faulty wiringTemperature trouble Material defects
Table 6: The search results (1) of experiment-2
Cause Search(V S1)Proposal Method
ContextD-1a ContextD-1bEvent word Rank Correlation value Rank Correlation value
“Defects on assembling” 3 0.291437 26 0.208319“Abnormal temperature” 19 0.233291 7 0.241409
CosineContextD-1a ContextD-1b
Event word Rank Correlation value Rank Correlation value
“Defects on assembling” 38 0.143499 58 0.000000“Abnormal temperature” 23 0.186410 23 0.151185
Table 7: The search results (2) of Experiment-2
Effect Search (V S2)Proposal Method
ContextD-2a ContextD-2bEvent word Rank Correlation value Rank Correlation value
“Command acceptance trouble” 4 0.272604 45 0.170714“Ignition Failure” 89 0.233291 9 0.372155
CosineContextD-2a ContextD-2b
Event word Rank Correlation value Rank Correlation value
“Command acceptance trouble” 63 0.070754 31 0.081992“Ignition Failure” 47 0.103142 23 0.119522
K. Takano and Y. Kiyoki / A Causality Computation Retrieval Method202
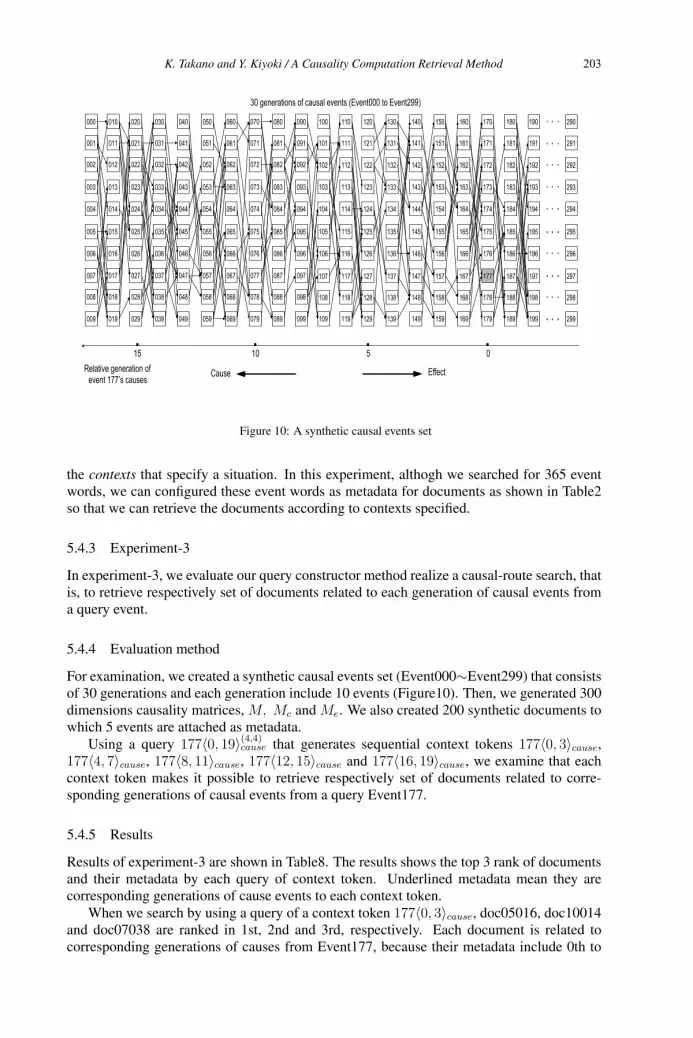
�
�
�
�
&
'
(
.
�
��
��
�
��
��
�&
�'
�(
�.
�
��
��
�
��
��
�&
�'
�(
�.
�
�
�
�
&
'
(
.
�
��
��
�
��
��
�&
�'
�(
�.
�
��
��
�
��
��
�&
�'
�(
�.
&
&�
&�
&
&�
&�
&&
&'
&(
&.
'
'�
'�
'
'�
'�
'&
''
'(
'.
(
(�
(�
(
(�
(�
(&
('
((
(.
.
.�
.�
.
.�
.�
.&
.'
.(
..
�
��
��
�
��
��
�&
�'
�(
�.
��
���
���
��
���
���
��&
��'
��(
��.
��
���
���
��
���
���
��&
��'
��(
��.
�
� �
� �
�
� �
� �
� &
� '
� (
� .
��
���
���
��
���
���
��&
��'
��(
��.
��
���
���
��
���
���
��&
��'
��(
��.
�&
�&�
�&�
�&
�&�
�&�
�&&
�&'
�&(
�&.
�'
�'�
�'�
�'
�'�
�'�
�'&
�''
�'(
�'.
�(
�(�
�(�
�(
�(�
�(�
�(&
�('
�((
�(.
�.
�.�
�.�
�.
�.�
�.�
�.&
�.'
�.(
�..
�.
�.�
�.�
�.
�.�
�.�
�.&
�.'
�.(
�..
���������� ������ �"������ �)��������������..+
!�"�������������������������'' ���� �
����
��� �� ������
Figure 10: A synthetic causal events set
the contexts that specify a situation. In this experiment, althogh we searched for 365 eventwords, we can configured these event words as metadata for documents as shown in Table2so that we can retrieve the documents according to contexts specified.
5.4.3 Experiment-3
In experiment-3, we evaluate our query constructor method realize a causal-route search, thatis, to retrieve respectively set of documents related to each generation of causal events froma query event.
5.4.4 Evaluation method
For examination, we created a synthetic causal events set (Event000∼Event299) that consistsof 30 generations and each generation include 10 events (Figure10). Then, we generated 300dimensions causality matrices, M, Mc and Me. We also created 200 synthetic documents towhich 5 events are attached as metadata.
Using a query 177〈0, 19〉(4,4)cause that generates sequential context tokens 177〈0, 3〉cause,
177〈4, 7〉cause, 177〈8, 11〉cause, 177〈12, 15〉cause and 177〈16, 19〉cause, we examine that eachcontext token makes it possible to retrieve respectively set of documents related to corre-sponding generations of causal events from a query Event177.
5.4.5 Results
Results of experiment-3 are shown in Table8. The results shows the top 3 rank of documentsand their metadata by each query of context token. Underlined metadata mean they arecorresponding generations of cause events to each context token.
When we search by using a query of a context token 177〈0, 3〉cause, doc05016, doc10014and doc07038 are ranked in 1st, 2nd and 3rd, respectively. Each document is related tocorresponding generations of causes from Event177, because their metadata include 0th to
K. Takano and Y. Kiyoki / A Causality Computation Retrieval Method 203

Table 8: The results for the query “177〈0, 19〉(4,4)cause”
Context token Rank Document ID Correlation Value Metadata
177〈0, 3〉cause 1 doc05016 0.4926 167 162 158 131 1302 doc10014 0.4783 218 167 165 158 1543 doc07038 0.4528 175 158 157 154 144
177〈4, 7〉cause 1 doc05032 0.5205 139 135 129 118 1012 doc05008 0.5147 135 125 118 114 1063 doc05013 0.5071 137 119 109 099 092
177〈8, 11〉cause 1 doc03044 0.4642 081 079 076 071 0642 doc05018 0.3667 066 059 034 025 0213 doc03038 0.3547 078 077 076 066 061
177〈12, 15〉cause 1 doc05018 0.5752 066 059 034 025 0212 doc03033 0.5662 034 030 023 013 0113 doc03047 0.5280 025 019 011 008 001
177〈16, 19〉cause 1 doc03047 0.4371 025 019 011 008 0012 doc10038 0.3607 065 050 010 003 0013 doc03033 0.3273 034 030 023 013 011
3rd generations of causes (Event158, Event131 and so on) from Event177. Also, by us-ing a query of a context token 177〈4, 7〉cause, doc05032, doc05008 and doc0513 are rankedin 1st, 2nd and 3rd, respectively. Their metadata include 4th to 7th generations of causes(Event101, Event 092 and so on) from Event177, so each document is related to correspond-ing geretaions of causes from Event177. In the same way, by using each context token177〈8, 11〉cause, 177〈12, 15〉cause and 177〈16, 19〉cause, documents related to correspondinggeretaions of causes from Event177 are retrieved respectively. In addition, doc05018 is re-trieved by both context tokens 177〈8, 11〉cause and 177〈12, 15〉cause. Similarly, doc03033 anddoc03047 are retrieved by both context tokens 177〈12, 15〉cause and 177〈16, 19〉cause. Thesedocuments are related to long range of generations of causes from Event177. Thus, usingsequential context tokens, we can find such documents related to long range of generationsof causality events.
The results shows our query constructor method realizes a causal-route search, whichretrieves respectively set of documents related to each generation of causal events from aquery event.
6 Conclusion
In this paper, we presented two essential methods for causality search, which are a causalitycomputation method with context dependent dynamics and a query construction method fora causality route search. We have implemented a search system for nonconformance infor-mation of an aerospace engineering fields and performed several experiments to show theeffectiveness and the feasibility of our search method.
Our search method makes it possible to rank highly the documents that describe causesor effects in the context that specify the situation of occurrent events. In our search method,to discover causes of some concerned events, we give context event words for specifying thecauses, then the documents that describe cause events can be retrieved in the context. Forstudying effects, we give context event words to specify the effects so that we can retrieve thedocuments that describes effects according to each context. Also, we realize causality route
K. Takano and Y. Kiyoki / A Causality Computation Retrieval Method204

search by a query construction method that generates context tokens representing sequentialgenerations of causal events. A query consisted of the sequential context tokens makes itpossible to retrieve respectively set of documents related to each generation of causal eventsfrom a query event.
As our future work, we will apply our method to a large scale set of document data andperform quantitative evaluations.
7 Acknowledgements
I would like to appreciate Taizo Zushi in Keio University, Ikunao Tada, Misa Namiuchi (atthat time) in Japan Aerospace Exploration Agency and Haruo Naka in Sho Engineering Corp.for their detailed comments and suggestions.
References
[1] Baeza-Yates, R., Ribeiro-Neto, B.: “Modern Information Retrieval”, Addison Wesley, 1999.
[2] Bollen, K.A.: Structural Equations With Latent Variables, John Wiley & Sons Inc (1989).
[3] Deerwester, S.C., Dumais, S.T., Furnas, G.W., Landauer, T.K. and Harshman, R.A.: “Indexing by latentsemantic analysis,” Journal of the American Society for Information Science, Vol.41, No.6, pp.391–407,
1991.
[4] Fung., R and Del Favero, B.:“ Applying bayesian networks to Information Retrieval,” Communications
of the ACM, Vol.38, No.3, pp. 42-48, 1995.
[5] Kiyoki, Y. and Kitagawa, T., “A metadatabase system for supporting semantic interoperability in multi-databases,” Information Modelling and Knowledge Bases, IOS Press, vol. V, pp. 287-298, 1994.
[6] Kiyoki, Y., Kitagawa, T. and Hayama, T.:“A metadatabase system for semantic image search by a mathe-
matical model of meaning,” ACM SIGMOD Record, Vol.23, No. 4, pp.34-41, Dec. 1994.
[7] Kiyoki, Y., Kitagawa, T. and Hayama, T.: “A Metadatabase System for Semantic Image Search by a
Mathematical Model of Meaning,” Multimedia Data Management – using metadata to integrate and apply
digital media –, McGrawHill, A. Sheth and W. Klas(editors), Chapter 7, 1998.
[8] Pearl, J.: “Probabilistic Reasoning in Intelligent Systems,” Morgan Kaufmann, San Francisco, CA (1988).
[9] Salton. G.: “The SMART Retrieval System – Experiments in Automatic Document Processing,” Prentice
Hall Inc., Englewood Cliffs, NJ, 1971.
[10] Salton, G., Wong, A. and Yang, C.S.: “A vector space model for automatic indexing,” Comm. ACM,
Vol.18, No.11, pp.613–620, 1975.
[11] Tada, I., Namiuchi, M., Nakagawa, K., Takano, K., Zushi, T., and Kiyoki, Y.: “An Application of the Se-
mantic Associative Search Method to Nonconformance Information Retrieval,” International Symposium
on Space Technology andScience, June 2004.
[12] Zushi, T., Takano, K., Kiyoki, Y., “A Causality Computation Method using a Vector Space Model and itsApplication to Aerospace Engineering,” International Conference on Advances in Intelligent Systems –
Theory and Applications (AISTA 2004), CD-ROM(5 pages), 2004.
[13] Zushi, T., Takano, K., Kiyoki, Y., “A Vector Space Retrieval Method with Causal Relationship Com-putation Functions for Event Data,” IEEE International Symposium on Applications and the Internet
(SAINT 2005) - the International Workshop on Cyberspace Technologies and Societies(IWCTS 2005),
IEEE Computer Society Press, pp.430–433, 2005.
K. Takano and Y. Kiyoki / A Causality Computation Retrieval Method 205
A Method of Automatic MetadataExtraction Corresponding to the Impression
by Sound of the Words
Hidenori HOMMA1, Takafumi NAKANISHI2, and Takashi KITAGAWA3
1,3 Graduate School of Systems and Information Engineering University of Tsukuba2 National Institute of Information and Communications Technology
E-mail: 1 [email protected], 2 [email protected],3 [email protected]
Abstract In this paper, we propose a method of automatic metadata extraction cor-responding to impressions of the word’s sounds. Generally, a word and a phraseevoke various impressions. The impressions are evoked by not only the semanticsof the word but also its sound. Especially, sounds of words are important to under-stand mutual emotion effectively in our communication. In order to realize searchcorresponding to the impression of words, it is important that we realize extractionfunction based on impressions for the sounds of arbitrary words. The correlation rela-tionships between impressions and sounds in Japanese are indicated by this researchcalled “Onso” which means the aspect of sound in Japanese. This method realizes ex-traction of metadata corresponding to impressions by the sound of the words utilizingthe research of “Onso”. We can realize the semantic associative search for impressionof the sounds of arbitrary words by applying this method.
1. Introduction
A large amount of media data have been distributed in wide-area networks. In this envi-ronment, it is a heavy workload for users to search or retrieve media data by only using logicalinformation when we communicate with a computer. For this reason, methodology for re-trieving media data corresponding to user’s impressions and reducing the workload turns outto be an important issue. One of the most important issues is how to extract the metadatacorresponding to user’s impressions for media data automatically.
We target impressions of arbitrary words and phrases. Generally, a word and a phraseevoke various impressions. The impressions are evoked by not only the semantics of the wordbut also its sounds including in phonologic. Especially, the sounds of words are important
M. Duží et al. (Eds.)Information Modelling and Knowledge Bases XVIII
IOS Press, 2007© 2007 The authors and IOS Press. All rights reserved.
206
to understand mutual emotion effectively in our communication[1]. In order to search orretrieve media data corresponding to the impression of words, it’s important that we realizeextraction function based on impressions for the sounds of arbitrary words. Assuming thatwe can realize an extraction method of metadata corresponding to impressions for the soundsof arbitrary words, we can realize an associative search by the impressions for the sounds ofthe words.
We have already proposed a semantic associative search method based on a mathematicalmodel of meaning[2, 3]. This model is applied to extract semantically related words by givingcontext words. This model can measure the relation between each word, media data and soon.
In this paper, we propose a new method of automatic metadata extraction correspondingto impressions of the sounds of words. This method can extract metadata from arbitrarywords corresponding to impressions by their sounds. The correlation relationships betweenimpressions and sounds in Japanese are indicated by this research called “Onso”[1]. The“Onso” means the aspect of sound in Japanese. This method applies the “Onso”. This methodrealizes extraction of metadata corresponding to the “Onso” from words or phrases.
The realization of an integrative method for handling of heterogeneous media representingvarious information like “Onso” can be the first step of the efficient communication mediacorresponding to human’s Kansei. We can realize the semantic associative search for impres-sions of the sounds of words by applying this method. In addition, it’s possible to realize lessdemanding interface by this method. This method can realize new search function for mediadata from various perspectives.
2. Mathematical model of meaning
The mathematical model of meaning[2, 3] provides semantic functions for computingspecific meanings of words which are used for retrieving media data unambiguously and dy-namically. The main feature of this model is that the semantic associative search is performedin the orthogonal semantic space. For details, see references [2, 3].
The mathematical model of meaning consists of:
1. Creation of a metadata spaceMDSCreate an orthonormal space for mapping the media data represented by vectors (here-after, this space is referred to as the metadata spaceMDS). The specific procedure isshown below.
Assume that m basic data and m feature vectors di(i = 1, · · · ,m), which enumerate nfeatures ( f1, f2, · · · , fn) for each basic data, are given. For given di, the data matrixM(Figure.1) is defined as the m × n matrix whose i-th row is di. Then, each column ofthe matrix is normalized by the 2-norm in order to create the matrix M.
(a) The correlation matrix MTM of M is computed, where MT represents the trans-pose of M.
H. Homma et al. / A Method of Automatic Metadata Extraction 207

f1 f2 · · · fn
d1 →d2 →
M...dm →
Figure 1: Representation of metadata items by matrix M
(b) The eigenvalue decomposition of MTM is computed.
MTM = Q
⎛⎜⎜⎜⎜⎜⎜⎜⎜⎜⎜⎜⎜⎜⎜⎜⎝
λ1. . .
λν0.·0
⎞⎟⎟⎟⎟⎟⎟⎟⎟⎟⎟⎟⎟⎟⎟⎟⎠
QT,
0 ≤ ν ≤ n.
The orthogonal matrix Q is defined by
Q = (q1, q2, · · · , qn)
where qi’s are the normalized eigenvectors of MTM. We call the eigenvectors“semantic elements” hereafter. Here, all the eigenvalues are real and all the eigen-vectors are mutually orthogonal because the matrix MTM is symmetric.
(c) Defining the metadata spaceMDS
MDS := span(q1, q2, · · · , qν).which is a linear space generated by linear combinations of {q1, · · · , qν}. We notethat {q1, · · · , qν} is an orthonormal basis ofMDS.
2. Representation of media data in n-dimensional vectorsEach media data is represented in the n-dimensional vector whose elements correspondto n features. The specific procedure is shown below.
A metadata for media data P is represented in t weighted impression words o1, o2, · · · , ot.These impression words are extracted from media-lexicon transformation operator shownin Section 3.1.
P = {o1, o2, · · · , ot}.Each impression word is defined as an n dimensional vector by using the same featuresas the features of the data matrix M.
oi = ( fi1, fi2, · · · , fin)
The weighted impression words o1, o2, · · · , ot are composed to form the media data vec-tor, which is represented as an n dimensional vector. The media data is represented asmedia data vector which is n dimensional vector by using same features as the featuresof the data matrix M.
H. Homma et al. / A Method of Automatic Metadata Extraction208
3. Mapping a media data vector into the metadata spaceMDSA media data vector which is represented in n-dimensional vectors is mapped into themetadata spaceMDS by computing the Fourier expansion for a media data vector andsemantic elements.
4. Semantic associative searchA set of all the projections from the metadata spaceMDS to the invariant subspaces(eigenspaces) is defined. Each subspace represents a phase of meaning and it corre-sponds to a context. A subspace of the metadata spaceMDS is selected according tothe context. An association of a media data is measured in the selected subspace.
3. A method of automatic metadata extraction corresponding to the impression bysound of the words
In this section, we represent an implementation method of automatic metadata extractioncorresponding to the impression by the sounds of words.
We have already proposed a media-lexicon transformation operator for media data[4].This operator can extract metadata which represents the impression of media data as weightedwords utilizing a research work done by an expert of a specific disciplinary area. This pro-posed method is realized by applying a framework of the media-lexicon transformation oper-ator.
In section 3.1, we introduce a media-lexicon transformation operator. In section 3.2, werepresent a new method of automatic metadata extraction corresponding to the impression bythe sound of words.
3.1. A framework of media-lexicon transformation operator
In Figure 2, we show a framework of the media-lexicon transformation operatorML[4].ML is an operator which represents a relation between media data and some group of wordsets given by a research work by an expert of a specific disciplinary area. The operatorMLis defined as
ML(Md) : Md �→ Ws
where, Md is an expression of media data and Ws is a specific set of words or a collection ofword sets usually with weights. The media data Md is a specific expression of the media datausually in a digital format. The word set Ws is selected by an expert to express impression ofthe specific media.
By this operatorML, we can search or retrieve the media data by arbitrary words issuedas a query, using the mathematical model of meaning[2, 3] which relates any given words tocertain word groups dependent on the given context.
H. Homma et al. / A Method of Automatic Metadata Extraction 209
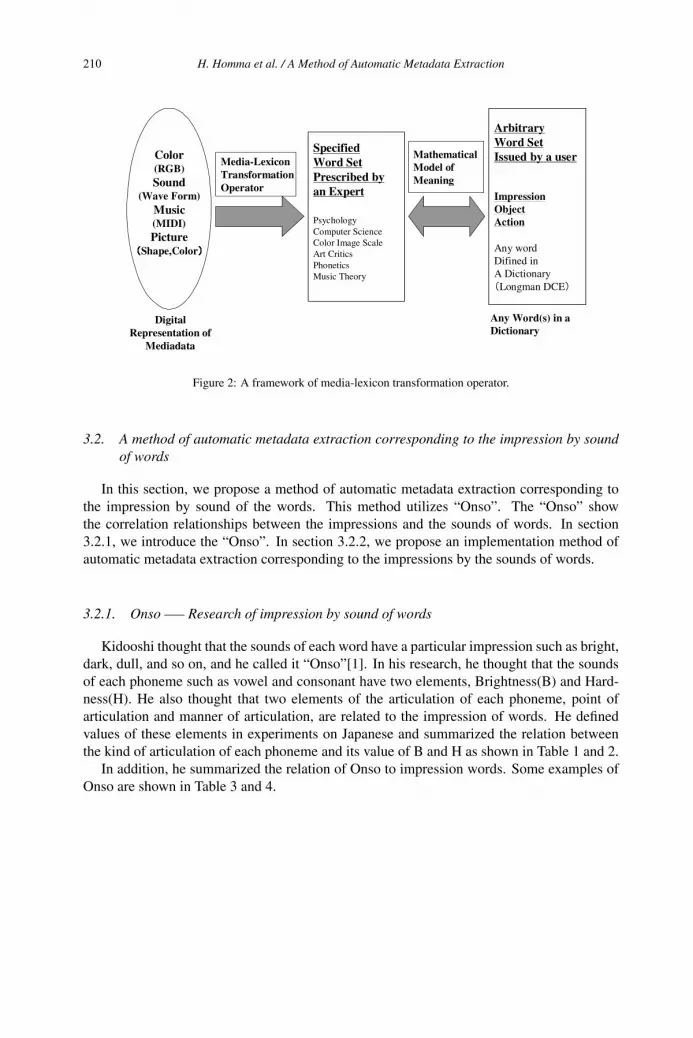
Color(RGB)Sound
(Wave Form)Music(MIDI)Picture
Shape,Color
SpecifiedWord SetPrescribed byan Expert
PsychologyComputer ScienceColor Image ScaleArt CriticsPhoneticsMusic Theory
ArbitraryWord SetIssued by a user
Impression Object Action
Any wordDifined in A DictionaryLongman DCE
Media-LexiconTransformationOperator
MathematicalModel ofMeaning
Digital Representation of
Mediadata
Any Word(s) in a Dictionary
Figure 2: A framework of media-lexicon transformation operator.
3.2. A method of automatic metadata extraction corresponding to the impression by soundof words
In this section, we propose a method of automatic metadata extraction corresponding tothe impression by sound of the words. This method utilizes “Onso”. The “Onso” showthe correlation relationships between the impressions and the sounds of words. In section3.2.1, we introduce the “Onso”. In section 3.2.2, we propose an implementation method ofautomatic metadata extraction corresponding to the impressions by the sounds of words.
3.2.1. Onso —– Research of impression by sound of words
Kidooshi thought that the sounds of each word have a particular impression such as bright,dark, dull, and so on, and he called it “Onso”[1]. In his research, he thought that the soundsof each phoneme such as vowel and consonant have two elements, Brightness(B) and Hard-ness(H). He also thought that two elements of the articulation of each phoneme, point ofarticulation and manner of articulation, are related to the impression of words. He definedvalues of these elements in experiments on Japanese and summarized the relation betweenthe kind of articulation of each phoneme and its value of B and H as shown in Table 1 and 2.
In addition, he summarized the relation of Onso to impression words. Some examples ofOnso are shown in Table 3 and 4.
H. Homma et al. / A Method of Automatic Metadata Extraction210
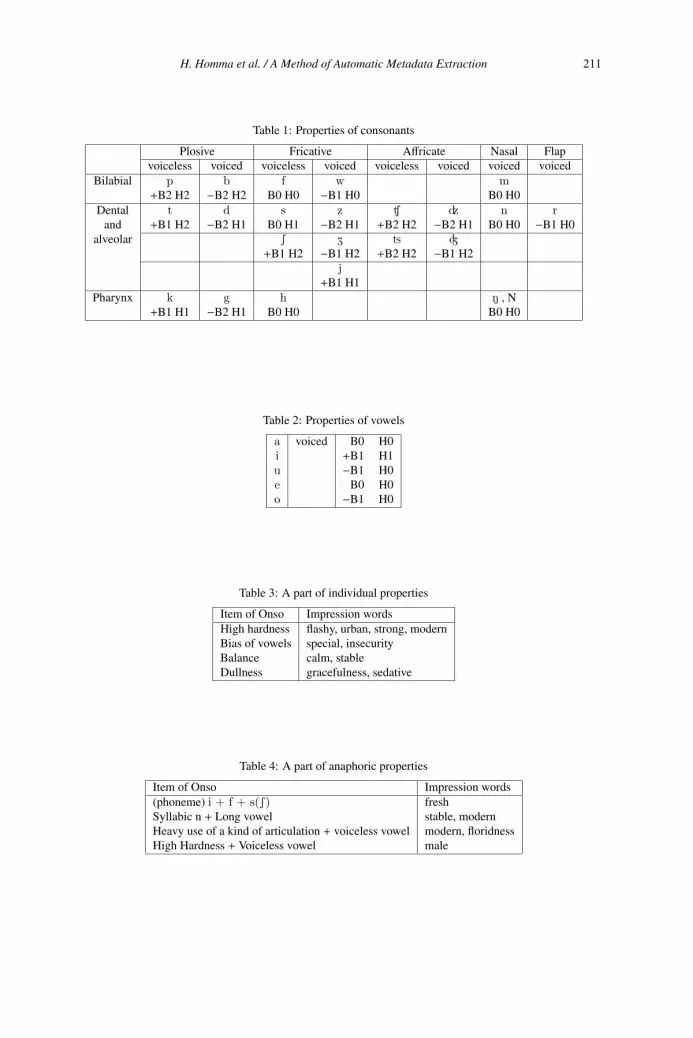
Table 1: Properties of consonants
Plosive Fricative Affricate Nasal Flapvoiceless voiced voiceless voiced voiceless voiced voiced voiced
Bilabial p b f w m+B2 H2 −B2 H2 B0 H0 −B1 H0 B0 H0
Dental t d s z Ù dz n rand +B1 H2 −B2 H1 B0 H1 −B2 H1 +B2 H2 −B2 H1 B0 H0 −B1 H0
alveolar S Z ţ Ã+B1 H2 −B1 H2 +B2 H2 −B1 H2
j+B1 H1
Pharynx k ě h N , N+B1 H1 −B2 H1 B0 H0 B0 H0
Table 2: Properties of vowels
a voiced B0 H0i +B1 H1u −B1 H0e B0 H0o −B1 H0
Table 3: A part of individual properties
Item of Onso Impression wordsHigh hardness flashy, urban, strong, modernBias of vowels special, insecurityBalance calm, stableDullness gracefulness, sedative
Table 4: A part of anaphoric properties
Item of Onso Impression words(phoneme) i + f + s(S) freshSyllabic n + Long vowel stable, modernHeavy use of a kind of articulation + voiceless vowel modern, floridnessHigh Hardness + Voiceless vowel male
H. Homma et al. / A Method of Automatic Metadata Extraction 211
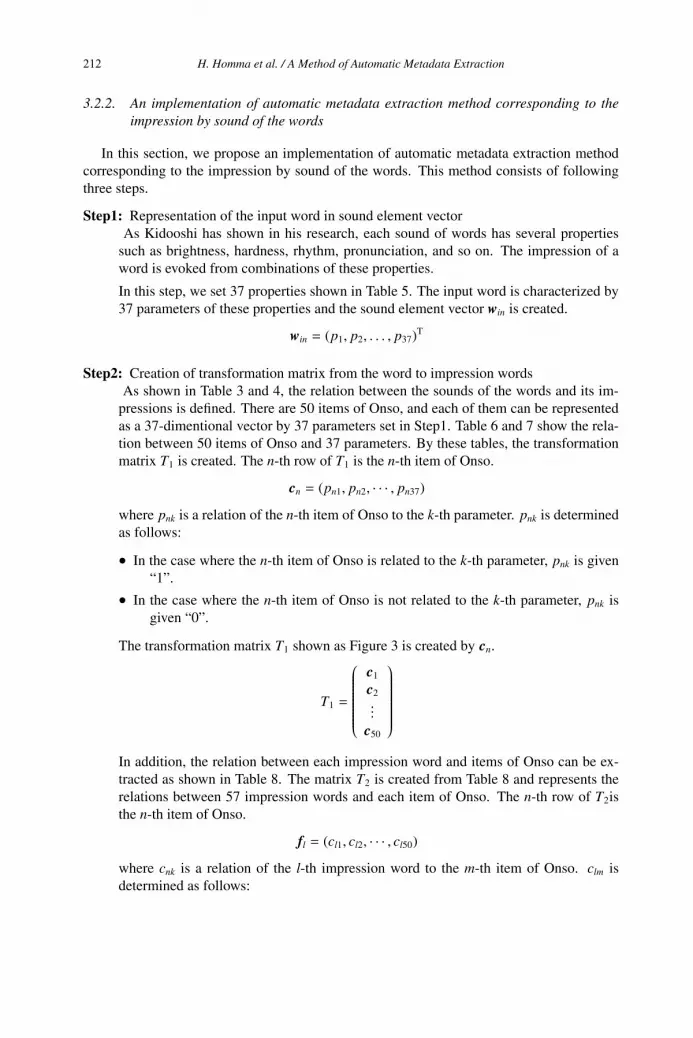
3.2.2. An implementation of automatic metadata extraction method corresponding to theimpression by sound of the words
In this section, we propose an implementation of automatic metadata extraction methodcorresponding to the impression by sound of the words. This method consists of followingthree steps.
Step1: Representation of the input word in sound element vectorAs Kidooshi has shown in his research, each sound of words has several properties
such as brightness, hardness, rhythm, pronunciation, and so on. The impression of aword is evoked from combinations of these properties.
In this step, we set 37 properties shown in Table 5. The input word is characterized by37 parameters of these properties and the sound element vector win is created.
win = (p1, p2, . . . , p37)T
Step2: Creation of transformation matrix from the word to impression wordsAs shown in Table 3 and 4, the relation between the sounds of the words and its im-
pressions is defined. There are 50 items of Onso, and each of them can be representedas a 37-dimentional vector by 37 parameters set in Step1. Table 6 and 7 show the rela-tion between 50 items of Onso and 37 parameters. By these tables, the transformationmatrix T1 is created. The n-th row of T1 is the n-th item of Onso.
cn = (pn1, pn2, · · · , pn37)
where pnk is a relation of the n-th item of Onso to the k-th parameter. pnk is determinedas follows:
• In the case where the n-th item of Onso is related to the k-th parameter, pnk is given“1”.
• In the case where the n-th item of Onso is not related to the k-th parameter, pnk isgiven “0”.
The transformation matrix T1 shown as Figure 3 is created by cn.
T1 =
⎛⎜⎜⎜⎜⎜⎜⎜⎜⎜⎜⎜⎜⎜⎜⎜⎝
c1
c2...
c50
⎞⎟⎟⎟⎟⎟⎟⎟⎟⎟⎟⎟⎟⎟⎟⎟⎠
In addition, the relation between each impression word and items of Onso can be ex-tracted as shown in Table 8. The matrix T2 is created from Table 8 and represents therelations between 57 impression words and each item of Onso. The n-th row of T2isthe n-th item of Onso.
fl = (cl1, cl2, · · · , cl50)
where cnk is a relation of the l-th impression word to the m-th item of Onso. clm isdetermined as follows:
H. Homma et al. / A Method of Automatic Metadata Extraction212
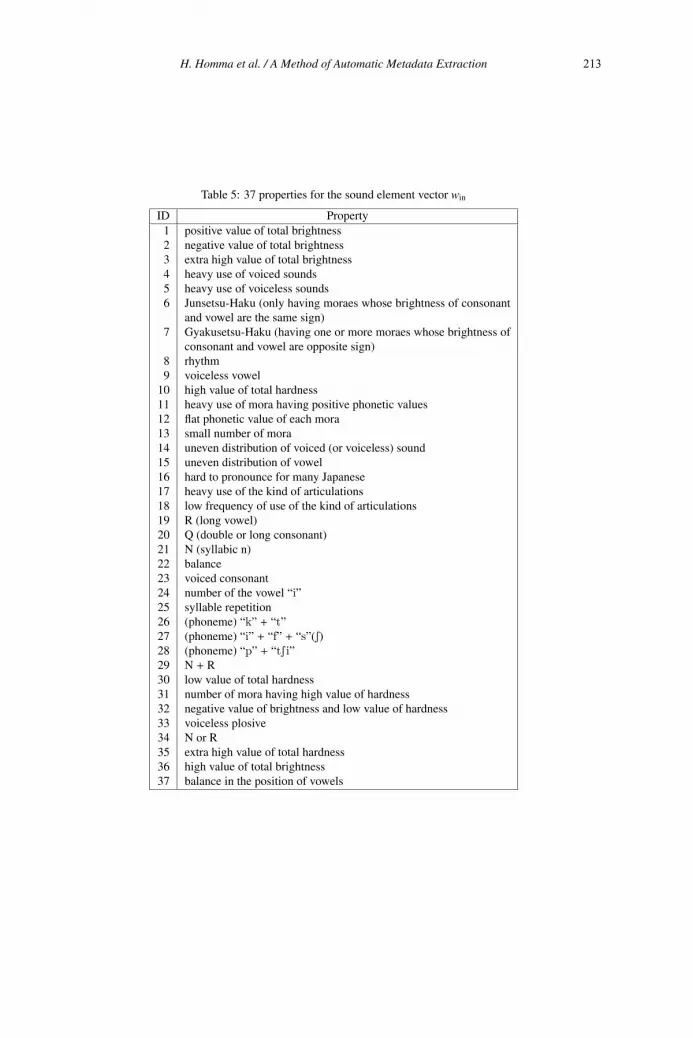
Table 5: 37 properties for the sound element vector win
ID Property1 positive value of total brightness2 negative value of total brightness3 extra high value of total brightness4 heavy use of voiced sounds5 heavy use of voiceless sounds6 Junsetsu-Haku (only having moraes whose brightness of consonant
and vowel are the same sign)7 Gyakusetsu-Haku (having one or more moraes whose brightness of
consonant and vowel are opposite sign)8 rhythm9 voiceless vowel
10 high value of total hardness11 heavy use of mora having positive phonetic values12 flat phonetic value of each mora13 small number of mora14 uneven distribution of voiced (or voiceless) sound15 uneven distribution of vowel16 hard to pronounce for many Japanese17 heavy use of the kind of articulations18 low frequency of use of the kind of articulations19 R (long vowel)20 Q (double or long consonant)21 N (syllabic n)22 balance23 voiced consonant24 number of the vowel “i”25 syllable repetition26 (phoneme) “k” + “t”27 (phoneme) “i” + “f” + “s”(S)28 (phoneme) “p” + “tSi”29 N + R30 low value of total hardness31 number of mora having high value of hardness32 negative value of brightness and low value of hardness33 voiceless plosive34 N or R35 extra high value of total hardness36 high value of total brightness37 balance in the position of vowels
H. Homma et al. / A Method of Automatic Metadata Extraction 213
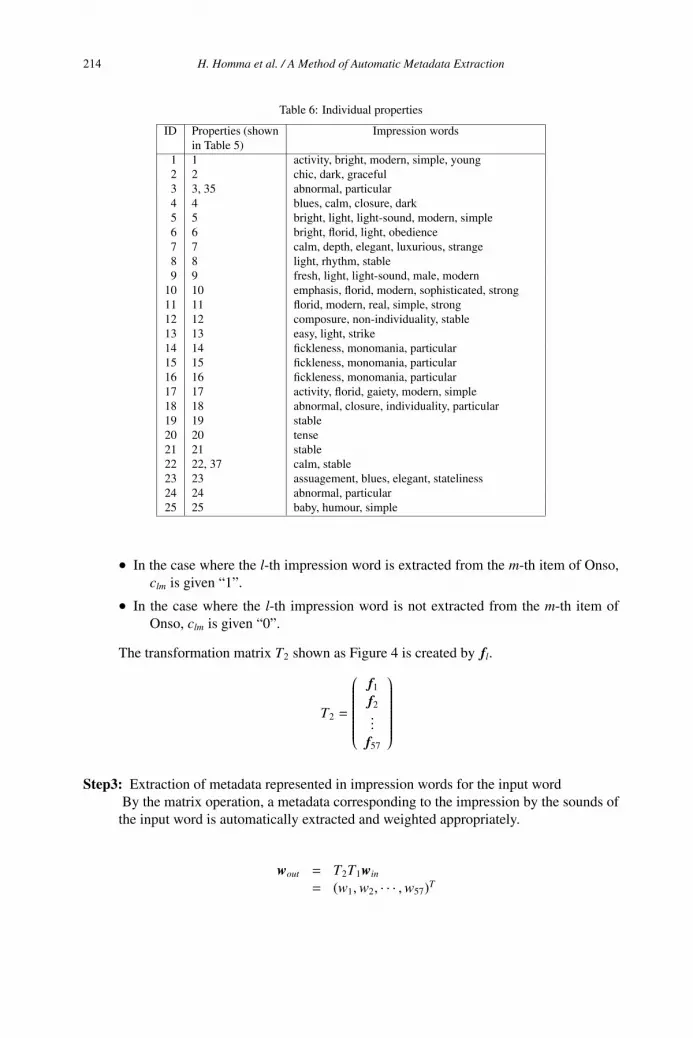
Table 6: Individual properties
ID Properties (shownin Table 5)
Impression words
1 1 activity, bright, modern, simple, young2 2 chic, dark, graceful3 3, 35 abnormal, particular4 4 blues, calm, closure, dark5 5 bright, light, light-sound, modern, simple6 6 bright, florid, light, obedience7 7 calm, depth, elegant, luxurious, strange8 8 light, rhythm, stable9 9 fresh, light, light-sound, male, modern
10 10 emphasis, florid, modern, sophisticated, strong11 11 florid, modern, real, simple, strong12 12 composure, non-individuality, stable13 13 easy, light, strike14 14 fickleness, monomania, particular15 15 fickleness, monomania, particular16 16 fickleness, monomania, particular17 17 activity, florid, gaiety, modern, simple18 18 abnormal, closure, individuality, particular19 19 stable20 20 tense21 21 stable22 22, 37 calm, stable23 23 assuagement, blues, elegant, stateliness24 24 abnormal, particular25 25 baby, humour, simple
• In the case where the l-th impression word is extracted from the m-th item of Onso,clm is given “1”.
• In the case where the l-th impression word is not extracted from the m-th item ofOnso, clm is given “0”.
The transformation matrix T2 shown as Figure 4 is created by fl.
T2 =
⎛⎜⎜⎜⎜⎜⎜⎜⎜⎜⎜⎜⎜⎜⎜⎜⎝
f1
f2...
f57
⎞⎟⎟⎟⎟⎟⎟⎟⎟⎟⎟⎟⎟⎟⎟⎟⎠
Step3: Extraction of metadata represented in impression words for the input wordBy the matrix operation, a metadata corresponding to the impression by the sounds of
the input word is automatically extracted and weighted appropriately.
wout = T2T1win
= (w1,w2, · · · ,w57)T
H. Homma et al. / A Method of Automatic Metadata Extraction214
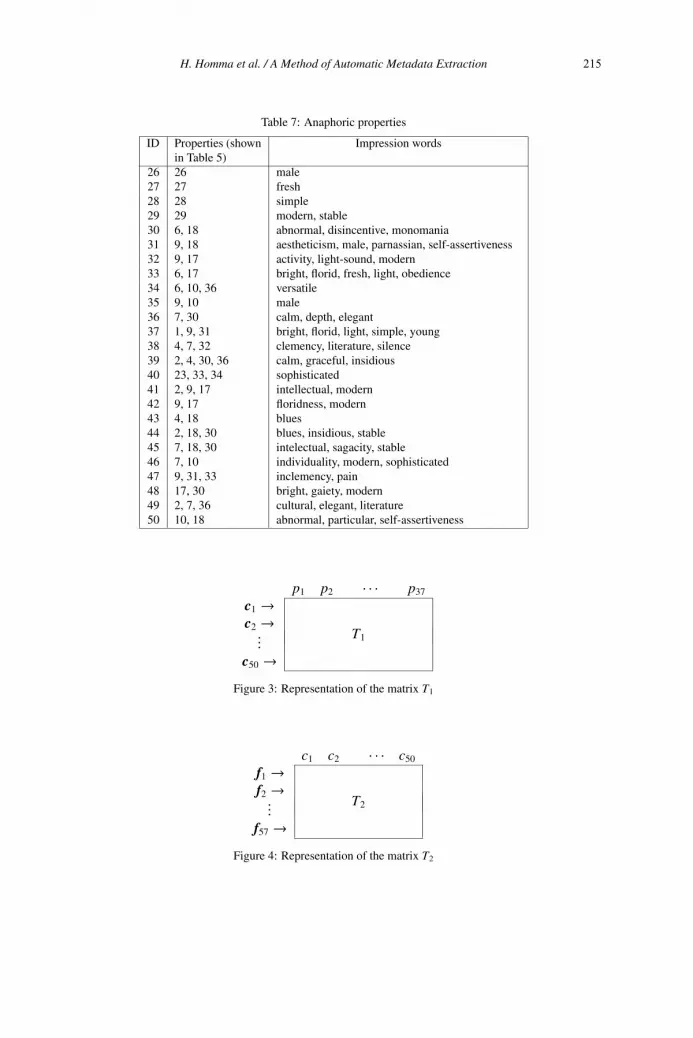
Table 7: Anaphoric properties
ID Properties (shownin Table 5)
Impression words
26 26 male27 27 fresh28 28 simple29 29 modern, stable30 6, 18 abnormal, disincentive, monomania31 9, 18 aestheticism, male, parnassian, self-assertiveness32 9, 17 activity, light-sound, modern33 6, 17 bright, florid, fresh, light, obedience34 6, 10, 36 versatile35 9, 10 male36 7, 30 calm, depth, elegant37 1, 9, 31 bright, florid, light, simple, young38 4, 7, 32 clemency, literature, silence39 2, 4, 30, 36 calm, graceful, insidious40 23, 33, 34 sophisticated41 2, 9, 17 intellectual, modern42 9, 17 floridness, modern43 4, 18 blues44 2, 18, 30 blues, insidious, stable45 7, 18, 30 intelectual, sagacity, stable46 7, 10 individuality, modern, sophisticated47 9, 31, 33 inclemency, pain48 17, 30 bright, gaiety, modern49 2, 7, 36 cultural, elegant, literature50 10, 18 abnormal, particular, self-assertiveness
p1 p2 · · · p37
c1 →c2 →
T1...c50 →
Figure 3: Representation of the matrix T1
c1 c2 · · · c50
f1 →f2 →
T2...f57 →
Figure 4: Representation of the matrix T2
H. Homma et al. / A Method of Automatic Metadata Extraction 215

Table 8: Relations between impression words and Onso
ID Word Onso ID Word Onso1 abnormal 3, 18, 24, 30, 50 30 intellectual 41, 452 activity 1, 17, 32 31 light 5, 6, 8, 9, 13, 33,
373 aestheticism 31 32 light sound 5, 9, 324 assuagement 23 33 literature 38, 495 baby 25 34 luxurious 76 blues 4, 23, 43, 44 35 male 8, 26, 31, 357 bright 1, 5, 6, 33, 37, 48 36 modern 1, 5, 9, 10, 11, 17,
29, 32, 41, 42, 46,48
8 calm 4, 7, 22, 36, 39 37 monomania 14, 15, 16, 309 chic 2 38 non-
individuality12
10 clemency 38 39 obedience 6, 3311 closure 4, 18 40 pain 4712 composure 12 41 parnassian 3113 cultural 49 42 particular 3, 14, 15, 16, 18,
24, 5014 dark 2, 4 43 real 1115 depth 7, 36 44 rhythm 816 disincentive 30 45 sagacity 4517 easy 13 46 self-
assertiveness31, 50
18 elegant 7, 23, 36, 49 47 silence 3819 emphasis 10 48 simple 1, 5, 11, 17, 25,
28, 3720 fickleness 14, 15, 16 49 sophisticated 10, 40, 4621 florid 6, 10, 11, 17, 33,
3750 stable 8, 12, 19, 21, 22,
29, 44, 4522 floridness 42 51 stateliness 2323 fresh 9, 27, 33 52 strange 724 gaiety 17, 48 53 strike 1325 graceful 2, 39 54 strong 10, 1126 humour 25 55 tense 2027 inclemency 47 56 versatile 3428 individuality 18, 46 57 young 1, 3729 insidious 39, 44
H. Homma et al. / A Method of Automatic Metadata Extraction216

where wn is a weight of the impression word fn.
4. Experiments
In this section, we show some experimental results. In section 4.3, we extract the impres-sion by sound of the word and show some examples. In section 4.4, we apply the proposedmethod for retrieval candidate media data. Then we perform the semantic associative searchto show the effectiveness of our method. And in section 4.5, we show the relations of recalland precision rate of the proposed method.
4.1. Experimental environment
To create metadata spaceMDS, we used the English-English dictionary Longman Dic-tionary of Contemporary English[5]. This dictionary uses only approximately 2000 basicwords to explain approximately 56,000 head-words. We created the data matrix M in Section2 by treating basic words as features and setting the element corresponding to a basic word to“1” when the basic word explaining a head-word had been used for an affirmative meaning,setting it to “-1” when the basic word had been used for a negative meaning, setting it to“0” when the basic word was not used, and setting it to “1” when the head-word itself wasa basic word. In this way, we generated the metadata spaceMDS, which is an orthonormalspace of approximately 2000-dimensions. This space can express 22000 different phases ofthe meaning.
4.2. Experiment 1 & 2
In these experiments, we picked up 10 brand names. We set these words as retrievalcandidates and their metadata extracted by the proposed method. And then we performed thesemantic associative search with some keywords as our impressions.
4.3. Experimental results 1
In this experiment, we show what impression words extracted from the input word by theproposed method. In each case, we show some examples of extracted words which have largeweight or describe the concept of the input word well.
Table 9, 10 and 11 show 10 impression words extracted from the name “Adidas”, “Bridge-stone” and “Head”. According to these results, we see that many Japanese have elegant, spe-cial, modern, and sophisticated images of these 3 brands. These images seem to be commonimages of many brand names.
But there are some differences between them. Many Japanese think that one of thestrongest impression on the name “Adidas” is “assertive”. In the case of “Bridgestone”, it
H. Homma et al. / A Method of Automatic Metadata Extraction 217
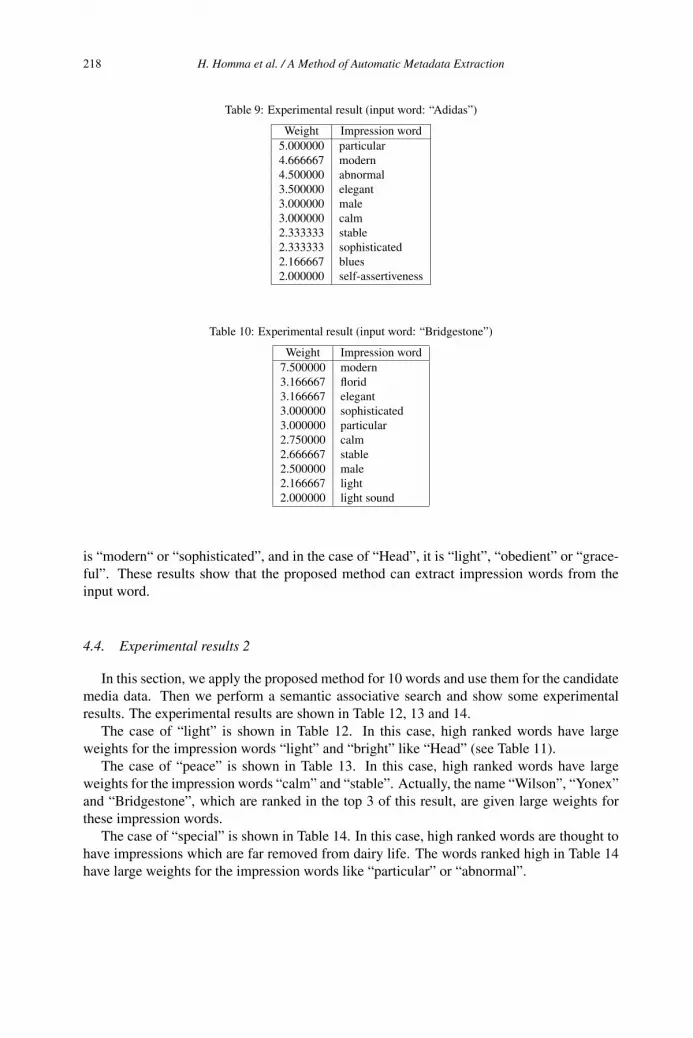
Table 9: Experimental result (input word: “Adidas”)
Weight Impression word5.000000 particular4.666667 modern4.500000 abnormal3.500000 elegant3.000000 male3.000000 calm2.333333 stable2.333333 sophisticated2.166667 blues2.000000 self-assertiveness
Table 10: Experimental result (input word: “Bridgestone”)
Weight Impression word7.500000 modern3.166667 florid3.166667 elegant3.000000 sophisticated3.000000 particular2.750000 calm2.666667 stable2.500000 male2.166667 light2.000000 light sound
is “modern“ or “sophisticated”, and in the case of “Head”, it is “light”, “obedient” or “grace-ful”. These results show that the proposed method can extract impression words from theinput word.
4.4. Experimental results 2
In this section, we apply the proposed method for 10 words and use them for the candidatemedia data. Then we perform a semantic associative search and show some experimentalresults. The experimental results are shown in Table 12, 13 and 14.
The case of “light” is shown in Table 12. In this case, high ranked words have largeweights for the impression words “light” and “bright” like “Head” (see Table 11).
The case of “peace” is shown in Table 13. In this case, high ranked words have largeweights for the impression words “calm” and “stable”. Actually, the name “Wilson”, “Yonex”and “Bridgestone”, which are ranked in the top 3 of this result, are given large weights forthese impression words.
The case of “special” is shown in Table 14. In this case, high ranked words are thought tohave impressions which are far removed from dairy life. The words ranked high in Table 14have large weights for the impression words like “particular” or “abnormal”.
H. Homma et al. / A Method of Automatic Metadata Extraction218
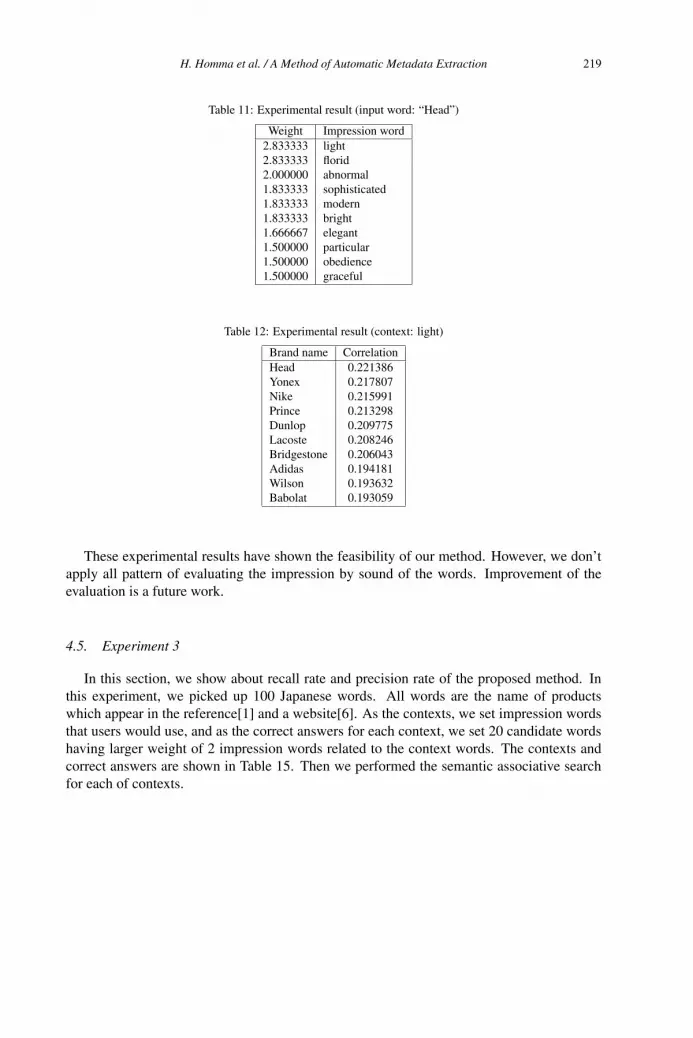
Table 11: Experimental result (input word: “Head”)
Weight Impression word2.833333 light2.833333 florid2.000000 abnormal1.833333 sophisticated1.833333 modern1.833333 bright1.666667 elegant1.500000 particular1.500000 obedience1.500000 graceful
Table 12: Experimental result (context: light)
Brand name CorrelationHead 0.221386Yonex 0.217807Nike 0.215991Prince 0.213298Dunlop 0.209775Lacoste 0.208246Bridgestone 0.206043Adidas 0.194181Wilson 0.193632Babolat 0.193059
These experimental results have shown the feasibility of our method. However, we don’tapply all pattern of evaluating the impression by sound of the words. Improvement of theevaluation is a future work.
4.5. Experiment 3
In this section, we show about recall rate and precision rate of the proposed method. Inthis experiment, we picked up 100 Japanese words. All words are the name of productswhich appear in the reference[1] and a website[6]. As the contexts, we set impression wordsthat users would use, and as the correct answers for each context, we set 20 candidate wordshaving larger weight of 2 impression words related to the context words. The contexts andcorrect answers are shown in Table 15. Then we performed the semantic associative searchfor each of contexts.
H. Homma et al. / A Method of Automatic Metadata Extraction 219

Table 13: Experimental result (context: peace)
Brand name CorrelationWilson 0.182243Yonex 0.177412Bridgestone 0.176190Lacoste 0.174605Adidas 0.173899Dunlop 0.173500Prince 0.172630Nike 0.168987Babolat 0.162705Head 0.161011
Table 14: Experimental result (context: special)
Brand name CorrelationAdidas 0.302984Bridgestone 0.291777Wilson 0.287877Lacoste 0.282357Dunlop 0.279992Prince 0.277618Yonex 0.277404Head 0.272655Nike 0.269173Babolat 0.265064
Table 15: Contexts and correct answers used in Experiment 3
Context Correct answersplain powerful 20 words having large weight in the impression words
“simple” and “strong”beautiful nice 20 words having large weight in the impression words
“elegant” and “graceful”
H. Homma et al. / A Method of Automatic Metadata Extraction220
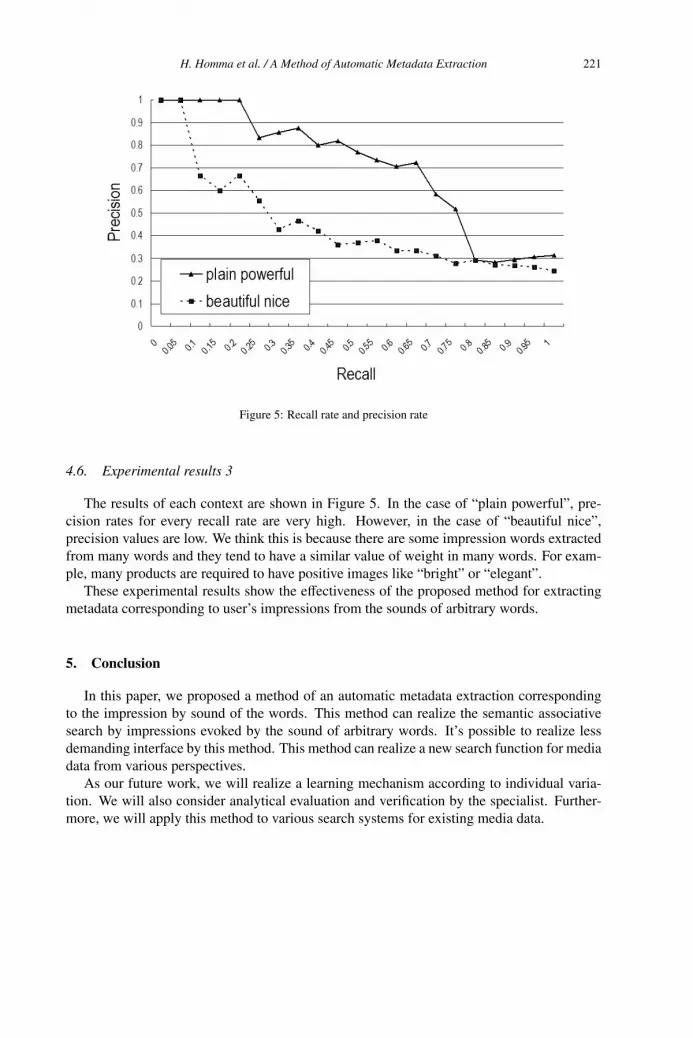
Figure 5: Recall rate and precision rate
4.6. Experimental results 3
The results of each context are shown in Figure 5. In the case of “plain powerful”, pre-cision rates for every recall rate are very high. However, in the case of “beautiful nice”,precision values are low. We think this is because there are some impression words extractedfrom many words and they tend to have a similar value of weight in many words. For exam-ple, many products are required to have positive images like “bright” or “elegant”.
These experimental results show the effectiveness of the proposed method for extractingmetadata corresponding to user’s impressions from the sounds of arbitrary words.
5. Conclusion
In this paper, we proposed a method of an automatic metadata extraction correspondingto the impression by sound of the words. This method can realize the semantic associativesearch by impressions evoked by the sound of arbitrary words. It’s possible to realize lessdemanding interface by this method. This method can realize a new search function for mediadata from various perspectives.
As our future work, we will realize a learning mechanism according to individual varia-tion. We will also consider analytical evaluation and verification by the specialist. Further-more, we will apply this method to various search systems for existing media data.
H. Homma et al. / A Method of Automatic Metadata Extraction 221

References
[1] T.Kidooshi, “Onso”, President-sya, (1990).
[2] T.Kitagawa, Y.Kiyoki, “The mathematical model of meaning and its application to multidatabase sys-tems”, Proceedings of 3rd IEEE International Workshop on Research Issues on Data Engineering: Inter-operability in Multidatabase Systems, pp.130–135, (1993).
[3] Y.Kiyoki, T.Kitagawa, T.Hayama, “A metadatabase system for semantic image search by a mathematicalmodel of meaning”, ACM SIGMOD Record, vol. 23, no. 4, pp.34-41, (1994).
[4] T.Kitagawa, Y.Kiyoki, “Fundamental framework for media data retrieval system using media lexico trans-formation operator”, Information Modeling and Knowledge Bases, vol.12, pp. 316–326, (2001).
[5] “Longman Dictionary of Contemporary English”, Longman, (1987).
[6] “SMBC Hit Product Ranking”, http://www.smbc-consulting.co.jp/BizWatch/Hit/
H. Homma et al. / A Method of Automatic Metadata Extraction222
Business Process Modeling
Ivo VONDRÁKDept. of Computer Science
Faculty of Electrical Engineering and Computer Science VSB – Technical University of Ostrava, Czech Republic
Abstract: Process modeling and workflow applications have become more an more important during last decade. The main reason for this increased interest is the need to provide computer aided system integration of the enterprise based on its business processes. This need requires a technology that enables to integrate modeling, simulation and enactment of processes into one single package. The primary focus of all tools is to describe the way how activities are ordered in time. This kind of partially ordered steps shows how the output of one activity can serve as the input to another one. But there is also another aspect of the business process that has to be involved – where the activities are executed. The spatial aspect of the process enactment represents a new dimension in the process engineering discipline. It is also important to understand that not just process enactment but also the early phases of process specification have to cope with this spatial aspect. The paper is going to discuss how all these above mentioned principles can be integrated together and how the standard approach in process specification might be extended with the spatial dimension to make business process models more natural and understandable.
Keywords: Business Process, Process Modeling, Simulation and Enactment, Object-Oriented Methods, Collaborative Networks, Petri Nets, Distributed Environment, Java Technology, Intra/Internet Applications
Introduction
Basic definitions as were defined by Workflow Management Coalition are introduced at the beginning of this paper to clarify what is the difference between Business Process, Process Model, Workflow, and Workflow Management System:
Business Process: A set of one or more linked procedures or activities which collectively realize a business objective or policy goal, normally within the context of an organizational structure defining functional roles and relationships.
Business Process Model: The representation of a business process in a form that supports automated manipulation, such as modeling, or enactment by a workflow management system. The process definition consists of a network of activities and their relationships, criteria to indicate the start and termination of the process, and information about the individual activities, such as participants, associated IT applications and data, etc.
M. Duží et al. (Eds.)Information Modelling and Knowledge Bases XVIII
IOS Press, 2007© 2007 The authors and IOS Press. All rights reserved.
223
Workflow: The automation of a business process, in whole or part, during which documents, information or tasks are passed from one participant to another for action, according to a set of procedural rules.
Workflow Management System: A system that defines, creates and manages the execution of workflows through the use of software, running on one or more workflow engines, which is able to interpret the process definition, interact with workflow participants and, where required, invoke the use of IT tools and applications.
Underlying concepts that are used for process modeling usually include or combine three following basic descriptive views (Christie 1995):
Functional View. The functional view is focused on activities as well as on entities that flow into and out of these activities. This view is often expressed by Data Flow Diagrams (DeMarco 1979).
Behavioral View. The behavioral view is focused on when and/or under what conditions activities are performed. This aspect of the process model is often based on various kinds of State Diagrams or Interaction Diagrams. More sophisticated approaches based on the theory of Petri Nets are convenient for systems that may exhibit asynchronous and concurrent activities (Peterson 1977). The behavioral view captures the control aspect of the process model. It means that the direction of the process is defined on current state of the system and event that occurs.
Structural View. The structural view is focused on the static aspect of the process. It captures objects that are manipulated and used by a process as well as the relationships that exist among them. These models are often based on the Entity-Relation Diagrams or any of the Object Diagrams that are used by the various kind of Object Oriented Methods.
Each process modeling technique uses some of these three views to model and define the process. For example, STATEMATE (Harel 1990) covers the traditional “who, what, where, when and how” of the process based on activity, state and module charts, while the IDEF0 (Ross 1985) technique employs a data flow perspective to define process. The large number of Object Oriented Methods employ the above mentioned aspects, as well. For example the specification of Unified Modeling Language (UML) contains extension for business modeling.
I. Vondrák / Business Process Modeling224
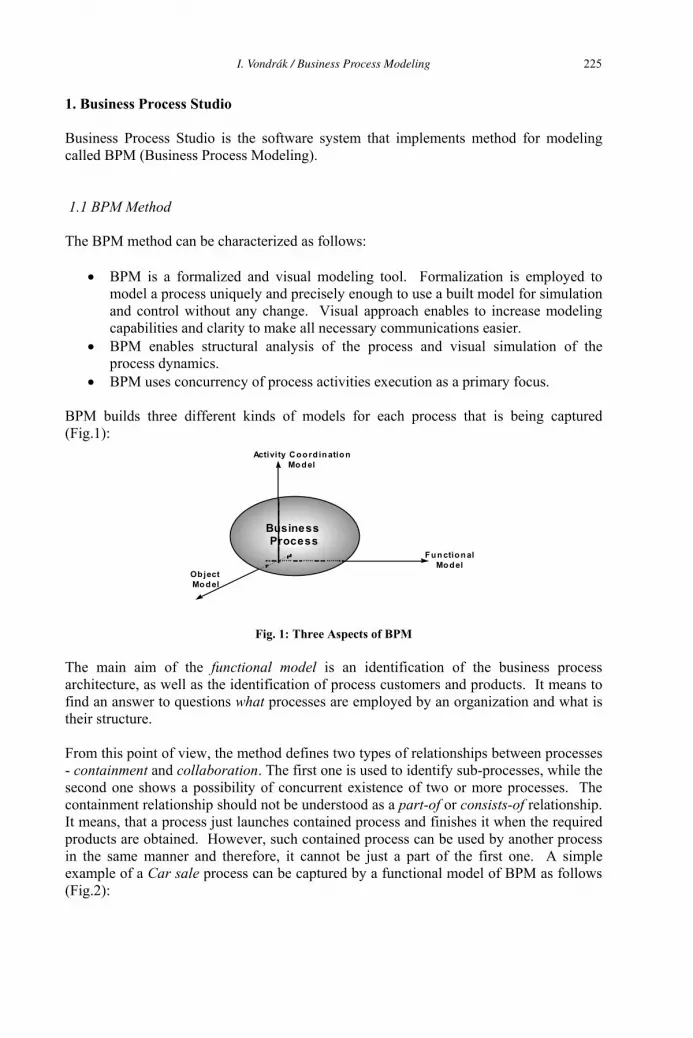
1. Business Process Studio
Business Process Studio is the software system that implements method for modeling called BPM (Business Process Modeling).
1.1 BPM Method
The BPM method can be characterized as follows:
BPM is a formalized and visual modeling tool. Formalization is employed to model a process uniquely and precisely enough to use a built model for simulation and control without any change. Visual approach enables to increase modeling capabilities and clarity to make all necessary communications easier. BPM enables structural analysis of the process and visual simulation of the process dynamics. BPM uses concurrency of process activities execution as a primary focus.
BPM builds three different kinds of models for each process that is being captured (Fig.1):
Functional
Model
Activity C oord ination
Model
Object
Model
BusinessProcess
Fig. 1: Three Aspects of BPM
The main aim of the functional model is an identification of the business process architecture, as well as the identification of process customers and products. It means to find an answer to questions what processes are employed by an organization and what is their structure.
From this point of view, the method defines two types of relationships between processes - containment and collaboration. The first one is used to identify sub-processes, while the second one shows a possibility of concurrent existence of two or more processes. The containment relationship should not be understood as a part-of or consists-of relationship. It means, that a process just launches contained process and finishes it when the required products are obtained. However, such contained process can be used by another process in the same manner and therefore, it cannot be just a part of the first one. A simple example of a Car sale process can be captured by a functional model of BPM as follows (Fig.2):
I. Vondrák / Business Process Modeling 225

Fig. 2: Functional Model of a Car Sale and Its Sub-processes
Customer who requires a car can be either unsatisfied or can get a Car in this process (process customer and its alternative products are specified by icons and corresponding arrows). The car sale process contains two sub-processes Financing and Car Deliverythat have to collaborate (car cannot be delivered until it is financed, bank needs a documentation of a car etc.). The owner of the process as a whole is the Salesman.
Object model identifies static structure of all entities (objects) that are essential for the enactment of the process. In other words, the answer to the question by whom and whatthe process is realized is searched. This model tries to capture all active objects responsible for an execution of activities and passive objects that can be understood as material, products or documents that are manipulated by the process. All these objects have a set of attributes associated. The notation used for this sort of models is similar to notation used by typical object-oriented method except that active and passive objects are represented by different icons to distinguish them. Object models are created for every process identified during the functional modeling. In our example of the car sale it means, that object model for sub-process of Financing can look as follows (Fig.3).
I. Vondrák / Business Process Modeling226
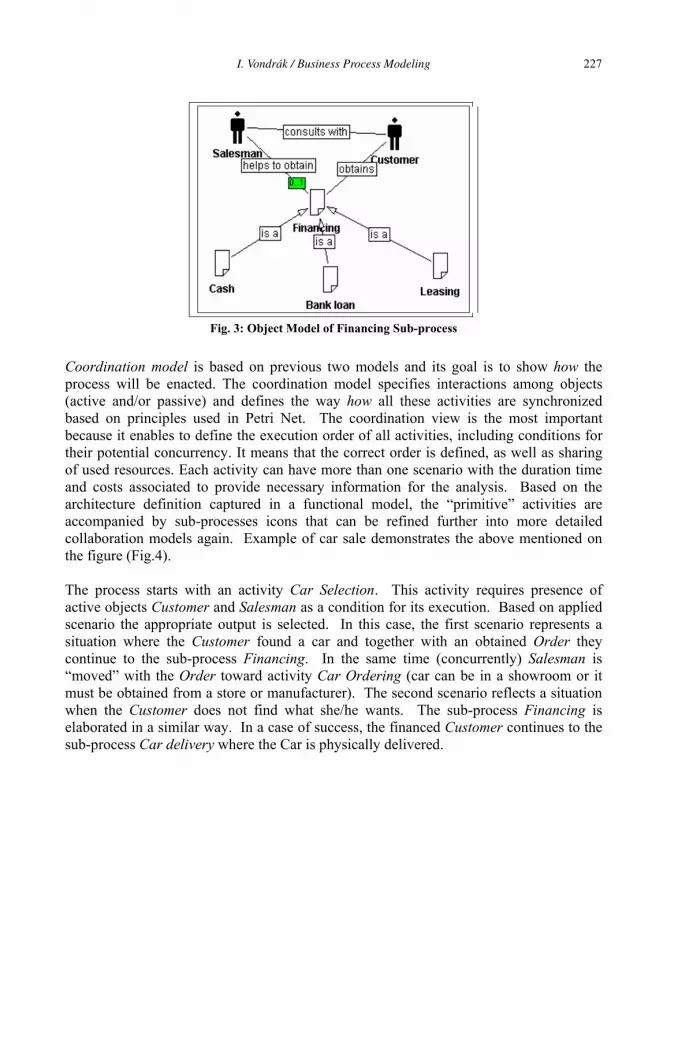
Fig. 3: Object Model of Financing Sub-process
Coordination model is based on previous two models and its goal is to show how the process will be enacted. The coordination model specifies interactions among objects (active and/or passive) and defines the way how all these activities are synchronized based on principles used in Petri Net. The coordination view is the most important because it enables to define the execution order of all activities, including conditions for their potential concurrency. It means that the correct order is defined, as well as sharing of used resources. Each activity can have more than one scenario with the duration time and costs associated to provide necessary information for the analysis. Based on the architecture definition captured in a functional model, the “primitive” activities are accompanied by sub-processes icons that can be refined further into more detailed collaboration models again. Example of car sale demonstrates the above mentioned on the figure (Fig.4).
The process starts with an activity Car Selection. This activity requires presence of active objects Customer and Salesman as a condition for its execution. Based on applied scenario the appropriate output is selected. In this case, the first scenario represents a situation where the Customer found a car and together with an obtained Order they continue to the sub-process Financing. In the same time (concurrently) Salesman is “moved” with the Order toward activity Car Ordering (car can be in a showroom or it must be obtained from a store or manufacturer). The second scenario reflects a situation when the Customer does not find what she/he wants. The sub-process Financing is elaborated in a similar way. In a case of success, the financed Customer continues to the sub-process Car delivery where the Car is physically delivered.
I. Vondrák / Business Process Modeling 227
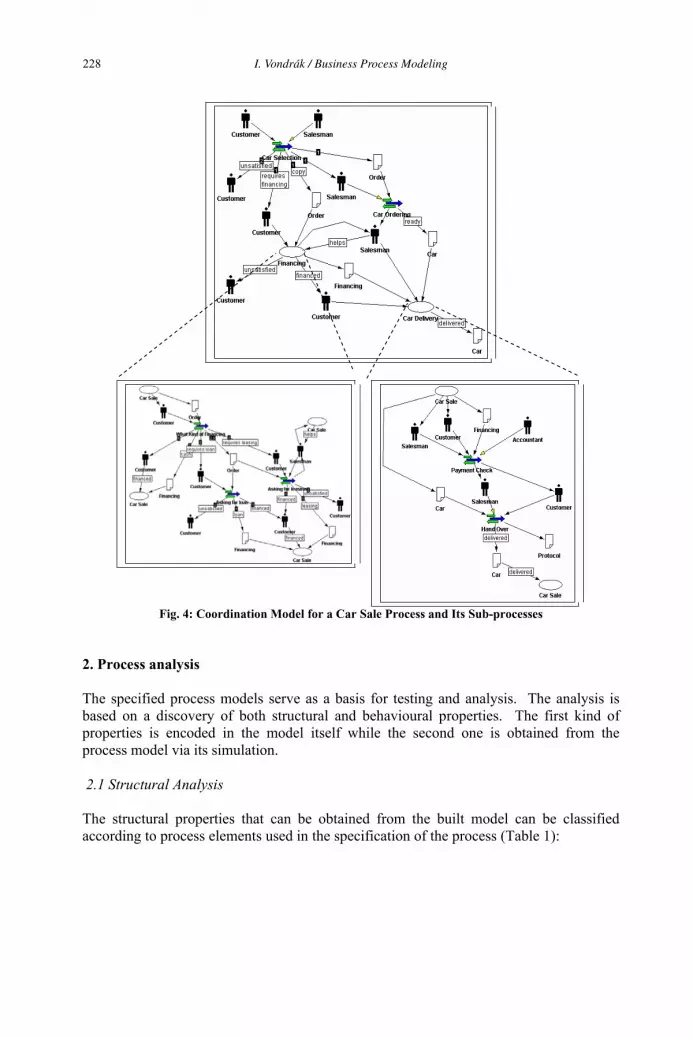
Fig. 4: Coordination Model for a Car Sale Process and Its Sub-processes
2. Process analysis
The specified process models serve as a basis for testing and analysis. The analysis is based on a discovery of both structural and behavioural properties. The first kind of properties is encoded in the model itself while the second one is obtained from the process model via its simulation.
2.1 Structural Analysis
The structural properties that can be obtained from the built model can be classified according to process elements used in the specification of the process (Table 1):
I. Vondrák / Business Process Modeling228
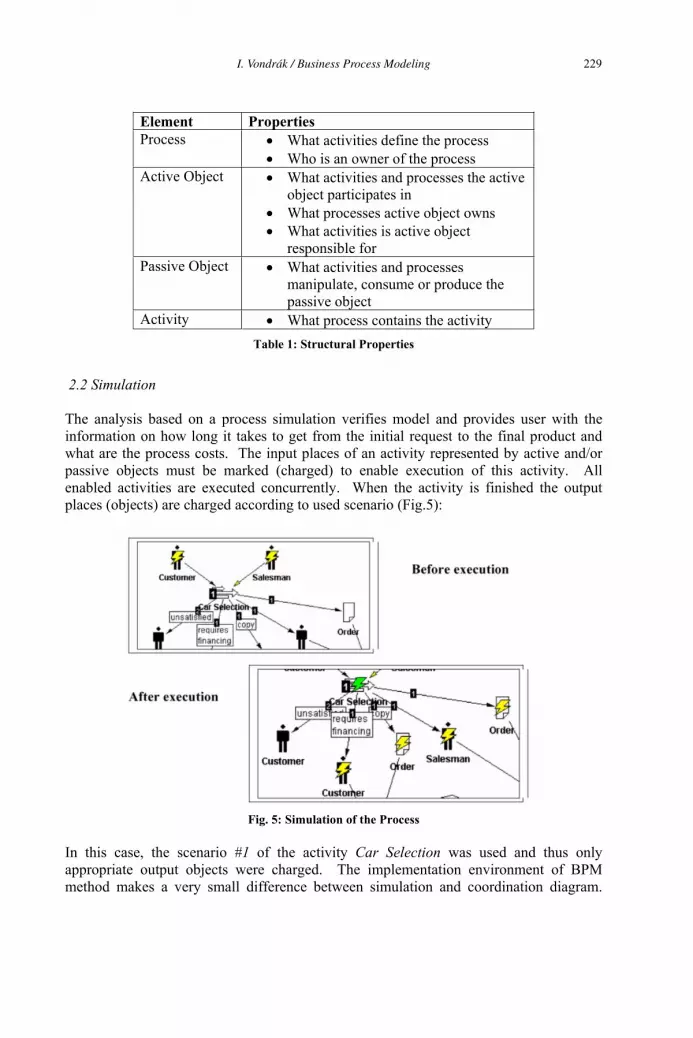
Element Properties Process What activities define the process
Who is an owner of the process Active Object What activities and processes the active
object participates in What processes active object owns What activities is active object responsible for
Passive Object What activities and processes manipulate, consume or produce the passive object
Activity What process contains the activity Table 1: Structural Properties
2.2 Simulation
The analysis based on a process simulation verifies model and provides user with the information on how long it takes to get from the initial request to the final product and what are the process costs. The input places of an activity represented by active and/or passive objects must be marked (charged) to enable execution of this activity. All enabled activities are executed concurrently. When the activity is finished the output places (objects) are charged according to used scenario (Fig.5):
Fig. 5: Simulation of the Process
In this case, the scenario #1 of the activity Car Selection was used and thus only appropriate output objects were charged. The implementation environment of BPM method makes a very small difference between simulation and coordination diagram.
I. Vondrák / Business Process Modeling 229
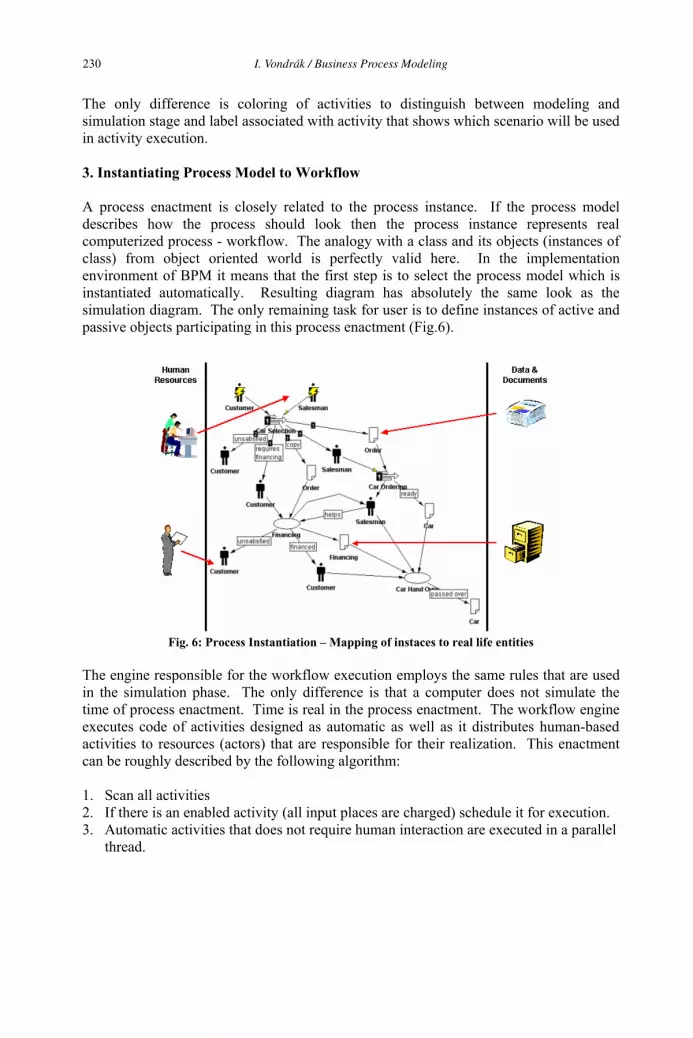
The only difference is coloring of activities to distinguish between modeling and simulation stage and label associated with activity that shows which scenario will be used in activity execution.
3. Instantiating Process Model to Workflow
A process enactment is closely related to the process instance. If the process model describes how the process should look then the process instance represents real computerized process - workflow. The analogy with a class and its objects (instances of class) from object oriented world is perfectly valid here. In the implementation environment of BPM it means that the first step is to select the process model which is instantiated automatically. Resulting diagram has absolutely the same look as the simulation diagram. The only remaining task for user is to define instances of active and passive objects participating in this process enactment (Fig.6).
Fig. 6: Process Instantiation – Mapping of instaces to real life entities
The engine responsible for the workflow execution employs the same rules that are used in the simulation phase. The only difference is that a computer does not simulate the time of process enactment. Time is real in the process enactment. The workflow engine executes code of activities designed as automatic as well as it distributes human-based activities to resources (actors) that are responsible for their realization. This enactment can be roughly described by the following algorithm:
1. Scan all activities 2. If there is an enabled activity (all input places are charged) schedule it for execution. 3. Automatic activities that does not require human interaction are executed in a parallel
thread.
I. Vondrák / Business Process Modeling230
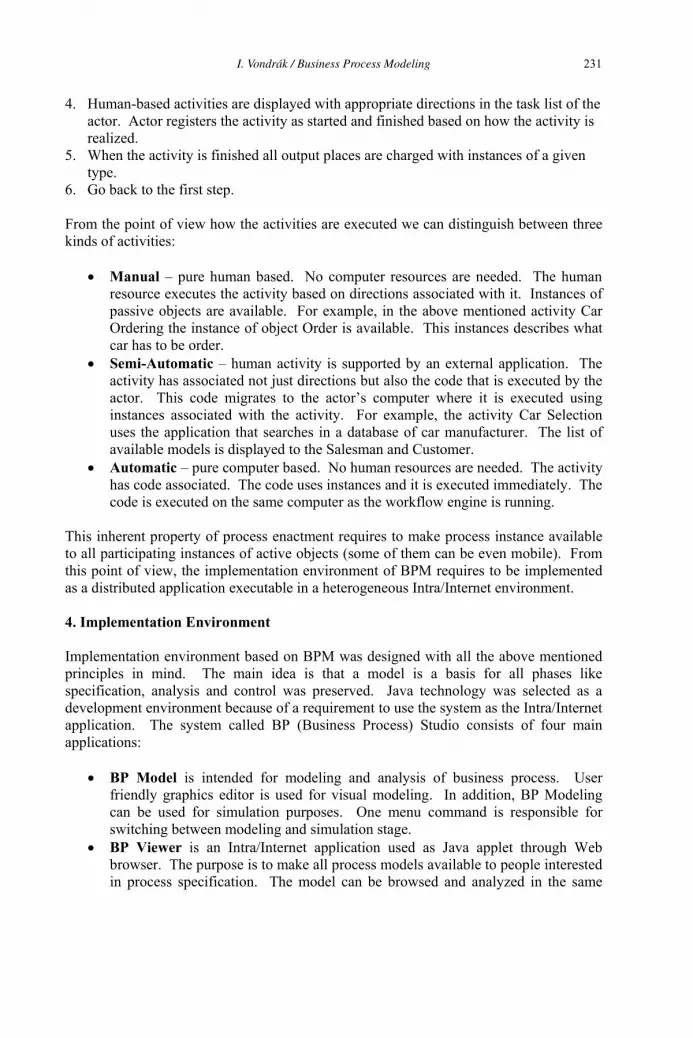
4. Human-based activities are displayed with appropriate directions in the task list of the actor. Actor registers the activity as started and finished based on how the activity is realized.
5. When the activity is finished all output places are charged with instances of a given type.
6. Go back to the first step.
From the point of view how the activities are executed we can distinguish between three kinds of activities:
Manual – pure human based. No computer resources are needed. The human resource executes the activity based on directions associated with it. Instances of passive objects are available. For example, in the above mentioned activity Car Ordering the instance of object Order is available. This instances describes what car has to be order. Semi-Automatic – human activity is supported by an external application. The activity has associated not just directions but also the code that is executed by the actor. This code migrates to the actor’s computer where it is executed using instances associated with the activity. For example, the activity Car Selection uses the application that searches in a database of car manufacturer. The list of available models is displayed to the Salesman and Customer. Automatic – pure computer based. No human resources are needed. The activity has code associated. The code uses instances and it is executed immediately. The code is executed on the same computer as the workflow engine is running.
This inherent property of process enactment requires to make process instance available to all participating instances of active objects (some of them can be even mobile). From this point of view, the implementation environment of BPM requires to be implemented as a distributed application executable in a heterogeneous Intra/Internet environment.
4. Implementation Environment
Implementation environment based on BPM was designed with all the above mentioned principles in mind. The main idea is that a model is a basis for all phases like specification, analysis and control was preserved. Java technology was selected as a development environment because of a requirement to use the system as the Intra/Internet application. The system called BP (Business Process) Studio consists of four main applications:
BP Model is intended for modeling and analysis of business process. User friendly graphics editor is used for visual modeling. In addition, BP Modeling can be used for simulation purposes. One menu command is responsible for switching between modeling and simulation stage. BP Viewer is an Intra/Internet application used as Java applet through Web browser. The purpose is to make all process models available to people interested in process specification. The model can be browsed and analyzed in the same
I. Vondrák / Business Process Modeling 231
way as BP Model provides it. The only restriction is that the model cannot be changed. BP Control instantiates model and enables process execution. Activities are scheduled automatically based on presence of all input objects and distributed through network together with all associated objects to actors – instances of active objects responsible for execution of the activity. The mechanism of distribution is based on remote object access enabled by ORB (Object Request Broker). Process is monitored by process manager through Gantt diagram generated from the coordination diagram of process model. BP Actor is the stand-alone application or applet that is used by instances of active objects responsible for execution of activities. BP Actor publishes task list generated by BP Control to the actor who starts the activity, finishes it and selects the used scenario. Since the activity is also associated with passive objects, the actor defines values of their attributes. Once the attributes are changed, they become available to other actors and process manager. The Intra/Internet nature of the described solution enables to use mobile equipment (notebook and mobile phones) to participate in the process enactment even when the actor is on the road.
All applications operate with a repository of process models and repository of process instances. The first one is used for modeling and analysis, while the second one is used only for process control. Models are also used for instantiation of process instances. Once the model is instantiated, it becomes a part of process instance definition and cannot be saved back to the model repository. The architecture of the BP Studio is following (Fig. 7):
ORB
BP Model Web BrowserBP Viewer
Model Repository
BP Control
Instance Repository
BP Actor
Web BrowserBP Actor
Fig. 7: Architecture of BP Studio
The entire system was designed with a goal to make all application user friendly and independent on used platform.
5. Spatial Aspect of Process Modeling and Enactment
To develop well-formed spatial view of the process represented by BPM the original notion has to be extended by the following information:
I. Vondrák / Business Process Modeling232
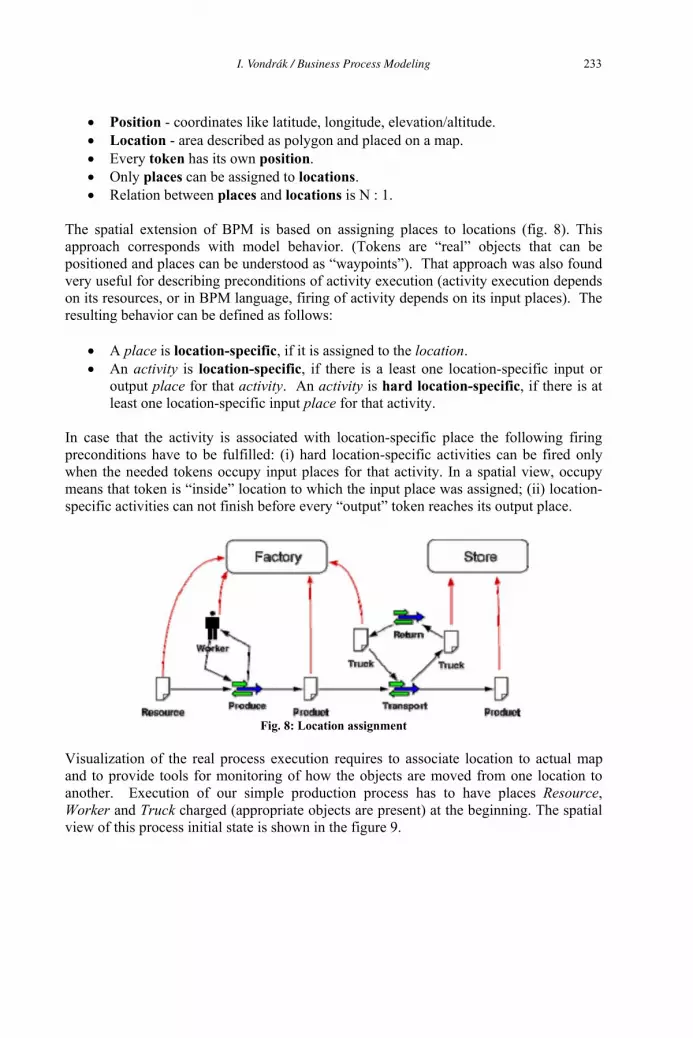
Position - coordinates like latitude, longitude, elevation/altitude. Location - area described as polygon and placed on a map. Every token has its own position.Only places can be assigned to locations.Relation between places and locations is N : 1.
The spatial extension of BPM is based on assigning places to locations (fig. 8). This approach corresponds with model behavior. (Tokens are “real” objects that can be positioned and places can be understood as “waypoints”). That approach was also found very useful for describing preconditions of activity execution (activity execution depends on its resources, or in BPM language, firing of activity depends on its input places). The resulting behavior can be defined as follows:
A place is location-specific, if it is assigned to the location.An activity is location-specific, if there is a least one location-specific input or output place for that activity. An activity is hard location-specific, if there is at least one location-specific input place for that activity.
In case that the activity is associated with location-specific place the following firing preconditions have to be fulfilled: (i) hard location-specific activities can be fired only when the needed tokens occupy input places for that activity. In a spatial view, occupy means that token is “inside” location to which the input place was assigned; (ii) location-specific activities can not finish before every “output” token reaches its output place.
Fig. 8: Location assignment
Visualization of the real process execution requires to associate location to actual map and to provide tools for monitoring of how the objects are moved from one location to another. Execution of our simple production process has to have places Resource,Worker and Truck charged (appropriate objects are present) at the beginning. The spatial view of this process initial state is shown in the figure 9.
I. Vondrák / Business Process Modeling 233
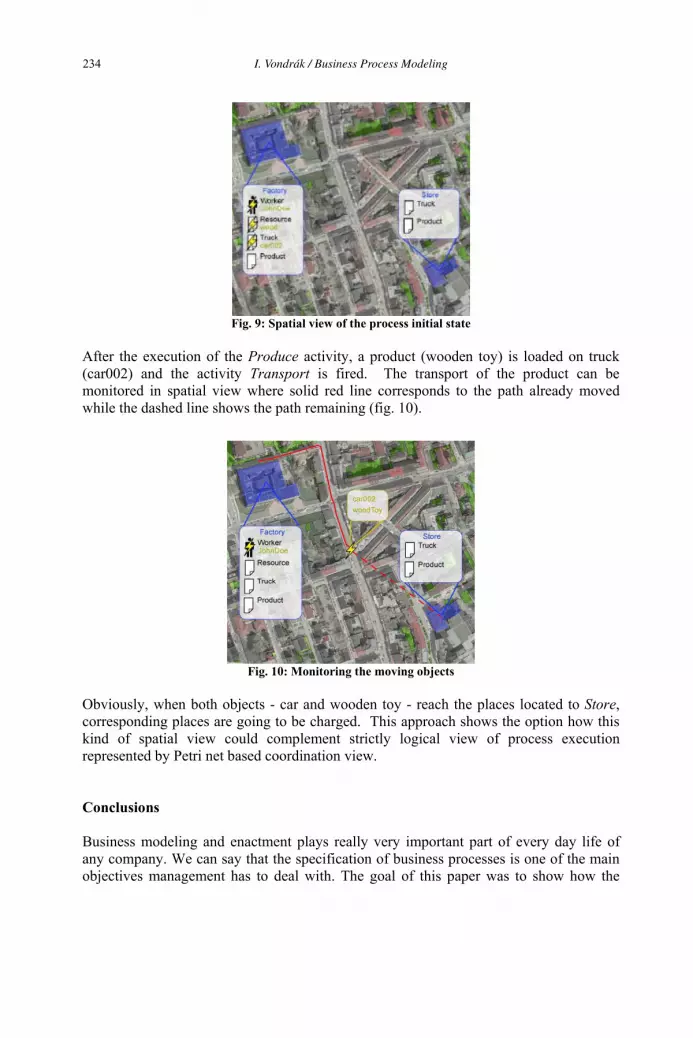
Fig. 9: Spatial view of the process initial state
After the execution of the Produce activity, a product (wooden toy) is loaded on truck (car002) and the activity Transport is fired. The transport of the product can be monitored in spatial view where solid red line corresponds to the path already moved while the dashed line shows the path remaining (fig. 10).
Fig. 10: Monitoring the moving objects
Obviously, when both objects - car and wooden toy - reach the places located to Store,corresponding places are going to be charged. This approach shows the option how this kind of spatial view could complement strictly logical view of process execution represented by Petri net based coordination view.
Conclusions
Business modeling and enactment plays really very important part of every day life of any company. We can say that the specification of business processes is one of the main objectives management has to deal with. The goal of this paper was to show how the
I. Vondrák / Business Process Modeling234
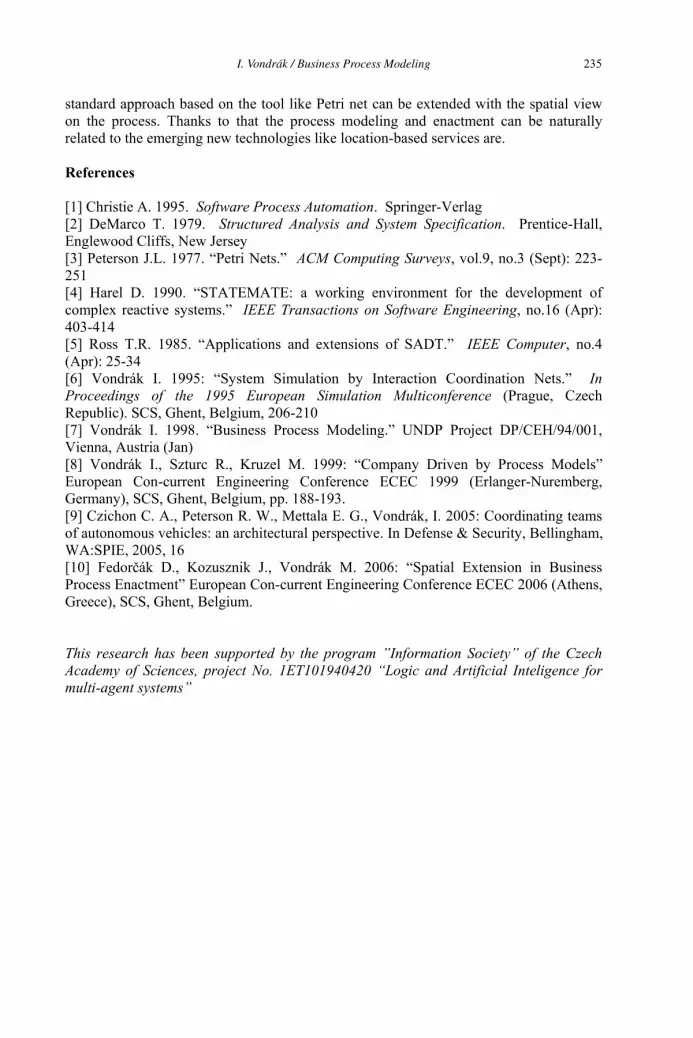
standard approach based on the tool like Petri net can be extended with the spatial view on the process. Thanks to that the process modeling and enactment can be naturally related to the emerging new technologies like location-based services are.
References
[1] Christie A. 1995. Software Process Automation. Springer-Verlag [2] DeMarco T. 1979. Structured Analysis and System Specification. Prentice-Hall, Englewood Cliffs, New Jersey [3] Peterson J.L. 1977. “Petri Nets.” ACM Computing Surveys, vol.9, no.3 (Sept): 223-251 [4] Harel D. 1990. “STATEMATE: a working environment for the development of complex reactive systems.” IEEE Transactions on Software Engineering, no.16 (Apr): 403-414 [5] Ross T.R. 1985. “Applications and extensions of SADT.” IEEE Computer, no.4 (Apr): 25-34 [6] Vondrák I. 1995: “System Simulation by Interaction Coordination Nets.” InProceedings of the 1995 European Simulation Multiconference (Prague, Czech Republic). SCS, Ghent, Belgium, 206-210 [7] Vondrák I. 1998. “Business Process Modeling.” UNDP Project DP/CEH/94/001, Vienna, Austria (Jan) [8] Vondrák I., Szturc R., Kruzel M. 1999: “Company Driven by Process Models” European Con-current Engineering Conference ECEC 1999 (Erlanger-Nuremberg, Germany), SCS, Ghent, Belgium, pp. 188-193. [9] Czichon C. A., Peterson R. W., Mettala E. G., Vondrák, I. 2005: Coordinating teams of autonomous vehicles: an architectural perspective. In Defense & Security, Bellingham, WA:SPIE, 2005, 16 [10] Fedor ák D., Kozusznik J., Vondrák M. 2006: “Spatial Extension in Business Process Enactment” European Con-current Engineering Conference ECEC 2006 (Athens, Greece), SCS, Ghent, Belgium.
This research has been supported by the program ”Information Society” of the Czech Academy of Sciences, project No. 1ET101940420 “Logic and Artificial Inteligence for multi-agent systems”
I. Vondrák / Business Process Modeling 235
Logic and Artificial Intelligencefor Multi-Agent Systems
Marie DUŽÍ, Daniela URÁKOVÁ, Pavel D RGEL, Petr GAJDOŠ, Jaroslav MÜLLERVSB-Technical University of Ostrava
17. listopadu 15, 708 33 Ostrava, Czech Republic http://labis.vsb.cz/
Abstract. The project Logic and Artificial Intelligence for Multi-Agent Systems isbriefly described and its structure is specified. First we introduce the underlying logical framework the Transparent Intensional Logic (TIL). Then we provide a description of particular problem areas, viz. knowledge representation including geographical data, languages apt for agents communication, and process management. Finally, future research and trends are specified.
1. IntroductionThe project “Logic and Artificial Intelligence for Multi-Agent Systems” is the pilot project conducted in the Research Laboratory of Intelligent Systems (LabIS: http://labis.vsb.cz/ ) that has been founded in February 2004. The research activities of LabIS cover the area and methods of Logic & Artificial Intelligence, in particular Knowledge Representation, Geographic Data and Process Management. We deal with investigating current methods as well as developing new ones, namely methods and systems based on a rigorous logical framework, which lay emphasis on the integration of syntax as well as an adequate fine-grained semantics. As a result, major research activities covered by LabIS can be summarized as follows: multi-agent systems, logical analysis of natural language, specification languages based on natural language, knowledge representation and management, inference machines, non-monotonic reasoning and belief revision, process management, control and coordination including prediction of critical situations.
In this contribution we are going to provide a survey of the most important aspects of the project and a brief description of particular research areas covered by the project.
The paper is organized as follows: Section 2 provides a brief overview of the project including the underlying theory. In Par. 2.1 knowledge representation philosophy is described, Par. 2.2 contains information on languages and communication means, Par. 2.3 on geographical data & MAS (multi-agent systems), and 2.4 deals with process management in multi-agent environment. Concluding Section 3 specifies future research and trends.
2. Project Specification The main goal of the project can be characterized as a research on information technologies needed for coordination of autonomous intelligent agents in extraordinary or emergency situations. We aim at modelling and predicting critical situations which typically tend to
M. Duží et al. (Eds.)Information Modelling and Knowledge Bases XVIII
IOS Press, 2007© 2007 The authors and IOS Press. All rights reserved.
236

exhibit unordered and chaotic behaviour. The use of information technologies as a means to control and coordinate real processes is well researched in the areas under normal conditions, i.e., when nothing extraordinary happens. However, extraordinary or critical situations have not been sufficiently studied so far, though in a situation when common behaviour fails the need for coordination and communication rapidly grows.
Research within the project is focused on the following three basic areas: process management including specification and prediction of critical situations, knowledge and data management, communication and infrastructure. The project structure is illustrated by Fig. 1:
Figure 1: Project Structure
The theoretical background is needed to pursue research in all the three areas. We concentrate on the development of a platform that makes it possible to adequately represent knowledge in the multi-agent world. A rational agent in a multi-agent world is able to reason about the world (what holds true and what does not), about its own cognitive state, and about that of other agents. A theory formalizing reasoning of autonomous intelligent agents has thus to be able to ‘talk about’ and quantify over the objects of agents’ attitudes, iterate attitudes of distinct agents, express self-referential statements and respect different inferential abilities of agents. Since agents have to communicate, react to particular events in the outer world, learn by experience and be less or more intelligent, a powerful logical tool is of a critical importance. To this end we make use of Pavel Tichý’s expressive system of Transparent Intensional Logic (TIL)1 which allows us to meet these goals in a rigorous and fine-grained way. Last but not least, the analysis and synthesis of intelligent systems that can derive useful conclusions under incomplete or imprecise knowledge is also studied.
When building a logical theory based on TIL we do not primarily strive after good mathematical and computational properties, such as semantic completeness or decidability of the calculus at the expense of TIL expressive power. On the contrary, these properties have often to be given up in benefit of the expressive power. We primarily need to understand and know ‘what is there’, and only afterwards to derive (some) conclusions from the respective assumptions.
1 See Tichý (1988, 2004), Duží (2004)
Communication & Infrastructure
ProcessManagement
Knowledge & Data
Management
TheoreticalBackground
M. Duží et al. / Logic and Artificial Intelligence for Multi-Agent Systems 237

The TIL original main purpose (logical analysis of natural language) gives it a great advantage in its usefulness in the area of artificial intelligence and multi-agent systems (MAS). Any situation where a computer needs to communicate in a natural language or in a way close to natural language can and should take use of the TIL approach. TIL is thus capable of capturing (almost) any semantic feature of natural language in the transparent, i.e., anti-contextualistic way. It includes temporal and modal attitudes, epistemic and doxastic logic and knowledge representation (even modelling knowledge of resource-bounded agents), change of the state of the world, etc. The referential transparency and availability of logical constructions are the two main reasons why we prefer TIL to better known Montague’s IL. Unlike IL, the logical notation of TIL does not mimic the reference shifts allegedly found in natural language. TIL shows how it is possible to apply one and the same interpreted notation to any sort of context; namely, by designing a semantics for the ‘hardest cases’ (i.e., hyper-intensional attitudes of knowing, believing, etc.) and applying it to ‘less hard’ cases by shifting between mentioning and using occurrences of constructions and when using occurrences of construction then by shifting between using with the de dicto and de resupposition. The availability of constructions enables a full-fledged theory of hyper-intensional attitudes without recourse to the problematic sententialism.
2.1 Knowledge Management
Methods applied to adequately represent and manage knowledge have to take into account the fact that agents are intelligent but not logically omniscient. They are resource bounded in several aspects: lack of inferential abilities, lack of time and space resources, incomplete and / or vague information. Classical epistemic logics handle either an ‘explicit’ or an ‘implicit’ knowledge. However, both these types of knowing are unrealistic: explicit knowing deprives an agent of any inferential abilities whereas the implicit knowing presupposes a logically genius agent. Therefore we distinguish between three kinds of knowledge, the most important of which is the so-called ‘inferable knowledge’. Particular kinds are as follows:
implicit (a set of propositions that an agent cannot falsify; this conception leads to an ‘explosion’ of knowledge and the paradox of omniscience);explicit (a set of propositions explicitly known by an agent, e.g., recorded in its memory; this conception deprives an agent of any inferential capabilities);inferable (a set of propositional constructions that an agent is able to infer; knowledge of a realistic resource-bounded agent with some inferential capabilities, who, however, is not logically omniscient).
The stock of inferable knowledge of a particular agent A is the stock of knowledge that A is able to infer from a given stock of A’s explicit knowledge by means of one or more rules of inference that A is able to use. Knowing is represented as a relation-in-intension between an agent and a logical construction (a structured abstract procedure that is a hyper-intensionally individuated mode of presentation of a possible-world semantic proposition) rather than a set of possible worlds or a piece of syntax2.
The TIL logic of Inferable Knowledge representation is proposed as the logic that accommodates the desiderata that should be met in a multi-agent world. The mutual relations between particular kinds of knowledge of an agent A are as follows:
Explicit Knowledge Inferable Knowledge Implicit Knowledge (A – “idiot”) (A mastering some (A – genius)
inference rules)
2 For details see Duží, Jespersen, Müller (2005)
M. Duží et al. / Logic and Artificial Intelligence for Multi-Agent Systems238
When building up an inference machine, it is necessary to use an expressive logical tool that makes a fine-grained analysis of premises possible, so that the inference machine does not over-infer (which leads to paradoxes) and under-infer (which leads to a lack of knowledge). The need for a fine-grained logical analysis can be illustrated by the following example:
The president of USA knows that John Kerry wanted to become the President of USA. The President of USA is George W. Bush. ––––––––––––––––––––––––––––––––––––––––––––––––––––––––––––––––––––Hence what?
Using the 1st order predicate logic we cannot easily prevent inferring a non-sense, namely that:
George W. Bush knows that John Kerry wanted to become George W. Bush.
Only when using the TIL procedural hyper-intensional semantics we validly infer that
George W. Bush knows that John Kerry wanted to become the President of USA.
Referring for details to Duží (2004), here is the solution, i.e., the fine-grained analysis of premises:
Types:Pres(ident of something) / ( ) – the function that depending on times (type ) and states-of-affairs (type ) associates an individual (of type ) with another individual. USA / – an individual (for the sake of simplicity) Know / ( 1) – an empirical (types , ) relation relating an individual ( ) with a construction (of type 1) of a proposition Kerry, Bush / – individuals WantBecome / ( ) – an empirical relation relating an individual with an individual office (of type ): when somebody wants to become the president of USA, he/she wishes that he/she holds the office rather than an individual, of course.is / ( ) – the identity of individuals
Synthesis: Variables w, t range over , , respectively.
w t [0Knowwt w t [0Preswt0USA]wt
0[ w t [0WantBecomewt 0Kerry w t [0Preswt
0USA]]]
w t [0is w t [0Preswt0USA]wt
0Bush]
w t [0Knowwt0Bush 0[ w t [0WantBecomewt
0Kerry w t [0Preswt0USA]]]
Leibniz’s law of substitution of identicals is valid, of course. The meaning of ‘the President of USA’ is independently of a context a logical construction of the respective office (an entity of type ), namely w t [0Preswt
0USA]. However, the substitution of the construction 0Bushfor the second occurrence of the construction w t [0Preswt
0USA] is blocked, as it should be.Note that non-constructions as well as (mentioned) constructions that are not to be
executed when evaluating the truth value of the so-constructed proposition at a particular state-of-affairs w, t have to be trivialized (notation ‘0’), which is in principle a device for supplying objects to operate on. Construction is a procedure (instruction how to arrive at the output) and its constituents have to be again (albeit trivial) instructions, rather than particular objects themselves.
The TIL is a typed system based on a ramified infinite hierarchy of types. Rich bi-dimensional typing not only prevents the system from inconsistencies stemming from self-referential statements and the need to define Truth within the system. It also makes it possible not only use particular higher-order objects, even constructions, but also to mention them
M. Duží et al. / Logic and Artificial Intelligence for Multi-Agent Systems 239

within the system without generating a paradox. This feature makes particular applications extremely flexible; a consequent utilization of the use-mention distinction on the object level became also a basic idea of the Universal Information Robot3 that has been developed by the eTrium Company and Masaryk University of Brno.
2.2 Communication & Languages
As mentioned above the agents have to communicate with each other as well as with the outer world in a standardised, natural-like language. To this end we develop the TL language4,which is a FIPA-style content language for multi-agent systems (see http://www.fipa.org). TL can be treated as a bridge between TIL and multi-agent systems. It provides a complex tool for natural-language analysis and can easily be implemented into systems following FIPA standards. The main features of TL are:
exact transparent semantics based on TIL; great expressive power needed for natural language analysis;compliance with FIPA standards for content language;appropriateness for multi-agent systems implementation.
Communication is a crucial point in a multi-agent environment. We conceive a messageto be a unit of communication. A message can be of an arbitrary form, but it has to be structured in terms of the following attributes:
a sender and a receiver type of the communicative act: inform, query, request, ... content: the message meaning encoded in a content language ontology: vocabulary of primitive concepts used by the content
The TL language is a formal standardised adjustment of the TIL language of constructions5. First, a standardised notation in ASCII code is defined. Second, the TIL ‘epistemic base’ is extended by types of an integer, string, sequence and action (event). Third, the TL language makes it possible to choose a conceptual system to work with by defining and fixing a particular ontology. To this end either a frame-like ontology (edited by Protege) or OWL semantic web language are used.
TL is implemented in the MAS framework JADE (open source, extensible development JAVA framework, strictly FIPA compliant).
2.3 Space, time & MAS
Since agents operate in space and time, a special attention is paid to spatio-temporal aspects of the system. Here we meet two kinds of problems. First, space and time have to be properly represented in MAS, and second, we have to realise agents’ spatio-temporal reasoning.
Concerning the former, space and time are represented using a geo-information system (GIS) which is fully integrated with MAS. This integration consists in handling the following:
Identity: a situated agent corresponds to a feature stored in GIS Causal relations: agents’ state and corresponding GIS feature state affect each other Temporal features: synchronisation of MAS and GIS Spatial context: GIS provides information on particular locations
From the spatial context point of view infrastructure and mobile agents are distinguished. Integration of GIS and MAS is supported by particular database and visualisation agents. A collection of such agents is used in the CASE study we currently work on, namely a traffic-
3 See Staní ek, Procházka (2005) 4 For details see Müller (2006) 5 See Duží (2004), Duží, Heimburger (2006)
M. Duží et al. / Logic and Artificial Intelligence for Multi-Agent Systems240
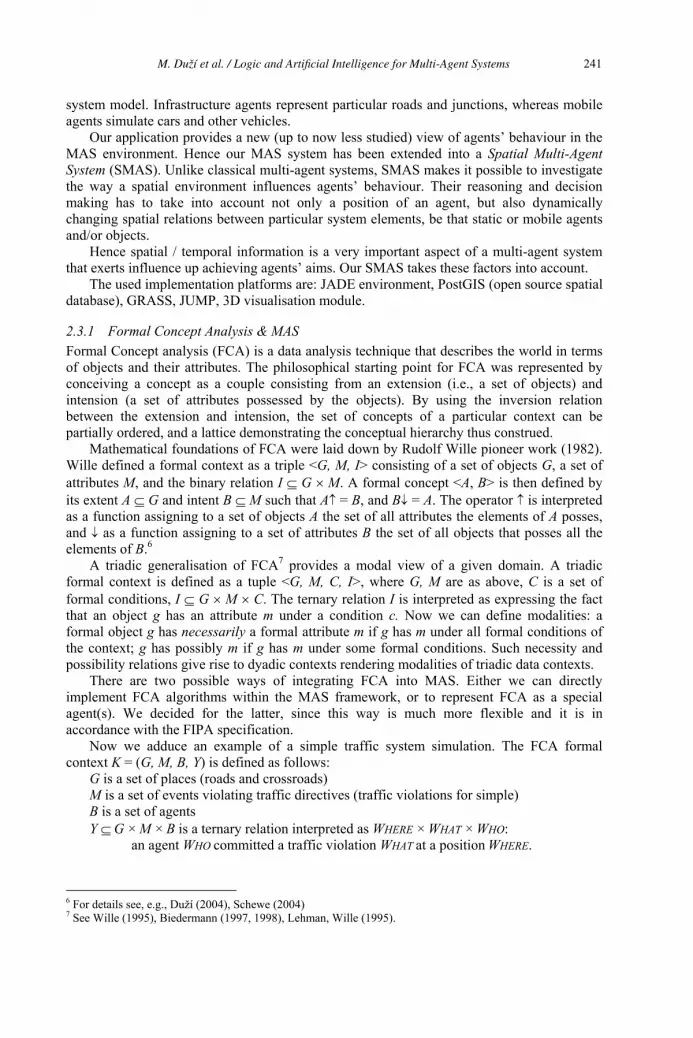
system model. Infrastructure agents represent particular roads and junctions, whereas mobile agents simulate cars and other vehicles.
Our application provides a new (up to now less studied) view of agents’ behaviour in the MAS environment. Hence our MAS system has been extended into a Spatial Multi-Agent System (SMAS). Unlike classical multi-agent systems, SMAS makes it possible to investigate the way a spatial environment influences agents’ behaviour. Their reasoning and decision making has to take into account not only a position of an agent, but also dynamically changing spatial relations between particular system elements, be that static or mobile agents and/or objects.
Hence spatial / temporal information is a very important aspect of a multi-agent system that exerts influence up achieving agents’ aims. Our SMAS takes these factors into account.
The used implementation platforms are: JADE environment, PostGIS (open source spatial database), GRASS, JUMP, 3D visualisation module.
2.3.1 Formal Concept Analysis & MAS Formal Concept analysis (FCA) is a data analysis technique that describes the world in terms of objects and their attributes. The philosophical starting point for FCA was represented by conceiving a concept as a couple consisting from an extension (i.e., a set of objects) and intension (a set of attributes possessed by the objects). By using the inversion relation between the extension and intension, the set of concepts of a particular context can be partially ordered, and a lattice demonstrating the conceptual hierarchy thus construed.
Mathematical foundations of FCA were laid down by Rudolf Wille pioneer work (1982). Wille defined a formal context as a triple <G, M, I> consisting of a set of objects G, a set of attributes M, and the binary relation I G M. A formal concept <A, B> is then defined by its extent A G and intent B M such that A = B, and B = A. The operator is interpreted as a function assigning to a set of objects A the set of all attributes the elements of A posses, and as a function assigning to a set of attributes B the set of all objects that posses all the elements of B.6
A triadic generalisation of FCA7 provides a modal view of a given domain. A triadic formal context is defined as a tuple <G, M, C, I>, where G, M are as above, C is a set of formal conditions, I G M C. The ternary relation I is interpreted as expressing the fact that an object g has an attribute m under a condition c. Now we can define modalities: a formal object g has necessarily a formal attribute m if g has m under all formal conditions of the context; g has possibly m if g has m under some formal conditions. Such necessity and possibility relations give rise to dyadic contexts rendering modalities of triadic data contexts.
There are two possible ways of integrating FCA into MAS. Either we can directly implement FCA algorithms within the MAS framework, or to represent FCA as a special agent(s). We decided for the latter, since this way is much more flexible and it is in accordance with the FIPA specification.
Now we adduce an example of a simple traffic system simulation. The FCA formal context K = (G, M, B, Y) is defined as follows:
G is a set of places (roads and crossroads) M is a set of events violating traffic directives (traffic violations for simple) B is a set of agents Y G × M × B is a ternary relation interpreted as WHERE × WHAT × WHO:
an agent WHO committed a traffic violation WHAT at a position WHERE.
6 For details see, e.g., Duží (2004), Schewe (2004) 7 See Wille (1995), Biedermann (1997, 1998), Lehman, Wille (1995).
M. Duží et al. / Logic and Artificial Intelligence for Multi-Agent Systems 241
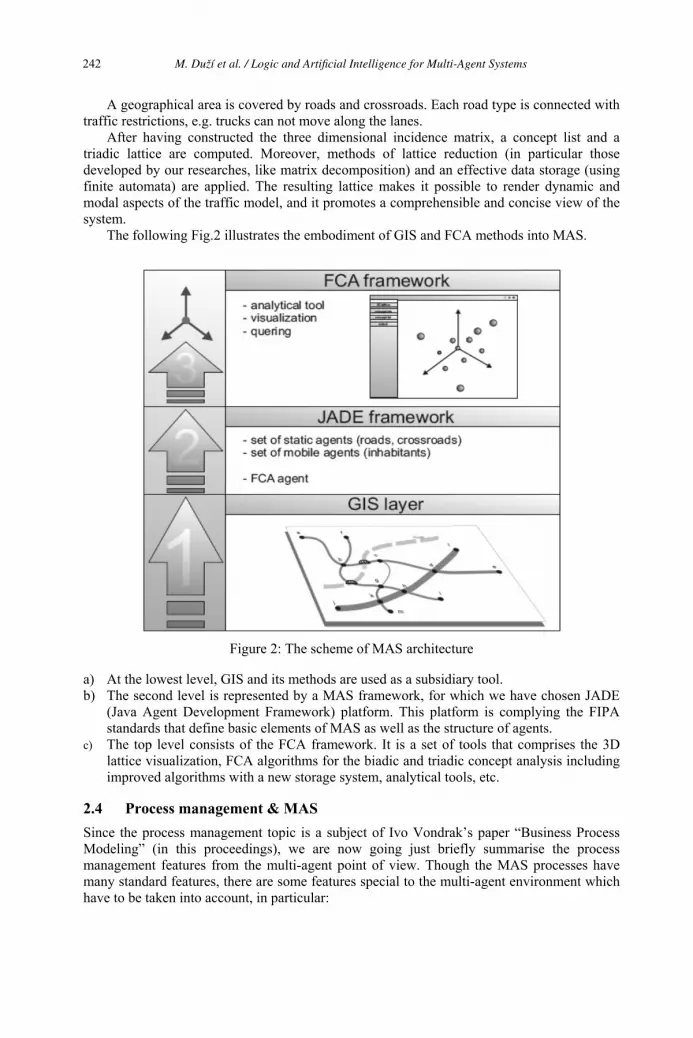
A geographical area is covered by roads and crossroads. Each road type is connected with traffic restrictions, e.g. trucks can not move along the lanes.
After having constructed the three dimensional incidence matrix, a concept list and a triadic lattice are computed. Moreover, methods of lattice reduction (in particular those developed by our researches, like matrix decomposition) and an effective data storage (using finite automata) are applied. The resulting lattice makes it possible to render dynamic and modal aspects of the traffic model, and it promotes a comprehensible and concise view of the system.
The following Fig.2 illustrates the embodiment of GIS and FCA methods into MAS.
Figure 2: The scheme of MAS architecture
a) At the lowest level, GIS and its methods are used as a subsidiary tool.b) The second level is represented by a MAS framework, for which we have chosen JADE
(Java Agent Development Framework) platform. This platform is complying the FIPA standards that define basic elements of MAS as well as the structure of agents.
c) The top level consists of the FCA framework. It is a set of tools that comprises the 3D lattice visualization, FCA algorithms for the biadic and triadic concept analysis including improved algorithms with a new storage system, analytical tools, etc.
2.4 Process management & MAS
Since the process management topic is a subject of Ivo Vondrak’s paper “Business Process Modeling” (in this proceedings), we are now going just briefly summarise the process management features from the multi-agent point of view. Though the MAS processes have many standard features, there are some features special to the multi-agent environment which have to be taken into account, in particular:
M. Duží et al. / Logic and Artificial Intelligence for Multi-Agent Systems242
functions, properties and agent skills have to be much closer to the real-world situations social behaviour of the system components agents) is emphasised the agents are autonomous and intelligent; their mutual communication is thus of a crucial importance the system is event driven the agents have to learn by experience and react to the environment changes
A process description consists of the specification of input objects, output objects and a set of possible realisations (executing the mapping: Inputs Outputs). Realisation describes an algorithm of transforming Inputs into Outputs depending on current values of parameters (situation, state of affairs, the other agents’ states). The choice of a suitable realisation thus depends on a current situation. Agent’s behaviour can evolve in time; the agents have to be able to reconfigure their state in accordance to the situation, in particular in case of emergency. To this end each agent is provided with its basic intelligence, i.e., built-in logic comprising its inference and decision abilities. The reconfiguration is performed on the set of possible realisations, and it consists of: a) selection of applicable realisations from a given process set, b) selection of the most suitable one of the former, c) execution of the selected realisation. There are two basic approaches to the reconfiguration: a process approach and a logical approach. Using the former, realisations are assigned to a process within the modelling phase, whereas using the latter consists in a real-time selection of appropriate realisations. Thus the process approach is easy to realise but provides a low degree of intelligence, whereas the logic approach is more complicated but provides a high degree of intelligence and flexibility. For this reason the two approaches are combined in our MAS system: the specification of applicable realisations is a part of the modelling phase whereas the choice of the most suitable realisation is postponed to the real-time execution.
The above behaviour features thus call for an extension of the standard UML approach. Therefore, the process development is handled and documented by an extended version of the standard UML tool. In particular, the activity diagram is extended by facilities that make it possible to specify message-driven communication. Each realization is described by one “Behaviour Activity Diagram” which is an extension of the standard UML Activity Diagram. Each message is provided with a sender / receiver role, i.e., one or all instances of an agent type. The name of a sender can be <<undefined>> in case of receiving a message from unknown or multiple sources.
The assets of this flexible approach are obvious: the system is robust and does not collapse in case an agent(s) dies. Particular agents have independent, autonomous life cycles based on their built-in intelligence. Last but not least, the system is easily adaptable to ever changing environment, and agents’ knowledge can easily be distributed and/or shared by particular agents.
3. Conclusion & Future Research In this paper we briefly described our research on Multi-Agent Systems and its applications. The work is still in progress and there is a lot to be done. More attention has to be paid to imperfect and vague information. To this end we use the fuzzy Prolog Ciao. The accurate inference machine based on TIL has to be precisely specified and implemented for the TL language. Currently we have defined the TL OWL language (see Müller 2006) that makes use of the Ontology Web Language (OWL). The TL language has also been extended in order to operate with the geographical data and to comprise spatio-temporal ontology. However, the spatio-temporal reasoning of agents, which is a great challenge, is not implemented in full as
M. Duží et al. / Logic and Artificial Intelligence for Multi-Agent Systems 243

yet. In the area of process management we are going to develop behaviour-model extensions in order to provide elaborate message specifications and interfaces, to automatically generate new generations of agents that learn by experience, and to distribute behaviour schemes and knowledge among the whole system.
Our current application is a model of a traffic system. In the near future we are going to develop and test more sophisticated applications that would demonstrate all the above-mentioned assets of the multi-agent approach.
––––––––––––––––––––––––––––––––––––––––––––––––––––––––––––––––––––––––––––––––––––––––
This research has been supported by the program "Information Society" of the Czech Academy of Sciences, project No. 1ET101940420 "Logic and Artificial Intelligence for multi-agent systems"
References
[1] Bellifemine, F. (2005):. Java Agent Development Framework Documentation. Retrievable at: http://jade.tilab.com/ .
[2] Biedermann, K. (1997): How triadic diagrams represent conceptual structures. In Proceedings of the 5th International Conference on Conceptual Structures (ICCS-97), vol. 1257 of LNAI, pp. 304–317, Berlin, Springer.
[3] Biedermann, K. (1998): Powerset trilattices. In Proceedings of the 6th International Conference on Conceptual Structures: Theory, Tools and Applications (ICCS-98), vol. 1453 of LNAI, pp. 209–224, Berlin, Springer.
[4] Duží, M.(2004): Concepts, Language and Ontologies (from the logical point of view). In Information Modelling and Knowledge Bases XV. Ed. Y. Kiyoki, H. Kangassalo, E Kawaguchi, IOS Press Amsterdam, Vol. XV, 193-209.
[5] Duží, M., Heimburger A. (2006): Web Ontology Languages: Theory and practice, will they ever meet?. In Information Modelling and Knowledge Bases XVII. Ed. Y. Kiyoki, J. Hanno, H. Jaakkola, H. Kangassalo, IOS Press Amsterdam, Vol. XVII, 20-37.
[6] Duží, M., Jespersen B, Müller, J. (2005): Epistemic Closure and Inferable Knowledge. In the Logica Yearbook 2004. Ed. Libor B hounek, Marta Bílková, Filosofia Praha, Vol. 2004, 1-15.
[7] Free Software Foundations (2006): JADE Documentation. Retrievable at: http://www.scs.ryerson.ca/%7edgrimsha/jade/doc/index.html.
[8] Lehmann, F. and Wille, R. (1995): A triadic approach to formal concept analysis. Lecture Notes in Computer Science, LNCS 954, Springer, pp.32–45.
[9] Müller, J. (2006): The TL OWL language. Retrievable at http://labis.vsb.cz/~jarin/tlowl/.[10] Odell, J. (2006): The Foundation for Intelligent Physical Agents. Retrievable at: http://www.fipa.org/.[11] Schewe, K.,D. (2003): A Logical Treatment of Concept Theories. In Information Modelling and
Knowledge Bases XIV. Ed. Hannu Jaakkola, Hannu Kangassalo, Eiji Kawagushi, Bernhard Thalheim, IOS Press Amsterdam, Vol. XVII, 1-13.
[12] Staní ek, Z., Procházka, F.(2005): eTrium: Concepts and Knowledge in Practice. Information Modelling and Knowledge Bases XVI, Kiyoki, Wangler, Jaakkola, Kangassalo (eds.), IOS Press Amsterdam, pp. 328-335.
[13] Tichý, P. (1988): The Foundations of Frege’s Logic. De Gruyter. [14] Tichý, P. (2004): Pavel Tichý’s Collected Papers in Logic and Philosophy. Svoboda, V., Jespersen, B.,
Cheyne, C. (editors), Filosofia Prague and University of Otago Press. [15] Vondrák, I. (2006): Business Process Modelling. In this proceedings. [16] Wille, R. (1982): Restructuring lattice theory: an approach based on hierarchies of concepts. In: Ordered
sets, pp. 445–470. [17] Wille, R. (1995): The basic theorem of triadic concept analysis. Order 12, pp. 149–158.
M. Duží et al. / Logic and Artificial Intelligence for Multi-Agent Systems244
A Visual and Semantic Image Retrieval Method Based on Similarity Computing with
Query-Context Recognition Xing CHEN1 and Yasushi KIYOKI2
1 Department of Information & Computer Sciences Kanagawa Institute of Technology
1030 Simo-Ogino, Atsugi-shi, Kanagawa 243-0292, Japan [email protected]
2 Department of Environmental Information Keio University
Fujisawa, Kanagawa 252-8520, Japan [email protected]
Abstract This paper presents an image retrieval method based on visual and semantic similarity computing with a query-context recognition mechanism. The motivation of our work is to solve the problem which can be described as that if only the visual similarity or only the semantic similarity judgment is performed on image retrieval, the retrieval results do not always match the query intentions of users. Our central idea is that similarity computing has to be performed between visual and semantic levels. To understand the relationship between the visual factors and the semantic factors in images, we have performed experimental studies. From our experimental studies, it is found that it is possible to extract semantic factors from the visual factors of images. Furthermore, it is found that users’ query intention can be detected from the difference of images in queries. Based on the experimental results, we develop a method to implement both the semantic and visual similarity judgment for image retrieval. In this method, several images are required to be given as the key images in a query for users to indicate their query intentions. Furthermore, an adjusting value is used for users to indicate their query intentions, intending on the visual similarity or the semantic similarity. Both the visual and semantic factors are extracted from the key images and the similarity computation is performed on the extracted factors. The effectiveness of the method is clarified based on our experimental results.
1. Introduction
As the increase of digital image resources, efficient image retrieval is becoming an important issue in the image database research field. There are two major approaches to implement image retrieval. One approach is to implement image retrieval by attaching keywords or text to images [1]. The other approach is implemented by extracting vision features like histograms, color layouts, textures and shapes from image data. A lot of systems are developed based on this approach, such as ART MUSEUM [2], QBIC [3], Photobook [4], VisulaSeek [5], Netra [6], Virage [7], RetrievalWare [8], etc. ART MUSEUM [2] is one of the earliest systems and QBIC [3] is the first commercial retrieval engine.
The previous research efforts are focused on improving the retrieval performance and quality based on visual similarity. However, it is happened in practice that even if the
M. Duží et al. (Eds.)Information Modelling and Knowledge Bases XVIII
IOS Press, 2007© 2007 The authors and IOS Press. All rights reserved.
245

images in the retrieval results match the images in a query in visual similarity, the retrieval results do not always match the users’ query intentions. Users’ feedback is one of the approaches to solve the problem. The MARS [9] system is one of the proposed systems where feedback is used to match multiple visual features for different applications and different users. Another approach is to judge the similarity of images on the semantic level. In [10], a semantic image retrieval method is proposed based on the Mathematical Model of Meaning. Methods for implementing semantic image retrieval by extracting semantic similarity factors from image groups are presented in [11] and [12].
Although many research efforts are performed, the problem still exists where the retrieval results do not always match the users’ query intentions. We have noticed that a user’s query intention is sometimes focused on the visual similarity and it is sometimesfocused on the semantic similarity. In this paper, we propose a method to implement the similarity judgment on both the visual level and the semantic level. This method is based on our experimental study on the relationship between the visual factors and the semantic factors [13]. In the following, we introduce our experimental study. Then, the mechanism for implementing the similarity judgment on both the visual and semantic levels is presented.
2. Relationships between the visual and semantic factors
We follow the next two steps to analyze the semantic elements in images. In step-1, image’s edge and its position information are derived and translated into edge characters by using the method presented in [14]. In step-2, a mathematic method called the Singular Value Decomposition (SVD) [15] is used to analyze whether the edge characters can be used to represent the semantic elements or not. We have demonstrated that the edge characters can be used to represent the semantic elements [13]. Next, we briefly review each steps technically.
Step-1: deriving and translating image’s edge and its position information into edge characters
In this processing, each image is divided into n blocks as shown in Fig. 1. Each block is represented by an edge character based on the edge information in it.
Fig. 1 Edge characters of images
In the figure, tij, (i,j = 1,2, ..., n), represents an edge character. The values of the edge characters are decided by the edge directions in the block. The edge direction is decided by formula (1), where, H and V are 3x3 matrixes (referred to as Sobel’s operators) and is the angle measured counterclockwise and defined in the range 0
by considering the horizontal direction as zero.
2tan 1
H
V (1)
Five values are given to the edge characters based on the direction of edges. Each value of the edge character represents one of the following edge directions: horizontal
t11 t12 ... t1n
t21 t22 ... t2n
...
tn1 tn2 ... tnn
X. Chen and Y. Kiyoki / A Visual and Semantic Image Retrieval Method246
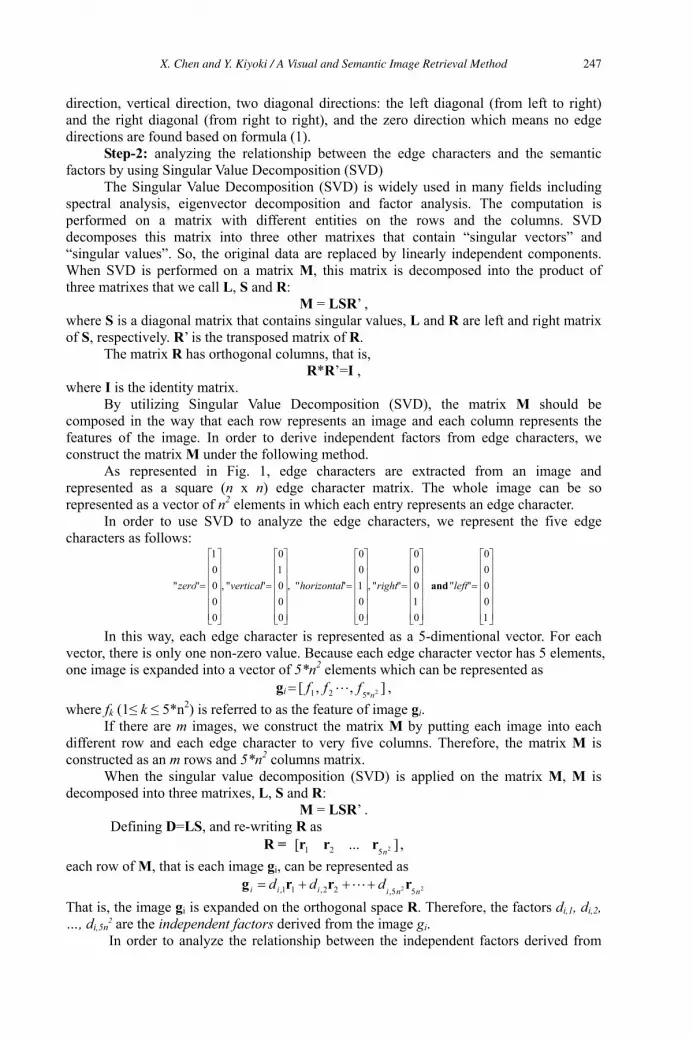
direction, vertical direction, two diagonal directions: the left diagonal (from left to right) and the right diagonal (from right to right), and the zero direction which means no edge directions are found based on formula (1).
Step-2: analyzing the relationship between the edge characters and the semantic factors by using Singular Value Decomposition (SVD)
The Singular Value Decomposition (SVD) is widely used in many fields including spectral analysis, eigenvector decomposition and factor analysis. The computation is performed on a matrix with different entities on the rows and the columns. SVD decomposes this matrix into three other matrixes that contain “singular vectors” and “singular values”. So, the original data are replaced by linearly independent components. When SVD is performed on a matrix M, this matrix is decomposed into the product of three matrixes that we call L, S and R:
M = LSR’ , where S is a diagonal matrix that contains singular values, L and R are left and right matrix of S, respectively. R’ is the transposed matrix of R.
The matrix R has orthogonal columns, that is, R*R’=I ,
where I is the identity matrix. By utilizing Singular Value Decomposition (SVD), the matrix M should be
composed in the way that each row represents an image and each column represents the features of the image. In order to derive independent factors from edge characters, we construct the matrix M under the following method.
As represented in Fig. 1, edge characters are extracted from an image and represented as a square (n x n) edge character matrix. The whole image can be so represented as a vector of n2 elements in which each entry represents an edge character.
In order to use SVD to analyze the edge characters, we represent the five edge characters as follows:
10000
""
01000
"",
00100
"",
00010
"",
00001
"" leftrighthorizontalverticalzero and
In this way, each edge character is represented as a 5-dimentional vector. For each vector, there is only one non-zero value. Because each edge character vector has 5 elements, one image is expanded into a vector of 5*n2 elements which can be represented as
gi ],,[ 2*521 nfff ,where fk (1 k 5*n2) is referred to as the feature of image gi.
If there are m images, we construct the matrix M by putting each image into each different row and each edge character to very five columns. Therefore, the matrix M is constructed as an m rows and 5*n2 columns matrix.
When the singular value decomposition (SVD) is applied on the matrix M, M is decomposed into three matrixes, L, S and R:
M = LSR’ . Defining D=LS, and re-writing R as
R = ]...[ 2521 nrrr ,each row of M, that is each image gi, can be represented as
22 55,22,11, nniiii ddd rrrgThat is, the image gi is expanded on the orthogonal space R. Therefore, the factors di,1, di,2,…, di,5n
2 are the independent factors derived from the image gi.In order to analyze the relationship between the independent factors derived from
X. Chen and Y. Kiyoki / A Visual and Semantic Image Retrieval Method 247
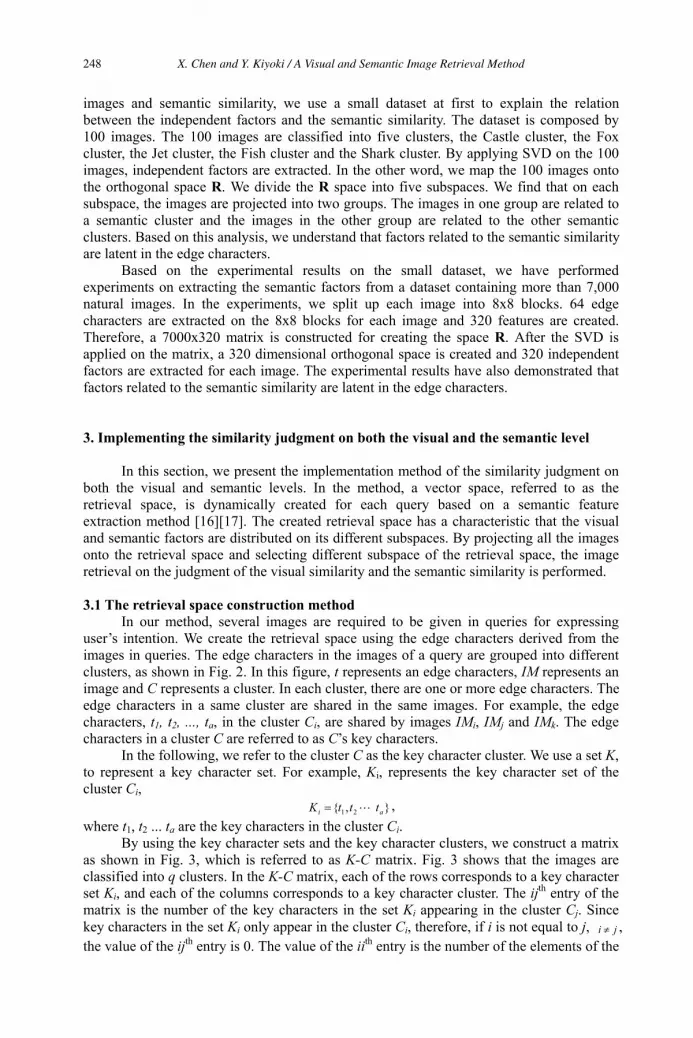
images and semantic similarity, we use a small dataset at first to explain the relation between the independent factors and the semantic similarity. The dataset is composed by 100 images. The 100 images are classified into five clusters, the Castle cluster, the Fox cluster, the Jet cluster, the Fish cluster and the Shark cluster. By applying SVD on the 100 images, independent factors are extracted. In the other word, we map the 100 images onto the orthogonal space R. We divide the R space into five subspaces. We find that on each subspace, the images are projected into two groups. The images in one group are related to a semantic cluster and the images in the other group are related to the other semantic clusters. Based on this analysis, we understand that factors related to the semantic similarity are latent in the edge characters.
Based on the experimental results on the small dataset, we have performed experiments on extracting the semantic factors from a dataset containing more than 7,000 natural images. In the experiments, we split up each image into 8x8 blocks. 64 edge characters are extracted on the 8x8 blocks for each image and 320 features are created. Therefore, a 7000x320 matrix is constructed for creating the space R. After the SVD is applied on the matrix, a 320 dimensional orthogonal space is created and 320 independent factors are extracted for each image. The experimental results have also demonstrated that factors related to the semantic similarity are latent in the edge characters.
3. Implementing the similarity judgment on both the visual and the semantic level
In this section, we present the implementation method of the similarity judgment on both the visual and semantic levels. In the method, a vector space, referred to as the retrieval space, is dynamically created for each query based on a semantic feature extraction method [16][17]. The created retrieval space has a characteristic that the visual and semantic factors are distributed on its different subspaces. By projecting all the images onto the retrieval space and selecting different subspace of the retrieval space, the image retrieval on the judgment of the visual similarity and the semantic similarity is performed.
3.1 The retrieval space construction method In our method, several images are required to be given in queries for expressing
user’s intention. We create the retrieval space using the edge characters derived from the images in queries. The edge characters in the images of a query are grouped into different clusters, as shown in Fig. 2. In this figure, t represents an edge characters, IM represents an image and C represents a cluster. In each cluster, there are one or more edge characters. The edge characters in a same cluster are shared in the same images. For example, the edge characters, t1, t2, ..., ta, in the cluster Ci, are shared by images IMi, IMj and IMk. The edge characters in a cluster C are referred to as C’s key characters.
In the following, we refer to the cluster C as the key character cluster. We use a set K,to represent a key character set. For example, Ki, represents the key character set of the cluster Ci,
},{ 21 ai tttK ,where t1, t2 ... ta are the key characters in the cluster Ci.
By using the key character sets and the key character clusters, we construct a matrix as shown in Fig. 3, which is referred to as K-C matrix. Fig. 3 shows that the images are classified into q clusters. In the K-C matrix, each of the rows corresponds to a key character set Ki, and each of the columns corresponds to a key character cluster. The ijth entry of the matrix is the number of the key characters in the set Ki appearing in the cluster Cj. Since key characters in the set Ki only appear in the cluster Ci, therefore, if i is not equal to j, ji ,the value of the ijth entry is 0. The value of the iith entry is the number of the elements of the
X. Chen and Y. Kiyoki / A Visual and Semantic Image Retrieval Method248
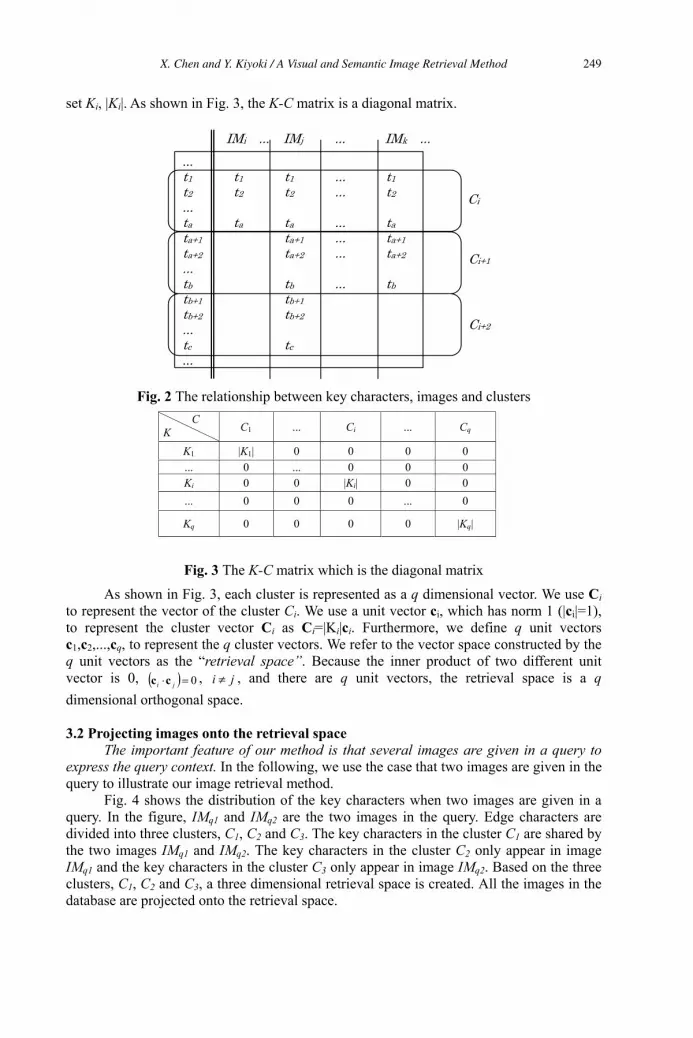
set Ki, |Ki|. As shown in Fig. 3, the K-C matrix is a diagonal matrix.
Fig. 2 The relationship between key characters, images and clusters CK C1 ... Ci ... Cq
K1 |K1| 0 0 0 0 ... 0 ... 0 0 0 Ki 0 0 |Ki| 0 0 ... 0 0 0 ... 0
Kq 0 0 0 0 |Kq|
Fig. 3 The K-C matrix which is the diagonal matrix
As shown in Fig. 3, each cluster is represented as a q dimensional vector. We use Cito represent the vector of the cluster Ci. We use a unit vector ci, which has norm 1 (|ci|=1), to represent the cluster vector Ci as Ci=|Ki|ci. Furthermore, we define q unit vectors c1,c2,...,cq, to represent the q cluster vectors. We refer to the vector space constructed by the q unit vectors as the “retrieval space”. Because the inner product of two different unit vector is 0, 0ji cc , ji , and there are q unit vectors, the retrieval space is a qdimensional orthogonal space.
3.2 Projecting images onto the retrieval space The important feature of our method is that several images are given in a query to
express the query context. In the following, we use the case that two images are given in the query to illustrate our image retrieval method.
Fig. 4 shows the distribution of the key characters when two images are given in a query. In the figure, IMq1 and IMq2 are the two images in the query. Edge characters are divided into three clusters, C1, C2 and C3. The key characters in the cluster C1 are shared by the two images IMq1 and IMq2. The key characters in the cluster C2 only appear in image IMq1 and the key characters in the cluster C3 only appear in image IMq2. Based on the three clusters, C1, C2 and C3, a three dimensional retrieval space is created. All the images in the database are projected onto the retrieval space.
...t1 t1 t1 ... t1t2 t2 t2 ... t2... ta ta ta ... tata+1 ta+1 ... ta+1ta+2 ta+2 ... ta+2...tb tb ... tbtb+1 tb+1tb+2 tb+2...tc tc...
Ci
Ci+1
Ci+2
IMi ... IMj ... IMk ...
X. Chen and Y. Kiyoki / A Visual and Semantic Image Retrieval Method 249
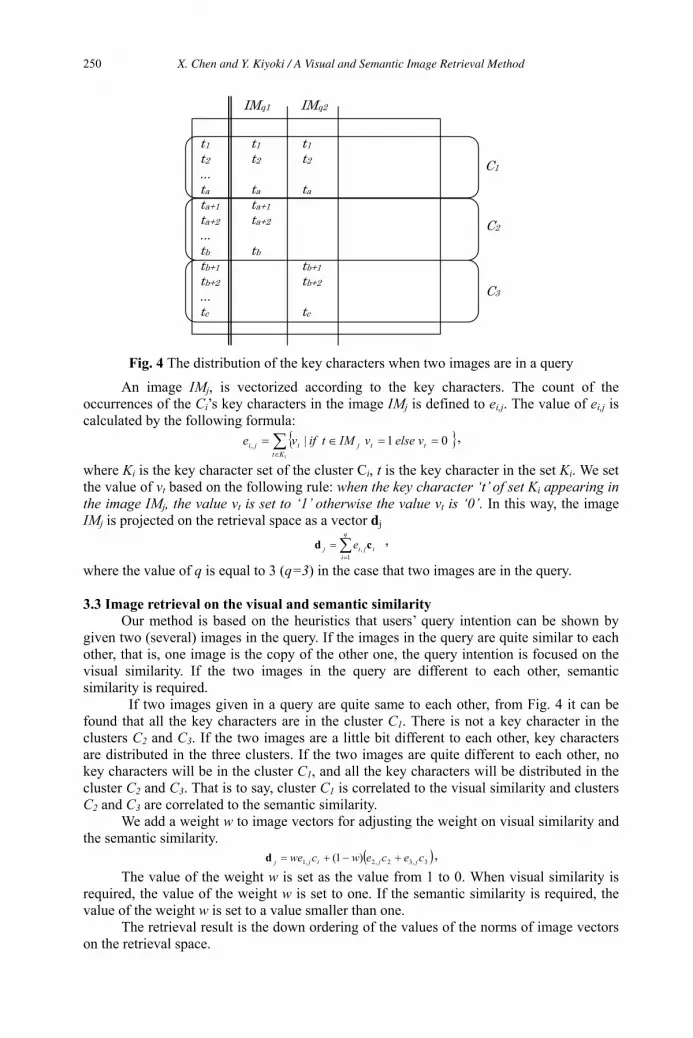
Fig. 4 The distribution of the key characters when two images are in a query
An image IMj, is vectorized according to the key characters. The count of the occurrences of the Ci’s key characters in the image IMj is defined to ei,j. The value of ei,j is calculated by the following formula:
iKtttjtji velsevIMtifve 01|,
,
where Ki is the key character set of the cluster Ci, t is the key character in the set Ki. We set the value of vt based on the following rule: when the key character ‘t’ of set Ki appearing in the image IMj, the value vt is set to ‘1’ otherwise the value vt is ‘0’. In this way, the image IMj is projected on the retrieval space as a vector dj
q
iijij e
1, cd ,
where the value of q is equal to 3 (q=3) in the case that two images are in the query.
3.3 Image retrieval on the visual and semantic similarity Our method is based on the heuristics that users’ query intention can be shown by
given two (several) images in the query. If the images in the query are quite similar to each other, that is, one image is the copy of the other one, the query intention is focused on the visual similarity. If the two images in the query are different to each other, semantic similarity is required.
If two images given in a query are quite same to each other, from Fig. 4 it can be found that all the key characters are in the cluster C1. There is not a key character in the clusters C2 and C3. If the two images are a little bit different to each other, key characters are distributed in the three clusters. If the two images are quite different to each other, no key characters will be in the cluster C1, and all the key characters will be distributed in the cluster C2 and C3. That is to say, cluster C1 is correlated to the visual similarity and clusters C2 and C3 are correlated to the semantic similarity.
We add a weight w to image vectors for adjusting the weight on visual similarity and the semantic similarity.
3,32,2,1 )1( cecewcwe jjijjd ,The value of the weight w is set as the value from 1 to 0. When visual similarity is
required, the value of the weight w is set to one. If the semantic similarity is required, the value of the weight w is set to a value smaller than one.
The retrieval result is the down ordering of the values of the norms of image vectors on the retrieval space.
t1 t1 t1t2 t2 t2... ta ta tata+1 ta+1 ta+2 ta+2 ...tb tb tb+1 tb+1tb+2 tb+2...tc tc
C1
C2
C3
IMq1 IMq2
X. Chen and Y. Kiyoki / A Visual and Semantic Image Retrieval Method250
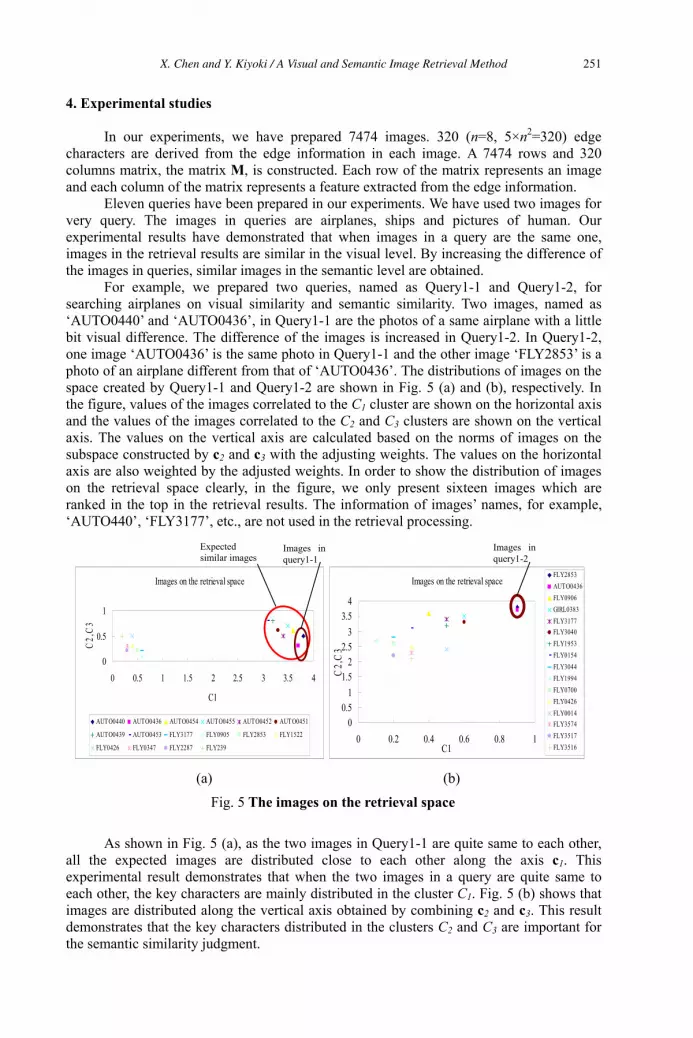
4. Experimental studies
In our experiments, we have prepared 7474 images. 320 (n=8, 5×n2=320) edge characters are derived from the edge information in each image. A 7474 rows and 320 columns matrix, the matrix M, is constructed. Each row of the matrix represents an image and each column of the matrix represents a feature extracted from the edge information.
Eleven queries have been prepared in our experiments. We have used two images for very query. The images in queries are airplanes, ships and pictures of human. Our experimental results have demonstrated that when images in a query are the same one, images in the retrieval results are similar in the visual level. By increasing the difference of the images in queries, similar images in the semantic level are obtained.
For example, we prepared two queries, named as Query1-1 and Query1-2, for searching airplanes on visual similarity and semantic similarity. Two images, named as ‘AUTO0440’ and ‘AUTO0436’, in Query1-1 are the photos of a same airplane with a little bit visual difference. The difference of the images is increased in Query1-2. In Query1-2, one image ‘AUTO0436’ is the same photo in Query1-1 and the other image ‘FLY2853’ is a photo of an airplane different from that of ‘AUTO0436’. The distributions of images on the space created by Query1-1 and Query1-2 are shown in Fig. 5 (a) and (b), respectively. In the figure, values of the images correlated to the C1 cluster are shown on the horizontal axis and the values of the images correlated to the C2 and C3 clusters are shown on the vertical axis. The values on the vertical axis are calculated based on the norms of images on the subspace constructed by c2 and c3 with the adjusting weights. The values on the horizontal axis are also weighted by the adjusted weights. In order to show the distribution of images on the retrieval space clearly, in the figure, we only present sixteen images which are ranked in the top in the retrieval results. The information of images’ names, for example, ‘AUTO440’, ‘FLY3177’, etc., are not used in the retrieval processing.
As shown in Fig. 5 (a), as the two images in Query1-1 are quite same to each other, all the expected images are distributed close to each other along the axis c1. This experimental result demonstrates that when the two images in a query are quite same to each other, the key characters are mainly distributed in the cluster C1. Fig. 5 (b) shows that images are distributed along the vertical axis obtained by combining c2 and c3. This result demonstrates that the key characters distributed in the clusters C2 and C3 are important for the semantic similarity judgment.
Images on the retrieval space
0
0.5
1
0 0.5 1 1.5 2 2.5 3 3.5 4
C1
C2,
C3
AUTO0440 AUTO0436 AUTO0454 AUTO0455 AUTO0452 AUTO0451
AUTO0439 AUTO0453 FLY3177 FLY0905 FLY2853 FLY1522
FLY0426 FLY0347 FLY2287 FLY239
Images on the retrieval space
00.5
11.5
22.5
33.5
4
0 0.2 0.4 0.6 0.8 1C1
C2,
C3
FLY2853AUTO0436FLY0906GIRL0383FLY3177FLY3040FLY1953FLY0154FLY3044FLY1994FLY0700FLY0426FLY0014FLY3574FLY3517FLY3516
(a) (b)
Fig. 5 The images on the retrieval space
Expectedsimilar images
Images in query1-1
Images in query1-2
X. Chen and Y. Kiyoki / A Visual and Semantic Image Retrieval Method 251
5. Conclusion
In this paper, we have presented a new method to implement the similarity judgment on both the visual and semantic similarities for image retrieval. In the method, two images are required to be included in a query for recognizing query context. In the method, edge information is used for extracting the visual factors and the semantic factors. A retrieval space is dynamically created based on the edge information of the images in queries. The created retrieval space has a characteristic that the visual and semantic factors are distributed on its different subspaces. By projecting all the images onto the retrieval space and selecting different subspaces of the retrieval space, the image retrieval on the judgment of the visual and semantic similarities is performed. Based on the experimental results, we have shown that our method is effective to sharply separate the visual similarity factors and the semantic similarity factors from images. We have demonstrated that based on the separated visual and semantic factors, the image retrieval on the judgment between the visual and semantic similarities can be effectively realized.
References
[1] Chang, S.K., “Image Database Systems,” Handbook of Pattern Recognition and Image Processing, Yong, T. Y. and Fu, K. S. (eds), pp. 371-393, Academic Press, 1986.
[2] Hirata, K. and Katzo, T. “Query by visual example, content based image retrieval,” in Advances in Database Technology-EDBT’92, Vol. 508, Pirotte, A., Delobel, C. and Gottlob, G., Eds., 1992.
[3] Niblack, W. et al., “The QBIC project: Quering images by content using color, texture and shape,” in Proc. SPIE Storage and Retrieval for Image and Video Data Bases, pp. 172-187, 1994.
[4] Pentland, A., Picard, R. W. and Sclaroff, S., “Photobook: Content-based manipulation of image databases,” Int. J. Comput. Vis., Vol. 18, pp. 233-254, 1996.
[5] Smith, J. R. and Chang, S., “Visual.seek: A fully automated content-based query system,” in Proc. ACM Multimedia’96, pp.87-98.
[6] Ma, W. Y. and Manjunath, B. S., “Netra: A toolbox for navigating large image databases,” in Proc. IEEE Int. Conf. Image Processing, pp. 568-571, 1997.
[7] Gupta, A. and Jain, R., “Visula information retrieval,” Commun. ACM, Vol. 40, pp. 70-79, 1997. [8] Dowe, J., “Content based retrieval in multimedia imaging,” in Proc. SPIE Conf. Storage and Retrieval
for Image and Video Database, 1993. [9] Rui, Y., Huang, T. S. and Mehrotra, S., “Content-based image retrieval with relevance feed-back in
Mars,” in Proc. IEEE Conf. Image Processing, pp. 815-818, 1997. [10] Kiyoki, Y., Kitagawa, T., Hayama, T., “A metadatabase system for semantic image search by a
mathematical model of meaning”, ACM SIGMOD Record, Vol.23, No. 4, pp.34-41, Dec. 1994. [11] Nakagoshi, T., Satoh, K., “User-dependent Similar Image Retrieval Based on Image Grouping and
Group Similarity',” IPSJ Transactions on Databases, Vol. 42, No. SIG 1 (TOD 8) pp. 21 -- 31 (2001) (in Japanese).
[12] Chen, X. and Kiyoki, Y., “Implementing Similar Image Retrieval Based on a Semantic Information Retrieval System,” The 8th IASTED International Conference on Internet and Multimedia Systems and Applications IMSA 2004, pp. 91-96, 2004.
[13] Chen, X. Delvecchio, T and DI LECCE, V., “Deriving Semantic from Images Based on the Edge Information,” Proceedings of the 15th European-Japanese Conference on Information Modeling and Knowledge Bases, pp. (8 pages), 2005.
[14] Di Lecce, V. and Guerriero, A., “A Comparative Evaluation of retrieval methods for Duplicate search in Image database”, Journal if Visual Languages and Computing, 2001, 12, 150-120.
[15] Forsythe,G. E., Malcolm, M. A. and Moler, C. B., “Computer Methods for Mathematical Computations,” Englewood Cliffs, NJ: PrenticeHall, 1977.
[16] Chen, X. and Kiyoki, Y., “A query-meaning Recognition Method with a Learning Mechanism for Document Information Retrieval,” Information Modelling and Knowledge Bases XV (IOS Press), Vol. 105, pp. 37-54, 2004.
[17] Chen, X. and Kiyoki, Y., “A Dynamic Retrieval Space Creation Method for Semantic Information Retrieval,” Proceedings of the 14th European-Japanese Conference on Information Modeling and Knowledge Bases, pp. 46-63, 2004.
X. Chen and Y. Kiyoki / A Visual and Semantic Image Retrieval Method252

Information Systems Development in the Age of Multimedia Web Systems
Benkt WANGLER, Alexander BACKLUND School of Humanities and Informatics, University of Skövde, Sweden
{benkt.wangler, alexander.backlund}@his.se
Abstract. This paper discusses the effects that the increasing use of Internet, web technology and multimedia in information systems, and the computer games industry will have on information systems work. The paper concludes that the look and feel aspect of information systems is becoming ever more important and that we will see an increasing involvement of people with artistic skills in information systems development. We should also be prepared to adjust our educational programs accordingly.
1. Introduction
Information systems as a discipline is broadly situated at the intersection of computer science, software engineering and business administration. Hence, information systems developers need some education in all of these areas. However, the advent of multi-media, Internet and web technology pose new and different demands on information systems developers and on their education. This paper therefore aims to discussing these effects and in particular the nature of information vis a vis human senses and experience, how the notion of an information system may be understood and how it is affected by the recent developments in information and communication technologies. These thoughts were put forward by the authors in [1] and are here further discussed.
The paper starts by discussing the nature of information and communication in general and how this relates to experience. It continues by delving into how (computerized) information systems may be understood. It ends by discussing the new demands on information systems developers posed by the fact that the look and feel aspect of any computerized system becomes more and more important.
2. Information
There are several ways to consider the nature of information. In broad terms it is usually understood as “knowledge communicated”. In this paper, we will discuss it from an information systems perspective. For a broader discussion of the notion of information the reader is referred to [2].
However, from an information system point of view, information and its relationship to knowledge can be understood in terms of a message (cf. Figure 1). First of all a message has a certain form, i.e. it may be formulated as a written message in some natural language or it may take the form of some other (visual, audible, smellable, tastable or tactile) symbol. Secondly, a message has some (intended) content. It is this intended content that we usually refer to as information. Of course, for different reasons, the form of the message might not always reflect the intended content, e.g. when the wording of a sentence is not quite correct.
M. Duží et al. (Eds.)Information Modelling and Knowledge Bases XVIII
IOS Press, 2007© 2007 The authors and IOS Press. All rights reserved.
253
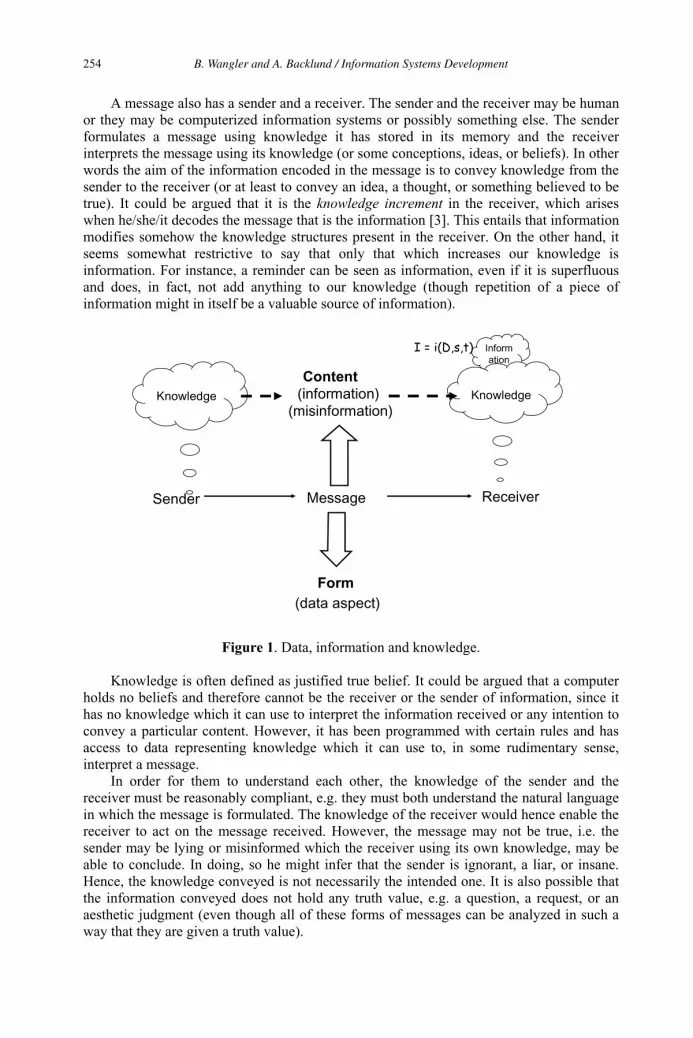
A message also has a sender and a receiver. The sender and the receiver may be human or they may be computerized information systems or possibly something else. The sender formulates a message using knowledge it has stored in its memory and the receiver interprets the message using its knowledge (or some conceptions, ideas, or beliefs). In other words the aim of the information encoded in the message is to convey knowledge from the sender to the receiver (or at least to convey an idea, a thought, or something believed to be true). It could be argued that it is the knowledge increment in the receiver, which arises when he/she/it decodes the message that is the information [3]. This entails that information modifies somehow the knowledge structures present in the receiver. On the other hand, it seems somewhat restrictive to say that only that which increases our knowledge is information. For instance, a reminder can be seen as information, even if it is superfluous and does, in fact, not add anything to our knowledge (though repetition of a piece of information might in itself be a valuable source of information).
Information
Message ReceiverSender
Form
Content(information)Knowledge Knowledge
(data aspect)
(misinformation)
I = i(D,s,t)
Figure 1. Data, information and knowledge.
Knowledge is often defined as justified true belief. It could be argued that a computer holds no beliefs and therefore cannot be the receiver or the sender of information, since it has no knowledge which it can use to interpret the information received or any intention to convey a particular content. However, it has been programmed with certain rules and has access to data representing knowledge which it can use to, in some rudimentary sense, interpret a message.
In order for them to understand each other, the knowledge of the sender and the receiver must be reasonably compliant, e.g. they must both understand the natural language in which the message is formulated. The knowledge of the receiver would hence enable the receiver to act on the message received. However, the message may not be true, i.e. the sender may be lying or misinformed which the receiver using its own knowledge, may be able to conclude. In doing, so he might infer that the sender is ignorant, a liar, or insane. Hence, the knowledge conveyed is not necessarily the intended one. It is also possible that the information conveyed does not hold any truth value, e.g. a question, a request, or an aesthetic judgment (even though all of these forms of messages can be analyzed in such a way that they are given a truth value).
B. Wangler and A. Backlund / Information Systems Development254

Börje Langefors has tried to define and characterize information by formulating his infological equation: ),,( tSDiI , where I is the information derived by the interpretation
process i from the data D and the pre-knowledge S during the time t [4, 5]. Communication is successful only if the S of the receiver and the sender are sufficiently overlapping. He distinguishes between the subset of our pre-knowledge required to interpret a message and the (probably larger) subset used to make inferences from the message received. The first step, interpreting the message, he calls direct interpretation, while the second step, making inferences and associations, is called indirect interpretation [4]. The interpretation of a message can be affected not only by our knowledge but also by the form of the data and by emotional aspects [4, 6].
The form of the message represents the syntactic (data) aspect of the message. The message content represents the semantic (information) dimension. Finally, the pragmatic dimension of the message has to do with the functional (knowledge) aspect of the message. The identification of the syntactic, semantic and pragmatic dimensions of a message is due to the American philosophers Peirce and Morris [7].
Wilson [8] defines information as “data plus the meaning ascribed to it” (p. 198), and says that computerized data processing systems become information systems only when their output is used by someone, and hence, an information system entails the users.
Naturally, there are several other ways to define information. Stafford Beer, for instance, defines information as “That which CHANGES us.” (p. 283). We know that we have been informed because our state has changed. There are similar definitions by Bateson and MacKay (cf. [9]). There is a point in these definitions, but it seems that if we are hit by a ton o bricks, that affects us but gives us no information.
People receive information through their senses: sight, hearing, smell, taste, and the perception of touch. For output, computerized information systems are so far only able to utilize the first two of those, except in rare cases such as the simulators used to train aircraft pilots or, for that matter, computer game joysticks, where also touch may be involved.
3. Information Systems
In general terms, an information system may be defined as a rule-driven system for communicating between people over space or time, i.e. it is a system for sending, storing (and manipulating), and receiving (i.e. presenting to the receiver) messages (cf. Figure 2). Hence, the central component, i.e. the database, may be thought of as a collection of stored messages.
The above definition also entails that information systems do not necessarily have to be computerized, and that in fact any established (and rule-driven) routines for communicating in an organizational environment is an information system, and that the people involved participate in that information system. We refer to this as an information system in the broad sense, as opposed to a computerized information system, where only the computerized artifact for entering, storing, manipulating, and presenting information is taken into account. However, if one wishes to stress the importance of informal communication channels, the requirement that information systems should be strictly rule-driven might be left out.
There are many ways to define and view information systems, though. Generally speaking, there seems to be two main perspectives: a humanly centered or information centered and a technology centered or data centered one. Authors adhering to the former view make a distinction between data processing systems (or computer systems) and information systems. People are a necessary, integral part of them. In the latter view, an information system is primarily a (mostly computerized) data processing system. [10]. Klein and Hirscheim [11] identify “two ontological dimensions to information systems: (1)
B. Wangler and A. Backlund / Information Systems Development 255
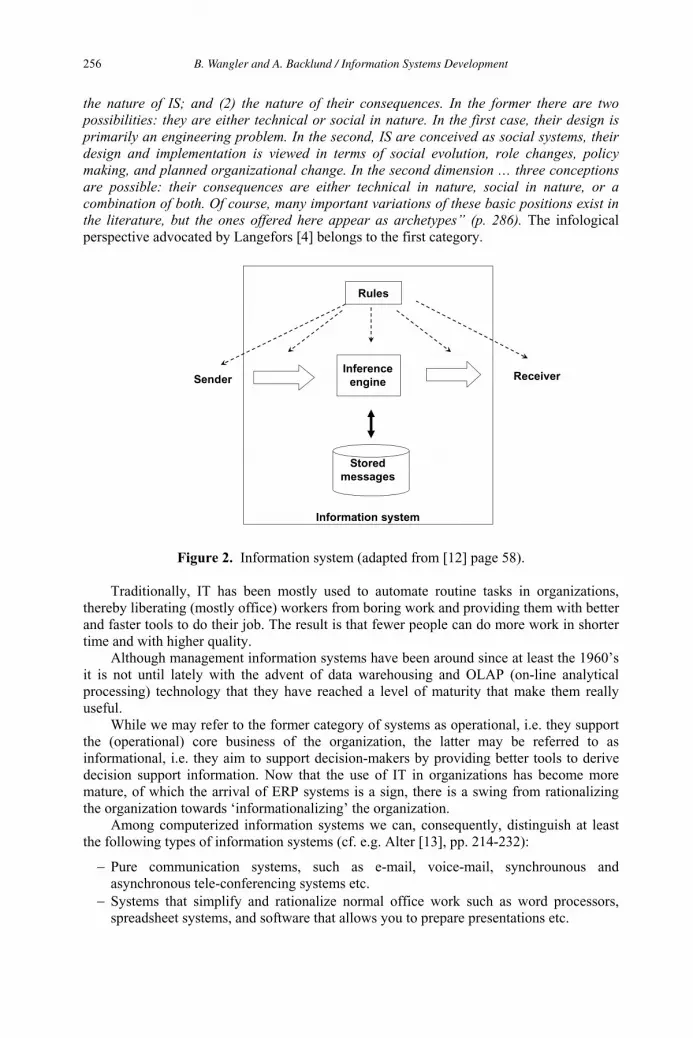
the nature of IS; and (2) the nature of their consequences. In the former there are two possibilities: they are either technical or social in nature. In the first case, their design is primarily an engineering problem. In the second, IS are conceived as social systems, their design and implementation is viewed in terms of social evolution, role changes, policy making, and planned organizational change. In the second dimension … three conceptions are possible: their consequences are either technical in nature, social in nature, or a combination of both. Of course, many important variations of these basic positions exist in the literature, but the ones offered here appear as archetypes” (p. 286). The infological perspective advocated by Langefors [4] belongs to the first category.
Inference
engine
Stored
messages
Information system
Rules
Sender Receiver
Figure 2. Information system (adapted from [12] page 58).
Traditionally, IT has been mostly used to automate routine tasks in organizations, thereby liberating (mostly office) workers from boring work and providing them with better and faster tools to do their job. The result is that fewer people can do more work in shorter time and with higher quality.
Although management information systems have been around since at least the 1960’s it is not until lately with the advent of data warehousing and OLAP (on-line analytical processing) technology that they have reached a level of maturity that make them really useful.
While we may refer to the former category of systems as operational, i.e. they support the (operational) core business of the organization, the latter may be referred to as informational, i.e. they aim to support decision-makers by providing better tools to derive decision support information. Now that the use of IT in organizations has become more mature, of which the arrival of ERP systems is a sign, there is a swing from rationalizing the organization towards ‘informationalizing’ the organization.
Among computerized information systems we can, consequently, distinguish at least the following types of information systems (cf. e.g. Alter [13], pp. 214-232):
Pure communication systems, such as e-mail, voice-mail, synchrounous and asynchronous tele-conferencing systems etc.
Systems that simplify and rationalize normal office work such as word processors, spreadsheet systems, and software that allows you to prepare presentations etc.
B. Wangler and A. Backlund / Information Systems Development256

Individual expert support applications. These may be knowledge-based such as in expert systems or they may be simpler systems meant to support individuals such as e.g. salesmen, in their daily work.
Systems that automate normal business transactions, i.e. what is nowadays sometimes referred to as OLTP (on-line transaction processing) systems. These systems may be interconnected and form standard software packages that provide seamless support to complete business processes, such as in ERP and supply chain management packages.
Systems that provide strategic and tactic decision support, i.e. executive information systems, possibly based on data warehousing and including OLAP functionality. Some ERP packages provide extensions that extract and aggregate information such as to form such a “business warehouse”. To conclude, information systems in the broad sense involve computerized as well as
manual routines and include people involved as agents manipulating and conveying information that concern the things that are dealt with in the organization. Furthermore, information systems may be viewed as either part of the operational business of an organization that they control and support, or as informational systems providing information to support decision-makers.
4. Information systems work
Information systems work concerns dealing with information systems in the broad sense, i.e. dealing with both the business aspects and the technical aspects, and doing so from the first idea through to disposal i.e. throughout the complete information systems life-cycle. It is important to understand that it is almost always the case in information systems development that there is an existing system that needs to be replaced, completely or partially, and/or there are existing systems that the newly developed system needs to interact with. Perhaps it is more correct to say that information systems development is always a question of adapting, changing or replacing existing systems and business structures. In that sense all information systems development may be thought of as maintenance.
Capturing, early on, the information systems requirements, or even helping the customer to understand and formulate its needs, and then managing the requirements throughout the systems life-cycle are typical activities of information systems development. Note also that not all information system software is developed for one particular customer, but that more and more systems are developed for a market (market-driven development) and sold to many customers. The resulting artifact is software, that when deployed in the organization is combined with the organizational business routines that may, hence, have to be adapted to the routines embedded in the software.
There are at least three broad areas of knowledge that are needed for successful work in information systems engineering (cf. Iivari [14]):
knowledge of information systems domains and applications,
knowledge about methods, models and tools for business and systems analysis and design, deployment, and operations and maintenance,
knowledge of technology needed for building systems and for integrating them with legacy components.
Furthermore, the advent of Internet and the WWW, multimedia, virtual reality and 3D screens, and the computer game industry etc. is bringing new types of competencies into the information systems industry. People with a background mostly in the communications industry have become involved in designing web-based multimedia systems. These people sometimes refer to themselves as content providers as opposed to software developers. As a
B. Wangler and A. Backlund / Information Systems Development 257
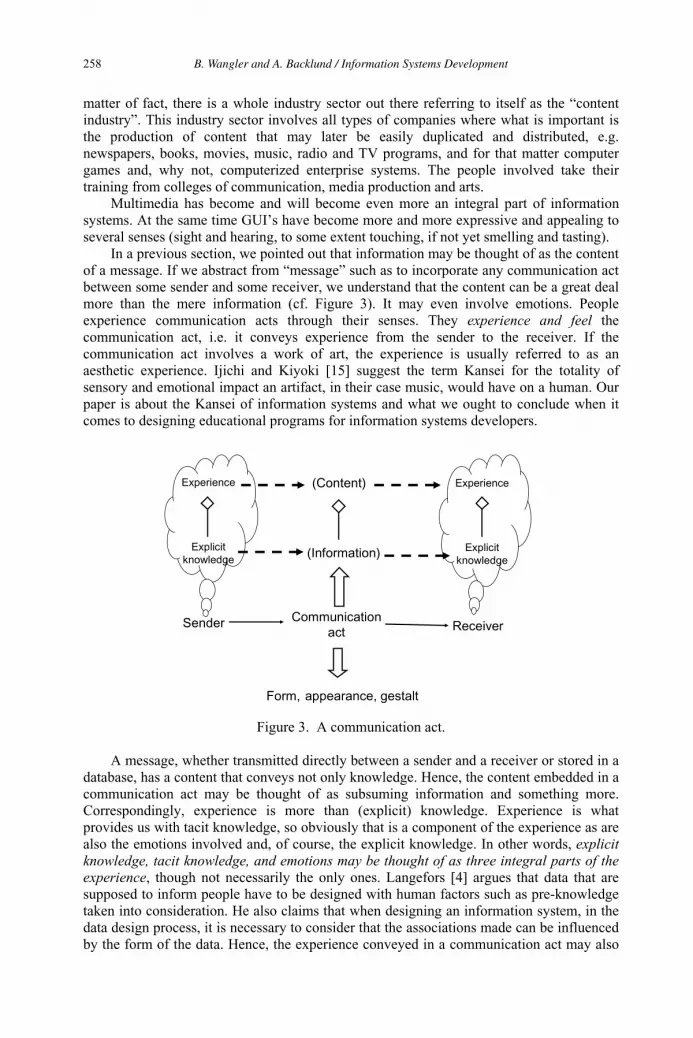
matter of fact, there is a whole industry sector out there referring to itself as the “content industry”. This industry sector involves all types of companies where what is important is the production of content that may later be easily duplicated and distributed, e.g. newspapers, books, movies, music, radio and TV programs, and for that matter computer games and, why not, computerized enterprise systems. The people involved take their training from colleges of communication, media production and arts.
Multimedia has become and will become even more an integral part of information systems. At the same time GUI’s have become more and more expressive and appealing to several senses (sight and hearing, to some extent touching, if not yet smelling and tasting).
In a previous section, we pointed out that information may be thought of as the content of a message. If we abstract from “message” such as to incorporate any communication act between some sender and some receiver, we understand that the content can be a great deal more than the mere information (cf. Figure 3). It may even involve emotions. People experience communication acts through their senses. They experience and feel the communication act, i.e. it conveys experience from the sender to the receiver. If the communication act involves a work of art, the experience is usually referred to as an aesthetic experience. Ijichi and Kiyoki [15] suggest the term Kansei for the totality of sensory and emotional impact an artifact, in their case music, would have on a human. Our paper is about the Kansei of information systems and what we ought to conclude when it comes to designing educational programs for information systems developers.
Communicationact
ReceiverSender
(Information)
Experience
Explicit
knowledge
Experience
Explicit
knowledge
(Content)
Form, appearance, gestalt
Figure 3. A communication act.
A message, whether transmitted directly between a sender and a receiver or stored in a database, has a content that conveys not only knowledge. Hence, the content embedded in a communication act may be thought of as subsuming information and something more. Correspondingly, experience is more than (explicit) knowledge. Experience is what provides us with tacit knowledge, so obviously that is a component of the experience as are also the emotions involved and, of course, the explicit knowledge. In other words, explicitknowledge, tacit knowledge, and emotions may be thought of as three integral parts of the experience, though not necessarily the only ones. Langefors [4] argues that data that are supposed to inform people have to be designed with human factors such as pre-knowledge taken into consideration. He also claims that when designing an information system, in the data design process, it is necessary to consider that the associations made can be influenced by the form of the data. Hence, the experience conveyed in a communication act may also
B. Wangler and A. Backlund / Information Systems Development258

be affected by its form. Furthermore, in [6] it is argued that the direct and indirect interpretation of data into information can be affected by emotional factors. This is well-known and also frequently utilized in mass communication and in art.
Form and content are inseparably connected to each other. When it comes to information systems, it is therefore reasonable to regard as content not only the content of its databases but also the screens that present the information to the user. In a way this corresponds to the stage setting in which a theatre play takes place. Hence, one might suggest the term screenograhy (cf. scenography) for this. All-in-all, the way the people involved experience and feel the human-computer discourse has become more and more important. Modern information systems do not only make work simpler, they also make it more fun.
Furthermore, in organized work human-computer interactions are interlinked in workflows that remind of narratives, and indeed the term “saga” has been suggested as a term to denote long lived transactions (LLT) that may be interleaved with other LLT:s [16]. From a business point of view such a saga may be said to represent the enactment of a business process. Furthermore storyboards, a well-known technique among communications people, have become a popular way of describing stereotypes of such sagas and thus to illustrate a workflow in the early stages of systems development. Hence, the business process and workflow designer may be regarded as the playwright and perhaps the director of the information system. He or she sets up and directs the drama of the workflow - the business process as docusoap (reality TV), if you like.
Consequently, it may be necessary in the future to distinguish more clearly, even at the educational level, the information systems content developers, i.e. those that design the business process narratives, from the software engineers, i.e. those that make the business narratives happen. The former would besides a certain level of computer science, information systems and psychology also need training in graphical design and in sub-fields of literature studies such as narratology and dramaturgy.
5. Conclusions
We would like to conclude that there is a need for several categories of information systems workers interacting during the development of an information system. It goes without saying that we still need people with business analysis and software engineering skills. To this we can now add a third category of people with artistic skills and with an understanding of how the human-computer discourse can be made interesting and fun. This is due to that:
- Communication acts such as those taking place between a computerized information system and a human user conveys much more than mere information.
- The experience and feel aspect of human/computer interaction, such as in the use of an information system, is becoming ever more important for each day. Information systems workers must take inspiration from e.g. the computer games industry.
- The content of a computerized information system is not only the content of its databases but also the screenography through which the human-computer discourse takes place. We may hence need screenographers that take their training from colleges of art.
- The human-computer discourse can be thought of as narratives that need a playwright to author the manuscript and a director to set it up. Just like a movie.
- Also other specialists such as graphics designers, photographers etc. are needed in different stages of the development. This in turn entails that the project leaders of information systems projects will become more like movie producers.
B. Wangler and A. Backlund / Information Systems Development 259

We believe, hence, that in the future it may be necessary to distinguish several types of
- The requirements engineers that elicit, formulate, collect, and manage requirements throughout the information systems lifecycle.
- Those that author the business narratives, directs the human-computer discourse, and designs the screenography, i.e. the stage setting and the costumes in which the information system is dressed.
- The software engineers that design the (physical) databases and implement the executable system.
It should be noted that we are just in the beginning of this era, and that changing the way systems developers work will take time. The authors are, however, convinced that we will see significant changes in the way information systems are designed during, say, the forthcoming ten years.
References
1. Wangler B., Backlund A., Information systems engineering: what is it?, Proceedings of 1st workshop on philosophical foundations of information systems engineering, Porto 2005.
2. Capurro R., Hjørland B.: The Concept of Information In: Blaise Cronin (Ed.): Annual Review of Information Science and Technology (ARIST), Vol. 37 (2003) Chapter 8, 343-411.
3. Falkenberg E.D., Hesse W., Lindgreen P., Nilsson B.E, Oei J.L.H, Rolland C., Stamper R.K., Van Assche F.J.M., Verreijn-Stuart A.A., Voss K.: A Framework of Information Systems Concepts: The Frisco Report (Web Edition), IFIP 1998, available from http://www.liacs.nl/~verrynst/fri-full-7.pdf[accessed 30 November, 2004].
4. Langefors B.: Essays on Infology, Studentlitteratur, Lund, 1995. 5. Langefors B.: Theoretical Analysis of Information Systems (fourth edition), Studentlitteratur, Lund,
1973.6. Backlund A.: The emotional grounds of infology: the infological equation revisited. In: Wilby J. & Allen
J. K. (eds.): Proceedings of the 45th Annual Conference of the International Society for the Systems Sciences, Asilomar, California, July 8-13, 2001.
7. Encyclopedia Brittanica Online: Semiotics (and related pages) (on-line). available from http://search.eb.com/eb/article?eu=68439&tocid=0&query=semiotics&ct= [accessed 27 November 2003]
8. Wilson B.: Systems: Concepts, Methodologies, and Applications. 2nd ed., John Wiley & Sons Ltd., Chichester, 1990.
9. Floridi L.: Information. In: Floridi L (ed.) The Blackwell Guide to the Philosophy of Computing and Information, Blackwell Publishing, Oxford, pp. 40-61, 2004.
10. Backlund, A.: Making Sense of Complexity in the Context of Information Systems. Licentiate’s dissertation, Dep. of Computer and Systems Sciences, Stockholm University, Sweden, 2004.
11. Klein, H. K, Hirschheim, R.: Social Change and the Future of Information Systems Development. In: Boland R. J., Hirschheim, R. A. (eds.): Critical Issues in Information Systems Research, John Wiley & Sons Ltd., Chichester, 1987.
12. Axelsson K.: Metodisk systemutveckling: att skapa samstämmighet mellan informationssystemarkitektur och verksamhet. PhD dissertation, Dept. of Computer and Information Science Linköping University, Sweden, 1998 (in Swedish).
13. Alter S.: Information Systems: A Management Perspective. 2nd Edition, The Benjamin/Cummings Publishing Company Inc., Menlo Park, 1996.
14. Iivari J.: Towards a Distinctive Body of Knowledge for Information Systems Experts: A Knowledge Work Perspective. Lecture notes, November, 2003.
15. Ijichi A., Kiyoki Y., A kansei metadata generation method for music data dealing with dramatic interpretation, Proceedings of the 14th European-Japanese conference on information modeling and databases, Skövde 2004.
16. Garcia-Molina H., Salem K.: Sagas. ACM SIGMOD Record, Proceedings of the 1987 International Conference on Management of Data, December 1987
information systems developers such as e.g.:
B. Wangler and A. Backlund / Information Systems Development260
NATO C3 Architectures and Difficulties of Application in National Environment
prof. Ladislav BURITA, Vojtech ONDRYHAL Communication and Information Systems Department
University of Defence, Brno, Czech Republic
Abstract. To achieve the goal of effective coalition operations, NATO common-funded C3 (Consultation, Command and Control) systems must be interoperable and be capable of interoperating with those of member and partner nations. In the same way, national and multi-national systems of members and partners must be interoperable to achieve this goal. There are currently several directives which provides framework to support C3 Systems Interoperability to enhance the Alliance’s operational effectiveness and improve efficiency of available resources by implementing interoperable and affordable C3 systems that will provide the right information to the right user at the right time. In the paper we would like to discuss basics of architecture approach for C3 systems development and difficulties which were already tackled during architecture approach application in CAF (Czech Army Forces) and MoD (Ministry of Defence).
Introduction
The common directive to support interoperability for NATO C3 Systems was published (NID – NATO C3 System Interoperability Directive) and one of the key parts of this directive is The NATO C3 System Architecture Framework. Other parts focus on technical architecture (NC3TA), testing infrastructure (NIETI), support tools (IST) and NATO/Non-NATO interface profiles. The NATO C3 System Architecture Framework (NAF) document provides the rules, guidance, and templates for developing and presenting architectures to ensure a common denominator for understanding, comparing, and integrating systems. The application of the Framework will enable architectures to contribute most effectively to acquiring and fielding cost-effective and interoperable military capabilities.
1. Background and terminology
Term architecture is widely used at a different level of abstraction, sometimes is misused. The most high-level abstraction in the IS branch is an enterprise architecture, where term enterprise can be defined as a collection of organizations that has a common set of goals and/or a single bottom line; it is usually a government agency, a whole corporation, a division of a corporation, a single department or a chain of geographically distant organizations linked together by common ownership. Architecture, as defined in ANSI/IEEE Std 1471-2000, is “the fundamental organization of a system, embodied in its components, their relationships to each other and the environment, and the principles governing its design and evolution”.
M. Duží et al. (Eds.)Information Modelling and Knowledge Bases XVIII
IOS Press, 2007© 2007 The authors and IOS Press. All rights reserved.
261
According to these definitions, NATO is an enterprise; we can even say the “very large” enterprise.
1.1 Enterprise architecture framework
Enterprise architecture is then understand as a comprehensive framework used to manage and align an organization's structure, processes, information, operations and projects with the organization's overall strategy. An architecture framework is a tool which can be used for developing a broad range of different architectures. It should describe a method for designing an information system in terms of a set of building blocks, and for showing how the building blocks fit together. It should contain a set of tools and provide a common vocabulary. It should also include a list of recommended standards and compliant products that can be used to implement the building blocks. Enterprise architecture is usually splitted up to the following four more detailed architecture types. Business architecture incorporates business strategy, governance, organization, and key business processes. Applications architecture provides a blueprint for the individual application systems to be deployed, their interactions, and their relationships to the core business processes of the organization. Data architecture describes the structure of an organization's logical and physical data assets and data management resources. Technology architecture describes the software infrastructure intended to support the deployment of core, mission-critical applications.
2. NATO Architecture Framework
NATO Architecture Framework (NAF) is one of the enterprise architecture frameworks that satisfies the above definitions. Other well-known architecture frameworks are for example Zachman Framework, The U.S. Department of Defense Architecture Framework (DoDAF), The Open Group Architecture Framework (TOGAF) or United States Government Federal Enterprise Architecture (FEA).
2.1 NAF architecture types
There are four types of architectures defined: baseline, overarching, reference and target. On the Figure 1 there are emphasized the relationships between them. Architectures are dynamic in nature and are updated regularly to reflect changes in requirements and technology.
2.1.1 Baseline Architecture
The NATO C3 System Baseline Architecture is a description of the fielded "as is" system in architectural template terms. Baselines are used in NATO’s Mission Oriented Analysis (MOA) process to help assess potential solutions to evolving operational requirements. Thus, they are tools necessary for the user, planner, manager, and system custodian to comprehensively establish, understand, and maintain the current enterprise or domain configuration. Baselines are rendered for NATO and National systems at a level of detail necessary for depiction of system components, their interconnectivity with each other, and any relevant external connectivity.
L. Burita and V. Ondryhal / NATO C3 Architectures and Difficulties of Application262
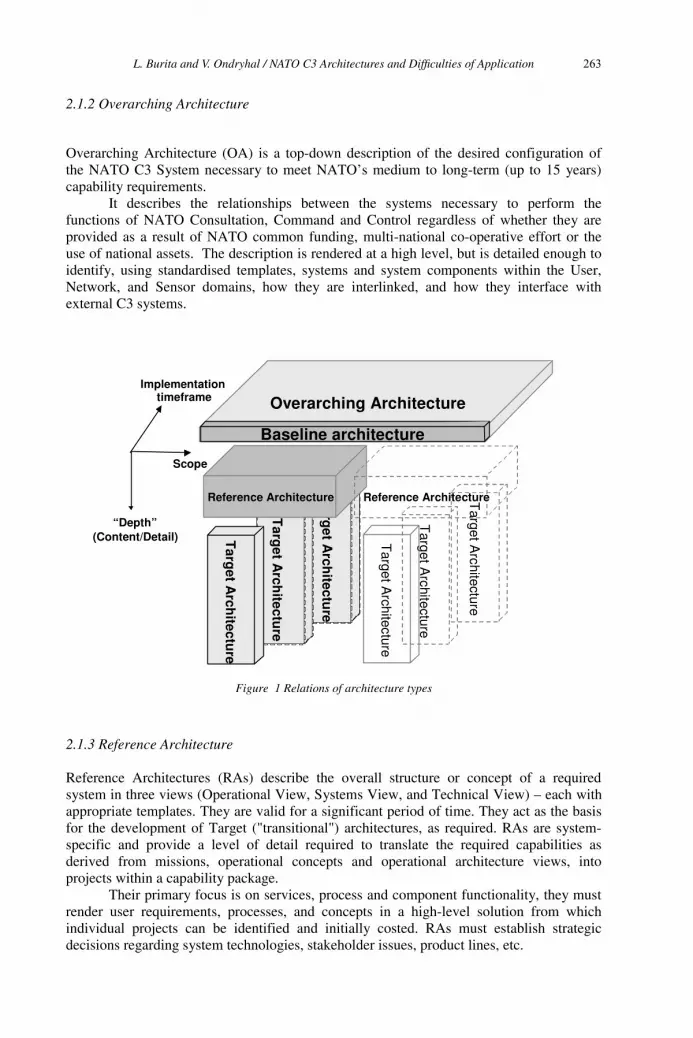
2.1.2 Overarching Architecture
Overarching Architecture (OA) is a top-down description of the desired configuration of the NATO C3 System necessary to meet NATO’s medium to long-term (up to 15 years) capability requirements. It describes the relationships between the systems necessary to perform the functions of NATO Consultation, Command and Control regardless of whether they are provided as a result of NATO common funding, multi-national co-operative effort or the use of national assets. The description is rendered at a high level, but is detailed enough to identify, using standardised templates, systems and system components within the User, Network, and Sensor domains, how they are interlinked, and how they interface with external C3 systems.
Overarching ArchitectureImplementation
timeframe
Target A
rchitecture
Target A
rchitecture
Targ
et Arch
itecture
Targ
et Arch
itecture
Targ
et Arch
itecture
“Depth”(Content/Detail) T
arget Architecture
Scope
Reference Architecture Reference Architecture
Baseline architecture
Figure 1 Relations of architecture types
2.1.3 Reference Architecture
Reference Architectures (RAs) describe the overall structure or concept of a required system in three views (Operational View, Systems View, and Technical View) – each with appropriate templates. They are valid for a significant period of time. They act as the basis for the development of Target ("transitional") architectures, as required. RAs are system-specific and provide a level of detail required to translate the required capabilities as derived from missions, operational concepts and operational architecture views, into projects within a capability package. Their primary focus is on services, process and component functionality, they must render user requirements, processes, and concepts in a high-level solution from which individual projects can be identified and initially costed. RAs must establish strategic decisions regarding system technologies, stakeholder issues, product lines, etc.
L. Burita and V. Ondryhal / NATO C3 Architectures and Difficulties of Application 263
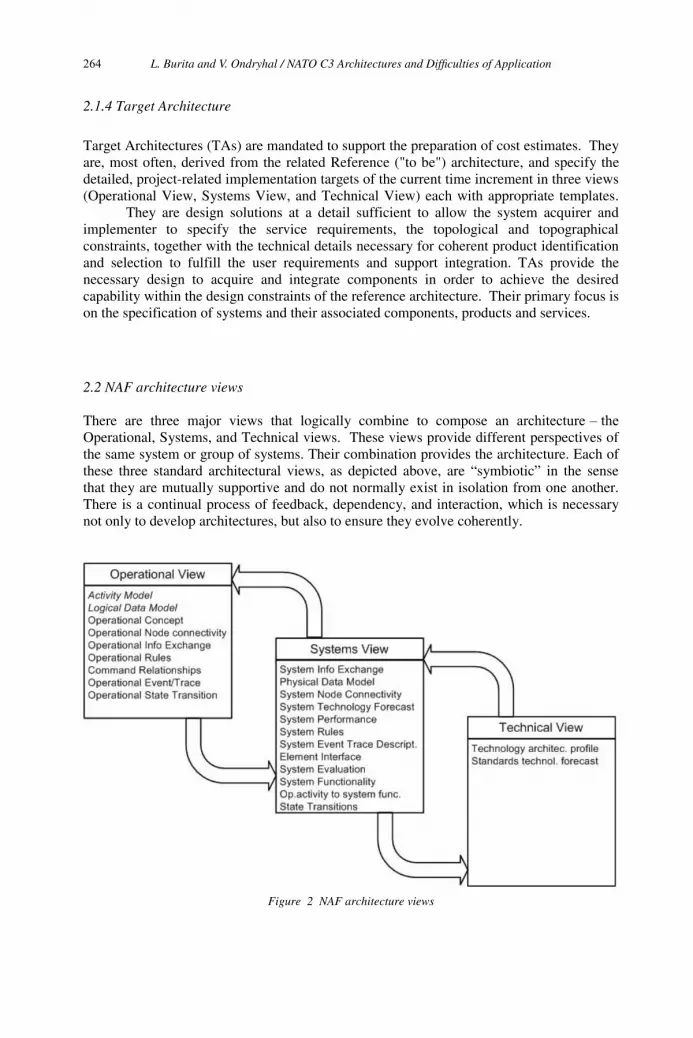
2.1.4 Target Architecture
Target Architectures (TAs) are mandated to support the preparation of cost estimates. They are, most often, derived from the related Reference ("to be") architecture, and specify the detailed, project-related implementation targets of the current time increment in three views (Operational View, Systems View, and Technical View) each with appropriate templates. They are design solutions at a detail sufficient to allow the system acquirer and implementer to specify the service requirements, the topological and topographical constraints, together with the technical details necessary for coherent product identification and selection to fulfill the user requirements and support integration. TAs provide the necessary design to acquire and integrate components in order to achieve the desired capability within the design constraints of the reference architecture. Their primary focus is on the specification of systems and their associated components, products and services.
2.2 NAF architecture views
the Operational, Systems, and Technical views. These views provide different perspectives of the same system or group of systems. Their combination provides the architecture. Each of these three standard architectural views, as depicted above, are “symbiotic” in the sense that they are mutually supportive and do not normally exist in isolation from one another. There is a continual process of feedback, dependency, and interaction, which is necessary not only to develop architectures, but also to ensure they evolve coherently.
Figure 2 NAF architecture views
There are three major views that logically combine to compose an architecture –
L. Burita and V. Ondryhal / NATO C3 Architectures and Difficulties of Application264
2.2.1 Operational View
The Operational View is a description of the tasks and activities, organisational and operational elements and information flows required to accomplish or support a military or consultation function. The sponsor generates this view unconstrained by any solution or presupposition on the details of technology that might be used to support the requirement.
2.2.2 Systems View
The Systems View is a description and identification of system(s), both internal and external, and interconnections required to accomplish or support the military or consultation function. The systems view may be used for many purposes including systems baselining, making investment decisions to satisfy operational requirements, and evaluating interoperability improvements.
2.2.3 Technical View
The Technical View is a description of the arrangement, interaction and interdependence of the elements of the system and takes into account the technical constraints imposed by the Systems View. The Technical View provides the minimal set of rules governing the selection of the appropriate standards and templates for implementation.
2.3 Architectural templates
NAF provides list of templates divided into four categories according to existing views. The first group of templates is common and can be used at all views.
NATO All-view templates (NAV) • Overview and Summary Information (NAV-1) • Integrated Dictionary (NAV-2)
NATO Operational view templates (NOV) • High-Level Operational Concept Diagram (NOV-1) • Operational Node Connectivity Diagram (NOV-2) • Operational Information Exchange Requirements (IER) Matrix (NOV-3)• Organisation Relationships Chart (NOV-4) • Operational Activity Models (NOV-5) • Concept Data Model (NOV-6)
NATO Systems view templates (NSV) • Systems Interface Description (NSV-1) • Systems Communications Description (NSV-2) • System-to-System Matrix (S2 Matrix) (NSV-3) • Systems Functionality Description (NSV-4) • Operational Activity to System Function Traceability Matrix (NSV-5) • Systems Information Exchange Matrix (NSV-6)
L. Burita and V. Ondryhal / NATO C3 Architectures and Difficulties of Application 265
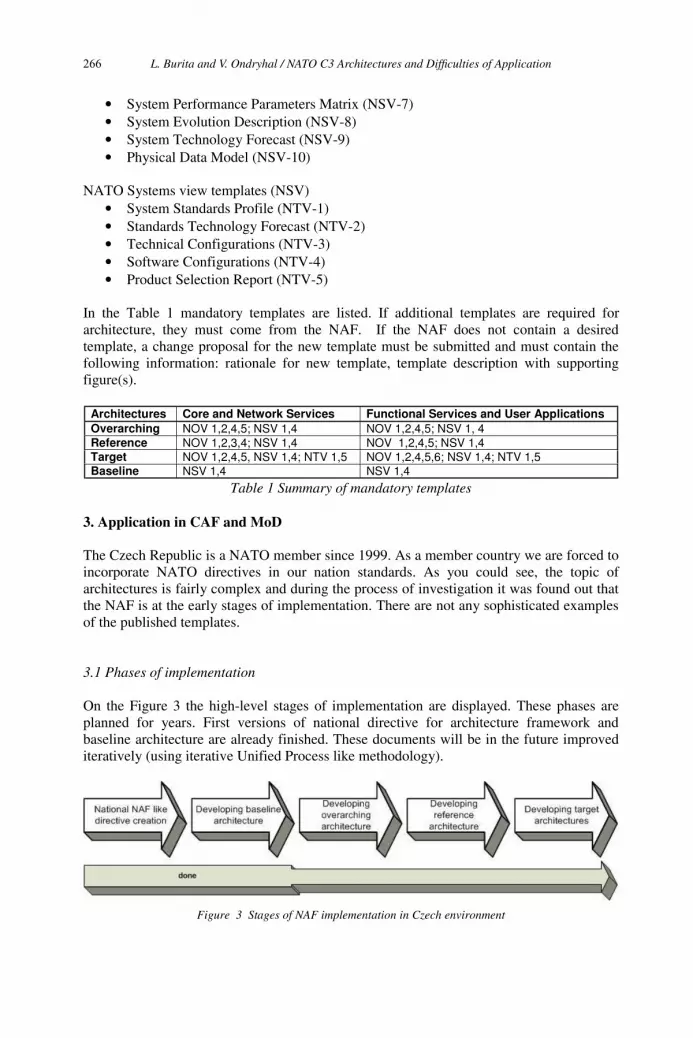
• System Performance Parameters Matrix (NSV-7) • System Evolution Description (NSV-8) • System Technology Forecast (NSV-9) • Physical Data Model (NSV-10)
NATO Systems view templates (NSV) • System Standards Profile (NTV-1) • Standards Technology Forecast (NTV-2) • Technical Configurations (NTV-3) • Software Configurations (NTV-4)• Product Selection Report (NTV-5)
In the Table 1 mandatory templates are listed. If additional templates are required for architecture, they must come from the NAF. If the NAF does not contain a desired template, a change proposal for the new template must be submitted and must contain the following information: rationale for new template, template description with supporting figure(s).
Architectures Core and Network Services Functional Services and User Applications Overarching NOV 1,2,4,5; NSV 1,4 NOV 1,2,4,5; NSV 1, 4 Reference NOV 1,2,3,4; NSV 1,4 NOV 1,2,4,5; NSV 1,4 Target NOV 1,2,4,5, NSV 1,4; NTV 1,5 NOV 1,2,4,5,6; NSV 1,4; NTV 1,5 Baseline NSV 1,4 NSV 1,4
Table 1 Summary of mandatory templates
3. Application in CAF and MoD
The Czech Republic is a NATO member since 1999. As a member country we are forced to incorporate NATO directives in our nation standards. As you could see, the topic of architectures is fairly complex and during the process of investigation it was found out that the NAF is at the early stages of implementation. There are not any sophisticated examples of the published templates.
3.1 Phases of implementation
On the Figure 3 the high-level stages of implementation are displayed. These phases are planned for years. First versions of national directive for architecture framework and baseline architecture are already finished. These documents will be in the future improved iteratively (using iterative Unified Process like methodology).
Figure 3 Stages of NAF implementation in Czech environment
L. Burita and V. Ondryhal / NATO C3 Architectures and Difficulties of Application266
3.2 Difficulties with implementation
Previous chapters described fragments of current approaches at architecture construction field. As you could see, there is large amount of layers, models, views. The first step for architecture approach application looks straightforward, so the first question was asked: What is the starting point? The answer for this simple question is one of the most difficult. As there is not proper methodology available and neither NAF covers this issue, it was as we hope properly decided to tailor NAF directive for nation environment. Current version of this document in the Czech national environment is much more simplified than original one; it includes also basics for methodology for architecture development.
3.2.1 Internal constraints
The current systems implemented in CAF and MoD are standalone separated systems without compatible architecture. There were created without any architectural boundaries, they are incompatible at all aspects from analysis and design to platforms and technologies. One of the current tasks is the systems integration at the national level. This integration should be compatible with related NATO systems. The first NAF implementation will be used for CAF and MoD CIS integration. As there are currently available about 20 different enterprise systems, this task is tremendous, thus only a feasibility study was realized. Background knowledge of national implementers was at level of currently implemented systems. Workshops that extend level of knowledge were taken and will be taken additional in the future. Topics like architecture principles, UML language, process analysis, Service Oriented Architecture are step by step covered.
3.2.2 External issues
Following issues were tackled during the NAF investigation and understanding. These issues often break work of architecture implementers.
• NAF diagrams and template descriptions are created using different notation styles from plain images to UML diagrams. These UML diagrams are incompatible in notation and different tools were user for their creation (especially non UML tools).
• Large number of views and deliverables at all levels exists for architecture construction.
• Missing methodology for architecture creation according to NAF directive. On of
3.3 Future development suggestions
In the next part suggestions for NAF improvements follow. These ideas were already delivered to NATO auditorium and were almost agreed.
• Unification of used notation, probably the best would be to use UML where possible. A set of new stereotypes can be defined for UML for architecture construction.
• Appropriate set of tools for architecture development should be selected and used by targeted group of users.
• Creation of templates for typical application of architecture in areas like system
the key difficulty was.
L. Burita and V. Ondryhal / NATO C3 Architectures and Difficulties of Application 267

integration, system development, acquisition etc. • Decrease number of view and deliverables at all levels to simplify architecture
construction, readability and usability. • Development of methodology for architecture creation. We suggest building
methodology based on Unified Process like methodology, especially for iterative and incremental approaches.
Conclusion
In the paper basics of architecture approach for C3 systems development and difficulties which were already tackled during architecture approach application in CAF (Czech Army Forces) and MoD (Ministry of Defence). Paper is based on author’s experience; authors have been involved in architecture approach definition. As the NAF is still under development and will be revised according to NEC (Network Enabled Capability) initiative, simple approach was taken. National directive for architecture development was created, which cover mostly stable parts of current NATO directive and the first version of baseline architecture was created. Next versions of baseline and other directives will be produced iteratively step by step and will incorporate new features of NAF future versions. Without iterative approach the whole process would be stacked without expected deliverables.
References
[1] NATO C3 System Interoperability Directive (NID). [2] NATO C3 System Architecture Framework (NAF). [3] Bi-SC AIS Target Architecture - Architecture Engineering Methodology (AEM). [4] Ondryhal V., Application of Object Oriented Approach and UML in Information Processes of
Czech Armed Forces., [University grant], University of Defense, 2004. [5] The Feasibility Study of the C-S IS for MoD of Czech Republic. Prague: UNISYS, 2004, 378 pp. [6] NATO C3 Technical Architecture. ADatP-34. [7]BURITA Ladislav. THE C2 ARCHITECTURE AND INFORMATION SUPPORT OF THE CZECH
ARMED FORCES. In CD proceeding „The Tenth International C2 Research and Technology Symposium 2005 (ICCRT-2005). The Future of Command and Control“. USA, McLean: DDCCRP, June 13-16, 2005, paper 068, 11 pp.
L. Burita and V. Ondryhal / NATO C3 Architectures and Difficulties of Application268

Mining International Academic ConferencePrograms on the Web
Tomoya Noro, Hidenori Negishi, and Takehiro Tokuda{noro, negishi, tokuda}@tt.cs.titech.ac.jp
Department of Computer Science, Tokyo Institute of TechnologyMeguro, Tokyo 152-8552, Japan
Abstract. Recently, a large number of international academic conferences have beenheld all over the world, and the number of conferences has been increasing year byyear, which makes it difficult for us to overview the whole situation. On the otherhand, explosive growth of the Internet makes it possible for us to obtain various in-formation about conferences from the Web. In this paper, we propose a method forgiving an overview of relation among conferences, such as clustering conferences anddiscovering the conference where active discussion is conducted in certain issues, byconstructing a research map from conference information obtained from the Web.
1 Introduction
Although a large number of international academic conferences have been held all over theworld recently, we can get the situation inside only a limited number of conferences 1 (e.g.similarity or difference in issues discussed in them) because of diversification of research fieldand rapid increase of the number of conferences (i.e. new conferences). Especially when itcomes to conferences where issues in a new research field is discussed, we would encountersome problems described below:
• Similar issues are discussed in more than two conferences on different research fields. Insome cases, the discussion is conducted individually and there is little cross-conferencediscussion.
• In the case that our research is related to several different research fields (i.e. research ina boundary area), we would wonder to which conference we should submit our paper.
For example, issues in the semantic Web are discussed not only in ISWC2005 2, where thesemantic Web is the main issue, but also in WWW2005 3, where general issues in the Webare discussed, and ICWE2005 4, where issues in Web engineering are mainly discussed. Inaddition, a few papers about the semantic Web are presented at LREC2004 5, where the mainissues are about natural language processing (NLP). On the other hand, discussion about
1In this paper, “conference” means “international academic conference”.2http://iswc2005.semanticweb.org/3http://www2005.org/4http://www.icwe2005.org/5http://www.lrec-conf.org/lrec2004/
M. Duží et al. (Eds.)Information Modelling and Knowledge Bases XVIII
IOS Press, 2007© 2007 The authors and IOS Press. All rights reserved.
269

the issues is not so active in COLING2004 6 and ACL2005 7, although issues in NLP arediscussed in both of the conferences. Although it is important for us to find such relationamong conferences in order to overview whole situation inside a research field we interestedin (e.g. relation among conferences), it is difficult to find the relation manually.
On the other hand, because of explosive growth of the Internet, it becomes common thatinformation about conferences (e.g. conference site and date, call for papers, conference pro-gram, program committee, etc.) is available on the Web. We could find the main issues dis-cussed in each conference and relation among the conferences by obtaining such information.In this paper, we propose a method for giving an overview of the relations, such as groupingthe conferences where the discussed issues are similar to one another, and discovering themain conference where active discussion is conducted in certain issues.
2 Conference Information Used for Analysis
A conference has a lot of information, such as basic information (official and abbreviatedconference names; conference site and date), call for papers (background, aims and issues ofthe conference; schedule for submission), a conference program (titles and authors of eachpaper; timetable; session titles), committees (chair, co-chairs and the other members), satelliteworkshops and so on. We use titles of each papers, keynote speeches, invited speeches andtutorials in a conference program since they are freely available from the Web in most of theconference sites and they describe contents of the papers briefly.
3 Methods for Mining the Conference Programs
A procedure of our method is as follows: (1) extract feature words from paper titles in eachconference program, (2) compute relevance of each conference to the others, and (3) clus-ter the conferences and discover the main conference in certain issues. The details of theseprocesses are described in the rest of this section.
3.1 Extraction of Feature Words
Feature words are extracted on the assumption that words appearing in the beginning of eachpaper or session title would be more important than the others, i.e. these words would indicatethe main topic of the paper or session. For example, in the case of a paper title “Buildinga large-scale Japanese CFG for syntactic parsing”, the main topic of this paper would be“building a large-scale Japanese CFG”, and “syntactic parsing” would be a kind of additionalinformation.
Based on the assumption, we define Head Part of a paper or session title as follows:
1. The word sequence between the top of the title and the first preposition is Head Part ofthe title.
2. If the number of content words between the top and the -th preposition ( ) is less
6http://www.issco.unige.ch/coling2004/ (Information about the conference has already removed)7http://www.aclweb.org/acl2005/
n n ≥ 1than 2, Head Part is extended to the next (i.e. the (n + 1)-th) preposition.
T. Noro et al. / Mining International Academic Conference Programs on the Web270
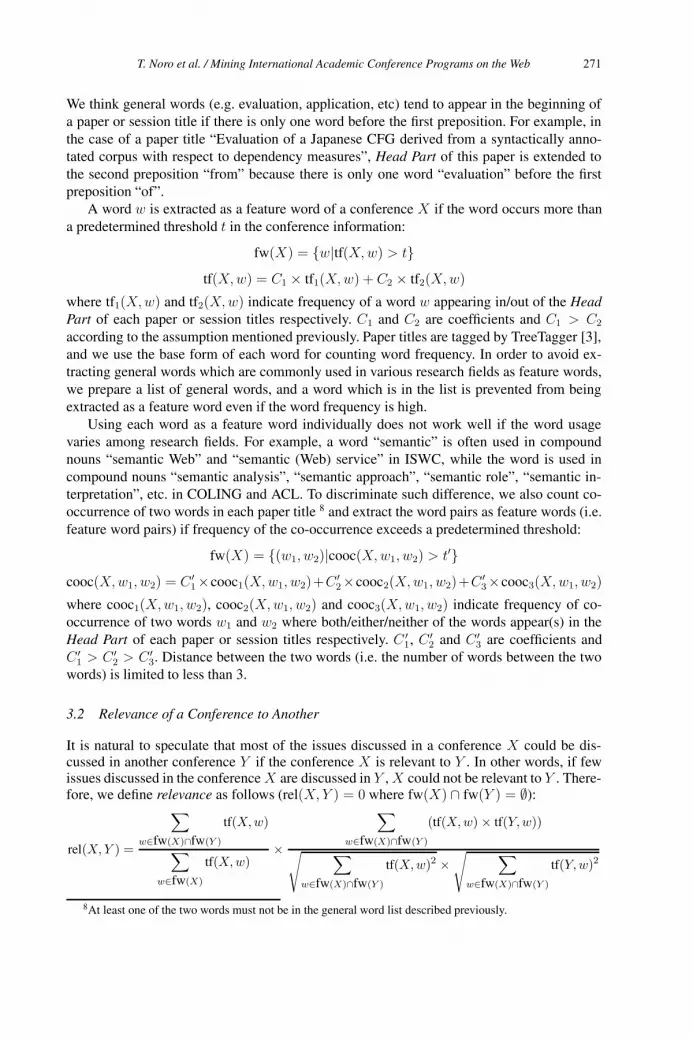
We think general words (e.g. evaluation, application, etc) tend to appear in the beginning ofa paper or session title if there is only one word before the first preposition. For example, inthe case of a paper title “Evaluation of a Japanese CFG derived from a syntactically anno-tated corpus with respect to dependency measures”, Head Part of this paper is extended tothe second preposition “from” because there is only one word “evaluation” before the firstpreposition “of”.
A word w is extracted as a feature word of a conference X if the word occurs more thana predetermined threshold t in the conference information:
fw(X) = {w|tf(X, w) > t}tf(X, w) = C1 × tf1(X, w) + C2 × tf2(X, w)
where tf1(X, w) and tf2(X, w) indicate frequency of a word w appearing in/out of the HeadPart of each paper or session titles respectively. C1 and C2 are coefficients and C1 > C2
according to the assumption mentioned previously. Paper titles are tagged by TreeTagger [3],and we use the base form of each word for counting word frequency. In order to avoid ex-tracting general words which are commonly used in various research fields as feature words,we prepare a list of general words, and a word which is in the list is prevented from beingextracted as a feature word even if the word frequency is high.
Using each word as a feature word individually does not work well if the word usagevaries among research fields. For example, a word “semantic” is often used in compoundnouns “semantic Web” and “semantic (Web) service” in ISWC, while the word is used incompound nouns “semantic analysis”, “semantic approach”, “semantic role”, “semantic in-terpretation”, etc. in COLING and ACL. To discriminate such difference, we also count co-occurrence of two words in each paper title 8 and extract the word pairs as feature words (i.e.feature word pairs) if frequency of the co-occurrence exceeds a predetermined threshold:
fw(X) = {(w1, w2)|cooc(X, w1, w2) > t′}cooc(X, w1, w2) = C ′
1×cooc1(X, w1, w2)+C ′2×cooc2(X, w1, w2)+C ′
3×cooc3(X, w1, w2)
where cooc1(X, w1, w2), cooc2(X, w1, w2) and cooc3(X, w1, w2) indicate frequency of co-occurrence of two words w1 and w2 where both/either/neither of the words appear(s) in theHead Part of each paper or session titles respectively. C ′
1, C ′2 and C ′
3 are coefficients andC ′
1 > C ′2 > C ′
3. Distance between the two words (i.e. the number of words between the twowords) is limited to less than 3.
3.2 Relevance of a Conference to Another
It is natural to speculate that most of the issues discussed in a conference X could be dis-cussed in another conference Y if the conference X is relevant to Y . In other words, if fewissues discussed in the conference X are discussed in Y , X could not be relevant to Y . There-fore, we define relevance as follows (rel(X, Y ) = 0 where fw(X) ∩ fw(Y ) = ∅):
rel(X,Y ) =
∑w∈fw(X)∩fw(Y )
tf(X,w)
∑w∈fw(X)
tf(X,w)×
∑w∈fw(X)∩fw(Y )
(tf(X,w) × tf(Y,w))
√ ∑w∈fw(X)∩fw(Y )
tf(X,w)2 ×√ ∑
w∈fw(X)∩fw(Y )
tf(Y,w)2
8At least one of the two words must not be in the general word list described previously.
T. Noro et al. / Mining International Academic Conference Programs on the Web 271
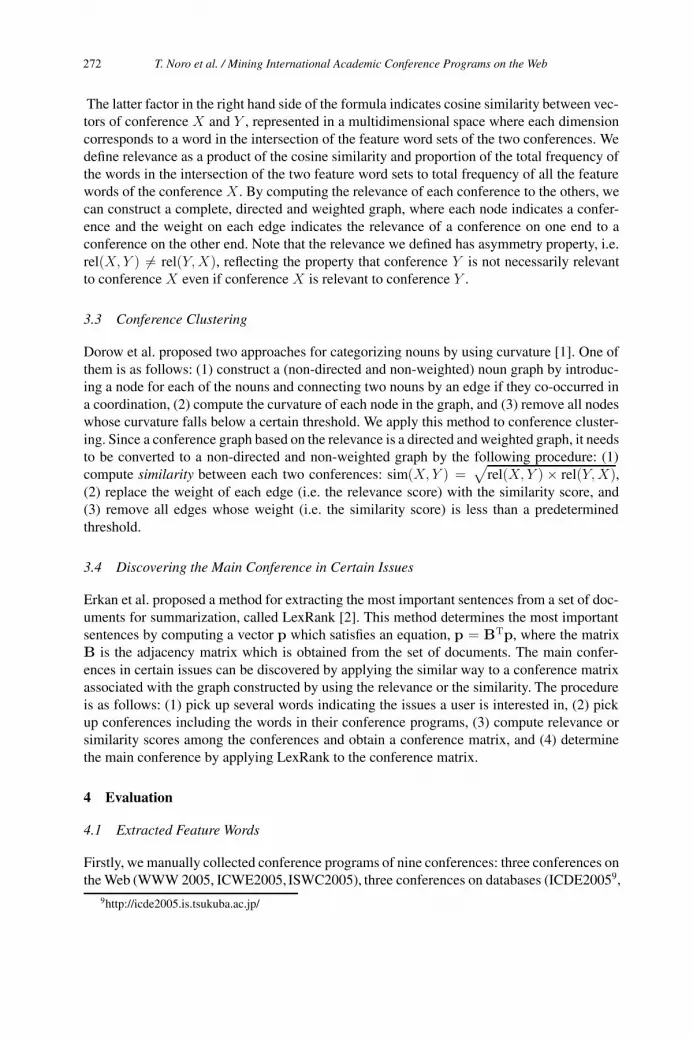
The latter factor in the right hand side of the formula indicates cosine similarity between vec-tors of conference X and Y , represented in a multidimensional space where each dimensioncorresponds to a word in the intersection of the feature word sets of the two conferences. Wedefine relevance as a product of the cosine similarity and proportion of the total frequency ofthe words in the intersection of the two feature word sets to total frequency of all the featurewords of the conference X . By computing the relevance of each conference to the others, wecan construct a complete, directed and weighted graph, where each node indicates a confer-ence and the weight on each edge indicates the relevance of a conference on one end to aconference on the other end. Note that the relevance we defined has asymmetry property, i.e.rel(X, Y ) �= rel(Y, X), reflecting the property that conference Y is not necessarily relevantto conference X even if conference X is relevant to conference Y .
3.3 Conference Clustering
Dorow et al. proposed two approaches for categorizing nouns by using curvature [1]. One ofthem is as follows: (1) construct a (non-directed and non-weighted) noun graph by introduc-ing a node for each of the nouns and connecting two nouns by an edge if they co-occurred ina coordination, (2) compute the curvature of each node in the graph, and (3) remove all nodeswhose curvature falls below a certain threshold. We apply this method to conference cluster-ing. Since a conference graph based on the relevance is a directed and weighted graph, it needsto be converted to a non-directed and non-weighted graph by the following procedure: (1)compute similarity between each two conferences: sim(X, Y ) =
√rel(X, Y ) × rel(Y, X),
(2) replace the weight of each edge (i.e. the relevance score) with the similarity score, and(3) remove all edges whose weight (i.e. the similarity score) is less than a predeterminedthreshold.
3.4 Discovering the Main Conference in Certain Issues
Erkan et al. proposed a method for extracting the most important sentences from a set of doc-uments for summarization, called LexRank [2]. This method determines the most importantsentences by computing a vector p which satisfies an equation, p = BTp, where the matrixB is the adjacency matrix which is obtained from the set of documents. The main confer-ences in certain issues can be discovered by applying the similar way to a conference matrixassociated with the graph constructed by using the relevance or the similarity. The procedureis as follows: (1) pick up several words indicating the issues a user is interested in, (2) pickup conferences including the words in their conference programs, (3) compute relevance orsimilarity scores among the conferences and obtain a conference matrix, and (4) determinethe main conference by applying LexRank to the conference matrix.
4 Evaluation
4.1 Extracted Feature Words
Firstly, we manually collected conference programs of nine conferences: three conferences onthe Web (WWW 2005, ICWE2005, ISWC2005), three conferences on databases (ICDE20059,
9http://icde2005.is.tsukuba.ac.jp/
T. Noro et al. / Mining International Academic Conference Programs on the Web272
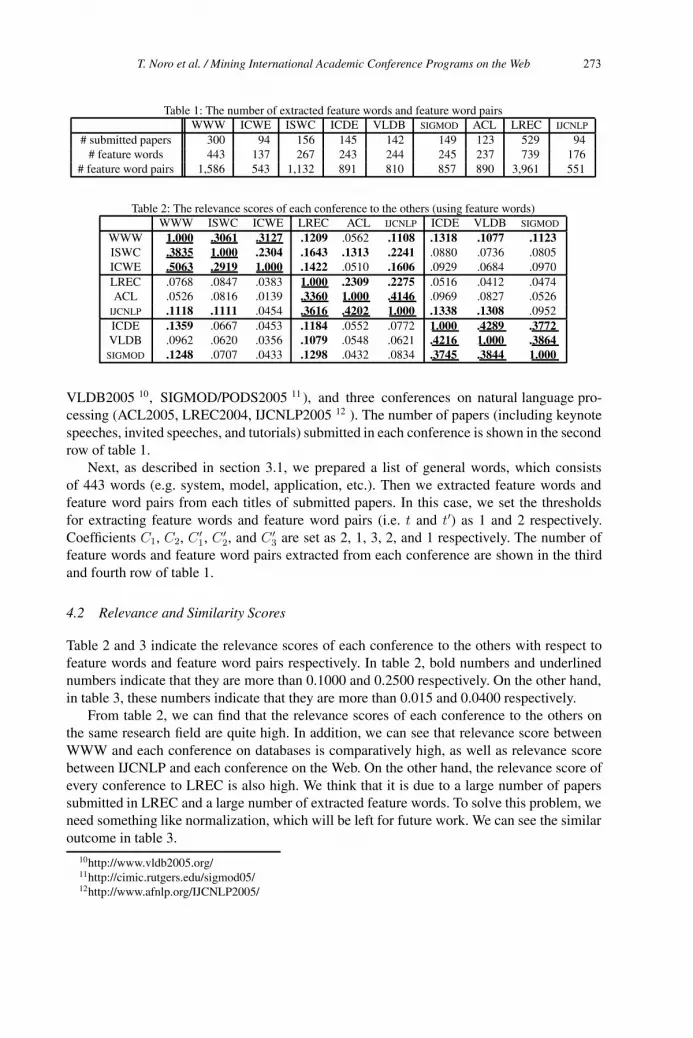
Table 1: The number of extracted feature words and feature word pairsWWW ICWE ISWC ICDE VLDB SIGMOD ACL LREC IJCNLP
# submitted papers 300 94 156 145 142 149 123 529 94# feature words 443 137 267 243 244 245 237 739 176
# feature word pairs 1,586 543 1,132 891 810 857 890 3,961 551
Table 2: The relevance scores of each conference to the others (using feature words)WWW ISWC ICWE LREC ACL IJCNLP ICDE VLDB SIGMOD
WWW 1.000 .3061 .3127 .1209 .0562 .1108 .1318 .1077 .1123ISWC .3835 1.000 .2304 .1643 .1313 .2241 .0880 .0736 .0805ICWE .5063 .2919 1.000 .1422 .0510 .1606 .0929 .0684 .0970LREC .0768 .0847 .0383 1.000 .2309 .2275 .0516 .0412 .0474ACL .0526 .0816 .0139 .3360 1.000 .4146 .0969 .0827 .0526
IJCNLP .1118 .1111 .0454 .3616 .4202 1.000 .1338 .1308 .0952ICDE .1359 .0667 .0453 .1184 .0552 .0772 1.000 .4289 .3772VLDB .0962 .0620 .0356 .1079 .0548 .0621 .4216 1.000 .3864
SIGMOD .1248 .0707 .0433 .1298 .0432 .0834 .3745 .3844 1.000
VLDB2005 10, SIGMOD/PODS2005 11 ), and three conferences on natural language pro-cessing (ACL2005, LREC2004, IJCNLP2005 12 ). The number of papers (including keynotespeeches, invited speeches, and tutorials) submitted in each conference is shown in the secondrow of table 1.
Next, as described in section 3.1, we prepared a list of general words, which consistsof 443 words (e.g. system, model, application, etc.). Then we extracted feature words andfeature word pairs from each titles of submitted papers. In this case, we set the thresholdsfor extracting feature words and feature word pairs (i.e. t and t′) as 1 and 2 respectively.Coefficients C1, C2, C ′
1, C ′2, and C ′
3 are set as 2, 1, 3, 2, and 1 respectively. The number offeature words and feature word pairs extracted from each conference are shown in the thirdand fourth row of table 1.
4.2 Relevance and Similarity Scores
Table 2 and 3 indicate the relevance scores of each conference to the others with respect tofeature words and feature word pairs respectively. In table 2, bold numbers and underlinednumbers indicate that they are more than 0.1000 and 0.2500 respectively. On the other hand,in table 3, these numbers indicate that they are more than 0.015 and 0.0400 respectively.
From table 2, we can find that the relevance scores of each conference to the others onthe same research field are quite high. In addition, we can see that relevance score betweenWWW and each conference on databases is comparatively high, as well as relevance scorebetween IJCNLP and each conference on the Web. On the other hand, the relevance score ofevery conference to LREC is also high. We think that it is due to a large number of paperssubmitted in LREC and a large number of extracted feature words. To solve this problem, weneed something like normalization, which will be left for future work. We can see the similaroutcome in table 3.
10http://www.vldb2005.org/11http://cimic.rutgers.edu/sigmod05/12http://www.afnlp.org/IJCNLP2005/
T. Noro et al. / Mining International Academic Conference Programs on the Web 273
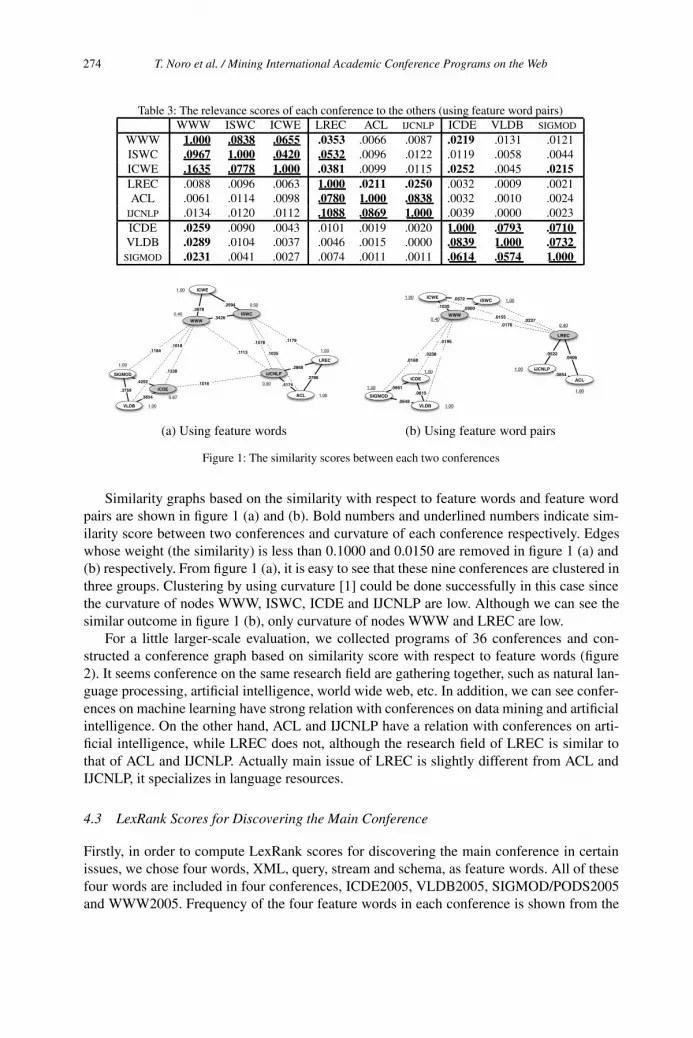
Table 3: The relevance scores of each conference to the others (using feature word pairs)WWW ISWC ICWE LREC ACL IJCNLP ICDE VLDB SIGMOD
WWW 1.000 .0838 .0655 .0353 .0066 .0087 .0219 .0131 .0121ISWC .0967 1.000 .0420 .0532 .0096 .0122 .0119 .0058 .0044ICWE .1635 .0778 1.000 .0381 .0099 .0115 .0252 .0045 .0215LREC .0088 .0096 .0063 1.000 .0211 .0250 .0032 .0009 .0021ACL .0061 .0114 .0098 .0780 1.000 .0838 .0032 .0010 .0024
IJCNLP .0134 .0120 .0112 .1088 .0869 1.000 .0039 .0000 .0023ICDE .0259 .0090 .0043 .0101 .0019 .0020 1.000 .0793 .0710VLDB .0289 .0104 .0037 .0046 .0015 .0000 .0839 1.000 .0732
SIGMOD .0231 .0041 .0027 .0074 .0011 .0011 .0614 .0574 1.000
SIGMOD
VLDB
ICDE
WWW
ICWE
ISWC
IJCNLP
LREC
ACL.3759
.3854
.4252
.1018.1184
.1338
.1016
.1113
.1578
.1035
.4174
.2786
.1179
.3426
.3978.2594
.28681.00
1.00
0.67
0.40
1.00
0.50
1.00
0.50
1.00 SIGMOD
VLDB
ICDE
WWW
ICWEISWC
IJCNLP
LREC
ACL
.0648
.0815.0661
.0195
.0168.0238
.0176
.0155
.0854
.0406
.0227
.0900.1035
.0572
.0522
1.00
1.00
1.00
0.40
1.001.00
0.40
1.00
1.00
(a) Using feature words (b) Using feature word pairs
Figure 1: The similarity scores between each two conferences
Similarity graphs based on the similarity with respect to feature words and feature wordpairs are shown in figure 1 (a) and (b). Bold numbers and underlined numbers indicate sim-ilarity score between two conferences and curvature of each conference respectively. Edgeswhose weight (the similarity) is less than 0.1000 and 0.0150 are removed in figure 1 (a) and(b) respectively. From figure 1 (a), it is easy to see that these nine conferences are clustered inthree groups. Clustering by using curvature [1] could be done successfully in this case sincethe curvature of nodes WWW, ISWC, ICDE and IJCNLP are low. Although we can see thesimilar outcome in figure 1 (b), only curvature of nodes WWW and LREC are low.
For a little larger-scale evaluation, we collected programs of 36 conferences and con-structed a conference graph based on similarity score with respect to feature words (figure2). It seems conference on the same research field are gathering together, such as natural lan-guage processing, artificial intelligence, world wide web, etc. In addition, we can see confer-ences on machine learning have strong relation with conferences on data mining and artificialintelligence. On the other hand, ACL and IJCNLP have a relation with conferences on arti-ficial intelligence, while LREC does not, although the research field of LREC is similar tothat of ACL and IJCNLP. Actually main issue of LREC is slightly different from ACL andIJCNLP, it specializes in language resources.
4.3 LexRank Scores for Discovering the Main Conference
Firstly, in order to compute LexRank scores for discovering the main conference in certainissues, we chose four words, XML, query, stream and schema, as feature words. All of thesefour words are included in four conferences, ICDE2005, VLDB2005, SIGMOD/PODS2005and WWW2005. Frequency of the four feature words in each conference is shown from the
T. Noro et al. / Mining International Academic Conference Programs on the Web274
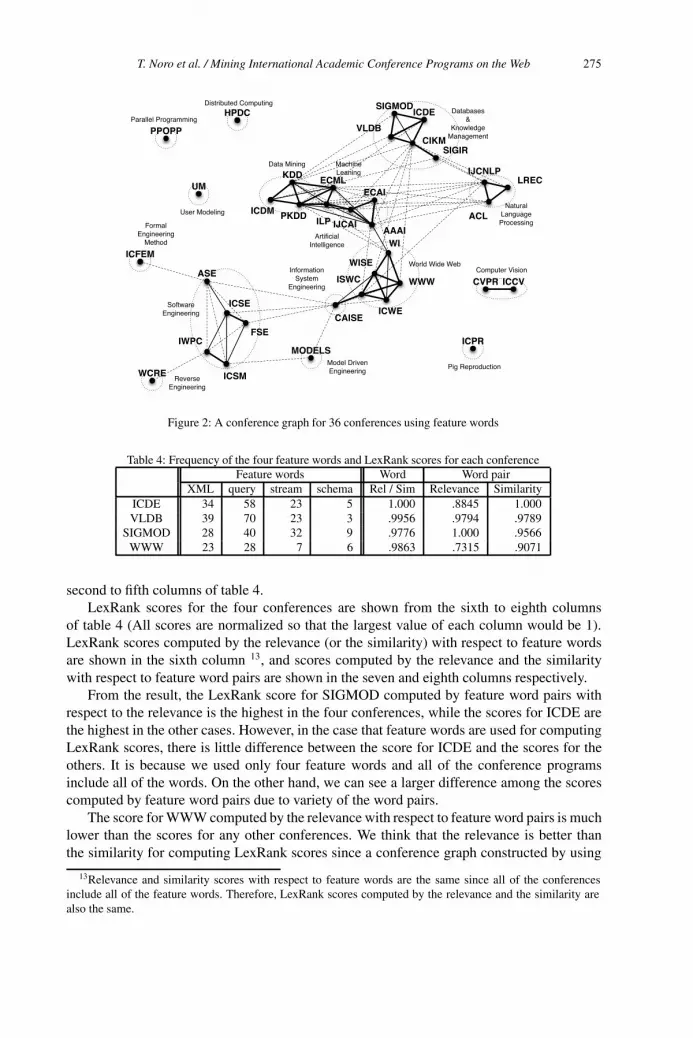
ECML
PKDD
WISE
WWW
ICDE
VLDB
ACL
IJCNLP
AAAIIJCAI
ICWE
ECAI
SIGMOD
KDD
CVPR ICCV
ICDM
ISWC
ILP
CIKMSIGIR
LREC
WI
FSE
CAISE
ICSM
IWPC
ICSE
ASE
MODELS
ICFEM
WCRE
HPDC
PPOPP
UM
ICPR
SoftwareEngineering
NaturalLanguageProcessing
Databases&
KnowledgeManagement
Data Mining
ArtificialIntelligence
World Wide WebComputer Vision
Distributed Computing
User Modeling
Pig Reproduction
Parallel Programming
Model DrivenEngineering
InformationSystem
Engineering
FormalEngineering
Method
ReverseEngineering
MachineLeaning
Figure 2: A conference graph for 36 conferences using feature words
Table 4: Frequency of the four feature words and LexRank scores for each conferenceFeature words Word Word pair
XML query stream schema Rel / Sim Relevance SimilarityICDE 34 58 23 5 1.000 .8845 1.000VLDB 39 70 23 3 .9956 .9794 .9789
SIGMOD 28 40 32 9 .9776 1.000 .9566WWW 23 28 7 6 .9863 .7315 .9071
second to fifth columns of table 4.LexRank scores for the four conferences are shown from the sixth to eighth columns
of table 4 (All scores are normalized so that the largest value of each column would be 1).LexRank scores computed by the relevance (or the similarity) with respect to feature wordsare shown in the sixth column 13, and scores computed by the relevance and the similaritywith respect to feature word pairs are shown in the seven and eighth columns respectively.
From the result, the LexRank score for SIGMOD computed by feature word pairs withrespect to the relevance is the highest in the four conferences, while the scores for ICDE arethe highest in the other cases. However, in the case that feature words are used for computingLexRank scores, there is little difference between the score for ICDE and the scores for theothers. It is because we used only four feature words and all of the conference programsinclude all of the words. On the other hand, we can see a larger difference among the scorescomputed by feature word pairs due to variety of the word pairs.
The score for WWW computed by the relevance with respect to feature word pairs is muchlower than the scores for any other conferences. We think that the relevance is better thanthe similarity for computing LexRank scores since a conference graph constructed by using
13Relevance and similarity scores with respect to feature words are the same since all of the conferencesinclude all of the feature words. Therefore, LexRank scores computed by the relevance and the similarity arealso the same.
T. Noro et al. / Mining International Academic Conference Programs on the Web 275
relevance score is directed and the direction of each edge in the graph indicates hierarchicalrelation between the two conferences at the both ends of the edge.
5 Conclusion
In this paper, in order to overview whole situation inside a research field we interested in,we proposed a method for grouping the conferences where the discussed issues are similar toone another, and discovering the main conference in certain issues.
Some services on the Web, such as EventSeer 14, CiteSeer 15 and Google Scholar 16, areavailable now. Our proposal is for giving an overview of whole situation among conferenceswhile CiteSeer and Google Scholar are useful for observing each paper or researcher. Wethink that our proposal does not compete these services, but combination of our proposalwith other services could provide a more useful service.
In the future, we intend to look into the following:
• In this paper, we used only nine conferences for evaluation. In order to carry out a larger-scale evaluation, we are planning to consider (semi-)automatic acquisition of conferenceinformation. If we could obtain a lot of information from the Web, we would use IDF forcomputing the relevance and the similarity instead of preparing a general word list.
• In our definition of the relevance, a relevance score of a small conference to a large onetends to be higher than it should be. On the other hand, sufficient amount of informationcannot be obtained from conferences where only a few papers are presented. We needto consider the problem in difference of the amount of information obtained from eachconference.
• Conference programs (titles of submitted papers) are not sufficient for indicating what iswritten in each paper. Other conference information, such as call for papers, abstract ofeach paper, papers themselves (PDF files), etc., could be useful although some of themare not available in some conference sites. We think this problem could be solved bycombining with other services on the Web as described previously.
• In order to make our achievement to public, results of the analysis need to be visualized.We are trying to carry out a preliminary experiment by using some heuristics.
References
[1] Beate Dorow, Dominic Widdows, Katarina Ling, Jean-Pierre Eckmann, Danilo Sergi, and Elisha Moses.Using curvature and Markov clustering in graphs for lexical acquisition and word sense discrimination. Inthe 2nd Workshop organized by the MEANING Project (MEANING-2005), 2005.
[2] Gunes Erkan and Dragomir R. Radev. LexRank: Graph-based lexical centrality as salience in text summa-rization. Journal of Artificial Intelligence Research, 22:457–479, 2004.
[3] Helmut Schmid. Probabilistic part-of-speech tagging using decision trees. In First International Conferenceon New Methods in Natural Language Processing (NemLap-94), pages 44–49, 1994.
14http://eventseer.net/15http://citeseer.ist.psu.edu/16http://scholar.google.com/
T. Noro et al. / Mining International Academic Conference Programs on the Web276
Towards Automatic Detection of PotentiallyImportant International Events/Phenomena
from News Articles at Mostly DomesticNews Sites
Pham Van Hai, Takahiro Aoyagi, Tomoya Noro, and Takehiro Tokuda{hai, takahiro, noro, tokuda}@tt.cs.titech.ac.jp
Department of Computer Science, Tokyo Institute of Technology,Meguro, Tokyo 152-8552, Japan
Abstract. Unlike the relative success of general Web search engines detecting impor-tant Web pages, it is not yet easy to detect potentially important events/phenomena(other than obvious major newspaper top headlines) happening outside the countryfrom observations of news articles on the Web. Current news index sites or newsprovider sites such as Google News, BBC, CNN, and Reuters, try to present streamsof latest news. We present a new approach to automatic detection of potentially im-portant events/phenomena happening outside the country based on the monitoring ofa number of different mostly domestic news sites.
1 Introduction
Unlike the relative success of general Web search engines detecting important Web pages, itis not yet easy to detect potentially important events/phenomena (other than obvious majornewspaper top headlines) happening outside the country from observations of news articleson the Web. This is partly because the importance of news can be greatly varying to individualrecipient persons, groups, organizations, and countries/regions.
If we try to automatically detect potentially important foreign events/phenomena, currentnews index sites or news provider sites such as Google News, BBC, CNN, and Reuters, maynot be suitable as follows.
1. Keyword based searching
In searching of news, we need to know keywords in advance to reach the article. Forpotentially important events/phenomena we do not know keywords.
2. Streams of latest news
In browsing of news, news sites present a huge amount of streams of latest news. Theamount of news even in one site may be more than one human can handle every day.
Notice that computer science has developed many techniques for news topic summarization,clustering, detection and identification. However, the judgement of potential importance ofnews articles has a quite different goal.
M. Duží et al. (Eds.)Information Modelling and Knowledge Bases XVIII
IOS Press, 2007© 2007 The authors and IOS Press. All rights reserved.
277
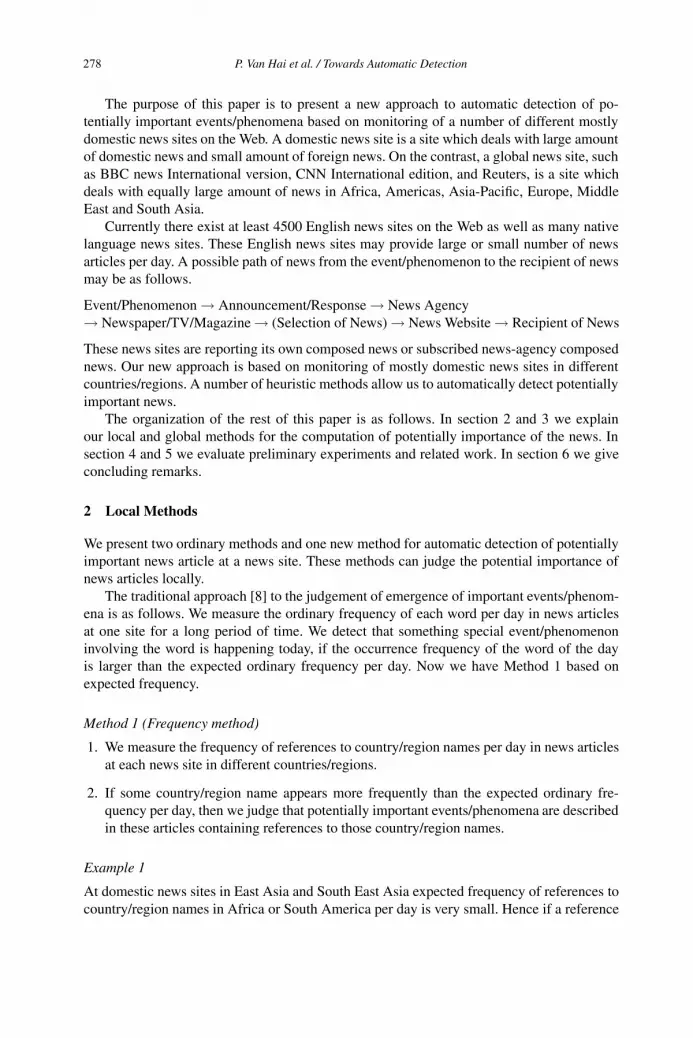
The purpose of this paper is to present a new approach to automatic detection of po-tentially important events/phenomena based on monitoring of a number of different mostlydomestic news sites on the Web. A domestic news site is a site which deals with large amountof domestic news and small amount of foreign news. On the contrast, a global news site, suchas BBC news International version, CNN International edition, and Reuters, is a site whichdeals with equally large amount of news in Africa, Americas, Asia-Pacific, Europe, MiddleEast and South Asia.
Currently there exist at least 4500 English news sites on the Web as well as many nativelanguage news sites. These English news sites may provide large or small number of newsarticles per day. A possible path of news from the event/phenomenon to the recipient of newsmay be as follows.
Event/Phenomenon → Announcement/Response → News Agency→ Newspaper/TV/Magazine → (Selection of News) → News Website → Recipient of News
These news sites are reporting its own composed news or subscribed news-agency composednews. Our new approach is based on monitoring of mostly domestic news sites in differentcountries/regions. A number of heuristic methods allow us to automatically detect potentiallyimportant news.
The organization of the rest of this paper is as follows. In section 2 and 3 we explainour local and global methods for the computation of potentially importance of the news. Insection 4 and 5 we evaluate preliminary experiments and related work. In section 6 we giveconcluding remarks.
2 Local Methods
We present two ordinary methods and one new method for automatic detection of potentiallyimportant news article at a news site. These methods can judge the potential importance ofnews articles locally.
The traditional approach [8] to the judgement of emergence of important events/phenom-ena is as follows. We measure the ordinary frequency of each word per day in news articlesat one site for a long period of time. We detect that something special event/phenomenoninvolving the word is happening today, if the occurrence frequency of the word of the dayis larger than the expected ordinary frequency per day. Now we have Method 1 based onexpected frequency.
Method 1 (Frequency method)
1. We measure the frequency of references to country/region names per day in news articlesat each news site in different countries/regions.
2. If some country/region name appears more frequently than the expected ordinary fre-quency per day, then we judge that potentially important events/phenomena are describedin these articles containing references to those country/region names.
Example 1
At domestic news sites in East Asia and South East Asia expected frequency of references tocountry/region names in Africa or South America per day is very small. Hence if a reference
P. Van Hai et al. / Towards Automatic Detection278
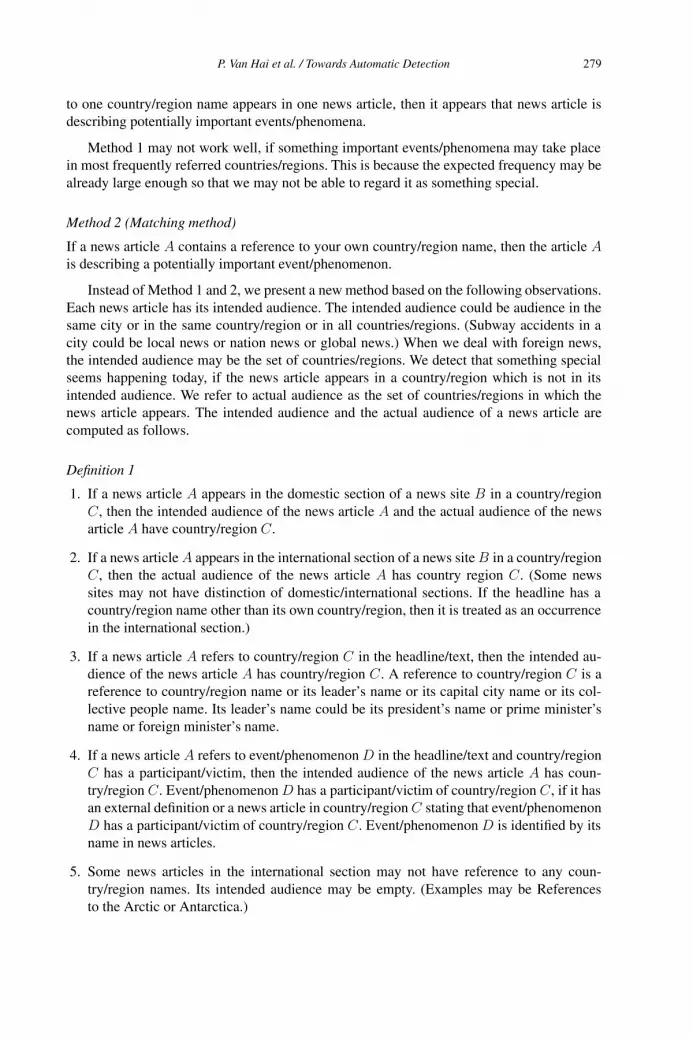
to one country/region name appears in one news article, then it appears that news article isdescribing potentially important events/phenomena.
Method 1 may not work well, if something important events/phenomena may take placein most frequently referred countries/regions. This is because the expected frequency may bealready large enough so that we may not be able to regard it as something special.
Method 2 (Matching method)
If a news article A contains a reference to your own country/region name, then the article Ais describing a potentially important event/phenomenon.
Instead of Method 1 and 2, we present a new method based on the following observations.Each news article has its intended audience. The intended audience could be audience in thesame city or in the same country/region or in all countries/regions. (Subway accidents in acity could be local news or nation news or global news.) When we deal with foreign news,the intended audience may be the set of countries/regions. We detect that something specialseems happening today, if the news article appears in a country/region which is not in itsintended audience. We refer to actual audience as the set of countries/regions in which thenews article appears. The intended audience and the actual audience of a news article arecomputed as follows.
Definition 1
1. If a news article A appears in the domestic section of a news site B in a country/regionC, then the intended audience of the news article A and the actual audience of the newsarticle A have country/region C.
2. If a news article A appears in the international section of a news site B in a country/regionC, then the actual audience of the news article A has country region C. (Some newssites may not have distinction of domestic/international sections. If the headline has acountry/region name other than its own country/region, then it is treated as an occurrencein the international section.)
3. If a news article A refers to country/region C in the headline/text, then the intended au-dience of the news article A has country/region C. A reference to country/region C is areference to country/region name or its leader’s name or its capital city name or its col-lective people name. Its leader’s name could be its president’s name or prime minister’sname or foreign minister’s name.
4. If a news article A refers to event/phenomenon D in the headline/text and country/regionC has a participant/victim, then the intended audience of the news article A has coun-try/region C. Event/phenomenon D has a participant/victim of country/region C, if it hasan external definition or a news article in country/region C stating that event/phenomenonD has a participant/victim of country/region C. Event/phenomenon D is identified by itsname in news articles.
5. Some news articles in the international section may not have reference to any coun-try/region names. Its intended audience may be empty. (Examples may be Referencesto the Arctic or Antarctica.)
P. Van Hai et al. / Towards Automatic Detection 279
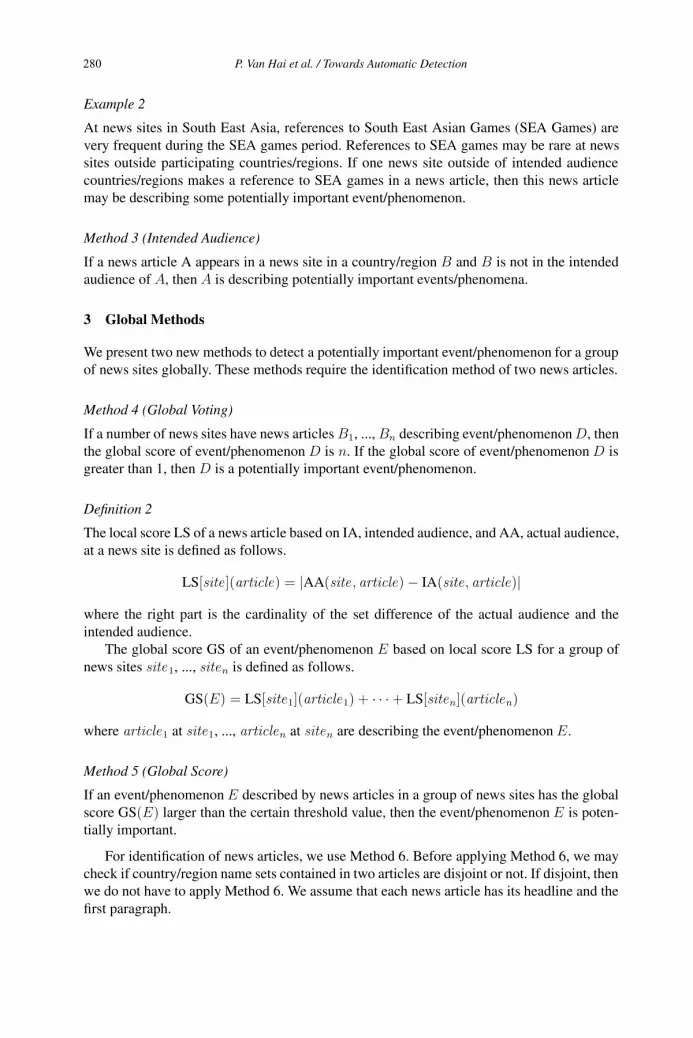
Example 2
At news sites in South East Asia, references to South East Asian Games (SEA Games) arevery frequent during the SEA games period. References to SEA games may be rare at newssites outside participating countries/regions. If one news site outside of intended audiencecountries/regions makes a reference to SEA games in a news article, then this news articlemay be describing some potentially important event/phenomenon.
Method 3 (Intended Audience)
If a news article A appears in a news site in a country/region B and B is not in the intendedaudience of A, then A is describing potentially important events/phenomena.
3 Global Methods
We present two new methods to detect a potentially important event/phenomenon for a groupof news sites globally. These methods require the identification method of two news articles.
Method 4 (Global Voting)
If a number of news sites have news articles B1, ..., Bn describing event/phenomenon D, thenthe global score of event/phenomenon D is n. If the global score of event/phenomenon D isgreater than 1, then D is a potentially important event/phenomenon.
Definition 2
The local score LS of a news article based on IA, intended audience, and AA, actual audience,at a news site is defined as follows.
LS[site ](article) = |AA(site , article) − IA(site, article)|
where the right part is the cardinality of the set difference of the actual audience and theintended audience.
The global score GS of an event/phenomenon E based on local score LS for a group ofnews sites site1, ..., siten is defined as follows.
GS(E) = LS[site1](article1) + · · · + LS[siten](articlen)
where article1 at site1, ..., articlen at siten are describing the event/phenomenon E.
Method 5 (Global Score)
If an event/phenomenon E described by news articles in a group of news sites has the globalscore GS(E) larger than the certain threshold value, then the event/phenomenon E is poten-tially important.
For identification of news articles, we use Method 6. Before applying Method 6, we maycheck if country/region name sets contained in two articles are disjoint or not. If disjoint, thenwe do not have to apply Method 6. We assume that each news article has its headline and thefirst paragraph.
P. Van Hai et al. / Towards Automatic Detection280

Method 6 (Equality checking)
We compute the TF-IDF term vector for each article. Articles dealing with the same event/phenomenon usually have the same information in the headline, 1st paragraph, and 2nd para-graph. We use nouns, proper nouns, verbs, and adjectives in the headline, 1st paragraph, and2nd paragraph to generate the term vector for each article. Each element of the term vector isthe score of each term. We score each term as follows.
Score(term , article) = Coefficient(term , article) × TF(term , article) × IDF(term , article)TF(term , article) = the number of occurrences of the term in the article
IDF(term , article) = log | the number of news articles at the site on the daythe number of news articles of the site on the day containing the term
|
Coefficient(term , article) =
⎧⎪⎨⎪⎩
C1 if the term is a proper noun
C2 else if the term is in the headline
C3 otherwise(C1 ≥ C2 > C3)
Then, We use the cosine distance of two term vectors as similarity measure. If the cosinedistance > K for the certain threshold value K, then we say that article1 and article2 aredealing with the same event/phenomenon.
Method 7 (Search-based equality)
For a given keyword Word 1 for a event/phenomenon, if two articles A1 and A2 have at leastone occurrence of the Word1, then we say A1 and A2 are dealing with the same event/phenom-enon.
4 Preliminary Experiments
Experiment 1
We picked up 10 English news sites on the Web for our automatic detection of potentiallyimportant events/phenomena, They are almost randomly chosen 10 domestic English newssites in 10 countries/regions, China, Japan, Korea, the Philippines, Russia, Singapore, Taiwan,Thailand, United States, and Vietnam.
Table 1 shows the expected frequency of references to country/region names from the 1stmost to the 5th most from Nov. 27 to Dec.27, 2005. Country/Region names are represented byISO 3166-1 code. Figure 1 shows the reference graph based on Table 1. A directed line fromcountry/region A to B exists, if a news site in A refers to B in Table 1. Table 2 shows most fre-quent pairs of two country/region names in one news article at each news site from Nov. 27 toDec.27, 2005. Table 3 shows examples of potentially important events/phenomena based onlocal method (Method 1). Table 4 shows examples of potentially important events/phenomenabased on global method (Method 5) with the threshold value 4.
Experiment 2
We performed one preliminary experiment of Method 6 for identification of news articlesdealing with same or different events/phenomena. We processed a collection of articles of 10news sites in 10 countries for 3 days with parameters C1 = C2 = 2, C3 = 1, and K = 0.8.We found 180 candidates of pairs of identical news articles with 94% precision.
P. Van Hai et al. / Towards Automatic Detection 281
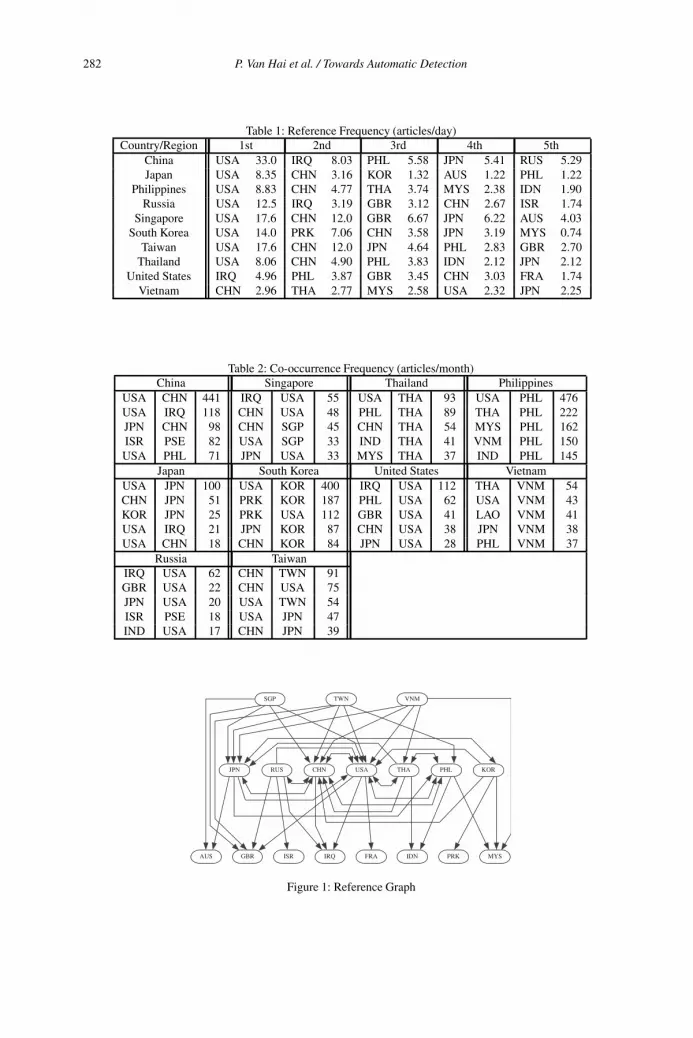
Table 1: Reference Frequency (articles/day)Country/Region 1st 2nd 3rd 4th 5th
China USA 33.0 IRQ 8.03 PHL 5.58 JPN 5.41 RUS 5.29Japan USA 8.35 CHN 3.16 KOR 1.32 AUS 1.22 PHL 1.22
Philippines USA 8.83 CHN 4.77 THA 3.74 MYS 2.38 IDN 1.90Russia USA 12.5 IRQ 3.19 GBR 3.12 CHN 2.67 ISR 1.74
Singapore USA 17.6 CHN 12.0 GBR 6.67 JPN 6.22 AUS 4.03South Korea USA 14.0 PRK 7.06 CHN 3.58 JPN 3.19 MYS 0.74
Taiwan USA 17.6 CHN 12.0 JPN 4.64 PHL 2.83 GBR 2.70Thailand USA 8.06 CHN 4.90 PHL 3.83 IDN 2.12 JPN 2.12
United States IRQ 4.96 PHL 3.87 GBR 3.45 CHN 3.03 FRA 1.74Vietnam CHN 2.96 THA 2.77 MYS 2.58 USA 2.32 JPN 2.25
Table 2: Co-occurrence Frequency (articles/month)China Singapore Thailand Philippines
USA CHN 441 IRQ USA 55 USA THA 93 USA PHL 476USA IRQ 118 CHN USA 48 PHL THA 89 THA PHL 222JPN CHN 98 CHN SGP 45 CHN THA 54 MYS PHL 162ISR PSE 82 USA SGP 33 IND THA 41 VNM PHL 150USA PHL 71 JPN USA 33 MYS THA 37 IND PHL 145
Japan South Korea United States VietnamUSA JPN 100 USA KOR 400 IRQ USA 112 THA VNM 54CHN JPN 51 PRK KOR 187 PHL USA 62 USA VNM 43KOR JPN 25 PRK USA 112 GBR USA 41 LAO VNM 41USA IRQ 21 JPN KOR 87 CHN USA 38 JPN VNM 38USA CHN 18 CHN KOR 84 JPN USA 28 PHL VNM 37
Russia TaiwanIRQ USA 62 CHN TWN 91GBR USA 22 CHN USA 75JPN USA 20 USA TWN 54ISR PSE 18 USA JPN 47IND USA 17 CHN JPN 39
SGP TWN VNM
RUS USA PHL
FRAAUS GBR IDN
JPN
IRQ
KOR
ISR MYS
THACHN
PRK
Figure 1: Reference Graph
P. Van Hai et al. / Towards Automatic Detection282
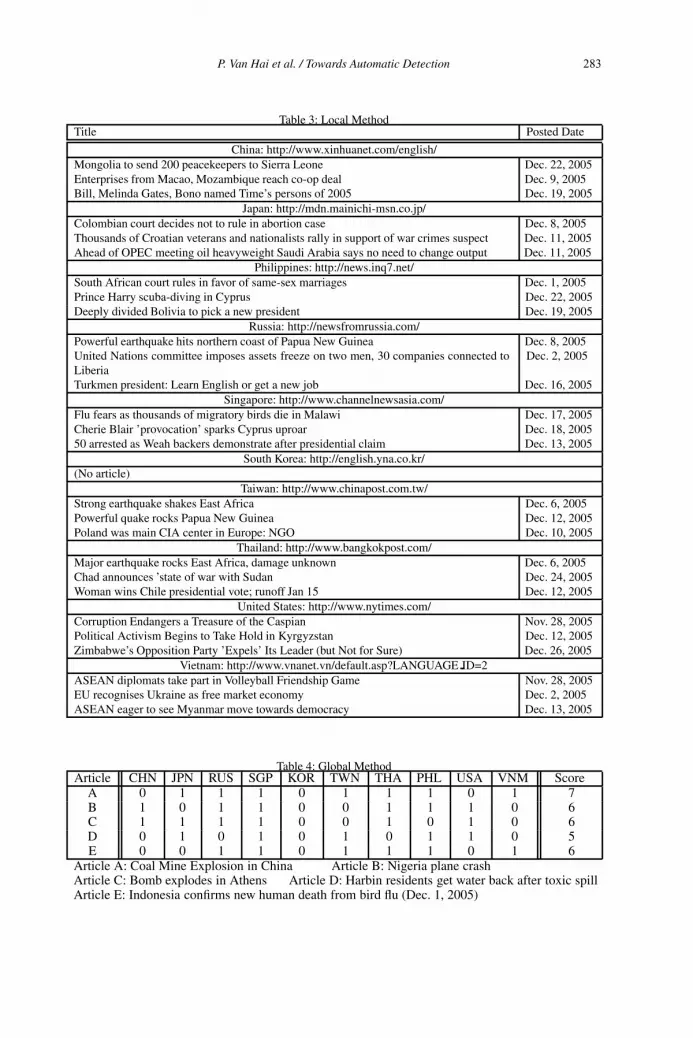
Table 3: Local MethodTitle Posted Date
China: http://www.xinhuanet.com/english/Mongolia to send 200 peacekeepers to Sierra Leone Dec. 22, 2005Enterprises from Macao, Mozambique reach co-op deal Dec. 9, 2005Bill, Melinda Gates, Bono named Time’s persons of 2005 Dec. 19, 2005
Japan: http://mdn.mainichi-msn.co.jp/Colombian court decides not to rule in abortion case Dec. 8, 2005Thousands of Croatian veterans and nationalists rally in support of war crimes suspect Dec. 11, 2005Ahead of OPEC meeting oil heavyweight Saudi Arabia says no need to change output Dec. 11, 2005
Philippines: http://news.inq7.net/South African court rules in favor of same-sex marriages Dec. 1, 2005Prince Harry scuba-diving in Cyprus Dec. 22, 2005Deeply divided Bolivia to pick a new president Dec. 19, 2005
Russia: http://newsfromrussia.com/Powerful earthquake hits northern coast of Papua New Guinea Dec. 8, 2005United Nations committee imposes assets freeze on two men, 30 companies connected toLiberia
Dec. 2, 2005
Turkmen president: Learn English or get a new job Dec. 16, 2005Singapore: http://www.channelnewsasia.com/
Flu fears as thousands of migratory birds die in Malawi Dec. 17, 2005Cherie Blair ’provocation’ sparks Cyprus uproar Dec. 18, 200550 arrested as Weah backers demonstrate after presidential claim Dec. 13, 2005
South Korea: http://english.yna.co.kr/(No article)
Taiwan: http://www.chinapost.com.tw/Strong earthquake shakes East Africa Dec. 6, 2005Powerful quake rocks Papua New Guinea Dec. 12, 2005Poland was main CIA center in Europe: NGO Dec. 10, 2005
Thailand: http://www.bangkokpost.com/Major earthquake rocks East Africa, damage unknown Dec. 6, 2005Chad announces ’state of war with Sudan Dec. 24, 2005Woman wins Chile presidential vote; runoff Jan 15 Dec. 12, 2005
United States: http://www.nytimes.com/Corruption Endangers a Treasure of the Caspian Nov. 28, 2005Political Activism Begins to Take Hold in Kyrgyzstan Dec. 12, 2005Zimbabwe’s Opposition Party ’Expels’ Its Leader (but Not for Sure) Dec. 26, 2005
Vietnam: http://www.vnanet.vn/default.asp?LANGUAGE ID=2ASEAN diplomats take part in Volleyball Friendship Game Nov. 28, 2005EU recognises Ukraine as free market economy Dec. 2, 2005ASEAN eager to see Myanmar move towards democracy Dec. 13, 2005
Table 4: Global MethodArticle CHN JPN RUS SGP KOR TWN THA PHL USA VNM Score
A 0 1 1 1 0 1 1 1 0 1 7B 1 0 1 1 0 0 1 1 1 0 6C 1 1 1 1 0 0 1 0 1 0 6D 0 1 0 1 0 1 0 1 1 0 5E 0 0 1 1 0 1 1 1 0 1 6
Article A: Coal Mine Explosion in China Article B: Nigeria plane crashArticle C: Bomb explodes in Athens Article D: Harbin residents get water back after toxic spillArticle E: Indonesia confirms new human death from bird flu (Dec. 1, 2005)
P. Van Hai et al. / Towards Automatic Detection 283

5 Related Work
Many Computer Science techniques have been developed for news topic summarization, clus-tering, detection and identification. Topic Detection and Tracking (TDT) [1] is a project whichdeveloped algorithms for automatically organizing news stories by the events they discuss.Their work is not aiming at evaluating the potential importance of the news article. LinkDetection, one of five tasks in TDT project, s similar to one part of our proposed methods.The purpose of Link Detection is to detect whether or not two news stories discuss the sametopic. There have been a number of approaches to Link Detection [2, 4, 5, 6]. The differencebetween our proposed method and their methods is that we deal with the structure of newsarticle in weighting terms. We also use country/region names referred in news articles to filterarticles which are not necessarily compared.
Personalized News [3, 7] tries to detect news stories which are most suitable for a specificuser profile. Our method is to detect potentially important events/phenomena which do notdepend on a specific user’s favorite keywords.
News sites, such as Yahoo News, provide Most Emailed News and Most RecommendedNews which provide popular news selected by users. However, these popular news articlesare not necessarily potentially important news.
6 Conclusion
We have presented a number of methods for automatic detection of potentially importantevents/phenomena through monitoring of different mostly domestic news sites on the Web.If we have a reasonable automatic detection system of potentially important news happeningoutside the country, then we might be able to understand the outside world and inside worldbetter than before.
References
[1] James Allan. Introduction to Topic Detection and Tracking, chapter 1. Kluwer Academic, 2002.
[2] James Allan, Victor Lavrenko, Daniela Malin, and Russell Swan. Detections, bounds, and timelines: UMassand TDT-3. In Topic Detection and Tracking Workshop (TDT-3), 2000.
[3] Liliana Ardissono, Luca Console, and Ilaria Torre. An adaptive system for the personalized access to news.AI Communications, 14(3):129–147, 2001.
[4] Ying-Ju Chen and Hsin-His Chen. NLP and IR approaches to monolingual and multilingual link detection.In COLING2002, 2002.
[5] Ayman Farahat, Francine Chen, and Thorsten Brants. Optimizing story link detection is not equivalent tooptimizing new event detection. In ACL-2003, pages 232–239, 2003.
[6] Victor Lavrenko, James Allan, Edward DeGuzman, Daniel La Flamme, Veera Pollard, and Steven Thomas.Relevance models for topic detection and tracking. In HLT 2002, 2002.
[7] Bernard Merialdo, Kyung Tak Lee, Dario Luparello, and Jeremie Roudaire. Automatic construction ofpersonalized tv news programs. In ACM Multimedia ’99, pages 323–331, 1999.
[8] Soma Roy, David Gevry, and William M. Pottenger. Methodologies for trend detection in textual datamining. In Textmine ’02 Workshop.
P. Van Hai et al. / Towards Automatic Detection284
ROC curves for the CART Algorithm in STATISTICA Data Miner1
Bohumil JAKOUBEK Faculty of Informatics and Management, Department of Informatics and Quantitative Methods, University of Hradec Kralove, Rokitanskeho 62, 500 03 Hradec Kralove 3,
Czech Republic
Abstract. ROC curves are widely used as a tool to evaluate classification models. This paper describes the use of the macro language STATISTICA Visual Basic to construct receiver operating characteristics curves (ROC) for the CART algorithm implemented in the data mining system STATISTICA Data Miner. STATISTICA has an option of ROC curves only for neural networks, therefore the macro presented here is useful for evaluation and comparison the classification models that are built with the CART algorithm. The possibilities of this macro are presented on one data set.
1. Introduction
Receiver operating characteristics curve (ROC) was first used in signal detection for description the radar’s ability to distinguish between signal and noise. The signal represented the true presence of a missile in the watched zone, while the noise was a kind of low signal that could lead to a false alarm [11]. It was up to the radar’s operator to select such a decision level (signal level) that would both maximize the detection of missiles and minimize the false alarm. Each decision level results in true-positive, true-negative, false-positive or true-negative decision. The ROC curve can be represented by plotting true-positive versus false-positive rate as the decision level changes. Later ROC curves became widespread in other fields, e.g. radiology, medical decision making and so on, where they were used for evaluation the diagnostic tests that discriminate between diseased and healthy patients. Now these curves are employed in data mining as well to evaluate classification models. The advantage of the use of ROC is in its ability to describe the classifier performance over all possible decision levels. In the case of data mining models, ROC describes the classifier performance when the external conditions change [8]. Moreover, ROC enables multiple comparisons of classification models with the use of a single graph (than the graph visualizes the ROC space of classification models). This paper assumes the binary classification only when the individuals are classified either into true or false class and describes the possibility to construct ROC curves for the CART algorithm in Statistica DM.
1 This paper was partly supported by the Grant Agency of Czech Republic – grant No 402/04/1308
M. Duží et al. (Eds.)Information Modelling and Knowledge Bases XVIII
IOS Press, 2007© 2007 The authors and IOS Press. All rights reserved.
285
2. Construction of ROC Curve
Each binary classification results in four possible classification outcomes. The individuals can be classified either as positive or negative (the terminology is taken from medicine) based on a certain level of substance (threshold). The true positive (TP) rate is the proportion of positive cases correctly classified as positive. The false positive rate (FP) is the proportion of negative cases incorrectly classified as positive. The true negative (TN) and false positive (FN) rates can be derived in the similar manner as the foregoing ones. Different classifications are recorded in so called confusion matrix as illustrated in Table 1.
Table 1
Observed Observed
Predicted D+ D- Total Predicted D+ D-
T+ a c a+c T+ TP FP
T- b d b+d T- FN TN
Total a+b c+d
Once the decision level has been selected, the classifier usually makes some misclassification and the confusion matrix can be formed. The capitals D+ and D- stand for disease present, respectively absent (a case classified as positive or negative). The T+ and T- stand for test or classifier results. The TP and 1-FP rate is called sensitivity, respectively specificity. The rates are determined by the following formulas:
ba
aTP
dc
cFP = yspecificit1
True positive rate is the conditional probability that a positive case will be classified as positive . False positive rate is the conditional probability that a negative case
will be classified as positive
)|( DTP)|( DTP .
An ROC curve represents a set of points whose coordinates are TP and FP rates, see Figure 1. The different TP and FP rates are obtained by changing the threshold (cutoff). There is a trade-off between sensitivity and specificity, which means that an increase in TP rate results in a decrease in FP rate and on the contrary [1,6]. The ideal classifier will have TP=1 and FP=0. In that case the curve is represented by a point placed in the left upper corner. The worst classifier is represented by a diagonal line corresponding to a random classification. The line is sometimes called a „random line“. An optimal position can be found on the ROC curve. This can be situation if the aim is to maximize the TP rate or to minimize the FP rate or another type of misclassification. The ROC curves can be theoretical or empirical. The empirical curve is plotted using TP and FP rates derived directly from data. The stairs-like shape of the curve is determined by the ordinal classification score and number of decision levels. If the continuous discrimination score and the infinite sample size are used, the curve becomes smoother and approximates the theoretical one [4]. The theoretical curve can be constructed based on the distribution assumptions of the classification score [6]. This paper deals only with construction of empirical curves.
There are several indexes that measure the classifier accuracy [8]. But the most used one is the area under the curve (AUC) since it enables comparing two or more models using a single index. The AUC takes on the values from 0–1. The higher the index is, the better
B. Jakoubek / ROC Curves for the CART Algorithm in STATISTICA Data Miner286
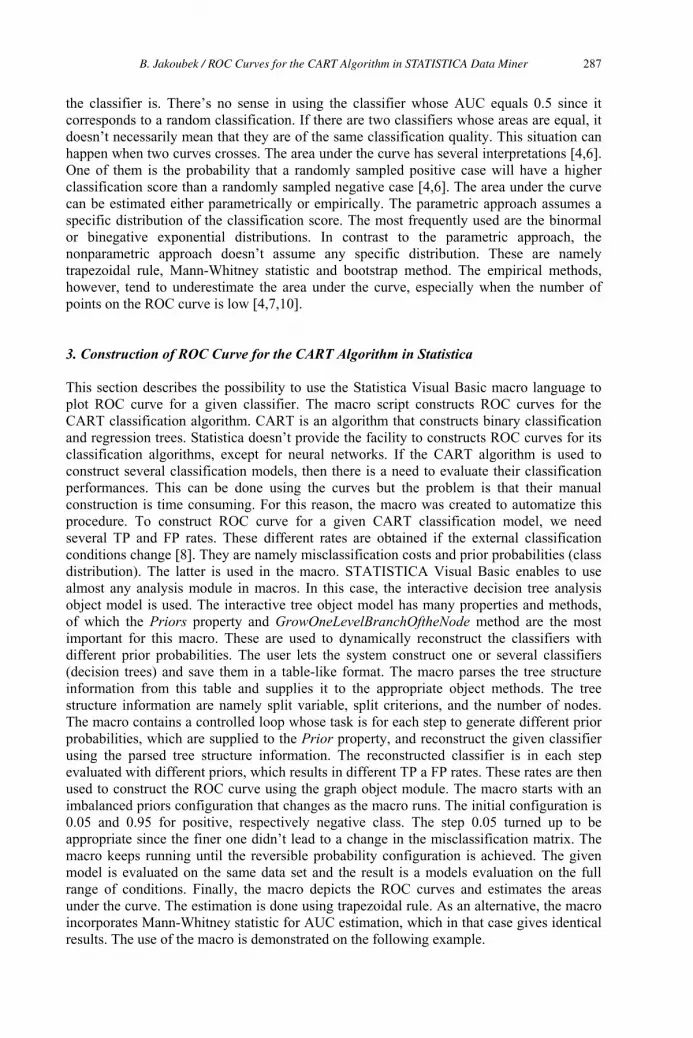
the classifier is. There’s no sense in using the classifier whose AUC equals 0.5 since it corresponds to a random classification. If there are two classifiers whose areas are equal, it doesn’t necessarily mean that they are of the same classification quality. This situation can happen when two curves crosses. The area under the curve has several interpretations [4,6]. One of them is the probability that a randomly sampled positive case will have a higher classification score than a randomly sampled negative case [4,6]. The area under the curve can be estimated either parametrically or empirically. The parametric approach assumes a specific distribution of the classification score. The most frequently used are the binormal or binegative exponential distributions. In contrast to the parametric approach, the nonparametric approach doesn’t assume any specific distribution. These are namely trapezoidal rule, Mann-Whitney statistic and bootstrap method. The empirical methods, however, tend to underestimate the area under the curve, especially when the number of points on the ROC curve is low [4,7,10].
3. Construction of ROC Curve for the CART Algorithm in Statistica
This section describes the possibility to use the Statistica Visual Basic macro language to plot ROC curve for a given classifier. The macro script constructs ROC curves for the CART classification algorithm. CART is an algorithm that constructs binary classification and regression trees. Statistica doesn’t provide the facility to constructs ROC curves for its classification algorithms, except for neural networks. If the CART algorithm is used to construct several classification models, then there is a need to evaluate their classification performances. This can be done using the curves but the problem is that their manual construction is time consuming. For this reason, the macro was created to automatize this procedure. To construct ROC curve for a given CART classification model, we need several TP and FP rates. These different rates are obtained if the external classification conditions change [8]. They are namely misclassification costs and prior probabilities (class distribution). The latter is used in the macro. STATISTICA Visual Basic enables to use almost any analysis module in macros. In this case, the interactive decision tree analysis object model is used. The interactive tree object model has many properties and methods, of which the Priors property and GrowOneLevelBranchOftheNode method are the most important for this macro. These are used to dynamically reconstruct the classifiers with different prior probabilities. The user lets the system construct one or several classifiers (decision trees) and save them in a table-like format. The macro parses the tree structure information from this table and supplies it to the appropriate object methods. The tree structure information are namely split variable, split criterions, and the number of nodes. The macro contains a controlled loop whose task is for each step to generate different prior probabilities, which are supplied to the Prior property, and reconstruct the given classifier using the parsed tree structure information. The reconstructed classifier is in each step evaluated with different priors, which results in different TP a FP rates. These rates are then used to construct the ROC curve using the graph object module. The macro starts with an imbalanced priors configuration that changes as the macro runs. The initial configuration is 0.05 and 0.95 for positive, respectively negative class. The step 0.05 turned up to be appropriate since the finer one didn’t lead to a change in the misclassification matrix. The macro keeps running until the reversible probability configuration is achieved. The given model is evaluated on the same data set and the result is a models evaluation on the full range of conditions. Finally, the macro depicts the ROC curves and estimates the areas under the curve. The estimation is done using trapezoidal rule. As an alternative, the macro incorporates Mann-Whitney statistic for AUC estimation, which in that case gives identical results. The use of the macro is demonstrated on the following example.
B. Jakoubek / ROC Curves for the CART Algorithm in STATISTICA Data Miner 287
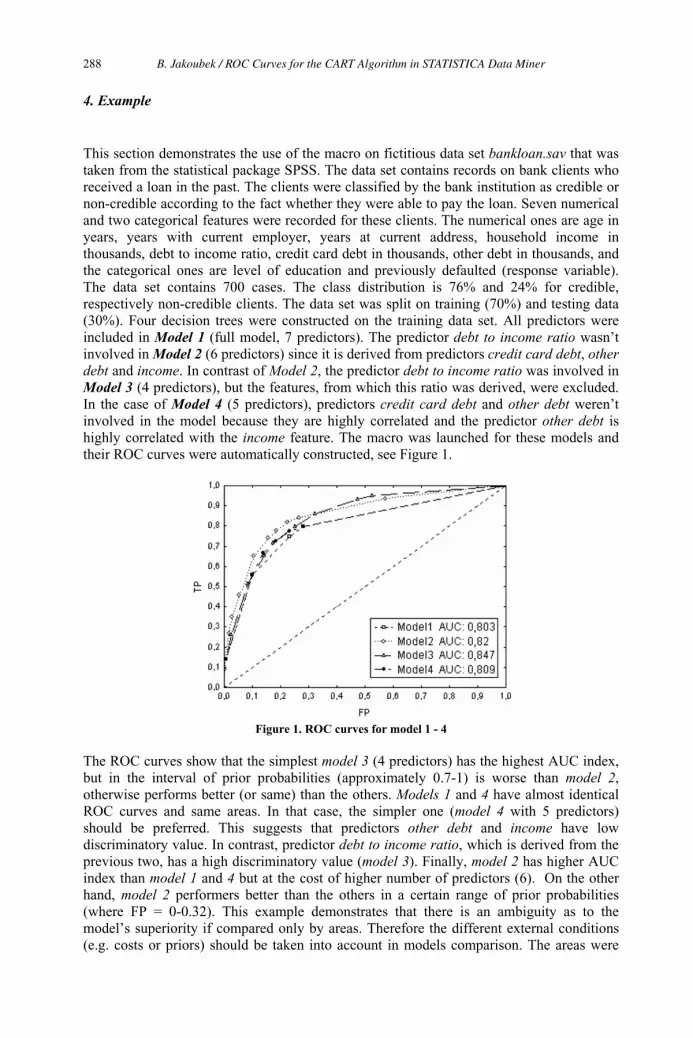
4. Example
This section demonstrates the use of the macro on fictitious data set bankloan.sav that was taken from the statistical package SPSS. The data set contains records on bank clients who received a loan in the past. The clients were classified by the bank institution as credible or non-credible according to the fact whether they were able to pay the loan. Seven numerical and two categorical features were recorded for these clients. The numerical ones are age in years, years with current employer, years at current address, household income in thousands, debt to income ratio, credit card debt in thousands, other debt in thousands, and the categorical ones are level of education and previously defaulted (response variable). The data set contains 700 cases. The class distribution is 76% and 24% for credible, respectively non-credible clients. The data set was split on training (70%) and testing data (30%). Four decision trees were constructed on the training data set. All predictors were included in Model 1 (full model, 7 predictors). The predictor debt to income ratio wasn’t involved in Model 2 (6 predictors) since it is derived from predictors credit card debt, otherdebt and income. In contrast of Model 2, the predictor debt to income ratio was involved in Model 3 (4 predictors), but the features, from which this ratio was derived, were excluded. In the case of Model 4 (5 predictors), predictors credit card debt and other debt weren’tinvolved in the model because they are highly correlated and the predictor other debt is highly correlated with the income feature. The macro was launched for these models and their ROC curves were automatically constructed, see Figure 1.
Figure 1. ROC curves for model 1 - 4
The ROC curves show that the simplest model 3 (4 predictors) has the highest AUC index, but in the interval of prior probabilities (approximately 0.7-1) is worse than model 2,otherwise performs better (or same) than the others. Models 1 and 4 have almost identical ROC curves and same areas. In that case, the simpler one (model 4 with 5 predictors) should be preferred. This suggests that predictors other debt and income have low discriminatory value. In contrast, predictor debt to income ratio, which is derived from the previous two, has a high discriminatory value (model 3). Finally, model 2 has higher AUC index than model 1 and 4 but at the cost of higher number of predictors (6). On the other hand, model 2 performers better than the others in a certain range of prior probabilities (where FP = 0-0.32). This example demonstrates that there is an ambiguity as to the model’s superiority if compared only by areas. Therefore the different external conditions (e.g. costs or priors) should be taken into account in models comparison. The areas were
B. Jakoubek / ROC Curves for the CART Algorithm in STATISTICA Data Miner288

estimated by the Mann-Whitney statistic as well, but the estimations were identical to the trapezoidal rule estimation.
5. Conclusions
ROC curves provide a multiple models comparison. They are an important tool to evaluate the classifier performance over all possible decision levels or in different external classification conditions. This paper describes the possibility to construct ROC curves for the CART algorithm using Statistica Visual Basic macro language. The classifier evaluation and comparison with other models is time-consuming if done manually. Model evaluation requires its multiple applications on the same data set in different classification conditions. For instance, comparing 5 models would require evaluating each model in 19 different conditions (priors), which means 95 times in total. This procedure can be automated by the presented macro. The macro automatically constructs ROC curves for given classifiers and estimates the AUCs using trapezoidal rule. The visualization of model performance with the use of ROC curves is considerably facilitated by the presented macro. An alternative macro was written as well. It doesn’t use prior probabilities to construct ROC curve but uses classification probabilities which is assigned to each case classification by the CART algorithm. The ROC curve constructed in this way was identical to that of constructed using different prior probabilities.
References
[1] Barbara, J. et al.: Primer on certain elements of medical decision making. N Engl J Med. 1975 Jul 31;293(5):211-5. ISSN: 0028-4793 [2] Berka, P.: Dobývání znalostí z databází. Academia, 2003 Praha. ISBN 80-200-1062-9. [3] Berthold, M., Hand, D.: Intelligent Data Analysis: An Introduction. Springer, 2003 Berlin, ISBN 3-540-43060-1. [4] Hanley, J.A., McNeil, B.J.: The meaning and use of the area under a receiver operating characteristic (ROC) curve. Radiology. 1982;143(1):29–36. [5] Hanley, J.A., McNeil, B.J.: A method of comparing the areas under receiver operating characteristic curves derived from the same cases. Radiology 1983;148(3):839–43. [6] Obuchowski, N.A.: Receiver Operating Characteristic Curves and Their Use in Radiology. Radiology. 2003, 229: 3-8. [7] Park, S.H., Goo, J.M., Jo Ch.H.: Receiver Operating Characteristic (ROC) Curve: Practical Review for Radiologists. Korean J Radiol 5(1), March 2004, pp.11-18 [8] Skalská, H.: Comparison the Quality of Classification Algorithms. Proceedings of the 23rd International Conference, Mathematical Methods in Economics 2005. Hradec Králové: Hana Skalská, 2005, pp 344-349. ISBN: 80-7041-535-5 [9] Vecchio, T.J.: Predictive value of a single diagnostic test in unselected populations. N. Engl. J. Med. 274,1171-1173 (1966).[10] Vida, S.: A computer program for non-parametric receiver operating characteristic analysis. Computer Methods and Programs in Biomedicine 40 (1993) 95-101. [11] Zweig, M. H., Robertson, E. A.: Use of receiver operating characteristic curves to evaluate the clinical performance of analytical systems. Clin Chem, 1981, 27: 1569-1574. [12] Zweig N.H., Robertson E.A.: Why we need better test evaluations. Clin Chem 1982; 28: 1272-6. [13] Zweig, M.H., Campbell, G.: Receiver-operating characteristic (ROC) plots: a fundamental evaluation tool in clinical medicine. [published erratum appears in Clin Chem 1993 Aug;39(8):1589]. Clin Chem 1993 39: 561-577. [14] Zweig, M.H., Broste, S.K., Reinhart, R.A.: ROC curve analysis: an example showing the relationships among serum lipid and apolipoprotein concentrations in identifying patients with coronary artery disease.Clin. Chem., Aug 1992; 38: 1425 - 1428.
B. Jakoubek / ROC Curves for the CART Algorithm in STATISTICA Data Miner 289
Development of Designed Q-R Code
Jun SASAKI, Hiroaki SHIMOMUKAI, Tae YONEDA, and Yutaka FUNYU
Iwate Prefectural University, Faculty of Software and Information Science
Sugo 152-52, Takizawa-mura, Iwate-ken, Japan
Abstract. The mobile Internet has been used widely in Japan. If we use a cellular phone
with the Q-R (Quick Response) code reader function (a two dimensional code
developed by Denso-Wave Corporation) we can very easily access a web-site. However,
though the existence of Q-R code reader function in the cellular phone is well known,
not many people who use the function. The reason is that the Q-R code is not intuitive
because it was developed to be read by machines. Our idea to solve the problem is to
combine the Q-R code with a designed particular picture or graphic. We propose a
method to produce the designed Q-R code and we develop its production system. This
paper describes the proposed method, the production system and evaluation results using
some designed Q-R codes produced by the system.
Introduction
In recent times, a 2D (two dimensional) code such as Q-R (Quick Response) code [1]
developed by Denso-Wave Corporation has been a popular way to access a web site using a
cellular phone. We proposed and developed a reliable and useful information distribution
system named “Kuchicomi Network”, which was reported in the 15th European-Japanese
Conference on Information Modelling and Knowledge Bases (15th-EJC 2005) [2]. In this
system, Q-R code, which includes the URL (Uniform Resource Locator) of the Kuchikomi site,
is used to access the site easily for a user.
Although about 90% people know about 2D code in Japan [3], only about 40% are real
users. As the two dimensional code was developed to be read only by machines, there are
no easily recognised characteristics for humans to see. With this in mind, we have
developed a designed two dimensional code which is more recognisable so that more
people will be able to use it.
The designed 2D code is produced by combining a 2D code with a particular picture or
graphic of a character or mark. We propose its production method and a system to develop
and to evaluate it. After experimental evaluation on the designed two dimensional code
produced by the system, we can obtain a good effect on the human feeling about the two
dimensional code.
1. Current Technology
The “C-C code” developed by Code Com Corporation [4] is a current technology that makes
two-dimensional code more useful by printing a number under the code. The code can be
accessed by typing the number into a cellular phone, even without a two dimensional code
reader available. Although this is the way to expand the accessibility of the code, it does not
improve the design characteristics. On the other hand, “Color code” developed by Color Zip
Corporation[5] uses color cells to make the design characteristics, but because there is a
limitation in the color distribution rule in Color code, which makes it unsuitable to combine a
meaningful code with a free designed mark.
M. Duží et al. (Eds.)Information Modelling and Knowledge Bases XVIII
IOS Press, 2007© 2007 The authors and IOS Press. All rights reserved.
290

2. Proposal of designed Q-R code
In this paper, we propose a method to combine Q-R code, which is the most familiar 2D code
in Japan, with a designed picture.
2.1. Principle of the combination with the Q-R code and a designed mark
When a two-dimensional code is read, by CCD (Charge-coupled device) camera for example,
it is transmitted as two picture parts, shadow and highlight. Our idea is that if we could include
a designed picture on the Q-R code without destroying the shadow and highlight condition it
would be advantageous. If we combined a Q-R code with a designed picture consisting of
particular mark or character in the overlapped part of shadow in the Q-R code, we could
transfer that part of the designed-picture color into a dark color recognized as shadow by a
Q-R code reader. In our proposal, the luminosity of the color in the overlapped part can be
classified into five levels as shown in Figure 1. A color in level 1 is too dark to be recognized
as a designed color because it can not be distinguished from the black of the Q-R code. A
color in level 2 can be available in the designed color and can be recognized as shadow of the
Q-R code. A color in level 3 is not suitable for the designed Q-R code because it is in the
middle level where the recognition of shadow or highlight could change depending on the
reading environment conditions, such as lighting. A color in level 4 can be available in the
designed color and can be recognized as highlight of the Q-R code. A color in level 5 is too
bright to be recognized as a designed color because it can not be distinguished from white of
the Q-R code.
Level 1
luminosity
255
204
153
102
51
0
Level 2
Level 3
Level 4
Level 5Almost white
Almost black
Recognized as Shadow
Recognized as Highlight
Middle level
Level 1
luminosity
255
204
153
102
51
0
Level 2
Level 3
Level 4
Level 5Almost white
Almost black
Recognized as Shadow
Recognized as Highlight
Middle level
Figure1. Five levels in luminosity of a color.
2.2. Equations for color transfer
The principal of color transfer is shown in Figure 2. When the original color Co with elements
of R (red), G (Green) and B (Blue) in an original designed mark are set in Ro, G
o and B
o, each
color of highlight or shadow in the overlapped part of Q-R code and the original mark is
transferred into following color of Ch with R
h, G
h, and B
h color elements or C
s with R
s, G
s, and
Bs color elements, respectively. Here, R
i, G
i and B
i (i = o, h, s) is a luminosity value from 0 to
255 of each color element.
The equations for color transfer are as follows,
For the highlight part;
Rh= R
4(1 + R
o/ 256), G
h= G
4(1 + G
o/ 256), B
h= B
4(1 + B
o/ 256), (1)
For the shadow part,
Rs= R
2(1 + R
o/ 256), G
s= G
2(1 + G
o/ 256), B
s= B
2(1 + B
o/ 256). (2)
J. Sasaki et al. / Development of Designed Q-R Code 291
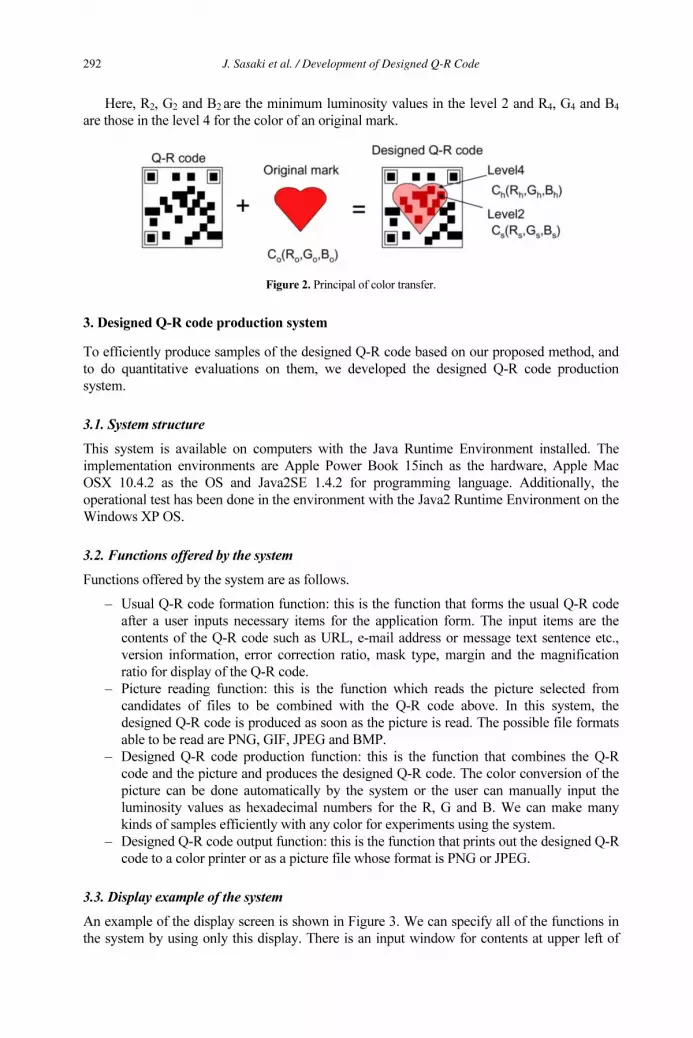
Here, R2, G
2 and B
2are the minimum luminosity values in the level 2 and R
4, G
4 and B
4
are those in the level 4 for the color of an original mark.
Figure 2. Principal of color transfer.
3. Designed Q-R code production system
To efficiently produce samples of the designed Q-R code based on our proposed method, and
to do quantitative evaluations on them, we developed the designed Q-R code production
system.
3.1. System structure
This system is available on computers with the Java Runtime Environment installed. The
implementation environments are Apple Power Book 15inch as the hardware, Apple Mac
OSX 10.4.2 as the OS and Java2SE 1.4.2 for programming language. Additionally, the
operational test has been done in the environment with the Java2 Runtime Environment on the
Windows XP OS.
3.2. Functions offered by the system
Functions offered by the system are as follows.
– Usual Q-R code formation function: this is the function that forms the usual Q-R code
after a user inputs necessary items for the application form. The input items are the
contents of the Q-R code such as URL, e-mail address or message text sentence etc.,
version information, error correction ratio, mask type, margin and the magnification
ratio for display of the Q-R code.
– Picture reading function: this is the function which reads the picture selected from
candidates of files to be combined with the Q-R code above. In this system, the
designed Q-R code is produced as soon as the picture is read. The possible file formats
able to be read are PNG, GIF, JPEG and BMP.
– Designed Q-R code production function: this is the function that combines the Q-R
code and the picture and produces the designed Q-R code. The color conversion of the
picture can be done automatically by the system or the user can manually input the
luminosity values as hexadecimal numbers for the R, G and B. We can make many
kinds of samples efficiently with any color for experiments using the system.
– Designed Q-R code output function: this is the function that prints out the designed Q-R
code to a color printer or as a picture file whose format is PNG or JPEG.
3.3. Display example of the system
An example of the display screen is shown in Figure 3. We can specify all of the functions in
the system by using only this display. There is an input window for contents at upper left of
J. Sasaki et al. / Development of Designed Q-R Code292
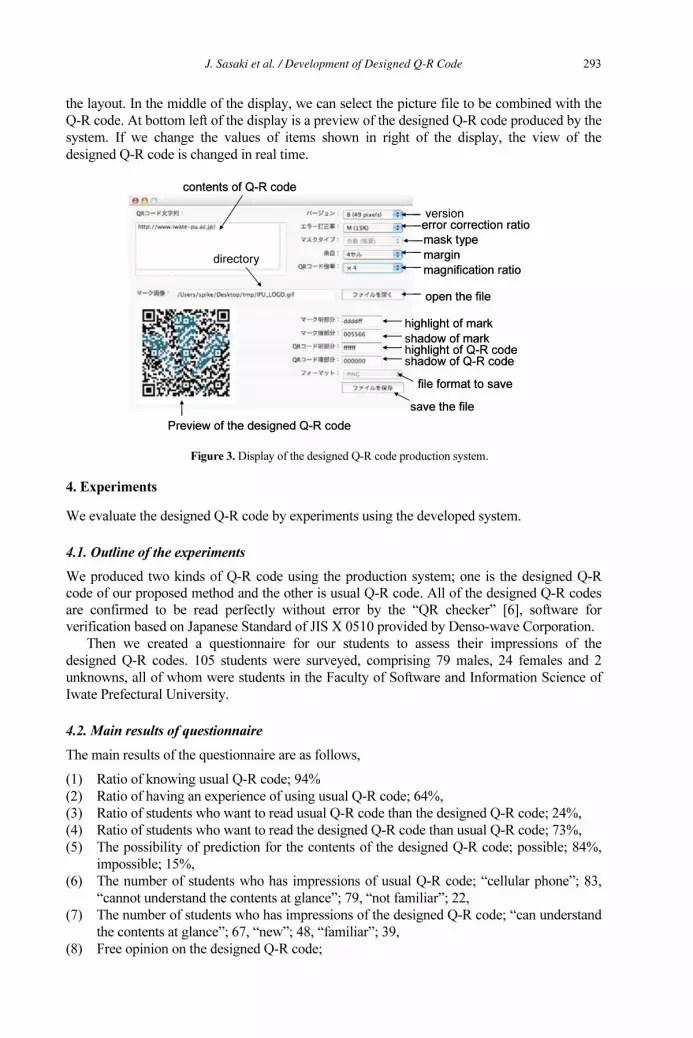
the layout. In the middle of the display, we can select the picture file to be combined with the
Q-R code. At bottom left of the display is a preview of the designed Q-R code produced by the
system. If we change the values of items shown in right of the display, the view of the
designed Q-R code is changed in real time.
version
error correction ratio
mask type
margin
magnification ratio
highlight of mark
shadow of mark
shadow of Q-R code
highlight of Q-R code
save the file
file format to save
open the file
directory
contents of Q-R code
Preview of the designed Q-R code
version
error correction ratio
mask type
margin
magnification ratio
highlight of mark
shadow of mark
shadow of Q-R code
highlight of Q-R code
save the file
file format to save
open the file
directory
contents of Q-R code
Preview of the designed Q-R code
Figure 3. Display of the designed Q-R code production system.
4. Experiments
We evaluate the designed Q-R code by experiments using the developed system.
4.1. Outline of the experiments
We produced two kinds of Q-R code using the production system; one is the designed Q-R
code of our proposed method and the other is usual Q-R code. All of the designed Q-R codes
are confirmed to be read perfectly without error by the “QR checker” [6], software for
verification based on Japanese Standard of JIS X 0510 provided by Denso-wave Corporation.
Then we created a questionnaire for our students to assess their impressions of the
designed Q-R codes. 105 students were surveyed, comprising 79 males, 24 females and 2
unknowns, all of whom were students in the Faculty of Software and Information Science of
Iwate Prefectural University.
4.2. Main results of questionnaire
The main results of the questionnaire are as follows,
(1) Ratio of knowing usual Q-R code; 94%
(2) Ratio of having an experience of using usual Q-R code; 64%,
(3) Ratio of students who want to read usual Q-R code than the designed Q-R code; 24%,
(4) Ratio of students who want to read the designed Q-R code than usual Q-R code; 73%,
(5) The possibility of prediction for the contents of the designed Q-R code; possible; 84%,
impossible; 15%,
(6) The number of students who has impressions of usual Q-R code; “cellular phone”; 83,
“cannot understand the contents at glance”; 79, “not familiar”; 22,
(7) The number of students who has impressions of the designed Q-R code; “can understand
the contents at glance”; 67, “new”; 48, “familiar”; 39,
(8) Free opinion on the designed Q-R code;
J. Sasaki et al. / Development of Designed Q-R Code 293
– Very good because we can predict the contents of Q-R code.
– It is simple, and could catch on.
– Good idea because the space for Q-R code can be reduced by overlapping Q-R code
and the mark.
– Entering the mark, it becomes more familiar.
– Contents are easy to understand certainly, but it feels to be a little harsh.
– Unless explanation of the designed Q-R code, confusion may occur.
– Contents may be easy to understand usually, but there would be little afraid of
misunderstanding.
Judging by the questionnaire results, the users were more interested in the proposed
designed Q-R code than the usual QR code. We found it was possible to assume the contents
of the code at a glance from the designed Q-R code. But we also confirmed that a few people
had a bad impression of the designed Q-R code. In order to solve the problem, it is necessary
to research on the optimal overlap technique of the mark and code from the user’s view point
of user’s impression.
5. Effect of the designed Q-R code
We expect that the effect of the designed Q-R code will be very large. As people become more
familiar with the designed code they will become interested in using it. Additionally, the
layout of advertisement space on a newspaper or a leaflet with Q-R code becomes more
flexible because there is no problem of overlap of pictures and Q-R code. As a result, new
businesses will be created. For example, sales of designed Q-R codes and providing
established businesses with tools to make Q-R codes and Web sites for cellular phones etc.
Further, we are looking forward to prevention of forgery or alteration of the Q-R code because
the copyright of the designed Q-R code can be registered as intellectual property.
6. Conclusion
In this paper, we proposed the designed Q-R code, which is more recognisable for people than
the usual Q-R code, and developed a method to produce it. In addition, we conducted a survey
with various designed Q-R codes produced by the system. which gave a good result showing
most people were interested in it and it was possible to assume the contents of the code at
glance. Further study is needed to clarify the optimal overlap condition of a designed mark and
Q-R code, because a few people have bad impression of it. Its effective utilization method
should be also studied.
The designed Q-R code we proposed has already been transferred to the Ginga-Tsushin
Corporation, and it is commercialized now.
Acknowledgements
We thank Mr. Takahiro Tabata, Mr. Ryuhachiro Suzuki, and Mr. Yoshinobu Sasaki of the
Ginga Tsushin Corporation along with their useful advice related to this research.
References
[1] Q-R code, http://www.qrcode.com/.
[2] Jun Sasaki, Tae Yoneda and Yutaka Funyu, “A reliable and useful information distribution system:
Kuchikomi Network”, EJC 2005.
[3] Report by Mitsubishi Research Institute, Inc. “14th portable telephone service user investigation”, 2005.
[4] C-C code, http://www.codecom.jp/.
[5] Color code, http://www.colorzip.co.jp/ja/.
[6] QR checker, http://www.denso-wave.com/ja/adcd/product/qrchecker/index.html.
J. Sasaki et al. / Development of Designed Q-R Code294
Process and Logic Approaches in the Intelligent Agents Behavior
Michal RADECKÝ, Petr GAJDOŠ Department of Computer Science, VŠB-Technical University of Ostrava
t . 17. listopadu 15, 708 33 Ostrava-Poruba [email protected], [email protected]
Abstract. The Multi-Agent System (MAS) technology is one of the possibilities of development of modern, powerful and advanced information systems. In the case of the multi-agent systems, some of standard approaches could be used, however they have to be adjusted or extended. This paper describes the ideas and methods for MAS modeling and developing, based on the internal agent behaviors and process modeling. This paper is concerned with the problems of behavior specification and reconfiguration. Our method is based on the process and logic approaches.
1 Introduction
The Multi-Agent System (MAS) technology is formed on the concepts of the Complex Systems (e.g. macromolecules, ants’ colony, and economical systems) and also on the facilities and capabilities of software information systems [2], where the essential of MAS properties are autonomy and intelligence of elements, communication among elements, mobility of elements, decentralization of the control, adaptability, robustness, etc.
The MAS can be developed as a general information system that is composed from a number of autonomous elements (called Agents) [8]. In this context, the Multi-Agent System is a framework for agents, their lives, their communication and mobility. The Agentis a software entity, within the framework, created in order to meet its design objectives that are subordinated autonomously with respect to the environment, sensorial perceptions and internal behavior and also to the cooperation with other Agents.
2 Modeling of the Agent Behavior
Each Agent is determined by its own objectives among others. The ways to meet these objectives are founded on the internal behavior of this Agent. The internal behavior of each Agent is specified by the processes which express the algorithms of behavior [4]. The Agent lives, behaves and reacts to stimulus and to the environment, in accordance to the requirements and states of the internal behavior.
M. Duží et al. (Eds.)Information Modelling and Knowledge Bases XVIII
IOS Press, 2007© 2007 The authors and IOS Press. All rights reserved.
295
It is necessary to take into account the fact that each Agent is an absolutely autonomous element of MAS and thus the internal behavior have to constructed only from the processes, activities, knowledge and facilities that belong to a given Agent. Then, the consequent behavior of whole MAS is formed by communication and cooperation of separated Agents and their behaviors. This interaction is realized by the usage of messagepassing that is adapted to the demands of MAS.
2.1 Behavior Modeling by UML and its Extension
The UML (Unified Modeling Language) is an essential tool for process modeling, both on the business level and analytic level of description [6, 7]. It can be applicable for modeling of the internal behavior of the Agents as well. The UML Activity Diagrams are a standard diagrammatic technique that describes the series of activities, processes and other control elements that together express the algorithm. They are especially suitable for modeling of agent behavior; however, some modifications and extensions are required.
The forenamed extensions are implemented by the Agent Behavior Diagrams (ABD) which could contain all of the standard UML Activity Diagram elements, and some new elements are defined likewise for the modeling purposes of the agent processes. These new elements are concerned with the message passing among the Agents or with the other specific attributes of MAS or its elements. In early phases of MAS development process, these extensions are provided by the implementation of special “send/receive activity nodes”which include additional information about messages content and messages receiver/sender identification, see figure 1. The decision nodes coming from the standard UML Activity Diagrams are improved too. The modified “decision nodes” and their output edges can hold some extra information that is usable for the next control flows determination based on the incoming messages. This control flows are selected according to the agent’s objectives.
Figure 1: The examples of the new communication activity nodes and illustration of the extended decision node.
M. Radecký and P. Gajdoš / Process and Logic Approaches296
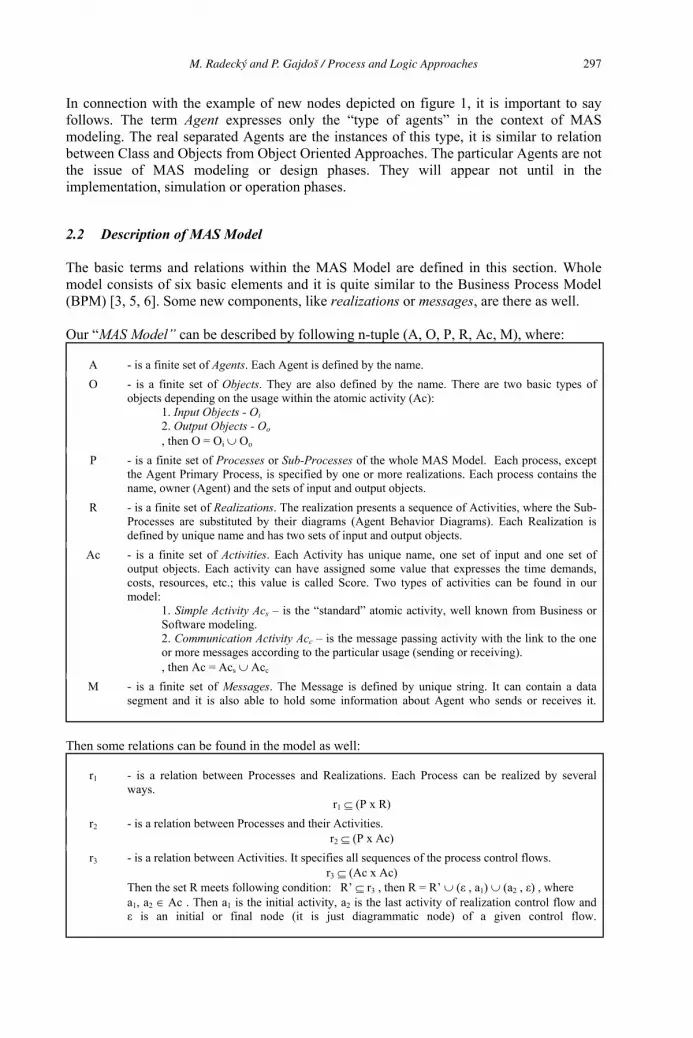
In connection with the example of new nodes depicted on figure 1, it is important to say follows. The term Agent expresses only the “type of agents” in the context of MAS modeling. The real separated Agents are the instances of this type, it is similar to relation between Class and Objects from Object Oriented Approaches. The particular Agents are not the issue of MAS modeling or design phases. They will appear not until in the implementation, simulation or operation phases.
2.2 Description of MAS Model
The basic terms and relations within the MAS Model are defined in this section. Whole model consists of six basic elements and it is quite similar to the Business Process Model (BPM) [3, 5, 6]. Some new components, like realizations or messages, are there as well.
Our “MAS Model” can be described by following n-tuple (A, O, P, R, Ac, M), where:
A - is a finite set of Agents. Each Agent is defined by the name. O - is a finite set of Objects. They are also defined by the name. There are two basic types of
objects depending on the usage within the atomic activity (Ac): 1. Input Objects - Oi2. Output Objects - Oo
, then O = Oi Oo
P - is a finite set of Processes or Sub-Processes of the whole MAS Model. Each process, except the Agent Primary Process, is specified by one or more realizations. Each process contains the name, owner (Agent) and the sets of input and output objects.
R - is a finite set of Realizations. The realization presents a sequence of Activities, where the Sub-Processes are substituted by their diagrams (Agent Behavior Diagrams). Each Realization is defined by unique name and has two sets of input and output objects.
Ac - is a finite set of Activities. Each Activity has unique name, one set of input and one set of output objects. Each activity can have assigned some value that expresses the time demands, costs, resources, etc.; this value is called Score. Two types of activities can be found in our model:
1. Simple Activity Acs – is the “standard” atomic activity, well known from Business or Software modeling. 2. Communication Activity Acc – is the message passing activity with the link to the one or more messages according to the particular usage (sending or receiving). , then Ac = Acs Acc
M - is a finite set of Messages. The Message is defined by unique string. It can contain a data segment and it is also able to hold some information about Agent who sends or receives it.
Then some relations can be found in the model as well:
r1 - is a relation between Processes and Realizations. Each Process can be realized by several ways.
r1 (P x R) r2 - is a relation between Processes and their Activities.
r2 (P x Ac) r3 - is a relation between Activities. It specifies all sequences of the process control flows.
r3 (Ac x Ac) Then the set R meets following condition: R’ r3 , then R = R’ ( , a1) (a2 , ) , where a1, a2 Ac . Then a1 is the initial activity, a2 is the last activity of realization control flow and is an initial or final node (it is just diagrammatic node) of a given control flow.
M. Radecký and P. Gajdoš / Process and Logic Approaches 297

r4 - is a relation between Activities and Objects r4i (Oi x Ac) , r4o (Ac x Oo) , r4 = r4i r4o
r5 - is a relation between Realizations and Objects r5i (Oi x R) | where for all (o , r) r5i there exists (o , a) r4i such that
(a , x) or (x , a) r and a,x Ac, o Oi , r R. r5o (R x Oo) | where for all (r , o) r5o there exists (a , o) r4o such that
(a , x) or (x , a) r and a,x Ac, o Oo , r R. Then r5 = r5i r5o
r6 - is a relation between Processes and Objects. r6i (Oi x P) | where for all (o , p) r6i there exists (o , r) r5i such that (p , r) r1
r6o (P x Oo) | where for all (p , o) r6o there exists (r , o) r5o such that (p , r) r1
Then r6 = r6i r6o
r7 - is a relation between Communication Activity and Messages. r7 (Acc x M)
3 Intelligence within the Agent Behavior
Above mentioned modeling is described from static and structural point of view only. Though, it is necessary to speak also about dynamical aspects which brings the term Intelligent Agent. It is a standard Agent that disposes of certain kind of “brainpower”. This capability is hidden inside the agent behavior and it can be found in various points of behavior algorithms. The intelligence can be ensured by the application of several tools, e.g. logic, artificial intelligence, expert system, etc.
The intelligence within the agent behavior can be concerned with three points: Intelligence contained in the Activities – it is a problem of activities implementation phase and it is hidden from the modeling perspective. Only the results of this activity firing are relevant. The task for the logic is to make decisions and derivate new information within the activity, e.g. weather forecast. Intelligence of the control flow routing – this application of logic or intelligent tools is covered in the decision points. The decision making and deduction of next behavior are activated whenever the “intelligent decision point” is reached during the process realization execution. The intelligent control flow routing can be used for all branching that request more complex and knowledge-based decision making, e.g. suitable car to a given cargo assignment. The control flow branching is based on the results of a given decision point and on its output edges and conditions. Intelligent selection of Process Realization – the third task of intelligence subsumed into the Agent life is concerned with the real-time operation of MAS. The potential and possibilities of this application is mentioned in the next chapter.
3.1 Intelligent Selection of Process Realization
Each Agent must try to realize its tasks and solve the upcoming situations in order to meet its design objectives. From this point of view, the standard Agent is grounded on the finite and constricted description of its behavior that is already defined during the modeling phase of the MAS. Therefore, there is no way to change the behavior during the Agent execution and life. In the case of Intelligent Agent it is able to do this. This kind of Agent can
M. Radecký and P. Gajdoš / Process and Logic Approaches298
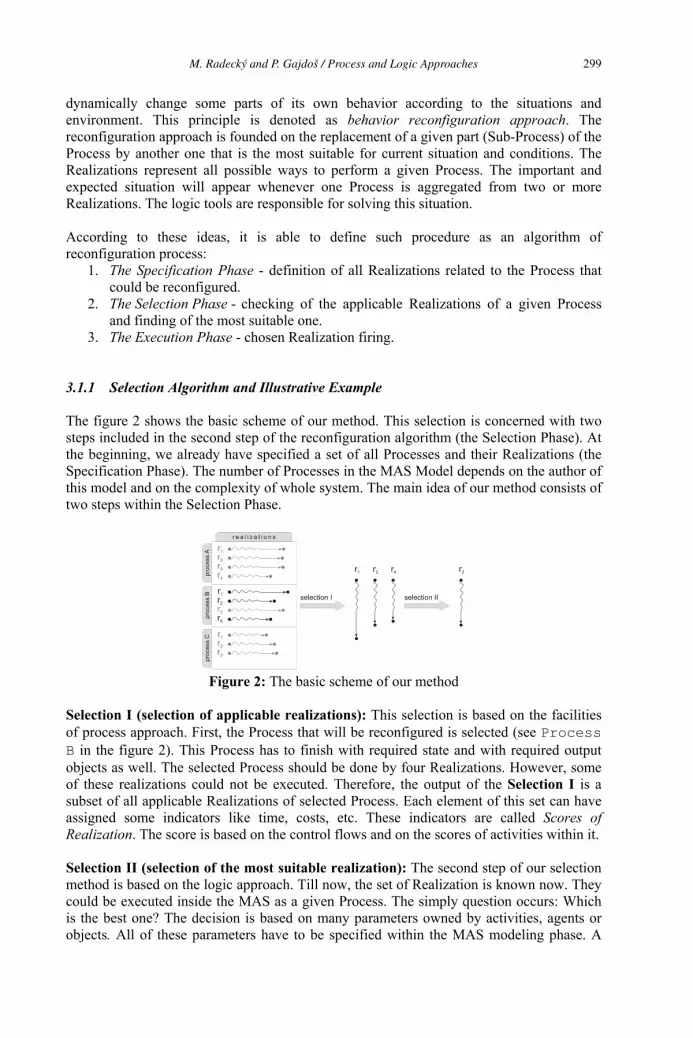
dynamically change some parts of its own behavior according to the situations and environment. This principle is denoted as behavior reconfiguration approach. The reconfiguration approach is founded on the replacement of a given part (Sub-Process) of the Process by another one that is the most suitable for current situation and conditions. The Realizations represent all possible ways to perform a given Process. The important and expected situation will appear whenever one Process is aggregated from two or more Realizations. The logic tools are responsible for solving this situation.
According to these ideas, it is able to define such procedure as an algorithm of reconfiguration process:
1. The Specification Phase - definition of all Realizations related to the Process that could be reconfigured.
2. The Selection Phase - checking of the applicable Realizations of a given Process and finding of the most suitable one.
3. The Execution Phase - chosen Realization firing.
3.1.1 Selection Algorithm and Illustrative Example
The figure 2 shows the basic scheme of our method. This selection is concerned with two steps included in the second step of the reconfiguration algorithm (the Selection Phase). At the beginning, we already have specified a set of all Processes and their Realizations (the Specification Phase). The number of Processes in the MAS Model depends on the author of this model and on the complexity of whole system. The main idea of our method consists of two steps within the Selection Phase.
Figure 2: The basic scheme of our method
Selection I (selection of applicable realizations): This selection is based on the facilities of process approach. First, the Process that will be reconfigured is selected (see ProcessB in the figure 2). This Process has to finish with required state and with required output objects as well. The selected Process should be done by four Realizations. However, some of these realizations could not be executed. Therefore, the output of the Selection I is a subset of all applicable Realizations of selected Process. Each element of this set can have assigned some indicators like time, costs, etc. These indicators are called Scores of Realization. The score is based on the control flows and on the scores of activities within it.
Selection II (selection of the most suitable realization): The second step of our selection method is based on the logic approach. Till now, the set of Realization is known now. They could be executed inside the MAS as a given Process. The simply question occurs: Which is the best one? The decision is based on many parameters owned by activities, agents or objects. All of these parameters have to be specified within the MAS modeling phase. A
M. Radecký and P. Gajdoš / Process and Logic Approaches 299

predicate, fuzzy logic, Transparent Intensional Logic (TIL) or some other approaches e.g. the Formal Concept Analysis could be used for finding of the most suitable and effective Realization.
4 Future Work
Till now, the meta-model of MAS, its elements and relationships have been specified. However, only the theoretical conclusions are not sufficient themselves. A real application has to be created to demonstrate theoretical results in practice. Now, the application called “AgentStudio” is ready for use. It makes it possible to specify Agent behavior with all above mentioned extensions. Next step will consists of the MAS Model analysis based on known approaches, e.g. on the Formal Concept Analysis, Cluster analysis etc. We want to use JADE framework and generate agents’ source codes or their templates directly from AgentStudio application. The main goal of our future work is to create software, that will be based on the clear methodology and that will allow to specify whole MAS without thorough knowledge of MAS framework.
5 ConclusionThis paper is concerned with the MAS technology especially with the specification of the Multi-Agent System Model. These specification tools must be designed with a respect to the skills of standard users that will be a “modelers” of the MAS and that will determined the objectives, requirements and behavior of whole MAS from the real-world point of view. Extended UML modeling approach was mentioned in this paper. Some new modeling elements and their graphical representation were defined. New application called “AgentStudio” was introduced for these purposes as well.
This paper has been supported by the program "Information Society" of the Czech Academy of Sciences, project No. 1ET101940420 "Logic and Artificial Intelligence for multi-agent systems"
6 References
[1] Aalst, W.M.P. van der. 1997. “Verification of Workflow Nets”. In Application and Theory of Petri Nets 1997, P. Azema and G. Balbo (Eds.), Springer-Verlag, Berlin, 407-426
[2] Kubik, A. 2004. “Intelligent Agents”, Computer Press, Prague, (publication in czech language).
[3] Radecky, M. and Vondrak, I. 2005. “Formalization of Business Process Modeling”. ISIM 2005, Hradec nad Moravici.
[4] Radecky, M. and Vondrak, I. 2005. “Modeling of Agents Behavior within MAS”. Information systems in practice 2005, MARQ, Ostrava, (paper in Czech).
[5] Radecky, M. and Vondrak, I. 2005. “Modeling of Processes”. WOFEX 2005, Ostrava.
[6] Vondrak, I. 2004 “Methods of Business Modeling”, VSB-TUO, Ostrava, (lecture notes in Czech).
[7] Bauer, B. and Muller, J.P. and Odell, J. 2001 “Agent UML”, Springer-Verlag, Berlin
[8] Muller, J.P. 1996 “The Design of Intelligent Agents. A Layered Approach”. Springer-Verlag, Berlin
M. Radecký and P. Gajdoš / Process and Logic Approaches300
Human Expert Modelling UsingNumerical Linear Algebra: a Heavy
Industry Case Study
Pavel Praks a,1, Jindrich Cernohorský b and Radim Briš a
a Dept. of Applied Mathematics, VŠB – Technical University of Ostrava,Czech Republic
b Dept. of Measurement and Control Systems, Centre of Applied Cybernetics,VŠB – Technical University of Ostrava, Czech Republic
Abstract. The article describes our experience with a method for an automatic
identification of image semantic, which is applied to the coking plant Mittal Steel
Ostrava, the Czech Republic. The image retrieval algorithm is based on Latent Se-
mantic Indexing (LSI) and involves Singular Value Decomposition of a document
matrix. Our case study indicates feasibility of the presented approach as a tool for
modelling of human expert behaviour in hard industry environment.
Keywords. Measurement, information retrieval, expert systems, security, human
factors, numerical linear algebra, Singular Value Decomposition
1. Introduction
The rapid development of information technologies provides users with a simple and
easy access to a very large amount of data, for instance text documents, voice, and im-
ages. Wide popular techniques, which are based on keyword matching, are not very ef-
ficient for real text databases because of polysemy (words having multiple meanings),
synonymy (multiple words having the same meaning) and omnipresent typing errors.
Moreover, real digital images contain reflex and noise, measured data that are always
weighed by measurement errors.
The numerical linear algebra is used as a basis for the information retrieval in the
retrieval strategy called Latent Semantic Indexing, see for instance [2], [4]. LSI can be
viewed as a variant of a vector space model, where the database is represented by the
document matrix, and a user’s query of the database is represented by a vector. LSI
also contains a low-rank approximation of the original document matrix via the Singular
Value Decomposition (SVD) or the other numerical methods. The SVD is used as an
automatic tool for identification and removing redundant information and noise from
data. The next step of LSI involves the computation of the similarity coefficients between
1Correspondence to: Pavel Praks, Dept. of Applied Mathematics, VŠB – Technical University of Ostrava,
17. listopadu 15, CZ 708 33 Ostrava, Czech Republic. Tel.: +420 59 732 4181; Fax: +420 59 691 9597; E-mail:
M. Duží et al. (Eds.)Information Modelling and Knowledge Bases XVIII
IOS Press, 2007© 2007 The authors and IOS Press. All rights reserved.
301

the filtered user’s query and filtered document matrix. The well-known cosine similarity
can be used for a similarity modelling. Recently, the methods of numerical linear algebra,
especially SVD, are also successfully used for the face recognition and reconstruction
[5], image retrieval [6,7], as a tool for information extraction from hydrochemical data
[9] and for iris recognition problem [8].
In this article, we present our experience with using Latent Semantic Indexing
method for the automatic modelling of human expert behaviour in heavy industry envi-
ronment. The aim of the research is creation of Knowledge system for evaluation of the
coking process quality which would replace human experts. Originally, LSI was devel-
oped for the semantic analysis of large amount of text documents. We have no informa-
tion about application of LSI for image retrieval in heavy industry.
2. Characteristic of Pilot Industrial Environment
The coking plant belongs to the industrial complex with several various parallelly ope-
rated technologies of chemically-thermal character which are, only theoretically, in full
accordance with theoretical conditions of the processes. There are more reasons of this
statement:
• absence of algorithmized forms of these technologies
• absence of inter-functional relations between single algorithms
• insufficient knowledge concerning the possibilities of application of communi-
cation and information technology in specific conditions of industrial complexes
including the influences of working environment
The pictures shown in Figure 1 and Figure 2 were picked up digitally at the coking
plant Mittal Steel Ostrava, Czech Republic. There are practical reasons why to develop a
sophisticated surveillance application for subsequent integration of the results with other
data processed by surrounding control and measurement systems at the coke plant. The
problems of integration of partial technological systems as well as isolated application
the result of which would be the elimination or moderation of negative expressions given
above are described in more details in an article [3].
3. Image Coding
In our approach [6,7], a raster image is coded as a sequence of pixels. Then the coded
image can be understood as a vector of a m-dimensional space, where m denotes the
number of pixels (attributes). Let a symbol A denote a m × n term-document matrix
related to m keywords (pixels) in n documents (images). Let us remind that the (i, j)-element of the term-document matrix A represents the colour of i-th position in the j-th
image document.
4. Implementation of Latent Semantic Indexing
We implemented and tested LSI procedure in the Matlab system by Mathworks. Let the
symbol A denote the m×n document matrix related to m pixels in n images. The pattern
P. Praks et al. / Human Expert Modelling Using Numerical Linear Algebra302
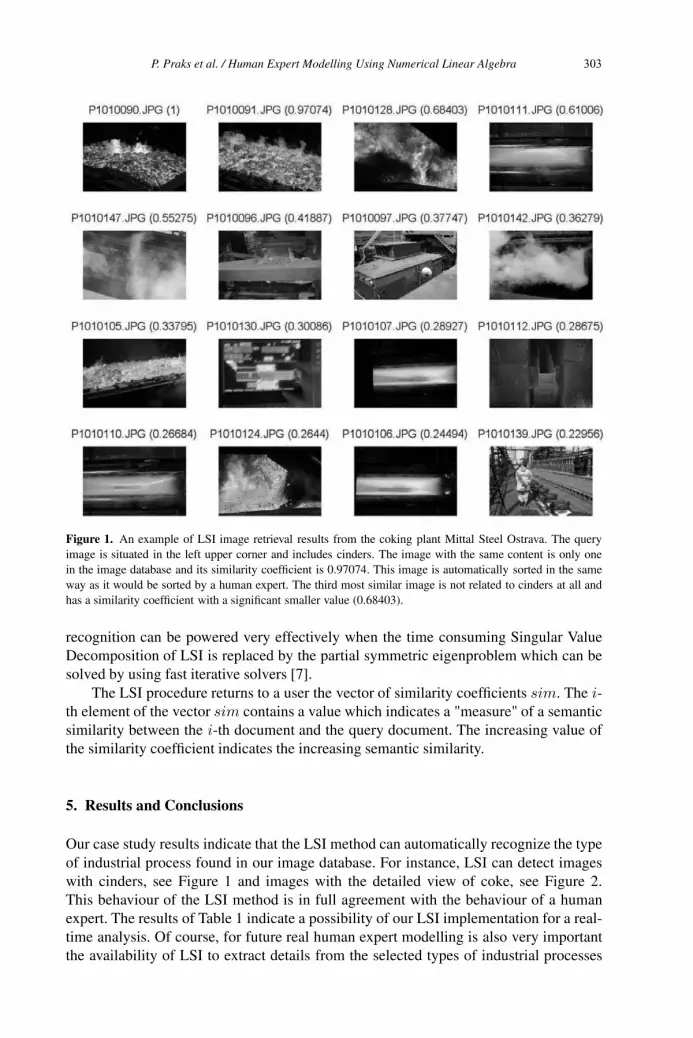
Figure 1. An example of LSI image retrieval results from the coking plant Mittal Steel Ostrava. The query
image is situated in the left upper corner and includes cinders. The image with the same content is only one
in the image database and its similarity coefficient is 0.97074. This image is automatically sorted in the same
way as it would be sorted by a human expert. The third most similar image is not related to cinders at all and
has a similarity coefficient with a significant smaller value (0.68403).
recognition can be powered very effectively when the time consuming Singular Value
Decomposition of LSI is replaced by the partial symmetric eigenproblem which can be
solved by using fast iterative solvers [7].
The LSI procedure returns to a user the vector of similarity coefficients sim. The i-th element of the vector sim contains a value which indicates a "measure" of a semantic
similarity between the i-th document and the query document. The increasing value of
the similarity coefficient indicates the increasing semantic similarity.
5. Results and Conclusions
Our case study results indicate that the LSI method can automatically recognize the type
of industrial process found in our image database. For instance, LSI can detect images
with cinders, see Figure 1 and images with the detailed view of coke, see Figure 2.
This behaviour of the LSI method is in full agreement with the behaviour of a human
expert. The results of Table 1 indicate a possibility of our LSI implementation for a real-
time analysis. Of course, for future real human expert modelling is also very important
the availability of LSI to extract details from the selected types of industrial processes
P. Praks et al. / Human Expert Modelling Using Numerical Linear Algebra 303
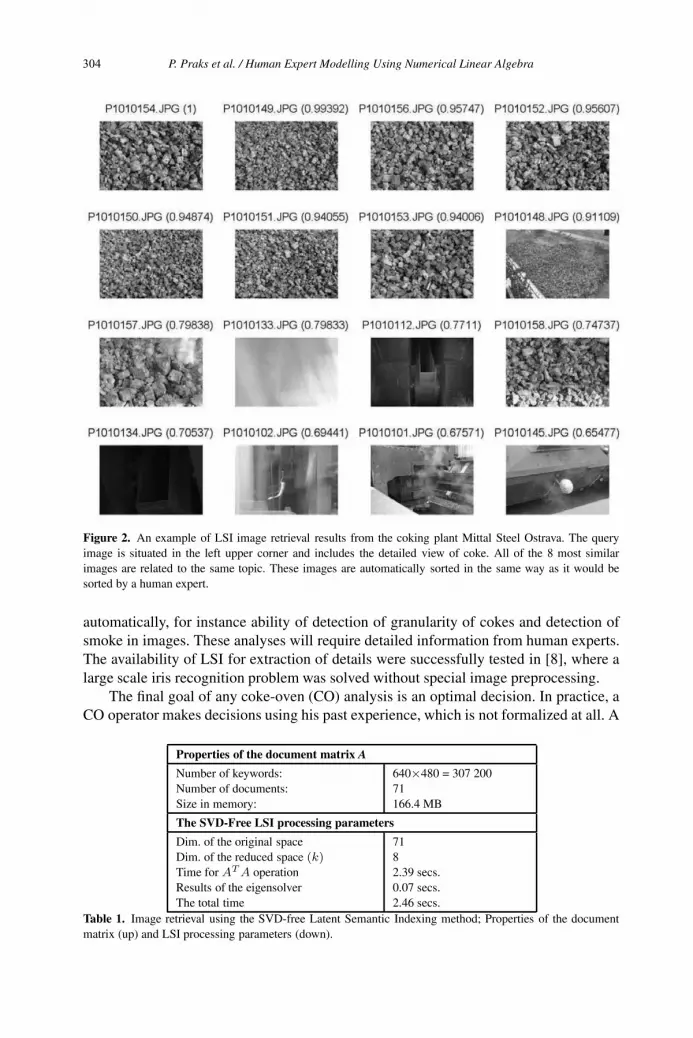
Figure 2. An example of LSI image retrieval results from the coking plant Mittal Steel Ostrava. The query
image is situated in the left upper corner and includes the detailed view of coke. All of the 8 most similar
images are related to the same topic. These images are automatically sorted in the same way as it would be
sorted by a human expert.
automatically, for instance ability of detection of granularity of cokes and detection of
smoke in images. These analyses will require detailed information from human experts.
The availability of LSI for extraction of details were successfully tested in [8], where a
large scale iris recognition problem was solved without special image preprocessing.
The final goal of any coke-oven (CO) analysis is an optimal decision. In practice, a
CO operator makes decisions using his past experience, which is not formalized at all. A
Properties of the document matrix A
Number of keywords:
Number of documents:
Size in memory:
640×480 = 307 200
71
166.4 MB
The SVD-Free LSI processing parameters
Dim. of the original space
Dim. of the reduced space (k)
Time for AT A operation
Results of the eigensolver
The total time
71
8
2.39 secs.
0.07 secs.
2.46 secs.
Table 1. Image retrieval using the SVD-free Latent Semantic Indexing method; Properties of the document
matrix (up) and LSI processing parameters (down).
P. Praks et al. / Human Expert Modelling Using Numerical Linear Algebra304
flexible coexistence of a human being reasoning power, computer memory and arithmetic
operation velocity is an effective artificial intelligence solution. The best expression of
expert knowledge is done by using a natural language. It is of main importance that the
vagueness represents the vague phenomenon of natural language and reflects the non-
specifity and ill definition of complex CO system structures and parameters very well.
This paper can be considered as a complement of [1].
Acknowledgements
The research has been partially supported by a program "Information Society" of the
Academy of Sciences of the Czech Republic, project No. 1ET401940412 and also by
project 1M0567 of the Ministry of Education, Youth and Sports of Czech Republic. The
work leading to this contribution has been also partially supported by the European Com-
mission under contract FP6-027026-K-SPACE.
References
[1] R. Briš, P. Praks. Simulation Approach for Modeling of Dynamic Reliability using Time De-
pendent Acyclic Graph. Special Issue of the International Journal of Polish Academy of Sci-
ences "Maintenance and Reliability" Nr 2(30)/2006. Warsaw. Ed. I. B. Frenkel, A. Lisnianski,
pg. 26-28. ISSN 1507-2711, http://darmaz.pollub.pl/ein/fultext/30.pdf(as of March 13th, 2006).
[2] W. M. Berry, Z. Drmac, and J. R. Jessup. Matrices, vector spaces, and information retrieval.
SIAM Review, 41(2):336–362, 1999.
[3] J. Cernohorský, J. Soukal, J. Štefaník. The information and control systems at the NH coking
plant and their integration. In: Proceedings of 29th. International cokemaking conference,
Malenovice, Ceská koksárenská spolecnost se sídlem v Ostrave, November 2002, pg. 150-
161, ISBN 80-2478-0116-2 (in Czech)
[4] D. Grossman and O. Frieder. Information retrieval: Algorithms and heuristics. Kluwer Aca-
demic Publishers, Second edition, 2000.
[5] N. Muller, L. Magaia, B.M. Herbst. Singular Value Decomposition, Eigenfaces, and 3D
Reconstructions. SIAM Review, 46(3):518–545, 2004.
[6] P. Praks, J. Dvorský, and V. Snášel. Latent semantic indexing for image retrieval systems. In
SIAM Conference on Applied Linear Algebra. The College of William and Mary, Williams-
burg, USA, July 2003, http://www.siam.org/meetings/la03/proceedings/Dvorsky.pdf (as of March 13th, 2006).
[7] P. Praks, J. Dvorský, V. Snášel, and J. Cernohorský. On svd-free latent semantic indexing
for image retrieval for application in a hard industrial environment. In IEEE International
Conference on Industrial Technology - ICIT 2003, 466–471. IEEE Press, Maribor, Slovenia,
December 2003.
[8] P. Praks, L. Machala, V. Snášel. On SVD-free Latent Semantic Indexing for iris recognition of
large databases. In V. A. Petrushin and L. Khan (Eds.) Multimedia Data mining and Knowl-
edge Discovery (Part V, Chapter 24). Springer Verlag 2006. In print.
[9] P. Praus, P. Praks. Information retrieval in hydrochemical data using the latent semantic in-
dexing approach. Journal of Hydroinformatics. IWA Publishing 2007, London, UK, ISSN
1464-7141. In print.
P. Praks et al. / Human Expert Modelling Using Numerical Linear Algebra 305
Computer Aided Support for Content Management Development
Antti LEHTINEN and Airi SALMINEN Department of Computer Science and Information Systems, University of Jyväskylä,
Finland
Abstract. Content management development searches for improvements in the utilization of information and communication technology in the management of various information resources, and for more systematic ways for the management. The goal of the development may be, for example, integration of different software systems, improvements in information retrieval or archival, building new kinds of services for people working in the development domain, or all these together. The paper discusses the differences in the content management and information systems development and the information modelling needs in content management development. The paper introduces a computer aided modelling tool built over a metaCASE tool for content management development. The tool has been used to analyze and describe content management in the Finnish legislative work. The paper reports experiences of using the tool.
Introduction
Content management in organizations concerns the production, use, maintenance, storage, and disposition of digital information resources important in business processes. The resources include, for example, documents in different formats, their components, and metadata related to documents. Together with the content items produced and used, content management concerns the business processes, organizations involved, roles of people in the processes, and systems used in the processes. Content management development searches for improvements in the utilization of information and communication technology in content management, and for more systematic ways for the management.
Contemporary development needs often concern interorganizational processes where a considerable number of organizations, people, and information systems are involved. Such processes are, for example, paper machine or air plane manufacturing processes, or on the public sector, legislative processes. In order to give a proposition of development activities needed in a manifold domain, the domain has to be analyzed and described systematically. Information models are an important means to describe complex domains. The number of models and their relationships then easily reaches the level where effective computer aided support is extremely important.
In information systems development computer aided support has long traditions and the tools built for the purpose are called CASE (Computer Aided Software/Systems Engineering) tools. The CASE technology has been later extended to metaCASE technology to facilitate building CASE tools with a single metaCASE tool [3]. Recently, much activity has centred on an approach named Domain-Specific Modelling which utilizes advanced metaCASE environments.
This paper will introduce a computer aided modelling tool built over a metaCASE tool for content management development. The tool was built to support the RASKE content management analysis methods (e.g. [5, 6, 7]). The development of the methods has been going on since 1994, primarily in collaborative projects where researchers of the University of Jyväskylä have participated in the content management development efforts of the Finnish Parliament and ministries.
M. Duží et al. (Eds.)Information Modelling and Knowledge Bases XVIII
IOS Press, 2007© 2007 The authors and IOS Press. All rights reserved.
306
1. Content Management Development vs. Information Systems Development
Systematic management of recorded content items having importance in the processes of organizations has been called by different names, depending on the type and purpose of items. The term records management is used when the recorded information items have evidential nature in business activities, the term document management has a wider meaning but it may be used to the management of records as well. The term contentmanagement has nowadays widely replaced the previous terms and includes management of various types (textual, visual, audio, multimedia) of content items [8].
Content management development in organizations differs from information systems development such that the focus is not in the development of a particular software system but in the development of solutions where recorded content units could be effectively used to support activities in business processes and communication between different kinds of actors and different kind of systems in the environment. The analysis phase has many special features:
Durability. The analysis process may be very long and may take several years. Analysis target. The analysis concerns content items, tools used to create, store,
manipulate, and delete the items, services provided, business processes, and work of people in the processes alike. The closest analysis concerns the content.
Participants. The knowledge acquisition and communication in the analysis is a challenging task since there is a need to acquire knowledge from very different kinds of experts and facilitate communication among the experts.
Connection to web standardization. In the contemporary networked environments Internet technology is an important means for content management. Content items are used and distributed over different networks: Internet, extranets, and intranets. Open, application independent standard formats for information resources are important facilitators of communication over the web.
Role of metadata. In content management environments the role of metadata content facilitating the management of some primary content is important; there is a need for metadata describing the structure and semantics of content as well as for metadata describing the context where the content is created and used.
These special features set special needs also to the information models used in the content management analysis, and have motivated in the RASKE research group the development of concepts, models, and methods especially intended for content management analysis. The development started in 1994, the same year as the development of UML started, and has been going on in different projects since. Some of the origins of the RASKE methods are the same as in UML, particularly E-R modelling and life-cycle modelling. Therefore some of the RASKE models can be described by some forms of UML models. Our goal however has been to limit the modelling concepts to support descriptive modelling with a few essential concepts. The models should be so simple that they would be useful to support communication and brainstorming among analysts, domain experts, and technical experts, and clear documentation of results. For focusing the analysis on the management of information resources, the central concepts and modelling methods of Information Control Nets (ICN; [1]) seemed to be particularly suitable as a starting point. Information control nets are essentially describing relationships between two kinds of entities: resources and activities. The relationships between activities are control flow relationships and the relationships participated by resources are information flow relationships.
A. Lehtinen and A. Salminen / Computer Aided Support 307
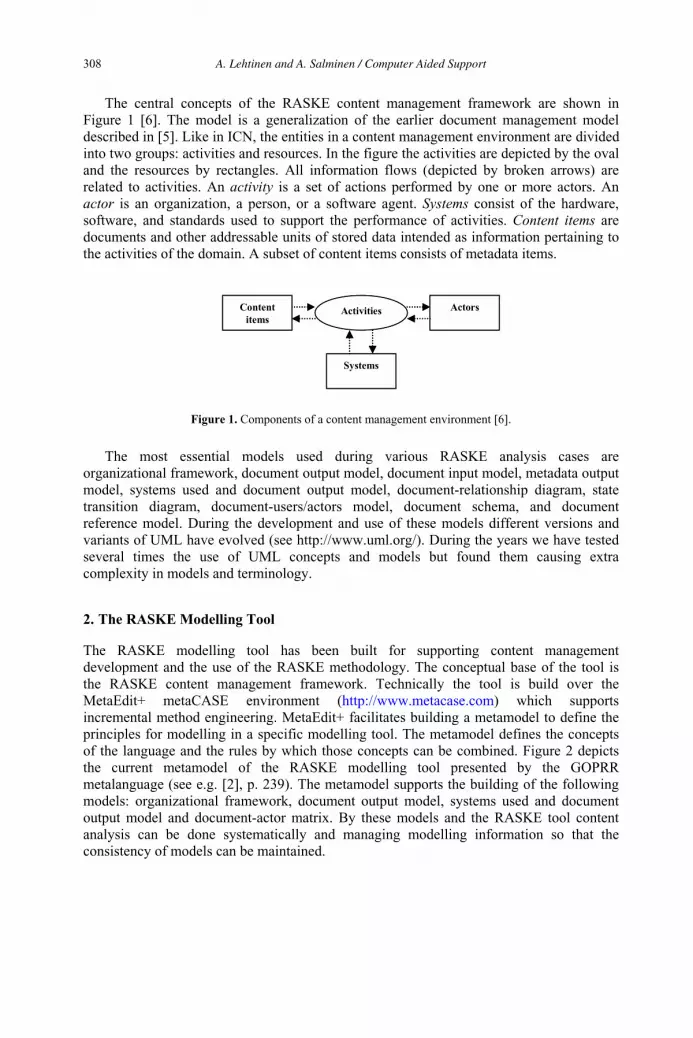
The central concepts of the RASKE content management framework are shown in Figure 1 [6]. The model is a generalization of the earlier document management model described in [5]. Like in ICN, the entities in a content management environment are divided into two groups: activities and resources. In the figure the activities are depicted by the oval and the resources by rectangles. All information flows (depicted by broken arrows) are related to activities. An activity is a set of actions performed by one or more actors. An actor is an organization, a person, or a software agent. Systems consist of the hardware, software, and standards used to support the performance of activities. Content items are documents and other addressable units of stored data intended as information pertaining to the activities of the domain. A subset of content items consists of metadata items.
Contentitems
Actors
Systems
ActivitiesContentitems
Actors
Systems
Activities
Figure 1. Components of a content management environment [6].
The most essential models used during various RASKE analysis cases are organizational framework, document output model, document input model, metadata output model, systems used and document output model, document-relationship diagram, state transition diagram, document-users/actors model, document schema, and document reference model. During the development and use of these models different versions and variants of UML have evolved (see http://www.uml.org/). During the years we have tested several times the use of UML concepts and models but found them causing extra complexity in models and terminology.
2. The RASKE Modelling Tool
The RASKE modelling tool has been built for supporting content management development and the use of the RASKE methodology. The conceptual base of the tool is the RASKE content management framework. Technically the tool is build over the MetaEdit+ metaCASE environment (http://www.metacase.com) which supports incremental method engineering. MetaEdit+ facilitates building a metamodel to define the principles for modelling in a specific modelling tool. The metamodel defines the concepts of the language and the rules by which those concepts can be combined. Figure 2 depicts the current metamodel of the RASKE modelling tool presented by the GOPRR metalanguage (see e.g. [2], p. 239). The metamodel supports the building of the following models: organizational framework, document output model, systems used and document output model and document-actor matrix. By these models and the RASKE tool content analysis can be done systematically and managing modelling information so that the consistency of models can be maintained.
A. Lehtinen and A. Salminen / Computer Aided Support308
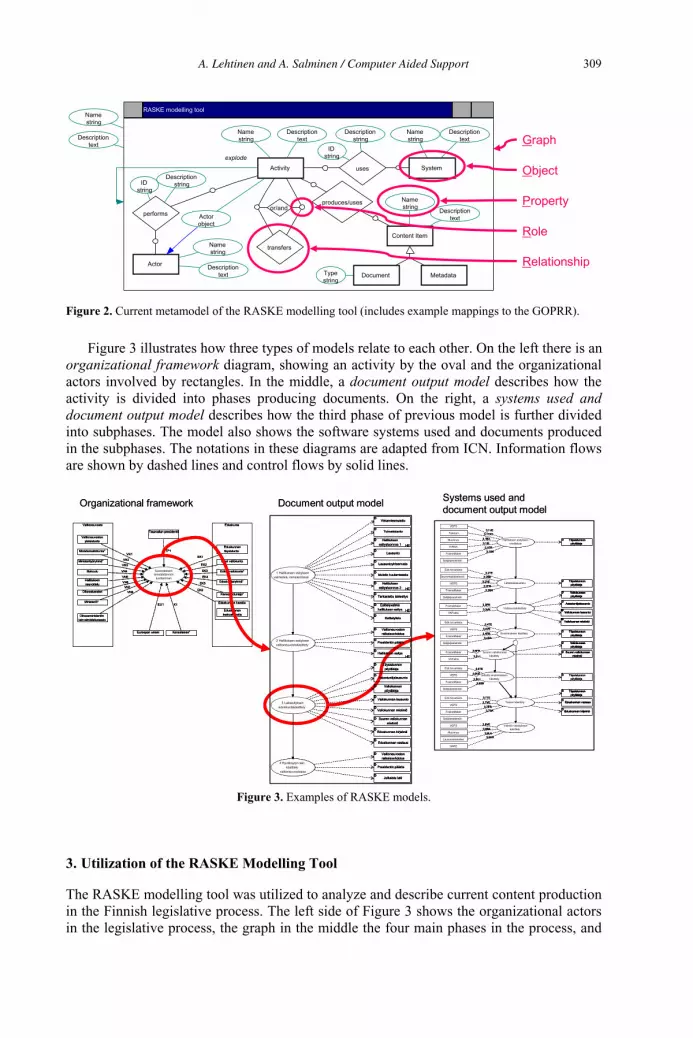
Document Metadata
Activity Systemuses
Namestring
Descriptiontext
Actor
Namestring
Namestring
Descriptiontext
Descriptiontext
transfers
Descriptionstring
produces/uses
Content Item
Namestring
Descriptiontext
performs Actorobject
RASKE modelling tool
or/and
IDstring
IDstring
Descriptionstring
Typestring
Namestring
Descriptiontext
explode
Graph
Object
Property
Role
Relationship
Figure 2. Current metamodel of the RASKE modelling tool (includes example mappings to the GOPRR).
Figure 3 illustrates how three types of models relate to each other. On the left there is an organizational framework diagram, showing an activity by the oval and the organizational actors involved by rectangles. In the middle, a document output model describes how the activity is divided into phases producing documents. On the right, a systems used and document output model describes how the third phase of previous model is further divided into subphases. The model also shows the software systems used and documents produced in the subphases. The notations in these diagrams are adapted from ICN. Information flows are shown by dashed lines and control flows by solid lines.
Oikeusministeriön
lainvalmisteluosasto
Tasavallan presidentti
Ministeriö*
Euroopan unioni
Eduskunta
Oikeuskansleri
Eduskuntaryhmä*
Kansanedustaja*
Suuri valiokunta
Erikoisvaliokunta*
Eduskunnan kanslia
Ministerivaliokunta*
Valtioneuvoston
yleisistunto
Eduskunnan
täysistunto
Eduskunnan
keskuskanslia
Ministerityöryhmä*
Iltakoulu
Hallituksen
neuvottelu
Kansalainen*
TP1
VN7
EU1
EK4
EK5
EK2
EK3
EK6VN8
VN6
VN2
VN1EK1
VN3
VN4
VN5
K1
Suomalaisen
lainsäädännön
tuottaminen
Organizational framework Document output model Systems used and document output model
Valiokuntakäsittely
Valiokunnan lausuntoD
Valiokunnan mietintöD
Lähetekeskustelu
Ensimmäinen käsittely
Toinen käsittely Eduskunnan vastausD
Suuren valiokunnan
käsittely
Suuren valiokunnan
mietintö
D
Eduskunnan kirjelmäD
Muunnos
EIRAK
Hallituksen esityksen
vireilletulo
Teksturi
Edk txt-arkisto
VKFakta
VEPS
FrameMaker
FrameMaker
FrameMaker
Muunnos
Valmiin vastauksen
käsittely
Seurantajärjestemä
VEPS
VEPS
VEPS
VEPS
Lausumarekisteri
Edk txt-arkisto
Edk txt-arkisto
AsiantuntijalausuntoD
Täysistunnon
pöytäkirja
D
Valiokunnan
pöytäkirja
D
Täysistunnon
pöytäkirja
D
Täysistunnon
pöytäkirja
D
Täysistunnon
pöytäkirja
D
Valiokunnan
pöytäkirja
D
HARE
FrameMaker
Salijärjestelmät
FrameMaker
Salijärjestelmät
FrameMaker
Salijärjestelmät
Salijärjestelmät
VKFakta
Jatkettu ensimmäinen
käsittely
Täysistunnon
pöytäkirja
DVEPS
Edk txt-arkisto
FrameMaker
Salijärjestelmät
3.1BA
3.1EI
3.1TXT
3.3VK
3.1VE
3.7FR
3.3FR
3.5FR
3.8BA
3.2SE
3.2VE
3.4VE
3.7VE
3.8VE
3.8LA
3.2TE
3.4TE
3.7TE
3.8HA
3.1FR
3.1SA
3.2FR
3.2SA
3.4FR
3.4SA
3.7SA
3.5VK
3.6TE
3.6VE
3.6FR
3.6SA
Valiokuntakäsittely
Valiokunnan lausuntoD
Valiokunnan mietintöD
Lähetekeskustelu
Ensimmäinen käsittely
Toinen käsittely Eduskunnan vastausD
Suuren valiokunnan
käsittely
Suuren valiokunnan
mietintö
D
Eduskunnan kirjelmäD
Muunnos
EIRAK
Hallituksen esityksen
vireilletulo
Teksturi
Edk txt-arkisto
VKFakta
VEPS
FrameMaker
FrameMaker
FrameMaker
Muunnos
Valmiin vastauksen
käsittely
Seurantajärjestemä
VEPS
VEPS
VEPS
VEPS
Lausumarekisteri
Edk txt-arkisto
Edk txt-arkisto
AsiantuntijalausuntoD
Täysistunnon
pöytäkirja
D
Valiokunnan
pöytäkirja
D
Täysistunnon
pöytäkirja
D
Täysistunnon
pöytäkirja
D
Täysistunnon
pöytäkirja
D
Valiokunnan
pöytäkirja
D
HARE
FrameMaker
Salijärjestelmät
FrameMaker
Salijärjestelmät
FrameMaker
Salijärjestelmät
Salijärjestelmät
VKFakta
Jatkettu ensimmäinen
käsittely
Täysistunnon
pöytäkirja
DVEPS
Edk txt-arkisto
FrameMaker
Salijärjestelmät
3.1BA
3.1EI
3.1TXT
3.3VK
3.1VE
3.7FR
3.3FR
3.5FR
3.8BA
3.2SE
3.2VE
3.4VE
3.7VE
3.8VE
3.8LA
3.2TE
3.4TE
3.7TE
3.8HA
3.1FR
3.1SA
3.2FR
3.2SA
3.4FR
3.4SA
3.7SA
3.5VK
3.6TE
3.6VE
3.6FR
3.6SA
1 Hallituksen esityksen
valmistelu ministeriöissä
2 Hallituksen esityksen
valtioneuvostokäsittely
3 Lakiesityksen
eduskuntakäsittely
4 Hyväksytyn lain
käsittely
valtioneuvostossa
Eduskunnan vastausD
Hallituksen esitysD
HE
Hallituksen
esitysluonnos 1
D
HE
LausuntoyhteenvetoD
Hallituksen
esitysluonnos 2
D
HE
VirkamiesmuistioD
EsittelylistaD
Julkaistu lakiD
Muistio kuulemisestaD
Eduskunnan kirjelmäD
Suuren valiokunnan
mietintö
D
Valiokunnan lausuntoD
Valiokunnan mietintöD
Valtioneuvoston
ratkaisuehdotus
D
Presidentin päätösD
Tarkastettu lakiesitysD
Esittelyvalmis
hallituksen esitys
D
HE
Täysistunnon
pöytäkirja
D
AsiantuntijalausuntoD
Valiokunnan
pöytäkirja
D
LausuntoD
ToimeksiantoD
Valtioneuvoston
ratkaisuehdotus
D
Presidentin päätösD
Oikeusministeriön
lainvalmisteluosasto
Tasavallan presidentti
Ministeriö*
Euroopan unioni
Eduskunta
Oikeuskansleri
Eduskuntaryhmä*
Kansanedustaja*
Suuri valiokunta
Erikoisvaliokunta*
Eduskunnan kanslia
Ministerivaliokunta*
Valtioneuvoston
yleisistunto
Eduskunnan
täysistunto
Eduskunnan
keskuskanslia
Ministerityöryhmä*
Iltakoulu
Hallituksen
neuvottelu
Kansalainen*
TP1
VN7
EU1
EK4
EK5
EK2
EK3
EK6VN8
VN6
VN2
VN1EK1
VN3
VN4
VN5
K1
Suomalaisen
lainsäädännön
tuottaminen
Organizational framework Document output model Systems used and document output model
Valiokuntakäsittely
Valiokunnan lausuntoD
Valiokunnan mietintöD
Lähetekeskustelu
Ensimmäinen käsittely
Toinen käsittely Eduskunnan vastausD
Suuren valiokunnan
käsittely
Suuren valiokunnan
mietintö
D
Eduskunnan kirjelmäD
Muunnos
EIRAK
Hallituksen esityksen
vireilletulo
Teksturi
Edk txt-arkisto
VKFakta
VEPS
FrameMaker
FrameMaker
FrameMaker
Muunnos
Valmiin vastauksen
käsittely
Seurantajärjestemä
VEPS
VEPS
VEPS
VEPS
Lausumarekisteri
Edk txt-arkisto
Edk txt-arkisto
AsiantuntijalausuntoD
Täysistunnon
pöytäkirja
D
Valiokunnan
pöytäkirja
D
Täysistunnon
pöytäkirja
D
Täysistunnon
pöytäkirja
D
Täysistunnon
pöytäkirja
D
Valiokunnan
pöytäkirja
D
HARE
FrameMaker
Salijärjestelmät
FrameMaker
Salijärjestelmät
FrameMaker
Salijärjestelmät
Salijärjestelmät
VKFakta
Jatkettu ensimmäinen
käsittely
Täysistunnon
pöytäkirja
DVEPS
Edk txt-arkisto
FrameMaker
Salijärjestelmät
3.1BA
3.1EI
3.1TXT
3.3VK
3.1VE
3.7FR
3.3FR
3.5FR
3.8BA
3.2SE
3.2VE
3.4VE
3.7VE
3.8VE
3.8LA
3.2TE
3.4TE
3.7TE
3.8HA
3.1FR
3.1SA
3.2FR
3.2SA
3.4FR
3.4SA
3.7SA
3.5VK
3.6TE
3.6VE
3.6FR
3.6SA
Valiokuntakäsittely
Valiokunnan lausuntoD
Valiokunnan mietintöD
Lähetekeskustelu
Ensimmäinen käsittely
Toinen käsittely Eduskunnan vastausD
Suuren valiokunnan
käsittely
Suuren valiokunnan
mietintö
D
Eduskunnan kirjelmäD
Muunnos
EIRAK
Hallituksen esityksen
vireilletulo
Teksturi
Edk txt-arkisto
VKFakta
VEPS
FrameMaker
FrameMaker
FrameMaker
Muunnos
Valmiin vastauksen
käsittely
Seurantajärjestemä
VEPS
VEPS
VEPS
VEPS
Lausumarekisteri
Edk txt-arkisto
Edk txt-arkisto
AsiantuntijalausuntoD
Täysistunnon
pöytäkirja
D
Valiokunnan
pöytäkirja
D
Täysistunnon
pöytäkirja
D
Täysistunnon
pöytäkirja
D
Täysistunnon
pöytäkirja
D
Valiokunnan
pöytäkirja
D
HARE
FrameMaker
Salijärjestelmät
FrameMaker
Salijärjestelmät
FrameMaker
Salijärjestelmät
Valiokuntakäsittely
Valiokunnan lausuntoD
Valiokunnan mietintöD
Lähetekeskustelu
Ensimmäinen käsittely
Toinen käsittely Eduskunnan vastausD
Suuren valiokunnan
käsittely
Suuren valiokunnan
mietintö
D
Eduskunnan kirjelmäD
Muunnos
EIRAK
Hallituksen esityksen
vireilletulo
Teksturi
Edk txt-arkisto
VKFakta
VEPS
FrameMaker
FrameMaker
FrameMaker
Muunnos
Valmiin vastauksen
käsittely
Seurantajärjestemä
VEPS
VEPS
VEPS
VEPS
Lausumarekisteri
Edk txt-arkisto
Edk txt-arkisto
AsiantuntijalausuntoD
Täysistunnon
pöytäkirja
D
Valiokunnan
pöytäkirja
D
Täysistunnon
pöytäkirja
D
Täysistunnon
pöytäkirja
D
Täysistunnon
pöytäkirja
D
Valiokunnan
pöytäkirja
D
HARE
FrameMaker
Salijärjestelmät
FrameMaker
Salijärjestelmät
FrameMaker
Salijärjestelmät
Salijärjestelmät
VKFakta
Jatkettu ensimmäinen
käsittely
Täysistunnon
pöytäkirja
DVEPS
Edk txt-arkisto
FrameMaker
Salijärjestelmät
3.1BA
3.1EI
3.1TXT
3.3VK
3.1VE
3.7FR
3.3FR
3.5FR
3.8BA
3.2SE
3.2VE
3.4VE
3.7VE
3.8VE
3.8LA
3.2TE
3.4TE
3.7TE
3.8HA
3.1FR
3.1SA
3.2FR
3.2SA
3.4FR
3.4SA
3.7SA
3.5VK
3.6TE
3.6VE
3.6FR
3.6SA
1 Hallituksen esityksen
valmistelu ministeriöissä
2 Hallituksen esityksen
valtioneuvostokäsittely
3 Lakiesityksen
eduskuntakäsittely
4 Hyväksytyn lain
käsittely
valtioneuvostossa
Eduskunnan vastausD
Hallituksen esitysD
HE
Hallituksen
esitysluonnos 1
D
HE
LausuntoyhteenvetoD
Hallituksen
esitysluonnos 2
D
HE
VirkamiesmuistioD
EsittelylistaD
Julkaistu lakiD
Muistio kuulemisestaD
Eduskunnan kirjelmäD
Suuren valiokunnan
mietintö
D
Valiokunnan lausuntoD
Valiokunnan mietintöD
Valtioneuvoston
ratkaisuehdotus
D
Presidentin päätösD
Tarkastettu lakiesitysD
Esittelyvalmis
hallituksen esitys
D
HE
Täysistunnon
pöytäkirja
D
AsiantuntijalausuntoD
Valiokunnan
pöytäkirja
D
LausuntoD
ToimeksiantoD
Valtioneuvoston
ratkaisuehdotus
D
Presidentin päätösD
1 Hallituksen esityksen
valmistelu ministeriöissä
2 Hallituksen esityksen
valtioneuvostokäsittely
3 Lakiesityksen
eduskuntakäsittely
4 Hyväksytyn lain
käsittely
valtioneuvostossa
Eduskunnan vastausD
Hallituksen esitysD
HE
Hallituksen
esitysluonnos 1
D
HE
LausuntoyhteenvetoD
Hallituksen
esitysluonnos 2
D
HE
VirkamiesmuistioD
EsittelylistaD
Julkaistu lakiD
Muistio kuulemisestaD
Eduskunnan kirjelmäD
Suuren valiokunnan
mietintö
D
Valiokunnan lausuntoD
Valiokunnan mietintöD
Valtioneuvoston
ratkaisuehdotus
D
Presidentin päätösD
Tarkastettu lakiesitysD
Esittelyvalmis
hallituksen esitys
D
HE
Täysistunnon
pöytäkirja
D
AsiantuntijalausuntoD
Valiokunnan
pöytäkirja
D
LausuntoD
ToimeksiantoD
Valtioneuvoston
ratkaisuehdotus
D
Presidentin päätösD
Figure 3. Examples of RASKE models.
3. Utilization of the RASKE Modelling Tool
The RASKE modelling tool was utilized to analyze and describe current content production in the Finnish legislative process. The left side of Figure 3 shows the organizational actors in the legislative process, the graph in the middle the four main phases in the process, and
A. Lehtinen and A. Salminen / Computer Aided Support 309
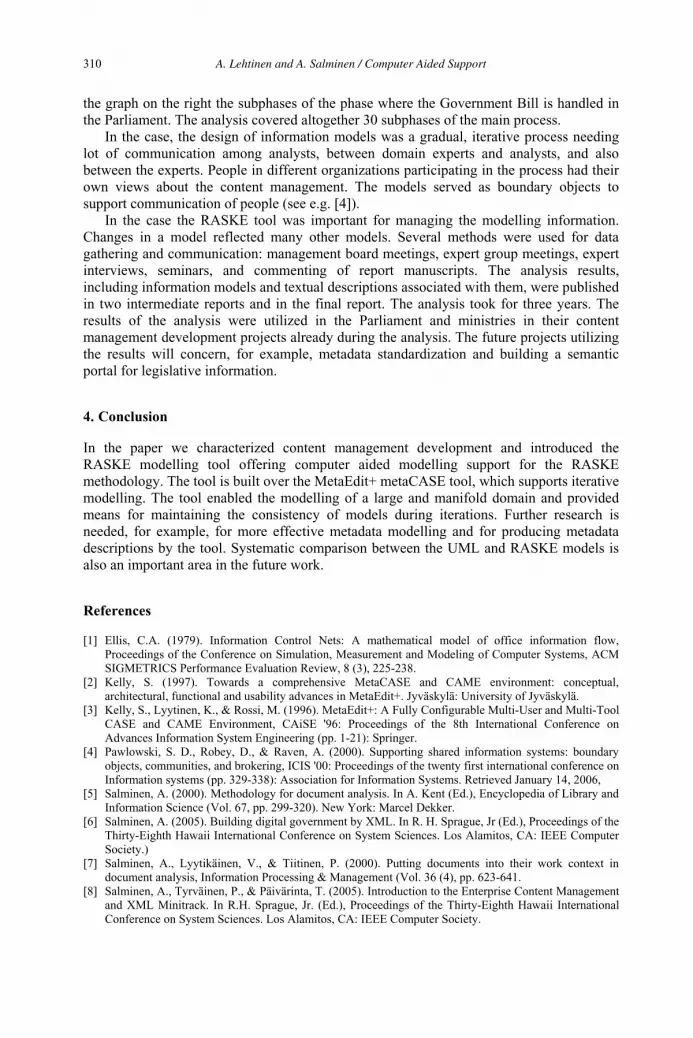
the graph on the right the subphases of the phase where the Government Bill is handled in the Parliament. The analysis covered altogether 30 subphases of the main process.
In the case, the design of information models was a gradual, iterative process needing lot of communication among analysts, between domain experts and analysts, and also between the experts. People in different organizations participating in the process had their own views about the content management. The models served as boundary objects to support communication of people (see e.g. [4]).
In the case the RASKE tool was important for managing the modelling information. Changes in a model reflected many other models. Several methods were used for data gathering and communication: management board meetings, expert group meetings, expert interviews, seminars, and commenting of report manuscripts. The analysis results, including information models and textual descriptions associated with them, were published in two intermediate reports and in the final report. The analysis took for three years. The results of the analysis were utilized in the Parliament and ministries in their content management development projects already during the analysis. The future projects utilizing the results will concern, for example, metadata standardization and building a semantic portal for legislative information.
4. Conclusion
In the paper we characterized content management development and introduced the RASKE modelling tool offering computer aided modelling support for the RASKE methodology. The tool is built over the MetaEdit+ metaCASE tool, which supports iterative modelling. The tool enabled the modelling of a large and manifold domain and provided means for maintaining the consistency of models during iterations. Further research is needed, for example, for more effective metadata modelling and for producing metadata descriptions by the tool. Systematic comparison between the UML and RASKE models is also an important area in the future work.
References
[1] Ellis, C.A. (1979). Information Control Nets: A mathematical model of office information flow, Proceedings of the Conference on Simulation, Measurement and Modeling of Computer Systems, ACM SIGMETRICS Performance Evaluation Review, 8 (3), 225-238.
[2] Kelly, S. (1997). Towards a comprehensive MetaCASE and CAME environment: conceptual, architectural, functional and usability advances in MetaEdit+. Jyväskylä: University of Jyväskylä.
[3] Kelly, S., Lyytinen, K., & Rossi, M. (1996). MetaEdit+: A Fully Configurable Multi-User and Multi-Tool CASE and CAME Environment, CAiSE '96: Proceedings of the 8th International Conference on Advances Information System Engineering (pp. 1-21): Springer.
[4] Pawlowski, S. D., Robey, D., & Raven, A. (2000). Supporting shared information systems: boundary objects, communities, and brokering, ICIS '00: Proceedings of the twenty first international conference on Information systems (pp. 329-338): Association for Information Systems. Retrieved January 14, 2006,
[5] Salminen, A. (2000). Methodology for document analysis. In A. Kent (Ed.), Encyclopedia of Library and Information Science (Vol. 67, pp. 299-320). New York: Marcel Dekker.
[6] Salminen, A. (2005). Building digital government by XML. In R. H. Sprague, Jr (Ed.), Proceedings of the Thirty-Eighth Hawaii International Conference on System Sciences. Los Alamitos, CA: IEEE Computer Society.)
[7] Salminen, A., Lyytikäinen, V., & Tiitinen, P. (2000). Putting documents into their work context in document analysis, Information Processing & Management (Vol. 36 (4), pp. 623-641.
[8] Salminen, A., Tyrväinen, P., & Päivärinta, T. (2005). Introduction to the Enterprise Content Management and XML Minitrack. In R.H. Sprague, Jr. (Ed.), Proceedings of the Thirty-Eighth Hawaii International Conference on System Sciences. Los Alamitos, CA: IEEE Computer Society.
A. Lehtinen and A. Salminen / Computer Aided Support310
Ontology based Text Annotation – OnTeA Michal Laclavik , Martin Seleng , Emil Gatial , Zoltan Balogh , Ladislav Hluchy
Institute of Informatics, Slovak Academy of Sciences, Dubravska cesta 9, Bratislava, 845 07, Slovakia
Abstract: In this paper we describe a solution for the semi-automatic ontology based text annotation (OnTeA) tool. The tool analyzes a document or text using regular expression patterns and detects equivalent semantics elements according to the defined domain ontology.
1. Introduction
Automated annotation of the Web documents is a key challenge of the Semantic Web effort. Web documents are structured but their structure is understandable only for humans, which is the major problem of the Semantic Web.
Annotation solutions can be divided into manual and semi-automatic methods. This different strategy depends on a use of the annotation. There is number of annotation tools and approaches such as CREAM [6] or Magpie [7] which follow the idea to provide users with useful visual tools for manual annotation, web page navigation, reading semantic tags and browsing [9] or provide infrastructure and protocols for manual stamping documents with semantic tags such as Annotea1, Rubby2 or RDF annotation3.
Semi-automatic solutions focus on creating semantic metadata for further computer processing, using semantic data in knowledge management [8] or in Semantic Organization4 applications (see chapter 4). Semi-automatic approaches are based on natural language processing [2] [3], a document structure analysis [4] or learning requiring training sets or supervision [5]. Moreover, other pattern-based semi-automatic solutions such as PANKOW and C-PANKOW [1] exist, using also Google API for automatic annotation. The algorithm seems to be slow when annotating a large number of documents needed in knowledge management or Semantic Organization applications. There is no evaluation of performance but description of the algorithm with frequent connections to Google API does not seem to be fast enough.
Ontea works on text, in particular domain described by domain ontology and uses regular expression patterns for semi-automatic semantic annotation. In Ontea we try to detect ontology elements within the existing application/domain ontology model. It means that by the Ontea annotation engine we want to achieve the following objectives:
• Detecting Meta data from Text • Preparing improved structured data for later computer processing • Structured data are based on application ontology model
2. Methodology and the Approach
The Ontea tool analyzes a document or text using regular expression patterns and detects equivalent semantics elements according to the defined domain ontology. Several cross application patterns are defined but in order to achieve good results, new patterns need to be defined for each application. In addition, Ontea creates a new ontology individual of a
1 http://www.w3.org/2001/Annotea/ 2 http://www.w3.org/TR/ruby/ 3 http://ilrt.org/discovery/2001/04/annotations/ 4 By “Semantic Organization” we understand applying semantic web ideas & technologies in organizations
a a a a a
a
M. Duží et al. (Eds.)Information Modelling and Knowledge Bases XVIII
IOS Press, 2007© 2007 The authors and IOS Press. All rights reserved.
311
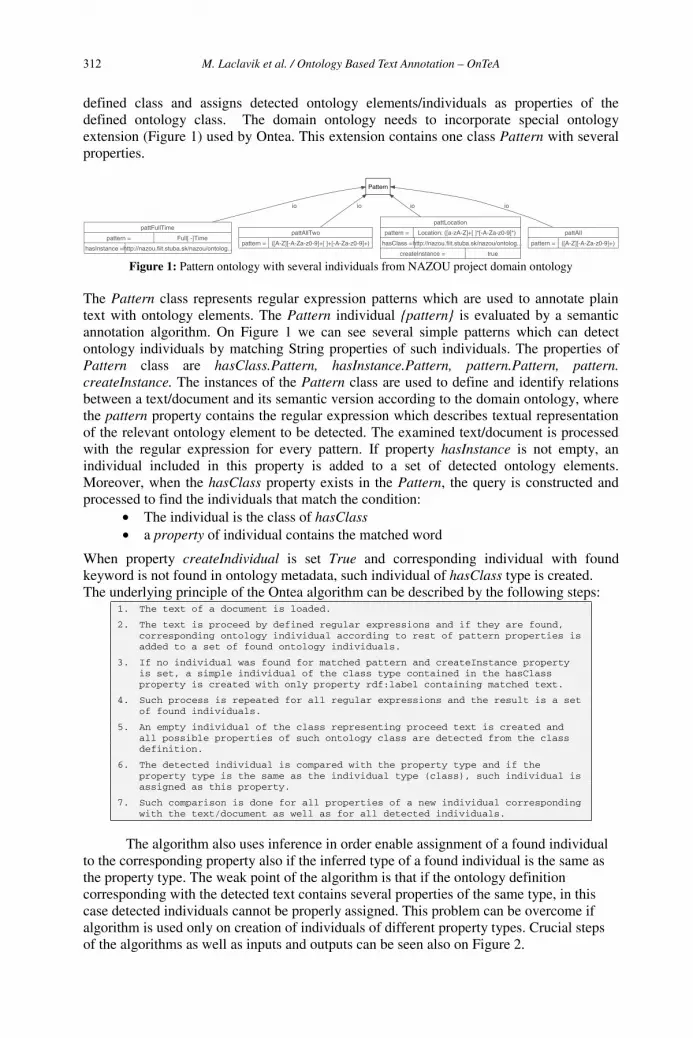
defined class and assigns detected ontology elements/individuals as properties of the defined ontology class. The domain ontology needs to incorporate special ontology extension (Figure 1) used by Ontea. This extension contains one class Pattern with several properties.
pattFullTime
pattern = Full[ -]Time
hasInstance =http://nazou.fiit.stuba.sk/nazou/ontolog...
Pattern
io
pattAllTwo
pattern = ([A-Z][-A-Za-z0-9]+[ ]+[-A-Za-z0-9]+)
io
pattLocation
pattern = Location: ([a-zA-Z]+[ ]*[-A-Za-z0-9]*)
hasClass =http://nazou.fiit.stuba.sk/nazou/ontolog...
createInstance = true
io
pattAll
pattern = ([A-Z][-A-Za-z0-9]+)
io
Figure 1: Pattern ontology with several individuals from NAZOU project domain ontology
The Pattern class represents regular expression patterns which are used to annotate plain text with ontology elements. The Pattern individual {pattern} is evaluated by a semantic annotation algorithm. On Figure 1 we can see several simple patterns which can detect ontology individuals by matching String properties of such individuals. The properties of Pattern class are hasClass.Pattern, hasInstance.Pattern, pattern.Pattern, pattern. createInstance. The instances of the Pattern class are used to define and identify relations between a text/document and its semantic version according to the domain ontology, where the pattern property contains the regular expression which describes textual representation of the relevant ontology element to be detected. The examined text/document is processed with the regular expression for every pattern. If property hasInstance is not empty, an individual included in this property is added to a set of detected ontology elements. Moreover, when the hasClass property exists in the Pattern, the query is constructed and processed to find the individuals that match the condition:
• The individual is the class of hasClass• a property of individual contains the matched word
When property createIndividual is set True and corresponding individual with found keyword is not found in ontology metadata, such individual of hasClass type is created. The underlying principle of the Ontea algorithm can be described by the following steps:
1. The text of a document is loaded.
2. The text is proceed by defined regular expressions and if they are found, corresponding ontology individual according to rest of pattern properties is added to a set of found ontology individuals.
3. If no individual was found for matched pattern and createInstance property is set, a simple individual of the class type contained in the hasClass property is created with only property rdf:label containing matched text.
4. Such process is repeated for all regular expressions and the result is a set of found individuals.
5. An empty individual of the class representing proceed text is created and all possible properties of such ontology class are detected from the class definition.
6. The detected individual is compared with the property type and if the property type is the same as the individual type (class), such individual is assigned as this property.
7. Such comparison is done for all properties of a new individual corresponding with the text/document as well as for all detected individuals.
The algorithm also uses inference in order enable assignment of a found individual to the corresponding property also if the inferred type of a found individual is the same as the property type. The weak point of the algorithm is that if the ontology definition corresponding with the detected text contains several properties of the same type, in this case detected individuals cannot be properly assigned. This problem can be overcome if algorithm is used only on creation of individuals of different property types. Crucial steps of the algorithms as well as inputs and outputs can be seen also on Figure 2.
M. Laclavik et al. / Ontology Based Text Annotation – OnTeA312
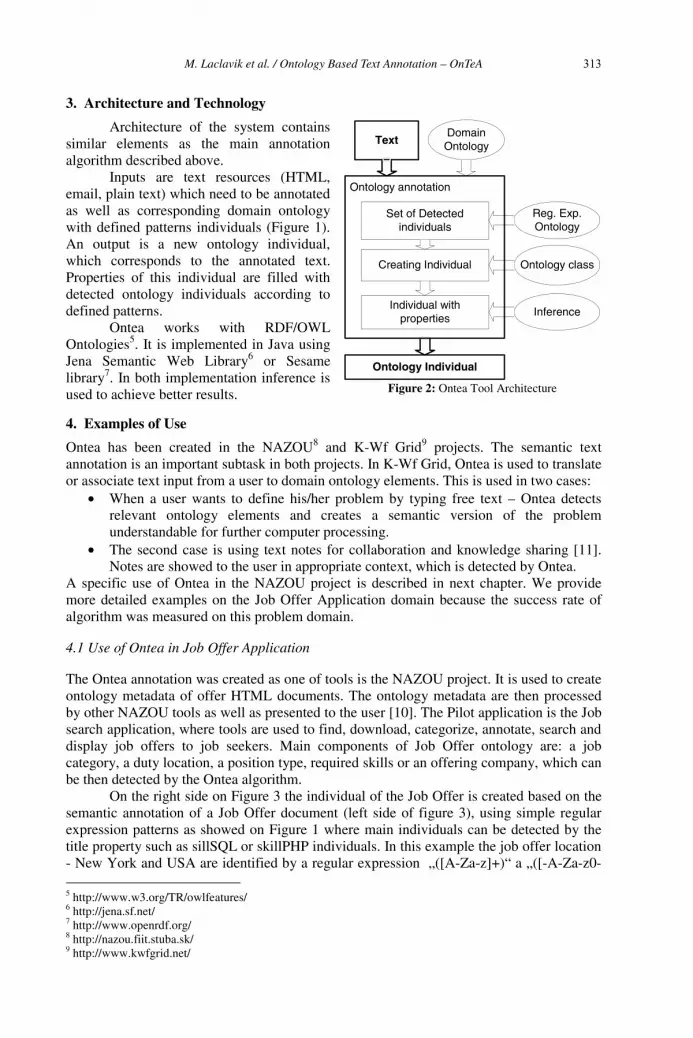
3. Architecture and Technology
Architecture of the system contains similar elements as the main annotation algorithm described above.
Inputs are text resources (HTML, email, plain text) which need to be annotated as well as corresponding domain ontology with defined patterns individuals (Figure 1). An output is a new ontology individual, which corresponds to the annotated text. Properties of this individual are filled with detected ontology individuals according to defined patterns.
Ontea works with RDF/OWL Ontologies5. It is implemented in Java using Jena Semantic Web Library6 or Sesame library7. In both implementation inference is used to achieve better results.
Text
Set of Detected individuals
Creating Individual
Individual with properties
Reg. Exp.Ontology
Ontology class
Inference
DomainOntology
Ontology Individual
Ontology annotation
Figure 2: Ontea Tool Architecture
4. Examples of Use
Ontea has been created in the NAZOU8 and K-Wf Grid9 projects. The semantic text annotation is an important subtask in both projects. In K-Wf Grid, Ontea is used to translate or associate text input from a user to domain ontology elements. This is used in two cases:
• When a user wants to define his/her problem by typing free text – Ontea detects relevant ontology elements and creates a semantic version of the problem understandable for further computer processing.
• The second case is using text notes for collaboration and knowledge sharing [11]. Notes are showed to the user in appropriate context, which is detected by Ontea.
A specific use of Ontea in the NAZOU project is described in next chapter. We provide more detailed examples on the Job Offer Application domain because the success rate of algorithm was measured on this problem domain.
4.1 Use of Ontea in Job Offer Application
The Ontea annotation was created as one of tools is the NAZOU project. It is used to create ontology metadata of offer HTML documents. The ontology metadata are then processed by other NAZOU tools as well as presented to the user [10]. The Pilot application is the Job search application, where tools are used to find, download, categorize, annotate, search and display job offers to job seekers. Main components of Job Offer ontology are: a job category, a duty location, a position type, required skills or an offering company, which can be then detected by the Ontea algorithm. On the right side on Figure 3 the individual of the Job Offer is created based on the semantic annotation of a Job Offer document (left side of figure 3), using simple regular expression patterns as showed on Figure 1 where main individuals can be detected by the title property such as sillSQL or skillPHP individuals. In this example the job offer location - New York and USA are identified by a regular expression „([A-Za-z]+)“ a „([-A-Za-z0-
5 http://www.w3.org/TR/owlfeatures/ 6 http://jena.sf.net/ 7 http://www.openrdf.org/ 8 http://nazou.fiit.stuba.sk/ 9 http://www.kwfgrid.net/
M. Laclavik et al. / Ontology Based Text Annotation – OnTeA 313

9]+ [ ]+[-A-Za-z0-9]+)“, because individual locNY has the property title „New York“, locUS has the property title „USA“.
Location
Town
isa
Country
isa
skillSQL
Skill
io
skillXML
io
skillPHP
io
JobType
jtPermanent
iohasCountry*
locNewYork
io
locUS
io
JobOffer
job_1_html
io
hasRequirements hasRequirements hasType
hasLocation
hasRequirementshasLocation
Figure 3: On left: Web Document; On the right: Job Offer Individual Created by Ontea
Similarly, other ontology elements are detected. Detected ontology individuals are then assigned as properties of job offer, thus ontology instance of job offer is created out of its text representation in the NAZOU pilot application.
5. Success Rate of Ontea Algorithm
In this chapter we discuss the algorithm success rate. As reference test data, we used 500 job offers filled in a defined ontology manually according to 500 html documents representing reference job offers. Ontea processed reference html documents using the reference ontology resulting in new ontology metadata consisting of 500 job offers, which were automatically compared with manually entered job offers ontology metadata. In this test, Ontea used only simple regular expressions matching from 1 to 4 words starting with a capital letter and Ontea did not create extra new property individuals.
Table 1. The comparison of results computed using the Ontea tool with reference data. The count row represents the number of job properties assigned to a job offer in reference data. The Ontea row represents the number of detected properties by the Ontea tool. The match row represents the number of same properties in the reference and Ontea ontology metadata. The precision, recall and F1-measure rows represent the performance of annotation.
Count 4 4 6 6 4 6 6 6 5 ... 6 6 4 4 5 4 Ontea 8 7 8 8 12 8 10 9 9 ... 7 7 6 6 7 6 Match 4 4 6 6 4 6 5 6 3 ... 5 5 3 3 4 4
Precision 0,5 0,57 0,75 0,75 0,33 0,75 0,5 0,67 0,33 … 0,71 0,71 0,5 0,5 0,57 0,67Recall 1 1 1 1 1 1 0,83 1 0,6 … 0,83 0,83 0,75 0,75 0,8 1
F1-measure 0,67 0,73 0,86 0,86 0,5 0,860,62 0,8 0,43 … 0,77 0,77 0,6 0,6 0,67 0,8
To evaluate the performance of annotation, we used the standard recall, precision and F1 measures (Table 1). Recall is defined as the ratio of correct positive predictions made by the system and the total number of positive examples. Precision is defined as the ratio of correct positive predictions made by the system and the total number of positive predictions made by the system:
Match Relevant retrievedRecall
Count All relevant= = ,
Match Relevant retrievedPrecision
Ontea All retrieved= = (1)
Recall and precision measures reflect the different aspects of annotation performance. Usually, if one of the two measures is increasing, the other will decrease. These measures were first used to measure IR (Information retrieval) system by Cleverdon [11]. To obtain a better measure to describe performance, we use the F1 measure (first introduced by van Rijsbergen [12]) which combines precision and recall measures, with equal importance, into a single parameter for optimization. F1 measure is weighted average of the precision and recall measures and is defined as follows:
M. Laclavik et al. / Ontology Based Text Annotation – OnTeA314

1
2* *Precision RecallF
Precision Recall=
+(2)
We computed global estimates of performance using macro-averaging. Then the performance of classification for all 500 job offers is:
0,63683025Precision = , 0,83163Recall = , 1 0,704550462F = (3)
As we can see, the F1 measure is high (over 70%), which means that Ontea tool gives satisfactory results.
6. Conclusions and Future Work
The described solution is used and evaluated in the K-Wf Grid and the NAZOU projects to detect relevant structured knowledge described by a domain specific ontology model in unstructured text. The most similar annotation solution to Ontea is PANKOW [1]. While PANKOW is a more generic solution, we think that Ontea is a simpler, faster (though the performance was not compared) solution with a better success rate, suitable for knowledge management or Semantic Organization applications.
The achieved results are quite satisfactory since the Ontea tool works with an average success over 70%, which is shown in the previous chapter. We believe that Ontea can be successfully used in a text analysis as well as in providing improved services for automatic text annotation, searching, categorizing, knowledge inference or reasoning.
In our future work we will strive to evaluate the algorithm on different application domains where we will be changing the number and quality of regular expression patterns, to find a good balance between precision and recall values.
This work is supported by projects NAZOU SPVV 1025/2004, K-Wf Grid EU RTD IST FP6-511385, RAPORT APVT-51-024604, VEGA No. 2/6103/6.
References
[1] Cimiano P., Ladwig G., Staab S.: Gimme' the context: context-driven automatic semantic annotation with c-pankow. In WWW '05, pages 332-341, NY, USA, 2005. ACM Press. ISBN 1-59593-046-9.
[2] Madche A., Staab S.: Ontology learning for the semantic web. IEEE Intelligent Syst., 16(2):72-79, 2001
[3] Charniak E., Berland M.: Finding parts in very large corpora. In Proceedings of the 37th Annual Meeting of the ACL, pages 57-64, 1999.
[4] Glover E., Tsioutsiouliklis K., Lawrence S., Pennock D., Flake G.: Using web structure for classifying and describing web pages. In Proc. of the 11th WWW Conference, pages 562-569. ACM Press, 2002.
[5] Reeve L., Hyoil Han: Survey of semantic annotation platforms. In SAC '05, pages 1634-1638, NY, USA, 2005. ACM Press. ISBN 1-58113-964-0. doi: http://doi.acm.org/10.1145/1066677.1067049.
[6] Handschuh S., Staab S.: Authoring and annotation of web pages in cream. In WWW '02, pages 462-473, NY, USA, 2002. ACM Press. ISBN 1-58113-449-5. doi: http://doi.acm.org/10.1145/511446.511506.
[7] Domingue J., Dzbor M.: Magpie: supporting browsing and navigation on the semantic web. In IUI '04, pages 191-197, New York, NY, USA, 2004. ACM Press. ISBN 1-58113-815-6.
[8] Uren V. et al.: Semantic annotation for knowledge management: Requirements and a survey of the state of the art. Journal of Web Semantics: Science, Services and Agents on the WWW, 4(1):14-28, 2005.
[9] Uren V. et al.: Browsing for information by highlighting automatically generated annotations: a user study and evaluation. In K-CAP '05, pages 75-82, NY, USA, 2005b. ACM Press. ISBN 1-59593-163-5
[10] Návrat P., Bieliková M., Rozinajová V.: Methods and Tools for Acquiring and Presenting Information and Knowledge in the Web. In: CompSysTech 2005, Varna, Bulgaria, June 2005. – pp. IIIB.7.1-IIIB.7.6.
[11] Laclavik M. et al.: Experience Management Based on Text Notes (EMBET); Innovation and the Knowledge Economy; IOS Press, pp.261-268. ISSN 1574-1230, ISBN 1-58603-563-0.
[12] Cleverdon, C. W.; Mills, J. & Keen, E. M. (1966). Factors determining the performance of indexing systems. Vol. 1-2. Cranfield, U.K.: College of Aeronautics.
[13] C. J. Van Rijsbergen, Information Retrieval, Butterworth-Heinemann, Newton, MA, 1979
M. Laclavik et al. / Ontology Based Text Annotation – OnTeA 315
An Implementation Method for Semantic Document Searchwith Dynamic Relevance Routing by Hierarchical and Causal
Relationships for Psychiatry
Yukiko Sone† Naofumi Yoshida† Yasushi Kiyoki††
†Graduate School of Media and Governance, Keio University††Faculty of Environmental Information, Keio University
5322 Endoh, Fujisawa, Kanagawa 252-8520, Japan{yukky,naofumi,kiyoki}@sfc.keio.ac.jp
Abstract. In this paper, we present an implementation method for semantic documentsearch with dynamic relevance routing by hierarchical and causal relationships amongconcepts. This method makes it possible for searchers to obtain semantically relateddocuments with various relationships of concepts, and by combining these severalsearches dependent on a searcher, this method realizes to obtain/discover semanticallyrelated information. We define the relevance routing as the combination of searches.The relevance routing is dynamically generated according to the searcher’s objective.Our method makes it possible to retrieve documents semantically related to the rele-vance routing. We apply our method to the psychiatric field, and clarify the feasibilityof our method.
1 Introduction
In modern society, mental illness is an universal matter. It is important for specialists who areengaged in diagnosing and treatments of a psychiatric patient (such as psychiatrists, clinicalpsychotherapists etc) and non-specialists (such as psychiatric patients, people related to thepatient etc) to gain appropriate information in the process of diagnosing, treatments or evenin everyday life.
The psychiatric field is a medical field where many complex relationships of conceptssuch as hierarchical (abstract and concrete concepts), causal (cause and effect) or aggregaterelationships exist. We have opportunities to obtain a large amount of document data on psy-chiatry exisiting in databases, however, it is difficult to acquire document data that meet thesearcher’s objectives because those document data include many relationships of concepts.
It is important to reflect such relationships of concepts to retrieve documents in the spe-cific field. Also, it is efficient for searchers to discover documents by combining searchesreflecting relationships of concepts.
In this paper, we aim to realize a search method to enable specialists and non-specialiststo obtain reliable and appropriate information in the psychiatric field, and we present animplementation method for semantic document search with dynamic relevance routing byhierarchical and causal relationships.
In the research area of databases and knowledge bases, it is already testified that searchmethods with vector space are effective for document search. The semantic associative searchmethod [1, 2] which computes semantic correlations with dynamic contexts among data,and the search method with the computation of causal relationships [3, 4] among data arealso available. We expand those existing methods, by realizing the computation of semanticcorrelations between concepts (hierarchical and aggregate relationships etc).
By our method, searchers are able to obtain documents semantically related to variousrelationships of concepts, and by combining these several searches dependent on a searcher,this method realizes to obtain/discover semantically related information.
M. Duží et al. (Eds.)Information Modelling and Knowledge Bases XVIII
IOS Press, 2007© 2007 The authors and IOS Press. All rights reserved.
316
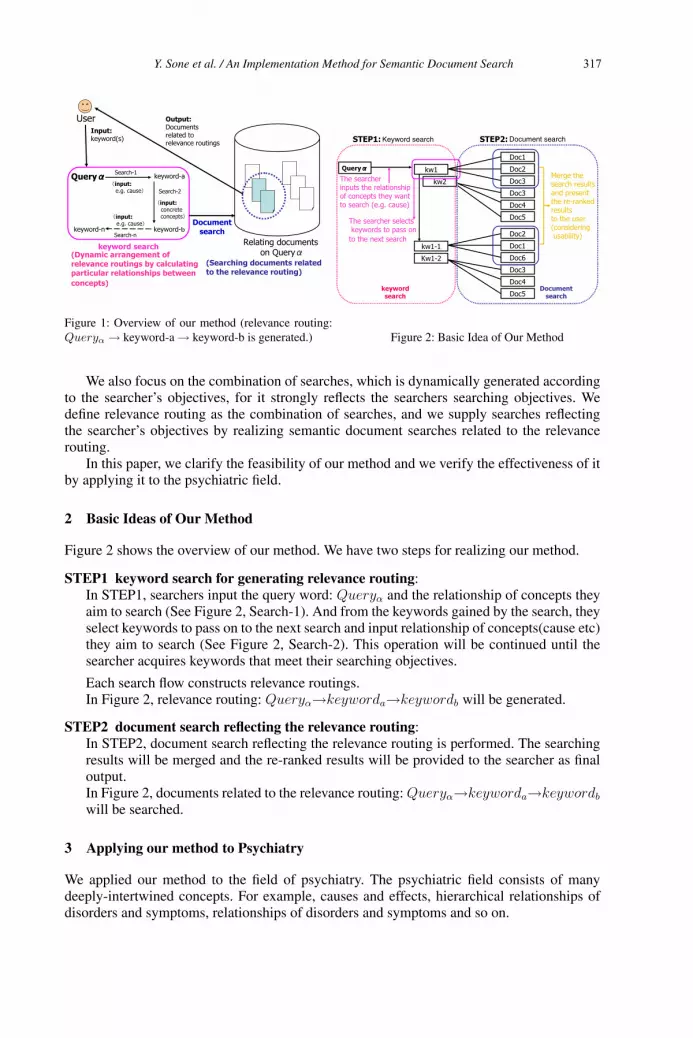
Query����Search-1
�input:e.g. cause� Search-2
�input:concreteconcepts�
User
Input:
keyword(s)
Documentsearch
keyword-a
keyword-�keyword-n
�input:e.g. cause�
Search-n
Relating documents on Query�
keyword search
Output:
Documents related to relevance routings
(Searching documents relatedto the relevance routing)
(Dynamic arrangement of relevance routings by calculating particular relationships between
concepts)
Figure 1: Overview of our method (relevance routing:Queryα → keyword-a → keyword-b is generated.) Figure 2: Basic Idea of Our Method
We also focus on the combination of searches, which is dynamically generated accordingto the searcher’s objectives, for it strongly reflects the searchers searching objectives. Wedefine relevance routing as the combination of searches, and we supply searches reflectingthe searcher’s objectives by realizing semantic document searches related to the relevancerouting.
In this paper, we clarify the feasibility of our method and we verify the effectiveness of itby applying it to the psychiatric field.
2 Basic Ideas of Our Method
Figure 2 shows the overview of our method. We have two steps for realizing our method.
STEP1 keyword search for generating relevance routing:In STEP1, searchers input the query word: Queryα and the relationship of concepts theyaim to search (See Figure 2, Search-1). And from the keywords gained by the search, theyselect keywords to pass on to the next search and input relationship of concepts(cause etc)they aim to search (See Figure 2, Search-2). This operation will be continued until thesearcher acquires keywords that meet their searching objectives.
Each search flow constructs relevance routings.In Figure 2, relevance routing: Queryα→keyworda→keywordb will be generated.
STEP2 document search reflecting the relevance routing:In STEP2, document search reflecting the relevance routing is performed. The searchingresults will be merged and the re-ranked results will be provided to the searcher as finaloutput.In Figure 2, documents related to the relevance routing: Queryα→keyworda→keywordb
will be searched.
3 Applying our method to Psychiatry
We applied our method to the field of psychiatry. The psychiatric field consists of manydeeply-intertwined concepts. For example, causes and effects, hierarchical relationships ofdisorders and symptoms, relationships of disorders and symptoms and so on.
Doc5
Doc4
Doc3
Doc6
Doc1
Doc2
Doc5
Doc4
Doc3
Doc3
Doc2
Doc1
Keyword search Document search STEP1: STEP2:
The searcher inputs the relationship of concepts they want to search (e.g. cause)
The searcher selects keywords to pass on
to the next search
Merge the search resultsand present the re-ranked results to the user(considering usability)
Kw1-2
keyword search
Documentsearch
kw1-1
kw2
kw1Query����
Y. Sone et al. / An Implementation Method for Semantic Document Search 317
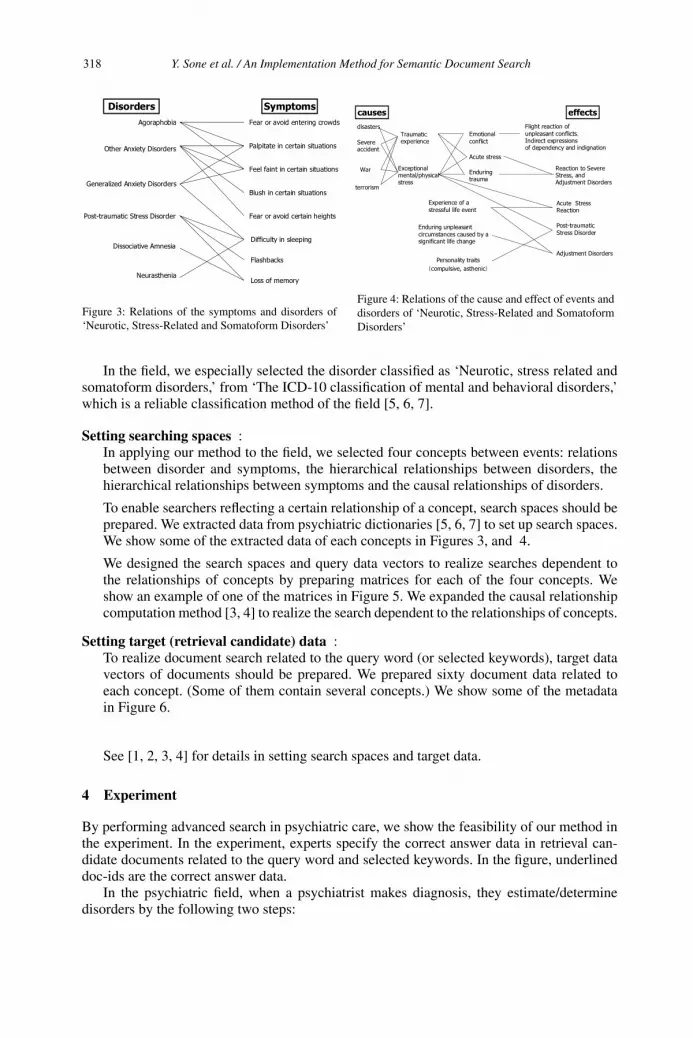
Other Anxiety Disorders
Agoraphobia
Generalized Anxiety Disorders
Dissociative Amnesia
Post-traumatic Stress Disorder
Neurasthenia
Fear or avoid certain heights
Fear or avoid entering crowds
Blush in certain situations
Palpitate in certain situations
Feel faint in certain situations
Difficulty in sleeping
Flashbacks
Loss of memory
Disorders Symptoms
Figure 3: Relations of the symptoms and disorders of‘Neurotic, Stress-Related and Somatoform Disorders’
Post-traumatic Stress Disorder
Reaction to SevereStress, andAdjustment Disorders
Adjustment Disorders
disasters
Severeaccident
War
terrorism
Traumaticexperience
Exceptionalmental/physicalstress
Enduring unpleasantcircumstances caused by asignificant life change
Acute stress
Enduring trauma
Emotionalconflict
Flight reaction of unpleasant conflicts�Indirect expressions of dependency and indignation
Personality traits
�compulsive, asthenic�
Acute�Stress�Reaction
Experience of astressful life event
causes effects
Figure 4: Relations of the cause and effect of events anddisorders of ‘Neurotic, Stress-Related and SomatoformDisorders’
In the field, we especially selected the disorder classified as ‘Neurotic, stress related andsomatoform disorders,’ from ‘The ICD-10 classification of mental and behavioral disorders,’which is a reliable classification method of the field [5, 6, 7].
Setting searching spaces :In applying our method to the field, we selected four concepts between events: relationsbetween disorder and symptoms, the hierarchical relationships between disorders, thehierarchical relationships between symptoms and the causal relationships of disorders.
To enable searchers reflecting a certain relationship of a concept, search spaces should beprepared. We extracted data from psychiatric dictionaries [5, 6, 7] to set up search spaces.We show some of the extracted data of each concepts in Figures 3, and 4.
We designed the search spaces and query data vectors to realize searches dependent tothe relationships of concepts by preparing matrices for each of the four concepts. Weshow an example of one of the matrices in Figure 5. We expanded the causal relationshipcomputation method [3, 4] to realize the search dependent to the relationships of concepts.
Setting target (retrieval candidate) data :To realize document search related to the query word (or selected keywords), target datavectors of documents should be prepared. We prepared sixty document data related toeach concept. (Some of them contain several concepts.) We show some of the metadatain Figure 6.
See [1, 2, 3, 4] for details in setting search spaces and target data.
4 Experiment
By performing advanced search in psychiatric care, we show the feasibility of our method inthe experiment. In the experiment, experts specify the correct answer data in retrieval can-didate documents related to the query word and selected keywords. In the figure, underlineddoc-ids are the correct answer data.
In the psychiatric field, when a psychiatrist makes diagnosis, they estimate/determinedisorders by the following two steps:
Y. Sone et al. / An Implementation Method for Semantic Document Search318
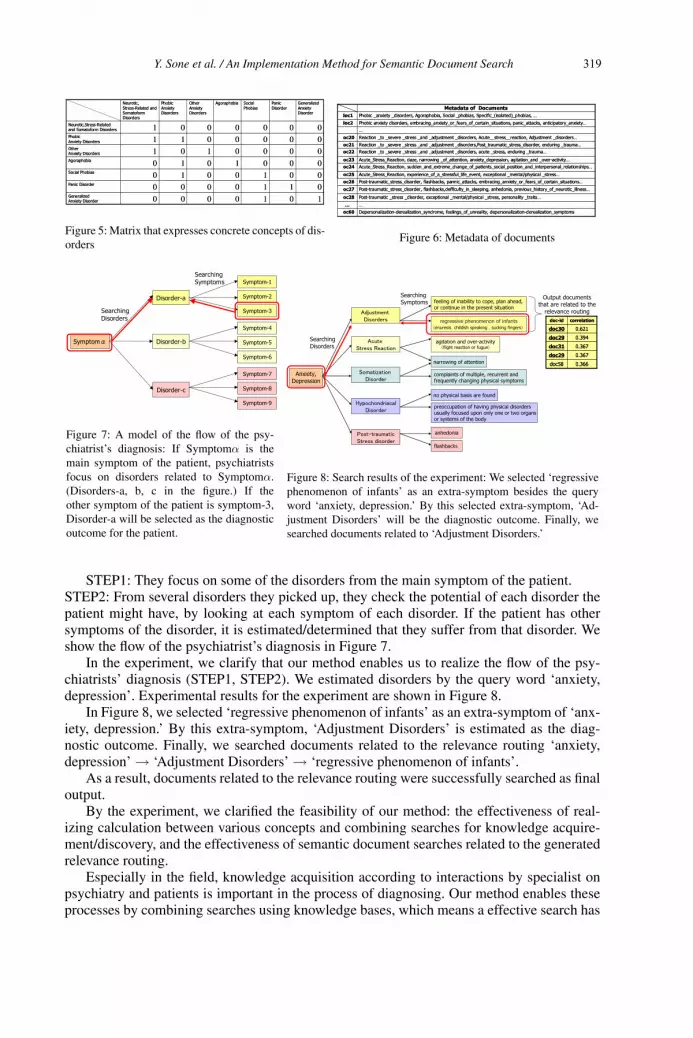
Figure 5: Matrix that expresses concrete concepts of dis-orders
Depersonalization-derealization_syndrome, feelings_of_unreality, depersonalization-derealization_symptomsoc60
……
Acute_Stress_Reaction, sudden_and_extreme_change_of_patients_social_position_and_interpersonal_relationships…oc24
Post-traumatic _stress _disorder, exceptional _mental/physical _stress, personality _traits…oc28
Post-traumatic_stress_disorder, flashbacks,defficulty_in_sleeping, anhedonia, previous_history_of_neurotic_illness…oc27
Post-traumatic_stress_disorder, flashbacks, pannic_attacks, embracing_anxiety_or_fears_of_certain_situations…oc26
Acute_Stress_Reaction, experience_of_a_stressful_life_event, exceptional _mental/physical _stress…oc25
Acute_Stress_Reaction, daze, narrowing _of_attention, anxiety_depression, agitation_and _over-activity…oc23
Reaction _to _severe _stress _and _adjustment _disorders, acute _stress, enduring _trauma…oc22
Reaction _to _severe _stress _and _adjustment _disorders,Post_traumatic_stress_disorder, enduring _trauma…oc21
Reaction _to _severe _stress _and _adjustment _disorders, Acute�stress�reaction, Adjustment _disorders…oc20
…
Phobic anxiety disorders, embracing_anxiety_or_fears_of_certain_situations, panic_attacks, anticipatory_anxiety…doc2
Phobic _anxiety _disorders, Agoraphobia, Social _phobias, Specific_(isolated)_phobias, …doc1
Metadata of Documents
Figure 6: Metadata of documents
Disorder-a
Disorder-b
Disorder-c
Symptom-1
Symptom-2
Symptom-3
Symptom-4
Symptom-5
Symptom-6
Symptom-7
Symptom-8
Symptom-9
Symptom�
SearchingDisorders
SearchingSymptoms
Figure 7: A model of the flow of the psy-chiatrist’s diagnosis: If Symptomα is themain symptom of the patient, psychiatristsfocus on disorders related to Symptomα.(Disorders-a, b, c in the figure.) If theother symptom of the patient is symptom-3,Disorder-a will be selected as the diagnosticoutcome for the patient.
Figure 8: Search results of the experiment: We selected ‘regressivephenomenon of infants’ as an extra-symptom besides the queryword ‘anxiety, depression.’ By this selected extra-symptom, ‘Ad-justment Disorders’ will be the diagnostic outcome. Finally, wesearched documents related to ‘Adjustment Disorders.’
STEP1: They focus on some of the disorders from the main symptom of the patient.STEP2: From several disorders they picked up, they check the potential of each disorder thepatient might have, by looking at each symptom of each disorder. If the patient has othersymptoms of the disorder, it is estimated/determined that they suffer from that disorder. Weshow the flow of the psychiatrist’s diagnosis in Figure 7.
In the experiment, we clarify that our method enables us to realize the flow of the psy-chiatrists’ diagnosis (STEP1, STEP2). We estimated disorders by the query word ‘anxiety,depression’. Experimental results for the experiment are shown in Figure 8.
In Figure 8, we selected ‘regressive phenomenon of infants’ as an extra-symptom of ‘anx-iety, depression.’ By this extra-symptom, ‘Adjustment Disorders’ is estimated as the diag-nostic outcome. Finally, we searched documents related to the relevance routing ‘anxiety,depression’ → ‘Adjustment Disorders’ → ‘regressive phenomenon of infants’.
As a result, documents related to the relevance routing were successfully searched as finaloutput.
By the experiment, we clarified the feasibility of our method: the effectiveness of real-izing calculation between various concepts and combining searches for knowledge acquire-ment/discovery, and the effectiveness of semantic document searches related to the generatedrelevance routing.
Especially in the field, knowledge acquisition according to interactions by specialist onpsychiatry and patients is important in the process of diagnosing. Our method enables theseprocesses by combining searches using knowledge bases, which means a effective search has
SearchingDisorders
SearchingSymptoms
Output documents that are related to the
relevance routing
doc-id correlation
doc30 0.621
doc29 0.394
doc31 0.367
doc29 0.367
doc58 0.366
doc-id correlation
doc30 0.621
doc29 0.394
doc31 0.367
doc29 0.367
doc58 0.366
flashbacks
anhedonia������������
��������������
no physical basis are found
preoccupation of having physical disordersusually focused upon only one or two organs or systems of the body
���������������
��������
Anxiety,Depression
complaints of multiple, recurrent and frequently changing physical symptoms
narrowing of attention
agitation and over-activity�flight reaction or fugue�
regressive phenomenon of infants�enuresis�childish speaking �sucking fingers�
feeling of inability to cope, plan ahead, or continue in the present situation
����������
��������
�����
��������������
���������
���������
1010000Generalized Anxiety Disorder
0110000Panic Disorder
0010010Social Phobias
0001010Agoraphobia
0000101OtherAnxiety Disorders
0000011PhobicAnxiety Disorders
0000001Neurotic,Stress-Related and Somatoform Disorders
Generalized Anxiety Disorder
Panic Disorder
Social Phobias
AgoraphobiaOtherAnxiety Disorders
PhobicAnxiety Disorders
Neurotic,Stress-Related and Somatoform Disorders
Y. Sone et al. / An Implementation Method for Semantic Document Search 319

been realized in the field.
5 Conclusion
In this paper, we have presented an implementation method for semantic document searchwith dynamic relevance routing by calculating relationships of concepts, such as hierarchicaland causal relationships. We have clarified the feasibility of our method by applying it to thefield of psychiatric care, where various technical relationships exist among concepts. By ourmethod, searchers are able to obtain semantically related documents with various relation-ships of concepts, and by combining these several searches dependent on a searcher, theyare able to obtain/discover information effectively. We have defined the relevance routing asthe combination of searches. The relevance routing is dynamically generated according tothe searcher’s objective. By realizing semantic document searches related to the relevancerouting, searchers are able to acquire documents that reflect their searching objectives.
As our future work, we develop methods of relevance routing decision support for sup-plying further advanced usability to searchers. We also examine to apply our method to otherfields such as the field of medical care, engineering and so on.
Acknowledgements
We acknowledge the contribution of Mr. Kosuke Takano, Mr. Shuichi Kurabayashi and Ms.Shiori Sasaki (Graduate School of Media and Governance, Keio University) for their valuablediscussions and helpful comments on this study.
References
[1] Kiyoki, Y., Kitagawa, T., Hayama, T.: “A Metadatabase System for Semantic Image Search by a Mathe-matical Model of Meaning,” ACM SIGMOD Record, Vol. 23, No. 3, pp. 34-41, September 1994.
[2] Kiyoki, Y. and Kitagawa, T., ”A metadatabase system for supporting semantic interoperability in multi-databases,” Information Modelling and Knowledge Bases, IOS Press, vol. V, pp. 287-298, 1994.
[3] Zushi, T., Takano, K., Kiyoki, Y.: A Causality Computation Method using a Vector Space Model and itsApplication to Aerospace Engineering, International Conference on Advances in Intelligent Systems –Theory and Applications (AISTA 2004), 2004.
[4] Zushi, T., Takano, K., Kiyoki, Y.: A Vector Space Retrieval Method with Causal Relationship ComputationFunctions for Event Data, IEEE International Symposium on Applications and the Internet (SAINT 2005)- International Workshop on Cyberspace Technologies and Societies (IWCTS2005), pp.430-433, 2005.
[5] World Health Organization:International Statistical Classification of Diseases and Related Health Prob-lems http://www3.who.int/icd/vol1htm2003/fr-icd.htm
[6] “The Icd-10 Classification of Mental and Behavioural Disorders : Clinical Descriptions and DiagnosticGuidelines,” World Health Organization
[7] “The ICD-10 Classification of Mental and Behavioural Disorders : Diagnostic Criteria for Research,”World Health Organization
Y. Sone et al. / An Implementation Method for Semantic Document Search320
Information Modelling and Knowledge Bases XVIII 321
M. Duží et al. (Eds.)
IOS Press, 2007
© 2007 The authors and IOS Press. All rights reserved.
Author Index
Akutsu, H. 62
Aoyagi, T. 277
Backlund, A. 253
Balogh, Z. 311
Briš, R. 301
Burita, L. 261
Černohorský, J. 301
Chen, X. 245
Choe, J.-W. 100
Děrgel, P. 236
Ďuráková, D. 236
Duží, M. v, 236
Funyu, Y. 290
Gajdoš, P. 236, 295
Gatial, E. 311
Goczyła, K. 17
Hausser, R. 100
Heimbürger, A. 136
Henno, J. 80
Hluchy, L. 311
Homma, H. 206
Jaakkola, H. v
Jakoubek, B. 285
Kangassalo, H. v
Kawaguchi, E. 50
Kawamoto, M. 120
Kitagawa, T. 206
Kiyoki, Y. v, 62, 120, 186, 245, 316
Laclavik, M. 311
Lehtinen, A. 306
Leppänen, M. 166
Maeta, M. 50
Mikkonen, T. 1
Multisilta, J. 136
Müller, J. 236
Nakanishi, T. 206
Negishi, H. 269
Noda, H. 50
Noro, T. 269, 277
Nozaki, K. 50
Ojansuu, K. 136
Ondryhal, V. 261
Pitkänen, R. 1
Praks, P. 301
Radecký, M. 295
Salminen, A. 306
Sasaki, J. 290
Sasaki, S. 62
Seleng, M. 311
Shimomukai, H. 290
Sone, Y. 316
Takano, K. 186
Thalheim, B. 30
Tokuda, T. 269, 277
Waloszek, A. 17
Waloszek, W. 17
Van Hai, P. 277
Wangler, B. 253
Vojtáš, P. 154
Vondrák, I. 223
Yoneda, T. 290
Yoshida, N. 316
Zawadzka, T. 17
Zawadzki, M. 17

This page intentionally left blank