Embed Size (px)
Citation preview
JULIUS-MAXIMILIANS-UNIVERSITÄT WÜRZBURG
WIRTSCHAFTSWISSENSCHAFTLICHE FAKULTÄT
Artificial Intelligence for Human Decision-Makers:
Systematization, Perception, and Adoption of
Intelligent Decision Support Systems in Industry 4.0
Inauguraldissertation
zur Erlangung des akademischen Grades
doctor rerum politicarum (Dr. rer. pol.)
vorgelegt von
Jonas Paul Wanner, M.Sc.
geboren in Aalen
This document is licensed under the Creative Commons Attribution-ShareAlike 4.0 International License (CC BY-SA 4.0): http://creativecommons.org/licenses/by-sa/4.0 This CC license does not apply to third party material (attributed to another source) in this publication.

Name und Anschrift: Jonas Paul Wanner
Gmünder Str. 14
73557 Mutlangen
Erstgutachter: Prof. Dr. Christian Janiesch
Zweitgutachter: Prof. Dr. Axel Winkelmann
Datum der Einreichung: 20. Oktober 2021

Artificial Intelligence for Human Decision-Makers
Eidesstattliche Erklärung i
Eidesstattliche Erklärung
Hiermit erkläre ich gemäß § 7 Abs. 2 Punkt 2 der Promotionsordnung der wirtschaftswissenschaftlichen
Fakultät der Universität Würzburg, dass ich diese Dissertation eigenständig, d.h. insbesondere selbstän-
dig und ohne Hilfe eines kommerziellen Promotionsberaters angefertigt habe. Ausgenommen davon
sind jene Abschnitte, bei deren Erstellung ein Koautor mitgewirkt hat. Diese Abschnitte sind entspre-
chend gekennzeichnet und die Namen der Koautoren sind vollständig und wahrheitsgemäß aufgeführt
– siehe dazu insbesondere Appendix II. Bei der Erstellung der Abschnitte, bei denen ein Koautor mit-
gewirkt hat, habe ich einen signifikanten Beitrag geleistet, der meine eigene Koautorenschaft rechtfer-
tigt.
Außerdem erkläre ich, dass ich außer den im Schrifttumsverzeichnis angegebenen Hilfsmitteln keine
weiteren benutzt habe und alle Stellen, die aus dem Schrifttum ganz oder annähernd entnommen sind,
als solche kenntlich gemacht und einzeln nach ihrer Herkunft nachgewiesen habe.
Würzburg, den 20. Oktober 2021
Jonas Paul Wanner
Artificial Intelligence for Human Decision-Makers
Acknowledgements ii
Acknowledgements
A PhD is a hard and lengthy journey. It is a mission with many sleepless nights, hard deadlines, strict
requirements, and challenges that give you the chance to mature. Without constant support and encour-
agement, a dissertation might never be completed. Fortunately for me, I had that support and was not
alone on this wild trip. On the one hand, I have researched as part of a team with some of my colleagues.
On the other hand, my friends and family have given me the necessary energy to get through this. I am
grateful for that and would like to express my special thanks to the most important people.
First of all, I would like to thank my colleague and comrade-in-arms Lukas-Valentin Herm. Together
we spent an incredible number of nights – working, laughing, and sometimes crying. Besides the work,
a true friendship has developed. Thank you so much for your great support! May the force be with you,
in all of your upcoming challenges. You really deserve all the best buddy. Secondly, I would like to
thank my doctoral supervisor, boss, and academic foster father Christian Janiesch. The dark side con-
sistently demanded more. It was not the easiest education, but I learned a lot from you. Also, this pushed
me to perform to a higher standard. The light side was a defender against all enemies from outside. You
never stopped believing in me, even when I doubted myself. Thank you so much for everything! I’m
sure that there will be further intersections of our future activities.
I would like to continue by extending my gratitude to Kai Heinrich and Patrick Zschech. For me, you
were my research mentors. Through your impressive skills and experience, coupled with your under-
standing and patience, I only regret one thing not having had you by my side sooner. I have learned so
much from you and achieved so much through you. Thanks for all you have done for me, buddies! I
hope that our paths will cross many more times. Similarly, I would like to thank Nikolai Stein, who
played a significant role in helping me focus my research efforts. One day I hope to find a way to become
as smart as (I think) you are. Another very special thanks to Christopher Wissuchek and Theresa Stein-
bach. Christopher was there from the beginning of my journey into the academic publishing world. You
have been with me several times since, and I thank you so much for everything! Theresa was probably
the best student assistant one could hope for. You have supported me energetically and beyond my
expectations over a long period of time. Thanks a lot for that! I would also like to extend this appreciation
to my valued co-authors who joined me on the scientific journey. Many thanks to all of you! A special
thank you also goes to Andrea Müller and Axel Winkelmann. You have always welcomed me as if I
were part of your own team.
Furthermore, I would like to thank my friends and family. The biggest thanks of all – and I cannot
express this in words – goes to my wife Franziska. You were always there. You were with me all the
time, through all these ups and downs, always. You never doubted my abilities even once. You are the
most important reason why this thesis came to fruition. I would also like to thank my little son Matteo.
Through him I got the motivation to finish the dissertation. Similarly, a big thank you to my parents,
Doris and Harald, and my sister Maren. I could always rely on you. You also never doubted that the
work would be a success. Thanks for the great effort and confidence you have given to me! Thanks also
to my parents-in-law, Christine and Rolf Goisser. You have supported me and Franziska so often, thus,
granting me important time to research and practice. The same is true for my sister-in-law and brother-
in-law, Elisabeth and Nicolai Seitzer. In addition, I would like to thank my best friends Lukas Balle,
Jonas Hägele, Patrick Betz, Daniel Kaiser, and Mirco Hackner. You have always remained by my side,

Artificial Intelligence for Human Decision-Makers
Acknowledgements iii
despite some neglect due to a life divided between home and Würzburg. I am extremely grateful for
this!
Likewise, my Würzburg buddies have accompanied me over the years. I would like to say thank you to
the ‘seniors’ Florian Imgrund, Marcus Fischer, and Nikolai Stein. Similarly, a big thank you to Adrian
Hofmann (I’m glad that our shared journey is not over yet, buddy), Alexander Dürr, Matthias Griebel,
Kevin Fuchs, and Giacomo Welsch. We all started out about the same and we really rocked it, brothers!
With all of you I have always felt at home in Würzburg. That was always the sunny side of the whole
PhD journey for me. We trained (hard), went out to eat, spent our evenings together, and even went on
vacation. We spent so much time together (before Corona hit-in) and I am grateful for every single
minute. Despite the stresses and strains, it was also a really awesome time. Thank you so much for
always giving me good vibes, guys!
Artificial Intelligence for Human Decision-Makers
Abstract iv
Abstract
The Fourth Industrial Revolution has already begun. It is assumed that this will lead to significant
changes. As a new production factor, information plays a particularly important role. Innovative possi-
bilities for data collection, networking, and evaluation are unleashing previously untapped potential.
However, harnessing this potential also requires a change in the way we work. In addition to expanded
automation, human-machine cooperation is becoming more important: The machine achieves a reduc-
tion in complexity for humans through artificial intelligence. In fractions of a second large amounts of
data of high decision quality are analyzed and suggestions are offered. The human being, for this part,
usually makes the ultimate decision. He validates the machine’s suggestions and, if necessary, (physi-
cally) executes them.
Both entities are highly dependent on each other to accomplish the task in the best possible way. There-
fore, it seems particularly important to understand to what extent such cooperation can be effective.
Current developments in the field of artificial intelligence show that research in this area is particularly
focused on neural network approaches. These are considered to be highly powerful but have the disad-
vantage of lacking transparency. Their inherent computational processes and the respective result rea-
soning remain opaque to humans. Some researchers assume that human users might therefore reject the
system’s suggestions. The research domain of explainable artificial intelligence (XAI) addresses this
problem and tries to develop methods to realize systems that are highly efficient and explainable.
This work is intended to provide further insights relevant to the defined goal of XAI. For this purpose,
artifacts are developed that represent research achievements regarding the systematization, perception,
and adoption of artificially intelligent decision support systems from a user perspective. The focus is on
socio-technical insights with the aim to better understand which factors are important for effective hu-
man-machine cooperation. The elaborations predominantly represent extended grounded research.
Thus, the artifacts imply an extension of knowledge in order to develop and/ or test effective XAI meth-
ods and techniques based on this knowledge. Industry 4.0, with a focus on maintenance, is used as the
context for this development.
The area of systematization of the research field includes the review of existing research in the area of
Industry 4.0 as well as a basic understanding of potential obstacles to effective human-machine cooper-
ation. The first step was a review of business analytics applications and trends in this environment. This
showed that many innovative approaches are being developed, particularly for industrial maintenance.
Increasingly, data evaluation is being technically implemented using approaches from the field of deep
learning. Since this leads to the aforementioned problem of such systems lacking explainability, a reap-
praisal of XAI transfer techniques was undertaken. Hereby, the inadequate transparency of such ap-
proaches is remedied by transferring them into per se explainable approaches. It was found that tech-
niques for visualization and rule-based target models are particularly widely used. Nevertheless, due to
the associated criticisms of loss of accuracy and increased complexity of applied XAI transfers, an ap-
plication-based implementation was extended. It was shown that the complexity of the translations does
not provide a user-adequate solution to allow effective human-machine cooperation.
The area of perception of (X)AI decision support systems deals with insights into users’ perceptions. In
the first applied study, factors influencing the perception of the objective truth of results of advanced
Artificial Intelligence for Human Decision-Makers
Abstract v
data analysis were investigated. It was found that the accuracy and completeness of the information
presented were particularly strong influences on the perception from a user perspective. The timeliness
of information appears to be less significant. In study two, these findings were applied to the XAI con-
text. Different types of AI models were examined with respect to the theoretically assumed trade-off
between system performance (=accuracy) and system explainability (=completeness). The trade-off was
confirmed. The ML type decision tree yielded the best trade-off solution, whereas the neural network
had the best performance with the lowest perceived explainability. In the third study, a link between
perceived explainability and user understanding was investigated. A positive correlation between the
two dimensions was proven. Here, the decision tree again performed particularly well. The best result,
however, was achieved by the modified neural network, which was made explainable ex-post via an
XAI framework.
Investigation into the area of adoption of (X)AI decision support systems provide extended insights into
the importance of individual influencing factors on users’ willingness to consider such a system in their
decision-making. First, we have determined which factors are particularly important for users in the
selection of an intelligent decision support system. Using a hierarchical analysis method, we have shown
that the performance of the system is the most important factor. Effort and explainability were second-
ary. Due to the perceived contradiction of this finding to previous assumptions, a further study was
undertaken. Using a separate adoption model, the importance of individual factors could be explored in
a broader context. The great significance of system performance was confirmed. In addition, system
transparency in terms of perceived explainability was shown to have a strong indirect influence on users’
willingness to adopt. Finally, the extent to which such (X)AI systems influence human decision-making
was investigated. In this context, it was shown that the decision-maker becomes more confident in his
decision due to the recommendation given by the machine. This is significantly positively related to the
final decision quality. The combination of human and machine achieved the best result. A difference
between different levels of explanation of the decision support system, however, could not be proven.
A structured research design is used to present the artifacts of this work. Each subdomain of systemati-
zation, perception, and adoption is defined using individual research objectives. The design and results
represent individual scientific publications. These, in turn, are related to each other and contribute to the
overarching research objective. In addition to a critical reflection on these findings, their connection
with existing research is also shown. Furthermore, suggestions are made regarding potential directions
for future work and how a practical implementation can be designed.
Artificial Intelligence for Human Decision-Makers
Kurzfassung vi
Kurzfassung
Die vierte industrielle Revolution ist bereits eingeleitet. Es wird davon ausgegangen, dass diese zu weit-
reichenden Veränderungen führt. Als neuer Produktionsfaktor kommt der Information hierbei eine be-
sonders große Bedeutung zu. Durch innovative Möglichkeiten der Datenerhebung, Vernetzung und Aus-
wertung werden Potenziale freigesetzt, die bisher ungenutzt sind. Die Nutzenmachung der Potenziale
bedingt jedoch auch eine Veränderung der Arbeitsweise. Neben einer erweiterten Automatisierung wird
die Mensch-Maschinen-Kooperation wichtiger: Die Maschine erreicht durch künstliche Intelligenz eine
Komplexitätsreduktion für den Menschen. In Sekundenbruchteilen werden Vorschläge aus großen Da-
tenmengen von hoher Entscheidungsqualität geboten, während der Mensch i.d.R. final die Entscheidung
trifft. Er validiert die Vorschläge der Maschine und führt diese ggf. (physisch) aus.
Beide Instanzen sind stark voneinander abhängig, um eine bestmögliche Aufgabenbewältigung zu er-
reichen. Es scheint daher insbesondere wichtig zu verstehen, inwiefern eine solche Kooperation effektiv
werden kann. Aktuelle Entwicklungen auf dem Gebiet der Künstlichen Intelligenz zeigen, dass die For-
schung hierzu insbesondere auf Ansätze Neuronaler Netze fokussiert ist. Diese gelten als hoch leistungs-
fähig, haben aber den Nachteil einer fehlenden Nachvollziehbarkeit. Ihre inhärenten Berechnungsvor-
gänge und die jeweilige Ergebnisfindung bleiben für den Menschen undurchsichtig. Einige Forscher
gehen davon aus, dass menschliche Nutzer daher die Systemvorschläge ablehnen könnten. Die For-
schungsdomäne erklärbare Künstlichen Intelligenz (XAI) nimmt sich der Problemstellung an und ver-
sucht Methoden zu entwickeln, um Systeme zu realisieren die hoch-leistungsfähig und erklärbar sind.
Diese Arbeit soll weitere Erkenntnisse für das definierte Ziel der XAI liefern. Dafür werden Artefakte
entwickelt, welche Forschungsleistungen hinsichtlich der Systematisierung, Wahrnehmung und Adop-
tion künstlich intelligenter Entscheidungsunterstützungssysteme aus Anwendersicht darstellen. Der Fo-
kus liegt auf sozio-technischen Erkenntnissen. Es soll besser verstanden werden, welche Faktoren für
eine effektive Mensch-Maschinen-Kooperation wichtig sind. Die Erarbeitungen repräsentieren überwie-
gend erweiterte Grundlagenforschung. Damit implizieren die Artefakte eine Erweiterung des Wissens,
um darauf aufbauend effektive XAI-Methoden und -Techniken zu entwickeln und/ oder zu erproben.
Als Kontext der eigenen Erarbeitung wird die Industrie 4.0 mit Schwerpunkt Instandhaltung genutzt.
Der Bereich der Systematisierung des Forschungsfeld umfasst die Aufarbeitung der bestehenden For-
schung im Umfeld Industrie 4.0 sowie das Grundverständnis über potenzielle Hindernisse für eine ef-
fektive Mensch-Maschinen-Kooperation. Als erstes erfolgte eine Aufarbeitung von Business Analytics
Anwendungen und Trends im genannten Umfeld. Hier zeigte sich, dass insbesondere für die industrielle
Instandhaltung viele innovative Vorgehensweisen entwickelt werden. Die Datenauswertung wird dabei
verstärkt durch Ansätze aus dem Bereich des Deep Learning technisch umgesetzt. Da dies die genannte
Problematik der fehlenden Erklärbarkeit solcher Systeme bedingt, wurde eine Aufarbeitung von XAI-
Transfertechniken unternommen. Hierdurch wird die fehlende Transparenz solcher Ansätze durch die
Überführung in per-se erklärbare Ansätze erreicht. Es zeigte sich, dass Techniken zur Visualisierung
und Regel-basierte Zielmodelle besonders verbreitet sind. Aufgrund der verbundenen Kritiken von Ge-
nauigkeitsverlust und erhöhter Komplexität wurde erweitert eine anwendungsbezogene Umsetzung re-
alisiert. Es zeigte sich, dass die Komplexität der Übersetzungen keine Nutzer-adäquate Lösung darstellt,
um eine effektive Mensch-Maschinen-Kooperation zu erlauben.
Artificial Intelligence for Human Decision-Makers
Kurzfassung vii
Der Bereich der Wahrnehmung von (X)AI Entscheidungsunterstützungssystemen befasst sich mit der
Erarbeitung von Erkenntnissen über die Auffassungen von Nutzern. In der ersten Studie wurden Ein-
flussfaktoren auf die Wahrnehmung der objektiven Wahrheit von Ergebnissen einer fortgeschrittenen
Datenanalyse untersucht. Die Genauigkeit und Vollständigkeit der dargestellten Informationen hatte be-
sonders starken Einfluss. Die Informationsaktualität war hingegen weniger bedeutend. In der zweiten
Studie wurden diese Erkenntnisse auf den XAI Kontext übertragen. Untersucht wurden verschiedene
KI-Modellarten hinsichtlich des theoretisch angenommenen Trade-offs zwischen der Systemperfor-
mance (=Genauigkeit) und Systemerklärbarkeit (=Vollständigkeit). Der Trade-off konnte bestätigt wer-
den. Der Entscheidungsbaum zeigte die beste Trade-off Lösung, wohingegen das Neuronale Netze die
beste Performanceleistung bei der geringsten wahrgenommenen Erklärbarkeit hatte. In der dritten Studie
wurde eine Verbindung aus wahrgenommener Erklärbarkeit und Nutzerverständnis untersucht. Es
konnte eine positive Korrelation zwischen den beiden Dimensionen bewiesen werden. Der Entschei-
dungsbaum schnitt erneut besonders gut ab. Das beste Ergebnis erreichte hingegen das über ein XAI-
Framework ex-post erklärbar gemachte Neuronale Netz.
Der Bereich der Adoption von (X)AI Entscheidungsunterstützungssystemen bietet erweiterte Erkennt-
nisse über die Bedeutung von einzelnen Einflussfaktoren auf die Bereitschaft von Nutzern, ein solches
System in ihrer Entscheidungsfindung zu berücksichtigen. Zunächst wurde untersucht, welche Faktoren
bei der Systemauswahl eines intelligenten Entscheidungsunterstützungssystems für Nutzer besonders
wichtig sind. Durch eine hierarchische Analysemethode zeigte sich, dass die Leistungsfähigkeit des
Systems den wichtigsten Faktor darstellt. Der Aufwand und die Erklärbarkeit waren sekundär. Aufgrund
des vermeintlichen Widerspruchs zu vorausgehenden Annahmen wurde eine weitere Studie unternom-
men. Über ein eigenes Adoptionsmodell konnten die Bedeutungen einzelner Faktoren in einem größeren
Zusammenhang erforscht werden. Die hohe Bedeutung der Systemperformance bestätigte sich. Darüber
hinaus zeigte sich, dass die Systemtransparenz i.S.d. wahrgenommenen Erklärbarkeit einen starken in-
direkten Einfluss auf die Adoptionsbereitschaft von Nutzern nimmt. Abschließend wurde untersucht,
inwiefern solche (X)AI-Systeme Einfluss auf die menschliche Entscheidungsfindung nehmen. Es zeigte
sich, dass der Entscheidungsträger durch die Maschine sicherer in seiner Entscheidung wird. Ebendies
steht in einem signifikant positiven Zusammenhang zur finalen Entscheidungsqualität, wobei die Kom-
bination aus Mensch und Maschine das beste Ergebnis erzielte. Ein Unterschied zwischen verschiedenen
Erklärungsstufen des Entscheidungsunterstützungssystems konnte nicht nachgewiesen werden.
Die Präsentation der Artefakte dieser Arbeit erfolgt anhand eines strukturierten Forschungsdesigns. Je-
der Teilbereich von Systematisierung, Wahrnehmung und Adoption wird anhand einzelner Forschungs-
ziele definiert. Die Ausgestaltung und Ergebnisse repräsentieren einzelne wissenschaftliche Publikatio-
nen. Diese stehen wiederum in Verbindung zueinander und leisten einen Beitrag zum jeweiligen For-
schungsziel. Neben einer kritischen Reflektion der eigenen Erkenntnisse wird deren Verbindung mit der
bestehenden Forschung aufgezeigt. Darüber hinaus wird erläutert, an welchen Stellen zukünftige Arbei-
ten anknüpfen können und wie eine jeweilige Umsetzung aussehen kann.
Artificial Intelligence for Human Decision-Makers
List of Contents viii
List of Contents
Eidesstattliche Erklärung ....................................................................................................................... i
Acknowledgements ................................................................................................................................ ii
Abstract .................................................................................................................................................. iv
Kurzfassung ........................................................................................................................................... vi
List of Contents .................................................................................................................................. viii
List of Figures ........................................................................................................................................ xi
List of Tables ...................................................................................................................................... xiii
List of Abbreviations ............................................................................................................................ xv
1 Introduction .................................................................................................................................... 1
1.1 Research Motivation .............................................................................................................. 1
1.2 Theoretical Foundation .......................................................................................................... 3
1.2.1 Technical Foundation ................................................................................................ 3
1.2.2 Social Foundation ..................................................................................................... 7
1.3 Related Work ....................................................................................................................... 10
1.4 Methodological Foundation ................................................................................................. 13
1.4.1 IS Research Foundations ......................................................................................... 13
1.4.2 Thesis Research Methods ........................................................................................ 15
1.5 Research Design ................................................................................................................... 16
1.6 Thesis Structure .................................................................................................................... 18
2 Systematization of the Field ......................................................................................................... 21
2.1 Business Analytics in Industry 4.0 ....................................................................................... 22
2.1.1 Introduction ............................................................................................................. 22
2.1.2 Context and Theoretical Background ...................................................................... 24
2.1.3 Methodology ............................................................................................................ 29
2.1.4 Taxonomy Development .......................................................................................... 31
2.1.5 Derivation of Archetypes ......................................................................................... 42
2.1.6 Analysis of Temporal Variations and Trends .......................................................... 46
2.1.7 Discussion and Conclusion ..................................................................................... 50
2.2 Transfer Techniques in Explainable AI ............................................................................... 52
2.2.1 Introduction ............................................................................................................. 52
2.2.2 Theoretical Background and Related Work ............................................................ 54
2.2.3 Related Work and Research Gap ............................................................................ 55
2.2.4 Status Quo of XAI Model Transfers ........................................................................ 56
2.2.5 Planned Research Design ....................................................................................... 57
2.2.6 XAI Study Design..................................................................................................... 58
Artificial Intelligence for Human Decision-Makers
List of Contents ix
2.2.7 Conclusion and Outlook .......................................................................................... 59
2.3 Example of Explainable AI Transfer ................................................................................... 60
2.3.1 Nutzenmachung von Daten für intelligente Wartungsansätze als Wettbewerbsfaktor
in der Fertigung....................................................................................................... 61
2.3.2 Theoretische Grundlagen der Datenanalyse ........................................................... 62
2.3.3 Schrittweiser Entwicklungsansatz für die Nutzung binärer Datenwerte hinsichtlich
moderner Instandhaltungsansätze ........................................................................... 63
2.3.4 Evaluation des schrittweisen Entwicklungsgangs anhand eines Demonstrators .... 69
2.3.5 Zusammenfassende Betrachtung für Praxis und Forschung ................................... 70
3 (X)AI DSS User Perception ......................................................................................................... 72
3.1 Big Data Analytics and Perceived Credibility of Information ............................................. 73
3.1.1 Introduction ............................................................................................................. 73
3.1.2 Sustainability Reporting and its Credibility Problem ............................................. 75
3.1.3 State-of-the-Art of Research on the Credibility Gap ............................................... 78
3.1.4 Bridging the Credibility Gap through Information Quality .................................... 82
3.1.5 Research Methodology ............................................................................................ 86
3.1.6 Perceived Credibility of Corporate Published Information in Sustainability Reports
................................................................................................................................. 87
3.1.7 Discussion of Results, Limitations and Further Research ...................................... 95
3.2 Model Performance and Model Explainability .................................................................... 96
3.2.1 Introduction ............................................................................................................. 97
3.2.2 Fundamentals and Related Work ............................................................................ 98
3.2.3 Methodology .......................................................................................................... 100
3.2.4 Results ................................................................................................................... 103
3.2.5 Conclusion, Limitations, and Outlook ................................................................... 106
3.3 Model Explainability and Model Comprehension ............................................................. 107
3.3.1 Introduction ........................................................................................................... 107
3.3.2 Theoretical Background and Related Work .......................................................... 109
3.3.3 Research Design .................................................................................................... 112
3.3.4 Data Analysis ........................................................................................................ 116
3.3.5 Discussion and Implications of Findings .............................................................. 119
3.3.6 Conclusion, Limitation, and Outlook .................................................................... 121
4 (X)AI DSS Adoption ................................................................................................................... 123
4.1 Decision Factors for AI-based DSS Adoption ................................................................... 124
4.1.1 Introduction ........................................................................................................... 124
4.1.2 Foundations, Related Work and Derivation of Evaluation Factors ...................... 126
4.1.3 Methodology and Use Case ................................................................................... 129
Artificial Intelligence for Human Decision-Makers
List of Contents x
4.1.4 Measurement Model .............................................................................................. 131
4.1.5 Identification of AI DSS, Implementation, and Results ......................................... 133
4.1.6 Decision Model and Results Discussion ................................................................ 136
4.1.7 Summary and Outlook ........................................................................................... 141
4.1.8 Acknowledgement .................................................................................................. 142
4.2 Adoption Barriers of AI-based DSS in Maintenance ......................................................... 142
4.2.1 Introduction ........................................................................................................... 143
4.2.2 Theoretical Background ........................................................................................ 144
4.2.3 Methodological Overview ..................................................................................... 147
4.2.4 Research Theorizing .............................................................................................. 148
4.2.5 Research Evaluation .............................................................................................. 153
4.2.6 Discussion ............................................................................................................. 161
4.3 Effects of XAI Framework on Model Explanation ............................................................ 165
4.3.1 Introduction ........................................................................................................... 165
4.3.2 Foundations and Related Work ............................................................................. 166
4.3.3 Methodology and Hypotheses................................................................................ 168
4.3.4 Empirical XAI Study .............................................................................................. 170
4.3.5 Results and Interpretation ..................................................................................... 172
4.3.6 Conclusion, Limitations, and Outlook ................................................................... 175
5 Discussion of the Results ............................................................................................................ 176
5.1 Connections Between Research Efforts ............................................................................. 176
5.2 Connections Between Contributions and Related Work .................................................... 181
6 Concluding Remarks and Future Research ............................................................................. 187
Appendix ............................................................................................................................................. 190
Appendix I: Overall List of Publications ...................................................................................... 190
Appendix II: Overview of Publications of this Thesis ................................................................. 192
Appendix III: Appendix of Publications of this Thesis ................................................................ 201
References ........................................................................................................................................... 221
Artificial Intelligence for Human Decision-Makers
List of Figures xi
List of Figures
Figure 1: Big Picture of the Interrelated Thesis Topics .......................................................................... 3
Figure 2: IS Research Framework ......................................................................................................... 14
Figure 3: Summary of the Research Design .......................................................................................... 17
Figure 4: Structure of the Thesis ........................................................................................................... 19
Figure 5: Evolution of Industrial Revolution ........................................................................................ 25
Figure 6: Maturity Levels of Analytics ................................................................................................. 27
Figure 7: Literature Results Sorted by Database ................................................................................... 32
Figure 8: Dendrogram of Clusters ......................................................................................................... 43
Figure 9: Temporal Development of BA in Smart Manufacturing ....................................................... 47
Figure 10: Temporal Development of BA Archetypes in Smart Manufacturing .................................. 49
Figure 11: Analysis of the Structured Literature Review ...................................................................... 57
Figure 12: Scenario of Human-centered Pairwise XAI Model Transfer Comparison .......................... 59
Figure 13: Verfahren für die Erzeugung künstlicher CaseIDs .............................................................. 65
Figure 14: Aufbau der fortschreitenden Überwachungsinstanz ............................................................ 68
Figure 15: Aufbau des Demonstrators für die entwickelte Instandhaltungsüberwachung .................... 70
Figure 16: Derived structural equation model without measurement criteria ....................................... 88
Figure 17: Derived structural equation model with measurement criteria ............................................ 91
Figure 18: Calculated structural equation model .................................................................................. 94
Figure 19: A Synthesis of Common ML Algorithm Classification Schemes ..................................... 100
Figure 20: Overall Methodology ......................................................................................................... 101
Figure 21: Theoretical vs. Empirical Scheme for the Tradeoff of Performance vs. Perceived
Explainability in Machine Learning ........................................................................................... 105
Figure 22: Relation of Performance, Explainability, and the Presumed Comprehensibility .............. 111
Figure 23: Research Methodology according to ................................................................................. 112
Figure 24: Measurement Model .......................................................................................................... 113
Figure 25: Example Introduction to the XANN Model and Prediction .............................................. 115
Figure 26: Choice of Preferred ML Model for Problem-Solving........................................................ 118
Figure 27: Boxplot on the Relative Comprehensibility per Model across All Scenarios .................... 118
Figure 28: Theoretical Assumption of Explainability and Comprehensibility vs. Study Results ....... 119
Figure 29: Research Methodology ...................................................................................................... 129
Artificial Intelligence for Human Decision-Makers
List of Figures xii
Figure 30: Model Explanation per Prognostic Approach .................................................................... 134
Figure 31: Factor Hierarchy for AHP ................................................................................................. 136
Figure 32: Visual Explanation of Each Prognostic Approach............................................................. 137
Figure 33: Decision Weights for the AI DSS Decision ....................................................................... 140
Figure 34. Methodology Overview ..................................................................................................... 147
Figure 35. Derived Acceptance Model for Intelligent Systems .......................................................... 151
Figure 36: Research Design and Methodology ................................................................................... 168
Figure 37: Example from the Empirical Study with Grey-box AI DSS .............................................. 170
Figure 38: Comparison of before and after treatment of the test series .............................................. 173
Figure 39: Connections Between Research Efforts ............................................................................. 176
Figure 40: Thesis Contributions vs. Related Work on RO1 – Systematization .................................. 181
Figure 41: Thesis Contributions vs. Related Work on RO2 – Perception ........................................... 183
Figure 42: Thesis Contributions vs. Related Work on RO3 – Adoption ............................................. 185
Figure 43: Temporal Variations of the Dimension Domain ................................................................ 202
Figure 44: Temporal Variations of the Dimension Orientation .......................................................... 202
Figure 45: Temporal Variations of the Dimension Data .................................................................... 203
Figure 46: Temporal Variations of the Dimension Method ................................................................ 203
Figure 47: Temporal Variations of the Archetype Quality Management (C1) ................................... 204
Figure 48: Temporal Variations of the Archetype MRO Planning (C2) ............................................. 205
Figure 49: Temporal Variations of the Archetype MRO Monitoring (C3) ......................................... 206
Figure 50: Temporal Variations of the Archetype Online Predictive Maintenance (C4) ................... 207
Figure 51: Temporal Variations of the Archetype Reactive Maintenance (C5).................................. 208
Figure 52: Temporal Variations of the Archetype Offline Predictive Maintenance (C6) ................... 209
Figure 53: Excerpt of sustainability report Henkel AG ...................................................................... 212
Figure 54: Excerpt of sustainability report Volkswagen AG .............................................................. 212
Figure 55: Dashboard Design .............................................................................................................. 213
Artificial Intelligence for Human Decision-Makers
List of Tables xiii
List of Tables
Table 1: Research summary of Chapter 2 ............................................................................................. 21
Table 2: Verification of Problem Relevance and Research Gaps ......................................................... 29
Table 3: Keywords for Literature Review ............................................................................................. 32
Table 4: Meta-characteristics ................................................................................................................ 33
Table 5: Performed Iterations in Taxonomy Development ................................................................... 34
Table 6: Taxonomy for Business Analytics in Smart Manufacturing ................................................... 35
Table 7: Application of Taxonomy, Example I to III ............................................................................ 41
Table 8: Archetypes of Business Analytics in Smart Manufacturing ................................................... 44
Table 9: Research summary of Chapter 3 ............................................................................................. 72
Table 10: Categorization and summary of current findings to counter the credibility gap ................... 79
Table 11: Criteria for the quality of information ................................................................................... 83
Table 12: Brief descriptions of the latent variables ............................................................................... 89
Table 13: Derived measurement indicators of the information quality criteria .................................... 90
Table 14: Results from the forecast validity of the measurement indicators ........................................ 92
Table 15: Results of the testing measures for the formative measurement models .............................. 93
Table 16: Result of the hypothesis test by nomological validity .......................................................... 94
Table 17. Overview of Datasets. ......................................................................................................... 101
Table 18. Overview of ML Algorithm Implementations. ................................................................... 102
Table 19. Performance Results of ML Models. .................................................................................. 103
Table 20. Comparison of Mean Explainability and Standard Deviation. ............................................ 103
Table 21: Dimensions of XAI research ............................................................................................... 110
Table 22: Results of Explainability and Comprehensibility................................................................ 117
Table 23: Research summary of Chapter 3 ......................................................................................... 123
Table 24: Evaluation Factors of AI DSS for High-stake Decisions .................................................... 128
Table 25: Measurement Results for High-stake Maintenance AI DSS ............................................... 136
Table 26: Results of the AHP, Including Attitude Effects .................................................................. 138
Table 27. Trust-based UTAUT Extensions ......................................................................................... 148
Table 28. System-Transparency-based UTAUT Extensions............................................................... 149
Table 29. Validation and Reliability Testing of Pre-Study ................................................................. 156
Table 30. Final Set of Measurement Items for Main Study ................................................................ 156
Artificial Intelligence for Human Decision-Makers
List of Tables xiv
Table 31. Validation and Reliability Testing of Main Study .............................................................. 158
Table 32. Results of Main Study ......................................................................................................... 158
Table 33: Results of the test-statistics per hypothesis ......................................................................... 173
Table 34: List of Author’s Publications .............................................................................................. 190
Table 35: Overview Publication P1 .................................................................................................... 192
Table 36: Overview Publication P2 .................................................................................................... 193
Table 37: Overview Publication P3 .................................................................................................... 194
Table 38: Overview Publication P4 .................................................................................................... 195
Table 39: Overview Publication P5 .................................................................................................... 196
Table 40: Overview Publication P6 .................................................................................................... 197
Table 41: Overview Publication P7 .................................................................................................... 198
Table 42: Overview Publication P8 .................................................................................................... 199
Table 43: Overview Publication P9 .................................................................................................... 200
Table 44: XAI Transfer Model Techniques Classified by ML Type .................................................. 210
Table 45: Mathematical models for timeliness of data ....................................................................... 211
Table 46: Mathematical models for completeness of data .................................................................. 211
Table 47: Mathematical models for accuracy of data ......................................................................... 212
Table 48: Measurement Item Collection Procedure ............................................................................ 214
Table 49: Validation and Reliability Testing Results Pre-Study......................................................... 217
Table 50: Fornell-Larcker Criterion Main Study ................................................................................ 219
Table 51: Cross-loadings Main Study ................................................................................................. 220
Artificial Intelligence for Human Decision-Makers
List of Abbreviations xv
List of Abbreviations
AGV Automated Guided Vehicles
AHP Analytical Hierarchical Process
AI Artificial Intelligence
AI DSS AI-based decision support systems
ANN Artificial Neural Network
ANP Analytical Networking Process
AR Augmented Reality
ATT Attitude Towards Technology
AVE Average Variance Extracted
BA Business Analytics
BI Behavioral Intention
BR Behavioral Research
C Chapter
CA Cronbach’s Alpha
CaseID Events zur Prozessinstanz
CBM Condition-Based Maintenance
CE Causal Explanation
C-MAPSS Modular Aero Propulsion System Simulation
CNN Convolutional Neural Network
CPS Cyber-physical Systems
CQ Control Question
CR Composite Reliability
CSR Corporate Social Responsibility
DARPA Defense Advanced Research Projects Agency
DGIQ Deutschen Gesellschaft für Informations- und Datenqualität
DL Deep Learning
DSR Design Science Research
DSS Decision Support System
DT Decision Tree
EBESCO Business Source Premier
EC Ending Condition
EE Effort Expectancy
EIS Executive Information System
ERP Enterprise Resource Planning
FL Fornell-Larcker
Artificial Intelligence for Human Decision-Makers
List of Abbreviations xvi
GDPR General Data Protection Regulation
GRI Global Reporting Initiative
H Hypothesis
HI Health Index
I4.0 Industry 4.0
IFT Inference Time
IMT Implementation Time
IoS Internet of Services
IoT Internet of Things
IS Information System
ISR Information Systems Research
IT Information Technology
LIME Local Interpretable Model-agnostic Explanations
LSTM Long-Short-Term Memory
MAS Multi-Agent Systems
MIS Management Information System
ML Machine Learning
MRO Maintenance, Repair and Operations
MSE Mean Squared Error
NGO Non-Governmental Organization
OLAP On-line Analytical Processing
P Publication
PE Performance Expectancy
PLS Partial Least Squares
PV Prediction Value
RF Random Forest
RFID Radio-Frequency Identification
RMSE Root Mean Square Error
RO Research Objective
RSL Required Skill Level
RUL Remaining Useful Life
SEM Structural Equation Model
SHAP SHapley Additive exPlanations
ST System Transparency
SVM Support-Vector Machine
TA Trust Ability
TAM Technology Acceptance Model

Artificial Intelligence for Human Decision-Makers
List of Abbreviations xvii
TB Trusting Beliefs
TT Training Time
UTAUT Unified Theory of Acceptance and Use of Technology
VE Visual Explanation
XAI Explainable Artificial Intelligence
XANN XAI-transferred ANN
Artificial Intelligence for Human Decision-Makers
1
1 Introduction
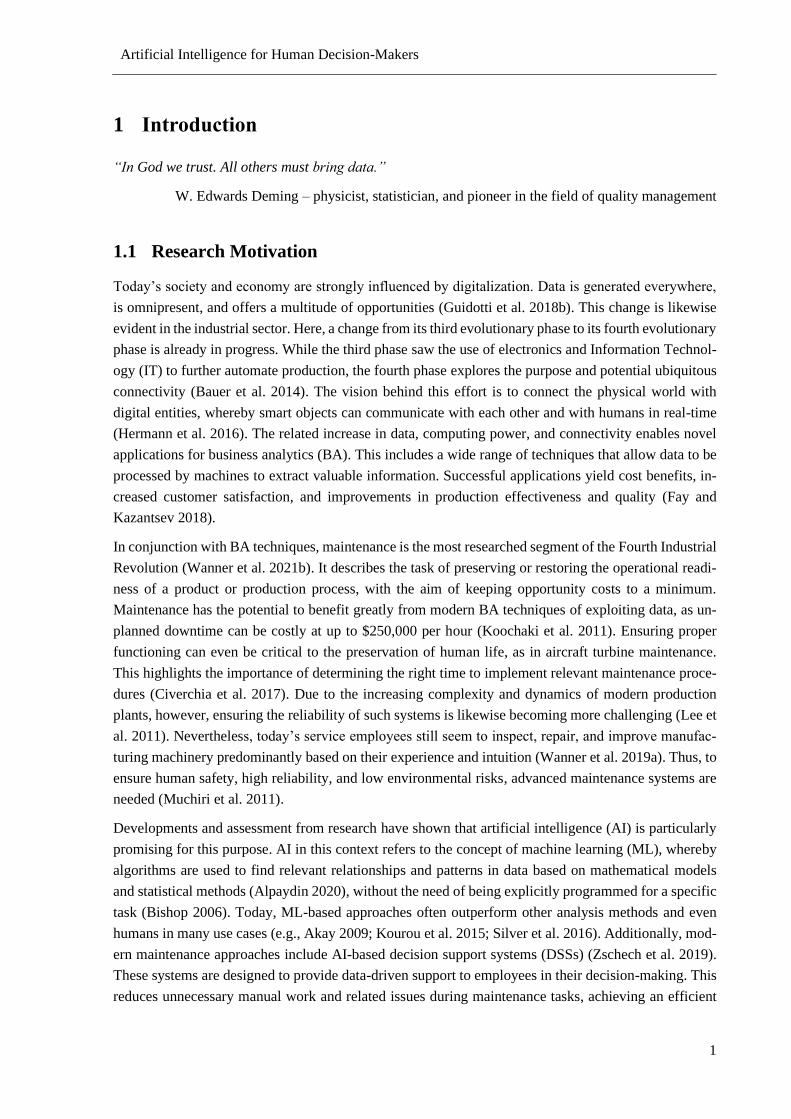
“In God we trust. All others must bring data.”
W. Edwards Deming – physicist, statistician, and pioneer in the field of quality management
1.1 Research Motivation
Today’s society and economy are strongly influenced by digitalization. Data is generated everywhere,
is omnipresent, and offers a multitude of opportunities (Guidotti et al. 2018b). This change is likewise
evident in the industrial sector. Here, a change from its third evolutionary phase to its fourth evolutionary
phase is already in progress. While the third phase saw the use of electronics and Information Technol-
ogy (IT) to further automate production, the fourth phase explores the purpose and potential ubiquitous
connectivity (Bauer et al. 2014). The vision behind this effort is to connect the physical world with
digital entities, whereby smart objects can communicate with each other and with humans in real-time
(Hermann et al. 2016). The related increase in data, computing power, and connectivity enables novel
applications for business analytics (BA). This includes a wide range of techniques that allow data to be
processed by machines to extract valuable information. Successful applications yield cost benefits, in-
creased customer satisfaction, and improvements in production effectiveness and quality (Fay and
Kazantsev 2018).
In conjunction with BA techniques, maintenance is the most researched segment of the Fourth Industrial
Revolution (Wanner et al. 2021b). It describes the task of preserving or restoring the operational readi-
ness of a product or production process, with the aim of keeping opportunity costs to a minimum.
Maintenance has the potential to benefit greatly from modern BA techniques of exploiting data, as un-
planned downtime can be costly at up to $250,000 per hour (Koochaki et al. 2011). Ensuring proper
functioning can even be critical to the preservation of human life, as in aircraft turbine maintenance.
This highlights the importance of determining the right time to implement relevant maintenance proce-
dures (Civerchia et al. 2017). Due to the increasing complexity and dynamics of modern production
plants, however, ensuring the reliability of such systems is likewise becoming more challenging (Lee et
al. 2011). Nevertheless, today’s service employees still seem to inspect, repair, and improve manufac-
turing machinery predominantly based on their experience and intuition (Wanner et al. 2019a). Thus, to
ensure human safety, high reliability, and low environmental risks, advanced maintenance systems are
needed (Muchiri et al. 2011).
Developments and assessment from research have shown that artificial intelligence (AI) is particularly
promising for this purpose. AI in this context refers to the concept of machine learning (ML), whereby
algorithms are used to find relevant relationships and patterns in data based on mathematical models
and statistical methods (Alpaydin 2020), without the need of being explicitly programmed for a specific
task (Bishop 2006). Today, ML-based approaches often outperform other analysis methods and even
humans in many use cases (e.g., Akay 2009; Kourou et al. 2015; Silver et al. 2016). Additionally, mod-
ern maintenance approaches include AI-based decision support systems (DSSs) (Zschech et al. 2019).
These systems are designed to provide data-driven support to employees in their decision-making. This
reduces unnecessary manual work and related issues during maintenance tasks, achieving an efficient
Artificial Intelligence for Human Decision-Makers
2
utilization of given resources (Elattar et al. 2016; Peng et al. 2010). On the downside, such systems have
the disadvantage that the processing mechanisms and their results are often difficult to reproduce as the
ML algorithms are, in many cases, not comprehensible to humans.
As a consequence, the adoption of AI-based systems has been lacking in practice. Organizational or
technical issues notwithstanding, this seems to be largely the result of a psychological barrier (Chui et
al. 2018; Milojevic and Nassah 2018). The ‘real problem’ behind this is assumed to be the dilemma
between ML model performance and ML model explainability (Gilpin et al. 2018; Gunning and Aha
2019). In the example of industrial maintenance, high complexity and a large amount of input data must
to be processed by today’s maintenance experts, which requires the support of high-performance, AI-
based DSSs (Raouf et al. 2006b). In turn, a high-performance system will only be effective if the user
has sufficient confidence in its calculations and results. Otherwise the user will not include the input of
the system in his subconscious decision-making (Adadi and Berrada 2018; Sheridan and Hennessy
1984). This requires the presence of explainability and trustworthy explanations (Hayes and Shah 2017;
Hoff and Bashir 2015; Mercado et al. 2016). Nevertheless, the focus within AI research is on improving
performance with little regard for explainability. This is especially evident by the successes of Deep
Learning (DL) (La Cava et al. 2021; Wang et al. 2018a). These algorithms are characterized by a com-
plex, multi-layered architecture yielding high performance, but lacking of transparency and thus ex-
plainability (LeCun et al. 2015; Siau and Wang 2018).
Research in the domain of explainable AI (XAI) attempts to address this issue by trying to formulate
models that offer both performance and explainability (Gunning and Aha 2019). Therefore, methods are
developed with the goal of making black-box ML models explainable. The term ‘explainable’ refers to
the aim of achieving interpretability for human users. Essentially, two XAI approaches can be distin-
guished: the transformation of black-box models into per se explainable white-box models (Wanner et
al. 2020c); and an ex-post model extension to reveal the internal computational logic (Rudin 2019) or
its reasoning for a particular recommendation (Dam et al. 2018; Lipton 2018). Still, both approaches are
criticized for lacking user focus (Arrieta et al. 2020). That is, provided explanations are neither con-
sistent with the original ML model nor intuitive to a human decision-maker (Rudin 2019). In response,
researchers have called for further socio-technical studies in (X)AI (among others, Lu et al. 2020; Saha
et al. 2019; Springer and Whittaker 2019; Weitz et al. 2019; Zahedi et al. 2019). Especially the lack of
user understanding regarding the perception of explanations and general acceptance criteria of such sys-
tems needs to be better understood.
With this in mind, this thesis attempts to conduct appropriate basic research in the area of socio-technical
(X)AI and to focus specifically on the user. This should contribute artifacts that assist in the structuring
of such techniques and systems and in a better understanding of the perception of explanations as well
as adoption preferences from a user perspective. Therefore, Industry 4.0 was chosen as the study context.
Both practitioners and researchers can benefit from this. On the one hand, the results allow for a better
understanding of the requirements for future development of effective XAI methods. On the other hand,
the results support the evaluation of relevant adoption barriers hindering the introduction and selection
of such AI-based DSS for practical use.
The thesis is divided into six chapters (C). C1, ‘Introduction’, gives an overview of the theoretical and
methodological foundations, the related work, the research design, and the thesis structure. C2 to C4
contain the three main areas of ‘Systematization of the Field’ (C2), ‘(X)AI DSS User Perception’ (C3),
Artificial Intelligence for Human Decision-Makers
3
and ‘(X)AI User Adoption’ (C4). In ‘Discussion of the Results’ (C5) the connections among the publi-
cations and related work are shown. Finally, ‘Concluding Remarks and Future Research’ follows in C6.
1.2 Theoretical Foundation
This chapter serves to provide a better understanding of the overall context of this thesis and the related
theoretical foundations. In addition, it aims to clarify how technical aspects meet social aspects in these
social-technical investigations.
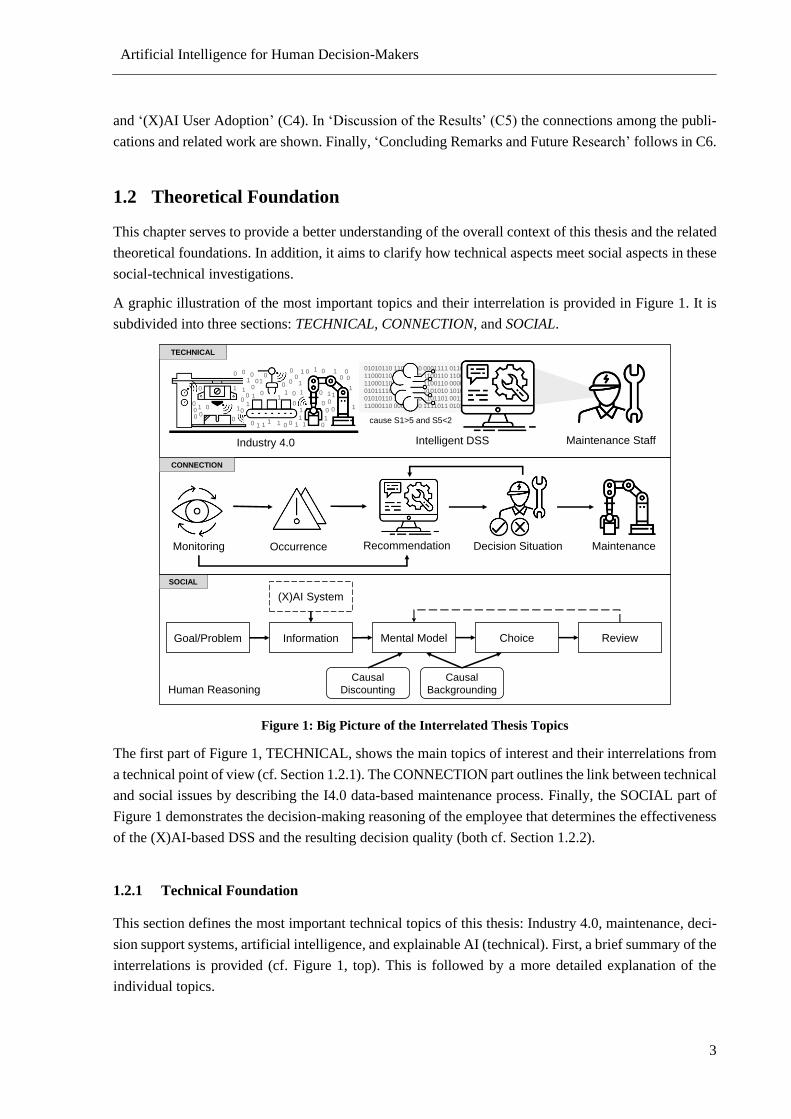
A graphic illustration of the most important topics and their interrelation is provided in Figure 1. It is
subdivided into three sections: TECHNICAL, CONNECTION, and SOCIAL.
Figure 1: Big Picture of the Interrelated Thesis Topics
The first part of Figure 1, TECHNICAL, shows the main topics of interest and their interrelations from
a technical point of view (cf. Section 1.2.1). The CONNECTION part outlines the link between technical
and social issues by describing the I4.0 data-based maintenance process. Finally, the SOCIAL part of
Figure 1 demonstrates the decision-making reasoning of the employee that determines the effectiveness
of the (X)AI-based DSS and the resulting decision quality (both cf. Section 1.2.2).
1.2.1 Technical Foundation
This section defines the most important technical topics of this thesis: Industry 4.0, maintenance, deci-
sion support systems, artificial intelligence, and explainable AI (technical). First, a brief summary of the
interrelations is provided (cf. Figure 1, top). This is followed by a more detailed explanation of the
individual topics.
01010110 11010010 0001111 01101010
11000110 00010010 1100110 11001100
11000110 00010010 1100110 00000000
01011110 11110010 0101010 10101010
01010110 11010010 1101101 00111010
11000110 00010010 1111011 0101
Intelligent DSS Maintenance StaffIndustry 4.0
11
11
1
1
1
11
1
11
11
10
0 0
0
0
0
0
0
0
0
0
0 0
0
0
0
00 1
0
0
0 1
1
10
0
00
0
0
1
0
1
1
0
0
0
0
00
00
0
11
111
1
cause S1>5 and S5<2
TECHNICAL
SOCIAL
CONNECTION
Occurrence RecommendationMonitoring Decision Situation Maintenance
Information ReviewGoal/Problem
Causal
Backgrounding
ChoiceMental Model
Causal
DiscountingHuman Reasoning
(X)AI System
Artificial Intelligence for Human Decision-Makers
4
Summary. In short (from left to right), there is extensive networking and data exchange within so-called
‘smart factories’. This name is given to factories that apply the principles and techniques of I4.0. The
provided data variety, volume, and velocity can be used by algorithms from the field of AI to identify
data patterns that indicate anomalies of interest. This information is valuable for maintenance tasks, and
thus for maintenance staff. However, to benefit from these opportunities, a suitable human-machine
collaboration is needed. Such information is therefore often provided by an AI-based DSS. This system
attempts to prepare the information in an appropriate manner for its user. One possibility to support this
in the context of black-box DL algorithms is offered by methods from the field of explainable AI.
Industry 4.0. The Fourth Industrial Revolution is about an overall connection and interaction between
objects within ‘smart factories’. Here, cyber-physical systems (CPSs), as each intelligent self-acting
object connected is, monitor physical processes, create virtual copies of the physical world, and make
decentralized decisions. Through the use of the Internet of Things (IoT) technology, CPSs communicate
and cooperate with each other and with humans in real time. Via the Internet of Services (IoS), both
internal and cross-organizational services are offered and used by the participants of the value chain
(Hermann et al. 2016). The term ‘Industry 4.0’ itself refers to a specific concept put forth by the German
federal government (Kagermann et al. 2013). In English-language literature, however, the term ‘smart
manufacturing’ is more frequently used (e.g., He and Wang 2018; Kang et al. 2016; Kusiak 2018; Mittal
et al. 2017). This variety of names notwithstanding, the concept is rather multifaceted as the ideas behind
it are fulfilled by diverse technological innovations (Hermann et al. 2016). So, for many experts the
focus of I4.0 is on the technological advances that are responsible for the changes in the value chain
(among others, Kagermann et al. 2013; Lu 2017; Zhou et al. 2015b).
An important sub-sector of manufacturing that can benefit greatly from the new principles and tech-
niques of I4.0 is industrial maintenance (Wanner et al. 2021b). According to the European standardiza-
tion of terms (CEN/TC 319), maintenance is understood as the combination of all technical, administra-
tive, and managerial measures that are necessary during the life-cycle of an item in order to keep it in a
condition or restore it to a condition in which it can fulfill its intended functions. Here, an item is a part,
component, device, subsystem, functional unit, equipment, or system, which can be described and con-
sidered individually. It can be either a piece of hardware, software, or both (Committee 2010). The need
for maintenance to keep an item in its working condition is due to the problem of wear. This is caused
by chemical and/or physical processes, such as corrosion or breakage. Upon reaching a certain degree
of wear, the individual wear limit of the item, a failure of the functional capability occurs. This undesir-
able condition can be remedied or even prevented through maintenance measures (Committee 2010).
Maintenance measures are part of a maintenance strategy. A maintenance strategy is a defined and time-
based combination of measures for machinery and/or related components based on a target function
(Biedermann 1990; Sturm 1996). This is the most common approach in order to minimize opportunity
costs (Liu and Xu 2017). The activities included can be both reactive, after the occurrence of a fault,
and preventive, with regard to anticipatory countermeasures (Delen 2014). The implementation of I4.0
paradigms expands the set of possible measurement options for manufacturers. This new data infrastruc-
ture allows for modern data-based evaluations and use cases. On the one hand, existing maintenance
strategies and measures can be improved. On the other hand, modern procedures, such as real-time data
monitoring for condition-based maintenance, become possible (e.g., Wanner et al. 2019a). In conclu-
Artificial Intelligence for Human Decision-Makers
5
sion, modern data evaluation procedures should minimize unplanned downtime (Mungani and Visser
2013; Pawellek 2016).
Decision Support Systems. The increasing complexity and amount of information in modern manufac-
turing cannot be fully processed by maintenance employees (Belciug and Gorunescu 2020). Research
in DSS attempts to address this problem by supporting the decision-maker with modern techniques and
optimization theory. Such systems are designed to encapsulate the complexity of the respective process
(Wanner et al. 2020a). While management information systems (MIS) offer decision support for struc-
tured decisions, modern DSSs provide support for semi-structured and unstructured decisions as well
(Belciug and Gorunescu 2020; Gorry and Morton 1971). In this capacity, they are able to process a wide
variety and volume of data, e.g., from different sensors, to gain insights (Belciug and Gorunescu 2020;
Kasie et al. 2017). Combined with domain-specific knowledge and analytical decision models, these
systems assist their users in selecting logical actions for given problems in a limited timeframe
(Hamouda 2011; Wang 1997). Through a human-machine interface, the computations are presented.
This allows the user to extract meaningful information to support his decision-making (Simonovic
1999). Especially in complex situations, more efficient and effective decisions become possible (Yam
et al. 2001).
According to Power, there are five types of DSSs. Model-driven DSSs allow one to access and manip-
ulate specific models (1). These can represent, for example, a financial, simulation, optimization, or
statistical model. Based on limited data, parameters, and quantitative methods, decision-makers are as-
sisted in analyzing a situation without the need for large databases (Power 2002). Data-driven DSSs
allow one to analyze time series data from various internal and external systems, and even real-time data
(2). Typical examples with different levels of functionality and decision support are data warehouses,
on-line analytical processing (OLAP), and executive information systems (EIS) (Power 2008). Commu-
nication-driven DSSs process data from networks and communication technologies to accelerate deci-
sion-relevant collaboration and communication (3). So, these DSSs include, for example, the data of e-
mail programs or meeting software (Power 2002). Document-driven DSSs retrieve and manage data
from structured and unstructured documents from a variety of origins, such as catalog data or product
specifications (4). An example of a decision-support tool associated with a document-driven DSS is a
search engine (Power 2002). Knowledge-driven DSSs recommend suitable actions to their users (5).
These systems have specialized problem-solving expertise for (a) particular domain(s) or task(s) (Power
2002). An example is a decision support system for ‘smart maintenance’. The system could monitor the
operating conditions of the machine and give a feedback about the wear status of a machine (part) to tell
the employee, for example, the optimal time for maintenance (Yam et al. 2001).
Over the years, DSSs have been enhanced with AI logic, making them intelligent DSSs (Bonczek et al.
2014). This is especially found in the case of knowledge-driven DSSs (Power 2001). Such systems are
intended, for example, to detect fraud and expedite financial transactions, to serve as a web-based advi-
sory system, or to improve scheduling in manufacturing operation (Power 2008).
Artificial Intelligence. AI in the field of Information Systems (IS) research is a generic term for ‘intel-
ligent agents’. These agents pursue a specific goal, which they try to maximize by perceiving and inter-
acting with the environment (Poole et al. 1998). Therefore, they need cognitive abilities of learning and
problem solving, which can be compared with intelligent abilities that resemble those of a human being
(Nilsson 2014). ML is a subfield of AI. It is the science of mathematical models and algorithms that use
Artificial Intelligence for Human Decision-Makers
6
machines to solve tasks (Alpaydin 2020). ML algorithms are able to learn iteratively from empirical
data, which enables them to find non-linear relationships and complex patterns without being explicitly
programmed to do so (Bishop 2006). Their implementation is divided into training and testing phases.
During training, the algorithm is trying to learn how to solve the data problem at hand most accurate. Its
performance is then tested and evaluated on new data unknown to it (Alpaydin 2020).
In general, there is a distinction between three forms of ML. Supervised ML describes a learning para-
digm in which inputs are consciously assigned to predefined outputs. By transferring input-output pairs
for training purposes, the machine can automatically assign (unknown) future cases (Marsland 2015;
Shalev-Shwartz and Ben-David 2014; Wang et al. 2012). In unsupervised ML, the input-output pairs
are not known, and the machines receive only inputs. The aim is to uncover previously undiscovered
patterns within the transferred input data by the use of the algorithm (Ghahramani 2003; Kubat 2017;
Shalev-Shwartz and Ben-David 2014). Reinforcement ML is a paradigm that automates learning and
decision-making processes. Here, a learning agent acts based on a predefined number of actions in a
defined digital environment and is trained by trial and error in combination with rewards. The overall
aim is to maximize the cumulative rewards, whereby the learner maximizes task-optimal behavior with
respect to conditions and actions (Alpaydin 2020; Sutton and Barto 2018; Tokic 2013; Wang et al. 2012).
In addition to the different forms of ML, different algorithms exist. Each of these has different strengths
and weaknesses. For example, algorithms of decision trees require manual feature selection to ensure
an efficient and effective training but are easier to interpret for a human user. However, the feature
selection task can be time-consuming. This is especially evident when the dataset is high-dimensional
or when the application context is not known to the ML engineer (Bini 2018). Artificial neural networks
(ANNs) attempt to alleviate these problems. Through different computational layers and the use of per-
ceptron, data inputs are processed through a variety of mathematical operations (Bini 2018). Due to the
large increase in data and complexity, algorithms with a high number of computational layers also re-
ferred to as ‘deep’ show particularly useful results (Schmidhuber 2015). Thus, DL algorithms often
outperform other ML algorithms as well as humans (e.g., Wang et al. 2018a). However, due to their
nested non-linear structure, they are not per se interpretable by a human user and are called ‘black boxes’
(Adadi and Berrada 2018; Samek et al. 2017).
Explainable AI (technical). The research area of explainable AI addresses the problems that arise from
the black-box properties of such models. XAI thus seeks to provide more transparent ML models that
simultaneously offer high model performance and high explanatory power (Gunning and Aha 2019).
This is accomplished by using algorithms and mathematical methods to explain the internal computa-
tional processes of the models (Abdul et al. 2018). In other words, it is about a better understanding of
how and why the ML model offers its recommendations. Answering the question of how is referred to
as ‘global explainability’. Here, the internal computational process should be made transparent (Dam et
al. 2018; Rudin 2019). The why question is addressed by so-called ‘local explainability’ of the model.
Here, it is about providing ex-post justifications for the AI’s recommendation in any particular case
(Dam et al. 2018; Lipton 2018). However, purposeful explanations are difficult to achieve. Highly ac-
curate explanations, such as a mathematical expression for ML model decision-making, are difficult for
humans to comprehend. Conversely, when an explanation is more abstract and thus easier to understand,
it often lacks predictive power (Gilpin et al. 2018; Guidotti et al. 2018a). Attempts such as those by
Artificial Intelligence for Human Decision-Makers
7
Ribeiro et al. (2016b) therefore seek to find an XAI approach that abstracts real-world complexity, and
thus model accuracy, in favor of better perception and increased human understanding.
Today, three technical branches of XAI research exist, which are not necessarily mutually exclusive.
First, there are XAI transfer techniques (Wanner et al. 2020c) (1). A black-box model is transferred into
a per se transparent ‘glass box’ model to explain its internal computational process (Holzinger et al.
2019). This can be done through the use of a second, more explainable ML model and/ or mathematical
methods (Abdul et al. 2018). An example is to convert a convolutional neural network (CNN) into a
human-readable ruleset (e.g., Oviedo et al. 2019; Xi and Panoutsos 2018). Nevertheless, the transfer
process reduces the accuracy of the resulting model in favor of greater explanatory power (Došilović et
al. 2018; Guidotti et al. 2018b). In addition, there is criticism of the procedures themselves for explaining
something that is per se not self-explanatory (Rudin 2019). In parallel, there is the technical possibility
of ex-post explanation frameworks such as Local Interpretable Model-Agnostic Explanations (LIME)
(Ribeiro et al. 2016b) and SHapley Additive exPlanations (SHAP) (Lundberg and Lee 2017) (2). These
allow particularly local explanations for recommendations of black-box ML models. An example would
be how strongly individual features contributed to a classification decision. Alternatively, there is also
the possibility to avoid black-box algorithms and focus on per se explainable white-box algorithms and
improve them iteratively (Rudin 2019) (3). By their design, these are already explainable to a human
user and provide an internal explanation, as in the case of decision trees (Herm et al. 2021b; Rudin
2019).
1.2.2 Social Foundation
This section defines the most important social topics of this thesis: human reasoning, explanation theory,
explainable AI (social), and implications for (X)AI models. First, the social-technical connection in the
use case of industrial maintenance is explained to shed light on the interrelation between human and
(intelligent) DSS (cf. Figure 1, middle). This is followed by a more detailed explanation of the topics
involved (cf. Figure 1, bottom).
Social-technical connection. In short (from left to right), there is a growing (partially) automated mon-
itoring of the production process or critical sub-components. By evaluating data from sensors, actuators,
and/or other data suppliers, the system can detect events of importance via the analysis of data patterns.
An example would be an unusually strong temperature rise with a sudden drop in valve pressure, indi-
cating a burst valve. The DSS provides the user with a notification of the potentially detected event via
the dashboard. In many AI-based systems, this includes a direct recommended action for the user. This
forces the decision-maker to decide. He can either agree/ trust the recommendation of the system or
reject it. In the first case he will act (maintain). In the rejection case, he will not do so. In case of uncer-
tainty, the human user will request further information from the system.
Due to the remaining error term of AI-based systems, a socio-technical dilemma arises. This is caused
in particular by the lack of traceability. It often remains unclear to the human user why the system has
issued its recommendation. A decision-maker may therefore elect not to consider the system’s recom-
mendation. It is not yet clear what information the human user needs and how it must be prepared to
counteract this issue. Furthermore, it remains unclear what other factors influence the decision-making
process. Conversely, the intelligent assistance system remains ineffective despite its improved per-
Artificial Intelligence for Human Decision-Makers
8
formance. Therefore, besides the technical feasibility of intelligent, data-based maintenance approaches,
addressing certain social/ psychological aspects via XAI research is crucial and requires further investi-
gation to ensure an effective hybrid intelligence (Dellermann et al. 2019; Wanner 2021).
Human Decision-Making. Human decision-making describes a logical sequence of mental activities
(Lunenburg 2010). Behind this is the ultimate goal of choosing the best possible course of action to
achieve one’s intentions (Eisenfuhr 2011). During the decision-making process, possible causal infer-
ences are drawn from given premises based on known causal relationships. Examples are theoretical
inferences or empirical arguments. In addition, the process is influenced by individual differences
(Bruine de Bruin et al. 2007), past experiences (Juliusson et al. 2005), personal relevance (Acevedo and
Krueger 2004), cognitive biases (Evans et al. 1983), and anchor effects (Tversky and Kahneman 1974).
Simon (1977) published a seminal work in which he divided the subconsciously occurring process into
several phases. This is the original backbone for many extensions and modifications by numerous re-
searchers (e.g., Mazzolini 1981; Mintzberg et al. 1976; Schwenk 1984; Vari and Vecsenyi 1988). Draw-
ing on these preliminary works, a five-part sequence can be derived, which is graphically illustrated in
Figure 1 (bottom): Goal/Problem (1), Information (2), Mental Model (3), Choice (4), and Review (5).
First, the decision goal or problem must be identified and defined (Pounds 1969; Vari and Vecsenyi
1988). This implies the recognition and diagnosis of the problem and possible causes (Mintzberg et al.
1976). Then, the decision-maker tries to obtain the appropriate information. This serves as input for the
generation of the mental model to weigh alternatives (Newstead et al. 2002; Schwenk 1984). In this
phase, a simplified model of reality is generated based on the problem descriptions and the given
knowledge (Johnson-Laird 1983; Jones et al. 2011). One part of this is causal discounting. It describes
the process by which the assumed probability of an option decreases due to the attribution of a causal
relationship of information with respect to a (better) alternative option (Hilton 1996). Another part is
causal backgrounding. Here, irrelevant causes are discarded (Miller 2019), which thus corresponds to a
selection process (Hilton 1996). Ultimately, alternatives are prioritized (Schwenk 1984) to select the
most relevant or best solution (Hilton 1996). After the decision is made, a critical review of one’s choice
takes place (Dietrich 2010; Schwenk 1984). The experiences and insights are incorporated into one’s
mental model and can influence future decision-making (Miller 2019; Vari and Vecsenyi 1988).
Explanation Theory. Corresponding information is collected for the mental model and the included
selection process. In its own context, this information often equates to rationalizations for or against a
recommendation provided by an (X)AI-based DSS. An explanation is considered cognitively. Thus, it
is always associated with causality (e.g., Salmon 1984). Extending this, context is crucial. For Miller
(2019) this implies the properties of contrastive, selective, and social. Contrastive circumscribes the
consideration of counterfactual cases, selective the possible cognitive biases, and social the transfer of
knowledge through social interaction (Miller 2019). In addition, an explanation can have different forms.
It is specified by its format, i.e., how it is expressed. This might be visualizations, text, or formal ex-
pressions. Further, it is specified by its form, i.e., what the explanation is about. These can be examples,
patterns, features, decisions, or simplifications (Mueller et al. 2019). The act of considering an explana-
tion or information is therefore a socially cognitive process in which knowledge is transferred in a spe-
cific form from the explainer to the recipient (Lombrozo 2006). Explanations allow recipients to revise
their beliefs, but only if the explanation helps construct an alternative mental model (Einhorn and
Hogarth 1986; Hilton 1996).
Artificial Intelligence for Human Decision-Makers
9
It is therefore important to understand what constitutes a good explanation. A variety of conceptual
models exist in explanation theory. Traditional concepts argue that an explanation is good if it expresses
cause-effect covariation. The same is true for the correct answer to a why question (Einhorn and Hogarth
1986; Hilton 1996; Lu et al. 2020; Van Bouwel and Weber 2002). However, it seems problematic that
recipients may differ in their characteristics, knowledge, and intentions. Therefore, an explanation is
highly dependent on the user group (Hilton 1996; Kulesza et al. 2013; Lu et al. 2020). Other approaches
argue that coherence is a main criterion for a good explanation. One example of this is the ‘Theory of
Explanatory Coherence’ (Thagard 1989). It specifies seven basic principles that explanations must ad-
here to in order to conform to prior beliefs and be accepted by the receiver. Furthermore, Mueller et al.
(2019) list eight characteristics of explanatory coherence. However, some features appear to be more
important than others. For example, Kulesza et al. (2013) have shown that completeness is more im-
portant than soundness and that oversimplification can be problematic.
Explainable AI (social). The socio-technical research of XAI must try to consider psychological and
social findings concerning good explainability in addition to the technical realization of new methods.
This is due to the need to make AI models explainable and to better grasp what constitutes them in their
own context. The term ‘explainability’ itself is often also a synonym for model interpretability (Wanner
et al. 2020c). In XAI research, explainability is defined, e.g., according to Dam et al. (2018) as “[...] the
degree to which a human observer can understand the reasons behind a decision (e.g., a prediction) made
by the model”. For Ribeiro et al. (2016b), a system is interpretable if the input-output relationship can
be formally i.e., logically or statistically determined to be optimal or correct. A more user-centered
formulation is found in Cui et al. (2019) and Arrieta et al. (2020). For Cui et al. (2019), explainability is
the ability of the system to cut down the given information gaps between itself and its intended users.
According to Arrieta et al. (2020), explainability refers to the details and reasons a model provides to
make its function clear or easy to understand for a given audience.
The need for explainability of (X)AI-based DSSs has several reasons. It is assumed that increased sys-
tem transparency has a positive influence on the user’s trust. In turn, it is only if the user trusts the system
that he or she will include the information in the decision-making process, thus rendering the system
effective (Dam et al. 2018; Ribeiro et al. 2016b). More specific rationales are provided by Adadi and
Berrada (2018). They distinguish four motivations: explain to justify (correct decision-making), explain
to control (prevention), explain to improve (models that are interpretable can be improved more easily),
and explain to discover (knowledge gain). Challenges related to this include confidentiality, security,
complexity, accountability, and unfairness. Confidentiality is about legal or institutional issues that must
be addressed. Security issues imply a verification capability guarding against internal and external at-
tacks. Complexity refers to the algorithm itself, attempting to explain the inner logic in a way that hu-
mans can understand. The accountability of the results and the check of unfairness of moral questions
help the user to avoid wrong decisions by providing additional verification information (Arrieta et al.
2020; Felten 2017).
Implications for (X)AI Models. This constitutes several prerequisites for explainable AI models and
explanatory techniques. Guidelines are provided by Ribeiro et al. (2016b). According to these, explain-
ers must create explanations that are interpretable and easy for the user to understand. There must be
local fidelity, so that explanations actually apply to the predicted instance. Furthermore, explainers are
(at best) model-agnostic. Similarly, explainers should provide an appropriate global explanation to build
Artificial Intelligence for Human Decision-Makers
10
trust in the model (Ribeiro et al. 2016b). For their part, Arrieta et al. (2020) also lay out four recommen-
dations. According to them, contextual factors must be considered. Examples include the purpose of the
AI model and the quality of the existing technology. Extending the explanatory approach must be in line
with the context or domain. This includes specific requirements, risks, needs, data resources, and
knowledge. Likewise, the style of the explanations chosen should take into consideration the impact on
ethics, fairness, and security. Finally, the authors advocate that the chosen explanatory approaches
should always be in line with the intended user group. Therefore, the expertise and cognitive abilities of
the intended user(s) must be considered (Arrieta et al. 2020).
Explainability of AI models can be manifested on two levels: global explainability and local explaina-
bility. Global explainability refers to transparency regarding the internal operations and properties of
the AI model. This includes the decision model, individual algorithms, or individual components (Cui
et al. 2019; Ras et al. 2018). For example, traceability can be created by an algorithm that is per-se
considered explainable, such as that of a decision tree. The same applies to technical realizations such
as the disclosure of feature importance by an XAI augmentation framework like SHAP. Nevertheless,
these approaches often require specific knowledge concerning the meaning and contexts, so that global
explainability primarily aims at explanations among AI experts (Cui et al. 2019). Local explainability
or ex-post explainability, on the other hand, refers to transparency regarding the computation of the
individual decision (Dam et al. 2018). Taking this further, a distinction is made between model-agnostic
and model-specific. In other words, depending on the chosen algorithm specific and/ or generally appli-
cable explanatory approaches can be realized (Arrieta et al. 2020). An overview of available explanatory
techniques and approaches is provided, e.g., by Arrieta et al. (2020), Wanner et al. (2020c), Adadi and
Berrada (2018), and Guidotti et al. (2018b). Summarizing these, the focus of AI model explainability is
on visualizations, textual explanations, and example-based explanations (Lipton 2018).
1.3 Related Work
Several research papers have been written to address the open challenges of criticizing the lack of user
orientation in (X)AI research and to provide support for the systematization, perception, and adoption
of AI-based DSSs. This has resulted in a large number of contributions related to this work. The follow-
ing is a brief outline of some of these efforts.
Systematization. The number of publications and the diversity in research in the field of I4.0 is very
extensive (Wanner et al. 2021b). Likewise, there are surveys and literature reviews that attempt to reduce
the resulting complexity for researchers and practitioners by structuring the I4.0 research field. For ex-
ample, some authors try to structure application fields of a certain type of technology within I4.0, such
as that of ML (e.g., Diez-Olivan et al. 2019; Sharp et al. 2018; Wuest et al. 2016). Others focus on the
organization of publications of a specific sub-area such as process monitoring (e.g., Sutharssan et al.
2015; Zhou and Xue 2018) or production planning (e.g., Reis and Gins 2017; Sutharssan et al. 2015).
For industrial maintenance in particular, there are a few structuring contributions for modern ap-
proaches. Zschech (2018), e.g., provides a taxonomy for maintenance analytics research publications.
The author focuses on analysis techniques, data properties, and the objective pursued by a particular
maintenance approach. Another example is the publication of Lee et al. (2014b). They develop a
Artificial Intelligence for Human Decision-Makers
11
classification framework for algorithms in the field of condition-based maintenance of rotating machin-
ery based on existing literature.
The same problem of a large quantity and diversity of research papers is found in XAI. Few structuring
articles exist, despite the high complexity of having a multitude of research areas involved, such as IS
and psychology. A survey article that has also sparked a new wave of interpretive AI approaches and
related explainable research efforts is that of Gunning and Aha (2019). The author is part of the Defense
Advanced Research Projects Agency (DARPA) initiative, which later also did a comprehensive litera-
ture review on XAI (Mueller et al. 2019). Another comprehensive literature survey on explainable arti-
ficial intelligence was written by Adadi and Berrada (2018). They motivated their work with the changes
of the Fourth Industrial Revolution, which will lead to a broad adoption of AI approaches, but might
overcome problems related to AI’s black-box characteristics (Adadi and Berrada 2018). Likewise, initial
structuring of XAI approaches has been found to support certain areas of activity, such as medicine
(Tjoa and Guan 2020). A comprehensive review and structuring that provides concepts, taxonomies,
opportunities and challenges for XAI has been written by Arrieta et al. (2020).
Perception. In XAI research, the perception of explanations is of great importance. In this context, types
of ML algorithms are divided into black, grey, and white boxes (Wanner et al. 2020b). Within related
work, white-box models usually refer to decision trees and linear regressions, while black-box models
include algorithms from the field of ANNs. Thereby, some theoretical division of common types of ML
algorithms exists according to the dilemma between the two dimensions of XAI: model performance
and model explainability (e.g., Angelov and Soares 2020; Arrieta et al. 2020; Dam et al. 2018; Duval
2019; Gunning and Aha 2019; James et al. 2013; Luo et al. 2019; Morocho-Cayamcela et al. 2019;
Nanayakkara et al. 2018; Salleh et al. 2017; Yang and Bang 2019). In addition, there is research that
deals with the changed perception of explainability in the context of different initial situations. Cui et
al. (2019), for example, show that explanations are highly dependent on the types of users that the AI-
based system is intended to support. A model should therefore always be designed to fit its user(s) (Cui
et al. 2019). Furthermore, it is assumed that the implicit criticality of the use case is crucial when deter-
mining the need for explainability. Related to this, Rudin (2019) argues against the use of ex-post ex-
plained black-box models in use cases with high criticality situations. She justifies this by the fact that
the explanatory model neither represents the original model nor provides suitable explanations for the
user (Rudin 2019).
Other researchers explore components enabling an effective hybrid intelligence. This has been shown
to be the most powerful form of decision-making (Dellermann et al. 2019). However, the user’s confi-
dence in the AI-based DSS plays a decisive role in this, as it directly correlates with the effectiveness of
such a system (among others, Dam et al. 2018). This, in turn, depends on different criteria related to
human decision-making. Here, the related work of Hoffman et al. (2018) can be highlighted in particular,
which lists several important XAI metrics. For example, they point to the need for goodness of expla-
nations and user satisfaction with the explanations. They also identify user understanding, perceived
trust, and the performance of a human-XAI system as relevant. In their publication, they also offer rec-
ommendations for substituting these metrics, e.g., by providing appropriate questioning options
(Hoffman et al. 2018). Another key work on this is that of Miller (2019). Here, the author elaborates on
existing knowledge about the explanatory process from the perspective of a user, who is subject to
Artificial Intelligence for Human Decision-Makers
12
numerous cognitive biases and social expectations. In doing so, he uses prior work from the fields of
philosophy, cognitive psychology/science, and social psychology (Miller 2019).
Adoption. The adoption of AI-based DSSs in industrial practice is still being met with some hesitation.
Therefore, an attempt has been made to shed light on this problem by identifying adoption barriers.
Results from studies indicate that high implementation effort, lack of data, and a lack of necessary
knowledge are seen as the most important barriers from a technical and organizational perspective (Chui
et al. 2018; Duscheck 2017; Milojevic and Nassah 2018). However, psychological barriers also seem to
be of great importance. In particular, the resulting social aspects, such as technology anxiety and alien-
ation from ‘known work’ due to lack of understanding and trust, are cited as resistance features (Mokyr
et al. 2015; Reder et al. 2019). Reder et al. (2019) shows that transparency of the decision-making behind
AI-based recommendations is a key factor here. Thus, it is assumed that improved transparency of such
systems will increase the likelihood that employees will adopt AI-based decision support tools (e.g.,
Dam et al. 2018; Reder et al. 2019). However, the studies themselves are often conducted by consulting
firms. In contrast, there is a lack of scientific studies that explore the relative importance of individual
factors. In IS research, there are extensive empirical methods available (Benbasat and Barki 2007). Most
notably, adoption research using the Technology Acceptance Model (TAM) and the Unified Theory of
Acceptance and Use of Technology (UTAUT) seems to be suitable. Here, the contributions of Venkatesh
and his co-authors are of central importance (Venkatesh et al. 2003; Venkatesh et al. 2016).
Studies on IT artifact adoption using TAM/ UTAUT exist mainly for e-commerce, social media, and
mobile technologies, as shown in a comprehensive review by Rad et al. (2018). Corresponding works
investigating users’ willingness to adopt new technologies based on AI are less numerous to date
(exceptions include e.g., Fan et al. 2018; Hein et al. 2018; Portela et al. 2013). The same is true for the
industrial application context. Nevertheless, for example, there are studies on users’ adoption readiness
in production toward intelligent robots (e.g., Bröhl et al. 2016; Lotz et al. 2019). Bröhl et al. (2016),
e.g., examining the extent to which the willingness of users to collaborate with passive robots and active
robots differs. For industrial maintenance in particular, Wang et al. (2016c) investigate aviation students’
experiences with Augmented Reality (AR)-based training. Similarly, Jetter et al. (2018) assess the adop-
tion readiness toward market-ready AR tools for employee training in automotive maintenance. Related
work on adoption research at the intersection of AI and industrial maintenance is rather small. Amadi-
Echendu and De Wit (2015) investigated factors that influence the readiness of users of an intelligent
maintenance DSS to adopt the system. They found that ex-ante user training had an especially strong
positive influence. Kluge and Termer (2017) studied user readiness for a mobile fault-finding applica-
tion among maintenance employees.
In addition to the ‘official adoptions research’, there are research efforts to better understand the impact
of AI-based DSSs on human decision-making. Here, the two target variables confidence and perfor-
mance seem particularly important. For example, Zhang et al. (2020) conduct two experiments to inves-
tigate the effect of confidence scores and local explanations on user prediction accuracy and confidence.
Similar studies can be found in Westbrook et al. (2005), Zhou et al. (2015a), and Heath and Gonzalez
(1995). In all cases, additional information seems to improve confidence in the decision, but not perfor-
mance. However, there are also studies that have demonstrated this improvement in performance in their
respective contexts (e.g., Dellermann et al. 2019; Lai and Tan 2019), validating the aim of an effective
hybrid intelligence. Additionally, these studies are strongly related to explanatory perception. For ex-
Artificial Intelligence for Human Decision-Makers
13
ample, Nourani et al. (2019) show that adequate, human-centered provision of explanations have a pos-
itive impact on the user’s decision-making ability. However, studies such as Poursabzi-Sangdeh et al.
(2018) and Schaffer et al. (2019) suggest that too much information leads to the opposite effect. The
user becomes overwhelmed, which reduces the influence of the AI system.
1.4 Methodological Foundation
This chapter serves to provide a better understanding of the methodological context of this thesis and
the related research method foundations.
The content is subdivided into IS Research Foundations and Thesis Research Methods. The former
describes the two main fields of IS research as well as their holistic linkage by the IS research framework
(cf. Section 1.4.1). The latter is a short summary of the most important research methods applied in this
thesis (cf. Section 1.4.2).
1.4.1 IS Research Foundations
The IS research lies at the intersection of economics and computer science, with tools from real, formal,
and engineering sciences (Wilde and Hess 2007). Below, the principles of IS research are given first.
This is followed by a more specific discussion of the two main types of research and the overarching
connection.
IS Research Principles. Fundamentally, the goals of analysis, explanation, prediction, and prescrip-
tiveness are pursued within IS research (Gregor 2006). Thus, the aim is to derive new insights for and
from information and communication systems in business, government, and the private sector (WKWI
1994). The research itself is divided into two main scientific paradigms for gaining knowledge (March
and Smith 1995): Behavioral Research (BR) and Design Science Research (DSR) (Winter 2008). Both
are separate but also connected to one another (Hevner et al. 2004). The BR paradigm relies on truth
and its corresponding exploration. In contrast, the DSR paradigm seeks to create artifacts that are effec-
tive against a defined problem (Bichler 2006). The close connection of both paradigms results from the
lack of separability of the two endeavors: Truth influences design, while utility contributes to the refine-
ment of theory (Hevner et al. 2004).
Behavioral Research. BR originates from natural science research methods (Hevner et al. 2004). It
strives to achieve truth or explanatory power. Here, assertions must be consistent with observed facts,
and the ability to predict future observations is a sign of explanatory success. Progress is made when
new theories provide deeper, more comprehensive, and more accurate explanations (March and Smith
1995). To this end, efforts are made to develop theories – and an understanding thereof – that explain or
predict the organizational and human phenomena associated with the analysis, design, implementation,
management, and use of information systems (Hevner et al. 2004). Therefore, BR methods analyze in-
formation systems with the overarching goal of uncovering cause-effect relationships (Österle et al.
2010). Such theories inform researchers and practitioners about the interactions among people, technol-
ogy, and organizations that must be managed for an IS to become effective and efficient in an organiza-
tion. These theories consequently affect and are affected by IS design decisions made with respect to
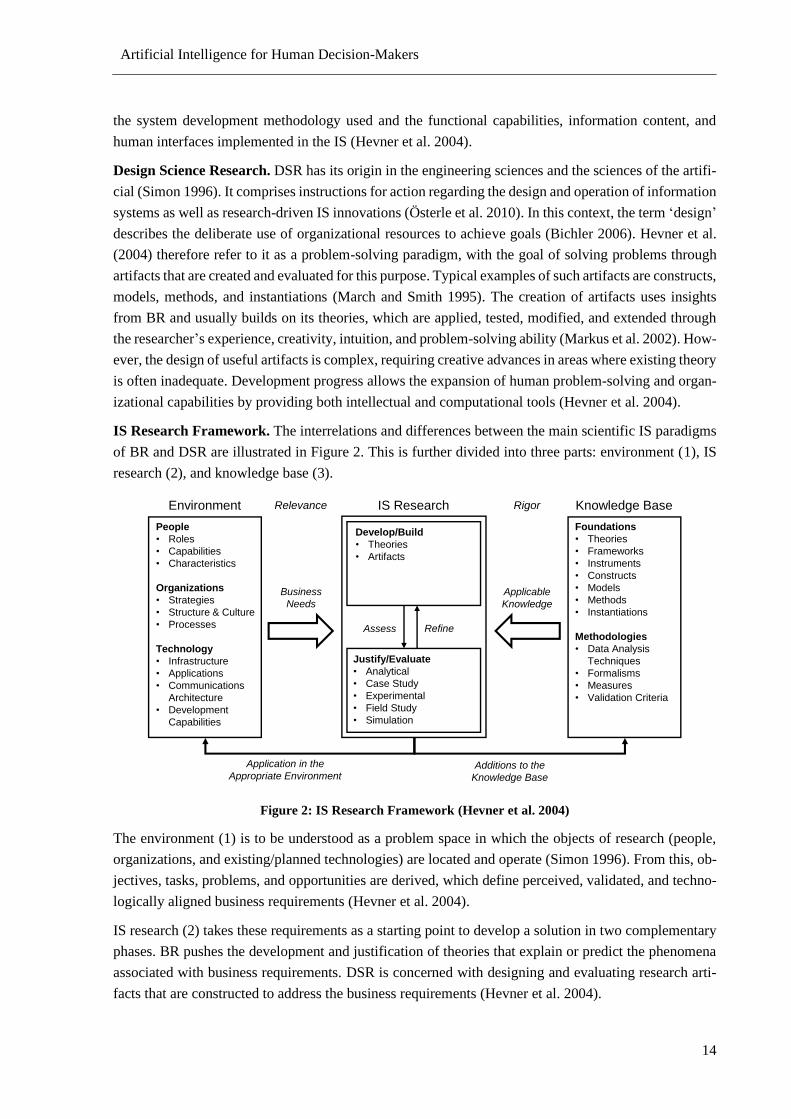
Artificial Intelligence for Human Decision-Makers
14
the system development methodology used and the functional capabilities, information content, and
human interfaces implemented in the IS (Hevner et al. 2004).
Design Science Research. DSR has its origin in the engineering sciences and the sciences of the artifi-
cial (Simon 1996). It comprises instructions for action regarding the design and operation of information
systems as well as research-driven IS innovations (Österle et al. 2010). In this context, the term ‘design’
describes the deliberate use of organizational resources to achieve goals (Bichler 2006). Hevner et al.
(2004) therefore refer to it as a problem-solving paradigm, with the goal of solving problems through
artifacts that are created and evaluated for this purpose. Typical examples of such artifacts are constructs,
models, methods, and instantiations (March and Smith 1995). The creation of artifacts uses insights
from BR and usually builds on its theories, which are applied, tested, modified, and extended through
the researcher’s experience, creativity, intuition, and problem-solving ability (Markus et al. 2002). How-
ever, the design of useful artifacts is complex, requiring creative advances in areas where existing theory
is often inadequate. Development progress allows the expansion of human problem-solving and organ-
izational capabilities by providing both intellectual and computational tools (Hevner et al. 2004).
IS Research Framework. The interrelations and differences between the main scientific IS paradigms
of BR and DSR are illustrated in Figure 2. This is further divided into three parts: environment (1), IS
research (2), and knowledge base (3).
Figure 2: IS Research Framework (Hevner et al. 2004)
The environment (1) is to be understood as a problem space in which the objects of research (people,
organizations, and existing/planned technologies) are located and operate (Simon 1996). From this, ob-
jectives, tasks, problems, and opportunities are derived, which define perceived, validated, and techno-
logically aligned business requirements (Hevner et al. 2004).
IS research (2) takes these requirements as a starting point to develop a solution in two complementary
phases. BR pushes the development and justification of theories that explain or predict the phenomena
associated with business requirements. DSR is concerned with designing and evaluating research arti-
facts that are constructed to address the business requirements (Hevner et al. 2004).
Environment IS Research Knowledge BaseRelevance Rigor
Business
Needs
Applicable
Knowledge
Application in the
Appropriate EnvironmentAdditions to the
Knowledge Base
Assess
People
• Roles
• Capabilities
• Characteristics
Organizations
• Strategies
• Structure & Culture
• Processes
Technology
• Infrastructure
• Applications
• Communications
Architecture
• Development
Capabilities
Foundations
• Theories
• Frameworks
• Instruments
• Constructs
• Models
• Methods
• Instantiations
Methodologies
• Data Analysis
Techniques
• Formalisms
• Measures
• Validation Criteria
Develop/Build
• Theories
• Artifacts
Refine
Justify/Evaluate
• Analytical
• Case Study
• Experimental
• Field Study
• Simulation
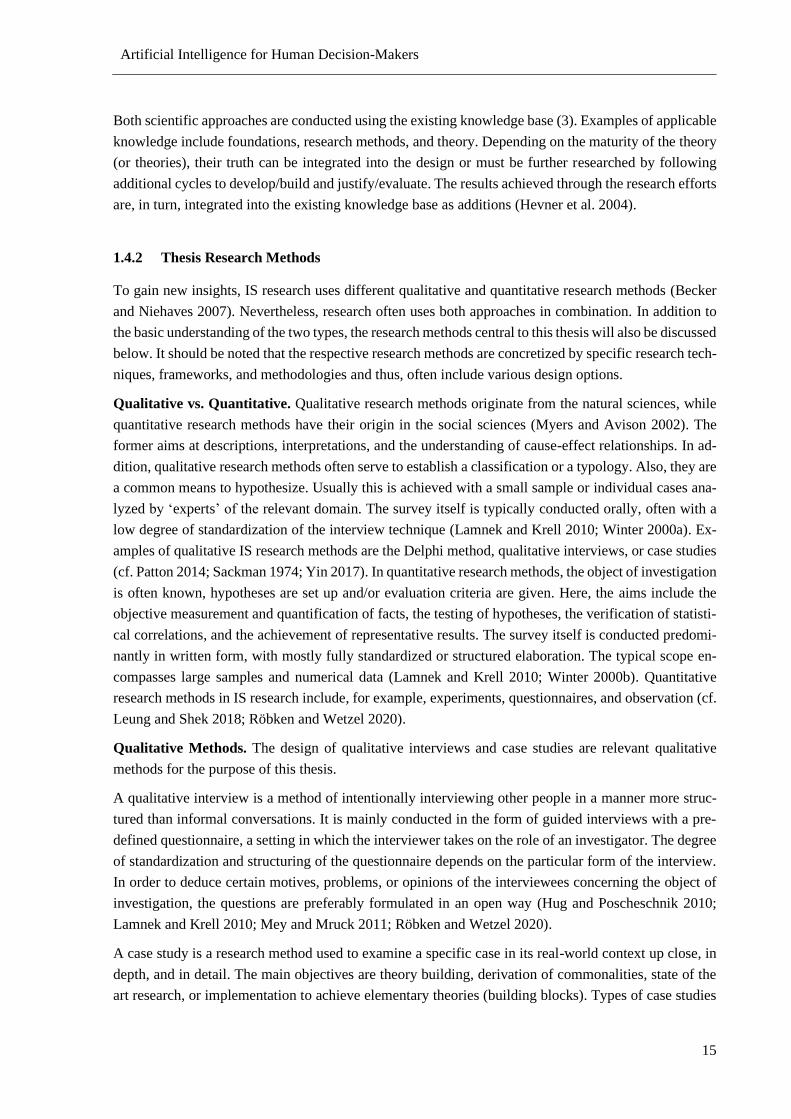
Artificial Intelligence for Human Decision-Makers
15
Both scientific approaches are conducted using the existing knowledge base (3). Examples of applicable
knowledge include foundations, research methods, and theory. Depending on the maturity of the theory
(or theories), their truth can be integrated into the design or must be further researched by following
additional cycles to develop/build and justify/evaluate. The results achieved through the research efforts
are, in turn, integrated into the existing knowledge base as additions (Hevner et al. 2004).
1.4.2 Thesis Research Methods
To gain new insights, IS research uses different qualitative and quantitative research methods (Becker
and Niehaves 2007). Nevertheless, research often uses both approaches in combination. In addition to
the basic understanding of the two types, the research methods central to this thesis will also be discussed
below. It should be noted that the respective research methods are concretized by specific research tech-
niques, frameworks, and methodologies and thus, often include various design options.
Qualitative vs. Quantitative. Qualitative research methods originate from the natural sciences, while
quantitative research methods have their origin in the social sciences (Myers and Avison 2002). The
former aims at descriptions, interpretations, and the understanding of cause-effect relationships. In ad-
dition, qualitative research methods often serve to establish a classification or a typology. Also, they are
a common means to hypothesize. Usually this is achieved with a small sample or individual cases ana-
lyzed by ‘experts’ of the relevant domain. The survey itself is typically conducted orally, often with a
low degree of standardization of the interview technique (Lamnek and Krell 2010; Winter 2000a). Ex-
amples of qualitative IS research methods are the Delphi method, qualitative interviews, or case studies
(cf. Patton 2014; Sackman 1974; Yin 2017). In quantitative research methods, the object of investigation
is often known, hypotheses are set up and/or evaluation criteria are given. Here, the aims include the
objective measurement and quantification of facts, the testing of hypotheses, the verification of statisti-
cal correlations, and the achievement of representative results. The survey itself is conducted predomi-
nantly in written form, with mostly fully standardized or structured elaboration. The typical scope en-
compasses large samples and numerical data (Lamnek and Krell 2010; Winter 2000b). Quantitative
research methods in IS research include, for example, experiments, questionnaires, and observation (cf.
Leung and Shek 2018; Röbken and Wetzel 2020).
Qualitative Methods. The design of qualitative interviews and case studies are relevant qualitative
methods for the purpose of this thesis.
A qualitative interview is a method of intentionally interviewing other people in a manner more struc-
tured than informal conversations. It is mainly conducted in the form of guided interviews with a pre-
defined questionnaire, a setting in which the interviewer takes on the role of an investigator. The degree
of standardization and structuring of the questionnaire depends on the particular form of the interview.
In order to deduce certain motives, problems, or opinions of the interviewees concerning the object of
investigation, the questions are preferably formulated in an open way (Hug and Poscheschnik 2010;
Lamnek and Krell 2010; Mey and Mruck 2011; Röbken and Wetzel 2020).
A case study is a research method used to examine a specific case in its real-world context up close, in
depth, and in detail. The main objectives are theory building, derivation of commonalities, state of the
art research, or implementation to achieve elementary theories (building blocks). Types of case studies
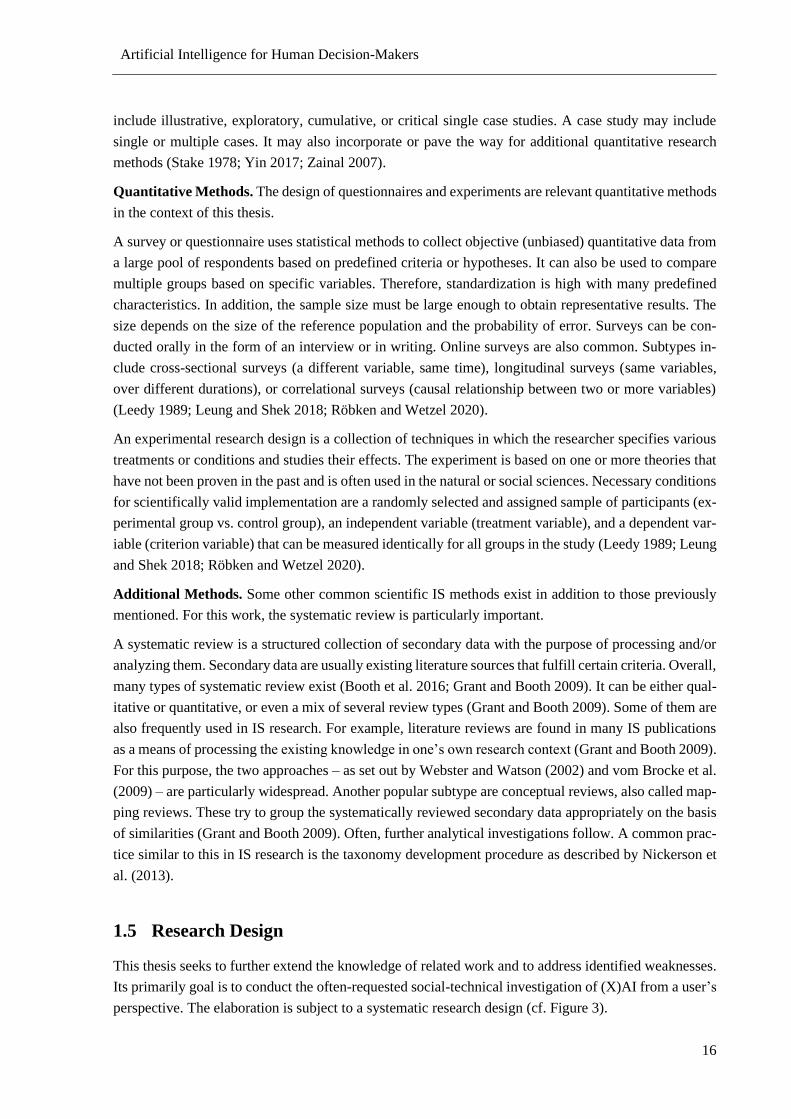
Artificial Intelligence for Human Decision-Makers
16
include illustrative, exploratory, cumulative, or critical single case studies. A case study may include
single or multiple cases. It may also incorporate or pave the way for additional quantitative research
methods (Stake 1978; Yin 2017; Zainal 2007).
Quantitative Methods. The design of questionnaires and experiments are relevant quantitative methods
in the context of this thesis.
A survey or questionnaire uses statistical methods to collect objective (unbiased) quantitative data from
a large pool of respondents based on predefined criteria or hypotheses. It can also be used to compare
multiple groups based on specific variables. Therefore, standardization is high with many predefined
characteristics. In addition, the sample size must be large enough to obtain representative results. The
size depends on the size of the reference population and the probability of error. Surveys can be con-
ducted orally in the form of an interview or in writing. Online surveys are also common. Subtypes in-
clude cross-sectional surveys (a different variable, same time), longitudinal surveys (same variables,
over different durations), or correlational surveys (causal relationship between two or more variables)
(Leedy 1989; Leung and Shek 2018; Röbken and Wetzel 2020).
An experimental research design is a collection of techniques in which the researcher specifies various
treatments or conditions and studies their effects. The experiment is based on one or more theories that
have not been proven in the past and is often used in the natural or social sciences. Necessary conditions
for scientifically valid implementation are a randomly selected and assigned sample of participants (ex-
perimental group vs. control group), an independent variable (treatment variable), and a dependent var-
iable (criterion variable) that can be measured identically for all groups in the study (Leedy 1989; Leung
and Shek 2018; Röbken and Wetzel 2020).
Additional Methods. Some other common scientific IS methods exist in addition to those previously
mentioned. For this work, the systematic review is particularly important.
A systematic review is a structured collection of secondary data with the purpose of processing and/or
analyzing them. Secondary data are usually existing literature sources that fulfill certain criteria. Overall,
many types of systematic review exist (Booth et al. 2016; Grant and Booth 2009). It can be either qual-
itative or quantitative, or even a mix of several review types (Grant and Booth 2009). Some of them are
also frequently used in IS research. For example, literature reviews are found in many IS publications
as a means of processing the existing knowledge in one’s own research context (Grant and Booth 2009).
For this purpose, the two approaches – as set out by Webster and Watson (2002) and vom Brocke et al.
(2009) – are particularly widespread. Another popular subtype are conceptual reviews, also called map-
ping reviews. These try to group the systematically reviewed secondary data appropriately on the basis
of similarities (Grant and Booth 2009). Often, further analytical investigations follow. A common prac-
tice similar to this in IS research is the taxonomy development procedure as described by Nickerson et
al. (2013).
1.5 Research Design
This thesis seeks to further extend the knowledge of related work and to address identified weaknesses.
Its primarily goal is to conduct the often-requested social-technical investigation of (X)AI from a user’s
perspective. The elaboration is subject to a systematic research design (cf. Figure 3).
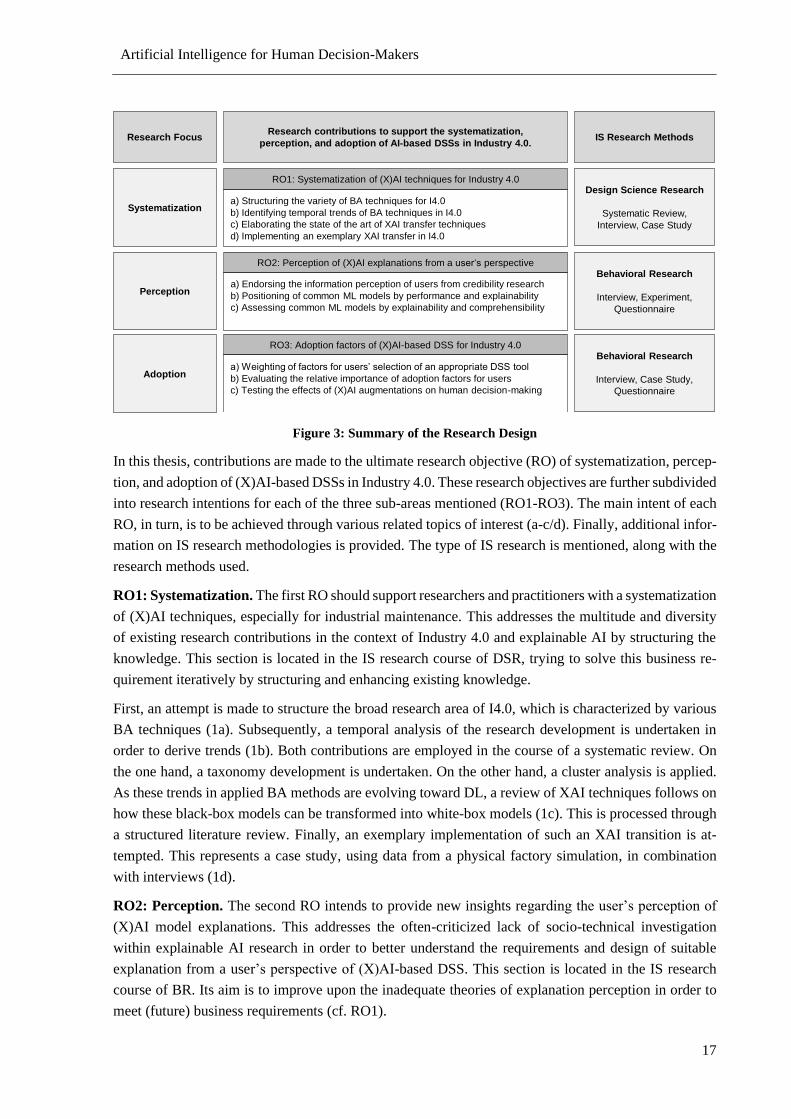
Artificial Intelligence for Human Decision-Makers
17
Figure 3: Summary of the Research Design
In this thesis, contributions are made to the ultimate research objective (RO) of systematization, percep-
tion, and adoption of (X)AI-based DSSs in Industry 4.0. These research objectives are further subdivided
into research intentions for each of the three sub-areas mentioned (RO1-RO3). The main intent of each
RO, in turn, is to be achieved through various related topics of interest (a-c/d). Finally, additional infor-
mation on IS research methodologies is provided. The type of IS research is mentioned, along with the
research methods used.
RO1: Systematization. The first RO should support researchers and practitioners with a systematization
of (X)AI techniques, especially for industrial maintenance. This addresses the multitude and diversity
of existing research contributions in the context of Industry 4.0 and explainable AI by structuring the
knowledge. This section is located in the IS research course of DSR, trying to solve this business re-
quirement iteratively by structuring and enhancing existing knowledge.
First, an attempt is made to structure the broad research area of I4.0, which is characterized by various
BA techniques (1a). Subsequently, a temporal analysis of the research development is undertaken in
order to derive trends (1b). Both contributions are employed in the course of a systematic review. On
the one hand, a taxonomy development is undertaken. On the other hand, a cluster analysis is applied.
As these trends in applied BA methods are evolving toward DL, a review of XAI techniques follows on
how these black-box models can be transformed into white-box models (1c). This is processed through
a structured literature review. Finally, an exemplary implementation of such an XAI transition is at-
tempted. This represents a case study, using data from a physical factory simulation, in combination
with interviews (1d).
RO2: Perception. The second RO intends to provide new insights regarding the user’s perception of
(X)AI model explanations. This addresses the often-criticized lack of socio-technical investigation
within explainable AI research in order to better understand the requirements and design of suitable
explanation from a user’s perspective of (X)AI-based DSS. This section is located in the IS research
course of BR. Its aim is to improve upon the inadequate theories of explanation perception in order to
meet (future) business requirements (cf. RO1).
IS Research Methods
Design Science Research
Systematic Review,
Interview, Case Study
Behavioral Research
Interview, Experiment,
Questionnaire
Behavioral Research
Interview, Case Study,
Questionnaire
Research FocusResearch contributions to support the systematization,
perception, and adoption of AI-based DSSs in Industry 4.0.
RO1: Systematization of (X)AI techniques for Industry 4.0
Systematization
Perception
Adoption
RO2: Perception of (X)AI explanations from a user‘s perspective
RO3: Adoption factors of (X)AI-based DSS for Industry 4.0
a) Structuring the variety of BA techniques for I4.0
b) Identifying temporal trends of BA techniques in I4.0
c) Elaborating the state of the art of XAI transfer techniques
d) Implementing an exemplary XAI transfer in I4.0
a) Endorsing the information perception of users from credibility research
b) Positioning of common ML models by performance and explainability
c) Assessing common ML models by explainability and comprehensibility
a) Weighting of factors for users’ selection of an appropriate DSS tool
b) Evaluating the relative importance of adoption factors for users
c) Testing the effects of (X)AI augmentations on human decision-making
Artificial Intelligence for Human Decision-Makers
18
First, existing knowledge from the area of credibility research is reviewed and transferred to the context
of (big) data processing (2a). The results are developed through an unstructured literature review and
subsequent surveys. The latter comprises a semi-structured expert interview and a quantitative question-
naire. The data analysis is based on a derived structural equation model (SEM). Then, the different ML
types are examined with respect to the assumed trade-off between model performance and model ex-
plainability (2b). Finally, the extent to which the user's perceived explainability of the model is con-
sistent with comprehensibility is examined (2c). The latter two research discourses mentioned corre-
spond methodologically to a research experiment with combined methods. This includes a technical
setup and related measurement. Furthermore, a quantitative survey and the associated data analysis
through descriptive and/or inferential statistics are used.
RO3: Adoption. The third RO proposes to shed light on the user’s willingness to adopt an (X)AI-based
DSS for practical tasks, especially in the context of I4.0. The research contributions aim to form a better
understanding of which factors are important and in what relative trade-off. Thus, it is about deriving
findings that will contribute to the removal of adoption barriers and the strengthening of positive influ-
ences. This section is located in the IS research course of BR. It is intended to further advance the
theories of RO2 regarding explanation perception by adding another perspective that is important to
meeting (future) business requirements.
First, it is an examination of the importance of potential adoption factors on human adoption propensity
(3a). To this end, the relative importance of the sections of effort, performance, and explainability for
the system selection decision of an AI-based DSS in the application context of I4.0 is investigated via
an Analytical Hierarchical Process (AHP). Likewise, inquiries are made into how and which of these
factors influence the intended user’s readiness for adoption of such systems (3b). For this purpose, a
modified UTAUT model for XAI research is formed first. This is followed by structured expert inter-
views to effectively measure the constructs derived in the use case of I4.0. The related results are used
for further quantitative questionnaires, using an SEM approach with partial least squares (PLS) calcula-
tions. Finally, the effects of (X)AI augmentations on human decision-making are tested (3c). An I4.0
case study is used in combination with a quantitative questionnaire and inferential statistics.
1.6 Thesis Structure
The structure of the thesis follows a sequential flow and includes six main chapters (cf. Figure 4). The
first main chapter (C1) constitutes the introduction of this research publication. It comprises the moti-
vation for the research (C1.1), followed by the theoretical (C1.2) and methodological foundations
(C1.3). Subsequently, an overview of the most important preceding works is provided for the sake of
context (C1.4), followed by the research design and related scientific background of the research con-
tributions (C1.5).
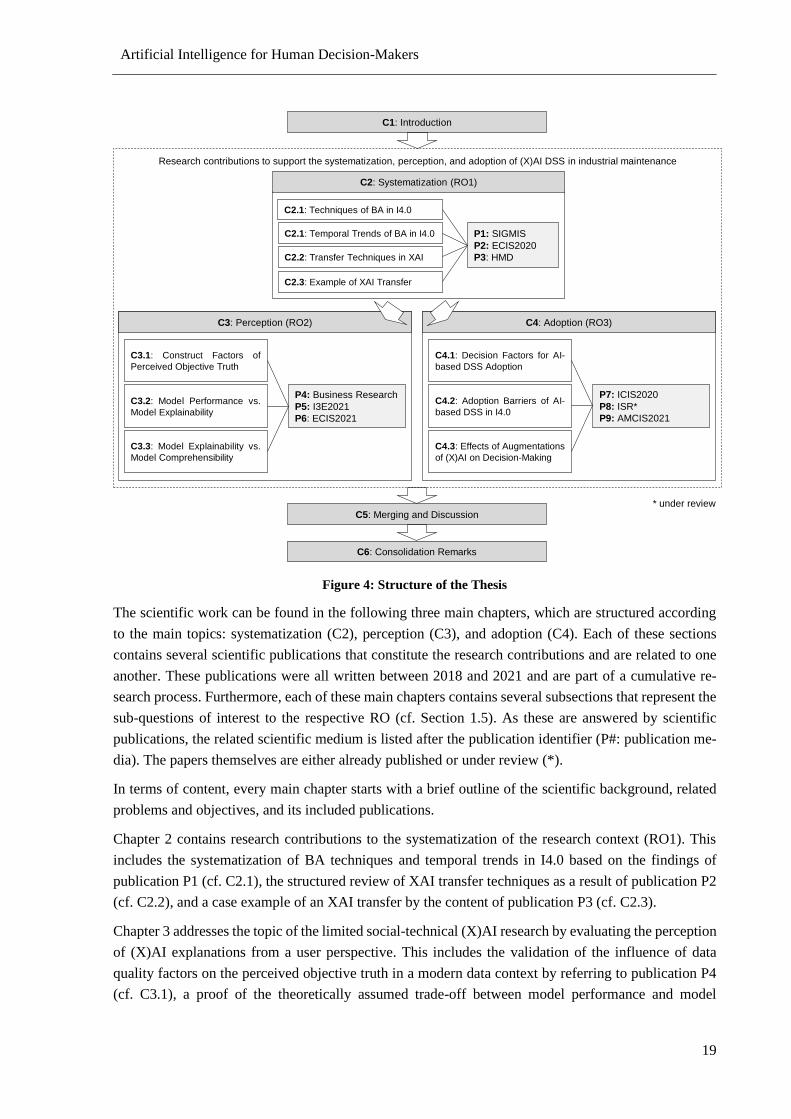
Artificial Intelligence for Human Decision-Makers
19
Figure 4: Structure of the Thesis
The scientific work can be found in the following three main chapters, which are structured according
to the main topics: systematization (C2), perception (C3), and adoption (C4). Each of these sections
contains several scientific publications that constitute the research contributions and are related to one
another. These publications were all written between 2018 and 2021 and are part of a cumulative re-
search process. Furthermore, each of these main chapters contains several subsections that represent the
sub-questions of interest to the respective RO (cf. Section 1.5). As these are answered by scientific
publications, the related scientific medium is listed after the publication identifier (P#: publication me-
dia). The papers themselves are either already published or under review (*).
In terms of content, every main chapter starts with a brief outline of the scientific background, related
problems and objectives, and its included publications.
Chapter 2 contains research contributions to the systematization of the research context (RO1). This
includes the systematization of BA techniques and temporal trends in I4.0 based on the findings of
publication P1 (cf. C2.1), the structured review of XAI transfer techniques as a result of publication P2
(cf. C2.2), and a case example of an XAI transfer by the content of publication P3 (cf. C2.3).
Chapter 3 addresses the topic of the limited social-technical (X)AI research by evaluating the perception
of (X)AI explanations from a user perspective. This includes the validation of the influence of data
quality factors on the perceived objective truth in a modern data context by referring to publication P4
(cf. C3.1), a proof of the theoretically assumed trade-off between model performance and model
C1: Introduction
C2: Systematization (RO1)
C2.1: Temporal Trends of BA in I4.0
C2.2: Transfer Techniques in XAI
C2.3: Example of XAI Transfer
P1: SIGMIS
P2: ECIS2020
P3: HMD
C3: Perception (RO2) C4: Adoption (RO3)
C5: Merging and Discussion
C6: Consolidation Remarks
C3.1: Construct Factors of
Perceived Objective Truth
P4: Business Research
P5: I3E2021
P6: ECIS2021
C3.2: Model Performance vs.
Model Explainability
C3.3: Model Explainability vs.
Model Comprehensibility
C4.1: Decision Factors for AI-
based DSS Adoption
C4.2: Adoption Barriers of AI-
based DSS in I4.0
C4.3: Effects of Augmentations
of (X)AI on Decision-Making
Research contributions to support the systematization, perception, and adoption of (X)AI DSS in industrial maintenance
P7: ICIS2020
P8: ISR*
P9: AMCIS2021
* under review
C2.1: Techniques of BA in I4.0
Artificial Intelligence for Human Decision-Makers
20
explainability with the help of publication P5 (cf. C3.2), and a critical evaluation of the correlation
between model explainability and model comprehensibility as a result of publication P6 (cf. C3.3).
Chapter 4 deals with the adoption of such (X)AI-based DSSs in practice. It is the shared intention of
both vendors and managers to make progress with respect to digitization. This includes examining the
relative importance of decision factors for the selection process of such systems with the help of publi-
cation P7 (cf. C4.1), the study of factors influencing employees’ readiness to adopt (X)AI-based DSSs
through publication P8 (cf. C4.2), and studying the effects of augmentations of (X)AI on human deci-
sion-making through publication P9 (cf. C4.3).
Chapter 5 discusses the scientific findings developed. To this end, a link between the publications and
results are first provided. Subsequently, the publications’ results are put into the context of related work
to critically reflect upon the scientific contributions.
In the last section (C6), concluding remarks are given. These comprise a short summary of all
publications and their respective limitations. In addition, an outlook on possible future research is
offered, which is linked to the developed research contributions.
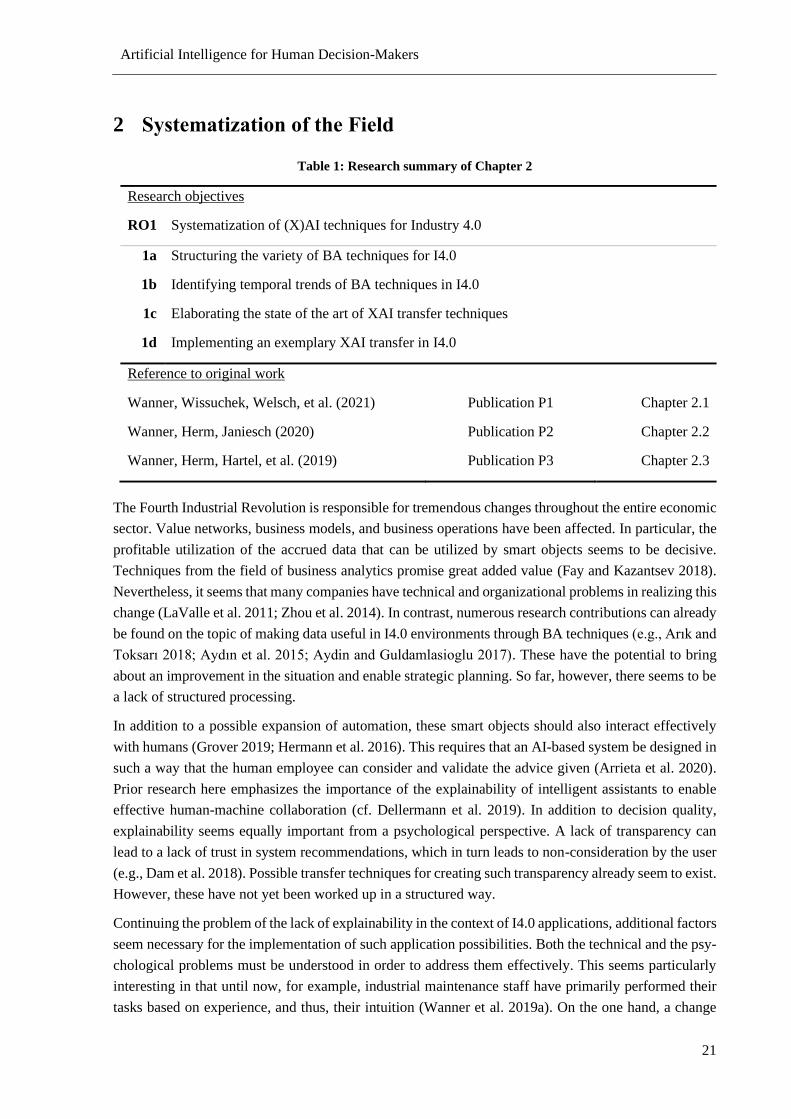
Artificial Intelligence for Human Decision-Makers
21
2 Systematization of the Field
Table 1: Research summary of Chapter 2
Research objectives
RO1 Systematization of (X)AI techniques for Industry 4.0
1a Structuring the variety of BA techniques for I4.0
1b Identifying temporal trends of BA techniques in I4.0
1c Elaborating the state of the art of XAI transfer techniques
1d Implementing an exemplary XAI transfer in I4.0
Reference to original work
Wanner, Wissuchek, Welsch, et al. (2021) Publication P1 Chapter 2.1
Wanner, Herm, Janiesch (2020) Publication P2 Chapter 2.2
Wanner, Herm, Hartel, et al. (2019) Publication P3 Chapter 2.3
The Fourth Industrial Revolution is responsible for tremendous changes throughout the entire economic
sector. Value networks, business models, and business operations have been affected. In particular, the
profitable utilization of the accrued data that can be utilized by smart objects seems to be decisive.
Techniques from the field of business analytics promise great added value (Fay and Kazantsev 2018).
Nevertheless, it seems that many companies have technical and organizational problems in realizing this
change (LaValle et al. 2011; Zhou et al. 2014). In contrast, numerous research contributions can already
be found on the topic of making data useful in I4.0 environments through BA techniques (e.g., Arık and
Toksarı 2018; Aydın et al. 2015; Aydin and Guldamlasioglu 2017). These have the potential to bring
about an improvement in the situation and enable strategic planning. So far, however, there seems to be
a lack of structured processing.
In addition to a possible expansion of automation, these smart objects should also interact effectively
with humans (Grover 2019; Hermann et al. 2016). This requires that an AI-based system be designed in
such a way that the human employee can consider and validate the advice given (Arrieta et al. 2020).
Prior research here emphasizes the importance of the explainability of intelligent assistants to enable
effective human-machine collaboration (cf. Dellermann et al. 2019). In addition to decision quality,
explainability seems equally important from a psychological perspective. A lack of transparency can
lead to a lack of trust in system recommendations, which in turn leads to non-consideration by the user
(e.g., Dam et al. 2018). Possible transfer techniques for creating such transparency already seem to exist.
However, these have not yet been worked up in a structured way.
Continuing the problem of the lack of explainability in the context of I4.0 applications, additional factors
seem necessary for the implementation of such application possibilities. Both the technical and the psy-
chological problems must be understood in order to address them effectively. This seems particularly
interesting in that until now, for example, industrial maintenance staff have primarily performed their
tasks based on experience, and thus, their intuition (Wanner et al. 2019a). On the one hand, a change
Artificial Intelligence for Human Decision-Makers
22
from subjectivity to an approach that is as objective as possible (data-based) appears to offer great po-
tential for improvement. On the other hand, routines and knowledge are alienated, which requires strong
reasoning and psychological sensitivity (Mokyr et al. 2015). IS research usually tries to investigate such
application-oriented research via case studies (among others, Chatzimparmpas et al. 2020; Cheng et al.
2020; Ha et al. 2020).
To this end, there seems to be a particular need for a structured reappraisal of (X)AI techniques for I4.0
(RO1, cf. Table 1). Chapter 2 therefore serves to provide the reader with a structured reappraisal of the
diversity of research into BA techniques for I4.0 application areas (1a). Linked to this, respective tem-
poral trends are highlighted to identify disruptive technologies (1b). An important one of these is repre-
sented by Deep Learning (DL) techniques, which offer considerable comprehensibility of the computa-
tional logic and results for the user. In order to know possibilities for their explanation via XAI transfer
techniques, a structured elaboration, which has been missing so far, seems to be worthwhile (1c). An
exemplary implementation of such a transfer and the associated problems are demonstrated in an appli-
cation case (1d).
2.1 Business Analytics in Industry 4.0
Abstract. Fueled by increasing data availability and the rise of technological advances for data pro-
cessing and communication, business analytics is a key driver for smart manufacturing. However, due
to the multitude of different local advances as well as its multidisciplinary complexity, both researchers
and practitioners struggle to keep track of the progress and acquire new knowledge within the field, as
there is a lack of a holistic conceptualization. To address this issue, we performed an extensive structured
literature review, yielding 904 relevant hits, to develop a quadripartite taxonomy as well as to derive
archetypes of business analytics in smart manufacturing. The taxonomy comprises the following meta-
characteristics: application domain, orientation as the objective of the analysis, data origins, and analysis
techniques. Collectively, they comprise eight dimensions with a total of 52 distinct characteristics. Using
a cluster analysis, we found six archetypes that represent a synthesis of existing knowledge on planning,
maintenance (reactive, offline, and online predictive), monitoring, and quality management. A temporal
analysis highlights the push beyond predictive approaches and confirms that deep learning already dom-
inates novel applications. Our results constitute an entry point to the field but can also serve as a refer-
ence work and a guide with which to assess the adequacy of one’s own instruments.1
2.1.1 Introduction
Driven by technological innovations such as cyber-physical systems (CPS) and the (Industrial) Internet
of Things (IoT), the age of the fourth industrial revolution is bringing disruptive and radical changes to
1 This paper will be published at the SIGMIS journal as ‘A Taxonomy and Archetypes of Business Analytics in
Smart Manufacturing’ (Wanner et al. 2021, forthcoming). A preprint is available at
https://arxiv.org/abs/2110.06124. The related supplementary material is given in Appendix III.
Artificial Intelligence for Human Decision-Makers
23
value networks, business models, and business operations in manufacturing. Thereby, the physical world
has become linked to digital entities. Smart objects communicate with each other and humans in real
time (Hermann et al. 2016), leaving massive amounts of digital traces, also termed “big data”, which
are the vehicle for intelligent automation (Grover 2019) and novel business analytics (BA) applications
to enable so-called smart manufacturing. The successful application of BA in smart manufacturing can
lead to cost advantages, increased customer satisfaction, and improvements in production effectiveness
and quality (Fay and Kazantsev 2018).
Studies confirm that a majority of organizations are aware of the importance of BA in smart manufac-
turing (Haas 2018). However, only a small proportion apply advanced analytics or fully exploit its po-
tential (Derwisch and Iffert 2017; Henke et al. 2016). This can be attributed to high technological and
organizational barriers as well as substantial implementation costs (LaValle et al. 2011; Zhou et al.
2014). While there has been a delay in the adoption of advanced analytics in practice, researchers have
already embraced applications of BA in smart manufacturing with a variety of different research efforts
(e.g., Arık and Toksarı 2018; Aydın et al. 2015; Aydin and Guldamlasioglu 2017) that have not yet been
systematized.
With our research, we tackle this issue and identify two underlying problems: i) lack of a holistic con-
ceptualization of the area of research and ii) formidable complexity-related barriers for practitioners.
As a way of structuring areas of interest, taxonomies have been proven useful in both the natural and
social sciences. They are increasingly being used in information systems research as they enable the
conceptualization and classification of objects (Nickerson et al. 2013) and can serve as theories (Gregor
2006) or for theory building (Bapna et al. 2004; Doty and Glick 1994). Hence, we deem them a suitable
artifact for our research objectives. Furthermore, the identification of recurring patterns and the estab-
lishment of reusable knowledge can support both researchers and practitioners (Brodsky et al. 2017;
Zschech 2018). Recurring patterns represent guidelines or templates and enable the synthesis of existing
knowledge in a cumulative form to extract specific archetypes (Russo 2016).
As of today, there is an apparent knowledge gap with respect to common ground for central concepts to
integrate perspectives and capabilities, as well as to assess the transformative potential of BA for smart
manufacturing. To address this gap, we extend the conceptualization of BA in this context by discerning
distinct archetypes of analytics applications based on their common characteristics and exploring their
importance for smart manufacturing. Taxonomies are not static and set in stone, but rather evolve over
time as a research domain shifts its priorities (Nickerson et al. 2013). How a research domain has
changed in the past, how interest has shifted over the years, and the direction of current research trends
are not readily apparent from the taxonomy itself. To address this, we perform a temporal analysis to
both demonstrate and visualize how the taxonomy’s inherent structure and the derived archetypes or
recurrent patterns have evolved. While enabling a coherent understanding of the past and current prior-
ities, this also reveals research gaps and possible research trends that may gain traction, empowering
both researchers and practitioners to position their work as well as anticipate future considerations.
We summarize these objectives with the following three research questions (RQ):
RQ1: What is a taxonomy that enables to conceptualize and structure the application of business ana-
lytics in smart manufacturing?
Artificial Intelligence for Human Decision-Makers
24
RQ2: What archetypes of business analytics in smart manufacturing can we derive from the taxonomy
and its underlying data?
RQ3: Which temporal variations or trends can be distinguished for business analytics in smart manu-
facturing?
We analyzed 904 articles on smart manufacturing to build and validate our taxonomy, derive archetypes,
and understand temporal variations in research. Through our research, we address two user groups: re-
searchers and practitioners who create and assess BA artifacts and theories. Novices especially can ben-
efit from the comprehensiveness of our survey when first entering the field. By answering our research
question, we provide the following concrete contributions to the fields of BA and smart manufacturing.
(1) We create a taxonomy that acts as a theory-building artifact for BA in smart manufacturing
research to support structuring the scientific discussion and to enable scientists new to the field to access
a comprehensive overview of relevant dimensions and characteristics. For example, these can be used
as a codebook for labeling the data and for automated explorative analysis.
(2) We use cluster analysis to derive and analyze archetypes of BA in smart manufacturing present
in contemporary research. These help to bring structure to the field and enable us to understand which
facets of BA exist in smart manufacturing, how they are composed, and how distinct areas (e.g., pro-
duction monitoring and security surveillance) may inspire each other through their use of similar tech-
niques such as real-time analysis.
(3) Finally, our survey enables us to see how research has evolved over time and to discover that
certain methods, such as deep learning, have experienced an unprecedented uptick of research innova-
tion. Discussion of the results allows for a better understanding of past and current priorities in the field.
Likewise, it becomes possible to evaluate research trends, which helps researchers and practitioners
alike to classify, structure, and evaluate their work. In addition, our results can serve as a guide for both
customers and vendors of BA in smart manufacturing to classify, compare, and evaluate existing appli-
cations, as well as design new applications with explicit consideration of relevant features for the in-
tended type of application.
For this purpose, we provide the theoretical background necessary to establish the context of our work
in Section 2.1.2. Section 2.1.3 comprises our research methodology. We answer RQ1 in Section 2.1.4
by describing the data collection, building the taxonomy, and introducing the taxonomy artifact. We
answer RQ2 in Section 2.1.5 based on a cluster analysis and discussion of the identified archetypes.
Subsequently, we answer RQ3 in Section 2.1.6 by using time analysis on both the taxonomies’ charac-
teristics and the respective archetypes. In Section 2.1.7, we discuss our contributions before closing with
a conclusion and an outlook.
2.1.2 Context and Theoretical Background
While we consider all kinds of BA methods for our study, we only examine those relevant to the context
of our research (Johns 2006), that is, smart manufacturing. This contextualization enables us to link our
observations to the point of view of smart manufacturing and its related facts (Rousseau and Fried 2001).
In order to do so, in the following we highlight those facts that define this field and determine the sig-
nificance and appearance of BA applications. Context, in this sense, comprises organizational and
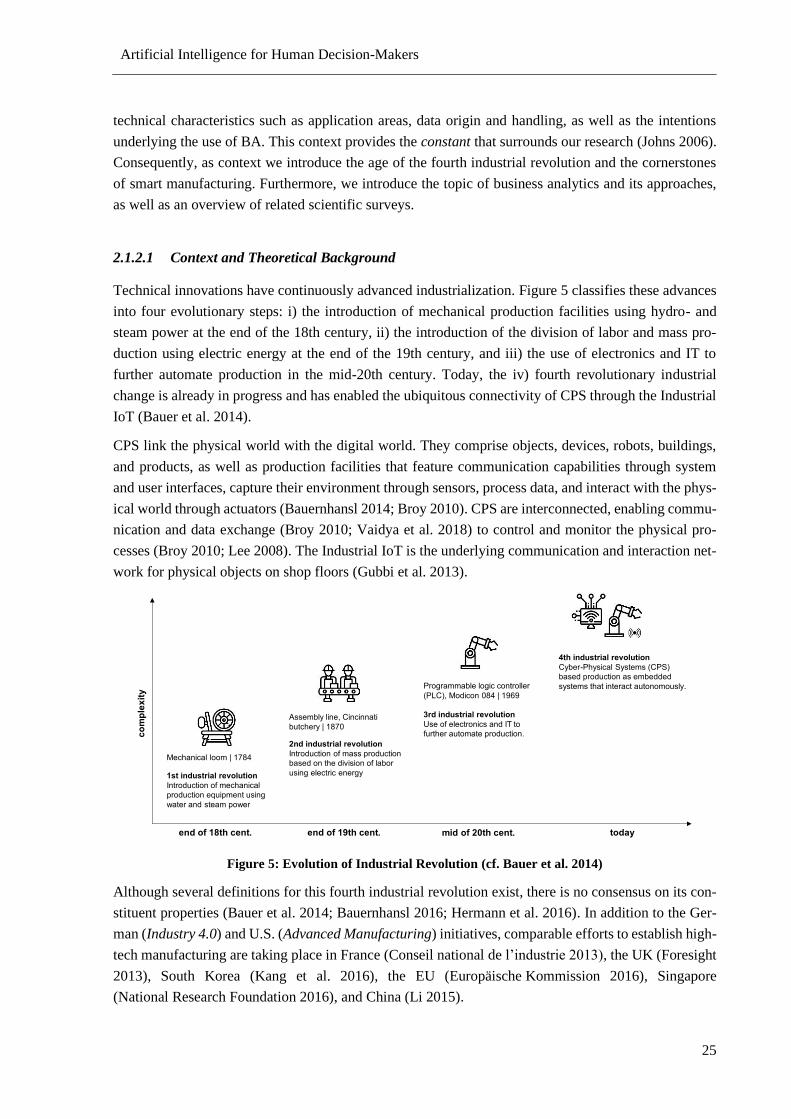
Artificial Intelligence for Human Decision-Makers
25
technical characteristics such as application areas, data origin and handling, as well as the intentions
underlying the use of BA. This context provides the constant that surrounds our research (Johns 2006).
Consequently, as context we introduce the age of the fourth industrial revolution and the cornerstones
of smart manufacturing. Furthermore, we introduce the topic of business analytics and its approaches,
as well as an overview of related scientific surveys.
2.1.2.1 Context and Theoretical Background
Technical innovations have continuously advanced industrialization. Figure 5 classifies these advances
into four evolutionary steps: i) the introduction of mechanical production facilities using hydro- and
steam power at the end of the 18th century, ii) the introduction of the division of labor and mass pro-
duction using electric energy at the end of the 19th century, and iii) the use of electronics and IT to
further automate production in the mid-20th century. Today, the iv) fourth revolutionary industrial
change is already in progress and has enabled the ubiquitous connectivity of CPS through the Industrial
IoT (Bauer et al. 2014).
CPS link the physical world with the digital world. They comprise objects, devices, robots, buildings,
and products, as well as production facilities that feature communication capabilities through system
and user interfaces, capture their environment through sensors, process data, and interact with the phys-
ical world through actuators (Bauernhansl 2014; Broy 2010). CPS are interconnected, enabling commu-
nication and data exchange (Broy 2010; Vaidya et al. 2018) to control and monitor the physical pro-
cesses (Broy 2010; Lee 2008). The Industrial IoT is the underlying communication and interaction net-
work for physical objects on shop floors (Gubbi et al. 2013).
Figure 5: Evolution of Industrial Revolution (cf. Bauer et al. 2014)
Although several definitions for this fourth industrial revolution exist, there is no consensus on its con-
stituent properties (Bauer et al. 2014; Bauernhansl 2016; Hermann et al. 2016). In addition to the Ger-
man (Industry 4.0) and U.S. (Advanced Manufacturing) initiatives, comparable efforts to establish high-
tech manufacturing are taking place in France (Conseil national de l’industrie 2013), the UK (Foresight
2013), South Korea (Kang et al. 2016), the EU (Europäische Kommission 2016), Singapore
(National Research Foundation 2016), and China (Li 2015).
echanical loo
ntro uction of echanical
pro uction e uip ent using
ater an stea po er
sse l line incinnati
utcher
ntro uction of ass pro uction
ase on the i ision of la or
using electric energ
rogra a le logic controller
) o icon
se of electronics an to
further auto ate pro uction
er h sical S ste s S)
ase pro uction as e e e
s ste s that interact autono ousl
Artificial Intelligence for Human Decision-Makers
26
2.1.2.2 Smart Manufacturing
While Industry 4.0 and Advanced Manufacturing designate initiatives undertaken as part of the fourth
industrial revolution, the term smart manufacturing predominates as a description of production in so-
called smart factories (e.g., Chiang et al. 2015; Chien et al. 2014a; Chien et al. 2014b; Chien et al. 2013).
Other terms denoting related concepts are the Industrial Internet (Evans and Annuziata 2012; Li et al.
2017), integrated industry (Bauernhansl 2016), intelligent manufacturing (Zhong et al. 2017), cloud
manufacturing (Liu and Xu 2017), and smart industry (Haverkort and Zimmermann 2017; Kaur and
Sood 2015). Utilizing Hermann et al.’s quantitative and qualitative literature analysis to structure the
field (Hermann et al. 2015; Hermann et al. 2016), we define smart manufacturing as “a collective term
for technologies and concepts of value chain organization. Within the modular structured smart factories
of Industry 4.0, CPS monitor physical processes, create a virtual copy of the physical world, and make
decentralized decisions. Over the IoT, CPS communicate and cooperate with each other and humans in
real-time” (Hermann et al. 2015).
Thus, smart manufacturing takes place in an interconnected industrial environment based on CPS and
the Industrial IoT. It exhibits several additional characteristics of interest for researchers and practition-
ers. First and foremost, smart manufacturing takes place in a value network, that is a system of individual
value creation processes, which is realized by autonomous, legally independent actors. Its integration
provides flexibility, new business opportunities, chances for (partial) automation, as well as intelligence
and interchangeability to address greater manufacturing complexity, dynamics-based economics, and
radically different performance objectives. Its networked, real-time, information-based setup transforms
reactive responses into predictive or even prescriptive approaches, shifts the focus from incident re-
sponse to prevention, and replaces vertical decision-making with distributed intelligence in order to
enable local decision-making with global impact (Davis et al. 2012).
Smart manufacturing relies on several key technologies. Apart from CPS and the IoT, most authors
include cloud computing (Mell and Grance 2011) and (big) data analytics (Müller et al. 2016) as central
enablers for smart manufacturing. Furthermore, technologies such as cybersecurity (Wells et al. 2014),
additive manufacturing (Kang et al. 2016; Thiesse et al. 2015), the Internet of Services (Terzidis et al.
2012), visualization technologies (Paelke 2014; Posada et al. 2015), and simulation (Smith 2003) are
crucial, as well.
2.1.2.3 Business Analytics
Analytics is a collection of methods, technologies, and tools for creating knowledge and insight from
data to solve complex problems and make better and faster decisions (Delen and Zolbanin 2018). A
definition of analytics can be abstracted into three dimensions (Holsapple et al. 2014 ): i) domain, ii)
methods, and iii) orientation. The domain is the field of application – i.e., the context – of analytics: for
example the supply chain (Trkman et al. 2010) or manufacturing (Zhong et al. 2017). Methods comprise
different techniques for analyzing data. Orientation describes the direction of thinking or the objective
of the analysis. It is not idiosyncratic towards a domain and is considered the core perspective of ana-
lytics (Delen and Zolbanin 2018; Holsapple et al. 2014).
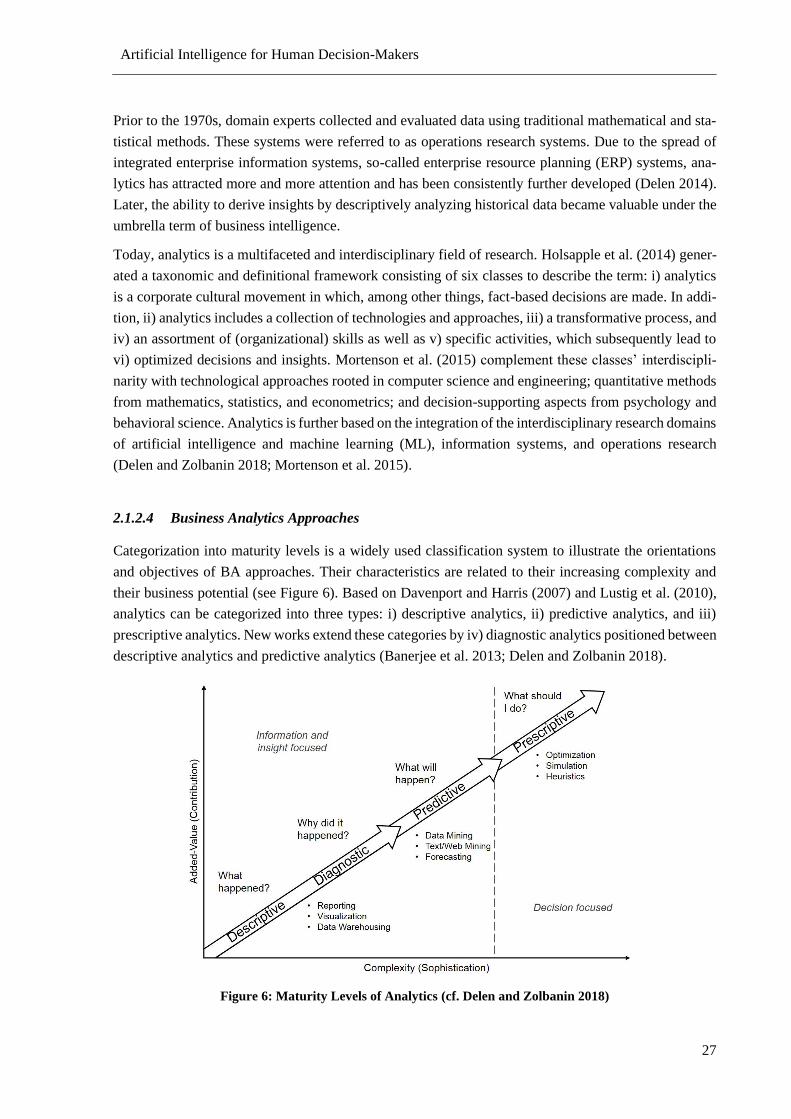
Artificial Intelligence for Human Decision-Makers
27
Prior to the 1970s, domain experts collected and evaluated data using traditional mathematical and sta-
tistical methods. These systems were referred to as operations research systems. Due to the spread of
integrated enterprise information systems, so-called enterprise resource planning (ERP) systems, ana-
lytics has attracted more and more attention and has been consistently further developed (Delen 2014).
Later, the ability to derive insights by descriptively analyzing historical data became valuable under the
umbrella term of business intelligence.
Today, analytics is a multifaceted and interdisciplinary field of research. Holsapple et al. (2014) gener-
ated a taxonomic and definitional framework consisting of six classes to describe the term: i) analytics
is a corporate cultural movement in which, among other things, fact-based decisions are made. In addi-
tion, ii) analytics includes a collection of technologies and approaches, iii) a transformative process, and
iv) an assortment of (organizational) skills as well as v) specific activities, which subsequently lead to
vi) optimized decisions and insights. Mortenson et al. (2015) complement these classes’ interdiscipli-
narity with technological approaches rooted in computer science and engineering; quantitative methods
from mathematics, statistics, and econometrics; and decision-supporting aspects from psychology and
behavioral science. Analytics is further based on the integration of the interdisciplinary research domains
of artificial intelligence and machine learning (ML), information systems, and operations research
(Delen and Zolbanin 2018; Mortenson et al. 2015).
2.1.2.4 Business Analytics Approaches
Categorization into maturity levels is a widely used classification system to illustrate the orientations
and objectives of BA approaches. Their characteristics are related to their increasing complexity and
their business potential (see Figure 6). Based on Davenport and Harris (2007) and Lustig et al. (2010),
analytics can be categorized into three types: i) descriptive analytics, ii) predictive analytics, and iii)
prescriptive analytics. New works extend these categories by iv) diagnostic analytics positioned between
descriptive analytics and predictive analytics (Banerjee et al. 2013; Delen and Zolbanin 2018).
Figure 6: Maturity Levels of Analytics (cf. Delen and Zolbanin 2018)
Artificial Intelligence for Human Decision-Makers
28
Descriptive Analytics seeks to create transparency, often through data visualization. It aims at provid-
ing answers to the questions “What is happening?” or “What is happening right now?” Tools for analysis
include periodic/ad hoc and dynamic/interactive online analytical processing (OLAP) and reporting, as
well as exploratory ML algorithms such as clustering. Descriptive analytics typically uses historical data
to uncover business potentials and problems that can support decision-making. Business intelligence is
frequently used as a synonym for descriptive analytics (Delen and Demirkan 2013; Delen and Zolbanin
2018).
Diagnostic Analytics processes data to answer the question “Why did it happen?” It leverages tech-
niques from descriptive analytics and methods from data discovery and statistics, including explanatory
statistical modeling (Shmueli 2010) to determine the cause of problems or incidents (Banerjee et al.
2013; Delen and Zolbanin 2018). Due to its emphasis on the past, insights from diagnostic analytics
may not be appropriate for predicting future events (Shmueli 2010).
Predictive Analytics determine phenomena that are likely to happen (e.g., trends and associations).
Consequently, it aims at answering the question “What will happen?” To this end, it typically uses
methods from ML and forecasting, such as decision trees, random forests, and artificial neural networks
(Breiman 2001; Shmueli 2010). In ML, the intention is to find generalizable associations between the
predictors (i.e., the independent variables) and the target (i.e., the dependent variable), an approach usu-
ally referred to as supervised learning (Fayyad et al. 1996; Marsland 2015).
Prescriptive Analytics processes data to estimate the best possible alternative under certain constraints
by using methods of mathematical optimization that calculate the optimal measure or decision. The
question to answer is “What must be done?” Prescriptive analytics can help to take advantage of future
events or mitigate potential risks by presenting the implications of the various options for action (Delen
2014; Delen and Zolbanin 2018; Lustig et al. 2010). Both predictive analytics and prescriptive analytics
are referred to as advanced analytics (Delen 2014).
2.1.2.5 Business Analytics in Smart Manufacturing
Interdisciplinary research on data-driven smart manufacturing has existed for quite some time. However,
there is still an inadequate structuring of this knowledge and thus a barrier to implementation in practice.
Using a systematic search of survey articles on BA in smart manufacturing as a pre-test (see our search
process in Section 4.1), we identified 39 publications that survey BA in smart manufacturing. In these
surveys, we identified (1) a lack of a holistic synthesis of the research area and determined that there are
(2) complexity-related barriers to the practical application. Table 2 uses Harvey balls to illustrate the
degree to which these research gaps have been addressed, differentiating between the categories fully
addressed, partially addressed, and not addressed.2
2 In describing the comprehensiveness of each survey, (1) fully addressed reflects that the publication takes a broad
view on smart manufacturing, partially addressed means that it focuses on a specific area or key technology, and
not addressed suggests that it does not try to synthesize the research area at all. Regarding the reduction of
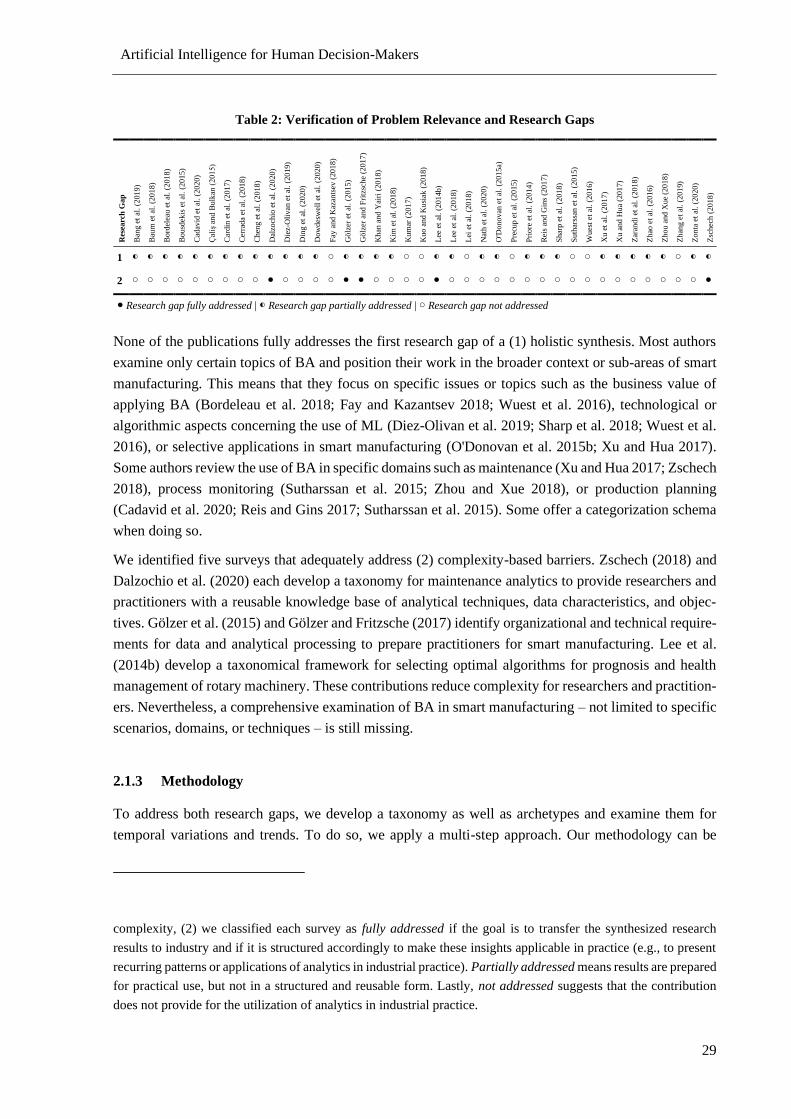
Artificial Intelligence for Human Decision-Makers
29
Table 2: Verification of Problem Relevance and Research Gaps R
esea
rch
Gap
Ban
g e
t al
. (2
019)
Bau
m e
t al
. (2
018)
Bord
elea
u e
t al
. (2
018)
Bousd
ekis
et
al.
(2015)
Cad
avid
et
al.
(2020)
Çaliş and Bulkan (2015)
Car
din
et
al.
(2017)
Cer
rada
et a
l. (
2018)
Chen
g e
t al
. (2
018)
Dal
zoch
io e
t al
. (2
020)
Die
z-O
livan
et
al.
(2019)
Din
g e
t al
. (2
020)
Dow
des
wel
l et
al.
(2020)
Fay
and K
azan
tsev
(2018)
Gölz
er e
t al
. (2
015)
Gölz
er a
nd F
ritz
sche
(2017)
Khan
and Y
airi
(2018)
Kim
et
al.
(2018)
Kum
ar (
2017)
Kuo a
nd K
usi
ak (
2018)
Lee
et
al.
(2014b)
Lee
et
al.
(2018)
Lei
et
al. (2
018)
Nat
h e
t al
. (2
020)
O'D
onovan
et
al.
(2015a)
Pre
cup e
t al
. (2
015)
Pri
ore
et
al.
(2014
)
Rei
s an
d G
ins
(2017)
Shar
p e
t al
. (2
018)
Suth
arss
an e
t al
. (2
015)
Wues
t et
al.
(2016)
Xu e
t al
. (2
017)
Xu a
nd H
ua
(2017)
Zar
andi
et a
l. (
2018)
Zhao
et
al.
(2016)
Zhou a
nd X
ue
(2018)
Zhan
g e
t al
. (2
019)
Zonta
et
al. (2
020)
Zsc
hec
h (
2018)
1 ◐ ◐ ◐ ◐ ◐ ◐ ◐ ◐ ◐ ◐ ◐ ◐ ◐ ○ ◐ ◐ ◐ ◐ ○ ○ ◐ ◐ ○ ◐ ◐ ○ ◐ ◐ ◐ ○ ○ ◐ ◐ ◐ ◐ ◐ ○ ◐ ◐
2 ○ ○ ○ ○ ○ ○ ○ ○ ○ ● ○ ○ ○ ○ ● ● ○ ○ ○ ○ ● ○ ○ ○ ○ ○ ○ ○ ○ ○ ○ ○ ○ ○ ○ ○ ○ ○ ●
● Research gap fully addressed | ◐ Research gap partially addressed | ○ Research gap not addressed
None of the publications fully addresses the first research gap of a (1) holistic synthesis. Most authors
examine only certain topics of BA and position their work in the broader context or sub-areas of smart
manufacturing. This means that they focus on specific issues or topics such as the business value of
applying BA (Bordeleau et al. 2018; Fay and Kazantsev 2018; Wuest et al. 2016), technological or
algorithmic aspects concerning the use of ML (Diez-Olivan et al. 2019; Sharp et al. 2018; Wuest et al.
2016), or selective applications in smart manufacturing (O'Donovan et al. 2015b; Xu and Hua 2017).
Some authors review the use of BA in specific domains such as maintenance (Xu and Hua 2017; Zschech
2018), process monitoring (Sutharssan et al. 2015; Zhou and Xue 2018), or production planning
(Cadavid et al. 2020; Reis and Gins 2017; Sutharssan et al. 2015). Some offer a categorization schema
when doing so.
We identified five surveys that adequately address (2) complexity-based barriers. Zschech (2018) and
Dalzochio et al. (2020) each develop a taxonomy for maintenance analytics to provide researchers and
practitioners with a reusable knowledge base of analytical techniques, data characteristics, and objec-
tives. Gölzer et al. (2015) and Gölzer and Fritzsche (2017) identify organizational and technical require-
ments for data and analytical processing to prepare practitioners for smart manufacturing. Lee et al.
(2014b) develop a taxonomical framework for selecting optimal algorithms for prognosis and health
management of rotary machinery. These contributions reduce complexity for researchers and practition-
ers. Nevertheless, a comprehensive examination of BA in smart manufacturing – not limited to specific
scenarios, domains, or techniques – is still missing.
2.1.3 Methodology
To address both research gaps, we develop a taxonomy as well as archetypes and examine them for
temporal variations and trends. To do so, we apply a multi-step approach. Our methodology can be
complexity, (2) we classified each survey as fully addressed if the goal is to transfer the synthesized research
results to industry and if it is structured accordingly to make these insights applicable in practice (e.g., to present
recurring patterns or applications of analytics in industrial practice). Partially addressed means results are prepared
for practical use, but not in a structured and reusable form. Lastly, not addressed suggests that the contribution
does not provide for the utilization of analytics in industrial practice.
Artificial Intelligence for Human Decision-Makers
30
divided into three main parts: i) taxonomy development, ii) archetypes derivation, and iii) temporal
analysis.
Taxonomy Development. First, we carry out the necessary preliminary work to identify suitable foun-
dations for our taxonomy by employing a structured literature search process (Section 2.1.4.1) following
the method proposed by vom Brocke et al. (2015). We used these publications as input for taxonomy
building (Section 2.1.4.2). Taxonomies are a structured result of classifying things or concepts, includ-
ing the principles underlying such classification. Nickerson et al. (2013) define a taxonomy T as a set
of n dimensions 𝐷𝑖 (i=1, …, n), each consisting of 𝑘𝑖 (𝑘𝑖 ≥ 2) mutually exclusive and complete char-
acteristics 𝐶𝑖𝑗 (j=1, …, 𝑘𝑖), so that each object has only one 𝐶𝑖𝑗 for each 𝐷𝑖:
𝑇 = {𝐷𝑖, 𝑖 = 1,… 𝑛 | 𝐷𝑖 = {𝐶𝑖𝑗, 𝑗 = 1,… , 𝑘𝑖; 𝑘𝑖 ≥ 2}}
Here, ‘mutually exclusive’ indicates that no object can have two different characteristics in one dimen-
sion, while ‘complete’ states that objects must have at least one characteristic for each dimension. A few
authors, who have developed taxonomies according to Nickerson et al. (2013), criticize this restriction
because some objects clearly have hierarchical and combinatorial relationships between characteristics.
This could lead to confusing taxonomies by introducing additional dimensions or characteristics. Ac-
cordingly, these authors recommend performing the taxonomy development without the restriction (e.g.,
Jöhnk et al. 2017; Püschel et al. 2016; Zschech 2018). We followed the restrictions of Nickerson et al.
(2013) in the first iteration, but renounced it in the subsequent iterations (for more details on the taxon-
omy building process, see Appendix III).
After completing the development of a taxonomy and describing it (Section 2.1.4.3), it is necessary to
evaluate its applicability in the domain under consideration (Nickerson et al. 2013). Szopinski et al.
(2019) suggest the use of illustrative scenarios as a way of demonstrating the usefulness of a taxonomy
(Section 2.1.4.4). We strengthen this by additionally performing a cluster analysis to derive archetypes
so that researchers can position their approaches in, or between, research streams – or so that practition-
ers can select a more specific purpose domain to guide them in real-world implementations initially.
Archetypes Derivation. Cluster analysis is an appropriate means by which to gain understanding from
data (Jahirabadkar and Kulkarni 2013). It aims at dividing a dataset into subsets (i.e., clusters), each
containing observations that are similar to each other and dissimilar to observations in different clusters
(Jahirabadkar and Kulkarni 2013; Kaufman and Rousseeuw 2009). Agglomerative hierarchical cluster-
ing is a popular clustering approach that performs a hierarchical separation of observations by their
degree of similarity. It is frequently used in information systems research for deriving archetypes from
taxonomies and corresponding data (e.g., Oses et al. 2016; Pandiyan et al. 2018; Patel and Choi 2014).
As “clustering is a subjective process in nature, which precludes an absolute judgment as to the relative
efficacy of all clustering techniques” (Xu and Wunsch 2005), it is necessary to explore the suitability of
different clustering algorithms and distance measures.
Therefore, we applied different reasonable combinations of popular agglomerative clustering algorithms
(i.e., single linkage, complete linkage, group average linkage, centroid linkage, and Ward’s method)
(Xu and Wunsch 2005) and distance measures suitable for binary input streams (i.e., Euclidean distance,
squared Euclidean distance, Jaccard distance, Hamming distance, Dice distance, and Yule distance)
(Choi et al. 2010). Subsequently, we evaluated the different outcomes (i.e., dendrograms and crosstab
analyses) by intensively discussing them within a group of four proficient researchers. Ultimately, we
Artificial Intelligence for Human Decision-Makers
31
agreed that the combination of Ward’s algorithm and the Euclidean distance led to the most reasonable
clusters (Section 2.1.5.1). This result is in line with several contributions in the information systems
literature that were able to derive meaningful archetypes from taxonomies and corresponding data by
applying Ward’s algorithm and a Euclidean distance metric (Ragab et al. 2016a; Ragab et al. 2017;
Ranjit et al. 2015). Subsequently, we introduce and explore the characteristics of the archetypes (Section
2.1.5.2).
Temporal Analysis. Temporal statistical analysis can be used to examine and model changes in varia-
bles of a dataset over a period of time. This allows researchers to draw conclusions about changes of
concentrations. In temporal analysis, the behavior of the variable under consideration is modeled as a
function of its previous data points in the same series using common tabular representations. A further
visualization of this data presents a superficial view of the variety of data by providing quick ways of
grasping important areas. As such, it supports trend analysis through the identification of rare anomalies
that are increasing in frequency (Vogel 2020).
In our analysis, we take a descriptive analytics approach. We do not include consideration and explana-
tions for influencing factors (Vogel 2020). We use time series plots of the raw data. Here, the time is
plotted on the x-axis and the observation(s) of the data series on the y-axis. For our temporal trends of
BA applications in smart manufacturing, we employ a two-staged approach. First, we consider changes
within the dimensions and characteristics of the created taxonomy. In this way, we derive thematic
trends that point towards future developments within the research field. Second, we consider changes
within the derived archetypes. In this way, we enable the reader – be it as a researcher or as a practitioner
– to develop awareness of future trends in specific coherent clusters of application.
2.1.4 Taxonomy Development
In the course of our taxonomy development, we pass through the following steps: i) data collection; ii)
taxonomy building; iii) taxonomy representation; and, finally, iv) showcasing the taxonomy using three
illustrative examples.
2.1.4.1 Literature Search Process and Data Collection
Our systematic literature search process follows the methodology recommendations of vom Brocke et
al. (2015). Before conducting the search process, we first define the scope of the search and correspond-
ing keywords.
Search Scope. To define and present the scope of our structure literature review, we made use of the
taxonomy of Cooper (1988): Our focus is on research and applications. The aim of the research is the
integration of the BA research topics in the context smart manufacturing, as well as the exploration of
related topics and key technologies. Furthermore, we chose a neutral representation with a representative
coverage. The results are to be methodically organized according to Nickerson et al. (2013). We define
technology and management-oriented audiences as our target groups.
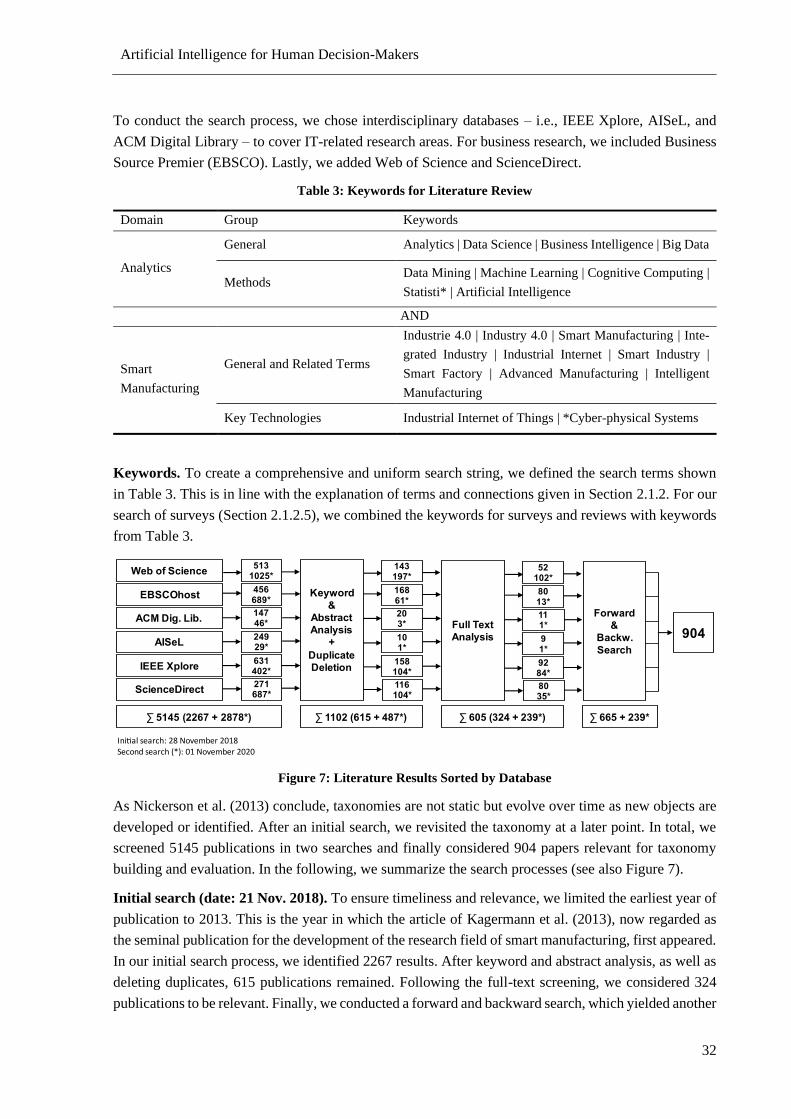
Artificial Intelligence for Human Decision-Makers
32
To conduct the search process, we chose interdisciplinary databases – i.e., IEEE Xplore, AISeL, and
ACM Digital Library – to cover IT-related research areas. For business research, we included Business
Source Premier (EBSCO). Lastly, we added Web of Science and ScienceDirect.
Table 3: Keywords for Literature Review
Domain Group Keywords
Analytics
General Analytics | Data Science | Business Intelligence | Big Data
Methods Data Mining | Machine Learning | Cognitive Computing |
Statisti* | Artificial Intelligence
AND
Smart
Manufacturing
General and Related Terms
Industrie 4.0 | Industry 4.0 | Smart Manufacturing | Inte-
grated Industry | Industrial Internet | Smart Industry |
Smart Factory | Advanced Manufacturing | Intelligent
Manufacturing
Key Technologies Industrial Internet of Things | *Cyber-physical Systems
Keywords. To create a comprehensive and uniform search string, we defined the search terms shown
in Table 3. This is in line with the explanation of terms and connections given in Section 2.1.2. For our
search of surveys (Section 2.1.2.5), we combined the keywords for surveys and reviews with keywords
from Table 3.
Figure 7: Literature Results Sorted by Database
As Nickerson et al. (2013) conclude, taxonomies are not static but evolve over time as new objects are
developed or identified. After an initial search, we revisited the taxonomy at a later point. In total, we
screened 5145 publications in two searches and finally considered 904 papers relevant for taxonomy
building and evaluation. In the following, we summarize the search processes (see also Figure 7).
Initial search (date: 21 Nov. 2018). To ensure timeliness and relevance, we limited the earliest year of
publication to 2013. This is the year in which the article of Kagermann et al. (2013), now regarded as
the seminal publication for the development of the research field of smart manufacturing, first appeared.
In our initial search process, we identified 2267 results. After keyword and abstract analysis, as well as
deleting duplicates, 615 publications remained. Following the full-text screening, we considered 324
publications to be relevant. Finally, we conducted a forward and backward search, which yielded another
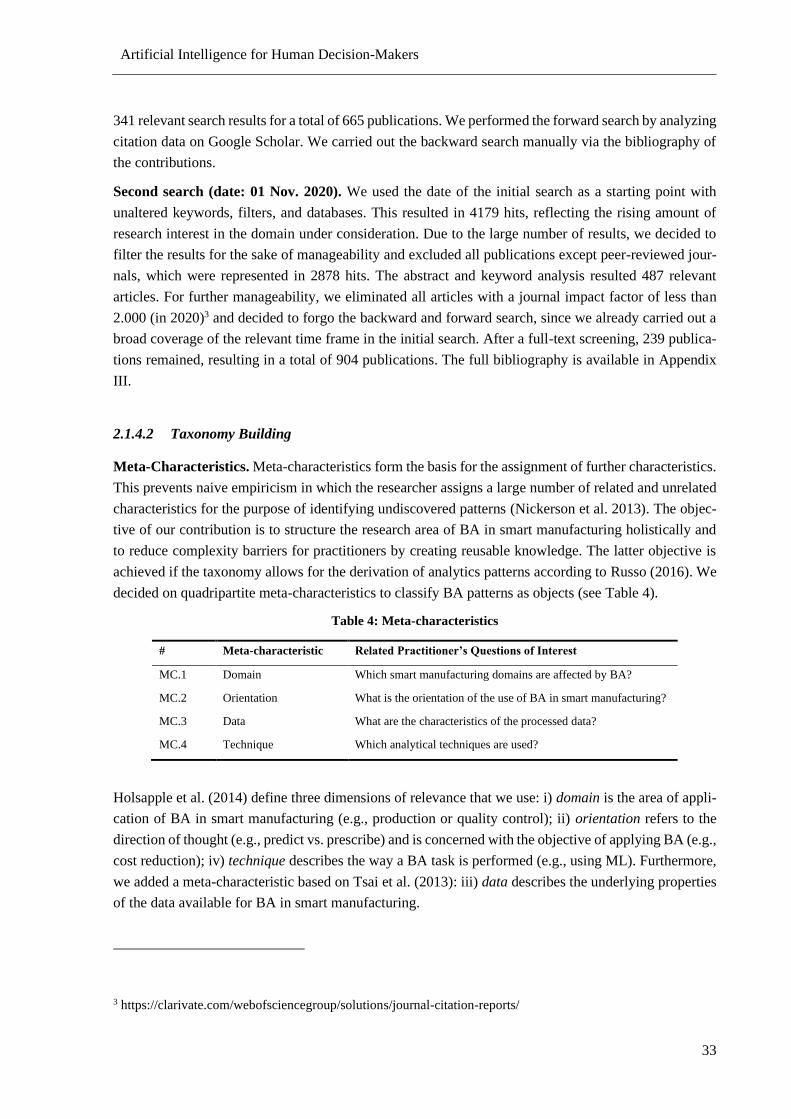
Artificial Intelligence for Human Decision-Makers
33
341 relevant search results for a total of 665 publications. We performed the forward search by analyzing
citation data on Google Scholar. We carried out the backward search manually via the bibliography of
the contributions.
Second search (date: 01 Nov. 2020). We used the date of the initial search as a starting point with
unaltered keywords, filters, and databases. This resulted in 4179 hits, reflecting the rising amount of
research interest in the domain under consideration. Due to the large number of results, we decided to
filter the results for the sake of manageability and excluded all publications except peer-reviewed jour-
nals, which were represented in 2878 hits. The abstract and keyword analysis resulted 487 relevant
articles. For further manageability, we eliminated all articles with a journal impact factor of less than
2.000 (in 2020)3 and decided to forgo the backward and forward search, since we already carried out a
broad coverage of the relevant time frame in the initial search. After a full-text screening, 239 publica-
tions remained, resulting in a total of 904 publications. The full bibliography is available in Appendix
III.
2.1.4.2 Taxonomy Building
Meta-Characteristics. Meta-characteristics form the basis for the assignment of further characteristics.
This prevents naive empiricism in which the researcher assigns a large number of related and unrelated
characteristics for the purpose of identifying undiscovered patterns (Nickerson et al. 2013). The objec-
tive of our contribution is to structure the research area of BA in smart manufacturing holistically and
to reduce complexity barriers for practitioners by creating reusable knowledge. The latter objective is
achieved if the taxonomy allows for the derivation of analytics patterns according to Russo (2016). We
decided on quadripartite meta-characteristics to classify BA patterns as objects (see Table 4).
Table 4: Meta-characteristics
# Meta-characteristic Related Practitioner’s Questions of Interest
MC.1 Domain Which smart manufacturing domains are affected by BA?
MC.2 Orientation What is the orientation of the use of BA in smart manufacturing?
MC.3 Data What are the characteristics of the processed data?
MC.4 Technique Which analytical techniques are used?
Holsapple et al. (2014) define three dimensions of relevance that we use: i) domain is the area of appli-
cation of BA in smart manufacturing (e.g., production or quality control); ii) orientation refers to the
direction of thought (e.g., predict vs. prescribe) and is concerned with the objective of applying BA (e.g.,
cost reduction); iv) technique describes the way a BA task is performed (e.g., using ML). Furthermore,
we added a meta-characteristic based on Tsai et al. (2013): iii) data describes the underlying properties
of the data available for BA in smart manufacturing.
3 https://clarivate.com/webofsciencegroup/solutions/journal-citation-reports/
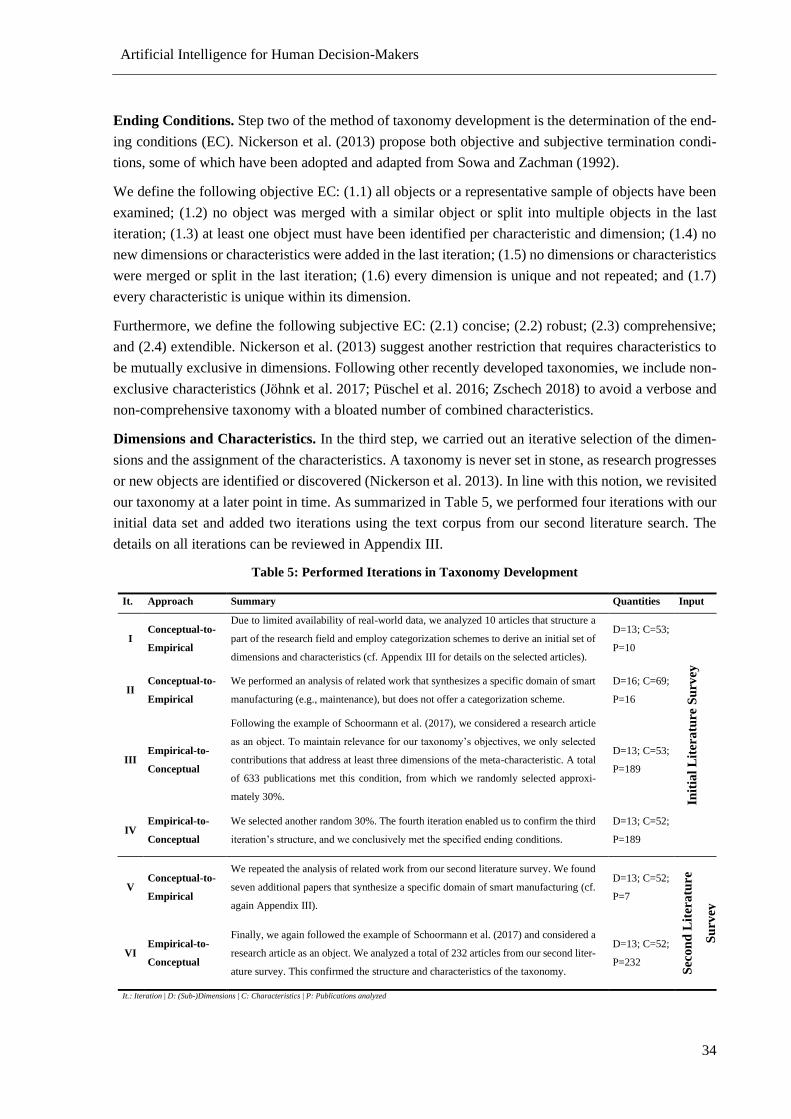
Artificial Intelligence for Human Decision-Makers
34
Ending Conditions. Step two of the method of taxonomy development is the determination of the end-
ing conditions (EC). Nickerson et al. (2013) propose both objective and subjective termination condi-
tions, some of which have been adopted and adapted from Sowa and Zachman (1992).
We define the following objective EC: (1.1) all objects or a representative sample of objects have been
examined; (1.2) no object was merged with a similar object or split into multiple objects in the last
iteration; (1.3) at least one object must have been identified per characteristic and dimension; (1.4) no
new dimensions or characteristics were added in the last iteration; (1.5) no dimensions or characteristics
were merged or split in the last iteration; (1.6) every dimension is unique and not repeated; and (1.7)
every characteristic is unique within its dimension.
Furthermore, we define the following subjective EC: (2.1) concise; (2.2) robust; (2.3) comprehensive;
and (2.4) extendible. Nickerson et al. (2013) suggest another restriction that requires characteristics to
be mutually exclusive in dimensions. Following other recently developed taxonomies, we include non-
exclusive characteristics (Jöhnk et al. 2017; Püschel et al. 2016; Zschech 2018) to avoid a verbose and
non-comprehensive taxonomy with a bloated number of combined characteristics.
Dimensions and Characteristics. In the third step, we carried out an iterative selection of the dimen-
sions and the assignment of the characteristics. A taxonomy is never set in stone, as research progresses
or new objects are identified or discovered (Nickerson et al. 2013). In line with this notion, we revisited
our taxonomy at a later point in time. As summarized in Table 5, we performed four iterations with our
initial data set and added two iterations using the text corpus from our second literature search. The
details on all iterations can be reviewed in Appendix III.
Table 5: Performed Iterations in Taxonomy Development
It. Approach Summary Quantities Input
I Conceptual-to-
Empirical
Due to limited availability of real-world data, we analyzed 10 articles that structure a
part of the research field and employ categorization schemes to derive an initial set of
dimensions and characteristics (cf. Appendix III for details on the selected articles).
D=13; C=53;
P=10
Init
ial
Lit
era
ture
Su
rvey
II
Conceptual-to-
Empirical
We performed an analysis of related work that synthesizes a specific domain of smart
manufacturing (e.g., maintenance), but does not offer a categorization scheme.
D=16; C=69;
P=16
III Empirical-to-
Conceptual
Following the example of Schoormann et al. (2017), we considered a research article
as an object. To maintain relevance for our taxonomy’s objectives, we only selected
contributions that address at least three dimensions of the meta-characteristic. A total
of 633 publications met this condition, from which we randomly selected approxi-
mately 30%.
D=13; C=53;
P=189
IV Empirical-to-
Conceptual
We selected another random 30%. The fourth iteration enabled us to confirm the third
iteration’s structure, and we conclusively met the specified ending conditions.
D=13; C=52;
P=189
V Conceptual-to-
Empirical
We repeated the analysis of related work from our second literature survey. We found
seven additional papers that synthesize a specific domain of smart manufacturing (cf.
again Appendix III).
D=13; C=52;
P=7
Sec
on
d L
iter
atu
re
Su
rvey
VI Empirical-to-
Conceptual
Finally, we again followed the example of Schoormann et al. (2017) and considered a
research article as an object. We analyzed a total of 232 articles from our second liter-
ature survey. This confirmed the structure and characteristics of the taxonomy.
D=13; C=52;
P=232
It.: Iteration | D: (Sub-)Dimensions | C: Characteristics | P: Publications analyzed
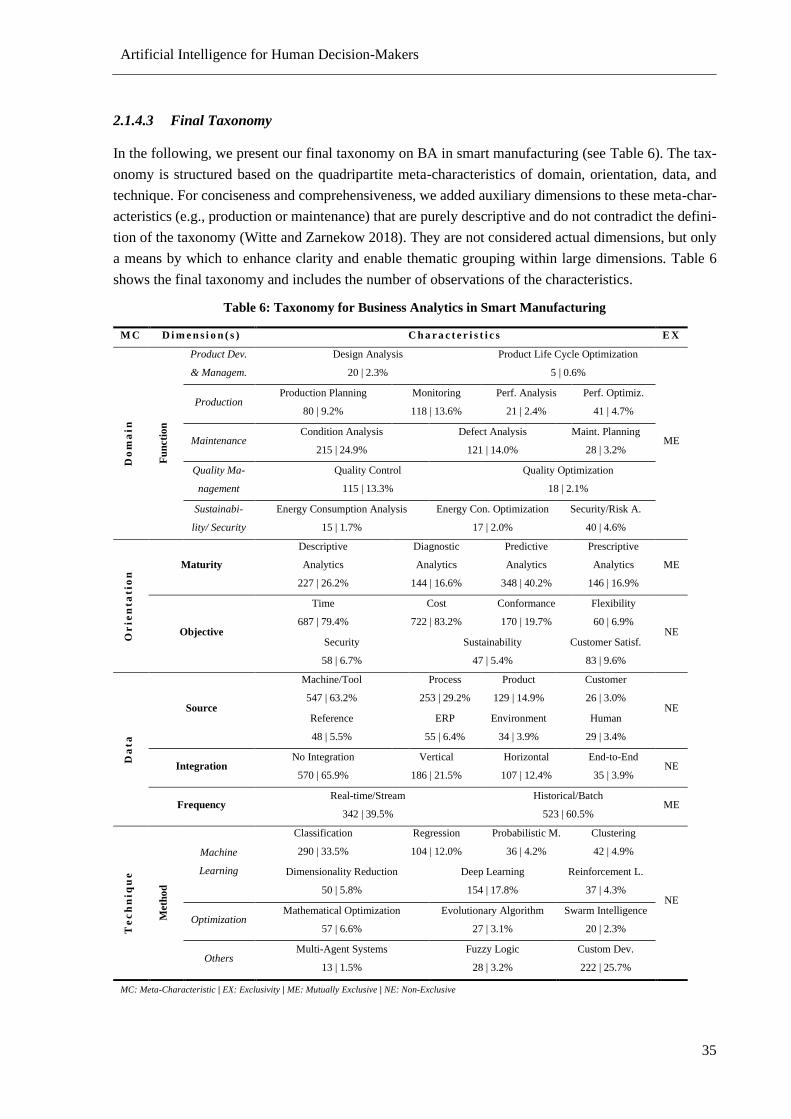
Artificial Intelligence for Human Decision-Makers
35
2.1.4.3 Final Taxonomy
In the following, we present our final taxonomy on BA in smart manufacturing (see Table 6). The tax-
onomy is structured based on the quadripartite meta-characteristics of domain, orientation, data, and
technique. For conciseness and comprehensiveness, we added auxiliary dimensions to these meta-char-
acteristics (e.g., production or maintenance) that are purely descriptive and do not contradict the defini-
tion of the taxonomy (Witte and Zarnekow 2018). They are not considered actual dimensions, but only
a means by which to enhance clarity and enable thematic grouping within large dimensions. Table 6
shows the final taxonomy and includes the number of observations of the characteristics.
Table 6: Taxonomy for Business Analytics in Smart Manufacturing
M C D i m e n s i o n ( s ) C h a r a c t e r i s t i c s E X
Do
ma
in
Fu
ncti
on
Product Dev.
& Managem.
Design Analysis
20 | 2.3%
Product Life Cycle Optimization
5 | 0.6%
ME
Production Production Planning
80 | 9.2%
Monitoring
118 | 13.6%
Perf. Analysis
21 | 2.4%
Perf. Optimiz.
41 | 4.7%
Maintenance Condition Analysis
215 | 24.9%
Defect Analysis
121 | 14.0%
Maint. Planning
28 | 3.2%
Quality Ma-
nagement
Quality Control
115 | 13.3%
Quality Optimization
18 | 2.1%
Sustainabi-
lity/ Security
Energy Consumption Analysis
15 | 1.7%
Energy Con. Optimization
17 | 2.0%
Security/Risk A.
40 | 4.6%
Or
ien
ta
tio
n Maturity
Descriptive
Analytics
227 | 26.2%
Diagnostic
Analytics
144 | 16.6%
Predictive
Analytics
348 | 40.2%
Prescriptive
Analytics
146 | 16.9%
ME
Objective
Time
687 | 79.4%
Cost
722 | 83.2%
Conformance
170 | 19.7%
Flexibility
60 | 6.9% NE
Security
58 | 6.7%
Sustainability
47 | 5.4%
Customer Satisf.
83 | 9.6%
Da
ta
Source
Machine/Tool
547 | 63.2%
Process
253 | 29.2%
Product
129 | 14.9%
Customer
26 | 3.0% NE
Reference
48 | 5.5%
ERP
55 | 6.4%
Environment
34 | 3.9%
Human
29 | 3.4%
Integration No Integration
570 | 65.9%
Vertical
186 | 21.5%
Horizontal
107 | 12.4%
End-to-End
35 | 3.9% NE
Frequency Real-time/Stream
342 | 39.5%
Historical/Batch
523 | 60.5% ME
Te
ch
niq
ue
Meth
od
Machine
Learning
Classification
290 | 33.5%
Regression
104 | 12.0%
Probabilistic M.
36 | 4.2%
Clustering
42 | 4.9%
NE
Dimensionality Reduction
50 | 5.8%
Deep Learning
154 | 17.8%
Reinforcement L.
37 | 4.3%
Optimization Mathematical Optimization
57 | 6.6%
Evolutionary Algorithm
27 | 3.1%
Swarm Intelligence
20 | 2.3%
Others Multi-Agent Systems
13 | 1.5%
Fuzzy Logic
28 | 3.2%
Custom Dev.
222 | 25.7%
MC: Meta-Characteristic | EX: Exclusivity | ME: Mutually Exclusive | NE: Non-Exclusive
Artificial Intelligence for Human Decision-Makers
36
2.1.4.3.1 Meta-Characteristic Domain
The meta-characteristic domain refers to the functions to which BA is applied (Holsapple et al. 2014).
We identified a variety of functional areas in smart manufacturing. We distinguish a total of 14 mutually
exclusive characteristics in one dimension with five auxiliary dimensions.
Product Development & Management. Product development covers all aspects that lead to a market-
able product, from product design to preparation for production (Brown and Eisenhardt 1995). Product
management deals with subsequent activities along the product life cycle (Murphy and Gorchels 1996).
Combined, these represent only 2.9% of applications for BA in smart manufacturing.
Product Development & Management comprises design analysis to improve product development based
on customer requirements and design data. In contrast, product development is associated with uncer-
tainties since customer preferences regarding product configurations are traditionally non-transparent
(Afshari and Peng 2015; Ma et al. 2017). In contrast, product life cycle optimization includes further
aspects of the product life cycle, going beyond the design phase by using BA, for example, to optimize
product repair processes, customer support, remanufacturing, and spare parts management (Cheng et al.
2018; Zhang et al. 2017).
Production. Production comprises all aspects directly related to manufacturing and represents about
29.9 % of all applications. The production cycle starts with planning, covers production and its moni-
toring, and ends with the finished product (Lee and Rosenblatt 1987).
Production planning covers the efficient allocation of production resources such as machines or person-
nel. The improvement brought about by BA is not only based on historical data but partly on real-time
data, which enables a dynamic adaptation to current circumstances of production (Nouiri et al. 2018;
Oses et al. 2016; Shiue et al. 2018; Wang and Liu 2015). BA is also used for monitoring of operations.
The primary objectives are transparency, fault detection, and the identification of anomalies in processes
(Caggiano 2018; He et al. 2013; Kozjek et al. 2017; Peres et al. 2018; Sanchez et al. 2018; Susto et al.
2017). Production planning and monitoring represent the major applications with a share of 9.2% and
13.6%, respectively. In addition to monitoring, performance analysis aims to measure production per-
formance (e.g., throughput time) to support decision-making (Kumru and Kumru 2014; Lingitz et al.
2018; Subramaniyan et al. 2016; Wedel et al. 2015). Performance optimization utilizes this analysis in
order to identify performance weaknesses for subsequent improvement (Chao-Chun et al. 2016;
Khakifirooz et al. 2018; Zheng et al. 2014).
Maintenance. Maintenance is about the necessary measures of a unit, as a specific part of a machinery,
to keep it in – or restore it to – a state in which it can perform the intended functions (Pawellek 2016).
Thus, maintenance addresses all aspects of servicing machines and tools and represents the most signif-
icant auxiliary dimension, with roughly 42.1% of applications.
Condition analysis analyzes the condition of machines or tools. It is the most extensive characteristic
and comprises a quarter of all applications. The focus of the analysis can be on the overall condition
(Villalonga et al. 2018; Yunusa-Kaltungo and Sinha 2017), the condition of specific components
(Soualhi et al. 2015), or the degree of wear (Ouyang et al. 2018; Shaban et al. 2017). Condition analysis
can lead to the identification of potential machine faults. However, there are objects in which BA is used
explicitly for fault analysis. Therefore, these analytics patterns are classified separately under the
Artificial Intelligence for Human Decision-Makers
37
function defect analysis. The objective is not the monitoring itself, but explicitly identifying faults,
anomalies, or defects (Chakravorti et al. 2018; Dou and Zhou 2016; Lu et al. 2017; Wang and Liu 2015;
Zhao et al. 2016; Zhu et al. 2018b). In both condition and defect analysis, the ultimate judgment con-
cerning the required maintenance strategy continues to be based on human decision-making (Lee et al.
2014a). Maintenance planning aims to enhance this by recommending the optimal maintenance intervals
and actions (Luangpaiboon 2015; Mbuli et al. 2017). It is a comparably small function with only 3.2%
of all applications.
Quality Management. Manual inspection of product quality is time-consuming, yet even minor irreg-
ularities can lead to lower customer satisfaction (Saucedo-Espinosa et al. 2017; Shatnawi and Al-
Khassaweneh 2014). It represents 15.4% of applications.
Within this auxiliary dimension, quality control focuses on monitoring quality and identifying defects,
typically in finished products or materials. It is the larger area of application with a share of 13.3%.
Quality optimization goes beyond this and tries to improve the quality proactively (Luangpaiboon 2015).
Sustainability and Security. Sustainability and security summarize BA approaches that focus on the
conscious and responsible use of production facilities. It has been a side-topic so far, with a combined
share of 8.3% (more than half of which is security/risk analysis).
Energy consumption analysis monitors the energy consumption of industrial systems to create transpar-
ency and detect anomalies (Ak and Bhinge 2015; Li et al. 2018a; Oses et al. 2016; Ouyang et al. 2018;
Tristo et al. 2015). Energy consumption optimization can be used to optimize the energy use to achieve
higher energy efficiency (Liang et al. 2018; Shao et al. 2017; Shin et al. 2017). Security/risk analysis
describes analytic patterns that focus on safety-relevant aspects, risk, and compliance. An example is
cybersecurity (Anton et al. 2018; Gawand et al. 2017; Xun et al. 2018; Yang et al. 2018a).
2.1.4.3.2 Meta-Characteristic Orientation
For BA, orientation refers to the direction of thought (Holsapple et al. 2014). We identified two mutually
exclusive dimensions with a total of 11 characteristics. While those of maturity are mutually exclusive,
as the more mature characteristic subsumes the prior characteristics, the characteristics of objectives are
non-exclusive.
Maturity. Maturity describes the complexity and expected business value of BA. It is concerned with
what BA offers at different levels of sophistication (see also Figure 6). We identified four characteristics
(Baum et al. 2018; Diez-Olivan et al. 2019; O'Donovan et al. 2015b; Zschech 2018). Most applications
in the surveyed time frame are predictive (40.2%), followed by descriptive analytics (26.2%), with di-
agnostic and prescriptive approaches being almost on par for the remainder.
As outlined above, descriptive analytics is purely delineative and answers questions through data inte-
gration, navigation, and visualization (Delen and Demirkan 2013; Delen and Zolbanin 2018). Diagnostic
analytics goes beyond the mere creation of transparency and attempts to identify the root cause of inci-
dents (He et al. 2017; Liu and Jin 2013; Tian et al. 2017). While descriptive and diagnostic analytics
focus on the past, predictive analytics aims to predict future events (Bousdekis et al. 2017; Hsu et al.
2016; Kanawaday and Sane 2017; Wanner et al. 2019b). Prescriptive analytics builds on the previous
Artificial Intelligence for Human Decision-Makers
38
characteristics to recommend concrete measures or alternative courses of action (Delen and Demirkan
2013; Delen and Zolbanin 2018).
Objective. Objective as the second dimension describes a positive impact, benefit, measure of perfor-
mance, or value which the use of BA can achieve for businesses. From an economic perspective, there
are four areas of performance in manufacturing environments: time, cost, quality (i.e., conformance to
specifications), and flexibility (Neely et al. 1995). These can be attributed directly to the application of
BA in smart manufacturing (Kagermann et al. 2013) and are confirmed as characteristics in taxonomy
development (Bordeleau et al. 2018; Fay and Kazantsev 2018; Wuest et al. 2016). Besides these four
fundamental performance measures, we identified the objectives of security, sustainability, and cus-
tomer satisfaction. All objectives are non-exclusive.
Time is a source of competitive advantage and can be considered a fundamental measure of performance
in manufacturing (Neely et al. 1995). It is used in 79.4% of approaches. The objective of cost defines
the reduction of monetary expenses achieved by using BA. It is the most important objective at 83.2%.
Furthermore, it yields the best possible allocation or combination of manufacturing resources. BA in
smart manufacturing also addresses the improvement of conformance to predefined specifications
(Neely et al. 1995), i.e., the quality of operations (19.7%). All other objectives account for less than 10%
each. Thereby, flexibility describes the ability to adapt efficiently to new circumstances and requirements
in daily manufacturing operations (Neely et al. 1995). Work security and safety can be an objective at
the production site (Domova and Dagnino 2017; Lavrova et al. 2018; Xu et al. 2016). In the age of
climate change, the objective of sustainability has gained importance and describes the application BA
for the purpose of increasing sustainability in manufacturing operations (Dutta et al. 2018; Shin et al.
2017). Finally, the primary goal of customer satisfaction is to improve the customer experience
(Shatnawi and Al-Khassaweneh 2014; Zhang et al. 2017).
2.1.4.3.3 Meta-Characteristic Data
The meta-characteristic data describes the properties of the processed data and all are non-exclusive
without any limitations for object classification. We identified three mutually exclusive dimensions with
a total of 12 non-exclusive characteristics and two exclusive characteristics concerning data frequency.
Source. Source describes the origin of data used for analysis (Kwon et al. 2014; Sahay and Ranjan
2008). We distinguished eight prevalent data sources. The most frequently used data source in smart
manufacturing is machines/tool with 63.2%. Processes (29.2%) and product (14.9%) represent addi-
tional important data sources, with the remainder not exceeding 6.4%
Machine/tool data comprises properties, conditions, parameters, and states. It is collected primarily by
CPS-connected sensors (Bousdekis et al. 2015; Bousdekis et al. 2017; Gölzer et al. 2015; Gölzer and
Fritzsche 2017; Zschech 2018). Processes generate data while connected tasks of production or mainte-
nance are executed (Kim et al. 2018; Reis and Gins 2017). The product’s data comprises product spec-
ifications and information regarding the usage behavior of customers (Adly et al. 2014; Ding and Jiang
2016). Product data is closely related to customer data, such as their requirements or preferences (Lou
et al. 2018; Saldivar et al. 2016). Reference data, such as test results and specifications, is another data
source (Librantz et al. 2017; Ren et al. 2018). In addition to product quality, the data is relevant for
Artificial Intelligence for Human Decision-Makers
39
quality control of manufacturing processes (Hu et al. 2016; Zhao et al. 2018). Furthermore, BA uses
ERP system data for evaluation. Examples are orders and production resources for scheduling and plan-
ning (Gölzer and Fritzsche 2017; Zhu et al. 2017). BA in smart manufacturing also takes human data
(e.g., working hours, health monitoring, activities, and location) into account (Zheng et al. 2018). Fi-
nally, environment data is collected in the vicinity and does not necessarily have to be related directly
to manufacturing operations (Filonenko and Jo 2018; Molka-Danielsen et al. 2018).
Integration. Three forms of integration for BA in smart manufacturing are commonly discussed: verti-
cal, horizontal, and end-to-end integration (Kagermann et al. 2013; Zhou et al. 2016). The integration
of IT resources and systems should naturally include the exchange of data, which enables new applica-
tions of data analysis.
Vertical integration (21.5%) comprises the integration of data among various hierarchical levels for
smart manufacturing, from the actuator and sensor level to the corporate planning level (Gölzer and
Fritzsche 2017; Kagermann et al. 2013). Horizontal (12.4%) integration encompasses not only the inte-
gration of data along the value chain but also across company boundaries (Dou and Zhou 2016;
Kagermann et al. 2013). In contrast, end-to-end integration describes data integration along the entire
product life cycle, from product development to recycling (Dou and Zhou 2016). Applications of this
type are comparatively rare, with 3.9%. In addition, we include the characteristic no integration, which
has been identified as a research gap by Sharp et al. (2018). For instance, in maintenance, most analytics
patterns are limited to individual machines, tools, or components. The effects on the overall system, the
production process, or other machines are not considered (Shao et al. 2018; Yuwono et al. 2016). It is
the de facto situation for most applications, with 65.9%.
Frequency. This dimension comprises the temporal perspective of data availability and collection as
well as its subsequent processing (Sahay and Ranjan 2008).
Real-time/stream analytics can be considered a fundamental requirement of smart manufacturing.
Saldivar et al. (2016) go as far as to describe the ability to analyze data in real time as the ‘key’ to smart
manufacturing. The data is continuously collected and evaluated (Verma et al. 2017). Continuous eval-
uation of the data enables a dynamic reaction to new requirements and accruing problems, addressing
the objectives of time, costs, and flexibility. In contrast, within historical/batch analysis, the data is not
processed continuously but periodically or irregularly (Carbone et al. 2015). The distribution is roughly
40% to 60%.
2.1.4.3.4 Meta-Characteristic Technique
In this context, the term ‘technique’ refers to the way a BA task is performed (Holsapple et al. 2014).
We identified a wide array of techniques applied in smart manufacturing, which are summarized in the
single-dimension method with a total of 13 non-exclusive characteristics that can be grouped into the
auxiliary dimensions of ML, optimization, and others (with ML being the most significant).
Machine Learning. ML is a paradigm that comprises algorithms, which learn from experience auto-
matically without being explicitly programmed to perform a task such as making decisions or predic-
tions (Marsland 2015; Samuel 1959). It can be divided into three types: supervised learning using labeled
Artificial Intelligence for Human Decision-Makers
40
data, unsupervised learning using unlabeled data, and reinforcement learning using reward functions.
Classification is the predominant method in supervised learning and used by roughly a third of all ap-
plications. It comprises the assignment of data to predefined classes (He et al. 2013; Ragab et al. 2016b;
Ray and Mishra 2016). In regression analysis, a function establishes relationships between variables to
make predictions (12%). The aim of clustering in unsupervised learning is to group similar data in order
to recognize undiscovered patterns or correlations. Another unsupervised learning method is dimension-
ality reduction. Its task is to reduce complexity by mapping data from a higher to a lower dimensional
level (Marsland 2015). This is also referred to as feature learning or representation learning. Task-spe-
cific techniques, such as regression and classification, often require data that is easy to process mathe-
matically (Argyriou et al. 2008). Probabilistic methods are applied in supervised and unsupervised ap-
proaches in a wide array of applications such as anomaly detection (Park et al. 2017), monitoring
(Windmann et al. 2015), and remaining useful lifetime estimation (Zhang et al. 2018b). Lastly, we iden-
tified reinforcement learning with an explorative character to create new knowledge (Ishii et al. 2002).
None of the above goes beyond 5.8% in use. In contrast, deep learning is a comprehensive class of ML
algorithms that combines feature learning with task-specific approaches (Deng and Yu 2014). In smart
manufacturing, deep learning is used when information from the real world (e.g., images, videos, or
sensor data) is transferred into the digital world (Sonntag et al. 2017; Srivastava and Salakhutdinov
2014). Its share accounts for 17.8% of applications.
Optimization. Optimization is concerned with the selection of the best element (according to specified
criteria) from a set of available options. We identified three common groups of optimization methods in
smart manufacturing.
Mathematical optimization, known as nonlinear programming or numerical optimization, can be de-
scribed as the science of determining the optimal solution to mathematically definable problems. The
problems are often models from production and management systems (Shaw et al. 1992). Biologically
inspired optimization methods are unique optimization methods inspired by biological processes and
phenomena. On the one hand, general evolutionary algorithms access collective phenomena such as
reproduction, mutation, and selection. On the other hand, there is swarm intelligence, based on the col-
lective social behavior of organisms. It entails the implementation of collective intelligence based on
many individual agents as inspired by the behavior of insect swarms (Binitha and Sathya 2012).
Others. In addition to optimization and ML methods, other approaches are employed in smart manu-
facturing which, due to their specificity, cannot be assigned to the other auxiliary dimensions or justify
a dimension of their own.
Multi-agent systems (MAS), also known as distributed artificial intelligence, are systems in which sev-
eral interacting intelligent software agents pursue specific goals or solve collective problems (Ferber
and Weiss 1999). MAS can be related to agent-based paradigms such as reinforcement learning or
swarm intelligence (Oses et al. 2016; Wang et al. 2016b). The application scenarios of MAS are mani-
fold: agent mining, for example, is an approach in which MAS is used for decision-making problems
(Cao et al. 2012). Fuzzy logic is a mathematical system to model manifestations of human decision-
making (Bothe 1995). Fuzzy logic is a many-valued logic. It can process partial truths, whereby the truth
value can lie between entirely true or false. Although fuzzy logic can be deployed with ML or optimi-
zation methods (Aydın et al. 2015; Ma et al. 2017), we consider it a separate characteristic (Andonovski
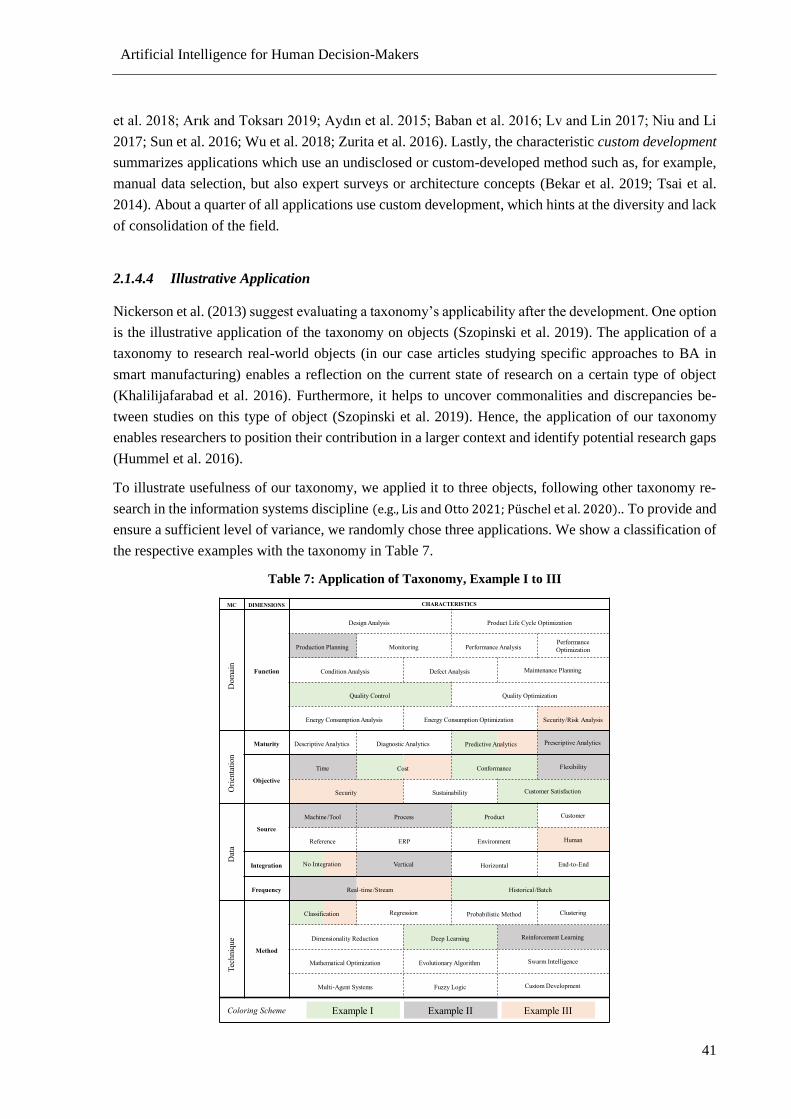
Artificial Intelligence for Human Decision-Makers
41
et al. 2018; Arık and Toksarı 2019; Aydın et al. 2015; Baban et al. 2016; Lv and Lin 2017; Niu and Li
2017; Sun et al. 2016; Wu et al. 2018; Zurita et al. 2016). Lastly, the characteristic custom development
summarizes applications which use an undisclosed or custom-developed method such as, for example,
manual data selection, but also expert surveys or architecture concepts (Bekar et al. 2019; Tsai et al.
2014). About a quarter of all applications use custom development, which hints at the diversity and lack
of consolidation of the field.
2.1.4.4 Illustrative Application
Nickerson et al. (2013) suggest evaluating a taxonomy’s applicability after the development. One option
is the illustrative application of the taxonomy on objects (Szopinski et al. 2019). The application of a
taxonomy to research real-world objects (in our case articles studying specific approaches to BA in
smart manufacturing) enables a reflection on the current state of research on a certain type of object
(Khalilijafarabad et al. 2016). Furthermore, it helps to uncover commonalities and discrepancies be-
tween studies on this type of object (Szopinski et al. 2019). Hence, the application of our taxonomy
enables researchers to position their contribution in a larger context and identify potential research gaps
(Hummel et al. 2016).
To illustrate usefulness of our taxonomy, we applied it to three objects, following other taxonomy re-
search in the information systems discipline (e.g., Lis and Otto 2021; Püschel et al. 2020).. To provide and
ensure a sufficient level of variance, we randomly chose three applications. We show a classification of
the respective examples with the taxonomy in Table 7.
Table 7: Application of Taxonomy, Example I to III
C I E SI S C ARACTERISTICS
Domain
Function
Design Analysis Product Life Cycle Optimization
Production Planning Monitoring Performance AnalysisPerformance
Optimization
Condition Analysis Defect Analysis Maintenance Planning
uality Control uality Optimization
Energy Consumption Analysis Energy Consumption Optimization Security Risk Analysis
Orientation
aturity Descriptive Analytics Diagnostic Analytics Prescriptive Analytics
b ective
Time Conformance lexibility
Security Sustainability Customer Satisfaction
Data
Source
Machine Tool Process Product Customer
Reference ERP Environment Human
Integration ertical Horizontal End-to-End
Fre uency Historical Batch
Technique
ethod
Regression Probabilistic Method Clustering
Dimensionality Reduction Deep Learning Reinforcement Learning
Mathematical Optimization Evolutionary Algorithm Swarm Intelligence
Multi-Agent Systems uzzy Logic Custom Development
ring
No Integration
Real-time Stream
Classification
Cost
Predictive Analytics
Example I Example II Example III
Artificial Intelligence for Human Decision-Makers
42
Example I. Ståhl et al. (2019) employ BA to detect problematic slab shapes in steel rolling. Their ap-
plication’s function is to model the dependencies between the measured product shape and control the
product’s conformance (function). As they predict the ratio of flawed products even before a critical
manufacturing operation, their approach is of predictive maturity (maturity). The application’s goals are
to increase customer satisfaction through higher product quality and reduce manufacturing costs (objec-
tive), as defective products can be detected before further process steps are initialized. There is no data
integration, as the approach collects the data at a specific point in the process (integration). The data,
slab width, and deviation from the targeted position are collected through multiple sensors directly from
the product (data source). The authors do not employ real-time analytics, but rather use a data set col-
lected before the analysis in their experimental set-up (frequency). They apply a classification approach
to decide between defective and non-defective steel slabs. Specifically, the application uses recurrent
neural networks with long-term memory cells, that is deep learning (method).
Example II. Hu et al. (2020) use BA for production planning, specifically the scheduling of automated
guided vehicles (AGVs) for material handling (function). The goal of their analysis is to find the optimal
mixed rule policy to identify the best course of action, which reflects a prescriptive analytics problem
(maturity). The goal of the analysis is to improve time efficiency, specifically the delay ratio of AGVs,
while simultaneously increasing their flexibility by enabling them to participate in various jobs, which
also leads to makespan optimization. The data used is multifaceted, including machines (AGVs) and the
production process (RFID and Industrial IoT sensors) (data source). The data is integrated vertically, as
various sources are tapped into and passed on to the analysis (integration) continuously in a real-time
fashion (frequency). Finally, the application employs a deep reinforcement learning-based approach to
schedule the AGVs and find the optimal mixed rule policy (method).
Example III. In contrast to the other examples, Arpaia et al. (2020) place the factory worker’s safety at
the center of their application (function) by predicting worker stress levels (maturity). The proposed
solution increases the worker’s safety and generally fosters a more secure manufacturing environment.
Positive side effects are an increase in product quality (less stress translates to more focused workers)
as well as a reduction of the cost of the production process (objective). Data is collected through a brain-
computer interface, specifically a wearable electroencephalography instrument monitoring the brain-
waves of the workers (data source). The proposed setup is not integrated (integration) and the data is
transferred in real time (frequency) to the analytical system. Classification algorithms are used to predict
the workers’ stress level (method).
2.1.5 Derivation of Archetypes
In this section, we perform a cluster analysis to derive archetypes for smart manufacturing that comprise
similar applications as those illustrated above. After detailing the derivation process, we explore the
resulting archetypes’ characteristics.
2.1.5.1 Cluster Analysis
To gain more insights into different research streams and archetypes, we performed a cluster analysis.
Before applying the clustering algorithm, we transformed the collected literature into binary vector
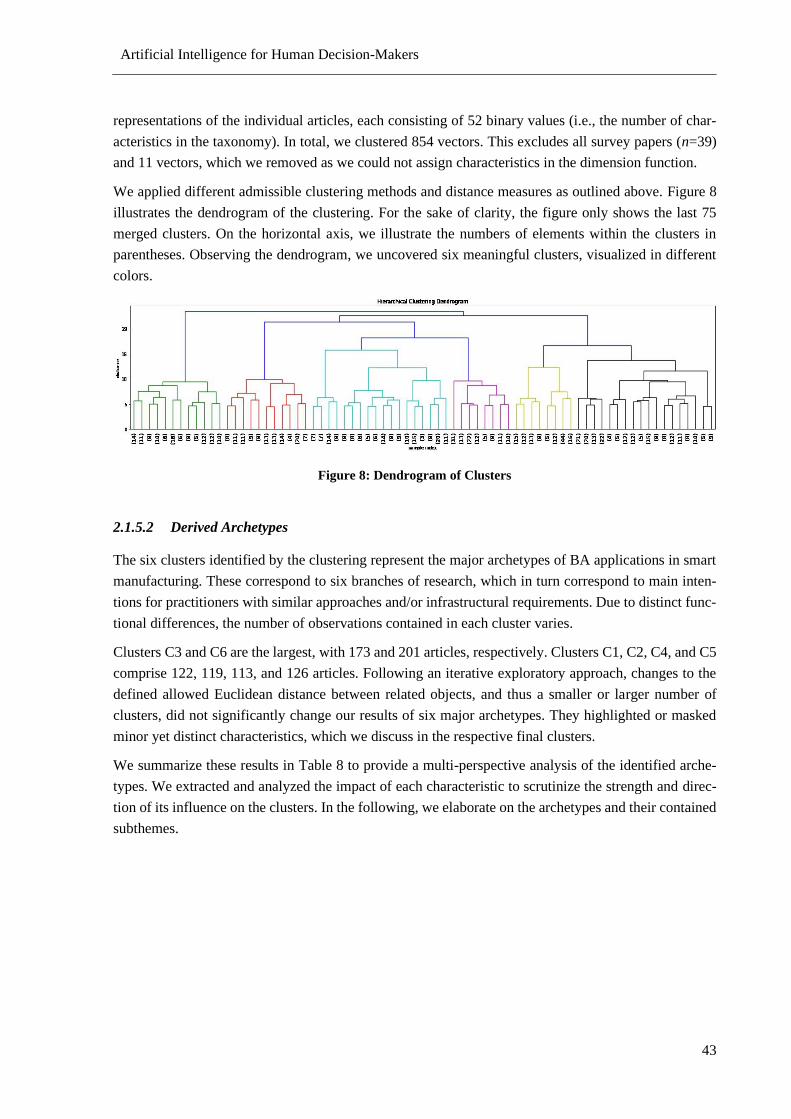
Artificial Intelligence for Human Decision-Makers
43
representations of the individual articles, each consisting of 52 binary values (i.e., the number of char-
acteristics in the taxonomy). In total, we clustered 854 vectors. This excludes all survey papers (n=39)
and 11 vectors, which we removed as we could not assign characteristics in the dimension function.
We applied different admissible clustering methods and distance measures as outlined above. Figure 8
illustrates the dendrogram of the clustering. For the sake of clarity, the figure only shows the last 75
merged clusters. On the horizontal axis, we illustrate the numbers of elements within the clusters in
parentheses. Observing the dendrogram, we uncovered six meaningful clusters, visualized in different
colors.
Figure 8: Dendrogram of Clusters
2.1.5.2 Derived Archetypes
The six clusters identified by the clustering represent the major archetypes of BA applications in smart
manufacturing. These correspond to six branches of research, which in turn correspond to main inten-
tions for practitioners with similar approaches and/or infrastructural requirements. Due to distinct func-
tional differences, the number of observations contained in each cluster varies.
Clusters C3 and C6 are the largest, with 173 and 201 articles, respectively. Clusters C1, C2, C4, and C5
comprise 122, 119, 113, and 126 articles. Following an iterative exploratory approach, changes to the
defined allowed Euclidean distance between related objects, and thus a smaller or larger number of
clusters, did not significantly change our results of six major archetypes. They highlighted or masked
minor yet distinct characteristics, which we discuss in the respective final clusters.
We summarize these results in Table 8 to provide a multi-perspective analysis of the identified arche-
types. We extracted and analyzed the impact of each characteristic to scrutinize the strength and direc-
tion of its influence on the clusters. In the following, we elaborate on the archetypes and their contained
subthemes.
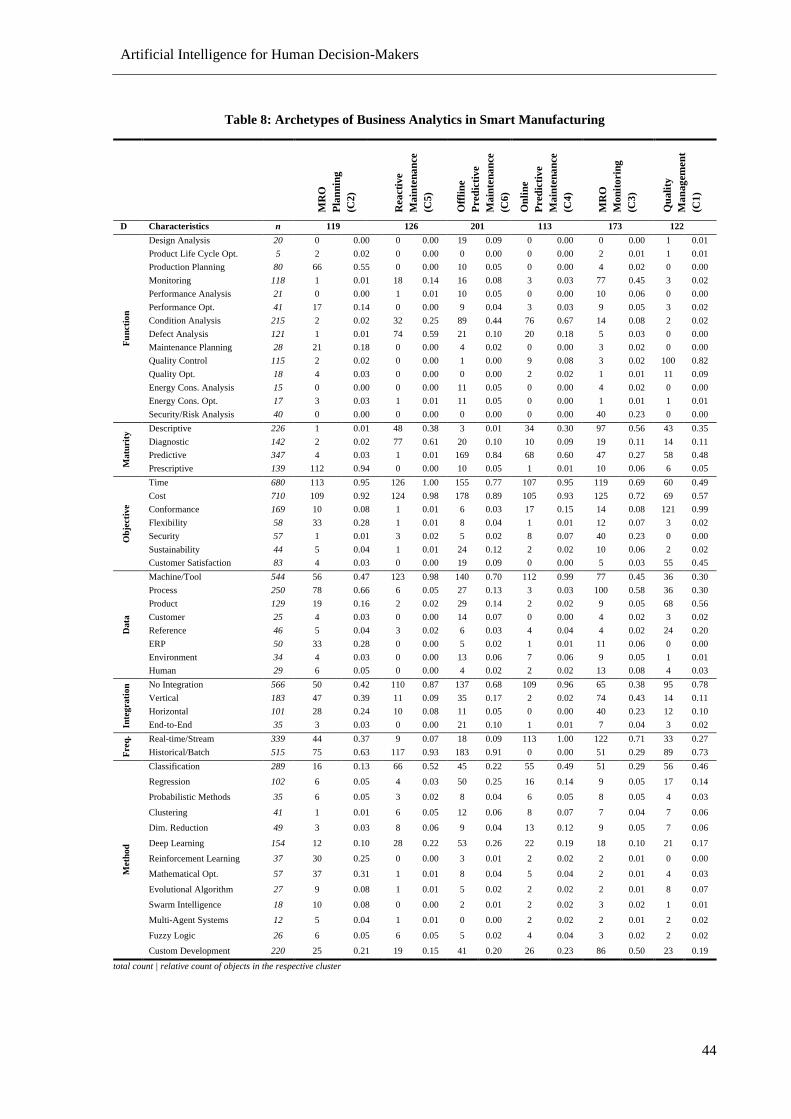
Artificial Intelligence for Human Decision-Makers
44
Table 8: Archetypes of Business Analytics in Smart Manufacturing
MR
O
Pla
nn
ing
(C2
)
Rea
cti
ve
Ma
inte
na
nce
(C5
)
Off
lin
e
Pred
icti
ve
Ma
inte
na
nce
(C6
)
On
lin
e
Pred
icti
ve
Ma
inte
na
nce
(C4
)
MR
O
Mo
nit
orin
g
(C3
)
Qu
ali
ty
Ma
nag
emen
t
(C1
)
D Characteristics n 119 126 201 113 173 122
Fu
ncti
on
Design Analysis 20 0 0.00 0 0.00 19 0.09 0 0.00 0 0.00 1 0.01
Product Life Cycle Opt. 5 2 0.02 0 0.00 0 0.00 0 0.00 2 0.01 1 0.01
Production Planning 80 66 0.55 0 0.00 10 0.05 0 0.00 4 0.02 0 0.00
Monitoring 118 1 0.01 18 0.14 16 0.08 3 0.03 77 0.45 3 0.02
Performance Analysis 21 0 0.00 1 0.01 10 0.05 0 0.00 10 0.06 0 0.00
Performance Opt. 41 17 0.14 0 0.00 9 0.04 3 0.03 9 0.05 3 0.02
Condition Analysis 215 2 0.02 32 0.25 89 0.44 76 0.67 14 0.08 2 0.02
Defect Analysis 121 1 0.01 74 0.59 21 0.10 20 0.18 5 0.03 0 0.00
Maintenance Planning 28 21 0.18 0 0.00 4 0.02 0 0.00 3 0.02 0 0.00
Quality Control 115 2 0.02 0 0.00 1 0.00 9 0.08 3 0.02 100 0.82
Quality Opt. 18 4 0.03 0 0.00 0 0.00 2 0.02 1 0.01 11 0.09
Energy Cons. Analysis 15 0 0.00 0 0.00 11 0.05 0 0.00 4 0.02 0 0.00
Energy Cons. Opt. 17 3 0.03 1 0.01 11 0.05 0 0.00 1 0.01 1 0.01
Security/Risk Analysis 40 0 0.00 0 0.00 0 0.00 0 0.00 40 0.23 0 0.00
Ma
turit
y Descriptive 226 1 0.01 48 0.38 3 0.01 34 0.30 97 0.56 43 0.35
Diagnostic 142 2 0.02 77 0.61 20 0.10 10 0.09 19 0.11 14 0.11
Predictive 347 4 0.03 1 0.01 169 0.84 68 0.60 47 0.27 58 0.48
Prescriptive 139 112 0.94 0 0.00 10 0.05 1 0.01 10 0.06 6 0.05
Ob
jecti
ve
Time 680 113 0.95 126 1.00 155 0.77 107 0.95 119 0.69 60 0.49
Cost 710 109 0.92 124 0.98 178 0.89 105 0.93 125 0.72 69 0.57
Conformance 169 10 0.08 1 0.01 6 0.03 17 0.15 14 0.08 121 0.99
Flexibility 58 33 0.28 1 0.01 8 0.04 1 0.01 12 0.07 3 0.02
Security 57 1 0.01 3 0.02 5 0.02 8 0.07 40 0.23 0 0.00
Sustainability 44 5 0.04 1 0.01 24 0.12 2 0.02 10 0.06 2 0.02
Customer Satisfaction 83 4 0.03 0 0.00 19 0.09 0 0.00 5 0.03 55 0.45
Da
ta
Machine/Tool 544 56 0.47 123 0.98 140 0.70 112 0.99 77 0.45 36 0.30
Process 250 78 0.66 6 0.05 27 0.13 3 0.03 100 0.58 36 0.30
Product 129 19 0.16 2 0.02 29 0.14 2 0.02 9 0.05 68 0.56
Customer 25 4 0.03 0 0.00 14 0.07 0 0.00 4 0.02 3 0.02
Reference 46 5 0.04 3 0.02 6 0.03 4 0.04 4 0.02 24 0.20
ERP 50 33 0.28 0 0.00 5 0.02 1 0.01 11 0.06 0 0.00
Environment 34 4 0.03 0 0.00 13 0.06 7 0.06 9 0.05 1 0.01
Human 29 6 0.05 0 0.00 4 0.02 2 0.02 13 0.08 4 0.03
Inte
gra
tio
n No Integration 566 50 0.42 110 0.87 137 0.68 109 0.96 65 0.38 95 0.78
Vertical 183 47 0.39 11 0.09 35 0.17 2 0.02 74 0.43 14 0.11
Horizontal 101 28 0.24 10 0.08 11 0.05 0 0.00 40 0.23 12 0.10
End-to-End 35 3 0.03 0 0.00 21 0.10 1 0.01 7 0.04 3 0.02
Freq
. Real-time/Stream 339 44 0.37 9 0.07 18 0.09 113 1.00 122 0.71 33 0.27
Historical/Batch 515 75 0.63 117 0.93 183 0.91 0 0.00 51 0.29 89 0.73
Meth
od
Classification 289 16 0.13 66 0.52 45 0.22 55 0.49 51 0.29 56 0.46
Regression 102 6 0.05 4 0.03 50 0.25 16 0.14 9 0.05 17 0.14
Probabilistic Methods 35 6 0.05 3 0.02 8 0.04 6 0.05 8 0.05 4 0.03
Clustering 41 1 0.01 6 0.05 12 0.06 8 0.07 7 0.04 7 0.06
Dim. Reduction 49 3 0.03 8 0.06 9 0.04 13 0.12 9 0.05 7 0.06
Deep Learning 154 12 0.10 28 0.22 53 0.26 22 0.19 18 0.10 21 0.17
Reinforcement Learning 37 30 0.25 0 0.00 3 0.01 2 0.02 2 0.01 0 0.00
Mathematical Opt. 57 37 0.31 1 0.01 8 0.04 5 0.04 2 0.01 4 0.03
Evolutional Algorithm 27 9 0.08 1 0.01 5 0.02 2 0.02 2 0.01 8 0.07
Swarm Intelligence 18 10 0.08 0 0.00 2 0.01 2 0.02 3 0.02 1 0.01
Multi-Agent Systems 12 5 0.04 1 0.01 0 0.00 2 0.02 2 0.01 2 0.02
Fuzzy Logic 26 6 0.05 6 0.05 5 0.02 4 0.04 3 0.02 2 0.02
Custom Development 220 25 0.21 19 0.15 41 0.20 26 0.23 86 0.50 23 0.19
total count | relative count of objects in the respective cluster
Artificial Intelligence for Human Decision-Makers
45
MRO Planning (C2). This cluster, with 13.9% (n=119) of all research, focuses on Maintenance, Repair
and Operations (MRO) planning activities. MRO planning ensures overall manufacturing effectiveness,
including addressing scheduling problems for production or maintenance as well manufacturing perfor-
mance optimization. Most applications are prescriptive, as the tasks require various optimization tech-
niques to find optimal policies. As with the maintenance-based archetypes, time and cost dominate the
objectives. The archetype has a noticeable share of the flexibility objective. Here, optimized planning
seems to lead to a more flexible production environment. Production planning and maintenance planning
are the main consumers for ERP data. Furthermore, applications use machine and process data. All
frequencies are present, but historical analyses outweigh real-time applications. Methods focus on typi-
cal prescriptive techniques like mathematical optimization but also include reinforcement learning,
swarm intelligence, and multi-agent systems.
Reactive Maintenance (C5). This cluster is also medium-sized, with 14.8% (n=126) of all research. It
includes reactive maintenance approaches of the functions condition analysis and defect analysis, with
the latter dominating this archetype. It constitutes a counterpart to both predictive maintenance arche-
types (C4, C6). Here, the focus is not on proactive but reactive industrial maintenance measures
(Pawellek 2016). The distribution of characteristics is mostly comparable with the other two archetypes.
Two distinct exceptions exist: First, the analytical maturity is only diagnostic. That is, future behavior
is not considered, and the applications are rather reactive in their detection of existing defects or condi-
tions in machine operations. Second, analysis is performed mainly on historical data. That is, the mainte-
nance task takes place after a malfunction has occurred. This is in contrast to the processing of real-time
data streams and predictive measures to avoid such malfunctions proactively (Pawellek 2016).
Offline Predictive Maintenance (C6). This is the largest cluster, with 23.5% (n=201), and it reflects
maintenance-based approaches that are of a proactive nature. This archetype exhibits great similarities
to C4. The distribution of the characteristics is close to identical. That is, analytics is primarily of pre-
dictive maturity in combination with functional applications of condition analysis followed by defect
analysis, both of which are typical maintenance operations. The main objectives are related to cost and
time. The machine is the central data source in this archetype, and the data is mostly not integrated,
which suggests that the overall production system is not considered. However, this archetype relies on
historical data collected up to a certain point in time. That is, in contrast to C4, approaches in this cate-
gory generally do not employ real-time analytics, but rather fall back on historical or batch-based data
frequencies. Furthermore, we see regression analysis as the primary method. From a functional perspec-
tive, energy consumption analysis, energy consumption optimization, and design analysis can be distin-
guished as distinct domains. In line with this, the sustainability objective is of a higher frequency. Con-
sequently, we see similarities between both use cases. Energy-related applications also predominantly
utilize predictive analytics, tap into the machine directly as a data source, and feature no integration,
indicating a possible novel research stream or gap in smart manufacturing. Finally, the objective of
customer satisfaction, aligned with the function design analysis, is present and refers to another (smaller)
comparable research stream.
Online Predictive Maintenance (C4). The fourth archetype represents the smallest cluster with 13.2%
(n=113) of all research and is the online rather than offline sibling of C6. In contrast to C6, all approaches
employ BA techniques in real-time, and thus online, having an intact and operational connection to
(smart) manufacturing objects. We mostly see the application of classification and deep learning
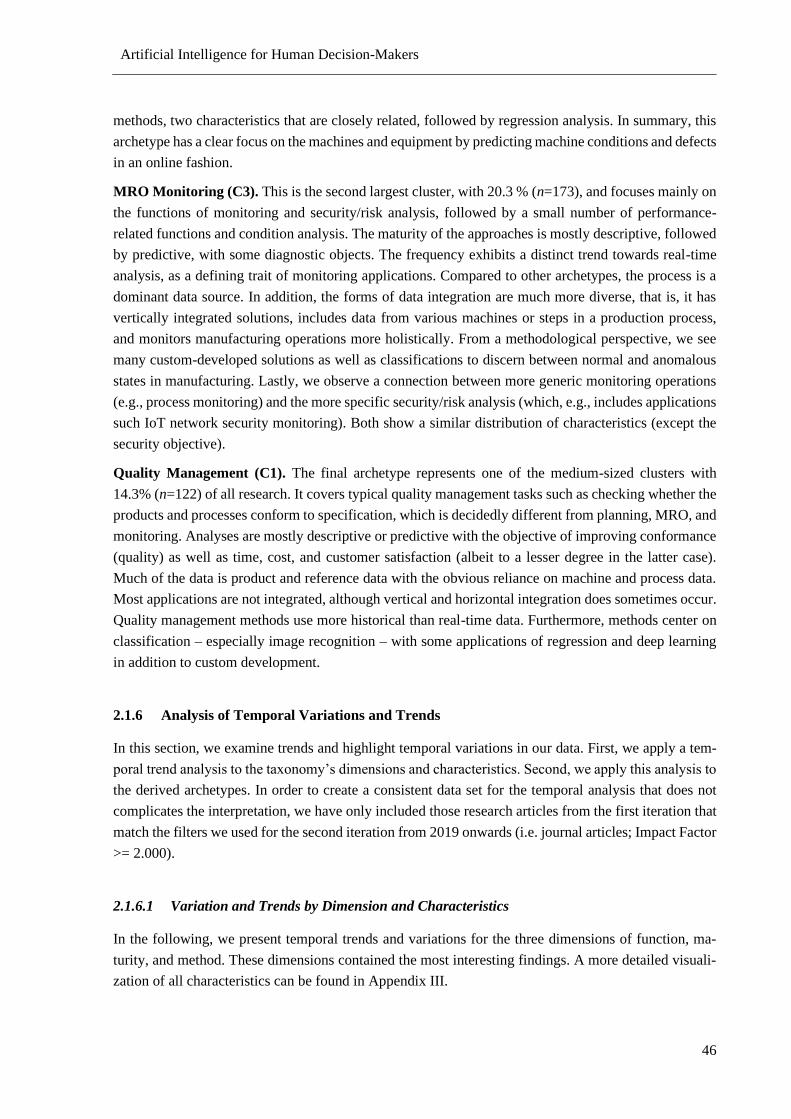
Artificial Intelligence for Human Decision-Makers
46
methods, two characteristics that are closely related, followed by regression analysis. In summary, this
archetype has a clear focus on the machines and equipment by predicting machine conditions and defects
in an online fashion.
MRO Monitoring (C3). This is the second largest cluster, with 20.3 % (n=173), and focuses mainly on
the functions of monitoring and security/risk analysis, followed by a small number of performance-
related functions and condition analysis. The maturity of the approaches is mostly descriptive, followed
by predictive, with some diagnostic objects. The frequency exhibits a distinct trend towards real-time
analysis, as a defining trait of monitoring applications. Compared to other archetypes, the process is a
dominant data source. In addition, the forms of data integration are much more diverse, that is, it has
vertically integrated solutions, includes data from various machines or steps in a production process,
and monitors manufacturing operations more holistically. From a methodological perspective, we see
many custom-developed solutions as well as classifications to discern between normal and anomalous
states in manufacturing. Lastly, we observe a connection between more generic monitoring operations
(e.g., process monitoring) and the more specific security/risk analysis (which, e.g., includes applications
such IoT network security monitoring). Both show a similar distribution of characteristics (except the
security objective).
Quality Management (C1). The final archetype represents one of the medium-sized clusters with
14.3% (n=122) of all research. It covers typical quality management tasks such as checking whether the
products and processes conform to specification, which is decidedly different from planning, MRO, and
monitoring. Analyses are mostly descriptive or predictive with the objective of improving conformance
(quality) as well as time, cost, and customer satisfaction (albeit to a lesser degree in the latter case).
Much of the data is product and reference data with the obvious reliance on machine and process data.
Most applications are not integrated, although vertical and horizontal integration does sometimes occur.
Quality management methods use more historical than real-time data. Furthermore, methods center on
classification – especially image recognition – with some applications of regression and deep learning
in addition to custom development.
2.1.6 Analysis of Temporal Variations and Trends
In this section, we examine trends and highlight temporal variations in our data. First, we apply a tem-
poral trend analysis to the taxonomy’s dimensions and characteristics. Second, we apply this analysis to
the derived archetypes. In order to create a consistent data set for the temporal analysis that does not
complicates the interpretation, we have only included those research articles from the first iteration that
match the filters we used for the second iteration from 2019 onwards (i.e. journal articles; Impact Factor
>= 2.000).
2.1.6.1 Variation and Trends by Dimension and Characteristics
In the following, we present temporal trends and variations for the three dimensions of function, ma-
turity, and method. These dimensions contained the most interesting findings. A more detailed visuali-
zation of all characteristics can be found in Appendix III.
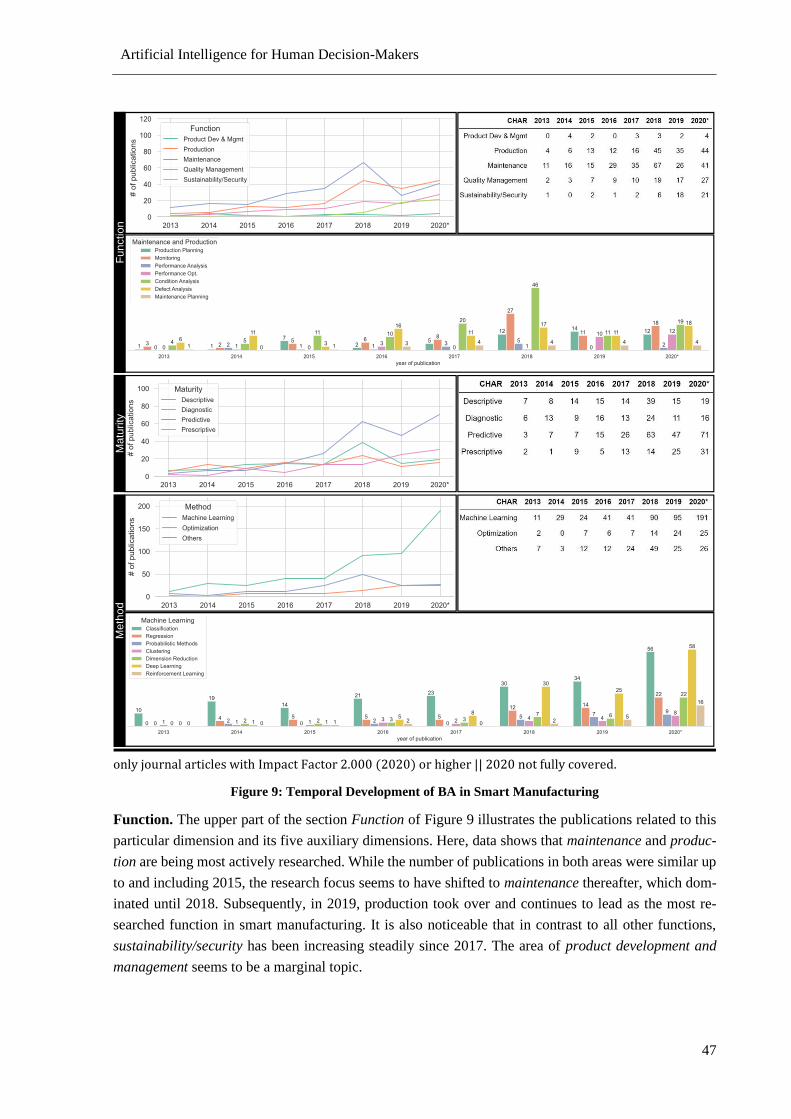
Artificial Intelligence for Human Decision-Makers
47
only journal articles with Impact Factor 2.000 (2020) or higher || 2020 not fully covered.
Figure 9: Temporal Development of BA in Smart Manufacturing
Function. The upper part of the section Function of Figure 9 illustrates the publications related to this
particular dimension and its five auxiliary dimensions. Here, data shows that maintenance and produc-
tion are being most actively researched. While the number of publications in both areas were similar up
to and including 2015, the research focus seems to have shifted to maintenance thereafter, which dom-
inated until 2018. Subsequently, in 2019, production took over and continues to lead as the most re-
searched function in smart manufacturing. It is also noticeable that in contrast to all other functions,
sustainability/security has been increasing steadily since 2017. The area of product development and
management seems to be a marginal topic.
Function
Ma
turity
Meth
od
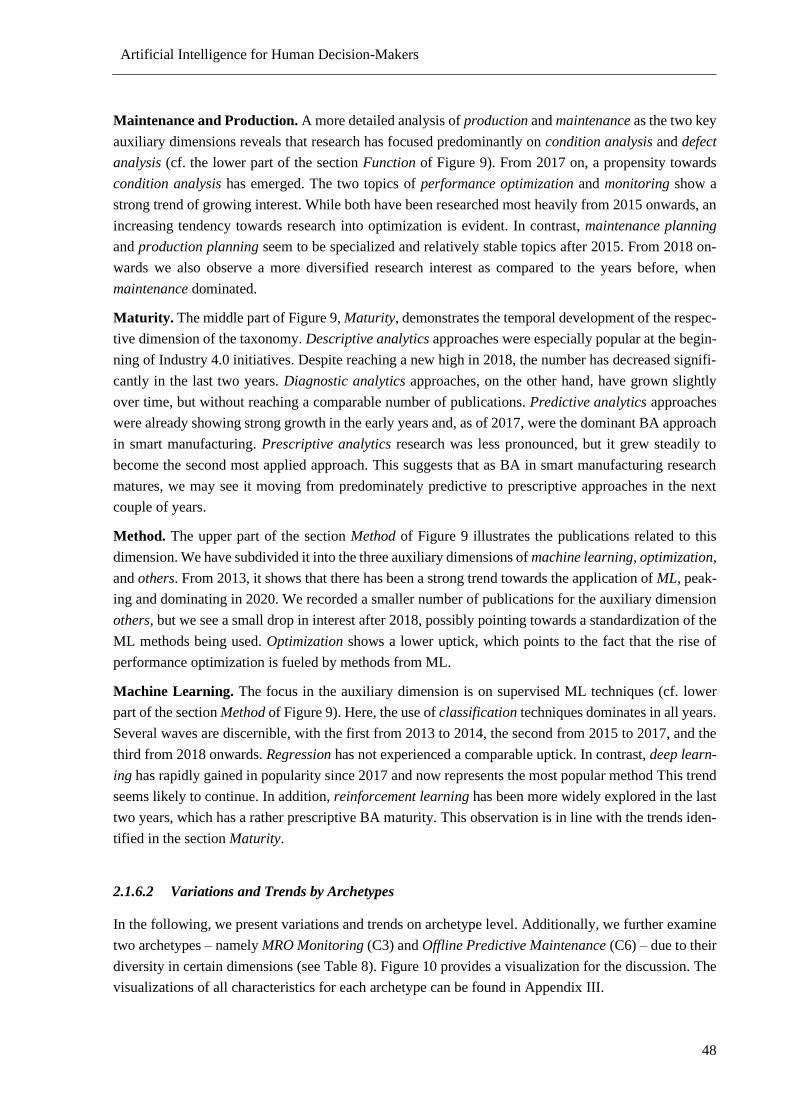
Artificial Intelligence for Human Decision-Makers
48
Maintenance and Production. A more detailed analysis of production and maintenance as the two key
auxiliary dimensions reveals that research has focused predominantly on condition analysis and defect
analysis (cf. the lower part of the section Function of Figure 9). From 2017 on, a propensity towards
condition analysis has emerged. The two topics of performance optimization and monitoring show a
strong trend of growing interest. While both have been researched most heavily from 2015 onwards, an
increasing tendency towards research into optimization is evident. In contrast, maintenance planning
and production planning seem to be specialized and relatively stable topics after 2015. From 2018 on-
wards we also observe a more diversified research interest as compared to the years before, when
maintenance dominated.
Maturity. The middle part of Figure 9, Maturity, demonstrates the temporal development of the respec-
tive dimension of the taxonomy. Descriptive analytics approaches were especially popular at the begin-
ning of Industry 4.0 initiatives. Despite reaching a new high in 2018, the number has decreased signifi-
cantly in the last two years. Diagnostic analytics approaches, on the other hand, have grown slightly
over time, but without reaching a comparable number of publications. Predictive analytics approaches
were already showing strong growth in the early years and, as of 2017, were the dominant BA approach
in smart manufacturing. Prescriptive analytics research was less pronounced, but it grew steadily to
become the second most applied approach. This suggests that as BA in smart manufacturing research
matures, we may see it moving from predominately predictive to prescriptive approaches in the next
couple of years.
Method. The upper part of the section Method of Figure 9 illustrates the publications related to this
dimension. We have subdivided it into the three auxiliary dimensions of machine learning, optimization,
and others. From 2013, it shows that there has been a strong trend towards the application of ML, peak-
ing and dominating in 2020. We recorded a smaller number of publications for the auxiliary dimension
others, but we see a small drop in interest after 2018, possibly pointing towards a standardization of the
ML methods being used. Optimization shows a lower uptick, which points to the fact that the rise of
performance optimization is fueled by methods from ML.
Machine Learning. The focus in the auxiliary dimension is on supervised ML techniques (cf. lower
part of the section Method of Figure 9). Here, the use of classification techniques dominates in all years.
Several waves are discernible, with the first from 2013 to 2014, the second from 2015 to 2017, and the
third from 2018 onwards. Regression has not experienced a comparable uptick. In contrast, deep learn-
ing has rapidly gained in popularity since 2017 and now represents the most popular method This trend
seems likely to continue. In addition, reinforcement learning has been more widely explored in the last
two years, which has a rather prescriptive BA maturity. This observation is in line with the trends iden-
tified in the section Maturity.
2.1.6.2 Variations and Trends by Archetypes
In the following, we present variations and trends on archetype level. Additionally, we further examine
two archetypes – namely MRO Monitoring (C3) and Offline Predictive Maintenance (C6) – due to their
diversity in certain dimensions (see Table 8). Figure 10 provides a visualization for the discussion. The
visualizations of all characteristics for each archetype can be found in Appendix III.
Artificial Intelligence for Human Decision-Makers
49
only journal articles with Impact Factor 2.000 (2020) or higher || 2020 not fully covered.
Figure 10: Temporal Development of BA Archetypes in Smart Manufacturing
Archetypes. The top section of Figure 10 illustrates the temporal development of the six archetypes.
Throughout the years, we see a steady increase for all archetypes, while both reactive maintenance and
offline predictive maintenance dominate 2013 and 2014. From 2014 to 2017, it is noticeable that reactive
maintenance and online predictive maintenance gain traction. After 2017, MRO monitoring and offline
predictive maintenance grow particularly rapidly. In contrast, the interest in reactive maintenance sig-
nificantly decreases after 2017. MRO planning, quality management, and online predictive maintenance
are rather steady in their growth. In 2019 we can observe a drop of research interest in MRO monitoring
and offline predictive maintenance. After 2019 we see continuous growth over nearly all archetypes,
with online predictive maintenance growing most rapidly. Again, both MRO monitoring and offline
predictive maintenance outperform the other clusters, but their growth rate has dropped considerably.
Reactive maintenance is the least considered in research.
Arc
he
typ
es
Inte
gra
tion
& F
un
ctio
n(C
3)
Me
tho
d &
In
teg
ratio
n (
C6
)
Artificial Intelligence for Human Decision-Makers
50
MRO Monitoring. This archetype is relatively diverse regarding the function dimension. Our temporal
analysis confirms the novel research stream or gap in security/risk analysis. The characteristic monitor-
ing is dominant in our first search iteration with data until 2018. Security/risk analysis, on the other
hand, exhibits rapid growth through 2020. Thus, security/risk analysis constitutes a novel research trend
in smart manufacturing and may even constitute a distinct archetype in the future. Regarding integration,
this archetype shows a significant percentage of vertical integration, pointing to multi-level monitoring.
In general, this archetype implemented more integration than others did.
Offline Predictive Maintenance. As the name suggests, this archetype relies not on integration, but
rather data that is copied for offline analysis. While we observe a slow increase in integration options,
it does not seem relevant for implementation in the near future. Furthermore, the archetype displays
dissimilar characteristics in the dimension method. The distribution and growth of classification, regres-
sion, and custom development are steady with no clear frontrunner until 2017, when a new contender
appears. Deep learning exhibits rapid growth and surpasses all other methods by 2018. It is by far the
most popular method today.
2.1.7 Discussion and Conclusion
Our study contributes to the descriptive knowledge of BA in smart manufacturing, as it explores a di-
verse, evolving, and not-yet-well-conceptualized domain. We conceptualized a taxonomy and derived
archetypes for BA in smart manufacturing and discussed their appearance as well as temporal trends in
this field. Our taxonomy, which comprises 52 characteristics, is based on the four meta-characteristics
of domain, orientation, data, and technique. Our archetypes summarize the field’s foci as MRO planning,
maintenance (reactive, offline predictive, online predictive), MRO monitoring, and quality management.
Our results reduce complexity for scientists and practitioners, in particular for those who are new to the
field, by organizing research into archetypes, which can serve as orientation and context for new arti-
facts. Our work has revealed several theoretical and practical implications.
Our main contributions are a theoretically well-founded and empirically validated multi-dimensional
taxonomy, which focuses on the functional and non-functional characteristics of BA applications in
smart manufacturing, and archetypes of applications, derived exploratorily through cluster analysis of
our comprehensive, coded bibliography.
As a first theoretical contribution, our taxonomy can be used to systematize BA in smart manufacturing
for later analysis and provides a new level of understanding of the novel innovations and technologies
within this emerging field. Scientists can use the taxonomy to study and hypothesize about relationships
among techniques and applications as well as their characteristics. Our taxonomy not only supports the
discussion about the area of research, but also provides a more profound knowledge of the emerging
patterns of BA in smart manufacturing by providing a scheme to classify BA applications into arche-
types.
While we said that Industry 4.0 and smart manufacturing represent the context as a constant for our
research, our results enable us to turn the tables. Our taxonomy is a concise conceptual representation
of the rich body of knowledge of BA in smart manufacturing literature. As Gregor (2006) points out,
taxonomies can serve as a theoretical basis for analysis beyond their descriptive and classificational
Artificial Intelligence for Human Decision-Makers
51
purpose. In their most basic form, they serve as taxonomic theory (Nickerson et al. 2017), which can be
the basis for more advanced theories that aim to explain and predict. Thus, our taxonomy can itself be
used as context for further investigations as it enables one to understand the domain and to describe
elements that take part in the phenomena of examination. Summarizing, Bapna et al. (2004) assert that
“a robust taxonomy can then be used to perform ex post theory building”. Given the comprehensiveness
of our data collection and analysis, we consider our taxonomy robust enough to serve such purposes.
Second, our cluster analysis revealed six archetypes, which explain different foci and applications of
BA, as well as their respective roles in smart manufacturing. This distinction can be used to differentiate
among the scientific results of BA and their uses. It supports clarifying terminology and thus can make
the academic discourse more concise. Furthermore, it helps to better interpret findings by being able to
judge them in the context of comparable applications. In sum, the taxonomical systematization of BA
and the uncovering of archetypes in smart manufacturing provide new tools for the scientific community
to understand better application opportunities. For example, it can help to uncover applications within
archetypes that exhibit comparable infrastructure and skill requirements despite being functionally dis-
tinct at first glance.
Moreover, our archetypes enable a more detailed analysis of the temporal variations of trends in research
topics of BA for smart manufacturing. Beyond the general observation of the importance of offline
maintenance and monitoring topics, as well as the demise of reactive maintenance research, we found a
generally stable relationship between the BA domains. Our archetype analysis further revealed that se-
curity topics have gained more traction in recent years. In addition, the maturity of BA research has
moved from descriptive to predictive approaches and may eventually transition to a predominant focus
on prescriptive approaches. While the data dimension did not reveal insights per se, a look at the arche-
types revealed that the distribution of characteristics is rather specific to them. Lastly, machine learning,
and in particular deep learning, has come to dominate contemporary method use in recent years. From
a scientific – but even more from a practical – point of view, this enables people to question and adjust
their priorities to address contemporary challenges with their research or in their work environment.
From a practical perspective, our taxonomy provides dimensions and characteristics that can serve as a
blueprint for BA selection and application in concrete real-world scenarios. Our taxonomy provides
measures to evaluate the different options for BA, to address a specific problem, area, or requirement.
We provide a distinction among archetypes that enables practitioners to find or review suitable config-
urations of BA to address their requirements. Assuming that research is several years ahead of produc-
tive practical applications, identifying these trends can create the awareness necessary to shape organi-
zational and technical developments towards these future opportunities, for example by acquiring the
requisite workforce skills.
As with any research, our study is not without its limitations. Taxonomies are never complete and should
be considered as a starting point for further contextualization. Ours is the result of a design search pro-
cess, which we have further documented in the appendices. While our data collection was rigorous, there
may be further relevant applications of BA in smart manufacturing that have appeared in other domains
of research and which we did not uncover in our data collection. The interpretation of data was not
without issues, either. Clustering algorithms and segmentation metrics rarely point to the consistent
segmentation of binary data. We consistently scrutinized our results qualitatively to ensure coherence
and applicability.
Artificial Intelligence for Human Decision-Makers
52
In conclusion, in moving to establish smart manufacturing, businesses must adapt to disruptive and rad-
ical changes in value networks, business models, and operations due to the ever-emerging technological
manufacturing innovations of the fourth industrial revolution. A massive increase in data, computing
power, and connectivity is fueling novel applications of BA that can lead to cost advantages, increased
customer satisfaction, and improvements in production effectiveness and quality.
Future research could examine the archetypes in more detail and, for example, focus on security/risk
analysis, both energy consumption characteristics, and design analysis, as they represent relatively uni-
form subclusters that we have not yet explored in greater depth. In addition, research should revisit
trending areas and, for example, explore the use of machine learning in smart manufacturing in more
detail as this will shed light on important future topics such as transfer learning and explainable artificial
intelligence.
2.2 Transfer Techniques in Explainable AI
Abstract. Machine learning enables computers to learn from data and fuels artificial intelligence sys-
tems with capabilities to make even super-human decisions. Yet, despite already outperforming preex-
isting methods and even humans for specific tasks in gaming or healthcare, machine learning faces sev-
eral challenges related to the uncertainty of the analysis result’s trustworthiness beyond training and
validation data. This is because many well-performing algorithms are black boxes to the user who –
consequently – cannot trace and understand the reasoning behind a model’s prediction when taking or
executing a decision. In response, explainable AI has emerged as a field of study to glass box the former
black box models. However, current explainable AI research often neglects the human factor. Against
this backdrop, we study from a user perspective the trade-off between completeness, as the accuracy of
a model’s prediction, and interpretability, as the way of model prediction understanding. In particular,
we evaluate how existing explainable AI model transfers can be used with a focus on the human recipient
and derive recommendations for improvements. As a first step, we have identified eleven types of glass
box models and defined the fundamentals of a well-founded survey design to understand better the fac-
tors that support interpretability and weighing them against improved yet black-boxed completeness.4
2.2.1 Introduction
Today’s society and economy have firmly settled into the digital age. Data is generated everywhere and
offers a multitude of valuable possibilities (Guidotti et al. 2018b), such as for example the right time to
maintain an industrial machinery (Civerchia et al. 2017). A mature and common technique to uncover
information in data analytically is to apply statistical methods such as regression analysis. Artificial
intelligence (AI) systems promise to improve this process. By AI, we refer to the concept of machine
4 This paper is published within the 28th European Conference on Information Systems as ‘HOW MUCH IS THE
BLACK BOX? THE VALUE OF EXPLAINABILITY IN MACHINE LEARNING MODELS (Wanner et al.
2020). The related supplementary material is given in Appendix III.
Artificial Intelligence for Human Decision-Makers
53
learning (ML), the science of mathematical models and algorithms that machines employ to solve tasks
without being explicitly programmed to do so (Bishop 2006). These ML systems tend to outperform
existing analytical methods or even humans for specific tasks, e.g., in medicine or gaming (e.g., Akay
2009; Kourou et al. 2015; Silver et al. 2016).
Despite its analytical benefits, ML faces several challenges. In particular, the remaining uncertainty and
its dependence on data quality are problematic (Patel et al. 2008; Quionero-Candela et al. 2009). Re-
searchers have addressed this issue by developing more robust and accurate model algorithms. While
reducing the bias problem, often the results simultaneously reduces traceability (Dam et al. 2018). These
algorithms are black box models whose internals are either unknown to the observer or they are known
but essentially uninterpretable by humans (Guidotti et al. 2018b). This results in a lack of trust (Dam et
al. 2018). Trust in our context refers to the confidence in an AI-based recommendation to act based on
it. Studies have shown that this is influenced by how much a person understands the behavior of a model,
rather than considering it a black box (Ribeiro et al. 2016b). Thus, an appropriate way of model expla-
nation will improve the user’s trust of model predictions and vice versa its acceptance (Dam et al. 2018;
Gilpin et al. 2018). We define explanation as the ability to fill the information gap between the AI system
and its user in an understandable way (Cui et al. 2019).
This is the objective of explainable AI (XAI). It aims to produce more explainable models, while main-
taining a high level of learning performance (Gunning and Aha 2019). The technical feasibility of ex-
plaining black box models is already advanced, but there is a lack of knowledge about the evaluation of
these models by humans (Miller 2019). Therefore, Cui et al. (2019) distinguish two types: functional
and social explanation. The former is about the explanation between AI experts, such as AI engineers
and AI developers (Ras et al. 2018). The latter is about the explanation between AI experts and intended
users, with the aim to strengthen trust and use by an appropriate type of presentation (Miller 2019).
Miller (2019) argues that AI researchers today are building explanatory agents for themselves, rather
than for the intended users. Various researchers in the XAI community are therefore calling vehemently
for further research on the social evaluation of AI (e.g., Miller 2019; Ribeiro et al. 2016b).
Especially in the last couple of years, XAI transfer techniques have been developed to convert black
box models into glass box models. A wide variety of initial and final models has been proposed. How-
ever, it remains questionable whether the research is also in line with the expectations of the intended
users. For this purpose, it must be understood, which model presentation is suitable, and which is not.
Further, the challenge behind the XAI transfer techniques remains to create explanations that are both,
complete and interpretable. This faces the trade-off that most accurate explanations are not easy for
humans to interpret and, inversely, most understandable explanations often lack predictive power
(Doran et al. 2017; Gilpin et al. 2018; Guidotti et al. 2018b). Against this background, we intent to reveal
the willingness of users to dispense accuracy of model prediction in favor of better explanations. Our
intention can be summarized with a research question, which partly also goes beyond the scope of this
paper:
“W i f t xisting XAI transf r t niqu s fr academics promise the best approach for the trade-
ff b tw n d a ura y and d xp ainabi ity fr an int nd d us r p rsp tiv ?”
Artificial Intelligence for Human Decision-Makers
54
The result allows us to guide future research in two ways: (i) to understand the explanatory goodness of
different ML model presentations and (ii) to understand the importance of the model’s degree of accu-
racy against its degree of explanation. This can be an important enabler for targeted optimizations.
Correspondingly, our paper is structured as follows: In Section 2.2.2, we describe the theoretical back-
ground and related work. Section 2.2.3 covers the status quo of XAI model transfer implementations.
We present our planned study design in Section 2.2.4. Finally, we conclude the paper and provide an
outlook for the upcoming research steps in Section 2.2.5.
2.2.2 Theoretical Background and Related Work
2.2.2.1 Machine Learning and Explainable Artificial Intelligence
Machine Learning. ML is the science of mathematical models and algorithms that machines employ
to solve tasks without being explicitly programmed (Bishop 2006). The internal computation often re-
mains incomprehensible due to its complexity. Thus, how and why of a result remain problematic
(Holzinger et al. 2017). This intensifies regarding several problems. Practitioners often overestimate the
accuracy of their models (Patel et al. 2008) as known test data might differ from the unknown ‘real
world’ data (Quionero-Candela et al. 2009). It is also possible that there is an unintentional leakage of
data distorting the overall accuracy (Kaufman et al. 2012). Furthermore, adversarial attacks, as a con-
scious manipulation of data to trick the ML system, are potential threats (Barreno et al. 2010). In con-
sequence, ML predictions cannot be acted upon in blind trust (Guidotti et al. 2018b; Ribeiro et al.
2016b).
Explainable AI. XAI is a research area, trying to address these problems. The main objective called out
is to produce more explanatory models whereas retaining a high learning performance (Gunning and
Aha 2019). Thus, it is foremost about dissolving the model’s black box problem. For this purpose, the
internal processes of the models are made explainable by algorithms and mathematical methods (Abdul
et al. 2018). So, today’s XAI research focuses on a transfer of black box models into so-called glass box
models (Holzinger et al. 2017). A glass box model is transparent. This makes the internal model’s rea-
soning comprehensible, so that it creates trust and increases its acceptance. This may be necessary in
companies for example due to legal liabilities (Dam et al. 2018; Gilpin et al. 2018). Nevertheless, XAI
aims at the multifaceted term of explanation. It is therefore important to understand what constitutes an
explanation (Miller 2019; Miller et al. 2017).
2.2.2.2 Artificial Intelligence Model’s Explanation Dilemma
Model Explanation. Research in various disciplines including philosophy, social science, psychology,
and computer science has pursued the question of what constitutes explainability and further how ex-
planations should be expressed to be readily grasped and valued by humans (Miller et al. 2017). We
adopt the definition of Dam et al. (2018) who state that “explainability or interpretability of a model
measures the degree to which a human observer can understand the reasons behind a decision (e.g. a
prediction) made by the model.” Understandable reasoning can be presented either by making the pro-
cess of decision making transparent (named as global explainability) or by providing explicit rationale
Artificial Intelligence for Human Decision-Makers
55
for the decision (named as local explainability) (Dam et al. 2018). A global explainability provides
transparency into the decision model (simulatability), components such as parameters (decomposabil-
ity), or algorithms (algorithmic transparency). This is typically addressed by a functional focus of XAI,
ensuring an appropriate explanation between AI experts (Ras et al. 2018). Local explainability enables
post-hoc interpretability of the concrete results through textual explanations (in natural language), vis-
ualizations, or examples (Lipton 2018). This is typically addressed by a social focus of XAI, aiming to
strengthen trust and use by an appropriate type of explanation presentation for intended users (Miller
2019).
Trade-off Dilemma. To provide the required explanation, explainers must address two constraints in
parallel: interpretability and completeness (Gilpin et al. 2018). In research, interpretability is often also
termed as explainability, comprehensibility, and transparency while completeness is used synonymous
to accuracy (Dam et al. 2018; Guidotti et al. 2018b). Interpretability on the one hand is defined as the
ability to explain or to present reasoning of the model’s prediction in understandable terms to a human
(Doshi-Velez and Kim 2017). The degree of interpretability is strongly depending on the individual’s
cognition, knowledge, and prejudices (Gilpin et al. 2018). Completeness on the other hand is defined as
the accuracy of the system operation description (Gilpin et al. 2018). A description, which is not com-
plete, has some kind of unquantified bias (Doshi-Velez and Kim 2017).
Highly accurate explanations, such as a pure mathematical expression of the model’s reasoning, are not
easy for humans to interpret. Therefore, attempts like Ribeiro et al. (2016b) focus on finding an expla-
nation that abstracts from ‘real world’ complexity towards fast perception. Inversely, if an explanation
is more abstract, and thus, better understandable it often lacks predictive power (Gilpin et al. 2018;
Guidotti et al. 2018a). However, it is not always necessary to provide a ML model with an explanation
of reasoning that is perfectly complete (Doran et al. 2017). It is rather depending on the expectation of
the individual, that, thus, must be understand first before optimizing the given trade-off.
2.2.3 Related Work and Research Gap
The idea of making models explainable is not new. It exists since the advent of first expert systems in
the 1970’s (Swartout 1983). These decision support systems (DSS) are defined as generation one, evolv-
ing to today’s DSS of generation three (Mueller et al. 2019). Apart from the technical progress of new
models, which tends to improve the accuracy at the expense of increased model complexity, the problem
remains the same: How to explain the model-based decision reasoning in an understandable manner,
without losing completeness? Primary within the last two years, several XAI transfer techniques have
been developed to convert black box models into glass box models. A wide variety of initial and final
models has been proposed but without a critical acknowledgement whether the research is also in line
with the expectations of the intended users. Thus, there seems to be a lack of user-based research to
understand the given trade-off (Sheh and Monteath 2018).
Classification and review. According to Lipton (2018), a classification will be a helping hand to ad-
dress this by identifying transparent or interpretable ML algorithms. This requires an comparison eval-
uating the different ML algorithms. Dam et al. (2018) classify explainability as a three-part component
consisting of the transparency of the model, the individual components as well as the ML algorithm
itself. The division into different levels of explanation was carried out by the authors themselves without
Artificial Intelligence for Human Decision-Makers
56
giving further evidence. Gunning and Aha (2019) and Duval (2019) follow a similar procedure. García
et al. (2009) try to make a simplified measurable calculation for this trade-off feasible. Further,
Kotsiantis et al. (2007) try to classify different ML algorithms by different criteria such as accuracy or
transparency. Adadi and Berrada (2018) and Mohseni et al. (2018) provide a review of existing XAI
model transfer approaches, but without differentiating between multiple ML algorithms.
User survey. Further, there are contributions concentrating on questioning the user perspective. How-
ever, these contributions primarily focus on proving the importance of such an approach, rather than
seeking to optimize the trade-off. Exceptions are the publications by Cui et al. (2019) and Hoffman et
al. (2018). Cui et al. (2019) study the trade-off from a functional explanation perspective. By applying
their developed framework they found out that a rule extraction method is the most advanced and prom-
ising method among current XAI transfer techniques. Hoffman et al. (2018) have designed metrics for
dimensioning the XAI model through literature and own psychometric evaluations. They present a re-
search design concept and corresponding survey possibilities as well as recommendations. They con-
sidering trust and the reliance of the trade-off between interpretability and completeness.
In summary, the evaluation and consideration of various XAI approaches from a user perspective is
rarely found in related work. This applies in particular to the comparison of different XAI approaches
for certain ML algorithms against the trade-off between interpretability and completeness. Further, we
could not find any contribution conducting a qualitative study that critically analyzes different, existing
XAI approaches and ML algorithms against the trade-off from a social user perspective.
2.2.4 Status Quo of XAI Model Transfers
We conducted a structured literature review based on the recommendations of Webster and Watson
(2002). Our aim was to identify research papers, which developed an XAI method including a practical
implementation. Therefore, we have focused on the Computer Science databases of IEEE Xplore and
ACM Digital Library. Further, we queried Information Systems related databases AIS eLibrary, Science
Direct, and Web of Science. Through Scopus, we addressed the topic’s interdisciplinary. Our search
term conforms to the following pseudocode: “((Interpretability | Explainability | Transparency | Com-
prehensibility | Understandability | Explanatory | Black box | Blackbox) AND (Machine Learning | Ar-
tificial Intelligence | AI | Deep Learning | Neural Net*))”. Through the extension of a forward and
backward search, we have identified 13.201 contributions. After screening title, keywords, abstract, and
a full-text analysis, a total of 74 contributions has been considered as relevant, excluding preprints (cf.
Table 41 in the Appendix III).
Figure 11 provides an overview of the distribution of the applied XAI methods. The left part sorts the
publication by date and by the applied black box ML model. The result underlines that only a few pro-
cedures for transferring black box models into glass box models existed before 2016 (n=13). Subse-
quently, the past couple of years show an exponential growth on new XAI model transfer techniques
(n=75). Approaches based on neutral nets dominate: Convolutional Neutral Networks (CNN) foremost
since 2018 (n=7) and Artificial Neural Networks (ANN) intensifying since 2019 (n=11). Also, there is
an increasing attempt to explain clustering algorithms (n=6). The data for 2020 only covers the first
quarter and does not allow for any quantitative assessments.
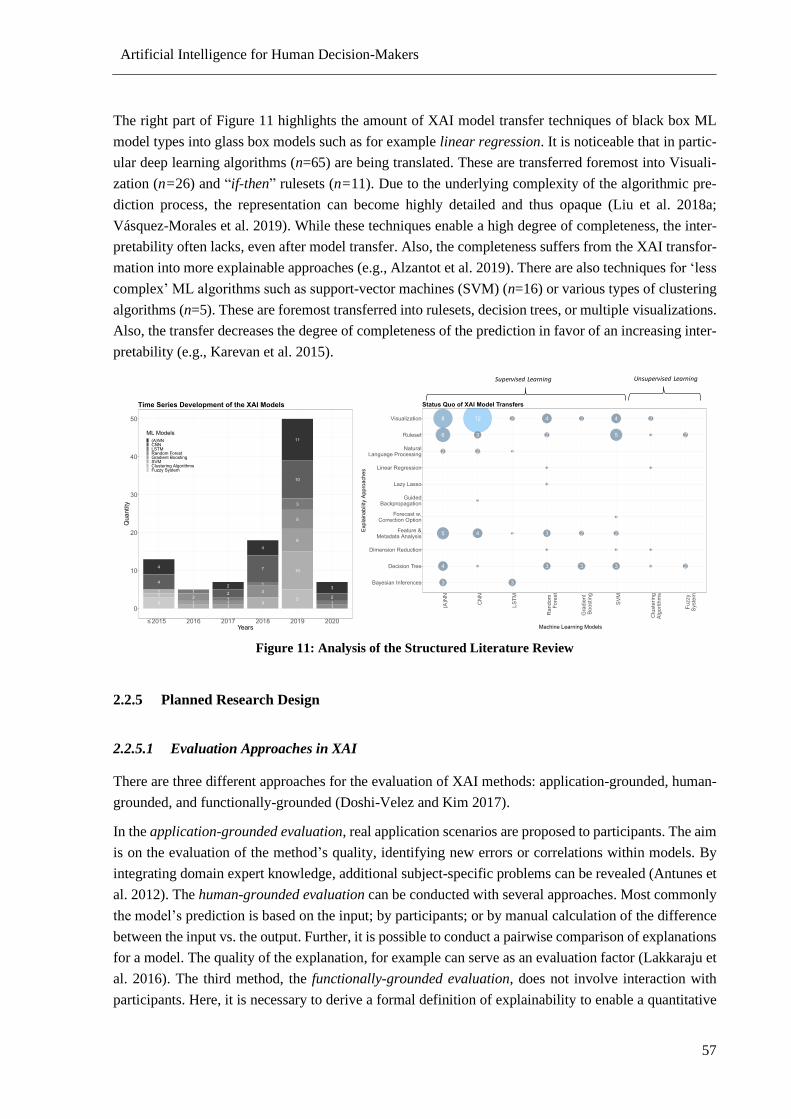
Artificial Intelligence for Human Decision-Makers
57
The right part of Figure 11 highlights the amount of XAI model transfer techniques of black box ML
model types into glass box models such as for example linear regression. It is noticeable that in partic-
ular deep learning algorithms (n=65) are being translated. These are transferred foremost into Visuali-
zation (n=26) and “if-then” rulesets (n=11). Due to the underlying complexity of the algorithmic pre-
diction process, the representation can become highly detailed and thus opaque (Liu et al. 2018a;
Vásquez-Morales et al. 2019). While these techniques enable a high degree of completeness, the inter-
pretability often lacks, even after model transfer. Also, the completeness suffers from the XAI transfor-
mation into more explainable approaches (e.g., Alzantot et al. 2019). There are also techniques for ‘less
complex’ ML algorithms such as support-vector machines (SVM) (n=16) or various types of clustering
algorithms (n=5). These are foremost transferred into rulesets, decision trees, or multiple visualizations.
Also, the transfer decreases the degree of completeness of the prediction in favor of an increasing inter-
pretability (e.g., Karevan et al. 2015).
Figure 11: Analysis of the Structured Literature Review
2.2.5 Planned Research Design
2.2.5.1 Evaluation Approaches in XAI
There are three different approaches for the evaluation of XAI methods: application-grounded, human-
grounded, and functionally-grounded (Doshi-Velez and Kim 2017).
In the application-grounded evaluation, real application scenarios are proposed to participants. The aim
is on the evaluation of the method’s quality, identifying new errors or correlations within models. By
integrating domain expert knowledge, additional subject-specific problems can be revealed (Antunes et
al. 2012). The human-grounded evaluation can be conducted with several approaches. Most commonly
the model’s prediction is based on the input; by participants; or by manual calculation of the difference
between the input vs. the output. Further, it is possible to conduct a pairwise comparison of explanations
for a model. The quality of the explanation, for example can serve as an evaluation factor (Lakkaraju et
al. 2016). The third method, the functionally-grounded evaluation, does not involve interaction with
participants. Here, it is necessary to derive a formal definition of explainability to enable a quantitative
Supervised Learning Unsupervised Learning
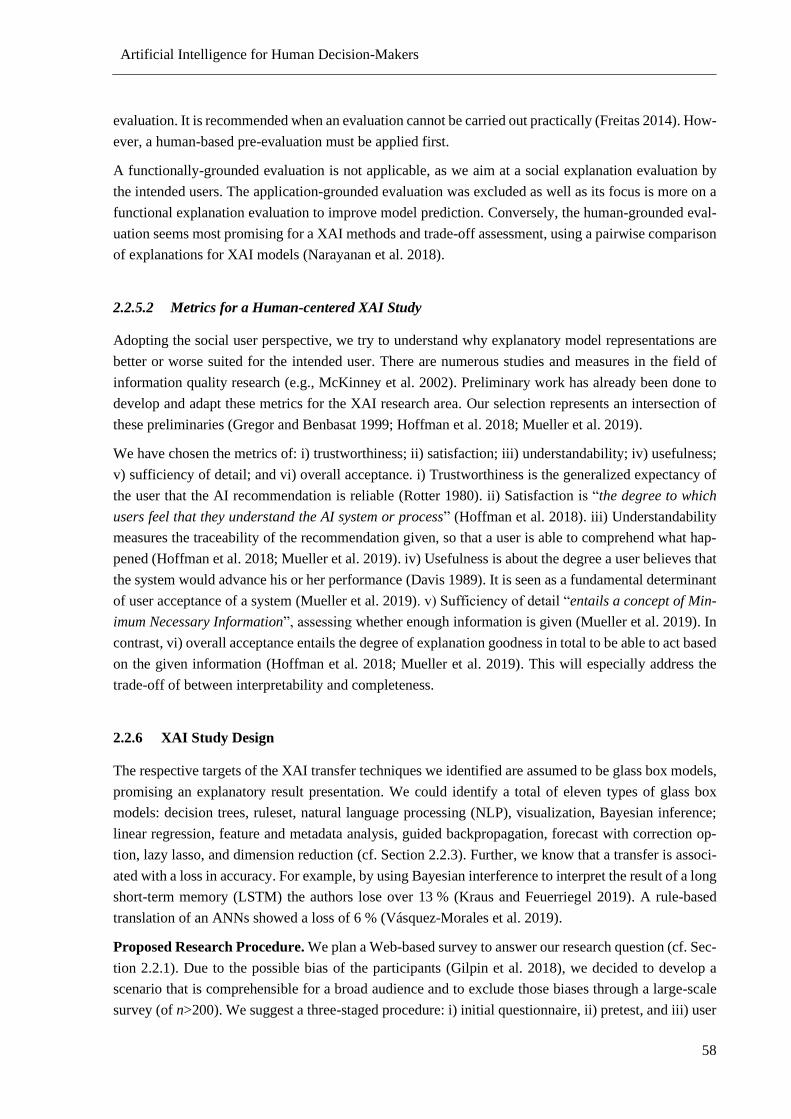
Artificial Intelligence for Human Decision-Makers
58
evaluation. It is recommended when an evaluation cannot be carried out practically (Freitas 2014). How-
ever, a human-based pre-evaluation must be applied first.
A functionally-grounded evaluation is not applicable, as we aim at a social explanation evaluation by
the intended users. The application-grounded evaluation was excluded as well as its focus is more on a
functional explanation evaluation to improve model prediction. Conversely, the human-grounded eval-
uation seems most promising for a XAI methods and trade-off assessment, using a pairwise comparison
of explanations for XAI models (Narayanan et al. 2018).
2.2.5.2 Metrics for a Human-centered XAI Study
Adopting the social user perspective, we try to understand why explanatory model representations are
better or worse suited for the intended user. There are numerous studies and measures in the field of
information quality research (e.g., McKinney et al. 2002). Preliminary work has already been done to
develop and adapt these metrics for the XAI research area. Our selection represents an intersection of
these preliminaries (Gregor and Benbasat 1999; Hoffman et al. 2018; Mueller et al. 2019).
We have chosen the metrics of: i) trustworthiness; ii) satisfaction; iii) understandability; iv) usefulness;
v) sufficiency of detail; and vi) overall acceptance. i) Trustworthiness is the generalized expectancy of
the user that the AI recommendation is reliable (Rotter 1980). ii) Satisfaction is “the degree to which
users feel that they understand the AI system or process” (Hoffman et al. 2018). iii) Understandability
measures the traceability of the recommendation given, so that a user is able to comprehend what hap-
pened (Hoffman et al. 2018; Mueller et al. 2019). iv) Usefulness is about the degree a user believes that
the system would advance his or her performance (Davis 1989). It is seen as a fundamental determinant
of user acceptance of a system (Mueller et al. 2019). v) Sufficiency of detail “entails a concept of Min-
imum Necessary Information”, assessing whether enough information is given (Mueller et al. 2019). In
contrast, vi) overall acceptance entails the degree of explanation goodness in total to be able to act based
on the given information (Hoffman et al. 2018; Mueller et al. 2019). This will especially address the
trade-off of between interpretability and completeness.
2.2.6 XAI Study Design
The respective targets of the XAI transfer techniques we identified are assumed to be glass box models,
promising an explanatory result presentation. We could identify a total of eleven types of glass box
models: decision trees, ruleset, natural language processing (NLP), visualization, Bayesian inference;
linear regression, feature and metadata analysis, guided backpropagation, forecast with correction op-
tion, lazy lasso, and dimension reduction (cf. Section 2.2.3). Further, we know that a transfer is associ-
ated with a loss in accuracy. For example, by using Bayesian interference to interpret the result of a long
short-term memory (LSTM) the authors lose over 13 % (Kraus and Feuerriegel 2019). A rule-based
translation of an ANNs showed a loss of 6 % (Vásquez-Morales et al. 2019).
Proposed Research Procedure. We plan a Web-based survey to answer our research question (cf. Sec-
tion 2.2.1). Due to the possible bias of the participants (Gilpin et al. 2018), we decided to develop a
scenario that is comprehensible for a broad audience and to exclude those biases through a large-scale
survey (of n>200). We suggest a three-staged procedure: i) initial questionnaire, ii) pretest, and iii) user
Artificial Intelligence for Human Decision-Makers
59
study. In the i) initial questionnaire, we define all relevant units that need to be retrieved from the re-
spondents, for example demographic information (e.g., gender and age) or the measurement items to
assess the interrelations between completeness and interpretability. Further, we will conduct a ii) pretest
to ensure that the measures of the questionnaire are applicable in our context. We plan to have several
individuals, split up into two groups (Brown et al. 2010). This allows us to understand problems of time,
language, and content. In addition, we will get an understanding of the usefulness of the results’
measures. Subsequently, we modify the survey and we plan to validate it equivalently with the second
group. Finally, we carry out the iii) user study in a two-staged process as described in the following.
User Study. First, we will introduce an overview to all XAI glass box models included in the survey.
Then, we begin our survey by presenting different scenarios to the participants (cf. Figure 12 left). Each
of which includes the presentation of a different glass box model result. The participants have to rate on
a 5-point Likert-scale how good they think the model explanation is (Adams et al. 2003). Afterwards,
there will be questions on the measures as described in Section 2.2.5.2. In this stage, participants are not
given any information about the accuracy of the model deliberately, so, that they assume them to be
equal first and will not take them into consideration in their choice making procedure. This allows us to
identify the best glass box model presentation independent of the trade-off with accuracy as the ‘ideal’
to strive for. By using the associated measurement criteria, we get a better understanding of the reasons.
Figure 12: Scenario of Human-centered Pairwise XAI Model Transfer Comparison
In stage two, we will have a pairwise comparison of the same glass box model explanations with the
same measures presented in stage one (cf. Figure 12). This time we reveal the information about the
accuracy of each model. Thus, we vary the accuracy independently of realistic values to find out the
pure trade-off between interpretability and accuracy. We further ask the participants on their model
preferences as this might differ due to the accuracy against their previous decision made.
2.2.7 Conclusion and Outlook
Besides the already proven advantages of modern AI algorithms based on ML, the development of ro-
bust and precise ML algorithms also results in a decrease of traceability of the results among
Big eyes?
Big ears?
Whiskers inthe face?
Cat
yes
yes
yes
no
…
no
dog
...
no
AI Prediction XAI Approach A XAI Metrics Questioning
Only shown at Stage 2: Which one do you prefer? Approach A Approach BNone of these
Only shown at Stage 2:
accuracy rate: 90%
I would trust this explanation.
I agree strongly
I agree somewhat
I disagree strongly
I disagree somewhat
I’m neutral about it
Legend:
PredictionCat
Input:This explanation is satisfying for me.
The explanation is comprehensible to me.
The explanation is useful for me.
The explanation is sufficiently explained.
I would make a decision based on the explanation.
Artificial Intelligence for Human Decision-Makers
60
practitioners (Guidotti et al. 2018b). This lack of traceability is accompanied by a lack of trust in ML
algorithms (Dam et al. 2018). To address the general objective of more explainable models while main-
taining a high level of learning performance (Gunning and Aha 2019), XAI researchers build a variety
of model transfers to make AI models explainable. Thus, better performing but opaque AI models (black
box models) are transformed into less accurate, explainable AI models (white box models).
However, these approaches have not been verified from a user’s perspective yet. Consequently, the
procedure for verifying these approaches constitutes a research gap, which we addressed with our re-
search-in-progress report. We have systematized the field of XAI research through a structured literature
review. Further, we have proposed a comprehensive user study on the effects of XAI model transfers on
the explainability of AI decisions and their perception by human users.
On the one hand, the results of our planned study will provide an understanding of the explainability of
the result presentation of the assumed glass box models. On the other hand, we will contribute to the
optimization of the trade-off between interpretability and completeness. This allows future research in
the field of XAI to concentrate on promising model transfer approaches and to optimize these towards
the expectations of intended user. Only with the trusting and understanding user in the loop, AI technol-
ogy can become a successful part in industrial and home applications of our digital age.
2.3 Example of Explainable AI Transfer
Abstract. The fourth industrial revolution is quickening the digital transformation of shop floors, ena-
bling immense potential for optimization. Maintenance is an important area that can profit decisively
from making digital information serviceable. It serves to guarantee a smooth production process. Cur-
rently, unexpected problems still lead to high opportunity costs. Effectively addressing them is ham-
pered by a lack of transparency, which makes it difficult for service staff to detect, localize, and identify
faults. Innovative data analysis methods, which allow to intelligently evaluate and use machine condi-
tion data, promise a remedy. In the future, these will support maintenance issues and optimize the overall
process. However, the condition of current shop floors in German medium-sized manufacturing compa-
nies appears inadequate. As a survey conducted by us revealed, machinery data still comes mainly from
light sensors, motor voltages, and positioning scanners. Such binary data values complicate data analysis
of modern evaluation methods. The paper at hand addresses this problem without a need for shop floor
extensions. Together with partners from industry, a step-by-step development approach was developed
to show how comprehensive maintenance support is possible despite restrictions on binary data values.
The implementation is based on techniques from the areas of process mining and machine learning. A
demonstrator evaluates the practical suitability.5
5 This paper is published at the HMD journal as ‘ erwendung binärer Datenwerte für eine KI-gestützte Instandhal-
tung 4.0’ (Wanner et al. 2019). The DOI is: https://doi.org/10.1365/s40702-019-00560-3.
Artificial Intelligence for Human Decision-Makers
61
2.3.1 Nutzenmachung von Daten für intelligente Wartungsansätze als Wettbewerbsfaktor in
der Fertigung
Die vierte industrielle Revolution fordert Unternehmen zum Umdenken. Durch eine umfassende Ver-
netzung von Einzelkomponenten (bspw. Sensoren, Auswertungseinheiten und Maschinenbauteile) ge-
langt ein Produktionsfaktor immer mehr in den Fokus: Information. Diesen gilt es wettbewerbsgerecht
zu nutzen, was eine zielorientierte Ausrichtung der Kommunikation und Reaktion der Einzelkomponen-
ten sowohl untereinander als auch mit dem Menschen bedingt (Hermann et al. 2016). Auch für die in
der Fertigung wichtige Aufgabe der Instandhaltung bestehen Bestrebungen einer intelligenten Nutzen-
machung von Daten. Unter der Instandhaltung wird hier die Wahrung bzw. Wiederherstellung der Be-
triebsbereitschaft eines Fertigungsablaufs verstanden, mit dem Ziel die Opportunitätskosten minimal zu
halten. Damit verbundene Tätigkeiten können reaktiv, nach Auftreten eines Fehlers, oder proaktiv, hin-
sichtlich einzuleitender Gegenmaßnahmen, sein (Delen 2014). Im Allgemeinen gilt jedoch auch hier die
Beachtung des Pareto-Prinzips. Eine kostenintensive Erweiterung der Fertigungsanlage um neue Sen-
sorik kann u. U. zu einem negativen Gesamtergebnis aus erhöhten Instandhaltungskosten gegenüber den
gewonnenen Einsparungen führen, und ist daher kritisch abzuwägen.
Eine effiziente Adressierung von Instandhaltungsfragen bedarf demnach einem umfangreichen Ver-
ständnis und der effektiven Handhabung komplexer Abläufe. Wie eigene Interviews (siehe unten) ge-
zeigt haben inspizieren, reparieren, und bessern Servicekräfte Fertigungsanlagen überwiegend auf Basis
von Erfahrungswerten, und damit ihrer Intuition, aus obwohl oft eine umfangreiche Dokumentation der
Hersteller vorliegt.
Eine effektive Nutzenmachung von Maschinenzustandsdaten bedingt das Verständnis über die Gege-
benheiten der abgreifbaren Daten. Um dies zu erlangen wurden mit Fokussierung auf den deutschen,
produzierenden Mittelstand qualitative Interviews mit Maschinenherstellern und Serviceprovidern
(n = 6) sowie eine quantitative Erhebung auf der Hannover Messe 2019 (n = 32) zum Thema Industrie
4.0 durchgeführt. Das Ergebnis bestätigt ein großes Interesse an automatisierten, informationsbasierten
Auswertungsmöglichkeiten für Instandhaltungsfragen (86,8 %). Aktuelle Fertigungsanlagen verfügen
(hierfür) aus Datensicht überwiegend über Lichtschranken, Motorenspannungen und Positionierungs-
taster (76,3 %). Eine moderne Lösung für die Verbesserung der Instandhaltung muss demnach mittels
binärer Datenwerte realisierbar sein. Bisher besteht hierzu keine Lösung (siehe Kapitel 2.3.3).
Unter Nutzung moderner Datenanalyseverfahren nimmt sich dieser Beitrag der Problemstellung an und
präsentiert einen schrittweisen Entwicklungsansatz. Dabei wird sowohl auf Nachrüstungen externer
Informationsquellen (z. B. Sensorik), als auch auf Veränderungen gegenüber dem aktuellen Produkti-
onsablauf verzichtet, um entstehende Mehraufwände für die Instandhaltung minimal zu halten. Die
Absicht des Beitrags lässt sich durch die nachfolgende Forschungsfrage zusammenfassen:
Wie können Fertigungsproduzenten die Möglichkeiten binärer Datenwerte für eine Optimierung ihrer
Maschineninstandhaltung auf Basis moderner Datenanalyseverfahren nutzen?
Artificial Intelligence for Human Decision-Makers
62
Im Nachfolgenden wird die Erarbeitung des schrittweisen Entwicklungsansatzes für eine moderne In-
standhaltung auf Basis binärer Datenwerte vorgestellt. Zunächst werden die notwendigen theoretischen
Grundlagen vermittelt (Kapitel 2.3.2). Diesen folgt mit Kapitel 2.3.3 die sukzessive Vorstellung der
Entwicklung, unterteilt in die gewählte Methodik, den deskriptiven Ansatz als grundlegende Überwa-
chungsinstanz und dem prädiktiven Ansatz als erweiterte Überwachungsinstanz. Kapitel 2.3.4 veran-
schaulicht die prototypische Ausgestaltung anhand eines Industrie 4.0 Demonstrators. In Kapitel 2.3.5
finden sich eine abschließende Einordnung und Wertung des Beitrags mit Hinblick auf Forschung und
Praxis.
2.3.2 Theoretische Grundlagen der Datenanalyse
2.3.2.1 Datenanalyse in der Instandhaltung
Mit dem übergeordneten Ziel die Opportunitätskosten zu minimieren definieren Fertigungsunterneh-
men eine individuelle Instandhaltungsrichtlinie. Unabhängig der unterschiedlichen Methoden, wie dem
korrektiven Wartungsansatz, basieren moderne Optimierungen auf der Nutzung von Daten. Die aka-
demische Literatur teilt die Instandhaltungstypen daher in drei Arten ein: deskriptive, prädiktive und
präskriptive Datenanalyse (Delen and Demirkan 2013).
Die deskriptive Datenanalyse unterstützt bei der Erkenntnisgewinnung über auftretende Probleme und
Chancen der Instandhaltung auf Basis der Auswertung historischer Daten (Wang et al. 2016a). In der
prädiktiven Datenanalyse werden mathematische Methoden angewendet, um erklärende und prädika-
tive Muster für die Darstellung von inhärenten Beziehungen zwischen Datenein- und -ausgängen zu
finden (Delen and Demirkan 2013). Dies erlaubt eine vorausschauende Instandhaltung. Die präskrip-
tive Datenanalyse erweitert dies durch eine multikriterielle Entscheidungsfindung mittels Optimie-
rungsmethoden (Wang et al. 2016a). Das Ergebnis ist entweder die beste Vorgehensweise zum jewei-
ligen Zeitpunkt oder ein unterstützender Ratschlag an den Entscheidungsträger der Instandhaltung
(Delen and Demirkan 2013).
2.3.2.2 Process Mining
Process Mining erlaubt eine deskriptive Untersuchung von Prozessdaten, um Sequenzen und Problem-
bereiche zu identifizieren. Ausgangsbasis stellen Eventlogs dar, eine Sammlung von Prozessdaten mit
vordefinierter Struktur. Als Voraussetzung für deren Nutzbarkeit müssen die darin aufgezeichneten Da-
ten einerseits einer Abfolge-basierten Speicherung (Zeitstempel) unterliegen, und andererseits einzelne
Prozessschritte (Events/ Aktivitäten) den zugehörigen Prozessinstanzen (CaseID) eindeutig zuordenbar
sein. Zusätzlich werden für Analysezwecke oft weitere Merkmale gespeichert (van der Aalst et al. 2011),
wie der Aktivitätslebenszyklus. Dieser beschreibt den Zustand, in welchem sich die Aktivität zum je-
weiligen Zeitpunkt befindet und wird mindestens in die Zustände Start, in Bearbeitung und Ende unter-
teilt. Dies erlaubt eine intuitive Nachvollziehbarkeit bei entsprechenden Auswertungen der Prozessda-
ten.
Innerhalb der Technik selbst werden drei Aufgabenbereiche voneinander unterschieden: Process Dis-
covery, Conformance Checking und Process Enhancement. Process Discovery erlaubt die
Artificial Intelligence for Human Decision-Makers
63
Transparenzschaffung von Ablaufprozessen aus den aufgezeichneten Datenlogs. Conformance Che-
cking dient der Überprüfung auf Prozessabweichungen vom identifizierten Standardprozess, als meist
frequentierter Prozessablauf. Process Enhancement erweitert die gewonnenen Prozesserkenntnisse,
z. B. durch Nutzung von Kennzahlen, um die Einhaltung von Service Levels zu prüfen oder kritische
Engpässe zu identifizieren (van der Aalst et al. 2011).
2.3.2.3 Machine Learning
Machine Learning (ML) ist ein Teilgebiet der künstlichen Intelligenz und unterstützt bei der manuellen
Datenanalyse. Ansätze aus dem ML zielen auf eine automatisierte Aufdeckung von Mustern und Ab-
hängigkeiten auf Grundlage vorhandener Daten und Algorithmen ab. Oftmals werden mathematische
Modelle verwendet, um den Algorithmus so zu trainieren, so dass er ein hinreichend valides, künstliches
Wissen generiert, welches vom Menschen nur unter großen Mühen erreichbar wäre (Marsland 2015).
Im ML werden drei grundlegende Lernansätze für die Schulung des Algorithmus differenziert: über-
wachtes Lernen (engl. supervised ML), unüberwachtes Lernen (engl. unsupervised ML) und verstärktes
Lernen (engl. reinforcement learning). Beim überwachten Lernen werden vordefinierte Input-Output-
Paare verwendet, um künftige Zuordnungen (bspw. durch Klassifizierung) automatisiert durchzuführen
(Marsland 2015). Das unüberwachte Lernen beschränkt sich auf Inputs. Durch Vergleich sollen nutzbare
Muster (bspw. durch Clustering) erkannt werden (Wang et al. 2012). Verstärktes Lernen hingegen schult
einen Lernagenten, der durch Versuch und Irrtum in Kombination mit Belohnungen versucht seine an-
genommenen Zustände und Aktionen auf die Maximierung der Belohnungen auszurichten (Kober et al.
2013).
2.3.3 Schrittweiser Entwicklungsansatz für die Nutzung binärer Datenwerte hinsichtlich mo-
derner Instandhaltungsansätze
2.3.3.1 Methodische Stringenz der Erarbeitung
Für die Erarbeitung des schrittweisen Entwicklungsansatzes wurde das Vorgehen der Aktionsforschung
aus dem Bereich der Wirtschaftsinformatik adaptiert. Deren Fokus liegt auf dem Aufgreifen praxisori-
entierter Probleme, welche durch engen Austausch zwischen Beteiligten aus Forschung und Praxis ge-
löst werden. Über mehrere Iterationsschritte werden ein wissenschaftliches Verständnis über den de-
signtechnischen Aufbau und ein praxisinspiriertes Artefakt geschaffen (Peffers et al. 2018). Das Vorge-
hen selbst unterteilt sich in vier Abschnitte: Zunächst ist das (1) Problem auf Basis von existierendem
Wissen auszuformulieren. Dies stellt oft eine Instanz einer Klasse von Problemen dar, die schrittweise
gelöst wird. Anschließend (2) beginnt die Umsetzung mit einer begleitenden Evaluierung. Wichtig dabei
ist, dass parallel (3) kontinuierlich reflektiert wird und ein fortdauerndes Lernen erfolgt. Das (4) finale
Artefakt muss letztlich eine generalisierbare Problemlösung sein (Peffers et al. 2018).
Als Problem wurde das Fehlen einer datenbasierten Instandhaltungsunterstützung auf Basis binärer Da-
tenwerte definiert, welche durch Praxisbefragungen als relevant identifiziert und durch Literaturrecher-
che als bisher nicht adressiert erkannt wurde. Das Problem unterteilt sich in die Bereiche der deskripti-
ven und prädikativen Datennutzung, die jeweils eigene Teilprobleme beinhalten (siehe Kapitel 2.3.3.2
Artificial Intelligence for Human Decision-Makers
64
und 2.3.3.3). Die schrittweise Erarbeitung eines praxisorientierten Artefakts wurde im engen Austausch
mit zwei Unternehmen realisiert, einem mittelständischen Serviceanbieter für Automatisierungstechnik
und einem mittelständischen Maschinenbauer für Sägewerkanlagen. Durch ständige Evaluierung und
Anpassung auf Basis gewonnener Erkenntnisse ließen sich die Anforderungen der Aktionsforschung
sichern. Alle Ergebnisse wurden entsprechend generalisiert und aufbereitet.
Die verbundene Literaturanalyse basiert auf den Empfehlungen nach (Webster and Watson 2002). Um
der Interdisziplinarität der Thematik gerecht zu werden, wurden sechs Datenbanken ausgewählt: IEEE
Xplore, AISeL und ACM Digital Library um informatiknahe Forschungsgebiete und jene der Ingeni-
eurswissenschaften abzudecken, Business Source Premier (EBSCO) für wirtschaftswissenschaftliche
und wirtschaftsnahe Inhalte sowie Web of Science und ScienceDirect für eine umfassende Auswahl
übergreifender Publikationen. Hinsichtlich der Qualität wurde sich zunächst auf Journal-Beiträge mit
einem Mindestrating von B nach VHB-Jourqual 3 konzentriert. Mittels einer Rückwärtssuche konnten
weitere, relevante Beiträge identifiziert werden. Ebenso wurde, mit Hilfe des hierfür empfohlenen Web
of Science (Webster and Watson 2002), eine Vorwärtssuche durchgeführt. Als verwendeter Suchtermi-
nus für die jeweiligen Problemabschnitte (siehe Kapitel 2.3.3.2 und 2.3.3.3) dienten die nachfolgenden
Pseudocodes:
(1) (process mining | descriptive analytics | maintenance) & (binary (sensor* | value* | feature*
| input* | file* | data | attribute* | descriptor*))
(2) (((supervised | machine) learning) | ((diagnostic | predictive) analytics)) & (binary (sensor* |
value* | feature* | input* | file* | data | attribute* | descriptor*))
Insgesamt konnten die Resultate auf 38 relevante Publikationen eingegrenzt werden. Nach einer durch-
geführten Volltextanalyse verblieben 12 Beiträge für den (1) deskriptiven und 8 für den (2) prädiktiven
Bereich.
2.3.3.2 Deskriptive Datennutzung als grundlegende Überwachungsinstanz
Die Initialisierung einer grundlegenden Überwachungsinstanz wird durch Transparenzschaffung im Fer-
tigungsprozess mit Hilfe von Process Mining möglich. Process Mining erlaubt die Visualisierung und
Nachvollziehbarkeit der gesamten Ablaufqualität und das Erkennen von Problemabschnitten. Im Kon-
text von Fertigungsprozessen finden sich bereits Anwendungen. Er et al. (2018) setzen Process Minin-
gein, um den Produktionsplanungsprozess eines großen Fertigungsbetriebs auf Basis seiner ERP-Daten
zu untersuchen. Halaška and Šperka (2018) erläutern mehrere Process-Mining-Anwendungsfälle und
deren Potenziale im Kontext der Industrie 4.0. In Yang et al. (2014) wird Process Mining verwendet,
um nach standardisierten Vorverarbeitungsschritten aus strukturierten und unstrukturierten Daten ana-
lysierbare Eventlogs zu generieren, die anschließend ausgewertet werden. Eine instandhaltungsbezo-
gene Nutzenmachung via Process Mining besteht bisher hingegen nicht.
Die Idee der Nutzenmachung besteht darin, aus den binären Datenwerte durch Process Mining (siehe
Kapitel 2.3.2.2) einen Referenzwert zu ermitteln, welcher künftig auf Abweichungen geprüft werden
kann. Dazu wird der damit identifizierbare Standardprozess als SOLL-Prozess definiert und zur Laufzeit
der Fertigung mit dem jeweiligen IST-Prozess (Echtzeitdaten) verglichen. Weicht der IST-Prozess vom
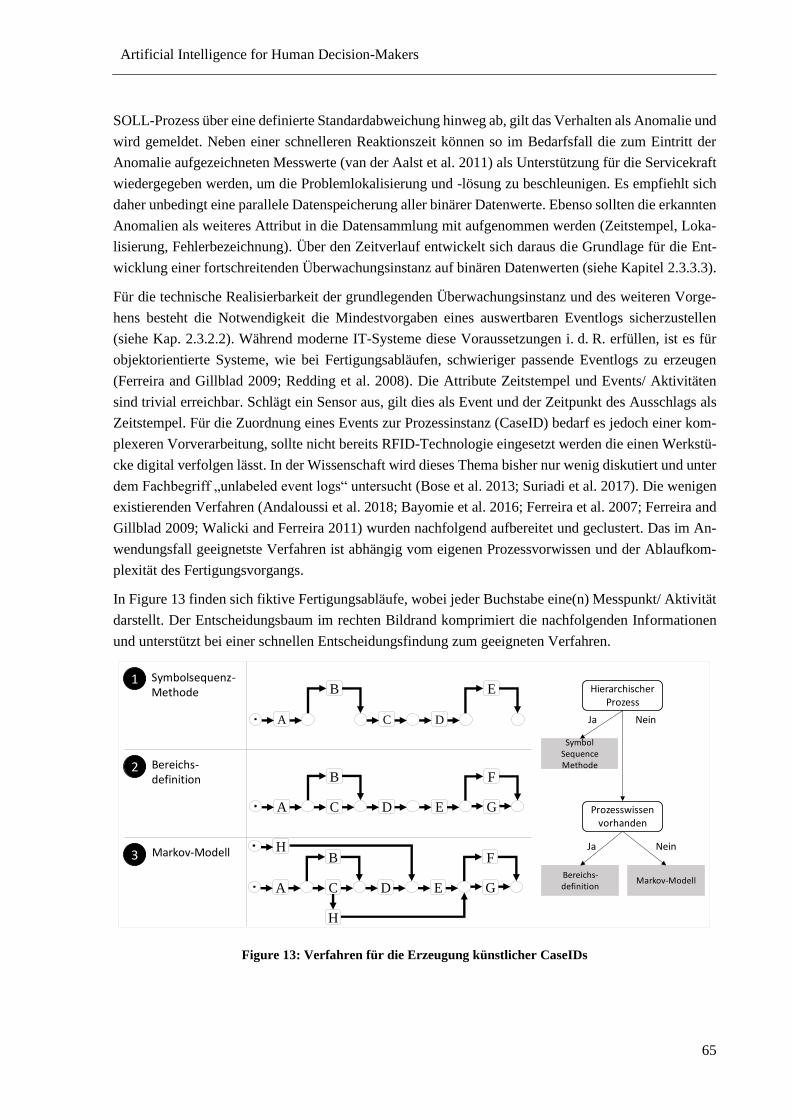
Artificial Intelligence for Human Decision-Makers
65
SOLL-Prozess über eine definierte Standardabweichung hinweg ab, gilt das Verhalten als Anomalie und
wird gemeldet. Neben einer schnelleren Reaktionszeit können so im Bedarfsfall die zum Eintritt der
Anomalie aufgezeichneten Messwerte (van der Aalst et al. 2011) als Unterstützung für die Servicekraft
wiedergegeben werden, um die Problemlokalisierung und -lösung zu beschleunigen. Es empfiehlt sich
daher unbedingt eine parallele Datenspeicherung aller binärer Datenwerte. Ebenso sollten die erkannten
Anomalien als weiteres Attribut in die Datensammlung mit aufgenommen werden (Zeitstempel, Loka-
lisierung, Fehlerbezeichnung). Über den Zeitverlauf entwickelt sich daraus die Grundlage für die Ent-
wicklung einer fortschreitenden Überwachungsinstanz auf binären Datenwerten (siehe Kapitel 2.3.3.3).
Für die technische Realisierbarkeit der grundlegenden Überwachungsinstanz und des weiteren Vorge-
hens besteht die Notwendigkeit die Mindestvorgaben eines auswertbaren Eventlogs sicherzustellen
(siehe Kap. 2.3.2.2). Während moderne IT-Systeme diese Voraussetzungen i. d. R. erfüllen, ist es für
objektorientierte Systeme, wie bei Fertigungsabläufen, schwieriger passende Eventlogs zu erzeugen
(Ferreira and Gillblad 2009; Redding et al. 2008). Die Attribute Zeitstempel und Events/ Aktivitäten
sind trivial erreichbar. Schlägt ein Sensor aus, gilt dies als Event und der Zeitpunkt des Ausschlags als
Zeitstempel. Für die Zuordnung eines Events zur Prozessinstanz (CaseID) bedarf es jedoch einer kom-
plexeren Vorverarbeitung, sollte nicht bereits RFID-Technologie eingesetzt werden die einen Werkstü-
cke digital verfolgen lässt. In der Wissenschaft wird dieses Thema bisher nur wenig diskutiert und unter
dem achbegriff „unlabeled event logs“ untersucht (Bose et al. 2013; Suriadi et al. 2017). Die wenigen
existierenden Verfahren (Andaloussi et al. 2018; Bayomie et al. 2016; Ferreira et al. 2007; Ferreira and
Gillblad 2009; Walicki and Ferreira 2011) wurden nachfolgend aufbereitet und geclustert. Das im An-
wendungsfall geeignetste Verfahren ist abhängig vom eigenen Prozessvorwissen und der Ablaufkom-
plexität des Fertigungsvorgangs.
In Figure 13 finden sich fiktive Fertigungsabläufe, wobei jeder Buchstabe eine(n) Messpunkt/ Aktivität
darstellt. Der Entscheidungsbaum im rechten Bildrand komprimiert die nachfolgenden Informationen
und unterstützt bei einer schnellen Entscheidungsfindung zum geeigneten Verfahren.
Figure 13: Verfahren für die Erzeugung künstlicher CaseIDs
A C D
EB
A D E
FB
C G
A D E
FB
C G
H
H
3
2
1 Symbolsequenz-Methode
Bereichs-definition
Markov-Modell
Hierarchischer Prozess
Symbol Sequence Methode
Bereichs-definition
Prozesswissen vorhanden
Markov-Modell
Ja Nein
NeinJa
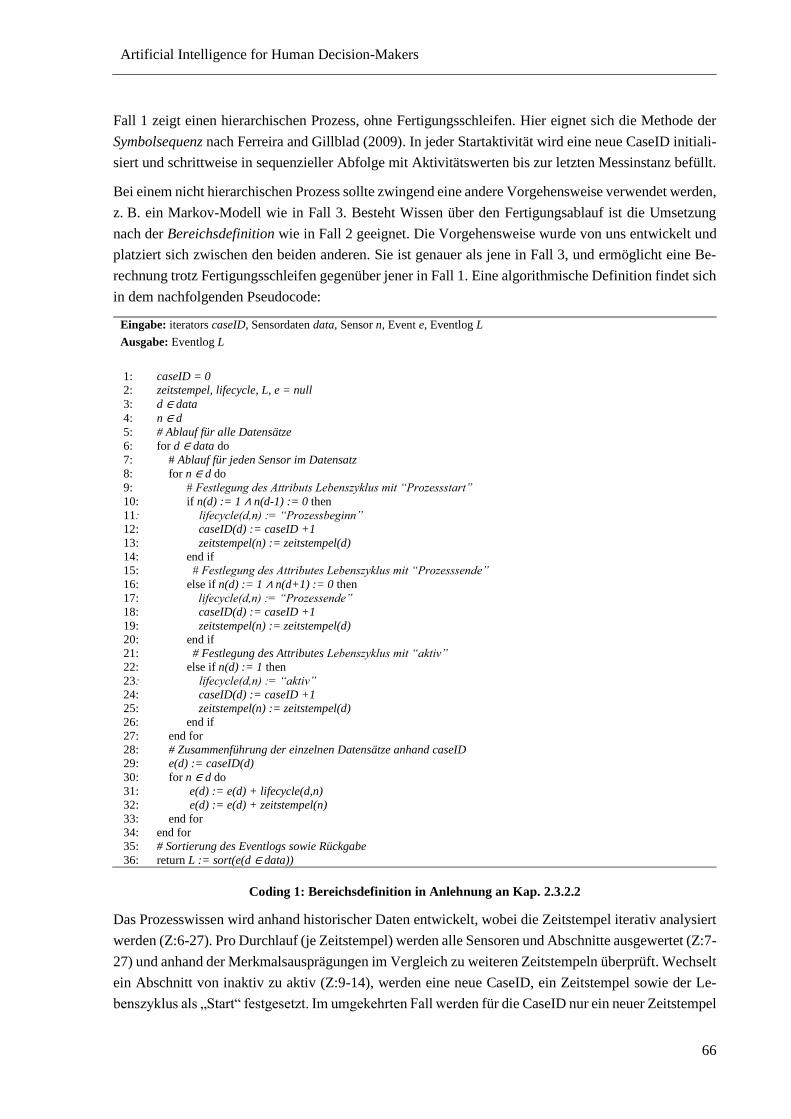
Artificial Intelligence for Human Decision-Makers
66
Fall 1 zeigt einen hierarchischen Prozess, ohne Fertigungsschleifen. Hier eignet sich die Methode der
Symbolsequenz nach Ferreira and Gillblad (2009). In jeder Startaktivität wird eine neue CaseID initiali-
siert und schrittweise in sequenzieller Abfolge mit Aktivitätswerten bis zur letzten Messinstanz befüllt.
Bei einem nicht hierarchischen Prozess sollte zwingend eine andere Vorgehensweise verwendet werden,
z. B. ein Markov-Modell wie in Fall 3. Besteht Wissen über den Fertigungsablauf ist die Umsetzung
nach der Bereichsdefinition wie in Fall 2 geeignet. Die Vorgehensweise wurde von uns entwickelt und
platziert sich zwischen den beiden anderen. Sie ist genauer als jene in Fall 3, und ermöglicht eine Be-
rechnung trotz Fertigungsschleifen gegenüber jener in Fall 1. Eine algorithmische Definition findet sich
in dem nachfolgenden Pseudocode:
Eingabe: iterators caseID, Sensordaten data, Sensor n, Event e, Eventlog L
Ausgabe: Eventlog L
1: caseID = 0
2: zeitstempel, lifecycle, L, e = null
3: d ∈ data
4: n ∈ d
5: # Ablauf für alle Datensätze
6: for d ∈ data do
7: # Ablauf für jeden Sensor im Datensatz
8: for n ∈ d do
9: # F st gung d s Attributs L b nszyk us it “Pr z ssstart”
10: if n(d) := 1 ∧ n(d-1) := 0 then
11: if y (d,n) := “Pr z ssb ginn”
12: caseID(d) := caseID +1
13: zeitstempel(n) := zeitstempel(d)
14: end if
15: # F st gung d s Attribut s L b nszyk us it “Pr z sss nd ”
16: else if n(d) := 1 ∧ n(d+1) := 0 then
17: if y (d,n) := “Pr z ss nd ”
18: caseID(d) := caseID +1
19: zeitstempel(n) := zeitstempel(d)
20: end if
21: # Festlegung des Attributes L b nszyk us it “aktiv”
22: else if n(d) := 1 then
23: if y (d,n) := “aktiv”
24: caseID(d) := caseID +1
25: zeitstempel(n) := zeitstempel(d)
26: end if
27: end for
28: # Zusammenführung der einzelnen Datensätze anhand caseID
29: e(d) := caseID(d)
30: for n ∈ d do
31: e(d) := e(d) + lifecycle(d,n)
32: e(d) := e(d) + zeitstempel(n)
33: end for
34: end for
35: # Sortierung des Eventlogs sowie Rückgabe
36: return L := sort(e(d ∈ data))
Coding 1: Bereichsdefinition in Anlehnung an Kap. 2.3.2.2
Das Prozesswissen wird anhand historischer Daten entwickelt, wobei die Zeitstempel iterativ analysiert
werden (Z:6-27). Pro Durchlauf (je Zeitstempel) werden alle Sensoren und Abschnitte ausgewertet (Z:7-
27) und anhand der Merkmalsausprägungen im Vergleich zu weiteren Zeitstempeln überprüft. Wechselt
ein Abschnitt von inaktiv zu aktiv (Z:9-14), werden eine neue CaseID, ein Zeitstempel sowie der Le-
benszyklus als „Start“ festgesetzt. Im umgekehrten all werden für die CaseID nur ein neuer Zeitstempel
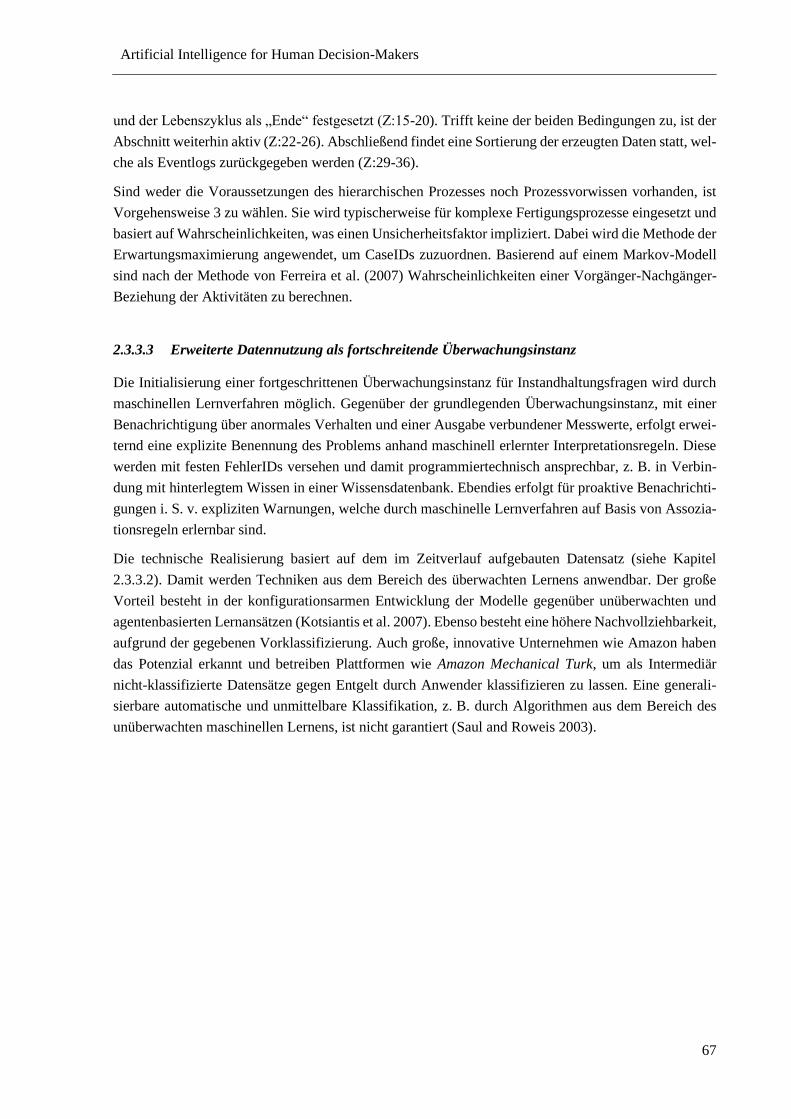
Artificial Intelligence for Human Decision-Makers
67
und der Lebenszyklus als „Ende“ festgesetzt (Z:15-20). Trifft keine der beiden Bedingungen zu, ist der
Abschnitt weiterhin aktiv (Z:22-26). Abschließend findet eine Sortierung der erzeugten Daten statt, wel-
che als Eventlogs zurückgegeben werden (Z:29-36).
Sind weder die Voraussetzungen des hierarchischen Prozesses noch Prozessvorwissen vorhanden, ist
Vorgehensweise 3 zu wählen. Sie wird typischerweise für komplexe Fertigungsprozesse eingesetzt und
basiert auf Wahrscheinlichkeiten, was einen Unsicherheitsfaktor impliziert. Dabei wird die Methode der
Erwartungsmaximierung angewendet, um CaseIDs zuzuordnen. Basierend auf einem Markov-Modell
sind nach der Methode von Ferreira et al. (2007) Wahrscheinlichkeiten einer Vorgänger-Nachgänger-
Beziehung der Aktivitäten zu berechnen.
2.3.3.3 Erweiterte Datennutzung als fortschreitende Überwachungsinstanz
Die Initialisierung einer fortgeschrittenen Überwachungsinstanz für Instandhaltungsfragen wird durch
maschinellen Lernverfahren möglich. Gegenüber der grundlegenden Überwachungsinstanz, mit einer
Benachrichtigung über anormales Verhalten und einer Ausgabe verbundener Messwerte, erfolgt erwei-
ternd eine explizite Benennung des Problems anhand maschinell erlernter Interpretationsregeln. Diese
werden mit festen FehlerIDs versehen und damit programmiertechnisch ansprechbar, z. B. in Verbin-
dung mit hinterlegtem Wissen in einer Wissensdatenbank. Ebendies erfolgt für proaktive Benachrichti-
gungen i. S. v. expliziten Warnungen, welche durch maschinelle Lernverfahren auf Basis von Assozia-
tionsregeln erlernbar sind.
Die technische Realisierung basiert auf dem im Zeitverlauf aufgebauten Datensatz (siehe Kapitel
2.3.3.2). Damit werden Techniken aus dem Bereich des überwachten Lernens anwendbar. Der große
Vorteil besteht in der konfigurationsarmen Entwicklung der Modelle gegenüber unüberwachten und
agentenbasierten Lernansätzen (Kotsiantis et al. 2007). Ebenso besteht eine höhere Nachvollziehbarkeit,
aufgrund der gegebenen Vorklassifizierung. Auch große, innovative Unternehmen wie Amazon haben
das Potenzial erkannt und betreiben Plattformen wie Amazon Mechanical Turk, um als Intermediär
nicht-klassifizierte Datensätze gegen Entgelt durch Anwender klassifizieren zu lassen. Eine generali-
sierbare automatische und unmittelbare Klassifikation, z. B. durch Algorithmen aus dem Bereich des
unüberwachten maschinellen Lernens, ist nicht garantiert (Saul and Roweis 2003).
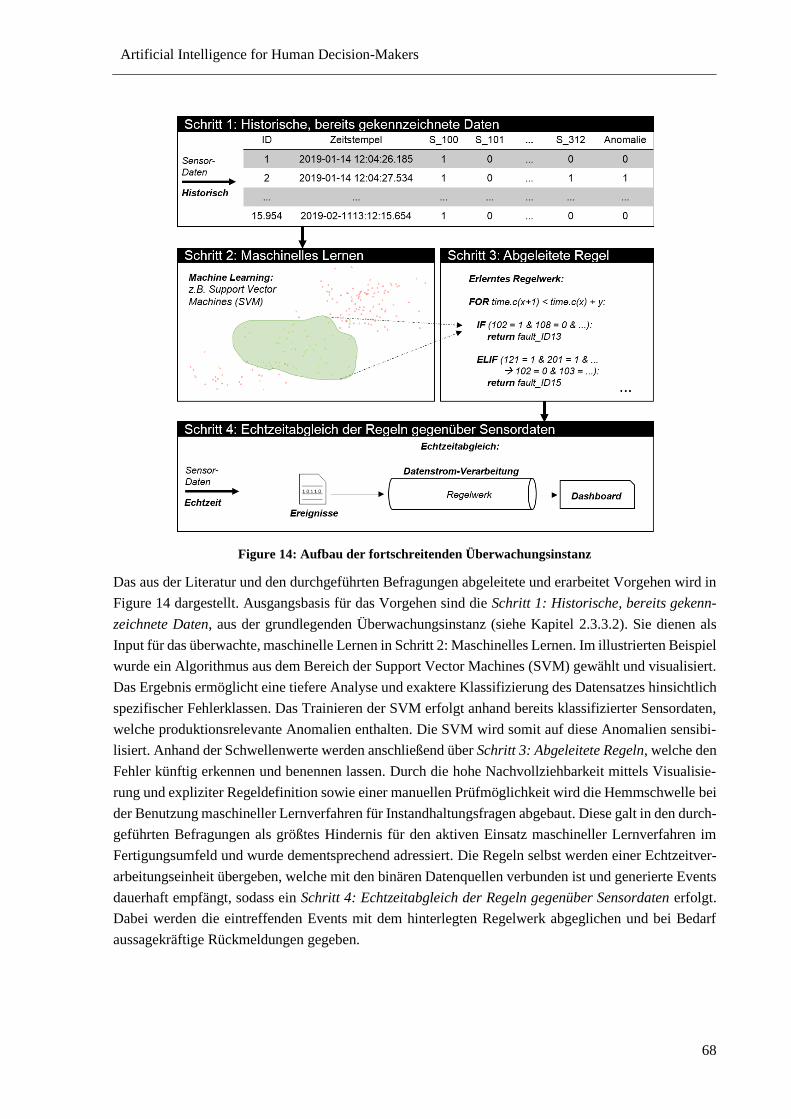
Artificial Intelligence for Human Decision-Makers
68
Figure 14: Aufbau der fortschreitenden Überwachungsinstanz
Das aus der Literatur und den durchgeführten Befragungen abgeleitete und erarbeitet Vorgehen wird in
Figure 14 dargestellt. Ausgangsbasis für das Vorgehen sind die Schritt 1: Historische, bereits gekenn-
zeichnete Daten, aus der grundlegenden Überwachungsinstanz (siehe Kapitel 2.3.3.2). Sie dienen als
Input für das überwachte, maschinelle Lernen in Schritt 2: Maschinelles Lernen. Im illustrierten Beispiel
wurde ein Algorithmus aus dem Bereich der Support Vector Machines (SVM) gewählt und visualisiert.
Das Ergebnis ermöglicht eine tiefere Analyse und exaktere Klassifizierung des Datensatzes hinsichtlich
spezifischer Fehlerklassen. Das Trainieren der SVM erfolgt anhand bereits klassifizierter Sensordaten,
welche produktionsrelevante Anomalien enthalten. Die SVM wird somit auf diese Anomalien sensibi-
lisiert. Anhand der Schwellenwerte werden anschließend über Schritt 3: Abgeleitete Regeln, welche den
Fehler künftig erkennen und benennen lassen. Durch die hohe Nachvollziehbarkeit mittels Visualisie-
rung und expliziter Regeldefinition sowie einer manuellen Prüfmöglichkeit wird die Hemmschwelle bei
der Benutzung maschineller Lernverfahren für Instandhaltungsfragen abgebaut. Diese galt in den durch-
geführten Befragungen als größtes Hindernis für den aktiven Einsatz maschineller Lernverfahren im
Fertigungsumfeld und wurde dementsprechend adressiert. Die Regeln selbst werden einer Echtzeitver-
arbeitungseinheit übergeben, welche mit den binären Datenquellen verbunden ist und generierte Events
dauerhaft empfängt, sodass ein Schritt 4: Echtzeitabgleich der Regeln gegenüber Sensordaten erfolgt.
Dabei werden die eintreffenden Events mit dem hinterlegten Regelwerk abgeglichen und bei Bedarf
aussagekräftige Rückmeldungen gegeben.

Artificial Intelligence for Human Decision-Makers
69
2.3.4 Evaluation des schrittweisen Entwicklungsgangs anhand eines Demonstrators
Das erarbeitete Entwicklungskonzept (Kapitel 2.3.3) wird anhand eines Demonstrators verdeutlicht.
Hierfür dient die Fabrik-Simulation 24V der Firma Fischertechnik, mit einer verbundenen Siemens SI-
TOP PSU8200 Steuerungsinstanz und SPS-programmierten SIMATIC ET 200SP Modulen. Die Fabrik
imitiert eine moderne Fertigungsanlage und erlaubt die parallele Bearbeitung mehrerer Werkstücke. Als
Messinstrumente dienen Lichtschranken, Motorspannungen und Positionierungstaster.
Parallel zum Fertigungsbetrieb wurde durch Abgriff und Speicherung der binären Datenwerte in Schritt
1: Erfassung und Transformation von Sensordaten in Sensorlogs eine Ausgangsdatenbasis geschaffen.
Je Event (= Messwert) bestand eine ID, ein Zeitstempel und ein zugehöriger Messwert. Jeder gespei-
cherte Eintrag (= Zeile) stellt wiederum die Aggregation mehrerer Events mit selbem Zeitstempel dar.
Aufgrund des Fehlens einer Trackingmöglichkeit einzelner Werkstücke (bspw. via RFID-Tags), und
damit einer fehlenden Prozessinstanz (CaseID), musste diese im Nachgang künstlich erzeugt werden,
um entsprechende Auswertungen mit Techniken aus dem Process Mining zu ermöglichen. Aufgrund
von Prozessvorwissen und Fertigungsschleifen wurde die Methode der Bereichsdefinition (siehe Kapitel
2.3.3.2) gewählt.
Anschließend konnte durch Schritt 2: Definition des Referenzprozesses anhand von Process Mining der
Standardprozess mit festgelegter (zeitlicher) Standardabweichung als Referenzpunkt gegenüber des
IST-Ablaufs definiert werden. Die Benachrichtigung über auftretende Anomalien erfolgte über ein
simples Dashboard, mit Ampelsystem und der Ausgabe der letzten Messeinträgen. Ebenso wurde die
Datenbasis um das „Anomalie-Attribut“ klassifizierend fortgeschrieben.
Nach gewisser Zeit erlaubte diese Klassifizierung des Datensatzes eine fortschreitende Überwachungs-
instanz, in Schritt 3: Spezifische Benachrichtigung und Benennung durch maschinell erlernte Regeln.
Hierfür wurden nach Beispiel von Wang et al. (2018b) verschiedene Verfahren aus den ML-Bereichen
der Entscheidungsbäume und der probabilistischen Klassifikatoren angewendet. Im aufgezeigten Bei-
spiel in Figure 15 wurde ein Support Vector Machine (SVM) Algorithmus verwendet, um zu erkennen,
wann und welche Probleme bei der Weitergabe eines Bauteils vom Fertigungsprozess des Brennofens
zu jenem der Säge auftreten sowie ob sich dies bereits proaktiv über bestimmte Sensorkombinations-
werte und Zeitabstände erkennen lässt. Durch eine visuelle Aufbereitung der Ergebnisse und eine Über-
führung der Erkenntnisse in geeignete Assoziationsregeln konnte ein umfassendes reaktives wie proak-
tive Regelwerk erstellt werden. Dieses dient fortan als Vergleichsbasis der Echtzeitverarbeitungseinheit.
Dementsprechend auftretende Anomalien sind durch die hinterlegten Fehlercodes benennbar, was eine
effektive Adressierung erlaubt. Da jedoch auch neue Fehlertypen oder Veränderungen an der Produkti-
onsanlage auftreten können sollte die erweiterte Überwachungsinstanz nach Schritt 3 nicht als final ab-
geschlossen angesehen werden. Vielmehr stellt das schrittweise Vorgehen einen iterativen Ansatz dar,
um die datenbasierte Überwachungsinstanz schrittweise zu verbessern und oder zu erweitern.
Die Umsetzung wurde in Figure 15 visuell dargestellt und anhand der erarbeiteten Methodik konzipiert
und realisiert:
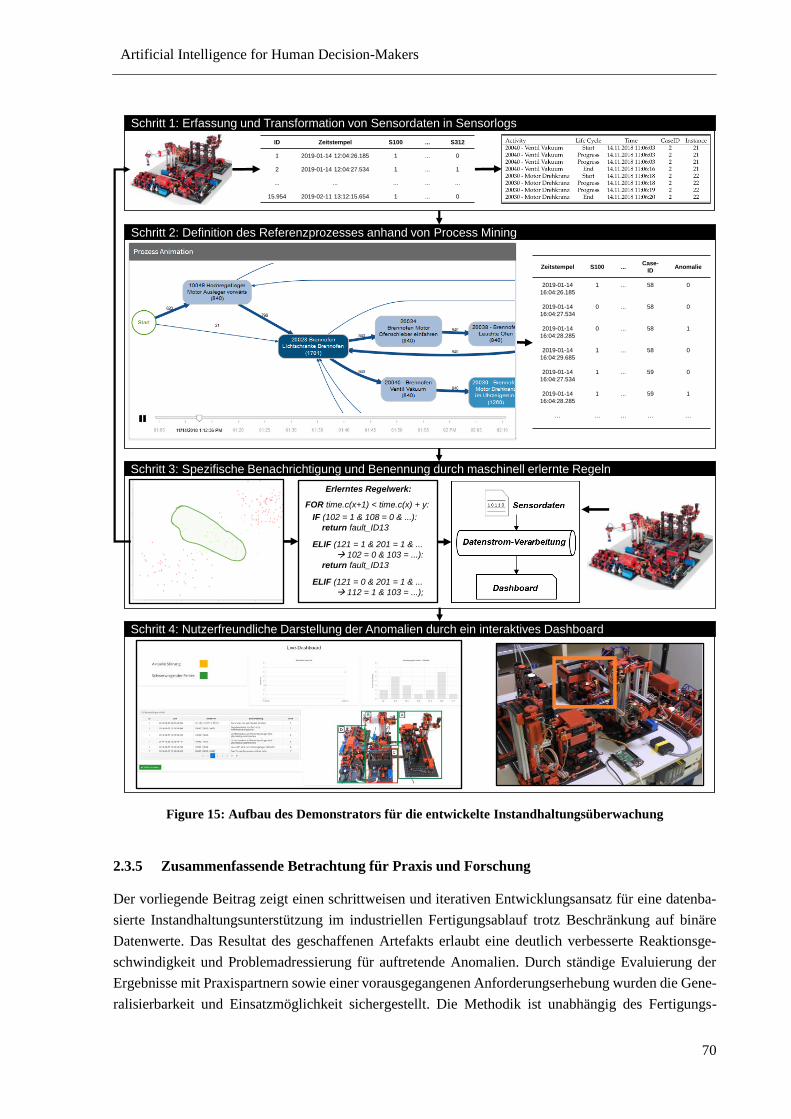
Artificial Intelligence for Human Decision-Makers
70
Figure 15: Aufbau des Demonstrators für die entwickelte Instandhaltungsüberwachung
2.3.5 Zusammenfassende Betrachtung für Praxis und Forschung
Der vorliegende Beitrag zeigt einen schrittweisen und iterativen Entwicklungsansatz für eine datenba-
sierte Instandhaltungsunterstützung im industriellen Fertigungsablauf trotz Beschränkung auf binäre
Datenwerte. Das Resultat des geschaffenen Artefakts erlaubt eine deutlich verbesserte Reaktionsge-
schwindigkeit und Problemadressierung für auftretende Anomalien. Durch ständige Evaluierung der
Ergebnisse mit Praxispartnern sowie einer vorausgegangenen Anforderungserhebung wurden die Gene-
ralisierbarkeit und Einsatzmöglichkeit sichergestellt. Die Methodik ist unabhängig des Fertigungs-
Erlerntes Regelwerk:
FOR time.c(x+1) < time.c(x) + y:
IF (102 = 1 & 108 = 0 & ...):
return fault_ID13
ELIF (121 = 1 & 201 = 1 & ...
→ 102 = 0 & 103 = ...):
return fault_ID13
ELIF (121 = 0 & 201 = 1 & ...
→ 112 = 1 & 103 = ...);
ID Zeitstempel S100 ... S312
1 2019-01-14 12:04:26.185 1 ... 0
2 2019-01-14 12:04:27.534 1 ... 1
... ... ... ... ...
15.954 2019-02-11 13:12:15.654 1 ... 0
Zeitstempel S100 ...Case-
IDAnomalie
2019-01-14
16:04:26.185
1 ... 58 0
2019-01-14
16:04:27.534
0 ... 58 0
2019-01-14
16:04:28.285
0 ... 58 1
2019-01-14
16:04:29.685
1 ... 58 0
2019-01-14
16:04:27.534
1 ... 59 0
2019-01-14
16:04:28.285
1 ... 59 1
… … … … …
Schritt 1: Erfassung und Transformation von Sensordaten in Sensorlogs
Schritt 2: Definition des Referenzprozesses anhand von Process Mining
Schritt 3: Spezifische Benachrichtigung und Benennung durch maschinell erlernte Regeln
Schritt 4: Nutzerfreundliche Darstellung der Anomalien durch ein interaktives Dashboard

Artificial Intelligence for Human Decision-Makers
71
prozesses i. S. v. notwendigen Nachrüstungen oder Veränderungen – ausgehenden aktuell gängiger inf-
rastruktureller Gegebenheiten im deutschen, produzierenden Mittelstand – realisierbar und kann damit
von nahezu jedem Fertigungsbetrieb angewendet werden. Ebenso wurde die Intransparenz maschineller
Lernverfahren als Einsatzhemmnis durch nachvollziehbare Assoziationsregeln adressiert.
Der schrittweise Entwicklungsansatz unterteilt sich in zwei Teilbereiche: eine grundlegende und eine
fortschreitende Überwachungsinstanz. Erstere erlaubt bereits nach kurzer Zeit eine komplexarme Über-
wachung, indem Abweichungen gegenüber des SOLL-Prozessablaufs erkannt und gemeldet werden.
Diese eignet sich damit auch für weniger informationsaffine Fertigungsunternehmen. Für die Forschung
stellen hierbei die Eigenentwicklung eines neuen Ansatzes für die Erzeugung einer künstlichen CaseID
(siehe Kapitel 2.3.3.2) und die durch das Vorgehen erschaffene Klassifizierung von Datenpunkten einen
Ausgangspunkt für weitere Bemühungen dar. Die fortschreitende Überwachungsinstanz wird hingegen
erst im Zeitverlauf umsetzbar und bietet insbesondere Unternehmen mit stärkeren informationstechni-
schen Ambitionen ein methodisches Vorgehen. Für die Forschung bietet hierbei wiederum die Reduzie-
rung der Blackbox-Thematik maschineller Lernverfahren einen weiteren Ausgangspunkt.
Artificial Intelligence for Human Decision-Makers
72
3 (X)AI SS User Perception
Table 9: Research summary of Chapter 3
Research objectives
RO2 Perception of (X)AI explanations from a user perspective
2a Endorsing the information perception of users from credibility research
2b Positioning of common ML models by performance and explainability
2c Assessment of common ML models by explainability and comprehensibility
Reference to original work
Wanner, Janiesch (2019) Publication P4 Chapter 3.1
Wanner, Herm, Heinrich, et al. (2021) Publication P5 Chapter 3.2
Herm, Wanner, Seubert, et al. (2021) Publication P6 Chapter 3.3
Current research on machine learning is dominated by a focus on the improvement of algorithmic per-
formance (La Cava et al. 2021). This is also reflected by today’s data challenges, since more complex
algorithms, especially from the field of DL, outperform classic ML algorithms for most tasks (e.g.,
Hyndman 2020). While the development shows success in improving performance, the user of the (X)AI
DSS seems to be of secondary importance. That is, complex models often lack explanatory power due
to their opaque inherent logic, rendering it impossible for human users to review their decision-making
process or interpret the results. Nevertheless, an (X)AI DSS in use is often reliant on the user’s action –
and thus the user’s perception – to be effective (Ribeiro et al. 2016b).
Today it is assumed that, in addition to model performance, the explainability as perceived by the user
plays a major role in his decision for or against a system’s recommendation (e.g., Dam et al. 2018;
Ribeiro et al. 2016b). As a trade-off between performance and explainability is assumed, it is difficult
to find a suitable solution for an ML model to convince a user to accept the artificial advice. In other
words, models with higher performance are often complex and thus lack explainability (and vice versa).
The research area of XAI tries to better understand this supposed trade-off, developing techniques that
maintain high model performance while also providing good model explainability (Gunning and Aha
2019).
Progress is being made mainly with regard to the technical side of XAI. Several XAI transfer techniques
(cf. Wanner et al. 2020c) and XAI augmentation frameworks (e.g., Lundberg and Lee 2017; Ribeiro et
al. 2016b) have been developed over the last couple of years. But there is still a tremendous call for
more behavioral (X)AI user studies to understand the perception of the systems’ recommendations and
related explanations from a user perspective (among others, Lu et al. 2020; Saha et al. 2019; Springer
and Whittaker 2019). These socio-technical insights are important to better understand the users’ needs.
Efforts in this area can drive technical XAI developments in the right direction and must therefore be
addressed.
Artificial Intelligence for Human Decision-Makers
73
To this end, it seems that there is a special need for behavioral evaluation of the users’ perception of
(X)AI DSS recommendations (RO2, cf. Table 9). Chapter 3 serves to form a better understanding of
both the expectations of data-centered information and its related credibility (2a). Likewise, in order to
differentiate between black-box and white-box models, it seems important to understand how good cur-
rent ML model types already solve the supposed trade-off (2b). This corresponds to a critical validation
of Rudin’s call to avoid conversions of black-box models into white-box models and instead use inter-
pretable models from the beginning (Rudin 2019). Beyond these concerns, the ultimate goal to achieve
the best possible decision quality is seen in a hybrid intelligence of man and machine (Dellermann et al.
2019). This implies the need for an understanding of the extent to which the perceived explainability
corresponds to the human capacity for comprehension (2c).
3.1 Big Data Analytics and Perceived Credibility of Information
Abstract. The credibility of sustainability reports has been the subject of scientific research for several
years. The problem is often referred to as the so-called credibility gap, which is based on information
asymmetries. The situation is further complicated by the limited rationality of human action as improve-
ments to reports do not necessarily translate into credibility gains. Research has proposed and extracted
several methods to overcome the issue. Hitherto, most approaches to solve the problem focused on mar-
keting-oriented approaches. This work takes a new approach and explores the extent to which infor-
mation technology can increase credibility using the potential of big data analytics. We base our research
on the relationship of the quality of information and on the perception of objective truth as postulated in
the Habermas Theory of Communicative Action. We use the forecast oriented Partial Least Squares
Methodology for the review of hypotheses extracted from literature and expert surveys. The result con-
firms potential of the criteria of volume and veracity while velocity and variety do not yield comparable
potential concerning sustainability reporting. Big data analytics in sustainability reports: an analysis
based on the perceived credibility of corporate published information.6
3.1.1 Introduction
In recent years, more and more companies and organizations have been trying to make their activities
more sustainable. To manage and measure own goals, performance, and operational changes, sustaina-
bility reports have become a very popular means (GRI 2016, p. 3). Sustainable actions and their trans-
parency through reporting activities lead to several advantages perceived by external groups of interest
such as an improved reputation (Weber 2014, p. 13f).
Despite the EU directive 2014/95/EU, the scope of this kind of reporting leaves companies with a lot of
room to maneuver (Nachhaltigkeitskodex 2016). For example, criticism is directed at the traceability of
6 This paper is published at the Journal Business Research as ‘Big data analytics in sustainability reports: an anal-
ysis based on the perceived credibility of corporate published information’ (Wanner and Janiesch, 2019). The DOI
is: https://doi.org/10.1007/s40685-019-0088-4. The related supplementary material is given in Appendix III.
Artificial Intelligence for Human Decision-Makers
74
the sources and the methods of data collection. The same applies to the completeness of measures and
their information value (Knebel and Seele 2015, p. 198ff). This raises the question of the perceived
credibility of published data and facts. The situation is regarded as precarious (Lock and Seele 2016, p.
186f; Nawratil 2006, p. 200ff) and is unfavorable for both sides – company and report recipient (Weber
2014, p. 97f). In science, the problem is referred to as the credibility gap, which is based on information
asymmetries as a state of insecurity due to differing efforts and levels of information.
Regardless of initial successes, this gap has not been closed yet (Knebel and Seele 2015, p. 196; Lock
and Seele 2016, p. 192). Previous approaches have in common that they only considered a situation
where the discovery of information and the processing has already been completed. Until now, the focus
has been chiefly on marketing-oriented approaches. We aim for a novel, alternative solution and inves-
tigate whether improvements to the credibility gap are possible before or during information retrieval
and processing. Our approach considers big data analytics as the key factor for information generation.
The assumption of the potential improvement is based on the recognition that the perceived credibility
correlates with the information quality of the report, which in turn depends on the quality of the data.
This indication is supported by psychological credibility research. We examine whether an approach
using innovative information processing capabilities, viz. big data analytics, can have a positive impact
on data quality in sustainability reports. That is in particular: Does the perceived credibility of sustaina-
bility reports improve?
Summarizing, the starting point of our own investigation is the overlap between the properties of credi-
ble communication with those of information quality and its improvement by big data analytics. This
leads to the following research questions:
RQ1: How can we conceptualize the credibility gap in sustainability reporting and operationalize in-
formation quality criteria to assess their impact on the perceived credibility of sustainability re-
ports?
RQ2: Which criteria of information quality and which characteristics of big data have an influence on
the credibility of sustainability reports and how can this finding be used to improve sustainabil-
ity reporting?
In doing so, we aim to contribute to research on the (ir)rationality of decisions in business research and
practice. We conceptualize criteria, which can guide complex management decisions regarding sustain-
ability reports by examining the limited rationality of human action when consuming and perceiving
reports, to derive practical recommendations on the effectiveness of big data analytics through its char-
acteristics.
The paper is organized as follows: We begin with the foundations of sustainability reporting, perceived
credibility, and the credibility of communication. The following section comprises the state-of-the-art
of scientific research on the credibility gap, which we use to identify the research gap. Section 3.1.4
links this gap to information quality and the potentials of big data analytics. Subsequently, we detail our
research methodology. In our main contribution, we establish hypotheses, perform operationalization as
Artificial Intelligence for Human Decision-Makers
75
well as construct a structural equation model, and present the results of a survey. Finally, we analyze
the findings and discuss them in light of related work.
3.1.2 Sustainability Reporting and its Credibility Problem
3.1.2.1 Sustainability Reporting
Sustainability. Sustainability is defined as “development that meets the needs of the present without
compromising the ability of future generations to meet their own needs” (Development 1987, p. 41).
Sustainable development therefore implies balancing three dimensions: economic, ecologic, and social
(Zimmermann 2016, p. 5). The objective of the economic dimension is to ensure long-term returns. To
achieve this, the use of resources is necessary. Sustainable management constrains this use through the
other two dimensions and, thus, provides a responsible scope for action. The ecological dimension em-
phasizes the elusive value of nature and the finiteness of nature’s resources. Its focus is on the protection
of the ecosystem as the basis of human existence. The social dimension focuses on distributive justice.
It is about equal opportunities and access to resources for countries, societies, and generations (Bansal
2005, p. 198f).
Concept of Corporate Social Responsibility. The concept of Corporate Social Responsibility (CSR)
is the entrepreneurial answer to integrate the idea of sustainability into economic action (Zimmermann
2016, p. 17). It refers to a broad spectrum of activities with which companies assimilate social and
sustainability interests into their business activities, mostly on a voluntary basis (Standardization 2010,
p. 3; Zimmermann 2016, p. 11). In doing so, any enterprise must take into account the expectations of
stakeholders, that is any group or individual who is affected by the achievement of corporate objectives
(BAMS 2011, p. 12; Freeman 2010, p. 46f). Stakeholder contribution to business activities is therefore
essential. Business must engage with those directly and indirectly involved (BAMS 2011, p. 26f).
Sustainability report. According to the Global Reporting Initiative (GRI) (de Boer et al. 2013, p. 12), a
sustainability report is the key platform for communicating qualitative and quantitative corporate sus-
tainability performance and impact in all three aforementioned dimensions – positive as well as negative
(GRI 2016, p. 3 and 13). According to Fifka (2014), p. 4) the information contained in the reports serves
internally for more sustainable control and the optimization of processes. Externally, it supports the
communication with stakeholders. A sustainability report can be part of a larger integrated report also
containing financial performance indicators.
In the following, we focus on sustainability reports of non-financial segments in all three dimensions.
Exemplary content are explanations or key figures of identified future trends, strategic orientations and
intentions, statements on corporate research and development, corporate energy consumption, occupa-
tional accidents, or social projects supported.
Credibility doubts. Frameworks for reporting such as the GRI, which have been largely compliant with
the EU directive 2014/95/EU before it became mandatory legislation, are widely used. Yet, at times
there are doubts as to whether the published information of the reports is true to the word (Fifka 2014,
p. 5; Weber 2014, p. 97). On the communicator side, there is temptation to achieve advantages from
positively communicated sustainability activities without carrying out the necessary efforts
Artificial Intelligence for Human Decision-Makers
76
(Zimmermann 2016, p. 10 & 17). This deception is called greenwashing. By deliberately exaggerating
or misreporting, companies try to be perceived in a more environmentally friendly and responsible man-
ner (Weber 2014, p. 104). The intent is to gain advantages such as improved reputation, an improved
awareness of the customer to purchase, or an improved motivation and recruiting of employees (Fifka
2014, p. 12; Weber 2014, p. 103). On the other hand, the credibility is at risk due to (unintentional)
deception if information is left out. A recipient of information itself does not distinguish between these
possibilities in his or her perception of truth (Köhnken 1990, p. 4).
3.1.2.2 Perceived Credibility
Credibility. In scientific literature, one can find two views on credibility. According to the communi-
cator-centered view, a message is credible if a communicator passes on information that he believes to
be accurate. Thus, the communicator does not have any intention to mislead the recipient (Köhnken
1990, p. 4). Conversely in the recipient-centered view, a message is not considered credible based on
the sender’s intention. It defines credibility as result of a subconscious appraisal process by the recipient
as an individual. This is applicable to persons or institutions, to spoken words, to texts, or even to visu-
alizations (Nawratil 1999, p. 15).
Perception of truth. Accordingly, the perception of truth is not directly related to the truth value of a
message. It is about the subjective belief that the message is true (Spelthahn et al. 2009, p. 62). Never-
theless, both views have in common that the perception of truth can be explained as one’s (i.e., the
communicator’s or recipient’s) subconscious comparison between the reality as an intended ideal of
truth and the given set of information. Reality itself can be understood as an objective external world,
which enables a subjective interpretation with a structured and systematic character by means of certain
characteristics or stimuli (Früh 1994, p. 22ff & 54). Hence, a credible message is subconsciously always
associated with a perceived truth value, which assumes a precise representation of the assumed real-
world (model).
Information asymmetries. The question of credibility itself arises when information becomes relevant
for decisions or actions but is not known yet from personal knowledge or experience (Köhnken 1990,
p. 1). In this sense, a sustainability report represents the starting point of an information asymmetry
between the sender and the recipient on whether or not the report contains the (full) truth. This represents
a state of uncertainty. At the same time a company aims to present information credibly as the recipient
will consider it in his decision-making if he perceives it as credible (Bentele 1988, p. 407). Conversely,
the potential benefits of a sustainability report are linked to a credible perception of its content, otherwise
its creation was for nothing or may even be harmful.
Agency dilemma. Agency theory is referred to as the scientific explanation for the state of insecurity
due to information asymmetries with two parties of different intents. One party (principal) is dependent
on the actions of another party (agent) (Pratt and Zeckhauser 1985, p. 2). Due to an information disad-
vantage, the principal cannot effectively control the agent and does not have direct control over him.
The agent will often deviate from the principal’s expectations in favor of his own interests. The greater
the asymmetry, the more difficult it is to counteract the principal. Aim of the theory is an incentive-
compatible remuneration system, which motivates the agent to make a decision in the sense of the prin-
cipal, so that direct control is not necessary (Kleine 1995, p. 1f & 29ff).
Artificial Intelligence for Human Decision-Makers
77
In the context of this paper, the publishing company is the principal, the respective recipient is the agent.
An agent will initially be critical of the published content, in this case a sustainability report (Fifka 2014,
p. 5; Weber 2014, p. 97). This raises the question of credibility. The problem has consequences for both
parties. It begins with an untruthful perception of the information in a sustainability report. The recipient
will not take the new knowledge into (future) decision-making process(es) (Bentele 1988, p. 407).
Thereby, the recipient’s lack of information on certain issues reduces the quality of his decision-making
with respect to the company. On the company side, the sustainability report becomes worthless or even
has a detrimental effect (Weber 2014, p. 97) towards its relation to the agent. To counteract these prob-
lems, a company publishing sustainability reports must focus on credible communication of content.
The aim must therefore be, to close the confidence gap, also known as the credibility gap, which is
derived from the information asymmetries of the agency dilemma and is closely linked to credible com-
munication.
3.1.2.3 Credibility of Communication
Communication. Communication and sustainability reporting are directly linked to each other (Lock
2016, p. 425). To overcome the credibility gap, one needs to gain an explicit understanding of the key
points responsible for the perception of a recipient on corporate communication. On the one side, the
communication act itself always consists of three entities: sender (communicator), message, and recipi-
ent. On the other side, (moral) legitimacy is the central problem of corporate communication and can be
traced back to the above-mentioned information asymmetries (Bentele and Seidenglanz 2015, p. 411f).
Legitimacy itself is defined as the perception, whether the company is in line with some socially con-
structed system of norms, values, beliefs, and definitions (Suchman 1995, p. 574).
Credibility. The Habermas Theory of Communicative Action discusses the sender, the recipient, the
message, and the legitimacy of the company (Habermas et al. 1984). The theory takes the practical and
theoretical meaning of communicative action of the modern society into account and tries to (theoreti-
cally) solve the questions of truth, truthfulness, and normative justice by examining different meanings
of rationality (Habermas et al. 1984). For a discourse leading to a credible interpretation, the theory
postulates that all participants have to communicate intelligibly, honestly, truthfully, and normatively
correct to reach mutual understanding and agreement among all participants (Lock 2016, p. 422f). While
credibility describes the believability of a source or message, rationality characterizes those who are
agreeable to reason. In deliberative discourse, the best argument wins and prevails as a consensus
(Habermas et al. 1984, p. 96). Despite its original context of speech situations, the theory is applicable
to (written) communication on sustainability issues as it has a political-normative character (Lock 2016,
p. 423ff). Hence, the theory can be regarded as an ideal to strive for in the context of sustainability
reporting (Lock 2016, p. 415).
Properties of credible communication. In his theory, Habermas prescribes the four properties, which
must be satisfied to perceive an interpretation of a message as credible (Habermas et al. 1984, p. 329):
1. Sincerity: Statements are reproduced honestly.
2. Truth: Statements are in line with objective truth.
3. Normative rightness: Statements are morally appropriate to society’s requirements.
4. Intelligibility: Statements are formulated intelligibly.
Artificial Intelligence for Human Decision-Makers
78
We regard intelligibility of the formulated statements as a foundational prerequisite. It is the only way,
language itself can be used as a medium to allow a rational assessment of honesty, truth, and moral
appropriateness. This counteracts possible misunderstandings and perceived falsifications (Habermas et
al. 1984, p. 88). Since any corporation seeks its published information to be perceived as credible, we
assume this dimension always to be met. Using the three further dimensions, we examine and structure
knowledge about the credibility gap to extract possible starting points.
3.1.3 State-of-the-Art of Research on the Credibility Gap
3.1.3.1 Currents State of Research
The credibility gap describes a lack of confidence in the abilities and intentions of the publishing com-
pany from the viewpoint of stakeholders (Dando and Swift 2003, p. 196ff). It has not yet been closed
(Knebel and Seele 2015, p. 196; Lock and Seele 2016, p. 192). Hence, a general statement about credi-
bility in sustainability reports cannot be made. However, in principle it is undisputed that it poses a
problem (Knebel and Seele 2015, p. 197; Milne and Gray 2013, p. 21; Sethi et al. 2015, p. 61). So far,
the focus of research has been largely on studying the dissemination of sustainability reports, the char-
acteristics of the publishing companies (such as size, country, industry), and the impact on financial
indicators. The empirical findings of Lock and Seele (2016) indicate that sustainability reports tend to
become more credible in recent years. Findings on perceived credibility from the recipient’s point of
view are rather rare (Lock and Seele 2016, p. 186).
Following Liljenström and Svedin (2005), we have categorized topics on countering the credibility gap
in sustainability reporting in three core levels of a corporate environment: micro, meso, and macro.
Macro or ‘macroscopic’ describes the entire ecological system. Meso or ‘mesoscopic’ describes a group
or population within the macro system. inally, micro or ‘microscopic’ describes the individual. Due to
the importance of reporting standards and the undergoing changes of legal requirements for sustainabil-
ity reports, we distinguish external influencing factors and standards and legal requirements on the
macro level. On the meso level, we have subsumed all actions and decisions of corporate external ser-
vices as external audits. On the micro level, we summarize corporate internal potentials, which infer
the possibility of a closer cooperation or access to information for involved parties. An overview of the
mentioned topics and their activities is given in Table 10. The table also includes references for proven
and refuted impacts of the subtopics.
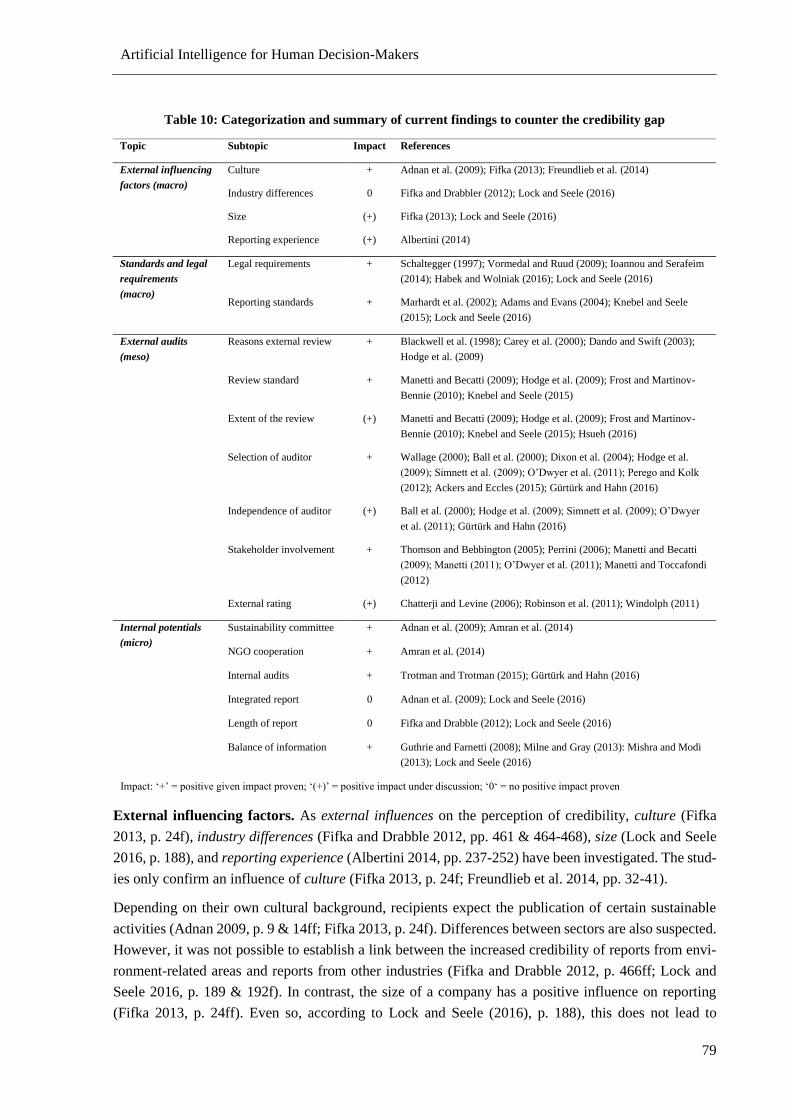
Artificial Intelligence for Human Decision-Makers
79
Table 10: Categorization and summary of current findings to counter the credibility gap
Impact: ‘+’ = positive given impact proven; ‘(+)’ = positive impact under discussion; ‘0‘ = no positive impact proven
External influencing factors. As external influences on the perception of credibility, culture (Fifka
2013, p. 24f), industry differences (Fifka and Drabble 2012, pp. 461 & 464-468), size (Lock and Seele
2016, p. 188), and reporting experience (Albertini 2014, pp. 237-252) have been investigated. The stud-
ies only confirm an influence of culture (Fifka 2013, p. 24f; Freundlieb et al. 2014, pp. 32-41).
Depending on their own cultural background, recipients expect the publication of certain sustainable
activities (Adnan 2009, p. 9 & 14ff; Fifka 2013, p. 24f). Differences between sectors are also suspected.
However, it was not possible to establish a link between the increased credibility of reports from envi-
ronment-related areas and reports from other industries (Fifka and Drabble 2012, p. 466ff; Lock and
Seele 2016, p. 189 & 192f). In contrast, the size of a company has a positive influence on reporting
(Fifka 2013, p. 24ff). Even so, according to Lock and Seele (2016), p. 188), this does not lead to
Topic Subtopic Impact References
External influencing
factors (macro)
Culture + Adnan et al. (2009); Fifka (2013); Freundlieb et al. (2014)
Industry differences 0 Fifka and Drabbler (2012); Lock and Seele (2016)
Size (+) Fifka (2013); Lock and Seele (2016)
Reporting experience (+) Albertini (2014)
Standards and legal
requirements
(macro)
Legal requirements + Schaltegger (1997); Vormedal and Ruud (2009); Ioannou and Serafeim
(2014); Habek and Wolniak (2016); Lock and Seele (2016)
Reporting standards + Marhardt et al. (2002); Adams and Evans (2004); Knebel and Seele
(2015); Lock and Seele (2016)
External audits
(meso)
Reasons external review + Blackwell et al. (1998); Carey et al. (2000); Dando and Swift (2003);
Hodge et al. (2009)
Review standard + Manetti and Becatti (2009); Hodge et al. (2009); Frost and Martinov-
Bennie (2010); Knebel and Seele (2015)
Extent of the review (+) Manetti and Becatti (2009); Hodge et al. (2009); Frost and Martinov-
Bennie (2010); Knebel and Seele (2015); Hsueh (2016)
Selection of auditor + Wallage (2000); Ball et al. (2000); Dixon et al. (2004); Hodge et al.
(2009); Simnett et al. (2009); O’Dwyer et al. (2011); Perego and Kolk
(2012); Ackers and Eccles (2015); Gürtürk and Hahn (2016)
Independence of auditor (+) Ball et al. (2000); Hodge et al. (2009); Simnett et al. (2009); O’Dwyer
et al. (2011); Gürtürk and Hahn (2016)
Stakeholder involvement + Thomson and Bebbington (2005); Perrini (2006); Manetti and Becatti
(2009); Manetti (2011); O’Dwyer et al. (2011); Manetti and Toccafondi
(2012)
External rating (+) Chatterji and Levine (2006); Robinson et al. (2011); Windolph (2011)
Internal potentials
(micro)
Sustainability committee + Adnan et al. (2009); Amran et al. (2014)
NGO cooperation + Amran et al. (2014)
Internal audits + Trotman and Trotman (2015); Gürtürk and Hahn (2016)
Integrated report 0 Adnan et al. (2009); Lock and Seele (2016)
Length of report 0 Fifka and Drabble (2012); Lock and Seele (2016)
Balance of information + Guthrie and Farnetti (2008); Milne and Gray (2013): Mishra and Modi
(2013); Lock and Seele (2016)
Artificial Intelligence for Human Decision-Makers
80
increased credibility. Reporters, however, go through a learning curve that can have a positive effect on
the relevance of the published information and its credibility in general (Albertini 2014, pp. 237-252).
Standards and legal requirements. Studies on the impact of (national) legal requirements (Habek and
Wolniak 2016, p. 412ff; Lock and Seele 2016, p. 189 & 193) and the use of (common) reporting stand-
ards (Knebel and Seele 2015, p. 199f & 204f; Lock and Seele 2016, p. 188 & 193) reveal that both
contribute to an increased credibility. The extent of this depends on the associated review methods of a
company.
Ioannou and Serafeim (2017) show that there is general improvement due to legal requirements. Ac-
cording to Schaltegger (1997), government regulations do not necessarily lead to an increase in quality.
Vormedal and Ruud (2009) attribute this to limited political and social options to influence. Legal re-
quirements only contribute to increased quality and credibility if the conditions and governmental con-
trols are appropriate (Habek and Wolniak 2016, p. 414).
A major problem of non-financial reporting is its incompleteness (Adams and Evans 2004, p. 104f).
Morhardt et al. (2002) indicate that the guidelines of the GRI lead to expanded reporting requirements
and improved completeness. Lock and Seele (2016) verify that the use of standardized GRI guidelines
leads to more credible reports than non-standardized reports. On the other hand, they refuted the as-
sumption that a stricter compliance with the guidelines leads to reports that are more credible.
External audits. An external audit is positively correlated with the perceived credibility of the respec-
tive recipients for several reasons (Hodge et al. 2009, p. 179ff). In addition, a review standard increases
the trustworthiness of the review process itself, whereas there is no general consensus on the extent of
the review (Hsueh 2018, p. 10ff; Knebel and Seele 2015, p. 201f & 206f). The selection and independ-
ence of the auditor is also important (Hodge et al. 2009, pp. 181-190). Stakeholder involvement in the
review process seems to have a positive impact as well (Manetti and Becatti 2009, pp. 292-295). Con-
sidering external ratings opinions differ (Chatterji and Levine 2006, p. 31ff; Robinson et al. 2011, pp.
498-503).
Blackwell et al. (1998) identified the reduction of information asymmetries to lenders as the main reason
for an external audit. Carey et al. (2000) confirm that external audits lead to better conditions and lower
monitoring efforts by financial institutions. Ball et al. (2000) found that no investigated report was ver-
ified independently in its entirety. The problem is payment of the reviewer by the communicator (prin-
cipal) rather than by the recipient (agent). Dando and Swift (2003) also confirm that a certified report is
no guarantee for credible perception.
Review standards counteract heterogeneity and arbitrariness of the auditing process. Hodge et al. (2009)
argue that the declaration of the audit statement does not lead to a more credible perception. For Frost
and Martinov-Bennie (2010), this is due to a considerable lack of understanding among the recipients
of the report. Related to this, the extent of the review seems to be related to legislation. However, the
selection and calculation of many indicators in a sustainability report vary, which makes them difficult
to assess (Knebel and Seele 2015, p. 198ff).
The selection and independence of the auditor has a direct effect on the quality of the reports (Perego
and Kolk 2012, pp. 176-186). According to Wallage (2000), professional auditors lead to higher quality
reports and better credibility. Ball et al. (2000) also share the same view. Perego and Kolk (2012) as
Artificial Intelligence for Human Decision-Makers
81
well as Ackers and Eccles (2015) confirm this finding. However, it is contradicted by the view of Dixon
et al. (2004) and Hodge et al. (2009). For them, specialized consultants have a higher level of compe-
tence and provide a more balanced audit explanation. Simnett et al. (2009) and O’Dwyer et al. (2011)
confirm this view.
For Manetti and Becatti (2009) further problems lie in the insufficient stakeholder involvement.
Thomson and Bebbington (2005) demonstrate a link between reporting quality and stakeholder engage-
ment. Nonetheless Perrini (2006) and Manetti (2011) prove that companies have so far been reluctant
to involve stakeholders in the decision-making process on the content of sustainability reports. This can
have advantages as shown by O’Dwyer et al. (2011) as well as Manetti and Toccafondi (2012).
The improvement through external ratings such as ranking lists, awards, and sustainability indices is
under discussion. They should serve as a neutral instance with own evaluation systems and criteria
(Chatterji and Levine 2006, p. 31f) to be an intermediary between corporations and their stakeholders
(Robinson et al. 2011, p. 495). Despite good intentions, there is criticism since they are depending on
the disclosure of quality information by the companies themselves as the issuing bodies do not make
their own measurements (Chatterji and Levine 2006, p. 32f). This has a weakening effect on their posi-
tive impact on credibility (Windolph 2011, p. 47f).
Internal potentials. Further research has been carried out on the impact of internal potentials of organ-
izations. Here, positive effects of an own sustainability committee (Adnan 2009, p. 10 & 13ff; Amran
et al. 2014, pp. 222f & 226-230), a non-governmental organization (NGO) cooperation (Amran et al.
2014, pp. 223 & 226-230), and internal audits (Gürtürk and Hahn 2016; Trotman and Trotman 2015)
of non-financial key figures could be demonstrated. This also applies to the balance of published posi-
tive and negative information (Guthrie and Farneti 2008, p. 363ff; Mishra and Modi 2013, pp. 434 &
441-446). Despite that, report length (Fifka and Drabble 2012, p. 461 & 465; Lock and Seele 2016, p.
187f & 191ff) and the type of integrated report (i.e. regular annual report with sustainability report)
(Lock and Seele 2016, p. 188f) does not improve the perceived credibility. In the case of the latter, the
credibility of the report even worsens (Adnan 2009, p. 7 & 13ff; Lock and Seele 2016, p. 192f).
3.1.3.2 Identified Research Gaps
When analyzing the current state of the art using the remaining three properties of credible communica-
tion, we found that both, the dimensions of sincerity and normative rightness, have been well covered
in attempts to improve perceived credibility and to close the credibility gap. The dimension of truth
seems to drag behind.
Sincerity. The initiation of sustainability committees as well as the balance of the content have a posi-
tive effect on sincerity. Sustainability committees ensue intensified efforts of employees involved in
sustainability; balance is explained through a more honest representation of information. External audit
standards and the involvement of stakeholders seem to have positive effects as well. External audits
limit the scope of action of the publishing company. The involvement of stakeholders leads to an accel-
erated need for explanations for the intended dissemination of information.
Normative rightness. Reporting standards, external audits, and the build-up of internal knowledge
have a positive impact on normative rightness. This can be attributed to the improved competence for
Artificial Intelligence for Human Decision-Makers
82
the implementation of an appropriate sustainability report. In combination with the influences of legal
requirements and the involvement of stakeholders into the creation and review process, the dimension
seems to be well covered.
Truth. We observe a research gap in methods to improve the objective truth as well as the perception
of truth as we only found few attempts dealing with this topic. Therefore, in the following we use it as
the focus for our own research. As a first step, we need to examine the relationship between the percep-
tion of the objective truth by the recipient and information quality as the key factor for representing and
improving objective truth as the actual state of reality in sustainability reports.
3.1.4 Bridging the Credibility Gap through Information Quality
3.1.4.1 Link between Truth and Information Quality
A comparison between the psychological construct of credibility and that of information quality shows
that it is difficult to make a clear cut. Recipients do not distinguish between credibility and quality of
given information (Wirth 1999, p. 57f). Both constructs are multidimensional (Bentele 1988, p. 421)
with similar to congruent criteria for their operationalization. This also applies to their evaluation: the
better an individual quality assessment for presented information is, the more likely it is that the content
will be used (Früh 1994, p. 22ff & 54f; Wolling 2004, p. 174).
Information quality. The quality of information is essential for the realistic and error-free reproduction
of information. Quality is defined as an individual rating criterion in the context of quality management
and assurance. The measurement is based on the ability of a product to satisfy declared or implied needs,
based on its totality of characteristics (Standardization 2000). Information is a multi-dimensional con-
struct that can be described by means of layers. On four hierarchy levels, characters with syntax form
data, data embedded in a context becomes information, and networked information come to be
knowledge (Krcmar 2015, p. 11f). Deduced from this, high decision quality is always based on a high
quality of information, which is based on high quality data. In line with this insight, we speak of ‘fitness
for use’, the suitability of information to the respective application context (Wang and Strong 1996, p.
6).
Information quality framework. In the following, we use the framework of Wang and Strong (1996).
They have defined a set of dimensions for information quality with criteria to measure. A critical review
of the framework has been mandated by the German Government and conducted by the Deutschen Ge-
sellschaft für Informations- und Datenqualität (DGIQ) (Rohweder et al. 2015). Their result can be found
in Table 11, an asterisk marks interpretational deviation from the original of Wang and Strong.
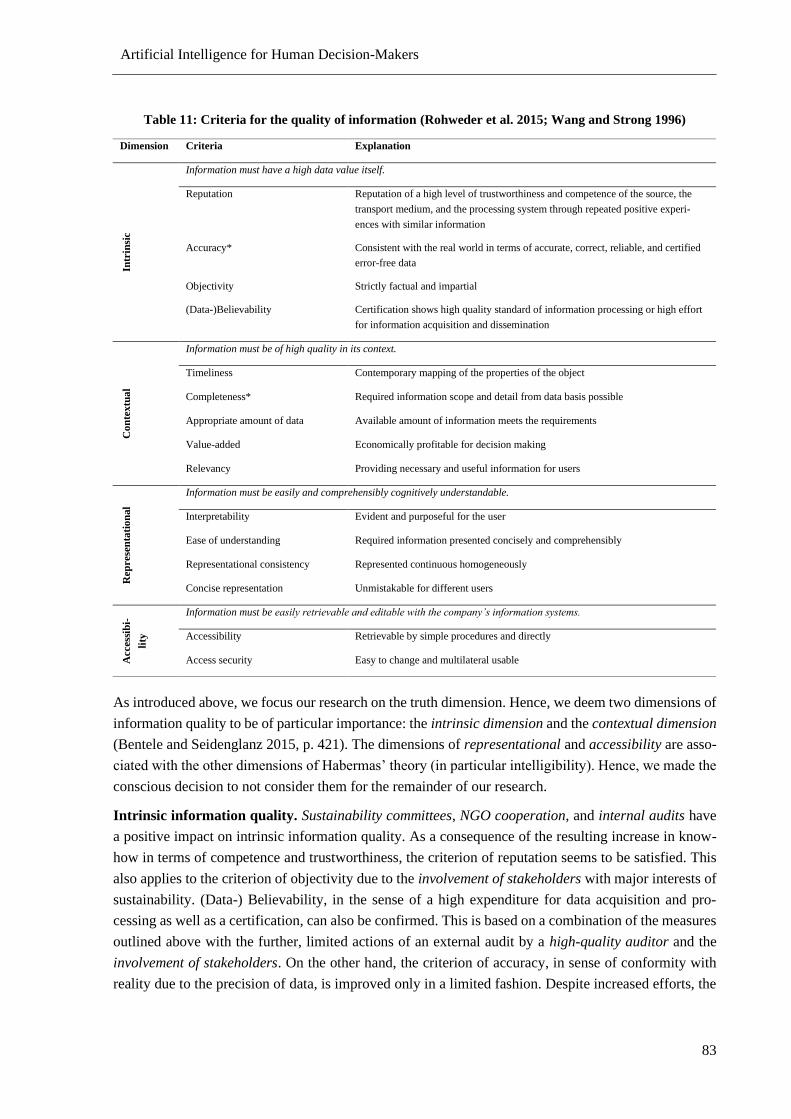
Artificial Intelligence for Human Decision-Makers
83
Table 11: Criteria for the quality of information (Rohweder et al. 2015; Wang and Strong 1996)
As introduced above, we focus our research on the truth dimension. Hence, we deem two dimensions of
information quality to be of particular importance: the intrinsic dimension and the contextual dimension
(Bentele and Seidenglanz 2015, p. 421). The dimensions of representational and accessibility are asso-
ciated with the other dimensions of Habermas’ theory (in particular intelligibility). Hence, we made the
conscious decision to not consider them for the remainder of our research.
Intrinsic information quality. Sustainability committees, NGO cooperation, and internal audits have
a positive impact on intrinsic information quality. As a consequence of the resulting increase in know-
how in terms of competence and trustworthiness, the criterion of reputation seems to be satisfied. This
also applies to the criterion of objectivity due to the involvement of stakeholders with major interests of
sustainability. (Data-) Believability, in the sense of a high expenditure for data acquisition and pro-
cessing as well as a certification, can also be confirmed. This is based on a combination of the measures
outlined above with the further, limited actions of an external audit by a high-quality auditor and the
involvement of stakeholders. On the other hand, the criterion of accuracy, in sense of conformity with
reality due to the precision of data, is improved only in a limited fashion. Despite increased efforts, the
Dimension Criteria Explanation
Intr
insi
c
Information must have a high data value itself.
Reputation Reputation of a high level of trustworthiness and competence of the source, the
transport medium, and the processing system through repeated positive experi-
ences with similar information
Accuracy* Consistent with the real world in terms of accurate, correct, reliable, and certified
error-free data
Objectivity Strictly factual and impartial
(Data-)Believability Certification shows high quality standard of information processing or high effort
for information acquisition and dissemination
Co
nte
xtu
al
Information must be of high quality in its context.
Timeliness Contemporary mapping of the properties of the object
Completeness* Required information scope and detail from data basis possible
Appropriate amount of data Available amount of information meets the requirements
Value-added Economically profitable for decision making
Relevancy Providing necessary and useful information for users
Rep
rese
nta
tio
nal
Information must be easily and comprehensibly cognitively understandable.
Interpretability Evident and purposeful for the user
Ease of understanding Required information presented concisely and comprehensibly
Representational consistency Represented continuous homogeneously
Concise representation Unmistakable for different users
Access
ibi-
lity
Information must be asi y r tri vab and ditab wit t pany’s inf r ati n syst s.
Accessibility Retrievable by simple procedures and directly
Access security Easy to change and multilateral usable
Artificial Intelligence for Human Decision-Makers
84
information quality of sustainability reports still only moderate. Thus, the intrinsic dimension seems to
be satisfied except for the criterion of limited accuracy.
Contextual information quality. Previous attempts to improve contextual information quality have
been less successful. Similarly, sustainability committees, NGO cooperation, and internal audits
strengthen sustainability reports. Due to the increase of expertise in the sense of competence and sug-
gested neutrality, the criteria of completeness and appropriate amount of data improve. However, we
question the satisfaction of the criteria due to the discovered quality deficiencies. In addition, the limited
impact of external audit methods, high-quality auditors, and stakeholder involvement can be expected
only to lead to a limited increase in relevancy and timeliness. The criterion of added-value seems to be
of lesser importance as it has not been considered so far. Thus, the contextual dimension does not even
seem to satisfy one criterion in its entirety.
Addressing the deficits. Due to the number of deficits in both dimensions, we limit ourselves to and,
thus, focus on a selection of meaningful criteria. Therefore, we have used the GRI v4 guidelines as the
most commonly used framework of sustainability reporting worldwide (de Boer et al. 2013, p. 12) for
prioritization. Their recommendations demand stakeholder inclusiveness, sustainability context, mate-
riality, completeness, balance, comparability, accuracy, timeliness, clarity, and reliability (GRI 2016,
pp. 9-18). Related research has shown that stakeholder inclusiveness, sustainability context, balance,
comparability, and clarity of presented information can be regarded as part of the dimension of intelli-
gibility and that reliability can be achieved through external audits. The criteria of materiality, com-
pleteness, accuracy, and timeliness remain problematic.
Three of the four criteria of GRI (GRI 2016, pp. 9-18) are consistent with those from Wang and Strong
(1996) as found in Table 11 Materiality is exclusive to GRI and provides recommendations for the
prioritization of topics in reports (GRI 2016, p. 11f). At first sight, this might suggest a trade-off with
the criterion of completeness. Yet, it is not, as completeness has to be understood as scope, boundary,
and time of the report incorporating the measure of prioritization as well as the practices of information
collection (GRI 2016, p. 12f & 17). Therefore, it is a prioritization principle that is applied when com-
piling the measures to include in the report. It does not affect the information quality of the reported
measure once they has been selected. Hence, we refrained from including materiality as a criterion.
The importance of the three remaining criteria of timeliness, completeness, and accuracy is supported
by a survey of Michnik and Lo (2009), p. 852). The author examined the relevance of the above-men-
tioned four-dimensional representation of information quality and their criteria for data users. Therefore,
we adopt timeliness, completeness, and accuracy as criteria for the representation of information quality.
3.1.4.2 Potential of Improvement with Big Data Analytics
The basic assumption is that credible perception correlates with the quality of information. As argued,
this in turn is dependent on the quality of data. It allows us to conclude that there is potential for im-
provement through effective and efficient data processing. Due to the emergence of data identified as of
big data, there is now a major trade-off between size, time, quality, and cost of information generation
that cannot be dealt with in terms of traditional business intelligence capabilities (Schön 2016, p. 19f)
and may even lead to a situation where companies are confronted with a data deluge (Müller et al. 2018,
Artificial Intelligence for Human Decision-Makers
85
p. 489). Thus, we assume that the perception of information in sustainability reports can be improved
through big data analytics.
Characteristics of big data. Ylijoki and Porras (2016), p. 74 & 79) provide an extensive, up-to-date
survey of big data definitions. They identified 17 interpretations from a total of 479 scientific articles.
The result confirms the importance of three characteristics: Volume (95 %), Variety (89 %) and Velocity
(74 %). Volume denotes an unusually large amount of data (Géczy 2014, p. 98; Tole 2013, p. 32). Variety
covers the diversity of data sources and formats and in particular enables the processing of unstructured
data (Géczy 2014, p. 98f; Tole 2013, p. 33). Velocity refers to the speed of data modification and eval-
uation (Géczy 2014, p. 98; Tole 2013, p. 32). In the following, we use the term data work to describe
different types of processing in big data analytics (e.g., in scope and frequency) leading to sustainability
reports.
Van Altena et al. (2016) come to the same conclusion. Deviations can be found in the dimensions Ve-
racity (23 %) and Value (27 %). These appear predominantly in newer interpretations and should there-
fore be taken into account. Veracity includes the reliability of data through extensive testing routines
(Schön 2016, p. 304; Van Altena et al. 2016, p. 9). Value refers to the value of the use of technology
from an economic point of view (Tole 2013, p. 32f; Van Altena et al. 2016, p. 9).
Reviewing the characteristics of big data, the size of the data set is not the defining criterion for big data.
However, at least one of the three main characteristics (i.e., volume, variety, velocity) should be linked
to its economic use.
Big data analytics. Big data requires “the use of powerful computational techniques to unveil trends
and patterns within and between these extremely large socioeconomic datasets” (George et al. 2014, p.
321). We term these techniques big data analytics. Big data analytics provides a physical (hardware
technology) and digital (software technology) materiality representing stable properties across contexts
and time. Examples for physical technologies include in-memory databases (chiefly volume, velocity)
or in general contemporary compute, storage, and network capabilities. Examples for software are more
diverse and include NoSQL databases such as Apache Cassandra or Amazon Dynamo (volume), event
stream processing engines such as Esper (velocity), or statistical software such as R (variety). They
provide affordances as potentials for action to process data and create comprehensive information for
media such as sustainability reports (Lehrer et al. 2018, p. 428f). A further overview of exemplary phys-
ical and digital technologies can be found in Lehrer et al. (2018).
Big data analytics, for instance, can give real-time access to analytics of trace data using sensor net-
works, scalable in-memory access to large amounts of data points, or text and sentiment analysis of
heterogeneous external reports or online conversations such as opinions or feedback. Considering all of
these applications, big data analytics offer diverse opportunities for innovation and business transfor-
mation. To capitalize on these affordances, one needs to use big data analytics appropriate to one’s
context.
Summarizing, the core aim of big data analytics is to improve insight, decision-making, and process
automation from the analysis of (complex) data sets under economically feasible conditions. Techno-
logical choices must be made according to one’s context and the extraction of the intended data value
must be carried out while ensuring high data quality. In term of sustainability reports, the result is an
Artificial Intelligence for Human Decision-Makers
86
increase in information quality through extensive data work in any or multiple of the mentioned dimen-
sions, which leads to an improved truth value of the content. This in turn should improve credibility.
3.1.5 Research Methodology
Due to the lack of scientific knowledge and novelty of the topic, we chose the survey of experts with
IT- and data-affine persons as the method of investigation (Przyborski and Wohlrab-Sahr 2014, p.
124ff). For its development, we carried out a quantitative and qualitative survey and evaluation. We
used the quantitative survey to pinpoint to what extent there is an agreement on the perception of the
credibility of recipients of sustainability reports with regard to information quality criteria. The qualita-
tive survey supported the item selection of the survey.
Statistical evaluation. We chose the causal analysis for the statistical evaluation. It allows the investi-
gation of collected data sets for suspected cause-effect relationships. Mathematically, this is based on a
combination of three statistical approaches: factor and path analysis and multilinear regression (Kühnle
and Dingelstedt 2014, pp. 1017-1028). We used the variance-analytical approach for the estimation of
the structural equation model with its multi-variable system of equations. The model is highly prognosis-
oriented, with the aim of explaining latent and/ or associated indicator variables. Both reflective and
formative measurement models can be used for the model structure (Chin and Newsted 1999, p. 314).
This allows us to prove the assumed interrelationships and assess potential improvements through big
data analytics.
We selected the partial least squares (PLS) as the statistical evaluation method. This method is suitable
due to its focus on predictions, lack of well-founded measurement and construct theories, and a lack of
covariance-based independence of the observed values (Chin and Newsted 1999, p. 314). The use of
PLS requires seven steps (Weiber and Mühlhaus 2014, p. 325): hypothesis and modeling, construct
conceptualization, construct operationalization, evaluation of the measurement models, model estima-
tion, evaluation of the overall model, and result interpretation.
Progression of research. First, we derived hypotheses and justified them based on the information
quality criteria presented above. We processed cause-effect relationships with the latent and manifest
variables in a structural equation model. Subsequently, we determined suitable indicators for all not
directly observable latent variables and, thus, for all theoretical constructs, which represent them in the
best possible way and which can be observed and evaluated. The operationalization of the latent varia-
bles was done by recording and measuring the hypothetical constructs based on indicators and measure-
ment rules. For this purpose, we generated a rough classification of potential measurement indicators,
defined the measurement concept, and designed the measurement specifications. We then tested the
measurement models for their quality based on several reliability and validity tests. For the model esti-
mation, we first cleaned the empirical data obtained during the main investigation and then applied it to
the structural equation model using SmartPLS. Reliability and validity of the overall model were again
tested to ensure a sufficient model fit. Finally, we examined the a-priori hypotheses on basis of the
empirically collected data and interpreted them.
Artificial Intelligence for Human Decision-Makers
87
3.1.6 Perceived Credibility of Corporate Published Information in Sustainability Reports
3.1.6.1 Hypothesis Determination and Derived Structural Equation Model
In the following, we examine whether it is possible to improve the perception of the objective truth of
published sustainability report information by the means of big data analytics. As indicated by our own
analysis so far, the improved representation of reality should lead to an improved objective truth and,
thus, an improved perceived credibility by the recipient. Nevertheless, the question remains to what
extent the limited rationality of human action in perceiving sustainability reports supports or refutes this
assumption. For the examination, we developed the following hypotheses for the selected criteria of
timeliness, completeness, and accuracy. The items are based on the above findings from research on
information quality as well as mathematical terms for their calculation from the field of data quality (for
more detail see the Appendix III). All of our hypothesis aim to improve the perception of objective truth
by the recipient as (a) we cannot observe and measure objective truth itself and (b) a true report, which
the recipient does not consider credible, is futile.
Timeliness. The common ground of measurement methods for determining the validity of data can be
found in the application of probability theory (Heinrich and Klier 2015; Hinrichs 2002). The value of
data decreases exponentially over time (Heinrich and Klier 2015, p. 91f). The timeliness of data remains
dependent on the time of delivery to the respective recipient. Consequently, this can only be validly
determined by the recipient (Wang and Strong 1996, p. 7). This leads to the following hypothesis H1:
‘The better the expected timeliness of data, the better the perceived objective truth.’
Velocity. Due to changes in the environment (Seufert 2016, p. 40) an increase of data value volatility
can be observed. This means that there is a reduced half-life of data. This increases the technical speed
requirements for the underlying data work (Seufert 2016, pp. 41 & 48-54; Vargas-Solar et al. 2016, pp.
2-12). A high up-to-date value implies new hardware and software technologies as promised by big data
analytics. Velocity is necessary per a certain level on the timeliness of data resulting in hypothesis H2:
‘The greater the need for the big data characteristic velocity, the better the expected timeliness of the
data.’
Completeness. A value for the completeness of data compared to reality can be determined at the level
of the database (Aljumaili et al. 2016; Heinrich and Klier 2015). Incomplete entries represent unknown
or missing data (Batini et al. 2009, p. 7). Completeness represents an expected extent to which relevant
data for a specific scope of application is available for big data analytics (Aljumaili et al. 2016, p. 244).
Conversely, we can assume as well that the more comprehensive the analysis and assignment of data
values, the better its completeness. Again, the quality can only be determined by the recipient (Wang
and Strong 1996, p. 7). Consequently, hypothesis H3 is defined as follows: ‘The better the expected
completeness, the better the perceived objective truth.’
Volume. Nowadays, large amounts of data have to be evaluated (Seufert 2016, p. 40f). This cannot be
realized in an economic fashion with traditional IT standards. Physical and digital big data analytics
technologies based on volume promise a remedy. Based on this, we formulate hypothesis H4: ‘The
greater the need for the big data characteristic volume, the better the expected completeness.’
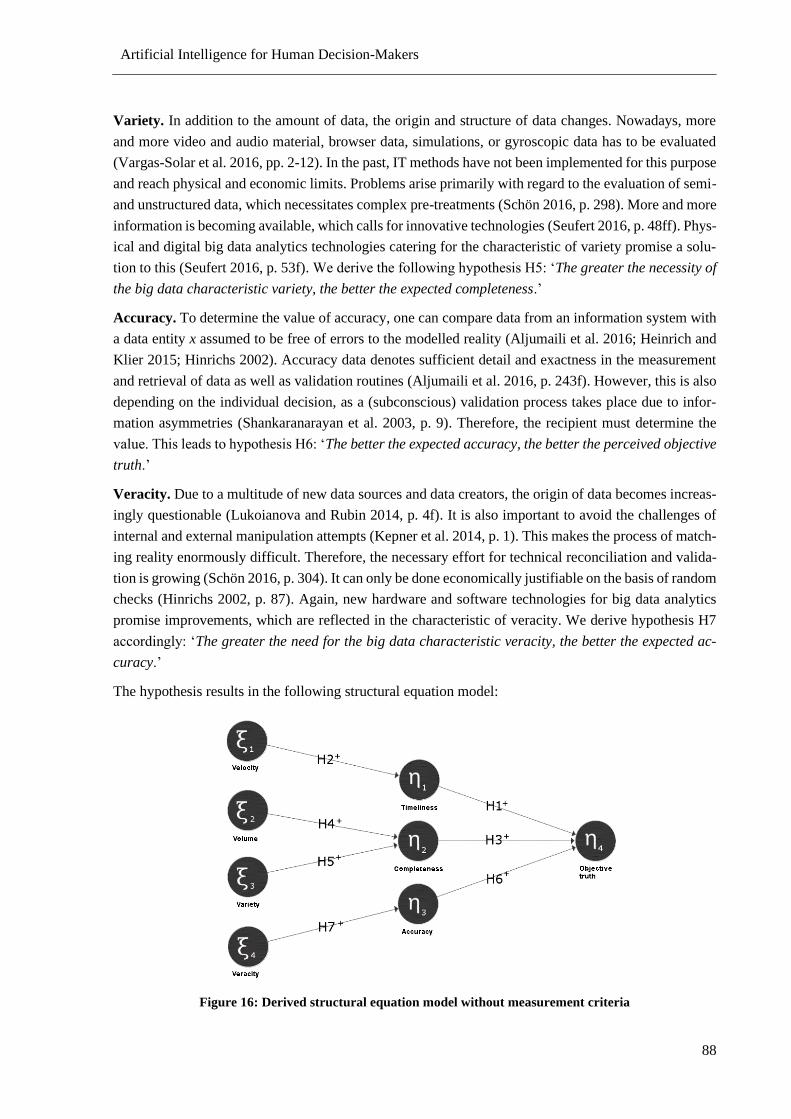
Artificial Intelligence for Human Decision-Makers
88
Variety. In addition to the amount of data, the origin and structure of data changes. Nowadays, more
and more video and audio material, browser data, simulations, or gyroscopic data has to be evaluated
(Vargas-Solar et al. 2016, pp. 2-12). In the past, IT methods have not been implemented for this purpose
and reach physical and economic limits. Problems arise primarily with regard to the evaluation of semi-
and unstructured data, which necessitates complex pre-treatments (Schön 2016, p. 298). More and more
information is becoming available, which calls for innovative technologies (Seufert 2016, p. 48ff). Phys-
ical and digital big data analytics technologies catering for the characteristic of variety promise a solu-
tion to this (Seufert 2016, p. 53f). We derive the following hypothesis H5: ‘The greater the necessity of
the big data characteristic variety, the better the expected completeness.’
Accuracy. To determine the value of accuracy, one can compare data from an information system with
a data entity x assumed to be free of errors to the modelled reality (Aljumaili et al. 2016; Heinrich and
Klier 2015; Hinrichs 2002). Accuracy data denotes sufficient detail and exactness in the measurement
and retrieval of data as well as validation routines (Aljumaili et al. 2016, p. 243f). However, this is also
depending on the individual decision, as a (subconscious) validation process takes place due to infor-
mation asymmetries (Shankaranarayan et al. 2003, p. 9). Therefore, the recipient must determine the
value. This leads to hypothesis H6: ‘The better the expected accuracy, the better the perceived objective
truth.’
Veracity. Due to a multitude of new data sources and data creators, the origin of data becomes increas-
ingly questionable (Lukoianova and Rubin 2014, p. 4f). It is also important to avoid the challenges of
internal and external manipulation attempts (Kepner et al. 2014, p. 1). This makes the process of match-
ing reality enormously difficult. Therefore, the necessary effort for technical reconciliation and valida-
tion is growing (Schön 2016, p. 304). It can only be done economically justifiable on the basis of random
checks (Hinrichs 2002, p. 87). Again, new hardware and software technologies for big data analytics
promise improvements, which are reflected in the characteristic of veracity. We derive hypothesis H7
accordingly: ‘The greater the need for the big data characteristic veracity, the better the expected ac-
curacy.’
The hypothesis results in the following structural equation model:
Figure 16: Derived structural equation model without measurement criteria
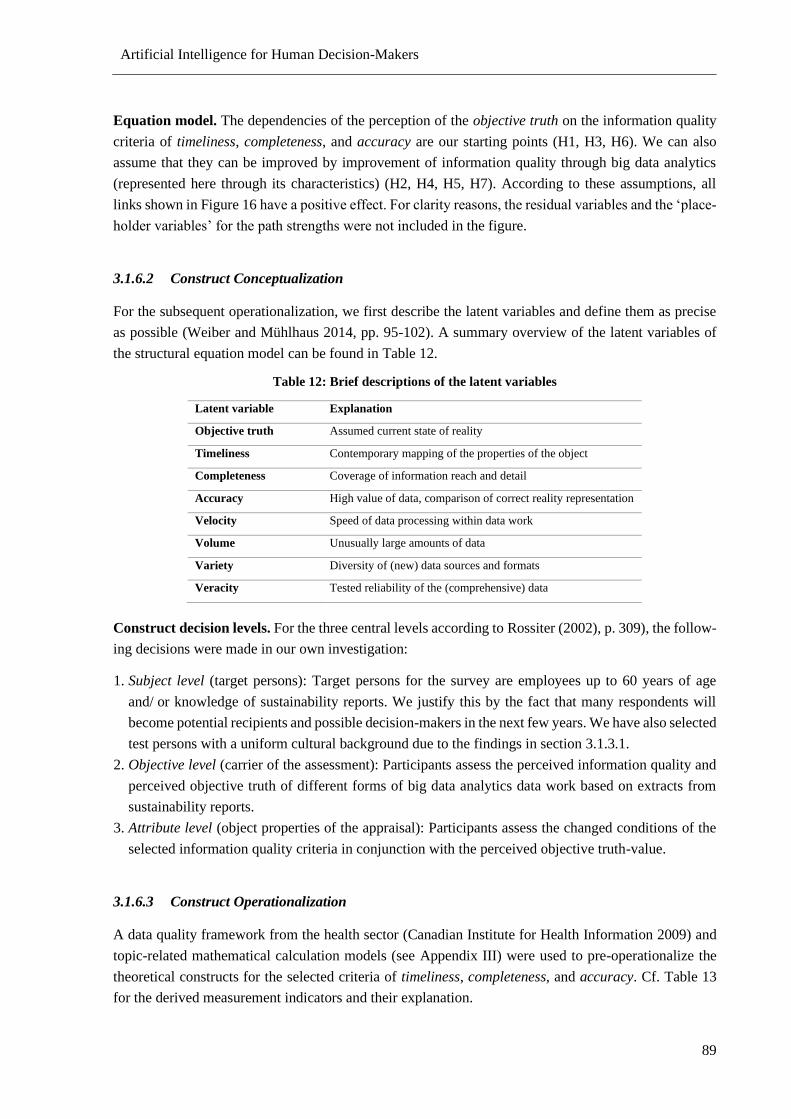
Artificial Intelligence for Human Decision-Makers
89
Equation model. The dependencies of the perception of the objective truth on the information quality
criteria of timeliness, completeness, and accuracy are our starting points (H1, H3, H6). We can also
assume that they can be improved by improvement of information quality through big data analytics
(represented here through its characteristics) (H2, H4, H5, H7). According to these assumptions, all
links shown in Figure 16 have a positive effect. or clarity reasons, the residual variables and the ‘place-
holder variables’ for the path strengths were not included in the figure.
3.1.6.2 Construct Conceptualization
For the subsequent operationalization, we first describe the latent variables and define them as precise
as possible (Weiber and Mühlhaus 2014, pp. 95-102). A summary overview of the latent variables of
the structural equation model can be found in Table 12.
Table 12: Brief descriptions of the latent variables
Latent variable Explanation
Objective truth Assumed current state of reality
Timeliness Contemporary mapping of the properties of the object
Completeness Coverage of information reach and detail
Accuracy High value of data, comparison of correct reality representation
Velocity Speed of data processing within data work
Volume Unusually large amounts of data
Variety Diversity of (new) data sources and formats
Veracity Tested reliability of the (comprehensive) data
Construct decision levels. For the three central levels according to Rossiter (2002), p. 309), the follow-
ing decisions were made in our own investigation:
1. Subject level (target persons): Target persons for the survey are employees up to 60 years of age
and/ or knowledge of sustainability reports. We justify this by the fact that many respondents will
become potential recipients and possible decision-makers in the next few years. We have also selected
test persons with a uniform cultural background due to the findings in section 3.1.3.1.
2. Objective level (carrier of the assessment): Participants assess the perceived information quality and
perceived objective truth of different forms of big data analytics data work based on extracts from
sustainability reports.
3. Attribute level (object properties of the appraisal): Participants assess the changed conditions of the
selected information quality criteria in conjunction with the perceived objective truth-value.
3.1.6.3 Construct Operationalization
A data quality framework from the health sector (Canadian Institute for Health Information 2009) and
topic-related mathematical calculation models (see Appendix III) were used to pre-operationalize the
theoretical constructs for the selected criteria of timeliness, completeness, and accuracy. Cf. Table 13
for the derived measurement indicators and their explanation.
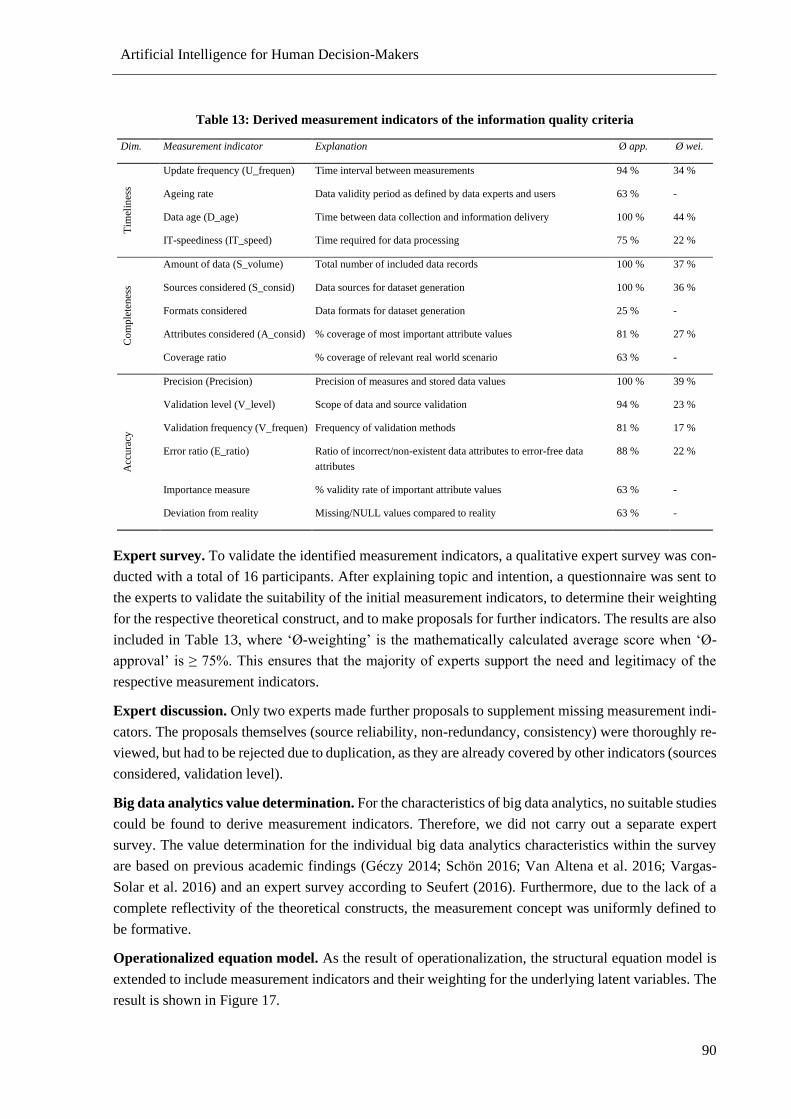
Artificial Intelligence for Human Decision-Makers
90
Table 13: Derived measurement indicators of the information quality criteria
Dim. Measurement indicator Explanation Ø app. Ø wei.
Tim
elin
ess
Update frequency (U_frequen) Time interval between measurements 94 % 34 %
Ageing rate Data validity period as defined by data experts and users 63 % -
Data age (D_age) Time between data collection and information delivery 100 % 44 %
IT-speediness (IT_speed) Time required for data processing 75 % 22 %
Co
mp
lete
nes
s
Amount of data (S_volume) Total number of included data records 100 % 37 %
Sources considered (S_consid) Data sources for dataset generation 100 % 36 %
Formats considered Data formats for dataset generation 25 % -
Attributes considered (A_consid) % coverage of most important attribute values 81 % 27 %
Coverage ratio % coverage of relevant real world scenario 63 % -
Acc
ura
cy
Precision (Precision) Precision of measures and stored data values 100 % 39 %
Validation level (V_level) Scope of data and source validation 94 % 23 %
Validation frequency (V_frequen) Frequency of validation methods 81 % 17 %
Error ratio (E_ratio) Ratio of incorrect/non-existent data attributes to error-free data
attributes
88 % 22 %
Importance measure % validity rate of important attribute values 63 % -
Deviation from reality Missing/NULL values compared to reality 63 % -
Expert survey. To validate the identified measurement indicators, a qualitative expert survey was con-
ducted with a total of 16 participants. After explaining topic and intention, a questionnaire was sent to
the experts to validate the suitability of the initial measurement indicators, to determine their weighting
for the respective theoretical construct, and to make proposals for further indicators. The results are also
included in Table 13, where ‘Ø-weighting’ is the mathematically calculated average score when ‘Ø-
approval’ is ≥ 75%. This ensures that the majority of experts support the need and legitimacy of the
respective measurement indicators.
Expert discussion. Only two experts made further proposals to supplement missing measurement indi-
cators. The proposals themselves (source reliability, non-redundancy, consistency) were thoroughly re-
viewed, but had to be rejected due to duplication, as they are already covered by other indicators (sources
considered, validation level).
Big data analytics value determination. For the characteristics of big data analytics, no suitable studies
could be found to derive measurement indicators. Therefore, we did not carry out a separate expert
survey. The value determination for the individual big data analytics characteristics within the survey
are based on previous academic findings (Géczy 2014; Schön 2016; Van Altena et al. 2016; Vargas-
Solar et al. 2016) and an expert survey according to Seufert (2016). Furthermore, due to the lack of a
complete reflectivity of the theoretical constructs, the measurement concept was uniformly defined to
be formative.
Operationalized equation model. As the result of operationalization, the structural equation model is
extended to include measurement indicators and their weighting for the underlying latent variables. The
result is shown in Figure 17.
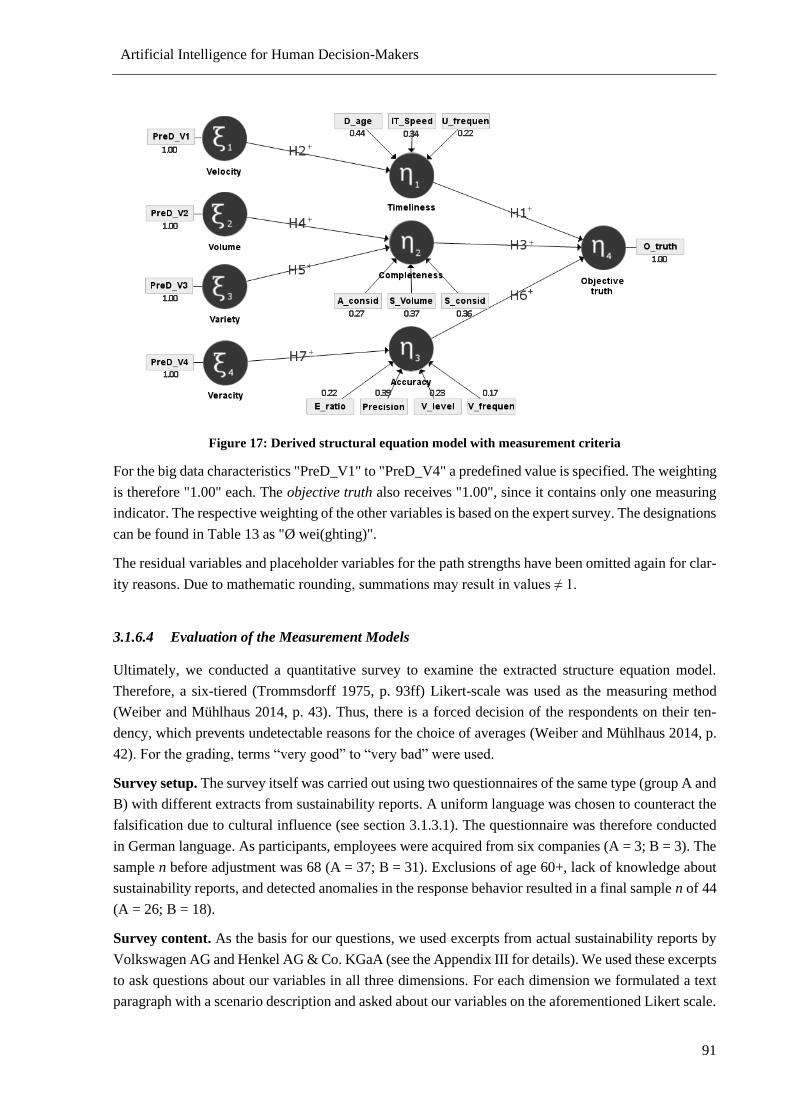
Artificial Intelligence for Human Decision-Makers
91
Figure 17: Derived structural equation model with measurement criteria
For the big data characteristics "PreD_V1" to "PreD_V4" a predefined value is specified. The weighting
is therefore "1.00" each. The objective truth also receives "1.00", since it contains only one measuring
indicator. The respective weighting of the other variables is based on the expert survey. The designations
can be found in Table 13 as "Ø wei(ghting)".
The residual variables and placeholder variables for the path strengths have been omitted again for clar-
ity reasons. Due to mathematic rounding, summations may result in values ≠ 1.
3.1.6.4 Evaluation of the Measurement Models
Ultimately, we conducted a quantitative survey to examine the extracted structure equation model.
Therefore, a six-tiered (Trommsdorff 1975, p. 93ff) Likert-scale was used as the measuring method
(Weiber and Mühlhaus 2014, p. 43). Thus, there is a forced decision of the respondents on their ten-
dency, which prevents undetectable reasons for the choice of averages (Weiber and Mühlhaus 2014, p.
42). or the grading, terms “very good” to “very bad” were used.
Survey setup. The survey itself was carried out using two questionnaires of the same type (group A and
B) with different extracts from sustainability reports. A uniform language was chosen to counteract the
falsification due to cultural influence (see section 3.1.3.1). The questionnaire was therefore conducted
in German language. As participants, employees were acquired from six companies (A = 3; B = 3). The
sample n before adjustment was 68 (A = 37; B = 31). Exclusions of age 60+, lack of knowledge about
sustainability reports, and detected anomalies in the response behavior resulted in a final sample n of 44
(A = 26; B = 18).
Survey content. As the basis for our questions, we used excerpts from actual sustainability reports by
Volkswagen AG and Henkel AG & Co. KGaA (see the Appendix III for details). We used these excerpts
to ask questions about our variables in all three dimensions. For each dimension we formulated a text
paragraph with a scenario description and asked about our variables on the aforementioned Likert scale.
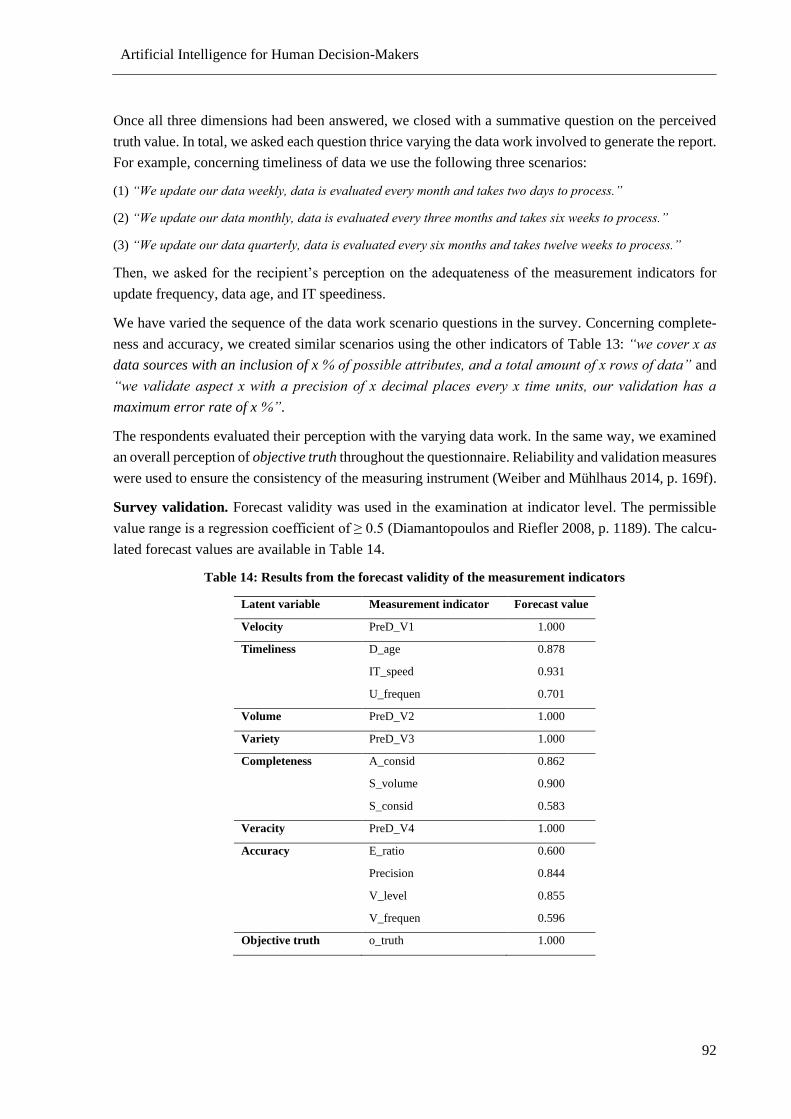
Artificial Intelligence for Human Decision-Makers
92
Once all three dimensions had been answered, we closed with a summative question on the perceived
truth value. In total, we asked each question thrice varying the data work involved to generate the report.
For example, concerning timeliness of data we use the following three scenarios:
(1) “W updat ur data w k y, data is va uat d v ry nt and tak s tw days t pr ss.”
(2) “W updat ur data nt y, data is va uat d v ry t r nt s and tak s six w ks t pr ss.”
(3) “W updat ur data quart r y, data is va uat d v ry six nt s and tak s tw v w ks t pr ss.”
Then, we asked for the recipient’s perception on the adequateness of the measurement indicators for
update frequency, data age, and IT speediness.
We have varied the sequence of the data work scenario questions in the survey. Concerning complete-
ness and accuracy, we created similar scenarios using the other indicators of Table 13: “w v r x as
data sources with an inclusion of x % f p ssib attribut s, and a t ta a unt f x r ws f data” and
“w va idat asp t x wit a pr isi n f x d i a p a s v ry x ti units, ur va idati n as a
maximum error rate of x %”.
The respondents evaluated their perception with the varying data work. In the same way, we examined
an overall perception of objective truth throughout the questionnaire. Reliability and validation measures
were used to ensure the consistency of the measuring instrument (Weiber and Mühlhaus 2014, p. 169f).
Survey validation. Forecast validity was used in the examination at indicator level. The permissible
value range is a regression coefficient of ≥ 0.5 (Diamantopoulos and Riefler 2008, p. 1189). The calcu-
lated forecast values are available in Table 14.
Table 14: Results from the forecast validity of the measurement indicators
Latent variable Measurement indicator Forecast value
Velocity PreD_V1 1.000
Timeliness D_age 0.878
IT_speed 0.931
U_frequen 0.701
Volume PreD_V2 1.000
Variety PreD_V3 1.000
Completeness A_consid 0.862
S_volume 0.900
S_consid 0.583
Veracity PreD_V4 1.000
Accuracy E_ratio 0.600
Precision 0.844
V_level 0.855
V_frequen 0.596
Objective truth o_truth 1.000
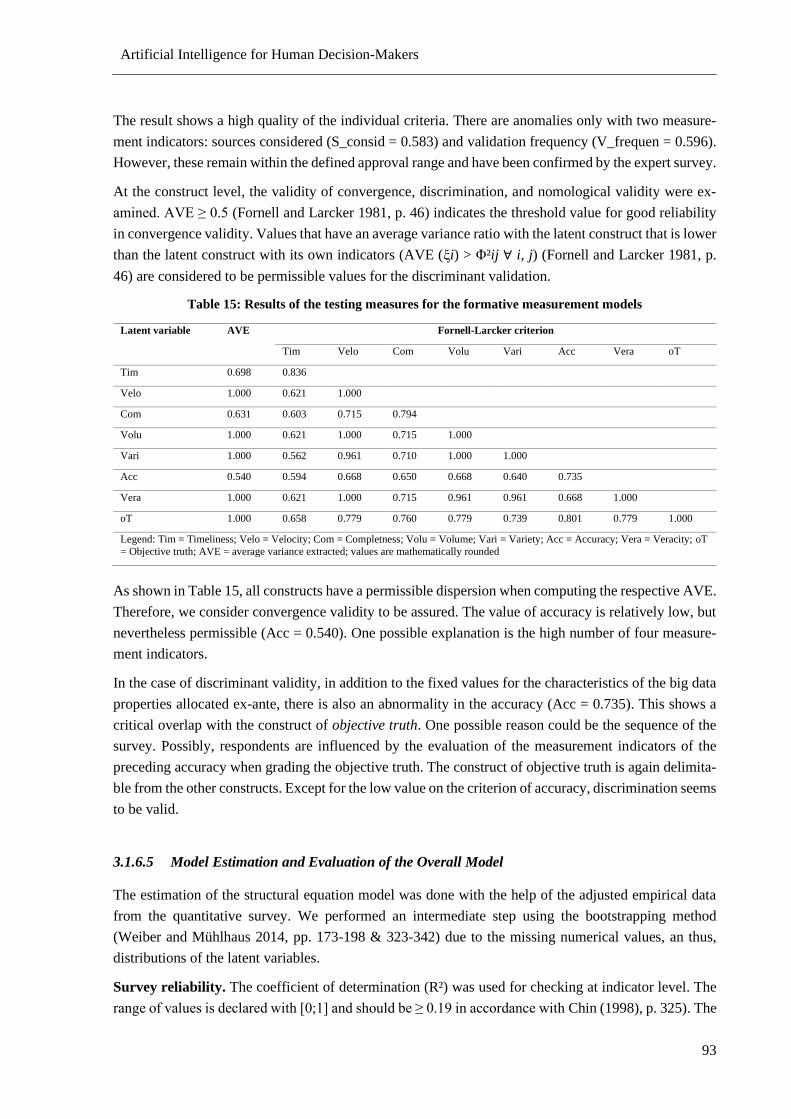
Artificial Intelligence for Human Decision-Makers
93
The result shows a high quality of the individual criteria. There are anomalies only with two measure-
ment indicators: sources considered (S_consid = 0.583) and validation frequency (V_frequen = 0.596).
However, these remain within the defined approval range and have been confirmed by the expert survey.
At the construct level, the validity of convergence, discrimination, and nomological validity were ex-
amined. A E ≥ 0.5 (Fornell and Larcker 1981, p. 46) indicates the threshold value for good reliability
in convergence validity. Values that have an average variance ratio with the latent construct that is lower
than the latent construct with its own indicators (AVE (ξi) > Φ²ij ∀ i, j) (Fornell and Larcker 1981, p.
46) are considered to be permissible values for the discriminant validation.
Table 15: Results of the testing measures for the formative measurement models
Latent variable AVE Fornell-Larcker criterion
Tim Velo Com Volu Vari Acc Vera oT
Tim 0.698 0.836
Velo 1.000 0.621 1.000
Com 0.631 0.603 0.715 0.794
Volu 1.000 0.621 1.000 0.715 1.000
Vari 1.000 0.562 0.961 0.710 1.000 1.000
Acc 0.540 0.594 0.668 0.650 0.668 0.640 0.735
Vera 1.000 0.621 1.000 0.715 0.961 0.961 0.668 1.000
oT 1.000 0.658 0.779 0.760 0.779 0.739 0.801 0.779 1.000
Legend: Tim = Timeliness; Velo = Velocity; Com = Completness; Volu = Volume; Vari = Variety; Acc = Accuracy; Vera = Veracity; oT
= Objective truth; AVE = average variance extracted; values are mathematically rounded
As shown in Table 15, all constructs have a permissible dispersion when computing the respective AVE.
Therefore, we consider convergence validity to be assured. The value of accuracy is relatively low, but
nevertheless permissible (Acc = 0.540). One possible explanation is the high number of four measure-
ment indicators.
In the case of discriminant validity, in addition to the fixed values for the characteristics of the big data
properties allocated ex-ante, there is also an abnormality in the accuracy (Acc = 0.735). This shows a
critical overlap with the construct of objective truth. One possible reason could be the sequence of the
survey. Possibly, respondents are influenced by the evaluation of the measurement indicators of the
preceding accuracy when grading the objective truth. The construct of objective truth is again delimita-
ble from the other constructs. Except for the low value on the criterion of accuracy, discrimination seems
to be valid.
3.1.6.5 Model Estimation and Evaluation of the Overall Model
The estimation of the structural equation model was done with the help of the adjusted empirical data
from the quantitative survey. We performed an intermediate step using the bootstrapping method
(Weiber and Mühlhaus 2014, pp. 173-198 & 323-342) due to the missing numerical values, an thus,
distributions of the latent variables.
Survey reliability. The coefficient of determination (R²) was used for checking at indicator level. The
range of values is declared with [0;1] and should be ≥ 0.19 in accordance with Chin (1998), p. 325). The
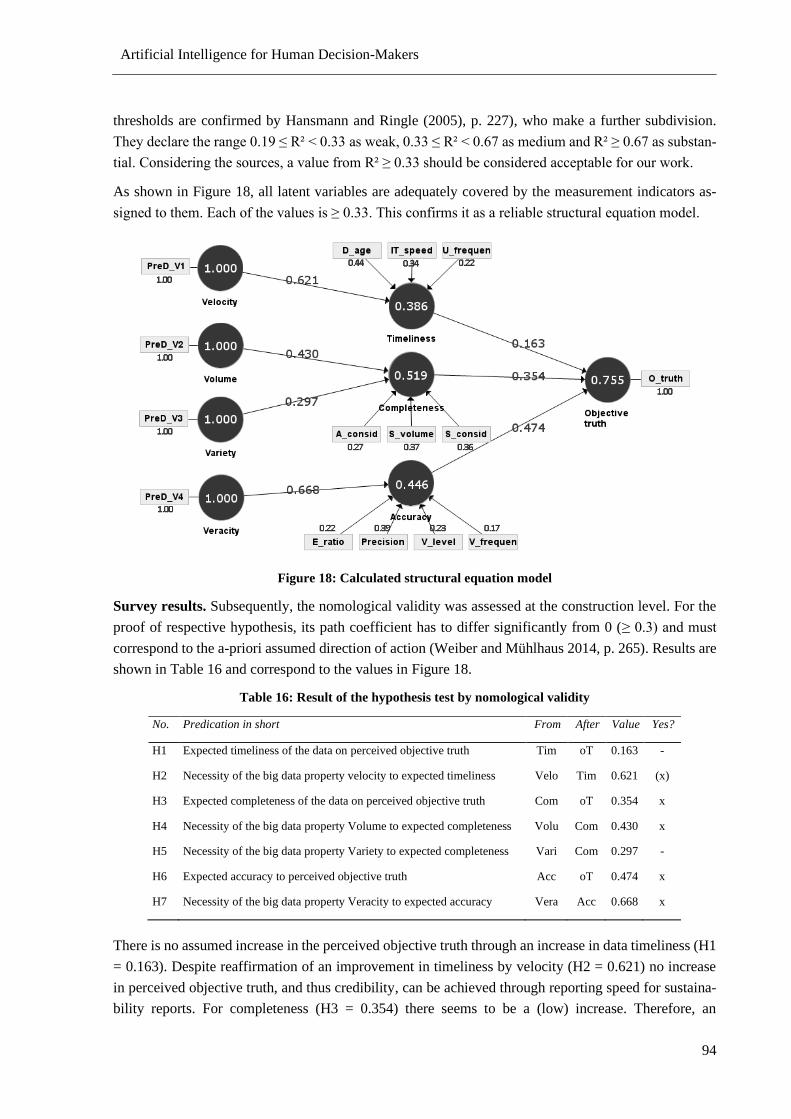
Artificial Intelligence for Human Decision-Makers
94
thresholds are confirmed by Hansmann and Ringle (2005), p. 227), who make a further subdivision.
They declare the range 0.19 ≤ R² < 0.33 as weak, 0.33 ≤ R² < 0.67 as medium and R² ≥ 0.67 as substan-
tial. Considering the sources, a value from R² ≥ 0.33 should be considered acceptable for our work.
As shown in Figure 18, all latent variables are adequately covered by the measurement indicators as-
signed to them. Each of the values is ≥ 0.33. This confirms it as a reliable structural equation model.
Figure 18: Calculated structural equation model
Survey results. Subsequently, the nomological validity was assessed at the construction level. For the
proof of respective hypothesis, its path coefficient has to differ significantly from 0 (≥ 0.3) and must
correspond to the a-priori assumed direction of action (Weiber and Mühlhaus 2014, p. 265). Results are
shown in Table 16 and correspond to the values in Figure 18.
Table 16: Result of the hypothesis test by nomological validity
No. Predication in short From After Value Yes?
H1 Expected timeliness of the data on perceived objective truth Tim oT 0.163 -
H2 Necessity of the big data property velocity to expected timeliness Velo Tim 0.621 (x)
H3 Expected completeness of the data on perceived objective truth Com oT 0.354 x
H4 Necessity of the big data property Volume to expected completeness Volu Com 0.430 x
H5 Necessity of the big data property Variety to expected completeness Vari Com 0.297 -
H6 Expected accuracy to perceived objective truth Acc oT 0.474 x
H7 Necessity of the big data property Veracity to expected accuracy Vera Acc 0.668 x
There is no assumed increase in the perceived objective truth through an increase in data timeliness (H1
= 0.163). Despite reaffirmation of an improvement in timeliness by velocity (H2 = 0.621) no increase
in perceived objective truth, and thus credibility, can be achieved through reporting speed for sustaina-
bility reports. For completeness (H3 = 0.354) there seems to be a (low) increase. Therefore, an
Artificial Intelligence for Human Decision-Makers
95
improvement of the objective truth by the connected criterion volume (= 0.430) can be assumed. How-
ever, this does not apply to variety (= 0.297). On the other hand, accuracy has a positive effect on ob-
jective truth (= 0.474). The criterion veracity leads to an increase in accuracy (= 0.668) and therefore to
an increase of the credibility as well.
3.1.7 Discussion of Results, Limitations and Further Research
The perceived credibility of sustainability reports has been a subject in research for years known as the
credibility gap. We have devised an approach incorporating the conflict between the (ir)rationality of
decisions in business and the limited rationality of human action to optimize the perception of sustaina-
bility reports, in particular in the perception of the dimension of objective truth. Despite the obvious
connections between the psychological construct of credibility and the quality of the information pro-
vided, the direct impact of big data analytics remained questionable due to the limited rationality of the
recipient to appreciate higher quality data. Our results indicate that the perception of sustainability re-
ports can be improved generally with big data analytics. In doing so, we incorporate both, the commu-
nicator-centered view stating that credible communication is improved by passing on superior infor-
mation and the recipient-centered view stating that credible communication is based on the recipient
appraisal of the information.
Discussion. As big data analytics covers a diverse range of physical and digital technologies, their use
has to be optimized for the application context. In the following, we discuss our findings on how to
improve sustainability reports using big data analytics. We have found that the timeliness of data seems
to have only a very small effect on the perception of truth by the recipients of sustainability reports.
There does not seem to be any improvement in sustainability reports from big data analytics technologies
such as in-memory or event processing in the velocity area. We assume that this is due to the fact that
sustainability reports are typically periodical publications and the implementation as an updated real-
time report does not provide substantial added value. Consequently, the value of real-time data for sus-
tainability reports should always be very critically reflected and general reports are unlikely to benefit.
Nevertheless, there may be niche applications where real-time data may be valued more. In contrast, the
criterion of completeness has a measurable impact on perception. Big data analytics with the character-
istic of volume such as physical storage technologies or NoSQL databases improve this criterion. Re-
cipients seem to value comprehensive data sets and analysis. Variety, on the other hand, as expressed
through innovative data mining tools does not seem to result in a significant increase for sustainability
reports. As discussed below, we assume this to be due to the area of application. Sustainability reports
are based on defined measurements and performance indicators of limited variety. Recipients apparently
do not value an increase of those. The criterion of accuracy shows the highest influence on the percep-
tion of credibility. This can be further increased by big data analytics using comprehensive and repro-
ducible algorithms to improve the veracity of big data.
Our results do not confirm the assumptions of Natarajan et al. (2017) who expects that variety is the
most significant factor of big data analytics. Natarajan et al. (2017) has made these assertions in the
context of medical information quality. It is conceivable, that for medical decisions a variety of infor-
mation, which points to the same diagnosis, is more important than volume or accuracy of individual
data points due to the issue of differential diagnoses. Consequently, and as indicated earlier, it is
Artificial Intelligence for Human Decision-Makers
96
important to clearly define the context in which big data analytics is employed to ensue maximal value
in the delivery of information.
Limitations. There are limitations to our process of investigation during the quantitative questioning
and to its scope. During the determination of the values per survey cycle, we provided explicit infor-
mation on the data work undertaken for each section of the sustainability report we presented. In prac-
tice, this information typically is not available or only available to a very limited extent. Validations
with other target groups also seem to be advisable to ensure that the information provided is of general-
izable nature.
The Habermas Theory of Communicative Action assumes idealized conditions of discourse (i.e. an ideal
speech situation) which is then immunized against repression and inequality in a special way. We have
used this theory to analyze the impact of big data analytics on information quality and, thus, on the
dimension of objective truth. Using the instrument of a survey, we have not analyzed the impact of
further influencing factors that are inherent to our imperfect world. Hence, it is conceivable that other
factors impact the recipient’s perception of sustainability reports such as current (negative) media re-
ports involving the respective companies or internet trolling.
Conclusion. We conclude that an improvement of the perceived credibility of sustainability reports is
generally possible with help of big data analytics. As a recommendation to creators of sustainability
reports, a focus should be placed on the information quality criteria of completeness and accuracy. Sim-
ilarly, further improvement measures through future physical and digital technologies of big data ana-
lytics seem to be possible primarily with technologies that focus on the characteristics of volume and
veracity, as this seems to promote the truth perception of published information in sustainability reports.
To further close the credibility gap, we suggest addressing all gaps identified by the objective truth in
Habermas theory as an ideal-typical implementation of sustainability report content. Further investiga-
tions should focus on the criteria of appropriate amount of data, value-added, and relevancy of the
contextual dimension of information quality.
3.2 Model Performance and Model Explainability
Abstract. Numerous machine learning algorithms have been developed and applied in the field. Their
application indicates that there seems to be a tradeoff between their model performance and explaina-
bility. That is, machine learning models with higher performance are often based on more complex
algorithms and therefore lack interpretability or explainability and vice versa. The true extent of this
tradeoff remains unclear while some theoretical assumptions exist. With our re-search, we aim to ex-
plore this gap empirically with a user study. Using four dis-tinct datasets, we measured the tradeoff for
five common machine learning algorithms. Our two-factor factorial design considers low-stake and
high-stake ap-plications as well as classification and regression problems. Our results differ from the
widespread linear assumption and indicate that the tradeoff between model performance and model
Artificial Intelligence for Human Decision-Makers
97
explainability is much less gradual when considering end user perception. Further, we found it to be
situational. Hence, theory-based recommendations cannot be generalized across applications.7
3.2.1 Introduction
Today, intelligent systems based on artificial intelligence (AI) technology primarily rely on machine
learning (ML) algorithms (Janiesch et al. 2021). Despite their prediction performance, there is a notice-
able delay in the adoption of advanced ML algorithms based on deep learning or ensemble learning in
practice (Wanner et al. 2020a). That is, practitioners prefer simpler, shallow ML algorithms such as
logistic regressions that exhibit a higher degree of explainability through their inherent interpretability
(Rudin 2019).
In contrast, much of the current AI research focuses on the performance of ML models (La Cava et al.
2021) and data competitions are dominated by deep learning algorithms such as artificial neural net-
works (ANN) that outperform shallow ML algorithms (e.g., Hyndman 2020). However, the processing
of these algorithms is practically untraceable due to its complex and intransparent inner calculation
logic. This renders it impossible for humans to interpret an ANN’s decision-making process and predic-
tion results, making it a black box.
This results in a tradeoff between performance and explainability which is not yet sufficiently under-
stood. The uncertainty and lack of control due to a lack of explainability can fuel algorithm aversion of
the end user. The aversion describes a phenomenon where users prefer humans over machines even
when the performance of the machine is superior to the human (Burton et al. 2020). In contrast, recent
work by Logg et al. (2019) implies that for some situations when performance is communicated, humans
may prefer machines resulting in algorithm appreciation. A better understanding of the tradeoff can help
to reduce algorithm aversion and may even foster algorithm appreciation from an end user perspective.
While the performance of an algorithm can be estimated by common performance indicators such as
precision, recall, or the F-score, it remains unclear, which ML algorithm’s inherent interpretability is
perceived as more explainable by end users. However, this is crucial as the perceived explainability of
a prediction determines the effectiveness of an intelligent system. That is, if the human decision maker
can interpret the behavior of an underlying ML model, he or she is more willing to act based on it
(Ribeiro et al. 2016b) – especially in cases where the recommendation does not conform to his or her
own expectations. As a consequence, intelligent systems without sufficient explainability may even be
inefficacious as end users will disregard their advice.
In scholarly literature, several theoretical considerations on the tradeoff of performance and explaina-
bility exist (Angelov and Soares 2020; Arrieta et al. 2020; Dam et al. 2018; Gunning and Aha 2019;
7 This paper is published within the 20th IFIP Conference on e-Business, e-Services, and e-Society as ‘Stop Order-
ing Machine Learning Algorithms by their Explainability! An Empirical Investigation of the Tradeoff between
Performance and Explainability’ (Wanner et al. 2021). The conference paper was invited for a special issue of the
International Journal of Information Management (IJIM).
Artificial Intelligence for Human Decision-Makers
98
James et al. 2013; Nanayakkara et al. 2018; Yang and Bang 2019), yet a scientific investigation or even
an empirical proof is still missing. We formulate our research question accordingly:
“How do machine learning models compare empirically in the tradeoff between their performance and
their explainability as perceived by end us rs?”
These insights have a high potential to better explain AI adoption of different ML algorithms contrib-
uting to a better understanding of AI decision-making and the future of work using hybrid intelligence.
That is on the one hand, the results can help us to understand to what extent various ML algorithms
differ in their perceived explainability from an end user perspective. This allows us to draw conclusions
about their future improvement as well as about their suitability for a given situation in practice. On the
other hand, the results can help us to understand how much performance end users are willing to forfeit
in favor of explainability. Ultimately, Rudin (2019)’s call to avoid explaining black-box models in favor
of using inherently interpretable white-box models could be better approached if the tradeoff was suffi-
ciently understood from a social-technical perspective.
In the following, Section 3.2.2 introduces fundamentals of ML and the state-of-the-art of existing ML
tradeoff schemes concerning model performance and model explainability. In Section 3.2.3, we describe
our methodology before we outline preparatory work comprising the datasets and algorithms. The sec-
tion also comprises the technical realization of the algorithms, the measurement for comparison, and the
survey design. In Section 3.2.4, we discuss the results of the empirical comparison. We close by sum-
marizing our results and pointing out limitations of our study in Section 3.2.5.
3.2.2 Fundamentals and Related Work
3.2.2.1 Machine Learning Algorithms
ML focuses on algorithms that are able to improve their performance through experience. That is, ML
algorithms are able to find non-linear relationships and patterns in datasets without being explicitly pro-
grammed to do so (Bishop 2006). The process of analytical modeling building to turn ML algorithms
into concrete ML models for the use in intelligent systems is a four-step process comprising data input,
feature extraction, model building, and model assessment (Janiesch et al. 2021).
Each ML algorithm has different strengths and weaknesses regarding their ability to process data. Many
shallow ML algorithms require the feature selection of relevant attributes for model training. This task
can be time-consuming if the dataset is high-dimensional, or the context is not well-known to the model
engineer. Common shallow ML algorithms are linear regressions, decision trees, and support vector
machines (SVM). ANNs with multiple hidden layers and advanced neurons for automatic representation
learning provide a computation- and data-intensive alternative called deep learning (Janiesch et al.
2021). These algorithms can master feature selection on increasingly complex data by themselves
(Schmidhuber 2015). In consequence, their performance surpasses shallow ML models and even exhib-
its super-human performance in applications such as data-driven maintenance (e.g., Wang et al. 2018a).
On the downside, the resulting models have a nested, non-linear structure that is not interpretable for
humans, and its results are difficult to reproduce.
Artificial Intelligence for Human Decision-Makers
99
In summary, while many shallow ML algorithms are considered interpretable and, thus, white boxes,
deep learning algorithms tend to perform better but are considered to be intransparent and, thus, black
boxes (Adadi and Berrada 2018).
3.2.2.2 Interpretability and Explainability in Machine Learning
Explanations have the ability to fill the information gap between the intelligent system and its user
similar to the situation in the principal-agent problem (Wanner et al. 2020a). They are decisive for the
efficacy of the system as the end user decides based on this information whether he or she integrates the
recommendation into his or her own decision-making or not. The question of what constitutes explain-
ability and how explanations should be presented to be of value to human users fuels an interdisciplinary
research field in various disciplines, including philosophy, social science, psychology, computer sci-
ence, and information systems.
From a technical point of view, explainability in intelligent systems is about two questions: the “how”
question and the “why” question. The former is about global explainability, which provides answers to
the ML algorithm’s internal processing (Dam et al. 2018; Rudin 2019). The latter is about local explain-
ability, which answers the ex-post reasoning about a concrete recommendation by a ML model (Dam et
al. 2018). To form a common understanding for our research artifact, we define explainability as “the
perceived quality of a given explanation by the user” (Adadi and Berrada 2018).
In this context, as noted above many shallow ML models are considered to be white boxes that are
interpretable per se (Arrieta et al. 2020). In contrast, a black-box ML model is either far too complicated
for humans to understand or opaque for a reason and, therefore, equally hard to understand (Rudin 2019).
Consequently in this research, in line with Adadi and Berrada (2018)’s argument we consider a model’s
explainability as its innate interpretability by end users not using any further augmentations.
3.2.2.3 Related Work on Machine Learning Tradeoffs
Considerations about the (hypothesized) tradeoff between model performance and model explainability
have been the subject of discussion for some time. Originating from theoretical statistics, a distinction
for different ML algorithms was first made between model interpretability and flexibility (James et al.
2013). More recently, this changed towards a comparison between model accuracy and interpretability
(e.g., Arrieta et al. 2020; Yang and Bang 2019) or algorithmic accuracy and explainability (e.g., Angelov
and Soares 2020; Dam et al. 2018). However, all tradeoffs address the same compromise of an algo-
rithm’s performance versus the algorithm’s degree of result traceability.
Overall, in the field many subjective classifications of this tradeoff exist (Angelov and Soares 2020;
Arrieta et al. 2020; Dam et al. 2018; Gunning and Aha 2019; James et al. 2013; Nanayakkara et al. 2018;
Yang and Bang 2019). These subjective classifications of the different authors show great similarities
but also some dissimilarities. We summarize the related work and their classifications (left side) in Fig-
ure 19 illustrating a high conformity between all authors. The resulting Cartesian coordinate system
(right side) shows five common ML algorithms ordered by their common performance (y-axis) and their
assumed explainability (x-axis). Grey-box models (i.e., ex-post explainers) are only subject of few
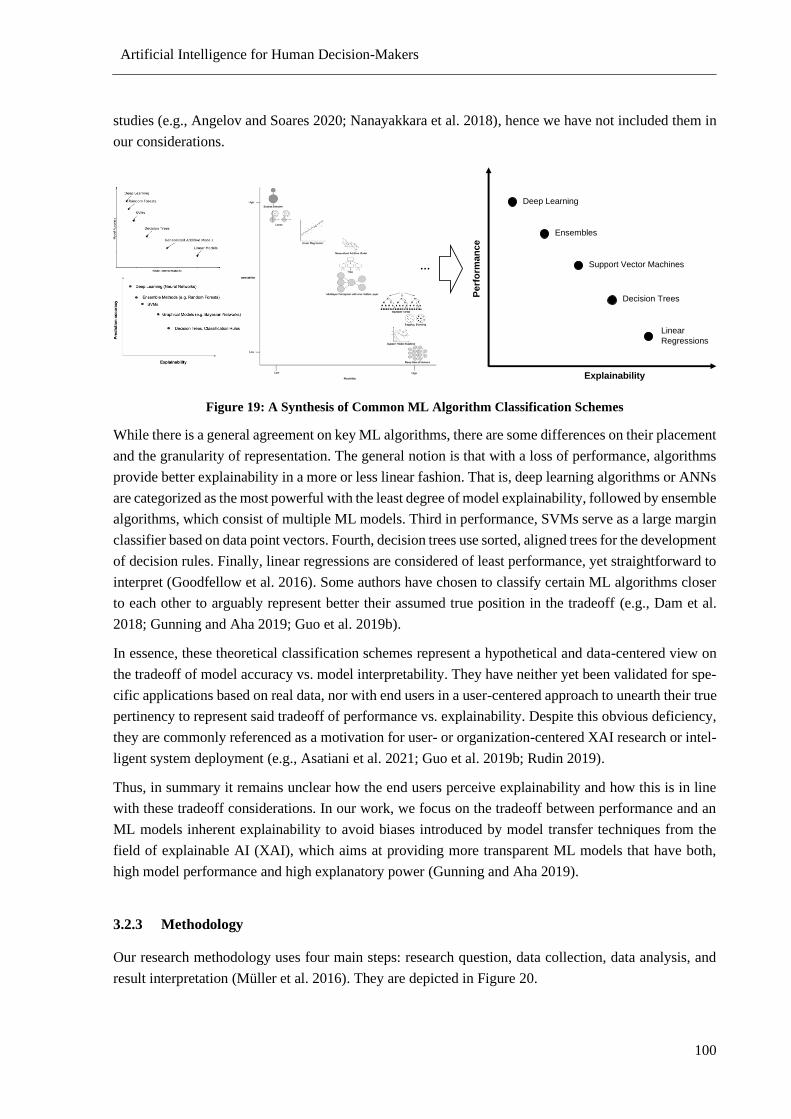
Artificial Intelligence for Human Decision-Makers
100
studies (e.g., Angelov and Soares 2020; Nanayakkara et al. 2018), hence we have not included them in
our considerations.
Figure 19: A Synthesis of Common ML Algorithm Classification Schemes
While there is a general agreement on key ML algorithms, there are some differences on their placement
and the granularity of representation. The general notion is that with a loss of performance, algorithms
provide better explainability in a more or less linear fashion. That is, deep learning algorithms or ANNs
are categorized as the most powerful with the least degree of model explainability, followed by ensemble
algorithms, which consist of multiple ML models. Third in performance, SVMs serve as a large margin
classifier based on data point vectors. Fourth, decision trees use sorted, aligned trees for the development
of decision rules. Finally, linear regressions are considered of least performance, yet straightforward to
interpret (Goodfellow et al. 2016). Some authors have chosen to classify certain ML algorithms closer
to each other to arguably represent better their assumed true position in the tradeoff (e.g., Dam et al.
2018; Gunning and Aha 2019; Guo et al. 2019b).
In essence, these theoretical classification schemes represent a hypothetical and data-centered view on
the tradeoff of model accuracy vs. model interpretability. They have neither yet been validated for spe-
cific applications based on real data, nor with end users in a user-centered approach to unearth their true
pertinency to represent said tradeoff of performance vs. explainability. Despite this obvious deficiency,
they are commonly referenced as a motivation for user- or organization-centered XAI research or intel-
ligent system deployment (e.g., Asatiani et al. 2021; Guo et al. 2019b; Rudin 2019).
Thus, in summary it remains unclear how the end users perceive explainability and how this is in line
with these tradeoff considerations. In our work, we focus on the tradeoff between performance and an
ML models inherent explainability to avoid biases introduced by model transfer techniques from the
field of explainable AI (XAI), which aims at providing more transparent ML models that have both,
high model performance and high explanatory power (Gunning and Aha 2019).
3.2.3 Methodology
Our research methodology uses four main steps: research question, data collection, data analysis, and
result interpretation (Müller et al. 2016). They are depicted in Figure 20.
Deep Learning
Ensembles
Support Vector Machines
Decision Trees
Linear
Regressions
Explainability
Perf
orm
an
ce
…
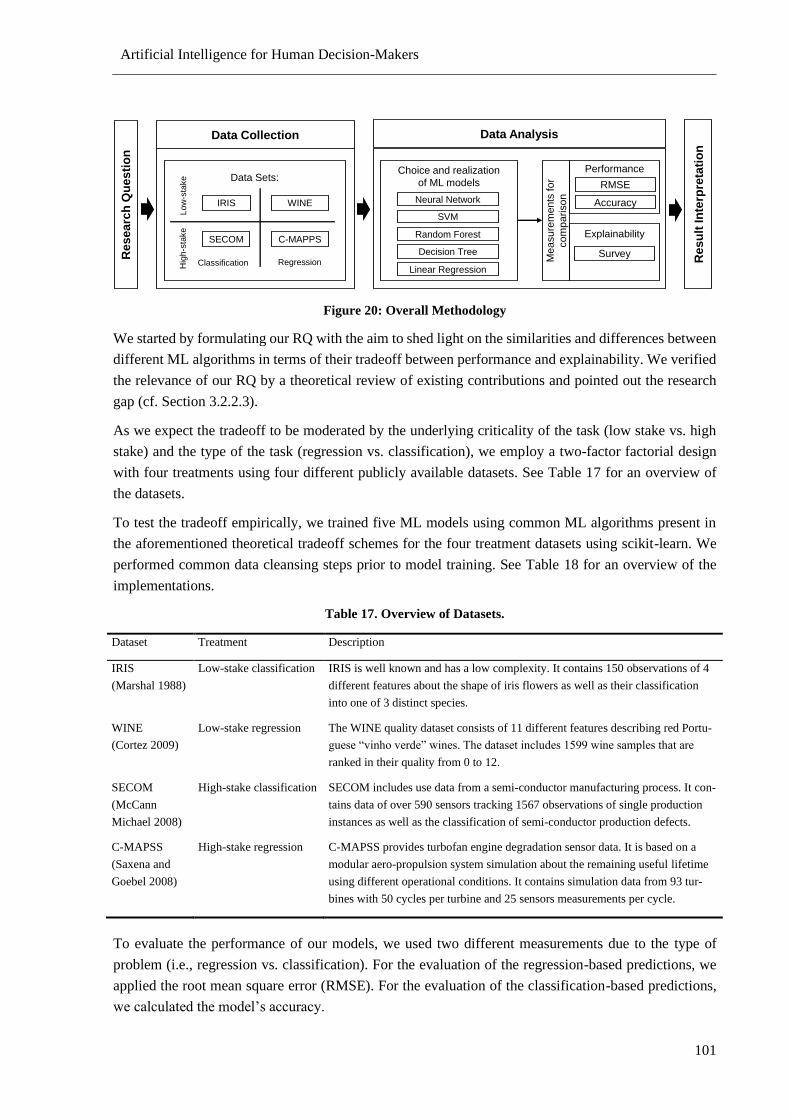
Artificial Intelligence for Human Decision-Makers
101
Figure 20: Overall Methodology
We started by formulating our RQ with the aim to shed light on the similarities and differences between
different ML algorithms in terms of their tradeoff between performance and explainability. We verified
the relevance of our RQ by a theoretical review of existing contributions and pointed out the research
gap (cf. Section 3.2.2.3).
As we expect the tradeoff to be moderated by the underlying criticality of the task (low stake vs. high
stake) and the type of the task (regression vs. classification), we employ a two-factor factorial design
with four treatments using four different publicly available datasets. See Table 17 for an overview of
the datasets.
To test the tradeoff empirically, we trained five ML models using common ML algorithms present in
the aforementioned theoretical tradeoff schemes for the four treatment datasets using scikit-learn. We
performed common data cleansing steps prior to model training. See Table 18 for an overview of the
implementations.
Table 17. Overview of Datasets.
Dataset Treatment Description
IRIS
(Marshal 1988)
Low-stake classification IRIS is well known and has a low complexity. It contains 150 observations of 4
different features about the shape of iris flowers as well as their classification
into one of 3 distinct species.
WINE
(Cortez 2009)
Low-stake regression The WINE quality dataset consists of 11 different features describing red Portu-
guese “vinho verde” wines. The dataset includes 1599 wine samples that are
ranked in their quality from 0 to 12.
SECOM
(McCann
Michael 2008)
High-stake classification SECOM includes use data from a semi-conductor manufacturing process. It con-
tains data of over 590 sensors tracking 1567 observations of single production
instances as well as the classification of semi-conductor production defects.
C-MAPSS
(Saxena and
Goebel 2008)
High-stake regression C-MAPSS provides turbofan engine degradation sensor data. It is based on a
modular aero-propulsion system simulation about the remaining useful lifetime
using different operational conditions. It contains simulation data from 93 tur-
bines with 50 cycles per turbine and 25 sensors measurements per cycle.
To evaluate the performance of our models, we used two different measurements due to the type of
problem (i.e., regression vs. classification). For the evaluation of the regression-based predictions, we
applied the root mean square error (RMSE). For the evaluation of the classification-based predictions,
we calculated the model’s accuracy.
Me
asu
rem
ents
fo
r
co
mp
arison
Data AnalysisR
esearc
h Q
uesti
on
Data Collection
Data Sets:
IRIS WINE
SECOM C-MAPPS
Choice and realization
of ML models
Neural Network
Random Forest
SVM
Decision Tree
Linear Regression
Performance
RMSE
Accuracy
Explainability
Survey
Resu
lt In
terp
reta
tio
n
Classification Regression
Low
-sta
ke
Hig
h-s
take
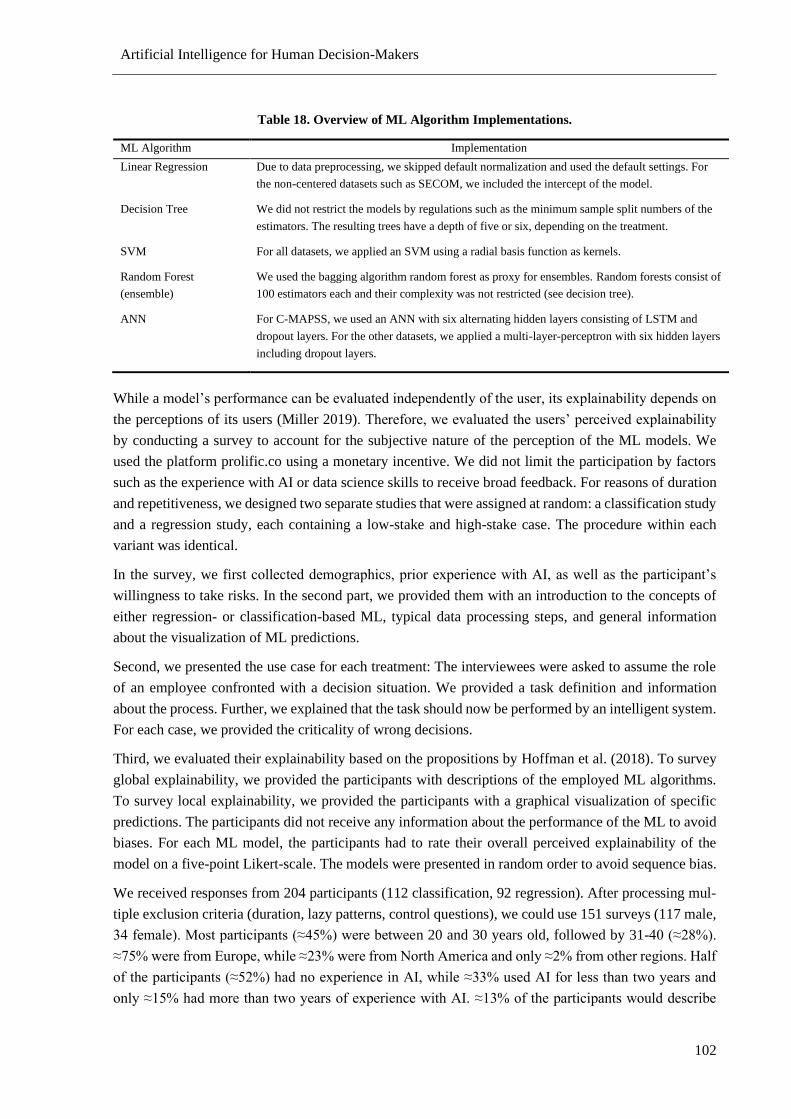
Artificial Intelligence for Human Decision-Makers
102
Table 18. Overview of ML Algorithm Implementations.
ML Algorithm Implementation
Linear Regression Due to data preprocessing, we skipped default normalization and used the default settings. For
the non-centered datasets such as SECOM, we included the intercept of the model.
Decision Tree We did not restrict the models by regulations such as the minimum sample split numbers of the
estimators. The resulting trees have a depth of five or six, depending on the treatment.
SVM For all datasets, we applied an SVM using a radial basis function as kernels.
Random Forest
(ensemble)
We used the bagging algorithm random forest as proxy for ensembles. Random forests consist of
100 estimators each and their complexity was not restricted (see decision tree).
ANN For C-MAPSS, we used an ANN with six alternating hidden layers consisting of LSTM and
dropout layers. For the other datasets, we applied a multi-layer-perceptron with six hidden layers
including dropout layers.
While a model’s performance can be evaluated independently of the user, its explainability depends on
the perceptions of its users (Miller 2019). Therefore, we evaluated the users’ perceived explainability
by conducting a survey to account for the subjective nature of the perception of the ML models. We
used the platform prolific.co using a monetary incentive. We did not limit the participation by factors
such as the experience with AI or data science skills to receive broad feedback. For reasons of duration
and repetitiveness, we designed two separate studies that were assigned at random: a classification study
and a regression study, each containing a low-stake and high-stake case. The procedure within each
variant was identical.
In the survey, we first collected demographics, prior experience with AI, as well as the participant’s
willingness to take risks. In the second part, we provided them with an introduction to the concepts of
either regression- or classification-based ML, typical data processing steps, and general information
about the visualization of ML predictions.
Second, we presented the use case for each treatment: The interviewees were asked to assume the role
of an employee confronted with a decision situation. We provided a task definition and information
about the process. Further, we explained that the task should now be performed by an intelligent system.
For each case, we provided the criticality of wrong decisions.
Third, we evaluated their explainability based on the propositions by Hoffman et al. (2018). To survey
global explainability, we provided the participants with descriptions of the employed ML algorithms.
To survey local explainability, we provided the participants with a graphical visualization of specific
predictions. The participants did not receive any information about the performance of the ML to avoid
biases. For each ML model, the participants had to rate their overall perceived explainability of the
model on a five-point Likert-scale. The models were presented in random order to avoid sequence bias.
We received responses from 204 participants (112 classification, 92 regression). After processing mul-
tiple exclusion criteria (duration, lazy patterns, control questions), we could use 151 surveys (117 male,
34 female). Most participants (≈45%) were between 20 and 30 years old, followed by 31-40 (≈28%).
≈75% were from Europe, while ≈23% were from North America and only ≈2% from other regions. Half
of the participants (≈52%) had no experience in AI, while ≈33% used AI for less than two years and
only ≈15% had more than two years of experience with AI. ≈13% of the participants would describe
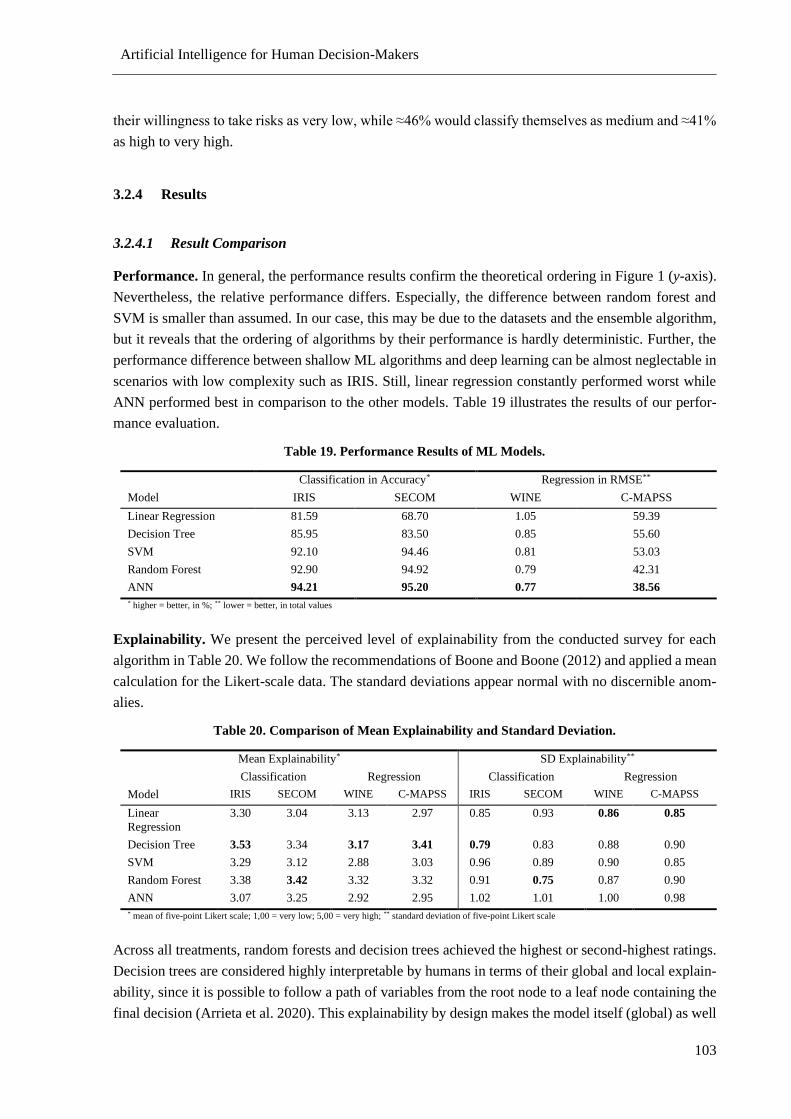
Artificial Intelligence for Human Decision-Makers
103
their willingness to take risks as very low, while ≈46% would classify themselves as medium and ≈41%
as high to very high.
3.2.4 Results
3.2.4.1 Result Comparison
Performance. In general, the performance results confirm the theoretical ordering in Figure 1 (y-axis).
Nevertheless, the relative performance differs. Especially, the difference between random forest and
SVM is smaller than assumed. In our case, this may be due to the datasets and the ensemble algorithm,
but it reveals that the ordering of algorithms by their performance is hardly deterministic. Further, the
performance difference between shallow ML algorithms and deep learning can be almost neglectable in
scenarios with low complexity such as IRIS. Still, linear regression constantly performed worst while
ANN performed best in comparison to the other models. Table 19 illustrates the results of our perfor-
mance evaluation.
Table 19. Performance Results of ML Models.
Classification in Accuracy* Regression in RMSE**
Model IRIS SECOM WINE C-MAPSS
Linear Regression 81.59 68.70 1.05 59.39
Decision Tree 85.95 83.50 0.85 55.60
SVM 92.10 94.46 0.81 53.03
Random Forest 92.90 94.92 0.79 42.31
ANN 94.21 95.20 0.77 38.56
* higher = better, in %; ** lower = better, in total values
Explainability. We present the perceived level of explainability from the conducted survey for each
algorithm in Table 20. We follow the recommendations of Boone and Boone (2012) and applied a mean
calculation for the Likert-scale data. The standard deviations appear normal with no discernible anom-
alies.
Table 20. Comparison of Mean Explainability and Standard Deviation.
Mean Explainability* SD Explainability**
Classification Regression Classification Regression
Model IRIS SECOM WINE C-MAPSS IRIS SECOM WINE C-MAPSS
Linear
Regression
3.30 3.04 3.13 2.97 0.85 0.93 0.86 0.85
Decision Tree 3.53 3.34 3.17 3.41 0.79 0.83 0.88 0.90
SVM 3.29 3.12 2.88 3.03 0.96 0.89 0.90 0.85
Random Forest 3.38 3.42 3.32 3.32 0.91 0.75 0.87 0.90
ANN 3.07 3.25 2.92 2.95 1.02 1.01 1.00 0.98
* mean of five-point Likert scale; 1,00 = very low; 5,00 = very high; ** standard deviation of five-point Likert scale
Across all treatments, random forests and decision trees achieved the highest or second-highest ratings.
Decision trees are considered highly interpretable by humans in terms of their global and local explain-
ability, since it is possible to follow a path of variables from the root node to a leaf node containing the
final decision (Arrieta et al. 2020). This explainability by design makes the model itself (global) as well
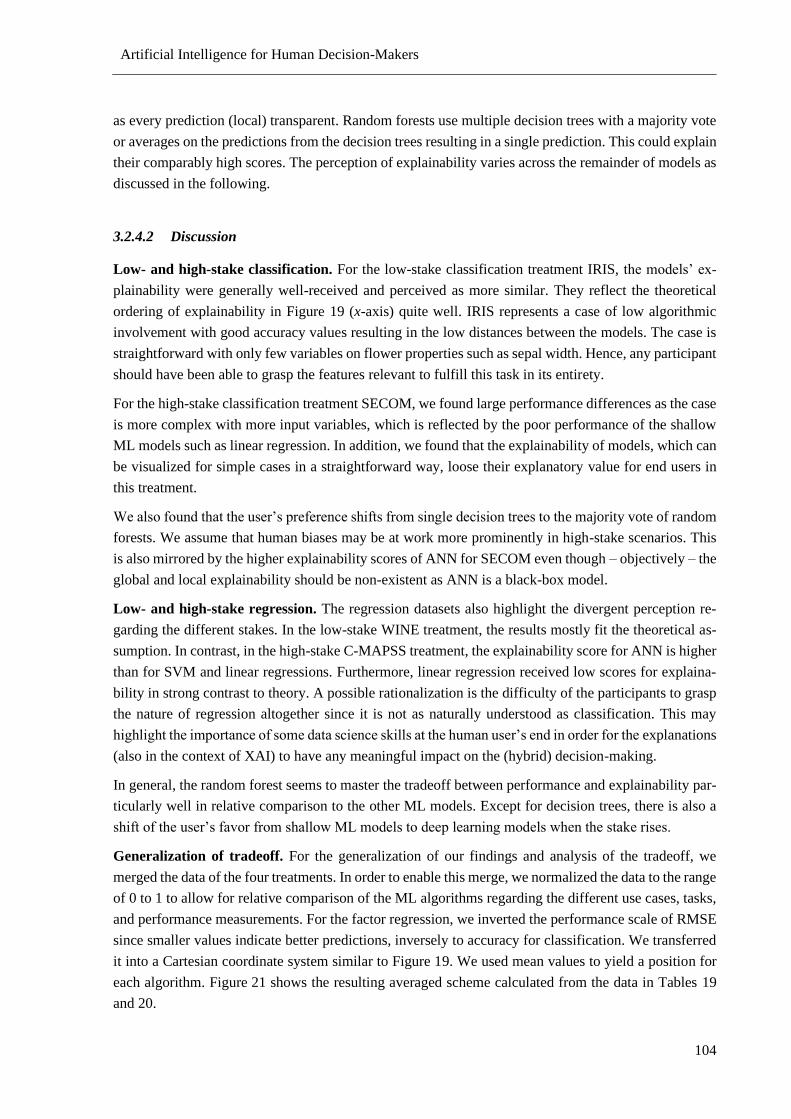
Artificial Intelligence for Human Decision-Makers
104
as every prediction (local) transparent. Random forests use multiple decision trees with a majority vote
or averages on the predictions from the decision trees resulting in a single prediction. This could explain
their comparably high scores. The perception of explainability varies across the remainder of models as
discussed in the following.
3.2.4.2 Discussion
Low- and high-stake classification. For the low-stake classification treatment IRIS, the models’ ex-
plainability were generally well-received and perceived as more similar. They reflect the theoretical
ordering of explainability in Figure 19 (x-axis) quite well. IRIS represents a case of low algorithmic
involvement with good accuracy values resulting in the low distances between the models. The case is
straightforward with only few variables on flower properties such as sepal width. Hence, any participant
should have been able to grasp the features relevant to fulfill this task in its entirety.
For the high-stake classification treatment SECOM, we found large performance differences as the case
is more complex with more input variables, which is reflected by the poor performance of the shallow
ML models such as linear regression. In addition, we found that the explainability of models, which can
be visualized for simple cases in a straightforward way, loose their explanatory value for end users in
this treatment.
We also found that the user’s preference shifts from single decision trees to the majority vote of random
forests. We assume that human biases may be at work more prominently in high-stake scenarios. This
is also mirrored by the higher explainability scores of ANN for SECOM even though – objectively – the
global and local explainability should be non-existent as ANN is a black-box model.
Low- and high-stake regression. The regression datasets also highlight the divergent perception re-
garding the different stakes. In the low-stake WINE treatment, the results mostly fit the theoretical as-
sumption. In contrast, in the high-stake C-MAPSS treatment, the explainability score for ANN is higher
than for SVM and linear regressions. Furthermore, linear regression received low scores for explaina-
bility in strong contrast to theory. A possible rationalization is the difficulty of the participants to grasp
the nature of regression altogether since it is not as naturally understood as classification. This may
highlight the importance of some data science skills at the human user’s end in order for the explanations
(also in the context of XAI) to have any meaningful impact on the (hybrid) decision-making.
In general, the random forest seems to master the tradeoff between performance and explainability par-
ticularly well in relative comparison to the other ML models. Except for decision trees, there is also a
shift of the user’s favor from shallow ML models to deep learning models when the stake rises.
Generalization of tradeoff. For the generalization of our findings and analysis of the tradeoff, we
merged the data of the four treatments. In order to enable this merge, we normalized the data to the range
of 0 to 1 to allow for relative comparison of the ML algorithms regarding the different use cases, tasks,
and performance measurements. For the factor regression, we inverted the performance scale of RMSE
since smaller values indicate better predictions, inversely to accuracy for classification. We transferred
it into a Cartesian coordinate system similar to Figure 19. We used mean values to yield a position for
each algorithm. Figure 21 shows the resulting averaged scheme calculated from the data in Tables 19
and 20.
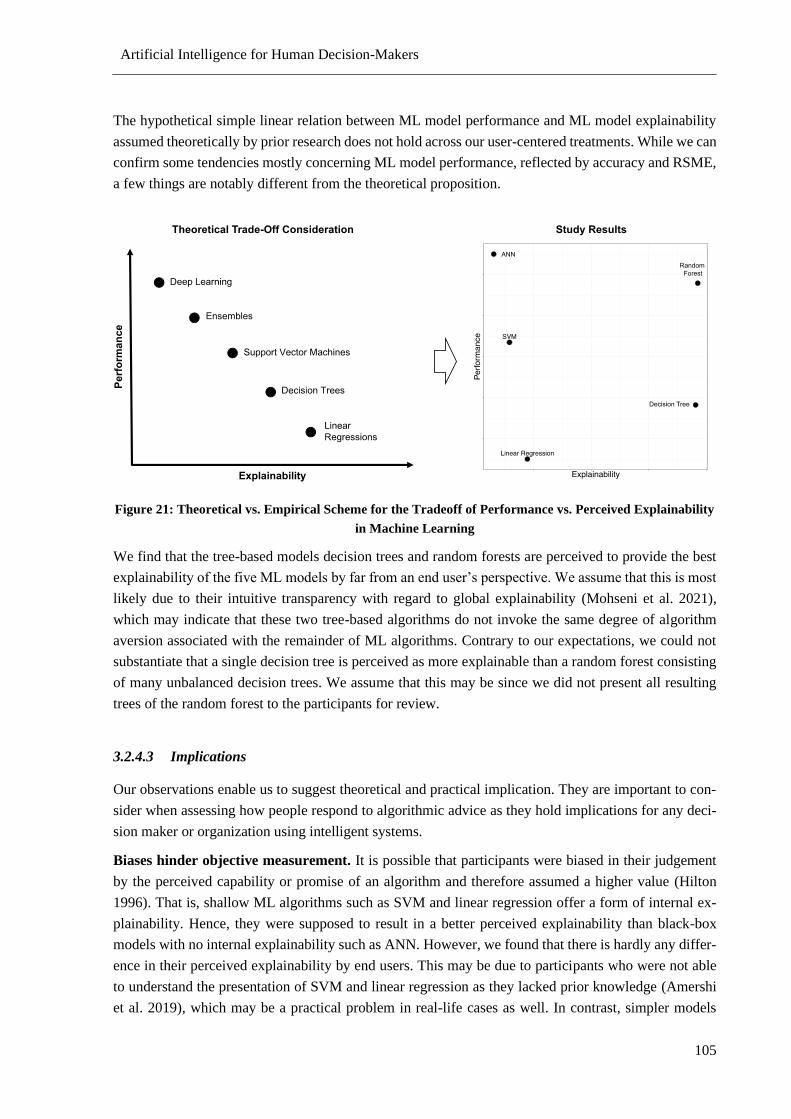
Artificial Intelligence for Human Decision-Makers
105
The hypothetical simple linear relation between ML model performance and ML model explainability
assumed theoretically by prior research does not hold across our user-centered treatments. While we can
confirm some tendencies mostly concerning ML model performance, reflected by accuracy and RSME,
a few things are notably different from the theoretical proposition.
Figure 21: Theoretical vs. Empirical Scheme for the Tradeoff of Performance vs. Perceived Explainability
in Machine Learning
We find that the tree-based models decision trees and random forests are perceived to provide the best
explainability of the five ML models by far from an end user’s perspective. We assume that this is most
likely due to their intuitive transparency with regard to global explainability (Mohseni et al. 2021),
which may indicate that these two tree-based algorithms do not invoke the same degree of algorithm
aversion associated with the remainder of ML algorithms. Contrary to our expectations, we could not
substantiate that a single decision tree is perceived as more explainable than a random forest consisting
of many unbalanced decision trees. We assume that this may be since we did not present all resulting
trees of the random forest to the participants for review.
3.2.4.3 Implications
Our observations enable us to suggest theoretical and practical implication. They are important to con-
sider when assessing how people respond to algorithmic advice as they hold implications for any deci-
sion maker or organization using intelligent systems.
Biases hinder objective measurement. It is possible that participants were biased in their judgement
by the perceived capability or promise of an algorithm and therefore assumed a higher value (Hilton
1996). That is, shallow ML algorithms such as SVM and linear regression offer a form of internal ex-
plainability. Hence, they were supposed to result in a better perceived explainability than black-box
models with no internal explainability such as ANN. However, we found that there is hardly any differ-
ence in their perceived explainability by end users. This may be due to participants who were not able
to understand the presentation of SVM and linear regression as they lacked prior knowledge (Amershi
et al. 2019), which may be a practical problem in real-life cases as well. In contrast, simpler models
Artificial Intelligence for Human Decision-Makers
106
seem to be especially good in explaining more straightforward scenarios. Consequently, due to high
valuation in one category (performance), end users may attribute higher scores in another category (ex-
plainability). This is called halo effect.
Interpretability does not entail explainability. The discrepancy between theory and our empirical
findings can be explained at least partly by the nature of our observations. While theoretical contribu-
tions look at the algorithmic and mathematical description of objects (data-centered perspective), we
have employed a socio-technical and thus user-centered perspective. That is, in our study, we targeted
the naturally biased perception of end users of an ML algorithm directly and found that the difference
between performance and explainability is not linearly increasing. Rather, we found that linear regres-
sion’s and S M’s (and ANN’s) explanatory value is far from tree-based algorithms in most situations.
While our results do not allow to uniformly rank and rate explainability for ML decisions (and were not
expected to), they add to the growing evidence that there is more to model explainability than transparent
mathematical parameters and good intentions. Moreover, ordering ML algorithms by their assumed
data-centered interpretability is not helpful as it is constantly being misinterpreted and misused in socio-
technical settings. In contrast, socio-technical aspects stand out as important for the efficacious use of
ML models and explainability may be the key factor for their acceptance by end users (Cramer et al.
2008; Lee 2018). According to our research, in non-augmented form decision trees and random forests
are currently the most suitable options to engage with end users.
3.2.5 Conclusion, Limitations, and Outlook
Albeit its fundamental importance for human decision-makers, empirical evidence regarding the
tradeoff between ML model performance and explainability is scarce. The goal of our research was to
conduct an empirical study to determine a more realistic depiction of this relationship and subsequently
compare the placement of common ML models to the existing theoretical propositions.
We found that the explanatory value of decision trees and random forests constantly dominates other
ML models. Comparing averages, we could not find noteworthy differences in the perceptions of ex-
plainability of SVM, linear regression, and even ANN. We did notice though that explainability was
generally better received for more straightforward cases such as low-stake classifications.
In summary, we found existing theoretical propositions to be data-centered and misleading oversimpli-
fications when compared to our user-centered observations. Our study shows that when explanations
are put to use, socio-technical factors of user perception dominate well-intended analytical considera-
tions concerning the goodness of visualizations by ML experts.
As with any empirical research, our study faces some limitations. First, our study was an online survey
with benchmarking datasets. While we only allowed for participants with a certain background, partic-
ipants may have been exposed to the scenarios and several of the ML algorithms for the first time.
Hence, we measured an initial explainability. Second, there was no time restriction for viewing and
assessing an explanation. We expect results to differ in a high-velocity treatment. Third and last, we
compared inherently interpretable shallow ML algorithms and ANN without further augmentations. We
assume that XAI augmentations will affect explainability positively. In contrast, other more diverse
ensembles than random forests may perform worse.
Artificial Intelligence for Human Decision-Makers
107
Concluding, we identified socio-technical aspects as highly important for the perception of explainabil-
ity and therefore further user studies with varying skill levels and cultural backgrounds are necessary to
better understand the biases at work. Further, explainability does not entail understandability. If explain-
ability only contributes to more trusted decision-making but not to a better understanding, research into
XAI may be on the wrong track and ultimately only lulls users into a false sense of security by adding
fancy yet inefficacious visualization.
3.3 Model Explainability and Model Comprehension
Abstract. In explainable artificial intelligence (XAI) researchers try to alleviate the intransparency of
high-performing but incomprehensible machine learning (ML) models. This should improve their adop-
tion in practice. While many XAI techniques have been developed, the impact of their possibilities on
the user is rarely being investigated. It is neither apparent whether an XAI-based model is perceived to
be more explainable than existing alternative ML models nor is it known whether the explanations ac-
tually increase the user comprehension of the problem, and thus, his or her problem-solving performance
ability. In an empirical study, we asked 165 participants about the perceived explainability of different
ML models and an XAI augmentation. We further tasked them to answer retention, transfer, and recall
questions within three use cases of different stake. The results reveal high comprehensibility and prob-
lem-solving performance of XAI augmentation compared to the tested ML models.8
3.3.1 Introduction
Artificial intelligence (AI) based decision support systems (DSS) are increasingly being transferred in
research and practice to support humans in various areas of daily life and business (Zhang et al. 2018a).
Thereby, AI describes a concept of data-driven problem solving using multiple mathematical algo-
rithms, often related to the research subset of machine learning (ML) (Goodfellow et al. 2016). During
the decades, several types of ML models have been developed, with different kinds of calculation logic
(Bishop 2006). In practice, it is noticeable that low-complex ML models, i.e., models that are transparent
from a user’s perspective, are often preferred over high-complex ML models that lack traceability even
though they may outperform their counterparts (Adadi and Berrada 2018; Rudin 2019). That is, users
prefer white-box ML models over black-box ML models. The reason is assumed to be that AI-based DSS
users would have to trust the recommendation of a black-box ML model without understanding what is
going on. Such a circumstance holds several dangers for decision-makers, such as legal issues regarding
general data protection regulation (GDPR) (Goodman and Flaxman 2017).
The research domain of explainable AI (XAI) deals with this issue by developing solutions to overcome
the intransparency of black-box ML models while maintaining their high model performance (Gunning
8 This paper is published within the 29th European Conference on Information Systems as ‘I DON’T GET IT, BUT
IT SEEMS VALID! THE CONNECTION BETWEEN EXPLAINABILITY AND COMPREHENSIBILITY IN
(X)AI RESEARCH’ (Herm et al. 2021).
Artificial Intelligence for Human Decision-Makers
108
and Aha 2019). Despite that there are already some XAI transfer techniques for transferring black-box
models to white-box models (Wanner et al. 2020c), they are heavily criticized. This is, two independent
models with their related complexity are trained instead of using a white-box ML model from the very
beginning and improve it iteratively to achieve a comparable performance (Rudin 2019). However, since
the performance power of black-box models is not to be dispensed with, more research is being done on
ex-post explanatory approaches. These are referred to as grey-box ML models (Gunning et al. 2019).
Through XAI augmentation techniques, methods are applied to the trained model to make its internal
logic or result computation transparent (Slack et al. 2020). There are first positive implications already
(Lundberg et al. 2020). Nevertheless, on the one hand, scientists claim that these methods are only an
approximation and, therefore, inherently inaccurate (Rudin 2019). On the other hand, little is known
about how users perceive (X)AI explanations (Adadi and Berrada 2018).
XAI research should therefore address both points of criticism to resolve best the trade-off given (Doran
et al. 2017; Gilpin et al. 2018; Guidotti et al. 2018a). A particular problem seems to be that an AI-based
DSS’s high performance is still associated with a high decision quality. However, the decision quality
only becomes effective, if the user of the system includes the recommendation of the algorithm in the
decision process, which requires a credible perception (Nawratil 2006). Existing XAI research shows
that this depends heavily on the extent to which a person understands the behavior of a model (Ribeiro
et al. 2016b). Therefore, the given information gap between the AI-based DSS and its user must be
closed by appropriate explanations (Cui et al. 2019; Dam et al. 2018; Gilpin et al. 2018).
Further, research demonstrates that a hybrid intelligence consisting of humans (here: system users) and
machines (here: AI-based DSS) can be considered state-of-the-art to accomplish tasks (Dellermann et
al. 2019). What seems to be problematic is that precise explanations are often not easy to interpret for
humans, and conversely, understandable explanations often lack predictive power (Doran et al. 2017;
Gilpin et al. 2018; Guidotti et al. 2018a). In addition to an explanation that is perceived as interpretable,
the question arises, to what extent the user really comprehends what the system explains to be able to
act as a validator and form a functional hybrid intelligence (Futia and Vetrò 2020).
As current XAI research focuses primarily on solving the trade-off between model performance and
model explainability from a feature perspective, we are trying to understand the correlation between
perceived explainability and subsequent comprehensibility. To do so, we ask ourselves to what extent
this circumstance already exists in today’s ML model types as the backbone of an AI-based DSS and to
what extent a popular XAI augmentation (feature influence method) can compete with those or even
surpass them. Thus, we first try to determine if and to what extent an (X)AI explanation is perceived as
explainable by system users. Following that, we examine if the perceived explainability improves the
comprehensibility for problem-solving. Thus, we formulate the following research question:
RQ: What is the relationship between the perceived explainability and comprehensibility of predictions
for the user of AI-based DSS and what influence do XAI augmentations have on this?
To answer the RQ, we structure our paper as follows: In Section 3.3.2, we present the theoretical back-
ground and the related work based on (XAI) dimension and interrelation, as well as a structured literature
review. Section 3.3.3 describes our research design, including the methodology, the theoretical deriva-
tion of the research model, the scenarios, technical realization, and the survey design. In Section 3.3.4
Artificial Intelligence for Human Decision-Makers
109
we describe the survey results. We critically discuss these in Section 3.3.5, including the own implica-
tions. Concluding in Section 3.3.6, we describe limitations, and provide an outlook for future research.
3.3.2 Theoretical Background and Related Work
3.3.2.1 Artificial Intelligence
AI in the Information Systems (IS) discipline research is a generic term for ‘intelligent agents’. These
agents pursue a specific goal, which they try to maximize by perceiving and interacting with the envi-
ronment (Poole et al. 1998). To do so, they need cognitive abilities of learning and problem solving,
which can be compared to intelligent abilities that resemble a human being (Nilsson 2014). In recent
years, for practitioners’ use especially ML is of great interest. It is the science of mathematical models
and algorithms improving their performance through experience (Goodfellow et al. 2016). This enables
them to learn iteratively from empirical data, allowing them to find non-linear relationships and complex
patterns without being explicitly programmed to do so (Bishop 2006).
The current focus of ML research is on the optimization of the model performance. More specifically,
deep learning (DL) models regularly outperform other types of ML models. Thereby, DL models, rep-
resent a specific type of ML algorithms, by using (deep) artificial neural networks (ANN) (Janiesch et
al. 2021). These models are especially good at analyzing highly complex datasets (Zhang et al. 2018a).
However, due to their complex structure, they are intransparent. Thus, a user often understands neither
inner model logic nor specific decision making (Ribeiro et al. 2016b). Therefore, these models are black
boxes that face the problem of a lack of trust, which reduces the willingness of users to accept the
recommendations of such a system (Adadi and Berrada 2018).
3.3.2.2 Explainable Artificial Intelligence
Since complex deep learning models tend to outperform lower complexity models, they are considered
to have the greatest potential for further optimization (Rudin 2019). The research area of XAI tries to
develop methods to explain these black-box models by converting them into comprehensible ‘grey-box
models’ (Gunning et al. 2019), while preserving their high model performance (Lundberg et al. 2020).
Here, comprehension refers to the ability to understand a decision logic within a model and therefore
the ability to use this knowledge in practice (Futia and Vetrò 2020). Therefore, grey-box models should
enable users to understand two different components of the model (Lipton 2018): the inner logic (global
explainability) and the reasoning for a specific result (local explainability).
Multiple XAI techniques have been developed. On the one hand, there is the option of XAI model
transfers. Here, a second, white-box model, that is a model that is perceived as per-se explainable
(global), is used to explain the black-box model (Adadi and Berrada 2018). On the other hand, there are
XAI augmentations calculated on top of the black-box model (local). Therefore, multiple augmentation
techniques are used, such as explanation by simplification, visualization, knowledge extraction, or in-
fluence methods. In terms of influence methods shapley additive explanations (SHAP) is a commonly
used XAI tool (Lundberg et al. 2020). These toolsets estimate the influence of a single feature on a
specific prediction post-hoc. By iterative manipulation of the feature values, the tools analyze how these
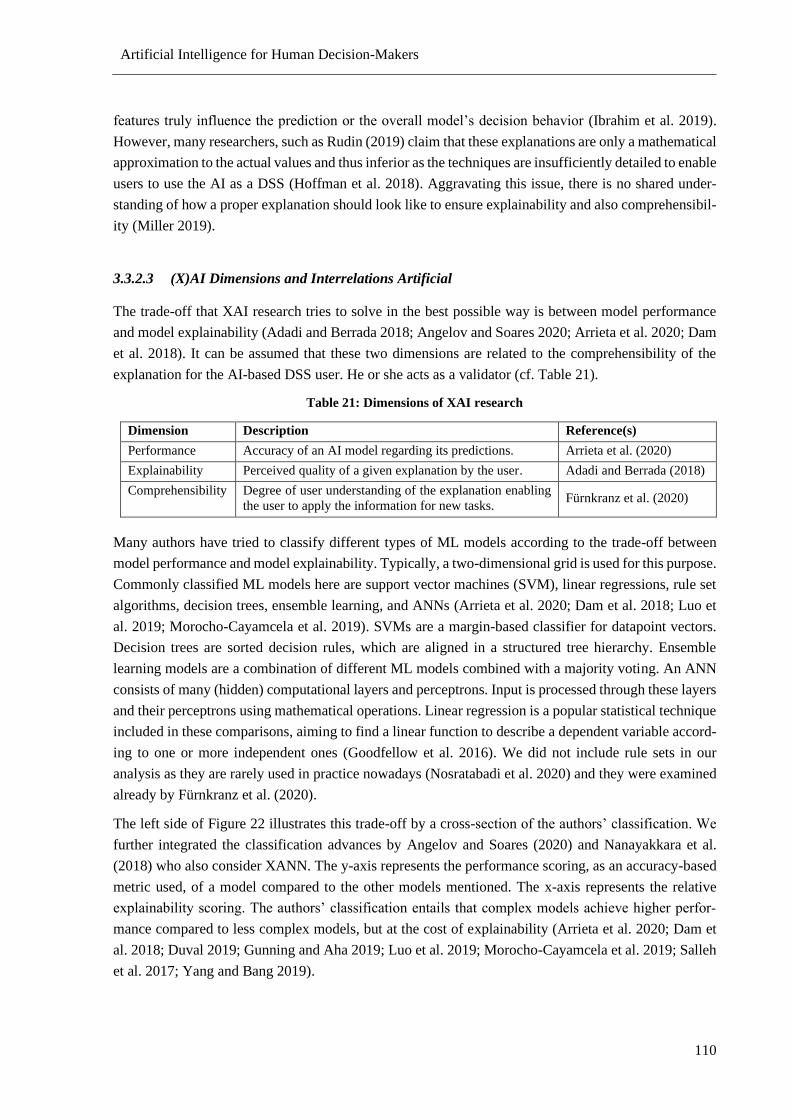
Artificial Intelligence for Human Decision-Makers
110
features truly influence the prediction or the overall model’s decision behavior (Ibrahim et al. 2019).
However, many researchers, such as Rudin (2019) claim that these explanations are only a mathematical
approximation to the actual values and thus inferior as the techniques are insufficiently detailed to enable
users to use the AI as a DSS (Hoffman et al. 2018). Aggravating this issue, there is no shared under-
standing of how a proper explanation should look like to ensure explainability and also comprehensibil-
ity (Miller 2019).
3.3.2.3 (X)AI Dimensions and Interrelations Artificial
The trade-off that XAI research tries to solve in the best possible way is between model performance
and model explainability (Adadi and Berrada 2018; Angelov and Soares 2020; Arrieta et al. 2020; Dam
et al. 2018). It can be assumed that these two dimensions are related to the comprehensibility of the
explanation for the AI-based DSS user. He or she acts as a validator (cf. Table 21).
Table 21: Dimensions of XAI research
Dimension Description Reference(s)
Performance Accuracy of an AI model regarding its predictions. Arrieta et al. (2020)
Explainability Perceived quality of a given explanation by the user. Adadi and Berrada (2018)
Comprehensibility Degree of user understanding of the explanation enabling
the user to apply the information for new tasks. Fürnkranz et al. (2020)
Many authors have tried to classify different types of ML models according to the trade-off between
model performance and model explainability. Typically, a two-dimensional grid is used for this purpose.
Commonly classified ML models here are support vector machines (SVM), linear regressions, rule set
algorithms, decision trees, ensemble learning, and ANNs (Arrieta et al. 2020; Dam et al. 2018; Luo et
al. 2019; Morocho-Cayamcela et al. 2019). SVMs are a margin-based classifier for datapoint vectors.
Decision trees are sorted decision rules, which are aligned in a structured tree hierarchy. Ensemble
learning models are a combination of different ML models combined with a majority voting. An ANN
consists of many (hidden) computational layers and perceptrons. Input is processed through these layers
and their perceptrons using mathematical operations. Linear regression is a popular statistical technique
included in these comparisons, aiming to find a linear function to describe a dependent variable accord-
ing to one or more independent ones (Goodfellow et al. 2016). We did not include rule sets in our
analysis as they are rarely used in practice nowadays (Nosratabadi et al. 2020) and they were examined
already by Fürnkranz et al. (2020).
The left side of Figure 22 illustrates this trade-off by a cross-section of the authors’ classification. We
further integrated the classification advances by Angelov and Soares (2020) and Nanayakkara et al.
(2018) who also consider XANN. The y-axis represents the performance scoring, as an accuracy-based
metric used, of a model compared to the other models mentioned. The x-axis represents the relative
explainability scoring. The authors’ classification entails that complex models achieve higher perfor-
mance compared to less complex models, but at the cost of explainability (Arrieta et al. 2020; Dam et
al. 2018; Duval 2019; Gunning and Aha 2019; Luo et al. 2019; Morocho-Cayamcela et al. 2019; Salleh
et al. 2017; Yang and Bang 2019).
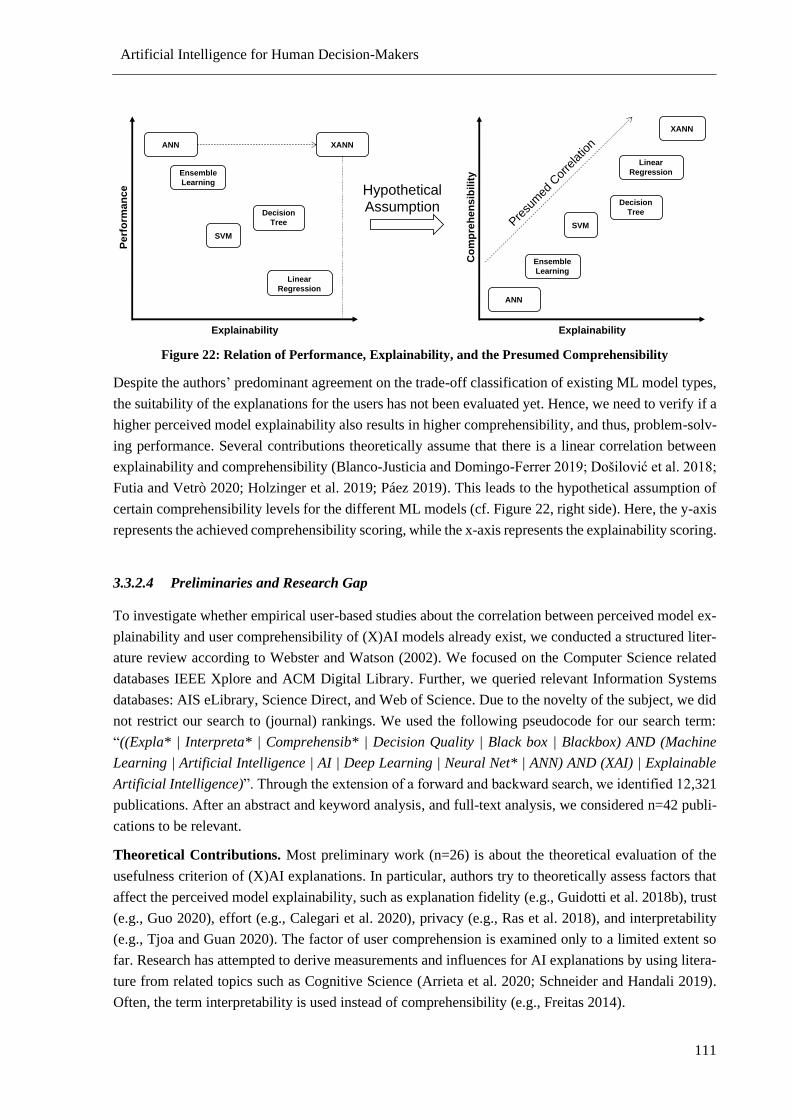
Artificial Intelligence for Human Decision-Makers
111
Figure 22: Relation of Performance, Explainability, and the Presumed Comprehensibility
Despite the authors’ predominant agreement on the trade-off classification of existing ML model types,
the suitability of the explanations for the users has not been evaluated yet. Hence, we need to verify if a
higher perceived model explainability also results in higher comprehensibility, and thus, problem-solv-
ing performance. Several contributions theoretically assume that there is a linear correlation between
explainability and comprehensibility (Blanco-Justicia and Domingo- errer 2019; Došilović et al. 2018;
Futia and Vetrò 2020; Holzinger et al. 2019; Páez 2019). This leads to the hypothetical assumption of
certain comprehensibility levels for the different ML models (cf. Figure 22, right side). Here, the y-axis
represents the achieved comprehensibility scoring, while the x-axis represents the explainability scoring.
3.3.2.4 Preliminaries and Research Gap
To investigate whether empirical user-based studies about the correlation between perceived model ex-
plainability and user comprehensibility of (X)AI models already exist, we conducted a structured liter-
ature review according to Webster and Watson (2002). We focused on the Computer Science related
databases IEEE Xplore and ACM Digital Library. Further, we queried relevant Information Systems
databases: AIS eLibrary, Science Direct, and Web of Science. Due to the novelty of the subject, we did
not restrict our search to (journal) rankings. We used the following pseudocode for our search term:
“((Expla* | Interpreta* | Comprehensib* | Decision Quality | Black box | Blackbox) AND (Machine
Learning | Artificial Intelligence | AI | Deep Learning | Neural Net* | ANN) AND (XAI) | Explainable
Artificial Intelligence)”. Through the extension of a forward and backward search, we identified 12,321
publications. After an abstract and keyword analysis, and full-text analysis, we considered n=42 publi-
cations to be relevant.
Theoretical Contributions. Most preliminary work (n=26) is about the theoretical evaluation of the
usefulness criterion of (X)AI explanations. In particular, authors try to theoretically assess factors that
affect the perceived model explainability, such as explanation fidelity (e.g., Guidotti et al. 2018b), trust
(e.g., Guo 2020), effort (e.g., Calegari et al. 2020), privacy (e.g., Ras et al. 2018), and interpretability
(e.g., Tjoa and Guan 2020). The factor of user comprehension is examined only to a limited extent so
far. Research has attempted to derive measurements and influences for AI explanations by using litera-
ture from related topics such as Cognitive Science (Arrieta et al. 2020; Schneider and Handali 2019).
Often, the term interpretability is used instead of comprehensibility (e.g., Freitas 2014).
Explainability
Pe
rfo
rma
nce
ANN XANN
Ensemble
Learning
Decision
Tree
SVM
Linear
Regression
Explainability
Co
mp
reh
en
sib
ilit
y
HypotheticalAssumption
ANN
XANN
Ensemble
Learning
Linear
Regression
Pre
sum
ed C
orre
latio
n
Decision
Tree
SVM
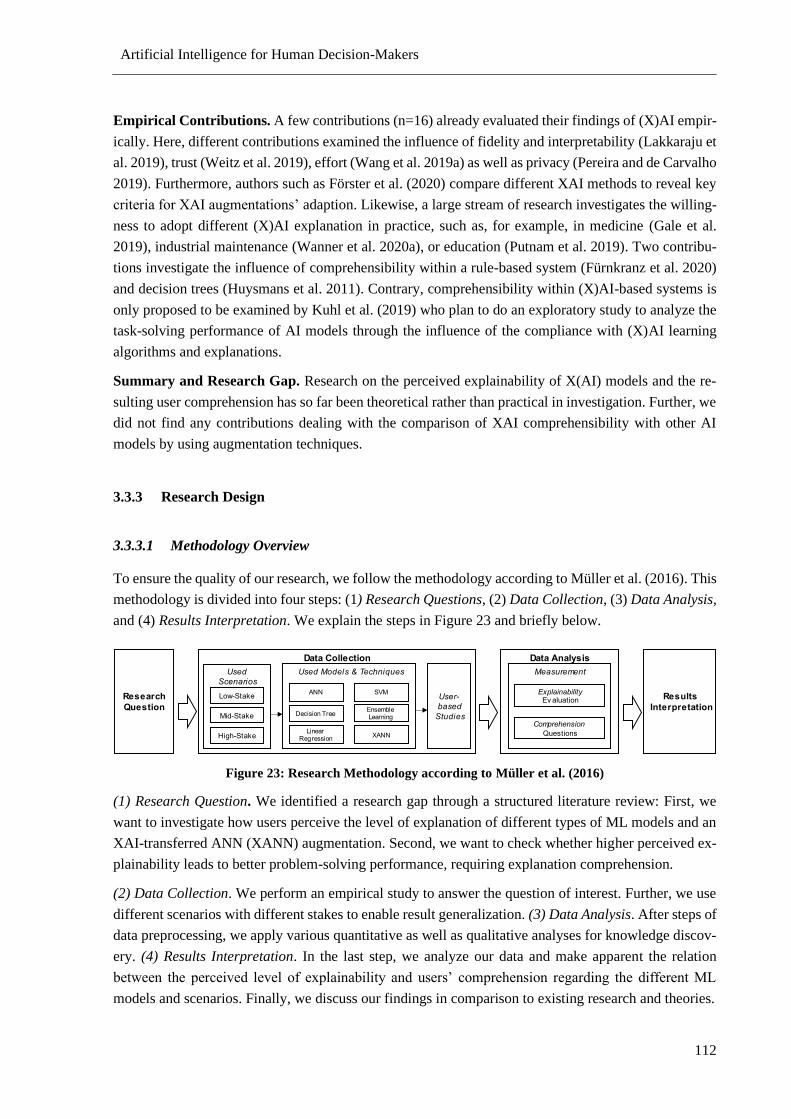
Artificial Intelligence for Human Decision-Makers
112
Empirical Contributions. A few contributions (n=16) already evaluated their findings of (X)AI empir-
ically. Here, different contributions examined the influence of fidelity and interpretability (Lakkaraju et
al. 2019), trust (Weitz et al. 2019), effort (Wang et al. 2019a) as well as privacy (Pereira and de Carvalho
2019). Furthermore, authors such as Förster et al. (2020) compare different XAI methods to reveal key
criteria for XAI augmentations’ adaption. Likewise, a large stream of research investigates the willing-
ness to adopt different (X)AI explanation in practice, such as, for example, in medicine (Gale et al.
2019), industrial maintenance (Wanner et al. 2020a), or education (Putnam et al. 2019). Two contribu-
tions investigate the influence of comprehensibility within a rule-based system (Fürnkranz et al. 2020)
and decision trees (Huysmans et al. 2011). Contrary, comprehensibility within (X)AI-based systems is
only proposed to be examined by Kuhl et al. (2019) who plan to do an exploratory study to analyze the
task-solving performance of AI models through the influence of the compliance with (X)AI learning
algorithms and explanations.
Summary and Research Gap. Research on the perceived explainability of X(AI) models and the re-
sulting user comprehension has so far been theoretical rather than practical in investigation. Further, we
did not find any contributions dealing with the comparison of XAI comprehensibility with other AI
models by using augmentation techniques.
3.3.3 Research Design
3.3.3.1 Methodology Overview
To ensure the quality of our research, we follow the methodology according to Müller et al. (2016). This
methodology is divided into four steps: (1) Research Questions, (2) Data Collection, (3) Data Analysis,
and (4) Results Interpretation. We explain the steps in Figure 23 and briefly below.
Figure 23: Research Methodology according to Müller et al. (2016)
(1) Research Question. We identified a research gap through a structured literature review: First, we
want to investigate how users perceive the level of explanation of different types of ML models and an
XAI-transferred ANN (XANN) augmentation. Second, we want to check whether higher perceived ex-
plainability leads to better problem-solving performance, requiring explanation comprehension.
(2) Data Collection. We perform an empirical study to answer the question of interest. Further, we use
different scenarios with different stakes to enable result generalization. (3) Data Analysis. After steps of
data preprocessing, we apply various quantitative as well as qualitative analyses for knowledge discov-
ery. (4) Results Interpretation. In the last step, we analyze our data and make apparent the relation
between the perceived level of explainability and users’ comprehension regarding the different ML
models and scenarios. Finally, we discuss our findings in comparison to existing research and theories.
o Sta e
i Sta e
igh Sta e
S
nse le earning
Decision ree
aluation
uestions
inear egression
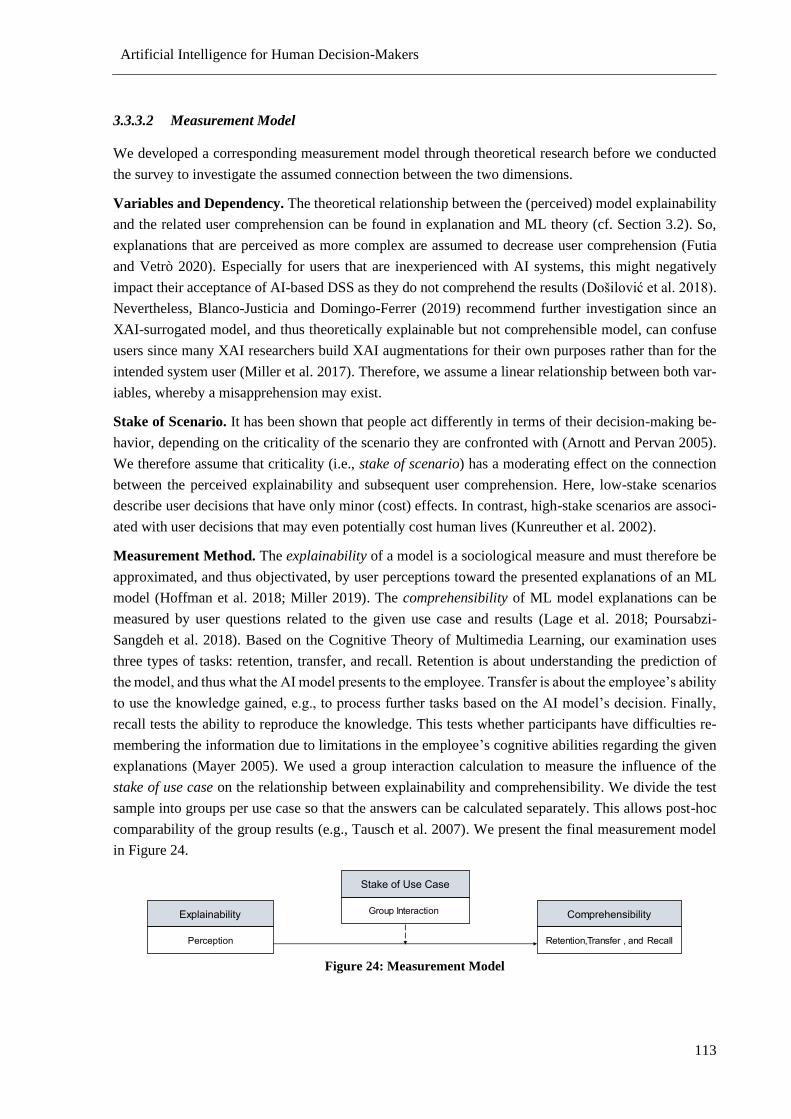
Artificial Intelligence for Human Decision-Makers
113
3.3.3.2 Measurement Model
We developed a corresponding measurement model through theoretical research before we conducted
the survey to investigate the assumed connection between the two dimensions.
Variables and Dependency. The theoretical relationship between the (perceived) model explainability
and the related user comprehension can be found in explanation and ML theory (cf. Section 3.2). So,
explanations that are perceived as more complex are assumed to decrease user comprehension (Futia
and Vetrò 2020). Especially for users that are inexperienced with AI systems, this might negatively
impact their acceptance of AI-based DSS as they do not comprehend the results (Došilović et al. 2018).
Nevertheless, Blanco-Justicia and Domingo-Ferrer (2019) recommend further investigation since an
XAI-surrogated model, and thus theoretically explainable but not comprehensible model, can confuse
users since many XAI researchers build XAI augmentations for their own purposes rather than for the
intended system user (Miller et al. 2017). Therefore, we assume a linear relationship between both var-
iables, whereby a misapprehension may exist.
Stake of Scenario. It has been shown that people act differently in terms of their decision-making be-
havior, depending on the criticality of the scenario they are confronted with (Arnott and Pervan 2005).
We therefore assume that criticality (i.e., stake of scenario) has a moderating effect on the connection
between the perceived explainability and subsequent user comprehension. Here, low-stake scenarios
describe user decisions that have only minor (cost) effects. In contrast, high-stake scenarios are associ-
ated with user decisions that may even potentially cost human lives (Kunreuther et al. 2002).
Measurement Method. The explainability of a model is a sociological measure and must therefore be
approximated, and thus objectivated, by user perceptions toward the presented explanations of an ML
model (Hoffman et al. 2018; Miller 2019). The comprehensibility of ML model explanations can be
measured by user questions related to the given use case and results (Lage et al. 2018; Poursabzi-
Sangdeh et al. 2018). Based on the Cognitive Theory of Multimedia Learning, our examination uses
three types of tasks: retention, transfer, and recall. Retention is about understanding the prediction of
the model, and thus what the AI model presents to the employee. Transfer is about the employee’s ability
to use the knowledge gained, e.g., to process further tasks based on the AI model’s decision. inally,
recall tests the ability to reproduce the knowledge. This tests whether participants have difficulties re-
membering the information due to limitations in the employee’s cognitive abilities regarding the given
explanations (Mayer 2005). We used a group interaction calculation to measure the influence of the
stake of use case on the relationship between explainability and comprehensibility. We divide the test
sample into groups per use case so that the answers can be calculated separately. This allows post-hoc
comparability of the group results (e.g., Tausch et al. 2007). We present the final measurement model
in Figure 24.
Figure 24: Measurement Model
o prehensi ilit plaina ilit
Sta e of se ase
erception etention ransfer an ecall
roup nteraction
Artificial Intelligence for Human Decision-Makers
114
3.3.3.3 Scenario Selection and Technical Realization for Survey
To enable a generalization of our findings, we use three different regression scenarios. These three sce-
narios differ in their stake (low; medium; and high) and are described in the following. Further we
describe the technical realization of our model implementations.
Dataset WINE. We used the dataset on WINE quality from the UCI machine learning library for our
low-stake scenario (Cortez 2009). We consider it low stake since a wrong prediction only results in
falsely predicted wine quality. The dataset consists of 11 different features describing different “vinho
verde” wines from Portugal. or our approach, we have used the red wine dataset only. This dataset
includes 1599 wines, which are ranked numerically between 0 to 12 in their quality level.
Dataset Bakery. We cooperated with a local German bakery retailer to obtain sales data from 40 stores
over the last 3.5 years. In total, we used 11 different features, such as weather data, past sales, or school
holidays, to predict the sales quantity for the next day. Since wrong order decisions reduce the com-
pany’s profit, we used this dataset as our medium-stake scenario.
Dataset C-MAPSS. We use the regression dataset modular aero propulsion system simulation (C-
MAPSS) from the NASA Prognostic Center of Excellence as our high-stake scenario (Saxena and
Goebel 2008). The dataset contains simulation data from different turbofan engines. The simulation of
each turbofan is tracked by 25 sensors and contains over 93 turbines on 50 simulation cycles each. After
each cycle, the remaining useful lifetime (RUL) is verified. A wrong decision and, thus, a turbine failure
can lead to the loss of human life. Hence, we consider the scenario to be of high stake.
Technical Realization. Starting with data processing, we stick to the recommendation of García et al.
(2016) and deleted any incomplete observations and outliers as well as applied a feature selection and
normalization. Subsequently, we have implemented the different ML models for each scenario described
in Figure 23. For the implementation of the models, we use the python package scikit-learn and keras
as well as the package SHAP for the XAI augmentation. We selected the parameters through hyperpa-
rameter tuning using scikit-learn’s GridSearch. Further, each result presentation is set in the same color
scheme. Further information about the technical realization is shown in Herm et al. (2021a).
3.3.3.4 Survey Design
To evaluate the three use cases chosen (cf. Section 3.3.4.1), we set up three separate surveys (cf. Section
3.3.3.3). Further, each survey is divided into three parts: i) demographics and introduction, ii) perceived
model explainability, and iii) examination of the user comprehensibility.
Demographics and Introduction. irst, we examined the participants’ demographics. In addition to
gender, age, and location, we asked them whether they already have had experience with AI systems
and whether they were willing to adopt them. Subsequently, we presented the procedure of the survey.
We also gave an introduction to AI to ensure a shared understanding of the necessary knowledge.
Perceived Model Explainability. Second, we examined the users’ perceived explainability of the im-
plemented ML models (cf. Section 3.3.4.1). We started with a description of the respective scenario.
This includes information about the use case, the dataset, the task objective, and the criticality of wrong
decisions. Afterward, we presented a prediction of a particular observation for each of our five ML
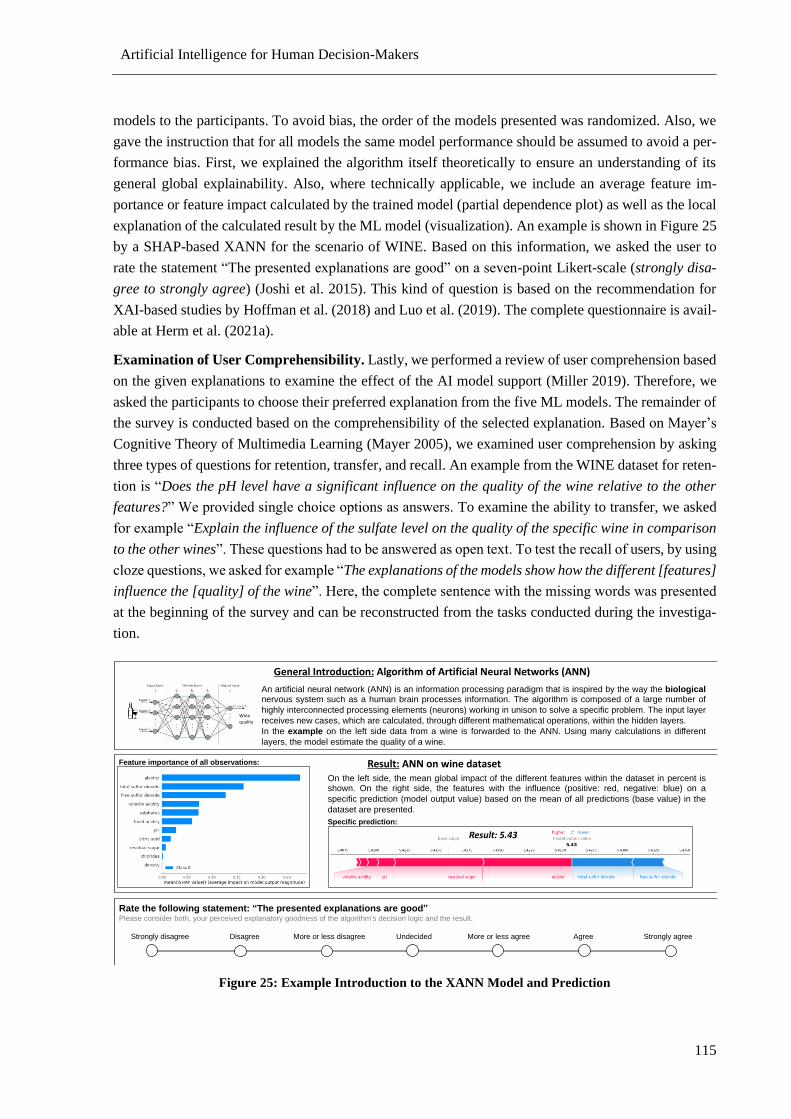
Artificial Intelligence for Human Decision-Makers
115
models to the participants. To avoid bias, the order of the models presented was randomized. Also, we
gave the instruction that for all models the same model performance should be assumed to avoid a per-
formance bias. First, we explained the algorithm itself theoretically to ensure an understanding of its
general global explainability. Also, where technically applicable, we include an average feature im-
portance or feature impact calculated by the trained model (partial dependence plot) as well as the local
explanation of the calculated result by the ML model (visualization). An example is shown in Figure 25
by a SHAP-based XANN for the scenario of WINE. Based on this information, we asked the user to
rate the statement “The presented explanations are good” on a seven-point Likert-scale (strongly disa-
gree to strongly agree) (Joshi et al. 2015). This kind of question is based on the recommendation for
XAI-based studies by Hoffman et al. (2018) and Luo et al. (2019). The complete questionnaire is avail-
able at Herm et al. (2021a).
Examination of User Comprehensibility. Lastly, we performed a review of user comprehension based
on the given explanations to examine the effect of the AI model support (Miller 2019). Therefore, we
asked the participants to choose their preferred explanation from the five ML models. The remainder of
the survey is conducted based on the comprehensibility of the selected explanation. Based on Mayer’s
Cognitive Theory of Multimedia Learning (Mayer 2005), we examined user comprehension by asking
three types of questions for retention, transfer, and recall. An example from the WINE dataset for reten-
tion is “Does the pH level have a significant influence on the quality of the wine relative to the other
features?” We provided single choice options as answers. To examine the ability to transfer, we asked
for example “Explain the influence of the sulfate level on the quality of the specific wine in comparison
to the other wines”. These questions had to be answered as open text. To test the recall of users, by using
cloze questions, we asked for example “The explanations of the models show how the different [features]
influence the [quality] of the wine”. Here, the complete sentence with the missing words was presented
at the beginning of the survey and can be reconstructed from the tasks conducted during the investiga-
tion.
Figure 25: Example Introduction to the XANN Model and Prediction
An artificial neural network (ANN) is an information processing paradigm that is inspired by the way the biologicalnervous system such as a human brain processes information. The algorithm is composed of a large number of
highly interconnected processing elements (neurons) working in unison to solve a specific problem. The input layer
receives new cases, which are calculated, through different mathematical operations, within the hidden layers.
In the example on the left side data from a wine is forwarded to the ANN. Using many calculations in different
layers, the model estimate the quality of a wine.
General Introduction: Algorithm of Artificial Neural Networks (ANN)
Result: ANN on wine datasetOn the left side, the mean global impact of the different features within the dataset in percent isshown. On the right side, the features with the influence (positive: red, negative: blue) on a
specific prediction (model output value) based on the mean of all predictions (base value) in the
dataset are presented.
Feature importance of all observations:
Specific prediction:
:
Dog6.93
Rate the following statement: “The presented explanations are good”Please consider both, your perceived explanatory goodness of the algorithm’s decision logic and the result.
Result: 5.43
Wine
quality
Strongly disagree Disagree More or less disagree Undecided More or less agree Agree Strongly agree
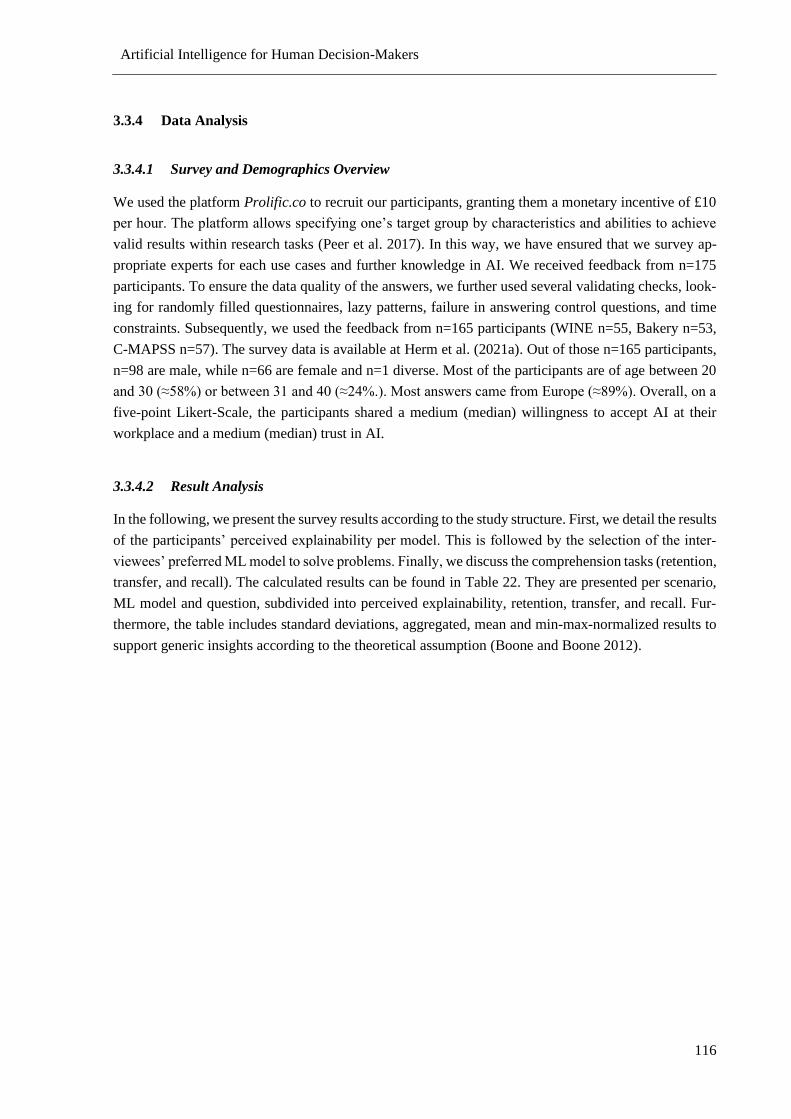
Artificial Intelligence for Human Decision-Makers
116
3.3.4 Data Analysis
3.3.4.1 Survey and Demographics Overview
We used the platform Prolific.co to recruit our participants, granting them a monetary incentive of £10
per hour. The platform allows specifying one’s target group by characteristics and abilities to achieve
valid results within research tasks (Peer et al. 2017). In this way, we have ensured that we survey ap-
propriate experts for each use cases and further knowledge in AI. We received feedback from n=175
participants. To ensure the data quality of the answers, we further used several validating checks, look-
ing for randomly filled questionnaires, lazy patterns, failure in answering control questions, and time
constraints. Subsequently, we used the feedback from n=165 participants (WINE n=55, Bakery n=53,
C-MAPSS n=57). The survey data is available at Herm et al. (2021a). Out of those n=165 participants,
n=98 are male, while n=66 are female and n=1 diverse. Most of the participants are of age between 20
and 30 (≈58%) or between 31 and 40 (≈24%.). Most answers came from Europe (≈89%). Overall, on a
five-point Likert-Scale, the participants shared a medium (median) willingness to accept AI at their
workplace and a medium (median) trust in AI.
3.3.4.2 Result Analysis
In the following, we present the survey results according to the study structure. First, we detail the results
of the participants’ perceived explainability per model. This is followed by the selection of the inter-
viewees’ preferred ML model to solve problems. inally, we discuss the comprehension tasks (retention,
transfer, and recall). The calculated results can be found in Table 22. They are presented per scenario,
ML model and question, subdivided into perceived explainability, retention, transfer, and recall. Fur-
thermore, the table includes standard deviations, aggregated, mean and min-max-normalized results to
support generic insights according to the theoretical assumption (Boone and Boone 2012).
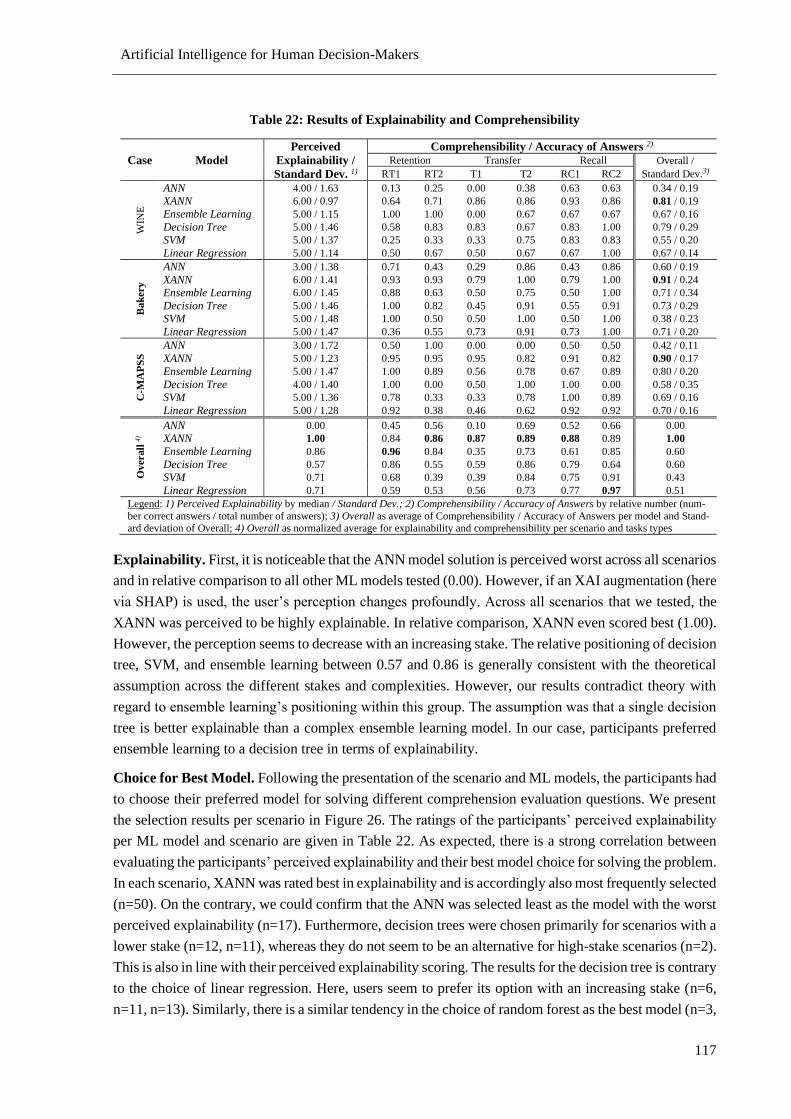
Artificial Intelligence for Human Decision-Makers
117
Table 22: Results of Explainability and Comprehensibility
Case Model
Perceived
Explainability /
Standard Dev. 1)
Comprehensibility / Accuracy of Answers 2)
Retention Transfer Recall Overall /
Standard Dev.3) RT1 RT2 T1 T2 RC1 RC2
WIN
E
ANN 4.00 / 1.63 0.13 0.25 0.00 0.38 0.63 0.63 0.34 / 0.19
XANN 6.00 / 0.97 0.64 0.71 0.86 0.86 0.93 0.86 0.81 / 0.19
Ensemble Learning 5.00 / 1.15 1.00 1.00 0.00 0.67 0.67 0.67 0.67 / 0.16
Decision Tree 5.00 / 1.46 0.58 0.83 0.83 0.67 0.83 1.00 0.79 / 0.29
SVM 5.00 / 1.37 0.25 0.33 0.33 0.75 0.83 0.83 0.55 / 0.20
Linear Regression 5.00 / 1.14 0.50 0.67 0.50 0.67 0.67 1.00 0.67 / 0.14
Ba
kery
ANN 3.00 / 1.38 0.71 0.43 0.29 0.86 0.43 0.86 0.60 / 0.19
XANN 6.00 / 1.41 0.93 0.93 0.79 1.00 0.79 1.00 0.91 / 0.24
Ensemble Learning 6.00 / 1.45 0.88 0.63 0.50 0.75 0.50 1.00 0.71 / 0.34
Decision Tree 5.00 / 1.46 1.00 0.82 0.45 0.91 0.55 0.91 0.73 / 0.29
SVM 5.00 / 1.48 1.00 0.50 0.50 1.00 0.50 1.00 0.38 / 0.23
Linear Regression 5.00 / 1.47 0.36 0.55 0.73 0.91 0.73 1.00 0.71 / 0.20
C-M
AP
SS
ANN 3.00 / 1.72 0.50 1.00 0.00 0.00 0.50 0.50 0.42 / 0.11
XANN 5.00 / 1.23 0.95 0.95 0.95 0.82 0.91 0.82 0.90 / 0.17
Ensemble Learning 5.00 / 1.47 1.00 0.89 0.56 0.78 0.67 0.89 0.80 / 0.20
Decision Tree 4.00 / 1.40 1.00 0.00 0.50 1.00 1.00 0.00 0.58 / 0.35
SVM 5.00 / 1.36 0.78 0.33 0.33 0.78 1.00 0.89 0.69 / 0.16
Linear Regression 5.00 / 1.28 0.92 0.38 0.46 0.62 0.92 0.92 0.70 / 0.16
Ov
erall
4)
ANN 0.00 0.45 0.56 0.10 0.69 0.52 0.66 0.00
XANN 1.00 0.84 0.86 0.87 0.89 0.88 0.89 1.00
Ensemble Learning 0.86 0.96 0.84 0.35 0.73 0.61 0.85 0.60
Decision Tree 0.57 0.86 0.55 0.59 0.86 0.79 0.64 0.60
SVM 0.71 0.68 0.39 0.39 0.84 0.75 0.91 0.43
Linear Regression 0.71 0.59 0.53 0.56 0.73 0.77 0.97 0.51
Legend: 1) Perceived Explainability by median / Standard Dev.; 2) Comprehensibility / Accuracy of Answers by relative number (num-
ber correct answers / total number of answers); 3) Overall as average of Comprehensibility / Accuracy of Answers per model and Stand-ard deviation of Overall; 4) Overall as normalized average for explainability and comprehensibility per scenario and tasks types
Explainability. First, it is noticeable that the ANN model solution is perceived worst across all scenarios
and in relative comparison to all other ML models tested (0.00). However, if an XAI augmentation (here
via SHAP) is used, the user’s perception changes profoundly. Across all scenarios that we tested, the
XANN was perceived to be highly explainable. In relative comparison, XANN even scored best (1.00).
However, the perception seems to decrease with an increasing stake. The relative positioning of decision
tree, SVM, and ensemble learning between 0.57 and 0.86 is generally consistent with the theoretical
assumption across the different stakes and complexities. However, our results contradict theory with
regard to ensemble learning’s positioning within this group. The assumption was that a single decision
tree is better explainable than a complex ensemble learning model. In our case, participants preferred
ensemble learning to a decision tree in terms of explainability.
Choice for Best Model. Following the presentation of the scenario and ML models, the participants had
to choose their preferred model for solving different comprehension evaluation questions. We present
the selection results per scenario in Figure 26. The ratings of the participants’ perceived explainability
per ML model and scenario are given in Table 22. As expected, there is a strong correlation between
evaluating the participants’ perceived explainability and their best model choice for solving the problem.
In each scenario, XANN was rated best in explainability and is accordingly also most frequently selected
(n=50). On the contrary, we could confirm that the ANN was selected least as the model with the worst
perceived explainability (n=17). Furthermore, decision trees were chosen primarily for scenarios with a
lower stake (n=12, n=11), whereas they do not seem to be an alternative for high-stake scenarios (n=2).
This is also in line with their perceived explainability scoring. The results for the decision tree is contrary
to the choice of linear regression. Here, users seem to prefer its option with an increasing stake (n=6,
n=11, n=13). Similarly, there is a similar tendency in the choice of random forest as the best model (n=3,
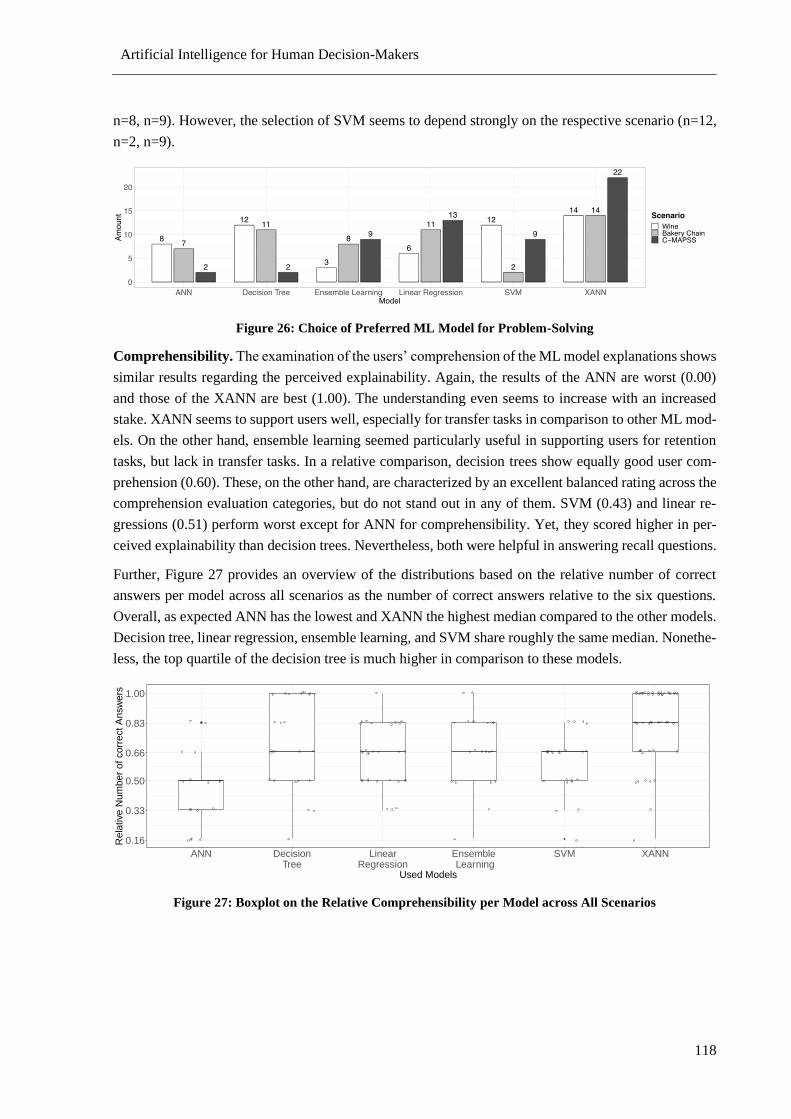
Artificial Intelligence for Human Decision-Makers
118
n=8, n=9). However, the selection of SVM seems to depend strongly on the respective scenario (n=12,
n=2, n=9).
Figure 26: Choice of Preferred ML Model for Problem-Solving
Comprehensibility. The examination of the users’ comprehension of the ML model explanations shows
similar results regarding the perceived explainability. Again, the results of the ANN are worst (0.00)
and those of the XANN are best (1.00). The understanding even seems to increase with an increased
stake. XANN seems to support users well, especially for transfer tasks in comparison to other ML mod-
els. On the other hand, ensemble learning seemed particularly useful in supporting users for retention
tasks, but lack in transfer tasks. In a relative comparison, decision trees show equally good user com-
prehension (0.60). These, on the other hand, are characterized by an excellent balanced rating across the
comprehension evaluation categories, but do not stand out in any of them. SVM (0.43) and linear re-
gressions (0.51) perform worst except for ANN for comprehensibility. Yet, they scored higher in per-
ceived explainability than decision trees. Nevertheless, both were helpful in answering recall questions.
Further, Figure 27 provides an overview of the distributions based on the relative number of correct
answers per model across all scenarios as the number of correct answers relative to the six questions.
Overall, as expected ANN has the lowest and XANN the highest median compared to the other models.
Decision tree, linear regression, ensemble learning, and SVM share roughly the same median. Nonethe-
less, the top quartile of the decision tree is much higher in comparison to these models.
Figure 27: Boxplot on the Relative Comprehensibility per Model across All Scenarios
0.16
0.33
0.50
0.66
0.83
1.00
ANN DecisionTree
LinearRegression
Ensemble Learning
SVM XANN
Used Models
Rela
tive
Num
be
r o
f corr
ect A
nsw
ers
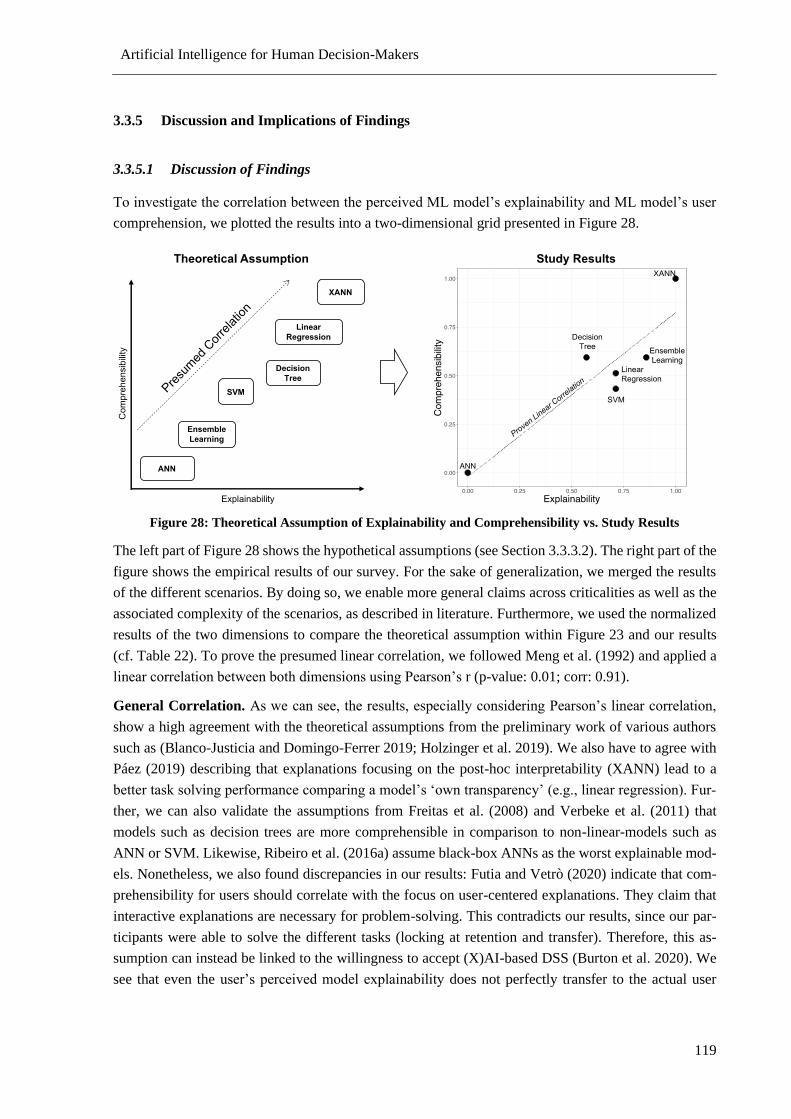
Artificial Intelligence for Human Decision-Makers
119
3.3.5 Discussion and Implications of Findings
3.3.5.1 Discussion of Findings
To investigate the correlation between the perceived ML model’s explainability and ML model’s user
comprehension, we plotted the results into a two-dimensional grid presented in Figure 28.
Figure 28: Theoretical Assumption of Explainability and Comprehensibility vs. Study Results
The left part of Figure 28 shows the hypothetical assumptions (see Section 3.3.3.2). The right part of the
figure shows the empirical results of our survey. For the sake of generalization, we merged the results
of the different scenarios. By doing so, we enable more general claims across criticalities as well as the
associated complexity of the scenarios, as described in literature. Furthermore, we used the normalized
results of the two dimensions to compare the theoretical assumption within Figure 23 and our results
(cf. Table 22). To prove the presumed linear correlation, we followed Meng et al. (1992) and applied a
linear correlation between both dimensions using Pearson’s r (p-value: 0.01; corr: 0.91).
General Correlation. As we can see, the results, especially considering Pearson’s linear correlation,
show a high agreement with the theoretical assumptions from the preliminary work of various authors
such as (Blanco-Justicia and Domingo-Ferrer 2019; Holzinger et al. 2019). We also have to agree with
Páez (2019) describing that explanations focusing on the post-hoc interpretability (XANN) lead to a
better task solving performance comparing a model’s ‘own transparency’ (e.g., linear regression). ur-
ther, we can also validate the assumptions from Freitas et al. (2008) and Verbeke et al. (2011) that
models such as decision trees are more comprehensible in comparison to non-linear-models such as
ANN or SVM. Likewise, Ribeiro et al. (2016a) assume black-box ANNs as the worst explainable mod-
els. Nonetheless, we also found discrepancies in our results: Futia and Vetrò (2020) indicate that com-
prehensibility for users should correlate with the focus on user-centered explanations. They claim that
interactive explanations are necessary for problem-solving. This contradicts our results, since our par-
ticipants were able to solve the different tasks (locking at retention and transfer). Therefore, this as-
sumption can instead be linked to the willingness to accept (X)AI-based DSS (Burton et al. 2020). We
see that even the user’s perceived model explainability does not perfectly transfer to the actual user
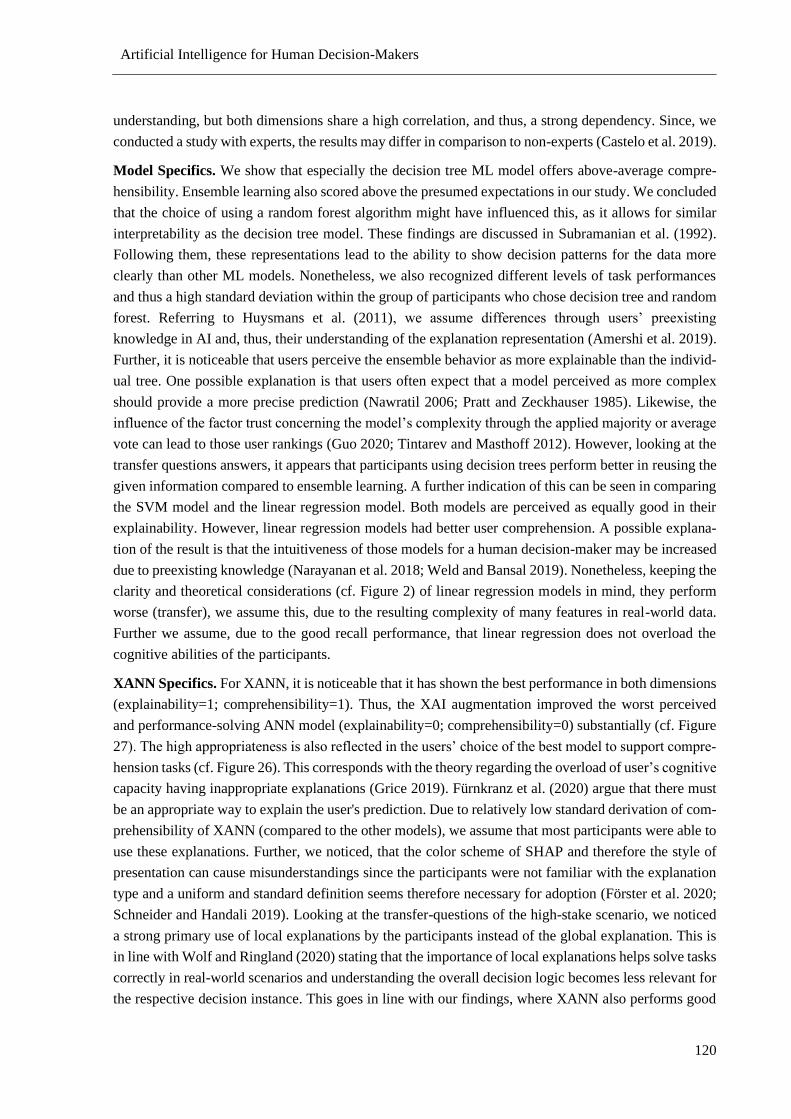
Artificial Intelligence for Human Decision-Makers
120
understanding, but both dimensions share a high correlation, and thus, a strong dependency. Since, we
conducted a study with experts, the results may differ in comparison to non-experts (Castelo et al. 2019).
Model Specifics. We show that especially the decision tree ML model offers above-average compre-
hensibility. Ensemble learning also scored above the presumed expectations in our study. We concluded
that the choice of using a random forest algorithm might have influenced this, as it allows for similar
interpretability as the decision tree model. These findings are discussed in Subramanian et al. (1992).
Following them, these representations lead to the ability to show decision patterns for the data more
clearly than other ML models. Nonetheless, we also recognized different levels of task performances
and thus a high standard deviation within the group of participants who chose decision tree and random
forest. Referring to Huysmans et al. (2011), we assume differences through users’ preexisting
knowledge in AI and, thus, their understanding of the explanation representation (Amershi et al. 2019).
Further, it is noticeable that users perceive the ensemble behavior as more explainable than the individ-
ual tree. One possible explanation is that users often expect that a model perceived as more complex
should provide a more precise prediction (Nawratil 2006; Pratt and Zeckhauser 1985). Likewise, the
influence of the factor trust concerning the model’s complexity through the applied majority or average
vote can lead to those user rankings (Guo 2020; Tintarev and Masthoff 2012). However, looking at the
transfer questions answers, it appears that participants using decision trees perform better in reusing the
given information compared to ensemble learning. A further indication of this can be seen in comparing
the SVM model and the linear regression model. Both models are perceived as equally good in their
explainability. However, linear regression models had better user comprehension. A possible explana-
tion of the result is that the intuitiveness of those models for a human decision-maker may be increased
due to preexisting knowledge (Narayanan et al. 2018; Weld and Bansal 2019). Nonetheless, keeping the
clarity and theoretical considerations (cf. Figure 2) of linear regression models in mind, they perform
worse (transfer), we assume this, due to the resulting complexity of many features in real-world data.
Further we assume, due to the good recall performance, that linear regression does not overload the
cognitive abilities of the participants.
XANN Specifics. For XANN, it is noticeable that it has shown the best performance in both dimensions
(explainability=1; comprehensibility=1). Thus, the XAI augmentation improved the worst perceived
and performance-solving ANN model (explainability=0; comprehensibility=0) substantially (cf. Figure
27). The high appropriateness is also reflected in the users’ choice of the best model to support compre-
hension tasks (cf. Figure 26). This corresponds with the theory regarding the overload of user’s cognitive
capacity having inappropriate explanations (Grice 2019). Fürnkranz et al. (2020) argue that there must
be an appropriate way to explain the user's prediction. Due to relatively low standard derivation of com-
prehensibility of XANN (compared to the other models), we assume that most participants were able to
use these explanations. Further, we noticed, that the color scheme of SHAP and therefore the style of
presentation can cause misunderstandings since the participants were not familiar with the explanation
type and a uniform and standard definition seems therefore necessary for adoption (Förster et al. 2020;
Schneider and Handali 2019). Looking at the transfer-questions of the high-stake scenario, we noticed
a strong primary use of local explanations by the participants instead of the global explanation. This is
in line with Wolf and Ringland (2020) stating that the importance of local explanations helps solve tasks
correctly in real-world scenarios and understanding the overall decision logic becomes less relevant for
the respective decision instance. This goes in line with our findings, where XANN also performs good
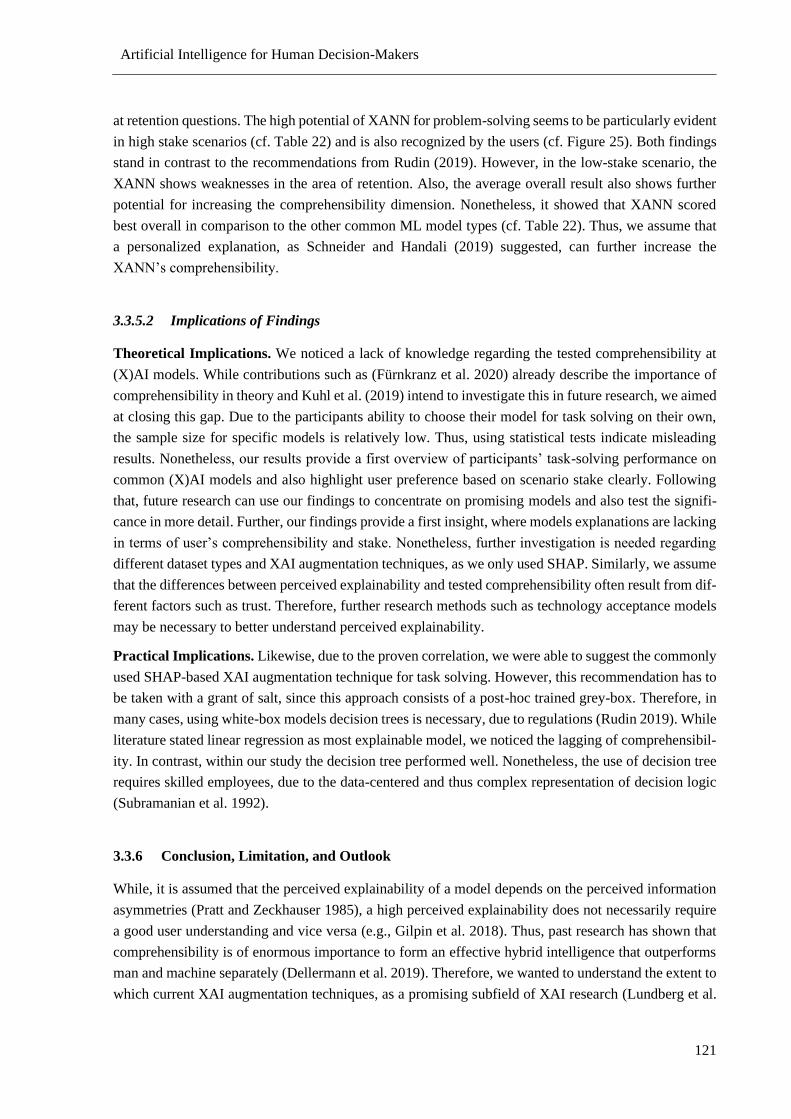
Artificial Intelligence for Human Decision-Makers
121
at retention questions. The high potential of XANN for problem-solving seems to be particularly evident
in high stake scenarios (cf. Table 22) and is also recognized by the users (cf. Figure 25). Both findings
stand in contrast to the recommendations from Rudin (2019). However, in the low-stake scenario, the
XANN shows weaknesses in the area of retention. Also, the average overall result also shows further
potential for increasing the comprehensibility dimension. Nonetheless, it showed that XANN scored
best overall in comparison to the other common ML model types (cf. Table 22). Thus, we assume that
a personalized explanation, as Schneider and Handali (2019) suggested, can further increase the
XANN’s comprehensibility.
3.3.5.2 Implications of Findings
Theoretical Implications. We noticed a lack of knowledge regarding the tested comprehensibility at
(X)AI models. While contributions such as (Fürnkranz et al. 2020) already describe the importance of
comprehensibility in theory and Kuhl et al. (2019) intend to investigate this in future research, we aimed
at closing this gap. Due to the participants ability to choose their model for task solving on their own,
the sample size for specific models is relatively low. Thus, using statistical tests indicate misleading
results. Nonetheless, our results provide a first overview of participants’ task-solving performance on
common (X)AI models and also highlight user preference based on scenario stake clearly. Following
that, future research can use our findings to concentrate on promising models and also test the signifi-
cance in more detail. Further, our findings provide a first insight, where models explanations are lacking
in terms of user’s comprehensibility and stake. Nonetheless, further investigation is needed regarding
different dataset types and XAI augmentation techniques, as we only used SHAP. Similarly, we assume
that the differences between perceived explainability and tested comprehensibility often result from dif-
ferent factors such as trust. Therefore, further research methods such as technology acceptance models
may be necessary to better understand perceived explainability.
Practical Implications. Likewise, due to the proven correlation, we were able to suggest the commonly
used SHAP-based XAI augmentation technique for task solving. However, this recommendation has to
be taken with a grant of salt, since this approach consists of a post-hoc trained grey-box. Therefore, in
many cases, using white-box models decision trees is necessary, due to regulations (Rudin 2019). While
literature stated linear regression as most explainable model, we noticed the lagging of comprehensibil-
ity. In contrast, within our study the decision tree performed well. Nonetheless, the use of decision tree
requires skilled employees, due to the data-centered and thus complex representation of decision logic
(Subramanian et al. 1992).
3.3.6 Conclusion, Limitation, and Outlook
While, it is assumed that the perceived explainability of a model depends on the perceived information
asymmetries (Pratt and Zeckhauser 1985), a high perceived explainability does not necessarily require
a good user understanding and vice versa (e.g., Gilpin et al. 2018). Thus, past research has shown that
comprehensibility is of enormous importance to form an effective hybrid intelligence that outperforms
man and machine separately (Dellermann et al. 2019). Therefore, we wanted to understand the extent to
which current XAI augmentation techniques, as a promising subfield of XAI research (Lundberg et al.
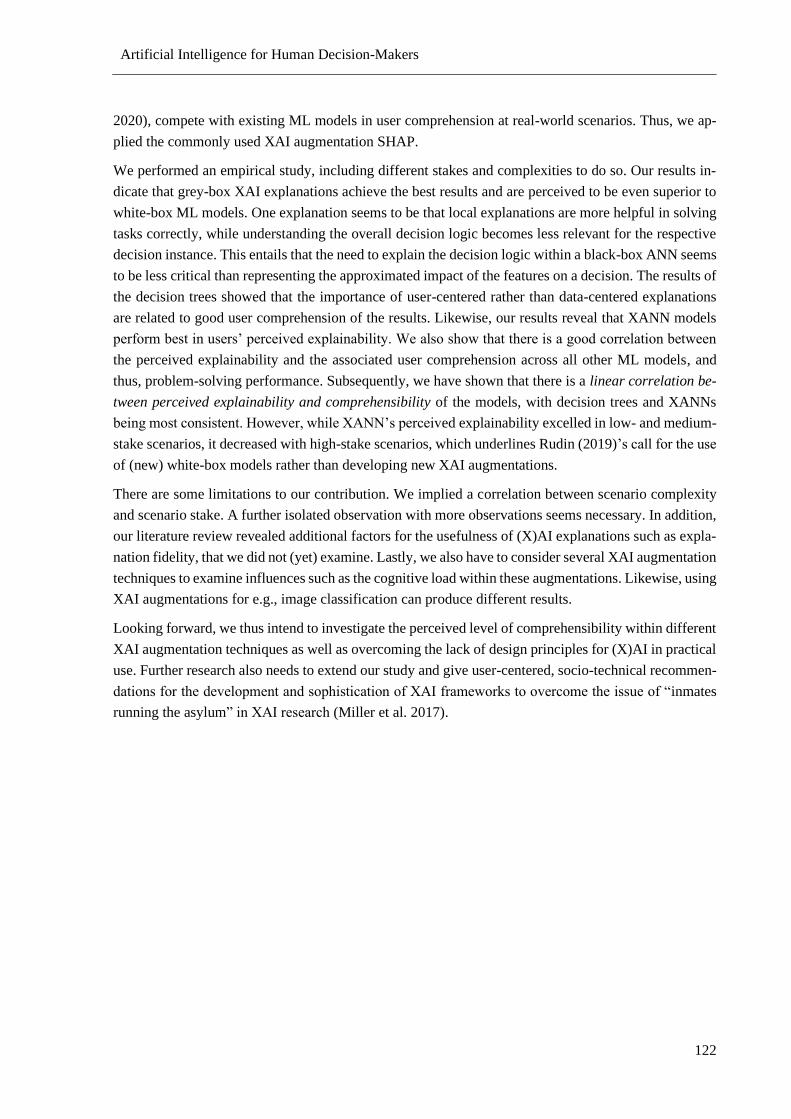
Artificial Intelligence for Human Decision-Makers
122
2020), compete with existing ML models in user comprehension at real-world scenarios. Thus, we ap-
plied the commonly used XAI augmentation SHAP.
We performed an empirical study, including different stakes and complexities to do so. Our results in-
dicate that grey-box XAI explanations achieve the best results and are perceived to be even superior to
white-box ML models. One explanation seems to be that local explanations are more helpful in solving
tasks correctly, while understanding the overall decision logic becomes less relevant for the respective
decision instance. This entails that the need to explain the decision logic within a black-box ANN seems
to be less critical than representing the approximated impact of the features on a decision. The results of
the decision trees showed that the importance of user-centered rather than data-centered explanations
are related to good user comprehension of the results. Likewise, our results reveal that XANN models
perform best in users’ perceived explainability. We also show that there is a good correlation between
the perceived explainability and the associated user comprehension across all other ML models, and
thus, problem-solving performance. Subsequently, we have shown that there is a linear correlation be-
tween perceived explainability and comprehensibility of the models, with decision trees and XANNs
being most consistent. However, while XANN’s perceived explainability excelled in low- and medium-
stake scenarios, it decreased with high-stake scenarios, which underlines Rudin (2019)’s call for the use
of (new) white-box models rather than developing new XAI augmentations.
There are some limitations to our contribution. We implied a correlation between scenario complexity
and scenario stake. A further isolated observation with more observations seems necessary. In addition,
our literature review revealed additional factors for the usefulness of (X)AI explanations such as expla-
nation fidelity, that we did not (yet) examine. Lastly, we also have to consider several XAI augmentation
techniques to examine influences such as the cognitive load within these augmentations. Likewise, using
XAI augmentations for e.g., image classification can produce different results.
Looking forward, we thus intend to investigate the perceived level of comprehensibility within different
XAI augmentation techniques as well as overcoming the lack of design principles for (X)AI in practical
use. Further research also needs to extend our study and give user-centered, socio-technical recommen-
dations for the development and sophistication of XAI frameworks to overcome the issue of “inmates
running the asylum” in XAI research (Miller et al. 2017).
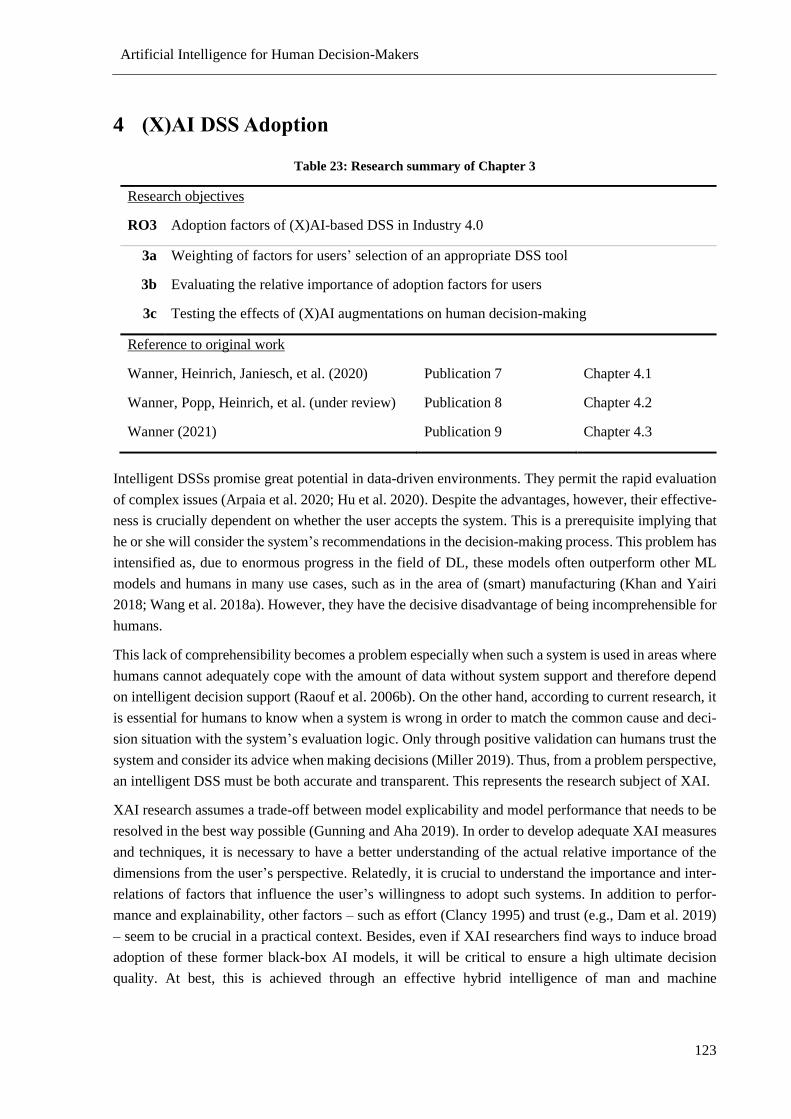
Artificial Intelligence for Human Decision-Makers
123
4 (X)AI SS Adoption
Table 23: Research summary of Chapter 3
Research objectives
RO3 Adoption factors of (X)AI-based DSS in Industry 4.0
3a Weighting of factors for users’ selection of an appropriate DSS tool
3b Evaluating the relative importance of adoption factors for users
3c Testing the effects of (X)AI augmentations on human decision-making
Reference to original work
Wanner, Heinrich, Janiesch, et al. (2020) Publication 7 Chapter 4.1
Wanner, Popp, Heinrich, et al. (under review) Publication 8 Chapter 4.2
Wanner (2021) Publication 9 Chapter 4.3
Intelligent DSSs promise great potential in data-driven environments. They permit the rapid evaluation
of complex issues (Arpaia et al. 2020; Hu et al. 2020). Despite the advantages, however, their effective-
ness is crucially dependent on whether the user accepts the system. This is a prerequisite implying that
he or she will consider the system’s recommendations in the decision-making process. This problem has
intensified as, due to enormous progress in the field of DL, these models often outperform other ML
models and humans in many use cases, such as in the area of (smart) manufacturing (Khan and Yairi
2018; Wang et al. 2018a). However, they have the decisive disadvantage of being incomprehensible for
humans.
This lack of comprehensibility becomes a problem especially when such a system is used in areas where
humans cannot adequately cope with the amount of data without system support and therefore depend
on intelligent decision support (Raouf et al. 2006b). On the other hand, according to current research, it
is essential for humans to know when a system is wrong in order to match the common cause and deci-
sion situation with the system’s evaluation logic. Only through positive validation can humans trust the
system and consider its advice when making decisions (Miller 2019). Thus, from a problem perspective,
an intelligent DSS must be both accurate and transparent. This represents the research subject of XAI.
XAI research assumes a trade-off between model explicability and model performance that needs to be
resolved in the best way possible (Gunning and Aha 2019). In order to develop adequate XAI measures
and techniques, it is necessary to have a better understanding of the actual relative importance of the
dimensions from the user’s perspective. Relatedly, it is crucial to understand the importance and inter-
relations of factors that influence the user’s willingness to adopt such systems. In addition to perfor-
mance and explainability, other factors – such as effort (Clancy 1995) and trust (e.g., Dam et al. 2019)
– seem to be crucial in a practical context. Besides, even if XAI researchers find ways to induce broad
adoption of these former black-box AI models, it will be critical to ensure a high ultimate decision
quality. At best, this is achieved through an effective hybrid intelligence of man and machine
Artificial Intelligence for Human Decision-Makers
124
(Dellermann et al. 2019). However, there is still debate as to whether this is the most powerful form or
whether man and machine separately outperform the hybrid one (Lai and Tan 2019; Zhang et al. 2020).
A better understanding of the adoption factors of (X)AI-based DSSs is necessary (RO3, cf. Table 23).
Chapter 4 explores the significance of individual factors in relation to the readiness of system users to
adopt. On the one hand, this will be done in the respective industry context on the basis of a selection of
concrete AI-based DSS prototypes (3a). It is also important to understand the other influential factors
that condition such a system selection and the associated readiness to adopt. This also implies the ne-
cessity of understanding whether there are indirect links between the factors in order not to derive false
conclusions (3b). Furthermore, it is important to clarify the extent to which such (X)AI-based DSSs
bring about an actual change in human decision-making and with what consequences in terms of deci-
sion quality (3c).
4.1 Decision Factors for AI-based DSS Adoption
Abstract. Artificial intelligence (AI) based on machine learning technology disrupts how knowledge is
gained. Nevertheless, ML’s improved accuracy of prediction comes at the cost of low traceability due
to its black-box nature. The field of explainable AI tries to counter this. However, for practical use in IT
projects, these two research streams offer only partial advice for AI adoption as the trade-off between
accuracy and explainability has not been adequately discussed yet. Thus, we simulate a decision process
by implementing three best practice AI-based decision support systems for a high-stake maintenance
decision scenario and evaluate the decision and attitude factors using the Analytical Hierarchy Process
(AHP) through an expert survey. The combined results indicate that system performance is still the most
important factor and that implementation effort and explainability are relatively even factors. Further,
we found that systems using similarity-based matching or direct modeling for remaining useful life es-
timation performed best.9
4.1.1 Introduction
In 2017, Gartner declared ‘Artificial Intelligence (AI) everywhere’ a mega-trend and called it the most
disruptive class of technologies over the next decade and its hype as well as its promise has not faded
since (Panetta 2017). A major reason is today’s ubiquitous use of IT and enhanced sensor technology
that facilitate the generation of large amounts of data, providing an ideal starting point for knowledge
discovery and improved decision support (Carvalho et al. 2019b; Zschech et al. 2019). This new way of
gaining knowledge holds great potential especially in critical areas such as cancer diagnostics in medical
science, machinery and vehicle maintenance, or in autonomous driving.
9 This paper is published within the 41st International Conference on Information Systems (ICIS) as ‘How Much
AI Do You Require? Decision actors for Adopting AI Technology’ (Wanner et al. 2020). The paper won the Best
Student Paper Award of the track ‘IT Implementation and Adoption’ and was nominated as Best Student Paper of
the 41st ICIS conference.
Artificial Intelligence for Human Decision-Makers
125
To process the data and to gain new insights, advanced AI capabilities are used that are based primarily
on algorithms from the field of machine learning (ML). Here, artificial neural networks (ANN) are par-
ticularly promising as they are able to identify complex nonlinear relationships within large datasets
based on flexible mathematical models (Miller and Brown 2018). Especially in tasks related to high-
dimensional data, such as classification and regression, ML algorithms show good applicability. By
learning from previous computations and extracting regularities from given examples, they can produce
accurate models and repeatable decisions. On the downside, AI-based decision support systems (AI
DSS) have the disadvantage that the processing mechanisms and their results are often difficult to re-
produce as ML algorithms usually show black-box characteristics (Miller and Brown 2018). Thus, de-
cision support based on a ‘black box’ AI model might not be fully explained or understood (Siau and
Wang 2018). This could lead to users not accepting the system and consequently, not using it (Dam et
al. 2018). Still, in domains where a lot of input information needs to be processed for decision making,
experts have to rely on automated, intelligent decision support (Raouf et al. 2006a). As a result, humans
need to align their common cause and effect evaluation of the decision situation with the assessment
reasoning of the system to accept the decision of the AI system (Miller 2019). This creates a dilemma
between the demand for accurate vs. transparent DSS, which is the object of research on explainable AI
(XAI) (Wanner et al. 2020c). Consequently, XAI aims at a high degree of model explanation while
maintaining the best performance possible (Gunning and Aha 2019).
While research focuses on these two areas, practical issue such as environmental constraints and indi-
vidual user preferences seem to be ignored. In particular, only cost and time seem to be considered as
crucial in (IT) projects (Clancy 1995; Lech 2013). Hence, today, we observe rather isolated research on
either model accuracy or model explainability. Yet in contrast, decisions towards adopting complex
technologies are very complex and are subject to a range of cognitive bias, especially for applications
that involve high-stake decisions and therefore are of high criticality (Das and Teng 1999). We under-
stand high-stake decisions as those where a wrong or late decision can result in the loss of human lives.
With this research, we want to explore the human factor in AI adoption. We aim to understand the
variables influencing the decision of choosing a particular AI technology for decision support in appli-
cations involving high-stake decisions (Stefani and Zschech 2018). Consequently, our research question
is as follows:
RQ: Which factors are of importance when choosing an AI DSS for high-stake decisions, and how can
we characterize the trade-off between different AI DSS implementations?
In order to answer this question, we derive decision factors and from the related domains ML, XAI, and
IT project management. Then, we propose observable measurements for those factors. After modeling
the decision as a hierarchy of decision factors and superior decision categories, we gather judgements
on factor importance from a survey. Lastly, we simulate the decision process for the case of a high-stake
maintenance scenario and weigh the proposed decision factors as a result of the survey.
Our research yields several contributions: First, we derive a theoretical construct of measurement vari-
ables from the interdisciplinary field of AI adoption, which is based on well-founded scientific theories
of Information Systems and Business Research and can also form the basis for further AI research.
Second, our research involves the derivation and implementation of best practices of AI DSS for the
case of high-stake maintenance, which are highly relevant for practical application. Third, our end-user-
Artificial Intelligence for Human Decision-Makers
126
based study results allow for a better understanding of the significance of decision criteria for AI adop-
tion. On the one hand, this benefits research, which can focus on promising approaches in addition to
further evaluation possibilities, and on the other hand, practice benefits from the decision model and
proposed measurements for implementing their own decision process.
Our paper is structured accordingly: In the next section, we present the theoretical background and de-
rive evaluation factors in terms of decision and attitude factors for AI-based system adoption. Subse-
quently, we depict our research methodology and describe the use case, followed by the introduction of
a measurement model for the decision factors as well as the high-stake maintenance case. We then pro-
ceed to introduce the decision model, describe the survey setup, and present our results. In the last sec-
tion, we summarize our contribution, discuss limitations, and present an outlook of further research
opportunities.
4.1.2 Foundations, Related Work and Derivation of Evaluation Factors
4.1.2.1 AI-based Decision Support Systems
From an economic point of view, a decision is an intellectual effort to make the best possible choice to
given circumstances. For a decision maker, information is the key to understand these circumstances
and make the best possible judgement. Due to the increasing use of information systems in daily busi-
ness, both the complexity and the amount of available information is growing (Bonczek et al. 2014).
Research on decision support tries to address this by providing support for the decision-maker using
modern techniques and optimization theory. To be more specific, a decision support system encapsulates
complexity and allows combining personal assessments about a necessary decision (problem) with com-
puter output in a user-machine interface. In this way, it produces meaningful information for support in
a decision-making process (Simonovic 1999). Through the years, these systems have developed into
‘intelligent’ systems called AI DSS (Bonczek et al. 2014). AI DSS are able to iteratively learn from
empirical data, allowing them to find non-linear relations and complex patterns without being explicitly
programmed (Bishop 2006).
Beyond the possibilities, however, there is the problem that decision makers must adopt and use the
system and its underlying information for its advice to be effective. This leads to the research area of
technology acceptance. A key construct of the related Unified Theory of Acceptance and Use of Tech-
nology (UTAUT) model is the user’s performance expectancy. It is defined as the degree to which an
individual perceives that using an information system will help him or her to attain an increase in his or
her job performance (Venkatesh et al. 2003). AI research, as the backbone of AI DSS, is therefore con-
cerned with the continuous improvement and expansion of algorithms. The basic quality of an AI algo-
rithm is measured on two kinds of indicators: prediction value (PV) and inference time (IFT) (e.g., Lane
et al. 2016). The former refers to the prognostic power of the algorithm model. The latter is defined as
the trained model’s delay in the calculation of a new data input in practice. Both can lead to consequen-
tial costs.
Thus, recent research efforts are particularly directed towards the development and application of ANN
with increasingly deeper architectures often summarized as deep learning (DL) (Zschech et al. 2019).
These show a high prediction value with parallel low inference time. Their multi-layered architecture
Artificial Intelligence for Human Decision-Makers
127
allows them to be fed with high-dimensional raw input data and then automatically discover internal
representations at different levels of abstraction (LeCun et al. 2015). DL approaches currently outper-
form traditional models for most applications, which constitutes them as state-of-the-art in the field of
data-driven practical ML implementation, for example in the field of (smart) maintenance (Khan and
Yairi 2018; Wang et al. 2018a).
4.1.2.2 Demand of Explainable AI-Systems
The high performance of ML and especially DL models comes at certain costs, as their nested, non-
linear structure creates a lack of transparency by constructing internal high-degree interactions between
input features, which are difficult to disaggregate into a human-understandable form. In other words, it
is not clear what information in the input data drives the models to generate their decisions. Therefore,
they are typically regarded as ‘black boxes’ (Samek et al. 2017). Although not every practical task might
require an explainable decision model, because it may be more important, for example, to prevent a
failure than to understand its cause (Dragomir et al. 2009), the lack of explainability still poses problem
for accepting an AI decision support system. For human intelligence, it is generally an important aspect
to be able to explain the rationale behind one’s decision, while simultaneously it can be considered as a
prerequisite for establishing a trustworthy relationship (Samek et al. 2017).
Trust issues in the context of an agency theory setup can result from the information asymmetry between
the AI DSS (agent) and its user (principal) (Kleine 1995). Due to the absence of knowledge about the
inner functions of the AI DSS, the user cannot effectively validate whether the system operates within
his interests or if is the subject of adversarial alteration (Heinrich et al. 2020). The missing observability
of the decision process as a property of black-box models renders it difficult to detect possible deviations
from the user’s expectations. While a black-box AI DSS has no ability to ‘act in its own interest’ as it
lacks an own agenda, its decision making process is not observable on its own, resulting in issues com-
parable to a moral hazard that can be avoided by increasing observability through measures of algorith-
mic self-signaling by the AI DSS. This call for improved observability of the inner decision logic of an
AI DSS is in line with the XAI community’s demand for explainable models while maintaining a high
degree of model predictability (Gunning and Aha 2019).
In this case, explainability is about the understanding of the reasoning behind a decision by a human
observer (Dam et al. 2018). Thus, the degree of model explainability remains dependent on the respec-
tive end user. However, there is a distinction between two types of explanation: global explanation and
local explanation (Dam et al. 2018). The former offers a causal explanation (CE). It is about the process
of making an AI-based decision traceable by providing transparency into the decision model, its com-
ponents such as parameters, or its algorithm (Ras et al. 2018). For this purpose, the causal model of the
algorithm is of great importance. Local explanation is about a post-hoc interpretability of an AI-based
decision recommendation through textual explanations, graphical presentations, or examples (Lipton
2018). It aims at an appropriate type of visual explanation (VE) for intended users (Heinrich et al. 2019;
Miller 2019).
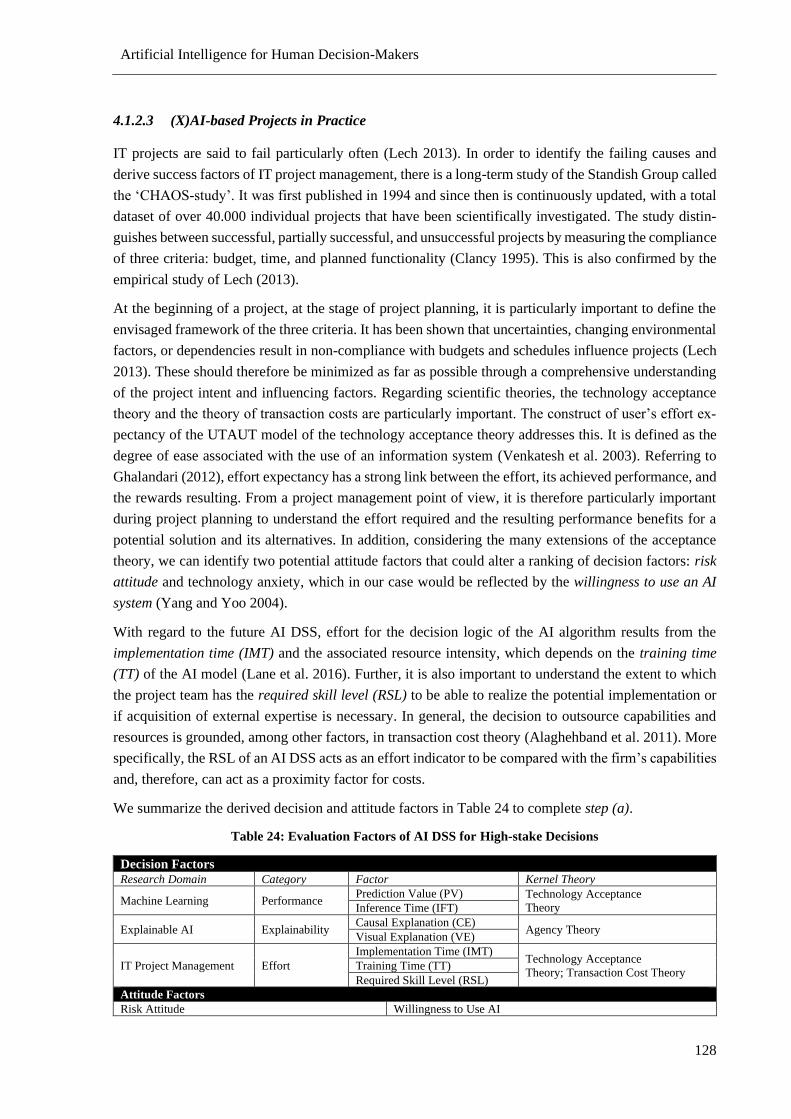
Artificial Intelligence for Human Decision-Makers
128
4.1.2.3 (X)AI-based Projects in Practice
IT projects are said to fail particularly often (Lech 2013). In order to identify the failing causes and
derive success factors of IT project management, there is a long-term study of the Standish Group called
the ‘CHAOS-study’. It was first published in 1994 and since then is continuously updated, with a total
dataset of over 40.000 individual projects that have been scientifically investigated. The study distin-
guishes between successful, partially successful, and unsuccessful projects by measuring the compliance
of three criteria: budget, time, and planned functionality (Clancy 1995). This is also confirmed by the
empirical study of Lech (2013).
At the beginning of a project, at the stage of project planning, it is particularly important to define the
envisaged framework of the three criteria. It has been shown that uncertainties, changing environmental
factors, or dependencies result in non-compliance with budgets and schedules influence projects (Lech
2013). These should therefore be minimized as far as possible through a comprehensive understanding
of the project intent and influencing factors. Regarding scientific theories, the technology acceptance
theory and the theory of transaction costs are particularly important. The construct of user’s effort ex-
pectancy of the UTAUT model of the technology acceptance theory addresses this. It is defined as the
degree of ease associated with the use of an information system (Venkatesh et al. 2003). Referring to
Ghalandari (2012), effort expectancy has a strong link between the effort, its achieved performance, and
the rewards resulting. From a project management point of view, it is therefore particularly important
during project planning to understand the effort required and the resulting performance benefits for a
potential solution and its alternatives. In addition, considering the many extensions of the acceptance
theory, we can identify two potential attitude factors that could alter a ranking of decision factors: risk
attitude and technology anxiety, which in our case would be reflected by the willingness to use an AI
system (Yang and Yoo 2004).
With regard to the future AI DSS, effort for the decision logic of the AI algorithm results from the
implementation time (IMT) and the associated resource intensity, which depends on the training time
(TT) of the AI model (Lane et al. 2016). Further, it is also important to understand the extent to which
the project team has the required skill level (RSL) to be able to realize the potential implementation or
if acquisition of external expertise is necessary. In general, the decision to outsource capabilities and
resources is grounded, among other factors, in transaction cost theory (Alaghehband et al. 2011). More
specifically, the RSL of an AI DSS acts as an effort indicator to be compared with the firm’s capabilities
and, therefore, can act as a proximity factor for costs.
We summarize the derived decision and attitude factors in Table 24 to complete step (a).
Table 24: Evaluation Factors of AI DSS for High-stake Decisions
Decision Factors Research Domain Category Factor Kernel Theory
Machine Learning Performance Prediction Value (PV) Technology Acceptance
Theory Inference Time (IFT)
Explainable AI Explainability Causal Explanation (CE)
Agency Theory Visual Explanation (VE)
IT Project Management Effort
Implementation Time (IMT) Technology Acceptance
Theory; Transaction Cost Theory Training Time (TT)
Required Skill Level (RSL)
Attitude Factors
Risk Attitude Willingness to Use AI
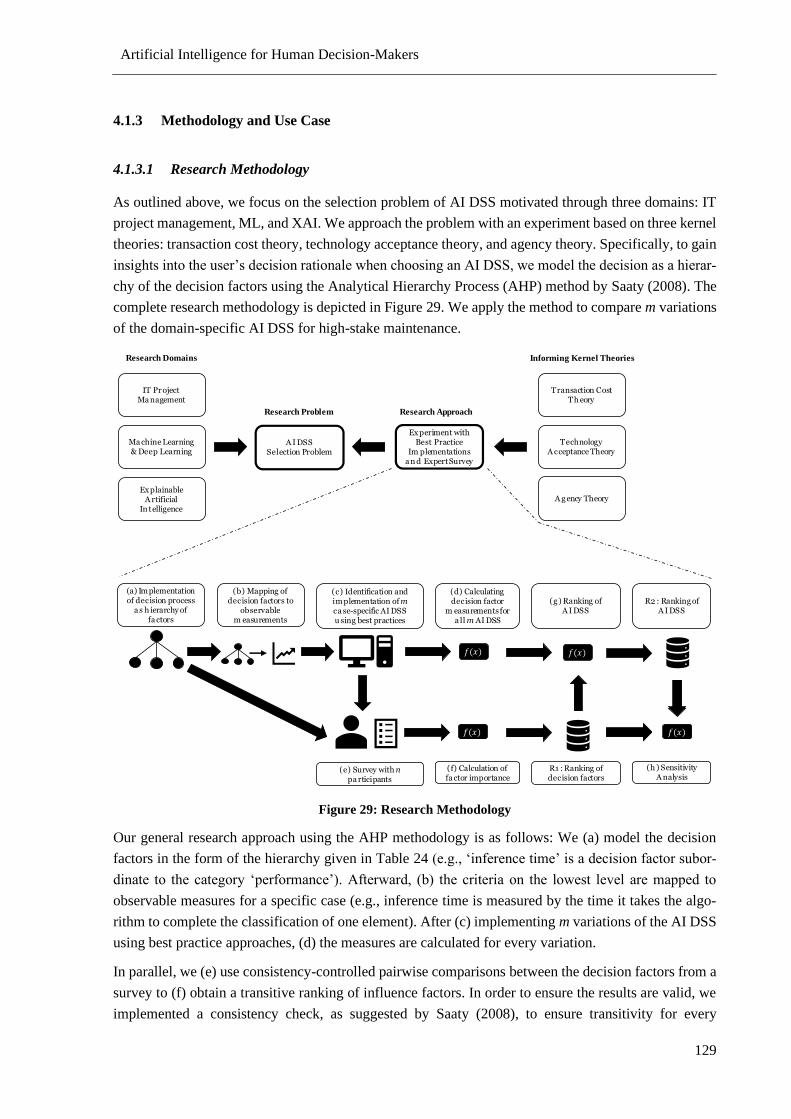
Artificial Intelligence for Human Decision-Makers
129
4.1.3 Methodology and Use Case
4.1.3.1 Research Methodology
As outlined above, we focus on the selection problem of AI DSS motivated through three domains: IT
project management, ML, and XAI. We approach the problem with an experiment based on three kernel
theories: transaction cost theory, technology acceptance theory, and agency theory. Specifically, to gain
insights into the user’s decision rationale when choosing an AI DSS, we model the decision as a hierar-
chy of the decision factors using the Analytical Hierarchy Process (AHP) method by Saaty (2008). The
complete research methodology is depicted in Figure 29. We apply the method to compare m variations
of the domain-specific AI DSS for high-stake maintenance.
Figure 29: Research Methodology
Our general research approach using the AHP methodology is as follows: We (a) model the decision
factors in the form of the hierarchy given in Table 24 (e.g., ‘inference time’ is a decision factor subor-
dinate to the category ‘performance’). Afterward, (b) the criteria on the lowest level are mapped to
observable measures for a specific case (e.g., inference time is measured by the time it takes the algo-
rithm to complete the classification of one element). After (c) implementing m variations of the AI DSS
using best practice approaches, (d) the measures are calculated for every variation.
In parallel, we (e) use consistency-controlled pairwise comparisons between the decision factors from a
survey to (f) obtain a transitive ranking of influence factors. In order to ensure the results are valid, we
implemented a consistency check, as suggested by Saaty (2008), to ensure transitivity for every
)
)
(e) Survey with npa rticipants
(c) Identification and implementation of mca se-specific AI DSS u sing best practices
(a) Implementation of decision process
a s h ierarchy of fa ctors
(f) Calculation of fa ctor importance
R1 : Ranking of decision factors
(b) Mapping of decision factors to
observable m easurements
(d) Calculating decision factor
m easurements for a ll m AI DSS
(g ) Ranking of A I DSS
)
R2 : Ranking of A I DSS
)
(h ) Sensitivity A nalysis
Ma chine Learning & Deep Learning
Ex plainable A rtificial
In telligence
A I DSS Selection Problem
Ex periment with Best Practice
Im plementations a n d Expert Survey
Technology A cceptance Theory
A g ency Theory
IT Pr oject Ma nagement
Transaction Cost Th eory
Informing Kernel TheoriesResearch Domains
Research Problem Research Approach
Artificial Intelligence for Human Decision-Makers
130
participant and his or her set of pairwise comparisons. The pairwise comparisons are carried out by
presenting a questionnaire to n potential expert users of the AI DSS using the nine-point Saaty scale
(1=equal importance, …, 9=extreme importance). As a result, we yield weights between 0 and 1 for the
decision factors and the superior decision categories. In order to observe the moderating effects summa-
rized in Table 1, we additionally included an item for each attitude factor using a five-point Likert scale.
Using the decision weight factors calculated in (f) and the measurements calculated in step (d), we can
(g) calculate an overall rating of the m AI DSS. As a result of the AHP approach, we yield a first ranking
(R1) of decision factor importance and, subsequently, a second ranking (R2) for the m AI DSS imple-
mentations. Finally, we conduct (h) a sensitivity analysis to explore the stability of the respective deci-
sions and weights regarding the individual attitude variables. In addition, we point out that step (d) is
independent of the use case so that the mapping can be adopted for other application areas that use AI
DSS.
4.1.3.2 Use Case of High-stake Condition-based Maintenance
Industrial maintenance is intended to maintain and restore operational readiness of machinery to keep
opportunity costs as low as possible. Related activities can be performed either i) after a break-down
occurred, ii) in periodic cycles, or iii) in a condition-based manner. As unplanned downtime costs up to
$250,000 per hour (Koochaki et al. 2011), or, in our specific case of high-stake maintenance cases, can
even put human lives at risk (Raouf et al. 2006a), a proactive condition-based maintenance (CBM) strat-
egy seems to be the most useful approach (Kothamasu et al. 2006). For this purpose, comprehensive
data collections are gathered and processed by a CBM system to assess the current state of the equipment
and derive recommendations for the optimal time of intervention (Jardine et al. 2006; Veldman et al.
2011). In contrast to reactive strategies, divergent machine behavior can be detected and classified at an
early stage by means of diagnostic techniques to avoid unnecessary work. Furthermore, by using suitable
indicators and prognostic techniques, it is possible to determine a machine’s future state or its remaining
useful life (RUL), which is often referred to as predictive maintenance (Elattar et al. 2016; Peng et al.
2010).
To support CBM prognostic tasks, corresponding DSS can be based on different principles and ap-
proaches. This includes physical models, knowledge-based approaches, statistical methods, or AI-based
approaches (Zschech 2018). Physical models are mathematical representations of physical processes,
such as specific degradation laws. They can provide accurate health information, as the remaining qual-
ity of the component or system of interest, but they also require a thorough understanding of underlying
mechanisms. Knowledge-based approaches are built on experiences from human experts. They can be
formalized, for example, by means of domain-specific rules or heuristics, which, however, are difficult
to obtain and hardly transferable to new contexts (Peng et al. 2010). Statistical methods, such as regres-
sion models, multivariate methods, and state-space models, use collected data observations to identify
and model relationships for prognostic purposes. They are useful to assess risks quantitatively, but also
heavily rely on assumptions of distributions, which in many real-world cases cannot be verified as ful-
filled (Peng et al. 2010; Zschech et al. 2019). AI-based approaches cover a variety of ML techniques,
such as support vector machines or different kinds of decision trees and ANN. They have the advantage
of automatically exploiting hidden insights in vast amounts of observed data records (Elattar et al. 2016).
Artificial Intelligence for Human Decision-Makers
131
Given the technological possibilities to collect large and multifaceted data assets in a simplified manner,
AI-based approaches using ML can currently be considered as the most promising candidate for CBM
decision support (Carvalho et al. 2019b).
4.1.4 Measurement Model
In order to determine the overall decision, we need to map the decision factors to observable measures
(in step (b)) and later calculate them for each of our m AI DSS (in step (d)).
Effort. Two characteristics can be quantified to approximate the effort of an algorithmic ML model: i)
implementation time and ii) training time. The former calculates the time required to implement the
selected algorithm, which is determined by the average of an estimation of several ML experts. This
includes both preliminary steps, which we summarize as pre-processing, and the algorithmic realization,
including re-engineering until a satisfactory solution is available. We define the implementation time
𝐼𝑀𝑇), measured in person hours, by equation (1):
(1) 𝐼𝑀𝑇 = ∑ 𝑃𝑃𝑖 + 𝐴𝑅𝑖)𝑛𝑖=1 ∗
1
𝑛
averaging over all estimations 𝑛 of the necessary time for pre-processing 𝑃𝑃𝑖 and the time needed to
realize the algorithm 𝐴𝑅𝑖 itself over all experts 𝑖.
The algorithm’s training time, on the other hand, indicates the resource intensity of a model for training.
Training time (𝑇𝑇) is measured in seconds and determined by equation (2):
(2) 𝑇𝑇 = ∑ ∑ | 𝑡𝑟𝑒𝑏𝑡 − 𝑡𝑟𝑒𝑏𝑡+1) + 𝑡𝑒𝑒𝑏𝑡 − 𝑡𝑒𝑒𝑏𝑡+1)|𝑛𝑏=1
𝑚𝑒=1
adding up the times needed to perform all training epochs 𝑒 over all batches 𝑏 as the number of samples
given to the model before model’s parameter updating, measured by the difference between the train-
ing’s start time (𝑡𝑟𝑒𝑏𝑡) and end time (𝑡𝑟𝑒𝑏𝑡+1), and its related times needed to test the result 𝑡𝑒𝑒𝑏𝑡 −
𝑡𝑒𝑒𝑏𝑡+1).
A further characteristic that has a significant effect on the effort when implementing algorithms is the
iii) required skillset (𝑅𝑆𝐿). This cannot be quantified directly and, thus, needs to be substituted for meas-
urement. We use the required training as a proxy variable to do so and obtain the values based on the
training courses on the platform datacamp.com. These courses were analyzed by data science experts
that beforehand were familiarized with the prognostic approaches to filter out the courses of interest.
Thus, we received a dictionary mapping the course short name and time to complete each of them (equa-
tion (3)):
(3) 𝑅𝑆𝐿𝑐 = {R|python basics: 8,ML basics: 8, ML regression: 4, DL: 12, Bayesian modeling: 8}
We then accumulated the number of hours of all courses that would be necessary for a computer science
student with no particular data science knowledge to implement the respective AI DSS, referred to as
Artificial Intelligence for Human Decision-Makers
132
the choice 𝑐. We used the implementations and source code provided by the authors of the respective
prognostic approaches identified in the next section10.
Performance. Two characteristics quantify the performance of an algorithmic model: i) prediction
value and ii) inference time. Prediction value (𝑃𝑉) refers to the prognostic power of an algorithm. We
identified two measures, which are used in RUL data challenges: the ‘PHM08’ score and the root mean
squared error (RMSE) (Zschech et al. 2019). ‘PHM08’ prefers an early prediction to a late one. Thus,
the scoring is asymmetric around the true time of failure, and late predictions are penalized more. The
penalty itself expands exponentially with increasing error (Saxena et al. 2008). Equation (4) and (5)
describe this:
(4) 𝑠 = ∑ 𝑠𝑖𝑁𝑖=1 𝑤𝑖𝑡ℎ 𝑆𝑖 = {
𝑒𝑑𝑖13 − 1 𝑜𝑟 𝑑𝑖 < 0
𝑒𝑑𝑖10 − 1 𝑜𝑟 𝑑𝑖 ≥ 0
(5) 𝑑𝑖 = �̂�𝑖 − 𝐿𝑖𝑇
with 𝑠 being the calculated score, 𝑁 the number of units to be maintained and 𝑑𝑖 the deviation of the
estimated RUL �̂�𝑖 against the real RUL 𝐿𝑖𝑇. The preference for premature predictions corresponds to a
risk-averse attitude and forces a high sensitivity to outliers in the exponential curve. A disadvantage is
that the prognostic distance is not included in the scoring evaluation and algorithms are preferred that
intentionally underestimate the RUL (Lim et al. 2014).
Thus, the RMSE is often used in parallel to measure the accuracy, punishing intentionally underesti-
mated RUL, and in this way, it allows for a critical sub-evaluation. It is calculated using equation (6):
(6) 𝑅𝑀𝑆𝐸 = √∑ �̂�𝑖−𝑦𝑖)²
𝑛𝑛𝑖=1
adding all �̂�𝑖 − 𝑦𝑖)² squared differences of the real values against the calculated values in relation to
the given sample size of 𝑛. The root obtains the actual deviation distance as the total error.
The inference time (𝐼𝐹𝑇) describes the delay in the calculation of an algorithmic model in practical use.
Thus, it is defined as the time a model takes between the input of new data and its calculated result,
representing its real-time ability. It is measured in microseconds. 𝐼𝐹𝑇 can be formulated using equation
(7):
(7) 𝐼𝐹𝑇 = ∑ |𝑡𝑖 − 𝑡𝑖+1|𝑛𝑖=1 ∗
1
𝑛
averaging over all time differences between the beginning of the calculation as the time of reading the
new data 𝑡𝑖 and the time the algorithm finished calculating the results 𝑡𝑖+1, which in turn represents the
start time of the new calculation process.
10 As a result, we found that every AI DSS implementation would require a basic set of courses in either R or
Python (8 hours). Further, similarity-based matching (𝐴𝐼 𝐷𝑆𝑆3) and direct RUL 𝐴𝐼 𝐷𝑆𝑆1) require basic ML skills
(4 hrs.), while direct RUL requires 𝐴𝐼 𝐷𝑆𝑆1) at least two additional courses in DL (12 hrs.). Indirect RUL
𝐴𝐼 𝐷𝑆𝑆2) requires Bayesian modeling (8 hrs.) in addition to basic ML course.
Artificial Intelligence for Human Decision-Makers
133
Explainability. Both explainability characteristics i) causal explanation (𝐶𝐸) and ii) visual explanation
(𝑉𝐸) can only be measured on an ordinal scale to create a ranking comparing the different solutions.
The former is about the ability of the algorithm to reveal the influence of each input variable with regard
to the output. We measure this as a binary function, following the categorization of Yang et al. (2019).
We set the measurement causal explanation=1 whenever a DL system can provide either a local and/or
global intrinsic explanation manner, and we set causal explanation=0 when this is not the case.
Since the model visualization quality largely depends on the human’s ability to interpret it, we chose to
use the model visualizations of the m prognostic approaches (cf. next section) to our participants and let
them rank the visualizations. Subsequently, we are calculating normalized weight scores for each AI
DSS as a measurement for visual explanation.
4.1.5 Identification of AI DSS, Implementation, and Results
4.1.5.1 Identification of Best Practice AI DSS Using Datasets for Predictive Maintenance
In order to decide on the number and types of the m AI DSS for implementation, we need to identify
best practices or at least promising examples of CBM using AI technology (in step(c)). As an AI-based
CBM prognostic approach requires sufficiently extensive machinery data including failures to draw
conclusions for early indicators, we decided to survey the most widely used datasets for high-stake
maintenance decisions to identify the best practices of AI DSS.
We limited of search to predictive maintenance datasets that are publicly available, deal with high-stake
maintenance cases, and have been used in a sufficient number of publications. We focused on the iden-
tification of existing comparative reviews first. We selected the following databases for our literature
review: IEEE Xplore Digital Library, EBSCOhost Academic Search Elite, EBSCOhost, Business Source
Complete, ACM Digital Library, ScienceDirect, and Web of Science using terminologies from predictive
and condition-based maintenance combined with generic terms of datasets, comparisons, and reviews.
Further, we have excluded terms from medical science, as these otherwise would have pre-dominated
the results. As a result, we identified 25 datasets from five review articles. We used a hit popularity
analysis to reveal the most popular datasets in research by the number of downloads and citations.
A closer analysis of the top three datasets highlight that Turbofan (NASA) and PHM 2008 share the same
data basis of NASA’s Prognostics Data Repository (Elattar et al. 2016; Zschech et al. 2019): The so-
called C-MAPSS data simulates large commercial engines (Richter 2012). It represents a high-stake
decision case as a failure of engine turbines can lead to a crash of an airplane and related human casu-
alties. To date, however, besides prognostic scoring, user acceptance has not been tested.
Using the taxonomy of Zschech et al. (2019), it is possible to make a distinction between three different
data-based prognostic approaches for CBM using the C-MAPSS dataset. Among others, the taxonomy
distinguishes the five existing scenarios of C-MAPSS. We consider this an essential limitation to ensure
comparability and to identify best practices. or our purpose, we chose the dataset of the ‘ D001’ sce-
nario as it is most commonly used in 60 out of 106 papers.
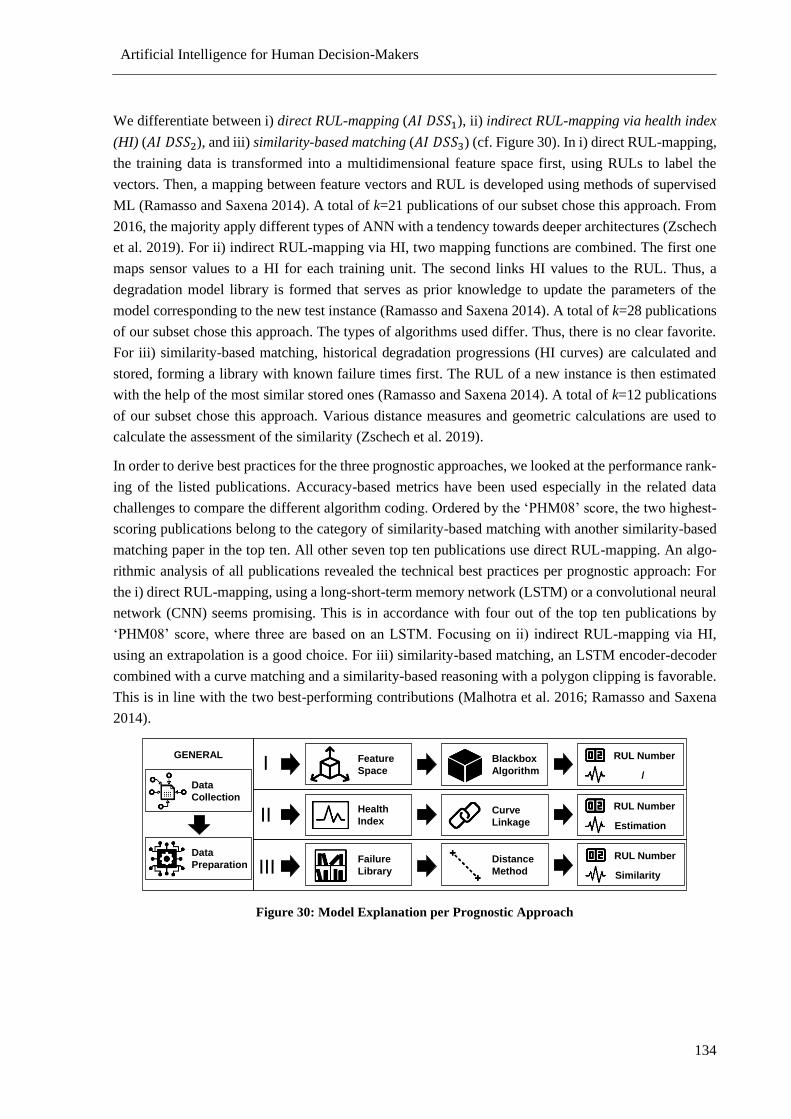
Artificial Intelligence for Human Decision-Makers
134
We differentiate between i) direct RUL-mapping (𝐴𝐼 𝐷𝑆𝑆1), ii) indirect RUL-mapping via health index
(HI) (𝐴𝐼 𝐷𝑆𝑆2), and iii) similarity-based matching (𝐴𝐼 𝐷𝑆𝑆3) (cf. Figure 30). In i) direct RUL-mapping,
the training data is transformed into a multidimensional feature space first, using RULs to label the
vectors. Then, a mapping between feature vectors and RUL is developed using methods of supervised
ML (Ramasso and Saxena 2014). A total of k=21 publications of our subset chose this approach. From
2016, the majority apply different types of ANN with a tendency towards deeper architectures (Zschech
et al. 2019). For ii) indirect RUL-mapping via HI, two mapping functions are combined. The first one
maps sensor values to a HI for each training unit. The second links HI values to the RUL. Thus, a
degradation model library is formed that serves as prior knowledge to update the parameters of the
model corresponding to the new test instance (Ramasso and Saxena 2014). A total of k=28 publications
of our subset chose this approach. The types of algorithms used differ. Thus, there is no clear favorite.
For iii) similarity-based matching, historical degradation progressions (HI curves) are calculated and
stored, forming a library with known failure times first. The RUL of a new instance is then estimated
with the help of the most similar stored ones (Ramasso and Saxena 2014). A total of k=12 publications
of our subset chose this approach. Various distance measures and geometric calculations are used to
calculate the assessment of the similarity (Zschech et al. 2019).
In order to derive best practices for the three prognostic approaches, we looked at the performance rank-
ing of the listed publications. Accuracy-based metrics have been used especially in the related data
challenges to compare the different algorithm coding. Ordered by the ‘PHM08’ score, the two highest-
scoring publications belong to the category of similarity-based matching with another similarity-based
matching paper in the top ten. All other seven top ten publications use direct RUL-mapping. An algo-
rithmic analysis of all publications revealed the technical best practices per prognostic approach: For
the i) direct RUL-mapping, using a long-short-term memory network (LSTM) or a convolutional neural
network (CNN) seems promising. This is in accordance with four out of the top ten publications by
‘PHM08’ score, where three are based on an LSTM. ocusing on ii) indirect RUL-mapping via HI,
using an extrapolation is a good choice. For iii) similarity-based matching, an LSTM encoder-decoder
combined with a curve matching and a similarity-based reasoning with a polygon clipping is favorable.
This is in line with the two best-performing contributions (Malhotra et al. 2016; Ramasso and Saxena
2014).
Figure 30: Model Explanation per Prognostic Approach
Data
Collection
Data
Preparation
GENERAL Blackbox
Algorithm
RUL NumberFeature
Space
Health
Index
Failure
Library
Distance
Method
I
II
III
Curve
Linkage
/
RUL Number
Estimation
RUL Number
Similarity
Artificial Intelligence for Human Decision-Makers
135
4.1.5.2 Implementation of Best Practice AI DSS
We have based our own prototypical implementations (in step (c)) on these best practices of prognostic
approaches. If their documentation was not available in a comprehensible way, we have tried to follow
a comparable study. It was particularly important for us to understand the technical challenges that the
implementation entails and the opportunities that arise as a result. For the i) direct RUL-mapping ap-
proach, we have implemented an LSTM. For ii) indirect RUL-mapping via HI, we have used an algo-
rithm based on extrapolation. The iii) similarity-based matching was reconstructed using a squared pol-
ynomial curve fitting. These three approaches represent our m=3 AI DSS for the case of high-stake
maintenance.
Direct RUL-mapping. For the RUL target function, we determined the RUL value by the difference
between the total runtime of the unit and the individual cycle numbers. This corresponds to a decreasing
trend. We set the maximum RUL estimation to 125, in accordance with Zhu et al. (2018a) and Malhotra
et al. (2016). The size of the time window is defined by 𝑁𝑡𝑤=30 (Li et al. 2018b; Zhu et al. 2018a). This
is equivalent to the window size in Zhu et al. (2018a) and has been proven by the results of Li et al.
(2018b), who made a comparison of time window sizes for the C-MAPSS dataset. We used the mean
squared error (MSE) as the loss function and selected all 21 sensors as inputs. The architecture of our
artificial network was based on Zheng et al. (2017) as the best ranked LSTM solution according to the
‘PHM08’ score. We have implemented a total of five layers: two LSTM layers, followed by two full
layers and another final full layer. For the parameterization of the LSTM layers, own cross-validation
studies have shown that two 64-units layers achieve more robust results than the 64- and 32-unit version
of the one in Zheng et al. (2017). The full layers were set to 8-units each. Further, Zheng et al. (2017)
mentioned the usage of a dropout rate without specifying its value. Our test set shown the best result for
dropout=0.2 and a final dropout=1.
Indirect RUL-mapping via HI. Our method for the indirect RUL-mapping via HI is based on the work
of Coble and Hines (2011). They have proposed a dynamic Bayesian updating procedure that allows a
priori information from the training data to be incorporated into the extrapolation procedure of the test
data to obtain the model parameters. So, the HI is calculated with linear regression, using the first 10%
of training instances as 1 and the last 10% as 0. Comparing different time windows of preliminaries, we
settled with 𝑁𝑡𝑤=15 (Li et al. 2018b). We smoothed the degradation curve using locally weighted scat-
terplot smoothing (LOWESS). It assigns the highest weight to the value to be smoothed and lower
weights to more distant values. To forecast the RUL, the degradation curve is plotted up to a predeter-
mined limit value indicating the extrapolated error status. We set this limit value to h=0. For the neces-
sary curve fitting, we used dynamic Bayesian updating with a polynomial of the 2nd order. Coble and
Hines (2011) proofed that while an exponential polynomial would be physically more useful, a quadratic
polynomial is more robust in terms of noise and results in a better fit.
Similarity-based matching. The implementation of our similarity-based algorithm follows the work of
Malhotra et al. (2016), who achieved the second-best score for the dataset ‘ D001’. First, we built a
reference library. Thus, we created one-dimensional degradation curves in the form of HIs from the
multidimensional training data. Our implementation of the first similarity-based approach was geared
to Wang et al. (2017). We calculated the new HI using linear regression and a squared polynomial for
curve matching. The parameters are determined by least-square fitting. We calculated the similarity
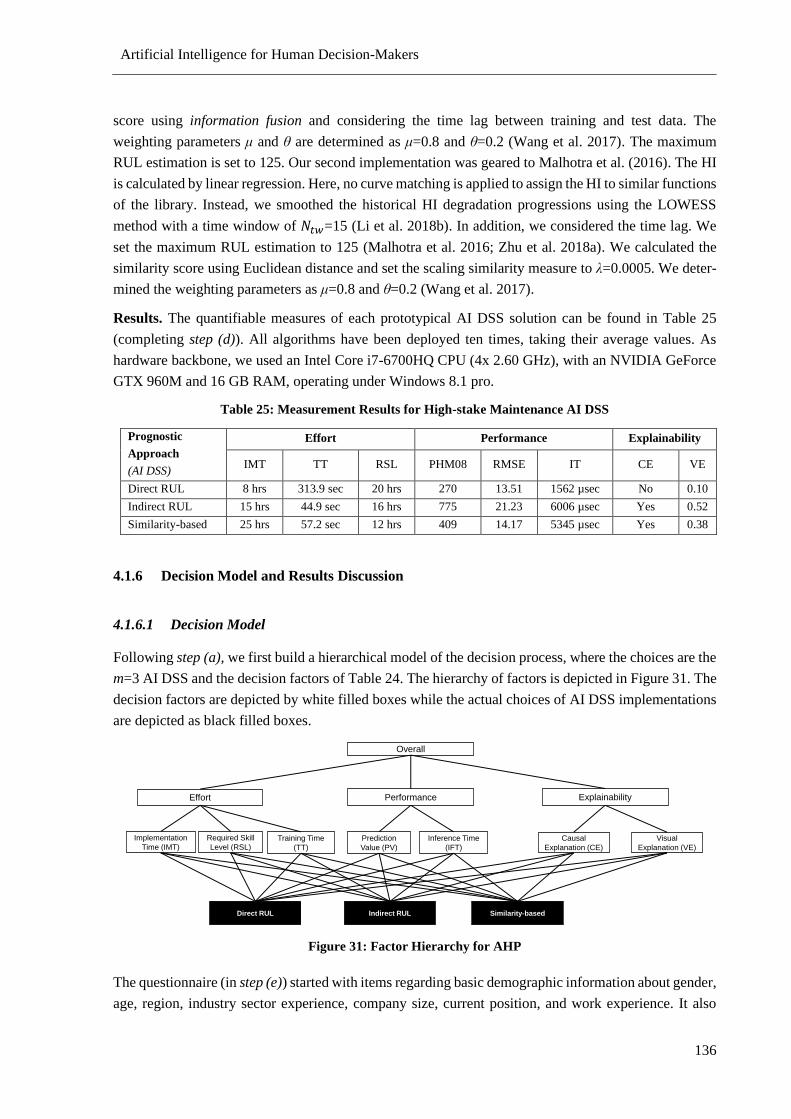
Artificial Intelligence for Human Decision-Makers
136
score using information fusion and considering the time lag between training and test data. The
weighting parameters μ and θ are determined as μ=0.8 and θ=0.2 (Wang et al. 2017). The maximum
RUL estimation is set to 125. Our second implementation was geared to Malhotra et al. (2016). The HI
is calculated by linear regression. Here, no curve matching is applied to assign the HI to similar functions
of the library. Instead, we smoothed the historical HI degradation progressions using the LOWESS
method with a time window of 𝑁𝑡𝑤=15 (Li et al. 2018b). In addition, we considered the time lag. We
set the maximum RUL estimation to 125 (Malhotra et al. 2016; Zhu et al. 2018a). We calculated the
similarity score using Euclidean distance and set the scaling similarity measure to λ=0.0005. We deter-
mined the weighting parameters as μ=0.8 and θ=0.2 (Wang et al. 2017).
Results. The quantifiable measures of each prototypical AI DSS solution can be found in Table 25
(completing step (d)). All algorithms have been deployed ten times, taking their average values. As
hardware backbone, we used an Intel Core i7-6700HQ CPU (4x 2.60 GHz), with an NVIDIA GeForce
GTX 960M and 16 GB RAM, operating under Windows 8.1 pro.
Table 25: Measurement Results for High-stake Maintenance AI DSS
Prognostic
Approach
(AI DSS)
Effort Performance Explainability
IMT TT RSL PHM08 RMSE IT CE VE
Direct RUL 8 hrs 313.9 sec 20 hrs 270 13.51 1562 µsec No 0.10
Indirect RUL 15 hrs 44.9 sec 16 hrs 775 21.23 6006 µsec Yes 0.52
Similarity-based 25 hrs 57.2 sec 12 hrs 409 14.17 5345 µsec Yes 0.38
4.1.6 Decision Model and Results Discussion
4.1.6.1 Decision Model
Following step (a), we first build a hierarchical model of the decision process, where the choices are the
m=3 AI DSS and the decision factors of Table 24. The hierarchy of factors is depicted in Figure 31. The
decision factors are depicted by white filled boxes while the actual choices of AI DSS implementations
are depicted as black filled boxes.
Figure 31: Factor Hierarchy for AHP
The questionnaire (in step (e)) started with items regarding basic demographic information about gender,
age, region, industry sector experience, company size, current position, and work experience. It also
Effort Performance Explainability
Overall
Implementation
Time (IMT)
Required Skill
Level (RSL)Training Time
(TT)
Prediction
Value (PV)
Inference Time
(IFT)
Causal
Explanation (CE)
Visual
Explanation (VE)
Direct RUL Indirect RUL Similarity-based
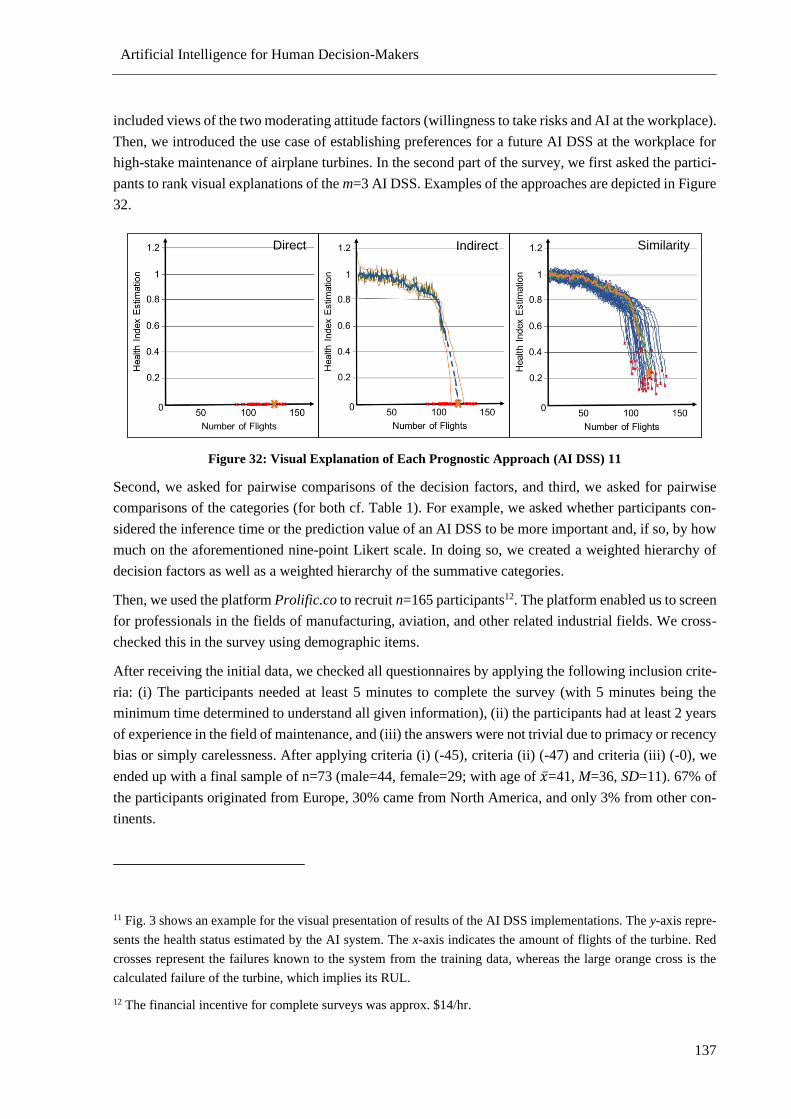
Artificial Intelligence for Human Decision-Makers
137
included views of the two moderating attitude factors (willingness to take risks and AI at the workplace).
Then, we introduced the use case of establishing preferences for a future AI DSS at the workplace for
high-stake maintenance of airplane turbines. In the second part of the survey, we first asked the partici-
pants to rank visual explanations of the m=3 AI DSS. Examples of the approaches are depicted in Figure
32.
Figure 32: Visual Explanation of Each Prognostic Approach (AI DSS) 11
Second, we asked for pairwise comparisons of the decision factors, and third, we asked for pairwise
comparisons of the categories (for both cf. Table 1). For example, we asked whether participants con-
sidered the inference time or the prediction value of an AI DSS to be more important and, if so, by how
much on the aforementioned nine-point Likert scale. In doing so, we created a weighted hierarchy of
decision factors as well as a weighted hierarchy of the summative categories.
Then, we used the platform Prolific.co to recruit n=165 participants12. The platform enabled us to screen
for professionals in the fields of manufacturing, aviation, and other related industrial fields. We cross-
checked this in the survey using demographic items.
After receiving the initial data, we checked all questionnaires by applying the following inclusion crite-
ria: (i) The participants needed at least 5 minutes to complete the survey (with 5 minutes being the
minimum time determined to understand all given information), (ii) the participants had at least 2 years
of experience in the field of maintenance, and (iii) the answers were not trivial due to primacy or recency
bias or simply carelessness. After applying criteria (i) (-45), criteria (ii) (-47) and criteria (iii) (-0), we
ended up with a final sample of n=73 (male=44, female=29; with age of ̅=41, M=36, SD=11). 67% of
the participants originated from Europe, 30% came from North America, and only 3% from other con-
tinents.
11 Fig. 3 shows an example for the visual presentation of results of the AI DSS implementations. The y-axis repre-
sents the health status estimated by the AI system. The x-axis indicates the amount of flights of the turbine. Red
crosses represent the failures known to the system from the training data, whereas the large orange cross is the
calculated failure of the turbine, which implies its RUL.
12 The financial incentive for complete surveys was approx. $14/hr.
Direct Indirect Similarity
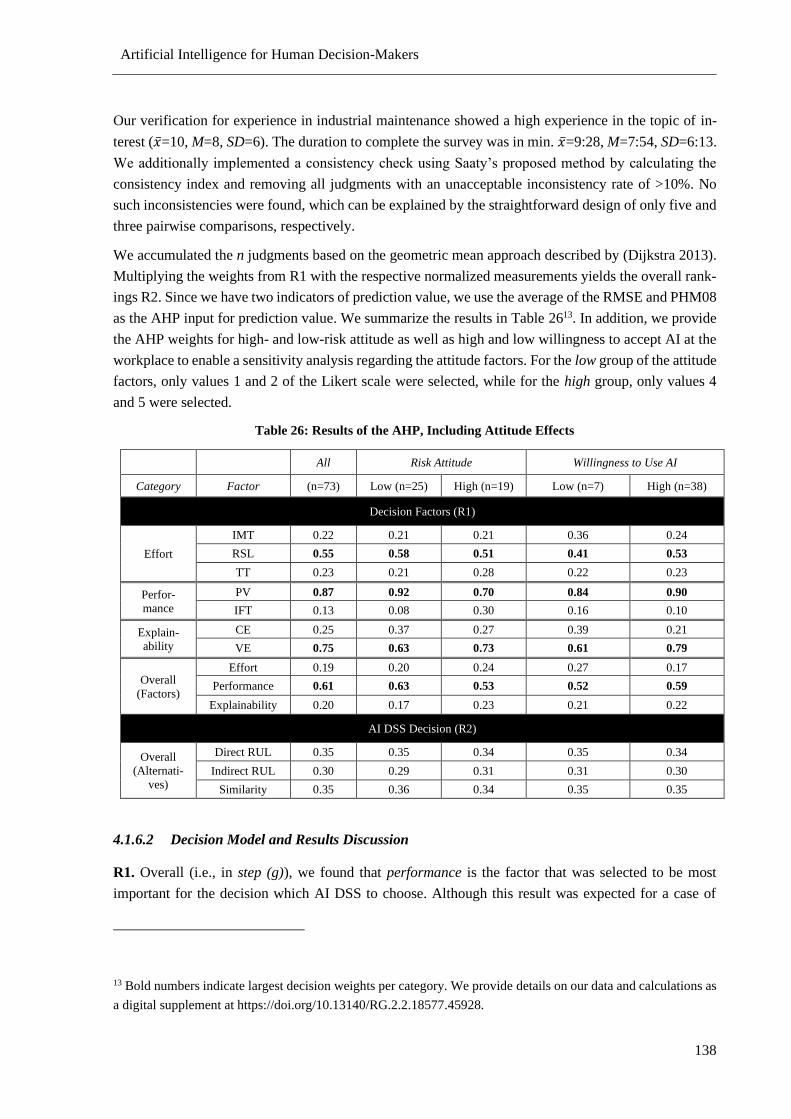
Artificial Intelligence for Human Decision-Makers
138
Our verification for experience in industrial maintenance showed a high experience in the topic of in-
terest ( ̅=10, M=8, SD=6). The duration to complete the survey was in min. ̅=9:28, M=7:54, SD=6:13.
We additionally implemented a consistency check using Saaty’s proposed method by calculating the
consistency index and removing all judgments with an unacceptable inconsistency rate of >10%. No
such inconsistencies were found, which can be explained by the straightforward design of only five and
three pairwise comparisons, respectively.
We accumulated the n judgments based on the geometric mean approach described by (Dijkstra 2013).
Multiplying the weights from R1 with the respective normalized measurements yields the overall rank-
ings R2. Since we have two indicators of prediction value, we use the average of the RMSE and PHM08
as the AHP input for prediction value. We summarize the results in Table 2613. In addition, we provide
the AHP weights for high- and low-risk attitude as well as high and low willingness to accept AI at the
workplace to enable a sensitivity analysis regarding the attitude factors. For the low group of the attitude
factors, only values 1 and 2 of the Likert scale were selected, while for the high group, only values 4
and 5 were selected.
Table 26: Results of the AHP, Including Attitude Effects
All Risk Attitude Willingness to Use AI
Category Factor (n=73) Low (n=25) High (n=19) Low (n=7) High (n=38)
Decision Factors (R1)
Effort
IMT 0.22 0.21 0.21 0.36 0.24
RSL 0.55 0.58 0.51 0.41 0.53
TT 0.23 0.21 0.28 0.22 0.23
Perfor-
mance
PV 0.87 0.92 0.70 0.84 0.90
IFT 0.13 0.08 0.30 0.16 0.10
Explain-
ability
CE 0.25 0.37 0.27 0.39 0.21
VE 0.75 0.63 0.73 0.61 0.79
Overall
(Factors)
Effort 0.19 0.20 0.24 0.27 0.17
Performance 0.61 0.63 0.53 0.52 0.59
Explainability 0.20 0.17 0.23 0.21 0.22
AI DSS Decision (R2)
Overall
(Alternati-
ves)
Direct RUL 0.35 0.35 0.34 0.35 0.34
Indirect RUL 0.30 0.29 0.31 0.31 0.30
Similarity 0.35 0.36 0.34 0.35 0.35
4.1.6.2 Decision Model and Results Discussion
R1. Overall (i.e., in step (g)), we found that performance is the factor that was selected to be most
important for the decision which AI DSS to choose. Although this result was expected for a case of
13 Bold numbers indicate largest decision weights per category. We provide details on our data and calculations as
a digital supplement at https://doi.org/10.13140/RG.2.2.18577.45928.
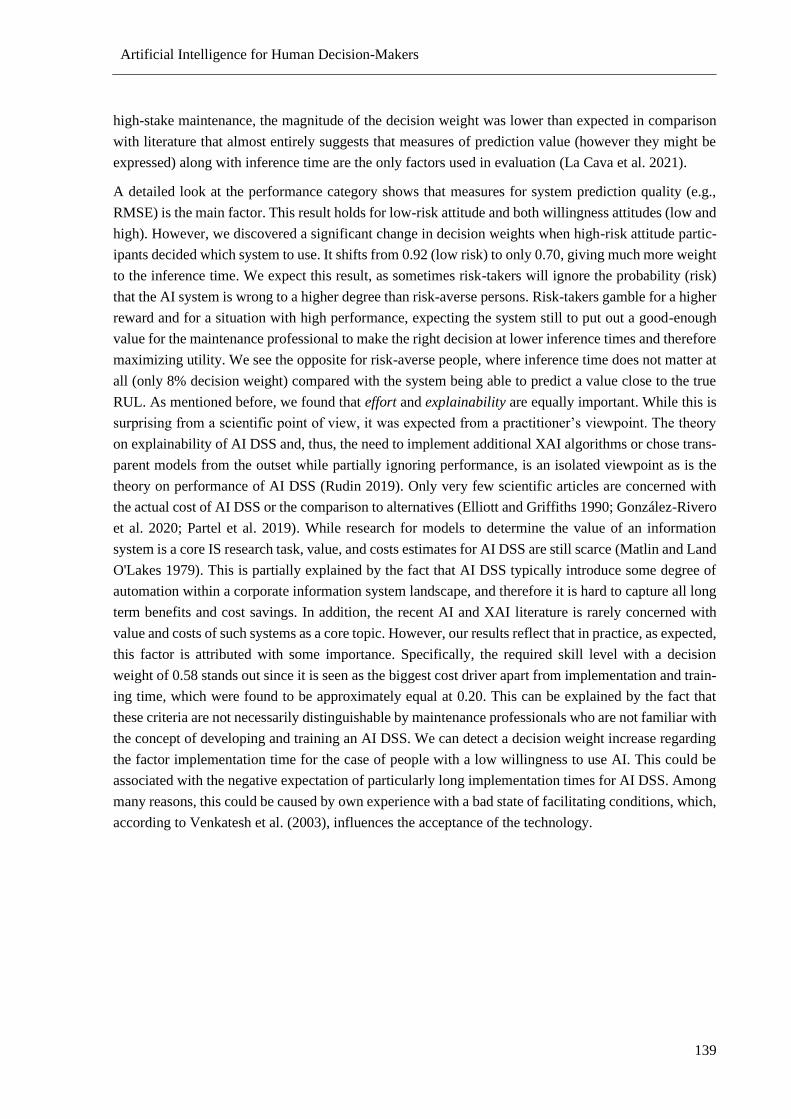
Artificial Intelligence for Human Decision-Makers
139
high-stake maintenance, the magnitude of the decision weight was lower than expected in comparison
with literature that almost entirely suggests that measures of prediction value (however they might be
expressed) along with inference time are the only factors used in evaluation (La Cava et al. 2021).
A detailed look at the performance category shows that measures for system prediction quality (e.g.,
RMSE) is the main factor. This result holds for low-risk attitude and both willingness attitudes (low and
high). However, we discovered a significant change in decision weights when high-risk attitude partic-
ipants decided which system to use. It shifts from 0.92 (low risk) to only 0.70, giving much more weight
to the inference time. We expect this result, as sometimes risk-takers will ignore the probability (risk)
that the AI system is wrong to a higher degree than risk-averse persons. Risk-takers gamble for a higher
reward and for a situation with high performance, expecting the system still to put out a good-enough
value for the maintenance professional to make the right decision at lower inference times and therefore
maximizing utility. We see the opposite for risk-averse people, where inference time does not matter at
all (only 8% decision weight) compared with the system being able to predict a value close to the true
RUL. As mentioned before, we found that effort and explainability are equally important. While this is
surprising from a scientific point of view, it was expected from a practitioner’s viewpoint. The theory
on explainability of AI DSS and, thus, the need to implement additional XAI algorithms or chose trans-
parent models from the outset while partially ignoring performance, is an isolated viewpoint as is the
theory on performance of AI DSS (Rudin 2019). Only very few scientific articles are concerned with
the actual cost of AI DSS or the comparison to alternatives (Elliott and Griffiths 1990; González-Rivero
et al. 2020; Partel et al. 2019). While research for models to determine the value of an information
system is a core IS research task, value, and costs estimates for AI DSS are still scarce (Matlin and Land
O'Lakes 1979). This is partially explained by the fact that AI DSS typically introduce some degree of
automation within a corporate information system landscape, and therefore it is hard to capture all long
term benefits and cost savings. In addition, the recent AI and XAI literature is rarely concerned with
value and costs of such systems as a core topic. However, our results reflect that in practice, as expected,
this factor is attributed with some importance. Specifically, the required skill level with a decision
weight of 0.58 stands out since it is seen as the biggest cost driver apart from implementation and train-
ing time, which were found to be approximately equal at 0.20. This can be explained by the fact that
these criteria are not necessarily distinguishable by maintenance professionals who are not familiar with
the concept of developing and training an AI DSS. We can detect a decision weight increase regarding
the factor implementation time for the case of people with a low willingness to use AI. This could be
associated with the negative expectation of particularly long implementation times for AI DSS. Among
many reasons, this could be caused by own experience with a bad state of facilitating conditions, which,
according to Venkatesh et al. (2003), influences the acceptance of the technology.
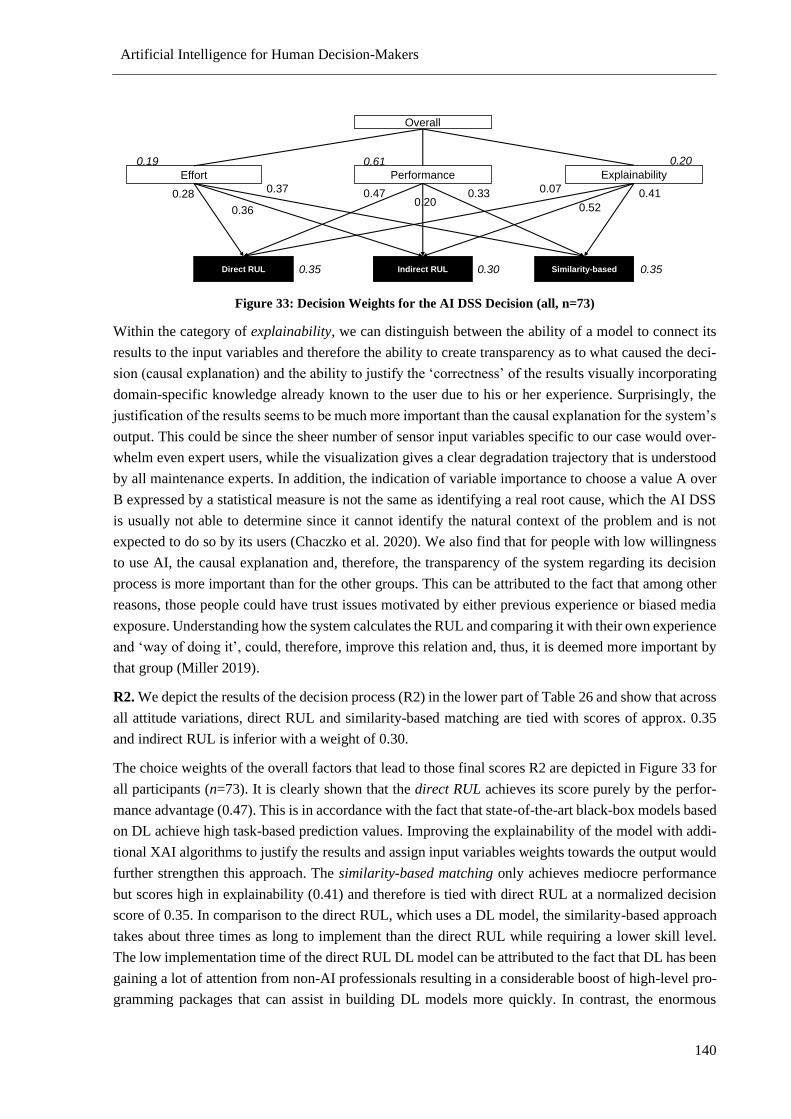
Artificial Intelligence for Human Decision-Makers
140
Figure 33: Decision Weights for the AI DSS Decision (all, n=73)
Within the category of explainability, we can distinguish between the ability of a model to connect its
results to the input variables and therefore the ability to create transparency as to what caused the deci-
sion (causal explanation) and the ability to justify the ‘correctness’ of the results visually incorporating
domain-specific knowledge already known to the user due to his or her experience. Surprisingly, the
justification of the results seems to be much more important than the causal explanation for the system’s
output. This could be since the sheer number of sensor input variables specific to our case would over-
whelm even expert users, while the visualization gives a clear degradation trajectory that is understood
by all maintenance experts. In addition, the indication of variable importance to choose a value A over
B expressed by a statistical measure is not the same as identifying a real root cause, which the AI DSS
is usually not able to determine since it cannot identify the natural context of the problem and is not
expected to do so by its users (Chaczko et al. 2020). We also find that for people with low willingness
to use AI, the causal explanation and, therefore, the transparency of the system regarding its decision
process is more important than for the other groups. This can be attributed to the fact that among other
reasons, those people could have trust issues motivated by either previous experience or biased media
exposure. Understanding how the system calculates the RUL and comparing it with their own experience
and ‘way of doing it’, could, therefore, improve this relation and, thus, it is deemed more important by
that group (Miller 2019).
R2. We depict the results of the decision process (R2) in the lower part of Table 26 and show that across
all attitude variations, direct RUL and similarity-based matching are tied with scores of approx. 0.35
and indirect RUL is inferior with a weight of 0.30.
The choice weights of the overall factors that lead to those final scores R2 are depicted in Figure 33 for
all participants (n=73). It is clearly shown that the direct RUL achieves its score purely by the perfor-
mance advantage (0.47). This is in accordance with the fact that state-of-the-art black-box models based
on DL achieve high task-based prediction values. Improving the explainability of the model with addi-
tional XAI algorithms to justify the results and assign input variables weights towards the output would
further strengthen this approach. The similarity-based matching only achieves mediocre performance
but scores high in explainability (0.41) and therefore is tied with direct RUL at a normalized decision
score of 0.35. In comparison to the direct RUL, which uses a DL model, the similarity-based approach
takes about three times as long to implement than the direct RUL while requiring a lower skill level.
The low implementation time of the direct RUL DL model can be attributed to the fact that DL has been
gaining a lot of attention from non-AI professionals resulting in a considerable boost of high-level pro-
gramming packages that can assist in building DL models more quickly. In contrast, the enormous
Effort Performance Explainability
Overall
Direct RUL Indirect RUL Similarity-based
0.470.20
0.330.28
0.36
0.37 0.41
0.52
0.07
0.19 0.61 0.20
0.35 0.30 0.35
Artificial Intelligence for Human Decision-Makers
141
training time of the direct RUL approach and the rather advanced required skillset explains its low over-
all score in effort (0.28) and, thus, direct RUL is inferior to the other approaches in terms of effort.
Although the indirect RUL scores highest in explainability, the overall rather low importance of these
factors, according to the survey participants, the low performance and the rather high effort renders it
inferior to the other two models. Our results clearly show that the often-proposed trade-off between
explainability and performance, while existent, is heavily skewed towards performance in the case of
high-stake decisions.
4.1.7 Summary and Outlook
In this paper, we simulated a decision process and implemented an AHP to gain insights into the weights
of decision factors for choosing an AI DSS. Therefore, we first derived decision factors from the three
domains of ML, XAI, and project management to reflect all aspects of AI DSS applications in the con-
text of a scenario with high-stake decisions where human lives are at risk. Second, we proposed a meas-
urement model for those decision factors. Third, we implemented the decision process for a case of high-
stake maintenance, more specifically, a maintenance case in aviation with the goal of preventing airplane
turbine failure (called C-MAPSS). Fourth, we conducted a survey to understand the weights attributed
to the decision factors and integrated this with measurement results from our implemented AI DSS.
We found that performance is still the overarching factor with effort and explainability tied in second
place. In addition, we found that attitude factors influence the importance of decision factors, especially
when people show low willingness to adopt AI and therefore have predispositions. For example, risk-
takers valued inference time at the cost of prediction value more significantly and risk-averse experts,
as well as experts with a low willingness to use AI, valued causal explanations to understand the AI
model at the cost of visual explanations of decisions. Further, we found that direct RUL-mapping and
similarity-based matching perform best with direct RUL-mapping benefiting from its prediction value
and similarity-based matching from its ability to explain decisions.
With this research, we provide multiple theoretical and practical contributions. First, we provide well-
founded and operationalized measurement variables for AI adoption that can form the basis for further
AI research. Second, we have identified best practices of AI DSS for high-stake maintenance decisions,
which yield high practical value. Third, our expert study enables an understanding of the significance
of decision factors and attitude factors for choosing an AI DSS or, in general, for AI adoption. Fourth,
we were able to draw conclusions, which factors should be focused on when certain risk attitudes and
willingness or resistance to use AI can be assumed. This benefits research as scientists can use our results
to better understand the trade-off between effort, performance, and explainability and devise further
holistic evaluations. Likewise, practice benefits from the decision model and measures when imple-
menting their own decision process.
As with all experimental research, we face some limitations. First, this is merely a descriptive study
regarding the case of high-stake maintenance. Although the criticality was emphasized in the study, we
cannot guarantee that it was always fully incorporated into the participant’s decisions, as it would have
if they were faced with a real-world situation. Second, we kept the description straightforward using a
general predisposition towards AI systems and avoided adding detailed attitude factors such as fear of
AI or AI-independent factors that can be derived from the UTAUT literature such as facilitating
Artificial Intelligence for Human Decision-Makers
142
conditions or previous experience alongside hedonic motivation or habit. Third, we were aiming to avoid
questionnaire bias from unintended questions regarding the case. Therefore, we set the criticality and
the environmental constraints as static factors within the case. However, this removed the ability to
implement a group design of experiment to further investigate special trade-offs when criticality changes
or other environmental constraints are present.
While we applied the decision process to a specific case to demonstrate it, it can be used for the general
problem of choosing an AI DSS for a case with high-stake decisions. The results of this study can be
used in both normative and prescriptive decision analysis regarding AI systems as a starting point to
investigate the trade-offs of decision factors for specific domains or even domain-independent contexts.
Thus, for further generalization, we plan to extend our study to additional settings, such as medical
diagnostics and autonomous driving. As such, we want to examine whether our results also apply to
similar high-stake decision scenarios. Likewise, we will investigate uncritical environments as a coun-
terpart to isolate the effect of a decision scenario’s criticality. or this purpose, our study design provides
a sufficiently generic basis to be applied to any conceivable domain and decision context. Furthermore,
we plan to extend the study design to include multiple stakeholder groups within an organization by
using the methodology of the Analytical Networking Process (ANP), which is an extension of the AHP
that allows for consideration of decision clusters (e.g., allowing different stakeholders).
In addition, our study also raises awareness of the preferences of practitioners when it comes to obtaining
an AI system. With the large focus on performance, specific issues like AI security and diagnosing
failure in critical applications through explainability might need to be communicated more thoroughly
through means of IS strategy (e.g., through corporate constraints) to be more resilient when facing these
new challenges in the age of AI.
4.1.8 Acknowledgement
This research and development project is funded by the Bayerische Staatsministerium für Wirtschaft,
Landesentwicklung und Energie (StMWi) within the framework concept “Informations- und Kommu-
nikationstechnik” (grant no. DIK0143 02) and managed by the project management agency DI+ DE
Innovation + Technik GmbH.
4.2 Adoption Barriers of AI-based DSS in Maintenance
Abstract. Contemporary decision support systems are increasingly relying on artificial intelligence
technology to form intelligent systems. These systems have human-like decision capacity for selected
applications based on advances in machine learning. In industrial maintenance, among other industries,
they already enhance maintenance tasks such as diagnosis and prognosis. However, adoption by end-
users remains rather hesitant. At the same time, there is a lack of (guidance for) independent, rigorous
studies that investigate this phenomenon. In response, our research is concerned with the application
and extension of the established Unified Theory of Acceptance and Use of Technology (UTAUT) to
provide a theoretical model that better explains the interaction of end-users with intelligent systems. In
particular, we consider the extension by the constructs of trust and transparency, which we consider as
major technology acceptance factors due to the black-box nature of many machine learning algorithms.
Artificial Intelligence for Human Decision-Makers
143
As a result, we derive an extended theoretical model based on a review of previous extensions for
UTAUT. Our model answers several new hypotheses, and our proposed study design includes measure-
ment items for the constructs trust ability, trusting beliefs, and system transparency. It provides the
foundation for a better understanding of the human factor in intelligent system acceptance and use.14
4.2.1 Introduction
Intelligent systems with human-like cognitive capacity have been a promise of artificial intelligence
(AI) research for decades. Due to the rise and sophistication of machine learning (ML) technology,
intelligent systems have become a reality and can now solve complex cognitive tasks (Benbya et al.
2021). They are being deployed rapidly in practice (Janiesch et al. 2021). More recently, deep learning
allowed tackling even more compound problems such as playing Go (Silver et al. 2016) or driving au-
tonomously in real traffic (Grigorescu et al. 2020) with super-human capabilities. On the downside, the
decision rationale of intelligent systems based on deep learning is not per se interpretable by humans
and requires explanations. That is, while the decision is documented, its rationale complex and essen-
tially intransparent from the point of human perception constituting a black box (Kroll 2018).
Further, users tend to credit anthropomorphic traits to an intelligent system subconsciously to ascribe
the system’s AI a sense of efficacy (Epley et al. 2007; Pfeuffer et al. 2019). In this respect, intelligent
systems are credited with the trait of agency (Baird and Maruping 2021), creating a situation comparable
to the principal-agent problem as their decision logic is self-trained (self-interest) and intransparent to
the principal. This results in an information asymmetry between the user (principal) and the intelligent
system (agent). This information asymmetry constitutes a major barrier for intelligent system acceptance
and initial trust in intelligent systems (McKnight et al. 2002; McKnight et al. 1998), because the system
cannot provide credible, meaningful information about or affective bonds with the agent (Bigley and
Pearce 1998).
Altogether, this lack of transparency and subsequently trust can be a hindrance when delegating tasks
or decisions to an intelligent system (Wanner et al. 2020a). More specifically, the adoption of AI cur-
rently remains rather hesitant (Chui and Malhotra 2018; Duscheck et al. 2017; Milojevic and Nassah
2018). The result is observable user behavior, such as algorithm aversion, where the user will not accept
an intelligent system in a professional context even though it outperforms human co-workers (Burton et
al. 2020). While this can be attributed at least partially to lack of control and the information asymmetry
due to its black-box nature, we also observe the inverse, algorithm appreciation, and, thus, acceptance
and use of intelligent system in other scenarios (Logg et al. 2019).
This is a crucial point, as intelligent systems can only be effective if users are willing to actively engage
with them and have confidence in their recommendations. Consequently, it is of great importance to
14 This paper is under review at the Journal of Information System Research (ISR) as ‘A Theoretical Model for
Acceptance and Use of Intelligent Systems’ (Wanner et al. 202x). The related supplementary material is given in
Appendix III.
Artificial Intelligence for Human Decision-Makers
144
understand what the intended users of such systems expect and which influences have to be considered
for successful adoption.
Explaining the acceptance and use of technological innovations has been a major area of research and
practice in the Information Systems (IS) discipline. Over the last several decades, a multitude of theo-
retical models has been proposed and used for examination. They offer different explanations for tech-
nology acceptance and use based on varying factors. Most notably, Venkatesh et al. (2003) introduced
the Unified Theory of Acceptance and Use of Technology (UTAUT), which has been used extensively
since. Scientists have proposed several extensions and contextual modifications.
With our research, we expand this area and propose an explanatory model that explores, in particular,
the role of transparency and trust in technology acceptance of intelligent systems (e.g., Adadi and
Berrada 2018; Miller 2019; Rudin 2019). We do so by extending and modifying the well-known
UTAUT model to fit the nature of intelligent systems and to understand the human attitude towards
them.
Thereby, we offer two key contributions. First, we provide an extension to the UTAUT model for the
context of intelligent system. It can serve as a starting point for research in distinct industries, for exam-
ple, industrial maintenance. Second, by validating established hypotheses, we provide a better under-
standing of the actual factors that influence the user’s adoption of intelligent systems and explain user
behavior towards AI-based systems in general. This allows both the use of this knowledge for the (ven-
dor’s) design and implementation of intelligent systems and its use for the (customer’s) process of soft-
ware selection.
Our paper is structured as follows: In Section 4.2.2, we introduce the theoretical background for our
research. In Section 4.2.3, we describe our research design. In Section 4.2.4, we describe our research
theorizing. This includes the review of existing UTAUT research on trust and system explainability as
well as the hypothesis and items of the derived constructs and relationships. In Section 4.2.5, we describe
the empirical testing of the theoretical derivations and their results. Finally, we discuss the results in
Section 4.2.6. Here, we provide implications of our findings for theory and practice before we summa-
rize and offer an outlook on future research in Section 4.2.7.
4.2.2 Theoretical Background
4.2.2.1 Artificial Intelligence and Intelligent Systems
AI is an umbrella term for any technique that enables computers to imitate human intelligence and rep-
licate or surpass human decision-making capacity for complex tasks (Russell and Norvig 2020).
In the past, AI focused on handcrafted inference models known as symbolic AI or the knowledge-based
approach (Goodfellow et al. 2016). While this approach is inherently transparent and enabled trust in
the decision process, it is limited by the human’s capability to explicate their tacit knowledge relevant
to the task (Brynjolfsson and Mcafee 2017). More recently, ML and deep learning algorithms have
overcome these limitations by automatically building analytical models from training data (Janiesch et
al. 2021). However, the resulting advanced analytical models often lack immediate interpretability con-
stituting an information asymmetry to the user.
Artificial Intelligence for Human Decision-Makers
145
Intelligent systems implement ML algorithms to enable decision-making in applications with human-
like cognitive capacity. They inherit characteristics associated with new, revolutionary technologies,
including technology-related anxiety and alienation of labor through a lack of comprehension and a lack
of trust (Mokyr et al. 2015). Hence, when facing these properties, due to effectance motivation, the
human has a “desire to reduce uncertainty and ambiguity, at least in part with the goal of attaining a
sense of predictability and control in one’s environment” (Epley et al. 2007).
4.2.2.2 Transparency and Trust in Intelligent Systems
Trust in the context of technology acceptance has widely been studied and derived from organizational
trust towards humans. Notably, besides the core construct of the cognition-based trust in the ability of
the system, additional affect-based trust aspects like the general propensity to trust technology and the
believed goodwill or benevolence of the trustee towards the trustor (Lee and Turban 2001). While it can
be argued that the system has no ill will by itself, in the case of black-box systems, we cannot observe
whether it acts as intended, possibly hindering initial trust formation (Dam et al. 2018).
Building trust in new technologies is initially hindered by unknown risk factors and thus uncertainty, as
well as a lack of total user control (McKnight et al. 2011). The main factors in building initial trust are
the ability of the system to show possession of the functionalities needed, to convey that they can help
the user when needed, and to operate consistently (Mayer et al. 1995; McKnight et al. 1998).
For human intelligence, it is generally an important aspect to be able to explain the rationale behind
one’s decision, while simultaneously, it can be considered as a prerequisite for establishing a trustworthy
relationship (Samek et al. 2017). Thus, observing a system’s behavior in terms of transparency plays an
important role. In IS research, it has been argued that transparency can increase the cognition-based part
of trust towards the system (Madsen and Gregor 2000). In addition, system transparency is assumed to
have an indirect influence on IS acceptance via trust in the context of recommending a favorable decision
to the user (Cramer et al. 2008).
While general performance indicators of ML models can be used to judge the recommendation perfor-
mance of an intelligent system, the learning process and the inner view of the intelligent system towards
the problem can be different from the human understanding, generating a dissonance, suggesting system
performance by itself is not sufficient as a criterion (Miller 2019).
Thus, the ML model underlying an intelligent system cannot address these factors itself. Therefore, it is
widely suggested that this issue can be alleviated or resolved by providing system transparency by of-
fering explanations of the decision-making process (i.e., global explanations) as well as explanations of
individual recommendations (i.e., local explanations) (Adadi and Berrada 2018). The field of explaina-
ble AI (XAI) offers augmentations or surrogate models that can explain the behavior of intelligent sys-
tem based on black-box ML models.
Altogether, the rise of design-based literature on explainable, intelligent systems suggests that the lack
of explainability of deep learning algorithms poses a problem for user acceptance, rendering the systems
inefficacious (Bentele and Seidenglanz 2015; Nawratil 2006).
It is reasonable to assume that system transparency or its explainability, as well as trust, play a central
role when investigating socio-technical aspects of technology acceptance. Furthermore, both seem to be
Artificial Intelligence for Human Decision-Makers
146
interrelated to one another. Nevertheless, it is not evident to what extent an increase in the user’s per-
ceived system explainability improves the user’s trust factor or how this affects the user’s technology
acceptance of intelligent systems (McKnight et al. 2002; Wang and Benbasat 2016).
4.2.2.3 Technology Acceptance
Technology acceptance has been widely studied in the context of several theoretical frameworks. In its
core idea, a behavioral study is used to draw conclusions regarding the willingness of a target group to
accept an investigative object (Jackson et al. 1997; Venkatesh et al. 2012).
Davis (1989) utilized the Theory of Reasoned Action to propose the Technology Acceptance Model
(TAM) that explains the actual use of a system through the perceived usefulness and perceived ease of
use of that system. It was later updated to include other factors such as subjective norms (Marangunić
and Granić 2015). An extension of the theory that includes the additional determinant is the Theory of
Planned Behavior by Taylor and Todd (1995). As a competing perspective of explanation, the Model of
PC Utilization includes determinants that are less abstract to the technology application environment,
such as job-fit, complexity, affect towards use, and facilitating conditions that reflect on the actual ob-
jective factors from the application environment, which can differ largely from case to case. The Inno-
vation Diffusion Theory by Rogers (2010) is specifically tailored to new technologies and the perception
of several determinants like a gained relative advantage, ease of use, visibility, and compatibility. Fur-
thermore, the Social Cognitive Theory was extended to explain individual technology acceptance by
determinants like outcome expectancy, self-efficacy, affect, and anxiety (Bandura 2001).
Venkatesh et al. (2003) combined those theories in the Unified Theory of Acceptance and Use of Tech-
nology (UTAUT). It provides a holistic model that includes adoption theories for new technologies and
approaches to computer usage that capture the actual factors of the implementation environment. Here,
behavioral intention (BI) acts as an explanatory factor for the actual user behavior. Determinants of BI
in the UTAUT model are, for example, performance expectancy (PE), effort expectancy (EE), or social
influence. UTAUT has been used extensively to explain and predict acceptance and use in a multitude
of scenarios (Williams et al. 2015).
Despite the fundamental theoretical foundation, it has become a common practice to form the measure-
ment model for a specific use case given by multiple iteration cycles (e.g, Yao and Murphy 2007). Thus,
many authors modify their UTAUT model (e.g., Oliveira et al. 2014; Shahzad et al. 2020; Slade et al.
2015). Typically, an extension is applied in three different ways (Slade et al. 2015; Venkatesh et al.
2012): i) using UTAUT for the evaluation of new technologies or new cultural settings (e.g., Gupta et
al. 2008); ii) adding new constructs to expand the investigation scope of UTAUT (e.g., Baishya and
Samalia 2020); and/or iii) to include exogenous predictors for the proposed UTAUT variables (e.g.,
Neufeld et al. 2007). Furthermore, many contributions such as Esfandiari and Sokhanvar (2016) or
Albashrawi and Motiwalla (2017), combine multiple extension methods to construct a new model.
Related work of technology acceptance research is primarily focused on e-commerce, mobile technol-
ogy, and social media (Rad et al. 2018). The intersection with AI innovations is rather small yet. Despite
contributions for autonomous driving (e.g., Hein et al. 2018; Kaur and Rampersad 2018) or healthcare
(e.g., Fan et al. 2018; Portela et al. 2013), only a few studies exist for industrial applications, such as on
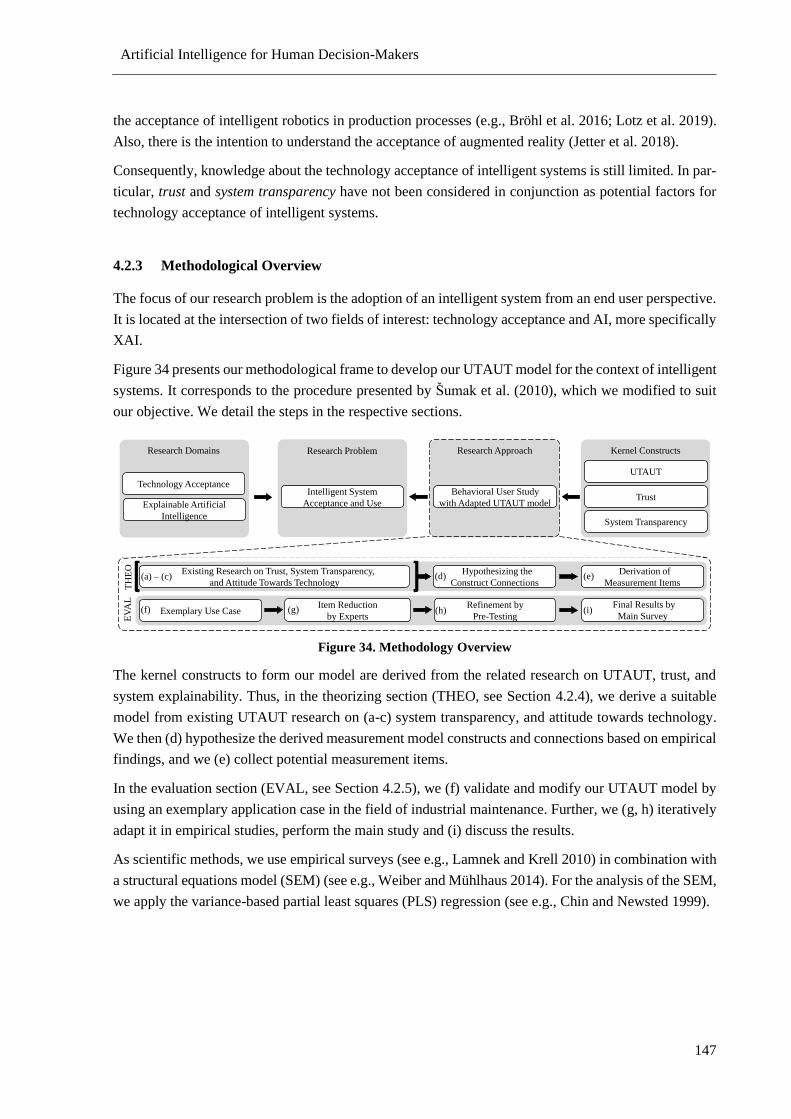
Artificial Intelligence for Human Decision-Makers
147
the acceptance of intelligent robotics in production processes (e.g., Bröhl et al. 2016; Lotz et al. 2019).
Also, there is the intention to understand the acceptance of augmented reality (Jetter et al. 2018).
Consequently, knowledge about the technology acceptance of intelligent systems is still limited. In par-
ticular, trust and system transparency have not been considered in conjunction as potential factors for
technology acceptance of intelligent systems.
4.2.3 Methodological Overview
The focus of our research problem is the adoption of an intelligent system from an end user perspective.
It is located at the intersection of two fields of interest: technology acceptance and AI, more specifically
XAI.
Figure 34 presents our methodological frame to develop our UTAUT model for the context of intelligent
systems. It corresponds to the procedure presented by Šumak et al. (2010), which we modified to suit
our objective. We detail the steps in the respective sections.
Figure 34. Methodology Overview
The kernel constructs to form our model are derived from the related research on UTAUT, trust, and
system explainability. Thus, in the theorizing section (THEO, see Section 4.2.4), we derive a suitable
model from existing UTAUT research on (a-c) system transparency, and attitude towards technology.
We then (d) hypothesize the derived measurement model constructs and connections based on empirical
findings, and we (e) collect potential measurement items.
In the evaluation section (EVAL, see Section 4.2.5), we (f) validate and modify our UTAUT model by
using an exemplary application case in the field of industrial maintenance. Further, we (g, h) iteratively
adapt it in empirical studies, perform the main study and (i) discuss the results.
As scientific methods, we use empirical surveys (see e.g., Lamnek and Krell 2010) in combination with
a structural equations model (SEM) (see e.g., Weiber and Mühlhaus 2014). For the analysis of the SEM,
we apply the variance-based partial least squares (PLS) regression (see e.g., Chin and Newsted 1999).
Existing Research on Trust, System Transparency,
and Attitude Towards Technology
Derivation of
Measurement Items
Hypothesizing the
Construct Connections
Exemplary Use CaseItem Reduction
by Experts
Final Results by
Main Survey
Refinement by
Pre-Testing
TH
EO
EV
AL
Trust
System Transparency
Kernel Constructs
Explainable Artificial
Intelligence
Research Domains
Technology Acceptance
UTAUT
Intelligent System
Acceptance and Use
Research Problem
Behavioral User Study
with Adapted UTAUT model
Research Approach
(a) – (c) (e)(d)
(f) (h)(g) (i)
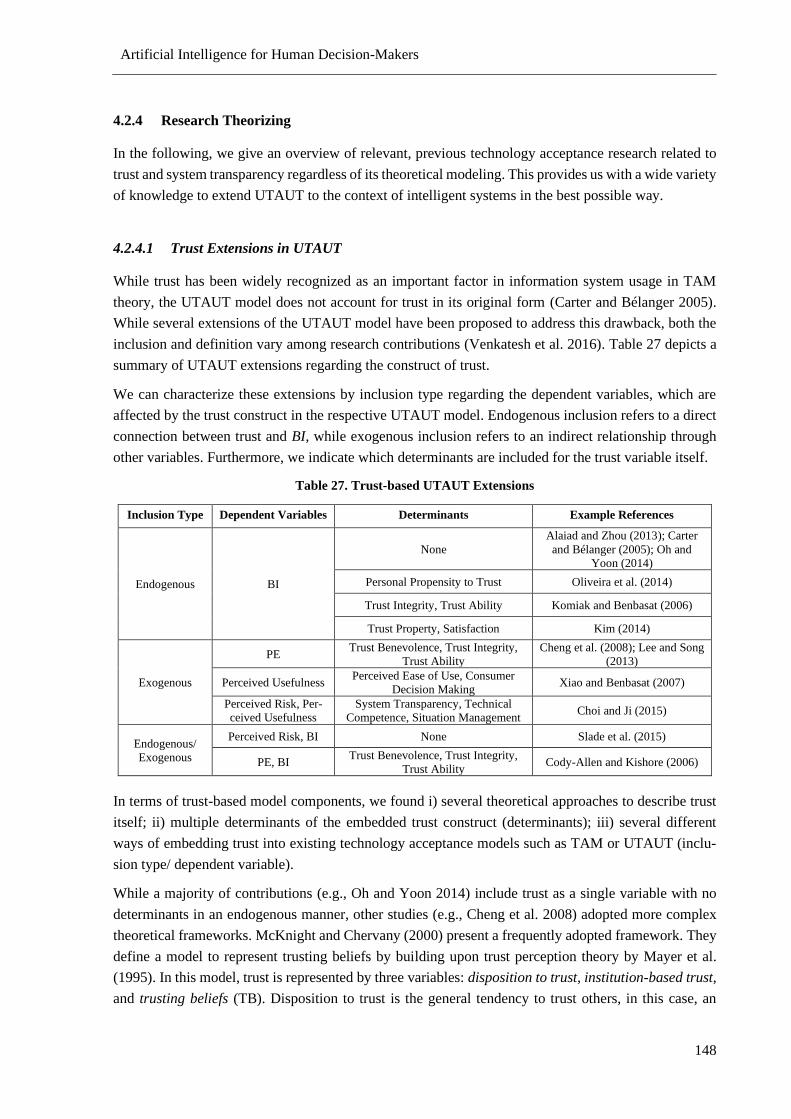
Artificial Intelligence for Human Decision-Makers
148
4.2.4 Research Theorizing
In the following, we give an overview of relevant, previous technology acceptance research related to
trust and system transparency regardless of its theoretical modeling. This provides us with a wide variety
of knowledge to extend UTAUT to the context of intelligent systems in the best possible way.
4.2.4.1 Trust Extensions in UTAUT
While trust has been widely recognized as an important factor in information system usage in TAM
theory, the UTAUT model does not account for trust in its original form (Carter and Bélanger 2005).
While several extensions of the UTAUT model have been proposed to address this drawback, both the
inclusion and definition vary among research contributions (Venkatesh et al. 2016). Table 27 depicts a
summary of UTAUT extensions regarding the construct of trust.
We can characterize these extensions by inclusion type regarding the dependent variables, which are
affected by the trust construct in the respective UTAUT model. Endogenous inclusion refers to a direct
connection between trust and BI, while exogenous inclusion refers to an indirect relationship through
other variables. Furthermore, we indicate which determinants are included for the trust variable itself.
Table 27. Trust-based UTAUT Extensions
Inclusion Type Dependent Variables Determinants Example References
Endogenous BI
None
Alaiad and Zhou (2013); Carter
and Bélanger (2005); Oh and
Yoon (2014)
Personal Propensity to Trust Oliveira et al. (2014)
Trust Integrity, Trust Ability Komiak and Benbasat (2006)
Trust Property, Satisfaction Kim (2014)
Exogenous
PE Trust Benevolence, Trust Integrity,
Trust Ability
Cheng et al. (2008); Lee and Song
(2013)
Perceived Usefulness Perceived Ease of Use, Consumer
Decision Making Xiao and Benbasat (2007)
Perceived Risk, Per-
ceived Usefulness
System Transparency, Technical
Competence, Situation Management Choi and Ji (2015)
Endogenous/
Exogenous
Perceived Risk, BI None Slade et al. (2015)
PE, BI Trust Benevolence, Trust Integrity,
Trust Ability Cody-Allen and Kishore (2006)
In terms of trust-based model components, we found i) several theoretical approaches to describe trust
itself; ii) multiple determinants of the embedded trust construct (determinants); iii) several different
ways of embedding trust into existing technology acceptance models such as TAM or UTAUT (inclu-
sion type/ dependent variable).
While a majority of contributions (e.g., Oh and Yoon 2014) include trust as a single variable with no
determinants in an endogenous manner, other studies (e.g., Cheng et al. 2008) adopted more complex
theoretical frameworks. McKnight and Chervany (2000) present a frequently adopted framework. They
define a model to represent trusting beliefs by building upon trust perception theory by Mayer et al.
(1995). In this model, trust is represented by three variables: disposition to trust, institution-based trust,
and trusting beliefs (TB). Disposition to trust is the general tendency to trust others, in this case, an
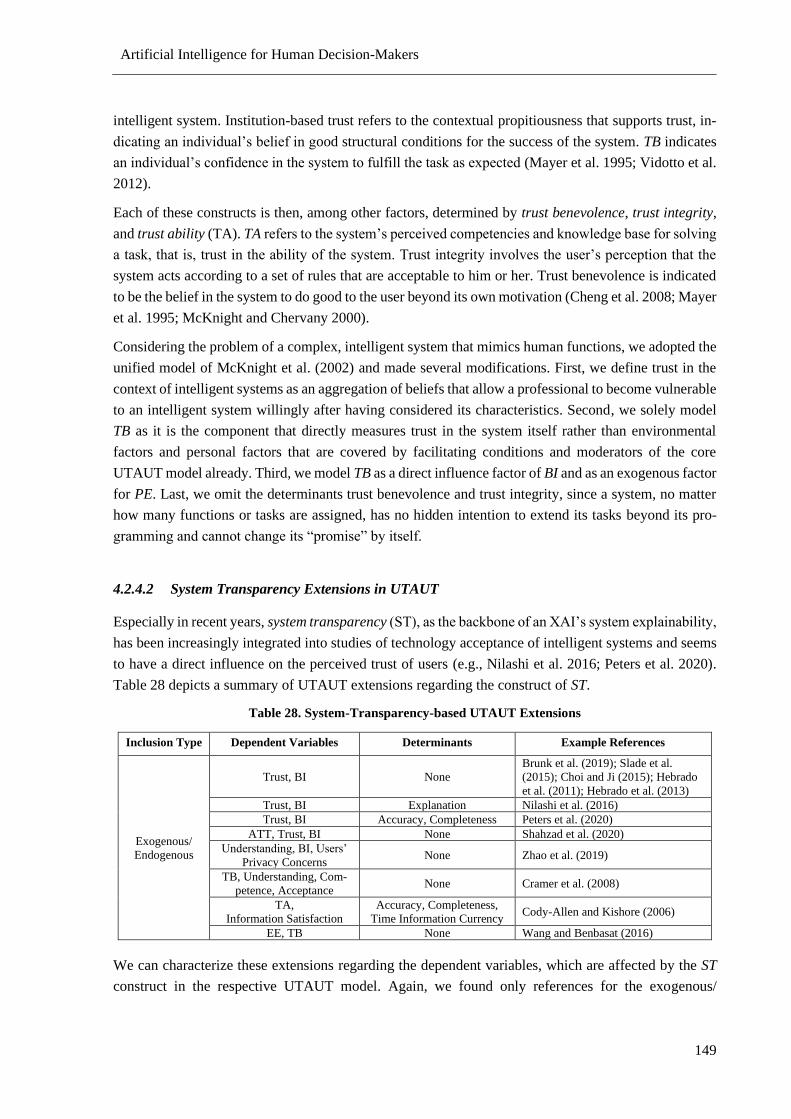
Artificial Intelligence for Human Decision-Makers
149
intelligent system. Institution-based trust refers to the contextual propitiousness that supports trust, in-
dicating an individual’s belief in good structural conditions for the success of the system. TB indicates
an individual’s confidence in the system to fulfill the task as expected (Mayer et al. 1995; Vidotto et al.
2012).
Each of these constructs is then, among other factors, determined by trust benevolence, trust integrity,
and trust ability (TA). TA refers to the system’s perceived competencies and knowledge base for solving
a task, that is, trust in the ability of the system. Trust integrity involves the user’s perception that the
system acts according to a set of rules that are acceptable to him or her. Trust benevolence is indicated
to be the belief in the system to do good to the user beyond its own motivation (Cheng et al. 2008; Mayer
et al. 1995; McKnight and Chervany 2000).
Considering the problem of a complex, intelligent system that mimics human functions, we adopted the
unified model of McKnight et al. (2002) and made several modifications. First, we define trust in the
context of intelligent systems as an aggregation of beliefs that allow a professional to become vulnerable
to an intelligent system willingly after having considered its characteristics. Second, we solely model
TB as it is the component that directly measures trust in the system itself rather than environmental
factors and personal factors that are covered by facilitating conditions and moderators of the core
UTAUT model already. Third, we model TB as a direct influence factor of BI and as an exogenous factor
for PE. Last, we omit the determinants trust benevolence and trust integrity, since a system, no matter
how many functions or tasks are assigned, has no hidden intention to extend its tasks beyond its pro-
gramming and cannot change its “promise” by itself.
4.2.4.2 System Transparency Extensions in UTAUT
Especially in recent years, system transparency (ST), as the backbone of an XAI’s system explainability,
has been increasingly integrated into studies of technology acceptance of intelligent systems and seems
to have a direct influence on the perceived trust of users (e.g., Nilashi et al. 2016; Peters et al. 2020).
Table 28 depicts a summary of UTAUT extensions regarding the construct of ST.
Table 28. System-Transparency-based UTAUT Extensions
Inclusion Type Dependent Variables Determinants Example References
Exogenous/
Endogenous
Trust, BI None
Brunk et al. (2019); Slade et al.
(2015); Choi and Ji (2015); Hebrado
et al. (2011); Hebrado et al. (2013)
Trust, BI Explanation Nilashi et al. (2016)
Trust, BI Accuracy, Completeness Peters et al. (2020)
ATT, Trust, BI None Shahzad et al. (2020)
Understanding, BI, Users’
Privacy Concerns None Zhao et al. (2019)
TB, Understanding, Com-
petence, Acceptance None Cramer et al. (2008)
TA,
Information Satisfaction
Accuracy, Completeness,
Time Information Currency Cody-Allen and Kishore (2006)
EE, TB None Wang and Benbasat (2016)
We can characterize these extensions regarding the dependent variables, which are affected by the ST
construct in the respective UTAUT model. Again, we found only references for the exogenous/
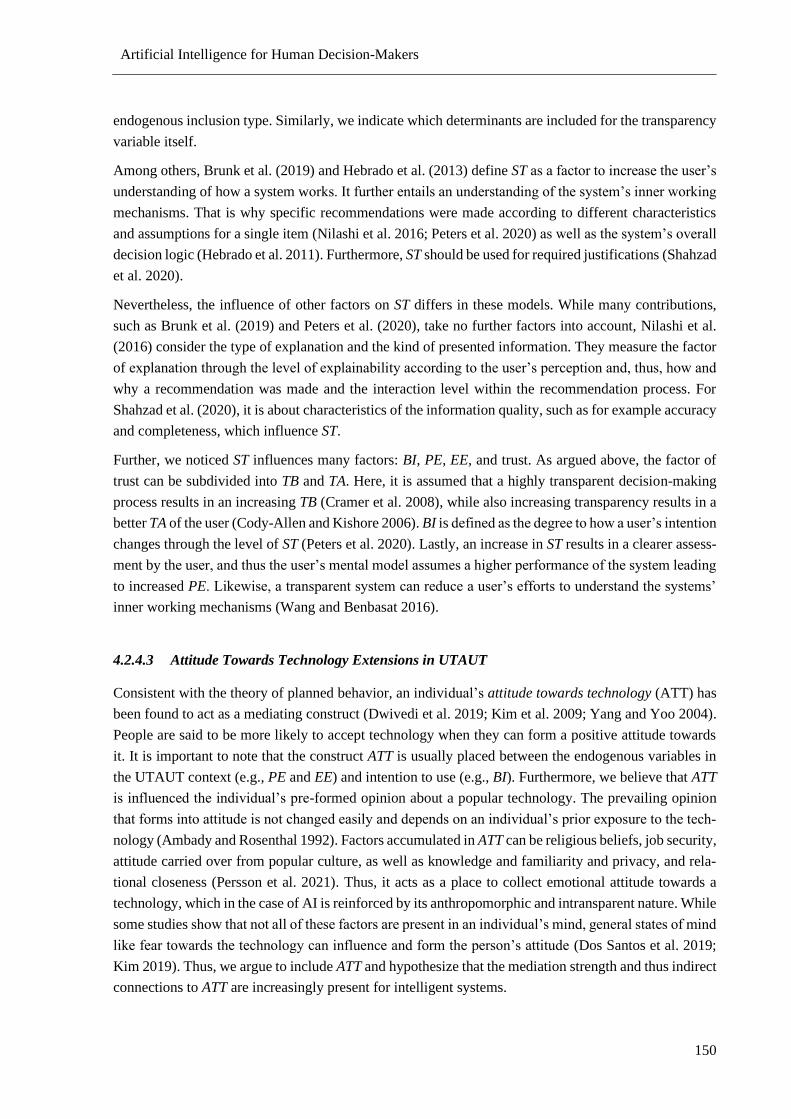
Artificial Intelligence for Human Decision-Makers
150
endogenous inclusion type. Similarly, we indicate which determinants are included for the transparency
variable itself.
Among others, Brunk et al. (2019) and Hebrado et al. (2013) define ST as a factor to increase the user’s
understanding of how a system works. It further entails an understanding of the system’s inner working
mechanisms. That is why specific recommendations were made according to different characteristics
and assumptions for a single item (Nilashi et al. 2016; Peters et al. 2020) as well as the system’s overall
decision logic (Hebrado et al. 2011). Furthermore, ST should be used for required justifications (Shahzad
et al. 2020).
Nevertheless, the influence of other factors on ST differs in these models. While many contributions,
such as Brunk et al. (2019) and Peters et al. (2020), take no further factors into account, Nilashi et al.
(2016) consider the type of explanation and the kind of presented information. They measure the factor
of explanation through the level of explainability according to the user’s perception and, thus, how and
why a recommendation was made and the interaction level within the recommendation process. For
Shahzad et al. (2020), it is about characteristics of the information quality, such as for example accuracy
and completeness, which influence ST.
Further, we noticed ST influences many factors: BI, PE, EE, and trust. As argued above, the factor of
trust can be subdivided into TB and TA. Here, it is assumed that a highly transparent decision-making
process results in an increasing TB (Cramer et al. 2008), while also increasing transparency results in a
better TA of the user (Cody-Allen and Kishore 2006). BI is defined as the degree to how a user’s intention
changes through the level of ST (Peters et al. 2020). Lastly, an increase in ST results in a clearer assess-
ment by the user, and thus the user’s mental model assumes a higher performance of the system leading
to increased PE. Likewise, a transparent system can reduce a user’s efforts to understand the systems’
inner working mechanisms (Wang and Benbasat 2016).
4.2.4.3 Attitude Towards Technology Extensions in UTAUT
Consistent with the theory of planned behavior, an individual’s attitude towards technology (ATT) has
been found to act as a mediating construct (Dwivedi et al. 2019; Kim et al. 2009; Yang and Yoo 2004).
People are said to be more likely to accept technology when they can form a positive attitude towards
it. It is important to note that the construct ATT is usually placed between the endogenous variables in
the UTAUT context (e.g., PE and EE) and intention to use (e.g., BI). Furthermore, we believe that ATT
is influenced the individual’s pre-formed opinion about a popular technology. The prevailing opinion
that forms into attitude is not changed easily and depends on an individual’s prior exposure to the tech-
nology (Ambady and Rosenthal 1992). Factors accumulated in ATT can be religious beliefs, job security,
attitude carried over from popular culture, as well as knowledge and familiarity and privacy, and rela-
tional closeness (Persson et al. 2021). Thus, it acts as a place to collect emotional attitude towards a
technology, which in the case of AI is reinforced by its anthropomorphic and intransparent nature. While
some studies show that not all of these factors are present in an individual’s mind, general states of mind
like fear towards the technology can influence and form the person’s attitude (Dos Santos et al. 2019;
Kim 2019). Thus, we argue to include ATT and hypothesize that the mediation strength and thus indirect
connections to ATT are increasingly present for intelligent systems.
Artificial Intelligence for Human Decision-Makers
151
4.2.4.4 Model and Hypotheses
As a result of the above construct derivation, we present our UTAUT model for intelligent systems along
with the hypotheses and their respective direction (- or +) in Figure 35. The measurement model can be
divided into three major parts: i) UTAUT core (PE, EE, and BI), ii) UTAUT AI (TA, TB, ST, and ATT),
and iii) moderators (gender, age, experience).
Figure 35. Derived Acceptance Model for Intelligent Systems
The derivation of the hypotheses from i) UTAUT core research is primarily based on general research
on UTAUT (e.g., Dwivedi et al. 2019; Venkatesh et al. 2003). Nevertheless, these construct interrela-
tions can also be found in UTAUT studies on trust or system transparency (e.g., Lee and Song 2013;
Wang and Benbasat 2016).
The construct BI represents our target variable. It measures the strength of a user’s intention to perform
a specific behavior (Fishbein and Ajzen 1977). Here, it is about the willingness of a user to adopt an
intelligent system. The construct is influenced endogenously by the two basic UTAUT constructs of PE
and EE. PE measures the degree to which an individual believes that using the system will help to attain
gains in job performance. This includes factors such as perceived usefulness, job-fit, relative advantage,
extrinsic motivation, and outcome expectation (Venkatesh et al. 2003). EE measures the degree of ease
associated with the use of the system, including factors such as perceived ease of use and complexity
(Venkatesh et al. 2003). For both constructs, we assume that they have a positive influence on BI. This
correlation can be seen in UTAUT (e.g., Dwivedi et al. 2019; Venkatesh et al. 2003) as well as in
UTAUT model studies on trust and on ST (Cheng et al. 2008; Cody-Allen and Kishore 2006; Lee and
Song 2013; Wang and Benbasat 2016). Thus, we state:
H1: Performance Expectancy positively affects Behavioral Intention.
H2: Effort Expectancy positively affects Behavioral Intention.
The hypotheses of ii) UTAUT AI, and thus, for ATT, TA, TB, and ST are primarily based on the refer-
ences from Table 27 and Table 28 as well as Venkatesh et al. (2003)’s considerations.
ATT is defined as an user’s overall affective reaction to using a technology or system (Venkatesh et al.
2003). While the authors did not include ATT in his final model, it is regularly used in the context of
H10(+)
H12(+) Performance
Expectancy (PE)
Effort Expectancy
(EE)
Gender Age Experience
Attitude Towards
Technology (ATT)
Interaction Moderation
Trusting Beliefs (TB)
System Transparency
(ST)
Trust Ability (TA)
Behavioral Intention
(BI)
H9(+)
H6(+)
H3(+)
H8(+)
H7
(+)H4(+)
H2(+)
UTAUT
Core
UTAUT
AI
H14(+)
Artificial Intelligence for Human Decision-Makers
152
decision support systems. UTAUT research, as well as TAM research on trust, indicate that ATT has a
positive effect on BI (e.g., Chen 2013; Hwang et al. 2016; Mansouri et al. 2010). That is, people form
intentions to engage in behaviors to which they have a positive attitude (Dwivedi et al. 2019). Inversely,
it is assumed that both PE and EE have a positive influence on a user’s ATT. Suleman et al. (2019)
derive this significantly positive influence from the TAM research (Hsu et al. 2013; Indarsin and Ali
2017) and later confirm it in their own research. Dwivedi et al. (2019) and Thomas et al. (2013) confirm
the connection. We summarize these findings by our next hypotheses:
H3: Attitude Towards Technology positively affects Behavioral Intention.
H4: Performance Expectancy positively affects Attitude Towards Technology.
H5: Effort Expectancy positively affects Attitude Towards Technology.
Trust is regarded as a necessary prerequisite to forming an effective intelligent system (e.g., Dam et al.
2018) and, thus, it is a crucial construct to building our model. In Section 4.2.4.1, we have explained
that two subtypes of trust are particularly important in our context: TA and TB. TA measures the assumed
technical competencies of the system to solve a task (Schoorman et al. 2007). TB is about the user’s
confidence in the system to fulfill a task as expected (Mayer et al. 1995). For TB, we expect a positive
effect on ATT and on BI, as preliminary trust-based UTAUT extensions indicate (e.g., Ha and Stoel
2009; Indarsin and Ali 2017). For Suleman et al. (2019), TB was the most influential and significant
factor affecting a participant’s ATT. The positive influence of TB on BI is well proven by several
UTAUT studies (Choi and Ji 2015; Lee and Song 2013). We summarize this with the next hypotheses:
H6: Trusting Beliefs positively affects Attitude Towards Technology.
H7: Trusting Beliefs positively affects Behavioral Intention.
In turn, we assume that TA has a positive influence on a user’s TB, which in turn has a positive influence
on PE. However, the direction of the latter construct linkage is disputed in prior research. While Oliveira
et al. (2014), Nilashi et al. (2016), and Wang and Benbasat (2016) assume that PE has a positive influ-
ence on TB, Cody-Allen and Kishore (2006), Lee and Song (2013), and Choi and Ji (2015) think that
TB affects PE. Yin et al. (2019) show that people’s confidence in a third party’s decision-making in-
creases when the observed performance of that third party, here the intelligent system, is higher than
their own expected decision rating for it. Therefore, we assume a positive influence of TB on PE. The
influence of TA on TB derived from the general trust perception theory by Mayer et al. (1995) is not
disputed. Cramer et al. (2008) or Choi and Ji (2015) show examples of a positive effect. Accordingly,
we formulate our hypotheses:
H8: Trusting Beliefs positively affects Performance Expectancy.
H9: Trust Ability positively affects Trusting Beliefs.
Trust – as a multifaced term – is assumed to have a strong correlation with ST (e.g., Dam et al. 2018).
ST measures the user’s understanding of how the decision logic of a system works (Hebrado et al. 2011).
In other words, it represents the why of an intelligent system’s decision considering its inner decision
logic as well as the characteristics that determine a certain result. As the user of such an intelligent
system decides whether or not to adopt the system recommendation, ST might influence his/her decision-
making process. We expect a positive effect of ST on TA and TB based on the findings of Pu and Chen
Artificial Intelligence for Human Decision-Makers
153
(2007) and Wang and Benbasat (2016). The former found that users assign a recommender system a
higher level of competence if the decision-making process is explained, which is traceable. The latter is
supported by the preliminary UTAUT research of Brunk et al. (2019), Hebrado et al. (2013), Nilashi et
al. (2016), Peters et al. (2020), and Chen and Sundar (2018). For example, Peters et al. (2020) found
that ST significantly positively influenced trust in the intelligent system in the context of testing the
consumer’s willingness to pay for transparency of such black-box systems. We conclude with the hy-
potheses:
H10: System Transparency positively affects Trust Ability.
H11: System Transparency positively affects Trusting Beliefs.
Technology acceptance research supposes that ST also influences the residual UTAUT constructs of PE,
EE, and BI. We derive the assumed positive effect of ST on PE from Zhao et al. (2019), who revealed
that a higher level of a DSS supports the user’s perception of the performance of that system. We assume
a negative effect for the influence of ST on EE. If users understand how a system works and how calcu-
lations are performed, they will perceive that the use of the system requires more effort (Gretzel and
Fesenmaier 2006). We expect a positive influence of ST for BI. Making the reasoning behind a recom-
mendation transparent allows for an understanding of the recommendation process, which significantly
increases acceptance (Bilgic and Mooney 2005). This significant and strong influence is also reflected
in further studies by Venkatesh et al. (2016) and Hebrado et al. (2011). From this, we derive the follow-
ing hypotheses.
H12: System Transparency positively affects Performance Expectancy.
H13: System Transparency negatively affects Effort Expectancy.
H14: System Transparency positively affects Behavioral Intention.
The hypothesis for the iii) moderators are also part of the original UTAUT model according to
Venkatesh et al. (2003).
We assume that gender, age, and experience have a moderating effect on the constructs of PE, EE, and
BI. We derive this assumption from the initial UTAUT model (Venkatesh et al. 2003). It has been con-
firmed in several other UTAUT studies (e.g., Alharbi 2014; Esfandiari and Sokhanvar 2016; Wang and
Benbasat 2016). We address this through two more hypotheses:
H15: Gender, Age, and Experience moderate the effects of PE on BI.
H16: Gender, Age, and Experience moderate the effects of EE on BI.
4.2.5 Research Evaluation
4.2.5.1 Study Use Case
In the following, we offer an exploration of the theoretical constructs put forward. For this purpose, we
defined a real-life use case and transferred it to the UTAUT model in a step-by-step procedure. In this
way, we validate the applicability of our proposed model. Moreover, we gain first insights into the user’s
willingness to accept intelligent systems at their workplace.
Artificial Intelligence for Human Decision-Makers
154
We consider industrial machine maintenance to be a suitable scenario. Its focus is to maintain and restore
the operational readiness of machinery to keep opportunity costs as low as possible. In contrast to reac-
tive strategies, anomalous machine behavior can be identified and graded early using statistical tech-
niques to avoid unnecessary work. Given the technological possibilities to collect large and multifaceted
data assets in a simplified manner, intelligent systems based on machine learning are a promising alter-
native for maintenance decision support (Carvalho et al. 2019b).
In this context, rolling bearings are used in many production scenarios of different manufacturers. For
example, they are often installed in conveyor belts for transport or within different engines and show
signs of wear and tear over time that requires maintenance (Pawellek 2016).
For our evaluation, we decided to use an automated production process to manufacture window and
door handles, as these are common everyday items every respondent can relate to. In our scenario, there
shall be several production sections connected by high-speed conveyor belts. Inside these conveyor
belts, several bearings are installed. These are monitored by sensors to monitor change (e.g., noise sen-
sor, vibration, and temperature). A newly introduced intelligent system evaluates this data automatically.
In case of anomalous data patterns, a dashboard displays warnings and errors with concrete recommen-
dations for action (cf. Appendix III).
The respondents of the survey(s) shall be confronted with a decision situation that tests whether or not
the user adopts the system recommendation in his or her own decision-making process. That is, they
need to decide for or against an active intervention in the production process as recommended by the
system. In an extreme case, the optical condition of the conveyor belt bearings is perceived as good.
However, the system recommends that the conveyor belt must be switched off immediately. This error
does not occur regularly, and the message contradicts the previous experience of the service employee
(here, the respondent) with this production section. As additional information, we provide the reliability
of the system recommendations and hint at the high follow-up costs in case of a wrong decision.
4.2.5.2 Study Design
Our design and conduct of the survey are based on Šumak et al. (2010), which we modified to our
objective. We used five steps to obtain our study results: i) collection of established measurement items;
ii) pre-selection by author team; iii) reduction by experts; iv) evaluation and refinement through pre-
study; and v) execution of the main study.
See Appendix III for the results of each step as well as primary and secondary source(s) for all meas-
urement items. A more detailed result table of the validity and reliability measures of the pre-study and
main study is available in Appendix III.
Step i). First, we collected those measurement items that already exist for the respective constructs of
interest and are, thus, empirically proven.
As we adopted PE, EE, and BI from Venkatesh et al. (2003), we built on their findings. Venkatesh et al.
(2003) chose the measurement items for UTAUT by conducting a study and testing the measurement
items for consistency and reliability. For the additional constructs ATT, ST, TA, and TB, we examined
the source construct measurement items as well as examples of secondary literature and derived con-
structs. Initially, we used three items to form the construct of ATT – one was adopted from Davis et al.
Artificial Intelligence for Human Decision-Makers
155
(1992) and two from Higgins and his co-authors (Compeau et al. 1999; Thompson et al. 1991). As we
derived ST from perceived understandability as well as perceived transparency, we initially included
five items from Madsen and Gregor (2000) in addition to two items from Cramer et al. (2008). The
measurement items for TA and TB were derived from McKnight et al. (2002) (trust benevolence) and
Lee and Turban (2001) (trust propensity).
Step ii). Next, we discussed the appropriateness of each of the collected measurement items within the
team of authors.
The team members merge knowledge in the respective domains of industrial maintenance, technology
acceptance, and (X)AI research. Special attention was paid to the duplication of potential item questions
and their feasibility for the use case. We reduced the total number of measurement items for the model’s
constructs from 71 to 24.
Step iii). Subsequently, we conducted an expert survey with practitioners from industrial maintenance
regarding our intended main study.
The survey with ten experts had two goals: reduction of the remaining measurement items and gaining
an understanding of the explainability of intelligent system dashboards. For the former, we explained
each of the model measurement constructs briefly to the experts. Subsequently, the experts had to select
the most appropriate remaining measurement items for the use case per measurement construct. They
were given at least one vote and at most votes for half the items. Then, we selected the final measurement
items based on a majority vote. For the latter, we presented the experts with four different maintenance
dashboards of intelligent systems as snapshots adapted from typical software in the respective field (e.g.,
Aboulian et al. 2018; Moyne et al. 2013). Here, the experts rated their perceived level of explanation
goodness on a seven-point Likert scale and chose their favorite dashboard. This ensured that the dash-
board for the quantitative survey has inherent explainability and thus provides enhanced system trans-
parency (cf. Appendix III).
Step iv). Then, we conducted a quantitative pilot study to examine our questionnaire and research design
critically (Brown et al. 2010). The testing includes checks for internal consistency, convergent reliabil-
ity, indicator reliability, and discriminant validity.
The study contained 60 valid responses. Here, we ensured representative respondents, that is, mainte-
nance professionals holding a position to use an intelligent system for their job-related tasks (e.g., expe-
rience in maintenance). We provided the participants with a description of the exemplary use case and
screenshots of the prototype. We asked them to respond to their perceptions of each of the measurement
items on a five-point Likert scale. See Table 29 for the assessment of measurement items and Appendix
III for a summary of our decisions on individual items.
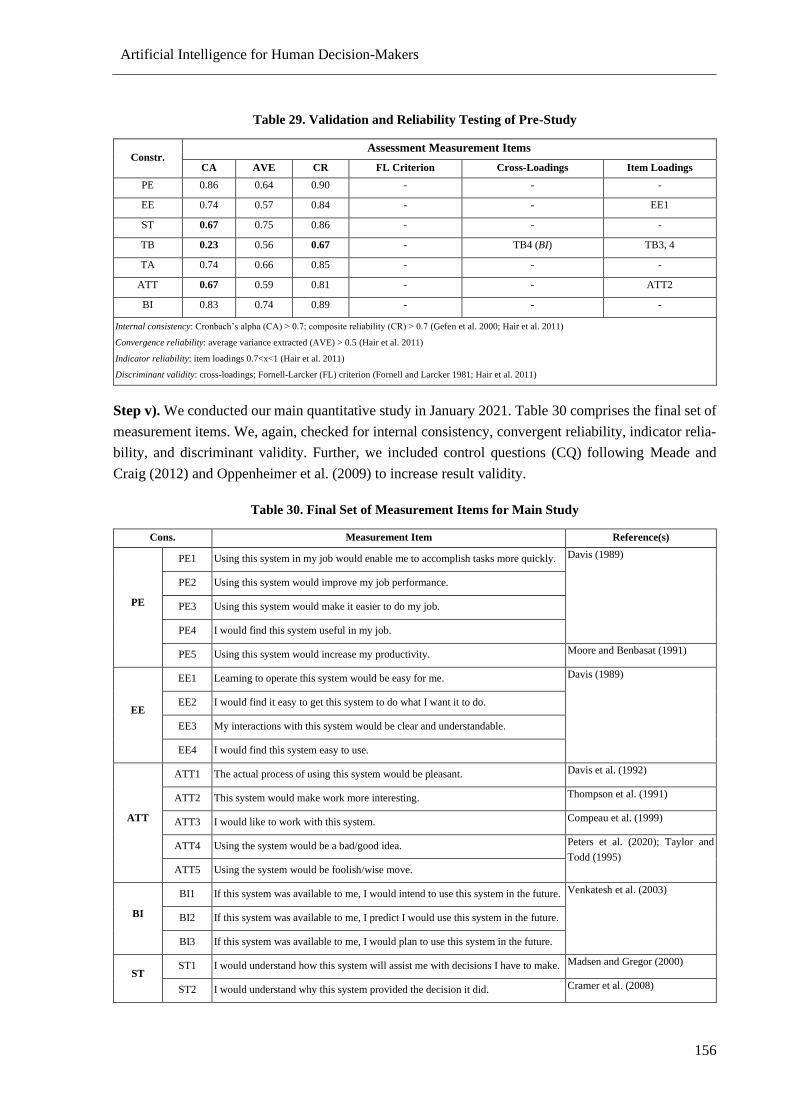
Artificial Intelligence for Human Decision-Makers
156
Table 29. Validation and Reliability Testing of Pre-Study
Constr. Assessment Measurement Items
CA AVE CR FL Criterion Cross-Loadings Item Loadings
PE 0.86 0.64 0.90 - - -
EE 0.74 0.57 0.84 - - EE1
ST 0.67 0.75 0.86 - - -
TB 0.23 0.56 0.67 - TB4 (BI) TB3, 4
TA 0.74 0.66 0.85 - - -
ATT 0.67 0.59 0.81 - - ATT2
BI 0.83 0.74 0.89 - - -
Internal consistency: Cronbach’s alpha (CA) > 0.7; composite reliability (CR) > 0.7 (Gefen et al. 2000; Hair et al. 2011)
Convergence reliability: average variance extracted (AVE) > 0.5 (Hair et al. 2011)
Indicator reliability: item loadings 0.7<x<1 (Hair et al. 2011)
Discriminant validity: cross-loadings; Fornell-Larcker (FL) criterion (Fornell and Larcker 1981; Hair et al. 2011)
Step v). We conducted our main quantitative study in January 2021. Table 30 comprises the final set of
measurement items. We, again, checked for internal consistency, convergent reliability, indicator relia-
bility, and discriminant validity. Further, we included control questions (CQ) following Meade and
Craig (2012) and Oppenheimer et al. (2009) to increase result validity.
Table 30. Final Set of Measurement Items for Main Study
Cons. Measurement Item Reference(s)
PE
PE1 Using this system in my job would enable me to accomplish tasks more quickly. Davis (1989)
PE2 Using this system would improve my job performance.
PE3 Using this system would make it easier to do my job.
PE4 I would find this system useful in my job.
PE5 Using this system would increase my productivity. Moore and Benbasat (1991)
EE
EE1 Learning to operate this system would be easy for me. Davis (1989)
EE2 I would find it easy to get this system to do what I want it to do.
EE3 My interactions with this system would be clear and understandable.
EE4 I would find this system easy to use.
ATT
ATT1 The actual process of using this system would be pleasant. Davis et al. (1992)
ATT2 This system would make work more interesting. Thompson et al. (1991)
ATT3 I would like to work with this system. Compeau et al. (1999)
ATT4 Using the system would be a bad/good idea. Peters et al. (2020); Taylor and
Todd (1995)
ATT5 Using the system would be foolish/wise move.
BI
BI1 If this system was available to me, I would intend to use this system in the future. Venkatesh et al. (2003)
BI2 If this system was available to me, I predict I would use this system in the future.
BI3 If this system was available to me, I would plan to use this system in the future.
ST ST1 I would understand how this system will assist me with decisions I have to make. Madsen and Gregor (2000)
ST2 I would understand why this system provided the decision it did. Cramer et al. (2008)
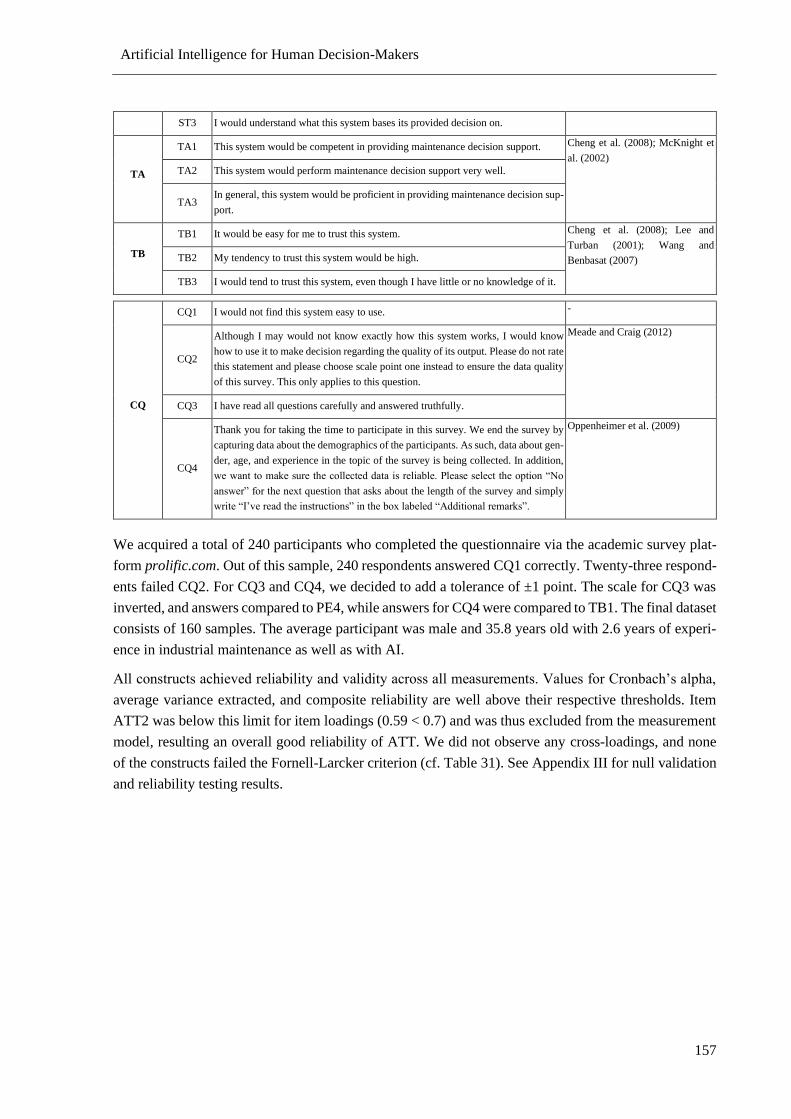
Artificial Intelligence for Human Decision-Makers
157
ST3 I would understand what this system bases its provided decision on.
TA
TA1 This system would be competent in providing maintenance decision support. Cheng et al. (2008); McKnight et
al. (2002)
TA2 This system would perform maintenance decision support very well.
TA3 In general, this system would be proficient in providing maintenance decision sup-
port.
TB
TB1 It would be easy for me to trust this system. Cheng et al. (2008); Lee and
Turban (2001); Wang and
Benbasat (2007) TB2 My tendency to trust this system would be high.
TB3 I would tend to trust this system, even though I have little or no knowledge of it.
CQ
CQ1 I would not find this system easy to use. -
CQ2
Although I may would not know exactly how this system works, I would know
how to use it to make decision regarding the quality of its output. Please do not rate
this statement and please choose scale point one instead to ensure the data quality
of this survey. This only applies to this question.
Meade and Craig (2012)
CQ3 I have read all questions carefully and answered truthfully.
CQ4
Thank you for taking the time to participate in this survey. We end the survey by
capturing data about the demographics of the participants. As such, data about gen-
der, age, and experience in the topic of the survey is being collected. In addition,
we want to make sure the collected data is reliable. Please select the option “No
answer” for the next question that asks about the length of the survey and simply
write “I’ve read the instructions” in the box labeled “Additional remarks”.
Oppenheimer et al. (2009)
We acquired a total of 240 participants who completed the questionnaire via the academic survey plat-
form prolific.com. Out of this sample, 240 respondents answered CQ1 correctly. Twenty-three respond-
ents failed CQ2. For CQ3 and CQ4, we decided to add a tolerance of ±1 point. The scale for CQ3 was
inverted, and answers compared to PE4, while answers for CQ4 were compared to TB1. The final dataset
consists of 160 samples. The average participant was male and 35.8 years old with 2.6 years of experi-
ence in industrial maintenance as well as with AI.
All constructs achieved reliability and validity across all measurements. alues for Cronbach’s alpha,
average variance extracted, and composite reliability are well above their respective thresholds. Item
ATT2 was below this limit for item loadings (0.59 < 0.7) and was thus excluded from the measurement
model, resulting an overall good reliability of ATT. We did not observe any cross-loadings, and none
of the constructs failed the Fornell-Larcker criterion (cf. Table 31). See Appendix III for null validation
and reliability testing results.
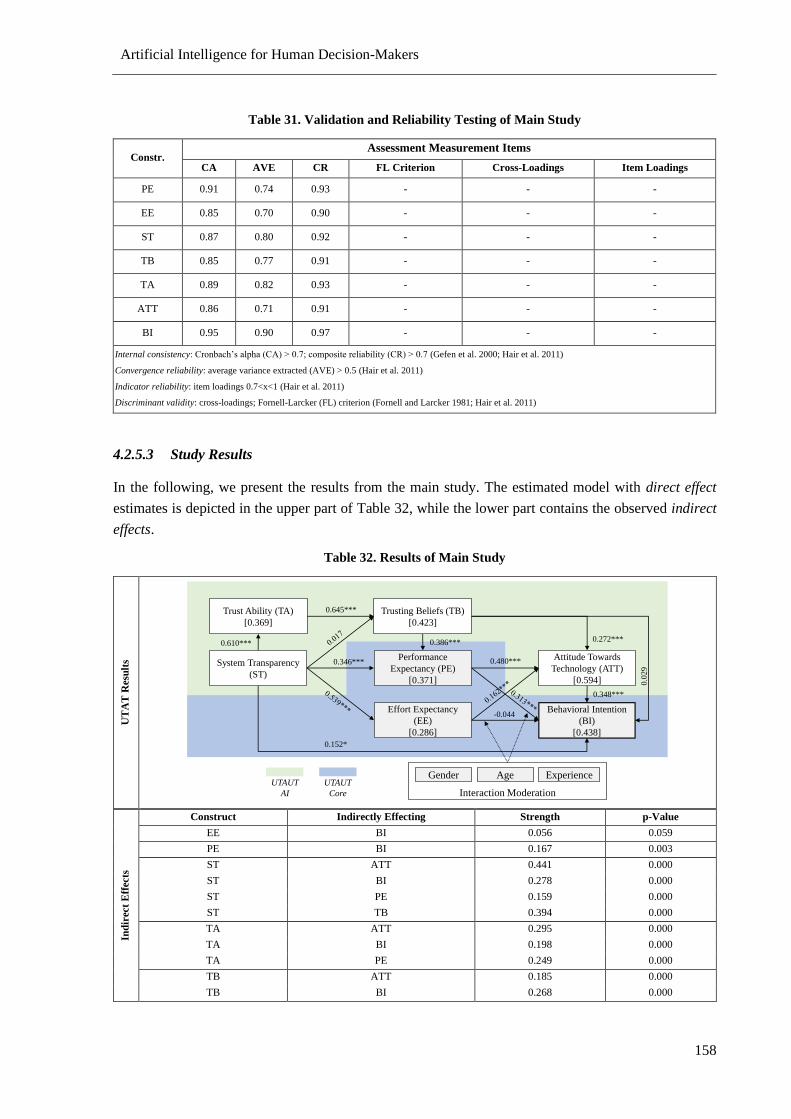
Artificial Intelligence for Human Decision-Makers
158
Table 31. Validation and Reliability Testing of Main Study
Constr. Assessment Measurement Items
CA AVE CR FL Criterion Cross-Loadings Item Loadings
PE 0.91 0.74 0.93 - - -
EE 0.85 0.70 0.90 - - -
ST 0.87 0.80 0.92 - - -
TB 0.85 0.77 0.91 - - -
TA 0.89 0.82 0.93 - - -
ATT 0.86 0.71 0.91 - - -
BI 0.95 0.90 0.97 - - -
Internal consistency: Cronbach’s alpha (CA) > 0.7; composite reliability (CR) > 0.7 (Gefen et al. 2000; Hair et al. 2011)
Convergence reliability: average variance extracted (AVE) > 0.5 (Hair et al. 2011)
Indicator reliability: item loadings 0.7<x<1 (Hair et al. 2011)
Discriminant validity: cross-loadings; Fornell-Larcker (FL) criterion (Fornell and Larcker 1981; Hair et al. 2011)
4.2.5.3 Study Results
In the following, we present the results from the main study. The estimated model with direct effect
estimates is depicted in the upper part of Table 32, while the lower part contains the observed indirect
effects.
Table 32. Results of Main Study
UT
AT
Resu
lts
Ind
irec
t E
ffec
ts
Construct Indirectly Effecting Strength p-Value
EE BI 0.056 0.059
PE BI 0.167 0.003
ST ATT 0.441 0.000
ST BI 0.278 0.000
ST PE 0.159 0.000
ST TB 0.394 0.000
TA ATT 0.295 0.000
TA BI 0.198 0.000
TA PE 0.249 0.000
TB ATT 0.185 0.000
TB BI 0.268 0.000
0.610***
0.346***Performance
Expectancy (PE)
[0.371]
Effort Expectancy
(EE)
[0.286]
Gender Age Experience
Attitude Towards
Technology (ATT)
[0.594]
Interaction Moderation
Trusting Beliefs (TB)
[0.423]
System Transparency
(ST)
Trust Ability (TA)
[0.369]
Behavioral Intention
(BI)
[0.438]
0.645***
0.272***
0.348***
0.386***0.0
29
0.480***
-0.044
UTAUT
Core
UTAUT
AI
0.152*
Artificial Intelligence for Human Decision-Makers
159
4.2.5.3.1 The Role of UTAUT Core Constructs
First, we examine the role of the initial exogenous UTAUT constructs PE and EE. In accordance with
Venkatesh et al. (2016) and Dwivedi et al. (2019), PE is connected significantly to BI. While we observe
this effect of PE with magnitude 0.313, we cannot confirm a significant effect of EE on BI. Thus, we
can confirm H1 but reject H2. However, we can confirm a significant effect from ATT to BI in its exog-
enous role with an effect strength of 0.348. With the established confirmation of H3, we can observe a
significant effect of magnitude 0.162 from EE to the construct ATT in its endogenous role, resulting in
an indirect relationship to BI. Likewise, with a comparably more substantial effect than its direct con-
nection (0.480), PE affects ATT significantly. We can therefore confirm H4 and H5, respectively. Com-
paring the bias-corrected confidence intervals of EE to BI (width 0.338, from -0.218 to 0.120) and EE
to ATT (width 0.25, from 0.027 to 0.278) further strengthen the notion that EE affects BI rather indirectly
through ATT in our context of intelligent systems, confirming results by Dwivedi et al. (2019) and
Thomas et al. (2013).
4.2.5.3.2 The Role of User’s Attitude Towards Intelligent Systems
Since ATT is defined as an affective reaction, we conclude that this construct has increased presence in
the case of intelligent systems, resulting in its role as a transitory connection of EE and PE to BI. It is
reasonable to assume that a user is less affectionate about AI technology when it seems to be complicated
to use. However, since intelligent systems are attributed with black-box properties, the ease of use can
be difficult to determine beforehand. Hence, a direct connection between EE and BI seems less likely in
the case of intelligent systems. The strong indirect relationship of PE to BI via ATT can be strengthened
further by the notion of algorithm appreciation. Logg et al. (2019) found that an algorithmic system that
is perceived as complex is expected to have high performance, preferable to that of humans. Thus, the
increased PE will positively influence their ATT before an intention to use is formed. Contrary, the
notion of algorithm aversion, as expressed by Castelo et al. (2019) can cause the PE to drop if it is
observed or expected that the system errs, resulting in a transitory decrease of positive attitude towards
the system and making it less likely for the intelligent system to be used. This can be explained by the
feeling of missing control over the (partially) autonomous intelligent system (Dietvorst et al. 2015).
4.2.5.3.3 The Role of Trust Towards Intelligent Systems
Further, we examine the role of the trust-related exogenous constructs. We observe a significant effect
from TB on ATT with a strength of 0.272. Again, we assume an indirect relation to BI through ATT,
since the direct effect of TB on BI is not significant. This confirms that, especially in the context of
intelligent systems, trust influences the affection towards technology and, in a transitory fashion, the
intention to use said technology. In addition, both TB and ATT are highly affection-based constructs,
and thus a connection between them seems highly appropriate. We can therefore confirm H6 and reject
H7. We also found that TB has an effect on PE with a magnitude of 0.345. The confidence interval
(width 0.269, from 0.239 to 0.508) confirms a strong effect along with hypothesis H8. The observations
are in accordance with the findings of Cody-Allen and Kishore (2006), Lee and Song (2013), Choi and
Ji (2015) and thus confirm H8. Drawing from the findings of Logg et al. (2019), we can explain the
Artificial Intelligence for Human Decision-Makers
160
increase in trust through algorithm appreciation that occurs with increasing performance of the algo-
rithm. Thus, if a user experiences a well-performing intelligent system, the user is more likely to increase
trust in the system subsequently. To no surprise, also the user’s pre-existing level of trust in the algo-
rithm’s ability to perform well, TA, has a very strong effect on TB with a magnitude of 0.645, confirming
H9.
4.2.5.3.4 The Role of Transparency of Intelligent Systems
Finally, we investigate the role of system transparency. Regarding the trust constructs TA and TB, we
can confirm H10 since we observe a very strong effect of ST on TA with a magnitude of 0.610. However,
we cannot confirm a significant direct connection from ST to TB and, thus, reject H11. This is not sur-
prising since we expect the user to form trusting beliefs based on the pre-existing trust in the system’s
ability that can be better assessed when the user has access to an explanation of the system or the under-
lying algorithms.
Regarding the initial UTAUT indicators, we find that an understanding of the system does also affect
the expected performance, as we observe a strong effect of 0.346 of ST on PE, confirming H12. The
effect can be explained by the influences of explanations on perceived performance and decision towards
an intelligent system as described by Wanner et al. (2020a) through the means of local and global ex-
planations. Through a global explanation of the intelligent system, the user is made aware of its com-
plexity, which can lead to increased performance expectancy using the fact that intelligent systems based
on deep learning models are expected to outperform other systems. Likewise, local explanations that
explain a single prediction enable a consensus between the mental model of the user and the system
resulting in increased PE. An even more potent effect of ST was observed regarding EE with magnitude
0.539 and confirming H13. Revealing the complexity of the system through global explanations also
enables the user to realize the effort required to implement an intelligent system, thus increasing EE.
Besides, we observe a direct effect of ST on BI, confirming H14 at the .10 significance level with a
magnitude of 0.152. These results are in line with Wanner et al. (2020a), who indicate that explainability
plays a key role when deciding on an intelligent system. The direct effect is rather low compared with
the indirect effect via PE, which is also in accordance with their findings, where explainability was not
as strong a decision factor as performance. In summary, we find that ST poses a strong influential factor
concerning the attitude and intention to use an intelligent system either indirectly through previously
introduced constructs or as a minor direct effect.
4.2.5.3.5 The Role of User Characteristics
Lastly, we look at the moderating effects of age, gender, and experience on PE and EE. We found no
significant moderating effects of either variable or construct, contradicting the findings of Alharbi
(2014) and Esfandiari and Sokhanvar (2016). We assume that this is because our pre-screening sets
boundary conditions that do not allow for a great deal of variance within the participants. Thus, we
observed mostly minor experience and age gaps. In addition, due to the application domain, the sample
was skewed towards men (68.75 %), barely allowing for reliable variation.
Artificial Intelligence for Human Decision-Makers
161
4.2.6 Discussion
4.2.6.1 Theoretical Implications
4.2.6.1.1 Performance is King (When Looking at Direct Effects)
We extended the modified UTAUT model by Dwivedi et al. (2019), which itself is based on the UTAUT
model of Venkatesh et al. (2003), and derived additional constructs and connections in the context of
intelligent systems acceptance and use. The direct and indirect effects of PE play a major role and are
comparable to the findings of Dwivedi et al. (2019). The findings of Wanner et al. (2020a) confirm the
dominating role of the expected performance. Contrary, we found that the expected effort is not of major
concern when looking at the direct effects since it only delivers impact via indirect connections. We
consider this as a first indication of the increased difficulty to build a direct intention to use in the case
of intelligent systems, since the intention relies on the affection towards the system more heavily as
expressed by the extended UTAUT model of Dwivedi et al. (2019). Thus, while performance is king, it
is insufficient to focus only on direct effects when evaluating intelligent systems acceptance and use.
4.2.6.1.2 Human Attitude and Trust Steer Acceptance as Latent Indirect Factors
As mentioned previously, the strength of indirect effects delivered through the more affectionate con-
struct of ATT is substantial and shows the necessity for recognizing the deviation from a purely perfor-
mance- and effort-centered model. Following that thought of increased affection constructs, we found
that initial TB plays an essential role in determining the PE regarding the system. Thus, we revealed a
significant indirect influence of PE so that we assume it is more likely that a user thinks the system will
perform well when he or she trusts the system.
This transitory connection reveals the importance of trust in the context of intelligent system acceptance.
The strong effect of TA also reveals that a prior belief in the system’s problem-solving capability is
fundamental. Especially when looking at the discussion of algorithm appreciation vs. algorithm aver-
sion, this particular construct plays a central role in building up TB towards the system. We theorize that
the observation of algorithm appreciation or aversion is connected to TA and TB since they determine
what to expect from a system. Trusting a system and expecting super-human performance in the case of
algorithm appreciation can turn into mistrust when an aversion is built up due to individuality of a single
task or erratic system behavior (Dietvorst et al. 2015; Logg et al. 2019). However, as argued in XAI
literature, an explanation of some sort can help to increase trust in the system (Adadi and Berrada 2018;
Páez 2019).
4.2.6.1.3 System Transparency Enables Trust Building and Contributes to Performance Expec-
tancy in Both Ways
Including ST, we found that revealing the system’s internal decision structure (global explanation) and
explaining how it decides in individual cases (local explanation) has positive effects on almost all con-
structs. First, we can confirm that an understanding of or at least visibility into the decision process of
the system has a powerful effect on the user’s (initial) trust in the system, confirming the often-
Artificial Intelligence for Human Decision-Makers
162
postulated connection that motivates much XAI research (Ribeiro et al. 2016b). Second, we find that ST
also has substantial effects on PE and in terms of usability (i.e., EE). We expected the strong connection
of ST to EE as a global system explanation is usually required to determine the effort it takes to effi-
ciently train and subsequently use an intelligent system (Wanner et al. 2020a). It is reasonable to assume
that the presence of an explanation in a psychological sense reduces uncertainty and thus technological
anxiety towards the system (Miller 2019). Therefore, we theorize that the presence of local and global
explanations lets the user shift to a more rational behavior since he or she can make more informed
decisions rather than relying on their gut when dealing with black-box intelligent systems.
When comparing the observed effects with related literature such as Wanner et al. (2020a), which deals
with determining the decision factors for adopting intelligent systems, we find that the relationship be-
tween explanation performance and using a system is a more complex one. While we cannot draw con-
clusions regarding a trade-off as stated in Wanner et al. (2020a), we found that the presence of an ex-
planation indirectly influences the expected performance of a system, which is often the dominant in-
fluence factor. Therefore, we argue that while performance remains an essential factor for the actual
intention to use, ST should be attributed a more critical role than current findings suggest since it can
significantly increase the PE (or lower it depending on the revealed information through the explana-
tion).
Additionally, taking temporal factors into account, we argue that initial trust factors and subsequently
expected performance and attitude towards the system are formed by the information that is revealed
before the system is used. That is, the availability of ST can steer those factors in one direction or another
before the user sets his or her PE. Thus, we argue that it is less of a situational trade-off and more of a
decision process that is repeated with each use and thereby manifesting in the user’s attitude toward the
system and AI technology in general.
4.2.6.2 Practical Implications
4.2.6.2.1 Use Expectation Management to Form Attitude Towards the System
In order to avoid disappointment and algorithmic aversion, managing the expectations towards perfor-
mance can increase subsequent intention to use, even if the problem field for application is limited in
the process since hesitation is build up through the system’s self-signaling of suboptimal performance.
In line with Dietvorst et al. (2016), it is important to manage expectation and show the user control
opportunities of the system. This can be done with a pre-deployment introductory course and involving
users in the configuration state while using their knowledge in the training of the algorithms at the base
of the intelligent system (Nadj et al. 2020).
Besides providing support for managing expectations and learning to use the system (Dwivedi et al.
2019), overcoming initial hesitation has a high priority in the case of intelligent systems.
Artificial Intelligence for Human Decision-Makers
163
4.2.6.2.2 Control the Level of System Transparency Based on the Target Audience’s Capabilities
and Requirements
Global explanations depict the inner functioning and complexity of an intelligent system. They are suit-
able to manage the expected effort when procuring an intelligent system, specifically through either
outsourcing or in-house development. In addition, global explanations can provide a problem/system-
fit perspective in that the user can observe whether the complexity of the model is suitable for the task.
For example, using a complex deep learning model for an intelligent system to detect simple geometric
shapes such as cracks might even decrease performance.
Local explanations can assist with explaining single predictions of intelligent systems, helping the user
to compare the decision process by i) visualizing the steps towards the decision (e.g., by creating images
of the intermediate layers of the artificial neural network) and by ii) attributing the input data importance
regarding the output decision (e.g., by creating a heatmap of input pixels that caused the intelligent
system’s decision).
Explanations can also prove useful as a communication bridge between developers of the intelligent
system who are not domain experts and the domain experts who are AI-novices. This helps to diagnose
the model and create a common understanding of the decision process from a human point of view
enabling all stakeholders to jointly avoid false system behavior that can lead to algorithm aversion, such
as learning a wrong input-output relation.
However, disclosing too much information about the principal logic of the intelligent system can lead
to the opposite effect (Hosanagar and Jair 2018; Kizilcec 2016). Especially for the stakeholder group of
domain experts that are the users of the system, as opposed to developers who are required a global
explanation to diagnose system failure.
4.2.6.2.3 Implement Trust Management Independent of Transparency Efforts
Our results also show that trust, while being influenced by transparency, is not solely explained by it. In
accordance with Madsen and Gregor (2000), the pre-existing propensity to trust that is reflected by TB
requires extra treatment that goes beyond simply providing explanations. Thus, trust issues need to be
addressed head-on by implementing guidelines for trustworthy AI (Thiebes et al. 2020). Furthermore,
companies should think about introducing trust management. For similar reasons, the standard and idea
of risk management were introduced decades ago: identify uncertainty roots and trust concerns and cre-
ate trust policies (Müller et al. 2021).
The uncertainty regarding PE and EE could be reduced proactively by offering training to the users to
experience the intelligent system to form a feeling of beneficence (Thiebes et al. 2020). Using the system
in a training session in a non-critical context can support the acceptance of the system and provide a
solution to the initial uncertainty about the performance. According to Miller (2019), this could provide
partial transparency, in this case, as an indicator of ability and performance.
Artificial Intelligence for Human Decision-Makers
164
4.2.6.3 Limitations
Within our study, we presented a use case based on a medium-stake scenario. Here, wrong decisions
have consequences such as machine breakdown or downtimes within the production plant. This can
result in high monetary loss. Nevertheless, wrong decisions do not endanger human lives. We used this
scenario for two reasons. First, for the sake of generalization, and second, we tried to replicate a typical
industrial mid-stake maintenance use case. However, following Rudin (2019), we need to keep in mind
that user behavior may differ in high-stake use cases due to the potential consequences of wrong deci-
sions. This also applies to low-stake use cases.
urther, we focused on user perception. Consequently, we cannot verify if the user’s perception corre-
sponds to the actual user behavior. This is especially related to the following: PE on whether the system
can increase the user’s productivity; EE on whether the user finds the system easy to use; and ST on
whether the user understands why the system made the decision it did. The latter is closely related to
findings from Herm et al. (2021b), who state a gap between the perceived explainability of intelligent
system explanations and user task solving performance in a hybrid intelligence situation.
Lastly, within our use case, we provided a textual and graphical explanation for intelligent system pre-
dictions. While many different XAI augmentation techniques have been developed in XAI research,
further evaluation of these techniques seems necessary. Similarly, the results may differ when different
XAI augmentation techniques are applied. Hereby, inappropriate explanations can cause an overload of
the user’s cognitive capacity (Grice 2019). Furthermore, a personalized explanation can increase the
behavior intention (Schneider and Handali 2019).
4.2.6.4 Conclusion and Outlook
By extending the UTAUT model with factors of attitude, trust, and system transparency, we were able
to explain better the factors that influence the willingness to accept intelligent systems in the workplace.
Our extension centers on affection constructs such as ATT, TB, and TA while simultaneously integrating
ST as an opportunity to steer both to address the information asymmetry between black-boxed, anthro-
pomorphic agents and their human principal.
On the one hand, our model enables researchers to understand the influence of this human factor for
intelligent systems and in more general for analytical AI models. On the other hand, our findings can
help to create measures to reduce adoption barriers in practice and thus better leverage AI capabilities.
Since our research is based on the UTAUT model and established extensions, we assume that our results
are of general nature and transferable to other domains.
Since our research results clearly indicate how behavioral intention is influenced by this human factor,
we aspire to develop design principles for intelligent systems that contribute to the user’s willingness to
accept and use these systems in their daily work.
Artificial Intelligence for Human Decision-Makers
165
4.3 Effects of XAI Framework on Model Explanation
Abstract. Digital products and services make it possible to use data profitably. Particularly in highly
complex applications, e.g., as those found in modern industry, such digital services in the form of intel-
ligent decision support systems (DSS) can be a great support for human decision-making. On the other
hand, these systems are subject to criticism because the underlying calculations are often not transparent
and contain a residual error. This may be reflected in user rejection of the system’s advice. To better
understand the impact of such systems, the paper addresses the problem with an empirical investigation
towards user confidence and performance. An industrial quality inspection scenario is used as an applied
application case. The results highlight that intelligent DSSs affect and even improve user confidence
and corresponding to their related performance. However, a significant difference in the influence of
different transparency levels between black-box-, grey-box-, and white-box-based DSS tool support was
rejected.15
4.3.1 Introduction
Digital products and services are increasingly being used, both within society and in business contexts.
This is also evident in the modern manufacturing environment, where production processes are becom-
ing progressively more complex due to modern machines, data processing, and fast cycle-times (e.g.,
Muchiri et al. 2011). To enable humans to cope with the immense amount of information, digital services
in the form of intelligent decision support systems (DSS) should help them. These artificial intelligence
(AI) systems process incoming data fully automatically to minimize the complexity of the real world.
Despite the immense advances in the capabilities of such AI systems, their effectiveness depends criti-
cally on the willingness of users to integrate their advice into the decision-making process (Dam et al.
2018).
In addition to organizational and technical challenges, there are, thus, psychological barriers to adoption.
Here, especially system transparency seems critical (Dam et al. 2018). This contradicts today’s research
efforts on AI algorithms focusing on performance (La Cava et al. 2021). A trade-off arises as the trend
intensifies the problem of a lack of human comprehension of the underneath AI model computational
logic as progress is achieved in particular through more complex modeling approaches. This trade-off
is the research subject in the field of explainable AI (XAI). XAI research seeks to develop models and
15 This paper is published within the 27th Americas Conference on Information Systems (AMCIS) as ‘Do You
Really Want to Know Why? Effects of AI-based DSS Advice on Human Decisions’ (Wanner 2021). The paper
was selected as ‘Top 25% Paper AMCIS’ and nominated for the Best Paper Award. The conference paper was
invited for a special issue of the AIS journal Transactions on Human-Computer Interaction (THCI).
A substantial preliminary work for this paper is the paper published within the 41st International Conference on
Information Systems (ICIS) as ‘White, Grey, Black: Effects of XAI Augmentation on the Confidence in AI-based
Decision Support Systems’ (Wanner et al. 2020).
Artificial Intelligence for Human Decision-Makers
166
methods that explain these powerful ‘black-box models’ in a user-friendly way (Gunning and Aha
2019).
Despite the yet still young XAI research domain, two ways show particular promise: the use of a per-se
explainable AI model that is iteratively optimized in its performance (Rudin 2019) and the use of ex-
post XAI augmentations for black-box models (‘white-box’). This is to make its inherent computational
logic (Rudin 2019) and or a particular system’s advice tractable (‘grey-box’) (Ribeiro et al. 2016b).
However, it remains unclear to what extent the explanations affect human decision-making.
Due to a lack of empirical evidence on explanatory approaches and designs, many XAI researchers are
calling for socio-technical research efforts (e.g., Miller 2019; Ribeiro et al. 2016b). This paper, therefore,
adopts a socio-technical perspective and is related to the Information Systems (IS) subfield of Behav-
ioral Science. Through its empirical form, it aims to better understand the extent to which advice from
(X)AI-based DSS affects the human decision-making process. For this purpose, an empirical study sim-
ulating a realistic decision-making task adapted from the domain of industrial quality control is used.
The main objects of investigation are the user’s perceived subjective confidence in his decision and the
associated objective decision performance. The intention is summarized in the research question (RQ):
RQ: How does advice from (X)AI-based DSS influence human decision-making in terms of subjective
confidence and objective performance?
The elaboration of the research question implies three major contributions. On the one hand, a theoretical
transfer of the human decision-making process to (X)AI research is made, which can serve as a starting
point for further research intentions. On the other hand, it is possible to better understand the extent to
which such DSSs affect their users in a data-driven practice context, such as the one chosen in this study
for the upcoming Industry 4.0 era. Furthermore, the results allow conclusions to be drawn about the
design of such intelligent digital services in terms of user expectations of the associated system explain-
ability.
To this end, the paper is structured as follows. irst, in the section ‘ oundations and Related Work’ the
theoretical foundations of AI-based DSS and the human decision-making process as well as relevant
prior work are presented. Section ‘Methodology and Hypotheses’ includes the methodological basis.
Likewise, the hypotheses to be tested are elaborated here. The section of ‘Empirical XAI Study’ provides
information on the design and implementation of the study. Next, ‘Results and Interpretation’ comprises
the statistical analysis and a critical interpretation of the results. inally, in ‘Conclusion, Limitations,
and Outlook’, a summary, limitations, and an outlook on future research opportunities are given.
4.3.2 Foundations and Related Work
Human Reasoning. Human decision-making is a logical sequence of mental activities to make the best
choice possible regarding a predefined aim. The following explanation is a consolidation of the elabo-
ration and insights given by Simon (1977), Schwenk (1984), Hilton (1996), and Miller (2019). The
sequence is divided into five sections: 1) goal/ problem; 2) information; 3) mental model; 4) choice; and
5) review.
First, the decision objective or problem must be identified and defined. This implies both the recognition
and diagnosis of the underlying problem and its possible causes. Consequently, the decision-maker
Artificial Intelligence for Human Decision-Makers
167
attempts to obtain appropriate information. This serves as input for generating his mental model to
weigh-up possible alternatives. In this process, a simplified model of reality is generated based on the
problem descriptions and the given knowledge. Here, on the one hand, causal discounting takes place.
It describes the process, in which the assumed probability of an option decreases due to the attribution
of a causal relationship of the information with respect to a (better) alternative option. In causal back-
grounding, on the other hand, irrelevant causes are discarded. This corresponds to a selection process.
Ultimately, alternatives are ranked based on the problem description to select the most relevant or best
solution. After the decision is made, a critical evaluation of one’s choice takes place. The choice expe-
riences and insights in turn feed back into one’s mental model and can impact future decision-making.
Intelligent (explainable) DSS. Decision support systems exist for several decades. While initially rule-
based approaches were used, today’s (intelligent) DSS often include AI models to calculate outcomes.
AI is to be understood as a subfield of machine learning, in which mathematical models and algorithms
are used to automatically recognize patterns in data series that are of particular interest for the respective
application (Alpaydin 2020). Nowadays, it is foremost about improving the performance of such models
(La Cava et al. 2021). This is enabled foremost by approaches from the field of artificial neural networks
(ANN). On the counterpart, these models have computational logic that is difficult for humans to com-
prehend. So, they are considered to be poorly explainable and are referred to as ‘black-box models’
(Adadi and Berrada 2018).
Information asymmetry between black-box models and their users might lead to an increased skepticism
about the system, regardless of its performance. The reason is seen in a lack of confidence that might
even avoid the user to consider the system’s advices given in one’s decision-making process (Dam et
al. 2018). Confidence is the degree of belief that an action is correct. It is related to the human ability to
estimate the probability that a decision is ‘right’ (Grimaldi et al. 2015). Therefore, XAI research seeks
to best solve the perceived trade-off between AI model’s performance and model’s explainability
(Gunning and Aha 2019). Model performance is described as the accuracy of the system to solve a task
(Gilpin et al. 2018). Model explainability is the degree to which the system is understandable to its user
(Dam et al. 2018).
In general, there are two XAI approaches to counter the problem related to the missing explainability of
black-box models: (1) The pure avoidance of black-box models. That is, using a white-box model that
is per-se considered explainable, which is then iteratively improved (Rudin 2019). The most common
example of this is decision trees. And (2) the transformation of a black-box model into a grey-box model.
This ex-post model extension is used to make the internal computational logic (Rudin 2019) or its
reasoning for a particular advice transparent to the user (Dam et al. 2018). For this purpose, some XAI
augmentation frameworks already exist that support this (e.g., Ribeiro et al. 2016b).
Related Studies. Research on the generic topic of explanation perception revealed first insights into
how different types of explanation (styles) affect human decision-making. Studies for example showed
that the provision of human-meaningful explanations (e.g., Koo et al. 2015), supports the mental model
building (e.g., Kulesza et al. 2013), moderates trust (e.g., Kizilcec 2016), and also influences the deci-
sion-making abilities of the user (e.g., Nourani et al. 2019). Providing too much information, however,
leads to an opposing effect as it exceeds the mental processing abilities and decreases the overall deci-
sion performance (Schaffer et al. 2019). Thus, in line with Dellermann et al. (2019), it is important to
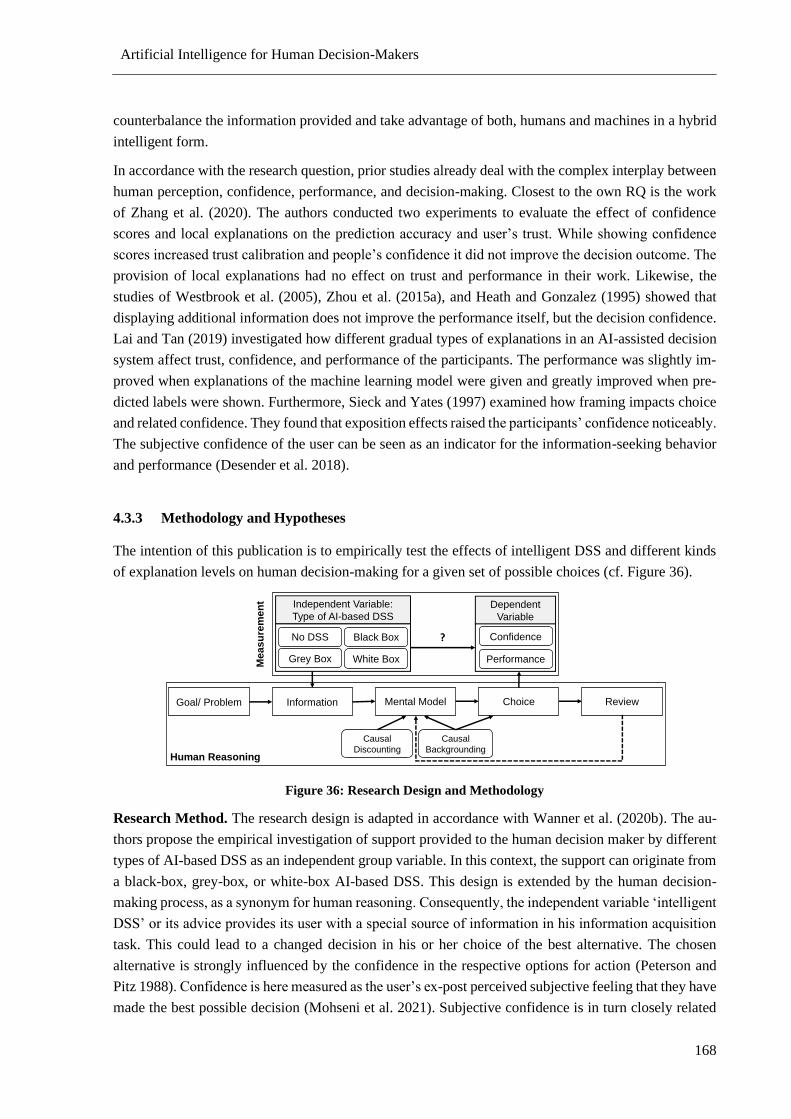
Artificial Intelligence for Human Decision-Makers
168
counterbalance the information provided and take advantage of both, humans and machines in a hybrid
intelligent form.
In accordance with the research question, prior studies already deal with the complex interplay between
human perception, confidence, performance, and decision-making. Closest to the own RQ is the work
of Zhang et al. (2020). The authors conducted two experiments to evaluate the effect of confidence
scores and local explanations on the prediction accuracy and user’s trust. While showing confidence
scores increased trust calibration and people’s confidence it did not improve the decision outcome. The
provision of local explanations had no effect on trust and performance in their work. Likewise, the
studies of Westbrook et al. (2005), Zhou et al. (2015a), and Heath and Gonzalez (1995) showed that
displaying additional information does not improve the performance itself, but the decision confidence.
Lai and Tan (2019) investigated how different gradual types of explanations in an AI-assisted decision
system affect trust, confidence, and performance of the participants. The performance was slightly im-
proved when explanations of the machine learning model were given and greatly improved when pre-
dicted labels were shown. Furthermore, Sieck and Yates (1997) examined how framing impacts choice
and related confidence. They found that exposition effects raised the participants’ confidence noticeably.
The subjective confidence of the user can be seen as an indicator for the information-seeking behavior
and performance (Desender et al. 2018).
4.3.3 Methodology and Hypotheses
The intention of this publication is to empirically test the effects of intelligent DSS and different kinds
of explanation levels on human decision-making for a given set of possible choices (cf. Figure 36).
Figure 36: Research Design and Methodology
Research Method. The research design is adapted in accordance with Wanner et al. (2020b). The au-
thors propose the empirical investigation of support provided to the human decision maker by different
types of AI-based DSS as an independent group variable. In this context, the support can originate from
a black-box, grey-box, or white-box AI-based DSS. This design is extended by the human decision-
making process, as a synonym for human reasoning. Consequently, the independent variable ‘intelligent
DSS’ or its advice provides its user with a special source of information in his information acquisition
task. This could lead to a changed decision in his or her choice of the best alternative. The chosen
alternative is strongly influenced by the confidence in the respective options for action (Peterson and
Pitz 1988). Confidence is here measured as the user’s ex-post perceived subjective feeling that they have
made the best possible decision (Mohseni et al. 2021). Subjective confidence is in turn closely related
Information ReviewGoal/ Problem
Causal
Backgrounding
ChoiceMental Model
Causal
Discounting
Independent Variable:
Type of AI-based DSS
No DSS Black Box
Grey Box White Box
Dependent
Variable
Performance
Human Reasoning
Confidence
Me
as
ure
me
nt
?
Artificial Intelligence for Human Decision-Makers
169
to objective accuracy, the choice resulting decision quality (e.g., Boldt and Yeung 2015). Therefore,
performance is used as a second dependent variable to better understand how DSS effects affect decision
quality (Zhang et al. 2020).
Hypothesis. The hypothesis development follows the division into the two target variables of subjective
confidence and objective performance as well as the stimuli by the design of the respective DSS assis-
tance.
In the human reasoning process, the complexity of reality is reduced by knowledge and experience. This
implies a critical weighing of the meaningfulness of any given information (Lombrozo 2006). The more
information is available, the more likely it is that a human can in-depth reason what is most valuable for
their own decision (Bosnić and Kononenko 2009). In the context of AI-based DSS, explanations of the
advice given can therefore be expected to help to improve trust and, consequently, to reduce perceived
risk (Miller 2019). In their hypothesis development, Wanner et al. (2020b) argue that this occurs in
particular through the given support in justifying outcomes. However, they also point out the potential
impact of misuse effects that arise from overconfidence in the AI system due to the easy availability of
relevant information (Bussone et al. 2015). A baseline value of ‘No DSS’ should make the theoretical
contradiction experimentally testable (Wanner et al. 2020b; Zhang et al. 2020). Thus, the following
hypothesis is adopted:
H1a: The use of an AI-based DSS will result in improved confidence in one’s own decision than using
no DSS (Wanner et al. 2020b).
System advice information differs between black-box, white-box, and grey-box model support. Due to
their nested non-linear structure, black-box models are not interpretable by a human user (Adadi and
Berrada 2018). Regarding the design of white-box models, it is assumed that they are already explaina-
ble for the human user and inherent an internal explanation (Rudin 2019). Thus, the user can critically
weight the advice and check for meaningfulness of given information (Lombrozo 2006). The same ap-
plies to ex-post explanations of grey-box models. However, the forms of representation and presented
advice information differ. As a consequence, negative aspects such as those of overconfidence can also
have different effects on the human reasoning (Bussone et al. 2015). This is considered in the next
hypothesis:
H1b: The influence of black-box, grey-box, and white-box augmentations on the confidence in the AI-
based DSS will be significantly different compared to each other (Wanner et al. 2020b).
Explanations can provide humans with information to validate prognoses and hypotheses and detect
causal connections (Bibal and Frénay 2016; Williams and Lombrozo 2013). Displaying suited explana-
tory content helps the user to interpret and predict the system’s operations and confirm the mental mod-
els (Mueller et al. 2019). If users mistakenly trust some advice, it can have fatal consequences for the
decision output and the performance. A correct mental model is therefore thought to be of great im-
portance in building trust and enhancing human-AI task performance (Bansal et al. 2019; Zhang et al.
2020). Prior work highlights that explanations in AI-based DSS such as confidence scores affect the
user’s mental model and shape the performance as well as the user’s trust and reliance (Lai and Tan
2019; Mueller et al. 2019; Zhang et al. 2020). Thus, it is hypothesized that AI-based systems are well-
suited to support the human reasoning and improve the performance compared to a ‘No DSS’ baseline,
leading to:
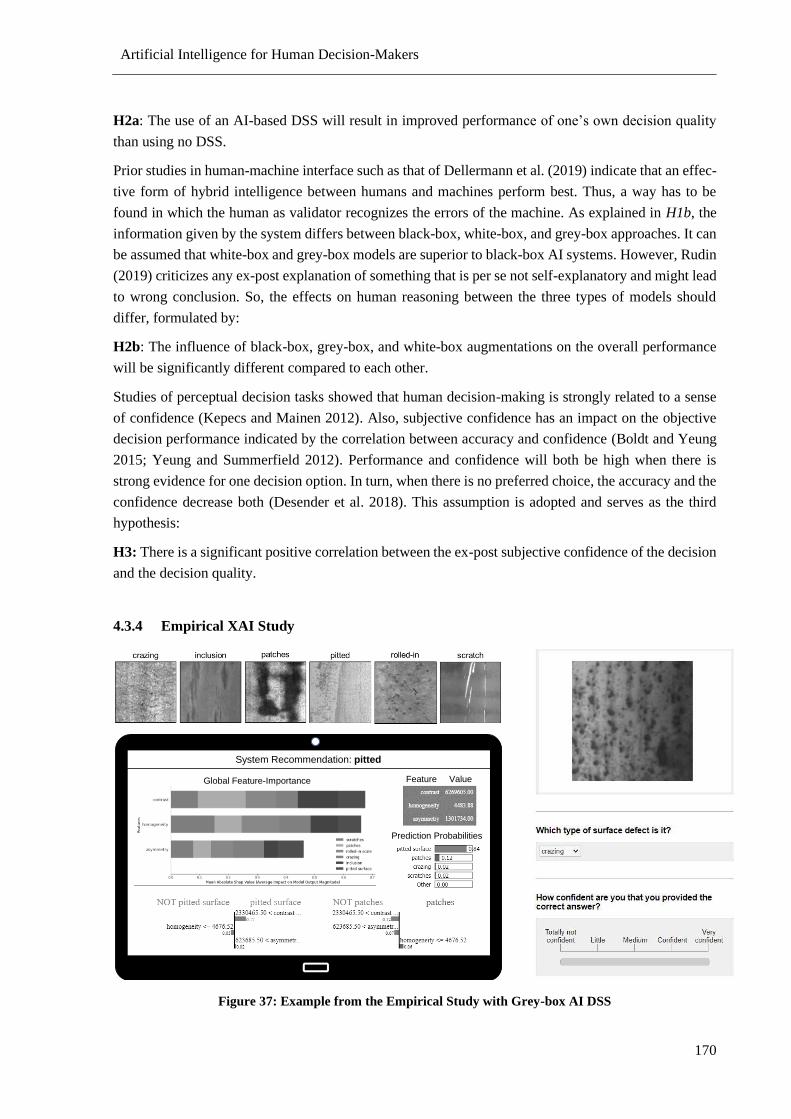
Artificial Intelligence for Human Decision-Makers
170
H2a: The use of an AI-based DSS will result in improved performance of one’s own decision quality
than using no DSS.
Prior studies in human-machine interface such as that of Dellermann et al. (2019) indicate that an effec-
tive form of hybrid intelligence between humans and machines perform best. Thus, a way has to be
found in which the human as validator recognizes the errors of the machine. As explained in H1b, the
information given by the system differs between black-box, white-box, and grey-box approaches. It can
be assumed that white-box and grey-box models are superior to black-box AI systems. However, Rudin
(2019) criticizes any ex-post explanation of something that is per se not self-explanatory and might lead
to wrong conclusion. So, the effects on human reasoning between the three types of models should
differ, formulated by:
H2b: The influence of black-box, grey-box, and white-box augmentations on the overall performance
will be significantly different compared to each other.
Studies of perceptual decision tasks showed that human decision-making is strongly related to a sense
of confidence (Kepecs and Mainen 2012). Also, subjective confidence has an impact on the objective
decision performance indicated by the correlation between accuracy and confidence (Boldt and Yeung
2015; Yeung and Summerfield 2012). Performance and confidence will both be high when there is
strong evidence for one decision option. In turn, when there is no preferred choice, the accuracy and the
confidence decrease both (Desender et al. 2018). This assumption is adopted and serves as the third
hypothesis:
H3: There is a significant positive correlation between the ex-post subjective confidence of the decision
and the decision quality.
4.3.4 Empirical XAI Study
Figure 37: Example from the Empirical Study with Grey-box AI DSS
System Recommendation: pitted
Global Feature-Importance Feature Value
Prediction Probabilities
Artificial Intelligence for Human Decision-Makers
171
4.3.4.1 Use Case
A practical application scenario from industrial quality control is used for the empirical study. It repre-
sents a task that does not require specific knowledge and is easy to understand. Thus, it allows for a
quantitative investigation. The dataset and scenario are provided by the Semeion’ institute (cf. Zhao et
al. 2017). Their declared objective is to implement a suitable machine learning model for automatic
pattern recognition.
The dataset chosen contains 1800 grayscale surface images of hot-rolled steel plates. Each of these is
related to one of the six different types of defects with some specific characteristics (cf. Figure 37, top
left). For each defect class, a total of 300 samples exists. Likewise, for each image, in addition to the
information of the defect class itself, pre-calculated image values based on a Grey-Level-Co-Occur-
rence-Matrix (GLCM) are given. These contain the five attributes contrast, homogeneity, dissimilarity,
energy, and asymmetry. Due to the grayscale differences, a suitable form of hybrid intelligence in par-
ticular seems to be target-oriented.
4.3.4.2 Technical Realization
Due to the nature of a classification problem, some common methods were tested including Decision-
Tree (DT), BaggingClassifier, RandomForestClassifier, ExtraTreesClassifier, and GradientBoost-
ingClassifier. DTs are considered to be per-se explainable to human users, and thus, were chosen as the
white-box DSS solution. The random forest (RF) serves as the backbone for the black-box DSS solution.
By applying hyper-tuning, an accuracy of about 90% was achieved for the RF. The DT gained an accu-
racy of about 85%. These results ensure good comparability between the two approaches. For the grey-
box DSS solution, two XAI augmentation frameworks were applied on top of the RF. For global ex-
plainability, the feature-importance by the SHapley Additive exPlanations (SHAP) is used. For local
explainability, the model’s confidence is presented by using Local Interpretable Model-agnostic Expla-
nations (LIME). This includes the probability per class and the reasoning behind the best two options
(cf. Figure 37, dashboard on the corner-left).
4.3.4.3 Study Design
In the study, the participants take on the role of a quality inspector. The task is to correctly classify pre-
sorted defects for an effective rework (cf. Figure 37, top right). As a light-constrain, this should be done
within a maximum of 15 seconds to avoid an interruption of production. Despite the high performance
of the respective DSSs, all three machine learning models correctly classified only 10 out of 14 (≈70%)
cases selected in the empirical study. The correctly classified cases differ partially.
The study design is a combination of within-subject and between-subject design. The former corre-
sponds to the fact that the study was divided into two rounds (Zhang et al. 2020). In both, the same 14
cases (images) are randomized shown, with one extra case being a control question. Both times, the
participant is asked to assign the case shown to one of the defect classes. Further, he or she should ex-
post rate his or her confidence in the decision made on a five-point Likert scale (cf. Figure 37, corner
right). The design of the questions is based on Huysmans et al. (2011). In the first round, the participant
does not receive any support. This subconsciously anchors his or her case decisions (see Figure 36).
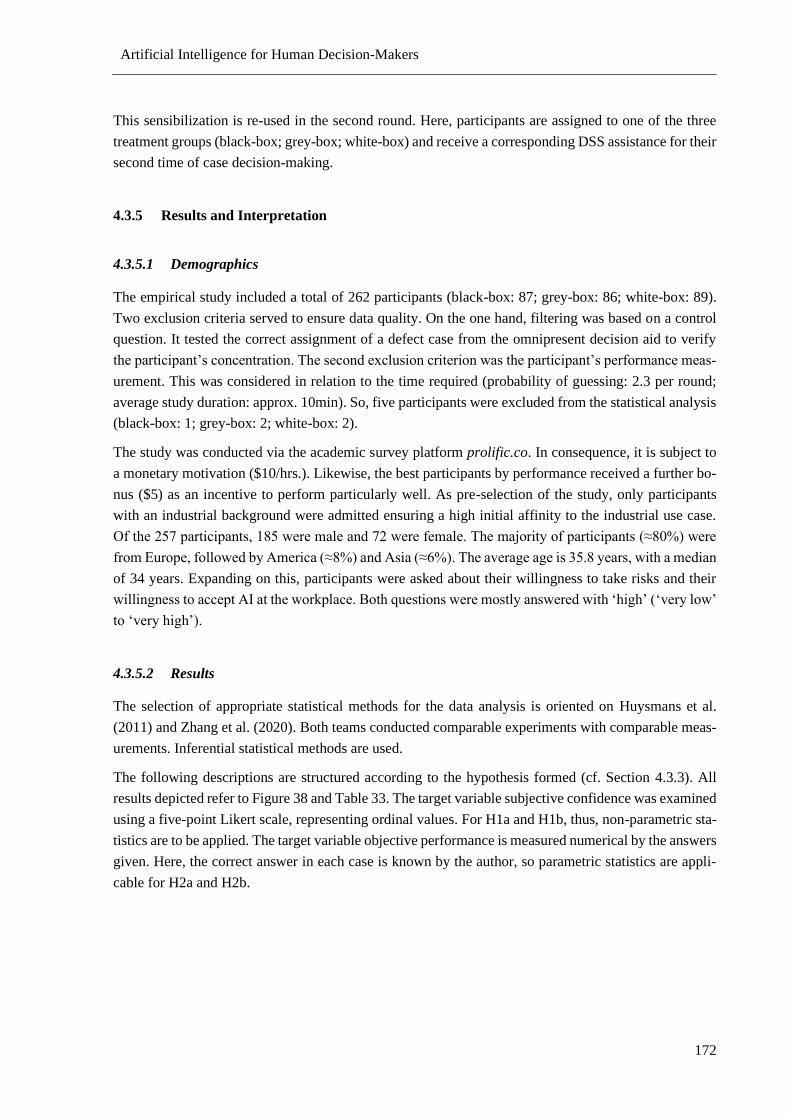
Artificial Intelligence for Human Decision-Makers
172
This sensibilization is re-used in the second round. Here, participants are assigned to one of the three
treatment groups (black-box; grey-box; white-box) and receive a corresponding DSS assistance for their
second time of case decision-making.
4.3.5 Results and Interpretation
4.3.5.1 Demographics
The empirical study included a total of 262 participants (black-box: 87; grey-box: 86; white-box: 89).
Two exclusion criteria served to ensure data quality. On the one hand, filtering was based on a control
question. It tested the correct assignment of a defect case from the omnipresent decision aid to verify
the participant’s concentration. The second exclusion criterion was the participant’s performance meas-
urement. This was considered in relation to the time required (probability of guessing: 2.3 per round;
average study duration: approx. 10min). So, five participants were excluded from the statistical analysis
(black-box: 1; grey-box: 2; white-box: 2).
The study was conducted via the academic survey platform prolific.co. In consequence, it is subject to
a monetary motivation ($10/hrs.). Likewise, the best participants by performance received a further bo-
nus ($5) as an incentive to perform particularly well. As pre-selection of the study, only participants
with an industrial background were admitted ensuring a high initial affinity to the industrial use case.
Of the 257 participants, 185 were male and 72 were female. The majority of participants (≈80%) were
from Europe, followed by America (≈8%) and Asia (≈6%). The average age is 35.8 years, with a median
of 34 years. Expanding on this, participants were asked about their willingness to take risks and their
willingness to accept AI at the workplace. Both questions were mostly answered with ‘high’ (‘very low’
to ‘very high’).
4.3.5.2 Results
The selection of appropriate statistical methods for the data analysis is oriented on Huysmans et al.
(2011) and Zhang et al. (2020). Both teams conducted comparable experiments with comparable meas-
urements. Inferential statistical methods are used.
The following descriptions are structured according to the hypothesis formed (cf. Section 4.3.3). All
results depicted refer to Figure 38 and Table 33. The target variable subjective confidence was examined
using a five-point Likert scale, representing ordinal values. For H1a and H1b, thus, non-parametric sta-
tistics are to be applied. The target variable objective performance is measured numerical by the answers
given. Here, the correct answer in each case is known by the author, so parametric statistics are appli-
cable for H2a and H2b.
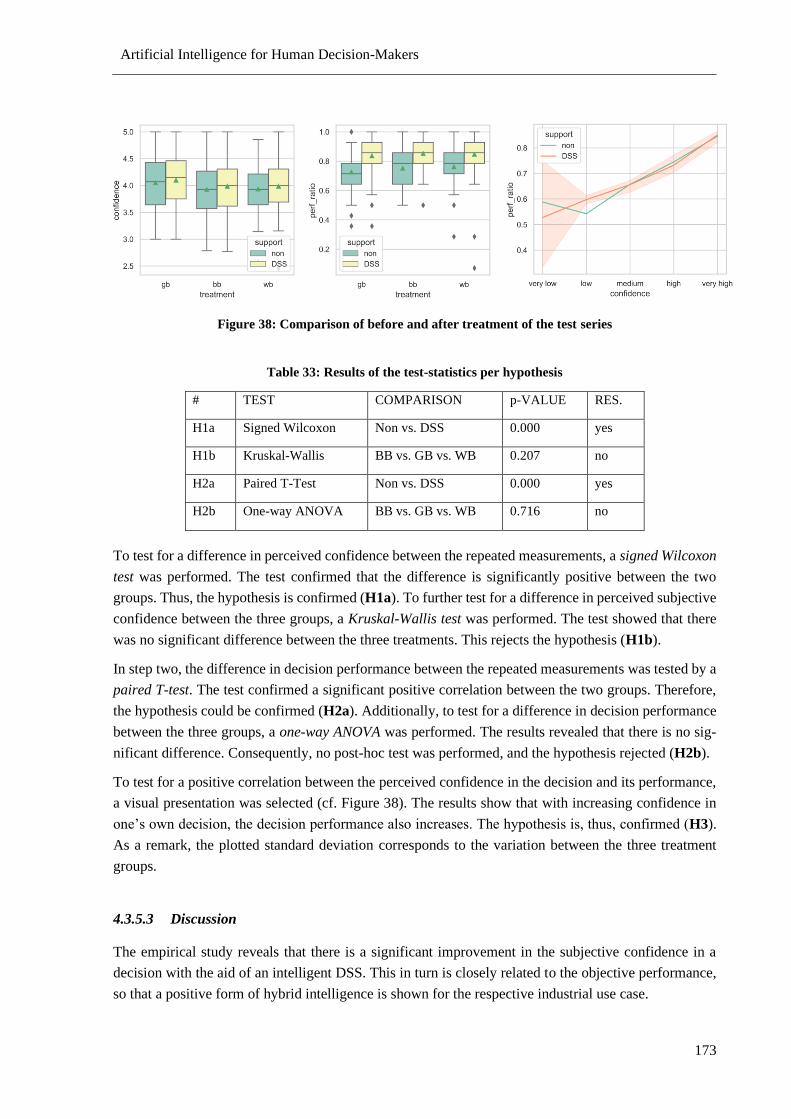
Artificial Intelligence for Human Decision-Makers
173
Figure 38: Comparison of before and after treatment of the test series
Table 33: Results of the test-statistics per hypothesis
# TEST COMPARISON p-VALUE RES.
H1a Signed Wilcoxon Non vs. DSS 0.000 yes
H1b Kruskal-Wallis BB vs. GB vs. WB 0.207 no
H2a Paired T-Test Non vs. DSS 0.000 yes
H2b One-way ANOVA BB vs. GB vs. WB 0.716 no
To test for a difference in perceived confidence between the repeated measurements, a signed Wilcoxon
test was performed. The test confirmed that the difference is significantly positive between the two
groups. Thus, the hypothesis is confirmed (H1a). To further test for a difference in perceived subjective
confidence between the three groups, a Kruskal-Wallis test was performed. The test showed that there
was no significant difference between the three treatments. This rejects the hypothesis (H1b).
In step two, the difference in decision performance between the repeated measurements was tested by a
paired T-test. The test confirmed a significant positive correlation between the two groups. Therefore,
the hypothesis could be confirmed (H2a). Additionally, to test for a difference in decision performance
between the three groups, a one-way ANOVA was performed. The results revealed that there is no sig-
nificant difference. Consequently, no post-hoc test was performed, and the hypothesis rejected (H2b).
To test for a positive correlation between the perceived confidence in the decision and its performance,
a visual presentation was selected (cf. Figure 38). The results show that with increasing confidence in
one’s own decision, the decision performance also increases. The hypothesis is, thus, confirmed (H3).
As a remark, the plotted standard deviation corresponds to the variation between the three treatment
groups.
4.3.5.3 Discussion
The empirical study reveals that there is a significant improvement in the subjective confidence in a
decision with the aid of an intelligent DSS. This in turn is closely related to the objective performance,
so that a positive form of hybrid intelligence is shown for the respective industrial use case.
Artificial Intelligence for Human Decision-Makers
174
The results are foremost in line with findings from previous works. In particular, the improved confi-
dence in one’s own decision by expanding the available information about the system’s advice has been
confirmed several times (e.g., Heath and Gonzalez 1995; Sieck and Yates 1997). However, evidence of
a direct positive relationship to objective performance seems unclear. For example, the results of Zhang
et al. (2020) show an improvement in confidence due to enhanced AI system advice information, but
without an improvement in decision outcome. This is in line with Westbrook et al. (2005), Heath and
Gonzalez (1995), and Zhou et al. (2015a). In contrast, the findings of Lai and Tan (2019) highlight that
enhanced explainability improves both: subjective confidence and objective performance. Zhang et al.
(2020) argue that this result is due to the strong difference between their study’s human performance
and AI performance. The empirical study at hand refutes this assumption. As shown in Figure 3, there
is initially comparable objective performance between humans (≈75%) and machines (≈70%). After
treatment by an intelligent DSS, it is improved. This finding of hybrid intelligence as the best performer
is consistent with the one by Dellermann et al. (2019). A possible explanation for the different results
would be a modified form of the argumentation by Gilpin et al. (2018). They argue that the perceived
explainability of models is highly dependent on the characteristics, knowledge, and experience of the
individual. Another explanatory approach is a strong dependence on the particular use case and the prior
knowledge required for it. Only if an explanation is both, perceived as explainable and the user under-
stands its meaning, it will have an impact on performance (Miller 2019).
For the second part of the empirical investigation, the results show no significant difference. Thus, a
treatment with different transparency levels to support the human decision-maker (black-box DSS; grey-
box DSS; and white-box DSS) does not seem to have a significant impact on confidence and perfor-
mance.
The result predominantly contradicts existing findings. It should be noted, however, that little empiri-
cally generated knowledge exists in this specific context yet. As argued above, enhanced insight into
system computation leads to improved confidence (Heath and Gonzalez 1995; Westbrook et al. 2005;
Zhou et al. 2015a). Both prior works in the AI-based DSS context by Lai and Tan (2019) and Zhang et
al. (2020) also support this statement. Thus, there should be a differential effect between the lack of
explainability of a black-box AI-based DSS vs. a given explainability by white-box or grey-box DSS.
This effect has even been experimentally demonstrated by Lai and Tan (2019). By gradually increasing
the system explainability, starting from a black-box model, they showed an improvement in confidence
and performance.
There are possible explanations for the divergent results of the conducted empirical study. On the one
hand, existing evidence from the field of explanation perception shows that human-meaningful expla-
nations are necessary for beneficial advice information from intelligent systems (Koo et al. 2015). There-
fore, it is possible that the advice information shown was not human-meaningful enough for the respec-
tive use case. On the other hand, there might be an overwhelming of too much information. Thus, the
positive effects of the higher transparency levels of white-box or grey-box DSS treatment have a par-
tially negative impact as well (Schaffer et al. 2019). Further, misuse effects may have affected an over-
reliance on the provided DSS regardless of its design, due to the ease of availability of appropriate
information (Bussone et al. 2015). However, the improved performance measured as a hybrid intelli-
gence argues against this, so it is rather unlikely here. Similarly, the result may be due to an ex-ante lack
of user understanding of the inherent logic of the AI-based DSS. The user did not receive any validation
Artificial Intelligence for Human Decision-Makers
175
of the results in the empirical study, so he could not know when the algorithm was right and when it was
wrong. In other words, the user could not be sure that the explanation was correct, even in the case of a
white-box and a grey-box AI DSS (Dietvorst et al. 2015). Therefore, there is much to suggest that the
nature of the explanation could not have had an impact.
4.3.6 Conclusion, Limitations, and Outlook
In this paper, the question of how (X)AI-based DSS affect human decision-making was investigated. A
case from industrial quality assurance was used as the basis for an empirical study. Through a before vs.
after treatment comparison and a group subdivision (black-box; grey-box; white-box), effects of AI DSS
advice on human decision-making could be revealed. On the one hand, the confidence in the participants
own decision increased, on the other hand, the correlated quality of performance improved. However, a
difference between the three system designs, and thus the explanation levels, could not be confirmed.
Possible reasons could be related to the existing limitations of this paper. On the one hand, subjective
influences are conceivable due to the empirical survey. Likewise, it remains unclear whether an in-
creased explicability of the system leads in parallel to an overwhelming of the decision-maker. Positive
influences due to created transparency could have an opposite effect after a certain level of advice in-
formation. In addition, a lack of difference between the types of explanations (black-box; grey-box;
white-box) could also have been the simplicity of the use case. Participants may therefore not have
needed further explanation. Moreover, the chosen example was without serious consequences for wrong
decisions and, thus, only of low-stake. Lastly, the participants could have inferior biases. This could be,
in particular, overconfidence in the quality of one’s own decisions. Likewise, the automation bias as
overly rely on algorithm and its opposite manifestation of automation aversion are possible (Westbrook
et al. 2005; Zhang et al. 2020).
This is where future research could come in and address these limitations. On the one hand, it should be
better understood what positive but also negative influences different forms of explainability have re-
garding the human decision-making process. On the other hand, it would be exciting to investigate
whether the transferable study design yields different results for other criticalities. An example would
be the extension to a low-stake use case (e.g., IRIS) and a high-stake use case (e.g., from cancer tomog-
raphy).
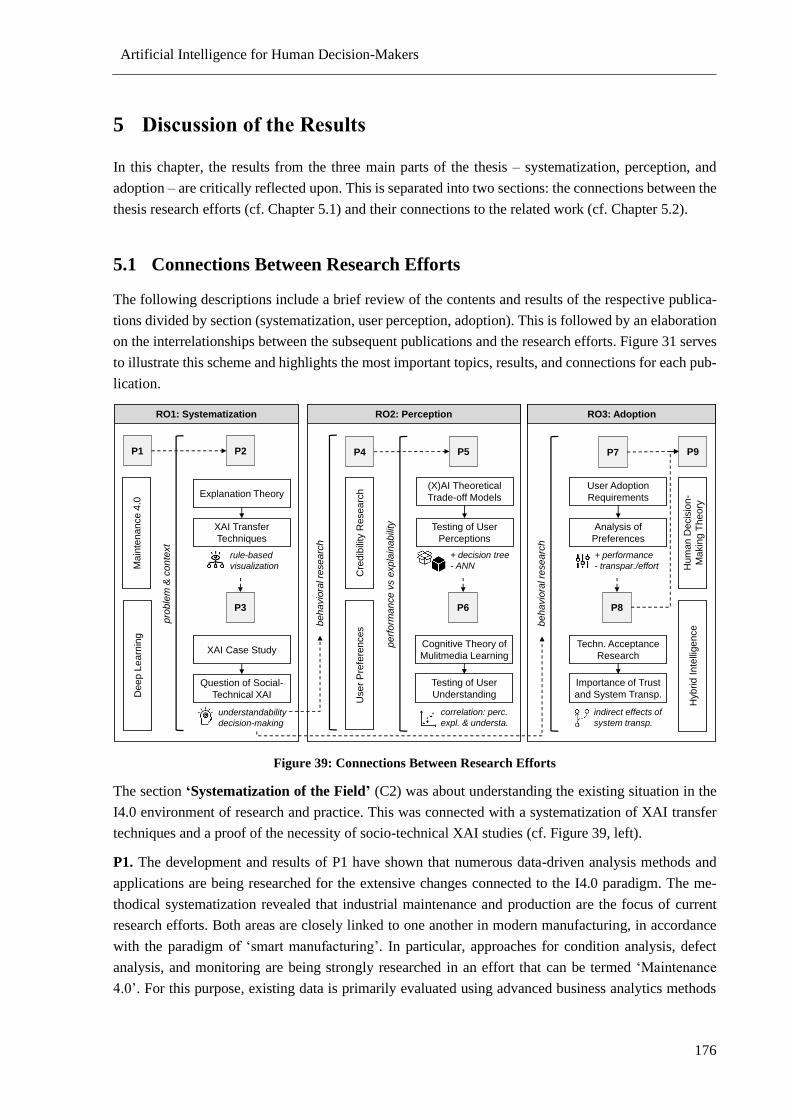
Artificial Intelligence for Human Decision-Makers
176
5 iscussion of the Results
In this chapter, the results from the three main parts of the thesis – systematization, perception, and
adoption – are critically reflected upon. This is separated into two sections: the connections between the
thesis research efforts (cf. Chapter 5.1) and their connections to the related work (cf. Chapter 5.2).
5.1 Connections Between Research Efforts
The following descriptions include a brief review of the contents and results of the respective publica-
tions divided by section (systematization, user perception, adoption). This is followed by an elaboration
on the interrelationships between the subsequent publications and the research efforts. Figure 31 serves
to illustrate this scheme and highlights the most important topics, results, and connections for each pub-
lication.
Figure 39: Connections Between Research Efforts
The section ‘Systematization of the Field’ (C2) was about understanding the existing situation in the
I4.0 environment of research and practice. This was connected with a systematization of XAI transfer
techniques and a proof of the necessity of socio-technical XAI studies (cf. Figure 39, left).
P1. The development and results of P1 have shown that numerous data-driven analysis methods and
applications are being researched for the extensive changes connected to the I4.0 paradigm. The me-
thodical systematization revealed that industrial maintenance and production are the focus of current
research efforts. Both areas are closely linked to one another in modern manufacturing, in accordance
with the paradigm of ‘smart manufacturing’. In particular, approaches for condition analysis, defect
analysis, and monitoring are being strongly researched in an effort that can be termed ‘Maintenance
4.0’. For this purpose, existing data is primarily evaluated using advanced business analytics methods
pro
ble
m&
co
nte
xt
P1
Ma
inte
nan
ce 4
.0D
ee
p L
ea
rnin
g
P2
RO1: Systematization
Explanation Theory
XAI Transfer
Techniques
rule-based
visualization
P3
XAI Case Study
Question of Social-
Technical XAI
understandability
decision-making
RO2: Perception RO3: Adoption
P4
be
ha
vio
ral re
se
arc
h
Cre
dib
ility
Re
se
arc
h
Testing of User
Perceptions
Use
r P
refe
rences
pe
rfo
rma
nce
vs
exp
lain
ab
ility
P5
(X)AI Theoretical
Trade-off Models
+ decision tree
- ANN
P6
Cognitive Theory of
Mulitmedia Learning
Testing of User
Understanding
correlation: perc.
expl. & understa.
be
ha
vio
ral re
se
arc
h
P7
User Adoption
Requirements
Analysis of
Preferences
Hu
ma
n D
ecis
ion
-
Ma
kin
g T
he
ory
P9
Hyb
rid
In
telli
ge
nce
P8
Techn. Acceptance
Research
Importance of Trust
and System Transp.
indirect effects of
system transp.
+ performance
- transpar./effort
Artificial Intelligence for Human Decision-Makers
177
foremost by predictive maturity and technically realized by ML approaches. Over the last three years
(since 2018), methods from the field of deep learning, in particular, have found increasing use.
These findings provided the research context for further studies. On the one hand, this is reflected in the
choice of application areas for the respective investigations. For example, P3 combined monitoring and
condition analysis with modern predictive maintenance analysis techniques. The studies from P5, P6,
and P7 focus on ML/ DL methods from the field of condition analysis in industrial maintenance scenar-
ios. P11 takes industrial defect analysis as an application domain. On the other hand, the results from
the temporal trend analysis in P1 are used as a starting point to clarify whether the trend towards DL
techniques can lead to the ineffectiveness of AI-based DSSs due to their inherent black-box model char-
acteristic. This leads to the research area of XAI, with a call for transparent AI models.
P2. The prior XAI finding and associated desire for transparent AI models formed the backbone of the
investigation in P2. First, the theoretical socio-technical backgrounds with the connected explanatory
theory were presented to better understand what is already known from the social side. Likewise, a
reappraisal of the existing XAI transfer techniques is given, which covers the technical side. The results
reveal that there are already a considerable number of possibilities to convert different types of AI black-
box models into white-box models to make them explainable. This served to foster understanding about
the initial models and final representation. The majority of XAI transfer techniques use a conversion to
visualizations and rules. In addition to existing capabilities, it became apparent that such transfers are
often criticized. For example, Rudin (2019) criticizes explaining something that is per se not explicable
to humans by introducing the associated complexity of a second (white-box) model. Similarly, some
researchers point out that there is a loss of model accuracy during transfers (e.g., Kraus and Feuerriegel
2019; Vásquez-Morales et al. 2019).
The findings from P2 formed the basis for some additional research efforts. On the one hand, P2 allows
us to recognize that visualizations and rule-based explanatory techniques are particularly promising.
This in turn implies the inclusion of ex-post explanatory approaches via grey-box models in XAI socio-
technical research efforts as a potential remedy to the assumed ineffectiveness (due to opacity) of black-
box AI approaches. Here, XAI research already offers augmentation frameworks such as SHAP and
LIME. The two frameworks mentioned were used in the publications of P6 and P9. Likewise, this
knowledge was utilized to design the dashboard variations for an explainable and technically feasible
AI-based DSS in P8.
P3. P3 takes the aforementioned criticisms of P2 as a starting point to better understand whether there
is a lack of explainability of such converted white-box models. In line with the results of the derivation
of the existing transfer techniques, a rule-based engine with a visual component should be used. Addi-
tionally, the goal was to understand whether there is a loss of model accuracy during transfers. The
publication P3 originates from a use case with its own developed procedure in the context of a practical
research project for industrial maintenance. The elaboration of the results showed that a transfer of in-
herent processes of a trained black-box model in a white-box model – here a rule-based system – is
feasible. In the thesis relevant industrial maintenance use case, no performance loss was observed as a
result of the transfer. The transparency created by the readable set of rules met with great interest from
researcher and practitioners. Nevertheless, it remains unclear to what extent the user can actually read
and understand the rules. In more complicated monitoring sections, the model’s inherent logic was
Artificial Intelligence for Human Decision-Makers
178
difficult to understand. The derived rules became quite long and non-intuitive, which contradicts the
conclusions derived from P2.
With the new findings of P3, it further became clear that there has been too little knowledge in the field
of socio-technical XAI research to understand how the opacity of modern AI modeling approaches af-
fects the user in specific scenarios. In other words, it remains uncertain how such approaches to making
black-box models transparent change human decision-making in practice. The positive feedback from
practitioners in response to the developed technical approach contradicts the recognized problem re-
garding difficult understandability. On the one hand, this requires an awareness of the user’s perception
of explainability and his or her associated comprehension of such AI-based recommendations. This mo-
tivated the research efforts in the section on ‘(X)AI DSS User Perception’ (C3). On the other hand, the
adoption readiness of those users to incorporate the AI-based DSS into their decision-making process is
not yet clear. More precisely, it is not known which attributes – such as the perceived explainability of
the system or the objective system performance – are of great importance for users, knowledge that is
necessary in order to derive effective actions to overcome adoption barriers. This motivated the research
efforts in the section on ‘(X)AI DSS Adoption’ (C4).
The section ‘(X)AI SS User Perception’ (C3) was about achieving a better understanding of the per-
ception of the explainability of ML/ DL models from a user perspective. This encompassed user prefer-
ences of the main dimensions of model performance and model explainability, as well as actual under-
standing (cf. Figure 39, middle).
P4. In publication P4, the effect of data analysis on the user’s perception of the objective truth of given
information was investigated. The target variable was determined by a structural equation model with
several derived constructs. Four constructs were represented by the four properties of Big Data – naming
velocity, volume, variety, and veracity. Additionally, three further constructs of the data quality were
used: timeliness, completeness, and accuracy. The results of a subsequent quantitative survey highlight
that the completeness and the associated accuracy of the information presented have a particularly strong
influence on the perception of objective truth. In contrast, the timeliness of the data seems less crucial.
Transferring these results to the context of XAI, it illustrates the necessity of the two dimensions of
model explainability and model performance. The dimension of ‘timeliness’ – i.e., the real-time capa-
bility of the systems – seems inessential. This confirmation served as evidence that further investigation
of the two theoretical XAI dimensions was merited. In particular, it remained unclear how the user’s
perception of the two dimensions varies regarding different kinds of ML/ DL models (P5) or even ex-
post explanations by XAI augmentation frameworks (P6). In addition, it is not known how perceived
explainability is correlated with user understanding (P6). These research efforts will extend the findings
from P2, where it was already recognized that visualizations and rule-based white-box models seem
promising. Likewise, it should be determined whether these two XAI dimensions are in a contrary rela-
tionship to each other or could be optimized independently.
P5. P5 was concerned with a better understanding of the trade-off between model performance and
model explainability. The subject of the investigation was different types of ML/DL. These have only
been theoretically compared against each other so far. Thus, the objective was to conduct such an inves-
tigation under realistic practical conditions. In accordance, representative AI models for linear regres-
sion, decision trees, support vector machines, ensembles, and deep learning were technical implemented.
Artificial Intelligence for Human Decision-Makers
179
This was realized in four different scenarios. The scenarios were intended to show whether there are
differences between low-stakes and high-stakes use cases, as well as classification and regression use
cases. To measure perceived explainability, the implementation was empirically assessed using a survey.
It was shown that there are some differences between the scenarios and stakes. Nevertheless, important
generalizable findings could be derived. It became clear that the DL model showed the best performance
with the worst explanatory power. In contrast, it was confirmed that rule-based approaches like the
decision tree are perceived as highly explainable by humans.
The results in P5 highlight two approaches that seem promising for the socio-technical optimization of
AI support in most use cases: 1) never using a black-box model and instead using a rule-based approach
such as a decision tree, or 2) using a back-box model if it offers the highest initial performance and make
it explainable in an appropriate way. However, both approaches raise further questions. On the one hand,
it remains unclear whether rule-based approaches, such as a decision tree, are also associated with a high
degree of comprehensibility of the presented results by the user. On the other hand, it is unclear to what
extent the use of XAI augmentation frameworks for ex-post explanation of black-boxes can keep up
with the perceived explainability of rule-based white-boxes (cf. P6).
P6. In publication P6, the relationship between perceived explainability and real comprehensibility from
a user perspective was examined in more detail. The aim was to better understand how well the user
understands the recommendations given by the important types of ML/DL models. The investigation
was carried out using the comprehensibility levels according to the ‘Cognitive Theory of Multimedia
Learning’ by Mayer (2005). In addition to the common ML methods and a pure DL black-box model,
an explained DL black-box variant was included. The ex-post explanation was done using the XAI aug-
mentation framework SHAP. Again, different criticality was considered by different application scenar-
ios. The underlying ML problems were of regression type only. Besides some differences in terms of
the stakes, generalizable findings could be derived. The results made clear that there is a correlation
between the two dimensions of perceived explainability and objective understandability. Here, again,
the decision tree showed a particularly good fit. Nevertheless, the ex-post explained DL black-box model
outperformed it with respect to both dimensions – model explainability and model performance.
The results of P6 highlight the importance of explaining DL approaches. Initial evidence was provided
that XAI augmentation frameworks can add value to human-machine interaction. This was demonstrated
by their high model performance and perceived model explainability. Such augmentation also offers
users a comprehensible presentation of the information. Nevertheless, the implications of the research
output of P6, along with its preceding publications P4 and P5, from the field of ‘(X)AI DSS User Per-
ception’ remain limited. In particular, it is not clear to what extent human users would actually consider
such intelligent decision support systems in their everyday work. Thus, it remains an open question as
to which factors are crucial for system adoption. Related to this is the need to understand how important
individual factors are for the user and to what extent these factors influence each other. Only in this way
can appropriate measures be derived to enable effective human-machine interaction and remove existing
barriers to adoption.
The section ‘(X)AI SS Adoption’ (C4) was about better understanding the most important adoption
factors for a human user deciding whether to incorporate the AI-based DSS into his or her task-solving.
This encompassed an understanding of the balancing of adoption factors, the direct and indirect effects
Artificial Intelligence for Human Decision-Makers
180
of individual factors, and the actual effects of AI-based DSS advice on human decision-making (cf.
Figure 39, right).
P7. P7 addressed the question of which factors are important to the user in selecting an appropriate AI-
based DSS system. For this purpose, a decision-making process was simulated by implementing three
AI-based best-practice decision support systems for a high-stakes decision-making scenario in industrial
maintenance. Through the use of an expert survey, decision and attitude factors were evaluated using
the Analytical Hierarchy Process (AHP) method. It was found that systems using similarity-based
matching or direct modeling for remaining useful life estimation performed best. On the factor level, the
results show that system performance is of particular importance to users. The two other dimensions –
implementation effort and system transparency – were not that important and were rated about the same.
These results somewhat contradict the assumptions made in previous research efforts. In particular, the
results in P5 and P6 suggested that explainability is as important to users as performance. This was
particularly evident in the demonstrated link between perceived explainability and user understanding.
In the absence of explainability, the user does not understand the results of the algorithm and must trust
it blindly. This would mean that users would rather follow the advice of the algorithm when it exhibits
higher performance as opposed to having the ability to critically question and thus validate the advice
of the system. This contradicts the commonly accepted understanding of an effective human-machine
interaction (e.g., Dellermann et al. 2019). Therefore, it seems as though not all influence factors and
possible biases have been considered. To address this, a further investigation of additional factors and
effect relationships was undertaken in P8.
P8. The intention behind the research effort in P8 was to clarify the question of why AI-based DSSs
have been used only hesitantly in industrial maintenance. The aim was to identify possible barriers re-
sponsible for this lack of acceptance. For this purpose, the Unified Theory of Acceptance and Use of
Technology (UTAUT) was used and modified accordingly to the context of intelligent DSS. The de-
signed modification of the UTAUT model expanded the UTAUT core, particularly with regard to the
constructs of trust and system transparency. Via expert panels and quantitative studies, it was ultimately
shown that system transparency has a positive indirect impact on a user’s willingness to adopt an AI-
based DSS. That is, increased system transparency causes the user to perceive other factors as more
important than they would be rated without this indirect influence, such as that of system performance.
These new findings in P8 confirm the preceding results from P7. The study again proves that the per-
ceived performance of an AI-based DSS has a high impact on the user’s willingness to adopt such sys-
tems. The extended investigation further allows for a better understanding of the effects of system trans-
parency. From the results of the new study, it can be deduced that although system transparency itself
is not perceived as highly significant by the user there is a strong indirect impact, which therefore implies
a certain unconscious bias. Nevertheless, despite the research achievements, it remains unclear to what
extent such a system will affect human decision-making in practice. In addition to the readiness for
adoption itself, it can be assumed that positive experiences in the sense of increased performance from
man and machine will promote sustainable and effective system use to boost overall adoption rates. This
open issue is addressed in P9.
P9. The aim of the research in P9 was to better understand how intelligent DSSs affect human decision-
making. In addition, the goal was to investigate whether there are differences between the assistance
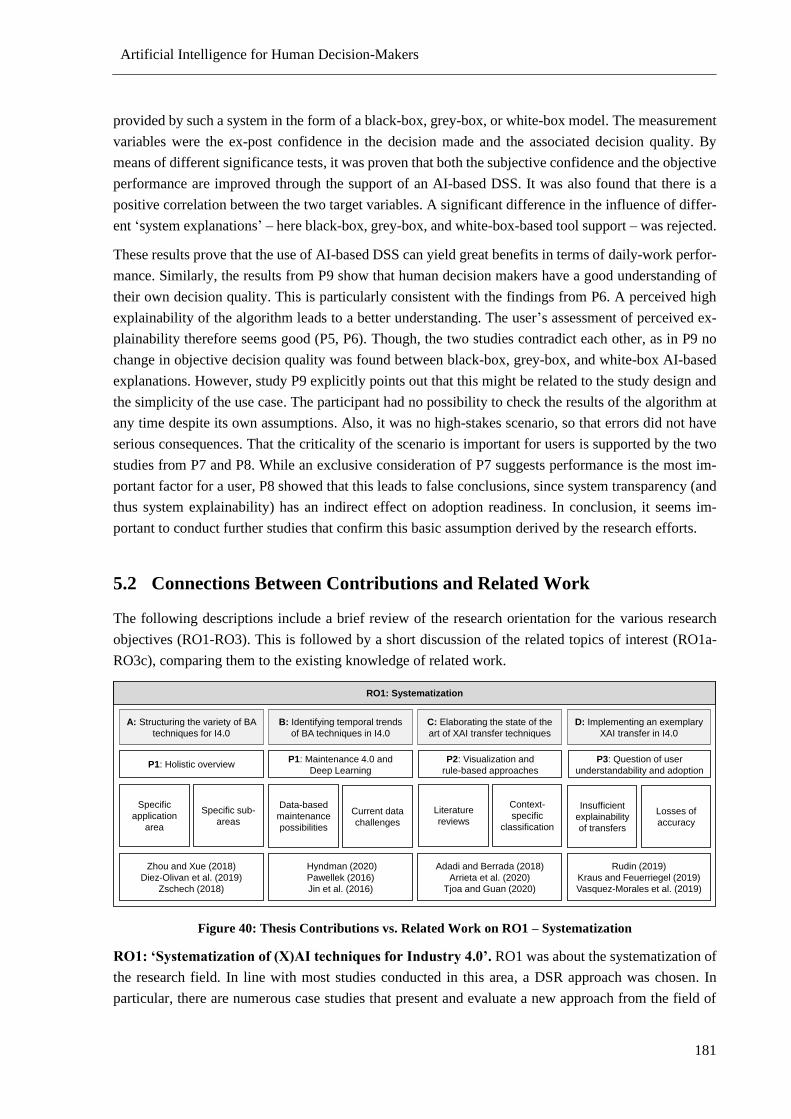
Artificial Intelligence for Human Decision-Makers
181
provided by such a system in the form of a black-box, grey-box, or white-box model. The measurement
variables were the ex-post confidence in the decision made and the associated decision quality. By
means of different significance tests, it was proven that both the subjective confidence and the objective
performance are improved through the support of an AI-based DSS. It was also found that there is a
positive correlation between the two target variables. A significant difference in the influence of differ-
ent ‘system explanations’ – here black-box, grey-box, and white-box-based tool support – was rejected.
These results prove that the use of AI-based DSS can yield great benefits in terms of daily-work perfor-
mance. Similarly, the results from P9 show that human decision makers have a good understanding of
their own decision quality. This is particularly consistent with the findings from P6. A perceived high
explainability of the algorithm leads to a better understanding. The user’s assessment of perceived ex-
plainability therefore seems good (P5, P6). Though, the two studies contradict each other, as in P9 no
change in objective decision quality was found between black-box, grey-box, and white-box AI-based
explanations. However, study P9 explicitly points out that this might be related to the study design and
the simplicity of the use case. The participant had no possibility to check the results of the algorithm at
any time despite its own assumptions. Also, it was no high-stakes scenario, so that errors did not have
serious consequences. That the criticality of the scenario is important for users is supported by the two
studies from P7 and P8. While an exclusive consideration of P7 suggests performance is the most im-
portant factor for a user, P8 showed that this leads to false conclusions, since system transparency (and
thus system explainability) has an indirect effect on adoption readiness. In conclusion, it seems im-
portant to conduct further studies that confirm this basic assumption derived by the research efforts.
5.2 Connections Between Contributions and Related Work
The following descriptions include a brief review of the research orientation for the various research
objectives (RO1-RO3). This is followed by a short discussion of the related topics of interest (RO1a-
RO3c), comparing them to the existing knowledge of related work.
Figure 40: Thesis Contributions vs. Related Work on RO1 – Systematization
R 1: ‘Systematization of (X)AI techni ues for Industry 4.0’. RO1 was about the systematization of
the research field. In line with most studies conducted in this area, a DSR approach was chosen. In
particular, there are numerous case studies that present and evaluate a new approach from the field of
A: Structuring the variety of BA
techniques for I4.0
P1: Holistic overview
Specific sub-
areas
Specific
application
area
B: Identifying temporal trends
of BA techniques in I4.0
P1: Maintenance 4.0 and
Deep Learning
Data-based
maintenance
possibilities
Current data
challenges
C: Elaborating the state of the
art of XAI transfer techniques
Zhou and Xue (2018)
Diez-Olivan et al. (2019)
Zschech (2018)
Hyndman (2020)
Pawellek (2016)
Jin et al. (2016)
Adadi and Berrada (2018)
Arrieta et al. (2020)
Tjoa and Guan (2020)
D: Implementing an exemplary
XAI transfer in I4.0
Rudin (2019)
Kraus and Feuerriegel (2019)
Vasquez-Morales et al. (2019)
P2: Visualization and
rule-based approaches
Literature
reviews
Context-
specific
classification
P3: Question of user
understandability and adoption
Insufficient
explainability
of transfers
Losses of
accuracy
RO1: Systematization
Artificial Intelligence for Human Decision-Makers
182
machine learning for an I4.0 application. The argumentation line per topic of interest that follows is
supported by a short overview in Figure 40, highlighting the contribution, the existing research focus
and the most important preliminary publications.
Existing research pertaining ‘a) Structuring the variety of BA techniques for I4.0’ has concentrated on
different forms of complexity reduction. The focus has mostly been on structuring specific application
areas such as ML (e.g., Diez-Olivan et al. 2019; Sharp et al. 2018; Wuest et al. 2016). Similarly, there
are contributions in specific sub-areas such as process monitoring (e.g., Sutharssan et al. 2015; Zhou
and Xue 2018) and production planning (e.g., Reis and Gins 2017; Sutharssan et al. 2015). A holistic
overview was lacking. Thus, the elaboration of P1 represents a valuable addition for practitioners and
researchers. This entails both, strengths and weaknesses compared to existing works. It provides the
reader with a better overview of the overall context and interrelationships. This prevents ‘silo mentality’.
In contrast, there is a lack of detail in specific dimensions and characteristics, so that important infor-
mation may have been lost. Positioning the developed taxonomy, it allows for a general understanding
and sensibilization from which further information should be considered. An example is the taxonomy
of Zschech (2018), which offers a detailed elaboration on and assistance for the design of maintenance
analytics.
In conjunction with this was ‘b) Identifying temporal trends of BA techniques in I4.0’. This can be crit-
ical as it allows for the strategic planning of ‘smart factories’ that prior work did only to a limited extent.
It also ensures that there is an awareness of necessary side-topics and problems. For example, mainte-
nance applications seem to be increasingly supported by deep learning approaches (Wanner et al.
2020a). In order for these approaches to become effective, it advocates solving related issues such as
the need for large amounts of data or removing possible psychological adoption barriers due to the lack
of comprehensibility of the inherent computational logic for human users. Such a holistic temporal anal-
ysis for the specific area of I4.0 has not existed until now. Therefore, there are no direct comparative
works. However, a number of current data challenges show that algorithms from the field of deep learn-
ing outperform common ML types (e.g., Hyndman 2020). Likewise, Pawellek (2016) and Jin et al.
(2016), among others, show that the area of maintenance can benefit greatly from data-based approaches
such as those found in the I4.0 paradigm.
‘c) Elaborating the state of the art of XAI transfer techniques’ was done in P2. The need derives from
the fact that existing XAI research contributions deal with a literary reappraisal of contexts and classi-
fications. Here, the works of Adadi and Berrada (2018) and Arrieta et al. (2020) seem particularly im-
portant. Similarly, further contributions for specific fields, such as medicine, can be found (Tjoa and
Guan 2020). Although a variety of XAI transfer techniques existed prior to the study in P2, there had
been no research effort to structure them. However, such a review validates the direction of the research
and allows for the identification of research gaps. The review in P2 of existing techniques (e.g., Kraus
and Feuerriegel 2019; Liu et al. 2004; Vásquez-Morales et al. 2019) confirmed that rule-based and visual
explanatory approaches are especially heavily researched. This is also in line with existing XAI assump-
tions: Decision trees are considered particularly suitable (e.g.,Rudin 2019) and visual representations
are often used for the ex-post explanation of black-box models by XAI augmentation frameworks such
as SHAP (Lundberg and Lee 2017). Likewise, the review structure enables one to either address a re-
search gap or implement an adequate XAI-transfer.
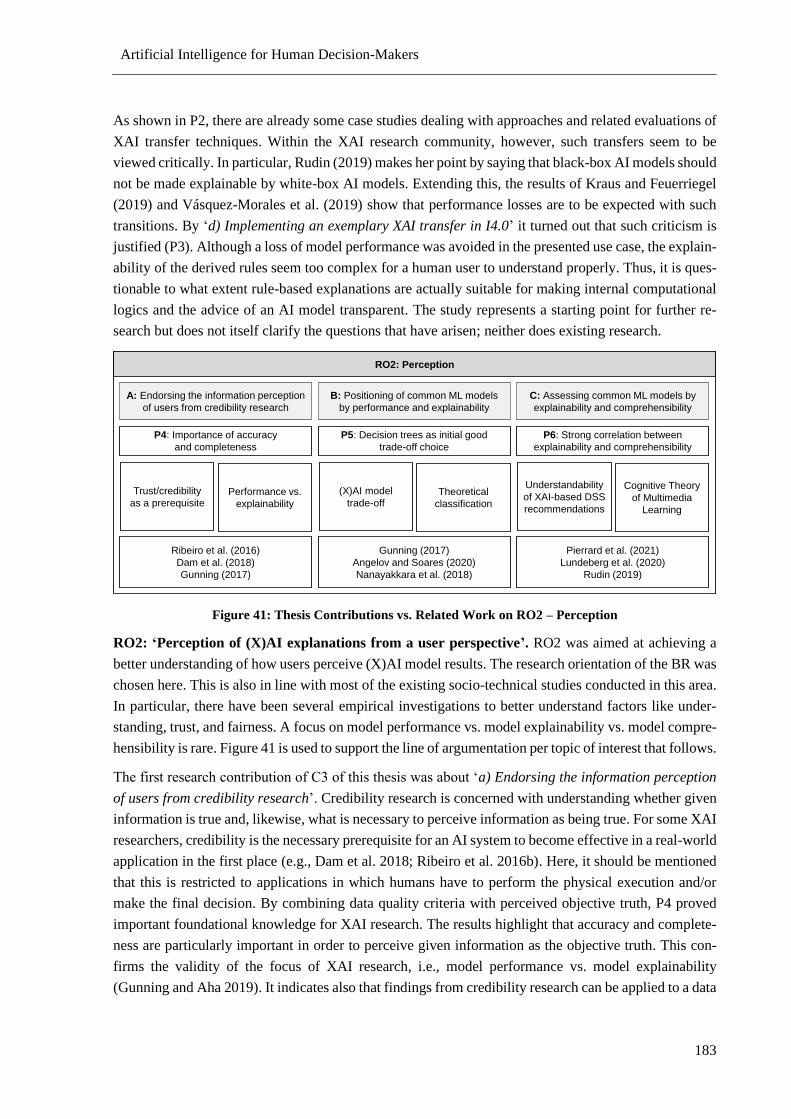
Artificial Intelligence for Human Decision-Makers
183
As shown in P2, there are already some case studies dealing with approaches and related evaluations of
XAI transfer techniques. Within the XAI research community, however, such transfers seem to be
viewed critically. In particular, Rudin (2019) makes her point by saying that black-box AI models should
not be made explainable by white-box AI models. Extending this, the results of Kraus and Feuerriegel
(2019) and Vásquez-Morales et al. (2019) show that performance losses are to be expected with such
transitions. By ‘d) Implementing an exemplary XAI transfer in I4.0’ it turned out that such criticism is
justified (P3). Although a loss of model performance was avoided in the presented use case, the explain-
ability of the derived rules seem too complex for a human user to understand properly. Thus, it is ques-
tionable to what extent rule-based explanations are actually suitable for making internal computational
logics and the advice of an AI model transparent. The study represents a starting point for further re-
search but does not itself clarify the questions that have arisen; neither does existing research.
Figure 41: Thesis Contributions vs. Related Work on RO2 – Perception
RO2: ‘Perception of (X)AI explanations from a user perspective’. RO2 was aimed at achieving a
better understanding of how users perceive (X)AI model results. The research orientation of the BR was
chosen here. This is also in line with most of the existing socio-technical studies conducted in this area.
In particular, there have been several empirical investigations to better understand factors like under-
standing, trust, and fairness. A focus on model performance vs. model explainability vs. model compre-
hensibility is rare. Figure 41 is used to support the line of argumentation per topic of interest that follows.
The first research contribution of C3 of this thesis was about ‘a) Endorsing the information perception
of users from credibility research’. Credibility research is concerned with understanding whether given
information is true and, likewise, what is necessary to perceive information as being true. For some XAI
researchers, credibility is the necessary prerequisite for an AI system to become effective in a real-world
application in the first place (e.g., Dam et al. 2018; Ribeiro et al. 2016b). Here, it should be mentioned
that this is restricted to applications in which humans have to perform the physical execution and/or
make the final decision. By combining data quality criteria with perceived objective truth, P4 proved
important foundational knowledge for XAI research. The results highlight that accuracy and complete-
ness are particularly important in order to perceive given information as the objective truth. This con-
firms the validity of the focus of XAI research, i.e., model performance vs. model explainability
(Gunning and Aha 2019). It indicates also that findings from credibility research can be applied to a data
A: Endorsing the information perception
of users from credibility research
P4: Importance of accuracy
and completeness
Performance vs.
explainability
Trust/credibility
as a prerequisite
Ribeiro et al. (2016)
Dam et al. (2018)
Gunning (2017)
RO2: Perception
B: Positioning of common ML models
by performance and explainability
P5: Decision trees as initial good
trade-off choice
Theoretical
classification
(X)AI model
trade-off
Gunning (2017)
Angelov and Soares (2020)
Nanayakkara et al. (2018)
C: Assessing common ML models by
explainability and comprehensibility
P6: Strong correlation between
explainability and comprehensibility
Cognitive Theory
of Multimedia
Learning
Understandability
of XAI-based DSS
recommendations
Pierrard et al. (2021)
Lundeberg et al. (2020)
Rudin (2019)
Artificial Intelligence for Human Decision-Makers
184
analytics context, which is, e.g., reflected in the importance of credibility for human decision-making
(Wanner 2021).
XAI research assumes a trade-off between model explainability and model performance, which must be
resolved in the best possible way (Gunning and Aha 2019). In theory, there are initial differences be-
tween different types of ML/ DL models, although this has not been practically demonstrated (Angelov
and Soares 2020; Morocho-Cayamcela et al. 2019; Nanayakkara et al. 2018). The investigation of ‘b)
Positioning of common ML models by performance and explainability’ in P5 thus addressed a research
gap. The results validated that the theoretical classification is mostly true. However, there is no linear
ordering of the different model types regarding the trade-off mentioned. Likewise, the statements about
the dependence of the respective users seem to be correct (Cui et al. 2019). Furthermore, the results
confirm Rudin’s argument that rule-based approaches, such as a decision tree, are particularly appropri-
ate for human decision-makers (Rudin 2019). In line with existing AI research, it had been previously
recognized that DL approaches are mostly superior to ML approaches (e.g., Hyndman 2020). Neverthe-
less, the results suggested that these models have a poor perceived explainability.
In addition to the perceived explainability of an (X)AI-based DSS on the part of the user, the extent to
which the user understands the explanations presented is particularly important with regard to the final
decision quality. Only in this way can he evaluate the recommendations of the system and effectively
contribute to a hybrid intelligence. While previous socio-technical XAI studies have already partially
investigated the understandability of (X)AI-based DSS (e.g., Hu et al. 2021; Pierrard et al. 2021; van
der Waa et al. 2021), there had been no investigation into a potential connection between model explain-
ability and model understandability. Therefore, P6 addressed the question ‘c) Assessing common ML
models by explainability and comprehensibility’. Overall, it was found that there is a positive correlation
between the two dimensions. The results again show that rule-based explanatory approaches, such as a
decision tree, provide good user comprehensibility (see also P2 and P5). Likewise, it was confirmed that
ex-post explanations of XAI augmentation frameworks (i.e., SHAP) are well suited to meet the expla-
nation expectations of users of such intelligent systems. This is in line with previous work such as that
of Lundberg et al. (2020). The criticism that such grey-box models are only an approximation and thus
inherently inaccurate (Rudin 2019) cannot be confirmed. In conclusion, the results illustrate that current
XAI research is moving in the right direction by developing new methods for ex-post explanations such
as LIME (Ribeiro et al. 2016b) and SHAP (Lundberg and Lee 2017).
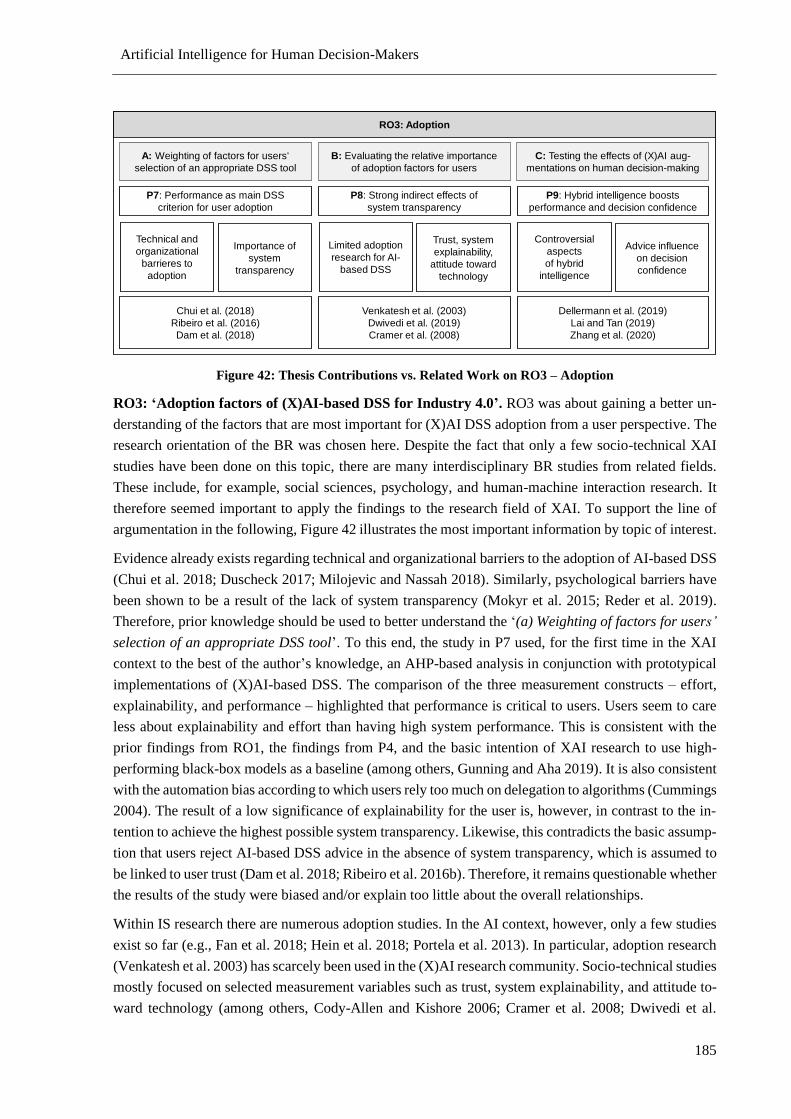
Artificial Intelligence for Human Decision-Makers
185
Figure 42: Thesis Contributions vs. Related Work on RO3 – Adoption
RO3: ‘Adoption factors of (X)AI-based DSS for Industry 4.0’. RO3 was about gaining a better un-
derstanding of the factors that are most important for (X)AI DSS adoption from a user perspective. The
research orientation of the BR was chosen here. Despite the fact that only a few socio-technical XAI
studies have been done on this topic, there are many interdisciplinary BR studies from related fields.
These include, for example, social sciences, psychology, and human-machine interaction research. It
therefore seemed important to apply the findings to the research field of XAI. To support the line of
argumentation in the following, Figure 42 illustrates the most important information by topic of interest.
Evidence already exists regarding technical and organizational barriers to the adoption of AI-based DSS
(Chui et al. 2018; Duscheck 2017; Milojevic and Nassah 2018). Similarly, psychological barriers have
been shown to be a result of the lack of system transparency (Mokyr et al. 2015; Reder et al. 2019).
Therefore, prior knowledge should be used to better understand the ‘(a) Weighting of factors for users’
selection of an appropriate DSS tool’. To this end, the study in P7 used, for the first time in the XAI
context to the best of the author’s knowledge, an AHP-based analysis in conjunction with prototypical
implementations of (X)AI-based DSS. The comparison of the three measurement constructs – effort,
explainability, and performance – highlighted that performance is critical to users. Users seem to care
less about explainability and effort than having high system performance. This is consistent with the
prior findings from RO1, the findings from P4, and the basic intention of XAI research to use high-
performing black-box models as a baseline (among others, Gunning and Aha 2019). It is also consistent
with the automation bias according to which users rely too much on delegation to algorithms (Cummings
2004). The result of a low significance of explainability for the user is, however, in contrast to the in-
tention to achieve the highest possible system transparency. Likewise, this contradicts the basic assump-
tion that users reject AI-based DSS advice in the absence of system transparency, which is assumed to
be linked to user trust (Dam et al. 2018; Ribeiro et al. 2016b). Therefore, it remains questionable whether
the results of the study were biased and/or explain too little about the overall relationships.
Within IS research there are numerous adoption studies. In the AI context, however, only a few studies
exist so far (e.g., Fan et al. 2018; Hein et al. 2018; Portela et al. 2013). In particular, adoption research
(Venkatesh et al. 2003) has scarcely been used in the (X)AI research community. Socio-technical studies
mostly focused on selected measurement variables such as trust, system explainability, and attitude to-
ward technology (among others, Cody-Allen and Kishore 2006; Cramer et al. 2008; Dwivedi et al.
A: Weighting of factors for users‘
selection of an appropriate DSS tool
P7: Performance as main DSS
criterion for user adoption
Importance of
system
transparency
Technical and
organizational
barrieres to
adoption
Chui et al. (2018)
Ribeiro et al. (2016)
Dam et al. (2018)
RO3: Adoption
B: Evaluating the relative importance
of adoption factors for users
P8: Strong indirect effects of
system transparency
Trust, system
explainability,
attitude toward
technology
Limited adoption
research for AI-
based DSS
Venkatesh et al. (2003)
Dwivedi et al. (2019)
Cramer et al. (2008)
C: Testing the effects of (X)AI aug-
mentations on human decision-making
P9: Hybrid intelligence boosts
performance and decision confidence
Advice influence
on decision
confidence
Controversial
aspects
of hybrid
intelligence
Dellermann et al. (2019)
Lai and Tan (2019)
Zhang et al. (2020)
Artificial Intelligence for Human Decision-Makers
186
2019). The publication P8 therefore deals with the question ‘b) Evaluating the relative importance of
ad pti n fa t rs f r us rs’. Through the study in P9, it was able to achieve a more holistic perspective
to understand interaction effects. On the one hand, the results confirmed the great importance of the
perceived performance of the AI-based DSS from section RO2 and P7. On the other hand, it became
clear that perceived system transparency, and thus system explainability, has a significant effect through
other constructs such as perceived performance. Therefore, the study results extend state of the art re-
search in that it proves that the focus of XAI research on model explainability and model performance
is justified. Likewise, it becomes clear that indirect effects exist, which need to be considered in subse-
quent studies.
In many potential application areas of (X)AI-based approaches, there is a need for human-machine in-
teraction. Here, the algorithm itself cannot act autonomously due to, e.g., necessary physical interven-
tions or legal requirements. Therefore, the investigation in P9 dealt with the question of ‘c) Testing the
effects of (X)AI augmentations on human decision-making’. The results confirm the positive effects of
a hybrid intelligence. This is in line with the results from previous works by Dellermann et al. (2019)
and Lai and Tan (2019). Similarly, a positive correlation between subjective confidence and objective
decision quality was demonstrated, which confirms prior work such as that of Lai and Tan (2019). Nev-
ertheless, some researchers seem to obtain different results here. While there is a consensus that subjec-
tive confidence can be improved by intelligent system support, the results of Zhang et al. (2020) and
Westbrook et al. (2005), for example, do not show any improvement in decision quality by the addition
of further information. This is consistent with the findings from P9 that white-box and grey-box models
do not represent a significant improvement over black-box models. However, the assumption is made
that biases are present due to the results of the preceding chapters of this work as well as the associated
study limitations from P9. In particular, the lack of evaluation of the algorithm by the user (Dietvorst et
al. 2015) and the problem of information overload (Poursabzi-Sangdeh et al. 2018; Schaffer et al. 2019)
seem to be important here. The partial finding of the same impact for white-box, grey-box, and black-
box AI-based DSS therefore seems questionable.
Artificial Intelligence for Human Decision-Makers
187
6 Concluding Remarks and Future Research
In the following, a short version of my own elaboration of each section is given first. This is followed
by a summary of limitations. Finally, suggestions for future research are presented.
Research Summary. The first part of this thesis was about the systematization of the field of (X)AI
research in I4.0. First, a structuring of the variety of BA techniques for I4.0 was investigated. It became
apparent that the field of industrial maintenance is being heavily researched (P1). This suggests that
there are profitable improvements to be made here through expanded measurement infrastructures, inter-
connection, and modern data analysis methods. This should address the subjectivity of task performance
and the lack of expert staff (Wanner et al. 2019a). Through the connected identification of temporal
trends of BA techniques in I4.0, it was evident that advanced BA approaches of predictive and prescrip-
tive maturity are emerging. The related technical realization is predominantly based on techniques from
the field of deep learning (P1). In turn, there is a need for XAI methods. DL models are not comprehen-
sible for the human decision-maker and can be met with rejection regardless of high-performance capa-
bility. Therefore, a review of the state-of-the-art of XAI transfer techniques was undertaken. This high-
lighted the technical XAI transfer methods developed to convert black-box AI models into per se ex-
plainable white-box AI models, such as decision trees. It was shown that transfer techniques for visual-
ization and derived rulesets are especially heavily researched (P2). The theoretical elaboration was prac-
tically evaluated with the help of an I4.0 use case, applying the approach of a derived ruleset. The limi-
tation insights show that further research is needed to obtain a better understanding of the trade-off
between model performance and model explainability in order to form an effective hybrid intelligence
(P3).
The second part of this thesis was about the perception of (X)AI explanations from a user perspective.
First, a connection was made to credibility research. This was done in the context of Big Data in order
to better understand the effects of analyzed data on the perceived objective truth of the presented infor-
mation by users. The scientific theory utilized was first presented in Habermas et al. (1984) ‘Theory of
Communicative Action’. It was shown that the accuracy of the presented information and the variety/
completeness have a significant impact on the target variable (P4). With this in mind, the next goal was
to better understand the trade-off between model performance and model explainability. For this pur-
pose, common ML algorithms were implemented in different use cases. A user study revealed the per-
ceived explainability for each. The results showed that rule-based approaches, such as a decision tree,
offer a particularly high level of perceived explainability. From a technical point of view, however, the
ANN model yielded the best result, which, on the other hand, scored worst in terms of perceived ex-
plainability (P5). In conclusion, it can be stated that effective explainability in modern approaches from
the field of DL is particularly desirable. If neither XAI augmentation nor XAI transfer is undertaken,
decision trees should be used. This was also shown in the assessment of common ML models in terms
of explainability and comprehensibility. Here, an attempt was made to better understand the extent to
which the human decision-maker actually understands the outcome presented by an AI-based DSS.
Again, different ML models were used. In addition, an XAI augmentation was applied to the ANN
algorithm via the SHAP framework. This yielded the best results, while the decision tree was second
(P6).
Artificial Intelligence for Human Decision-Makers
188
The third part of this thesis was about the adoption of (X)AI DSS. Here, again, the research context was
I4.0. First, there was an investigation into which factors are most important to the intended user when
selecting a proper system as an AI-based DSS. The three areas of effort, performance, and explainability
– derived from central IS theories – were investigated and substituted by different measures like, e.g.,
the inference time. By means of an AHP according to Saaty (2004) the users’ preferences could be
derived. Here it was shown that users particularly care about the performance of the systems. Explaina-
bility and effort, on the other hand, were about equal but less important (P7). This illustrates that the
development of XAI augmentation frameworks focused on making DL and ensemble ML approaches
explainable, which have an initial high-performance capability but low per-se explainability, is reason-
able and important. From a higher-level perspective, the next goal was to better understand the factors
on the decision to adopt an AI-based DSS system. For this purpose, a proprietary adoption model was
derived using the UTAUT reference model of Venkatesh et al. (2003). Through multiple studies and
statistical analyses, it was revealed that system transparency, and thus model explainability, plays a
much more important role than first assumed. Highly significant indirect effects on other constructs such
as trust or perceived performance were proven (P8). This highlights the importance of XAI research
investigations. In conclusion, an attempt was made to better understand through these findings how
performance and system explainability affect human decision-making. To this end, a test design was
developed to compare the impact of different types of (X)AI models (no support, black-box, white-box,
grey-box) on users’ choice confidence and the related quality of the outcome. For this purpose, a use
case to test this design was performed (P9). The result showed that (X)AI DSS support has a positive
effect on perceived confidence in one’s decision. Furthermore, a correlation between confidence and
decision quality was demonstrated. In other words, an effective hybrid intelligence of human and ma-
chine achieved a better result either entity on its own. With respect to a distinction between the degrees
of explanation of black-box, white-box, and grey-box, however, no significant differences could be de-
tected (P9). It can be assumed that this is due to the low criticality and connected simplicity of the
selected use case as this result contrasts with preliminary findings (among others, Lai and Tan 2019).
Research Limitations. The numerous developments and associated contributions within the research
field of socio-technical XAI are partly subject to limitations or else require further evaluation. In partic-
ular, it is pointed out that the strong empirical research orientation is associated with common limitations
of surveys per se. In particular, this implies certain shortcomings of the study design and the subjectivity
of participants. Depending on the context of application and design, different biases can thus become
apparent and distort the results. Even if an attempt was made to keep these biases to a minimum and to
ensure a high degree of generalizability through appropriately large samples, this must be accounted for.
It should also be mentioned that monetary incentives were used in some of the studies. Likewise, the
use of publicly accessible data sets to ensure the traceability of the research itself is associated with a
corresponding restriction in terms of practical reality.
This is associated with a critical weighing of the research artifacts created. In other words, the results
can always be questioned in an expanding manner. The associated problem is often that individual pub-
lications are subject to limitations in the treatment of topics and formal requirements. Empirical surveys
that have been carried out could therefore have been further evaluated and substantiated in some cases.
Further statements made remain limited to the respective investigations. Here, a generalization of the
Artificial Intelligence for Human Decision-Makers
189
results would have to take place through future work, in order to be able to derive theories and recom-
mendations for action, if necessary.
Future research. Future research could start at different points and extend the studies presented here.
In the section ‘Systematization of the ield’, a taxonomy for socio-technical XAI studies is conceivable.
On the one hand, such a reappraisal could represent the current state of research in a compact way and
could be a complement to the frequently cited contribution of Adadi and Berrada (2018). On the other
hand, such a reappraisal would provide future XAI researchers with guidelines to design their own study
investigations. Furthermore, it is becoming easier to discuss study results and incorporate these into the
research context. Likewise, more research can be done on the technical side of XAI transfers. Specifi-
cally, there is a lack of concrete use cases in real-world practice environments, such as those presented
by Wanner et al. (2019a). Other use cases, such as within the domain of medicine (Holzinger et al. 2019)
or regarding the application of further existing XAI transfer techniques (Wanner et al. 2020c), are con-
ceivable.
In the section dealing with ‘(X)AI DSS User Perception’, future research efforts could push the investi-
gation into the differences among various XAI augmentation frameworks. Examples of the use of frame-
works such as SHAP, LIME, and Anchor show that calculations and representations can differ. There-
fore, on the one hand, it would be interesting to better understand how human decision-makers perceive
ex-post explanations. On the other hand, as in the preceding research by Wanner et al. (2021a) or Herm
et al. (2021b), performance must also be considered. This implies a review of, e.g., the accuracy of the
frameworks’ substitution of the calculation. Another conceivable approach would be to conduct a study
with scientific reference to diminishing returns. Preliminary work, such as that of Zhang et al. (2020),
indicates that above a certain performance level by the AI algorithm behind a decision support system,
there is no significant improvement in the user’s confidence in the calculation correctness. It would
therefore be interesting to better understand the relationship between explainability and performance
under an economic substitution. In other words, it would be valuable to understand how much a human
decision-maker is willing to sacrifice performance to achieve better explainability and vice versa.
In the section addressing ‘(X)AI DSS Adoption’, for example, it would be interesting to better under-
stand the extent to which different stakeholders weight certain features of an intelligent DSS in their
selection preference. This can be done by extending the AHP study design (cf. Wanner et al. 2020a) to
an ANP. Furthermore, it would be equally intriguing to see to what extent this reveals differences in
various domains and at different criticalities. Decision-makers from different domains have varying
personal characteristics and experience or knowledge relevant to their respective use case. This could
also change with different levels of criticality. Another promising area for future research is the effec-
tiveness of hybrid intelligence. Both Dellermann et al. (2019) and Wanner (2021) show that this is the
ideal to strive for, as it offers the best overall performance. However, since there are also many contrary
findings here (e.g., Lai and Tan 2019; Zhang et al. 2020), it would be important to better understand
whether this is conditioned by the use case with its criticality, individual characteristics of the respond-
ents, study setups, or other influences. In particular, there seems to be a lack of use cases in real envi-
ronments, with real problems and the corresponding employees who perform with such AI-based system
support in their daily work.
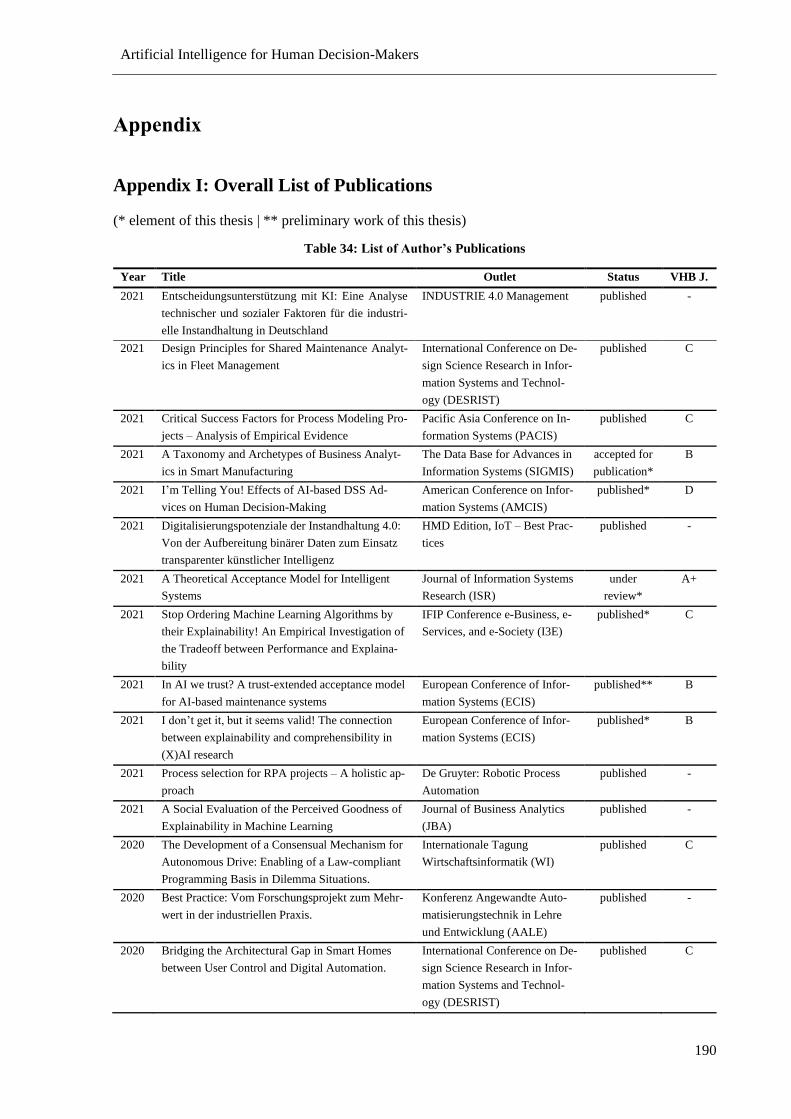
Artificial Intelligence for Human Decision-Makers
190
Appendix
Appendix I: Overall List of Publications
(* element of this thesis | ** preliminary work of this thesis)
Table 34: List of Author’s Publications
Year Title Outlet Status VHB J.
2021 Entscheidungsunterstützung mit KI: Eine Analyse
technischer und sozialer Faktoren für die industri-
elle Instandhaltung in Deutschland
INDUSTRIE 4.0 Management published -
2021 Design Principles for Shared Maintenance Analyt-
ics in Fleet Management
International Conference on De-
sign Science Research in Infor-
mation Systems and Technol-
ogy (DESRIST)
published C
2021 Critical Success Factors for Process Modeling Pro-
jects – Analysis of Empirical Evidence
Pacific Asia Conference on In-
formation Systems (PACIS)
published C
2021 A Taxonomy and Archetypes of Business Analyt-
ics in Smart Manufacturing
The Data Base for Advances in
Information Systems (SIGMIS)
accepted for
publication*
B
2021 I’m Telling You! Effects of AI-based DSS Ad-
vices on Human Decision-Making
American Conference on Infor-
mation Systems (AMCIS)
published* D
2021 Digitalisierungspotenziale der Instandhaltung 4.0:
Von der Aufbereitung binärer Daten zum Einsatz
transparenter künstlicher Intelligenz
HMD Edition, IoT – Best Prac-
tices
published -
2021 A Theoretical Acceptance Model for Intelligent
Systems
Journal of Information Systems
Research (ISR)
under
review*
A+
2021 Stop Ordering Machine Learning Algorithms by
their Explainability! An Empirical Investigation of
the Tradeoff between Performance and Explaina-
bility
IFIP Conference e-Business, e-
Services, and e-Society (I3E)
published* C
2021 In AI we trust? A trust-extended acceptance model
for AI-based maintenance systems
European Conference of Infor-
mation Systems (ECIS)
published** B
2021 I don’t get it, but it seems valid! The connection
between explainability and comprehensibility in
(X)AI research
European Conference of Infor-
mation Systems (ECIS)
published* B
2021 Process selection for RPA projects – A holistic ap-
proach
De Gruyter: Robotic Process
Automation
published -
2021 A Social Evaluation of the Perceived Goodness of
Explainability in Machine Learning
Journal of Business Analytics
(JBA)
published -
2020 The Development of a Consensual Mechanism for
Autonomous Drive: Enabling of a Law-compliant
Programming Basis in Dilemma Situations.
Internationale Tagung
Wirtschaftsinformatik (WI)
published C
2020 Best Practice: Vom Forschungsprojekt zum Mehr-
wert in der industriellen Praxis.
Konferenz Angewandte Auto-
matisierungstechnik in Lehre
und Entwicklung (AALE)
published -
2020 Bridging the Architectural Gap in Smart Homes
between User Control and Digital Automation.
International Conference on De-
sign Science Research in Infor-
mation Systems and Technol-
ogy (DESRIST)
published C
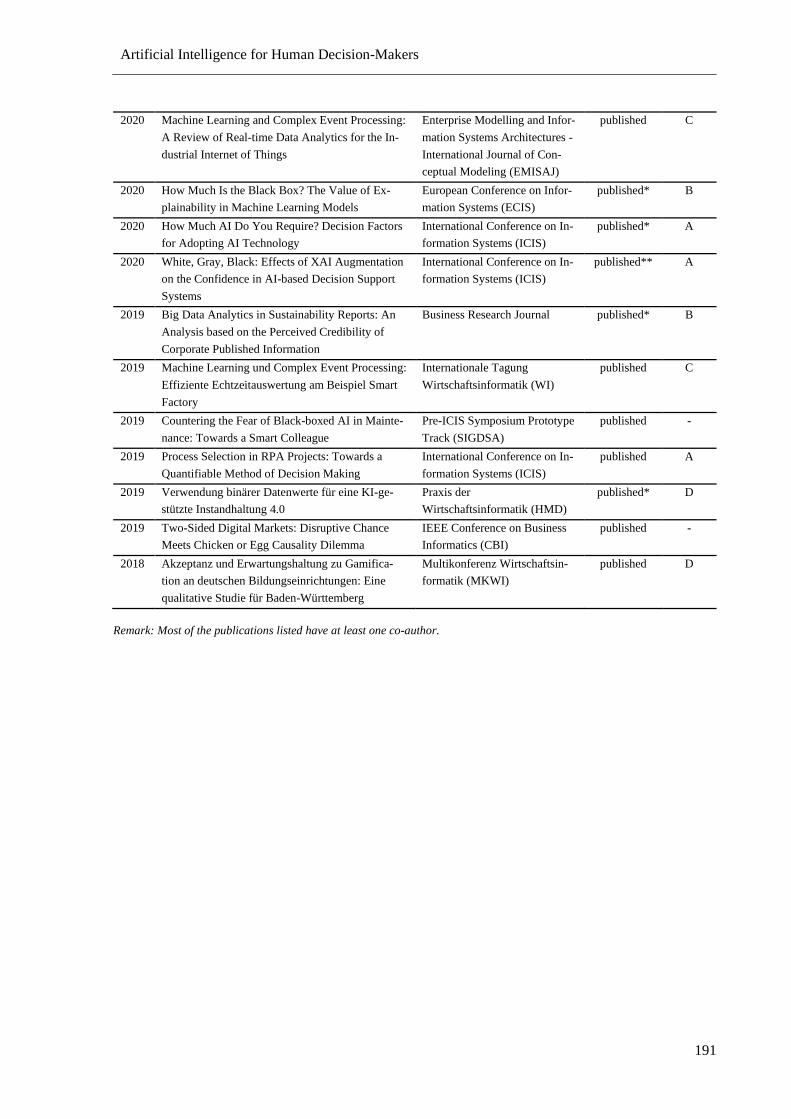
Artificial Intelligence for Human Decision-Makers
191
2020 Machine Learning and Complex Event Processing:
A Review of Real-time Data Analytics for the In-
dustrial Internet of Things
Enterprise Modelling and Infor-
mation Systems Architectures -
International Journal of Con-
ceptual Modeling (EMISAJ)
published C
2020 How Much Is the Black Box? The Value of Ex-
plainability in Machine Learning Models
European Conference on Infor-
mation Systems (ECIS)
published* B
2020 How Much AI Do You Require? Decision Factors
for Adopting AI Technology
International Conference on In-
formation Systems (ICIS)
published* A
2020 White, Gray, Black: Effects of XAI Augmentation
on the Confidence in AI-based Decision Support
Systems
International Conference on In-
formation Systems (ICIS)
published** A
2019 Big Data Analytics in Sustainability Reports: An
Analysis based on the Perceived Credibility of
Corporate Published Information
Business Research Journal published* B
2019 Machine Learning und Complex Event Processing:
Effiziente Echtzeitauswertung am Beispiel Smart
Factory
Internationale Tagung
Wirtschaftsinformatik (WI)
published C
2019 Countering the Fear of Black-boxed AI in Mainte-
nance: Towards a Smart Colleague
Pre-ICIS Symposium Prototype
Track (SIGDSA)
published -
2019 Process Selection in RPA Projects: Towards a
Quantifiable Method of Decision Making
International Conference on In-
formation Systems (ICIS)
published A
2019 Verwendung binärer Datenwerte für eine KI-ge-
stützte Instandhaltung 4.0
Praxis der
Wirtschaftsinformatik (HMD)
published* D
2019 Two-Sided Digital Markets: Disruptive Chance
Meets Chicken or Egg Causality Dilemma
IEEE Conference on Business
Informatics (CBI)
published -
2018 Akzeptanz und Erwartungshaltung zu Gamifica-
tion an deutschen Bildungseinrichtungen: Eine
qualitative Studie für Baden-Württemberg
Multikonferenz Wirtschaftsin-
formatik (MKWI)
published D
Remark: Most of the publications listed have at least one co-author.
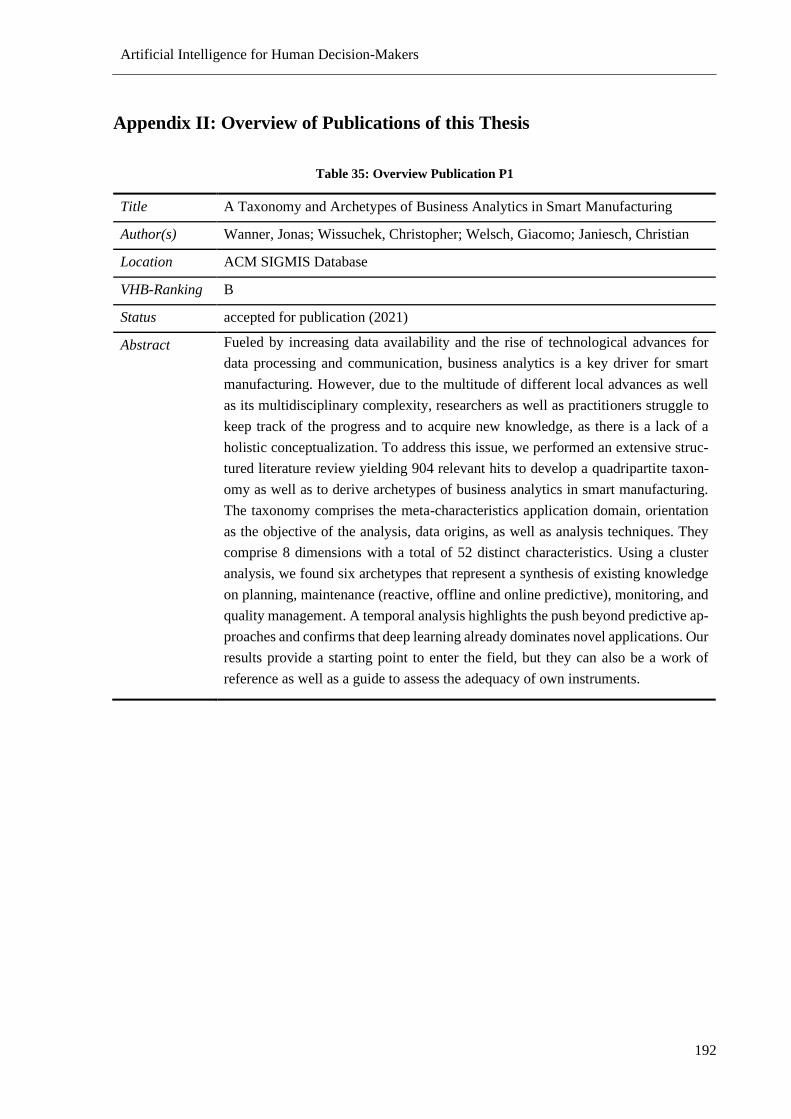
Artificial Intelligence for Human Decision-Makers
192
Appendix II: Overview of Publications of this Thesis
Table 35: Overview Publication P1
Title A Taxonomy and Archetypes of Business Analytics in Smart Manufacturing
Author(s) Wanner, Jonas; Wissuchek, Christopher; Welsch, Giacomo; Janiesch, Christian
Location ACM SIGMIS Database
VHB-Ranking B
Status accepted for publication (2021)
Abstract Fueled by increasing data availability and the rise of technological advances for
data processing and communication, business analytics is a key driver for smart
manufacturing. However, due to the multitude of different local advances as well
as its multidisciplinary complexity, researchers as well as practitioners struggle to
keep track of the progress and to acquire new knowledge, as there is a lack of a
holistic conceptualization. To address this issue, we performed an extensive struc-
tured literature review yielding 904 relevant hits to develop a quadripartite taxon-
omy as well as to derive archetypes of business analytics in smart manufacturing.
The taxonomy comprises the meta-characteristics application domain, orientation
as the objective of the analysis, data origins, as well as analysis techniques. They
comprise 8 dimensions with a total of 52 distinct characteristics. Using a cluster
analysis, we found six archetypes that represent a synthesis of existing knowledge
on planning, maintenance (reactive, offline and online predictive), monitoring, and
quality management. A temporal analysis highlights the push beyond predictive ap-
proaches and confirms that deep learning already dominates novel applications. Our
results provide a starting point to enter the field, but they can also be a work of
reference as well as a guide to assess the adequacy of own instruments.
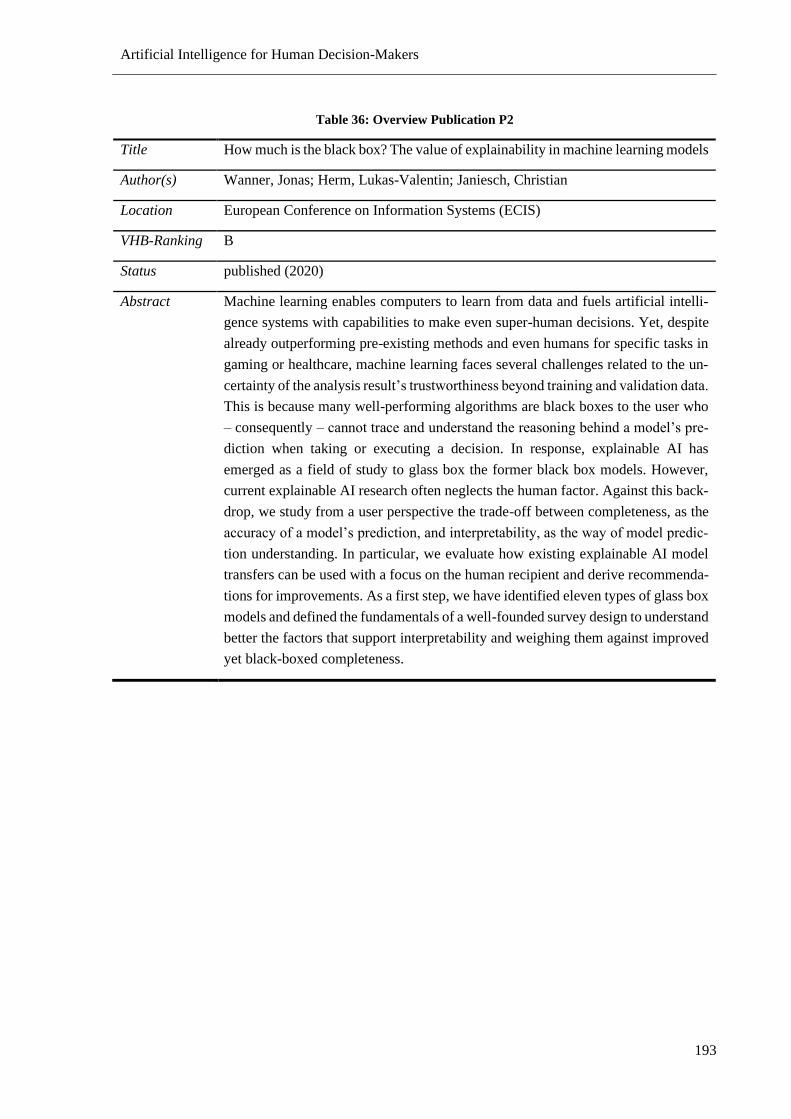
Artificial Intelligence for Human Decision-Makers
193
Table 36: Overview Publication P2
Title How much is the black box? The value of explainability in machine learning models
Author(s) Wanner, Jonas; Herm, Lukas-Valentin; Janiesch, Christian
Location European Conference on Information Systems (ECIS)
VHB-Ranking B
Status published (2020)
Abstract Machine learning enables computers to learn from data and fuels artificial intelli-
gence systems with capabilities to make even super-human decisions. Yet, despite
already outperforming pre-existing methods and even humans for specific tasks in
gaming or healthcare, machine learning faces several challenges related to the un-
certainty of the analysis result’s trustworthiness beyond training and validation data.
This is because many well-performing algorithms are black boxes to the user who
– consequently – cannot trace and understand the reasoning behind a model’s pre-
diction when taking or executing a decision. In response, explainable AI has
emerged as a field of study to glass box the former black box models. However,
current explainable AI research often neglects the human factor. Against this back-
drop, we study from a user perspective the trade-off between completeness, as the
accuracy of a model’s prediction, and interpretability, as the way of model predic-
tion understanding. In particular, we evaluate how existing explainable AI model
transfers can be used with a focus on the human recipient and derive recommenda-
tions for improvements. As a first step, we have identified eleven types of glass box
models and defined the fundamentals of a well-founded survey design to understand
better the factors that support interpretability and weighing them against improved
yet black-boxed completeness.
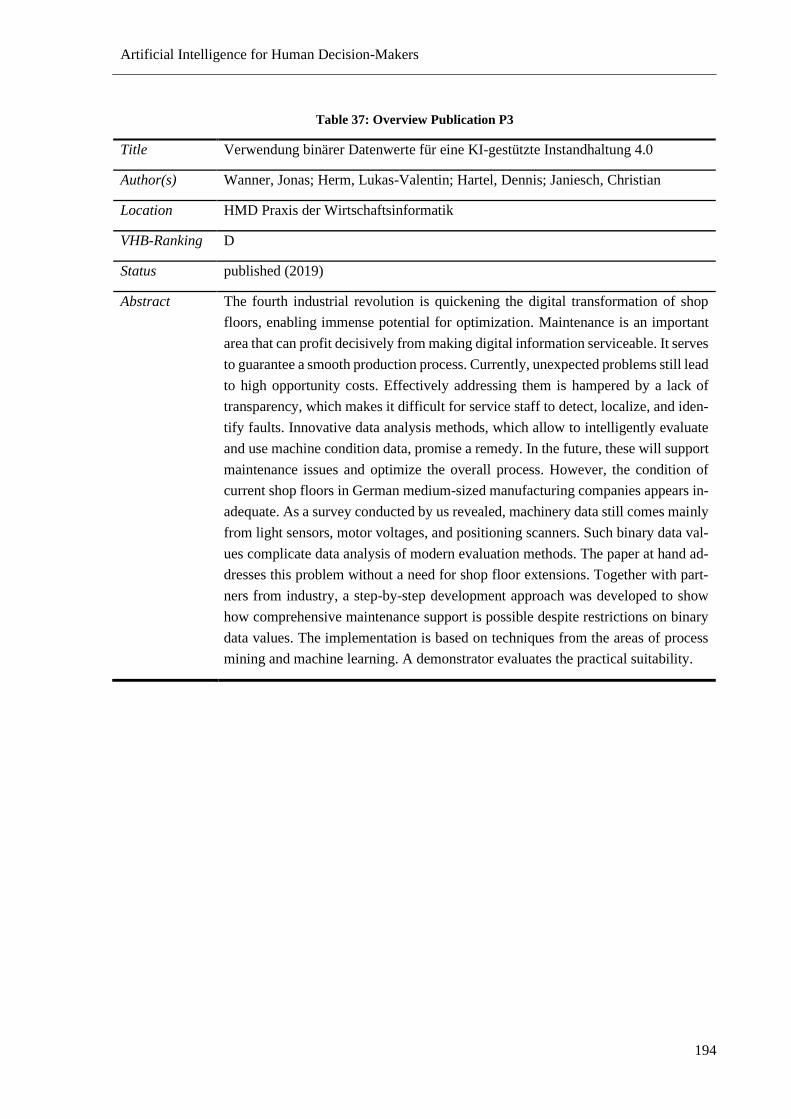
Artificial Intelligence for Human Decision-Makers
194
Table 37: Overview Publication P3
Title Verwendung binärer Datenwerte für eine KI-gestützte Instandhaltung 4.0
Author(s) Wanner, Jonas; Herm, Lukas-Valentin; Hartel, Dennis; Janiesch, Christian
Location HMD Praxis der Wirtschaftsinformatik
VHB-Ranking D
Status published (2019)
Abstract The fourth industrial revolution is quickening the digital transformation of shop
floors, enabling immense potential for optimization. Maintenance is an important
area that can profit decisively from making digital information serviceable. It serves
to guarantee a smooth production process. Currently, unexpected problems still lead
to high opportunity costs. Effectively addressing them is hampered by a lack of
transparency, which makes it difficult for service staff to detect, localize, and iden-
tify faults. Innovative data analysis methods, which allow to intelligently evaluate
and use machine condition data, promise a remedy. In the future, these will support
maintenance issues and optimize the overall process. However, the condition of
current shop floors in German medium-sized manufacturing companies appears in-
adequate. As a survey conducted by us revealed, machinery data still comes mainly
from light sensors, motor voltages, and positioning scanners. Such binary data val-
ues complicate data analysis of modern evaluation methods. The paper at hand ad-
dresses this problem without a need for shop floor extensions. Together with part-
ners from industry, a step-by-step development approach was developed to show
how comprehensive maintenance support is possible despite restrictions on binary
data values. The implementation is based on techniques from the areas of process
mining and machine learning. A demonstrator evaluates the practical suitability.
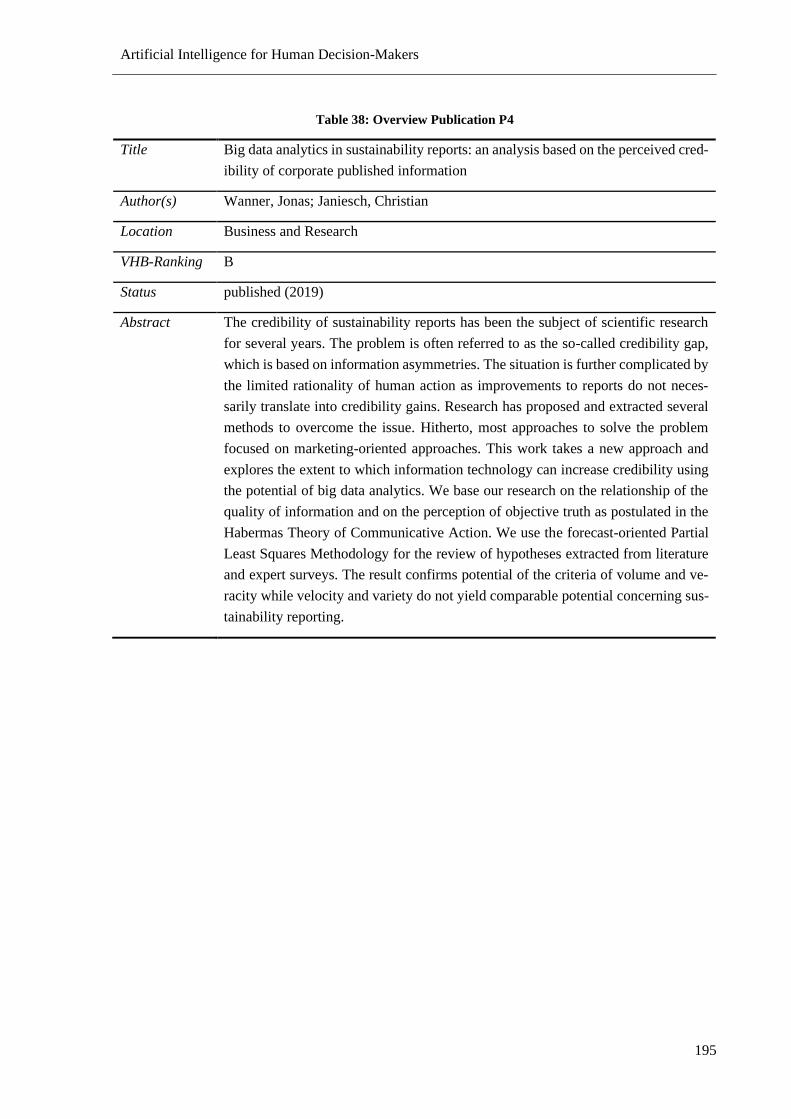
Artificial Intelligence for Human Decision-Makers
195
Table 38: Overview Publication P4
Title Big data analytics in sustainability reports: an analysis based on the perceived cred-
ibility of corporate published information
Author(s) Wanner, Jonas; Janiesch, Christian
Location Business and Research
VHB-Ranking B
Status published (2019)
Abstract The credibility of sustainability reports has been the subject of scientific research
for several years. The problem is often referred to as the so-called credibility gap,
which is based on information asymmetries. The situation is further complicated by
the limited rationality of human action as improvements to reports do not neces-
sarily translate into credibility gains. Research has proposed and extracted several
methods to overcome the issue. Hitherto, most approaches to solve the problem
focused on marketing-oriented approaches. This work takes a new approach and
explores the extent to which information technology can increase credibility using
the potential of big data analytics. We base our research on the relationship of the
quality of information and on the perception of objective truth as postulated in the
Habermas Theory of Communicative Action. We use the forecast-oriented Partial
Least Squares Methodology for the review of hypotheses extracted from literature
and expert surveys. The result confirms potential of the criteria of volume and ve-
racity while velocity and variety do not yield comparable potential concerning sus-
tainability reporting.
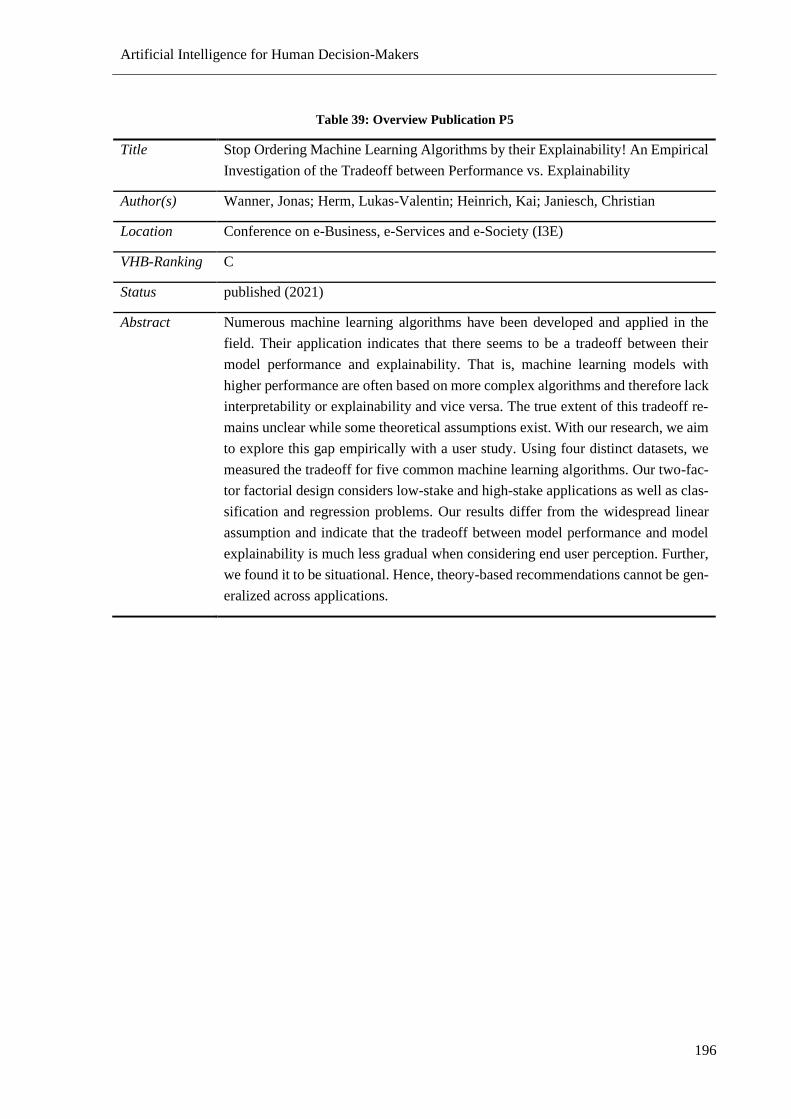
Artificial Intelligence for Human Decision-Makers
196
Table 39: Overview Publication P5
Title Stop Ordering Machine Learning Algorithms by their Explainability! An Empirical
Investigation of the Tradeoff between Performance vs. Explainability
Author(s) Wanner, Jonas; Herm, Lukas-Valentin; Heinrich, Kai; Janiesch, Christian
Location Conference on e-Business, e-Services and e-Society (I3E)
VHB-Ranking C
Status published (2021)
Abstract Numerous machine learning algorithms have been developed and applied in the
field. Their application indicates that there seems to be a tradeoff between their
model performance and explainability. That is, machine learning models with
higher performance are often based on more complex algorithms and therefore lack
interpretability or explainability and vice versa. The true extent of this tradeoff re-
mains unclear while some theoretical assumptions exist. With our research, we aim
to explore this gap empirically with a user study. Using four distinct datasets, we
measured the tradeoff for five common machine learning algorithms. Our two-fac-
tor factorial design considers low-stake and high-stake applications as well as clas-
sification and regression problems. Our results differ from the widespread linear
assumption and indicate that the tradeoff between model performance and model
explainability is much less gradual when considering end user perception. Further,
we found it to be situational. Hence, theory-based recommendations cannot be gen-
eralized across applications.
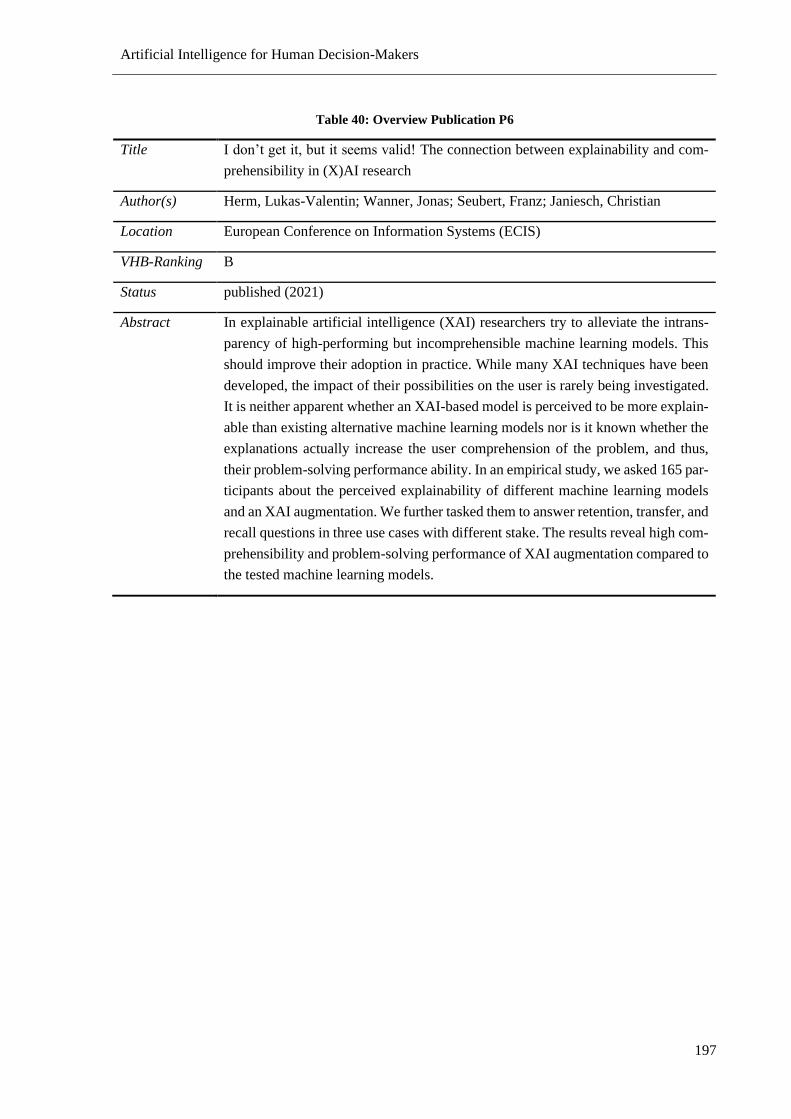
Artificial Intelligence for Human Decision-Makers
197
Table 40: Overview Publication P6
Title I don’t get it, but it seems valid! The connection between explainability and com-
prehensibility in (X)AI research
Author(s) Herm, Lukas-Valentin; Wanner, Jonas; Seubert, Franz; Janiesch, Christian
Location European Conference on Information Systems (ECIS)
VHB-Ranking B
Status published (2021)
Abstract In explainable artificial intelligence (XAI) researchers try to alleviate the intrans-
parency of high-performing but incomprehensible machine learning models. This
should improve their adoption in practice. While many XAI techniques have been
developed, the impact of their possibilities on the user is rarely being investigated.
It is neither apparent whether an XAI-based model is perceived to be more explain-
able than existing alternative machine learning models nor is it known whether the
explanations actually increase the user comprehension of the problem, and thus,
their problem-solving performance ability. In an empirical study, we asked 165 par-
ticipants about the perceived explainability of different machine learning models
and an XAI augmentation. We further tasked them to answer retention, transfer, and
recall questions in three use cases with different stake. The results reveal high com-
prehensibility and problem-solving performance of XAI augmentation compared to
the tested machine learning models.
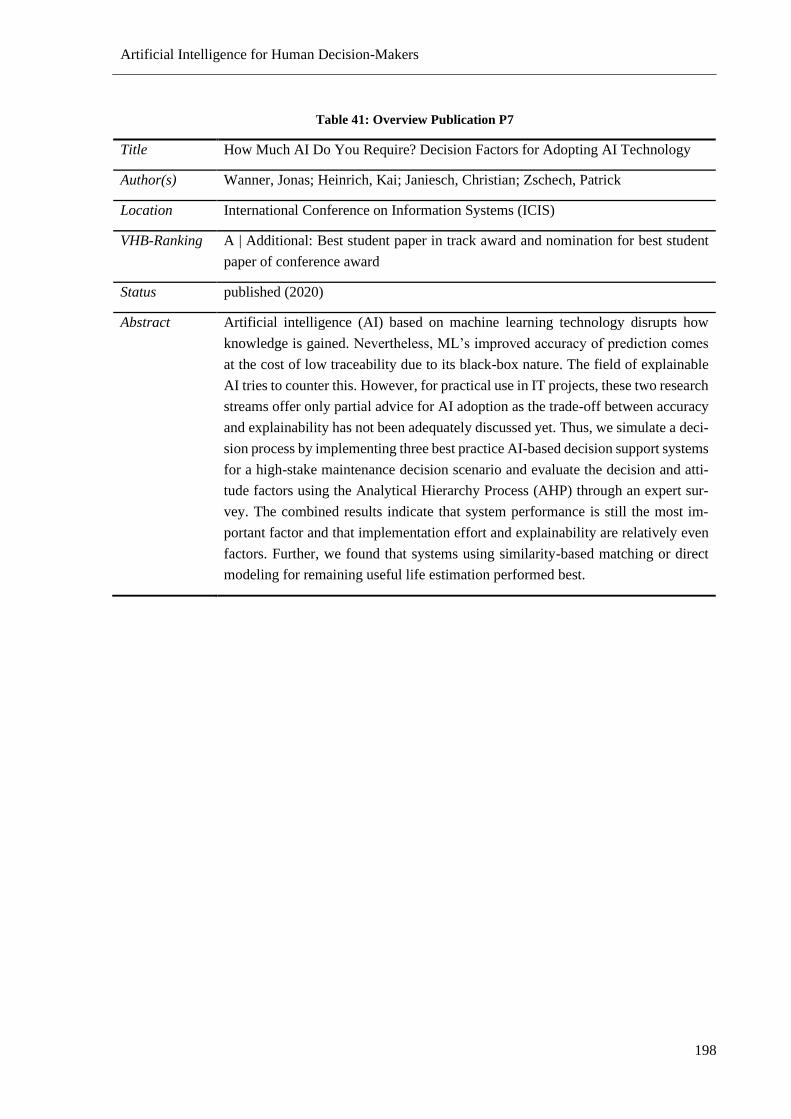
Artificial Intelligence for Human Decision-Makers
198
Table 41: Overview Publication P7
Title How Much AI Do You Require? Decision Factors for Adopting AI Technology
Author(s) Wanner, Jonas; Heinrich, Kai; Janiesch, Christian; Zschech, Patrick
Location International Conference on Information Systems (ICIS)
VHB-Ranking A | Additional: Best student paper in track award and nomination for best student
paper of conference award
Status published (2020)
Abstract Artificial intelligence (AI) based on machine learning technology disrupts how
knowledge is gained. Nevertheless, ML’s improved accuracy of prediction comes
at the cost of low traceability due to its black-box nature. The field of explainable
AI tries to counter this. However, for practical use in IT projects, these two research
streams offer only partial advice for AI adoption as the trade-off between accuracy
and explainability has not been adequately discussed yet. Thus, we simulate a deci-
sion process by implementing three best practice AI-based decision support systems
for a high-stake maintenance decision scenario and evaluate the decision and atti-
tude factors using the Analytical Hierarchy Process (AHP) through an expert sur-
vey. The combined results indicate that system performance is still the most im-
portant factor and that implementation effort and explainability are relatively even
factors. Further, we found that systems using similarity-based matching or direct
modeling for remaining useful life estimation performed best.
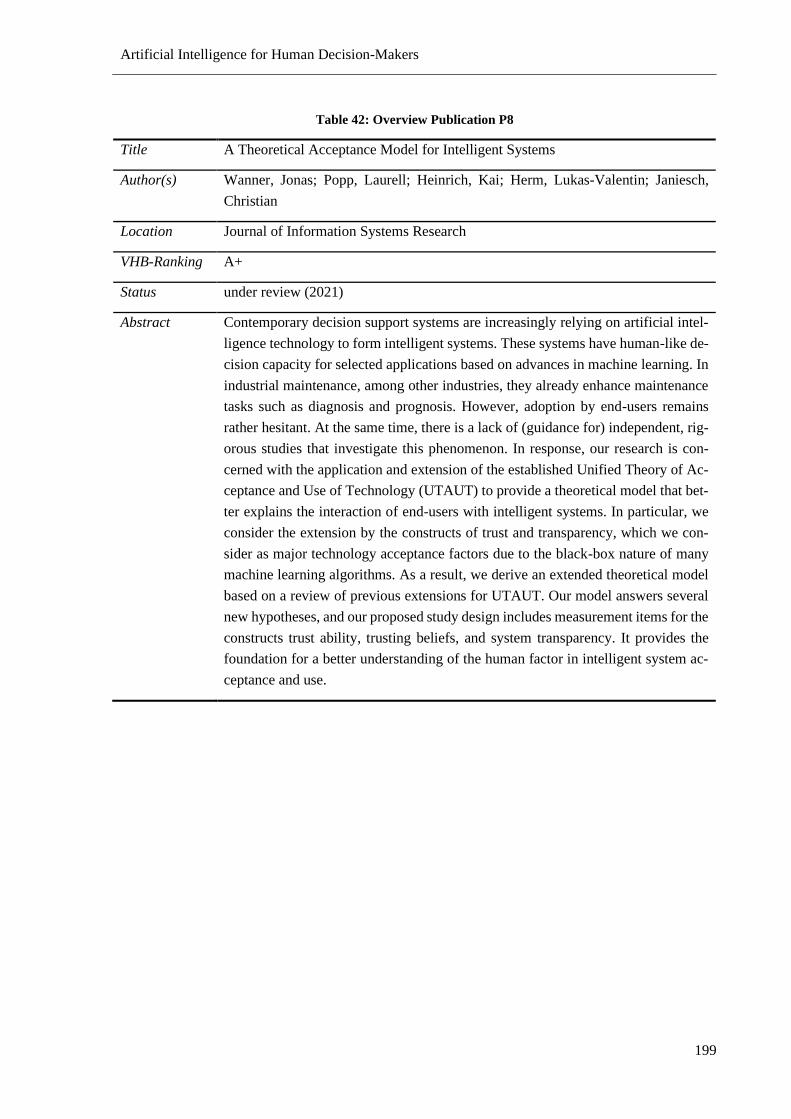
Artificial Intelligence for Human Decision-Makers
199
Table 42: Overview Publication P8
Title A Theoretical Acceptance Model for Intelligent Systems
Author(s) Wanner, Jonas; Popp, Laurell; Heinrich, Kai; Herm, Lukas-Valentin; Janiesch,
Christian
Location Journal of Information Systems Research
VHB-Ranking A+
Status under review (2021)
Abstract Contemporary decision support systems are increasingly relying on artificial intel-
ligence technology to form intelligent systems. These systems have human-like de-
cision capacity for selected applications based on advances in machine learning. In
industrial maintenance, among other industries, they already enhance maintenance
tasks such as diagnosis and prognosis. However, adoption by end-users remains
rather hesitant. At the same time, there is a lack of (guidance for) independent, rig-
orous studies that investigate this phenomenon. In response, our research is con-
cerned with the application and extension of the established Unified Theory of Ac-
ceptance and Use of Technology (UTAUT) to provide a theoretical model that bet-
ter explains the interaction of end-users with intelligent systems. In particular, we
consider the extension by the constructs of trust and transparency, which we con-
sider as major technology acceptance factors due to the black-box nature of many
machine learning algorithms. As a result, we derive an extended theoretical model
based on a review of previous extensions for UTAUT. Our model answers several
new hypotheses, and our proposed study design includes measurement items for the
constructs trust ability, trusting beliefs, and system transparency. It provides the
foundation for a better understanding of the human factor in intelligent system ac-
ceptance and use.
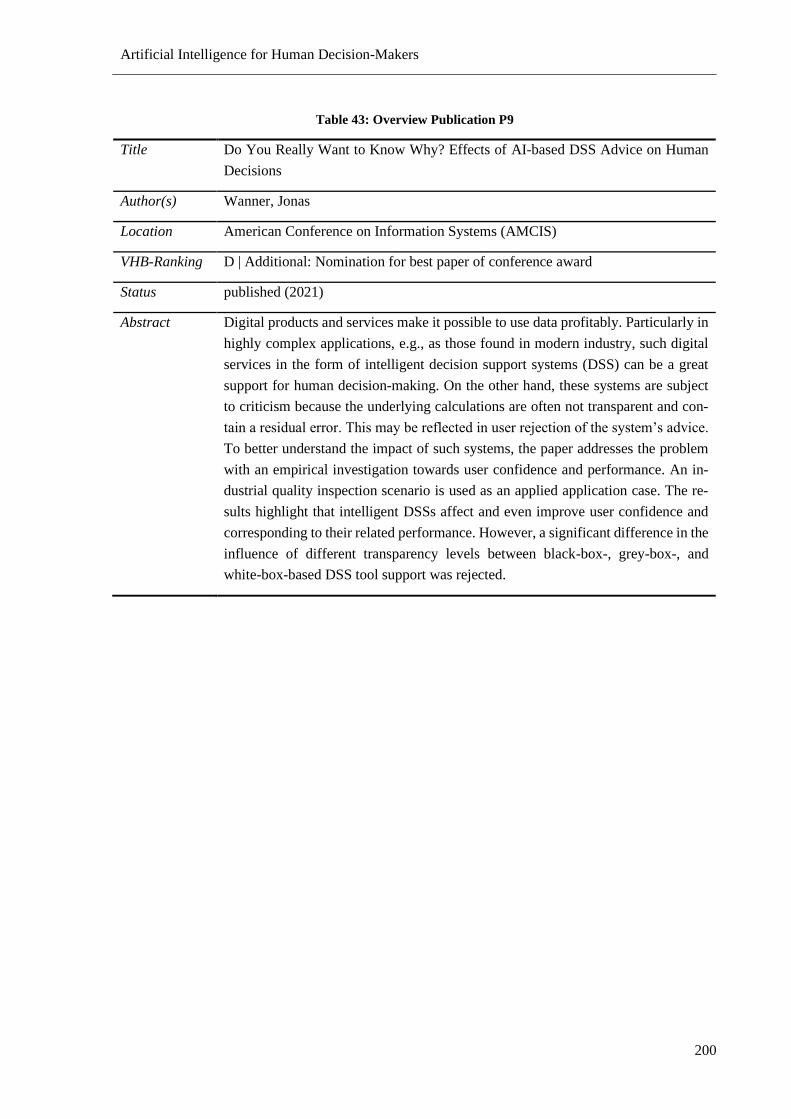
Artificial Intelligence for Human Decision-Makers
200
Table 43: Overview Publication P9
Title Do You Really Want to Know Why? Effects of AI-based DSS Advice on Human
Decisions
Author(s) Wanner, Jonas
Location American Conference on Information Systems (AMCIS)
VHB-Ranking D | Additional: Nomination for best paper of conference award
Status published (2021)
Abstract Digital products and services make it possible to use data profitably. Particularly in
highly complex applications, e.g., as those found in modern industry, such digital
services in the form of intelligent decision support systems (DSS) can be a great
support for human decision-making. On the other hand, these systems are subject
to criticism because the underlying calculations are often not transparent and con-
tain a residual error. This may be reflected in user rejection of the system’s advice.
To better understand the impact of such systems, the paper addresses the problem
with an empirical investigation towards user confidence and performance. An in-
dustrial quality inspection scenario is used as an applied application case. The re-
sults highlight that intelligent DSSs affect and even improve user confidence and
corresponding to their related performance. However, a significant difference in the
influence of different transparency levels between black-box-, grey-box-, and
white-box-based DSS tool support was rejected.
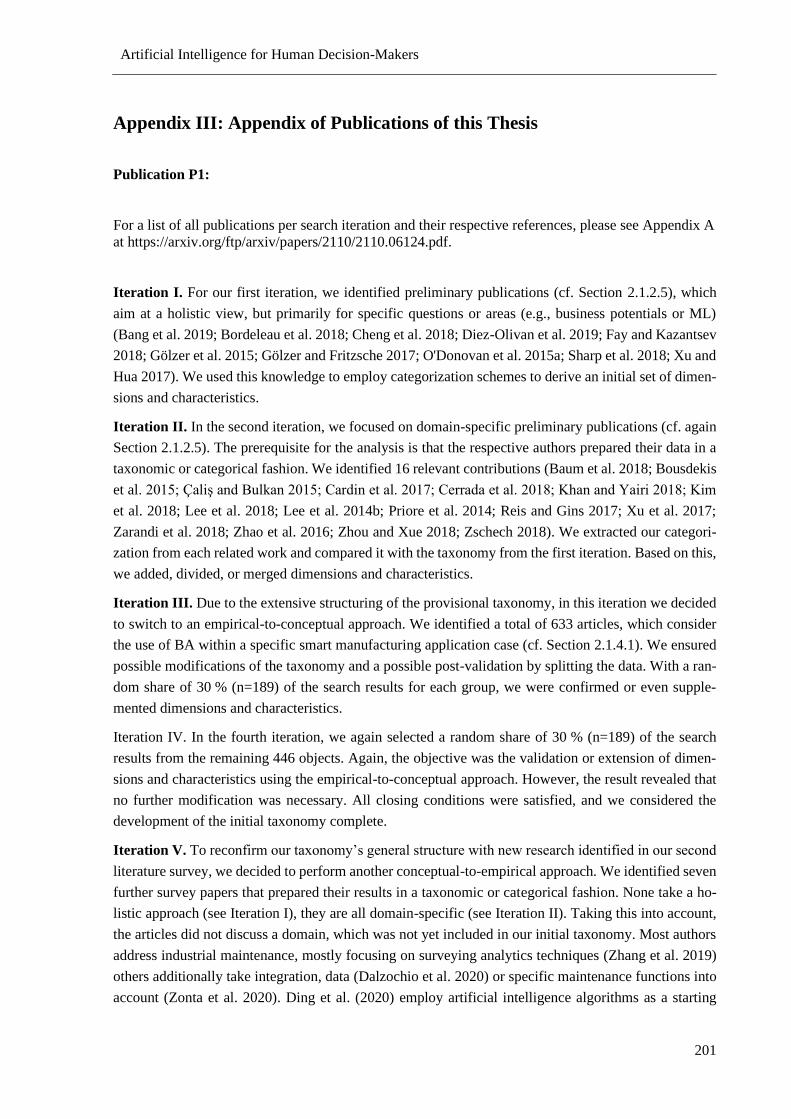
Artificial Intelligence for Human Decision-Makers
201
Appendix III: Appendix of Publications of this Thesis
Publication P1:
For a list of all publications per search iteration and their respective references, please see Appendix A
at https://arxiv.org/ftp/arxiv/papers/2110/2110.06124.pdf.
Iteration I. For our first iteration, we identified preliminary publications (cf. Section 2.1.2.5), which
aim at a holistic view, but primarily for specific questions or areas (e.g., business potentials or ML)
(Bang et al. 2019; Bordeleau et al. 2018; Cheng et al. 2018; Diez-Olivan et al. 2019; Fay and Kazantsev
2018; Gölzer et al. 2015; Gölzer and Fritzsche 2017; O'Donovan et al. 2015a; Sharp et al. 2018; Xu and
Hua 2017). We used this knowledge to employ categorization schemes to derive an initial set of dimen-
sions and characteristics.
Iteration II. In the second iteration, we focused on domain-specific preliminary publications (cf. again
Section 2.1.2.5). The prerequisite for the analysis is that the respective authors prepared their data in a
taxonomic or categorical fashion. We identified 16 relevant contributions (Baum et al. 2018; Bousdekis
et al. 2015; Çaliş and Bulkan 2015; Cardin et al. 2017; Cerrada et al. 2018; Khan and Yairi 2018; Kim
et al. 2018; Lee et al. 2018; Lee et al. 2014b; Priore et al. 2014; Reis and Gins 2017; Xu et al. 2017;
Zarandi et al. 2018; Zhao et al. 2016; Zhou and Xue 2018; Zschech 2018). We extracted our categori-
zation from each related work and compared it with the taxonomy from the first iteration. Based on this,
we added, divided, or merged dimensions and characteristics.
Iteration III. Due to the extensive structuring of the provisional taxonomy, in this iteration we decided
to switch to an empirical-to-conceptual approach. We identified a total of 633 articles, which consider
the use of BA within a specific smart manufacturing application case (cf. Section 2.1.4.1). We ensured
possible modifications of the taxonomy and a possible post-validation by splitting the data. With a ran-
dom share of 30 % (n=189) of the search results for each group, we were confirmed or even supple-
mented dimensions and characteristics.
Iteration IV. In the fourth iteration, we again selected a random share of 30 % (n=189) of the search
results from the remaining 446 objects. Again, the objective was the validation or extension of dimen-
sions and characteristics using the empirical-to-conceptual approach. However, the result revealed that
no further modification was necessary. All closing conditions were satisfied, and we considered the
development of the initial taxonomy complete.
Iteration V. To reconfirm our taxonomy’s general structure with new research identified in our second
literature survey, we decided to perform another conceptual-to-empirical approach. We identified seven
further survey papers that prepared their results in a taxonomic or categorical fashion. None take a ho-
listic approach (see Iteration I), they are all domain-specific (see Iteration II). Taking this into account,
the articles did not discuss a domain, which was not yet included in our initial taxonomy. Most authors
address industrial maintenance, mostly focusing on surveying analytics techniques (Zhang et al. 2019)
others additionally take integration, data (Dalzochio et al. 2020) or specific maintenance functions into
account (Zonta et al. 2020). Ding et al. (2020) employ artificial intelligence algorithms as a starting
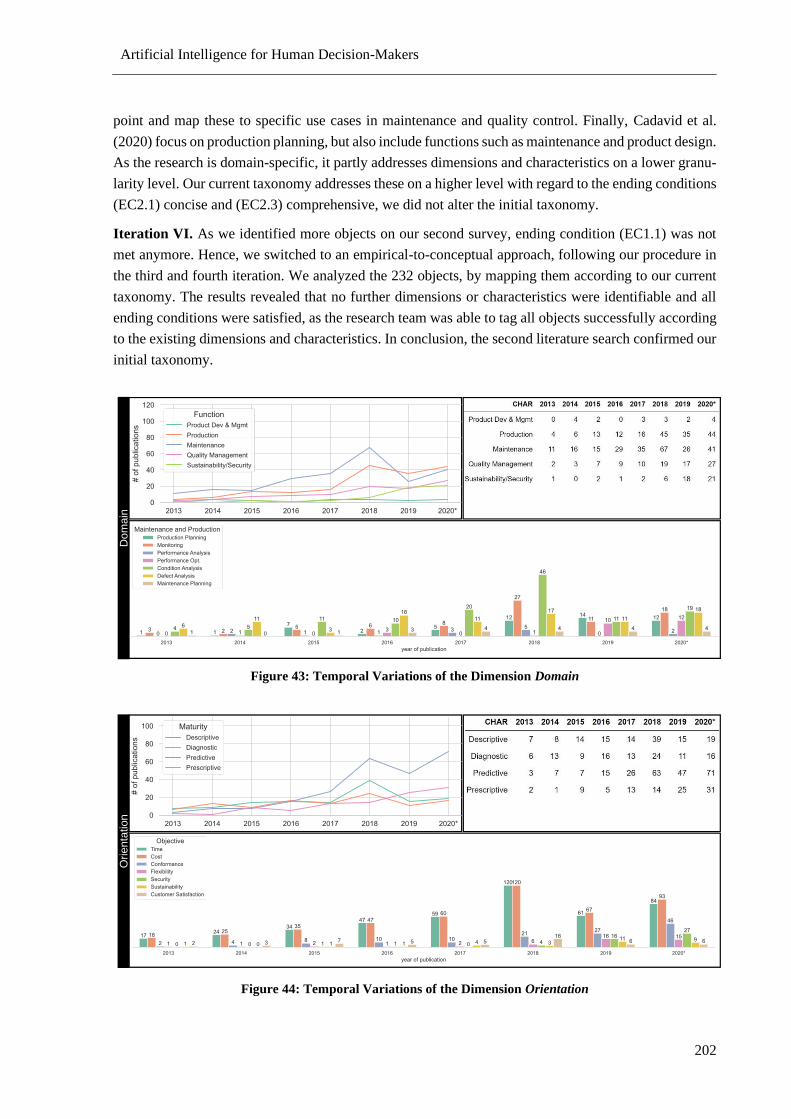
Artificial Intelligence for Human Decision-Makers
202
point and map these to specific use cases in maintenance and quality control. Finally, Cadavid et al.
(2020) focus on production planning, but also include functions such as maintenance and product design.
As the research is domain-specific, it partly addresses dimensions and characteristics on a lower granu-
larity level. Our current taxonomy addresses these on a higher level with regard to the ending conditions
(EC2.1) concise and (EC2.3) comprehensive, we did not alter the initial taxonomy.
Iteration VI. As we identified more objects on our second survey, ending condition (EC1.1) was not
met anymore. Hence, we switched to an empirical-to-conceptual approach, following our procedure in
the third and fourth iteration. We analyzed the 232 objects, by mapping them according to our current
taxonomy. The results revealed that no further dimensions or characteristics were identifiable and all
ending conditions were satisfied, as the research team was able to tag all objects successfully according
to the existing dimensions and characteristics. In conclusion, the second literature search confirmed our
initial taxonomy.
Figure 43: Temporal Variations of the Dimension Domain
Figure 44: Temporal Variations of the Dimension Orientation
Dom
ain
Orienta
tion
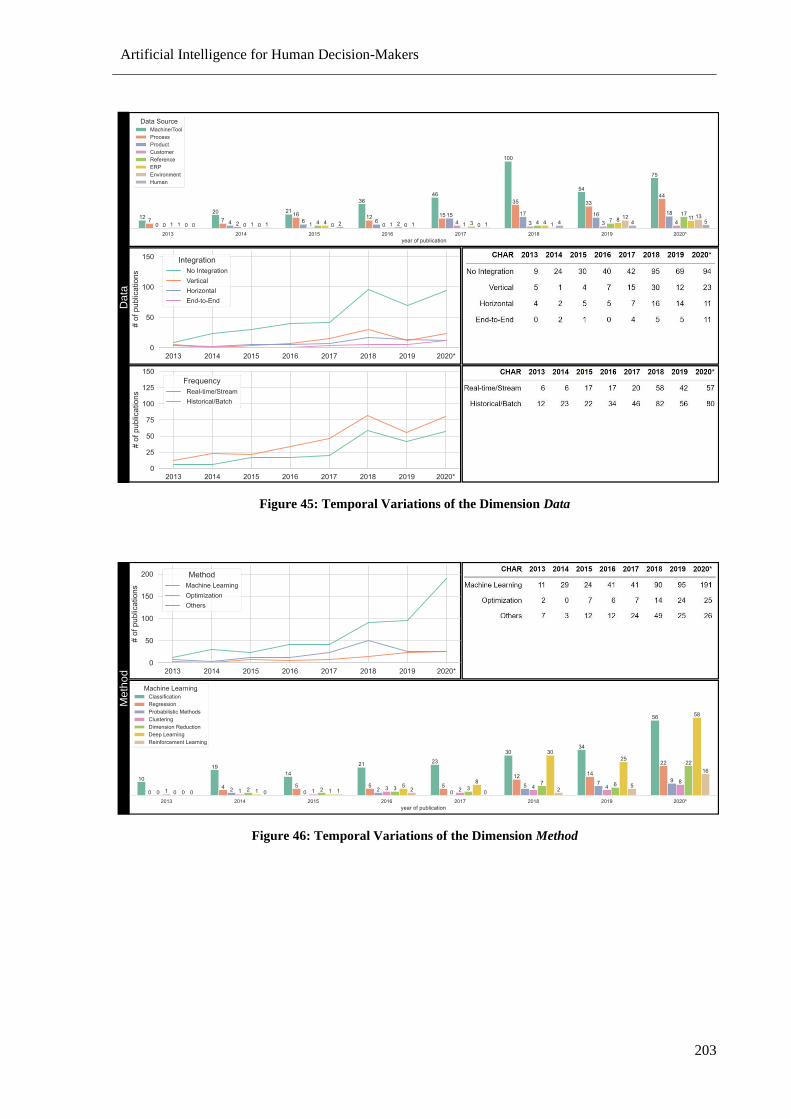
Artificial Intelligence for Human Decision-Makers
203
Figure 45: Temporal Variations of the Dimension Data
Figure 46: Temporal Variations of the Dimension Method
Da
taM
eth
od
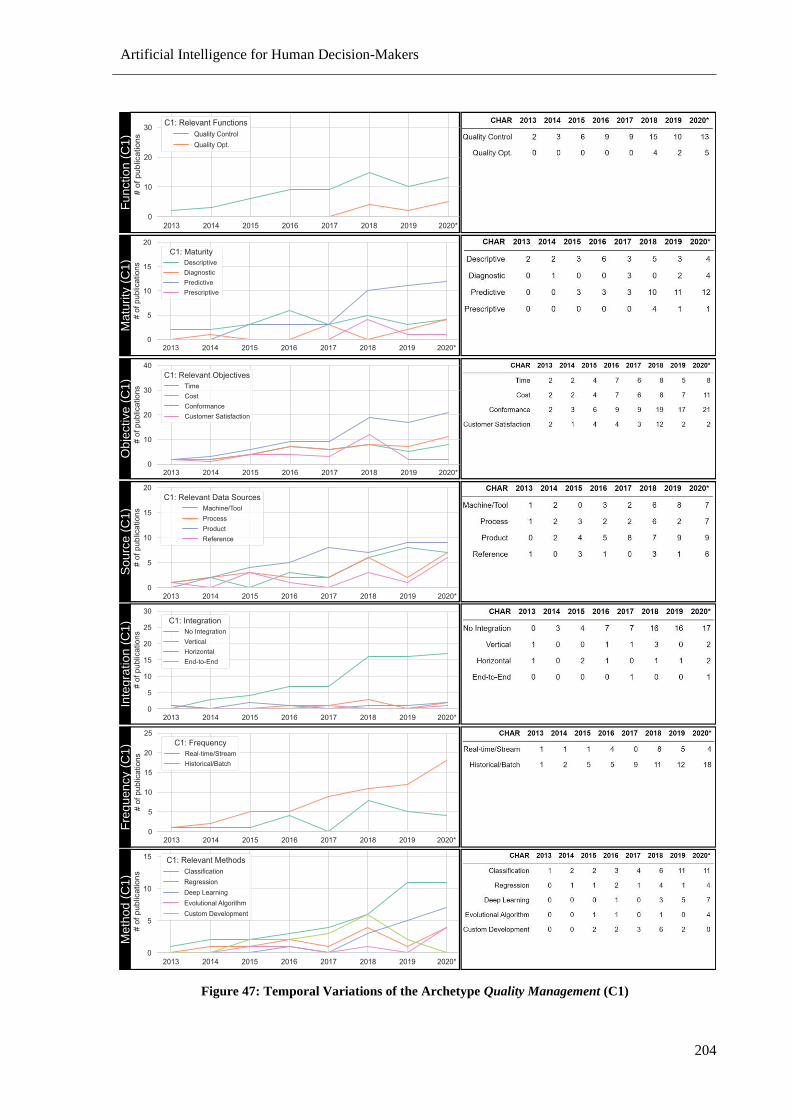
Artificial Intelligence for Human Decision-Makers
204
Figure 47: Temporal Variations of the Archetype Quality Management (C1)
Function (
C1)
Matu
rity
(C1)
Obje
ctive
(C1)
Sourc
e (
C1)
Inte
gra
tion (
C1)
Fre
quency
(C1)
Meth
od (
C1)
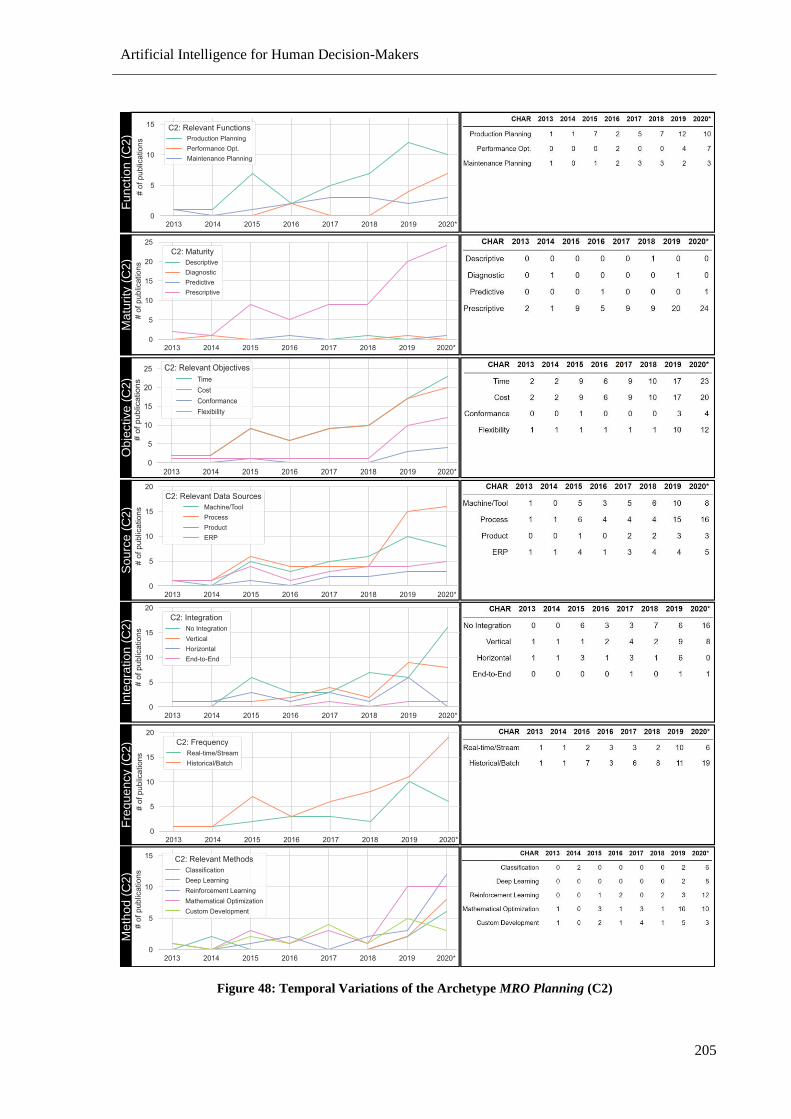
Artificial Intelligence for Human Decision-Makers
205
Figure 48: Temporal Variations of the Archetype MRO Planning (C2)
Me
tho
d (
C2
)F
un
ctio
n(C
2)
Ma
turi
ty(C
2)
Ob
jective
(C2
)S
ou
rce
(C
2)
Inte
gra
tio
n (
C2
)F
req
ue
ncy
(C2
)
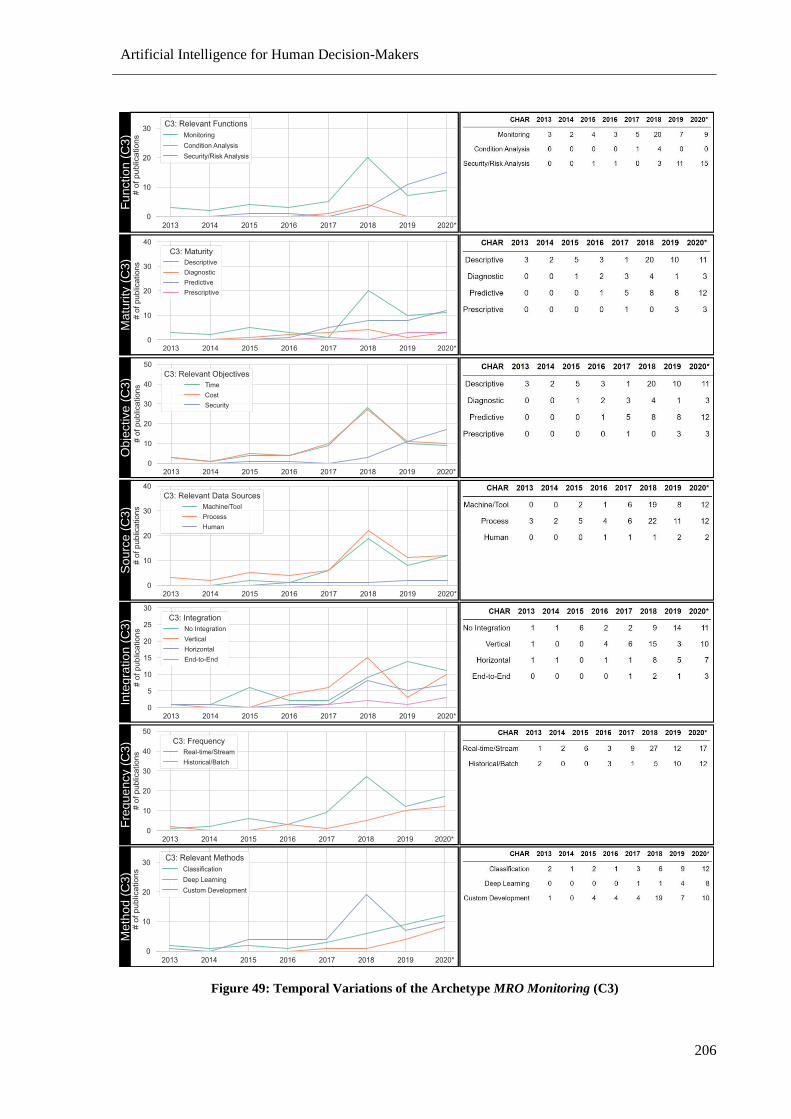
Artificial Intelligence for Human Decision-Makers
206
Figure 49: Temporal Variations of the Archetype MRO Monitoring (C3)
Fu
nctio
n(C
3)
Ma
turi
ty (
C3
)O
bje
ctive
(C3
)S
ou
rce
(C
3)
Inte
gra
tio
n (
C3
)F
req
ue
ncy (
C3
)M
eth
od
(C
3)
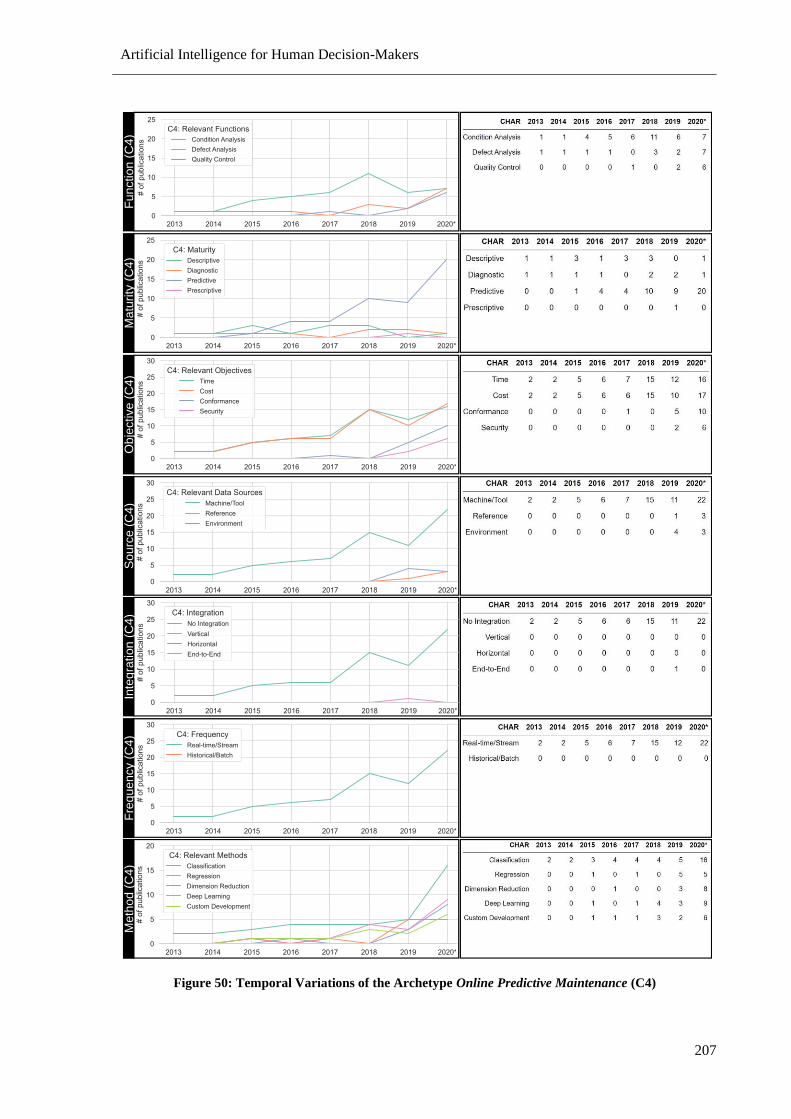
Artificial Intelligence for Human Decision-Makers
207
Figure 50: Temporal Variations of the Archetype Online Predictive Maintenance (C4)
Me
tho
d (
C4
)F
un
ctio
n(C
4)
Ma
turi
ty(C
4)
Ob
jective
(C
4)
So
urc
e (
C4
)In
teg
ratio
n (
C4
)F
req
ue
ncy
(C4
)
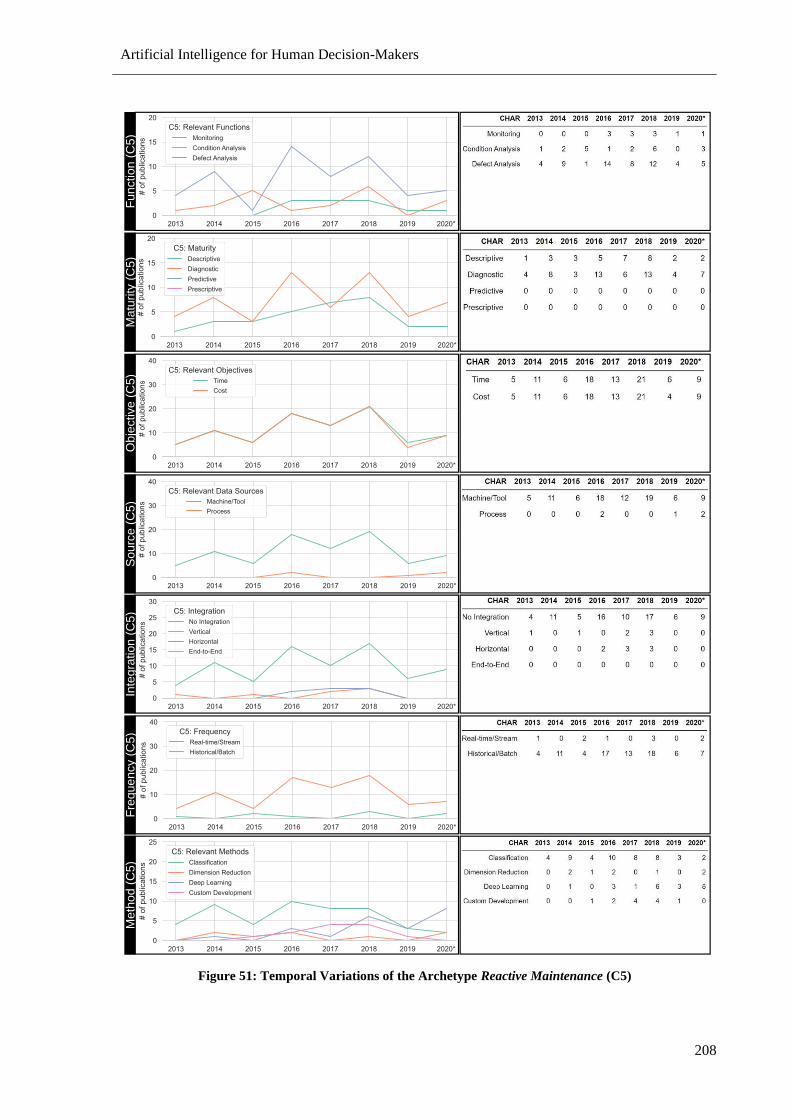
Artificial Intelligence for Human Decision-Makers
208
Figure 51: Temporal Variations of the Archetype Reactive Maintenance (C5)
Meth
od (
C5)
Function
(C5)
Matu
rity
(C5)
Obje
ctive
(C5)
Sourc
e (
C5)
Inte
gra
tion (
C5)
Fre
quency
(C5)
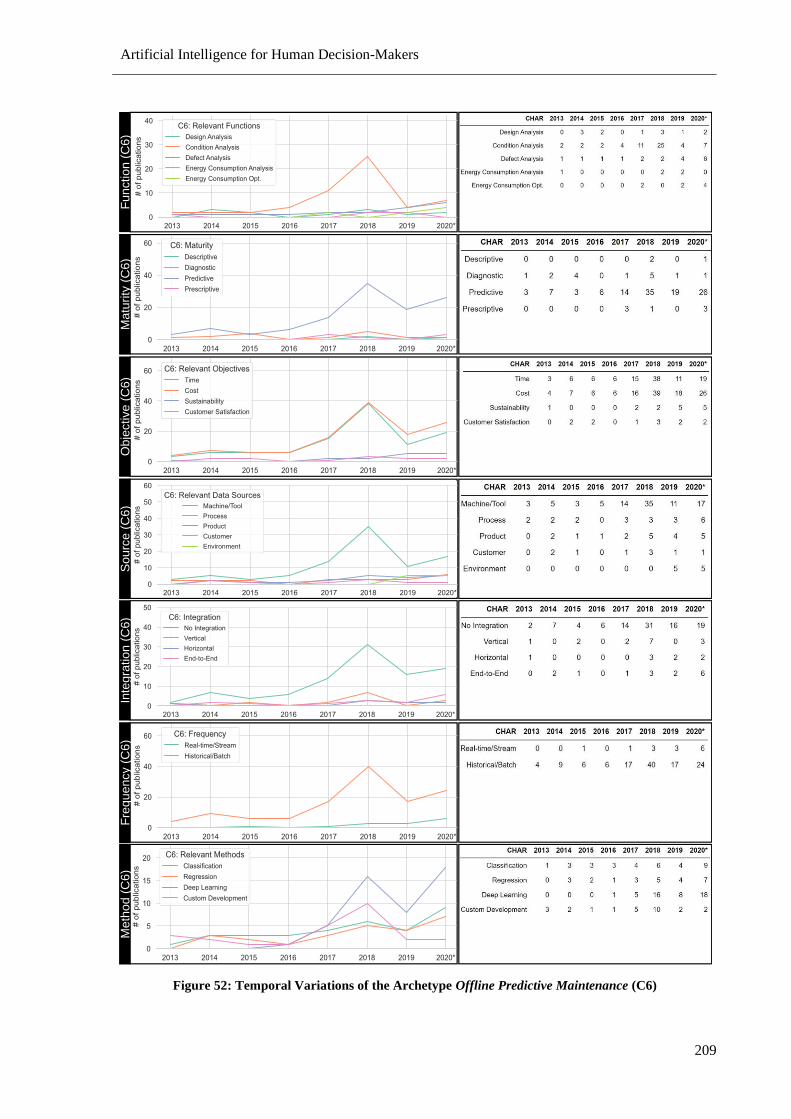
Artificial Intelligence for Human Decision-Makers
209
Figure 52: Temporal Variations of the Archetype Offline Predictive Maintenance (C6)
Fu
nctio
n (
C6
)M
atu
rity
(C
6)
Ob
jective
(C
6)
So
urc
e (
C6
)In
teg
ratio
n (
C6
)F
req
ue
ncy (
C6
)M
eth
od
(C
6)
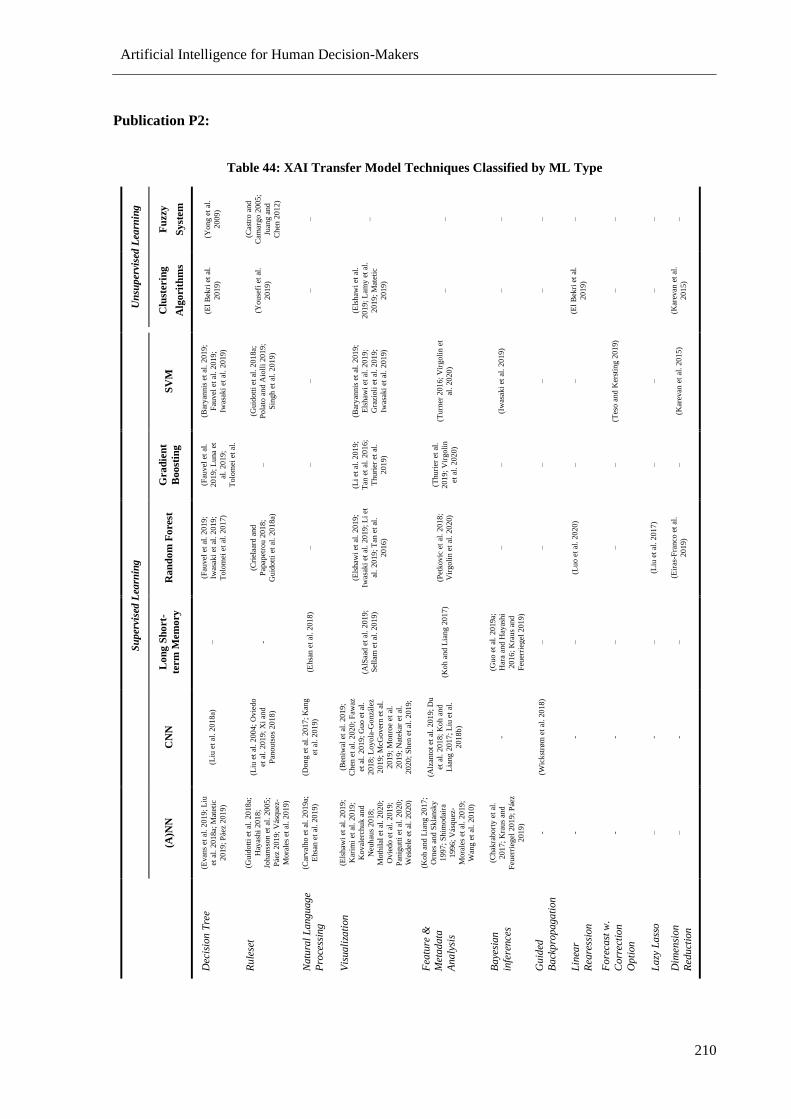
Artificial Intelligence for Human Decision-Makers
210
Publication P2:
Table 44: XAI Transfer Model Techniques Classified by ML Type
Un
sup
erv
ised
Lea
rnin
g
Fu
zzy
Sy
stem
(Yong e
t al
.
2009)
(Cas
tro a
nd
Cam
argo 2
005;
Juan
g a
nd
Chen
2012)
‒
‒
‒
‒
‒
‒
‒
‒
‒
Clu
sterin
g
Alg
ori
thm
s
(El
Bek
ri e
t al
.
2019)
(Youse
fi e
t al
.
2019)
‒
(Els
haw
i et
al.
2019;
Lam
y e
t al
.
2019;
Mat
etic
2019)
‒
‒
‒
(El
Bek
ri e
t al
.
2019)
‒
‒
(Kar
evan
et
al.
2015)
Su
perv
ised
Lea
rnin
g
SV
M
(Bar
yan
nis
et
al.
2019;
Fau
vel
et
al.
2019;
Iwas
aki
et a
l. 2
019)
(Guid
ott
i et
al.
2018a;
Pola
to a
nd A
ioll
i 2019;
Sin
gh e
t al
. 2019)
‒
(Bar
yan
nis
et
al.
2019;
Els
haw
i et
al.
2019;
Gra
zioli
et
al.
2019;
Iwas
aki
et a
l. 2
019)
(Turn
er 2
016;
Vir
goli
n e
t
al.
2020)
(Iw
asak
i et
al.
2019)
‒
‒
(Tes
o a
nd K
erst
ing 2
019)
‒
(Kar
evan
et
al.
2015)
Gra
die
nt
Boo
stin
g
(Fau
vel
et
al.
2019;
Luna
et
al.
2019;
Tolo
mei
et
al.
2017)
‒
‒
(Li
et a
l. 2
019;
Tan
et
al.
2016;
Thuri
er e
t al
.
2019)
(Thuri
er e
t al
.
2019;
Vir
goli
n
et a
l. 2
020)
‒
‒
‒
‒
‒
‒
Ra
nd
om
Fo
rest
(Fau
vel
et
al.
201
9;
Iwas
aki
et a
l. 2
019;
Tolo
mei
et
al.
2017)
(Cri
elaa
rd a
nd
Pap
apet
rou 2
018;
Guid
ott
i et
al.
2018a)
‒
(Els
haw
i et
al.
2019;
Iwas
aki
et a
l. 2
019;
Li
et
al.
2019;
Tan
et
al.
2016)
(Pet
kovic
et
al.
2018;
Vir
goli
n e
t al
. 2020)
‒
‒
(Luo e
t al
. 2020)
‒
(Liu
et
al.
2017)
(Eir
as-F
ranco
et
al.
2019)
Lo
ng
Sh
ort-
term
Mem
ory
‒ -
(Ehsa
n e
t al
. 2018)
(AlS
aad e
t al
. 2019;
Sel
lam
et
al.
2019)
(Koh a
nd L
iang 2
017)
(Guo e
t al
. 2019a;
Har
a an
d H
ayas
hi
2016;
Kra
us
and
Feu
erri
egel
2019)
‒
‒
‒
‒
‒
CN
N
(Liu
et
al.
2018a)
(Liu
et
al.
2004;
Ovie
do
et a
l. 2
019;
Xi
and
Pan
outs
os
2018)
(Dong e
t al
. 2017;
Kan
g
et a
l. 2
019)
(Ben
iwal
et
al.
2019;
Chen
et
al.
2020;
Faw
az
et a
l. 2
019;
Guo e
t al
.
2018;
Loyola
-Gonzá
lez
2019;
McG
over
n e
t al
.
2019;
Monro
e et
al.
2019;
Nat
ekar
et
al.
2020;
Shen
et
al.
2019;
Wan
g e
t al
. 2019b;
Yan
g
et a
l. 2
018b)
(Alz
anto
t et
al.
2019;
Du
et a
l. 2
018;
Koh a
nd
Lia
ng 2
017;
Liu
et
al.
2018b)
-
(Wic
kst
røm
et
al.
2018)
- - - -
(A)N
N
(Evan
s et
al.
2019;
Liu
et a
l. 2
018a;
Mat
etic
2019;
Páe
z 2019)
(Guid
ott
i et
al.
2018a;
Hay
ashi
2018;
Johan
sson e
t al
. 2005;
Páe
z 2019;
Vás
quez
-
Mora
les
et a
l. 2
019)
(Car
val
ho e
t al
. 2019a;
Ehsa
n e
t al
. 2019)
(Els
haw
i et
al.
2019;
Kar
imi
et a
l. 2
019;
Koval
erch
uk a
nd
Neu
hau
s 2018;
Moth
ilal
et
al.
2020;
Ovie
do e
t al
. 2019;
Pan
igutt
i et
al.
2020;
Wei
del
e et
al.
2020)
(Koh a
nd L
iang 2
017;
Orn
es a
nd S
kla
nsk
y
1997;
Shim
odai
ra
1996;
Vás
quez
-
Mora
les
et a
l. 2
019;
Wan
g e
t al
. 2010)
(Chak
rabort
y e
t al
.
2017;
Kra
us
and
Feu
erri
egel
2019;
Páe
z
2019)
- - - ‒
‒
Dec
isio
n T
ree
Ru
lese
t
Natu
ral
Lang
uag
e
Pro
cess
ing
Vis
uali
zati
on
Fea
ture
&
Met
ad
ata
Ana
lysi
s
Ba
yesi
an
infe
rence
s
Gu
ided
Ba
ckp
rop
aga
tion
Lin
ear
Reg
ress
ion
Fo
reca
st w
.
Co
rrec
tio
n
Op
tion
La
zy L
ass
o
Dim
ensi
on
Red
uct
ion
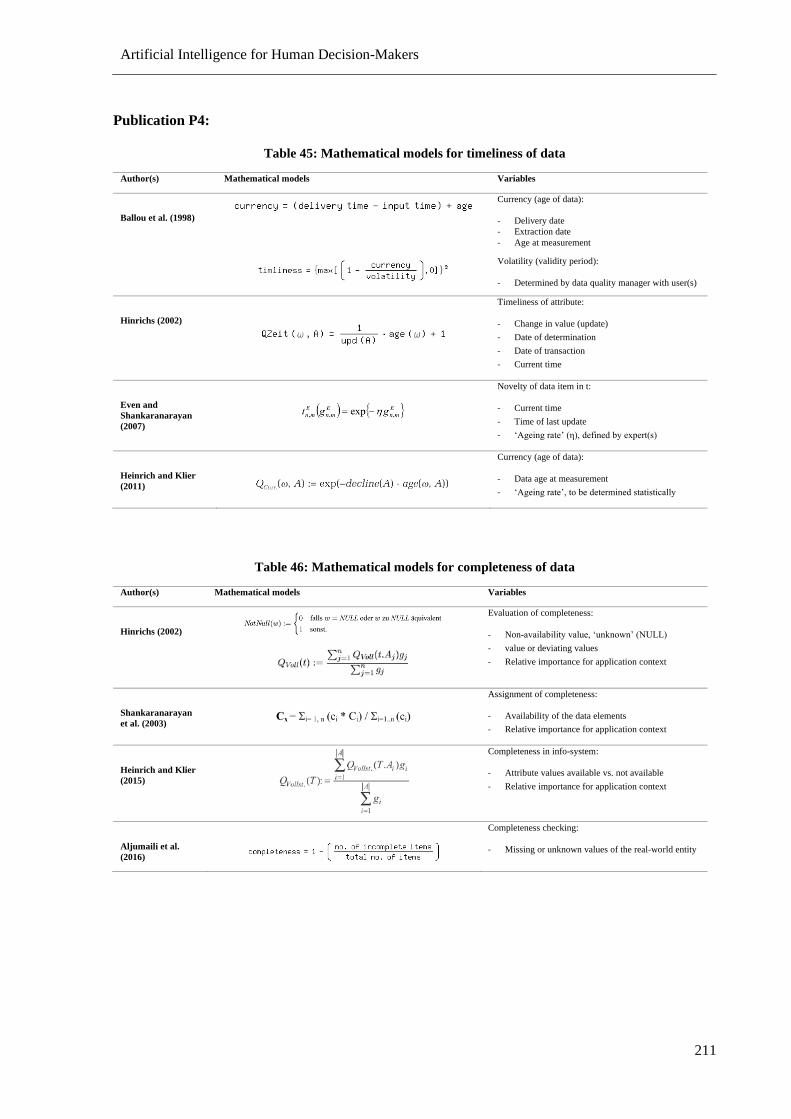
Artificial Intelligence for Human Decision-Makers
211
Publication P4:
Table 45: Mathematical models for timeliness of data
Author(s) Mathematical models Variables
Ballou et al. (1998)
Currency (age of data):
- Delivery date
- Extraction date
- Age at measurement
Volatility (validity period):
- Determined by data quality manager with user(s)
Hinrichs (2002)
Timeliness of attribute:
- Change in value (update)
- Date of determination
- Date of transaction
- Current time
Even and
Shankaranarayan
(2007)
Novelty of data item in t:
- Current time
- Time of last update
- ‘Ageing rate’ (η), defined by expert(s)
Heinrich and Klier
(2011)
Currency (age of data):
- Data age at measurement
- ‘Ageing rate’, to be determined statistically
Table 46: Mathematical models for completeness of data
Author(s) Mathematical models Variables
Hinrichs (2002)
Evaluation of completeness:
- Non-availability value, ‘unknown’ (NULL)
- value or deviating values
- Relative importance for application context
Shankaranarayan
et al. (2003)
Assignment of completeness:
- Availability of the data elements
- Relative importance for application context
Heinrich and Klier
(2015)
Completeness in info-system:
- Attribute values available vs. not available
- Relative importance for application context
Aljumaili et al.
(2016)
Completeness checking:
- Missing or unknown values of the real-world entity
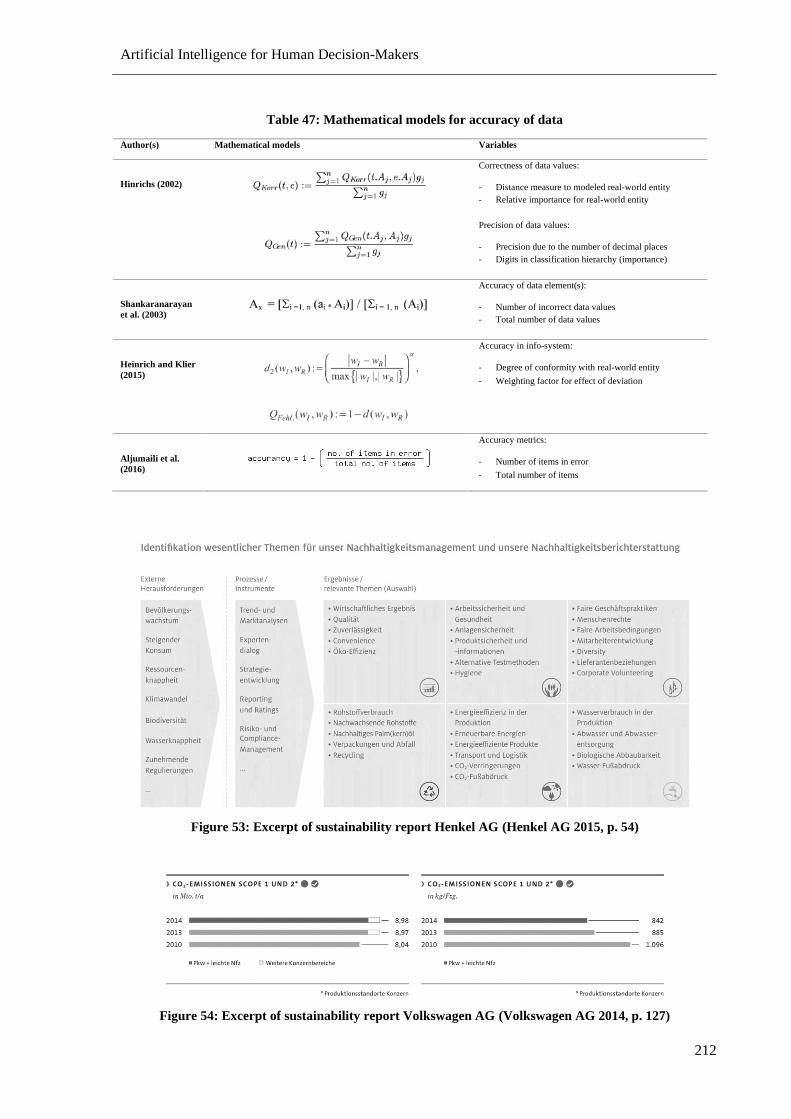
Artificial Intelligence for Human Decision-Makers
212
Table 47: Mathematical models for accuracy of data
Author(s) Mathematical models Variables
Hinrichs (2002)
Correctness of data values:
- Distance measure to modeled real-world entity
- Relative importance for real-world entity
Precision of data values:
- Precision due to the number of decimal places
- Digits in classification hierarchy (importance)
Shankaranarayan
et al. (2003)
Accuracy of data element(s):
- Number of incorrect data values
- Total number of data values
Heinrich and Klier
(2015)
Accuracy in info-system:
- Degree of conformity with real-world entity
- Weighting factor for effect of deviation
Aljumaili et al.
(2016)
Accuracy metrics:
- Number of items in error
- Total number of items
Figure 53: Excerpt of sustainability report Henkel AG (Henkel AG 2015, p. 54)
Figure 54: Excerpt of sustainability report Volkswagen AG (Volkswagen AG 2014, p. 127)
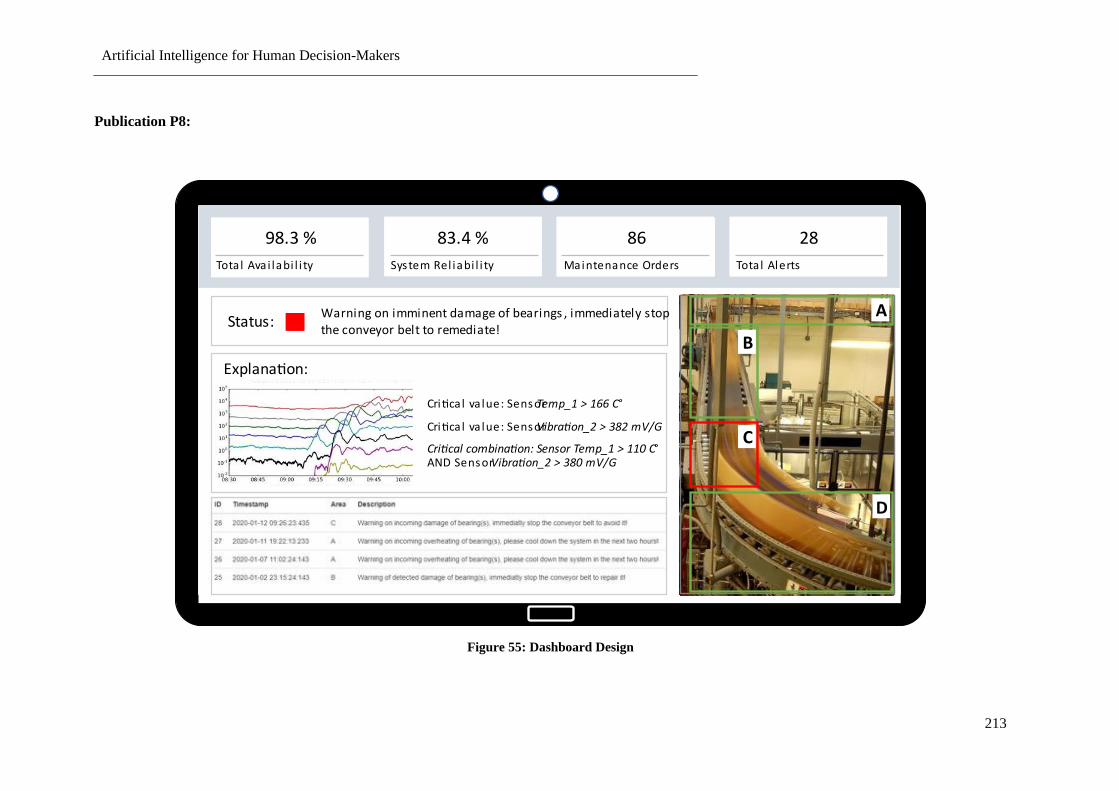
Artificial Intelligence for Human Decision-Makers
213
Publication P8:
Figure 55: Dashboard Design
em
ra n m
r al m na n en r em ra n m
em
ra n m
r al m na n en r em ra n m
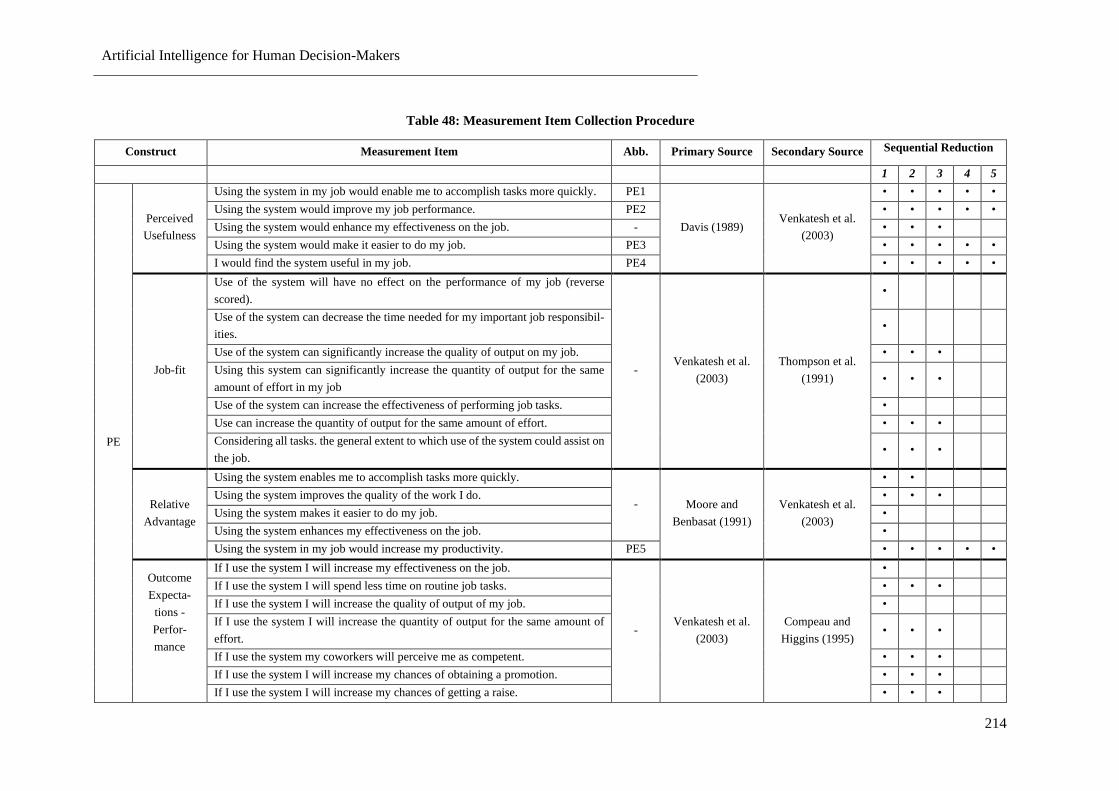
Artificial Intelligence for Human Decision-Makers
214
Table 48: Measurement Item Collection Procedure
Construct Measurement Item Abb. Primary Source Secondary Source Sequential Reduction
1 2 3 4 5
PE
Perceived
Usefulness
Using the system in my job would enable me to accomplish tasks more quickly. PE1
Davis (1989) Venkatesh et al.
(2003)
• • • • •
Using the system would improve my job performance. PE2 • • • • •
Using the system would enhance my effectiveness on the job. - • • •
Using the system would make it easier to do my job. PE3 • • • • •
I would find the system useful in my job. PE4 • • • • •
Job-fit
Use of the system will have no effect on the performance of my job (reverse
scored).
- Venkatesh et al.
(2003)
Thompson et al.
(1991)
•
Use of the system can decrease the time needed for my important job responsibil-
ities. •
Use of the system can significantly increase the quality of output on my job. • • •
Using this system can significantly increase the quantity of output for the same
amount of effort in my job • • •
Use of the system can increase the effectiveness of performing job tasks. •
Use can increase the quantity of output for the same amount of effort. • • •
Considering all tasks. the general extent to which use of the system could assist on
the job. • • •
Relative
Advantage
Using the system enables me to accomplish tasks more quickly.
- Moore and
Benbasat (1991)
Venkatesh et al.
(2003)
• •
Using the system improves the quality of the work I do. • • •
Using the system makes it easier to do my job. •
Using the system enhances my effectiveness on the job. •
Using the system in my job would increase my productivity. PE5 • • • • •
Outcome
Expecta-
tions -
Perfor-
mance
If I use the system I will increase my effectiveness on the job.
- Venkatesh et al.
(2003)
Compeau and
Higgins (1995)
•
If I use the system I will spend less time on routine job tasks. • • •
If I use the system I will increase the quality of output of my job. •
If I use the system I will increase the quantity of output for the same amount of
effort. • • •
If I use the system my coworkers will perceive me as competent. • • •
If I use the system I will increase my chances of obtaining a promotion. • • •
If I use the system I will increase my chances of getting a raise. • • •
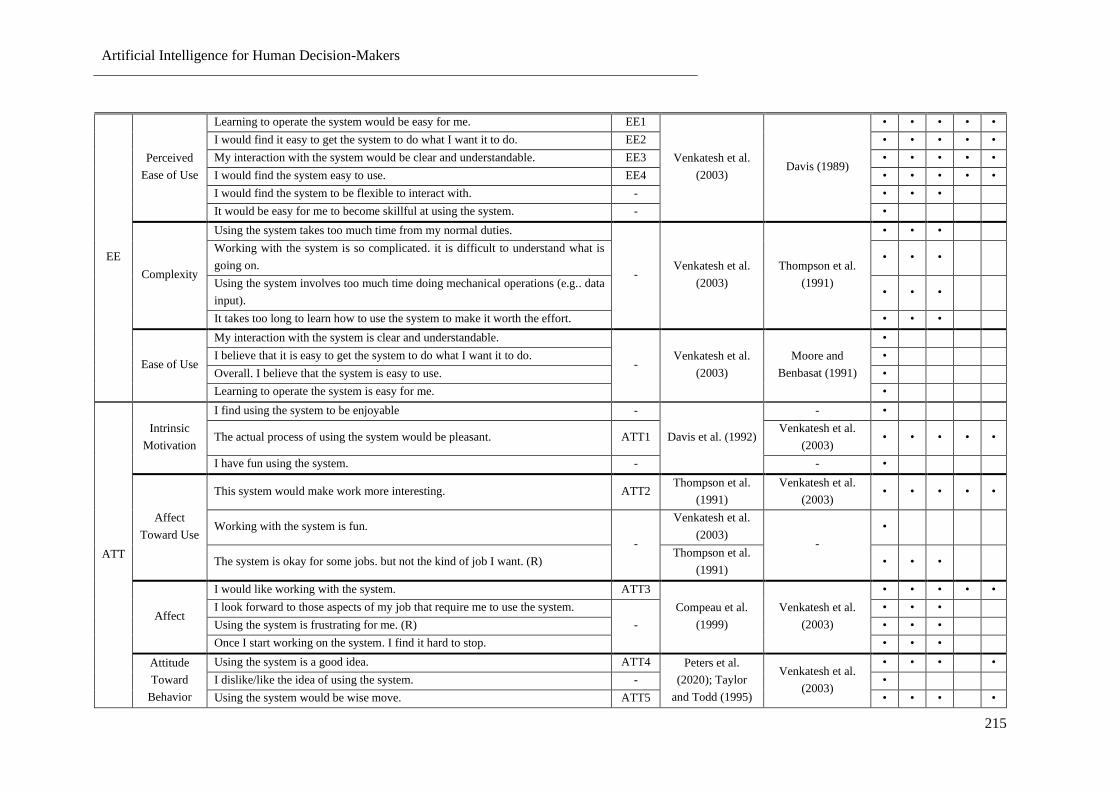
Artificial Intelligence for Human Decision-Makers
215
EE
Perceived
Ease of Use
Learning to operate the system would be easy for me. EE1
Venkatesh et al.
(2003) Davis (1989)
• • • • •
I would find it easy to get the system to do what I want it to do. EE2 • • • • •
My interaction with the system would be clear and understandable. EE3 • • • • •
I would find the system easy to use. EE4 • • • • •
I would find the system to be flexible to interact with. - • • •
It would be easy for me to become skillful at using the system. - •
Complexity
Using the system takes too much time from my normal duties.
- Venkatesh et al.
(2003)
Thompson et al.
(1991)
• • •
Working with the system is so complicated. it is difficult to understand what is
going on. • • •
Using the system involves too much time doing mechanical operations (e.g.. data
input). • • •
It takes too long to learn how to use the system to make it worth the effort. • • •
Ease of Use
My interaction with the system is clear and understandable.
- Venkatesh et al.
(2003)
Moore and
Benbasat (1991)
•
I believe that it is easy to get the system to do what I want it to do. •
Overall. I believe that the system is easy to use. •
Learning to operate the system is easy for me. •
ATT
Intrinsic
Motivation
I find using the system to be enjoyable -
Davis et al. (1992)
- •
The actual process of using the system would be pleasant. ATT1 Venkatesh et al.
(2003) • • • • •
I have fun using the system. - - •
Affect
Toward Use
This system would make work more interesting. ATT2 Thompson et al.
(1991)
Venkatesh et al.
(2003) • • • • •
Working with the system is fun.
-
Venkatesh et al.
(2003) -
•
The system is okay for some jobs. but not the kind of job I want. (R) Thompson et al.
(1991) • • •
Affect
I would like working with the system. ATT3
Compeau et al.
(1999)
Venkatesh et al.
(2003)
• • • • •
I look forward to those aspects of my job that require me to use the system.
-
• • •
Using the system is frustrating for me. (R) • • •
Once I start working on the system. I find it hard to stop. • • •
Attitude
Toward
Behavior
Using the system is a good idea. ATT4 Peters et al.
(2020); Taylor
and Todd (1995)
Venkatesh et al.
(2003)
• • • •
I dislike/like the idea of using the system. - •
Using the system would be wise move. ATT5 • • • •
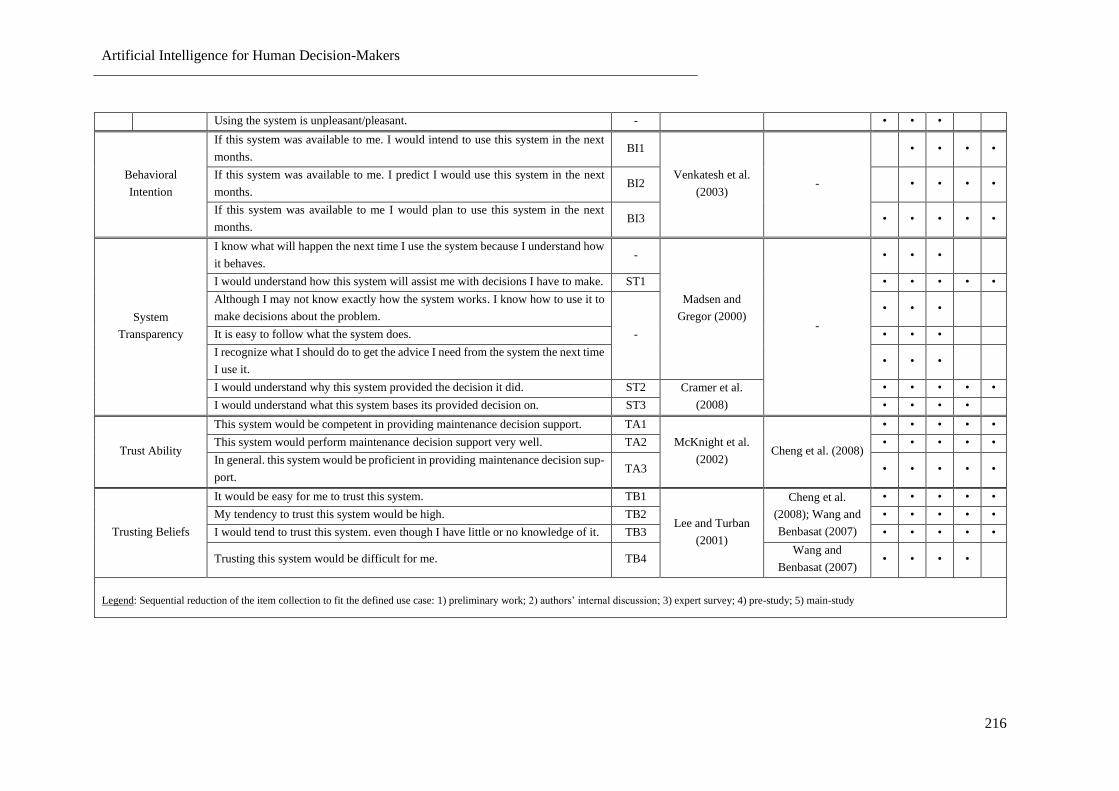
Artificial Intelligence for Human Decision-Makers
216
Using the system is unpleasant/pleasant. - • • •
Behavioral
Intention
If this system was available to me. I would intend to use this system in the next
months. BI1
Venkatesh et al.
(2003) -
• • • •
If this system was available to me. I predict I would use this system in the next
months. BI2
• • • •
If this system was available to me I would plan to use this system in the next
months. BI3 • • • • •
System
Transparency
I know what will happen the next time I use the system because I understand how
it behaves. -
Madsen and
Gregor (2000) -
• • •
I would understand how this system will assist me with decisions I have to make. ST1 • • • • •
Although I may not know exactly how the system works. I know how to use it to
make decisions about the problem.
-
• • •
It is easy to follow what the system does. • • •
I recognize what I should do to get the advice I need from the system the next time
I use it. • • •
I would understand why this system provided the decision it did. ST2 Cramer et al.
(2008)
• • • • •
I would understand what this system bases its provided decision on. ST3 • • • •
Trust Ability
This system would be competent in providing maintenance decision support. TA1
McKnight et al.
(2002) Cheng et al. (2008)
• • • • •
This system would perform maintenance decision support very well. TA2 • • • • •
In general. this system would be proficient in providing maintenance decision sup-
port. TA3 • • • • •
Trusting Beliefs
It would be easy for me to trust this system. TB1
Lee and Turban
(2001)
Cheng et al.
(2008); Wang and
Benbasat (2007)
• • • • •
My tendency to trust this system would be high. TB2 • • • • •
I would tend to trust this system. even though I have little or no knowledge of it. TB3 • • • • •
Trusting this system would be difficult for me. TB4 Wang and
Benbasat (2007) • • • •
Legend: Sequential reduction of the item collection to fit the defined use case: 1) preliminary work; 2) authors’ internal discussion; 3) expert survey; 4) pre-study; 5) main-study
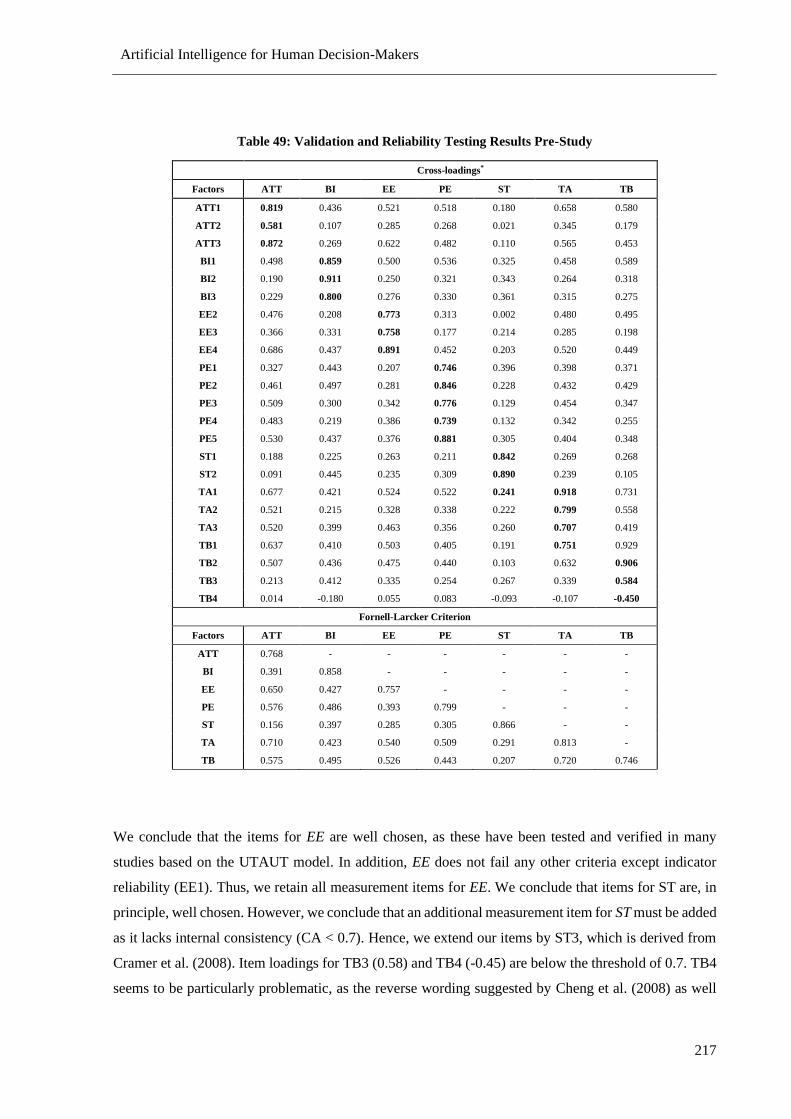
Artificial Intelligence for Human Decision-Makers
217
Table 49: Validation and Reliability Testing Results Pre-Study
Cross-loadings*
Factors ATT BI EE PE ST TA TB
ATT1 0.819 0.436 0.521 0.518 0.180 0.658 0.580
ATT2 0.581 0.107 0.285 0.268 0.021 0.345 0.179
ATT3 0.872 0.269 0.622 0.482 0.110 0.565 0.453
BI1 0.498 0.859 0.500 0.536 0.325 0.458 0.589
BI2 0.190 0.911 0.250 0.321 0.343 0.264 0.318
BI3 0.229 0.800 0.276 0.330 0.361 0.315 0.275
EE2 0.476 0.208 0.773 0.313 0.002 0.480 0.495
EE3 0.366 0.331 0.758 0.177 0.214 0.285 0.198
EE4 0.686 0.437 0.891 0.452 0.203 0.520 0.449
PE1 0.327 0.443 0.207 0.746 0.396 0.398 0.371
PE2 0.461 0.497 0.281 0.846 0.228 0.432 0.429
PE3 0.509 0.300 0.342 0.776 0.129 0.454 0.347
PE4 0.483 0.219 0.386 0.739 0.132 0.342 0.255
PE5 0.530 0.437 0.376 0.881 0.305 0.404 0.348
ST1 0.188 0.225 0.263 0.211 0.842 0.269 0.268
ST2 0.091 0.445 0.235 0.309 0.890 0.239 0.105
TA1 0.677 0.421 0.524 0.522 0.241 0.918 0.731
TA2 0.521 0.215 0.328 0.338 0.222 0.799 0.558
TA3 0.520 0.399 0.463 0.356 0.260 0.707 0.419
TB1 0.637 0.410 0.503 0.405 0.191 0.751 0.929
TB2 0.507 0.436 0.475 0.440 0.103 0.632 0.906
TB3 0.213 0.412 0.335 0.254 0.267 0.339 0.584
TB4 0.014 -0.180 0.055 0.083 -0.093 -0.107 -0.450
Fornell-Larcker Criterion
Factors ATT BI EE PE ST TA TB
ATT 0.768 - - - - - -
BI 0.391 0.858 - - - - -
EE 0.650 0.427 0.757 - - - -
PE 0.576 0.486 0.393 0.799 - - -
ST 0.156 0.397 0.285 0.305 0.866 - -
TA 0.710 0.423 0.540 0.509 0.291 0.813 -
TB 0.575 0.495 0.526 0.443 0.207 0.720 0.746
We conclude that the items for EE are well chosen, as these have been tested and verified in many
studies based on the UTAUT model. In addition, EE does not fail any other criteria except indicator
reliability (EE1). Thus, we retain all measurement items for EE. We conclude that items for ST are, in
principle, well chosen. However, we conclude that an additional measurement item for ST must be added
as it lacks internal consistency (CA < 0.7). Hence, we extend our items by ST3, which is derived from
Cramer et al. (2008). Item loadings for TB3 (0.58) and TB4 (-0.45) are below the threshold of 0.7. TB4
seems to be particularly problematic, as the reverse wording suggested by Cheng et al. (2008) as well

Artificial Intelligence for Human Decision-Makers
218
as Wang and Benbasat (2007) causes convergence reliability issues. Removing TB4 leads to a higher
CA (0.75), AVE (0.68), and CR (0.86). Since using reversed wording is not advised (Van Sonderen et
al. 2013; Zhang et al. 2016), we decide to drop TB4. We decided to follow Lee and Turban (2001) and
use the original wording in line with the other items for the main study (TB5). We decide to retain TB3
in the main study, as the loading is satisfactory and the construct itself is reliable if TB4 is dropped. As
ATT2 performs subpar in terms of item loading, we decided to add additional items. Additionally, ATT
has a low value for CA, indicating low internal consistency. Thus, we added ATT4 and ATT5 following
Taylor and Todd (1995). It was recently used in a similar context by Peters et al. (2020).
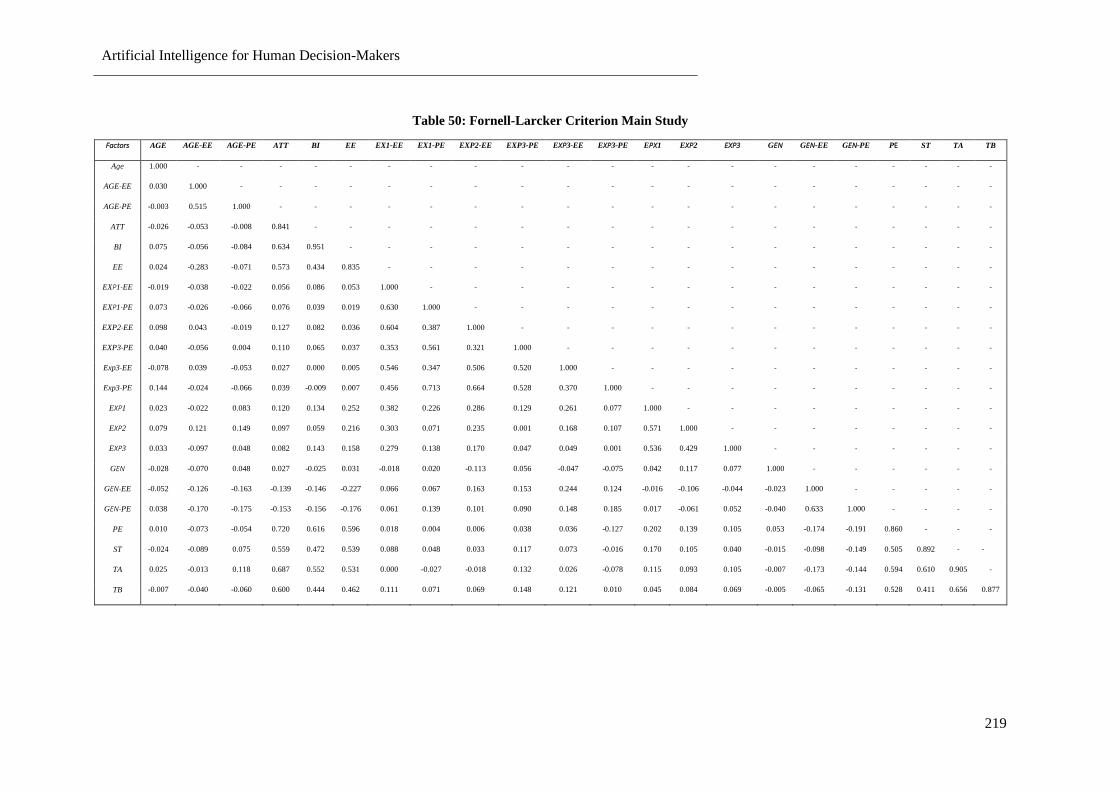
Artificial Intelligence for Human Decision-Makers
219
Table 50: Fornell-Larcker Criterion Main Study
Factors AGE AGE-EE AGE-PE ATT BI EE EX1-EE EX1-PE EXP2-EE EXP3-PE EXP3-EE EXP3-PE EPX1 EXP2 EXP3 GEN GEN-EE GEN-PE PE ST TA TB
Age 1.000 - - - - - - - - - - - - - - - - - - - - -
AGE-EE 0.030 1.000 - - - - - - - - - - - - - - - - - - - -
AGE-PE -0.003 0.515 1.000 - - - - - - - - - - - - - - - - - - -
ATT -0.026 -0.053 -0.008 0.841 - - - - - - - - - - - - - - - - - -
BI 0.075 -0.056 -0.084 0.634 0.951 - - - - - - - - - - - - - - - - -
EE 0.024 -0.283 -0.071 0.573 0.434 0.835 - - - - - - - - - - - - - - - -
EXP1-EE -0.019 -0.038 -0.022 0.056 0.086 0.053 1.000 - - - - - - - - - - - - - - -
EXP1-PE 0.073 -0.026 -0.066 0.076 0.039 0.019 0.630 1.000 - - - - - - - - - - - - - -
EXP2-EE 0.098 0.043 -0.019 0.127 0.082 0.036 0.604 0.387 1.000 - - - - - - - - - - - - -
EXP3-PE 0.040 -0.056 0.004 0.110 0.065 0.037 0.353 0.561 0.321 1.000 - - - - - - - - - - - -
Exp3-EE -0.078 0.039 -0.053 0.027 0.000 0.005 0.546 0.347 0.506 0.520 1.000 - - - - - - - - - - -
Exp3-PE 0.144 -0.024 -0.066 0.039 -0.009 0.007 0.456 0.713 0.664 0.528 0.370 1.000 - - - - - - - - - -
EXP1 0.023 -0.022 0.083 0.120 0.134 0.252 0.382 0.226 0.286 0.129 0.261 0.077 1.000 - - - - - - - - -
EXP2 0.079 0.121 0.149 0.097 0.059 0.216 0.303 0.071 0.235 0.001 0.168 0.107 0.571 1.000 - - - - - - - -
EXP3 0.033 -0.097 0.048 0.082 0.143 0.158 0.279 0.138 0.170 0.047 0.049 0.001 0.536 0.429 1.000 - - - - - - -
GEN -0.028 -0.070 0.048 0.027 -0.025 0.031 -0.018 0.020 -0.113 0.056 -0.047 -0.075 0.042 0.117 0.077 1.000 - - - - - -
GEN-EE -0.052 -0.126 -0.163 -0.139 -0.146 -0.227 0.066 0.067 0.163 0.153 0.244 0.124 -0.016 -0.106 -0.044 -0.023 1.000 - - - - -
GEN-PE 0.038 -0.170 -0.175 -0.153 -0.156 -0.176 0.061 0.139 0.101 0.090 0.148 0.185 0.017 -0.061 0.052 -0.040 0.633 1.000 - - - -
PE 0.010 -0.073 -0.054 0.720 0.616 0.596 0.018 0.004 0.006 0.038 0.036 -0.127 0.202 0.139 0.105 0.053 -0.174 -0.191 0.860 - - -
ST -0.024 -0.089 0.075 0.559 0.472 0.539 0.088 0.048 0.033 0.117 0.073 -0.016 0.170 0.105 0.040 -0.015 -0.098 -0.149 0.505 0.892 - -
TA 0.025 -0.013 0.118 0.687 0.552 0.531 0.000 -0.027 -0.018 0.132 0.026 -0.078 0.115 0.093 0.105 -0.007 -0.173 -0.144 0.594 0.610 0.905 -
TB -0.007 -0.040 -0.060 0.600 0.444 0.462 0.111 0.071 0.069 0.148 0.121 0.010 0.045 0.084 0.069 -0.005 -0.065 -0.131 0.528 0.411 0.656 0.877
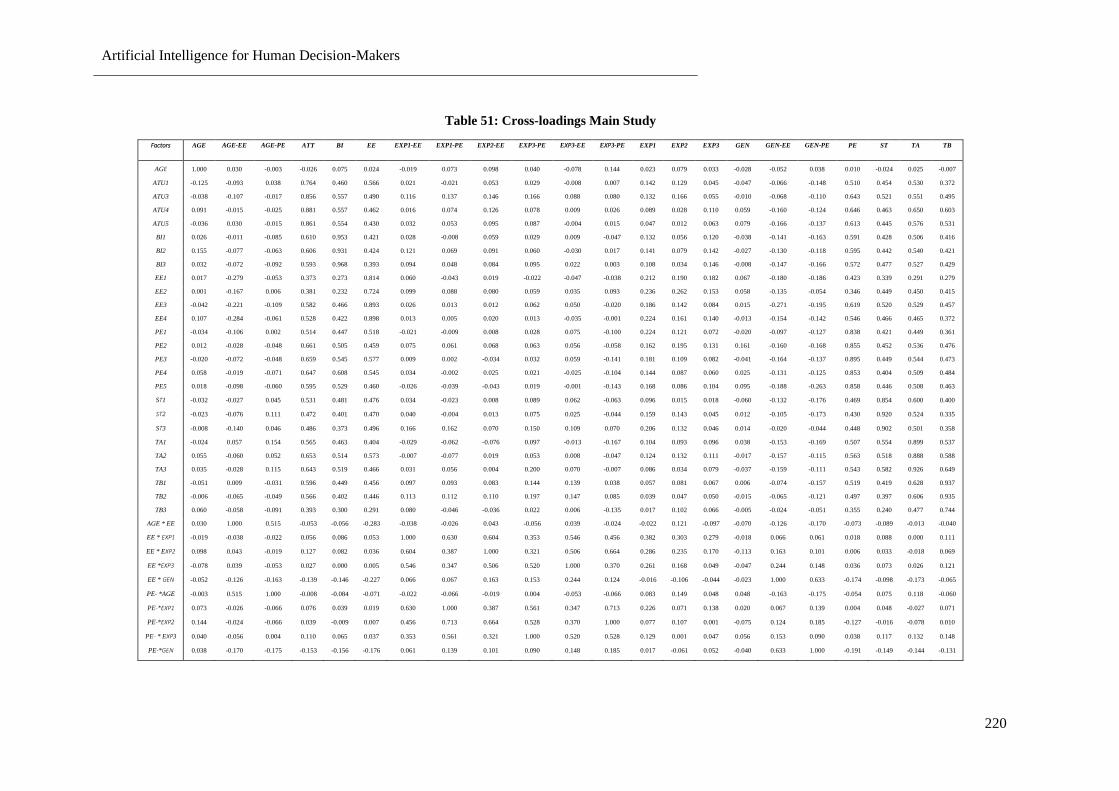
Artificial Intelligence for Human Decision-Makers
220
Table 51: Cross-loadings Main Study
Factors AGE AGE-EE AGE-PE ATT BI EE EXP1-EE EXP1-PE EXP2-EE EXP3-PE EXP3-EE EXP3-PE EXP1 EXP2 EXP3 GEN GEN-EE GEN-PE PE ST TA TB
AGE 1.000 0.030 -0.003 -0.026 0.075 0.024 -0.019 0.073 0.098 0.040 -0.078 0.144 0.023 0.079 0.033 -0.028 -0.052 0.038 0.010 -0.024 0.025 -0.007
ATU1 -0.125 -0.093 0.038 0.764 0.460 0.566 0.021 -0.021 0.053 0.029 -0.008 0.007 0.142 0.129 0.045 -0.047 -0.066 -0.148 0.510 0.454 0.530 0.372
ATU3 -0.038 -0.107 -0.017 0.856 0.557 0.490 0.116 0.137 0.146 0.166 0.088 0.080 0.132 0.166 0.055 -0.010 -0.068 -0.110 0.643 0.521 0.551 0.495
ATU4 0.091 -0.015 -0.025 0.881 0.557 0.462 0.016 0.074 0.126 0.078 0.009 0.026 0.089 0.028 0.110 0.059 -0.160 -0.124 0.646 0.463 0.650 0.603
ATU5 -0.036 0.030 -0.015 0.861 0.554 0.430 0.032 0.053 0.095 0.087 -0.004 0.015 0.047 0.012 0.063 0.079 -0.166 -0.137 0.613 0.445 0.576 0.531
BI1 0.026 -0.011 -0.085 0.610 0.953 0.421 0.028 -0.008 0.059 0.029 0.009 -0.047 0.132 0.056 0.120 -0.038 -0.141 -0.163 0.591 0.428 0.506 0.416
BI2 0.155 -0.077 -0.063 0.606 0.931 0.424 0.121 0.069 0.091 0.060 -0.030 0.017 0.141 0.079 0.142 -0.027 -0.130 -0.118 0.595 0.442 0.540 0.421
BI3 0.032 -0.072 -0.092 0.593 0.968 0.393 0.094 0.048 0.084 0.095 0.022 0.003 0.108 0.034 0.146 -0.008 -0.147 -0.166 0.572 0.477 0.527 0.429
EE1 0.017 -0.279 -0.053 0.373 0.273 0.814 0.060 -0.043 0.019 -0.022 -0.047 -0.038 0.212 0.190 0.182 0.067 -0.180 -0.186 0.423 0.339 0.291 0.279
EE2 0.001 -0.167 0.006 0.381 0.232 0.724 0.099 0.088 0.080 0.059 0.035 0.093 0.236 0.262 0.153 0.058 -0.135 -0.054 0.346 0.449 0.450 0.415
EE3 -0.042 -0.221 -0.109 0.582 0.466 0.893 0.026 0.013 0.012 0.062 0.050 -0.020 0.186 0.142 0.084 0.015 -0.271 -0.195 0.619 0.520 0.529 0.457
EE4 0.107 -0.284 -0.061 0.528 0.422 0.898 0.013 0.005 0.020 0.013 -0.035 -0.001 0.224 0.161 0.140 -0.013 -0.154 -0.142 0.546 0.466 0.465 0.372
PE1 -0.034 -0.106 0.002 0.514 0.447 0.518 -0.021 -0.009 0.008 0.028 0.075 -0.100 0.224 0.121 0.072 -0.020 -0.097 -0.127 0.838 0.421 0.449 0.361
PE2 0.012 -0.028 -0.048 0.661 0.505 0.459 0.075 0.061 0.068 0.063 0.056 -0.058 0.162 0.195 0.131 0.161 -0.160 -0.168 0.855 0.452 0.536 0.476
PE3 -0.020 -0.072 -0.048 0.659 0.545 0.577 0.009 0.002 -0.034 0.032 0.059 -0.141 0.181 0.109 0.082 -0.041 -0.164 -0.137 0.895 0.449 0.544 0.473
PE4 0.058 -0.019 -0.071 0.647 0.608 0.545 0.034 -0.002 0.025 0.021 -0.025 -0.104 0.144 0.087 0.060 0.025 -0.131 -0.125 0.853 0.404 0.509 0.484
PE5 0.018 -0.098 -0.060 0.595 0.529 0.460 -0.026 -0.039 -0.043 0.019 -0.001 -0.143 0.168 0.086 0.104 0.095 -0.188 -0.263 0.858 0.446 0.508 0.463
ST1 -0.032 -0.027 0.045 0.531 0.481 0.476 0.034 -0.023 0.008 0.089 0.062 -0.063 0.096 0.015 0.018 -0.060 -0.132 -0.176 0.469 0.854 0.600 0.400
ST2 -0.023 -0.076 0.111 0.472 0.401 0.470 0.040 -0.004 0.013 0.075 0.025 -0.044 0.159 0.143 0.045 0.012 -0.105 -0.173 0.430 0.920 0.524 0.335
ST3 -0.008 -0.140 0.046 0.486 0.373 0.496 0.166 0.162 0.070 0.150 0.109 0.070 0.206 0.132 0.046 0.014 -0.020 -0.044 0.448 0.902 0.501 0.358
TA1 -0.024 0.057 0.154 0.565 0.463 0.404 -0.029 -0.062 -0.076 0.097 -0.013 -0.167 0.104 0.093 0.096 0.038 -0.153 -0.169 0.507 0.554 0.899 0.537
TA2 0.055 -0.060 0.052 0.653 0.514 0.573 -0.007 -0.077 0.019 0.053 0.008 -0.047 0.124 0.132 0.111 -0.017 -0.157 -0.115 0.563 0.518 0.888 0.588
TA3 0.035 -0.028 0.115 0.643 0.519 0.466 0.031 0.056 0.004 0.200 0.070 -0.007 0.086 0.034 0.079 -0.037 -0.159 -0.111 0.543 0.582 0.926 0.649
TB1 -0.051 0.009 -0.031 0.596 0.449 0.456 0.097 0.093 0.083 0.144 0.139 0.038 0.057 0.081 0.067 0.006 -0.074 -0.157 0.519 0.419 0.628 0.937
TB2 -0.006 -0.065 -0.049 0.566 0.402 0.446 0.113 0.112 0.110 0.197 0.147 0.085 0.039 0.047 0.050 -0.015 -0.065 -0.121 0.497 0.397 0.606 0.935
TB3 0.060 -0.058 -0.091 0.393 0.300 0.291 0.080 -0.046 -0.036 0.022 0.006 -0.135 0.017 0.102 0.066 -0.005 -0.024 -0.051 0.355 0.240 0.477 0.744
AGE * EE 0.030 1.000 0.515 -0.053 -0.056 -0.283 -0.038 -0.026 0.043 -0.056 0.039 -0.024 -0.022 0.121 -0.097 -0.070 -0.126 -0.170 -0.073 -0.089 -0.013 -0.040
EE * EXP1 -0.019 -0.038 -0.022 0.056 0.086 0.053 1.000 0.630 0.604 0.353 0.546 0.456 0.382 0.303 0.279 -0.018 0.066 0.061 0.018 0.088 0.000 0.111
EE * EXP2 0.098 0.043 -0.019 0.127 0.082 0.036 0.604 0.387 1.000 0.321 0.506 0.664 0.286 0.235 0.170 -0.113 0.163 0.101 0.006 0.033 -0.018 0.069
EE *EXP3 -0.078 0.039 -0.053 0.027 0.000 0.005 0.546 0.347 0.506 0.520 1.000 0.370 0.261 0.168 0.049 -0.047 0.244 0.148 0.036 0.073 0.026 0.121
EE * GEN -0.052 -0.126 -0.163 -0.139 -0.146 -0.227 0.066 0.067 0.163 0.153 0.244 0.124 -0.016 -0.106 -0.044 -0.023 1.000 0.633 -0.174 -0.098 -0.173 -0.065
PE- *AGE -0.003 0.515 1.000 -0.008 -0.084 -0.071 -0.022 -0.066 -0.019 0.004 -0.053 -0.066 0.083 0.149 0.048 0.048 -0.163 -0.175 -0.054 0.075 0.118 -0.060
PE-*EXP1 0.073 -0.026 -0.066 0.076 0.039 0.019 0.630 1.000 0.387 0.561 0.347 0.713 0.226 0.071 0.138 0.020 0.067 0.139 0.004 0.048 -0.027 0.071
PE-*EXP2 0.144 -0.024 -0.066 0.039 -0.009 0.007 0.456 0.713 0.664 0.528 0.370 1.000 0.077 0.107 0.001 -0.075 0.124 0.185 -0.127 -0.016 -0.078 0.010
PE- * EXP3 0.040 -0.056 0.004 0.110 0.065 0.037 0.353 0.561 0.321 1.000 0.520 0.528 0.129 0.001 0.047 0.056 0.153 0.090 0.038 0.117 0.132 0.148
PE-*GEN 0.038 -0.170 -0.175 -0.153 -0.156 -0.176 0.061 0.139 0.101 0.090 0.148 0.185 0.017 -0.061 0.052 -0.040 0.633 1.000 -0.191 -0.149 -0.144 -0.131
Artificial Intelligence for Human Decision-Makers
221
References
Abdul, A., Vermeulen, J., Wang, D., Lim, B. Y., and Kankanhalli, M. 2018. "Trends and Trajectories
for Explainable, Accountable and Intelligible Systems: An Hci Research Agenda," in:
Conference on human factors in computing systems (CHI). Montreal, Canada: ACM, pp. 1-18.
Aboulian, A., Green, D. H., Switzer, J. F., Kane, T. J., Bredariol, G. V., Lindahl, P., Donnal, J. S., and
Leeb, S. B. 2018. "Nilm Dashboard: A Power System Monitor for Electromechanical
Equipment Diagnostics," IEEE Transactions on Industrial Informatics (15:3), pp. 1405-1414.
Acevedo, M., and Krueger, J. 2004. "Two Egocentric Sources of the Decision to Vote: The Voter's
Illusion and the Belief in Personal Relevance," Political Psychology (25), pp. 115-134.
Ackers, B., and Eccles, N. 2015. "Mandatory Corporate Social Responsibility Assurance Practices: The
Case of King Iii in South Africa," Accounting, Auditing & Accountability Journal (28:4), pp.
515-550.
Adadi, A., and Berrada, M. 2018. "Peeking inside the Black-Box: A Survey on Explainable Artificial
Intelligence (Xai)," IEEE Access (6), pp. 52138-52160.
Adams, B. D., Bruyn, L. E., and Houde, S. 2003. Trust in Automated Systems, Literature Review.
Toronto, Canada: Humansystems Incorporated.
Adams, C., and Evans, R. 2004. "Accountability, Completeness, Credibility and the Audit Expectations
Gap," Journal of Corporate Citizenship (14), pp. 97-115.
Adly, F., Yoo, P. D., Muhaidat, S., and Al-Hammadi, Y. 2014. "Machine-Learning-Based Identification
of Defect Patterns in Semiconductor Wafer Maps: An Overview and Proposal," in: International
Parallel & Distributed Processing Symposium Workshops. Phoenix, United States: IEEE, pp.
420-429.
Adnan, S. 2009. "Do Culture and Governance Structure Influence Csr Reporting Quality: Evidence from
China, India, Malaysia and the United Kingdom." Auckland, Australia: University of Auckland.
Afshari, H., and Peng, Q. 2015. "Using Big Data to Minimize Uncertainty Effects in Adaptable Product
Design," in: International Design Engineering Technical Conferences and Computers and
Information in Engineering Conference (IDETC-CIE). Boston, United States: ASME, pp. 1-17.
Ak, R., and Bhinge, R. 2015. "Data Analytics and Uncertainty Quantification for Energy Prediction in
Manufacturing," in: International Conference on Big Data. Santa Clara, United States: IEEE,
pp. 2782-2784.
Akay, M. F. 2009. "Support Vector Machines Combined with Feature Selection for Breast Cancer
Diagnosis," Expert Systems with Applications (36:2), pp. 3240-3247.
Alaghehband, F. K., Rivard, S., Wu, S., and Goyette, S. 2011. "An Assessment of the Use of Transaction
Cost Theory in Information Technology Outsourcing," The Journal of Strategic Information
Systems (20:2), pp. 125-138.
Alaiad, A., and Zhou, L. 2013. "Patients’ Behavioral Intention toward Using Healthcare Robots," in:
Americas Conference on Information Systems (AMCIS). Chicago, United States: AIS, pp. 1-11.
Albashrawi, M., and Motiwalla, L. 2017. "When Is Success Model Meets Utaut in a Mobile Banking
Context: A Study of Subjective and Objective System Usage," in: Conference of the South
African Immunology Society (SAIS). St. Simons Island, South Africa: IEEE, pp. 1-7.
Albertini, E. 2014. "A Descriptive Analysis of Environmental Disclosure: A Longitudinal Study of
French Companies," Journal of Business Ethics (121:2), pp. 233-254.
Alharbi, S. T. 2014. "Trust and Acceptance of Cloud Computing: A Revised Utaut Model," in:
International conference on computational science and computational intelligence (CSCI). Las
Vegas, United States: IEEE, pp. 131-134.
Aljumaili, M., Karim, R., and Tretten, P. 2016. "Metadata-Based Data Quality Assessment," VINE
Journal of Information and Knowledge Management Systems (46:2), pp. 232-250.
Alpaydin, E. 2020. Introduction to Machine Learning. Cambridge, United States: MIT press.
AlSaad, R., Malluhi, Q., Janahi, I., and Boughorbel, S. 2019. "Interpreting Patient-Specific Risk
Prediction Using Contextual Decomposition of Bilstms: Application to Children with Asthma,"
BMC Medical Informatics and Decision Making (19:1), pp. 214-225.
Artificial Intelligence for Human Decision-Makers
222
Alzantot, M., Widdicombe, A., Julier, S., and Srivastava, M. 2019. "Neuromask: Explaining Predictions
of Deep Neural Networks through Mask Learning," in: International Conference on Smart
Computing (SMARTCOMP). Washington, United States: IEEE, pp. 81-86.
Amadi-Echendu, J., and De Wit, F. 2015. "Technology Adoption: A Study on Post-Implementation
Perceptions and Acceptance of Computerised Maintenance Management Systems," Technology
in Society (43), pp. 209-218.
Ambady, N., and Rosenthal, R. 1992. "Thin Slices of Expressive Behavior as Predictors of Interpersonal
Consequences: A Meta-Analysis," Psychological Bulletin (111:2), pp. 256–274.
Amershi, S., Weld, D., Vorvoreanu, M., Fourney, A., Nushi, B., Collisson, P., Suh, J., Iqbal, S., Bennett,
P. N., and Inkpen, K. 2019. "Guidelines for Human-Ai Interaction," in: Conference on Human
Factors in Computing Systems (CHI). Glasgow, Scotland: ACM, pp. 1-13.
Amran, A., Lee, S., and Devi, S. 2014. "The Influence of Governance Structure and Strategic Corporate
Social Responsibility toward Sustainability Reporting Quality," Business Strategy and the
Environment (23), pp. 217-235.
Andaloussi, A. A., Burattin, A., and Weber, B. 2018. "Toward an Automated Labeling of Event Log
Attributes," in Enterprise, Business-Process and Information Systems Modeling. Cham,
Switzerland: Springer, pp. 82-96.
Andonovski, G., Mušič, G., and Škrjanc, I. 2018. " ault Detection through Evolving uzzy Cloud-Based
Model," IFAC-PapersOnLine (51:2), pp. 795-800.
Angelov, P., and Soares, E. 2020. "Towards Explainable Deep Neural Networks (Xdnn)," Neural
Networks (130), pp. 185-194.
Anton, S. D., Kanoor, S., Fraunholz, D., and Schotten, H. D. 2018. "Evaluation of Machine Learning-
Based Anomaly Detection Algorithms on an Industrial Modbus/Tcp Data Set," in: International
Conference on Availability, Reliability and Security (ARES). Hamburg, Germany: ACM, pp. 1-
9.
Antunes, P., Herskovic, V., Ochoa, S. F., and Pino, J. A. 2012. "Structuring Dimensions for
Collaborative Systems Evaluation," ACM Computing Surveys (CSUR) (44:2), pp. 8-44.
Argyriou, A., Evgeniou, T., and Pontil, M. 2008. "Convex Multi-Task Feature Learning," Machine
Learning (73:3), pp. 243-272.
Arık, O. A., and Toksarı, M. D. 2018. "Multi-Objective Fuzzy Parallel Machine Scheduling Problems
under Fuzzy Job Deterioration and Learning Effects," International Journal of Production
Research (56:7), pp. 2488-2505.
Arık, O. A., and Toksarı, M. D. 2019. " uzzy Parallel Machine Scheduling Problem under uzzy Job
Deterioration and Learning Effects with Fuzzy Processing Times," in Advanced Fuzzy Logic
Approaches in Engineering Science, M. Ram (ed.). Hershey, United States: IGI Global, pp. 49-
67.
Arnott, D., and Pervan, G. 2005. "A Critical Analysis of Decision Support Systems Research," Journal
of Information Technology (20:2), pp. 67-87.
Arpaia, P., Moccaldi, N., Prevete, R., Sannino, I., and Tedesco, A. 2020. "A Wearable Eeg Instrument
for Real-Time Frontal Asymmetry Monitoring in Worker Stress Analysis," IEEE Transactions
on Instrumentation and Measurement (69:10), pp. 8335-8343.
Arrieta, A. B., Díaz-Rodríguez, N., Del Ser, J., Bennetot, A., Tabik, S., Barbado, A., García, S., Gil-
López, S., Molina, D., and Benjamins, R. 2020. "Explainable Artificial Intelligence (Xai):
Concepts, Taxonomies, Opportunities and Challenges toward Responsible Ai," Information
Fusion (58), pp. 82-115.
Asatiani, A., Malo, P., Nagbøl, P. R., Penttinen, E., Rinta-Kahila, T., and Salovaara, A. 2021.
"Sociotechnical Envelopment of Artificial Intelligence: An Approach to Organizational
Deployment of Inscrutable Artificial Intelligence Systems," Journal of the Association for
Information Systems (22:2), pp. 325-352.
Aydın, İ., Karaköse, M., and Akın, E. 2015. "Combined Intelligent Methods Based on Wireless Sensor
Networks for Condition Monitoring and Fault Diagnosis," Journal of Intelligent Manufacturing
(26:4), pp. 717-729.
Artificial Intelligence for Human Decision-Makers
223
Aydin, O., and Guldamlasioglu, S. 2017. "Using Lstm Networks to Predict Engine Condition on Large
Scale Data Processing Framework," in: International Conference on Electrical and Electronic
Engineering (ELECO). Bursa, Turkey: IEEE, pp. 281-285.
Baban, C. F., Baban, M., and Suteu, M. D. 2016. "Using a Fuzzy Logic Approach for the Predictive
Maintenance of Textile Machines," Journal of Intelligent & Fuzzy Systems (30:2), pp. 999-1006.
Baird, A., and Maruping, L. M. 2021. "The Next Generation of Research on Is Use: A Theoretical
Framework of Delegation to and from Agentic Artifacts," MIS Quarterly (45:1b), pp. 315-341.
Baishya, K., and Samalia, H. V. 2020. "Extending Unified Theory of Acceptance and Use of Technology
with Perceived Monetary Value for Smartphone Adoption at the Bottom of the Pyramid,"
International Journal of Information Management (51:C), pp. 1-12.
Ball, A., Owen, D., and Gray, R. 2000. "External Transparency or Internal Capture? The Role of Third-
Party Statements in Adding Value to Corporate Environmental Reports," Business Strategy and
the Environment (9:1), pp. 1-23.
Ballou, D., Wang, R., Pazer, H., and Tayi, G. 1998. "Modeling Information Manufacturing Systems to
Determine Information Product Quality," Management Science (44:4), pp. 462-484.
BAMS. 2011. "Die Din Iso 26000 „Leitfaden Zur Gesellschaftlichen erantwortung Von
Organisationen," B.f.A.u. Soziales (ed.).
Bandura, A. 2001. "Social Cognitive Theory: An Agentic Perspective," Annual Review of Psychology
(52:1), pp. 1-26.
Banerjee, A., Bandyopadhyay, T., and Acharya, P. 2013. "Data Analytics: Hyped up Aspirations or True
Potential?," Vikalpa (38:4), pp. 1-12.
Bang, S. H., Ak, R., Narayanan, A., Lee, Y. T., and Cho, H. 2019. "A Survey on Knowledge Transfer
for Manufacturing Data Analytics," Computers in Industry (104), pp. 116-130.
Bansal, G., Nushi, B., Kamar, E., Weld, D. S., Lasecki, W. S., and Horvitz, E. 2019. "Updates in Human-
Ai Teams: Understanding and Addressing the Performance/Compatibility Tradeoff," in:
Conference on Artificial Intelligence. Honolulu, United States: AAAI, pp. 2429-2437.
Bansal, P. 2005. "Evolving Sustainability: A Longitudinal Study of Corporate Sustainable
Development," Strategic Management Journal (26), pp. 197-218.
Bapna, R., Goes, P., Gupta, A., and Jin, Y. 2004. "User Heterogeneity and Its Impact on Electronic
Auction Market Design: An Empirical Exploration," MIS Quarterly (28:1), pp. 21-43.
Barreno, M., Nelson, B., Joseph, A. D., and Tygar, J. D. 2010. "The Security of Machine Learning,"
Machine Learning (81:2), pp. 121-148.
Baryannis, G., Dani, S., and Antoniou, G. 2019. "Predicting Supply Chain Risks Using Machine
Learning: The Trade-Off between Performance and Interpretability," Future Generation
Computer Systems (101), pp. 993-1004.
Batini, C., Cappiello, C., Francalanci, C., and Maurino, A. 2009. "Methodologies for Data Quality
Assessment and Improvement," ACM Computing Surveys (41:3), pp. 1-52.
Bauer, W., Schlund, S., Marrenbach, D., and Ganschar, O. 2014. "Industrie 4.0 – Volkswirtschaftliches
Potenzial Für Deutschland," BITKOM/Fraunhofer IAO, Berlin, Germany.
Bauernhansl, T. 2014. "Die Vierte Industrielle Revolution – Der Weg in Ein Wertschaffendes
Produktionsparadigma," in Industrie 4.0 in Produktion, Automatisierung Und Logistik, T.
Bauernhansl, M.T. Hompel and B. Vogel-Heuser (eds.). Wiesbaden, Germany: Springer
Vieweg, pp. 5-36.
Bauernhansl, T. 2016. "Wake-up Call for Enterprises - Why We Need a Common Understanding of
Industrie 4.0," ZWF Zeitschrift für wirtschaftlichen Fabrikbetrieb (111:7-11), pp. 453-457
Baum, J., Laroque, C., Oeser, B., Skoogh, A., and Subramaniyan, M. 2018. "Applications of Big Data
Analytics and Related Technologies in Maintenance—Literature-Based Research," Machines
(6:4), p. 54.
Bayomie, D., Helal, I. M., Awad, A., Ezat, E., and ElBastawissi, A. 2016. "Deducing Case Ids for
Unlabeled Event Logs," in Bpm 2015, M. Reichert and H.A. Reijers (eds.). Cham, Switzerland:
Springer, pp. 242-254.
Artificial Intelligence for Human Decision-Makers
224
Becker, J., and Niehaves, B. 2007. "Epistemological Perspectives on Is Research: A Framework for
Analysing and Systematizing Epistemological Assumptions," Information Systems Journal
(17:2), pp. 197-214.
Bekar, E. T., Skoogh, A., Cetin, N., and Siray, O. 2019. "Prediction of Industry 4.0’s Impact on Total
Productive Maintenance Using a Real Manufacturing Case," in The International Symposium
for Production Research, D. N. and G.M. (eds) (eds.). Cham, Switzerland: Springer, pp. 136-
149.
Belciug, S., and Gorunescu, F. 2020. "A Brief History of Intelligent Decision Support Systems," in
Intelligent Decision Support Systems—a Journey to Smarter Healthcare. Cham, Switzerland:
Springer, pp. 57-70.
Benbasat, I., and Barki, H. 2007. "Quo Vadis Tam?," Journal of the Association for Information Systems
(8:4), pp. 211-218.
Benbya, H., Pachidi, S., and Jarvenpaa, S. 2021. "Special Issue Editorial: Artificial Intelligence in
Organizations: Implications for Information Systems Research," Journal of the Association for
Information Systems (22:2), pp. 281-303.
Beniwal, A., Dadhich, R., and Alankar, A. 2019. "Deep Learning Based Predictive Modeling for
Structure-Property Linkages," Materialia (8:100435), pp. 1-11.
Bentele, G. 1988. "Der Faktor Glaubwürdigkeit. Forschungsergebnisse Und Fragen Für Die
Sozialisationsperspektive," Publizistik (33:2), pp. 406-426.
Bentele, G., and Seidenglanz, R. 2015. "Vertrauen Und Glaubwürdigkeit," in Handbuch Der Public
Relations – Wissenschaftliche Grundlagen Und Berufliches Handeln. Mit Lexikon, G. Bentele,
R. Fröhlich and P. Szyszka (eds.). Wiesbaden, Germany: VS Verlag für Sozialwissenschaften,
pp. 411-430.
Bibal, A., and Frénay, B. 2016. "Interpretability of Machine Learning Models and Representations: An
Introduction," in: European Symposium on Artificial Neural Networks, Computational
Intelligence and Machine Learning (ESANN). Bruges, Belgium: IEEE.
Bichler, M. 2006. "Design Science in Information Systems Research," Wirtschaftsinformatik (48:2), pp.
133-135.
Biedermann, H. 1990. Anlagenmanagement: Managementwerkzeuge Zur Rationalisierung. Cologne,
Germany: TÜV Rheinland.
Bigley, G. A., and Pearce, J. L. 1998. "Straining for Shared Meaning in Organization Science: Problems
of Trust and Distrust," Academy of Management Review (23:3), pp. 405-421.
Bilgic, M., and Mooney, R. J. 2005. "Explaining Recommendations: Satisfaction Vs. Promotion," in:
Workshop at the International Conference on Intelligent User Interfaces (IUI). San Diego,
United States: ACM, pp. 1-8.
Bini, S. A. 2018. "Artificial Intelligence, Machine Learning, Deep Learning, and Cognitive Computing:
What Do These Terms Mean and How Will They Impact Health Care?," The Journal of
Arthroplasty (33:8), pp. 2358-2361.
Binitha, S., and Sathya, S. S. 2012. "A Survey of Bio Inspired Optimization Algorithms," International
Journal of Soft Computing and Engineering (2:2), pp. 137-151.
Bishop, C. M. 2006. Pattern Recognition and Machine Learning. New York, United States: Springer-
Verlag.
Blackwell, D., Noland, T., and Winters, D. 1998. "The Value of Auditor Assurance: Evidence from
Loan Pricing," Journal of Accounting Research (36), pp. 57-70.
Blanco-Justicia, A., and Domingo-Ferrer, J. 2019. "Machine Learning Explainability through
Comprehensible Decision Trees," Lecture Notes in Computer Science (11713), pp. 15-26.
Boldt, A., and Yeung, N. 2015. "Shared Neural Markers of Decision Confidence and Error Detection,"
Journal of Neuroscience (35:8), pp. 3478-3484.
Bonczek, R. H., Holsapple, C. W., and Whinston, A. B. 2014. Foundations of Decision Support Systems.
New York, United States: Academic Press.
Boone, H. N., and Boone, D. A. 2012. "Analyzing Likert Data," Journal of Extension (50:2), pp. 1-5.
Booth, A., Sutton, A., and Papaioannou, D. 2016. Systematic Approaches to a Successful Literature
Review. Los Angeles, United States: SAGE Publications.
Artificial Intelligence for Human Decision-Makers
225
Bordeleau, F.-E., Mosconi, E., and Santa-Eulalia, L. A. 2018. "Business Intelligence in Industry 4.0:
State of the Art and Research Opportunities," in: Hawaii International Conference on System
Sciences (HICSS). Hawai, United States: AIS, pp. 3944-3953.
Bose, R. J. C., Mans, R. S., and van der Aalst, W. M. 2013. "Wanna Improve Process Mining Results?,"
in: Symposium on Computational Intelligence and Data Mining (CIDM). Singapore, Singapore:
IEEE, pp. 127-134.
Bosnić, Z., and Kononenko, I. 2009. "An Overview of Advances in Reliability Estimation of Individual
Predictions in Machine Learning," Intelligent Data Analysis (13:2), pp. 385-401.
Bothe, H.-H. 1995. Fuzzy Logic: Einführung in Theorie Und Anwendungen. Berlin, Germany: Springer.
Bousdekis, A., Magoutas, B., Mentzas, G., and (2018), L. e. a. 2015. "Review, Analysis and Synthesis
of Prognostic-Based Decision Support Methods for Condition Based Maintenance," Journal of
Intelligent Manufacturing (29:6), pp. 1303-1316.
Bousdekis, A., Papageorgiou, N., Magoutas, B., Apostolou, D., and Mentzas, G. 2017. "A Proactive
Event-Driven Decision Model for Joint Equipment Predictive Maintenance and Spare Parts
Inventory Optimization," Procedia CIRP (59), pp. 184-189.
Breiman, L. 2001. "Statistical Modeling: The Two Cultures," Statistical Science (16:3), pp. 199-231.
Brodsky, A., Shao, G. D., Krishnamoorthy, M., Narayanan, A., Menasce, D., and Ak, R. 2017. "Analysis
and Optimization Based on Reusable Knowledge Base of Process Performance Models,"
International Journal of Advanced Manufacturing Technology (88:1-4), pp. 337-357.
Bröhl, C., Nelles, J., Brandl, C., Mertens, A., and Schlick, C. M. 2016. "Tam Reloaded: A Technology
Acceptance Model for Human-Robot Cooperation in Production Systems," in: International
Conference on Human-Computer Interaction (HCI). Toronto, Canada: Springer, pp. 97-103.
Brown, S. A., Dennis, A. R., and Venkatesh, V. 2010. "Predicting Collaboration Technology Use:
Integrating Technology Adoption and Collaboration Research," Journal of Management
Information Systems (27:2), pp. 9-54.
Brown, S. L., and Eisenhardt, K. M. 1995. "Product Development: Past Research, Present Findings, and
Future Directions," The Academy of Management Review (20:2), pp. 343-378.
Broy, M. 2010. "Cyber-Physical Systems - Wissenschaftliche Herausforderungen Bei Der
Entwicklung," in Cyber-Physical Systems - Innovation Durch Softwareintensive Eingebettete
Systeme, M. Broy (ed.). Berlin, Germany: Springer-Verlag, pp. 17-33.
Bruine de Bruin, W., Parker, A. M., and Fischhoff, B. 2007. "Individual Differences in Adult Decision-
Making Competence," Journal of Personality and Social Psychology (92:5), pp. 938-956.
Brunk, J., Mattern, J., and Riehle, D. M. 2019. "Effect of Transparency and Trust on Acceptance of
Automatic Online Comment Moderation Systems," in: Conference on Business Informatics
(CBI). Moscow, Russia: IEEE, pp. 429-435.
Brynjolfsson, E., and Mcafee, A. 2017. "The Business of Artificial Intelligence," Harvard Business
Review (7), pp. 3-11.
Burton, J., Stein, M. K., and Jensen, T. 2020. "A Systematic Review of Algorithm Aversion in
Augmented Decision Making," Journal of Behavioral Decision Making (33:2), pp. 220-239.
Bussone, A., Stumpf, S., and O'Sullivan, D. 2015. "The Role of Explanations on Trust and Reliance in
Clinical Decision Support Systems," in: International Conference on Healthcare Informatics
(ICHI). Dallas, United States: IEEE, pp. 160-169.
Cadavid, J. P. U., Lamouri, S., Grabot, B., Pellerin, R., and Fortin, A. 2020. "Machine Learning Applied
in Production Planning and Control: A State-of-the-Art in the Era of Industry 4.0," Journal of
Intelligent Manufacturing (31), pp. 1531–1558.
Caggiano, A. 2018. "Cloud-Based Manufacturing Process Monitoring for Smart Diagnosis Services,"
International Journal of Computer Integrated Manufacturing (31:7), pp. 612-623.
Calegari, R., Ciatto, G., and Omicini, A. 2020. "On the Integration of Symbolic and Sub-Symbolic
Techniques for Xai: A Survey," Intelligenza Artificiale (14:1), pp. 7-32.
Çaliş, B., and Bulkan, S. 2015. "A Research Survey: Review of Ai Solution Strategies of Job Shop
Scheduling Problem," Journal of Intelligent Manufacturing (26:5), pp. 961-973.
Canadian Institute for Health Information. 2009. "The Cihi Data Quality Framework," CIHI (ed.).
Ottawa.
Artificial Intelligence for Human Decision-Makers
226
Cao, L., Weiss, G., and Philip, S. Y. 2012. "A Brief Introduction to Agent Mining," Autonomous Agents
and Multi-Agent Systems (25:3), pp. 419-424.
Carbone, P., Katsifodimos, A., Ewen, S., Markl, V., Haridi, S., and Tzoumas, K. 2015. "Apache Flink:
Stream and Batch Processing in a Single Engine," Bulletin of the IEEE Computer Society
Technical Committee on Data Engineering (36:4), pp. 28-38.
Cardin, O., Trentesaux, D., Thomas, A., Castagna, P., Berger, T., and Bril El-Haouzi, H. 2017.
"Coupling Predictive Scheduling and Reactive Control in Manufacturing Hybrid Control
Architectures: State of the Art and Future Challenges," Journal of Intelligent Manufacturing
(28:7), pp. 1503-1517.
Carey, P., Simnett, R., and Tanewski, G. 2000. "Voluntary Demand for Internal and External Auditing
by Family Businesses," Auditing: A Journal of Theory and Practice (19), pp. 37-51.
Carter, L., and Bélanger, F. 2005. "The Utilization of E‐Government Services: Citizen Trust, Innovation
and Acceptance Factors," Information Systems Journal (15:1), pp. 5-25.
Carvalho, A., Levitt, A., Levitt, S., Khaddam, E., and Benamati, J. 2019a. "Off-the-Shelf Artificial
Intelligence Technologies for Sentiment and Emotion Analysis: A Tutorial on Using Ibm
Natural Language Processing," Communications of the Association for Information Systems
(44:1), pp. 918-943.
Carvalho, T. P., Soares, F. A., Vita, R., Francisco, R. d. P., Basto, J. P., and Alcalá, S. G. 2019b. "A
Systematic Literature Review of Machine Learning Methods Applied to Predictive
Maintenance," Computers & Industrial Engineering (137), pp. 1-10.
Castelo, N., Bos, M. W., and Lehmann, D. R. 2019. "Task-Dependent Algorithm Aversion," Journal of
Marketing Research (56:5), pp. 809-825.
Castro, P. A., and Camargo, H. A. 2005. "Focusing on Interpretability and Accuracy of a Genetic Fuzzy
System," in: International Conference on Fuzzy Systems (FUZZ). Reno, United States: IEEE,
pp. 696-701.
Cerrada, M., Sánchez, R.-V., Li, C., Pacheco, F., Cabrera, D., de Oliveira, J. V., and Vásquez, R. E.
2018. "A Review on Data-Driven Fault Severity Assessment in Rolling Bearings," Mechanical
Systems and Signal Processing (99), pp. 169-196.
Chaczko, Z., Kulbacki, M., Gudzbeler, G., Alsawwaf, M., Thai-Chyzhykau, I., and Wajs-Chaczko, P.
2020. "Exploration of Explainable Ai in Context of Human-Machine Interface for the Assistive
Driving System," in: Asian Conference on Intelligent Information and Database Systems
(ACIIDS). Phuket, Thailand: Springer, pp. 507-516.
Chakraborty, S., Tomsett, R., Raghavendra, R., Harborne, D., Alzantot, M., Cerutti, F., Srivastava, M.,
Preece, A., Julier, S., and Rao, R. M. 2017. "Interpretability of Deep Learning Models: A Survey
of Results," in: SmartWorld, Ubiquitous Intelligence & Computing, Advanced & Trusted
Computed, Scalable Computing & Communications, Cloud & Big Data Computing, Internet of
People and Smart City Innovation (SmartWorld/SCALCOM/UIC/ATC/CBDCom/IOP/SCI). San
Francisco, United States: IEEE, pp. 1-6.
Chakravorti, N., Rahman, M. M., Sidoumou, M. R., Weinert, N., Gosewehr, F., and Wermann, J. 2018.
"Validation of Perform Reference Architecture Demonstrating an Application of Data Mining
for Predicting Machine Failure," Procedia CIRP (72), pp. 1339-1344.
Chao-Chun, C., Min-Hsiung, H., Po-Yi, L., Jia-Xuan, L., Yu-Chuan, L., and Chih-Jen, L. 2016.
"Development of a Cyber-Physical-Style Continuous Yield Improvement System for
Manufacturing Industry," in: International Conference on Automation Science and Engineering
(CASE). Fort Worth, United States: IEEE, pp. 1307-1312.
Chatterji, A., and Levine, D. 2006. "Breaking Down the Wall of Codes: Evaluation Non-Financial
Performance Measurement," California Management Review (48:2), pp. 29-51.
Chatzimparmpas, A., Martins, R. M., and Kerren, A. 2020. "T-Visne: Interactive Assessment and
Interpretation of T-Sne Projections," IEEE Transactions on Visualization and Computer
Graphics (26:8), pp. 2696-2714.
Chen, T.-W., and Sundar, S. S. 2018. "This App Would Like to Use Your Current Location to Better
Serve You: Importance of User Assent and System Transparency in Personalized Mobile
Artificial Intelligence for Human Decision-Makers
227
Services," in: Conference on Human Factors in Computing Systems (CHI). Montreal, Canada:
ACM, pp. 1-13.
Chen, X.-B. 2013. "Tablets for Informal Language Learning: Student Usage and Attitudes," Language
Learning & Technology (17:1), pp. 20-36.
Chen, Y., Qin, X., Xiong, J., Xu, S., Shi, J., Lv, H., Li, L., Xing, H., and Zhang, Q. 2020. "Deep Transfer
Learning for Histopathological Diagnosis of Cervical Cancer Using Convolutional Neural
Networks with Visualization Schemes," Journal of Medical Imaging and Health Informatics
(10:2), pp. 391-400.
Cheng, D., Liu, G., Qian, C., and Song, Y.-F. 2008. "Customer Acceptance of Internet Banking:
Integrating Trust and Quality with Utaut Model," in: International Conference on Service
Operations and Logistics, and Informatics (SOLI). Beijing, China: IEEE, pp. 383-388.
Cheng, F., Ming, Y., and Qu, H. 2020. "Dece: Decision Explorer with Counterfactual Explanations for
Machine Learning Models," IEEE Transactions on Visualization and Computer Graphics
(27:2), pp. 1438-1447.
Cheng, Y., Chen, K., Sun, H. M., Zhang, Y. P., and Tao, F. 2018. "Data and Knowledge Mining with
Big Data Towards Smart Production," Journal of Industrial Information Integration (9), pp. 1-
13.
Chiang, L. H., Jiang, B., Zhu, X., Huang, D., and Braatz, R. D. 2015. "Diagnosis of Multiple and
Unknown Faults Using the Causal Map and Multivariate Statistics," Journal of Process Control
(28), pp. 27-39.
Chien, C.-F., Chang, K.-H., and Wang, W.-C. 2014a. "An Empirical Study of Design-of-Experiment
Data Mining for Yield-Loss Diagnosis for Semiconductor Manufacturing," Journal of
Intelligent Manufacturing (25:5), pp. 961-972.
Chien, C.-F., Diaz, A. C., and Lan, Y.-B. 2014b. "A Data Mining Approach for Analyzing
Semiconductor Mes and Fdc Data to Enhance Overall Usage Effectiveness," International
Journal of Computational Intelligence Systems (7:sup2), pp. 52-65.
Chien, C.-F., Hsu, C.-Y., and Chen, P.-N. 2013. "Semiconductor Fault Detection and Classification for
Yield Enhancement and Manufacturing Intelligence," Flexible Services and Manufacturing
Journal (25:3), pp. 367-388.
Chin, W., and Newsted, P. 1999. "Structural Equation Modeling Analysis with Small Samples Using
Partial Least Squares," Statistical Strategies for Small Sample Research (1:1), pp. 307-341.
Chin, W. W. 1998. "Issues and Opinion on Structural Equation Modeling," Management Information
Systems Quarterly (22), pp. 7-16.
Choi, J. K., and Ji, Y. G. 2015. "Investigating the Importance of Trust on Adopting an Autonomous
Vehicle," International Journal of Human-Computer Interaction (31:10), pp. 692-702.
Choi, S.-S., Cha, S.-H., and Tappert, C. C. 2010. "A Survey of Binary Similarity and Distance
Measures," Journal of Systemics, Cybernetics and Informatics (8:1), pp. 43-48.
Chui, M., and Malhotra, S. 2018. "Ai Adoption Advances, but Foundational Barriers Remain,"
McKinsey Global Institute, San Francisco, United States.
Chui, M., Manyika, J., Miremadi, M., Henke, N., Chung, R., Nel, P., and Malhotra, S. 2018. "Notes
from the Ai Frontier: Insights from Hundreds of Use Cases," McKinsey Global Institute, San
Francisco, United States.
Civerchia, F., Bocchino, S., Salvadori, C., Rossi, E., Maggiani, L., and Petracca, M. 2017. "Industrial
Internet of Things Monitoring Solution for Advanced Predictive Maintenance Applications,"
Journal of Industrial Information Integration (7), pp. 4-12.
Clancy, T. 1995. "The Standish Group Report," in: Chaos Report.
Coble, J., and Hines, J. W. 2011. "Applying the General Path Model to Estimation of Remaining Useful
Life," International Journal of Prognostics and Health Management (2:1), pp. 71-82.
Cody-Allen, E., and Kishore, R. 2006. "An Extension of the Utaut Model with E-Quality, Trust, and
Satisfaction Constructs," in: Conference on Computer Personnel Research (CPR). New York,
United States: ACM, pp. 82-89.
Committee, S. P. a. S. 2010. "Maintenance — Maintenance Terminology." BSI Standards Publication.
Artificial Intelligence for Human Decision-Makers
228
Compeau, D., Higgins, C. A., and Huff, S. 1999. "Social Cognitive Theory and Individual Reactions to
Computing Technology: A Longitudinal Study," MIS Quarterly (23:2), pp. 145-158.
Compeau, D. R., and Higgins, C. A. 1995. "Computer Self-Efficacy: Development of a Measure and
Initial Test," MIS Quarterly (19:2), pp. 189-211.
Conseil national de l’industrie. 2013. "The New ace of Industry in rance," rench National Industry
Council, Paris, France.
Cooper, H. M. 1988. "Organizing Knowledge Syntheses. A Taxonomy of Literature Reviews,"
Knowledge in Society (1:1), pp. 104-126.
Cortez, P. 2009. "Viticulture Commission of the Vinho Verde Region (Cvrvv)." Retrieved 07/15/2020,
from archive.ics.uci.edu/ml/datasets/wine+quality
Cramer, H., Evers, V., Ramlal, S., Van Someren, M., Rutledge, L., Stash, N., Aroyo, L., and Wielinga,
B. 2008. "The Effects of Transparency on Trust in and Acceptance of a Content-Based Art
Recommender," User Modeling and User-Adapted Interaction (18:5), pp. 455–496.
Crielaard, L., and Papapetrou, P. 2018. "Explainable Predictions of Adverse Drug Events from
Electronic Health Records Via Oracle Coaching," in: International Conference on Data Mining
Workshops (ICDMW). Singapore, Singapore: IEEE, pp. 707-714.
Cui, X., Lee, J. M., and Hsieh, J. 2019. "An Integrative 3c Evaluation Framework for Explainable
Artificial Intelligence," in: American Conference on Information Systems (AMCIS). Cancun,
Mexico: pp. 1-10.
Cummings, M. 2004. "Automation Bias in Intelligent Time Critical Decision Support Systems," in:
Intelligent Systems Technical Conference. Chicago, United States: AIAA, pp. 1-6.
Dalzochio, J., Kunst, R., Pignaton, E., Binotto, A., Sanyal, S., Favilla, J., and Barbosa, J. 2020. "Machine
Learning and Reasoning for Predictive Maintenance in Industry 4.0: Current Status and
Challenges," Computers in Industry (123), pp. 1-15.
Dam, H. K., Tran, T., and Ghose, A. 2018. "Explainable Software Analytics," in: International
Conference on Software Engineering (ICSE). New York, United States: IEEE, pp. 53-56.
Dando, N., and Swift, T. 2003. "Transparency and Assurance: Minding the Credibility Gap," Journal of
Business Ethics (44:2), pp. 195-200.
Das, T., and Teng, B. S. 1999. "Cognitive Biases and Strategic Decision Processes: An Integrative
Perspective," Journal of Management Studies (36:6), pp. 757-778.
Davenport, T. H., and Harris, J. G. 2007. Competing on Analytics: The New Science of Winning.
Brighton, United States: Harvard Business Review Press.
Davis, F. D. 1989. "Perceived Usefulness, Perceived Ease of Use, and User Acceptance of Information
Technology," MIS Quarterly (13:3), pp. 319-340.
Davis, F. D., Bagozzi, R. P., and Warshaw, P. R. 1992. "Extrinsic and Intrinsic Motivation to Use
Computers in the Workplace," Journal of Applied Social Psychology (22:14), pp. 1111-1132.
Davis, J., Edgar, T., Porter, J., Bernaden, J., and Sarli, M. 2012. "Smart Manufacturing, Manufacturing
Intelligence and Demand-Dynamic Performance," Computers & Chemical Engineering (47),
pp. 145-156.
de Boer, Y., Bartels, W., McKenzie, M., Austin, E., Javaux, B., and Canteenwalla, A. 2013. "The Kpmg Survey
of Corporate Responsibility Reporting 2013," KPMG International, Zurich, Switzerland.
Delen, D. 2014. Real-Word Data Mining - Applied Business Analytics and Decision Making. Upper
Saddle River, United States: Pearson Education, Inc.
Delen, D., and Demirkan, H. 2013. "Data, Information and Analytics as Services," Decision Support
Systems (55:1), pp. 359-363.
Delen, D., and Zolbanin, H. M. 2018. "The Analytics Paradigm in Business Research," Journal of
Business Research (90), pp. 186-195.
Dellermann, D., Ebel, P., Söllner, M., and Leimeister, J. M. 2019. "Hybrid Intelligence," Business &
Information Systems Engineering (61:5), pp. 637-643.
Deng, L., and Yu, D. 2014. "Deep Learning: Methods and Applications," Foundations and Trends in
Signal Processing (7:3–4), pp. 197-387.
Derwisch, S., and Iffert, L. 2017. "Advanced & Predictive Analytics - Data Science Im Fachbereich -
Anwenderstudie." CXP Group.
Artificial Intelligence for Human Decision-Makers
229
Desender, K., Boldt, A., and Yeung, N. 2018. "Subjective Confidence Predicts Information Seeking in
Decision Making," Psychological Science (29:5), pp. 761-778.
Development, T. W. C. o. E. a. 1987. Our Common Future. Oxford, United States: Oxford University
Press.
Diamantopoulos, A., and Riefler, P. 2008. "Formative Indikatoren: Einige Anmerkungen Zu Ihrer Art,
Validität Und Multikollinearität," Zeitschrift für Betriebswirtschaft (78:11), pp. 1183-1196.
Dietrich, C. 2010. "Decision Making: Factors That Influence Decision Making, Heuristics Used, and
Decision Outcomes," Inquiries Journal (2:2), pp. 1-7.
Dietvorst, B. J., Simmons, J. P., and Massey, C. 2015. "Algorithm Aversion: People Erroneously Avoid
Algorithms after Seeing Them Err," Journal of Experimental Psychology: General (144:1), pp.
114-126.
Dietvorst, B. J., Simmons, J. P., and Massey, C. 2016. "Overcoming Algorithm Aversion: People Will
Use Imperfect Algorithms If They Can (Even Slightly) Modify Them," Management Science
(64:3), pp. 1155-1170.
Diez-Olivan, A., Del Ser, J., Galar, D., and Sierra, B. 2019. "Data Fusion and Machine Learning for
Industrial Prognosis: Trends and Perspectives Towards Industry 4.0," Information Fusion (50),
pp. 92-111.
Dijkstra, T. K. 2013. "On the Extraction of Weights from Pairwise Comparison Matrices," Central
European Journal of Operations Research (21:1), pp. 103-123.
Ding, H., Gao, R. X., Isaksson, A. J., Landers, R. G., Parisini, T., and Yuan, Y. 2020. "State of Ai-Based
Monitoring in Smart Manufacturing and Introduction to Focused Section," IEEE/ASME
Transactions on Mechatronics (25:5), pp. 2143-2154.
Ding, K., and Jiang, P. 2016. "Incorporating Social Sensors and Cps Nodes for Personalized Production
under Social Manufacturing Environment," Procedia CIRP (56), pp. 366-371.
Dixon, R., Mousa, G., and Woodhead, A. 2004. "The Necessary Characteristics of Environmental
Auditors: A Review of the Contribution of the financial Auditing Profession," Accounting
Forum (28), pp. 119-138.
Domova, V., and Dagnino, A. 2017. "Towards Intelligent Alarm Management in the Age of Iiot," in:
Global Internet of Things Summit (GIoTS). Geneva, Switzerland: IEEE, pp. 1-5.
Dong, Y., Su, H., Zhu, J., and Zhang, B. 2017. "Improving Interpretability of Deep Neural Networks
with Semantic Information," in: Conference on Computer Vision and Pattern Recognition
(CVPRW). Honolulu, United States: IEEE, pp. 4306-4314.
Doran, D., Schulz, S., and Besold, T. R. 2017. "What Does Explainable Ai Really Mean? A New
Conceptualization of Perspectives," arXiv preprint arXiv:1710.00794.
Dos Santos, D. P., Giese, D., Brodehl, S., Chon, S., Staab, W., Kleinert, R., Maintz, D., and Baeßler, B.
2019. "Medical Students' Attitude Towards Artificial Intelligence: A Multicentre Survey,"
European Radiology (29:4), pp. 1640-1646.
Doshi-Velez, F., and Kim, B. 2017. "Towards a Rigorous Science of Interpretable Machine Learning,"
arXiv preprint arXiv:1702.08608.
Došilović, . K., Brčić, M., and Hlupić, N. 2018. "Explainable Artificial Intelligence: A Survey," in:
International convention on information and communication technology, electronics and
microelectronics (MIPRO). Opatija, Croatia: IEEE, pp. 210-215.
Doty, D. H., and Glick, W. H. 1994. "Typologies as a Unique Form of Theory Building: Toward
Improved Understanding and Modeling," Academy of Management Review (19:2), pp. 230-251.
Dou, D., and Zhou, S. 2016. "Comparison of Four Direct Classification Methods for Intelligent Fault
Diagnosis of Rotating Machinery," Applied Soft Computing (46), pp. 459-468.
Dowdeswell, B., Sinha, R., and MacDonell, S. G. 2020. "Finding Faults: A Scoping Study of Fault
Diagnostics for Industrial Cyber–Physical Systems," Journal of Systems and Software (168),
pp. 1-16.
Dragomir, O. E., Gouriveau, R., Dragomir, F., Minca, E., and Zerhouni, N. 2009. "Review of Prognostic
Problem in Condition-Based Maintenance," in: European Control Conference (ECC).
Budapest, Hungary: IEEE, pp. 1587-1592.
Artificial Intelligence for Human Decision-Makers
230
Du, M., Liu, N., Song, Q., and Hu, X. 2018. "Towards Explanation of Dnn-Based Prediction with
Guided Feature Inversion," in: International Conference on Knowledge Discovery & Data
Mining (SIGKDD). London, England: ACM, pp. 1358-1367.
Duscheck, F., R., B., and S., G. 2017. "Predictive Maintenance Red Paper | Bearingpoint." Retrieved
20/06/2020, from https://www.bearingpoint.com/files/BearingPoint_Studie_Maintenance_.pdf
Duscheck, J. 2017. "Wearable Sensors Can Tell When You Are Getting Sick." Stanford Medicine.
Dutta, R., Mueller, H., and Liang, D. 2018. "An Interactive Architecture for Industrial Scale Prediction:
Industry 4.0 Adaptation of Machine Learning," in: International Systems Conference (SysCon).
Vancouver, Canada: IEEE, pp. 1-5.
Duval, A. 2019. "Explainable Artificial Intelligence (Xai)," MA4K9 Scholarly Report, Mathematics
Institute, The University of Warwick).
Dwivedi, Y. K., Rana, N. P., Jeyaraj, A., Clement, M., and Williams, M. D. 2019. "Re-Examining the
Unified Theory of Acceptance and Use of Technology (Utaut): Towards a Revised Theoretical
Model," Information Systems Frontiers (21:3), pp. 719-734.
Ehsan, U., Harrison, B., Chan, L., and Riedl, M. O. 2018. "Rationalization: A Neural Machine
Translation Approach to Generating Natural Language Explanations," in: Conference on AI,
Ethics, and Society (AIES). New York, United States: ACM, pp. 81-87.
Ehsan, U., Tambwekar, P., Chan, L., Harrison, B., and Riedl, M. O. 2019. "Automated Rationale
Generation: A Technique for Explainable Ai and Its Effects on Human Perceptions," in:
International Conference on Intelligent User Interfaces (IUI). Los Angeles, United States:
ACM, pp. 263-274.
Einhorn, H. J., and Hogarth, R. M. 1986. "Judging Probable Cause," Psychological Bulletin (99:1), p.
3.
Eiras-Franco, C., Guijarro-Berdiñas, B., Alonso-Betanzos, A., and Bahamonde, A. 2019. "A Scalable
Decision-Tree-Based Method to Explain Interactions in Dyadic Data," Decision Support
Systems (127), pp. 1-10.
Eisenfuhr, F. 2011. "Decision Making," Academy of Management Review (19:2), pp. 312-330.
El Bekri, N., Kling, J., and Huber, M. F. 2019. "A Study on Trust in Black Box Models and Post-Hoc
Explanations," in: International Workshop on Soft Computing Models in Industrial and
Environmental Applications. Seville, Spain: Springer, pp. 35-46.
Elattar, H. M., Elminir, H. K., and Riad, A. 2016. "Prognostics: A Literature Review," Complex &
Intelligent Systems (2:2), pp. 125-154.
Elliott, D., and Griffiths, B. 1990. "A Low Cost Artificial Intelligence Vision System for Piece Part
Recognition and Orientation," International Journal of Production Research (28:6), pp. 1111-
1121.
Elshawi, R., Al-Mallah, M. H., and Sakr, S. 2019. "On the Interpretability of Machine Learning-Based
Model for Predicting Hypertension," BMC Medical Informatics and Decision Making (19:1),
pp. 146-178.
Epley, N., Waytz, A., and Cacioppo, J. T. 2007. "On Seeing Human: A Three-Factor Theory of
Anthropomorphism," Psychological Review (114:4), pp. 864-886.
Er, M., Arsad, N., Astuti, H. M., Kusumawardani, R. P., and Utami, R. A. 2018. "Analysis of Production
Planning in a Global Manufacturing Company with Process Mining," Journal of Enterprise
Information Management (31:2), pp. 317-337.
Esfandiari, R., and Sokhanvar, F. 2016. "Modified Unified Theory of Acceptance and Use of
Technology in Investigating Iranian Language Learners’ Attitudes toward Mobile Assisted
Language Learning (Mall)," Interdisciplinary Journal of Virtual Learning in Medical Sciences
(6:4), pp. 93-105.
Europäische Kommission. 2016. "Factories of the Future Ppp: Towards Competitive Eu
Manufacturing," Europäische Kommission, Brüssel, Belgium.
Evans, B. P., Xue, B., and Zhang, M. 2019. "What's inside the Black-Box?: A Genetic Programming
Method for Interpreting Complex Machine Learning Models," in: Genetic and Evolutionary
Computation Conference (GECCO). Prague, Czech Republic: ACM, pp. 1012-1020.
Artificial Intelligence for Human Decision-Makers
231
Evans, J. S. B. T., Barston, J. L., and Pollard, P. 1983. "On the Conflict between Logic and Belief in
Syllogistic Reasoning," Memory & Cognition (11:3), pp. 295-306.
Evans, P. C., and Annuziata, M. 2012. "Industrial Internet: Pushing the Boundaries of Minds and
Machines," General Electric, Boston, United States.
Even, A., and Shankaranarayan, G. 2007. "Utility-Driven Assessment of Data Quality," ACM SIGMIS
Database (38:2), pp. 75-93.
Fan, W., Liu, J., Zhu, S., and Pardalos, P. M. 2018. "Investigating the Impacting Factors for the
Healthcare Professionals to Adopt Artificial Intelligence-Based Medical Diagnosis Support
System (Aimdss)," Annals of Operations Research (294), pp. 567-592.
Fauvel, K., Masson, V., Fromont, E., Faverdin, P., and Termier, A. 2019. "Towards Sustainable Dairy
Management-a Machine Learning Enhanced Method for Estrus Detection," in: International
Conference on Knowledge Discovery & Data Mining (SIGKDD). Anchorage, United States:
ACM, pp. 3051-3059.
Fawaz, H. I., Forestier, G., Weber, J., Idoumghar, L., and Muller, P.-A. 2019. "Accurate and
Interpretable Evaluation of Surgical Skills from Kinematic Data Using Fully Convolutional
Neural Networks," International Journal of Computer Assisted Radiology and Surgery (14:9),
pp. 1611-1617.
Fay, M., and Kazantsev, N. 2018. "When Smart Gets Smarter: How Big Data Analytics Creates Business
Value in Smart Manufacturing," in: International Conference on Information Systems (ICIS).
San Francisco, CA: AIS, pp. 1-9.
Fayyad, U., Piatetsky-Shapiro, G., and Smyth, P. 1996. "From Data Mining to Knowledge Discovery in
Databases," AI Magazine (17:3), p. 37.
elten, E. 2017. "What Does It Mean to Ask for an “Explainable” Algorithm." Retrieved 06 18 2020,
from https://freedom-to-tinker.com/2017/05/31/what-does-it-mean-to-ask-for-an-explainable-
algorithm/
Ferber, J., and Weiss, G. 1999. Multi-Agent Systems: An Introduction to Distributed Artificial
Intelligence. Boston, United States: Addison-Wesley Reading.
Ferreira, D., Zacarias, M., Malheiros, M., and Ferreira, P. 2007. "Approaching Process Mining with
Sequence Clustering: Experiments and Findings," in Bpm 2007, G. Alonso, P. Dadam and M.e.
Rosemann (eds.). Heidelberg, Germany: Springer, pp. 360-374.
Ferreira, D. R., and Gillblad, D. 2009. "Discovering Process Models from Unlabelled Event Logs," in
Bpm 2009, U. Dayal, J. Eder, J. Koehler and H.A.e. Reijers (eds.). Heidelberg, Germany:
Springer, pp. 143-158.
Fifka, M. 2013. "Corporate Responsibility Reporting and Its Determinants in Comparative Perspective
– a Review of the Empirical Literature and a Meta-Analysis," Business Strategy and the
Environment (22:1), pp. 1-35.
Fifka, M. 2014. "Einführung – Nachhaltigkeitsberichtserstattung: Eingrenzung Eines Heterogenen
Phänomen," in Csr Und Reporting – Nachhaltigkeits- Und Csr-Berichtserstattung Verstehen
Und Erfolgreich Umsetzen, M. Fifka (ed.). Berlin, Germany: Gabler Verlag, pp. 1-20.
Fifka, M., and Drabble, M. 2012. "Focus and Standardization of Sustainability Reporting. A
Comparative Study of the United Kingdom and Finland," Business Strategy and the
Environment (21:7), pp. 455-474.
Filonenko, A., and Jo, K. 2018. "Fast Fire Flame Detection on Videos Using Adaboost and Parallel
Processing," in: Industrial Cyber-Physical Systems (ICPS). St. Petersburg, Russia: IEEE, pp.
645-650.
Fishbein, M., and Ajzen, I. 1977. "Belief, Attitude, Intention, and Behavior: An Introduction to Theory
and Research," Philosophy and Rhetoric (10:2), pp. 130-132.
Foresight. 2013. "The Future of Manufacturing: A New Era of Oppurtunity and Challenge for the Uk -
Summary Report," The Government Office for Science, London, England.
Fornell, C., and Larcker, D. F. 1981. "Evaluating Structural Equation Models with Unobservable
Variables and Measurement Error," Journal of Marketing Research (18:1), pp. 39-50.
Artificial Intelligence for Human Decision-Makers
232
Förster, M., Klier, M., Kluge, K., and Sigler, I. 2020. "Evaluating Explainable Artifical Intelligence -
What Users Really Appreciate," in: European Conference on Information Systems (ECIS).
Marrakesh, Morocco: AIS.
Freeman, E. 2010. Strategic Management – a Stakeholder Approach. Cambridge, United States:
Cambridge University Press.
Freitas, A. A. 2014. "Comprehensible Classification Models: A Position Paper," ACM SIGKDD
Explorations Newsletter (15:1), pp. 1-10.
Freitas, A. A., Wieser, D. C., and Apweiler, R. 2008. "On the Importance of Comprehensible
Classification Models for Protein Function Prediction," IEEE/ACM Transactions on
Computational Biology and Bioinformatics (7:1), pp. 172-182.
Freundlieb, M., Gräuler, M., and Teuteberg, F. 2014. "Corporate Social Responsibility Reporting: A
Transnational Analysis of Online Corporate Social Responsibility Reports by Market-Listed
Companies: Contents and Their Evolution," International Journal of Innovation and
Sustainable Development (7:1), pp. 1-26.
Frost, G., and Martinov-Bennie, N. 2010. Sustainability Reporting Assurance: Market Trends and
Information Content. Melbourne, Australia: CPA Australia.
Früh, W. 1994. Realitätsvermittlung Durch Massenmedien. Wiesbaden, Germany: Westdeutscher
Verlag.
Fürnkranz, J., Kliegr, T., and Paulheim, H. 2020. "On Cognitive Preferences and the Plausibility of
Rule-Based Models," Machine Learning (109:4), pp. 853-898.
Futia, G., and Vetrò, A. 2020. "On the Integration of Knowledge Graphs into Deep Learning Models
for a More Comprehensible Ai," Information (11:2), pp. 122-132.
Gale, W., Oakden-Rayner, L., Carneiro, G., Palmer, L. J., and Bradley, A. P. 2019. "Producing
Radiologist-Quality Reports for Interpretable Deep Learning," in: International Symposium on
Biomedical Imaging (ISBI). Kalkutta, India: IEEE, pp. 1275-1279.
García, S., Fernández, A., Luengo, J., and Herrera, F. 2009. "A Study of Statistical Techniques and
Performance Measures for Genetics-Based Machine Learning: Accuracy and Interpretability,"
Soft Computing (13:10), pp. 959-977.
García, S., Ramírez-Gallego, S., Luengo, J., Benítez, J. M., and Herrera, F. 2016. "Big Data
Preprocessing: Methods and Prospects," Big Data Analytics (1:9), pp. 1-22.
Gawand, H. L., Bhattacharjee, A. K., and Roy, K. 2017. "Securing a Cyber Physical System in Nuclear
Power Plants Using Least Square Approximation and Computational Geometric Approach,"
Nuclear Engineering and Technology (49:3), pp. 484-494.
Géczy, P. 2014. "Big Data Characteristics," The Macrotheme Review (3:6), pp. 94-104.
Gefen, D., Straub, D., and Boudreau, M.-C. 2000. "Structural Equation Modeling and Regression:
Guidelines for Research Practice," Communications of the Association for Information Systems
(4:1), pp. 1-79.
George, G., Haas, M., and Pentland, A. 2014. "Big Data and Management," Academy of Management
Journal (57:2), pp. 321-326.
Ghahramani, Z. 2003. "Unsupervised Learning," in: Summer School on Machine Learning. Canberra,
Australia: Springer, pp. 72-112.
Ghalandari, K. 2012. "The Effect of Performance Expectancy, Effort Expectancy, Social Influence and
Facilitating Conditions on Acceptance of E-Banking Services in Iran: The Moderating Role of
Age and Gender," Middle-East Journal of Scientific Research (12:6), pp. 801-807.
Gilpin, L. H., Bau, D., Yuan, B. Z., Bajwa, A., Specter, M., and Kagal, L. 2018. "Explaining
Explanations: An Overview of Interpretability of Machine Learning," in: International
Conference on Data Science and Advanced Analytics (DSAA). Turin, Italy: IEEE, pp. 80-89.
Gölzer, P., Cato, P., and Amberg, M. 2015. "Data Processing Requirements of Industry 4.0 - Use Cases
for Big Data Applications," in: European Conference on Information Systems (ECIS). Münster,
Germany: AIS, pp. 1-13.
Gölzer, P., and Fritzsche, A. 2017. "Data-Driven Operations Management: Organisational Implications
of the Digital Transformation in Industrial Practice," Production Planning & Control (28:16),
pp. 1332-1343.
Artificial Intelligence for Human Decision-Makers
233
González-Rivero, M., Beijbom, O., Rodriguez-Ramirez, A., Bryant, D. E., Ganase, A., Gonzalez-
Marrero, Y., Herrera-Reveles, A., Kennedy, E. V., Kim, C. J., and Lopez-Marcano, S. 2020.
"Monitoring of Coral Reefs Using Artificial Intelligence: A Feasible and Cost-Effective
Approach," Remote Sensing (12:3), pp. 489-510.
Goodfellow, I., Bengio, Y., and Courville, A. 2016. Deep Learning. Cambridge, United States: MIT
Press
Goodman, B., and Flaxman, S. 2017. "European Union Regulations on Algorithmic Decision-Making
and a “Right to Explanation”," AI Magazine (38:3), pp. 50-57.
Gorry, A. G., and Morton, M. S. S. 1971. "A Framework for Management Information Systems," Sloan
Management Review (13), pp. 55-70.
Grant, M. J., and Booth, A. 2009. "A Typology of Reviews: An Analysis of 14 Review Types and
Associated Methodologies," Health Information & Libraries Journal (26:2), pp. 91-108.
Grazioli, G., Roy, S., and Butts, C. T. 2019. "Predicting Reaction Products and Automating Reactive
Trajectory Characterization in Molecular Simulations with Support Vector Machines," Journal
of Chemical Information and Modeling (59:6), pp. 2753-2764.
Gregor, S. 2006. "The Nature of Theory in Information Systems," MIS Quarterly (30:3), pp. 611-642.
Gregor, S., and Benbasat, I. 1999. "Explanations from Intelligent Systems: Theoretical Foundations and
Implications for Practice," MIS Quarterly (23:4), pp. 497-530.
Gretzel, U., and Fesenmaier, D. R. 2006. "Persuasion in Recommender Systems," International Journal
of Electronic Commerce (11:2), pp. 81-100.
GRI. 2016. "Gri G4 - Sustainability Reporting Guidelines."
Grice, H. P. 2019. "Logic and Conversation," in Speech Acts, P. Cole and J.L. Morgan (eds.). Leiden,
Netherlands: Brill, pp. 41-58.
Grigorescu, S., Trasnea, B., Cocias, T., and Macesanu, G. 2020. "A Survey of Deep Learning
Techniques for Autonomous Driving," Journal of Field Robotics (37:3), pp. 362-386.
Grimaldi, P., Lau, H., and Basso, M. A. 2015. "There Are Things That We Know That We Know, and
There Are Things That We Do Not Know We Do Not Know: Confidence in Decision-Making,"
Neuroscience & Biobehavioral Reviews (55), pp. 88-97.
Grover, V. 2019. "Surviving and Thriving in the Evolving Digital Age: A Peek into the Future of Is
Research and Practice," ACM SIGMIS Database: the DATABASE for Advances in Information
Systems (50:1), pp. 25-34.
Gubbi, J., Buyya, R., Marusic, S., and Palaniswami, M. 2013. "Internet of Things (Iot): A Vision,
Architectural Elements, and Future Directions," Future Generation Computer Systems (29:7),
pp. 1645-1660.
Guidotti, R., Monreale, A., Ruggieri, S., Pedreschi, D., Turini, F., and Giannotti, F. 2018a. "Local Rule-
Based Explanations of Black Box Decision Systems," arXiv preprint arXiv:1805.10820.
Guidotti, R., Monreale, A., Ruggieri, S., Turini, F., Giannotti, F., and Pedreschi, D. 2018b. "A Survey
of Methods for Explaining Black Box Models," ACM Computing Surveys (CSUR) (51:5), pp.
1-42.
Gunning, D., and Aha, D. 2019. "Darpa’s Explainable Artificial Intelligence (Xai) Program," AI
Magazine (40:2), pp. 44-58.
Gunning, D., Stefik, M., Choi, J., Miller, T., Stumpf, S., and Yang, G.-Z. 2019. "Xai - Explainable
Artificial Intelligence," Science Robotics (4:37), pp. 1-37.
Guo, K., Ren, S., Bhuiyan, M. Z. A., Li, T., Liu, D., Liang, Z., and Chen, X. 2019a. "Mdmaas: Medical-
Assisted Diagnosis Model as a Service with Artificial Intelligence and Trust," IEEE
Transactions on Industrial Informatics (16:3), pp. 2102-2114.
Guo, M., Zhang, Q., Liao, X., and Chen, Y. 2019b. "An Interpretable Machine Learning Framework for
Modelling Human Decision Behavior," arXiv preprint arXiv:1906.01233.
Guo, W. 2020. "Explainable Artificial Intelligence for 6g: Improving Trust between Human and
Machine," IEEE Communications Magazine (58:6), pp. 39-45.
Guo, W., Mu, D., Xu, J., Su, P., Wang, G., and Xing, X. 2018. "Lemna: Explaining Deep Learning
Based Security Applications," in: Conference on Computer and Communications Security
(CCS). Toronto, Canada: ACM, pp. 364-379.
Artificial Intelligence for Human Decision-Makers
234
Gupta, B., Dasgupta, S., and Gupta, A. 2008. "Adoption of Ict in a Government Organization in a
Developing Country: An Empirical Study," The Journal of Strategic Information Systems (17),
pp. 140-154.
Gürtürk, A., and Hahn, R. 2016. "An Empirical Assessment of Assurance Statements in Sustainability
Reports: Smoke Screens or Enlightening Information?," Journal of Cleaner Production (136),
pp. 30-41.
Guthrie, J., and Farneti, F. 2008. "Gri Sustainability Reporting by Australian Public Sector
Organizations," Public Money & Management (28:6), pp. 361-366.
Ha, S., and Stoel, L. 2009. "Consumer E-Shopping Acceptance: Antecedents in a Technology
Acceptance Model," Journal of Business Research (62:5), pp. 565-571.
Ha, T., Sah, Y. J., Park, Y., and Lee, S. 2020. "Examining the Effects of Power Status of an Explainable
Artificial Intelligence System on Users’ Perceptions," Behaviour & Information Technology),
pp. 1-13.
Haas, M. 2018. "Germany Industry 4.0 Index 2018," Staufen AG und Staufen Digital neonex GmbH,
Köngen, Germany.
Habek, P., and Wolniak, R. 2016. "Assessing the Quality of Corporate Social Responsibility Reports:
The Case of Reporting Practices in Selected European Union Member States," Quality &
Quantity (50:1), pp. 399-420.
Habermas, J., McCarthy, T., and McCarthy, T. 1984. The Theory of Communicative Action. Boston,
United States: Beacon Press.
Hair, J. F., Ringle, C. M., and Sarstedt, M. 2011. "Pls-Sem: Indeed a Silver Bullet," Journal of Marketing
Theory and Practice (19:2), pp. 139-152.
Halaška, M., and Šperka, R. 2018. "Process Mining - the Enhancement of Elements Industry 4.0," in:
International Conference on Computer and Information Sciences (ICCOINS). Singapore,
Singapore: IEEE, pp. 1-6.
Hamouda, M. 2011. "Selecting Sustainable Point-of-Use and Point-of-Entry Drinking Water Treatment:
A Decision Support System," in: Civil Engineering. Waterloo, Canada: University of Waterloo.
Hansmann, K., and Ringle, C. 2005. "Strategische Erfolgswirkung Einer Teilnahme an
Unternehmensnetzwerken: Eine Empirische Untersuchung," Die Unternehmung - Swiss
Journal of Business Research and Practice (59:3), pp. 217-236.
Hara, S., and Hayashi, K. 2016. "Making Tree Ensembles Interpretable," arXiv preprint
arXiv:1606.05390.
Haverkort, B. R., and Zimmermann, A. 2017. "Smart Industry: How Ict Will Change the Game!," IEEE
Internet Computing (21:1), pp. 8-10.
Hayashi, Y. 2018. "Use of a Deep Belief Network for Small High-Level Abstraction Data Sets Using
Artificial Intelligence with Rule Extraction," Neural Computation (30:12), pp. 3309-3326.
Hayes, B., and Shah, J. A. 2017. "Improving Robot Controller Transparency through Autonomous
Policy Explanation," in: International Conference on Human-Robot Interaction (HRI). Vienna,
Austria: ACM/IEEE, pp. 303-312.
He, Q. P., and Wang, J. 2018. "Statistics Pattern Analysis: A Statistical Process Monitoring Tool for
Smart Manufacturing," Computer Aided Chemical Engineering (44), pp. 2071-2076.
He, S.-G., He, Z., and Wang, G. A. 2013. "Online Monitoring and Fault Identification of Mean Shifts
in Bivariate Processes Using Decision Tree Learning Techniques," Journal of Intelligent
Manufacturing (24:1), pp. 25-34.
He, Y., Zhu, C., He, Z., Gu, C., and Cui, J. 2017. "Big Data Oriented Root Cause Identification Approach
Based on Axiomatic Domain Mapping and Weighted Association Rule Mining for Product
Infant Failure," Computers & Industrial Engineering (109), pp. 253-265.
Heath, C., and Gonzalez, R. 1995. "Interaction with Others Increases Decision Confidence but Not
Decision Quality: Evidence against Information Collection Views of Interactive Decision
Making," Organizational Behavior and Human Decision Processes (61:3), pp. 305-326.
Hebrado, J., Lee, H. J., and Choi, J. 2011. "The Role of Transparency and Feedback on the Behavioral
Intention to Reuse a Recommender System," in: International Conference on Information
Resources Management (CONF-IRM). Seoul, Korea: AIS, pp. 1-9.
Artificial Intelligence for Human Decision-Makers
235
Hebrado, J. L., Lee, H. J., and Choi, J. 2013. "Influences of Transparency and Feedback on Customer
Intention to Reuse Online Recommender Systems," Journal of Society for e-Business Studies
(18:2), pp. 279-299.
Hein, D., Rauschnabel, P., He, J., Richter, L., and Ivens, B. 2018. "What Drives the Adoption of
Autonomous Cars?," in: International Conference on Information Systems (ICIS). San
Francisco, United States: AIS, pp. 1-17.
Heinrich, B., and Klier, M. 2011. "Assessing Data Currency – a Probabilistic Approach.," Journal of
Information Science (37:1), pp. 86-100.
Heinrich, B., and Klier, M. 2015. "Datenqualitätsmetriken Für Ein Ökonomisch Orientiertes
Qualitätsmanagement," in Daten- Und Informationsqualität – Auf Dem Weg Zur Information
Excellence, K. Hildebrand, M. Gebauer, H. Hinrichs and M. Mielke (eds.). Wiesbaden,
Germany: Vieweg+Teubner, pp. 49-68.
Heinrich, K., Graf, J., Chen, J., Laurisch, J., and Zschech, P. 2020. "Fool Me Once, Shame on You, Fool
Me Twice, Shame on Me: A Taxonomy of Attack and De-Fense Patterns for Ai Security," in:
European Conference on Information Systems (ECIS). Marrakesh, Morocco: AIS, pp. 1-17.
Heinrich, K., Zschech, P., Skouti, T., Griebenow, J., and Riechert, S. 2019. "Demystifying the Black
Box: A Classification Scheme for Interpretation and Visualization of Deep Intelligent Systems,"
in: Americas Conference on Information Systems (AMCIS). Cancún, United States: pp. 1-10.
Henke, N., Bughin, J., Chui, M., Manyika, J., Saleh, T., Wiseman, B., and Sethupathy, G. 2016. "The
Age of Analytics: Competing in a Data-Driven World," McKinsey Global Institute, San
Francisco, United States.
Henkel AG. 2015. "Nachhaltigkeitsbericht."
Herm, L.-V., Wanner, J., Seubert, F., and Janiesch, C. 2021a. "B2share Repository „I Don’t Get It, but
It Seems Valid! The Connection between Explainability and Comprehensibility in (X)Ai
Research“."
Herm, L.-V., Wanner, J., Seubert, F., and Janiesch, C. 2021b. "I Don't Get It, but It Seems Valid! The
Connection between Explainability and Comprehensibility in (X)Ai Research," in: European
Conference on Information Systems (ECIS). Marrackech, Morocco: IEEE, pp. 1-17.
Hermann, M., Pentek, T., and Otto, B. 2015. "Design Principles for Industrie 4.0 Scenarios: A Literature
Review," TU Dortmund, Dortmund, Germany.
Hermann, M., Pentek, T., and Otto, B. 2016. "Design Principles for Industrie 4.0 Scenarios," in: Hawaii
International Conference on System Sciences (HICSS). Koloa, United States: IEEE, pp. 3928-
3937.
Hevner, A. R., March, S. T., Park, J., and Ram, S. 2004. "Design Science in Information Systems
Research," MIS Quarterly (28:1), pp. 75-105.
Hilton, D. J. 1996. "Mental Models and Causal Explanation: Judgements of Probable Cause and
Explanatory Relevance," Thinking & Reasoning (2:4), pp. 273-308.
Hinrichs, H. 2002. "Datenqualitätsmanagement in Data Warehouse-Systemen." Oldenburg, Germany:
University of Oldenburg.
Hodge, K., Subramaniam, N., and Stewart, J. 2009. "Assurance of Sustainability Reports: Impact on
Report Users’ Confidence and Perceptions of Information Credibility," Australian Accounting
Review (19:3), pp. 178-194.
Hoff, K. A., and Bashir, M. 2015. "Trust in Automation: Integrating Empirical Evidence on Factors That
Influence Trust," Human Factors (57:3), pp. 407-434.
Hoffman, R. R., Mueller, S. T., Klein, G., and Litman, J. 2018. "Metrics for Explainable Ai: Challenges
and Prospects," arXiv preprint arXiv:1812.04608.
Holsapple, C., Lee-Post, A., and Pakath, R. 2014. "A Unified Foundation for Business Analytics,"
Decision Support Systems (64), pp. 130-141.
Holzinger, A., Biemann, C., Pattichis, C. S., and Kell, D. B. 2017. "What Do We Need to Build
Explainable Ai Systems for the Medical Domain?," arXiv preprint arXiv:1712.09923.
Holzinger, A., Langs, G., Denk, H., Zatloukal, K., and Müller, H. 2019. "Causability and Explainability
of Artificial Intelligence in Medicine," Wiley Interdisciplinary Reviews: Data Mining and
Knowledge Discovery (9:4), pp. 1-13.
Artificial Intelligence for Human Decision-Makers
236
Hosanagar, K., and Jair, V. 2018. "We Need Transparency in Algorithms, but Too Much Can Backfire,"
Harvard Business Review (25), p. 2018.
Hsu, C.-Y., Kang, L.-W., and Weng, M.-F. 2016. "Big Data Analytics: Prediction of Surface Defects on
Steel Slabs Based on One Class Support Vector Machine," in: Conference on Information
Storage and Processing Systems (ISPS). Santa Clara, United States: ASME, pp. 1-3.
Hsu, C. L., Lin, J. C. C., and Chiang, H. S. 2013. "The Effects of Blogger Recommendations on
Customers’ Online Shopping Intentions," Internet Research (23:1), pp. 69-88.
Hsueh, J. 2018. "Governance Structure and the Credibility Gap: Experimental Evidence on Family
Businesses’ Sustainability Reporting," Journal of Business Ethics (153:2), pp. 547-568.
Hu, H., Jia, X., He, Q., Fu, S., and Liu, K. 2020. "Deep Reinforcement Learning Based Agvs Real-Time
Scheduling with Mixed Rule for Flexible Shop Floor in Industry 4.0," Computers & Industrial
Engineering (149), pp. 1-9.
Hu, Q., Lu, Y., Pan, Z., Gong, Y., and Yang, Z. 2021. "Can Ai Artifacts Influence Human Cognition?
The Effects of Artificial Autonomy in Intelligent Personal Assistants," International Journal of
Information Management (56), pp. 1-15.
Hu, S., Zhao, L., Yao, Y., and Dou, R. 2016. "A Variance Change Point Estimation Method Based on
Intelligent Ensemble Model for Quality Fluctuation Analysis," International Journal of
Production Research (54:19), pp. 5783-5797.
Hug, T., and Poscheschnik, G. 2010. Empirisch Forschen - Die Planung Und Umsetzung Von Projekten
Im Studium. Wien, Austria: UVK Verlagsgesellschaft.
Hummel, D., Schacht, S., and Maedche, A. 2016. "Determinants of Multi-Channel Behavior: Exploring
Avenues for Future Research in the Services Industry," in: International Conference on
Information Systems (ICIS). Dublin, Ireland: AIS, pp. 1-12.
Huysmans, J., Dejaeger, K., Mues, C., Vanthienen, J., and Baesens, B. 2011. "An Empirical Evaluation
of the Comprehensibility of Decision Table, Tree and Rule Based Predictive Models," Decision
Support Systems (51:1), pp. 141-154.
Hwang, W.-Y., Shih, T. K., Ma, Z.-H., Shadiev, R., and Chen, S.-Y. 2016. "Evaluating Listening and
Speaking Skills in a Mobile Game-Based Learning Environment with Situational Contexts,"
Computer Assisted Language Learning (29:4), pp. 639-657.
Hyndman, R. J. 2020. "A Brief History of Forecasting Competitions," International Journal of
Forecasting (36:1), pp. 7-14.
Ibrahim, M., Louie, M., Modarres, C., and Paisley, J. 2019. "Global Explanations of Neural Networks:
Mapping the Landscape of Predictions," in: Conference on AI, Ethics, and Society (AIES).
Honolulu, United States: ACM, pp. 279-287.
Indarsin, T., and Ali, H. 2017. "Attitude toward Using M-Commerce: The Analysis of Perceived
Usefulness Perceived Ease of Use, and Perceived Trust: Case Study in Ikens Wholesale Trade,
Jakarta–Indonesia," Saudi Journal of Business and Management Studies (2:11), pp. 995-1007.
Ioannou, I., and Serafeim, G. 2017. "The Consequences of Mandatory Corporate Sustainability
Reporting: Evidence from Four Countries," Harvard Business School Research Working Paper
(11-100), pp. 1-44.
Ishii, S., Yoshida, W., and Yoshimoto, J. 2002. "Control of Exploitation–Exploration Meta-Parameter
in Reinforcement Learning," Neural Networks (15:4-6), pp. 665-687.
Iwasaki, Y., Sawada, R., Stanev, V., Ishida, M., Kirihara, A., Omori, Y., Someya, H., Takeuchi, I.,
Saitoh, E., and Yorozu, S. 2019. "Identification of Advanced Spin-Driven Thermoelectric
Materials Via Interpretable Machine Learning," npj Computational Materials (5:1), pp. 1-6.
Jackson, C. M., Chow, S., and Leitch, R. A. 1997. "Toward an Understanding of the Behavioral Intention
to Use an Information System," Decision Sciences (28:2), pp. 357-389.
Jahirabadkar, S., and Kulkarni, P. 2013. "Scaf an Effective Approach to Classify Subspace Clustering
Algorithms," arXiv preprint arXiv:1304.3603.
James, G., Witten, D., Hastie, T., and Tibshirani, R. 2013. An Introduction to Statistical Learning. New
York, United States: Springer.
Janiesch, C., Zschech, P., and Heinrich, K. 2021. "Machine Learning and Deep Learning," Electronic
Markets (-), pp. 1-11.
Artificial Intelligence for Human Decision-Makers
237
Jardine, A. K., Lin, D., and Banjevic, D. 2006. "A Review on Machinery Diagnostics and Prognostics
Implementing Condition-Based Maintenance," Mechanical Systems and Signal Processing
(20:7), pp. 1483-1510.
Jetter, J., Eimecke, J., and Rese, A. 2018. "Augmented Reality Tools for Industrial Applications: What
Are Potential Key Performance Indicators and Who Benefits?," Computers in Human Behavior
(87), pp. 18-33.
Jin, X., Weiss, B. A., Siegel, D., and Lee, J. 2016. "Present Status and Future Growth of Advanced
Maintenance Technology and Strategy in Us Manufacturing," International Journal of
Prognostics and Health Management (7:Spec Iss on Smart Manufacturing PHM), pp. 1-35.
Johansson, U., Konig, R., and Niklasson, L. 2005. "Automatically Balancing Accuracy and
Comprehensibility in Predictive Modeling," in: International Conference on Information
Fusion (FUSION). Philadelphia, United States: IEEE, pp. 1554-1560.
Jöhnk, J., Röglinger, M., Thimmel, M., and Urbach, N. 2017. "How to Implement Agile It Setups: A
Taxonomy of Design Options," in: European Conference on Information Systems (ECIS).
Guimarães, Portugal: AIS, pp. 1521-1535.
Johns, G. 2006. "The Essential Impact of Context on Organizational Behavior," Academy of
Management Review (31:2), pp. 386-408.
Johnson-Laird, P. N. 1983. Mental Models: Towards a Cognitive Science of Language, Inference, and
Consciousness. Cambridge, United States: Harvard University Press.
Jones, N. A., Ross, H., Lynam, T., Perez, P., and Leitch, A. 2011. "Mental Models: An Interdisciplinary
Synthesis of Theory and Methods," Ecology and Society (16:1).
Joshi, A., Kale, S., Chandel, S., and Pal, D. K. 2015. "Likert Scale: Explored and Explained," Current
Journal of Applied Science and Technology (7:4), pp. 396-403.
Juang, C.-F., and Chen, C.-Y. 2012. "Data-Driven Interval Type-2 Neural Fuzzy System with High
Learning Accuracy and Improved Model Interpretability," IEEE Transactions on Cybernetics
(43:6), pp. 1781-1795.
Juliusson, E. Á., Karlsson, N., and Gärling, T. 2005. "Weighing the Past and the Future in Decision
Making," European Journal of Cognitive Psychology (17:4), pp. 561-575.
Kagermann, H., Wahlster, W., and Helbig, J. 2013. "Umsetzungsempfehlung Für Das Zukunftsprojekt
Industrie 4.0 - Deutschlands Zukunft Als Produktionsstandort Sichern - Abschlussbereicht Des
Arbeitskreises Industrie 4.0.," Forschungsunion Wirtschaft – Wissenschaft/acatech, Frankfurt,
Germany.
Kanawaday, A., and Sane, A. 2017. "Machine Learning for Predictive Maintenance of Industrial
Machines Using Iot Sensor Data," in: International Conference on Software Engineering and
Service Science (ICSESS). Beijing, China: IEEE, pp. 87-90.
Kang, H.-S., Lee, J. Y., Choi, S., Kim, H., Park, J. H., Son, J. Y., Kim, B. H., and Noh, S. D. 2016.
"Smart Manufacturing: Past Research, Present Findings, and Future Directions," International
Journal of Precision Engineering and Manufacturing - Green Technology (3:1), pp. 111-128.
Kang, Y., Cheng, I.-L., Mao, W., Kuo, B., and Lee, P.-J. 2019. "Towards Interpretable Deep Extreme
Multi-Label Learning," in: International Conference on Information Reuse and Integration for
Data Science (IRI). Los Angeles, United States: IEEE, pp. 69-74.
Karevan, Z., Mehrkanoon, S., and Suykens, J. A. 2015. "Black-Box Modeling for Temperature
Prediction in Weather Forecasting," in: International Joint Conference on Neural Networks
(IJCNN). Killarney, Ireland: IEEE, pp. 1-8.
Karimi, M., Wu, D., Wang, Z., and Shen, Y. 2019. "Deepaffinity: Interpretable Deep Learning of
Compound–Protein Affinity through Unified Recurrent and Convolutional Neural Networks,"
Bioinformatics (35:18), pp. 3329-3338.
Kasie, F. M., Bright, G., and Walker, A. 2017. "Decision Support Systems in Manufacturing: A Survey
and Future Trends," Journal of Modelling in Management (12:3), pp. 432–454.
Kaufman, L., and Rousseeuw, P. J. 2009. Finding Groups in Data: An Introduction to Cluster Analysis.
New York, United States: John Wiley & Sons.
Artificial Intelligence for Human Decision-Makers
238
Kaufman, S., Rosset, S., Perlich, C., and Stitelman, O. 2012. "Leakage in Data Mining: Formulation,
Detection, and Avoidance," ACM Transactions on Knowledge Discovery from Data (TKDD)
(6:4), pp. 15-36.
Kaur, K., and Rampersad, G. 2018. "Trust in Driverless Cars: Investigating Key Factors Influencing the
Adoption of Driverless Cars," Journal of Engineering and Technology Management (48), pp.
87-96.
Kaur, N., and Sood, S. K. 2015. "Cognitive Decision Making in Smart Industry," Computers in Industry
(74), pp. 151-161.
Kepecs, A., and Mainen, Z. F. 2012. "A Computational Framework for the Study of Confidence in
Humans and Animals," Philosophical Transactions of the Royal Society B: Biological Sciences
(367:1594), pp. 1322-1337.
Kepner, J., Gadepally, V., Michaleas, P., Schear, N., Varia, M., Yerukhimovich, A., and Cunningham,
R. 2014. "Computing on Masked Data: A High Performance Method for Improving Big Data
Veracity," High Performance Extreme Computing Conference (HPEC) (2014 IEEE), pp. 1-6.
Khakifirooz, M., Chien, C. F., and Chen, Y.-J. 2018. "Bayesian Inference for Mining Semiconductor
Manufacturing Big Data for Yield Enhancement and Smart Production to Empower Industry
4.0," Applied Soft Computing (68), pp. 990-999.
Khalilijafarabad, A., Helfert, M., and Ge, M. 2016. "Developing a Data Quality Research Taxonomy-
an Organizational Perspective," in: International Conference on Information Quality (ICIQ).
Ciudad Real, Spain: MIT, pp. 176-186.
Khan, S., and Yairi, T. 2018. "A Review on the Application of Deep Learning in System Health
Management," Mechanical Systems and Signal Processing (107), pp. 241-265.
Kim, D.-H., Kim, T. J., Wang, X., Kim, M., Quan, Y.-J., Oh, J. W., Min, S.-H., Kim, H., Bhandari, B.,
and Yang, I. 2018. "Smart Machining Process Using Machine Learning: A Review and
Perspective on Machining Industry," International Journal of Precision Engineering and
Manufacturing-Green Technology (5:4), pp. 555-568.
Kim, D. J. 2014. "A Study of the Multilevel and Dynamic Nature of Trust in E-Commerce from a Cross-
Stage Perspective," International Journal of Electronic Commerce (19:1), pp. 11-64.
Kim, J. 2019. " ear of Artificial Intelligence on People’s Attitudinal & Behavioral Attributes: An
Exploratory Analysis of Ai Phobia," Global Scientific Journals (7:10), pp. 9-20.
Kim, Y. J., Chun, J. U., and Song, J. 2009. "Investigating the Role of Attitude in Technology Acceptance
from an Attitude Strength Perspective," International Journal of Information Management
(29:1), pp. 67-77.
Kizilcec, R. F. 2016. "How Much Information? Effects of Transparency on Trust in an Algorithmic
Interface," in: Conference on Human Factors in Computing Systems (CHI). San Jose, United
States: ACM, pp. 2390-2395.
Kleine, A. 1995. Entscheidungstheoretische Aspekte Der Principal-Agent-Theorie. Heidelberg,
Germany: Springer-Verlag.
Kluge, A., and Termer, A. 2017. "Human-Centered Design (Hcd) of a Fault-Finding Application for
Mobile Devices and Its Impact on the Reduction of Time in Fault Diagnosis in the
Manufacturing Industry," Applied Ergonomics (59), pp. 170-181.
Knebel, S., and Seele, P. 2015. "Quo Vadis Gri? A (Critical) Assessment of Gri 3.1 a+ Non-Financial
Reports and Implications for Credibility and Standardization," Corporate Communications an
International Journal (20:2), pp. 196-212.
Kober, J., Bagnell, J. A., and Peters, J. 2013. "Reinforcement Learning in Robotics: A Survey," The
International Journal of Robotics Research (32:11), pp. 1238-1274.
Koh, P. W., and Liang, P. 2017. "Understanding Black-Box Predictions Via Influence Functions," in:
International Conference on Machine Learning (ICML). Sydney, Australia: ACM, pp. 1885-
1894.
Köhnken, G. 1990. Glaubwürdigkeit. Untersuchungen Zu Einem Psychologischen Konstrukt. Munich,
Germany: Psychologie-Verl.-Union.
Komiak, S. Y., and Benbasat, I. 2006. "The Effects of Personalization and Familiarity on Trust and
Adoption of Recommendation Agents," MIS Quarterly (30:4), pp. 941-960.
Artificial Intelligence for Human Decision-Makers
239
Koo, J., Kwac, J., Ju, W., Steinert, M., Leifer, L., and Nass, C. 2015. "Why Did My Car Just Do That?
Explaining Semi-Autonomous Driving Actions to Improve Driver Understanding, Trust, and
Performance," International Journal on Interactive Design and Manufacturing (IJIDeM) (9:4),
pp. 269-275.
Koochaki, J., Bokhorst, J., Wortmann, H., and Klingenberg, W. 2011. "Evaluating Condition Based
Maintenance Effectiveness for Two Processes in Series," Journal of Quality in Maintenance
Engineering (17:4), pp. 399-414.
Kothamasu, R., Huang, S. H., and VerDuin, W. H. 2006. "System Health Monitoring and Prognostics—
a Review of Current Paradigms and Practices," The International Journal of Advanced
Manufacturing Technology (28:9-10), pp. 1012-1024.
Kotsiantis, S. B., Zaharakis, I., and Pintelas, P. 2007. "Supervised Machine Learning: A Review of
Classification Techniques," Emerging Artificial Intelligence Applications in Computer
Engineering (160:1), pp. 3-24.
Kourou, K., Exarchos, T. P., Exarchos, K. P., Karamouzis, M. V., and Fotiadis, D. I. 2015. "Machine
Learning Applications in Cancer Prognosis and Prediction," Computational and Structural
Biotechnology Journal (13), pp. 8-17.
Kovalerchuk, B., and Neuhaus, N. 2018. "Toward Efficient Automation of Interpretable Machine
Learning," in: International Conference on Big Data (Big Data). Seattle, United States: IEEE,
pp. 4940-4947.
Kozjek, D., Kralj, D., and Butala, P. 2017. "A Data-Driven Holistic Approach to Fault Prognostics in a
Cyclic Manufacturing Process," Procedia CIRP (63), pp. 664-669.
Kraus, M., and Feuerriegel, S. 2019. "Forecasting Remaining Useful Life: Interpretable Deep Learning
Approach Via Variational Bayesian Inferences," Decision Support Systems (125), pp. 1-13.
Krcmar, H. 2015. Informationsmanagement. Berlin, Germany: Springer Gabler Verlag.
Kroll, J. A. 2018. "The Fallacy of Inscrutability," Philosophical Transactions of the Royal Society A:
Mathematical, Physical and Engineering Sciences (376:2133), pp. 1-14.
Kubat, M. 2017. An Introduction to Machine Learning. Springer.
Kuhl, N., Lobana, J., and Meske, C. 2019. "Do You Comply with Ai? - Personalized Explanations of
Learning Algorithms and Their Impact on Employees' Compliance Behavior," in: International
Conference on Information Systems (ICIS). Munich, Germany: AIS, pp. 1-6.
Kühnle, S., and Dingelstedt, A. 2014. "Kausalität," in Handbuch Methoden Der Empirischen
Sozialforschung, N. Baur and J. Blasius (eds.). Wiesbaden, Germany: VS Verlag für
Sozialwissenschaften, pp. 1017-1028.
Kulesza, T., Stumpf, S., Burnett, M., Yang, S., Kwan, I., and Wong, W.-K. 2013. "Too Much, Too
Little, or Just Right? Ways Explanations Impact End Users' Mental Models," in: Symposium on
Visual Languages and Human Centric Computing. San Jose, United States: IEEE, pp. 3-10.
Kumar, S. L. 2017. "State of the Art-Intense Review on Artificial Intelligence Systems Application in
Process Planning and Manufacturing," Engineering Applications of Artificial Intelligence (65),
pp. 294-329.
Kumru, M., and Kumru, P. Y. 2014. "Using Artificial Neural Networks to Forecast Operation Times in
Metal Industry," International Journal of Computer Integrated Manufacturing (27:1), pp. 48-
59.
Kunreuther, H., Meyer, R., Zeckhauser, R., Slovic, P., Schwartz, B., Schade, C., Luce, M. F., Lippman,
S., Krantz, D., and Kahn, B. 2002. "High Stakes Decision Making: Normative, Descriptive and
Prescriptive Considerations," Marketing Letters (13:3), pp. 259-268.
Kuo, Y.-H., and Kusiak, A. 2018. "From Data to Big Data in Production Research: The Past and Future
Trends," International Journal of Production Research (57:15-16), pp. 4828-4853.
Kusiak, A. 2018. "Smart Manufacturing," International Journal of Production Research (56:1-2), pp.
508-517.
Kwon, O., Lee, N., and Shin, B. 2014. "Data Quality Management, Data Usage Experience and
Acquisition Intention of Big Data Analytics," International Journal of Information
Management (34:3), pp. 387-394.
Artificial Intelligence for Human Decision-Makers
240
La Cava, W., Williams, H., Fu, W., Vitale, S., Srivatsan, D., and Moore, J. H. 2021. "Evaluating
Recommender Systems for Ai-Driven Biomedical Informatics," Bioinformatics (37:2), pp. 250-
256.
Lage, I., Ross, A., Gershman, S. J., Kim, B., and Doshi-Velez, F. 2018. "Human-in-the-Loop
Interpretability Prior," in: Conference on Neural Information Processing Systems (NeurIPS).
Montréal: NIPS Foundation, pp. 10159-10168.
Lai, V., and Tan, C. 2019. "On Human Predictions with Explanations and Predictions of Machine
Learning Models: A Case Study on Deception Detection," in: Conference on Fairness,
Accountability, and Transparency (FAT). Atlanta , United States: ACM, pp. 29-38.
Lakkaraju, H., Bach, S. H., and Leskovec, J. 2016. "Interpretable Decision Sets: A Joint Framework for
Description and Prediction," in: International Conference on Knowledge Discovery and Data
Mining (SIGKDD). San Francisco, United States: ACM, pp. 1675-1684.
Lakkaraju, H., Kamar, E., Caruana, R., and Leskovec, J. 2019. "Faithful and Customizable Explanations
of Black Box Models," in: Conference on AI, Ethics, and Society (AIES). Honolulu, United
States: ACM, pp. 131-138.
Lamnek, S., and Krell, C. 2010. Qualitative Sozialforschung. Weinheim, Switzerland: Psych.-Verl.-
Union.
Lamy, J.-B., Sekar, B., Guezennec, G., Bouaud, J., and Séroussi, B. 2019. "Explainable Artificial
Intelligence for Breast Cancer: A Visual Case-Based Reasoning Approach," Artificial
Intelligence in Medicine (94), pp. 42-53.
Lane, N. D., Bhattacharya, S., Georgiev, P., Forlivesi, C., Jiao, L., Qendro, L., and Kawsar, F. 2016.
"Deepx: A Software Accelerator for Low-Power Deep Learning Inference on Mobile Devices,"
in: International Conference on Information Processing in Sensor Networks (IPSN). Vienna,
Austria: IEEE, pp. 1-12.
LaValle, S., Lesser, E., Shockley, R., Hopkins, M. S., and Kruschwitz, N. 2011. "Big Data, Analytics
and the Path from Insights to Value," MIT Sloan Management Review (52:2), pp. 21-32.
Lavrova, D., Poltavtseva, M., and Shtyrkina, A. 2018. "Security Analysis of Cyber-Physical Systems
Network Infrastructure," in: Industrial Cyber-Physical Systems (ICPS). St. Petersburg, Russia:
IEEE, pp. 818-823.
Lech, P. 2013. "Time, Budget, and Functionality? - It Project Success Criteria Revised," Information
Systems Management (30:3), pp. 263-275.
LeCun, Y., Bengio, Y., and Hinton, G. 2015. "Deep Learning," Nature (521:7553), pp. 436-444.
Lee, E. A. 2008. "Cyber Physical Systems: Design Challenges," in: Symposium on Object Oriented
Real-Time Distributed Computing. Washington, United States: IEEE, pp. 363-369.
Lee, G. Y., Kim, M., Quan, Y. J., Kim, M. S., Kim, T. J. Y., Yoon, H. S., Min, S., Kim, D. H., Mun, J.
W., Oh, J. W., Choi, I. G., Kim, C. S., Chu, W. S., Yang, J., Bhandari, B., Lee, C. M., Ihn, J.
B., and Ahn, S. H. 2018. "Machine Health Management in Smart Factory: A Review," Journal
of Mechanical Science and Technology (32:3), pp. 987-1009.
Lee, H. L., and Rosenblatt, M. J. 1987. "Simultaneous Determination of Production Cycle and
Inspection Schedules in a Production System," Management Science (33:9), pp. 1125-1136.
Lee, J.-H., and Song, C.-H. 2013. "Effects of Trust and Perceived Risk on User Acceptance of a New
Technology Service," Social Behavior and Personality: an International Journal (41:4), pp.
587-597.
Lee, J., Ghaffari, M., and Elmeligy, S. 2011. "Self-Maintenance and Engineering Immune Systems:
Towards Smarter Machines and Manufacturing Systems," Annual Reviews in Control (35:1),
pp. 111-122.
Lee, J., Kao, H.-A., and Yang, S. 2014a. "Service Innovation and Smart Analytics for Industry 4.0 and
Big Data Environment," Procedia CIRP (16), pp. 3-8.
Lee, J., Wu, F., Zhao, W., Ghaffari, M., Liao, L., and Siegel, D. 2014b. "Prognostics and Health
Management Design for Rotary Machinery Systems—Reviews, Methodology and
Applications," Mechanical Systems and Signal Processing (42:1-2), pp. 314-334.
Lee, M. K. 2018. "Understanding Perception of Algorithmic Decisions: Fairness, Trust, and Emotion in
Response to Algorithmic Management," Big Data & Society (5:1), pp. 1-16.
Artificial Intelligence for Human Decision-Makers
241
Lee, M. K., and Turban, E. 2001. "A Trust Model for Consumer Internet Shopping," International
Journal of Electronic Commerce (6:1), pp. 75-91.
Leedy, P. D. 1989. Practical Research: Planning and Design. New York, United States: Macmillan
Publishing Company.
Lehrer, C., Wieneke, A., vom Brocke, J., Jung, R., and Seidel, S. 2018. "How Big Data Analytics
Enables Service Innovation: Materiality, Affordance, and the Individualization of Service,"
Journal of Management Information Systems (35:2), pp. 424-460.
Lei, Y., Li, N., Guo, L., Li, N., Yan, T., and Lin, J. 2018. "Machinery Health Prognostics: A Systematic
Review from Data Acquisition to Rul Prediction," Mechanical Systems and Signal Processing
(104), pp. 799-834.
Leung, J.-y., and Shek, D.-l. 2018. "Quantitative Research Methods," in Sage Encyclopedia of
Educational Research, Measurement, and Evaluation, B.e. Frey (ed.). Thousand Oaks, United
States: SAGE Publications, pp. 1349-1352.
Li, C., Tao, Y., Ao, W., Yang, S., and Bai, Y. 2018a. "Improving Forecasting Accuracy of Daily
Enterprise Electricity Consumption Using a Random Forest Based on Ensemble Empirical
Mode Decomposition," Energy (165), pp. 1220-1227.
Li, J.-Q., Yu, F. R., Deng, G., Luo, C., Ming, Z., and Yan, Q. 2017. "Industrial Internet: A Survey on
the Enabling Technologies, Applications, and Challenges," IEEE Communications Surveys &
Tutorials (19:3), pp. 1504-1526.
Li, K. 2015. "Made in China 2025," State Council of China, Beijing, China.
Li, N., Lei, Y., Yan, T., Li, N., and Han, T. 2018b. "A Wiener-Process-Model-Based Method for
Remaining Useful Life Prediction Considering Unit-to-Unit Variability," Transactions on
Industrial Electronics (66:3), pp. 2092-2101.
Li, Y., Yang, L., Yang, B., Wang, N., and Wu, T. 2019. "Application of Interpretable Machine Learning
Models for the Intelligent Decision," Neurocomputing (333), pp. 273-283.
Liang, Y. C., Lu, X., Li, W. D., and Wang, S. 2018. "Cyber Physical System and Big Data Enabled
Energy Efficient Machining Optimisation," Journal of Cleaner Production (187), pp. 46-62.
Librantz, A., Araújo, S., Alves, W., Belan, P., Mesquita, R., and Selvatici, A. 2017. "Artificial
Intelligence Based System to Improve the Inspection of Plastic Mould Surfaces," Journal of
Intelligent Manufacturing (28:1), pp. 181-190.
Liljenström, H., and Svedin, U. 2005. "System Features, Dynamics and Resilience - Some Introductory
Remarks," in Micro Meso Macro - Addressing Complex Systems Couplings, H. Liljenström and
U. Svedin (eds.). Singapore, Singapore: World Scientific Publishing, pp. 1-18.
Lim, P., Goh, C. K., Tan, K. C., and Dutta, P. 2014. "Estimation of Remaining Useful Life Based on
Switching Kalman Filter Neural Network Ensemble," in: Annual Conference of the Prognostics
and Health Management Society (PHM). Fort Worth, United States: IEEE, pp. 2–9.
Lingitz, L., Gallina, V., Ansari, F., Gyulai, D., Pfeiffer, A., and Monostori, L. 2018. "Lead Time
Prediction Using Machine Learning Algorithms: A Case Study by a Semiconductor
Manufacturer," Procedia CIRP (72), pp. 1051-1056.
Lipton, Z. C. 2018. "The Mythos of Model Interpretability: In Machine Learning, the Concept of
Interpretability Is Both Important and Slippery," Queue (16:3), pp. 31-57.
Lis, D., and Otto, B. 2021. "Towards a Taxonomy of Ecosystem Data Governance," in: Hawaii
International Conference on System Sciences (HICSS). Hawaii, United States: AIS, pp. 6067-
6076.
Liu, N., Kumara, S., and Reich, E. 2017. "Explainable Data-Driven Modeling of Patient Satisfaction
Survey Data," in: International Conference on Big Data (Big Data). Boston, United States:
IEEE, pp. 3869-3876.
Liu, X., Wang, X., and Matwin, S. 2018a. "Improving the Interpretability of Deep Neural Networks
with Knowledge Distillation," in: International Conference on Data Mining Workshops
(ICDMW). Singapore, Singapore: IEEE, pp. 905-912.
Liu, X., Wang, X., and Matwin, S. 2018b. "Interpretable Deep Convolutional Neural Networks Via
Meta-Learning," in: International Joint Conference on Neural Networks (IJCNN). Rio de
Janeiro, Brazil: IEEE, pp. 1-9.
Artificial Intelligence for Human Decision-Makers
242
Liu, Y., and Jin, S. 2013. "Application of Bayesian Networks for Diagnostics in the Assembly Process
by Considering Small Measurement Data Sets," The International Journal of Advanced
Manufacturing Technology (65:9-12), pp. 1229-1237.
Liu, Y., Liu, H., Zhang, B., and Wu, G. 2004. "Extraction of If-Then Rules from Trained Neural
Network and Its Application to Earthquake Prediction," in: International Conference on
Cognitive Informatics (ICCI). Victoria, Canada: IEEE, pp. 109-115.
Liu, Y., and Xu, X. 2017. "Industry 4.0 and Cloud Manufacturing: A Comparative Analysis," Journal
of Manufacturing Science and Engineering (139:3), pp. 1-8.
Lock, I. 2016. "Glaubwürdigkeit in Der Csr-Kommunikation – Entwicklung Eines Legitimitätsbasierten
Ansatzes," Publizistik (61), pp. 413-429.
Lock, I., and Seele, P. 2016. "The Credibility of Csr (Corporate Social Responsibility) Reports in
Europe," Journal of Cleaner Production (122), pp. 186-200.
Logg, J. M., Minson, J. A., and Moore, D. A. 2019. "Algorithm Appreciation: People Prefer Algorithmic
to Human Judgment," Organizational Behavior and Human Decision Processes (151), pp. 90-
103.
Lombrozo, T. 2006. "The Structure and Function of Explanations," Trends in Cognitive Sciences
(10:10), pp. 464-470.
Lotz, V., Himmel, S., and Ziefle, M. 2019. "You’re My Mate - Acceptance Factors for Human-Robot
Collaboration in Industry," in: International Conference on Competitive Manufacturing
(COMA). Stellenbosch, South Africa: Stellenbosch University, pp. 405-411.
Lou, S., Feng, Y., Zheng, H., Gao, Y., and Tan, J. 2018. "Data-Driven Customer Requirements
Discernment in the Product Lifecycle Management Via Intuitionistic Fuzzy Sets and
Electroencephalogram," Journal of Intelligent Manufacturing ( 31), pp. 1721–1736.
Loyola-González, O. 2019. "Black-Box Vs. White-Box: Understanding Their Advantages and
Weaknesses from a Practical Point of View," IEEE Access (7), pp. 154096-154113.
Lu, C., Wang, Z., and Zhou, B. 2017. "Intelligent Fault Diagnosis of Rolling Bearing Using Hierarchical
Convolutional Network Based Health State Classification," Advanced Engineering Informatics
(32), pp. 139-151.
Lu, J., Lee, D. D., Kim, T. W., and Danks, D. 2020. "Good Explanation for Algorithmic Transparency,"
in: Conference on AI, Ethics, and Society (AIES). New York, United States: ACM, pp. 1-64.
Lu, Y. 2017. "Industry 4.0: A Survey on Technologies, Applications and Open Research Issues,"
Journal of Industrial Information Integration (6), pp. 1-10.
Luangpaiboon, P. 2015. "Evolutionary Elements on Composite Ascent Algorithm for Multiple Response
Surface Optimisation," Journal of Intelligent Manufacturing (26:3), pp. 539-552.
Lukoianova, T., and Rubin, V. L. 2014. "Veracity Roadmap: Is Big Data Objective, Truthful and
Credible?," Advances in Classification Research Online (24:1), pp. 4-15.
Luna, J. M., Gennatas, E. D., Ungar, L. H., Eaton, E., Diffenderfer, E. S., Jensen, S. T., Simone, C. B.,
Friedman, J. H., Solberg, T. D., and Valdes, G. 2019. "Building More Accurate Decision Trees
with the Additive Tree," National Academy of Sciences (116:40), pp. 19887-19893.
Lundberg, S., and Lee, S.-I. 2017. "A Unified Approach to Interpreting Model Predictions," in:
International Conference on Neural Information Processing Systems (NeurlPS). Los Angeles,
United States: NIPS Foundation, pp. 4768-4777.
Lundberg, S. M., Erion, G., Chen, H., DeGrave, A., Prutkin, J. M., Nair, B., Katz, R., Himmelfarb, J.,
Bansal, N., and Lee, S.-I. 2020. "From Local Explanations to Global Understanding with
Explainable Ai for Trees," Nature Machine Intelligence (2:1), pp. 56-67.
Lunenburg, F. C. 2010. "The Decision Making Process," National Forum of Educational Administration
& Supervision Journal (27:4), pp. 1-12.
Luo, J., Yan, X., and Tian, Y. 2020. "Unsupervised Quadratic Surface Support Vector Machine with
Application to Credit Risk Assessment," European Journal of Operational Research (280:3),
pp. 1008-1017.
Luo, Y., Tseng, H.-H., Cui, S., Wei, L., Ten Haken, R. K., and El Naqa, I. 2019. "Balancing Accuracy
and Interpretability of Machine Learning Approaches for Radiation Treatment Outcomes
Modeling," BJR| Open (1:1), pp. 1-12.
Artificial Intelligence for Human Decision-Makers
243
Lustig, I., Dietrich, B., Johnson, C., and Dziekan, C. 2010. "The Analytics Journey," Analytics Magazine
(3:6), pp. 11-13.
Lv, Y., and Lin, D. 2017. "Design an Intelligent Real-Time Operation Planning System in Distributed
Manufacturing Network," Industrial Management & Data Systems (117:4), pp. 742-753.
Ma, H., Chu, X., Xue, D., and Chen, D. 2017. "A Systematic Decision Making Approach for Product
Conceptual Design Based on Fuzzy Morphological Matrix," Expert Systems with Applications
(81), pp. 444-456.
Madsen, M., and Gregor, S. 2000. "Measuring Human-Computer Trust," in: Australasian Conference
on Information Systems (ACIS). Brisbane, Australia: AIS, pp. 6-8.
Malhotra, P., TV, V., Ramakrishnan, A., Anand, G., Vig, L., Agarwal, P., and Shroff, G. 2016. "Multi-
Sensor Prognostics Using an Unsupervised Health Index Based on Lstm Encoder-Decoder,"
arXiv preprint arXiv:1608.06154.
Manetti, G. 2011. "The Quality of Stakeholder Engagement in Sustainability Reporting: Empirical
Evidence and Critical Points," Corporate Social Responsibility and Environmental
Management (18), pp. 110-122.
Manetti, G., and Becatti, L. 2009. "Assurance Services for Sustainability Reports: Standards and
Empirical Evidence," Journal of Business Ethics (87:1), pp. 289-298.
Manetti, G., and Toccafondi, S. 2012. "The Role of Stakeholders in Sustainability Reporting
Assurance," Journal of Business Ethics (107:3), pp. 363-377.
Mansouri, S., Kaghazi, B., and Khormali, N. 2010. "Survey of Students Attitude About M-Learning in
Gonbad Payam-Noor University," in: The first Conference of Mobile Value-added Services in
Iran. Tehran, Iran: unkown, pp. 1-9.
Marangunić, N., and Granić, A. 2015. "Technology Acceptance Model: A Literature Review from 1986
to 2013," Universal Access in the Information Society (14:1), pp. 81-95.
March, S. T., and Smith, G. F. 1995. "Design and Natural Science Research on Information
Technology," Decision Support Systems (15:4), pp. 251-266.
Markus, M. L., Majchrzak, A., and Gasser, L. 2002. "A Design Theory for Systems That Support
Emergent Knowledge Processes," MIS Quarterly (26:3), pp. 179-212.
Marshal, M. 1988. "Iris Data Set." Retrieved 05/01/2020, from
https://archive.ics.uci.edu/ml/datasets/iris
Marsland, S. 2015. Machine Learning: An Algorithmic Perspective. New York, United States: CRC
Press.
Matetic, M. 2019. "Mining Learning Management System Data Using Interpretable Neural Networks,"
in: International Convention on Information and Communication Technology, Electronics and
Microelectronics (MIPRO). Opatija, Croatia: IEEE, pp. 1282-1287.
Matlin, G., and Land O'Lakes, I. 1979. "What Is the Value of Investment in Information Systems?," MIS
Quarterly (3:3), pp. 5-34.
Mayer, R. C., Davis, J. H., and Schoorman, F. D. 1995. "An Integrative Model of Organizational Trust,"
Academy of Management Review (20:3), pp. 709-734.
Mayer, R. E. 2005. The Cambridge Handbook of Multimedia Learning. Cambridge, United States:
Cambridge University Press.
Mazzolini, R. 1981. "How Strategic Decisions Are Made," Long Range Planning (14:3), pp. 85-96.
Mbuli, J., Trentesaux, D., Clarhaut, J., and Branger, G. 2017. "Decision Support in Condition-Based
Maintenance of a Fleet of Cyber-Physical Systems: A Fuzzy Logic Approach," in: Intelligent
Systems Conference (IntelliSys). London, United Kingdom: IEEE, pp. 82-89.
McCann Michael, J. A. 2008. "Secom Data Set " Retrieved 05/05/2020, from
archive.ics.uci.edu/ml/datasets/secom
McGovern, A., Lagerquist, R., John Gagne, D., Jergensen, G. E., Elmore, K. L., Homeyer, C. R., and
Smith, T. 2019. "Making the Black Box More Transparent: Understanding the Physical
Implications of Machine Learning," Bulletin of the American Meteorological Society (100:11),
pp. 2175-2199.
Artificial Intelligence for Human Decision-Makers
244
McKinney, V., Yoon, K., and Zahedi, F. M. 2002. "The Measurement of Web-Customer Satisfaction:
An Expectation and Disconfirmation Approach," Information Systems Research (13:3), pp. 296-
315.
McKnight, D. H., Carter, M., Thatcher, J. B., and Clay, P. F. 2011. "Trust in a Specific Technology: An
Investigation of Its Components and Measures," ACM Transactions on Management
Information Systems (TMIS) (2:2), pp. 1-25.
McKnight, D. H., and Chervany, N. L. 2000. "What Is Trust? A Conceptual Analysis and an
Interdisciplinary Model," in: Americas Conference on Information Systems (AMCIS). Long
Beach, United States: AIS, pp. 827-833.
McKnight, D. H., Choudhury, V., and Kacmar, C. 2002. "Developing and Validating Trust Measures
for E-Commerce: An Integrative Typology," Information Systems Research (13:3), pp. 334-
359.
McKnight, D. H., Cummings, L. L., and Chervany, N. L. 1998. "Initial Trust Formation in New
Organizational Relationships," Academy of Management Review (23:3), pp. 473-490.
Meade, A. W., and Craig, S. B. 2012. "Identifying Careless Responses in Survey Data," Psychological
Methods (17:3), p. 437.
Mell, P., and Grance, T. 2011. "The Nist Definition of Cloud Computing," National Institute of
Standards and Technology, Gaithersburg, United States.
Meng, X.-L., Rosenthal, R., and Rubin, D. B. 1992. "Comparing Correlated Correlation Coefficients,"
Psychological Bulletin (111:1), pp. 172-175.
Mercado, J. E., Rupp, M. A., Chen, J. Y., Barnes, M. J., Barber, D., and Procci, K. 2016. "Intelligent
Agent Transparency in Human–Agent Teaming for Multi-Uxv Management," Human Factors
(58:3), pp. 401-415.
Mey, G., and Mruck, K. 2011. "Qualitative Interviews," in Qualitative Marktforschung in Theorie Und
Praxis, G. Naderer and E.e. Balzer (eds.). Wiesbaden, Germany: Springer, pp. 258-288.
Michnik, J., and Lo, M.-C. 2009. "The Assessment of the Information Quality with the Aid of Multiple
Criteria Analysis," European Journal of Operational Research (195), pp. 850-856.
Miller, D. D., and Brown, E. W. 2018. "Artificial Intelligence in Medical Practice: The Question to the
Answer?," The American Journal of Medicine (131:2), pp. 129-133.
Miller, T. 2019. "Explanation in Artificial Intelligence: Insights from the Social Sciences," Artificial
Intelligence (267), pp. 1-38.
Miller, T., Howe, P., and Sonenberg, L. 2017. "Explainable Ai: Beware of Inmates Running the Asylum
Or: How I Learnt to Stop Worrying and Love the Social and Behavioural Sciences," arXiv
preprint arXiv:1712.00547.
Milne, M., and Gray, R. 2013. "W(H)Ither Ecology? The Triple Bottom Line, the Global Reporting
Initiative, and Corporate Sustainability Reporting," Journal of Business Ethics (118), pp. 13-29.
Milojevic, M., and Nassah, F. 2018. "Digital Industrial Revolution with Predictive Maintenance - Are
European Businesses Ready to Streamline Their Operations and Reach Higher Levels of
Efficiency," CXP Group, London, United Kingdom.
Mintzberg, H., Raisinghani, D., and Theoret, A. 1976. "The Structure of "Unstructured" Decision
Processes," Administrative Science Quarterly (21:2), pp. 246-275.
Mishra, S., and Modi, S. 2013. "Positive and Negative Corporate Social Responsibility, Financial
Leverage, and Idiosyncratic Risk," Journal of Business Ethics (117:2), pp. 431-448.
Mittal, S., Khan, M. A., Romero, D., and Wuest, T. 2017. "Smart Manufacturing: Characteristics,
Technologies and Enabling Factors," Proceedings of the Institution of Mechanical Engineers,
Part B: Journal of Engineering Manufacture (233:5), pp. 1342-1361.
Mohseni, S., Zarei, N., and Ragan, E. D. 2018. "A Survey of Evaluation Methods and Measures for
Interpretable Machine Learning," arXiv preprint arXiv:1811.11839.
Mohseni, S., Zarei, N., and Ragan, E. D. 2021. "A Multidisciplinary Survey and Framework for Design
and Evaluation of Explainable Ai Systems," ACM Transactions on Interactive Intelligent
Systems (TiiS) (11:3-4), pp. 1-45.
Artificial Intelligence for Human Decision-Makers
245
Mokyr, J., Vickers, C., and Ziebarth, N. L. 2015. "The History of Technological Anxiety and the Future
of Economic Growth: Is This Time Different?," Journal of Economic Perspectives (29:3), pp.
31-50.
Molka-Danielsen, J., Engelseth, P., and Wang, H. 2018. "Large Scale Integration of Wireless Sensor
Network Technologies for Air Quality Monitoring at a Logistics Shipping Base," Journal of
Industrial Information Integration (10), pp. 20-28.
Monroe, W. S., Anthony, T., Tanik, M. M., and Skidmore, F. M. 2019. "Towards a Framework for
Validating Machine Learning Results in Medical Imaging: Opening the Black Box," in: Practice
and Experience in Advanced Research Computing (PEARC). Chicago, United States: ACM, pp.
1-5.
Moore, G. C., and Benbasat, I. 1991. "Development of an Instrument to Measure the Perceptions of
Adopting an Information Technology Innovation," Information Systems Research (2:3), pp.
192-222.
Morhardt, J., Baird, S., and Freeman, K. 2002. "Scoring Corporate Environmental and Sustainability
Reports Using Gri 2000, Iso 14031 and Other Criteria," Corporate Social Responsibility and
Environmental Management (9), pp. 215-233.
Morocho-Cayamcela, M. E., Lee, H., and Lim, W. 2019. "Machine Learning for 5g/B5g Mobile and
Wireless Communications: Potential, Limitations, and Future Directions," IEEE Access (7), pp.
137184-137206.
Mortenson, M. J., Doherty, N. F., and Robinson, S. 2015. "Operational Research from Taylorism to
Terabytes: A Research Agenda for the Analytics Age," European Journal of Operational
Research (241), pp. 583-595.
Mothilal, R. K., Sharma, A., and Tan, C. 2020. "Explaining Machine Learning Classifiers through
Diverse Counterfactual Explanations," in: Conference on Fairness, Accountability, and
Transparency (FAT). Barcelona, Spain: ACM, pp. 607-617.
Moyne, J., Iskandar, J., Hawkins, P., Walker, T., Furest, A., Pollard, B., and Stark, D. 2013. "Deploying
an Equipment Health Monitoring Dashboard and Assessing Predictive Maintenance," in:
Advanced Semiconductor Manufacturing Conference (ASMC). New York, United States: IEEE,
pp. 105-110.
Muchiri, P., Pintelon, L., Gelders, L., and Martin, H. 2011. "Development of Maintenance Function
Performance Measurement Framework and Indicators," International Journal of Production
Economics (131:1), pp. 295-302.
Mueller, S. T., Hoffman, R. R., Clancey, W., Emrey, A., and Klein, G. 2019. "Explanation in Human-
Ai Systems: A Literature Meta-Review, Synopsis of Key Ideas and Publications, and
Bibliography for Explainable Ai," arXiv preprint arXiv:1902.01876.
Müller, M., Ostern, N., Koljada, D., Grunert, K., Rosemann, M., and Küpper, A. 2021. "Trust Mining:
Analyzing Trust in Collaborative Business Processes," IEEE Access (9), pp. 65044-65065.
Müller, O., Fay, M., and vom Brocke, J. 2018. "The Effect of Big Data and Analytics on Firm
Performance: An Econometric Analysis Considering Industry Characteristics," Journal of
Management Information Systems (35:2), pp. 488-509.
Müller, O., Junglas, I., Brocke, J. v., and Debortoli, S. 2016. "Utilizing Big Data Analytics for
Information Systems Research: Challenges, Promises and Guidelines," European Journal of
Information Systems (25:4), pp. 289-302.
Mungani, D. S., and Visser, J. K. 2013. "Maintenance Approaches for Different Production Methods,"
South African Journal of Industrial Engineering (24:3), pp. 1-13.
Murphy, W. H., and Gorchels, L. 1996. "How to Improve Product Management Effectiveness,"
Industrial Marketing Management (25:1), pp. 47-58.
Myers, M. D., and Avison, D. 2002. Qualitative Research in Information Systems. London, United
Kingdom: SAGE Publications.
Nachhaltigkeitskodex, D. 2016. "Nachhaltigkeitskodex Erfüllt Zukünftige Eu-Berichtspflichten."
Retrieved 03/04/2017, from http://www.deutscher-nachhaltigkeitskodex.de/de/dnk/eu-
berichtspflicht.html
Artificial Intelligence for Human Decision-Makers
246
Nadj, M., Knaeble, M., Li, M. X., and Maedche, A. 2020. "Power to the Oracle? Design Principles for
Interactive Labeling Systems in Machine Learning," KI-Künstliche Intelligenz (34), pp. 131–
142.
Nanayakkara, S., Fogarty, S., Tremeer, M., Ross, K., Richards, B., Bergmeir, C., Xu, S., Stub, D., Smith,
K., and Tacey, M. 2018. "Characterising Risk of in-Hospital Mortality Following Cardiac Arrest
Using Machine Learning: A Retrospective International Registry Study," PLoS Medicine
(15:11), p. e1002709.
Narayanan, M., Chen, E., He, J., Kim, B., Gershman, S., and Doshi-Velez, F. 2018. "How Do Humans
Understand Explanations from Machine Learning Systems? An Evaluation of the Human-
Interpretability of Explanation," arXiv preprint arXiv:1802.00682.
Natarajan, P., Frenzel, J. C., and Smaltz, D. H. 2017. Demystifying Big Data and Machine Learning for
Healthcare. Boca Raton, United States: CRC Press.
Natekar, P., Kori, A., and Krishnamurthi, G. 2020. "Demystifying Brain Tumor Segmentation
Networks: Interpretability and Uncertainty Analysis," Frontiers in Computational
Neuroscience (14), pp. 1-12.
Nath, A. G., Udmale, S. S., and Singh, S. K. 2020. "Role of Artificial Intelligence in Rotor Fault
Diagnosis: A Comprehensive Review," Artificial Intelligence Review (54:4), pp. 2609-2668.
National Research Foundation. 2016. "Research - Innovation - Enterprise (Rie) 2020," Ministry of Trade
and Industry, Singapore, Singapore.
Nawratil, U. 1999. "Glaubwürdigkeit Als Faktor Im Prozess Medialer Kommunikation," in
Glaubwürdigkeit Im Internet, P.e. Rössler and M. Wirth (eds.). Munich, Germany: Fischer, pp.
15-31.
Nawratil, U. 2006. Glaubwürdigkeit in Der Sozialen Kommunikation. Munich, Germany: Westdeutscher
Verlag.
Neely, A., Gregory, M., and Platts, K. 1995. "Performance Measurement System Design: A Literature
Review and Research Agenda," International Journal of Operations & Production
Management (15:4), pp. 80-116.
Neufeld, D. J., Dong, L., and Higgins, C. 2007. "Charismatic Leadership and User Acceptance of
Information Technology," European Journal of Information Systems (16:4), pp. 494-510.
Newstead, S. E., Thompson, V. A., and Handley, S. J. 2002. "Generating Alternatives: A Key
Component in Human Reasoning?," Memory & Cognition (30:1), pp. 129-137.
Nickerson, R. C., Varshney, U., and Muntermann, J. 2013. "A Method for Taxonomy Development and
Its Application in Information Systems," European Journal of Information Systems (22:3), pp.
336-359.
Nickerson, R. C., Varshney, U., and Muntermann, J. 2017. "Of Taxonomies and Taxonomic Theories,"
in: American Conference on Information Systems (AMCIS). Boston, United States: AIS.
Nilashi, M., Jannach, D., bin Ibrahim, O., Esfahani, M. D., and Ahmadi, H. 2016. "Recommendation
Quality, Transparency, and Website Quality for Trust-Building in Recommendation Agents,"
Electronic Commerce Research and Applications (19), pp. 70-84.
Nilsson, N. J. 2014. Principles of Artificial Intelligence. San Francisco, United States: Morgan
Kaufmann.
Niu, G., and Li, H. 2017. "Ietm Centered Intelligent Maintenance System Integrating Fuzzy Semantic
Inference and Data Fusion," Microelectronics Reliability (75), pp. 197-204.
Nosratabadi, S., Mosavi, A., Duan, P., Ghamisi, P., Filip, F., Band, S. S., Reuter, U., Gama, J., and
Gandomi, A. H. 2020. "Data Science in Economics: Comprehensive Review of Advanced
Machine Learning and Deep Learning Methods," Mathematics (8:10), pp. 1799-1824.
Nouiri, M., Bekrar, A., Jemai, A., Niar, S., and Ammari, A. C. 2018. "An Effective and Distributed
Particle Swarm Optimization Algorithm for Flexible Job-Shop Scheduling Problem," Journal
of Intelligent Manufacturing (29:3), pp. 603-615.
Nourani, M., Kabir, S., Mohseni, S., and Ragan, E. D. 2019. "The Effects of Meaningful and
Meaningless Explanations on Trust and Perceived System Accuracy in Intelligent Systems," in:
Conference on Human Computation and Crowdsourcing (HCOMP). Skamania Lodge, United
States: AAAI, pp. 97-105.
Artificial Intelligence for Human Decision-Makers
247
O'Donovan, P., Leahy, K., Bruton, K., and O'Sullivan, D. T. J. 2015a. "Big Data in Manufacturing: A
Systematic Mapping Study," Journal of Big Data (2:1), pp. 1-22.
O'Donovan, P., Leahy, K., Bruton, K., and O'Sullivan, D. T. J. 2015b. "An Industrial Big Data Pipeline
for Data-Driven Analytics Maintenance Applications in Large-Scale Smart Manufacturing
Facilities," Journal of Big Data (2:1), pp. 1-26.
O’Dwyer, B., Owen, D., and Unerman, J. 2011. "Seeking Legitimacy for New Assurance orms: The
Case of Assurance on Sustainability Reporting," Accounting Organizations and Society (31:1),
pp. 31-52.
Oh, J.-C., and Yoon, S.-J. 2014. "Predicting the Use of Online Information Services Based on a Modified
Utaut Model," Behaviour & Information Technology (33:7), pp. 716-729.
Oliveira, T., Faria, M., Thomas, M. A., and Popovič, A. 2014. "Extending the Understanding of Mobile
Banking Adoption: When Utaut Meets Ttf and Itm," International Journal of Information
Management (34:5), pp. 689-703.
Oppenheimer, D. M., Meyvis, T., and Davidenko, N. 2009. "Instructional Manipulation Checks:
Detecting Satisficing to Increase Statistical Power," Journal of Experimental Social Psychology
(45:4), pp. 867-872.
Ornes, C., and Sklansky, J. 1997. "A Neural Network That Explains as Well as Predicts Financial Market
Behavior," in: Computational Intelligence for Financial Engineering (CIFEr). New York,
United States: IEEE, pp. 43-49.
Oses, N., Legarretaetxebarria, A., Quartulli, M., Garcia, I., and Serrano, M. 2016. "Uncertainty
Reduction in Measuring and Verification of Energy Savings by Statistical Learning in
Manufacturing Environments," International Journal of Interactive Design and Manufacturing
(10:3), pp. 291-299.
Österle, H., Becker, J., Frank, U., Hess, T., Karagiannis, D., Krcmar, H., Loos, P., Mertens, P.,
Oberweis, A., and Sinz, E. J. 2010. "Memorandum Zur Gestaltungsorientierten
Wirtschaftsinformatik," Zeitschrift für betriebswirtschaftliche Forschung (6:62), pp. 664-672.
Ouyang, Z. Y., Sun, X. K., Chen, J. G., Yue, D., and Zhang, T. F. 2018. "Multi-View Stacking Ensemble
for Power Consumption Anomaly Detection in the Context of Industrial Internet of Things,"
IEEE Access (6), pp. 9623-9631.
Oviedo, F., Ren, Z., Sun, S., Settens, C., Liu, Z., Hartono, N. T. P., Ramasamy, S., DeCost, B. L., Tian,
S. I., and Romano, G. 2019. "Fast and Interpretable Classification of Small X-Ray Diffraction
Datasets Using Data Augmentation and Deep Neural Networks," npj Computational Materials
(5:1), pp. 1-9.
Paelke, V. 2014. "Augmented Reality in the Smart Factory: Supporting Workers in an Industry 4.0.
Environment," in: Emerging Technology and Factory Automation (ETFA). Barcelona, Spain:
IEEE, pp. 1-4.
Páez, A. 2019. "The Pragmatic Turn in Explainable Artificial Intelligence (Xai)," Minds and Machines
(29:3), pp. 441-459.
Pandiyan, V., Caesarendra, W., Tjahjowidodo, T., and Tan, H. H. 2018. "In-Process Tool Condition
Monitoring in Compliant Abrasive Belt Grinding Process Using Support Vector Machine and
Genetic Algorithm," Journal of Manufacturing Processes (31), pp. 199-213.
Panetta, K. 2017. "Enterprises Should Explain the Business Potential of Blockchain, Artificial
Intelligence and Augmented Reality." Top Trends in the Gartner Hype Cycle for Emerging
Technologies, 2017 Retrieved 04/29/2020, from
https://www.gartner.com/smarterwithgartner/top-trends-in-the-gartner-hype-cycle-for-
emerging-technologies-2017/
Panigutti, C., Perotti, A., and Pedreschi, D. 2020. "Doctor Xai: An Ontology-Based Approach to Black-
Box Sequential Data Classification Explanations," in: Conference on Fairness, Accountability,
and Transparency (FAccT). Barcelona, Spain: ACM, pp. 629-639.
Park, C. Y., Laskey, K. B., Salim, S., and Lee, J. Y. 2017. "Predictive Situation Awareness Model for
Smart Manufacturing," in: International Conference on Information Fusion (FUSION). Xi'an,
China: IEEE, pp. 1-8.
Artificial Intelligence for Human Decision-Makers
248
Partel, V., Kakarla, S. C., and Ampatzidis, Y. 2019. "Development and Evaluation of a Low-Cost and
Smart Technology for Precision Weed Management Utilizing Artificial Intelligence,"
Computers and Electronics in Agriculture (157), pp. 339-350.
Patel, J., and Choi, S.-K. 2014. "An Enhanced Classification Approach for Reliability Estimation of
Structural Systems," Journal of Intelligent Manufacturing (25:3), pp. 505-519.
Patel, K., Fogarty, J., Landay, J. A., and Harrison, B. 2008. "Investigating Statistical Machine Learning
as a Tool for Software Development," in: Conference on Human Factors in Computing Systems
(CHI). Florence, Italy: ACM, pp. 667-676.
Patton, M. Q. 2014. Qualitative Evaluation and Research Methods: Integrating Theory and Practice.
Saint Paul, United States: SAGE Publications.
Pawellek, G. 2016. Integrierte Instandhaltung Und Ersatzteillogistik: Vorgehensweisen, Methoden,
Tools. Berlin, Germany: Springer-Verlag.
Peer, E., Brandimarte, L., Samat, S., and Acquisti, A. 2017. "Beyond the Turk: Alternative Platforms
for Crowdsourcing Behavioral Research," Journal of Experimental Social Psychology (70), pp.
153-163.
Peffers, K., Tuunanen, T., and Niehaves, B. 2018. "Design Science Research Genres: Introduction to
the Special Issue on Exemplars and Criteria for Applicable Design Science Research,"
European Journal of Information Systems (27:2), pp. 129-139.
Peng, Y., Dong, M., and Zuo, M. J. 2010. "Current Status of Machine Prognostics in Condition-Based
Maintenance: A Review," The International Journal of Advanced Manufacturing Technology
(50:1-4), pp. 297-313.
Perego, P., and Kolk, A. 2012. "Multinationals‘ Accountability on Sustainability: The Evolution of
Third-Party Assurance of Sustainability Reports," Journal of Business Ethics (110:2), pp. 173-
190.
Pereira, G. T., and de Carvalho, A. C. 2019. "Bringing Robustness against Adversarial Attacks," Nature
Machine Intelligence (1:11), pp. 499-500.
Peres, R. S., Dionisio Rocha, A., Leitao, P., and Barata, J. 2018. "Idarts – Towards Intelligent Data
Analysis and Real-Time Supervision for Industry 4.0," Computers in Industry (101), pp. 138-
146.
Perrini, . 2006. "The Practitioner’s Perspective on Non-Financial Reporting," California Management
Review (48), pp. 73-103.
Persson, A., Laaksoharju, M., and Koga, H. 2021. "We Mostly Think Alike: Individual Differences in
Attitude Towards Ai in Sweden and Japan," The Review of Socionetwork Strategies (15:1), pp.
123-142.
Peters, F., Pumplun, L., and Buxmann, P. 2020. "Opening the Black Box: Consumer's Willingness to
Pay for Transparency of Intelligent Systems," in: European Conference of Information Systems
(ECIS). Marrakech, Morocco: AIS, pp. 1-17.
Peterson, D. K., and Pitz, G. F. 1988. "Confidence, Uncertainty, and the Use of Information," Journal
of Experimental Psychology: Learning, Memory, and Cognition (14:1), p. 85.
Petkovic, D., Barlaskar, S. H., Yang, J., and Todtenhoefer, R. 2018. "From Explaining How Random
Forest Classifier Predicts Learning of Software Engineering Teamwork to Guidance for
Educators," in: Frontiers in Education Conference (FIE). San Jose, United States: IEEE, pp. 1-
7.
Pfeuffer, N., Benlian, A., Gimpel, H., and Hinz, O. 2019. "Anthropomorphic Information Systems,"
Business & Information Systems Engineering (61:4), pp. 523-533.
Pierrard, R., Poli, J.-P., and Hudelot, C. 2021. "Spatial Relation Learning for Explainable Image
Classification and Annotation in Critical Applications," Artificial Intelligence (292), pp. 1-50.
Polato, M., and Aiolli, F. 2019. "Boolean Kernels for Rule Based Interpretation of Support Vector
Machines," Neurocomputing (342), pp. 113-124.
Poole, D., Mackworth, A., and Goebel, R. 1998. Computational Intelligence. New York, United States:
Oxford University Press.
Artificial Intelligence for Human Decision-Makers
249
Portela, F., Aguiar, J., Santos, M. F., Silva, Á., and Rua, F. 2013. "Pervasive Intelligent Decision Support
System–Technology Acceptance in Intensive Care Units," in Advances in Information Systems
and Technologies. Berlin, Germany: Springer, pp. 279-292.
Posada, J., Toro, C., Barandiaran, I., Oyarzun, D., Stricker, D., de Amicis, R., Pinto, E. B., Eisert, P.,
Döllner, J., and Vallarino. 2015. "Visual Computing as Key Enabling Technology for Industrie
4.0 & Industrial Internet," IEEE Computer Graphics and Applications (25:2), pp. 26-40.
Pounds, W. F. 1969. "The Process of Problem Finding," Industrial Management Review (11), pp. 1-19.
Poursabzi-Sangdeh, F., Goldstein, D. G., Hofman, J. M., Vaughan, J. W., and Wallach, H. 2018.
"Manipulating and Measuring Model Interpretability," arXiv preprint arXiv:1802.07810.
Power, D. J. 2001. "Supporting Decision-Makers: An Expanded Framework," Informing Science (1),
pp. 1901-1915.
Power, D. J. 2002. Decision Support Systems: Concepts and Resources for Managers. Westport, United
States: Greenwood Publishing Group.
Power, D. J. 2008. "Decision Support Systems: A Historical Overview," in Handbook on Decision
Support Systems 1, F. Burstein and C.W. Holsapple (eds.). Berlin, Germany: Springer, pp. 121-
140.
Pratt, J. W., and Zeckhauser, R. J. 1985. "Principals and Agents: An Overview," in Principals and
Agents: The Structure of Business, J.W. Pratt and R.J. Zeckhauser (eds.). Boston, United States:
Harvard Business School Press, pp. 1-36.
Precup, R.-E., Angelov, P., Costa, B. S. J., and Sayed-Mouchaweh, M. 2015. "An Overview on Fault
Diagnosis and Nature-Inspired Optimal Control of Industrial Process Applications," Computers
in Industry (74), pp. 75-94.
Priore, P., Gómez, A., Pino, R., and Rosillo, R. 2014. "Dynamic Scheduling of Manufacturing Systems
Using Machine Learning: An Updated Review," Artificial Intelligence for Engineering Design,
Analysis and Manufacturing (28:1), pp. 83-97.
Przyborski, A., and Wohlrab-Sahr, M. 2014. "Forschungsdesigns Für Die Qualitative Sozialforschung,"
in Handbuch Methoden Der Empirischen Sozialforschung, N. Baur and J. Blasius (eds.).
Wiesbaden, Germany: VS Verlag für Sozialwissenschaften, pp. 117-133.
Pu, P., and Chen, L. 2007. "Trust-Inspiring Explanation Interfaces for Recommender Systems,"
Knowledge-Based Systems (20:6), pp. 542-556.
Püschel, L., Schlott, H., and Röglinger, M. 2016. "What's in a Smart Thing? Development of a Multi-
Layer Taxonomy," in: International Conference on Information Systems (ICIS), AIS (ed.).
Dublin, Irland: AIS, pp. 1-19.
Püschel, L. C., Röglinger, M., and Brandt, R. 2020. "Unblackboxing Smart Things—a Multilayer
Taxonomy and Clusters of Nontechnical Smart Thing Characteristics," IEEE Transactions on
Engineering Management (forthcoming), pp. 1-15.
Putnam, V., Riegel, L., and Conati, C. 2019. "Toward Xai for Intelligent Tutoring Systems: A Case
Study," arXiv preprint arXiv:1912.04464.
Quionero-Candela, J., Sugiyama, M., Schwaighofer, A., and Lawrence, N. D. 2009. Dataset Shift in
Machine Learning. London, United States: The MIT Press.
Rad, M. S., Nilashi, M., and Dahlan, H. M. 2018. "Information Technology Adoption: A Review of the
Literature and Classification," Universal Access in the Information Society (17:2), pp. 361-390.
Ragab, A., Ouali, M.-S., Yacout, S., and Osman, H. 2016a. "Remaining Useful Life Prediction Using
Prognostic Methodology Based on Logical Analysis of Data and Kaplan–Meier Estimation,"
Journal of Intelligent Manufacturing (27:5), pp. 943-958.
Ragab, A., Yacout, S., Ouali, M.-S., and Osman, H. 2016b. "Prognostics of Multiple Failure Modes in
Rotating Machinery Using a Pattern-Based Classifier and Cumulative Incidence Functions,"
Journal of Intelligent Manufacturing (30:1), pp. 255-274.
Ragab, A., Yacout, S., Ouali, M. S., and Osman, H. 2017. "Pattern‐Based Prognostic Methodology for
Condition‐Based Maintenance Using Selected and Weighted Survival Curves," Quality and
Reliability Engineering International (33:8), pp. 1753-1772.
Ramasso, E., and Saxena, A. 2014. "Performance Benchmarking and Analysis of Prognostic Methods
for Cmapss Datasets," International Journal of Prognostics Health Management (5), pp. 1-15.
Artificial Intelligence for Human Decision-Makers
250
Ranjit, M., Gazula, H., Hsiang, S. M., Yu, Y., Borhani, M., Spahr, S., Taye, L., Stephens, C., and Elliott,
B. 2015. "Fault Detection Using Human–Machine Co-Construct Intelligence in Semiconductor
Manufacturing Processes," IEEE Transactions on Semiconductor Manufacturing (28:3), pp.
297-305.
Raouf, A., Duffuaa, S., Ben‐Daya, M., Dhillon, B., and Liu, Y. 2006a. "Human Error in Maintenance:
A Review," Journal of Quality in Maintenance Engineering (12:1), pp. 21-36.
Raouf, A., Duffuaa, S., Ben‐Daya, M., Tsang, A. H., Yeung, W., Jardine, A. K., and Leung, B. P. 2006b.
"Data Management for Cbm Optimization," Journal of Quality in Maintenance Engineering).
Ras, G., van Gerven, M., and Haselager, P. 2018. "Explanation Methods in Deep Learning: Users,
Values, Concerns and Challenges," in Explainable and Interpretable Models in Computer
Vision and Machine Learning. Cham, Switzerland: Springer, pp. 19-36.
Ray, P., and Mishra, D. P. 2016. "Support Vector Machine Based Fault Classification and Location of
a Long Transmission Line," Engineering Science and Technology, an International Journal
(19:3), pp. 1368-1380.
Redding, G., Dumas, M., Ter Hofstede, A. H., and Iordachescu, A. 2008. "Transforming Object-
Oriented Models to Process-Oriented Models," in Bpm Workshops 2007, A.H.M. ter Hofstede,
B. Benatallah and H.-Y.e. Paik (eds.). Heidelberg, Germany: Springer LNCS, pp. 132-143.
Reder, B., Freimark, A., Lixenfeld, C., Maurer, J., Schonscheck, O., and Schweizer, M. 2019. "Studie
Machine Learning / Deep Learning," IDG Business Media GmbH, Munich, Germany.
Reis, M. S., and Gins, G. 2017. "Industrial Process Monitoring in the Big Data/Industry 4.0 Era: From
Detection, to Diagnosis, to Prognosis," Processes (5:3), pp. 1-16.
Ren, L., Sun, Y., Cui, J., and Zhang, L. 2018. "Bearing Remaining Useful Life Prediction Based on
Deep Autoencoder and Deep Neural Networks," Journal of Manufacturing Systems (48), pp.
71-77.
Ribeiro, M. T., Singh, S., and Guestrin, C. 2016a. "Model-Agnostic Interpretability of Machine
Learning," arXiv preprint arXiv:1606.05386.
Ribeiro, M. T., Singh, S., and Guestrin, C. 2016b. ""Why Should I Trust You?" Explaining the
Predictions of Any Classifier," in: International Conference on Knowledge Discovery and Data
Mining (KDD). San Francisco, United States: ACM, pp. 1135-1144.
Richter, H. 2012. "Multiple Sliding Modes with Override Logic: Limit Management in Aircraft Engine
Controls," Journal of Guidance, Control, and Dynamics (35:4), pp. 1132-1142.
Robinson, M., Kleffner, A., and Bertels, S. 2011. "Signaling Sustainability Leadership: Empirical
Evidence of the Value of Djsi Membership," Journal of Business Ethics (101:3), pp. 493-505.
Röbken, H., and Wetzel, K. 2020. Qualitative Und Quantitative Forschungsmethoden. Oldenburg,
Germany: Carl von Ossietzky Universität.
Rogers, E. M. 2010. Diffusion of Innovations. New York, United States: The Free Press.
Rohweder, J., Kasten, G., Malzahn, D., Piro, A., and Schmid, J. 2015. "Informationsqualität –
Definitionen, Dimensionen Und Begriffe," in Daten- Und Informationsqualität – Auf Dem Weg
Zur Information Excellence, K. Hildebrand, M. Gebauer, H. Hinrichs and M. Mielke (eds.).
Wiesbaden, Germany: Vieweg+Teubner, pp. 25-46.
Rossiter, J. 2002. "The C-Oar-Se Procedure for Scale Development in Marketing," International Journal
of Research in Marketing (19), pp. 305-335.
Rotter, J. B. 1980. "Interpersonal Trust, Trustworthiness, and Gullibility," American Psychologist
(35:1), pp. 1–7.
Rousseau, D. M., and Fried, Y. 2001. "Location, Location, Location: Contextualizing Organizational
Research," Journal of Organizational Behavior (22:1), pp. 1-13.
Rudin, C. 2019. "Stop Explaining Black Box Machine Learning Models for High Stakes Decisions and
Use Interpretable Models Instead," Nature Machine Intelligence (1:5), pp. 206-215.
Russell, S., and Norvig, P. 2020. Artificial Intelligence: A Modern Approach. Hoboken, United States:
Pearson.
Russo, B. 2016. "The Need for Data Analysis Patterns (in Software Engineering)," in Perspectives on
Data Science for Software Engineering, T. Menzies, L. Williams and T. Zimmermann (eds.).
Cambridge, United States: Morgan Kaufmann, pp. 19-23.
Artificial Intelligence for Human Decision-Makers
251
Saaty, T. L. 2004. "Decision Making - the Analytic Hierarchy and Network Processes (Ahp/Anp),"
Journal of Systems Science and Systems Engineering (13:1), pp. 1-35.
Saaty, T. L. 2008. "Decision Making with the Analytic Hierarchy Process," International Journal of
Services Sciences (1:1), pp. 83-98.
Sackman, H. 1974. "Delphi Assessment: Expert Opinion, Forecasting, and Group Process," The Rand
Corporation, Santa Monica, United States.
Saha, D., Schumann, C., McElfresh, D. C., Dickerson, J. P., Mazurek, M. L., and Tschantz, M. C. 2019.
"Measuring Non-Expert Comprehension of Machine Learning Fairness Metrics," arXiv preprint
arXiv: 2001.00089.
Sahay, B., and Ranjan, J. 2008. "Real Time Business Intelligence in Supply Chain Analytics,"
Information Management & Computer Security (16:1), pp. 28-48.
Saldivar, A. A. F., Goh, C., Chen, W., and Li, Y. 2016. "Self-Organizing Tool for Smart Design with
Predictive Customer Needs and Wants to Realize Industry 4.0," in: Congress on Evolutionary
Computation (CEC). Vancouver, Canada: IEEE, pp. 5317-5324.
Salleh, M. N. M., Talpur, N., and Hussain, K. 2017. "Adaptive Neuro-Fuzzy Inference System:
Overview, Strengths, Limitations, and Solutions," in: International Conference on Data Mining
and Big Data (DMBD). Fukuoka, Japan: Springer, pp. 527-535.
Salmon, W. C. 1984. Scientific Explanation and the Causal Structure of the World. Princeton, United
States: Princeton University Press.
Samek, W., Wiegand, T., and Müller, K.-R. 2017. "Explainable Artificial Intelligence: Understanding,
Visualizing and Interpreting Deep Learning Models," arXiv preprint arXiv:1708.08296.
Samuel, A. L. 1959. "Some Studies in Machine Learning Using the Game of Checkers," IBM Journal
of Research and Development (3:3), pp. 210–229.
Sanchez, J. A., Conde, A., Arriandiaga, A., Wang, J., and Plaza, S. 2018. "Unexpected Event Prediction
in Wire Electrical Discharge Machining Using Deep Learning Techniques," Materials (11:7).
Saucedo-Espinosa, M., Escalante, H., and Berrones, A. 2017. "Detection of Defective Embedded
Bearings by Sound Analysis: A Machine Learning Approach," Journal of Intelligent
Manufacturing (28:2), pp. 489-500.
Saul, L. K., and Roweis, S. T. 2003. "Think Globally, Fit Locally: Unsupervised Learning of Low
Dimensional Manifolds," Journal of Machine Learning Research (4), pp. 119-155.
Saxena, A., and Goebel, K. 2008. "Turbofan Engine Degradation Simulation Data Set - Nasa Ames
Prognostics Data Repository." Retrieved 08/08/2020, from
www.ti.arc.nasa.gov/tech/prognostic-data-repository/#turbofan
Saxena, A., Goebel, K., Simon, D., and Eklund, N. 2008. "Damage Propagation Modeling for Aircraft
Engine Run-to-Failure Simulation," in: International Conference on Prognostics and Health
Management (PHM), IEEE (ed.). Denver, United States: IEEE, pp. 1-9.
Schaffer, J., O'Donovan, J., Michaelis, J., Raglin, A., and Höllerer, T. 2019. "I Can Do Better Than Your
Ai: Expertise and Explanations," in: International Conference on Intelligent User Interfaces
(IUI). Los Angeles, United States: ACM, pp. 240-251.
Schaltegger, S. 1997. "Information Costs, Quality of Information and Stakeholder Involvement,"
Corporate Social Responsibility and Environmental Management (4:11), pp. 87-97.
Schmidhuber, J. 2015. "Deep Learning in Neural Networks: An Overview," Neural networks (61), pp.
85-117.
Schneider, J., and Handali, J. 2019. "Personalized Explanation in Machine Learning: A
Conceptualization," arXiv preprint arXiv:1901.00770.
Schön, D. 2016. Planung Und Reporting – Grundlagen, Business Intelligence, Mobile Bi Und Big-Data-
Analytics. Wiesbaden, Germany: Springer Verlag.
Schoorman, F. D., Mayer, R. C., and Davis, J. H. 2007. "An Integrative Model of Organizational Trust:
Past, Present, and Future," Academy of Management Review (32:2), pp. 344-354.
Schoormann, T., Behrens, D., and Knackstedt, R. 2017. "Sustainability in Business Process Models: A
Taxonomy-Driven Approach to Synthesize Knowledge and Structure the Field," in:
International Conference on Information Systems (ICIS). Seoul, South Korea: AIS, pp. 1-13.
Artificial Intelligence for Human Decision-Makers
252
Schwenk, C. R. 1984. "Cognitive Simplification Processes in Strategic Decision‐Making," Strategic
Management Journal (5:2), pp. 111-128.
Sellam, T., Lin, K., Huang, I., Yang, M., Vondrick, C., and Wu, E. 2019. "Deepbase: Deep Inspection
of Neural Networks," in: International Conference on Management of Data (MOD).
Amsterdam, Netherlands: ACM, pp. 1117-1134.
Sethi, P., Martell, T., and Demir, M. 2015. "Enhancing the Role and Effectiveness of Corporate Social
Responsibility (Csr) Reports: The Missing Element of Content Verification and Integrity
Assurance," Journal of Business Ethics (4), pp. 1-24.
Seufert, A. 2016. "Die Digitalisierung Als Herausforderung Für Unternehmen: Status Quo, Chancen
Und Herausforderungen Im Umfeld Bi & Big Data," in Big Data – Grundlagen, Systeme Und
Nutzungspotenziale, D. Fasel and A. Meier (eds.). Wiesbaden, Germany: Springer Vieweg, pp.
39-58.
Shaban, Y., Yacout, S., Balazinski, M., and Jemielniak, K. 2017. "Cutting Tool Wear Detection Using
Multiclass Logical Analysis of Data," Machining Science and Technology (21:4), pp. 526-541.
Shahzad, F., Xiu, G., Khan, M. A. S., and Shahbaz, M. 2020. "Predicting the Adoption of a Mobile
Government Security Response System from the User's Perspective: An Application of the
Artificial Neural Network Approach," Technology in Society (62), pp. 1-17.
Shalev-Shwartz, S., and Ben-David, S. 2014. Understanding Machine Learning: From Theory to
Algorithms. Cambridge, United States: Cambridge University Press.
Shankaranarayan, G., Ziad, M., and Wang, R. 2003. "Managing Data Quality in Dynamic Decision
Environments: An Information Product Approach," Journal of Database Management (14:4),
pp. 14-32.
Shao, G., Brodsky, A., Shin, S.-J., and Kim, D. 2017. "Decision Guidance Methodology for Sustainable
Manufacturing Using Process Analytics Formalism," Journal of Intelligent Manufacturing
(28:2), pp. 455-472.
Shao, H., Jiang, H., Zhang, H., Duan, W., Liang, T., and Wu, S. 2018. "Rolling Bearing Fault Feature
Learning Using Improved Convolutional Deep Belief Network with Compressed Sensing,"
Mechanical Systems and Signal Processing (100), pp. 743-765.
Sharp, M., Ak, R., and Hedberg, T. 2018. "A Survey of the Advancing Use and Development of Machine
Learning in Smart Manufacturing," Journal of Manufacturing Systems (48), pp. 170-179.
Shatnawi, Y., and Al-Khassaweneh, M. 2014. "Fault Diagnosis in Internal Combustion Engines Using
Extension Neural Network," IEEE Transactions on Industrial Electronics (61:3), pp. 1434-
1443.
Shaw, M. J., Park, S., and Raman, N. 1992. "Intelligent Scheduling with Machine Learning Capabilities:
The Induction of Scheduling Knowledge," IIE Transactions (24:2), pp. 156-168.
Sheh, R., and Monteath, I. 2018. "Defining Explainable Ai for Requirements Analysis," KI-Künstliche
Intelligenz (32:4), pp. 261-266.
Shen, S., Han, S. X., Aberle, D. R., Bui, A. A., and Hsu, W. 2019. "An Interpretable Deep Hierarchical
Semantic Convolutional Neural Network for Lung Nodule Malignancy Classification," Expert
Systems with Applications (128), pp. 84-95.
Sheridan, T. B., and Hennessy, R. T. 1984. "Research and Modeling of Supervisory Control Behavior.
Report of a Workshop," National Research Council Washington, D.C. Commitee on Human
Factors, Washington, United States.
Shimodaira, H. 1996. "A Method of Selecting Learning Data in the Prediction of Time Series with
Explanatory Variables Using Neural Networks," in: International Conference on Neural
Networks (ICNN). Washington, United States: IEEE, pp. 1176-1181.
Shin, S.-J., Kim, D., Shao, G., Brodsky, A., and Lechevalier, D. 2017. "Developing a Decision Support
System for Improving Sustainability Performance of Manufacturing Processes," Journal of
Intelligent Manufacturing (28:6), pp. 1421-1440.
Shiue, Y.-R., Lee, K.-C., and Su, C.-T. 2018. "Real-Time Scheduling for a Smart Factory Using a
Reinforcement Learning Approach," Computers & Industrial Engineering (125), pp. 604-614.
Shmueli, G. 2010. "To Explain or to Predict?," Statistical Science (25:3), pp. 289-310.
Artificial Intelligence for Human Decision-Makers
253
Siau, K., and Wang, W. 2018. "Building Trust in Artificial Intelligence, Machine Learning, and
Robotics," Cutter Business Technology Journal (31:2), pp. 47-53.
Sieck, W., and Yates, J. F. 1997. "Exposition Effects on Decision Making: Choice and Confidence in
Choice," Organizational Behavior and Human Decision Processes (70:3), pp. 207-219.
Silver, D., Huang, A., Maddison, C. J., Guez, A., Sifre, L., Van Den Driessche, G., Schrittwieser, J.,
Antonoglou, I., Panneershelvam, V., and Lanctot, M. 2016. "Mastering the Game of Go with
Deep Neural Networks and Tree Search," Nature (529:7587), pp. 484-489.
Simnett, R., Vanstraelen, A., and Chua, W. 2009. "Assurance on Sustainability Reports: An
International Comparison," The Accounting Review (84:3), pp. 937-967.
Simon, H. A. 1977. "The Logic of Heuristic Decision Making," University of Pittsburgh Press,
Pittsburgh, United States, pp. 154-175.
Simon, H. A. 1996. The Sciences of the Artificial, (3rd ed.). Cambridge, Massachusetts: MIT press.
Simonovic, S. P. 1999. "Decision Support System for Flood Management in the Red River Basin,"
Canadian Water Resources Journal (24:3), pp. 203-223.
Singh, N., Singh, P., and Bhagat, D. 2019. "A Rule Extraction Approach from Support Vector Machines
for Diagnosing Hypertension among Diabetics," Expert Systems with Applications (130), pp.
188-205.
Slack, D., Hilgard, S., Jia, E., Singh, S., and Lakkaraju, H. 2020. "Fooling Lime and Shap: Adversarial
Attacks on Post Hoc Explanation Methods," in: Conference on AI, Ethics, and Society (AIES).
New York, United States: ACM, pp. 180-186.
Slade, E. L., Dwivedi, Y. K., Piercy, N. C., and Williams, M. D. 2015. "Modeling Consumers’ Adoption
Intentions of Remote Mobile Payments in the United Kingdom: Extending Utaut with
Innovativeness, Risk, and Trust," Psychology & Marketing (32:8), pp. 860-873.
Smith, J. S. 2003. "Survey on the Use of Simulation for Manufacturing System Design and Operation,"
Journal of Manufacturing Systems (22:2), pp. 157-171.
Sonntag, D., Zillner, S., van der Smagt, P., and Lörincz, A. 2017. "Overview of the Cps for Smart
Factories Project: Deep Learning, Knowledge Acquisition, Anomaly Detection and Intelligent
User Interfaces," in Industrial Internet of Things. Cham, Switzerland: Springer, pp. 487-504.
Soualhi, A., Medjaher, K., and Zerhouni, N. 2015. "Bearing Health Monitoring Based on Hilbert–Huang
Transform, Support Vector Machine, and Regression," IEEE Transactions on Instrumentation
and Measurement (64:1), pp. 52-62.
Sowa, J. F., and Zachman, J. A. 1992. "Extending and Formalizing the Framework for Information
Systems Architecture," IBM Systems Journal (31:3), pp. 590-616.
Spelthahn, S., Fuchs, L., and Demele, U. 2009. "Glaubwürdigkeit in Der
Nachhaltigkeitsberichterstattung," uwf UmweltWirtschaftsForum (17:1), pp. 61-68.
Springer, A., and Whittaker, S. 2019. "Progressive Disclosure: Empirically Motivated Approaches to
Designing Effective Transparency," in: International Conference on Intelligent User Interfaces
(IUI). Los Angeles, United States: ACM, pp. 107-120.
Srivastava, N., and Salakhutdinov, R. 2014. "Multimodal Learning with Deep Boltzmann Machines,"
Journal of Machine Learning Research (15), pp. 2949-2980.
Ståhl, N., Mathiason, G., Falkman, G., and Karlsson, A. 2019. "Using Recurrent Neural Networks with
Attention for Detecting Problematic Slab Shapes in Steel Rolling," Applied Mathematical
Modelling (70), pp. 365-377.
Stake, R. E. 1978. "The Case Study Method in Social Inquiry," Educational Researcher (7:2), pp. 5-8.
Standardization, I. O. f. 2000. "Quality Management Systems – Requirements," in: DS/EN ISO,
9001:2015. pp. 1-29.
Standardization, I. O. f. 2010. "Guidance on Social Responsibility," in: 26000:2010 (E), ISO/FDIS (ed.).
Geneva.
Stefani, K., and Zschech, P. 2018. "Constituent Elements for Prescriptive Analytics Systems," in:
European Conference on Information System (ECIS), AIS (ed.). Stockholm, Sweden: AIS, pp.
1-16.
Sturm, A. 1996. Zustandswissen Für Betriebsführung Und Instandhaltung: Mit Cd-Rom
Betriebsführung Bfs++. Essen, Germany: VGB-Kraftwerkstechnik GmbH.
Artificial Intelligence for Human Decision-Makers
254
Subramanian, G. H., Nosek, J., Raghunathan, S. P., and Kanitkar, S. S. 1992. "A Comparison of the
Decision Table and Tree," Communications of the ACM (35:1), pp. 89-94.
Subramaniyan, M., Skoogh, A., Gopalakrishnan, M., and Hanna, A. 2016. "Real-Time Data-Driven
Average Active Period Method for Bottleneck Detection," International Journal of Design &
Nature and Ecodynamics (11:3), pp. 428-437.
Suchman, M. C. 1995. "Managing Legitimacy: Strategic and Institutional Approaches," Academy of
Management Review (20), pp. 571-610.
Suleman, D., Zuniarti, I., Sabil, E. D. S., Yanti, V. A., Susilowati, I. H., Sari, I., Marwansyah, S., Hadi,
S. S., and Lestiningsih, A. S. 2019. "Decision Model Based on Technology Acceptance Model
(Tam) for Online Shop Consumers in Indonesia," Academy of Marketing Studies Journal (23:4),
pp. 1-14.
Šumak, B., Polancic, G., and Hericko, M. 2010. "An Empirical Study of irtual Learning Environment
Adoption Using Utaut," in: International Conference on Mobile, Hybrid, and On-line Learning
(eLmL). St. Maarten, Netherlands: IEEE, pp. 17-22.
Sun, D., Lee, V. C., and Lu, Y. 2016. "An Intelligent Data Fusion Framework for Structural Health
Monitoring," in: Conference on Industrial Electronics and Applications (IEACon). Kota
Kinabalu, Malaysia: IEEE, pp. 49-54.
Suriadi, S., Andrews, R., ter Hofstede, A. H., and Wynn, M. T. 2017. "Event Log Imperfection Patterns
for Process Mining: Towards a Systematic Approach to Cleaning Event Logs," Information
Systems (64), pp. 132-150.
Susto, G. A., Terzi, M., and Beghi, A. 2017. "Anomaly Detection Approaches for Semiconductor
Manufacturing," Procedia Manufacturing (11), pp. 2018-2024.
Sutharssan, T., Stoyanov, S., Bailey, C., and Yin, C. 2015. "Prognostic and Health Management for
Engineering Systems: A Review of the Data-Driven Approach and Algorithms," The Journal of
Engineering (2015:7), pp. 215-222.
Sutton, R. S., and Barto, A. G. 2018. Reinforcement Learning: An Introduction. Cambridge, United
States: MIT press.
Swartout, W. R. 1983. "Xplain: A System for Creating and Explaining Expert Consulting Programs,"
Artificial intelligence (21:3), pp. 285-325.
Szopinski, D., Schoormann, T., and Kundisch, D. 2019. "Because Your Taxonomy Is Worth It: Towards
a Framework for Taxonomy Evaluation," in: European Conference on Information Systems
(ECIS). Stockholm and Uppsala, Sweden: AIS, pp. 1-19.
Tan, H. F., Hooker, G., and Wells, M. T. 2016. "Tree Space Prototypes: Another Look at Making Tree
Ensembles Interpretable," arXiv preprint arXiv:1611.07115.
Tausch, N., Tam, T., Hewstone, M., Kenworthy, J., and Cairns, E. 2007. "Individual‐Level and Group‐Level Mediators of Contact Effects in Northern Ireland: The Moderating Role of Social
Identification," British Journal of Social Psychology (46:3), pp. 541-556.
Taylor, S., and Todd, P. 1995. "Decomposition and Crossover Effects in the Theory of Planned
Behavior: A Study of Consumer Adoption Intentions," International Journal of Research in
Marketing (12:2), pp. 137-155.
Terzidis, O., Oberle, D., Friesen, A., Janiesch, C., and Barros, A. 2012. "The Internet of Services and
Usdl," in Handbook of Service Description. Boston, United States: Springer, pp. 1-16.
Teso, S., and Kersting, K. 2019. "Explanatory Interactive Machine Learning," in: Conference on
Artifical Intelligence, Ethics, and Society (AIES). Honolulu, United States: AAAI, pp. 1-7.
Thagard, P. 1989. "Explanatory Coherence," Behavioral and Brain Sciences (12:3), pp. 435-502.
Thiebes, S., Lins, S., and Sunyaev, A. 2020. "Trustworthy Artificial Intelligence," Electronic Markets
(31:2), pp. 447-464.
Thiesse, F., Wirth, M., Kemper, H. G., Moisa, M., Morar, D., Lasi, H., Piller, F., Buxmann, P., Mortara,
L., Ford, S., and Minshall, T. 2015. "Economic Implications of Additive Manufacturing and the
Contribution of Mis," Business & Information Systems Engineering (57:2), pp. 139-148.
Thomas, T., Singh, L., and Gaffar, K. 2013. "The Utility of the Utaut Model in Explaining Mobile
Learning Adoption in Higher Education in Guyana," International Journal of Education and
Development using ICT (9:3), pp. 71-85.
Artificial Intelligence for Human Decision-Makers
255
Thompson, R. L., Higgins, C. A., and Howell, J. M. 1991. "Personal Computing: Toward a Conceptual
Model of Utilization," MIS Quarterly (15:1), pp. 125-143.
Thomson, I., and Bebbington, J. 2005. "Social and Environmental Reporting in the Uk: A Pedagogic
Evaluation," Critical Perspectives on Accounting (16), pp. 507-533.
Thurier, Q.-G., Hua, N., Boyle, L., and Spyker, A. 2019. "Inspecting a Machine Learning Based Clinical
Risk Calculator: A Practical Perspective," in: International Symposium on Computer-Based
Medical Systems (CBMS). Cordoba, Spain: IEEE, pp. 325-330.
Tian, J., Azarian, M. H., Pecht, M., Niu, G., and Li, C. 2017. "An Ensemble Learning-Based Fault
Diagnosis Method for Rotating Machinery," in: Prognostics and System Health Management
Conference (PHM). Harbin, China: IEEE, pp. 1-6.
Tintarev, N., and Masthoff, J. 2012. "Evaluating the Effectiveness of Explanations for Recommender
Systems," User Modeling and User-Adapted Interaction (22:4-5), pp. 399-439.
Tjoa, E., and Guan, C. 2020. "A Survey on Explainable Artificial Intelligence (Xai): Toward Medical
Xai," IEEE Transactions on Neural Networks and Learning Systems (forthcoming), pp. 1 - 21.
Tokic, M. 2013. "Reinforcement Learning: Psychologische Und Neurobiologische Aspekte," KI-
Künstliche Intelligenz (27:3), pp. 213-219.
Tole, A. 2013. "Big Data Challenges," Database Systems Journal (4:3), pp. 31-40.
Tolomei, G., Silvestri, F., Haines, A., and Lalmas, M. 2017. "Interpretable Predictions of Tree-Based
Ensembles Via Actionable Feature Tweaking," in: International Conference on Knowledge
Discovery and Data Mining (KDD). Halifax, Canada: ACM, pp. 465-474.
Tristo, G., Bissacco, G., Lebar, A., and alentinčič, J. 2015. "Real Time Power Consumption
Monitoring for Energy Efficiency Analysis in Micro Edm Milling," The International Journal
of Advanced Manufacturing Technology (78:9-12), pp. 1511-1521.
Trkman, P., McCormack, K., de Oliveira, M., and Ladeira, M. 2010. "The Impact of Business Analytics
on Supply Chain Performance," Decision Support Systems (49:3), pp. 318-327.
Trommsdorff, V. 1975. Die Messung Von Produktimages Für Das Marketing: Grundlagen Und
Operationalisierung. Cologne, Germany: Heymann Verlag.
Trotman, A., and Trotman, K. 2015. "Internal Audit’s Role in Ghg Emission and Energy Reporting:
Evidence from Audit Committees, Senior Accountants and Internal Auditors," Auditing: A
Journal of Practice & Theory (34:1), pp. 199-230.
Tsai, C.-W., Lai, C.-F., Chiang, M.-C., and Yang, L. T. 2013. "Data Mining for Internet of Things: A
Survey," IEEE Communications Surveys & Tutorials (16:1), pp. 77-97.
Tsai, C.-Y., Chen, C.-J., and Lo, Y.-T. 2014. "A Cost-Based Module Mining Method for the Assemble-
to-Order Strategy," Journal of Intelligent Manufacturing (25:6), pp. 1377-1392.
Turner, R. 2016. "A Model Explanation System," in: International Workshop on Machine Learning for
Signal Processing (MLSP). Salerno, Italy: IEEE, pp. 1-6.
Tversky, A., and Kahneman, D. 1974. "Judgment under Uncertainty: Heuristics and Biases," Science
(185:4157), pp. 1124-1131.
Vaidya, S., Ambad, P., and Bhosle, S. 2018. "Industry 4.0 - a Glimpse," Procedia Manufacturing (20),
pp. 233-238.
Van Altena, A., Moerland, P., Zwinderman, A., and Olabarriaga, S. 2016. "Understanding Big Data
Themes from Scientific Biomedical Literature through Topic Modeling," Journal of Big Data
(3:23), pp. 1-21.
Van Bouwel, J., and Weber, E. 2002. "Remote Causes, Bad Explanations?," Journal for the Theory of
Social Behaviour (32:4), pp. 437-449.
van der Aalst, W., Adriansyah, A., De Medeiros, A. K. A., Arcieri, F., Baier, T., Blickle, T., Bose, J. C.,
Van Den Brand, P., Brandtjen, R., and Buijs, J. 2011. "Process Mining Manifesto," in:
International Conference on Business Process Management (BPM). Clermont-Ferrand, France:
Springer, pp. 169-194.
van der Waa, J., Nieuwburg, E., Cremers, A., and Neerincx, M. 2021. "Evaluating Xai: A Comparison
of Rule-Based and Example-Based Explanations," Artificial Intelligence (291), pp. 1-19.
Van Sonderen, E., Sanderman, R., and Coyne, J. C. 2013. "Ineffectiveness of Reverse Wording of
uestionnaire Items: Let’s Learn from Cows in the Rain," PloS One (8:7), pp. 1-7.
Artificial Intelligence for Human Decision-Makers
256
Vargas-Solar, G., J., E.-O., and Zechinelli-Martini, L. 2016. "Big Continuous Data: Dealing with
Velocity by Composing Event Streams," in Big Data Concepts, Theories, and Applications, S.
Yu and G. Song (eds.). Cham, Switzerland: Springer Verlag, pp. 1-28.
Vari, A., and Vecsenyi, J. 1988. "Concepts and Tools of Artificial Intelligence for Human Decision
Making," Acta Psychologica (68:1-3), pp. 217-236.
Vásquez-Morales, G. R., Martínez-Monterrubio, S. M., Moreno-Ger, P., and Recio-García, J. A. 2019.
"Explainable Prediction of Chronic Renal Disease in the Colombian Population Using Neural
Networks and Case-Based Reasoning," IEEE Access (7), pp. 152900-152910.
Veldman, J., Wortmann, H., and Klingenberg, W. 2011. "Typology of Condition Based Maintenance,"
Journal of Quality in Maintenance Engineering (17:2), pp. 183-202.
Venkatesh, V., Morris, M. G., Davis, G. B., and Davis, F. D. 2003. "User Acceptance of Information
Technology: Toward a Unified View," MIS Quarterly (27:3), pp. 425-478.
Venkatesh, V., Thong, J. Y., and Xu, X. 2012. "Consumer Acceptance and Use of Information
Technology: Extending the Unified Theory of Acceptance and Use of Technology," MIS
Quarterly (36:1), pp. 157-178.
Venkatesh, V., Thong, J. Y., and Xu, X. 2016. "Unified Theory of Acceptance and Use of Technology:
A Synthesis and the Road Ahead," Journal of the Association for Information Systems (17:5),
pp. 328-376.
Verbeke, W., Martens, D., Mues, C., and Baesens, B. 2011. "Building Comprehensible Customer Churn
Prediction Models with Advanced Rule Induction Techniques," Expert Systems with
Applications (38:3), pp. 2354-2364.
Verma, S., Kawamoto, Y., Fadlullah, Z. M., Nishiyama, H., and Kato, N. 2017. "A Survey on Network
Methodologies for Real-Time Analytics of Massive Iot Data and Open Research Issues," IEEE
Communications Surveys & Tutorials (19:3), pp. 1457-1477.
Vidotto, G., Massidda, D., Noventa, S., and Vicentini, M. 2012. "Trusting Beliefs: A Functional
Measurement Study," Psicologica: International Journal of Methodology and Experimental
Psychology (33:3), pp. 575-590.
Villalonga, A., Beruvides, G., Castaño, F., Haber, R. E., and Novo, M. 2018. "Condition-Based
Monitoring Architecture for Cnc Machine Tools Based on Global Knowledge," IFAC-
PapersOnLine (51:11), pp. 200-204.
Virgolin, M., Alderliesten, T., and Bosman, P. A. 2020. "On Explaining Machine Learning Models by
Evolving Crucial and Compact Features," Swarm and Evolutionary Computation (53), pp. 1-
13.
Vogel, P. U. 2020. Trending in Der Pharmazeutischen Industrie. Wiesbaden, Germany: Springer
Spektrum.
Volkswagen AG. 2014. "Nachhaltigkeitsbericht 2014."
vom Brocke, J., Simons, A., Niehaves, B., Niehaves, B., Reimer, K., Plattfaut, R., and Cleven, A. 2009.
"Reconstructing the Giant: On the Importance of Rigour in Documenting the Literature Search
Process," in: European Conference on Information Systems (ECIS). Verona, Italy: IEEE.
vom Brocke, J., Simons, A., Riemer, K., Niehaves, B., Plattfaut, R., and Cleven, A. 2015. "Standing on
the Shoulders of Giants: Challenges and Recommendations of Literature Search in Information
Systems Research," Communications of the Association for Information Systems (37:1), p. 9.
Vormedal, I., and Ruud, A. 2009. "Sustainability Reporting in Norway – an Assessment of Performance
in the Context of Legal Demands and Socio-Political Drivers," Business Strategy and the
Environment (18:4), pp. 207-222.
Walicki, M., and Ferreira, D. R. 2011. "Sequence Partitioning for Process Mining with Unlabeled Event
Logs," Data & Knowledge Engineering (70:10), pp. 821-841.
Wallage, P. 2000. "Assurance on Sustainability Reporting: An Auditor’s iew," Auditing: A Journal of
Practice & Theory (19:1), pp. 53-65.
Wang, D., Yang, Q., Abdul, A., and Lim, B. Y. 2019a. "Designing Theory-Driven User-Centric
Explainable Ai," in: Conference on Human Factors in Computing Systems (CHI). Glasgow,
United Kingdom: ACM, pp. 1-15.
Artificial Intelligence for Human Decision-Makers
257
Wang, G., Gunasekaran, A., Ngai, E. W., and Papadopoulos, T. 2016a. "Big Data Analytics in Logistics
and Supply Chain Management: Certain Investigations for Research and Applications,"
International Journal of Production Economics (176), pp. 98-110.
Wang, H. 1997. "Intelligent Agent-Assisted Decision Support Systems: Integration of Knowledge
Discovery, Knowledge Analysis, and Group Decision Support," Expert Systems with
Applications (12:3), pp. 323-335.
Wang, J., Gou, L., Zhang, W., Yang, H., and Shen, H.-W. 2019b. "Deepvid: Deep Visual Interpretation
and Diagnosis for Image Classifiers Via Knowledge Distillation," IEEE Transactions on
Visualization and Computer Graphics (25:6), pp. 2168-2180.
Wang, J., Ma, Y., Zhang, L., Gao, R. X., and Wu, D. 2018a. "Deep Learning for Smart Manufacturing:
Methods and Applications," Journal of Manufacturing Systems (48), pp. 144-156.
Wang, J., Zhang, W., Qin, B., and Shi, W. 2010. "Research on Rules Extraction from Neural Network
Based on Linear Insertion," in: International Conference on Information Engineering (WASE).
Washington, United States: IEEE, pp. 33-36.
Wang, R., and Strong, D. 1996. "Beyond Accuracy: What Data Quality Means to Data Consumers,"
Journal of Management Information Systems (12:4), pp. 5-33.
Wang, S., Chaovalitwongse, W., and Babuska, R. 2012. "Machine Learning Algorithms in Bipedal
Robot Control," IEEE Transactions on Systems, Man, and Cybernetics, Part C (42:5), pp. 728-
743.
Wang, S., and Liu, M. 2015. "Multi-Objective Optimization of Parallel Machine Scheduling Integrated
with Multi-Resources Preventive Maintenance Planning," Journal of Manufacturing Systems
(37), pp. 182-192.
Wang, W., and Benbasat, I. 2007. "Recommendation Agents for Electronic Commerce: Effects of
Explanation Facilities on Trusting Beliefs," Journal of Management Information Systems
(23:4), pp. 217-246.
Wang, W., and Benbasat, I. 2016. "Empirical Assessment of Alternative Designs for Enhancing
Different Types of Trusting Beliefs in Online Recommendation Agents," Journal of
Management Information Systems (33:3), pp. 744-775.
Wang, X., Wang, H., and Qi, C. 2016b. "Multi-Agent Reinforcement Learning Based Maintenance
Policy for a Resource Constrained Flow Line System," Journal of Intelligent Manufacturing
(27:2), pp. 325-333.
Wang, Y., Anne, A., and Ropp, T. 2016c. "Applying the Technology Acceptance Model to Understand
Aviation Students’ Perceptions toward Augmented Reality Maintenance Training Instruction,"
International Journal of Aviation, Aeronautics, and Aerospace (3:4), p. 3.
Wang, Z., Gao, J., Chen, R., and Wang, J. 2018b. "A Modified Knn Algorithm for Activity Recognition
in Smart Home," in: International Congress of Economics and Business. Guilin, China: ICEB.
Wang, Z., Tang, W., and Pi, D. 2017. "Trajectory Similarity-Based Prediction with Information Fusion
for Remaining Useful Life," in: International Conference on Intelligent Data Engineering and
Automated Learning (IDEAL). Guilin, China: Springer, pp. 270-278.
Wanner, J. 2021. "I'm Telling You! Effects of Ai-Based Dss Information on Human Decision-Making,"
in: American Conference on Information Systems (AMCIS). Montreal, Canada: IEEE.
Wanner, J., Heinrich, K., Janiesch, C., and Zschech, P. 2020a. "How Much Ai Do You Require?
Decision Factors for Adopting Ai Technology," in: International Conference on Information
Systems (ICIS). Hyderabad, India: AIS, pp. 1-17.
Wanner, J., Herm, L.-V., Hartel, D., and Janiesch, C. 2019a. "Verwendung Binärer Datenwerte Für Eine
Ki-Gestützte Instandhaltung 4.0," HMD Praxis der Wirtschaftsinformatik (56:6), pp. 1268-
1281.
Wanner, J., Herm, L.-V., Heinrich, K., Janiesch, C., and Zschech, P. 2020b. "White, Grey, Black: Effects
of Xai Augmentation on the Confidence in Ai-Based Decision Support Systems," in:
International Conference on Information Systems (ICIS). Hyderabad, India: AIS.
Wanner, J., Herm, L.-V., and Janiesch, C. 2020c. "How Much Is the Black Box? The Value of
Explainability in Machine Learning Models," in: European Conference on Information Systems
(ECIS). Marakkesh, Morocco: IEEE, pp. 1-14.
Artificial Intelligence for Human Decision-Makers
258
Wanner, J., Herm, L., Heinrich, K., and Janiesch, C. 2021a. "Stop Ordering Machine Learning
Algorithms by Their Explainability! An Empirical Investigation of the Tradeoff between
Performance and Explainability," in: Conference e-Business, e-Services, and e-Society (I3E).
Galway, Ireland: IFIP.
Wanner, J., Wissuchek, C., and Janiesch, C. 2019b. "Machine Learning Und Complex Event Processing:
Effiziente Echtzeitauswertung Am Beispiel Smart Factory," in: Internationalen Tagung
Wirtschaftsinformatik (WI), T. Ludwig and V. Pipek (eds.). Siegen, Germany: AIS, pp. 47-61.
Wanner, J., Wissuchek, C., Welsch, G., and Janiesch, C. 2021b. "A Taxonomy and Archetypes of
Business Analytics in Smart Manufacturing," The Data Base for Advances in Information
Systems (tbd:tbd), p. tbd.
Weber, T. 2014. "Nachhaltigkeitsberichterstattung Als Bestandteil Marketingbasierter Csr-
Kommunikation," in Csr Und Reporting – Nachhaltigkeits- Und Csr-Berichtserstattung
Verstehen Und Erfolgreich Umsetzen, M. Fifka (ed.). Berlin, Germany: Springer Gabler, pp.
95-106.
Webster, J., and Watson, R. 2002. "Analyzing the Past to Prepare for the Future: Writing a Literature
Review," Management Information Systems Quarterly (26:2), pp. xiii-xxiii.
Wedel, M., von Hacht, M., Hieber, R., Metternich, J., and Abele, E. 2015. "Real-Time Bottleneck
Detection and Prediction to Prioritize Fault Repair in Interlinked Production Lines," Procedia
CIRP (37), pp. 140-145.
Weiber, R., and Mühlhaus, D. 2014. Strukturgleichungsmodellierung: Eine Anwendungsorientierte
Einführung in Die Kausalanalyse Mit Hilfe Von Amos, Smartpls Und Spss. Berlin, Germany:
Springer.
Weidele, D. K. I., Weisz, J. D., Oduor, E., Muller, M., Andres, J., Gray, A., and Wang, D. 2020.
"Autoaiviz: Opening the Blackbox of Automated Artificial Intelligence with Conditional
Parallel Coordinates," in: International Conference on Intelligent User Interfaces (IUI).
Cagliari, Italy: ACM, pp. 308-312.
Weitz, K., Schiller, D., Schlagowski, R., Huber, T., and André, E. 2019. ""Do You Trust Me?"
Increasing User-Trust by Integrating Virtual Agents in Explainable Ai Interaction Design," in:
International Conference on Intelligent Virtual Agents (IVA). Paris, France: ACM, pp. 7-9.
Weld, D. S., and Bansal, G. 2019. "The Challenge of Crafting Intelligible Intelligence,"
Communications of the ACM (62:6), pp. 70-79.
Wells, L. J., Camelio, J. A., Williams, C. B., and White, J. 2014. "Cyber-Physical Security Challenges
in Manufacturing Systems," Manufacturing Letters (2:2), pp. 74-77.
Westbrook, J. I., Gosling, A. S., and Coiera, E. W. 2005. "The Impact of an Online Evidence System on
Confidence in Decision Making in a Controlled Setting," Medical Decision Making (25:2), pp.
178-185.
Wickstrøm, K., Kampffmeyer, M., and Jenssen, R. 2018. "Uncertainty Modeling and Interpretability in
Convolutional Neural Networks for Polyp Segmentation," in: International Workshop on
Machine Learning for Signal Processing (MLSP). Aalborg, Denmark: IEEE, pp. 1-6.
Wilde, T., and Hess, T. 2007. "Forschungsmethoden Der Wirtschaftsinformatik," Wirtschaftsinformatik
(49:4), pp. 280-287.
Williams, J. J., and Lombrozo, T. 2013. "Explanation and Prior Knowledge Interact to Guide Learning,"
Cognitive Psychology (66:1), pp. 55-84.
Williams, M. D., Rana, N. P., and Dwivedi, Y. K. 2015. "The Unified Theory of Acceptance and Use
of Technology (Utaut): A Literature Review," Journal of Enterprise Information Management
(28:3), pp. 443-488.
Windmann, S., Jungbluth, F., and Niggemann, O. 2015. "A Hmm-Based Fault Detection Method for
Piecewise Stationary Industrial Processes," in: Conference on Emerging Technologies &
Factory Automation (ETFA). Luxembourg, Luxembourg: IEEE, pp. 1-6.
Windolph, S. 2011. "Assessing Corporate Sustainability through Ratings: Challenges and Their
Causes," Journal of Environmental Sustainability (1:1), pp. 61-80.
Winter, R. 2008. "Design Science Research in Europe," European Journal of Information Systems
(17:5), pp. 470-475.
Artificial Intelligence for Human Decision-Makers
259
Winter, S. 2000a. "Quantitative Und Qualitative Methoden Der Lehrveranstaltungsevaluation," in
Handbuch Hochschullehre. Bonn, Germany: Raabe.
Winter, S. 2000b. "Quantitative Vs. Qualitative Methoden," Retrieved from Uni Karlsruhe:
http://imihome. imi. uni-karlsruhe. de/nquantitative_vs_qualitative_methoden_b. html.
Wirth, W. 1999. "Methodologische Und Konzeptionelle Aspekte Der Glaubwürdigkeitsforschung," in
Glaubwürdigkeit Im Internet. Fragestellungen, Modelle, Empirische Befunde, P. Rössler and
W. Wirth (eds.). Munich, Germany: Reinhard Fischer Verlag.
Witte, A.-K., and Zarnekow, R. 2018. "Is Open Always Better? - a Taxonomy-Based Analysis of
Platform Ecosystems for Fitness Trackers," in: Multikonferenz Wirtschaftsinformatik.
Lueneburg, Germany: AIS, pp. 732-743.
WKWI, W. d. W. 1994. "Profil Der Wirtschaftsinformatik. Ausführungen Der Wissenschaftlichen
Kommission Der Wirtschaftsinformatik," Wirtschaftsinformatik (36:1).
Wolf, C. T., and Ringland, K. E. 2020. "Designing Accessible, Explainable Ai (Xai) Experiences," ACM
SIGACCESS Accessibility and Computing:125), pp. 1-1.
Wolling, J. 2004. "Qualitätserwartungen, Qualitätswahrnehmungen Und Die Nutzung Von
Fernsehserien," Publizistik (49:2), pp. 171-193.
Wu, J., Su, Y., Cheng, Y., Shao, X., Deng, C., and Liu, C. 2018. "Multi-Sensor Information Fusion for
Remaining Useful Life Prediction of Machining Tools by Adaptive Network Based Fuzzy
Inference System," Applied Soft Computing (68), pp. 13-23.
Wuest, T., Weimer, D., Irgens, C., and Thoben, K.-D. 2016. "Machine Learning in Manufacturing:
Advantages, Challenges, and Applications," Production & Manufacturing Research (4:1), pp.
23-45.
Xi, Z., and Panoutsos, G. 2018. "Interpretable Machine Learning: Convolutional Neural Networks with
Rbf Fuzzy Logic Classification Rules," in: International Conference on Intelligent Systems (IS).
Madeira, Portuguese: IEEE, pp. 448-454.
Xiao, B., and Benbasat, I. 2007. "E-Commerce Product Recommendation Agents: Use, Characteristics,
and Impact," MIS Quarterly (31:1), pp. 137-209.
Xu, R., and Wunsch, D. 2005. "Survey of Clustering Algorithms," IEEE Transactions on Neural
Networks (16:3), pp. 645-678.
Xu, X., Zhong, M., Wan, J., Yi, M., and Gao, T. 2016. "Health Monitoring and Management for
Manufacturing Workers in Adverse Working Conditions," Journal of Medical Systems (40:10),
p. 222.
Xu, X. Y., and Hua, Q. S. 2017. "Industrial Big Data Analysis in Smart Factory: Current Status and
Research Strategies," IEEE Access (5), pp. 17543-17551.
Xu, Y., Sun, Y., Wan, J., Liu, X., and Song, Z. 2017. "Industrial Big Data for Fault Diagnosis:
Taxonomy, Review, and Applications," IEEE Access (5), pp. 17368-17380.
Xun, P., Zhu, P. D., Zhang, Z. Y., Cui, P. S., and Xiong, Y. Q. 2018. "Detectors on Edge Nodes against
False Data Injection on Transmission Lines of Smart Grid," Electronics (7:6), pp. 1-12.
Yam, R., Tse, P., Li, L., and Tu, P. 2001. "Intelligent Predictive Decision Support System for Condition-
Based Maintenance," The International Journal of Advanced Manufacturing Technology (17:5),
pp. 383-391.
Yang, F., Du, M., and Hu, X. 2019. "Evaluating Explanation without Ground Truth in Interpretable
Machine Learning," arXiv preprint arXiv:1907.06831.
Yang, H.-d., and Yoo, Y. 2004. "It's All About Attitude: Revisiting the Technology Acceptance Model,"
Decision Support Systems (38:1), pp. 19-31.
Yang, H., Park, M., Cho, M., Song, M., and Kim, S. 2014. "A System Architecture for Manufacturing
Process Analysis Based on Big Data and Process Mining Techniques," in: International
Conference on Big Data (Big Data). Washington, United States: IEEE, pp. 1024-1029.
Yang, J., Zhou, C., Yang, S., Xu, H., and Hu, B. 2018a. "Anomaly Detection Based on Zone Partition
for Security Protection of Industrial Cyber-Physical Systems," IEEE Transactions on Industrial
Electronics (65:5), pp. 4257-4267.

Artificial Intelligence for Human Decision-Makers
260
Yang, Y., Tresp, V., Wunderle, M., and Fasching, P. A. 2018b. "Explaining Therapy Predictions with
Layer-Wise Relevance Propagation in Neural Networks," in: International Conference on
Healthcare Informatics (ICHI). New York, United States: IEEE, pp. 152-162.
Yang, Y. J., and Bang, C. S. 2019. "Application of Artificial Intelligence in Gastroenterology," World
Journal of Gastroenterology (25:14), pp. 1666–1683.
Yao, Y., and Murphy, L. 2007. "Remote Electronic Voting Systems: An Exploration of Voters'
Perceptions and Intention to Use," European Journal of Information Systems (16:2), pp. 106-
120.
Yeung, N., and Summerfield, C. 2012. "Metacognition in Human Decision-Making: Confidence and
Error Monitoring," Philosophical Transactions of the Royal Society B: Biological Sciences
(367:1594), pp. 1310-1321.
Yin, M., Wortman Vaughan, J., and Wallach, H. 2019. "Understanding the Effect of Accuracy on Trust
in Machine Learning Models," in: Conference on Human Factors in Computing Systems (CHI).
Glasgow, United Kingdom: ACM, pp. 1-12.
Yin, R. K. 2017. Case Study Research and Applications: Design and Methods. Los Angeles, United
States: SAGE publications.
Ylijoki, O., and Porras, J. 2016. "Perspectives to Definition of Big Data: A Mapping Study and
Discussion," Journal of Innovation Management (4:1), pp. 69-91.
Yong, Q., Zong-yi, X., Li-min, J., and Ying-ying, W. 2009. "Study on Interpretable Fuzzy Classification
System Based on Neural Networks," in: International Conference on Control, Automation and
Systems (ICCAS-SICE). Fukuoka, Japan: IEEE, pp. 5318-5321.
Yousefi, L., Swift, S., Arzoky, M., Sacchi, L., Chiovato, L., and Tucker, A. 2019. "Opening the Black
Box: Exploring Temporal Pattern of Type 2 Diabetes Complications in Patient Clustering Using
Association Rules and Hidden Variable Discovery," in: International Symposium on Computer-
Based Medical Systems (CBMS). Córdoba, Spain: IEEE, pp. 198-203.
Yunusa-Kaltungo, A., and Sinha, J. K. 2017. "Effective Vibration-Based Condition Monitoring (Evcm)
of Rotating Machines," Journal of Quality in Maintenance Engineering (23:3), pp. 279-296.
Yuwono, M., Qin, Y., Zhou, J., Guo, Y., Celler, B. G., and Su, S. W. 2016. "Automatic Bearing Fault
Diagnosis Using Particle Swarm Clustering and Hidden Markov Model," Engineering
Applications of Artificial Intelligence (47), pp. 88-100.
Zahedi, Z., Olmo, A., Chakraborti, T., Sreedharan, S., and Kambhampati, S. 2019. "Towards
Understanding User Preferences for Explanation Types in Model Reconciliation," in:
International Conference on Human-Robot Interaction (HRI). Daegu, Republic of Korea:
ACM/IEEE, pp. 648-649.
Zainal, Z. 2007. "Case Study as a Research Method," Jurnal Kemanusiaan (5:1), pp. 1-6.
Zarandi, M. H. F., Asl, A. A. S., Sotudian, S., and Castillo, O. 2018. "A State of the Art Review of
Intelligent Scheduling," Artificial Intelligence Review (53:1), pp. 501-593.
Zhang, Q., Yang, L. T., Chen, Z., and Li, P. 2018a. "A Survey on Deep Learning for Big Data,"
Information Fusion (42), pp. 146-157.
Zhang, S., Zhang, Y., and Zhu, J. 2018b. "Residual Life Prediction Based on Dynamic Weighted
Markov Model and Particle Filtering," Journal of Intelligent Manufacturing (29:4), pp. 753-
761.
Zhang, W., Yang, D., and Wang, H. 2019. "Data-Driven Methods for Predictive Maintenance of
Industrial Equipment: A Survey," IEEE Systems Journal (13:3), pp. 2213-2227.
Zhang, X., Noor, R., and Savalei, V. 2016. "Examining the Effect of Reverse Worded Items on the
Factor Structure of the Need for Cognition Scale," PloS One (11:6), pp. 1-15.
Zhang, Y., Liao, Q. V., and Bellamy, R. K. 2020. "Effect of Confidence and Explanation on Accuracy
and Trust Calibration in Ai-Assisted Decision Making," in: Conference on Fairness,
Accountability, and Transparency (FAT). New York, United States: ACM, pp. 295-305.
Zhang, Y., Ren, S., Liu, Y., and Si, S. 2017. "A Big Data Analytics Architecture for Cleaner
Manufacturing and Maintenance Processes of Complex Products," Journal of Cleaner
Production (142), pp. 626-641.
Artificial Intelligence for Human Decision-Makers
261
Zhao, G., Zhang, G., Ge, Q., and Liu, X. 2016. "Research Advances in Fault Diagnosis and Prognostic
Based on Deep Learning," in: Prognostics and System Health Management Conference (PHM).
Chengdu, China: IEEE, pp. 1-6.
Zhao, L., Yan, F., Wang, L., and Yao, Y. 2018. "Research on Intelligent Evaluation Method for
Machining State Oriented to Process Quality Control," in: Conference on Machine Learning
and Cybernetics (ICMLC). Chengdu, China: IEEE, pp. 343-347.
Zhao, R., Benbasat, I., and Cavusoglu, H. 2019. "Transparency in Advice-Giving Systems: A
Framework and a Research Model for Transparency Provision," in: Workshops at the
International Conference on Intelligent User Interfaces (IUI). Los Angeles, United States:
ACM, pp. 1-10.
Zhao, Y. J., Yan, Y. H., and Song, K. C. 2017. "Vision-Based Automatic Detection of Steel Surface
Defects in the Cold Rolling Process: Considering the Influence of Industrial Liquids and Surface
Textures," The International Journal of Advanced Manufacturing Technology (90:5-8), pp.
1665-1678.
Zheng, L., Zeng, C., Li, L., Jiang, Y., Xue, W., Li, J., Shen, C., Zhou, W., Li, H., Tang, L., Li, T., Duan,
B., Lei, M., and Wang, P. 2014. "Applying Data Mining Techniques to Address Critical Process
Optimization Needs in Advanced Manufacturing," in: International Conference on Knowledge
Discovery and Data Mining (KDD). New York, USA: ACM, pp. 1739-1748.
Zheng, S., Ristovski, K., Farahat, A., and Gupta, C. 2017. "Long Short-Term Memory Network for
Remaining Useful Life Estimation," in: International Conference on Prognostics and Health
Management (ICPHM). Dallas, United States: IEEE, pp. 88-95.
Zheng, X. C., Wang, M. Q., and Ordieres-Mere, J. 2018. "Comparison of Data Preprocessing
Approaches for Applying Deep Learning to Human Activity Recognition in the Context of
Industry 4.0," Sensors (18:7), pp. 1-13.
Zhong, R. Y., Xu, X., Klotz, E., and Newman, S. T. 2017. "Intelligent Manufacturing in the Context of
Industry 4.0: A Review," Engineering (3:5), pp. 616-630.
Zhou, J., Bridon, C., Chen, F., Khawaji, A., and Wang, Y. 2015a. "Be Informed and Be Involved: Effects
of Uncertainty and Correlation on User's Confidence in Decision Making," in: Conference
Extended Abstracts on Human Factors in Computing Systems (CHI). Seoul, Republic of Korea:
ACM, pp. 923-928.
Zhou, K., Liu, T., and Liang, L. 2016. "From Cyber-Physical Systems to Industry 4.0: Make Future
Manufacturing Become Possible," International Journal of Manufacturing Research (11:2), pp.
167-188.
Zhou, K., Liu, T., and Zhou, L. 2015b. "Industry 4.0: Towards Future Industrial Opportunities and
Challenges," in: International Conference on Fuzzy Systems and Knowledge Discovery (FSKD).
Zhangjiajie, China: IEEE, pp. 2147-2152.
Zhou, Y., and Xue, W. 2018. "Review of Tool Condition Monitoring Methods in Milling Processes,"
The International Journal of Advanced Manufacturing Technology (96:5), pp. 2509-2523.
Zhou, Z.-H., Chawla, N. V., Jin, Y., and Williams, G. J. 2014. "Big Data Opportunities and Challenges:
Discussions from Data Analytics Perspectives," IEEE Computational Intelligence Magazine
(9:4), pp. 62-72.
Zhu, J., Liapis, A., Risi, S., Bidarra, R., and Youngblood, G. M. 2018a. "Explainable Ai for Designers:
A Human-Centered Perspective on Mixed-Initiative Co-Creation," in: Conference on
Computational Intelligence and Games (CIG). Maastricht, Netherlands: IEEE, pp. 1-8.
Zhu, X., Xiong, J., and Liang, Q. 2018b. "Fault Diagnosis of Rotation Machinery Based on Support
Vector Machine Optimized by Quantum Genetic Algorithm," IEEE Access (6), pp. 33583-
33588.
Zhu, X. C., Qiao, F., and Cao, Q. S. 2017. "Industrial Big Data-Based Scheduling Modeling Framework
for Complex Manufacturing System," Advances in Mechanical Engineering (9:8), pp. 1–12.
Zimmermann, F. 2016. "Was Ist Nachhaltigkeit – Eine Perspektivenfrage?," in Nachhaltigkeit Wofür?
Von Chancen Und Herausforderungen Für Eine Nachhaltige Zukunft, F. Zimmermann (ed.).
Berlin, Germany: Springer Spektrum, pp. 1-24.

Artificial Intelligence for Human Decision-Makers
262
Zonta, T., da Costa, C. A., da Rosa Righi, R., de Lima, M. J., da Trindade, E. S., and Li, G. P. 2020.
"Predictive Maintenance in the Industry 4.0: A Systematic Literature Review," Computers &
Industrial Engineering (150), pp. 1-17.
Zschech, P. 2018. "A Taxonomy of Recurring Data Analysis Problems in Maintenance Analytics," in:
European Conference on Information Systems (ECIS). Portsmouth, United Kingdom: AIS, pp.
1-16.
Zschech, P., Bernien, J., and Heinrich, K. 2019. "Towards a Taxonomic Benchmarking Framework for
Predictive Maintenance: The Case of Nasa’s Turbofan Degradation," in: International
Conference on Information Systems (ICIS). Munich, Germany: AIS, pp. 1-15.
Zurita, D., Delgado, M., Carino, J. A., Ortega, J. A., and Clerc, G. 2016. "Industrial Time Series
Modelling by Means of the Neo-Fuzzy Neuron," IEEE Access (4), pp. 6151-6160.


