Embed Size (px)
Citation preview
Development of single nucleotide polymorphism markersin Theobroma cacao and comparison to simple sequencerepeat markers for genotyping of Cameroon clones
Donald S. Livingstone III • Juan Carlos Motamayor •
Raymond J. Schnell • Kathleen Cariaga • Barbie Freeman •
Alan W. Meerow • J. Steven Brown • David N. Kuhn
Received: 28 August 2009 / Accepted: 17 February 2010
� US Government 2010
Abstract Single nucleotide polymorphism (SNP)
markers are increasingly being used in crop breeding
programs, slowly replacing simple sequence repeats
(SSR) and other markers. SNPs provide many benefits
over SSRs, including ease of analysis and unambiguous
results across various platforms. We have identified and
mapped SNP markers in the tropical tree crop Theo-
broma cacao, and here we compare SNPs to SSRs for
the purpose of determining off-types in clonal collec-
tions. Clones are used as parents in breeding programs
and the presence of mislabeled clones (off-types) can
lead to the propagation of undesired traits and limit
genetic gain from selection. Screening was performed
on 186 trees representing 19 Theobroma cacao clones
from the Institute of Agricultural Research for Devel-
opment (IRAD) breeding program in Cameroon. Our
objectives were to determine the correct clone geno-
types and off-types using both SSR and SNP markers.
SSR markers that amplify 11 highly polymorphic loci
from six linkage groups and 13 SNP markers that
amplify eight loci from seven linkage groups were used
to genotype the 186 trees and the results from the two
different marker types were compared. The SNP assay
identified 98% of the off-types found via SSR screen-
ing. SNP markers spread across multiple linkage
groups may serve as a more cost-effective and
reliable method for off-type identification, especially in
cacao-producing countries where the equipment neces-
sary for SSR analysis may not be available.
Keywords SNP � Cacao � Genotype �SSR � Clone � Off-type
Introduction
The advancement of molecular markers has altered
the field of plant breeding, with markers being linked
to a variety of traits including yield, disease resis-
tance, and nutrition (Borrone et al. 2004; Brown et al.
2005; Clement et al. 2003; Faleiro et al. 2006;
Gordon et al. 2007; Kuhn et al. 2003; McCouch et al.
1997). Numerous commodity and specialty crops,
including Theobroma cacao L., have incorporated
marker-assisted selection (MAS) into their breeding
programs (Dubcovsky 2004; Schneider et al. 1997;
Schnell et al. 2007). T. cacao, a perennial tree crop
grown in the tropics, offers many challenges not
present in annual commodity crop breeding pro-
grams, such as increased land usage and long juvenile
periods (Schnell et al. 2007).
D. S. Livingstone III � R. J. Schnell � K. Cariaga �B. Freeman � A. W. Meerow � J. S. Brown �D. N. Kuhn (&)
USDA-ARS, Subtropical Horticulture Research Station,
13601 Old Cutler Rd., Miami, FL 33158, USA
e-mail: [email protected]
D. S. Livingstone III
e-mail: [email protected]
J. C. Motamayor
Mars, Inc., Hackettstown, NJ 07840, USA
123
Mol Breeding
DOI 10.1007/s11032-010-9416-2
Theobroma cacao (cacao) is native to South
America (Motamayor et al. 2008), and the beans
are used in the production of chocolate and cosmet-
ics. In Central and South America, outbreaks of
disease in the major growing areas have devastated
crops, resulting in the emergence of West Africa as
the largest cacao-producing region (Borrone et al.
2004; Brown et al. 2005). This underscores the
importance of breeding programs to identify and
incorporate disease resistance traits. Due to a three- to
four-year juvenile period, the cost of maintaining to
reproductive age a tree that does not contain the
desired traits is draining on a breeding program. MAS
promises to identify desired traits earlier in the
lifecycle of a tree, thereby eliminating undesirable
trees while still in the nursery and focusing pheno-
typic data gathering on more promising candidates.
Breeding programs rely on selecting parental lines
that contain traits of economic and agronomic
importance. In tree breeding, each parental line is
vegetatively propagated as genetically identical
clones to ensure a consistent genetic source to breed
in the desired traits by crossing two different lines of
parental clones and to provide sufficient numbers of
flowers. Unfortunately, in large breeding programs
parental clones may become mislabeled or root stock
may be mistaken for the cloned parent (Motamayor
et al. 2008). These misidentified clones are referred to
as off-types. In West Africa, two different parental
clones from a seed nursery are crossed to produce
hybrid seeds which are distributed to farmers. Mis-
identification of the parental clones in these seed
nurseries means that the distributed seed is not
improved and will not provide increased production.
Because an off-type is genetically different from
the desired clone, molecular markers are used to
screen clonal populations. All the plants of a
specific vegetatively propagated clone will have
identical alleles at each locus assayed, while the off-
types will have alleles that differ from those found
in the original cloned plant. The number of markers
that will identify off-types will depend on how
closely related the off-type is to the clonal type, as
closely related individuals will share a similar
genetic structure. Also, highly polymorphic markers
with balanced allele frequencies are more likely to
indicate an off-type than a marker with fewer alleles
or very low minor allele frequencies (Goddard et al.
2000).
Simple sequence repeats (SSRs) are perhaps the
most widely used molecular markers in breeding
programs; this is particularly true of specialty crops
(Borrone et al. 2007; Mauro-Herrera et al. 2006;
Meerow et al. 2005; Schnell et al. 2003; Zhang et al.
2009). SSRs are highly polymorphic, PCR-based
markers consisting of tandem nucleotide repeats that
vary in length. They are assayed by electrophoresis,
and are amenable to high-throughput analysis (Kuhn
et al. 2008; Weber and May 1989). Unfortunately, the
development and scoring of SSR markers is often
laborious, requiring skilled technicians and expensive
equipment. Scoring of SSRs can be performed by
simple size separation of the PCR-amplified marker on
polyacrylamide gels; however, this method is not
amenable to the high-throughput analysis needed for
large populations. Throughput concerns can be over-
come by assaying SSRs by electrophoresis with
automated sequencers; however, the exact size of
alleles varies from platform to platform, which com-
plicates the sharing of genotype data from different
laboratories. Unfortunately, resources for automated
sequencers are not always available in cacao-produc-
ing countries, and while gel-based SSR platforms are
readily available in these regions, throughput concerns
and difficulty in calling alleles of similar size have
precluded their wide scale adoption. Often samples
from producer regions get outsourced to larger labo-
ratories in the United States for genotyping. Despite
their shortcomings, the successful use of SSRs in
linkage analysis and off-typing has made them the
currently preferred marker for genetic diversity studies
and breeding programs.
In recent years, single nucleotide polymorphisms
(SNPs) have become widely used as markers in
humans and are increasingly being used in crop
systems (Altshuler et al. 2000; Ha et al. 2007; Mochida
et al. 2004; Rafalski 2002). As the most frequent DNA
polymorphism, SNP markers allow for more detailed
genetic maps and are found more frequently than SSRs
in the coding region of genes (Rafalski 2002). As
biallelic, PCR-based markers, SNPs are unambiguous
and can be screened by a number of non-electropho-
retic means, allowing for platform independence.
Though SNPs are easier to develop and analyze, they
are by nature less polymorphic than SSRs, and as such
may require more markers to perform off-typing.
A number of SNPs in cacao have been previously
identified (Argout et al. 2008; Borrone et al. 2004;
Mol Breeding
123
Kuhn et al. 2005; Lima et al. 2009). Most notably,
research to improve disease resistance has resulted in
the identification of various cacao SNPs from candi-
date genes thought to be involved in witches’ broom
resistance (Borrone et al. 2004; Kuhn et al. 2005;
Lima et al. 2009). A number of these identified SNPs
have been developed into single-strand conforma-
tional polymorphism (SSCP) markers that have been
shown to successfully genotype cacao plants (Bor-
rone et al. 2004; Kuhn et al. 2005, 2008). SSCP
markers have been added to genetic linkage maps of
cacao (Brown et al. 2005). In this article, we describe
the conversion of these SSCP markers into SNP
markers. The newly developed SNP markers were
mapped in a segregating population to determine
distribution across the genome. We also evaluated
their ability to differentiate clones of T. cacao and
off-types among putative parental clones from a
breeding facility in Cameroon. Our objectives were to
compare the ability of markers based on SNPs and
SSRs to identify off-types, and to estimate the costs
associated with using each marker system. While
SNPs have been identified in cacao previously
(Borrone et al. 2004), this is, to our knowledge, the
first report of the application of a non-electrophoretic
SNP marker assay in T. cacao.
Materials and methods
Plant material
SNP markers were mapped in a genetically segregat-
ing population that was produced by selfing TSH 516,
an individual tree from the cross of SCA 6 9 ICS 1.
The F2 population consisted of 140 individuals.
Additional details of this mapping population can
be found in Brown et al. (2005).
Leaves from 186 individual T. cacao trees were
obtained from various field collections of the Institute
of Agricultural Research for Development (IRAD) in
Cameroon, and sent to the USDA-ARS Subtropical
Horticulture Research Station (SHRS) in Miami,
Florida, for analysis. These 186 individual plants are
representatives of 19 different vegetatively propa-
gated clones from the germplasm and breeding
collections at IRAD. A list of the 19 clones can be
found in Table 1.
Mapping procedure
Mapping was performed using 13 SNP markers and a
combination of 180 previously mapped SSR and
SSCP markers (Brown et al. 2005). Genotype data
was imported into JoinMap v4 (Van Ooijen 2006),
and was used to create the map using the Kosambi
mapping function (Kosambi 1944). One SNP marker
(w8s119) could not be used for mapping as it was
monomorphic in the mapping population. Thus, the
final mapping dataset consisted of 140 individuals
screened with a total of 192 markers.
DNA extractions
DNA was isolated from leaf discs following a modified
protocol of the Fast DNA Kit (Bio101, Carlsbad,
CA,USA) as described in Kuhn et al. (2003). All
isolated DNA was first quantified using a Sybr Green I
based assay (Livingstone et al. 2009). In brief, 24 ll of
water, 1 ll of DNA sample, and 25 ll of 60 9 Sybr
Green I (diluted in 10 mM Tris pH 7.5, 1 mM EDTA
buffer) were combined in a 96-well plate. The reaction
plate was then incubated at room temperature in the
dark for 5 min before fluorescence was measured in a
BioTek FLx800 TBP fluorescence microplate reader
(BioTek Instruments, Winooski, VT, USA). Fluores-
cence was converted to concentration by comparison to
a standard curve. After quantifying, all samples were
normalized to 4 ng/ll.
SSR analysis
SSR analysis was performed using eleven markers
(mTcCir6, mTcCir9, mTcCir12, mTcCir15, mTcCir17,
mTcCir18, mTcCir21, mTcCir24, mTcCir25, mTc-
Cir26, SHRSTc23), following the procedure described
in Efombagn et al. (2008). This set of markers is currently
used in our laboratory because of its high polymorphism
level. Additional marker information can be found
online (http://www.cacaogenomedb.org/). Amplified
SSR fragments were separated by capillary electropho-
resis using an ABI 3730 sequencer, and allele size was
scored with GeneMapper (ABI, Foster City, CA, USA).
The allele size of each marker was recorded in a
spreadsheet.
Mol Breeding
123

SNP analysis
A subset of SSCP markers described previously
(Kuhn et al. 2008) was chosen and converted into
SNP markers. Unlabeled SSCP primers were used to
amplify TSH 516, SCA 6, and ICS 1 (the parent and
grandparents of the mapping population) and the
amplicons for each locus were sequenced as
described in Kuhn et al. (2008). The resulting
sequences from a given SSCP primer pair were
aligned and examined for SNPs using the phred/
phrap/polyphred/consed pipeline (Ewing and Green
1998; Ewing et al. 1998; Gordon et al. 1998;
Stephens et al. 2006). The consensus sequences for
these loci were used to design Taqman-MGB probes
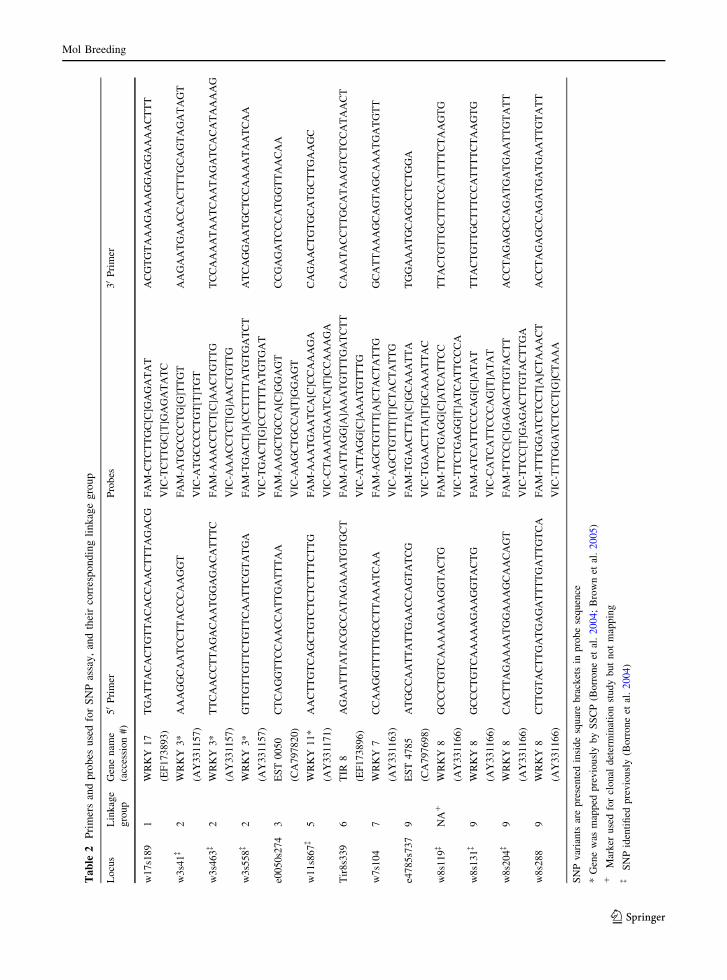
and primers (Table 2) using the Primer Express 3.0
software (Applied Biosystems). SNP markers were
named with a locus and position identifier. For
example, in the SNP marker w17s189, the w17
represents the locus, WRKY17, while s189 represents
the SNP position at nucleotide 189 in reference to the
GenBank entry for WRKY17 (EF173893).
SNP analysis was performed using a 50 nuclease
(Taqman) assay (Holland et al. 1991; Livak 1999). In
brief, a total reaction volume of 10 ll included 0.9 ll
of each primer (10 mM), 0.2 ll of FAM-labeled
probe (10 mM), 0.2 ll of VIC-labeled probe
(10 mM), 1.8 ll water, 5 ll Taqman Genotyping
Master Mix with ROX (29) (Applied Biosystems),
and 1 ll of template DNA (4 ng/ll). Allelic deter-
mination was performed by first recording back-
ground fluorescence using a 7300 Real-Time PCR
system (ABI). Then, PCR amplification was carried
out on either the 7300 Real-Time PCR machine or on
a standard thermocycler using the following cycling
parameters: one cycle at 95�C for 10 min, 40 cycles
at 95�C for 15 s, then 60�C for 1 min. After
amplification, an end-point fluorescence measure-
ment was taken using the 7300 Real-Time PCR
machine. A ratio of fluorescence values (Relative
Table 1 Clonal groups in the Cameroon population and the number of off-types determined by SSR and SNP markers
Clonal group Diversity/STRUCTURE
group
Total samples Number
of off-types
identified
by SSRs
Average number
of SSR loci varying
within an off-type
Number of
off-types
identified
by SNPs
Average number
of SNP loci varying
within off-type
SNK 13 Trinitario 20 7 7.1 7 7.7
SNK 16 Trinitario 19 6 8.8 6 4.7
SNK 64 Trinitario 16 2 6.5 2 5.5
SNK 413 Trinitario 20 6 8.8 6 5.8
T79/501 (Iquitos 9 Maranon) 9
Trinitario
24 5 7.8 4 4.6
UPA 143 Iquitos 9 Trinitario 17 5 4.8 5 4.6
BE10 Amelonado 6 0 0
Catongo Amelonado 5 0 0
EQX33G0/3 ((Nanay 9 Iquitos) 9
Trinitario) 9 Trinitario
5 2 10.5 2 4.5
GU225-V Guiana 7 5 10 5 7.4
ICS1 Trinitario 9 1 7 1 5
IFC5 Amelonado 8 6 9 6 6.8
IMC60 Iquitos 3 0 0
M020 Nacional 5 0 0
Playa alta 2 Amelonado 4 0 0
SIC5 Amelonado 5 1 7 1 10
SNK602 Trinitario 4 0 0
SNK619 Trinitario 5 0 0
UF676 Trinitario 4 0 0
Total 186 46 8.1 45 6.0
Mol Breeding
123
Ta
ble
2P
rim
ers
and
pro
bes
use
dfo
rS
NP
assa
y,
and
thei
rco
rres
po
nd
ing
lin
kag
eg
rou
p
Lo
cus
Lin
kag
e
gro
up
Gen
en
ame
(acc
essi
on
#)
50
Pri
mer
Pro
bes
30
Pri
mer
w1
7s1
89
1W
RK
Y1
7
(EF
17
38
93
)
TG
AT
TA
CA
CT
GT
TA
CA
CC
AA
CT
TT
AG
AC
GF
AM
-CT
CT
TG
C[C
]GA
GA
TA
TA
CG
TG
TA
AA
GA
AA
GG
AG
GA
AA
AC
TT
T
VIC
-TC
TT
GC
[T]G
AG
AT
AT
C
w3
s41�
2W
RK
Y3
*
(AY
33
11
57
)
AA
AG
GC
AA
TC
CT
TA
CC
CA
AG
GT
FA
M-A
TG
CC
CC
TG
[G]T
TG
TA
AG
AA
TG
AA
CC
AC
TT
TG
CA
GT
AG
AT
AG
T
VIC
-AT
GC
CC
CT
GT
[T]T
GT
w3
s463�
2W
RK
Y3
*
(AY
33
11
57
)
TT
CA
AC
CT
TA
GA
CA
AT
GG
AG
AC
AT
TT
CF
AM
-AA
AC
CT
CT
[C]A
AC
TG
TT
GT
CC
AA
AA
TA
AT
CA
AT
AG
AT
CA
CA
TA
AA
AG
VIC
-AA
AC
CT
CT
[G]A
AC
TG
TT
G
w3
s558�
2W
RK
Y3
*
(AY
33
11
57
)
GT
TG
TT
GT
TC
TG
TT
CA
AT
TC
GT
AT
GA
FA
M-T
GA
CT
[A]C
CT
TT
TA
TG
TG
AT
CT
AT
CA
GG
AA
TG
CT
CC
AA
AA
TA
AT
CA
A
VIC
-TG
AC
T[G
]CC
TT
TT
AT
GT
GA
T
e00
50s2
74
3E
ST
00
50
(CA
797
82
0)
CT
CA
GG
TT
CC
AA
CC
AT
TG
AT
TT
AA
FA
M-A
AG
CT
GC
CA
[C]G
GA
GT
CC
GA
GA
TC
CC
AT
GG
TT
AA
CA
A
VIC
-AA
GC
TG
CC
A[T
]GG
AG
T
w1
1s8
67�
5W
RK
Y1
1*
(AY
33
11
71
)
AA
CT
TG
TC
AG
CT
GT
CT
CT
CT
TT
CT
TG
FA
M-A
AA
TG
AA
TC
A[C
]CC
AA
AG
AC
AG
AA
CT
GT
GC
AT
GC
TT
GA
AG
C
VIC
-CT
AA
AT
GA
AT
CA
[T]C
CA
AA
GA
Tir
8s3
39
6T
IR8
(EF
17
38
96
)
AG
AA
TT
TA
TA
CG
CC
AT
AG
AA
AT
GT
GC
TF
AM
-AT
TA
GG
[A]A
AA
TG
TT
TG
AT
CT
TC
AA
AT
AC
CT
TG
CA
TA
AG
TC
TC
CA
TA
AC
T
VIC
-AT
TA
GG
[C]A
AA
TG
TT
TG
w7
s104
7W
RK
Y7
(AY
33
11
63
)
CC
AA
GG
TT
TT
TG
CC
TT
AA
AT
CA
AF
AM
-AG
CT
GT
TT
[A]C
TA
CT
AT
TG
GC
AT
TA
AA
GC
AG
TA
GC
AA
AT
GA
TG
TT
VIC
-AG
CT
GT
TT
[T]C
TA
CT
AT
TG
e47
85s7
37
9E
ST
47
85
(CA
797
69
8)
AT
GC
CA
AT
TA
TT
GA
AC
CA
GT
AT
CG
FA
M-T
GA
AC
TT
A[C
]GC
AA
AT
TA
TG
GA
AA
TG
CA
GC
CT
CT
GG
A
VIC
-TG
AA
CT
TA
[T]G
CA
AA
TT
AC
w8
s119�
NA
?W
RK
Y8
(AY
33
11
66
)
GC
CC
TG
TC
AA
AA
AG
AA
GG
TA
CT
GF
AM
-TT
CT
GA
GG
[C]A
TC
AT
TC
CT
TA
CT
GT
TG
CT
TT
CC
AT
TT
TC
TA
AG
TG
VIC
-TT
CT
GA
GG
[T]A
TC
AT
TC
CC
A
w8
s131�
9W
RK
Y8
(AY
33
11
66
)
GC
CC
TG
TC
AA
AA
AG
AA
GG
TA
CT
GF
AM
-AT
CA
TT
CC
CA
G[C
]AT
AT
TT
AC
TG
TT
GC
TT
TC
CA
TT
TT
CT
AA
GT
G
VIC
-CA
TC
AT
TC
CC
AG
[T]A
TA
T
w8
s204�
9W
RK
Y8
(AY
33
11
66
)
CA
CT
TA
GA
AA
AT
GG
AA
AG
CA
AC
AG
TF
AM
-TT
CC
[C]G
AG
AC
TT
GT
AC
TT
AC
CT
AG
AG
CC
AG
AT
GA
TG
AA
TT
GT
AT
T
VIC
-TT
CC
[T]G
AG
AC
TT
GT
AC
TT
GA
w8s2
88
9W
RK
Y8
(AY
33
11
66
)
CT
TG
TA
CT
TG
AT
GA
GA
TT
TT
GA
TT
GT
CA
FA
M-T
TT
GG
AT
CT
CC
T[A
]CT
AA
AC
TA
CC
TA
GA
GC
CA
GA
TG
AT
GA
AT
TG
TA
TT
VIC
-TT
TG
GA
TC
TC
CT
[G]C
TA
AA
SN
Pvar
iants
are
pre
sente
din
side
squar
ebra
cket
sin
pro
be
sequen
ce
*G
ene
was
map
ped
pre
vio
usl
yb
yS
SC
P(B
orr
on
eet
al.
20
04;
Bro
wn
etal
.2
00
5)
?M
ark
eru
sed
for
clo
nal
det
erm
inat
ion
stu
dy
bu
tn
ot
map
pin
g�
SN
Pid
enti
fied
pre
vio
usl
y(B
orr
on
eet
al.
20
04)
Mol Breeding
123
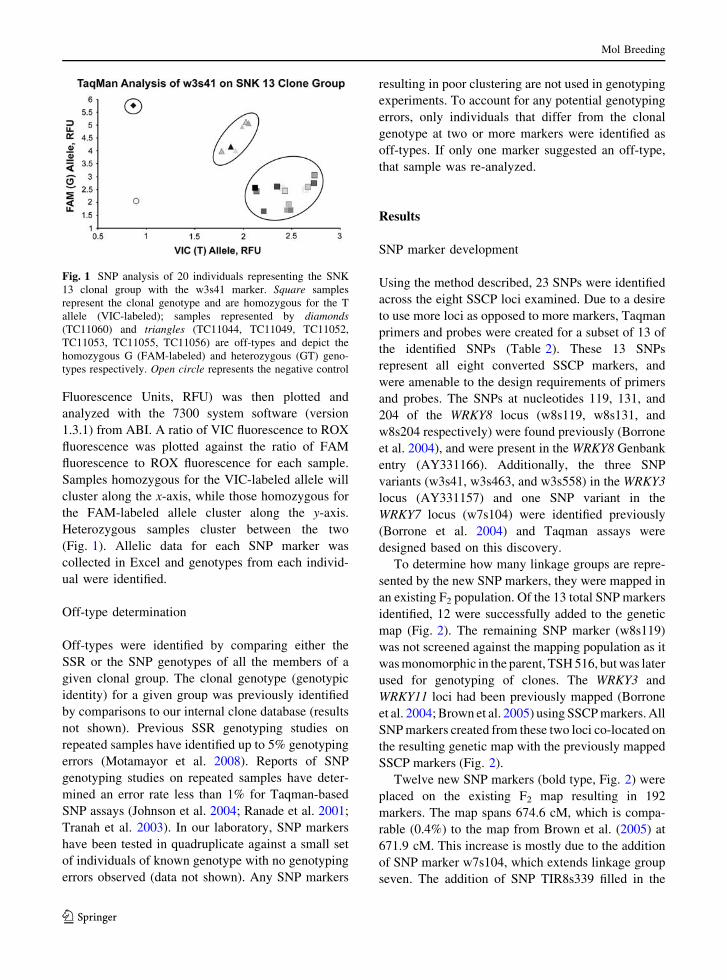
Fluorescence Units, RFU) was then plotted and
analyzed with the 7300 system software (version
1.3.1) from ABI. A ratio of VIC fluorescence to ROX
fluorescence was plotted against the ratio of FAM
fluorescence to ROX fluorescence for each sample.
Samples homozygous for the VIC-labeled allele will
cluster along the x-axis, while those homozygous for
the FAM-labeled allele cluster along the y-axis.
Heterozygous samples cluster between the two
(Fig. 1). Allelic data for each SNP marker was
collected in Excel and genotypes from each individ-
ual were identified.
Off-type determination
Off-types were identified by comparing either the
SSR or the SNP genotypes of all the members of a
given clonal group. The clonal genotype (genotypic
identity) for a given group was previously identified
by comparisons to our internal clone database (results
not shown). Previous SSR genotyping studies on
repeated samples have identified up to 5% genotyping
errors (Motamayor et al. 2008). Reports of SNP
genotyping studies on repeated samples have deter-
mined an error rate less than 1% for Taqman-based
SNP assays (Johnson et al. 2004; Ranade et al. 2001;
Tranah et al. 2003). In our laboratory, SNP markers
have been tested in quadruplicate against a small set
of individuals of known genotype with no genotyping
errors observed (data not shown). Any SNP markers
resulting in poor clustering are not used in genotyping
experiments. To account for any potential genotyping
errors, only individuals that differ from the clonal
genotype at two or more markers were identified as
off-types. If only one marker suggested an off-type,
that sample was re-analyzed.
Results
SNP marker development
Using the method described, 23 SNPs were identified
across the eight SSCP loci examined. Due to a desire
to use more loci as opposed to more markers, Taqman
primers and probes were created for a subset of 13 of
the identified SNPs (Table 2). These 13 SNPs
represent all eight converted SSCP markers, and
were amenable to the design requirements of primers
and probes. The SNPs at nucleotides 119, 131, and
204 of the WRKY8 locus (w8s119, w8s131, and
w8s204 respectively) were found previously (Borrone
et al. 2004), and were present in the WRKY8 Genbank
entry (AY331166). Additionally, the three SNP
variants (w3s41, w3s463, and w3s558) in the WRKY3
locus (AY331157) and one SNP variant in the
WRKY7 locus (w7s104) were identified previously
(Borrone et al. 2004) and Taqman assays were
designed based on this discovery.
To determine how many linkage groups are repre-
sented by the new SNP markers, they were mapped in
an existing F2 population. Of the 13 total SNP markers
identified, 12 were successfully added to the genetic
map (Fig. 2). The remaining SNP marker (w8s119)
was not screened against the mapping population as it
was monomorphic in the parent, TSH 516, but was later
used for genotyping of clones. The WRKY3 and
WRKY11 loci had been previously mapped (Borrone
et al. 2004; Brown et al. 2005) using SSCP markers. All
SNP markers created from these two loci co-located on
the resulting genetic map with the previously mapped
SSCP markers (Fig. 2).
Twelve new SNP markers (bold type, Fig. 2) were
placed on the existing F2 map resulting in 192
markers. The map spans 674.6 cM, which is compa-
rable (0.4%) to the map from Brown et al. (2005) at
671.9 cM. This increase is mostly due to the addition
of SNP marker w7s104, which extends linkage group
seven. The addition of SNP TIR8s339 filled in the
Fig. 1 SNP analysis of 20 individuals representing the SNK
13 clonal group with the w3s41 marker. Square samples
represent the clonal genotype and are homozygous for the T
allele (VIC-labeled); samples represented by diamonds(TC11060) and triangles (TC11044, TC11049, TC11052,
TC11053, TC11055, TC11056) are off-types and depict the
homozygous G (FAM-labeled) and heterozygous (GT) geno-
types respectively. Open circle represents the negative control
Mol Breeding
123

Fig. 2 Genetic map of TSH516 selfed F2 population from
Brazil. This population consisted of 140 individuals, and the
map produced contains 192 total markers. Newly identified
SNP markers are presented in bold type. Previously mapped
SSCP markers are denoted by asterisk, while SSR markers
used for clonal determination are denoted by plus sign
Mol Breeding
123
largest gap in the previous F2 map on linkage group
six, reducing the maximum distance between markers
from 22.3 to 18.4 cM. In terms of positioning SNP
markers evenly throughout the genome, the SNPs
identified from the eight converted SSCP markers are
spread across seven out of ten of the linkage groups
(Table 2) of T. cacao.
SSR analysis
SSR data was analyzed using Genemapper software
to determine allele sizes for all of the individuals
among the 19 groups. The clonal genotype (genotypic
identity) of each group was identified as described in
Materials and methods. Any individual deviating
from the clonal genotype at two or more SSR loci
was designated an off-type. SSR analysis was able to
identify a total of 46 off-types (Table 1) with 11
highly polymorphic markers. The average number of
SSR loci for which off-types did not match their
clonal group is also presented in Table 1. As a whole,
identified off-types differed from their labeled clones
by an average of 8.1 SSR markers per individual. No
off-type differed by less than four SSRs.
SNP analysis
Allele data for each sample was recorded in a
spreadsheet, and a genotype was identified as the
collection of the allele data for all the markers for each
individual. SNP data from 13 markers (Table 2) were
collected for all the individuals and assembled into
genotypes. The clonal genotype (genotypic identity)
was determined as described in Materials and methods.
SNPs were able to identify 47 putative off-types;
however, two of these were only identified with a
single SNP marker. These samples were re-amplified
to remove any missing data and to eliminate any
potential errors in allele calling. Re-analysis of one of
these individuals (TC11129) remained consistent
across all SNP markers analyzed, with only a single
SNP marker identifying the sample as an off-type.
Interestingly, this sample was identified as an off-type
with SSRs, suggesting that additional informative SNP
markers may correctly identify this sample as an off-
type. However, in order to fairly evaluate the perfor-
mance of the SNP markers, this sample was considered
a ‘‘clone’’ as it did not meet the criteria for an off-type.
The other putative off-type identified by a single SNP
(TC11174) yielded inconclusive results due to poor
amplification on re-analysis (data not shown). After
removal of these two individuals from the list, 45 trees
were identified as off-types by SNP analysis (Table 1).
The average number of SNP markers for which off-
types did not match their clonal group is presented in
Table 1. As a whole, identified off-types differed from
their labeled clones by an average of 6.0 SNP markers
per individual.
SSR versus SNP comparison
SSR markers identified 46 off-types, while SNPs
identified 45, all of which are concordant with the
SSR data. The genotype of some off-types matched
the genotype of other labeled clones. This genotype
data collected for both SNPs and SSRs can be seen in
Tables 3 and 4, respectively.
Discussion
While used commonly in MAS breeding programs,
SSR markers still suffer from problems because the
assay is based on electrophoresis. A previous study
compared SSRs to SNP-based SSCP markers in
cacao (Kuhn et al. 2008). SSCP markers suffer from
difficult and time-consuming analysis. The SNP
marker analysis described in this paper, however, is
far simpler than SSCP or SSR marker analysis as it
does not require any electrophoretic separation. Since
the previously developed SSCP markers are based on
SNPs, we converted them into Taqman-based SNP
markers, evaluated them and compared their effi-
ciency to SSR markers.
Genotypic data was collected for the SNP markers
in an F2 mapping population, and was combined with
previously collected SSR and SSCP data from the
same population in order to determine the position of
the SNPs in the genome. The addition of the SNP
markers resulted in a genetic map (Fig. 2) containing
ten linkage groups, consistent with the ten chromo-
somes of T. cacao (Brown et al. 2005). The SNPs
assayed are spread across seven different linkage
groups (Table 2), while the SSRs assayed represent
six of the linkage groups. Markers that are on
separate linkage groups should provide a better
reflection of genetic variability as they are inherited
independently. However, the informativeness of the
Mol Breeding
123
markers in a given sample population is also impor-
tant, and is likely one of the reasons SSR markers
were able to identify more off-types than SNP
markers.
One would expect previously mapped SSCP
markers to map at the same position as any SNP
markers identified from that locus. Our data con-
firmed this when the WRKY3 SSCP marker and SNP
markers w3s41, w3s463, and w3s558 all mapped to
the same position (Fig. 2). This was further con-
firmed by the SNP marker w11s867 co-locating with
the previously mapped SSCP WRKY11 locus from
which the SNP was identified.
Mapping SNP markers in T. cacao will allow for a
substantially more detailed genetic map to be devel-
oped. The ability to use SNP markers in germplasm
collections and seed gardens, especially on site in
cacao-producing countries, is the ultimate goal. The
vegetative clonal propagation of parental lines is a
common practice, which allows the preservation and
transfer of desired traits through select crossing of
different cloned parents. However, the long life cycle
and grafting techniques involved with tree crops
make identifying off-types necessary. There are two
different types of off-types: mislabeled clones that
are part of the germplasm collection, and trees that
are rootstock or clone progeny. Despite the diligence
of germplasm curators, off-types can be found in
most germplasm collections. Mislabeling of clones in
germplasm collections is a common problem, with a
population in Trinidad reporting approximately 30%
misidentified clones (Schnell et al. 2004). This is
particularly problematic when clones are exchanged
between germplasm collection sites and seed gardens.
As such, the identification of off-types within a
germplasm collection is an essential task, and should
serve as a practical test for the utility of SSR and SNP
markers. While it is possible to identify some off-
types phenotypically, one needs to be familiar with
the physical traits of all the expected clones, and may
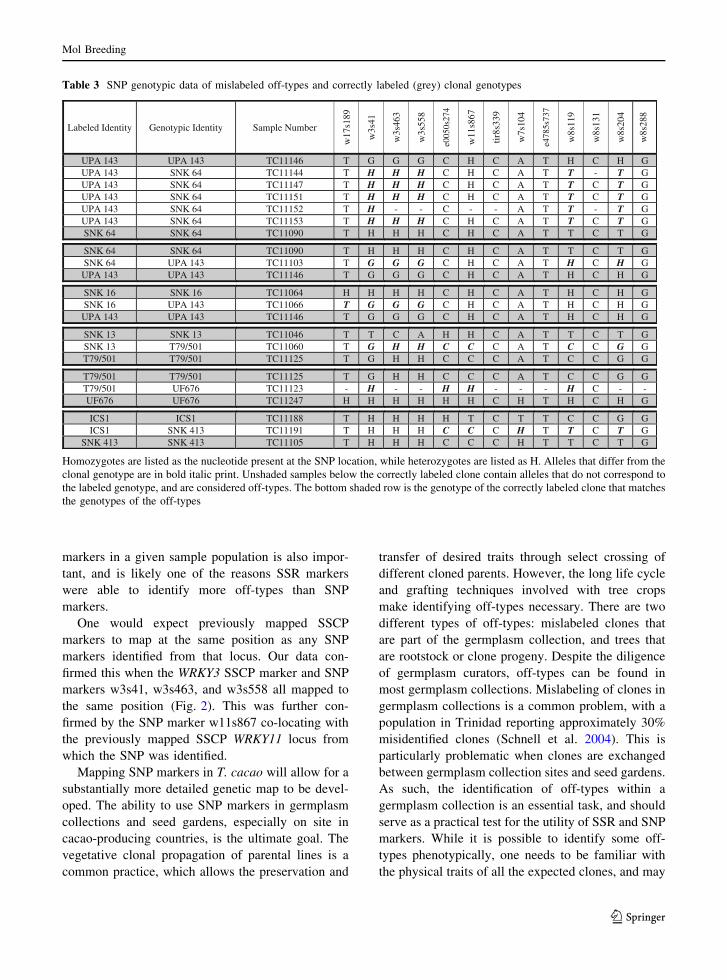
Table 3 SNP genotypic data of mislabeled off-types and correctly labeled (grey) clonal genotypes
Labeled Identity Genotypic Identity Sample Number
w17
s189
w3s
41
w3s
463
w3s
558
e005
0s27
4
w11
s867
tir8s
339
w7s
104
e478
5s73
7
w8s
119
w8s
131
w8s
204
w8s
288
UPA 143 UPA 143 TC11146 T G G G C H C A T H C H G UPA 143 SNK 64 TC11144 T H H H C H C A T T - T GUPA 143 SNK 64 TC11147 T H H H C H C A T T C T GUPA 143 SNK 64 TC11151 T H H H C H C A T T C T GUPA 143 SNK 64 TC11152 T H - - C - - A T T - T GUPA 143 SNK 64 TC11153 T H H H C H C A T T C T GSNK 64 SNK 64 TC11090 T H H H C H C A T T C T G
SNK 64 SNK 64 TC11090 T H H H C H C A T T C T G SNK 64 UPA 143 TC11103 T G G G C H C A T H C H G
UPA 143 UPA 143 TC11146 T G G G C H C A T H C H G
SNK 16 SNK 16 TC11064 H H H H C H C A T H C H G SNK 16 UPA 143 TC11066 T G G G C H C A T H C H G UPA 143 UPA 143 TC11146 T G G G C H C A T H C H G
SNK 13 SNK 13 TC11046 T T C A H H C A T T C T G SNK 13 T79/501 TC11060 T G H H C C C A T C C G GT79/501 T79/501 TC11125 T G H H C C C A T C C G G
T79/501 T79/501 TC11125 T G H H C C C A T C C G G T79/501 UF676 TC11123 - H - - H H - - - H C - - UF676 UF676 TC11247 H H H H H H C H T H C H G
ICS1 ICS1 TC11188 T H H H H T C T T C C G G ICS1 SNK 413 TC11191 T H H H C C C H T T C T G
SNK 413 SNK 413 TC11105 T H H H C C C H T T C T G
Homozygotes are listed as the nucleotide present at the SNP location, while heterozygotes are listed as H. Alleles that differ from the
clonal genotype are in bold italic print. Unshaded samples below the correctly labeled clone contain alleles that do not correspond to
the labeled genotype, and are considered off-types. The bottom shaded row is the genotype of the correctly labeled clone that matches
the genotypes of the off-types
Mol Breeding
123
require mature trees to compare pod shape and color.
Clonal determination with molecular markers can be
done much sooner, saving the resources required to
nurture a newly grafted clone until fruit set, and in the
case of SNP markers can be done with minimally
trained personnel.
Using SSR markers, 46 of the 186 (24.7%) total
individuals examined were determined to be off-
types, while SNP markers identified 45 off-types
(24.2%), all of which are concordant with those
determined by SSRs. The off-types identified varied
from the labeled clonal genotype at an average of 8.1
SSR marker loci per individual tree, and 6.0 SNP loci
per individual (Table 1). This is not surprising as the
polymorphic nature of SSRs provide more opportu-
nity for a single marker to be informative. However,
despite the lower overall average, in some of the
clonal groups the average number of SNP markers
varying within an off-type was nearly equal (UPA
143) and for some groups (SNK 13, SIC5) greater
than the average number of SSR markers (Table 1).
This suggests that the informativeness of any
given marker is affected by the genotypes within
the population being screened. This is further
demonstrated by SNP marker w8s119, which was
completely uninformative in the F2 mapping popula-
tion from Brazil, but was able to identify 32 off-types
(71%) in the Cameroon clonal population.
The lower average of SNP markers per individual
that were informative for off-types is likely due to the
nature of the two marker types. SNPs are biallelic,
whereas SSRs have multiple alleles (Kuhn et al. 2008).
The effect of the polymorphic nature of these two
markers is perhaps best illustrated when we examine
the probability of identity (PI), or the probability that
two individuals drawn at random from a population
will have the same genotype at multiple loci (Lisette
et al. 2001). The entire SSR data and SNP data were
treated as individual populations and the number of
loci needed to achieve a PI factor of 0.005 was
determined with GenAlEx v6 (Peakall and Smouse
2006). To reach this PI factor, SNP markers require six
loci, while SSR markers only require three, which is
indicative of the more polymorphic nature of SSRs.
However, it is worth noting that the 11 SSR markers
used in this study were chosen because they are among
the most polymorphic out of approximately 400 SSR
markers developed for cacao, and they have been
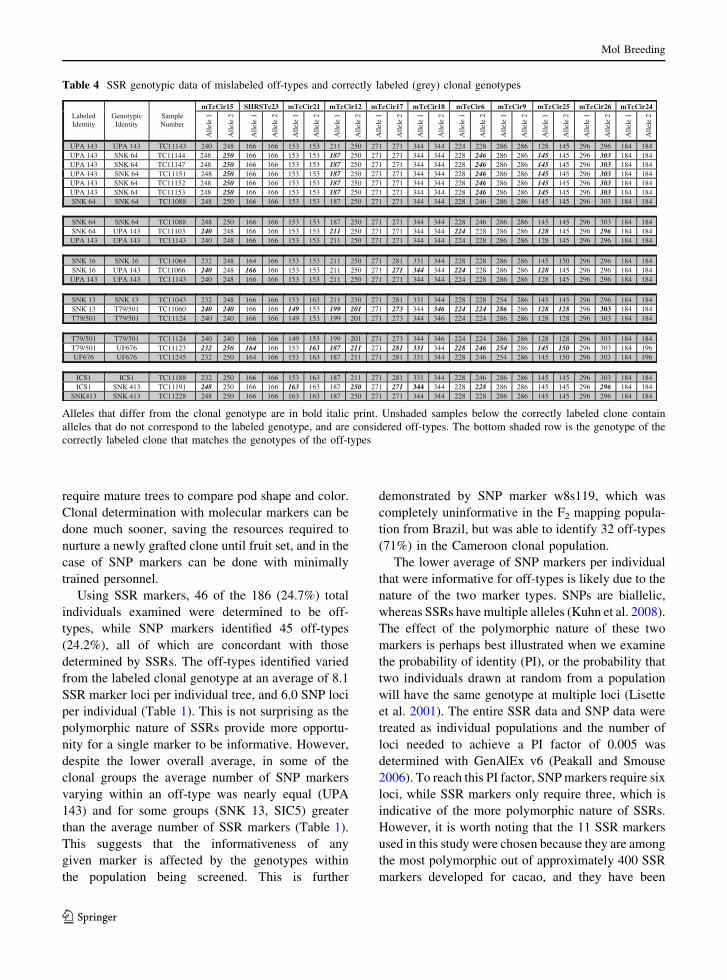
Table 4 SSR genotypic data of mislabeled off-types and correctly labeled (grey) clonal genotypes
mTcCir15 SHRSTc23 mTcCir21 mTcCir12 mTcCir17 mTcCir18 mTcCir6 mTcCir9 mTcCir25 mTcCir26 mTcCir24 Labeled Identity
Genotypic Identity
Sample Number
Alle
le 1
Alle
le 2
Alle
le 1
Alle
le 2
Alle
le 1
Alle
le 2
Alle
le 1
Alle
le 2
Alle
le 1
Alle
le 2
Alle
le 1
Alle
le 2
Alle
le 1
Alle
le 2
Alle
le 1
Alle
le 2
Alle
le 1
Alle
le 2
Alle
le 1
Alle
le 2
Alle
le 1
Alle
le 2
UPA 143 UPA 143 TC11143 240 248 166 166 153 153 211 250 271 271 344 344 224 228 286 286 128 145 296 296 184 184 UPA 143 SNK 64 TC11144 248 250 166 166 153 153 187 250 271 271 344 344 228 246 286 286 145 145 296 303 184 184 UPA 143 SNK 64 TC11147 248 250 166 166 153 153 187 250 271 271 344 344 228 246 286 286 145 145 296 303 184 184 UPA 143 SNK 64 TC11151 248 250 166 166 153 153 187 250 271 271 344 344 228 246 286 286 145 145 296 303 184 184 UPA 143 SNK 64 TC11152 248 250 166 166 153 153 187 250 271 271 344 344 228 246 286 286 145 145 296 303 184 184 UPA 143 SNK 64 TC11153 248 250 166 166 153 153 187 250 271 271 344 344 228 246 286 286 145 145 296 303 184 184 SNK 64 SNK 64 TC11088 248 250 166 166 153 153 187 250 271 271 344 344 228 246 286 286 145 145 296 303 184 184
SNK 64 SNK 64 TC11088 248 250 166 166 153 153 187 250 271 271 344 344 228 246 286 286 145 145 296 303 184 184 SNK 64 UPA 143 TC11103 240 248 166 166 153 153 211 250 271 271 344 344 224 228 286 286 128 145 296 296 184 184
UPA 143 UPA 143 TC11143 240 248 166 166 153 153 211 250 271 271 344 344 224 228 286 286 128 145 296 296 184 184
SNK 16 SNK 16 TC11064 232 248 164 166 153 153 211 250 271 281 331 344 228 228 286 286 145 150 296 296 184 184 SNK 16 UPA 143 TC11066 240 248 166 166 153 153 211 250 271 271 344 344 224 228 286 286 128 145 296 296 184 184
UPA 143 UPA 143 TC11143 240 248 166 166 153 153 211 250 271 271 344 344 224 228 286 286 128 145 296 296 184 184
SNK 13 SNK 13 TC11043 232 248 166 166 153 163 211 250 271 281 331 344 228 228 254 286 145 145 296 296 184 184 SNK 13 T79/501 TC11060 240 240 166 166 149 153 199 201 271 273 344 346 224 224 286 286 128 128 296 303 184 184 T79/501 T79/501 TC11124 240 240 166 166 149 153 199 201 271 273 344 346 224 224 286 286 128 128 296 303 184 184
T79/501 T79/501 TC11124 240 240 166 166 149 153 199 201 271 273 344 346 224 224 286 286 128 128 296 303 184 184 T79/501 UF676 TC11123 232 250 164 166 153 163 187 211 271 281 331 344 228 246 254 286 145 150 296 303 184 196 UF676 UF676 TC11245 232 250 164 166 153 163 187 211 271 281 331 344 228 246 254 286 145 150 296 303 184 196
ICS1 ICS1 TC11188 232 250 166 166 153 163 187 211 271 281 331 344 228 246 286 286 145 145 296 303 184 184 ICS1 SNK 413 TC11191 248 250 166 166 163 163 187 250 271 271 344 344 228 228 286 286 145 145 296 296 184 184
SNK413 SNK 413 TC11228 248 250 166 166 163 163 187 250 271 271 344 344 228 228 286 286 145 145 296 296 184 184
Alleles that differ from the clonal genotype are in bold italic print. Unshaded samples below the correctly labeled clone contain
alleles that do not correspond to the labeled genotype, and are considered off-types. The bottom shaded row is the genotype of the
correctly labeled clone that matches the genotypes of the off-types
Mol Breeding
123
shown to be informative in distinguishing populations
(Lanaud et al. 1999; Saunders et al. 2004). The SNP
markers that were used, on the other hand, were chosen
from previously developed SSCP markers that were
easily converted into SNP markers (Kuhn et al. 2008).
The fact that nearly all of the off-types found by SSRs
were also identified by the SNP markers suggests that
the lower degree of polymorphism in SNP markers
relative to SSRs can be overcome by the addition of
more informative SNP markers. This data is consistent
with findings from the Bovine HapMap Consortium
which found that parentage assignment of cattle could
be performed with as few as 50 SNP markers of the
37,000 assayed (The Bovine HapMap Consortium
2009). Furthermore, the requirement for more SNP loci
to be screened should not reduce their effectiveness for
genotyping, as the abundance of SNPs in the genome
and the improvement of high-throughput screening
methods make the screening of more loci relatively
easy. As more SNPs are discovered, especially those
spread across different linkage groups and with a high
minor allele frequency, one would expect that a
reference set of SNP markers covering all ten cacao
linkage groups may become the most commonly used
genotyping method, as the unambiguous genotype data
can be shared transparently among the international
cacao research community.
SNP markers were able to perform nearly as well
as SSR markers in determining off-types. Interest-
ingly, the presentation of the SNP genotype as a
simple string of letters (Table 3) allows for easier
pattern recognition than SSR data, which is presented
as pairs of numbers representing fragment size
(Table 4). It was noticed that some of the off-types
may actually be mislabeled clones from another
group, as opposed to rootstock escapes. This suggests
a mislabeling of plants either in the field or during the
collection/DNA extraction process. The SSR and
SNP data were re-examined to see if the allele calls
for any off-types match the allele calls for other
clonal trees. SNP markers identified 16 off-types that
appear to have the same genetic identity as other
clonal trees different from the off-type’s labeled
group, while SSR markers found 13 off-types that
have the same genetic identity as different clonal
groups. The SNP and SSR data agree for ten off-types
(Tables 3, 4), strongly suggesting that the labeled
identity of these ten individuals is simply incorrect. It
is likely that increasing the number of SNP and SSR
markers would identify the remaining off-types for
which the two markers did not agree as clone progeny
or rootstock rather than mislabeled clones.
Despite their similar ability to determine off-types,
SNP and SSR markers each have advantages and
disadvantages. In this study, each individual SNP
marker was less polymorphic than any individual
SSR marker. Since SSRs have been used more often
in the past, there tends to be more markers and more
marker data on clones available. However, SNPs are
the most common genetic variation, thus the potential
number of markers in a species is far greater for SNPs
than for SSRs. In fact, preliminary data from the
Cacao Genome Project (http://www.cacaogenomedb.
org/main) has identified 3,500 putative SSRs in the
entire transcriptome, while 285,000 putative SNPs
have been identified in the cacao leaf transcriptome
(data not shown). Assay setup, essentially a PCR
reaction, is nearly the same for both markers, though
SSR markers require an additional step to add a size
standard prior to electrophoresis. Assay analysis,
however, is significantly easier for SNP markers,
requiring minimal training as the genotype is the
immediate output of the assay. SSR marker analysis
requires a higher level of training and more time to
identify the alleles present. Additionally, since SSR
marker data is dependent upon electrophoretic size
separation of fragments, the actual measured allele
lengths vary from machine to machine. Thus, SSR
genotype data cannot be reliably shared among
members of the international cacao research com-
munity, as no two groups use the same SSR assay
platform. This problem with variable allele lengths
also applies to SSR markers analyzed with poly-
acrylamide gels, which, while substantially less
expensive than automated sequencers, can only pro-
vide a rough estimate of fragment size, and cannot
differentiate between homozygous alleles of similar
size. The SNP assay requires no electrophoresis step,
which provides for consistent results across different
platforms. The electrophoresis step adds approxi-
mately 1 h to the SSR assay, whereas the SNP assay
takes less than 5 min to obtain the data.
We compared the two assays on a cost basis. Using
a 10 ll reaction and similar grade reagents (ABI
Amplitaq Gold Master Mix and ABI Genotyping
Master Mix) for both assays, an approximate per
reaction price was calculated. The SNP assay costs
approximately USD 0.43 per reaction, while the SSR
Mol Breeding
123
assay reactions cost USD 0.50 per reaction, with the
bulk of the costs for both reactions coming from the
polymerase master mix. Although the costs per
reaction are fairly similar, the equipment costs are
vastly different. The SSR assay relies on an auto-
mated sequencer, in our case an ABI 3730. Addi-
tionally, proprietary software (GeneMapper v4.0) is
needed to analyze the SSR data. The combined list
price of this equipment and software is around USD
375,000. While polyacrylamide gel-based analysis of
SSRs can be performed much more cheaply, this
method suffers from lower throughput, non-transfer-
able data, and difficulty in identifying alleles of
similar size, which has prevented the widespread
adoption of this method in cacao-producing regions,
despite its availability. The SNP assay as described in
this paper utilizes an ABI 7300 Realtime PCR station
and the included software. The list price of this
machine is approximately USD 35,000: *10% of the
equipment cost of the SSR assay. Since the SNP
assay reaction can be amplified on standard thermo-
cyclers, the ABI 7300 Realtime PCR station need
only be used for end-point fluorescence readings, a
process that takes mere minutes, thus providing a
near tenfold increase in throughput over SSR marker
analysis with an ABI 3730. Additionally, the SNP
assay can be performed using only a standard
thermocycler and a fluorescent microplate reader
which can be obtained for half the price of a realtime
PCR machine. The cost savings for equipment make
the SNP assay particularly interesting for use in
cacao-producing countries where resources for sci-
entific research are often very limited.
In conclusion, the SNP assay performed nearly as
well as the SSR assay in the task of determining off-
types from a clonal population. The savings in terms
of analysis time and equipment cost, as well as the
unambiguous platform independence of the SNP
marker analysis make it the more efficient assay. For
a laboratory that has already invested hundreds of
thousands of dollars for SSR marker analysis, the
savings offered by SNP markers do not justify an
abandonment of SSR markers. However, the abun-
dance of potential SNP markers within any species
and their ease of analysis certainly support future
investment in SNP markers. Additionally, the SNP
assay may be preferred in cacao-producing countries
where the equipment and technical training necessary
for SSR marker analysis are prohibitively expensive.
We are currently collaborating with scientists at
the Cocoa Research Institute of Ghana (CRIG) to use
this SNP assay on a microplate fluorescence reader to
assay clonal genotypes in the clonal seed gardens
used for improved hybrid seed distribution to farm-
ers. In addition, we are investigating rapid, one-step
DNA isolation methods to use these SNP markers in
MAS for disease resistance in seedlings of new
crosses.
Acknowledgments The authors wish to thank Olivier
Souniga and Bruno Efombagn from the Institute of
Agricultural Research for Development (IRAD) in Cameroon
for providing the plant material. The authors also would like to
thank USDA-ARS and MARS, Inc. for their continued
financial support.
References
Altshuler D, Pollara VJ, Cowles CR, Van Etten WJ, Baldwin J,
Linton L, Lander ES (2000) An SNP map of the human
genome generated by reduced representation shotgun
sequencing. Nature 407:513–516
Argout X, Fouet O, Wincker P, Gramacho K, Legavre T, Sabau
X, Risterucci A, Da Silva C, Cascardo J, Allegre M, Kuhn
D, Verica J, Courtois B, Loor G, Babin R, Sounigo O,
Ducamp M, Guiltinan M, Ruiz M, Alemanno L, Machado
R, Phillips W, Schnell R, Gilmour M, Rosenquist E,
Butler D, Maximova S, Lanaud C (2008) Towards the
understanding of the cocoa transcriptome: production and
analysis of an exhaustive dataset of ESTs of Theobromacacao L. generated from various tissues and under various
conditions. BMC Genomics 9:512
Borrone J, Kuhn D, Schnell R (2004) Isolation, characteriza-
tion, and development of WRKY genes as useful genetic
markers in Theobroma cacao. Theor Appl Genet
109:495–507
Borrone JW, Schnell RJ, Violi HA, Ploetz R (2007) Seventy
microsatellite markers from Persea americana Miller
(avocado) expressed sequence tags. Mol Ecol Notes
7:439–444
Brown JS, Schnell RJ, Motamayor JC, Lopes U, Kuhn DN,
Borrone JW (2005) Resistance gene mapping for witches’
broom disease in Theobroma cacao L. in an F2 population
using SSR markers and candidate genes. J Am Soc Hort
Sci 130:366–373
Clement D, Risterucci AM, Motamayor JC, N’Goran J, Lanaud
C (2003) Mapping quantitative trait loci for bean traits
and ovule number in Theobroma cacao L. Genome
46:103–111
Consortium TheBovineHapMap (2009) Genome-wide survey
of SNP variation uncovers the genetic structure of cattle
breeds. Science 324:528–532
Dubcovsky J (2004) Marker-assisted selection in public
breeding programs: the wheat experience. Crop Sci 44:
1895–1898
Mol Breeding
123
Efombagn I, Motamayor J, Sounigo O, Eskes A, Nyasse S,
Cilas C, Schnell R, Manzanares-Dauleux M, Kolesnikova-
Allen M (2008) Genetic diversity and structure of farm
and GenBank accessions of cacao (Theobroma cacao L.)
in Cameroon revealed by microsatellite markers. Tree
Genet Genom 4:821–831
Ewing B, Green P (1998) Base-calling of automated sequencer
traces using phred. II. Error probabilities. Genome Res
8:186–194
Ewing B, Hillier L, Wendl MC, Green P (1998) Base-calling of
automated sequencer traces using phred. I. Accuracy
assessment. Genome Res 8:175–185
Faleiro FG, Queiroz VT, Lopes UV, Guimaraes CT, Pires JL,
Yamada MM, Araujo IS, Pereira MG, Schnell R, de Souza
GA, Ferreira CF, Barros EG, Moreira MA (2006) Map-
ping QTLs for witches’ broom (Crinipellis perniciosa)
resistance in cacao (Theobroma cacao L.). Euphytica
149:227–235
Goddard KAB, Hopkins PJ, Hall JM, Witte JS (2000) Linkage
disequilibrium and allele-frequency distributions for 114
single-nucleotide polymorphisms in five P populations.
Am J Hum Genet 66:216–234
Gordon D, Abajian C, Green P (1998) Consed: A graphical tool
for sequence finishing. Genome Res 8:195–202
Gordon SG, Kowitwanich K, Pipatpongpinyo W, St. Martin
SK, Dorrance AE (2007) Molecular marker analysis of
soybean plant introductions with resistance to Phytoph-thora sojae. Phytopathology 97:113
Ha B-K, Hussey RS, Boerma HR (2007) Development of SNP
assays for marker-assisted selection of two southern root-
knot nematode resistance QTL in soybean. Crop Sci
47:S73–S82
Holland PM, Abramson RD, Watson R, Gelfand DH (1991)
Detection of specific polymerase chain reaction product
by utilizing the 50–30 exonuclease activity of Thermusaquaticus DNA polymerase. Proc Natl Acad Sci USA
88:7276–7280
Johnson VJ, Yucesoy B, Luster MI (2004) Genotyping of
single nucleotide polymorphisms in cytokine genes using
real-time PCR allelic discrimination technology. Cytokine
27:135–141
Kosambi DD (1944) The estimation of map distance from
recombination values. Ann Eugen 12:172–175
Kuhn DN, Heath M, Wisser RJ, Meerow A, Brown JS, Lopes
U, Schnell RJ (2003) Resistance gene homologues in
Theobroma cacao as useful genetic markers. Theor Appl
Genet 107:191–202
Kuhn DN, Borrone J, Meerow AW, Motamayor JC, Brown JS,
Schnell RJ (2005) Single-strand conformation polymor-
phism analysis of candidate genes for reliable identifica-
tion of alleles by capillary array electrophoresis.
Electrophoresis 26:112–125
Kuhn DN, Motamayor JC, Meerow AW, Borrone JW, Schnell
RJ (2008) SSCP markers provide a useful alternative to
microsatellites in genotyping and estimating genetic
diversity in populations and germplasm collections of
plant specialty crops. Electrophoresis 29:1–14
Lanaud C, Risterucci AM, Pieretti I, Falque M, Bouet A,
Lagoda PJL (1999) Isolation and characterization of micro-
satellites in Theobroma cacao L. Mol Ecol 8:2141–2143
Lima L, Gramacho K, Carels N, Novais R, Gaiotto F, Lopes U,
Gesteira A, Zaidan H, Cascardo J, Pires J, Micheli F
(2009) Single nucleotide polymorphisms from Theobromacacao expressed sequence tags associated with witches’
broom disease in cacao. Gen Mol Res 8:799–808
Lisette PW, Gordon L, Pierre T (2001) Estimating the proba-
bility of identity among genotypes in natural populations:
cautions and guidelines. Mol Ecol 10:249–256
Livak KJ (1999) Allelic discrimination using fluorogenic
probes and the 50 nuclease assay. Genet Anal Biomol Eng
14:143–149
Livingstone D III, Freeman B, Tondo CL, Cariaga KA, Oleas
NH, Meerow AW, Schnell RJ, Kuhn DN (2009)
Improvement of high-throughput genotype analysis after
implementation of a dual-curve sybr green I-based quan-
tification and normalization procedure. HortScience
44:1228–1232
Mauro-Herrera M, Meerow AW, Borrone JW, Kuhn DN,
Schnell RJ (2006) Ten informative markers developed
from WRKY sequences in coconut (Cocos nucifera). Mol
Ecol Notes 6:904–906
McCouch SR, Chen X, Panaud O, Temnykh S, Xu Y, Cho YG,
Huang N, Ishii T, Blair M (1997) Microsatellite marker
development, mapping and applications in rice genetics
and breeding. Plant Mol Biol 35:89–99
Meerow AW, Gideon M, Kuhn DN, Schnell RJ (2005) Isola-
tion and characterization of 10 microsatellite loci from Iris
hexagona (Iridaceae). Mol Ecol Notes 5:410–412
Mochida K, Yamazaki Y, Ogihara Y (2004) Discrimination of
homoeologous gene expression in hexaploid wheat by
SNP analysis of contigs grouped from a large number of
expressed sequence tags. Mol Genet Genom 270:371–377
Motamayor JC, Lachenaud P, e Mota JW, Loor R, Kuhn DN,
Brown JS, Schnell RJ (2008) Geographic and genetic
population differentiation of the Amazonian chocolate
tree (Theobroma cacao L). PLoS ONE 3:e3311
Peakall R, Smouse PE (2006) Genalex 6: genetic analysis in
Excel. Population genetic software for teaching and
research. Mol Ecol Notes 6:288–295
Rafalski A (2002) Applications of single nucleotide polymor-
phisms in crop genetics. Curr Opin Plant Biol 5:94–100
Ranade K, Chang M-S, Ting C-T, Pei D, Hsiao C-F, Olivier M,
Pesich R, Hebert J, Chen Y-DI, Dzau VJ, Curb D, Olshen
R, Risch N, Cox DR, Botstein D (2001) High-throughput
genotyping with single nucleotide polymorphisms. Gen-
ome Res 11:1262–1268
Saunders J, Mischke S, Leamy E, Hemeida A (2004) Selection
of international molecular standards for DNA finger-
printing of Theobroma cacao. Theor Appl Genet 110:
41–47
Schneider KA, Brothers ME, Kelly JD (1997) Marker-assisted
selection to improve drought resistance in common bean.
Crop Sci 37:51–60
Schnell RJ, Brown JS, Olano CT, Power EJ, Krol CA, Kuhn
DN, Motamayor JC (2003) Evaluation of avocado germ-
plasm using microsatellite markers. J Am Soc Hort Sci
128:881–889
Schnell RJ, Heath MA, Johnson ES, Brown JS, Olano CT,
Motamayor JC (2004) Frequency of off-type progeny
among the original ICS1 x SCA6 reciprocal families made
Mol Breeding
123
for selection for disease resistance in Trinidad. INGENIC
newsletter 9:34–39
Schnell RJ, Kuhn DN, Brown JS, Olano CT, Phillips-Mora W,
Amores FM, Motamayor JC (2007) Development of a
marker assisted selection program for cacao. Phytopa-
thology 97:1664–1669
Stephens M, Sloan JS, Robertson PD, Scheet P, Nickerson DA
(2006) Automating sequence-based detection and geno-
typing of SNPs from diploid samples. Nat Genet 38:
375–381
Tranah GJ, Lescault PJ, Hunter DJ, De Vivo I (2003) Multiple
displacement amplification prior to single nucleotide
polymorphism genotyping in epidemiologic studies. Bio-
technol Lett 25:1031–1036
Van Ooijen JW (2006) JoinMap 4, Software for the calculation
of genetic linkage maps in experimental populations.
Kyazma B. V, Wageningen
Weber JL, May PE (1989) Abundant class of human DNA
polymorphisms which can be typed using the polymerase
chain reaction. Am J Hum Genet 44:388–396
Zhang D, Mischke S, Johnson E, Phillips-Mora W, Meinhardt
L (2009) Molecular characterization of an international
cacao collection using microsatellite markers. Tree Genet
Genom 5:1–10
Mol Breeding
123


