Embed Size (px)
Citation preview

Live Health User Guide
09-12040-003September 2001
B Beta
Important Notice
Network Health is a registered trademark of Concord Communications, Inc. Concord, the Concord logo, eHealth, eHealth Suite, Application Health, System Health, Live Health, and the 24x7 logo are trademarks of Concord Communications, Inc. Other trademarks are the property of their respective owners.
Adobe, Acrobat, and the Acrobat logo are trademarks, which may be registered in certain jurisdictions, and PostScript is a registered trademark of Adobe Systems Incorporated. CA-OpenIngres and Ingres II are registered trademarks of Computer Associates International, Inc.Hewlett-Packard, HP OpenView, HP, and HP-UX are trademarks or registered trademarks of Hewlett-Packard Company in the United states and other countries.Intel is a registered trademark of Intel Corporation. Motif is a trademark of Open Systems Foundation, Inc.Netscape, Netscape Certificater Server, Netscape FastTrack Server, Netscape Navigator, Netscape ONE, SuiteSpot, and the Netscape N and Ship’s Wheel logos are registered trademarks of Netscape Communications Corporation in the United States and other countries. Netscape® Enterprise Server is also a trademark of Netscape Communications Corporation, which may be registered in other countries.Sun, Sun-4, SunOS, SunNet, and OpenWindows are trademarks, and Sun Microsystems, Sun Workstation, and NFS are registered trademarks of Sun Microsystems, Inc. SPARCstation and SPARCserver are trademarks, and SPARC is a registered trademark of SPARC International, Inc.UNIX is a registered trademark in the United States and other countries licensed exclusively through X/Open Company Ltd.Windows and Windows NT are trademarks of Microsoft Corporation.
SMIC. Copyright 1992 SynOptics Communications, Inc. All Rights Reserved. SynOptics makes no representations about the suitability of this software for any particular purpose. The software is supplied “as is”, and SynOptics makes no warranty, either express or implied, as to the use, operation, condition, or performance of the software. SynOptics retains all title and ownership in the software.
eHealth incorporates compression code by the Info-ZIP group. There are no extra charges or costs due to the use of this code, and the original compression sources are freely available from ftp://ftp.cdrom.com/pub/infozip/ on the Internet and from the Concord Web site: http://www.concord.com.
© Copyright Bigelow and Holmes 1986, 1985. Lucida is a registered trademark of Bigelow & Holmes. Sun Microsystems Inc., AT&T, and Bigelow & Holmes make no representations about the suitability of the source code for any purpose. It is provided “as is” without express or implied warranty of any kind.
General Notice: Some of the product names used herein have been used for identification purposes only and may be trademarks of their respective companies.
Proprietary Notice
The information and descriptions contained herein are the property of Concord Communications, Inc. Such information and descriptions may not be copied, disseminated, or distributed without the express written consent of Concord Communications, Inc. Concord Communications, Inc., assumes no responsibility for any inaccuracies that may appear in this document. Concord Communications, Inc., reserves the right to improve its products and change specifications at any time without notice.
U. S. Government Restricted Rights
Use, reproduction, and disclosure by the U.S. Government are subject to the restrictions set forth in FAR §52.227-19 (c) (1) and (2) and DFARS §252.227-7013 (c) (1) (ii).
Patent Information
U. S. Patent 5,615,323Patents Pending
2001 Concord Communications, Inc.All Rights Reserved

iii
Table of Contents
Preface 7
Audience. . . . . . . . . . . . . . . . . . . . . . . . . . . . . . . . . . . . . . . . . . . . . . . . 7About This Guide . . . . . . . . . . . . . . . . . . . . . . . . . . . . . . . . . . . . . . . . 7
Reading Path . . . . . . . . . . . . . . . . . . . . . . . . . . . . . . . . . . . . . . . . . 8Revision Information . . . . . . . . . . . . . . . . . . . . . . . . . . . . . . . . . . 8Documentation Conventions . . . . . . . . . . . . . . . . . . . . . . . . . . . 8
Customer Support . . . . . . . . . . . . . . . . . . . . . . . . . . . . . . . . . . . . . . . . 9Professional Services . . . . . . . . . . . . . . . . . . . . . . . . . . . . . . . . . . . . . 10
Chapter 1 Getting Started 11
Live Health Overview . . . . . . . . . . . . . . . . . . . . . . . . . . . . . . . . . . . . 11About Live Exceptions . . . . . . . . . . . . . . . . . . . . . . . . . . . . . . . . 11About Live Status . . . . . . . . . . . . . . . . . . . . . . . . . . . . . . . . . . . . 13About Live Trend . . . . . . . . . . . . . . . . . . . . . . . . . . . . . . . . . . . . 14
System Requirements . . . . . . . . . . . . . . . . . . . . . . . . . . . . . . . . . . . . 14Installing Live Health . . . . . . . . . . . . . . . . . . . . . . . . . . . . . . . . . . . . 15
Downloading the Installation Program . . . . . . . . . . . . . . . . . . 15Running the Installation Program on Windows . . . . . . . . . . . 16Running the Installation Program on UNIX . . . . . . . . . . . . . . 23

iv • Table of Contents
Live Health User Guide
Chapter 2 Live Exceptions Concepts 27
Live Exceptions Overview . . . . . . . . . . . . . . . . . . . . . . . . . . . . . . . . . 27Fundamental Concepts of Live Exceptions . . . . . . . . . . . . . . . . . . . 28
Alarm Rules . . . . . . . . . . . . . . . . . . . . . . . . . . . . . . . . . . . . . . . . . 28Event Rules . . . . . . . . . . . . . . . . . . . . . . . . . . . . . . . . . . . . . . . . . 30
Profiles Overview . . . . . . . . . . . . . . . . . . . . . . . . . . . . . . . . . . . . . . . . 32Alarms and Exceptions . . . . . . . . . . . . . . . . . . . . . . . . . . . . . . . . . . . 32
Relationships Among Alarms, Exceptions, and Events . . . . . . 34Connection Between Exceptions and Profiles . . . . . . . . . . . . . 34
Chapter 3 Starting Live Health 35
Using Live Health. . . . . . . . . . . . . . . . . . . . . . . . . . . . . . . . . . . . . . . . 35Obtaining Live Health Permission . . . . . . . . . . . . . . . . . . . . . . . . . . 36Starting Live Health Applications. . . . . . . . . . . . . . . . . . . . . . . . . . . 36
On Windows . . . . . . . . . . . . . . . . . . . . . . . . . . . . . . . . . . . . . . . . 36On UNIX . . . . . . . . . . . . . . . . . . . . . . . . . . . . . . . . . . . . . . . . . . . 38Command Syntax . . . . . . . . . . . . . . . . . . . . . . . . . . . . . . . . . . . . 38Logging in to Live Health . . . . . . . . . . . . . . . . . . . . . . . . . . . . . . 40Logging in to Another eHealth System . . . . . . . . . . . . . . . . . . . 43Exiting from a Live Health Application . . . . . . . . . . . . . . . . . . 43
Chapter 4 Using Live Exceptions 45
Live Exceptions Browser Overview . . . . . . . . . . . . . . . . . . . . . . . . . 46Refresh Rate . . . . . . . . . . . . . . . . . . . . . . . . . . . . . . . . . . . . . . . . . 48Displaying Additional Browsers . . . . . . . . . . . . . . . . . . . . . . . . 48Using the Organization Pane . . . . . . . . . . . . . . . . . . . . . . . . . . . 48Using the Event Chart . . . . . . . . . . . . . . . . . . . . . . . . . . . . . . . . 49Using the Event Table. . . . . . . . . . . . . . . . . . . . . . . . . . . . . . . . . 51
Viewing Event Alarms in the Live Exceptions Browser . . . . . . . . . 62Additional Browser Views . . . . . . . . . . . . . . . . . . . . . . . . . . . . . . . . . 64
Top Ten Exceptions Window . . . . . . . . . . . . . . . . . . . . . . . . . . 65Consolidating Events Over Time. . . . . . . . . . . . . . . . . . . . . . . . 66Displaying Alarm Occurrences . . . . . . . . . . . . . . . . . . . . . . . . . 66

Table of Contents • v
Live Health User Guide
eHealth Reports Overview . . . . . . . . . . . . . . . . . . . . . . . . . . . . . . . . 68At-a-Glance Reports. . . . . . . . . . . . . . . . . . . . . . . . . . . . . . . . . . 68Trend Reports . . . . . . . . . . . . . . . . . . . . . . . . . . . . . . . . . . . . . . . 69Live Trend Reports . . . . . . . . . . . . . . . . . . . . . . . . . . . . . . . . . . . 69Reports. . . . . . . . . . . . . . . . . . . . . . . . . . . . . . . . . . . . . . . . . . . . . 69System Information Query . . . . . . . . . . . . . . . . . . . . . . . . . . . . 70Response Transaction Log . . . . . . . . . . . . . . . . . . . . . . . . . . . . . 70Subject Reports . . . . . . . . . . . . . . . . . . . . . . . . . . . . . . . . . . . . . . 70
Chapter 5 Using Live Status 73
About Live Status. . . . . . . . . . . . . . . . . . . . . . . . . . . . . . . . . . . . . . . . 73Using the Live Status Diagram . . . . . . . . . . . . . . . . . . . . . . . . . 74Refresh Rate . . . . . . . . . . . . . . . . . . . . . . . . . . . . . . . . . . . . . . . . 77Obtaining the Group List, Group, and Element Status . . . . . 77Drilling Down for More Information. . . . . . . . . . . . . . . . . . . . 78Creating a Diagram . . . . . . . . . . . . . . . . . . . . . . . . . . . . . . . . . . 81Opening Live Status Diagrams . . . . . . . . . . . . . . . . . . . . . . . . . 82Configuring Live Status . . . . . . . . . . . . . . . . . . . . . . . . . . . . . . . 83Configuring the Live Status Legend . . . . . . . . . . . . . . . . . . . . . 84Editing the Diagram Title . . . . . . . . . . . . . . . . . . . . . . . . . . . . . 85Opening a New Live Status Window . . . . . . . . . . . . . . . . . . . . 86Deleting a Diagram. . . . . . . . . . . . . . . . . . . . . . . . . . . . . . . . . . . 86
Chapter 6 Using Live Trend 87
Live Trend Overview . . . . . . . . . . . . . . . . . . . . . . . . . . . . . . . . . . . . . 87Creating a Live Trend Chart . . . . . . . . . . . . . . . . . . . . . . . . . . . 88Editing a Multi-Element Live Trend Chart . . . . . . . . . . . . . . . 90Editing a Multi-Variable Live Trend Chart . . . . . . . . . . . . . . . 95Viewing a Live Trend Chart. . . . . . . . . . . . . . . . . . . . . . . . . . . . 98Renaming a Live Trend Chart . . . . . . . . . . . . . . . . . . . . . . . . . . 99Deleting a Live Trend Chart . . . . . . . . . . . . . . . . . . . . . . . . . . . 99

vi • Table of Contents
Live Health User Guide
Chapter 7 Troubleshooting Live Health Applications 101
Cannot Log in to Live Health Applications . . . . . . . . . . . . . . . . . . 101Problems with Client or Server Software Versions . . . . . . . . . . . . 103Problems with the Web Interface Live Health Tab. . . . . . . . . . . . 104Problems with the Live Exceptions Browser Display . . . . . . . . . . 104Problems with Live Trend. . . . . . . . . . . . . . . . . . . . . . . . . . . . . . . . 106
Chapter 8 Reinstalling and Removing Live Health 107
Reinstalling Live Health. . . . . . . . . . . . . . . . . . . . . . . . . . . . . . . . . . 107Running the Reinstallation Program on UNIX . . . . . . . . . . . 107Running the Reinstallation Program on Windows . . . . . . . . 109
Removing Live Health . . . . . . . . . . . . . . . . . . . . . . . . . . . . . . . . . . . 115Removing Live Health on Windows . . . . . . . . . . . . . . . . . . . 115Removing Live Health on UNIX . . . . . . . . . . . . . . . . . . . . . . . 120
Glossary 121
Index 137
7
Preface
This guide describes how to use the Live Health suite of tools, which includes Live Status, Live Exceptions, and Live Trend. This guide supports eHealth Release 5.0 and later.
AudienceThis guide is intended for anyone who wants to use Live Health applications to monitor their network. These users are referred to as Live Health users.
To use this guide, you should know how to use windows-based applications and have some understanding of the operating system and networking concepts.
This guide does not describe how to administer Live Health; refer to the Live Health Administration Guide for this information.
About This GuideThis section describes the possible reading paths that you should follow, depending on your needs, as well as the changes and enhancements that have been made since the last release of this guide. It also includes the documentation conventions used in this guide.

8 • Preface
Live Health User Guide
Reading PathPrior to reading this guide, you should review the concepts described in the Introduction to eHealth.
All users should read the following chapters:
• Chapter 1, “Getting Started”
• Chapter 2, “Live Exceptions Concepts”
• Chapter 3, “Starting Live Health”
Live Health users interested in Live Status should read Chapter 4, “Using Live Status.” Live Health users interested in Live Exceptions or Live Exceptions – Fault Manager should read Chapter 5, “Using Live Exceptions.” Live Health users interested in Live Trend should read Chapter 7, “Using Live Trend.”
Revision InformationThis guide originally contained administration and general user information. The administration portion of the material now resides in the Live Health Administration Guide. The Live Health User Guide has been reorganized and rewritten to contain more specific information for general users.
Documentation ConventionsTable 1 lists the conventions used in this document.
Table 1. Documentation Conventions (Page 1 of 2)
Convention Description
)LOH�RU�'LUHFWRU\�1DPH
File or directory names.
code System, code, or operating system command line examples.
emphasis Emphasis and guide titles.
enter Text that you must type exactly as shown.

Customer Support • 9
Live Health User Guide
Customer SupportIf you need any assistance with eHealth, contact Customer Support at the following:
Phone: (888) 832-4340
(508) 303-4300
Fax: (508) 303-4343
E-mail: [email protected]
Web site: http://www.concord.com
Name Text that defines menus, fields in dialog boxes, or keyboard keys.
New Term A new term, that is, one that is being introduced.
Variable Variable values that you substitute.
→ A sequence of menus or menu options. For example, File → Exit means “Choose Exit from the File menu.”
NOTE Important information, tips, or other noteworthy details.
CAUTIONInformation that helps you avoid data corruption or system failures.
WARNING Information that helps you avoid physical danger.
Table 1. Documentation Conventions (Page 2 of 2)
Convention Description

10 • Preface
Live Health User Guide
Professional ServicesIf you need any assistance with customizing eHealth, contact Professional Services at the following:
Phone: (800) 851-8725 (Choose option 7)
Fax: (508) 486-4555
E-mail: [email protected]
Web site: http://www.concord.com
11
1
Getting Started
This chapter introduces the Live Health applications, their system requirements, and describes how to install Live Health.
Live Health OverviewLive Health consists of the following applications:
• Live Exceptions
• Live Status
• Live Trend
This section provides an introduction to these applications.
About Live ExceptionsLive Exceptions provides network operations center (NOC) and systems, application, and network management personnel with real-time exceptions condition reporting by identifying problems that include delay, errors, failures, security, or configuration changes. It can display information about exceptions in its Browser, as well as send traps (alarms) to network management systems (NMSs) and other trap destinations. For integrated NMSs, users can view a condition, identify the system component that generated it, and then run

12 • Chapter 1 Getting Started
Live Health User Guide
eHealth historical reports to analyze the problem further. Live Exceptions provides consistency and reduces alarm duplication by using eHealth historical data to ensure that the alarms are meaningful.
Live Exceptions includes default exception profiles for all technologies. The profiles organize exception variables by delay, availability, unusual workload, and latency. Users with Live Health administrator permissions define exception conditions by specifying variables to examine, thresholds to detect, and intervals over which to examine the data. For more information about Live Exceptions, refer to Chapter 4,“Using Live Exceptions.” For more information about administering Live Exceptions, refer to the Live Health Administration Guide.
Fault ManagerLive Health – Fault Manager is an enhancement to Live Exceptions and the Live Health suite of tools. It allows eHealth to receive Simple Network Management Protocol (SNMP) trap messages from other systems and devices and take actions based on Live Exceptions alarm rules. Fault Manager can receive traps from any device or other NMS (such as HP OpenView). By default, Fault Manager can recognize a variety of trap types (that is, it has certified trap types); however, administrators may also define additional trap sources for use with Fault Manager. You can also request that Concord certify additional trap types.
Unlike other trap collecting applications that create logs of trap messages, Fault Manager interprets and processes trap information. It reduces the noise of duplicate and repeated messages and alerts you to the problems and conditions that interest you. When the eHealth system receives a trap, it processes the trap based on Live Exceptions rules and profiles that the Live Health administrator configures. Thus, you can configure Fault Manager to raise an alarm for the associated element, or to ignore various trap messages.

Live Health Overview • 13
Live Health User Guide
1Fault Manager takes advantage of the eHealth poller configuration information to associate the IP address in the trap message with an element. You see the more informative element name, not just the IP address. Thus, when traps raise alarms, you can drill-down to additional reports to obtain more detailed information about the element and the problem.
If Fault Manager receives a trap for an IP address that eHealth is not monitoring, it can still report the problem and raise an alarm for the unknown element.
When Fault Manager receives traps from other sources, it processes this data as it does data collected by eHealth: it compares the performance statistics to rules defined in profiles and generates intelligent alarms when thresholds are exceeded. You can view these alarms in the Live Exceptions Browser, which provides access to element-specific drill-down information when available. For more information about Fault Manager, refer to Chapter 4,“Using Live Exceptions.”
About Live StatusLive Status provides a high-level view of the current status of your critical resources as determined by Live Exceptions. Live Status displays a diagram of the elements in a group list. Icons that represent the elements are color-coded to reflect their alarm and monitoring status. You can look at the display and quickly assess the status of your resources based on color changes in a logically grouped graph.
You can identify the trouble spots at a glance and quickly drill down for details to understand the nature of the problem. For more information about Live Status, refer to Chapter 5, “Using Live Status.”

14 • Chapter 1 Getting Started
Live Health User Guide
About Live TrendStatistics elements are members of an eHealth element type that includes various LAN and WAN interfaces; Frame Relay circuits; Asynchronous Transfer Mode (ATM) paths, ports, and channels; various components of routers and systems, as well as the router and systems themselves; and various remote access resources.
Live Trend is an application that you can use to create charts that monitor statistics elements that you are polling using eHealth. You can create a single chart or multiple charts in various styles to represent two types of element trends—a single element with multiple variables, and variable trends—a single variable for multiple elements. Live Trend updates the charts each time eHealth polls the elements.
You can display the following types of data:
• As polled
• Fast sampled
• Up to 48 hours of history data
For more information about Live Trend, refer to Chapter 6, “Using Live Trend.”
System RequirementsA system or workstation that has an installed version of the Live Health software is called a Live Health client.
If you plan to download and install the Live Health applications on your local workstation, your workstation must meet the following requirements:
Table 2. Workstation Requirements (Page 1 of 2)
Component Software Requirement
Operating system
One of the following:
• Windows NT 4.x with Service Pack 5 or 6
• Windows 2000 Professional with Service Pack 1
• Windows 98
• Sun Solaris 2.7 or 2.8 (32- or 64-bit)
• HP-UX 11 or 11i (32- or 64-bit)

Installing Live Health • 15
Live Health User Guide
1
Installing Live HealthYou can install Live Health on Windows or UNIX systems. To install Live Health on Windows, you must do the following:
1. Download the Live Health installation program from the eHealth Web server.
2. Run the Live Health Setup program. The Live Health Setup Wizard automatically runs to perform the installation.
To install Live Health on UNIX, you must do the following:
1. Download the setup script from the eHealth Web server.
2. Uncompress the Live Health setup program file.
3. Run the setup script to install Live Health.
The following sections describe these steps in more detail.
Downloading the Installation ProgramIf your eHealth Web user account has permission to view the Live Health tab, you can download the Live Health installation program. If you do not have permission, the message “No Tools Available” appears on the Live Health page. Contact the eHealth Web administrator to obtain permission.
Patches Operating system-specific patches to support Java1
Browser One of the following:
• Netscape Navigator 4.5.0 – 4.7.5
• Internet Explorer 5.0 – 5.5
1. For the latest patch information and downloads, refer to the Java Web site at http://java.sun.com.
Table 2. Workstation Requirements (Page 2 of 2)
Component Software Requirement

16 • Chapter 1 Getting Started
Live Health User Guide
To download the installation program:
1. Log in to the eHealth Web server.
2. Select the Live Health tab.
3. On the Live Health page, read any available instructions, and click the link to download the software.
4. Specify the destination directory for the installation program and download the file.
The following sections describe the installation procedure for each operating system.
Running the Installation Program on WindowsThis section describes how to install Live Health on a Windows system.
To install Live Health:
1. Click Start and select Run.
2. In the Run dialog box, specify the following command, where drive is the letter of the directory and path is the full pathname where you downloaded the file.
drive:\path\LVHLTH_NT.exe
The Location to Save Setup Files dialog box appears.

Installing Live Health • 17
Live Health User Guide
13. Accept the default location to place setup files during the
installation and click Next. To specify a different location, click Change and use the Browse for Folder dialog box to select a different location.
4. The Setup program extracts the installation files and configures the Windows Installer. After this completes, a message may appear stating that you must restart your system. Click Restart.

18 • Chapter 1 Getting Started
Live Health User Guide
5. After your system restarts, the Welcome to the Setup Wizard for Live Health dialog box appears.
6. Click Next to start the Live Health installation. The License Agreement dialog box appears.

Installing Live Health • 19
Live Health User Guide
17. Read the license agreement and do one of the following:
• Select I accept the terms in the license agreement and click Next.
• Select I do not accept the terms in the license agreement and click Cancel to exit the installation.
The Destination Folder dialog box appears.
8. Accept the default location to install Live Health and click Next. To specify a different location, click Change, and select another location in the Change Current Destination Folder dialog box.

20 • Chapter 1 Getting Started
Live Health User Guide
a. Do one or both of the following:
• To verify available disk space, click Disk Usage. The Disk Space Requirements dialog box appears.
Use this dialog box to determine the disk space available to install Live Health.

Installing Live Health • 21
Live Health User Guide
1• If you do not want Live Health to add Live Status,
Live Exceptions, and Live Trend icons on your desktop, deselect Add shortcuts to the desktop for Live Health applications.
b. Click Next. The Ready to Install the Program dialog box appears.
9. Review the installation settings. If necessary, click Back to modify any settings; then click Install to continue. The Installing Live Health dialog box appears.

22 • Chapter 1 Getting Started
Live Health User Guide
10. When the installation is complete, the Setup Wizard Completed dialog box appears.
11. Do one of the following:
• Click Read Me to view post-installation instructions and information.

Installing Live Health • 23
Live Health User Guide
1• Click Finish to exit the installation. The Live Health
Installer Information dialog box appears.
Click Yes to restart your system and finish the installation process.
The installation adds Live Health to the Start Program menu. It also places Live Status, Live Exceptions, and Live Trend icons on the desktop if you selected that option. For information on starting the Live Health applications, refer to “Starting Live Health Applications” on page 36.
Running the Installation Program on UNIX
This section describes how to install Live Health on a UNIX system.
To install Live Health on UNIX:
1. After downloading the installation program, in a terminal window, change to the directory where you downloaded the file:
cd directory
2. At the UNIX command line, enter the following command to uncompress the setup program. Replace opsys with your UNIX operating system, for example, SUN:
uncompress LVHLTH.opsys.sh.Z

24 • Chapter 1 Getting Started
Live Health User Guide
3. Run the script by entering the following command, where opsys is your operating system:
sh ./LVHLTH.opsys.sh
4. When the script prompts you, enter a directory where you want to install Live Health.
5. After the script extracts and verifies the Live Health files, enter y to view the Readme file.
The following is a sample Solaris installation script:
sh ./LVHLTH.SUN.sh
---------------------------------------------------
Live Health SunOS 5.7 Generic_106541-12 Release 5.0Installation
Copyright (C) Concord Communications 2001.
All rights reserved.
------------------------------------------------------------
Live Health Location
Specify a install directory that has at least 50M of free diskspace.
Where should Live Health be installed? /live/livehealth
---------------------------------------------------
Extracting files...
---------------------------------------------------
Starting Live Health verification checks...
0% 25% 50% 75% 100%
|||||||||||||||||||||||||||||||||||||||||||||||||||
Live Health checksums verified successfully.
Would you like to see the Live Health README file? [y] n
Cleaning up...
---------------------------------------------------

Installing Live Health • 25
Live Health User Guide
1Installation log is in:
/live/livehealth/client/log/installLiveHealth.log
---------------------------------------------------
For information on starting the Live Health applications, refer to “Starting Live Health Applications” on page 36.


27
2
Live Exceptions Concepts
This chapter describes and introduces basic Live Exceptions concepts and terminology.
Live Exceptions OverviewLive Exceptions provides notifications of potential delay, failure, and other indicators of problems within networks, systems, and applications. It uses the historical data that eHealth gathers and maintains to assess potential problems over time. Therefore, Live Exceptions greatly reduces the noise, or extra alarms, associated with traditional threshold-only methods of generating alarms.
eHealth acquires and stores measurements from various kinds of computers, agents, and devices including routers, switches, systems, and desktop workstations. Measured variables include data volume, latency, errors, and transaction response time. Because these measurements cover the entire range of a networked client/server environment, Live Exceptions can inform you of problems anywhere in the infrastructure, and assist in pinpointing the source of troubles. Live Exceptions is thus an end-to-end notification system.
An additional benefit of using historical data as part of a notification system is that it offers you the ability to predict potential problems. Often, an alarm can inform you of trouble before it exceeds the danger level, allowing correction before

28 • Chapter 2 Live Exceptions Concepts
Live Health User Guide
the problem reaches a critical state. An important use for this capability is in service level agreement (SLA) enforcement. If you can resolve SLA troubles before they are violated, and without requiring additional network resources or servers, you can avoid excessive effort and expense.
Fundamental Concepts of Live ExceptionsLive Exceptions uses rules, exceptions, and profiles to provide notification of problems. This section describes these concepts.
Alarm RulesAlarm rules define the type of element and conditions to monitor, thresholds and time duration, and the problem’s severity. Together, these alarm components define problems that indicate network delay, failure, or an unusual workload. When Live Exceptions detects that the conditions of the alarm rule have been met, it generates an alarm for that element.
Live Exceptions uses simple and compound alarm rules. A simple alarm rule describes a condition which must be satisfied by a single variable defined on a single element. A compound alarm rule is a combination of two conditions for one element—both conditions must be true to generate an alarm.
NOTE
Release 5.0 does not support compound alarm rules for a combination of element types.
The next section uses the Time Over Threshold condition to demonstrate how Live Exceptions works.
Time Over Threshold Condition
The Time Over Threshold condition identifies when a threshold is exceeded for a certain amount of time. Figure 1 illustrates this condition. As the eHealth system receives data, Live Exceptions examines an interval of time into the past. This interval is the analysis window. It compares data values in this

Fundamental Concepts of Live Exceptions • 29
Live Health User Guide
2
1interval with a predefined threshold, and computes the total time that the value has exceeded the threshold. Live Exceptions raises an alarm if this total time is greater than a predefined condition window, the total time that the data value must be above the threshold to raise an alarm.
Figure 1. Time Over Threshold Condition
While simple, the Time Over Threshold condition is very powerful. Transient problems—brief spikes in the data—do not raise an alarm. However, recurring spikes do raise an alarm. This draws an important distinction between quick spikes which would be mere annoyances should they trip an alarm, and a series of such spikes which indicate a problem that requires attention. In addition, continuous time spent over the threshold also raises an alarm, indicating a persistent condition which should be corrected.

30 • Chapter 2 Live Exceptions Concepts
Live Health User Guide
A Live Health administrator is a Web user who has permission to create and modify rules and profiles.
As shown in Figure 1, a Live Health administrator can set the following parameters:
• Threshold is the data value above which time is accumulated.
• Analysis window is the time interval within which time is accumulated.
• Condition window is the required total time that the data value must be above the threshold to raise an alarm.
In Figure 1, the time at which Live Exceptions raises an alarm is the alarm start time. The time at which the data value initially crossed the threshold which subsequently led to the alarm is the problem start time. The time from the problem start time to the current time is the duration of the alarm. Live Exceptions displays each of these times in the Live Exceptions Browser.
When Live Exceptions raises an alarm, the alarm is active. Live Exceptions continues the analysis using the same parameters that it used to raise the alarm. The alarm continues in an active state until its conditions are no longer true, at which time Live Exceptions clears the alarm. The alarm thus becomes inactive.
NOTE
Live Exceptions continues to watch for Time Over Threshold conditions as time advances. This means that the alarm will not clear arbitrarily. This reduces the probability of flapping alarms—those which continually assert themselves even though a troublesome condition has been posted and is well known by operators.
Event RulesA trap is an SNMP event. An event is an unsolicited message delivered to the eHealth
system. SNMP agents and NMSs such as eHealth send trap messages to a console or NMS when a specific condition occurs. Live Health – Fault Manager allows the Live Health administrator to write rules that Live Exceptions can use to raise alarms resulting from traps sent by devices and agents in your infrastructure. When Fault Manager receives traps from

Fundamental Concepts of Live Exceptions • 31
Live Health User Guide
2
1other sources, it processes this data as it does data collected by eHealth: it compares the performance statistics to rules defined in profiles and generates intelligent alarms when thresholds are exceeded. You can view these alarms in the Live Exceptions Browser.
Event Rule – Basic
Figure 2 illustrates a basic event rule which generates an alarm whenever Live Exceptions receives a specific type of trap.
Figure 2. Event Rule - Basic
In this example, Live Exceptions first raises an alarm (at 10:02) when it receives a trap indicating that the SNA Logical Unit is down. A subsequent trap indicating that the SNA Logical Unit is up clears the trap. Live Exceptions raises a new alarm (at 10:25) when it receives a new trap indicating that the SNA

32 • Chapter 2 Live Exceptions Concepts
Live Health User Guide
Logical Unit is down again. Additional traps received from 10:27 to 10:45 do not raise new alarms. Instead, Live Exceptions interprets these traps as the same event. Since this rule specifies that an alarm is cleared after one hour, Live Exceptions clears the alarm at 11:45.
Profiles OverviewYou must have a rule defined for each condition about which you want to be warned. Since there are many possible conditions, and you have many elements, eHealth uses rule profiles to ease the management tasks. A profile is a set of one or more alarm rules that the Live Health administrator applies to a subject to monitor. Subjects can include groups or group lists. Live Exceptions applies each rule in the profile to each element in the group or group list that matches the element type of the rule. Once profiles and groups (or group lists) are associated, Live Exceptions begins to monitor the polled data from the specified elements and generates alarms accordingly.
�1+B+20( is the directory where eHealth is installed.
Live Exceptions includes default profiles for several technology types such as Ethernet, Token Ring, Frame Relay, Routers, and so on. Live Health administrators can create or modify profiles and alarm rules to adapt the default profiles to your specific environment. The Live Health administrator can also create calendars that specify when the profiles are in effect. For detailed documentation on the default profiles, refer to the Live Exceptions Default Profile White Paper located in the �1+B+20(?GRF directory.
Alarms and ExceptionsAlarms exist over a time interval, during which they possess a severity which is the state of the alarm. Over the course of its existence, an alarm has only a single severity value.

Alarms and Exceptions • 33
Live Health User Guide
2
1An exception combines the states of one or more alarms for an element. The severity of an exception is the maximum severity of any of the alarms currently active on an element within a given profile.
Figure 3. The Exception Severity
When an element does not have any active alarms, the first alarm that Live Exceptions raises generates an exception. Thereafter, subsequent alarms that it raises and clears simply change the severity of the exception. When the last alarm for an exception clears, Live Exceptions clears the exception itself.
As shown in Figure 3, two alarms, a1 and a2, are defined on an element. The a1 alarm is a minor alarm; a2 is critical. The following events occur:
• When Live Exceptions raises a1, it generates an exception with minor severity.
• When it raises a2, it updates the exception to critical severity.
• When a1 clears, the exception severity remains critical.
• When a2 clears, it clears the exception.

34 • Chapter 2 Live Exceptions Concepts
Live Health User Guide
Relationships Among Alarms, Exceptions, and Events
It is important to understand the differences between Live Exceptions Browser alarms, exceptions, and events. Alarms become active when their conditions are true. An exception becomes active when the first alarm in a profile is active. As the original alarm and other alarms become active or Live Exceptions clears them, the exception remains active until Live Exceptions clears the last alarm in the profile for an element.
An event is an unsolicited message delivered to the eHealth system that may carry useful information. Traps are SNMP events that are commonly sent to NMSs by routers, switches, and agents. SNMP agents and NMSs, such as eHealth, send trap messages to a console or NMS when a specific condition occurs. Live Exceptions receives traps and generates an alarm when rules which define specific conditions are true.
Connection Between Exceptions and ProfilesA profile is typically defined for a specific technology and purpose such as backbone ATM wide area network (WAN) links. Each profile contains rules which detect broadly related problems appropriate for its technology, such as delay or security problems. Exceptions are associated with elements and profiles to distinguish the status of an element with respect to its use. Live Exceptions displays each exception-profile pair as a separate row entry in the Live Exceptions Browser. Refer to Chapter 4 for a description of the Live Exceptions Browser.

35
3
Starting Live Health
This chapter describes how to start the Live Health applications.
Using Live HealthThe eHealth administrator is the person responsible for managing and administering the eHealth system from the eHealth console.
The Live Health tab on the eHealth Web interface allows you to download the Live Health applications. To use the applications, however, the eHealth administrator must first identify the elements that you want to monitor. For each element, eHealth stores information in the eHealth database and in the poller configuration. The poller configuration contains polling information such as the element name, its configuration information, and the polling frequency.
To use Live Health, the eHealth administrator must also define eHealth groups and group lists. Groups organize elements of similar technologies to model business organizations, geographic locations, or similar vendor types. Group lists organize related groups. The eHealth administrator can also use groups or group lists to restrict a user’s view of reports to a specific organization.

36 • Chapter 3 Starting Live Health
Live Health User Guide
Obtaining Live Health PermissionThe eHealth Web administrator is the person responsible for managing and administering the eHealth Web server and eHealth Web interface.
Web user permissions control whether you can run any Live Health application. By default, a Web user does not have Live Health privileges. Before you can use any Live Health application, the eHealth Web administrator must grant you permission to use the application. The eHealth Web administrator can also grant you administrator privileges which allow you to create and modify exception profiles, create rules, and create calendars to specify when profiles take effect. For more information about Live Health administration, refer to the Live Health Administration Guide.
Permissions also control which groups and group lists you can see in Live Health. In addition, the eHealth Web administrator can grant additional eHealth permissions to allow you to view At-a-Glance, Trend, and other reports; view Web tabs; change your password; and so on.
Starting Live Health ApplicationsAfter the Web administrator has set up your user account and its permission, you can run the Live Health applications.
On Windows To start a Live Health application on Windows, you can use icons, menus, or the command line.
Using the Menu
On Windows, the installation creates an eHealth program menu on the Windows Start menu.
The program menu includes the following:
• Live Health Read Me
• Live Health User Guide (an online version of this guide)
• Live Exceptions program
• Live Status program
• Live Trend program

Starting Live Health Applications • 37
Live Health User Guide
3
1To run a Live Health application:
1. Select Start → Programs → eHealth.
2. Select one of the following applications:
• Live Exceptions
• Live Status
• Live Trend
Using IconsIf your system has desktop icons, you can start a Live Health application by double-clicking an icon as shown in Table 3.
Using the Command LineTo start one of the applications from a command prompt, run one of the following commands from the directory where the software was installed.
NOTE
If you add the drive�?live?FOLHQW?ELQ of the directory where you installed Live Health to your PATH environment variable, you can just run the command.
Table 3. Live Health Icons
Live Health Application Icon
Live Status
Live Exceptions
Live Trend

38 • Chapter 3 Starting Live Health
Live Health User Guide
OLYH is the directory where you installed the application.
Table 4 lists the installation directory and commands.
For example, if you used the default directory F�?/LYH+HDOWK, you can run the following command to start Live Status:
c:\LiveHealth\client\bin\nhLiveStatus
Refer to the section “Command Syntax” on this page for the syntax for these commands.
On UNIX
OLYH is the directory where you installed the application.
To start one of the applications on UNIX, run one of the following commands from the directory where the software was installed. Table 5 lists the installation directory and commands.
Command SyntaxThis section lists the syntax for the nhLiveStatus, nhLiveExceptions, and nhLiveTrend commands. All arguments are optional.
Table 4. Windows Directories and Commands
Application Directory Command
Live Status drive�?live?FOLHQW?ELQ nhLiveStatus
Live Exceptions drive�?live?FOLHQW?ELQ nhLiveExceptions
Live Trend drive�?live?FOLHQW?ELQ nhLiveTrend
Table 5. UNIX Directories and Commands
Application Directory Command
Live Status �live�FOLHQW�ELQ nhLiveStatus
Live Exceptions �live�FOLHQW�ELQ nhLiveExceptions
Live Trend �live�FOLHQW�ELQ nhLiveTrend

Starting Live Health Applications • 39
Live Health User Guide
3
1Table 6 describes the nhLiveStatus command syntax.
Table 7 describes the nhLiveExceptions command syntax.
Table 6. nhLiveStatus Syntax
Argument Description
-h Displays help for this command.
-rev Displays the Live Status version number.
-hostname name or -hn name
Specifies the hostname of the eHealth system to which you want to connect.
-port port Specifies the eHealth Web server port number.
-user username Specifies the name of the eHealth Web user account.
-passwd password Specifies the password for the eHealth Web user account.
-threshold n Specifies the maximum number of elements for diagrams with fixed sized icons. Diagrams that have more than n elements will use dynamically sized icons. The default is 750.
Table 7. nhLiveExceptions Syntax (Page 1 of 2)
Argument Description
-h Displays help for this command.
-rev Displays the Live Exceptions version number.
-hostname name or -hn name
Specifies the hostname of the eHealth System to which you want to connect.

40 • Chapter 3 Starting Live Health
Live Health User Guide
Table 8 describes the nhLiveTrend command syntax.
Logging in to Live HealthWhen you first start a Live Health application, the Login dialog box appears with two tabs: a User tab for regular logins and a Network tab. Use the Network tab for installations requiring a proxy server or secure socket layer connections between the Live Health client and eHealth system machines. Refer to the next section, “Logging in to a Proxy Server,” for more information.
-port port Specifies the eHealth Web server port number.
-user username Specifies the name of the eHealth Web user account.
-passwd password Specifies the password for the eHealth Web user account.
Table 8. nhLiveTrend Syntax
Argument Description
-h Displays help for this command.
-rev Displays the Live Trend version number
-hostname name or -hn name
Specifies the hostname of the eHealth system to which you want to connect.
-port port Specifies the eHealth Web server port number.
-user username Specifies the name of the eHealth Web user account.
-passwd password Specifies the password for the eHealth Web user account.
Table 7. nhLiveExceptions Syntax (Page 2 of 2)
Argument Description

Starting Live Health Applications • 41
Live Health User Guide
3
1NOTE
The Login dialog box does not appear if you specify the hostname, username, and password in the command line.
To log in to Live Health:
1. From the User tab, in the eHealth System field, specify the name of the eHealth system. Specify a colon and the port only if the eHealth Web server uses a port other than 80 (the default). For example:
newyork:8082
2. In the Web User field, specify the name of the eHealth Web user account. It can be a privileged account such as admin or another user with access to Live Health.
3. In the Password field, specify the password for the eHealth Web user account.
4. Optionally, select Use as Default Login to save these settings as the default login information. If you select this field, the Login dialog box will not appear the next time you start a Live Health application. Instead it automatically connects to the specified eHealth system using the specified account and password.
5. Click OK.

42 • Chapter 3 Starting Live Health
Live Health User Guide
NOTENOTE
If the login information is incorrect, Live Health displays a message. Click OK to redisplay the Login dialog box and specify the information correctly. For more information, refer to Chapter 7, “Troubleshooting Live Health Applications.”
Logging in to a Proxy Server
Use the Network tab to enter information for a Web proxy system if your workstation requires proxy access. A proxy is a system in your network that provides Web access; that is, a firewall, perhaps. Contact your system administrator to determine whether you need to specify a proxy to access the eHealth system.
To specify a proxy server:
1. From the Login dialog box, select the Network tab.
2. In the HTTP Proxy Address field, specify the name or IP address of the proxy server. Specify a colon and the port only if the proxy server uses a port other than the default (8080). For example:
newyork:8082

Starting Live Health Applications • 43
Live Health User Guide
3
13. Optionally, in the User field, specify the user name if
required by the proxy machine.
4. Optionally, in the Password field, specify the password if required by the proxy machine.
5. Optionally, under Security, select Use Secure Connection to use the Netscape/iPlanet secure server setup. This enables Live Health applications to use secure socket layers for requests to the eHealth system.
6. Select the User tab and click OK.
Logging in to Another eHealth SystemYou can connect to another eHealth system while using any Live Health application. To connect to another system, select File → Connect to New System in any application to access the Login dialog box. Enter the eHealth system name to which you want to connect.
Exiting from a Live Health ApplicationTo exit from a Live Health application, select File → Exit.


45
4
Using Live Exceptions
This chapter describes how to use Live Exceptions and explains how to do the following:
• Use the Live Exceptions Browser.
• Filter, collapse, and hide alarm and exception event information and change displays.
• View trap alarms.
• Display historical reports.
46 • Chapter 4 Using Live Exceptions
Live Health User Guide
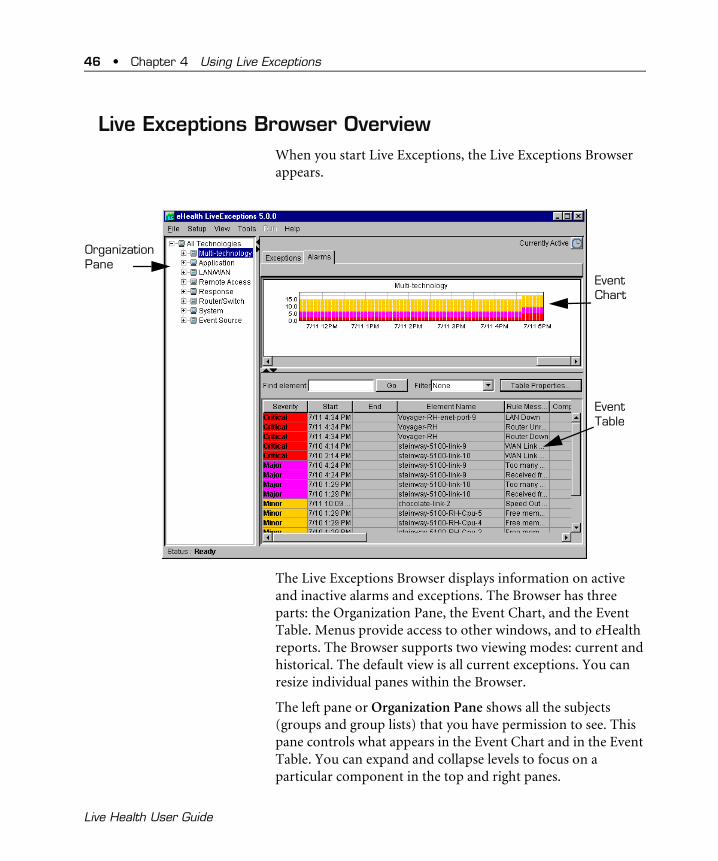
Live Exceptions Browser OverviewWhen you start Live Exceptions, the Live Exceptions Browser appears.
The Live Exceptions Browser displays information on active and inactive alarms and exceptions. The Browser has three parts: the Organization Pane, the Event Chart, and the Event Table. Menus provide access to other windows, and to eHealth reports. The Browser supports two viewing modes: current and historical. The default view is all current exceptions. You can resize individual panes within the Browser.
The left pane or Organization Pane shows all the subjects (groups and group lists) that you have permission to see. This pane controls what appears in the Event Chart and in the Event Table. You can expand and collapse levels to focus on a particular component in the top and right panes.
Event Chart
Event Table
Organization Pane

Live Exceptions Browser Overview • 47
Live Health User Guide
4
5
1The top right pane or Event Chart supports two views: Historical and Live. The historical view lets you view alarms over a time period of up to seven days. The live view shows current exception or alarm events.
By selecting either the Exceptions or Alarms tab, the Event Chart graphs the total number of active exceptions on elements for the group or group list selected in the Organization Pane, or the total number of active alarms. Each bar represents the total exception or alarm count for the given time period. Colors within each bar represent the severity level during that period.
The bottom right pane or Event Table contains a table with sortable columns showing the elements, groups or group lists, alarm types (for example time over threshold), severity levels, and other exceptions information. Table Properties allow you to refine the table view.
You can alter the appearance of the Browser so that it is more useful to you. You can hide, collapse, or filter columns to manage the information that appears in the Browser. You can also click the arrows next to the panes to widen or shrink a pane.
You can select an alarm or exception row in the Event Table and drill down to historical eHealth reports such as At-a-Glance and Trend reports, and run Live Trend to learn more about the alarm. By default, Live Exceptions sends traps to this Browser. Traps can also be sent to other trap destinations and NMSs.
At the bottom of the Browser is a Status display area for Live Exceptions messages.

48 • Chapter 4 Using Live Exceptions
Live Health User Guide
Refresh RateBy default, eHealth refreshes or updates the Live Exceptions Browser every five minutes. The eHealth Web administrator can modify the refresh rate for each user account for Live Exceptions. Refer to the Live Health Administration Guide for more information.
CAUTION
eHealth starts the refresh timer when you select a group or group list in the Organization Pane. Note that eHealth starts a similar refresh timer when you open a Live Status diagram. The timers’ refresh rates are separate; thus these displays could appear “out-of sync” when viewed at the same time.
Displaying Additional BrowsersTo open additional Live Exceptions Browsers from within Live Exceptions, select File → New LE Browser.
Using the Organization PaneThe only groups and group lists that you can see are those that your Web user account has permission to see.
The Organization Pane shows the groups and group lists that you can view. By default, the Organization Pane displays all groups and group lists. You can expand or collapse levels in this pane to focus on a particular component by clicking the plus (+) or minus (-) icon to the left of the technology type. This pane controls what appears in the Event Chart and the Event Table.

Live Exceptions Browser Overview • 49
Live Health User Guide
4
5
1If your eHealth system has Fault Manager, you may also see a technology type called Event Source. The Event Source group contains unknown elements associated with trap alarms. For more information, refer to “Viewing Event Alarms in the Live Exceptions Browser” on page 62.
To view a specific group or group list:
1. In the Organization pane, if necessary double-click All Technologies to expand the list of technologies.
2. Select the technology type and click the plus (+) icon to navigate through the groups or group lists to locate a specific one.
3. Select the group or group list. The group or group list appears in the Event Chart and Event Table.
NOTE
Each technology has a group named All. This group contains all elements that are members of that technology.
Using the Event ChartThe Event Chart shows the total number of alarms or exceptions on elements. You can set the chart to display the currently active alarms or a specified historical time range. The chart’s vertical axis shows the highest number of exceptions for the group or group list selected in the Organization pane. The chart’s horizontal access represents time. The default is two days. The Event Chart shows all alarms, or only the latest alarms, depending on the mode you select. See the next section “Displaying Currently Active or Historical Alarms and Exceptions” for more information.

50 • Chapter 4 Using Live Exceptions
Live Health User Guide
Displaying Currently Active or Historical Alarms and ExceptionsYou can view currently active or historical alarms and exceptions. The default display is currently active, and the chosen viewing mode appears at the top right of the Event Chart. Use the historical mode to analyze event bars.
To select live or historical views:
1. Click the clock icon. The Display Mode Settings dialog box appears.
2. Do one of the following:
• Select Live to view only the currently active alarms or exceptions.
• Select Historical to specify a historical time range of up to seven days. Under Time Range, select start and end time range information.

Live Exceptions Browser Overview • 51
Live Health User Guide
4
5
1a. Specify a From day and time for when you want the
range to start.
b. Specify a To day and time for when you want the range to end.
3. Do one of the following:
• Click Apply to apply the view or time range to the Event Chart. The dialog remains open and you can add additional time ranges to view.
• Click OK to close the dialog box. The Live Exceptions Browser appears with the settings you selected.
Using the Event TableThe Event Table shows details for alarms or exceptions depending on the groups or group lists you select in the Organization Pane. To learn more about the exceptions, you can run eHealth reports for more historical detail.
Finding ElementsThe Event Table find feature allows you to search for alarms or exceptions for an element. This feature supports case-insensitive word matching anywhere in the element name. For example, if you enter chicago, the Find element field locates both CHICAGO-RTR and East-Chicago-Svr elements.

52 • Chapter 4 Using Live Exceptions
Live Health User Guide
To locate an element in the Event Table:
1. Specify an element name in the Find element field.
2. Click Go.
3. Optionally, repeat Step 2 to find additional instances of the specified string.
Displaying Single Exceptions or Multiple AlarmsExceptions can have one or more active alarms. To change the Event Table display, do one of the following:
• Select the Alarms tab to show all alarms and display Alarm Detail reports. For more information on these reports, refer to “Alarm Detail Reports” on page 69.
• Select the Exceptions tab to show all exceptions and only the highest alarm severity for those exceptions that have multiple alarms.
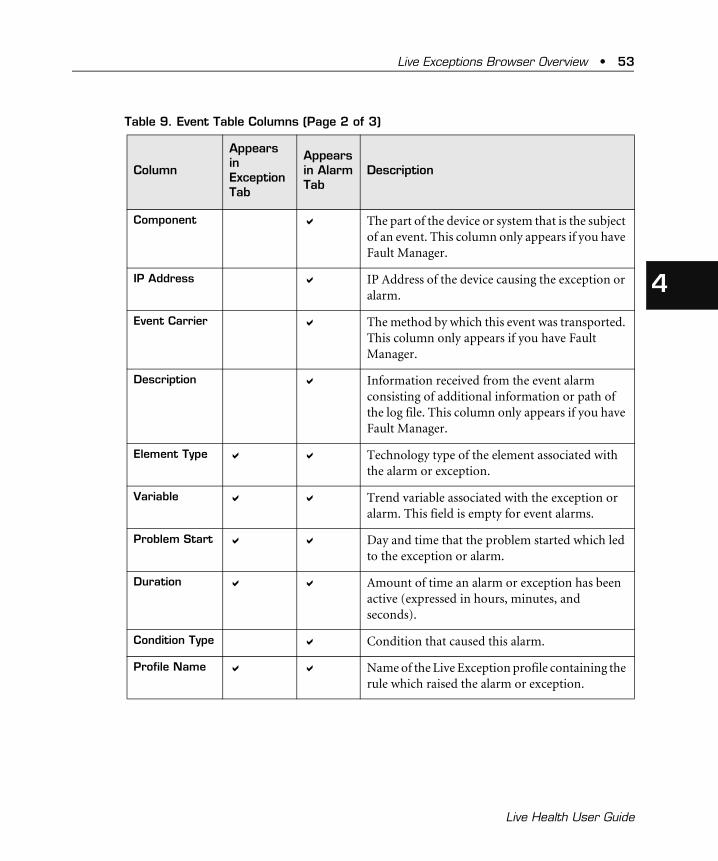
Understanding the Event Table ColumnsTable 9 describes the Event Table columns. The actual columns depend on whether you select the Alarms or Exceptions tab.
Table 9. Event Table Columns (Page 1 of 3)
Column
Appears in ExceptionTab
Appears in AlarmTab
Description
Severity a a Severity level associated with exceptions or alarms.
Start a a Day and time the exception or alarm was raised.
End a a Day and time that the alarm was cleared. If blank, the exception or alarm is still active.
Element Name a a Element associated with the exception.
Rule Message a User-specified description of the alarm.
Live Exceptions Browser Overview • 53
Live Health User Guide
4
5
1
Component a The part of the device or system that is the subject of an event. This column only appears if you have Fault Manager.
IP Address a IP Address of the device causing the exception or alarm.
Event Carrier a The method by which this event was transported. This column only appears if you have Fault Manager.
Description a Information received from the event alarm consisting of additional information or path of the log file. This column only appears if you have Fault Manager.
Element Type a a Technology type of the element associated with the alarm or exception.
Variable a a Trend variable associated with the exception or alarm. This field is empty for event alarms.
Problem Start a a Day and time that the problem started which led to the exception or alarm.
Duration a a Amount of time an alarm or exception has been active (expressed in hours, minutes, and seconds).
Condition Type a Condition that caused this alarm.
Profile Name a a Name of the Live Exception profile containing the rule which raised the alarm or exception.
Table 9. Event Table Columns (Page 2 of 3)
Column
Appears in ExceptionTab
Appears in AlarmTab
Description

54 • Chapter 4 Using Live Exceptions
Live Health User Guide
Understanding Severity LevelsWhen you select the Exceptions tab, the Event Table Severity column displays the highest severity level of all alarms associated with each element. When you select the Alarms tab, the Severity column displays all severity levels as separate rows.
Group (List) Name
a a Group or group list associated with the profile.
Reason Cleared
a a Reason an alarm has cleared. The following are valid reasons:
• Normal
• Partial day
• Change in monitoring
• Server reset
Alarm/Trap Count
a a In the Exceptions view, the number of alarm occurrences or events for this exception. In the Consolidate Events Over Time view, the total number of instances of the same alarm or event.
Table 9. Event Table Columns (Page 3 of 3)
Column
Appears in ExceptionTab
Appears in AlarmTab
Description

Live Exceptions Browser Overview • 55
Live Health User Guide
4
5
1Table 10 lists the severity levels from least to most severe, their corresponding color on the Event Table and Chart, and their suggested uses. Note that muted colors show severity levels that have been cleared.
Sorting, Rearranging, and Resizing ColumnsYou can sort, rearrange and resize the columns in the Event Table. You can sort the column contents to group exceptions by alarm severity, group, element type, and so on. Most columns sort alphabetically; you can sort severity by ascending or descending levels.
To sort on a column in the Event Table, click the column label on which you want to sort.
To reorder or rearrange columns in the Event Table:
1. Place the cursor over the column label that you want to move, click, and hold down the left mouse button.
2. Drag the column to a new location in the table and release the mouse button.
Table 10. Severity Description
Severity Color Suggested Description
All Types Muted Muted colors indicate alarms that have been cleared.
Warning Green The element’s workload is unusual compared to a baseline.
Minor Yellow The element is contributing to delay.
Major Orange The element has too many errors or may fail.
Critical Red The element is down.

56 • Chapter 4 Using Live Exceptions
Live Health User Guide
To resize columns in the Event Table:
1. Place the cursor over the column label that you want to resize; click and hold down the left mouse button. The cursor changes to a double-arrow.
2. Drag the column horizontally to resize the column.
3. Release the mouse button.
By default the Event Table view is unfiltered, that is, the table shows all alarms or exceptions regardless of their active or inactive status. You can change the information that appears in the Event table.
Collapsing Columns in the Event TableYou can collapse columns in the Alarms view of the Event Table. Collapsing columns can make it easier to find problems by reducing the number of items in view. For example, suppose the following alarms appear in the Event Table for the Sales Group:
When you select Element as the column to collapse, the following appears in the Event Table:
Severity Element Group
Major Router-1 Sales
Warning Router-42 Sales
Minor Router-57 Sales
Major EtherSwitch-5 Sales
Warning OrderServer Sales
Severity Element Group
Major * Sales

Live Exceptions Browser Overview • 57
Live Health User Guide
4
5
1When you select columns to collapse, Live Health compares information in certain columns to see if it is the same. If it is, the rows are combined. The Severity, Start, End, and Alarm Count columns are aggregated as follows:
• Severity. Live Exceptions displays the maximum severity of the collapsed events.
• Start. Live Exceptions displays the earliest start time found in the set of collapsed events.
• End. Live Exceptions displays the latest end time found in the set of collapsed events but only if all events have been cleared. If there are active events, this column is blank.
• Count. Live Exceptions displays the sum of the alarm count for the collapsed events.
All other columns display actual data or an asterisk (*). The Rule Message column always contains an asterisk (*).
To collapse columns in the Event Table
1. From the Alarms view, select Setup → Table Properties. The Table Properties dialog box appears.

58 • Chapter 4 Using Live Exceptions
Live Health User Guide
2. From the Collapse tab, select Collapse Alarms to enable collapsing columns. If you select Show All Alarms, you cannot collapse columns.
3. Under Differentiate alarms by, select the columns that you want to collapse in the Event Table. Click Select All to select all columns. Click Clear All to deselect all columns. If you click Default, Live Exceptions applies the default which collapses all columns except Severity, Start, End, Rule Message, and Alarm Count.
4. Do one on the following:
• Click Apply to collapse the columns. The dialog box remains open and you can collapse additional columns.
• Click OK to collapse the columns and close the dialog box. The Event Table appears with the columns collapsed.
Hiding Columns in the Event TableYou can hide columns in the Alarms or Exceptions view of the Live Exceptions Browser. Hiding columns can make it easier to find problems by eliminating the information you do not want to view.
To hide columns in the Event Table:
1. Select Setup → Table Properties or click Table Properties in the Event Table. The Table Properties dialog box appears. The Collapse tab appears if you open the Table Properties dialog box from the Alarms view, the Hide tab appears if you open the dialog box from the Exceptions view.

Live Exceptions Browser Overview • 59
Live Health User Guide
4
5
12. Select the Hide tab, if necessary.
3. Select one of the following:
• Select Columns for Alarms view to hide columns in the Alarms view of the browser.
• Select Columns for Exceptions view to hide columns in the Exceptions view of the browser.
4. Under Select Columns to Hide, select the columns that you want to hide. Click Select All to select all columns. Click Clear All to deselect all columns.
5. Do one on the following:
• Click Apply to hide the column. The dialog box remains open and you can hide additional columns.
• Click OK to hide the columns and close the dialog box. The Event Table appears with the columns hidden.
Filtering Elements in the Event TableBy default, the Event Table is unfiltered; that is, the table shows all alarms or exceptions regardless of their active or inactive status. You can filter the view so that the Event Table is more useful.

60 • Chapter 4 Using Live Exceptions
Live Health User Guide
To create a filter:
1. Select Setup → Table Properties or click Table Properties in the Event Table. The Table Properties dialog box appears.
2. Select the Filter tab, if necessary and select the features you want to filter. Select the left-most column to activate the criteria. Select Include to only view the item you specified. Select Exclude to view all items except the one you specified.
• To filter the alarm state, select State and do the following:
• Select Active to display all active alarms or exceptions.
• Select Cleared to display all cleared alarms.
• Select Severity to include or exclude the severity level that you select from the Severity list.
• Select Element Type to include or exclude the element type that you select from the Element Type list.
• Select Variable to include or exclude the variable you specify in the Variable field.

Live Exceptions Browser Overview • 61
Live Health User Guide
4
5
1• Select Element Name to include or exclude the element
name you specify in the Element Name field. eHealth filters with partial matches.
• Select Message to include or exclude the message you specify in the Message filed. This filter appears in the Alarms view only.
• If you have Fault Manager, select Component to include or exclude the component you specify in the Component field. This filter appears in the Alarms view only.
3. Do one of the following:
• Click Apply to observe the effect of the filter. The dialog remains open and you can select other filter settings.
• Click OK to apply the filter and close the dialog box. The Event Table appears with the filter applied.
Viewing the Event TableYou can switch the views in the Event Table so that you can quickly view customized information. Next to Filter, do one of the following:
• Select None to show all alarms or exceptions. This is the default.
• Select Show Active to show only active alarms or exceptions.
• Select Show Cleared to show only cleared alarms or exceptions.
• Select Show Custom to view the Event Table with collapsed, hidden, and/or filtered columns.
Saving Event Table PropertiesYou can save the changes you make to the Event Table so that the changes appear the next time you log in. Select Setup → Save Table Properties.

62 • Chapter 4 Using Live Exceptions
Live Health User Guide
Viewing Event Alarms in the Live Exceptions BrowserIf your eHealth system has Fault Manager, the Live Exceptions Browser will display event alarms. An event occurs when a system or device sends an SNMP trap to the eHealth system. When the Live Health administrator applies rules for these events, the Live Exception Browser displays a event alarm.
If your eHealth system has Fault Manager, the Live Exceptions Browser has the following additions:
• Technology type in the Organization pane called Event Source
• Three additional columns in the Event Table: Component, Event Carrier, and Description
The discovery process locates systems and devices that contain SNMP agents in your infrastructure and creates elements to represent these resources.
Any system or device can send a trap to the eHealth system. This includes elements that are unknown to the eHealth system (that is, the elements have not been discovered by eHealth). When eHealth receives a trap from an unknown element, the Live Exceptions Browser groups these elements in the Organization pane under Event Source.
While Live Health can receive all traps, the information that appears for an event alarm in the Event Table depends on whether the event alarm is from a certified or uncertified trap. A certified trap has a trap rule file (TRF) which describes exactly what appears in the Live Exceptions Browser when this specific trap arrives. If a trap arrives at the eHealth system and there is a specific TRF for this type of event, the Live Exceptions Browser displays the information for this event alarm as defined in the TRF. Table 11 describes what appears in the Live Exceptions Browser.

Viewing Event Alarms in the Live Exceptions Browser • 63
Live Health User Guide
4
5
1
An uncertified trap is one that is not defined to eHealth and does not have a specific TRF. However, the Live Health administrator can apply a profile that contains rules which use information from a default TRF. This TRF describes what appears in your Browser, depending on whether the alarm came from a known (discovered) element or any unknown element. Table 12 describes what appears in the Event Table.
Table 11. Certified Trap Alarms
Event Table Column
Discovered Element
Undiscovered Element with SystemEDGE
Undiscovered Element - No SystemEDGE Agent
Element Name Element Name or Alias
Event Source-IP Address Event Source
Element Type Element Type SystemEDGE Event Source Generic Event Source
Component The part of the device or system that is the subject of an event (if there is one).
Field is blank
Event Carrier The method by which this event was transported. Consists of the word “Trap:” and some combination of the trap name.
Description Additional information about the event.
Table 12. Uncertified Trap Alarms (Page 1 of 2)
Event Table Column
Discovered Element Undiscovered Element
Element Name Element Name or Alias Event Source
Element Type Element Type Generic Event Source

64 • Chapter 4 Using Live Exceptions
Live Health User Guide
Additional Browser ViewsLive Exceptions provides other ways of viewing alarms and exceptions. The View menu provides the following additional choices.
• Top Ten Exceptions window displays the ten groups containing the most active exceptions.
• Consolidate Events Over Time consolidates events into one line in the Browser and increases the alarm count with each poll as appropriate.
• Alarm Occurrences displays a separate window of all alarms associated with an exception in the Exceptions view and displays consolidated alarm occurrences in the Consolidated Events Over Time view.
The following sections describe each view in greater detail.
Component Field is blank
Event Carrier Trap: Generic type n, specific type n, enterprise[enterprise oid]
The value n is a number and oid is an object identifier.
Description Path of the log file in the following format:
Logfile:/�1+B+20(�ORJ�WUDS/RJ�date�time�ELQ�id number�n
The value $NH_HOME is the directory where eHealth is installed and n is the identification number of the trap in the log file
Table 12. Uncertified Trap Alarms (Page 2 of 2)
Event Table Column
Discovered Element Undiscovered Element

Additional Browser Views • 65
Live Health User Guide
4
5
1Top Ten Exceptions Window
The Top Ten Exceptions window is an easy way to see the ten groups with the most active exceptions. You can select a top ten exception or its group and open a new Live Exceptions Browser to investigate the exception further. Live Exceptions refreshes this window with every poll.
To use the Top Ten Exceptions Window:
1. Select View → Top Ten Exceptions. The Top Ten Exception Window appears.
2. Select a value under Total Exception Count or Subject Name. A new Live Exceptions Browser appears.
3. Use the new Live Exceptions Browser to learn more about the exceptions in the selected group.
4. If desired, select Run to display an eHealth report for that exception.
For more information on eHealth reports, refer to “eHealth Reports Overview” on page 68.

66 • Chapter 4 Using Live Exceptions
Live Health User Guide
Consolidating Events Over TimeWhen viewing historical data, you can consolidate several instances of the same exception in the Event Chart to simplify the information that Live Exceptions displays. In the Alarms view, consolidated events show the severity in the Severity column for a given event, as well as the total alarms. Live Exceptions does not consolidate alarms with different severities that are otherwise identical. The Browser updates the information with each poll.
To consolidate or expand events in the Browser, select View → Consolidate Events Over Time. A check mark to the left of the menu choice indicates that consolidation is in effect.
Displaying Alarm OccurrencesLive Exceptions lets you display a separate window containing all alarm occurrences that an exception contains or the individual alarm instances that a consolidated alarm contains. The table rows display the same information as the Event Table, and you can perform the same report drill down tasks in an Alarm Occurrences window as in the Event Table.
For more information, refer to “Understanding the Event Table Columns” on page 52 and “eHealth Reports Overview” on page 68.
NOTE
If you collapse columns in the Alarms view of the Event Table, you also affect the information that appears in the Alarm Occurrences window. For more information about hiding columns, refer to “Collapsing Columns in the Event Table” on page 56.

Additional Browser Views • 67
Live Health User Guide
4
5
1To display alarm occurrences:
1. Select a row in the Event Table with an Alarm Count greater than 1.
2. Do one of the following:
• From the Browser menu, select View → Alarm Occurrences.
• Right-click and select Alarm Occurrences.
The Alarm Occurrences window appears.
The columns that appear in the Alarm Occurrences window are the same columns that appear in the Event Table. For more information about these columns, refer to “Understanding the Event Table Columns” on page 52.
NOTENOTE
Live Exceptions updates Alarm Occurrences windows. However, if you change groups in the Organizational Pane, Live Exceptions prompts you and closes all windows.

68 • Chapter 4 Using Live Exceptions
Live Health User Guide
eHealth Reports OvervieweHealth reports enhance Live Exceptions by providing additional information on the element or variable associated with an exception or alarm, as well as historical reports for an element or variable.
Your account permissions determine the reports that you can view. The type of variables that you select also determines which reports are available. For more information on these reports, refer to the Web Help and the eHealth Reports Guide.
You can run a report using any of the following methods:
• Select a row in the Event Table and right-click to display a pop-up menu.
• From the Live Exceptions menu, select Run → reportType.
• From the Alarm Occurrences window, select a row and right-click to display a pop-up menu.
• From the Top Ten Exceptions window, select a group or group list to display another Live Exceptions Browser showing just the exceptions for that group. Select Run → reportType.
NOTE
If you collapse rows in the Event Table, it may affect the reports that you can run. Use the Alarm Occurrences window to run the report.
At-a-Glance ReportsAt-a-Glance reports summarize information about an element’s performance over a period of time. They contain several charts on a single page so you can compare the performance of several significant variables.
NOTE
At-a-Glance reports are not available for system components or for router CPUs.

eHealth Reports Overview • 69
Live Health User Guide
4
5
1Trend Reports
Trend reports provide details about one or more variables for one or more elements based on elements you select in the Live Exceptions Browser.
NOTE
When the Live Exceptions Browser is set to the Alarms view and you select Trend Report, you actually run an Alarm Detail report.
Alarm Detail ReportsAlarm Detail reports are a type of Trend report available in the Browser’s Alarms view or from the Alarm Occurrences window. They illustrate the threshold crossings and any available historical baseline data for an alarm selected in the Event Chart.
Use Alarm Detail reports to determine when and how often the variable exceeded or fell below the threshold.
Live Trend ReportsIf your eHealth system has a Live Trend license, you can display a Live Trend chart for the element that displays up to 10 variables and one hour of history. For more information on Live Trend and its reports, refer to Chapter 6, “Using Live Trend.”
NOTE
Live Trend reports are not available for imported elements.
Reports
Select the element and select Reports (web) to view the available reports for the element. A Web browser appears displaying the Organization page with the element selected. The right hand frame displays the report list for that element.

70 • Chapter 4 Using Live Exceptions
Live Health User Guide
System Information Query
If your eHealth system has an AdvantEDGE View license, you can select an element that has a SystemEDGE agent and select System Information (web) to drill down to the System Information Query in AdvantEDGE View.
Response Transaction Log
If your eHealth system has an Application Response license, you can select a row that has an Application Response agent and select Response Transaction Log (web) to drill down to the Agent Transaction Viewer. The viewer appears for that element.
Subject ReportsYou can obtain summary and detail information about subjects (groups and group lists) and the profiles that are associated with them.
Monitored Subjects Summary ReportA Monitored Subjects Summary report shows group and profile information including the following:
• Elements that do not have any applicable alarm rules
• Alarm rules that do not have any applicable elements
• An element and alarm type that match, but the alarm variable does not match
The Monitored Subjects Summary report also shows the total number of elements that Live Exceptions is monitoring.
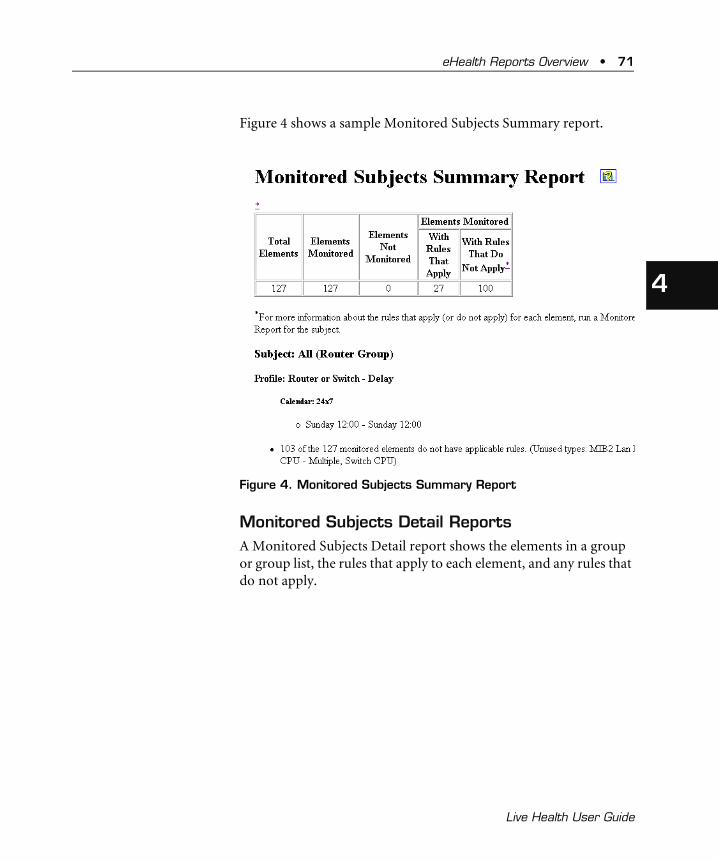
eHealth Reports Overview • 71
Live Health User Guide
4
5
1Figure 4 shows a sample Monitored Subjects Summary report.
Figure 4. Monitored Subjects Summary Report
Monitored Subjects Detail ReportsA Monitored Subjects Detail report shows the elements in a group or group list, the rules that apply to each element, and any rules that do not apply.

72 • Chapter 4 Using Live Exceptions
Live Health User Guide
Figure 5 shows a sample portion of a Monitored Subjects Detail report.
Figure 5. Monitored Subjects Detail Report
Displaying the Monitored Subjects ReportsThe reports that you can create depend on which groups and groups lists that you have permissions to view.
To display a Monitored Subjects Summary or Monitored Subjects Detail report:
1. In the Organization Pane, select the subject on which you want to report.
2. In the Live Exceptions Browser, do one of the following:
• Select Tools → Monitored subjects summary report
• Select Tools → Monitored subjects detail report

73
5
Using Live Status
This chapter describes how to use and configure Live Status.
About Live StatusLive Status provides a real-time, high-level, diagram of your IT resources so that you can identify the status of critical resources. Using colors and shapes, Live Status allows you to quickly assess your network based on color changes in a logically grouped graph. To simplify troubleshooting, Live Status is integrated with other components, providing drill downs to Live Exceptions, Live Trend, various reports, the Response Transaction Log, and System Information Queries using AdvantEDGE View. Using these drill downs, you can obtain element-specific information or group and group list information to troubleshoot the problem.
You can display more than one Live Status window to monitor several critical group lists; in addition, you can change the diagram to view a different group list at any time. You can also save your favorite or most frequently used diagrams to open them at any time.
Before you can use Live Status, the eHealth administrator must define eHealth groups and group lists and the Live Health administrator must use Live Exceptions to define rules and profiles for this group or group list.

74 • Chapter 5 Using Live Status
Live Health User Guide
Using the Live Status DiagramAfter starting Live Status (refer to “Starting Live Health Applications” on page 36), and selecting the group list that you want to see, the Live Status window appears displaying the Live Status diagram.
There are two versions of Live Status, depending on the number of elements in the group list. The version shown above appears for a group list that contains less than 750 elements. A larger version of the Live Status diagram appears for group lists that contain more than 750 elements.
At the core of either diagram is the group list. Radiating from the group list in a fish-bone pattern are the groups that comprise that group list.
Group List Name
Title
Groups
Legend
Elements
Status Bar

About Live Status • 75
Live Health User Guide
4
5
1Groups are arranged alpha-numerically by group name starting from the top right corner of the diagram and moving toward the left, then starting at the bottom right corner and moving toward the left. If a group is in a multi-technology group list, the names that appear in the diagram also contain the technology type.
NOTE
If the eHealth administrator modifies a group list (for example, removes a group from the group list), Live Status automatically updates the diagram.
Elements can be parent element and child elements. Parent elements are the main device while child elements are subcomponents. Common parent elements are systems and routers.
Elements are arranged alpha-numerically by element name starting from the group list and moving outward. Each element has an icon that shows the severity status of the element. The color of the element icon reflects the highest severity alarm for the element. If an element has no alarms, the status is normal. If an element is a parent element, it is represented by one icon, although the icon may represent the parent element and its components (but only if the components are in the same group). Alarms aggregate to the parent element if there is an alarm for the child element and the child element is in the same group as the parent element.
NOTE
The Live Status diagram may appear truncated if the number of elements in a group or number of groups in a group list is large, or if you minimize the size of the diagram. For example, if you have 200 groups that contain two elements each, or 500 elements in one group, the diagram will appear truncated. Live Status displays a Truncation Warning message to notify you when this occurs. Click OK. Live Status displays the diagram with a dotted line at the end of the diagram.
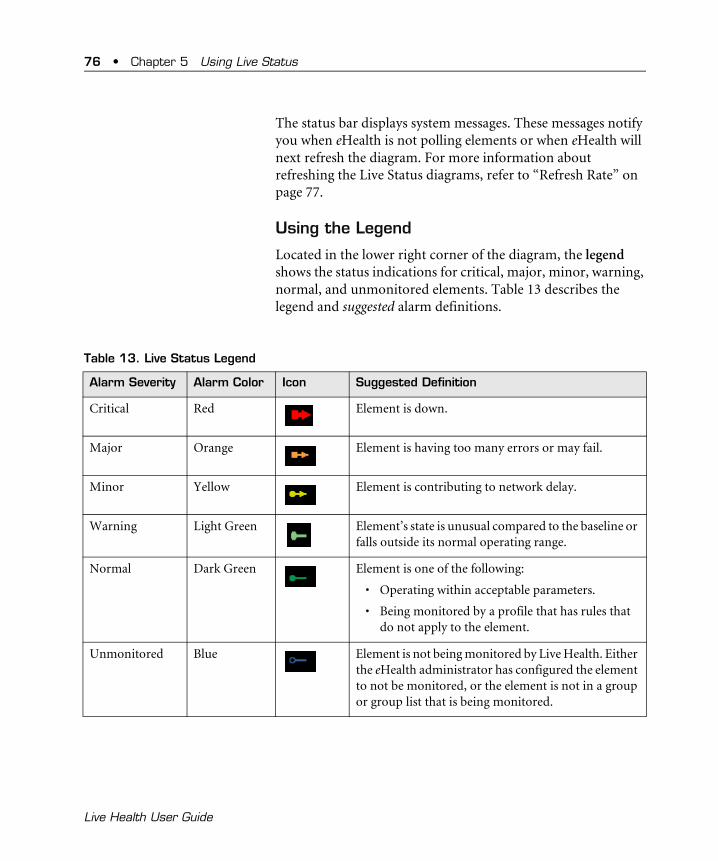
76 • Chapter 5 Using Live Status
Live Health User Guide
The status bar displays system messages. These messages notify you when eHealth is not polling elements or when eHealth will next refresh the diagram. For more information about refreshing the Live Status diagrams, refer to “Refresh Rate” on page 77.
Using the Legend
Located in the lower right corner of the diagram, the legend shows the status indications for critical, major, minor, warning, normal, and unmonitored elements. Table 13 describes the legend and suggested alarm definitions.
Table 13. Live Status Legend
Alarm Severity Alarm Color Icon Suggested Definition
Critical Red Element is down.
Major Orange Element is having too many errors or may fail.
Minor Yellow Element is contributing to network delay.
Warning Light Green Element’s state is unusual compared to the baseline or falls outside its normal operating range.
Normal Dark Green Element is one of the following:
• Operating within acceptable parameters.
• Being monitored by a profile that has rules that do not apply to the element.
Unmonitored Blue Element is not being monitored by Live Health. Either the eHealth administrator has configured the element to not be monitored, or the element is not in a group or group list that is being monitored.

About Live Status • 77
Live Health User Guide
4
5
1You can select whether the legend appears on the diagram. Refer to “Configuring the Live Status Legend” on page 84 for more information.
Refresh RateBy default, eHealth refreshes or updates the Live Status diagram every five minutes. The eHealth Web administrator can modify the refresh rate for each user account for Live Status. Refer to the Live Health Administration Guide for more information.
CAUTION
eHealth starts the refresh timer when you open a Live Status diagram. Note that eHealth starts a similar refresh timer when you select a group or group list in the Organization Pane of the Live Exceptions Browser. The timers’ refresh rates are separate; thus these displays could appear “out-of sync” when viewed at the same time.
Obtaining the Group List, Group, and Element Status
When you hover the cursor over an element, group, or group list in the diagram, a pop-up display provides more information. For example, when you hover over the group list name, the pop-up display shows the group list name, the number of groups within it, the number of elements in the group list, and the number of alarms by severity for the entire group list.
When you hover over the group name, the pop-up display shows the group name, the number of elements in the group, and the number of alarms by severity for the entire group.
When you hover over an element, the pop-up display shows the element name, IP address, and the number of alarms by severity for this element and other associated elements (for example a router alarm also includes alarms from CPUs).
78 • Chapter 5 Using Live Status
Live Health User Guide
Drilling Down for More Information
You can right-click an element, group, or group list to display a pop-up menu that allows you to obtain more information. You can also select the element, group, or group list and use the View and Run menus to obtain more information.
Drilling Down from the Group or Group List
From the group or group list, you can drill down to Live Exceptions or to a report list. Select a group or group list and right click to display a pop-up menu. If you select Live Exceptions, eHealth displays the Live Exceptions Browser filtered to that group or group list. You can also select the group or group list and select Run → Live Exceptions.
From the pop-up menu, you can select Reports (web) to view a Web page that contains a list of existing reports run for that group or group list. If your account has permission, you can also run other reports. You can also select the group or group list and select View → Reports (web).
Drilling Down from an ElementDepending on the type of element, your account permissions, the licenses on the eHealth system, and whether there is an event or non-event alarm, you can also drill down from an element to the following:
• Alarm Occurrences window in Live Exceptions
• Live Trend
• At-a-Glance report
• Trend report
• Reports list
• System Information Query for elements with SystemEDGE agents
• Response Transaction Log for elements with Application Response agents

About Live Status • 79
Live Health User Guide
4
5
1For more information about event alarms, refer to “Viewing Event Alarms in the Live Exceptions Browser” on page 62.
Drilling Down to the Live Exceptions Alarm Occurrences Window. If an element has an alarm, you can select the element and right click to drill down to a modified version of the Alarm Occurrences windows in Live Exceptions. The window appears with all alarms — including event alarms if the eHealth system has Fault Manager— for that element. If an element is a parent, the window contains alarms for its children (subcomponents) also. If the element is a path, the window also contains alarms for all source and destination elements. If you create, delete, or view a different diagram, Live Status notifies you and closes all alarm occurrence windows.
You can also select the element and select View → Alarm Occurrences.
Drilling Down to Live Trend. If an element has an alarm based on a variable, you can select the element and right click to drill down to Live Trend. You cannot drill down to Live Trend if it is an event alarm. A submenu appears with a list of elements that contributed to the element’s alarm severity status. Each element displays its highest alarm severity status.
A Live Trend chart appears for the element displaying up to 10 variables and one hour of history. If the element is a parent, the Live Trend chart displays the variables associated with the parent element, not the child element.
You can also select the element and select Run → Live Trend.
Drilling down to an At-a-Glance Report. Select the element and right-click to drill down to an At-a-Glance report. eHealth runs an At-a-Glance report for that element for the previous 24 hours.
You can also select the element and select Run → At-A-Glance Report.

80 • Chapter 5 Using Live Status
Live Health User Guide
Drilling Down to a Trend Report. If the element has an alarm based on a variable, select the element and right-click to drill down to a Trend Report. You cannot drill down to a Trend report if it is an event alarm. A submenu appears with a list of elements that contributed to the element’s alarm severity status. Each element displays its highest alarm severity status.
A Trend report appears for the element displaying up to 10 variables and 24 hours of history. If the element is a parent, the Trend report displays the variables associated with the parent element, not the child element.
When you drill down to a Trend report, the Trend report contains each variable that makes up the element’s alarms. This is the same drilldown report that you get when you drill down to a Trend report in the Exceptions view in Live Exceptions.
You may prefer to view an Alarm Detail report. Drill down to the Alarm Occurrences window. From this window, select a row (alarm), right-click to display a pop-up menu and select Trend Report. This is the same drilldown report that you get when you drill down to a Trend report from Live Exceptions in the Alarms view. For more information about Alarm Detail reports, refer to “Alarm Detail Reports” on page 69.
You can also select the element and select Run → Trend Report.
Drilling down to Reports. Select the element and right-click to drill down to the available reports for the element. A Web browser appears displaying the Organization page with the element selected. The right frame displays the report list for that element.
You can also select the element and select View → Reports (web).
Drilling Down to System Information Query. If you have an AdvantEDGE View license, you can select an element that has a SystemEDGE agent and right-click to drill down to the System Information Query in AdvantEDGE View.

About Live Status • 81
Live Health User Guide
4
5
1You can also select the element and select View → System Information (web).
Drilling Down to Response Transaction Log. If you have an Application Response license, you can select an element that has an Application Response agent and right-click to drill down to the Agent Transaction Viewer. The viewer appears for that element.
You can also select the element and select View → Response Transaction Log (web).
Creating a DiagramTo view the status of a group list, you must create a Live Status diagram. Live Status saves diagrams on the eHealth system for each Web user account, so that you can access a diagram from any client. You will see only the diagrams created from that account.
NOTE
You can over-write diagrams if more than one user shares the same account on the same eHealth system.

82 • Chapter 5 Using Live Status
Live Health User Guide
To create a Live Status diagram:
1. Select File → New Diagram. The New Diagram dialog box appears.
2. Specify a name for this Live Status diagram in the Title field. This name appears at the top of the Live Status diagram. The name must be unique for this account on this eHealth system. It can include spaces.
3. Select the technology that you want to view from the Technology list. The group lists associated with that technology appear in the Group List list.
4. Select a group list.
5. Click OK. The diagram appears in the Live Status window.
Opening Live Status DiagramsYou can open a diagram in the current Live Status window. Refer to“Opening a New Live Status Window” on page 86 for information about displaying more than one Live Status window.

About Live Status • 83
Live Health User Guide
4
5
1To open a Live Status diagram:
1. Select File → Open Diagram. The Open Diagram dialog box appears.
2. All existing Live Status diagrams that you have created appear under Title. The group list associated with the diagram appears under Group List. Select the Live Status diagram and click OK. The Live Status window displays the diagram you selected.
NOTENOTE
If the eHealth administrator deletes a group list or removes your privilege to view the group list, a message appears stating that the group list was not found.
You can also select a diagram to view from the File menu; it lists the four most recent diagrams that you viewed.
Configuring Live StatusYou can select how Live Status appears when you start the application.

84 • Chapter 5 Using Live Status
Live Health User Guide
To configure Live Status:
1. Select File → Preferences. The Preferences dialog box appears.
2. Under On startup, always, select one of the following:
• Select Show last diagram viewed to open Live Status with the diagram you last viewed.
• Select Ask to select a diagram to open the Open Diagram dialog box when you start Live Status or open the New Diagram dialog box if you have not created any diagrams.
• Select Show and select a diagram from the list. Live Status always opens with the diagram that you select.
3. Click OK.
Configuring the Live Status LegendYou can select whether the legend appears on all Live Status diagrams.

About Live Status • 85
Live Health User Guide
4
5
1To configure the legend:
1. Select View → Preferences. The Preferences dialog box appears.
2. Do one of the following:
• Select Show Legend to display the legend in the lower right corner of the diagram.
• Deselect Show Legend to hide the legend.
3. Click OK.
Editing the Diagram TitleYou can change the name of the title of the Live Status diagram. Double-click the title, specify a new name in the Change Title dialog box, and click OK.

86 • Chapter 5 Using Live Status
Live Health User Guide
Opening a New Live Status WindowYou can display more than one Live Status window to monitor several critical group lists simultaneously. To open a new window, select File → New Live Status Window. A new Live Status window opens displaying the existing diagram. To view a different diagram, refer to “Opening Live Status Diagrams” on page 82, or to create a new diagram, refer to “Creating a Diagram” on page 81.
Deleting a DiagramYou can delete a Live Status diagram that you no longer want to display. To delete a diagram, you first display it and delete the active diagram.
CAUTION
If you delete a diagram in a Web user account that is shared by more than one person, you could delete a diagram that someone else is viewing. The diagram you delete is viewable by someone else until they switch diagrams.
To delete a diagram:
1. Select File → Open Diagram. The Open Diagram dialog box appears.
2. Select the Live Status diagram that you want to delete and click OK. The Live Status diagram appears.
3. Select File → Delete Diagram. A confirmation message appears.
4. Click Yes. The Live Status diagram no longer appears in the window or in the list of Live Status diagrams.
After you delete the diagram, the Live Status window clears (is empty). You can create a new diagram or open an existing one.

87
6
Using Live Trend
This chapter describes how to create, edit, and view Live Trend charts.
Live Trend OverviewLive Trend is an application that you can use to create charts that monitor statistics elements that you are polling using eHeath. With Live Trend, you can create a single chart or multiple charts, in various styles, to represent both element trends (a single element with multiple variables) and variable trends (a single variable for multiple elements). Live Trend updates the charts each time eHealth polls the elements. You can display data as polled, with charts updated every five minutes; fast sampled, with charts updated every 30 seconds; or up to 48 hours of history.
When you run Live Trend without enabling the fast sampling feature, all eHealth variables are supported for any SNMP-polled statistics element. When you enable the fast sampling feature, aggregated variables on parent elements are not supported.
If your Web user account has permission, you can enable the fast sampling feature when creating a new chart, or while viewing an existing chart. Fast sampled data is not sent to the database, therefore the data gathered by fast sampling is not saved.

88 • Chapter 6 Using Live Trend
Live Health User Guide
You also have the option of displaying up to 48 hours of history when you create a new chart. You cannot, however, enable this feature while viewing a chart that has already been created.
Refer to “Starting Live Health Applications” on page 42 for instructions on starting Live Trend. After you log in, the Chart Definition Manager appears.
Use the Live Trend Chart Definition Manager to create, edit, delete, and rename Live Trend charts.
Creating a Live Trend ChartYou create a chart as follows:
1. Define a chart.
2. Edit a chart definition.
Defining a Chart Defining a chart consists of specifying a chart name and defining whether it is a multiple-element or multiple-variable chart.
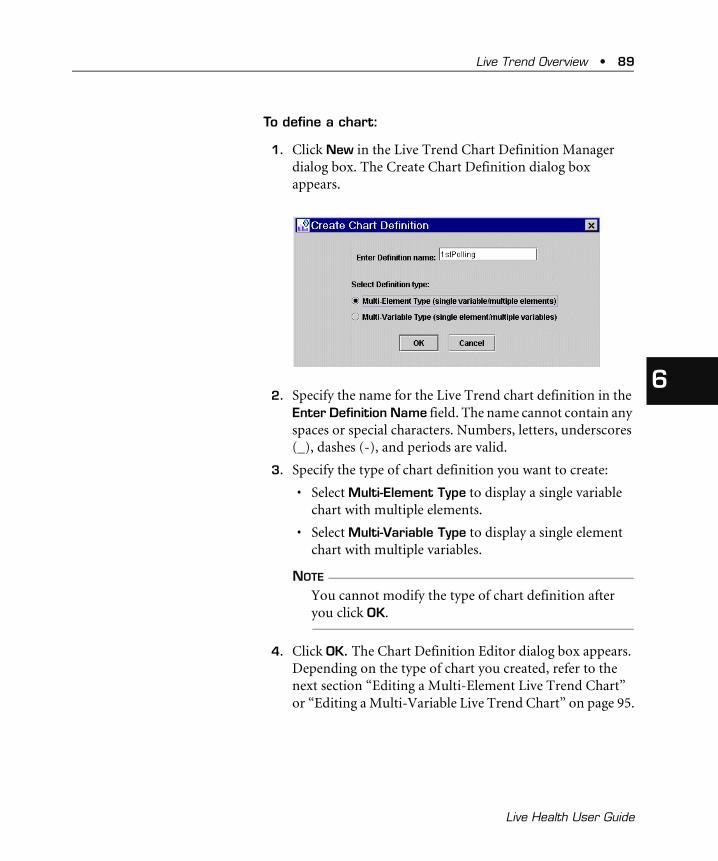
Live Trend Overview • 89
Live Health User Guide
1
6
To define a chart:
1. Click New in the Live Trend Chart Definition Manager dialog box. The Create Chart Definition dialog box appears.
2. Specify the name for the Live Trend chart definition in the Enter Definition Name field. The name cannot contain any spaces or special characters. Numbers, letters, underscores (_), dashes (-), and periods are valid.
3. Specify the type of chart definition you want to create:
• Select Multi-Element Type to display a single variable chart with multiple elements.
• Select Multi-Variable Type to display a single element chart with multiple variables.
NOTENOTE
You cannot modify the type of chart definition after you click OK.
4. Click OK. The Chart Definition Editor dialog box appears. Depending on the type of chart you created, refer to the next section “Editing a Multi-Element Live Trend Chart” or “Editing a Multi-Variable Live Trend Chart” on page 95.

90 • Chapter 6 Using Live Trend
Live Health User Guide
Editing a Multi-Element Live Trend Chart
To edit a multi-element chart definition:
1. Select a chart definition from the Live Trend Chart Definition Manager dialog box and click Edit. The Chart Definition Editor dialog box appears.
2. From the Technology Type(s) list, select the technology type of the element that you want to monitor. All elements that are associated with the technology you selected appear in the Available Element(s) list.
NOTENOTE
You cannot display elements that have different technology types in the same chart.

Live Trend Overview • 91
Live Health User Guide
1
6
3. Select the elements that you want to include in the chart definition from the Available Element(s) list. To reduce the number of elements, specify a string in the Available Element(s) field and click Find. You can use wildcards such as an asterisk (*) to match any single character. To view all elements, click Reset.
To select multiple elements, do one of the following:
• Select the first element that begins a range, scroll through the list, press Shift, and then select the element that ends the range.
• Select non-adjacent elements by pressing Ctrl while selecting elements.
Click the left arrow button to move your selection to the Selected Element(s) list.

92 • Chapter 6 Using Live Trend
Live Health User Guide
4. Click the Variables tab. Select the variable to include in the chart definition from the Available Variable(s) list and click Select. The variable appears in the Selected Variable(s) field.
NOTENOTE
Live Trend displays all variables for an element type. If you select a variable that eHealth does not support for the selected element, Live Trend displays an empty chart.

Live Trend Overview • 93
Live Health User Guide
1
6
5. Click the Presentation tab.
6. From the Presentation tab, select the following:
a. Next to Select Chart Format, do one of the following:
• Select One item per chart with multiple charts per window
• Select Multiple items per chart with one chart per window
b. Next to Select Chart Style, select one of the following to define the chart format:
• Hi/Low Bar
• Bar
• Line
• Filled Area

94 • Chapter 6 Using Live Trend
Live Health User Guide
c. Optionally, to include a trend of previously polled data when you open the chart, select Show previous and specify the number of hours of history, up to a maximum of 48, in the hours of history field.
NOTENOTE
You may show historical data when you display data as polled or fast sampled.
d. Next to Display Data, select one of the following:
• As Polled. Live Trend updates the chart every five minutes.
• Fast Sampled (30 seconds). Live Trend updates the chart every 30 seconds.
NOTENOTE
You must enable the Fast Sampling feature each time you run a chart. If you select Fast Sampled for a chart definition, close the chart and then start it again, the Fast Sampling feature is disabled. You may enable the feature while viewing a chart in the Live Trend Chart Display dialog box by selecting View → Fast Sampled (30 seconds).
7. Click OK.

Live Trend Overview • 95
Live Health User Guide
1
6
Editing a Multi-Variable Live Trend Chart
To edit a multi-variable chart definition:
1. Select a chart definition from the Live Trend Chart Definition Manager dialog box and click Edit. The Chart Definition Editor dialog box appears.
2. From the Technology Type(s) list, select the technology type that you want for the chart definition. Elements that are associated with the technology you selected appear in the Available Element(s) list.
3. Select the element that you want to include in the chart definition from the Available Element(s) list and click Select. To reduce the amount of elements in the list, specify a string in the Available Element(s) field and click Find. You can use wildcards such as an asterisk (*) to match any single character. To view all elements, click Reset.

96 • Chapter 6 Using Live Trend
Live Health User Guide
4. Click the Variables tab and select the variables to include in the chart definition from the Available Variable(s) list. To reduce the number of variables in the list, specify a string in the Available Variable(s) field and click Find. You can use wildcards such as an asterisk (*) to match any single character. To view all variables, click Reset.
To select multiple variables from the Available Variable(s) list, do one of the following:
• Select the first variable that begins a range, scroll through the list, press Shift, and then select the variable that ends the range.
• Select non-adjacent variables by pressing Ctrl while selecting variables.
Click the left arrow button to move your selection to the Selected Variable(s) list.
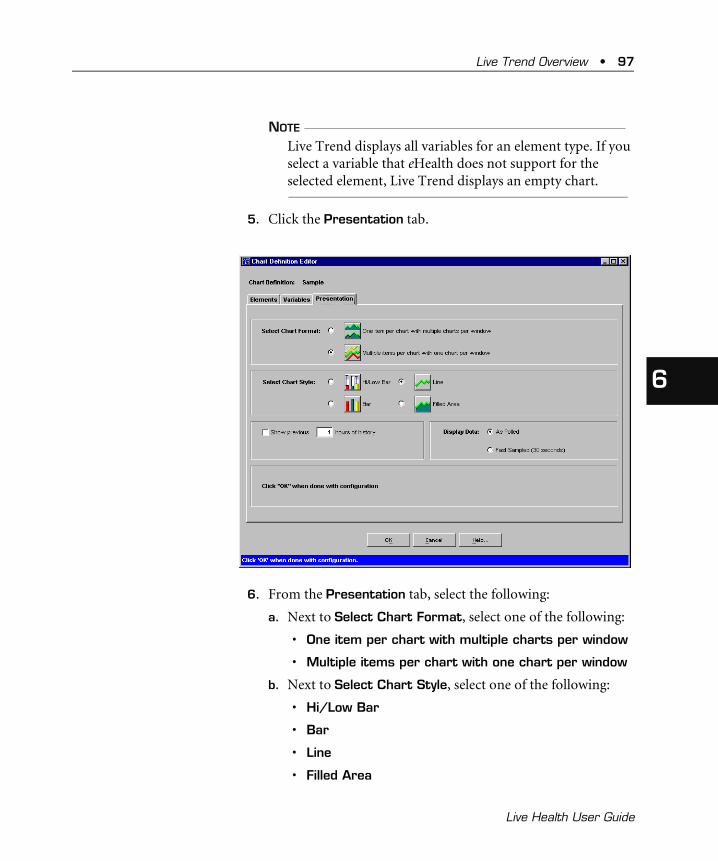
Live Trend Overview • 97
Live Health User Guide
1
6
NOTENOTE
Live Trend displays all variables for an element type. If you select a variable that eHealth does not support for the selected element, Live Trend displays an empty chart.
5. Click the Presentation tab.
6. From the Presentation tab, select the following:
a. Next to Select Chart Format, select one of the following:
• One item per chart with multiple charts per window
• Multiple items per chart with one chart per window
b. Next to Select Chart Style, select one of the following:
• Hi/Low Bar
• Bar
• Line
• Filled Area

98 • Chapter 6 Using Live Trend
Live Health User Guide
c. Optionally, to include a trend of previously polled data when you open the chart, select Show previous and specify the number of hours of history, up to a maximum of 48, in the hours of history field.
NOTENOTE
You may show historical data when you display data as polled or fast sampled.
d. Next to Display Data, select one of the following:
• As Polled. Live Trend updates the chart every five minutes.
• Fast Sampled (30 seconds). Live Trend updates the chart every 30 seconds.
NOTENOTE
You must enable the Fast Sampling feature each time you run a chart. If you select Fast Sampled for a chart definition, close the chart and then start it again, the Fast Sampling feature is disabled. You may enable the feature while viewing a chart in the Live Trend Chart Display dialog box from the View menu.
7. Click OK.
Viewing a Live Trend ChartTo start an existing Live Trend chart, select a chart definition from the Live Trend Chart Definition Manager dialog box and click Start. The Live Trend Chart Display dialog box displays the chart in the format in which it was last viewed and saved. You can modify the chart you are viewing using the View Menu.

Live Trend Overview • 99
Live Health User Guide
1
6
Renaming a Live Trend Chart
To rename an existing Live Trend chart definition:
1. Select a chart definition in the Live Trend Chart Definition Manager dialog box and click Rename. The Rename Chart Definition dialog box appears.
2. Specify a new name. The name cannot contain any spaces or special characters. Numbers, letters, underscores (_), dashes (-), and periods are acceptable.
3. Click OK. The new name appears in the chart definition list in the Live Trend Chart Definition Manager.
Deleting a Live Trend Chart
To delete a chart definition:
1. Select a chart definition in the Live Trend Chart Definition Manager dialog box and click Delete.
2. If the chart you want to delete is open, the following warning appears in the Close Chart confirmation window: “Closing the chart removes the chart data from Live Trend.”
3. Click OK. The Delete Chart Definition confirmation window appears.
4. Click Yes. The chart definition is deleted.


101
7
Troubleshooting Live Health Applications
This chapter describes common Live Health problems and provides corrective actions. Problems and errors typically fall under the following categories:
• Log in problems
• Client or software version problems
• Problems downloading the installation software
• Problems with the Live Exceptions Browser
• Problems with Live Trend
Cannot Log in to Live Health ApplicationsThis section describes common problems you may encounter when you log in to Live Health applications.
ProblemThe Login incorrect dialog box displays the message “Web user and password are required fields. Please reenter them.”
Meaning and ActionYou entered incorrect information in one or more fields.
102 • Chapter 7 Troubleshooting Live Health Applications
Live Health User Guide
To fix:
1. Click OK to dismiss the Login incorrect dialog box.
2. Specify the correct information in the Login dialog box. Note that the fields are case-sensitive.
3. Click OK.
4. Repeat Steps 1 through 3 for each field as needed.
Problem
A dialog box displays the message “Either the system, Web user, or password is invalid, please retry. If a port number is required, enter the eHealth system name, followed by a colon and the port number, e.g., netadmin:8080.”
Meaning and ActionYou entered incorrect information in one or more fields.
To fix:
1. Click OK to dismiss the Login incorrect dialog box.
2. Verify that you are using the correct Web server port number.
3. Specify the correct information in the Login dialog box. Note that the fields are case-sensitive.
4. Click OK.
5. Repeat Steps 1 through 4 for each field as needed.
Problem
The No license available dialog box displays the message “This Web user account does not have Live Exceptions/Live Trend/Live Status access. Contact your eHealth system administrator.”
Problems with Client or Server Software Versions • 103
Live Health User Guide
7
1Meaning and Action
The Web user account does not have permission to run Live Status, Live Exceptions, or Live Trend. Contact the eHealth administrator.
Problems with Client or Server Software VersionsThis section describes common software problems you may encounter when you log in to Live Health applications.
ProblemThe Upgrade Client dialog box displays the message “The eHealth system is at a later revision than the Live Health client, please upgrade the client.”
Meaning and ActionThe version of the Live Health application on the client and eHealth server machines do not match. Follow the installation steps in Chapter 8, “Reinstalling and Removing Live Health” to upgrade the software on your client workstation.
You can also enter the following commands in the Live Health ?FOLHQW?ELQ directory to verify the Java .-$5 file versions:
• nhLiveStatus -rev
• nhLiveExceptions -rev
• nhLiveTrend -rev
ProblemThe Incompatible Client dialog box displays the message “The eHealth system is at an incompatible, earlier version than this Live Health client. Contact your eHealth system administrator.”
Meaning and ActionThe versions of the Live Health software on the client and eHealth server machines do not match. Notify your eHealth administrator that the eHealth system needs to be upgraded.

104 • Chapter 7 Troubleshooting Live Health Applications
Live Health User Guide
Problems with the Web Interface Live Health TabThis section describes common problems you may encounter when you download the Live Health installation program from the eHealth Web interface.
ProblemThe Live Health tab is not visible in the eHealth Web interface.
Meaning and ActionYour Web user account does not have permission to view the tab. The eHealth Web administrator must modify the user account’s permissions.
ProblemLive Health download software link is not available on the Live Health tab.
Meaning and ActionThe client operating system does not support the Live Health installation software. Make sure that you are using a supported browser and operating system. For more information, refer to “System Requirements” on page 14.
Problems with the Live Exceptions Browser DisplayThis section describes common problems you may encounter when you use the Live Exceptions Browser.
Problem One of the following problems occurs:
• The Event Chart does not show alarms.
• The Top Ten Exceptions dialog box does not show any exceptions.

Problems with the Live Exceptions Browser Display • 105
Live Health User Guide
7
1Meaning and ActionThe Web user account does not have the necessary permissions, or the Live Health client system browser has not been set up correctly.
Depending on your Web user account privileges, do the following:
• eHealth Web administrators: Verify that the user account has permissions to view groups and group lists.
• Live Exceptions administrators: Verify that the Subjects to Monitor dialog box has some profile and group or group list associations.
ProblemLive Exceptions does not monitor any elements.
Meaning and ActionOne or both of the following may be true:
• The eHealth administrator did not enable the Live Exceptions scheduled jobs in the eHealth console.
• The Live Health administrator did not associate any subjects to monitor.
ProblemLive Exceptions monitors some, but not all, desired elements in a group or group list.
Meaning and ActionThe eHealth administrator did not enable those elements for monitoring in the eHealth console Poller Configuration dialog box.

106 • Chapter 7 Troubleshooting Live Health Applications
Live Health User Guide
To fix:
1. The eHealth Administrator must enable the elements in the eHealth console. For more information, contact your eHealth administrator.
2. To verify that Live Exceptions is monitoring elements correctly, in the Live Exceptions Browser, select Tools → Monitored Subjects Detail Reports. For more information on this report, refer to “Monitored Subjects Detail Reports” on page 71.
Problems with Live TrendThis section describes common problems you may encounter when using Live Trend.
ProblemLive Trend displays the message “Poll not ready. Will retry at local time n:nn.”
Meaning and ActionThis message occurs because there is no data for the element. Select a different element for a chart.
ProblemLive Trend displays a blank chart.
Meaning and ActioneHealth does not support the variable that you selected for an element. You can confirm this by running a Trend report from the Web. Click Validate which filters out variables that do not apply for the selected element. Create a new chart with a different variable.

107
8
Reinstalling and Removing Live Health
This chapter explains how to reinstall the Live Health client software to install patches or upgrades, as well as how to remove the Live Health software from the Live Health client.
Reinstalling Live HealthWhen the eHealth system is upgraded, you might also have to upgrade/reinstall your client installation. To reinstall the Live Health client software, use the installation program already on your system or download a new Setup program from the eHealth Web Live Health tab. For more information on the installation program, or to review how to download the installation software if you are upgrading, refer to “Installing Live Health” on page 15.
Running the Reinstallation Program on UNIXBe sure to exit any Live Health applications before you reinstall the program.
To upgrade Live Health:
1. Run the Live Health installation program LVHTH.opsys.sh, where opsys is the type of UNIX system.

108 • Chapter 8 Reinstalling and Removing Live Health
Live Health User Guide
2. At the following prompt, enter the name of a directory containing at least 50 MB of free space.
Where Should Live Health be Installed
3. At the following prompt, enter y.
Would you like to overwrite directory_name?
The program installs the files, checks them, and then generates a log file.
The following is a sample log file from a Solaris installation:
livehealth> sh ./LVHLTH.SUN.sh
---------------------------------------------------
Live Health SunOS 5.7 Generic_106541-12 Release 5.0 Installation
Copyright (C) Concord Communications 2001.
All rights reserved.
---------------------------------------------------
Live Health Location
Specify a install directory that has at least 50M of free diskspace.
Where should Live Health be installed?
[/live/lh50]
This install will create a directory named ’client’ under /live/nh50, but this directory already exists.
Would you like to overwrite /live/lh50/client (y|n)? [y]
---------------------------------------
Extracting files...
---------------------------------------
Starting Live Health verification checks...
0% 25% 50% 75% 100%
|||||||||||||||||||||||||||||||||||||||||||||||||||
Live Health checksums verified successfully.

Reinstalling Live Health • 109
Live Health User Guide
8
1Would you like to see the Live Health README file? [y] n
Cleaning up...
---------------------------------------------------
Installation log is in:
/live/lh50/client/log/installLiveHealth1.log
------------------------------------------
Running the Reinstallation Program on Windows Be sure to exit any Live Health applications before you reinstall the program.
To upgrade Live Health:
1. Click Start and select Run.
2. In the Run dialog box, specify the following command, where drive is the letter of the directory and path is the full pathname where you downloaded the file.
drive:\path\LVHLTH_NT.exe
The Location to Save Setup Files dialog box appears.

110 • Chapter 8 Reinstalling and Removing Live Health
Live Health User Guide
3. Accept the default location to place setup backup files during the installation and click Next. To specify a different location, click Change and use the Browse for Folder dialog box to specify a different location. Click OK.
4. The Setup program begins extracting the installation files. The Extracting Files dialog box appears.
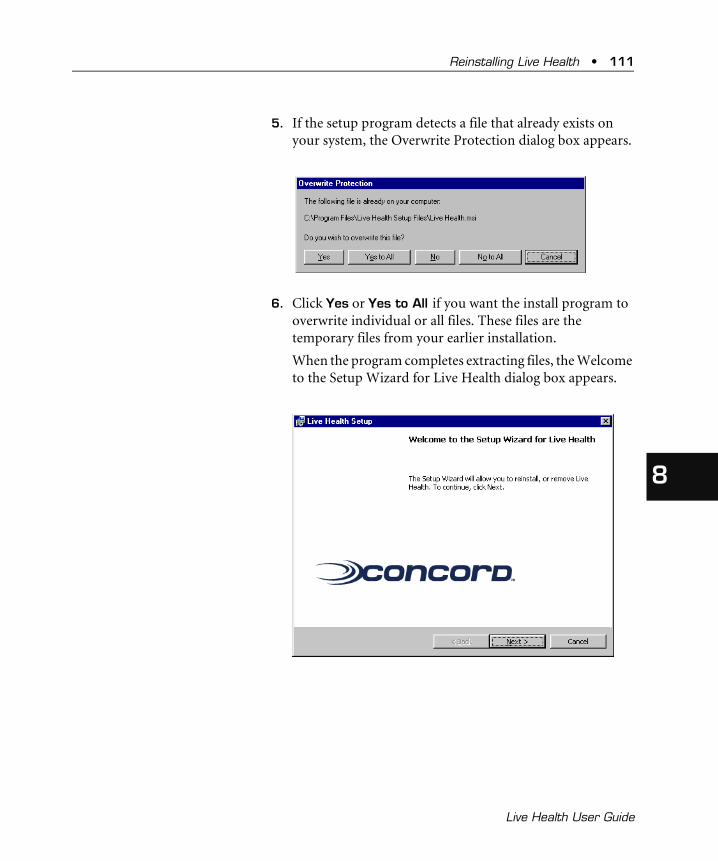
Reinstalling Live Health • 111
Live Health User Guide
8
15. If the setup program detects a file that already exists on
your system, the Overwrite Protection dialog box appears.
6. Click Yes or Yes to All if you want the install program to overwrite individual or all files. These files are the temporary files from your earlier installation.
When the program completes extracting files, the Welcome to the Setup Wizard for Live Health dialog box appears.

112 • Chapter 8 Reinstalling and Removing Live Health
Live Health User Guide
7. Click Next. The Program Maintenance dialog box appears.
8. Accept the default setting Reinstall and click Next. A warning message appears.

Reinstalling Live Health • 113
Live Health User Guide
8
19. Make sure that all Live Health applications are closed and
click OK. The Ready to Reinstall the Program dialog box appears.
10. Review the installation settings. If necessary, click Back to modify any settings; then click Install to continue. The Installing Live Health dialog box appears.

114 • Chapter 8 Reinstalling and Removing Live Health
Live Health User Guide
11. When the installation is complete, the Setup Wizard Completed dialog box appears.
12. Click Finish. The Live Health Installation Information dialog box appears.
13. Click Yes to restart your system and finish the installation process.

Removing Live Health • 115
Live Health User Guide
8
1Removing Live Health
To remove the Live Health software from your client system, use the installation program already on your system or download a new Setup program from the eHealth Web Live Health tab. For more information on the installation program or downloading the program, refer to “Installing Live Health” on page 15.
Removing Live Health on Windows Be sure to exit any Live Health applications before you remove the program.
To remove Live Health:
1. Click Start and select Run.
2. In the Run dialog box, specify the following command, where drive is the letter of the directory where you downloaded the file.
drive:\path\LVHLTH_NT.exe
The Location to Save Setup Files dialog box appears.

116 • Chapter 8 Reinstalling and Removing Live Health
Live Health User Guide
3. Accept the default location to place setup backup files during the installation and click Next. To specify a different location, click Change and use the Browse for Folder dialog box to specify a different location and click OK.
4. The Setup program begins extracting the installation files. If the setup program detects a file that already exists on your system, the Overwrite Protection dialog box appears.

Removing Live Health • 117
Live Health User Guide
8
15. Click Yes or Yes to All if you want the install program to
overwrite individual or all files. These files are the temporary files from your earlier installation.
When the program completes extracting files, the Welcome to the Setup Wizard for Live Health dialog box appears.

118 • Chapter 8 Reinstalling and Removing Live Health
Live Health User Guide
6. Click Next. The Program Maintenance dialog box appears.
7. Select Remove and click Next. The Remove the Program dialog box appears.

Removing Live Health • 119
Live Health User Guide
8
18. Click Remove. When the removal of Live Health is
complete, the Setup Wizard Completed dialog box appears.
9. Click Finish. The Live Health Installation Information dialog box appears.
10. Click Yes to restart your system and finish the removal process.

120 • Chapter 8 Reinstalling and Removing Live Health
Live Health User Guide
Removing Live Health on UNIXBe sure to exit any Live Health applications before you remove the program.
To remove Live Health:
1. From a UNIX command line, change to the directory where you installed Live Health.
cd directory
2. Enter the following command to remove Live Health:
rm -rf client
3. In your home directory, remove the �OLYHKHDOWK file.

121
Glossary
absolute from mean A Live Exceptions variable rule that detects when the polled value falls above or below the mean by a fixed amount.
Acrobat Reader The report-viewing software developed by Adobe Systems Incorporated that is installed with eHealth.
AdvantEDGE Point module A plug-in (supplementary program) that extends the functionality of the SystemEDGE agent. Point modules add the capability to manage application-specific events, processes, thresholds, and health.
AdvantEDGE View A Web-based management interface for use with the SystemEDGE agent that enables an administrator to use a Web browser to manage systems and applications.
agent In network management, a program that provides information from a management information base (MIB) for SNMP agents. eHealth or a network management system (NMS) use the information about managed devices and take corrective action when appropriate.
alarm In Live Exceptions, a notification of a problem or potential problems somewhere in the infrastructure. Live Exceptions has several types of alarms including: unusual value alarms, Reachability alarms, and Availability alarms.

122 • Glossary
Live Health User Guide
alias name A name for an element that is typically easier to understand than the element name. eHealth assigns element names; they must be unique in the eHealth system. By contrast, alias names can be duplicates. Users can enter localized text for alias names.
American Standard Code for Information Interchange (ASCII) The most common format for character
representation in computers and the Internet. Characters fit into a single byte. It was developed by the American National Standards Institute (ANSI).
ASCII See American Standard Code for Information Interchange (ASCII).
At-a-Glance report An eHealth report that displays multiple charts of performance variables for a single element and is designed to fit on one page.
availability The percentage of time that an element is operational during the eHealth report period. eHealth calculates availability for devices, interfaces, system processors and process sets, and response paths. The availability calculation depends on the element type.
baseline A level of performance that is considered normal, average, or typical over a period of time such as a day, week, or month. Compare current performance metrics against baseline data to identify trends in performance levels and service delivery.
central processing unit (CPU) The component within a device that performs the instruction execution for the applications and programs that run on the device. Also referred to as a processor or microprocessor.
class of service (CoS) A method of identifying different types of traffic and assigning a priority level for processing it. CoS-based routers can detect and avoid network congestion as well as provide different levels of service to various types of traffic.

Glossary • 123
Live Health User Guide
client A computer system, usually a desktop computer or laptop, that presents data directly to a user and accepts input. They drive the computing process, supporting local processing and accessing remote servers as needed for data access and analysis.
Also refers to the application software residing on a machine that is used by an end user.
congestion A condition in which the network traffic is greater than the amount that the network can carry. Often causes performance problems and delays on a network.
connect time The total time that a user is connected to a network. Commonly used for defining customer expectations in a service level agreement.
console See eHealth console.
CoS See class of service (CoS).
CPU See central processing unit (CPU).
delay The time required for a packet or frame to travel from the sending station (source) to the receiving station (destination).
deviation from mean A Live Exceptions variable rule that detects when the polled value falls above or below the mean by a percentile that is computed dynamically based on standard deviation. The higher the percentile, the further from the mean the polled value must fall before it deviates from normal. See also deviation from normal.
deviation from normal A Live Exceptions variable rule that detects when the most recent polled variable value falls above or below the variable’s normal value range. See also absolute from mean, baseline, deviation from mean, and percentage from mean.
discards The total number of frames discarded by an element. For example, a router can discard frames if it detects congestion in the network, or if it does not have enough buffers.

124 • Glossary
Live Health User Guide
discover The process by which eHealth searches for devices with SNMP (Simple Network Management Protocol) agents, obtains information from the MIB (management information base) view of each device, and creates elements based on that information.
DNS See domain name system (DNS).
domain name system (DNS) The system that locates and translates Internet domain names such as concord.com into Internet Protocol (IP) addresses. A DNS server is typically a device that translates domain names to IP addresses within your network.
drill-down report A report that appears when a user uses the mouse to click a bar or an element name in a Web-based eHealth report.
eHealth administrator A person responsible for managing and administering the eHealth system from the eHealth console.
eHealth console The administration and configuration console that allows an administrator to start and stop eHealth, manage the poller and the database, and administer the eHealth system. This is not the same as the eHealth Web interface.
eHealth Web administrator A person responsible for managing and administering the eHealth Web server and eHealth Web interface.
eHealth Web interface The eHealth interface that allows a user to run and view reports from a Web browser. See also eHealth console.
element A device or resource (such as a router, server, interface, modem, modem pool, or application) for which eHealth collects and analyzes data to generate reports.

Glossary • 125
Live Health User Guide
element name eHealth assigns element names to elements in the poller configuration. These names must be unique in the eHealth system. Users can enter localized text for element names.
element type The classification that eHealth uses to identify an element. eHealth has two categories of element types: conversation and statistics.
events An occurrence on a system that typically results in a message, such as an SNMP trap, being sent to a configured management system. Common events include system failures, system reboots, exceeded thresholds, or any user-configurable situation that the user wants to identify.
exception In Live Health, a condition that reflects one or more alarms for an element. The state of an alarm is one of four severity levels: warning, minor, major, and critical. The exception severity is the maximum severity of any of the alarms currently active on an element within a specific profile. See also alarm and exception profile.
exception profile In Live Exceptions, a set of alarm rules applied to groups or group lists of elements. Once a Live Health administrator assigns a profile to a subject, Live Exceptions monitors the subject and displays alarms when any of the rules in the profile are violated.
File Transfer Protocol (FTP) A means for uploading and downloading files on the Internet (the oldest Internet protocol for retrieving files). You can use an FTP client application to request files from or transfer files to an FTP server.
filter A set of selection criteria used to focus a report on the desired data.
FTP See File Transfer Protocol (FTP).
group A collection of monitored elements. Typically, groups are used to organize elements by geographic location, department, market segment, vendor, or customer. Users can enter localized text for group names.

126 • Glossary
Live Health User Guide
group list A set of one or more groups. Users can enter localized text for group list names.
Health report An optional eHealth report that includes several sections: Exceptions, Summary, Top Ten, Element Detail, and Supplemental. Using a series of charts, each Health report can show current performance compared to historical performance for all elements or a group of elements.
hostname The name for an individual IP (Internet Protocol) address on a computer. While many computers have only one hostname, some machines, such as network servers have multiple hostnames.
HTML See Hypertext Markup Language (HTML).
HTTP See Hypertext Transfer Protocol (HTTP).
Hypertext Markup Language (HTML) A programmatic language used for controlling the way that text and images appear when a file is displayed on the World Wide Web.
Hypertext Transfer Protocol (HTTP) An application protocol that defines the set of rules for exchanging files (text, graphics, multimedia, and other files) on the World Wide Web.
Information Technology (IT) A widely-used term to describe all of the technologies used for creating, exchanging, managing, and using information in various forms.
internet infrastructure The applications, systems, and networks that a company uses to run its business, for both internal use and for interfaces to the outside world.
Internet Protocol (IP) The method (or protocol) by which packets of information are sent across the Internet. IP defines addressing, error handling, routing, and option codes for data transmission. IP requires no continuing connection between the endpoints that are communicating.

Glossary • 127
Live Health User Guide
Internet Service Provider (ISP) A company that provides individuals and companies with access to the Internet. ISPs also provide related services such as Web site building and virtual hosting.
IP See Internet Protocol (IP).
ISP See Internet Service Provider.
IT See Information Technology (IT).
LAN See local area network (LAN).
LAN segment A section of a network that is bounded by bridges, routers, or switches.
latency A measure of delay, often network delay. Depending on the type of element, eHealth reports can show two types of latency: round-trip latency, which is the length of time in milliseconds for a ping packet to travel from the eHealth system to a polled element and back. Alternate latency, which is the length of time in milliseconds for a ping packet to travel from a network resource (the alternate latency source) such as a router to other critical network resources such as routers and servers (the alternate latency partner).
limit A setting for response elements that reflects service level agreements for response time. Service providers agree to provide average response times under the limit.
local area network (LAN) A shared communication medium that connects computers and devices over a limited area. The area limitations of a LAN usually result from the electrical signal limits of the medium.
management information base (MIB) A formal description of a set of network objects that can be managed using Simple Network Management Protocol (SNMP).
MB Megabytes.
Mbits Megabits.
MBps An acronym representing megabytes per second.

128 • Glossary
Live Health User Guide
Mbps An acronym representing megabits per second, a common measurement of data transfer rates.
MIB See management information base (MIB).
MIB Translation File (MTF) A file that normalizes the data collected from standard and proprietary SNMP (Simple Network Management Protocol) agents. eHealth uses an MTF to translate MIB variables into its own variables. Each MTF consists of the associated MIB and its filename, an agent for the element type, and a set of statements that map MIB variables to the appropriate eHealth database column.
modem A device that converts digital signals to analog (voice) signals and back again. Modem is an abbreviation of the words modulator/demodulator. Modems enable dial-up connections for remote devices.
modem pool A configured collection of modems, Integrated Services Digital Network (ISDN) cards, or other remote access cards that reside in one or more remote access servers.
MTF See MIB Translation File (MTF).
network A collection of computers, printers, routers, switches, and other devices that are able to communicate using a common transmission media such as TCP/IP.
network management system (NMS) An application program usually residing on a computer that manages at least part of a network, including systems and applications. The NMS communicates with agents to monitor network statistics and resources, control network device configuration, and analyze network problems. See also agent.

Glossary • 129
Live Health User Guide
network operations center (NOC) The place where network administrators manage a telecommunications network or networks. It usually contains visualizations of the networks and workstations that are used to distribute software, troubleshoot problems, and monitor performance.
network time The time spent establishing network connections to complete a transaction.
NMS See network management system (NMS).
normal The range of values that are to be expected for a polled variable. eHealth computes normal values using a baseline time period (typically 6 weeks) for each hour of each day of the week. The normal values are calculated in one of three ways: absolute from mean, percentage from mean, or deviation from mean. See also deviation from normal.
normalize A process by which a function is applied to a value to place the resulting value within a specific range or to convert values to a common unit. When appropriate, eHealth normalizes data to ensure consistent content and to allow for meaningful performance comparisons.
operating system (OS) The program that manages all other programs (applications or application programs) on a computer. Provides the following services: determining the order in which each application runs and the time allotted for that application, managing the sharing of internal memory among multiple applications and handling input to and output from attached hardware devices.
operational support system (OSS) A network management system (NMS) with a specific focus such as provisioning services or alarm surveillance.
OS See operating system (OS).
OSS See operational support system (OSS).

130 • Glossary
Live Health User Guide
page In computers that utilize virtual memory, a unit of data storage. Systems transfer pages of data from disk storage to memory and back again.
On the World Wide Web, a file written using Hypertext Markup Language (HTML) that specifies how text, images, and other multimedia will be presented to the user. A Web site delivers information to the user one page at a time.
percentage from mean A Live Exceptions variable rule that detects when the polled value falls above or below the mean by a percentage.
ping An Internet echo message used to confirm the reachability of a network device. An abbreviation for Packet Internet or Inter-Network Groper.
poll An instance of the process of collecting data from the elements on which eHealth is reporting.
polling interval The rate at which eHealth polls elements for information. It is the amount of time elapsed between two polls.
port The physical (hardware) connection on a device that connects the device to a network.
profile See exception profile .
protocol The set of rules by which the endpoints in a telecommunication connection communicate. The protocol defines the packet format of the transmitted information. On the Internet, common protocols are TCP, IP, HTTP and FTP. For eHealth – Response, the protocol is the type of application for which eHealth is measuring response time and service availability on a path element.
push A technology method in which information or Web pages are sent to the user, sometimes without a user request. Administrators can use push technology to distribute agents to client machines using a software distribution system, such as Microsoft SMS or Tivoli IT Director.

Glossary • 131
Live Health User Guide
QoS See Quality of Service (QoS).
Quality of Service (QoS) An eHealth technology that allows you to configure different levels of service for different types of network traffic. With QoS, you can use your network connections more efficiently and as a service provider, you can provide consistent network response to your customers.
queue In a system, a set of jobs awaiting resources. In a network device such as a router, a collection of packets waiting to be processed or forwarded. Insufficient central processing unit (CPU) speed, memory, or interface speeds can contribute to long queues, and therefore, to delay on the network.
RAS See remote access server (RAS).
reachability The ability of eHealth to contact an element over the network. eHealth uses ping to determine reachability. See also ping.
real-time A level of computer responsiveness that an end user would deem as immediate or fast enough to show incremental changes of an external process (for example, to present visualizations of the weather as it constantly changes).
remote access server (RAS) A device that provides remote users with dial-up access to a network. RAS devices usually contain modem or Integrated Services Digital Network (ISDN) cards that provide the connection services.
remote time The portion of total transaction time that includes server processing time, network transmission, and latency time.
report period The time range specified by the user to be included in an eHealth report. The time options vary with each report type but the report period could consist of hours, days, weeks, or months.

132 • Glossary
Live Health User Guide
report variables Performance indicators for which eHealth gathers or calculates statistics. Trend reports show one or more report variables for one or more elements. At-a-Glance reports show the performance of an element against several report variables. Health reports show the performance of the elements against certain report variables as well as the Trend threshold and Health Index.
router A device that connects networks. Routers learn the addresses of the network points that send data by reading the address information in the data frames. Hardware vendors often use the terms router and switch interchangeably. See also switch.
routing The process of finding paths through a network to a destination.
server A program that provides services to other programs in the same and other computers.
Also a computer that performs file storage and application hosting as well as provides computing services to other devices and users on the network. Typically has one or more central processing units (CPUs), disks, interfaces, and storage partitions.
server time The amount of time that a server requires to process a transaction. It is calculated by determining network time and subtracting it from remote time.
service level agreement (SLA) A contract between a provider and a user that details the service commitments to a user. An SLA typically includes the following: specific descriptions of services being delivered (including the criteria used to evaluate the service), reporting requirements, escalation agreements (how to address serious interruptions), and penalties for failing to meet the contract terms.
service level expectations The level of service that a business unit expects the IT organization to provide. This is typically an informal service level agreement (SLA).

Glossary • 133
Live Health User Guide
service level management An approach to managing networks, systems, and applications in order to meet service level agreements (SLAs).
service level percentiles The settings in eHealth that correspond to goals in service level agreements.
service level ranges The settings in eHealth that correspond to goals in service level agreements (SLAs). The eHealth administrator sets these ranges in the service profile. These ranges are the standard against which actual data is compared in Service Level reports.
Service Level report An eHealth report that displays daily, weekly, or monthly summaries of the performance of the elements in a group or group list. There are four types of Service Level reports: Executive, IT Manager, Service Customer and Business Unit. These reports can show the percentage of time that the elements operated within service level ranges, and the percentage of elements that operated within the specified ranges.
service profile A set of defined Health Index thresholds, Trend thresholds, and service level ranges and percentiles. During creation of a Health or Service Level report, eHealth analyzes and interprets polled data against the thresholds, ranges, and percentiles in the specified service profile.
Simple Network Management Protocol (SNMP) The network management protocol used almost exclusively in data networks. A method for monitoring and controlling network devices, as well as managing configurations, statistics collection, performance, and security.
SLA See service level agreement (SLA).
SNMP See Simple Network Management Protocol (SNMP).

134 • Glossary
Live Health User Guide
SNMP agent A program such as the SystemEDGE agent that conforms to a management information base (MIB) specification to collect information about managed devices and to take corrective action (using SNMP traps) when appropriate.
speed The capacity (bandwidth) of an interface in bits per second (bps).
statistics element An eHealth element type that includes various LAN and WAN interfaces; Frame Relay circuits; Asynchronous Transfer Mode (ATM) paths, ports, and channels; routers and servers (and their various subcomponents); and various remote access resources.
switch A network device that determines the path for sending a frame across a network. It may also specify the adjacent network point where the frame will be sent. In general, a switch is considered a simpler and faster device than a router. However, hardware vendors often use these terms interchangeably. See also router.
SystemEDGE agent Concord’s SNMP agent that autonomously monitors system configuration, status, performance, users, applications, file systems, and other critical resources.
Systems Management MIB A set of MIB (management information base) objects that extends the capabilities of the Host Resources MIB. It provides greater visibility into systems and specific information about Windows NT and UNIX systems.
TCP/IP See Transmission Control Protocol (TCP) and Internet Protocol (IP).
throughput The rate of data transfer on an interface over time. At each poll, eHealth calculates throughput by dividing the total number of bits for an interface by the elapsed time in seconds since the previous poll.

Glossary • 135
Live Health User Guide
time over dynamic threshold A Live Exceptions variable rule that compares the most recent polled variable value against a threshold value whose magnitude is dynamically computed using historic data and values that were specified when the rule was created.
time over threshold A Live Exceptions variable rule that compares the most recent polled variable value against the threshold value that was specified when the rule was created.
Top N reports An eHealth tabular report that lists all elements in a group, or all elements in a group that exceed or fall below the report criteria goals that you specify.
Transmission Control Protocol (TCP) A connection-based protocol used along with the Internet Protocol (IP) to send data in the form of message units between computers over the Internet. While IP is responsible for the actual delivery of the data, TCP is responsible for dividing data into packets at the sending system and constructing the data message from individual packets at the receiving system.
trap A message sent by an SNMP agent to a console or network management system (NMS) to indicate that a threshold has been reached or another user-defined condition has occurred. The SystemEDGE agent defines a number of traps for system and application management.
Trend report An eHealth report that shows the value of a single variable for one to ten elements, or the values of one to ten variables for a single element or a group. (The latter reveals relationships among variables, while the former reveals relationships among elements.)
Trend threshold The upper limits on variables such as utilization, volume, and errors. If the value of a variable approaches or exceeds the Trend threshold, eHealth assigns exception points and tracks the trend in the Situations to Watch chart of the Health report. The eHealth administrator sets the Trend threshold values in

136 • Glossary
Live Health User Guide
the service profile used for the Health or Service Level reports. The SystemEDGE agent also monitors trend thresholds that administrators can set through the SystemEDGE self-monitoring features.
variable A performance metric for an element. A characteristic or behavior upon which eHealth gathers data and evaluates the performance of the element. The SystemEDGE agents can also monitor local variables to reduce network polls and increase scalability.
variance A statistical term that indicates how closely most of the data points differ from the average of the data points.
WAN See wide area network (WAN).
Web See World Wide Web (WWW, Web).
wide area network (WAN) A network that interconnects multiple systems or networks over unlimited distances.
workload The average volume of network traffic processed each second by the remote access server (RAS). eHealth calculates the average workload by dividing the total number of bytes transmitted and received by all elements in the remote access server by the number of seconds in the polling interval.
workstation A powerful computer that is equipped with a fast processor, a large amount of random access memory, and other features such as high-speed graphical rendering that make it suitable for business users such as engineers, graphic designers, and architects.
World Wide Web (WWW, Web) All of the resources on the Internet that use Hypertext Transfer Protocol (HTTP). Users of the Web access information through browser software.

137
Index
Aabsolute from mean 121Acrobat Reader 121AdvantEDGE Point modules 121AdvantEDGE View 70, 80, 121agents 121, 128Alarm Detail reports 69Alarm Occurrences window 66, 79alarm rules 28alarms
active 30cleared 30definition of 28, 121differences between alarms, exceptions,
and events 34displaying
active or historical 50all 50, 52
displaying occurrences 66duration of 30inactive 30start time 30state 32
Alarms tab 47alias names 122alternate latency 127
American Standard Code for Information Interchange 122
analysis window, definition of 28ASCII, See American Standard Code for
Information Interchange.At-a-Glance reports 68, 79, 122availability 122average workload calculation 136
Bbaselines 122Browse for Folder dialog box 17, 110, 116
Ccentral processing units 122Change Current Destination Folder dialog
box 19Chart Definition Editor dialog box 90, 95class of service 122cleared alarms, definition 30clients 123compound alarms, definition of 28condition window, definition of 29congestion 123

Live Health User Guide
138 • Index
connect time 123console 124CoS, See class of service.CPU, See central processing units.Create Chart Definition dialog box 89Customer Support, contacting 9
Ddelay 123desktop icons 37Destination Folder dialog box 19deviation from mean 123deviation from normal 123dialog box
Browse for Folder 17, 110, 116Change Current Destination Folder 19Chart Definition Editor 90, 95Create Chart Definition 89Destination Folder 19Disk Space Requirements 20Display Mode Settings 50Extracting Files 110Incompatible Client 103Installing Live Health 21, 113License Agreement 18Live Health Installation Information 23,
114, 119Live Trend Chart Definition Manager 88Location to Save Setup Files 109, 115Login 40Login incorrect 101New Diagram 82No license available 102Open Diagram 83Overwrite Protection 111, 116Preferences 84, 85
Program Maintenance 112, 118Ready to Install the Program 21Ready to Reinstall the Program 113Remove the Program 118Rename Chart Definition 99Save Setup Files 16Setup Wizard Completed 22, 114, 119Table Properties 57, 58, 60Upgrade client 103Welcome to the Setup Wizard for Live
Health 18, 111, 117discards 123discover 124Disk Space Requirements dialog box 20Display Mode Settings dialog box 50DNS, See domain name system.documentation conventions 8domain name systems 124drill-down reports 124duration of alarm 30
EeHealth administrator 124eHealth console 124eHealth Web administrator 124eHealth Web interface 124element names 125element types 125elements 124Event Chart
Live Exceptions Browser 47troubleshooting 104using 49

Live Health User Guide
Index • 139
Event Table 47consolidating events 66displaying
active or historical alarms 50single or multiple alarms 52
filtering elements 59finding elements 51hiding columns 58moving columns 55resizing columns 56
events 30, 125exception profiles 34, 125exceptions 33, 125Exceptions tab 47exiting from Live Health 43Extracting Files dialog box 110
FFault Manager 12, 30, 62File Transfer Protocol 125filters 125FTP, See File Transfer Protocol.
Ggroup lists 126groups 125
HHealth reports 126hostnames 126HTML, See Hypertext Markup Language.HTTP, See Hypertext Transfer Protocol.Hypertext Markup Language 126Hypertext Transfer Protocol 126
Iicons 37inactive alarms 30Incompatible Client dialog box 103Information Technology 126Installing Live Health dialog box 21, 113internet infrastructure 126Internet Protocol 126Internet Service Providers 127IP, See Internet Protocol.ISP, See Internet Service Provider.IT, See Information Technology.
JJAR file revisions 103
LLAN segments 127LAN, See local area network.latency 127License Agreement dialog box 18limits 127Live Exceptions
Browseradditional views 64consolidating events 66displaying reports 68Event Chart 47Event Table 47Organization Pane 46overview 46status bar 47
concepts and terms 27desktop icon 37overview 11, 27reports 69

Live Health User Guide
140 • Index
Live Healthaccessing documentation 36configuring 36exiting 43logging in 40Readme file 36reinstalling
UNIX 107Windows 109
removingUNIX 120Windows 115
setup programUNIX 23Windows 16, 109, 115
User Guide, accessing online 36workstation requirements 14
Live Health Installation Information dialog box 23, 114, 119
Live StatusAlarm Occurrences window 79At-a-Glance reports 79configuring 83creating diagrams 81deleting diagrams 86desktop icon 37drilling down 78editing titles 85legend 76, 84Live Trend 79opening diagrams 82opening new windows 86overview 13, 73reports 69, 80Response Transaction Log 70, 81status bar 76System Information Query 70, 80
Trend reports 80versions of 74
Live Trendcreating charts 88deleting charts 99desktop icon 37from Live Status 79multi-elements charts 90multi-variable charts 95overview 14, 87renaming charts 99reports 69viewing charts 98
Live Trend Chart Definition Manager dialog box 88
local area networks 127Location to Save Setup Files dialog
box 109, 115logging in
another eHealth system 43Live Health 40proxy server 42
Login dialog box 40Login incorrect dialog box 101LVHLTH.NT.EXE file 16, 109, 115LVHLTH.UNIX.EXE file 23
Mmanagement information base 127Mbits 127Mbps 128MIB Translation File 128MIB, See management information base.modem pools 128modems 128

Live Health User Guide
Index • 141
Monitored Subjectsdetail reports 71summary reports 70
MTF, See MIB Translation File.
Nnetwork management systems 128network operations center 129network time 129networks 128New Diagram dialog box 82nhLiveExceptions 38, 39, 103nhLiveStatus 38, 39, 103nhLiveTrend 38, 40, 103NMS, See network management systems.No license available dialog box 102NOC, See network operations center.normal 129normalize 129
OOpen Diagram dialog box 83operating systems 129operational support systems 129Organization Pane
overview 46using 48
OS, See operating system.OSS, See operational support system.Overwrite Protection dialog box 111, 116
Ppacket internet groper 130pages 130percentage from mean 130permissions 36
ping 130polling intervals 130polls 130ports 130Preferences dialog box 84, 85problem start time 30Professional Services, contacting 10profiles, definition of 32Program Maintenance dialog box 112, 118protocols 130push 130
QQoS, See Quality of Service.Quality of Service 131queues 131
RRAS, See remote access server.reachability 131Readme file 36Ready to Install the Program dialog box 21Ready to Reinstall the Program dialog
box 113real-time 131refresh rate 48, 77reinstalling Live Health 107remote access servers 131remote time 131Remove the Program dialog box 118removing Live Health 115Rename Chart Definition dialog box 99report periods 131report variables 132reports
Alarm Detail 69At-a-Glance 68, 79, 122

Live Health User Guide
142 • Index
displaying from the Live Exceptions Browser 68
displaying from the Top Ten Exceptions window 68
Health 126Monitored Subjects Detail Report 71Monitored Subjects Summary Report 70Service Level 133Top N 135Trend 69, 135
Response Transaction Log 70, 81round-trip latency 127routers 132, 134routing 132
SSave Setup Files dialog box 16server time 132servers 132service level
expectations 132management 133percentiles 133ranges 133
service level agreements 132enforcement of 28
Service Level reports 133service profiles 133setup program for Live Health
UNIX 23Windows NT 16, 109, 115
Setup Wizard Completed dialog box 22, 114, 119
severity levels 32Live Exceptions 54Live Status 76
simple alarm rules, definition of 28Simple Network Management Protocol 133SNMP agents 134SNMP traps 125, 135SNMP, See Simple Network Management
Protocol.speeds 134statistics elements 134status bar
Live Exceptions Browser 47Live Status 76
switches 134system requirements 14SystemEDGE agents 134Systems Management MIB 134
TTable Properties dialog box 57, 58, 60TCP, See Transmission Control Protocol.TCP/IP 126threshold, definition of 29throughput 134time over dynamic threshold 135time over threshold 135Time Over Threshold rule 29Top N reports 135Top Ten Exceptions window 65
displaying reports 68troubleshooting 104
Transmission Control Protocol 135trap rule file 62traps 135Trend reports 69, 80, 135Trend thresholds 135

Live Health User Guide
Index • 143
troubleshootingcannot log in 101, 102Event Chart 104incompatible client message 103Java JAR file versions 103Live Exceptions monitoring some
elements 105Live Exceptions not monitoring
elements 105Live Health tab not visible 104Login incorrect dialog box 101No license available dialog box 102software not available on Live Health
tab 104Top Ten Exceptions window 104upgrade client message 103
UUpgrade client dialog box 103users, configuring permissions 36
Vvariables 136variance 136
WWAN, See wide area network.Web pages 130Web, See World Wide Web.Welcome to the Setup Wizard for Live
Health dialog box 18, 111, 117wide area networks 136workstations 136World Wide Web 136WWW, See World Wide Web.


CONTACT CONCORD COMMUNICATIONS AT:
CONCORD COMMUNICATIONS, INC.NORTH AMERICA
600 NICKERSON ROAD
MARLBORO, MASSACHUSETTS 01752800-851-8725P 508-460-4646F 508-481-9772
CONCORD COMMUNICATIONS EUROPE
DELFTECHPARK 262628 XH DELFT
THE NETHERLANDS
P +31 (0) 15 2600 930F +31 (0) 15 2600 929
CONCORD COMMUNICATIONS ASIA PACIFIC
LEVEL 7, 53 WALKER STREET
NORTH SYDNEY NSW 2060AUSTRALIA
P 61-2-9965-0600F 61-2-9929-0411
FRANCE: +33 (0) 1 4692 2420GERMANY +49 (0) 89 944 90 105UK: 00800 3283 2888
JAPAN 813-5778-7629SINGAPORE: 65-4309533
CONCORD.COM