Embed Size (px)
Citation preview

Journal of Investigative Psychology and Offender ProfilingJ. Investig. Psych. Offender Profil. (2013)Published online in Wiley Online Library (wileyonlinelibrary.com). DOI: 10.1002/jip.1395
Linking Crimes Using Behavioural Clues: Current Levels ofLinking Accuracy and Strategies for Moving Forward
CRAIG BENNELL1,*, REBECCA MUGFORD1, HOLLY ELLINGWOOD1
and JESSICA WOODHAMS2
1Department of Psychology, Carleton University, Ottawa, Ontario, Canada2School of Psychology, University of Birmingham, Edgbaston, Birmingham, UK
Abstract
The number of published studies examining crime linkage analysis has grown rapidlyover the last decade, to the point where a special issue of this journal has recentlybeen dedicated to the topic. Many of these studies have used a particular measure(the area under the receiver operating characteristic curve, or the AUC) to quantifythe degree to which it is possible to link crimes. This article reviews studies that haveutilised the AUC and examines how good we are currently at linking crimes (withinthe context of these research studies) and what factors impact linking accuracy. Theresults of the review suggest that, in the majority of cases, moderate levels of linkingaccuracy are achieved. Of the various factors that have been examined that mightimpact linking accuracy, the three factors that appear to have the most significantimpact are crime type, behavioural domain, and jurisdiction. We discuss howgeneralisable these results are to naturalistic investigative settings. We also highlightsome of the important limitations of the linking studies that we reviewed and offer upsome strategies for moving this area of research forward. Copyright © 2013 JohnWiley & Sons, Ltd.
Key words: crime linkage analysis; serial crime; behavioural consistency
Research suggests that the majority of crime is committed by a minority of offenders(Paulsen, Bair, & Helms, 2009). Given this, police investigators will often face thedifficult task of determining whether a set of crimes has been committed by the sameoffender. If high quality physical evidence is available at crime scenes, the task ofdetermining whether multiple crimes were committed by the same offender is rela-tively straightforward, although not necessarily without challenges (Burrows, Tarling,
*Correspondence to: Craig Bennell, Department of Psychology, Carleton University, 1125 Colonel By Drive,Ottawa, Ontario, Canada K1S 5B6.E-mail: [email protected]
Copyright © 2013 John Wiley & Sons, Ltd.

C. Bennell et al.
Mackie, Poole, & Hodgson, 2005).1 When such evidence is lacking, however, thelinking task can become much more difficult. In these cases, the behaviours exhibitedby offenders across the crimes they have committed are often used to establish crimelinkages (Grubin, Kelly, & Brunsdon, 2001). The primary task when taking such anapproach is to identify stable but distinct patterns of behaviour in an offender’scrimes, which allow one to distinguish between that offender’s crimes and those ofother offenders.One of the ultimate goals for researchers in this area is to identify approaches for
analysing the behavioural clues left by offenders that maximise linking accuracy (Bennell& Canter, 2002). It is doubtful that one can focus on any single factor to accomplish thisgoal. Instead, linking accuracy will likely be maximised by carefully considering multiplefactors, including the behaviours focused on in the analysis, the way these behaviours areoperationalised, the method used to assess across-crime similarity, and the statistical tech-nique used to analyse similarity scores (e.g. refer to Davies, Tonkin, Bull, & Bond, 2012;Ellingwood, Mugford, Melnyk, Bennell, & Fritzon, 2013; Tonkin, Woodhams, Bull,Bond, & Santtila, 2012 for explorations of these various issues). To achieve this goal,we must first understand how good we are currently at detecting crime linkages. We mustthen determine how to enhance our ability to link serial crimes.Unfortunately, attempts to draw conclusions about crime linkage analysis from the
results reported across different studies are often hindered by the fact that researchersfrequently use different approaches for assessing linking accuracy. This sometimes makesit difficult to determine whether differences found across studies reflect important study-specific factors (e.g. the analytical approach adopted, the crime type examined, and theoffenders that were sampled) or the accuracy metric that was used. Arguably, what wouldbe helpful for resolving this issue is the use of a common metric for quantifying linkingaccuracy. One potential candidate, which we will focus on in the current paper, is the areaunder the receiver operating characteristic curve (AUC; Swets, 1996).In this paper, we explain what this measure is and why it might be useful, and we review
all studies of crime linkage analysis where the researchers have opted to use the AUC as ameasure of linking accuracy. Our primary goals in carrying out this review are to determinehow good we are currently at linking serial crimes (within the context of research studies)and to identify factors that impact linking accuracy. Our focus on studies that have reliedon the AUC is not meant to indicate that other linking studies are unimportant or that theyhave not expanded our knowledge of crime linkage analysis—clearly this is not the case.Our decision simply reflects the fact that it is very difficult to directly compare resultsacross studies when researchers have adopted different performance metrics. In addition,given that the number of studies using the AUC as a measure of linking accuracy hasincreased steadily over the last 10 years, there are now a substantial number of studiesavailable for review. Thus, it made sense for us to focus our initial efforts on this subsetof studies.
The AUC as a measure of linking accuracy
The AUC is generally used as a measure of diagnostic accuracy. It is generated fromreceiver operating characteristic (ROC) analysis, which is a procedure used to model the
1For example, issues such as poor communication between forensic science units can make it difficult for suchlinkages to be made, especially in a timely manner, even when high quality DNA evidence is available.
Copyright © 2013 John Wiley & Sons, Ltd. J. Investig. Psych. Offender Profil. (2013)
DOI: 10.1002/jip

Linking crimes using behavioural clues
ability of decision-makers (or decision-making tools) to make accurate predictions in two-alternative (yes–no type) diagnostic tasks (Swets, 1996). For example, the analysis iscommonly used in fields such as radiology and psychology to assess the accuracy withwhich diagnosticians can identify cancerous (versus non-cancerous) patients (e.g. Getty,Seltzer, Tempany, Pickett, Swets, & McNeil, 1997) or offenders who are likely (versusunlikely) to recidivate (e.g. Steadman et al., 2000). The recommendation to use the AUCas a measure of accuracy in the linking context originated with a study by Bennell andCanter (2002). They argued that the AUC should be relevant to crime linkage analysiswhen the linking task is construed in a particular way (i.e. when it is thought of as atwo-alternative diagnostic task, which would be the case, for example, when decidingwhether pairs of crimes have [versus have not] been committed by the same offender orwhen deciding whether a particular crime belongs [versus does not belong] to a particularcrime series).
For most diagnostic tasks, a decision threshold must usually be set, which leads to acertain prediction being made. In the linking context, this threshold could be a particularlevel of across-crime similarity calculated for pairs of crimes, which might range from0 (no similarity) to 1 (complete similarity) on the basis of a specific set of behaviours.When a particular threshold is used to make predictions for numerous cases (e.g. that crimepairs are linked or not), and those predictions are compared with actual outcomes (e.g. whetherthe crime pairs were in fact committed by the same offender), it is possible to determine thefrequency of various linking outcomes. More specifically, we can determine how frequentlyfour types of decisions are made, which capture all possible outcomes in two-alternativediagnostic tasks. These outcomes are hits (predicting that two crimes were committed by thesame offender when they actually were), false alarms (predicting that two crimes werecommitted by the same offender when they actually were not), misses (predicting that twocrimes were not committed by the same offender when they actually were), and correctrejections (predicting that two crimes were not committed by the same offender when theyactually were not). Decision accuracy can then potentially be assessed using a measure suchas percent accuracy (i.e. the frequency of correct decisions [hits and correct rejections] dividedby the total number of decisions made).
However, one of the major problems with such measures is that they are threshold-specific; in other words, they produce accuracy values that are only relevant for a particularthreshold, and the accuracy values vary as the threshold varies (e.g. as the across-crimesimilarity score used to make linking decisions is made more lenient, not only more hitswill be made but also more false alarms). This makes it difficult to determine how accuratea decision-making procedure actually is. ROC analysis is a method that avoids this problem.Rather than focusing on the types of decisions being made when using one particularthreshold, ROC analysis captures the decisions that result from various thresholds that mightbe used. More specifically, ROC analysis involves the calculation of hit rates and false alarmrates across multiple thresholds. These values are then plotted on a graph (with the hit rate onthe y-axis and the false alarm rate on the x-axis), and the points are connected to form an ROCcurve.2 The AUC reflects the proportion of the ROC graph that falls below an ROC curve, and
2In fact, although hit rates and false alarm rates are focused on in ROC analysis, information pertaining to all fourdecision outcomes is captured on an ROC graph. Miss rates are represented on the axis opposite to hit rates, andcorrect rejection rates are represented on the axis opposite to false alarm rates. This is the case because miss ratesand correct rejection rates are simply the complements of hit rates and false alarm rates, respectively. More spe-cifically, the hit rate (H) equals hits/(hits +misses) and the miss rate equals 1�H. The false alarm rate (FA) equalsfalse alarms/(false alarms + correct rejections) and the correct rejection rate equals 1�FA.
Copyright © 2013 John Wiley & Sons, Ltd. J. Investig. Psych. Offender Profil. (2013)
DOI: 10.1002/jip

C. Bennell et al.
it is generally used as an index of how accurate the decision-making procedure is that gaverise to the curve; the higher the AUC, the more accurate the procedure. This makes sensebecause higher ROC curves result from a higher proportion of hits relative to false alarmsacross the various thresholds that have been tested.Values of the AUC can vary between 0 (none of the graph falls beneath the curve) and 1
(the entire graph falls beneath the curve). However, values between 0.50 and 1 are morecommonly reported. An AUC value of 0.50 indicates that the decision-making procedurein use results in decisions that are no better than chance, whereas an AUC value of 1signals perfect decision accuracy. In technical terms, the AUC represents the likelihoodthat a randomly selected ‘positive’ case (e.g. a crime pair that was committed by the sameoffender) will have a higher across-crime similarity score, for example, than a randomlyselected ‘negative’ case (e.g. a crime pair that was committed by different offenders). Thus,an AUC of 0.80 indicates that there is an 80% chance that a randomly selected pair ofcrimes that was committed by the same offender will exhibit greater across-crime similaritythan a randomly selected pair of crimes that was committed by different offenders.Although there are no firm rules, and different guidelines exist (cf. Hosmer &
Lemeshow, 2000), AUCs are often interpreted using criteria established by Swets(1988). He suggested that AUCs below 0.50 are non-informative, AUCs between 0.50and 0.70 indicate low levels of accuracy, AUCs between 0.70 and 0.90 indicate moderatelevels of accuracy, and AUCs between 0.90 and 1 reflect high levels of accuracy. Theappropriateness of these guidelines will depend on many things, such as the importanceassociated with the particular diagnostic decision under investigation. For example, whatis considered a ‘high enough’ AUC in one context may not be considered high enoughin another context if the diagnostic decision being made is highly consequential (e.g. lifethreatening, as might be the case with cancer screening).Although certainly not the only measure that can be used to assess linking accuracy, the
AUC does have several advantages associated with it (Bennell, 2005), which may explainwhy it has become so popular in linking studies. This is especially true when the AUC isbeing used to examine levels of linkage accuracy across different studies. One advantage,which has already been mentioned, is that the AUC is independent of the decision thresh-old that is used to make linking decisions (Swets, 1996). This is because the AUC repre-sents the location of the entire ROC curve in its graph, which represents all possibledecision thresholds, rather than any single point along the ROC curve. Thus, the AUCgives a more valid estimate of the level of accuracy associated with the linking procedureused to derive an ROC curve. A second advantage is that the AUC is relatively unaffectedby base rates (e.g. the proportion of linked crimes in any given sample; Rice & Harris,1995). This is because the AUC is not based on the raw frequencies of the various linkagedecisions that can be made (i.e. hits, false alarms, misses, and correct rejections) but ontheir proportions. Given this, the AUC can be used to compare levels of linking accuracyacross studies that may vary with respect to the base rate (as might happen, for instance,when studies of serial burglary and serial homicide are compared).3 Finally, the AUC isa very flexible measure. In other words, it can be used to assess linking accuracy across
3Available statistics suggest that serial burglars will tend to have longer crime series than serial killers, on average,and thus the base rate of linked crimes will likely be higher in studies of serial burglary. Indeed, it is not uncom-mon to read about average series lengths in serial burglary cases reaching 20 crimes (e.g. Snook, Zito, Bennell, &Taylor, 2005) and series exceeding 50+ crimes have been reported (e.g. Wright, Decker, Redfern, & Smith, 1992).These sorts of very long, linked crime series are much rarer in cases of serial homicide, although some certainlyexist. For example, most serial homicide cases rarely exceed 10 victims (Hickey, 1991).
Copyright © 2013 John Wiley & Sons, Ltd. J. Investig. Psych. Offender Profil. (2013)
DOI: 10.1002/jip

Linking crimes using behavioural clues
a wide variety of situations. For example, it can be used to assess the performance of differentdecision-making tools (e.g. human judgments, logistic regression models, and discriminantfunction analysis) and to assess the predictive accuracy associated with different types ofpredictor variables (e.g. across-crime similarity scores based on property stolen, inter-crimedistances, and temporal proximity).
THE PRESENT REVIEW
For the purpose of conducting our analysis, all published manuscripts written in Englishthat dealt with the topic of crime linkage analysis were reviewed to identify those thathad used the AUC to estimate the accuracy of linking decisions.4 To find all relevantstudies, two databases were searched (PsycINFO and Scholars Portal) using the followingsearch phrases: crime link* (* captures all variations of crime link, such as crime linkingand crime linkage), case link*, comparative case analysis, behavioural linkage analysis,behavioural linking, and behavioural consistency. Parallel searches using US English(e.g. behavior) were also conducted, and reference sections of all identified papers werereviewed to ensure that all relevant papers were captured. A total of 19 published studiesreporting a total of 146 AUCs met our inclusion criteria by the end of January 2013.5
We considered conducting a formal meta-analysis of these studies so as to identifyaverage levels of linking accuracy and potential moderators of accuracy, but as a first step,we opted instead to conduct a qualitative review of this research to examine these issues.Our primary reason for taking this approach is that many of the AUCs reported withinpublished studies are not independent of one another (e.g. the AUCs are associated withdifferent combinations of predictors but the same samples of crimes). Thus, many AUCswould have been excluded from a meta-analysis. Excluding such values is not necessaryin a qualitative review, but the lack of independent results should still be carefully consideredwhen reviewing the findings.
As part of our review, we will carry out the following: (1) attempt to determine howgood we are currently at detecting crime linkages in the context of the research beingconducted; (2) identify the factors examined in these studies that seem to influence thedegree of linkage accuracy that can be achieved; (3) discuss how generalisable these resultsare to naturalistic investigative settings; (4) highlight some of the important limitations ofthe linking studies that we reviewed; and (5) offer up some strategies for moving this areaof research forward.
RESULTS
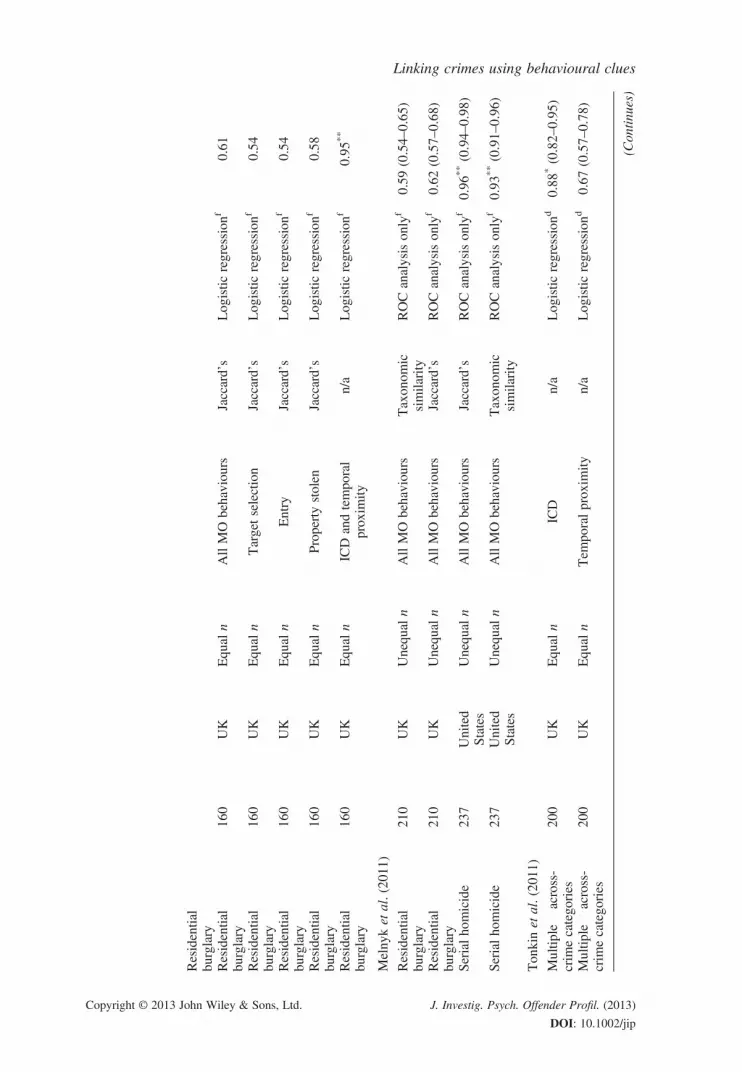
The results from all the studies that were reviewed are summarised in tabular format in theAppendix. As can be seen from this table, the published linking studies that have relied onthe AUC have focused on a variety of crime types, including serial burglary, serial robbery,serial car theft, serial arson, serial sexual assault, serial rape, and serial homicide. On the
4To the best of our knowledge, no non-English linking studies using the AUC have been published to date.5This number reflects the number of studies (N= 19) and not the number of separate papers (N= 17). Melnyk et al.(2011) reported two studies, one examining serial homicide and one examining serial burglary. Because Tonkin,Woodhams, Bull, Bond, & Santtila (2012) also examined two different crime types from different locations, theirpaper was also classified as containing two separate studies for the purposes of our review.
Copyright © 2013 John Wiley & Sons, Ltd. J. Investig. Psych. Offender Profil. (2013)
DOI: 10.1002/jip

C. Bennell et al.
basis of sample size, the studies range from relatively small-scale studies (e.g. N = 86crimes; Bennell & Canter, 2002) to reasonably large-scale studies (e.g. N= 386 crimes;Tonkin, Grant, & Bond, 2008). The data that have been relied upon originate from multiplelocations, including the UK, Finland, and South Africa (although the UK is certainlydisproportionately represented, with around 79% of the studies relying on UK data). Logisticregression has been the primary form of analysis used in these studies, with most studiesexamining a wide range of potential predictors of linkage status, frequently including variousbehavioural (e.g. similarity between the methods used to acquire a car in car thefts), temporal(e.g. the time elapsed between two car thefts), and spatial factors (e.g. the distance inkilometres between two car thefts, also called the inter-crime distance).6
The accuracy of linking decisions
The first issue we considered was overall linking accuracy. As shown in the Appendix, thenumber of linking models examined in each study, and therefore the number of AUCsreported, varies substantially. On the low end, one study reported only one AUC (i.e. Bennell,Jones, & Melnyk, 2009); on the high end, one study reported 30 AUCs (i.e. Bennell & Jones,2005). Likewise, a great deal of variability in reported AUCs is evident across studies, withsome AUCs being very low (e.g. AUC=0.45 in Burrell, Bull, & Bond, 2012) and some beingextremely high (e.g. AUC=0.96 in Melnyk, Bennell, Gauthier, & Gauthier, 2011). Using thecriteria established by Swets (1988), we were interested in the proportion of reported AUCsthat fall in the non-informative, low, moderate, and high range. Given these guidelines, thelargest proportion of reported AUCs fall within the moderate range. Specifically, 1% of theAUCs fall in the non-informative range, 36% fall in the low range, 49% fall in the moderaterange, and 14% fall in the high range. To ensure that the large number of AUCs reported byBennell and Jones (2005) did not bias these results, we examined the proportions without thatstudy included. The pattern of results did not substantially change when this was carried out—2% of AUCs fall in the non-informative range, 29% fall in the low range, 54% fall in themoderate range, and 15% fall in the high range.
Factors affecting linking accuracy
The second issue we considered was what factors might explain the variation in AUCs thatis observed across the published studies included in the Appendix. Given that we could notconsider all possible factors that may be influencing linking accuracy in this paper, weselected potential moderators that are commonly mentioned in the crime linkingliterature (e.g. Woodhams, Hollin, & Bull, 2007). The factors we considered includedthe following (in the order they are presented in the Appendix): the crime type examined,the jurisdiction the crimes were sampled from, the sampling method employed in thestudy, the particular behaviours examined, the similarity coefficient used to assessacross-crime similarity, and the statistical technique used by the authors to analysethe data.
6Crime pairs are the unit of analysis in studies using logistic regression to develop linking models. Thus, thedichotomous outcome variable in this context reflects whether a particular crime pair is linked (typically codedas 1) or unlinked (coded as 0), and the predictor variables are usually similarity scores that relate to various aspectsof the crimes (e.g., behavioural, temporal, or geographic variables).
Copyright © 2013 John Wiley & Sons, Ltd. J. Investig. Psych. Offender Profil. (2013)
DOI: 10.1002/jip

Linking crimes using behavioural clues
Crime type
As shown in the Appendix, the most commonly explored crime types in the studieswere residential burglary (five studies) and sexual assault/rape (four studies). Threestudies examined car theft or car key theft, two examined commercial burglary, twoexamined multiple crime types, and only one examined each of the remaining crimetypes (commercial robbery, personal robbery, arson, and homicide). The highestAUC obtained in the studies (0.96) involved the only sample of serial homicide whena combined set of modus operandi (MO) behaviours was examined (Melnyk et al., 2011).The lowest AUC obtained in the studies (0.45) involved a study of personal robbery byBurrell et al. (2012) when they examined the predictive accuracy of variables related toproperty stolen.
Many of the studies examining serial sexual assault and rape report moderate levels ofpredictive accuracy across all linking models. For instance, Bennell, Gauthier, Gauthier,Melnyk, and Musolino (2010) reported AUCs ranging from 0.76 to 0.81, Woodhamsand Labuschagne (2012a) reported AUCs of 0.77 and 0.88, and Winter, Lemeire,Meganck, Geboers, Rossi, and Mokros (2013) reported AUCs ranging from 0.74 to0.89. Likewise, moderate to high levels of predictive accuracy were found for arson acrossthe analyses reported by Ellingwood et al. (2013), with AUCs ranging from 0.72 to 0.93,and for the analyses of commercial robbery reported by Woodhams and Toye (2007), withAUCs ranging from 0.70 to 0.95.
In comparison, there seems to be wider variation in the AUCs found in studies ofburglary, car theft, and personal robbery. For example, Bennell and Canter (2002) reportedAUCs ranging from 0.63 to 0.81 for residential burglary. Similarly, Bennell and Jones(2005) reported AUCs ranging from 0.53 to 0.94 for residential burglary and 0.52 to0.89 for commercial burglary. Comparable ranges for burglary were reported by Markson,Woodhams, and Bond (2010), Melnyk et al. (2011), and Tonkin, Santtila, and Bull (2012)(interestingly, levels of linking accuracy in Finnish burglaries appear to be substantiallyhigher; Tonkin, Santtila et al., 2012). The AUC ranges in studies of car theft are also verywide (0.54–0.93 in Davies et al., 2012; 0.56–0.81 in Tonkin et al., 2008; and 0.50–0.82 inTonkin, Woodhams, Bull, Bond, & Santtila, 2012), as is the range in the lone study ofpersonal robbery (0.45–0.92; Burrell et al., 2012).
Jurisdiction
Although cross-cultural comparisons are still sorely lacking in this area of research,variations in linking accuracy are beginning to emerge across the countries beingexamined. For example, when Tonkin, Santtila et al. (2012) examined linking accuracy ina sample of Finnish residential burglaries, they found that the level of accuracy was greaterthan that observed in previous UK-based research. As Tonkin (forthcoming) states, ‘. . . theAUC value for all MO behaviours in Finland was 0.72 (which compared to an average AUCvalue in UK-based research of 0.65), the AUC value for the target domain in Finland was0.73 (compared to a UK average of 0.60), and the AUCs for entry and internal behaviourswere both 0.66 (compared to UK averages of 0.58 and 0.51, respectively)’ (p. 13).
As Tonkin (forthcoming) also makes clear, variation in linking accuracy has also beenfound between different police forces within the same country (e.g. Bennell, 2002; notincluded in this review), and there is even evidence for substantial variation in linkingaccuracy between different districts within a single police force (Bennell & Jones, 2005).
Copyright © 2013 John Wiley & Sons, Ltd. J. Investig. Psych. Offender Profil. (2013)
DOI: 10.1002/jip

C. Bennell et al.
Sampling technique
Another difference among studies that have examined crime linkage analysis is thesampling technique employed by the researchers. The primary difference across studiesrelates to the way in which the researchers sample linked and unlinked crimes. Specifically,some researchers do not control for the number of linked crime pairs relative to the numberof unlinked crime pairs in their sample (resulting in many more unlinked pairs than linkedpairs; labelled ‘unequal n’ in the Appendix), whereas others do control for this factor andensure that the number of linked and unlinked crime pairs that are analysed is approxi-mately equal (labelled ‘equal n’ in the Appendix). However, examining the AUCs acrossequal versus unequal n studies in the Appendix reveals no consistent differences in linkingaccuracy. For instance, when holding things constant by examining inter-crime distanceonly, moderate to high levels of linking accuracy have been found regardless of whetherequal or unequal samples have been used (e.g. AUCs ranging from 0.75 to 0.92 and0.76 to 0.94, respectively). Likewise, comparisons of studies that have examined the samecrime type, but have used a different sampling technique, reveal no meaningful variationsin the AUCs that are reported (e.g. Bennell & Jones, 2005 versus Markson et al., 2010).
Crime scene behaviours
Another important factor to consider is how the behaviours under examination impactlinking accuracy. Upon examination of the studies in the Appendix, there seems to berelatively consistent variation from one behavioural domain to the next in terms of theAUC. The most consistent finding is that inter-crime distance and temporal proximityare associated with some of the largest AUC values, and these values often exceed theAUCs associated with more common MO behaviours (such as the type of home that wastargeted in a burglary or what property was stolen; Bennell & Canter, 2002; Bennell &Jones, 2005; Markson et al., 2010; Tonkin, Santtila et al., 2012; Tonkin, Woodhams, Bull,Bond, & Santtila, 2012). As Tonkin (forthcoming) has noted, similar findings have alsobeen observed with car theft (Davies et al., 2012; Tonkin et al., 2008) and personal robbery(Burrell et al., 2012), but research examining the potential value of spatial and temporalvariables in cases of sexual assault/rape and homicide is lacking. One of the reasons for thisis that, for linking studies involving interpersonal crimes to have sufficiently large samples,the crimes would need to be much more geographically and temporally dispersed than forstudies of high-volume property crimes. Given this, any assessment of inter-crime distanceor temporal proximity as a clue to linkage status in cases of sexual assault/rape or homicidewould likely result in deceptively high levels of predictive accuracy.
Similarity coefficient
The vast majority of studies to date have used Jaccard’s (J) coefficient to quantify thebehavioural similarity between crimes. In total, 14 studies have used J, whereas threestudies have compared the performance of J with the taxonomic similarity index (Δs)(Bennell et al., 2010; two studies in Melnyk et al., 2011), and one study has comparedthe performance of J with the simple matching coefficient (S) (Ellingwood et al., 2013).7
These results generally suggest that comparable AUCs are found when using differentsimilarity coefficients. For example, in the study by Bennell et al. (2010) involving serial
7Refer to Ellingwood et al. (2013) for an explanation of the computational differences between these three simi-larity measures.
Copyright © 2013 John Wiley & Sons, Ltd. J. Investig. Psych. Offender Profil. (2013)
DOI: 10.1002/jip

Linking crimes using behavioural clues
sexual assaults, AUCs of 0.81 and 0.76 were obtained for J and Δs, respectively. Likewise,Melnyk et al. (2011) found AUCs of 0.59 (J) and 0.62 (Δs) for their study involving serialresidential burglaries and AUCs of 0.96 (J) and 0.93 (Δs) for their study involving serialhomicides. That being said, with their sample of serial arsons, Ellingwood et al. (2013)found consistently higher AUCs for S (ranging from 0.82 to 0.93) than they did for J(ranging from 0.72 to 0.89), although these differences were not significant. As such, itis possible that some similarity coefficients may outperform J with certain crime types;however, further research is needed to determine whether these differences are significant.
Statistical technique
The majority of linking studies that report AUCs (approximately 68%) have relied on logisticregression analysis to develop linking models. One study used both logistic regression andclassification tree analysis (Tonkin, Woodhams, Bull, Bond, & Santtila, 2012), and one studyused discriminant function analysis and naïve Bayesian classifiers (Winter et al., 2013). Theremaining studies used only ROC analysis without an accompanying prediction tool (e.g.Melnyk et al., 2011).8
It is difficult to reliably compare the level of linking accuracy achieved when employingdifferent statistical techniques when only two studies have used techniques other thanlogistic regression analysis. That being said, it does appear that logistic regression cansometimes produce slightly higher AUCs than other statistical techniques. For example,Tonkin, Woodhams, Bull, Bond, & Santtila (2012) used a sample of residential burglariesto compare the performance of iterative classification trees (ICT) to stepwise logisticregression modelling and found that, although both procedures selected the same predictors(i.e. inter-crime distance, internal behaviours, and entry behaviours), the logistic regressionmodel (AUC=0.87) outperformed the ICT model (AUC=0.80), but not significantly. Moreresearch using different statistical techniques will allow us to determine with greater certaintywhich statistical techniques provide optimal linking results.
DISCUSSION
The studies reviewed in this paper suggest that it is frequently possible to link serial crimeson the basis of behavioural clues left at crime scenes. When one considers the AUCsreported in these studies, the majority fall in the moderate range, according to Swets’ (1988)guidelines. This could only happen if serial offenders display relatively stablepatterns of individual differences across their crimes, which suggests that offenders’behaviour is determined, at least in part, by internal dispositions to commit crimesin a particular way. However, rarely do AUCs in these studies exceed 0.90. Thus, of-fenders are clearly not perfectly stable or distinct across their crimes, nor should weexpect them to be. Human variability, stemming largely from the impact of situationalfactors, will prevent exceptionally high AUCs from being found for the vast majorityof crime scene behaviours. Unreliable or inaccurate coding of variables is also a factor
8Studies that used ROC analysis only rather than ROC analysis in combination with another statistical methodol-ogy to develop different linking models did so because their goal was to examine the predictive accuracy of allMO behaviours combined rather than the relative performance of different MO domains. Although some studieshave used logistic regression in combination with ROC analysis to examine all MO behaviours combined (e.g.Woodhams & Labuschagne, 2012a), they primarily did so for model validation purposes.
Copyright © 2013 John Wiley & Sons, Ltd. J. Investig. Psych. Offender Profil. (2013)
DOI: 10.1002/jip

C. Bennell et al.
that will prevent very high levels of linking accuracy from being observed (Bennell,Snook, MacDonald, House, & Taylor, 2012).As argued previously, linking accuracy is likely to be impacted by multiple variables,
and the studies reviewed here confirm that this is the case. The variables that appear to havethe most impact on the AUC include the crime type being examined and the behavioursincluded in the analysis. There is also some evidence that linking accuracy varies acrossjurisdictions, although it is currently unclear what aspects of a police jurisdiction are likelyto be associated with high (or low) AUCs. At present, there is little evidence to suggest thatthe sampling technique adopted by researchers, the similarity coefficient used, or the statisti-cal methods employed have a significant impact on linking accuracy. That being said, futureresearch may suggest that these issues are important determinants of linking accuracy.
The impact of crime type, behaviours, and jurisdictions on linking accuracy
Although too few direct comparisons have been made to draw any strong conclusionsabout the impact of crime type on linking accuracy, given the results reported here, it doesappear that linking accuracy is higher on average for certain interpersonal crimes (e.g. sexualassault/rape and homicide) compared with certain property crimes (e.g. burglary and carthefts). There are a number of possible explanations for this finding, each of which remainsuntested. First, it may be that the data associated with interpersonal crimes are more accuratelyand reliably coded than property crime data and thus, more likely to reveal patterns ofbehavioural stability and distinctiveness. This could be due to the seriousness of interpersonalcrimes, the attention they receive from police agencies, and/or the presence of victims whocan report on the offender’s actions (at least in the case of sexual assault and rape).9 Second,it may be that the behaviour of property offenders is more restricted (and therefore lessdistinct) than interpersonal offenders given the limited number of ways in which crimes suchas burglary and car theft can be carried out (e.g. due to a lack of victim interaction). Third,because the behaviour of violent interpersonal offenders may be frequently guided by deeplyengrained fantasy-based scripts (Canter & Heritage, 1990; Davies, 1992; Hazelwood &Warren, 1990), this might mean that these offenders exhibit higher levels of stability anddistinctiveness compared with property offenders. Finally, it is possible that the differencebetween crime types is a function of the manner in which interpersonal (versus property)crime have been explored to date. For example, unlike studies of property crime, studies ofinterpersonal crime have focused on MO behaviours in combination rather than separateMO domains. Given this, it is more likely in studies of interpersonal crime that poorperforming behavioural domains remain hidden. Future research is needed to address all ofthese possibilities.Multiple explanations also exist for the finding that spatial and temporal behaviours are
typically more stable and distinct than other MO behaviours in studies of property crime.One common explanation that has been put forward relates to the degree of control thatoffenders possess in expressing various offending behaviours (e.g. Bennell & Canter, 2002).Some behaviours, such as where crimes are committed, appear to be largely under the controlof the offender (they are offender-driven behaviours or operant behaviours; Funder &Colvin, 1991), whereas other behaviours, such as what items an offender steals from a home,
9Relatedly, it may also be that richer information can be gathered from victim interviews in cases of sexual assaultand rape than the sparsely populated MO text fields in police databases that are usually the primary source ofbehavioural information in studies of property crime.
Copyright © 2013 John Wiley & Sons, Ltd. J. Investig. Psych. Offender Profil. (2013)
DOI: 10.1002/jip

Linking crimes using behavioural clues
appear to be largely a function of situational factors, relying as they do on what items are avail-able to be stolen (they are situation-driven behaviours or respondent behaviours; Funder &Colvin, 1991). If this is true, it makes sense that variables such as inter-crime distance will bemore stable and distinct than behaviours such as property stolen. A second, equally plausibleexplanation is that differences in linking accuracy observed across behavioural domains relateto coding reliability. In other words, it could simply be that the spatial aspects of a crime aremore reliably coded than MO behaviours, such as property stolen, and are more likely toreveal the stability and distinctiveness that offenders do exhibit. This makes sense whenone considers that many police forces rely on GPS technology to accurately code the locationof crimes, whereas the coding of other crime scene behaviours typically relies on the poten-tially problematic testimony of victims and/or witnesses or on inferences drawn fromevidence at the crime scene (Alison, Snook, & Stein, 2001). Future research will need toconfirm that the spatial and temporal aspects of interpersonal crimes are exhibited in a morestable and distinct fashion compared with other MO behaviours, although challenges incarrying out such comparisons with interpersonal crimes (as discussed earlier) will be difficultto overcome.
Finally, with respect to jurisdiction, the findings that AUCs can vary substantiallydepending on where the crime data were collected ‘demonstrates that the potential forcrime linkage cannot be assumed to have a universal value across all police jurisdictions’(Tonkin, forthcoming, p. 13). Rather, it is important to establish for each police jurisdictionthe degree to which offenders operating within those areas display levels of behaviouralstability and distinctiveness that make crime linkage possible. There are a number offactors that might explain such cross-jurisdiction variation. These factors could includedifferences in data coding and storage practices, the distribution of potential targets/victimswithin the environment, the design of roadways and other topographic features that arecharacteristic of the jurisdictions, and differences in the stability and distinctivenessexhibited by offender populations (Tonkin, forthcoming). Future research will need todetermine which of these factors account for cross-jurisdiction differences in linking accu-racy. It will also be important for future research to establish which behaviours are effectiveclues for linkage analysis in each jurisdiction given that this will likely vary. For example,Woodhams and Labuschagne (2012b) recently showed that the base rates for some MObehaviours differ between the UK, US, Finland, and South Africa, which would presumablyimpact their ability to be used to distinguish between crimes committed by different offenderswithin these jurisdictions. Finally, future research has to be conducted using data fromcountries other than those that are represented in current studies, particularly Canada andthe US where crime linkage analysis is commonly practiced.
The generalisability of results from linking studies
Despite the potentially positive implications associated with the findings reported earlier, itis still not clear whether the results generalise to naturalistic investigative settings. Twoissues in particular are cause for concern. First, the samples of crimes that researchers drawon in most linking studies bear little resemblance to the sorts of samples that crime analystsand investigators encounter in investigative settings. For example, most research to datehas focused on relatively small samples of solved serial offences, which tend to consistof just one particular crime type (e.g. burglary; Tonkin, forthcoming). However, bothsolved and unsolved offences must be considered by analysts/investigators, as well asone-off and serial offences. In addition, offenders who commit a diverse range of crimes
Copyright © 2013 John Wiley & Sons, Ltd. J. Investig. Psych. Offender Profil. (2013)
DOI: 10.1002/jip

C. Bennell et al.
(e.g. burglary and car theft) may be as common as specialist offenders (Leitner & Kent,2009; Levine & Lee, 2009; Tonkin, Woodhams, Bull, Bond, & Palmer, 2011).Each aspect of commonly used samples (i.e. small, solved, serial, and specialist) may
lead to overestimates or underestimates of the degree of linking accuracy that is actuallypossible when faced with realistic samples. For example, although a focus on solved crimesmakes it easier for researchers to establish ground truth in linking studies (i.e. whether apair of crimes is actually linked or not), the sole reliance on solved crimes may lead toartificially high AUCs because serial crimes might be solved in the first place because theyare characterised by a high degree of behavioural stability and distinctiveness (Bennell &Canter, 2002). Before linking researchers can be confident that their findings do in factgeneralise to investigative settings, they will have to improve the quality of their studiesso that they mimic the conditions under which analysts and investigators are working.Fortunately, researchers are now making attempts to do this (e.g. Tonkin, Woodhams, Bull,& Bond, 2012; Winter et al., 2013; Woodhams & Labuschagne, 2012a).Second, beyond these issues related to potentially inappropriate samples, results from the
currently sampled studies may not generalise to investigative settings because of the natureof the linking task that is focused on in this research. One potential problem is that the stud-ies reviewed in this paper have attempted to find links between crime pairs that are includedwithin relatively large samples of serial crimes. However, this is not the only type of linkingtask that exists (Canter, 2012), nor is this well-studied task necessarily the sort of task thatthe police most frequently struggle with in investigative settings (Rainbow, forthcoming).For example, it is not uncommon for analysts to be presented with an index offence byinvestigators with a request to identify other crimes included in a database that are the workof the same offender (Woodhams, Bull, & Hollin, 2007). Alternatively, investigators may wantto know how likely it is that a known set of crimes has been committed by the same offender.Although different linking approaches may be required to achieve optimal results in each
type of linking task, it may in fact be possible to apply the sorts of prediction modelsdeveloped in the current set of studies to these different types of task. The important pointis that no research has been conducted to date that examines the degree to which this ispossible, and therefore, we cannot estimate at present the levels of linking accuracy thatwould result when this is done. So as to determine the value of current linking researchfor solving ‘real-world’ linking problems, this type of research needs to be made a priority.In general, researchers need to test the sorts of prediction models for crime linkage analysisthat are currently being developed under more realistic conditions.10
As future research in this area is being planned, serious consideration should be given tothe use of a common metric for quantifying linking accuracy. We believe this will help ininterpreting the results that emerge from this research. Given the previously stated advan-tages associated with the AUC, this measure should be a potential candidate. If that were tohappen, however, additional work is needed to improve our ability to interpret the practicalmeaning of the AUC in the linking context. Despite how it frequently seems to beinterpreted in practical settings, the AUC does not simply reflect the percentage of timesa correct linking decision will be made (as pointed out earlier, it indicates the percentageof times a randomly selected linked crime pair will be associated with a particular pieceof evidence [e.g. shorter inter-crime distances] compared with a randomly selected
10Researchers should also consider incorporating non-behavioural information into the linking models theydevelop given that MO behaviours represent only some of the information that is collected for linkage analysispurposes. Currently, data collected for this purpose often include things such as physical evidence, eyewitnessdescriptions, vehicle descriptions, and weapon information (Collins, Johnson, Choy, Davidson, & MacKay, 1998).
Copyright © 2013 John Wiley & Sons, Ltd. J. Investig. Psych. Offender Profil. (2013)
DOI: 10.1002/jip

Linking crimes using behavioural clues
unlinked crime pair). An approach needs to be developed to translate the AUC into a moremeaningful measure of accuracy for investigators and analysts. One of the things we sug-gest researchers do is provide information about the frequencies of the various decisionoutcomes (i.e. hits, false alarms, misses, and correct rejections) that result from the linkingapproach that gave rise to a specific AUC when a particular decision threshold was used.This information will give end users a better sense of how they will perform when usingthe approach in question and will ensure that their expectations are reasonably accurate.11
If ROC analysis (and the AUC) continues to grow in popularity within this field, addi-tional work will also have to be carried out to resolve other issues as well. One particularlyimportant issue that has largely been ignored by crime linkage researchers to date is how togo about setting appropriate thresholds for making linking decisions (i.e. determining howsimilar two crimes should be before a decision is made to link them). Although ROCanalysis can help with this decision (e.g. by clarifying what the decision outcomes willactually be when applying various thresholds), the procedure itself cannot solve this problem(Mossman, 2013). What is ideally needed for this to happen is a better understanding of baserates (i.e. the proportion of crimes that are committed by the same offender versus differentoffenders) for various crime types in particular jurisdictions and an appreciation for therelative costs and benefits associated with the various linking outcomes (i.e. hits, false alarms,misses, and correct rejections).12 Armed with this information, it should be possible to setappropriate, perhaps even optimal, thresholds (refer to Swets, Dawes, & Monahan, 2000for procedures to accomplish this). Of course, the challenge is that it will be difficult toquantify many of these values (e.g. what is the exact cost of a miss in the linking context?).
CONCLUSION
Over the past decade, the number of studies exploring the crime linkage task has grownconsiderably. Because many of these studies rely on a common measure (the AUC) forassessing linking accuracy, it is now possible to start exploring how accurate we can bewhen making linking decisions and the sorts of factors that influence our ability to linkcrimes. Current studies suggest that moderate levels of linking accuracy are possible andthat, under certain conditions, even high levels of linking accuracy can be achieved.However, there is still a long way to go before we can be confident that the findings fromthese studies generalise to investigative settings. Issues of ecological validity need to bemore seriously considered by researchers in the future, with particular attention paid tothe types of samples studied and the sorts of linking tasks that are being explored. Whatwe are confident about is that through the continued efforts of researchers interested inthe topic of crime linkage analysis, and the increased attention that is being placed on
11This is particularly important in the linking context given the very low base rate of linked crimes that is typical inmost studies. Very large AUCs (>0.90) can lead to impressions that few decision errors will be made, but suchhigh AUCs can still be associated with an extremely large number of false alarms if the base rate of linked crimesis very low. This does not necessarily mean that the linking approach under investigation is not useful and poten-tially more effective than other linking approaches in current use, but it is important for investigators and analyststo be aware of this fact.12A common but sub-optimal approach for setting decision thresholds is to use the point on an ROC curve thatfalls closest to the top-left corner of the ROC graph (where the hit rate is 1 and the false alarm rate is 0; Bennellet al., 2009). However, this assumes that the base rates of linked and unlinked crimes are equal and that the costsand benefits associated with the decision outcomes are equivalent. It is doubtful that this will ever be the case inreality.
Copyright © 2013 John Wiley & Sons, Ltd. J. Investig. Psych. Offender Profil. (2013)
DOI: 10.1002/jip

C. Bennell et al.
academic–practitioner partnerships in this field of study, new lines of research will providesome empirical answers to many of the important, unresolved questions that have beenraised in this review.
ACKNOWLEDGEMENT
The authors would like to thank Matthew Tonkin for his very helpful comments on an ear-lier draft of this paper.
REFERENCES
Alison, L. J., Snook, B., & Stein, K. L. (2001). Unobtrusive measurement: Using police informationfor forensic research. Qualitative Research, 1, 241–254. doi: 10.1177/146879410100100208
Bennell, C. (2002). Behavioural consistency and discrimination in serial burglary. Unpublisheddoctoral dissertation, University of Liverpool, Liverpool, UK.
Bennell, C. (2005). Improving police decision making: General principles and practical applicationsof receiver operating characteristic analysis. Applied Cognitive Psychology, 19, 1157–1175. doi:10.1002/acp.1152
Bennell, C., & Canter, D. V. (2002). Linking commercial burglaries by modus operandi: Tests usingregression and ROC analysis. Science & Justice, 42, 153–164. doi: 10.1016/S1355-0306(02)71820-0
Bennell, C., Gauthier, D., Gauthier, D., Melnyk, T., & Musolino, E. (2010). The impact of data deg-radation and sample size on the performance of two similarity coefficients used in behaviourallinkage analysis. Forensic Science International, 199, 85–92. doi: 10.1016/j.forsciint.2010.03.017
Bennell, C., & Jones, N. J. (2005). Between a ROC and a hard place: A method for linking serialburglaries by modus operandi. Journal of Investigative Psychology and Offender Profiling,2, 23–41. doi: 10.1002/jip.21
Bennell, C., Jones, N. J., & Melnyk, T. (2009). Addressing problems with traditional crime linkingmethods using receiver operating characteristic analysis. Legal and Criminological Psychology,14, 293–310. doi: 10.1348/135532508X349336
Bennell, C., Snook, B., MacDonald, S., House, J. C., & Taylor, P. J. (2012). Computerized crimelinkage systems: A critical review and research agenda. Criminal Justice and Behavior, 39,620–634. doi: 10.1177/0093854811435210
Burrell, A., Bull, R., & Bond, J. (2012). Linking personal robbery offences using offender behaviour.Journal of Investigative Psychology and Offender Profiling, 9, 201–222. doi: 10.1002/jip.1365
Burrows, J., Tarling, R., Mackie, A., Poole, H., & Hodgson, B. (2005). Forensic science Pathfinderproject: Evaluating increased forensic activity in two English police forces. Home Office OnlineReport 46/05. London, UK: Home Office.
Canter, D.V. (2012). An ideographic approach to case-linkage. Paper presented at the 14th Interna-tional Conference of Investigative Psychology, London, UK.
Canter, D. V., & Heritage, R. (1990). A multivariate model of sexual offence behaviour:Developments in ‘offender profiling’. Journal of Forensic Psychiatry, 1, 185–212. doi:10.1080/09585189008408469
Collins, P. I., Johnson, G. F., Choy, A., Davidson, K. T., & MacKay, R. E. (1998). Advances inviolent crime analysis and law enforcement: The Canadian Violent Crime Linkage Analysis System.Journal of Government Information, 25, 277–284. doi: 10.1016/S1352-0237(98)00008-2
Davies, A. (1992). Rapists’ behaviour: A three aspect model as a basis for analysis and identificationof serial crime. Forensic Science International, 55, 173–194. doi: 10.1016/0379-0738(92)90122-D
Davies, K., Tonkin, M., Bull, R., & Bond, J. W. (2012). The course of case linkage never did runsmooth: A new investigation to tackle the behavioural changes in serial car theft. Journal of Inves-tigative Psychology and Offender Profiling, 9(3), 274–295. doi: 10.1002/jip.1369
Ellingwood, H., Mugford, R., Melnyk, T., Bennell, C., & Fritzon, K. (2013). Linking serial arson:Comparing the Simple Matching Index to Jaccard’s Coefficient. Journal of Investigative Psychol-ogy and Offender Profiling, 10(1), 1–27. doi: 10.1002/jip.1364
Copyright © 2013 John Wiley & Sons, Ltd. J. Investig. Psych. Offender Profil. (2013)
DOI: 10.1002/jip

Linking crimes using behavioural clues
Funder, D. C., & Colvin, C. R. (1991). Explorations in behavioral consistency: Propertiesof persons, situations, and behaviors. Journal of Personality and Social Psychology, 60,773–794. doi: 10.1037/0022-3514.60.5.773
Getty, D. J., Seltzer, S.E., Tempany, C. M., Pickett, R. M., Swets, J. A., & McNeil, B. J. (1997).Prostate cancer: Relative effects of demographic, clinical, histologic, and MR imaging variableson the accuracy of staging. Radiology, 204, 471–479. PMid:9240538
Grubin, D., Kelly, P., & Brunsdon, C. (2001). Linking serious sexual assaults through behaviour.London, UK: Home Office.
Hazelwood, R. R., &Warren, J. (1990). The criminal behavior of the serial rapist. FBI Law EnforcementBulletin, February, 11–17.
Hickey, E. W. (1991). Serial murderers and their victims. Belmont, CA: WadsworthPublishing Company.
Hosmer, D.W., & Lemeshow, S. (2000). Applied logistic regression. New York, NY: Wiley.Leitner, M., & Kent, J. (2009). Bayesian journey to crime modeling of single- and multiple crime
type series in Baltimore County, MD. Journal of Investigative Psychology & Offender Profiling,6(3), 213–236. doi: 10.1002/jip.109
Levine, N., & Lee, P. (2009). Bayesian journey to crime modeling of juvenile and adult offenders bygender in Manchester. Journal of Investigative Psychology & Offender Profiling, 6(3), 237–251.
Markson, L., Woodhams, J., & Bond, J. W. (2010). Linking serial residential burglary: Comparingthe utility of modus operandi behaviours, geographic proximity, and temporal proximity. Journalof Investigative Psychology and Offender Profiling, 7, 91–107. doi: 10.1002/jip.120
Melnyk, T., Bennell, C., Gauthier, D., & Gauthier, D. (2011). Another look at across-crime similaritycoefficients for use in behavioural linkage analysis: An attempt to replicate Woodhams, Grant, andPrice (2007). Psychology, Crime & Law, 17, 359–380. doi: 10.1080/10683160903273188
Mossman, D. (2013). Evaluating risk assessments using receiver operating characteristic analysis:Rationale, advantages, insights, and limitations. Behavioral Sciences & the Law, 31, 23–39.doi: 10.1002/bsl.2050
Paulsen, D. J., Bair, S., & Helms, D. (2009). Tactical crime analysis: Research and investigation.Boca Raton, FL: CRC Press.
Rainbow, L. (forthcoming). A practitioner’s perspective: Theory, research, and practice. In J. Woodhams,& C. Bennell (Eds.), Crime linkage: Theory, research and practice. Boca Raton, FL: CRC Press.
Rice, M. E., & Harris, G. T. (1995). Violent recidivism: Assessing predictive validity. Journal ofConsulting and Clinical Psychology, 63, 737–748. doi: 10.1037/0022-006X.63.5.737
Snook, B., Zito, M., Bennell, C., & Taylor, P. J. (2005). On the complexity and accuracy of geographicprofiling strategies. Journal of Quantitative Criminology, 21, 1–26. doi: 10.1007/s10940-004-1785-4
Steadman, H., Silver, E., Monahan, J., Appelbaum, P., Robbins, P., Mulvey, E., et al. (2000). Aclassification tree approach to the development of actuarial violence risk assessment tools. Lawand Human Behavior, 24, 83–100. doi: 10.1023/A:1005478820425
Swets, J. A. (1988). Measuring the accuracy of diagnostic systems. Science, 240, 1285–1293.doi: 10.1126/science.3287615
Swets, J. A. (1996). Signal detection theory and ROC analysis in psychology and diagnostics:Collected papers. Mahwah, NJ: Erlbaum.
Swets, J.A., Dawes, R.M., & Monahan, J. (2000). Psychological science can improve diagnosticdecisions. Psychological Science in the Public Interest, 1, 1–26. doi: 10.1111/1529-1006.001
Tonkin, M. (forthcoming). Testing the theories underpinning crime linkage. In J. Woodhams, & C.Bennell (Eds.), Crime linkage: Theory, research and practice. Boca Raton, FL: CRC Press.
Tonkin, M., Grant, T. D., & Bond, J. W. (2008). To link or not to link: A test of the case linkageprinciples using serial car theft data. Journal of Investigative Psychology and Offender Profiling,5, 59–77. doi: 10.1002/jip.74
Tonkin, M., Santtila, P., & Bull, R. (2012). The linking of burglary crimes using offender behaviour:Testing research cross-nationally and exploring methodology. Legal and Criminological Psychology,17, 276–293. doi: 10.1111/j.2044-8333.2010.02007.x
Tonkin, M., Woodhams, J., Bull, R., & Bond, J.W. (2012). Behavioural case linkage with solved andunsolved crimes. Forensic Science International, 222, 146–153. doi: 10.1016/j.forsciint.2012.05.017
Tonkin, M., Woodhams, J., Bull, R., Bond, J. W., & Palmer, E. J. (2011). Linking different types ofcrime using geographical and temporal proximity. Criminal Justice and Behavior, 38, 1069–1088.doi: 10.1177/0093854811418599
Copyright © 2013 John Wiley & Sons, Ltd. J. Investig. Psych. Offender Profil. (2013)
DOI: 10.1002/jip

C. Bennell et al.
Tonkin, M., Woodhams, J., Bull, R., Bond, J. W., & Santtila, P. (2012). A comparison of logisticregression and classification tree analysis for behavioural case linkage. Journal of InvestigativePsychology and Offender Profiling, 9, 235–258. doi: 10.1002/jip.1367
Winter, J.M., Lemeire, J., Meganck, S., Geboers, J., Rossi, G., & Mokros, A. (2013). Comparing thepredictive accuracy of case linkage methods in serious sexual assaults. Journal of InvestigativePsychology and Offender Profiling, 10, 28–56. doi: 10.1002/jip.1372
Woodhams, J., Bull, R., & Hollin, C. R. (2007). Case linkage: Identifying crimes committed by thesame offender. In R. N. Kocsis (Ed.), Criminal profiling: International theory, research and practice(pp. 117–133). Totowa, N.J.: The Humana Press Inc.
Woodhams, J., Hollin, C. R., & Bull, R. (2007). The psychology of linking crimes: A review of theevidence. Legal and Criminological Psychology, 12, 233–249. doi: 10.1348/135532506X118631
Woodhams, J., & Labuschagne, G. (2012a). A test of case linkage principles with solved and unsolvedserial rapes. Journal of Police and Criminal Psychology, 27, 85–98. doi: 10.1007/s11896-011-9091-1
Woodhams, J., & Labuschagne, G. (2012b). South African serial rapists: The offenders, theirvictims and their offences. Sexual Abuse: A Journal of Research and Treatment, 24(6),544–574. doi: 10.1177/1079063212438921
Woodhams, J., & Toye, K. (2007). An empirical test of the assumptions of case linkage andoffender profiling with serial commercial robberies. Psychology, Public Policy, and Law,13, 59–85. doi: 10.1037/1076-8971.13.1.59
Wright, R., Decker, S. H., Redfern, A. K., & Smith, D. L. (1992). A snowball’s chance in hell: Doingfieldwork with active residential burglars. Journal of Research in Crime and Delinquency, 29,148–161. doi: 10.1177/0022427892029002003
Copyright © 2013 John Wiley & Sons, Ltd. J. Investig. Psych. Offender Profil. (2013)
DOI: 10.1002/jip

APPENDIX
Crime
type
Sam
plesize
(#crim
es)a
Sam
ple
locatio
nb
Sampling
technique
(crimepairs)
Behavioural
domain(s)
Sim
ilarity
coefficient
Statistical
method
AUC(95%
CI)
BennellandCanter(2002)
Com
mercial
burglary
86UK
Unequal
nICDc
n/a
Logistic
regression
d0.80
*
Com
mercial
burglary
86UK
Unequal
nEntry
Jaccard’s
Logistic
regression
d0.65
Com
mercial
burglary
86UK
Unequal
nTargetselection
Jaccard’s
Logistic
regression
d0.68
Com
mercial
burglary
86UK
Unequal
nPropertystolen
Jaccard’s
Logistic
regression
d0.63
Com
mercial
burglary
86UK
Unequal
nICD
andentry
Jaccard’s
Logistic
regression
d0.81
*
BennellandJones(2005)
e
Com
mercial
burglary
—UK
Unequal
nICD
n/a
Logistic
regression
d0.76
*(0.69–0.83)
Com
mercial
burglary
—UK
Unequal
nICD
n/a
Logistic
regression
d0.88
*(0.85–0.91)
Com
mercial
burglary
—UK
Unequal
nICD
n/a
Logistic
regression
d0.88
*(0.85–0.91)
Com
mercial
burglary
—UK
Unequal
nEntry
Jaccard’s
Logistic
regression
d0.57
(0.49–0.64)
Com
mercial
burglary
—UK
Unequal
nEntry
Jaccard’s
Logistic
regression
d0.57
(0.52–0.62)
Com
mercial
burglary
—UK
Unequal
nEntry
Jaccard’s
Logistic
regression
d0.57
(0.52–0.62)
—UK
Unequal
nTargetselection
Jaccard’s
Logistic
regression
d0.60
(0.52–0.68)
(Contin
ues)
Linking crimes using behavioural clues
Copyright © 2013 John Wiley & Sons, Ltd. J. Investig. Psych. Offender Profil. (2013)
DOI: 10.1002/jip

Table
0.(Contin
ued)
Crime
type
Sam
plesize
(#crim
es)a
Sam
ple
locatio
nb
Sam
pling
technique
(crimepairs)
Behavioural
domain(s)
Sim
ilarity
coefficient
Statistical
method
AUC(95%
CI)
Com
mercial
burglary
Com
mercial
burglary
—UK
Unequal
nTargetselection
Jaccard’s
Logistic
regression
d0.62
(0.56–0.67)
Com
mercial
burglary
—UK
Unequal
nTargetselection
Jaccard’s
Logistic
regression
d0.62
(0.56–0.67)
Com
mercial
burglary
—UK
Unequal
nItem
sstolen
Jaccard’s
Logistic
regression
d0.52
(0.45–0.60)
Com
mercial
burglary
—UK
Unequal
nItem
sstolen
Jaccard’s
Logistic
regression
d0.52
(0.47–0.58)
Com
mercial
burglary
—UK
Unequal
nItem
sstolen
Jaccard’s
Logistic
regression
d0.62
(0.47–0.58)
Com
mercial
burglary
—UK
Unequal
nICD,itemsstolen,
andtarget
selection
Jaccard’s
Logistic
regression
d0.76
*(0.68–0.82)
Com
mercial
burglary
—UK
Unequal
nICD,target
selection,
entry,
itemsstolen
Jaccard’s
Logistic
regression
d0.89
*(0.86–0.91)
Com
mercial
burglary
—UK
Unequal
nICD
and
itemsstolen
Jaccard’s
Logistic
regression
d0.89
*(0.86–0.91)
Residential
burglary
—UK
Unequal
nICD
n/a
Logistic
regression
d0.94
**(0.92–0.97)
Residential
burglary
—UK
Unequal
nICD
n/a
Logistic
regression
d0.91
**(0.88–0.93)
Residential
burglary
—UK
Unequal
nICD
n/a
Logistic
regression
d0.85
*(0.79–0.91)
Residential
burglary
—UK
Unequal
nEntry
Jaccard’s
Logistic
regression
d0.57
(0.48–0.66)
—UK
Unequal
nEntry
Jaccard’s
Logistic
regression
d0.62
(0.57–0.67)
(Contin
ues)
C. Bennell et al.
Copyright © 2013 John Wiley & Sons, Ltd. J. Investig. Psych. Offender Profil. (2013)
DOI: 10.1002/jip

Table
0.(Contin
ued)
Crime
type
Sam
plesize
(#crim
es)a
Sam
ple
locatio
nb
Sampling
technique
(crimepairs)
Behavioural
domain(s)
Sim
ilarity
coefficient
Statistical
method
AUC(95%
CI)
Residential
burglary
Residential
burglary
—UK
Unequal
nEntry
Jaccard’s
Logistic
regression
d0.59
(0.45–0.73)
Residential
burglary
—UK
Unequal
nTargetselection
Jaccard’s
Logistic
regression
d0.53
(0.45–0.61)
Residential
burglary
—UK
Unequal
nTargetselection
Jaccard’s
Logistic
regression
d0.57
(0.52–0.62)
Residential
burglary
—UK
Unequal
nTargetselection
Jaccard’s
Logistic
regression
d0.64
(0.52–0.75)
Residential
burglary
—UK
Unequal
nItem
sstolen
Jaccard’s
Logistic
regression
d0.56
(0.47–0.65)
Residential
burglary
—UK
Unequal
nItem
sstolen
Jaccard’s
Logistic
regression
d0.59
(0.54–0.64)
Residential
burglary
—UK
Unequal
nItem
sstolen
Jaccard’s
Logistic
regression
d0.63
(0.50–0.76)
Residential
burglary
—UK
Unequal
nICD
andentry
Jaccard’s
Logistic
regression
d0.94
**(0.92–0.96)
Residential
burglary
—UK
Unequal
nICD,entry,
and
itemsstolen
Jaccard’s
Logistic
regression
d0.91
**(0.89–0.94)
Residential
burglary
—UK
Unequal
nICD
n/a
Logistic
regression
d0.85
**(0.79–0.91)
Woodham
sandToye(2007)
Com
mercial
robbery
160
UK
Equal
nICD
n/a
Logistic
regression
f0.89
*(0.82–0.94)
Com
mercial
robbery
160
UK
Equal
nTargetselection
Jaccard’s
Logistic
regression
f0.79
*(0.71–0.86)
(Contin
ues)
Linking crimes using behavioural clues
Copyright © 2013 John Wiley & Sons, Ltd. J. Investig. Psych. Offender Profil. (2013)
DOI: 10.1002/jip

Table
0.(Contin
ued)
Crime
type
Sam
plesize
(#crim
es)a
Sam
ple
locatio
nb
Sam
pling
technique
(crimepairs)
Behavioural
domain(s)
Sim
ilarity
coefficient
Statistical
method
AUC(95%
CI)
Com
mercial
robbery
160
UK
Equal
nPlanning
Jaccard’s
Logistic
regression
f0.70
*(0.56–0.82)
Com
mercial
robbery
160
UK
Equal
nControl
Jaccard’s
Logistic
regression
f0.90
**(0.84–0.94)
Com
mercial
robbery
160
UK
Equal
nControl,p
lanning,
andICD
Jaccard’s
Logistic
regression
f0.95
**(0.90–0.98)
Tonkinet
al.(200
8)
Car
theft
386
UK
Equal
nICD
n/a
Logistic
regression
f0.81
*(0.77–0.86)
Car
theft
386
UK
Equal
nInter-dumpdistance
n/a
Logistic
regression
f0.77
*(0.69–0.85)
Car
theft
386
UK
Equal
nTargetselection
Jaccard’s
Logistic
regression
f0.57
(0.51–0.63)
Car
theft
386
UK
Equal
nTargetacquisition
Jaccard’s
Logistic
regression
f0.56
(0.49–0.62)
Car
theft
386
UK
Equal
nDisposalbehaviours
Jaccard’s
Logistic
regression
f0.56
(0.50–0.62)
Bennellet
al.(2009)
Serious
sexual
assault
126
UK
Unequal
nAllMO
behaviours
Jaccard’s
ROCanalysisonly
f0.75
*(0.70–0.80)
Bennellet
al.(2010)
Serious
sexual
assault
126
UK
Unequal
nAllMO
behaviours
Jaccard’s
ROCanalysisonly
f0.81
*(0.77–0.85)
Serious
sexual
assault
126
UK
Unequal
nAllMO
behaviours
Taxonom
icsimilarity
ROCanalysisonly
f0.76
*(0.72–0.81)
Markson
etal.(2010)
Residential
burglary
160
UK
Equal
nICD
n/a
Logistic
regression
f0.90
**
160
UK
Equal
nTem
poralproxim
ityn/a
Logistic
regression
f0.86
*
(Contin
ues)
C. Bennell et al.
Copyright © 2013 John Wiley & Sons, Ltd. J. Investig. Psych. Offender Profil. (2013)
DOI: 10.1002/jip
Table
0.(Contin
ued)
Crime
type
Sam
plesize
(#crim
es)a
Sam
ple
locatio
nb
Sampling
technique
(crimepairs)
Behavioural
domain(s)
Sim
ilarity
coefficient
Statistical
method
AUC(95%
CI)
Residential
burglary
Residential
burglary
160
UK
Equal
nAllMO
behaviours
Jaccard’s
Logistic
regression
f0.61
Residential
burglary
160
UK
Equal
nTargetselection
Jaccard’s
Logistic
regression
f0.54
Residential
burglary
160
UK
Equal
nEntry
Jaccard’s
Logistic
regression
f0.54
Residential
burglary
160
UK
Equal
nPropertystolen
Jaccard’s
Logistic
regression
f0.58
Residential
burglary
160
UK
Equal
nICD
andtemporal
proxim
ityn/a
Logistic
regression
f0.95
**
Melnyket
al.(2011)
Residential
burglary
210
UK
Unequal
nAllMO
behaviours
Taxonom
icsimilarity
ROCanalysisonly
f0.59
(0.54–0.65)
Residential
burglary
210
UK
Unequal
nAllMO
behaviours
Jaccard’s
ROCanalysisonly
f0.62
(0.57–0.68)
Serialhomicide
237
United
States
Unequal
nAllMO
behaviours
Jaccard’s
ROCanalysisonly
f0.96
**(0.94–0.98)
Serialhomicide
237
United
States
Unequal
nAllMO
behaviours
Taxonom
icsimilarity
ROCanalysisonly
f0.93
**(0.91–0.96)
Tonkinet
al.(2011
)
Multip
leacross-
crim
ecategories
200
UK
Equal
nICD
n/a
Logistic
regression
d0.88
*(0.82–0.95)
Multip
leacross-
crim
ecategories
200
UK
Equal
nTem
poralproxim
ityn/a
Logistic
regression
d0.67
(0.57–0.78)
(Contin
ues)
Linking crimes using behavioural clues
Copyright © 2013 John Wiley & Sons, Ltd. J. Investig. Psych. Offender Profil. (2013)
DOI: 10.1002/jip

Table
0.(Contin
ued)
Crime
type
Sam
plesize
(#crim
es)a
Sam
ple
locatio
nb
Sampling
technique
(crimepairs)
Behavioural
domain(s)
Sim
ilarity
coefficient
Statistical
method
AUC(95%
CI)
Multip
leacross-
crim
ecategories
200
UK
Equal
nICD
andtemporal
proxim
ityn/a
Logistic
regression
d0.88
*(0.82–0.95)
Multip
leacross-
crim
etypes
200
UK
Equal
nICD
n/a
Logistic
regression
d0.90
**(0.84–0.97)
Multip
leacross-
crim
etypes
200
UK
Equal
nTem
poralproxim
ityn/a
Logistic
regression
d0.74
*(0.64–0.83)
Multip
lewith
in-
crim
etypes
200
UK
Equal
nICD
n/a
Logistic
regression
d0.91
**(0.84–0.97)
Multip
lewith
in-
crim
etypes
200
UK
Equal
nTem
poralproxim
ityn/a
Logistic
regression
d0.74
*(0.64–0.84)
Burrellet
al.(2012)g
Personalrobbery
166
UK
Equal
nICD
n/a
Logistic
regression
d0.92
**(0.86–0.97)
Personalrobbery
166
UK
Equal
nTem
poralproxim
ityn/a
Logistic
regression
d0.83
*(0.74–0.92)
Personalrobbery
166
UK
Equal
nAllMO
behaviours
Jaccard’s
Logistic
regression
d0.64
(0.52–0.76)
Personalrobbery
166
UK
Equal
nTargetselection
Jaccard’s
Logistic
regression
d0.64
(0.52–0.76)
Personalrobbery
166
UK
Equal
nControl
Jaccard’s
Logistic
regression
d0.56
(0.44–0.69)
Personalrobbery
166
UK
Equal
nPropertystolen
Jaccard’s
Logistic
regression
d0.45
(0.32–0.57)
Personalrobbery
166
UK
Equal
nTargetselectionand
ICD
Jaccard’s
Logistic
regression
d0.90
**(0.84–0.97)
Personalrobbery
166
UK
Equal
nICD
n/a
Logistic
regression
d0.75
*(0.64–0.86)
Personalrobbery
166
UK
Equal
nTem
poralproxim
ityn/a
Logistic
regression
d0.72
*(0.60–0.83)
Personalrobbery
166
UK
Equal
nAllMO
behaviours
Jaccard’s
Logistic
regression
d0.70
*(0.59–0.82)
Personalrobbery
166
UK
Equal
nTargetselection
Jaccard’s
Logistic
regression
d0.69
(0.58–0.81)
Personalrobbery
166
UK
Equal
nControl
Jaccard’s
Logistic
regression
d0.66
(0.54–0.78)
Personalrobbery
166
UK
Equal
nPropertystolen
Jaccard’s
Logistic
regression
d0.45
(0.33–0.58)
Personalrobbery
166
UK
Equal
nTargetselectionand
ICD
Jaccard’s
Logistic
regression
d0.78
*(0.68–0.88)
(Contin
ues)
C. Bennell et al.
Copyright © 2013 John Wiley & Sons, Ltd. J. Investig. Psych. Offender Profil. (2013)
DOI: 10.1002/jip

Table
0.(Contin
ued)
Crime
type
Sam
plesize
(#crim
es)a
Sam
ple
locatio
nb
Sampling
technique
(crimepairs)
Behavioural
domain(s)
Sim
ilarity
coefficient
Statistical
method
AUC(95%
CI)
Davieset
al.(2012)
Car
andcar
keythefts
258
UK
Unequal
nICD
n/a
Logistic
regression
d0.91
**(0.85–0.97)
Car
andcar
keythefts
258
UK
Unequal
nInter-dumpdistance
n/a
Logistic
regression
d0.88
*(0.79–0.97)
Car
andcar
keythefts
258
UK
Equal
nTem
poralproxim
ityn/a
Logistic
regression
d0.78
*(0.69–0.86)
Car
andcar
keythefts
258
UK
Equal
nTargetselection
(old)
Jaccard’s
Logistic
regression
d0.62
(0.53–0.72)
Car
andcar
keythefts
258
UK
Equal
nTargetselection
(new
)Jaccard’s
Logistic
regression
d0.76
*(0.68–0.84)
Car
andcar
keythefts
258
UK
Equal
nTargetacquisition
Jaccard’s
Logistic
regression
d0.64
(0.55–0.74)
Car
andcar
keythefts
258
UK
Equal
nTargetdisposal
Jaccard’s
Logistic
regression
d0.54
(0.44–0.64)
Car
andcar
keythefts
258
UK
Equal
nCar
agedifference
n/a
Logistic
regression
d0.62
(0.52–0.72)
Car
andcar
keythefts
258
UK
Equal
nCar
valuedifference
n/a
Logistic
regression
d0.56
(0.46–0.67)
Car
andcar
keythefts
258
UK
Equal
nICD,tem
poral
proxim
ity,
target
selection
(new
),and
target
acquisition
Jaccard’s
Logistic
regression
d0.93
**(0.89–0.97)
Tonkin,
Santtila,&
Bull(2012)
Residential
burglary
234
Finland
Equal
nICD
n/a
Logistic
regression
d0.84
*(0.75–0.93)
(Contin
ues)
Linking crimes using behavioural clues
Copyright © 2013 John Wiley & Sons, Ltd. J. Investig. Psych. Offender Profil. (2013)
DOI: 10.1002/jip

Table
0.(Contin
ued)
Crime
type
Sam
plesize
(#crim
es)a
Sam
ple
locatio
nb
Sampling
technique
(crimepairs)
Behavioural
domain(s)
Sim
ilarity
coefficient
Statistical
method
AUC(95%
CI)
Residential
burglary
234
Finland
Equal
nTem
poralproxim
ityn/a
Logistic
regression
d0.82
*(0.74–0.90)
Residential
burglary
234
Finland
Equal
nAllMO
behaviours
Jaccard’s
Logistic
regression
d0.72
*(0.63–0.81)
Residential
burglary
234
Finland
Equal
nTargetselection
Jaccard’s
Logistic
regression
d0.73
*(0.64–0.82)
Residential
burglary
234
Finland
Equal
nEntry
Jaccard’s
Logistic
regression
d0.66
(0.56–0.76)
Residential
burglary
234
Finland
Equal
nInternal
behaviours
Jaccard’s
Logistic
regression
d0.66
(0.56–0.76)
Residential
burglary
234
Finland
Equal
nPropertystolen
Jaccard’s
Logistic
regression
d0.58
(0.48–0.69)
Residential
burglary
234
Finland
Equal
nICD,tem
poral
proxim
ity,
andtarget
selection
Jaccard’s
Logistic
regression
d0.86
*(0.78–0.93)
Residential
burglary
234
Finland
Equal
nICD
andtemporal
proxim
ityn/a
Logistic
regression
d0.86
*(0.79–0.84)
Residential
burglary
234
Finland
Equal
nICD
n/a
Logistic
regression
d0.85
*(0.76–0.93)
Residential
burglary
234
Finland
Equal
nTem
poralproxim
ityn/a
Logistic
regression
d0.82
*(0.74–0.90)
Residential
burglary
234
Finland
Equal
nAllMO
behaviours
Jaccard’s
Logistic
regression
d0.73
*(0.64–0.82)
Residential
burglary
234
Finland
Equal
nTargetselection
Jaccard’s
Logistic
regression
d0.71
*(0.61–0.80)
Residential
burglary
234
Finland
Equal
nEntry
Jaccard’s
Logistic
regression
d0.66
(0.56–0.76)
(Contin
ues)
C. Bennell et al.
Copyright © 2013 John Wiley & Sons, Ltd. J. Investig. Psych. Offender Profil. (2013)
DOI: 10.1002/jip

Table
0.(Contin
ued)
Crime
type
Sam
plesize
(#crim
es)a
Sam
ple
locatio
nb
Sampling
technique
(crimepairs)
Behavioural
domain(s)
Sim
ilarity
coefficient
Statistical
method
AUC(95%
CI)
Residential
burglary
234
Finland
Equal
nInternal
behaviours
Jaccard’s
Logistic
regression
d0.72
*(0.63–0.81)
Residential
burglary
234
Finland
Equal
nPropertystolen
Jaccard’s
Logistic
regression
d0.55
(0.44–0.66)
Residential
burglary
234
Finland
Equal
nICD,tem
poral
proxim
ity,
andtarget
selection
Jaccard’s
Logistic
regression
d0.88
*(0.81–0.95)
Residential
burglary
234
Finland
Equal
nICD
andtemporal
proxim
ityn/a
Logistic
regression
d0.89
*(0.82–0.96)
Tonkin,
Woodham
s,Bull,&
Bond(2012)
Multip
leacross-
crim
ecategories
264
UK
Equal
nICD
n/a
Logistic
regression
d0.88
*(0.82–0.95)
Multip
leacross-
crim
ecategories
264
UK
Equal
nTem
poralproxim
ityn/a
Logistic
regression
d0.67
(0.57–0.78)
Multip
leacross-
crim
ecategories
264
UK
Equal
nICD,tem
poral
proxim
ityn/a
Logistic
regression
d0.88
*(0.82–0.95)
Multip
leacross-
crim
etypes
264
UK
Equal
nICD
n/a
Logistic
regression
d0.90
**(0.84–0.97)
Multip
leacross-
crim
etypes
264
UK
Equal
nTem
poralproxim
ityn/a
Logistic
regression
d0.74
*(0.64–0.83)
Multip
lewith
in-
crim
etypes
264
UK
Equal
nICD
n/a
Logistic
regression
d0.91
**(0.84–0.97)
Multip
lewith
in-
crim
etypes
264
UK
Equal
nTem
poralproxim
ityn/a
Logistic
regression
d0.74
*(0.64–0.84)
(Contin
ues)
Linking crimes using behavioural clues
Copyright © 2013 John Wiley & Sons, Ltd. J. Investig. Psych. Offender Profil. (2013)
DOI: 10.1002/jip

Table
0.(Contin
ued)
Crime
type
Sam
plesize
(#crim
es)a
Sam
ple
locatio
nb
Sam
pling
technique
(crimepairs)
Behavioural
domain(s)
Sim
ilarity
coefficient
Statistical
method
AUC(95%
CI)
Tonkin,
Woodham
s,Bull,Bond,
&Santtila
(2012)
Car
theft
376
UK
Unequal
nICD
anddisposal
behaviours
Jaccard’s
Iterative
classificatio
ntree
d
0.78
*(0.74–0.83)
Car
theft
376
UK
Unequal
nICD
Jaccard’s
Logistic
regression
d0.82
*(0.78–0.86)
Car
theft
376
UK
Unequal
nAllMO
behaviours
Jaccard’s
Logistic
regression
d0.56
(0.50–0.62)
Car
theft
376
UK
Unequal
nTargetselection
Jaccard’s
Logistic
regression
d0.54
(0.49–0.60)
Car
theft
376
UK
Unequal
nTargetacquisition
Jaccard’s
Logistic
regression
d0.54
(0.48–0.60)
Car
theft
376
UK
Unequal
nDisposalbehaviour
Jaccard’s
Logistic
regression
d0.50
(0.44–0.57)
Car
theft
376
UK
Unequal
nICD,target
selection,
and
disposal
Jaccard’s
Logistic
regression
d0.80
*(0.76–0.84)
Residential
burglary
160
Finland
Unequal
nICD,entry,
internal
behaviours
Jaccard’s
Iterative
classificatio
ntree
d
0.80
*(0.71–0.88)
Residential
burglary
160
Finland
Unequal
nICD
Jaccard’s
Logistic
regression
d0.83
*(0.76–0.89)
Residential
burglary
160
Finland
Unequal
nAllMO
behaviours
Jaccard’s
Logistic
regression
d0.82
*(0.76–0.89)
Residential
burglary
160
Finland
Unequal
nTargetselection
Jaccard’s
Logistic
regression
d0.77
*(0.69–0.85)
Residential
burglary
160
Finland
Unequal
nEntry
Jaccard’s
Logistic
regression
d0.70
*(0.61–0.79)
Residential
burglary
160
Finland
Unequal
nInternal
behaviours
Jaccard’s
Logistic
regression
d0.78
*(0.72–0.84)
Residential
burglary
160
Finland
Unequal
nPropertyStolen
Jaccard’s
Logistic
regression
d0.66
(0.57–0.75)
(Contin
ues)
C. Bennell et al.
Copyright © 2013 John Wiley & Sons, Ltd. J. Investig. Psych. Offender Profil. (2013)
DOI: 10.1002/jip

Table
0.(Contin
ued)
Crime
type
Sam
plesize
(#crim
es)a
Sam
ple
locatio
nb
Sampling
technique
(crimepairs)
Behavioural
domain(s)
Sim
ilarity
coefficient
Statistical
method
AUC(95%
CI)
Residential
burglary
160
Finland
Unequal
nICD,entry,
internal
behaviours
Jaccard’s
Logistic
regression
d0.87
*(0.81–0.92)
Woodham
sandLabuschagne
(2012a)
Serious
sexual
assault
119
South
Africa
Unequal
nAllMO
behaviours
Jaccard’s
Logistic
regression
d0.88
*(0.86–0.89)
Alloffences
from
each
series
Serious
sexual
assault
119
South
Africa
Unequal
nAllMO
behaviours
Jaccard’s
Logistic
regression
d0.77
*(0.67–0.87)
Constantn
umber
ofoffences
per
series
Ellingwoodet
al.(2013)
Arson
114
UK
Unequal
nAllMO
behaviours
Sim
pleMatching
Logistic
regression
d0.93
**(0.89–0.96)
Arson
114
UK
Unequal
nInstrumentalPerson
Sim
pleMatching
Logistic
regression
d0.90
**(0.87–0.94)
Arson
114
UK
Unequal
nInstrumentalObject
Sim
pleMatching
Logistic
regression
d0.83
*(0.78–0.89)
Arson
114
UK
Unequal
nExpressivePerson
Sim
pleMatching
Logistic
regression
d0.82
*(0.76–0.87)
Arson
114
UK
Unequal
nInstrumentalperson,
instrumentalobject,
andexpressive
person
Sim
pleMatching
Logistic
regression
d0.92
**(0.88–0.95)
Arson
114
UK
Unequal
nAllMO
behaviours
Jaccard’s
Logistic
regression
d0.89
*(0.85–0.94)
Arson
114
UK
Unequal
nInstrumentalPerson
Jaccard’s
Logistic
regression
d0.77
*(0.69–0.84)
Arson
114
UK
Unequal
nInstrumentalObject
Jaccard’s
Logistic
regression
d0.82
*(0.76–0.88)
Arson
114
UK
Unequal
nExpressivePerson
Jaccard’s
Logistic
regression
d0.72
*(0.64–0.79)
Arson
114
UK
Unequal
nInstrumentalobject
andinstrumental
person
Jaccard’s
Logistic
regression
d0.84
*(0.78–0.90)
(Contin
ues)
Linking crimes using behavioural clues
Copyright © 2013 John Wiley & Sons, Ltd. J. Investig. Psych. Offender Profil. (2013)
DOI: 10.1002/jip

Table
0.(Contin
ued)
Crime
type
Sam
plesize
(#crim
es)a
Sam
ple
locatio
nb
Sam
pling
technique
(crimepairs)
Behavioural
domain(s)
Similarity
coefficient
Statistical
method
AUC(95%
CI)
Winteret
al.(2013)h
Attempted
and
completed
rape
219
UK
90serial
offences
Location-indoor,
locatio
n-outdoor,controlling
behaviour,expressive
violent
acts,forcedsexual
acts,d
egrading
behaviour,
undressing/re-
dressing
n/a
Discrim
inant
functio
nanalysisd
0.74
*(0.72–0.76)
Attempted
and
completed
rape
219
UK
90serial
and
129one-off
offences
Asabove
n/a
Discrim
inant
functio
nanalysisd
0.80
*(0.79–0.81)
Attempted
and
completed
rape
219
UK
90serial
offences
46offence
behaviours
n/a
Naïve
bayesian
classifier
d0.84
*(0.82–0.85)
Attempted
and
completed
rape
219
UK
90serial
and
129one-off
offences
46offence
behaviours
n/a
Naïve
bayesian
classifier
d0.89
*(0.88–0.89)
a Sam
plesize
refersto
theoveralln
umberof
crim
esused
inthestudy.
The
exactn
umberof
crim
esused
ineach
linking
modelin
agivenstudymay
vary
slightly
dueto
missing
data.
bItisimportanttonotethatanumberof
thesestudieshave
used
very
similarsamples.A
ssuch,eachstudycannotbe
interpretedas
beingcompletelyindependentofone
another.Fo
rexample,Tonkin,Woodham
s,Bull,Bond,&Santtila.(2012)used
verysimilarsam
plestothoseused
inTonkinetal.(2008)and
Tonkin,Santtilaetal.(2012).
c ICD,inter-crim
edistance.
dWith
model
cross-valid
ation.
e Sam
plesize
was
unavailableforBennellandJones(2005).
f With
outmodel
cross-valid
ation.
gThe
firstseven
AUCsreflectunlinkedcrim
epairsfrom
differentboroughs,whereas
thelastsevenAUCsreflectunlinkedcrim
epairsfrom
thesameboroughonly.
hOnlysingle
crim
es,n
otcrim
epairs,wereused
inWinteret
al.(2013).
*ModerateAUCaccordingto
Swets’
(1988)
guidelines.
**HighAUCaccordingto
Swets’
(1988)
guidelines.
C. Bennell et al.
Copyright © 2013 John Wiley & Sons, Ltd. J. Investig. Psych. Offender Profil. (2013)
DOI: 10.1002/jip


