Embed Size (px)
Citation preview
O
Le
S5
a
ARA
KTAmIT
I
ntvDmoca2fve(
its
1h
Dendrochronologia 30 (2012) 287–294
Contents lists available at SciVerse ScienceDirect
Dendrochronologia
journa l homepage: www.e lsev ier .de /dendro
riginal article
inking aerial survey data of forest insect defoliation and tree ring data tostimate forest level growth losses
teen Magnussen ∗, René I. Alfaro06 West Burnside Road, Natural Resources Canada, Canadian Forest Service, Victoria, BC, V8Z 1M5 Canada
r t i c l e i n f o
rticle history:eceived 7 July 2011ccepted 8 March 2012
eywords:ree ring analysisutoregressive conditional heteroscedasticodel
nsect surveysree response to defoliation and climate
a b s t r a c t
Aerial surveys provide valuable information on the scale and severity of defoliation and mortality causedby forest insects. However, methods to estimate the losses in growth using aerial survey data are not avail-able. This study presents a method to link aerial survey data of location and severity of insect defoliationto tree ring series of radial growth in order to quantify potential growth losses due to defoliation. Themethod includes estimation of potentially confounding effects of climate. As an example we used aerialsurveys of hemlock looper defoliation in the Mt. Revelstoke region of British Columbia, and tree ring seriesof radial growth of 351 western hemlock trees located in 22 plots and exposed to various levels of periodicdefoliation. An autoregressive conditional heteroskedasticity time-series model (ARCH) of standardizedgrowth indices identified significant direct and lagged effects of climate and defoliation on radial growthbetween 1930 and 2005. Defoliation effects were statistically significant in all plots (P < 0.05). The varia-
tion in both timing and strength of estimated growth reductions varied considerably among plots. Duringyears of observed defoliation the radial growth was reduced by an average of 10%. Growth reductionsattributed to defoliation were most pronounced in the second and third year of a looper outbreak. Ourmodelling approach linked tree ring data to aerial survey data of defoliation through a logistic distancetion aCopy
cooiwG
1becwod
as
dependent threshold funcCrown
ntroduction
Large scale insect defoliation of forest trees is a common phe-omenon in Canada’s forests (Cooke et al., 2007). Information abouthe location, extent, and severity of defoliation is typically pro-ided by annual aerial surveys of insect defoliation (Harris andawson, 1979; Iqbal and MacLean, 2010). For an effective manage-ent of forest resources an assessment of the impact of defoliation
n growth of forest trees is also needed. This information typi-ally arrives from well-studied, on the ground forest plots withknown defoliation history of individual trees (Zhang and Alfaro,002; Mayfield et al., 2005). However, it has generally not beeneasible to link ground-based tree-level responses to aerial obser-ations of defoliation severity (Erdle and MacLean, 1999; Pothiert al., 2005), mostly due to unresolved scaling and accuracy issuesHarris and Dawson, 1979; MacLean and MacKinnon, 1996).
This study demonstrates how tree ring series of radial growth
ncrements in trees growing in areas exposed to repeated defolia-ion events can be used, in combination with aerial survey-basedketch maps of location, extent, and severity of defoliation, to∗ Corresponding author. Tel.: +1 250 298 2423; fax: +1 250 363 0775.E-mail address: [email protected] (S. Magnussen).
aH(a1ec
125-7865/$ – see front matter. Crown Copyright © 2012 Published by Elsevier GmbH onttp://dx.doi.org/10.1016/j.dendro.2012.03.001
nd affords a quantitative estimation of regional growth losses.right © 2012 Published by Elsevier GmbH on behalf of Istituto Italiano di
Dendrocronologia. All rights reserved.
ompute plot-level estimates of growth losses due to defoliation. Tour knowledge this is the first attempt of this kind. We demonstrateur generally applicable approach with an example of defoliationn western hemlock (Hw, Tsuga heterophylla (Raf.) Sarg.) by the
estern hemlock looper (Lambdina fiscellaria (Hulst) Lepidoptera:eometridae) or HL for short.
The HL occurs throughout most of North America (Jardine,969). The larvae feed on the foliage of most conifers and someroad-leaved species, but prefer western hemlock. The west-rn subspecies, lugubrosa, periodically increases in numbers andauses defoliation and subsequent tree mortality over limited,ell-defined areas in British Columbia, resulting in large losses
f timber during periodic outbreaks (Kinghorn, 1954). A detailedescription of the looper biology can be found in Jardine (1969).
Looper outbreak populations can remove nearly all of the newnd old needles on a tree in a single season. The severity and inten-ity of defoliation, however, is known to vary considerably amongreas affected during an outbreak (Kinghorn, 1954; Jardine, 1969;arris et al., 1985; Alfaro et al., 1999). According to Stock et al.
2005) mature, dense, and uneven aged (multilayered) stands with
high proportion of western hemlock in valley bottoms (below400 m a.s.l.) are the most susceptible. Although outbreaks gen-rally last no more than three to four years, western hemlock isonsidered intolerant of defoliation, and mortality can occur after
behalf of Istituto Italiano di Dendrocronologia. All rights reserved.
288 S. Magnussen, R.I. Alfaro / Dendrochronologia 30 (2012) 287–294
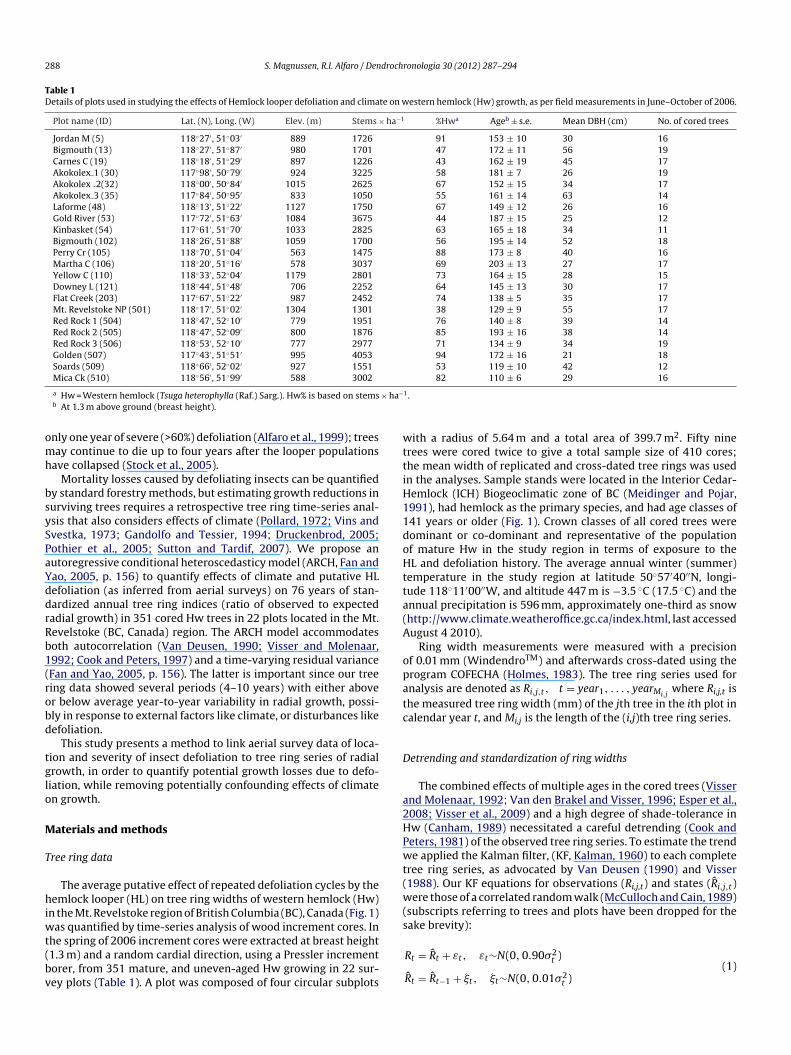
Table 1Details of plots used in studying the effects of Hemlock looper defoliation and climate on western hemlock (Hw) growth, as per field measurements in June–October of 2006.
Plot name (ID) Lat. (N), Long. (W) Elev. (m) Stems × ha−1 %Hwa Ageb ± s.e. Mean DBH (cm) No. of cored trees
Jordan M (5) 118◦27′ , 51◦03′ 889 1726 91 153 ± 10 30 16Bigmouth (13) 118◦27′ , 51◦87′ 980 1701 47 172 ± 11 56 19Carnes C (19) 118◦18′ , 51◦29′ 897 1226 43 162 ± 19 45 17Akokolex 1 (30) 117◦98′ , 50◦79′ 924 3225 58 181 ± 7 26 19Akokolex 2(32) 118◦00′ , 50◦84′ 1015 2625 67 152 ± 15 34 17Akokolex 3 (35) 117◦84′ , 50◦95′ 833 1050 55 161 ± 14 63 14Laforme (48) 118◦13′ , 51◦22′ 1127 1750 67 149 ± 12 26 16Gold River (53) 117◦72′ , 51◦63′ 1084 3675 44 187 ± 15 25 12Kinbasket (54) 117◦61′ , 51◦70′ 1033 2825 63 165 ± 18 34 11Bigmouth (102) 118◦26′ , 51◦88′ 1059 1700 56 195 ± 14 52 18Perry Cr (105) 118◦70′ , 51◦04′ 563 1475 88 173 ± 8 40 16Martha C (106) 118◦20′ , 51◦16′ 578 3037 69 203 ± 13 27 17Yellow C (110) 118◦33′ , 52◦04′ 1179 2801 73 164 ± 15 28 15Downey L (121) 118◦44′ , 51◦48′ 706 2252 64 145 ± 13 30 17Flat Creek (203) 117◦67′ , 51◦22′ 987 2452 74 138 ± 5 35 17Mt. Revelstoke NP (501) 118◦17′ , 51◦02′ 1304 1301 38 129 ± 9 55 17Red Rock 1 (504) 118◦47′ , 52◦10′ 779 1951 76 140 ± 8 39 14Red Rock 2 (505) 118◦47′ , 52◦09′ 800 1876 85 193 ± 16 38 14Red Rock 3 (506) 118◦53′ , 52◦10′ 777 2977 71 134 ± 9 34 19Golden (507) 117◦43′ , 51◦51′ 995 4053 94 172 ± 16 21 18Soards (509) 118◦66′ , 52◦02′ 927 1551 53 119 ± 10 42 12Mica Ck (510) 118◦56′ , 51◦99′ 588 3002 82 110 ± 6 29 16
× ha−
omh
bsySPaYddrRb1(robd
tglo
M
T
hiwt(bv
wttiH11doHtta(A
opatc
D
a2HPwt(w(s
a Hw = Western hemlock (Tsuga heterophylla (Raf.) Sarg.). Hw% is based on stemsb At 1.3 m above ground (breast height).
nly one year of severe (>60%) defoliation (Alfaro et al., 1999); treesay continue to die up to four years after the looper populations
ave collapsed (Stock et al., 2005).Mortality losses caused by defoliating insects can be quantified
y standard forestry methods, but estimating growth reductions inurviving trees requires a retrospective tree ring time-series anal-sis that also considers effects of climate (Pollard, 1972; Vins andvestka, 1973; Gandolfo and Tessier, 1994; Druckenbrod, 2005;othier et al., 2005; Sutton and Tardif, 2007). We propose anutoregressive conditional heteroscedasticy model (ARCH, Fan andao, 2005, p. 156) to quantify effects of climate and putative HLefoliation (as inferred from aerial surveys) on 76 years of stan-ardized annual tree ring indices (ratio of observed to expectedadial growth) in 351 cored Hw trees in 22 plots located in the Mt.evelstoke (BC, Canada) region. The ARCH model accommodatesoth autocorrelation (Van Deusen, 1990; Visser and Molenaar,992; Cook and Peters, 1997) and a time-varying residual varianceFan and Yao, 2005, p. 156). The latter is important since our treeing data showed several periods (4–10 years) with either abover below average year-to-year variability in radial growth, possi-ly in response to external factors like climate, or disturbances likeefoliation.
This study presents a method to link aerial survey data of loca-ion and severity of insect defoliation to tree ring series of radialrowth, in order to quantify potential growth losses due to defo-iation, while removing potentially confounding effects of climaten growth.
aterials and methods
ree ring data
The average putative effect of repeated defoliation cycles by theemlock looper (HL) on tree ring widths of western hemlock (Hw)
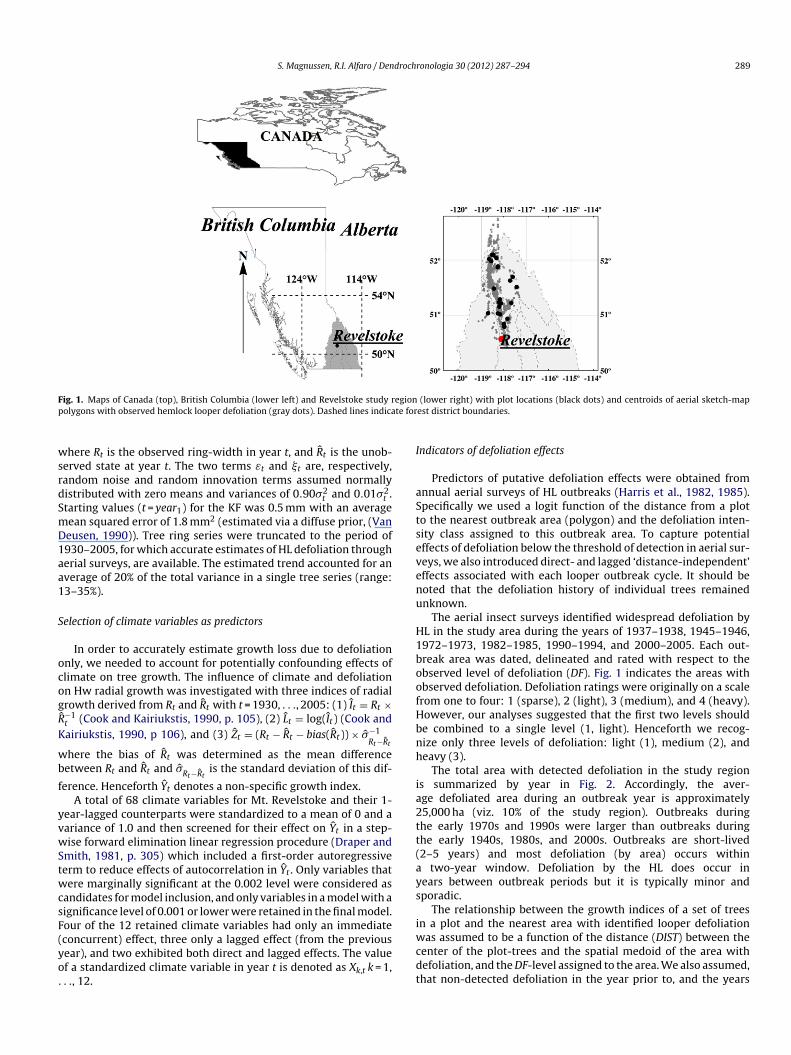
n the Mt. Revelstoke region of British Columbia (BC), Canada (Fig. 1)as quantified by time-series analysis of wood increment cores. In
he spring of 2006 increment cores were extracted at breast height1.3 m) and a random cardial direction, using a Pressler incrementorer, from 351 mature, and uneven-aged Hw growing in 22 sur-ey plots (Table 1). A plot was composed of four circular subplots
1.
ith a radius of 5.64 m and a total area of 399.7 m2. Fifty ninerees were cored twice to give a total sample size of 410 cores;he mean width of replicated and cross-dated tree rings was usedn the analyses. Sample stands were located in the Interior Cedar-emlock (ICH) Biogeoclimatic zone of BC (Meidinger and Pojar,991), had hemlock as the primary species, and had age classes of41 years or older (Fig. 1). Crown classes of all cored trees wereominant or co-dominant and representative of the populationf mature Hw in the study region in terms of exposure to theL and defoliation history. The average annual winter (summer)
emperature in the study region at latitude 50◦57′40′′N, longi-ude 118◦11′00′′W, and altitude 447 m is −3.5 ◦C (17.5 ◦C) and thennual precipitation is 596 mm, approximately one-third as snowhttp://www.climate.weatheroffice.gc.ca/index.html, last accessedugust 4 2010).
Ring width measurements were measured with a precisionf 0.01 mm (WindendroTM) and afterwards cross-dated using therogram COFECHA (Holmes, 1983). The tree ring series used fornalysis are denoted as Ri,j,t, t = year1, . . . , yearMi,j
where Ri,j,t ishe measured tree ring width (mm) of the jth tree in the ith plot inalendar year t, and Mi,j is the length of the (i,j)th tree ring series.
etrending and standardization of ring widths
The combined effects of multiple ages in the cored trees (Vissernd Molenaar, 1992; Van den Brakel and Visser, 1996; Esper et al.,008; Visser et al., 2009) and a high degree of shade-tolerance inw (Canham, 1989) necessitated a careful detrending (Cook andeters, 1981) of the observed tree ring series. To estimate the trende applied the Kalman filter, (KF, Kalman, 1960) to each complete
ree ring series, as advocated by Van Deusen (1990) and Visser1988). Our KF equations for observations (Ri,j,t) and states (Ri,j,t)ere those of a correlated random walk (McCulloch and Cain, 1989)
subscripts referring to trees and plots have been dropped for theake brevity):
Rt = Rt + εt, εt∼N(0, 0.90�2t )
Rt = Rt−1 + �t, �t∼N(0, 0.01�2t )
(1)
S. Magnussen, R.I. Alfaro / Dendrochronologia 30 (2012) 287–294 289
F egionp te for
wsrdSmD1aa1
S
ocogR
K
wb
f
yvwStwcsF(yo.
I
aStsevenu
H1boofHbnh
ia2tt(ays
i
ig. 1. Maps of Canada (top), British Columbia (lower left) and Revelstoke study rolygons with observed hemlock looper defoliation (gray dots). Dashed lines indica
here Rt is the observed ring-width in year t, and Rt is the unob-erved state at year t. The two terms εt and �t are, respectively,andom noise and random innovation terms assumed normallyistributed with zero means and variances of 0.90�2
t and 0.01�2t .
tarting values (t = year1) for the KF was 0.5 mm with an averageean squared error of 1.8 mm2 (estimated via a diffuse prior, (Vaneusen, 1990)). Tree ring series were truncated to the period of930–2005, for which accurate estimates of HL defoliation througherial surveys, are available. The estimated trend accounted for anverage of 20% of the total variance in a single tree series (range:3–35%).
election of climate variables as predictors
In order to accurately estimate growth loss due to defoliationnly, we needed to account for potentially confounding effects oflimate on tree growth. The influence of climate and defoliationn Hw radial growth was investigated with three indices of radialrowth derived from Rt and Rt with t = 1930, . . ., 2005: (1) It = Rt ×
ˆ−1t (Cook and Kairiukstis, 1990, p. 105), (2) Lt = log(It) (Cook andairiukstis, 1990, p 106), and (3) Zt = (Rt − Rt − bias(Rt)) × �−1
Rt−Rt
here the bias of Rt was determined as the mean differenceetween Rt and Rt and �Rt−Rt
is the standard deviation of this dif-
erence. Henceforth Yt denotes a non-specific growth index.A total of 68 climate variables for Mt. Revelstoke and their 1-
ear-lagged counterparts were standardized to a mean of 0 and aariance of 1.0 and then screened for their effect on Yt in a step-ise forward elimination linear regression procedure (Draper and
mith, 1981, p. 305) which included a first-order autoregressiveerm to reduce effects of autocorrelation in Yt . Only variables thatere marginally significant at the 0.002 level were considered as
andidates for model inclusion, and only variables in a model with aignificance level of 0.001 or lower were retained in the final model.our of the 12 retained climate variables had only an immediate
concurrent) effect, three only a lagged effect (from the previousear), and two exhibited both direct and lagged effects. The valuef a standardized climate variable in year t is denoted as Xk,t k = 1,. ., 12.wcdt
(lower right) with plot locations (black dots) and centroids of aerial sketch-mapest district boundaries.
ndicators of defoliation effects
Predictors of putative defoliation effects were obtained fromnnual aerial surveys of HL outbreaks (Harris et al., 1982, 1985).pecifically we used a logit function of the distance from a ploto the nearest outbreak area (polygon) and the defoliation inten-ity class assigned to this outbreak area. To capture potentialffects of defoliation below the threshold of detection in aerial sur-eys, we also introduced direct- and lagged ‘distance-independent’ffects associated with each looper outbreak cycle. It should beoted that the defoliation history of individual trees remainednknown.
The aerial insect surveys identified widespread defoliation byL in the study area during the years of 1937–1938, 1945–1946,972–1973, 1982–1985, 1990–1994, and 2000–2005. Each out-reak area was dated, delineated and rated with respect to thebserved level of defoliation (DF). Fig. 1 indicates the areas withbserved defoliation. Defoliation ratings were originally on a scalerom one to four: 1 (sparse), 2 (light), 3 (medium), and 4 (heavy).owever, our analyses suggested that the first two levels shoulde combined to a single level (1, light). Henceforth we recog-ize only three levels of defoliation: light (1), medium (2), andeavy (3).
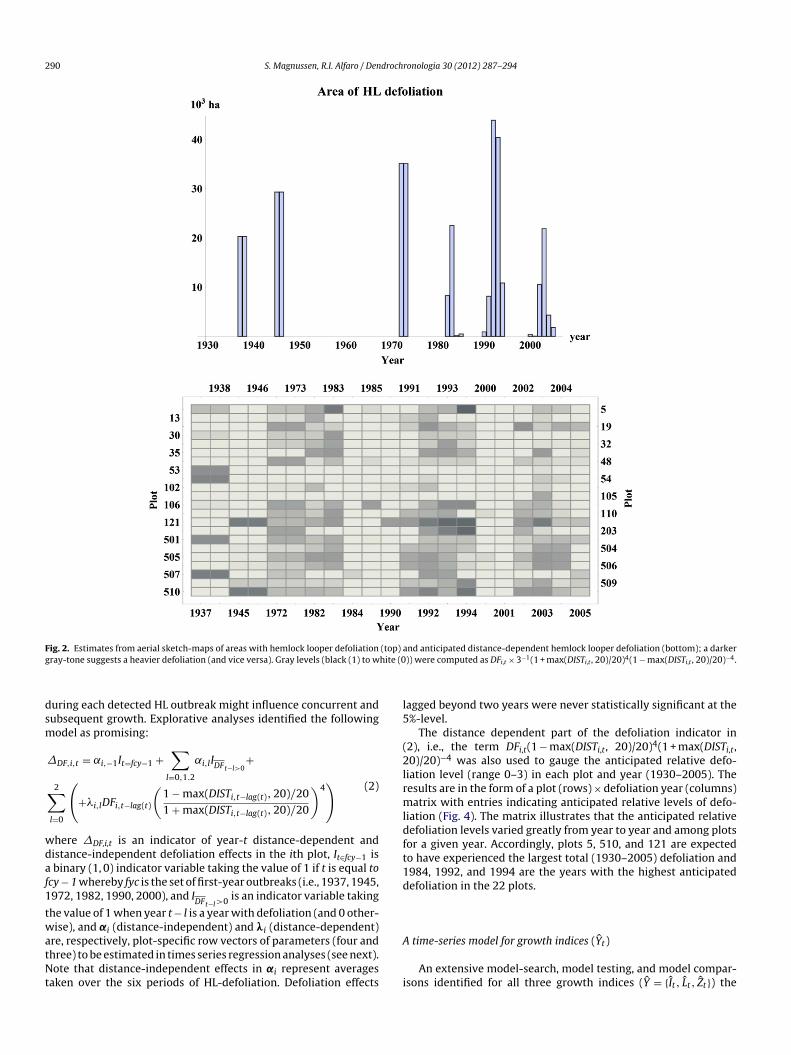
The total area with detected defoliation in the study regions summarized by year in Fig. 2. Accordingly, the aver-ge defoliated area during an outbreak year is approximately5,000 ha (viz. 10% of the study region). Outbreaks duringhe early 1970s and 1990s were larger than outbreaks duringhe early 1940s, 1980s, and 2000s. Outbreaks are short-lived2–5 years) and most defoliation (by area) occurs within
two-year window. Defoliation by the HL does occur inears between outbreak periods but it is typically minor andporadic.
The relationship between the growth indices of a set of treesn a plot and the nearest area with identified looper defoliation
as assumed to be a function of the distance (DIST) between theenter of the plot-trees and the spatial medoid of the area withefoliation, and the DF-level assigned to the area. We also assumed,hat non-detected defoliation in the year prior to, and the years
290 S. Magnussen, R.I. Alfaro / Dendrochronologia 30 (2012) 287–294
F (top) ag hite (0
dsm
wdaf1
twatNt
l5
(2lrmldft1d
ig. 2. Estimates from aerial sketch-maps of areas with hemlock looper defoliationray-tone suggests a heavier defoliation (and vice versa). Gray levels (black (1) to w
uring each detected HL outbreak might influence concurrent andubsequent growth. Explorative analyses identified the followingodel as promising:
�DF,i,t = ˛i,−1It=fcy−1 +∑
l=0,1.2
˛i,lIDFt−l>0+
2∑l=0
(+�i,lDFi,t−lag(t)
(1 − max(DISTi,t−lag(t), 20)/201 + max(DISTi,t−lag(t), 20)/20
)4) (2)
here �DF,i,t is an indicator of year-t distance-dependent andistance-independent defoliation effects in the ith plot, It∈fcy−1 isbinary (1, 0) indicator variable taking the value of 1 if t is equal to
cy − 1 whereby fyc is the set of first-year outbreaks (i.e., 1937, 1945,972, 1982, 1990, 2000), and I
DFt−l>0 is an indicator variable taking
he value of 1 when year t − l is a year with defoliation (and 0 other-ise), and ˛i (distance-independent) and �i (distance-dependent)
re, respectively, plot-specific row vectors of parameters (four andhree) to be estimated in times series regression analyses (see next).ote that distance-independent effects in ˛i represent averages
aken over the six periods of HL-defoliation. Defoliation effects
A
i
nd anticipated distance-dependent hemlock looper defoliation (bottom); a darker)) were computed as DFi,t × 3−1(1 + max(DISTi,t , 20)/20)4(1 − max(DISTi,t , 20)/20)−4.
agged beyond two years were never statistically significant at the%-level.
The distance dependent part of the defoliation indicator in2), i.e., the term DFi,t(1 − max(DISTi,t, 20)/20)4(1 + max(DISTi,t,0)/20)−4 was also used to gauge the anticipated relative defo-
iation level (range 0–3) in each plot and year (1930–2005). Theesults are in the form of a plot (rows) × defoliation year (columns)atrix with entries indicating anticipated relative levels of defo-
iation (Fig. 4). The matrix illustrates that the anticipated relativeefoliation levels varied greatly from year to year and among plotsor a given year. Accordingly, plots 5, 510, and 121 are expectedo have experienced the largest total (1930–2005) defoliation and984, 1992, and 1994 are the years with the highest anticipatedefoliation in the 22 plots.
time-series model for growth indices (Yt)
An extensive model-search, model testing, and model compar-sons identified for all three growth indices (Y = {It , Lt , Zt}) the
drochronologia 30 (2012) 287–294 291
f(
wtoaεddhostovhatac
R{f
R
BrIe
bwstdrNfov1o
oe
m(ee
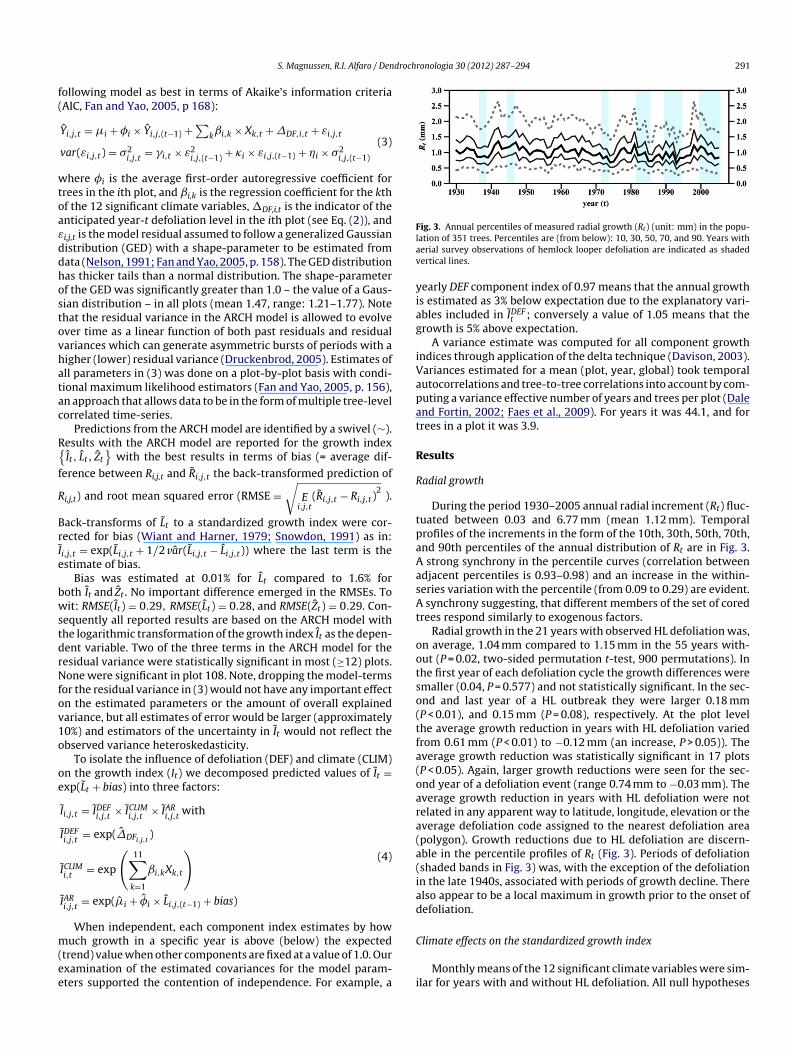
Fig. 3. Annual percentiles of measured radial growth (R ) (unit: mm) in the popu-lav
yiag
iVapat
R
R
tpaAasAt
ootso(tfa(oara(a(iad
S. Magnussen, R.I. Alfaro / Den
ollowing model as best in terms of Akaike’s information criteriaAIC, Fan and Yao, 2005, p 168):
Yi,j,t = �i + �i × Yi,j,(t−1) +∑
kˇi,k × Xk,t + �DF,i,t + εi,j,t
var(εi,j,t) = �2i,j,t
= i,t × ε2i,j,(t−1) + i × εi,j,(t−1) + �i × �2
i,j,(t−1)
(3)
here �i is the average first-order autoregressive coefficient forrees in the ith plot, and ˇi,k is the regression coefficient for the kthf the 12 significant climate variables, �DF,i,t is the indicator of thenticipated year-t defoliation level in the ith plot (see Eq. (2)), andi,j,t is the model residual assumed to follow a generalized Gaussianistribution (GED) with a shape-parameter to be estimated fromata (Nelson, 1991; Fan and Yao, 2005, p. 158). The GED distributionas thicker tails than a normal distribution. The shape-parameterf the GED was significantly greater than 1.0 – the value of a Gaus-ian distribution – in all plots (mean 1.47, range: 1.21–1.77). Notehat the residual variance in the ARCH model is allowed to evolvever time as a linear function of both past residuals and residualariances which can generate asymmetric bursts of periods with aigher (lower) residual variance (Druckenbrod, 2005). Estimates ofll parameters in (3) was done on a plot-by-plot basis with condi-ional maximum likelihood estimators (Fan and Yao, 2005, p. 156),n approach that allows data to be in the form of multiple tree-levelorrelated time-series.
Predictions from the ARCH model are identified by a swivel (∼).esults with the ARCH model are reported for the growth indexIt , Lt , Zt
}with the best results in terms of bias (= average dif-
erence between Ri,j,t and Ri,j,t the back-transformed prediction of
i,j,t) and root mean squared error (RMSE =√
Ei,j,t
(Ri,j,t − Ri,j,t)2
).
ack-transforms of Lt to a standardized growth index were cor-ected for bias (Wiant and Harner, 1979; Snowdon, 1991) as in:i,j,t = exp(Li,j,t + 1/2 var(Li,j,t − Li,j,t)) where the last term is thestimate of bias.
Bias was estimated at 0.01% for Lt compared to 1.6% foroth It and Zt . No important difference emerged in the RMSEs. Toit: RMSE(It) = 0.29, RMSE(Lt) = 0.28, and RMSE(Zt) = 0.29. Con-
equently all reported results are based on the ARCH model withhe logarithmic transformation of the growth index It as the depen-ent variable. Two of the three terms in the ARCH model for theesidual variance were statistically significant in most (≥12) plots.one were significant in plot 108. Note, dropping the model-terms
or the residual variance in (3) would not have any important effectn the estimated parameters or the amount of overall explainedariance, but all estimates of error would be larger (approximately0%) and estimators of the uncertainty in It would not reflect thebserved variance heteroskedasticity.
To isolate the influence of defoliation (DEF) and climate (CLIM)n the growth index (It) we decomposed predicted values of It =xp(Lt + bias) into three factors:
Ii,j,t = IDEFi,j,t
× ICLIMi,j,t
× IARi,j,t
with
IDEFi,j,t
= exp(�DFi,j,t)
ICLIMi,t
= exp
(11∑
k=1
ˇi,kXk,t
)
IARi,j,t
= exp(�i + �i × Li,j,(t−1) + bias)
(4)
When independent, each component index estimates by how
uch growth in a specific year is above (below) the expectedtrend) value when other components are fixed at a value of 1.0. Ourxamination of the estimated covariances for the model param-ters supported the contention of independence. For example, a
C
i
t
ation of 351 trees. Percentiles are (from below): 10, 30, 50, 70, and 90. Years witherial survey observations of hemlock looper defoliation are indicated as shadedertical lines.
early DEF component index of 0.97 means that the annual growths estimated as 3% below expectation due to the explanatory vari-bles included in IDEF
t ; conversely a value of 1.05 means that therowth is 5% above expectation.
A variance estimate was computed for all component growthndices through application of the delta technique (Davison, 2003).ariances estimated for a mean (plot, year, global) took temporalutocorrelations and tree-to-tree correlations into account by com-uting a variance effective number of years and trees per plot (Dalend Fortin, 2002; Faes et al., 2009). For years it was 44.1, and forrees in a plot it was 3.9.
esults
adial growth
During the period 1930–2005 annual radial increment (Rt) fluc-uated between 0.03 and 6.77 mm (mean 1.12 mm). Temporalrofiles of the increments in the form of the 10th, 30th, 50th, 70th,nd 90th percentiles of the annual distribution of Rt are in Fig. 3.strong synchrony in the percentile curves (correlation between
djacent percentiles is 0.93–0.98) and an increase in the within-eries variation with the percentile (from 0.09 to 0.29) are evident.synchrony suggesting, that different members of the set of cored
rees respond similarly to exogenous factors.Radial growth in the 21 years with observed HL defoliation was,
n average, 1.04 mm compared to 1.15 mm in the 55 years with-ut (P = 0.02, two-sided permutation t-test, 900 permutations). Inhe first year of each defoliation cycle the growth differences weremaller (0.04, P = 0.577) and not statistically significant. In the sec-nd and last year of a HL outbreak they were larger 0.18 mmP < 0.01), and 0.15 mm (P = 0.08), respectively. At the plot levelhe average growth reduction in years with HL defoliation variedrom 0.61 mm (P < 0.01) to −0.12 mm (an increase, P > 0.05)). Theverage growth reduction was statistically significant in 17 plotsP < 0.05). Again, larger growth reductions were seen for the sec-nd year of a defoliation event (range 0.74 mm to −0.03 mm). Theverage growth reduction in years with HL defoliation were notelated in any apparent way to latitude, longitude, elevation or theverage defoliation code assigned to the nearest defoliation areapolygon). Growth reductions due to HL defoliation are discern-ble in the percentile profiles of Rt (Fig. 3). Periods of defoliationshaded bands in Fig. 3) was, with the exception of the defoliationn the late 1940s, associated with periods of growth decline. Therelso appear to be a local maximum in growth prior to the onset ofefoliation.
limate effects on the standardized growth index
Monthly means of the 12 significant climate variables were sim-lar for years with and without HL defoliation. All null hypotheses
292 S. Magnussen, R.I. Alfaro / Dendrochronologia 30 (2012) 287–294
Table 2Plot-level effect-sizes of the 12 retained climate variables in the climate component (ICLIM
t ) of the standardized western hemlock growth index (It ). All table entries areestimates obtained via the ARCH model in (3) with Lt as the dependent variable. An effect-size is a multiplier to the trend growth component (Rt ) when all other modeleffects are held constant at their average value.
Climate variable Lag Mean Sdev. Min Max No of plots w.signf. effect
February mean daily maximum temp. (◦C) 0 1.040 0.027 0.981 1.092 19February mean daily maximum temp. (◦C) 1 1.011 0.017 0.978 1.040 11March mean daily temp. (◦C) 0 1.037 0.025 0.944 1.075 22March mean daily minimum temp (◦C) 1 1.002 0.010 0.982 1.020 6April precipitation (mm) 0 0.998 0.015 0.972 1.028 10May mean daily temp. (◦C) 0 0.986 0.014 0.965 1.013 14July mean daily temp. (◦C) 1 0.980 0.024 0.949 1.029 17August precipitation (mm) 1 1.017 0.013 0.978 1.038 17September precipitation (mm) 0 0.999 0.016 0.97 1.037 7September precipitation (mm) 1 1.012October precipitation (mm) 0 1.012October precipitation (mm) 1 0.993
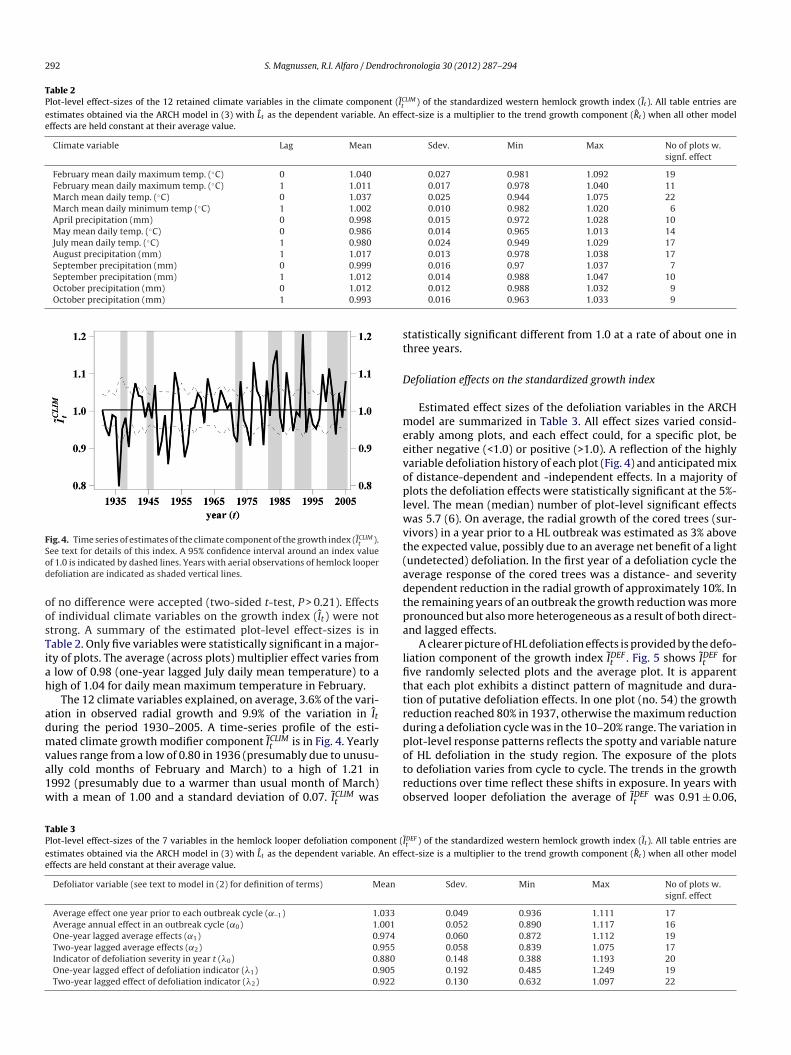
Fig. 4. Time series of estimates of the climate component of the growth index (ICLIMt ).
Sod
oosTiah
admva1w
st
D
meevoplwvt(adtpa
lfittrdp
TPee
ee text for details of this index. A 95% confidence interval around an index valuef 1.0 is indicated by dashed lines. Years with aerial observations of hemlock looperefoliation are indicated as shaded vertical lines.
f no difference were accepted (two-sided t-test, P > 0.21). Effectsf individual climate variables on the growth index (It) were nottrong. A summary of the estimated plot-level effect-sizes is inable 2. Only five variables were statistically significant in a major-ty of plots. The average (across plots) multiplier effect varies fromlow of 0.98 (one-year lagged July daily mean temperature) to aigh of 1.04 for daily mean maximum temperature in February.
The 12 climate variables explained, on average, 3.6% of the vari-tion in observed radial growth and 9.9% of the variation in Ituring the period 1930–2005. A time-series profile of the esti-ated climate growth modifier component ICLIM
t is in Fig. 4. Yearly
alues range from a low of 0.80 in 1936 (presumably due to unusu-lly cold months of February and March) to a high of 1.21 in992 (presumably due to a warmer than usual month of March)ith a mean of 1.00 and a standard deviation of 0.07. ICLIMt was
otro
able 3lot-level effect-sizes of the 7 variables in the hemlock looper defoliation component (Istimates obtained via the ARCH model in (3) with Lt as the dependent variable. An effeffects are held constant at their average value.
Defoliator variable (see text to model in (2) for definition of terms) Mean
Average effect one year prior to each outbreak cycle (˛–1) 1.033Average annual effect in an outbreak cycle (˛0) 1.001One-year lagged average effects (˛1) 0.974Two-year lagged average effects (˛2) 0.955Indicator of defoliation severity in year t (�0) 0.880One-year lagged effect of defoliation indicator (�1) 0.905Two-year lagged effect of defoliation indicator (�2) 0.922
0.014 0.988 1.047 100.012 0.988 1.032 90.016 0.963 1.033 9
tatistically significant different from 1.0 at a rate of about one inhree years.
efoliation effects on the standardized growth index
Estimated effect sizes of the defoliation variables in the ARCHodel are summarized in Table 3. All effect sizes varied consid-
rably among plots, and each effect could, for a specific plot, beither negative (<1.0) or positive (>1.0). A reflection of the highlyariable defoliation history of each plot (Fig. 4) and anticipated mixf distance-dependent and -independent effects. In a majority oflots the defoliation effects were statistically significant at the 5%-
evel. The mean (median) number of plot-level significant effectsas 5.7 (6). On average, the radial growth of the cored trees (sur-
ivors) in a year prior to a HL outbreak was estimated as 3% abovehe expected value, possibly due to an average net benefit of a lightundetected) defoliation. In the first year of a defoliation cycle theverage response of the cored trees was a distance- and severityependent reduction in the radial growth of approximately 10%. Inhe remaining years of an outbreak the growth reduction was moreronounced but also more heterogeneous as a result of both direct-nd lagged effects.
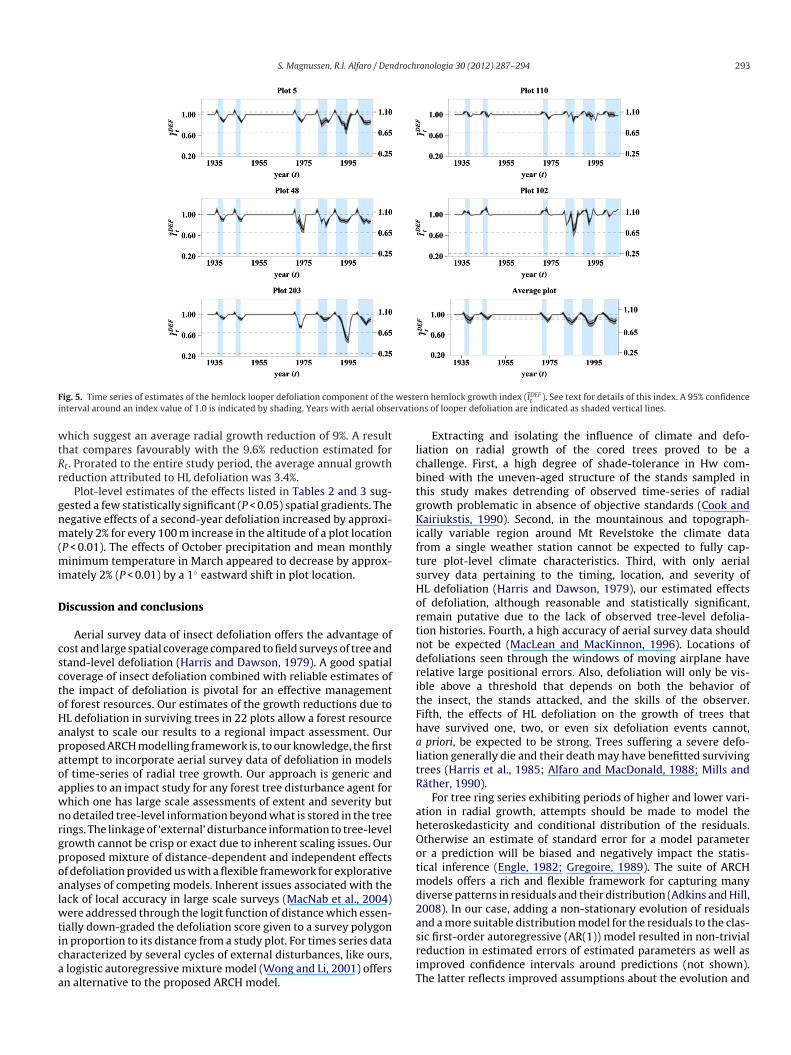
A clearer picture of HL defoliation effects is provided by the defo-iation component of the growth index IDEF
t . Fig. 5 shows IDEFt for
ve randomly selected plots and the average plot. It is apparenthat each plot exhibits a distinct pattern of magnitude and dura-ion of putative defoliation effects. In one plot (no. 54) the growtheduction reached 80% in 1937, otherwise the maximum reductionuring a defoliation cycle was in the 10–20% range. The variation inlot-level response patterns reflects the spotty and variable nature
f HL defoliation in the study region. The exposure of the plotso defoliation varies from cycle to cycle. The trends in the growtheductions over time reflect these shifts in exposure. In years withbserved looper defoliation the average of IDEFt was 0.91 ± 0.06,
DEFt ) of the standardized western hemlock growth index (It ). All table entries arect-size is a multiplier to the trend growth component (Rt ) when all other model
Sdev. Min Max No of plots w.signf. effect
0.049 0.936 1.111 170.052 0.890 1.117 160.060 0.872 1.112 190.058 0.839 1.075 170.148 0.388 1.193 200.192 0.485 1.249 190.130 0.632 1.097 22
S. Magnussen, R.I. Alfaro / Dendrochronologia 30 (2012) 287–294 293
F westei rvatio
wtRr
gnm(mi
D
csctoHapaoawnrgpoalwticaa
lcbtgKiftsHortndritFhaltR
ahOotmd2a
ig. 5. Time series of estimates of the hemlock looper defoliation component of thenterval around an index value of 1.0 is indicated by shading. Years with aerial obse
hich suggest an average radial growth reduction of 9%. A resulthat compares favourably with the 9.6% reduction estimated fort. Prorated to the entire study period, the average annual growtheduction attributed to HL defoliation was 3.4%.
Plot-level estimates of the effects listed in Tables 2 and 3 sug-ested a few statistically significant (P < 0.05) spatial gradients. Theegative effects of a second-year defoliation increased by approxi-ately 2% for every 100 m increase in the altitude of a plot location
P < 0.01). The effects of October precipitation and mean monthlyinimum temperature in March appeared to decrease by approx-
mately 2% (P < 0.01) by a 1◦ eastward shift in plot location.
iscussion and conclusions
Aerial survey data of insect defoliation offers the advantage ofost and large spatial coverage compared to field surveys of tree andtand-level defoliation (Harris and Dawson, 1979). A good spatialoverage of insect defoliation combined with reliable estimates ofhe impact of defoliation is pivotal for an effective managementf forest resources. Our estimates of the growth reductions due toL defoliation in surviving trees in 22 plots allow a forest resourcenalyst to scale our results to a regional impact assessment. Ourroposed ARCH modelling framework is, to our knowledge, the firstttempt to incorporate aerial survey data of defoliation in modelsf time-series of radial tree growth. Our approach is generic andpplies to an impact study for any forest tree disturbance agent forhich one has large scale assessments of extent and severity buto detailed tree-level information beyond what is stored in the treeings. The linkage of ‘external’ disturbance information to tree-levelrowth cannot be crisp or exact due to inherent scaling issues. Ourroposed mixture of distance-dependent and independent effectsf defoliation provided us with a flexible framework for explorativenalyses of competing models. Inherent issues associated with theack of local accuracy in large scale surveys (MacNab et al., 2004)
ere addressed through the logit function of distance which essen-ially down-graded the defoliation score given to a survey polygon
n proportion to its distance from a study plot. For times series dataharacterized by several cycles of external disturbances, like ours,logistic autoregressive mixture model (Wong and Li, 2001) offersn alternative to the proposed ARCH model.sriT
rn hemlock growth index (IDEFt ). See text for details of this index. A 95% confidence
ns of looper defoliation are indicated as shaded vertical lines.
Extracting and isolating the influence of climate and defo-iation on radial growth of the cored trees proved to be ahallenge. First, a high degree of shade-tolerance in Hw com-ined with the uneven-aged structure of the stands sampled inhis study makes detrending of observed time-series of radialrowth problematic in absence of objective standards (Cook andairiukstis, 1990). Second, in the mountainous and topograph-
cally variable region around Mt Revelstoke the climate datarom a single weather station cannot be expected to fully cap-ure plot-level climate characteristics. Third, with only aerialurvey data pertaining to the timing, location, and severity ofL defoliation (Harris and Dawson, 1979), our estimated effectsf defoliation, although reasonable and statistically significant,emain putative due to the lack of observed tree-level defolia-ion histories. Fourth, a high accuracy of aerial survey data shouldot be expected (MacLean and MacKinnon, 1996). Locations ofefoliations seen through the windows of moving airplane haveelative large positional errors. Also, defoliation will only be vis-ble above a threshold that depends on both the behavior ofhe insect, the stands attacked, and the skills of the observer.ifth, the effects of HL defoliation on the growth of trees thatave survived one, two, or even six defoliation events cannot,priori, be expected to be strong. Trees suffering a severe defo-
iation generally die and their death may have benefitted survivingrees (Harris et al., 1985; Alfaro and MacDonald, 1988; Mills andäther, 1990).
For tree ring series exhibiting periods of higher and lower vari-tion in radial growth, attempts should be made to model theeteroskedasticity and conditional distribution of the residuals.therwise an estimate of standard error for a model parameterr a prediction will be biased and negatively impact the statis-ical inference (Engle, 1982; Gregoire, 1989). The suite of ARCH
odels offers a rich and flexible framework for capturing manyiverse patterns in residuals and their distribution (Adkins and Hill,008). In our case, adding a non-stationary evolution of residualsnd a more suitable distribution model for the residuals to the clas-
ic first-order autoregressive (AR(1)) model resulted in non-trivialeduction in estimated errors of estimated parameters as well asmproved confidence intervals around predictions (not shown).he latter reflects improved assumptions about the evolution and
2 droch
dma
R
A
A
A
C
C
C
C
C
D
DDD
E
E
E
F
F
G
G
H
H
H
H
I
J
K
K
M
M
M
M
M
M
N
P
P
S
S
S
V
V
V
V
V
V
W
94 S. Magnussen, R.I. Alfaro / Den
istribution of model residuals. We fully recommend the ARCHodelling framework for tree ring analysis as we believe that vari-
nce heteroskedasticity is widespread and common.
eferences
dkins, L.C., Hill, R.C., 2008. Using Stata for Principles of Econometrics, 3rd ed. Wiley,Hoboken, 611 pp.
lfaro, R.I., MacDonald, R.N., 1988. Effects of defoliation by the western false hemlocklooper on Douglas-fir tree-ring chronologies. Tree-Ring Bulletin 48, 3–11.
lfaro, R.I., Taylor, S., Brown, G., Wegwitz, E., 1999. Tree mortality caused by thewestern hemlock looper in landscapes of central British Columbia. Forest Ecol-ogy and Management 124, 285–291.
anham, C.D., 1989. Different respones to gaps among shade-tolerant tree species.Ecology Letters 70, 548–550.
ook, E.R., Kairiukstis, L.A. (Eds.), 1990. Methods of Dendrochronology: Applica-tions in the Environmental Sciences. Kluwer Academic Publishers, Dordrecht,Netherlands, p. 394.
ook, E.R., Peters, K., 1981. The smoothing spline: a new approach to standardiz-ing forest interior tree-ring width series for dendroclimatic studies. Tree-RingBulletin 41, 45–53.
ook, E.R., Peters, K., 1997. Calculating unbiased tree-ring indices for the study ofclimatic and environmental change. Holocene 7, 361–370.
ooke, B.J., Nealis, V.G., Régnière, J., 2007. Insect defoliators as periodic disturbancesin northern forest ecosystems. In: Johnson, E.A., Miyansishi, K. (Eds.), Plant Dis-turbance Ecology: The Process and the Response. Elsevier, Burlington, MA, pp.487–525.
ale, M.R.T., Fortin, M.J., 2002. Spatial autocorrelation and statistical tests in ecology.Ecoscience 9, 162–167.
avison, A.C., 2003. Statistical Models. Cambridge University Press, Cambridge.raper, N.R., Smith, H., 1981. Applied Regression Analysis. Wiley, New York, 709 pp.ruckenbrod, D.L., 2005. Dendroecological reconstructions of forest disturbance his-
tory using time-series analysis with intervention detection. Canadian Journal ofForest Research 35, 868–876.
ngle, R.F., 1982. Autoregressive conditional heteroscedasticity with estimates ofthe variance of United Kingdom inflation. Econometrica 50, 987–1007.
rdle, T.A., MacLean, D.A., 1999. Stand growth model calibration for use in forestpest impact assessment. Forestry Chronicle 75, 141–152.
sper, J., Niederer, R., Bebi, P., Frank, D., 2008. Climate signal age effects—evidencefrom young and old trees in the Swiss Engadin. Forest Ecology and Management255, 3783–3789.
aes, C., Molenberghs, G., Aerts, M., Verbeke, G., Kenward, M.G., 2009. The effectivesample size and an alternative small-sample degrees-of-freedom method. TheAmerican Statistician 63, 389–399.
an, J., Yao, Q., 2005. Nonlinear Time Series. Nonparametric and Parametric Methods.Springer, New York, 551 pp.
andolfo, C., Tessier, L., 1994. Dendroecological analysis of fir (Abies alba) and spruce(Picea abies) at different stages of defoliation in the forest of Vigo di Ton (Trento,Italy). Annales des Sciences Forestières 51, 391–406.
regoire, T.G., 1989. The effect of muliplicative heteroscedasticity on the error rateof statistical tests of regression equality. In: Pelz, D.R. (Ed.), IUFRO Conferenceon Forest Statistics. Univ. Freiburg, Freiburg, pp. 222–232.
arris, J.W.E., Dawson, A.F., 1979. Evaluation of forest pest damage survey tech-niques in British Columbia. Pacific Forest Research Centre, Victoria, BritishColumbia; Canada, 22 pp.
arris, J.W.E., Dawson, A.F., Brown, R.G., 1982. The Western Hemlock Looper in
British Columbia. Canadian Forest Service, Information Report, BC-X-234, 18pp.arris, J.W.E., Dawson, A.F., Brown, R.G., 1985. The Western False Hemlock Looperin British Columbia 1942–1984. Information Report, Pacific Forestry Centre,Canada, 11–11 pp.
W
Z
ronologia 30 (2012) 287–294
olmes, R., 1983. Computer-assisted quality control in tree-ring dating and mea-surement. Tree-Ring Bulletin 43, 69–75.
qbal, J., MacLean, D.A., 2010. Estimating cumulative defoliation of balsam fir fromhemlock looper and balsam fir sawfly using aerial defoliation survey in westernNewfoundland. Canada. Forest Ecology and Management 259, 591–597.
ardine, A.K., 1969. Western Hemlock Looper in British Columbia. Canadian ForestService, Leaflet no. 21, 4 pp.
alman, R.E., 1960. A new approach to linear filtering and prediction problems.Journal of Basic Engineering, Transactions of the ASME, Series D 82, 35–45.
inghorn, J.M., 1954. The influence of stand composition on the mortality of variousconifers, caused by defoliation by the western hemlock looper on VancouverIsland, British Columbia. Forestry Chronicle 30, 380–400.
acLean, D.A., MacKinnon, W.E., 1996. Accuracy of aerial sketch-mapping estimatesof spruce budworm defoliation in New Brunswick. Canadian Journal of ForestResearch 26, 2099–2108.
acNab, Y.C., Farrell, P.J., Gustafson, P., Wen, S.J., 2004. Estimation in Bayesian dis-ease mapping. Biometrics 60, 865–873.
ayfield III, A.E., Allen, D.C., Briggs, R.D., 2005. Radial growth impact of pinefalse webworm defoliation on eastern white pine. Canadian Journal of ForestResearch 35, 1071–1086.
cCulloch, C.E., Cain, M.L., 1989. Analyzing discrete movement data as a correlatedrandom walk. Ecology 70, 383–388.
eidinger, D., Pojar, J., 1991. Ecosystems of British Columbia. BC Ministry of ForestsResearch Branch, 330.
ills, N.J., Räther, M., 1990. Hemlock loopers in Canada; biology, pest status andpotential for biological control. Biocontrol News and Information 11, 209–222.
elson, D.B., 1991. Conditional heteroskedasticity in asset returns: a new approach.Econometrica 59, 347–370.
ollard, D.F.W., 1972. Estimating woody dry matter loss resulting from defoliation.Forest Science 18, 135–138.
othier, D., Mailly, D., Tremblay, S., 2005. Predicting balsam fir growth reductioncaused by spruce budworm using large-scale historical records of defoliation.Annals of Forest Science 62, 261–267.
nowdon, P., 1991. A ratio estimator for bias correction in logarithmic regressions.Canadian Journal of Forest Research 21, 720–724.
tock, A., Duthie-Holt, M., Walsh, S., Turner, J., Swift, K., 2005. Southern InteriorForest Region: Forest Health Stand Establishment Decision Aids. BC Journal ofEcosystems and Management, FORREX—Forest Research Extension Partnership,Kamloops; Canada, 55–73 pp.
utton, A., Tardif, J.C., 2007. Dendrochronological reconstruction of forest tent cater-pillar outbreaks in time and space, western Manitoba, Canada. Canadian Journalof Forest Research 37, 1643–1657.
an den Brakel, J.A., Visser, H., 1996. The influence of environmental conditions ontree-ring series of Norway spruce for different canopy and vitality classes. ForestScience 42, 206–219.
an Deusen, P.C., 1990. Evaluating time-dependent tree ring and climate relation-ships. Journal of Environmental Quality 19, 481–488.
ins, B., Svestka, M., 1973. Influence of defoliation by nun moths on the incrementof Norway spruce stands. Prace VULHM 44, 5–38.
isser, H., 1988. Kalman filter analysis in dendroclimatology. Biometrics 44,929–940.
isser, H., Büntgen, R., D’Arrigo, R., Petersen, A.C., 2009. Detecting instabilities intree-ring proxy calibration. Climate of the Past 6, 367–377.
isser, H., Molenaar, J., 1992. Estimating trends and stochastic response functionsin dendroecology with an application to fir decline. Forest Science 38, 221–234.
iant, H.V., Harner, E.J., 1979. Percent bias and standard error in logarithmic regres-sion. Forest Science 25, 167–168.
ong, C.S., Li, W.K., 2001. On a logistic mixture autoregressive model. Biometrika88, 833–846.
hang, Q., Alfaro, R.I., 2002. Periodicity of two-year cycle spruce budworm out-breaks in Central British Columbia: a dendro-ecological analysis. Forest Science48, 722–731.


