Embed Size (px)
Citation preview

Lincoln University Digital Dissertation
Copyright Statement
The digital copy of this dissertation is protected by the Copyright Act 1994 (New Zealand).
This dissertation may be consulted by you, provided you comply with the provisions of the Act and the following conditions of use:
you will use the copy only for the purposes of research or private study you will recognise the author's right to be identified as the author of the dissertation
and due acknowledgement will be made to the author where appropriate you will obtain the author's permission before publishing any material from the
dissertation.

An Investigation into Zinc and Suspended Solids in Urban Stormwater
and their Effect on Water Quality in the Heathcote River
A dissertation
submitted in partial fulfilment
of the requirement for the degree of
Masters of Applied Science
At
Lincoln University
By
Cain Duncan
Lincoln University
2005
'~ ;'.:->J.-::~:::. t' .... ~-. ~',.. 4_ ••

Abstract of a dissertation submitted in partial fulfilment of the
requirements for the Degree of M.Appl.Sc.
An Investigation into Zinc and Suspended Solids in Urban Stormwater
and their Effect on Water Quality in the Heathcote River
By C.R. Duncan
A study of sediment and zinc concentrations in stormwater from the Garlands Road
outfall was carried out to gain an understanding of the effects these two
contaminants have on water quality in the Heathcote River and to investigate if any
relationship existed between the two contaminants.
Sampling was undertaken at three sit~s, the Garlands Road stormwater outfall and
two sites on the Heathcote River, one upstream of the outfall beside the Garlands
Road Bridge and another approximately 103 metres downstream of the outfall.
Sampling was carried out during four separate storm events at low tide. Two
sampling runs were undertaken within the first hour of a storm event to represent
contaminant loadings in the first flush while the other sampling runs were conducted
at two hours and five hours into a storm event respectively. Sampling was
undertaken using the grab sample technique and the samples were analysed for
suspended solids and zinc by the Environment Canterbury Water Laboratory.
The results of the study found suspended solid concentrations from the stormwater
outfall were up to twenty times higher than the suspended solid concentrations in the
Heathcote River. Suspended solid concentrations were higher during the 'first flush'
period when compared to samples taken outside this period. There appeared to be
little impact on the downstream suspended solid concentrations as a result of the
discharges from the Garlands Road stormwater outfall. Overall the suspended solid
concentrations in the Lower Heathcote River were low, being between 13 and
67mg/L at all sites, despite the dirty appearance of the water in the study area.
Zinc levels followed the same trend as suspended solids being substantially higher in
the stormwater samples than in the river samples. There was little noticeable
difference in upstream results compared with downstream, despite the influence of
ii
r~ -~:~:~~~~:~~: ~ ;"'----~~.: . .: . ..:~-.: •. .-."" .. " ..

high loadings from the Garlands Road stormwater outfall. Overall zinc levels in the
stormwater were higher than typical urban stormwater and in the Heathcote River
itself zinc levels on two of the four sample days breached the Australia New Zealand
Environment and Conservation Council guidelines for zinc concentrations in a highly
modified ecosystem.
The correlation between suspended solids and zinc showed a strong positive
relationship based on the small number of samples taken. This supports other
research that has found direct relationships between suspended solid loadings in
urban runoff and heavy metals.
The stormwater network was investigated using drainage maps from the
Christchurch City Council. This study found only one site in the catchment with any
form of stormwater treatment. All other stormwater discharged untreated from
hardstand areas and roofs into the reticulated network and then into the Heathcote
River.
III
-'.~"

Contents
Abstract
Contents
Tables
Figures
.-
1
2
2.1 2.2 2.3
Introduction
Literature Review
Drainage
Heathcote River and Avon Heathcote Estuary
Sedimentation
2.4 Zinc
2.5 Zinc and Sediment Interaction
2.6 Stormwater and Contaminant Loadings
3 Aim, Method, Hypothesis and Current Legislation
3.1 Aim
3.2 Method
3.3 Hypothesis
3.4 Current Legislation and Regulatory Authorities
4 Results
4.1 Sampling Dates and Times
4.2 Rainfall Data
4.3 Suspended Solids
4.4 Zinc
4.5 Catchment Study
5 Discussion
5.1 Suspended Solids
5.2 Total Suspended Solids
Page
ii
iv
vi
vii
1
8
8
8
9
12 14
16
17
17
17
22 23
24 24
24
25
29 33
36 36
39 5.3 Effects of Stormwater Suspended Solids on the Heathcote River 42
5.4 Zinc 45
5.5 Total Zinc 47
5.6 Effects of Zinc contained in Stormwater on the Heathcote River 49
5.7 Suspended Solids and Zinc Correlations 50
5.8 Catchment Study 53
_' •• "_, J,~' __
i-.-.'" .-':_-!
,c.
I ',- '~-; _ ._'::
iv

6
6.1
6.2 7
Study Limitations and Further Research
Study Limitations
Further Research
Conclusions
Acknowledgements
References
Appendices
Page
56
56 57 59
62 63 68
~r;-. -~ ';, -_~', -_-~
v

List of Tables ;~-" . - .... ","
Page
4.1 Sample Dates and Times 24 5.1 Christchurch City Council and Heathcote Study Suspended
Solid Sampling Results 38 5.2 First Flush Suspended Solids and Rainfall 39
~-
5.3 Suspended Solids and Rainfall Excluding First Flush 40 5.4 First Flush Zinc Concentrations and Rainfall 47 5.5 Zinc Concentrations and Rainfall Excluding First Flush 47 5.6 Industry or Zone and Possible Contaminants 54
:" "
vi

List of Figures .' ..... -~ .,~ :,~
i.:;:::~~-::;.:::
Page
1.1 Garlands Road Stormwater Outfall 1
1.2 Upstream Sampling Site 2
1.3 Downstream Sampling Site 2
1.4 View of Heathcote River downstream of the Garlands Road
Stormwater Outfall 4
1.5 View of Heathcote River upstream of the Garlands Road
Stormwater Outfall 4
1.6 General Catchment Location - Map 6
1.7 Garlands Road Storm water Catchment - Aerial Photograph 7
4.1 Rainfall on Sampling Dates 24
4.2 Upstream Suspended Solid Concentrations 25
4.3 Outfall Suspended Solid Concentrations 26
4.4 Downstream Suspended Solid Concentrations 26
4.5 Suspended Solid Concentrations 18 June 2004 27
4.6 Suspended Solid Concentrations 3 July 2004 27
4.7 Suspended Solid Concentrations 28 August 2004 28 ~.
4.8 Suspended Solid Concentrations 1 October 2004 28
4.9 Upstream Zinc Concentrations 29
4.10 Outfall Zinc Concentrations 29
4.11 Downstream Zinc Concentrations 30
4.12 Zinc Concentrations 18 June 2004 31
4.13 Zinc Concentrations 3 July 2004 31
4.14 Zinc Concentrations 28 August 2004 32
4.15 Zinc Concentrations 1 October 2004 32
4.16 Garlands Road Outfall Stormwater Catchment Zoning 33 --
4.17 Catchment Area and Zones 34
4.18 Catchment Area and Zones 35
5.1 Suspended Solid Concentrations Over Time 41
5.2 Zinc Concentrations Over Time 48
5.3 Correlation between Upstream Suspended Solids and Zinc 51
5.4 Correlation between Outfall Suspended Solids and Zinc 52
5.5 Correlation between Downstream Suspended Solids and Zinc 52 T (.',_7
., ,-
VB
Chapter 1 - Introduction
1.1 Introduction
Stormwater has been identified as one of the major waterway polluters in nearly all
developed cities around the world. In Canterbury, local and regional authorities are
focussing more on stormwater treatment and the traditional method of piping
stormwater directly to waterways has become less acceptable.
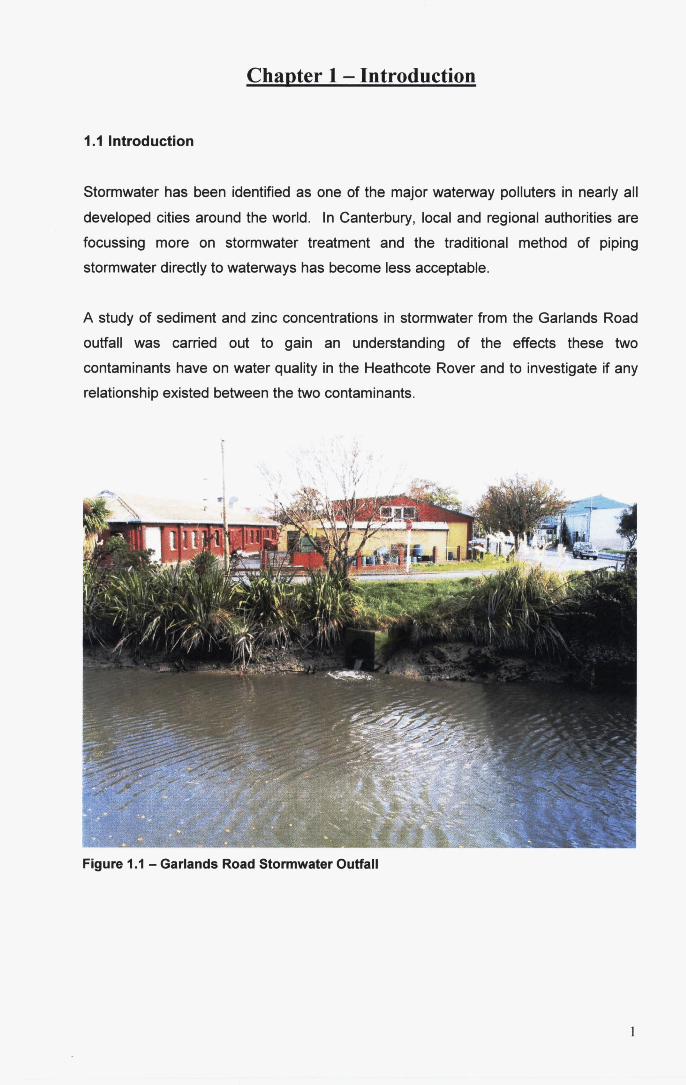
A study of sediment and zinc concentrations in stormwater from the Garlands Road
outfall was carried out to gain an understanding of the effects these two
contaminants have on water quality in the Heathcote Rover and to investigate if any
relationship existed between the two contaminants.
Figure 1.1 - Garlands Road Stormwater Outfall
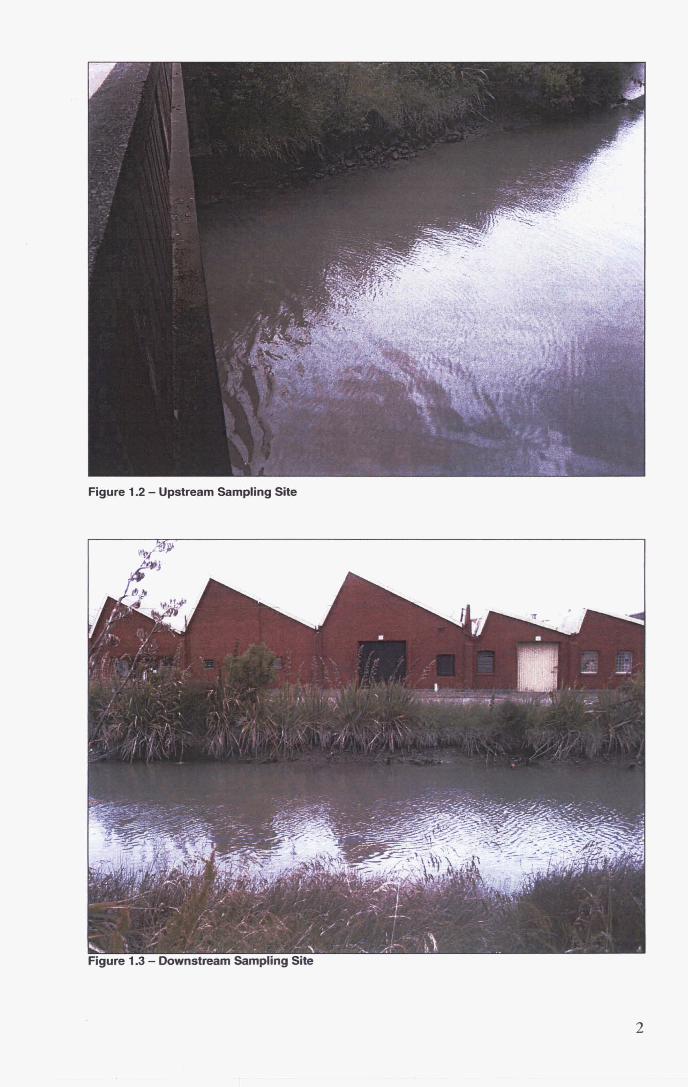
Figure 1.2 - Upstream Sampling Site
Figure 1.3 - Downstream Sampling Site
2

The study catchment is located in the Woolston Industrial area of Christchurch and
comprises a mixture of heavy and light industries, residential properties and urban
roadways. This study primarily focused on stormwater discharged from the Garlands
Road stormwater outfall into the Lower Heathcote River.
The outfall discharge point is located approximately 10 metres downstream of the
Garlands Road Bridge on the western side of the Heathcote River. The Garlands
Road outfall discharges stormwater from a catchment that encompasses Garlands
Road as far west as Radley Street (includes approximately half of Tanner Street) and
Radley Street (including Adams Place) as far north as Chichester Street. The
catchment is shown in Figures 1.6 and 1.7.
The Heathcote River study areas extend from the upstream side of the Garlands
Road Bridge to 103 metres downstream of the Garlands Road stormwater outfall.
The Heathcote River is tidal in its lower reaches and water levels vary according to
tidal conditions. Figure 1.1 shows the Garlands Road stormwater outfall at low tide
and Figures 1.2 and 1.3 show the up and downstream sample sites respectively.
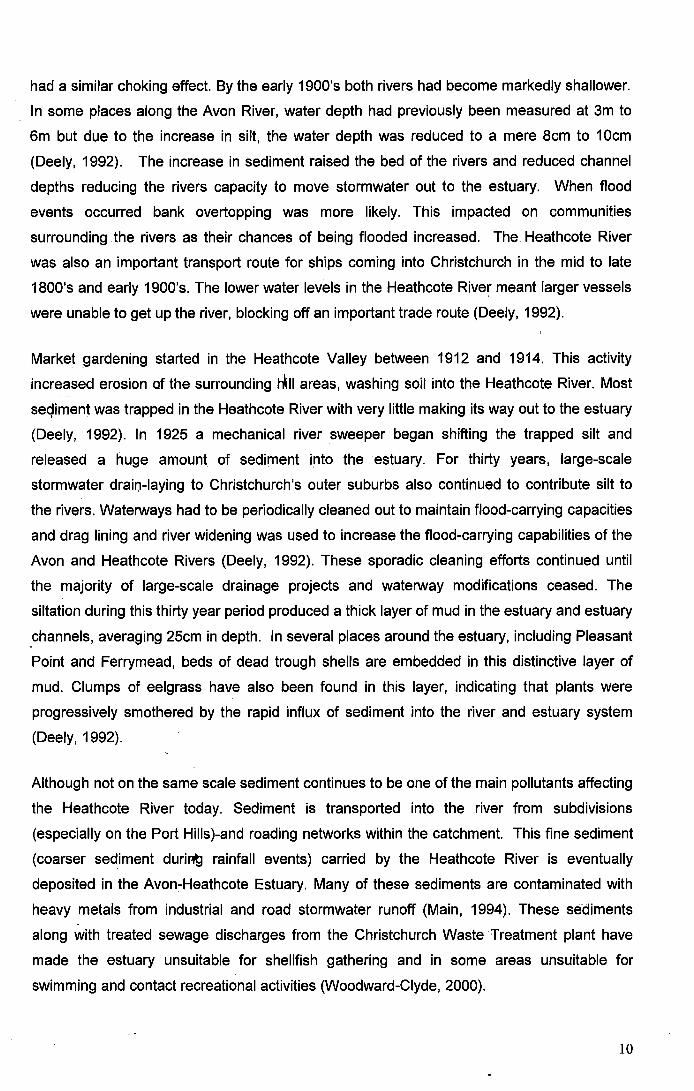
Figures 1.4 and 1.5 give an overview of the study area looking downstream and
upstream of the Garlands Road stormwater outfall.
The Lower Heathcote River has a discoloured look even during times of no rainfall
and the bed is covered in a thick layer of mud. The river is often used as an illegal
dumping ground for rubbish. Numerous foreign objects were noted in the study area,
including Coke ™ bottles, shopping trolleys and car parts.
Work has been undertaken by the Christchurch City Council to improve the ecology
of the Lower Heathcote River and water quality has improved substantially since
industrial trade wastes ceased being discharged to the river in the early 1980's
(Deely, 1992).
In recent years, the banks of the Lower Heathcote River have been planted out in
flaxes, cabbage trees and grasses by the City Council. This will provide a native
riparian zone once fully established.
3
'-': ... ~ :~.' ..
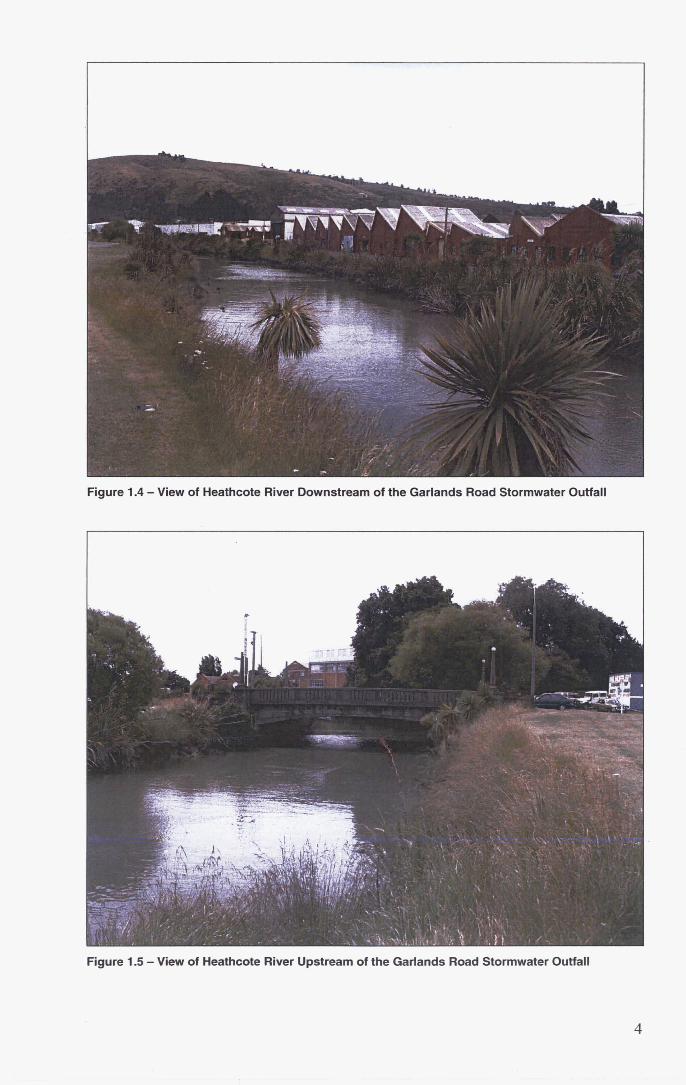
Figure 1.4 - View of Heathcote River Downstream of the Garlands Road Stormwater Outfall
Figure 1.5 - View of Heathcote River Upstream of the Garlands Road Stormwater Outfall
4

Despite the City Council's improvements, the location of the Lower Heathcote River
in a major Christchurch industrial area, the dirty look of the water and the litter on the
riverbanks and in the water still give an impression of poor water quality. This may
lead to the public undervaluing this environmental asset.
5
',' -. ~-;:"'-~i<t> .'';'-~~.-->; •. ':-"'':'
j--

Map - General Location of the Garlands Road Stormwater Catchment
/
. .\
\ .' . . }
Figure 1.6 - General Catchment Location
i !
I I I I
I-------~!----
Estuary of thfJ Avon and Heathcote RivefS
6
I I 1 I
I I
I I I
.I I

rrllll tTeVH:W
100m !~~~~ The accuracy of this plan and the measurements shown are not guaranteed but should
be verified by inspection.
Garlands Road Stormwater Catchment
Produced by Figure 1.6 at 00:58 on 1212212004
http://webmap.ccc.govt.nz/tools/printadvancedJprint_preview _landscape.asp?Persistence=
Page 1 ot 1,
Garlands Road Stormwater Catchement Aerial Photo
A CHRISTCHURCH CITY COIJNC;.l · YOUI! PFQ .... ~ . YQ\J1t CIT·'
Figure 1.7 - Garlands Road Stormwater Catchment
7

Chapter 2 - Literature Review
2.1 Drainage
Much of Christchurch City has been constructed on swamplands drained by a network of
natural and human constructed waterways. As the City has developed, large areas of
pervious land have been paved, eliminating the natural soakage capacity of soils and rough
surfaces which retard water flows (Christchurch City Council, 2003). The reduction in
pervious areas increases stormwater runoff and the speed and efficiency at which it is
transported to waterways. This result can be greater peak flows and shorter lag times for
stream flows in urban areas as well as a reduction in the natural treatment of stormwater
.prior to it entering waterways or groundwater (Christchurch City Council, 2003).
In the early to mid 1900's drainage networks were designed to convey water quickly, thus
reducing the likelihood of flooding. Little attention was paid to environmental or ecological
values and many streams and rivers were artificially straightened or contained within
reinforced banks (Deely, 1992). Channels were regularly cleaned out to ensure stream flows
were not impeded. These modifications destroyed natural fish breading grounds and
invertebrate habitats.
Attitudes towards Christchurch's waterways have gradually changed and communities, city
~ engineers and planners now realise that ecological values can be restored and maintained
'~JWithout significantly reducing water carrying capacity. Flood mitigation solutions have been
developed that move away from traditional engineering practices and focus more on
protecting natural habitats and restoring the health of Christchurch's urban waterways. The
Wigram retention basin is one such example of this new soft-engineering philosophy.
Constructed in 1994, the retention basin acts as a holding area for flood and general
stormwater thus reducing storm surges. The retention basin has been planted out with native
trees and shrubs, providing a more natural alternative to traditional engineering solutions
(Nichols, 1991). In addition, a valued recreation area has been developed around the basin
and is commonly used for walking and running.
2.2 Heathcote River and Avon-Heathcote Estuary
The Heathcote River has a catchment area of approximately 104 km2 including many of the
tributaries of the Port Hills. The Heathcote River is predominantly spring-fed and flows
through mainly urbanised areas. The lower part of the river is tidal with salt water penetrating
8
r.·..,. .... _ ... ·,····-_, ""--.1:""--:'-

as far as 11 km upstream during low flows (Woodward-Clyde, 2000). The Lower Heathcote
Catchment and estuary area can be seen in Fig 1.6.
Between 1860 and 1925 the Woolston and Sydenham areas were New Zealand's main iron
working and industrial centres. From 1880 to 1925, industrial wastes were poured into the
Heathcote River from numerous industries including a gasworks, rubber factory, gelatine
factory, woollen mill, glue factory, tannery, battery factory, woolscour and a fellmongery.
These discharges contributed to a river environment that was so polluted that virtually no
plants could live in it (Deely, 1992). Although many industries closed before 1925 pollution
levels in the Heathcote continued to be high. About 150 industries discharged 10 million litres
of effluent a day directly into the river (Deely, 1992). In the late 1970's an industrial sewer
connection was commissioned between Woolston and the Bromley sewage works. This
allowed almost all industrial and domestic wastes to be treated at Bromley before
discharging into the Avon-Heathcote Estuary. This connection greatly improved water quality
although long-term heavy metal deposits remain in the river sediments (Gelfand, 1991). The
last direct discharge of industrial. effluent into the Heathcote River ceased in 1981 when the
gas works finally closed (Deely, 1992).
Discharges of raw sewage still occur at six overflow sites on the Heathcote River, althOU9~/---~. . ..•...
these only operate during periods of high rainfall or when blockages occur in the sewage
reticulation network. The river is generally in flood when these overflows occur and the solids .
normally remain within the reticulation network. The environmental effect of these overflows
have been reviewed and are considered minimal (Christchurch City Council, 1998). In 2003,
Environment Canterbury granted resource consent authorising these limited discharges into
the Heathcote River.
Sedimentation, nutrient overloads (caused by Ravensdown Fertiliser Works and farming in
the upper reaches) and heavy metals (roading and industrial sources) are the major pollution
sources still entering the Heathcote River today (Woodward-Clyde, 2000).
2.3 Sedimentation
Sedimentation has been an issue in the Heathcote and Avon Rivers since the Christchurch
area was first drained. Huge quantities of fine loess soil were washed via stormwater drains
from the cleared land into the two rivers. In the mid 1800's William Deans introduced
watercress to Christchurch waterways. The watercress grew prolifically and causing silt to
become trapped in water channels. By the 1880's, many areas of the Avon River were
choked with weed and silt. Introduced willows were planted along the Heathcote River and
9
I, ';""_ ~ __ - __
had a similar choking effect. By the early 1900's both rivers had become markedly shallower.
In some places along the Avon River, water depth had previously been measured at 3m to
6m but due to the increase in silt, the water depth was reduced to a mere 8cm to 10cm
(Deely, 1992). The increase in sediment raised the bed of the rivers and reduced channel
depths reducing the rivers capacity to move stormwater out to the estuary. When flood
events occurred bank overtopping was more likely. This impacted on communities
surrounding. the rivers as their chances of being flooded increased. The Heathcote River
was also an important transport route for ships coming into Christchurch in the mid to late
1800's and early 1900's. The lower water levels in the Heathcote River meant larger vessels
were unable to get up the river, blocking off an important trade route (Deely, 1992).
Market gardening started in the Heathcote Valley between 1912 and 1914. This activity
increased erosion of the surrounding till areas, washing soil into the Heathcote River. Most
seqiment was trapped in the Heathcote River with very little making its way out to the estuary
(Deely, 1992). In 1925 a mechanical river sweeper began shifting the trapped silt and
released a huge amount of sediment into the estuary. For thirty years, large-scale
stormwater drair,l-Iaying to Christchurch's outer suburbs also continued to contribute silt to
the rivers. Waterways had to be periodically cleaned out to maintain flood-carrying capacities
and drag lining and river widening was used to increase the flood-carrying capabilities of the
Avon and Heathcote Rivers (Deely, 1992). These sporadic cleaning efforts continued until
the majority of large-scale drainage projects and waterway modifications ceased. The
siltation during this thirty year period produced a thick layer of mud in the estuary and estuary
,channels, averaging 25cm in depth. In several places around the estuary, including Pleasant
Point and Ferrymead, beds of dead trough shells are embedded in this distinctive layer of
mud. Clumps of eelgrass have also been found in this layer, indicating that plants were
progressively smothered by the rapid influx of sediment into the river and estuary system
(Deely, 1992).
Although not on the same scale sediment continues to be one of the main pollutants affecting
the Heathcote River today. Sediment is transported into the river from subdivisions
(especially on the Port Hills)-and roading networks within the catchment. This fine sediment
(coarser sediment duri~ rainfall events) carried by the Heathcote River is eventually
deposited in the Avon-Heathcote Estuary. Many of these sediments are contaminated with
heavy metals from industrial and road stormwater runoff (Main, 1994). These sediments -
along with treated sewage discharges from the Christchurch Waste Treatment plant have
made the estuary unsuitable for shellfish gathering and in some areas unsuitable for
swimming and contact recreational activities (Woodward-Clyde, 2000).
10
-'-.. :: -', -'.
,; ".,",-"
In 1978-79, the Christchurch Drainage Board conducted an invertebrate survey of the Avon
and Heathcote Rivers (Christchurch Drainage Board, 1980) and the Christchurch City
Council made follow-up studies in 1989 and 1989-90 (Christchurch City Council, 1992;
Christchurch City Council, 1994). Canterbury Regional Council commissioned the National
Institute of Marine and Fresh Water Research to look at the effects of urbanisation on
invertebrates within the Avon and Heathcote Rivers and rural streams in the region. (Suren,
1993). The purpose of these &urveys was to gain an indication of biodiversity in the rivers
and to provide an indicator of ecosystem health. By ~tudying the presence, condition, and
numbers of certain types of fish, insects, algae, and plants accurate information can be
gained about the health of a waterway (United States Environmental Protection Agency,
2002). Initial investigations provide a baseline on abundance and distribution of key indicator
species and the different types/taxa of invertebrates present. Follow-up surveys can be
compared to this baseline giving an indication on whether ecosystem health is improving or
declining (Froude, 1998). All of the surveys carried out by Christchurch Drainage Board, City
Council and Regional Council noted there were less insect taxa in the urban streams
compared with the rural streams although the relative abundance of insects was small in all
catchments (Elliott, 1997). These studies suggest that sedimentation along with reduced river
base flows, the presence of filamentous algae and higher nutrient levels have had a major
effect on invertebrate community composition and contributed to the lower diversity and
reduced presence of insects in the urban catchments (Elliott, 1997).
Fine silts tend to be of most concern as they have the potential to make waterway sediments
finer, hence changing the instream habitat, affecting the waterway biota and increasing
turbidity (Elliott, 1997). Turbidity is a measure of water clarity and therefore high turbidity is a
direct indicator of poor water clarity and high suspended solid loadings. High turbidity means
less light is able to pass through the water therefore plant growth is reduced and less food is
available for invertebrates and ultimately fish (Environment Canterbury, 2002).
Sediment in the water column can directly affect aquatic life by clogging and damaging fish
gills and reducing visibility, which makes food difficult to find. Indirectly, as stated previously,
high sediment loads reduce the ability of light to pass through water, therefore plants cannot
photosynthesise as effectively and their growth is reduced. This results in less food being
available to aquatic life. If a majority of plants die, this can cause dramatic changes in
habitat (Environment Canterbury, 2002). Sediment that drops out of the water column also
has detrimental effects as sediment can suffocate eggs and aquatic insect larvae on the
bottom of streams and rivers and fill in spaces between gravel where fish lay eggs and
11
. ' .. ' .'~ :.' '.,. -
.-.. - . - - --.--.~

aquatic insects find protection preventing them being washed downstream (Environment
Canterbury, 2002).
If poor water clarity causes a large numbers of plants to die or alternatively is caused by
organic particles, such as weed from waterway herbicide spraying then microbial breakdown
of the plant matter can consume oxygen in the water, leading to eutrophication of the
waterbody. In extreme circumstances this can lead to a complete use of all the oxygen in the
waterbody resulting in no aquatic life being able to survive (Environment Canterbury, 2002). )
Sediments can also carry other pollutants such as heavy metals that attach to sediment
particles. Once in the waterbody, these chemical and toxic pollutants will either remain bound
to the sediment or detach and become soluble in the water column. This causes problems
with contaminants such as heavy metal, organochloride pesticides, hydrocarbons, dioxins
and PCB's entering the estuary and. being deposited with sediment on the estuary floor
where they could accumulate to potential toxic levels. Biota that ingest contaminated
sediments (e.g. mudsnails) or filter particles directly from the water (e.g. cockles) can also
accumulate large quantities of heavy metals and organic contaminants within their tissue,
this may then be passed onto animals further up the food chain (Woodward-Clyde, 2000).
2.4 Zinc
Zinc is part of the heavy metal family, which includes copper (Cu), lead (Pb), mercury (Hg),
nickel (Ni), cobalt (Co) and chromium (Cr). These are common trace constituents in the
earth's crust and occur naturally in low concentrations in most fresh waters due to the
weathering of minerals (Novotny, 1995). Zinc is a bluish-white, moderately hard metal. It is
brittle at room temperature and at temperatures above 150 degrees celsius, being workable
only in the range between 100 degrees celsius and 150 degrees celsius (Nave, 2000). Zinc
is commonly used in the galvanising process for iron sheets and nails, making alloys, brass
and as the outside electrode in dry cell batteries (United States Environmental Protection
Agency, 2003).
Zinc sulphate is produced by combining zinc with sulphuric acid and is commonly used as a
disinfectant, a white pigment in paints, and to supply zinc in animal supplements, fertilisers
and agricultural sprays (Great Vista Chemicals, 2004).
In the environment excessive zinc can accumulate in fish and it is particularly toxic to many
species of algae, crustaceans, and salmonoids. Elevated water concentrations of zinc have
especially strong impacts on macro invertebrates such as molluscs, crustaceans, odonates,
12

and ephemeropterans (Irwin, et al. 1997). When zinc enters the body of aquatic life such as
fish it can bio-accumulate up the food chain affecting other species such as humans. This is
especially true for popular foods such as shellfish that can accumulate large quantities of
zinc in their tissue. In the Avon-Heathcote Estuary and surrounding beaches shellfish
gathering is no longer recommended due to the build-up of toxins and heavy metals
(Christchurch City Council, 2004a).
Zinc accumulation in soils often cause plants to have zinc uptakes that result in growth
impediment. Only certain plants can tolerate high zinc concentrations so zinc-rich soils can
be a threat to farm production. Generally typical soils and pastures have zinc concentrations
of 1-2 mg/kg and the availability to plants is greatly reduced by increasing the pH of the soil.
I~New Zealand the most common zinc tolerant plant is flax (Conomikes, et al. 2000). In
soils zinc can also negatively influence the activity of micro-organisms and earthworms
resulting in a serious slowdown in the breakdown of organic matter (Anon, 2004).
Studies undertaken by Wilber anq Hunter compared the metal contributions from stormwater,
treated sewer effluent and rainwater discharging into a river in New Jersey, USA. They found
that storm water was responsible for as much as 86% of the total metal loading to the river
and that 84% of the total metal loading was either zinc or lead (Wilber & Hunter, 1975).
The majority of zinc found in modern urban runoff originates from galvanised roofing and tyre
wear from vehicles (Main, 1994). Other sources may include industrial discharges, the
combustion of materials and its subsequent atmospheric deposition, contaminated sites and
corrosion.
In trace quantities zinc and many other metals are essential nutrients for human, animal and
aquatic life and only become a problem when they occur at high levels in the environment.
According to the Texas Department of Health, too much zinc can lead to nausea, vomiting
aod lack of muscular control. If a person eats too much zinc over many years, it can increase
cholesterol, clog arteries and cause anaemia (Sturdevant, 2003). The Texas Department of
Health recommends that the average 70kg person should consume approximately 21
milligrams of zinc per day (Sturdevant, 2003). A study by the University of Texas looked at
the link between shellfish consumption and zinc levels in humans. The study focussed on
the zinc concentrations of oysters in Nueces Bay, Texas, USA and found that if someone
were to eat a 225-gram meal of the most highly contaminated oysters they would be
consuming 522 milligrams of zinc. Even at this high level it is unlikely most people would feel
any ill health effects, although it may cause nausea, vomiting and diarrhoea in children,
13

"-
elderly people or pregnant women. However, the long term effects of eating these levels of
zinc could lead to anaemia, which is the loss of productive red blood cells as zinc attaches to
the iron in the blood cells (Sturdevant, 2003).
Short term zinc exposure by inhalation can cause an illness commonly called metal fume
fever. The condition usually lasts 24 - 48 hours and causes chills, fever, excessive sweating
and weakness (Illinois Department of Public Health, 2004). The Washington State
Department of Health states the ingestion of high doses of zinc 100 - 150 milligrams over a
short- period of time can result in stomach cramps and vomiting and longer term cause
damage to the pancreas, irritability, muscle stiffness and pain, loss of appetite, nausea,
vomiting, anaemia and interfere with the ability of the body to absorb and use other minerals
such as iron and copper (Washington State Department of Health, 1996).
2.5 Zinc and Sediment Interaction
Heavy metal contamination of sediments and water via stormwater discharges and land
drainage is related to the catchment type. For example levels of zinc attached to sediments
found in rural stormwater will be significantly lower than the zinc levels found in heavily
urbanised stormwater sediments (Wiesner, et al. 1998). A number of studies have been
undertaken on heavy metal concentrations in sediments within catchments, especially urban
catchments. A common conclusion is that there is a direct relationship between suspended
solid loadings in urban runoff and heavy metals (Wiesner, 1998). Headly and Lockley looked
at road surface runoff and reported evidence of a direct relationship between increasing
suspended loads and increasing heavy metal concentrations (Headley, et al. 1975).
Zinc, and its interaction with sediment, is particularly interesting in that its presence in
stormwater shows some variability when compared to sediment loadings. The variability in
loadings within similar urban catchments around the world compared to particulate
concentrations is largely explained by differences in population density and motor vehicle
use. If zinc concentrations in sediment versus fuel consump~ion are plotted it reveals a direct
correlation between increasing zinc concentrations and fuel consumption (Wiesner, 1998).
This suggests that tyre wear may be the principle source of particulate zinc in urban runoff
and the global variability in particulate zinc concentrations may be explained on motor
vehicle use (Wiesner, et al. 1998).
Wilber and Hunter examined the effects of urbanisation on the distribution of heavy metals.
Their study was based on sediments in the Saddle River, USA, which were considered to be
heavily affected by urban runoff. They separated sediment into particle sizes ranging from
14
;_ ~ ' •• - _ - r ":J- -_'
.~ .... ,

greater than 2000 IJm to approximately 0.01 IJm and found metal concentrations increased
with decreasing particle size (Wilber, et al. 1979). They also found that the larger size
fractions displayed successively higher metal concentrations as the Saddle River flowed
through the city of Lodi, New Jersey and the river became more susceptible to the effects of
urban runoff. While the smaller sized fractions continued to have high metal concentrations
as the river flowed through the city, sediments greater than 420 IJm showed the largest
increase in metal concentrations. The study also showed that smaller particles are more
likely to remain in suspension and therefore be transported to an estuary or other low shear
environments before settling out of the water column (Wilber, et al. 1979).
High organic loadings can also increase the concentrations of metals attached to sediment.
Wilber and Hunter hypothesised that this may be the result of metals in stormwater
combining with suspended organic matter (Wilber, 1979). This hypothesis was supported by
other studies that concluded that as much as 30% of lead and zinc is associated with organic
materials (Wiesner, et al. 1998).
Once metals enter a water body such as the Heathcote River, they may undergo numerous
transport and transformation processes. This makes determining the exact quantities of
metals difficult (Wiesner, et al. 1998). Dissolved metals may attach to sediment particle
surfaces or be taken up by plants and organisms. Metals that are attached to organic matter
may subsequently attach to sediment particle surfaces. Metals may also precipitate, dissolve,
desorb, or participate in oxidisation reduction (Wiesner, et al. 1998). The solid metal phases
(sorbed or precipitated) are likely to playa critical role in determining the fate of metals that
enter surface waters via urban stormwater. In particular the degree of aggregation that
occurs in the runoff stream will directly affect the fate and transport of the particles, and thus
the metals associated with them. Aggregation of sub-micron particles may enhance the
attachment of metals to sediments as metals on smaller, unsettleable particles are
incorporated into larger, faster settling particles (Wiesner, et al. 1998).
It is likely that most suspended particulates in urban waterways are incorporated as
aggregates rather than as individual particles, and that significant combining of particles
occurs in a relatively short period of time. These particles combine into larger colloids, which
are limited in size depending on when break up begins to occur. Overall this means
particulates and associated metals are rapidly converted into larger particle sizes in runoff
and thus deposited closer to stormwater outfalls or if entrained in the river flows, in areas
closer to the entrance of an estuary, lake, etc (Wiesner, et al. 1998).
15
'i-'_. __ ~'.o'_'.-~-~':';"

The combining of suspended particulates is likely to be sped up in the tidal zones of the
Heathcote River by a process called flocculation. Small particles (particularly clay) in fresh
water are kept in suspension by their molecular motion. Particles carry a negative charge
that repulses individual particles away from each other. In saline environments such as the
Lower Heathcote River where fresh water (including stormwater discharges) meets and
interacts with ionically charged salt water the negative charges are neutralised and sediment
particles become attractive. As they collide, they tend to coalesce or stick together thus
forming larger aggregates or clumps of sediment called flocs. These flocs then settle out of
suspension a lot faster than individual sediment particles (Oberrecht, 1997).
2.6 Stormwater and Contaminant Loadings
Contaminant loads in stormwater are variable depending on rainfall duration, intensity and
the length of time between rainfall events. Rainfall duration can be influential on stormwater
loadings as the longer it rains, the more contaminants will be washed into a receiving
waterbody. This only holds true f()r a certain time period as eventually all contaminants that
are going to be moved by a rainfall event (assuming rainfall intenSity does not vary) will be
mobilised. This is important in understanding why the 'first flush' will generally contain far
higher contaminant loads than water that is discharged hours into a rainfall event.
Contaminants will be washed off roads, roofs and other hardstand areas as rainfall begins.
This continues until most contaminants are washed from these areas and thus stormwater
becomes progressively less contaminated.
The time between storm events is critical in determining stormwater contaminant loadings. If
there has been an extended period of dry weather, then contaminants such as suspended
solids and metals will accumUlate in road curb and channels, carparks, yard areas and on
roofs (Elliott, 1997). When it eventually does rain more contaminants are available to be
mobilised by the rainfall event. Stormwater contamination is greater in this circumstance than
if there is a short period of time between rainfall events. The length of time between rainfall
events is particularly relevant when dealing with contaminants that are suspended solids or
those derived as a result of dust and actual physical accumulation. Rainfall intensity is the
final factor in determining stormwater contaminant loadings. If rainfall intensity is low (Le.
drizzle) then the ability of the water to move contaminants such as sediment will also be low.
On the other hand, if rainfall intenSity is high then there will be more water flowing at a higher
rate. This will enable the movement of more sediment and contaminants, including sediment
or contaminants that are larger in size (Melville, 1991).
16

Chapter 3 - Aim, Methods, Hypothesis & Current
Legislation
3.1 Aim
The aim of this dissertation is to investigate the effects of sediment and zinc in urban
stormwater runoff on the Lower Heathcote River and determine if any relationship
exists between the two contaminants. It looks at suspended solids and zinc from the
Garlands Road stormwater outfall and the effects these contaminants have on water
quality in the Lower Heathcote River. Contamination sources and control industries
and the Christchurch City Council have or should have in place to reduce suspended
solids and zinc entering stormwater systems and eventually the Heathcote River will
also be considered.
3.2 Method
Samples were collected from the Garlands Road stormwater outlet into the
Heathcote River during four separate rainfall events. Two samples were taken after a
period of continued rainfall (longer than 2 hours of rain) and the other two captured
'first flush' stormwater. This sampling program gave a representation of the level of
contaminants entering the Lower Heathcote River via the Garlands Road stormwater
outlet at different time periods into a storm event. Samples were tested for
suspended solids and zinc. The 'first flush' sampling was based on predictions from
Christchurch City Council engineers that it takes approximately one hour for the 'first
flush' to move through the stormwater reticulation system to the discharge point in
the Heathcote River (R. Donnelley, personal communication, March 2004). Only four
samples were taken due to the limited time available to conduct this study.
During the same sampling event samples were taken from the upstream side of the
Garlands Road Bridge and downstream of the Garlands Road stormwater outfall at a
I distance of 103 metres. This distance was obtained using the following formula:
L=(\jw)x25 where:
L = the sampling point in metres downstream of the discharge point
17
'. " -. ,~ .. - -~- - .
W = the width of flow measured in metres at the point of discharge.
This allows for adequate mixing of stormwater from the discharge source to occur
before a sample is taken and is based on the zone of non-compliance requirements
in Environment Canterbury's Proposed Natural Resources Regional Plan, Chapter 4:
Water Quality (Environment Canterbury, 2004a). The zone of non-compliance is a
length of channel in which the discharge can mix with the receiving water as long as
the discharge is not in a specified "sensitive area". The Heathcote River is not
regarded as a "sensitive area". The size of the mixing zone or zone of non-
compliance as referred to in Natural Resources Regional Plan is determined as a
function of the width of the water in the channel to which the discharge occurs. The
size of the mixing zone is determined by the square root of the channel width
multiplied by 25. Using the square root of the channel width means that the formulae
provides a reasonable length of river channel flow to allow for mixing in smaller
rivers, yet as the width increases it truncates the length of the mixing zone, thereby
preventing the mixing zone becoming excessively long on larger rivers (Environment
Canterbury, 2004b). Studies undertaken by Main found this formula was appropriate
when used for smaller single channel rivers such as the Heathcote and Avon. It was
less appropriate for large braided rivers such as the Waimakariri where the zone of
mixing can vary greatly for a given flow, depending on channel width and other
associated variables, principally velocity and depth (Main, 2003). From the modelling
carried out by Main the zone of non-compliance formula in the Natural Resources
Regional Plan is satisfactory for looking at mixing within the Lower Heathcote River
and a more complex formula that encompasses flow velocity, channel width, channel
depth, acceleration due to gravity and hydraulic radius is not necessarily required
(Main, 2003).
Suspended solid samples were collected in one litre plastic bottles and zinc samples
in 125ml metal bottles (acid washed and acid preserved).
Samples at the Garlands Road stormwater outlet were collected directly from the
stormwater discharge (refer Fig 1.1). Water and contaminants in this discharge were
thoroughly mixed therefore direct filling of the bottles was appropriate (note: metal
bottle is acid preserved therefore no rinsing of the bottle takes place).
The upstream and downstream suspended solid samples were collected using an
extendable sample pole, which enables a sample to be taken approximately 3 metres
18
1-"-I· ... ,.: ,. I- ,","
out from the bank. The grab sampling technique provides an instantaneous
representation of the source sampled. The bottle was plunged bottle neck
downwards, below the surface; the bottle was then tilted until the neck pointed
slightly upwards (beneath the surface) with the mouth directed towards the current.
Care was taken to ensure the bottom of the riverbed was not disturbed or sampled
and that the areas above the sample point were not disturbed or walked in. This was
achieved by taking the downstream sample first followed by the outfall sample and
finally the upstream sample. The grab sampling technique is used throughout New
Zealand and the world. It is listed as a recommended sampling method by the United
States Environmental Protection Agency (United States Environmental Protection
Agency, 1997) and here in Canterbury is a standard sampling procedure for
Environment Canterbury when collecting water samples from streams and smaller
rivers.
The upstream and downstream zinc samples were taken from the suspended solids
bottle as the metals bottle cannot be held by the extendable pole. The suspended
solids bottle was then re-filled, again using the grab sampling technique.
Analysis of the samples was carried out by the Environment Canterbury Laboratory
(IANZ accredited) using the APHA 2540 D (20 Ed) - Gravimetric method for
suspended solids and the APHA 3111 B (20th Ed) - Acid soluble method for zinc. A
copy of these methods can be found in Appendix 2.
The suspended solid results can be compared with surface water quality data in the
Heathcote River collected by the Christchurch City Council over the last 15 years in
close proximity to the Garlands Road sampling site. Using rainfall data from the area
the results obtained can be extrapolated to give an indication of the total suspended
solid load entering the system in a storm event of a certain duration.
Historic heavy metal data is limited with the only continuous sampling point on the
Heathcote River downstream of the Garlands Road stormwater outfall located at the
Ferry Road Bridge. Results from the Garlands Road sampling can be compared to
the historical data. This has limitations as there are numerous other stormwater
sources that enter the Heathcote River between where the Garlands Road
stormwater outlet enters the river and the Christchurch City Council's heavy metal
sampling area at the Ferrymead Bridge.
19
-,-' ,".-;., .. '~' . . ~ ".: ,',' '. I. ~ • .... .:-....· ..... ·.·.-4~t..
. . ~ .

In conjunction with the sampling program a catchment study was undertaken. This
looked at the various industries and roading networks that connect into the Garlands
Road stormwater drain. The catchment was defined using stormwater drainage plans
from the Christchurch City Council. The maps (Figures 4.16 & 4.17) show the
location of stormwater sumps and pipes in the study catchment and gives a general
indication of where the catchment boundaries are. The catchment was more
accurately defined by visiting the area and visually inspecting stormwater sump
locations and hardstand areas.
The different zones in the catchment i.e. industrial, reading, etc. were identified by a
site visit. The different land uses were highlighted on the drainage plan, which also
showed land parcels, enabling the different land uses in the catchment to be
accurately identified into either residential, industrial, commercial or roading zones.
Finally a third site visit was made to the area to identify what levels of stormwater
protection were in place on the various roads, industries and commercial sites.
Knowledge from site visits made to the main industries in the catchment as part of
my job as a Compliance Monitoring Officer with Environment Canterbury were also
used. Part of my role in this occupation is to look at stormwater protection.
In order to put the results from my sampling into context relevant guidelines were
required to compare against. Of most relevance in New Zealand are the Australia
New Zealand Environment and Conservation Council guidelines developed in 2000.
These provide an authoritative guide for setting water quality objectives required to
sustain current or likely future environmental values for natural and semi-natural
water resources in Australia and New Zealand (Australia New Zealand Environment
and Conservation Council, 2000b). The guidelines adopt a risk based approach which
means values are derived from a given exposure scenario (i.e. protection of human
health) or the protection of a nominal proportion of species in an ecosystem. The
other common type of approach is a threshold approach where values may be
derived from toxicological data where insufficient data is available to develop risk-
based thresholds. Guideline values may also be classified as threshold values where
insufficient information on their derivation is available. The level of protection afforded
from threshold values is unable to be determined (Ministry for the Environment,
2003). The New Zealand Ministry for the Environment recommends that in the first
instance New Zealand risk-based guidelines are used as these have been developed
using international best practice. They have been through substantial national and
20
1.-'_, •.. ____ •••.

international peer review, and are accepted by national and local government and
industry. In some cases they also reflect exposure pathways common in New
Zealand that are often omitted from international documents (Ministry for the
Environment, 2003) For these reasons the Australia New Zealand Environment and
Conservation Council guidelines for aquatic ecosystems are acceptable for use as a
guideline value for zinc in this project.
For this study Environment Bay of Plenty's general authorisation for stormwater has
been adopted as a guideline on what is an acceptable level of suspended solids in
stormwater as Environment Canterbury has no such guidelines at this time.
Environment Bay of plenty has undertaken some investigations to support their limit
of 150 mg/L and have justified this based on suspended solids carrying a number of
other contaminants. By restricting suspended solid inputs it will restrict other
contaminants such as heavy metals and nutrients that are bound to the sediment
(Environment Bay of Plenty, 2001). Environment Bay of Plenty's study found that a
suspended solids concentration limit. of 3QO-500 mg/L would protect aquatic
ecosystems from the effects of common urban contaminants from residential areas.
In commercial areas a limit of 100 mg/L would be required and 100-150 mg/L in
industrial areas. This is a reflection of the different types and quantities of
contaminants that are present in each of the catchments. As the study catchment for
this investigation is mainly residential and industrial areas, the stormwater limit of
150mg/L is an appropriate guideline.
Suspended solid levels in the Heathcote River itself were compared to the guidelines
set under the Victoria State Environmental Protection Policy 1988 for water. These
were developed for general and ecosystem protection. The guideline of 80mg/L of
suspended solids provides a basis for environmental quality objectives in the
absence of regionally specific data (Clarke, et al. 1999). The guidelines are based on
the type of surface waters and the inherent differences in water quality across
different regions (Environmental Protection Agency Victoria, 2003). In the absence of
any local guidelines for Canterbury the guideline provided by Victorian State
Environmental Protection Policy for lowland rivers, which the Heathcote can be
classified as, is appropriate.
21
~>.-'-. -

3.3 Hypothesis
During a storm with constant rainfall intensity, the concentration of suspended solids
in the outfall drain is expected to be high, in excess of 150mg/L during the first flush
but then reduce as sediment is gradually washed from hardstand areas and roads
through the stormwater system. It is also expected that the high sediment loadings
being discharged from the Garlands Road stormwater outlet will cause an increase in
suspended solids in the Heathcote River downstream of the outfall.
(Zinc concentrations are expected to be high due to the 14,900 vehicles per day
(especially heavy vehicles) that use Garlands Road (Stapleton, Christchurch City
Council, Personal Communication, December 2004) and the fact tyre wear
associated with vehicles is one of the major contributors to zinc in stormwater. Other
possible sources in the catchment include Mecca Foundary and Skellerup Industries.
Zinc is also associated with galvanising such as on iron roofs and nails, so some
contamination may come from ttiese sources. Zinc levels are expected to be high in
stormwater from the Garlands Road outfall but lower in the downstream river
samples due to zinc being diluted in the in the main river flow and also bound to
sediments that subsequently fall out of suspension)
The effects of suspended solids and zinc from the Garlands Road stormwater outfall
on water quality in the Lower Heathcote are expected to be more cumulative as
sampling occurs when other stormwater drains are also discharging into the
Heathcote River.
Zinc and heavy metals' have been found to bind to suspended solids. It is expected
there will be a positive relationship between zinc and suspended solids from samples
taken at the Garlands Road outfall and the two sites on the Heathcote River.
It is likely that there will be no stormwater pollution controls installed on sites or in the
stormwater network. All stormwater is directed from roads, hardstand areas and roofs
into stormwater sumps and then transported directly to the Heathcote River.
This study looks to determine if these hypotheses are correct.
22
"-'., .......... '- ~- ..... ,-
- . ,-'~.~-'.';-:-::.'> . -~'-.
. .-'.- ,'. ~ - ~ " ,~
1-','-,'-"-,
':-",

3.4 Current Legislation/Regulatory Authorities
Stormwater issues within Christchurch City are dealt with by the City Council and
Canterbury Regional Council (Environment Canterbury). Controlling the actual
discharges from the City Councils reticulated network into various surface water
bodies (via a general stormwater authorisation under the Transitional Regional Plan)
is Environment Canterbury's responsibility and the Christchurch City Trade Waste
Bylaws restrict what can be discharged into the actual stormwater network, although
the power to control this can also be vested with the Regional Council under section
15 of the Resource Management Act 1991.
23
".-.-.-'-

Chapter 4 - Results
4.1 Sampling Dates and Times
Sampling Date Time Lapsed since Start of Storm Event and when Sample was Taken
18/06/04 2 hrs 03/07104 0.5 hrs 28/08/04 5 hrs 01/10104 0.25 hrs
Table 4.1 - Sampling Dates and Times
Sampling was undertaken on four days between 18 June and 1 October 2004. The time of
sampling varied from 0.25 hours into a storm event on 1 October up to five hours into a storm
event on 28 August 2004.
4.2 Rainfall Data
Rainfall Data (mmlday)
110 r--------+--~~~~~--~--~
~ ~ 8 ~----~----~~~~----~--~
18106104 31712004 28108104 1/1012004
Figure 4.1 - Rainfall on Sampling Dates
Rainfall data was obtained from the Christchurch City Council Tunnel Road monitoring
station. Rainfall varied between 15.4mm (24 hour period) on the 28 August 2004 to 1.8mm
(24 hour period) on the 3 July 2004.
24

4.3 Suspended Solids
At the upstream sampling site, suspended solid concentrations ranged between 13 and 67
mg/L. The highest levels were recorded on 28 August 2004 when sampling was undertaken
four to five hours into the storm event.
Heathcote Upstream Suspended Solids
~OOr-~~--~~~~~ .. !! '0 0~~~~ __ ~~~~~
i c
~~ ~---------------::J o
10
611812004 (2hrs) 7/312004 (0.5 hrs) 8/2812004 (5 hrs)
Data and Tim! Lapse Since Start d Storm
Figure 4.2 - Upstream Suspended Solid Concentrations
101112004 (0.25 hrs)
Suspended solid concentrations in samples taken from the Garlands Road stormwater outfall
were higher when sampled during the 'first flush' or within the first hour of rainfall. Samples
taken outside this period showed a reduction in suspended solids as shown in Figure 4.3 on
18 June and 28 August 2004. The 18 June sample was collected after approximately two
hours of continuous rain and 28 August sample five hours into the storm event. Overall
suspended solid concentrations at the outfall varied between 32 mg/L on 28 August 2004
and 970 mg/L on 3 July 2004.
Suspended solid concentrations in the downstream samples (Figure 4.4) showed no
noticeable changes as a result of stormwater discharges from the Garlands Road outfall.
The downstream suspended solid levels were almost exactly the same as the upstream
results and in some cases slightly lower. As at the upstream site suspended solid levels
were highest on 28 August 2004 and lowest on 18 June 2004.
25

Outfall Suspended Solids
611812004 (2hrs) 7/312004 (0.5 hrs) 812812004 (5 hrs)
Date and Time Lapse Since Start of Stonn
Figure 4.3 - Outfall Suspended Solid Concentrations
Heathcote Downstream Suspended Solids
~ E ~40 ~-------------------'0 II) 'U ~ t 30 .. ~
10
6/1812004 (2hrs) 71312004 (0.5 hrs) 812812004 (5 hrs)
Date and Time Lapsed Since Start of Storm
Figure 4.4 - Downstream Suspended Solid Concentrations
101112004 (0.25 hrs)
101112004 (0.25 hrs)
Comparing the results from all three sites, suspended solids in stormwater from the outfall
site were significantly higher (twenty times higher on 5 July and about fourteen times higher
on 18 June and 1 October 2004) when compared to the river upstream and downstream
results.
26
Suspended Solids Sampling Results 18th June 2004 (2hrs Since Start of Storm Event)
1~ ~--~----~~~~~~~~~
!1~ r---------~~~~~~~---:2 '0 0100 ~--~~ __ ~~ __ ~ ________ _
i i ~ r-~--------~----~~----'~ :s o
OO r---------~---------------
Upstream Outfall
SIte
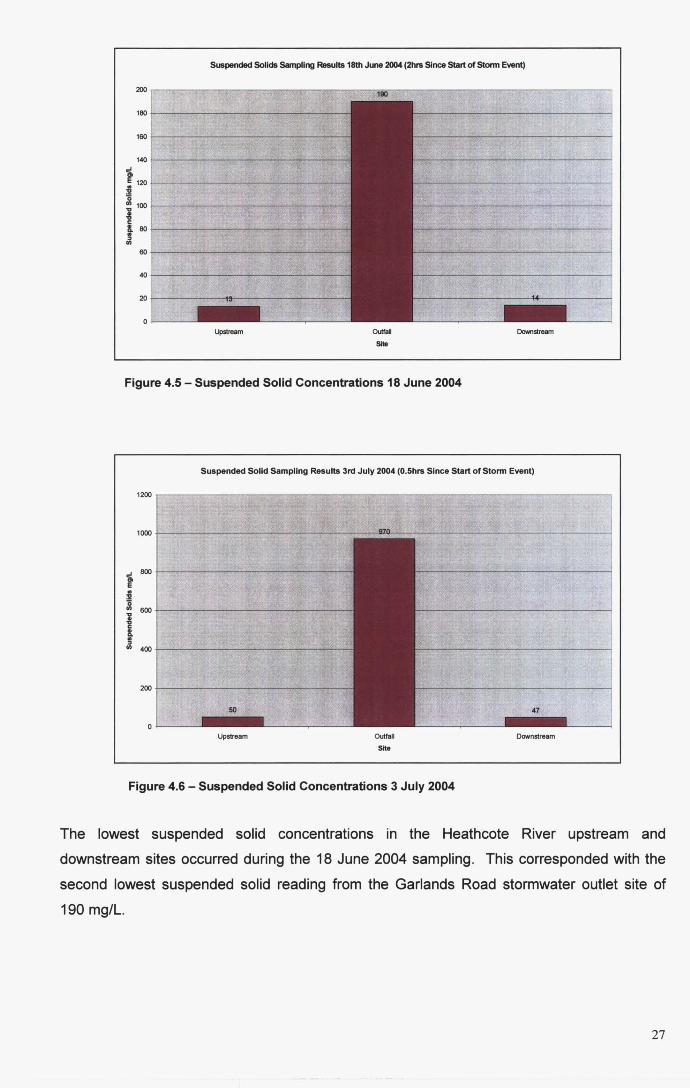
Figure 4.5 - Suspended Solid Concentrations 18 June 2004
Downstream
Suspended Solid Sampling Results 3rd July 2004 (0.5hrs Since Start of Stonn Event)
1200
1000
'i 800
E . :!:! '0 0 '0
600 -8 i :s 0 400
200
Upstream Outfall
Site
Figure 4.6 - Suspended Solid Concentrations 3 July 2004
Downstream
The lowest suspended solid concentrations in the Heathcote River upstream and
downstream sites occurred during the 18 June 2004 sampling. This corresponded with the
second lowest suspended solid reading from the Garlands Road stormwater outlet site of
190 mg/L.
27

Suspended Solids Sampling Results 28th August 2004 (Shrs Since Start of Stann Event)
~ :120 ~----~--~~~~~~~~~~~~~~~~~~~----~~~--~~ :!! '0 o 100 ~~------~~~--~~~~~~~~~--~~~~~~----~------~
I t 80 ~~----------------~--~~~~~~~~~~~----------------~ o
60 t----".--.,-,-
40 t--..:.:.....:.--=-
20 t--...,:.=....:,..:.:;.
Upstream Outfall
Site
Figure 4.7 - Suspended Solid Concentrations 28 August 2004
Downstream
Samples taken at the outfall site on 28 August 2004 had the lowest suspended solid levels of
any samples from the outfall, yet suspended solid concentrations at the upstream and
downstream sites on the same date were the highest out of all four sampling events.
Suspended Solid Sample Results 1st October 2004 (0.2Shrs Since Start of Storm Event)
~ 300 E III :!!250 ~----~~7-~--~----~~~ ;g 1200 ~----------~--~~----~~ ! :;, o 1~ ~--------~~--~~--------
Upstream Outfall
Site
Figure 4.8 Suspended Solid Concentrations 1 October 2004
Downstream
28

4.4 Zinc
Zinc levels in the Heathcote River varied from below the detection limit of 0.02 mg/L up to
0.07mg/L.
Upstream Zinc Concentrations
0.08
0.07
0.06
O.OS
~ III
.§. 0.04 u c N
0.03
0.02
0.01
18/06/2004 (2hrs) 03/07/2004 (O.Shrs) 28/08/2004 (Shrs) 01/10/2004 (0.2Shrs)
Date and Time Lapse Since Start of Storm
Figure 4.9 - Upstream Zinc Concentrations
Upstream zinc levels were highest on 28 August 2004 at 0.07mg/L and on 3 July 2004 at
0.04mg/L. On the other two sample dates zinc levels were below the analysis method
detection limit.
Outfall Zinc Concentrations
~ .§.4 ~~--~~~~~~~~ u c N
o 18/06/2004 (2hrs) 03/07/2004 (O.Shrs) 28/08/2004 (Shrs)
Date and Time Lapse Since Start of Storm
Figure 4.10 - Outfall Zinc Concentrations
01/10/2004 (0.2Shrs)
29
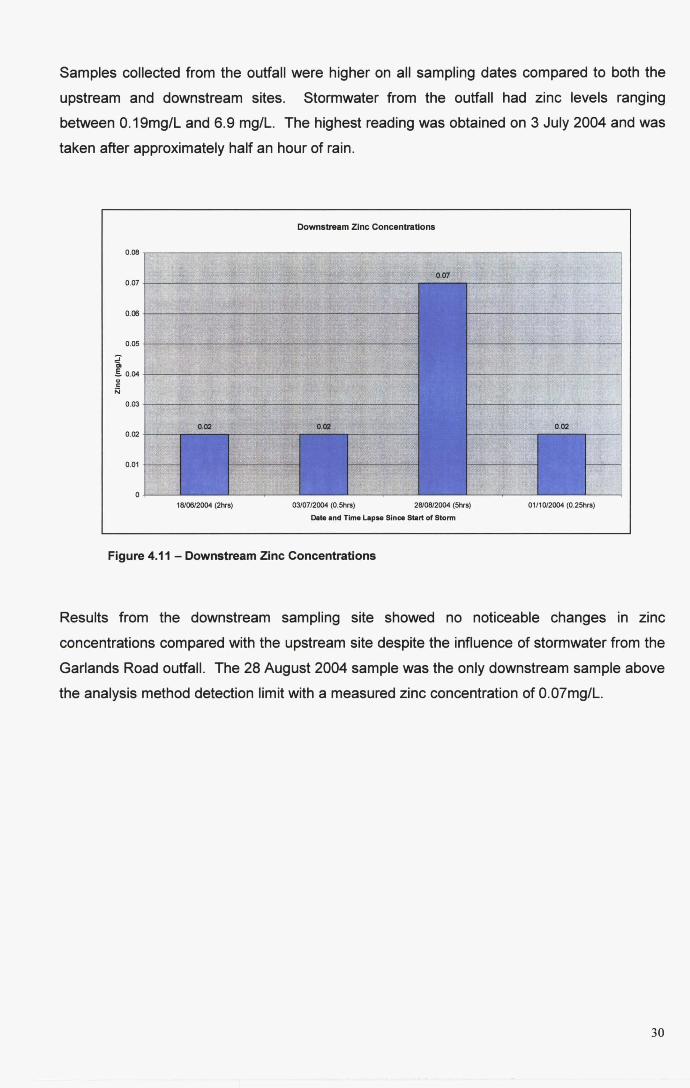
Samples collected from the outfall were higher on all sampling dates compared to both the
upstream and downstream sites. Stormwater from the outfall had zinc levels ranging
between 0.19mg/L and 6.9 mg/L. The highest reading was obtained on 3 July 2004 and was
taken after approximately half an hour of rain.
Downstream Zinc Concentrations
0.08 .,-----:::~---"--____ ..,...__....___.,,,...--___,_-----~----__,
;J" at §. 0.04 +---------'-'--...,--.:::..----:-:------...-------' .. c N
0.02
0.01
18/06/2004 (2hrs) 03/07/2004 (0.5hrs) 28108/2004 (5hrs)
Date and Time Lapse Since Start of Storm
Figure 4.11 - Downstream Zinc Concentrations
01/10/2004 (0.25hrs)
Results from the downstream sampling site showed no noticeable changes in zinc
concentrations compared with the upstream site despite the influence of stormwater from the
Garlands Road outfall. The 28 August 2004 sample was the only downstream sample above
the analysis method detection limit with a measured zinc concentration of 0.07mg/L.
30

Zinc Sample Results 3rd July 2004 (0.5hrs Since Start of Storm Event)
7 +---"";
6 +---...,.,
'§.5 E u ~ 4 +------' ~ ::J o 3 +-..;;;;;;:;~~
o +----"---Upstream Outfall
Site
Figure 4.12 - Zinc Concentrations 18 June 2004
0.035
~ 0.03 ~
~~~~~~~~~--~---~~ ~
E 0.025 i
-----~~--~----------~ c
Downstream
0.02 ~
~ 0.015 i
~ => 0.01
0.005
------+ 0
Note that on 3 July 2004 zinc levels at the downstream site were lower than the upstream
site despite zinc levels from the outfall being at there highest level of 6.9mg/L.
1.4 +----
1 .2 +-~...".......
~ E 1 +----. u c N ~ 0.8 +--~":-"'"
c5 0.6 +----
0.4 +----
0.2 +----"-
0 +-----'-
Zinc Sample Results 18th June 2004 (2hrs Since Start of Storm event)
Upstream Outfall
Site
Downstream
Figure 4.13 - Zinc Concentrations 3 July 2004
-----1 0.02
'§. E u c
0.015 N E COl e -;; c ~
0.01 ~
0.005
e -;; Q. =>
---+ 0
31

0.16 ~'...:::......-,-'-
0.14 +--...,......;.,.-"-""
~ 0.12 -1---::.....;.:. E u ~ 0.1 +--...,......,..,..,.,;,..;.
~ o 0.08 -J-...:!:'.'---"-~
0.06 -1--~......-
0.02 +---.........:-~
Upstream
Zinc Results 28th August 2004 (5hrs Since Start of Stonn Event)
Outfall
Site Downstream
Figure 4.14 - Zinc Concentrations 28 August 2004
0.9
0.8
0.7
0.6
~ E 0.5 u c N ~ 0.4 0
0.3
0.2
0.1
0
Zinc Results 1st October 2004 (O.25hrs Since Start of Stonn Event)
Upstream Outfall
Site Downstream
Figure 4.15 - Zinc Concentrations 1 October 2004
0.07
0.06 ~ ";;"::"'-.,-,---j E
u ,:...:.......~,.............j 0.05 ~
E ~
0.04 i .:..-.,,":":"""'---j 0.03 i
0.02
~_---j 0.01
'--------4- 0
"---"---'-----1 0.02
2! 1ii Q. ;:)
~ E u c
0.015 N E ~ 1ii
! 0.01 E
0.005
l...--_---I- 0
~ Q. ;:)
As shown in Figures 4.12 - 4.15 downstream zinc levels did not increase from those
upstream on any of the sample dates even though there was stormwater from the Garlands
Road stormwater outfall being discharged between the two sites that had zinc levels ranging
between 0.19 and 6.9 mg/L.
32

4.5 Catchment Study
On 20 June 2004 an investigation into the various industries, businesses and residential
areas connected to the Garlands Road stormwater outfall was made. The purpose of the
investigation was to understand the contributing sources to the outfall based on land uses.
The catchment and zoning is shown on Figures 4.17 and 4.18. The catchment was divided
into industrial, commercial, residential and roading zones.
Overall the catchment (based on area) is approximately 50% residential, 220/0 industrial, 5%
commercial and 23%, roading as seen in Figure 4.16. f ..... \. ,
Catchment Study Zoning
5%
Figure 4.16 - Garlands Road Outfall Stormwater Catchment Zoning
50010 Residential
• Commercial o Industrial o Roading
33

1 lJUl 1 IvVl~VV
100 m l;! ~~~~ The accuracy of this plan and the measurements shown are not guaranteed but should
be verified by inspection.
Catchment Area and Zones 1
Produced by 192.148.221.25 at 22:11 on 1012812004
http://webmap.ccc.govt.nz/tools/printadvancedlprint_preview _landscape.asp?Persistence=
I I
---1 ----
Catchment Zones
" CHRISTCHURCH ~. ",,\7' aT\' C:OU"Cl",· \'OUII "(~. 'QUA c;lTY
Protected Trees Pipe Protection Storm Water Private Storm Water Nodes Storm Water Linear Storm Water Structures Waterways Parcel Base
Key
D = I ndustrial Site
D = Commercial Site
• = Residential Area
~ Copyright reserved Figure 4.17 - Catchment Area and Zones
34

l
•
72-76
100 m !t;;;_~~~ The accuracy of this plan and the measurements shown are not guaranteed but should
be verified by inspection.
Catchment Area and Zones 2
:Jl
41
4S
Produced by 192.148.221.25 at 16:09 on 1012512004
http://webmap.ccc.govt.nz/tools/printadvanced/print_preview_Iandscape.asp?Persistence=
162
t64 ,. MB
170
t1'Z
114
mi
e Copyright reserved :
- -0- - - - -
Catchement Zones
" CHRISTCHURCH "'~'" ~>,.: ... • • ,::>- \ ClTY c;.au~u, • YDUII nDl'I,J • YI;IUR CITY
Protected Trees Pipe Protection Storm Water Private Storm Water Nodes Storm Water Linear Storm Water Structures Waterways Parcel Base
Key
D = Industrial Site
D = Commercial Site
• = Residential Area
Figure 4.18 - Catchment Area and Zones
35

Chapter 5 - Discussion
5.1 Suspended Solids
Suspended solid concentrations were highly variable, depending on the site location, time of
sampling, rainfall intensity and the number of dry days prior to sampling. The highest
suspended concentrations from the Garlands Road stormwater outfall were recorded when
sampling was undertaken during the 'first flush' or within the first hour of rainfall. This is
shown in Figure 4.2 and in the results from 3 July and 1 October 2004. Both these samples
were collected within the first hour of the storm event.
Within a catchment, silt, soil and litter is accumulated on roads and hardstand areas. This
accumulated matter is moved by the force of stormwater resulting in a higher contaminant
loading during the first flush.· Contaminants become entrained in stormwater flows and are
carried along the curb and channel, into underground pipes and eventually into the
Heathcote River. The volume of$uspended material carried by stormwater is directly related
to the intensity and duration of the rainfall event. Most sediment will discharge into the
Heathcote River when there is a high intensity rainfall event with a long duration. A high
intensity storm event will cause water to flow at a faster rate across surfaces into the
stormwater system, thus water will have more energy available to collect material and
transport it to the receiving environment.
Eventually contaminant loads begin to reduce even if rainfall intensity remains constant as
contaminants that have accumulated on roads and hardstand areas are washed through the
stormwater system and into the receiving environment. An increase in rainfall intensity will
increase the ability of contaminants to be entrained in stormwater flows thereby increasing
the contaminant loading even if the storm event has been continuing for a number of hours.
Once these accumulated materials have been removed a significant drop-off in contaminant
levels is experienced, this is shown in the suspended solid sample taken at the outfall site on
28 August 2004 after five hours of rain (Figure 4.3). The suspended solid levels on 28 May
2004 at the outfall site were low compared to results at the start of a storm event. This
illustrates how suspended solid loadings decrease after accumulated sediment is transported
through the stormwater network into the Heathcote River.
After accumulated material has been removed only newly generated sediment is available for
transport. New sediment generation will be minimal during a storm event as wet conditions
are not conducive to generating dust or its subsequent movement onto hardstanding areas.
36
,""'",-
, :"
This situation would not apply where a continuous sediment source is available such as is in
some of the Port Hills catchments where a continuous flow of fine loess sediment discharges
to waterways during a rainfall event.
There was a large difference in the results taken from the outfall site on 1 October and 3 July
2004 despite being taken at almost the same time into a storm event. This shows
contaminant loads vary between storm events. The variations could be caused by a number
of factors including those mentioned above. There may have been a lower rainfall intenSity
on 1 October 2004 resulting in less sediment· entrained in the stormwater, or there may have
been previous rainfall on the days prior to sampling. This is supported by rainfall data from
the Christchurch City Council's Tunnel Road rain gauge. This gauge showed 26.4mm of rain
fell in the seven days leading up to the 1 October sampling whereas on the seven days
leading up to the 3 July sampling only O.4mm of rain fell. Hardstand areas in the catchment
on 1 October would have had less accumulated sediment, as a proportion of this would have
been removed by the previous rainfall events. Subsequently lower suspended solids were
found to be entrained in stormwater from the Garlands Road stormwater outfall on 1 October
compared to 3 July 2004.
Sediment loadings of up to 970mg/L from the Garlands Road stormwater outfall appeared to
have minimal impacts on sediment loadings in the Heathcote River. As seen in Figures 4.4
and 4.7 there was a small increase in suspended solids downstream of the Garlands Road
stormwater outfall when compared with upstream results on 18 June and 1 October. On the
other two sampling dates, suspended solids downstream were less than upstream, including
on 3 July 2004 when suspended solids from the outfall were recorded at 970mg/L.
If high sediment-laden water is being discharged it would be expected that samples taken
upstream of the discharge pOint would have lower suspended solids than those taken
downstream of the discharge point. The sampling areas are located in the Lower Heathcote
River which is heavily influenced by tidal patterns. All sampling was undertaken at low tide
although no assessment was made on whether the tide was coming in or out. If the tide was
coming in (water levels rising) then the normal flow of the Heathcote River out to the estuary
may have been affected. This could result in uneven sediment mixing, the movement of
sediment upstream or a period of zero flow where the tide coming in and the flow of the
Heathcote out are balanced. In this balanced situation, conditions would be conducive to
allowing sediment settle out of the water column. The differences in the up and downstream
results only varied by a maximum of 6mg/L across all sampling days and the reduction in
suspended solids in the downstream samples on 3 July and 28 August 2004 could be due to
37

samples being taken in an area of water that was slightly less contaminated even though
there should have been time for sediment mix evenly into the main waterbody.
With the exception of 28 June 2004 results suspended solid concentrations in the Heathcote
River sampling sites showed increases in suspended solid concentrations with longer rainfall
durations. This is likely due to the cumulative affects of all stormwater discharged into the
Heathcote River catchment and the delay it takes for sediment to get into the river from
stormwater catchments and for sediment to progress downstream to the study sample
locations.
Since 1986, Christchurch City Council has undertaken water quality testing at sixteen sites
on the Heathcote River. While a large quantity of data has been produced there is a lack of
compatible key data such as weather conditions at the time of sampling. Further, some of
the variables were only tested at a single site rather than all sixteen.
Appendix 3 shows the suspended solids data collected by Christchurch City Council from
Garlands Road Bridge (same position as this study's upstream site), Tunnel Road Bridge
and Ferrymead Bridge. Rainfall data obtained from Christchurch City Council's Tunnel Road
station has also been added to give an indication of weather conditions at the time of
sampling.
On days when there was no measured rainfall, results of suspended solids sampling by
Christchurch City Council at the Garlands Road Bridge were between <5 - 28mg/L.
Suspended solid concentrations in the City Council's data increase at sites further
downstream to between <5 - 55mg/L at Ferrymead Bridge. During rainfall events
suspended solids at the three City Council sites increased in comparison with the zero rain
results. The upper suspended solids range at the Garlands Road site increased to 49 mg/L
during rainfall sampling and at the Ferrymead Bridge site the upper suspended solids range
increased to 109mg/L during rainfall sampling.
Dissertation Garlands Tunnel Road Ferrymead Heathcote Sampling Road (CCC) Bridge (CCC) Bridge (CCC)
sUS Solids mg/L Sus Solids mg/L Sus Solids mg/L Sus Solids mg/L Zero Rain NA <5 - 28 <5-38 <5-55 Rain 13- 67 <5 -49 <5-87 <5 -109
Table 5.1 - Christchurch City Council and Heathcote Study Suspended Solid Sampling Results
The results of sampling at the upstream and downstream sites produced a higher range of
values than sampling carried out by Christchurch City Council in the same area. The
38
.'-l ....... ~.,. ....... -_~.
,~--.': -- --~
.... -,_ .. ,.
;:j-
suspended solid result of 67 mg/L at my upstream site (equivalent to the Christchurch City
Council's Garlands Road Bridge site) was the higher than any of the results in the data
supplied by the City Council. The City Council data indicates that suspended solids do
increase in the Lower Heathcote River as a result of rainfall as the range of suspended solid
results increase when sampling was undertaken on days where rainfall had occurred.
The City Council data also indicates that suspended solids increase at sample sites further
downstream, possibly from tidal influences or stormwater discharges. .It is likely to be a
com~ination of these two factors as even during zero rainfall, suspended solids still increase
at sites closer to the estuary.
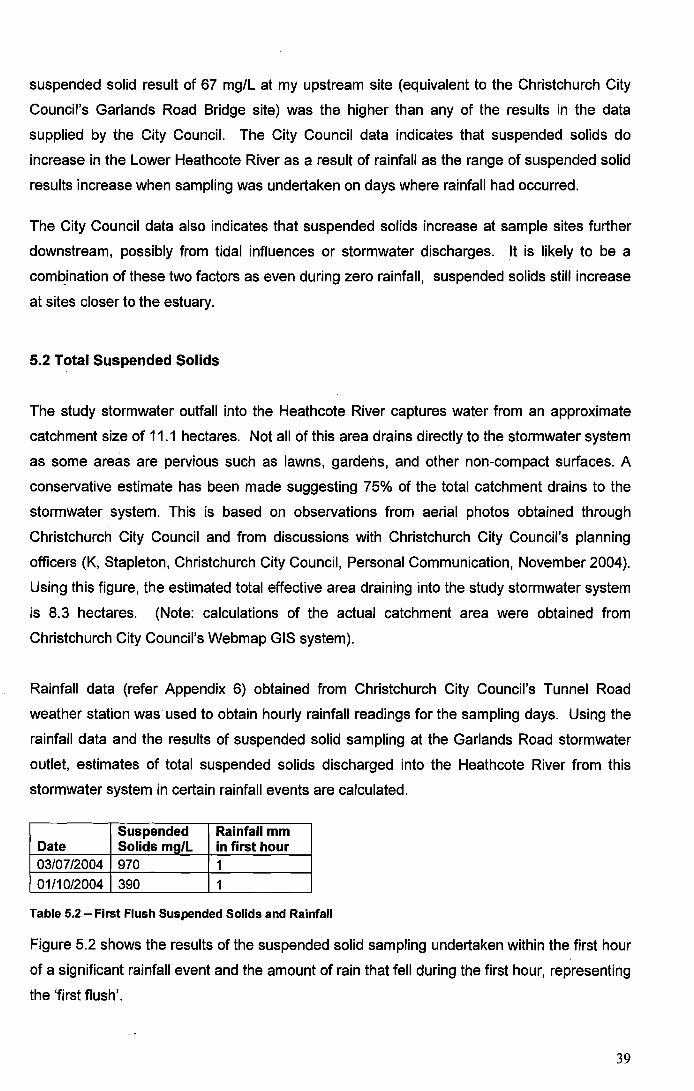
5.2 Total Suspended Solids
The study stormwater outfall into the Heathcote River captures water from an approximate
catchment size of 11.1 hectares. Not all of this area drains directly to the stormwater system
as some areas are pervious such as lawns, gardens, and other non-compact surfaces. A
conservative estimate has been made suggesting 75% of the total catchment drains to the
stormwater system. This is based on observations from aerial photos obtained through
Christchurch City Council and from discussions with Christchurch City Council's planning
officers (K, Stapleton, Christchurch City Council, Personal Communication, November 2004).
Using this figure, the estimated total effective area draining into the study stormwater system
is 8.3 hectares. (Note: calculations of the actual catchment area were obtained from
Christchurch City Council's Webmap GIS system).
Rainfall data (refer Appendix 6) obtained from Christchurch City Council's Tunnel Road
weather station was used to obtain hourly rainfall readings for the sampling days. Using the
rainfall data and the results of suspended solid sampling at the Garlands Road stormwater
outlet, estimates of total suspended solids discharged into the Heathcote River from this
stormwater system in certain rainfall events are calculated.
Suspended Rainfall mm Date Solids mg/L in first hour 03/07/2004 970 1 01/10/2004 390 1
Table 5.2 - First Flush Suspended Solids and Rainfall
Figure 5.2 shows the results of the suspended solid sampling undertaken within the first hour
of a significant rainfall event and the amount of rain that fell during the first hour, representing
the 'first flush'.
39
,- .--," ."'~ , -~ ','-
.;~,.,~.-.:. ',' -';',' :~~-~.~':' .. --..... "':-
','
.. -.- ....... .
t'::'.

By extrapolating the amount of rainfall in the first hour across the study stormwater
catchment (8.3 hectares) a total of 83m3 of water would have discharged from the Garlands
Road stormwater outfall into the Heathcote River during the 'first flush'. On 3 July 2004
approximately 80 kg of sediment would have discharged into the Heathcote River via the
Garlands Road stormwater drain in the first hour of rain and 32 kg on 1 October 2004. These
figures give an indication of the quantities of sediment that can be discharged in the initial
stages of a storm event and assumes a constant sediment concentration over the first hour
of rainfall. In reality it is likely the sediment loading would vary, even during the 'first flush'.
The figures obtained are based on the following calculations:
Catchment Area = 8.3ha or 83000m2
Rainfall = 0.001m in first hour
Total water discharged in first hour = 83000 x 0.001 = 83m3 or 83000 litres
Sediment = 970mg/L (03/07/2004)
Total Sediment Discharged in First Hour = 970 x 83000 = 80510000mg or 80.51 kg
After the 'first flush', suspended solid levels begin to decrease as sediment accumulated on
roofs, carparks and roads is washed through the stormwater system into the Heathcote
River. This is illustrated in the results taken on 18 June and 28 August 2004 after two and
five hours of rain respectively (Table 5.3).
Suspended Rainfall Daily Total Solids Excluding First
Date (mg/L) Flush/Hour (mm) 18/06/2004 190 2.2 (7 hours) 28/08/2004 32 15.4L20 hours)
Table 5.3 - Suspended Solids and Rainfall Excluding First Flush
The results of sampling at the Garlands Road stormwater outfall outside the 'first flush'
period show total sediment loadings decreasing. On 18 June 2004, assuming suspended
solid concentrations remained as sampled, 34.7 kg of sediment would have discharged into
the Heathcote River over a seven hour period, while 41 kg would have discharged over a
twenty hour period on 28 August 2004.
Although these results are only based on four samples, two taken during the first hour of a
storm event and two taken outside the first hour of a storm event, they show suspended solid
loadings during the first flush can exceed the loadings discharged throughout the remaining
40
.~."~-.·r" t,' '.
, ", "-. - ... ~ - - . - -,-
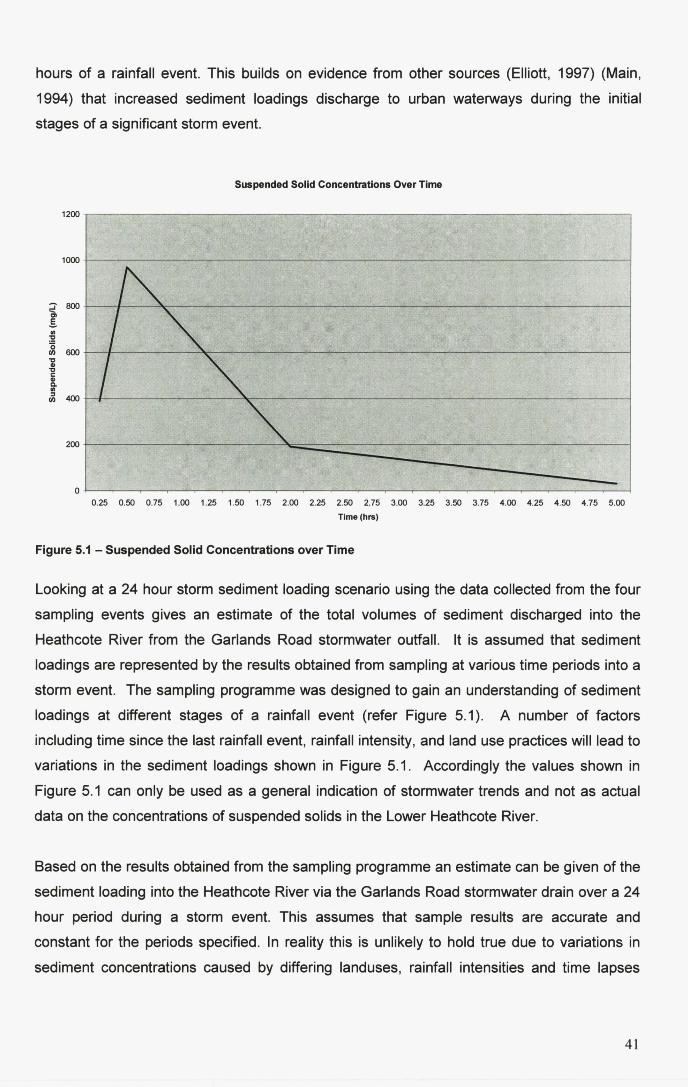
hours of a rainfall event. This builds on evidence from other sources (Elliott, 1997) (Main,
1994) that increased sediment loadings discharge to urban waterways during the initial
stages of a significant storm event.
:J C, S III :2 '0 UJ 'C CD 'C C CD Q. III :I
UJ
1200
1000
800
600
400
200
Suspended Solid Concentrations Over Time
0.25 0.50 0.75 1.00 1.25 1.50 1.75 2.00 2.25 2.50 2.75 3.00 3.25 3.50 3.75 4.00 4.25 4.50 4.75 5.00 Time (hrs)
Figure 5.1 - Suspended Solid Concentrations over Time
Looking at a 24 hour storm sediment loading scenario using the data collected from the four
sampling events gives an estimate of the total volumes of sediment discharged into the
Heathcote River from the Garlands Road stormwater outfall. It is assumed that sediment
loadings are represented by the results obtained from sampling at various time periods into a
storm event. The sampling programme was designed to gain an understanding of sediment
loadings at different stages of a rainfall event (refer Figure 5.1). A number of factors
including time since the last rainfall event, rainfall intensity, and land use practices will lead to
variations in the sediment loadings shown in Figure 5.1. Accordingly the values shown in
Figure 5.1 can only be used as a general indication of stormwater trends and not as actual
data on the concentrations of suspended solids in the Lower Heathcote River.
Based on the results obtained from the sampling programme an estimate can be given of the
sediment loading into the Heathcote River via the Garlands Road stormwater drain over a 24
hour period during a storm event. This assumes that sample results are accurate and
constant for the periods specified. In reality this is unlikely to hold true due to variations in
sediment concentrations caused by differing landuses, rainfall intensities and time lapses
41

since the last rainfall event. The estimates given should only be used as examples and not
as an accurate picture of sediment loadings in the Lower Heathcote River.
0.0 - 0.5hrs - 390 mg/L Suspended Solids Discharged
0.5 - 1.5hrs - 970 mg/L Suspended Solids Discharged
1.5 - 4.0hrs -190 mg/L Suspended Solids Discharged
4.0 - 24 hrs - 32 mg/L Suspended Solids Discharged
Rainfall intensities have been obtained from the Christchurch City Council's Waterways,
Wetlands and Drainage Guide - Part B: Design, which gives typical hourly rainfall intensities
for a number of different return periods within Christchurch City (refer Appendix 5).
Looking at a two year recurrence interval, 24 hour duration rainfall event, theJypig~1 ,hQ,YJiy.. rainfall intensity in Christchurch is 2.2mm (Christchurch City Council, 2003) _(~ppendix 5). _...o-_~~_. co""'--"~_ _ _ _ _ __
Using this figure with the above sediment concentrations the following possible total
sediment loadings into the Heathcote would occur via the Garlands Road stormwater outfall:
0.0 - 0.5hrs - Catchment Area Draining to Stormwater = 8.3ha or 83000m2
83000m2 x 0.0011m(1/2 hourly rainfall intensity) = 91.3m3 or 91300 Litres 91300L x 390mg/L (sediment concentration) = 35607000mg or 35.6 kg
0.5 -1.5hrs = 177 kg 1.5 - 4.0hrs = 87 kg 4.0 - 24hrs = 116 kg
Total Sediment Discharged in 24 hour, 2 Year Return Period Storm Event = 416 kg
5.3 Effects of Stormwater Suspended Solids on the Heathcote River
Perceptions of the Lower Heathcote River's water quality are of dirty, highly turbid water that
has a high sediment loading (Deely, 1992). Compared with Christchurch's other urban
rivers; the Styx and the Avon (are also spring feed and pass through similar urban
environments), the measured suspended solids are higher when compared to results
published in Christchurch City Council Surface Water Quality Data 1995 - 1997. (suspended
solids in the lower reaches of the Styx River ranged between <5 - 9mg/L and in the tidal
reaches of the Avon between <5 - 16mg/L. Over the same time period results in the lower
reaches of the Heathcote ranged between 11 - 30mg/L (Gilson, 1999~ These samples were
not taken at any particular time and no data is provided by Christchurch City Council on
whether sampling was undertaken during rainfall events or the conditions at the time of
sampling.
42
" . '. __ '''' .~. w_·

Stormwater discharged from the Garlands Road stormwater outfall was generally high in
suspended solids except on 28 August when sampling was undertaken after five hours of
constant rain. Although numerous publications (Environment Canterbury, 2002; Elliott 1997;
Suren, 2000) state that high suspended solids may have a detrimental effect on waterway
flora and fauna, there are few guidelines worldwide that give a value as to what constitutes
high suspended solid loadings in different types of waterways. Most guidelines are based on
turbidity rather than suspended solid loadings and specify an allowable reduction on water
clarity downstream. Environment Bay of Plenty has adopted a suspended solids limit on
storrflwater and has undertaken some scientific investigations to support this limit.
Environment Bay of Plenty a suspended solids limit at 150 mg/L and this figure has been
justified based on the assumption that suspended solids carried a number of other
contaminants. By restricting suspended solid inputs this limit also restricts other
contaminants such as heavy metals and nutrients (Environment Bay of Plenty, 2001).
Using Environment Bay of Plenty's stormwater guidelines, sediment discharges from the
Garlands Road outfall into the Heathcote River can be classified as high, especially during
the first flush where results ranged between 390 - 970mg/L. With these high sediment
inputs downstream sediment loadings were expected to be higher than the 50 and 27mg/L
recorded on the 3 July and 1 October 2004 respectively. These suspended solid loadings
are relatively low when compared to guidelines set in Victoria, Australia for lowland streams
of less than 80mg/L of suspended solids (Clarke, et al. 1999). Sampling was undertaken in
storm events, when flows in the Heathcote River and associated sediment loadings would be
at their highest, yet the results showed the suspended solid loadings in the Heathcote River
were low.
These results raise two questions:
1. What actually happens to the sediment discharged from the Garlands Road
stormwater outfall?
2. Why does the Heathcote River have such a dirty appearance in the lower reaches
despite relatively low suspended solid loadings?
The bed of the Heathcote River in the sampling area is extremely muddy indicating a build-
up of sediment. This sedimentation is caused by the Heathcote River becoming wider
(getting a larger x-section) and the flow velocity gradually decreasing. During this process
smaller and smaller sediment particles fall out of suspension and settle on the bottom,
43
:';". ~--, -: ',:7 ~: :-:::~;: .--.,.-.... -",. .. -~-.--- .....
1:.'- __ .,".','

therefore larger rocks and coarser gravels are found further upstream and finer sediments
downstream (Oberrecht, 1997). The build-up of sediment in the lower reaches of the
Heathcote River is also influenced by tidal patterns, which alter the velocity of the river and
saline water conditions. Small particles (particularly clay) in fresh water are kept in
suspension by their molecular motion (Oberrecht, 1997). If flows in the Lower Heathcote
River are changed or even reach a pOint where the flow of the river out to sea is balanced by
the incoming tide the molecular motion of the particles reduce and sediment falls out of
suspension.
( Particles carry a negative charge that repulse individual particles away from each other. In
saline environments, such as the Lower Heathcote River, where fresh water (including
stormwater discharges) meets and interacts with ionically charged salt water the negative
charges are neutralised and sediment particles become attractive. As they collide, they tend
to coalesce or stick together thus forming larger aggregates or clumps of sediment called
flocs. These flocs then settle out of suspension a lot faster than individual sediment particles
(Oberrecht, 1997). This process may explain why in the saline reaches of the Heathcote
River there is a larger build up of sediment on the bed of the river and may also explain why
the impacts of stormwater discharges are not seen in the downstream sample results.7
Peoples' perception of dirty, highly turbid water in the Lower Heathcote River still hold true
even in times of zero rainfall, yet sampling undertaken by Christchurch City Council from
February 1997 at the Garlands Road Bridge (same site as my upstream sampling site)
shows 21 of the 31 samples taken have suspended solid levels of 1Smg/L or less
(Christchurch City Council, 2004).
G is likely peoples' perception of highly discoloured water maybe caused by the bed of the
river being very dark due to the historic and continuing build-up of sediment; therefore light
reflecting off the bed of the river gives the water a distinct dirty look (Microsoft Encarta,
2003). Very fine sediments may also be a contributing factor as they are small and weigh
very little, therefore they are not a great contributor to suspended solid weights but may still
give the water in the Heathcote River a dirty appearance.)
Historic stormwater discharges into the Heathcote River have been a major contributor to
sedimentation problems especially during the initial drainage of Christchurch in the mid to
late 1800's. 6"he bed of the Heathcote River in the lower reaches is already covered in a
thick layer of cohesive mud. This muddy substrate provides little likelihood of fish being able
to lay eggs or a habitat able to support a diverse range of aquatic invertebrate. The muddy
44

substrate is also likely to limit invertebrate communities by altering the amount and quantities
of food due to smothering and provide little protection for invertebrates in times of high flows,
washing them downstream} Silt deposition and associated factors generally bring about
changes in invertebrate communities, with a loss of stonefly and mayfly species and an
increase in population of animals such as chironomids and oligochaetes that can borrow into
the silt (Suren, 2000).
Overall sediment from the Garlands Road outfall is not a major contributor to silt in the
Heathcote River individually but when combined with all the other stormwater outlets and
hillside streams that enter the river the cumulative effects are likely to be substantial,
especially if sediment loadings of upwards of 900 mg/L are common in the first flush from the
majority of other stormwater drains.
This study does not investigate sources of sediment other than that generated from roading
and hardstand areas feeding into the Garlands Road stormwater network. Other sediment
sources in the Heathcote River Catchment may include the Port Hills, which during rainfall
events contribute a steady source of fine loess sediment into hillside streams and eventually
into the Heathcote River (Dougherty, 2004). Other sources may include sediment carried
from the estuary on the incoming tide, or sediment that is re-suspended during bed
disturbance.
5.4 Zinc
LZinc levels were relatively constant at both the Heathcote River upstream and downstream
sites, varying by only 0.05mg/L across all samples. The outfall sampling results varied
considerably ranging between 0.19 and 6.9mg/L) The results had a high correlation with ,/
suspended solids, which is discussed later but tended to vary depending on sediment
loadings and the time of sampling.
In the river study zones there were no differences between the upstream and downstream
sample results except on 3 July when zinc levels were slightly lower upstream than
downstream. This is surprising as this was the day the highest levels of zinc were found to
be discharging from the Garlands Road stormwater outfall.
The results within the Heathcote River were lower than anticipated yet in some cases still
exceed the Australia New Zealand Environment and Conservation Council recommended
guideline for the protection of key species in a highly disturbed ecosystem (Australia New
45
.. -........... , .. -:-~.:.:<>-:: .. -~~, ~.~--- :-",:.;~---: .-:,;.;"'--

Zealand Environment and Conservation Council, 2000). This guideline is set at 0.031 mg/L ~, ---~---.--.------- -~~
and is designed to protect 80% of species living in the freshwater environment. For'more .---------,--,'~,-"'-, ",,--
pristine and unmodified ecosystems a 99% protection limit should be used and zinc levels -------.=- ---~----"" .---- --- - - -- -should, not exceed 0.0024mg/L (Australia New Zealand Environment and Conservation
,-~:-'---
Council, 2000).
Results obtained on 3 July (upstream) and 28 August 2004 (upstream and downstream)
breach the Australia New Zealand Environment and Conservation Council guidelines for
protection of key species in a highly modified environment. This appears to only occur in
storm events although Christchurch City Council water quality data on heavy metals (does
not integrate rainfall data) sampled at the Ferrymead bridge (refer Figure 1.6) showed 42%
of sample results exceeded the Australia New Zealand Environment and Conservation
guidelines for protection of key species in a highly modified environment (Christchurch City
Council, 2004).
Discharges from the Garlands Road stormwater outlet had zinc concentrations of up to
6.9mg/L (well in excess of the Australia New Zealand Environment and Conservation
guidelines). Once this water has mixed with the main flow of the Heathcote River, the zinc
levels are reduced as seen in the downstream sampling results (Figure 4.11). While zinc
concentrations in the water column reduced, zinc still poses a concern as when it falls out of
suspension it is bound to sediments, potentially contaminating the riverbed.
Typical stormwater concentrations are presented in the Christchurch City Council's
Waterways, Wetlands and Drainage Guide Part B. These figures have been taken from a
study by Williamson on the impacts of urban stormwater on water quality. This study
reported typical zinc levels in urban stormwater to be 0.26mg/L (Williamson, 1993).
Williamson's figures are significantly lower than the results of sampling at the Garlands Road
stormwater outfall, which were as high as 6.9mg/L.
The higher zinc levels in samples taken from the Garlands Road stormwater outfall could be
due to the high traffic volumes that use Garlands Road, causing more zinc to be present from
tyre wear, or industries in the catchment including a foundry and rubber manufacturer that
may contribute higher zinc concentrations to stormwater than industries in a normal urban
environment.
46
",' . ~ ........ --.... --~~-... , ,-,~ ",:.,~,"":'-~; y~ '"-' •• ---""'"-\..:-.... --~.:..,< .. ~
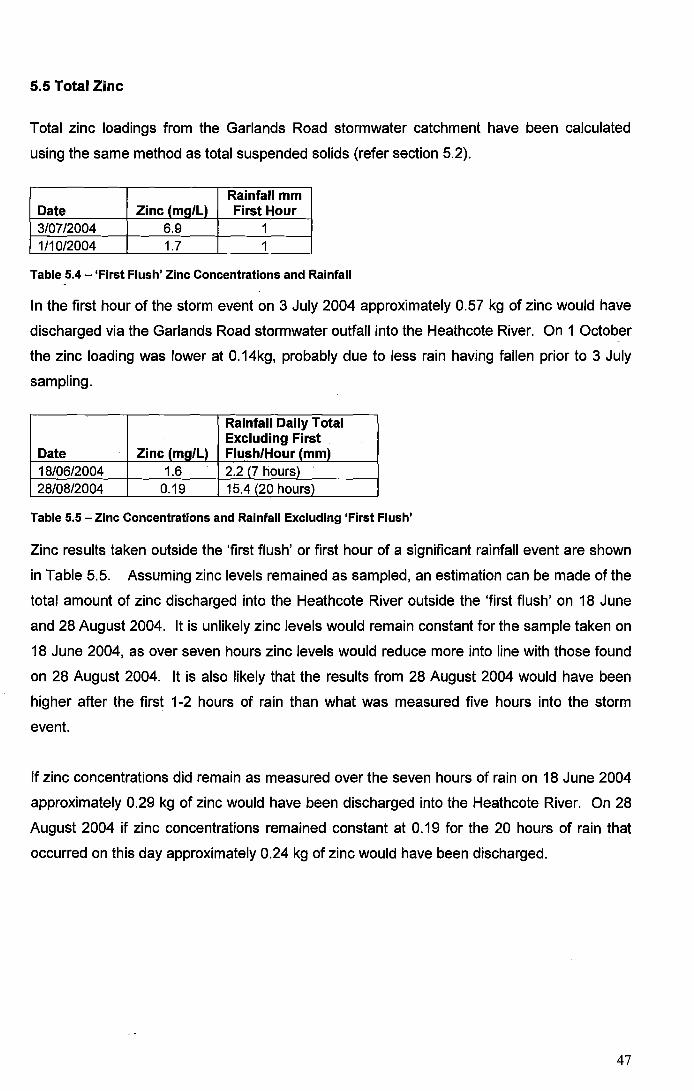
5.5 Total Zinc
Total zinc loadings from the Garlands Road stormwater catchment have been calculated
using the same method as total suspended solids (refer section 5.2).
Rainfall mm Date Zinc (mg/L) First Hour 3/07/2004 6.9 1 1/10/2004 1.7 1
Table 5.4 - 'First Flush' Zinc Concentrations and Rainfall
In the first hour of the storm event on 3 July 2004 approximately 0.57 kg of zinc would have
discharged via the Garlands Road stormwater outfall into the Heathcote River. On 1 October
the zinc loading was lower at 0.14kg, probably due to less rain having fallen prior to 3 July
sampling.
Rainfall Daily Total Excluding First .
Date ZinclmglLl Flush/Hour (mml 18/06/2004 1.6 2.2 (7 hours) . 28/08/2004 0.19 15.4 (20 hours)
Table 5.5 - Zinc Concentrations and Rainfall Excluding 'First Flush'
Zinc results taken outside the 'first flush' or first hour of a significant rainfall event are shown
in Table 5.5. Assuming zinc levels remained as sampled, an estimation can be made of the
total amount of zinc discharged into the Heathcote River outside the 'first flush' on 18 June
and 28 August 2004. It is unlikely zinc levels would remain constant for the sample taken on
18 June 2004, as over seven hours zinc levels would reduce more into line with those found
on 28 August 2004. It is also likely that the results from 28 August 2004 would have been
higher after the first 1-2 hours of rain than what was measured five hours into the storm
event.
If zinc concentrations did remain as measured over the seven hours of rain on 18 June 2004
approximately 0.29 kg of zinc would have been discharged into the Heathcote River. On 28
August 2004 if zinc concentrations remained constant at 0.19 for the 20 hours of rain that
occurred on this day approximately 0.24 kg of zinc would have been discharged.
47
. -",,:.~.' ""~'-"'. ~ ;"~""'4"''''''_'f~·';·4· • . . '.: .- . .,.,". "---~ ..

Zinc Concentrations over Time
7 ~--------~~----~--~~------------~------~-----------------4
6 r---~-+--~----~--~--~~--~~~------~------~-------------4
:::J a. g5 ~~--~~~~~----~~~~~~~~~~~~~~~~----~~~--~
III c:: o
E4 r-----~~-------=~~~~=__7~--~~~~~~~----------~----~ c:: 8 c:: o ~3 ~~~----~~--~--~~~--~--~~--~--~--~----------------~ c:: N
o 0.25 0.5 0.75 1.25 1.5 1.75 2 2.25 2.5 2.75 3 3.25 3.5 3.75 4 4.25 4.5 4.75 5 Time (hrs)
Figure 5.2 - Zinc Concentrations over Time.
Looking at a 24 hour storm zinc loading scenario using the data collected from the four
sampling events gives an estimate of the total zinc discharged into the Heathcote River from
the Garlands Road stormwater outfall. It is assumed that zinc loadings are represented by
the results obtained from my sampling at various time periods into a storm event. The
sampling programme was designed to gain an understanding of zinc loadings at different
stages of a rainfall event (refer Figure 5.2). A number of factors including time since the last
rainfall event, rainfall intensity, and land use practices will lead to variations in the sediment
loadings shown in Figure 5.2. As explained in relation to Figure 5.1 the values shown can
only be used as a general indication of stormwater trends and not as actual data on the
concentrations of zinc in the Lower Heathcote River.
Based on the results obtained from the sampling programme an estimate can be given of the
zinc loading into the Heathcote River via the Garlands Road stormwater drain over a 24 hour
period during a storm event. The estimates given should only be used as examples and not
as an accurate picture of zinc loadings in the Lower Heathcote River, due to the variations
that will occur in zinc loadings over the periods specified.
0.0 - 0.5hrs -1.7 mg/L Zinc Discharged
0.5 - 1.5hrs - 6.9 mg/L Zinc Discharged
1.5 - 4.0hrs - 1.6 mg/L Zinc Discharged
4.0 - 24 hrs - 0.19 mg/L Zinc Discharged
48

Rainfall intensities have been obtained from the Christchurch City Council's Waterways,
Wetlands and Drainage Guide - Part B: Design, which gives typical hourly rainfall intensities
for a number of different return periods within Christchurch City (refer Appendix 5).
Looking at a two year recurrence interval, 24 hour duration rainfall event the typical hourly
rainfall intensity in Christchurch is 2.2mm (Christchurch City Council, 2003). Using this figure
with the above zinc concentrations the following total zinc loadings into the Heathcote would
occur via the Garlands Road stormwater outfall:
0.0 - 0.5hrs - Catchment Area Draining to Stormwater = 8.3ha or 83000m2
83000m2 x 0.0011 m(1/2 hourly rainfall intensity) = 91.3m3 or 91300 Litres 91300L x 1.7mg/L (zinc concentration) = 155210mg or 0.155 kg
0.5 - 1.5hrs = 1.25 kg 1.5 - 4.0hrs = 0.73 kg 4.0 - 24hrs = 0.69 kg
Total Sediment Discharged in 24 hour, 2 Year Return Period Storm Event = 2.8 kg
5.6 Effects of Zinc contained in Stormwater on the Heathcote River
The effects of zinc on the Heathcote River and in the Avon-Heathcote Estuary are most likely
to be due to bio-accumulation in shellfish and sediment rather than immediate eco-system
and human health problems caused as a result of short term exposure to zinc in the
river/estuarine environment. The Drinking Water Standards for New Zealand 2000 do not
provide a maximum acceptable value for zinc in terms of health effects but do list a maximum
value of 3mg/L for aesthetic purposes, such as appearance and taste (Ministry of Health,
2000). The zinc levels in the Heathcote River at the sample sites and from sampling
undertaken by the Christchurch City Council at the Ferrymead Bridge have never exceeded
0.67mg/L and generally ranged between less than 0.02 to 0.09mg/L (Christchurch City
Council, 2004) (refer Appendix 4). The Washington State Department of Health found that
ingestion of 100-150 mg of zinc is required before people start experiencing any adverse
effects as a result of excessive zinc (Washington State Department of Health, 1996). The
zinc levels in the Heathcote River per litre of water are well below 100mg even using the
worst results from the Garlands Road stormwater outfall. You would need to ingest 14.5
litres of the most contaminated water from the Garlands Road stormwater outfall before
experiencing any adverse health effect from excessive zinc. The 14.5 litres was determined
by dividing 100 (mg/L of zinc whereby adverse health effects may occur) by the highest zinc
concentration from the outfall site (6.9 mg/L).
49
';~f:::' :~:-:~:~: <"::,' .~. -:.~-: ---..... -. -. -:.

~he primary concern with zinc levels in the Heathcote River is bio-accumulation of heavy
metals in aquatic organisms such as shellfish and sea snails and a build up in the riverbed
sediments. Local and international research has found that shellfish and other organisms
are especially prone to accumulation of metals such as zinc. Shellfish are filter feeders and
therefore pass water and sediment through their bodies (Irwin, et al. 1997). During this
process heavy metals accumulate in their tissues and overtime metal concentrations build up
in the shellfish. When predators such as humans eat the shellfish the metal concentrations
may have built up to a level that is potentially harmful. (Sturdevant, 2003). )
~inc can also build up in sediment. This study shows that sediment and zinc have a strong
positive relationship (refer next section) and that zinc tends to bind to sediment particles. As
sediment falls out of suspension:)netals can be bound up in the sediment and thus
accumulate in bed sediments) In the lower reaches of the Heathcote River, sediment
appears to settle out more rapidly and the metals associated with this can be found in the
muddy substrate of the Heathcote River. When the sediments become mobilised or the bed
of the river is disturbed, this contaminated sediment is entered back into the river flow.
5.7 Suspended Solids and Zinc Correlations
A number of studies have been undertaken that look at the interaction between sediment and
heavy metals. Wiesner concluded there was a common link between heavy metal
concentrations in urban catchments and suspended solids (Wiesner, 1998). The results of
this study support this conclusion and are presented below.
The correlations were calculated using the following formula:
(Microsoft, 2003a)
Where x and yare the sample means A VERAGE(zinc) and A VERAGE(suspended solids)
A correlation coefficient is a measure of the linear relationship between two variables. In this
case the study looks at suspended solids and zinc as variables. The correlation coefficient
can be any number between plus and minus one. A negative correlation coefficient' indicates
an inverse relationship where one variable increases the other decreases. A positive
50
.~":. •. :> ... ~.>:::-,:. : ...... --:.-.. < ...... ...:.-.:'-~ '.'.:"~ -.• ~-<-.\..
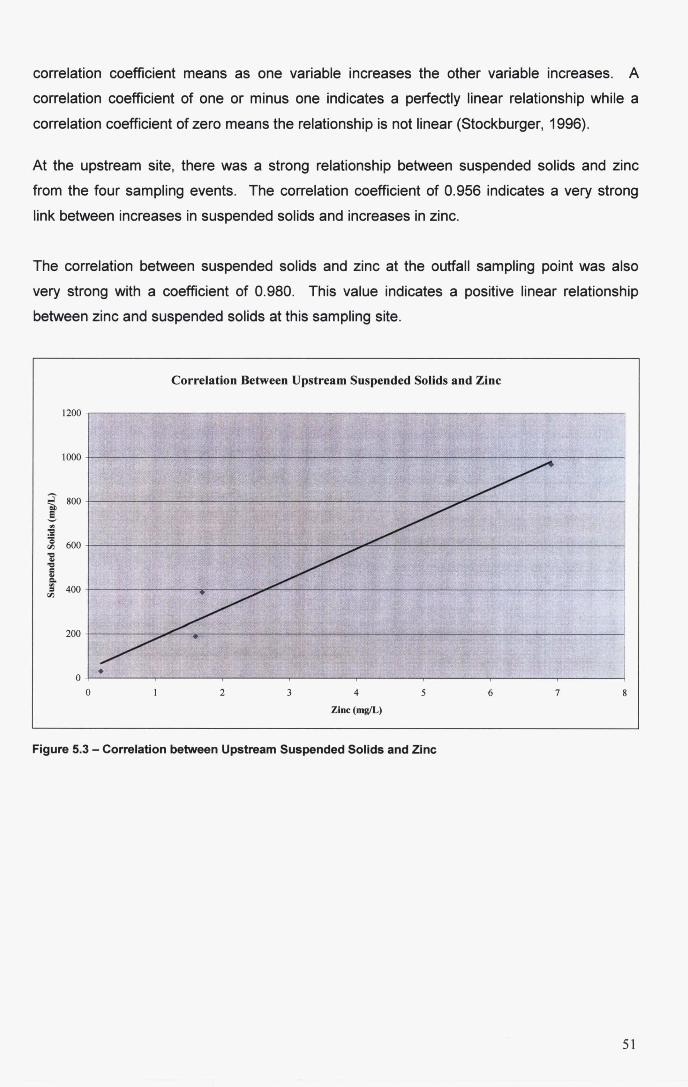
correlation coefficient means as one variable increases the other variable increases. A
correlation coefficient of one or minus one indicates a perfectly linear relationship while a
correlation coefficient of zero means the relationship is not linear (Stockburger, 1996).
At the upstream site, there was a strong relationship between suspended solids and zinc
from the four sampling events. The correlation coefficient of 0.956 indicates a very strong
link between increases in suspended solids and increases in zinc.
The correlation between suspended solids and zinc at the outfall sampling point was also
very strong with a coefficient of 0.980. This value indicates a positive linear relationship
between zinc and suspended solids at this sampling site.
Correlation Between Upstream Suspended Solids and Zinc
1200
1000
~ 800
! rIJ
:5! Q 600 r-'J
~ ~ = 401
~ 400 = r-'J
200
2 3 4 5 6 7 8
Zinc (mgIL)
Figure 5.3 - Correlation between Upstream Suspended Solids and Zinc
51

Correlation Between Outfall Suspended Solids and Zinc
1200
1000
~ 800
! ~
~
=§ 600 rJ:J
~ ~ = Q,j c. ~
400 = rJ:J
200
• 0
0 2 3 4 5 6
Zinc (mgIL)
Figure 5.4 - Correlation between Outfall Suspended Solids and Zinc
50
~ e ';' 40 :s! -= rJ:J
~ 30 = Q,j
~ = rJ:J 20
10
0
0 0.01
Correlation Between Downstream Suspended Solids and Zinc
•
0.02 0.03 0.04
Zinc (mgIL)
0.05 0.06
Figure 5.5 - Correlation between Downstream Suspended Solids and Zinc
7 8
0.07 0.08
52

At the downstream sampling site, the relationship was not as strong with the correlation
coefficient equal to 0.759, although this still represents a relatively good link between zinc
and suspended solids. The weakened relationship may be due to the majority of sample
results being below the method detection limit. Overall the results show a strong positive link
between suspended solids and zinc and support other studies undertaken in this area.
5.8 Catchment Study
As represented in Table 5.6 all four zones within the study catchment have the potential to
contribute contaminants to the stormwater system, although most of these contaminants are
not looked at directly in this study. Seven major industrial sites were identified as having the
potential to contribute to stormwater pollution in the area, along with roading and both the
commercial and residential zones.
Businesses, local authorities and individuals. have a duty under Sections 15 (1) (a) and (b) of
the Resource Management Act 1991 to prevent the pollution of stormwater and subsequently
the Heathcote River.
The industrial sites identified in Table 5.6 were inspected and treatment systems on road
sumps were also checked. l Caltex Diesel Stop had an API Oil Interceptor installed which is
designed to contain hydrocarbons within a three-chamber system, thus preventing
discharges of oil and sediment into the stormwater system. An emergency shut-off valve
was also installed after the interceptor, which can be closed off if a large spill occurs. Spilt
product is then contained primarily within the oil interceptor and recovered via a vacuum
tanker. Other thanCaltex no other industry had stormwater pollution control or treatment
devices installed. ~)
6he site inspection found roadway stormwater treatment devices were non-existent with
standard City Council sumps being used. No other measures were in place to prevent "<
sediment and heavy metals being discharged into the Heathcote River. )'
53
«-:-::-:-::<::-:-:-.:-.-..... -.-.. : .. :..,; .... . ·.-.·_-.·_-.·.·.·_~L'

~ \
Industry or Zone Possible Contaminants Caltex Diesel Stop Hydrocarbons, i.e Diesel, Oil etc. Skellerup (Storage Areas, South Factory) Zinc, rubber waste, solvents, hydrocarbons,
paints and thinners. Mecca Group Foundry Heavy Metals, (Aluminium, Brass, Copper,
Bronze), Particulate. Contex Engineering Heavy Metals, Hydrocarbons, Particulate. Vegetable Processing Particulate (Vegetable matter, high BOD) Lowes Industries Ltd Heavy Metals Plastech Industries Ltd Resins and Binders, Solvents, Plastic
Granules, Particulates. Residential Zones Detergents, Particulates Commercial Zones Particulate, Hydrocarbons (car parking) Industrial Zones See Above, Variety of Contaminants Possible. Roading Particulate, Hydrocarbons, Heavy Metals.
Table 5.6 - Industry or Zone and Possible Contaminants
A number of treatment systems are now available to reduce stormwater contaminant
loadings, although there are restrictions on the technologies that can be used in this area
due to space limitations. This rules out technologies such as retention basins and end of
pipe swales, which require large areas of land.
Hynds Environmental Ltd have developed an in-line system that could be used to treat --~--~--
stormwater at the end of pipe prior to discharging into the Heathcote River. The Downstream
Defender uses a vortex separation system that provides high removal efficiencies of
settleable solids and floatables over a wide range of flow rates (Hynds, 2002). Stormwater is
introduced tangentially into the side of the cylinder and spirals down the perimeter allowing
heavier particles to settle out by gravity and the drag forces on the wall and base of the
vessel. The base of the unit is formed at a 30 degree angle. As the flow rotates around the
vertical axis, solids are directed towards the base of the vessel where they are stored in a
collection facility. The internal components direct the main flow away from the perimeter and
back up the middle of the vessel as a narrower spiralling column rotating at a slower velocity
than the downward flow. By the time the flow reaches the top of the vessel, it is virtually free
of solids and is discharged through an outlet pipe (Hynds, 2002). This type of system could
be installed under an existing road so no extra land is required.
Total Treatment Systems have also developed a system called FloFast. This system uses
gravitational methods and filtration to provide for the effective containment of more than 95%
of suspended solids and removal of hydrocarbons and heavy metals. Again the unit is
compact and does not require a large area of land to install (Total Treatment Systems,
2004).
54
,::-,:,:-.,;-:.,:~:,:<.;'-..;...:.o:. ..... -.. ~' •. ~.:

The two systems outlined above are by no means an exhaustive list but provide evidence that systems are available that could be used to provide stormwater treatment prior to its discharge into the Heathcote River.
55
.~- :'~_;T~'· ,"--,:,
.... ~ . ..:..;,<, ..... ~.~,-,
: .. ~.:,. :: _."

Chapter 6 - Study Limitations & Further Research
6.1 Study Limitations
The main limitation to this study was the small number and frequency of sample
results. With additional time and resources available to sample throughout an entire
storm event, a far more accurate profile of suspended solids and zinc over time
would have been obtained. It would also have been beneficial to sample a number of
different storm events that had different durations, rainfall intensities and dry periods
prior to sampling.
Sampling was further constrained by having to physically get out to the sample site,
especially to capture the 'first flush'within the first hour of a storm event. There were
limited opportunities to sample the 'first flush' as this often occurred at night or at a
time when other commitments prevented sampling from being undertaken.
On the two occasions when sampling of the 'first flush' did occur, the time was not
available to stay and sample throughout the entire storm event (or to analyse all the
results), nor was funding available to pay for analysis of the large number of samples
this would have generated.
The sample sites within the Heathcote River were in tidal zones. Although samples
were collected at low tide no assessment was made of whether the tide was coming
in or out. The tidal patterns in the Lower Heathcote River may have affected how
stormwater from the Garlands Road stormwater outlet was mixed. If the tide was
coming in, stormwater may have been carried upstream causing higher results at the
upstream site. Ideally downstream sampling should be undertaken on an outgoing
tide so contaminants from the stormwater discharge are carried downstream.
When making assumptions on total sediment and zinc loadings, as in Sections 5.2
and 5.5, only two sample results were used to predict the 'first flush' total sediment
and zinc loadings. Two samples were also only used to predict the total sediment
and zinc loadings outside the 'first flush'. Ideally more sample results for both
contaminants would have been used to gain a better idea of the variations in
sediment and zinc concentrations during the 'first flush' and the hours preceding this.
56
r" .---
The same problem also exists when looking at the 24 hour storm event loadings as
the 24 hour sediment and zinc loading profile (Figures 5.1 & 5.2) were based on only
four samples. If samples were taken throughout the rainfall events a better indication
of suspended solid and zinc concentrations would have been available.
The correlations presented in section 5.7 are also influenced by a lack of sample
results. While the correlations show a strong positive relationship between
suspended solids and zinc, the calculations are only based on four samples. Ideally
more samples would be used to add certainty to these results.
In analysing the suspended solid results there was a lack of suitable guidelines for
comparison. The study results were compared to a limit set by Environment Bay of
Plenty for stormwater discharges. Their limit of 150mg/L was set as a result of other
contaminants being bound to sediment rather than the effects sediment itself has on
water quality.
The results of this study did not show large increases in sediment and zinc
concentrations downstream of the Garlands Road outfall. Had this been the case
the contribution from four smaller stormwater outfalls between the Garlands Road
stormwater outlet and the downstream sampling site would need to have been
considered. This study ignored any influences these outfalls may have had on the
sample results.
Overall a number of predictions, estimations and correlations have been made on a
limited range of sampling results. While this study's data has been strengthened to a
certain extent by data collected by Christchurch City Council, more sampling data is
required to add certainty to the results.
6.2 Further Research
This study found a number of areas where further research would be beneficial. The
areas are as follows:
1. A sediment analysis on the size and distribution of sediment in the Lower
Heathcote River. This would provide a better understanding of what happens
to sediment when it discharges into the Heathcote River via stormwater
57
.. _-.-.:- ....... ,-.- ..
. . . .. ... -. - ~
',".:." .', ,"." -.:.

outfalls. It would also provide a better understanding of the water visual
clarity issue in the Lower Heathcote River by identifying if small sediment
particles are present in the water column.
2. A riverbed sediment analysis to determine the levels of zinc bound to the
sediments on the bed of the Lower Heathcote River. This would give
information to support or disprove the theory that zinc falls out of suspension
with sediment and ends up deposited on the bed of the Lower Heathcote
River.
3. Research into the effects of zinc levels exceeding the Australia New Zealand
Environment and Conservation Council Guidelines have on aquatic
organisms and the general ecology of the Heathcote River.
4. Further and more detailed sampling of the Garlands Road stormwater outfall.
The sampling should encompass a range of different storm events for their
entire duration. This would provide a more accurate idea of how suspended
solids and zinc concentrations vary throughout a rainfall event. When
undertaking this research sampling should be linked to different rainfall
intensities and the number of dry days prior to sampling. This would
determine how these variables influence suspended solid and zinc
concentrations.
5. In the discussion section the concept of flocculation was discussed. Further
research on this concept would be valuable especially the part it plays in
sediment deposition in the Lower Heathcote River.
6. Further research would be valuable on how sediments and zinc accumulate
on hardstand areas and other sources of these contaminants other than from
stormwater.
7. This study focused on only two contaminants, suspended solids and zinc.
Further research is required on the other types of contaminants entering the
Lower Heathcote River via stormwater outfalls.
58
- :;-:-

Chapter 7 - Conclusions
7.1 Conclusions
The aims of this study were to investigate the effects of suspended solids and zinc
from the Garlands Road stormwater outfall on water quality of the Lower Heathcote
River. It also looked to determine if there was a positive relationship between
suspended solids and zinc. The study also looked at sources and controls of
stormwater contamination and has achieved the aims as stated in Chapter 3 of this
dissertation.
The results of my sampling, while limited due to the small sample number (four),
showed that suspended solids discharging from the Garlands Road stormwater
outfall ranged between 32mg/L and 970mg/L. The suspended solid concentrations \
were compared to the Environment Bay of Plenty's stormwater general authorisation
limit of 150mg/L (Environment Bay of Plenty, 2001). Three of the samples from the
Garlands Road outfall exceeded this limit. Samples collected during the 'first flush' or
first hour of a rainfall event were higher than those collected outside this period and
suspended solid concentrations decreased (not including the 'first flush') as rainfall
continued.
At the Heathcote River sample sites the suspended solid concentrations were
relatively low when compared to the loadings from the Garlands Road stormwater
outfall the Victoria water quality guideline of less than 80mg/L of suspended solids for
lowland waterways (Clarke, et al. 1999). Suspended solids ranged between 13 and
67mg/L at the upstream site and 14 and 61mg/L at the downstream site. These
results appear to contradict the perception people have of high sediment loadings in
the Lower Heathcote River. Looking at the water in the river it does appear dirty and
this may be due to the colour of the riverbed or to fine silts causing discolouration but
contributing very little weight to the suspended solid results. Further research is
required in this area. With the exception of 18 June 2004 sampling results, the ,
suspended solid concentrations in the Heathcote River showed the reverse
relationship to the outfall with suspended solids becoming higher the longer a rainfall
event continued. This is likely due to the cumulative effects of stormwater discharges
throughout the catchment and the time delay in sediment at the top of the catch!Tlent
progressing through into the lower reaches of the Heathcote River.
59
... ~ ,:.-.- '.~~":"- "

There was little variation in suspended solid concentrations upstream compared to
downstream despite the influence of the Garlands Road stormwater outfall. On 3
July 2004 upstream results were higher than downstream despite the highest
suspended solid concentrations being discharged from the Garlands Road
stormwater outfall. This may be due to tidal influences effecting the mixing of the
sediment into the main water body. Sediment could also be carried upstream on the
incoming tide or a balancing of the incoming tide and outgoing river flow may cause
zero flow and increased sediment settle out.
The effects of suspended solids from the Garlands Road stormwater outfall on the
Heathcote River are still unclear. There was no defined increase in suspended solids
in the water of the Heathcote River as a result of stormwater discharges from the
outfall. Further sampling 1 taking into account tidal influences, is required to gain a
fuller understanding of the effects of suspended solids from the Garlands Road
stormwater outfall have on water quality in the Heathcote River.
Zinc concentrations discharged from the Garlands Road stormwater outfall ranged
between 0.19 and 6.9mg/L. These were compared to typical stormwater
concentrations reported in a study by Williamson of 0.26mg/L (Williamson, 1993).
The zinc concentrations in stormwater from the Garlands Road outfall were higher
than those reported by Williamson (except on 28 August 2004). This is likely due to
the type of catchment the study took place in as it incorporates a foundary and
rubber manufacturing operation (sources of zinc) and Garlands Road which is a
heavily used urban roadway especially by heavy vehicles. Studies undertaken by
Wiesner suggest tyre wear is a major contributor to zinc contamination of stormwater
in urban areas (Wiesner, 1998).
Concentrations of Zinc in the Heathcote River were compared to Australia New
Zealand Environment and Conservation Council (ANZECC) guidelines which
recommend zinc levels do not exceed 0.031 mg/L in a highly disturbed ecosystem
(Australia New Zealand Environment and Conservation Council, 2000). Generally
results from the upstream and downstream sampling sites were below this guideline,
except on 3 July and 28 August 2004 at the upstream site and 28 August 2004 at the
downstream site. Results obtained from the Christchurch City Council at the
Ferrymead Bridge showed 42% of their sample results exceeded the Australia New
Zealand Environment and Conservation Council guideline. The effects of these
accedences could not be directly measured and this area requires further research.
60

It is likely the effects will be from metal accumulation in filter feeders such as
shellfish, which could then be eaten by other predators such as humans. The effects
of zinc bound to sediment that is subsequently deposited in the bed of the Heathcote
River was also not investigated and further research would be valuable in
determining whether zinc concentrations are high in riverbed sediments. Based on
research undertaken by the Washington State Department of Health and the New
Zealand Drinking Water Standards the levels of zinc found in stormwater from the
Garlands Road outfall and the Heathcote River are unlikely to pose a direct human
health effect (Washington State Department of Health, 1996 and Ministry of Health,
2000). The effects are likely to be more ecological or indirect health effects through
bioaccumulation.
Correlations were made between suspended solid and zinc concentrations and for all
four sites a strong positive correlation was found. This supports research by Wiesner
and Headly that there is a direct relationship between suspended solid loadings in
urban runoff and heavy metals:
Finally this study investigated the Garlands Road stormwater catchment and the
various industries and stormwater treatment systems being used. The catchment
survey identified three industries in particular that have the potential to contribute
higher zinc concentrations to storm water. Further research is required to determine
whether these sites do contribute higher zinc concentrations. In terms of suspended
solid concentrations virtually all industries have the potential to contribute suspended
solids although those associated with engineering, manufacturing and vegetable
processing were identified as having a higher contamination potential.
Stormwater treatment was not used at any sites within the catchment other than the
Caltex Diesel Stop. All other industries had standard sumps that discharged to the
City Council's reticulated system and subsequently into the Heathcote River. No
stormwater treatment is provided within the City Council's network, at source or prior
to discharge to the Heathcote River.
61

Acknowledgements
I am grateful to Environment Canterbury for partially funding this project and giving
me the time to undertake and complete this dissertation. In particular I wish to thank
the Laboratory and Compliance Monitoring staff.
I should like to thank the Christchurch City Council, especially Tom Brian and Rex
Donnelly for their assistance in defining the drainage network and providing access
to the City Council's Webmap GIS System. I also wish to thank Gary Tibbie and
Mike Gilson for providing Christchurch City Council rainfall data and results of the
City Council's water quality sampling program in the Heathcote River.
I should like to thank my supervisor, Lynn Torgerson (Lincoln University), for her
guidance and reviewing of my drafts, especially over the Christmas holidays.
Finally I wish to thank· my flatmates, james and Mel, for the support they have
provided especially during the last two months of this project.
62
'._r_ .

Reference List
/Anon. 2004. Environmental effects of Zinc. Lenntech Water Purification and Air Treatment.
( http://www.lenntech.com/Periodic-chart-elements/Zn-en.htm
Australia New Zealand Environment and Conservation Council (ANZECC). 2000. National
Water Quality Management Strategy: Australian and New Zealand Guidelines for Fresh and
Marine Water Quality 2000. Australian and New Zealand Environment and Conservation
CounCil, Australia.
Australia New Zealand Environment and Conservation Council (ANZECC). 2000b. National
Water Quality Management Strategy: An Introduction to the Australian and New Zealand
Guidelines for Fresh and Marine Water Quality. Australian and New Zealand Environment
and Conservation Council, Australia.
Christchurch City Council (CCC)-. 1992. A Biological Re-Evaluation of the Avon River
Catchment 1989-90. Drainage and Waste Management Unit.
(jhristchurch City Council (CCC). 1994. A Biological Re-Evaluation of the Heathcote River
Catchment 1989-91. Drainage and Waste Management Unit.
J Christchurch City Council (CCC). 1998. Assessment of Environmental Effects Christchurch
Wastewater Discharges to Natural Water. Christchurch City Council, Christchurch.
) Christchurch City Council. 2003. Waterways, Wetlands and Drainage Guide, Part B: Design.
Christchurch City Council, Christchurch.
Christchurch City Council. 2004. Surface Water Quality Data. Unpublished. Obtained from M.
Gilson, Christchurch City Council Waste Management Laboratory, Christchurch.
,r\~hristchurch City Council. 2004a . Beach and Coastal Areas, Quick Answers.
~ttP://www.ccc.govt.nzlquickanswers/parkswaterways/beachescoastalareas/f603.asp
Christchurch Drainage Board (COB). 1980. A Biological Survey of the Rivers in the
Metropolitan Christchurch Area and Outlying Districts: the A von, Heathcote and Styx Rivers
and their Tributaries.
63
.",_ ... /-....... _ .. -.; ....

"
Clarke, T., Lonska, A, & Gato, S. 1999. Victoria Water Quality Monitoring Annual Report:
1998. Department of Natural Resources and Environment, Victoria.
Conomikes, M., Cottew, H., Whitehead, B. 2000. Plant Selection in Soils with Zinc Toxicity,
Environmental Horticulture II. University of Melbourne, Victoria.
http://www.student.unimelb.edu.au/-mrcono/ZincToxicitynoPics.htm
Deely, J. 1992. The last 150 years - the effect of urbanisation. In S. J. Owen (Ed), The
Estuary Where our Rivers meet the Sea. (pp. 107-121). Christchurch: Christchurch City
Council Parks Unit.
Dougherty, N., Duncan, C. 2004. Investigation into Suspended Solids from Bowenvale
Reserve. Unpublished Investigation, Environment Canterbury, Christchurch.
Elliott, A 1997. Analysis of Potential Stormwater Quality Controls in Christchurch.
Canterbury: Lincoln University Department of Natural Resources Engineering.
Environment Bay of Plenty (B.O.P). 2001. Urban Stormwater. Environment Bay of Plenty,
Whakatane.
/En"ironment Canterbury (Ecan). 2002. What we measure. Canterbury Water Quality.
http://www.ecan.govt.nzlWater/what-we-measure.html
Environment Canterbury (Ecan). 2004a. Natural Resources Regional Plan, Chapter 4: Water
Quality. Environment Canterbury, Christchurch.
Environment Canterbury (Ecan). 2004b• Section 32 Report, Variation 1, Proposed Natural
Resources Regional Plan, for Chapter 4: Water Quality. Environment Canterbury,
Christchurch.
Environmental Protection Agency Victoria (EPA Victoria). 2003. Policy Impact Assessment:
State Environmental Protection Policy (Waters of Victoria). Environmental Protection Agency
Victoria.
/Froude, V. 1998. Environmental Performance Indicators: An Analysis of Potential Indicators
for Freshwater Biodiversity. Ministry for the Environment Technical Paper No. 48. Ministry for
the Environment, Wellington.
64
....... -..... -.... , ......... . . -- .-.-~ '- ".'."., '.' .~-~: /~::.;:.::~;.~~
. . ',',' . ;...~--::--~ :..7·.-..:...·~------O:-

Gelfand, L. 1991. Death by bypass. Terra Nova November 1991, 11, 12-15.
Gilson, M., and Mitchell, K. 1999. Christchurch City Surface Water Quality Data 1995-97,
Water Quality Trends 1986-97. Christchurch City Council Waste Management Unit
Laboratory, Christchurch.
Great Vista Chemicals, 2004. Zinc Sulphide Product Information Sheet. Great Vista
Chemicals, Zhejiang, China.
http://www.greatvistachemicfals.com/industrialandspecialitychemicals/zincsulfate.htm
Headly, G., & Lockley, J.C. 1975. Quality of water discharged from an urban motorway.
Water Pollution Control Federation, 74, 659-674.
Hynds Environmental Systems Ltd (Hynds). 2002. Downstream Defender Environmental
Stormwater Treatment Systems. Hynds Environmental Systems Ltd, Auckland.
Illinois Department of Public Health. 2004. ,Environmental health fact sheet - zinc. Illinois
Department of Public Health Website.
http://www.idph.state.il.us/envhealth/factsheets/zinc.htm
Irwin, R.J., VanMouwerik, M., Stevens, L., Seese, M.D., and Basham, W. 1997.
Environmental Contaminants Encyclopaedia. National Park Service, Water Resources
Division, Fort Collins, Colorado.
Main, M. 1994. A Limited Investigation of Storm water Quality in the Avon-Heathcote
Catchment. (Report No R94(24)). Canterbury Regional Council, Christchurch.
Main, M. 2003. Assessment of non compliance zones rules. Unpublished memo from M.
Main. 3 December 2003. File PL5C-00157.
Melville, A. 1991. Stormwater - the pervasive polluter. Terra Nova August 1991, 8,40-41.
Microsoft. 2003. Encarta Encyclopaedia Standard 2003. Microsoft Corporation.
Microsoft. 20038• Microsoft Excel Help 2003. Microsoft Corporation.
65

Ministry for the Environment. 2003. Contaminated Land Management Guidelines No.2:
. Hierarchy and Application in New Zealand of Environmental Guideline Values. Ministry for
the Environment, Wellington.
(Ministry of Health. 2000. Drinking Water Standards for New Zealand 2000. Ministry of Health, /,
Wellington.
Nave, C. 2000. Zinc. HyperPhysics - Georgia State University. http://hyperphysics.phy-
astr.gsu.edu/hbase/pertab/Zn.html
Nichols, A. 1991. Wigram Retention Basin Environmental Statement. Christchurch City
Council Drainage and Waste Management Unit, Christchurch.
/Novotny, V. 1995. Diffuse sources of pollution by toxic metals on receiving waters. In W.
. Salomons, U. Forstner & P Mader (Eds~), Heavy Metals - Problems and Solutions. Germany:
Springer - Verlay Berlin Heidelberg.
Oberrecht, K. 1997. Sediment Transport and Deposition. South Slough National Estuarine
Research Reserve: Estuaries Feature Series.
http://www.southsloughestuary.org/EFS/sediment.htm
Stockburger, D. 1996. Introductory Statistics: Concepts, Models and Applications -
Correlations. Southwest Missouri State University.
http://www.psychstat.smsu.edu/introbooklsbk17.htm
Sturdevant, M. 2003, October 23." Nueces Bay zinc levels falling. Corpus Christi Caller-
Times. http://www.caller.com/ccctilocal news/article/O, 1641, CCCT 811 2369964,00. html
/uren, A. 1993. The effects of urbanisation on the invertebrate fauna of the Avon and
Heathcote Rivers. New Zealand Freshwater Miscellaneous Report No. 36. National Institute
of Marine and Freshwater Research.
/ Suren, A. 2000. Effects of urbanisation. In K.J. Collier & M.J. Winterbourn (Eds.), New
Zealand stream invertebrates: ecology and implications for management (pp. 260-288). New
Zealand Limnological Society, Christchurch.
Total Treatment Systems. 2004. FloFast Treatment Systems - Where Design and Ecology
Meet. Total Treatment Systems, Auckland.
66
.~ : ." ."-- . ; : --.
t' - .
United States Environmental Protection Agency (USEPA). 1999. NPDES Multi-Sector Storm
Water General Permit Monitoring Guidance. United States Environmental Protection Agency,
Washington.
United States Environmental Protection Agency (USEPA). 2002. About Biological Indicators.
United States Environmental Protection Agency, Washington.
http://www.epa.gov/bioindicators/html/about.html
United States Environmental Protection Agency (USEPA). 2003. Toxicological Review of
Zinc Compounds. In Support of Summary Information on the Integrated Risk Information
System (IRIS) - External Review Draft. United States Environmental Protection Agency,
Washington.
Washington State Department of Health. 1996. Zinc Fact Sheet. Office of Environmental
Health and Safety, Washington State Department of Health, Washington.
Wiesner, M.R., Characklis, G.W., & Brejchova, D. 1998. Metals and colloids in urban runoff.
In H.E. Allen., AW. Garrison & G.W. Luther III (Eds), Metals in Surface Waters (chapter 2).
Houston: Sleeping Bear Press Inc.
Wilber, W.G., and Hunter J.V. 1975. Contributions of metals resulting from stormwater runoff
and precipitation in Lodi, New Jersey. Urbanization and Water Quality Control. American
Water Resources Association.
Wilber, W.G., & Hunter, J.v. 1979. The impact of urbanisation on the distribution of heavy
metals in bottom sediments of the saddle river. Water Resources Bulletin. 15. 790-800.
Williamson, B.R. 1993. Urban Runoff Data Book. A Manual for the Preliminary Evaluation of
Urban Stormwater Impacts on Water Quality. Water Quality Centre Publication No 20.
National Institute of Water and Atmospheric Research (NIWA), Hamilton.
Woodward-Clyde (NZ) Ltd. 2000. Assessment of the Avon and Heathcote Rivers
contaminant mass loads. Technical Reports Volume 1,' Assessment of Environmental Effects
for Christchurch Wastewater Discharge. Christchurch: URS New Zealand Ltd.
67
- - '.~ -'

Appendices
Appendix 1:
Appendix 2:
Appendix 3:
Appendix 4:
Appendix 5:
Appendix 6:
Raw Data and Environment Canterbury Laboratory Reports
Laboratory Analysis Methods
Christchurch City Council Suspended Solids and Rainfall Data
Christchurch City Council Heavy Metal Sampling Results
Christchurch Rainfall Intensities
Christchurch City Council Tunnel Road Rainfall Data for Sampling
Dates
68

'~<T'" •• ~ •••
Appendix 1 - Raw Data and Ecan Laboratory Reports
"'-.'-'.'-,_.'

Raw Data Summary '7.'·:.-<'.-:~~;~';~~t~~:~ :~:~~
Heathcote Upstream Date Sus Solids Zinc 18/06/04 13 <0.02 3/07104 50 0.04 28/08/04 67 0.01 1/10104 22 <0.02
Outfall Date Sus Solids Zinc 18/06/04 190 1.6 3/07104 970 6.9 28/08/04 32 0.19 1/10104 390 1.7
Heathcote Downstream Date Sus Solids Zinc 18/06/04 14 <0.02
c' 3/07104 47 <0.02 . ,-:, .~-<,->,>".
28/08/04 61 0.07 1/10104 27 <0.02

24 June 2004
Cain Duncan
Mr Cain Duncan
Environment Canterbury POBox 345, CHRISTCHURCH
58 Kilmore Street. PO Box 345. Christchurch. Telephone: (03) 365-3828. Fax: (03) 365-3194. Website: VVW\N.ecan.govt.nz
ECanLABORATORY REPORT Report No: 2400868
Results for samples received on: 18 June 2004 Order number: Uni Project
Sampled By: Cain Duncan
Lab. No. Client 10 Parameter Result Units Method
2404292 Heathcote R Total Suspended 190 mg/L APHA 2540 0 (20 Ed) - Gravimetric
Outfall Solids
Zinc 1.6 mg/L APHA 3111 B (20th Ed) acid soluble
2404293 Heathcote R Total Suspended 13 mg/L APHA 2540 0 (20 Ed) - Gravimetric Upstream Solids
Zinc <0.02 mg/L APHA 3111 B (20th Ed) acid soluble
2404294 Heathcote R Total Suspended 14 mg/L APHA 2540 0 (20 Ed) - Gravimetric D/stream Solids
Zinc <0.02 mg/L APHA 3111 B (20th Ed) acid soluble
report no. 2400868 Page 1 of 2 Environment Canterbury is 1I1E promotional name of tI-18 Canterbury Regional CoL

< less than > greater than
Paul Woods SENIOR CHEMIST
Analytical results relate to sample as received. Details of methods are available on request. This report may only be reproduced in full.
report no. 2400868 Page 2 of 2
~::A 808 All tests reported o. herein have been
I <:> perfonned in accordance new zealand acc..-cllted with the laboratory's laboratory scope of accreditation

9 July 2004
Mr Cain Duncan
Environment Canterbury POBox 345, CHRISTCHURCH
58 Kilrnore Street, PO Box 345, Christchurch, Telephone: (03) 365-3828, Fax: (03) 365-3194, Website: www.ecan.govt.nz
ECan LABORATORY REPORT Report No: 2400932
Results for samples received on: 5 July 2004 Order number: Uni Project
Sampled By: Cain Duncan
Lab. No. Client 10 Parameter Result Units Method
2404568 Heathcote R Total Suspended 970 mg/L APHA 2540 D (20 Ed) - Gravimetric
Outfall Solids
Zinc 6.9 mg/L APHA 3111 B (20th Ed) acid soluble
2404569 Heathcote R Total Suspended 50 mg/L APHA 2540 D (20 Ed) - Gravimetric
Upstream Solids
Zinc 0.04 mg/L APHA 3111 B (20th Ed) acid soluble
2404570 Heathcote R Total Suspended 47 mg/L APHA 2540 D (20 Ed) - Gravimetric
D/stream Solids
Zinc <0.02 mg/L APHA 3111 B (20th Ed) acid soluble
report no. 2400932 Page 1 of 2
Environment Canterbury is tl·le prornotional name of the Canterb~ lIy Regional CO'

: less than > greater than
~ 'aul Woods ;ENIOR CHEMIST
malytical results relate to sample as receivedo >etails of methods are available on request. °his report may only be reproduced in full.
°eport noo 2400932 Page 2 of 2
~::A 808 All tests reported • herein have been
Lo <:> perfonned in accordance new zulancl accredited with the laboratory's laboratory scope of accreditation

3 September 2004
Cain Duncan Environment Canterbury
PO Box 345 CHRISTCHURCH
58 Kilmore Street. PO Box 345, Christchurch, Telephone: (03) 365-3828, Fax: (03) 365-3194, Website: vvww.ecan.govt.nz
ECan LABORATORY REPORT Report No: 2401256
Results for samples received on: 30 August 2004
Sampled By: Cain Duncan
Lab. No.
2406323
2406324
2406325
Client 10
GarlandsRd SIW0 utfaII
Heathcote Upstream
Heathcote D/Stream
report no. 2401256
Parameter
Total Suspended Solids
Zinc
Total Suspended Solids
Zinc
Total Suspended Solids
Zinc
Page 1 of 2
Order number:Uni Project
Result Method
32 mg/L APHA 2540 0 (20 Ed) - Gravimetric
0.19 mg/L APHA 3111 B (20th Ed) acid soluble
67 mg/L APHA 2540 0 (20 Ed) - Gravimetric
0.07 mg/L APHA 3111 B (20th Ed) acid soluble
61 mg/L APHA 2540 0 (20 Ed) - Gravimetric
0.07 mg/L APHA 3111 B (20th Ed) acid soluble
. Environment Canterbury is ti le prornul iorl3 1 name o f tile Cflnie rl.:>LlfY f=iegio nal C OLI

<: less than > greater than
Paul Woods SENIOR CHEMIST
~nalytical results relate to sample as r~ceived. Details of methods are available on request. This report may only be reproduced in full.
·eport no. 2401256 Page 2 of 2
808 All tests reported ~:~A herein have been
10 a performed in accordance new zealand accredited with the laboratory's laboratory scope of accreditation

7 October 2004
Cain Duncan Environment Canterbury
PO Box 345 CHRISTCHURCH
58 Kilmore Street. PO Box 345, Christchurch, Telephone: (03) 365-3828, Fax: (03) 365-3194, Website: vvww.ecan.govt.nz
ECanLABORATORY REPORT Report No: 2401452
Results for samples received on: 1 October 2004
Sampled By: Cain Duncan
Lab. No.
2407330
2407331
2407332
Client 10
Heathcote R Outfall
Heathcote R Upstream
Heathcote R D/stream
report no. 2401452
Parameter
Total Suspended Solids
Zinc digested
Total Suspended Solids
Zinc digested
Total Suspended Solids
Zinc digested
Page 1 of 2
Order number: Uni Project
Method
390 mg/L APHA 2540 0 (20 Ed) • Gravimetric
1.7 mg/L NI· APHA 3111 B (20th Ed) AAS
22 mg/L APHA 2540 0 (20 Ed) - Gravimetric
<0.02 mg/L NI- APHA 3111 B (20th Ed) AAS
27 mg/L APHA 2540 0 (20 Ed) - Gravimetric
<0.02 mg/L NI- APHA 3111 B (20th Ed) AAS
Environment Canterbury is H-le promotional name of the Canterbury Regional CoL

< less than > greater than
Paul Woods SENIOR CHEMIST
Analytical results relate to sample as received. Details of methods are available on request. This report may only be reproduced in full.
report no. 2401452 Page 2 of 2
~~A 808 All tests reported • herein have been
10 <:> perfonned in accordance new zealand lICCf'edited with the laboratory's laborat:ory scope of accreditation

"-' .,'
Appendix 2 - Laboratory Analysis Methods
I .

FLAME ATOMIC ABSORPTION SPECTROMETRY (3111)/Direct Air-Acetylene Flame Method 3-17
31'11 B. Direct Air-Acetylene Flame Method
1. General Discussion
This method is applicable to the detennination of antimony, bismuth, cadmium, calcium, cesium, chromium, cobalt, copper, gold, iridium, iron, lead, lithium, magnesium, manganese, nickel, palladium, platinum, potassium, rhodium, ruthenium. silver. so-dium, strontium, thallium, tin, and zinc.
2. Apparatus
Atomic absorption spectrometer and associated equipment: See Section 31 I 1 A.6. Use burner head recommended by the manu-facturer.
3. Reagents
a. Air, cleaned and dried through a suitable filter to 'remove oil, water, and other foreign substances. The source may be a compressor or commercially bottled gas.
b. Acetylene, standard commercial grade. Acetone, which al-ways is present in acetylene cylinders, can be prevented from entering and damaging the burner head by replacing a cylinder when its pressure has fallen to 689 kPa (100 psi) acetylene.
CAUTION: Acetylene gas represents an explosive hazard in the laboratory. Follow instrument manufacturer's directions in plumbing and using this gas. Do not allow gas contact with cop-per, brass with >65% copper, silver, or liquid mercury; do not use copper or brass tubing, regulators. or fittings.
c. Metal-free water: Use metal-free water for preparing all re-agents and calibration standards and as dilution water. Prepare metal-free water by deionizing tap water andlor by using one of the following processes, depending on the metal concentration in the sample: single distillation, redistillation, or sub-boiling. Al-ways check deionized or distilled water to detennine whether the element of interest is present in trace amounts. (NOTE: If the source water contains Hg or other volatile metals, single- or re-distilled water may not be suitable for trace analysis because these metals distill over with the distilled water. In such case", use sub-boiling to prepare metal-jree water).
d. Calcium solution: Dissolve 630 mg calcium carbonate. CaC03, in 50 mL of I + 5 HC)' If necessary, boil gently to obtain complete solution. Cool and dilute to 1000 mL with water.
e. Hydrochloric acid, HCI, 1 %, 10%, 20% (all v/v), 1 + 5, 1 +- I, and cone.
f Lanthanum solution: Dissolve 58.65 g lantnanum oxide, La203, in 250 mL cone HC)' Add acid slowly until the material is dissolved and dilute to 1000 mL with water.
g. Hydrogen peroxide, 30%. h. Nitric acid, HN03, 2% (v/v), 1 + 1, and cone. i. Aqua regia: Add 3 volumes cone HCI to 1 volume cone
HN03•
j. Standard metal solutions: Prepare a series of standard metal solutions in the optimum concentration range by appropriate di-lution of the following stock metal solutions with water contain-ing 1.5 mL cone HN031L. Stock standard solutions are available from a number of commercial suppliers. Alternatively, prepare as described below. Thoroughly dry reagents before use. In general,
use reagents of the highest purity. For hydrates, use fresh rea-gents.
1) Antimony: Dissolve 0.2669 g K(SbO)C4H40 6 in water, add 10 mL 1"+ 1 HC1 and dilute to 1000 mL with water; 1.00 ~L = 100 I1g Sb.
2) Bismuth: Dissolve 0.100 g bismuth metal in a minimum volume of 1 + I HN03• Dilute to 1000 mL with 2% (v/v) HN03;
1.00 mL = 100 I1g Bi. 3) Cadmium: Dissolve 0.100 g cadmium metal in 4 mL cone
HN03. Add 8.0 mL conc HN03 and dilute to 1000 mL with water; 1.00 mL = 100 I1g Cd.
4) Calcium: Suspend 0.2497 g CaC~ (dried at 1800 for I h before weighing) in water and dissolve cautiously with a mini-mum amount of 1 + 1 HN03• Add 10.0 mL cone HN03 and dilute to 1000 mL with water; 1.00 mL = 100 I1g Ca.
5) Cesium: Dissolve 0.1267 g cesium chloride. CsCI. in 1000 mL water; 1.00 mL = 100 f.Lg Cs.
6) Chromium: Dissolve 0.1923 g CrO) in water. When solu-tion is complete, acidify with 10 mL cone HN03 and dilute to 1000 mL with water; 1.00 mL = ) 00 I1g Cr.
7) Cobalt: Dissolve 0.1000 g cobalt metal in a minimum amount of 1 + 1 HN03• Add 10.0 mL 1 + I HCI and dilute to 1000 mL with water; 1.00 mL = 100 I1g Co.
8) Copper: Dissolve 0.) 00 g copper metal in 2 mL conc HN03, add 10.0 mL cone HN03 and dilute to 1000 mL with water; ).00 mL = 100 f.Lg Cu.
9) Gold: Dissolve 0.100 g gold metal in a minimum volume of aqua regia. Evaporate to dryness, dissolve residue in 5 mL cone HCI. cool, and dilute to 1000 mL with water; 1.00 mL = 100 I1g Au.
10) Iridium: Dissolve 0.1147 g ammonium chloroiridate, (NH4)zIrCI6• in a minimum volume of 1% (v/v) HC) and dilute to 100 mL with 1% (v/v) HCI; 1.00 mL = 500 I1g Ir.
ll) Iron: Dissolve 0.100 g iron wire in a mixture of 10 mL 1 + 1 HCI and 3 mL cone HN03. Add 5 mL conc HN03 and dilute to 1000 mL with water; 1.00 mL = 100 I1g Fe.
12) Lead: Dissolve 0.1598 g lead nitrate, Pb(N03)z, in a min-imum amount of 1 + 1 HN03• add 10 mL cone HN03• and dilute to 1000 mL with water; 1.00 mL = 100 f.Lg Pb.
13) Lithium: Dissolve 0.5323 g lithium carbonate, LhC03, in a minimum volume of 1 + 1 HN03. Add 10.0 mL cone HN03 and dilute to !OOO mL with water; 1.00 mL = 100 I1g Li.
14) Magnesium: Dissolve 0.1658 g MgO in a minimum amount of] + ) HNO). Add 10.0 mL cone HN03 and dilute to 1000 mL with water; 1.00 mL = 100 I1g Mg.
15) Manganese: Dissolve 0.1000 g manganese metal in 10 mL cone HC1 mixed with I mL conc HN03. Dilute to 1000 mL with water; 1.00 mL = 100 f.Lg Mn.
16) Nickel: Dissolve 0.1000 g nickel metal in 10 mL hot conc HN03, cool, and dilute to 1000 mL with watr~' 1.00 mL = 100 f.Lg Ni.
17) Palladium: Dissolve 0.100 g palladium wire in a minimum volume of aqua regia and evaporate just to dryness. Add 5 mL conc HCl and 25 mL water and warm until dissolution is com-plete. Dilute to -1000 mL with water; 1.00 mL = 100 f.Lg Pd.
18) Platinum: Dissolve 0.100 g platinum metal in a minimum volume of aqua regia and evaporate just to dryness. Add 5 mL conc HCl and 0.1 g NaCl and again evaporate just to dryness.

18
ssolve residue in 20 mL of I + I HCl and dilute to 1000 mL th water; 1.00 mL = 100 J.Lg Pt. 19) Potassium: Dissolve 0.1907 g potassium chloride, KCI, ried at 110°C) in water and make up to 1000 mL; 1.00 mL = () J.Lg K. 20) Rhodium: Dissolve 0.386 g ammonium hexachlororhodate, fH4)3RhCk 1.5H20, in a minimum volume of 10% (v/v) HCl and lute to 1000 mL with 10% (v/v) HCI; 1.00 mL = 100 J.Lg Rh. 21) Ruthenium: Dissolve 0.205 g ruthenium chloride, RuCI3, a minimuT'" volume of 20% (v/v) HCI and dilute to 1000 mL
Ith 20% (v/v)-HCI; 1.00 mL = 100 J.Lg Ru. 22) Silver: Dissolve 0.1575 g silver nitrate, AgN03, in 100 mL iter, add J 0 mL conc HN03• and make up to 1000 mL; 1.00 L = 100 J.Lg Ag. 23) Sodium: Dissolve 0.2542 g sodium chloride, NaCl, dried 140°C, in water, add 10 mL conc HN03 and make up to 1000
L; 1.00 mL = 100 J.Lg Na. 24) Strontium: Suspend 0.1685 g srCo3 in water and dissolve utiously with a minimum amount of I + I HNC3. Add 10.0 L conc HN03 and dilute to 1000 mL with water: I mL = 100 5 Sr. 25) Thallium: Dissolve 0.1303 g thallium nitrate, T1N03, in ater. Add 10 mL conc HN03 and dilute to 1000 mL with water; 00 mL = 100 f.Lg Tl. 26) Tin: Dissolve 1.000 g tin metal in 100 mL conc HCI and lute to 1000 mL with water; 1.00 mL = J .00 mg Sn. 27) Zinc: Dissolve 0.100 g zinc metal in 20 mL J + 1 HCI
Id dilute to 1000 mL with water; 1.00 mL = 100 J.Lg Zn.
Procedure
a. Sample preparation: Required sample preparation depends I the metal form being measured. If dissolved metals are to be determined, see Section 3030B
,r sample preparation. If total or acid-extractable metals are to ~ determined, see Sections 3030C through K. For all samples, ake certain that the concentrations of acid and matrix modifiers e the same in both samples and standards. When determining Ca or Mg, dilute and mix 100 mL sample
. standard with 10 mL lanthanum solution (~ 3j) before aspirat-g. When determining Fe or Mn, mix I Db mL with 25 mL of a solution (11 3d) before aspirating. When determining Cr, mix mL 30% H20 2 with each 100 mL before aspirating. Alterna-{ely use proportionally smaller volumes. h. Instrument operation: Because of differences between akes and models of atomic absorption spectrometers, it is not )ssible to formulate instructions applicable to every instrument. ~e manufacturer's operating manual. In general, proceed accord-g to the following: Install a hollow~(':;thode lamp for the desired etal in the instrument and roughly set the wavelength dial ac-)rding to Table 3111 :1. Set slit width according to manufac-rer's suggested setting for the element being measured. Turn on strument, apply to the hollow-cathode lamp the current sug-~sted by the manufacturer, and let instrument warm up until lergy source stabilizes, generally about 10 to 20 min. Readjust lrrent as necessary after warmup. Optimize wavelength by ad-
METALS (3000)
justing wavelength dial until optimum energy gain is obtained. Align lamp in accordance with maJ1Ufacturer's instructions.
Install suitable burner head and adjust. burner head position. Turn on air and adjust flow rateta that specified by manufacturer to give maximum sensitivity for the metal being measured. Turn on acetylene, adjust flow rate to value specified, and ignite flame. Let flame stabilize for a few minutes. Aspirate a blank consisting of deionized. water containing the same concentration of acid in standards and samples. Zero the instrument. Aspirate a standard solution and adjust aspiration rate of the nebuliZer to obtain max-imum sensitivity. Adjust burner both vertically and horizontally to obtain maximum response. Aspirate blank again and rezero the instrument. Aspirate a standard near the middle of the linear range. Record absorbance of this standard when freshly prepared and with a new hollow-cathode lamp. Refer to these data on sub-sequent determinations of the same element to check consistency of instrument setup and aging of hollow-cathode lamp and standard.
The instrument now is ready to operate. When analyses are finished, extinguish flame by turning off first acetylene and then air.
c. Standardization: Select at least three concentrations of each standard metal solution (prepared as in ~ 3j above) to bracket the expected metal concentration of a sample. Aspirate blank and zero the instrument. Then aspirate each standard in tum into flame and record absorbance.
Prepare a calibration curve by plotting on linear graph paper absorbance of standards versus their concentrations. For instru-ments equipped with direct concentration readout, this step is un-necessary. With some instruments it may be necessary to convert percent absorption to absorbance by using a table generally pro-vided by the manufacturer. Plot calibration curves for Ca and Mg based on original concentration of standards before dilution with lanthanum solution. Plot calibration curves for Fe and Mn based on original concentration of standards before dilution with Ca solution. Plot calibration curve for Cr based on original concen-tration of standard before addition of H20 2.
d. AnalYSis of samples: Rinse nebulizer by aspirating water containing 1.5 mL conc HNOiL. Aspirate blank and z.ero instru-ment. Aspirate sample and determine its absorbance.
5. Calculations .
Calculate concentration of each metal i011, in micrograms per liter for trace elements, and in milligrams per liter for more common metals, by referring to the appropriate calibration curve prepared according to ~ 4c. Alternatively, read concentration di-rectly from .the instrument readout if the instrument is so equipped. If. the sample has been diluted, multiply by the appro-priate dilution factor.
6. Bibliography
WILUS, J.B. 1962. Detennination of lead and other heavy metals in urine by atomic absorption spectrophotometry. Anal. Chem. 34:614.
Also see Section 3111A.8 and 9.
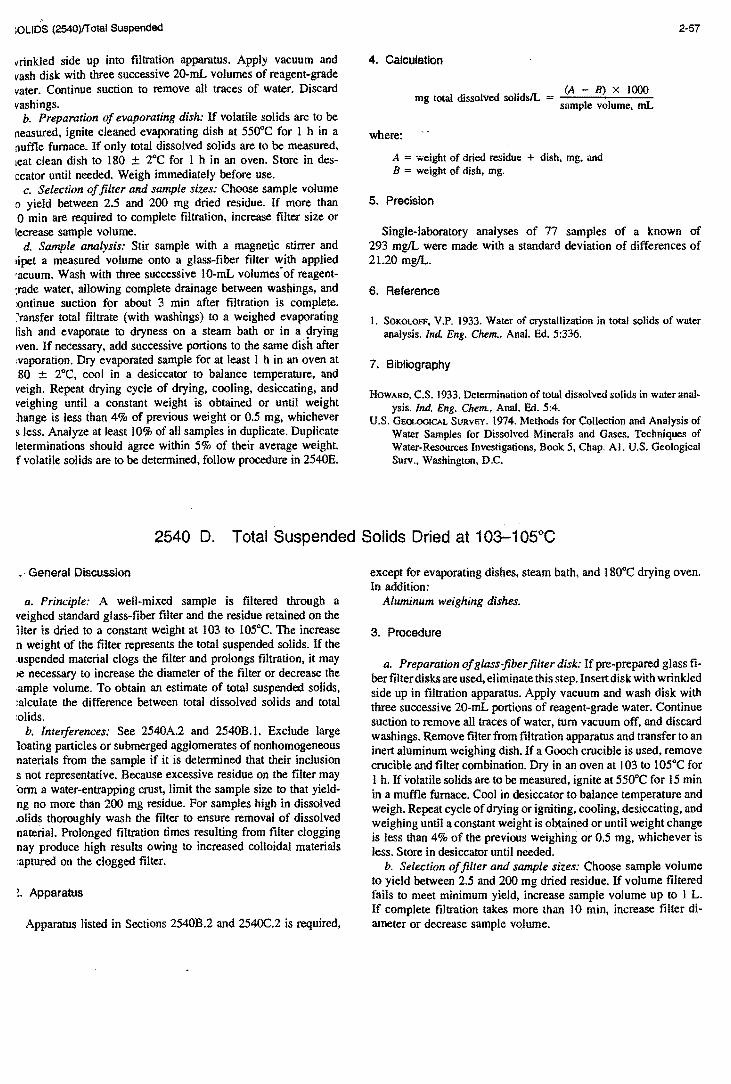
;OLlOS (2540)lTotal Suspended
{rinkled side up into filtration apparatus. Apply vacuum and vash disk with three successive 20-mL volumes of reagent-grade vater. Continue suction to remove all traces of water. Discard vashings.
b. Preparation of evaporating dish: If volatile solids are to be neasured, ignite cleaned evaporating dish at 550"C for 1 h in a nuffle furnace. If only total dissolved solids are to be measured, leat clean dish to 180 ± 2°C for 1 h in an oven. Store in des-ccator until needed. Weigh immediately before use.
c. Selection of filter and sample sizes: Choose sample volume o yield between 2.5 and 200 mg dried residue. If more than o min are required to complete filtration, increase filter size or tecrease sample volume.
d. Sample analysis: Stir sample with a magnetic stirrer and lipet a measured volume onto a glass-fiber filter ~ith applied 'acuum. Wash with three successive lO-mL volumes of reagent-:rade water, allowing complete drainage between washings, and :ontinue suction for about 3 min after filtration is complete. ~ransfer total fil~te (with washings) to a weighed evaporating lish and evaporate to dryness on a steam bath or in a~rying Iven. If necessary. add successive portions to the same dish after :vaporation. Dry evaporated sample for at least 1 h in an oven at 80 ± 2°C, cool in a desiccator to balance temperature, and veigh. Repeat drying cycle of drying, cooling, desiccating, and veighing until a constant weight is obtained or until weight :hange is less than 4% of previous wei ght or 0.5 mg, whichever s less. Analyze at least \0% of all samples in duplicate. Duplicate leterminations should agree within 5% of their average weight. f volatile solids are to be determined, follow procedure in 2540E.
4. Calculation
(A - B) x 1000 mg total dissolved solidslL = I I mL samp e vo ume,
where:
A = weight of dried residue + dish. mg. and B = weight of dish. mg,
5. Precision
2-57
Single-laboratory analyses of 77 samples of a known of 293 mgIL were made with a standard deviation of differences of 21.20 mgIL.
6. Reference
I. SOKOLOFF, V.P. 1933. Water of crystallization in total solids of water analysis, Ind, Eng. Chern., Anal. Ed. 5:336.
7. Bibliography
HOWARD. C.S. 1933. Determination of total dissolved solids in water anal-ysis. Ind. Eng. Chern., Anal. Ed. 5:4.
U.S. GEOLOGICAL SURVEY. 1974. Methods for Collection and Analysis of Water Samples for Dissolved Minerals and Gases. Techniques of Water-Resources Investigations. Book 5, Chap. AI. U.S. Geological Surv" Washington. D.C.
2540 D. Total Suspended Solids Dried at 103-105°C
. General Discussion
a. Principle: A well-mixed sample is filtered through a veighed standard glass-fiber filter and the residue retained on the ilter is dried to a constant weight at 103 to 105°C. The increase n weight of the filter represents the total suspended solids. If the .uspended material clogs the filter and prolongs filtration, it may )e necessary to increase the diameter of the filter or decrease the .ample volume. To obtain an estimate of total suspended solids. :alculate the difference between total dissolved solids and total :olids.
b. Interferences: See 2540A.2 and 2540B.1. Exclude large 10ating particles or submerged agglomerates of nonhomogeneous naterials from the sample if it is determined that their inclusion s not representative. Because excessive residue on the filter may 'orm a water-entrapping crust, limit the sample size to that yield-ng no more than 200 mg residue. For samples high in dissolved :olids thoroughly wash the filter to ensure removal of dissolved naterial. Prolonged filtration times resulting from filter clogging nay produce high results owing to increased colloidal materials :aptured on the clogged filter.
~. Apparatus
Apparatus listed in Sections 2540B.2 and 254OC.2 is required,
except for evaporating dishes, steam bath. and IS0°C drying oven. In addition:
Aluminum weighing dishes.
3. Procedure
a. Preparation of glass-fiber filter disk: If pre-prepared glass fi-ber filter disks are used, eliminate this step. Insert disk with wrinkled side up in filtration apparatus. Apply vacuum and wash disk with three successive 20-mL portions of reagent-grade water. Continue suction to remove all traces of water, tum vacuum off, and discard washings. Remove filter from filtration apparatus and transfer to an inert aluminum weighing dish. If a Gooch crucible is used, remove crucible and filter combination. Dry in an oven at 103 to 105°C for I h. If volatile solids are to be measured, ignite at 550°C for 15 min in a muffle furnace. Cool in desiccator to balance temperature and weigh. Repeat cycle of drying or igniting, cooling, desiccating, and weighing until a constant weight is obtained or until weight change is less than 4% of the previous weighing or 0.5 mg, whichever is less, Store in desiccator until needed.
b. Selection of filter and sample sizes: Choose sample volume to yield between 2.5 and 200 mg dried residue. If volume filtered fails to meet minimum yield, increase sample volume up to I L. If complete filtration takes more than 10 min, increase filter di-ameter or decrease sample volume.

2-58
c. Sample analysis: Assemble filtering apparatus and filter and begin suction. Wet filter with a small volume of reagent-grade water to seat it. Stir sample with a magnetic stirrer at a speed to shear larger particles, if practical, to obtain a more uniform (pref-:!rably homogeneous) particle size. Centrifugal force may separate particles by size and density, resulting in poor precision when point of sample withdrawal is varied. While stiffing, pipet a meas-ured ",>Iume onto the seated glass-fiber filter. For homogeneous samples, pipet from the approximate midpoint of container but not in vortex. Choose a point both middepth and midway between wall and vortex. Wash filter with three successive lO-m .... volumes of reagent-grade water, allowing complete drainage between washings, and continue suction for about 3 min after filtration is complete. Samples with high dissolved solids may require addi-tional washings. Carefully remove filter from filtration apparatus and transfer to an aluminum weighing dish as a suppbrt. Alter-natively, remove the crucible and filter combination from the cru-cible adapter if a Gooch crucible is used. Dry for at least 1 h at 103 to 105"C in an oven, cool in a desiccator to balance temper-ature, and weigh. Repeat the cycle of drying, cooling, desiccating, and weighing until a constant weight is obtained or until the weight change is less than 4% of the previous weight or 0.5 mg, whichever is less. Analyze at least 10% of all samples in dupli-cate. Duplicate determinations should agree within 5% of their average weight. If volatile solids are to be determined, treat the residue according to 2540E.
4. Calculation
(A - B) x 1000 mg total suspended solidslL = I I L samp e vo ume, m
where:
A = weight of filter + dried residue, mg, and B == weight of filter, mg.
PHYSICAL &.AGGREGATE PROPERTIES (2000)
5. Precision
The standard deviation was 5.2 mgIL (coefficient of variation 33%) at 15 mgIL, 24 mg/L (iO%) at 242 mg/L, and 13 mgIL (0.76%) at 1707 mgIL in studies by two analysts of four sets of 10 determinations each.
Single-laboratory duplicate analyses 0[50 samples of water and wastewater were made with a standard deviation of differences of 2.8 mgIL.
6. Bibliography
DEGEN, J. & F.E. NUSSBERGER. 1956. Notes on the determination of sus-pended solids. Sewage ltuL Wastes 28:237.
CHANIN, G., E.H. CHOW, R.B. ALEXANDER & J. POWERS. 1958. Use of glass fiber filter medium in the suspended solids determination. Sew-age Ind. Wastes 30:1062.
NUSBAUM, I. 1958. New method for determination of suspended solids. Sewage Ind. Wastes 30:1066.
SMITH, A.L. & A.E. GREENBERG. 1963. Evaluation of methods for deter-mining suspended solids in wastewater. J. Water Pollut. Control Fed. 35:940.
WYCKOFF, B.M. 1964. Rapid solids determination using glass fiber filters. Water Sewage Works 11 1:277.
NATIONAL COUNCIL OF THE PAPER INDUSTRY FOR AIR AND STREAM IM-PROVEMENT. 1975. A Preliminary Review of Analytical Methods for the Determination of Suspended Solids in Paper Industry Effluents for Compliance with EPA-NPDES Permit Terms. Spec. Rep. No. 75-01. National Council of the Paper Industry for Air & Stream Improvement, New York, N.Y.
NATIONAL COUNCIL OF THE PAP.ER INDUSTRY FOR AIR AND STREAM IM-PROVEMENT. 1977. A Study of the Effect of Alternate Procedures on Effluent Suspended Solids Measurement. Stream Improvement Tech. Bull. No. 291, National Council of the Paper Industry for Air & Stream Improvement, New York., N.Y.
TREES, C.C. 1978. Analytical analysis of the effect of dissolved solids on suspended solids determination. J. Water Pollut. Control Fed. 50:2370.
2540 E. Fixed and Volatile Solids Ignited at 550°C
1. General Discussion 2. Apparatus
a. Principle: The residue from Method B, C, or D is ignited to constant weight at 550°C. The remaining solids represent the fixed total, dissolved, or suspended solids while the weight lost on ignition is the volatile solids. The determination is useful in control of wastewater treatment plant operation because it offers d rough approximation of the amount of organic matter present in the solid fraction of wastewater, activated sludge, and industrial wastes.
b. Interferences: Negative errors in the volatile solids may be produced by loss of volatile matter during drying. Determination :>f low concentrations of volatile solids in the presence of high fixed solids concentrations may be subject to considerable error. In such cases, measure for suspect volatile components by another :est, for example, total organic carbon (Section 5310). Highly alkaline residues may react with silica in sample or silica-con-taining crucibles.
See Sections 2540B.2, 254OC.2, and 2540D.2.
3. Procedure
Ignite residue produced by Method 2540B, C, or D to constant weight in a muffle furnace at a temperature of 550°C. Ignite a blank glass fiber filter along with samples. Have furnace up to temperature before inserting sample. Usually, 15 to 20 min igni-tion are required for 200 mg residue. However, more than one sample and/or heavier residues may overtax the furnace and ne-cessitate longer ignition times. Let dish or filter disk cool partially in air until most of the heat has been dissipated. Transfer to a desiccator for final cooling in a dry atmosphere. Do not overload desiccator. Weigh dish or disk as soon as it has cooled to balance temperature. Repeat cycle of igniting, cooling, desiccating, and weighing until a constant weight is obtained or until weight

Appendix 3 - Christchurch City Council Suspended Solids and Rainfall Data
."-:.:·T;: :; .'~ •• _." 4_".' ••
"- .. -. ~ . ~ -
-..... -_. "

~ummary Data 1
Data Selected from 01/01/1997 to 31/12/2004
6 GARLANDS 7TUNNELRD 8 FERRYMD. ROAD BRIDGE BRIDGE BRIDGE
Sus. solids. Sus. solids Sus. solids CCC Rainfall Tunnel Road Day Date Time ppm ppm ppm .mm/day -Tue 0410211997 30.00 16.00 54.00 4.6 Thu 17104/1997 15.00 25.00 30.00 0 Tue 2910711997 15.00 20.00 30.00 0 Tue 11111/1997 < 5.00 <5.00 < 5.00 0 Tue 2410211998 < 5.00 <5.00 < 5.00 4.6 .. '.'---,_ .... ---Tut;1 1210511998 < 5.00 < 5.00 < 5.00 0 Wed 1910811998 15.00 20.00 40.00 0 Rain day before
Tue 1711111998 < 5.00 <5.00 < 5.00 0 Thu 2810111999 25.00 30.00 60.00 4 Thu 1310511999 < 5.00 25.00 55.00 0 Tue 1010811999 15.00 20.00 45.00 0 Rain day before Thu 0411111999 < 5.00 20.00 45.00 2.8 Tue 0110212000 11.00 17.00 15.00 0.6 Tue 1610512000 49.00 87.00 109.00 14.4 Tue 0810812000 15.00 14.00 11.00 0 , Thu 0711212000 < 5.00 <5.00 <5.00 0 Tue 0610312001 28.00 32.00 41.00 0 Tue 19/0612001 <5.00 < 5.00 <5.00 0 Rain day before
Tue 19/0612001 10:15 9.20 . 9.00 8.40 0 Rain day before
Tue 13111/2001 20.00 <5.00 <5.00 0 Tue 11/1212001 14.00 15.00 23.00 0 Rain day before
Tue 2610312002 16.00 19.00 40.00 0 Thu 0610612002 16.00 22.00 44.00 0 Rain day before
Tue 1710912002 < 15.00 <5.00 <5.00 0 Tue '1511012002
', .... 10.00 18.00 30.00 0 Rain day before
Tue 2810112003 < 5.00 20.00 33.00 0.2 Rain day before Tue 1310512003 20.00 38.00 52.00 0 Rain day before
Tue 1210812003 13.00 20.00 26.00 0.6 Wed 0511112003 19.00 24.00 39.00 0 Tue 0310212004 24.00 30.00 31.00 0.6 Tue 1810512004 11.00 16.00 26.00 0.2
18/06/04 13 2.6 3/07104 50 1.8
28/08/04 67 15.4 13.2mm day before
1/10/04 22 4.2 N 31 31 31
Minimum < 5.00 <5.00 < 5.00 Maximum 49.00 87.00 109.00
Median 15.00 19.00 30.00 Mean 0> than 0> than o > than
SD 10 < than 8 < than 8 < than Total
Page 1

SAMPLING SITES I ll'~llIIII / ~ '111111,1 ........ HEATHCOTE (TIDAL)
~ .. 4;
Q
~('" <S'
.~Tl;
": ..
/
ESTUARY OF THE AVON & HEATHCOTE
RIVERS
J
':J CD 0 -+-':J () 0 -+-CD ...,
I~' ...,
!\J. ill

Appendix 4 - Christchurch City Council Heavy Metal Sampling Results ,
~ -.,.- -.~.-. -.:-:--

Summary Data 1
Data Selected from 01/01/1997 to 31/12/2004 B FERRYMD. B FER~YMD. B FERRYMD. BFERRYMD. B FERRYMD.
BRIDGE BRIDGE BRIDGE BRIDGE BRIDGE Arsenic Copper Chromium Nickel Zinc
Day Date Time ppb ppb 'ppb IlPb ppb Tue 1110311997 < 1.00 1.00 4.00 < 1.00 40.00 Tue 1010611997 20.00 Man 0810911997 < 1.00 4.00 3.00 1.00 670.00 Fri 0910111998 < 1.00 1.00 3.00 2.00 40.00
Man 2310211998 < 1.00 < 1.00 2.00 < 1.00 < 20.00 Thu 0710511998 < 1.00 1.00 3.00 1.00 < 20.00 Thu 2310711998 1.00 3.00 3.00 1.00 20.00 Man 2111211998 1.00 4.00 3.00 1.00 40.00 Man 1510211999 < 1.00 2.00 2.00 < 1.00 30.00 Wed 0510511999 < 1.00 7.00 4.00 2.00 90.00 Wed 2210911999 1.00 8.00 3.00 ·60.00 30.00 Tue 0110mOOO 1.00 3.00 2.00 < 1.00 30.00 Man 1710412000 < 1.00 3.00 3.00 < 1.00 < 20.00 Wed 0510712000 < 1.00 3.00 4.00 1.00 30.00 Tue 1411112000 < 1.00 7.00 3.00 1.00 20.00 Man 29/0112001 3.00 4.00· 3.00 2.00 20.00 Tue 10/07/2001 < 1.00 1.00 1.00 < 1.00 < 20.00 Thu 0411012001 3.00 3.00 3.00 2.00 < 20.00 Fri 0810212002 1.00 5.00 4.00 10.00 80.00 Tue 2810512002 < 1.00 < 1.00 2.00 3.00 30.00 Fri 0910812002 < 1.00 8.00 4.00 3.00 30.00 Tue 1511012002 < 1.00 1.00 < 1.00 1.00 40.00 Man 2010112003 < 1.00 12.00 3.00 90.00 Tue 1510412003 < 1.00 8.00 3.00 13.00 20.00 Tue 1510712003 < 1.00 6.00 3.20 2.00 40.00 Thu 2311012003 < 1.00 3.00 4.00 < 1.00 30.00 Man 0210212004 40.00 Fri 2310412004 40.00
N 25 25 25 24 28 Minimum 1.00 1.00 1.00 1.00 20.00 Maximum 3.00 12.00 4.00 . 60.00 670.00
Median < 1.00 3.00 3.00 1.00 30.00 Mean 0> than 0> than 0> than 0> than 0> than
SD 18 < than 2 < than 1 < than 7 < than 5 < than Total
Page 1
BFERRYMD. BRIDGE
Cadmium ppb
0.24 < 0.10 <0.10
0.10 0.10
<0.10 <0.10 <0.10 <0.10 <0.10 <0.10 <0.10 <0.10 <0.10 <0.10 <0.10 <0.10 < 0.10 < 1.00 < 1.00 < 1.00 < 1.00 < 1.00 < 1.00 < 1.00 < 1.00
26 <0.10 < 1.00 < 0.10
0> than
23 < than
B FERRYMD. BRIDGE
Lead ppb
7.00 3.00 4.00 4.00 9.00 5.00
'. 8.00 6.00 4.00
11.00 8.00 3.00 4.00 5.00 4.00 3.00
< 1.00 3.00
13.00 9.00
14.00 19.00 11.00 5.00 1.00 1.00
26 < 1..00 19.00 5.00
0> than
1 < than
~:;'~ <.:.:-:.:.:<-:-~ -:.:. .. ~~~ . .: ;.!.~.~.: ~
I",'

;~:>::::\;::::-:::'.>~ .':-:.~"~ .. ~: ... :.~ .. '.
Appendix 5 - Christchurch Rainfall Intensities
'-.-. --- .-:

Christchurch Rainfall Intensities (mm/hr)
10 35.7 53.5 66.0 78.5 95." 100 9.B 14.8 18.2 21.7 26.3 II 33.8 SO.7 62.6 7 ..... 90.5 102 9.7 14.6 18.0 21.04 26.1 12 32.2 048.3 59.6 70.9 86.2 104 9.6 14." 17.8 21.2 25.8 13 30.8 46.2 57.0 67.8 82.04 106 9.5 14.3 17.6 21.0 25.5 14 29.6 ..... 3 54.7 65.1 79.1 108 9." '''., 17.5 20.8 25.2 15 28.4 ~6 52.6 62.6 76.1 11 0 9.3 14.0 17.3 20.6 25.0 16 27." 41.1 SO.8 60 ... 13.4 112 9.2 13.9 17.1 20.3 24.7 17 26.5 39.7 49.1 58 ... 70.9 114 9.2 13.7 16.9 20.1 24.5 18 25.7 38.5 47.5 56.5 68.7 116 9.1 13.6 16.8 20.0 24.2 19 204.9 37.04 46.1 54.8 66.7 118 9.0 13.5 16.6 19.8 24.0 20 24.2 36.6 .... .8 53.3 64.8 120 8.9 1.3.3 16.5 19.6 23.8 21 23.6 35.3 "3.6 51.9 63.0 125 8.7 13.0 16.1 19.1 23.3 22 23.0 304.04 42.5 50.5 61. .. 130 8.5 12.7 15.7 18.7 22.8 23 22.4 33.5 41.5 049.3 59.9 135 8.3 12.5 15 ... 18.3 22.3 24 21.9 32.8 40.5 048.1 58.5 140 8.2 12.2 15.1 18.0 21.8 25 21 ... 32.0 39.6 47.0 57.2 , .. 5 8.0 12.0 14.8 17.6 21.4 26 20.9 31.3 38.7 46.0 55.9 ISO 7.9 11 .8 14.5 17.3 21.0 27 20.5 30.7 37.9 "5.1 54.8 ISS 7.7 11.6 1".3 17.0 20.6 28 20.1 30.1 37.1 44.2 53.7 160 7.6 11 .4 14.0 16.7 20.3 29 19.7 29.5 36.4 43.3 52.6 165 7.4 11.2 13.8 16.4 19.9 30 19.3 llU 35.7 42.5 51.6 170 7.3 11 .0 13.6 16.1 19.6 31 19.0 28.4 35.1 4 1.7 50.7 175 7.2 10.8 13.3 15.9 19.3 32 18.6 27.9 34.5 41.0 49.8 180 7,1 10.6 '13. 1 15.6 19.0 33 18.3 27.4 33.9 40.3 49.0 190 6.9 10.3 12.7 15.1 18.4 H 18.0 27.0 3).3 39.6 48.2 200 6.7 10.0 12.4 , .. .7 17.9 --- --------35 17.7 26.5 32.8 39.0 47.4 21 0 6.5 9.8 12.0 14.3 17.4 36 17.4 26.1 32.) 38.4 46.6 220 6.3 9.5 11.7 14.0 17.0 )7 17.2 25.7 31.8 37.8 45.9 230 6.2 9.3 11 .4 13.6 16.5 38 16.9 25 .4 31.3 37.2 45.2 l~ . ,· ·~O 3,;g..': .'=-J I .2· .. .
t3:J~ • 16,,) 39 16.7 25 .0 30.9 36.7 44.6 250 5.9 8.8 10.9 13.0 15 .8 40 16.4 24.6 30.4 36.2 44.0 260 5.8 B.7 10.7 12.7 15,4 41 16.2 24.3 30.0 35.7 43.4 270 5.7 8.5 10.5 12.4 15.1 42 16.0 24.0 29.6 35.2 42.8 280 5.5 8.3 10.3 12.2 14.8 43 15.8 23.7 29.2 34.7 42.2 290 5.4 8.1 10.1 12.0 14.5 44 15.6 23.4 28.8 34.3 41.7 300 " .5.3 . ' 8.0" "'9: 9' - ' ' 11 .7 - 14j ·
45 15,4 23.1 28.5 33.9 41.2 310 5.2 7.8 9.7 11 .5 14.0 46 15.2 22.8 28.1 33.5 40.7 320 5.1 7.7 9.5 11.3 13.8 47 15.0 22.5 27.8 33.1 40.2 330 5.1 7.6 9.4 11.1 13.5 48 104.8 22.3 27.5 32.7 39.7 340 5.0 7.4 9.2 10.9 13J 49 14.7 22.0 27.2 32.3 39.3 350 4.9 7.3 9.1 10.8 13.1
.' .- -- . SO 14.5 21.7 26.9 31.9 38.8 51 104,4 21.5 26.6 31.6 38.4
Duration . .. . Return Period . . ·(Ho!.!rs) ' 2yr -, c· 5yr . ' lfrfl' 20yr SOY"
52 14.2 21.3 26.3 31.2 38.0 6 4.8 7.2 8.9 10.6 12.9 53 14.0 21.1 26.0 30.9 37.6 6.5 4.6 6.9 8.5 10.1 12.3 54 13.9 20.8 25.7 30.6 37.2 7 4.4 6.6 8.2 9.7 11 .8 --.-_. -- ---- _.- - --- ---- ._ .. . ~.- .- -.- .<- - - .. .• . . - - . -- - _._-55 13 .8 20.6 25.5 30.3 36.8 7.5 4.2 6,4 7.9 9,4 11 .4 56 13.6 20.4 25.2 30.0 36.4 8 4.1 6.1 7.6 9.0 11.0 57 13.5 20.2 25 .0 29.7 36.1 8.5 4.0 5.9 7.3 8.7 10.6 58 13.4 20.0 24.7 29.4 35.7 9 3.8 5.8 7.1 8.4 10J 59 13.2 19.8 24.5 29.1 35.4 9.5 3.7 5.6 6.9 8.2 10.0 6Q 13.1 1~.6 . 2 .. .3 .28,8 35.1 10 3.6 5.4 6.7 8.0 9.7 62 12.9 19.3 23.8 28.3 304.04 10.5 3.5 5.3 6.5 7.7 9,4 64 12.6 18.9 23 .4 27.8 33.8 II 3.4 5.1 6.3 7.5 9.2 66 12.4 IB.6 23.0 27.3 33.2 11 .5 3.3 5.0 6.2 7.4 8.9 68 12.2 18.3 22.6 26.9 32.7 12. J'j 4.9 6.0' 7.2 8.7 70 12.0 18.0 22.3 26.5 32.2 13 3.1 4.7 5.8 6.9 8.0 72 11.8 17.7 21.9 26.0 31.7 14 3.0 4.5 5.5 6.6 8.0 704 11.7 17.5 21.6 25.7 31.2 IS 2.9 4.3 5.3 6.3 7.7 76 11 .5 17.2 21.3 25.3 30.7 16 2.8 4.2 5.1 6.1 7.4 78 11.3 17.0 20.9 24.9 30.3 18 2.6 3.9 4.8 5.7 7.0
BO 11.2 16.7 20.7 24.6 29.8 20 2.5 3.7 4.5 5.4 6.6 82 11 .0 16.5 20,4 24.2 29.04 22 2.3 3.5 4.3 5.1 6.2 84 10.9 16.3 20.1 23.9 29.0 24 2.2 3.3 4.1 4.9 5.9 B6 10.7 16.1 19.8 23.6 28.7 30 2.0 2.9 3.6 4.3 5.2 88 10.6 15.9 19.6 23.3 28.3 36 1.8 2.6 3.3 3.9 4.7 90 10,4 15.7 19.3 23.0 27.9 42 1.6 2.4 3.0 3.6 4.3 92 10.3 15.5 19.1 22.7 27.6 48 1.5 2.3 2.8 3.3 4.0 94 10.2 15.3 18.9 22.4 27.0 60 1.3 2.0 2.5 2.9 3.6 96 10.1 15.1 IB.7 22.2 27.0 72 1.2 1.8 2.2 2.6 3,2 98 10.0 14.9 18.4 21.9 26.6 84 1.1 1.7 2.0 2.4 2.9 100 9.8 14.B IB.2 21.7 26.3 96 1.0 1.5 1.9 2.2 2.7
Ex Pea1'5on (1992). based on 24 hour mean annual point estimate rainfall (M24) of 60 mm.
Waterways. Wetlands and Drainage Guide-Ka Te Anga Whakaora ma Ngo Arawai Repa • Part B: Design Christchurch City Council • February 20uJ
x o z w a.. a.. c(

Appendix 6 - Christchurch City Council Tunnel Road Rainfall Data for Sampling Dates
L. _ ~' •••. -, ._~ " ~
I~· - - - -~ ~". '. '
.-" .... ,
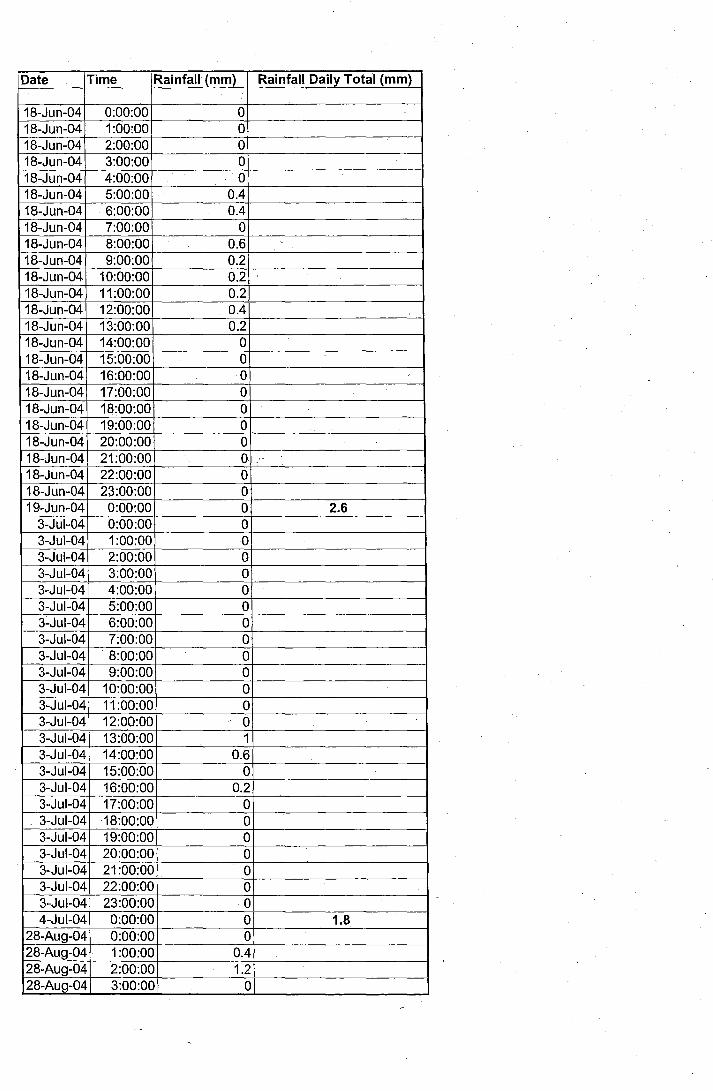
Date Time Rainfall (mm) Rainfall Daily Total (mm) , .. ,.-.: ........ ..:,'
18-Jun-04 0:00:00 0 .. _".'.'.'-'-.'--.~w:":~; .. ;~ ~~; ~:~~_.:~.
18-Jun-04 1 :OO~OO 0 18-Jun-04 2:00:00 0 18-Jun-04 3:00:00 0 18-Jun-04 4:00:00 0 18-Jun-04 5:00:00 0.4 18-Jun-04 6:00:00 0.4 18-Jun-04 7:00:00 0 18-Jun-04 8:00:00 0.6 c
18-Jun~04 9:00:00 0.2 18-Jun-04 10:00:00 0.2 ~
18-Jun-04 11:00:00 0.2 18-Jun-04 12:00:00 0.4 18-Jun-04 13:00:00 0.2 18-Jun-04 14:00:00 0 18-Jun-04 15:00:00 0 18-Jun-04 16:00:00 0 18-Jun-04 17:00:00 0 18-Jun-04 18:00:00 0 18-Jun-04 19:00:00 0 18-Jun-04 20:00:00 0 18-Jun-04 21:00:00 0 18-Jun-04 22:00:00 0 18-Jun-04 23:00:00 0 19-Jun-04 0:00:00 0 2.6
3-Jul-04 0:00:00 0 3-Jul-04 1:00:00 0 3-JuF-04 2:00:00 0 3-Jul-04 3:00:00 0 3-Jul-04 4:00:00 0 3-Jul-04 5:00:00 0 3~Jul-04 6:00:00 0 3-Jul-04 7:00:00 0 3-Jul-04 ·8:00:00 0 3-Jul-04 9:00:00 0 3-Jul-04 10:00:00 0 3-Jul-04 11:00:00 0 3-Jul-04 12:00:00 0 3-Jul-04 13:00:00 1 3-Jul-04 14:00:00 0.6 3-Jul-04 15:00:00 0 3-Jul-04 16:00:00 0.2 3-Jul-04 17:00:00 0 3-Jul-04 18:00:00 0 3-Jul-04 19:00:00 0 3-Jul"04 20:00:00 0 3-Jul-04 21 :00:00 0 3-Jul-04 22:00:00 0 3-Jul-04 23:00:00 0 4-Jul-04 0:00:00 0 1.8
28-Aug-04 0:00:00 0 28-Aug-04 1 :00:00 0.4 28-Aug-04 2:00:00 1.2 28-Aug-04 3:00:00 0

28-Aug-04 4:00:00 0.2 28-Aug-04 5:00:00 0.2 28-Aug-04 6:00:00 0.4 28-Aug-04 7:00:00 0 28-Aug-04 8:00:00 0 28-Aug-04 9:00:00 0 28-Aug-04 10:00:00 1 28-Aug-04 11:00:00 1.6 28-Aug-04 12:00:00 1.4 28-Aug-04 13:00:00 2.4 28-Aug-04 14:00:00 0.4 28-Aug-04 15:00:00 0.6 28-Aug-04 16:00:00 0.6 28-Aug-04 17:00:00 0.4 28-Aug-04 18:00:00 0.6 28-Aug-04 19:00:00 0.8 28-Aug-04 20:00:00 0.8 28-Aug-04 21 :00:00 0.8 28-Aug-04 22:00:00 0.6 28-Aug-04 23:00:00 0.2 29-Aug-04 0:00:00 0.8 15.4
1-0ct-04 0:00:00 0 1-0ct-04 1:00:00 0 1-0ct-04 2:00:00 0 1-0ct-04 3:00:00 0 . -,
1-0ct-04 4:00:00 0 1-0ct-04 5:00:00 0 1-0ct-04 6:00:00 0 1-0ct-04 7:00:00 0 1-0ct-04 8:00:00 0 1-0ct-04 9:00:00 0 1-0ct-04 10:00:00 0 1-0ct-04 11 :00:00 0 1-0ct-04 12:00:00 0 1-0ct-04 13:00:00 0 1-0ct-04 14:00:00 0 1-0ct-04 15:00:00 0.2 1-0ct-04 16:00:00 1 1-0ct-04 17:00:00 0.2 1-0ct-04 18:00:00 0.8 1-0ct-04 19:00:00 0 1-0ct-04 20:00:00 0.4 1-0ct-04 21.:00:00 0.8 1-0ct-04 22:00:00 0.2 1-0ct-04 23:00:00 0.4 2-0ct-04 0:00:00 0.2 4.2


