Embed Size (px)
Citation preview
University of Bath
MPHIL
Improved Manufacturing Processes for Machining of Hard Metal Alloys in an SME
Jamshidi, Akbar
Award date:2017
Awarding institution:University of Bath
Link to publication
Alternative formatsIf you require this document in an alternative format, please contact:[email protected]
Copyright of this thesis rests with the author. Access is subject to the above licence, if given. If no licence is specified above,original content in this thesis is licensed under the terms of the Creative Commons Attribution-NonCommercial 4.0International (CC BY-NC-ND 4.0) Licence (https://creativecommons.org/licenses/by-nc-nd/4.0/). Any third-party copyrightmaterial present remains the property of its respective owner(s) and is licensed under its existing terms.
Take down policyIf you consider content within Bath's Research Portal to be in breach of UK law, please contact: [email protected] with the details.Your claim will be investigated and, where appropriate, the item will be removed from public view as soon as possible.
Download date: 11. Jul. 2022
Improved Manufacturing Processes for Machining of Hard Metal Alloys in an SME
AKBAR JAMSHIDI
A Thesis Submitted for the Degree of
Master of Philosophy
UNIVERSITY OF BATH
Department of Mechanical Engineering
2016
COPYRIGHT
Attention is drawn to the fact that copyright of this thesis rests with the author. A copy of this
thesis has been supplied on condition that anyone who consults it is understood to recognise
that its copyright rests with the author and that they must not copy it or use material from it
except as permitted by law or with the consent of the author.
RESTRICTIONS
This thesis may not be consulted, photocopied or lent to other libraries without the permission
of the author for three years from the date of acceptance of the thesis.

Akbar Jamshidi – 119380709 ii
Declaration
I, Akbar Jamshidi, hereby state that all the work included in this thesis is my own. I
confirm, to my knowledge, that it has not been submitted for assessment for
academic or other purposes, and I verify that all work of others has been quoted and
properly referenced to its original authors.

Akbar Jamshidi – 119380709 iii
Acknowledgements
I would like to express my deepest gratitude to my supervisors Professor Stephen
Newman and Dr Martin Ansell for their constant help, patience and great support
throughout this research. It has been my greatest pleasure to work under their
supervision.
I would like to thank Innovate UK and the staff from University of Bath and Helander
Precision Engineering (Jon Cave and Martin Speight) who shared their knowledge
and research experience with me. It has been great honour to work in this
environment.
Akbar Jamshidi – 119380709 iv
Abstract
This thesis examines the implementation of an improved manufacturing information
system for production engineering that was carried out over a period of 30 months
within a Knowledge Transfer Partnership (KTP). The Department of Mechanical
Engineering at the University of Bath collaborated with the Helander Precision
Engineering Company in Tewkesbury.
The operations, manufacturing processes and information systems used by Helander
are described together with a review of the hard metals used for the precise
machining of industrial components manufactured from stainless steel, cobalt-based
superalloys and nickel-based superalloys. The thesis contains a review of machining
of hard alloys, statistical process control of machining and measurement systems
analysis and an experimental study of the Inconel 718 superalloy is included which
demonstrates how microstructure and mechanical hardness are affected by the
machining process.
Methods of process control & process verification for manufacture including the use
of gauge R&R are described to verify the accuracy of measurement tools. These
methods are applied in two case studies which examine the manufacture of a simple
part and a complex part. Helander’s manufacturing processes are reviewed and
practical methodologies are implemented for avoiding out of specification machined
components. Improved accuracy in machining is achieved by the use of the Ballbar
test to check accurate machine tool positioning. A future direction for Helander is
additive layer manufacturing for net shape components and trials were undertaken by
sub-contractors for Helander.
The KTP programme has made significant improvements in process control and
understanding of hard to machine materials by integrating industrial and academic
expertise in the field of precision engineering.
Akbar Jamshidi – 119380709 v
Table of Contents
ABSTRACT ............................................................................................................................................ IV
LIST OF FIGURES ............................................................................................................................... VIII
LIST OF TABLES ................................................................................................................................... X
ABBREVIATIONS .................................................................................................................................. XI
1 INTRODUCTION ............................................................................................................................ 1
1.1 BACKGROUND............................................................................................................................ 1
1.2 OBJECTIVES .............................................................................................................................. 3
1.3 RESEARCH QUESTION ................................................................................................................ 5
1.4 ORGANISATION OF THESIS ......................................................................................................... 5
2 MANUFACTURING PROCESS & INFORMATION SYSTEMS AT HELANDER .......................... 7
2.1 COMPANY STRUCTURE .............................................................................................................. 7
2.2 MANUFACTURING PROCESSES AT HELANDER .............................................................................. 9
2.3 ORDER PROCESS SYSTEMS AT HELANDER................................................................................ 10
3 LITERATURE REVIEW OF METALS & THEIR MANUFACTURING ......................................... 13
3.1 INTRODUCTION ........................................................................................................................ 13
3.2 STAINLESS STEELS .................................................................................................................. 13
3.3 COBALT-BASED SUPERALLOYS .................................................................................................. 15
3.4 NICKEL-BASED SUPERALLOYS ................................................................................................... 17
4 MACHINING HARD METAL ALLOYS – LITERATURE REVIEW .............................................. 21
4.1 CHALLENGES OF MACHINING HARD METAL ALLOYS ..................................................................... 21
4.2 MACHINING METHODS .............................................................................................................. 22
4.3 MACHINING PARAMETERS ........................................................................................................ 26
4.4 STATISTICAL PROCESS CONTROL (SPC) FOR MACHINING METAL ALLOYS ................................... 28
4.5 MEASUREMENT SYSTEM ANALYSIS ............................................................................................ 32
5 MATERIAL EVALUATION OF HELANDER ALLOYS ................................................................ 35
5.1 INTRODUCTION ........................................................................................................................ 35
5.2 MATERIAL EVALUATION OF INCONEL 718 .................................................................................. 37
5.3 HARDNESS MEASUREMENT OF COMMERCIAL INCONEL 718 ALLOYS ............................................. 46
6 PROCESS CONTROL & PROCESS VERIFICATION ................................................................ 48
6.1 INTRODUCTION ........................................................................................................................ 48
Akbar Jamshidi – 119380709 vi
6.2 METHODS OF PROCESS CONTROL (PC) AND PROCESS VERIFICATION (PV) ................................ 49
6.3 GAUGE R&R CASE STUDY ........................................................................................................ 52
6.4 CONTROL OF THE PROCESSES IN MANUFACTURING .................................................................... 56
6.5 CASE STUDY OF SIMPLE PRODUCT ........................................................................................... 59
6.6 CASE STUDY OF COMPLEX PRODUCT ....................................................................................... 70
7 CONTROL OF HELANDER’S MANUFACTURING PROCESSES ............................................. 78
7.1 INTRODUCTION ........................................................................................................................ 78
7.2 PROCESS CONTROL FOR MANUFACTURING (HELANDER) ........................................................... 78
7.3 REVIEW OF EXISTING MANUFACTURING PROCESS ..................................................................... 83
7.4 DEVELOPMENT AND IMPLEMENTATION OF MANUFACTURING RE-ENGINEERING PROCEDURE........ 87
8 PERFORMANCE MEASUREMENT OF HELANDER MACHINE TOOLS .................................. 91
8.1 INTRODUCTION ........................................................................................................................ 91
8.2 BENEFITS OF REGULAR MACHINE CHECKING............................................................................. 92
8.3 MACHINE TOOL POSITIONING ................................................................................................... 93
8.4 THE IMPORTANCE OF POSITIONING ACCURACY .......................................................................... 94
8.5 THE PROCEDURE OF POSITIONING ............................................................................................ 96
8.6 MONITORING PROCESS OF MACHINE TESTING .......................................................................... 99
9 FINISHING OF ADDITIVE LAYER MANUFACTURED PARTS ............................................... 103
9.1 INTRODUCTION ...................................................................................................................... 103
9.2 AN ALTERNATIVE TO MACHINING - ADDITIVE LAYER MANUFACTURING ....................................... 103
9.3 REPLACING SUBTRACTIVE MANUFACTURING WITH COMBINED ADDITIVE AND SUBTRACTIVE
MANUFACTURING ............................................................................................................................... 106
9.4 CASE STUDY ON FINISHING OF ADDITIVE MANUFACTURED PARTS ............................................ 107
10 DISCUSSION ............................................................................................................................. 110
10.1 MATERIAL EVALUATION OF HELANDER ALLOYS........................................................................ 110
10.2 METHODS OF PROCESS CONTROL & PROCESS VERIFICATION .................................................. 110
10.3 CONTROL OF HELANDER’S MANUFACTURING PROCESS ........................................................... 112
10.4 PERFORMANCE MEASUREMENT OF HELANDER MACHINE TOOLS .............................................. 112
10.5 FINISHING OF ADDITIVE LAYER MANUFACTURED PARTS ........................................................... 113
10.6 ADDRESSING CUSTOMER NEEDS FOR INTRODUCTION OF NEW PRODUCTS ................................. 113
11 CONCLUSIONS AND FUTURE WORKS .................................................................................. 115
11.1 CONCLUSIONS ....................................................................................................................... 115
11.2 FUTURE WORK ...................................................................................................................... 116

Akbar Jamshidi – 119380709 vii
REFERENCES .................................................................................................................................... 118
APPENDICES ..................................................................................................................................... 122
APPENDIX 1 ...................................................................................................................................... 122
APPENDIX 2 ...................................................................................................................................... 123
APPENDIX 3 ...................................................................................................................................... 125
APPENDIX 4 ...................................................................................................................................... 128
APPENDIX 5 ...................................................................................................................................... 131
APPENDIX 6 ...................................................................................................................................... 132
Akbar Jamshidi – 119380709 viii
List of Figures
FIGURE 1-1 CALDER GROUP LOCATIONS ........................................................................................................................... 2
FIGURE 2-1 HELANDER COMPANY FACILITIES ...................................................................................................................... 8
FIGURE 2-2 HELANDER COMPANY LAYOUT......................................................................................................................... 9
FIGURE 2-3 RISK REGISTER PROPOSED AT HELANDER TO IDENTIFY POTENTIAL RISKS ON ORDERS ................................................. 11
FIGURE 3-1 SELF-HEALING PROCESS IN STAINLESS STEEL (ASSDA, 2015) .............................................................................. 14
FIGURE 3-2 Γ’ (GAMMA PRIME) PHASE – THE MAJOR PRECIPITATE PHASE (HEUBNER, 1998) ..................................................... 19
FIGURE 3-3 HARDNESS VERSUS DENSITY FOR STAINLESS STEELS AND NICKEL-BASED AND COBALT-BASED SUPERALLOYS .................... 20
FIGURE 4-1EFFECT ON THE HEAT AFFECTED ZONE AND OF (A) DRY MACHINING AND (B) USE OF COOLANT FOR A SUPERALLOY PART
(ZHOU ET AL. 2012) .......................................................................................................................................... 23
FIGURE 4-2 HIGH RESOLUTION SEM IMAGES TO DETERMINE THE SUBSURFACE FEATURES OF DEFORMATION USING (A) NEW AND (C)
WORN TOOLS (ZHOU ET AL. 2012) ....................................................................................................................... 24
FIGURE 4-3 THE MOST COMMON TOOL WEAR IN MACHINING (CAMPBELL, 2006)................................................................... 28
FIGURE 4-4 STATISTICAL PROCESS CONTROL CHART IN A GRAPHICAL DISPLAY (MONTGOMERY, 2009) ........................................ 29
FIGURE 4-5 CONTROL CHART WHICH DEFINES MACHINING LIMITS FOR DESIGN AGAINST MANUFACTURING (COURTESY OF NPL GUIDE,
NO 80, 2005) LS = LOWER SPECIFICATION, US = UPPER SPECIFICATION ...................................................................... 30
FIGURE 4-6 FOUR PROCESS STATES (ADAPTED FROM TUBIAK AND BENBOW, 2009) ................................................................ 31
FIGURE 4-7 MEASUREMENT SYSTEMS VARIABILITY IN FISHBONE DIAGRAM (AIAG, 2010) ...................................................... 34
FIGURE 5-1 SPEEDS AND FEEDS (COURTESY FROM WIKIPEDIA/SPEEDS AND FEEDS) .................................................................. 36
FIGURE 5-2 PREPARATION OF POLISHED SECTIONS FOR MICROSCOPICAL ANALYSIS (A) CUTTING SPECIMENS FROM AN INCONEL 718
BAR, (B) MOUNTING SPECIMENS IN RESIN, (C) LAPPING MOUNTED SPECIMENS AND (D) FINELY POLISHED SECTIONS ............... 38
FIGURE 5-3 MICROSCOPIC IMAGE OF THE INCONEL 718 AFTER POLISHING AND ETCHING PROCESS ............................................. 39
FIGURE 5-4 INVERTED REFLECTED LIGHT MICROSCOPE IMAGES OF INCONEL 718 - GRAIN SIZE ASTM 5 – IMAGE IS FROM NEAR THE
SURFACE OF MACHINED ALLOY ............................................................................................................................. 40
FIGURE 5-5 INVERTED REFLECTED LIGHT MICROSCOPE IMAGES OF INCONEL 718 - GRAIN SIZE ASTM 5 – IMAGE IS FROM A DEPTH OF
5 TO 9 MM IN THE MACHINED ALLOY ..................................................................................................................... 40
FIGURE 5-6 INVERTED REFLECTED LIGHT MICROSCOPE IMAGES OF INCONEL 718 - GRAIN SIZE ASTM 5 – IMAGE IS FROM THE SURFACE
OF THE MACHINED ALLOY .................................................................................................................................... 41
FIGURE 5-7 THE INDENTATION OF HARDNESS TEST ON INCONEL 718 .................................................................................... 42
FIGURE 5-8 RESULTS OF HARDNESS TEST ON THREE AREAS OF INCONEL 718 BAR AFTER MACHINING ........................................... 43
FIGURE 5-9 CHART METHOD TO DETERMINE THE AVERAGE GRAIN SIZE (ASTM METHOD E112) FOR 100X MAGNIFICATION
(AMRUTIYA, 2015), ASTM NUMBERS ARE SHOWN IN THE CENTRE OF THE CHART ......................................................... 44
Akbar Jamshidi – 119380709 ix
FIGURE 5-10 INCONEL 718 SAMPLE FROM DIFFERENT ORIENTATIONS AT THE SAME MAGNIFICATION INDICATED BY ARROWS: (A) IMAGE
AT 2MM FROM THE SURFACE, (B) IMAGE AT 5MM FROM THE SURFACE (C) IMAGE FROM CORE SECTION OF THE BAR 10MM
FROM THE SURFACE ........................................................................................................................................... 45
FIGURE 6-1 PROCESS CONTROL FRAMEWORK (ADAPTED FROM RENISHAW TRAINING MANUAL, 2010) ...................................... 50
FIGURE 6-2 THE PROCESS OF PPAP AT HELANDER ............................................................................................................ 51
FIGURE 6-3 MEASURED FIGURES AGAINST SPECIFIED ALLOWANCE TOLERANCE ........................................................................ 53
FIGURE 6-4 PERFORMANCE VS. MATURITY (WILSON, 2007) .............................................................................................. 58
FIGURE 6-5 SAMPLE PART ............................................................................................................................................ 60
FIGURE 6-6 PRODUCT/PROCESS CONTROL PLAN (ADAPTED FROM AIRBUS SAS, 2016) .......................................................... 63
FIGURE 6-7 DETAILS OF COST OF QUALITY (BRAUN, 2011) ................................................................................................ 66
FIGURE 6-8 SWOT ANALYSIS AND RESULTS OF THE STUDY ON SIMPLE PART ........................................................................... 70
FIGURE 6-9 COMPLEX PART .......................................................................................................................................... 71
FIGURE 6-10 USE OF PPAP ......................................................................................................................................... 72
FIGURE 6-11 PPAP PROCESS FLOW USED FOR PPAP IMPLEMENTATION ............................................................................... 73
FIGURE 6-12 VARIATIONS IN MACHINE SET UP DOCUMENT BETWEEN DIFFERENT TEAM LEADERS ................................................ 74
FIGURE 6-13 PROPOSED SOLUTION FOR BALLOONING AND USING INTEGRATED PROCESS IMPROVEMENT ..................................... 76
FIGURE 6-14 SWOT ANALYSIS AND RESULTS OF THE STUDY ON COMPLEX PART ...................................................................... 77
FIGURE 7-1 CHECK THE PIN IS IN THE CORRECT POSITION AND ENSURE THE PIN IS NOT WELDED OVER THE SLOT ALSO ENSURING THE
INTERNAL SIDE OF THE PIN IS UNDER FLUSH (LEFT IMAGE) OR FLUSH. THE RIGHT HAND IMAGE IS OVER FLUSH AND THEREFORE A
REJECT PART. .................................................................................................................................................... 79
FIGURE 7-2 EXAMPLE OF POOR FORMING AND ACCEPTABLE FORM FINISHING ON HELANDER PARTS (MARKED EDGES ARE NOT FORMED
TO CUSTOMER SPECIFICATION) ............................................................................................................................. 80
FIGURE 7-3 GENERATING FORMS TO SUPPORT OPERATIONS AND MACHINE SETUPS.................................................................. 83
FIGURE 7- 4 SIMPLIFIED PROCESS FLOW WITHIN AN SME ................................................................................................... 85
FIGURE 7-5 TUBE MAP OF HPE (HELANDER PRECISION ENGINEERING) ................................................................................. 86
FIGURE 7-6 CROSS FUNCTIONAL DIAGRAM SHOWS THE INTERACTIONS BETWEEN ENQUIRY AND QUOTATION PROCESS .................... 89
FIGURE 8-1 TYPICAL FACTORS WHICH CAN AFFECT MACHINE PERFORMANCE (ADOPTED FROM: LOPEZ DE LACALLE, AND LAMIKIZ,
2009) ............................................................................................................................................................ 95
FIGURE 8-2 BALLBAR TEST IN 3 ORTHOGONAL PLANES VIA A SINGLE REFERENCE POINT (RENISHAW, 2014) .................................. 96
FIGURE 8-3 A SAMPLE OF VOLUMETRIC TEST RESULT ......................................................................................................... 97
FIGURE 8-4 PROPOSED PROCESS OF PERIODIC VERIFICATION ON MACHINE TOOLS AT HELANDER ............................................... 100
FIGURE 8-5 MEASURING THE ROTARY POSITIONING ACCURACY OF AN AXIS (RENISHAW, 2014) ............................................... 101
FIGURE 9-1 PRINCIPLE OF ADDITIVE LAYER MANUFACTURING (GEBHARDT, 2011) ................................................................. 104
FIGURE 9-2 ALM PARTS SIMILAR TO HELANDER MANUFACTURED COMPONENTS THAT IS COSTLY OR MAY NOT BE ABLE TO BE MADE
WITH SUBTRACTIVE METHOD (ROYAL ACADEMY OF ENGINEERING, 2012) .................................................................. 106
FIGURE 9-3 ADDITIVE VS. MACHINED PART .................................................................................................................... 107
Akbar Jamshidi – 119380709 x
List of Tables
TABLE 3-1 GROUPS OF STAINLESS STEEL (CES EDUPACK, 2015) ......................................................................................... 14
TABLE 3-2 SELECTED CHEMICAL AND MECHANICAL PROPERTIES OF STAINLESS STEEL 17-4 WROUGHT - PARTICIPATION HARDENED
(ADAPTED FROM CES EDUPACK, 2015) ............................................................................................................... 15
TABLE 3-3 SELECTED CHEMICAL AND MECHANICAL PROPERTIES OF STELLITE 6 (ADAPTED FROM CES EDUPACK, 2015) ................. 16
TABLE 3-4 FUNCTION OF CERTAIN ELEMENTS IN COBALT ALLOYS (ADAPTED FROM COBALT FACTS, 2006) ................................... 16
TABLE 3-5 NICKEL BASED ALLOYS (ADAPTED FROM UDOMPHOL, 2007) ........................................................................ 17
TABLE 3-6 SELECTED CHEMICAL AND MECHANICAL PROPERTIES OF INCONEL 718 (ADAPTED FROM CES EDUPACK, 2015) ............. 18
TABLE 4-1 METHODS OF MACHINING SUPERALLOYS (EL-HOFY 2005, LU ET AL. 2013, SHOKRANI ET AL. 2013) .......................... 25
TABLE 5-1 GRINDING AND POLISHING METHOD USED FOR INCONEL 718 ............................................................................... 38
TABLE 5-2 RESULTS OF HARDNESS TEST AT DIFFERENT DEPTH OF MACHINED INCONEL 718 ....................................................... 43
TABLE 5-3 CHEMICAL ANALYSIS OF SAMPLE ALLOYS BASED ON THEIR CERTIFICATION TEST ......................................................... 46
TABLE 5-4 RESULTS OF THE MACHINE RUN ON 3 SAMPLES (AVERAGE OF A MINIMUM OF FIVE HARDNESS TESTS IN EACH CASE) ......... 47
TABLE 6-1 RESULTS OF GAUGE R&R STUDY WITH TWO DIFFERENT MEASUREMENT TOOL (RESULTS GENERATED FROM STUDY IN
MINITAB) - 1) COMPARATOR GAUGE 2) MANUAL MICROMETER ................................................................................ 53
TABLE 6-2 AIAG GUIDELINES FOR THE GAGE R&R TABLE (MINITAB, 2010) .......................................................................... 54
TABLE 6-3 SAMPLING PLAN FREQUENCIES FOR HIGH VOLUME SIMPLE PARTS ........................................................................... 57
TABLE 6-4 COMPLIANCE AND DEVIATION MATRIX (STUDY ON SIMPLE PART) ........................................................................... 61
TABLE 6-5 CONTROL PLAN FOR SIMPLE PRODUCT .............................................................................................................. 64
TABLE 6-6 GAP ANALYSIS DESIGNED BY THE AUTHOR TO STUDY ON SIMPLE PART ..................................................................... 68
TABLE 9-1 COMPARISON OF SOME COMMON ALM METHODS FOR METALS (ADAPTED FROM GU, 2015) .................................. 105
TABLE 9-2 CHEMICAL COMPOSITION OF COBALT CHROME ALLOY VS. STELLITE® 6 (ADAPTED FROM CES EDUPACK, 2015; RENISHAW,
2015 AND EOS 2015) .................................................................................................................................... 108
TABLE 9-3 MECHANICAL PROPERTIES OF COBALT CHROME ALLOY VS. STELLITE® 6 (ADAPTED FROM CES EDUPACK, 2015;
RENISHAW, 2015 AND EOS, 2015) .................................................................................................................. 109
Akbar Jamshidi – 119380709 xi
Abbreviations
2D Two Dimensions
3D Three Dimensions
ALM Additive Layer Manufacturing
APQP Advanced Product Quality Planning
ASME American Society of Mechanical Engineers
ASTM American Society for Testing and Materials
BOM Bill of Material
CAD Computer Aided Design
CAE Computer Aided Engineering
CAM Computer Aided Manufacturing
CAPA Corrective And Preventive Actions
CIM Computer Integrated Manufacturing
CMM Coordinate Measuring Machine
CNC Computer Numerical Control
DLMS Direct Metal Laser Sintering
ERP Enterprise Resource Planning
FAIR First Article Inspection Report
FCC Face Cantered Cubic
FMEA Failure Mode and Effect Analysis
Gauge R&R Gauge Repeatability and Reproducibility
GD&T Geometric Dimensioning and Tolerancing
IPI Integrated Process Improvement
ISO International Organization for Standardization
LIMA Laboratory of Integrated Metrology Applications
MRP Manufacturing Requirement Planning
MSA Measurement Systems Analysis
NCR Non Conformance Report
NPD New Product Development
NPI New Product Introduction
Akbar Jamshidi – 119380709 xii
OEE Overall Equipment Effectiveness
OEM Original Equipment Manufacturer
PC Process Control
PCP Part/Process Control Plan
PDCA Plan, Do, Action, Check
PDM Product Data Management
PFMEA Process Failure Mode and Effect Analysis
PLM Product Lifecycle Management
PPAP Production Part Approval Process
PSW Production Submission Warrant
PV Process Verifications
QCP Quality Control Plan
RFQ Request for Quotation
ROI Return on Investment
SABRe Supplier Advanced Business Relationship
SCM Supply Chain Management
SME Small and Medium Enterprises
SOP Standard Operating Procedure
SRP Supplier Requirement Procedure
SWOT Strengths, Weaknesses, Opportunities and Threats
TQM Total Quality Management
TQM Total Quality Management
VMC Vertical Machining Centre
VSM Value Stream Mapping
Chapter One: Introduction
Akbar Jamshidi – 119380709 1
Chapter One: Introduction
1 Introduction
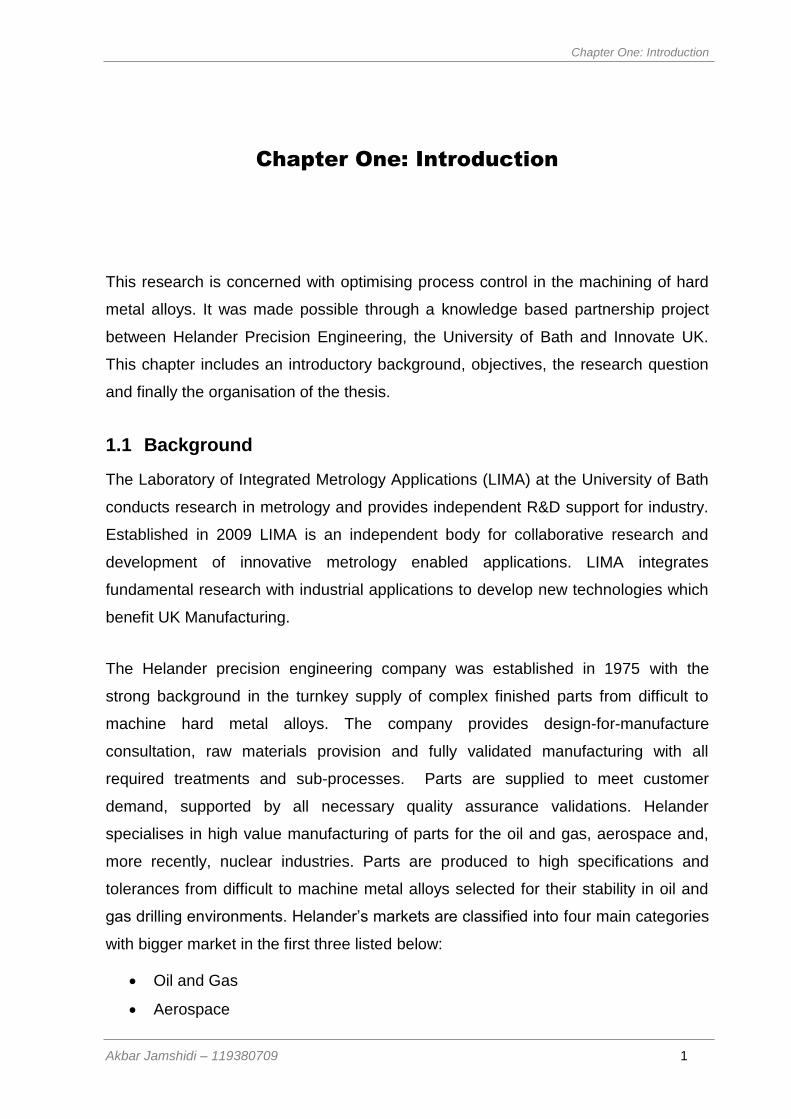
This research is concerned with optimising process control in the machining of hard
metal alloys. It was made possible through a knowledge based partnership project
between Helander Precision Engineering, the University of Bath and Innovate UK.
This chapter includes an introductory background, objectives, the research question
and finally the organisation of the thesis.
1.1 Background
The Laboratory of Integrated Metrology Applications (LIMA) at the University of Bath
conducts research in metrology and provides independent R&D support for industry.
Established in 2009 LIMA is an independent body for collaborative research and
development of innovative metrology enabled applications. LIMA integrates
fundamental research with industrial applications to develop new technologies which
benefit UK Manufacturing.
The Helander precision engineering company was established in 1975 with the
strong background in the turnkey supply of complex finished parts from difficult to
machine hard metal alloys. The company provides design-for-manufacture
consultation, raw materials provision and fully validated manufacturing with all
required treatments and sub-processes. Parts are supplied to meet customer
demand, supported by all necessary quality assurance validations. Helander
specialises in high value manufacturing of parts for the oil and gas, aerospace and,
more recently, nuclear industries. Parts are produced to high specifications and
tolerances from difficult to machine metal alloys selected for their stability in oil and
gas drilling environments. Helander’s markets are classified into four main categories
with bigger market in the first three listed below:
Oil and Gas
Aerospace
Chapter One: Introduction
Akbar Jamshidi – 119380709 2
Nuclear
Defence
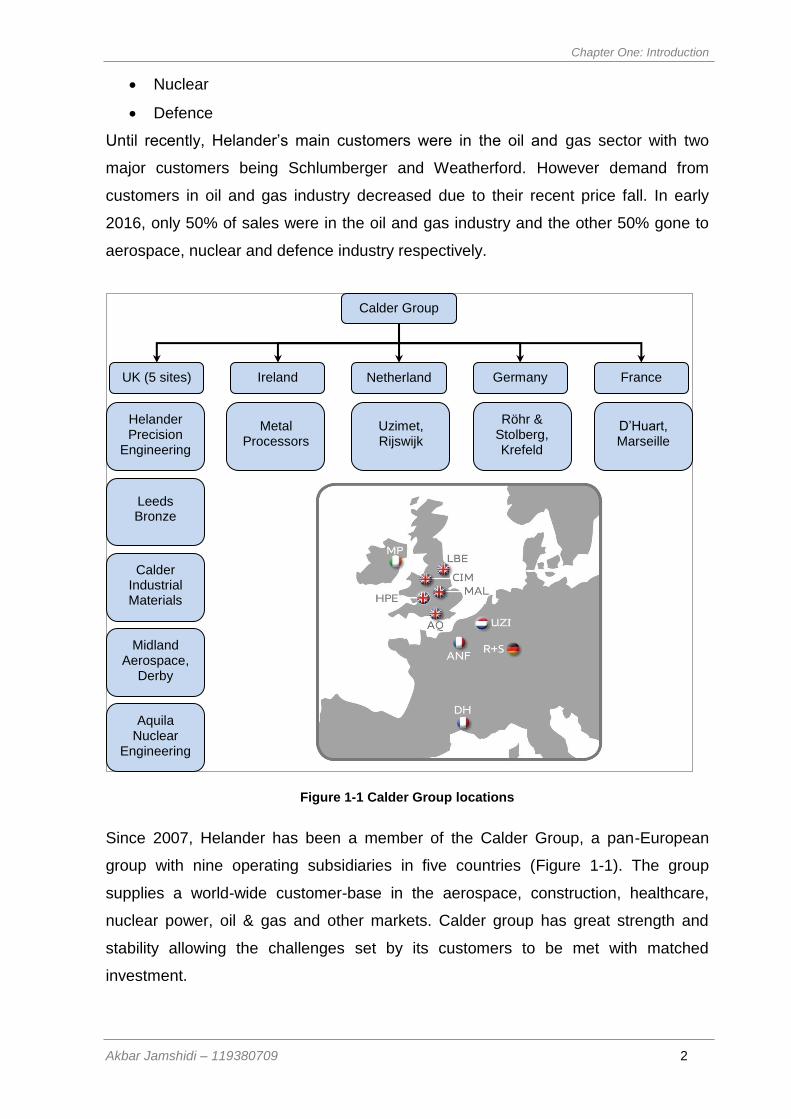
Until recently, Helander’s main customers were in the oil and gas sector with two
major customers being Schlumberger and Weatherford. However demand from
customers in oil and gas industry decreased due to their recent price fall. In early
2016, only 50% of sales were in the oil and gas industry and the other 50% gone to
aerospace, nuclear and defence industry respectively.
Figure 1-1 Calder Group locations
Since 2007, Helander has been a member of the Calder Group, a pan-European
group with nine operating subsidiaries in five countries (Figure 1-1). The group
supplies a world-wide customer-base in the aerospace, construction, healthcare,
nuclear power, oil & gas and other markets. Calder group has great strength and
stability allowing the challenges set by its customers to be met with matched
investment.
Calder Group
UK (5 sites) Ireland Germany Netherlands
France
Helander Precision
Engineering
Calder Industrial Materials
Midland Aerospace,
Derby
Leeds Bronze
Aquila Nuclear
Engineering
Metal Processors
Uzimet, Rijswijk
Röhr & Stolberg, Krefeld
D’Huart, Marseille
Chapter One: Introduction
Akbar Jamshidi – 119380709 3
The KTP project was introduced in the Helander company to enhance the existing
process capability for long-term contracts with focus on excellent service and cost
effectiveness. The goal was to develop a process and product verification system
that complied with the requirements of upcoming industries as new customers. There
are more than 35 SMEs working in the Helander supply chain. Products received and
sent to these companies with different capabilities must be verified, based on
different standard levels required and targeted by customers. The research reported
in this thesis introduces a robust verification process that is aligned with Helander’s
capabilities and improves the confidence level in all stages of manufacturing
operations. The aim is to impose systematic verification in Helander’s supply chain to
reduce variations in manufacturing components from batch to batch. These advances
are in tune with the requirements of the nuclear, defence and aerospace industries
which demand greater certification and documentation in comparison with
conventional oil and gas customer.
1.2 Objectives
The aims of KTP project are:
i. To understand the needs of Helander customers which are mainly from the oil
and gas sector (design intent, manufacturing process, onsite installation and
maintenance).
This section is explained in detail in chapter six and chapter seven. In chapter
six the compliance and deviation matrix shows the oil and gas requirements
and Helander’s approach towards answering each need based on customer
contractual requirement. Also in chapter seven, Helander’s manufacturing
process is explained in line with customer design intent and visual aids used in
control plans to emphasise the customer’s key characteristics.
ii. To understand and apply new methods and systems for design interpretation,
measurement, machining and process verification.
This section is explained in chapter six by introducing and implementing the
FAIR (First Article Inspection Report) process with support of the IPI
(Integrated Process Improvement) solution software to highlight and ensure
the key customer characteristics are identified and appropriate solutions
chosen for verification purpose.
Chapter One: Introduction
Akbar Jamshidi – 119380709 4
iii. To work with customers within the supply chain to understand problems and
future risks.
In chapter six, details are given about visiting customers and discussing
design procedures with customers. This is required to expand tolerances
where possible and reduce risks in manufacturing procedures.
iv. To standardise the verification methodologies and convey the knowledge
gained to existing production and quality staff by effective implementation of
new design and process verification methods at Helander.
In chapter six, two components were chosen as case study parts. The
procedures from the early stage (quoting) until delivery of the parts were
reviewed. Based on the reviewed components, it was identified which
elements of the procedure needed modifying in order to reduce the cost and
improve quality. The savings for each component were quantified and
outlined. If the manufacturing method changes by using control plans and
more accurate work instructions the benefits would be up to more than 5% of
the revenue for the part in total.
These aims are in line with the objectives of MPhil which are:
i. A description of Helander including their operations, manufacturing processes
and information systems, explained in detail in chapter two.
ii. A review of hard metals including stainless steel, cobalt-based superalloys
and nickel-based superalloys. The review for each material group is provided
in chapter three.
iii. A review of machining of hard alloys, statistical process control of machining
and measurement systems analysis. Chapter four discusses this area as part
of literature review.
iv. An experimental study of Inconel 718, reporting on microstructure and
evaluating hardness as a function of distance from the machined surface.
Chapter five describes the microstructural details for Inconel 718 in detail.
v. An investigation of methods of process control & process verification for
manufacture including the use of Gauge R&R (Gauge Repeatability and
Reproducibility) to verify the accuracy of measurement tools is shown in detail
in chapter six. The Gauge R&R study results are presented in section three of
chapter six.
Chapter One: Introduction
Akbar Jamshidi – 119380709 5
vi. Two case studies of the manufacture of a simple part and a complex part.
These parts are taken as examples for simple and complex part produced in
Helander. Manufacturing procedures for each example were analysed in detail
and savings are shown with new procedures being put in place.
vii. A practical study of Helander’s manufacturing processes and methodologies
for avoiding out of specification machined components. Manufacturing re-
engineering procedure was proposed for this section from undertaking a
review of the current process and introducing control plans and visual guides
for critical areas of the components. This method aims to reduce the cost of
quality substantially as most of the failures in production were repeated after
few months due to not having a detailed and consistent process plan in place.
viii. An investigation of machine tool positioning including the use of the Ballbar
testing is the context of chapter eight. The log system introduced and training
performed for the Helander engineering team to perform the Ballbar test at
regular time intervals in order to have confidence in the machines capability in
manufacturing precise products to the machine standards.
ix. A description of additive layer manufacturing for net shape components and
trials undertaken by sub-contractors for Helander. This is performed as
development project for Helander’s future products in chapter nine.
1.3 Research Question
Thus the research question can be formulated as follows:
“How can a new robust verification methodology be designed and
implemented to give the Helander company a right first time manufacturing
capability?”
1.4 Organisation of Thesis
This thesis has eleven chapters, including an introduction (chapter one) and
conclusion (chapter eleven). Chapter two is an introduction to the KTP project
company. Chapters three and four review the literature on manufacturing process
and information systems, and materials and their manufacture at Helander,
respectively. These chapters are generally for understanding what has been done so
far and focuses on Helander alloys and manufacturing capabilities.
Chapter One: Introduction
Akbar Jamshidi – 119380709 6
An in depth Helander material analysis and the impacts of machining process on the
material microscopical structure and physical attribute are discussed in chapter five.
In chapter Six two parts (simple and complex) are selected for detail analysis of time
and cost savings and process improvements. The chapter also includes a gauge
R&R study and reviews the process of manufacturing at Helander. Processes of
manufacturing at Helander are reviewed in detail in chapter Seven and the processes
are mapped at Helander as a whole company. In addition, cross functional diagrams
are designed at Helander which describe the procedures that need to be followed
according to the requirements of internal and external customers.
In chapter eight the process of machine performance and machine tool adjustment is
described which is of critical importance for the quality and production. Chapter nine
introduces the ALM process as not only a method for making prototypes but also for
production and manufacturing with different alloys.
Finally, chapter ten is the general discussion and chapter eleven focuses on future
work. The appendix section contains samples of forms and procedures for
manufacturing that were designed and used at Helander company during the KTP
project.
Chapter Two: Manufacturing Process & Information Systems at Helander
Akbar Jamshidi – 119380709 7
Chapter Two: Manufacturing Process & Information
Systems at Helander
2 Manufacturing Process & Information Systems at Helander
This chapter focuses on structure of the Helander company and the processes and
systems that Helander is adopting to achieve lean manufacturing capabilities and to
reduce uncertainties in measurement.
2.1 Company Structure
Helander Precision Engineering provides manufacturing services, specialising in high
value machining of metal alloy parts for the oil & gas, aerospace and, lately, nuclear
industries. Parts are produced to high specifications and tolerances from difficult to
machine materials selected for their stability in oil and gas drilling environments.
Helander has a good reputation for working with major oil & gas service companies
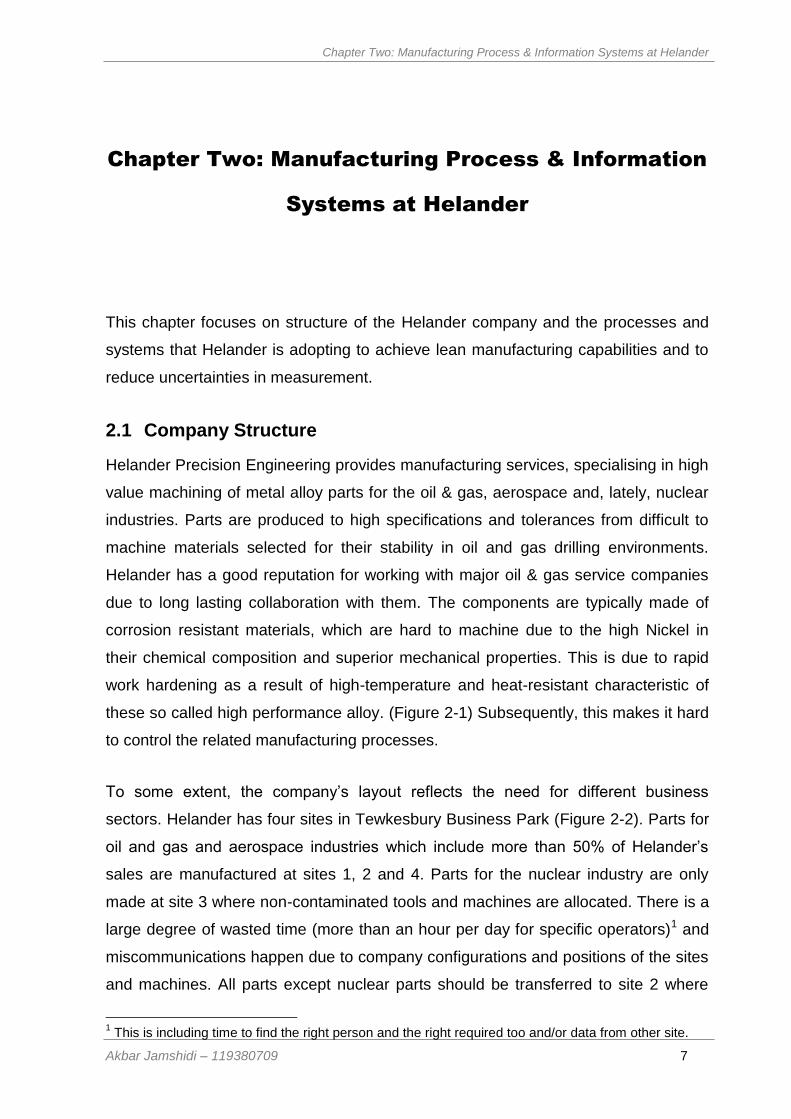
due to long lasting collaboration with them. The components are typically made of
corrosion resistant materials, which are hard to machine due to the high Nickel in
their chemical composition and superior mechanical properties. This is due to rapid
work hardening as a result of high-temperature and heat-resistant characteristic of
these so called high performance alloy. (Figure 2-1) Subsequently, this makes it hard
to control the related manufacturing processes.
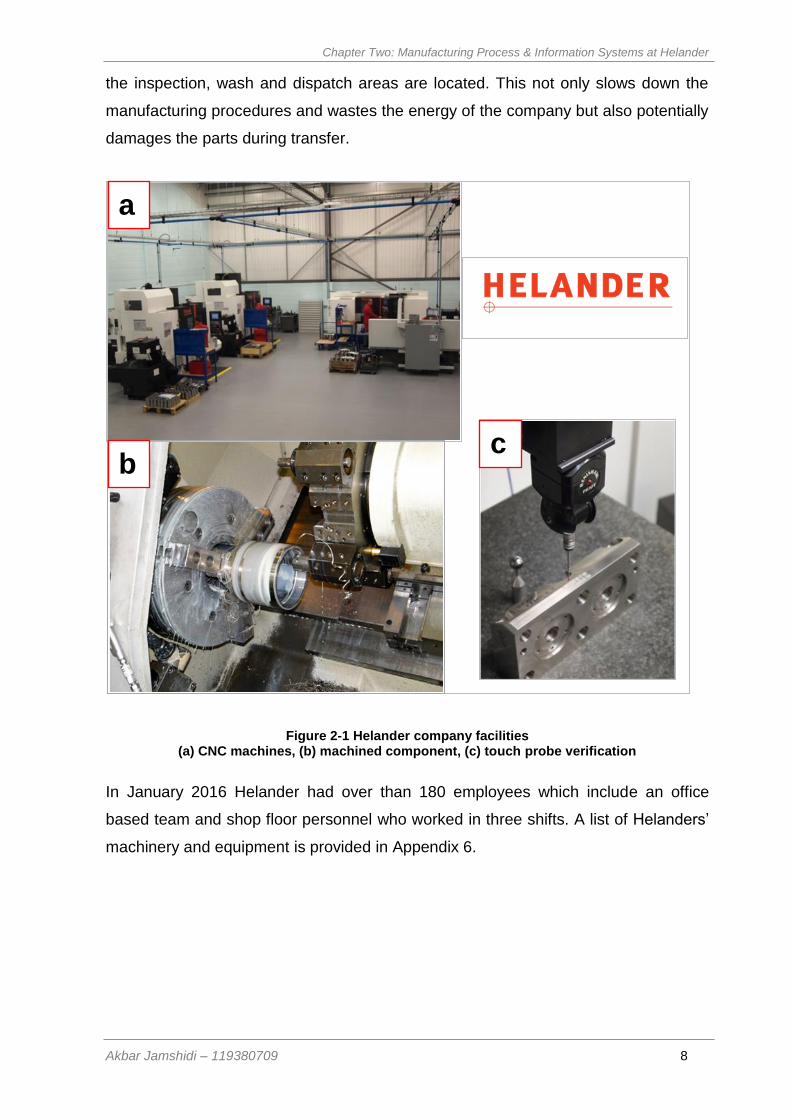
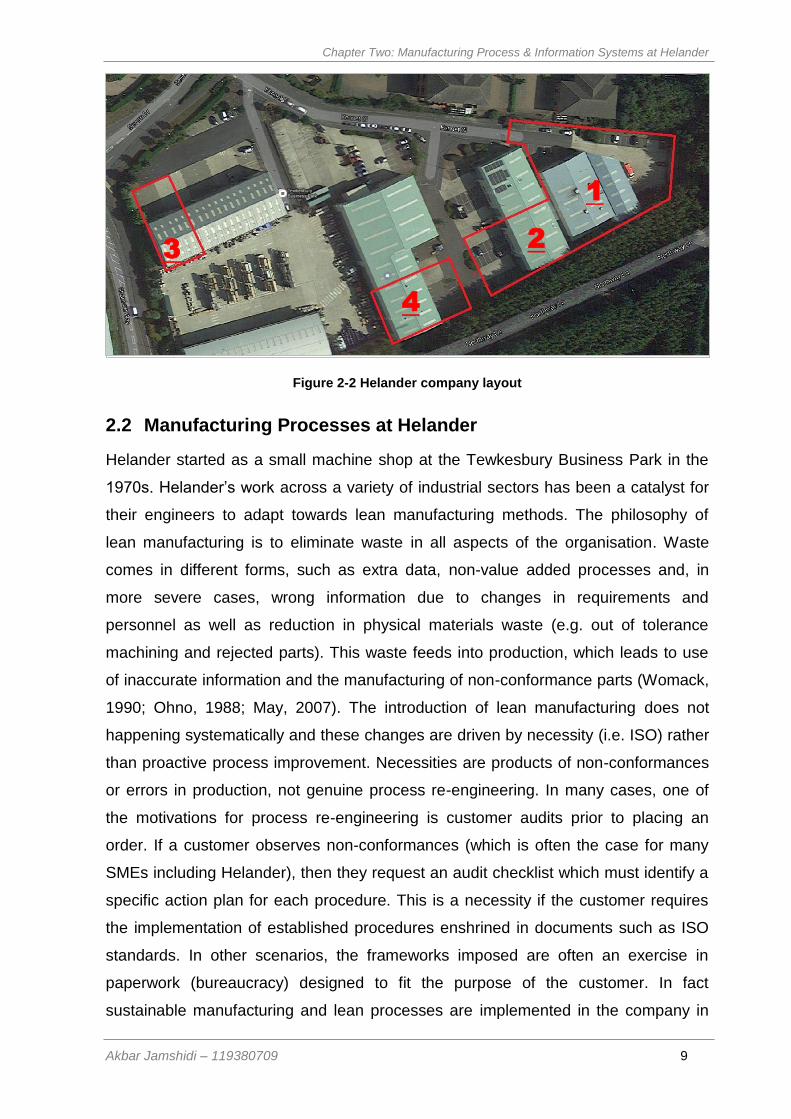
To some extent, the company’s layout reflects the need for different business
sectors. Helander has four sites in Tewkesbury Business Park (Figure 2-2). Parts for
oil and gas and aerospace industries which include more than 50% of Helander’s
sales are manufactured at sites 1, 2 and 4. Parts for the nuclear industry are only
made at site 3 where non-contaminated tools and machines are allocated. There is a
large degree of wasted time (more than an hour per day for specific operators)1 and
miscommunications happen due to company configurations and positions of the sites
and machines. All parts except nuclear parts should be transferred to site 2 where
1 This is including time to find the right person and the right required too and/or data from other site.
Chapter Two: Manufacturing Process & Information Systems at Helander
Akbar Jamshidi – 119380709 8
the inspection, wash and dispatch areas are located. This not only slows down the
manufacturing procedures and wastes the energy of the company but also potentially
damages the parts during transfer.
Figure 2-1 Helander company facilities (a) CNC machines, (b) machined component, (c) touch probe verification
In January 2016 Helander had over than 180 employees which include an office
based team and shop floor personnel who worked in three shifts. A list of Helanders’
machinery and equipment is provided in Appendix 6.
a
b c
Chapter Two: Manufacturing Process & Information Systems at Helander
Akbar Jamshidi – 119380709 9
Figure 2-2 Helander company layout
2.2 Manufacturing Processes at Helander
Helander started as a small machine shop at the Tewkesbury Business Park in the
1970s. Helander’s work across a variety of industrial sectors has been a catalyst for
their engineers to adapt towards lean manufacturing methods. The philosophy of
lean manufacturing is to eliminate waste in all aspects of the organisation. Waste
comes in different forms, such as extra data, non-value added processes and, in
more severe cases, wrong information due to changes in requirements and
personnel as well as reduction in physical materials waste (e.g. out of tolerance
machining and rejected parts). This waste feeds into production, which leads to use
of inaccurate information and the manufacturing of non-conformance parts (Womack,
1990; Ohno, 1988; May, 2007). The introduction of lean manufacturing does not
happening systematically and these changes are driven by necessity (i.e. ISO) rather
than proactive process improvement. Necessities are products of non-conformances
or errors in production, not genuine process re-engineering. In many cases, one of
the motivations for process re-engineering is customer audits prior to placing an
order. If a customer observes non-conformances (which is often the case for many
SMEs including Helander), then they request an audit checklist which must identify a
specific action plan for each procedure. This is a necessity if the customer requires
the implementation of established procedures enshrined in documents such as ISO
standards. In other scenarios, the frameworks imposed are often an exercise in
paperwork (bureaucracy) designed to fit the purpose of the customer. In fact
sustainable manufacturing and lean processes are implemented in the company in
1
2 3
4
Chapter Two: Manufacturing Process & Information Systems at Helander
Akbar Jamshidi – 119380709 10
one way or another due to necessity. In reality, sustainable manufacturing operations
need to include advanced and integrated aspects of verification to ensure all aspects
of the product and the process are considered.
Bryan (1984) believes philosophy is an important factor in precision engineering that
requires belief in the idea that the causes of variations in machine tools are the effect
of incorrect processes in manufacturing. Incorrect processes can be understood and
controlled. There is nothing random about the behaviour of a manufacturing process
in precision engineering as long as the control plans are in-place to verify the
products in different stages. Helander’s philosophy has improved throughout their
history through self-experience and sometimes closes collaborations with their
customers. Every time customer requirements change under the framework of ISO
2001:2008 standard, Helander tries to adapt their process to satisfy customer
demand. Helander’s values have evolved by continuous improvement, elimination of
non-productive procedures and investment in equipment. The current collaboration
with academia (KTP Project) was the first of its kind where Helander chose to
familiarise itself with different aspects of future market demand and to act accordingly
in advance. These actions have determined Helander to work on its capability to
manufacture parts for the nuclear and aerospace industry. Helander processes at the
start of the KTP project were not adequate to respond to required documentation for
nuclear and aerospace industries.
2.3 Order Process Systems at Helander
Upon receiving a Request for Quotation (RFQ), manufacturing businesses such as
Helander should first identify key characteristics of a part to answer the questions
“can we make it”, “do we have the tools to make it” and “do we have a machine to
make it on”. There is also a question of adaptation and application in “design for
manufacture” and “design for assembly”. The initial challenge should be “what about
measurement?” A significant number of manufacturing companies have the ability to
make some very complex parts, however hardly any SME have the reasonable
competence to correctly measure parts or measure within an acceptable range of
uncertainty. Helander have a metrology department but their facilities were not
utilised to the best of their ability at the start of this research.
Chapter Two: Manufacturing Process & Information Systems at Helander
Akbar Jamshidi – 119380709 11
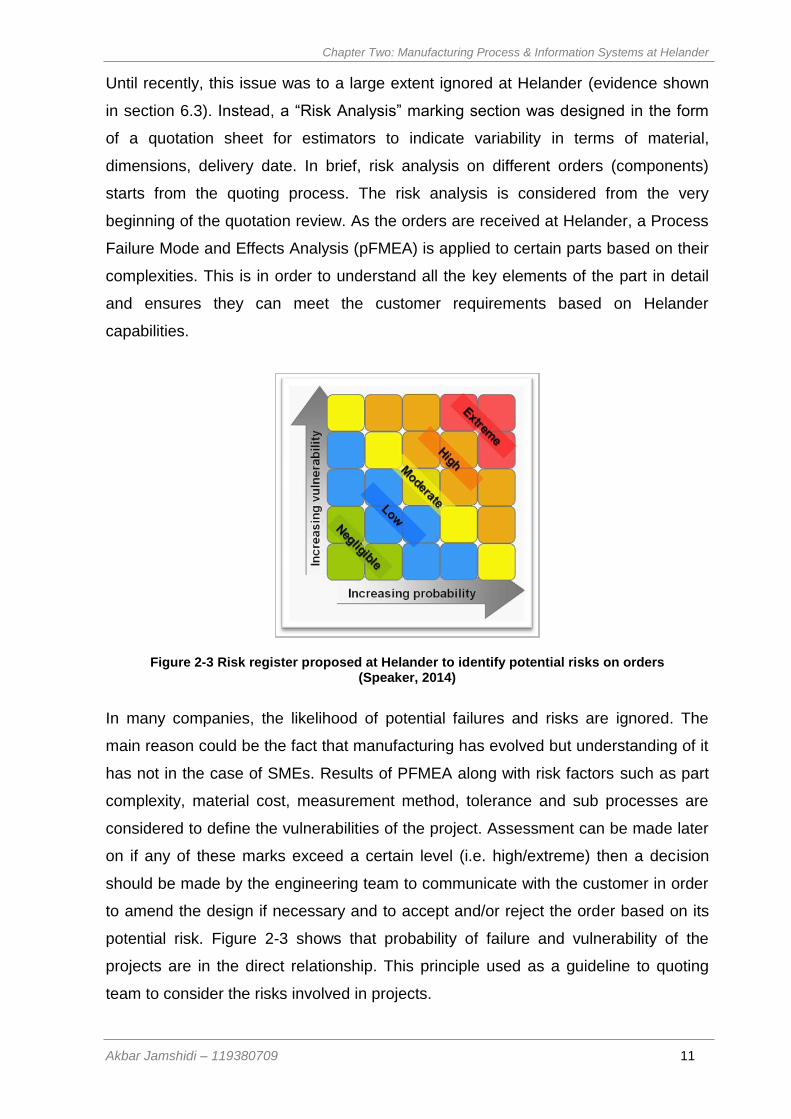
Until recently, this issue was to a large extent ignored at Helander (evidence shown
in section 6.3). Instead, a “Risk Analysis” marking section was designed in the form
of a quotation sheet for estimators to indicate variability in terms of material,
dimensions, delivery date. In brief, risk analysis on different orders (components)
starts from the quoting process. The risk analysis is considered from the very
beginning of the quotation review. As the orders are received at Helander, a Process
Failure Mode and Effects Analysis (pFMEA) is applied to certain parts based on their
complexities. This is in order to understand all the key elements of the part in detail
and ensures they can meet the customer requirements based on Helander
capabilities.
Figure 2-3 Risk register proposed at Helander to identify potential risks on orders (Speaker, 2014)
In many companies, the likelihood of potential failures and risks are ignored. The
main reason could be the fact that manufacturing has evolved but understanding of it
has not in the case of SMEs. Results of PFMEA along with risk factors such as part
complexity, material cost, measurement method, tolerance and sub processes are
considered to define the vulnerabilities of the project. Assessment can be made later
on if any of these marks exceed a certain level (i.e. high/extreme) then a decision
should be made by the engineering team to communicate with the customer in order
to amend the design if necessary and to accept and/or reject the order based on its
potential risk. Figure 2-3 shows that probability of failure and vulnerability of the
projects are in the direct relationship. This principle used as a guideline to quoting
team to consider the risks involved in projects.
Chapter Two: Manufacturing Process & Information Systems at Helander
Akbar Jamshidi – 119380709 12
Another factor which needs to be addressed at Helander is material variations in
machining different alloys. Machinability will be affected by variations in composition
and the nature of heat treatment which may cause these variations. To understand
these variations test pieces of the same alloy are ordered and machining operations
conducted with the same machining feed and speed. Also the same machine tools
are used to find out which sample is easier to cut and what the causes of variations
are from one alloy billet to another. Samples are also taken to the materials
laboratory and prepared for microscopical analysis to observe the crystal structure
and hence one of the causes of variation in machinability, explained in more detail in
chapter 5.
On the inspection and measurement side of Helander, it was found that even after
multiple verifications and inspections throughout manufacturing, occasionally parts
shipped to customers were returned as rejects, mainly due to their dimensional non-
conformities. Lack of knowledge in conventional manufacturing companies causes a
tremendous amount of rework on products. These results increase cost, lead time
and are responsible for capacity problems at Helander. Having the best MRP system
in place in addition to advanced measurement systems is not helpful if companies
are failing to assess their own capabilities in verification and manufacturing. Gauge
R&R (Repeatability and Reproducibility) is an ideal tool for examining assessment
programs that require subjective interpretation. Gauge R&R assists companies in
understanding their own processes and validates the measured figures collected
through the company’s measurement systems. Gauge R&R brings more confidence
to manufacturing processes and prevents rework caused by manufacturing out of
specification parts. Results of the gauge R&R study are shown in detail in chapter 6.
Helander manufacturing system explained in brief with a short highlight on the
problems right from receiving the order in the quoting procedure. The author tries to
focus on the issue with regards to measurement and verification in the order review
stage. This will reduce the risk to Helander while accepting each order. In order to
have this process it is vital to have information support system that fully understood
by engineering and inspection department with good knowledge about Helander
supply chain.
Chapter Three: Machining Hard Metal Alloys – Literature Review
Akbar Jamshidi – 119380709 13
Chapter Three: Literature Review of Metals & their
Manufacturing
3 Literature Review of Metals & their Manufacturing
3.1 Introduction
Developments in the oil & gas, nuclear and aerospace industries demand materials
with high performance and high temperature resistance under corrosive and oxidising
environments. Helander’s expertise lies in machining hard metal alloys which include
stainless steels, cobalt-based superalloys and nickel-based superalloys. Superalloys
were developed in the second half of the 20th century as high strength materials for
use in severe environments. Superalloys are considered to be difficult-to-cut in
machining operations. Furthermore, due to the precision required for superalloys
applications such as aerospace industry, in many cases they must be manufactured
with tight tolerances. This chapter describes the composition and properties of these
alloys and challenges associated with machining them.
3.2 Stainless Steels
One of the most common materials used in metal fabrication is stainless steel.
Stainless steel is used in a wide range of environments and applications due to its
good machinability and anti-corrosive quality. In general terms, stainless steel is the
name for group of iron-based metal alloys that contain 16-30% chromium. The
chromium reacts with oxygen and forms an invisible barrier that protects the iron from
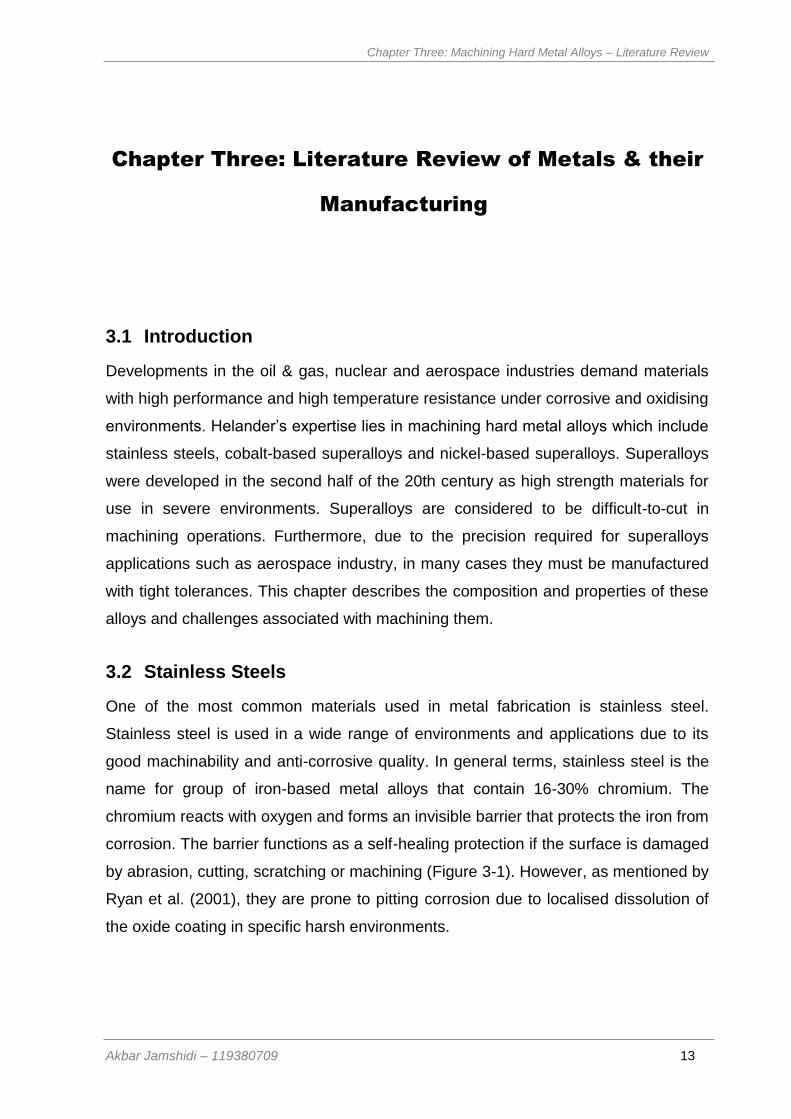
corrosion. The barrier functions as a self-healing protection if the surface is damaged
by abrasion, cutting, scratching or machining (Figure 3-1). However, as mentioned by
Ryan et al. (2001), they are prone to pitting corrosion due to localised dissolution of
the oxide coating in specific harsh environments.
Chapter Three: Machining Hard Metal Alloys – Literature Review
Akbar Jamshidi – 119380709 14
Figure 3-1 Self-healing process in stainless steel (ASSDA, 2015)
Unlike other groups of metal alloys, stainless steel is 100% recyclable. These metal
alloys are highly formable and it is possible to make thin sheet material with
consistent properties. Additionally, stainless steel has a moderately low melting point
that makes it a suitable option for manufacturing by casting. Its durability makes it a
popular alloy in many industries. Stainless steel can be nonmagnetic if annealed and
hardened by cold work only (ASSDA, 2015). Stainless steel does not need
protection, such as coating and painting, which makes it the first choice for a range of
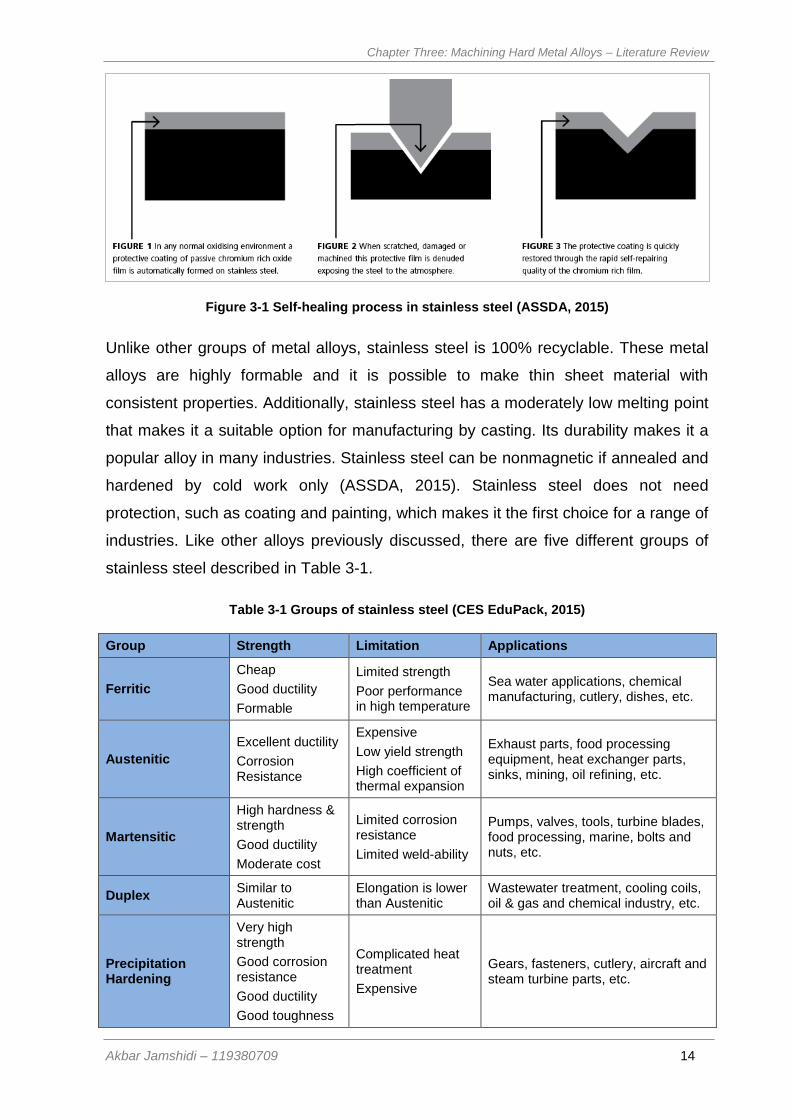
industries. Like other alloys previously discussed, there are five different groups of
stainless steel described in Table 3-1.
Table 3-1 Groups of stainless steel (CES EduPack, 2015)
Group Strength Limitation Applications
Ferritic
Cheap
Good ductility
Formable
Limited strength
Poor performance in high temperature
Sea water applications, chemical manufacturing, cutlery, dishes, etc.
Austenitic
Excellent ductility
Corrosion Resistance
Expensive
Low yield strength
High coefficient of thermal expansion
Exhaust parts, food processing equipment, heat exchanger parts, sinks, mining, oil refining, etc.
Martensitic
High hardness & strength
Good ductility
Moderate cost
Limited corrosion resistance
Limited weld-ability
Pumps, valves, tools, turbine blades, food processing, marine, bolts and nuts, etc.
Duplex Similar to Austenitic
Elongation is lower than Austenitic
Wastewater treatment, cooling coils, oil & gas and chemical industry, etc.
Precipitation Hardening
Very high strength
Good corrosion resistance
Good ductility
Good toughness
Complicated heat treatment
Expensive
Gears, fasteners, cutlery, aircraft and steam turbine parts, etc.
Chapter Three: Machining Hard Metal Alloys – Literature Review
Akbar Jamshidi – 119380709 15
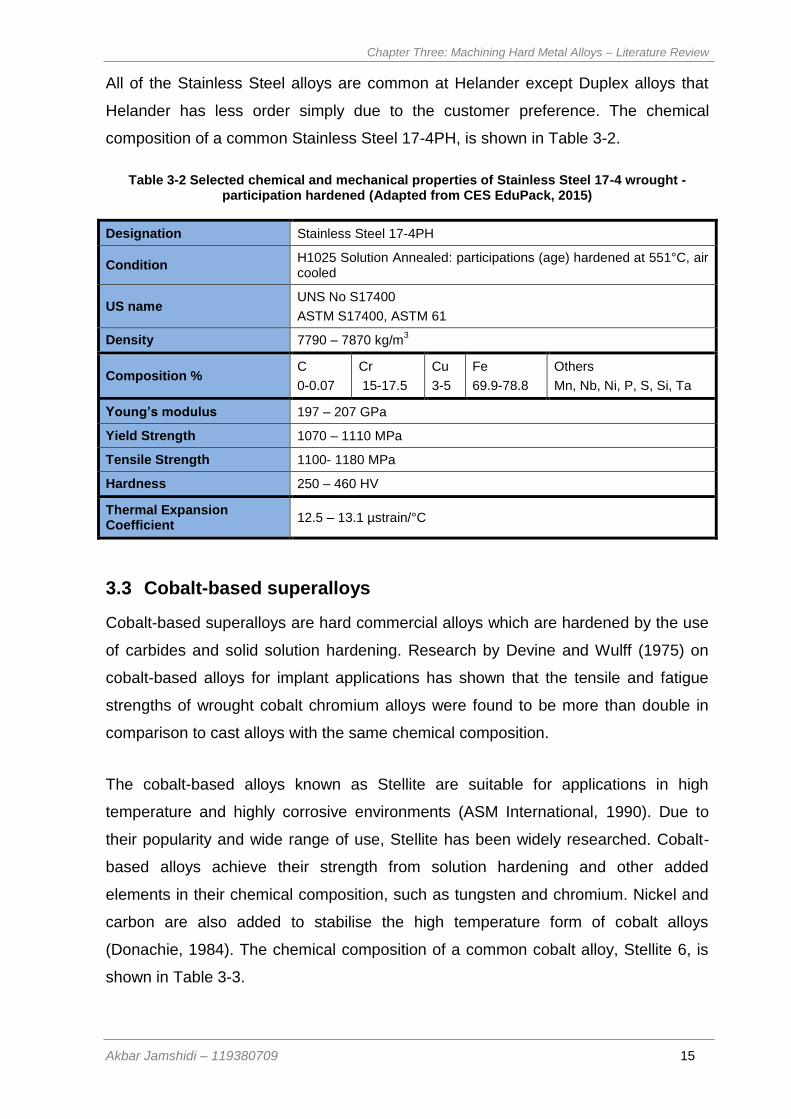
All of the Stainless Steel alloys are common at Helander except Duplex alloys that
Helander has less order simply due to the customer preference. The chemical
composition of a common Stainless Steel 17-4PH, is shown in Table 3-2.
Table 3-2 Selected chemical and mechanical properties of Stainless Steel 17-4 wrought - participation hardened (Adapted from CES EduPack, 2015)
Designation Stainless Steel 17-4PH
Condition H1025 Solution Annealed: participations (age) hardened at 551°C, air cooled
US name UNS No S17400
ASTM S17400, ASTM 61
Density 7790 – 7870 kg/m3
Composition % C
0-0.07
Cr
15-17.5
Cu
3-5
Fe
69.9-78.8
Others
Mn, Nb, Ni, P, S, Si, Ta
Young’s modulus 197 – 207 GPa
Yield Strength 1070 – 1110 MPa
Tensile Strength 1100- 1180 MPa
Hardness 250 – 460 HV
Thermal Expansion Coefficient
12.5 – 13.1 µstrain/°C
3.3 Cobalt-based superalloys
Cobalt-based superalloys are hard commercial alloys which are hardened by the use
of carbides and solid solution hardening. Research by Devine and Wulff (1975) on
cobalt-based alloys for implant applications has shown that the tensile and fatigue
strengths of wrought cobalt chromium alloys were found to be more than double in
comparison to cast alloys with the same chemical composition.
The cobalt-based alloys known as Stellite are suitable for applications in high
temperature and highly corrosive environments (ASM International, 1990). Due to
their popularity and wide range of use, Stellite has been widely researched. Cobalt-
based alloys achieve their strength from solution hardening and other added
elements in their chemical composition, such as tungsten and chromium. Nickel and
carbon are also added to stabilise the high temperature form of cobalt alloys
(Donachie, 1984). The chemical composition of a common cobalt alloy, Stellite 6, is
shown in Table 3-3.
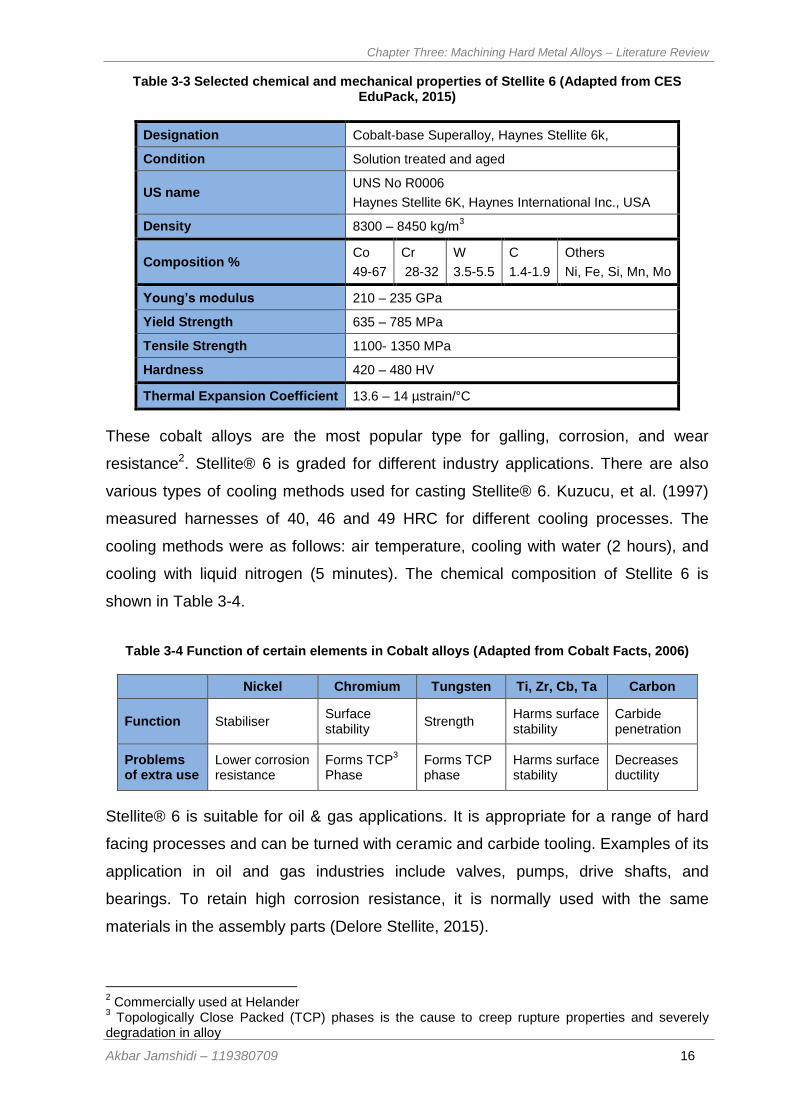
Chapter Three: Machining Hard Metal Alloys – Literature Review
Akbar Jamshidi – 119380709 16
Table 3-3 Selected chemical and mechanical properties of Stellite 6 (Adapted from CES EduPack, 2015)
Designation Cobalt-base Superalloy, Haynes Stellite 6k,
Condition Solution treated and aged
US name UNS No R0006
Haynes Stellite 6K, Haynes International Inc., USA
Density 8300 – 8450 kg/m3
Composition % Co
49-67
Cr
28-32
W
3.5-5.5
C
1.4-1.9
Others
Ni, Fe, Si, Mn, Mo
Young’s modulus 210 – 235 GPa
Yield Strength 635 – 785 MPa
Tensile Strength 1100- 1350 MPa
Hardness 420 – 480 HV
Thermal Expansion Coefficient 13.6 – 14 µstrain/°C
These cobalt alloys are the most popular type for galling, corrosion, and wear
resistance2. Stellite® 6 is graded for different industry applications. There are also
various types of cooling methods used for casting Stellite® 6. Kuzucu, et al. (1997)
measured harnesses of 40, 46 and 49 HRC for different cooling processes. The
cooling methods were as follows: air temperature, cooling with water (2 hours), and
cooling with liquid nitrogen (5 minutes). The chemical composition of Stellite 6 is
shown in Table 3-4.
Table 3-4 Function of certain elements in Cobalt alloys (Adapted from Cobalt Facts, 2006)
Nickel Chromium Tungsten Ti, Zr, Cb, Ta Carbon
Function Stabiliser Surface stability
Strength Harms surface stability
Carbide penetration
Problems of extra use
Lower corrosion resistance
Forms TCP3
Phase Forms TCP phase
Harms surface stability
Decreases ductility
Stellite® 6 is suitable for oil & gas applications. It is appropriate for a range of hard
facing processes and can be turned with ceramic and carbide tooling. Examples of its
application in oil and gas industries include valves, pumps, drive shafts, and
bearings. To retain high corrosion resistance, it is normally used with the same
materials in the assembly parts (Delore Stellite, 2015).
2 Commercially used at Helander
3 Topologically Close Packed (TCP) phases is the cause to creep rupture properties and severely
degradation in alloy
Chapter Three: Machining Hard Metal Alloys – Literature Review
Akbar Jamshidi – 119380709 17
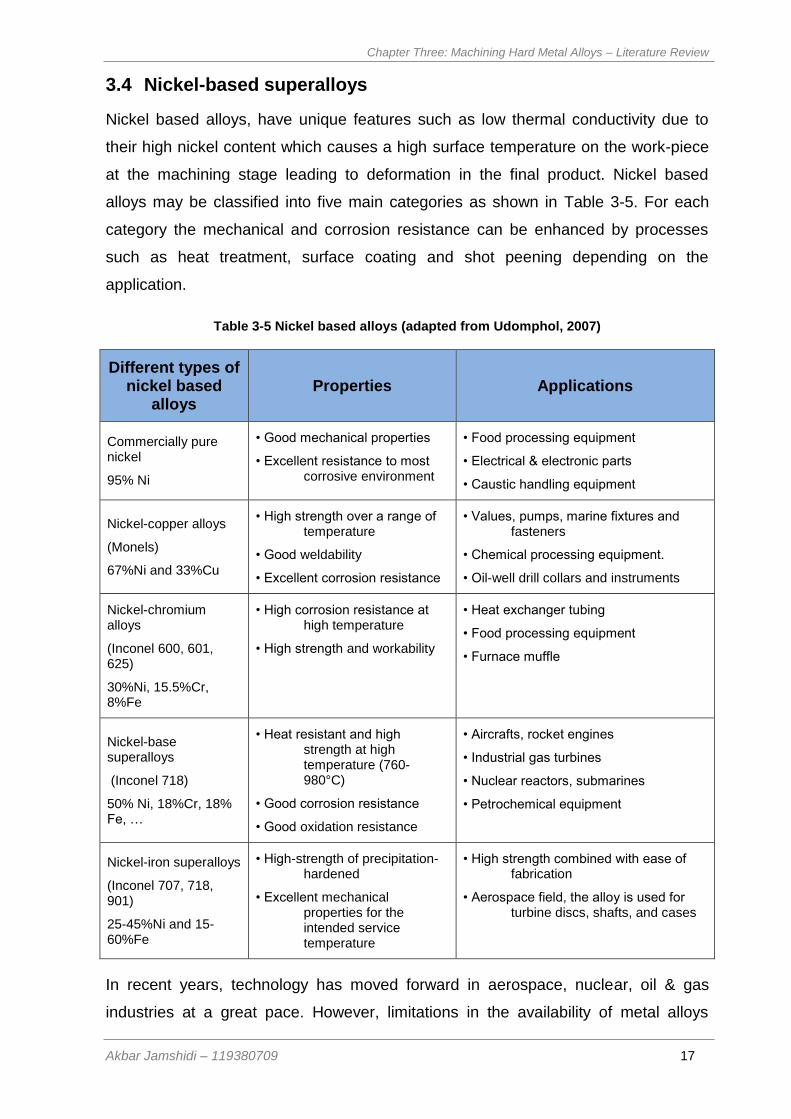
3.4 Nickel-based superalloys
Nickel based alloys, have unique features such as low thermal conductivity due to
their high nickel content which causes a high surface temperature on the work-piece
at the machining stage leading to deformation in the final product. Nickel based
alloys may be classified into five main categories as shown in Table 3-5. For each
category the mechanical and corrosion resistance can be enhanced by processes
such as heat treatment, surface coating and shot peening depending on the
application.
Table 3-5 Nickel based alloys (adapted from Udomphol, 2007)
Different types of nickel based
alloys Properties Applications
Commercially pure nickel
95% Ni
• Good mechanical properties
• Excellent resistance to most corrosive environment
• Food processing equipment
• Electrical & electronic parts
• Caustic handling equipment
Nickel-copper alloys
(Monels)
67%Ni and 33%Cu
• High strength over a range of temperature
• Good weldability
• Excellent corrosion resistance
• Values, pumps, marine fixtures and fasteners
• Chemical processing equipment.
• Oil-well drill collars and instruments
Nickel-chromium alloys
(Inconel 600, 601, 625)
30%Ni, 15.5%Cr, 8%Fe
• High corrosion resistance at high temperature
• High strength and workability
• Heat exchanger tubing
• Food processing equipment
• Furnace muffle
Nickel-base superalloys
(Inconel 718)
50% Ni, 18%Cr, 18% Fe, …
• Heat resistant and high strength at high temperature (760- 980°C)
• Good corrosion resistance
• Good oxidation resistance
• Aircrafts, rocket engines
• Industrial gas turbines
• Nuclear reactors, submarines
• Petrochemical equipment
Nickel-iron superalloys
(Inconel 707, 718, 901)
25-45%Ni and 15-60%Fe
• High-strength of precipitation- hardened
• Excellent mechanical properties for the intended service temperature
• High strength combined with ease of fabrication
• Aerospace field, the alloy is used for turbine discs, shafts, and cases
In recent years, technology has moved forward in aerospace, nuclear, oil & gas
industries at a great pace. However, limitations in the availability of metal alloys
Chapter Three: Machining Hard Metal Alloys – Literature Review
Akbar Jamshidi – 119380709 18
operating at high temperature with good strength and corrosion resistance is still an
issue for the development of jet engines for aerospace and down-hole equipment for
oil industries. Therefore the use of superalloys is very common in such industries.
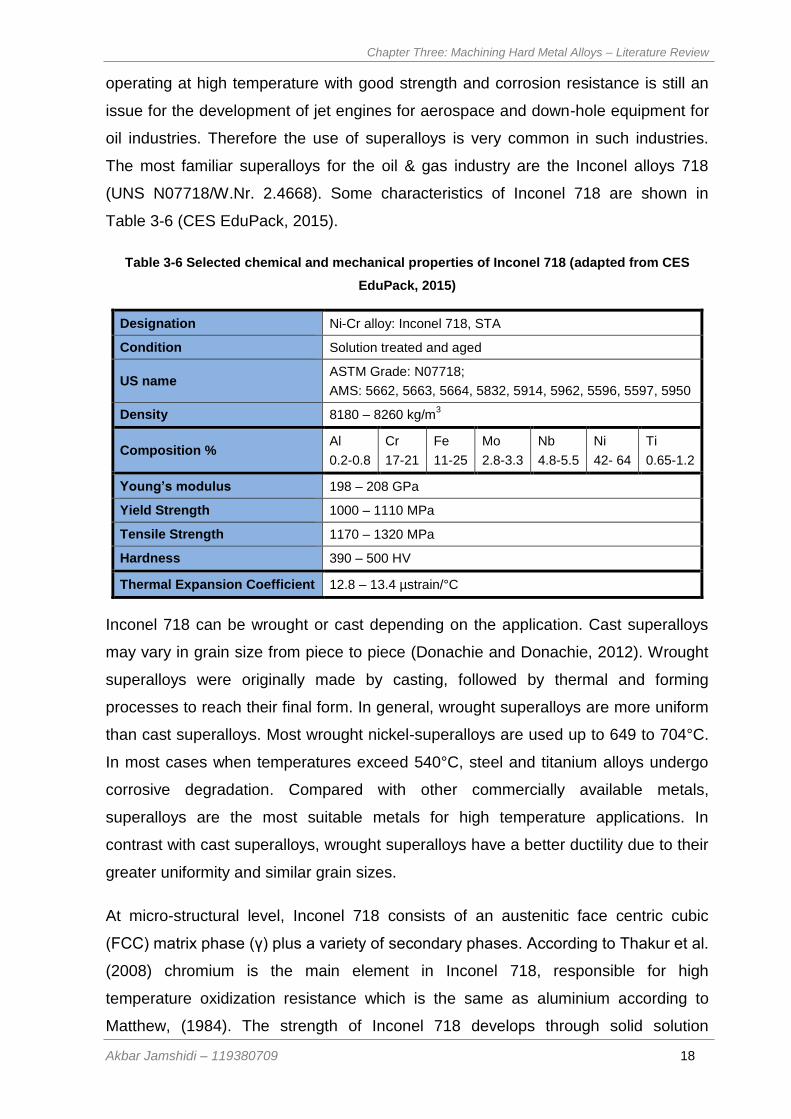
The most familiar superalloys for the oil & gas industry are the Inconel alloys 718
(UNS N07718/W.Nr. 2.4668). Some characteristics of Inconel 718 are shown in
Table 3-6 (CES EduPack, 2015).
Table 3-6 Selected chemical and mechanical properties of Inconel 718 (adapted from CES
EduPack, 2015)
Designation Ni-Cr alloy: Inconel 718, STA
Condition Solution treated and aged
US name ASTM Grade: N07718;
AMS: 5662, 5663, 5664, 5832, 5914, 5962, 5596, 5597, 5950
Density 8180 – 8260 kg/m3
Composition % Al
0.2-0.8
Cr
17-21
Fe
11-25
Mo
2.8-3.3
Nb
4.8-5.5
Ni
42- 64
Ti
0.65-1.2
Young’s modulus 198 – 208 GPa
Yield Strength 1000 – 1110 MPa
Tensile Strength 1170 – 1320 MPa
Hardness 390 – 500 HV
Thermal Expansion Coefficient 12.8 – 13.4 µstrain/°C
Inconel 718 can be wrought or cast depending on the application. Cast superalloys
may vary in grain size from piece to piece (Donachie and Donachie, 2012). Wrought
superalloys were originally made by casting, followed by thermal and forming
processes to reach their final form. In general, wrought superalloys are more uniform
than cast superalloys. Most wrought nickel-superalloys are used up to 649 to 704°C.
In most cases when temperatures exceed 540°C, steel and titanium alloys undergo
corrosive degradation. Compared with other commercially available metals,
superalloys are the most suitable metals for high temperature applications. In
contrast with cast superalloys, wrought superalloys have a better ductility due to their
greater uniformity and similar grain sizes.
At micro-structural level, Inconel 718 consists of an austenitic face centric cubic
(FCC) matrix phase (γ) plus a variety of secondary phases. According to Thakur et al.
(2008) chromium is the main element in Inconel 718, responsible for high
temperature oxidization resistance which is the same as aluminium according to
Matthew, (1984). The strength of Inconel 718 develops through solid solution
Chapter Three: Machining Hard Metal Alloys – Literature Review
Akbar Jamshidi – 119380709 19
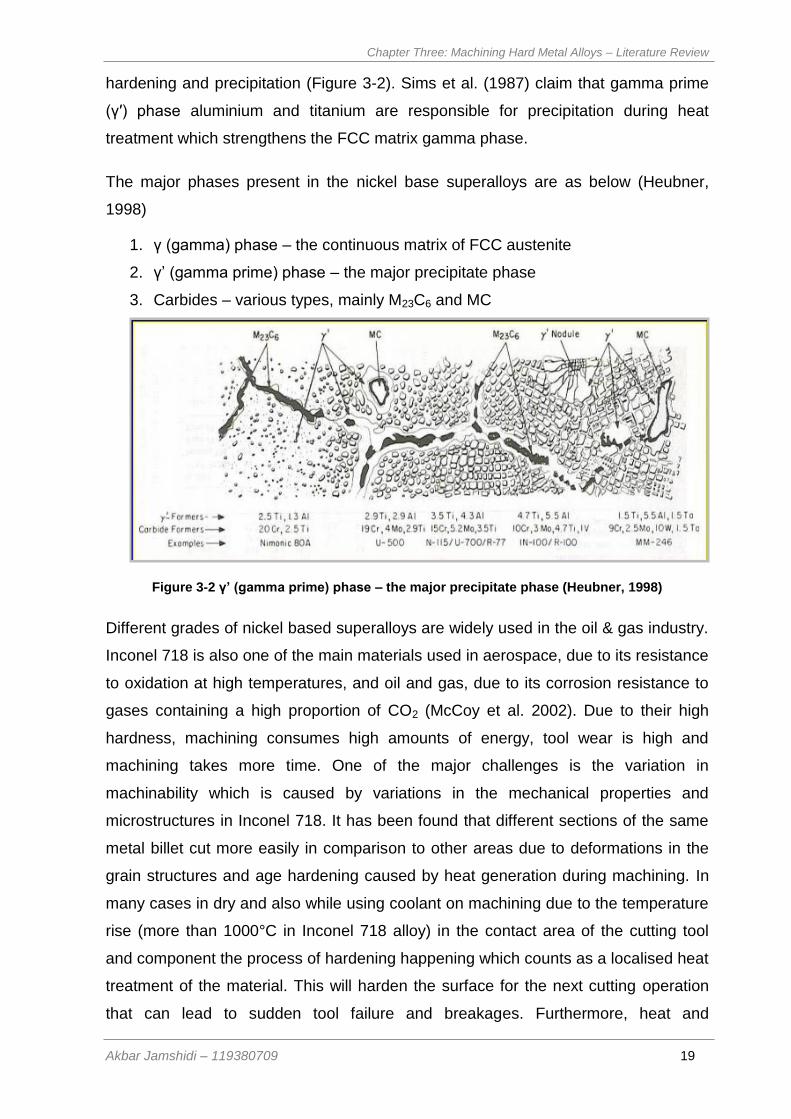
hardening and precipitation (Figure 3-2). Sims et al. (1987) claim that gamma prime
(γ′) phase aluminium and titanium are responsible for precipitation during heat
treatment which strengthens the FCC matrix gamma phase.
The major phases present in the nickel base superalloys are as below (Heubner,
1998)
1. γ (gamma) phase – the continuous matrix of FCC austenite
2. γ’ (gamma prime) phase – the major precipitate phase
3. Carbides – various types, mainly M23C6 and MC
Figure 3-2 γ’ (gamma prime) phase – the major precipitate phase (Heubner, 1998)
Different grades of nickel based superalloys are widely used in the oil & gas industry.
Inconel 718 is also one of the main materials used in aerospace, due to its resistance
to oxidation at high temperatures, and oil and gas, due to its corrosion resistance to
gases containing a high proportion of CO2 (McCoy et al. 2002). Due to their high
hardness, machining consumes high amounts of energy, tool wear is high and
machining takes more time. One of the major challenges is the variation in
machinability which is caused by variations in the mechanical properties and
microstructures in Inconel 718. It has been found that different sections of the same
metal billet cut more easily in comparison to other areas due to deformations in the
grain structures and age hardening caused by heat generation during machining. In
many cases in dry and also while using coolant on machining due to the temperature
rise (more than 1000°C in Inconel 718 alloy) in the contact area of the cutting tool
and component the process of hardening happening which counts as a localised heat
treatment of the material. This will harden the surface for the next cutting operation
that can lead to sudden tool failure and breakages. Furthermore, heat and
Chapter Three: Machining Hard Metal Alloys – Literature Review
Akbar Jamshidi – 119380709 20
deformation generate cracks and micro structural changes that impact on the
hardness of the material (Ezugwu and Tang, 1995).
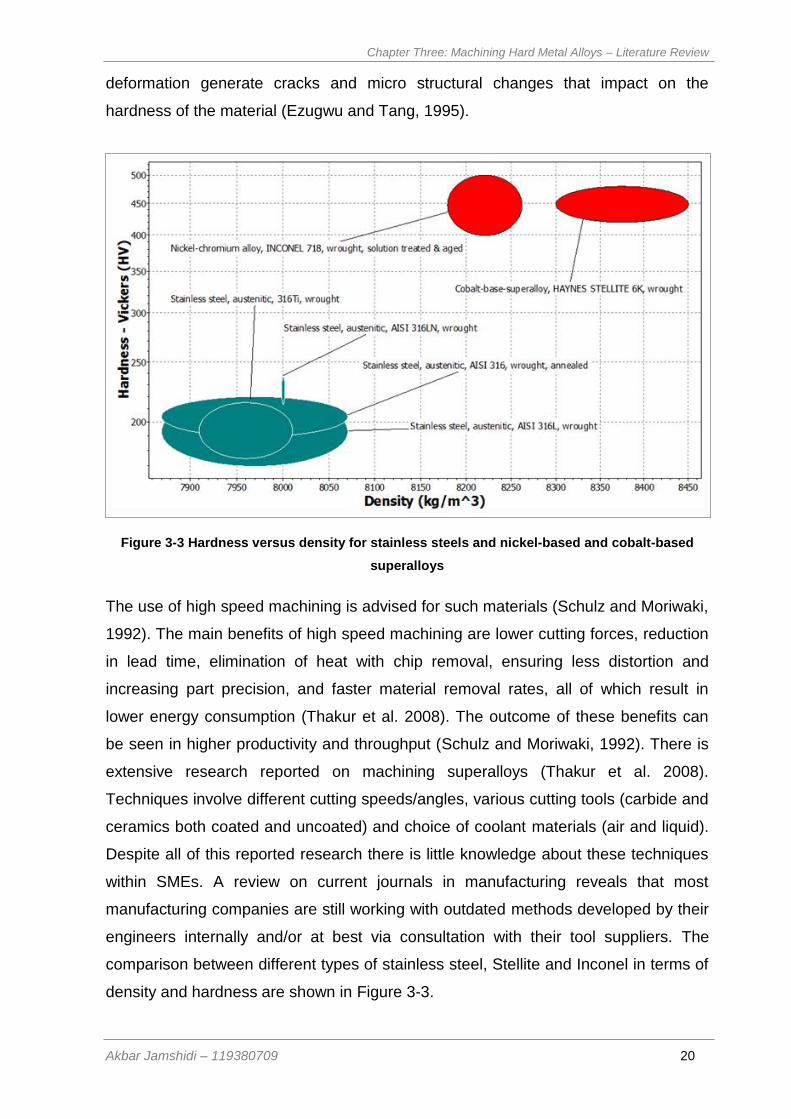
Figure 3-3 Hardness versus density for stainless steels and nickel-based and cobalt-based
superalloys
The use of high speed machining is advised for such materials (Schulz and Moriwaki,
1992). The main benefits of high speed machining are lower cutting forces, reduction
in lead time, elimination of heat with chip removal, ensuring less distortion and
increasing part precision, and faster material removal rates, all of which result in
lower energy consumption (Thakur et al. 2008). The outcome of these benefits can
be seen in higher productivity and throughput (Schulz and Moriwaki, 1992). There is
extensive research reported on machining superalloys (Thakur et al. 2008).
Techniques involve different cutting speeds/angles, various cutting tools (carbide and
ceramics both coated and uncoated) and choice of coolant materials (air and liquid).
Despite all of this reported research there is little knowledge about these techniques
within SMEs. A review on current journals in manufacturing reveals that most
manufacturing companies are still working with outdated methods developed by their
engineers internally and/or at best via consultation with their tool suppliers. The
comparison between different types of stainless steel, Stellite and Inconel in terms of
density and hardness are shown in Figure 3-3.
Chapter Four: Machining Hard Metal Alloys – Literature Review
Akbar Jamshidi – 119380709 21
Chapter Four: Machining hard metal alloys –
literature review
4 Machining hard metal alloys – literature review
4.1 Challenges of machining hard metal alloys
Machining is generally the final stage of production at component level due to the
accuracy in size and surface finish that can be achieved. It is also considered to be a
costly process in manufacturing. In high value manufacturing, the machining process
consists of selection of machining parameters, CNC part programming, design and
use of different fixtures, the selection of various cutting tools and other detailed
considerations regarding part inspection and machine tool utilization. Inconel 718 is
considered to be one of the most popular materials for the oilfield industry. It is well-
known for its challenges when it comes to machining due to material movement and
hardening throughout the process. It has certain characteristics that make it popular
for high temperature applications and it is widely used in gas turbine engines.
Material variations have a significant impact on machining quality. The main causes
of variations originate from changes in chemical composition which affect mechanical
properties such as hardness. The non-uniform distribution of metallic elements is a
major source of variation in metallurgical structures. Different heat treatments are
used to transform the material to the desired hardness levels based on application.
For instance, in the case of Inconel 718 for drill string (assembled collection of the
drill pipe) components in oilfield environment where high fatigue strength and high-
corrosion resistance is required, a heat treatment protocol is used to develop fine
grain size in the material. As Bhavsar et al. (2001) discuss, fatigue strength in Inconel
718 is highly affected by grain size. ASTM grain sizes 3 to size 5 are found to have
optimum fatigue life and endurance4 in corrosive environments.
4 endurance limit is found to be greater than 60 ksi (414 MPa) on Inconel 718
Chapter Four: Machining Hard Metal Alloys – Literature Review
Akbar Jamshidi – 119380709 22
Niemi (1971) reported that alloys strengthened by heat treatment (i.e. Inconel 718)
are the most sensitive to micro structural changes. In order to achieve the required
properties for Inconel 718, several standards for material specification are used
commercially. One of the major standards is Aerospace Material Specifications
(AMS) that specifies both the engineering materials and the fabrication process. The
use of different standards is based on product specifications determined by the
application. AMS 56625 and AMS 56636 are the most common heat treatment
standards, which are also used in the oil & gas industry. AMS 5663 focuses on
hardness and tensile properties at room temperature. The only difference between
the two standards is that AMS 5662 requires solution heat treatment (Rockwell
hardness about 20-25 HRC) whereas AMS 5663 requires heat treatment in addition
to precipitation hardening (hardness about 36-44 HRC) (Wang, 2011). Precipitation
hardening is the process that enhances the strength and hardness of the material by
formation of very small uniformly dispersed particles of the second phase within the
original matrix phase. Precipitation hardening is also called “age hardening” because
the process develops over time below the solvus7 temperature (Khaira, 2013). The
study of different standards suggests that Inconel 718 can be heat treated to a lower
hardness prior to the machining process. Therefore it is wiser to use AMS 5662 with
less hardness, which facilitates lower machining force by comparison and increases
the tool life, and then heat treat the components to AMS 5663 level. Research by
Bhavsar et al. (2001) has shown the same results, that the alternative solution to
reducing the machine cost is to use oilfield heat treatment which meets NACE
(National Association of Corrosion Engineers) requirement (40 HRC max with 120-ksi
(827 MPa) yield strength) rather than AMS 5663 (150-ksi (1,034 MPa) yield strength).
4.2 Machining Methods
Machining superalloys has always been a challenge due to the hard nature of the
metal itself. Superalloys tend to harden during the machining process. The low
thermal conductivity of superalloys builds up heat during machining operations
(Figure 4-1, (a)) resulting in high temperatures at the cutting area. Research by Zhou
et al. (2012) clearly shows that large deformation at the grain boundary is caused by
5 AMS 5662 Solution Treatment: 1725°F - 1850°F + Air Cool
6 ASM 5663 specification (solution heat treatment 1 hour in Ar at 950°C then air cooled, followed by precipitation heat treatment
at 718°C for 8 hours, furnace cooled at 38°C/min. to 620°C held for 8 hours and finally air cooled) 7Solvus (temperature) is a line (binary system) or surface (ternary system) on a phase diagram which separates a
homogeneous solid solution from other phases which may form by unstable or partial melting
Chapter Four: Machining Hard Metal Alloys – Literature Review
Akbar Jamshidi – 119380709 23
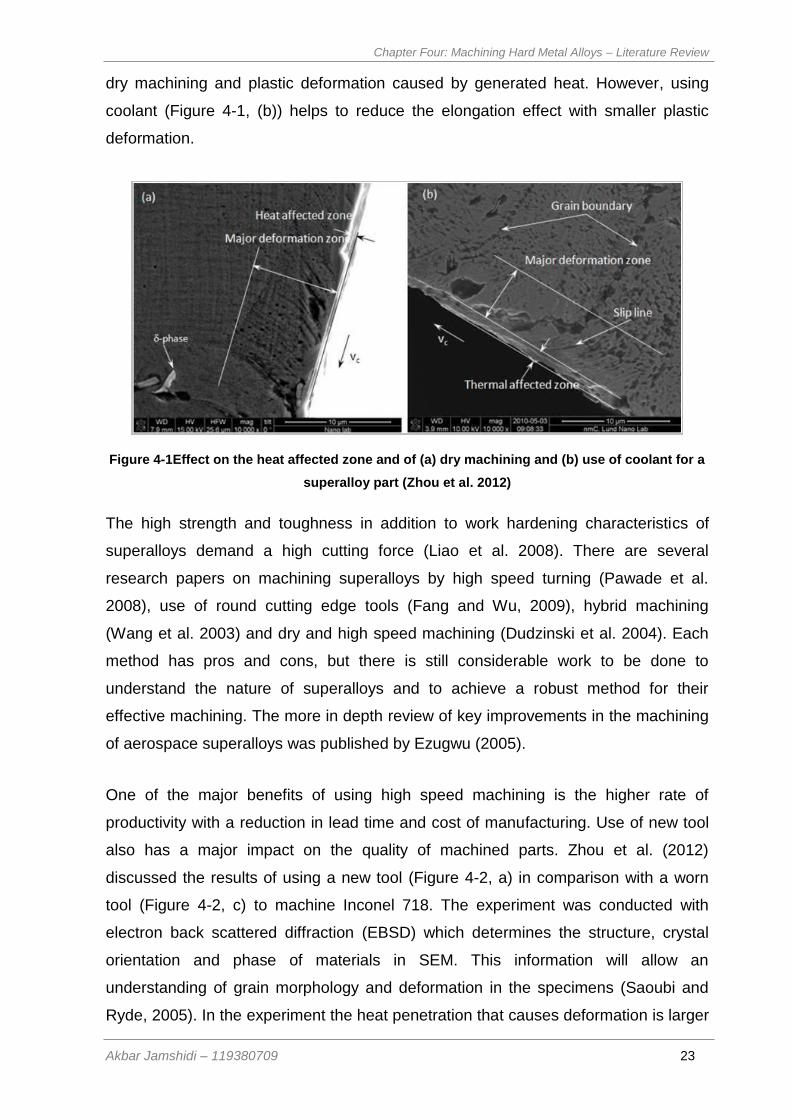
dry machining and plastic deformation caused by generated heat. However, using
coolant (Figure 4-1, (b)) helps to reduce the elongation effect with smaller plastic
deformation.
Figure 4-1Effect on the heat affected zone and of (a) dry machining and (b) use of coolant for a
superalloy part (Zhou et al. 2012)
The high strength and toughness in addition to work hardening characteristics of
superalloys demand a high cutting force (Liao et al. 2008). There are several
research papers on machining superalloys by high speed turning (Pawade et al.
2008), use of round cutting edge tools (Fang and Wu, 2009), hybrid machining
(Wang et al. 2003) and dry and high speed machining (Dudzinski et al. 2004). Each
method has pros and cons, but there is still considerable work to be done to
understand the nature of superalloys and to achieve a robust method for their
effective machining. The more in depth review of key improvements in the machining
of aerospace superalloys was published by Ezugwu (2005).
One of the major benefits of using high speed machining is the higher rate of
productivity with a reduction in lead time and cost of manufacturing. Use of new tool
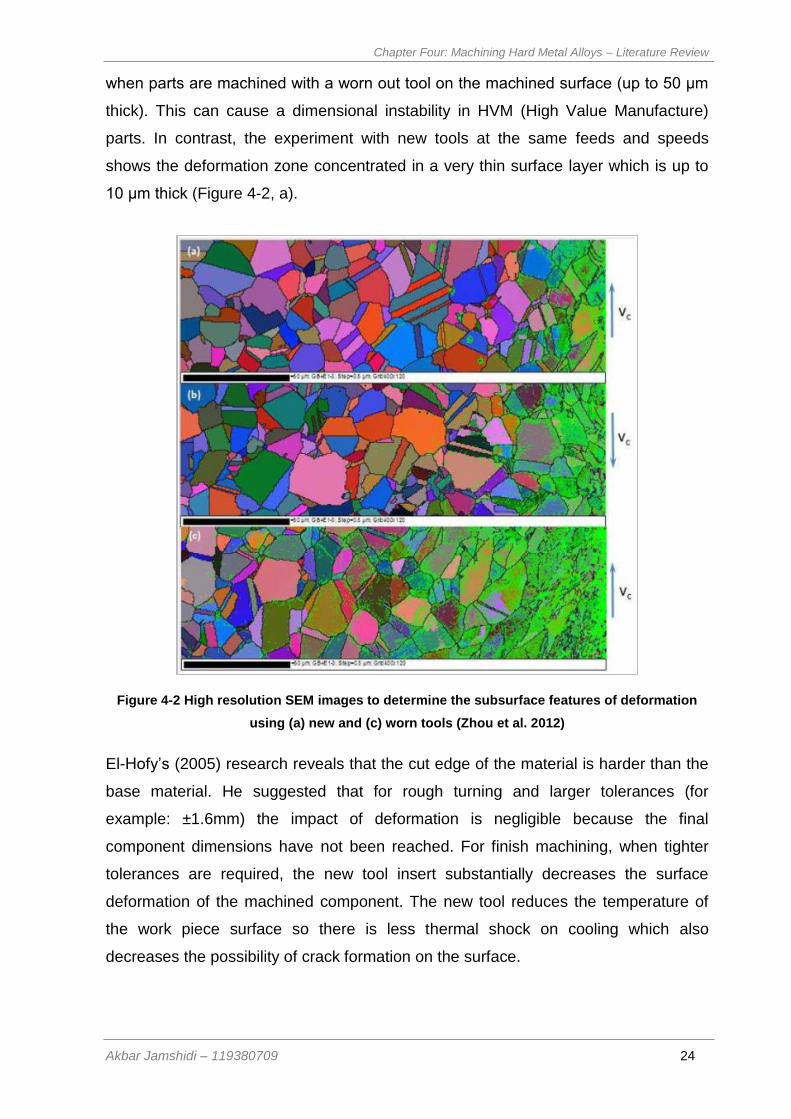
also has a major impact on the quality of machined parts. Zhou et al. (2012)
discussed the results of using a new tool (Figure 4-2, a) in comparison with a worn
tool (Figure 4-2, c) to machine Inconel 718. The experiment was conducted with
electron back scattered diffraction (EBSD) which determines the structure, crystal
orientation and phase of materials in SEM. This information will allow an
understanding of grain morphology and deformation in the specimens (Saoubi and
Ryde, 2005). In the experiment the heat penetration that causes deformation is larger
Chapter Four: Machining Hard Metal Alloys – Literature Review
Akbar Jamshidi – 119380709 24
when parts are machined with a worn out tool on the machined surface (up to 50 μm
thick). This can cause a dimensional instability in HVM (High Value Manufacture)
parts. In contrast, the experiment with new tools at the same feeds and speeds
shows the deformation zone concentrated in a very thin surface layer which is up to
10 μm thick (Figure 4-2, a).
Figure 4-2 High resolution SEM images to determine the subsurface features of deformation
using (a) new and (c) worn tools (Zhou et al. 2012)
El-Hofy’s (2005) research reveals that the cut edge of the material is harder than the
base material. He suggested that for rough turning and larger tolerances (for
example: ±1.6mm) the impact of deformation is negligible because the final
component dimensions have not been reached. For finish machining, when tighter
tolerances are required, the new tool insert substantially decreases the surface
deformation of the machined component. The new tool reduces the temperature of
the work piece surface so there is less thermal shock on cooling which also
decreases the possibility of crack formation on the surface.
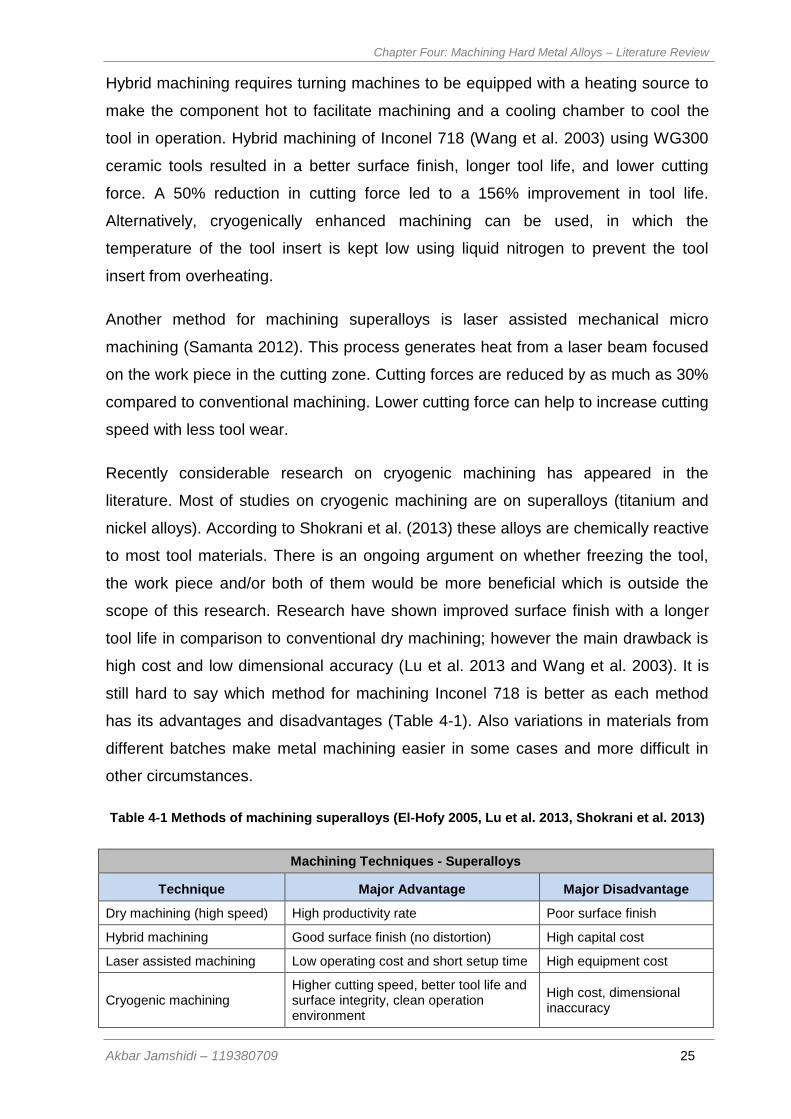
Chapter Four: Machining Hard Metal Alloys – Literature Review
Akbar Jamshidi – 119380709 25
Hybrid machining requires turning machines to be equipped with a heating source to
make the component hot to facilitate machining and a cooling chamber to cool the
tool in operation. Hybrid machining of Inconel 718 (Wang et al. 2003) using WG300
ceramic tools resulted in a better surface finish, longer tool life, and lower cutting
force. A 50% reduction in cutting force led to a 156% improvement in tool life.
Alternatively, cryogenically enhanced machining can be used, in which the
temperature of the tool insert is kept low using liquid nitrogen to prevent the tool
insert from overheating.
Another method for machining superalloys is laser assisted mechanical micro
machining (Samanta 2012). This process generates heat from a laser beam focused
on the work piece in the cutting zone. Cutting forces are reduced by as much as 30%
compared to conventional machining. Lower cutting force can help to increase cutting
speed with less tool wear.
Recently considerable research on cryogenic machining has appeared in the
literature. Most of studies on cryogenic machining are on superalloys (titanium and
nickel alloys). According to Shokrani et al. (2013) these alloys are chemically reactive
to most tool materials. There is an ongoing argument on whether freezing the tool,
the work piece and/or both of them would be more beneficial which is outside the
scope of this research. Research have shown improved surface finish with a longer
tool life in comparison to conventional dry machining; however the main drawback is
high cost and low dimensional accuracy (Lu et al. 2013 and Wang et al. 2003). It is
still hard to say which method for machining Inconel 718 is better as each method
has its advantages and disadvantages (Table 4-1). Also variations in materials from
different batches make metal machining easier in some cases and more difficult in
other circumstances.
Table 4-1 Methods of machining superalloys (El-Hofy 2005, Lu et al. 2013, Shokrani et al. 2013)
Machining Techniques - Superalloys
Technique Major Advantage Major Disadvantage
Dry machining (high speed) High productivity rate Poor surface finish
Hybrid machining Good surface finish (no distortion) High capital cost
Laser assisted machining Low operating cost and short setup time High equipment cost
Cryogenic machining Higher cutting speed, better tool life and surface integrity, clean operation environment
High cost, dimensional inaccuracy
Chapter Four: Machining Hard Metal Alloys – Literature Review
Akbar Jamshidi – 119380709 26
The major types of wear are abrasion, micro-chipping, surface deformation and built-
up edge (BUE) on tools. Changes in dimensional instability occur, caused by residual
stresses at microstructure level, depending on machining parameters (Subhas et al.
2000). Residual stress in machining is caused by non-uniform plastic deformation
which is affected by thermal and micro-structural changes during chip removal and
also interaction between the tool edge and work piece (Arunachalam et al. 2004).
The other challenge in these alloys is the movement of the machined part due to
material instability especially in superalloys (Ezugwu, 2005; Kitagawa et al. 1997).
4.3 Machining Parameters
In comparison to stainless steel, Inconel 718 has two major disadvantages. First, the
cost of the alloy is much higher than stainless steel, and second, the machinability of
Inconel is more challenging than stainless steel. Rashmi et al. (2001) claimed that in
the use of carbide tooling, the feed and speed is 2 to 4 times less in Inconel 718
compared to austenitic stainless steel. Rashmi et al. (2001) suggest using oilfield
standard (40 HRC) rather than AMS 5663 with heat treatment with 150 ksi (1,034
MPa) yield stress since the change in strength can significantly reduce the machining
cost.
Inconel 718 has a high temperature capability and its resistance to creep make it a
first choice for aerospace, oil & gas, and nuclear industries. However Inconel 718
tends to be influenced by work hardened effects in machining, resulting in
strengthening of the work-piece material and further reduction in machineability. One
of the main issues with Inconel 718 is material uniformity, which has a considerable
impact on machining as two different batches from the same supplier can exhibit
different machining characteristics. Due to the nature of high value manufacturing,
which increases the use of tight dimensional tolerances, it is important to improve the
control of the microstructure of superalloys. Mechanical energy to remove the metal
in machining processes generates heat and plastic deformation. This heat usually
alters the microstructure of the surface (up to 0.20 mm deep) to some degree and
causes residual stress (Ezugwu and Tang, 1995). Plastic deformation and heat
generation can lead to cracks at a microscopic level that may also cause dimensional
instability and affect the structural integrity of manufactured parts (Arunachalam et al.
2004). High value manufacturing requires many stages of part verification at different
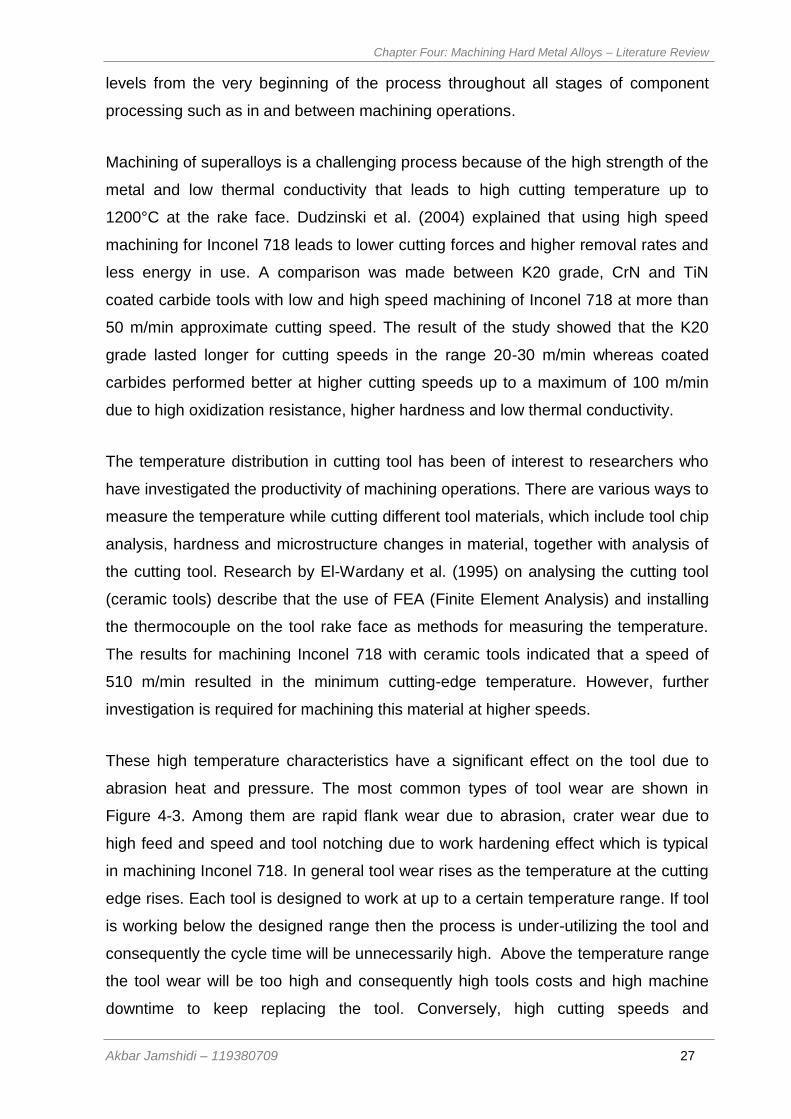
Chapter Four: Machining Hard Metal Alloys – Literature Review
Akbar Jamshidi – 119380709 27
levels from the very beginning of the process throughout all stages of component
processing such as in and between machining operations.
Machining of superalloys is a challenging process because of the high strength of the
metal and low thermal conductivity that leads to high cutting temperature up to
1200°C at the rake face. Dudzinski et al. (2004) explained that using high speed
machining for Inconel 718 leads to lower cutting forces and higher removal rates and
less energy in use. A comparison was made between K20 grade, CrN and TiN
coated carbide tools with low and high speed machining of Inconel 718 at more than
50 m/min approximate cutting speed. The result of the study showed that the K20
grade lasted longer for cutting speeds in the range 20-30 m/min whereas coated
carbides performed better at higher cutting speeds up to a maximum of 100 m/min
due to high oxidization resistance, higher hardness and low thermal conductivity.
The temperature distribution in cutting tool has been of interest to researchers who
have investigated the productivity of machining operations. There are various ways to
measure the temperature while cutting different tool materials, which include tool chip
analysis, hardness and microstructure changes in material, together with analysis of
the cutting tool. Research by El-Wardany et al. (1995) on analysing the cutting tool
(ceramic tools) describe that the use of FEA (Finite Element Analysis) and installing
the thermocouple on the tool rake face as methods for measuring the temperature.
The results for machining Inconel 718 with ceramic tools indicated that a speed of
510 m/min resulted in the minimum cutting-edge temperature. However, further
investigation is required for machining this material at higher speeds.
These high temperature characteristics have a significant effect on the tool due to
abrasion heat and pressure. The most common types of tool wear are shown in
Figure 4-3. Among them are rapid flank wear due to abrasion, crater wear due to
high feed and speed and tool notching due to work hardening effect which is typical
in machining Inconel 718. In general tool wear rises as the temperature at the cutting
edge rises. Each tool is designed to work at up to a certain temperature range. If tool
is working below the designed range then the process is under-utilizing the tool and
consequently the cycle time will be unnecessarily high. Above the temperature range
the tool wear will be too high and consequently high tools costs and high machine
downtime to keep replacing the tool. Conversely, high cutting speeds and
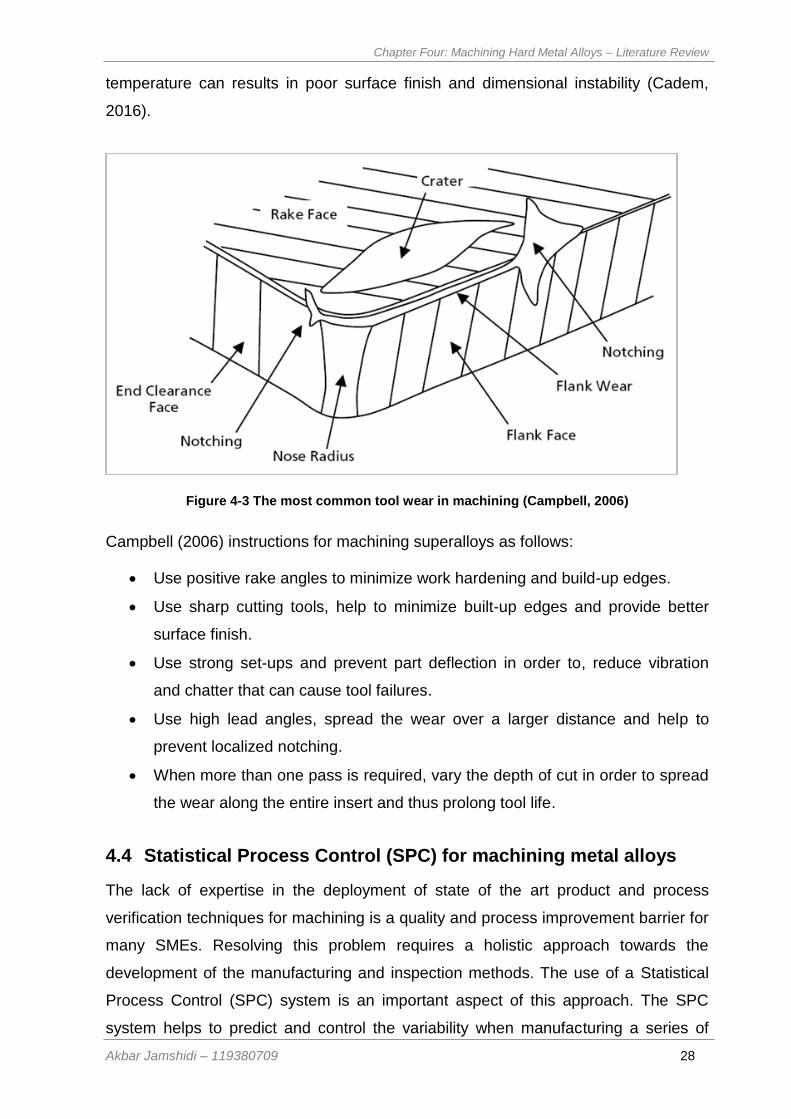
Chapter Four: Machining Hard Metal Alloys – Literature Review
Akbar Jamshidi – 119380709 28
temperature can results in poor surface finish and dimensional instability (Cadem,
2016).
Figure 4-3 The most common tool wear in machining (Campbell, 2006)
Campbell (2006) instructions for machining superalloys as follows:
Use positive rake angles to minimize work hardening and build-up edges.
Use sharp cutting tools, help to minimize built-up edges and provide better
surface finish.
Use strong set-ups and prevent part deflection in order to, reduce vibration
and chatter that can cause tool failures.
Use high lead angles, spread the wear over a larger distance and help to
prevent localized notching.
When more than one pass is required, vary the depth of cut in order to spread
the wear along the entire insert and thus prolong tool life.
4.4 Statistical Process Control (SPC) for machining metal alloys
The lack of expertise in the deployment of state of the art product and process
verification techniques for machining is a quality and process improvement barrier for
many SMEs. Resolving this problem requires a holistic approach towards the
development of the manufacturing and inspection methods. The use of a Statistical
Process Control (SPC) system is an important aspect of this approach. The SPC
system helps to predict and control the variability when manufacturing a series of
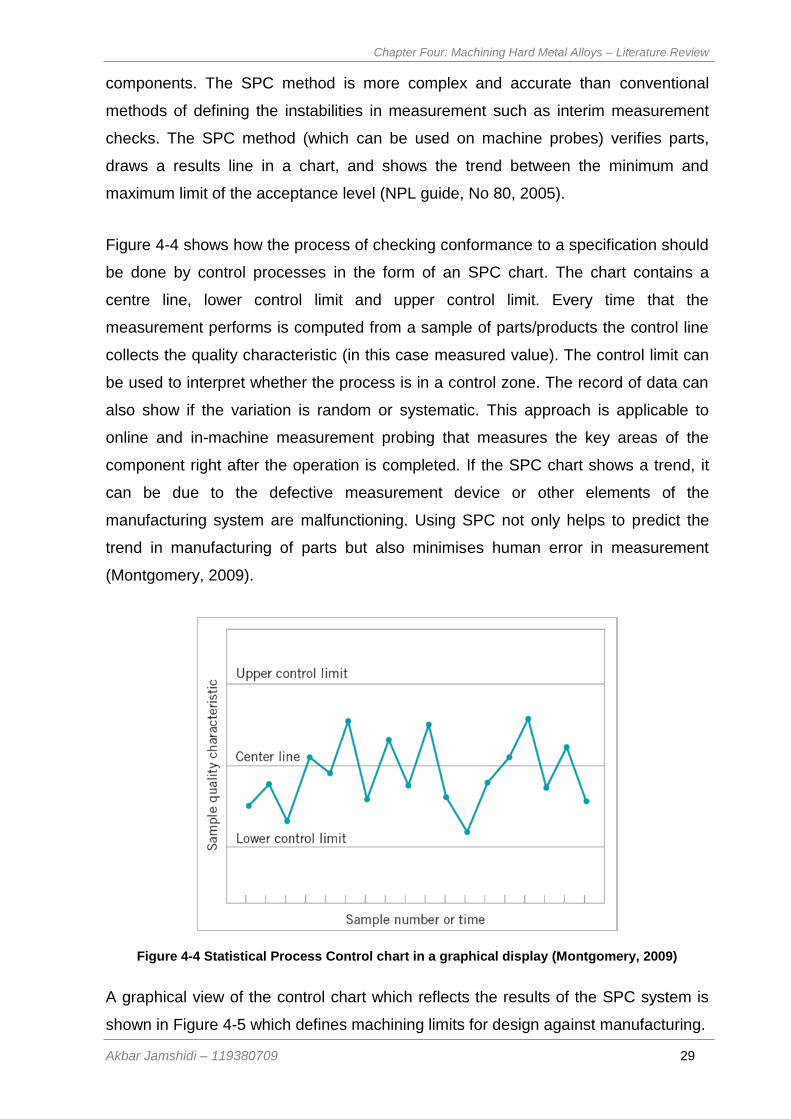
Chapter Four: Machining Hard Metal Alloys – Literature Review
Akbar Jamshidi – 119380709 29
components. The SPC method is more complex and accurate than conventional
methods of defining the instabilities in measurement such as interim measurement
checks. The SPC method (which can be used on machine probes) verifies parts,
draws a results line in a chart, and shows the trend between the minimum and
maximum limit of the acceptance level (NPL guide, No 80, 2005).
Figure 4-4 shows how the process of checking conformance to a specification should
be done by control processes in the form of an SPC chart. The chart contains a
centre line, lower control limit and upper control limit. Every time that the
measurement performs is computed from a sample of parts/products the control line
collects the quality characteristic (in this case measured value). The control limit can
be used to interpret whether the process is in a control zone. The record of data can
also show if the variation is random or systematic. This approach is applicable to
online and in-machine measurement probing that measures the key areas of the
component right after the operation is completed. If the SPC chart shows a trend, it
can be due to the defective measurement device or other elements of the
manufacturing system are malfunctioning. Using SPC not only helps to predict the
trend in manufacturing of parts but also minimises human error in measurement
(Montgomery, 2009).
Figure 4-4 Statistical Process Control chart in a graphical display (Montgomery, 2009)
A graphical view of the control chart which reflects the results of the SPC system is
shown in Figure 4-5 which defines machining limits for design against manufacturing.
Chapter Four: Machining Hard Metal Alloys – Literature Review
Akbar Jamshidi – 119380709 30
Figure 4-5 Control chart which defines machining limits for design against manufacturing
(Courtesy of NPL guide, No 80, 2005) LS = lower specification, US = upper specification
The real world is different to the design world when it comes to measurements. As
shown in Figure 4-5, line C illustrates the design specification (data from CAD model
and drawing) and line D illustrates the physical measurement following verification.
From the point of view of the designer, the region labelled No 1 is the zone of
conformance specified by designers and the region labelled 2 is the non-
conformance zone. In terms of real life physical measurement, zone 3 is the optimum
range of acceptable machining and zone 4 is completely out of tolerance. The
problem is that in the real manufacturing world, no absolute boundaries exist to
separate the LS (lower specification) and US (upper specification) limits. (The LS and
US are determined as part of the design and functionality of the component. Instead,
there is a grey area (shown with No. 5) known as the uncertainty range which limits
the area of conformance by designers to an area of conformance by manufacturers.
This area of uncertainty in the best case scenario illustrates that there is a 50%
chance that the measured figure is in the acceptance area. As shown, half of the
area No. 5 is in the design acceptance zone (yellow) and the other half shown in
“red” is in the non-conformance zone. The aim of the SPC in manufacturing is to
show the direction and range of measured parts and notify the operator when the
process will go out of the “green zone” and into the “yellow zone”. This gives the
operator a chance to perform corrective and preventative actions (CAPAs) and
redirect the control line into zone 3, the “green zone” (NPL guide, No. 80, 2005).
Using the SPC system enables manufacturing operators to verify all parts on the
machine fixture and show where the trend is. This process is part of integrating
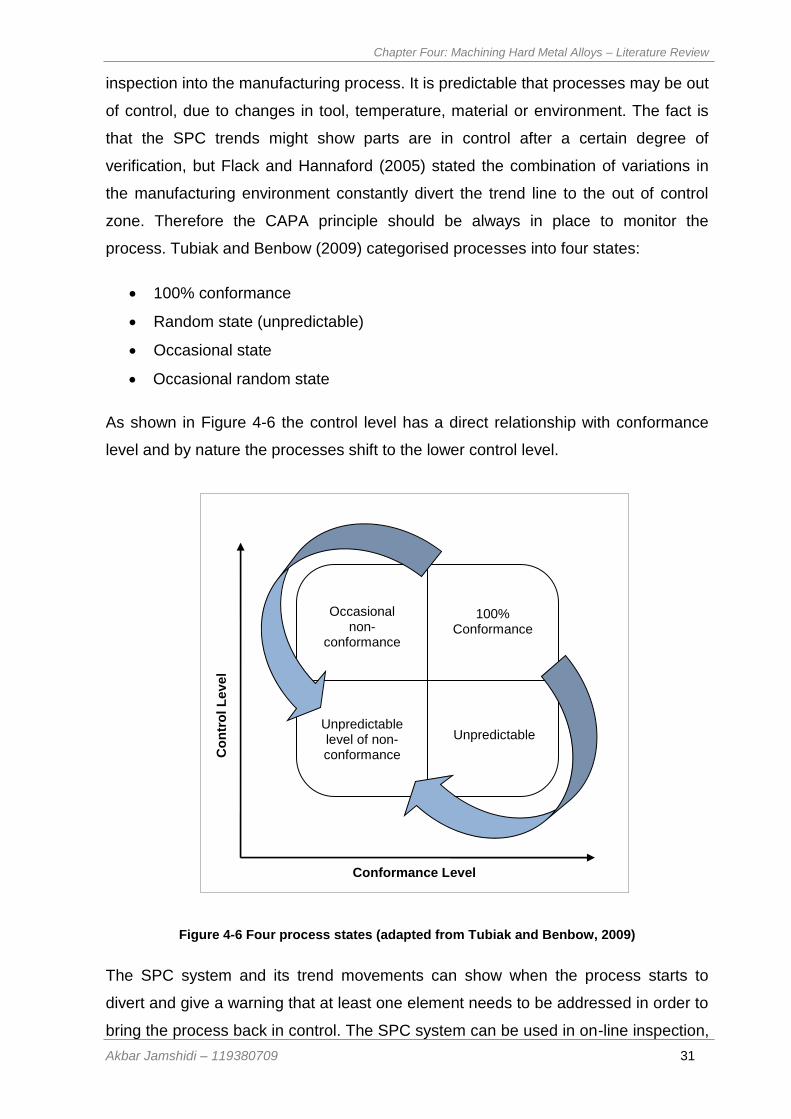
Chapter Four: Machining Hard Metal Alloys – Literature Review
Akbar Jamshidi – 119380709 31
inspection into the manufacturing process. It is predictable that processes may be out
of control, due to changes in tool, temperature, material or environment. The fact is
that the SPC trends might show parts are in control after a certain degree of
verification, but Flack and Hannaford (2005) stated the combination of variations in
the manufacturing environment constantly divert the trend line to the out of control
zone. Therefore the CAPA principle should be always in place to monitor the
process. Tubiak and Benbow (2009) categorised processes into four states:
100% conformance
Random state (unpredictable)
Occasional state
Occasional random state
As shown in Figure 4-6 the control level has a direct relationship with conformance
level and by nature the processes shift to the lower control level.
Figure 4-6 Four process states (adapted from Tubiak and Benbow, 2009)
The SPC system and its trend movements can show when the process starts to
divert and give a warning that at least one element needs to be addressed in order to
bring the process back in control. The SPC system can be used in on-line inspection,
Occasional non-
conformance
100% Conformance
Unpredictable level of non-conformance
Unpredictable
Co
ntr
ol L
eve
l
Conformance Level
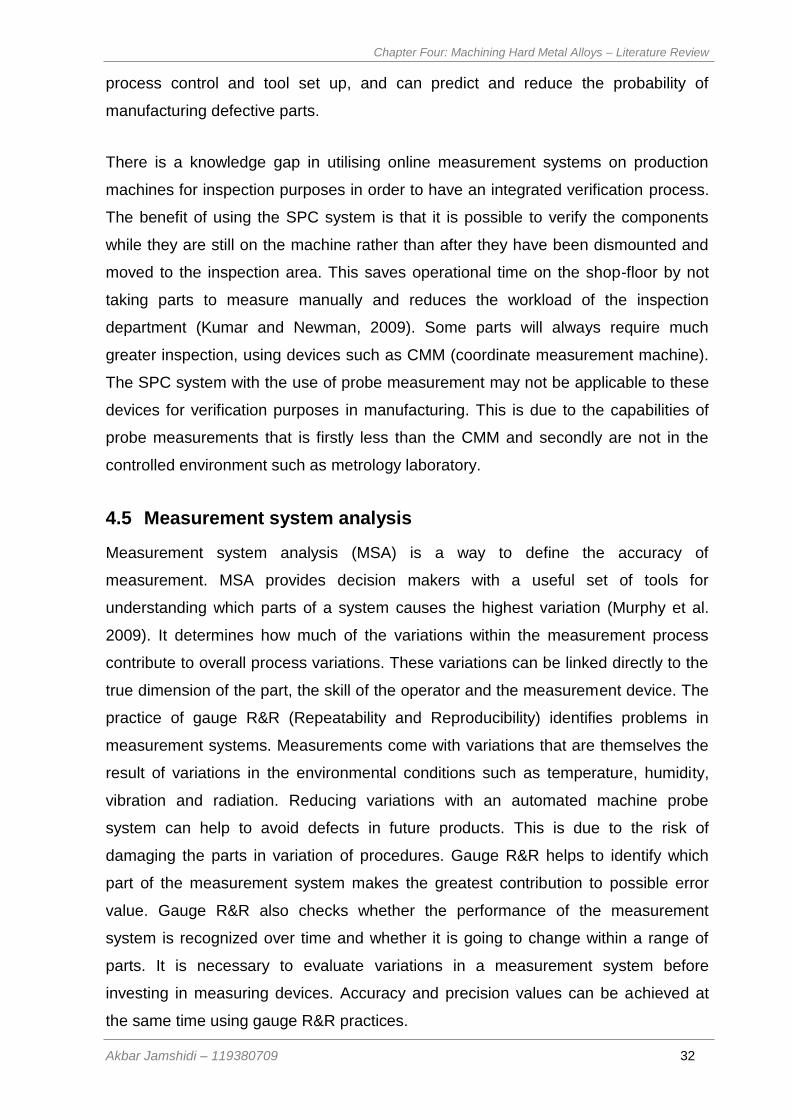
Chapter Four: Machining Hard Metal Alloys – Literature Review
Akbar Jamshidi – 119380709 32
process control and tool set up, and can predict and reduce the probability of
manufacturing defective parts.
There is a knowledge gap in utilising online measurement systems on production
machines for inspection purposes in order to have an integrated verification process.
The benefit of using the SPC system is that it is possible to verify the components
while they are still on the machine rather than after they have been dismounted and
moved to the inspection area. This saves operational time on the shop-floor by not
taking parts to measure manually and reduces the workload of the inspection
department (Kumar and Newman, 2009). Some parts will always require much
greater inspection, using devices such as CMM (coordinate measurement machine).
The SPC system with the use of probe measurement may not be applicable to these
devices for verification purposes in manufacturing. This is due to the capabilities of
probe measurements that is firstly less than the CMM and secondly are not in the
controlled environment such as metrology laboratory.
4.5 Measurement system analysis
Measurement system analysis (MSA) is a way to define the accuracy of
measurement. MSA provides decision makers with a useful set of tools for
understanding which parts of a system causes the highest variation (Murphy et al.
2009). It determines how much of the variations within the measurement process
contribute to overall process variations. These variations can be linked directly to the
true dimension of the part, the skill of the operator and the measurement device. The
practice of gauge R&R (Repeatability and Reproducibility) identifies problems in
measurement systems. Measurements come with variations that are themselves the
result of variations in the environmental conditions such as temperature, humidity,
vibration and radiation. Reducing variations with an automated machine probe
system can help to avoid defects in future products. This is due to the risk of
damaging the parts in variation of procedures. Gauge R&R helps to identify which
part of the measurement system makes the greatest contribution to possible error
value. Gauge R&R also checks whether the performance of the measurement
system is recognized over time and whether it is going to change within a range of
parts. It is necessary to evaluate variations in a measurement system before
investing in measuring devices. Accuracy and precision values can be achieved at
the same time using gauge R&R practices.
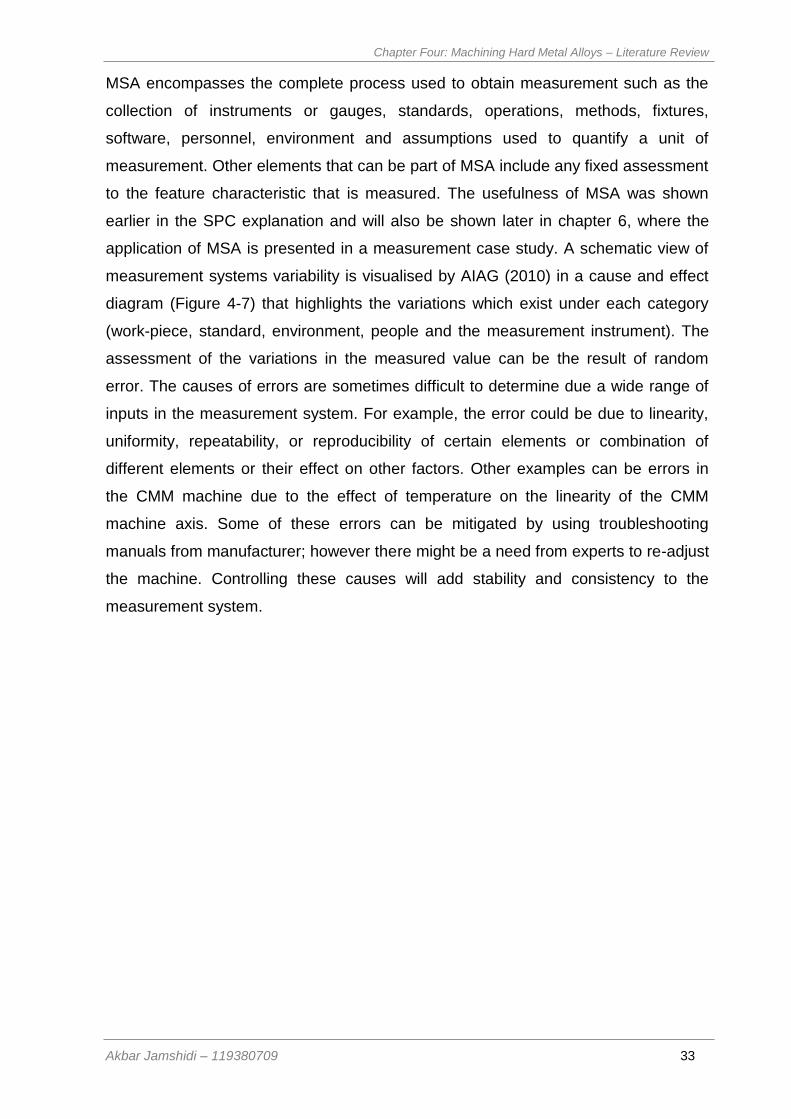
Chapter Four: Machining Hard Metal Alloys – Literature Review
Akbar Jamshidi – 119380709 33
MSA encompasses the complete process used to obtain measurement such as the
collection of instruments or gauges, standards, operations, methods, fixtures,
software, personnel, environment and assumptions used to quantify a unit of
measurement. Other elements that can be part of MSA include any fixed assessment
to the feature characteristic that is measured. The usefulness of MSA was shown
earlier in the SPC explanation and will also be shown later in chapter 6, where the
application of MSA is presented in a measurement case study. A schematic view of
measurement systems variability is visualised by AIAG (2010) in a cause and effect
diagram (Figure 4-7) that highlights the variations which exist under each category
(work-piece, standard, environment, people and the measurement instrument). The
assessment of the variations in the measured value can be the result of random
error. The causes of errors are sometimes difficult to determine due a wide range of
inputs in the measurement system. For example, the error could be due to linearity,
uniformity, repeatability, or reproducibility of certain elements or combination of
different elements or their effect on other factors. Other examples can be errors in
the CMM machine due to the effect of temperature on the linearity of the CMM
machine axis. Some of these errors can be mitigated by using troubleshooting
manuals from manufacturer; however there might be a need from experts to re-adjust
the machine. Controlling these causes will add stability and consistency to the
measurement system.
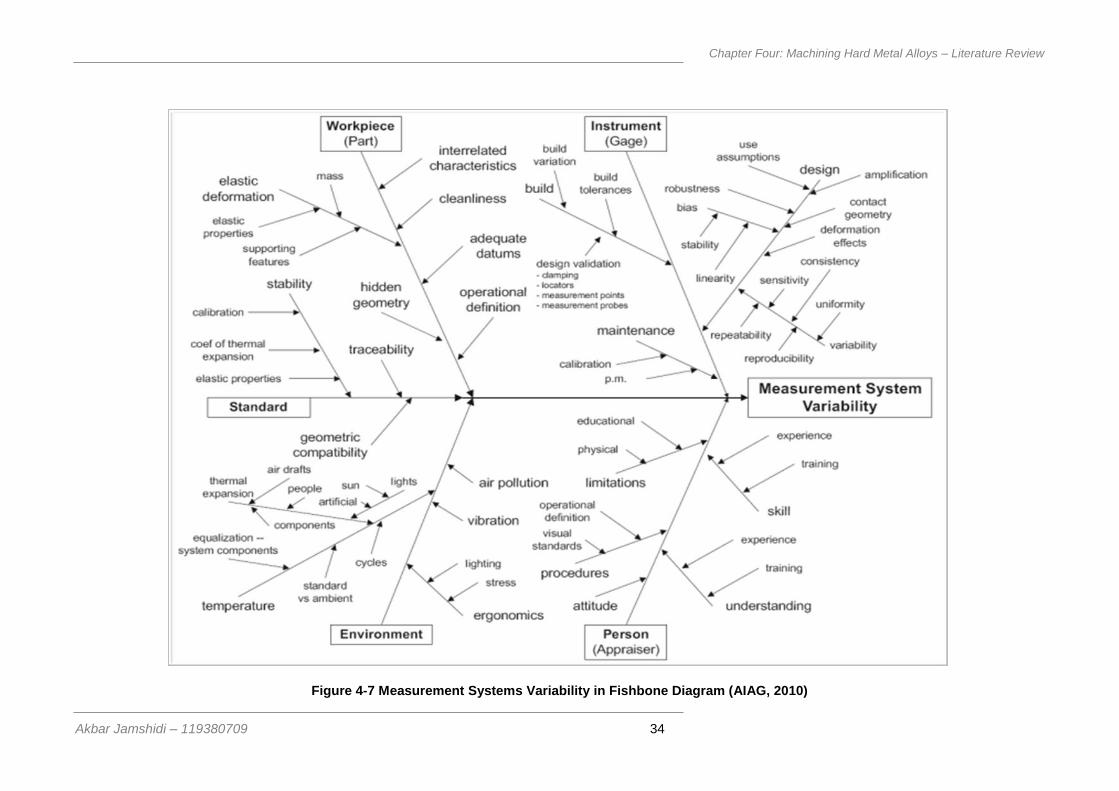
Chapter Four: Machining Hard Metal Alloys – Literature Review
Akbar Jamshidi – 119380709 34
Figure 4-7 Measurement Systems Variability in Fishbone Diagram (AIAG, 2010)
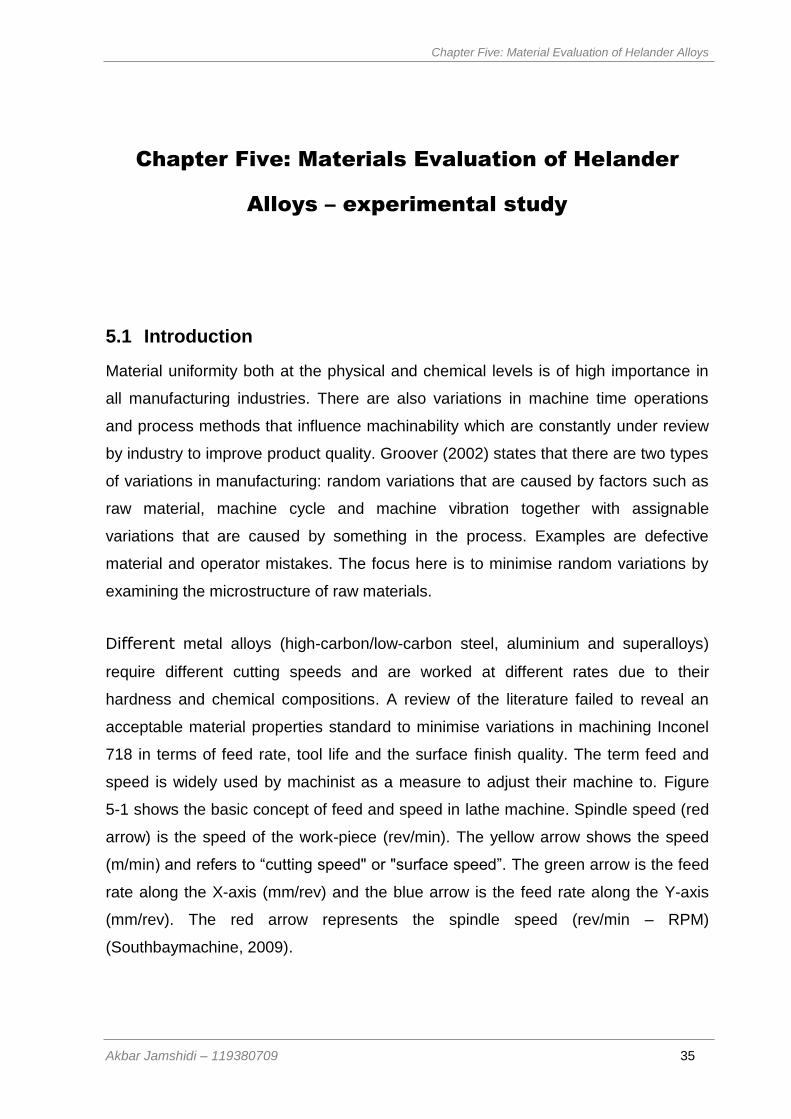
Chapter Five: Material Evaluation of Helander Alloys
Akbar Jamshidi – 119380709 35
Chapter Five: Materials Evaluation of Helander
Alloys – experimental study
5 Material Evaluation of Helander Alloys
5.1 Introduction
Material uniformity both at the physical and chemical levels is of high importance in
all manufacturing industries. There are also variations in machine time operations
and process methods that influence machinability which are constantly under review
by industry to improve product quality. Groover (2002) states that there are two types
of variations in manufacturing: random variations that are caused by factors such as
raw material, machine cycle and machine vibration together with assignable
variations that are caused by something in the process. Examples are defective
material and operator mistakes. The focus here is to minimise random variations by
examining the microstructure of raw materials.
Different metal alloys (high-carbon/low-carbon steel, aluminium and superalloys)
require different cutting speeds and are worked at different rates due to their
hardness and chemical compositions. A review of the literature failed to reveal an
acceptable material properties standard to minimise variations in machining Inconel
718 in terms of feed rate, tool life and the surface finish quality. The term feed and
speed is widely used by machinist as a measure to adjust their machine to. Figure
5-1 shows the basic concept of feed and speed in lathe machine. Spindle speed (red
arrow) is the speed of the work-piece (rev/min). The yellow arrow shows the speed
(m/min) and refers to “cutting speed" or "surface speed”. The green arrow is the feed
rate along the X-axis (mm/rev) and the blue arrow is the feed rate along the Y-axis
(mm/rev). The red arrow represents the spindle speed (rev/min – RPM)
(Southbaymachine, 2009).
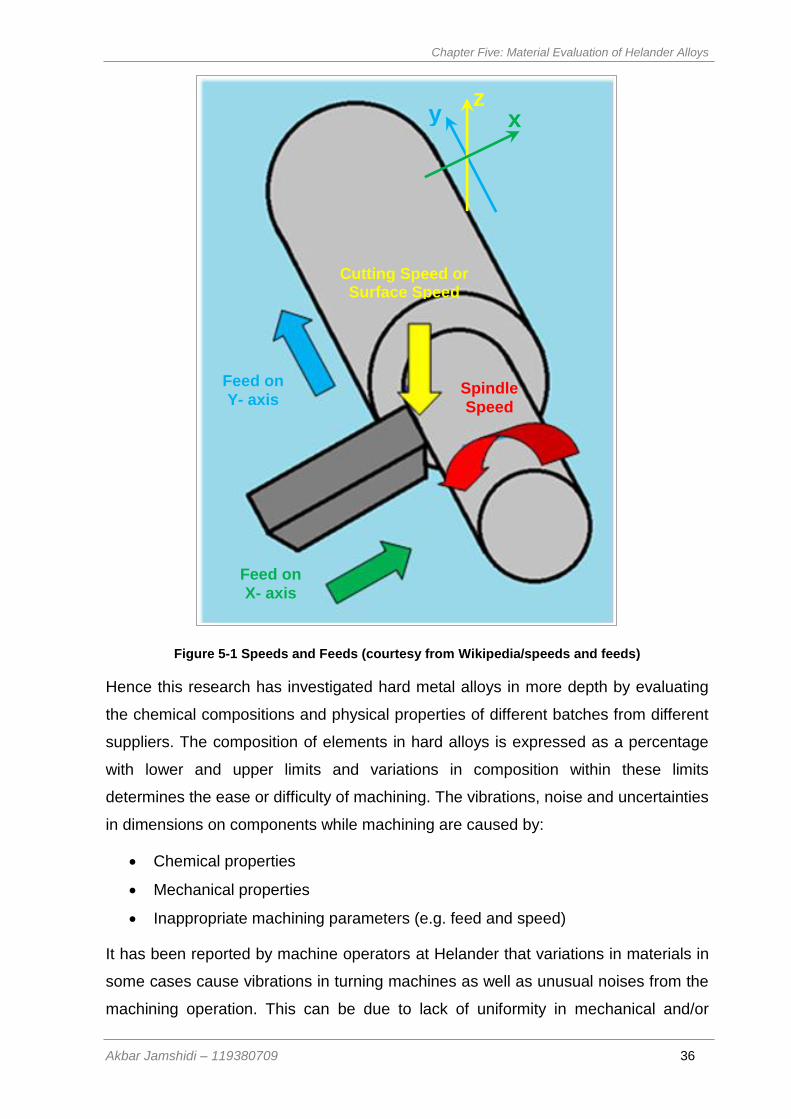
Chapter Five: Material Evaluation of Helander Alloys
Akbar Jamshidi – 119380709 36
Figure 5-1 Speeds and Feeds (courtesy from Wikipedia/speeds and feeds)
Hence this research has investigated hard metal alloys in more depth by evaluating
the chemical compositions and physical properties of different batches from different
suppliers. The composition of elements in hard alloys is expressed as a percentage
with lower and upper limits and variations in composition within these limits
determines the ease or difficulty of machining. The vibrations, noise and uncertainties
in dimensions on components while machining are caused by:
Chemical properties
Mechanical properties
Inappropriate machining parameters (e.g. feed and speed)
It has been reported by machine operators at Helander that variations in materials in
some cases cause vibrations in turning machines as well as unusual noises from the
machining operation. This can be due to lack of uniformity in mechanical and/or
Spindle
Speed
Feed on
X- axis
Feed on
Y- axis
Cutting Speed or Surface Speed
z x y
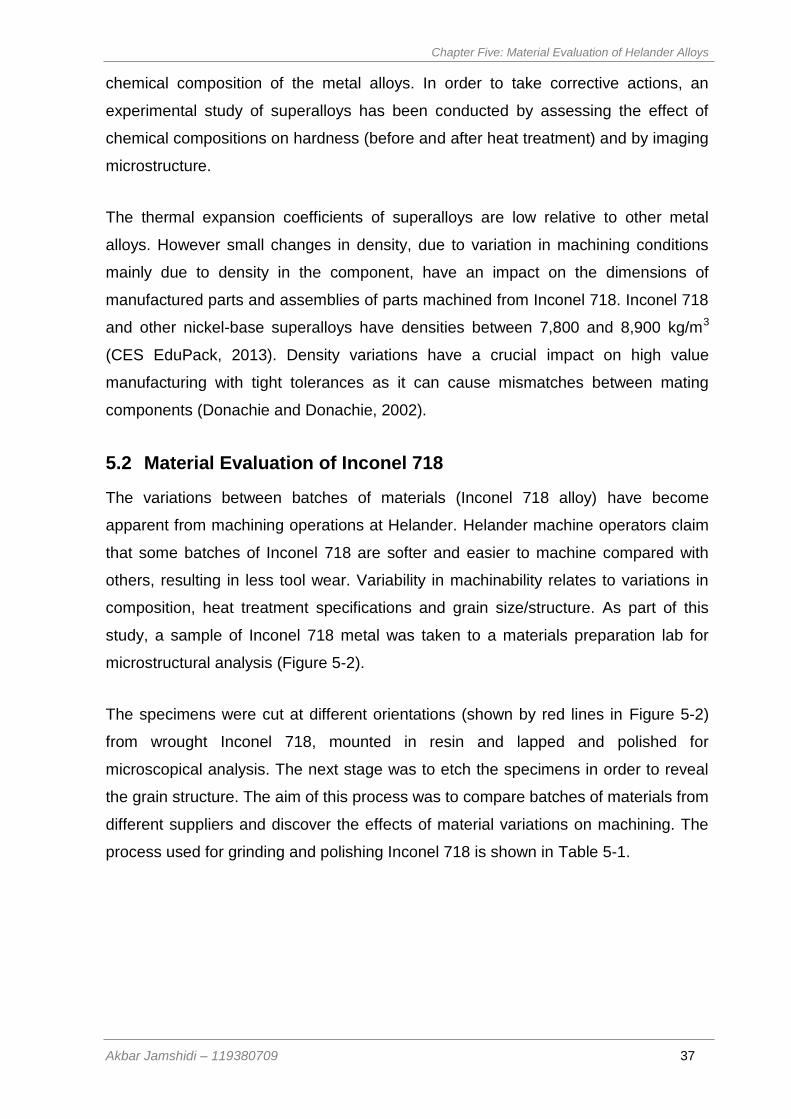
Chapter Five: Material Evaluation of Helander Alloys
Akbar Jamshidi – 119380709 37
chemical composition of the metal alloys. In order to take corrective actions, an
experimental study of superalloys has been conducted by assessing the effect of
chemical compositions on hardness (before and after heat treatment) and by imaging
microstructure.
The thermal expansion coefficients of superalloys are low relative to other metal
alloys. However small changes in density, due to variation in machining conditions
mainly due to density in the component, have an impact on the dimensions of
manufactured parts and assemblies of parts machined from Inconel 718. Inconel 718
and other nickel-base superalloys have densities between 7,800 and 8,900 kg/m3
(CES EduPack, 2013). Density variations have a crucial impact on high value
manufacturing with tight tolerances as it can cause mismatches between mating
components (Donachie and Donachie, 2002).
5.2 Material Evaluation of Inconel 718
The variations between batches of materials (Inconel 718 alloy) have become
apparent from machining operations at Helander. Helander machine operators claim
that some batches of Inconel 718 are softer and easier to machine compared with
others, resulting in less tool wear. Variability in machinability relates to variations in
composition, heat treatment specifications and grain size/structure. As part of this
study, a sample of Inconel 718 metal was taken to a materials preparation lab for
microstructural analysis (Figure 5-2).
The specimens were cut at different orientations (shown by red lines in Figure 5-2)
from wrought Inconel 718, mounted in resin and lapped and polished for
microscopical analysis. The next stage was to etch the specimens in order to reveal
the grain structure. The aim of this process was to compare batches of materials from
different suppliers and discover the effects of material variations on machining. The
process used for grinding and polishing Inconel 718 is shown in Table 5-1.
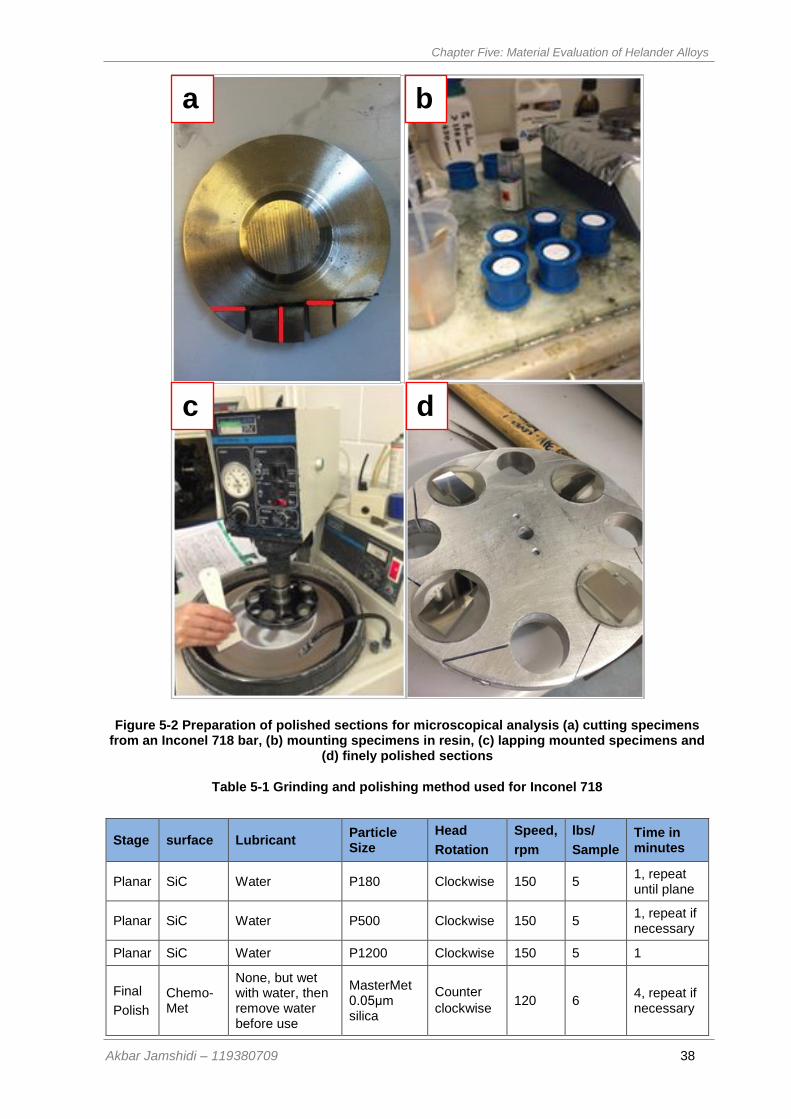
Chapter Five: Material Evaluation of Helander Alloys
Akbar Jamshidi – 119380709 38
Figure 5-2 Preparation of polished sections for microscopical analysis (a) cutting specimens from an Inconel 718 bar, (b) mounting specimens in resin, (c) lapping mounted specimens and
(d) finely polished sections
Table 5-1 Grinding and polishing method used for Inconel 718
Stage surface Lubricant Particle Size
Head
Rotation
Speed,
rpm
lbs/
Sample
Time in minutes
Planar SiC Water P180 Clockwise 150 5 1, repeat until plane
Planar SiC Water P500 Clockwise 150 5 1, repeat if necessary
Planar SiC Water P1200 Clockwise 150 5 1
Final
Polish
Chemo-Met
None, but wet with water, then remove water before use
MasterMet 0.05μm silica
Counter
clockwise 120 6
4, repeat if necessary
d c
b a

Chapter Five: Material Evaluation of Helander Alloys
Akbar Jamshidi – 119380709 39
Kalling’s No. 28 etchant was used to etch the specimens, as shown in a polarised
light optical micrograph (Figure 5-3).
Figure 5-3 Microscopic image of the Inconel 718 after polishing and etching process
The microscopical images (Figure 5-4 to Figure 5-6) captured at different depths from
the surface of Inconel 718 after machining (see Figure 5-2a) reveal fewer small
grains near the surface (Figure 5-4) due to the heat generated during
cutting/machining. This micro-structural change introduced by the machining process
causes dimensional inaccuracies as a function of time (Dudzinski et al. 2004). These
inaccuracies cause problems when it comes to assembly, which is why finished parts
with tight tolerances were returned to Helander for rework by the customer. Large
grain sizes help to prevent creep, while smaller grain sizes enhance strength and
fatigue resistance (Campbell, 2006). The size of grains can be related to the 100µm
scale bar. The depth of each section from surface of the alloy is shown in the image
labels.
8 Kalling No.2: 2.5g CuCl2, 50ml Concentrated HCl & 50 ml Ethanol
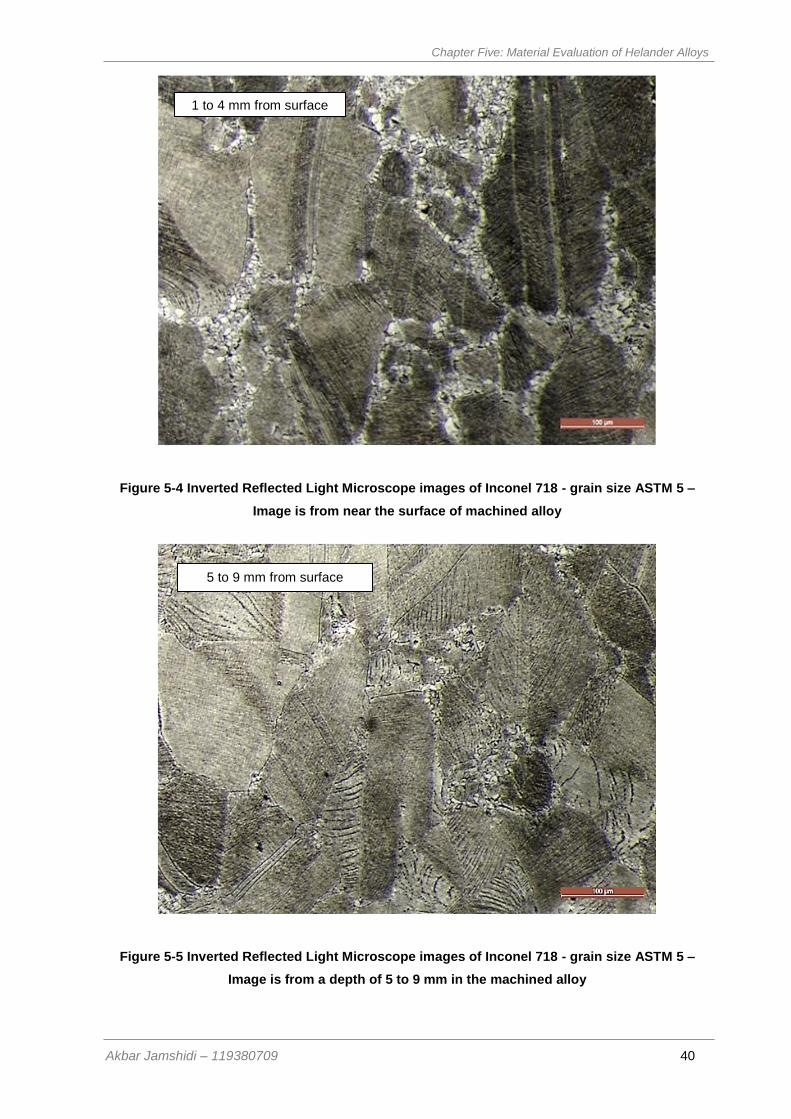
Chapter Five: Material Evaluation of Helander Alloys
Akbar Jamshidi – 119380709 40
Figure 5-4 Inverted Reflected Light Microscope images of Inconel 718 - grain size ASTM 5 –
Image is from near the surface of machined alloy
Figure 5-5 Inverted Reflected Light Microscope images of Inconel 718 - grain size ASTM 5 –
Image is from a depth of 5 to 9 mm in the machined alloy
1 to 4 mm from surface
5 to 9 mm from surface
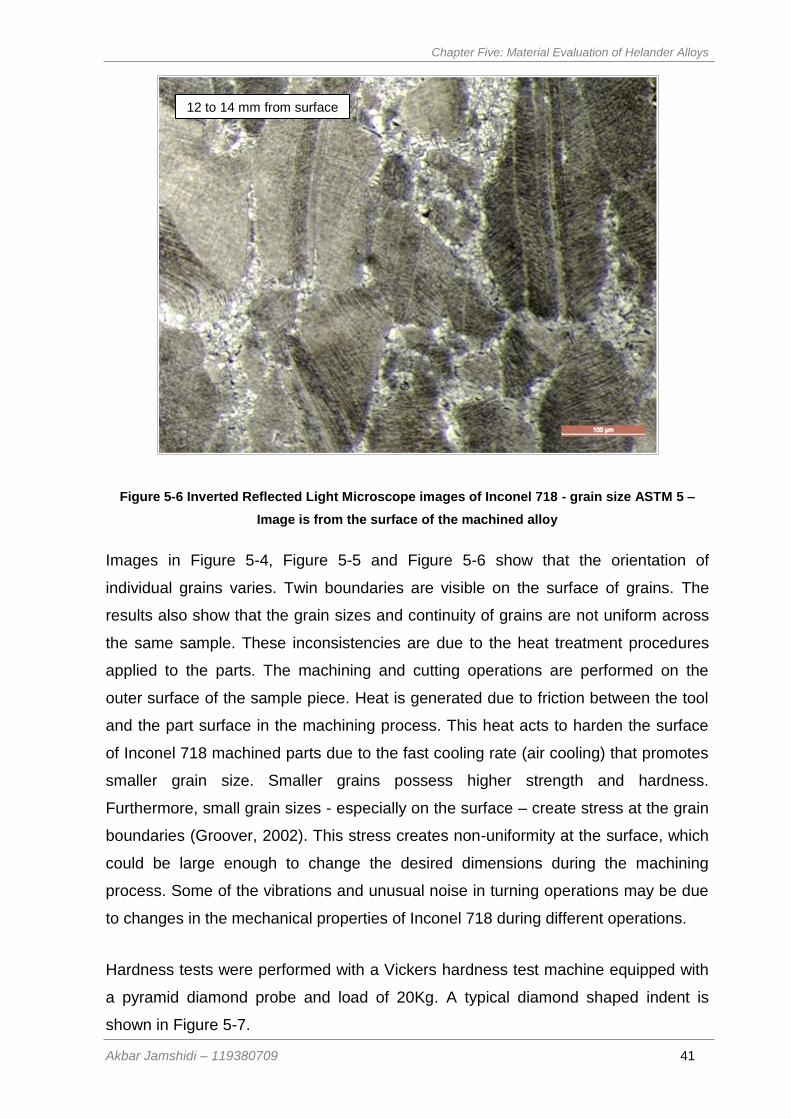
Chapter Five: Material Evaluation of Helander Alloys
Akbar Jamshidi – 119380709 41
Figure 5-6 Inverted Reflected Light Microscope images of Inconel 718 - grain size ASTM 5 –
Image is from the surface of the machined alloy
Images in Figure 5-4, Figure 5-5 and Figure 5-6 show that the orientation of
individual grains varies. Twin boundaries are visible on the surface of grains. The
results also show that the grain sizes and continuity of grains are not uniform across
the same sample. These inconsistencies are due to the heat treatment procedures
applied to the parts. The machining and cutting operations are performed on the
outer surface of the sample piece. Heat is generated due to friction between the tool
and the part surface in the machining process. This heat acts to harden the surface
of Inconel 718 machined parts due to the fast cooling rate (air cooling) that promotes
smaller grain size. Smaller grains possess higher strength and hardness.
Furthermore, small grain sizes - especially on the surface – create stress at the grain
boundaries (Groover, 2002). This stress creates non-uniformity at the surface, which
could be large enough to change the desired dimensions during the machining
process. Some of the vibrations and unusual noise in turning operations may be due
to changes in the mechanical properties of Inconel 718 during different operations.
Hardness tests were performed with a Vickers hardness test machine equipped with
a pyramid diamond probe and load of 20Kg. A typical diamond shaped indent is
shown in Figure 5-7.
12 to 14 mm from surface
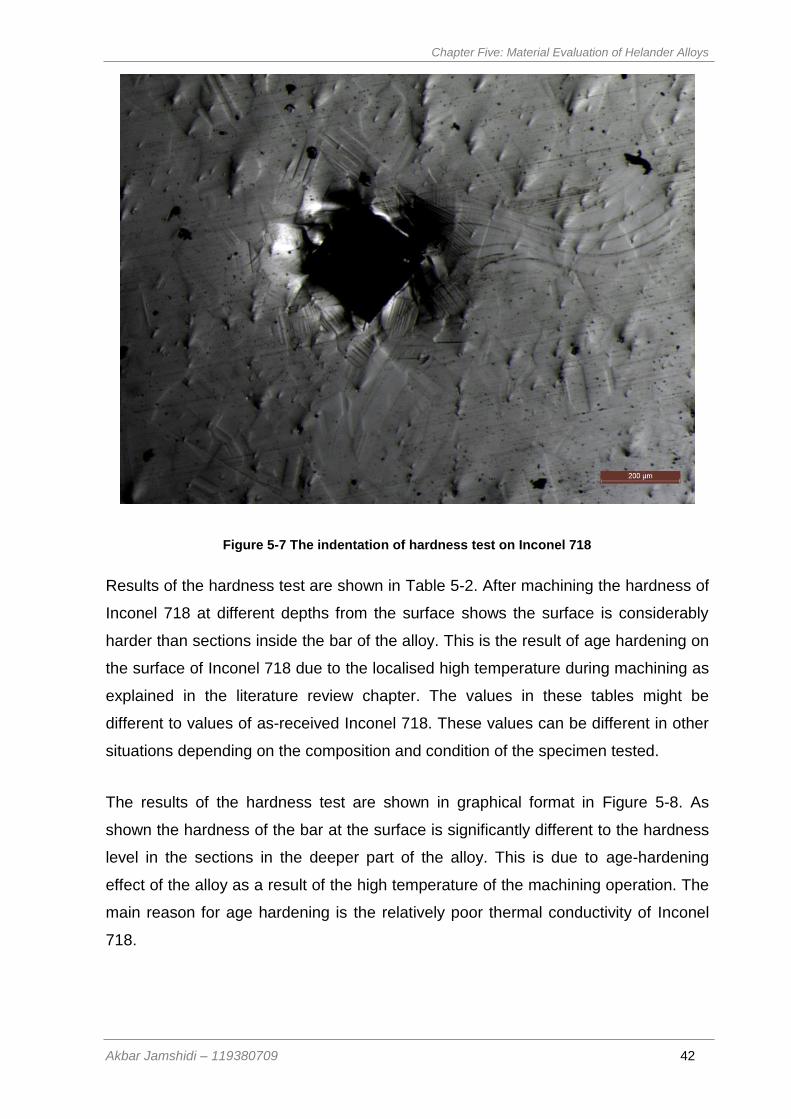
Chapter Five: Material Evaluation of Helander Alloys
Akbar Jamshidi – 119380709 42
Figure 5-7 The indentation of hardness test on Inconel 718
Results of the hardness test are shown in Table 5-2. After machining the hardness of
Inconel 718 at different depths from the surface shows the surface is considerably
harder than sections inside the bar of the alloy. This is the result of age hardening on
the surface of Inconel 718 due to the localised high temperature during machining as
explained in the literature review chapter. The values in these tables might be
different to values of as-received Inconel 718. These values can be different in other
situations depending on the composition and condition of the specimen tested.
The results of the hardness test are shown in graphical format in Figure 5-8. As
shown the hardness of the bar at the surface is significantly different to the hardness
level in the sections in the deeper part of the alloy. This is due to age-hardening
effect of the alloy as a result of the high temperature of the machining operation. The
main reason for age hardening is the relatively poor thermal conductivity of Inconel
718.
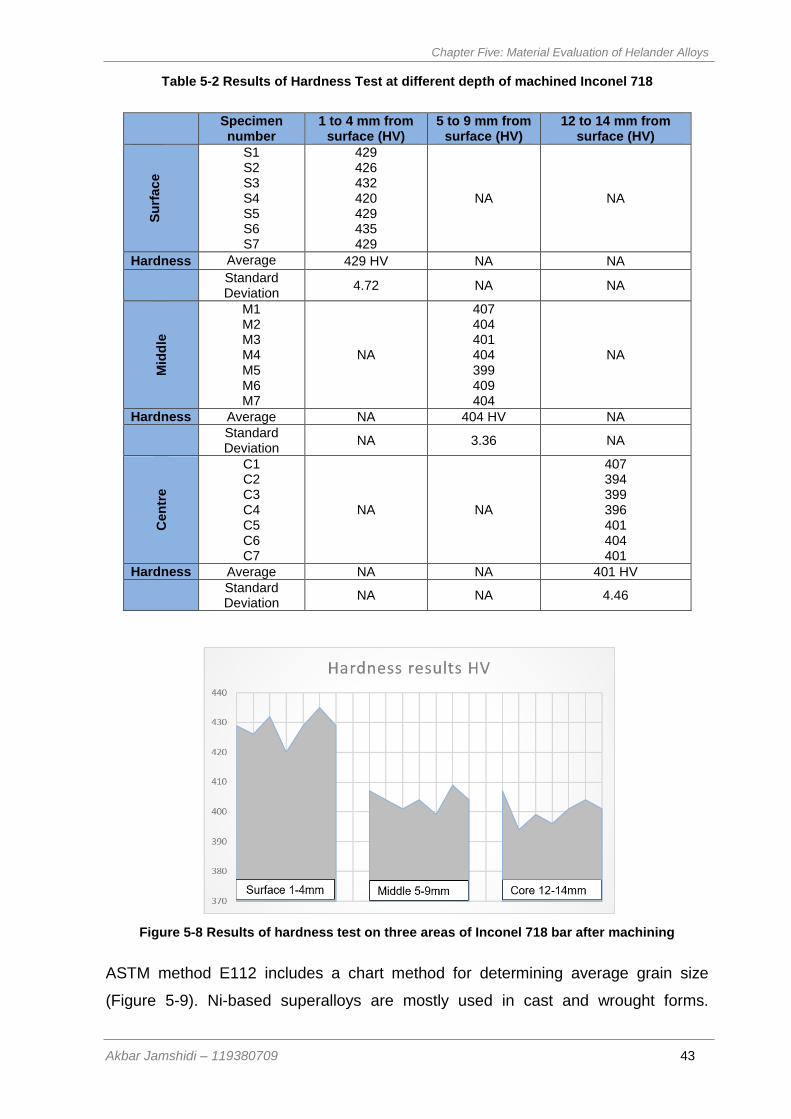
Chapter Five: Material Evaluation of Helander Alloys
Akbar Jamshidi – 119380709 43
Table 5-2 Results of Hardness Test at different depth of machined Inconel 718
Specimen number
1 to 4 mm from surface (HV)
5 to 9 mm from surface (HV)
12 to 14 mm from surface (HV)
Su
rfac
e
S1 S2 S3 S4 S5 S6 S7
429 426 432 420 429 435 429
NA NA
Hardness Average 429 HV NA NA
Standard Deviation
4.72 NA NA
Mid
dle
M1 M2 M3 M4 M5 M6 M7
NA
407 404 401 404 399 409 404
NA
Hardness Average NA 404 HV NA
Standard Deviation
NA 3.36 NA
Cen
tre
C1 C2 C3 C4 C5 C6 C7
NA NA
407 394 399 396 401 404 401
Hardness Average NA NA 401 HV
Standard Deviation
NA NA 4.46
Figure 5-8 Results of hardness test on three areas of Inconel 718 bar after machining
ASTM method E112 includes a chart method for determining average grain size
(Figure 5-9). Ni-based superalloys are mostly used in cast and wrought forms.
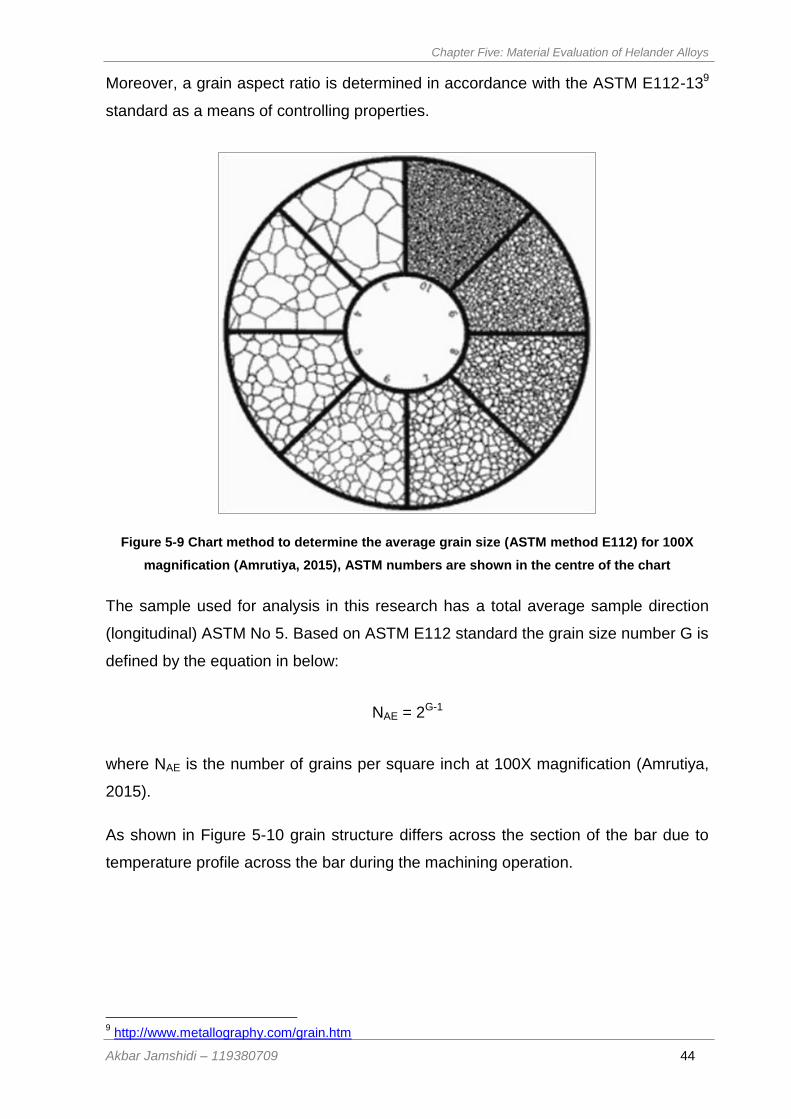
Chapter Five: Material Evaluation of Helander Alloys
Akbar Jamshidi – 119380709 44
Moreover, a grain aspect ratio is determined in accordance with the ASTM E112-139
standard as a means of controlling properties.
Figure 5-9 Chart method to determine the average grain size (ASTM method E112) for 100X
magnification (Amrutiya, 2015), ASTM numbers are shown in the centre of the chart
The sample used for analysis in this research has a total average sample direction
(longitudinal) ASTM No 5. Based on ASTM E112 standard the grain size number G is
defined by the equation in below:
NAE = 2G-1
where NAE is the number of grains per square inch at 100X magnification (Amrutiya,
2015).
As shown in Figure 5-10 grain structure differs across the section of the bar due to
temperature profile across the bar during the machining operation.
9 http://www.metallography.com/grain.htm

Chapter Five: Material Evaluation of Helander Alloys
Akbar Jamshidi – 119380709 45
Figure 5-10 Inconel 718 sample from different orientations at the same magnification indicated by arrows: (a) image at 2mm from the surface, (b) image at 5mm from the surface (c) image
from core section of the bar 10mm from the surface
a
b
c
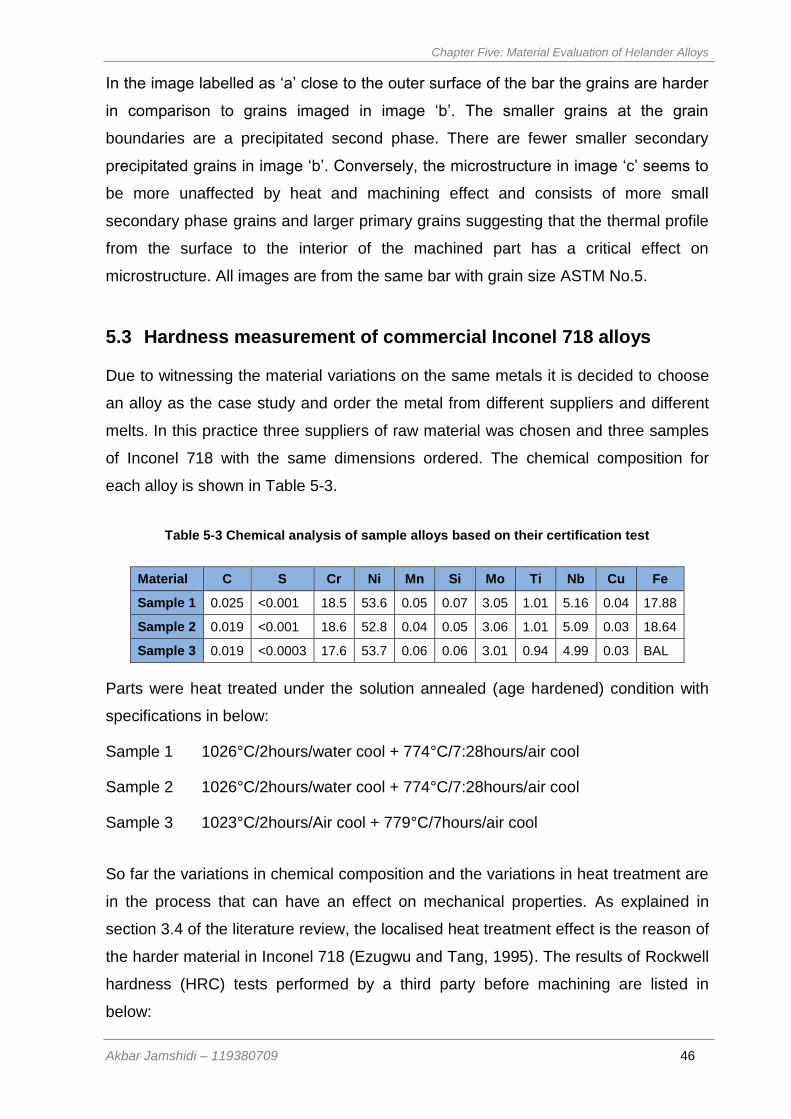
Chapter Five: Material Evaluation of Helander Alloys
Akbar Jamshidi – 119380709 46
In the image labelled as ‘a’ close to the outer surface of the bar the grains are harder
in comparison to grains imaged in image ‘b’. The smaller grains at the grain
boundaries are a precipitated second phase. There are fewer smaller secondary
precipitated grains in image ‘b’. Conversely, the microstructure in image ‘c’ seems to
be more unaffected by heat and machining effect and consists of more small
secondary phase grains and larger primary grains suggesting that the thermal profile
from the surface to the interior of the machined part has a critical effect on
microstructure. All images are from the same bar with grain size ASTM No.5.
5.3 Hardness measurement of commercial Inconel 718 alloys
Due to witnessing the material variations on the same metals it is decided to choose
an alloy as the case study and order the metal from different suppliers and different
melts. In this practice three suppliers of raw material was chosen and three samples
of Inconel 718 with the same dimensions ordered. The chemical composition for
each alloy is shown in Table 5-3.
Table 5-3 Chemical analysis of sample alloys based on their certification test
Material C S Cr Ni Mn Si Mo Ti Nb Cu Fe
Sample 1 0.025 <0.001 18.5 53.6 0.05 0.07 3.05 1.01 5.16 0.04 17.88
Sample 2 0.019 <0.001 18.6 52.8 0.04 0.05 3.06 1.01 5.09 0.03 18.64
Sample 3 0.019 <0.0003 17.6 53.7 0.06 0.06 3.01 0.94 4.99 0.03 BAL
Parts were heat treated under the solution annealed (age hardened) condition with
specifications in below:
Sample 1 1026°C/2hours/water cool + 774°C/7:28hours/air cool
Sample 2 1026°C/2hours/water cool + 774°C/7:28hours/air cool
Sample 3 1023°C/2hours/Air cool + 779°C/7hours/air cool
So far the variations in chemical composition and the variations in heat treatment are
in the process that can have an effect on mechanical properties. As explained in
section 3.4 of the literature review, the localised heat treatment effect is the reason of
the harder material in Inconel 718 (Ezugwu and Tang, 1995). The results of Rockwell
hardness (HRC) tests performed by a third party before machining are listed in
below:
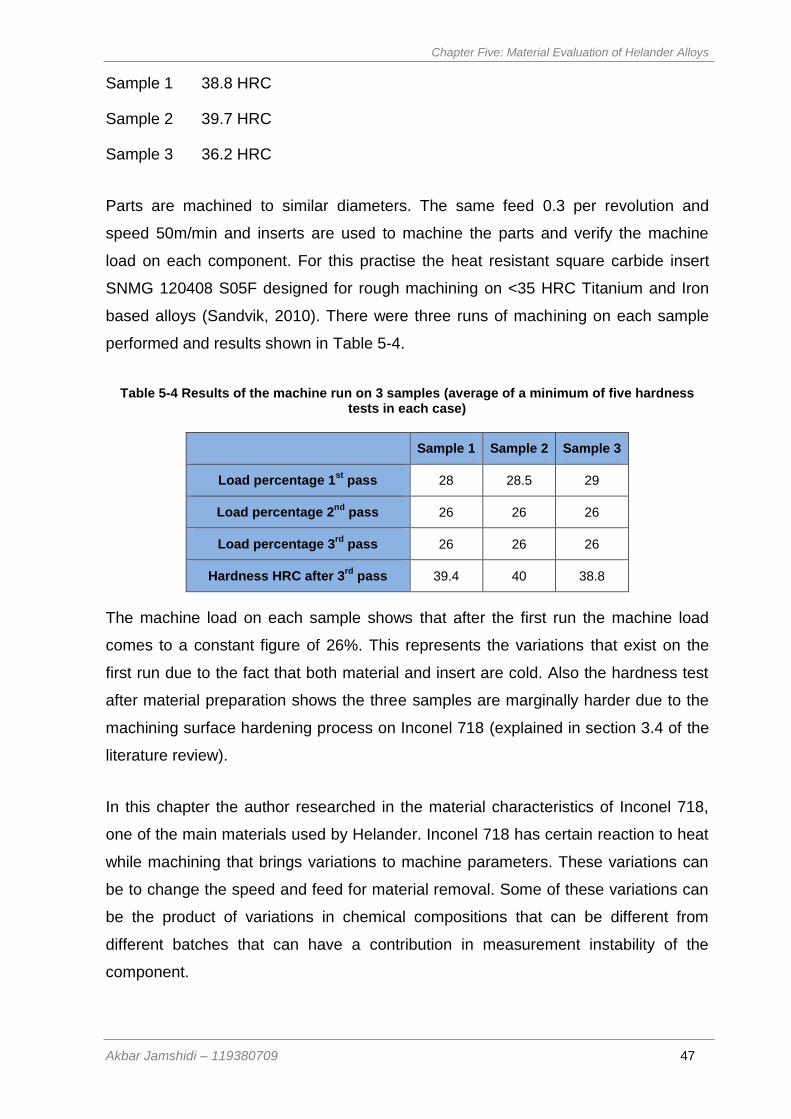
Chapter Five: Material Evaluation of Helander Alloys
Akbar Jamshidi – 119380709 47
Sample 1 38.8 HRC
Sample 2 39.7 HRC
Sample 3 36.2 HRC
Parts are machined to similar diameters. The same feed 0.3 per revolution and
speed 50m/min and inserts are used to machine the parts and verify the machine
load on each component. For this practise the heat resistant square carbide insert
SNMG 120408 S05F designed for rough machining on <35 HRC Titanium and Iron
based alloys (Sandvik, 2010). There were three runs of machining on each sample
performed and results shown in Table 5-4.
Table 5-4 Results of the machine run on 3 samples (average of a minimum of five hardness tests in each case)
Sample 1 Sample 2 Sample 3
Load percentage 1st
pass 28 28.5 29
Load percentage 2nd
pass 26 26 26
Load percentage 3rd
pass 26 26 26
Hardness HRC after 3rd
pass 39.4 40 38.8
The machine load on each sample shows that after the first run the machine load
comes to a constant figure of 26%. This represents the variations that exist on the
first run due to the fact that both material and insert are cold. Also the hardness test
after material preparation shows the three samples are marginally harder due to the
machining surface hardening process on Inconel 718 (explained in section 3.4 of the
literature review).
In this chapter the author researched in the material characteristics of Inconel 718,
one of the main materials used by Helander. Inconel 718 has certain reaction to heat
while machining that brings variations to machine parameters. These variations can
be to change the speed and feed for material removal. Some of these variations can
be the product of variations in chemical compositions that can be different from
different batches that can have a contribution in measurement instability of the
component.
Chapter Six: Methods of Process Control & Process Verification
Akbar Jamshidi – 119380709 48
Chapter Six: Process Control and
Process Verification
6 Process Control & Process Verification
6.1 Introduction
At the SME level, different customers require different levels of verification and
documentation. In recent times, Helander’s main area of expertise was oil & gas. The
documentation requirements for this industry are far less in comparison with other
sectors that Helander has recently joined. In this chapter, the requirements for the
main customers in oil & gas are reviewed and examples are chosen from the same
industry sector.
The Supplier Requirement Procedure (SRP) or customer flow-down requirement, as
a more general term, is a contractual document that customers want their suppliers to
work towards. This document is attached (or referenced) to every single order from
the customer indicating main and generic requirements and, where needed,
subordinate documents accompany the order. The objective of the SRP is to define
and communicate the minimum quality deliverables required by the customer from
Helander outside of any specific product file requirements.
For example, one of Helander’s suppliers provides a “Material Requirement
Document” as a secondary requirement for each alloy. At Helander, metal alloys are
received with a “Delivery Ticket” and a “Test Certificate” provided by the original
supplier. Each batch should be verified by a third party specialised in testing
materials prior to issuing the “Test Certificate”. There is also a “Goods Received”
note that Helander’s inspectors check against purchase orders to ensure parts are of
the correct specification. In this case, there is a specification for grain size, hardness,
and chemical composition that must be used as a guideline for verification in “Goods
Inwards” before the raw material passes to the production department. This process
should be robust enough to identify any errors from suppliers.
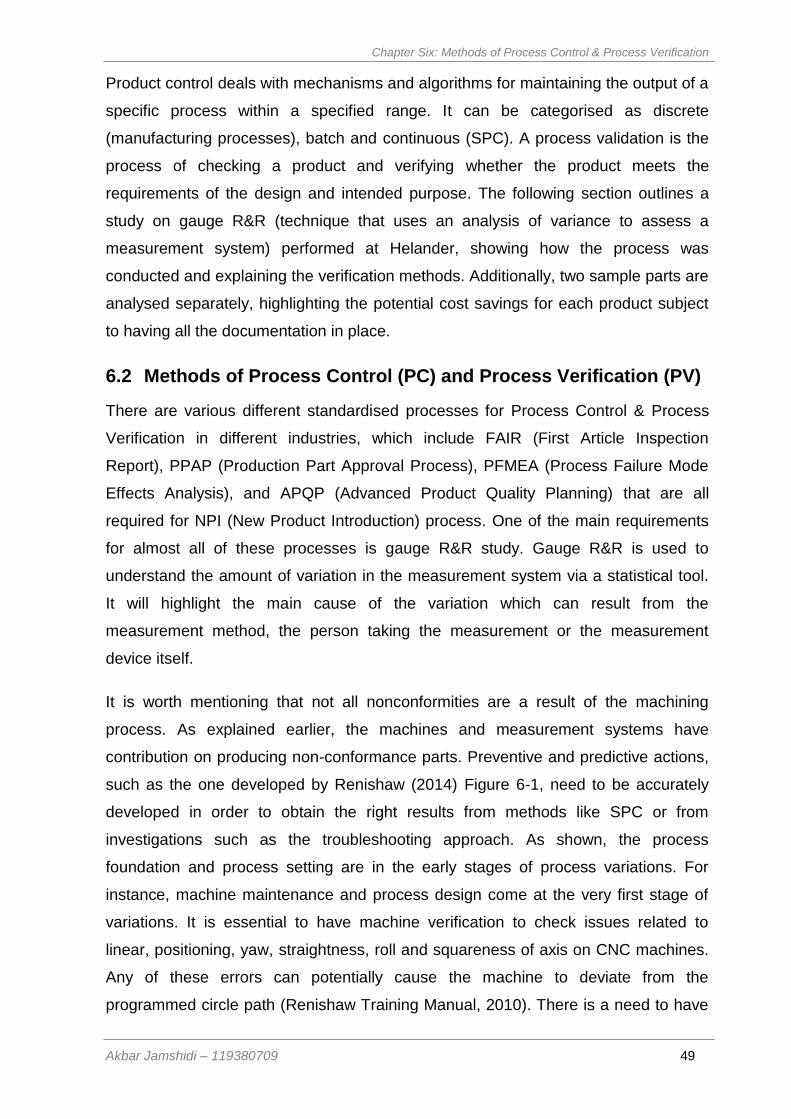
Chapter Six: Methods of Process Control & Process Verification
Akbar Jamshidi – 119380709 49
Product control deals with mechanisms and algorithms for maintaining the output of a
specific process within a specified range. It can be categorised as discrete
(manufacturing processes), batch and continuous (SPC). A process validation is the
process of checking a product and verifying whether the product meets the
requirements of the design and intended purpose. The following section outlines a
study on gauge R&R (technique that uses an analysis of variance to assess a
measurement system) performed at Helander, showing how the process was
conducted and explaining the verification methods. Additionally, two sample parts are
analysed separately, highlighting the potential cost savings for each product subject
to having all the documentation in place.
6.2 Methods of Process Control (PC) and Process Verification (PV)
There are various different standardised processes for Process Control & Process
Verification in different industries, which include FAIR (First Article Inspection
Report), PPAP (Production Part Approval Process), PFMEA (Process Failure Mode
Effects Analysis), and APQP (Advanced Product Quality Planning) that are all
required for NPI (New Product Introduction) process. One of the main requirements
for almost all of these processes is gauge R&R study. Gauge R&R is used to
understand the amount of variation in the measurement system via a statistical tool.
It will highlight the main cause of the variation which can result from the
measurement method, the person taking the measurement or the measurement
device itself.
It is worth mentioning that not all nonconformities are a result of the machining
process. As explained earlier, the machines and measurement systems have
contribution on producing non-conformance parts. Preventive and predictive actions,
such as the one developed by Renishaw (2014) Figure 6-1, need to be accurately
developed in order to obtain the right results from methods like SPC or from
investigations such as the troubleshooting approach. As shown, the process
foundation and process setting are in the early stages of process variations. For
instance, machine maintenance and process design come at the very first stage of
variations. It is essential to have machine verification to check issues related to
linear, positioning, yaw, straightness, roll and squareness of axis on CNC machines.
Any of these errors can potentially cause the machine to deviate from the
programmed circle path (Renishaw Training Manual, 2010). There is a need to have
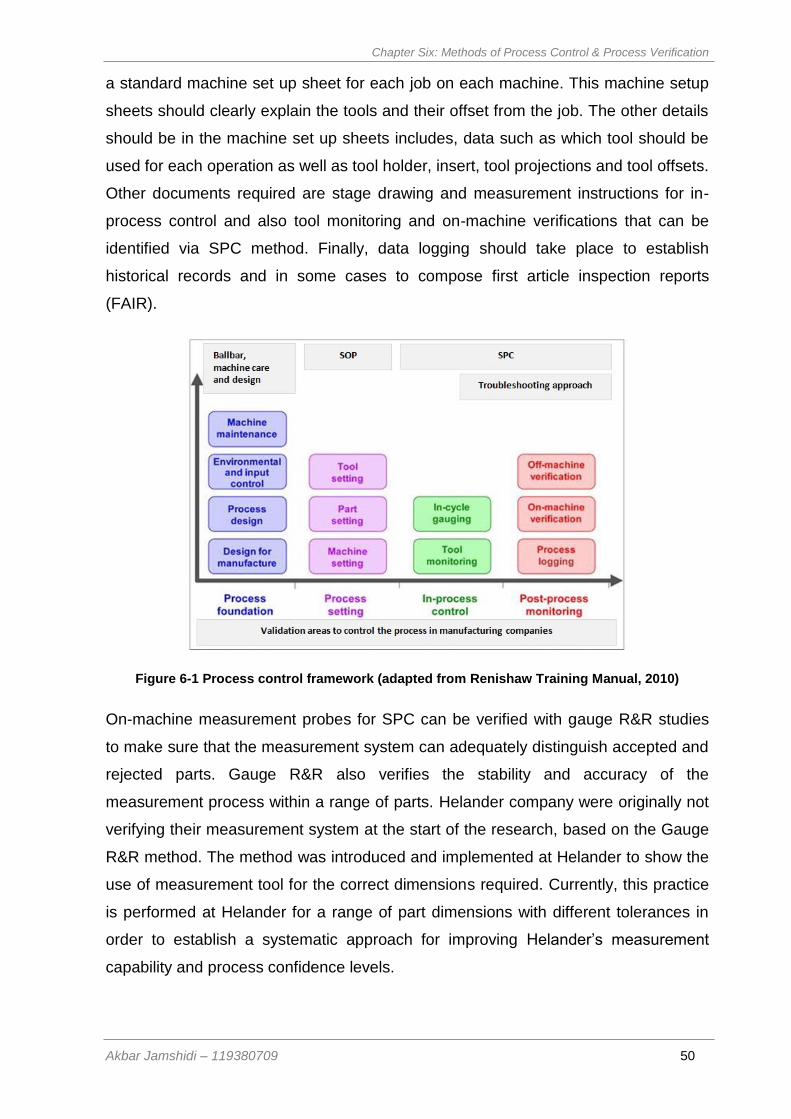
Chapter Six: Methods of Process Control & Process Verification
Akbar Jamshidi – 119380709 50
a standard machine set up sheet for each job on each machine. This machine setup
sheets should clearly explain the tools and their offset from the job. The other details
should be in the machine set up sheets includes, data such as which tool should be
used for each operation as well as tool holder, insert, tool projections and tool offsets.
Other documents required are stage drawing and measurement instructions for in-
process control and also tool monitoring and on-machine verifications that can be
identified via SPC method. Finally, data logging should take place to establish
historical records and in some cases to compose first article inspection reports
(FAIR).
Figure 6-1 Process control framework (adapted from Renishaw Training Manual, 2010)
On-machine measurement probes for SPC can be verified with gauge R&R studies
to make sure that the measurement system can adequately distinguish accepted and
rejected parts. Gauge R&R also verifies the stability and accuracy of the
measurement process within a range of parts. Helander company were originally not
verifying their measurement system at the start of the research, based on the Gauge
R&R method. The method was introduced and implemented at Helander to show the
use of measurement tool for the correct dimensions required. Currently, this practice
is performed at Helander for a range of part dimensions with different tolerances in
order to establish a systematic approach for improving Helander’s measurement
capability and process confidence levels.
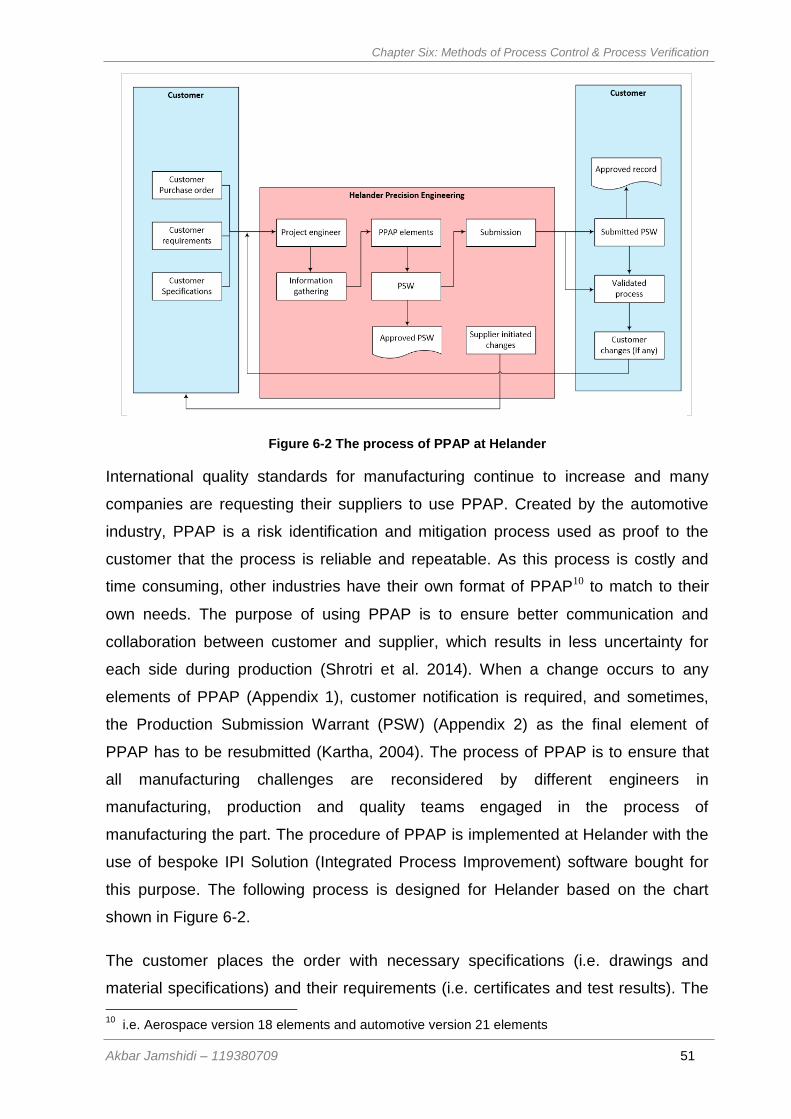
Chapter Six: Methods of Process Control & Process Verification
Akbar Jamshidi – 119380709 51
Figure 6-2 The process of PPAP at Helander
International quality standards for manufacturing continue to increase and many
companies are requesting their suppliers to use PPAP. Created by the automotive
industry, PPAP is a risk identification and mitigation process used as proof to the
customer that the process is reliable and repeatable. As this process is costly and
time consuming, other industries have their own format of PPAP10 to match to their
own needs. The purpose of using PPAP is to ensure better communication and
collaboration between customer and supplier, which results in less uncertainty for
each side during production (Shrotri et al. 2014). When a change occurs to any
elements of PPAP (Appendix 1), customer notification is required, and sometimes,
the Production Submission Warrant (PSW) (Appendix 2) as the final element of
PPAP has to be resubmitted (Kartha, 2004). The process of PPAP is to ensure that
all manufacturing challenges are reconsidered by different engineers in
manufacturing, production and quality teams engaged in the process of
manufacturing the part. The procedure of PPAP is implemented at Helander with the
use of bespoke IPI Solution (Integrated Process Improvement) software bought for
this purpose. The following process is designed for Helander based on the chart
shown in Figure 6-2.
The customer places the order with necessary specifications (i.e. drawings and
material specifications) and their requirements (i.e. certificates and test results). The
10
i.e. Aerospace version 18 elements and automotive version 21 elements
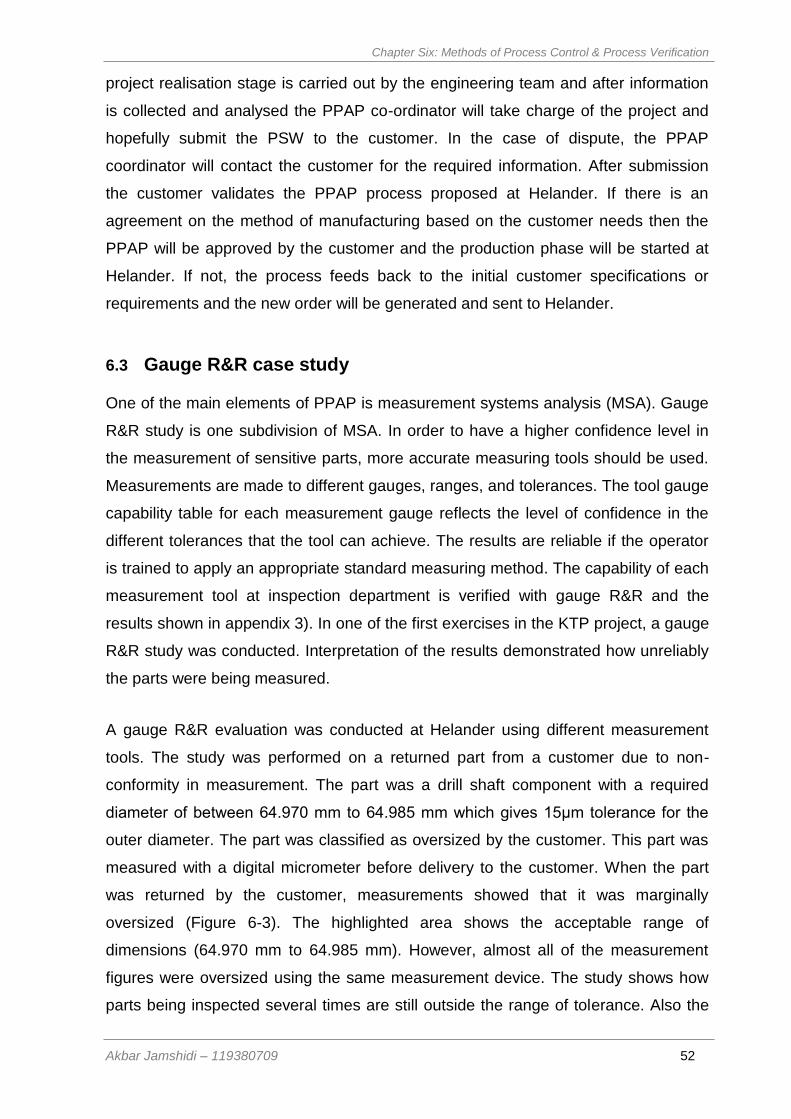
Chapter Six: Methods of Process Control & Process Verification
Akbar Jamshidi – 119380709 52
project realisation stage is carried out by the engineering team and after information
is collected and analysed the PPAP co-ordinator will take charge of the project and
hopefully submit the PSW to the customer. In the case of dispute, the PPAP
coordinator will contact the customer for the required information. After submission
the customer validates the PPAP process proposed at Helander. If there is an
agreement on the method of manufacturing based on the customer needs then the
PPAP will be approved by the customer and the production phase will be started at
Helander. If not, the process feeds back to the initial customer specifications or
requirements and the new order will be generated and sent to Helander.
6.3 Gauge R&R case study
One of the main elements of PPAP is measurement systems analysis (MSA). Gauge
R&R study is one subdivision of MSA. In order to have a higher confidence level in
the measurement of sensitive parts, more accurate measuring tools should be used.
Measurements are made to different gauges, ranges, and tolerances. The tool gauge
capability table for each measurement gauge reflects the level of confidence in the
different tolerances that the tool can achieve. The results are reliable if the operator
is trained to apply an appropriate standard measuring method. The capability of each
measurement tool at inspection department is verified with gauge R&R and the
results shown in appendix 3). In one of the first exercises in the KTP project, a gauge
R&R study was conducted. Interpretation of the results demonstrated how unreliably
the parts were being measured.
A gauge R&R evaluation was conducted at Helander using different measurement
tools. The study was performed on a returned part from a customer due to non-
conformity in measurement. The part was a drill shaft component with a required
diameter of between 64.970 mm to 64.985 mm which gives 15μm tolerance for the
outer diameter. The part was classified as oversized by the customer. This part was
measured with a digital micrometer before delivery to the customer. When the part
was returned by the customer, measurements showed that it was marginally
oversized (Figure 6-3). The highlighted area shows the acceptable range of
dimensions (64.970 mm to 64.985 mm). However, almost all of the measurement
figures were oversized using the same measurement device. The study shows how
parts being inspected several times are still outside the range of tolerance. Also the
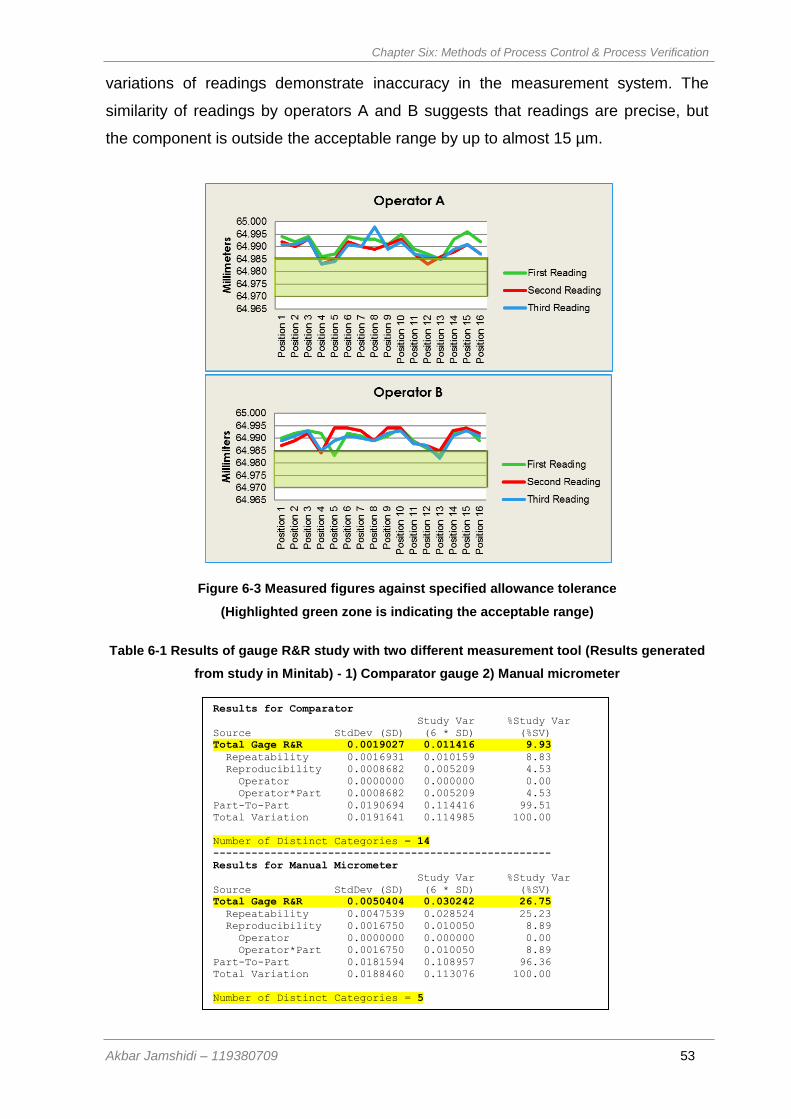
Chapter Six: Methods of Process Control & Process Verification
Akbar Jamshidi – 119380709 53
variations of readings demonstrate inaccuracy in the measurement system. The
similarity of readings by operators A and B suggests that readings are precise, but
the component is outside the acceptable range by up to almost 15 µm.
Figure 6-3 Measured figures against specified allowance tolerance
(Highlighted green zone is indicating the acceptable range)
Table 6-1 Results of gauge R&R study with two different measurement tool (Results generated
from study in Minitab) - 1) Comparator gauge 2) Manual micrometer
Results for Comparator
Study Var %Study Var
Source StdDev (SD) (6 * SD) (%SV)
Total Gage R&R 0.0019027 0.011416 9.93
Repeatability 0.0016931 0.010159 8.83
Reproducibility 0.0008682 0.005209 4.53
Operator 0.0000000 0.000000 0.00
Operator*Part 0.0008682 0.005209 4.53
Part-To-Part 0.0190694 0.114416 99.51
Total Variation 0.0191641 0.114985 100.00
Number of Distinct Categories = 14
-----------------------------------------------------
Results for Manual Micrometer
Study Var %Study Var
Source StdDev (SD) (6 * SD) (%SV)
Total Gage R&R 0.0050404 0.030242 26.75
Repeatability 0.0047539 0.028524 25.23
Reproducibility 0.0016750 0.010050 8.89
Operator 0.0000000 0.000000 0.00
Operator*Part 0.0016750 0.010050 8.89
Part-To-Part 0.0181594 0.108957 96.36
Total Variation 0.0188460 0.113076 100.00
Number of Distinct Categories = 5
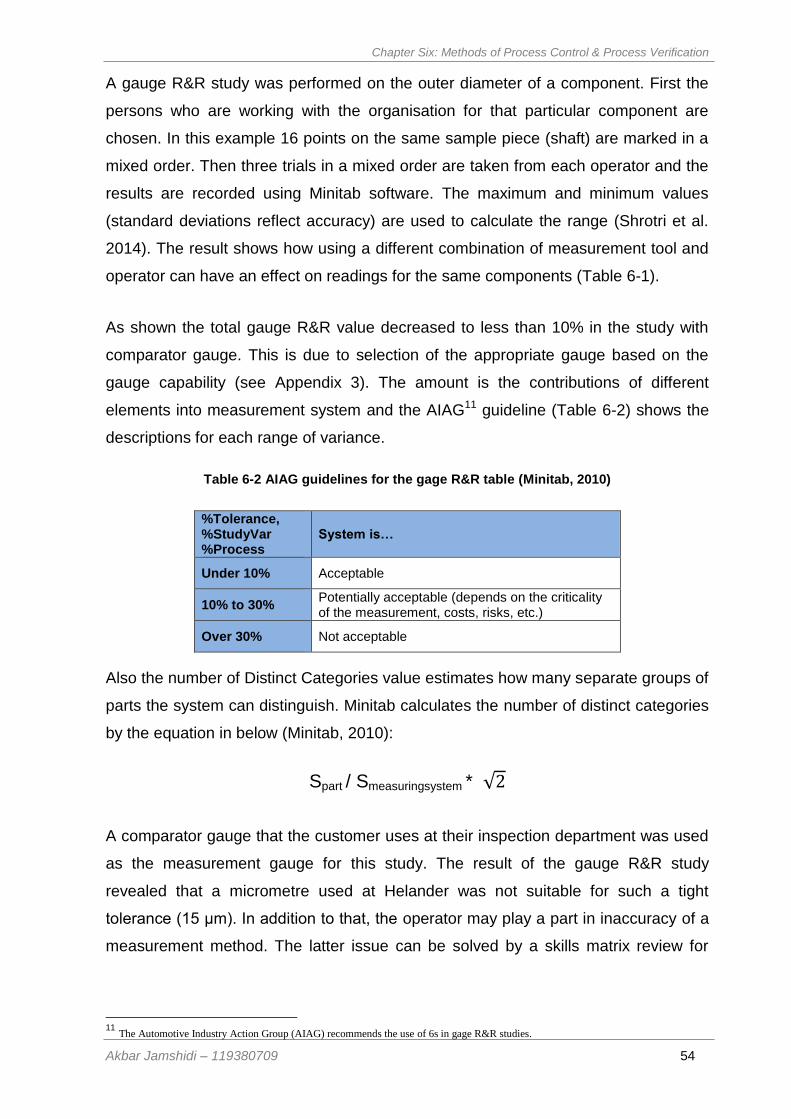
Chapter Six: Methods of Process Control & Process Verification
Akbar Jamshidi – 119380709 54
A gauge R&R study was performed on the outer diameter of a component. First the
persons who are working with the organisation for that particular component are
chosen. In this example 16 points on the same sample piece (shaft) are marked in a
mixed order. Then three trials in a mixed order are taken from each operator and the
results are recorded using Minitab software. The maximum and minimum values
(standard deviations reflect accuracy) are used to calculate the range (Shrotri et al.
2014). The result shows how using a different combination of measurement tool and
operator can have an effect on readings for the same components (Table 6-1).
As shown the total gauge R&R value decreased to less than 10% in the study with
comparator gauge. This is due to selection of the appropriate gauge based on the
gauge capability (see Appendix 3). The amount is the contributions of different
elements into measurement system and the AIAG11 guideline (Table 6-2) shows the
descriptions for each range of variance.
Table 6-2 AIAG guidelines for the gage R&R table (Minitab, 2010)
%Tolerance, %StudyVar %Process
System is…
Under 10% Acceptable
10% to 30% Potentially acceptable (depends on the criticality of the measurement, costs, risks, etc.)
Over 30% Not acceptable
Also the number of Distinct Categories value estimates how many separate groups of
parts the system can distinguish. Minitab calculates the number of distinct categories
by the equation in below (Minitab, 2010):
Spart / Smeasuringsystem * √2
A comparator gauge that the customer uses at their inspection department was used
as the measurement gauge for this study. The result of the gauge R&R study
revealed that a micrometre used at Helander was not suitable for such a tight
tolerance (15 μm). In addition to that, the operator may play a part in inaccuracy of a
measurement method. The latter issue can be solved by a skills matrix review for
11
The Automotive Industry Action Group (AIAG) recommends the use of 6s in gage R&R studies.
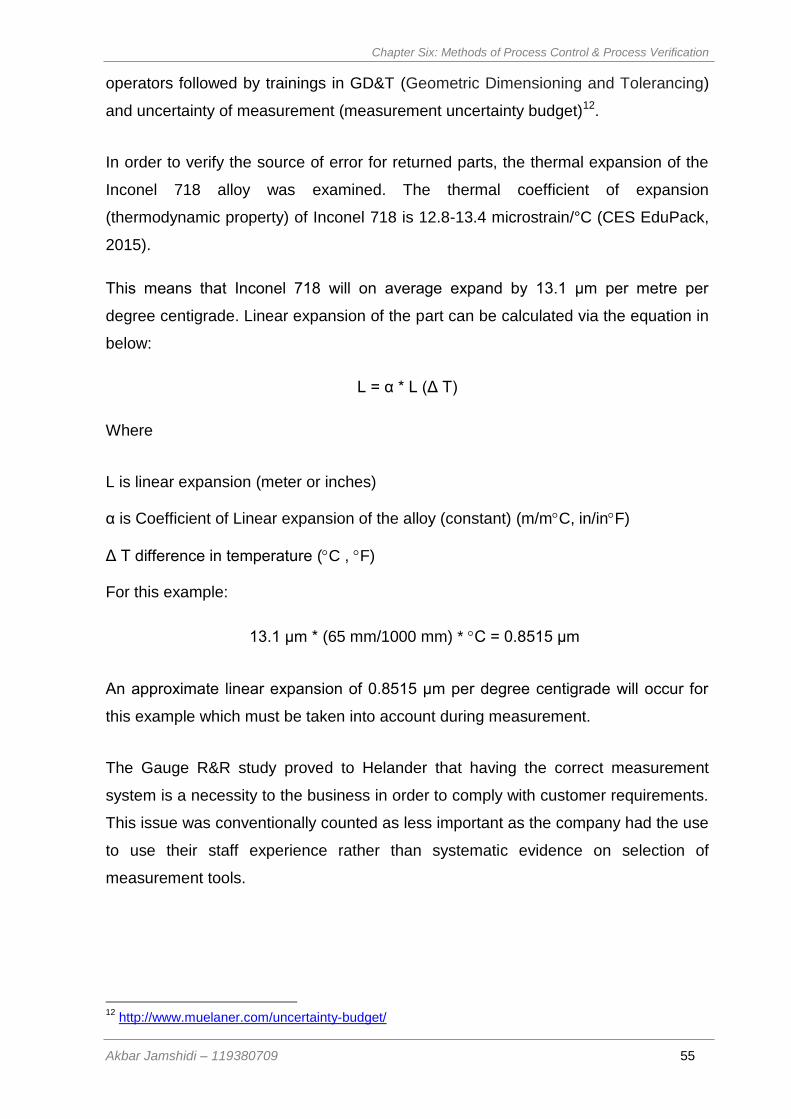
Chapter Six: Methods of Process Control & Process Verification
Akbar Jamshidi – 119380709 55
operators followed by trainings in GD&T (Geometric Dimensioning and Tolerancing)
and uncertainty of measurement (measurement uncertainty budget)12.
In order to verify the source of error for returned parts, the thermal expansion of the
Inconel 718 alloy was examined. The thermal coefficient of expansion
(thermodynamic property) of Inconel 718 is 12.8-13.4 microstrain/°C (CES EduPack,
2015).
This means that Inconel 718 will on average expand by 13.1 μm per metre per
degree centigrade. Linear expansion of the part can be calculated via the equation in
below:
L = α * L (Δ T)
Where
L is linear expansion (meter or inches)
α is Coefficient of Linear expansion of the alloy (constant) (m/mC, in/inF)
Δ T difference in temperature (C , F)
For this example:
13.1 μm * (65 mm/1000 mm) * C = 0.8515 μm
An approximate linear expansion of 0.8515 μm per degree centigrade will occur for
this example which must be taken into account during measurement.
The Gauge R&R study proved to Helander that having the correct measurement
system is a necessity to the business in order to comply with customer requirements.
This issue was conventionally counted as less important as the company had the use
to use their staff experience rather than systematic evidence on selection of
measurement tools.
12
http://www.muelaner.com/uncertainty-budget/
Chapter Six: Methods of Process Control & Process Verification
Akbar Jamshidi – 119380709 56
6.4 Control of the processes in manufacturing
Three common methods are introduced to control the processes in manufacturing
organisations (Gillespie, 1988). These methods are part sampling, SPC and
troubleshooting approaches. Depending on the sensitivity of the components,
dimensional tolerances, volume and design of the components and/or value of the
jobs, one or more methods should be considered for controlling the process. Part
sampling is the method of part verification that works based on verifying a random
sample of the quantity of batch that represents the uniformity of parts made by
specific operation. It has never been easy for manufacturing companies to
understand their confidence level in terms of how accurate and to what degree of
flexibility parts can be made. This brings uncertainty in determining the most suitable
manufacturing method as well as in controlling the product and process verification
systems. Therefore it is necessary to develop a system for capturing the company’s
knowledge and expertise and reflect it into the MRP system. One of the key aspects
of this system is measuring manufacturing and machining capabilities to a
reasonable confidence level. An in-line control measurement system was introduced
to address this concern.
At Helander inspection and verification of sample parts is done using a CMM
machine or different gauges depending on the engineering specifications of the part
and the capability of the measurement systems. This process dictates that if one item
is rejected due to a specific defect, the whole batch should be inspected for that
defect. Due to the nature of random selection in the batches, this process does not
generate accurate and trustworthy verification, especially for high value and
specification components. As mentioned in Portas’ Law (Blunt and Knapp, 2013):
“Random results are the consequence of random procedures”, which is an issue of
concern in this current research.
It has been proved that certain measurement devices are not capable of measuring
tight tolerances (up to 15µ). This seems obvious in many cases; however when the
tolerances are at the micron level it is challenging to decide what measurement tool
should be used. The study on gauge R&R at Helander company along with the
capability charts prepared by Rolls Royce SABRe (SABRe is the name of the project
launched by Rolls Royce which stands for Supplier Advanced Business Relationship)
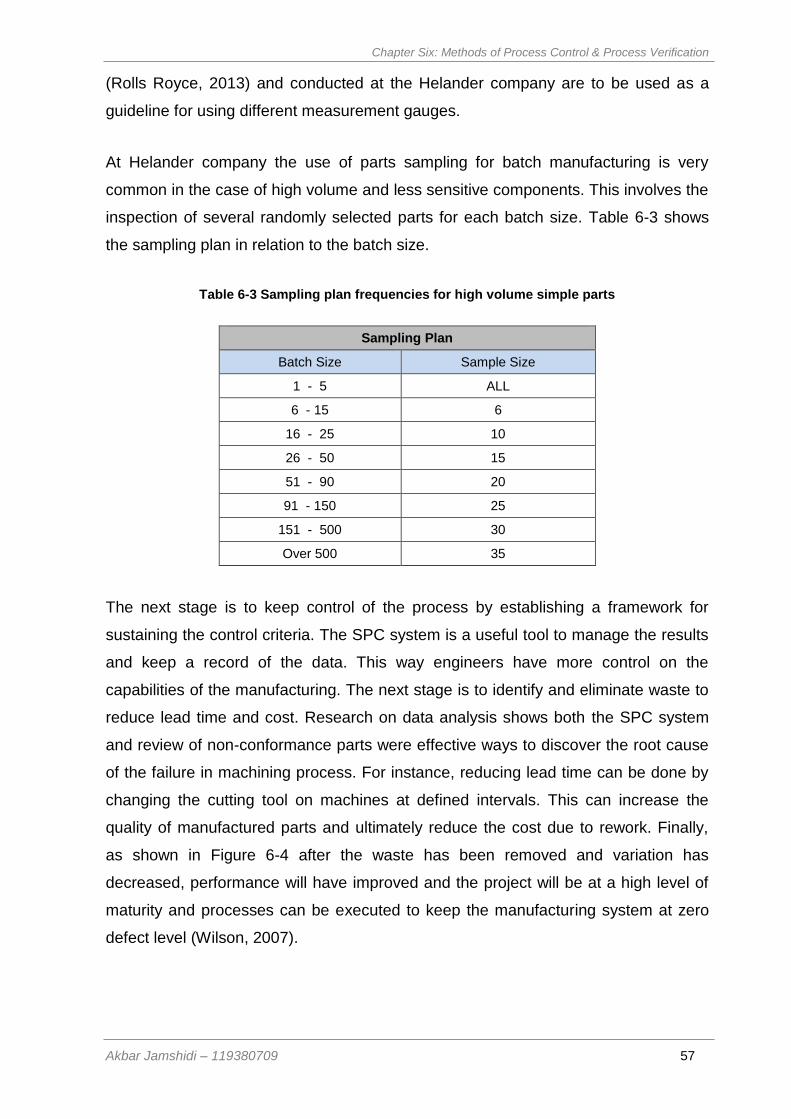
Chapter Six: Methods of Process Control & Process Verification
Akbar Jamshidi – 119380709 57
(Rolls Royce, 2013) and conducted at the Helander company are to be used as a
guideline for using different measurement gauges.
At Helander company the use of parts sampling for batch manufacturing is very
common in the case of high volume and less sensitive components. This involves the
inspection of several randomly selected parts for each batch size. Table 6-3 shows
the sampling plan in relation to the batch size.
Table 6-3 Sampling plan frequencies for high volume simple parts
Sampling Plan
Batch Size Sample Size
1 - 5 ALL
6 - 15 6
16 - 25 10
26 - 50 15
51 - 90 20
91 - 150 25
151 - 500 30
Over 500 35
The next stage is to keep control of the process by establishing a framework for
sustaining the control criteria. The SPC system is a useful tool to manage the results
and keep a record of the data. This way engineers have more control on the
capabilities of the manufacturing. The next stage is to identify and eliminate waste to
reduce lead time and cost. Research on data analysis shows both the SPC system
and review of non-conformance parts were effective ways to discover the root cause
of the failure in machining process. For instance, reducing lead time can be done by
changing the cutting tool on machines at defined intervals. This can increase the
quality of manufactured parts and ultimately reduce the cost due to rework. Finally,
as shown in Figure 6-4 after the waste has been removed and variation has
decreased, performance will have improved and the project will be at a high level of
maturity and processes can be executed to keep the manufacturing system at zero
defect level (Wilson, 2007).
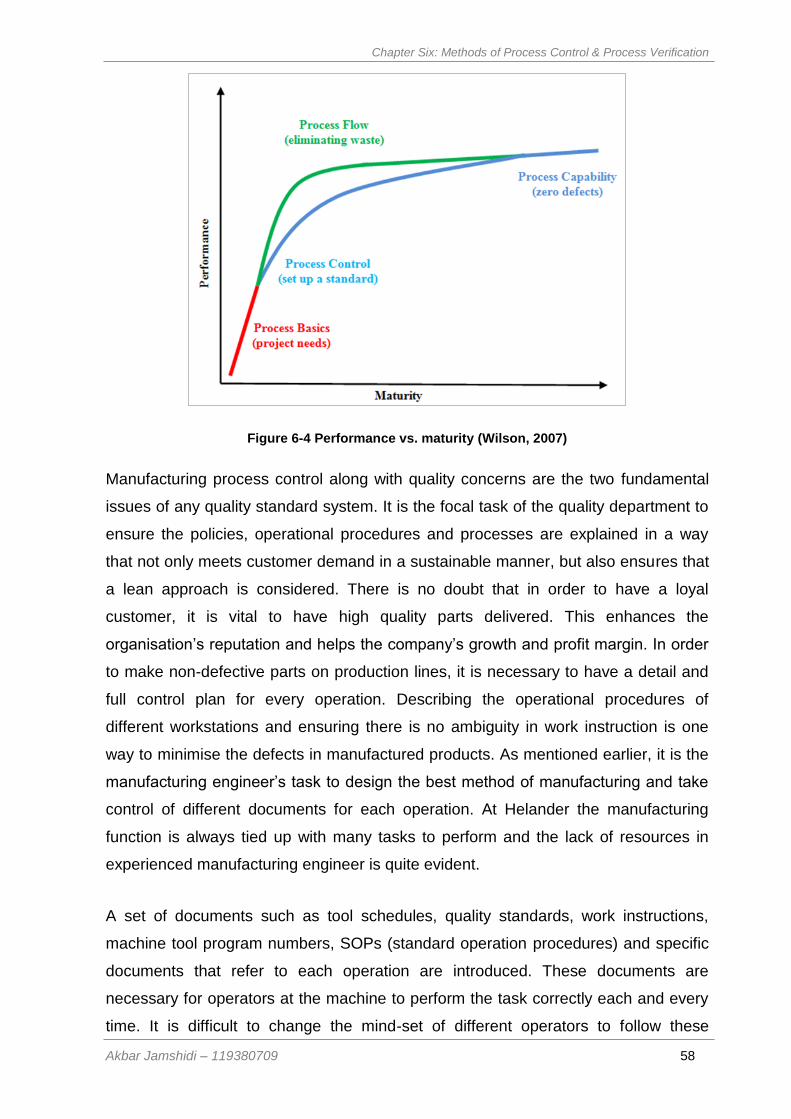
Chapter Six: Methods of Process Control & Process Verification
Akbar Jamshidi – 119380709 58
Figure 6-4 Performance vs. maturity (Wilson, 2007)
Manufacturing process control along with quality concerns are the two fundamental
issues of any quality standard system. It is the focal task of the quality department to
ensure the policies, operational procedures and processes are explained in a way
that not only meets customer demand in a sustainable manner, but also ensures that
a lean approach is considered. There is no doubt that in order to have a loyal
customer, it is vital to have high quality parts delivered. This enhances the
organisation’s reputation and helps the company’s growth and profit margin. In order
to make non-defective parts on production lines, it is necessary to have a detail and
full control plan for every operation. Describing the operational procedures of
different workstations and ensuring there is no ambiguity in work instruction is one
way to minimise the defects in manufactured products. As mentioned earlier, it is the
manufacturing engineer’s task to design the best method of manufacturing and take
control of different documents for each operation. At Helander the manufacturing
function is always tied up with many tasks to perform and the lack of resources in
experienced manufacturing engineer is quite evident.
A set of documents such as tool schedules, quality standards, work instructions,
machine tool program numbers, SOPs (standard operation procedures) and specific
documents that refer to each operation are introduced. These documents are
necessary for operators at the machine to perform the task correctly each and every
time. It is difficult to change the mind-set of different operators to follow these
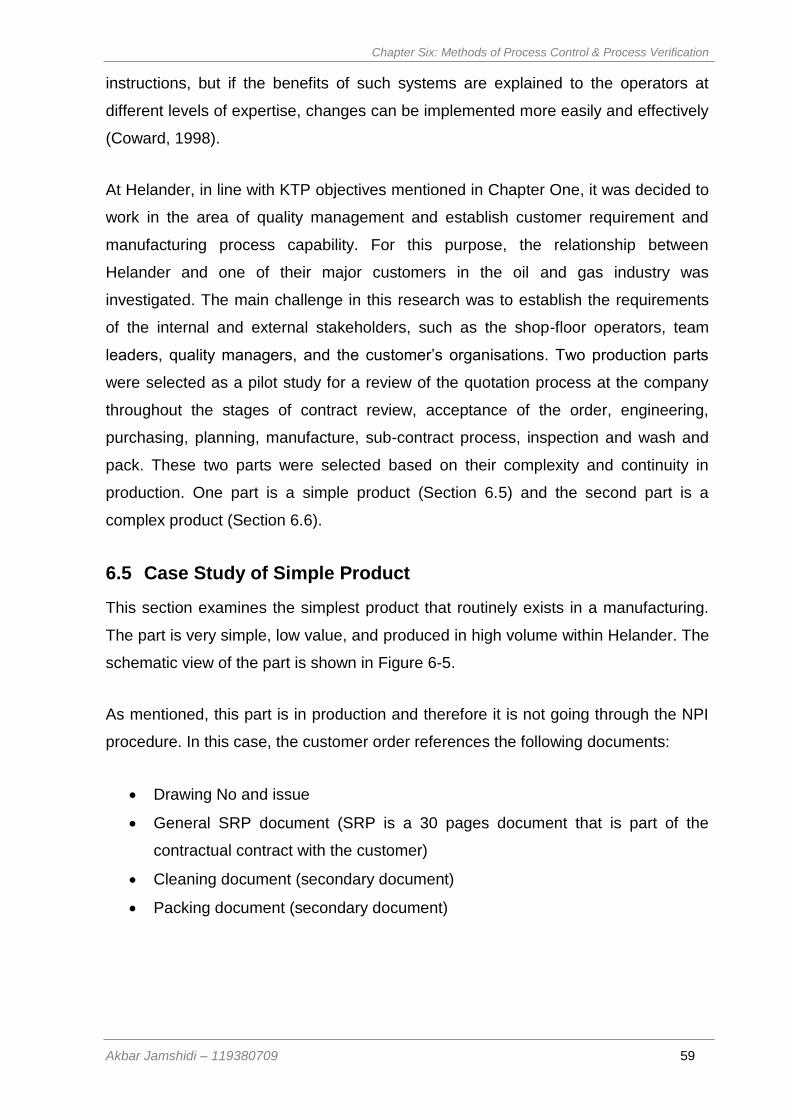
Chapter Six: Methods of Process Control & Process Verification
Akbar Jamshidi – 119380709 59
instructions, but if the benefits of such systems are explained to the operators at
different levels of expertise, changes can be implemented more easily and effectively
(Coward, 1998).
At Helander, in line with KTP objectives mentioned in Chapter One, it was decided to
work in the area of quality management and establish customer requirement and
manufacturing process capability. For this purpose, the relationship between
Helander and one of their major customers in the oil and gas industry was
investigated. The main challenge in this research was to establish the requirements
of the internal and external stakeholders, such as the shop-floor operators, team
leaders, quality managers, and the customer’s organisations. Two production parts
were selected as a pilot study for a review of the quotation process at the company
throughout the stages of contract review, acceptance of the order, engineering,
purchasing, planning, manufacture, sub-contract process, inspection and wash and
pack. These two parts were selected based on their complexity and continuity in
production. One part is a simple product (Section 6.5) and the second part is a
complex product (Section 6.6).
6.5 Case Study of Simple Product
This section examines the simplest product that routinely exists in a manufacturing.
The part is very simple, low value, and produced in high volume within Helander. The
schematic view of the part is shown in Figure 6-5.
As mentioned, this part is in production and therefore it is not going through the NPI
procedure. In this case, the customer order references the following documents:
Drawing No and issue
General SRP document (SRP is a 30 pages document that is part of the
contractual contract with the customer)
Cleaning document (secondary document)
Packing document (secondary document)
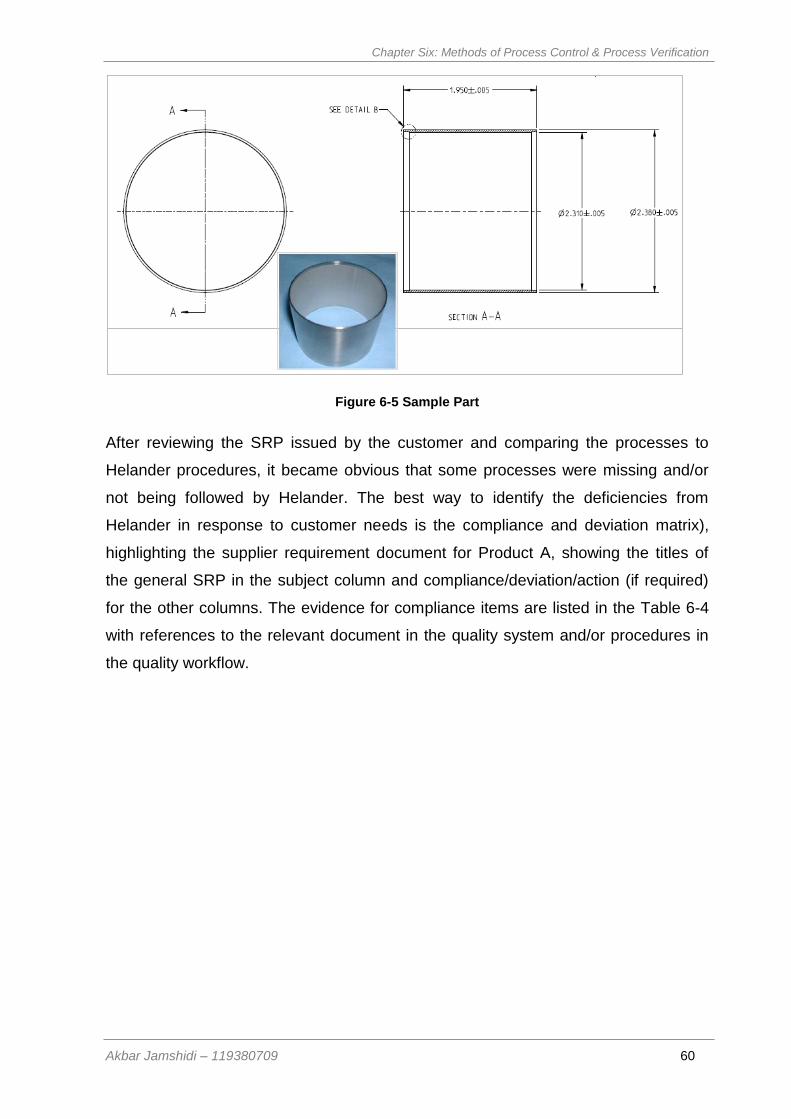
Chapter Six: Methods of Process Control & Process Verification
Akbar Jamshidi – 119380709 60
Figure 6-5 Sample Part
After reviewing the SRP issued by the customer and comparing the processes to
Helander procedures, it became obvious that some processes were missing and/or
not being followed by Helander. The best way to identify the deficiencies from
Helander in response to customer needs is the compliance and deviation matrix),
highlighting the supplier requirement document for Product A, showing the titles of
the general SRP in the subject column and compliance/deviation/action (if required)
for the other columns. The evidence for compliance items are listed in the Table 6-4
with references to the relevant document in the quality system and/or procedures in
the quality workflow.
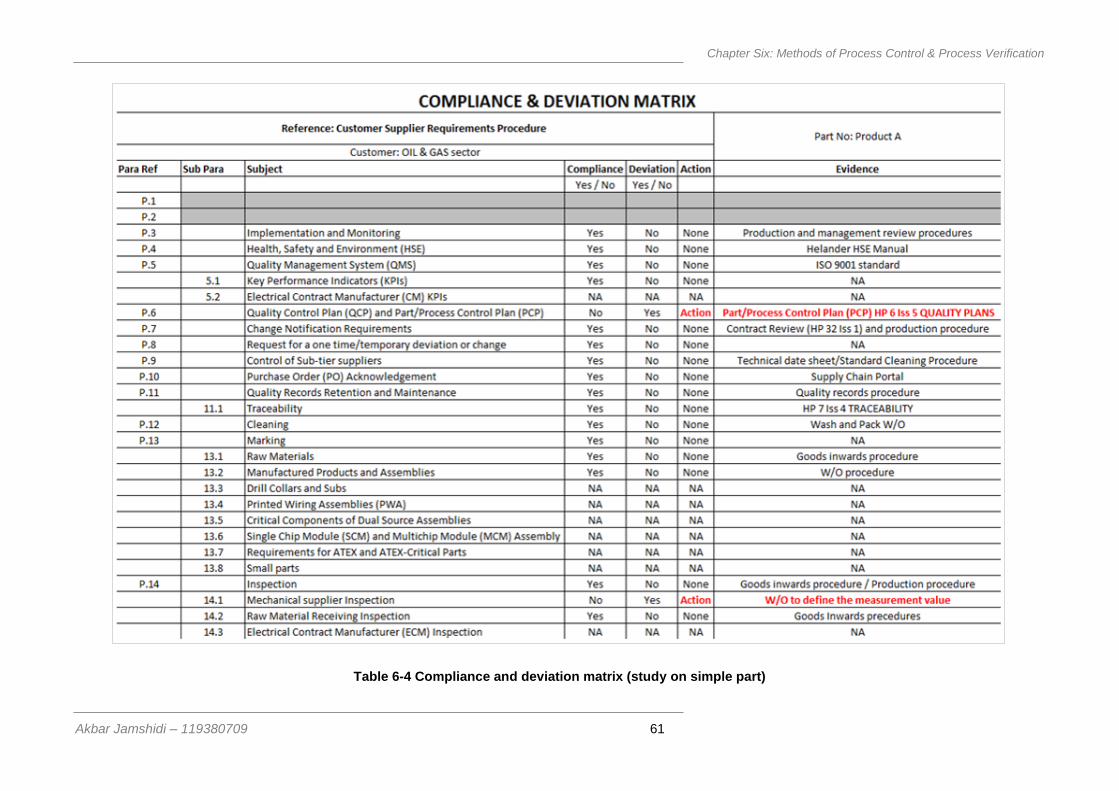
Chapter Six: Methods of Process Control & Process Verification
Akbar Jamshidi – 119380709 61
Table 6-4 Compliance and deviation matrix (study on simple part)
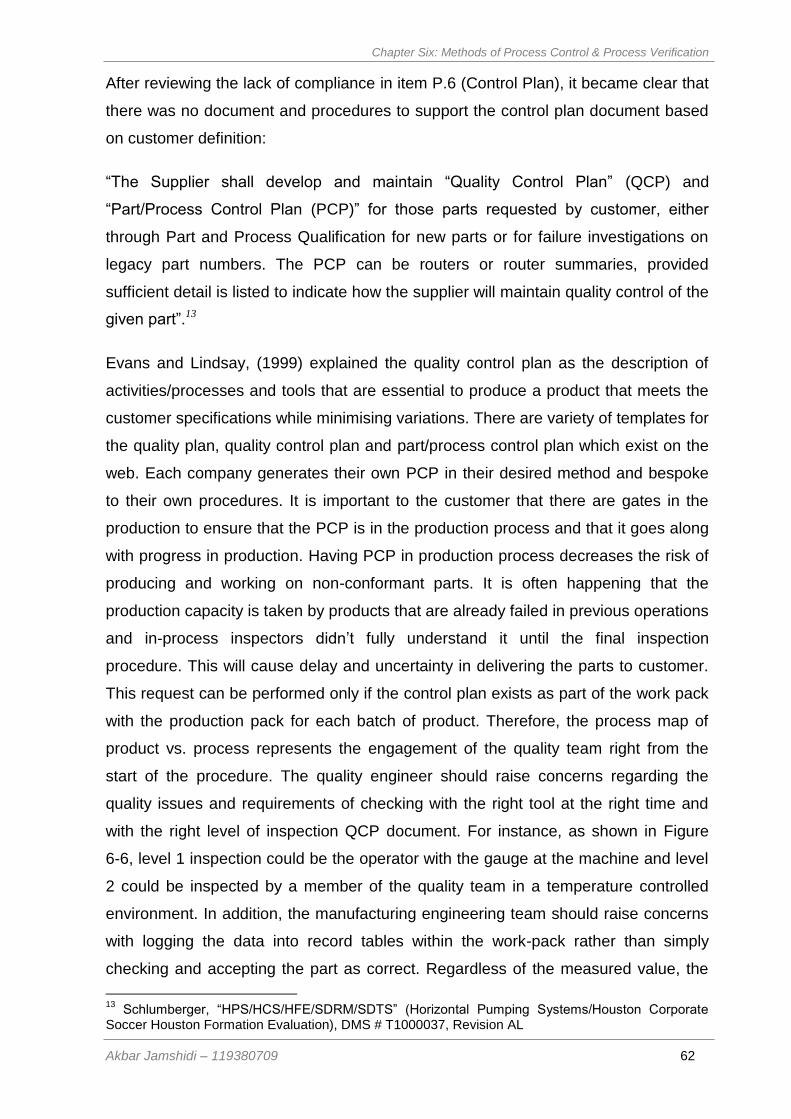
Chapter Six: Methods of Process Control & Process Verification
Akbar Jamshidi – 119380709 62
After reviewing the lack of compliance in item P.6 (Control Plan), it became clear that
there was no document and procedures to support the control plan document based
on customer definition:
“The Supplier shall develop and maintain “Quality Control Plan” (QCP) and
“Part/Process Control Plan (PCP)” for those parts requested by customer, either
through Part and Process Qualification for new parts or for failure investigations on
legacy part numbers. The PCP can be routers or router summaries, provided
sufficient detail is listed to indicate how the supplier will maintain quality control of the
given part”.13
Evans and Lindsay, (1999) explained the quality control plan as the description of
activities/processes and tools that are essential to produce a product that meets the
customer specifications while minimising variations. There are variety of templates for
the quality plan, quality control plan and part/process control plan which exist on the
web. Each company generates their own PCP in their desired method and bespoke
to their own procedures. It is important to the customer that there are gates in the
production to ensure that the PCP is in the production process and that it goes along
with progress in production. Having PCP in production process decreases the risk of
producing and working on non-conformant parts. It is often happening that the
production capacity is taken by products that are already failed in previous operations
and in-process inspectors didn’t fully understand it until the final inspection
procedure. This will cause delay and uncertainty in delivering the parts to customer.
This request can be performed only if the control plan exists as part of the work pack
with the production pack for each batch of product. Therefore, the process map of
product vs. process represents the engagement of the quality team right from the
start of the procedure. The quality engineer should raise concerns regarding the
quality issues and requirements of checking with the right tool at the right time and
with the right level of inspection QCP document. For instance, as shown in Figure
6-6, level 1 inspection could be the operator with the gauge at the machine and level
2 could be inspected by a member of the quality team in a temperature controlled
environment. In addition, the manufacturing engineering team should raise concerns
with logging the data into record tables within the work-pack rather than simply
checking and accepting the part as correct. Regardless of the measured value, the
13
Schlumberger, “HPS/HCS/HFE/SDRM/SDTS” (Horizontal Pumping Systems/Houston Corporate Soccer Houston Formation Evaluation), DMS # T1000037, Revision AL
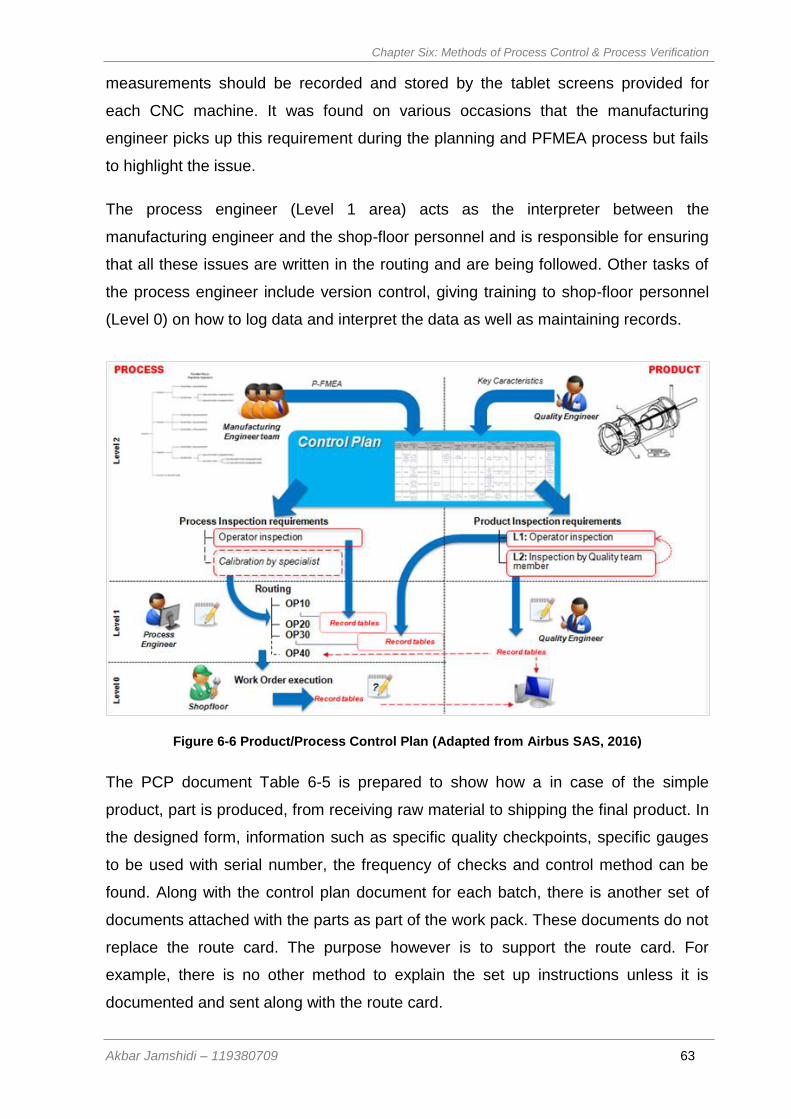
Chapter Six: Methods of Process Control & Process Verification
Akbar Jamshidi – 119380709 63
measurements should be recorded and stored by the tablet screens provided for
each CNC machine. It was found on various occasions that the manufacturing
engineer picks up this requirement during the planning and PFMEA process but fails
to highlight the issue.
The process engineer (Level 1 area) acts as the interpreter between the
manufacturing engineer and the shop-floor personnel and is responsible for ensuring
that all these issues are written in the routing and are being followed. Other tasks of
the process engineer include version control, giving training to shop-floor personnel
(Level 0) on how to log data and interpret the data as well as maintaining records.
Figure 6-6 Product/Process Control Plan (Adapted from Airbus SAS, 2016)
The PCP document Table 6-5 is prepared to show how a in case of the simple
product, part is produced, from receiving raw material to shipping the final product. In
the designed form, information such as specific quality checkpoints, specific gauges
to be used with serial number, the frequency of checks and control method can be
found. Along with the control plan document for each batch, there is another set of
documents attached with the parts as part of the work pack. These documents do not
replace the route card. The purpose however is to support the route card. For
example, there is no other method to explain the set up instructions unless it is
documented and sent along with the route card.
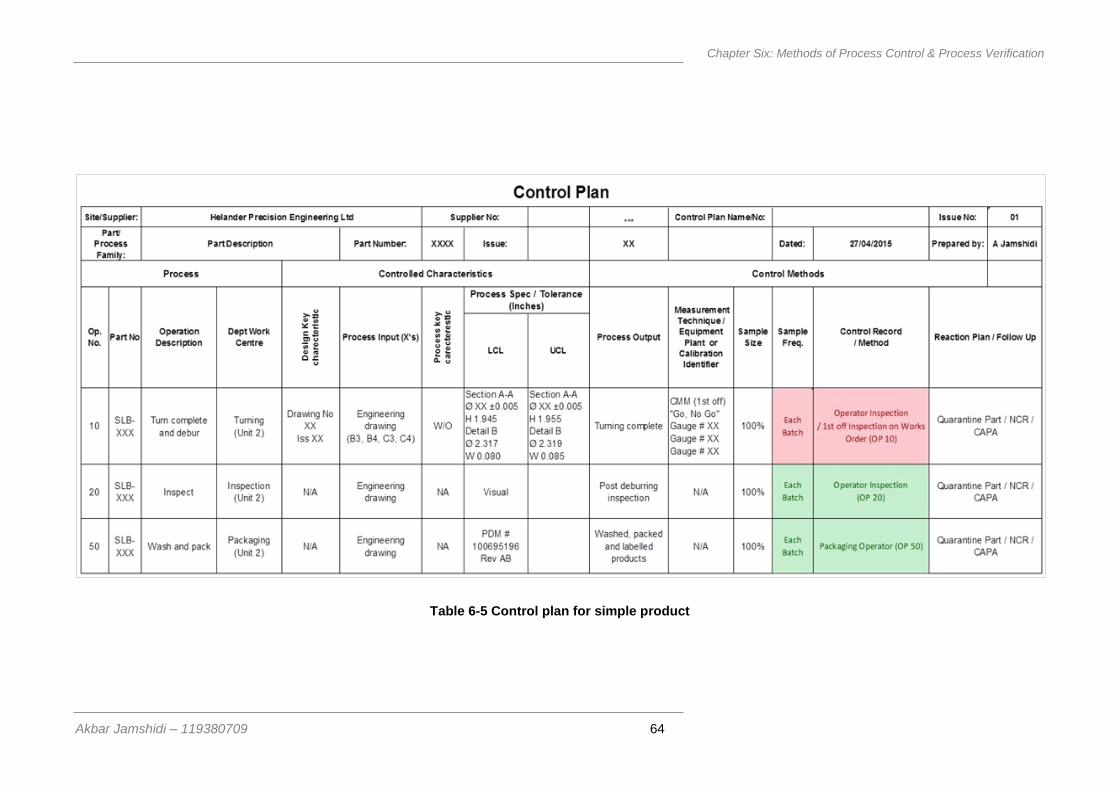
Chapter Six: Methods of Process Control & Process Verification
Akbar Jamshidi – 119380709 64
Table 6-5 Control plan for simple product
Chapter Six: Methods of Process Control & Process Verification
Akbar Jamshidi – 119380709 65
Due to a lack of existing up-to-date procedures on the start of this research, the
setup document with controlling versions did not exist in Helander. This issue by itself
is considered the largest factor which results in variations in repeated work with the
company.
In Section 6.5, other sets of documents have been introduced to Helander which now
accompany each batch are as follows:
Manufacturing drawing (customer drawing)
Operations route card (written by process engineer)
Material document (proof of material verification and acceptance)
Process change records (changes – if required – to master route template)
Non-conforming part record (5 why questionnaire)14
Additional material requisitions (for return/scrap purposes)
Final inspection records (to record the measurements on the final stage)
After reviewing the SRP and realising the need for other documents to support the
procedure, it was decided to modify the current forms and add other documents such
as:
Machines tooling setup sheet (machine set up instruction)
Work instructions (stages/orders of work for each operation)
Work instruction drawing (showing what tool for which face plus offsets)
Stage drawing (simplified drawing for each operation, live drawing)
Quality Schedule (replacing item 7 final inspection records)
The process of change at Helander takes a while until the shop floor operators get
used to the new procedures. Due to this unfamiliarity and due to not having a set up
instruction for machines, there were losses in time, variations in set up procedure,
variation in products, scrap and rework. Adding to elements mentioned every time,
the team leader of the site was responsible for setting up the machine, running the
first product, and verifying the part to ensure the machine was set correctly before
leaving it to the machine operator. The procedure set up is highly dependent on
certain individuals (team leaders) to adjust the machines. During the machine set up,
the machine operator was idle regardless of the time for machine set up (sometimes
14
5 Why is a technique used to explore the cause-and-effect relationships that causing a particular problem
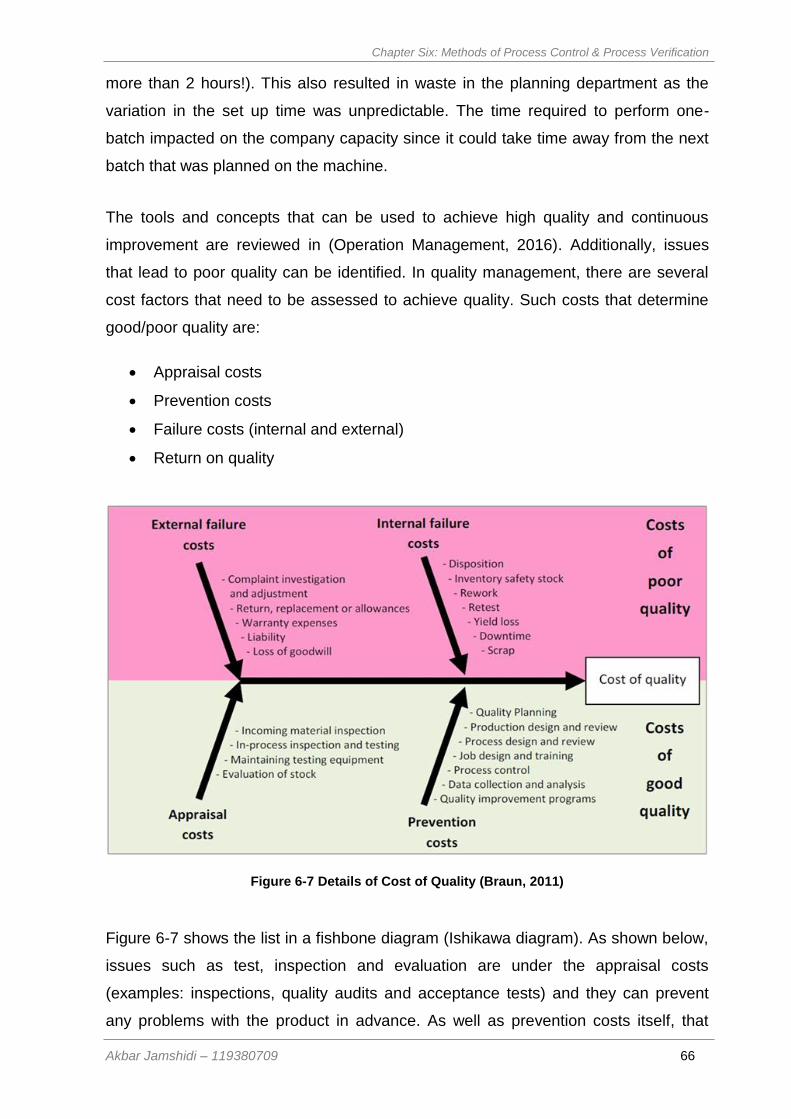
Chapter Six: Methods of Process Control & Process Verification
Akbar Jamshidi – 119380709 66
more than 2 hours!). This also resulted in waste in the planning department as the
variation in the set up time was unpredictable. The time required to perform one-
batch impacted on the company capacity since it could take time away from the next
batch that was planned on the machine.
The tools and concepts that can be used to achieve high quality and continuous
improvement are reviewed in (Operation Management, 2016). Additionally, issues
that lead to poor quality can be identified. In quality management, there are several
cost factors that need to be assessed to achieve quality. Such costs that determine
good/poor quality are:
Appraisal costs
Prevention costs
Failure costs (internal and external)
Return on quality
Figure 6-7 Details of Cost of Quality (Braun, 2011)
Figure 6-7 shows the list in a fishbone diagram (Ishikawa diagram). As shown below,
issues such as test, inspection and evaluation are under the appraisal costs
(examples: inspections, quality audits and acceptance tests) and they can prevent
any problems with the product in advance. As well as prevention costs itself, that
Chapter Six: Methods of Process Control & Process Verification
Akbar Jamshidi – 119380709 67
includes process related information. Examples include quality training, quality
assurance, and quality planning. If these costs are not budgeted in the organisation
then there is high chance that the cost of quality will need to be paid later in the
process or product. The effects of failure can be internal or external, depending on
the nature of the reason for poor quality product. An example for internal costs
includes retest, rework, scrap, or redesign. External failure costs can be non-
conformities, replacements, or defects. Failures severely damage the organisation’s
reputation due to delay in delivery, mistrust to the company’s capability, and
interdepartmental issues (production vs. sales department).
According to Giakatis et al. (2001), the problem is a lack of a systematic approach on
how to deal with the cost of quality. BS 6143 Standard (Guide to the economics of
quality, prevention, appraisal and failure model) was proposed to note the failure
costs first. This will lead to an increase in appraisal and prevention, consequently, the
increase in quality awareness in different levels of the organisation. Therefore all
three costs of quality will decrease.
The recommended procedure for the simple part was to increase the engineering
instructions in the work-pack. This way, the operators can better understand the
procedure and increase information flow in the company. The other benefit was the
recording and documentation of the engineering data for each part. This way there
was less variation in the process due to change in workforce (the operator is the
main cause of variation).
In order to identify the potential cost saving solutions for Helander, a meeting with
manufacturing team leaders of the project (case study component – Can Cell -
simple part) was arranged and a gap analysis (Table 6-6) of the Helander processes
for the targeted part was undertaken. The gap analysis designed by the author was
selected to show the actions and opportunities (recommendations) for each action.
These recommendations were mostly targeted at the engineering team with a
template from the quality department to be written by senior engineers. The Gap
analysis is between the customer process requirement (column title: Process),
International Standard (Column title: ISO 9001) and case study company process
cycle. In the columns “Actions” and “Opportunities”, the sample part does not comply
with for both the customer document and the standard cycle are highlighted in green,
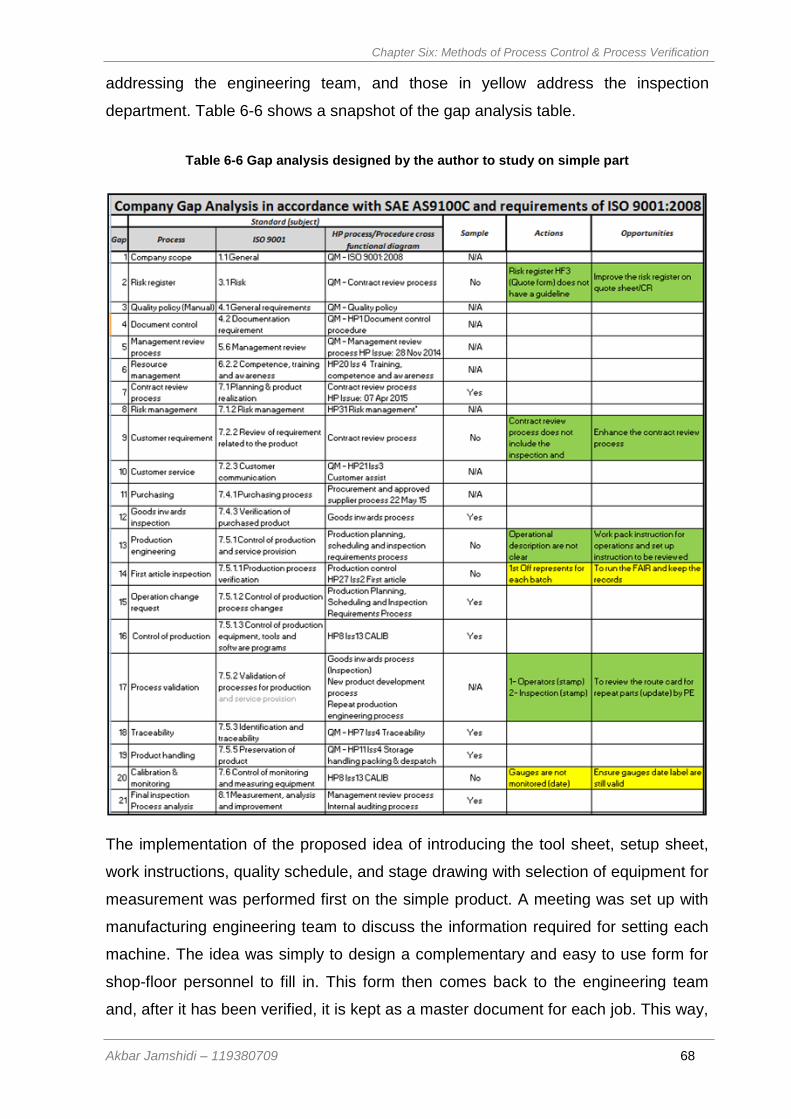
Chapter Six: Methods of Process Control & Process Verification
Akbar Jamshidi – 119380709 68
addressing the engineering team, and those in yellow address the inspection
department. Table 6-6 shows a snapshot of the gap analysis table.
Table 6-6 Gap analysis designed by the author to study on simple part
The implementation of the proposed idea of introducing the tool sheet, setup sheet,
work instructions, quality schedule, and stage drawing with selection of equipment for
measurement was performed first on the simple product. A meeting was set up with
manufacturing engineering team to discuss the information required for setting each
machine. The idea was simply to design a complementary and easy to use form for
shop-floor personnel to fill in. This form then comes back to the engineering team
and, after it has been verified, it is kept as a master document for each job. This way,
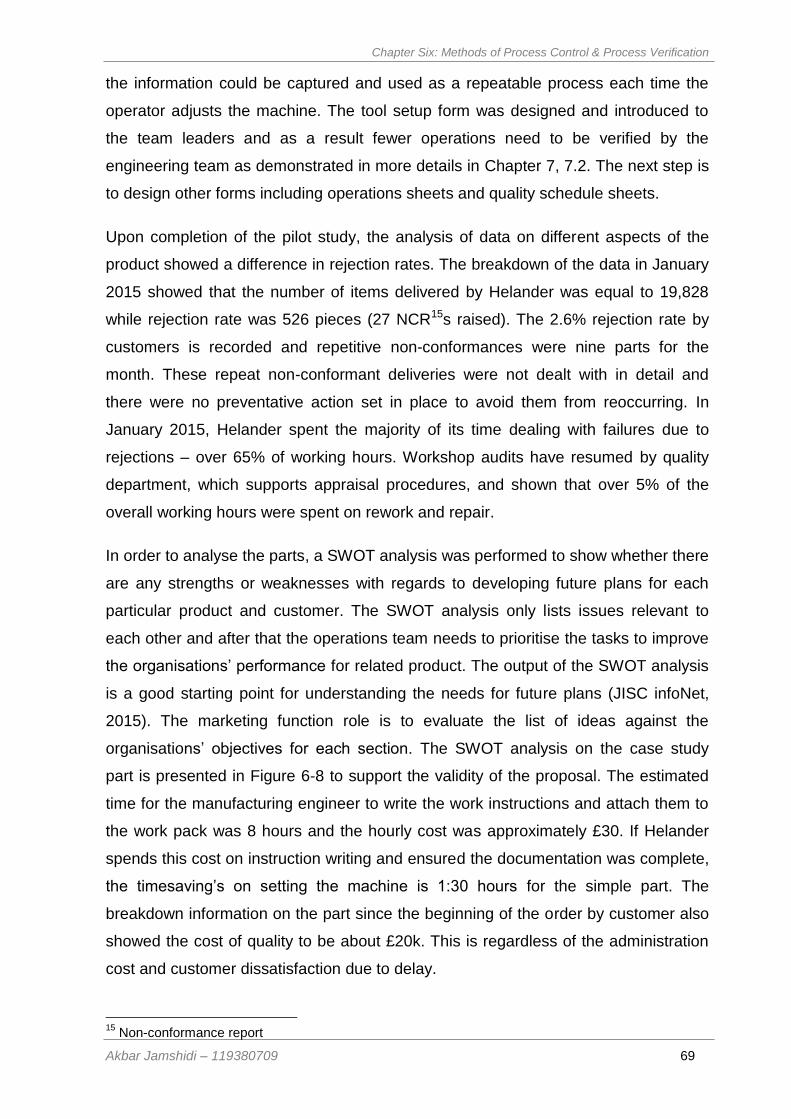
Chapter Six: Methods of Process Control & Process Verification
Akbar Jamshidi – 119380709 69
the information could be captured and used as a repeatable process each time the
operator adjusts the machine. The tool setup form was designed and introduced to
the team leaders and as a result fewer operations need to be verified by the
engineering team as demonstrated in more details in Chapter 7, 7.2. The next step is
to design other forms including operations sheets and quality schedule sheets.
Upon completion of the pilot study, the analysis of data on different aspects of the
product showed a difference in rejection rates. The breakdown of the data in January
2015 showed that the number of items delivered by Helander was equal to 19,828
while rejection rate was 526 pieces (27 NCR15s raised). The 2.6% rejection rate by
customers is recorded and repetitive non-conformances were nine parts for the
month. These repeat non-conformant deliveries were not dealt with in detail and
there were no preventative action set in place to avoid them from reoccurring. In
January 2015, Helander spent the majority of its time dealing with failures due to
rejections – over 65% of working hours. Workshop audits have resumed by quality
department, which supports appraisal procedures, and shown that over 5% of the
overall working hours were spent on rework and repair.
In order to analyse the parts, a SWOT analysis was performed to show whether there
are any strengths or weaknesses with regards to developing future plans for each
particular product and customer. The SWOT analysis only lists issues relevant to
each other and after that the operations team needs to prioritise the tasks to improve
the organisations’ performance for related product. The output of the SWOT analysis
is a good starting point for understanding the needs for future plans (JISC infoNet,
2015). The marketing function role is to evaluate the list of ideas against the
organisations’ objectives for each section. The SWOT analysis on the case study
part is presented in Figure 6-8 to support the validity of the proposal. The estimated
time for the manufacturing engineer to write the work instructions and attach them to
the work pack was 8 hours and the hourly cost was approximately £30. If Helander
spends this cost on instruction writing and ensured the documentation was complete,
the timesaving’s on setting the machine is 1:30 hours for the simple part. The
breakdown information on the part since the beginning of the order by customer also
showed the cost of quality to be about £20k. This is regardless of the administration
cost and customer dissatisfaction due to delay.
15
Non-conformance report
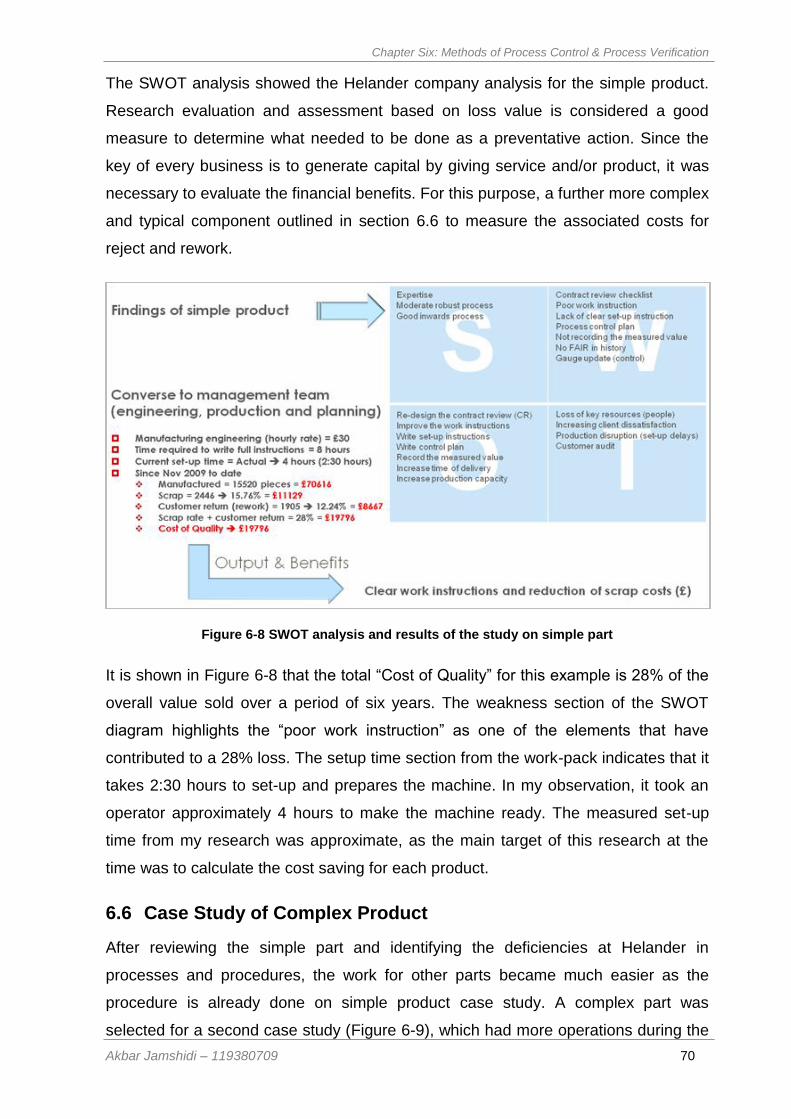
Chapter Six: Methods of Process Control & Process Verification
Akbar Jamshidi – 119380709 70
The SWOT analysis showed the Helander company analysis for the simple product.
Research evaluation and assessment based on loss value is considered a good
measure to determine what needed to be done as a preventative action. Since the
key of every business is to generate capital by giving service and/or product, it was
necessary to evaluate the financial benefits. For this purpose, a further more complex
and typical component outlined in section 6.6 to measure the associated costs for
reject and rework.
Figure 6-8 SWOT analysis and results of the study on simple part
It is shown in Figure 6-8 that the total “Cost of Quality” for this example is 28% of the
overall value sold over a period of six years. The weakness section of the SWOT
diagram highlights the “poor work instruction” as one of the elements that have
contributed to a 28% loss. The setup time section from the work-pack indicates that it
takes 2:30 hours to set-up and prepares the machine. In my observation, it took an
operator approximately 4 hours to make the machine ready. The measured set-up
time from my research was approximate, as the main target of this research at the
time was to calculate the cost saving for each product.
6.6 Case Study of Complex Product
After reviewing the simple part and identifying the deficiencies at Helander in
processes and procedures, the work for other parts became much easier as the
procedure is already done on simple product case study. A complex part was
selected for a second case study (Figure 6-9), which had more operations during the
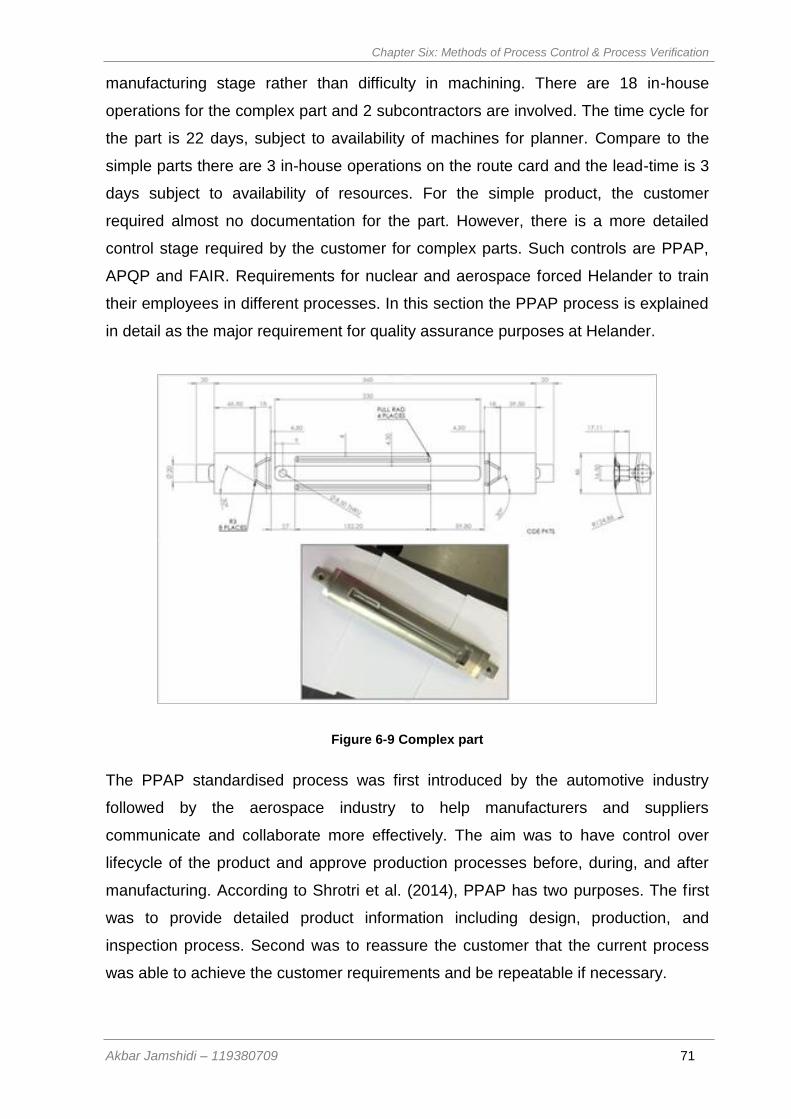
Chapter Six: Methods of Process Control & Process Verification
Akbar Jamshidi – 119380709 71
manufacturing stage rather than difficulty in machining. There are 18 in-house
operations for the complex part and 2 subcontractors are involved. The time cycle for
the part is 22 days, subject to availability of machines for planner. Compare to the
simple parts there are 3 in-house operations on the route card and the lead-time is 3
days subject to availability of resources. For the simple product, the customer
required almost no documentation for the part. However, there is a more detailed
control stage required by the customer for complex parts. Such controls are PPAP,
APQP and FAIR. Requirements for nuclear and aerospace forced Helander to train
their employees in different processes. In this section the PPAP process is explained
in detail as the major requirement for quality assurance purposes at Helander.
Figure 6-9 Complex part
The PPAP standardised process was first introduced by the automotive industry
followed by the aerospace industry to help manufacturers and suppliers
communicate and collaborate more effectively. The aim was to have control over
lifecycle of the product and approve production processes before, during, and after
manufacturing. According to Shrotri et al. (2014), PPAP has two purposes. The first
was to provide detailed product information including design, production, and
inspection process. Second was to reassure the customer that the current process
was able to achieve the customer requirements and be repeatable if necessary.
Chapter Six: Methods of Process Control & Process Verification
Akbar Jamshidi – 119380709 72
PPAP has a set of elements dependent on the targeted industry. For instance, the
automotive version has 21 elements that are listed in Figure 6-10. At Helander there
are a set of gateways described which have better control over the process. After
receiving the purchase order from customer service and checking the initial areas
(scope, price, quality, and delivery) and approving all stages it then depends on the
part/customer requirement if all or just a few elements of PPAP are required to be
reviewed. This is because these elements may not be applicable for the targeted
part/customer. In the PPAP area, the stars represent factors added by the Helander
company to the initial 21 elements of PPAP. In the Gate 3 area, the selected
elements are reviewed and passed to the task owners with allocated time and then
PSW (Part Submission Warrant) form is completed and sent to the customer if
needed as proof for PPAP.
Figure 6-10 Use of PPAP
PPAP needs to be performed on NPI products, but there are also other cases where
PPAP should be used. For example, a PPAP is required anytime there is a change in
manufacturing on an existing part or process.
Gate 1 Gate 2 Gate 3 Gate 4
Pu
rch
ase
Ord
er
Scope
Price
Quality
Delivery
PPAP 21 Element
Product Definition / Engineering Specification
Authorised Engineering Change Documents
Customer Engineering Approvals
Design Failure and Mode Analysis (Design FMEA)
Process Flow Diagram
Process Failure Mode and Effect Analysis (PFMEA)
Control Plan
Test / Inspection Criteria and Planing
Qualified Laboratory Documentation
Packaging and Labelling Standards and Documentation
Sample Production Product
Measurement system Analysis Studies
Dimensional Results
Records of Material / Performance Tests Results
Initial Process Studies
Process Control Surveillance Results
Initial Manufacturing Process Studies
Customer Specific Requirements
First Article Inspection Report (FAIR)
Process Control Document (PCD)
Production Submission Warrant (PSW)
**** Pro
du
ction
Ap
pro
ved
NPI
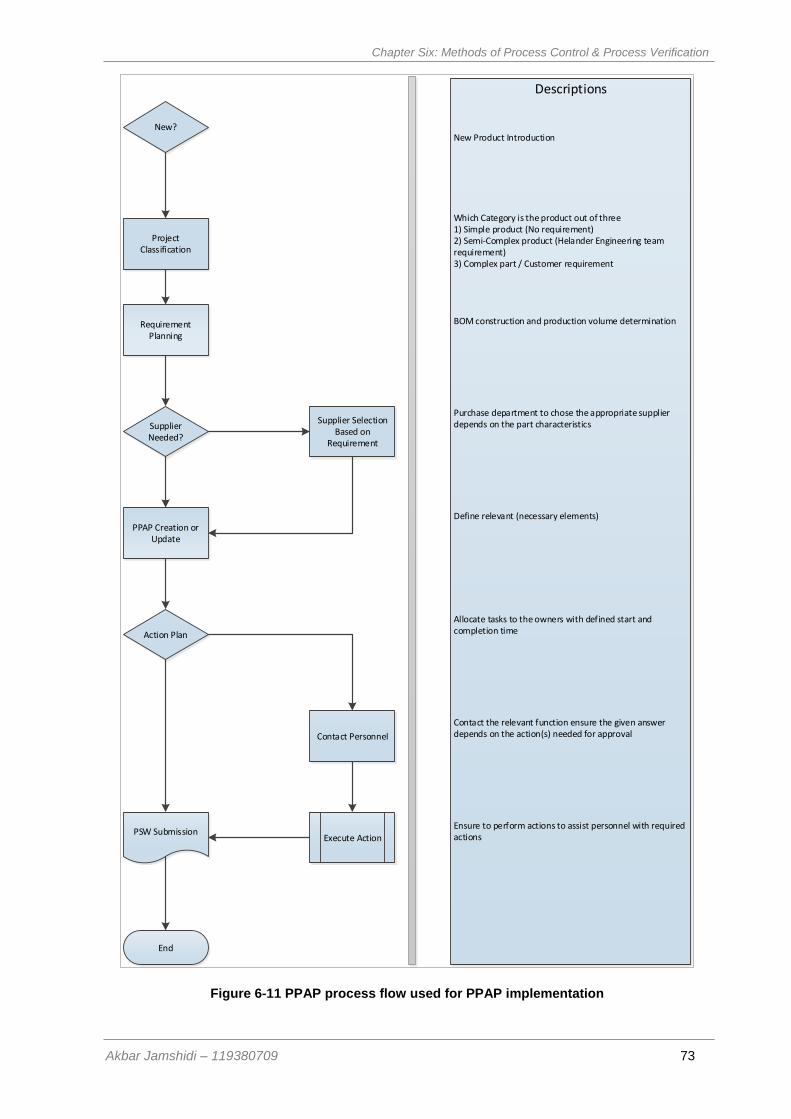
Chapter Six: Methods of Process Control & Process Verification
Akbar Jamshidi – 119380709 73
Figure 6-11 PPAP process flow used for PPAP implementation
New?
Project Classification
Requirement Planning
Supplier Needed?
Supplier Selection Based on
Requirement
PPAP Creation or Update
Action Plan
Contact Personnel
PSW Submission
End
Execute Action
Descriptions
New Product Introduction
Which Category is the product out of three1) Simple product (No requirement)2) Semi-Complex product (Helander Engineering team requirement)3) Complex part / Customer requirement
BOM construction and production volume determination
Purchase department to chose the appropriate supplier depends on the part characteristics
Define relevant (necessary elements)
Allocate tasks to the owners with defined start and completion time
Contact the relevant function ensure the given answer depends on the action(s) needed for approval
Ensure to perform actions to assist personnel with required actions
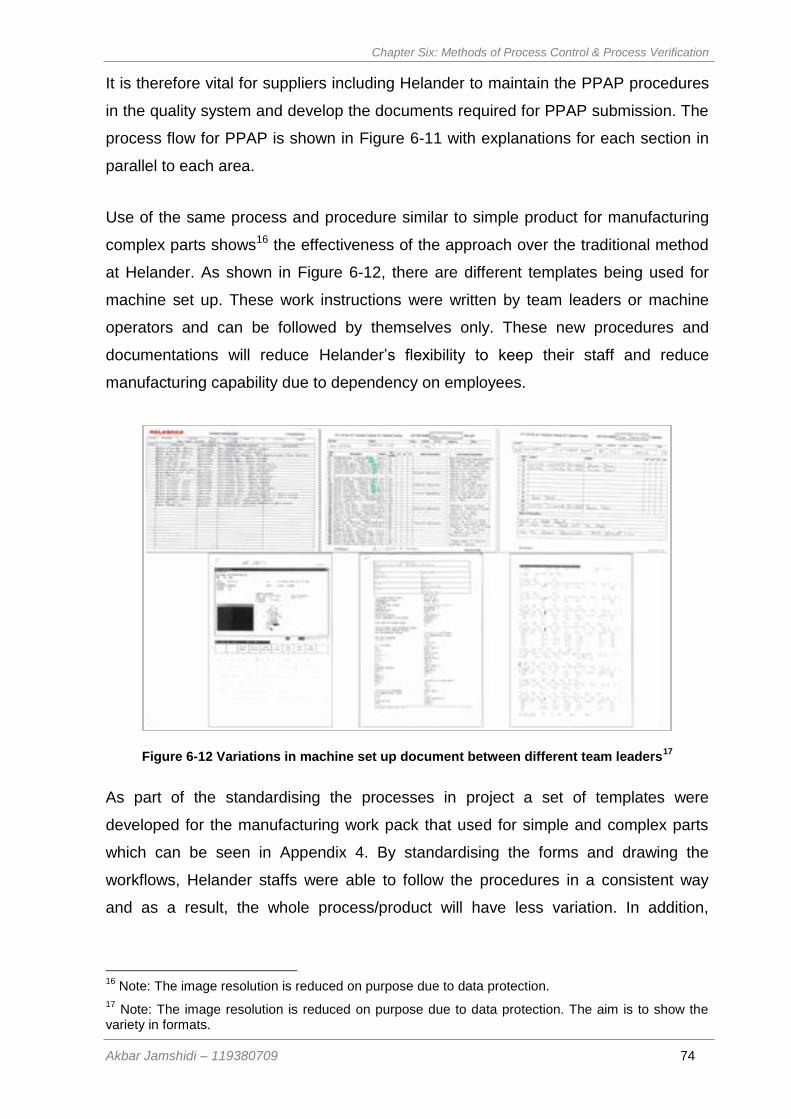
Chapter Six: Methods of Process Control & Process Verification
Akbar Jamshidi – 119380709 74
It is therefore vital for suppliers including Helander to maintain the PPAP procedures
in the quality system and develop the documents required for PPAP submission. The
process flow for PPAP is shown in Figure 6-11 with explanations for each section in
parallel to each area.
Use of the same process and procedure similar to simple product for manufacturing
complex parts shows16 the effectiveness of the approach over the traditional method
at Helander. As shown in Figure 6-12, there are different templates being used for
machine set up. These work instructions were written by team leaders or machine
operators and can be followed by themselves only. These new procedures and
documentations will reduce Helander’s flexibility to keep their staff and reduce
manufacturing capability due to dependency on employees.
Figure 6-12 Variations in machine set up document between different team leaders17
As part of the standardising the processes in project a set of templates were
developed for the manufacturing work pack that used for simple and complex parts
which can be seen in Appendix 4. By standardising the forms and drawing the
workflows, Helander staffs were able to follow the procedures in a consistent way
and as a result, the whole process/product will have less variation. In addition,
16
Note: The image resolution is reduced on purpose due to data protection.
17 Note: The image resolution is reduced on purpose due to data protection. The aim is to show the
variety in formats.
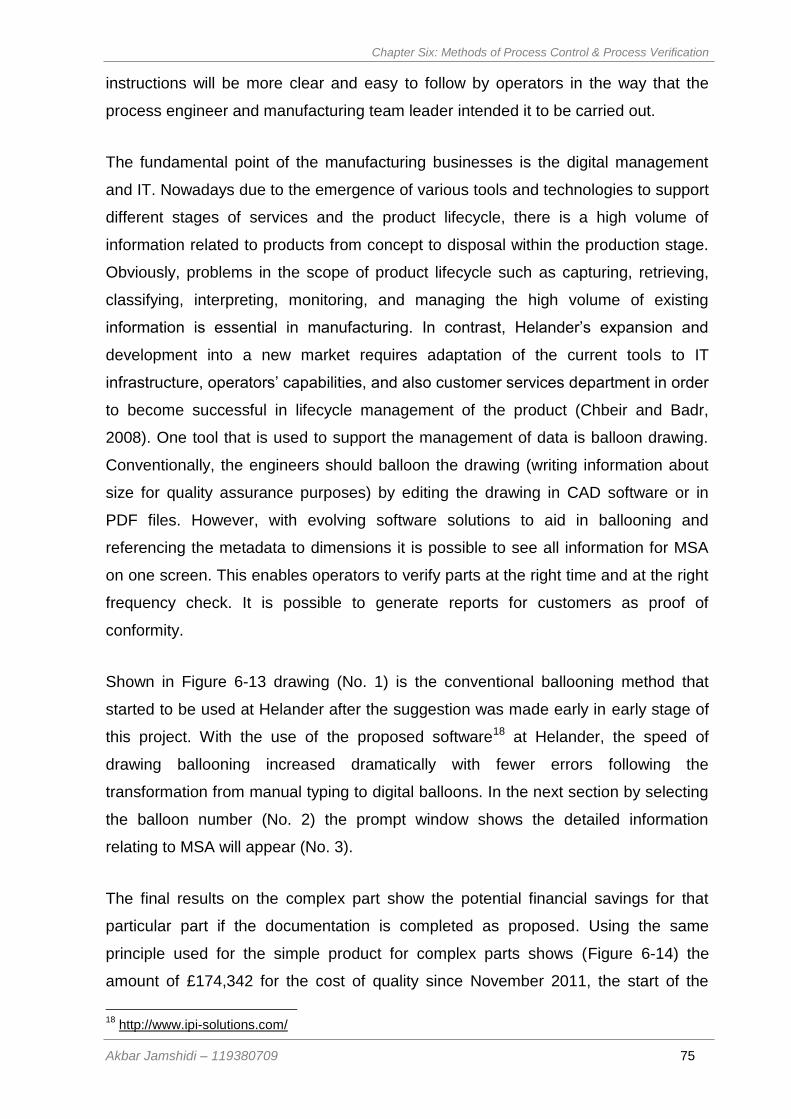
Chapter Six: Methods of Process Control & Process Verification
Akbar Jamshidi – 119380709 75
instructions will be more clear and easy to follow by operators in the way that the
process engineer and manufacturing team leader intended it to be carried out.
The fundamental point of the manufacturing businesses is the digital management
and IT. Nowadays due to the emergence of various tools and technologies to support
different stages of services and the product lifecycle, there is a high volume of
information related to products from concept to disposal within the production stage.
Obviously, problems in the scope of product lifecycle such as capturing, retrieving,
classifying, interpreting, monitoring, and managing the high volume of existing
information is essential in manufacturing. In contrast, Helander’s expansion and
development into a new market requires adaptation of the current tools to IT
infrastructure, operators’ capabilities, and also customer services department in order
to become successful in lifecycle management of the product (Chbeir and Badr,
2008). One tool that is used to support the management of data is balloon drawing.
Conventionally, the engineers should balloon the drawing (writing information about
size for quality assurance purposes) by editing the drawing in CAD software or in
PDF files. However, with evolving software solutions to aid in ballooning and
referencing the metadata to dimensions it is possible to see all information for MSA
on one screen. This enables operators to verify parts at the right time and at the right
frequency check. It is possible to generate reports for customers as proof of
conformity.
Shown in Figure 6-13 drawing (No. 1) is the conventional ballooning method that
started to be used at Helander after the suggestion was made early in early stage of
this project. With the use of the proposed software18 at Helander, the speed of
drawing ballooning increased dramatically with fewer errors following the
transformation from manual typing to digital balloons. In the next section by selecting
the balloon number (No. 2) the prompt window shows the detailed information
relating to MSA will appear (No. 3).
The final results on the complex part show the potential financial savings for that
particular part if the documentation is completed as proposed. Using the same
principle used for the simple product for complex parts shows (Figure 6-14) the
amount of £174,342 for the cost of quality since November 2011, the start of the
18
http://www.ipi-solutions.com/
Chapter Six: Methods of Process Control & Process Verification
Akbar Jamshidi – 119380709 76
project by Helander. It is wise to say half of the money spent due to quality issues
could be saved by clear work instructions. It was found that almost 20% of customer
returned parts were due to repeat errors, but the lack of CAPA (corrective and
preventive actions) contributed a substantial amount to the cost of quality. The
SWOT analysis highlights the potential savings, which is similar to the simple part
analysis as they are from the same company.
Figure 6-13 Proposed solution for ballooning and using integrated process improvement
Suggestions that are made for corrective and preventive actions (CAPA) based on
the financial saving results will increase Helander’s awareness in the cost of quality.
In the reviewing process, visits were arranged to key customer inspection
departments to understand their standards and accreditation processes. The key
attributes of the parts and design intent of each element of product were captured
after liaising with the customer inspection department. It is believed that lack of
communication between Helander and the customer inspection department as the
gateway for acceptance or rejection of the parts which had a huge negative effect on
1
2
3
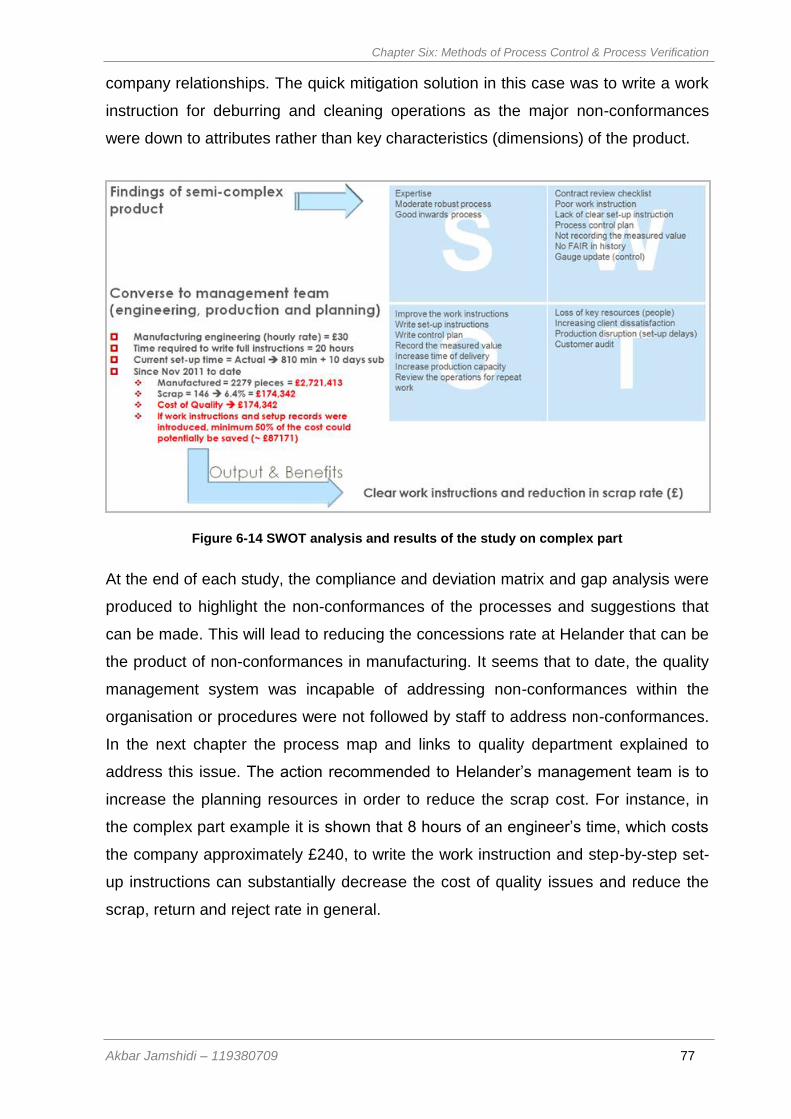
Chapter Six: Methods of Process Control & Process Verification
Akbar Jamshidi – 119380709 77
company relationships. The quick mitigation solution in this case was to write a work
instruction for deburring and cleaning operations as the major non-conformances
were down to attributes rather than key characteristics (dimensions) of the product.
Figure 6-14 SWOT analysis and results of the study on complex part
At the end of each study, the compliance and deviation matrix and gap analysis were
produced to highlight the non-conformances of the processes and suggestions that
can be made. This will lead to reducing the concessions rate at Helander that can be
the product of non-conformances in manufacturing. It seems that to date, the quality
management system was incapable of addressing non-conformances within the
organisation or procedures were not followed by staff to address non-conformances.
In the next chapter the process map and links to quality department explained to
address this issue. The action recommended to Helander’s management team is to
increase the planning resources in order to reduce the scrap cost. For instance, in
the complex part example it is shown that 8 hours of an engineer’s time, which costs
the company approximately £240, to write the work instruction and step-by-step set-
up instructions can substantially decrease the cost of quality issues and reduce the
scrap, return and reject rate in general.
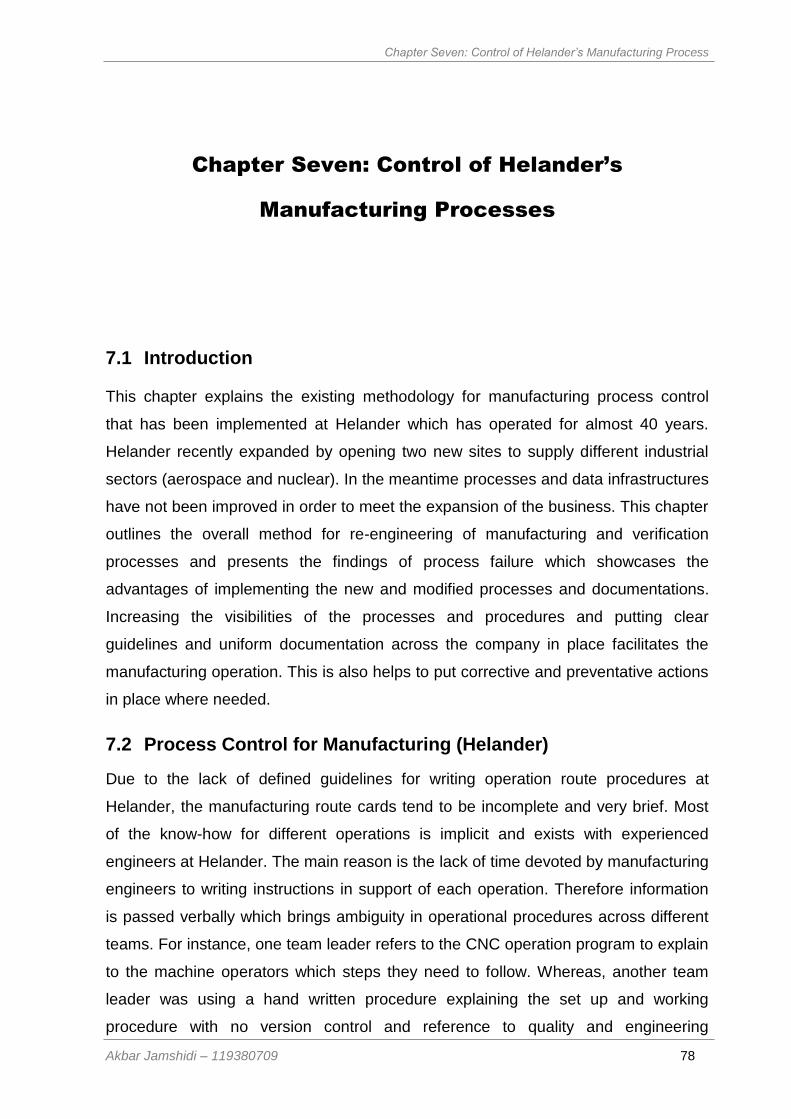
Chapter Seven: Control of Helander’s Manufacturing Process
Akbar Jamshidi – 119380709 78
Chapter Seven: Control of Helander’s
Manufacturing Processes
7 Control of Helander’s Manufacturing Processes
7.1 Introduction
This chapter explains the existing methodology for manufacturing process control
that has been implemented at Helander which has operated for almost 40 years.
Helander recently expanded by opening two new sites to supply different industrial
sectors (aerospace and nuclear). In the meantime processes and data infrastructures
have not been improved in order to meet the expansion of the business. This chapter
outlines the overall method for re-engineering of manufacturing and verification
processes and presents the findings of process failure which showcases the
advantages of implementing the new and modified processes and documentations.
Increasing the visibilities of the processes and procedures and putting clear
guidelines and uniform documentation across the company in place facilitates the
manufacturing operation. This is also helps to put corrective and preventative actions
in place where needed.
7.2 Process Control for Manufacturing (Helander)
Due to the lack of defined guidelines for writing operation route procedures at
Helander, the manufacturing route cards tend to be incomplete and very brief. Most
of the know-how for different operations is implicit and exists with experienced
engineers at Helander. The main reason is the lack of time devoted by manufacturing
engineers to writing instructions in support of each operation. Therefore information
is passed verbally which brings ambiguity in operational procedures across different
teams. For instance, one team leader refers to the CNC operation program to explain
to the machine operators which steps they need to follow. Whereas, another team
leader was using a hand written procedure explaining the set up and working
procedure with no version control and reference to quality and engineering
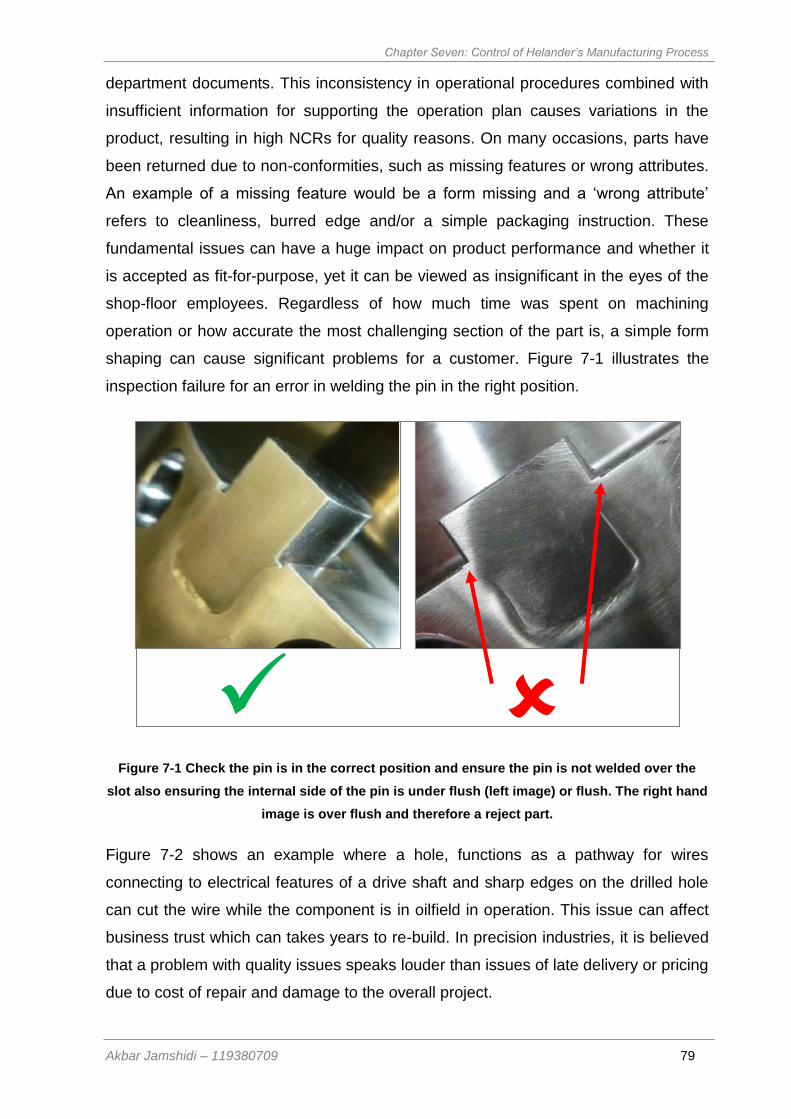
Chapter Seven: Control of Helander’s Manufacturing Process
Akbar Jamshidi – 119380709 79
department documents. This inconsistency in operational procedures combined with
insufficient information for supporting the operation plan causes variations in the
product, resulting in high NCRs for quality reasons. On many occasions, parts have
been returned due to non-conformities, such as missing features or wrong attributes.
An example of a missing feature would be a form missing and a ‘wrong attribute’
refers to cleanliness, burred edge and/or a simple packaging instruction. These
fundamental issues can have a huge impact on product performance and whether it
is accepted as fit-for-purpose, yet it can be viewed as insignificant in the eyes of the
shop-floor employees. Regardless of how much time was spent on machining
operation or how accurate the most challenging section of the part is, a simple form
shaping can cause significant problems for a customer. Figure 7-1 illustrates the
inspection failure for an error in welding the pin in the right position.
Figure 7-1 Check the pin is in the correct position and ensure the pin is not welded over the
slot also ensuring the internal side of the pin is under flush (left image) or flush. The right hand
image is over flush and therefore a reject part.
Figure 7-2 shows an example where a hole, functions as a pathway for wires
connecting to electrical features of a drive shaft and sharp edges on the drilled hole
can cut the wire while the component is in oilfield in operation. This issue can affect
business trust which can takes years to re-build. In precision industries, it is believed
that a problem with quality issues speaks louder than issues of late delivery or pricing
due to cost of repair and damage to the overall project.
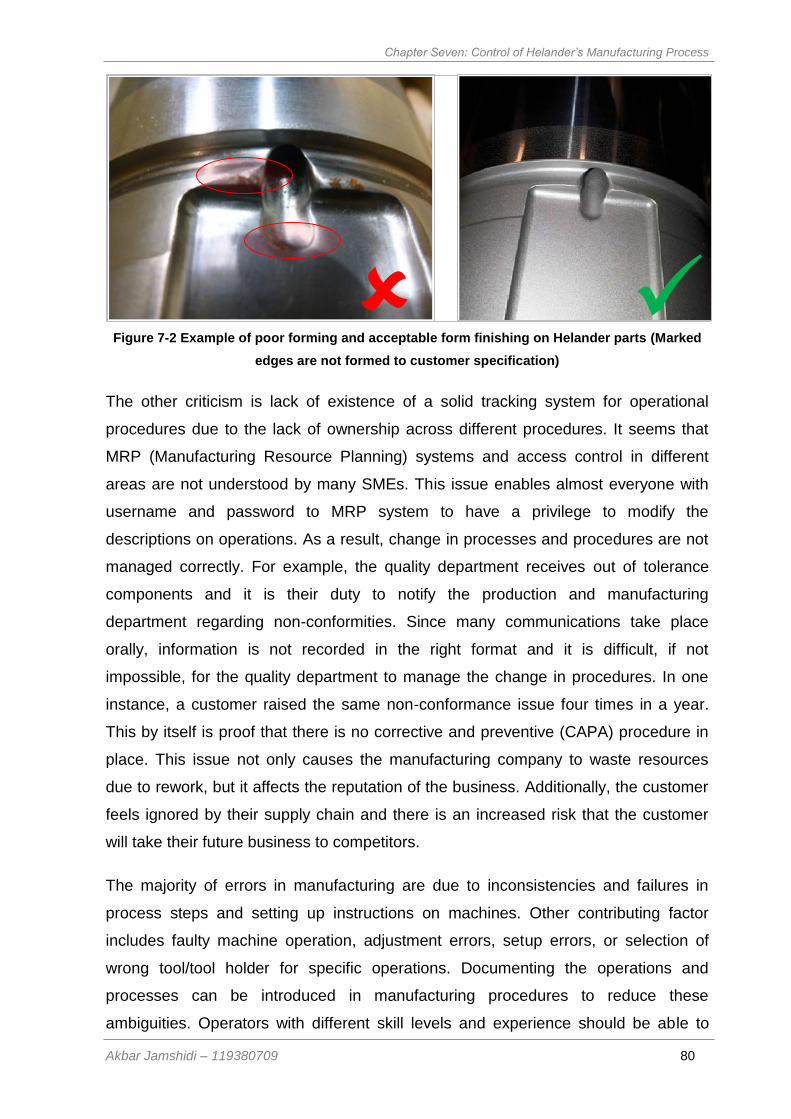
Chapter Seven: Control of Helander’s Manufacturing Process
Akbar Jamshidi – 119380709 80
Figure 7-2 Example of poor forming and acceptable form finishing on Helander parts (Marked
edges are not formed to customer specification)
The other criticism is lack of existence of a solid tracking system for operational
procedures due to the lack of ownership across different procedures. It seems that
MRP (Manufacturing Resource Planning) systems and access control in different
areas are not understood by many SMEs. This issue enables almost everyone with
username and password to MRP system to have a privilege to modify the
descriptions on operations. As a result, change in processes and procedures are not
managed correctly. For example, the quality department receives out of tolerance
components and it is their duty to notify the production and manufacturing
department regarding non-conformities. Since many communications take place
orally, information is not recorded in the right format and it is difficult, if not
impossible, for the quality department to manage the change in procedures. In one
instance, a customer raised the same non-conformance issue four times in a year.
This by itself is proof that there is no corrective and preventive (CAPA) procedure in
place. This issue not only causes the manufacturing company to waste resources
due to rework, but it affects the reputation of the business. Additionally, the customer
feels ignored by their supply chain and there is an increased risk that the customer
will take their future business to competitors.
The majority of errors in manufacturing are due to inconsistencies and failures in
process steps and setting up instructions on machines. Other contributing factor
includes faulty machine operation, adjustment errors, setup errors, or selection of
wrong tool/tool holder for specific operations. Documenting the operations and
processes can be introduced in manufacturing procedures to reduce these
ambiguities. Operators with different skill levels and experience should be able to
Chapter Seven: Control of Helander’s Manufacturing Process
Akbar Jamshidi – 119380709 81
follow the methods outlined on the process documents. Each operation should have
an SOP, work instruction (visual if necessary) and other supporting documents (i.e.
images). Minimising the variations in final product can only happen if the
manufacturing process clearly addresses all necessary details for shop-floor
operators. The flow of information in SMEs should be developed in a way that allows
only the senior engineers to design work instructions. Currently, the shop-floor
operators and team leaders are troubleshooting operational problems by firefighting
or reactive methods. The process of having such a system starts right from the point
when the company wins an order and the work order is about to be sent to the shop-
floor. The process of re-engineering the operations procedures requires a holistic
approach that involves change of current company culture and providing detailed
information to operators rather than verbally transferring the information via senior
engineers on the shop floor. Once the information is transferred using job cards, the
next step is to follow the instructions and machine the work-piece. Here the operator
is responsible and the owner of the process and any quality issues arising. The
operator will be in charge of taking actions accordingly based on defined methods.
With this method it is possible to deliver an attractive task with clear instructions to
operators which will allow them to complete tasks with a high level of quality. By
adopting this systematic approach it is possible to get feedback (if any) from
operators, feed the information back to the engineering department and control
changes based on traceable documents in the MRP system. This process seems to
be obvious in manufacturing environment and might be expected to appear in ISO
standards. The main reason that these processes are not part of ISO certification is
that the details of the operation procedures are not believed to be important. There is
also a lack of commitment to change company procedures to address this issue.
Differences in communications have resulted in gaps in data transformation within
the organisation. An example is the transfer of know-how from the last generation of
engineers to the next generation of engineers. Knowledge use and reuse in
advanced manufacturing technology enables engineers to improve speed and
productivity with a higher level of confidence. However, Pahl et al. (1988) claimed
that 80% of new designs are from reused knowledge, whereas research by Ettlie and
Kubarek in 2008 showed that only 28% of new designs are from reused knowledge.
Reed et al. (2010) reported that the application of advanced manufacturing
Chapter Seven: Control of Helander’s Manufacturing Process
Akbar Jamshidi – 119380709 82
techniques reduces errors and increases product familiarity for staff while maintaining
product consistency levels.
Helander has identified that capturing and reviewing data and documenting
information for different processes is key factor in sustaining the business. Therefore
Helander decided to define the process in order to re-engineer the manufacturing
procedures and format them into a data-store so that any operator with sufficient
knowledge of CNC machining could perform the task by using the relevant
component route cards. Other achievements would be to reduce the time taken for
new staff to adapt to company procedures and to help the company maintain the
quality in manufactured products.
It was decided to give the ownership of the process control documents to engineering
team leaders. These instructions need to be explained in detail and accompanied by
the CAD models and stage drawings if required for CNC machine operations. At first
glance, this appears to require a remarkable effort from team leaders to configure
such a system for every single operation. To reduce the effort for the team and have
a consistent method, a template for each document is introduced and supplied to the
current operators for completion. This template replaces the documents that each
team leader generated for themselves to control the machine setup procedure
(Figure 7-3). Team leaders are then required to review and edit instructions rather
than writing procedures from scratch. This idea speeds up the documentation
process and eliminates the time required for process engineers to write-up all the
procedures. Reference numbers are stored in the databases and are assigned to
every work instruction and SOP (standard operating procedure). The reference
number can be found on the operations route card and can be cross-referenced to
the right document for performing specific tasks. The operation can be as complex as
CNC machining or as simple as de-burring, washing or even providing packing
instructions. All of them have a unique reference number that can be found both in
manufacturing route cards and Helander’s main manufacturing repository file. As
long as there is documented know-how available, errors can be minimised. Sample
templates of different documents required for typical operation can be found in
Appendix 4.
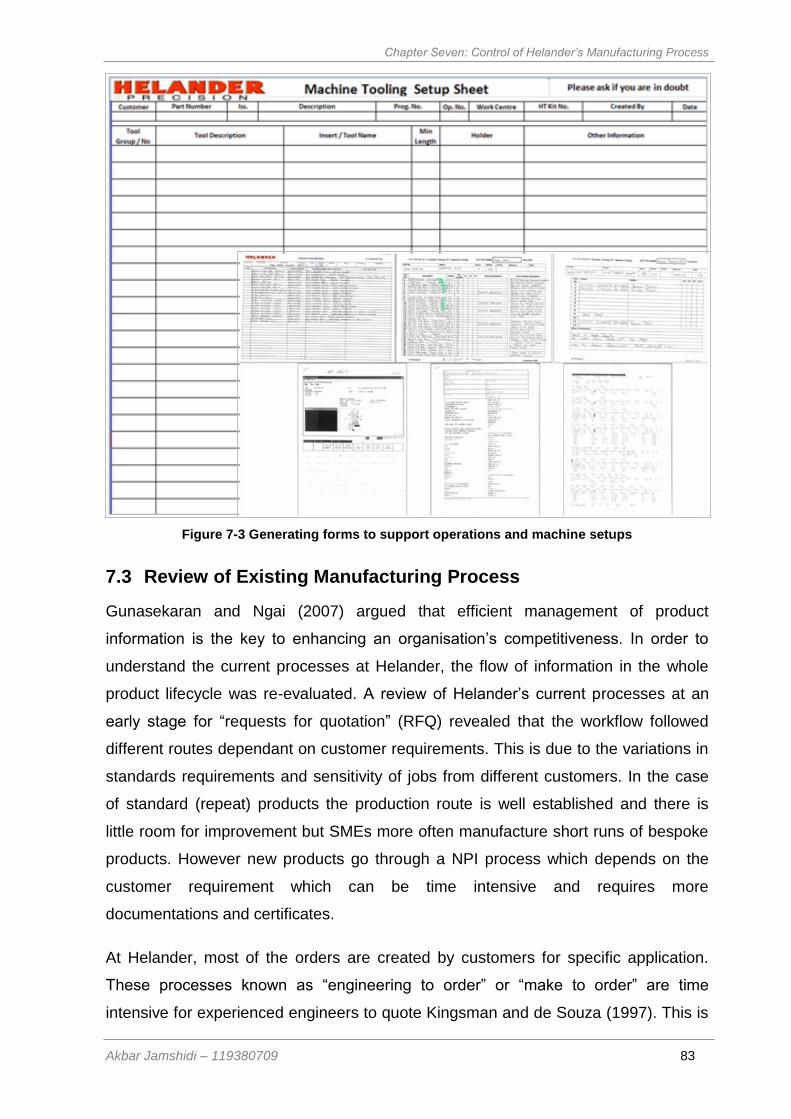
Chapter Seven: Control of Helander’s Manufacturing Process
Akbar Jamshidi – 119380709 83
Figure 7-3 Generating forms to support operations and machine setups
7.3 Review of Existing Manufacturing Process
Gunasekaran and Ngai (2007) argued that efficient management of product
information is the key to enhancing an organisation’s competitiveness. In order to
understand the current processes at Helander, the flow of information in the whole
product lifecycle was re-evaluated. A review of Helander’s current processes at an
early stage for “requests for quotation” (RFQ) revealed that the workflow followed
different routes dependant on customer requirements. This is due to the variations in
standards requirements and sensitivity of jobs from different customers. In the case
of standard (repeat) products the production route is well established and there is
little room for improvement but SMEs more often manufacture short runs of bespoke
products. However new products go through a NPI process which depends on the
customer requirement which can be time intensive and requires more
documentations and certificates.
At Helander, most of the orders are created by customers for specific application.
These processes known as “engineering to order” or “make to order” are time
intensive for experienced engineers to quote Kingsman and de Souza (1997). This is
Chapter Seven: Control of Helander’s Manufacturing Process
Akbar Jamshidi – 119380709 84
due to the variations in required standards and sensitivity of jobs from different
customers. For instance, orders from the nuclear industry are reviewed in detail by
the quality department to ensure all relevant requirements are fully considered. RFQ
is reviewed by an estimator based on their area of expertise. Using the company
standard cost estimation spreadsheet, a cost sheet for every stage of the job is
issued. At this stage, the estimated cost of different operations, sub-contract
processes, and man-hours are reviewed and added to a burden rate. The burden
rate is a constant ratio from the finance department that entails the inventory,
machinery and employee costs. This is a conventional method of cost analysis for
many SMEs, which are not big enough to procure high tech software for cost
estimation. It has been argued that although this method is reasonably accurate, it
takes significant time away from qualified personnel for quote generation rather than
value adding activities such as process improvement (García-Crespo, 2011). Other
criticisms, such as risk inaccuracy, time consuming processes and late quote
response, are not covered here as they are outside of the scope of this research.
In the next stage, if the customer agrees on the quoted price, then they will place the
purchase order. The order goes under engineering contract review to plan the best
method of manufacturing. At this stage, depending on the complexity of the job, a
cross-functional team determines the operations order. Typical members of the team
include the original estimator, senior manufacturing engineer, manufacturing team
leader, purchasing department representative, customer service representative,
quality manager and production planner. Zhao et al. (2011) argue that from a
measurement point of view, process planning can be divided into two categories:
Micro level, includes the machine program, inspection program, and motion
commands
Macro level, more generic decisions need to be made which include choice of
the machine tool based on tolerance of the part, desired uncertainties and the
question of when and what to measure on key performance metrics to ensure
the process is under control
SMEs seem to undertake a more in-depth review at the micro-level, as this is a
requirement of the component production process. The verification and validation of
the manufactured parts in different stages is the key element to be discussed here.
Macro decisions are of greater importance but also less focused in many SMEs,

Chapter Seven: Control of Helander’s Manufacturing Process
Akbar Jamshidi – 119380709 85
mainly due to lack of time and resources. The area that Helander is focusing on to
improve accuracy and productivity is to have everything in plan prior to
manufacturing. For example it often happens that a part is manufactured in
operations 10, 20 and 30 with no problem. Then operation 40 requires a fixture or
specially designed tool which is not prepared in time. The knock on effect of re-
planting by production team can cause problems on other opportunities Helander
might have. Such problems includes failure in production planning, delay in overall
delivery and the payment of a penalty premium to subcontractors to prepare the tool
or use other machine capacity and reschedule their work.
Figure 7- 4 Simplified process flow within an SME
At the next stage, team members agree on a plan and the component is passed to
the production department to plan activities and notify the delivery date to customer.
After receiving the RFQ (Request of Quotation) form customer and ensure the part is
quoted correctly and terms and conditions are within the company’s scope in
conjunction with the Manufacturing Team Leader, the Manufacturing Manager closely
monitors the component at different stages of production to ensure high quality of the
component. As shown in Figure 7- 4, the simplified big picture of the procedure
illustrates when parts are made and the verification process is undertaken by the
quality (inspection) department. There is a risk of failure (producing scrap

Chapter Seven: Control of Helander’s Manufacturing Process
Akbar Jamshidi – 119380709 86
components) due to the lack of a simultaneous verification system to perform on-line
checking while components are made on the machines using this model. The
operations procedure is initially written by manufacturing team leaders. At this stage,
if the components have not been made before, the operating procedure undergoes
multiple revisions until the best method is found and the process passes the FAIR
(first article inspection report) stage. It is again the team leaders and manufacturing
engineers who validate and ensure that the right method is recorded.
The overall map of the Helander company and procedures is shown in the format of
tube map. The idea of using a tube map was proposed by a quality manager
suggesting that this map is more easily understood by individuals at different levels
and by teams at Helander. Legends used for the tube map in Figure 7-5 are self-
descriptive and each colour shows the different functions of the teams at Helander.
Functions in here are referring to different personnel for specific roles. The roadmap
is only used as a general guideline to show the flow of information and documents.
Documents should be with the component in the shop floor during the manufacturing
operation.
Figure 7-5 Tube map of HPE (Helander Precision Engineering)
Chapter Seven: Control of Helander’s Manufacturing Process
Akbar Jamshidi – 119380709 87
7.4 Development and Implementation of Manufacturing
Re-engineering Procedure
In today’s modern manufacturing industry there is an increasing need to improve
internal processes to meet diverse client needs. Process re-engineering is an
important activity, but the re-engineering procedure rate in SME level is very little.
Business pressures shift the focus of SMEs toward winning new projects and
contracts rather than developing long-term, sustainable manufacturing processes.
Variations in manufacturing processes are inevitable, but the amount of non-
conformities often exceeds acceptable levels. This section is focused on the re-
engineering of the manufacturing and verification procedures for discrete parts
production with the aim of enhancing process control and product verification.
The ideologies of the ‘Push’ and ‘Pull’ approaches to manufacturing are useful in the
context of process re-engineering for data improvement. Currently information is
pulled from the market and prominent customers, and manufacturing companies try
to (Push) make the right product by following customer procedures that attempt to
verify against specifications. This approach can result in significant quality control
challenges. It is important to re-engineer processes and product verification in SME
manufacturing companies as they have a higher tendency to remain static in contrast
to the changing pace of technology. Leadership, culture, ownership and process
management are among the main attributes required for the successful deployment
of process re-engineering.
SMEs can be reluctant to adopt new techniques in their processes and procedures.
In SMEs, conventional methods are more popular because these methods are well
established. As technology moves on, these companies ignore spending on research
and development (R&D), primarily due to lack of resources. The lacks of investment
in R&D lead to a lack of competitiveness and also problems in both quality and lead
time. One example is that SMEs frequently under-perform when quoting. It is mainly
because the quotation is done manually and relevant correspondence is saved by
different team members. Quoting software (knowledge based system) has been
introduced into Helander and it helps to treat all orders in the same way. This
eliminates issues of bias and personal experience which might arise across different
engineers. All relevant files relevant to each order and customer are saved and
Chapter Seven: Control of Helander’s Manufacturing Process
Akbar Jamshidi – 119380709 88
maintained within the company regardless of who worked on them (García-Crespo,
2011).
There are various tools and techniques which exist to put company policy into
practice. Various bespoke services must be evolved in order to apply procedures at
SMEs in a successful manner. Besides, the working environment should facilitate the
concept of continuous improvement. This is only possible if TQM19 is supported by
key management functions such as people, processes and systems in the
organisation.
At Helander company, different methods are applied in parallel. There is Plan, Do,
Check, Action (PDCA) for interdepartmental processes that are reviewed for different
procedures. In parallel to this, the processes are mapped in cross-functional charts
for different departments showing the flow of documents and data. These cross-
functional charts show the bigger picture of interdepartmental procedures and enable
the managers and team leaders to see the opportunities for improvement. The other
method that is used at Helander is to give training to staff and promote awareness to
employees. Employees are educated by the quality department to raise issues on the
format of non-conformities and make problem solving more comprehensive, rather
than fire-fighting, reducing chaos in the organisation. It is vital to the company that
employees know what the true requirements are to deliver their tasks and whether or
not they have the capability to meet those expectations consistently. Therefore, the
workflow should clearly define the procedures so that everyone knows their internal
and external customer. If any non-conformity occurs in the workflows or procedures,
it is the primary task of the affected person or team to raise a non-conformance
report to the quality team. Later on, the quality team will modify the workflow in a way
to prevent the scenario from reoccurring. A sample of the workflow in the format of
the cross functional diagram is shown and explained in Figure 7-6. The chart is
designed to be used as a reference of workflow between different functions of the
organisation. So often, even employees with experience in their role pass information
to the wrong people in the organisation and expect results back within a fixed
timescale. Obviously the wrong people cannot answer the need and due to their
workload or their competency and interest they will not notify the right people to deal
with the requested information. This scenario will cause delay in the process and can
19
Total Quality Management (TQM) is a structured approach to companies to improve the quality of products and services through responses to their continuous feedback (Rouse, 2016).
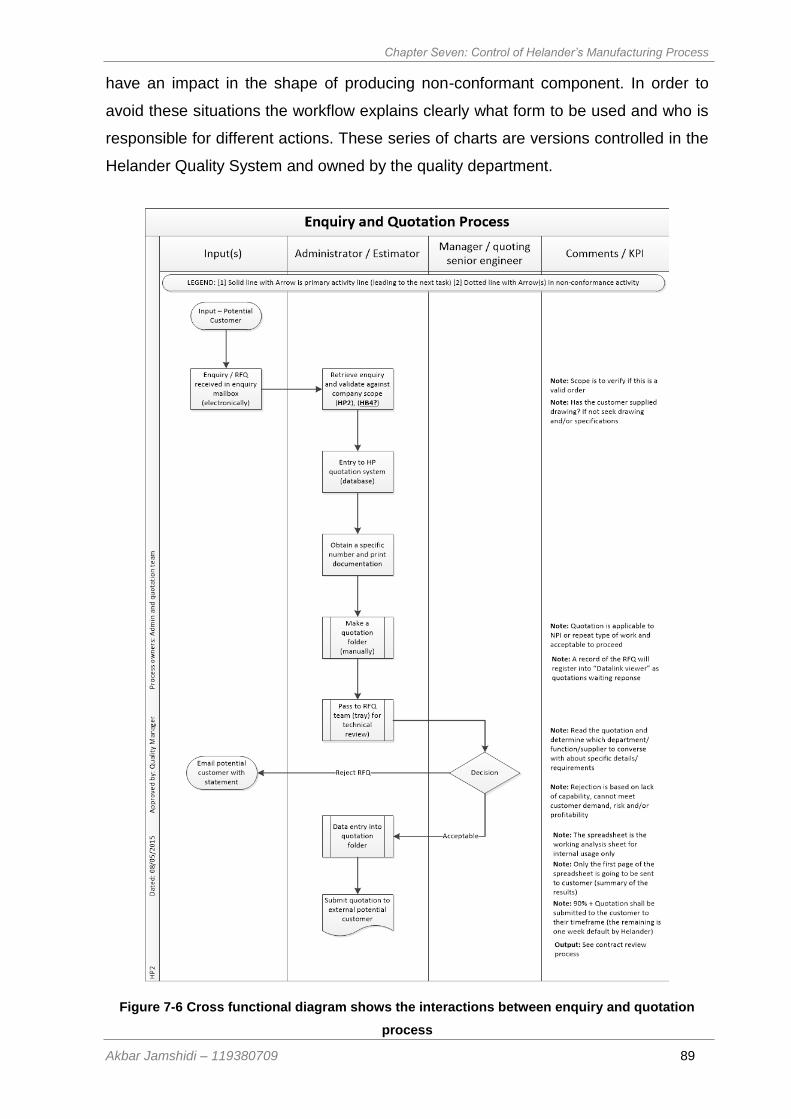
Chapter Seven: Control of Helander’s Manufacturing Process
Akbar Jamshidi – 119380709 89
have an impact in the shape of producing non-conformant component. In order to
avoid these situations the workflow explains clearly what form to be used and who is
responsible for different actions. These series of charts are versions controlled in the
Helander Quality System and owned by the quality department.
Figure 7-6 Cross functional diagram shows the interactions between enquiry and quotation
process
Chapter Seven: Control of Helander’s Manufacturing Process
Akbar Jamshidi – 119380709 90
The author’s contribution to the SME case study is to show the importance of
standardized forms for operations in (section 7.2). It is explained that the vitality of
the implementation of standard operating procedure in the shop floor in order to have
uniform documents and processes across the company which increases personnel’s
understanding of parts and operations (section 7.2). This will help Helander to have a
more consistent process in manufacturing which can increase the chance of
repeatability in manufacturing.
Also the general visual guides designed for different parts show the forms of pass
and reject for each product. This was used as a clear guideline (section 7.4) to
prevent manufacturing of out of specification products at the inspection stage rather
than at the customer.
The other work done by the author is showing the organisation chart in different
formats that can be understood by employees with different backgrounds across the
shop floor. It also shows the procedures in visual format to facilitate the interpretation
of communication between different departments (section 7.2).
Chapter Eight Performance Measurement of Helander Machine Tools
Akbar Jamshidi – 119380709 91
Chapter Eight: Performance Measurement of
Helander Machine Tools
8 Performance Measurement of Helander Machine Tools
8.1 Introduction
Manufacturing industries rely on machine tools such as CNC, milling, turning, and
grinding machines. The quality of finished products is closely linked to machine tool
quality. The quality and accuracy of machine tools can be defined by measuring
repeatability in machine tool positioning. Prakosa et al. (2011) explain that high
accuracy refers to process repeatability while precision refers to degree of conformity
to its exact value. Five axis machines are becoming more popular as customers
demand parts that are more complex. In high value manufacturing, the importance of
machine tools to produce high accuracy products is essential. High accuracy is
defined by producing parts in a repeatable manner and ensuring precision in
compliance to the defined value in the part drawing.
The performance of the machines is often affected by positional errors. Causes can
be related to incorrect tool offset and incorrect centres of rotation. Such errors can
also be the result of thermal expansion, machine setups and/or collisions between
the tool and part. Consequently, it can be difficult to produce highly accurate parts
consistently. It is therefore necessary to ensure machine tools are tested for
positioning accuracy. Often SMEs have to ignore such factors due to extreme
limitations in resources and time. In other instances, companies have the
measurement system but it is not utilised due to the skills required and complexity of
the procedure. On the other hand SMEs routinely use sub-contractors for highly
complex work. There is a requirement for rapid improvement in the effectiveness of
the supply chains with support from downstream companies who might perform
functions such as welding and coating. Some benefits of machine tool verification are
listed below based on observations at Helander:
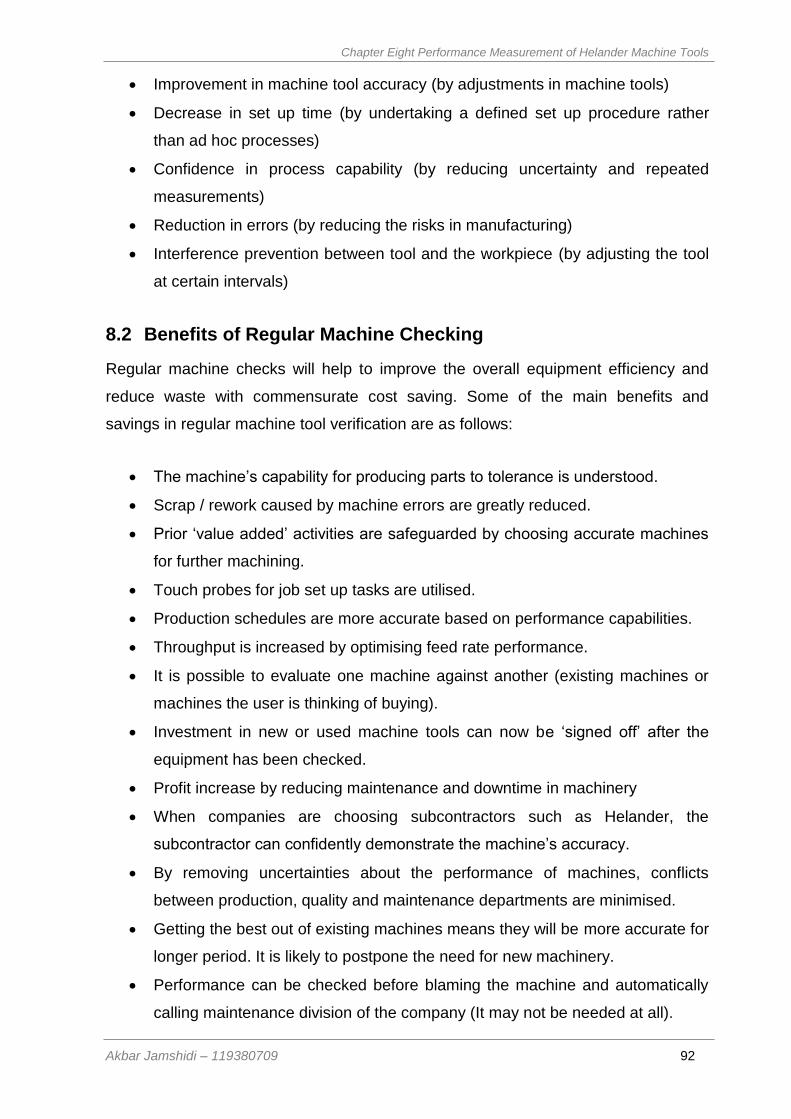
Chapter Eight Performance Measurement of Helander Machine Tools
Akbar Jamshidi – 119380709 92
Improvement in machine tool accuracy (by adjustments in machine tools)
Decrease in set up time (by undertaking a defined set up procedure rather
than ad hoc processes)
Confidence in process capability (by reducing uncertainty and repeated
measurements)
Reduction in errors (by reducing the risks in manufacturing)
Interference prevention between tool and the workpiece (by adjusting the tool
at certain intervals)
8.2 Benefits of Regular Machine Checking
Regular machine checks will help to improve the overall equipment efficiency and
reduce waste with commensurate cost saving. Some of the main benefits and
savings in regular machine tool verification are as follows:
The machine’s capability for producing parts to tolerance is understood.
Scrap / rework caused by machine errors are greatly reduced.
Prior ‘value added’ activities are safeguarded by choosing accurate machines
for further machining.
Touch probes for job set up tasks are utilised.
Production schedules are more accurate based on performance capabilities.
Throughput is increased by optimising feed rate performance.
It is possible to evaluate one machine against another (existing machines or
machines the user is thinking of buying).
Investment in new or used machine tools can now be ‘signed off’ after the
equipment has been checked.
Profit increase by reducing maintenance and downtime in machinery
When companies are choosing subcontractors such as Helander, the
subcontractor can confidently demonstrate the machine’s accuracy.
By removing uncertainties about the performance of machines, conflicts
between production, quality and maintenance departments are minimised.
Getting the best out of existing machines means they will be more accurate for
longer period. It is likely to postpone the need for new machinery.
Performance can be checked before blaming the machine and automatically
calling maintenance division of the company (It may not be needed at all).
Chapter Eight Performance Measurement of Helander Machine Tools
Akbar Jamshidi – 119380709 93
Regular machine tool verification is an essential process / pre-requisite when
implementing a preventative maintenance programme with minimal
manpower.
Verification helps to examine performance trends, helping to predict (and thus
prevent) major machine tool breakdowns.
Results can be archived to provide a traceable history of the performance of
each machine.
Management can make better informed decisions regarding which machines
require priority attention and those that need replacement.
The information helps to reduce the number of breakdowns, therefore reduces
pressure on machine tool maintenance resources.
The best possible performance out of machines can be achieved, irrespective
of age or condition.
Inspection failures can be reduced by improving the processes.
The capability of the process can be proved without the need for lengthy
investigations.
Deterioration in performance over time can be detected by historical review
and be used to schedule maintenance work prior to machine breakdown.
This list is indicative of the considerable benefits arising from machine tool
verification and regular machine tool monitoring. These benefits need to be
considered by industry in the process of prioritising these activities alongside
production tasks, to achieve the optimal level of productivity and quality.
8.3 Machine Tool Positioning
The fundamental part of any CNC machine is the positioning of the tool. The
accuracy and quality of the final product depends upon the accuracy of the machine
tool. Like any mechanical device, the precision of the machine reduces with time and
this affects the parts produced. It is therefore very important to ensure that the
machine tool is monitored and checked at specific intervals in order to ensure
machines are capable of manufacturing parts with minimum variations. Kwon et al.
(2005) argued that positioning of the machine tool has a direct impact on in-process
inspection using a touch probe. Instead of relying only on the touch probe
measurements for part quality assurance, machine tool accuracy and capability
analysis need to be taken into account. This issue is considered as a redundant
Chapter Eight Performance Measurement of Helander Machine Tools
Akbar Jamshidi – 119380709 94
process or counts as a less important issue for SMEs. The process of verifying
machine tools is often seen as an additional cost and a non-productive activity that is
costly and reduces profit. However, regular machine tool verification can reduce the
cost of non-conforming products and increases the overall equipment effectiveness
(OEE), resulting in increased profitability and greater customer satisfaction. Today,
this issue is addressed by machine tool maintenance providers. A diagnostic test can
be performed on the machine identifying any error in the machine tools so that
deviations can be adjusted. Unfortunately, due to the lack of investment on resources
and understanding the importance of the machine adjustments, this issue is seen as
troubleshooting and reactive procedure rather than preventive action. Regular
verification of machine tools brings confidence to companies and ensures that the
equipment is performing within its accuracy specification. ISO 9001 states the
following in Quality Management: Guidelines (1998):
“The supplier shall identify and plan the production, installation and servicing
processes which directly affect quality and shall ensure that these processes are
carried out under controlled conditions which shall include the following:
Suitable maintenance of equipment to ensure continuing capability is
maintained.”
8.4 The Importance of Positioning Accuracy
Helander company has invested in machine tools, tool setting probes and spindle
probe verification equipment, which are not used to their full capacity. It is planned
that each machine should be entered onto the “gauge register” file to ensure that a
determined regular check is carried out to monitor the capability and performance of
the machine tool. The outcome of this section is to reduce the maintenance costs
and increase productivity by reducing downtime and producing conformance
products. This study helps Helander company to develop a learning plan for the
company’s staff in order to understand the importance of measuring machine tool
performance and to maintain the machine tool performance within agreed limits. On-
going monitoring is planned to ensure the accuracy of machined components is
maintained and “surprise machine tool breakdowns” are reduced to a minimum or
eliminated. Furthermore, to maintain the machine tool’s accuracy it is necessary to
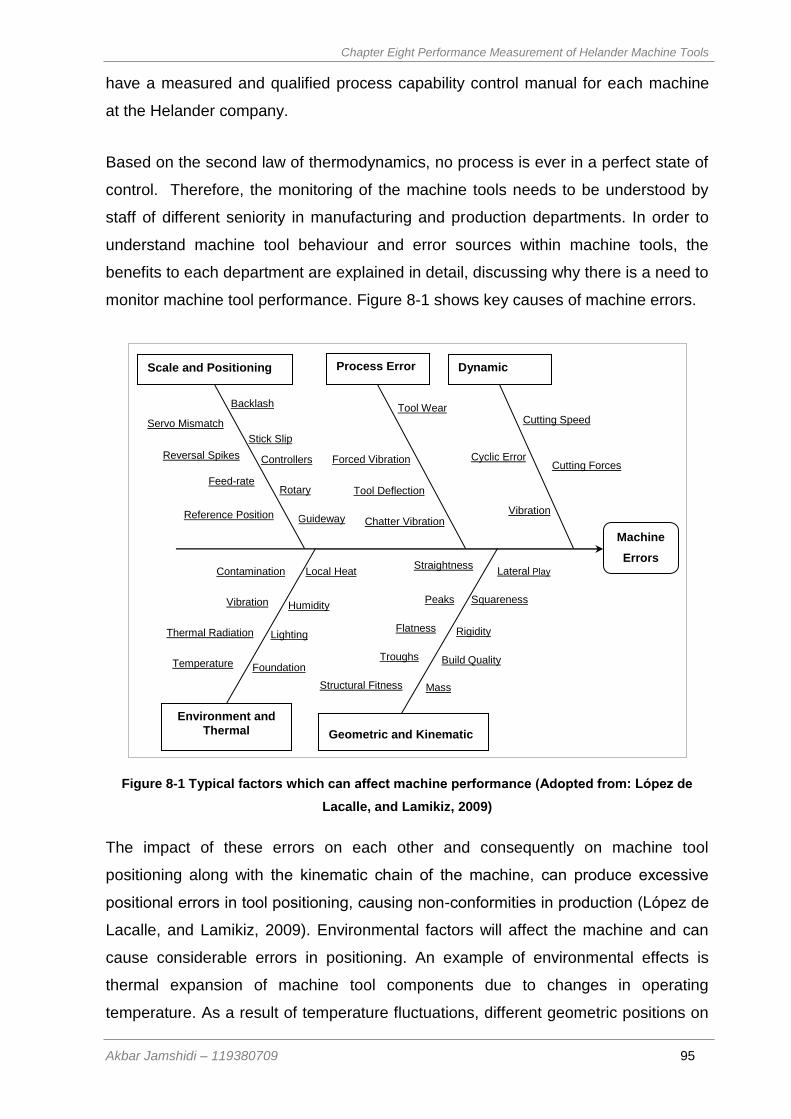
Chapter Eight Performance Measurement of Helander Machine Tools
Akbar Jamshidi – 119380709 95
have a measured and qualified process capability control manual for each machine
at the Helander company.
Based on the second law of thermodynamics, no process is ever in a perfect state of
control. Therefore, the monitoring of the machine tools needs to be understood by
staff of different seniority in manufacturing and production departments. In order to
understand machine tool behaviour and error sources within machine tools, the
benefits to each department are explained in detail, discussing why there is a need to
monitor machine tool performance. Figure 8-1 shows key causes of machine errors.
Figure 8-1 Typical factors which can affect machine performance (Adopted from: Lopez de
Lacalle, and Lamikiz, 2009)
The impact of these errors on each other and consequently on machine tool
positioning along with the kinematic chain of the machine, can produce excessive
positional errors in tool positioning, causing non-conformities in production (Lopez de
Lacalle, and Lamikiz, 2009). Environmental factors will affect the machine and can
cause considerable errors in positioning. An example of environmental effects is
thermal expansion of machine tool components due to changes in operating
temperature. As a result of temperature fluctuations, different geometric positions on
Contamination
Vibration
Foundation
Thermal Radiation
Temperature
Local Heat
Humidity
Lighting
Environment and
Thermal
Vibration
Cutting Forces
Cutting Speed
Dynamic
Cyclic Error
Straightness
Peaks
Build Quality
Flatness
Troughs
Lateral Play
Squareness
Rigidity
Mass Structural Fitness
Machine
Errors
Chatter Vibration
Tool Wear
Process Error
Tool Deflection
Forced Vibration
Guideway
Geometric and Kinematic
Reference Position
Rotary
Controllers
Stick Slip
Backlash
Scale and Positioning
Feed-rate
Reversal Spikes
Servo Mismatch
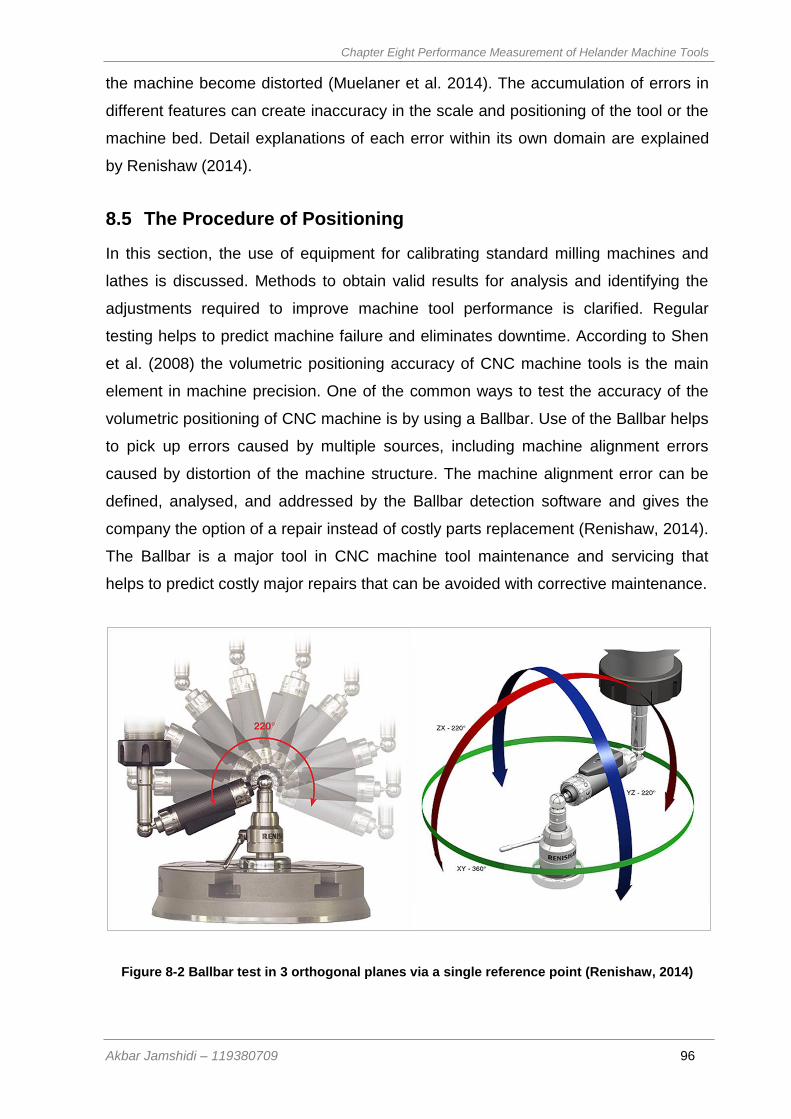
Chapter Eight Performance Measurement of Helander Machine Tools
Akbar Jamshidi – 119380709 96
the machine become distorted (Muelaner et al. 2014). The accumulation of errors in
different features can create inaccuracy in the scale and positioning of the tool or the
machine bed. Detail explanations of each error within its own domain are explained
by Renishaw (2014).
8.5 The Procedure of Positioning
In this section, the use of equipment for calibrating standard milling machines and
lathes is discussed. Methods to obtain valid results for analysis and identifying the
adjustments required to improve machine tool performance is clarified. Regular
testing helps to predict machine failure and eliminates downtime. According to Shen
et al. (2008) the volumetric positioning accuracy of CNC machine tools is the main
element in machine precision. One of the common ways to test the accuracy of the
volumetric positioning of CNC machine is by using a Ballbar. Use of the Ballbar helps
to pick up errors caused by multiple sources, including machine alignment errors
caused by distortion of the machine structure. The machine alignment error can be
defined, analysed, and addressed by the Ballbar detection software and gives the
company the option of a repair instead of costly parts replacement (Renishaw, 2014).
The Ballbar is a major tool in CNC machine tool maintenance and servicing that
helps to predict costly major repairs that can be avoided with corrective maintenance.
Figure 8-2 Ballbar test in 3 orthogonal planes via a single reference point (Renishaw, 2014)
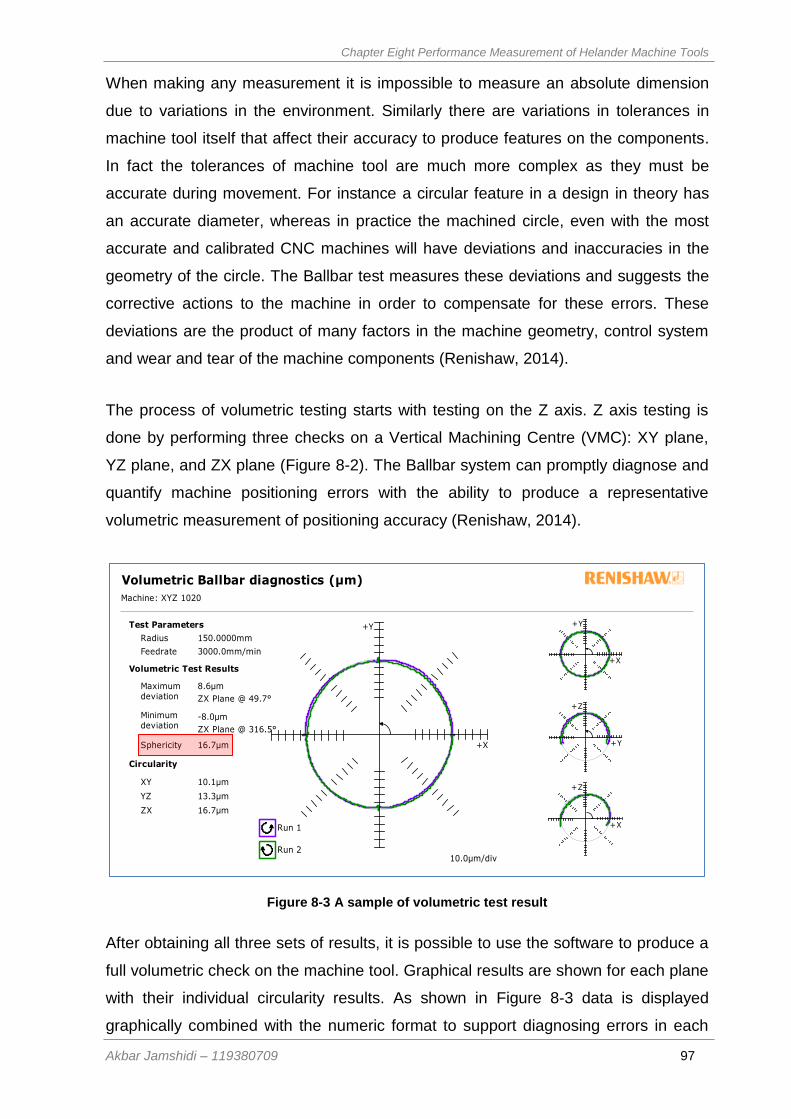
Chapter Eight Performance Measurement of Helander Machine Tools
Akbar Jamshidi – 119380709 97
When making any measurement it is impossible to measure an absolute dimension
due to variations in the environment. Similarly there are variations in tolerances in
machine tool itself that affect their accuracy to produce features on the components.
In fact the tolerances of machine tool are much more complex as they must be
accurate during movement. For instance a circular feature in a design in theory has
an accurate diameter, whereas in practice the machined circle, even with the most
accurate and calibrated CNC machines will have deviations and inaccuracies in the
geometry of the circle. The Ballbar test measures these deviations and suggests the
corrective actions to the machine in order to compensate for these errors. These
deviations are the product of many factors in the machine geometry, control system
and wear and tear of the machine components (Renishaw, 2014).
The process of volumetric testing starts with testing on the Z axis. Z axis testing is
done by performing three checks on a Vertical Machining Centre (VMC): XY plane,
YZ plane, and ZX plane (Figure 8-2). The Ballbar system can promptly diagnose and
quantify machine positioning errors with the ability to produce a representative
volumetric measurement of positioning accuracy (Renishaw, 2014).
Figure 8-3 A sample of volumetric test result
After obtaining all three sets of results, it is possible to use the software to produce a
full volumetric check on the machine tool. Graphical results are shown for each plane
with their individual circularity results. As shown in Figure 8-3 data is displayed
graphically combined with the numeric format to support diagnosing errors in each
+X
+Z
+Y
+Z
+X
+Y
Feedrate
+X
+Y
Run 1
Run 210.0µm/div
Volumetric Test Results
Sphericity 16.7µm
Maximum deviation
8.6µm
Minimum deviation
-8.0µm
ZX Plane @ 49.7°
ZX Plane @ 316.5°
Test Parameters
Radius 150.0000mm
3000.0mm/min
Circularity
XY 10.1µm
YZ 13.3µm
ZX 16.7µm
Volumetric Ballbar diagnostics (µm)
Machine: XYZ 1020
Chapter Eight Performance Measurement of Helander Machine Tools
Akbar Jamshidi – 119380709 98
plane. The plane circularity errors which are generated during the operation of the
multi-axis machine tool directly affect the machining precision. This structured
process improvement tool enables Helander to improve its product verification and
right first time capabilities by focussing on the appropriate use of measurement
across the manufacturing operations.
According to Pahk and Kim (2001) assessing the 3D volumetric errors in such
machine tools is a prerequisite for accuracy enhancement and quality assurance.
These errors can be monitored over time to produce a history for comparison
purposes and tolerances can be set based on captured data. This approach is
perfect to verify multi-axis machine tool performance. As shown in Figure 8-3 the
minimum and maximum deviation on each plane reports a sphericity error of 16.7 µm
in volumetric diagnosis. Reviewing these errors can show how machine performance
degrades over time, therefore corrective actions can be put into place to minimise the
potential deviations. It is prudent to have a part programme for the machine tool
ready and loaded into the controller, which reduces the production downtime
considerably and enables a machine to be tested within 15 minutes prior to resuming
production.
After all tools, methods and the importance of machine tool calibration are discussed
it is important to explain the error sources and the consequences for machined
components. The corrective actions should be taken to reduce and eliminate the
errors and an overview of additional equipment used to improve machine tool
accuracy. Renishaw Ballbar software has an effective help file that explains each
error source and how to investigate and correct them. Corrections can be done
reliably by testing errors on a machine with a known part (test piece) and adjusting
parameters to see what effects these corrections have on improving machine tool
performance (BS ISO 10791-7, 2012).
Identifying control limits for each error source within machine tools and setting control
limits in the testing software is explained in detail. This is useful to determine the
frequency of checks to maintain accurate machine tool performance along with
predicting when a machine may fail. For instance, monitoring wear within specific
parts of the machine tool and knowing when to repair the machine tool before it fails
will force the company to perform reactively which is costly. Some of these machine

Chapter Eight Performance Measurement of Helander Machine Tools
Akbar Jamshidi – 119380709 99
failures are due to the weight of moving parts within the machine. The weight of the
work piece can cause a repeatable displacement of the machine structure and
consequently can impact and manipulate the link between the guide-ways and
machine tool position and ultimately affect machine accuracy (Muelaner et al. 2014).
The next step is to modify the machine elements by setting control limits for each tool
and individual tests. This will enable the test to develop to a full test procedure to
comply with AS9100 and SC2120. The aim is to develop a balanced testing
programme to ensure each machine tool is tested within specified time intervals.
Finally, assistance is given in developing “in-house” test processes and procedures
to cover the control of testing and due dates. The monitoring process will be utilised
by the external verification body (e.g. LIMA BTC). LIMA at university of Bath is
working with Helander company in interval visits to validate the testing procedure and
ensure that testing programme is performing as planned by this project.
8.6 Monitoring Process of Machine Testing
At the end of the testing procedure plan, each machine tool will have its own set of
control limits and individual testing programme or procedure to maintain accuracy
and predict failure modes. Personnel are trained to use the testing equipment and
how to interpret the test results whilst developing a matrix of machine tool controller
parameters that can be adjusted to improve and maintain machine accuracy.
Success will be measured through reduced machine tool breakdowns and reduced
non-conformance (scrap), which will also assist in increasing machine tool efficiency
and overall OEE. Data needs to be collected prior to the start of each project so an
accurate measure of success can be identified. A simple calculation sheet can be
provided to identify “machine tool break down” time and the costs along with the cost
of non-conformance.
The company will register the machine tools on the current gauge register (Gagetrak)
and checking and verification is conducted every three months (Figure 8-4). This has
been staggered so that only three machines per week are verified in order to
20
SC21 is a change programme designed to accelerate the competitiveness of the aerospace and defence industry by raising the performance of its supply chains.
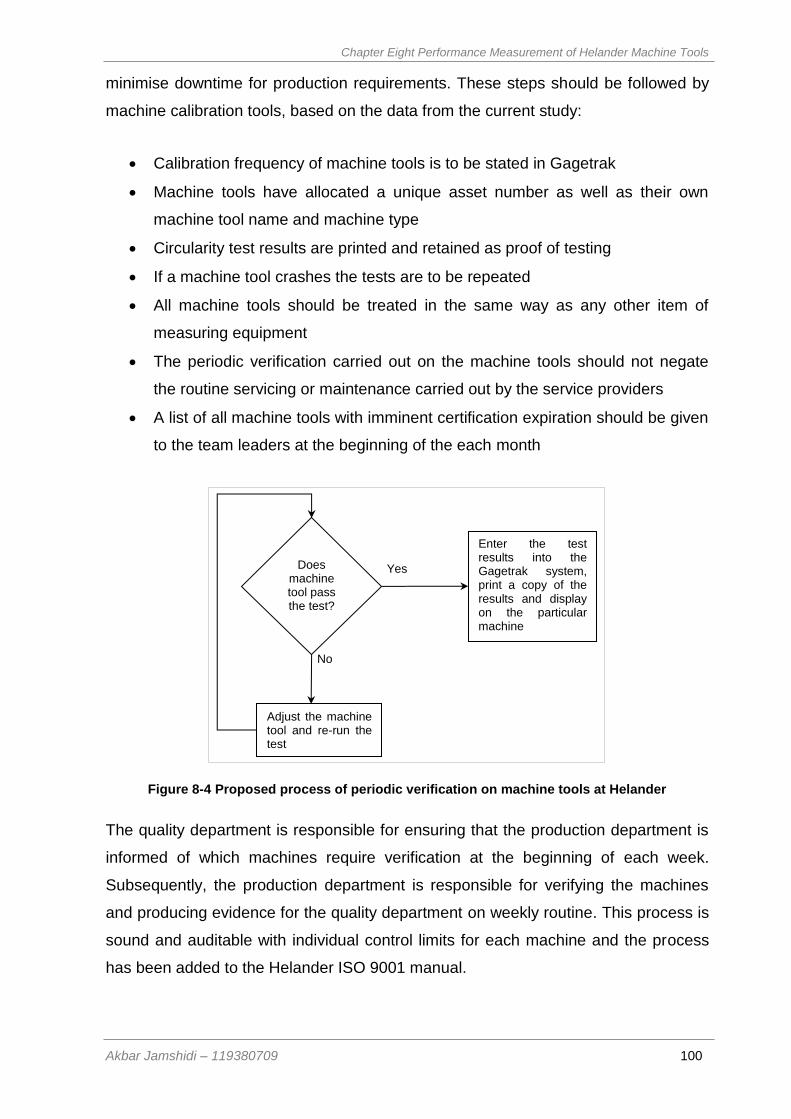
Chapter Eight Performance Measurement of Helander Machine Tools
Akbar Jamshidi – 119380709 100
minimise downtime for production requirements. These steps should be followed by
machine calibration tools, based on the data from the current study:
Calibration frequency of machine tools is to be stated in Gagetrak
Machine tools have allocated a unique asset number as well as their own
machine tool name and machine type
Circularity test results are printed and retained as proof of testing
If a machine tool crashes the tests are to be repeated
All machine tools should be treated in the same way as any other item of
measuring equipment
The periodic verification carried out on the machine tools should not negate
the routine servicing or maintenance carried out by the service providers
A list of all machine tools with imminent certification expiration should be given
to the team leaders at the beginning of the each month
Figure 8-4 Proposed process of periodic verification on machine tools at Helander
The quality department is responsible for ensuring that the production department is
informed of which machines require verification at the beginning of each week.
Subsequently, the production department is responsible for verifying the machines
and producing evidence for the quality department on weekly routine. This process is
sound and auditable with individual control limits for each machine and the process
has been added to the Helander ISO 9001 manual.
Yes
No
Does machine tool pass the test?
Adjust the machine tool and re-run the test
Enter the test results into the Gagetrak system, print a copy of the results and display on the particular machine
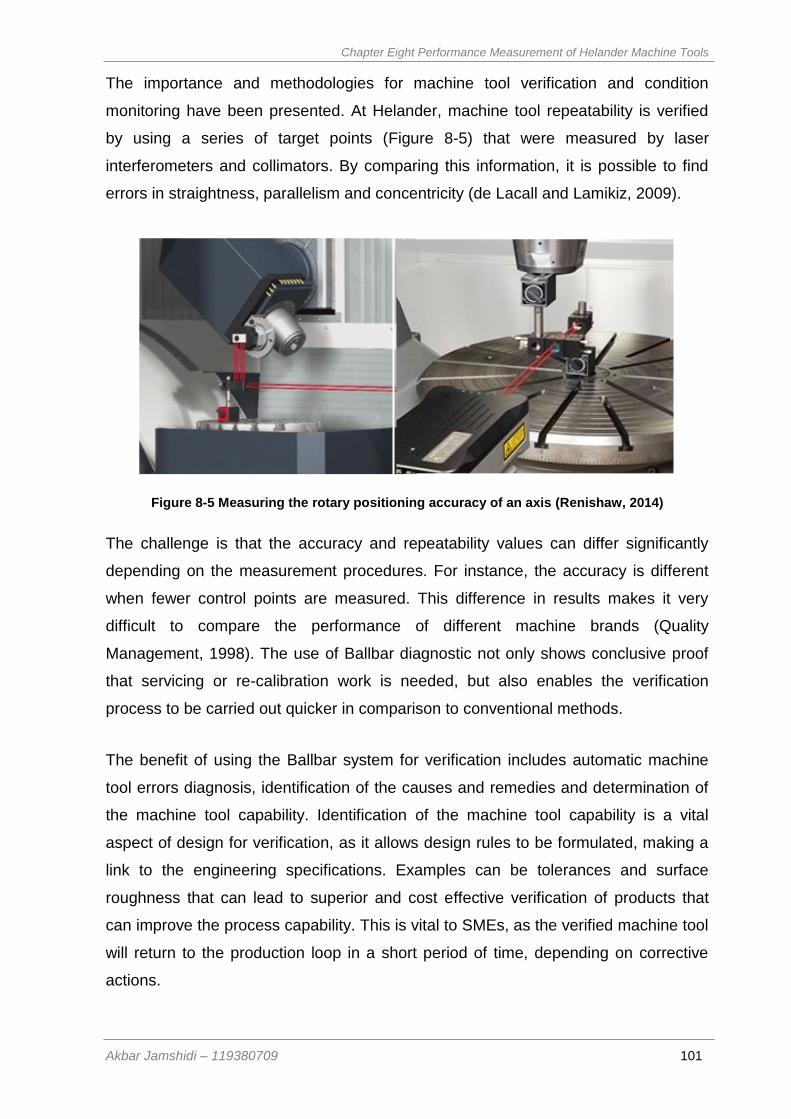
Chapter Eight Performance Measurement of Helander Machine Tools
Akbar Jamshidi – 119380709 101
The importance and methodologies for machine tool verification and condition
monitoring have been presented. At Helander, machine tool repeatability is verified
by using a series of target points (Figure 8-5) that were measured by laser
interferometers and collimators. By comparing this information, it is possible to find
errors in straightness, parallelism and concentricity (de Lacall and Lamikiz, 2009).
Figure 8-5 Measuring the rotary positioning accuracy of an axis (Renishaw, 2014)
The challenge is that the accuracy and repeatability values can differ significantly
depending on the measurement procedures. For instance, the accuracy is different
when fewer control points are measured. This difference in results makes it very
difficult to compare the performance of different machine brands (Quality
Management, 1998). The use of Ballbar diagnostic not only shows conclusive proof
that servicing or re-calibration work is needed, but also enables the verification
process to be carried out quicker in comparison to conventional methods.
The benefit of using the Ballbar system for verification includes automatic machine
tool errors diagnosis, identification of the causes and remedies and determination of
the machine tool capability. Identification of the machine tool capability is a vital
aspect of design for verification, as it allows design rules to be formulated, making a
link to the engineering specifications. Examples can be tolerances and surface
roughness that can lead to superior and cost effective verification of products that
can improve the process capability. This is vital to SMEs, as the verified machine tool
will return to the production loop in a short period of time, depending on corrective
actions.
Chapter Eight Performance Measurement of Helander Machine Tools
Akbar Jamshidi – 119380709 102
The benefits of this chapter to Helander and any SMEs are unlimited as adjustments
in machine tools could substantially reduce the risk of failures in manufacturing.
Regardless of the amount of time that the machine programmers and the engineering
team spent on the procedures if the machine does not work to its accuracy the final
product would still be poor in quality.
In this chapter the author emphasised the importance of performing adjustments to
the machine tool and benefits of machine checking and their link to time saving, cost
and productivity are described in the format of bullet points. Also the probable impact
of machine tool accuracy on decision making process within the planning department
is explained.
The methodology for in-process control and verification of machine tool positioning
for the SMEs recognized and conducted by investments made at Helander as a case
study. At the end, the process of control and monitoring the Ballbar testing process is
described in detail and records kept in record logs for quality management system.
Chapter Nine Finishing of Additive Layer Manufactured Parts
Akbar Jamshidi – 119380709 103
Chapter Nine: Finishing of Additive Layer
Manufactured Parts
9 Finishing of Additive Layer Manufactured Parts
9.1 Introduction
Additive layer manufacturing (ALM) is a modern fabrication process that allows near
net shape manufacture of engineering materials. This method has been primarily
used in the past for plastic, polymer and nylon materials. This chapter outlines the
use of ALM for manufacturing artefacts from hard metal alloys. These alloys include
nickel-based superalloys, such as Inconel 718. ALM parts are being used to
manufacture gas turbines components with high creep and corrosion resistance.
Conventional methods for producing net shape components from these hard alloys
involve machining, which is a costly and slow process compared to ALM (Thomas
and Gilbert 2014). The drawback, however, is the potential degradation of the alloy’s
microstructure. As part of this MPhil project, a comparison was made of the
properties of Inconel 718 machined conventionally at the University of Bath and parts
produced by ALM within the Helander supply chain (Banks, 2015).
9.2 An alternative to machining - Additive Layer Manufacturing
Additive Layer Manufacturing is a method of adding material in the form of layers
made by fusing fine powders in order to make physically tangible parts. Each layer
normally has equal thickness and they are deposited on a platform and then on top of
each other to generate a 3D dimensional component (Figure 9-1). As a result of the
constant layer thickness, the created component will have a stair-stepping shape on
the surface (Gebhardt, 2011). The method was initially employed to manufacture
parts with resin and then nylon and since the beginning of 90s metal components
have been created.
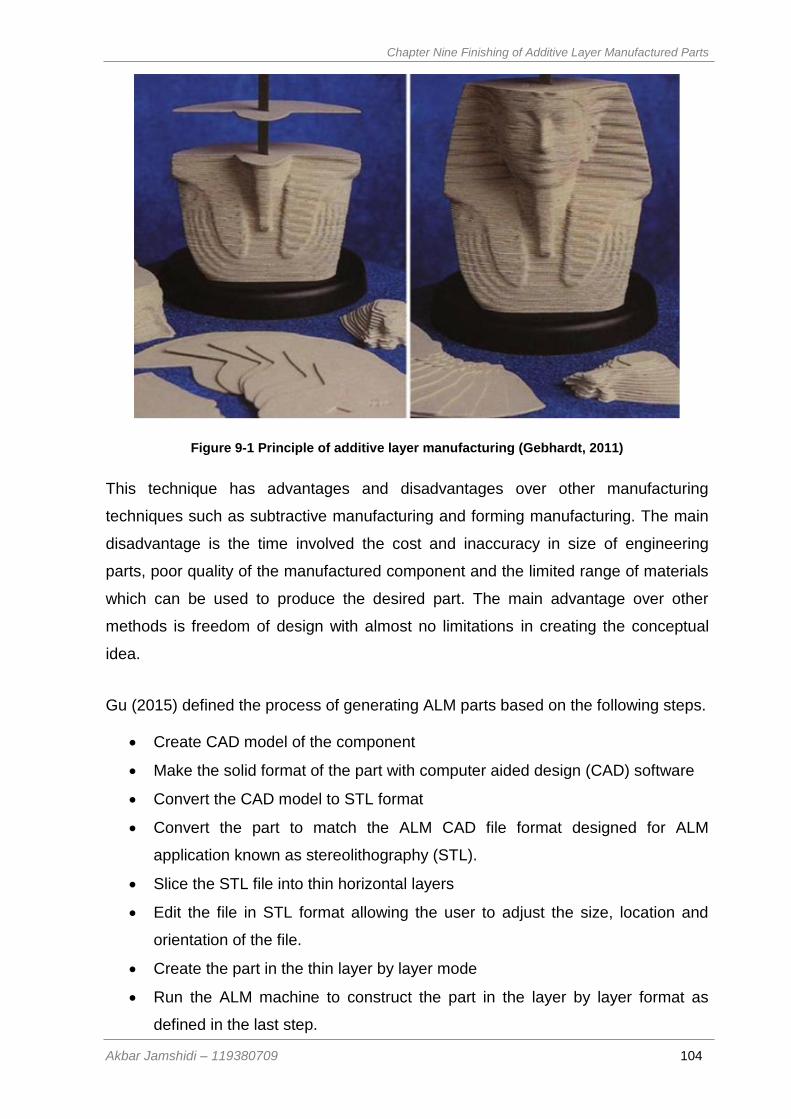
Chapter Nine Finishing of Additive Layer Manufactured Parts
Akbar Jamshidi – 119380709 104
Figure 9-1 Principle of additive layer manufacturing (Gebhardt, 2011)
This technique has advantages and disadvantages over other manufacturing
techniques such as subtractive manufacturing and forming manufacturing. The main
disadvantage is the time involved the cost and inaccuracy in size of engineering
parts, poor quality of the manufactured component and the limited range of materials
which can be used to produce the desired part. The main advantage over other
methods is freedom of design with almost no limitations in creating the conceptual
idea.
Gu (2015) defined the process of generating ALM parts based on the following steps.
Create CAD model of the component
Make the solid format of the part with computer aided design (CAD) software
Convert the CAD model to STL format
Convert the part to match the ALM CAD file format designed for ALM
application known as stereolithography (STL).
Slice the STL file into thin horizontal layers
Edit the file in STL format allowing the user to adjust the size, location and
orientation of the file.
Create the part in the thin layer by layer mode
Run the ALM machine to construct the part in the layer by layer format as
defined in the last step.
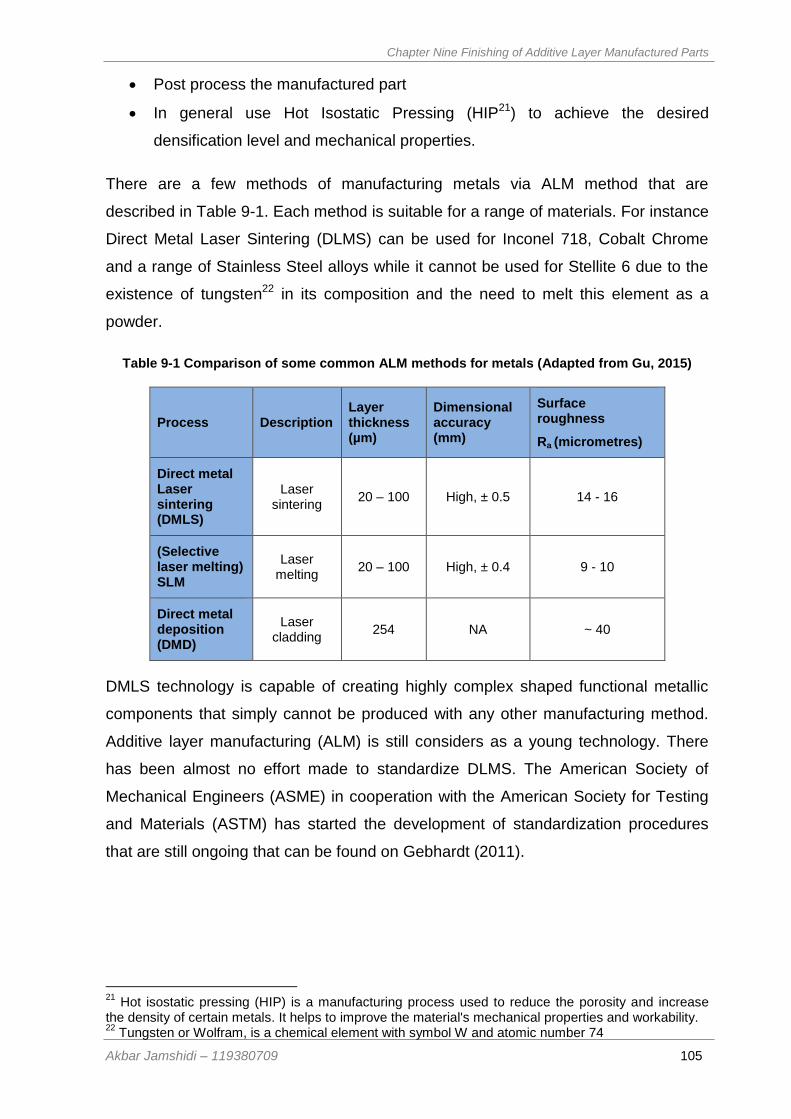
Chapter Nine Finishing of Additive Layer Manufactured Parts
Akbar Jamshidi – 119380709 105
Post process the manufactured part
In general use Hot Isostatic Pressing (HIP21) to achieve the desired
densification level and mechanical properties.
There are a few methods of manufacturing metals via ALM method that are
described in Table 9-1. Each method is suitable for a range of materials. For instance
Direct Metal Laser Sintering (DLMS) can be used for Inconel 718, Cobalt Chrome
and a range of Stainless Steel alloys while it cannot be used for Stellite 6 due to the
existence of tungsten22 in its composition and the need to melt this element as a
powder.
Table 9-1 Comparison of some common ALM methods for metals (Adapted from Gu, 2015)
Process Description Layer thickness (µm)
Dimensional accuracy (mm)
Surface roughness
Ra (micrometres)
Direct metal Laser sintering (DMLS)
Laser sintering
20 – 100 High, ± 0.5 14 - 16
(Selective laser melting) SLM
Laser melting
20 – 100 High, ± 0.4 9 - 10
Direct metal deposition (DMD)
Laser cladding
254 NA ~ 40
DMLS technology is capable of creating highly complex shaped functional metallic
components that simply cannot be produced with any other manufacturing method.
Additive layer manufacturing (ALM) is still considers as a young technology. There
has been almost no effort made to standardize DLMS. The American Society of
Mechanical Engineers (ASME) in cooperation with the American Society for Testing
and Materials (ASTM) has started the development of standardization procedures
that are still ongoing that can be found on Gebhardt (2011).
21
Hot isostatic pressing (HIP) is a manufacturing process used to reduce the porosity and increase the density of certain metals. It helps to improve the material's mechanical properties and workability. 22
Tungsten or Wolfram, is a chemical element with symbol W and atomic number 74
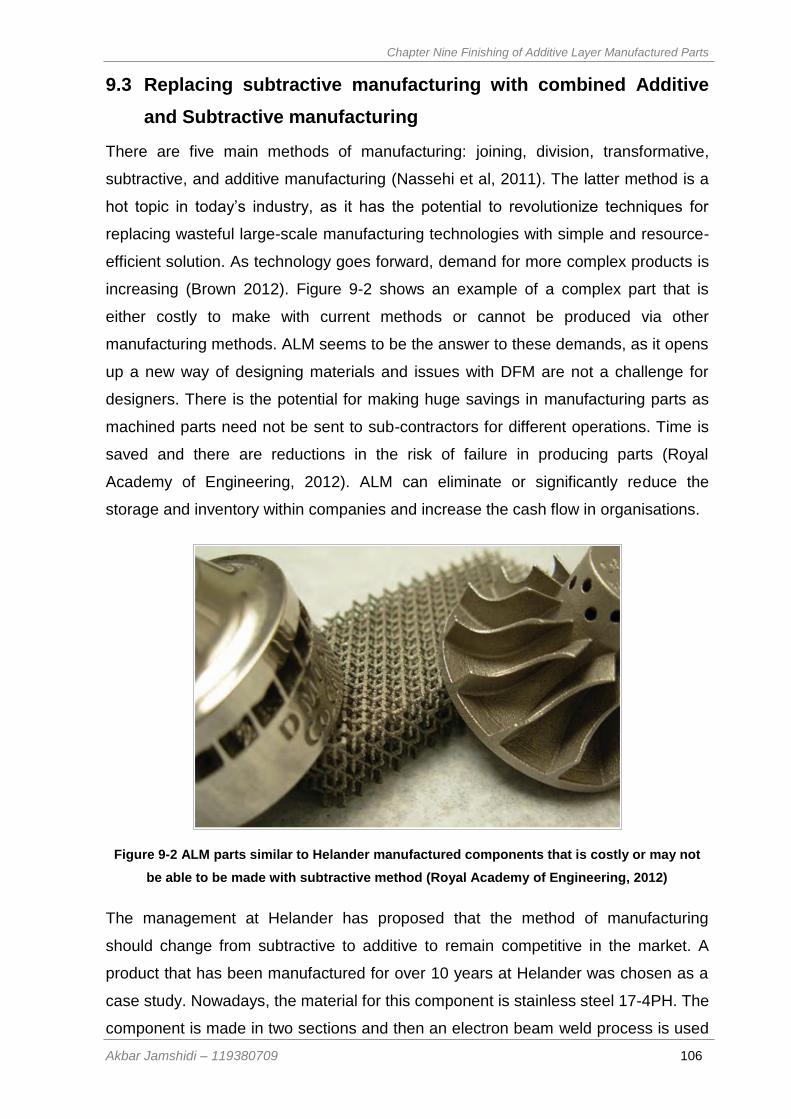
Chapter Nine Finishing of Additive Layer Manufactured Parts
Akbar Jamshidi – 119380709 106
9.3 Replacing subtractive manufacturing with combined Additive
and Subtractive manufacturing
There are five main methods of manufacturing: joining, division, transformative,
subtractive, and additive manufacturing (Nassehi et al, 2011). The latter method is a
hot topic in today’s industry, as it has the potential to revolutionize techniques for
replacing wasteful large-scale manufacturing technologies with simple and resource-
efficient solution. As technology goes forward, demand for more complex products is
increasing (Brown 2012). Figure 9-2 shows an example of a complex part that is
either costly to make with current methods or cannot be produced via other
manufacturing methods. ALM seems to be the answer to these demands, as it opens
up a new way of designing materials and issues with DFM are not a challenge for
designers. There is the potential for making huge savings in manufacturing parts as
machined parts need not be sent to sub-contractors for different operations. Time is
saved and there are reductions in the risk of failure in producing parts (Royal
Academy of Engineering, 2012). ALM can eliminate or significantly reduce the
storage and inventory within companies and increase the cash flow in organisations.
Figure 9-2 ALM parts similar to Helander manufactured components that is costly or may not
be able to be made with subtractive method (Royal Academy of Engineering, 2012)
The management at Helander has proposed that the method of manufacturing
should change from subtractive to additive to remain competitive in the market. A
product that has been manufactured for over 10 years at Helander was chosen as a
case study. Nowadays, the material for this component is stainless steel 17-4PH. The
component is made in two sections and then an electron beam weld process is used

Chapter Nine Finishing of Additive Layer Manufactured Parts
Akbar Jamshidi – 119380709 107
to weld the components to each other (due to lack of accessibility by 5-axis machine)
by a subcontractor operation. The component is made in 15 different operations in
batches of 30 pieces and the lead time for a batch size of 30 is over 3 months23.
The history of the parts being manufactured at Helander over a period of 10 years is
2240 pieces up to 2014 according to the MRP system. Initially, this particular
component was made from Stellite 6 alloy via a casting method and then machined
to finish the critical features. The strong characteristics of Stellite 6 make the part
long lasting in its operations (to be used in highly corrosive and abrasive
environments). Problems due to inconsistency in casting products such as porosity
and breaking of the part in operation due to the weak structure of castings, forced
Helander to use other methods. The replacement method is to cut the piece in half,
machining the stainless steel 17-4PH material component and perform a vacuum
brazing operation to join the component. Figure 9-3 shows a section of the
manufactured part by the ALM method (right image) and 5-axis machine (left image).
Figure 9-3 Additive vs. machined part24
9.4 Case Study on Finishing of Additive Manufactured Parts
At Helander, the manufacture of components conventionally machined with a 5-axis
machine for the oil and gas industry is compared with manufacture with the ALM
method. The business case was made and described to a major customer. Cobalt
chrome alloy was proposed for use as it has better characteristics in abrasive and
corrosive conditions in comparison to stainless steel 17-PH. The customer agreed to
make test pieces by the ALM method for their laboratory analysis. Based on business 23
This is due to capacity issues at Helander and machining operations and sub-contract operations to finish the batch size. 24
The full part cannot be shown due to company policy
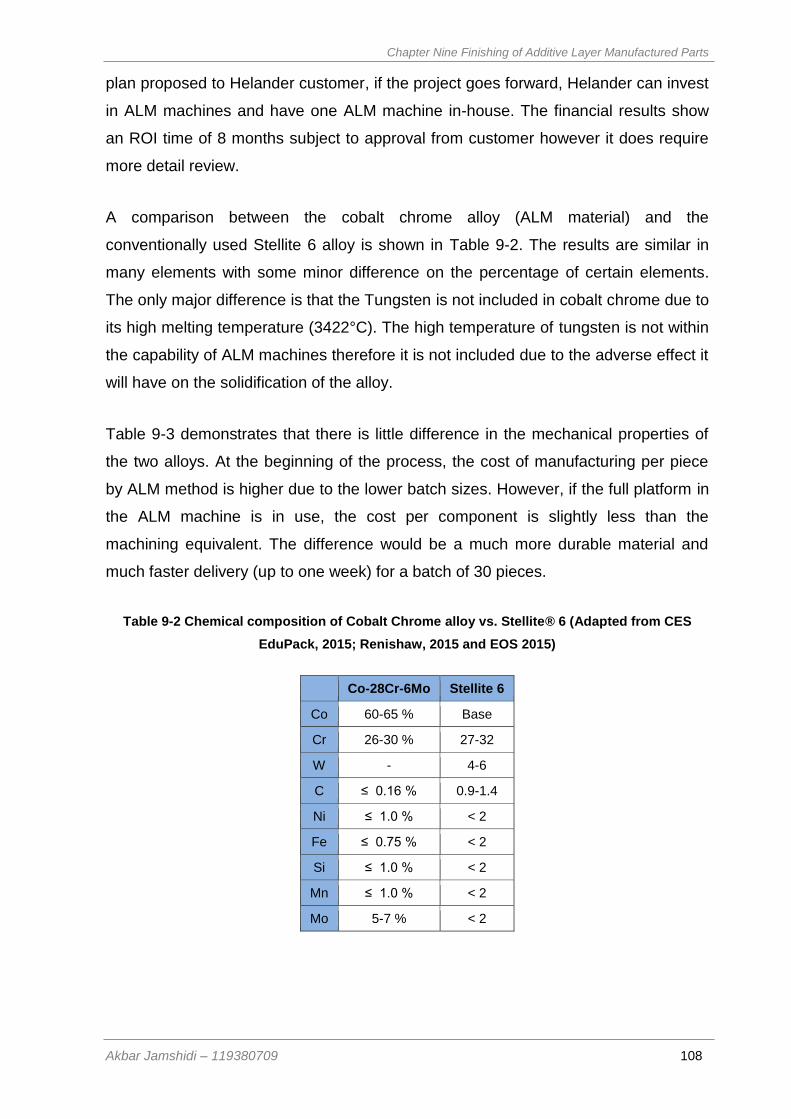
Chapter Nine Finishing of Additive Layer Manufactured Parts
Akbar Jamshidi – 119380709 108
plan proposed to Helander customer, if the project goes forward, Helander can invest
in ALM machines and have one ALM machine in-house. The financial results show
an ROI time of 8 months subject to approval from customer however it does require
more detail review.
A comparison between the cobalt chrome alloy (ALM material) and the
conventionally used Stellite 6 alloy is shown in Table 9-2. The results are similar in
many elements with some minor difference on the percentage of certain elements.
The only major difference is that the Tungsten is not included in cobalt chrome due to
its high melting temperature (3422°C). The high temperature of tungsten is not within
the capability of ALM machines therefore it is not included due to the adverse effect it
will have on the solidification of the alloy.
Table 9-3 demonstrates that there is little difference in the mechanical properties of
the two alloys. At the beginning of the process, the cost of manufacturing per piece
by ALM method is higher due to the lower batch sizes. However, if the full platform in
the ALM machine is in use, the cost per component is slightly less than the
machining equivalent. The difference would be a much more durable material and
much faster delivery (up to one week) for a batch of 30 pieces.
Table 9-2 Chemical composition of Cobalt Chrome alloy vs. Stellite® 6 (Adapted from CES
EduPack, 2015; Renishaw, 2015 and EOS 2015)
Co-28Cr-6Mo Stellite 6
Co 60-65 % Base
Cr 26-30 % 27-32
W - 4-6
C ≤ 0.16 % 0.9-1.4
Ni ≤ 1.0 % < 2
Fe ≤ 0.75 % < 2
Si ≤ 1.0 % < 2
Mn ≤ 1.0 % < 2
Mo 5-7 % < 2
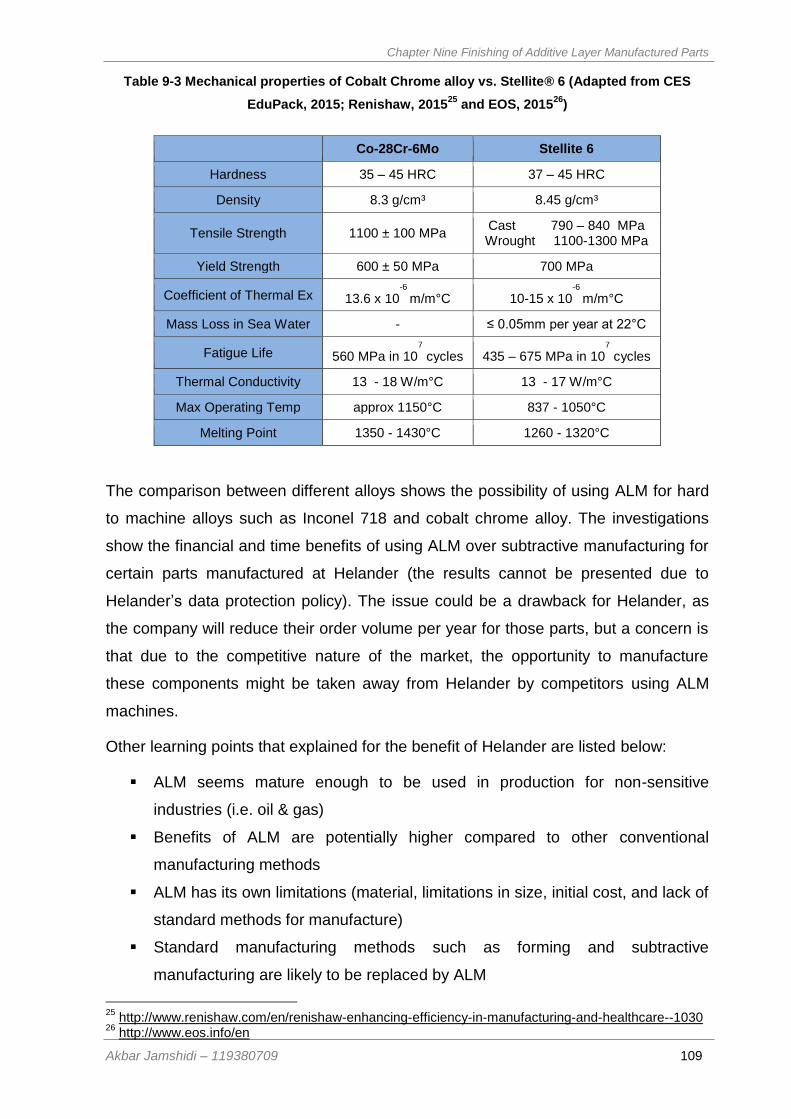
Chapter Nine Finishing of Additive Layer Manufactured Parts
Akbar Jamshidi – 119380709 109
Table 9-3 Mechanical properties of Cobalt Chrome alloy vs. Stellite® 6 (Adapted from CES
EduPack, 2015; Renishaw, 201525
and EOS, 201526
)
Co-28Cr-6Mo Stellite 6
Hardness 35 – 45 HRC 37 – 45 HRC
Density 8.3 g/cm³ 8.45 g/cm³
Tensile Strength 1100 ± 100 MPa Cast 790 – 840 MPa Wrought 1100-1300 MPa
Yield Strength 600 ± 50 MPa 700 MPa
Coefficient of Thermal Ex 13.6 x 10⁻⁶
m/m°C 10-15 x 10-6
m/m°C
Mass Loss in Sea Water - ≤ 0.05mm per year at 22°C
Fatigue Life 560 MPa in 107
cycles 435 – 675 MPa in 107
cycles
Thermal Conductivity 13 - 18 W/m°C 13 - 17 W/m°C
Max Operating Temp approx 1150°C 837 - 1050°C
Melting Point 1350 - 1430°C 1260 - 1320°C
The comparison between different alloys shows the possibility of using ALM for hard
to machine alloys such as Inconel 718 and cobalt chrome alloy. The investigations
show the financial and time benefits of using ALM over subtractive manufacturing for
certain parts manufactured at Helander (the results cannot be presented due to
Helander’s data protection policy). The issue could be a drawback for Helander, as
the company will reduce their order volume per year for those parts, but a concern is
that due to the competitive nature of the market, the opportunity to manufacture
these components might be taken away from Helander by competitors using ALM
machines.
Other learning points that explained for the benefit of Helander are listed below:
ALM seems mature enough to be used in production for non-sensitive
industries (i.e. oil & gas)
Benefits of ALM are potentially higher compared to other conventional
manufacturing methods
ALM has its own limitations (material, limitations in size, initial cost, and lack of
standard methods for manufacture)
Standard manufacturing methods such as forming and subtractive
manufacturing are likely to be replaced by ALM
25
http://www.renishaw.com/en/renishaw-enhancing-efficiency-in-manufacturing-and-healthcare--1030 26
http://www.eos.info/en
Chapter Ten: Discussion
Akbar Jamshidi – 119380709 110
Chapter Ten: Discussion
10 Discussion
Due to having different topics in each chapter of the thesis it is decided to break the
discussion for each chapter separately. This chapter explains the discussions related
to each chapter within the scope of the project.
10.1 Material Evaluation of Helander Alloys
Inconel 718 is one of the common materials used at the Helander company. The
nickel based material is hard to machine due to its high strength and hardness. It is
explained in section 5.2 that Inconel 718 suffers from minor variations in
machinability which relates to variations in microstructure and heat treatment as a
raw material. These minor variations bring uncertainty in machining, which can
increase tool wear or lead to underutilisation of the machining operation. The results
of material analysis from different suppliers show how these small variations make an
impact on machine force. In section 5.2 results of material analysis shown the
variations in Inconel 718 from different batches the differences in their grain structure
and the impact machining on each batch are also varies. To address this issue and
reduce material variation, a study was proposed as further work to analyse changes
in heat treatment temperature and cooling method as well as narrowing down the
chemical composition to a lower limit. In section 5.3 the results of hardness test is
evidence of the need to alter the machine elements (feeds and speeds) during
machining operation. This strategy will potentially increase the cost of raw material,
but will extend the life of the tooling and reduce the scrap rate for high value
components.
10.2 Methods of Process control & Process Verification
In order to manufacture products right first time and every time, the correct process
needs to be in place. To manufacture repeatable products, a close look at the causes
of variation and making changes in the raw materials or the production process is
essential which is explained in more details in sections 6.1 and 6.2. This issue can be
Chapter Ten: Discussion
Akbar Jamshidi – 119380709 111
resolved by using process control and verification tools. Helander, as process owner,
will define product characteristics to minimise the combined production, labour and
machine cost and the cost of quality losses such as scrap, rework and repair.
In section 6.3 the use of statistical tools such as gauge R&R (section 6.3), SPC
(statistical process control) and machine capability was explained and it was shown
that these processes will increase the company’s confidence to establish and
maintain a robust process. Many customers are demanding evidence from FAIR (first
article inspection report), PPAP (production part approval plan), APQP (advanced
product quality plan) as part of the NPI (new product introduction) process. PPAP is a
standard process that helps to ensure the processes used to manufacture parts is
consistent and can reproduce the parts at stated production rates during routine
production runs. APQP is a quality framework intended to produce a product quality
record to be used for developing new products based on customer requirements in
an organisation (Rolls Royce supplier training, 2013). Section 6.2 shows the map of
the PPAP process that is implemented at Helander. The sample slide used as a
guideline on how to use the IPI software for PPAP process is shown in Appendix 5.
FAI (first article inspection) is required for each process as evidence for the method
of manufacturing. When any change happens in the process of manufacturing, such
as modifications in the use of different inserts, changes in machining processes and
the use of a new supplier for the particular sub-process, the new FAI should be filled
and kept in quality documents.
These elements are missing in Helander’s manufacturing engineering sector. Section
6.5 and 6.6 presents a detailed analysis of two manufacturing parts (simple and
complex) that are used as a case study to identify the savings that could be made if
the detailed work instruction and control plans were in place. The SWOT analysis
shows the cost of quality in each case. Also benefits and financial savings achieved
by implementing the above concepts are evaluated. The pre-requisite of such
methods is to have a review plan for each new part and for every repeat part in
production and to adjust their process with CAPA (corrective and preventive actions)
processes.
Chapter Ten: Discussion
Akbar Jamshidi – 119380709 112
10.3 Control of Helander’s Manufacturing Process
After implementation of NPI and all pre-requisites at Helander, improving the
uniformity of the process was necessary. The process was approved by the customer
and passed the FAIR stage, but because everything was done on a piece of software
(IPI Solutions) and on a paper document, required elements were not in place. The
required elements can be physical, such as tooling or special gauge, or they can be
documents, such as process flow and sequence of information flow within the
organisation. Therefore, various cross-functional diagrams and organisation maps
need to be designed (Sections 7.3 and 7.4) and held in the quality system to explain
what should be done at each stage of manufacturing. Additionally, SOP (standard
operating procedure) is required to show the process for each and every operation
(including deburr, wash, and pack) and standard forms for tooling, set ups, visual
work instructions, stage drawings, and other forms to enrich the operator knowledge
to execute best practice operations.Maintenance of operation documents in the
manufacturing engineering department and process flows in quality system should be
the ultimate goal of the organisation in order to have control over the manufacturing
process.
10.4 Performance Measurement of Helander Machine Tools
Machine tool accuracy is the most critical issue in precision engineering. Section 8.1
describes that regular machine tool positioning will increase confidence and
decrease the number of non-conforming products. Repeatability of the machining
operation depends on consistent performance of the machine tool and its ability to
accurately position the tool tip. The tool tip positioning should be verified and
monitored frequently to ensure the accuracy of the machined artefact. This issue can
be resolved with in-house Ballbar testing. Management should be aware of the
importance and benefits of the machine tool and regular checks required for the test.
At Helander company, this issue has to date been under-prioritised due to lack of
information about the importance of the Ballbar test. Benefits of regular machine
accuracy are listed in section 8.2. The machine tool study was reviewed and trained
to senior engineers. Errors that will lead to machine error were categorised and the
compensation techniques addressed based on the Renishaw Ballbar test software
(Section 8.4). In section 8.6 monitoring plans are set out to check the machines
Chapter Ten: Discussion
Akbar Jamshidi – 119380709 113
regularly. In order to maintain machine accuracy, the production of a measured and
qualified process capability control manual for each machine is recommended.
10.5 Finishing of Additive Layer Manufactured Parts
Additive manufacturing is a new method to be used in manufacturing. Many
organisations believe additive manufacturing is not currently mature enough to be
used in production and that it is merely good for proof of concept and prototype
modelling in the design sector. In section 9.2 it is discussed that ALM can be used as
an alternative to many machining operations and only the finish machining stage can
be perform as the final stage. This will lead to substantial savings in cost and
increase in lead time to market for certain parts in production. In section 9.3 the
process of ALM is explained by making a business case and bringing evidence of
proof of durability for additive manufactured component. Helander is going to invest
more in this area. The use of additive manufactured parts for the oil and gas industry
is more probable due to reduced standards for materials in comparison to other
business sectors, such as the aerospace, automotive and nuclear industries. Sample
parts were made by ALM sub-contractors (Section 9.3) and finish machining
operations were performed at Helander before the final part was sent to the customer
in the oil and gas sector. The next step was to use the sample part in an oilrig drive
shaft assembly for testing and validation. Preliminary responses from the test were
positive (based on management feedback - company policy prevents the test results
from being published) and more test pieces were ordered for examination in different
environments. Future works in this area will investigate which manufactured parts are
more suitable to be made using the ALM method.
10.6 Addressing customer needs for introduction of new products
A review of the literature (Chapters 3 and 4) failed to reveal an acceptable solution to
new product introduction process at small to midsize organisations. A new product
introduction procedure (Chapter 6) was investigated by the author, and the elements
required to achieve a robust system for new products was prepared and
implemented at the case study company. The objective for repeat products was also
to rewrite the operation stages in unified format based on company’s capability. The
new standard operating procedure was designed along with process mapping at the
company to address the issues with non-conformances from major customers.

Chapter Ten: Discussion
Akbar Jamshidi – 119380709 114
The procedure gave the company an advantage over their competitors, and allowed
them to win new long-term contracts in well-recognised nuclear and defence
industries. Having these procedures in place shows that the company has the
capability to follow customer flow-down requirements and comply with customer
needs.
Chapter Eleven: Conclusions and Future Works
Akbar Jamshidi – 119380709 115
Chapter Eleven: Conclusions and Future Works
11 Conclusions and Future Works
11.1 Conclusions
Superalloys have been developed for use in harsh conditions. For the same reasons,
they are hard to cut and machine to the specific required dimensions. Studies
performed in this area focus on the chemical properties and change in physical
properties of material before and after machining. It has been shown that machining
has a big impact on the hardness of the alloy, especially at the surface, which leads
to uncertainty in the use of machine parameters as well as measurement instability in
the final manufactured component.
The results from the machining of different parts at Helander show that significant
savings can be made in different areas to speed up the manufacturing lead time and
increase the customer satisfaction by reducing the non-conformance parts. These
easy steps seem rational in a manufacturing environment, but they do not exist within
SMEs since engineers are tied-up with fire-fighting day-to-day (and repeat) problems.
As discussed, most uncertainties in production could be reduced by applying control
plans in the supply chain and in the manufacturing process itself. The idea of having
“sealed” manufacturing27 is logical for repeat products, however best practices need
to be examined for the parts. There are many operations in the company that are
done by using engineers’ experience rather than clear work instructions. The use of
standard operating procedures is highly recommended in these cases, with different
forms and procedures designed, mapped and implemented throughout the company.
These elements are essential in identifying best practice and eventually turn them
into sealed production procedures.
27
Sealed manufacturing: Expression used commonly in manufacturing industries referring to (repeatable) best practice manufacturing method
Chapter Eleven: Conclusions and Future Works
Akbar Jamshidi – 119380709 116
In the manufacture of new products, the NPI procedure is defined and the company
process is mapped to demonstrate what production steps are required. The design
stage of the manufacturing method should be followed in a structured manner to
ensure no element is missing in the production phase. With complex parts, it is
essential to have a project coordinator responsible for preparing the different required
elements. These elements are listed, explained, and implemented within the
company to address the needs for new product development.
Finally, the machine tool verification technique is explained and the importance and
benefits of having regular machine checks listed. The machine tool accuracy and
machine health check can be the root cause of many variations in manufactured
parts. As an alternative approach to 5-axis machining, the ALM process has been
introduced and the benefits of using this process explained to a potential customer by
manufacturing a sample part. The testing stage was positively received by the
customer and the development stage continues to be assessed through further work
on this project.
11.2 Future Work
Research into different methods for manufacturing superalloys such as the use of
different machining methods, different inserts, and use of different machining
elements (i.e. feeds and speeds) has been ongoing since their introduction. Process
control and supply chain control at the SME level will reduce the risk of variability
often experienced when machining superalloys. In order to reduce the tool wear and
control the alloy’s machinability, research to identify the optimum chemical
composition and heat treatment of the alloy combined with the ideal cooling method
can be considered as future work.
Other research gaps in the manufacturing industries are the lack of reviewing and
understanding customer needs in the NPI process. Customer requirement procedure
and its sub documents referenced to the customer purchase order are the main
documents required to be reviewed by suppliers. In many instances, the customer
quality standards (or customer flow-down requirements) are ignored or categorised
as less important than manufacturing the components themselves. Many SMEs,
including Helander, found that suppliers start manufacturing the component before
fully understanding the customer requirement. As the manufacturing starts, corrective
Chapter Eleven: Conclusions and Future Works
Akbar Jamshidi – 119380709 117
actions become more challenging. There are processes in place to answer arising
challenges (Shrotri et al. 2014). These processes include NPI, PPAP, APQP and
control plan, PFMEA, FAIR and VSM. Each of these methods requires understanding
and implementation within the organisations in line with their configuration. Little has
been done to answer these needs at the SME level. Understanding these relatively
simple processes is a big challenge for SMEs and having proof of these concepts
and procedures is a big advantage for gaining approval from major industries (i.e.
Rolls Royce). The main companies in the automotive, aerospace and nuclear
industries are asking for more standardised processes in order to evolve leaner and
more traceable supply chains. Adopting these processes will be a major advantage
for SMEs if they wish to have long-term business with major industries.
Appendices
Akbar Jamshidi – 119380709 118
References
AIAG (2010) “Measurement Systems Analysis” 4th edition ed. 2010, Automotive Industry Action Group, AIAG
Airbus SAS, (2016) “Airbus Operations S.A.S.”, http://www.airbus.com/
Amrutiya, A., (2015) “ASTM E 112 grain size measuring methods full standard, mechanical”, http://www.slideshare.net/jeetamrutiya1/astm-e-112-grain-size-measuring-methods-full-standard, Accessed on Feb 2016
Arunachalam, R.M. Mannan, M.A. and Spowage, A.C., (2004) “Residual Stress and Surface Roughness when Facing Age
Hardened Inconel 718 with CBN and Ceramic Cutting Tool”, International Journal of Machine Tools and Manufacture,
Vol. 44. pp 879-887
ASM International (1990) “ASM Handbook, Volume 02 - Properties and Selection: Nonferrous Alloys and Special-Purpose
Materials”, ISBN978-0-87170-378-1
ASSDA, (2016) “What is Stainless Steel?”, Australian Stainless Steel Development Association, https://www.assda.asn.au/
Banks, M. (2015) “Additive Layer Manufacturing of Metal Alloys”, Faculty of Engineering and Design, Final Year MEng
Project Report
Bhavsar, R. B., Collins, A. and Silverman, S., (2001) “Use of Alloy 718 and 725 in Oil and Gas Industry”, Edited by E.A. Lorin, TMS (The Alinernls. hletnls S: Materials Society)
Blunt, L., and Knapp. W., (2013) “Laser Metrology and Machine Performance X”, 10th International Conference of Exhibition on Laser Metrology Machine Tool CMM and Robotics
Braun, M., (2011) “Cost of Quality or Why It’s Good to be Retro”, Copyright: Martin Braun Consulting, March 2011
Brown, H. (2012) “Additive versus Subtractive Manufacturing”, http://www.dmass.net/blog/2012/01/17/additive-versus-subtractive-manufacturing
Bryan, J.B., (1984) “Power of deterministic thinking in machine tool accuracy”, Conference of international machine tool engineers, Tokyo, Japan
BS ISO 10791-7, (2012) Test conditions for machining centres - Part 7, Accuracy of a finished test piece, ASIN: B000XYTAOU
Cadem, D,. (2016) “Cutting speed and RPM – difference”, Onlione resources: http://cadem.com/cncetc/cutting-speed-rpm-
difference/, Accessed on Feb 2016
Campbell, F.C., (2006) “Manufacturing Technology for Aerospace Structural Materials”, Elsevier Ltd, ISBN-13: 978-1-85-
617495-4
CES EduPack, (2015) Version 15.3.10
Chbeir, R. and Badr, Y. (2008) “Digital Information Management”, Product Lifecycle Management, Vol. 3, No. 2-3, pp. 91-
95.
Cheshire, A., (2011) “How to Interpret Gage R&R Output - Part 2”, The Minitab Blog (online resource), Available from: http://blog.minitab.com/ Accessed: 09 May 2014
Cobalt Facts (2006) “Metallurgical Uses”, Cobalt development Institute, white paper
Coward D.G., (1998) Manufacturing Management, Macmillan Press, ISBN 0333647777
de Lacall L.N. and Lamikiz, A. (2009) “Machine tools for High Performance machining”, Springer
Delore Stellite, (2015) “Stellite® 6 Alloy”, White paper, http://stellite.co.uk/Portals/0/Stellite%206%20Final.pdf
Devine, T. M. and Wulff, J. (1975) “Cast vs. wrought cobalt-chromium surgical implant alloys”, Journal of Biomed Mater
Res, Vol. 9, Iss. 2, pp 151-67
Donachie M.J. and Donachie S.J., (2002) “Superalloys - a Technical Guide”, Second Edition, ASM International
Donachie, M.J., (1984) “Superalloys: Source Book”, Asm Intl, ISBN-10: 0871701707
Dudzinski D., Devillez A., Moufki A., Larrouquère D., Zerrouki V., Vigneau J., (2004) “A Review of Developments
Towards Dry And High Speed Machining of Inconel 718 Alloy”, International Journal of Machine Tools and Manufacture, Vol. 44, pp. 439-456
El-Hofy, H.A., (2005) “Advanced Machining Processes”, McGraw-Hill
Appendices
Akbar Jamshidi – 119380709 119
El-Wardany, T.I., mohammed, E. And Elbestawi, M.A. (1995) “Cutting temperature of ceramic tools in high speed
machining of difficult to cut materials”, International Journal of Machine Tolls Manufacture, Vol. 36 No. 5, pp611-634
Ettlie, J., and Kubarek, M., (2008) Design Reuse in Manufacturing and Services, Journal of Product Innovation Management.
25 (5): 457–472
Evans, J.R. and Lindsay W.M., (1999) “The management and control of quality”, West Publishing Company
Ezugwu E.O. and Tang, S.H., (1995) “Surface abuse when machining cast iron (G-17) and nickel-base superalloy (Inconel 718) with ceramic tools”, Journal of Materials Processing Technology, Vol. 55, pp. 63–69
Ezugwu E.O., (2005), “Key Improvements in the Machining of Difficult to Cut Aerospace Superalloys”, International Journal of Machine Tools and Manufacture, Vol.45, pp. 1353-1367
Fang N. and Wu Q., (2009) “A Comparative Study of the Cutting Forces in High Speed Machining of Ti-6Al-4V and Inconel 718 with a Round Cutting Edge Tool”, Journal of Materials Processing Technology, Vol. 209, pp. 4385-4398
Flack, D. and Hannaford J., (2005) NPL Guide No 80, A National Measurement Good Practice Guide
García-Crespo A, Ruiz-Mezcua B, López-Cuadrado J.L., González-Carrasco I., (2011) A review of conventional and
knowledge based systems for machining price quotation, Journal of Intelligent Manufacturing, Vol. 22, Iss. 6. pp. 829-
841
Gebhardt, A. (2011) “Understanding Additive Manufacturing”, Hanser Publications, Cincinnati
Ghobadian A, and Gallear D.N., (1996) Total quality management in SMEs, Omega, Vol. 24, Iss. 1, pp. 83-106
Giakatis, G., Enkawa, T., and Washitani, K. (2001) “Hidden quality costs and the distinction between quality cost and quality
loss”, Total Quality Management, VOL. 12, No. 2, pp. 179-190
Gillespie, K.L. (1988) “Troubleshooting Manufacturing Processes: Adapted from the Tool and Manufacturing Engineers
Handbook”, Society of Manufacturing Engineers, Technology & Engineering, ISBN 0872633268, 9780872633261
Grooer, M.P., (2002) Fundamentals of Modern Manufacturing: JOHN WILLEY & SONS INC. US
Gu, D., (2015) “Additive Layer Manufacturing for High Performance Materials”, Springer
Gunasekaran A, and Ngai EWT., (2007) “Knowledge management in 21st century manufacturing”, International Journal of
Production Research, Vol. 45, Iss. 11, pp. 2391-2418
Heubner, U. (1998) “Nickel Alloys”, CRC Press, ISBN-10: 0824704401
JISC infoNet, (2015) “PESTLE and SWOT analyses”, http://www.jiscinfonet.ac.uk/tools/pestle-swot/, Accessed 14 Oct 2015
Karta, C.P., (2004),"A comparison of ISO 9000:2000 quality system standards, QS9000, ISO/TS 16949 and Baldrige
criteria", The TQM Magazine, Vol. 16, Iss 5, pp. 331 – 340
Khaira, H. K., (2013) “Precipitation Hardening” MSME MANIT, Bhopal, Online resource,
http://www.slideshare.net/RakeshSingh125/f-precipitation-hardening, Accessed on June 2015
Kingsman, B.G., and de Souza, A.A. (1997) “A knowledge-based decision support system for cost estimation and pricing decisions in versatile manufacturing companies”, International Journal of Production Economics, Vol. 53, pp.119–139
Kitagawa T, Kubo A, and Maekawa K, (1997) Temperature and wear of cutting tools in high-speed machining of Incone1718 and Ti-6A1-6V-2Sn wear, Vol. 202, pp.142-148
Kumar S, Newman ST, (2009) Standardized process control system for CNC manufacturing, Advanced Design and Manufacturing Based on STEP, Springer Series in Advanced Manufacturing, pp. 233-259
Kuzucu, V., Ceylan, M., Celik, H. and Aksoy, I. (1997) “Microstructure and phase analyses of Stellite 6 plus 6 wt.% Mo alloy”, Journal of Materials Processing Technology, Vol. 69, pp. 257 -263
Kwon, Y., Ertekin, Y.M., and Tseng, B. (2005) “In-process and post-process quantification of machining accuracy in circular
CNC milling”, Machining Science and Technology, Vol. 9, pp. 27-38
Liao Y.S., Lin H.M. and Wang J.H., (2008) “Behaviours of End Milling Inconel 718 Superalloys by Cemented Carbide
Tools”, Journal of Material Processing Technology, Vol. 20I, pp. 460-465
Lopez de Lacalle, L.N., Lamikiz, A. (2009) Machine tools for high performance machining, Springer London, ISBN:
9781849967952
Lu, T. W., Dillon, Jr. and Jawahir, S. I., (2013) “A thermal analysis framework for cryogenic machining and its contribution to product and process sustainability”, GCSM, 11th International Conference on Sustainable Manufacturing
Matthew, J. Jr. (1984) Superalloys Source Book. A Collection of Outstanding Articles from the Technical Literature: American Society for Metals

Appendices
Akbar Jamshidi – 119380709 120
McCoy, S., Puckett, B. C., and Hibner, E. L. (2002) “High performance age-hardenable nickel alloys solve problems in sour
oil and gas service”, Corrotherm International
Minitab, (2010) “Gage Studies for Continues Data”, Minitab Inc. Rel16 Ver 1.0 TRMEM160.SQA
Montgomery, D.C., (2009) “Introduction to Statistical Quality Control”, Wiley, 978-0-470-16992-6
Muelaner, J.E., Yang, B.R., Davy, C., Vermaa, M.R., and Maropoulos, P.G. (2014) Rapid Machine Tool Verification, 8th
International Conference on Digital Enterprise Technology
Murphy S.A., Moeller S.E., Page J.R., Cerqua J., and Boarman M. (2009) “Leveraging Measurement System Analysis
(MSA) to Improve Library Assessment: The Attribute Gage R&R”, College & Research Libraries, Vol. 70, No. 6, pp. 568-577
Nassehi A., Newman S.T., Dhokia V., Zhu, Z., Imani Asrai R., (2011) “Using formal methods to model hybrid
manufacturing processes”, 4th CIRP International Conference on Changeable, Agile, Reconfigurable and Virtual
Production, Montreal, Canada
Niemi, R.M., (1971) “Surface Integrity Prediction”, Paper NoIQ71-226, Dearbon, Michigan, SME Technical Paper
NPL guide No 80, (2005) “Measurement good practice guide No 80”, Crown, ISSN 1386-6550
Operations Management, (2016) “Chapter 9: Management of Quality, Portions not contributed by visitors are Copyright 2016
Tangient LLC, https://ids355.wikispaces.com/
Pahk, H.J. and Kim, Y.S, (2001) Apparatus for measuring three-dimensional volumetric errors in multiaxis machine tools,
United States patent, No. 6,269,544 B1
Pahl, G., W. Beitz, J. Feldhusen, and K.H. Grote, (1998) “Engineering Design: A systematic approach”, London: The Design
Council
Pawade R.S., Suhas S.J. and Brahmanhkar P.K., (2008) “Effect of Machining Parameters and Cutting Edge Geometry on
Surface Integrity of High Speed Turned Inconel 718”, International Journal of Machine Tools and Manufacture, Vol. 48, pp. 15-28
Prakosa, T., Nasril, Yuwana, Y and Nurhadi, I., (2011) “Development and Manufacturing of A Measurement Apparatus for
NC Machine Tools Diagnosis by Double Shaft-Hole Bar (DSB) Method”, White Paper, Mechanical Engineering,
Bandung Institute of Technology, Indonesia
Quality Management (1998) Guidelines, Thomas Telford, ISBN 0727726404
Quality Management: Guidelines, Thomas Telford, ISBN 0727726404 (1998)
Rashmi, B., Bhavsar, P.E., Collins, A. And Silverman, s. (2001) “Use of Alloy 718 and 725 in Oil and Gas Industry”,
Schlumberger Reservoir Completions Center, TMS (The Minerals, Metals& Materials Society)
Reed, N., J. Scanlan, G. Wills, and S. Halliday. (2010) “Providing value to a business using a lightweight design system to
support knowledge reuse by designers”, International Conference on Engineering Design–ICED09: Stanford, USA.
Renishaw (2014) Laser measurement and ballbar diagnosis for motion systems, XL-80 laser system QC20-W wireless ballbar
system, on-line resource: http://www.renishaw.com/en/mp700-high-accuracy-touch-probe--6104, Accessed on Nov 2014
Renishaw (2014) Transform your manufacturing - Process control activities, http://www.renishaw.com/en/transform-your-manufacturing--14152 Accessed: 27 Oct 2014
Renishaw training manual, (2010) QC20-W ballbar training course manual, Renishaw plc
Rolls Royce (2013) “Guide to Dimensional Measurement Equipment”, Version 3.1, May 2013
Rolls Royce supplier training, (2013) “Initial manufacturing performance studies handout”
Rouse, M., (2016) “Total Quality Management”, http://whatis.techtarget.com/
Royal Academy of Engineering, (2012) “Additive manufacturing: opportunities and constraints”, White Paper,
http://www.raeng.org.uk/publications/reports/additive-manufacturing
Ryan, M.P., Williams, D.E., Chater, R.J., Hutton, B.M and McPhail, D.S. (2002) “Why Stainless Steel corrodes?” International Weekly Journal of Science, Vol. 415, pp. 770-774
Samanta, A., T. Mahesh, and R.K. Singh. (2012) Surface Integrity in Laser Assisted Mechanical Micro-Machining (Lamm) Of Inconel 625. Proceeding of: 7th International Conference on Micromanufacturing
Sandvik, (2010) “Heat resistant super alloys”, Application Guide, AB Sandvik Coromant 2010.08
Saoubi, R. M. and Ryde L., (2005) “Application of the EBSD technique for the characterisation of deformation zones in metal cutting”, Journal of Materials Science and Engineering, A 405, pp339-349
Appendices
Akbar Jamshidi – 119380709 121
Schulz, H. and Moriwaki, T., (1992) “High Speed Machining”, CIRP Annals - Manufacturing Technology, Vol. 41, Iss. 2,
pp. 637–643
Shen, J.H., Yang, J.G., Wang, C., (2008) Analysis of volumetric positioning error development due to thermal effect based
on diagonal, Advanced design and manufacture to gain a comparative edge, Springer, ISBN 978-1-84800-200-1
Shokrani, A., Dhokia, V., Munoz-Escalona, P. and Newman, S., (2013) “State-of-the-art cryogenic machining and processing”, International Journal of Computer Integrated Manufacturing, Vol.26, Iss 7, pp. 616-648
Shrotri, A.P., Dandekar, A.R. and Khandagale, S.B., (2014) “Essential Requirements of PPAP”, International Journal of Electronics Communication and Computer Technology, Vol.3, Iss. 3, pp.502-505
Sims, C.T., N.S. Stolloff, and W.C. Hagal., (1987) Superalloys II: High-temperature Materials for Aerospace and Industrial Power. New York: Wiley
Southbaymachine, (2009) “Cutting Speed & Feed Rates”, online resource:
http://www.southbaymachine.com/setups/cuttingspeeds.htm, Accessed on Feb 2016
Speaker, C., (2014) “Risk-based adaptation and community planning in Elkford, British Columbia”, Chief Administrative
Officer District of Elkford, Natural Resources Canda
Subhas B. K., R. Bhat, and K. Ramachandra, (2000) Simultaneous Optimization of Machining Parameters for Dimensional
Instability Control in Aero Gas Turbine Components Made of Inconel 718 Alloy. Journal of Manufacturing Science and
Engineering. 122:586–590
Thakur, D.G., Ramamoorthy, B. and Vijayaraghavan, L., (2008) “Study in the Machinability Characteristics of Superalloy Inconel 718 during High Speed Turning”, Journal of Material and Design, Vol. 30, pp.1718-1725
Thomas, D.S. and Gilbert, S.W., (2014) “Costs and Cost Effectiveness of Additive Manufacturing”, National Institute of
Standards and Technology
Trott JR, Leng B, (1997) An engineering approach for troubleshooting case bases, Case-Based Reasoning Research and
Development, Springer, 1266: 178-189
Tubiak, T.M. and D. W. Benbow, (2009) “The Certified Six Sigma Black Belt Handbook”, Second Edition: ASQ Quality
Press. Milwaukee. Wisc
Udomphol, T. (2007) “Nickel and its alloys”, Lecture 6, Suranaree University of Technology
Wang Z.Y., Rajurkar K.P., Fan J., Lei S., Shin Y.C., and Petrescu G., (2003) “Hybrid Machining of Inconel 718”, International Journal of Machine Tools and Manufacture, Vol. 43, pp. 1391-1396
Wang, W., (2011) “Reverse Engineering: Technology of Reinvention”, Taylor & Francis Group
Wang, Z.Y., K.P. Rajurkar, J. Fan, S. Lei, Y.C. Shin, and G. Petrescu. (2003) “Hybrid Machining of Inconel 718”, International Journal of Machine Tools and Manufacture. 43:1391–1396
Wilson, S. (2007) Process Excellence Getting the Basics Right: Rolls Royce-the post. June 2007
Zhao FY, Kramer RT, Brown JR, Xu X, (2011) Information Modeling for Interoperable Dimensional Metrology, Springer, ISBN 978-1-4471-2166-4
Zhou, J., Bushlya, V., Peng, R.L. and Stahl, J.E., (2012) “Identification of Subsurface Deformation in Machining of Inconel 718”, Journal of Applied Mechanics and Materials, Vol. 117-119, pp 1681-1688
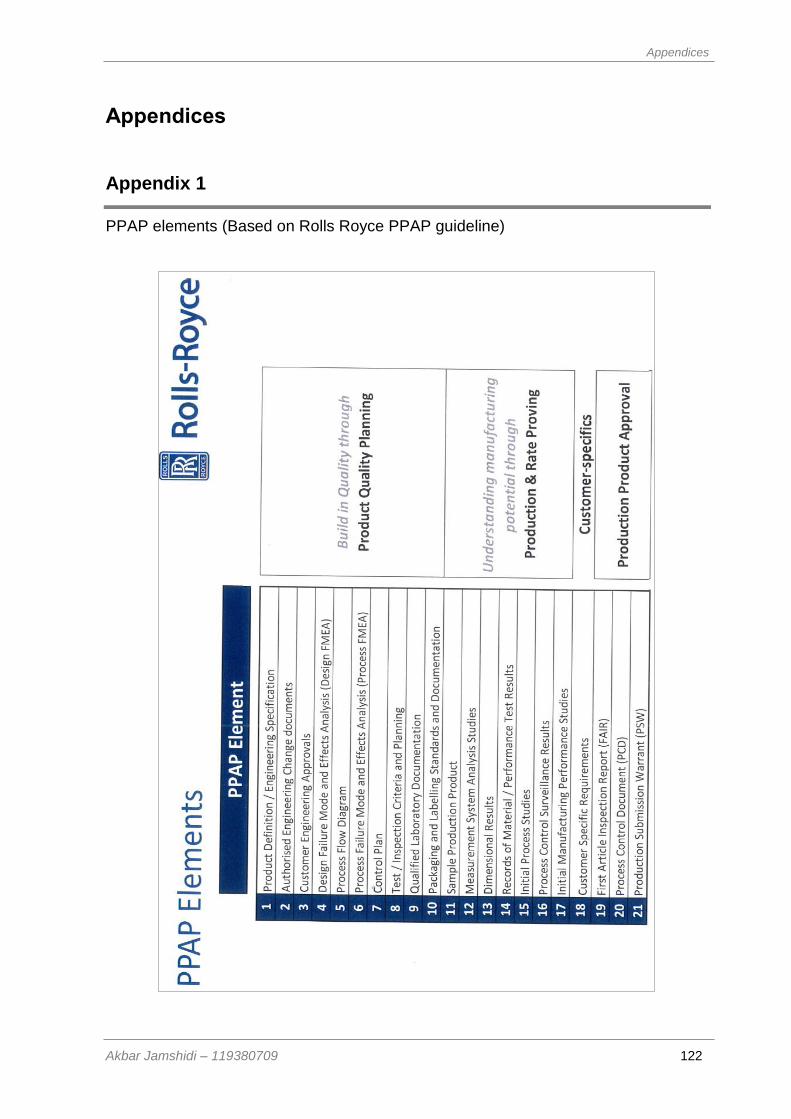
Appendices
Akbar Jamshidi – 119380709 122
Appendices
Appendix 1
PPAP elements (Based on Rolls Royce PPAP guideline)
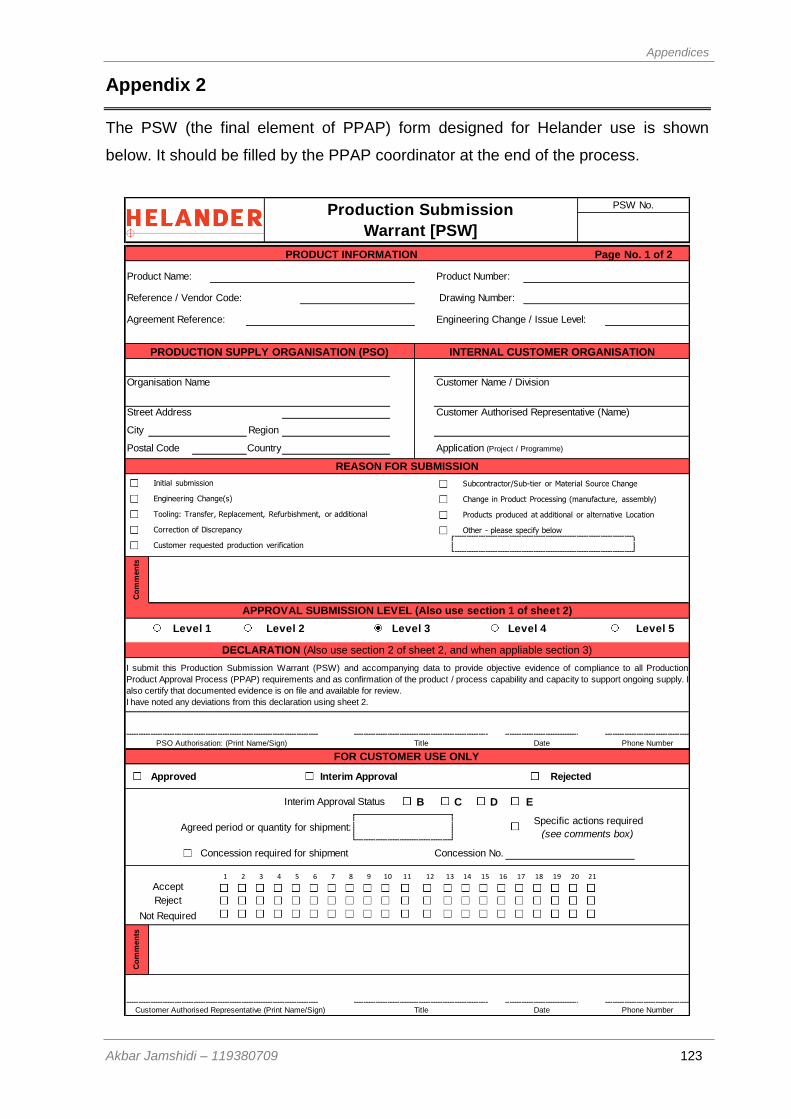
Appendices
Akbar Jamshidi – 119380709 123
Appendix 2
The PSW (the final element of PPAP) form designed for Helander use is shown
below. It should be filled by the PPAP coordinator at the end of the process.
Product Number:
Drawing Number:
City Region
Postal Code Application (Project / Programme)
Co
mm
en
ts
Level 1 Level 2 Level 3 Level 4 Level 5
B C D E
Co
mm
en
ts
Title
Production Submission
Warrant [PSW]
PSW No.
INTERNAL CUSTOMER ORGANISATION
Agreement Reference: Engineering Change / Issue Level:
PRODUCTION SUPPLY ORGANISATION (PSO)
Organisation Name Customer Name / Division
Product Name:
Street Address Customer Authorised Representative (Name)
DECLARATION (Also use section 2 of sheet 2, and when appliable section 3)
APPROVAL SUBMISSION LEVEL (Also use section 1 of sheet 2)
Approved Interim Approval
Title
REASON FOR SUBMISSION
I submit this Production Submission Warrant (PSW) and accompanying data to provide objective evidence of compliance to all Production
Product Approval Process (PPAP) requirements and as confirmation of the product / process capability and capacity to support ongoing supply. I
also certify that documented evidence is on file and available for review.
I have noted any deviations from this declaration using sheet 2.
PSO Authorisation: (Print Name/Sign)
Not Required
Concession required for shipment
Agreed period or quantity for shipment: Specific actions required
(see comments box)
Phone Number
Phone Number
Concession No.
Date
Interim Approval Status
DateCustomer Authorised Representative (Print Name/Sign)
Rejected
Accept
Reject
PRODUCT INFORMATION Page No. 1 of 2
FOR CUSTOMER USE ONLY
Reference / Vendor Code:
Country
1 2 3 4 5 6 7 8 9 10 11 12 13 14 15 16 17 18 19 20 21
Other - please specify below
Products produced at additional or alternative Location
Change in Product Processing (manufacture, assembly)
Subcontractor/Sub-tier or Material Source Change
Customer requested production verification
Correction of Discrepancy
Tooling: Transfer, Replacement, Refurbishment, or additional
Engineering Change(s)
Initial submission
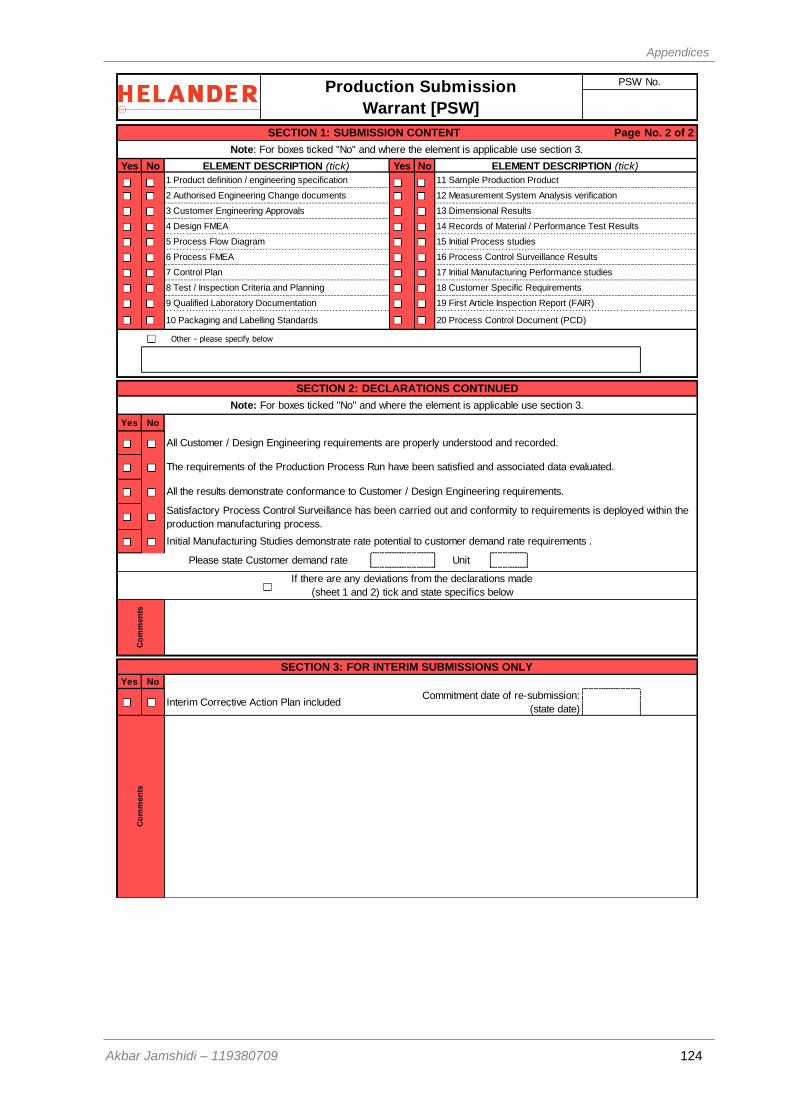
Appendices
Akbar Jamshidi – 119380709 124
Yes No Yes No
Yes No
Unit
Yes No
PSW No.
Co
mm
en
ts
Note: For boxes ticked "No" and where the element is applicable use section 3.
SECTION 1: SUBMISSION CONTENT
Initial Manufacturing Studies demonstrate rate potential to customer demand rate requirements .
Production Submission
Warrant [PSW]
8 Test / Inspection Criteria and Planning
SECTION 3: FOR INTERIM SUBMISSIONS ONLY
Please state Customer demand rate
SECTION 2: DECLARATIONS CONTINUED
All Customer / Design Engineering requirements are properly understood and recorded.
The requirements of the Production Process Run have been satisfied and associated data evaluated.
All the results demonstrate conformance to Customer / Design Engineering requirements.
Satisfactory Process Control Surveillance has been carried out and conformity to requirements is deployed within the
production manufacturing process.
Page No. 2 of 2
Commitment date of re-submission:
(state date)
Co
mm
en
ts
Note: For boxes ticked "No" and where the element is applicable use section 3.
9 Qualified Laboratory Documentation 19 First Article Inspection Report (FAIR)
20 Process Control Document (PCD)
ELEMENT DESCRIPTION (tick)
6 Process FMEA
4 Design FMEA
5 Process Flow Diagram
11 Sample Production Product
3 Customer Engineering Approvals
7 Control Plan
18 Customer Specific Requirements
17 Initial Manufacturing Performance studies
10 Packaging and Labelling Standards
1 Product definition / engineering specification
2 Authorised Engineering Change documents
16 Process Control Surveillance Results
12 Measurement System Analysis verification
Interim Corrective Action Plan included
ELEMENT DESCRIPTION (tick)
13 Dimensional Results
14 Records of Material / Performance Test Results
15 Initial Process studies
If there are any deviations from the declarations made
(sheet 1 and 2) tick and state specifics below
Other - please specify below
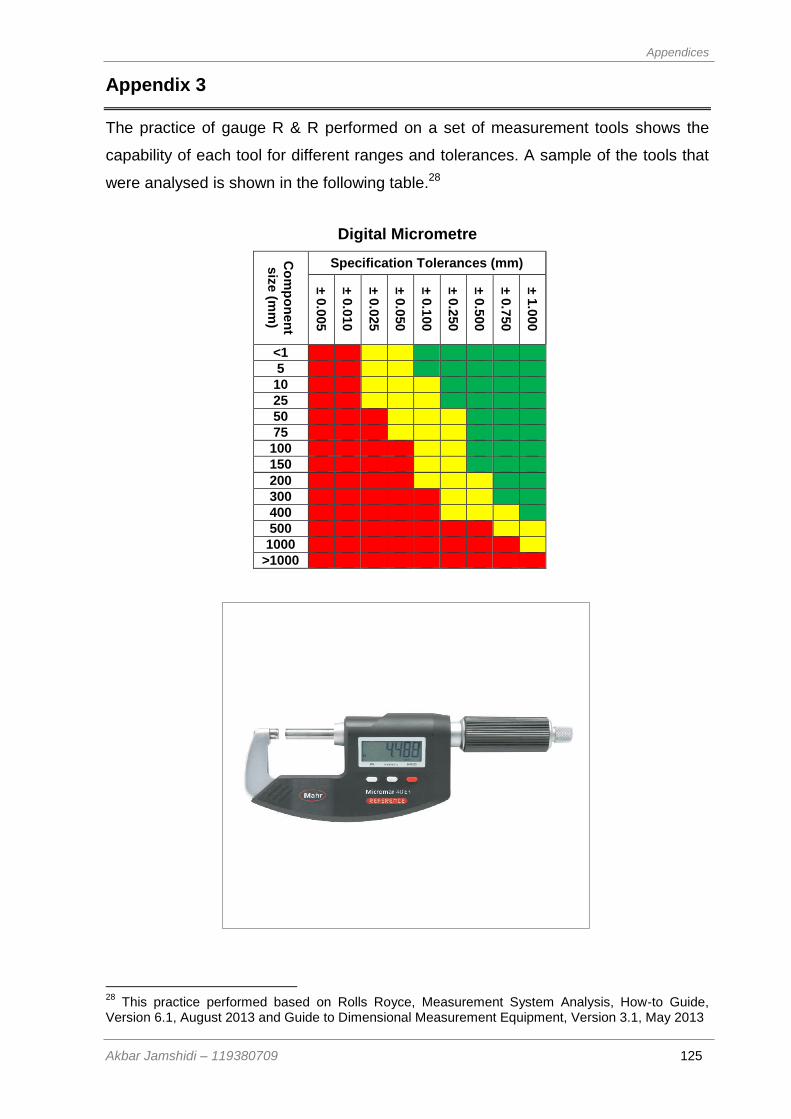
Appendices
Akbar Jamshidi – 119380709 125
Appendix 3
The practice of gauge R & R performed on a set of measurement tools shows the
capability of each tool for different ranges and tolerances. A sample of the tools that
were analysed is shown in the following table.28
Digital Micrometre
Co
mp
on
en
t
siz
e (m
m)
Specification Tolerances (mm)
± 0
.005
± 0
.010
± 0
.025
± 0
.050
± 0
.100
± 0
.250
± 0
.500
± 0
.750
± 1
.000
<1
5
10
25
50
75
100
150
200
300
400
500
1000
>1000
28
This practice performed based on Rolls Royce, Measurement System Analysis, How-to Guide, Version 6.1, August 2013 and Guide to Dimensional Measurement Equipment, Version 3.1, May 2013
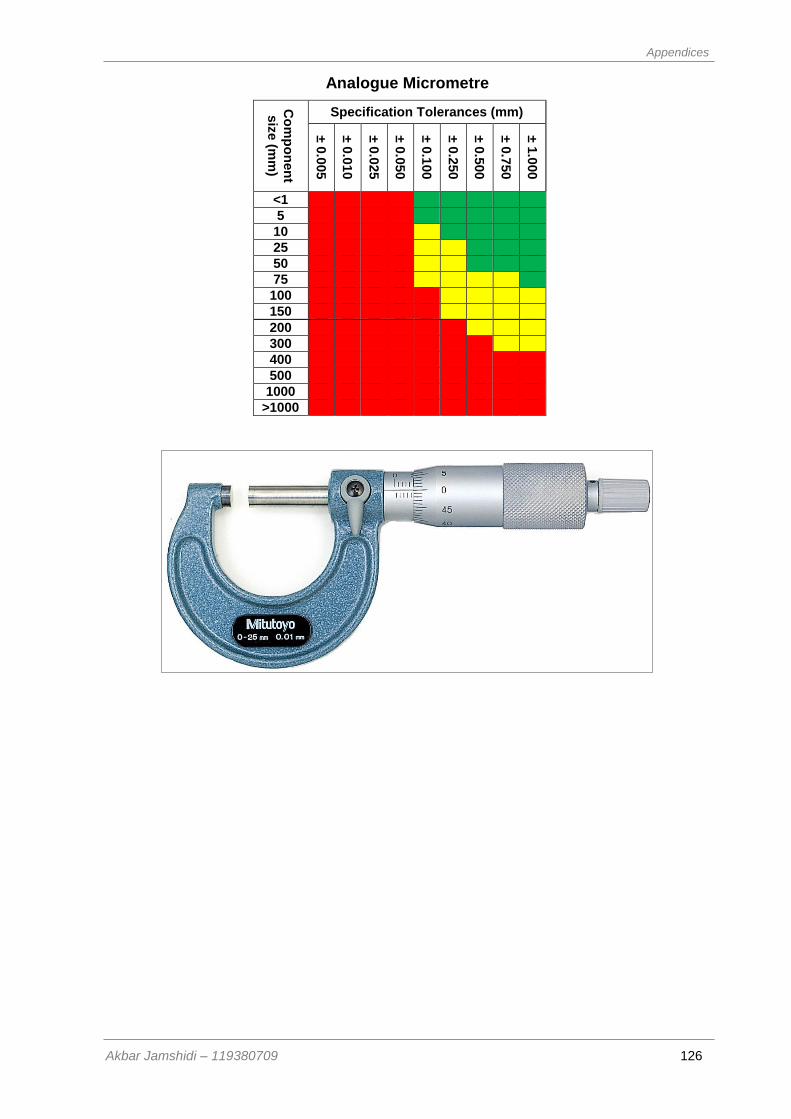
Appendices
Akbar Jamshidi – 119380709 126
Analogue Micrometre
Co
mp
on
en
t
siz
e (m
m)
Specification Tolerances (mm)
± 0
.005
± 0
.010
± 0
.025
± 0
.050
± 0
.100
± 0
.250
± 0
.500
± 0
.750
± 1
.000
<1
5
10
25
50
75
100
150
200
300
400
500
1000
>1000

Appendices
Akbar Jamshidi – 119380709 127
Digital Calliper
Co
mp
on
en
t siz
e (m
m)
Specification Tolerances (mm)
± 0
.005
± 0
.010
± 0
.025
± 0
.050
± 0
.100
± 0
.250
± 0
.500
± 0
.750
± 1
.000
<1
5
10
25
50
75
100
150
200
300
400
500
1000
>1000
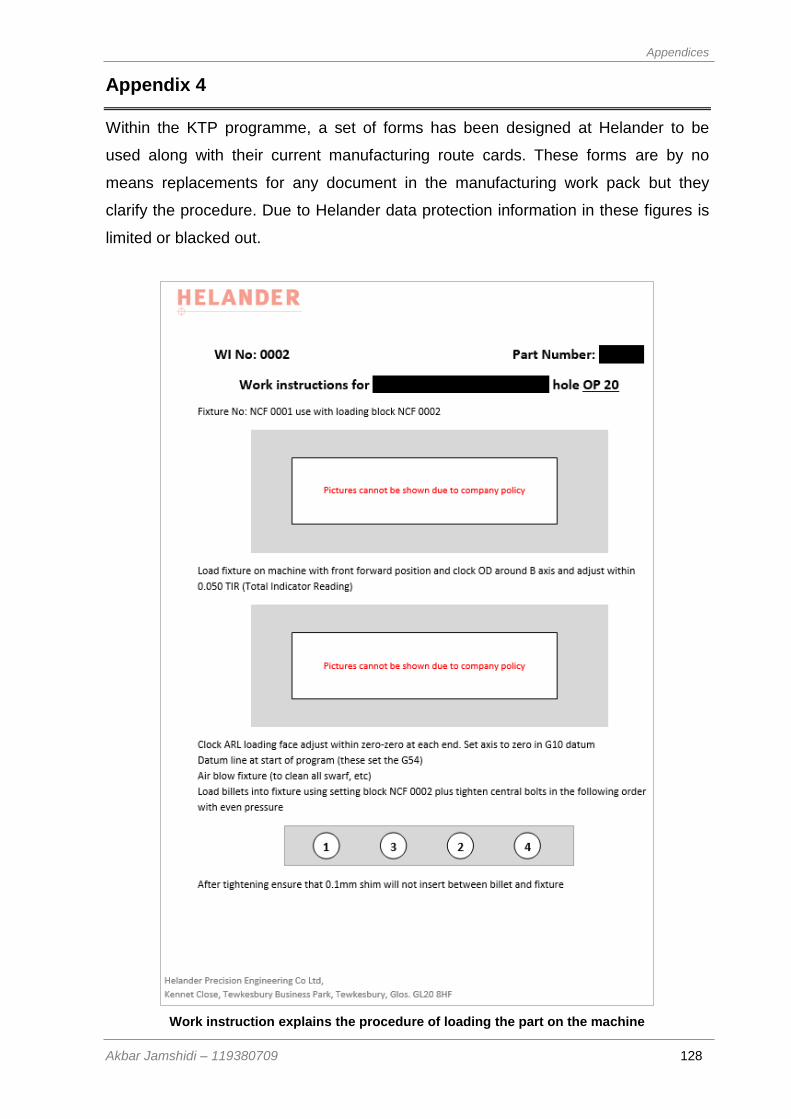
Appendices
Akbar Jamshidi – 119380709 128
Appendix 4
Within the KTP programme, a set of forms has been designed at Helander to be
used along with their current manufacturing route cards. These forms are by no
means replacements for any document in the manufacturing work pack but they
clarify the procedure. Due to Helander data protection information in these figures is
limited or blacked out.
Work instruction explains the procedure of loading the part on the machine
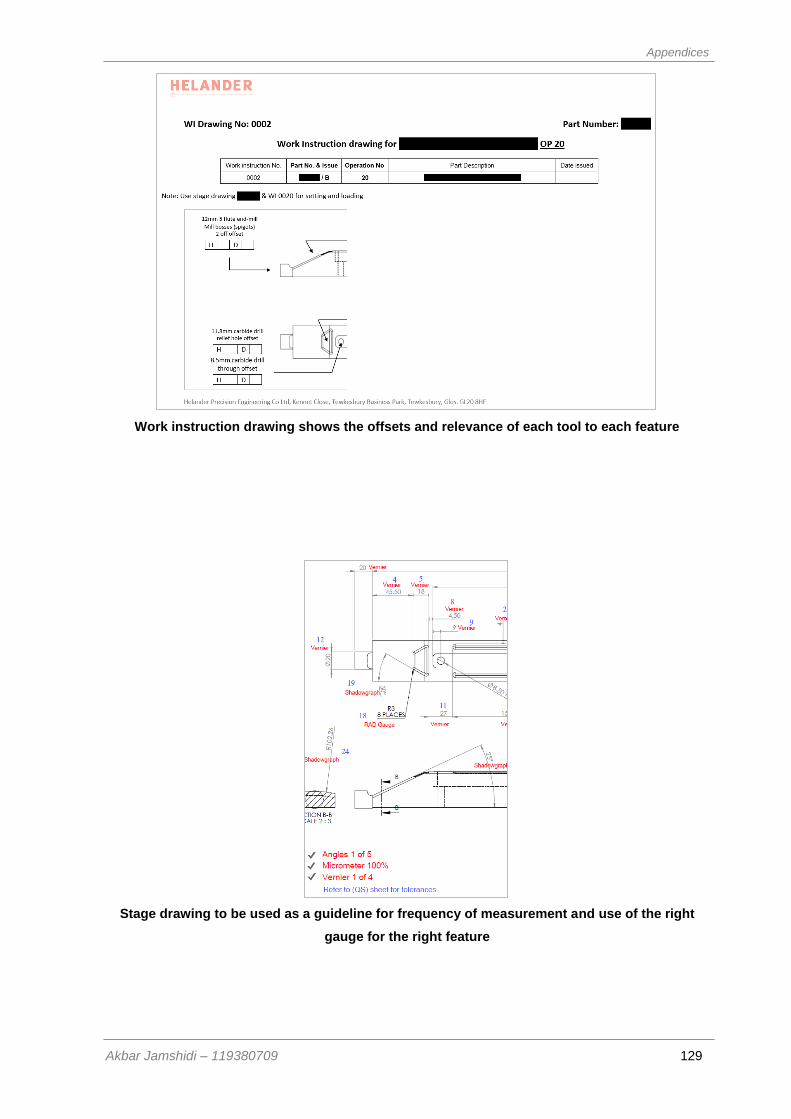
Appendices
Akbar Jamshidi – 119380709 129
Work instruction drawing shows the offsets and relevance of each tool to each feature
Stage drawing to be used as a guideline for frequency of measurement and use of the right
gauge for the right feature

Appendices
Akbar Jamshidi – 119380709 130
Quality Schedule form to record the measured size of different features
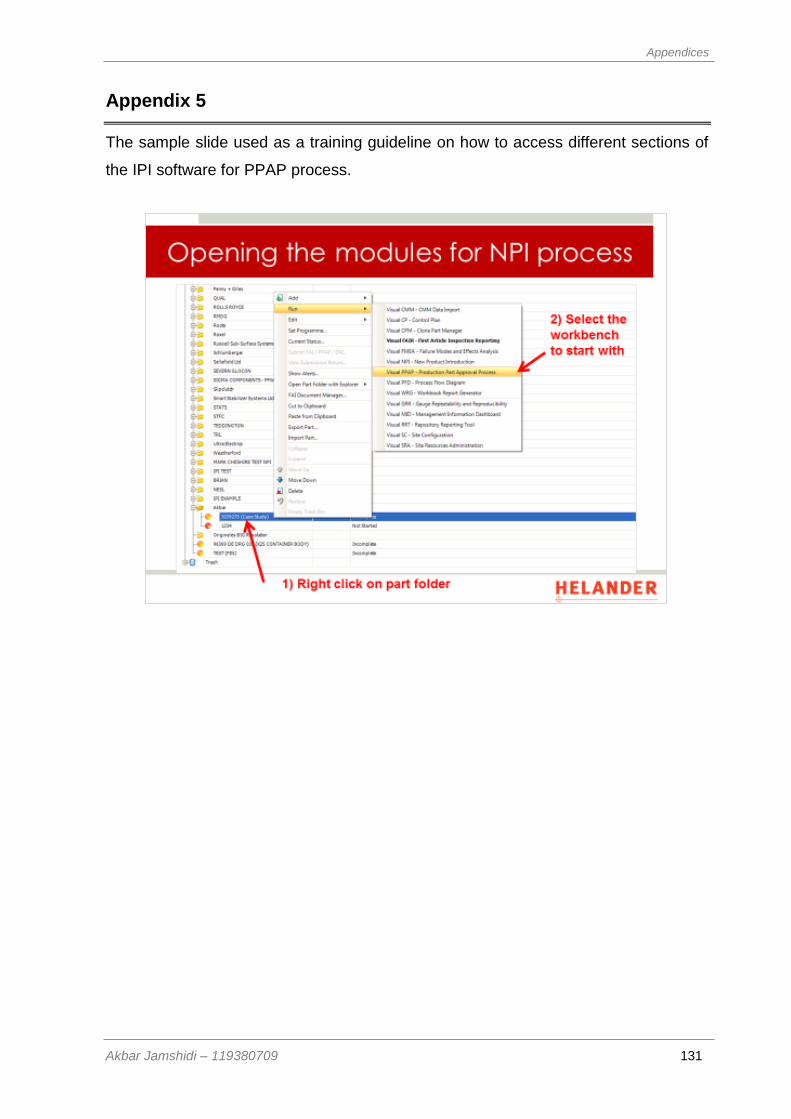
Appendices
Akbar Jamshidi – 119380709 131
Appendix 5
The sample slide used as a training guideline on how to access different sections of
the IPI software for PPAP process.

Appendices
Akbar Jamshidi – 119380709 132
Appendix 6
The list of Helander machinery with their working volume and cooling methods


