Embed Size (px)
Citation preview

Life is Getting Better: Societal Evolution and Fitwith Human Nature
Ruut Veenhoven
Accepted: 10 November 2009 / Published online: 30 December 2009� The Author(s) 2009. This article is published with open access at Springerlink.com
Abstract Human society has changed much over the last centuries and this process of
‘modernization’ has profoundly affected the lives of individuals; currently we live quite
different lives from those forefathers lived only five generations ago. There is difference of
opinion as to whether we live better now than before and consequently there is also
disagreement as to whether we should continue modernizing or rather try to slow the
process down. Quality-of-life in a society can be measured by how long and happy its
inhabitants live. Using these indicators I assess whether societal modernization has made
life better or worse. Firstly I examine findings of present day survey research. I start with a
cross-sectional analysis of 143 nations in the years 2000–2008 and find that people live
longer and happier in today’s most modern societies. Secondly I examine trends in modern
nations over the last decade and find that happiness and longevity have increased in most
cases. Thirdly I consider the long-term and review findings from historical anthropology,
which show that we lived better in the early hunter-gatherer society than in the later
agrarian society. Together these data suggest that societal evolution has worked out dif-
ferently for the quality of human life, first negatively, in the change from a hunter-gatherer
existence to agriculture, and next positively, in the more recent transformation from an
agrarian to an industrial society. We live now longer and happier than ever before.
Keywords Quality-of-life � Life expectancy � Happiness � Evolution �Progress
Earlier versions of this paper have been published in: Yew-Kwang Ng & Lok Sang Ho (Eds.) ‘Happinessand Public Policy, Theory, Case studies and Implications’ Palgrave-Macmillan, New York, 2006, pp. 19–44and in the European Psychologist, 2005, 10:330–343.
R. Veenhoven (&)Faculty of Social Sciences, Erasmus University Rotterdam,P.O. Box 1738, 3000DR Rotterdam, Netherlandse-mail: [email protected]
123
Soc Indic Res (2010) 97:105–122DOI 10.1007/s11205-009-9556-0

1 Introduction
The human species has lived for most of its time in simple hunter-gatherer societies.
Agrarian societies developed less than 5.000 years ago and it is only in the last 200 years
that a ‘modern’ industrial society has come into being. Today this industrial society is
rapidly transforming into a global information society.
Is this societal evolution a change for the better? There has always been much con-
troversy over this question, and currently the dispute seems more intense than ever, pos-
sibly for the reason that we are more aware today that society is of our making and because
social change is taking place at an ever increasing rate. One of the issues in this ongoing
debate is the quality-of-life in modern society.1 Progress optimists believe that we live
better now than earlier generations, while pessimists argue that life is getting worse.
1.1 The Positive View
The idea that life is getting better draws on several achievements of modern society. One is
the unprecedented rise in the material standard of living; the average citizen lives more
comfortably now than kings did a few centuries ago. Another improvement that strikes the
eye is that the chance of an untimely death is greatly reduced; ever fewer people die in
accidents and epidemics and fewer are murdered. A number of social evils have been
abated, such as poverty, inequality, ignorance and oppression. A recent statement of this
view can be found in ‘It’s getting better all the time’ by Moore and Simon (2000).
This notion of improvement is typically part of an evolutionary view, in which society is
seen as a human tool that is gradually perfected. This idea developed during the period of
enlightenment in the 18th century and lives today. The idea that we can improve society by
‘social engineering’ is part of this belief and forms the ideological basis of many major
contemporary institutions, such as the welfare state and development aid organizations.
This journal of ‘Social Indicators Research’ roots in that movement.
The idea that life is getting better breaks with the traditional religious view of earthly
life as a phase of penance awaiting paradise in the afterlife. It is deemed possible to reduce
suffering by creating a better world and societal development is seen to head in that way,
be it with some ups and downs.
1.2 The Negative View
The view that life is getting worse is typically fuelled by concern about contemporary
social problems. One kind of problems is deviant behavior, such as criminality, drug use
and school refusal. Another group of problems seen to reduce the quality of life is social
conflicts, such as labor disputes, ethnic troubles and political terrorism. The decline of the
influence of the church, the family and the local community are also seen to impoverish the
quality of life of modern people, as are the rising divorce rates. A recent statement of this
view is found in Easterbrook (2003) ‘The progress paradox’.
This notion of decay is often part of the idea of society drifting away from human
nature, because society has changed a lot, while human nature has not. In this view society
1 The quality of individual life in society is only one of the themes in a wider debate about the quality ofsociety and in fact a rather recent theme. Most of the discourse about societal development is about power,contribution to human civilization and moral value. This difference between quality in and of society iselaborated in Veenhoven (2009d).
106 R. Veenhoven
123

is not a piece of equipment, but rather an uncontrollable force that presses humans into a
way of life that does not really fit them. The idea that life is getting worse fits a long
tradition of social criticism and apocalyptic prophecies. In this view paradise is lost and is
unlikely to be restored.
1.3 Dominance of the Negative View
The negative view prevails in most discussions, both in social scientific discourse and in
public opinion.
Themes in Classic Social TheoryMany renowned social theorists were typically not very positive about the quality-of-life in
modern society. For instance, Marx (1871) prophesied that the blind forces of capitalism
would result in a process of ‘Verelendung’ (miserysation), the working class getting ever
poorer and larger. In this line Braverman (1974) argued that mechanization and special-
ization have ‘degraded’ work in the 20th century.
Sociologist Emile Durkheim (1897) was also not very positive and observed growing
moral disorientation, which he called ‘anomie’. In his view, the modernization process
disrupts the communal basis of morality, amongst other things because social control is
reduced, and he provided evidence that this development had boosted suicide rates. Many
later sociologists echo this view. Appealing books written in this tradition include Ries-
man’s (1950) ‘‘Lonely crowd’’, Ritzer’s (1993) ‘‘The McDonaldization of society’’ and
Putnam’s (2000) ‘‘Bowling alone’’. Sociologists have become more negative about modern
society over the last decade, an analysis of the sociological abstracts showed a doubling in
the use of gloomy words between 1970 and 2000 (Elchardus 2004: 507).
In psychology Freud (1930) provides an outspoken example of the theory that life is
getting worse. In his book ‘‘Unbehagen in der Kultur’’ (society and its discontents) Freud
asserts that any social organization requires the repression of instinctual urges, and that the
development of modern society necessitates ever more repression of natural impulses.
Hence he believed that societal civilization is antithetical to human happiness and that we
are typically less happy than our primitive forefathers. Likewise, some evolutionary psy-
chologists believe that natural selection cannot keep pace with societal development (e.g.,
Nesse 2004:1343).
Focus in Social ReportingSocial statistics deal with misery in the first place. There are statistics for accidents rates,
suicide rates, depression rates, drug abuse, victimization and poverty, but few for enjoy-
ment of life.2 Moreover social reports tend to emphasize negative trends on these matters.
This is at least the case in current western society; in the former communist countries
social statistics were typically used to emphasize positive developments in an attempt to
conceal a deteriorating quality-of-life.
Majority in Public OpinionSurvey studies in modern nations show wide support for the idea that life was better in the
‘good old days’. In the USA the majority agrees with the statement ‘‘In spite of what some
people say, the lot of the average man is getting worse, not better’’. Support for this idea is
2 Of the 34 social indicators mentioned by the OECD (2006) 15 denote negative matters, such as ‘suicide’and ‘prisoners’. Most of the other indicators have a neutral connotation (e.g., health expenditures).
Life is Getting Better 107
123

growing, the percent affirmative answers rose from about 55% in the 1970s to 70% in the early
1990s. Curiously, this idea is not reflected in self-reports of an individual’s own life, since
most people feel that the quality of their personal life has improved (Hagerty 2003).
1.4 Relevance of the Issue
This discussion is not just some academic matter to be argued over in ivory towers; it has
profound policy implications. If modernization makes society less livable, we should try to
stop the process, or at least to slow it down. Conservatives have a strong point in this case
and can convincingly argue for restorative policies. However, if modernization tends to
improve the quality-of-life, we better go along, which would rather fit the liberal political
agenda. In the latter case there is also ground to further modernization, which would
support various reformist tendencies in advanced nations and justifies missionary activities
such as ‘development aid’ for ‘under-developed’ nations.
2 Measurement of Quality of Life
How can we assess whether life gets better or worse? This first requires a clear definition of
quality-of-life and next a feasible operationalisation of this concept.
2.1 Concepts of ‘Quality of Life’
The term ‘quality-of-life’ serves as a catchword for different notions of the good life. It is
used in fact to denote a bunch of qualities of life, which can be ordered on the basis of the
following two distinctions.
A first distinction is between opportunities for a good life and the outcomes of life. This
distinction is quite common in the field of public-health research. Pre-conditions for good
health, such as adequate nutrition and professional care are seldom mixed up with the concept
of health. A second difference is between external and inner qualities. In the first case the
quality is in the environment, in the latter it is in the individual. This distinction is also quite
common in public health. External pathogens are distinguished from inner afflictions.
Combining of these two dichotomies yields a fourfold matrix, presented in Fig. 1.
In the upper half of the figure, we see, next to the outer opportunities in one’s envi-
ronment, the inner capacities required to exploit these. The environmental conditions can
be denoted by the term livability, the personal capacities with the word life-ability. This
difference is not new. In sociology, the distinction between ‘social capital’ and ‘psycho-
logical capital’ is sometimes used in this context, and in the psychology of stress the
difference is labeled negatively in terms of ‘burden’ and ‘bearing power’.
The lower half of the figure is about the quality of life with respect to its outcomes.
These outcomes can be judged by their value for one’s environment and by their value for
oneself. The external worth of a life is denoted by the term utility of life. The inner
valuation of a life is called enjoyment of life. These matters are of course related. Knowing
that one’s life is useful will typically add to ones appreciation of life. Yet useful-lives are
not always happy lives and not every ‘good-for-nothing’ is unhappy.
Livability of the EnvironmentThe left top quadrant denotes the meaning of good living conditions, which I call ‘liv-
ability’. One could also speak of the ‘habitability’ of an environment, though that term is
108 R. Veenhoven
123

also used for the quality of housing in particular. Elsewhere I have explored the concept of
livability in more detail (Veenhoven 1996:7–9).
Ecologists see livability in the natural environment and describe it in terms of pollution,
global warming and degradation of nature. Currently, they associate livability typically
with environmental preservation. City planners see livability in the built environment and
associate it with sewer systems, traffic jams and ghettos. Here the good life is seen to be the
fruit of human intervention. In public health this all is referred to as a ‘sane’ environment.
Society is central in the sociological view. Firstly, livability is associated with the
quality of society as a whole. Classic concepts of the ‘good society’ stress material welfare
and social equality, sometimes equating the concept more or less with the welfare state.
Current communitaristic notions emphasize close networks, strong norms and active
voluntary associations. The reverse of this livability concept is ‘social fragmentation’.
Secondly, livability is seen in one’s position in society. For a long time, the emphasis was
on the ‘under-class’ but currently attention is shifting to the ‘outer-class’. The corre-
sponding antonyms are ‘deprivation’ and ‘exclusion’.
Life-Ability of the PersonThe right top quadrant denotes inner life-chances. That is: how well we are equipped to
cope with the problems of life. I call this ‘life-ability’, which contrasts elegantly with
‘livability’.
The most common depiction of this quality of life is an absence of functional defects.
This is ‘health’ in the limited sense, sometimes referred to as ‘negative health’. In this
context, doctors focus on unimpaired functioning of the body, while psychologists stress
the absence of mental defects. This use of words presupposes a ‘normal’ level of func-
tioning. A good quality of life is seen to be the body and mind working as designed. This is
the common meaning used in curative care.
Next to absence of disease, one can consider excellence of function. This is referred to
as ‘positive health’ and associated with energy and resilience. Psychological concepts of
positive mental health also involve autonomy, reality control, creativity and inner synergy
of traits and strivings. This broader definition is the favorite of the training professions and
is central to the ‘positive psychology’ movement.
Outer qualities Inner qualities
Life chances Livability of environment Life-ability of the person
Life results Utility of life Enjoyment of life
Fig. 1 Four qualities of life
Life is Getting Better 109
123

Utility of LifeThe left bottom quadrant represents the notion that a good life must be good for something
more than itself. I refer to these external turnouts as the ‘utility’ of life. When evaluating
the external effects of a life, one can consider its functionality for the environment. In this
context, doctors stress how essential a patient’s life is to their intimates. At a higher level,
quality of life is seen as a contribution to society. Historians see quality in the additions an
individual can make to human culture, and rate for example the lives of great inventors
higher than those of anonymous peasants. Moralists see quality in the preservation of the
moral order, and would deem the life of a saint to be better than that of a sinner. In this
vein, the quality of a life is also linked to effects on the ecosystem. Ecologists see more
quality in a life lived in a ‘sustainable’ manner than in the life of a polluter.
Enjoyment of LifeFinally, the bottom right quadrant represents the inner outcomes of life. That is the quality
of life in the eye of the beholder. As we deal with conscious humans, this quality boils
down to subjective appreciation of life. This is commonly referred to by terms such as
‘subjective wellbeing’, ‘life-satisfaction’ and ‘happiness’ in a limited sense of the word.
Humans are capable of evaluating their life in different ways. We have, in common with
all higher animals, an ability to appraise our situation affectively. We feel good or bad
about particular things and our mood level signals overall adaptation. As in animals these
affective appraisals are automatic, but unlike other animals, humans can reflect on this
experience. We have an idea of how we have felt over the last year, while a cat does not.
Humans can also judge life cognitively by comparing life as it is with notions of how it
should be.
Happiness can be defined as the degree to which a person evaluates the overall quality
of his or her present life-as-a-whole positively. In other words, how much the person likes
the life he/she leads.3 This evaluation appears to draw on affective information in the first
place, if people appraise how happy there are, they estimate how well they feel most of the
time (Veenhoven 2009b).
2.2 Analogous Concepts in Biology
In evolutionary biology, external living conditions are referred to as the ‘biotope’ or
‘habitat’. A biotope can be a more or less suitable for a species, depending on e.g.,
availability of food, shelter and competition. This is analogous to what I call ‘livability’.
An organism’s capability to survive in the environment is called ‘fitness’ by biologists.
This latter term acknowledges the fact that the capabilities must meet (fit) environmental
demand. This is equivalent to what I call ‘life-ability’. With respect to outcomes of life
biologists also distinguish between external and internal effects. External effects are var-
ious ecological functions, such as being prey for other creatures, and the continuation of
the species. This is analogous to what I call the ‘utility’ of life. The outcome of life for the
organism itself is depicted as ‘survival’, which is seen to result from the fit between
capabilities and environment. This notion corresponds to what I call ‘enjoyment of life’.
Below I will argue that this is more than mere correspondence, because subjective
enjoyment is also a signal of good adaptation. These biological concepts are summarized in
Fig. 2.
3 I have elaborated this definition in more detail elsewhere (Veenhoven 1984, Chap. 2).
110 R. Veenhoven
123

2.3 Measuring Quality of Life
Quality of life in nations is usually measured using indexes that involve indicators from
each of the quadrants in Fig. 1, for instance the human development index (UNDP 1990)
includes income per head (top left), education (top right) and life expectancy (bottom
right). Yet this makes no sense and the figures help us to see why not.
Comprehensive Measurement not PossibleQuality of life cannot be measured by totaling quadrants. There is no point in combining
the qualities in the upper and the lower half of the figure, since this involves the adding of
chances and outcomes. Combining the qualities at the left and the right makes little sense
either and in particular not in the case of life chances, where it is not the sum that matters,
but rather the fit between external conditions and inner capacities.
Still another problem is that three of these four qualities cannot be measured very well.
We can only make guesses about the features that constitute the livability of an envi-
ronment and it is also quite difficult to establish what abilities are most required. Though it
is clear that some necessities must be met, it is not so clear what is required on top of these,
and in what quantities and in what mix. Measuring the utility of life is not really feasible
either, since external effects are quite diverse and often difficult to assess. Due to this lack
of sound scientific criteria, any measurements depend very much on assumption and
ideology and hence there is little agreement how to measure these qualities of life.
Measuring happiness is less problematic however. Since happiness is an overall judg-
ment of life, we cease to have the problem of trying to add and compare apples and
oranges: as happiness a state of mind for an individual we can assess it rather easily by
asking that person how happy he or she feels.
Most Inclusive Measure is How Long and Happy People LiveIn biology, ‘survival’ is assumed to result from the ‘fit’ between the abilities of the
organism and environmental demands. This fit cannot be observed as such, but is typically
Outer quality Inner quality
Life chances Biotope Fitness
Life results Continuation of species
Ecological functions
Survival
Fig. 2 Comparable concepts in biology
Life is Getting Better 111
123

inferred from survival rates. If an organism perishes before its programmed lifetime, there
is apparently something wrong with this chance constellation.
In this line we can also infer the life chances in a human society from the outcomes in
happiness. If people live happily, their environment is apparently sufficiently livable and
their abilities appropriate. This may not appeal to supporters of the theory that happiness is
a culturally constructed illusion,4 but it fits well with the view that happiness is a biological
signal of how well we thrive.5
In simple animals, good adaptation reflects only in survival, in higher animals, good
adaptation also reflects in hedonic experience. Negative affect is indicative of poor
adaptation and tends to inhibit the organism, while positive affect is indicative of good
adaptation and works as a ‘go’ signal (Frederickson 1998; Nesse 2004). So, an animal that
does not feel good is probably not doing well.
This inner experience is no great issue in biology, because we cannot assess how
animals feel. Still there is ground to see hedonic experience as an additional mani-
festation of good adaptation and in this vein one could argue that an animal that feels
well most of its lifetime seems to be better adapted than an animal that lives equally
long but feels less well. Humans are capable of reflecting on their experiences, and can
condense positive and negative affects into an overall appraisal of happiness. They are
also capable of communicating that appraisal to investigators. Hence in the case of
humans we can use the additional sign of good adaptation and assess how long andhappy they live.
The degree to which people live long and happy is denoted in the right bottom quadrant
in Fig. 1 and is the most inclusive measure of outcomes of life for the individual. It is also
indicative for the qualities denoted by the two top quadrants. If people live long and happy,
their environment is apparently livable and their life-abilities must be adequate. So, this
measure covers in fact three of the four quadrants and is therefore the most comprehensive
measure of quality-of-life available. I have underpinned this position in more detail
elsewhere and distinguished this measure of ‘apparent’ quality-of-life from currents counts
of ‘presumed’ blessing (Veenhoven 1996, 2000a).
2.4 Measure of Happy Life Years
The degree to which people live long and happy in a society can be measured by com-
bining two sources of information: average longevity in the country and average happiness.
Measurement of Longevity in NationsHow long people live in a country can be assessed using civil registration and by
assessing the average number of years between birth and death. This will give an
adequate measure for past generations, but not for those still alive. Hence, a next step is
to estimate how long the living remain alive and these estimates can be generalized to
give a general population average. This estimate is called ‘life expectancy’ and is
commonly used in world health statistics. Data is available for almost all countries in
the world and yearly updates are published in the human development reports (UNDP
2008).
4 Elsewhere I have discussed this theory and shown that it is wrong (Veenhoven 1991, 1995, 2010).5 This signal theory of happiness fits well with the findings of long-term follow-up studies that happinesspredicts longevity (e.g., Danner et al. 2001).
112 R. Veenhoven
123

Measurement of Happiness in NationsHappiness was defined as subjective enjoyment of one’s life as a whole. Since that is
something people have in mind, it can be measured using questioning. A common survey
question is:
Taking all together, how satisfied or dissatisfied are you currently with your life as a whole?
1 2 3 4 5 6 7 8 9 10
Dissatisfied Satisfied
Since the 1970’s, such questions have been included in many surveys worldwide and there
is now a growing body of data on happiness in nations. Presently there are comparable
surveys in 143 nations. The data have been brought together in the ‘World Database of
Happiness (2009)’, collection of ‘Happiness in Nations’(Veenhoven 2009a).
There are many qualms about such simple self-reports of happiness, in particular
about their validity and about comparability across nations. Elsewhere I have considered
the objections and inspected the empirical evidence for claims about bias (Veenhoven
1993). I found no proof for any of the objections, so I assume that happiness can be
measured in this way. Others have come to the same conclusion (Diener 1994; Saris
et al. 1998). Suffice to note that cross-national differences in happiness correspond in the
predicted way with national rates of depression (VanHemert et al. 2002), and suicide
(Helliwell 2007).
Combination with LongevityHow long and happy people live in a country can be measured by combining information
about length of life, drawn from civil registrations of births and deaths, with data on average
appreciation of life as assessed in surveys. The following simple formula can be applied:
Happy-Life� Years ¼ Life-expectancy at birth� 0�1 happiness
Suppose that life expectancy in a country is 60 years, and that the average score on a 0–10-
step happiness scale is 5. Converted to a 0–1 scale, the happiness score is than 0.5. The
product of 60 and 0.5 is 30. So the number of happy life years is 30 in that country. If life
expectancy is also 60 years but average happiness 8, the number of happy life years is 48
(60 9 0.8).
Theoretically, this indicator has a broad variation. The number of happy life years is
zero if nobody can live in the country, and will be endless if society is ideal or its
inhabitants immortal. The practical range is between about 10 and 70 years. Presently at
least, life expectancy at birth in nations varies between 40 and 80 years, while average
happiness varies between 0.3 and 0.8. The number of happy-life-years (HLY) will always
be lower than standard life expectancy. It can equal real length of life only if everybody is
perfectly happy in a country (score 1 on scale 0 to 1).
A high HLY means that citizens live both long and happily; a low HLY implies that the
life of the average citizen is short and miserable. Medium HLY values can mean three
things: (1) both moderate length-of-life and moderate appreciation-of-life, (2) long but
unhappy life, and (3) short but happy life. I treat these intermediate outcomes as equal, but
one can of course prefer one to the other.
I have described this indicator in more detail elsewhere (Veenhoven 1996, 2000a,
2005a). It scored highest in a scholarly review of social indicators (Hagerty et al. 2001).
Life is Getting Better 113
123
3 Quality of Life in Modern Society
Using this indicator, we can now answer the question whether life is getting better or worse in
modern society. For this purpose I will first compare the quality-of-life in more and less modern
nations in the early 2000s. Next consider the available data on trends over the last decades.
3.1 Difference Between More and Less Modern Nations
The present day world counts about 180 nation states and for 143 of these we know how
long and how happy its citizens lived in the period 2000–2008 (Veenhoven 2009c). These
cases cover about 90% of the world’s population.
The level of modernity or ‘development’ of these nations can be measured in different
ways; since there are different views on the essence of modernity, there are also different
indicators of the matter. Some focus on the mode of production and measure modernity by
the ratio of agrarian and industrial production, whereas others see mental development as
the core and measure modernity using the average level of education. There are also
several multi dimensional indicators of modernity, such as the human development index
mentioned above and the index of social progress (Estes 1984). All these measures appear
to be highly correlated with buying power per head (UNPD 2008), and since this measure
is available for all the nations I use it in this analysis.
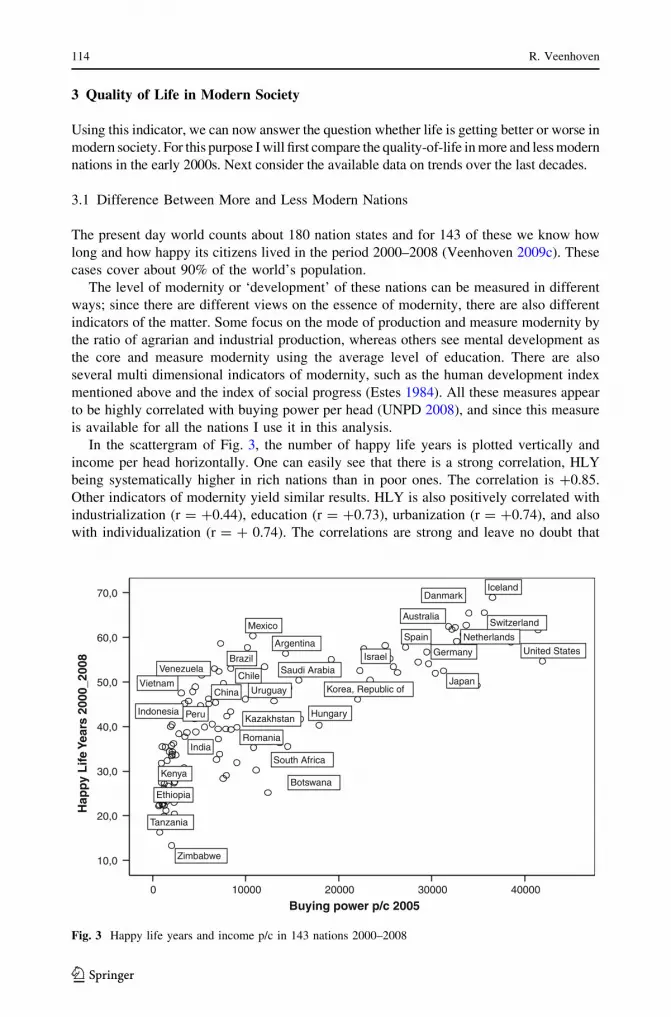
In the scattergram of Fig. 3, the number of happy life years is plotted vertically and
income per head horizontally. One can easily see that there is a strong correlation, HLY
being systematically higher in rich nations than in poor ones. The correlation is ?0.85.
Other indicators of modernity yield similar results. HLY is also positively correlated with
industrialization (r = ?0.44), education (r = ?0.73), urbanization (r = ?0.74), and also
with individualization (r = ? 0.74). The correlations are strong and leave no doubt that
400003000020000100000
Buying power p/c 2005
70,0
60,0
50,0
40,0
30,0
20,0
10,0
Hap
py
Lif
e Ye
ars
2000
_200
8
Zimbabwe
Vietnam
Venezuela
Uruguay
United States
Tanzania
Switzerland
Spain
South Africa
Saudi Arabia
Romania
Peru
NetherlandsMexico
Korea, Republic of
Kenya
Kazakhstan
Japan
Israel
Indonesia
India
Iceland
Hungary
Germany
Ethiopia
Danmark
China
Chile
Brazil
Botswana
Australia
Argentina
Fig. 3 Happy life years and income p/c in 143 nations 2000–2008
114 R. Veenhoven
123
people live longer and happier in the most modern societies. This point is elaborated in
more detail elsewhere (Heylighen and Bernheim 2000; Diener and Diener 1996).
The pattern is similar if we consider happiness and longevity separately. The correlation
of modernity, as measured by income per head, with average happiness is ?0.78 and the
correlation with life-expectancy ?0.67. These effects are largely independent; controlling
for life expectancy, the partial correlation of modernity with happiness is still ?0.60.
Controlling for happiness, the partial correlation of modernity with life-expectancy is much
less, but still ?0.23. This independence of the effects is another justification for the use of
this combined measure of happy life years.
3.2 Trend of Happy Life Years in Modern Nations over the Last Decades
The differences observed in the cross-sectional analysis above could be due to intervening
variables, for example they may be due to the fact that modern nations are mainly found in
moderate climate zones or to variation in genetic endowment. Such distortions can be
controlled for if we compare over time within separate nations. If life is getting better, this
must also manifest in a positive trend.
Assessment of the development in HLY in nations requires trend data on happiness and
life expectancy. In the case of life expectancy this is no problem, since considerable time
series are available for many nations. Time series on happiness are less abundant however.
Series of 30 years or longer and based on identical survey questions are available for only
11 nations and these are all highly developed ones. These nations are: the USA since 1945,
Japan since 1958 and for the first nine member states of the European Union since 1973.6
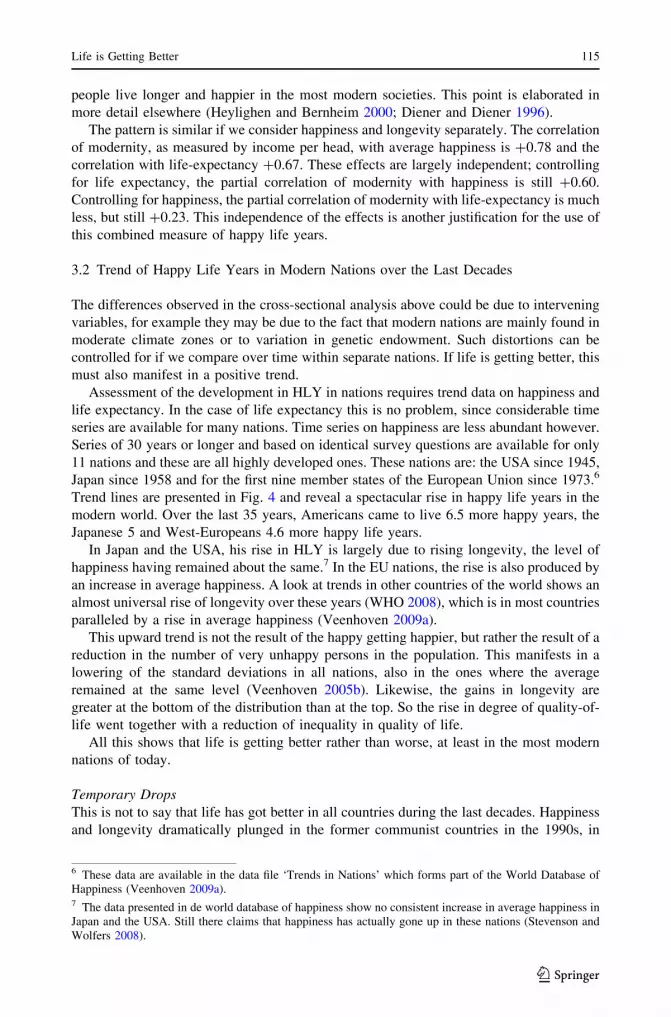
Trend lines are presented in Fig. 4 and reveal a spectacular rise in happy life years in the
modern world. Over the last 35 years, Americans came to live 6.5 more happy years, the
Japanese 5 and West-Europeans 4.6 more happy life years.
In Japan and the USA, his rise in HLY is largely due to rising longevity, the level of
happiness having remained about the same.7 In the EU nations, the rise is also produced by
an increase in average happiness. A look at trends in other countries of the world shows an
almost universal rise of longevity over these years (WHO 2008), which is in most countries
paralleled by a rise in average happiness (Veenhoven 2009a).
This upward trend is not the result of the happy getting happier, but rather the result of a
reduction in the number of very unhappy persons in the population. This manifests in a
lowering of the standard deviations in all nations, also in the ones where the average
remained at the same level (Veenhoven 2005b). Likewise, the gains in longevity are
greater at the bottom of the distribution than at the top. So the rise in degree of quality-of-
life went together with a reduction of inequality in quality of life.
All this shows that life is getting better rather than worse, at least in the most modern
nations of today.
Temporary DropsThis is not to say that life has got better in all countries during the last decades. Happiness
and longevity dramatically plunged in the former communist countries in the 1990s, in
6 These data are available in the data file ‘Trends in Nations’ which forms part of the World Database ofHappiness (Veenhoven 2009a).7 The data presented in de world database of happiness show no consistent increase in average happiness inJapan and the USA. Still there claims that happiness has actually gone up in these nations (Stevenson andWolfers 2008).
Life is Getting Better 115
123

particular in Russia (Veenhoven 2001), probably in response to the sudden transformations
in these societies. The latest data suggest that the post-communist nadir is passed (Bal-
tatescu 2006). We see this also in the case of Russia in Fig. 4.
One must also realize that the effects of economic development are less smooth than
suggested in Fig. 3. In some cases at least, early industrialization was accompanied by a
shortening of life and even by a reduction in average body size (Komlos 1998). The wide
variation in the left half of Fig. 3 can be interpreted as an indication that similar things are
happening in today’s developing nations. Further it is beyond doubt that progress causes
the ‘pain of incomprehension’ during periods of transition (Hays 1994).
4 Quality-of-Live over Human History
The above evidence concerns contemporary societies and does not rule out that quality-of-
life has been better in earlier times. All the cases considered are modern to some extent.
Hence these data cannot settle the question of whether we would have lived better in an
ancient society.
One way to check this would be to look at the quality-of-life in present day ‘primitive’
societies. Yet there are few such societies today and the few that remain are to be found in
poor ecological conditions, impinged on by ‘modern’ society to their detriment. Moreover,
the last century’s anthropological research does not give us a clear picture of the quality-of-
life in the primitive societies that were surveyed. There are accounts of positive features in
such societies, such as Mead’s (1953) description of relaxed sexual practices in Samoa, but
there is also evidence of rampant evils, such as violence and superstition (Edgerton 1992).
Anthropologists have never attempted to assess happiness, possibly because of their belief
in cultural relativism (Thin 2008). Recently psychologists Biswas-Diener et al. (2005) did
better in study on happiness among the Inughuit, the Amesh and the Maasai, in which they
20102000199019801970196019501940
60
50
40
30
20
USA
EU9
Japan
Russia
Fig. 4 Trend happy life years in the EU-9, Japan, Russia and the USA
116 R. Veenhoven
123

found the herding Maasai to be about as happy as people in modern western societies,
while the agricultural Amesh appeared to be much less happy.
More important clues can be found in historical anthropology and in particular in work
by Maryanski and Turner (1992) and Sanderson (1995). This literature departs from the
insight that the human species developed in the context of hunter-gatherer bands and that
this type of social organization prevailed for most of the 50.000 years that Homo sapiens
has existed. More complex kinds of societies seem to have developed only fairly recently in
human history, first horticultural societies, then agrarian societies and finally our present day
industrial society, which is rapidly becoming post-industrial in the west (Lenski et al. 1995,
Chap. 1). There are good indications that these types of societies were not equally livable,
and in particular that the agrarian phase marked a historic dip in human quality-of-life.
4.1 Less Free in Agrarian Society
One indication is that the development of freedom seems to have followed a U-curve over
human history. Hunter-gatherer societies can impose few constraints on their members,
since dissenters can support themselves for a while and join other bands. Accumulation of
wealth and power is difficult in these conditions and hence this kind of society tends to be
free and egalitarian.
This changes profoundly in an agrarian society, where survival requires control of the
land and people became more dependent on their family and vulnerable to exploitation by
a warrior caste. According to Maryanski and Turner (1992) this drove mankind into the
‘social cage’ of collectivistic society. In their view, such strong social bonds are less
required in the context of industrial existence, among other things because the ongoing
division of labor involves a shift of dependencies to anonymous institutions such as the
state. Durkheim (1897) described that latter phenomenon as the change from ‘mechanic
solidarity’ to ‘organic solidarity’.
This theory fits the above observation that people live happier in the most modern
societies of this time and in particular it fits the observed relation between happiness and
freedom in nations (Veenhoven 1999). It also provides an explanation for the ongoing
migration from the land to cities.
4.2 Less healthy in Agrarian Society
Another sign of the low quality-of-life in agrarian society can be found in anthropometric
indicators of health. The average health of past generations can to some extend be
reconstructed from human remains. On the basis of excavated bones and teeth we can
estimate how long people have lived and to some degree how healthy they were when they
lived.
Research along these lines suggests that people lived about equally long in early hunter-
gatherer societies and later agrarian societies, but that they lived more healthily in the
former than in the latter. Hunter-gatherers appear to have been better-nourished and less
disease ridden than historical agrarian populations and they seem to have been less bur-
dened with work. Much of the literature on this subject is reviewed in Sanderson (1995:
340–343). Apparently, the obvious advantages of a sedentary pastoral life are counter
balanced in some way, amongst other things probably by increased exposure to disease and
to social stress. Present day industrial societies score better on anthropometric indicators
than both of the other types do. We live longer and healthier than ever and also grow taller
than our forefathers ever did.
Life is Getting Better 117
123

Such historical data cover health and longevity and can be combined in an index of
healthy life years that concurs with the measure of ‘disability adjusted life years’ that is
currently used by the WHO ( 2004). This resembles the ‘happy life years’ I used in the
above analysis of contemporary nations, but it is not quite the same. Since survey research
is a recent invention we will probably never know how happy people were in the past.
Hence we must make do with the available data on health and longevity. Still, these
matters appear to be strongly correlated with happiness8 and both can be seen as mani-
festations of human thriving.
If we consider the data on longevity it is also easy to see that our forefathers cannot have
lived as many happy years as we do now. The average length of life was about 45, both in a
hunter-gatherer society and in an agrarian society. This means that the HLY could not be
higher than 45, even if everybody was perfectly happy. This is clearly below the level in
present day modern nations, where HLY varies between 50 and 60 (cf. Fig. 3).
4.3 Long Term Pattern
Together these data suggest that societal evolution has worked out differently on the
quality of human life, first negatively in the change from hunter-gatherer existence to
agriculture and next positively in the recent transformation from an agrarian to an
industrial society. This pattern is depicted graphically in Fig. 5.
It is not unlikely that the upward trend will continue in the future, both happiness and
longevity are likely to rise. Currently average happiness ranges between 3.2 (Tanzania) and
8.5 (Iceland). This means that there is still much to win. There is no reason to assume that
Tanzania cannot reach the level of Iceland. The maximally possible average may be close
to 9. An average of 10 in a nation is clearly not possible, not only because human life
involves inevitable suffering but also because no society can serve everybody’s needs
equally well.
It is also quite likely that longevity will continue to rise. The underdeveloped nations
are catching up at an unprecedented rate, and there is reason to expect that longevity will
further extend in the developed world, among other things as the result of medical tech-
nology. There is speculation that the average life might be extended to 100 years or more
(Manton et al. 1991; Vaupel and Lundstrom 1993). For the time being at least, gains in
length of life have not come at the cost of quality of life. Elderly people are slightly happier
than the middle-aged. The dotted trend line at the right side of Fig. 5 depicts these
projections.
5 Discussion
These findings raise several questions: one is about compatibility with claims to the
contrary and in particular with reports of alarming rises in rates of depression in modern
society. A second question is what are the mechanisms behind the recent rise in the quality
of human life and the third is to ask why progress pessimism still prevails in the social
sciences.
8 See note 5.
118 R. Veenhoven
123

5.1 No ‘Loss of Happiness in Market Democracies’?
The results of this study directly contradict those of Lane (2000). In his much-cited book
‘The loss of happiness in advanced market democracies’ Lane presents evidence of
declining happiness using similar survey data. How does he come to such a different
conclusion? The first answer is that Lane considers only the case of the USA. As noted in
section 3.2, happiness has remained at the same level in this country, while it has risen in
several other western nations. Secondly, Lane presents data for an era when happiness
declined slightly in the USA, i.e., the years 1972–1994. When we consider all the available
data for the USA (1946–2002), we see no decline. Thirdly, Lane only considers the trend
for ‘very happy’ responses and thus fails to acknowledge that the percentage of ‘unhappy’
responses has declined. Ott (2001) has discussed these flaws in more detail. Lastly, Lane
does not acknowledge that Americans live longer now and that this is a blessing given their
high level of happiness. In his eagerness to promote ‘the medicine of more companion-
ship’, Lane has overstated the disease.
5.2 No Contradiction with Rising Rates of Depression?
Mental illness is no exception in modern societies, about 16% of the US citizens have
experienced episodes of serious depression and every year depression interferes with
effective functioning of some 6% of them for two weeks or more (Kessler et al. 2003).
There are signs of increasing rates of depression, especially among youth and there is talk
about a depression epidemic (Seligman 1990: 10). How does this fit with a rising number
of happy life years?
The first thing to note is that depression is strongly correlated with happiness. Depressed
individuals are clearly less happy and there is a strong correlation between rates of
depression and average happiness in nations (VanHemert et al. 2002). A second point to
keep in mind is that depression is temporary in most cases, and good times can balance the
bad times. Thirdly, we are not sure that the rate of depression has risen. There is an
increase in the numbers for people diagnosed as being depressed, but this may due to better
recognition by professionals of the signs of depression and by better treatments being
available to cure depression. It is possible that depression is less well recognized in under
developed nations, not only because the people are less aware of the syndrome, but also
because bad feelings can be more easily attributed to bad conditions. However it is also
possible that in modern societies people are more aware of how they feel, because they
have more choice and use how they feel more to help them to assess what they want. If
there is a real rise in rates of depression in modern society, that can still co-exist with a rise
in average happiness. Modernization can be to the advantage of a majority, but can come at
Fig. 5 Long-term trend in quality of life
Life is Getting Better 119
123

the expense of a minority who are pushed into depression; no society can suit the needs of
all equally well. If this has happened at all, it has not resulted in a split between happy and
unhappy, since the dispersion of happiness is lessening in modern societies (Veenhoven
2005b).
5.3 Why is life getting better?
The observed growth of years lived happily and healthily can be attributed to several
factors. One is obviously that several common evils of the past have been overcome in
modern societies or at least much abated. For instance, few in the West die of hunger
anymore and the chance of being killed is greatly reduced. A second factor is in the
increased freedom in modern individualized society. The social system allows us more
opportunity to choose and we have also become more capable of making choices which,
taken together, has increased our chance that we will live a life that fits our individual
needs (Veenhoven 1999). This links up with a third explanation, which is that modern
society provides a challenging environment that fits an innate human need for self-actu-
alization. In this view, the human species evolved in rather tough conditions and therefore
typically thrives in modern society with its complexities, competition and choices.9
Probably, increased self-understanding has also contributed to the quality-of-life of modern
man. Lastly, a more ‘critical’ explanation could be that the modern nations successfully
exploit the rest of the world. There may be some truth in this contention, but life is also
getting better in most non-western nations. Most of the poor countries became less poor
over the last decade and life expectancy is also rising in most countries (UNDP 2002,
2004).
5.4 Why then do we still believe that life is getting worse?
This leaves us with the question of why so many people think that our quality of life is
decreasing and, in particular, why this belief is so strong among trained society watchers.
One answer to this question is that we tend to overestimate present problems; yester-
day’s problems are not only less vivid in our minds, but we also know that we survived
them. This may link up with an innate tendency to be alert to signs of danger. This
perceptual bias is enhanced by the professional interest of journalists and social scientists
who earn their living dealing with social problems and for that reason tend to emphasize
evil. These tendencies seem to veil our awareness of actual improvements in the quality of
the life we live. Possibly this works as a self-denying prophecy; the overstatement of
problems results in timely solutions.
6 Conclusion
Societal evolution has not always improved the quality of life. The change from hunter-
gatherer bands to agrarian society seems to have involved deterioration, but the later
transition to modern industrial society brought a change for the better. We now live longer
and are healthier than ever before and we are probably also happier. There are good
reasons to believe that this trend will continue in the near future.
9 In this line I have explained why people do not thrive better in welfare states (Veenhoven 2000b).
120 R. Veenhoven
123

Open Access This article is distributed under the terms of the Creative Commons Attribution Noncom-mercial License which permits any noncommercial use, distribution, and reproduction in any medium,provided the original author(s) and source are credited.
References
Baltatescu, S. M. (2006). Transition is over, Wait to see the benefits: A comparative evaluation of the effectsof post-communist transition on life satisfaction. (Paper presented at conference’ The End of Tran-sition?’, Budapest).
Biswas-Diener, R., Vitterso, J., & Diener, E. (2005). Most people are pretty happy, but there is culturalvariation: The Inughuit, the Amish and the Maasai. Journal of Happiness Studies, 6, 205–226.
Braverman, H. (1974). Labor and monopoly capital: The degradation of work in the 20th century. NewYork: Monthly Review Press.
Danner, D. D., Snowdow, D. A., & Friesen, W. V. (2001). Positive emotions in early life and longevityfindings from the nun study. Journal of Personality and Social Psychology, 80, 804–813.
Diener, E. (1994). Assessing subjective wellbeing: Progress and opportunities. Social Indicators Research,1994(31), 103–157.
Diener, E., & Diener, C. (1996). Most people are happy. Psychological Science, 1996(7), 181–185.Durkheim, E. (1897). Le suicide : etude de sociologie. Paris: Alcan.Easterbrook, G. (2003). The progress paradox: How life gets better while people feel worse. New York:
Random House.Edgerton, R. B. (1992). Sick societies; challenging the myth of primitive harmony. New York: The Free
Press.Elchardus, M. (2004). Sociologie in de onbehaaglijke samenleving (sociology in uncomfortable society).
Sociologische Gids, 51, 507–515.Estes, R. J. (1984). The social progress of nations. New York: Praeger.Frederickson, B. L. (1998). What good are positive emotions? Review of General Psychology, 2, 300–319.Freud, S. (1930). Das Unbehagen in der Kultur. Abriss der Psychoanalyse. (Frankfurt am Main: Fischer).Hagerty, M. R. (2003). Was life better in the ‘good old days’? Inter temporal judgement of life-satisfaction.
Journal of Happiness Studies, 4, 115–139.Hagerty, M. R., Cummins, R. A., Ferris, A. L., Land, K., Michalos, A. C., Peterson, M., et al. (2001).
Quality of life indexes for national policy: Review and agenda for research. Social IndicatorsResearch, 5, 1–96.
Hays, D. G. (1994). On the painfulness of progress. Cross-Cultural Research, 28, 322–326.Helliwell, J. F. (2007). Well-being and social capital: Does suicide pose a puzzle? Social Indicators
Research, 2007(81), 455–496.Heylighen, F., & Bernheim, J. (2000). Global progress I; empirical evidence for ongoing increase in quality
of life. Journal of Happiness Studies, 1, 293–321.Kessler, R. C., Berglund, P., Demler, O., Jin, R., Koretz, D., Merikangas, K. R., et al. (2003). The epide-
miology of major depressive disorder. JAMA, 289, 3095–3105.Komlos, J. (1998). Shrinking in a growing economy? The mystery of physical stature during the industrial
revolution. The Journal of Economic History, 58, 779–802.Lane, R. (2000). The loss of happiness in market democracies. New Haven: Yale University Press.Lenski, G., Nolan, P., & Lenski, J. (1995). Human societies; an introduction into macro sociology. New
York: McGraw-Hill.Manton, K. G., Stallard, E., & Tolley, H. D. (1991). Limits to human life expectancy: Evidence prospects,
and implications. Population and Development Review, 17, 603–637.Marx, K. (1871). Das Kapital. Collected works. Berlin: Akademie Verlag. Translated as ‘Capital: a critique
of political economy’ (London: Lawrence & Wishart).Maryanski, A., & Turner, J. H. (1992). The social cage, human nature and the evolution of society. Stanford,
CA: Stanford University Press.Mead, M. (1953). Coming to age in Samoa: a psychological study of primitive youth for Western civili-
zation. New York: Modern Library.Moore, S., & Simon, J. L. (2000). It’s getting better all the time. Greatest trends of the last 100 years.
Washington: Cato Institute.Nesse, R. M. (2004). Natural selection and the elusiveness of happiness. Philosophical Transactions of the
Royal Society, Biological Sciences, 359, 1333–1347.
Life is Getting Better 121
123

OECD. (2006). Society at glance: OECD social indicators-2006 edition. Paris: Organization for EconomicCooperation and Development.
Ott, J. C. (2001). Did the market depress happiness in the US? Journal of Happiness Studies, 2, 433–443.Putnam, R. D. (2000). Bowling alone: the collapse and revival of American community. New York: Simon
& Schuster.Riesman, D. (1950). Lonely crowd: a study of the changing American character. New Haven: Yale Uni-
versity Press.Ritzer, G. (1993). The McDonaldization of society. Thousand Oaks: Pine Forge Press.Sanderson, S. K. (1995). Social transformations. Oxford: Blackwell UK.Saris, W., Scherpenzeel, A. C., & VanWijk, T. (1998). Validity and reliability of subjective social indi-
cators. Social Indicators Research, 1998(45), 173–199.Seligman, M. E. (1990). Learned optimism. New York: Pocket Books.Stevenson, B. & Wolfers, J. (2008). Economic growth and happiness: reassessing the easterlin paradox.
Brookings Papers on Economic Activity, 1, 1–87.Thin, N. (2008). Realizing the substance of their happiness: How anthropology forgot about HOMO
GAUISUS. In: A. Corsin Jimenez (Ed.), Culture and well-being (pp. 134–155). London: Pluto Press.UNPD (1990, 2002, 2004, 2008). Human development report. United Nations Development Program
(UNDP). New York: Oxford University Press.VanHemert, D. A., VandeVijver, F., & Poortinga, Y. P. (2002). The Beck depression inventory as a measure
of subjective wellbeing in a cross-national study. Journal of Happiness Studies, 3, 257–286.Vaupel, J. W. & Lundstrom, H. (1993). The future of mortality at older ages in developed countries. In W.
Lutz (Ed.), The future population of the world: What can we assume today?. London: IIASA.Earthscan Publications Ltd.
Veenhoven, R. (1984). Conditions of happiness. Drodrecht: Kluwer Academic.Veenhoven, R. (1991). Is happiness relative? Social Indicators Research, 24, 1–34.Veenhoven, R. (1993). Happiness in nations. Rotterdam: RISBO. A 2004 update is available on:
http://worlddatabaseofhappiness.eur.nl/hap_nat/introtexts/intronat-contents.html.Veenhoven, R. (1995). The cross-cultural pattern of happiness. Test of predictions implied in three theories
of happiness. Social Indicators Research, 34, 33–68.Veenhoven, R. (1996). Happy life-expectancy: A comprehensive measure of quality-of-life in nations.
Social Indicators Research, 39, 1–58.Veenhoven, R. (1999). Quality-of-life in individualistic society: A comparison of 43 nations in the early
1990 s. Social Indicators Research, 48, 157–186.Veenhoven, R. (2000a). The four qualities of life: Ordering concepts and measures of the good life. Journal
of Happiness Studies, 1, 1–39.Veenhoven, R. (2000b). Wellbeing in the welfare state: level not higher distribution not more equitable.
Journal of Comparative Policy Analysis, 2, 91–125.Veenhoven, R. (2001). Are the Russians as unhappy as they say they are? Journal of Happiness Studies, 2,
111–136.Veenhoven, R. (2005a). Apparent quality of life: How long and happy people live. Social Indicators
Research, 71, 61–86.Veenhoven, R. (2005b). Return of inequality in modern society? Test by trend in dispersion of life-
satisfaction across time and nations. Journal of Happiness Studies, 6, 457–487.Veenhoven, R. (2009a). World database of happiness: Continuous register of research on subjective
enjoyment of life. The Netherlands: Erasmus University Rotterdam. Available at http://worlddatabaseofhappiness.eur.nl.
Veenhoven, R. (2009b). How do we assess how happy we are? In: A. Dutt, & B. Radcliff, (Eds.), Happiness,Economics and Politics (pp. 45–69). USA: Edward Elgar Publishers.
Veenhoven, R. (2009c). Happy life years in 143 nations 2000–2008. World database of happiness, Rankreport 2009-2a. Available at: http://worlddatabaseofhappiness.eur.nl/hap_nat/findingreports/RankReport_HappyLifeYears.htm.
Veenhoven, R. (2009d). Well-being in nations and well-being of nations: Is there a conflict betweenindividual and society? Social Indicators Research, 91, 5–21.
Veenhoven, R. (2010). How universal is happiness? Chapter 11 In E. D. Diener, J. F. Helliwell & D.Kahneman (Eds.) International Differences in Well-Being. New York: Oxford University Press.
WHO. (2004). World health report 2004. Switzerland: Geneva.WHO. (2008). World health report 2008. Switzerland: Geneva.World Database of Happiness. See Veenhoven 2009.
122 R. Veenhoven
123


