Embed Size (px)
Citation preview


In many ways, a dot is the starting point of all life forms. This dot denotes the atom, the basic building block of all organisms. This dot denotes the beginning point of a line and the birth of all design. A dot linked with many other dots helps weave a magical spread that we call the universe. Life is a series of events coming together, each one marking a new dot, an end in itself yet a new beginning. Where we go in life is a matter of how well we connect the dots. MCB is a banking partner in your life. We are involved in keeping an eye out for the finer details in life, making sure you connect the right dots to take you higher, make you better and keep you happy.
Life is About Connectingthe Dots

ANNUAL REPORT 2013

3
Vision & MissionStrategic ObjectivesCore ValuesAwardsProducts and ServicesCorporate InformationBoard of DirectorsProfile of the Board of DirectorsBoard CommitteesOrganizational StructureManagement CommitteesOther Senior ManagementEntity Credit RatingCorporate Profile of the BankChairman’s MessagePresident’s Review
Stakeholder’s InformationAnnual Trend 2003 – 2013Highlights 2013Key performance indicatorsReview of Six Years’ PerformanceSix Years’ Financial SummarySix Years’ Non Financial SummarySix Years’ Summary of Concentration & MaturitiesConcentration of Advances, Deposits, NPLs and Off Balance Sheet Items - 2013Maturity Analysis of Assets and LiabilitiesKey Interest Bearing Assets and LiabilitiesGraphical Presentation of Financial StatementsStatement of Value AddedSummary of cash flowsCommentary on 6 year cash flowsCash Flow Statement Direct MethodGroupwise Deposits & AdvancesNon Performing LoansInvestmentsMarkup & Non Markup IncomeAdministrative ExpensesVertical AnalysisHorizontal AnalysisCommentary on 6 year Horizontal & Vertical AnalysisMCB CalendarQuarterly Variance Analysis - 2013Quarterly PerformanceMarket Statistics of MCBs ShareShare Price Sensitivity AnalysisDirectors’ Report to the MembersCorporate Sustainability ReportHuman resource managementManaging Conflicts of InterestIT Governance
Whistle Blowing PolicyRecord Management PolicySWOT AnalysisRisk & Opportunity ReportStakeholder’s Engagement PolicyCode of ConductStatement on Internal ControlStatement of Compliance with the Code of Corporate GovernanceAuditors’ Review Report to the Members on Code of Corporate GovernanceReport of the Audit Committee
Standalone Financial StatementsAuditors’ Report to the MembersStatement of Financial PositionProfit and Loss AccountStatement of Comprehensive IncomeCash Flow StatementStatement of Changes in EquityNotes to the Financial StatementsAnnexure
Consolidated Financial StatementsDirectors’ Report on Consolidated Financial StatementsAuditors’ Report to the MembersConsolidated Statement of Financial PositionConsolidated Profit and Loss AccountConsolidated Statement of Comprehensive IncomeConsolidated Cash Flow StatementConsolidated Statement of Changes in EquityNotes to the Consolidated Financial StatementsAnnexureBranch NetworkPattern of ShareholdingCategories of ShareholdersPattern of Shareholding under Code of Corporate GovernanceNotice of 66th Annual General MeetingGlossary of TermsForm of Proxy
05071517192324263337404142434445
4748495053555657
58585960616162636465666768697071727374757693979899
101101102103105106107110
111
112
114115116117118119120188
216
217218219220221222223296304306306307
309313315
Contents

ANNUAL REPORT 2013
4

5
VisionTo be the leading financial services provider, partnering with our customers for a more prosperous and secure future.
MissionWe are a team of committed professionals, providing innovative and efficient financial solutions to create and nurture long-term relationships with our customers. In doing so, we ensure that our shareholders can invest with confidence in us.
Vision & Mission

ANNUAL REPORT 2013
6

7
Strategic Objectives
Delivering remarkable returns to stakeholders, sustainable performance, exceeding market and shareholder expectations.
Providing value added services through operational expansion, geography and upgraded systems.
Building a corporate culture of equality, trust and team spirit as we remain dedicated to be a socially responsible organization.

ANNUAL REPORT 2013
8

9
We understand that the little decisions in our daily life eventually change our overall state of existence. You are working hard to ensure that your future is prosperous. MCB is marching right next to you, helping you with each decision, ensuring a state of affluence and abundance in your life with our efforts.
Connecting the Dots to Prosperity

ANNUAL REPORT 2013
10
11
Your relationship with MCB helps you enjoy a unique happiness that only a reliable and vigilant banking solution can give. We are working day and night to identify the next dot that brings you closer to a joyous life.
Connecting the Dots to Happiness
ANNUAL REPORT 2013
12

13
Life is often unpredictable. For any unexpected turns that it might take, MCB works out efficient plans to help keep your tomorrow secure and give you greater independence with however you wish to design your life.
Connecting the Dots to Security

ANNUAL REPORT 2013
14

15
IntegrityWe are the trustees of public funds and serve our community with integrity. We believe in being the best at always doing the right thing. We deliver on our responsibilities and commitments to our customers as well as our colleagues.
InnovationWe encourage and reward people who challenge the status quo and think beyond the boundaries of the conventional. Our teams work together for the smooth and efficient implementation of ideas and initiatives.
ExcellenceWe take personal responsibility for our role as leaders in pursuit of excellence. We are a performance driven, result oriented organization where merit is the only criterion for reward.
Customer CentricityOur customers are at the heart of everything we do. We thrive on the challenge of understanding their needs and aspirations, both realized and unrealized. We make every effort to exceed customer expectations through superior services and solutions.
RespectWe respect our customers’ values, beliefs, culture and history. We value the equality of gender and diversity of experience and education that our employees bring with them. We create an environment where each individual is enabled to succeed.
Core Values

ANNUAL REPORT 2013
16

17
2013 The Asset Triple A:2013 The Asset Triple A:2013 ICAP and ICMAP:2013 LK Domain Registry Sri Lanka:2013 Lanka Clear Pvt. Limited:
2012 The Asset Triple A:2012 Euromoney:2012 NFEH:2012 ICAP and ICMAP:2012 World Finance:2012 Pakistan Centre for Philanthropy:
2011 CFA Association Pakistan:2011 CFA Association Pakistan:2011 Euromoney:2011 ICAP / ICMAP:2011 SAFA:
2010 The Asian Banker:2010 The Asian Banker:2010 MMT:2010 ICAP / ICMAP:2010 SAFA:
2009 Asiamoney:2009 The Asset:2008 Euromoney:2008 Euromoney:2008 Asiamoney:
2006 Asiamoney:2006 Euromoney:2005 Asiamoney:2005 Euromoney:
2004 Euromoney:2004 Asiamoney:2003 Euromoney:2001 Euromoney:2000 Euromoney:
Best Domestic Bank - PakistanBest Islamic Deal1st - BCR Award 2012 - Banking SectorBest Website AwardT+1 Cheque Clearing Award
Best Domestic Bank - PakistanBest Bank in PakistanCSR Business Excellence Award “Best Media Coverage”2nd Best Corporate Report Award 2011 - Banking SectorBest Commercial Bank - PakistanPCP Corporate Philanthropy Award
Most Stable Bank of the YearBest Bank of the YearBest Bank in Pakistan1st - BCR Award 2010 - Banking SectorJoint 2nd Runner-up for BCR 2010
Strongest Bank in PakistanLeadership Achievement AwardBest Bank Led MMT Service1st - BCR Award 2009 - Banking SectorCertificate of Merit Award for BCR 2009
Best Domestic Bank in PakistanBest Domestic Bank in PakistanBest Bank in AsiaBest Bank in PakistanBest Domestic Bank in Pakistan
Best Domestic Bank in PakistanBest Bank in PakistanBest Domestic Bank in PakistanBest Bank in Pakistan
Best Bank in PakistanBest Domestic Bank in PakistanBest Bank in PakistanBest Bank in PakistanBest Bank in Pakistan
Awards

Products & Services MCB Corporate FinancingMCB Corporate Financing provides access to diversified financing options, including working capital loans, term loans, trade finance services and investment banking.
MCB Project & Structured Finance
structure, where the loan is tightly structured around the cash flows, risks are allocated amongst various stakeholders, and there is limited or no recourse to the sponsors.
MCB Syndicated Loans and Debt Capital MarketsMCB Syndicated Loans and Debt Capital Markets involves arrangement, underwriting and placement services for significant financing requirements by large corporate and institutional clients to other financial institutions or through the debt capital markets.
MCB Quasi Equity/Hybrid InstrumentsMCB Quasi Equity/Hybrid Instruments structure and place a category of debt that has some characteristics of equity such as being unsecured, subordinated or with a potential equity upside.
MCB Equity Capital RaisingMCB Equity Capital Raising relates to raising capital for our clients by offering common or preferred equity to public or private investors, through initial public offers, offers for sale, rights issues and private equity placements.
MCB Advisory ServicesFinancial and Capital Raising Advisory provides our clients with financial advisory services, commercial structuring support and access to capital resources to help companies successfully finance their business/project.
MCB Islamic BankingMCB-Islamic Banking Group (IBG) provides Shariah-compliant solutions to its valued customers to fullfill their deposit’s as well as financing needs. Customers’ needs on deposit side are being satisfied keeping in view of their business, short term and long term investment requirements; whereas on financing side, the Working Capital, Capital Expenditures, Trade Business and Consumer requirements are being satisfied through available sharia compliant financing products. In addition to existing IB products, IBG believe in facilitating it’s customer by offering new products both on assets and liability side. This year, IBG has introduced a new asset based product for satisfying exporter’s pre-shipment financing needs by offering “Istisna Pre-shipment Export Finance”. And for its valued depositors, a special term deposit scheme with attractive profit rates for senior citizens and widows under the name of “Aasoodgi” was also introduced.
MCB-Islamic Banking is offering its product through its 27 dedicated Islamic Banking branches in 14 cities across the country. In order to facilitate it’s customer and to increase outreach of Islamic banking deposit products, an initiative was taken by introducing Islamic
which is expected to further enhance in future.
MCB Agri ProductsMCB is committed to the farming community to support their national objectives of self-sufficiency and food security to the people of Pakistan. Dedicated and specialized staff, supervised by the Agri Credit Division, is posted in lending branches to cater for strong business relationships and facilitation. The bank’s extensive branch network in all the provinces and diversified product range extends our reach of agri credit facilities to encompass both crop and non-crop sectors.
MCB Trade ProductsTrade Products provides a wide range of standard as well as tailor-made products and solutions to trade customers from all walks of life. Despite having inventory of standard market products in refined shape, specific new-to-market products include: “Quick-LC”, which is an internal design of desktop application allowing customers to type-in and print out LC application form. The “XFlex” solution facilitates external export business for customers in cases where transportation of documents is not available at the counters of MCB’s discounting/financing branch on the date of extending financing. “MCB-TRIMS” facilitates the financing of inland trade through the involvement of MCB at both ends thereby allowing an exporter to get receivables discounted, i.e. the exporter receives payment in a given time (in 48 hours) after performing obligations. “Econ-LC” product program allows drafts/bills of exchange to be waived as a requirement under LCs available by negotiation; as a consequence, there is reduction in overall transaction cost. “Avalization (Export)” has been designed to facilitate the financing of export by allowing an Exporter (Seller) to discount its receivables under credit granted to a counter party, i.e. Importer (Buyer), without taking payment risk on the Importer (Buyer) under a contract (non LC transactions). Under this “China LC Confirmation programme” branches of MCB’s partner bank located in Hong Kong and China add “Confirmation” to MCB LCs on “Free of Cost” basis thus increasing acceptability of MCB’s Import LCs and facilitate import customers.
We overwhelmingly cherish and stay committed to support the farmers in view of unparallel significance of agri sector in our national life aligned witheconomic priorities of the country and role of our bank as a responsible corporate citizen.
MCB PrivilegeAs the first local bank to introduce high end retail banking, MCB Privilege through its dedicated, world-class Privilege Centers offers a higher level of personalized services, more rewarding in-branch experience and a wide array of deposit and investment products that are tailored to meet the financial expectations of our affluent clientele. As members of MCB Privilege, customers experience unparalleled advantages that put them ahead of others. MCB's dedicated Privilege Centers wait to welcome you in Karachi, Lahore, Islamabad, Faisalabad, Sialkot, Rawalpindi and Multan with plans to expand to more locations.
MCB Salary ClubA payroll solution designed to make life easy; it simplifies all the monthly payroll related banking needs of employers and opens the door to a world of special offers for employees. Salary Club provides the convenience of having an extensive range of financial services available to employees at their place of work.
MCB Investment ServicesInvestment Services operate with the aim to help you make the most of your wealth with investment opportunities that match your unique financial aspirations. MCB Investment Services offers distribution of mutual funds managed by the leading fund managers of Pakistan. We can suggest the products most suited for your needs, or work with you to create a personalized solution completely focused on your expectations of the capital markets.
Current AccountMCB Bank offers a variety of current accounts in local and foreign currency to cater to the everyday transactional needs of various customers. These accounts ensure ease and freedom to bank from any of the 1200+ branches across the country. The different accounts include: the Basic Banking Account that has no minimum balance requirement; Business Account offering free online transactions, demand drafts, pay orders and lots more to meet the day-to-day business requirements; Current Life Account that offers the security of life insurance free of cost; and for all others, the conventional Current Account.
Savings AccountMCB Bank offers a wide array of local and foreign currency savings products that suit short-term growth and transactional needs. Our savings accounts offer attractive profit rates to diverse customer strata; have a tiered profit payment and different profit payment frequencies. The customers have an attractive Savings Accounts menu to choose from, like Savings 365 Gold Account for high-end depositors desiring higher returns, along with other attractive rate options for high, medium and low end savers and the generic Profit & Loss Saving Account for all other depositors. MCB savings accounts have something for everyone!
Term DepositMCB Term Deposits offer attractive short to mid-term investment options with flexibility, convenience and security. With various tenor options available, customers can choose one that suits their needs. This is combined with different profit pay-out options and the added facility of being able to avail credit facility against their deposits.
MCB Fun Club – Banking for KidsMCB Fun Club – Banking for Kids is a product designed for the minors. This product offers two types of accounts; Savings & Current. The main features of this product include: customized and branded chequebook and debit card that are issued in the name of the minor & guardian both. The debit card is loaded with various deals and discount offered at several outlets across Pakistan. In addition to this, Fun Club also offers two augmented features; WWF-Tag a Plant, where the minor gets to tag a tree in his name and Adamjeelife – Education Plan, that acts as an insurance cover for the minor’s education.
MCB Online BankingMCB has a fast growing network of 1200+ online branches in the country providing customers real-time online transaction facilities.
MCB MNETMNET is an electronic inter-bank connectivity platform for online transactions on ATM and other remote banking channels. It offers other value added services that include a portfolio of e-banking and payment system products as well as management and day-to-day operations of the same. Members include 10 local and foreign financial institutions enjoying ATM sharing and value added services.
MCB Cash ManagementCash Management provides a wide range of value-added services to large corporations through its vast network of online branches. Our structured and customized products enable our customers to realize their sales proceeds swiftly from all over the country, supported by real-time MIS. Cash Management also provides payment solutions through MCB network, dividend pay-outs, custodian banking and utility companies’ bills processing.
MCB Channel FinancingMCB Channel financing provides working capital facilities to dealers and vendors of selected companies under a structured product programme. This product enables our customer’s dealers to leverage themselves and increase their business capacity with their respective business partners.
MCB Home RemittanceMCB Home Remittances offers unmatched services for overseas Pakistanis to send money home FAST and FREE at no cost across Pakistan through MCB’s large network of over 1200 branches. Money can be sent FREE & INSTANT through our international send agents like MoneyGram, Xpress Money and many others.
MCB Motherland AccountThe Motherland account allows Non-Resident Pakistani's to open accounts in their home country while residing abroad. It is designed to allow transferring of funds to family & loved ones back home with the convenience of your own personal account.
MCB Transaction BankingTransaction Banking provides a wide range of value-added services to large corporations through its vast network of online branches. Our structured and customized products enable our customers to realize their sales proceeds swiftly from all across the country, supported by real-time MIS. Transaction Banking also provides payment solutions on MCB & other bank’s network.
TBD-Online Fund Transfer (OFT)This web based electronic fund transfer facility has been specifically designed to enable large network of franchises /dealers/distributors to conduct real time branch less transactions through secured MCB web site. TBD-Tejarat CardTejarat card is a closed loop debit card designed for cash-less electronic cash transactions empowering businesses to conduct branchless transactions through Point of Sale (POS) terminal with 24-hour Call Center Support 111-000-622(MCB).
TBD-Sub Clearing ArrangementMicro finance banks that do not have operating licenses for clearing can now rely on MCB to act as their sub clearing agent for processing transactions through NIFT.
TBD-Dividend Warrant ManagementTBD provides a complete and comprehensive dividend solution to customers, from printing of dividend warrants to subsequent encashment though MCB branches & followed by a complete reconciliation. Foreign dividends through remittances are also processed by TBD.
MCB Local Correspondent BankingLocal Correspondents Banking Department at MCB provides Cash Management Services to Financial Institutions such as Asset Management Companies, Mutual Funds, Insurance and Leasing companies.
Local Rupee Drawing Arrangements, a product for small banks and financial institutions to use our vast branch network platform to make payments in areas where their own branch network does not exist, thus extends their reach nationwide.
MCB Project & Structured Finance involves financing complex projects, usually in SPV
banking windows in conventional branches. This initiative was taken up with 50+ IB windows,
Rupee Travelers Cheque
ANNUAL REPORT 2013
18

Products & Services MCB Corporate FinancingMCB Corporate Financing provides access to diversified financing options, including working capital loans, term loans, trade finance services and investment banking.
MCB Project & Structured Finance
structure, where the loan is tightly structured around the cash flows, risks are allocated amongst various stakeholders, and there is limited or no recourse to the sponsors.
MCB Syndicated Loans and Debt Capital MarketsMCB Syndicated Loans and Debt Capital Markets involves arrangement, underwriting and placement services for significant financing requirements by large corporate and institutional clients to other financial institutions or through the debt capital markets.
MCB Quasi Equity/Hybrid InstrumentsMCB Quasi Equity/Hybrid Instruments structure and place a category of debt that has some characteristics of equity such as being unsecured, subordinated or with a potential equity upside.
MCB Equity Capital RaisingMCB Equity Capital Raising relates to raising capital for our clients by offering common or preferred equity to public or private investors, through initial public offers, offers for sale, rights issues and private equity placements.
MCB Advisory ServicesFinancial and Capital Raising Advisory provides our clients with financial advisory services, commercial structuring support and access to capital resources to help companies successfully finance their business/project.
MCB Islamic BankingMCB-Islamic Banking Group (IBG) provides Shariah-compliant solutions to its valued customers to fullfill their deposit’s as well as financing needs. Customers’ needs on deposit side are being satisfied keeping in view of their business, short term and long term investment requirements; whereas on financing side, the Working Capital, Capital Expenditures, Trade Business and Consumer requirements are being satisfied through available sharia compliant financing products. In addition to existing IB products, IBG believe in facilitating it’s customer by offering new products both on assets and liability side. This year, IBG has introduced a new asset based product for satisfying exporter’s pre-shipment financing needs by offering “Istisna Pre-shipment Export Finance”. And for its valued depositors, a special term deposit scheme with attractive profit rates for senior citizens and widows under the name of “Aasoodgi” was also introduced.
MCB-Islamic Banking is offering its product through its 27 dedicated Islamic Banking branches in 14 cities across the country. In order to facilitate it’s customer and to increase outreach of Islamic banking deposit products, an initiative was taken by introducing Islamic
which is expected to further enhance in future.
MCB Agri ProductsMCB is committed to the farming community to support their national objectives of self-sufficiency and food security to the people of Pakistan. Dedicated and specialized staff, supervised by the Agri Credit Division, is posted in lending branches to cater for strong business relationships and facilitation. The bank’s extensive branch network in all the provinces and diversified product range extends our reach of agri credit facilities to encompass both crop and non-crop sectors.
MCB Trade ProductsTrade Products provides a wide range of standard as well as tailor-made products and solutions to trade customers from all walks of life. Despite having inventory of standard market products in refined shape, specific new-to-market products include: “Quick-LC”, which is an internal design of desktop application allowing customers to type-in and print out LC application form. The “XFlex” solution facilitates external export business for customers in cases where transportation of documents is not available at the counters of MCB’s discounting/financing branch on the date of extending financing. “MCB-TRIMS” facilitates the financing of inland trade through the involvement of MCB at both ends thereby allowing an exporter to get receivables discounted, i.e. the exporter receives payment in a given time (in 48 hours) after performing obligations. “Econ-LC” product program allows drafts/bills of exchange to be waived as a requirement under LCs available by negotiation; as a consequence, there is reduction in overall transaction cost. “Avalization (Export)” has been designed to facilitate the financing of export by allowing an Exporter (Seller) to discount its receivables under credit granted to a counter party, i.e. Importer (Buyer), without taking payment risk on the Importer (Buyer) under a contract (non LC transactions). Under this “China LC Confirmation programme” branches of MCB’s partner bank located in Hong Kong and China add “Confirmation” to MCB LCs on “Free of Cost” basis thus increasing acceptability of MCB’s Import LCs and facilitate import customers.
We overwhelmingly cherish and stay committed to support the farmers in view of unparallel significance of agri sector in our national life aligned witheconomic priorities of the country and role of our bank as a responsible corporate citizen.
MCB PrivilegeAs the first local bank to introduce high end retail banking, MCB Privilege through its dedicated, world-class Privilege Centers offers a higher level of personalized services, more rewarding in-branch experience and a wide array of deposit and investment products that are tailored to meet the financial expectations of our affluent clientele. As members of MCB Privilege, customers experience unparalleled advantages that put them ahead of others. MCB's dedicated Privilege Centers wait to welcome you in Karachi, Lahore, Islamabad, Faisalabad, Sialkot, Rawalpindi and Multan with plans to expand to more locations.
MCB Salary ClubA payroll solution designed to make life easy; it simplifies all the monthly payroll related banking needs of employers and opens the door to a world of special offers for employees. Salary Club provides the convenience of having an extensive range of financial services available to employees at their place of work.
MCB Investment ServicesInvestment Services operate with the aim to help you make the most of your wealth with investment opportunities that match your unique financial aspirations. MCB Investment Services offers distribution of mutual funds managed by the leading fund managers of Pakistan. We can suggest the products most suited for your needs, or work with you to create a personalized solution completely focused on your expectations of the capital markets.
Current AccountMCB Bank offers a variety of current accounts in local and foreign currency to cater to the everyday transactional needs of various customers. These accounts ensure ease and freedom to bank from any of the 1200+ branches across the country. The different accounts include: the Basic Banking Account that has no minimum balance requirement; Business Account offering free online transactions, demand drafts, pay orders and lots more to meet the day-to-day business requirements; Current Life Account that offers the security of life insurance free of cost; and for all others, the conventional Current Account.
Savings AccountMCB Bank offers a wide array of local and foreign currency savings products that suit short-term growth and transactional needs. Our savings accounts offer attractive profit rates to diverse customer strata; have a tiered profit payment and different profit payment frequencies. The customers have an attractive Savings Accounts menu to choose from, like Savings 365 Gold Account for high-end depositors desiring higher returns, along with other attractive rate options for high, medium and low end savers and the generic Profit & Loss Saving Account for all other depositors. MCB savings accounts have something for everyone!
Term DepositMCB Term Deposits offer attractive short to mid-term investment options with flexibility, convenience and security. With various tenor options available, customers can choose one that suits their needs. This is combined with different profit pay-out options and the added facility of being able to avail credit facility against their deposits.
MCB Fun Club – Banking for KidsMCB Fun Club – Banking for Kids is a product designed for the minors. This product offers two types of accounts; Savings & Current. The main features of this product include: customized and branded chequebook and debit card that are issued in the name of the minor & guardian both. The debit card is loaded with various deals and discount offered at several outlets across Pakistan. In addition to this, Fun Club also offers two augmented features; WWF-Tag a Plant, where the minor gets to tag a tree in his name and Adamjeelife – Education Plan, that acts as an insurance cover for the minor’s education.
MCB Online BankingMCB has a fast growing network of 1200+ online branches in the country providing customers real-time online transaction facilities.
MCB MNETMNET is an electronic inter-bank connectivity platform for online transactions on ATM and other remote banking channels. It offers other value added services that include a portfolio of e-banking and payment system products as well as management and day-to-day operations of the same. Members include 10 local and foreign financial institutions enjoying ATM sharing and value added services.
MCB Cash ManagementCash Management provides a wide range of value-added services to large corporations through its vast network of online branches. Our structured and customized products enable our customers to realize their sales proceeds swiftly from all over the country, supported by real-time MIS. Cash Management also provides payment solutions through MCB network, dividend pay-outs, custodian banking and utility companies’ bills processing.
MCB Channel FinancingMCB Channel financing provides working capital facilities to dealers and vendors of selected companies under a structured product programme. This product enables our customer’s dealers to leverage themselves and increase their business capacity with their respective business partners.
MCB Home RemittanceMCB Home Remittances offers unmatched services for overseas Pakistanis to send money home FAST and FREE at no cost across Pakistan through MCB’s large network of over 1200 branches. Money can be sent FREE & INSTANT through our international send agents like MoneyGram, Xpress Money and many others.
MCB Motherland AccountThe Motherland account allows Non-Resident Pakistani's to open accounts in their home country while residing abroad. It is designed to allow transferring of funds to family & loved ones back home with the convenience of your own personal account.
MCB Transaction BankingTransaction Banking provides a wide range of value-added services to large corporations through its vast network of online branches. Our structured and customized products enable our customers to realize their sales proceeds swiftly from all across the country, supported by real-time MIS. Transaction Banking also provides payment solutions on MCB & other bank’s network.
TBD-Online Fund Transfer (OFT)This web based electronic fund transfer facility has been specifically designed to enable large network of franchises /dealers/distributors to conduct real time branch less transactions through secured MCB web site. TBD-Tejarat CardTejarat card is a closed loop debit card designed for cash-less electronic cash transactions empowering businesses to conduct branchless transactions through Point of Sale (POS) terminal with 24-hour Call Center Support 111-000-622(MCB).
TBD-Sub Clearing ArrangementMicro finance banks that do not have operating licenses for clearing can now rely on MCB to act as their sub clearing agent for processing transactions through NIFT.
TBD-Dividend Warrant ManagementTBD provides a complete and comprehensive dividend solution to customers, from printing of dividend warrants to subsequent encashment though MCB branches & followed by a complete reconciliation. Foreign dividends through remittances are also processed by TBD.
MCB Local Correspondent BankingLocal Correspondents Banking Department at MCB provides Cash Management Services to Financial Institutions such as Asset Management Companies, Mutual Funds, Insurance and Leasing companies.
Local Rupee Drawing Arrangements, a product for small banks and financial institutions to use our vast branch network platform to make payments in areas where their own branch network does not exist, thus extends their reach nationwide.
MCB Project & Structured Finance involves financing complex projects, usually in SPV
banking windows in conventional branches. This initiative was taken up with 50+ IB windows,
Rupee Travelers Cheque
19

ANNUAL REPORT 2013
20
Products & Services competition in a short span of time. Currently we have a portfolio of 100+ brands. Our next call to success was when we launched our Smart Phone Loyalty App the first of its kind in the banking industry offering discounts on all type of plastics including Prepaid Cards. For every PKR 10,000 spent a month virtually means PKR 2300 saved. Now that’s a lot saved!
MCB Merchant Acquiring MCB is the second largest merchant acquirer in Pakistan with 32% market share, currently our acceptance is spread around 41 cities of Pakistan. Quality service, Competitive Discount Rates and state of the art POS terminals are the primary objectives on which our business thrives. We readily accept Visa, Master & Union Pay local and international credit & debit cards
MCB Car4UMCB Car4U brings for you an affordable and flexible opportunity to have your very own car. To suit your needs, our car financing solution is designed to give you unmatched convenience in helping you acquire a car of your choice in the shortest possible time at very competitive rates.
MCB Home LoanA home of your own is a blessing and a long-held aspiration of many. Now with MCB Home Loan, fulfilling this dream has never been so easy. MCB Home Loan opens doors to numerous sensible financing options to help you purchase, build or renovate your new / existing home.
MCB Cash4CashA finance facility for individuals for fulfilling their personal needs, which is collateralized against securities such as local and foreign currency term deposits, national saving schemes instruments, mutual funds, bank guarantees, etc. This offering facilitates our customers in getting easy access to liquidity for fulfilling their immediate and/or long-term personal needs against their otherwise long-term savings stuck up in various investments made by them.
MCB Personal LoanA Fast, Affordable and Flexible option for financing that offers loan limit up to PKR 2 million (subject to Terms & Conditions). The pricing is competitive, and no processing fee is charged if the loan is not approved. It is basically an option to meet all short term financing needs of our customers.
MCB Instant FinanceWith MCB Instant Finance, get a loan instantly at any MCB branch against liquid collateral at competitive pricing.
MCB Rupee Travellers ChequeMCB Rupee Travellers Cheque is the best and safest alternate way of carrying cash. It can be used by travellers, businessmen or by the general public in meeting their day-to-day cash requirements while they travel. It is a safe and secure way to make payments because it gives the purchaser security that even if the cheque is lost it can be refunded. Unlike other modes of funds/remittance transfer, which can only be drawn at a particular branch and can be encashed only at that branch, MCB Rupee Travellers Cheque can be encashed at any of our branches across the country.
MCB LockersMCB Lockers are the best protection for your valuables. Lockers of different capacities are available nationwide.
MCB Full-Day BankingEnjoy the convenience of extended banking hours from 9am to 5pm, including Saturdays at MCB Full-Day Banking branches across the country.
MCB BancassuranceAs dreams pass into the reality of action, from the actions stems the dream again. This interdependence constructs the highest form of living. Your dreams may be to give your children the best education, live a dignified life after retirement, or just keep your loved ones financially secure and protected. What everyone wants from life is a continuous and genuine happiness. Your action to plan for your future financially will stem your dreams. MCB Bancassurance has a financial plan that fits all your needs by fulfilling you and your loved ones dreams and keeping your ‘Har Pal Mehfooz.’
Combining the best of banking and financial solutions, MCB Bancassurance provides a one-stop shop solution for you by guaranteeing convenience and security with a wide range of products available for all your financial needs.All our plans are specially designed by reputable insurance providers. These companies have excellent experience with insurance products and guarantee that your funds would be in good hands as there is a team of professional investment experts in each company working on making the funds grow higher in a secure manner.Each plan is designed to give you a peace of mind because we know that in the end, it’s not the years in your life that counts. It’s the life in your years.
MCB Internet Banking
Offshore Banking - OBU BahrainMCB Bank offers a variety of offshore banking services like current, savings & term deposits, trade finance and other funded/unfunded banking facilities mainly in US$ to eligible and select clients through its offshore banking Unit in Bahrain.
MCB, our aim is to provide end to end approach to banking – we believe that our success is directly linked to achieve your investment objectives. We offer you the diversified range of investment products from the basic and classic options to the more evolved and structure ones. With our ability to provide you a range of products to suit your needs, we give you an opportunity to meet both your short & long term investment needs, following are rapid highlights below;
Mutual Funds: we help you identify a suitable mix of Mutual Fund schemes spreading across Equity, Balanced, Fixed Income and Liquid Funds.Equity Funds: Equity funds are schemes where higher weight in investments is in equity and equity related securities of various companies.Balanced Funds: Balanced fund is scheme geared toward mixture of safety, income and modest capital appreciationTax saving Funds: Tax savings funds are special products offered by mutual funds. To avail tax benefits, these funds have a lock-in-period. This period can change subject to amendments in “Income Tax Ordinance.”Fixed income Funds: These funds invest primarily in government and corporate debt. While fund holdings may appreciate in value, the primary objective of these funds is to provide a steady cash flow to investors.Liquid Funds: Liquid Funds are investing in short-term money market instruments including treasury bills, commercial paper and certificates of deposit.
1.
2.
3.
4.
5.
6.
MCB Visa Credit CardMCB offers a complete suite of Classic, Gold and Platinum Visa Credit Cards focusing on providing superior services, travel privileges and shopping pleasures. It also offers comprehensive insurance and installment plans, reward points and SMS alerts that give a different feel to the world of credit cards. Our other unique features include I Revolve, I Dial, I Switch, I Cash on Call, I Bill which makes MCB Credit Card the only card that is packed with world class features.
MCB LiteThe worlds 1st socially connected mobile wallet that lets you transfer money from your bank account over to your mobile wallet. That’s not all it is also enabled by a visa powered card that helps you withdraw money from an ATM or use it on a POS machine locally or Internationally, more so you may invite family and friends onto the MCB Lite grid and conveniently transfer money from one wallet to another, creating a financial connect in your inner circles while having full control over your funds.
MCB Visa Debit CardMCB Visa Debit Card lets you have access to the money in your account wherever you are, whenever you want, wherever you see the Visa symbol. MCB Visa debit Card is Pakistan’s first chip-based debit card with global acceptance at over 50 million merchants and close to 2 million ATMs across 200+ countries. The MCB Visa Debit Card also offers innovative promotional schemes designed to reward our customers every time they use the card at a Point of Sale (POS) for shopping, dining, fuel, travelling, etc.
MCB Gold Plus –The Mobile Enabled Visa Debit: MCB Gold Plus is Pakistan’s 1st chip based, mobile enabled Visa debit card. In just one and a half years, more than 300,000 Gold Plus customers enjoy easy access to ATM’s and merchant networks. They also benefit from our award winning MCB Mobile service that has opened up a new, more convenient banking channel for transactions on the go.
MCB ATMsMCB has one of the nation’s largest ATM networks with 750+ ATMs covering 182 cities across the country and continues to grow at fast pace. MCB ATMs give you 24-hour access to cash withdrawal, mini-statement, utility bill payments, mobile top-ups, funds transfer services and much more as an added convenience
MCB Mobile ATMMCB Mobile ATM brings extra comfort & convenience in our existing banking services. Our innovative MCB mobile ATM van ensures that we offer our services wherever the need may be felt be it concerts, fairs or any other occasion/special event.
MCB Call Centre- Here to help round the clock!MCB Call Centre is the first financial call centre in the industry that provides the comfort of preferred Regional languages and enables you to manage your VISA Credit and ATM/Visa Debit Cards, confirm account balances and view last 6 transactions, pay unlimited utility/mobile phone and MCB Visa Credit Card bills, top-up your mobile, transfer money within MCB network accounts and register complaints or order MCB Lite over the phone & it also provides the feature of Call rating. Most importantly it provides you with our very own banking consultant to discuss your financial needs and requirements. Simply call at 111-000-MCB (622) round the clock 24/7 and we’ll do the rest. MCB MobileMCB Mobile is a quick, easy and secure way to recharge mobile phones, transfer money, pay bills and do much more. Visit the nearest MCB ATM or call 111-000-622 to activate and login to www.mcbmobile.com using your mobile phone or any other internet enabled device including a laptop or a PC to start transacting.
MCB Internet BankingMCB Internet Banking Service is a convenient way to access your account(s) 24/7. It is secure; free of cost and lets you bank freely with a choice of location and time. This service allows you to transfer funds, pay utility/mobile bills, set up standing order instruction, download account statement and much more
MCB SMS Alert ServiceMCB SMS Alerts Service helps keep track of your Banking transactions 24/7. By subscribing to the service, you can receive real-time SMS updates for transactions conducted on your account. SMS Alerts service makes your life easier and more convenient than ever before. Now you do not need to call or visit the branch to inquire about your daily transactions.
MCB Loyalty & AlliancesMCB entered the Loyalty & Alliance race in the year 2013, and now stands ahead of its
MCB Internet Banking Service is a convenient way to access your account(s) 24/7. It is secure, free of cost and lets you do your banking whenever and wherever it suits you. This service allows you to transfer funds, pay utility/mobile bills, set up standing order instruction, download account statement and much more.

21
Products & Services competition in a short span of time. Currently we have a portfolio of 100+ brands. Our next call to success was when we launched our Smart Phone Loyalty App the first of its kind in the banking industry offering discounts on all type of plastics including Prepaid Cards. For every PKR 10,000 spent a month virtually means PKR 2300 saved. Now that’s a lot saved!
MCB Merchant Acquiring MCB is the second largest merchant acquirer in Pakistan with 32% market share, currently our acceptance is spread around 41 cities of Pakistan. Quality service, Competitive Discount Rates and state of the art POS terminals are the primary objectives on which our business thrives. We readily accept Visa, Master & Union Pay local and international credit & debit cards
MCB Car4UMCB Car4U brings for you an affordable and flexible opportunity to have your very own car. To suit your needs, our car financing solution is designed to give you unmatched convenience in helping you acquire a car of your choice in the shortest possible time at very competitive rates.
MCB Home LoanA home of your own is a blessing and a long-held aspiration of many. Now with MCB Home Loan, fulfilling this dream has never been so easy. MCB Home Loan opens doors to numerous sensible financing options to help you purchase, build or renovate your new / existing home.
MCB Cash4CashA finance facility for individuals for fulfilling their personal needs, which is collateralized against securities such as local and foreign currency term deposits, national saving schemes instruments, mutual funds, bank guarantees, etc. This offering facilitates our customers in getting easy access to liquidity for fulfilling their immediate and/or long-term personal needs against their otherwise long-term savings stuck up in various investments made by them.
MCB Personal LoanA Fast, Affordable and Flexible option for financing that offers loan limit up to PKR 2 million (subject to Terms & Conditions). The pricing is competitive, and no processing fee is charged if the loan is not approved. It is basically an option to meet all short term financing needs of our customers.
MCB Instant FinanceWith MCB Instant Finance, get a loan instantly at any MCB branch against liquid collateral at competitive pricing.
MCB Rupee Travellers ChequeMCB Rupee Travellers Cheque is the best and safest alternate way of carrying cash. It can be used by travellers, businessmen or by the general public in meeting their day-to-day cash requirements while they travel. It is a safe and secure way to make payments because it gives the purchaser security that even if the cheque is lost it can be refunded. Unlike other modes of funds/remittance transfer, which can only be drawn at a particular branch and can be encashed only at that branch, MCB Rupee Travellers Cheque can be encashed at any of our branches across the country.
MCB LockersMCB Lockers are the best protection for your valuables. Lockers of different capacities are available nationwide.
MCB Full-Day BankingEnjoy the convenience of extended banking hours from 9am to 5pm, including Saturdays at MCB Full-Day Banking branches across the country.
MCB BancassuranceAs dreams pass into the reality of action, from the actions stems the dream again. This interdependence constructs the highest form of living. Your dreams may be to give your children the best education, live a dignified life after retirement, or just keep your loved ones financially secure and protected. What everyone wants from life is a continuous and genuine happiness. Your action to plan for your future financially will stem your dreams. MCB Bancassurance has a financial plan that fits all your needs by fulfilling you and your loved ones dreams and keeping your ‘Har Pal Mehfooz.’
Combining the best of banking and financial solutions, MCB Bancassurance provides a one-stop shop solution for you by guaranteeing convenience and security with a wide range of products available for all your financial needs.All our plans are specially designed by reputable insurance providers. These companies have excellent experience with insurance products and guarantee that your funds would be in good hands as there is a team of professional investment experts in each company working on making the funds grow higher in a secure manner.Each plan is designed to give you a peace of mind because we know that in the end, it’s not the years in your life that counts. It’s the life in your years.
MCB Internet Banking
Offshore Banking - OBU BahrainMCB Bank offers a variety of offshore banking services like current, savings & term deposits, trade finance and other funded/unfunded banking facilities mainly in US$ to eligible and select clients through its offshore banking Unit in Bahrain.
MCB, our aim is to provide end to end approach to banking – we believe that our success is directly linked to achieve your investment objectives. We offer you the diversified range of investment products from the basic and classic options to the more evolved and structure ones. With our ability to provide you a range of products to suit your needs, we give you an opportunity to meet both your short & long term investment needs, following are rapid highlights below;
Mutual Funds: we help you identify a suitable mix of Mutual Fund schemes spreading across Equity, Balanced, Fixed Income and Liquid Funds.Equity Funds: Equity funds are schemes where higher weight in investments is in equity and equity related securities of various companies.Balanced Funds: Balanced fund is scheme geared toward mixture of safety, income and modest capital appreciationTax saving Funds: Tax savings funds are special products offered by mutual funds. To avail tax benefits, these funds have a lock-in-period. This period can change subject to amendments in “Income Tax Ordinance.”Fixed income Funds: These funds invest primarily in government and corporate debt. While fund holdings may appreciate in value, the primary objective of these funds is to provide a steady cash flow to investors.Liquid Funds: Liquid Funds are investing in short-term money market instruments including treasury bills, commercial paper and certificates of deposit.
1.
2.
3.
4.
5.
6.
MCB Visa Credit CardMCB offers a complete suite of Classic, Gold and Platinum Visa Credit Cards focusing on providing superior services, travel privileges and shopping pleasures. It also offers comprehensive insurance and installment plans, reward points and SMS alerts that give a different feel to the world of credit cards. Our other unique features include I Revolve, I Dial, I Switch, I Cash on Call, I Bill which makes MCB Credit Card the only card that is packed with world class features.
MCB LiteThe worlds 1st socially connected mobile wallet that lets you transfer money from your bank account over to your mobile wallet. That’s not all it is also enabled by a visa powered card that helps you withdraw money from an ATM or use it on a POS machine locally or Internationally, more so you may invite family and friends onto the MCB Lite grid and conveniently transfer money from one wallet to another, creating a financial connect in your inner circles while having full control over your funds.
MCB Visa Debit CardMCB Visa Debit Card lets you have access to the money in your account wherever you are, whenever you want, wherever you see the Visa symbol. MCB Visa debit Card is Pakistan’s first chip-based debit card with global acceptance at over 50 million merchants and close to 2 million ATMs across 200+ countries. The MCB Visa Debit Card also offers innovative promotional schemes designed to reward our customers every time they use the card at a Point of Sale (POS) for shopping, dining, fuel, travelling, etc.
MCB Gold Plus –The Mobile Enabled Visa Debit: MCB Gold Plus is Pakistan’s 1st chip based, mobile enabled Visa debit card. In just one and a half years, more than 300,000 Gold Plus customers enjoy easy access to ATM’s and merchant networks. They also benefit from our award winning MCB Mobile service that has opened up a new, more convenient banking channel for transactions on the go.
MCB ATMsMCB has one of the nation’s largest ATM networks with 750+ ATMs covering 182 cities across the country and continues to grow at fast pace. MCB ATMs give you 24-hour access to cash withdrawal, mini-statement, utility bill payments, mobile top-ups, funds transfer services and much more as an added convenience
MCB Mobile ATMMCB Mobile ATM brings extra comfort & convenience in our existing banking services. Our innovative MCB mobile ATM van ensures that we offer our services wherever the need may be felt be it concerts, fairs or any other occasion/special event.
MCB Call Centre- Here to help round the clock!MCB Call Centre is the first financial call centre in the industry that provides the comfort of preferred Regional languages and enables you to manage your VISA Credit and ATM/Visa Debit Cards, confirm account balances and view last 6 transactions, pay unlimited utility/mobile phone and MCB Visa Credit Card bills, top-up your mobile, transfer money within MCB network accounts and register complaints or order MCB Lite over the phone & it also provides the feature of Call rating. Most importantly it provides you with our very own banking consultant to discuss your financial needs and requirements. Simply call at 111-000-MCB (622) round the clock 24/7 and we’ll do the rest. MCB MobileMCB Mobile is a quick, easy and secure way to recharge mobile phones, transfer money, pay bills and do much more. Visit the nearest MCB ATM or call 111-000-622 to activate and login to www.mcbmobile.com using your mobile phone or any other internet enabled device including a laptop or a PC to start transacting.
MCB Internet BankingMCB Internet Banking Service is a convenient way to access your account(s) 24/7. It is secure; free of cost and lets you bank freely with a choice of location and time. This service allows you to transfer funds, pay utility/mobile bills, set up standing order instruction, download account statement and much more
MCB SMS Alert ServiceMCB SMS Alerts Service helps keep track of your Banking transactions 24/7. By subscribing to the service, you can receive real-time SMS updates for transactions conducted on your account. SMS Alerts service makes your life easier and more convenient than ever before. Now you do not need to call or visit the branch to inquire about your daily transactions.
MCB Loyalty & AlliancesMCB entered the Loyalty & Alliance race in the year 2013, and now stands ahead of its
MCB Internet Banking Service is a convenient way to access your account(s) 24/7. It is secure, free of cost and lets you do your banking whenever and wherever it suits you. This service allows you to transfer funds, pay utility/mobile bills, set up standing order instruction, download account statement and much more.

ANNUAL REPORT 2013
22

* Independent Non-Executive Director under CCG having relevant industry experience.
23
Board of Directors
Mian Mohammad Mansha (Non-Executive Director)Chairman
S. M. Muneer (Non-Executive Director)Vice Chairman
Tariq Rafi (Non-Executive Director)
Shahzad Saleem (Non-Executive Director)
Sarmad Amin (Non-Executive Director)
Mian Raza Mansha (Non-Executive Director)
Aftab Ahmad Khan (Non-Executive Director)
Mian Umer Mansha (Non-Executive Director)
*Ahmad Alman Aslam (Non-Executive Director)
Dato’ Seri Ismail Shahudin (Non-Executive Director)
Muhammad Ali Zeb (Non-Executive Director)
Imran Maqbool (Executive Director)President and CEO
Audit Committee
Tariq Rafi (Non-Executive Director)Chairman
Aftab Ahmad Khan (Non-Executive Director)
Dato’ Seri Ismail Shahudin (Non-Executive Director)
Ahmad Alman Aslam (Non-Executive Director)
Chief Financial OfficerSalman Zafar Siddiqi
Company SecretarySyed Mudassar Hussain Naqvi
AuditorsM/s. A. F. Ferguson & Co.Chartered Accountants
Legal AdvisorsM/s. Khalid Anwer & Co.Advocates & Legal Consultants
Principal/Registered OfficeMCB Building, 15-Main GulbergJail Road, Lahore, Pakistan.
Contact us:UAN: +92 42 111 000 622Email: [email protected] us: www.mcb.com.pk
Registrar’s and Share Registration OfficeHead OfficeM/s. THK Associates (Pvt.) Ltd.State Life Building No.3Dr. Ziauddin Ahmed Road Karachi, Pakistan.
Branch OfficeM/s. THK Associates (Pvt.) Ltd.2nd Floor, DYL Motorcycles Ltd. Office BuildingPlot No. 346, Block No. G-III, Khokhar ChowkMain Boulevard, Johar Town, Lahore, Pakistan.
Corporate Information

ANNUAL REPORT 2013
24
Board of Directors

25

ANNUAL REPORT 2013
26
Board of Directors
Mian Mohammad ManshaChairman
Mian Mohammad Mansha started his career at the age of 24 as the CEO for Nishat Mills Ltd. At present, the business group is one of the leading and most diversified in South East Asia, having presence in the Textile, Cement, Insurance, Banking, Financial Services, Power Generation, Hotel & Hospitality, Dairy, Paper Products and Aviation sectors. It operates in various countries across the globe including Sri Lanka, Azerbaijan, UAE, USA, Honk Kong and Bahrain.
Mr. Mansha served as the Chairman of MCB Bank since its privatization in 1991. Presently, he is the Chairman of Business Strategy & Development Committee, Human Resource & Remuneration Committee and Write Off & Waiver Committee, at MCB Bank Limited. Previously, he has been associated with Punjab Mineral Company (Pvt) Limited, Civil Aviation Authority, Board of Investment (BOI), Pakistan Industrial Development Corporation (Pvt.) Limited (PIDC), Int’l Advisory Board, Babson College USA, National Management Foundation, Textile College Faisalabad and Government College of Faisalabad. He has also served as the president for All Pakistan Textile Mills Association (APTMA) and APTMA, Punjab.
He was presented with Pakistan’s Civil Award, the Sitara-e-Imtiaz, for his contributions to industrial development, in 2004.
Directorships:• MCB Bank Limited• Punjab Board of Investment & Trade (PBIT)• Shalamar Medical & Dental College• Commonwealth Business Council• Foundation for Advancement of Engineering Sciences & Advanced Technologies (FASAT)• MCB Leasing Company, Azerbaijan• MCB-Arif Habib Savings and Investments Ltd (formerly: Arif Habib Investments Ltd.)

27
S. M. MuneerVice Chairman
With experience in sectors ranging from tanneries, textiles, Mr. Muneer is a consummate industrialist. He has been awarded with The Best Export Performance trophy by the Federation of Pakistan Chamber of Commerce & Industry (FPCCI), the Gold Medallion Award from the International Export Association, UK and Best Businessman of the Year Award from FPCCI.
In addition, he has received the Sitara-e-Isaar and the Sitara-e-Imtiaz in 2006 and 2007 respectively by the President of Pakistan. His contributions and achievements go beyond the economic sphere into the education sector as well. He was awarded an Honorary PhD degree by the Governor of Sindh and is also a member of the Board of Directors of CBM and Greenwich College, Karachi and the Director of Shaukat Khannum Cancer Hospital, Lahore. Mr. S. M. Muneer is the Chairman of Chiniot Anjuman Islamia running many Hospitals, Maternity Homes, Schools & Colleges in Karachi, Faisalabad and Chiniot. Mr. S. M. Muneer was awarded “Life Time Achievement Award” by the President of Pakistan, Mr. Asif Ali Zardari, in the President House in 2012.
Directorships:• MCB Bank Limited• Din Textile Mills Limited• Din Leather (Pvt.) Limited• Din Farm Products (Pvt.) Limited
Tariq RafiDirector
Mr. Tariq Rafi is the Chairman of Siddiqsons Group and is a recipient of the coveted civil award Sitara-e-Imtiaz and the Best Businessman of the year award. He is also the Honorary Counsel General of Republic of Serbia. At MCB Bank, he is on the board since privatization of the bank and presently is the Chairman of the Audit Committee and member of Write Off & Waiver Committee.
Directorships:• MCB Bank Limited• Siddiqsons Limited• Siddiqsons Tin Plate Limited• Canvas Company of Pakistan (Pvt.) Limited• Askari Siddiqsons Development Company Ltd• Central Depository Co. of Pakistan Ltd.

ANNUAL REPORT 2013
28
Sarmad AminDirector
Mr. Amin has over 33 years of business experience in the fields of construction, electrical equipment’s manufacturing and textiles. He is the Chairman of M/s. Samin Textiles Limited and is a Director of Schneider Electric Pakistan (Pvt.) Ltd. (Formerly AREVA T&D Pakistan (Pvt.) Ltd), Euronet Pakistan, MNET Services (Pvt.) Ltd and Alstom Grid Pakistan (Pvt.) Ltd.
At MCB Bank, he is the Chairman of the Committee on Physical Planning & Contingency Arrangements and a member of the Risk Management & Portfolio Review Committee and SBP Report Compliance Monitoring Committee.
Shahzad SaleemDirector
Mr. Shahzad Saleem is the Chairman of Nishat Chunian Group, which comprises of Nishat Chunian Ltd. and Nishat Chunian Power Ltd. He graduated from the Lahore University of Management Sciences (LUMS) with a Masters in Business Administration in 1989 and laid the foundation of the Nishat Chunian Group with the setting up of a spinning mill in 1990. The group has since diversified into spinning, weaving, dyeing/printing, fabrication and power generation. Nishat Chunian Ltd. ranks amongst the top 5 textile companies in Pakistan.
Shahzad served on the board of Adamjee Insurance Company Ltd. from 2004-2009. He is on the board of MCB Bank since 1995 and has played a key role in the successful ventures undertaken by MCB Bank including listing on the London Stock Exchange and sale of 20 percent stake of MCB Bank to Maybank, Malaysia.
With strong ties to LUMS, Shahzad continues to serve the institution in various capacities. He is the founder of the LUMS Alumni Association and has served as its President for several tenures. He is currently serving on the Board of Trustees of LUMS as well as Director of Saleem Memorial Trust Hospital.

29
Aftab Ahmad KhanDirector
Mr. Aftab Ahmad Khan is a fellow Chartered Accountant of the Institute of Chartered Accountants of Pakistan. Mr. Aftab Ahmad Khan has over 50 years of diversified professional experience in various sectors. Presently he serves on the board of various organizations i.e. Commercial Banking, Textile, Paper, Energy, Hotel and Tourism sectors. He had also served on the Punjab Industrial Development Board and in Public sector organizations such as Ghee, Sugar and Rice mills. At MCB Bank, he is a member of the Audit Committee, IT Committee, Write-off and Waiver Committee and Policy Review Committee.
Directorships:• MCB Bank Limited• Nishat Paper Products Co. Limited (Un-listed)• Nishat (Chunian) Limited• Nishat Chunian Power Limited• Nishat Paper Products Co. Limited (Un-listed)• Nishat (Gulberg) Hotels and Properties Limited (Un-listed)• Nishat (Raiwind) Hotels and Properties Limited (Un-listed)• Nishat (Aziz Avenue) Hotels and Properties Limited (Un-listed)
Mian Raza ManshaDirector
Mian Raza Mansha received his Bachelors Degree from the University of Pennsylvania, USA, in 1994. He has more than 19 years diversified professional experience in various business sectors including Banking, Textile, Power, Cement, Insurance, Hotels, Properties, Natural Gas, Agriculture, Dairy etc.
Mr. Raza joined MCB Bank in 1997. At MCB, he is the Chairman of the IT Committee and a member of Business Strategy & Development Committee and Human Resource & Remuneration Committee.
Directorships:• MCB Bank Limited• D. G. Khan Cement Company Limited• Sui Northern Gas Pipeline Limited (SNGPL)• Nishat Paper Products Co. Limited (Un-listed)• Nishat Hotels & Properties Limited (Un-listed)• Nishat Developers (Pvt.) Limited• Adamjee Life Assurance Company Limited (Un-listed)• MCB Financial Services Limited• MNET Services (Pvt.) Limited• Euronet Pakistan (Pvt.) Limited• Nishat (Gulberg) Hotels and Properties Limited (Un-listed)• Nishat (Raiwind) Hotels and Properties Limited (Un-listed)• Nishat (Aziz Avenue) Hotels and Properties Limited (Un-listed)• Nishat Dairy (Pvt.) Limited• Nishat Agriculture Farming (Pvt) Limited

ANNUAL REPORT 2013
30
Mian Umer ManshaDirector
Mian Umer Mansha was elected as Director to the MCB Board in November 1997 and served till September 2007. He was re-elected as a Director at MCB Bank in the 61st AGM held on March 27, 2009. Presently, he is the Chairman of the Risk Management & Portfolio Review Committee and is a member of Business Strategy & Development Committee and Physical Planning and Contingency Arrangements at MCB Bank.
In addition, he has been serving on the board of various other businesses. Mr. Umer received his Bachelors Degree from Babson College, Boston, USA
Directorships:• MCB Bank Limited• Nishat Mills Limited• Adamjee Insurance Company Limited• Adamjee Life Assurance Company Limited (Un-listed)• Nishat Hotels & Properties Limited (Un-listed)• Nishat Developers (Pvt.) Limited• Nishat (Raiwind) Hotels and Properties Limited (Un-listed)• Nishat (Aziz Avenue) Hotels and Properties Limited (Un-listed)• Nishat (Gulberg) Hotels and Properties Limited (Un-listed)• Nishat Dairy (Pvt.) Limited• Nishat Agriculture Farming (Pvt.) Limited
Ahmad Alman AslamDirector
Mr. Aslam has over 38 years of professional experience in investment banking, corporate finance and advisory services. He is currently a managing partner of Ahmad Alman Aslam and Associates, an enterprise engaged in investment banking. Mr. Aslam started his career with Citibank in 1975 and continued with Citibank for 28 years, serving in various capacities. He was the Managing Director, based in New York, responsible for all debt issued by borrowers in the emerging markets. Mr. Aslam has also served as an advisor to EMP Washington, a US$ 6 billion private equity fund.
In Pakistan, he has served on the boards of the State Bank of Pakistan, OGDC, Adamjee Insurance, IGI Asset Management, Punjab Coal Mining Company, The Bank of Punjab, Punjab Small Industries Corporation and the Private Power and Infrastructure Board.
Mr. Aslam has Masters in Business Administration from Punjab University and has attended the program for Management Development at Harvard University, Cambridge.
31
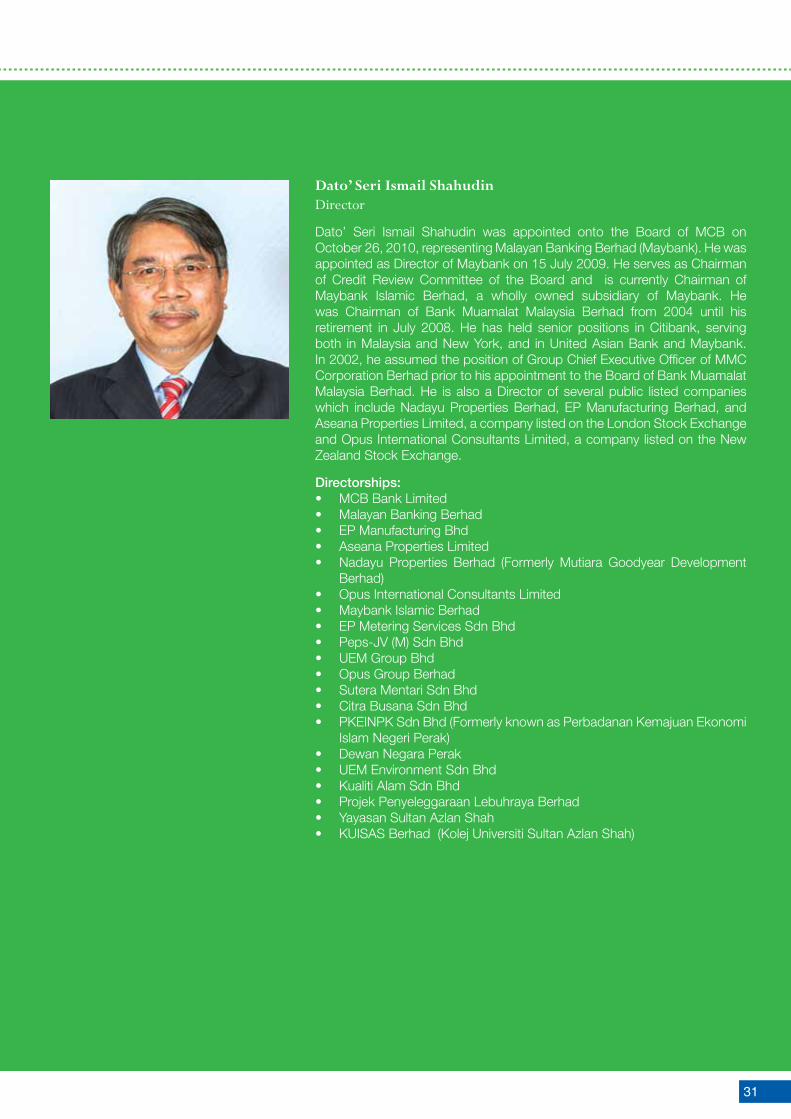
Dato’ Seri Ismail ShahudinDirector
Dato’ Seri Ismail Shahudin was appointed onto the Board of MCB on October 26, 2010, representing Malayan Banking Berhad (Maybank). He was appointed as Director of Maybank on 15 July 2009. He serves as Chairman of Credit Review Committee of the Board and is currently Chairman of Maybank Islamic Berhad, a wholly owned subsidiary of Maybank. He was Chairman of Bank Muamalat Malaysia Berhad from 2004 until his retirement in July 2008. He has held senior positions in Citibank, serving both in Malaysia and New York, and in United Asian Bank and Maybank. In 2002, he assumed the position of Group Chief Executive Officer of MMC Corporation Berhad prior to his appointment to the Board of Bank Muamalat Malaysia Berhad. He is also a Director of several public listed companies which include Nadayu Properties Berhad, EP Manufacturing Berhad, and Aseana Properties Limited, a company listed on the London Stock Exchange and Opus International Consultants Limited, a company listed on the New Zealand Stock Exchange.
Directorships:• MCB Bank Limited• Malayan Banking Berhad• EP Manufacturing Bhd• Aseana Properties Limited• Nadayu Properties Berhad (Formerly Mutiara Goodyear Development
Berhad)• Opus International Consultants Limited• Maybank Islamic Berhad• EP Metering Services Sdn Bhd• Peps-JV (M) Sdn Bhd• UEM Group Bhd• Opus Group Berhad• Sutera Mentari Sdn Bhd• Citra Busana Sdn Bhd• PKEINPK Sdn Bhd (Formerly known as Perbadanan Kemajuan Ekonomi
Islam Negeri Perak)• Dewan Negara Perak• UEM Environment Sdn Bhd• Kualiti Alam Sdn Bhd• Projek Penyeleggaraan Lebuhraya Berhad• Yayasan Sultan Azlan Shah• KUISAS Berhad (Kolej Universiti Sultan Azlan Shah)

ANNUAL REPORT 2013
32
Imran MaqboolPresident / CEO
Mr. Imran Maqbool serves as President & Chief Executive Officer of MCB Bank Limited. He is a seasoned professional with over three decades of diverse banking experience. Before taking on the CEO position, he was Head of Commercial Branch Banking Group, where he successfully managed the largest group of the Bank in terms of market diversity, size of workforce, number of branches on countrywide basis and diversified spectrum of products. In earlier roles, he worked as Head Wholesale Banking Group–North, remained Country Head of MCB Bank’s Sri Lanka Operations, spearheaded Islamic Banking and Special Asset Management Groups. Prior to joining MCB Bank in 2002, Mr. Maqbool was associated with local banking operations of Bank of America and CitiBank for more than seventeen years. He worked at various senior management level positions in respective banks. He is currently an Executive Member of Pakistan Banks’ Association (PBA). Mr. Maqbool holds an MBA from Institute of Business Administration (IBA) Karachi and MS in Management from MIT Sloan School of Management, Massachusetts USA.
Directorship status of Mr. Imran Maqbool, as at December 31, 2013, is as follows:
Directorships:• MCB Bank Limited President & CEO• MNET Services (Pvt) Limited Chairman• MCB Financial Services Limited Director• Adamjee Insurance Company Limited Director
Muhammad Ali ZebDirector
Mr. Muhammad Ali Zeb is currently the CEO of Adamjee Insurance Company Limited. He is a fellow member of Institute of Chartered Accountants of Pakistan and has more than 17 years of professional experience in Finance, Insurance & Manufacturing sectors.
He was co-opted as a Director at MCB in June 2013. At MCB, he is member of Risk Management and Portfolio Review Committee. He is also a member of Board of Directors of Adamjee Life Assurance Company Limited.

33
Audit Committee
Meetings held: 5
Composition:
1. Mr. Tariq Rafi – Chairman
2. Mr. Aftab Ahmad Khan
3. Dato’ Seri Ismail Shahudin
4. Mr. Ahmad Alman Aslam
Terms of Reference:
Determining appropriate measures to safeguard the Bank’s assets, reviewing quarterly, half-yearly and annual financial statements of the Bank, prior to their approval by the Board of Directors, focusing on major judgmental areas; significant adjustments resulting from the audit; the going concern assumption; any changes in accounting policies and practices; compliance with applicable accounting standards; compliance with listing regulations and other statutory and regulatory requirements; and significant related party transactions, reviewing preliminary announcements of results prior to publication, facilitating the external audit and discussion with external auditors of major observations arising from interim and final audits and any matter that the auditors may wish to highlight (in the absence of management, where necessary), reviewing management letter issued by external auditors and management’s response thereto, ensuring coordination between the internal and external auditors of the Bank, making recommendation to the Board of Directors for appointment of external auditors, their removal, audit fees, the provision by the external auditors of any service to the Bank in addition to audit of its financial statements, reviewing the scope and extent of internal audit and ensuring that the internal audit function has adequate resources and is appropriately placed within the Bank, consideration of major findings of internal investigations of activities characterized by fraud, corruption and abuse of power and management’s response thereto, ascertaining that the internal control systems including financial and operational controls, accounting systems for timely and appropriate recording of purchases and sales, receipts and payments, assets and liabilities and the reporting structure are adequate and effective, reviewing of the Bank’s statement on internal control systems prior to endorsement by the Board of Directors and internal audit reports, instituting special projects, value for money studies or other investigations on any matter specified by the Board of Directors, in consultation with the CEO and to consider remittance of any matter to the external auditors or to any other external body, determining compliance with relevant statutory requirements, monitoring compliance with the best practices of corporate governance and identification of significant violations thereof and considering any other issue or matter as may be assigned by the Board of Directors.
Business Strategy and Development Committee
Meetings held: 4
Composition
1. Mian Mohammad Mansha - Chairman
2. Mr. S. M. Muneer
3. Mian Raza Mansha
4. Mian Umer Mansha
5. Mr. Ahmad Alman Aslam
6. President & CEO
Terms of Reference:
The main terms of reference of the Committee are to review and develop vision and mission statements and core values for MCB both from long and short term perspective, develop Bank’s initiatives relating to business philosophy and acquisition, strategic investment and divestment, capital raising exercise, strategic alliances and brand management, reviewing the important matters with respect to policy initiatives; business organization; oversee expansion plans and contingency planning relating to business realignment, review and devise short, medium and long term business plans and policies based on strategy, future direction and milestones set by the Board, monitor the progress of the key strategy initiatives undertaken by the Bank and undertake such other tasks as may be delegated by the Board from time to time.
Board Committees

ANNUAL REPORT 2013
34
Human Resource and Remuneration Committee
Meetings held: 5
Composition
1. Mian Mohammad Mansha - Chairman
2. Mian Raza Mansha
3. Mr. Ahmad Alman Aslam
4. President & CEO
Terms of Reference:
The main tasks of the Committee shall be to ensure that the existing policies are reviewed periodically, and, as necessary, revised and recommended to the Board, in order to attract and retain highly qualified employees, the latest entry-level procedures are put in place for recruitment of entrants, the existing training facilities for the new entrants as well as for up-gradation of skill level of all employees are reviewed and revised, proper classification and reclassification of employees’ pay scales, job description, and methods of their periodical review are put in place, an objective criterion for work appraisal/performance is developed & linked with the annual merit increase, a review is undertaken of the organizational structure to bring it in line with business strategy & development plan and approve an organizational set up or any revision in the existing set up taking into account the recommendations of the President, an in-house human resource expertise is developed. As appropriate, the Committee is empowered to hire Consultant(s) to undertake market analysis of above policies with a view to developing MCB policies, effective management information system is developed to monitor the implementation of policies as approved by the Board, the selection, evaluation, compensation (including retirement benefits) and succession planning of the CEO and recommend to the Board, the consideration and approval on recommendations of CEO on such matters for key management positions who report directly to CEO, the selection, evaluation, compensation (including retirement benefits) and succession planning of the CFO, Company Secretary and Head of Internal Audit and recommend to the Board.
Risk Management and Portfolio Review Committee
Meetings held: 4
Composition
1. Mian Umer Mansha - Chairman
2. Mr. Sarmad Amin
3. Mr. Muhammad Ali Zeb
4. President & CEO
Terms of Reference:
Main terms of the committee are review the strategies relating to Bank’s risk and policy framework for management of credit, market and operational risks, in light of internal developments, guidelines issued by the regulators and international best practices, on as and when required basis, monitoring of Bank’s progress towards Basel-II implementation on as and when required basis (but at least on half yearly basis), review and recommend to Board Bank’s risk appetite statement, as and when required and review various reports pertaining to the risk in the bank’s portfolio prepared by the Risk Management Group. The Committee shall also consider comments of the relevant senior management official/ Committee while reviewing such reports and communicate the planned/executed corrective actions to the Board, if required.
Committee on Physical Planning and Contingency Arragements
Meetings held: 4
Composition
1. Mr. Sarmad Amin – Chairman
2. Mr. S. M. Muneer
3. Mian Umer Mansha
4. President & CEO
Terms of Reference:
The main terms of reference of the Committee are to develop and device an overall plan for physical infrastructure and contingency arrangements for the Bank, to review and monitor all work in progress, including construction of premises and renovations, which shall, inter alia, be based on physical planning, to review, monitor and recommend to the Board the building plans, master development agreements and contingency arrangements and to review, from time to time, as the Committee deems appropriate, the administrative structures and plans in place to ensure the ongoing health and safety of utilities and physical assets, including land & buildings and recommend, as appropriate, changes in plans arising from this review.

35
IT Committee
Meetings held: 4
Composition
1. Mian Raza Mansha - Chairman
2. Mr. Ahmad Alman Aslam
3. Mr. Aftab Ahmad Khan
4. President & CEO
Terms of Reference:
The main terms of reference of the Committee with regard to governance and supervision include approval of an overall plan for IT system for the Bank, approval of the organizational strategic plan to ensure an effective use of information technology by all departments and branches, approval and overseeing the management’s program to automate the organization’s use of internal information to ensure that data is organized and shared in a manner that adds value and enhances productivity, to approve and oversee a reliable and secure communications infrastructure with the capacity to address future growth, to approve policies those promote development of information technology resources in an organized, deliberate, secured, and cost effective manner, to review and approve Management recommendations for IT standards for ensuring compliance with regulatory requirements and identifying and mitigating significant IT related risks, to review and approve the Administrative IT structure, to undertake any other IT related work assigned to the Committee by the Board.
SBP Report Compliance Monitoring Committee
Meetings held: 2
Composition
1. Mr. S. M. Muneer
2. Mr. Sarmad Amin
3. Mr. Ahmad Alman Aslam
4. President & CEO
Terms of Reference:
The terms of reference of the Committee are to review six monthly reports prepared by the Compliance Group and routed through the President on the actions taken on the recommendations and observations of SBP in its Annual Inspection Report, to guide the management in the matters pertaining to compliance of SBP’s observations, to carry on liaison between the Board and the Management with a view to ensuring compliance pertaining to the SBP’s observations; and to make recommendations to the Board, if necessary, for taking decisions on expedient and appropriate disposal of observations of SBP Inspection Report.
Write Off and Waiver Committee
Composition
1. Mian Mohammad Mansha - Chairman
2. Mr. Tariq Rafi
3. Mr. Aftab Ahmad Khan
Terms of Reference:
The terms of reference of the Committee are to review and approve write off & waiver cases on behalf of the Board of Directors and to submit cases of write off and waiver for post facto ratification by the Board.

ANNUAL REPORT 2013
36
Organizational Structure

37
Chairman/Board of Directors
Audit Committee
Audit & RAR(Kamran Zafar
Muggo)
Risk Management(Mohammed Nauman
Chughtai)
Human ResourceManagement
(Usman Hassan)
Treasury & Forex(Mohammad
Ramzan)
Wholesale Banking(Muhtashim Ashai)
Retail Banking(Ali Mubashir Kazmi)
Operations(Agha Saeed Khan)
Strategic Planning &Investment(Ali Munir)
Information Technology(Imtiaz Mahmood)
Compliance & Control(Raheel Ejaz)
Financial Control(Salman Zafar Siddiqi)
Special Assets Management(Laqa Sarwar)
CSR & Security(Kamran Rasool)
Islamic Banking(Syed Rashid
Rehman)
CCM & Special Projects(Shahid Malik)
Corporate & Legal Affairs
(Syed Mudassar Hussain Naqvi)
President (Imran Maqbool)

Management Committee
ANNUAL REPORT 2013
38

39

ANNUAL REPORT 2013
40
1. Management Committee
1. Mr. Imran Maqbool - Chairman2. Mr. Ali Munir3. Mr. Mohammad Ramzan4. Mr. Agha Saeed Khan 5. Mr. Raheel Ijaz6. Mr. Usman Hassan 7. Mr. Imtiaz Mahmood8. Mr. Ali Mubashir Kazmi9. Mr. Muhtashim Ashai10. Mr. Laqa Sarwar11. Mr. Syed Rashid Rehman12. Mr. Salman Zafar Siddiqi13. Mr. M. Nauman Chughtai14. Mr. Syed Mudassar Naqvi15. Mr. Kamran Rasool16. Mr. Shahid Malik
2. Assets & Liabilities Committee
1. Mr. Imran Maqbool - Chairman2. Mr. Ali Munir3. Mr. Salman Zafar Siddiqi4. Mr. Muhtashim Ashai 5. Mr. Agha Saeed Khan6. Mr. Ali Mubashir Kazmi7. Mr. Mohammad Ramzan8. Mr. Syed Rashid Rehman9. Mr. M. Nauman Chughtai
3. Purchase & Expense Committee
1. Mr. Agha Saeed Khan - Chairman2. Mr. Ali Mubashir Kazmi3. Mr. Salman Zafar Siddiqi 4. Mr. Kamran Rasool
4. Investment Committee
1. Mr. Imran Maqbool - Chairman2. Mr. Ali Munir 3. Mr. Mohammad Ramzan4. Mr. Salman Zafar Siddiqi 5. Mr. Muhtashim Ashai6. Mr. Ali Mubashir Kazmi7. Mr. M. Nauman Chughtai
5. Write off Committee
1. Mr. Imran Maqbool - Chairman2. Mr. Ali Munir 3. Mr. Salman Zafar Siddiqi4. Mr. Muhtashim Ashai5. Mr. Ali Mubashir Kazmi6. Mr. Omair Safdar7. Mr. M. Nauman Chughtai8. Mr. Laqa Sarwar
6. IT Steering Committee
1. Mr. Imran Maqbool - Chairman2. Mr. Ali Munir 3. Mr. Salman Zafar Siddiqi4. Mr. Imtiaz Mahmood5. Mr. Agha Saeed Khan6. Mr. Ali Mubashir Kazmi7. Mr. Muhtashim Ashai8. Mr. M. Nauman Chughtai
7. Disciplinary Action Committee
1. Mr. Usman Hassan - Chairman2. Mr. Agha Saeed Khan3. Mr. Raheel Ijaz4. Mr. Laqa Sarwar5. Mr. Kamran Rasool

41
Other Senior Management

ANNUAL REPORT 2013
42
MCB is one of the oldest banks of Pakistan, incorporated in 1947. It was privatized in 1991. To accede to international capital markets, the Bank launched Global Depositary Receipts (GDRs) in 2006. It was the first Pakistani Bank that got its GDRs listed on the London Stock Exchange. In 2008, the Bank entered into a strategic partnership with Maybank, Malaysia, which owns 20% stake in it through Mayban International Trust (Labuan) Berhad.
Subsidiaries
MCB Financial Services LimitedHolding: 99.999%Profile: Float, administer and manage modaraba funds, modarabas and also acts as trustees of various mutualfunds.
MNET Services (Private) LimitedHolding: 99.95%Profile: One of the largest service providers for Electronic Transactions to various financial institutions/banksincluding related services in Information Technology, software and data processing.
MCB Trade Services LimitedHolding: 100%Profile: Provides agency services.
Arif Habib Investments LimitedHolding: 51.33%Profile: Asset management, investment advisory, portfolio management, equity research and underwriting.
“MCB Leasing” Closed Joint Stock Company, AzerbaijanHolding: 95.00%Profile: It leases various types of industrial equipment, public transports, real estate and retail auto leases.
With reference to significant holding, the following entities are associates of the Bank;
First Women Bank LimitedHolding: 15.46%
Adamjee Insurance Company LimitedHolding: 29.13%
Euronet Pakistan (Private) LimitedHolding: 30%
Corporate Profile of the BankEntity Credit Rating
LONG TERM SHORT TERM

43
MCB is one of the oldest banks of Pakistan, incorporated in 1947. It was privatized in 1991. To accede to international capital markets, the Bank launched Global Depositary Receipts (GDRs) in 2006. It was the first Pakistani Bank that got its GDRs listed on the London Stock Exchange. In 2008, the Bank entered into a strategic partnership with Maybank, Malaysia, which owns 20% stake in it through Mayban International Trust (Labuan) Berhad.
Subsidiaries
MCB Financial Services LimitedHolding: 99.999%Profile: Float, administer and manage modaraba funds, modarabas and also acts as trustees of various mutualfunds.
MNET Services (Private) LimitedHolding: 99.95%Profile: One of the largest service providers for Electronic Transactions to various financial institutions/banksincluding related services in Information Technology, software and data processing.
MCB Trade Services LimitedHolding: 100%Profile: Provides agency services.
Arif Habib Investments LimitedHolding: 51.33%Profile: Asset management, investment advisory, portfolio management, equity research and underwriting.
“MCB Leasing” Closed Joint Stock Company, AzerbaijanHolding: 95.00%Profile: It leases various types of industrial equipment, public transports, real estate and retail auto leases.
With reference to significant holding, the following entities are associates of the Bank;
First Women Bank LimitedHolding: 15.46%
Adamjee Insurance Company LimitedHolding: 29.13%
Euronet Pakistan (Private) LimitedHolding: 30%
Corporate Profile of the BankEntity Credit Rating
LONG TERM SHORT TERM
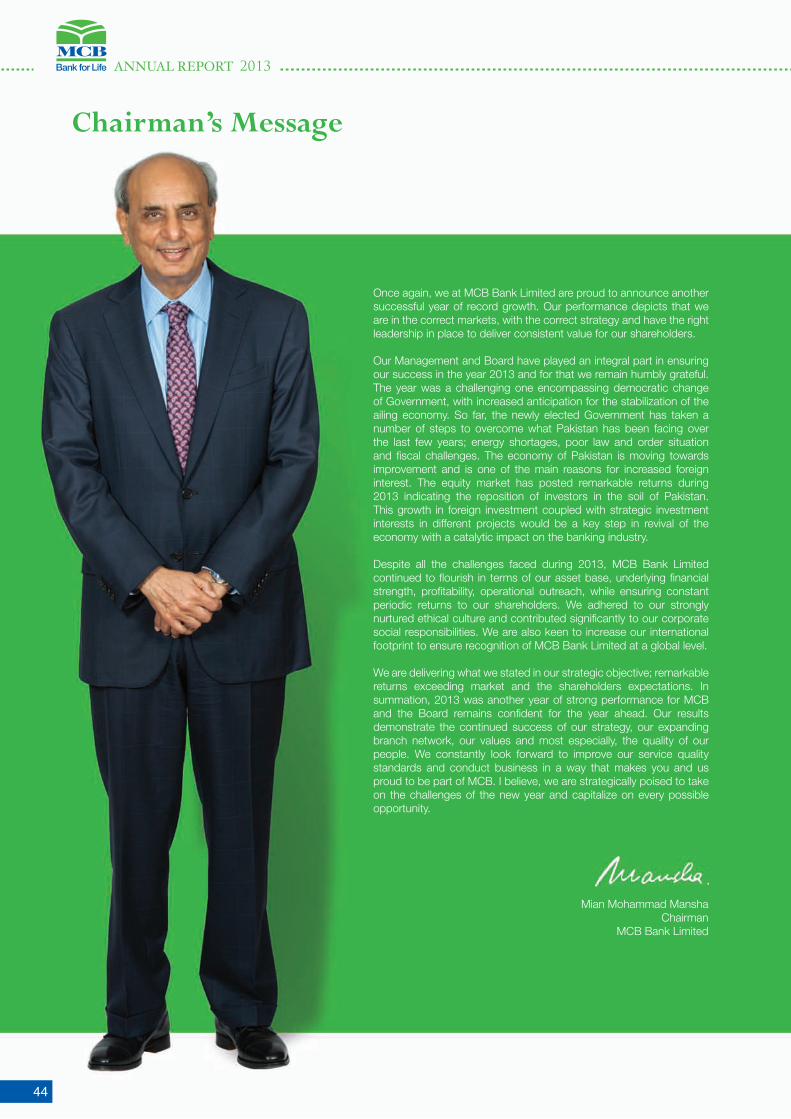
ANNUAL REPORT 2013
44
Once again, we at MCB Bank Limited are proud to announce another successful year of record growth. Our performance depicts that we are in the correct markets, with the correct strategy and have the right leadership in place to deliver consistent value for our shareholders.
Our Management and Board have played an integral part in ensuring our success in the year 2013 and for that we remain humbly grateful. The year was a challenging one encompassing democratic change of Government, with increased anticipation for the stabilization of the ailing economy. So far, the newly elected Government has taken a number of steps to overcome what Pakistan has been facing over the last few years; energy shortages, poor law and order situation and fiscal challenges. The economy of Pakistan is moving towards improvement and is one of the main reasons for increased foreign interest. The equity market has posted remarkable returns during 2013 indicating the reposition of investors in the soil of Pakistan. This growth in foreign investment coupled with strategic investment interests in different projects would be a key step in revival of the economy with a catalytic impact on the banking industry.
Despite all the challenges faced during 2013, MCB Bank Limited continued to flourish in terms of our asset base, underlying financial strength, profitability, operational outreach, while ensuring constant periodic returns to our shareholders. We adhered to our strongly nurtured ethical culture and contributed significantly to our corporate social responsibilities. We are also keen to increase our international footprint to ensure recognition of MCB Bank Limited at a global level.
We are delivering what we stated in our strategic objective; remarkable returns exceeding market and the shareholders expectations. In summation, 2013 was another year of strong performance for MCB and the Board remains confident for the year ahead. Our results demonstrate the continued success of our strategy, our expanding branch network, our values and most especially, the quality of our people. We constantly look forward to improve our service quality standards and conduct business in a way that makes you and us proud to be part of MCB. I believe, we are strategically poised to take on the challenges of the new year and capitalize on every possible opportunity.
Mian Mohammad Mansha Chairman MCB Bank Limited
Chairman’s Message

45
MCB Bank Limited, a name synonymous with quality service and trust, is a recognized brand based on decades of above par financial performance and sustainable business growth.
Our exemplary performance history shapes the way we explore future growth opportunities. The Bank remains committed in providing its valued customers with efficient services; tailored to the specific financial requirements of respective customers while simultaneously identifying and catering to the needs of unbanked segments in Pakistan. We have been consistently gaining market share over the years, reposing confidence of our stakeholders and strengthening their faith in the financial stability of MCB Bank Limited. The Bank is blessed with an enormous talent pool of dedicated and committed professionals, who successfully embrace every challenge and endeavor to outperform competition across all our businesses while maintaining the highest standards of service quality.
Our broad spectrum of products and services provides a cutting edge advantage to service our customers countrywide through online branch network offering Corporate, Retail, Islamic and Investment banking products that have contributed towards making MCB Bank one of the leading banks in Pakistan. To account for change in trends and adding further ‘customer-friendly’ parameters, MCB’s Internet Banking was re-launched during the year. Our revamped Call Centres is yet another step to reinforce our strategy to provide 24/7 product support and assistance to our valued clientele. To strengthen the retail product suite, consumer lending products i.e. personal loan and home loan facilities, were reintroduced to enlarge the range of MCB’s products. Our Mobile Banking continues to be a strong player; attracting large segment of young educated tech-savvy professionals. Bancassurance / Investment products and Visa Debit Cards have been among MCB’s best sellers and have gained substantial market share during the year under review.
As developing technology–driven product range is the need of the hour, MCB is moving in that direction with a clear vision. We are all set for the commercial launch of our ‘Branchless Banking’ initiative – MCB Lite, from January 1, 2014, which is expected to usher a new chapter of ‘banking convenience’ for MCB’s existing and prospective customer base. We are confident that through these innovative products, coupled with our quality service standards, MCB would significantly increase its share of the business and support financial inclusion through alternate distribution channels.
Our extensive distribution network of over 1200 branches ensures countrywide reach; especially underserved regions through 430 rural branches, augmented by 789 ATMs performing at an impressive
President’s Review

ANNUAL REPORT 2013
46
average uptime of over 91% during 2013. On the security front, a total of 70 bank robberies were reported throughout the country, out of which only a single attempt was made on MCB branch. This speaks volumes of the security policy we follow and fortifies our initiative of ‘guard-less’ branches. 200 of our branches are already operating successfully on this new model while another 250 are in the process of being converted. In the domain of technology platform, our Core Banking System (CBS) is also being upgraded by key resources of the Bank to further improve internal systems and controls. The upgraded CBS would assist us in achieving scalability and sustainability to serve growing customer traffic generating higher transaction volumes resulting from diversified product range.
Overall performance of the banking sector during the year remained under pressure due to challenging operating environment with high level of competition and economic uncertainties. Under these challenging conditions, bank’s profit (before tax) increased by 2% while profit (after tax) increased by an impressive 4% over last year. These strong results translated into a healthy ROA of 2.72% and ROE of 23.09%. From a peak of 14% in June 2011, the discount rate declined 400 basis points over the last two years, forcing net margins to follow a downward trajectory. To counter this declining trend, MCB focused on other business avenues i.e. trade, capital markets, treasury, other fee based income streams and recovery of NPLs to remain on the path of sustainable profit growth.
Loans to customers (net volume) increased by 4% reflecting improving business optimism in the economy. The Bank’s asset base grew by 6% to Rs. 815 billion during 2013. MCB Bank followed its credit underwriting standards and actively pursued remedial risk management resulting in a 9% reduction in its infected portfolio. During the year, deposit base registered a robust growth of 16% with continuous focus on Current and Savings deposits, resulting into an all-time-high CASA composition of 90%.
In line with Bank’s Five Year Business Strategy, our financial results reflected strong underlying performance across virtually all our businesses, fueled by strong Balance Sheet management and profit growth. We also maintained our leadership positions and continued to gain market share in key areas of our franchise. This financial performance has resulted in good stock performance to support growth in market capitalization.
Over the years, Bank has earned a series of accolades from prestigious institutions and during the year another award was conferred by ‘The Asset;’ declaring MCB Bank Limited as the ‘Best Domestic Bank.’ This goes, hand in hand, with highest entity rating of “AAA” (long-term) and “A1+” (short term) assigned to MCB by Pakistan Credit Rating Agency (PACRA) in 2013.
On the spectrum of social responsibility to the community, Bank donated Rs. 25 million for Earthquake Relief Fund for Baluchistan, while charity contribution of Rs. 5 Million to the Earthquake Relief fund and Rs. 5 million for rehabilitation of minority community were made by MCB.
Taking into account the importance of international footprint
to serve growing customer base, MCB is exploring various viable options to widen its business network into South Asia, Middle East, Africa and Europe. Similarly, in-line with SBP’s strategic focus on Islamic banking, MCB is working actively towards establishing its own dedicated Islamic Bank to take the first mover advantage in serving growing Islamic Banking customer base which currently represents 12% of the overall banking system in the country.
On behalf of team MCB, I extend my heartiest gratitude to the Chairman and Board of Directors of MCB Bank for their vision, foresight and guidance in achieving 2013 results. I would also like to thank State Bank of Pakistan and other regulatory bodies for their continued support, our shareholders for their trust and belief in us, and last but not the least, management and staff of MCB Bank Limited for their teamwork, unity of purpose and faith in God in translating our goals for 2013 into reality.
Based on the successful 2013 results and our business momentum going forward, I expect 2014 to be yet another banner year. We will continue to remain prudent in areas of risk, cost, investment and will be using our strong balance sheet strength to service customer needs, distinguishing MCB as the most credible bank and making it “Bank for Life” for our stakeholders.
Imran Maqbool President & CEO MCB Bank Limited
211.5 221.1 229.3 257.5
292.1 330.2
367.6
431.4
491.2
545.1
632.3
2003 2004 2005 2006 2007 2008 2009 2010 2011 2012 2013
DepositsCAGR 12%
(Rs.
in b
illion
)
272.3 259.2 298.8
342.1
410.5 443.6
509.2
567.6
653.8
767.1 815.5
2003 2004 2005 2006 2007 2008 2009 2010 2011 2012 2013
Total AssetsCAGR 12%
(Rs.
in b
illion
)
Fund Based IncomeCAGR 18%
InvestmentsCAGR 13%
7.4 7.0
15.0
21.3 23.9
28.5
35.8 36.8
44.5
40.9 37.9
2003 2004 2005 2006 2007 2008 2009 2010 2011 2012 2013
(Rs.
in b
illion
)
104.0
144.0
188.1 206.8
229.7
272.8 269.7 274.1
249.9 262.4 268.2
2003 2004 2005 2006 2007 2008 2009 2010 2011 2012 2013
(Rs.
in b
illion
)
Gross AdvancesCAGR 10%
4.5 4.2
5.8 5.0
6.4 5.8 5.6
6.3
8.1
9.2
11.2
2003 2004 2005 2006 2007 2008 2009 2010 2011 2012 2013
(Rs.
in b
illion
)
Non Markup IncomeCAGR 9%
3.6 4.1
13.0
18.5
21.3 21.9 23.2
26.3
31.5 31.6 32.3
2003 2004 2005 2006 2007 2008 2009 2010 2011 2012 2013
(Rs.
in b
illion
)
Profit Before TaxCAGR 24%
128.3
67.2 69.5 63.5
113.1 96.6
167.1
213.1
316.7
402.1
449.0
2003 2004 2005 2006 2007 2008 2009 2010 2011 2012 2013
(Rs.
in b
illion
)
Profit After TaxCAGR 25%
2.2 2.4
8.9
12.1
15.3 15.4 15.5 16.9
19.4 20.7
21.5
2003 2004 2005 2006 2007 2008 2009 2010 2011 2012 2013
(Rs.
in b
illion
)

47
211.5 221.1 229.3 257.5
292.1 330.2
367.6
431.4
491.2
545.1
632.3
2003 2004 2005 2006 2007 2008 2009 2010 2011 2012 2013
DepositsCAGR 12%
(Rs.
in b
illion
)
272.3 259.2 298.8
342.1
410.5 443.6
509.2
567.6
653.8
767.1 815.5
2003 2004 2005 2006 2007 2008 2009 2010 2011 2012 2013
Total AssetsCAGR 12%
(Rs.
in b
illion
)
Fund Based IncomeCAGR 18%
InvestmentsCAGR 13%
7.4 7.0
15.0
21.3 23.9
28.5
35.8 36.8
44.5
40.9 37.9
2003 2004 2005 2006 2007 2008 2009 2010 2011 2012 2013
(Rs.
in b
illion
)
104.0
144.0
188.1 206.8
229.7
272.8 269.7 274.1
249.9 262.4 268.2
2003 2004 2005 2006 2007 2008 2009 2010 2011 2012 2013
(Rs.
in b
illion
)
Gross AdvancesCAGR 10%
4.5 4.2
5.8 5.0
6.4 5.8 5.6
6.3
8.1
9.2
11.2
2003 2004 2005 2006 2007 2008 2009 2010 2011 2012 2013
(Rs.
in b
illion
)
Non Markup IncomeCAGR 9%
3.6 4.1
13.0
18.5
21.3 21.9 23.2
26.3
31.5 31.6 32.3
2003 2004 2005 2006 2007 2008 2009 2010 2011 2012 2013
(Rs.
in b
illion
)
Profit Before TaxCAGR 24%
128.3
67.2 69.5 63.5
113.1 96.6
167.1
213.1
316.7
402.1
449.0
2003 2004 2005 2006 2007 2008 2009 2010 2011 2012 2013
(Rs.
in b
illion
)
Profit After TaxCAGR 25%
2.2 2.4
8.9
12.1
15.3 15.4 15.5 16.9
19.4 20.7
21.5
2003 2004 2005 2006 2007 2008 2009 2010 2011 2012 2013
(Rs.
in b
illion
)
Financial Performance10 Years Trend (2003 - 2013)

ANNUAL REPORT 2013
48
PAT PKR 21.5 Billion (+4%)
Deposits PKR 632 Billion (+16%, CASA 90%)
Market Value 281.17/share
ROA (2.72%)
ROE (23.09%)
Non-Markup Expense PKR 19.5 Billion (+9%)
Best Corporate Report Award Winner for 2012
Provisions Reversal of PKR 2.8 Billion
Investments PKR 449 Billion (+12%)
Non-Markup Income PKR 11.2 Billion (+22%)
Highlights 2013

49
KPI
Profitability
Shareholder returns
Deposit generation
Asset Quality
Effective and efficient cost control
Capital ratios
Forward-looking disclosures of annual report 2012
MCB Bank Limited remains determine in maintaining its status as a leading bank, offering tailored products to meet the financial requirements of its customer base. The strength depicted in the financial position would continue to be translated into profits, ensuring quality asset reflection.
Performance of the Bank in 2013
As an update on the forward looking information presented in 2012 financial statements, the Bank has been able to achieve strategic targets specified for 2013. We have added quality products and services to our menu with infrastructural and technical developments ensuring convenience to our large customer base.
From financial performance perspective, MCB has posted 2% and 4% growth in PBT & PAT respectively. The asset quality of the Bank has depicted considerable improvement with infection ratio decreasing from 9.74% in 2012 to 8.68% in 2013.Detailed analysis covering performance and achievements of respective groups against their targets for 2013 is included in the Director’s Report.
Objective
Sustained profitability while coping up with the operational challenges. Being recognized as one of the most profitable bank of the industry.
The Bank aims to deliver sustained payout to its investors.
The Bank aims to increase its share in the domestic deposit pie along with international deposit generation.
To ensure quality asset retention with measures to constantly decrease the NPL base of the Bank.
Introduction of cost cutting techniques ensuring operational efficiency.
To maintain a strong capital base
Analysis
Despite tough operating environment, MCB Bank posted a moderate growth in PBT of 2% with PAT growing by 4% over 2012. This was achieved despite the interest rate volatility and regulatory revisions in minimum deposit rate impacting net interest margins.
The Bank has paid 140% cash dividend in 2013 (2012: 130%) along with 10% bonus issue (2012:10%)
Deposits to the tune of Rs. 87 billion added to the base in the year 2013 with CASA base touching 90%. Initiatives undertaken to increase international footprint of the franchise. During the year market share of deposits increased to 8.40% (2012: 8.16%).
Significant recoveries to the tune of Rs 1.1 Billion and Rs. 2.3 Billion have been posted in years 2012 & 2013 respectively. The infection ratio has improved significantly from 9.74% as at December 2012 to 8.68% as at December 31, 2013.
Moderate increase posted in the operating expenses block in line with the surged observed in inflationary pressures. Cost to income ratio is reported at 40.05 which can be rated as exceptional in such operating circumstances.
The capital adequacy ratios of the Bank are well above the specified percentages. Bank maintained Tier-1 to total risk weighted assets ratio at 20.89% against requirement of 6.50%.
Future relevance
The KPI shall remain relevant in future
The KPI shall remain relevant in future
The KPIs shall remain relevant in future
The KPI shall remain relevant in future
The KPI shall remain relevant in future
The KPI shall remain relevant in future
Key Performance Indicators

ANNUAL REPORT 2013
50
Review of Six Years’ Performance
In this section, commentary on the six years’ performance of the Bank is being provided, covering most prominent highlights;
Statement of Financial Position
Total Assets:
The asset base of the Bank has almost doubled over the last 6 years growing from Rs. 443 billion as at December 31, 2008 to Rs. 815 billion at the end of financial year 2013, translating into an annual growth of 12% for the last six years; Prime contributors to the said increase have been advances and investments over years, which increased contributions from investments in the recent years. MCB Bank has been prudently able to manage the risks and returns of its earning asset base to deliver maximum return to its stakeholders.
Advances:
The macro-economic instability coupled with energy crisis has adversely affected the private sector credit demand of the local banking industry and a similar pattern can be observed for MCB Bank Limited. Being mainstream business line of the Bank, credit growth remained prime focus of the Bank but the lack of credit opportunities and intense competition resulted in a moderate growth in gross advances base. However, based on significant additions recorded in investment base, the ADR had been decreased as a result of shift in asset mix from 83% reported in 2008 to 42% reported for 2013.
Non-performing Loans:
Based on the stringent risk management policies and strengthened framework, the Bank has been able to control the infection in asset quality. The quality of asset has been one of the prime focus areas of the Bank and the significant recoveries posted in the last two years clearly spell out the
efforts that have been directed in this achieving this goal. After registering a decrease of Rs. 1.1 billion in NPLS in 2012, the NPL base has further contracted by Rs. 2.3 billion in 2013. The Bank has been conservative on the provisioning side which is substantiated by the fact that the Bank carries an unencumbered provision charge of Rs. 268M as general provision and has not taken the benefit of “FSV”, in its specific provision classification. The coverage ratio of the Bank has improved from 54.17% in 2008 to 83.59% in 2013. Moreover, the NPLs classified in “loss” category constitute more than 90% of the NPLs base as at December 31, 2013, which specifies the adequacy of provision held in the books of the Bank.
Investments:
The lacks of credit opportunities have paved way for build-up in investment base over the years. The investment base of the Bank has increased extravagantly from Rs. 96 billion in 2008 to Rs. 449 billion in 2013 with major concentration levels in risk free Market Treasury bills and Pakistan Investment Bonds.
Deposits:
The deposit base of the Bank has steadily grown over the last six years, with absolute numbers increasing from Rs. 330B in 2008 to Rs. 632B in 2013. MCB Bank’s competitive edge has been the highest CASA base, supporting its lower cost of deposits. The Bank has been constantly shifting its high cost deposit to low cost deposits, as CASA base has more than doubled in last 6 years, increasing from Rs. 268 billion in 2008 to Rs. 568 billion in 2013; MCB Bank has been able to maintain its share in the domestic industry deposit pie with an average share of approximately 8%. As depicted by the deposit categorization, the quality of service and returns provided by the Bank has enabled to keep the CASA base above 80% for the last six years.

51
Equity and Dividends
• The paid-up capital of the Bank has grown from Rs. 6.2B in 2008 to Rs. 10.1B in 2013, meeting the capital requirements set by the Central Bank.
• In 2008, most affluence strategic partnership occurred in Pakistan where the largest Bank of Malaysia, Maybank Berhad, acquired 20% holding in MCB Bank Limited. This brought synergies in technology, human resource and decision making.
• The equity base of the Bank is reflective of the outstanding financial results and underlying financial strength achieved through consistent performance over years.. The capital base of the Bank can be rated as strong which is substantiated by the reported CAR of 22.25% as at December 31, 2013 against the statutory specified percentage of 10%. The Shareholders’ equity stands at Rs. 97B as at December 31, 2013 growing from Rs. 52B in 2008.
• The Bank has been amongst the leading distributor of cash dividends with regular interim dividends and remains one of the prime stocks preferred by foreign institutions / stakeholders.
Profit and Loss account
Net Interest Margin
• The composition of markup income has seen a shift in the last six years on the back of volumetric shift in the earning asset base of the Bank. The contribution from markup income earned on advances has reduced from 75.6% in 2008 to 38.4% in 2013 while markup income from investments has increased to 60.3% (2008: 21.7%).
• The volatility in the net interest margin of the Bank is on account of the movement in the
monetary policy rate and the setting of the minimum deposit rates to be offered on saving and fixed deposits and its linkage with interest rate corridor.
However, the Bank has been able to capitalize on the lower cost of deposits due to significant CASA base, translating into higher profitability numbers.
Non-Markup Income
• To coupe up with the interest rate volatility, the bank has strategically focused on the increased contribution from non-markup based income. The product development teams of the Bank have been tapping the unbanked segment of the population and offering them tailored products to meet their specific financial requirements. Numbers of products have been launched in past 6 years in order to increase non-markup income like credit card, mobile banking, visa debit card, MCB Lite, prepaid cards etc.
• The fee, commission and brokerage block of the Bank has been constantly increasing over years with major contributions coming from commission earned on bancassurance business, remittances and intercity / intra-city cash transfers.
• The equity investment base of the Bank has been providing outstanding dividend yields with dividend income registering the second highest contribution to non-markup income. During the year 2013, substantial capital gains were earned, benefitting from the record levels posted by the equity markets.
Operating Expenses
• Owing to the strengthened risk management framework, the provision charge of the Bank has been on a declining trend over years. The provision and write-off charge was reported at Rs. 7.4billion for the year 2009 which has
ANNUAL REPORT 2013
52
reduced substantially to Rs. 291M for the year 2012. For the year 2013, the Bank reversed provisions to the tune of Rs. 2.8 billion based on the recoveries posted in loss categorized advances. It is pertinent to add that the Bank has been conservative on the provision side and has not taken the benefit of FSV in specific provision calculation for the year 2013.
• The growth in administrative block of the bank has been nominal considering the inflationary patterns followed over the period of six years and falls within the budgetary limits set. The management has been able to introduce cost effective techniques / methods to exercise control over the administrative expenses. This has helped the Bank to register one of the lowest cost to income ratios in the industry despite the inflationary pressures on core operating expenses which has currently been reported at 40.05% (2008:24.41%).
Profit before tax and Profit after tax:
• MCB Bank has been able to post outstanding profitability numbers over the period of last six years as corroborated by the highest EPS and remarkable return on asset. The annual pre-tax profitability numbers have grown from Rs. 21.9 billion for 2008 to Rs. 32.3 billion for 2013.
• The profitability ratios have been one of the best in the banking industry which are reflective of the effective management of the affairs and adoption of prudent strategies.
Other statistics
• The Bank has generated 1 million additional customers in the past six years and now a total number of customers are close to 5 million mark and has expanded its operational network by 157 new branches.
• With active participation in trade, MCB Bank has been able to improve trade volume in last 6 years which have increased to Rs. 421 billion
for imports and Rs. 209 billion for exports.
• The Bank has been able to increase its market share in the remittance business growing from Rs. 26 billion in 2008, the Bank has now volume of above Rs. 150 billion in a year.
• After its launch in 2007, MCB internet banking has been a preferred choice of our large customer base. We have been able to increase our customer base gradually with transactions volume in excess off 1.6 million.
• In 2008, the Bank launched Bancassurance which was a unique cross functional service to the customers of the Bank. With only 131 policies and 129 customers in 2008, MCB Bank now manages approximately 15,000 policies and customers with premium amount of over Rs. 2.5 billion.
• MCB Bank launched mobile banking in 2009 with approximately 53K customers reported by the end ofthe year. As of 2013, the numbers of mobile customers have grown to approximately 542 K , with transaction volume of above Rs. 10 billion.
• The Bank launched Privilege Banking in 2009 targeting a specific customer base. As of 2013, Privilege Bank proposition serves 2,389 customers.

53
Six Years Financial Summary 2008 - 2013
2013 2012 2011 2010 2009 2008
Profit & Loss account Mark-up/ return earned Rs. Mln 65,064 68,356 68,147 54,821 51,616 40,044 Mark-up/ return expensed “ “ 27,196 27,500 23,620 17,988 15,837 11,561 Fund based income “ “ 37,868 40,856 44,526 36,834 35,779 28,483 Fee, Commission, brokerage & FX income “ “ 8,108 7,131 6,373 5,310 4,409 4,537 Dividend Income & Capital gains “ “ 3,063 2,022 1,739 956 1,234 1,255 Total income “ “ 49,039 50,010 52,639 43,099 41,422 34,275 Operating expenses “ “ 19,639 18,077 16,987 13,160 10,801 8,365 Operating profit before tax and provision “ “ 29,400 31,933 35,651 29,938 30,620 25,910 Provisions / write-offs “ “ (2,888) 291 4,168 3,685 7,465 4,042 Profit before tax “ “ 32,288 31,642 31,483 26,253 23,155 21,868 Profit after tax “ “ 21,495 20,673 19,425 16,873 15,495 15,375 Cash Dividends* “ “ 14,166 11,959 10,036 8,743 7,602 7,225 Bonus shares* “ “ 1,012 920 836 760 691 628 Statement of Financial Position Authorised capital “ “ 15,000 10,000 10,000 10,000 10,000 10,000 Paid up capital “ “ 10,118 9,199 8,362 7,602 6,911 6,283 Reserves “ “ 46,601 44,253 42,186 40,163 38,386 36,769 Unappropriated Profit “ “ 40,552 35,425 28,724 21,416 15,779 9,193 Shareholder’s equity “ “ 97,272 88,877 79,273 69,180 61,076 52,245 Surplus on revaluation of assets - net of tax “ “ 12,959 13,594 9,887 10,024 8,664 6,191 Net Assets “ “ 110,231 102,471 89,160 79,203 69,740 58,436 Total Assets “ “ 815,508 767,075 653,782 567,553 509,224 443,616 Earning Assets “ “ 718,990 663,330 569,128 494,605 444,188 380,187 Gross Advances “ “ 268,192 262,392 249,914 274,144 269,722 272,847 Advances - net of provisions “ “ 248,243 239,583 227,580 254,552 253,249 262,135 Non-Performing Loans (NPLs) “ “ 23,268 25,562 26,665 24,544 23,239 18,269 Investments “ “ 449,006 402,069 316,652 213,061 167,134 96,632 Total Liabilities “ “ 705,277 664,604 564,622 488,349 439,484 385,180 Deposits & other accounts “ “ 632,330 545,061 491,189 431,372 367,605 330,182 Current & Saving Deposits (CASA) “ “ 567,728 464,411 399,687 351,298 304,953 268,501 Borrowings “ “ 38,543 78,951 39,101 25,685 44,662 22,664 Interest bearing Liabilities “ “ 456,348 434,619 362,843 305,902 283,369 240,470 Contingencies and Commitments “ “ 265,428 143,803 165,014 136,246 119,922 266,251 Profitability Ratios: Profit before tax ratio % 49.63% 46.29% 46.20% 47.89% 44.86% 54.61%Gross Yield on Average Earning Assets “ “ 9.42% 11.08% 12.80% 11.68% 12.52% 11.07%Gross Yield on Avg. Earning Assets (incl. dividend & capital gains) “ “ 9.86% 11.42% 13.14% 11.88% 12.82% 11.42%Gross Spread “ “ 58.20% 59.77% 65.34% 67.19% 69.32% 71.13%Non interest income to total income “ “ 22.78% 18.30% 15.41% 14.54% 13.62% 16.90%Return on average equity (ROE) “ “ 23.09% 24.64% 26.23% 25.91% 27.35% 31.49%Return on average assets (ROA) “ “ 2.72% 2.91% 3.18% 3.13% 3.25% 3.60%Return on Capital Employed (ROCE) “ “ 23.09% 24.64% 26.23% 25.91% 27.35% 31.49%Cost to income ratio “ “ 40.05% 36.15% 32.27% 30.54% 26.08% 24.41%Cost to income ratio (excluding pf reversal) “ “ 43.52% 40.01% 36.43% 38.01% 35.55% 40.16% Investment ratios:Earnings per share (after tax)** Rs. 21.24 20.43 19.20 16.68 15.31 15.19 Earnings per share (before tax)** “ “ 31.91 31.27 31.11 25.95 22.88 21.61 Breakup value per share (excl. surplus on rev. of assets)** “ “ 96.13 87.84 77.99 68.37 60.36 51.63 Net assets per share** “ “ 108.94 110.62 96.54 94.71 83.40 69.88 Market Ratios Cash Dividend % 140% 130% 120% 115% 110% 115%Bonus Shares Issued “ “ 10.00% 10.00% 10.00% 10.00% 10.00% 10.00%Dividend Yield ratio (based on cash dividend) “ “ 4.98% 6.20% 8.92% 5.03% 5.01% 9.14%Dividend Payout ratio “ “ 70.61% 62.29% 55.97% 56.32% 53.52% 51.08%Price to book value ratio Times 2.92 2.39 1.73 3.34 3.64 2.44 Price to earning ratio “ “ 13.24 10.27 7.01 13.71 14.35 8.28 Dividend cover ratio “ “ 1.52 1.75 1.94 1.75 1.68 1.60

ANNUAL REPORT 2013
54
2013 2012 2011 2010 2009 2008
Share InformationMarket value per share - Dec 31 Rs. 281.17 209.76 134.60 228.54 219.68 125.81 High - during the year “ “ 323.00 216.75 250.48 233.80 244.00 494.80 Low - during the year “ “ 182.20 133.00 134.00 173.04 75.00 125.81 Market Capitalisation Rs. Mln 284,501 192,950 112,557 173,740 151,822 79,044
Asset Quality and Liquidity ratios:Gross Advances to deposits ratio % 42.41% 48.14% 50.88% 63.55% 73.37% 82.64%Net Advances to deposits ratio “ “ 39.26% 43.96% 46.33% 59.01% 68.89% 79.39%Investments to deposits ratio “ “ 71.01% 73.77% 64.47% 49.39% 45.47% 29.27%Weighted Average Cost of Deposits “ “ 4.00% 4.45% 4.35% 3.96% 3.97% 3.03%CASA to total deposits “ “ 89.78% 85.20% 81.37% 81.44% 82.96% 81.32%NPLs to Gross advances ratio “ “ 8.68% 9.74% 10.67% 8.95% 8.62% 6.70%Coverage Ratio (specific provision/ NPLs) “ “ 83.59% 87.55% 82.02% 77.13% 67.47% 54.17%Earning assets to total assets ratio “ “ 88.16% 86.45% 87.31% 87.15% 87.23% 85.70%Earning assets to interest bearing Liabilities Times 1.58 1.53 1.57 1.62 1.57 1.58 Deposits to shareholder equity “ “ 6.50 6.13 6.22 6.24 6.02 6.32 Assets to Equity “ “ 8.38 8.63 8.28 8.20 8.34 8.49
Risk AdequacyTier I Capital Rs. Mln 95,102 86,341 77,030 67,701 59,896 51,301 Total Eligible Capital “ “ 101,296 93,526 82,014 72,856 64,357 54,235 Risk Weighted Assets (RWA) “ “ 455,189 422,583 376,442 330,135 337,417 329,537 Tier I to RWA % 20.89% 20.43% 20.46% 20.51% 17.75% 15.57%RWA to total assets “ “ 55.82% 55.17% 57.63% 58.17% 66.26% 74.28%Capital Adequacy Ratio “ “ 22.25% 22.13% 21.79% 22.07% 19.07% 16.28%Net Return on Average RWA “ “ 4.90% 5.24% 5.50% 5.06% 4.65% 4.82%
Industry Share***Deposits % 8.40% 8.16% 8.72% 8.42% 8.50% 8.55%Advances “ “ 6.59% 6.80% 7.32% 7.85% 8.24% 8.63%Investments “ “ 11.03% 10.34% 10.66% 10.14% 10.16% 9.85%Total Assets “ “ 8.43% 8.41% 8.76% 8.37% 8.52% 8.51%Classified Advances “ “ 3.98% 4.16% 4.51% 4.41% 5.21% 5.09%Profit Before Tax “ “ 20.14% 18.18% 18.92% 25.78% 30.29% 37.03%Market Capitalisation “ “ 22.96% 23.58% 20.40% 24.10% 22.35% 18.59%Home Remittance “ “ 10.48% 10.52% 9.97% 9.29% 6.44% 5.20%
ConsolidatedTotal Assets Rs. Mln 821,278 771,458 656,874 570,482 511,742 445,286 Shareholders’ Equity “ “ 100,165 91,350 81,392 71,228 63,120 54,121 Net Assets “ “ 115,463 106,475 92,012 81,999 72,313 60,132 Profit before tax “ “ 32,932 32,065 31,322 26,510 23,349 21,887 Profit after tax “ “ 21,950 21,153 19,274 16,873 15,665 15,323 Return on Average Assets % 2.76% 2.94% 3.14% 3.12% 3.27% 3.57%Return on Average Equity “ “ 22.80% 24.14% 25.24% 25.12% 26.72% 30.21%Earnings per share** Rs. 21.62 20.64 20.95 20.18 18.73 18.32 Breakup value per share (excl. surplus on rev. of assets)** “ “ 114.11 99.07 88.63 85.18 75.48 64.72 Capital Adequacy Ratio % 22.18% 22.16% 21.88% 22.04% 19.10% 16.37%
Per BranchGross Advances Rs. Mln 220.37 221.06 213.06 242.18 249.51 257.40 Deposits “ “ 519.58 459.19 418.75 381.07 340.06 311.49 CASA “ “ 466.50 391.25 340.74 310.33 282.10 253.30 PBT “ “ 26.53 27.00 26.84 23.19 21.42 20.63
* This includes final cash dividend & bonus proposed by BOD** Adjusted for prior years to reflect bonus shares issued during the year*** Based on Banking Sector Data issued by SBP
Shares held by sponsors / directors / executives and associated companies is disclosed on Page # 307
Six Years’ Financial Summary 2008-2013

55
Six Years’ Non Financial Summary 2008-2013
2013 2012 2011 2010 2009 2008
No. of accounts Absolute 5,299,439 4,931,631 4,687,993 4,239,487 3,893,531 3,915,009
No. of branches “ 1,217 1,187 1,173 1,132 1,081 1,060
No. of permanent employees “ 10,372 10,612 10,090 9,583 9,397 10,160
ATMs No. of ATMs “ 789 680 676 493 495 370
Total active smart/ debit card issued “ 1,875,258 1,367,858 1,242,271 1,144,403 1,490,887 1,283,430
No. of smart cards/Debit cards issued during the year “ 508,241 469,814 319,390 338,534 259,473 255,468
*Debit cards launched in 2011 “
Credit Cards No. of new issuance “ 7,187 3,261 2,846 2,845 7,152 24,738
No. of customers “ 53,460 68,075 68,515 69,503 69,737 70,835
Total spend (transaction volume) Rs. Mln 4,306 4,005 4,140 4,386 4,836 5,540
Virtual BankingNo. of customers Absolute 88,131 82,462 75,669 66,795 57,024 47,312
No. of transactions “ 1,603,669 998,789 741,818 663,411 458,985 612,359
Volume of transactions Rs. Mln 30,725 14,627 9,333 5,379 7,296 10,818
Mobile Banking
No. of customers Absolute 542,449 292,756 149,057 105,372 53,182 -
No. of transactions - financial “ 906,522 704,008 501,876 437,870 102,021 -
No. of transactions - non-financial “ 2,996,584 2,673,556 2,139,421 1,857,001 1,278,687 -
Volume of transactions Rs. Mln 10,484 8,516 5,647 3,104 525 -
BancassuranceNo. of customers Absolute 14,714 10,769 7,835 5,644 2,507 129
No. of policies “ 15,481 11,001 8,060 5,812 2,614 131
Bancassurance Premium Rs. Mln 2,837 1,888 1,160 683 247 9
Bancassurance Revenue Rs. Mln 723 474 385 275 136 6
Privilege BankingNo. of accounts Absolute 2,833 2,372 1,988 1,430 733 -
No. of customers “ 2,389 1,872 1,494 1,048 579 -
Trade Imports - volume Rs. Mln 420,964 326,120 341,348 280,392 186,418 204,748
Exports - volume “ 208,640 161,776 149,603 121,870 88,321 85,623
Market share of total market trade % 7.03% 7.61% 8.20% 8.03% 6.87% 7.28%
Home RemittanceVolume of home remittance - MCB USD Mln 1,529 1,470 1,242 898 560 365
Volume of home remittance - MCB Rs. Mln 154,656 137,376 106,791 76,485 45,772 25,795
Home Remittance MCB Market Share % 10.48% 10.52% 9.97% 9.29% 6.44% 5.20%

ANNUAL REPORT 2013
56
(Rs. in Billion)
Maturities of Total Assets and Total Liabilities
Concentration of Advances, NPLs, Deposits and Off-Balance Sheet Items
Maturities of Assets (2008-2013)
Upto 3M 3M to 1Y 1Y to 3Y 3Y to 5Y 5Y & above
2013 2012 2011 2010 2009 2008
483
315
251
254
198
146
61
177
203
185
188
184
147
122
95
57
55
67
74
109
71
39
39
26
50
45
35
33
31
22
Maturities of Liabilities (2008-2013)(Rs. in Billion)
153 16
6
140 15
4
133
119
63
92
82
121
223
194
293
240
202
116
49
44
146
125
106
83
17
17
50
42
35
15
19
13
2013 2012 2011 2010 2009 2008
Upto 3M 3M to 1Y 1Y to 3Y 3Y to 5Y 5Y & above
Others Financial Power (electricity), gas, water, sanitary Footwear and leather garments Chemical, Petroleum and pharmaceuticals Individuals Transport, storage and communication
Construction Sugar Textile Services Wholesale and Retail Trade Electronics & Automobiles Cement Agriculture, forestry, hunting and fishing
Deposits (2008-2013)
Agriculture, forestry, hunting and fishing Cement Electronics & Automobiles Wholesale and Retail Trade Services Textile Sugar Construction
Transport, storage and communication Individuals Chemical, Petroleum and pharmaceuticals Footwear and leather garments Power (electricity), gas, water, sanitary Financial Others
Gross Advances (2008-2013)
0%
10%
20%
30%
40%
50%
60%
70%
80%
90%
100%
2013 2012 2011 2010 2009 2008
0%
10%
20%
30%
40%
50%
60%
70%
80%
90%
100%
2013 2012 2011 2009 2009 2008
Others Financial Power (electricity), gas, water, sanitary Footwear and leather garments Chemical, Petroleum and pharmaceuticals Individuals Transport, storage and communication Construction
Sugar Textile Services Wholesale and Retail Trade Electronics & Automobiles Cement Agriculture, forestry, hunting and fishing
Off Balance Sheet Items (2008-2013)
0%
10%
20%
30%
40%
50%
60%
70%
80%
90%
100%
2013 2012 2011 2010 2009 2008
0%
10%
20%
30%
40%
50%
60%
70%
80%
90%
100%
2013 2012 2011 2010 2009 2008
Classified Advances (2008-2013)
Others Financial Power (electricity), gas, water, sanitary Footwear and leather garments Chemical, Petroleum and pharmaceuticals Individuals Transport, storage and communication Construction
Sugar Textile Services Wholesale and Retail Trade Electronics & Automobiles Cement Agriculture, forestry, hunting and fishing
Six Years’ Concentration & Maturities

Advances (Gross)
Agriculture, forestry, hunting and fishing Textile Chemical and pharmaceuticals Cement Sugar
Footwear and leather garments Transport and Electronics Power sector Wholesale and Retail Trade Export/Import
Deposits
Agriculture, forestry, hunting and fishing Textile Chemical and pharmaceuticals Cement Sugar
Footwear and leather garments Transport and Electronics Power sector Wholesale and Retail Trade Export/Import
Classified Advances
Agriculture, forestry, hunting and fishing Textile Chemical and pharmaceuticals Cement Sugar
Footwear and leather garments Transport and Electronics Power sector Wholesale and Retail Trade Export/Import
1.14%
15.33%
13.75%
0.33% 5.79%
1.75%
1.31% 9.78% 8.09%
3.22%
9.79%
0.69%
5.16%
23.86%
8.24%
0.39% 3.34%
0.13% 0.37%
0.06%
0.41% 5.93%
4.86% 0.20%
0.46%
1.63%
55.57%
18.41%
1.09%
17.72%
0.79%
0.56%
1.84%
0.37%
1.72%
0.00%
15.00%
2.36%
2.55% 3.50%
13.70%
38.80%
0.89% 3.62%
11.97%
0.60% 0.56%
0.65%
1.09%
0.62%
0.62%
1.52% 3.45%
53.97%
0.02%
20.41%
Off balance sheet items
Agriculture, forestry, hunting and fishing Textile Chemical and pharmaceuticals Cement Sugar
Footwear and leather garments Transport and Electronics Power sector Wholesale and Retail Trade Export/Import
57
Concentration of Advances, NPLs, Deposits & Off-Balance Sheet Items
Advances (Gross) Classified Advances Deposits Off balance sheet items
Segments by class of business PKR Mln Mix Var. % PKR Mln Mix Var. % PKR Mln Mix Var. % PKR Mln Mix Var. %
Agriculture, forestry, hunting and fishing 3,057 1% 2% 255 1% -18% 52,085 8% 10% 2,366 1% -29%
Textile 41,120 15% 9% 4,122 18% -21% 2,436 0% -14% 9,612 4% -1%
Chemical, petroleum and pharmaceuticals 36,888 14% 173% 183 1% -7% 21,103 3% 640% 31,781 12% 265%
Cement 894 0% -33% 131 1% -56% 830 0% 52% 1,596 1% 97%
Sugar 15,537 6% 37% 428 2% -59% 2,314 0% 86% 1,474 1% 31%
Footwear and leather garments 4,683 2% 40% 86 0% -18% 386 0% 109% 1,718 1% 42%
Transport and Electronics 3,522 1% 20% 401 2% -21% 2,598 0% -16% 2,898 1% 44%
Power sector 26,224 10% -12% - 0% -100% 37,510 6% 258% 1,651 1% -70%
Wholesale and Retail Trade 21,689 8% 34% 3,490 15% -14% 30,726 5% -3% 1,640 1% -2%
Export/Import 8,644 3% 98% 548 2% - 1,284 0% 11% 4,035 2% 16%
Transport, storage and communication 26,260 10% -56% 593 3% -8% 2,914 0% -2% 9,164 3% 6%
Financial Institutions 1,842 1% -30% 815 4% -26% 10,307 2% 37% 143,263 54% 227%
Individuals 13,851 5% -5% 3,188 14% -6% 351,397 56% 15% 43 0% 57%
Others 63,980 24% 4% 9,027 39% 6% 116,440 18% -9% 54,186 20% 1%
Total 268,192 100% 2% 23,268 100% -9% 632,330 100% 16% 265,428 100% 85%

ANNUAL REPORT 2013
58
9.47% 9.36% 9.43% 9.54% 9.58% 9.60% 9.08% 9.12% 9.27% 9.55% 9.78% 10.14%
10.00% 9.50% 9.50% 9.50% 9.50% 9.00% 9.00% 9.00% 9.50% 9.50% 10.00% 10.00%
Jan-13 Feb-13 Mar-13 Apr-13 May-13 Jun-13 Jul-13 Aug-13 Sep-13 Oct-13 Nov-13 Dec-13
KIBOR - 6 Month Discount Rate
Total Upto 3M 3M to 1Y 1Y to 3Y 3Y to 5Y 5Y & above
Assets Cash and balances with treasury banks 59,946 59,946 - - - - Balances with other banks 1,537 1,537 - - - - Lendings to financial institutions 1,225 1,225 - - - - Investments - net 449,006 314,337 24,984 66,071 26,770 16,844 Advances - net 248,243 89,421 30,652 77,513 36,780 13,877 Operating fixed assets 28,595 450 1,351 3,603 3,603 19,587 Deferred tax assets 353 20 81 251 - - Other assets - net 26,956 15,872 4,386 - 6,699 -
815,861 482,809 61,454 147,439 73,852 50,308
LiabilitiesBills payable 10,139 10,139 - - - - Borrowings 38,543 29,318 6,866 2,359 - - Deposits and other accounts 632,330 104,600 49,699 286,585 143,637 47,809 Deferred tax liabilities 4,554 50 123 714 2,285 1,382 Other liabilities 20,064 8,950 6,733 3,348 272 761
705,630 153,057 63,421 293,006 146,194 49,952
*Maturities of deposits are based on working prepared by the Assets and Liabilities Committee of the Bank.
Key Interest Bearing Assets and Liabilities 2013 2012
Avg. Vol Effective Interest Avg. Vol Effective Interest (Mln) Interest Rate % (Mln) (Mln) Interest Rate % (Mln)
Interest Earning AssetsLendings to Financial Institutions 8,592 8.68 746 2,777 10.1 280
Gross Advances (excluding NPLs) 229,192 10.90 24,990 227,210 12.7 28,811
Gross Investments (excluding equity investments) 396,573 9.89 39,233 335,753 11.6 39,034
Interest Bearing LiabilitiesDeposits (excluding current deposits) 376,239 6.26 23,561 341,105 6.8 23,043
Borrowings 33,656 8.36 2,813 39,353 9.6 3,782
Spread
Maturities of Assets & Liabilities
Discount Rate & KIBOR - 6 months
(Rs. in Millions)

59
Graphical Presentation of Financial Statements

ANNUAL REPORT 2013
60
Statement of Value Added
2013 2012
PKR Mln % PKR Mln %
Value AddedNet interest income 37,868 40,856Non interest income 11,171 9,153Operating expenses excluding staff costs,depreciation, amortization and WWF (8,582) (8,751)Provision against advances, investments & others 2,888 (291)
Value added available for distribution 43,345 40,968
Distribution of value added:
To employeesRemuneration, provident fund and other benefits 10,286 23.73% 8,948 21.84%Pension fund reversal (1,701) -3.93% (1,933) -4.72%
8,584 19.80% 7,015 17.12% To government Worker welfare fund 646 1.49% 641 1.56%Income tax 10,793 24.90% 10,969 26.77%
11,439 26.39% 11,610 28.34%
To providers of capitalCash dividends to shareholders 14,166 32.68% 11,959 29.19%Bonus shares 1,012 2.33% 920 2.25%
15,178 35.02% 12,878 31.44%
To SocietyDonations 25 0.06% 31 0.08% To expansion and growthDepreciation 1,541 3.56% 1,379 3.37%Amortization 260 0.60% 260 0.63%Retained earnings 6,318 14.58% 7,795 19.03%
8,120 18.73% 9,433 23.03%
43,345 100% 40,968 100%

61
2013 2012 2011 2010 2009 2008
Cash flows from operating activities 69,725 96,701 124,460 58,701 78,148 2,032
Cash flows from investing activities (54,177) (82,369) (105,805) (48,123) (70,369) 8,234
Cash flows from financing activities (12,673) (11,815) (9,785) (8,568) (6,736) (10,313)
Cash and cash equivalents at beginning of the year 57,783 55,293 46,886 44,785 43,674 43,491
Cash and cash equivalents at end of the year 60,857 57,783 55,293 46,886 44,785 43,674
Summary of Cashflows
Commentary on Cash Flow Statement:Operating ActivitiesFrom an operational perspective, the cash flow activities present a different layout for the respective year. Net cash outflow from operating activities in 2013 is Rs.69.7 billion growing from Rs. 2.0 billion in 2008. Operational cashflow of 2011 depicts an inflow of Rs. 124.4 billion, primarily on account of recoveries recorded in advances and significant build-up of Rs. 59.8 billion in deposits. Inflows observed in operating activities were observed mainly due to increase in deposit base of the bank during past 6 years as advances have shown steady growth over 6 years.
Investing ActivitiesTotal cash outflow from investing activities was at the highest level in 2011 amounting to Rs. 106 billion. Cash outflow in investing activities can be observed over years primarily on account of increased concentration levels of investment base.
Financing ActivitiesCash outflow from financing activities was primarily by way of dividends to shareholders over the years. MCB has the history of paying higher return to its shareholders. Approximately Rs. 60 billion has been paid to shareholders over 6 years span.
69.7
96.7
124.5
58.7
78.1
2.0
(54.2)
(82.4)
(105.8)
(48.1)
(70.4)
8.2
(12.7) (11.8) (9.8) (8.6) (6.7) (10.3)
(115.0)
(85.0)
(55.0)
(25.0)
5.0
35.0
65.0
95.0
125.0
2013 2012 2011 2010 2009 2008
Operating Activities Investing Activities Financing Activities
(Rs. in Millions)
(Rs.
in B
illion
s)
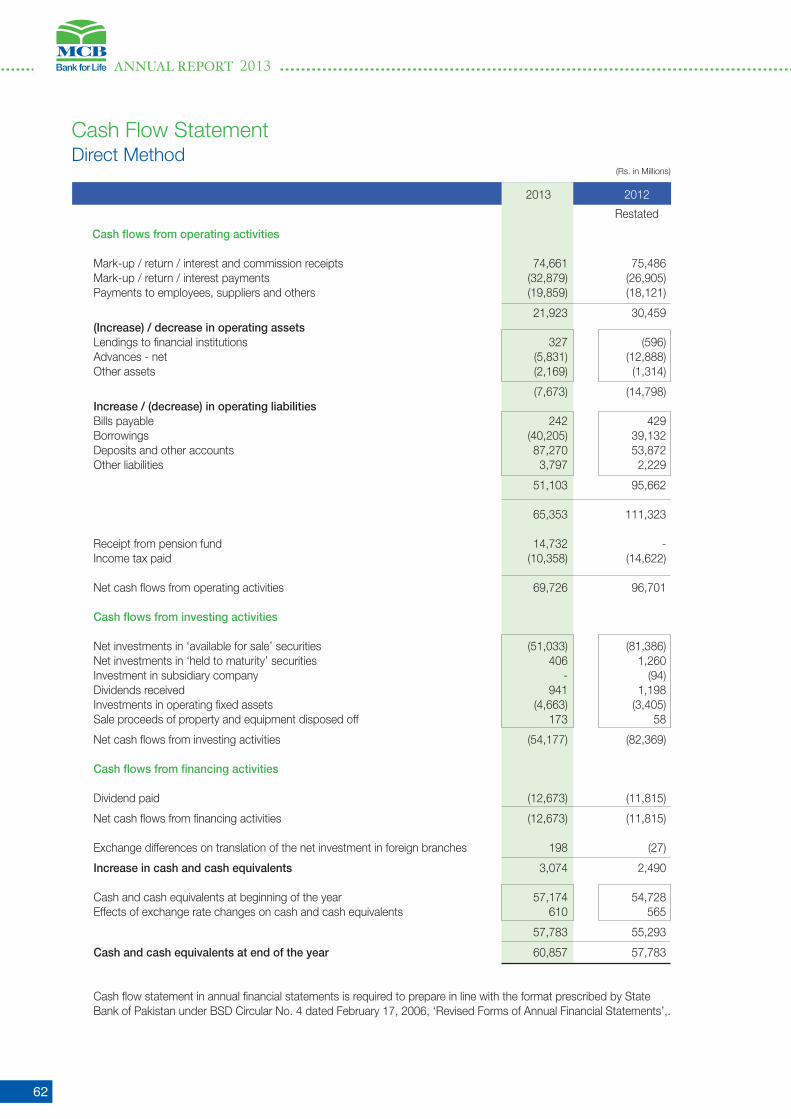
ANNUAL REPORT 2013
62
Cash Flow Statement
(Rs. in Millions)
Direct Method
2013 2012
Restated
Cash flows from operating activities
Mark-up / return / interest and commission receipts 74,661 75,486 Mark-up / return / interest payments (32,879) (26,905)Payments to employees, suppliers and others (19,859) (18,121)
21,923 30,459 (Increase) / decrease in operating assets Lendings to financial institutions 327 (596)Advances - net (5,831) (12,888)Other assets (2,169) (1,314)
(7,673) (14,798)Increase / (decrease) in operating liabilities Bills payable 242 429 Borrowings (40,205) 39,132 Deposits and other accounts 87,270 53,872 Other liabilities 3,797 2,229
51,103 95,662 65,353 111,323 Receipt from pension fund 14,732 - Income tax paid (10,358) (14,622) Net cash flows from operating activities 69,726 96,701 Cash flows from investing activities Net investments in ‘available for sale’ securities (51,033) (81,386)Net investments in ‘held to maturity’ securities 406 1,260 Investment in subsidiary company - (94)Dividends received 941 1,198 Investments in operating fixed assets (4,663) (3,405)Sale proceeds of property and equipment disposed off 173 58
Net cash flows from investing activities (54,177) (82,369) Cash flows from financing activities Dividend paid (12,673) (11,815)
Net cash flows from financing activities (12,673) (11,815) Exchange differences on translation of the net investment in foreign branches 198 (27)
Increase in cash and cash equivalents 3,074 2,490 Cash and cash equivalents at beginning of the year 57,174 54,728 Effects of exchange rate changes on cash and cash equivalents 610 565
57,783 55,293
Cash and cash equivalents at end of the year 60,857 57,783
Cash flow statement in annual financial statements is required to prepare in line with the format prescribed by State Bank of Pakistan under BSD Circular No. 4 dated February 17, 2006, ‘Revised Forms of Annual Financial Statements’,.

63
89.78%
85.20%
81.37% 81.44%82.96%
81.32%
2013 2012 2011 2010 2009 2008
CASA to Total Deposit (2008-2013)%
Weighted Average Cost of Deposits (2008-2013)%
4.00%4.45% 4.35%
3.96% .3.97%
3.03%
2013 2012 2011 2010 2009 2008
5.40%
5.60%
5.80%
6.00%
6.20%
6.40%
6.60%
6.80%
6.00%
6.50%
7.00%
7.50%
8.00%
8.50%
9.00%
9.50%
10.00%
W1
W2
W3
W4
W5
W6
W7
W8
W9
W10
W11
W12
W13
W14
W15
W16
W17
W18
W19
W20
W21
W22
W23
W24
W25
W26
W27
W28
W29
W30
W31
W32
W33
W34
W35
W36
W37
W38
W39
W40
W41
W42
W43
W44
W45
W46
W47
W48
W49
W50
W51
W52
MCB's Industry share in Deposits and Advances - 2013
210
215
220
225
230
235
240
245
250
255
260
470
490
510
530
550
570
590
610
630
650
W1
W2
W3
W4
W5
W6
W7
W8
W9
W10
W11
W12
W13
W14
W15
W16
W17
W18
W19
W20
W21
W22
W23
W24
W25
W26
W27
W28
W29
W30
W31
W32
W33
W34
W35
W36
W37
W38
W39
W40
W41
W42
W43
W44
W45
W46
W47
W48
W49
W50
W51
W52
Weekly Trend of MCB Deposits and Advances - 2013
(Dep
osits
in b
illion
)
(Adv
ance
s in
billi
on)
Weekly Deposits Weekly Advances
Weekly Deposits Weekly Advances
Deposits & Advances
Groupwise Deposits Groupwise Advances
2013 2012 Variance 2013 2012 Variance
Amount % Amount %
Commercial 576 508 68 13% 70 59 11 19%
Corporate 31 15 15 99% 155 162 -7 -4%
Consumer 6 6 1 15% 11 12 -1 -11%
Islamic 11 10 2 16% 11 10 1 13%
Others 8 6 2 26% 21 19 2 9%
Total 632 545 87 16% 268 262 6 2%
(Rs. in Billion)

ANNUAL REPORT 2013
64
23.3 25.6
26.7 24.5
23.2
18.3
-9.0% -4.1%
8.6% 5.6%
27.2%
2013 2012 2011 2010 2009 2008
NPLs Variance
NPLs and Variance (2008-2013)
Infection and Coverage Ratios (2008-2013)
8.7%9.7%
10.7%
9.0% 8.6%
6.7%
83.6%87.6%
82.0%77.1%
67.5%
54.2%
2013 2012 2011 2010 2009 2008
Infection ratio Coverage ratio
2013 2012 Variance 2013
NPLs Provision NPLs Provision NPLs Provision Coverage
Categorywise
Substandard 255 56 286 36 -11% 56% 22%
Doubtful 1,453 406 850 424 71% -4% 28%
Loss 21,560 18,988 24,426 21,920 -11.7% -13% 88%
Total 23,268 19,450 25,562 22,380 -9% -13% 84%
Groupwise
Commercial Banking 3,704 3,569 5,098 4,896 -27% -27% 96%
Consumer Banking 2,326 2,263 2,883 2,759 -19% -18% 97%
Corporate Banking 3,952 2,925 5,388 4,963 -27% -41% 74%
SAMG 8,252 8,193 7,590 7,554 9% 8% 99%
Islamic 8 2 2 0 410% 1545% 25%
Overseas 5,026 2,498 4,601 2,208 9% 13% 50%
Total 23,268 19,450 25,562 22,380 -9% -13% 84%
Non-Performing Loans(Rs. in Millions)

65
INVESTMENTS
Top 10 Listed Equity Holdings as on December 31, 2013
Company Name Total Shares / units (number)
Book Value (Rs. Mln)
Market Value (Rs. Mln)
Sui Northern Gas Pipelines Limited 55,126,789 2,205.25 1,174.20
Fauji Fertilizer Company Limited 10,032,000 738.91 1,123.18
Allied Bank Limited 8,830,421 547.66 794.74
Pakistan Oilfields Limited 1,190,045 509.43 592.30
United Bank Limited 4,544,340 445.09 602.35
Pakistan Petroleum Limited 2,135,918 432.01 457.00
Attock Petroleum 990,426 387.52 494.91
National Bank of Pakistan 7,385,000 378.33 428.77
Bank Al-Habib 12,851,435 355.24 533.98
Kot Addu Power Company 5,955,500 349.78 367.75
Investment in Associates and Subsidiaries
Company Name Holding Total Shares (numbers)
Book Value (Rs. Mln)
AssociatesAdamjee Insurance Company Limited 29.13% 101,950,924 943.60
First Women Bank Limited 15.46% 23,095,324 63.30
Euronet Pakistan (Pvt.) Limited 30.00% 52,521 52.52
SubsidiariesMCB - Arif Habib Savings & Investments Limited 51.33% 36,956,768 320.12
MNET Services Limited 99.95% 4,997,500 49.98
MCB Financial Services Limited 99.999% 2,750,000 27.50
MCB Trade Services Limited 100.00% 10,000 0.08
MCB Leasing Closed Joint Company Limited 95.00% 1,585,400 178.83
431
376
295
196
151
77
9 10 11 11 10 15 8 11 12 7 8 10
-
50
100
150
200
250
300
350
400
450
500
2013 2012 2011 2010 2009 2008
T-Bills and PIBs Debt Securities Equity Securities
Category of Investments (2008-2013)(Rs. in Billion)
71.0%73.8%
64.5%
49.4%45.5%
29.3%
0.0%
10.0%
20.0%
30.0%
40.0%
50.0%
60.0%
70.0%
80.0%
2013 2012 2011 2010 2009 2008
Investments to Deposits Ratio
55.1%52.5%
48.5%
37.5%32.8%
21.8%
0.0%
10.0%
20.0%
30.0%
40.0%
50.0%
60.0%
2013 2012 2011 2010 2009 2008
Investments to Total Assets Ratio

ANNUAL REPORT 2013
66
Markup and Non Markup Income
2013 2012 2011 2010 2009 2008
Markup Income
Loans and advances 24,990 29,002 33,985 32,816 36,413 30,260
Investments 39,233 39,034 33,120 20,320 13,894 8,690
Deposits with financial institutions 95 40 12 16 133 110
Securities purchased under resale agreements 732 257 958 1,564 838 582
Money at call 14 23 72 105 336 402
65,064 68,356 68,146 54,821 51,615 40,044
Markup Expense
Deposits 23,561 23,043 20,083 15,806 13,867 9,427
Securities under repurchase agreements 1,706 2,628 1,575 623 723 945
Other short-term borrowings 1,108 1,154 1,211 902 775 520
Discount, Commission and brokerage 534 512 662 554 449 443
Others 288 164 89 103 24 226
27,196 27,500 23,620 17,988 15,837 11,560
Net Markup Income 37,868 40,856 44,526 36,833 35,777 28,484
2013 2012 2011 2010 2009 2008
Non Markup Income
Fee, Commission & Brokerage Income 6,741 5,934 4,921 4,130 3,332 2,953
Dividend Income 933 1,198 1,003 544 460 618
Income from dealing in foreign currency 917 823 921 632 341 728
Gain on sale of securities 2,130 825 736 412 774 637
Other Income 450 374 531 548 736 856
11,171 9,153 8,112 6,266 5,643 5,792
38.4
%
42.4
% 49.9
%
48.6
% 59.9
%
37.1
%
26.9
%
75.6
%
21.7
%
70.5
%
60.3
%
57.1
%
2013 2012 2011 2010 2009 2008
Markup Income from Advances and Investments(2008 - 2013)
Income on Advances to Markup Income
Income on Investments to Markup Income
2013 2012 2011 2010 2009 2008
Income Composition(2008 - 2013)
Net Markup Income to Gross Markup
Non-Markup Income to Net Revenue
58.2
%
59.8
%
65.3
%
15.4
%
67.2
%
14.5
%
13.6
%
71.1
%
16.9
%
69.3
%
22.8
%
18.3
%
(Rs. in Millions)

67
2013 2012 2011 2010 2009 2008
Personnel expenses
Salaries and allowances 9,698 8,434 8,307 7,218 6,471 6,696
Contributions to defined contribution plan - provident fund 198 188 177 159 149 135
Post retirement medical benefits 188 187 170 136 130 99
Employees’ contributory benevolent scheme 55 40 51 71 65 48
Employees’ compensated absences 147 98 181 191 151 (76)
10,286 8,948 8,886 7,775 6,966 6,903
Others Administrative expenses
Rent, taxes, insurance, electricity 2,555 1,965 1,695 1,569 1,356 1,040
Legal and professional charges 272 177 187 222 240 202
Communications 862 932 936 842 995 844
Repairs and maintenance 1,103 1,208 949 681 534 506
Stationery and printing 503 402 385 363 330 327
Advertisement and publicity 119 393 427 232 215 197
Auditors’ remuneration 32 21 25 15 15 16
Depreciation 1,541 1,379 1,115 1,012 909 815
Amortization of intangible asset 260 260 250 160 153 142
Travelling, conveyance and fuel 214 745 728 684 589 619
Entertainment 118 110 102 69 74 100
Training Expenses 41 30 46 58 47 96
Petty Capital items 33 35 56 64 49 103
Credit Card Related Expenses 238 147 129 129 58 64
Non-executive directors’ fees 32 33 36 32 10 4
Cash transportation charges 482 461 450 403 516 399
Instrument clearing charges 125 187 198 166 137 113
Subscription 20 18 28 26 14 24
Donations 25 31 84 15 25 -
Others 1,551 1,926 1,063 877 799 431
Total other administrative expenses 10,126 10,462 8,888 7,619 7,069 6,043
Administrative expenses - without PF reversal 20,411 19,410 17,774 15,394 14,035 12,946
Pension fund reversal (1,701) (1,933) (2,189) (3,220) (3,923) (5,399)
Total Administrative expenses 18,710 17,477 15,585 12,174 10,111 7,547
Administrative Expenses
43.5% 40.0%
36.4% 38.0% 35.6%
40.2%
2013 2012 2011 2010 2009 2008
Cost to Income Ratio (excluding pension fund reversal)
2013 2012 2011 2010 2009 2008
Cost to Income Ratio
40.0%
36.1%
32.3% 30.5%
26.1% 24.4%
(Rs. in Millions)

ANNUAL REPORT 2013
68
Six Years’ Vertical AnalysisStatement of Financial Position / Profit & Loss
2013 2012 2011 2010 2009 2008
Rs. Mln % Rs. Mln % Rs. Mln % Rs. Mln % Rs. Mln % Rs. Mln %
Statement of Financial Position
Assets
Cash and balances with treasury banks 59,946 7% 57,420 8% 53,123 8% 45,407 8% 38,775 8% 39,631 9%
Balances with other banks 1,537 0.2% 1,192 0.2% 2,281 0.4% 1,479 0.3% 6,010 1% 4,043 1%
Lendings to financial institutions 1,225 0.2% 1,551 0.2% 955 0.2% 4,402 1% 3,000 1% 4,100 1%
Investments 449,006 55% 402,069 52% 316,652 48% 213,061 38% 167,134 33% 96,632 22%
Advances 248,243 30% 239,583 31% 227,580 35% 254,552 45% 253,249 50% 262,135 59%
Operating fixed assets 28,595 4% 23,738 3% 22,008 3% 20,948 4% 18,015 4% 17,264 4%
Other assets 26,956 3% 41,520 5% 31,184 5% 27,706 5% 23,040 5% 19,810 4%
815,508 100% 767,075 100% 653,782 100% 567,553 100% 509,224 100% 443,616 100%
Liabilities
Bills payable 10,139 1% 9,896 1% 9,467 1% 10,266 2% 8,201 2% 10,551 2%
Borrowings 38,543 5% 78,951 10% 39,101 6% 25,685 5% 44,662 9% 22,664 5%
Deposits 632,330 78% 545,061 71% 491,189 75% 431,372 76% 367,605 72% 330,182 74%
Deferred tax liabilities 4,201 1% 9,530 1% 6,488 1% 4,934 1% 3,197 1% 437 0.1%
Other liabilities 20,064 2% 21,166 3% 18,378 3% 16,092 3% 15,819 3% 21,346 5%
705,277 87% 664,604 86% 564,622 86% 488,349 86% 439,484 86% 385,180 87%
Net Assets 110,231 14% 102,471 13% 89,160 14% 79,204 14% 69,740 14% 58,436 13%
Represented by
Share capital 10,118 1% 9,199 1% 8,362 1% 7,602 1% 6,911 1% 6,283 1%
Reserves 46,601 6% 44,253 6% 42,186 6% 40,163 7% 38,386 8% 36,769 8%
Unappropriated profit 40,552 5% 35,425 4% 28,724 5% 21,416 4% 15,779 3% 9,193 2%
Surplus on revaluation of assets - net of tax 12,959 2% 13,594 2% 9,887 2% 10,024 2% 8,664 2% 6,191 1%
110,231 14% 102,471 13% 89,160 14% 79,204 14% 69,740 14% 58,436 13%
Profit & Loss Account
Mark-up earned 65,064 85% 68,356 88% 68,147 89% 54,821 90% 51,616 90% 40,044 87%
Mark-up expensed (27,196) -36% (27,500) -35% (23,620) -31% (17,988) -29% (15,837) -28% (11,561) -25%
Net mark-up income 37,868 50% 40,856 53% 44,526 58% 36,834 60% 35,779 62% 28,483 62%
Provisions & write off 2,888 4% (291) -0% (4,168) -5% (3,685) -6% (7,465) -13% (4,042) -9%
Net mark-up income after provisions 40,756 53% 40,565 52% 40,358 53% 33,148 54% 28,314 49% 24,441 53%
Non-mark-up income 11,171 15% 9,153 12% 8,112 11% 6,265 10% 5,643 10% 5,791 13%
Non-mark-up expenses (19,639) -26% (18,077) -23% (16,987) -22% (13,160) -22% (10,801) -19% (8,365) -18%
Profit before taxation 32,288 42% 31,642 41% 31,483 41% 26,253 43% 23,155 40% 21,868 48%
Taxation (10,793) -14% (10,969) -14% (12,058) -16% (9,380) -15% (7,660) -13% (6,493) -14%
Profit after taxation 21,495 28% 20,673 27% 19,425 25% 16,873 28% 15,495 27% 15,375 34%

69
2013 13 Vs 12 2012 12 Vs 11 2011 11 Vs 10 2010 10 Vs 09 2009 09 Vs 08 2008 08 Vs 07
Rs. Mln % Rs. Mln % Rs. Mln % Rs. Mln % Rs. Mln % Rs. Mln %
Statement of Financial Position
Assets
Cash and balances with treasury banks 59,946 4% 57,420 8% 53,123 17% 45,407 17% 38,775 -2% 39,631 -0.1%
Balances with other banks 1,537 29% 1,192 -48% 2,281 54% 1,479 -75% 6,010 49% 4,043 6%
Lendings to financial institutions 1,225 -21% 1,551 62% 955 -78% 4,402 47% 3,000 -27% 4,100 290%
Investments 449,006 12% 402,069 27% 316,652 49% 213,061 27% 167,134 73% 96,632 -15%
Advances 248,243 4% 239,583 5% 227,580 -11% 254,552 1% 253,249 -3% 262,135 20%
Operating fixed assets 28,595 20% 23,738 8% 22,008 5% 20,948 16% 18,015 4% 17,264 8%
Other assets 26,956 -35% 41,520 33% 31,184 13% 27,706 20% 23,040 16% 19,810 11%
815,508 6% 767,075 17% 653,782 15% 567,553 11% 509,224 15% 443,616 8%
Liabilities
Bills payable 10,139 2% 9,896 5% 9,467 -8% 10,266 25% 8,201 -22% 10,551 1%
Borrowings 38,543 -51% 78,951 102% 39,101 52% 25,685 -42% 44,662 97% 22,664 -42%
Deposits 632,330 16% 545,061 11% 491,189 14% 431,372 17% 367,605 11% 330,182 13%
Deferred tax liabilities 4,201 -56% 9,530 47% 6,488 31% 4,934 54% 3,197 631% 437 -63%
Other liabilities 20,064 -5% 21,166 15% 18,378 14% 16,092 2% 15,819 -26% 21,346 82%
705,277 6% 664,604 18% 564,622 16% 488,349 11% 439,484 14% 385,180 8%
Net Assets 110,231 8% 102,471 15% 89,160 13% 79,204 14% 69,740 19% 58,436 6%
Represented by
Share capital 10,118 10% 9,199 10% 8,362 10% 7,602 10% 6,911 10% 6,283 0%
Reserves 46,601 5% 44,253 5% 42,186 5% 40,163 5% 38,386 4% 36,769 8%
Unappropriated profit 40,552 14% 35,425 23% 28,724 34% 21,416 36% 15,779 72% 9,193 79%
Surplus on revaluation of assets - net of tax 12,959 -5% 13,594 37% 9,887 -1% 10,024 16% 8,664 40% 6,191 -36%
110,231 8% 102,471 15% 89,160 13% 79,204 14% 69,740 19% 58,436 6%
Profit & Loss Account
Mark-up earned 65,064 -5% 68,356 0% 68,147 24% 54,821 6% 51,616 29% 40,044 26%
Mark-up expensed (27,196) -1% (27,500) 16% (23,620) 31% (17,988) 14% (15,837) 37% (11,561) 47%
Net mark-up income 37,868 -7% 40,856 -8% 44,526 21% 36,834 3% 35,779 26% 28,483 19%
Provisions & write off 2,888 -1093% (291) -93% (4,168) 13% (3,685) -51% (7,465) 85% (4,042) 32%
Net mark-up income after provisions 40,756 0% 40,565 1% 40,358 22% 33,149 17% 28,314 16% 24,441 17%
Non-mark-up income 11,171 22% 9,153 13% 8,112 29% 6,265 11% 5,643 -3% 5,791 -10%
Non-mark-up expenses (19,639) 9% (18,077) 6% (16,987) 29% (13,160) 22% (10,801) 29% (8,365) 39%
Profit before taxation 32,288 2% 31,642 1% 31,483 20% 26,254 13% 23,155 6% 21,868 3%
Taxation (10,793) -2% (10,969) -9% (12,058) 29% (9,380) 22% (7,660) 18% (6,493) 7%
Profit after taxation 21,495 4% 20,673 6% 19,425 15% 16,873 9% 15,495 1% 15,375 1%
Six Years’ Horizontal AnalysisStatement of Financial Position / Profit & Loss

ANNUAL REPORT 2013
70
Commentary on Horizontal and Vertical Analysis:
Horizontal Analysis
Asset base of the bank has increased considerably over the past 6 years; highest increase was observed in 2012 where
assets have increased by 17%, mainly contributed by investments in terms of volume. On an annualized basis, the asset base
has recorded an increase of 13% over the last six years with major contributions coming from investments. Highest increase
in investments was posted in 2009 summing up to 73%, followed by 49% increase reported for 2011.
The deposit base of the Bank has increased considerably over the years growing from Rs. 330 billion in 2008 to Rs. 632
billion in 2013 translating into an annual growth of 14% over past 6 years. Equity of the bank has also posted healthy increase
due to higher profitability in past 6 years, translating into 14% average growth over 6 year period.
Moving on to Profit and Loss side, gross markup earned has posted an average increase of 10% over a span of six years.
Corresponding to the shift in asset mix, contribution from income on investments has increased over years. The increase
in markup expense on deposits is on account of regulatory revisions enacted by the Central Bank and increased deposit
base. In 2008, minimum deposit rate (MDR) was set at 5% by the Central Bank. In 2012, the MDR was revised to 6% on all
local currency saving and fixed deposit products. In 2013, two regulatory revisions were enacted; computation of interest on
average balance basis and pegging of MDR with the floor rate of the repo corridor.
Non Markup income have shown steady growth of 14% average over 6 years while PBT and PAT have shown 8% and 7%
average growth in past 6 years. Non markup expense has shown 19% average growth over past 6 years which is in-line with
the operational growth and inflationary surge over the past few years. Provision against advances and investments has been
on the decreasing trend with reversal to the tune of Rs. 2.8 billion recorded for 2013.
Vertical Analysis
Vertical analysis highlight over the last six years signifies higher concentration levels of investments and advances in the asset
base of the Bank. The advances base of the Bank has posted moderate growth over the last few years due to the lack of
credit opportunities and intense competition impacting earning potential. Resultantly, the significant increase in deposit base
has been invested in T-Bills and PIBs over years with a substantial increase in the concentration levels from 22% in 2008 to
55% in 2013.
Corresponding to the infrastructural and operational growth registered by the Bank, the deposit base has increased
considerably over the period of six years. Improved quality service levels and tailored products has earned the loyalty of our
customers. The fact can be substantiated with the fact that the CASA base of the bank has been above 80% over the last
many years.
Markup income growth has been steady over the last 6 years. On an average, the contribution from markup income
approximates 88% of the total revenue. Markup expense has increased over the last 6 years, based on regulatory revisions
enacted over the period and growth registered in the deposit base. Non markup income has a steady concentration of almost
12% of gross revenue.

71
Calendar of Major Events
Incorporation 1947Nationalisation 1974Investment in First Women Bank 1989Privatisation 1991Incorporation of MCB Finanical Services Limited 1992Incorporation of MNET Services (Private) Limited 2001Investment in Adamjee Insurance Company Limited 2004Incorporation of MCB Trade Services Limited 2005Incorporation of MCB Asset Management Company Limited 2005Change of name from Muslim Commercial Bank Limited 2005Issuance and Listing of Global Depository Receipts on London Stock Exchange 2006Strategic acquisition by Maybank 2008Incorporation of MCB Leasing Closed Joint Stock Company 2009Investment in Euronet Pakistan (Private) Limited 2011Amalgamation of MCB Asset Management Company with Arif Habib Investment Limited 2011
Financial Calendar2013
1st Quarter Results issued on April 29, 20132nd Quarter Results issued on August 16, 20133rd Quarter Results issued on October 24, 2013Annual Results issued on February 11, 201466th Annual General Meeting March 27, 2014
20121st Quarter Results issued on April 24, 20122nd Quarter Results issued on August 7, 20123rd Quarter Results issued on October 17, 2012Annual Results issued on February 7, 201365th Annual General Meeting March 26, 2013
20111st Quarter Results issued on April 26, 20112nd Quarter Results issued on July 26, 20113rd Quarter Results issued on October 25, 2011Annual Results issued on February 21, 201264th Annual General Meeting March 27, 2012
20101st Quarter Results issued on April 21, 20102nd Quarter Results issued on August 05, 20103rd Quarter Results issued on October 26, 2010Annual Results issued on February 10, 201163rd Annual General Meeting March 31, 2011
20091st Quarter Results issued on April 23, 20092nd Quarter Results issued on August 08, 20093rd Quarter Results issued on October 23, 2009Annual Results issued on February 25, 201062nd Annual General Meeting March 26, 2010
20081st Quarter Results issued on April 25, 20082nd Quarter Results issued on August 22, 20083rd Quarter Results issued on October 24, 2008 Annual Results issued on February 16, 200961st Annual General Meeting March 27, 2009
MCB Calendar

ANNUAL REPORT 2013
72
Quarterly Variance Analysis - 2013
Statement of Financial Position
The statement of financial positions analysis highlights that MCB has been gradually increasing the asset base over the financial year 2013 with robust increase posted in the fourth quarter. The last quarter recorded a growth of Rs. 69 billion which was primarily contributed by investments to the tune of Rs. 44 billion with advances contributing Rs. 24 billion to the said increase.
During the 2nd quarter of 2013, the bank crossed the land mark deposit base of Rs. 600 billion. During the financial year 2013, the Bank continued with its strategy of shifting its base to low cost current and saving accounts, each growing by 13% and 28% respectively over December 31, 2012 and taking the total CASA base to an all-time high of 90%. Strategic decrease in term deposit base can be marked over the quarterly intervals converging with the declining interest rate scenario. The overall decrease in term deposit sums upto 20% for the year 2013 when compared with December 2012. The Bank reported constant improvement in its CASA base in each quarter, ensuring that the negative impact of interest rate volatility is minimized. An extravagant growth in CASA base was observed in 2nd quarter and 4th quarter with Rs. 46 billion and 45 billion added respectively for the said quarters.
Equity of the bank has also increased averaging out Rs. 2 billion in each quarter.
Profit & Loss AccountIn terms of profitability, the Bank reported highest quarterly profit before tax in excess of Rs. 9 billion for the 2nd quarter of 2013 in its history.
The substantial reversal in provision charge is reflective of the prudent and aggressive provision strategy adopted and rigorous efforts put in by the recovery units. In all quarters substantial recovery efforts were put in place and massive recovery of approximately 2.8B has been made out of which 830 million was made in Q1.
On markup Income side, the volatility in interest rate environment had its effect on quarterly earnings with MCB earning the highest markup income in 1st quarter of 2013 as compared to subsequent quarters. Interest income
on advances was Rs. 6.8 billion in the first quarter with a decreasing trend observed in the 2nd and 3rd quarters with increase recorded in the last quarter.
On the interest expense on deposit side, the year saw some regulatory revisions in terms of revision in interest calculation formula and pegging of minimum deposit rate (MDR) with the floor of SBP repo corridor. These revisions resulted in compression in net interest margins earned by the Banks which was off-set by strategic decrease of high cost deposits. Corresponding to the revisions in the monetary policy rate, the MDR has been revised to 6.5% for the months of October and November, 2013 and to 7% for the month of December 2013.
Non Markup Income was the highest in 2nd quarter due to capital gain on sale of shares of Uniliver holding. The Bank was able to increase its fee, commission and brokerage block by 14% with major contributions coming commission income earned on bancassurance, home remittances and card related business.
The administrative expense base of the Bank depicted a controlled increase despite the surge in inflationary pressures recorded in the later part of the financial year. The increase in administrative expenses block reported in the last quarter of 2013 is primarily on account of the Voluntary Separation Scheme offered to the clerical/non-clerical staff. The cumulative charge on account of VSS sums to Rs. 1.058 billion other than charge recorded in respective employee retirement benefits.
215
210
222
200
353
312 313
289
90%89%
88%
86%
80%
82%
84%
86%
88%
90%
92%
150
200
250
300
350
400
450
500
550
600
Q4 2013 Q3 2013 Q2 2013 Q1 2013
Current deposits Savings deposits CASA Ratio
6.7
5.3
6.1
5.6
6.67%
6.00%6.00%
6.00%
2.00
4.00
6.00
8.00
3.0
4.0
5.0
6.0
7.0
Q4 2013 Q3 2013 Q2 2013 Q1 2013
Markup Expense Deposits MDR minimum balance MDR average balance
6.1 5.6
6.4 6.8
10.2
9.4 9.8 9.8
2.0
3.5
5.0
6.5
8.0
9.5
11.0
Q4 2013 Q3 2013 Q2 2013 Q1 2013
Advances Investments

73
2013 2012
4th Quarter 3rd Quarter 2nd Quarter Ist Quarter 4th Quarter 3rd Quarter 2nd Quarter Ist Quarter
Profit & Loss Account
Mark-up earned 16,593 15,496 16,260 16,715 16,453 17,411 16,947 17,545
Mark-up expensed (7,216) (5,814) (7,173) (6,993) (6,838) (7,075) (6,740) (6,847)
Net mark-up income 9,377 9,682 9,087 9,723 9,616 10,335 10,207 10,698
Provisions & write off 987 524 546 830 (190) 351 (360) (91)
Non-mark-up income 2,618 2,711 3,492 2,350 2,218 1,740 2,782 2,413
Non-mark-up expenses (6,441) (4,869) (4,102) (4,226) (5,276) (4,226) (4,097) (4,478)
Profit before taxation 6,540 8,048 9,023 8,677 6,367 8,200 8,532 8,543
Taxation (2,227) (2,753) (2,903) (2,909) (2,247) (2,852) (2,897) (2,972)
Profit after taxation 4,313 5,295 6,119 5,768 4,120 5,347 5,635 5,571
Statement of Financial Position
Assets
Cash and balances with treasury banks 59,946 58,231 62,563 49,532 57,420 49,880 52,771 46,916
Balances with other banks 1,537 1,695 1,920 2,820 1,192 2,113 3,159 2,452
Lendings to financial institutions 1,225 3,474 6,412 375 1,551 3,308 32 2,820
Investments 449,006 405,071 410,222 402,733 402,069 415,212 327,513 327,630
Advances 248,243 224,241 223,090 240,384 239,583 228,339 240,954 230,457
Operating fixed assets 28,595 25,345 24,913 24,126 23,738 23,920 23,645 22,369
Other assets 26,956 28,468 46,037 39,146 41,520 38,510 38,029 34,001
815,508 746,525 775,156 759,116 767,075 761,282 686,103 666,644
Liabilities
Bills payable 10,139 11,608 9,588 9,422 9896.284 8,683 9,679 8,405
Borrowings 38,543 15,579 18,397 49,504 78951.103 84,802 27,523 28,545
Deposits and other accounts 632,330 584,239 610,341 565,799 545060.728 541,613 529,366 512,067
Deferred tax liabilities 4,201 8,331 10,440 9,045 9529.727 8,487 6,813 6,538
Other liabilities 20,064 20,191 17,726 21,026 21166.166 17,856 17,896 18,658
705,277 639,948 666,491 654,796 664,604 661,441 591,277 574,213
Net assets 110,231 106,578 108,665 104,320 102,471 99,842 94,826 92,431
Represented by:
Share capital 10,118 10,118 10,118 10,118 9,199 9,199 9,199 9,199
Reserves 46,601 46,188 45,461 44,890 44,253 43,720 43,103 42,506
Unappropriated profit 40,552 40,319 39,086 37,015 35,425 33,614 32,473 30,110
Surplus on revaluation of assets - net of tax 12,959 9,952 13,999 12,297 13,594 13,309 10,052 10,616
110,231 106,578 108,665 104,320 102,471 99,842 94,826 92,431
Rs. In Million
Quarterly Performance - 2012 & 2013

ANNUAL REPORT 2013
74
Market Statistics of MCB’s Share
Share Price Free Float Market Capitalisation
MCB Scrip (Rs.)
GDRs (REG S) USD Shares
%Capital Value
High Low Closing Closing (‘000s) (Mln) (Mln)
2013
December 31, 2013 303.25 245.00 281.17 4.20 382,395 37.79% 10,118 284,501
September 30, 2013 314.85 240.50 263.05 4.92 381,355 37.69% 10,118 266,166
June 30, 2013 323.00 188.86 242.59 1.94 380,890 37.64% 10,118 245,464
March 31, 2013 239.30 182.20 189.29 2.44 374,879 37.05% 10,118 191,532
2012
December 31, 2012 216.75 180.63 209.76 4.32 336,953 36.63% 9,199 192,950
September 30, 2012 192.34 165.85 186.03 3.92 335,126 36.43% 9,199 171,122
June 30, 2012 184.24 154.00 166.24 3.52 335,221 36.44% 9,199 152,918
March 31, 2012 190.9 133.00 175.44 3.86 334,435 36.36% 9,199 161,380
Dividend and Bonus 2013 2012
Mln % Mln %
Final cash dividend 3,541 35 2,760 30
3rd interim dividend 3,541 35 2,760 30
2nd interim dividend 3,541 35 3,679 40
1st interim dividend 3,541 35 2,760 30
Bonus 1,012 10 920 10

75
Share Price Sensitivity Analysis
Factors that can influence the share price of MCB Bank Limited are given below:
Discount rate / Monetary Policy:
Based on different assessment parameters, the State Bank of Pakistan can change the monetary policy rate. Any decrease
in discount rate will result in lower net interest income and reduce profitability of the Bank. As a result, its share price may
drop.
Minimum Rate of Return on Deposits
Any upward revision in the minimum deposit rate will result in compression in net interest margins earned due to increased
cost of deposits. Such revision can negatively impact the earning and correspondingly the share price of the scrip.
Inflation
Inflation is considered as a key determinant for policy rate change. Any uptick in the inflation statistics will have a corresponding
impact on the monetary policy rate. With higher discount rates, the Banks will be able to invest in high yielding investments,
thus resulting in increased profitability. This, in turn will have a positive impact on the share price.
Political Stability & Law and order situation
Political stability and controlled law & order situation is a pre-requisite for any economic development. This in turn reposes
investor confidence in the soils of Pakistan, making our corporates a potential investment opportunity. However, any act of
terrorism or political instability can negatively impact the equity market and share prices of traded stocks.

ANNUAL REPORT 2013
76
7.00
7.50
8.00
8.50
9.00
9.50
10.00
10.50
Jan-13 Feb-13 Mar-13 Apr-13 May-13 Jun-13 Jul-13 Aug-13 Sep-13 Oct-13 Nov-13 Dec-13
Core Inflation NFNE
repayments, huge oil import bill and market interventions to curtail USD/PKR slide. Such pressures resulted in Pakistan entering in IMF program (Extended Fund Facility – EFF) worth $6.5 billion in September 2013.
Numbers of Monetary policy shifts were observed during the year. It was eased in the first half of the year. However, State Bank of Pakistan (SBP) increased the policy rate by 50 basis points each in September and November to tame inflation outlook and curtail deterioration in balance of payments. Turning to the prospects for the 2014, our outlook for the domestic economy remains positive. With the GSP-plus status accorded to Pakistan by EU, settlement of circular debt, removal of subsidies, some fiscal consolidation measures in place, uptick in credit to private sector and the economic activity seems to be looking up. Significant risks remain, nevertheless, particularly on energy and law-and order side.
Economy Snapshot
Period Average Inflation 2013 8.64
Discount Rate December 31, 2013 10.0
KIBOR (6 month Offer) December 31, 2013 9.47
USD Exchange rate as on December 31, 2013 105.3246
Liquid Foreign Exchange Reserve – (USD Mln) 8,521.4
Inflation base year 07/08 =100
Group Reviews
Wholesale Banking Group
2013 remained a challenging year for wholesale banking group. We continued to maintain a low infection loan book in comparison to the industry. Advances growth, in a conservative credit expansion era witnessing energy crises and security issues, was further hampered due to delay in offtake of approved lines by the Telecom sector due to postponement in 3G license auction and decreased commodity offtake. Overseas operations also continued to show stable growth despite depressed global conditions, with profitability in Sri Lanka and Bahrain increasing in double digits.
Directors’ Report to the Members
I am pleased to place before you, on behalf of the Board of Directors, the 66th annual report of MCB Bank Limited for the year ended December 31, 2013.
Economy Review
As we enter in 2014 the world economy is on a sounder footing albeit still quite nascent. The new policy challenges lie ahead and policy spillovers are becoming a major concern. Market players are of view that U.S. monetary policy is reaching a turning point. Although the U.S. economy is showing a positive momentum there is still a need to resolve long term fiscal issues. Volatility in Europe has reduced during the previous year but the region is still hampered by financial fragmentation and downside risk to the economic recovery remains significant. After leadership transition the Chinese government has shifted its focus from investment to consumption led growth. Economic growth in China is expected to settle down at lower levels than previously seen. Growth in Emerging and Frontier economies showed resilience during the year. Going forward their progression hinges on how they respond to the shift in U.S. monetary policy through their macroeconomic policies.
In Pakistan, after the successful transition of the Government to PML-N in May, the country’s economic conditions have moderated in the second half of 2013. Pakistan’s gross domestic product (GDP) increased by 5.0% in Q3 2013 as compared to 2.9% same period last year. The economic activity picked up on the back of new government settling the circular debt and business community’s confidence in the newly elected pro-growth government.
During the year the new government set the ambitious target of reducing the fiscal deficit from 8% to 6%. To ease the pressure on fiscal account the government increased the electricity tariffs in two stages during the year. On the other hand, to boost the revenue, they increased the General Sales Tax (GST) from 16% to 17% and withdrew tax exemption on few products. This step while increasing the revenue base of the Bank, adversely affected the outlook of inflation as it accelerated from the 5 year low of 5.1% in May to 10.9% in November.
On the external sector Pakistan’s foreign exchange reserves dwindled to critical level on account of large IMF loan

77
Strong rate competition in top tier corporate clients and fluctuation in policy rates during the year had a negative impact on spreads. Despite these challenges, the group managed to achieve its profitability targets with growth in fee based income through enhanced volumes. To ensure that growth in the group’s loan book is in a structured manner with minimal risk, the group has ensured periodic monitoring of corporate exposure in terms of industrial sectors and regional concentration. During the year, a number of concentration management papers for large corporate groups, sector study reports and Risk Asset Acceptance Criteria (RAAC) were developed for enhanced risk assessment on an ongoing basis. The investment and Corporate banking arms were involved in various transactions focusing on provision of effective tailored solutions to cater to business requirements of our corporate clients. During the year WBG succeeded in earning accolades for the bank through dedication and hard work of its business teams in various areas. - Best Islamic Deal Award 2013 – “The Asset Triple A” in 2013 awarded to MCB Bank, the highly commended Best Islamic Deal Pakistan Award for the syndicated long term multi-financing facility arranged for Pakistan Mobile Communication Limited (PMCL) for PKR 6B in which MCB Bank Limited acted as Lead Advisor, Arranger, Exclusive Agent, and Investment Agent. The increasing trade deficit required prudent and watchful eye on trade assets and commitments. We managed to focus and deliver exceptional growth in 2013. The bank’s market share in foreign trade business of Pakistan increased from 6.41% in 2012 to 6.95% in 2013; with 30% increase in the bank’s trade volumes. WBG’s transaction banking business made significant product and volume progress and achieved high growths during 2013. Our throughput volumes were close to Rs. 1 Trillion. This growth has been achieved despite several challenges and constraints such as fierce competition from other banks and customers becoming more cost conscious and demanding in view of tight economic conditions and requirement for technically advanced solutions. In 2013, work on “Payment Station” started which would become a front line product in 2014, enabling TBD to substantially increase fee base income. MCB along with its foreign remittance houses tapped by the Transaction Banking team has become a household name in the field of Home Remittance. Our real time system allows payments in all our branches within minutes of being initiated overseas. While we have strong foothold in traditional Middle East and Saudi Arabian markets, we have started exploring European and American corridors. In 2013 we have particularly focused on branding our products under the name of Burqraftaar Cash and Burqraftaar Transfer for Non-Resident Pakistanis. We also offer Motherland Account allowing overseas Pakistanis to open accounts in their home country whilst abroad. During 2013, TBD’s focus remained concentrated on cross sell with Retail Banking by opening dealers, low cost deposits
accounts and migrating conventional branch network related businesses to electronic business platforms to achieve further efficiencies. In this regard we migrated TBD’s Telecom business to automated fund transfer solutions. During 2013, TBD has also refurbished its systems and applications to have more stability so that they are ready to handle even more challenging volumes. WBG is all geared up to continue with its growth strategy and focus on book building, service based fee and FX revenue yielding transactions through introducing innovative products and solutions, identifying new opportunities and leveraging on growing FI relationships with customers. In Overseas Operations, we are on the verge of completing two decades of presence in Sri Lanka. Out of our many accomplishments throughout this journey, we hold the 3rd largest branch network among the foreign peer banks in the country. Internet banking facility is also available to our customers through our award winning website www.mcb.com.lk by LK Domain Registry. Our operational efficiency has been recognized by the award received as Best Facilitator T+1 Cheque Clearing Award (small bank category) offered by Lanka Clear Pvt. Ltd for our effective and efficient clearing processes. During 2013 MCB expanded its operations in Sri Lanka by opening a new branch in Galle, in the southern part of the country. In 2014 there are plans to enhance our international footprint through opening of new branches at existing as well as new locations, subject to regulatory approvals.
Special Assets Management Group
During 2013, SAMG surpassed all previous records of recovery by achieving highest ever figure of Rs.1.502 billion and maintained its average recovery yield @19%. This year Group has not only exhibited a consistent run-rate in recovery across the period but also extended its recovery base, in terms of number of settlements /cases, by 23% over the previous year. More so, with a comprehensive strategy, covering multiple remedial measures, SAMG has been successful in settling a number of chronic, complex and protracted big ticket defaults during this period.
Resultantly, Group during 2013 maintained its legacy of recovering over Rs.1.000 billion for the 6th consecutive year and over Rs.1.500 billion for the 2nd year in a row. Achievement of such a humongous goal with a lean & mean setup was not possible without a team of committed professionals, whose untiring commitment and dedication in execution of professional responsibilities has produced such remarkable results. This performance is even more note-worthy amidst current political milieu, time consumption in legal processes and weak repayment capacity of the borrowers.
The strength of SAMG is not only about the numbers being achieved in a year – it is also about the foundation SAMG has built for the future.
Going forward, keeping in view the volume of non-performing loans, special assets management function will continue to perform a pivotal role during 2014. In this regard, SAMG

ANNUAL REPORT 2013
78
has planned to further enhance its operational capability and efficiency. Building on its current human resource and infrastructure base, the underlying philosophy of “innovative pro-activism” will further be entrenched into the mindset of SAMG’s workforce, which will positively contribute towards the achievement of organizational goals in times to come.
Consumer Banking Segment (Retail Banking Group)
Consumer Banking (Product) has continued to show impressive growth in profitability and revenue in 2013 coupled with robust expense management. As part of our strategy, we have been focusing on the right mix of product and services by shifting from lending to non-lending revenue streams. Our non-lending business is supported by 2 strong pillars i.e. Remote Banking and Bancassurance while the Investment Service business continues to show steady improvement.
Remote Banking’s contribution towards Revenue, Net Profit and customer engagement continued on the increasing trend throughout 2013. MCB saw a historic moment when its Visa Debit Card (VDC) Launch to date issuance reached 1 MM landmark which is one of the quickest in the industry. By the end of 2013, we have been able to sell more than 500,000 debit cards in the same year. MCB also activated the option of having supplementary cards against VDCs. MCB Mobile has also continued to grow at a fast pace with active customer base touching ~400 K customers. Our focus has been to maximize the value of our Alternate Delivery Channels (ADCs) including ATMS, Mobile Banking, Internet Banking and Call Center.
In 2013, MCB re-launched Internet banking which is an upgrade of the existing virtual banking system with enhanced features. This is part of our overall strategy to shift load from branches to ADCs. MCB Bank’s ATM tally crossed 750 making it one of the biggest networks in the country. Our call center is also equipped to handle increasing call volume due to introduction of new products on the back of technology / infrastructure upgrade. We take pride in the fact that MCB call center offers multiple regional languages for customer service. Another important achievement in 2013 has been the introduction of MCB Loyalty card which enables MCB customers to get discounts at more than 65 different outlets. Moreover, in 2013, MCB successfully launched a new service “SMS Alerts” for customer convenience and transactional updates.
Another segment which falls in the ambit of Remote Banking is the Point of Sale (POS) business. MCB is one of the biggest players in the industry in terms of total POS machines deployed. Due to tactical placement of POS machines, MCB has one of the highest per POS productivity in the industry. In the twilight of 2013, MCB successfully got the license from State Bank of Pakistan to go commercial with MCB Lite which is one of the most innovative products offered in banking industry in Pakistan. This is a mobile wallet powered with a Debit Card which is Inter Bank Fund Transfer enabled. In the coming years, this will be one of the most important tools in increasing the customer base of the bank (mainly low cost deposit) and customer retention on the back of convenience and features it offers.
In 2013, MCB made another strategic move by putting Bancassurance and Investment Services under the Wealth Management umbrella. The Bancassurance business continued its rapid pace of growth in 2013 with total premium since inception crossing the PKR 3 billion mark. Even more importantly, 2013 was the first year in which new premium crossed PKR 1 Bn, with full year sales of close to PKR 1.3 billion. Portfolio persistency level remained above 75% in 2013 for the first time, making MCB eligible for a persistency bonus from its Insurance partner. Our Investment Services business also showed growth despite low-yields in the market, and this business is poised for further growth in 2014 with the issuance and distribution of some new financial instruments. MCB is the leader in Mutual Fund Sales through branch network with coverage in ~ 350 branches across Pakistan.
Substantial growth was observed in 2013 from only 9 operational Privilege Centers across Pakistan with a major positive shift in CASA:TD mix. We intend to provide value added services, with a focus on cross-sell, to our top depository clients through this set up.
Rupee Traveller Cheque (RTC) business is yet another feather in MCB cap. With total sales hovering around ~PKR 54 Bn in 2013, MCB leads the market in this segment and caters to the bulk of total industry needs. The product is offered from more than 800 Active branches out of the total network of more than 1,150 MCB branches.
Due to merger of Consumer Banking and Commercial Banking into Retail Banking Group, clear cut synergies were observed in the consumer lending front where the credit card issuance increased more than 2 times in 2013 as compared to 2012. A similar trend was observed in Auto Loans sale as well wherein the quantum almost increased by 43%. Not only the total sales number increased but due to concentrated efforts, the sales team also managed to increase the Net Financed Amount (NFA) per customer. With introduction of Product shop in the Retail Banking Group which focuses on management of existing Retail Banking Products (both consumer and commercial) as well as prime objective of developing new products, a lot of activity was observed on this front. This immediately resulted in re-launch of Personal Loan & Home Loan products, giving MCB a full suite of consumer lending products once again. With this, the focus is now very much on building a healthy consumer lending book in 2014.
Priorities in 2014
• Emphasis on ADCs i.e. Internet Banking, Mobile
Banking, Call Center, ATMs and cards
• Salesentrenchment
• Resourceoptimization
• ImproveNonFundrevenue
• Leveragingretailclientbase
• Bestinclassservicequality
• Attractmoredeposits
• Leadintransacting convenience

79
Commercial Branch Banking (Retail Banking Group)
CBBG (Network) continued to make sustained progress in growing its deposits base in 2013. Representing 91% of MCB’s total deposits, a growth of 13.4% was contributed by Network over last year, with a net amount of PKR 68B added to the deposit base. Important to note was the improvement in overall CASA portfolio which went above 90% (historic high) despite tremendous increase in volume. Throughout the year, MCB Retail Banking deposit growth rate remained above the overall industry deposit growth apart from a few weeks in the last quarter.
A total of 29 branches were added to the branch network bringing the number of outlets to 1,161 and the Bank continued its focus on sustainable low cost deposits. The management placed special emphasis on managing operational risks and this was reflected in significant improvement in internal audit ratings which improved to 94% during the year as compared to 85% in 2012.Responding to customer needs, MCB ATMs also recorded higher uptimes throughout the year despite deteriorating law and order situation and energy crisis in the country.
One of the biggest achievements of Retail Banking Group in 2013 was an extraordinary success during Hajj campaign. The team went for this campaign with a different and innovative theme of “being the first hosts of the people on their sacred journey”. With dedicated and focused efforts across the network, MCB became the market leader and set a record of catering highest Hajj applications in the industry.
In 2013, MCB Product shop developed another important product offering “Fun Club” which focuses on the banking needs of the children. Besides serving the banking needs, this product maintains balance between personal, corporate, social and environmental responsibilities. MCB has entered into an agreement with WWF for sowing a plant in the name of the kid who subscribes for this product. The progress of the plant growth can be observed through Google earth.
Another important initiative taken in 2013 was introduction of Islamic counter in conventional branches for basic banking needs. A pilot project was run in more than 50 branches after obtaining necessary approvals from State Bank of Pakistan to cater the industry needs. This not only helped MCB increase its book size but also helped in retention of existing customers.
Due to a focused strategy, MCB managed to substantially increase commercial lending book by ~PKR 11 Bn in 2013. This also helped in increasing the overall commercial Trade which crossed PKR 190 Bn.
For 2014, goal is to continue growth of sustainable and low-cost CASA deposits. The group will focus on introducing new liability products to address market needs & will also continue to focus on cross-selling, growing quality loans and aggressive volume growth in Trade.
Priorities in 2014
• Strategicrelationshipmanagement
• Leadintradebusiness
• Accelerateuseofalternatedeliverychannels
• Reduceoperationalrisk
• Betterqualitylending
• Relyonlowcostaccountbase
• Optimizeusageofexistingnetwork
Islamic Banking Group
MCB- Islamic Banking Group offers the solutions of Shariah Compliant products and services both on the liability and asset sides to its valued customers of all demographic segments to cater their wide range of needs of safe keeping of funds for business use, sharia compliant investments to earn Halal profit, Working Capital financing, Capital Expenditures, Trade business and consumer’s requirements.
On liability side, these products include the Hidayat Current Account, Hifazat Saving Account and Na’mat Term Deposit. In addition to these products a special term deposit scheme with attractive profit rates for senior citizens and widows under the name of “Aasoodgi” was also introduced. Whereas, on the Asset sides, our product includes Murabaha, Car Ijarah, Equipment Ijarah, Diminishing Musharka (Equipment), Musharka Export Finance, Shariah Compliant Bank Guarantee, Istisna Pre-shipment Export Finance and Letter of Credit.
Islamic banking group also provides customized solution to its valued customers for execution of complex financial transactions and Shariah advisory services in structuring of various syndicated transactions.
MCB-Islamic Banking has a network of 27 branches in 14 cities across the country. In the year 2013, MCB also focused on further improvement of MCB- Islamic Banking brand images like the last years. This was made possible through branding of all new Islamic Banking products and dedicated Islamic Banking branches. In line with regulator’s strategy of spreading awareness of Islamic banking concepts and products, MCB-Islamic Banking Group also participated in various forums for awareness of its Islamic Banking Products through distribution of brochures, marketing campaigns, participating in seminars and placing of stalls on Islamic Finance conferences etc.
During 2013, the group remained cost efficient in its business operations. To strengthen Islamic banking book size, MCB Islamic banking has shown significant growth both in liability and assets portfolio.
To comply with instructions of regulatory authority and bank’s policy, Islamic Banking Group has got reviewed and approved its Operational and Islamic banking Asset based product manuals. Further, under the instructions of regulator, Islamic Banking Group has also developed a Pool Management System for transparent calculation and distribution of profit for its customers.
Like the past year’s excellent trend, in 2013, IBG arranged ex-house and In-house training for its staff members and for other groups of the bank, on Shariah Compliant Products. The group shall continue the trainings of its staff members to remain competitive and quality services provider and to mitigate the reputation risk of Shariah non-compliance of Islamic banking transactions in the coming years as well.

ANNUAL REPORT 2013
80
Moreover, In order to facilitate it’s customer and to increase outreach of Islamic banking deposit products, an initiative was taken by introducing Islamic banking windows in conventional branches of Retail Banking Group after inculcating the training of sharia compliant product. This initiative was taken up with more than 50 Islamic Banking windows, which will further enhance in future.
We are pleased to inform that MCB Bank Limited applied for an NOC in 2013 for establishment of full fledge Islamic Bank as its subsidiary with a Paid-up Capital of Rs. 10 Billion. This request has duly been approved by the State Bank of Pakistan in 2014. This initiative will certainly help in further growth of Islamic Banking Business and to serve it’s valued customers by offering a complete set of Sharia compliant product with excellent service quality.
Treasury and FX Group
In the year 2013, Treasury & FX Group exhibited incredible growth. It outperformed its achievements by a colossal margin in all areas of its operations. The Group’s contribution towards bank was significant once again in terms of both interest-based and non-interest based revenues. Its superior success was mainly due to the effective interest rate management and by calling the market direction accurately in spite of high level of uncertainties in the financial markets during the year. Treasury succeeded in managing this challenge quite well by keeping abreast of the key developments on the economic and political fronts. However, the key element of its success was the high quality of its ability to predict the future course of economic events and policies. The changes in the composition of its portfolio over the year are reflective of the Group’s success in this regard. The effective duration management and appropriate use of yield enhancing techniques provided the much-needed stability to the Bank’s revenues during times when the banking industry’s spreads remained under pressure. The Group has also managed to achieve significant growth in case of Non-markup income despite multiple challenges through timely and effective decision-making and by employing effective strategies. Going forward, Treasury aims to focus on further strengthening its existing client relationships, penetrate into new markets and niches and enhance its product capabilities, especially the derivatives and structured products. This is in harmony with Treasury’s customer centric marketing approach and aims value-addition to our clients’ business models. In order to complement these goals, and as part of the Group’s overall strategy, Treasury will strengthen the alignment of objectives with other stakeholders within the bank. Treasury management is acutely sensitive towards its leading role within the bank.
Information Technology Group
In 2013, MCB Bank has positioned itself at the peak not only with the induction of advanced technology but by upgrading the existing at par, in order to meet the parallel challenges like, new releases of the mission critical applications, Business needs, strengthening stability, scalability and security, providing enhacnements and adequate plateform for those enahcements and to meet the right and precised technolgicial requirement of new projects.
IT Solutions & Business Applications: IT solutions play a strategic role in capturing, drawing and transforming data from transactions into a decision making framework for designing and administering innovative products as well as enhancing the quality of service delivery:
- IBFT enabled New Internet Banking Solution (Oracle
FlexCube Direct Banking).
- IBM Message Broker (Middleware)
- Migration to Microsoft Outlook
- IBM Email & File Archiving Solution.
- SMS alerts on banking transactions.
- ATM EJ & Proview Integration.
- Oracle Enterprise Monitoring Tool & ATS (Apps & DB
performance testing tools).
- Oracle WebLogic.
- Very Early Smoke Detection Apparatus (VESDA)
Technology Infrastructure Upgrade & Business
Continuity:
- Oracle Database upgrade to 11g.
- Call Center (IVR, CTI, Nice & PABX)
- CRM Unison II & RDV Upgrade
- ATM Helpline Centralization
- Deployment of IBM PureFlex Engineered System
- Data Domain Upgrade.
- Data Center Energy Optimization.
- DR Drill of critical applications.
- IT Application DR drill plan 2014 approval.
Technology Infrastructure Enhancement
- Backend Communication Infrastructure Implementation
- Cloud Computing (Thin Clients - 1000 Units Implemen-
tation).
- Addition of 133 ATMs in ATMs/CCDMs Footprint
Connectivity Platform:
- Core Network Upgrade with the installation of Juniper
Qfabric & CITRIX load balancer.
- Replacement of all obsolete network equipment.
- 100 % branches on Dual Media.
- Branch end media upgrade to 1 Mbps.
Information Security:
- PCI DSS Compliance (In Process): Bank has almost
achieved more than 60 % compliance.
- Anti-Skimming Devices for ATMs
- ATM Transaction Video Solution.
- Vulnerability Assessment & Penetration testing of all
critical websites.

81
In-House Business Solutions:
- Shariah compliant Pool management system (Islamic
Profit distribution).
- Warehouse Management System.
- Banca Assurance System.
- Loan Management system.
- IBAN adaption.
Compliance & Governance:
- Exceeding 92 % Compliance of audit observation raised
by External Auditor, Internal Auditor and SBP.
- Finalization of Long Term Strategy (LTS) 5 Years (2013-
2017).
- Finalization of Short Term Strategy (STS) FY 2014.
- Conducted 6 IT Steering Committee & 4 Board IT
Committee meetings.
- Review and approval of Information Security and
Information Technology Policy.
Looking Forward 2014: Both Revolution & Evolution:All along, it must be remembered that IT is not an end in itself, but acquired and deployed to serve business requirements efficiently. IT strategies (LTS & STS) have been sewn into the fabric of the bank’s vision and business strategy. In order to be able to meet customer demands, IT Group is determined to follow a prudent asset procurement plan to invest in technology, upgrade technology infrastructure and deploy new technology solutions:
• Datacenters environments Revamp (primary and
secondary as well).
• InternetSegmentUpgrade.
• UpgradeofBranchendnetworkequipment.
• VideoConferencing/TelePresencerecordingsolution.
• ExpansionofTelepresencesolution.
• ImplementationofSecurityOperationCenter(SOC)
• AcquisitionandDeploymentof“Derivative”solution.
• Feasibility study for “Workflow management solution”
and “Data warehousing”.
• DRdrillofcriticalapplications.
• Enhancement/Improvementsinexistingsolutions:
• OracleEBS
• OracleFCDB(InternetBanking)
• Development and deployment of Reward Point
Management System.
• UpgradeofOracleMantastoOracleFCCM.
• DeploymentofOracleFCCMforAMLcasemanagement
& “Know Your customer” (KYC).
• Acquisition/Development and implementation of Core
banking system (CBS) at Bahrain.
• Integration of CRM with Core banking system (CBS):Improvement in customer experience.
Operations Group
Customer service; operational efficiency; and strengthened controls & compliance environment within the Bank remained key priority areas for Operations Group throughout the year. The group is leading a major system implementation project, i.e. Upgrade of the Core Banking Application that will bring significant advantages for the Bank, which include enhanced functionalities for process automation and straight-through integration; implementation of modules relating to Advances for Limit monitoring, Collateral and Loan management, improved user access and controls; technology platform upgrade; and centralized architecture for better maintenance & support. Functional support was provided in developing and strengthening business processes especially in the backdrop of various system implementations, changes in regulations, products and processes helping businesses launch/enhance new/existing products, channels, and services. In order to achieve account number standardization resulting in efficient and effective processing of electronic funds transfer transactions, International Bank Account Number (IBAN) has been enabled. More than 1000 branches across Pakistan are now centralized for account opening whereas footprint of Trade Services Centers has expanded to 8 major cities covering trade processing for the entire country. In order to bring servicing efficiencies in currency management, a new Cash House was opened in Multan city. As part of the MasterCard initiative to move its local processing onto an automated process, MCB implemented the same in May 2013, leading to reduction in cost. As mandated by Visa International, Visa Money Transfer Service was also enabled during the year.
Aggressive business targets related to various consumer products/ channels such as SMS Alerts, Internet Banking, Visa Debit/Credit/Prepaid/Fun Club/Tejarat Cards, MCB Lite, MCB Mobile, UBP/ Telcos, Auto Loans and Motherland Accounts were fully complemented with operational expertise and processing support. Exponentially high volumes were witnessed while servicing transaction banking/ home remittances transactions. Infrastructure projects for new branches and offices including renovation of buildings were completed across the country; highlights being the new state of the art office complex ‘MCB Center’ and Corporate branch ‘MCB @ The Boulevard’ in Lahore. As part of Skill Profiling initiative, the branch operations have been strengthened through development of role based training modules along with HRM Group and other functions for Branch Operations Manager (BOMs) and Regional Operations Managers (ROMs). During the year, exclusive trainings on role based modules were conducted for BOMs and similar trainings are being planned for ROMs during 2014. Senior resources of the group also conducted in-house trainings for Bank staff during the year.
Strategic Planning and Development Group
The Strategic Planning Division (SPD) made significant strides towards its vision of building a leading international bank, becoming the partner of choice for our customers and creating value for all our stakeholders. The focus has been on expanding our global footprint by expanding into new markets like Europe, Africa, South Asia and the Far East. In line with our objective of growing our presence in

ANNUAL REPORT 2013
82
the Islamic Banking Space, MCB has made considerable progress towards establishing an Islamic banking subsidiary in Pakistan and is in the process of finalizing the acquisition of a local Islamic Bank. MCB has also received approval by the State Bank of Pakistan to set up a wholly owned subsidiary.
The Capital Markets Division of SPIG continued to build on the previous years performance under its scope as 2013 witnessed record contributions by the Division to the Bank’s bottom line. Net income was an extraordinary 4.5x the years target. These gains can be attributed to careful allocation changes to position the portfolio to fully benefit from market events. The group carefully refines its outlook on the macroeconomic environment into actionable investment strategies and asset allocation decisions to achieve risk/return objectives. Our positions in Unilever, Mutual Funds, the Banking and Oil sector stocks provided significant upside. Going forward the group will continue to look for potential pockets of value while closely monitoring risk.
Service Quality
To ensure a culture of Quality Customer Service within MCB Bank Limited, we have a dedicated Service Quality Division. The objective of this Division is to strengthen the bank’s Service culture, competitiveness and infrastructure by working closely with other Divisions. The emphasis is on achieving an enhanced overall Customer Satisfaction level. Moreover, the Division also initiates Process Improvements in order to achieve the fundamental business objectives of ‘growing’, ‘deepening’ and ‘retaining’ customer relationships. Achievements of Service Quality during the year 2013 are given in Corporate Sustainability.
Compliance and Controls Group
Compliance and Controls Group (CCG) continued to strengthen its processes across the Bank during the year. Keeping in view the Bank’s strategic objectives, CCG enforces a well-integrated and robust compliance framework that identifies, manages & monitors all potential risks that could lead to breach of laws & regulations.
Regulatory Risk & International Compliance is a key CCG function which provides support and advice to management and staff on compliance and regulatory issues. It also reviews policies and procedures, supports new Initiatives, products, services, etc. along with maintaining relationship with regulatory authorities. The function is also involved in managing CDD/AML aspects for Correspondent Banks and Money Services Business. CDD & AML/CFT Procedural Handbook has been updated and made available across the Board in line with changes in AML/CFT Laws and Regulations. It is also involved in the process of developing a Digital Library which will provide access to all internal circulars issued by the bank along with all circulars issued by SBP, FMU & SECP along other multimedia with just a click to all users.
AML function is committed to the highest standards of AML / CFT compliance and requires management and employees to adhere to these standards to prevent use of bank’s channels, products and services for money laundering and terrorist financing. It monitors out of pattern transactions
to detect possible Money Laundering activities through Transaction Monitoring Solution (MANTAS). In addition AML function in collaboration with Regulatory Risk & International Compliance reviews products and policies from AML perspective.
Compliance Assurance function is essentially concerned with identification, monitoring and resolution of regulatory/control issues through on-site reviews by Regional Compliance Officers , who also provide training to the branch staff. It also conducts Know Your Employee (KYE) exercise by reviewing credentials of newly hired regular employees. Issues Tracking & Monitoring (ITAM) Committee structure, with members comprising of Senior Management, is in place which spearheads expeditious resolution of issues pointed out by SBP.
The Internal Control function promotes higher standards of control through implementation of internationally accepted COSO framework. The Bank’s Risk & Control Self-Assessment (RCSA) framework is effectively functioning for ensuring ongoing operating effectiveness of key controls.
Compliance Training & Validations function in coordination with Human Resource Management Group initiated a specialized program under “Certified Branch Managers (CBM)” & “Certified Branch Operation Managers (CBOM)”. Further, comprehensive training programs on compliance and controls were also developed and implemented for field staff. In order to enhance Compliance and Controls awareness, Compliance knowledge testing through CKAS was managed for all newly hired permanent staff.
The Issues Resolution function enhanced its working scope during the year by carrying out off-site reviews of critical accounts and GL control heads while also ensuring effective monitoring.
Whilst focusing on creativity and innovation, Compliance & Controls Group will continue to increase its effectiveness through professional development of its staff and strengthening of functional solutions.
Audit and Risk and Review Group
Internal audit function plays a pivotal role in an organization’s control structure– serving as a foundation intended to lift the organization to a greater level of operational excellence. Audit & RAR Group is responsible for the internal audit function within MCB Bank Ltd. The Group conducts audits/reviews of various areas of the bank under the globally recognized Risk Based Auditing Methodology.
2013 was a year of significance for the Audit & RAR Group. The Group embarked on its journey with a commitment to further improve its operations through creative thinking. Enhancement in efficiency of audit operations without compromising on effective auditing was the key to all the development and re-engineering that the Group went through during the year. Prime focus was placed on the automation of various processes operating within the Group. While the Group ensured coverage of various critical areas of the Bank, measures were also taken to improve the visibility of results of the audit activities. The Group also aligned its activities in a

83
manner so as to address the critical challenges being faced by the banking industry in Pakistan. During 2013 the Bank demonstrated significant improvement in both the design and implementation aspects of the internal controls whilst enhancing its focused efforts to strengthen the compliance culture. Audit Group takes pride in providing significant assistance to the bank in achieving these milestones.
With a commitment to support the Bank in its journey towards continuous improvement, Audit & RAR Group will continue to strengthen its resources and framework to cope with the changing and challenging banking environment.
Human Resource
In 2013, HRMG maintained its focus on addressing performance needs to address strategic imperatives of the business. This has translated into provision and development of trained and motivated human resource to meet the requirements of the business. The year also marked the realignment of a number of HR functions for better service delivery and efficient resource management. This also resulted in role enhancement and job enrichment for a number of key positions in HR with a corresponding reduction in manpower and delivery costs.
HRM also embarked on a number of new initiatives in the areas of recruitment, training, organizational development, compensation, HR operations & HR financial services in order to stay abreast of increasing challenges faced by the business in an increasingly competitive environment.
The Balance scorecard Performance management system was strengthened across the retail banking network to ensure objectivity in assessment of performance. This included use of automated decision support systems driven by technology including target and achievement matrices, Audit report and operational result monitoring as well as results of service quality audits. A number of HR policies were reviewed and new policies introduced after extensive deliberations with stake holders to ensure customer centricity while strengthening controls across the spectrum including introduction of subsidiary ledgers to monitor costs on more specific bases. The composition of the workforce was managed to increase the proportion of permanent officer and executive cadres, thereby resulting in a positive impact on long term costs and improving controls. The subsequent demands on Talent Acquisition to meet the personnel requirements across the retail banking network were fulfilled through timely implementation of a comprehensive hiring plan with the support of the business. The induction of more than 2600 employees in the bank during 2013 bears testimony to the massive efforts to ensure smooth business continuity for the bank within the ambit of our rigorous selection and placement criteria.
As mentioned earlier, organizational structures were strengthened to provide job enrichment and upward mobility not only in HR but across the bank. The bank also participated in salary surveys to address compensation needs in line with prevalent market trends. The learning and development division contributed over 40,800 man days of training in core banking areas and management development programs which was a 63% increase over 2012 and 36% above the yearly target.
Another significant development on the service delivery front was the automation of HR operations across the board using SAP infrastructure. This included material improvements in the organization and standardization of HR database in leave management, transfer posting and training management to create real time MIS delivery to the business groups as well as HR managers. Furthermore, the creation of employee self-service portals for SVP & above staff as well as employee centered dashboards for Group Heads has initiated efficient decision support and instant information access.
The Human Resource Group, in 2014 would like to further broaden its focus as a strategic business partner of the business and pro-actively respond to emerging challenges to take its customer service and delivery to a world class level in keeping with the bank’s vision and organization mission.
CSR and Security
Security & CSR Group performed it’s assigned functions with commendable results, particularly when seen in the context of a precarious security environment all over the country. As many as 70 bank robberies were committed across Pakistan in 2013, only one of which was in an MCB Branch. In addition to this the Group launched an initiative to replace night guards from selected branches with electronic sensors, alarms with armed response and patrolling. 211 branches were converted to the guard less model in 2013. The Group plans to take number to 600 in 2014.
Risk Management Framework
Better management of risk is one of the corner stones that underlays our leadership role in the banking industry and our strong profitability.
The Board of Directors, at MCB Bank Ltd., drive a risk management framework that provide an active approach in dealing with factors that influence the bank’s financial standing. Bank, under the guidance of BOD, has always sought to generate recurrent earnings and create meaningful returns for its shareholder.
An Effective Risk Management Framework and the Risk Governance Structure remains a cornerstone towards ensuring realization of the Bank’s vision.
Collectively the bank’s risk profile’s strength comprises of:
• RobustRiskGovernanceStructure
• StrongCapitalandLiquidityPosition
• QualityofcreditPortfolio
Empowerment and independence in risk management is the basic principle that is applied as a fundamental part of BOD's vision. Independence of areas that are responsible for measuring, analyzing, controlling and monitoring risk from the frontline risk takers (i.e. business soliciting groups) is ensured within the bank. In line with this principle, CRO functionally reports to the “Risk Management & Portfolio Review Committee” (RM&PRC) which is a sub-committee of the BOD.

ANNUAL REPORT 2013
84
mitigating controls are assessed on design and operating effectiveness. Quarterly updates on Operational Risk events are presented to senior management and Board’s risk committee. The bank has an internal Operational Risk awareness program which is aimed at building capacity and inculcating risk culture in the staff through workshops and on-job awareness. Currently, the bank is reporting operational risk capital charge under Basic Indicator Approach (BIA). However, the bank continues to pursue a number of initiatives for the adoption of The Alternative Standardized Approach (ASA) including business line mapping and risk and control self-assessment exercises. The bank is engaged into dialogue with regulator for adoption of advance approach for operational risk.
Bank has been selective in disbursing its loan to good quality borrowers engaged in different businesses. The Bank continues to maintain lower than average industry level NPL ratios. Bank has a fairly diversified loan portfolio. Even the top 20 Non-Government Borrowers account for less than 25% of total (Funded + Non-Funded) exposure. For risk categorized as sovereign/government risk, our lending exposure is spread over multiple government owned or controlled organizations and departments which are engaged in a variety of tasks that range from different development related works to utility distribution and production etc. Many of these government owned corporations operate on profitable self-sustained basis. To manage worst outcomes in terms of scenarios multiple factors in bank’s lending structure provide additional comfort and support, these include quality of eligible collateral, pre disbursement safety measures, post disbursement monitoring, etc.
Capital Assessment and AdequacyMCB maintains the highest Capital Adequacy Ratio (CAR) among peer banks. The Bank remains a well-capitalized institution with a capital base well above the regulatory limits and Basel-III requirements. Bank continues the policy of sufficient profit retention to increase its risk taking capacity. Quality of the capital is evident from Bank’s Tier-1 to total risk weighted assets ratio which comes to 20.89% against requirement of 6.50%.
The Bank has complied with all externally imposed capital requirements throughout the year. Furthermore, there has been no material change in the Bank’s management of capital during the year. The Bank has carried out an assessment of its future capital requirements in accordance with Basel III regulations which are being phased in over subsequent periods, and the existing capital structure comfortably supports future growth.
Liquidity Management and strategy to overcome liquidity problemBank’s comprehensive liquidity management framework assists it to closely watch the liquidity position through monitoring of early warning indicators and stress testing thus enabling an effective decision-making. MCB’s liquidity risk management approach involves intraday liquidity management, managing funding sources and evaluation of structural imbalances in the balance sheet.
Asset Liability Management Committee of the bank has the responsibility for the formulation of overall strategy
This separation of functions between the risk takers and the risk managers provides sufficient independence and yet joint responsibility in decision making. Four-Eye-Principle is the structure that provides a tangible shape and assigns joint responsibility to business & risk approving authorities on credit & market areas’ lending/exposure requests.
Additionally, use of better risk measurement and management techniques is also a hallmark of bank’s overall Risk Management Framework that provides enabling environment to generate recurrent earnings and create shareholder value.
The Board of Directors and its Risk Management & Portfolio Review Committee have ensured formulation and implementation of a comprehensive Risk Management Framework. Under Board of Directors’ guidance, the Bank continued to execute the risk strategy and undertake controlled risk-taking activities within this risk management framework; combining core policies, procedures and process design with active portfolio management. The Bank continuously challenges and improves its Risk Management Framework in the light of the international best practices and State Bank of Pakistan guidelines.
Various policies related to management of different risks were approved or renewed by the BOD on recommendations of the RM&PRC. The RM&PRC guides the management on its risk taking activities within the Board approved policy framework.
Regular meetings of RM&PRC were convened to oversee the risk exposures and their trends as a result of the bank’s activities. The committee reviewed different aspects of the loan portfolio which, among others, include asset growth, credit quality, credit concentration, lending business trend and cross sectional analysis. Review of various aspects of Operational and Market risks including sub areas functions of these risks was also a regular feature. Management Committee for Risk is an additional platform to discuss and deliberate key risk issues in the portfolio at the management level.
Bank is exposed to market risks through its trading and other activities. A comprehensive structure is in place aimed at ensuring the bank does not exceed its qualitative and quantitative tolerance for market risk. The bank has followed a non-aggressive and balanced approach towards risk taking in the market risk area coupled with robust risk management architecture, thus achieving the target of keeping the exposures within the defined risk appetite and a reward justifying the efforts. A number of metrics like VaR methodologies complemented by sensitivity measures, notional limits, loss triggers at a detailed portfolio level, and extensive stress testing are used to capture and report the multi-dimensional aspects of market risk. The Bank will continue to pursue to have a risk return balanced portfolio to keep its market risk exposure in line within the approved risk limits.
In accordance with the Operational Risk policy and framework, a database covering losses, control breaches and near misses is being maintained. Major risk events are analyzed from the control breaches perspective and

85
and oversight of the Asset Liability management function. Board has approved a comprehensive Liquidity Risk Policy (part of Risk Management Policy), which stipulates policies regarding maintenance of various ratios, funding preferences, and evaluation of Banks’ liquidity under normal and crisis situation.
Bank’s liquidity position remained satisfactory. Bank’s large and stable base of customer deposits, along with bank’s strong capital base provided a source of strength and supported maintenance of strong liquidity position during the year. Bank also has a substantial portfolio of marketable securities that can be realized in the event of liquidity stress. Bank's Liquidity Coverage Ratio and Net Stable Funding Ratio are well within the Basel prescribed limits.
Financial HighlightsMCB Bank Limited delivered remarkable results for the year ended December 31, 2013 meeting stakeholder expectations ensuring significant contribution to the sector and economy:
Profit and AppropriationThe profit before and after taxation for the year ended December 31, 2013 together with appropriations is as under:
Rs. In Million
Profit before taxation 32,288Taxation 10,793Profit after taxation 21,495
Un-appropriated Profit Brought Forward 35,425Remeasurement of defined benefit plans - net of tax 49Transfer from Surplus on Revaluation of Fixed Assets (net of tax) 36 35,510 Profit Available for Appropriation 57,005
Appropriations: Statutory Reserve 2,150Final Cash Dividend - December 2012 920Issue of Bonus Shares - December 2012 2,760Interim Cash Dividend - March 2013 3,541Interim Cash Dividend - June 2013 3,541Interim Cash Dividend - September 2013 3,541Total Appropriations 16,453Un-appropriated Profit Carried Forward 40,552
DividendsThe Board has recommended a final cash dividend @ 35% and bonus shares @10% for the year ended December 31, 2013. This is in addition to 105% interim cash dividends announced during the year. The effect of the recommendation is not reflected in the above appropriations.
In addition to the financial analysis presented in the stakeholder’s information section, detailed analysis of MCB Bank Limited’s performance compared to the previous year is as follows:
ProfitabilityProfit after tax of the Bank rose to Rs. 21.495 billion with an increase of 4% over last year while profit before tax was reported at Rs. 32.288 billion with an increase of 2% over restated profit of 2012. Markup income has decreased by Rs. 3.292 billion whereas non-markup income of the Bank registered a healthy increase of Rs. 2.017 billion primarily on account of higher capital gains. The comparative reduction in the monetary policy rate resulted in a decrease in markup earned on advances which was off-set by an increase in average advances.
On the investments side, the negative interest rate impact of 6.58B is off set by the volumetric positive variance of 6.7B.
On the interest bearing liabilities side, the total cost of deposit has decreased by 36 bps with average volume increase of 59B over December 2012. The cost of saving deposits has increased by 4.49B translating into 55 bps increase. On the fixed deposit side, the interest has decreased by 3.972B when compared with corresponding period last year. The price variance analysis highlights that 1.8B of the said decrease is contributed by volume whereas the balancing 2.1B is due to decreased interest rates. There have been few regulatory revisions by the Central Bank on the minimum deposit rate being offered on saving and term deposits. The comparison highlights that the Banks offered 5% as MDR for the first four months of 2012 before it was revised to 6% from May 2012 onwards. From April 2013 onwards, the formula for computation on interest on deposits was revised from minimum monthly balance to average monthly balance by the Central Bank. In September 2013, Central Bank linked the MDR with the floor rate of the repo corridor where Banks where mandated to offer 50bps less than the floor repo rate on saving and fixed deposits. Corresponding to the revisions
Markup Income on Advances(Rs. in Million)
02 ,000 4,000 6,000 8,000 10,000
Q4 2013 6,138
5,633
6,390
6,830
6,601
7,249
7,520
7,632
Q3 2013
Q2 2013
Q1 2013
Q4 2012
Q3 2012
Q2 2012
Q1 2012

ANNUAL REPORT 2013
86
in the monetary policy rate, the MDR has been revised to 6.5% for the months of October and November, 2013 and to 7% for the month of December 2013.
The Bank registered a growth of Rs. 2.017 billion in non-markup income owing to Rs. 1.306 million increase in capital gains and Rs. 807 million increase in fee, commission and brokerage income. The overall increase has improved the ratio of non-markup income to net revenue to 22.8% from 18.3% in 2012.
Components attributing to the increase in fee, commission and brokerage income this year were commission earned from ATM and Debit cards (+ Rs. 272 million),commission income from Bancassurance (+ Rs. 268 million) and commission earned on remittance business (+ Rs. 141 million).
The substantial reversal in provision charge is reflective of the prudent and aggressive provision strategy adopted and rigorous efforts put in by the recovery units. A massive recovery of approximately 2.8B was reported in the loss categorized loans which enabled the bank to reverse the specific provision held in respect of such loans.
Continuing with its cost centric approach, the Bank was able to contain growth in its operating expense block to acceptable levels.
On the administrative expenses side, the Bank recorded a one-off charge for the voluntary separation scheme offered to its clerical / non-clerical staff for which an approximate cost of 1.1B was recorded in the financial results for the year ended December 31, 2013. Charge amounting to 1.058B on account of Ex-gratia/VSS settlement is reflected in the administrative charge breakup with the balancing amount recorded as settlement loss / gain of respective funds. Nullifying the impact of VSS charge and pension fund reversal, the administrative expense base of the Bank recorded a decrease of approximately 117M which is indicative of the cost effective synergies attained through central authorizations and annual capping. The pension fund reversal for the period was 1.7B as compared to 1.9B reported for last year.
Markup Expense on Deposits(Rs. in Million)
Q4 2013 6,663
5,289
6,050
5,559
5,880
5,843
5,802
5,519
Q3 2013
Q2 2013
Q1 2013
Q4 2012
Q3 2012
Q2 2012
Q1 2012
Administrative Expenses(Rs. in Million)
Q4 2013 6,072
4,694
3,906
4,038
5,031
4,051
4,158
4,237
Q3 2013
Q2 2013
Q1 2013
Q4 2012
Q3 2012
Q2 2012
Q1 2012

87
was recorded in the transport, storage and communication chemicals.
The Bank, with its risk averse lending approach, has constantly been able to improve the asset quality of its portfolio. As of December 31, 2013, the Bank’s classified advances were reported at Rs. 23.2 billion compared to Rs. 25.5 billion as at December 31, 2012 registering a decrease of Rs. 2.3 billion. The reduction was primarily the result of strengthened risk management framework and efforts posted by the recovery teams. With reference to the concentration of NPLs, 92.66% of the total base is categorized in the “loss” category for which 100% provision is held after deducting liquid security benefit. It is pertinent to highlight that MCB has not taken benefit of “Forced Sales Value” and carries an unencumbered general provision of around 0.1% of the gross advances which signifies the conservative and aggressive stance on provisioning.
The reduction in NPL base has improved the infection ratio of the Bank to 8.68% compared to 9.74% as at December 31, 2012. Coverage ratio of the Bank came to 85.74% (2012: 89.23%).
The gross investment base of the Bank has grown by 11% over December 2012 and was reported at 450Bn, reflecting an increase of approximately 50B over December 31, 2012 in absolute terms. Approximately 95.82% of the investment base is in government securities with major additions in Pakistan Investment Bonds growing by 22.5B whereas T-Bills increased by 32.2B over December, 2012. The weighted average yield on the current PIB portfolio is
Statement of Financial Position
The Bank’s total asset base strengthened with an increase of 6% to Rs. 816 billion. The increase was led by Rs. 46.9 billion increase in investments and Rs. 8.6 billion increase in net advances.
Advances gained a stable growth momentum this year and closed at Rs. 268.2 billion with an increase of Rs. 5.8 billion over 2012. This increase of 2% is attributed to commercial banking group that contributed an increase of Rs. 11.2 billion (16%) and while corporate banking advances have shown decrease of Rs. 7.2 billion (5%). The Islamic banking and overseas advances have also continued to grow and provide an increase of Rs. 1.3 billion (12%) and Rs. 1.2 billion respectively. In line with the system increase in advances, the market share of the Bank has decreased to 6.23% from 6.46% as at December 31, 2012.
The Bank remained focused in serving the credit demand of the private sector with a substantial share of Rs. 218 billion out of the total gross advances as at December 31, 2013. Sectoral split of advances highlights growth of 173% in Chemical, Petroleum and pharmaceuticals sector followed by 37% growth in sugar sector. Textile, carrying one of the highest concentration level in advances base registered an increase of 9% over 2012. A significant decrease of 56%

ANNUAL REPORT 2013
88
around 11.71% and 9.25% on T-Bills. With reference to the concentration levels in different maturity buckets, 88% of the T-Bill exposure is classified in 3-Month tenor, 8% in 6 month category and balancing 4% in 1 year category. On the PIBs side, 35% is concentrated in 3 years, 51% in 5 years and 14% in 10 year category. On the equities side, the decrease is primarily reflected by disposal of Metro Soverign Fund and Unilever Shares resulting in a capital gain of approximately 1.1B in the financial year 2013.
The deposit base of the Bank posted an extravagant increase of 87 B, translating into 16% over December 31, 2012. The Bank continued with its strategy of shifting its base to low cost current and saving accounts, each growing by 13% and 28% respectively over December 31, 2012 and taking the total CASA base to an all-time high of 90%. Convergent with the declining interest rate scenario, the decrease in high cost fixed deposits can be marked over a series of quarters, with a 20% decline for the year 2013 when compared with 2012 numbers. With the domestic deposit industry growing by 12.6% over December 2012, the share of the Bank has increased by 23bps when compared with December 2012 pie of the domestic deposits of the industry.
Non-financial performance
Non-financial performance during the year is tabulated below: 2013 2012Volume of home remittance-MCB USD MIn 1,529 1,470Credit card issued during the year Numbers 7,187 3,261Branches opened during the year Numbers 30 14ATM installed during the year Numbers 109 4ATM card issued during the year Numbers 508,241 469,841
Market Performance
During the year 2013, Karachi Stock Exchange continued its up trending, crossing previous highs and closed at 25,261. The year posted remarkable returns for equity investors after a democratic change of pro- business PML-N led government, resulting in reposition of the investor confidence. The year recorded investment at local and foreign fund levels, resulting in an outperforming growth statistics for the capital markets of the country. Basic statistics are summarized below:
Listed companies 560
Listed Capital (Billion Rupees) 1,129.79
Market Capitalization (Billion Rupees) 4,455.65
Index KSE 100
High 25,579.33
Low 16,107.89
Closing 25,261.14
MCB Bank’s scrip remained the sector leader both in terms of price and free float on the local exchanges. Market capitalisation of the Bank was recorded at Rs. 284.5 billion and the share price closed at Rs. 281.17.76 (High: Rs. 323.00, Low: Rs. 182.20).
Key sources of estimation uncertainty
The key sources of estimation uncertainty are discussed in detail in note 4.3 of the financial statements.
Future Outlook
2014 embarks with significant challenges in the shape of deteriorated law and order situation, energy crises / circular debt management and fiscal reforms. While the Government has amply proven its intentions by deploying its resources and energies in the right direction in 2013, the moderate stability achieved remains fragile. Structural reforms shaping up for the financial year 2014 will pave out the way for economic development and achieving the targets set for fiscal development and budgetary deficit. From the banking industry perspective, the volatility in the monetary policy along with regulatory revisions in the minimum deposit rates remains a key risk to profitability. However, higher deposit rates coupled with service quality levels provide an opportunity to bring the unbanked segments into banking net. To capitalize on such growth opportunities, the industry will focus on introduction of new products and services taking advantage of the technological development.
89
From MCB’s perspective, we are committed to deliver exceptional financial performance while strategizing our way forward in wake of the developing challenges. Our key focus areas include global recognition through increased international presence, improvement in our asset quality, deployment of cost efficient techniques and increased contribution from non-markup income block. Apart from international expansion, we are looking forward to a quick penetration in the unbanked segment of the population through branchless banking tools and an Islamic Banking setup to serve the financial needs of our domestic customers.
We remain hopeful that we would maintain the status of one of the leading banks operating in Pakistan through improved service quality, financially viable tailored products to meet requirements of our esteemed customer and translating the underlying financial strength of the entity into profits.
Corporate Awards and Recognitions – 2013
- Top 25 Companies award by the Karachi Stock Exchange.
- MCB won the Best Domestic Bank in Pakistan in The Asset Triple A Country Awards 2012.
- Annual report of MCB Won Best Corporate Report Award 2012- Banks category, by the Joint Committee of Institute of Chartered Accountants Pakistan (ICAP) and Institute of Cost Management Accountants of Pakistan (ICMAP).
- Annual report of MCB for 2011 ranked 2nd runner in Banking sector up by South Asia Federation of Accountants (SAFA).
- Best website (www.mcb.com.lk) award won by LK domain registry Sri Lanka.
- Best Facilitator T+1 Cheque Clearing Award (small bank category) by Lanka Clear Pvt. Limited.
- Best Islamic Deal Award 2013 by "The Asset AAA".
Credit Rating
The Pakistan Credit Rating Agency (PACRA) upgraded the long term entity credit rating to AAA [triple A] and maintained the short term rating to A1+ [A one plus], through its notification in February 2013.
Statement on Internal Control
The Board is pleased to endorse the statement made by management relating to Internal Control over Financial Reporting (ICFR) and overall internal controls. The Management’s Statement on Internal Controls is included in the Annual Report.
Evaluation of Board Performance
The Board is vested with the fiduciary duty of safeguarding the interests of the shareholders, setting up strategic direction, devising roadmap for attaining the strategic map and evaluating the performance while ensuring regulatory compliance. The broader role of the Board is specified in the Companies Ordinance along with Code of Corporate Governance. Specific guidelines on composition of Board
and its sub-committees along with the training requirements set by the statute, is an embedded control feature set up by the regulators operating in Pakistan. Board annually reviews the significant activities and achievement made by the Board committees. The Board evaluates its performance by looking at the overall performance of the Bank. Every members of the Board of Directors tries to attend all the meeting of the Board and to actively participate in its proceedings.
During the year Board deliberated on below significant issues:
• Approvedannualbusinessplanfor2014andstrategicplan for 2013-2017;
• Considered matters recommended by the Boardcommittees
• Reviewed and approved quarterly operating results ofthe Bank and performance of business groups
• Internal audit reports, including cases of fraud andirregularities of a material nature;
• Managementletterissuedbytheexternalauditors;
• Status and implications of allmaterial law suit filedbyand against the Bank
• Reviewedreportongovernance,riskmanagementandcompliance issues
• ReviewedreportonCSRactivities
Evaluation criteria
It is the duty of the Board of Directors to serve as a prudent fiduciary for shareholders and to oversee the management of the Bank's business. To fulfill its responsibilities and to discharge its duty, The Board of Directors set following evaluation criteria to judge its performance.
1. Ensuring adequate systems and controls are in place for identification and redress of grievances arising from unethical practices.
2. Ensuring professional standards and corporate values are put in place that promote integrity for the board, senior management and other employees in the form of a Code of Conduct, defining therein acceptable and unacceptable behaviors. The board shall take appropriate steps to disseminate Code of Conduct throughout the Bank along with supporting policies and procedures and these shall be put on the Bank’s website.
3. Ensuring that a vision and/or mission statement and overall corporate strategy for the Bank is prepared and adopted.
4. Ensuring that that significant policies have been formulated.
5. The directors shall exercise their powers and carry out their fiduciary duties with a sense of objective judgment and independence in the best interests of the Bank.
6. The Board exercises its powers as required under Code of Corporate Governance and Companies Ordinance 1984.
7. The Board ensure that a system of sound internal control is established, which is effectively implemented and maintained at all levels within the Bank.

ANNUAL REPORT 2013
90
8. Compliance with the legislative system in which the Bank operates, particularly Companies Ordinance, 1984, listing regulation of Stock Exchanges.
Performance Evaluation of the Chief Executive Officer
President / Chief Executive Officer of the Bank is vested with the responsibility of managing overall affairs of the Bank. The Board, assuming a monitoring role, delegates its authority to the CEO to effectively manage the Bank, implement strategic decisions / policies and align the Bank’s direction with the vision and set objectives. Performance evaluation of the CEO covers quantitative as well as qualitative aspects and is conducted on defined parameters which primarily cover financial performance against budgets, adherence to regulations, nurturing an ethical culture within the organization and goal congruence of the entire MCB family. The assessment is conducted on quarterly intervals where specific queries / observations raised by the BOD are addressed.
For the Year 2013, MCB Bank’s overall performance covering every aspect, has been exceptional under the able leadership of Mr Imran Maqbool and has been duly recognized by the BOD. Such performance becomes even more noteworthy considering it was achieved in a challenging operating environment with high level of competition and in a highly regulated industry.
Statement under Code of Corporate Governance
The Board of Directors is aware of its responsibilities under the Code of Corporate Governance and is pleased to report that:
• Thefinancialstatements,preparedbythemanagementof the Bank, present its state of affairs fairly, the result of its operations, cash flows and changes in equity;
• Proper books of account of the Bank have beenmaintained;
• Appropriateaccountingpolicieshavebeenconsistentlyapplied in preparation of financial statements except for except for the change in accounting policy as described in note 5.6 and accounting estimates are based on reasonable and prudent judgment;
• International Financial Reporting Standards, as
applicable in Pakistan, have been followed in preparation of financial statements and any departure there from has been adequately disclosed and explained;
• There has been no material departure from the bestpractices of corporate governance.
• Thesystemofinternalcontrolissoundindesignandhasbeen effectively implemented and monitored;
• TherearenosignificantdoubtsupontheBank’sabilitytocontinue as a going concern;
• Key operating and financial data of last six years ispresented in the stakeholder’s section of this report;
• PatternofShareholding,complyingwiththerequirementsprescribed by the code is annexed with the report;
• Statement of Compliance with Code of CorporateGovernance is included in the Annual Report;
• The number of board and committees’meetings heldduring the year and attendance by each director is mentioned below;
• TheValueof investmentofprovidentandpensionfundas at June 30, 2013 on the basis of audited accounts is Rs. 15,687.379 Million and Rs. 4,884.797 Million respectively;
• TheBoardmembershavetheprescribededucationandexperience required for exemption from training programs of Directors pursuant to clause xi of CCG. However, one of the directors does not fulfill the exemption criteria; therefore, he has completed Directors Training Program during the year 2013.
Change in Board of Directors
During the year 2013, two casual vacancies occurred on the Board of Directors. One was filled within the prescribed period as narrated in Clause (iii) of the Code of Corporate Governance (CCG) by Mr. Muhammad Ali Zeb who was co-opted as Director by the Board on June 17, 2013 in place of Mr. Manzar Mushtaq. The other casual vacancy occurred due to the resignation of Datuk Abdul Farid Bin Alias, which was accepted by the Board on October 01, 2013. However, Securities and Exchange Commission of Pakistan, vide its letter No. SMD/SE/2(10)2002, dated January 22, 2014, granted the relaxation to the Bank from the requirement of Clause (iii) of CCG and extended the period of filling such casual vacancy till February 28, 2014.
Board of Director AC BSDC RM PRC HR & RC PPCA ITC SBP RCMC
Meetings Held: 5 Meetings Held: 5 Meetings Held: 4 Meetings Held: 4 Meetings Held: 5 Meetings Held: 4 Meetings Held: 4 Meetings Held: 2
Member Attendance Member Attendance Member Attendance Member Attendance Member Attendance Member Attendance Member Attendance Member Attendance
Mian Mohammad Mansha u 5 - - u 4 - - u 5 - - - - - -
S. M. Muneer u 3 - - u 3 - - - - u 2 - - u 2
Tariq Rafi u 3 u 4 - - - - - - - - - - - -
Shahzad Saleem u 3 - - - - - - - - - - - - - -
Sarmad Amin u 5 - - - - u 4 - - u 4 - - u 2
Mian Raza Mansha u 5 - - u 4 - - u 4 - - u 4 - -
Abdul Farid Bin Alias u 1* - - u 1* u 1* - - - - - - - -
Aftab Ahmad Khan u 4 u 4 - - - - - - - - u 4 - -
Dato’ Seri Ismail Shahudin u 5 u 5 - - - - - - - - - - - -
Mian Umer Mansha u 4 - - u 3 u 4 - - u 4 - - - -
Manzar Mushtaq u 1** - - - - u 2** - - - - - - - -
Ahmad Alman Aslam u 5 u 5 u 3 - - u 5 - - u 4 u 2
Muhammad Ali Zeb u 3 - - - - u 1*** - - - - - - - -
Imran Maqbool (President & CEO) u 5 - - u 4 u 4 u 5 u 4 u 4 u 2

91
Board of Director AC BSDC RM PRC HR & RC PPCA ITC SBP RCMC
Meetings Held: 5 Meetings Held: 5 Meetings Held: 4 Meetings Held: 4 Meetings Held: 5 Meetings Held: 4 Meetings Held: 4 Meetings Held: 2
Member Attendance Member Attendance Member Attendance Member Attendance Member Attendance Member Attendance Member Attendance Member Attendance
Mian Mohammad Mansha u 5 - - u 4 - - u 5 - - - - - -
S. M. Muneer u 3 - - u 3 - - - - u 2 - - u 2
Tariq Rafi u 3 u 4 - - - - - - - - - - - -
Shahzad Saleem u 3 - - - - - - - - - - - - - -
Sarmad Amin u 5 - - - - u 4 - - u 4 - - u 2
Mian Raza Mansha u 5 - - u 4 - - u 4 - - u 4 - -
Abdul Farid Bin Alias u 1* - - u 1* u 1* - - - - - - - -
Aftab Ahmad Khan u 4 u 4 - - - - - - - - u 4 - -
Dato’ Seri Ismail Shahudin u 5 u 5 - - - - - - - - - - - -
Mian Umer Mansha u 4 - - u 3 u 4 - - u 4 - - - -
Manzar Mushtaq u 1** - - - - u 2** - - - - - - - -
Ahmad Alman Aslam u 5 u 5 u 3 - - u 5 - - u 4 u 2
Muhammad Ali Zeb u 3 - - - - u 1*** - - - - - - - -
Imran Maqbool (President & CEO) u 5 - - u 4 u 4 u 5 u 4 u 4 u 2
Number of Board and sub-committee meetings held and attendance by each Director
*Mr. Abdul Farid Bin Alias resignation as director was accepted by Board of Directors on October 01, 2013. Hence he attended.
• One(1)BoardofDirectorsmeeting
• One(1)BusinessStrategy&DevelopmentCommitteemeeting
• One(1)RiskManagement&PortfolioReviewCommitteemeeting
**Mr. Manzar Mushtaq resignation as director was accepted by Board of Directors on June 17, 2013. Hence he attended.
• One(1)BoardofDirectorsmeeting
• Two(2)RiskManagement&PortfolioReviewCommitteemeetings
*** Mr. Muhammad Ali Zeb was co-opted on the board on June 17, 2013 by casual vacancy created with resignation of Mr. Manzar Mushtaq. Hence he attended.
• Three(3)BoardofDirectorsmeetings
• One(1)RiskManagement&PortfolioReviewCommitteemeeting
Pattern of shareholdingsThe aggregate shares held by directors, their spouses and minor children along with other executives of the Bank as at December 31, 2013, are as follows:
Directors Self Spouse & Minor Children Total
Mian Mohammad Mansha 7,122 5,840,052 5,847,174S. M. Muneer 1,872 2,207,260 2,209,132Tariq Rafi 29,098,968 5,195,540 34,294,508Shahzad Saleem 820 - 820Sarmad Amin 2,592 - 2,592Mian Raza Mansha 11,510,624 25,873,969 37,384,593Mian Umer Mansha 29,078,526 - 29,078,526Aftab Ahmad Khan 832 - 832Ahmad Alman Aslam 605 - 605Dato’ Seri Ismail Shahudin 609 - 609Muhammad Ali Zeb 500 - 500
Other executives 15,269

ANNUAL REPORT 2013
92
Auditors
The retiring auditor M/s A.F. Ferguson & Co. Chartered Accountants, being eligible for the next term have offered themselves for reappointment. Upon recommendation of the Audit Committee, the Board recommends appointment of M/s A.F. Ferguson & Co., Chartered Accountants, as the auditors for the year 2014.
Acknowledgements
The Board would like to thank the State Bank of Pakistan, Securities and Exchange Commission of Pakistan, Ministry of Finance and Federal Board of Revenue for their cooperation, improved regulatory policies and governance framework and their continued effort to improve the banking sector and state of the economy. Our gratitude is also extended to the senior management for their determination to achieve targeted milestones and to the business, support and operational staff for their contribution in materializing set goals. On behalf of Directors,
Mian Mohammad Mansha ChairmanFebruary 11, 2014 MCB Bank Limited
All the trade in shares carried out by Directors, CEO, CFO, Secretary, their spouses and minor children is reported as under:
Name No. of Shares Purchase / Sale / Transfer
Muhammad Ali Zeb 500 Purchased

93
It requires the Bank to get involved in social, economic, environmental, cultural and innovational conduct besides the financial deliverables. A better future of convenience for the stakeholders of MCB Bank; by convenience we mean all aspects from service to personal care. Technology is one front via which we aim to work on centricity lags.
Our aim is to float the products and services that could help improve the life of customers, masses and communities in which we operate.
In the past the Bank has developed a strong product portfolio that has brought innovative solutions, innovative front-end services and improvement in customer dependency.
Bank for Life
MCB Bank truly adheres to its philosophy i.e. “Bank for Life”. It is our commitment to empower all our stakeholders with best corporate practices and constructive projects that help them in pursuing their goals and achievements.
The Bank maintains highly professional working culture in its organization that includes mandatory compliance towards the betterment of its stakeholders at every level. Hence various capacity building and welfare projects have been initiated in the current years to promote the living standard of the communities as whole to ensure their high performance and instill a sense of satisfaction amongst them.
Corporate Social Responsibility
MCB Bank being one of the market leaders in banking sector understands its pivotal role in the national economy and it continues to operate with strict adherence to regulations and principles of good governance.
The Bank is always active in carrying out community services under its different programs aimed at nurturing the various facets of life and to foster the growth of communities in which it operates. It has so far accomplished numerous projects and services in the areas of education, health, environment, sports, social awareness, promotion of culture and welfare of charitable organizations keeping in view the greater interest of its employees, customers and beloved country as a whole.
The Bank holds an approved “Corporate Social Responsibility Policy” by the Board that shows Bank’s commitment to serve the community.
CSR at MCB Bank has continuously geared up its capabilities in order to act as an adequate point of convergence for the design and implementation of specific initiatives intended to further its engagement with the society and its people. These initiatives have also been recognized by entities such as Pakistan Centre of Philanthropy.
Education for All: MCB Bank places special emphasis on education and extends maximum financial support to individuals and schools for the promotion of this noble cause. The Bank has been engaged with CARE Foundation to support its extensive network of schools. It aims to develop personality and character of Pakistan’s future generations by perpetrating qualities of inner discipline and control. In this regard, the bank has signed an agreement with LUMS for the purpose of providing soft loans to undergraduate students. MCB
also did a virtual classroom project with CISCO to promote a good standard of education for the less privileged children. MCB CSR has allocated funds especially for the activities brought in by various educational institutes. Some of these activities include sponsorship for Forman Christian College Model United Nations, 5th Inter School Debate Competition and The LUMS Model United Nations Society on 10th Annual LUMS UN Conference. On the same lines, MCB Bank has provided sponsership to Roots International School Education Next: Future School and also took part in the cultural engagement events organized by Civil Services Academy - Sindh.
Human Rights: At MCB Bank, our mission is to ensure the political, educational, social and economic quality of rights of communities that we operate in and to help advocate the elimination of social biases and hatred. The Bank pays special attention to human rights and ensures that its policies reflect the interest of all of its members and customers without any discrimination. Environment at MCB is maintained with utmost professionalism, instilling a feeling of mutual respect, aiding in upholding the basic rights of the people coming in at the bank. We have supported various nonprofit initiatives that serve for the rights of humanity.
Sports: MCB Bank’s CSR has always been at the forefront for promoting various sports at all levels. In such an endeavor, the Bank facilitated the Ibex Golf Club – Sargodha, Pakistan Club and the Interact Club of Karachi Continental. Further, it has also assisted the All Pakistan Multan Open Golf Championship – 2013, Jashan-e-Baharan Festival by Pakistan Expatriates Coop Housing along with the Ramzan Sports Gala-2013 held by CDA. Further, the Bank has been able to sponsor Punjab Youth Festival 2013-2014.
Energy conservation
MCB Bank carries a very conscious approach towards the current energy crisis. Keeping this concern in mind; the Bank financed few ‘Bagasse Based Generation Power Projects’. These Projects are being setup under the Framework for Power Co-generation 2013 for Bagasse / Bio Mass to include bagasse/ biomass under the ambit of the ‘Renewable Energy Policy, 2006’. This Alternative Energy Development Policy incentivizes the sugar companies to expand and upgrade their power generation businesses.
The Bank also believes that energy conservation is a dire need of time. It should be rooted in the behavior of every human being to get more effect towards the plan of energy conservation. The Bank has constructed a new building near Lahore Airport that truly reflects the concept of “Going Green”. Also, MCB Karachi Tower is considered as an “Efficient Building” wherein the ‘Air-Conditioning’ is solely run through “waste-heat”.
The Bank is currently involved in a project that aims to generate energy with the help of windmills. It also supports the idea of solar energy panels and plans to transform its branches to alternate energy generation portfolios. In 2013, the bank has improved the energy efficiency of its offices and branches wherein electricity expenses have been decreased by 7.73%.
Environmental protection measures
MCB Bank recognizes the importance of safe environment that is closely linked to the welfare of our community at large. The bank has taken initiatives to promote a paperless environment in order to control operating expenses resulting from photocopy and printed papers.
Corporate Sustainability Report

ANNUAL REPORT 2013
94
In 2013, MCB Product shop developed another important product offering “Fun Club” which focuses on the banking needs of the children. Besides serving the banking needs, this product maintains balance between personal, corporate, social and environmental responsibilities. MCB has entered into an agreement with WWF for sowing a plant in the name of the kid who subscribes for this product. The progress of the plant growth can be observed through Google earth.
MCB offices are very particular about plantation; special staff is hired that looks after the greenery and plantation within and in the surroundings of our buildings. In 2013, the bank has spent an overall 13.4 million on plantation expenses which is an evidence of its profound interest towards healthy environment measures. Community investment & welfare schemes
MCB Bank’s initiatives have been aimed at supporting the deprived and underprivileged. To cater the needs of these, aided by advances in information and communication technology, The Bank has partnered with various NGOs that have helped to focus attention on the social and capacity building issues of the communities e.g. ‘Our Lady of Fatima Church’, ‘Pakistan Foundation Fighting Blindness’, ‘The Lahore Businessmen Association for Rehabilitation of the Disabled (LABARD)’ and ‘Rehman Kayani Memorial Society’ are few such names. Moreover, The Bank also supported ‘Al-Khidmat Orphan Care Program’ by providing them financial assistance so that they can also excel and move on in the mainstream life cycle. The Bank has also been supporting “Breast Cancer Awareness” across the country with “Pink Ribbon”.
The Bank in collaboration with ‘Sundas Foundation’ has organized a blood donating camp at MCB House Lahore and MCB Tower Karachi. The turnarounds at these camps were tremendous and Sundas Foundation managed to collect around 400 blood bottles for the treatment of its patients.
Realizing the needs of our minority groups, The Bank has sponsored various activities for minorities during the year e.g. Fund Raising events for St. Anthony’s Church Lahore and St. Patrick’s Cathedral Karachi.
Besides direct financial support, MCB Bank has helped various charities through alternative and innovative mediums e.g. fund-raising via electronic banking, distribution of flyers with bills & statements and free media space to charities so that they can conveniently advocate for their cause over mass mediums. Edhi, The Citizens Foundation, LABARD, Al-Shifa, and SOS, to name a few.
Consumer protection measures
MCB Bank is committed to provide world-class quality products and services to its customers and is very much concerned about the safety of its consumers. It maintains a privacy statement for the usage of its products i.e. Credit Cards, ATM pins etc. Staff at customer care department is trained to specially ensure the customer privacy and protection policy while dealing with sensitive information.
To ensure a culture of “Quality Customer Service” within the Bank, we have a dedicated Service Quality Division. The objective of this Division is to strengthen the Bank’s service culture, competitiveness and infrastructure by working closely with other divisions. The emphasis is on achieving an enhanced overall “Customer
Satisfaction” level. Moreover, the Division also initiates process improvements in order to achieve the fundamental business objectives of ‘growing’, ‘deepening’ and ‘retaining’ customer relationships.
Regular training sessions were conducted in all circles, call centers and other front-end staff on “Service Excellence” & “Customer Satisfaction”.
Customer Satisfaction: is the core element of any business. We truly believe in pampering our customers. Their satisfaction is the key to our success. Our help desks are always there to resolve queries. A total of 48,249 complaints were resolved and an overall 99.2% complaint resolution rate has been recorded during 2013.
2013 2012
Total Complaints Received 48,621 41,828
Average complaints per 1,000 customers 9.18 8.48Total Complaints Resolved 48,249 40,852% Complaints Resolved 99% 98%Average complaints per 1,000 customers 9.10 8.28Complaints Resolved (Avg TAT) 8.19 6.00
Turn Around Time (TAT) Monitoring: Monitoring and Evaluation of Service Indicators is a part of the belief in increasing and retaining our customer base by improving the turnaround time and process improvements. In order to keep a strong hold on processes within the bank, that can cause customer satisfaction or dissatisfaction, SQ evolved several controllable measures based on the market practice. Against each measure, a tolerance level along with the timelines is set. Similar to the Branch Banking, Indicators for Consumer Assets, Credit Cards, Bancassurance, Call Centre, Mobile Banking and ATM Uptime are monitored monthly by SQ. The TAT for day-to-day activity and their performance against it is then presented to the management to ensure excellent service through fast delivery process.
Service Management Program (SMP): Service Quality has ensured that all Service Related activities and (TAT) Turn Around Times for Branch Banking are documented. This SMP has been launched in MCB Branches to ensure that a program is always available to reference regarding the service related issues.
Service Council: Service Council has been formulated to bring together key stakeholders from across the bank with a view to place service on the forefront through thought leadership, collaborative discussions and creation of a clear roadmap supported by facts and data. A meeting is held periodically which is convened by SQD Head and chaired by the President himself along with all the Group Heads and relevant Business Heads.
Service Protocols, Complaint Logging and Suggestion Forms: SQ introduced Service Protocols Booklet in all the branches for the Standardization Service Standards. Also Complaint Management Posters are made available in all branches for “Customers” to log their complaints as and when required. A new, improved complaint and suggestions forms “Your Priority, Our Concerns!” has been introduced in the branches for customer convenience in order to get their feedback recorded.
Quality Checks and Mystery Shopping: During the year, around 400 branches were ‘Mystery Shopped’ by independent external agency and results of this activity were shared with management
Corporate Sustainability Report
95
for further improvement. The average scores remained between 73 percent to 78 percent of all the regions including far-flung troubled areas.
Further, during the year, around 550 branches were internally gauged on defined parameters by SQ. Considerate support has been provided to all branches for betterment and improvement of Service Health. The overall ‘Health and Quality Check’ score remained between 80 percent to 85 percent for these branches.
Industrial relations:
MCB Bank being a collectivist and pluralist in its outlook is fully responsible for maintaining a healthy relationship between individual workers, employees and plays a critical role in facilitating the staff coming in from all walks of life. It gives special heed towards the agreement and satisfaction of its staff as a whole. The bank has been taking various interventions to match with the pace of its labor union. An agreement has been signed with the Staff Union of clerical and non-clerical staff at MCB Bank’s head office so that it works on the same pace as does the other teams working at the bank. The Bank has allocated a dedicated staff who is there to ensure fair labor practices, grievance handling and to ensure just businesses amongst the labor union.
MCB Bank has introduced a special staff finance facility along with Voluntary Separation Scheme (VSS). It has been introduced for the purpose of facilitating the clerical and non-clerical staff. Further, scholarships are being offered to enhance the educational needs of the children that are being supported by all the clerical and non-clerical staff working with the Bank.
The management has always been very cordial and receptive towards staff issues and it staunchly believes in the power of one when it comes to leading a group of people coming in from various walks of life.
Employment of special persons
MCB Bank is an equal opportunity provider. It has never discriminated on the basis of race, gender, age or disability. The bank has recruited a sufficient number of special persons at various branches all over Pakistan. At MCB Bank, special persons are not discriminated on the basis of their handicaps. We believe in skills more than the conditions that have been bestowed on us from Mother Nature. The Bank is a staunch believer of the fact that diversity comes with variety only and that talent can never be discouraged merely because of natural hindrances.
Occupational safety & health
The safety and health of personnel are of paramount importance to the Bank. The Bank ensures that maximum safety standards are met at all businesses, offices and branches and encourages all employees to promote the safety of their fellow employees and customers. A special “Safety and Health Policy” has been developed for this purpose. This Policy aims at providing a safe and healthy working environment to the people working and visiting the Bank.
Emergency Lights, Fire Proof Cabinets, Fire Detection, Alarm System, Portable Fire Extinguishers, Safety-Anti Shatter Films, Conducive Working Environment, First Aid Kits, Evacuation Drills, Arrangement for Disables, Emergency Exit Doors, Fire Sprinkler
System and Medical Health Insurance are some of the measures that the Bank assures for the safety and security of its stakeholders.
At ATMs and other Alternative Delivery Channels (ADC), special safety measures have been taken to protect customers by implementing Installation of locks and cameras in all ATM Rooms with 24/7 recording, Anti-Skimming devices have been installed on all ATMs, ATM-safe-usage-guidelines are displayed on all ATM screens before the customer undertakes a transaction, all customer calls to Call Centre are recorded, IVR Transactions are secured via a separate Telephone Banking, PIN (T-PIN), SMS alerts service keeps the customers constantly updated of any activity (Debit or Credit) in their account.
Developing a positive health and safety culture, where safe and healthy working becomes second nature to everyone is what MCB Bank aims to achieve and for that, all possible efforts are being continuously utilized to touch an optimum level.
Business ethics & anti-corruption measures
“Fraudulent Market and Credit Risk” cannot be eliminated however the Bank has always been active in identifying and mitigating possible risks and losses through promulgation of policies and procedures to reduce possibility of such incidents. To achieve this, the “Compliance & Control Group” of the Bank devised tests to encourage awareness on areas specifically related to “Know-Your-Customers”. This exercise is aimed to educate the Bank’s employees to better understand the terminologies of “Know-Your-Customer” and “Anti Money Laundering”, its requirements and hence minimize the chances of error or frauds and help the Bank to remain fully compliant of regulatory instructions.
The “Human Resources Management Group” of the Bank provides “Code of Conduct and Standard of Ethics”; a comprehensive document is in place as a part of the Human Resource Policy & Procedure Manual which is available to all staff members on the Bank’s Intranet. The document is approved by the Board’s Human Resource and Remuneration Committee. The Disciplinary Action Committee (DAC) takes action on any violation of policies & procedures, act of fraud & forgery, breach of discipline and code of conduct, ethics & business practices, law of land and statutory regulations by an employee. Appeals of the staff against whom DAC has already taken disciplinary action is reviewed by an independent Disciplinary Action Review Committee (DARC) which is formed with a view to ensure a fresh review of each appeal filed against the DAC decision. Details of the Standard of Ethics, Business Practices & Code of Conduct are available in this Annual Report.
The Bank wants to deliver long-term value for its shareholders and society. This means having the right culture, structures and processes in place to ensure that we practice strong governance, serve our clients and customers well and provide a great workplace for our people. Doing what we can to combat financial crime and protect the environment is one of the utmost components that have taken the Bank ahead till now.
National Cause Donations
Supporting national cause for the betterment of community at large is the utmost philosophy that MCB Bank is proud of. The bank very generously takes part in charitable activities. In 2013, rupees five million were donated by Islamic Banking Group for the effected Christian Community owing to riots in Joseph Colony, Badami Bagh, Lahore. Also, rupees thirty million (including Rs. 5 million
Corporate Sustainability Report

ANNUAL REPORT 2013
96
charity by IBG) were donated to the Prime Minister’s Earth Quake Relief Fund for Baluchistan 2013.
MCB Bank’s contribution towards the community has also been recognized by various local and international organizations. We have received “CSR Business Excellence Award” and have recently been ranked 8th because of the volume of donation among 490 top Pakistani companies which is definitely a source of motivation for us to continue towards such gallant initiatives.
Contribution to national exchequer
The number one bank in highest market capitalisation and one of the most profitable bank, MCB Bank always one of the leaders in contribution to the national exchequer. The Bank paid Rs. 10.36 billion as income tax to Government treasury during 2013. Furthermore, the Bank contributed over Rs. 5 billion to the National Exchequer as withholding tax agent under different provisions of Income Tax Ordinance 2001.
The Bank’s contribution to the national economy by way of value addition was Rs. 43.35 Billion, out of which Rs. 10.29 Billion was distributed to employees and Rs. 15.18 Billion to shareholders.
The Bank has generated direct and indirect employment for a large number of people over the years. With the payment of taxes and the investment in the network, the bank is making a significant contribution to the country’s development and growth.
Rural development programmes
MCB Bank realizes the pivotal role agriculture plays in driving the growth of our economy. Pakistan is an agrarian society and majority of its population is dependent on the agriculture sector for their livelihood. Keeping this fact in mind, MCB deliberately took part in the 5th Farmers Festival (HARI MELO) & National Conference in order to further enhance the agriculture sector of the country.
The bank has partnered with State Bank of Pakistan by partially sponsoring the Farmers Financial Literacy and Awareness Program Phase – II (FFLP). It is an Agricultural Awareness Program that is held at District Level in order to educate the agrarians at grass root level. Also, the bank has initiated a Kisan Dost Help Desk campaign at its selected branches from where farmers can confidently consult professionals for any relevant assistance.
MCB has 430 rural branches where we offer customized product menu to suit and meet the requirements of these people. MCB is committed in enhancing knowledge and understanding of banking business vis-a.-vis spreading and exploring neglected regions of the country.
Corporate Sustainability Report

97
Human Resource Management
The focus of Human Resource Management and Development at MCB Bank is to recruit, develop, retain, reward best talent. We strive to ensure that our employment policies meet relevant social, statutory and regulatory conditions and remain committed to building and maintaining strong collective relationships and agreements. We have an employee relations presence providing regulatory support in all our key markets, ensuring greater alignment of our people -governance policies while also promoting flexible employment practices. Creating a workplace that endorses diversity and recognises the generational differences of our growing multi-generational workforce remains a key priority for us.
We have also continued to improve employee awareness and understanding of our Speaking Up policy, which enables staff to confidentially report concerns about misconduct, as part of our focus on ensuring fair and sustainable employee relations.
HRMG-Learning & Development
People development is the focal point of HR activities and involves continuous efforts to develop the skills of the employees at all levels. Various accomplishments & initiatives taken by MCB HRMG-Learning & Development in order to achieve and maintain a competitive advantage for the organization during the Year 2013 reflect the commitment of management towards employee development.
With the aim of improving the performance of the employees, various learning opportunities (In-house, ex-house & overseas) were organized during the Year 2013 to impart knowledge and skills to 15060 participants earning around 40850 Training man-days.
In house Learning approach is being provided by our Learning & Development Centers across Pakistan and AJK.
Elite Leadership Program: MCB HRMG organized an Elite Leadership Program by Dr. Marshall Goldsmith in Karachi & Lahore as Lead sponsor. It was a unique opportunity to allow our executives the exposure and learning that would not only enhance their potential to add greater value to their roles but would also help them develop their skills.
7 Habits of Highly Effective People signature programs were conducted for Senior and Middle Management.
Certification Programs - CBOM, CBM: A first of its kind initiative was taken via diverse certification programs such as CBOM and CBM. These are tailored made programs, comprising of in-house Training Sessions led by in-house trainers. These programs address the developmental needs of different functional roles in Branch banking. The overall aim of these programs is to enrich the available human capital through role based training & assessment, while simultaneously enabling the management to benefit from the availability of our vast talent pool for future strategic planning & deployment.
Succession Planning
“Succession Management is the development and retention of high potential employees so as to create a talent pool from which to fill key positions in the organization. Succession planning is a continuous process that involves identification, assessment and development of talent, to ensure that an organization’s management can keep up with the changing business environment.
Recognizing the need for securing future leadership capability and achieving strategic viability, MCB has incorporated the Succession Management initiative in its HR policy, as part of its organizational development efforts. The Bank has formulated a comprehensive succession plan for critical positions to ensure operational continuity and grooming of our talent for subsequent elevation to higher assignments. Succession plans are revised periodically in line with the business needs and career development of employees
Motivational Environment and Merit Culture
MCB ensures motivational environment and merit culture throughout its operational units. It is a Bank that encourages its employees to do their best and get equal reward, position and monetary incentive on performance and merit basis.
The incentive-based pay system at Bank encourages competition among the employees and fosters the talent of staff members to perform their tasks remarkably with commitment.
MCB deploys KPI-based performance evaluation system to align and measure deliverables from the leadership to the front line managers ensuring that all employees contribute to the overall objectives of the bank as one team.
The Bank compensates its employees well in accordance with their work performance and completion of targets. Hence, employees are rewarded timely and meritoriously that provides exceptional results in the context of organizational effectiveness and employee motivation.
Equal Opportunity Employer
MCB Bank’s recruitment policies provide unbiased criteria for hiring people from any religion as long as they qualify for the professional criteria required by the Bank. Our culture at MCB Bank also depicts a healthy, team based and cooperative environment. As of 2013, the Bank held a ratio of 9,142(88%) male and 1,230 (12%) female ratio with approximately 1 % of the employees from the minority population of the country.
Reward – Award Program
In order to provide the due recognition and incentive to the staff and keep them motivated this Program is successfully being run by SQ. Realizing that employees are a valuable commodity in today’s ever-changing workplace, and recognition is a key component to employee satisfaction, we feel that Service Awards are an ideal way to ensure that all of our employees receive the recognition they need to be productive members of the corporate team. In the Year 2013, around 1,175 Employees were given “Cash Awards” on providing excellent service to the customers. Moreover, 657 Employees were recognized on monthly performance and were awarded with “Employee of the Month” award. Apart from this the collective efforts of Teams were recognized from all Groups Quarterly and yearly and were awarded with “Service Team of the Quarter” and “Team of the Year Awards”.

ANNUAL REPORT 2013
98
Managing Conflict of Interest
Overview
A director owes certain fiduciary duties, including the duties of loyalty, diligence, and confidentiality, to Bank, which require that a director must act in good faith and exercise his or her powers for shareholders’ interests and not for their own or others’ interest.
The Board and management of MCB Bank Limited is committed to the transparent disclosure, management and constant monitoring of potential conflicts of interest to ensure that no undue benefit is passed on. The BOD recognizes the responsibility to adhere to the defined policies / procedures and avoid perceived conflicts of interest that may arise during the course of business.
The Bank in compliance with the Code of Corporate Governance annually circulates Code of Conduct applicable to all its employees and Directors, which is specifically signed off by all concerned. Apart from business ethics, the Code of Conduct specifically highlights scenarios where conflict of interest arises and specifies ways to deal with such situations.
Related Party transactions
The Bank has devised a fool proof mechanism for identification of related parties and execution of related party transaction at arm length, which are executed in the normal course of business. Based on the statutory requirements, complete transactional details of related parties are presented before the Audit Committee for review and deliberations on a quarterly interval. The Audit Committee reviews and recommends the related party transactions to the Board for approval.
Moreover, as a statutory requirement, a comprehensively prepared return is submitted on a half yearly interval to the State Bank of Pakistan that primarily covers every related party transaction executed during the said period.
Disclosure of interest by director
Every director (including spouse and minor children) of a Bank who
is in any way, whether directly or indirectly, concerned or interested in any contract or arrangement entered into, or to be entered into, by or on behalf of the Bank shall disclose the nature of his concern or interest at a meeting of the directors. Directors are required to disclose existing or perceived conflicts of interest prior to the commencement of each Board meeting.
Where a conflict of interest or potential conflict of interest has been disclosed, the Board member concerned shall not take part in the Board discussion of that topic. The member who has disclosed the conflict cannot vote on that item.
Exposure in companies where directors are interested
The Bank takes exposure in the companies in which our Directors (including their spouses, parents, and children) hold key management positions, or are interested as partner, director or guarantor, or shareholders holding 5% or more of the share capital of that concern, with the approval of the majority of the directors excluding the director concerned. The facilities to the persons mentioned above shall be extended at market terms and conditions and be dealt with at arm length basis.
Bank is not taking exposure against the guarantee of any of its directors, any of the family members of any of directors and any firm or private company in which our directors are interested as director, proprietor and partner.
Conflicts of Interest Register
The Bank maintains a register in which shall be entered separately particulars of all contracts, arrangements or appointments in which directors are interested.
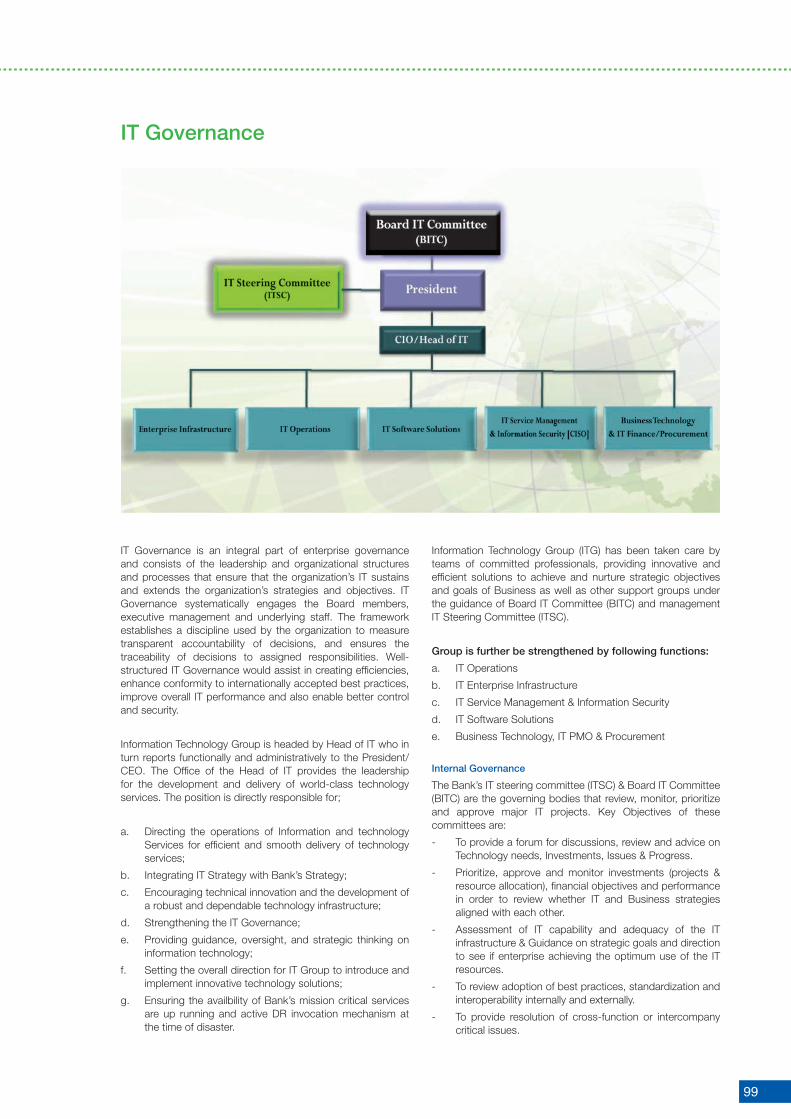
99
IT Governance is an integral part of enterprise governance and consists of the leadership and organizational structures and processes that ensure that the organization’s IT sustains and extends the organization’s strategies and objectives. IT Governance systematically engages the Board members, executive management and underlying staff. The framework establishes a discipline used by the organization to measure transparent accountability of decisions, and ensures the traceability of decisions to assigned responsibilities. Well-structured IT Governance would assist in creating efficiencies, enhance conformity to internationally accepted best practices, improve overall IT performance and also enable better control and security.
Information Technology Group is headed by Head of IT who in turn reports functionally and administratively to the President/CEO. The Office of the Head of IT provides the leadership for the development and delivery of world-class technology services. The position is directly responsible for;
a. Directing the operations of Information and technology Services for efficient and smooth delivery of technology services;
b. Integrating IT Strategy with Bank’s Strategy;
c. Encouraging technical innovation and the development of a robust and dependable technology infrastructure;
d. Strengthening the IT Governance;
e. Providing guidance, oversight, and strategic thinking on information technology;
f. Setting the overall direction for IT Group to introduce and implement innovative technology solutions;
g. Ensuring the availbility of Bank’s mission critical services are up running and active DR invocation mechanism at the time of disaster.
Information Technology Group (ITG) has been taken care by teams of committed professionals, providing innovative and efficient solutions to achieve and nurture strategic objectives and goals of Business as well as other support groups under the guidance of Board IT Committee (BITC) and management IT Steering Committee (ITSC).
Group is further be strengthened by following functions:
a. IT Operations
b. IT Enterprise Infrastructure
c. IT Service Management & Information Security
d. IT Software Solutions
e. Business Technology, IT PMO & Procurement
Internal Governance
The Bank’s IT steering committee (ITSC) & Board IT Committee (BITC) are the governing bodies that review, monitor, prioritize and approve major IT projects. Key Objectives of these committees are:
- To provide a forum for discussions, review and advice on Technology needs, Investments, Issues & Progress.
- Prioritize, approve and monitor investments (projects & resource allocation), financial objectives and performance in order to review whether IT and Business strategies aligned with each other.
- Assessment of IT capability and adequacy of the IT infrastructure & Guidance on strategic goals and direction to see if enterprise achieving the optimum use of the IT resources.
- To review adoption of best practices, standardization and interoperability internally and externally.
- To provide resolution of cross-function or intercompany critical issues.
IT Governance

ANNUAL REPORT 2013
100
- Consideration of risk exposures and monitoring of risk management.
- To review the communication path between the board/executive and middle management.
Information Security & Compliance: MCB management has centralized the authority, direction, management, and monitoring of Information Security activities for the entire organization in the Information Technology Group (ITG) under the umbrella of Information Security (IS) Team, led by Head of Information Security. This function is responsible for establishing, elaborating, and maintaining IT system’s security compliance, define security controls in the following listed sections of Information Security Policy, processes, and documentation (SOPs, manuals, etc.) commensurate with Information Security Policy, departmental framework, and the changing threat landscape. Information Security function is responsible to ensure bank wide compliance with Information Security Policy, handling incidents of security breach, and recommending corrective action. Other responsibilities includes; IT Compliance of regulatory guidelines, internal policies and processes, Risk & Control Self-Assessment (RCSA) and to bridge the reviews, audits, inspections, and special assignments as conducted by the Regulator, Internal & External Audit, etc.
Project Governance: Effective project governance needs to be in place to ensure the Project is adequately supported and guided towards achieving its intended outcomes, and to ensure key decisions are made with appropriate governance oversight. BT/IT PMO is a central point of contact at Information Technology Group to facilitate ITG’s other verticals and Other Groups for endeavoring successful deliveries of major and critical “IT Projects”. The function is mainly responsible for:
- Establishing a connect between Technology and Business to understand business needs and to translate into technology solutions;
- Providing an Interface of the IT Group for other business groups to discuss their initiatives/projects for end-state solutions;
- End to end Project management of technology solution specifically and providing support for all other business initiatives in general, from technology perspective only;
- Project governance, support processes and methodologies for successful delivery of projects and customer requirements;

101
Preamble
The purpose of this policy is to provide a channel in MCB Bank Limited (the Bank) for the bank’s staff and outside parties to raise concerns, expose irregularities, help uncover financial malpractices, prevent frauds, eliminate personnel harassments and attend to grievances of those associated without any fear of reprisal or adverse consequences.
Objectives
The main objective of the policy is to address the concerns of customers and employees for reported wrongdoings, impropriety and services inefficiencies affecting bank‘s overall performance, as per scope approved by the Board of Directors.
Scope
The policy refers to the deliberate, voluntary disclosure of individual or organizational impropriety by a person who has or had privileged access to data, event or information about an actual, suspected or anticipated wrongdoing within or by an organization that is within its ability to control.
Protection of Whistleblowers
The MCB Bank is committed to the protection of genuine complainants against action taken in reprisal for the making of protected disclosures. Confidentiality of the complainant’s identity, the nature of the report, and the suspected person’s identity is strictly maintained.
The Bank does not tolerate harassment or victimization and takes action, which could involve disciplinary proceedings, to protect complainant when they raise a concern in good faith. Retaliation against a whistleblower is prohibited regardless of the outcome of the investigation.
Incentives for Whistle Blowing
Complainant may be awarded monetary benefit / career advancement depending upon the nature and gravity of the disclosure.
Whistle Blowing Mechanism
Employees or outside parties may report their concerns or complaints to Whistle Blowing Unit through any of the following means:
Hotline E-mail Fax Regular Mail
Concerns and complaints received through these means are investigated and findings are shared with the senior management for their necessary action. These findings are also shared with the Audit Committee.
Number of instances reported to Audit Committee
Number of whistle blowing incidences reported to the Audit Committee during the year 2013 were 22.
Whistle Blowing Policy
Record Management PolicyThe Bank has put in place comprehensive guidelines for the management and control of its business records. These guidelines outline the processes for handling, protection, retention, retrieval, and disposition of recorded business information in a consistent, efficient and reliable manner. The guidelines cover following aspects:
Identification of Record
All business and support functions are required to identify, protect and retain records as required for normal business activities and for such periods as are necessary to fulfill the Bank’s obligations to customers, employees, and stakeholders and for compliance with all applicable laws and regulations.
Classification of Record
Records are classified as to their value to the Bank and maintained and kept according, to their usage (activity level) and retention characteristics. Recorded information is classified as. Vital, Essential or Non-Essential.
Handling of Record
After classification, the recorded information is given a retention schedule that documents how the records will be handled, stored and disposed of form creation through active and inactive status to ultimate disposition. Appropriate procedures are followed to ensure that all records / documentation are carefully secured after business hours. It is ensured that all security stationery, negotiable instruments, confidential customer, employee documents etc., are properly placed in the vaults/ cabinets and before the close of the branch/ office appropriate controls and procedures related to securing records, data storage and backup are complied. Further, all business and support functions are required to ensure that no records are destroyed while under legal or regulatory requirements or the subject of pending or anticipated litigation.
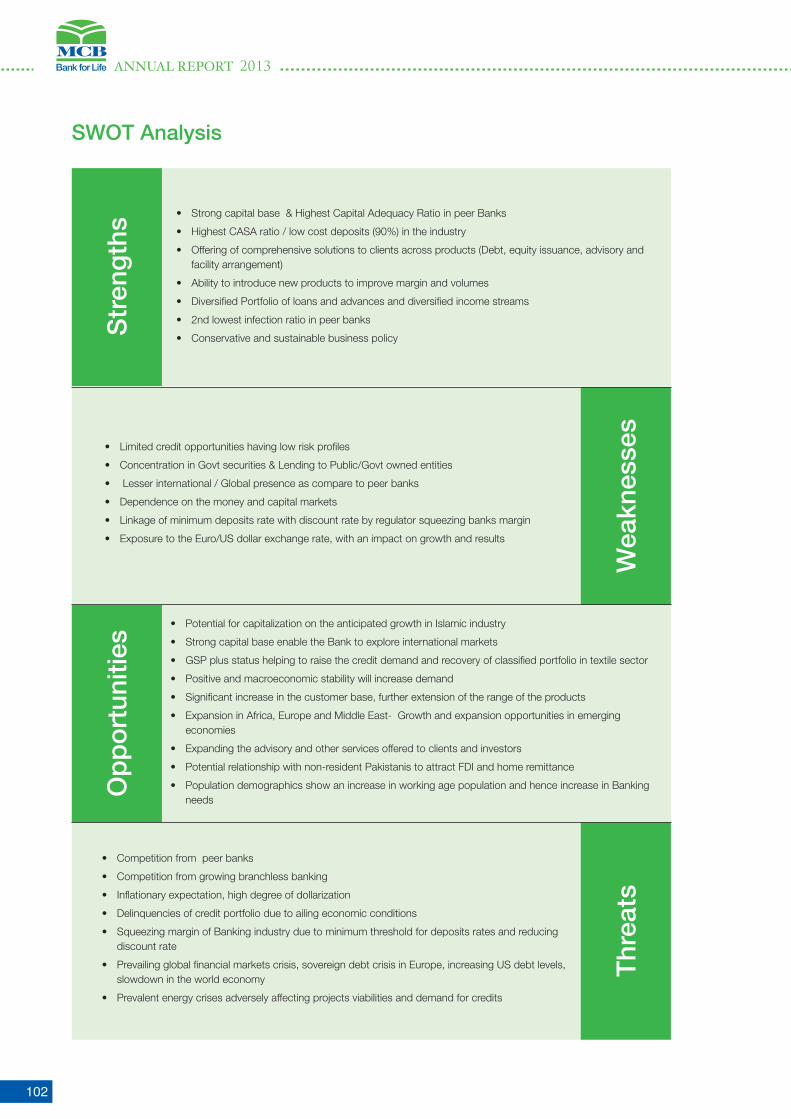
ANNUAL REPORT 2013
102
Thr
eats
• Competition from peer banks
• Competition from growing branchless banking
• Inflationary expectation, high degree of dollarization
• Delinquencies of credit portfolio due to ailing economic conditions
• Squeezing margin of Banking industry due to minimum threshold for deposits rates and reducing discount rate
• Prevailing global financial markets crisis, sovereign debt crisis in Europe, increasing US debt levels, slowdown in the world economy
• Prevalent energy crises adversely affecting projects viabilities and demand for credits
Op
po
rtun
ities
• Potential for capitalization on the anticipated growth in Islamic industry
• Strong capital base enable the Bank to explore international markets
• GSP plus status helping to raise the credit demand and recovery of classified portfolio in textile sector
• Positive and macroeconomic stability will increase demand
• Significant increase in the customer base, further extension of the range of the products
• Expansion in Africa, Europe and Middle East- Growth and expansion opportunities in emerging economies
• Expanding the advisory and other services offered to clients and investors
• Potential relationship with non-resident Pakistanis to attract FDI and home remittance
• Population demographics show an increase in working age population and hence increase in Banking needs
Wea
knes
ses
• Limited credit opportunities having low risk profiles
• Concentration in Govt securities & Lending to Public/Govt owned entities
• Lesser international / Global presence as compare to peer banks
• Dependence on the money and capital markets
• Linkage of minimum deposits rate with discount rate by regulator squeezing banks margin
• Exposure to the Euro/US dollar exchange rate, with an impact on growth and results
SWOT Analysis
• Strong capital base & Highest Capital Adequacy Ratio in peer Banks
• Highest CASA ratio / low cost deposits (90%) in the industry
• Offering of comprehensive solutions to clients across products (Debt, equity issuance, advisory and facility arrangement)
• Ability to introduce new products to improve margin and volumes
• Diversified Portfolio of loans and advances and diversified income streams
• 2nd lowest infection ratio in peer banks
• Conservative and sustainable business policyStr
eng
ths

103
Risk and Opportunity Report
Risk, being inherent in the banking business has to be mitigated through operational design to ensure safeguarding of an entity’s value. At MCB, an appropriate risk appetite is defined for every identified risk to ensure that Bank has evaluated the associated risk and has designed an operational mitigating control. On the flip side, the Bank remains committed to pounce on every possible opportunity to translate it into revenues / returns for the stakeholders, while making sure that the related risk is adequately addressed.
In the chart to follow, we have summarized risks and opportunities and the related mitigating factors.
Risks:
Risk type Description Plans and Strategies for Mitigating Risks & Capitalizing Opportunities
Capital adequacy risk The risk that the Bank has insufficient capital or is unable to meet the statutory defined capital requirements
The Bank remains a well-capitalized institution with a capital base well above the regulatory limits and Basel-III requirements. The Bank regularly assesses the capital requirements and ensures that the minimum capital requirements specified by the Central Bank are adhered to. Quality of the capital is evident from Bank’s Tier-1 to total risk weighted assets ratio which comes to 20.89% against requirement of 6.5% for 2013 .
The Bank will continue the policy of sufficient profit retention to increase its risk taking capacity and capitalize opportunities
Liquidity risk The risk that the Bank is unable to meet its financial liabilities as they fall due.
MCB performs regular liquidity stress tests as part of its liquidity monitoring activities. The purpose of the liquidity stress tests is intended to ensure sufficient liquidity for the Bank under both idiosyncratic and systemic market stress conditions. MCB’s liquidity risk management approach involves intraday liquidity management, managing funding sources and evaluation of structural imbalances in balance sheet structure.
The Bank’s large and stable base of customer deposits, along with Bank’s strong capital base supplemented underlying strength and strong liquidity position during the year. Bank also has a substantial portfolio of marketable securities that can be realized in the event of liquidity stress. Bank’s Liquidity Coverage Ratio and Net Stable Funding Ratio are well within the Basel prescribed limits.
Credit risk The risk that the Bank will incur losses owing to the failure of a customer or counterparty to meet its obligation to settle outstanding amounts.
Bank has been selective in disbursing its loan to good quality borrowers engaged in different businesses. The Bank continues to maintain lower than average industry level NPL ratios. Bank has a fairly diversified loan portfolio. Even the top 20 Non-Government Borrowers account for less than 25% of total (Funded + Non-Funded) exposure. For risk categorized as sovereign/government risk, our lending exposure is spread over multiple government owned or controlled organizations and departments which are engaged in a variety of tasks that range from different development related works to utility distribution and production etc.
To manage worst outcomes in terms of scenarios multiple factors in bank’s lending structure provide additional comfort and support, these include quality of eligible collateral, pre disbursement safety measures, post disbursement monitoring, etc.
Credit Risk Management function identify measure, manage, monitor and mitigate credit risk. Organizational structure of this function ensures pre and post-facto management of credit risk. While, Credit Review function provides pre-fact evaluation of counterparties, the Credit Risk Control (CRC) performs post-fact evaluation of financing facilities and reviews clients’ performance on an ongoing process.

ANNUAL REPORT 2013
104
Market risk The risk arising from fluctuations in interest rates, foreign currency, credit spreads, equity prices, commodity prices and risk related factors such as market volatilities
Bank is exposed to market risks through its trading and other activities. A comprehensive structure is in place aimed at ensuring the bank does not exceed its qualitative and quantitative tolerance for market risk. The bank has followed a non-aggressive and balanced approach towards risk taking in the market risk area coupled with robust risk management architecture, thus achieving the target of keeping the exposures within the defined risk appetite and a reward justifying the efforts. A number of metrics like VaR methodologies complemented by sensitivity measures, notional limits, loss triggers at a detailed portfolio level, and extensive stress testing are used to capture and report the multi-dimensional aspects of market risk.
The Bank will continue to pursue to have a risk return balanced portfolio to keep its market risk exposure in line within the approved risk limits.
Operational risk The risk of loss resulting from inadequate or failed processes, people, systems or from external events.
In accordance with the Operational Risk policy and framework, a database covering losses, control breaches and near misses is being maintained. Major risk events are analyzed from the control breaches perspective and mitigating controls are assessed on design and operating effectiveness. Quarterly updates on Operational Risk events are presented to senior management and Board’s risk committee. The bank has an internal Operational Risk awareness program which is aimed at building capacity and inculcating risk culture in the staff through workshops and on-job awareness.
Regulatory risk The risk arising from noncompliance with regulatory requirements, regulatory change or regulator expectations
Management of regulatory risk entails early identification and effective management of changes in legislative and regulatory requirements that may affect the Bank. We review key regulatory developments in order to anticipate changes and their potential impact on our performance
Country risk The risk of material losses arising from significant country specific events.
Country Exposure Limits are in place, which broadly capture direct exposure on sovereigns and exposures on foreign domiciled counter parties. Additionally, business product wise sub limits involving cross border exposure are also implemented. Monitoring of these limits is a regular feature of Risk Management.
Opportunities• Strong capital base and highest Capital adequacy Ratio in peer banks provides the opportunity of exploring International
avenues in emerging market.
• Growing Islamic Banking Market will be capitalized through incorporating Islamic Bank subsidiary
• Various Risks described below are counterbalanced by the opportunities that could result from positive trends
• MCB has launched MCB Lite first chip based card to capitalize branchless Banking opportunities
• MCB re-launched Payara Ghar , Personnel Loan, Student Loan, etc during the year
• Potential relationship with non-resident Pakistanis to attract FDI and home remittance
• Population demographics show an increase in working age population and hence increase in Banking needs
• MCB expanding its network to tapped unbanked population
Risk and Opportunity Report

105
Stakeholder engagement
Stakeholders are those individuals, groups of individuals or organisations that impact and/ or could be impacted by our Bank’s activities, products or services. In achieving and entrenching its integrated approach to sustainability, MCB Bank takes a highly collaborative approach, ensuring maximum interaction with, and input by, all its stakeholders.
For MCB, stakeholder engagement involves far more than merely communicating to our various stakeholder groups. We regard all our stakeholders as partners with our and make every effort to use the engagement we have with them to provide full disclosure, deepen our relationships and afford them opportunities to provide us with valuable input and feedback that will help us to grow and strengthen our business.
The following tables provide an overview of MCB’s stakeholder engagements:
Stakeholder Reasons for EngagementFrequency of Engagement
Methods of Engagement
Employees - To ensure that we remain an employer of choice by providing a safe, positive and inspiring working environment.
- To understand and respond to the needs and concerns of our staff members.
- To provide staff with strategic direction and pertinent information regarding Bank’s activities.
Ongoing and daily engagement at all levels of the Bank. As and when required by staff members.
In addition to the regular communication that took place with direct managers and teams through a range of interactive channels, specific employees engagement included:
1. Regular electronic and printed newsletters
2. Compliance letters3. Annual conference4. Strategy sessions
Customers - To gain a better understanding of the financial services needs of our customers
- To provide appropriate advice and solutions to meet our customers’ identified financial needs.
- To ensure accuracy of personal information.
Dependent on customers’ needsNew products launch
Interactions through branch outlets, relationship managers and call centres, social media, surveys and marketing and advertising activities.
Shareholders - To provide relevant, timeous information to current and potential shareholders
- To keep shareholders informed at all times, to ensure that our shares trade at a fair value
- To ensure that our image and the trust placed in us by shareholders, continues to improve, thereby minimizing the potential for reputational risk.
Formally, four times a year at the release of year-end, half year, first- and third-quarter results. As requested by the analysts and investors.
Local and international road shows.Communications and answering investor/ analyst questions.Annual general meeting Press releases.
Regulator - To maintain open, honest and transparent relationships with regulator.
- To ensure compliance with legal and regulatory requirements
Daily, weekly, quarterly and as required.
These include meetings with representative of regulator and written communication on need basis.
Communities - To create partnerships that best facilitates our integrated sustainability activities.
- To obtain input from communities regarding key focus areas.
- To create awareness of our integrated sustainability commitment and initiatives
Dependent on events, requirements and request from either side
Ongoing support of projects and interaction with a wide variety of non-profit organization
Government - To build and strengthen relationships with government, both as a partner in the development of the country and as a current or potential client.
- To provide input into legislative development processes that will affect our activities and operations.
- To reaffirm our commitment to public sector business development through proactive interaction with government
As deemed necessary or requested by either side.
These include meetings with representative of Government bodies
Media - To leverage the media as a channel to communicate with relevant stakeholders and public at large
Frequent interaction with print and electronic media
Personal engagement, written reply, phone calls, interviews and capacity building seminars
ANNUAL REPORT 2013
106
In line with “Statement of Ethics and Business Practices” prepared in 2002, the Employees of the bank shall;
Abidance of Laws / Rules
• Conform to and abide by the Bank rules and policies and obey all lawful orders and directives which may from time to time be given by any person or persons under whose jurisdiction, superintendence or control, the persona will, for the time being, be placed. To undertake at all times compliance with and observation of all applicable laws, regulations and Bank’s policies, wherever the bank operates.
Integrity
• Conduct the highest standards of ethics, professional integrity and dignity in all dealings with the public, customers, investors, employees, and government officials, State Bank of Pakistan and fellow bankers and non-engagement in acts discreditable to the Bank, profession and nation.
• In case of awareness of any breaches of laws and regulations, frauds and other criminal activities or other
• similar serious incidents that might affect the interests of the Bank, the same shall be informed to the senior management immediately, including any issue, which may pose a reputational risk.
• Not use this policy to raise grievances or act in bad faith against colleagues.
Professionalism
• Serve the Bank honestly and faithfully and strictly serve the Bank’s affairs and the affairs of its constituents.
• Use utmost endeavour to promote the interest and goodwill of the Bank and show courtesy and attention
• in all transactions/correspondence with officers of Government, State Bank of Pakistan, other Banks &
• Financial Institutions, other establishments dealing with the Bank, the Bank’s constituents and the public.
• Disclose and assign to MCB all interest in any invention,improvement, discovery or work of authorship that may be made or conceived and which may arise out of the employment with MCB.
• In case the employment is terminated, all rights to property and information generated or obtained as part of employment relationship will remain the exclusive property of MCB.
• Comply with the laws and regulations on money
• laundering and fraud prevention and immediate reporting of all suspicions of money laundering as per the guidelines provided in KYC & AML Procedures Handbook for Management and Staff.
• Not to engage in any act of violation of KYC & AML guidelines given by State Bank of Pakistan and exercising of extreme vigilance in protecting MCB from being misused by anyone to launder money by violating these guidelines.
• Ensure that all customer complaints are resolved quickly, fairly and recorded appropriately.
Conflict of Interest
• Avoid all such circumstances in which there is personal interest conflict, or may appear to be in conflict, with the interest of the Bank or its customers.
• In case of potential conflict of interest, the same should be declared immediately to senior management, action is taken to resolve and manage it in open manner and resolving the conflict of interest on their own would be avoided.
• Report to the Company Secretary about any sale and purchase of MCB shares (own or spouse) in case the annual basic salary exceeds Rs. 500,000/-.
Political Participation
• Stand firmly against supporting the activities of any Group or individual that unlawfully threatens public order and safety.
• Not obtain membership of any political party, or take part in, subscribing in aid of, or assist in any way, any political movement in or outside of Pakistan or relating to the affairs of Pakistan.
• Not express views detrimental to the ideology, sovereignty or integrity of Pakistan.
• Not canvass or otherwise interfere or use influence in connection with or take part in any election as a candidate to a legislative/local body or issue an address to the electorate or in any manner announce or allowed to be announced publicly as a candidate or prospective candidate whether in Pakistan or elsewhere. However, the right to vote can be exercised.
• Not bring or attempt to bring political or other pressure/influence directly or indirectly to bear on the authorities/superior officers or indulge in derogatory pamphleteering, contribute, or write letters to the newspapers, anonymously or in own name contribute or appear in media, with an intent to induce the authority/superior officers to act in a manner inconsistent with rules, in respect of any matter relating to appointment, promotion, transfer, punishment, retirement or for any other conditions of service of employment.
Financial Interest
Not indulge in any of the following activities:
• Borrow money from or in any way place myself under pecuniary obligation to a broker or moneylender or
Code of Conduct

107
anyone, including but not limited to any firm, company or person having dealings with the Bank.
• Buy or sell stock, shares or securities of any description without funds to meet the full cost in the case of purchase or scripts for delivery in the case of sale.
• However, a bona-fide investment of own funds in such stocks, shares and securities as wished can be made.
• Lend money in private capacity to a constituent of the Bank or have personal dealings with a constituent in the purchase or sale of bills of exchange, Government paper or any other securities.
• Act as agent for an insurance company otherwise than as agent for or on behalf of the Bank.
• Be connected with the formation or management of a joint stock company or hold office of a director.
• Engage in any other commercial business or pursuit, either on own account or as agent for another or others.
• Accept or seek any outside employment or office whether stipendiary or honorary.
• Undertake part-time work for a private or public body or private person, or accept fee thereof.
Gift, Favors Etc.
• Not use the employment status to seek personal gain from those doing business or seeking to do business with MCB, nor accept such gain if offered.
• Not accept any gift, favors, entertainment or other benefit the size or frequency of which exceeds normal business contacts from a constituent or a subordinate employee of the Bank or from persons likely to have dealings with the Bank and candidates for employment in the Bank.
• Not accept any benefit from the estate of, or a trust created by a customer, or from an estate or trust of which a Bank’s Company or business unit is an executor, administrator or trustee.
• Not give or accept bribes or engage in any form of corruption.
Confidentiality
• Maintain the privacy and confidentiality (during the course of employment and after its termination for whatever reason), of all the information acquired during the course of professional activities and refrain from disclosing the same unless otherwise required by statutory authorities / law. All such information will remain as a trust and will only be used for the purpose for which it is intended and will not be used for the personal benefit of any individual(s).
• Not use for self gain, or for that of others either directly or
indirectly, all inside information about Bank’s customers / affairs including customer data, product manuals, confidential research work, technical processes, operating manuals, marketing plans and strategies and other confidential financial and business information of the Bank etc.
• Not trade in relevant investments or indulge in giving tips to another person or dealing on behalf of relatives, friends or any other third parties, whilst in possession of non-public price sensitive information.
• Not disclose that a suspicious transaction or related information is being reported for investigation to the customer or any irrelevant quarter.
Data Security
• Only access or update the system and data according to the authority given by the bank. Any unauthorized access or updation will hold the person liable for a penal action by the bank in accordance with HR policies.
• Not compromise access to system by communicating my identification and /or passwords to others.
Communication / Contact with Media
• Be truthful in all advertisings and promotional efforts and to publish only accurate information about the Bank’s operations under valid authority as prescribed in the Bank’s policy.
• Not give any interview on behalf of the Bank or in official capacity in the print/electronic media or have the photograph displayed or an act in television/stage plays or in cinema without having permission from the competent authority.
Business / Work Ethics
• Respect fellow colleagues and work as a team. To be, at all times, courteous and to not let any personal differences affect work.
• Treat every customer of the Bank with respect and courtesy.
Personal Responsibility
• Demonstrate commitment to the code through words and actions.
• Be responsible for data relating to official responsibilities and to not alter / modify / amend Bank’s record so as to obtain any personal benefits, attempt which in doing so shall hold the person liable to disciplinary action as per Bank’s policy.
• Safeguard as a personal responsibility, both the tangible and intangible assets of MCB and its customer(s) that are under personal control and to not use Bank’s assets for personal benefits except where permitted by MCB.
• Not use any Bank facilities including a car or telephone to promote trade union activities, or carry weapons

ANNUAL REPORT 2013
108
into Bank premises unless so authorized by the management, or to carry on trade union activities during office hours, or subject Bank officials to physical harassment or abuse.
• Not indulge in any kind of harassment or intimidation whether committed by or against any senior/ junior, coworker, customer, vendor or visitor.
• Not use language, written or spoken in intra-office or communication(s) with individual(s) outside the office that may contain any statement or material that is offensive to others.
• Not engage in any discrimination against an individual’s race, colour, religion, gender, age, marital status, sexual orientation or disability.
Punctuality
• Ensure good attendance and punctuality and demonstrate a consistently good record in this area.
• Obtain, for any absence during working hours, written permission of the immediate supervisor.
• Not absent oneself from assigned duties, nor leave station over night, without having first obtained the permission of the competent authority. In case of emergency, if it is not possible to obtain prior permission, necessary permission / confirmation to be obtained from the competent authority within 24 hours.
Dress Code
• Maintain a standard of personal hygiene and dress appropriate for attendance at work. The appearance must inspire confidence and convey a sense of professionalism.
Work Environment
• Help in maintaining a healthy and productive work environment to meet the responsibilities to fellow employees, customers and investors, and to not get engaged in the selling, manufacturing, distributing, using any illegal substance or getting under the influence of illegal drugs while on the job.
• Ensure strict adherence to all policies of the Bank, as announced by the management from time to time and will contribute utmost effort in maintaining a conducive work environment by meticulously adhering and ensuring adherence to Anti Harassment and SHE (Safety, Health & Environment) Policies of the Bank.
Usage of Communication Tools
• Ensure strict adherence to the use of internet, emails and telephone provided by the Bank for professional use only.
• Never use the Bank’s system to transmit or receive electronic images or text containing ethnic slurs,
social epithets or any thing that might be construed as harassing, offensive or insulting to others.
• Never utilize Bank’s system to disseminate any material detrimental to the ideology, sovereignty or integrity of Pakistan.
• Never utilize the Bank’s system for supporting any terrorist activity within and/or outside Pakistan.
Reporting and Accountability
• Maintain all books, data, information and records with scrupulous integrity, reflecting in an accurate and timely manner and to ensure that all business transactions are reported and documented correctly according to the business practices.
Ensure facts are not misinterpreted pertaining to:
• Issuing an incorrect account statement / any other information for any customer or staff member.
• Placing a fake claim for reimbursement of any expenses.
• Unrecorded funds or assets of Bank in custody for any reason.
• Posting of false, artificial or misleading entries in the books or record of the Bank.
• Intimate Human Resources Management of any changes in the personal circumstances relating to employment or benefits.

109
The Bank’s internal control structure comprises of the Board of Directors, Senior Management, Risk Management Group, Compliance & Control Group, Financial Control Group, Audit & RAR Group and self-Assessment process within business groups. The Management is responsible for establishing and maintaining a system of adequate internal controls and procedures for implementing strategy and policies as approved by the Board of Directors, designed to provide reasonable assurance as to the integrity and reliability of those controls and reports produced there from; developing processes that identify, measure, monitor and control risks incurred by the Bank; maintaining an organizational structure that clearly assigns responsibilities, authority and reporting relationships; ensuring that delegated responsibilities are effectively carried out; setting appropriate internal control policies; monitoring the adequacy and effectiveness of the internal control system through evaluation and validation by internal auditors who have been entrusted the supervisory function with respect review of internal controls, the internal auditors reporting significant findings directly to Audit Committee of the Board; and taking timely due cognizance of the observations / recommendations concerning the system of internal controls made by the internal auditors, external auditors and the regulators. In view of the above and based on its supervision the Management has evaluated the effectiveness of the Bank’s internal controls that encompassed material matters and reports that the System of Internal Control is sound in design and has been effectively implemented and monitored for material aspects. Keeping in view the risk exposure and identification, evaluation and management of significant risks faced by the Bank and based on regular review of internal controls and reports on their soundness, improvements are brought about by the Management with the approval of Board of Directors in the internal controls and policies. These are being continually reviewed and updated not only to conform to and achieve full compliance with State Bank of Pakistan’s Guidelines on Internal Controls, but also to conform, wherever feasible and practicable, with international best practices and good corporate governance models.
However, it needs to be stated that systems are designed to manage, rather than eliminate the risk of failure to achieve the business objectives and can only provide reasonable and not absolute assurance against material misstatement or loss. In making this assessment, the Bank used criteria established by the Committee of Sponsoring Organizations of the Treadway Commission (COSO) Framework. The Bank’s assessment included documenting, evaluating and testing of the design and operating effectiveness of its internal controls over financial reporting (ICFR). The Bank’s internal controls over financial reporting include those policies and procedures that: (i) pertain to the maintenance of records that in reasonable detail accurately and fairly reflect the transactions and dispositions of the assets of the Bank; (ii) provide reasonable assurance that transactions are recorded as necessary to permit preparation of financial statements in accordance with approved accounting standards, and that receipts and expenditures of the Bank are being made only in accordance with authorizations of Management and Directors of the Bank; and (iii) provide reasonable assurance regarding prevention or timely detection of unauthorized acquisition, use or disposition of the Bank’s assets that could have a material effect on the financial statements. Because of its inherent limitations, Internal Controls over Financial Reporting may not prevent or detect misstatements. Also, projections of any revaluation of effectiveness to future periods are subject to the risk that controls may become inadequate because of changes in conditions, or that the degree of compliance with the policies or procedures may deteriorate. Furthermore, the bank has developed a comprehensive management testing and reporting framework for
ensuring ongoing operating effectiveness of majority of key controls.In accordance with SBP directives, the Bank has completed all stages of ICFR roadmap and the third Long Form Report (LFR) for the year 2012 issued by the statutory auditors has been submitted to SBP as per given timeline, on June 28, 2013. The Bank will continue enhancing its coverage and compliance with the SBP guidelines on Internal Controls and further strengthen its control environment on an ongoing basis.
A separate Issues Tracking & Monitoring (ITAM) Committee structure with membership comprising of Senior Management is in place to expedite the resolution/compliance of identified issues.The ITAM Committee is assisted by a ‘Working Group’, which regularly conducts meetings and follows up with the process owners for resolution of issues. The Working Group escalate/refer key issues to ITAM Committee for its advice, decision or support. Moreover, the ITAM Committee regularly monitors performance of the Working Group in its meetings.
The scope of Audit & RAR Group, independent from line management, inter-alia includes, review and assess the adequacy and effectiveness of the control activities across the Bank as well as implementation of and compliance with all the prescribed policies and procedures. All significant and material findings of the internal audit reviews are reported to the Audit Committee of the Board of Directors. The Audit Committee actively monitors implementation, to ensure that identified risks are mitigated to safeguard the interest of the Bank.
February 11, 2014 Raheel IjazLahore Chief Compliance Officer
Statement on Internal Controls

ANNUAL REPORT 2013
110
This statement is being presented to comply with the Code of Corporate Governance (CCG) contained in Regulation No. 35 of Listing Regulations of Karachi, Lahore and Islamabad Stock Exchanges, for the purpose of establishing a framework of good governance, whereby a listed company is managed in compliance with the best practices of corporate governance.
The Bank has applied the principles contained in the CCG in the following manner:
1. The Bank encourages representation of non-executive directors on its Board of Directors. At present all the directors on the Board are non-executive except for President & CEO.
2. The directors have confirmed that none of them is serving as a director on more than seven listed companies, including this Bank (excluding the listed subsidiaries of listed holding companies).
3. All the resident directors of the Bank are registered as taxpayers and none of them has defaulted in payment of any loan to a banking company, a DFI or an NBFI or, being a member of a stock exchange, has been declared as a defaulter by that stock exchange.
4. During the year, two casual vacancies occurred on the Board, one was filled within the prescribed period while relaxation was obtained from the Securities and Exchange Commission of Pakistan for the second, as per clause xlii of CCG.
5. The Bank has prepared a “Code of Conduct” and has ensured that appropriate steps have been taken to disseminate it throughout the Bank along with its supporting policies and procedures.
6. The Board has developed a vision/mission statement, overall corporate strategy and significant policies of the Bank. A complete record of particulars of significant policies along with the dates on which they were approved or amended has been maintained.
7. All the powers of the Board have been duly exercised and decisions on material transactions, including appointment and determination of remuneration and terms and conditions of employment of the CEO and non-executive directors, have been taken by the board/shareholders.
8. The meetings of the Board were presided over by the Chairman and, in his absence, by a director elected by the Board for this purpose and the Board met at least once in every quarter. Written notices of the Board meetings, along with agenda and working papers, were circulated at least seven days before the meetings. The minutes of the meetings were appropriately recorded and circulated.
9. The Board members have the prescribed education and experience required for exemption from training programs of Directors pursuant to clause xi of CCG. However, one of the directors does not fulfill the exemption criteria; therefore, he has completed Directors Training Program during the year 2013.
10. No new appointments of CFO and Head of Internal Audit were made during the year by the Board except for Company Secretary, whose remuneration and terms & condditions of employeement were approved by the Board.
11. The Directors’ Report for this year has been prepared in compliance with the requirements of the CCG and fully describes the salient matters required to be disclosed.
12. The financial statements of the Bank were duly endorsed by CEO and CFO before approval of the Board.
13. The directors, CEO and executives do not hold any interest in the shares of the Bank other than that disclosed in the pattern of shareholding.
14. The Bank has complied with all the corporate and financial reporting requirements of the CCG.
15. The Board has formed an Audit Committee. It comprises four (4) members; all of whom are non-executive directors including the Chairman of the Committee.
16. The meetings of the audit committee were held at least once every quarter prior to approval of interim and final results of the Bank and as required by the CCG. The terms of reference of the committee have been formed and advised to the Committee for compliance.
17. The Board has formed an HR and Remuneration Committee. It comprises four (4) members, of whom three (3) are non-executive directors including the Chairman of the Committee.
18. The Board has set up an effective internal audit function which is considered suitably qualified and experienced for the purpose and is conversant with the policies and procedures of the Bank.
19. The statutory auditors of the Bank have confirmed that they have been given a satisfactory rating under the quality control review program of the ICAP, that they or any of the partners of the firm, their spouses and minor children do not hold shares of the Bank and that the firm and all its partners are in compliance with International Federation of Accountants (IFAC) guidelines on code of ethics as adopted by the ICAP.
20. The statutory auditors or the persons associated with them have not been appointed to provide other services except in accordance with the listing regulations and the auditors have confirmed that they have observed IFAC guidelines in this regard.
21. The ‘closed period’, prior to the announcement of interim/final results, and business decisions, which may materially affect the market price of Bank’s securities, was determined and intimated to directors, employees and stock exchange(s).
22. Material/price sensitive information has been disseminated among all market participants at once through stock exchange(s).
23. We confirm that all other material principles enshrined in the CCG have been complied with.
February 11, 2014 Mian Mohammad ManshaLahore Chairman
Statement of Compliance with the best practices of Code of Corporate Governance for the year ended December 31, 2013

111
We have reviewed the Statement of Compliance with the best
practices contained in the Code of Corporate Governance
prepared by the Board of Directors of MCB Bank Limited to
comply with Regulation G-1 of the Prudential Regulations
for Corporate /Commercial Banking issued by the State
Bank of Pakistan, Regulation No. 35 of the Karachi Stock
Exchange, the Lahore Stock Exchange and the Islamabad
Stock Exchange, where the Bank is listed.
The responsibility for compliance with the Code of
Corporate Governance is that of the Board of Directors of
the Bank. Our responsibility is to review, to the extent where
such compliance can be objectively verified, whether the
Statement of Compliance reflects the status of the Bank’s
compliance with the provisions of the Code of Corporate
Governance and report if it does not. A review is limited
primarily to inquiries of the Bank’s personnel and review of
various documents prepared by the Bank to comply with
the Code.
As part of our audit of the financial statements, we are
required to obtain an understanding of the accounting and
internal control systems sufficient to plan the audit and
develop an effective audit approach. We have not carried
out any special review of the internal control system to
enable us to express an opinion as to whether the Board’s
statement on internal control covers all controls and the
effectiveness of such internal controls.
Regulation 35(x) of the Listing Regulations requires the
Company to place before the Board of Directors for their
consideration and approval, related party transactions
distinguishing between transactions carried out on terms
equivalent to those that prevail in arm’s length transactions
and transactions which are not executed at arm’s length
price recording proper justification for using such alternate
pricing mechanism. Further, all such transactions are also
required to be separately placed before the Audit Committee.
We are only required and have ensured compliance of
requirement to the extent of approval of related party
transactions by the Board of Directors and placement of
such transactions before the Audit Committee.
We have not carried out any procedures to determine
whether the related party transactions were undertaken at
arm’s length prices or not. Based on our review, nothing
has come to our attention which causes us to believe that
the Statement of Compliance does not appropriately reflect
the Company’s compliance, in all material respects, with
the best practices contained in the Code of Corporate
Governance as applicable to the Company for the year
ended December 31, 2013.
A. F. Ferguson & Co.
Chartered Accountants
Lahore Engagement Partner
Dated: February 28, 2014 Imran Farooq Mian
Review Report to the Members on Statement of Compliancewith Best Practices of Code of Corporate Governance

ANNUAL REPORT 2013
112
The Audit Committee comprises only of non-executive directors including one independent Director. The Committee is playing active role in resolving Bank’s financial matters and governance issues. The committee has deepened its focus on the effectiveness of internal controls, compliance, assurance and internal audit functions, and the work undertaken and the challenges provided by Board of Directors:
The Audit Committee has concluded its review of the conduct and operations of the Bank during 2013, and reports that:
• FivemeetingsoftheAuditCommitteewereheldduringtheyear2013
• TheAuditCommitteereviewedquarterly,half-yearlyandannualfinancialstatementsoftheBankpriortotheirapprovalby the Board of Directors
• TheAuditCommitteehasreviewedandapprovedallrelatedpartytransactions.
• TheAuditCommitteehasrecommendedtotheBoardthatM/sA.F.Ferguson&Company,CharteredAccountants,being eligible, be appointed to act as statutory auditors of MCB Bank Limited for the financial year ending December 31, 2014.
• TheAuditCommitteehasreviewedmanagementletterissuedbyexternalauditorsandmanagement’sresponse.Thecommittee is checking status of Compliance of External Auditor’s Management Letters on quarterly basis.
• TheHeadofInternalAudithasdirectaccesstotheChairmanoftheBoardAuditCommitteeandtheCommitteehasensured staffing of personnel with sufficient internal audit acumen and that the function has all necessary access to Management and the right to seek information and explanations.
• TheInternalAuditfunctionhascarriedoutitsdutiesunderthecharterdefinedbytheCommittee.
Apart from above, the Committee also reviewed and deliberated upon:
• StatusofimplementationbyGroups,ofdecisionsmadebyBoardanditsSub-CommitteesandtheirvalidationbyInternal Audit.
• AnupdateonentireauditactivitycarriedoutbytheInternalAuditFunctionduringtheyear.
• SignificantInternalAuditfindingspertainingtoBranchAudits,ManagementAuditandRiskAssetsReviews.
• RectificationactiontakenonInternalAuditFindings.
• Updateonevaluationofinternalcontrolsystembyinternalauditaswellascompliancethereonbythemanagement.
• ReviewofInternalAuditPolicies.
• ReviewandrecommendationofscopeandfeeofExternalAssessor forExternalQualityAssessmentof theAuditGroup.
• CompliancestatusofSBPInspectionReports.
• ResolutionofcomplaintsreceivedunderWhistleblowingProgramoftheBank.
• ThecommitteehasreviewedstatementoninternalcontrolsystemspriortoendorsementbytheBoardofDirectorsand internal audit reports;
Tariq RafiDated: February 11, 2014 Chairman Lahore Audit Committee
Report of the Audit Committee
Tariq Rafi
MCB Bank LimitedFinancial Statements For the year ended December 31, 2013

ANNUAL REPORT 2013
114
We have audited the annexed unconsolidated statement of financial position of MCB Bank Limited as at December 31, 2013 and the related unconsolidated profit and loss account, unconsolidated statement of comprehensive income, unconsolidated cash flow statement and unconsolidated statement of changes in equity together with the notes forming part thereof (herein-after referred to as the ‘financial statements’) for the year then ended, in which are incorporated the unaudited certified returns from the branches except for fifty branches which have been audited by us and eight branches audited by auditors abroad and we state that we have obtained all the information and explanations which, to the best of our knowledge and belief, were necessary for the purposes of our audit.
It is the responsibility of the Bank’s management to establish and maintain a system of internal control, and prepare and present the financial statements in conformity with approved accounting standards and the requirements of the Banking Companies Ordinance, 1962 (LVII of 1962), and the Companies Ordinance, 1984 (XLVII of 1984). Our responsibility is to express an opinion on these financial statements based on our audit.
We conducted our audit in accordance with the international standards of auditing as applicable in Pakistan. These standards require that we plan and perform the audit to obtain reasonable assurance about whether the financial statements are free of any material misstatement. An audit includes examining, on a test basis, evidence supporting the amounts and disclosures in the financial statements. An audit also includes assessing the accounting policies and significant estimates made by management, as well as, evaluating the overall presentation of the financial statements. We believe that our audit provides a reasonable basis for our opinion and, after due verification, which in the case of loans and advances covered more than sixty percent of the total loans and advances of the bank, we report that:
(a) in our opinion, proper books of account have been kept by the Bank as required by the Companies Ordinance, 1984 (XLVII of 1984), and the returns referred to above received from the branches have been found adequate for the purpose of our audit;
(b) in our opinion:
(i) the unconsolidated statement of financial position and unconsolidated profit and loss account together with the notes thereon have been drawn up in conformity with the Banking Companies Ordinance, 1962 (LVII of 1962), and the Companies Ordinance, 1984 (XLVII of 1984), and are in agreement with the books of account and are further in accordance with accounting policies consistently applied, except for the change in accounting policy referred to in note 5.6, With which we concur;
(ii) the expenditure incurred during the year was for the purpose of the Bank’s business; and
(iii) the business conducted, investments made and the expenditure incurred during the year were in accordance with the objects of the Bank and the transactions of the Bank which have come to our notice have been within the powers of the Bank;
(c) in our opinion and to the best of our information and according to the explanations given to us, the unconsolidated statement of financial position, unconsolidated profit and loss account, unconsolidated statement of comprehensive income, unconsolidated cash flow statement and unconsolidated statement of changes in equity together with the notes forming part thereof conform with approved accounting standards as applicable in Pakistan, and give the information required by the Banking Companies Ordinance, 1962 (LVII of 1962), and the Companies Ordinance, 1984 (XLVII of 1984), in the manner so required and give a true and fair view of the state of the Bank’s affairs as at December 31, 2013 and its true balance of profit, its comprehensive income, its cash flows and changes in equity for the year then ended; and
(d) in our opinion Zakat deductible at source under the Zakat and Ushr Ordinance, 1980 (XVIII of 1980), was deducted by the Bank and deposited in the Central Zakat Fund established under Section 7 of that Ordinance.
A. F. Ferguson & Co. Chartered AccountantsLahore Engagement Partner Dated: February 28, 2014 Imran Farooq Mian
Auditors’ Report To The Members

115
Note 2013 2012 2011
Restated Restated
(Rupees in ‘000)
ASSETS
Cash and balances with treasury banks 6 59,946,150 57,420,129 53,122,522 Balances with other banks 7 1,536,946 1,191,974 2,281,263 Lendings to financial institutions 8 1,224,638 1,551,472 955,087 Investments - net 9 449,006,019 402,068,916 316,651,613 Advances - net 10 248,242,965 239,583,320 227,580,139 Operating fixed assets 11 28,595,338 23,738,454 22,007,903 Deferred tax assets - net - - - Other assets - net 12 26,956,315 41,520,432 31,183,765
815,508,371 767,074,697 653,782,292
LIABILITIES
Bills payable 14 10,138,726 9,896,284 9,466,818 Borrowings 15 38,542,660 78,951,103 39,100,627 Deposits and other accounts 16 632,330,286 545,060,728 491,188,710 Sub-ordinated loan - - - Liabilities against assets subject to finance lease - - - Deferred tax liabilities - net 17 4,201,373 9,529,727 6,487,525 Other liabilities 18 20,064,345 21,166,166 18,378,373
705,277,390 664,604,008 564,622,053
NET ASSETS 110,230,981 102,470,689 89,160,239
Represented byShare capital 19 10,118,461 9,198,601 8,362,365
Reserves 20 46,601,214 44,253,270 42,186,467
Unappropriated profit 40,552,043 35,424,921 28,723,928
97,271,718 88,876,792 79,272,760
Surplus on revaluation of assets - net of tax 21 12,959,263 13,593,897 9,887,479
110,230,981 102,470,689 89,160,239
Contingencies and commitments 22
The annexed notes 1 to 46 and Annexures I to V form an integral part of these financial statements.
Statement of Financial PositionAs at December 31, 2013
Imran MaqboolPresident and Chief Executive
Tariq RafiDirector
Mian Umer ManshaDirector
Muhammad Ali ZebDirector

ANNUAL REPORT 2013
116
Note 2013 2012
Restated
(Rupees in ‘000)
Mark-up / return / interest earned 24 65,064,123 68,356,191 Mark-up / return / interest expensed 25 27,195,894 27,500,019
Net mark-up / interest income 37,868,229 40,856,172
Provision / (reversal) for diminution in the value of investments - net 9.3 (6,834) (3,044)Provision / (reversal) against loans and advances - net 10.5.2 (2,828,783) 480,903 Bad debts written off directly 10.6.1 - 206
(2,835,617) 478,065
Net mark-up / interest income after provisions 40,703,846 40,378,107
Non-mark-up / interest income Fee, commission and brokerage income 6,741,404 5,934,472 Dividend income 932,717 1,197,615 Income from dealing in foreign currencies 916,572 822,856Gain on sale of securities - net 26 2,130,341 824,539Unrealized gain on revaluation of investments classified as held for trading - - Other income 27 449,604 373,849
Total non-mark-up / interest income 11,170,638 9,153,331
51,874,484 49,531,438
Non-mark-up / interest expenses
Administrative expenses 28 18,709,969 17,476,862 Other provision / (reversal) - net 12.3 (52,285) (187,305)Other charges 29 928,595 599,974
Total non-mark-up / interest expenses 19,586,279 17,889,531 Extra ordinary / unusual item - -
Profit before taxation 32,288,205 31,641,907
Taxation - Current year 15,170,974 9,600,760 - Prior years - 116,725 - Deferred (4,378,107) 1,251,420
30 10,792,867 10,968,905
Profit after taxation 21,495,338 20,673,002
Unappropriated profit brought forward 35,424,921 28,723,928 Transfer from surplus on revaluation of fixed assets - net of tax 35,788 35,789
35,460,709 28,759,717
Profit available for appropriation 56,956,047 49,432,719
Basic and diluted earnings - after tax Rupees per share 33 21.24 20.43
The annexed notes 1 to 46 and Annexures I to V form an integral part of these financial statements.
Profit and Loss AccountFor the year ended December 31, 2013
Imran MaqboolPresident and Chief Executive
Tariq RafiDirector
Mian Umer ManshaDirector
Muhammad Ali ZebDirector
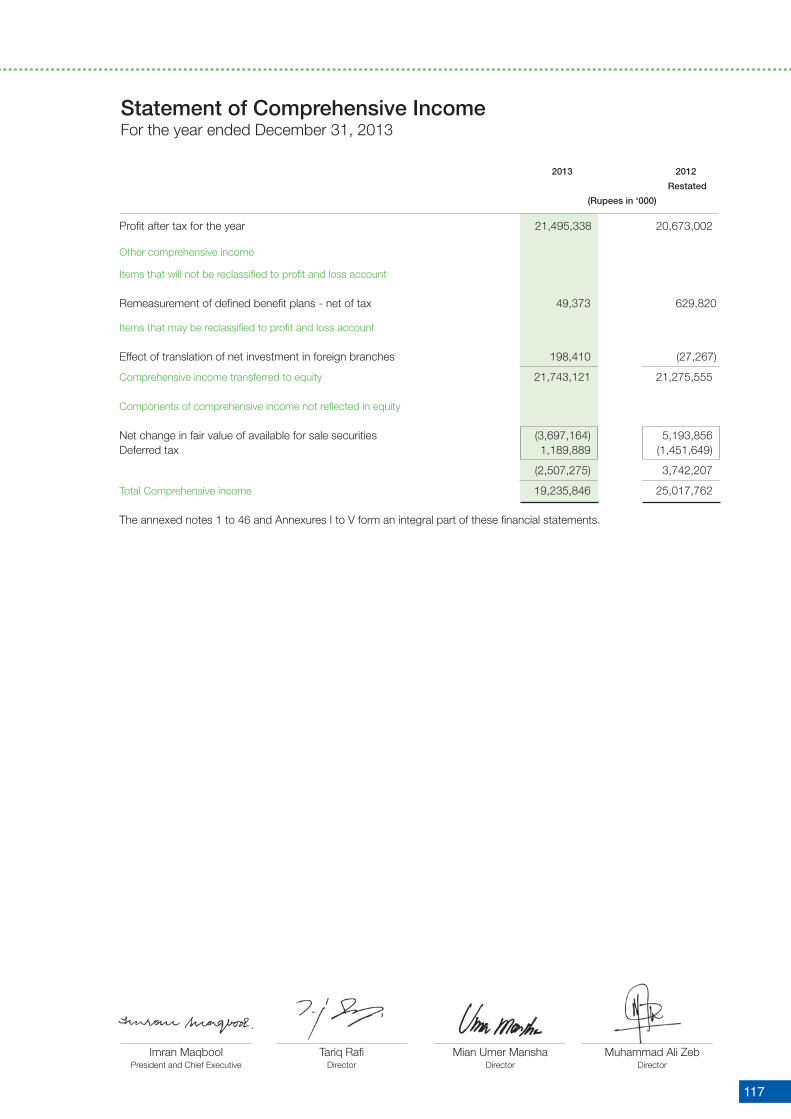
117
2013 2012
Restated
(Rupees in ‘000)
Profit after tax for the year 21,495,338 20,673,002
Other comprehensive income
Items that will not be reclassified to profit and loss account
Remeasurement of defined benefit plans - net of tax 49,373 629,820
Items that may be reclassified to profit and loss account
Effect of translation of net investment in foreign branches 198,410 (27,267)
Comprehensive income transferred to equity 21,743,121 21,275,555
Components of comprehensive income not reflected in equity
Net change in fair value of available for sale securities (3,697,164) 5,193,856 Deferred tax 1,189,889 (1,451,649)
(2,507,275) 3,742,207
Total Comprehensive income 19,235,846 25,017,762
The annexed notes 1 to 46 and Annexures I to V form an integral part of these financial statements.
Statement of Comprehensive IncomeFor the year ended December 31, 2013
Imran MaqboolPresident and Chief Executive
Tariq RafiDirector
Mian Umer ManshaDirector
Muhammad Ali ZebDirector

ANNUAL REPORT 2013
118
Cash Flow StatementFor the year ended December 31, 2013
Note 2013 2012 Restated (Rupees in ‘000)
Cash flows from operating activities
Profit before taxation 32,288,205 31,641,907 Less: Dividend income (932,717) (1,197,615)
31,355,488 30,444,292
Adjustments for non-cash chargesDepreciation 11.2 1,541,314 1,378,970 Amortization 11.3 260,424 259,932 Provision / (reversal) against loans and advances - net 10.5.2 (2,828,783) 480,903 Provision / (reversal) for diminution in the value of investments - net 9.3 (6,834) (3,044)Other provision / (reversal) - net 12.3 (52,285) (187,305)Bad debts written off directly 10.6.1 - 206 Provision for Workers’ Welfare Fund 29 645,764 641,075 Charge / (reversal) for defined benefit plan 28 (1,311,767) (1,608,008)Gain on disposal of fixed assets - net 27 (42,687) (22,586)
(1,794,854) 940,143
29,560,634 31,384,435 (Increase) / decrease in operating assets Lendings to financial institutions 326,834 (596,385)Advances - net (5,830,862) (12,888,489)Other assets - net (2,778,730) (1,694,467)
(8,282,758) (15,179,341)
Increase / (decrease) in operating liabilitiesBills payable 242,442 429,466 Borrowings (40,205,492) 39,132,085 Deposits and other accounts 87,269,558 53,872,018 Other liabilities (2,529,334) 2,055,177 44,777,174 95,488,746 66,055,050 111,693,840 Defined benefits paid (706,361) (370,756)Receipt from pension fund 14,731,898 - Income tax paid (10,355,097) (14,622,132)
Net cash flows from operating activities 69,725,490 96,700,952 Cash flows from investing activities
Net investments in ‘available for sale’ securities (51,033,235) (81,386,276)Net investments in ‘held to maturity’ securities 405,975 1,260,172 Investment in subsidiary company - (94,299)Dividends received 940,745 1,198,485 Investments in operating fixed assets (4,663,196) (3,404,698)Sale proceeds of property and equipment disposed off 173,089 57,831
Net cash flows from investing activities (54,176,622) (82,368,785) Cash flows from financing activities
Dividend paid (12,673,334) (11,814,973)
Net cash flows from financing activities (12,673,334) (11,814,973)
Exchange differences on translation of the net investment in foreign branches 198,410 (27,267)
Increase in cash and cash equivalents 3,073,944 2,489,927
Cash and cash equivalents at beginning of the year 57,173,579 54,727,784Effects of exchange rate changes on cash and cash equivalents 609,601 565,469 57,783,180 55,293,253
Cash and cash equivalents at end of the year 34 60,857,124 57,783,180
The annexed notes 1 to 46 and Annexures I to V form an integral part of these financial statements.
Imran MaqboolPresident and Chief Executive
Tariq RafiDirector
Mian Umer ManshaDirector
Muhammad Ali ZebDirector

119
Statement of Changes in Equity For the year ended December 31, 2013
Capital Reserves Revenue Reserves
Share capital Reserve for issue of Share Exchange Statutory General Unappropriated Total
of bonus shares premium translation reserve reserve reserve profit
(Rupees in ‘000)
Balance as at December 31, 2011 8,362,365 - 9,702,528 427,049 13,456,890 18,600,000 28,366,171 78,915,003 Effect of change in accounting policy - note 5.6 - - - - - - 357,757 357,757
Balance as at December 31, 2011 - restated 8,362,365 - 9,702,528 427,049 13,456,890 18,600,000 28,723,928 79,272,760 Profit after taxation for the year ended December 31, 2012 - - - - - - 20,673,002 20,673,002
Remeasurement of defined benefitplans - net of tax - - - - - - 629,820 629,820
Exchange differences on translation of net investment in foreign branches - - - (27,267) - - - (27,267)
Transferred from surplus on revaluation of fixed assets to unappropriated profit - net of tax - - - - - - 35,789 35,789
Transferred to statutory reserve - - - - 2,094,070 - (2,094,070) -
Transfer to reserve for issue of bonus shares - 836,236 - - - - (836,236) -
Issue of bonus shares - December 2011 836,236 (836,236) - - - - - -
Final cash dividend - December 2011 - - - - - - (2,508,709) (2,508,709)
Interim cash dividend - March 2012 - - - - - - (2,759,581) (2,759,581)
Interim cash dividend - June 2012 - - - - - - (3,679,441) (3,679,441)
Interim cash dividend - September 2012 - - - - - - (2,759,581) (2,759,581)
Balance as at December 31, 2012 9,198,601 - 9,702,528 399,782 15,550,960 18,600,000 35,424,921 88,876,792
Profit after taxation for the year ended December 31, 2013 - - - - - - 21,495,338 21,495,338
Remeasurement of defined benefitplans - net of tax - - - - - - 49,373 49,373
Exchange differences on translation of net investment in foreign branches - - - 198,410 - - - 198,410
Transferred from surplus on revaluation of fixed assets to unappropriated profit - net of tax - - - - - - 35,788 35,788
Transferred to statutory reserve - - - - 2,149,534 - (2,149,534) -
Transfer to reserve for issue of bonus shares - 919,860 - - - - (919,860) -
Issue of bonus shares - December 2012 919,860 (919,860) - - - - - -
Final cash dividend - December 2012 - - - - - - (2,759,581) (2,759,581)
Interim cash dividend - March 2013 - - - - - - (3,541,471) (3,541,471)
Interim cash dividend - June 2013 - - - - - - (3,541,470) (3,541,470)
Interim cash dividend - September 2013 - - - - - - (3,541,461) (3,541,461)
Balance as at December 31, 2013 10,118,461 - 9,702,528 598,192 17,700,494 18,600,000 40,552,043 97,271,718
For details of dividend declaration and appropriations, please refer note 45 to these financial statements.
The annexed notes 1 to 46 and Annexures I to V form an integral part of these financial statements.
Imran MaqboolPresident and Chief Executive
Tariq RafiDirector
Mian Umer ManshaDirector
Muhammad Ali ZebDirector

ANNUAL REPORT 2013
120
1. STATUS AND NATURE OF BUSINESS
MCB Bank Limited (the ‘Bank’) is a banking company incorporated in Pakistan and is engaged in commercial banking and related services. The Bank’s ordinary shares are listed on all the stock exchanges in Pakistan whereas its Global Depository Receipts (GDRs) representing two ordinary shares (2012: two ordinary shares) are traded on the International Order Book (IOB) system of the London Stock Exchange. The Bank’s Registered Office and Principal Office are situated at MCB -15 Main Gulberg, Lahore. The Bank operates 1,208 branches including 27 Islamic banking branches (2012: 1,179 branches including 27 Islamic banking branches) within Pakistan and 9 branches (2012: 8 branches) outside the country (including the Karachi Export Processing Zone branch).
2. BASIS OF PRESENTATION
2.1 These financial statements represent separate financial statements of MCB Bank Limited. The consolidated financial statements of the Group are being issued separately.
2.2 In accordance with the directives of the Federal Government regarding the shifting of the banking system to Islamic modes, the State Bank of Pakistan has issued various circulars from time to time. Permissible forms of trade-related modes of financing include purchase of goods by banks from their customers and immediate resale to them at appropriate mark-up in price on deferred payment basis. The purchases and sales arising under these arrangements are not reflected in these financial statements as such but are restricted to the amount of facility actually utilized and the appropriate portion of mark-up thereon.
2.3 The financial results of the Islamic Banking branches have been consolidated in these financial statements for reporting purposes, after eliminating material inter-branch transactions / balances. Key financial figures of the Islamic Banking branches are disclosed in Annexure II to these financial statements.
2.4 For the purpose of translation, rates of Rs. 105.3246 per US Dollar (2012: Rs. 97.1497) and Rs. 0.8052 per LKR (2012: Rs.0.7611) have been used.
3. STATEMENT OF COMPLIANCE
3.1 These financial statements have been prepared in accordance with the approved accounting standards as applicable in Pakistan. Approved Accounting Standards comprise of such International Financial Reporting Standards (IFRS) issued by the International Accounting Standards Board and Islamic Financial Accounting Standards (IFAS) issued by the Institute of Chartered Accountants of Pakistan as are notified under the Companies
Ordinance, 1984, provisions of and directives issued under the Companies Ordinance, 1984 and Banking Companies Ordinance, 1962. In case requirements differ, the provisions and directives given in Companies Ordinance, 1984 and Banking Companies Ordinance, 1962 shall prevail.
The State Bank of Pakistan has deferred the applicability of International Accounting Standard (IAS) 39, ‘Financial Instruments: Recognition and Measurement’ and IAS 40, ‘Investment Property’ for Banking Companies through BSD Circular No. 10 dated August 26, 2002. The Securities and Exchange Commission of Pakistan (SECP) has deferred applicability of IFRS-7 Financial Instruments: Disclosures on banks through S.R.O 411(1) /2008 dated April 28, 2008. Accordingly, the requirements of these standards have not been considered in the preparation of these financial statements. However, investments have been classified and valued in accordance with the requirements prescribed by the State Bank of Pakistan through various circulars.
IFRS 8, ‘Operating Segments’ is effective for the Bank’s accounting period beginning on or after January 1, 2009. All banking companies in Pakistan are required to prepare their annual financial statements in line with the format prescribed under BSD Circular No. 4 dated February 17, 2006, ‘Revised Forms of Annual Financial Statements’, effective from the accounting year ended December 31, 2006. The management of the Bank believes that as the SBP has defined the segment categorisation in the above mentioned circular, the SBP requirements prevail over the requirements specified in IFRS 8. Accordingly, segment information disclosed in these financial statements is based on the requirements laid down by the SBP.
3.2 Standards, amendments and interpretations to published approved accounting standards that are effective in the current year
The following standards, amendments and interpretations of approved accounting standards are effective for accounting periods beginning on or after January 01, 2013:
- IAS 1 ‘ Financial statements presentation’ has been amended effective January 1, 2013. The main change resulting from these amendments is a requirement for entities to group items presented in ‘Other Comprehensive Income’ (OCI) on the basis of whether they are potentially reclassifiable to profit and loss subsequently reclassification adjustments). The specified changes has been made in the statements of other comprehensive income for the year.
- IAS 19 Employee Benefits (revised) which became effective for annual periods beginning on or after January 01, 2013 amends accounting for employees benefits. The amended IAS 19 includes the amendments that require actuarial gains and losses to be recognized immediately
Notes to the Financial StatementsFor the year ended December 31, 2013

121
in other comprehensive income; to immediately recognize all past service costs; and to replace interest cost and expected return on plan assets with a net interest amount that is calculated by applying the discount rate to the net defined benefit liability / asset.
- There are other new and amended standards and interpretations that are mandatory for accounting periods beginning on or after January 1, 2013 but are considered not relevant or do not have a significant effect on the Bank’s operations and therefore are not detailed in the financial statements.
3.3 Standards, amendments and interpretations to published approved accounting standards that are relevant and not yet effective
The following standards, amendments and interpretations of approved accounting standards will be effective for accounting periods beginning on or after January 01, 2014.
Effective date (accounting periods beginning on or after)
IAS 32 - Financial Instruments: Presentation (Amendment) January 01, 2014
IFRS 10 ‘ Consolidated Financial statements January 01, 2014
IFRS 12 ‘Disclosure of interest in other entities’ January 01, 2014
IFAS 3 - Profit and Loss Sharing on Deposits January 01, 2014
There are other new and amended standards and interpretations that are mandatory for the Bank’s accounting periods beginning on or after January 1, 2014 but are considered not to be relevant or do not have any significant effect on the Bank’s operations and are therefore not detailed in these financial statements.
4. BASIS OF MEASUREMENT
4.1 These financial statements have been prepared under the historical cost convention except that certain classes of fixed assets are stated at revalued amounts and certain investments and commitments in respect of certain forward exchange contracts have been marked to market and are carried at fair value.
4.2 The financial statements are presented in Pak Rupees, which is the Bank’s functional and presentation currency. The amounts are rounded off to the nearest thousand.
4.3 Critical accounting estimates and judgments
The preparation of financial statements in conformity with the approved accounting standards requires the use of certain critical accounting estimates. It also requires the management to exercise its judgment in the process of applying the Bank’s accounting policies. Estimates and judgments are continually evaluated and are based on historical experiences, including expectations of future events that are
believed to be reasonable under the circumstances. The areas where various assumptions and estimates are significant to the Bank’s financial statements or where judgment was exercised in the application of accounting policies are as follows:
a) Classification of investments
In classifying investments the Bank follows the guidance provided in SBP circulars:
- Investments classified as ‘held for trading’, are securities which are acquired with an intention to trade by taking advantage of short term market / interest rate movements and are to be sold within 90 days of acquisition.
- Investments classified as ‘held to maturity’ are non-derivative financial assets with fixed or determinable payments and fixed maturity. In making this judgment, the Bank evaluates its intention and ability to hold such investment to maturity.
- The investments which are not classified as ‘held for trading’ or ‘held to maturity’ are classified as ‘available for sale’.
b) Provision against advances
The Bank reviews its loan portfolio to assess the amount of non-performing advances and provision required there against on regular basis. While assessing this requirement various factors including the delinquency in the account, financial position of the borrowers and the requirements of the Prudential Regulations are considered. The amount of general provision is determined in accordance with the relevant regulations and management’s judgment as explained in notes 10.5.3 and 10.5.5.
c) Impairment of ‘available for sale’ equity investments
The Bank determines that ‘available for sale’ equity investments are impaired when there has been a significant or prolonged decline in the fair value below its cost. The determination of what is significant or prolonged requires judgment. In making this judgment, the Bank evaluates among other factors, the normal volatility in share price. In addition, the impairment may be appropriate when there is an evidence of deterioration in the financial health of the investee and sector performance, changes in technology and operational/financial cash flows.
d) Taxation
In making the estimates for income taxes currently payable by the Bank, the management considers the current income tax laws and the decisions of appellate authorities on certain issues in the past.
Notes to the Financial StatementsFor the year ended December 31, 2013

ANNUAL REPORT 2013
122
e) Fair value of derivatives
The fair values of derivatives which are not quoted in active markets are determined by using valuation techniques. The valuation techniques take into account the relevant interest rates at the balance sheet date and the rates contracted.
f) Depreciation, amortization and revaluation of operating fixed assets
In making estimates of the depreciation / amortization method, the management uses the method which reflects the pattern in which economic benefits are expected to be consumed by the Bank. The method applied is reviewed at each financial year end and if there is a change in the expected pattern of consumption of the future economic benefits embodied in the assets, the method is changed to reflect the changed pattern. Such change is accounted for as change in accounting estimates in accordance with International Accounting Standard (IAS) 8 Accounting Policies, Changes in Accounting Estimates and Errors. Further, the Bank estimates the revalued amount of land and buildings on a regular basis. The estimates are based on valuations carried out by independent professional valuers under the market conditions.
g) Staff retirement benefits
Certain actuarial assumptions have been adopted as disclosed in Note 36 of these financial statements for the actuarial valuation of staff retirement benefit plans. Actuarial assumptions are entity’s best estimates of the variables that will determine the ultimate cost of providing post employment benefits. Changes in these assumptions in future years may affect the liability / asset under these plans in those years.
5. SUMMARY OF SIGNIFICANT ACCOUNTING POLICIES
5.1 Investments
The Bank classifies its investments as follows:
a) Held for trading
These are securities, which are either acquired for generating profit from short-term fluctuations in market prices, interest rate movements, dealers margin or are securities included in a portfolio in which a pattern of short-term profit taking exists.
b) Held to maturity
These are securities with fixed or determinable payments and fixed maturity in respect of which the Bank has the positive intent and ability to hold to maturity.
c) Available for sale
These are investments, other than those in subsidiaries and associates, that do not fall under the ‘held for trading’ or ‘held to maturity’ categories.Investments are initially recognized at cost which in case of investments other than ‘held for trading’ include transaction costs associated with the investment.
All purchases and sales of investments that require delivery within the time frame established by regulation or market convention are recognized at the trade date. Trade date is the date on which the Bank commits to purchase or sell the investment.
In accordance with the requirements of the State Bank of Pakistan, quoted securities, other than those classified as ‘held to maturity’, investments in subsidiaries and investments in associates are subsequently re-measured to market value. Surplus / (deficit) arising on revaluation of quoted securities which are classified as ‘available for sale’, is taken to a separate account which is shown in the balance sheet below equity. Surplus / (deficit) arising on revaluation of quoted securities which are classified as ‘held for trading’, is taken to the profit and loss account, currently.
Unquoted equity securities (excluding investments in subsidiaries and associates) are valued at the lower of cost and break-up value. Break-up value of equity securities is calculated with reference to the net assets of the investee company as per the latest available audited financial statements. Investments classified as ‘held to maturity’ are carried at amortized cost.
Associates are all entities over which the Group has significant influence but not control. Subsidiaries are all entities over which the Group has the power to govern the financial and operating policies accompanying a shareholding of more than one half of the voting rights Investments in subsidiaries and investments in associates are carried at cost less accumulated impairment losses, if any.
Provision for impairment in the values of securities (except debentures, participation term certificates and term finance certificates) is made currently. Provisions for impairment in value of debentures, participation term certificates and term finance certificates are made as per the requirements of the Prudential Regulations issued by the State Bank of Pakistan.
5.2 Sale and repurchase agreements
Securities sold subject to a repurchase agreement (repo) are retained in the financial statements as investments and the counter party liability is included in borrowings. Securities purchased under an agreement to resell (reverse repo) are not recognized in the financial statements as investments and the amount extended to the counter party is included
Notes to the Financial StatementsFor the year ended December 31, 2013

123
in lendings to financial institutions. The difference between the purchase / sale and re-sale / re-purchase price is recognized as mark-up income / expense on a time proportion basis, as the case may be.
5.3 Advances
Advances are stated net of specific and general provisions. Specific provision is determined on the basis of the Prudential Regulations and other directives issued by the State Bank of Pakistan (SBP) and charged to the profit and loss account. Provisions are held against identified as well as unidentified losses. Provisions against unidentified losses include general provision against Consumer and Small Enterprise (SEs) loans made in accordance with the requirements of the Prudential Regulations issued by SBP and provision based on historical loss experience on advances. Advances are written off when there is no realistic prospect of recovery.
Leases where the Bank transfers substantially all the risks and rewards incidental to ownership of an asset to the lessee are classified as finance leases. A receivable is recognized at an amount equal to the present value of the lease payments including any guaranteed residual value. Finance lease receivables are included in advances to the customers.
5.4 Operating fixed assets and depreciation
Property and equipment, other than land carrying value of which is not amortized, are stated at cost or revalued amount less accumulated depreciation and accumulated impairment losses, if any. Land is carried at revalued amount. Cost of property and equipment of foreign operations includes exchange differences arising on currency translation at year-end rates.
Capital work-in-progress is stated at cost less accumulated impairment losses, if any. These are transferred to specific assets as and when assets become available for use.
Depreciation on all operating fixed assets is charged using the straight line method in accordance with the rates specified in note 11.2 to these financial statements and after taking into account residual value, if any. The residual values, useful lives and depreciation methods are reviewed and adjusted, if appropriate, at each balance sheet date.
Depreciation on additions is charged from the month the assets are available for use while no depreciation is charged in the month in which the assets are disposed off.
Surplus on revaluation of land and buildings is credited to the surplus on revaluation account. Revaluation is carried out with sufficient regularity to ensure that the carrying amount of assets does not differ materially from the fair value. To the extent of the incremental depreciation charged on the revalued assets, the related surplus on revaluation
of land and buildings (net of deferred taxation) is transferred directly to unappropriated profit.
Gains / losses on sale of property and equipment are credited / charged to the profit and loss account currently, except that the related surplus on revaluation of land and buildings (net of deferred taxation) is transferred directly to unappropriated profit.
Subsequent costs are included in the asset’s carrying amount or are recognized as a separate asset, as appropriate, only when it is probable that future economic benefits associated with the item will flow to the Bank and the cost of the item can be measured reliably. All other repairs and maintenance are charged to the profit and loss account.
5.4.1 Intangible assets
Intangible assets are stated at cost less accumulated amortization and accumulated impairment losses, if any. Intangible assets are amortized from the month when these assets are available for use, using the straight line method, whereby the cost of the intangible assets are amortized over its estimated useful lives over which economic benefits are expected to flow to the Bank. The useful lives are reviewed and adjusted, if appropriate, at each balance sheet date.
5.4.2 Leases (Ijarah)
Assets leased out under ‘Ijarah’ are stated at cost less accumulated depreciation and accumulated impairment losses, if any. Assets under Ijarah are depreciated over the period of lease term. However, in the event the asset is expected to be available for re-ijarah, depreciation is charged over the economic life of the asset using straight line basis.
5.5 Impairment
The carrying amount of assets are reviewed at each balance sheet date for impairment whenever events or changes in circumstances indicate that the carrying amounts of the assets may not be recoverable. If such indication exists and where the carrying value exceeds the estimated recoverable amount, assets are written down to their recoverable amounts. Recoverable amount is the greater of net selling price and value in use. The resulting impairment loss is taken to the profit and loss account except for impairment loss on revalued assets, which is adjusted against the related revaluation surplus to the extent that the impairment loss does not exceed the surplus on revaluation of that asset.
5.6 Staff retirement benefits
The Bank operates the following staff retirement benefits for its employees:
a) For clerical / non-clerical staff who did not opt for the new scheme, the Bank operates the following:- an approved contributory provident fund;
Notes to the Financial StatementsFor the year ended December 31, 2013

ANNUAL REPORT 2013
124
- an approved gratuity scheme; and- a contributory benevolent scheme
b) For clerical / non-clerical staff who joined the Bank after the introduction of the new scheme and for others who opted for the new scheme introduced in 1975, the Bank operates the following:
- an approved non-contributory provident fund introduced in lieu of the contributory provident
fund;- an approved pension fund; and- contributory benevolent scheme
c) For officers who joined the Bank after the introduction of the new scheme and for others who opted for the new scheme introduced in 1977, the Bank operates the following:
- an approved non-contributory provident fund introduced in lieu of the contributory provident fund; and
- an approved pension fund.- contributory benevolent fund.
However, the management has replaced the pension benefits for employees in the officer category with a contributory provident fund for services rendered after December 31, 2003.
d) For executives and officers who joined the Bank on or after January 01, 2000, the Bank operates an approved contributory provident fund.
e) Post retirement medical benefits to entitled employees.
Annual contributions towards the defined benefit plans and schemes are made on the basis of actuarial advice using the Projected Unit Credit Method. The above benefits are payable to staff at the time of separation from the Bank’s services subject to the completion of qualifying period of service.
Past service cost is the change in the present value of the defined benefit obligation resulting from a plan amendment or curtailment. The Bank recognise past service cost as an expense at the earlier of the following dates:
(i) when the plan amendment or curtailment occurs
(ii) and when the Bank recognises related restructuring costs or termination benefits
Employees’ compensated absences
Liability in respect of employees’ compensated absences is accounted for in the year in which these are earned on the basis of actuarial valuation carried out using the Projected Unit Credit Method.
During the current year, the Bank has changed its accounting policy in respect of post retirement defined benefits plans as required under International
Accounting Standard (IAS) 19, ‘Employee Benefits’. Previously, the net cumulative actuarial gains / losses at each balance sheet date were recognized equally over a period of three years or the expected remaining average working lives of employees, whichever was lower. According to new policy actuarial gains and losses are recognized in other comprehensive income (OCI) in the periods in which they occur. Amounts recorded in the profit and loss account are limited to current and past service costs, gains or losses on settlements, and net interest income (expense). All other changes in the net defined benefit obligation are recognized directly in other comprehensive income with no subsequent recycling through the profit and loss account.
The change in accounting policy has been accounted for retrospectively in accordance with the requirements of IAS 8, ‘Accounting Policies, Changes in Accounting Estimates and Errors’ and comparative figures have been restated. The effect of the change in accounting policy on the current and prior periods financial statements have been summarised below:
December 31, December 31, December 31, 2013 2012 2011 (Rupees in ‘000)
Impact on statement of financial position Increase in other assets 1,631,876 1,175,705 549,069Increase / (decrease) in other liabilities 448,405 68,192 (1,327)Increase in deferred tax liabilities 414,215 387,629 192,638Increase in Un-appropriated profit 769,256 719,883 357,757
December 31, December 31, 2013 2012 (Rupees in ‘000)
Impact on profit and loss accountIncrease in administrative expenses 394,490 411,837Decrease in profit before tax 394,490 411,837Decrease in profit after tax 256,419 267,694Decrease in earning per share Rupees 0.253 0.265
5.7 Taxation
Current
Provision for current taxation is based on taxable income at the current rates of taxation after taking into consideration available tax credits and rebates. The charge for current tax also includes adjustments where considered necessary, relating to prior years which arise from assessments framed / finalized during the year.
Deferred
Deferred tax is recognised using the balance sheet liability method on all temporary differences between the amounts attributed to assets and liabilities for financial reporting purposes and amounts used for taxation purposes. The Bank records deferred tax assets / liabilities using the tax rates, enacted or substantively enacted by the balance sheet date expected to be applicable at the time of its reversal. Deferred tax asset is recognised only to the extent that it is probable that future taxable profits will be available against which the asset can be utilised. Deferred tax assets are reduced to the extent that
Notes to the Financial StatementsFor the year ended December 31, 2013

125
it is no longer probable that the related tax benefit will be realised. The Bank also recognises deferred tax asset / liability on deficit / surplus on revaluation of securities and deferred tax liability on surplus on revaluation of fixed assets which is adjusted against the related deficit / surplus in accordance with the requirements of International Accounting Standard (IAS) 12, ‘Income Taxes’.
Deferred tax liability is not recognized in respect of taxable temporary differences associated with exchange translation reserves of foreign operations, where the timing of the reversal of the temporary difference can be controlled and it is probable that the temporary differences will not reverse in the foreseeable future.
5.8 Provisions
Provisions are recognized when the Bank has a legal or constructive obligation as a result of past events and it is probable that an outflow of resources will be required to settle the obligation and a reliable estimate of the amount can be made. Provisions are reviewed at each balance sheet date and are adjusted to reflect the current best estimates.
5.9 Foreign currencies
5.9.1 Foreign currency transactions
Transactions in foreign currencies other than the results of foreign operations discussed in note 5.9.2 are translated to Rupees at the foreign exchange rates prevailing on the transaction date. Monetary assets and liabilities in foreign currencies are expressed in Rupee terms at the rates of exchange prevailing at the balance sheet date. Foreign bills purchased and forward foreign exchange contracts other than those relating to foreign currency deposits are valued at the rates applicable to their respective maturities.
5.9.2 Foreign operations
The assets and liabilities of foreign branches are translated to Rupees at exchange rates prevailing at the balance sheet date. The results of foreign operations are translated to Rupees at the average rate of exchange for the year.
5.9.3 Translation gains and losses
Translation gains and losses are included in the profit and loss account, except those arising on the translation of the Bank’s net investment in foreign branches, which are taken to the capital reserve (exchange translation reserve) until the disposal of the net investment, at which time these are recognised in the profit and loss account.
5.9.4 Commitments
Commitments for outstanding forward foreign
exchange contracts are disclosed in these financial statements at committed amounts. Contingent liabilities / commitments for letters of credit and letters of guarantee denominated in foreign currencies are expressed in Rupee terms at the rates of exchange prevailing at the date of the statement of financial position.
5.10 Acceptances
Commitments for outstanding forward foreign exchange contracts are disclosed in these financial statements at committed amounts. Contingent liabilities / commitments for letters of credit and letters of guarantee denominated in foreign currencies are expressed in Rupee terms at the rates of exchange prevailing at the date of the statement of financial position.
5.11 Revenue recognition
- Mark-up / interest on advances and returns on investments are recognized on a time proportion basis using the effective interest method except that mark-up / interest on non-performing advances and investments is recognized on a receipt basis, in accordance with the requirements of the Prudential Regulations issued by the State Bank of Pakistan (SBP) or as permitted by the regulations of the overseas regulatory authorities of countries where the branches operate. Where debt securities are purchased at premium or discount, such premium / discount is amortized through the profit and loss account over the remaining period of maturity.
- Financing method is used in accounting for income from lease financing. Under this method, the unearned lease income (excess of the sum of total lease rentals and estimated residual value over the cost of leased assets) is deferred and taken to income over the term of the lease period so as to produce a constant periodic rate of return on the outstanding net investment in lease. Gains / losses on termination of lease contracts are recognized as income when these are realized.
- Ijarah income is recognized on an accrual basis as and when the rental becomes due.
- Commission income is recognized on a time proportion basis.
- Dividend income is recognized when the Bank’s right to receive dividend is established.
- Gain / loss on sale of investments is credited /
charged to profit and loss account currently.
5.12 Operating leases
Operating lease rentals are recorded in profit and loss account on a time proportion basis over the term of the lease arrangements.
Notes to the Financial StatementsFor the year ended December 31, 2013

ANNUAL REPORT 2013
126
5.13 Assets acquired in satisfaction of claims
The Bank occasionally acquires assets in settlement of certain advances. These are stated at lower of the carrying value or current fair value of such assets.
5.14 Cash and cash equivalents
Cash and cash equivalents include cash and balances with treasury banks and balances with other banks (net of overdrawn Nostro balances) in current and deposit accounts.
5.15 Financial instruments
5.15.1 Financial assets and financial liabilities
Financial instruments carried on the statement of financial position include cash and balances with treasury banks, balances with other banks, lendings to financial institutions, investments (excluding investment in associates and subsidiaries), advances, other assets, bills payable, borrowings, deposits and other liabilities. The particular recognition methods adopted for significant financial assets and financial liabilities are disclosed in the individual policy statements associated with these assets and liabilities.
5.15.2 Derivative financial instruments
Derivative financial instruments are initially recognized at fair value on the date on which a derivative contract is entered into and are subsequently remeasured at their fair value using valuation techniques. All the derivative financial instruments are carried as an asset when the fair value is positive and as a liability when the fair value is negative. Any change in the fair value of derivative financial instruments is taken to the profit and loss account currently.
5.15.3 Off setting
Financial assets and financial liabilities are set off and the net amount is reported in the financial statements when there is a legally enforceable right to set off and the Bank intends either to settle on a net basis, or to realize the assets and settle the liabilities, simultaneously.
5.16 Borrowings / deposits
Borrowings / deposits are recorded at the proceeds received. The cost of borrowings / deposits is recognized as an expense in the period in which this is incurred.
5.17 Segment reporting
A segment is a distinguishable component of the Bank that is engaged in providing products or services (business segment) or in providing products or services within a particular economic environment (geographical segment), which is subject to risks
and rewards that are different from those of other segments. The Bank’s primary format of reporting is based on business segments.
5.17.1 Business segments
Corporate Finance
Corporate Finance includes underwriting, securitization, investment banking, syndications, IPO related activities (excluding investments) and secondary private placements.
Trading and Sales
It includes fixed income, equity, foreign exchange commodities, lendings to and borrowings from financial institutions and brokerage debt.
Retail and Consumer Banking
It includes retail lending and deposits, banking services, private lending and deposits, banking services and retail offered to its retail customers and small and medium enterprises.
Commercial Banking
It includes project finance, export finance, trade finance, leasing, lending, guarantees and bills of exchange relating to its corporate customers.
5.17.2 Geographical segments
The Bank operates in three geographic regions being:
- Pakistan- South Asia- Middle East
5.18 Dividend distribution and appropriation
Dividends (including bonus dividend) and other appropriations (except appropriations which are required by law) are recognized in the period in which these are approved.
5.19 Earnings per share
The Bank presents basic and diluted earnings per share (EPS). Basic EPS is calculated by dividing the profit or loss attributable to ordinary shareholders of the Bank by the weighted average number of ordinary shares outstanding during the year.
Notes to the Financial StatementsFor the year ended December 31, 2013
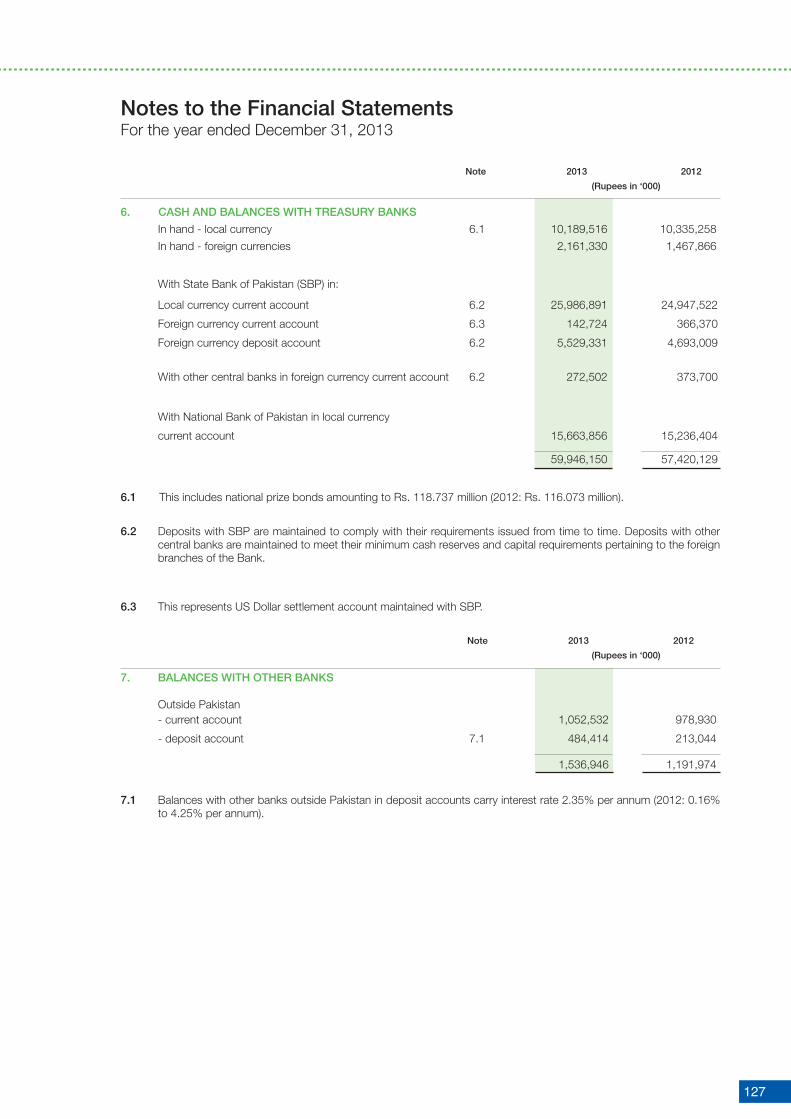
127
Note 2013 2012
(Rupees in ‘000)
6. CASH AND BALANCES WITH TREASURY BANKS
In hand - local currency 6.1 10,189,516 10,335,258
In hand - foreign currencies 2,161,330 1,467,866
With State Bank of Pakistan (SBP) in:
Local currency current account 6.2 25,986,891 24,947,522
Foreign currency current account 6.3 142,724 366,370
Foreign currency deposit account 6.2 5,529,331 4,693,009
With other central banks in foreign currency current account 6.2 272,502 373,700
With National Bank of Pakistan in local currency
current account 15,663,856 15,236,404
59,946,150 57,420,129
6.1 This includes national prize bonds amounting to Rs. 118.737 million (2012: Rs. 116.073 million).
6.2 Deposits with SBP are maintained to comply with their requirements issued from time to time. Deposits with other central banks are maintained to meet their minimum cash reserves and capital requirements pertaining to the foreign
branches of the Bank.
6.3 This represents US Dollar settlement account maintained with SBP.
Note 2013 2012
(Rupees in ‘000)
7. BALANCES WITH OTHER BANKS
Outside Pakistan - current account 1,052,532 978,930
- deposit account 7.1 484,414 213,044
1,536,946 1,191,974
7.1 Balances with other banks outside Pakistan in deposit accounts carry interest rate 2.35% per annum (2012: 0.16% to 4.25% per annum).
Notes to the Financial StatementsFor the year ended December 31, 2013

ANNUAL REPORT 2013
128
Note 2013 2012
(Rupees in ‘000)
8. LENDINGS TO FINANCIAL INSTITUTIONS
Call money lendings 8.2 & 8.3 664,261 -
Repurchase agreement lendings 8.2 & 8.3 560,377 1,551,472
1,224,638 1,551,472
8.1 Particulars of lendings
In local currency 996,766 1,482,973 In foreign currencies 227,872 68,499
1,224,638 1,551,472
8.2. These carry mark up rates ranging from 6.50% to 10% per annum (2012 : 7.50% to 9.15%).
8.3 Securities held as collateral against lendings to financial institutions
2013 2012
Held by Further Total Held by Further Total bank given as bank given as collateral collateral
(Rupees in ‘000)
Market Treasury Bills 560,377 - 560,377 1,551,472 - 1,551,472
560,377 - 560,377 1,551,472 - 1,551,472
Notes to the Financial StatementsFor the year ended December 31, 2013

129
9. INVESTMENTS - NET
9.1 Investments by types 2013 2012
Note / Held by Further Total Held by Further Total Annexure bank given as bank given as collateral collateral (Rupees in ‘000)
Available-for-sale securities
- Market Treasury Bills 9.4 304,804,941 16,631,860 321,436,801 226,894,492 63,100,246 289,994,738
- Pakistan Investment Bonds 9.4 107,615,147 - 107,615,147 83,428,081 - 83,428,081
- Shares in listed companies 9.4 & Annexure I (note 1) 7,792,448 - 7,792,448 6,807,354 - 6,807,354
- Units in open ended mutual fund - - - 4,050,000 - 4,050,000
- Shares in unlisted companies 9.4 & Annexure I (note 2) 142,807 - 142,807 244,217 - 244,217
- NIT units 9.4 & 5,253 - 5,253 5,253 - 5,253
- Sukuk Bonds 2,700,000 - 2,700,000 3,400,000 - 3,400,000
- Term Finance Certificates (TFCs) 9.4 & Annexure I (note 3) 958,412 - 958,412 1,912,343 - 1,912,343
424,019,008 16,631,860 440,650,868 326,741,740 63,100,246 389,841,986
Held-to-maturity securities
- Market Treasury Bills 9.5 1,656,039 64,836 1,720,875 771,355 67,824 839,179
- Pakistan Investment Bonds - - - 1,676,918 - 1,676,918
- Provincial Government Securities 118 - 118 118 - 118
- Sukuk Bonds Annexure I (note 4) 442,838 - 442,838 653,616 - 653,616
- Euro Bonds Annexure I (note 4) 2,344,907 - 2,344,907 1,693,483 - 1,693,483
- Term Finance Certificates (TFCs),
Debentures, Bonds and Participation
Term Certificates (PTCs) Annexure I (note 3 & 4) 2,778,015 - 2,778,015 2,831,442 - 2,831,442
7,221,917 64,836 7,286,753 7,626,932 67,824 7,694,756
Subsidiaries Annexure I (note 5)
- MNET Services (Private) Limited 49,975 - 49,975 49,975 - 49,975
- MCB Trade Services Limited 77 - 77 77 - 77
- MCB - Arif Habib Savings & Investments Limited 320,123 - 320,123 320,123 - 320,123
- MCB Leasing Closed Joint Stock Company 178,832 - 178,832 178,832 - 178,832
- MCB Financial Services Limited 27,500 - 27,500 27,500 - 27,500
576,507 - 576,507 576,507 - 576,507
Associates Annexure I (note 6)
- Adamjee Insurance Company Limited 9.6 943,600 - 943,600 943,600 - 943,600
- Euronet Pakistan (Private) Limited 52,521 - 52,521 52,521 - 52,521
- First Women Bank Limited 63,300 - 63,300 63,300 - 63,300
1,059,421 - 1,059,421 1,059,421 - 1,059,421
Investments at cost 432,876,853 16,696,696 449,573,549 336,004,600 63,168,070 399,172,670
Less: Provision for diminution in value of investments 9.3 (2,549,959) - (2,549,959) (2,783,347) - (2,783,347)
Investments (net of provisions) 430,326,894 16,696,696 447,023,590 333,221,253 63,168,070 396,389,323
Surplus / (Deficit) on revaluation of
available for sale securities - net 21.2 1,995,296 (12,867) 1,982,429 5,634,413 45,180 5,679,593
Investments at revalued amounts - net of provisions 432,322,190 16,683,829 449,006,019 338,855,666 63,213,250 402,068,916
Notes to the Financial StatementsFor the year ended December 31, 2013
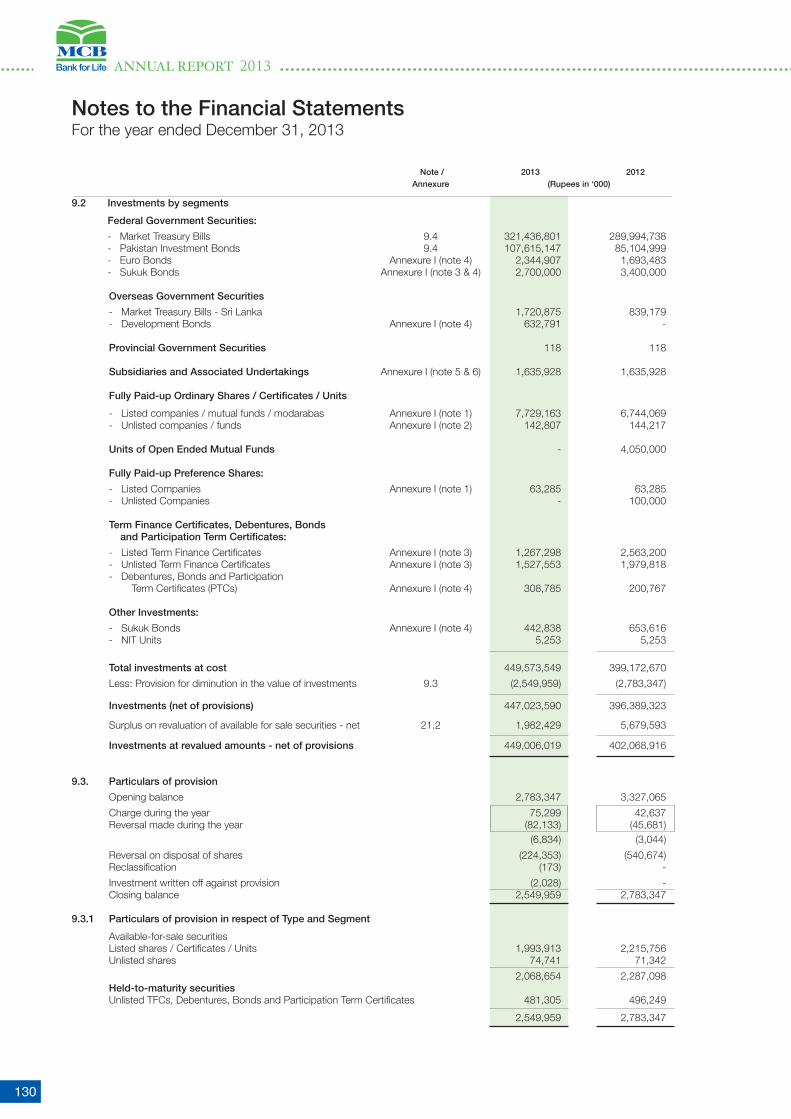
ANNUAL REPORT 2013
130
Note / 2013 2012 Annexure (Rupees in ‘000)
9.2 Investments by segments
Federal Government Securities:
- Market Treasury Bills 9.4 321,436,801 289,994,738 - Pakistan Investment Bonds 9.4 107,615,147 85,104,999 - Euro Bonds Annexure I (note 4) 2,344,907 1,693,483 - Sukuk Bonds Annexure I (note 3 & 4) 2,700,000 3,400,000
Overseas Government Securities
- Market Treasury Bills - Sri Lanka 1,720,875 839,179 - Development Bonds Annexure I (note 4) 632,791 - Provincial Government Securities 118 118
Subsidiaries and Associated Undertakings Annexure I (note 5 & 6) 1,635,928 1,635,928
Fully Paid-up Ordinary Shares / Certificates / Units
- Listed companies / mutual funds / modarabas Annexure I (note 1) 7,729,163 6,744,069 - Unlisted companies / funds Annexure I (note 2) 142,807 144,217
Units of Open Ended Mutual Funds - 4,050,000
Fully Paid-up Preference Shares:
- Listed Companies Annexure I (note 1) 63,285 63,285 - Unlisted Companies - 100,000 Term Finance Certificates, Debentures, Bonds and Participation Term Certificates:
- Listed Term Finance Certificates Annexure I (note 3) 1,267,298 2,563,200 - Unlisted Term Finance Certificates Annexure I (note 3) 1,527,553 1,979,818 - Debentures, Bonds and Participation Term Certificates (PTCs) Annexure I (note 4) 308,785 200,767
Other Investments:
- Sukuk Bonds Annexure I (note 4) 442,838 653,616 - NIT Units 5,253 5,253
Total investments at cost 449,573,549 399,172,670
Less: Provision for diminution in the value of investments 9.3 (2,549,959) (2,783,347)
Investments (net of provisions) 447,023,590 396,389,323
Surplus on revaluation of available for sale securities - net 21.2 1,982,429 5,679,593
Investments at revalued amounts - net of provisions 449,006,019 402,068,916
9.3. Particulars of provision
Opening balance 2,783,347 3,327,065
Charge during the year 75,299 42,637 Reversal made during the year (82,133) (45,681) (6,834) (3,044)
Reversal on disposal of shares (224,353) (540,674) Reclassification (173) -
Investment written off against provision (2,028) - Closing balance 2,549,959 2,783,347
9.3.1 Particulars of provision in respect of Type and Segment
Available-for-sale securities Listed shares / Certificates / Units 1,993,913 2,215,756 Unlisted shares 74,741 71,342
2,068,654 2,287,098 Held-to-maturity securities Unlisted TFCs, Debentures, Bonds and Participation Term Certificates 481,305 496,249
2,549,959 2,783,347
Notes to the Financial StatementsFor the year ended December 31, 2013

131
9.4 Quality of ‘available for sale’ securities
2013 2012
Note Market value Credit rating Market value Credit rating
(Rupees in ‘000) (Rupees in ‘000)
Market Treasury Bills 9.4.1 321,150,456 Unrated 290,505,477 Unrated
Pakistan Investment Bonds 9.4.1 107,720,565 Unrated 86,166,935 Unrated
Listed Term Finance Certificates
Askari Bank Limited 253,321 AA- 275,754 AA- Bank Alfalah Limited 527,480 AA- 522,712 AA- Allied Bank Limited 205,081 AA 237,013 AA United Bank Limited - - 777,380 AA NIB Bank limited - - 167,118 A+ Pak Arab Fertilizers Limited - - 30,011 AA 985,882 2,009,988
Shares in Listed Companies
Abbott Laboratories Pakistan Limited 25,814 Not available 19,645 Not available Aisha Steel Mills Limited 1,345 A- & A2 1,690 A- & A2 Allied Bank Limited 794,738 AA+ & A1+ 496,754 AA+ & A1+ Arif Habib Limited 3,067 Not available 2,686 Not available Arif Habib Corporation Limited 41,188 AA & A1+ 44,650 AA & A1+ Attock Cement Pakistan Limited 2,754 Not available 1,676 Not available Attock Petroleum Limited 494,906 Not available 420,756 Not available Attock Refinery Limited - - 37,270 AA & A 1+ Bank Alfalah Limited 8,112 AA & A1+ 5,046 AA & A1+ Bank Al-Habib Limited 533,977 AA+ & A1+ 201,959 AA+ & A1+ Archroma Pakistan Limited (Formerly Clariant Pakistan Limited) 34,410 Not available 14,524 Not available Fauji Cement Company Limited 22,330 Not available - Fauji Fertilizer Bin Qasim Company Limited 168,909 Not available 112,374 Not available Fauji Fertilizer Company Limited 1,123,183 Not available 1,175,148 Not available First Al - Noor Modaraba 27,766 Not available 24,990 Not available Habib Bank Limited 111,669 AAA & A1+ 317,869 AAA & A1+ Habib Metropolitan Bank Limited 2,883 AA+ & A1+ 2,168 AA+ & A1+ Hub Power Company Limited 230,190 AA+ & A1+ 18,096 AA+ & A1+ IGI Insurance Limited 11,507 AA - AA Indus Motors Company Limited 9,000 Not available 7,297 Not available Kohinoor Energy Limited 1,952 AA & A1+ 1,238 AA & A1+ Kot Addu Power Company Limited 367,752 AA+ & A1+ 145,083 AA+ & A1+ Masood Textile Mills Limited - preference shares 50,000 Not available 50,000 Not available Meezan Bank Limited 15,627 AA & A1+ 10,743 AA- & A1+ Millat Tractors Limited 29 Not available 50,582 Not available Murree Brewery Company Limited 9,460 Not available 2,861 Not available National Foods Limited 11,430 A+ & A1 4,941 A+ & A1 National Refinery Limited - 44,236 AAA & A1+ National Bank of Pakistan 428,773 AAA & A1+ - Nestle Pakistan Ltd Limited 40,378 Not available 25,314 Not available * Next Capital Limited 9,750 Not available 9,555 Not available Oil & Gas Development Company Limited 130,783 AAA & A1+ 27,377 AAA & A1+ Balance carried forward 4,713,682 3,276,528
Notes to the Financial StatementsFor the year ended December 31, 2013

ANNUAL REPORT 2013
132
2013 2012 Note Market value Credit rating Market value Credit rating
(Rupees in ‘000) (Rupees in ‘000)
Balance brought forward 4,713,682 3,276,528
Pakistan Oilfields Limited 592,297 Not available 510,038 Not available Pakistan Petroleum Limited 457,001 Not available 140,515 Not available Pakistan State Oil Company Limited 96,410 AA+ & A1+ - AA+ & A1+ Pakistan Telecommunication Company Limited 32,706 Not available - Not available Pakistan Tobacco Company Limited 27,572 Not available 3,310 Not available Rafhan Maize Products Limited 127,037 Not available 23,858 Not available Rupali Polyester Limited 2,985 Not available 3,994 Not available Samba Bank Limited 66,947 AA- & A1 75,216 AA- & A1 Searle Pakistan Limited 11,244 BBB & A-3 3,010 BBB & A-3 ** Sui Northern Gas Pipelines Limited 1,174,200 AA & A1+ 1,165,180 AA- & A1+ * Trust Securities & Brokerage Limited 885 Not available 1,050 Not available Unilever Pakistan Limited - - 799,920 Not available Unilever Pakistan Foods Limited 8,063 Not available 3,728 Not available United Bank Limited 602,352 AA+ & A1+ 655,173 AA+ & A1+ Zulfiqar Industries Limited 3,481 Not available 3,183 Not available
7,916,862 6,664,703
Open Ended Mutual Fund
Metro-Bank Pakistan Sovereign Fund—Perpetual - - 4,236,489 AA(f) MCB Dynamic Stock Fund - - 61,506 4-STAR & STAR
- 4,297, 995
Shares in Un-listed Companies 9.4.2
* National Investment Trust Limited 100 AM2- 100 AM2- * SME Bank Limited 6,527 BBB & A3 10,106 BBB & A3 First Capital Investment (Private) Limited 2,500 AM4+ 2,500 AM4+ Pak Asian Fund 11,500 Not available 11,500 Not available * Arabian Sea Country Club 2,194 Not available 3,514 Not available * Central Depository Company of Pakistan Limited 10,000 Not available 10,000 Not available * National Institutional Facilitation Technologies (Private) Limited 1,526 Not available 1,526 Not available Society for Worldwide Inter Fund Transfer (SWIFT) 1,738 Not available 1,738 Not available Fazal Cloth Mills Limited - preference share - - 100,000 A- & A2 Islamabad Stock Exchange Limited 30,346 Not available 30,346 Not available Lanka Clearing (Private) Limited 805 Not available 761 Not available Lanka Financial Services Bureau Limited 805 Not available 761 Not available Credit Information Bureau of Srilanka 25 Not available 23 Not available
68,066 172,875 Other Investment Sukuk Bonds 9.4.1 2,717,310 Unrated 3,412,836 Unrated
N.I.T. Units 5,502 AM2- 3,672 AM2- 440,564,643 393,234,481
Notes to the Financial StatementsFor the year ended December 31, 2013

133
9.4.1 These are Government of Pakistan guaranteed securities.
9.4.2 Investments in unlisted companies are stated at carrying value. The above excludes unlisted shares of companies
which are fully provided for in these financial statements.
*These are the strategic investments of the Bank.
** This includes 37.292 million shares valuing Rs. 794.309 million (2012: 33.901 million shares valuing Rs. 788.207
million) which are held as strategic investment by the Bank.
9.5 Available for sale Market Treasury Bills and Pakistan Investment Bonds are eligible for rediscounting with the State
Bank of Pakistan. The market value of Market Treasury Bills classified as ‘held to maturity’ as at December 31, 2013
amounted to Rs. 1,720.875 million (2012: Rs. 839.179 million).
9.6 Investment of the Bank in Adamjee Insurance Company Limited is carried at cost amounting to Rs. 943.600 million
(2012: Rs. 943.600 million) as at December 31, 2013. The market value of the investment in Adamjee Insurance
Company Limited as at December 31, 2013 amounted to Rs. 3,809.906 million (2012: Rs. 2,455.336 million).
9.7 Investments include Pakistan Investment Bonds amounting to Rs. 232.60 million (2012: Rs. 232.60 million) earmarked
by the SBP and National Bank of Pakistan against TT / DD discounting facilities and demand note facilities sanctioned
to the Bank. In addition, Pakistan Investment Bonds amounting to Rs. 5 million (2012: Rs. 5 million) have been
pledged with the Controller of Military Accounts on account of Regimental Fund account.
9.8 Information relating to investments in ordinary shares and preference shares of listed companies and unlisted
companies required to be disclosed as part of the financial statements under BSD Circular No.04 of 2006 dated
February 17, 2006, is given in Annexure I.
9.9 Certain approved / Government securities are kept with the SBP to meet statutory liquidity requirements calculated
on the basis of domestic demand and time liabilities.
Notes to the Financial StatementsFor the year ended December 31, 2013

ANNUAL REPORT 2013
134
Note 2013 2012
(Rupees in ‘000)
10. ADVANCES - NET
Loans, cash credits, running finances, etc. In Pakistan 230,190,144 227,859,344 Outside Pakistan 13,943,718 12,689,510
244,133,862 240,518,854
Islamic Financing and related assets 10.2 11,303,966 9,983,417
Net investment in finance lease 10.3
In Pakistan 1,027,911 1,004,761 Outside Pakistan 108,534 162,475
1,136,445 1,167,236
Bills discounted and purchased (excluding treasury bills) Payable in Pakistan 1,455,467 830,471 Payable outside Pakistan 10,162,518 9,892,365
11,617,985 10,722,836
Advances - gross 268,192,258 262,392,343
Provision against advances 10.5 Specific provision (19,450,148) (22,380,087) General provision (267,860) (257,457) General provision against consumer loans (201,354) (145,568) General provision for potential lease losses (in Sri Lanka operations) (29,931) (25,911)
(19,949,293) (22,809,023) Advances - net of provision 248,242,965 239,583,320
10.1 Particulars of advances (gross) 10.1.1 In local currency 222,305,289 236,920,261 In foreign currencies 45,886,969 25,472,082 268,192,258 262,392,343
10.1.2 Short-term 202,500,963 200,621,290 Long-term 65,691,295 61,771,053 268,192,258 262,392,343
10.2 Islamic Financing and related assets Annexure -II
Islamic Financing 5,468,451 5,047,652 Inventories 4,580,773 3,319,863 Advance against Murabaha 756,568 1,394,444 Advance against Future Ijara 268,721 25,779 Advance against Diminishing Musharaka 229,453 195,679 11,303,966 9,983,417
Notes to the Financial StatementsFor the year ended December 31, 2013
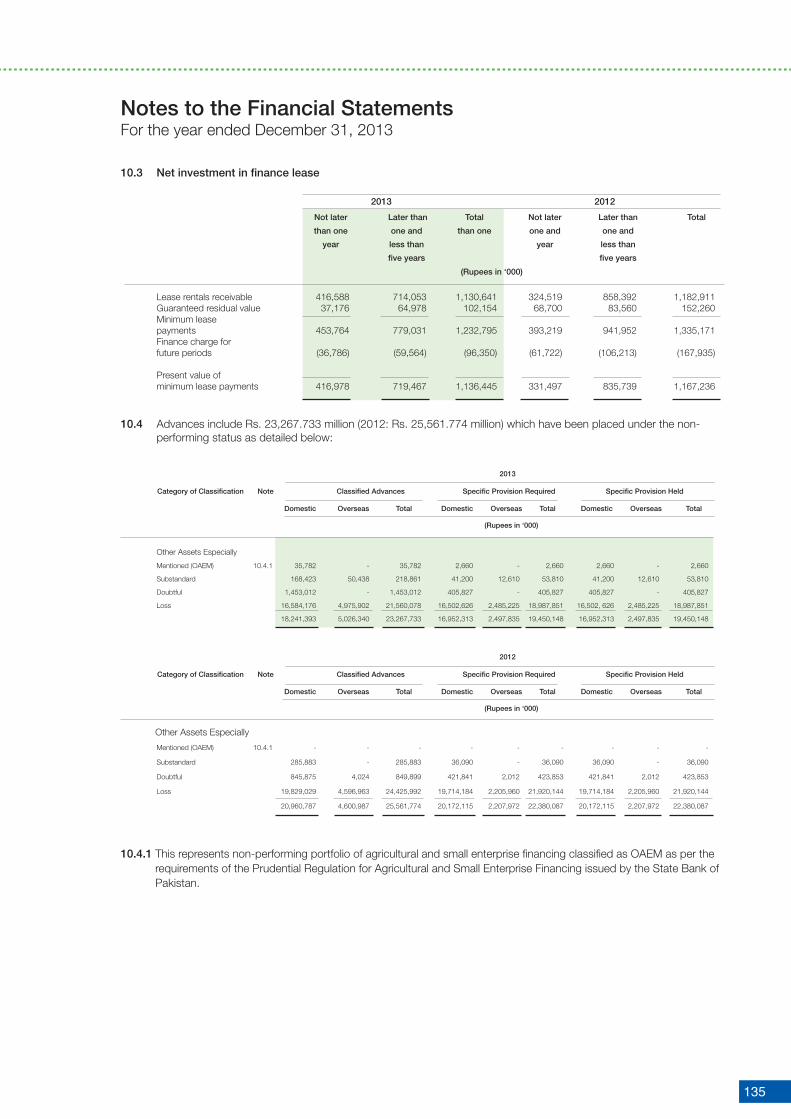
135
10.3 Net investment in finance lease
2013 2012
Not later Later than Total Not later Later than Total
than one one and than one one and one and
year less than year less than
five years five years
(Rupees in ‘000)
Lease rentals receivable 416,588 714,053 1,130,641 324,519 858,392 1,182,911 Guaranteed residual value 37,176 64,978 102,154 68,700 83,560 152,260 Minimum lease payments 453,764 779,031 1,232,795 393,219 941,952 1,335,171 Finance charge for future periods (36,786) (59,564) (96,350) (61,722) (106,213) (167,935)
Present value of minimum lease payments 416,978 719,467 1,136,445 331,497 835,739 1,167,236
10.4 Advances include Rs. 23,267.733 million (2012: Rs. 25,561.774 million) which have been placed under the non- performing status as detailed below:
2013
Category of Classification Note Classified Advances Specific Provision Required Specific Provision Held
Domestic Overseas Total Domestic Overseas Total Domestic Overseas Total
(Rupees in ‘000)
Other Assets Especially
Mentioned (OAEM) 10.4.1 35,782 - 35,782 2,660 - 2,660 2,660 - 2,660
Substandard 168,423 50,438 218,861 41,200 12,610 53,810 41,200 12,610 53,810
Doubtful 1,453,012 - 1,453,012 405,827 - 405,827 405,827 - 405,827
Loss 16,584,176 4,975,902 21,560,078 16,502,626 2,485,225 18,987,851 16,502, 626 2,485,225 18,987,851
18,241,393 5,026,340 23,267,733 16,952,313 2,497,835 19,450,148 16,952,313 2,497,835 19,450,148
2012
Category of Classification Note Classified Advances Specific Provision Required Specific Provision Held
Domestic Overseas Total Domestic Overseas Total Domestic Overseas Total
(Rupees in ‘000)
Other Assets Especially
Mentioned (OAEM) 10.4.1 - - - - - - - - -
Substandard 285,883 - 285,883 36,090 - 36,090 36,090 - 36,090
Doubtful 845,875 4,024 849,899 421,841 2,012 423,853 421,841 2,012 423,853
Loss 19,829,029 4,596,963 24,425,992 19,714,184 2,205,960 21,920,144 19,714,184 2,205,960 21,920,144
20,960,787 4,600,987 25,561,774 20,172,115 2,207,972 22,380,087 20,172,115 2,207,972 22,380,087
10.4.1 This represents non-performing portfolio of agricultural and small enterprise financing classified as OAEM as per the requirements of the Prudential Regulation for Agricultural and Small Enterprise Financing issued by the State Bank of Pakistan.
Notes to the Financial StatementsFor the year ended December 31, 2013

ANNUAL REPORT 2013
136
2013
Note Specific General General Leasing Total
provision (general)
against
consumer loans
(Rupees in ‘000)
10.5 Particulars of provision against advances
Opening balance 22,380,087 257,457 145,568 25,911 22,809,023 Exchange adjustments 129,419 - - 1,502 130,921 Provision made during the year 1,619,488 10,403 55,786 2,518 1,688,195 Reversals (4,516,978) - - - (4,516,978)
(2,897,490) 10,403 55,786 2,518 (2,828,783)
Amounts written off 10.6.1 (161,868) - - - (161,868)
Closing balance 19,450,148 267,860 201,354 29,931 19,949,293
2012
Note Specific General General Leasing Total
provision (general)
against
consumer loans (Rupees in ‘000)
Opening balance 21,869,401 248,135 198,340 17,566 22,333,442 Exchange adjustments 101,078 - - - 101,078
Provision made during the year 4,881,254 9,322 - 8,345 4,898,921 Reversals (4,365,246) - (52,772) - (4,418,018)
516,008 9,322 (52,772) 8,345 480,903 Amounts written off 10.6.1 (106,400) - - - (106,400)
Closing balance 22,380,087 257,457 145,568 25,911 22,809,023
2013 2012
Specific General total Specific General Total (total) (total)
(Rupees in ‘000)
10.5.1 Particulars of provisions against advances
In local currency 16,952,313 469,214 17,421,527 20,172,115 403,025 20,575,140 In foreign currencies 2,497,835 29,931 2,527,766 2,207,972 25,911 2,233,883
19,450,148 499,145 19,949,293 22,380,087 428,936 22,809,023
Note 2013 2012
(Rupees in ‘000)
10.5.2 The following amounts have been charged to the profit and loss account:
Specific provision (2,897,490) 516,008 General provision 10.5.3 10,403 9,322 General provision against consumer & 10.5.5 55,786 (52,772) Small Enterprise loans General provision for potential lease losses 2,518 8,345 (in Sri Lanka operations) (2,828,783) 480,903
10.5.3 General provision against advances represents provision maintained at around 0.1% of gross advances.
10.5.4 State Bank of Pakistan vide BSD Circular No. 2 dated January 27, 2009, BSD Circular No. 10 dated October 20, 2009, BSD Circular No. 02 of 2010 dated June 03, 2010 and BSD Circular No.1 of 2011 dated October 21, 2011 has allowed benefit of forced sale value (FSV) of Plant & Machinery under charge, pledged stock and mortgaged residential, commercial & industrial properties (land and building only) held as collateral against NPLs for five years from the date of classification. However, management has not taken the FSV benefit in calculation of specific provision.
10.5.5 General provision against consumer loans represents provision maintained at an amount equal to 1.5% of the fully secured performing portfolio and 5% of the unsecured performing portfolio as required by the Prudential Regulations issued by the SBP. General provision against Small Enterprise Finance is maintained at rate of 1% of fully secured performing portfolio.
Notes to the Financial StatementsFor the year ended December 31, 2013

137
Note 2013 2012
(Rupees in ‘000)
10.6 Particulars of write offs:
10.6.1 Against provisions 10.5 161,868 106,400 Directly charged to the profit and loss account - 206
161,868 106,606
10.6.2 Write offs of Rs. 500,000 and above 10.6.3 150,079 90,372 Write offs of below Rs. 500,000 11,789 16,234
161,868 106,606
10.6.3 Details of loan write offs of Rs. 500,000 and above
In terms of sub-section (3) of Section 33A of the Banking Companies Ordinance, 1962, the statement in respect of written-off loans or any other financial relief of five hundred thousand Rupees or above allowed to a person(s) during the year ended December 31, 2013 is given at Annexure-III in standalone financial statements. However, this write off does not affect the Bank’s right to recover the debts from these customers.
Note 2013 2012
(Rupees in ‘000)
10.7 Particulars of advances to directors, executives, associated companies, etc.
Debts due by executives or officers of the Bank or any of them either severally or jointly with any other persons
Balance at beginning of the year 3,884,019 4,179,037
Loans granted during the year 581,008 527,091
Repayments (831,052) (822,109)
Balance at end of the year 3,633,975 3,884,019 Debts due by subsidiary companies, controlled firms, managed modarabas and other related parties
Balance at beginning of the year 640,465 580,774
Loans granted during the year 474,797 467,712
Repayments (402,105) (408,021) Balance at end of the year 713,157 640,465
4,347,132 4,524,484
11. OPERATING FIXED ASSETS
Capital work-in-progress 11.1 1,888,504 1,460,403
Property and equipment 11.2 26,117,418 21,769,226
Intangible asset 11.3 589,416 508,825
28,595,338 23,738,454
11.1 Capital work-in-progress
Civil works 1,260,427 1,032,549
Advances to suppliers and contractors 149,642 240,852
Others 478,435 187,002
1,888,504 1,460,403
Notes to the Financial StatementsFor the year ended December 31, 2013

ANNUAL REPORT 2013
138
11.2 Property and equipment
2013 Cost/ Revalued amount Accumulated depreciation
Description At January Additions/ Revaluation Reversal due Transfer in / At At January Charge for the year/ Reversal due to Transfer in / At Net book Annual rate of
01, 2013 (disposals) / surplus to revaluation (out) December 31, 01, 2013 (description on revaluation (out) December 31, value at depreciation
exchange and 2013 disposal exchange 2013 December 31, estimated
other adjustments and other adjustments 2013 useful life
(Rupees in ‘000)
Land - Freehold 12,057,399 809,296 1,507,217 - - 14,373,912 - - - - - 14,373,912 -
Land - Leasehold 120,100 - 5,532 - - 125,632 - - - - - 125,632 -
Buildings on 6,101,743 1,062,697 592,273 (526,948) 57,731 7,289,486 295,597 213,047 (526,948) 17,544 - 7,289,486 upto 70 years freehold land 1,990 760 Buildings on 538,898 1,836 16,465 (14,013) (493,999) 49,996 181,563 2,007 (14,013) (170,314) - 49,996 upto 50 years leasehold land 809 757 Leasehold - 225,847 - - 436,268 663,619 154,583 - 152,770 310,115 353,504 3 years Improvements* 1,504 2,762 Furniture and fixture 982,427 97,216 - - 1,072,104 538,266 97,350 - - 628,341 443,763 10% (9,533) (6,790) 1,994 (485) Electrical, Computers 7,662,200 790,075 - - - 8,369,575 5,536,781 732,143 - - 6,188,453 2,181,122 10% to 25% and office Equipment (88,094) (84,727) 5,394 4,256 Vehicles 580,209 233,183 - - - 742,585 359,677 75,598 - - 379,173 363,412 20% (73,053) (57,648) 2,246 1,546
Ijarah Assets Assets held under 285,284 523,090 - - - 750,029 61,550 111,509 - - 144,970 605,059 20% Ijarah - Car (58,345) (28,089) Assets held under 537,749 150,840 - - - 563,369 123,349 155,077 - - 231,837 331,532 20% Ijarah- Equipment (125,220) (46,589)
28,866,009 3,894,080 2,121,487 (540,961) - 34,000,307 7,096,783 1,541,314 (540,961) - 7,882,889 26,117,418 (354,245) (223,843) 13,937 9,596 * Leasehold Improvements have been classified separately from Buildings on leasehold land.
2012 Cost/ Revalued amount Accumulated depreciation Description At January Additions/ At December At January Charge for the year/ At December Net book Annual rate of 01, 2012 (disposals) / 31, 2012 01, 2012 (description on 31, 2012 value at depreciation / exchange and (disposals) /exchange Decembe 31, 2012 estimated useful life other adjustments other adjustments
(Rupees in ‘000)
Land - Freehold 10,788,123 1,269,276 12,057,399 - - - 12,057,399 - Land - Leasehold 120,100 - 120,100 - - - 120,100 - Buildings on freehold land 5,542,637 559,106 6,101,743 133,016 162,581 295,597 5,806,146 upto 70 years Buildings on leasehold land 307,012 233,291 538,898 120,908 77,620 181,563 357,335 3 to 50 years (1,405) (16,965) Furniture and fixture 901,776 82,857 982,427 432,210 107,373 538,266 444,161 10% (2,239) (1,390) 33 73 Electrical, Computers and 7,150,209 562,062 7,662,200 4,746,335 813,470 5,536,781 2,125,419 10% to 25% office Equipment (19,008) (9,986) (31,063) (13,038)
Vehicles 562,237 59,344 580,209 325,743 65,386 359,677 220,532 20% (40,216) (30,987) (1,156) (465) Ijarah Assets Assets held under 105,537 206,629 285,284 30,031 45,172 61,550 223,734 20% Ijarah - Car (26,882) (13,653) Assets held under 318,957 222,059 537,749 16,332 107,368 123,349 414,400 20% Ijarah - Equipment (3,267) (351)
25,796,588 3,194,624 28,866,009 5,804,575 1,378,970 7,096,783 21,769,226 (91,612) (56,367) (33,591) (30,395)
Notes to the Financial StatementsFor the year ended December 31, 2013

139
11.2.1 The land and buildings of the Bank are revalued in December 2013 by independent valuers (Arch-e-Decon & Sardar Enterprises), valuation and engineering consultants, on the basis of market value. The information relating to location of revalued assets is given in Annexure V. The details of revalued amounts are as follows:
(Rupees in ‘000)
Total revalued amount of land 14,499,544 Total revalued amount of buildings 7,339,482
Had the land and buildings not been revalued, the total carrying amounts of revalued properties as at December 31, 2013 would have been as follows: (Rupees in ‘000)
Land 4,989,758 Buildings 4,603,788
11.2.2 The gross carrying amount (cost) of fully depreciated assets that are still in use are as follows:
Furniture and fixture 298,550 Electrical, computers and office equipment 3,770,909 Vehicles 358,023 Leasehold Improvements 98,600 Intangible asset 1,207,762
11.2.3 Details of disposal of operating fixed assets
The information relating to disposal of operating fixed assets required to be disclosed as part of the financial statements by the State Bank of Pakistan is given in Annexure IV and is an integral part of these financial statements.
11.3 Intangible asset 2013
Description Cost Accumulated amortization
At January Additions / At December At January Amortization At December Net book Annual rate
01, 2013 exchange 31, 2013 01, 2013 for the year / 31, 2013 value at of
adjustments adjustments December amortization
31, 2013 %
(Rupees in ‘000)
Computer software 1,861,486 340,366 2,205,379 1,352,661 260,424 1,615,963 589,416 33.33
3,527 2,878
1,861,486 340,366 2,205,379 1,352,661 260,424 1,615,963 589,416
3,527 2,878
2012
Description Cost Accumulated amortization
At January Additions / At December At January Amortization At December Net book Annual rate
01, 2012 adjustments 31, 2012 01, 2012 for the year / 31, 2012 value at of
adjustments December amortization
31, 2012 %
(Rupees in ‘000)
Computer software 1,500,549 348,311 1,861,486 1,078,753 259,932 1,352,661 508,825 33.33
12,626 13,976
1,500,549 348,311 1,861,486 1,078,753 259,932 1,352,661 508,825
12,626 13,976
Notes to the Financial StatementsFor the year ended December 31, 2013

ANNUAL REPORT 2013
140
Note 2013 2012
Restated
(Rupees in ‘000)
12. OTHER ASSETS - NET
Income / mark-up accrued on advances and investments - local currency 8,403,945 8,019,107 Income / mark-up accrued on advances and investments - foreign currencies 192,928 84,381 Accrued income, advances, deposits, and other prepayments 1,075,992 959,630 Advance taxation (payments less provisions) 6,081,521 10,894,522 Compensation for delayed income tax refunds 44,802 44,802 Non-banking assets acquired in satisfaction of claims 12.1 1,939,184 1,398,703 Unrealised gain on derivative financial instruments 12.2 1,649,163 134,339 Stationery and stamps on hand 66,910 43,067 Prepaid exchange risk fee 257 169 Receivable from the pension fund 36.3 5,854,207 18,428,483 Others 2,729,121 2,645,206
28,038,030 42,652,409
Less: Provision held against other assets 12.3 1,081,715 1,131,977
26,956,315 41,520,432
12.1 The market value of non-banking assets with carrying value of Rs. 1,814.981 million (2012: Rs. 1,276.093 million) net of provision as per the valuation reports dated December 31, 2013 amounted to Rs. 1,831.591 million (2012: Based on valuation as of December 31, 2012 Rs. 1,374.399 million).
12.2 Unrealised gain on derivative financial instruments
Contract / National Amount Unrealised gain
2013 2012 2013 2012
(Rupees in ‘000)
Unrealised gain on: FX Options 216,344 - 1,062 -
Forward exchange contracts 90,769,449 22,169,486 1,648,101 134,339
90,985,793 22,169,486 1,649,163 134,339
2013 2012 (Rupees in’000)
12.3 Provision held against other assets
Opening balance 1,131,977 1,289,687
Charge for the year 31,376 59,858
Reversal during the year (83,661) (247,163)
(52,285) (187,305)
Write off during the year (40,091) (12,324) Exchange adjustments / reclassification 42,114 41,919
Closing balance 1,081,715 1,131,977
13. CONTINGENT ASSETS
There were no contingent assets of the Bank as at December 31, 2013 and December 31, 2012.
2013 2012 (Rupees in ‘000)
14. BILLS PAYABLE
In Pakistan 10,113,386 9,849,905
Outside Pakistan 25,340 46,379
10,138,726 9,896,284
Notes to the Financial StatementsFor the year ended December 31, 2013

141
Note 2013 2012
(Rupees In ‘000)
15. BORROWINGS
In Pakistan 30,267,778 76,644,529
Outside Pakistan 8,274,882 2,306,574
38,542,660 78,951,103
15.1 Particulars of borrowings with respect to currencies
In local currency 30,267,778 76,644,529 In foreign currencies 8,274,882 2,306,574
38,542,660 78,951,103
15.2 Details of borrowings (secured / unsecured)
Secured
Borrowings from State Bank of Pakistan Export refinance scheme 15.3 & 15.5 8,939,210 8,780,720 Long term financing facility 15.4 & 15.5 3,832,857 3,448,638 Long term financing - export oriented projects scheme 15.4 & 15.5 213,965 555,277 Financing Facility for Storage of Agricultural Produce 670,858 768,806
13,656,890 13,553,441
Repurchase agreement borrowings 15.6 16,675,724 63,158,913 30,332,614 76,712,354
Unsecured
Borrowings from other financial institution 15.7 2,633,818 292,605 Call borrowings 15.8 4,950,256 1,117,221
Overdrawn nostro accounts 625,972 828,923
8,210,046 2,238,749
38,542,660 78,951,103
15.3 The Bank has entered into agreements for financing with the State Bank of Pakistan (SBP) for extending export finance to customers. As per the agreements, the Bank has granted SBP the right to recover the outstanding amount from the Bank at the date of maturity of the finance by directly debiting the current account maintained by the Bank with SBP. These carry mark-up at rate of 8.40%.
15.4 The amount is due to SBP and has been obtained for providing long term finance to customers for export oriented projects. As per the agreements with SBP, the Bank has granted SBP the right to recover the outstanding amount from the Bank at the date of maturity of the finance by directly debiting the current account maintained by the Bank with SBP.
15.5 Borrowings from SBP under the export refinance and long term financing for export oriented projects schemes are secured against the Bank’s cash and security balances held by the SBP. These carry mark-up at rates ranging from 8.40% to 8.80% per annum.
15.6 These carry mark-up rates ranging from 7.75% to 10.25% per annum (2012: 6.50% to 12.82% per annum) and are secured against government securities of carrying value of Rs. 16,741.876 million (2012: Rs. 63,213.250 million).
15.7 These carry mark-up ranging from 1.20% to 2.20% per annum (2012: 1.50% to 3.25% per annum).
15.8 These carry mark-up ranging from 0.80% to 3% per annum (2012: 0.80% to 1.45% per annum). These are repayable by April, 2014.
Notes to the Financial StatementsFor the year ended December 31, 2013

ANNUAL REPORT 2013
142
2013 2012
(Rupees in ‘000)
16. DEPOSITS AND OTHER ACCOUNTS
Customers
Fixed deposits 60,524,016 80,649,846 Saving deposits 349,223,728 268,927,052 Current accounts 206,720,753 183,176,846 Margin accounts 3,937,113 3,520,404
620,405,610 536,274,148 Financial institutions
Remunerative deposits 8,058,094 6,090,878 Non-remunerative deposits 3,866,582 2,695,702
11,924,676 8,786,580
632,330,286 545,060,728 16.1 Particulars of deposits
In local currency 596,310,639 515,607,927 In foreign currencies 36,019,647 29,452,801
632,330,286 545,060,728
16.2 Deposits include deposits from related parties amounting to Rs. 16,547.558 million (2012: Rs. 30,811.575 million).
Note 2013 2012
Restated
(Rupees in ‘000)
17. DEFERRED TAX LIABILITY / (ASSET) - NET
The details of the tax effect of taxable and deductible temporary differences are as follows:
Taxable temporary differences on:
Surplus on revaluation of operating fixed assets 21.1 957,493 763,706 Accelerated tax depreciation 1,236,316 1,109,270 Receivable from pension fund 2,048,974 6,449,969 Surplus on revaluation of securities 21.2 311,153 1,501,042
4,553,936 9,823,987 Deductible temporary differences on:
Provision for bad debts (19,766) (12,632) Provision for post retirement benefits (332,797) (281,628)
(352,563) (294,260)
4,201,373 9,529,727
Notes to the Financial StatementsFor the year ended December 31, 2013
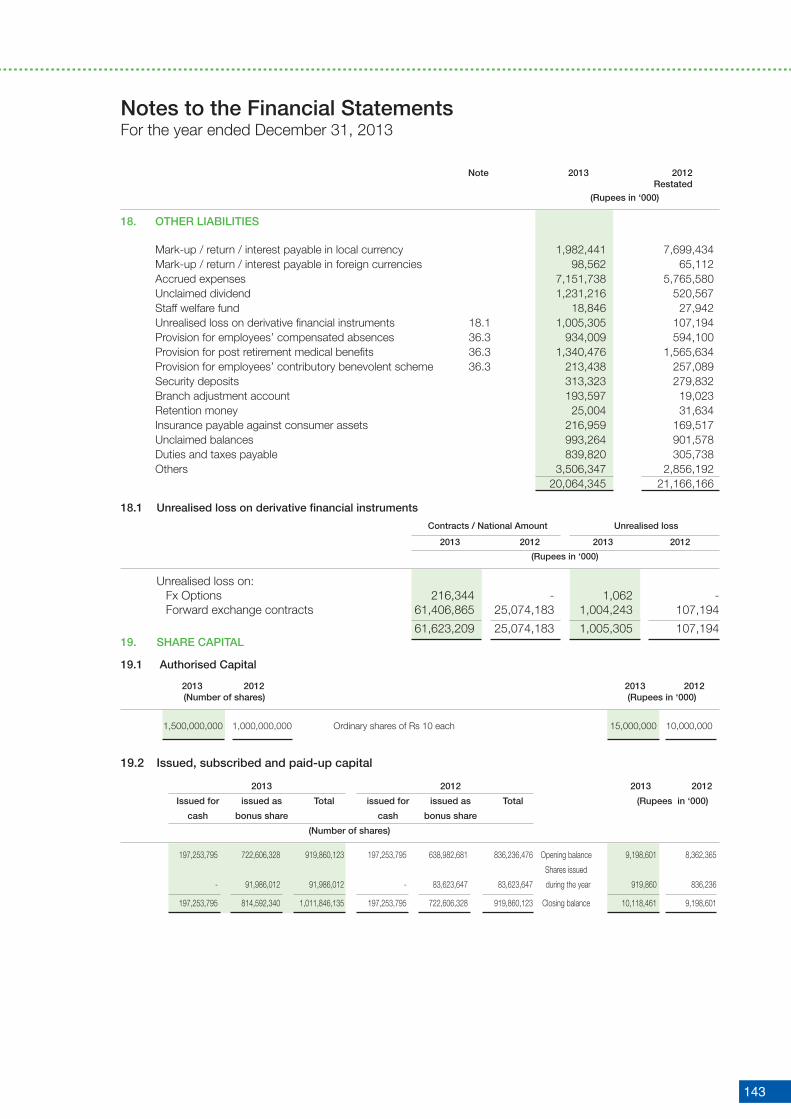
143
Note 2013 2012 Restated (Rupees in ‘000)
18. OTHER LIABILITIES
Mark-up / return / interest payable in local currency 1,982,441 7,699,434 Mark-up / return / interest payable in foreign currencies 98,562 65,112 Accrued expenses 7,151,738 5,765,580 Unclaimed dividend 1,231,216 520,567 Staff welfare fund 18,846 27,942 Unrealised loss on derivative financial instruments 18.1 1,005,305 107,194 Provision for employees’ compensated absences 36.3 934,009 594,100 Provision for post retirement medical benefits 36.3 1,340,476 1,565,634 Provision for employees’ contributory benevolent scheme 36.3 213,438 257,089 Security deposits 313,323 279,832 Branch adjustment account 193,597 19,023 Retention money 25,004 31,634 Insurance payable against consumer assets 216,959 169,517 Unclaimed balances 993,264 901,578 Duties and taxes payable 839,820 305,738 Others 3,506,347 2,856,192 20,064,345 21,166,166
18.1 Unrealised loss on derivative financial instruments
Contracts / National Amount Unrealised loss
2013 2012 2013 2012
(Rupees in ‘000)
Unrealised loss on: Fx Options 216,344 - 1,062 - Forward exchange contracts 61,406,865 25,074,183 1,004,243 107,194
61,623,209 25,074,183 1,005,305 107,19419. SHARE CAPITAL 19.1 Authorised Capital
2013 2012 2013 2012 (Number of shares) (Rupees in ‘000)
1,500,000,000 1,000,000,000 Ordinary shares of Rs 10 each 15,000,000 10,000,000
19.2 Issued, subscribed and paid-up capital
2013 2012 2013 2012
Issued for issued as Total issued for issued as Total (Rupees in ‘000)
cash bonus share cash bonus share
(Number of shares)
197,253,795 722,606,328 919,860,123 197,253,795 638,982,681 836,236,476 Opening balance 9,198,601 8,362,365
Shares issued
- 91,986,012 91,986,012 - 83,623,647 83,623,647 during the year 919,860 836,236
197,253,795 814,592,340 1,011,846,135 197,253,795 722,606,328 919,860,123 Closing balance 10,118,461 9,198,601
Notes to the Financial StatementsFor the year ended December 31, 2013

ANNUAL REPORT 2013
144
Note 2013 2012 (Rupees in ‘000)
19.3 Number of shares held by the associated undertakings as at December 31, are as follows:
Adamjee Insurance Company Limited 29,914,034 28,641,486 Nishat Mills Limited 73,272,629 66,611,481 D.G. Khan Cement Company Limited 92,979,303 84,526,640 Din Leather (Private) Limited 6,305,758 5,732,508 Siddiqsons Limited 12,978,603 11,798,731 Mayban International Trust (Labuan) Berhad 202,369,225 183,972,923
417,819,552 381,283,769
20. RESERVES
Share premium 9,702,528 9,702,528 Exchange translation reserve 598,192 399,782 Statutory reserve 20.1 17,700,494 15,550,960 General reserve 18,600,000 18,600,000
46,601,214 44,253,270
20.1 Statutory reserve represents amount set aside as per the requirements of section 21 of the Banking Companies Ordinance, 1962.
Note 2013 2012 (Rupees in ‘000)
21. SURPLUS ON REVALUATION OF ASSETS - NET OF TAX
Surplus / (deficit) arising on revaluation (net of tax) of:
- fixed assets 21.1 11,287,987 9,415,346 - available-for-sale securities 21.2 1,671,276 4,178,551
12,959,263 13,593,897
21.1 Surplus on revaluation of fixed assets-net of tax
Surplus on revaluation of fixed assets as at January 01 10,179,052 10,234,112 Surplus during the year 2,121,487 -
Transferred to unappropriated profit in respect of incremental depreciation charged during the year - net of deferred tax (35,788) (35,789) Related deferred tax liability (19,271) (19,271)
(55,059) (55,060)
Surplus on revaluation of fixed assets as at December 31 12,245,480 10,179,052
Less: Related deferred tax liability on:
Revaluation as at January 01 763,706 782,977 Surplus during the year 213,058 -
Incremental depreciation charged during the year transferred to profit and loss account (19,271) (19,271)
957,493 763,706
11,287,987 9,415,346
Notes to the Financial StatementsFor the year ended December 31, 2013

145
Note 2013 2012 (Rupees in ‘000)
21.2 Surplus / (deficit) on revaluation of available for sale securities - net of tax
Federal Government Securities - Market Treasury Bills (286,345) 510,739 - Pakistan Investment Bonds 105,418 2,738,854 Listed Securities - Shares / Certificates / Units 2,116,420 2,071,198 - Open Ended Mutual Funds 2,156 248,321 - Term Finance Certificates 27,470 97,645
2,146,046 2,417,164
Sukuk Bonds 17,310 12,836
1,982,429 5,679,593 Add: Related deferred tax (liability) / asset 17 (311,153) (1,501,042)
1,671,276 4,178,551
22. CONTINGENCIES AND COMMITMENTS
22.1 Direct credit substitutes
Contingent liabilities in respect of guarantees given favouring
Government 6,488,041 5,129,432 Banks and financial institutions 2,347,585 3,585,501 Others 16,054,851 13,956,922
24,890,477 22,671,85522.2 Transaction-related contingent liabilities
Guarantees in favour of Banks and financial institutions 20,933 - Others 1,500,019 686,615 Suppliers’ credit / payee guarantee 2,489,432 2,600,833
4,010,384 3,287,448
22.3 Trade-related contingent liabilities 80,638,690 69,423,741
22.4 Other contingencies
Claims against the Bank not acknowledged as debts 3,035,863 620,416
These represent certain claims by third parties against the Bank, which are being contested in the Courts of law. The management is of the view that these relate to the normal course of business and the possibility of an outflow of economic resources is remote.
22.5 Commitments to extend credit
The Bank makes commitments to extend credit in the normal course of its business but these being revocable commitments do not attract any significant penalty or expense if the facility is unilaterally withdrawn.
Note 2013 2012
(Rupees in ‘000)
22.6 Commitments in respect of forward foreign exchange contracts Purchase 72,216,751 25,546,035 Sale 79,959,563 21,697,63422.7 Commitments for the acquisition of fixed assets 243,614 555,398
22.8 Other commitments FX options (notional amount) 23.1 & 23.2 Purchase 216,344 - Sale 216,344 -
Notes to the Financial StatementsFor the year ended December 31, 2013

ANNUAL REPORT 2013
146
22.9 Taxation For assessment year 1988-89 through tax year 2012, the tax department disputed Bank’s treatment on certain issues,
where the Bank’s appeals are pending at various appellate forums, entailing an additional tax liability of Rs.4,189 million (2012: Rs.9,639 million) which has been paid. Such issues inter alia principally include disallowance of expenses for non deduction of withholding tax and non availability of underlying records, provision for non performing loans, attribution of expenses to heads of income other than income from business and disallowance of credit for taxes paid in advance / deducted at source.
The Bank has filed appeals which are pending at various appellate forums. In addition, certain decisions made in favour of the Bank are being contested by the department at higher forums. No provision has been made in the financial statements regarding the aforesaid additional tax demand and already issued favourable decisions where the department is in appeal, as the management is of the view that the issues will be decided in the Bank’s favour as and when these are taken up by the Appellate Authorities.
For tax years 2003 through 2006 and tax year 2011, aggregate liability of Rs 584 million has been adjudged under section 161 of the Income Tax Ordinance, 2001 on the grounds that Bank failed to deduct applicable withholding tax while making payments on certain accounts. Such liability has not been provided for in these financial statements as Bank’s management is of the view that while departmental action for tax years 2003 through 2006 is barred by applicable limitation of time while the liability for tax year 2011 has been adjudged on an arbitrary basis.
23. DERIVATIVE INSTRUMENTS Most corporate (counter parties) have either interest rate exposures arising from debt financing or excess liquidity or
currency exposures arising out of commercial and business transactions. In the event of a shift in interest or foreign exchange (FX) rates, these corporate may incur higher borrowing costs or higher cash outflows that will adversely affect profitability.
The Bank provides solutions to this conundrum through derivatives. Through this, counterparties will be hedging exposure to adverse price movements in a security, typically when the counterparty has a concentrated position in the security and is acutely exposed to movements in the underlying risk factors. The Bank is in a better position to hedge that risk, and is thus able to provide cost efficient hedging solutions to the counterparties enabling them to concentrate on their business risk.
Other Objectives include: - contribution to the development of Pakistani financial markets. - provision of financial solutions to the counterparties.
Risk management is performed at: a) Strategic level: By senior management Assets and Liabilities Management Committee (ALCO), Risk Management
Committee (RMC) and the Board of Directors to institute a risk management framework and to ensure provision of all resources and support required for effective risk management on Bank-wide basis.
b) Macro Level: By Financial Institution Public Sector (FIPS) & Market Risk Management (MRM) Division, responsible for policy formulation, procedure development & implementation, monitoring and reporting.
c) Micro Level: Treasury Derivatives & Structured Product Desk and Treasury Operations, where risks are actually created.
FIPS & MRM Division is responsible for coordinating for risk management of derivatives.
The risk management system generates marked to market risk numbers (i.e. VaR, PVBP, duration, etc.) of Interest rate derivative portfolio. These numbers are reported to senior management on a daily basis.
As per the State Bank of Pakistan’s (SBP) regulations, currency options are hedged back to back and thus the risk associated with such transactions are minimal.
Risk Limits Before initiating any new derivative transaction, Treasury Division requests the FIPS & MRM Division for risk limits. Limit
requests are approved by the appropriate level of authority. Presently the Bank has defined notional limits both for the portfolio and the counterparty.
Notes to the Financial StatementsFor the year ended December 31, 2013

147
Notes to the Financial StatementsFor the year ended December 31, 2013
23.1 Product analysis 2013
Counter parties Cross Currency Swaps Interest Rate Swaps FX Options No. of Notional No. of Notional No. of Notional Contracts Principal Contracts Principal Contracts Principal (Rupees (Rupees (Rupees in ‘000) in ‘000) in ‘000)
With Banks for Hedging - - - - 2 216,344 Market Making - - - - - -
With other entities for Hedging - - - - - - Market Making - - - - 2 216,344 Total Hedging - - - - 2 216,344 Market Making - - - - 2 216,344
2012
Counter parties Cross Currency Swaps Interest Rate Swaps FX Options No. of Notional No. of Notional No. of Notional Contracts Principal Contracts Principal Contracts Principal (Rupees (Rupees (Rupees in ‘000) in ‘000) in ‘000)
With Banks for Hedging - - - - - - Market Making - - - - - -
With other entities for Hedging - - - - - - Market Making - - - - - - Total Hedging - - - - - - Market Making - - - - - - 23.2 Maturity analysis 2013 Remaining maturity No. of Notional Mark to Market Contracts Principal Negative Positive Net (Rupees in ‘000)
FX Options Over 1 to 3 months 4 432,688 (1,062) 1,062 -
2012 Remaining maturity No. of Notional Mark to Market Contracts Principal Negative Positive Net (Rupees in ‘000)
FX Options Over 1 to 3 months - - - - - -

ANNUAL REPORT 2013
148
2013 2012
(Rupees in ‘000)
24. MARK-UP / RETURN / INTEREST EARNED
On loans and advances to:
Customers 24,990,221 29,001,920
On investments in:
Held for trading securities 15,541 571,924 Available for sale securities 38,442,248 37,623,042 Held to maturity securities 775,352 838,773
39,233,141 39,033,739
On deposits with financial institutions 95,220 40,446 On securities purchased under resale agreements 731,612 256,648 On money at call 13,929 23,438 65,064,123 68,356,191
25. MARK-UP / RETURN / INTEREST EXPENSED Deposits 23,560,817 23,042,790 Securities sold under repurchase agreements 1,705,713 2,628,154 Other short-term borrowings 1,107,629 1,153,569 Discount, commission and brokerage 533,513 511,562 Others 288,222 163,944
27,195,894 27,500,019
26. GAIN ON SALE OF SECURITIES - NET
Federal Government Securities Market Treasury Bills 37,828 37,567 Pakistan Investment Bonds 193,812 25,516 Sukuk Bonds - 3,000 Others
- Shares and units- Listed 1,870,758 445,383 - Unlisted shares - 313,073
Term Finance Certificates 27,943 -
2,130,341 824,539
27. OTHER INCOME
Rent on property / lockers 166,055 162,819 Net profit on sale of property and equipment 42,687 22,586 Bad debts recovered 60,522 48,817 Postal, SWIFT and other charges recovered 180,340 139,627
449,604 373,849
Notes to the Financial StatementsFor the year ended December 31, 2013

149
Note 2013 2012
(Rupees in ‘000)
28. ADMINISTRATIVE EXPENSES
Salaries and allowances 8,640,410 8,434,242 Charge / (reversal) for defined benefit plans and other benefits: - Approved pension fund 36.7 (1,701,451) (1,933,027) - Post retirement medical benefits 36.7 187,792 187,136 - Employees’ contributory benevolent scheme 36.7 55,269 40,192 - Employees’ compensated absences 36.7 146,623 97,691
(1,311,767) (1,608,008)
Contributions to defined contribution plan - provident fund 197,721 188,417 Voluntary Separation Scheme 28.1 1,057,724 - Non-executive directors’ fees 31,674 33,431 Rent, taxes, insurance and electricity 2,555,281 2,460,324 Legal and professional charges 272,431 176,615 Communications 861,849 931,840 Repairs and maintenance 1,103,210 1,208,462 Stationery and printing 502,943 472,490 Advertisement and publicity 119,184 393,092 Cash transportation charges 481,736 461,279 Instrument clearing charges 124,667 117,439 Donations 28.2 25,000 31,162 Auditors’ remuneration 28.3 32,112 20,522 Depreciation 11.2 1,541,314 1,378,970 Amortization of intangible asset 11.3 260,424 259,932 Travelling, conveyance and fuel 213,763 249,571 Subscription 19,574 18,392 Entertainment 117,750 110,114 Training Expenses 41,376 30,429 Petty Capital items 32,689 34,890 Card Related Expenses 238,147 147,490 Outsourced security guards, tea services and janitorial expenses etc 1,333,108 1,701,004 CNIC verification charges 52,716 60,276 Others 164,933 164,487 18,709,969 17,476,862
28.1 During the year, the Bank announced a Voluntary Separation Scheme (VSS) for clerical & non-clerical employees. 571 employees of the Bank opted for retirement under this scheme. The above expense excludes the payments made under retirement funds.
28.2 None of the directors, executives or their spouses had any interest in the donee. Detail of donations made during the year is as follows:
2013 2012
(Rupees in ‘000)
Construction of houses in flood affected areas - 12,088 Network equipment to PSWO - 7,901
Hyderabad Relief & Rehabilitation Trust - 3,832
Al-Shifa Trust, Fighting Against Blindness - 1,000 Sindh Institute of Urology & Transplantation (SIUT) - 5,000 Shoukat Khanum Memorial Trust - 100 Cost of establishing of centre of learning in collaboration with CISCO system and CARE foundation - 1,241 Prime Minister’s Earthquake Relief Fund 2013, for Baluchistan 25,000 - 25,000 31,16228.3 Auditors’ remuneration Annual Audit fee 12,128 11,550 Fee for audit and other certifications of overseas branches 4,477 2,316 Tax and other sundry services 14,732 5,966 Out-of-pocket expenses 775 690 32,112 20,522
Notes to the Financial StatementsFor the year ended December 31, 2013

ANNUAL REPORT 2013
150
2013 2012
(Rupees in ‘000)
29. OTHER CHARGES
Provision for Penalties of State Bank of Pakistan - 220,000 Workers welfare fund 645,764 641,075 VAT and Crop Insurance Levy - Sri Lanka 57,611 43,643 Education cess 4,693 - Provision against balance with banks - (304,744)
Impairment loss on Non-Banking assets 210,428 -
Loss on sale of Non-Banking assets 10,099 - 928,595 599,974 30. TAXATION
For the year Current 15,170,974 9,600,760 Deferred (4,378,107) 1,251,420
10,792,867 10,852,180
Prior years Current - 116,725 Deferred - -
- 116,725 10,792,867 10,968,905
30.1 Relationship between tax expense and accounting profit
Accounting profit for the year 32,288,205 31,641,907
Tax rate 35% 35%
Tax on income 11,300,872 11,074,667 Tax effect on separate block of income (taxable at reduced rate) (456,439) (226,188) Tax effect of permanent differences - 87,907 Tax effect of prior years provisions - 116,725 Others (51,566) (84,206)
Tax charge for the year 10,792,867 10,968,905
31. CREDIT RATING
PACRA through its notification dated February 04, 2013, has upgraded bank’s long term credit rating from AA+ [double A plus] to AAA [Triple A] and maintained short-term credit rating of A1+ [A one plus].
2013 2012
(Rupees in ‘000)
32. BASIC AND DILUTED EARNINGS PER SHARE - PRE TAX
Profit before taxation 32,288,205 31,641,907
(Number of Shares)
Weighted average number of shares outstanding during the year 1,011,846,135 1,011,846,135
(Rupees)
Basic and diluted earnings per share - pre tax 31.91 31.27
Notes to the Financial StatementsFor the year ended December 31, 2013

151
2013 2012
(Rupees in ‘000)
33. BASIC AND DILUTED EARNINGS PER SHARE - AFTER TAX
Profit after taxation 21,495,338 20,673,002
(Number of Shares)
Weighted average number of shares outstanding during the year 1,011,846,135 1,011,846,135
(Rupees)
Basic and diluted earnings per share - after tax 21.24 20.43
* Weighted average number of shares outstanding for 2012 have been restated to give effect of bonus shares issued during the year.
Note 2013 2012
(Rupees in ‘000)
34. CASH AND CASH EQUIVALENTS
Cash and balances with treasury banks 6 59,946,150 57,420,129
Balances with other banks 7 1,536,946 1,191,974
Overdrawn nostro accounts 15 (625,972) (828,923)
60,857,124 57,783,180
Note 2013 2012
(Numbers)
35. STAFF STRENGTH
Permanent 10,372 10,612
Temporary/contractual basis 81 71
Bank’s own staff strength at the end of the year 10,453 10,683
Outsourced 35.1 1,477 1,928
Total staff strength 11,930 12,611
35.1 This excludes outsourced security guards and tea services staff.
36. DEFINED BENEFIT PLANS AND OTHER BENEFITS
36.1 General description
The Bank operates the following retirement benefits for its employees: - Pension fund (final salary plan) - funded
- Benevolent scheme - unfunded
- Post retirement medical benefits - unfunded
- Employees compensated absence - unfunded
The plan assets and defined benefit obligations are based in Pakistan.
Notes to the Financial StatementsFor the year ended December 31, 2013

ANNUAL REPORT 2013
152
36.2 Principal actuarial assumptions The latest actuarial valuations of the approved pension fund, employees’ contributory benevolent scheme, post retirement
medical benefits and employee’s compensated absences were carried out at December 31, 2013. The principal actuarial
assumptions used are as follows:
Approved pension fund Employees’ contributory Post retirement Employees’
benevolent scheme medical benefits compensated absences
2013 2012 2013 2012 2013 2012 2013 2012
%
Valuation discount rate 13 12 13 12 13 12 13 12
Expected rate of return on plan assets 13 12 - - - - - -
Salary increase rate 11 9 11 9 11 9 11 9
Medical cost inflation rate - - - - 13 6 - -
Exposure inflation rate - - - - 3 3 - -
The expected return on plan assets is based on the market expectations and depends on the asset portfolio of the Bank, at
the beginning of the period, for returns over the entire life of the related obligation.
36.3 (Receivable from) / payable to defined benefit plans and other benefits
Approved pension fund Employees’ contributory Post retirement Employees’
benevolent scheme medical benefits compensated absences
Note 2013 2012 2013 2012 2013 2012 2013 2012
(Rupees in ‘000)
Present value of defined
benefit obligations 36.5 3,834,422 4,259,671 213,438 257,089 1,340,476 1,565,634 934,009 594,100
Fair value of plan assets 36.6 (9,688,629) (22,688,154) - - - - - -
Net actuarial gains / (losses)
not recognised - - - - - - - -
Net (receivable) / payable
recognised as at the year-end (5,854,207) (18,428,483) 213,438 257,089 1,340,476 1,565,634 934,009 594,100
The effect of increase of one percent and the effect of a decrease of one percent in the medical trend rates on the present
value of medial obligation at December 31, 2013 would be Rs. 48.492 million (2012: Rs. 95.010 million) and Rs. 43.458
million (2012: Rs. 80.020 million) respectively.
36.4 Movement in balance (receivable) / payable
Approved pension fund Employees’ contributory Post retirement Employees’
benevolent scheme medical benefits compensated absences
Note 2013 2012 2013 2012 2013 2012 2013 2012
(Rupees in ‘000)
Opening balance of (receivable) / payable (18,428,483) (15,280,967) 257,089 283,477 1,565,634 1,388,970 594,100 535,870
Expense recognised 36.7 (1,701,451) (1,933,027) 55,269 40,192 187,792 187,136 146,623 97,691
Employees’ contribution - - 7,564 8,708 - - - -
Benefits paid - - (101,510) (48,953) (234,011) (140,422) (370,840) (181,381)
Other Comprehensive income (456,171) (1,214,489) (4,974) (26,335) (178,939) 129,950 564,126 141,920
Refund / withdrawn from fund 14,731,898 - - - - - - -
Closing balance of (receivable) / payable (5,854,207) (18,428,483) 213,438 257,089 1,340,476 1,565,634 934,009 594,100
Notes to the Financial StatementsFor the year ended December 31, 2013

153
36.5 Reconciliation of the present value of the defined benefit obligations
Approved pension fund Employees’ contributory Post retirement Employees’
benevolent scheme medical benefits compensated absences
2013 2012 2013 2012 2013 2012 2013 2012
(Rupees in ‘000)
Present value of obligation as at January 01, 4,259,671 4,262,421 257,089 283,477 1,565,634 1,388,970 594,100 535,870
Current service cost 53,739 53,499 13,826 15,230 13,773 15,697 36,447 62,860
Interest cost 451,727 518,091 24,760 33,670 173,835 171,439 49,042 34,831
Benefits paid (990,554) (554,210) (101,510) (48,953) (234,011) (140,422) (370,840) (181,381)
Loss / (gain) on settlement (23,251) - 24,247 - 184 - 61,134 -
-(Gain) / loss from change in demographic assumptions 22,670 - 5,824 - 39,965 - (6,687) -
-(Gain) / loss from change in financial assumptions 34,000 (143,163) 12,141 (14,400) 30,238 (47,162) (62,754) 1,599
-Experience (gains) / losses 26,420 123,033 (22,939) (11,935) (249,142) 177,112 633,567 140,321
83,090 (20,130) (4,974) (26,335) (178,939) 129,950 564,126 141,920
Present value of obligation as at December 31, 3,834,422 4,259,671 213,438 257,089 1,340,476 1,565,634 934,009 594,100
36.6 Changes in fair values of plan assets Approved pension fund Employees’ contributory Post retirement Employees’
Note benevolent scheme medical benefits compensated absences
2013 2012 2013 2012 2013 2012 2013 2012 (Rupees in ‘000)
Net assets as at January 01, 22,688,154 19,543,388 - - - - - -
Expected return on plan assets 2,183,666 2,504,617 - - - - - -
Refund / withdrawn from fund (14,731,898) - - - - - - -
Benefits paid (990,554) (554,210) - - - - - -
Actuarial gain / (loss) 539,261 1,194,359 - - - - - -
Net assets as at December 31, 36.9 9,688,629 22,688,154 - - - - - -
36.7 Charge for defined benefit plans and other benefits
The following amounts have been charged to the profit and loss account in respect of defined benefit plans and other benefits:
Approved pension fund Employees’ contributory Post retirement Employees’
benevolent scheme medical benefits compensated absences
2013 2012 2013 2012 2013 2012 2013 2012
(Rupees in ‘000)
Current service cost 53,739 53,499 13,826 15,230 13,773 15,697 36,447 62,860
Interest cost 451,727 518,091 24,760 33,670 173,835 171,439 49,042 34,831
Expected return on plan assets (2,183,666) (2,504,617) - - - - - -
Contributions employees - - (7,564) (8,708) - - - -
Loss / (gain) on settlement (23,251) - 24,247 - 184 - 61,134 -
(1,701,451) (1,933,027) 55,269 40,192 187,792 187,136 146,623 97,691
The effect of increase of one percent and the effect of a decrease of one percent in the medical trend rates on the aggregate of the current service cost and interest cost components of net period post - employment medical costs would be Rs. 6.129 million (2012: Rs. 13.369 million) and Rs. 5.496 million (2012: Rs. 11.207 million) respectively.
36.8 Actual return on plan assets
Approved pension fund Employees’ contributory Post retirement Employees’
benevolent scheme medical benefits compensated absences
2013 2012 2013 2012 2013 2012 2013 2012
(Rupees in ‘000)
Actual return on plan assets 2,722,927 3,698,976 - - - - - -
Notes to the Financial StatementsFor the year ended December 31, 2013
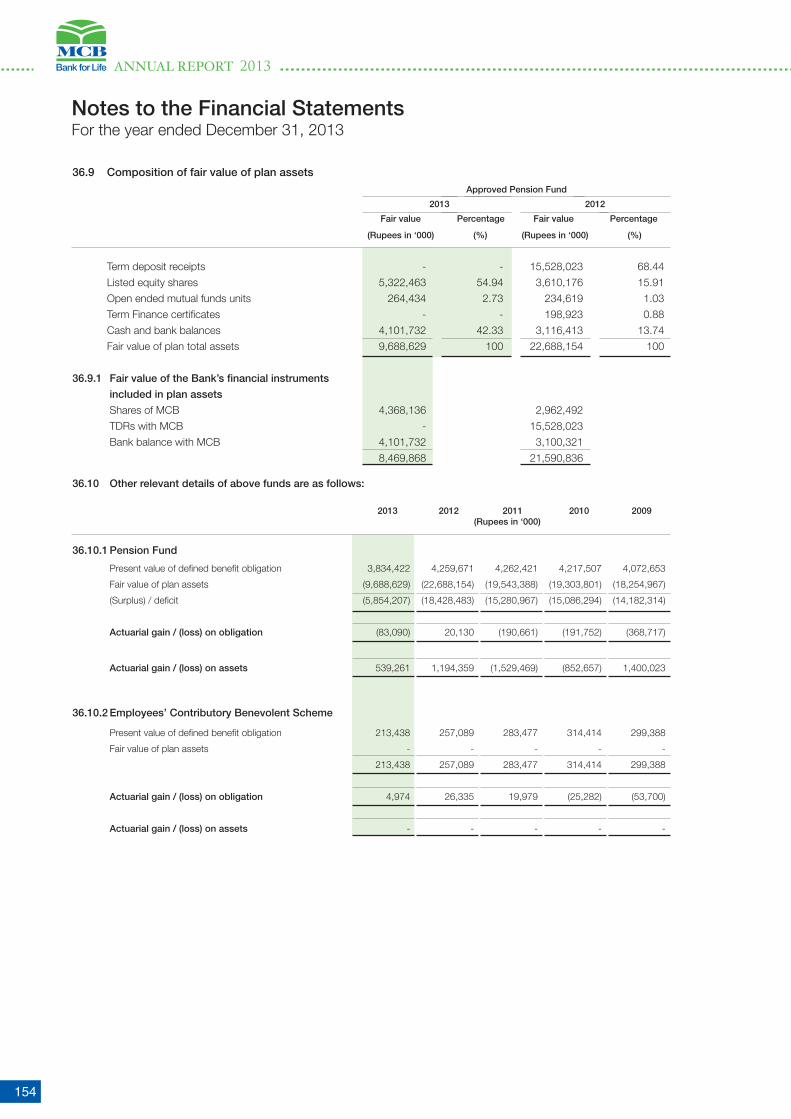
ANNUAL REPORT 2013
154
36.9 Composition of fair value of plan assets Approved Pension Fund
2013 2012
Fair value Percentage Fair value Percentage
(Rupees in ‘000) (%) (Rupees in ‘000) (%)
Term deposit receipts - - 15,528,023 68.44
Listed equity shares 5,322,463 54.94 3,610,176 15.91
Open ended mutual funds units 264,434 2.73 234,619 1.03
Term Finance certificates - - 198,923 0.88
Cash and bank balances 4,101,732 42.33 3,116,413 13.74
Fair value of plan total assets 9,688,629 100 22,688,154 100
36.9.1 Fair value of the Bank’s financial instruments
included in plan assets
Shares of MCB 4,368,136 2,962,492
TDRs with MCB - 15,528,023
Bank balance with MCB 4,101,732 3,100,321
8,469,868 21,590,836
36.10 Other relevant details of above funds are as follows:
2013 2012 2011 2010 2009 (Rupees in ‘000)
36.10.1 Pension Fund
Present value of defined benefit obligation 3,834,422 4,259,671 4,262,421 4,217,507 4,072,653
Fair value of plan assets (9,688,629) (22,688,154) (19,543,388) (19,303,801) (18,254,967)
(Surplus) / deficit (5,854,207) (18,428,483) (15,280,967) (15,086,294) (14,182,314)
Actuarial gain / (loss) on obligation (83,090) 20,130 (190,661) (191,752) (368,717)
Actuarial gain / (loss) on assets 539,261 1,194,359 (1,529,469) (852,657) 1,400,023
36.10.2 Employees’ Contributory Benevolent Scheme
Present value of defined benefit obligation 213,438 257,089 283,477 314,414 299,388
Fair value of plan assets - - - - -
213,438 257,089 283,477 314,414 299,388
Actuarial gain / (loss) on obligation 4,974 26,335 19,979 (25,282) (53,700)
Actuarial gain / (loss) on assets - - - - -
Notes to the Financial StatementsFor the year ended December 31, 2013

155
2013 2012 2011 2010 2009 (Rupees in ‘000)
36.10.3 Post Retirement Medical Benefits
Present value of defined benefit obligation 1,340,476 1,565,634 1,388,970 1,320,933 1,287,348
Fair value of plan assets - - - - -
1,340,476 1,565,634 1,388,970 1,320,933 1,287,348
Actuarial gain / (loss) on obligation 178,939 (129,950) (19,198) 30,671 2,101
36.10.4 Compensated absences
Present value of defined benefit obligation 934,009 594,100 535,870 555,792 541,116
Fair value of plan assets - - - - - 934,009 594,100 535,870 555,792 541,116
Actuarial gain / (loss) on obligation (564,126) (141,920) (75,701) (81,138) (5,687)
36.11. No contribution to the pension fund is expected in the next year.
37. DEFINED CONTRIBUTION PLAN The Bank operates an approved contributory provident fund for 7,306 (2012: 7,919) employees where contributions
are made by the Bank and employees at 8.33% per annum (2012: 8.33% per annum) of the basic salary. During the year, the Bank contributed Rs. 197.721 million (2012: Rs. 188.417 million) in respect of this fund.
38. COMPENSATION OF DIRECTORS AND EXECUTIVES
The aggregate amount charged in the financial statements for compensation, including all benefits, to the Chief Executive, Directors and Executives of the Bank as follows:
Note President / Chief Executive Directors Executives
2013 2012 2013 2012 2013 2012
(Rupees in ‘000)
Fees - - 31,674 33,431 - - Managerial remuneration 23,013 29,355 - - 1,122,733 951,978 Bonus and others 16,913 17,576 - - 546,861 535,357 Settlement benefits - 23,831 - - - - Retirement benefits 1,892 - - - 76,370 64,942 Rent and house maintenance 10,215 10,142 - - 391,944 345,304 Utilities 2,270 2,254 - - 86,593 77,274 Medical - - - - 23,256 18,997 Conveyance - - - - 444,493 403,588
38.1 54,303 83,158 31,674 33,431 2,692,250 2,397,440
Number of persons 1 2 12 12 887 774
38.1. Comparative figures includes remuneration of ex-president and current president from December 22, 2012.
38.2. The Chairman has been provided with free use of the Bank maintained car. In addition to the above, the Chief Executive and certain
executives are provided with free use of the Bank’s maintained cars and household equipments in accordance with the terms of their
employment.
Notes to the Financial StatementsFor the year ended December 31, 2013

ANNUAL REPORT 2013
156
39. FAIR VALUE OF FINANCIAL INSTRUMENTS The fair value of traded investments is based on quoted market prices, except for tradable securities classified by the
Bank as ‘held to maturity’. Fair value of unquoted equity investments is determined on the basis of break up value of these investments as per the latest available audited financial statements.
Fair value of fixed term loans, other assets, other liabilities and fixed term deposits cannot be calculated with sufficient reliability due to absence of current and active market for such assets and liabilities and reliable data regarding market rates for similar instruments. The provision for impairment of loans and advances has been calculated in accordance with the Bank’s accounting policy as stated in note 5.3 to these financial statements.
The maturity and repricing profile and effective rates are stated in notes 43.3, 43.4.1 and 43.4.2 respectively. In the opinion of the management, the fair value of the remaining financial assets and liabilities are not significantly
different from their carrying values since assets and liabilities are either short-term in nature or in the case of customer loans and deposits are frequently re-priced.
40. SEGMENT DETAILS WITH RESPECT TO BUSINESS ACTIVITIES
The segment analysis with respect to business activity is as follows:
Corporate Trading and Retail & Commercial Inter Total Finance Sales Consumer Banking segment Banking elimination (Rupees in ‘000)
2013
Total income 135,559 8,059,020 33,480,427 7,363,861 - 49,038,867
Total expenses (30,302) (1,194,453) (14,452,521) (1,073,386) - (16,750,662)
Income tax expense - - - - - (10,792,867)
Net income 105,257 6,864,567 19,027,906 6,290,475 - 21,495,338
Segment assets - (Gross of NPL’s provision) 390,941 494,256,812 694,394,864 202,347,916 (562,513,535) 828,876,998
Advance taxation (payments less provisions) - - - - - 6,081,521
Total assets 390,941 494,256,812 694,394,864 202,347,916 (562,513,535) 834,958,519
Segment non performing loans - - 9,600,755 13,666,978 - 23,267,733
Segment specific provision required - - 9,565,097 9,885,051 - 19,450,148
Segment liabilities 38,582 469,328,689 622,852,777 171,369,504 (562,513,535) 701,076,017
Deferred tax liability - - - - - 4,201,373
Total liabilities - net 38,582 469,328,689 622,852,777 171,369,504 (562,513,535) 705,277,390
Segment return on assets (ROA) (%) 34.68% 1.63% 4.89% 3.83% - -
Segment cost of fund (%) - 9.27% 5.41% 8.94% - -
Notes to the Financial StatementsFor the year ended December 31, 2013
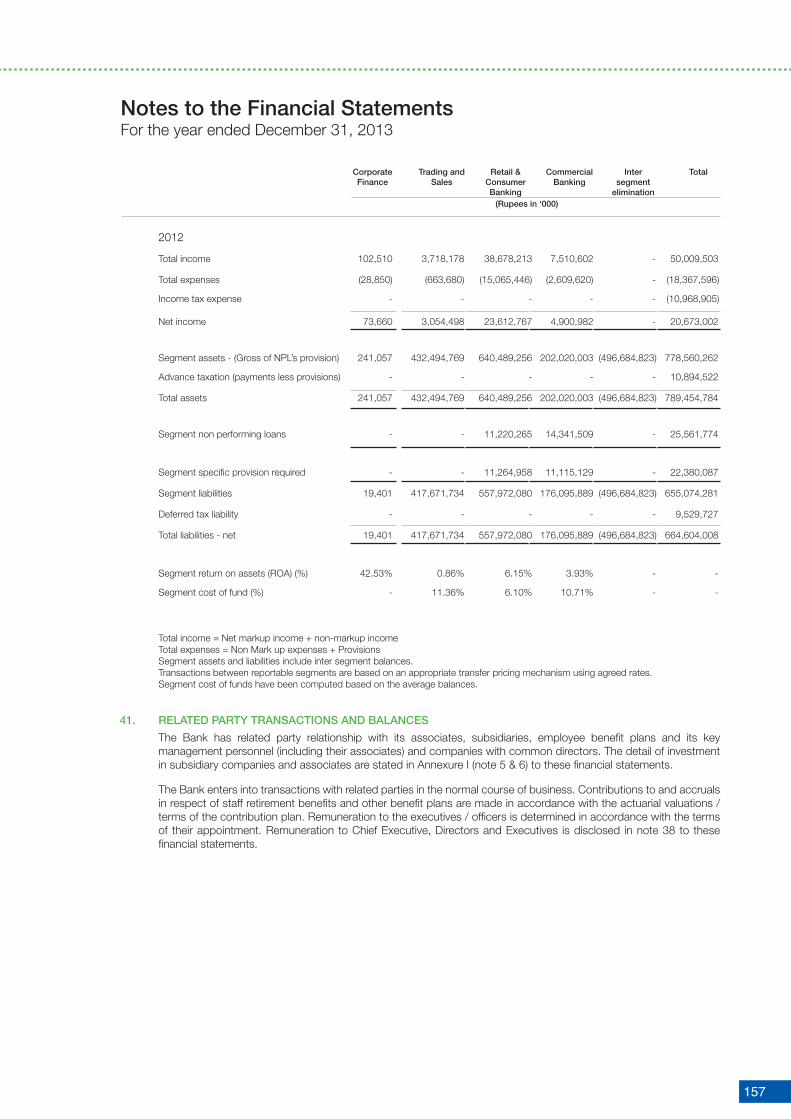
157
Corporate Trading and Retail & Commercial Inter Total Finance Sales Consumer Banking segment Banking elimination (Rupees in ‘000)
2012
Total income 102,510 3,718,178 38,678,213 7,510,602 - 50,009,503
Total expenses (28,850) (663,680) (15,065,446) (2,609,620) - (18,367,596)
Income tax expense - - - - - (10,968,905)
Net income 73,660 3,054,498 23,612,767 4,900,982 - 20,673,002
Segment assets - (Gross of NPL’s provision) 241,057 432,494,769 640,489,256 202,020,003 (496,684,823) 778,560,262
Advance taxation (payments less provisions) - - - - - 10,894,522
Total assets 241,057 432,494,769 640,489,256 202,020,003 (496,684,823) 789,454,784
Segment non performing loans - - 11,220,265 14,341,509 - 25,561,774
Segment specific provision required - - 11,264,958 11,115,129 - 22,380,087
Segment liabilities 19,401 417,671,734 557,972,080 176,095,889 (496,684,823) 655,074,281
Deferred tax liability - - - - - 9,529,727
Total liabilities - net 19,401 417,671,734 557,972,080 176,095,889 (496,684,823) 664,604,008
Segment return on assets (ROA) (%) 42.53% 0.86% 6.15% 3.93% - -
Segment cost of fund (%) - 11.36% 6.10% 10.71% - -
Total income = Net markup income + non-markup income Total expenses = Non Mark up expenses + Provisions Segment assets and liabilities include inter segment balances. Transactions between reportable segments are based on an appropriate transfer pricing mechanism using agreed rates. Segment cost of funds have been computed based on the average balances.
41. RELATED PARTY TRANSACTIONS AND BALANCES
The Bank has related party relationship with its associates, subsidiaries, employee benefit plans and its key management personnel (including their associates) and companies with common directors. The detail of investment in subsidiary companies and associates are stated in Annexure I (note 5 & 6) to these financial statements.
The Bank enters into transactions with related parties in the normal course of business. Contributions to and accruals in respect of staff retirement benefits and other benefit plans are made in accordance with the actuarial valuations / terms of the contribution plan. Remuneration to the executives / officers is determined in accordance with the terms of their appointment. Remuneration to Chief Executive, Directors and Executives is disclosed in note 38 to these financial statements.
Notes to the Financial StatementsFor the year ended December 31, 2013

ANNUAL REPORT 2013
158
Directors Associates Subsidiaries Other related parties Key management
2013 2012 2013 2012 2013 2012 2013 2012 2013 2012
(Rupees in ‘000)
A. Balances
Deposits
Opening balance 2,863,874 4,398,756 976,642
18,859,601
766,387 74,461 43,854 26,850,559 25,393,804 46,039 50,178
Received during the year 4,273,706 4,888,505 11,121,938 167,560 1,531,424 61,540,324 38,267,581 1,176,959 1,168,053
Withdrawn during the year (6,205,915) (6,423,387) (18,857,835) (10,911,683) (217,250) (1,500,817) (73,903,366) (36,810,826) (1,097,801) (1,172,192)
Closing balance 931,665 2,863,874 978,408 976,642 24,771 74,461 14,487,517 26,850,559 125,197 46,039
Advances (secured )
Opening balance 2,795 - - - 485,749 449,729 98,056 81,302 53,865 49,743
Additions / adjustments during the year - 3,367 - - 40,874 36,020 406,354 415,889 27,569 12,436
Repaid during the year (610) (572) - - - - (387,826) (399,135) (13,669) (8,314)
Closing balance 2,185 2,795 - - 526,623 485,749 116,584 98,056 67,765 53,865
Outstanding Balance of credit card 545 852 - - - - 2 - 2,635 951
Receivable from Pension fund - - - - - - 5,854,207 18,428,483 - -
B. Other transactions (including profit and loss related transactions)
Directors Associates Subsidiaries Other related parties Key management
2013 2012 2013 2012 2013 2012 2013 2012 2013 2012
(Rupees in ‘000)
Outstanding commitments and contingent liabilities - - 10,805 8,365 - - 90,171 819,873 - -
Forward foreign exchange contracts (Notional) - outstanding - - - - - - 5,623,351 - -
Unrealized gain on forward foreign exchange contracts - outstanding - - - -
- -
- -
- - - - - - -
-
- -
- - - - - -
19,424 - -
Forward contracts during the year - - 34,665,422 - -
Repo deals during the year - 39,742,107 -
- - - -
Borrowings - - - - - -
-
3,159,738 - - -
Trade payable - - 7,594 14,321 3,918 12,177 27,433 7,019 - -
Retention money - - - - - 3,612 - -
Markup payable - 156 504 405 12,645 156 1,071,287 1,045,622 80 541
Advance receivable - - - - - - 58,085 20,000 - -
Markup Receivable - - - - 4,630 4,448 5,121 2,237 - -
Receivable for other expenses - - - -
- -
7,381 2,145 - - -
Commission Receivable - - 25,181 9,826 -
-
- - -
Outstanding Investments in mutual funds - - - - - 4,050,000 -
-
-
-
-
Divestment in Khushali Bank Limited - - - - 300,000
Insurance premium paid-net of refund - - 247,803 309, 472 - - - -
Insurance claim settled - - 95,645 39,193 - - - -
- - - -
- -
Markup income on advances - - 23,665 25,180 7,983 7,640 6,269 2,848
Rent Income Received - - 2,025 2,430 - -
Dividend Income - - 126,118 54,051 92,392 83,153 159,570 408,639 - -
Capital gain / (loss) - - - - - -
- -
- -
303,215 (33,916) - -
Commission income - - 751,069 509,698 38,803 36,074 7,209 8,449 - -
Reimbursement of expenses - - - - 12,081 13,199 - - - -
Brokerage expense - - - - - 354 - -
Proceeds from sale of fixed assets - - - - - -
- -
- -
2,896
(2,307)
562
Gain / (loss) on sale of fixed assets - - - - - -
-
- -
- -
- -
-
ATM Outsourcing Expense - - 161,486 131,972 - - -
Outsourcing service expenses - - - - 24,550 76,366 - -
Switch Expense - - - - 26,925 8,313 - -
-
- -
- -
Cash sorting expenses
- - - - - -
49,915 42,528
Stationery Expenses 207,063 194,565
Security guard expenses - - - - - - 298,394 255.033
Remuneration and non-executive directors fee 85,977 116,589 - - - - 311,605 324,266
Mark-up expense 103,394 321,897 71,275 55,657 1,483 2,096 2,080,760 2,983,890 2,317 3,333
Clearing expenses paid to NIFT - - - - - 124,315 115,958 - -
Contribution to provident fund - - - - - -
-
197,721 188,417 - - Gas Charges - - - - - - 10,939 12,770 - - Miscellaneous expenses and payments - - 177,089 119,432 - - 117,738 42,628 - -
The details of director’s compensations are given in note 38 to these financial statements.
Notes to the Financial StatementsFor the year ended December 31, 2013

159
42. CAPITAL ASSESSMENT AND ADEQUACY
42.1 Scope of Applications
The Basel-III Framework is applicable to the bank both at the consolidated level (comprising of wholly/partially owned subsidiaries & associates) and also on a stand alone basis. Subsidiaries are included while calculating Consolidated Capital Adequacy for the Bank using full consolidation method whereas associates in which the bank has significant influence on equity method. Standardized Approach is used for calculating the Capital Adequacy for Credit and Market risk, whereas, Basic Indicator Approach (BIA) is used for Operational Risk Capital Adequacy purposes.
42.2 Capital Management Objectives and goals of managing capital
The Bank manages its capital to attain following objectives and goals: - an appropriately capitalized status, as defined by banking regulations; - acquire strong credit ratings that enable an optimized funding mix and liquidity sources at lesser costs; - cover all risks underlying business activities; - retain flexibility to harness future investment opportunities; build and expand even in stressed times.
Statutory minimum capital requirement and Capital Adequacy Ratio
The State Bank of Pakistan through its BSD Circular No.07 of 2009 dated April 15, 2009 requires the minimum paid up capital (net of losses) for all locally incorporated banks to be raised to Rs. 10 billion by the year ended on December 31, 2013. The raise is to be achieved in a phased manner requiring Rs.10 billion paid up capital (net of losses) by the end of the financial year 2013. The paid up capital of the Bank for the year ended December 31, 2013 stands at Rs. 10.118 billion and is in compliance with the SBP requirement for the said year.
The capital adequacy ratio of the Bank was subject to the Basel III capital adequacy guidelines stipulated by the State Bank of Pakistan through its circular BPRD Circular No. 06 of 2013 dated August 15, 2013. These instructions are effective from December 31, 2013 in a phased manner with full implementation intended by December 31, 2019. Under Basel III guidelines banks are required to maintain the following ratios on an ongoing basis:
Phase-in arrangement and full implementation of the minimum capital requirements:
Year End As of Dec 31
Sr. No Ratio 2013 2014 2015 2016 2017 2018 31-12-2019
1 CET1 5.00% 5.50% 6.00% 6.00% 6.00% 6.00% 6.00%
2 ADT-1 1.50% 1.50% 1.50% 1.50% 1.50% 1.50% 1.50%
3 Tier 1 6.50% 7.00% 7.50% 7.50% 7.50% 7.50% 7.50%
4 Total Capital 10.00% 10.00% 10.00% 10.00% 10.00% 10.00% 10.00%
5 *CCB - - 0.25% 0.65% 1.275% 1.90% 2.50%
6 Total Capital
plus CCB 10.00% 10.00% 10.25% 10.65% 11.275% 11.90% 12.50%
*(Consisting of CET1 only)
Bank’s regulatory capital is analysed into three tiers.
- Common Equity Tier 1 capital (CET1), which includes fully paid up capital (including the bonus shares), balance in share premium account, general reserves, statutory reserves as per the financial statements and net unappropriated profits after all regulatory adjustments applicable on CET1 (refer to note 42.3 )
- Additional Tier 1 Capital (AT1), which includes perpetual non-cumulative preference shares and Share premium resulting from the issuance of preference shares balance in share premium account after all regulatory adjustments applicable on AT1 (refer to note 42.3 )
Notes to the Financial StatementsFor the year ended December 31, 2013

ANNUAL REPORT 2013
160
- Tier 2 capital, which includes Subordinated debt/ Instruments, share premium of issuance of Subordinated debt/ Instruments, general provisions for loan losses (up to a maximum of 1.25 % of credit risk weighted assets), Net of tax reserves on revaluation of fixed assets and equity investments up to a maximum of 45 % of the balance and foreign exchange translation reserves after all regulatory adjustments applicable on Tier-2 (refer to note 42.3 )
The required capital adequacy ratio (10% of the risk-weighted assets) is achieved by the Bank through improvement in the asset quality at the existing volume level, ensuring better recovery management and composition of asset mix with low risk. Banking operations are categorized as either trading book or banking book and risk-weighted assets are determined according to specified requirements of the State Bank of Pakistan that seek to reflect the varying levels of risk attached to assets and off-balance sheet exposures. The total risk-weighted exposures comprise of the credit risk, market risk and operational risk.
Basel-III Framework enables a more risk-sensitive regulatory capital calculation to promote long term viability of the Bank. As the Bank carry on the business on a wide area network basis, it is critical that it is able to continuously monitor the exposure across entire organization and aggregate the risks so as to take an integrated approach/view. Maximization of the return on risk-adjusted capital is the principal basis to be used in determining how capital is allocated within the Bank to particular operations or activities.
The Bank remained compliant with all externally imposed capital requirements through out the year. Further, there has been no material change in the Bank’s management of capital during the year.
Notes to the Financial StatementsFor the year ended December 31, 2013

161
42.3 Capital Structure
2013 2012
Amounts subject to Pre - Basel III treatment
(Rupees in ‘000)
Common Equity Tier 1 capital (CET1): Instruments and reserves1. Fully Paid-up Capital 10,118,461 9,198,601 2 Balance in Share Premium Account 9,702,528 9,702,528 3 Reserve for issue of Bonus Shares - - 4 General/ Statutory Reserves 36,300,494 34,150,960 5 Gain/(Losses) on derivatives held as Cash Flow Hedge - - 6 Unappropriated profits 40,552,043 35,424,921
7 CET 1 before Regulatory Adjustments 96,673,526 88,477,010 Common Equity Tier 1 capital: Regulatory adjustments
8 Goodwill (net of related deferred tax liability) - -10 All other intangibles (net of any associated deferred tax liability) 836,813 626,621 11 Shortfall of provisions against classified assets - - 12 Deferred tax assets that rely on future profitability excluding those arising from temporary differences (net of related tax liability) - - 13 Defined-benefit pension fund net assets 3,805,233 - 14 Reciprocal cross holdings in CET1 capital instruments - 10,777 15 Cash flow hedge reserve - - 16 Investment in own shares/ CET1 instruments - - 17 Securitization gain on sale - - 18 Capital shortfall of regulated subsidiaries - - 19 Deficit on account of revaluation from bank’s holdings of property/ AFS - - 20 Investments in the capital instruments of banking, financial and insurance entities that are outside the scope of regulatory consolidation, where the bank does not own more than 10% of the issued share capital (amount above 10% threshold) - - 21 Significant investments in the capital instruments issued by banking, financial and insurance entities that are outside the scope of (amount above 10% threshold) - - 22 Deferred Tax Assets arising from temporary differences (amount above 10% threshold, net of related tax liability) - - 23 Amount exceeding 15% threshold - -24 of which: significant investments in the common stocks of financial entities - - 25 of which: deferred tax assets arising from temporary differences - - 26 National specific regulatory adjustments applied to CET1 capital - -27 Investment in TFCs of other banks exceeding the prescribed limit - -28 Any other deduction specified by SBP (mention details) - -29 Regulatory adjustment applied to CET1 due to insufficient - - AT1 and Tier 2 to cover deductions* 735,066 779,21130 Total regulatory adjustments applied to CET1 1,571,879 1,416,609 Common Equity Tier 1 (a) 95,101,647 87,060,401
Additional Tier 1 (AT 1) Capital31 Qualifying Additional Tier-1 instruments plus any related share premium - - 32 of which: Classified as equity - - 33 of which: Classified as liabilities - - 34 Additional Tier-1 capital instruments issued by consolidated subsidiaries and held by third parties (amount allowed in group AT 1) - - 35 of which: instrument issued by subsidiaries subject to phase out - - 36 AT1 before regulatory adjustments - -
Notes to the Financial StatementsFor the year ended December 31, 2013

ANNUAL REPORT 2013
162
2013 2012
Amounts subject to Pre - Basel III treatment
(Rupees in ‘000)
37 Investment in mutual funds exceeding the prescribed limit (SBP specific adjustment) - - 38 Investment in own AT1 capital instruments - - 39 Reciprocal cross holdings in Additional Tier 1 capital instruments - - 40 Investments in the capital instruments of banking, financial and insurance entities that are outside the scope of regulatory consolidation, where the bank does not own more than 10% of the issued share capital (amount above 10% threshold) - - 41 Significant investments in the capital instruments issued by banking, financial and insurance entities that are outside the scope of regulatory consolidation - - 42 Portion of deduction applied 50:50 to core capital and supplementary capital based on pre-Basel III treatment which, during transitional period, remain subject to deduction from tier-1 capital* 735,066 779,211 43 Regulatory adjustments applied to Additional Tier 1 due to insufficient Tier 2 to cover deductions44 Total of Regulatory Adjustment applied to AT1 capital 735,066 779,211 45 Additional Tier 1 capital 46 Additional Tier 1 capital recognized for capital adequacy (b) - - Tier 1 Capital (CET1 + admissible AT1) (c=a+b) 95,101,647 87,060,401 Tier 2 Capital47 Qualifying Tier 2 capital instruments under Basel III - - 48 Capital instruments subject to phase out arrangement from tier 2 (Pre-Basel III instruments) - - 49 Tier 2 capital instruments issued to third party by consolidated subsidiaries (amount allowed in group tier 2) - - 50 of which: instruments issued by subsidiaries subject to phase out - - 51 General Provisions or general reserves for loan losses-up to maximum of 1.25% of Credit Risk Weighted Assets 499,145 428,936 52 Revaluation Reserves 5,831,668 7,136,390 53 of which: Revaluation reserves on Property 5,079,594 4,580,573 54 of which: Unrealized Gains/Losses on AFS 752,074 2,555,817 55 Foreign Exchange Translation Reserves 598,192 399,782 56 Undisclosed/Other Reserves (if any) - - 57 T2 before regulatory adjustments 6,929,005 7,965,108
Tier 2 Capital: regulatory adjustments58 Portion of deduction applied 50:50 to core capital and supplementary capital based on pre-Basel III treatment which, during transitional period, remain subject to deduction from tier-2 capital 735,066 779,211 59 Reciprocal cross holdings in Tier 2 instruments - - 60 Investment in own Tier 2 capital instrument - - 61 Investments in the capital instruments of banking, financial and insurance entities that are outside the scope of regulatory consolidation, where the bank does not own more than 10% of the issued share capital (amount above 10% threshold) - - 62 Significant investments in the capital instruments issued by banking, financial and insurance entities that are outside the scope of regulatory consolidation - - 63 Amount of Regulatory Adjustment applied to T2 capital 735,066 779,211
64 Tier 2 capital (T2) 6,193,939 7,185,897 65 Tier 2 capital recognized for capital adequacy 6,193,939 7,185,897 66 Excess Additional Tier 1 capital recognized in Tier 2 capital - - 67 Total Tier 2 capital admissible for capital adequacy (d) 6,193,939 7,185,897
TOTAL CAPITAL (T1 + admissible T2) (e=c+d) 101,295,586 94,246,298
Notes to the Financial StatementsFor the year ended December 31, 2013

163
2013 2012
Amounts subject to Pre - Basel III treatment
(Rupees in ‘000)
Total Risk Weighted Assets (RWA) (i=f+g+h) 455,188,687 423,759,088
68 Total Credit Risk Weighted Assets (f) 312,996,433 273,021,950 69 Risk weighted assets in respect of amounts subject to Pre-Basel III Treatment70 of which: recognized portion of investment in capital of banking, financial and insurance entities where holding is more than 10% of the issued common share capital of the entity - - 71 of which: deferred tax assets - - 72 of which: Defined-benefit pension fund net assets 3,805,233 - 73 of which: Others - - 74 Total Market Risk Weighted Assets (g) 49,590,569 60,785,173 75 Total Operational Risk Weighted Assets (h) 92,601,685 89,951,965 Capital Ratios and buffers (in percentage of risk weighted assets) 76 CET1 to total RWA (a/i) 20.89% 20.54%77 Tier-1 capital to total RWA (c/i) 20.89% 20.54%78 Total capital to RWA (e/i) 22.25% 22.24%79 Bank specific buffer requirement (minimum CET1 requirement
plus capital conservation buffer plus any other buffer requirement) - -
80 of which: capital conservation buffer requirement - -
81 of which: countercyclical buffer requirement - -
82 of which: D-SIB or G-SIB buffer requirement - -
83 CET1 available to meet buffers (as a percentage of risk weighted assets) - -
National minimum capital requirements prescribed by SBP
84 CET1 minimum ratio 5.00% -
85 Tier 1 minimum ratio 6.50% -
86 Total capital minimum ratio 10.00% 10.00%
Amounts below the thresholds for deduction (before risk weighting)
87 Non-significant investments in the capital of other financial entities - -
88 Significant investments in the common stock of financial entities - -
89 Deferred tax assets arising from temporary differences (net of related tax liability) - -
Applicable caps on the inclusion of provisions in Tier 2
90 Provisions eligible for inclusion in Tier 2 in respect of exposures subject
to standardized approach (prior to application of cap) 499,145 428,936
91 Cap on inclusion of provisions in Tier 2 under standardized approach 3,912,455 3,412,774
92 Provisions eligible for inclusion in Tier 2 in respect of exposures
subject to internal ratings-based approach (prior to application of cap) - -
93 Cap for inclusion of provisions in Tier 2 under internal ratings-based approach - -
*As the Bank has not Tier 1 capital, deduction was made from CET1.
**2012 based on BASEL II framework.
Notes to the Financial StatementsFor the year ended December 31, 2013

ANNUAL REPORT 2013
164
42.4 Capital Structure Reconciliation
Step 1 As per published Under financial regulatory statements scope of consolidation
2013 2013
(Rupees in ‘000)
Assets
Cash and balances with treasury banks 59,946,150 59,946,150 Balanced with other banks 1,536,946 1,536,946 Lending to financial institutions 1,224,638 1,224,638 Investments 449,006,019 449,006,019 Advances 248,242,965 248,242,965 Operating fixed assets 28,595,338 28,595,338 Deferred tax assets - - Other assets 26,956,315 26,956,315 Total assets 815,508,371 815,508,371
Liabilities & Equity
Bills payable 10,138,726 10,138,726 Borrowings 38,542,660 38,542,660 Deposits and other accounts 632,330,286 632,330,286 Sub-ordinated loans - - Liabilities against assets subject to finance lease - - Deferred tax liabilities 4,201,373 4,201,373 Other liabilities 20,064,345 20,064,345 Total liabilities 705,277,390 705,277,390
Share capital 10,118,461 10,118,461 Reserves 46,601,214 46,601,214 Unappropriated profit 40,552,043 40,552,043 Minority Interest - - Surplus on revaluation of assets 12,959,263 12,959,263 Total Equity 110,230,981 110,230,981
Total liabilities & equity 815,508,371 815,508,371
Step 2 As per published Under financial regulatory statements scope of consolidation
2013 2013
(Rupees in ‘000)
Assets
Cash and balances with treasury banks 59,946,150 59,946,150 Balanced with other banks 1,536,946 1,536,946 Lending to financial institutions 1,224,638 1,224,638 Investments 449,006,019 449,006,019 of which: Non-significant capital investments in capital of other financial institutions exceeding 10% threshold - - of which: significant capital investments in financial sector entities exceeding regulatory threshold - 102,566 of which: Mutual Funds exceeding regulatory threshold - of which: reciprocal crossholding of capital instrument - of which: others Advances 248,242,965 248,242,965 shortfall in provisions/ excess of total EL amount over eligible provisions under IRB - - general provisions reflected in Tier 2 capital 499,145 499,145
a
bcde
fg
Ref
Notes to the Financial StatementsFor the year ended December 31, 2013
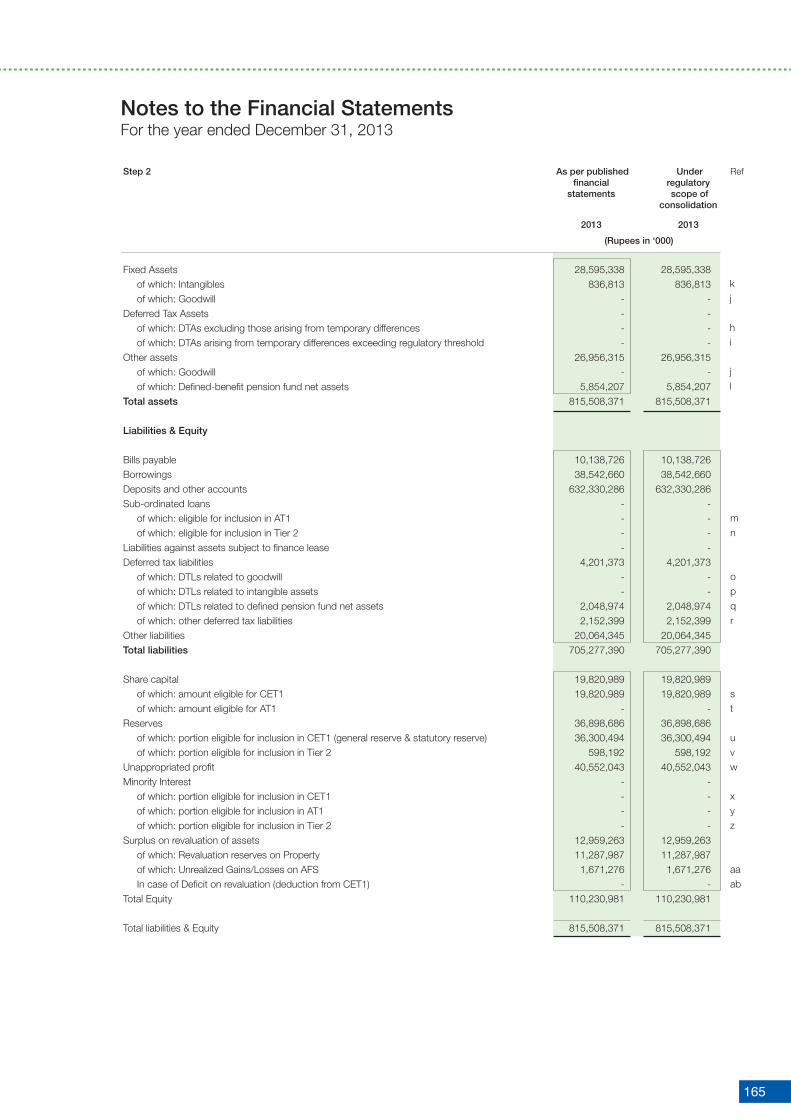
165
Step 2 As per published Under financial regulatory statements scope of consolidation
2013 2013
(Rupees in ‘000)
Fixed Assets 28,595,338 28,595,338 of which: Intangibles 836,813 836,813 of which: Goodwill - -Deferred Tax Assets - - of which: DTAs excluding those arising from temporary differences - - of which: DTAs arising from temporary differences exceeding regulatory threshold - - Other assets 26,956,315 26,956,315 of which: Goodwill - - of which: Defined-benefit pension fund net assets 5,854,207 5,854,207 Total assets 815,508,371 815,508,371
Liabilities & Equity
Bills payable 10,138,726 10,138,726 Borrowings 38,542,660 38,542,660 Deposits and other accounts 632,330,286 632,330,286 Sub-ordinated loans - - of which: eligible for inclusion in AT1 - - of which: eligible for inclusion in Tier 2 - - Liabilities against assets subject to finance lease - - Deferred tax liabilities 4,201,373 4,201,373 of which: DTLs related to goodwill - - of which: DTLs related to intangible assets - - of which: DTLs related to defined pension fund net assets 2,048,974 2,048,974 of which: other deferred tax liabilities 2,152,399 2,152,399 Other liabilities 20,064,345 20,064,345 Total liabilities 705,277,390 705,277,390
Share capital 19,820,989 19,820,989 of which: amount eligible for CET1 19,820,989 19,820,989 of which: amount eligible for AT1 - - Reserves 36,898,686 36,898,686 of which: portion eligible for inclusion in CET1 (general reserve & statutory reserve) 36,300,494 36,300,494 of which: portion eligible for inclusion in Tier 2 598,192 598,192 Unappropriated profit 40,552,043 40,552,043 Minority Interest - - of which: portion eligible for inclusion in CET1 - - of which: portion eligible for inclusion in AT1 - - of which: portion eligible for inclusion in Tier 2 - - Surplus on revaluation of assets 12,959,263 12,959,263 of which: Revaluation reserves on Property 11,287,987 11,287,987 of which: Unrealized Gains/Losses on AFS 1,671,276 1,671,276 In case of Deficit on revaluation (deduction from CET1) - - Total Equity 110,230,981 110,230,981
Total liabilities & Equity 815,508,371 815,508,371
kj
hi
jl
mn
opqr
st
uvw
xyz
aaab
Ref
Notes to the Financial StatementsFor the year ended December 31, 2013

ANNUAL REPORT 2013
166
Step 3 Component of Source based regulatory on reference capital reported number from by bank step 2
(Rupees in ‘000)
Common Equity Tier 1 capital (CET1): Instruments and reserves1 Fully Paid-up Capital 10,118,461 (s) 2 Balance in Share Premium Account 9,702,528 3 Reserve for issue of Bonus Shares - 4 General/ Statutory Reserves 36,300,494 (u) 5 Gain/(Losses) on derivatives held as Cash Flow Hedge - 6 Unappropriated/unremitted profits/(losses) 40,552,043 (w)
8 CET 1 before Regulatory Adjustments 96,673,526 Common Equity Tier 1 capital: Regulatory adjustments 9 Goodwill (net of related deferred tax liability) - (j) - (o) 10 All other intangibles (net of any associated deferred tax liability) 836,813 (k) - (p) 11 Shortfall of provisions against classified assets - (f) 12 Deferred tax assets that rely on future profitability excluding those arising from temporary differences (net of related tax liability) - {(h) - (r} * 0% 13 Defined-benefit pension fund net assets - {(l) - (q)} * 0% 14 Reciprocal cross holdings in CET1 capital instruments - (d) 15 Cash flow hedge reserve - 16 Investment in own shares/ CET1 instruments - 17 Securitization gain on sale - 18 Capital shortfall of regulated subsidiaries - 19 Deficit on account of revaluation from bank’s holdings of property/ AFS - (ab) 20 Investments in the capital instruments of banking, financial and insurance entities that are outside the scope of regulatory consolidation, where the bank does not own more than 10% of the issued share capital (amount above 10% threshold) - (a) - (ac) - (ae) 21 Significant investments in the capital instruments issued by banking, financial and insurance entities that are outside the scope of regulatory consolidation (amount above 10% threshold) - (b) - (ad) - (af) 22 Deferred Tax Assets arising from temporary differences (amount above 10% threshold, net of related tax liability) - (i) 23 Amount exceeding 15% threshold - 24 of which: significant investments in the common stocks of financial entities - 25 of which: deferred tax assets arising from temporary differences - 26 National specific regulatory adjustments applied to CET1 capital - 27 Investment in TFCs of other banks exceeding the prescribed limit - 28 Any other deduction specified by SBP (mention details) - 29 Regulatory adjustment applied to CET1 due to insufficient AT1 and Tier 2 to cover deductions 735,066
30 Total regulatory adjustments applied to CET1 1,571,879
Common Equity Tier 1 95,101,647
Notes to the Financial StatementsFor the year ended December 31, 2013

167
Additional Tier 1 (AT 1) Capital
31 Qualifying Additional Tier-1 instruments plus any related share premium - 32 of which: Classified as equity - (t) 33 of which: Classified as liabilities - (m) 34 Additional Tier-1 capital instruments issued by consolidated subsidiaries and held by third parties (amount allowed in group AT 1) - (y) 35 of which: instrument issued by subsidiaries subject to phase out - 36 AT1 before regulatory adjustments - Additional Tier 1 Capital: regulatory adjustments 37 Investment in mutual funds exceeding the prescribed limit (SBP specific adjustment) - 38 Investment in own AT1 capital instruments - 39 Reciprocal cross holdings in Additional Tier 1 capital instruments - 40 Investments in the capital instruments of banking, financial and insurance entities that are outside the scope of regulatory consolidation, where the bank does not own more than 10% of the issued share capital (amount above 10% threshold) - (ac) 41 Significant investments in the capital instruments issued by banking, financial and insurance entities that are outside the scope of regulatory consolidation - (ad) 42 Portion of deduction applied 50:50 to core capital and supplementary capital based on pre-Basel III treatment which, during transitional period, remain subject to deduction from tier-1 capital 735,066 43 Regulatory adjustments applied to Additional Tier 1 due to insufficient Tier 2 to cover deductions - 44 Total of Regulatory Adjustment applied to AT1 capital 735,066 45 Additional Tier 1 capital -
46 Additional Tier 1 capital recognized for capital adequacy -
Tier 1 Capital (CET1 + admissible AT1) 95,101,647
Tier 2 Capital47 Qualifying Tier 2 capital instruments under Basel III - 48 Capital instruments subject to phase out arrangement from tier 2 (Pre-Basel III instruments) - (n)49 Tier 2 capital instruments issued to third party by consolidated subsidiaries (amount allowed in group tier 2) - (z) 50 of which: instruments issued by subsidiaries subject to phase out - 51 General Provisions or general reserves for loan losses-up to maximum of 1.25% of Credit Risk Weighted Assets 499,145 (g) 52 Revaluation Reserves eligible for Tier 2 5,831,668 53 of which: portion pertaining to Property 5,079,594 54 of which: portion pertaining to AFS securities 752,074 portion of (aa)55 Foreign Exchange Translation Reserves 598,192 (v) 56 Undisclosed/Other Reserves (if any) - 57 T2 before regulatory adjustments 6,929,005 Tier 2 Capital: regulatory adjustments
58 Portion of deduction applied 50:50 to core capital and supplementary capital based on pre-Basel III treatment which, during transitional period, remain subject to deduction from tier-2 capital 735,066 59 Reciprocal cross holdings in Tier 2 instruments - 60 Investment in own Tier 2 capital instrument -
Notes to the Financial StatementsFor the year ended December 31, 2013

ANNUAL REPORT 2013
168
61 Investments in the capital instruments of banking, financial and insurance entities that are outside the scope of regulatory consolidation, where the bank does not own more than 10% of the issued share capital (amount above 10% threshold) - (ae) 62 Significant investments in the capital instruments issued by banking, financial and insurance entities that are outside the scope of regulatory consolidation - (af) 63 Amount of Regulatory Adjustment applied to T2 capital 735,066 64 Tier 2 capital (T2) 6,193,939 65 Tier 2 capital recognized for capital adequacy 6,193,939 66 Excess Additional Tier 1 capital recognized in Tier 2 capital - 67 Total Tier 2 capital admissible for capital adequacy 6,193,939
TOTAL CAPITAL (T1 + admissible T2) 101,295,586
42.5 Main Features Template of Regulatory Capital Instruments
1 Issuer MCB Bank Limited
2 Unique identifier (eg KSE Symbol or Bloomberg identifier etc.) MCB
3 Governing law(s) of the instrument Capital Market Law
Regulatory treatment
4 Transitional Basel III rules Common equity Tier 1
5 Post-transitional Basel III rules Common equity Tier 1
6 Eligible at solo/ group/ group & solo Group & standalone
7 Instrument type Common Shares
8 Amount recognized in regulatory capital (Currency in PKR thousands, as of reporting date) 95,101,647
9 Par value of instrument PKR 10
10 Accounting classification Shareholder equity
11 Original date of issuance 1947
12 Perpetual or dated Perpetual
13 Original maturity date No maturity
14 Issuer call subject to prior supervisory approval No
15 Optional call date, contingent call dates and redemption amount Not applicable
16 Subsequent call dates, if applicable Not applicable
Coupons / dividends
17 Fixed or floating dividend/ coupon Not applicable
18 coupon rate and any related index/ benchmark Not applicable
19 Existence of a dividend stopper No
20 Fully discretionary, partially discretionary or mandatory Fully discretionary
21 Existence of step up or other incentive to redeem No
22 Noncumulative or cumulative Not applicable
23 Convertible or non-convertible Non-convertible
24 If convertible, conversion trigger (s) Not applicable
25 If convertible, fully or partially Not applicable
26 If convertible, conversion rate Not applicable
27 If convertible, mandatory or optional conversion Not applicable
28 If convertible, specify instrument type convertible into Not applicable
29 If convertible, specify issuer of instrument it converts into Not applicable
30 Write-down feature Not applicable
31 If write-down, write-down trigger(s) Not applicable
32 If write-down, full or partial Not applicable
33 If write-down, permanent or temporary Not applicable
34 If temporary write-down, description of write-upmechanism Not applicable
35 Position in subordination hierarchy in liquidation (specify instrument type immediately senior to instrument) Not applicable
36 Non-compliant transitioned features Not applicable
37 If yes, specify non-compliant features Not applicable
Notes to the Financial StatementsFor the year ended December 31, 2013
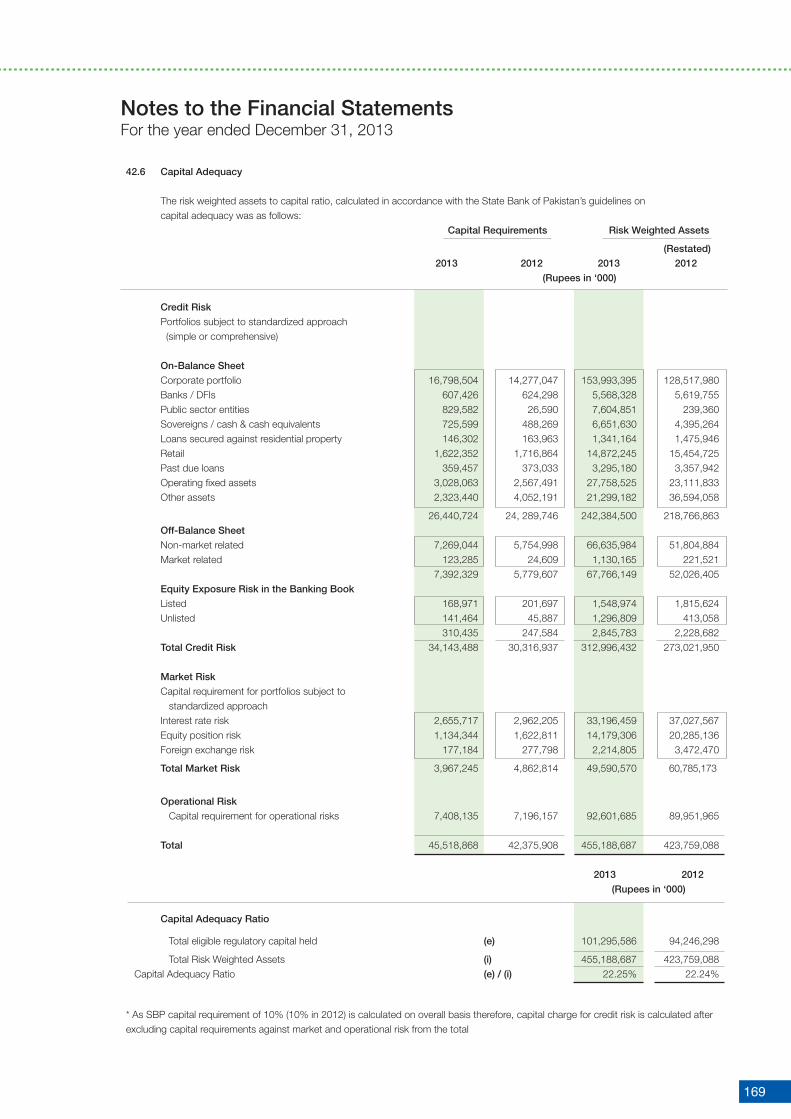
169
42.6 Capital Adequacy
The risk weighted assets to capital ratio, calculated in accordance with the State Bank of Pakistan’s guidelines on capital adequacy was as follows: Capital Requirements Risk Weighted Assets
(Restated)
2013 2012 2013 2012
(Rupees in ‘000)
Credit Risk
Portfolios subject to standardized approach (simple or comprehensive) On-Balance Sheet
Corporate portfolio 16,798,504 14,277,047 153,993,395 128,517,980 Banks / DFIs 607,426 624,298 5,568,328 5,619,755 Public sector entities 829,582 26,590 7,604,851 239,360 Sovereigns / cash & cash equivalents 725,599 488,269 6,651,630 4,395,264 Loans secured against residential property 146,302 163,963 1,341,164 1,475,946 Retail 1,622,352 1,716,864 14,872,245 15,454,725 Past due loans 359,457 373,033 3,295,180 3,357,942 Operating fixed assets 3,028,063 2,567,491 27,758,525 23,111,833 Other assets 2,323,440 4,052,191 21,299,182 36,594,058
26,440,724 24, 289,746 242,384,500 218,766,863 Off-Balance Sheet Non-market related 7,269,044 5,754,998 66,635,984 51,804,884 Market related 123,285 24,609 1,130,165 221,521 7,392,329 5,779,607 67,766,149 52,026,405 Equity Exposure Risk in the Banking Book Listed 168,971 201,697 1,548,974 1,815,624 Unlisted 141,464 45,887 1,296,809 413,058 310,435 247,584 2,845,783 2,228,682 Total Credit Risk 34,143,488 30,316,937 312,996,432 273,021,950 Market Risk
Capital requirement for portfolios subject to standardized approach Interest rate risk 2,655,717 2,962,205 33,196,459 37,027,567 Equity position risk 1,134,344 1,622,811 14,179,306 20,285,136 Foreign exchange risk 177,184 277,798 2,214,805 3,472,470
Total Market Risk 3,967,245 4,862,814 49,590,570 60,785,173
Operational Risk Capital requirement for operational risks 7,408,135 7,196,157 92,601,685 89,951,965 Total 45,518,868 42,375,908 455,188,687 423,759,088
2013 2012
(Rupees in ‘000)
Capital Adequacy Ratio
Total eligible regulatory capital held (e) 101,295,586 94,246,298
Total Risk Weighted Assets (i) 455,188,687 423,759,088 Capital Adequacy Ratio (e) / (i) 22.25% 22.24%
* As SBP capital requirement of 10% (10% in 2012) is calculated on overall basis therefore, capital charge for credit risk is calculated after excluding capital requirements against market and operational risk from the total
Notes to the Financial StatementsFor the year ended December 31, 2013

ANNUAL REPORT 2013
170
43 RISK MANAGEMENT Risk is an inherent part of banking business activities. The risk management framework and governance structure
at MCB helps to mitigate and counter any foreseeable risk in its various lines of business. Risk awareness forms an integral part of strategic and operational activities of risk management. Through its risk management policy the Bank sets the best course of action under uncertainty by identifying, prioritizing, mitigating and monitoring risk issues, with the goal of enhancing shareholders’ value. Bank’s risk management structure is based on the following five guiding principles:
•Optimizingrisk/returninacontrolledmanner •Establishingclearresponsibilityandaccountability •Establishingindependentandproperlyresourcedriskmanagementfunction. •Promotingopenriskculture •Adoptinginternationalbestpracticesinriskmanagement Keeping in view dynamics of internal and external environment, the bank regularly reviews and updates policy manuals
/ frameworks and procedures in accordance with domestic regulatory environment and international standards.
The Bank executes its risk strategy and undertakes controlled risk-taking activities within its risk management framework. The Board of Directors and its relevant committee, i.e. the Risk Management & Portfolio Review Committee (RM&PRC), the senior management and its relevant committees, i.e. the Risk Management Committee (RMC), Asset Liability Committee (ALCO), etc., are responsible to ensure formulation and implementation of comprehensive Risk Management Framework. This framework is based on prudent risk identification, measurement, management and monitoring process which are closely aligned with the activities of the bank. The framework combines core policies, procedures and process designs with broad oversight and is supported by an efficient monitoring mechanism across the bank to ensure that risks are kept within an acceptable level.
The Bank ensures that not only the relevant risks are identified but their implications are also considered and basis provided for managing and measuring the risks. Through Internal Control units, the Bank ensures that effective controls are in place to mitigate each of the identified risk.
Independent from business groups, Head of Risk Management reports functionally to the Risk Management & Portfolio Review Committee (RM&PRC) and administratively to the President; the RM&PRC committee convenes regularly to evaluate bank’s risk and portfolio concentrations. The Risk Management Group performs the following critical functions:
•CreditRiskManagement •CreditReview •CreditRiskControl •MarketRiskManagement •LiquidityRiskManagement •OperationalRiskManagement
Keeping in view the international best practices and SBP requirements, Board of Directors of the Bank has approved a Risk Appetite Statement, which takes into account quantitative and qualitative risk indicators, covering target ratios, credit, market, operational, liquidity and business risks.
Notes to the Financial StatementsFor the year ended December 31, 2013

171
43.1 Credit Risk Credit risk arises from our dealings with individuals, corporate borrowers, financial institutions, sovereigns etc. The Bank
is exposed to credit risk through its lending and investment activities. It stems from Bank’s both on and off-balance sheet activities. Credit risk makes up the largest part of the Bank’s exposure. Purpose of Credit Risk Management function is to identify, measure, manage, monitor and mitigate credit risk. Organizational structure of this function ensures pre and post-facto management of credit risk. While, Credit Review function provides pre-fact evaluation of counterparties, the Credit Risk Control (CRC) performs post-fact evaluation of financing facilities and reviews clients’ performance on an ongoing process.
The Bank has adopted Standardized Approach to measure Credit risk regulatory capital charge in compliance with Basel-II requirements. The approach mainly takes into account the assessment of external credit rating agencies. In line with SBP guidelines on Internal Credit Ratings Systems, the Bank has developed a system and all its corporate and commercial borrowers are internally rated. Bank is in the process of continuously improving the system and bringing it inline with the Basel framework requirements.
In order to manage bank’s credit risk, following policies and procedures are in place:
• IndividualswhotakeormanagerisksclearlyunderstandtheminordertoprotecttheBankfromavoidablerisks; • Theapprovalofcreditlimitstocounterpartiesaresubjecttopre-factreview; • Extensionincreditfacilityormaterialchangetothecreditfacilityissubjecttocreditreview; • ApprovalandreviewprocessisreviewedbyRM&PRCandinternalaudit; • Managementperiodicallyreviewsthepowersofcreditapprovingandcreditreviewingauthorities.
As a part of credit assessment Bank uses internal rating framework as well as the ratings assigned by the external credit rating agencies, wherever available.
Ongoing administration of the credit portfolio is an essential part of the credit process that supports and controls extension and maintenance of credit. The Bank’s Credit Risk Control, being an independent function from the business and operations groups, is responsible for performing following activities:
• Creditdisbursementauthorization; • Collateralcoverageandmonitoring; • Complianceofloancovenants/termsofapproval; • Maintenance/custodyofcollateralandsecuritydocumentation.
Credit Risk Monitoring is based on a comprehensive reporting framework. Continuous monitoring of the credit portfolio and the risks attached thereto are carried out at different levels including businesses, Audit & Risk Assets Review, Credit Risk Control, Credit Risk Management Division, etc.
To ensure a prudent distribution of asset portfolio, the Bank manages its lending and investment activities within an appropriate limits framework. Per party exposure limit is maintained in accordance with SBP Prudential Regulation R-1.
The Bank creates specific provision against Non- Performing Loans (NPLs) in accordance with the Prudential Regulations and other directives issued by the State Bank of Pakistan (SBP) and charged to the profit and loss account. Provisions are held against identified as well as unidentified losses. Provisions against unidentified losses include general provision against consumer loans made in accordance with the requirements of the Prudential Regulations issued by SBP and provision based on historical loss experience on advances. Please refer note No. 10.5 for reconciliation of changes in specific and general provisions.
Management of Non Performing Loans
The Bank has a Special Asset Management Group (SAMG), which is responsible for management of non performing loans. SAMG undertakes restructuring / rescheduling of problem loans, as well as litigation of both civil and criminal cases for collection of debt.
Stress Testing
Credit Risk stress testing is a regular exercise. Bank’s all credit expsoures including funded and non-funded facilities are subject to stress test. This exercise is conducted on a quarterly basis through assigning shocks to all assets of the Bank and assessing its resulting affect on capital adequacy inline with SBP requirements.
Notes to the Financial StatementsFor the year ended December 31, 2013

ANNUAL REPORT 2013
172
43.1.1 Segmental information
Segmental Information is presented in respect of the class of business and geographical distribution of advances (gross), deposits, contingencies and commitments.
2013
Advances (Gross) Deposits Contingencies and commitments
(Rupees Percent (Rupees Percent (Rupees Percent
in ‘000) (%) in ‘000) (%) in ’000) (%)
43.1.1.1 Segments by class of business
Agriculture, forestry, hunting and fishing 3,057,169 1.14 52,085,320 8.24 2,365,835 0.89
Mining and quarrying 5,000 0.00 1,233,151 0.20 2,136,618 0.80
Textile 41,120,102 15.33 2,436,221 0.39 9,611,601 3.62
Chemical, Petroleum and pharmaceuticals 36,888,331 13.75 21,103,199 3.34 31,780,773 11.97
Cement 894,170 0.33 830,008 0.13 1,596,090 0.60
Sugar 15,537,248 5.79 2,314,203 0.37 1,474,420 0.56
Footwear and leather garments 4,682,822 1.75 386,090 0.06 1,718,371 0.65
Automobile and transportation equipment 586,303 0.22 2,063,712 0.33 1,532,315 0.58
Electronics and electrical appliances 2,935,545 1.09 534,111 0.08 1,365,650 0.51
Construction 714,696 0.27 3,181,489 0.50 3,640,172 1.37
Power (electricity), gas, water, sanitary 26,224,336 9.78 37,509,966 5.93 1,651,373 0.62
Wholesale and Retail Trade 21,688,938 8.09 30,725,517 4.86 1,639,982 0.62
Exports / imports 8,644,043 3.22 1,283,752 0.20 4,035,185 1.52
Transport, storage and communication 26,260,405 9.79 2,914,036 0.46 9,164,468 3.45
Financial 1,841,644 0.69 10,307,209 1.63 143,262,515 53.97
Insurance 60,415 0.02 1,617,467 0.26 11,282 0.00
Services 6,480,676 2.42 97,366,136 15.40 19,073,590 7.19
Individuals 13,851,499 5.16 351,396,962 55.57 43,385 0.02
Others 56,718,916 21.16 13,041,737 2.06 29,324,405 11.05
268,192,258 100 632,330,286 100 265,428,030 100
2012
Advances (Gross) Deposits Contingencies and commitments
(Rupees Percent (Rupees Percent (Rupees Percent
in ‘000) (%) in ‘000) (%) in ’000) (%)
Agriculture, forestry, hunting and fishing 2,474,463 0.94 46,722,076 8.57 1,362,196 0.95
Mining and quarrying 510,819 0.19 762,435 0.14 1,957,783 1.36
Textile 37,796,532 14.40 2,839,175 0.52 9,675,745 6.73
Chemical, Petroleum and pharmaceuticals 13,536,095 5.16 3,972,061 0.73 24,413,483 16.98
Cement 1,340,198 0.51 545,143 0.10 812,238 0.56
Sugar 11,373,856 4.33 1,246,046 0.23 1,126,804 0.78
Footwear and leather garments 3,351,288 1.28 185,094 0.03 1,211,665 0.84
Automobile and transportation equipment 350,182 0.13 1,655,254 0.30 883,112 0.61
Electronics and electrical appliances 2,581,319 0.98 1,442,975 0.26 1,133,798 0.79
Construction 512,732 0.20 2,504,747 0.46 1,718,908 1.20
Power (electricity), gas, water, sanitary 29,778,732 11.35 10,474,169 1.92 5,596,136 3.89
Wholesale and Retail Trade 16,155,626 6.16 31,693,748 5.81 1,669,454 1.16
Exports / imports 4,374,769 1.67 1,155,293 0.21 3,464,399 2.41
Transport, storage and communication 60,303,139 22.98 2,963,980 0.54 8,605,809 5.98
Financial 2,625,187 1.00 7,529,434 1.38 43,797,027 30.46
Insurance 100,145 0.04 1,933,344 0.35 9,428 0.01
Services 8,408,320 3.20 103,086,339 18.91 15,323,823 10.66
Individuals 14,525,679 5.53 304,770,547 55.90 27,556 0.01
Others 52,293,262 19.95 19,578,868 3.60 21,013,163 14.62
262,392,343 100 545,060,728 100 143,802,527 100
Notes to the Financial StatementsFor the year ended December 31, 2013

173
2013
Advances (Gross) Deposits Contingencies
and commitments
(Rupees in ‘000) (%) (Rupees in ‘000) (%) (Rupees in ‘000) (%)
43.1.1.2 Segment by sector
Public / Government 50,019,400 18.65 47,467,154 7.51 82,894,499 31.23
Private 218,172,858 81.35 584,863,132 92.49 182,533,531 68.77
268,192,258 100 632,330,286 100 265,428,030 100
2012
Advances (Gross) Deposits Contingencies
and commitments
(Rupees in ‘000) (%) (Rupees in ‘000) (%) (Rupees in ‘000) (%)
Public / Government 61,853,400 23.57 14,204,857 2.61 64,122,798 44.59
Private 200,538,943 76.43 530,855,871 97.39 79,679,729 55.41
262,392,343 100 545,060,728 100 143,802,527 100
43.1.1.3 Details of non-performing advances and specific provisions by class of business segment
2013 2012
Classified Specific Classified Specific Advances Provision Held Advances Provision Held
(Rupees in ‘000)
Agriculture, forestry, hunting and fishing 254,545 241,739 312,154 312,154 Mining and quarrying - - - - Textile 4,122,275 4,079,378 5,209,642 5,198,660 Chemical and pharmaceuticals 183,434 183,434 196,304 196,304 Cement 130,950 130,950 295,603 295,603 Sugar 428,224 428,224 1,035,221 1,035,221 Footwear and leather garments 85,595 85,595 103,951 103,951 Automobile and transportation equipment 26,155 25,337 54,984 47,781 Electronics and electrical appliances 374,522 374,522 451,436 451,436 Construction 118,363 118,363 127,365 127,365 Power (electricity), gas, water, sanitary - - 180,086 90,070 Wholesale and retail trade 3,490,188 3,401,412 4,075,703 4,075,582 Exports / imports 548,372 548,017 596,963 596,796 Transport, storage and communication 593,413 589,033 645,059 335,919 Financial 814,600 814,600 1,107,782 918,893 Services 594,830 590,498 721,978 721,978 Individuals 3,188,170 3,117,058 3,393,709 3,265,164 Others 8,314,097 4,721,988 7,053,834 4,607,210 23,267,733 19,450,148 25,561,774 22,380,087
43.1.1.4 Details of non-performing advances and specific provisions by sector Public/ Government 639,825 - - - Private 22,627,908 19,450,148 25,561,774 22,380,087
23,267,733 19,450,148 25,561,774 22,380,087
Notes to the Financial StatementsFor the year ended December 31, 2013

ANNUAL REPORT 2013
174
43.1.1.5 Geographical segment analysis
2013
Profit before Total assets Net assets Contingencies & taxation employed employed commitments
(Rupees in ‘000)
Pakistan 31,708,602 798,416,691 109,635,974 259,694,660
South Asia 327,628 11,314,474 334,864 5,188,358
Middle East 251,975 5,777,206 260,143 545,012
32,288,205 815,508,371 110,230,981 265,428,030
2012 (Restated)
Profit before Total assets Net assets Contingencies & taxation employed employed commitments
(Rupees in ‘000)
Pakistan 31,122,871 754,345,689 101,984,972 138,333,357 South Asia 305,084 8,500,160 286,887 5,012,636
Middle East 213,952 4,228,848 198,830 456,534
31,641,907 767,074,697 102,470,689 143,802,527
Total assets employed include intra group items of Rs. NIL (2012: Rs. NIL).
43.1.2 Credit Risk - General Disclosures The Bank has adopted Standardized approach of Basel II for calculation of capital charge against credit risk in line with
SBP’s requirements.
43.1.2.1 Credit Risk: Disclosures for portfolio subject to the Standardized Approach Under standardized approach, the capital requirement is based on the credit rating assigned to the counterparties
by the External Credit Assessment Institutions (ECAIs) duly recognized by SBP for capital adequacy purposes. Bank utilizes, wherever available, the credit ratings assigned by the SBP recognized ECAIs, viz. PACRA (Pakistan Credit Rating Agency), JCR-VIS (Japan Credit Rating Company– Vital Information Systems), Fitch, Moody’s and Standard & Poors . Credit rating data for advances is obtained from recognized External Credit Assessment Institutions and then mapped to State Bank of Pakistan’s Rating Grades.
Type of Exposures for which the ratings from the External Credit Rating Agencies are used by the Bank.
Exposures JCR-VIS PACRA Other (S&P / Moody’s
/ Fitch)
Corporate Yes Yes -
Banks Yes Yes Yes
Sovereigns - - Yes SME’s Yes Yes -
The criteria for transfer public issue ratings onto comparable assets in the banking book and the alignment of the
alphanumerical scale of each agency used with risk buckets is the same as specified by the banking regulator SBP in BSD
Circular No.8 table 2.3.
Notes to the Financial StatementsFor the year ended December 31, 2013

175
Long - Term Ratings Grades Mapping
SBP Rating Grade PACRA JCR-VIS Fitch Moody’s S&P ECA Scores
1 AAA AAA AAA Aaa AAA 1 AA+ AA+ AA+ Aa1 AA+ AA AA AA Aa2 AA AA- AA- AA- Aa3 AA-
2 A+ A+ A+ A1 A+ 2 A A A A2 A A- A- A- A3 A-
3 BBB+ BBB+ BBB+ Baa1 BBB+ 3 BBB BBB BBB Baa2 BBB BBB- BBB- BBB- Baa3 BBB-
4 BB+ BB+ BB+ Ba1 BB+ 4 BB BB BB Ba2 BB BB- BB- BB- Ba3 BB-
5 B+ B+ B+ B1 B+ 5,6 B B B B2 B B- B- B- B3 B-
6 CCC+ and CCC+ and CCC+ and Caa1 and CCC+ and 7 below below below Below below
Short - Term Ratings Grades Mapping
SBP Rating Grade PACRA JCR-VIS Fitch Moody’s S&P
S1 A-1 A-1 F1 P-1 A-1+, A-1
S2 A-2 A-2 F2 P-2 A-2
S3 A-3 A-3 F3 P-3 A-3
S4 Others Others Others Others Others
Notes to the Financial StatementsFor the year ended December 31, 2013

ANNUAL REPORT 2013
176
Credit Exposures subject to Standardized approach
2013 2012
Exposures Rating Amount Deduction Net Amount Deduction Net Outstanding CRM amount Outstanding CRM amount
(Rupees in ‘000)
Corporate 1 12,965,194 - 12,965,194 19,892,545 - 19,892,545
2 16,023,019 - 16,023,019 18,297,215 - 18,297,215
3,4 666,209 - 666,209 60,937 - 60,937
5,6 - - - 61,960 - 61,960
Unrated 142,722,637 - 142,722,637 115,236,986 - 115,236,986
Bank
1 18,704,638 - 18,704,638 17,947,964 - 17,947,964
2,3 1,263,692 - 1,263,692 2,244,629 - 2,244,629
4,5 527,759 - 527,759 417,248 - 417,248
6 18,718 - 18,718 306,199 - 306,199
Unrated 1,482,555 - 1,482,555 140,624 - 140,624
Public Sector Entities in Pakistan
1 - - - 218,872 - 218,872
2,3 - - - - - -
4,5 - - - - - -
6 - - - - - -
Unrated 47,872,322 32,662,619 15,209,703 60,212,217 59,821,046 391,171
Sovereigns and on Government of Pakistan or
provincial governments or SBP or Cash 45,126,907 - 45,126,907 44,378,128 - 44,378,128
1 - - - - - -
2 - - - - - -
3 - - - - - -
4,5 3,571,381 - 3,571,381 1,212,879 - 1,212,879
6 478,848 - 478,848 2,075,915 - 2,075,915
Unrated 2,361,976 - 2,361,976 68,513 - 68,513
Mortgage 3,831,898 - 3,831,898 4,216,989 - 4,216,989
Retail 19,829,660 - 19,829,660 20,606,300 - 20,606,300
43.1.3 Credit Risk: Disclosures with respect to Credit Risk Mitigation for Standardized Approach
The Bank does not make use of on and off-balance sheet netting in capital charge calculations under Basel-II’s Standardized Approach for Credit Risk.
43.1.3.1 Credit Risk: Disclosures for portfolio subject to the Standardized Approach
The Bank has strong policies and processes for collateral valuation and collateral management thus ensuring that collateral valuation happens at regular defined intervals. Collaterals are normally held for the life of exposure. Regular monitoring of coverage of exposure by the collateral and lien/ charge registered over the collaterals is carried out besides ensuring that collateral matches the purpose, nature and structure of the transaction and also reflect the form and capacity of the obligor, its operations, nature of business and economic environment. The Bank mitigates its risk by taking collaterals that may include assets acquired through the funding provided, as well as cash, government securities, marketable securities, current assets, fixed assets, and specific equipment, commercial and personal real estate.
The Standardized Approach of Basel-II guidelines allows the Bank to take benefit of credit risk mitigation of financial collaterals against total exposures in the related loan facilities. As a prudent and conservative measure while calculating capital charge for credit risk of on balance sheet activities, bank has taken only the benefit of Sovereign guarantees.
Notes to the Financial StatementsFor the year ended December 31, 2013

177
MCB manages limits and controls concentrations of credit risk as identified, in particular, to individual counterparties and groups, and also reviews exposure to industry sectors and geographical regions on a regular basis. Limits are applied in a variety of forms to portfolios or sectors where MCB considers it appropriate to restrict credit risk concentrations or areas of higher risk, or to control the rate of portfolio growth.
Concentration of risk
Out of the total financial assets of Rs. 774,815.595 million (2012: Rs. 720,858.534 million) the financial assets which are subject to credit risk amounting to Rs. 762,464.749 million (2012: Rs. 709,055.410 million). To manage credit risk the Bank applies credit limits to its customers and obtains adequate collaterals. Investments amounting to Rs. 434,096.855 million (2012: Rs. 380,193.220 million) are guaranteed by the Government of Pakistan. In addition, an amount of Rs. 31,931.448 million (2012: Rs. 30,380.601 million) are held by the Bank with the State Bank of Pakistan and central banks of other countries.
43.1.3.2 Equity position risk in the banking book
The Bank takes proprietary equity positions for both trading and strategic purposes. The Bank has invested in its subsidiaries and associated companies to achieve long term strategic objectives. As of December 31, 2013 the composition of equity investments, subsidiaries and associated companies is as follows:
Composition of equity investments
Exposures Held for trading Available for Sale Subsidiary and Associates
(Rupees in ‘000)
Equity investments – publicly traded - 7,797,701 1,263,723
Equity investments - others - 142,807 372,205
Total value - 7,940,508 1,635,928
Classification of equity investments
Banks classify its equity investment portfolio in accordance with the directives of SBP as follows:
• Investments-Heldfortrading
• Investments-Availableforsale
• Investmentsinsubsidiaries
• InvestmentsinAssociates
Policies, valuation and accounting of equity investments
The accounting policies for equity investments are designed and their valuation is carried out under the provisions and
directives of State Bank of Pakistan, Securities and Exchange Commission of Pakistan and the requirements of approved
International Accounting Standards as applicable in Pakistan.
In accordance with the requirements of the State Bank of Pakistan, quoted securities, other than investments in subsidiaries
and investments in associates are subsequently re-measured to market value. Surplus / (deficit) arising on revaluation of
quoted securities which are classified as ‘available for sale’, is taken to a separate account which is shown in the statement
of financial position below equity. Surplus / (deficit) arising on revaluation of quoted securities which are classified as ‘held for
trading’, is taken to the profit and loss account directly.
Unquoted equity securities are valued at the lower of cost and break-up value. Break-up value of equity securities is calculated
with reference to the net assets of the investee company as per the latest available audited financial statements.
The cumulative realized gain of Rs. 1,870.758 million has been charged to profit & loss account from sale of equity securities;
however unrealized gain of Rs. 2,118.576 million was recognized in the balance sheet in respect of AFS equity securities.
Further a provision for impairment in value of equity investments amounting to Rs. 5.909 million has been charged to profit
and loss account.
Notes to the Financial StatementsFor the year ended December 31, 2013

ANNUAL REPORT 2013
178
43.2 Market Risk Management
Market Risk arises from changes in market rates such as Interest Rates, Foreign Exchange Rates, Equity Prices, credit spreads and/or commodity prices as well as their correlations and volatilities resulting in a loss to earnings and capital. MCB is exposed to market risk primarily through its trading activities, which are centered in the Treasury and Foreign Exchange Group and the Capital Market Group. Market risk exposure also arises from market-making, facilitation of client business and proprietary positions in equities, fixed income and interest rate products and foreign exchange, which exposes bank to interest rate risk, foreign exchange risk and equity price risk.
The Bank’s Market Risk Management structure consists of Risk Management & Portfolio Review Committee (RM&PRC) of the Board, Risk Management Committee of management, ALCO and independent Market Risk Management Division reporting directly to Group Head Risk Management. Market Risk is an independent risk management function that works in close partnership with the business segments to identify and monitor market risks throughout the Bank and to define market risk policies and procedures. Market Risk Division seeks to facilitate efficient risk/return decisions, reduce volatility in operating performance and provide transparency in reporting the Bank’s market risk profile to the senior management, the Board of Directors and regulator. Market risk management authority, including approval of market risk limits and exposure levels is vested in the ALCO.
In line with regulatory requirements, MCB has clearly defined, in its Risk Management policy, the positions which shall be subject to market risk. The definition covers the accounting classifications as well as positions booked by different business groups under Available for Sale category. The assets subject to trading book treatment are frequently, mostly on daily basis, valued and actively managed. The positions which does not fulfil the criteria of Trading book falls under the Banking Book and are treated as per SBP requirements.
The Bank measures and manages Market Risk by using conventional methods i.e. notional amounts, sensitivity and combinations of various limits. Bank has established a specific Market Risk Limit Policy providing guideline for assuming controlled market risk, its monitoring and management. These Limits are compared with the numbers generated by the market risk management systems based on the trading activity and the outstanding positions.
Beside conventional methods, the Bank also uses VaR (Value at Risk) technique for market risk assessment of positions assumed by its treasury and capital market groups. In-house solutions are used for calculating mark to market value of positions and generating VaR (value at risk) and sensitivity numbers. Thresholds for different positions are established to compare the expected losses at a given confidence level and over a specified time horizon.
A framework of stress testing, scenario analysis and reverse stress tests of both banking and trading books as per SBP guidelines is also in place. The results of the stress tests are reviewed by the Senior Management and also reported to the SBP.
The Bank is also exposed to interest rate risk both in trading and banking books. Risk numbers along with the marked to market values of government securities held by the Bank’s treasury are generated on daily basis. The risk numbers include duration, PVBP, and VaR on individual security basis as well as on portfolio basis. These reports are presented to the senior management for review on a daily basis.
43.2.1 Foreign Exchange Risk Management
Foreign exchange risk exposes the bank to changes in the values of current holdings and future cash flows denominated in currencies other than home currency due to the exchange rate fluctuation and volatility. The types of instruments exposed to this risk include investments in foreign branches, foreign currency-denominated loans, foreign currency-denominated deposits, future cash flows in foreign currencies arising from foreign exchange transactions, etc.
The core objective of foreign exchange risk management is to ensure the foreign exchange exposure of the Bank remain within defined risk appetite and insulate bank against undue losses that may arise due to volatile movements in foreign exchange rates or interest rates.
Limit structure to manage Foreign exchange risk is in place. Gap limits on different tenors in major currencies are in place to control risk. Bank’s net open position and Foreign exchange exposure limit (FEEL) is monitored and reported on daily basis. Additionally, daily reports are generated to evaluate the exposure in different currencies. Risk management system generates VaR numbers for foreign exchange portfolio to estimate the potential loss under normal conditions. Stress testing of foreign exchange portfolio is also performed and reported to senior management. All these activities are performed on a daily basis.
Notes to the Financial StatementsFor the year ended December 31, 2013

179
2013
Assets Liabilities Off-balance Net foreign
sheet items currency exposure
(Rupees in ‘000)
Pakistan Rupee 757,862,650 654,735,583 6,922,673 110,049,740 Sri Lankan Rupee 11,049,130 11,099,250 45,462 (4,658)United States Dollar 44,685,577 31,710,628 (12,854,354) 120,595 Pound Sterling 876,537 3,495,434 2,630,109 11,212 Japanese Yen 10,881 51,448 53,717 13,150 Euro 993,614 4,185,047 3,202,393 10,960 Other currencies 29,982 - - 29,982
815,508,371 705,277,390 - 110,230,981
2012 (Restated)
Assets Liabilities Off-balance Net foreign sheet items currency exposure
(Rupees in ‘000)
Pakistan Rupee 735,139,674 628,989,912 (3,931,941) 102,217,821
Sri Lankan Rupee 8,115,171 8,159,735 18,620 (25,944)
United States Dollar 22,693,261 20,998,827 (1,510,732) 183,702
Pound Sterling 481,165 2,857,211 2,383,939 7,893
Japanese Yen 42,693 70 (40,618) 2,005
Euro 548,178 3,598,253 3,080,732 30,657
Other currencies 54,555 - - 54,555
767,074,697 664,604,008 - 102,470,689
43.2.2 Equity Price Risk
Bank’s proprietary positions in the equity instruments expose it to the equity price risk in its trading and banking books. Equity
price risk is managed by applying trading limit, scrip-wise and portfolio wise nominal limits. VaR analysis and stress testing
of the equity portfolio are also performed and reported to senior management on daily basis. The stress test for equity price
risk assesses the impact of the decline in market prices of scrips under certain assumptions. Additionally, historical scenario
analysis on equities is also performed periodically as advised by the State Bank of Pakistan through Guideline on Stress
Testing.
43.2.3 Country Risk
The world is changing rapidly and interdependencies and inter linkages of banks operating in different countries are ever
increasing. Thus the banks having cross border exposures whether on-balance sheet or off-balance sheet are susceptible to
the changing conditions in various countries of the world. Therefore, it becomes very important for institutions to effectively
manage their cross border exposures to avoid any unfavourable situation.
MCB understands the risks involved in taking cross border exposure. The risk is managed under the umbrella of Board
approved Country Risk Policy. The Policy not only envisages a centralized approach to measure, monitor and manage
country risk but also strengthen overall risk management framework in the Bank.
Country Exposure Limits are in place, which broadly capture direct exposure on sovereigns and exposures on foreign
domiciled counter parties. Additionally, business product wise sub limits involving cross border exposure are also implemented.
Monitoring of these limits is a regular feature of Risk Management.
Notes to the Financial StatementsFor the year ended December 31, 2013

ANNUAL REPORT 2013
180
Yiel
d /
inte
rest
rate
sen
sitiv
ity p
ositi
on fo
r on-
bala
nce
shee
t ins
trum
ents
is b
ased
on
the
earli
er o
f con
tract
ual r
e-pr
icin
g or
mat
urity
dat
e an
d fo
r off-
bala
nce
shee
t ins
trum
ents
is
base
d on
set
tlem
ent d
ate.
20
13
Ef
fect
ive
Tota
l E
xpos
ed to
Yie
ld/ I
nter
est r
isk
Not e
xpos
ed
Yi
eld/
Up
to
Ove
r 1
Ove
r 3
Ove
r 6
Ove
r 1
Ove
r 2
Ove
r 3
Ove
r 5
Abo
ve
to Y
ield
/
Inte
rest
1 m
onth
to
3
to 6
m
onth
s to
to
2
to 3
to
5
to 1
0
10
year
s
Inte
rest
rate
m
onth
s
mon
ths
1
yea
r y
ears
y
ears
y
ears
y
ears
Risk
(R
upee
s in
‘000
)
On-b
alan
ce s
heet
fina
ncia
l inst
rum
ents
Asse
ts
Cash
and
bala
nces
with
trea
sury
ban
ks
0%
59,
946,
150
4
,146
,998
-
-
-
-
-
-
-
-
5
5,79
9,15
2 Ba
lance
s with
oth
er b
anks
2.
35%
1
,536
,946
4
84,4
14
-
-
-
-
-
-
-
-
1,0
52,5
32
Lend
ings t
o fin
ancia
l inst
itutio
ns
6.5%
to 1
0%
1,2
24,6
38
1,2
24,6
38
-
-
-
-
-
-
-
-
-
Inves
tmen
ts -
net
8.95
% to
13.
20%
4
47,3
70,0
91
102
,012
,978
2
11,4
91,0
20
16,
915,
652
1
1,32
7,08
9
21,
398,
565
3
9,06
6,34
2
24,
125,
404
1
3,09
2,61
1
-
7,9
40,4
30
Adva
nces
- ne
t 10
.77%
2
48,2
42,9
65
210
,483
,644
1
8,07
3,29
9
4,2
90,7
33
1,3
58,3
61
5,2
39,7
20
2,6
41,4
80
3,1
11,6
16
2,4
42,3
67
601
,745
-
Ot
her a
sset
s - n
et
1
6,49
4,80
5
-
-
-
-
-
-
-
-
-
16,
494,
805
774
,815
,595
3
18,3
52,6
72
229
,564
,319
2
1,20
6,38
5
12,
685,
450
2
6,63
8,28
5
41,
707,
822
2
7,23
7,02
0
15,
534,
978
6
01,7
45
81,
286,
919
Liab
ilitie
s
Bills
pay
able
1
0,13
8,72
6
-
-
-
-
-
-
-
-
-
10,
138,
726
Borro
wing
s 0.
8% to
10.
25%
3
8,54
2,66
0
19,
312,
395
1
0,00
5,13
5
4,4
69,6
05
2,3
96,6
84
2,3
58,8
41
-
-
-
-
-
Depo
sits a
nd o
ther
acc
ount
s 7%
to 1
0.75
%
632
,330
,286
3
73,7
18,7
28
19,
136,
275
8
,714
,275
1
5,47
2,80
1
217
,157
2
19,9
38
326
,664
-
-
2
14,5
24,4
48
Othe
r liab
ilities
16,
064,
197
-
-
-
-
-
-
-
-
-
1
6,06
4,19
7
697
,075
,869
3
93,0
31,1
23
29,
141,
410
1
3,18
3,88
0
17,
869,
485
2
,575
,998
2
19,9
38
326
,664
-
-
2
40,7
27,3
71
On-b
alan
ce s
heet
gap
77,
739,
726
(7
4,67
8,45
1)
200
,422
,909
8
,022
,505
(5
,184
,035
) 2
4,06
2,28
7
41,
487,
884
2
6,91
0,35
6
15,
534,
978
6
01,7
45
(159
,440
,452
)
Off-b
alan
ce s
heet
fina
ncia
l inst
rum
ents
FX o
ption
s pur
chas
e
216
,344
-
2
16,3
44
-
-
-
-
-
-
-
-
Fore
ign e
xcha
nge
cont
ract
s Pur
chas
e
72,
216,
751
4
2,58
3,68
3
23,
239,
215
6
,393
,853
-
-
-
-
-
-
-
72,
433,
095
4
2,58
3,68
3
23,
455,
559
6
,393
,853
-
-
-
-
-
-
-
FX o
ption
s sale
216
,344
-
2
16,3
44
-
-
Fo
reign
exc
hang
e co
ntra
cts P
urch
ase
7
9,95
9,56
3
44,
369,
336
2
5,26
6,53
1
9,9
57,4
17
366
,279
-
-
-
-
-
-
80,
175,
907
4
4,36
9,33
6
25,
482,
875
9
,957
,417
3
66,2
79
-
-
-
-
-
-
Off-b
alan
ce s
heet
gap
(7,
742,
812)
(1
,785
,653
) (2
,027
,316
) (3
,563
,564
) (3
66,2
79)
-
-
-
-
-
-
Tota
l yie
ld /
inte
rest
risk
sen
sitivi
ty g
ap
(76,
464,
104)
1
98,3
95,5
93
4,4
58,9
41
(5,5
50,3
14)
24,
062,
287
4
1,48
7,88
4
26,
910,
356
1
5,53
4,97
8
601
,745
Cum
ulat
ive y
ield
/ in
tere
st ri
sk s
ensit
ivity
gap
(
76,4
64,1
04)
121
,931
,489
1
26,3
90,4
30
120
,840
,116
1
44,9
02,4
03
186
,390
,287
2
13,3
00,6
43
228
,835
,621
2
29,4
37,3
66
43.3
M
ism
atch
of I
nter
est
Rat
e S
ensi
tive
Ass
ets
and
Lia
bili
ties
Notes to the Financial StatementsFor the year ended December 31, 2013
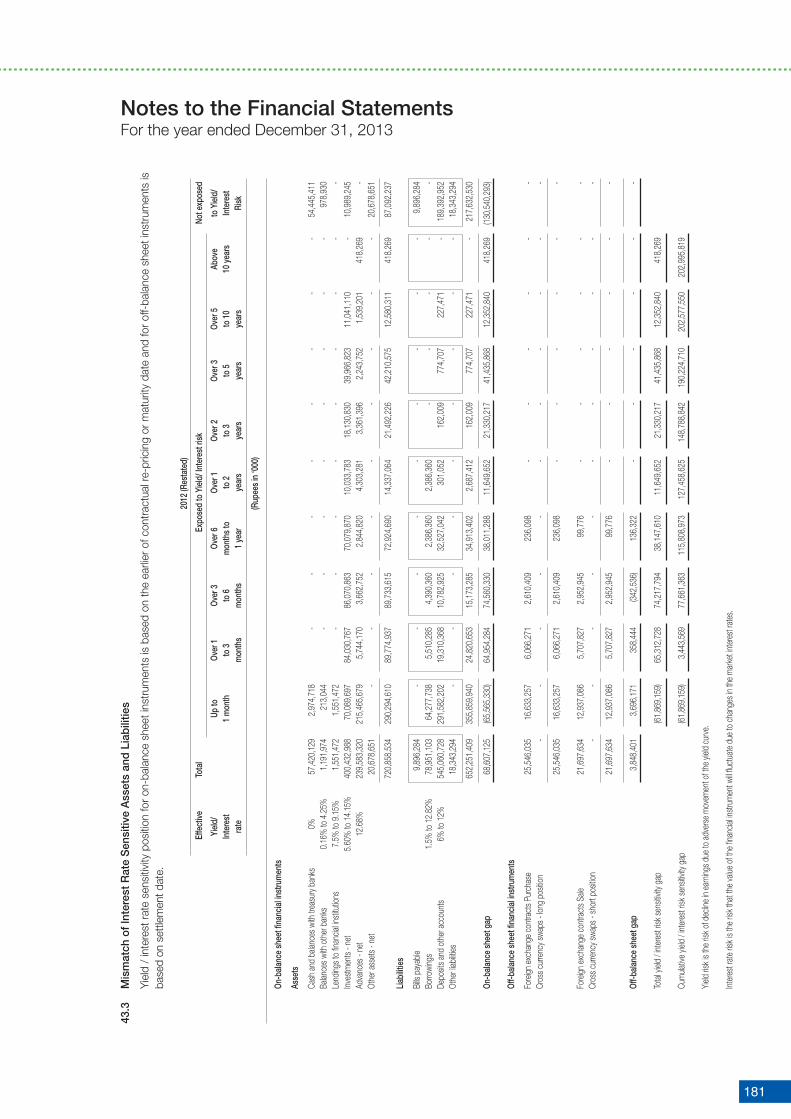
181
Yiel
d /
inte
rest
rate
sen
sitiv
ity p
ositi
on fo
r on-
bala
nce
shee
t ins
trum
ents
is b
ased
on
the
earli
er o
f con
tract
ual r
e-pr
icin
g or
mat
urity
dat
e an
d fo
r off-
bala
nce
shee
t ins
trum
ents
is
base
d on
set
tlem
ent d
ate.
20
12 (R
esta
ted)
Ef
fect
ive
Tota
l E
xpos
ed to
Yie
ld/ I
nter
est r
isk
Not e
xpos
ed
Yi
eld/
Up
to
Ove
r 1
Ove
r 3
Ove
r 6
Ove
r 1
Ove
r 2
Ove
r 3
Ove
r 5
Abo
ve
to Y
ield
/
Inte
rest
1 m
onth
to
3
to 6
m
onth
s to
to
2
to 3
to
5
to 1
0
10
year
s
Inte
rest
rate
m
onth
s
mon
ths
1
yea
r y
ears
y
ears
y
ears
y
ears
Risk
(R
upee
s in
‘000
)
On-b
alan
ce s
heet
fina
ncia
l inst
rum
ents
Asse
ts
Cash
and
bala
nces
with
trea
sury
ban
ks
0%
57,
420,
129
2
,974
,718
-
-
-
-
-
-
-
-
5
4,44
5,41
1 Ba
lance
s with
oth
er b
anks
0.
16%
to 4
.25%
1
,191
,974
2
13,0
44
-
-
-
-
-
-
-
-
978
,930
Le
nding
s to
finan
cial in
stitu
tions
7.
5% to
9.1
5%
1,5
51,4
72
1,5
51,4
72
-
-
-
-
-
-
-
-
-
Inves
tmen
ts -
net
5.60
% to
14.
15%
4
00,4
32,9
88
70,
089,
697
8
4,03
0,76
7
86,
070,
863
7
0,07
9,87
0
10,
033,
783
1
8,13
0,83
0
39,
966,
823
1
1,04
1,11
0
-
10,
989,
245
Adva
nces
- ne
t 12
.68%
2
39,5
83,3
20
215
,465
,679
5
,744
,170
3
,662
,752
2
,844
,820
4
,303
,281
3
,361
,396
2
,243
,752
1
,539
,201
4
18,2
69
-
Othe
r ass
ets -
net
20,
678,
651
-
-
-
-
-
-
-
-
-
2
0,67
8,65
1
720
,858
,534
2
90,2
94,6
10
89,
774,
937
8
9,73
3,61
5
72,
924,
690
1
4,33
7,06
4
21,
492,
226
4
2,21
0,57
5
12,
580,
311
4
18,2
69
87,
092,
237
Liab
ilitie
s
Bills
pay
able
9
,896
,284
-
-
-
-
-
-
-
-
-
9
,896
,284
Bo
rrowi
ngs
1.5%
to 1
2.82
%
78,
951,
103
6
4,27
7,73
8
5,5
10,2
85
4,3
90,3
60
2,3
86,3
60
2,3
86,3
60
-
-
-
-
-
Depo
sits a
nd o
ther
acc
ount
s 6%
to 1
2%
545
,060
,728
2
91,5
82,2
02
19,
310,
368
1
0,78
2,92
5
32,
527,
042
3
01,0
52
162
,009
7
74,7
07
227
,471
-
1
89,3
92,9
52
Othe
r liab
ilities
18,
343,
294
-
-
-
-
-
-
-
-
-
1
8,34
3,29
4
652
,251
,409
3
55,8
59,9
40
24,
820,
653
1
5,17
3,28
5
34,
913,
402
2
,687
,412
1
62,0
09
774
,707
2
27,4
71
-
217
,632
,530
On-b
alan
ce s
heet
gap
68,
607,
125
(6
5,56
5,33
0)
64,
954,
284
7
4,56
0,33
0
38,
011,
288
1
1,64
9,65
2
21,
330,
217
4
1,43
5,86
8
12,
352,
840
4
18,2
69
(130
,540
,293
)
Off-b
alan
ce s
heet
fina
ncia
l inst
rum
ents
Fore
ign e
xcha
nge
cont
ract
s Pur
chas
e
25,
546,
035
1
6,63
3,25
7
6,0
66,2
71
2,6
10,4
09
236
,098
-
-
-
-
-
-
Cr
oss c
urre
ncy s
waps
- lon
g po
sition
-
-
-
-
-
-
-
-
-
-
-
25,
546,
035
1
6,63
3,25
7
6,0
66,2
71
2,6
10,4
09
236
,098
-
-
-
-
-
-
Fore
ign e
xcha
nge
cont
ract
s Sale
21,
697,
634
1
2,93
7,08
6
5,7
07,8
27
2,9
52,9
45
99,
776
-
-
-
-
-
-
Cr
oss c
urre
ncy s
waps
- sh
ort p
ositio
n
-
-
-
-
-
-
-
-
-
-
-
21,
697,
634
1
2,93
7,08
6
5,7
07,8
27
2,9
52,9
45
99,
776
-
-
-
-
-
-
Off-b
alan
ce s
heet
gap
3,8
48,4
01
3,6
96,1
71
358
,444
(3
42,5
36)
136
,322
-
-
-
-
-
-
Tota
l yiel
d / i
nter
est r
isk se
nsitiv
ity g
ap
(61
,869
,159
) 6
5,31
2,72
8
74,
217,
794
3
8,14
7,61
0
11,
649,
652
2
1,33
0,21
7
41,
435,
868
1
2,35
2,84
0
418
,269
Cum
ulativ
e yie
ld / i
nter
est r
isk se
nsitiv
ity g
ap
(6
1,86
9,15
9)
3,4
43,5
69
77,
661,
363
1
15,8
08,9
73
127
,458
,625
1
48,7
88,8
42
190
,224
,710
2
02,5
77,5
50
202
,995
,819
Yield
risk
is th
e ris
k of
dec
line
in ea
rning
s due
to a
dver
se m
ovem
ent o
f the
yield
cur
ve.
Inter
est r
ate
risk
is th
e ris
k th
at th
e va
lue o
f the
finan
cial in
stru
men
t will
fluct
uate
due
to c
hang
es in
the
mar
ket in
tere
st ra
tes.
43.3
M
ism
atch
of I
nter
est
Rat
e S
ensi
tive
Ass
ets
and
Lia
bili
ties
Notes to the Financial StatementsFor the year ended December 31, 2013

ANNUAL REPORT 2013
182
Reconciliation to total assets 2013 2012 Reconciliation to total liabilities 2013 2012 (Rupees in ‘000) (Rupees in ‘000)
Balance as per balance sheet 815,508,371 767,074,697 Balance as per balance sheet 705,277,390 664,604,008
Less: Non financial assets Less: Non financial liabilities
Investments 1,635,928 1,635,928 Other liabilities 4,000,148 2,822,872
Operating fixed assets 28,595,338 23,738,454 Deferred tax liability 4,201,373 9,529,727
Other assets 10,461,510 20,841,781 8,201,521 12,352,599
40,692,776 46,216,163
Total financial assets 774,815,595 720,858,534 Total financial liabilities 697,075,869 652,251,409
43.4 Liquidity Risk
Liquidity represents the ability to fund assets and meet obligations as they become due. The Bank understands that liquidity does not come for free, and surplus liquidity has an opportunity cost which needs to be recognized. Liquidity risk is a risk of not being able to obtain funds at a reasonable price within a reasonable time period to meet obligations as they become due. Liquidity is essential to the ability to operate financial services businesses and, therefore, the ability to maintain surplus levels of liquidity through economic cycles is crucial, particularly during periods of adverse conditions, liquidity management is among the most important activities that the MCB conducts during both normal and stress periods. MCB recognizes that liquidity risk can arise from the Bank’s activities and can be grouped into three categories:
- Inflows/Outflows from on-balance sheet items (other than marketable securities and wholesale borrowings) and off-balance sheet items;
- Marketability of trading securities; and
- Capacity to borrow from the wholesale markets for funding as well as trading activities.
Liquidity Management
Asset Liability Management Committee of the bank has the responsibility for the formulation of overall strategy and oversight of the Asset Liability management function. Board has approved a comprehensive Liquidity Risk Policy (part of Risk Management Policy), which stipulates policies regarding maintenance of various ratios, funding preferences, and evaluation of Banks’ liquidity under normal and crisis situation. MCB Bank monitors and assesses the impact of increase in NPLs, deposits concentration, deposits withdrawal, decline in earnings, expanded business opportunities, acquisitions and negative reputation, on its liquidity positions. Liquidity Strategy is also in place, to ensure that the Bank can meet its temporal liquidity needs and optimize the contribution towards the profitability of the Bank. A framework to assess the maturity profile of non-contractual assets and liabilities is in place to supplement the liquidity management. As per preliminary assessments, the Bank’s Liquidity Coverage Ratio and Net Stable Funding Ratio as per Basel III are well within the prescribed limits.
MCB’s liquidity risk management framework is designed to identify measure and manage in a timely manner the liquidity risk position of the Bank. The underlying policies and procedures include: Risk Management policy, Treasury Policy, Investment policy, Contingency Funding Plan, Liquidity Strategy and Limit Structure which are reviewed and approved regularly by the senior management /Board members. MCB Bank also conducts Liquidity Risk Analysis on regular basis. MCB liquidity Risk Policy envisages to project the Bank’s funding position during temporary and long-term liquidity changes, including those caused by liability erosion and explicitly identifying quantifying and ranking all sources of funding preferences, such as reducing assets, modifying or increasing liability structure; and using other alternatives for controlling statement of financial position changes. MCB performs regular liquidity stress tests as part of its liquidity monitoring activities. The purpose of the liquidity stress tests is intended to ensure sufficient liquidity for the Bank under both idiosyncratic and systemic market stress conditions. MCB’s liquidity risk management approach involves intraday liquidity management, managing funding sources and evaluation of structural imbalances in balance sheet structure.
Intraday Liquidity Management
Intraday liquidity management is about managing the daily payments and cash flows. Bank has policies to ensure that sufficient cash is maintained during the day to make payments through local payment system. The policy of the Bank is to maintain adequate liquidity at all times, in all geographical locations and for all currencies and hence to be in a position, in the normal course of business, to meet obligations, repay depositors and fulfill commitments.
Managing Funding Sources
Managing funding sources, as per policy MCB maintain a portfolio of marketable securities that can either be sold outright or sold through a repurchase agreement to generate cash flows for meeting unexpected liquidity requirement. As a part of liquidity management MCB maintains borrowing relationships to ensure the continued access to diverse market of funding sources. MCB’s sound credit rating together with excellent market reputation has enabled MCB to secure ample call lines with local and foreign banks. The level of liquidity reserves as per regulatory requirements also mitigates risks. MCB’s investment in marketable securities is much higher than the Statutory Liquidity requirements.
Notes to the Financial StatementsFor the year ended December 31, 2013

183
20
13
To
tal
Up
to 1
O
ver
1
Ove
r 3
O
ver
6
Ove
r 1
O
ver
2
Ove
r 3
O
ver
5
Abo
ve
mon
th
to 3
t
o 6
m
onth
s to
to
2
to 3
to
5
to 1
0
10
year
s
mon
ths
m
onth
s
1 y
ear
y
ears
y
ears
y
ears
y
ears
(R
upee
s in
‘000
)
Asse
ts
Cas
h an
d ba
lanc
es w
ith tr
easu
ry b
anks
5
9,94
6,15
0
59,
946,
150
-
-
-
-
-
-
-
-
Ba
lanc
es w
ith o
ther
ban
ks
1,5
36,9
46
1,5
36,9
46
-
-
-
-
-
-
-
-
Lend
ings
to fi
nanc
ial in
stitu
tions
1
,224
,638
1
,224
,638
-
-
-
-
-
-
-
-
In
vest
men
ts -
net
449
,006
,019
1
00,8
77,1
18
213
,459
,894
1
1,77
3,57
7
13,
209,
949
2
6,61
1,92
1
39,
459,
204
2
6,77
0,12
4
15,
208,
304
1
,635
,928
Ad
vanc
es -
net
248
,242
,965
5
4,75
5,87
6
34,
665,
006
2
4,56
4,08
5
6,0
87,8
00
41,
703,
166
3
5,80
9,84
0
36,
780,
148
1
3,19
2,80
9
684
,235
O
pera
ting
fixed
ass
ets
28,
595,
338
1
50,1
45
300
,290
4
50,4
35
900
,869
1
,801
,738
1
,801
,738
3
,603
,476
9
,008
,690
1
0,57
7,95
7 D
efer
red
tax
asse
ts
352
,563
6
,825
1
3,65
1
20,
476
6
0,71
8
81,
904
1
68,9
89
-
-
-
Oth
er a
sset
s - n
et
26,
956,
315
7
,033
,468
8
,838
,558
1
,732
,474
2
,653
,299
-
-
6
,698
,516
-
-
8
15,8
60,9
34
225
,531
,166
2
57,2
77,3
99
38,
541,
047
2
2,91
2,63
5
70,
198,
729
7
7,23
9,77
1
73,
852,
264
3
7,40
9,80
3
12,
898,
120
Liab
ilitie
s
Bills
pay
able
1
0,13
8,72
6
10,
138,
726
-
-
-
-
-
-
-
-
Bo
rrow
ings
3
8,54
2,66
0
19,
312,
395
1
0,00
5,13
5
4,4
69,6
05
2,3
96,6
84
2,3
58,8
41
-
-
-
-
Dep
osits
and
oth
er a
ccou
nts
632
,330
,286
5
88,2
43,1
76
19,
136,
275
8
,714
,275
1
5,47
2,80
1
217
,157
2
19,9
38
326
,664
-
-
D
efer
red
tax
liabi
lities
4
,553
,936
4
1,36
8
9,1
14
19,
953
1
02,7
77
378
,637
3
35,6
93
2,2
84,8
33
616
,778
7
64,7
83
Oth
er lia
biliti
es
20,
064,
345
6
,083
,397
2
,866
,485
4
,722
,981
2
,010
,004
2
,670
,442
6
77,9
80
271
,894
7
61,1
62
-
7
05,6
29,9
53
623
,819
,062
3
2,01
7,00
9
17,
926,
814
1
9,98
2,26
6
5,6
25,0
77
1,2
33,6
11
2,8
83,3
91
1,3
77,9
40
764
,783
Net
ass
ets
110
,230
,981
(3
98,2
87,8
96)
225
,260
,390
2
0,61
4,23
3
2,9
30,3
69
64,
573,
652
7
6,00
6,16
0
70,
968,
873
3
6,03
1,86
3
12,
133,
337
Shar
e ca
pita
l 1
0,11
8,46
1 Re
serv
es
46,
601,
214
Una
ppro
pria
ted
profi
t 4
0,55
2,04
3 Su
rplu
s on
reva
luat
ion
of a
sset
s -
net o
f tax
1
2,95
9,26
3
1
10,2
30,9
81
43.4
.1 M
atur
ities
of A
sset
s an
d L
iab
ilitie
s -
Bas
ed o
n co
ntra
ctua
l mat
urity
of t
he a
sset
s an
d li
abili
ties
of t
he B
ank
Notes to the Financial StatementsFor the year ended December 31, 2013
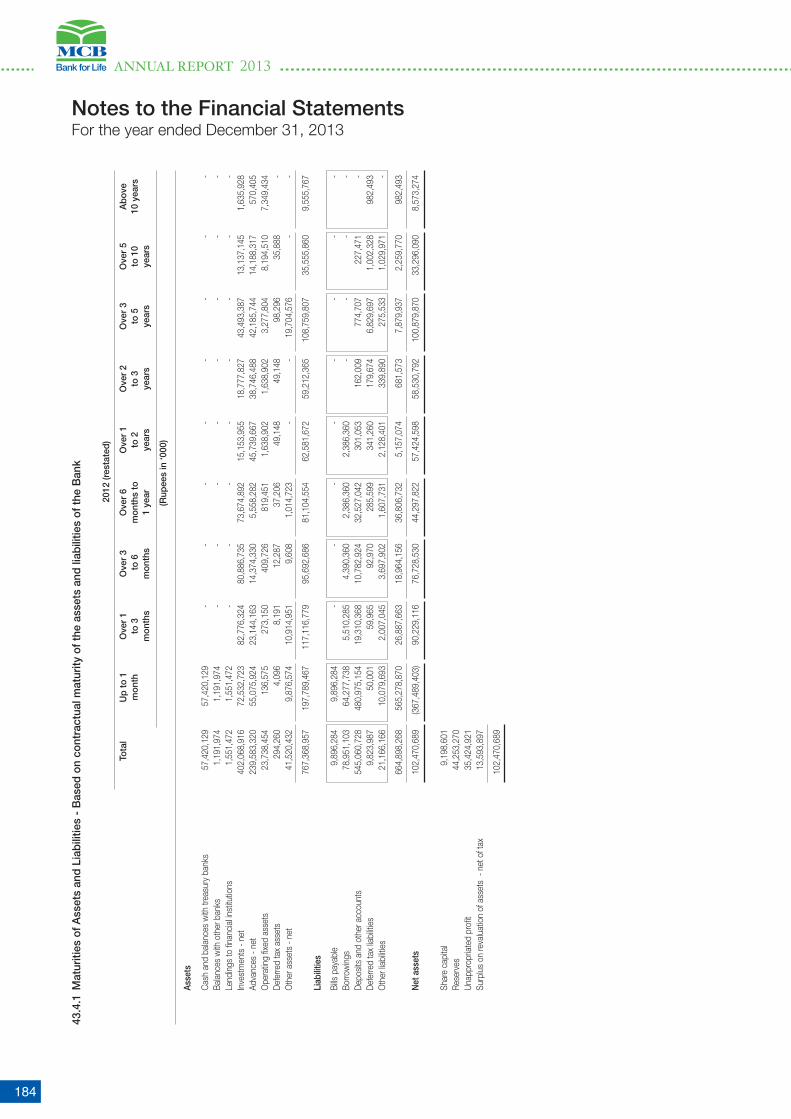
ANNUAL REPORT 2013
184
20
12 (r
esta
ted)
To
tal
Up
to 1
O
ver
1
Ove
r 3
O
ver
6
Ove
r 1
O
ver
2
Ove
r 3
O
ver
5
Abo
ve
mon
th
to 3
t
o 6
m
onth
s to
to
2
to 3
to
5
to 1
0
10
year
s
mon
ths
m
onth
s
1 y
ear
y
ears
y
ears
y
ears
y
ears
(R
upee
s in
‘000
)
Asse
ts
Cas
h an
d ba
lanc
es w
ith tr
easu
ry b
anks
5
7,42
0,12
9
57,
420,
129
-
-
-
-
-
-
-
-
Ba
lanc
es w
ith o
ther
ban
ks
1,1
91,9
74
1,1
91,9
74
-
-
-
-
-
-
-
-
Lend
ings
to fi
nanc
ial in
stitu
tions
1
,551
,472
1
,551
,472
-
-
-
-
-
-
-
-
In
vest
men
ts -
net
402
,068
,916
7
2,53
2,72
3
82,
776,
324
8
0,88
6,73
5
73,
674,
892
1
5,15
3,95
5
18,
777,
827
4
3,49
3,38
7
13,
137,
145
1
,635
,928
Ad
vanc
es -
net
239
,583
,320
5
5,07
5,92
4
23,
144,
163
1
4,37
4,33
0
5,5
58,2
82
45,
739,
667
3
8,74
6,48
8
42,
185,
744
1
4,18
8,31
7
570
,405
O
pera
ting
fixed
ass
ets
23,
738,
454
1
36,5
75
273
,150
4
09,7
26
819
,451
1
,638
,902
1
,638
,902
3
,277
,804
8
,194
,510
7
,349
,434
D
efer
red
tax
asse
ts
294
,260
4
,096
8
,191
1
2,28
7
37,
206
4
9,14
8
49,
148
9
8,29
6
35,
888
-
O
ther
ass
ets
- net
4
1,52
0,43
2
9,8
76,5
74
10,
914,
951
9
,608
1
,014
,723
-
-
1
9,70
4,57
6
-
-
7
67,3
68,9
57
197
,789
,467
1
17,1
16,7
79
95,
692,
686
8
1,10
4,55
4
62,
581,
672
5
9,21
2,36
5
108
,759
,807
3
5,55
5,86
0
9,5
55,7
67
Liab
ilitie
s
Bills
pay
able
9
,896
,284
9
,896
,284
-
-
-
-
-
-
-
-
Bo
rrow
ings
7
8,95
1,10
3
64,
277,
738
5
,510
,285
4
,390
,360
2
,386
,360
2
,386
,360
-
-
-
-
D
epos
its a
nd o
ther
acc
ount
s 5
45,0
60,7
28
480
,975
,154
1
9,31
0,36
8
10,
782,
924
3
2,52
7,04
2
301
,053
1
62,0
09
774
,707
2
27,4
71
-
Def
erre
d ta
x lia
biliti
es
9,8
23,9
87
50,
001
5
9,96
5
92,
970
2
85,5
99
341
,260
1
79,6
74
6,8
29,6
97
1,0
02,3
28
982
,493
O
ther
liabi
lities
2
1,16
6,16
6
10,
079,
693
2
,007
,045
3
,697
,902
1
,607
,731
2
,128
,401
3
39,8
90
275
,533
1
,029
,971
-
6
64,8
98,2
68
565
,278
,870
2
6,88
7,66
3
18,
964,
156
3
6,80
6,73
2
5,1
57,0
74
681
,573
7
,879
,937
2
,259
,770
9
82,4
93
Net
ass
ets
102
,470
,689
(3
67,4
89,4
03)
90,
229,
116
7
6,72
8,53
0
44,
297,
822
5
7,42
4,59
8
58,
530,
792
1
00,8
79,8
70
33,
296,
090
8
,573
,274
Shar
e ca
pita
l 9
,198
,601
Re
serv
es
44,
253,
270
Una
ppro
pria
ted
profi
t 3
5,42
4,92
1 Su
rplu
s on
reva
luat
ion
of a
sset
s -
net o
f tax
1
3,59
3,89
7
1
02,4
70,6
89
43.4
.1 M
atur
ities
of A
sset
s an
d L
iab
ilitie
s -
Bas
ed o
n co
ntra
ctua
l mat
urity
of t
he a
sset
s an
d li
abili
ties
of t
he B
ank
Notes to the Financial StatementsFor the year ended December 31, 2013
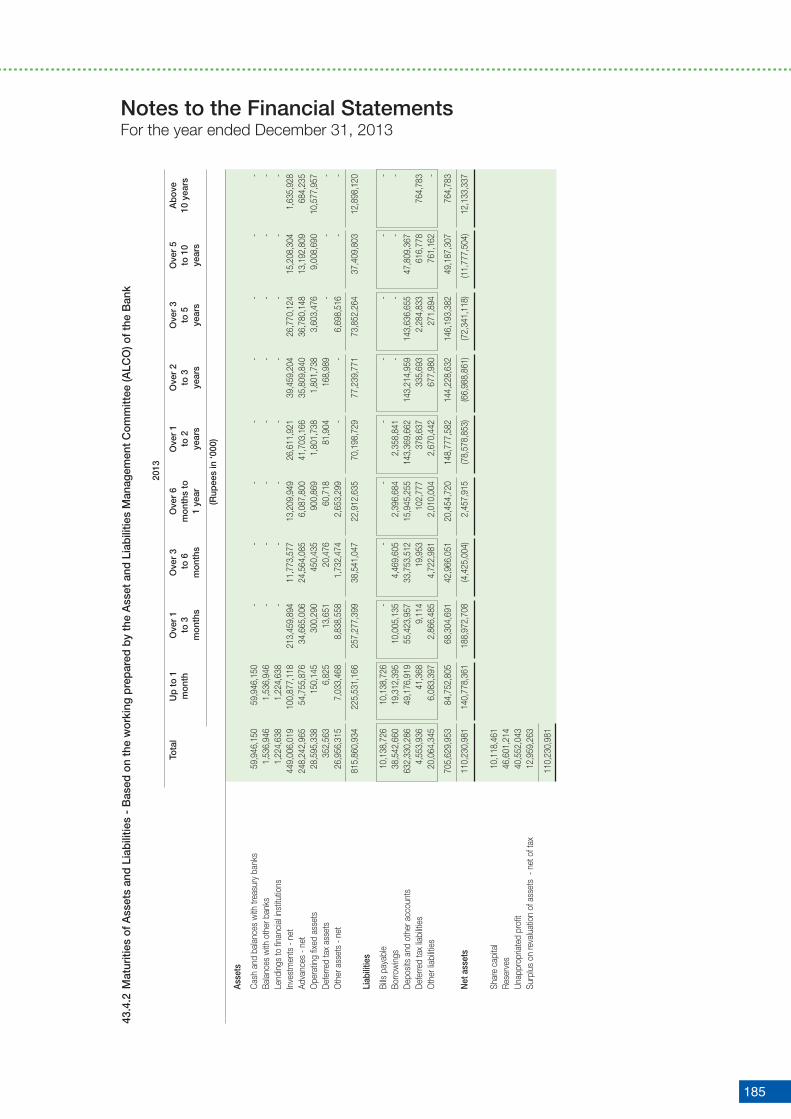
185
20
13
To
tal
Up
to 1
O
ver
1
Ove
r 3
O
ver
6
Ove
r 1
O
ver
2
Ove
r 3
O
ver
5
Abo
ve
mon
th
to 3
t
o 6
m
onth
s to
to
2
to 3
to
5
to 1
0
10
year
s
mon
ths
m
onth
s
1 y
ear
y
ears
y
ears
y
ears
y
ears
(R
upee
s in
‘000
)
Asse
ts
Cas
h an
d ba
lanc
es w
ith tr
easu
ry b
anks
5
9,94
6,15
0
59,
946,
150
-
-
-
-
-
-
-
-
Ba
lanc
es w
ith o
ther
ban
ks
1,5
36,9
46
1,5
36,9
46
-
-
-
-
-
-
-
-
Lend
ings
to fi
nanc
ial in
stitu
tions
1
,224
,638
1
,224
,638
-
-
-
-
-
-
-
-
In
vest
men
ts -
net
449
,006
,019
1
00,8
77,1
18
213
,459
,894
1
1,77
3,57
7
13,
209,
949
2
6,61
1,92
1
39,
459,
204
2
6,77
0,12
4
15,
208,
304
1
,635
,928
Ad
vanc
es -
net
248
,242
,965
5
4,75
5,87
6
34,
665,
006
2
4,56
4,08
5
6,0
87,8
00
41,
703,
166
3
5,80
9,84
0
36,
780,
148
1
3,19
2,80
9
684
,235
O
pera
ting
fixed
ass
ets
28,
595,
338
1
50,1
45
300
,290
4
50,4
35
900
,869
1
,801
,738
1
,801
,738
3
,603
,476
9
,008
,690
1
0,57
7,95
7 D
efer
red
tax
asse
ts
352
,563
6
,825
1
3,65
1
20,
476
6
0,71
8
81,
904
1
68,9
89
-
-
-
Oth
er a
sset
s - n
et
26,
956,
315
7
,033
,468
8
,838
,558
1
,732
,474
2
,653
,299
-
-
6
,698
,516
-
-
8
15,8
60,9
34
225
,531
,166
2
57,2
77,3
99
38,
541,
047
2
2,91
2,63
5
70,
198,
729
7
7,23
9,77
1
73,
852,
264
3
7,40
9,80
3
12,
898,
120
Liab
ilitie
s
Bills
pay
able
1
0,13
8,72
6
10,
138,
726
-
-
-
-
-
-
-
-
Bo
rrow
ings
3
8,54
2,66
0
19,
312,
395
1
0,00
5,13
5
4,4
69,6
05
2,3
96,6
84
2,3
58,8
41
-
-
-
-
Dep
osits
and
oth
er a
ccou
nts
632,
330,
286
4
9,17
6,91
9
55,
423,
957
3
3,75
3,51
2
15,
945,
255
1
43,3
69,6
62
143
,214
,959
1
43,6
36,6
55
47,
809,
367
Def
erre
d ta
x lia
biliti
es
4,5
53,9
36
41,
368
9
,114
1
9,95
3
102
,777
3
78,6
37
335
,693
2
,284
,833
6
16,7
78
764
,783
O
ther
liabi
lities
2
0,06
4,34
5
6,0
83,3
97
2,8
66,4
85
4,7
22,9
81
2,0
10,0
04
2,6
70,4
42
677
,980
2
71,8
94
761
,162
-
7
05,6
29,9
53
84,
752,
805
6
8,30
4,69
1
42,
966,
051
2
0,45
4,72
0
148
,777
,582
1
44,2
28,6
32
146
,193
,382
4
9,18
7,30
7
764
,783
Net
ass
ets
110,
230,
981
1
40,7
78,3
61
188
,972
,708
(4
,425
,004
) 2
,457
,915
(7
8,57
8,85
3)
(66,
988,
861)
(7
2,34
1,11
8)
(11,
777,
504)
1
2,13
3,33
7
Shar
e ca
pita
l 1
0,11
8,46
1 Re
serv
es
46,
601,
214
Una
ppro
pria
ted
profi
t 4
0,55
2,04
3 Su
rplu
s on
reva
luat
ion
of a
sset
s -
net o
f tax
1
2,95
9,26
3
1
10,2
30,9
81
43.4
.2 M
atur
ities
of A
sset
s an
d L
iab
ilitie
s -
Bas
ed o
n th
e w
orki
ng p
rep
ared
by
the
Ass
et a
nd L
iab
ilitie
s M
anag
emen
t C
omm
ittee
(ALC
O) o
f the
Ban
kNotes to the Financial StatementsFor the year ended December 31, 2013

ANNUAL REPORT 2013
186
20
12 (r
esta
ted)
To
tal
Up
to 1
O
ver
1
Ove
r 3
O
ver
6
Ove
r 1
O
ver
2
Ove
r 3
O
ver
5
Abo
ve
mon
th
to 3
t
o 6
m
onth
s to
to
2
to 3
to
5
to 1
0
10
year
s
mon
ths
m
onth
s
1 y
ear
y
ears
y
ears
y
ears
y
ears
(R
upee
s in
‘000
)
Asse
ts
Cas
h an
d ba
lanc
es w
ith tr
easu
ry b
anks
5
7,42
0,12
9
57,
420,
129
-
-
-
-
-
-
-
-
Ba
lanc
es w
ith o
ther
ban
ks
1,1
91,9
74
1,1
91,9
74
-
-
-
-
-
-
-
-
Lend
ings
to fi
nanc
ial in
stitu
tions
1
,551
,472
1
,551
,472
-
-
-
-
-
-
-
-
In
vest
men
ts -
net
402
,068
,916
7
2,53
2,72
3
82,
776,
324
8
0,88
6,73
5
73,
674,
892
1
5,15
3,95
5
18,
777,
827
4
3,49
3,38
7
13,
137,
145
1
,635
,928
Ad
vanc
es -
net
239
,583
,320
5
5,07
5,92
4
23,
144,
163
1
4,37
4,33
0
5,5
58,2
82
45,
739,
667
3
8,74
6,48
8
42,
185,
744
1
4,18
8,31
7
570
,405
O
pera
ting
fixed
ass
ets
23,
738,
454
1
36,5
75
273
,150
4
09,7
26
819
,451
1
,638
,902
1
,638
,902
3
,277
,804
8
,194
,510
7
,349
,434
D
efer
red
tax
asse
ts
294
,260
4
,096
8
,191
1
2,28
7
37,
206
4
9,14
8
49,
148
9
8,29
6
35,
888
-
O
ther
ass
ets
- net
4
1,52
0,43
2
9,8
76,5
74
10,
914,
951
9
,608
1
,014
,723
-
-
1
9,70
4,57
6
-
-
7
67,3
68,9
57
197
,789
,467
1
17,1
16,7
79
95,
692,
686
8
1,10
4,55
4
62,
581,
672
5
9,21
2,36
5
108
,759
,807
3
5,55
5,86
0
9,5
55,7
67
Liab
ilitie
s
Bills
pay
able
9
,896
,284
9
,896
,284
-
-
-
-
-
-
-
-
Bo
rrow
ings
7
8,95
1,10
3
64,
277,
738
5
,510
,285
4
,390
,360
2
,386
,360
2
,386
,360
-
-
-
-
D
epos
its a
nd o
ther
acc
ount
s 5
45,0
60,7
28
37,
848,
059
3
6,10
3,02
6
46,
614,
760
3
2,94
9,49
1
117
,300
,456
1
17,0
20,5
96
117
,914
,926
3
9,30
9,41
4
-D
efer
red
tax
liabi
lities
9
,823
,987
5
0,00
1
59,
965
9
2,97
0
285
,599
3
41,2
60
179
,674
6
,829
,697
1
,002
,328
9
82,4
93
Oth
er lia
biliti
es
21,
166,
166
1
0,07
9,69
3
2,0
07,0
45
3,6
97,9
02
1,6
07,7
31
2,1
28,4
01
339
,890
2
75,5
33
1,0
29,9
71
-
6
64,8
98,2
68
122
,151
,775
4
3,68
0,32
1
54,
795,
992
3
7,22
9,18
1
122
,156
,477
1
17,5
40,1
60
125
,020
,156
4
1,34
1,71
3
982
,493
Net
ass
ets
102
,470
,689
7
5,63
7,69
2
73,
436,
458
4
0,89
6,69
4
43,
875,
373
(5
9,57
4,80
5)
(58,
327,
795)
(1
6,26
0,34
9)
(5,7
85,8
53)
8,5
73,2
74
Shar
e ca
pita
l 9
,198
,601
Re
serv
es
44,
253,
270
Una
ppro
pria
ted
profi
t 3
5,42
4,92
1 Su
rplu
s on
reva
luat
ion
of a
sset
s -
net o
f tax
1
3,59
3,89
7
1
02,4
70,6
89
Liqu
idity
Gap
Rep
ortin
g
Whe
n an
ass
et o
r lia
bilit
y do
es n
ot h
ave
any
cont
ract
ual m
atur
ity d
ate,
the
perio
d in
whi
ch th
ese
are
assu
med
to m
atur
e ha
s be
en ta
ken
as th
e ex
pect
ed d
ate
of m
atur
ity. B
ank
regu
larly
con
duct
s an
obj
ectiv
e an
d sy
stem
atic
beh
avio
ral s
tudy
usi
ng re
gres
sion
ana
lysi
s te
chni
que
to a
scer
tain
the
mat
urity
of i
ts n
on-c
ontra
ctua
l ass
ets
and
liabi
litie
s. C
ore
and
non-
core
par
ts o
f the
non
-con
tract
ual a
sset
s an
d lia
bilit
ies
are
segr
egat
ed
thro
ugh
the
beha
vior
al s
tudy
. Non
Cor
e pa
rt is
pla
ced
amon
g th
e sh
ort t
erm
mat
urity
buc
kets
i.e.
up
to 1
Yea
r bas
ed o
n th
e m
odel
resu
lts, w
here
as c
ore
part
is d
istri
bute
d am
ong
the
long
er te
rms
buck
ets
base
d on
th
e di
scus
sion
and
dec
isio
n by
the
ALC
O. F
ollo
win
g pe
rcen
tage
s ar
e us
ed to
dis
tribu
te th
e co
re a
sset
s an
d lia
bilit
ies
amon
g lo
nger
term
buc
kets
:
Cur
rent
ly fo
llow
ing
perc
enta
ges
are
bein
g us
ed to
dis
tribu
te th
e co
re a
sset
s an
d lia
bilit
ies
amon
g lo
nger
term
buc
kets
:
O
ver
1 to
2 Y
ears
O
ver
2 to
3 Y
ears
O
ver
3 to
5 Y
ears
O
ver
5 to
10
Year
s
30
%
30%
30
%
10%
43.4
.2 M
atur
ities
of A
sset
s an
d L
iab
ilitie
s -
Bas
ed o
n th
e w
orki
ng p
rep
ared
by
the
Ass
et a
nd L
iab
ilitie
s M
anag
emen
t C
omm
ittee
(ALC
O) o
f the
Ban
k
Notes to the Financial StatementsFor the year ended December 31, 2013

187
43.5 Operational Risk
Operational risk is the risk of loss resulting from inadequate or failed internal processes, people, and systems or from external events. This definition includes legal risks but excludes strategic and reputational risks.
The Bank’s operational risk management framework, as laid down in the operational risk policy, duly approved by BOD, is flexible enough to implement in stages and permits the overall risk management approach to evolve in the light of organizational learning and the future needs of the Bank. Operational loss events are reviewed and appropriate corrective actions taken on an ongoing basis, including measures to improve control procedures with respect to design and operative effectiveness.
Operational Risk Management helps the Bank understand risks and improve mitigating controls so as to minimize operational risks that are inherent in almost all areas of the Bank. Going forward, the Bank will further strengthen its risk function, policies and procedures to facilitate its operations and improve quality of assets to safeguard interest of depositors.
43.5.1 Operational Risk-Disclosures Basel II Specific
Currently, the bank is reporting operational risk capital charge under Basic Indicator Approach (BIA). However, a number of initiatives are underway for adoption of The Standardized Approach (TSA) / Alternative Standardized Approach (ASA) like business line mapping, risk and control self assessment exercises.
Operational loss data pertaining to key risk events is also collected on bank-wide basis. Periodic review and analysis is prepared for senior management and Risk Management and Portfolio Review Committee (RM&PRC) of the Board. The report covers the significant risk events with root cause analysis and recommendations for further improvements.
44. GENERAL
Comparative information has been reclassified and rearranged in these financial statements for the purpose of better presentation. No significant reclassification has been made except in note 40 and as follows:
Reclassified Description Amount From To (Rupees in ‘000)
Fuel expenses - generators 495,706 Travelling, Rent, conveyance taxes, and fuel insurance and electricity
Outsourced staff costs 743,039 Salaries Outsourced and service allowances charges
45. NON-ADJUSTING EVENT
The Board of Directors in its meeting held on February 11, 2014 has announced a final cash dividend in respect of the year ended December 31, 2013 of Rs. 3.50 per share (2012: Rs. 3.0 per share) and bonus shares of 10% (2012: 10%). These Financial Statements for the year ended December 31, 2013 do not include the effect of these appropriations which will be accounted for subsequent to the year end.
46. DATE OF AUTHORIZATION FOR ISSUE
These Financial Statements were authorized for issue by the Board of Directors of the Bank in their meeting held on February 11, 2014.
Notes to the Financial StatementsFor the year ended December 31, 2013
Imran MaqboolPresident and Chief Executive
Tariq RafiDirector
Mian Umer ManshaDirector
Muhammad Ali ZebDirector
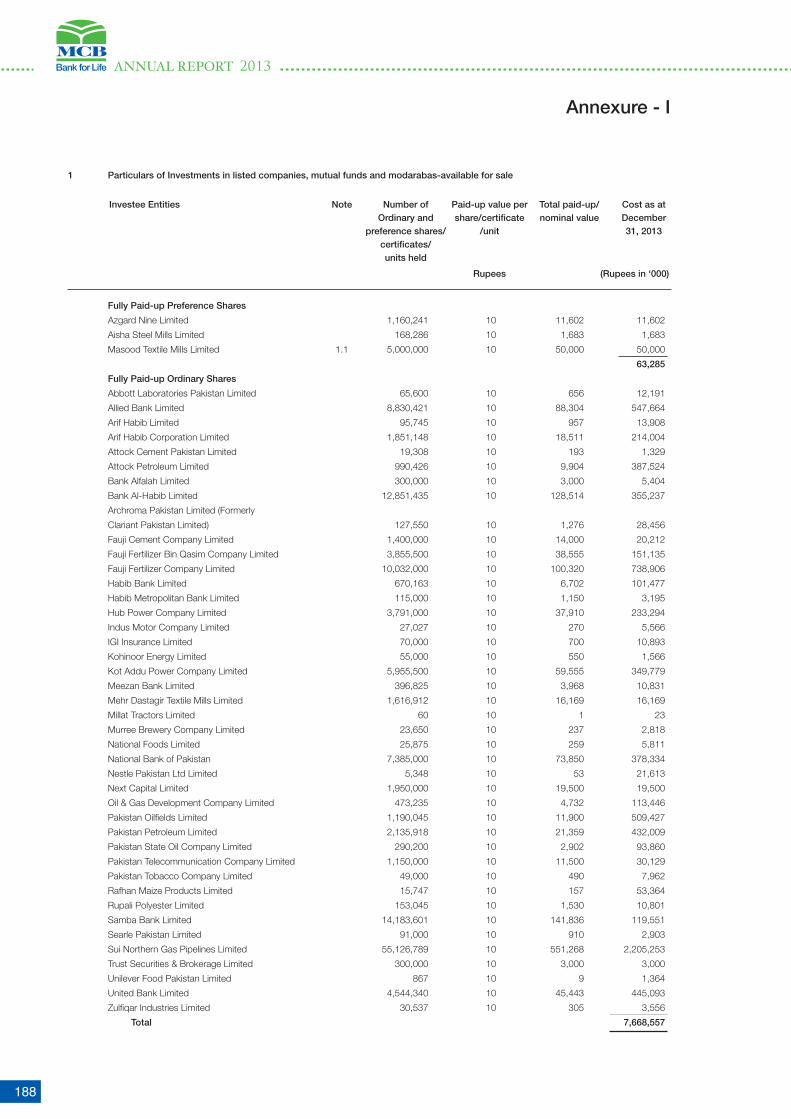
ANNUAL REPORT 2013
188
1 Particulars of Investments in listed companies, mutual funds and modarabas-available for sale
Investee Entities Note Number of Paid-up value per Total paid-up/ Cost as at Ordinary and share/certificate nominal value December preference shares/ /unit 31, 2013 certificates/ units held
Rupees (Rupees in ‘000)
Fully Paid-up Preference Shares
Azgard Nine Limited 1,160,241 10 11,602 11,602
Aisha Steel Mills Limited 168,286 10 1,683 1,683
Masood Textile Mills Limited 1.1 5,000,000 10 50,000 50,000
63,285
Fully Paid-up Ordinary Shares
Abbott Laboratories Pakistan Limited 65,600 10 656 12,191
Allied Bank Limited 8,830,421 10 88,304 547,664
Arif Habib Limited 95,745 10 957 13,908
Arif Habib Corporation Limited 1,851,148 10 18,511 214,004
Attock Cement Pakistan Limited 19,308 10 193 1,329
Attock Petroleum Limited 990,426 10 9,904 387,524
Bank Alfalah Limited 300,000 10 3,000 5,404
Bank Al-Habib Limited 12,851,435 10 128,514 355,237
Archroma Pakistan Limited (Formerly
Clariant Pakistan Limited) 127,550 10 1,276 28,456
Fauji Cement Company Limited 1,400,000 10 14,000 20,212
Fauji Fertilizer Bin Qasim Company Limited 3,855,500 10 38,555 151,135
Fauji Fertilizer Company Limited 10,032,000 10 100,320 738,906
Habib Bank Limited 670,163 10 6,702 101,477
Habib Metropolitan Bank Limited 115,000 10 1,150 3,195
Hub Power Company Limited 3,791,000 10 37,910 233,294
Indus Motor Company Limited 27,027 10 270 5,566
IGI Insurance Limited 70,000 10 700 10,893
Kohinoor Energy Limited 55,000 10 550 1,566
Kot Addu Power Company Limited 5,955,500 10 59,555 349,779
Meezan Bank Limited 396,825 10 3,968 10,831
Mehr Dastagir Textile Mills Limited 1,616,912 10 16,169 16,169
Millat Tractors Limited 60 10 1 23
Murree Brewery Company Limited 23,650 10 237 2,818
National Foods Limited 25,875 10 259 5,811
National Bank of Pakistan 7,385,000 10 73,850 378,334
Nestle Pakistan Ltd Limited 5,348 10 53 21,613
Next Capital Limited 1,950,000 10 19,500 19,500
Oil & Gas Development Company Limited 473,235 10 4,732 113,446
Pakistan Oilfields Limited 1,190,045 10 11,900 509,427
Pakistan Petroleum Limited 2,135,918 10 21,359 432,009
Pakistan State Oil Company Limited 290,200 10 2,902 93,860
Pakistan Telecommunication Company Limited 1,150,000 10 11,500 30,129
Pakistan Tobacco Company Limited 49,000 10 490 7,962
Rafhan Maize Products Limited 15,747 10 157 53,364
Rupali Polyester Limited 153,045 10 1,530 10,801
Samba Bank Limited 14,183,601 10 141,836 119,551
Searle Pakistan Limited 91,000 10 910 2,903
Sui Northern Gas Pipelines Limited 55,126,789 10 551,268 2,205,253
Trust Securities & Brokerage Limited 300,000 10 3,000 3,000
Unilever Food Pakistan Limited 867 10 9 1,364
United Bank Limited 4,544,340 10 45,443 445,093
Zulfiqar Industries Limited 30,537 10 305 3,556
Total 7,668,557
Annexure - I

189
Investee Entities Name of Number of Paid-up value per Total paid-up/ Cost as at
Management Ordinary and share/certificate/ nominal value December Company preference shares/ unit 31, 2013 certificates/ units held (Rupees) (Rupees in ‘000)
Fully Paid-up Modaraba Certificates
First Al-Noor Modaraba Al-Noor Modaraba 5,553,270 10 55,532.70 60,606
Management
(Private) Limited Total 60,606
Carrying value (before revaluation and provision) Listed Shares ‘available for sale’ 7,792,448
Provision for diminution in value of investments (1,992,006)
Surplus on revaluation of securities 2,116,420
Market value as at December 31, 2013 7,916,862
Fully Paid-up Ordinary Certificate/ Name of Number of Paid-up Total paid-up/ Cost as at Units of Mutual Funds Management units held value per nominal value December Company unit 31, 2013
(Rupees) (Rupees in ‘000)
National Investments Trust National Investment Trust Limited 110,602 50 5,530 5,253
Carrying value before revaluation & provision 5,253
Provision for diminution in value of investments (1,907) Surplus on revaluation of securities 2,156
Market value as at December 31, 2013 5,502
1.1 These are redeemable after the end of the fourth year from June 2005 at the option of the issuer either in whole or multiples of 10% of outstanding issue at a price of Rs. 10 per share plus any accumulated preference dividend. Dividend rate is 6 months KIBOR + 200 bps per annum.
Annexure - I

ANNUAL REPORT 2013
190
Annexure - I
2 Particulars of Investment held in unlisted companies-available for sale
Company Name Percentage of Number of shares / Cost as at Net Asset Based on audited Name of Chief Executive holding certificates held December Value of total financial statements (%) 31, 2013 investment as at
(Rupees in ‘000)
Shareholding more than 10%
Fully paid up Ordinary Shares/ Certificates/ Units
Pak Asian Fund Limited 10.22% 1,150,000 11,500 19,462 June 30, 2013 Mr. Ashfaq A. Berdi
Central Depository Company of Pakistan Limited 10.00% 6,500,000 10,000 174,624 June 30, 2013 Mr. Mohammad Hanif Jakhura
21,500
Shareholding upto 10%
Fully paid up Ordinary Shares/ Certificates/ Units
First Capital Investment Limited 275,000 2,500 2,982 June 30, 2013 Mr. Shahzad Jawahar
National Institute of Facilitation Technology Private Limited 1,478,227 1,526 91,014 June 30, 2013 Mr. M.M. Khan
National Investment Trust Limited 79,200 100 178,348 June 30, 2012 Mr. Manzoor Ahmed
SME Bank Limited 1,490,619 10,106 6,527 September 30, 2013 Mr. Naseer Durrani
Arabian Sea Country Club 500,000 5,000 2,194 June 30, 2013 Mr. Arif Ali Khan Abbasi
Islamabad Stock Exchange Limited 3,034,603 30,346 32,663 September 30, 2013 Mian Ayyaz Afzal
Society for Worldwide Inter Fund Transfer (SWIFT) 18 1,738 5,941 December 31, 2012 Mr. Gottfried Leibbrandt
Credit Information Bureau of Sri Lanka 300 25 14,200 December 31, 2012 Mr. G. P. Karunaratne
Lanka Clear (Private) Limited 100,000 805 4,945 March 31, 2013 Mr. S. B. Weerasooriya
Lanka Financial Services Bureau Limited 100,000 805 802 March 31, 2013 Mr. Minindu Rajaratne
Pakistan Agro Storage and Services corporation* 2,500 2,500 - - -
Al-Ameen Textile Mills Limited.* 19,700 197 - - -
Ayaz Textile Mills Limited.* 225,250 2,252 - - -
Custodian Management Services* 100,000 1,000 - - -
Musarrat Textile Mills Limited.* 3,604,500 36,045 - - -
Sadiqabad Textile Mills Limited.* 2,636,100 26,362 - -
121,307
Cost of unlisted shares/ certificates/ units 142,807
Provision against unlisted shares (74,741)
Carrying value of unlisted shares/ certificates/ units 68,066
* These are fully provided unlisted shares.

191
3. Particulars of investments in Term Finance Certificates and Sukuk Bonds- (refer note 9)
Investee Number of Paid up Total Paid up Profit Principal Redemption Balance as Name of certificates value per Value (before at December Chief Executive held certificate redemption) 31, 2013
(Rupees) (Rupees in ‘000)
LISTED TERM FINANCE CERTIFICATES - available for sale
Askari Bank Limited - issue no. III 50,000 5,000 250,000,000 249,600 Syed Majeedullah Husaini
Bank Alfalah Limited - issue no. IV 100,000 5,000 500,000,000 6 months KIBOR + 2.5% p.a. 499,200 Mr. Atif Bajwa
Allied Bank Limited - issue no. I 11,196 5,000 55,980,000 6 months KIBOR + 1.90% 27,902 Mr. Tariq Mahmood
Allied Bank Limited - issue no. II 37,000 5,000 185,000,000 181,710 Mr. Tariq Mahmood
Carrying value before revaluation 958,412
Surplus on revaluation of securities 27,470
Market value of listed TFCs (revalued amount) 985,882
SUKUK BONDS - available for sale Terms of Redemption Rate of Currency
Principal Interest interest
Government of Pakistan Ijara Sukuks At maturity Half-yearly 6-Month MTB PKR 2,700,000
Auction Weighted
Average Yield.
Surplus on revaluation of securities 17,310
Market value of sukuk bonds 2,717,310
0.32% of principal amount in the first 96 months and remaining principal in four equal semi annual installments starting from the 102nd month from issue.
0.26% of principal amount in the first 78 months and remaining principal in three semi -annual installment staring from the 84th month.
0.38% of principal amount in the first 114 months and remaining principal will be paid at maturity
6 months KIBOR + 0.85% p.a. for first five years & 6 months KIBOR+1.30% for next 5 years.
0.38% of principal amount in the first 114 months and remaining principal will be paid at maturity
6 months KIBOR + 2.5% p.a. for first five years & 6 months KIBOR +2.95% for next five years
Annexure - I

ANNUAL REPORT 2013
192
TERM FINANCE CERTIFICATES - held to maturity
Investee Number of Paid up Total Paid up Profit Principal Redemption Balance as Name ofcertificates value per Value (before at December Chief Executive
held certificate redemption) 31, 2013
(Rupees) (Rupees in ‘000)
Bank Alfalah Limited - issue no. V 100,000 5,000 500,000,000 6 months KIBOR + 1.25% p.a. 482,114 Mr. Atif Bajwa
Bank Al Habib Limited- - issue no. IV 20,000 5,000 100,000,000 99,900 Mr. Abbas D. Habib
Jahangir Siddiqui and Company Limited 56 5,000,000 280,000,000 69,776 Mr. Suleman Lalani
United Bank Limited - issue no. III 56,978 5,000 284,890,000 94,343 Mr. Atif R. Bokhari
Allied Bank Limited - issue no. II 46,400 5,000 232,000,000 231,629 Mr. Tariq Mahmood
JDW Sugar Mills Limited 45,000 5,000 225,000,000 3 months KIBOR + 1.25% p.a.
6 Month KIBOR +2.25% p.a.from March 2012
25,000 Mr. Jehangir Khan Tareen
Azgard Nine Limited 13,878 5,000 69,390,000 NIL 69,390 Mr. Ahmed Shaikh
Shakarganj Mills Limited 16,000 5,000 80,000,000 48,000 Mr. Ahsan Saleem
Pakistan Mobile Communication Limited 200,000 5,000 1,000,000,000 3 Month KIBOR +2.65% p.a. In 17 equal quarterly installments 705,881 Mr. Rashid Khanstarting from 12th month after first disbursement and subsequently every three months.
Carrying value of TFCs - HTM
The above excludes unlisted term finance certificates, debentures, bonds and participation term certificates of companies which are fully provided for in these financial statements.
1,826,033
0.3% of the principal will be redeemed in the first 90 months and remaining principal of 99.70% at maturity in the 96th month
6th - 108th month: 0.36%; 114th and 120th month: 49.82% each
In 4 equal semi-annual installments, starting from 8-1/2 years from December 2004.
0.2% of the principal in the first 60 months and remaining principal in 6 equal semi annual installments from September 2006.
0.38% of principal amount in the first 114 months and remaining principal will be paid at maturity
Quarterly installments starting from March 23, 2010
In 7 semi-annual installments starting from 24th month
In 10 equal semi-annual installments starting from March 2012 .
"Payable six monthly at 15.00% p.a. for first 5 years and 15.50%p.a. for next 5 years"
6 months KIBOR + 1.5% to 2.2% p.a. over 10 years
6 months KIBOR + 1.7% p.a.
6 months KIBOR + 0.85% p.a. for first five years & 6 months KIBOR+1.30% for next 5 years.
Annexure - I

193
4. Details of Bonds, Debentures and Federal Government Securities (refer note 9) - held to maturity
Description Terms of Redemption Rate of interest Currency Foreign Currency Carrying value as Principal Interest Amount at December 31, 2013 (‘000) (Rupees in ‘000)
Debentures Bank of Ceylon At maturity Half-yearly Weighted Average Six LKR 250,000 201,300 Month T Bill Rate (Before Tax) + 0.75%
Sukuk Bonds
Sampath Bank At maturity Half-yearly 13.40% LKR 64,610 52,024
NDB Bank At maturity Half-yearly 13.40% LKR 62,760 50,534
Development Bonds
Government of Sri Lanka At maturity Half-yearly 6 Month LIBOR + 400 BP LKR 785,880 632,791
Sukuk Bonds
-
-
Sukuk Bonds
Sukuk Bonds
Maple Leaf Cement Factory Limited Sukuk Bonds In 8 unequal semi-annual installments.
Half-yearly 6 Month KIBOR+1.70% PKR 327,328
-
-
-
Quetta Textile Mills Limited Sukuk Bonds In 12 equal semi-annual installments.
Half-yearly 6 Month KIBOR+1.50% PKR 53,793
J.D.W Sugar Mills Limited Sukuk Bonds In 18 unequal quarterlyinstallments.
Quarterly 3 Month KIBOR+1.25% PKR 19,444
Sitara Energy Limited In 8 equal semi-annual installments.
Half-yearly 6 Month KIBOR+1.15% PKR 42,273
Pakistan Euro Bonds At maturity installments. Half-yearly 7.125% & 6.875 US$ 22,264 2,344,907
442,838
5 Investment in subsidiaries Details of the Bank’s subsidiary companies are as follows: Name % of holding Country of Year of incorporation incorporation
MCB Financial Services Limited * 99.99 Pakistan 1992
MNET Services (Private) Limited * 99.95 Pakistan 2001
MCB Trade Services Limited 100 Hong Kong 2005
MCB - Arif Habib Savings & Investments Limited 51.33 Pakistan 2005
"MCB Leasing" Closed Joint Stock Company 95 Azerbaijan 2009
* Remaining shares are held by certain individuals as nominees of the Bank.
6 Summarized financial information of associates (refer note 9)
The gross amount of assets, liabilities, revenue, profit and net assets of associates are as follows:
Name of associates Country of Assets Liabilities Net assets Revenue Profit after tax % of interest incorporation (Rupees in ‘000) held
2013
Euronet Pakistan (Private) Limited (unaudited based on December 31, 2013) Pakistan 249,379 37,962 211,417 266,718 25,823 30% First Women Bank Limited (unaudited based on September 30, 2013) Pakistan 19,120,022 17,452,030 1,667,992 613,719 * (157,631) 15.46% Adamjee Insurance Company Limited (unaudited based on September 30, 2013) Pakistan 27,321,610 14,457,637 12,863,973 4,099,609 1,735,188 29.13%
2012
Euronet Pakistan (Private) Limited (unaudited based on December 31, 2012) Pakistan 222,073 36,480 185,593 200,242 8,589 30% First Women Bank Limited (unaudited based on September 30, 2012) Pakistan 17,822,172 15,716,519 2,105,653 663,988 * 71,746 15.46% Adamjee Insurance Company Limited (unaudited based on September 30, 2012) Pakistan 25,372,524 13,630,640 11,741,884 4,300,489 ** 841,941 29.13% * Represents net mark-up / interest income and non mark up income ** Represents net premium revenue
Annexure - I

ANNUAL REPORT 2013
194
The Shareholders of MCB Bank Limited
The year under review was 2013 of Banking Operations of MCB Islamic banking Group (MCB IB G). The fundamental objective of Islamic Banking Group is to fabricate unique Shari’ah compliant efficient products & services, rather being disciple of conventional banking products.
A lot of work is being done on existing and new Liability side products and variety of assets products catering financial needs & demand of all walk of society, are in finalization stage.
During the year MCB IBG developed and executed a number of Islamic Commercial Banking Products in consultation with the Shari’ah Advisor of the Bank. Currently the Bank is offering a number of Shari’ah Compliant Banking Products on both asset and liability sides which include:
LIABILITY SIDE:
For general deposits and treasury functions (Based on Islamic contract of Mudarabah, Wakalah & Qard):
Existing Products:
- Hifazat Saving Account (A Mudarabah based Saving Account Product for general depositors, corporate entities, non-banking financial institutions and mutual funds).
- Hifazat Plus Saving Account (A Slab based Mudarabah Saving Account Product for general depositors, corporate entities, non-banking financial institutions and mutual funds).
- Aasoodgi one year Term Deposit Receipt (TDR) for senior citizens and widows.
- Na’mat Term Deposit Account (A Mudarabah based Term Deposit Receipt (TDR) Product for general depositors, corporate entities, non-banking financial institutions and mutual funds).
- Hidayat Current Account (A Qard based Current Account Product for general depositors, corporate entities, non-banking financial institutions and mutual funds).
- Receiving funds from MCB Treasury based on Mudarabah.
- Receiving funds in foreign currency from foreign branches of MCB based on Wakalah.
Repackaging of Products:
- Following repackaging of existing current & saving accounts has been made keeping in view need of corporate customers:
• HidayatBusinessCurrentAccount
• HifazatBusinessSavingAccount.
Upcoming Products:
- FCY Deposit Product to generate foreign currency deposits.
Tailor-Made products:
- In addition to above, Islamic Banking Group also catered the specific needs of the customers and structured unique tailor made products.
- Long term deposits product specially designed for the large number of employees of a big institutions.
ASSETS SIDE:
Existing Products:
• Corporate Banking Products (Based on Islamiccontracts of Murabaha, Ijarah, and Musharakah - Shirkat-ul-Milk & Shirkat-ul-Aqd)
- Maeeshat Murabaha (A Murabaha based facility f or working capital finance)
- Running Finance Musharakah
- Spot Payment Murabaha facility specially designs for Ship breaking industry.
- Pre-shipment Export Financing (An Istisna based facility to finance manufacturing of export consignment)
- For Medium & Long Term Finance for Plant, Machinery & Equipment
• RafaqatMusharakahFinancing(AMusharakahbasedfacility for tangible asset financing)
• San’at Equipment Ijarah (An Ijarah based facility fortangible assets financing)
- Salamat Car Ijarah (An Ijarah based motor vehicles financing product)
- Islamic Export Refinance Scheme (IERS)
• TradeFinancefacilities
- Bar’aamad Export Financing (A Musharakah based Shari’ah Compliant alternative for conventional banking Foreign Bill Purchased (FBP) Product.
- Letters of Credit (Sight & Usance) local and foreign.
• Kafalat Bank Guarantee (Non funds based facility toissue different guarantees based on Islamic contract of Kafalah)
Tailor-Made products:
- In addition to above, Islamic Banking Group has catered the specific needs by structuring Shari’ah compliant Ijarah facility customized for the employees of a big corporate entity.
Islamic Banking BusinessReport of Shari’ah Advisor
ANNEXURE - II

195
Structuring for syndication deals
- IBG structured large syndication deal based on Services Ijarah
- IBG is in the process of development and refinement of its products to make the products competitive in the market, conforming to the preferred standard of Shari’ah Compliance.
CHARITY
The opening balance of undistributed charity was PKR 6,892,000/-. During the year under review, PKR 8,485,000/- received from customers on account of charity due to late payments of Bank dues and disbursed PKR 12,500,000/- to registered charitable institutions. The closing balance of undistributed charity is PKR 2,877,000.
SHARI’AH ADVISORY
Shari’ah Advisory services have been extended by Islamic Banking Group for Syndicated Structuring.
SHARI’AH COMPLIANCE
During the year, I visited Islamic Banking Branches and observed its general banking operational activities from Shari’ah perspective which I found satisfactory. These activities were included basic Shari’ah knowledge of staff members, display of profit sharing ratio & weightages of various deposit types for the next month, display of profit rates of previous month, timely distribution of profit to depositors, Shari’ah compliance of account opening forms etc. Relevant reports have also been issued by the undersigned from time to time. During the year, I also reviewed/verified the assignment of weightages to various depositors, calculation of profit on monthly basis and its’ distribution, application of profit and loss sharing ratios to distributable profit and allocation of funds, which were found satisfactory from Shari’ah perspective. I have also reviewed the transactions executed by the bank and found that the transactions were done as per the approved/suggested mechanism. However, while carrying out the Shari’ah compliance process, the following observations are made to further improve the Shari’ah compliance of the transactions:
1. In some Murabaha cases, I advised that soon after the goods are procured by the customer as bank’s agent, offer & acceptance should be executed without allowing any further period to the customer, because at this particular stage, all risk pertaining to ownership of asset remains with the bank. In case, the asset is not insured, and faces partial/full destruction within this grace period, bank shall have to bear the loss, as it may lead to expose Shari’ah/bank risks.
2. Though, the bank has started the process of making Takaful arrangement instead of conventional insurance, yet Islamic Banking Portfolio must continue the conversion of conventional insurance into Takaful arrangement.
3. Although, few training programs were arranged but I would like to suggest that Long tenure extensive
training program should be arranged for IBG and Islamic windows staff for better understanding of Islamic banking products & services.
4. I would like to refer following seven products already developed duly approved by Shari’ah Advisor namely;
a. Running Finance Musharakahb. Musharakah Export Financing Foreign c. Istisna based pre-shipment export financingd. Long term deposits product for very large number of
employees of a big institution.
e. Aasoodgi TDR product for senior citizens & widowsf. Wakalah based investment banking product for receiving
foreign currency by MCB foreign branches.
g. FCY deposit product and would emphasize to take better benefits of the above products specially Running Finance Musharakah which was developed and approved ten years back and the same was ready to offer to customers.
5. It is observed that in most of the cases Invoices are being allowed in the name of agent, though the same is allowed under regulations with the approval of Shari’ah Advisor, however, it is advised that branches should start obtaining invoices in the name of MCB on best efforts basis.
6. I could not have an opportunity to jointly verify with the external auditors the distribution of profit & loss, as per SBP instructions.
7. Staff Provident Fund of Islamic Banking Group should be managed under Shari’ah guidelines & invested in Shari’ah compliant avenues.
8. It is unfortunate that though the Islamic Banking Group has developed Shari’ah Compliant Staff Financing and HR Policy & Implementation Manual, duly approved by BOD, but the same is still not available to the staff of Islamic Banking Group.
I would like to take this opportunity to offer praise to Almighty Allah and seek his guidance and Tawfeeq, and to express my wishes for further progress, development and prosperity of Islamic Banking, Alhamdulillah under the sincere efforts of senior management, and Islamic Banking industry in Pakistan as a whole.
Regards,
Dr. Muhammad Zubair Usmani Shari’ah Advisor MCB Islamic Banking Group 21st Floor, MCB Tower,Dated: January 30, 2014 I.I Chundrigar Road, Karachi
178
7. Though, the Islamic Banking Group has developed
Shari’ah Compliant Staff Financing and HR Policy &
Implementation Manual, duly approved by BoD, but
the same is still not available to the staff of Islamic
Banking Group.
IBG is in the process of development and refinement
of its products to make the products competitive in the
market, conforming to the preferred standard of Shari’ah
Compliance.
I would like to take this opportunity to offer praise to Almighty
Allah and seek his guidance and Tawfeeq, and to express
my wishes for further progress, development and prosperity
of MCB IBG and Islamic Banking industry in Pakistan as a
whole.
Regards,
Dr. Muhammad Zubair Usmani
Shari’ah Advisor
MCB Islamic Banking Group
21st Floor, MCB Tower,
I.I Chundrigar Road, Karachi
Dated: January 22, 2013
ANNEXURE - II

ANNUAL REPORT 2013
196
ISLAMIC BANKING BUSINESS The Bank is operating 27 Islamic banking branches at the end of December 31, 2013 (2012: 27 branches). Statement of Financial Position As at December 31, 2013
2013 2012
(Restated)
Notes (Rupees in ‘000)
ASSETS Cash and balance with treasury banks 609,797 708,174 Balance with other banks - - Due form Financial Institution - - Investments - net 2,817,667 1,955,421 Islamic Financing & Related Assets A-II.1 11,207,333 9,907,791 Operating fixed assets 1,632,910 1,303,957 Deferred Tax Assets - - Other Assets 90,592 92,384 Total Assets 16,358,299 13,967,727 LIABILITIES Bill payable 107,938 88,464 Due to Financial Institution 682,770 581,051 Deposits and other accounts - Current Accounts 1,302,177 1,406,660 - Saving Accounts 2,391,100 2,634,184 - Term Deposits 2,765,346 3,061,869 - Others 96,641 3,343 Deposits from Financial Institution - Remunerative 4,609,453 2,516,102 Deposits from Financial Institution - Non Remunerative 12 21 Due to head Office 1,898,328 1,889,975 Deferred tax liability - - Other liabilities 729,273 358,772 14,583,037 12,540,441 Net Assets 1,775,262 1,427,286 REPRESENTED BY Islamic banking fund 1,500,000 1,300,000 Other reserves - - Unappropriated profit 257,952 118,380 1,757,952 1,418,380 Surplus on revaluation of assets - net of tax 17,310 8,906 1,775,262 1,427,286 Remuneration to Shariah Advisor / Board 1,944 1,944 CHARITY FUND Opening balance 6,892 782 Additions during the year Received from customers on delayed payments 8,208 7,739 Profit on charity saving account 277 296 8,485 8,035 Payments / utilization during the year Social Welfare (1,000) (1,300) Health (500) (625) Education (1,000) Relief and disaster recovery (10,000) (12,500) (1,925) Closing balance 2,877 6,892
ANNEXURE - II

197
ANNEXURE - II
ISLAMIC BANKING BUSINESS Profit and Loss Account For the year ended December 31, 2013 2013 2012
(Rupees in ‘000)
Income / return / profit earned 1,120,157 1,200,152 Income / return / profit expensed 655,873 881,654 464,284 318,498 Provision against loans and advances - net (129) 129 Provision for diminution in the value of investments - - Bad debts written off directly - - (129) 129 Net profit / income after provisions 464,413 318,369 Other income
Fees, commission and brokerage income 392,592 243,293 Dividend income - - Income from dealing in foreign currencies 14,546 8,545 Other Income 22,295 4,186 Total other income 429,433 256,024 893,846 574,393 Other expenses
Administrative expenses 635,888 455,949 Other provisions / write offs - - Other charges (penalty paid to SBP) 6 64 Total other expenses 635,894 456,013 Extra ordinary / unusual items - - Profit before taxation 257,952 118,380 Taxation - Current - - - Prior years - - - Deferred - - - - Profit after taxation 257,952 118,380

ANNUAL REPORT 2013
198
ISLAMIC BANKING BUSINESSCash Flow StatementFor the year ended December 31, 2013
2013 2012
(Rupees in ‘000)
Cash flows from operating activities
Profit before taxation 257,952 118,380 Less: Dividend income - - Adjustments for non-cash charges 257,952 118,380 Depreciation on fixed assets 305,718 176,960 Depreciation on ijarah assets - - Provision against loans and advances - net (129) 129 Provision / (reversal) for diminution in the value of investments - net - - Other provisions / (reversals) - - Bad debts written off directly - - Gain on disposal of fixed assets - net (2,135) (556) 303,454 176,533 561,406 294,913 (Increase) / decrease in operating assets Net investment in held for trading securities - - Islamic Financing & Related Assets (1,299,413) (1,637,872) 1,791 43,148 (1,297,622) (1,594,724) Increase / (decrease) in operating liabilities Bills payable 19,474 43,167 Due to Financial Institution 101,719 (1,083,945) Deposits and other accounts 1,542,550 2,819,201 Other liabilities 370,501 42,005 2,034,244 1,820,428 1,298,028 520,617 Income tax paid - - Net cash flows from operating activities 1,298,028 520,617 Cash flows from investing activities
Net investments in available-for-sale securities (1,027,120) 400,000 Net investments in held-to-maturity securities 173,278 568,813 Due to Head office 8,353 (668,649) Profit remitted to Head Office (118,380) (270,199) Sale proceeds of operating fixed assets disposed off 111,171 16,487 Investment in operating fixed assets (743,707) (493,293) Net cash flows from investing activities (1,596,405) (446,841) Cash flows from financing activities Increase in share capital 200,000 300,000 Net cash flows from financing activities 200,000 300,000 Increase in cash and cash equivalents (98,377) 373,776 Cash and cash equivalents at beginning of the period 708,174 334,398 Cash and cash equivalents at end of period 609,797 708,174
ANNEXURE - II
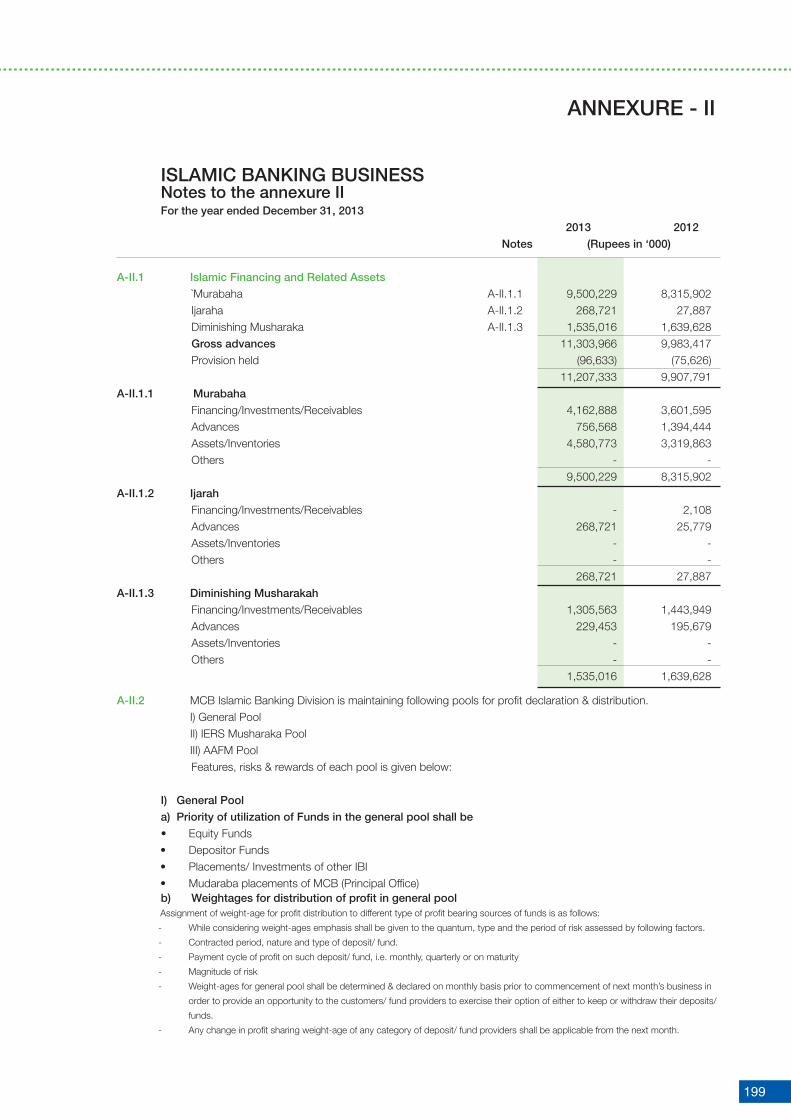
199
ISLAMIC BANKING BUSINESSNotes to the annexure IIFor the year ended December 31, 2013
2013 2012
Notes (Rupees in ‘000)
A-II.1 Islamic Financing and Related Assets
`Murabaha A-II.1.1 9,500,229 8,315,902 Ijaraha A-II.1.2 268,721 27,887 Diminishing Musharaka A-II.1.3 1,535,016 1,639,628 Gross advances 11,303,966 9,983,417
Provision held (96,633) (75,626) 11,207,333 9,907,791
A-II.1.1 Murabaha
Financing/Investments/Receivables 4,162,888 3,601,595 Advances 756,568 1,394,444 Assets/Inventories 4,580,773 3,319,863 Others - - 9,500,229 8,315,902
A-II.1.2 Ijarah
Financing/Investments/Receivables - 2,108 Advances 268,721 25,779 Assets/Inventories - - Others - - 268,721 27,887
A-II.1.3 Diminishing Musharakah
Financing/Investments/Receivables 1,305,563 1,443,949 Advances 229,453 195,679 Assets/Inventories - - Others - - 1,535,016 1,639,628
A-II.2 MCB Islamic Banking Division is maintaining following pools for profit declaration & distribution. I) General Pool II) IERS Musharaka Pool III) AAFM Pool
Features, risks & rewards of each pool is given below:
I) General Pool
a) Priority of utilization of Funds in the general pool shall be
• EquityFunds• DepositorFunds• Placements/InvestmentsofotherIBI• MudarabaplacementsofMCB(PrincipalOffice)b) Weightages for distribution of profit in general pool
Assignment of weight-age for profit distribution to different type of profit bearing sources of funds is as follows:
- While considering weight-ages emphasis shall be given to the quantum, type and the period of risk assessed by following factors.
- Contracted period, nature and type of deposit/ fund.
- Payment cycle of profit on such deposit/ fund, i.e. monthly, quarterly or on maturity
- Magnitude of risk
- Weight-ages for general pool shall be determined & declared on monthly basis prior to commencement of next month’s business in
order to provide an opportunity to the customers/ fund providers to exercise their option of either to keep or withdraw their deposits/
funds.
- Any change in profit sharing weight-age of any category of deposit/ fund providers shall be applicable from the next month.
ANNEXURE - II
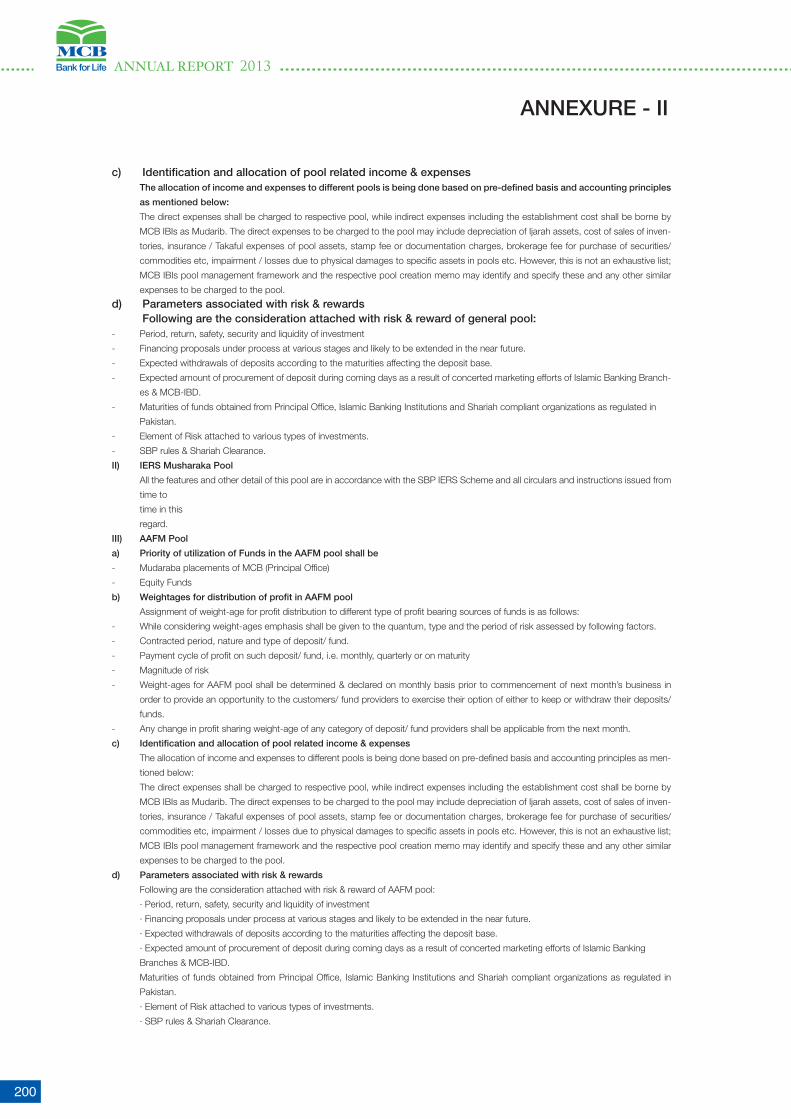
ANNUAL REPORT 2013
200
ANNEXURE - II
c) Identification and allocation of pool related income & expenses The allocation of income and expenses to different pools is being done based on pre-defined basis and accounting principles
as mentioned below:
The direct expenses shall be charged to respective pool, while indirect expenses including the establishment cost shall be borne by
MCB IBIs as Mudarib. The direct expenses to be charged to the pool may include depreciation of Ijarah assets, cost of sales of inven-
tories, insurance / Takaful expenses of pool assets, stamp fee or documentation charges, brokerage fee for purchase of securities/
commodities etc, impairment / losses due to physical damages to specific assets in pools etc. However, this is not an exhaustive list;
MCB IBIs pool management framework and the respective pool creation memo may identify and specify these and any other similar
expenses to be charged to the pool.
d) Parameters associated with risk & rewards Following are the consideration attached with risk & reward of general pool:- Period, return, safety, security and liquidity of investment
- Financing proposals under process at various stages and likely to be extended in the near future.
- Expected withdrawals of deposits according to the maturities affecting the deposit base.
- Expected amount of procurement of deposit during coming days as a result of concerted marketing efforts of Islamic Banking Branch-
es & MCB-IBD.
- Maturities of funds obtained from Principal Office, Islamic Banking Institutions and Shariah compliant organizations as regulated in
Pakistan.
- Element of Risk attached to various types of investments.
- SBP rules & Shariah Clearance.
II) IERS Musharaka Pool
All the features and other detail of this pool are in accordance with the SBP IERS Scheme and all circulars and instructions issued from
time to
time in this
regard.
III) AAFM Pool
a) Priority of utilization of Funds in the AAFM pool shall be
- Mudaraba placements of MCB (Principal Office)
- Equity Funds
b) Weightages for distribution of profit in AAFM pool
Assignment of weight-age for profit distribution to different type of profit bearing sources of funds is as follows:
- While considering weight-ages emphasis shall be given to the quantum, type and the period of risk assessed by following factors.
- Contracted period, nature and type of deposit/ fund.
- Payment cycle of profit on such deposit/ fund, i.e. monthly, quarterly or on maturity
- Magnitude of risk
- Weight-ages for AAFM pool shall be determined & declared on monthly basis prior to commencement of next month’s business in
order to provide an opportunity to the customers/ fund providers to exercise their option of either to keep or withdraw their deposits/
funds.
- Any change in profit sharing weight-age of any category of deposit/ fund providers shall be applicable from the next month.
c) Identification and allocation of pool related income & expenses
The allocation of income and expenses to different pools is being done based on pre-defined basis and accounting principles as men-
tioned below:
The direct expenses shall be charged to respective pool, while indirect expenses including the establishment cost shall be borne by
MCB IBIs as Mudarib. The direct expenses to be charged to the pool may include depreciation of Ijarah assets, cost of sales of inven-
tories, insurance / Takaful expenses of pool assets, stamp fee or documentation charges, brokerage fee for purchase of securities/
commodities etc, impairment / losses due to physical damages to specific assets in pools etc. However, this is not an exhaustive list;
MCB IBIs pool management framework and the respective pool creation memo may identify and specify these and any other similar
expenses to be charged to the pool.
d) Parameters associated with risk & rewards
Following are the consideration attached with risk & reward of AAFM pool:
· Period, return, safety, security and liquidity of investment
· Financing proposals under process at various stages and likely to be extended in the near future.
· Expected withdrawals of deposits according to the maturities affecting the deposit base.
· Expected amount of procurement of deposit during coming days as a result of concerted marketing efforts of Islamic Banking
Branches & MCB-IBD.
Maturities of funds obtained from Principal Office, Islamic Banking Institutions and Shariah compliant organizations as regulated in
Pakistan.
· Element of Risk attached to various types of investments.
· SBP rules & Shariah Clearance.

201
A-II.3 Avenues/sectors of economy/business where Mudaraba based deposits have been deployed:
2013 2012 (Rupees ‘000)
Chemical and Pharmaceuticals 304,980 639,761 Agribusiness 5,090 200,228 Textile 1,369,692 1,638,054 GOP Ijarah Sukuk 2,821,494 1,700,000 Sugar 159,159 195,738 Production and transmission of energy - 70,450 Commerce / Trade - 30,879 Transport, Storage and Communication - 1,666 Services 51,034 68,750 Individuals - 221 Ship Breaking 2,075,472 2,788,694 Food & Tobacco Except Sugar 6,430,141 3,751,546 Others 908,397 886,218 14,125,459 11,972,205
A-II.4 Basis of Profit Allocation:
Profit was distributed between Mudarib & Rabbul Maal with below profit sharing ratio based upon Gross Income approach (Gross Income less Direct Expenses) Rabbul Maal 50% Mudarib 50%Charging ExpensesThe direct expenses is being charged to respective pool, while indirect expenses including the establishment cost is being borne by MCB IBD as Mudarib. The direct expenses to be charged to the pool may include depreciation of Ijarah assets, cost of sales of inventories, insurance / Takaful expenses of pool assets, stamp fee or documentation charges, brokerage fee for purchase of securities/commodities etc, impairment / losses due to physical damages to specific assets in pools etc. However, this is not an exhaustive list; IBI pool management framework and the respective pool creation memo may identify and specify these and any other similar expenses to be charged to the pool. ProvisionThe general and specific provisions created against non-performing financings and diminution in the value of investments as under prudential regulations and other SBP directives shall be borne by the MCB IB as Mudarib. However, write-offs of financings and loss on sale of invest-ments shall be charged to respective pool along with other direct expenses. The losses on financings and investments due to misconduct/negligence/breach of contract by MCB IB shall not be charged to the pool; the MCB IB as Mudarib shall be responsible for absorbing such losses. The financing approved and disbursed and investment made in contraven-tion to the prudential regulations or the MCB IB’s own policies, procedures and processes as determined by internal auditor, external auditor
and/or SBP inspection team will be treated as the negligence on the part of the MCB IB.
A-II.5 Mudarib Share (in amount and Percentage of Distributable income)
2013 2012 (Rupees in ‘000) % (Rupees in ‘000) %
Rabbul Maal 496,915 56% 593,356 68%Mudarib 382,588 44% 277,821 32%Distributable Income 879,503 871,177
A-II.6 Amount & percentage of Mudarib share transferred to depositors through Hiba
2013 2012 (Rupees in ‘000) Mudarib Share 382,588 277,821Hiba 72,238 171,526 Hiba percentage of Mudarib Share 19% 62%
A-II.7 Profit Rate Earned vs Profit rate Distributed to the depositors during the year:
2013 2012* Profit Rate Earned 10.77% 11.19% Profit Rate distributed to Depositors 6.65% 8.06% * The profit rate earned means the return on earning assets.
ANNEXURE - II

ANNUAL REPORT 2013
202
1 Al
Rah
im E
nter
prise
s M
ehar
Muh
amm
ad A
sraf
38
401-
3484
742-
5 M
ahala
Kha
n 13
,231
6
,633
1
74
20,
038
-
-
4
,970
4
,970
Ho
use
No. 2
72, A
shra
f Man
zil,
Meh
ar E
hsan
Ahm
ad
3840
1-42
7371
6-7
Meh
ar G
hulam
Hus
sin
Bl
ock
No. 0
5, B
halw
al Di
stt.-
Sarg
odha
2 M
alik
Muh
amm
ad A
fzal
M
alik
Muh
amm
ad A
fzal
3520
2-27
4625
0-1
Mali
k Na
zir A
hmed
-
2
,387
5
0
2,4
37
-
-
2,4
37
2,4
37
H
# 83
, Bloc
k D,
New
Mus
lim To
wn L
ahor
e
3 Co
ntin
enta
l Cap
ital M
anag
emen
t (Pv
t.) L
td.
Muh
amm
ad A
rif 42
301-
4611
735-
5 Ab
dul M
ajeed
-
3
,466
1
26
3,5
92
-
-
3,5
92
3,5
92
70
8, 7
th F
loor,
Busin
ess &
Fina
nce
Cent
re, I
.I M
uham
mad
Adn
an
4230
1-46
1183
0-5
Muh
amm
ad A
rif
Chun
driga
r Roa
d, K
arac
hi M
uham
mad
Far
han
Arif
4230
1-15
7067
8-7
Muh
amm
ad A
rif
4 Ka
zmi E
ngg.
Inds
. Sy
ed R
izwan
Ahm
ed K
azm
i 42
201-
3110
338-
9 Sy
ed M
oham
mad
Rau
f Kaz
mi
-
1,8
09
-
1,8
09
-
-
1,8
09
1,8
09
7-
36, R
.K.S
quar
e, S
hahr
ah-e
-Liaq
at, K
arac
hi
5 ST
Inte
rnat
iona
l M
alik
Tahir
Hale
em
3710
1-62
2246
5-9
Mali
k Ab
dul H
aleem
-
1
,536
3
8
1,5
74
-
-
1,5
74
1,5
74
Ho
use
# 17
, Nea
r Mad
ina C
NG, D
ar U
l
Salam
Colo
ny, A
ttock
6 Irf
anul
lah
& Co
Irf
anull
ah
3430
1-23
1900
8-9
Saifu
llah
-
963
-
9
63
-
-
1,0
24
1,0
24
Vi
llage
Mian
Rah
iman
, Teh
sil &
Dist
t Hafi
zaba
d
7 M
akka
h Ce
ntre
M
uham
mad
Afza
l 35
202-
7687
744-
9 M
ubar
ak A
li 2
,977
1
,312
4
6
4,3
35
-
-
1,3
71
1,3
71
Sh
op N
o 1,
2,3,
4 St
reet
no
14 M
ain
Muh
amm
ad yo
unas
35
201-
1361
492-
3 Na
wab
Din
Ba
zar,
Mak
kah
Colon
y, Gu
lberg
Lah
ore
8 Jo
har B
enqu
et H
all
Saad
at A
nees
Bha
tti
3520
2-19
8401
8-1
Muh
amm
ad R
afiqu
e Bh
atti
-
1,1
79
1
,179
-
-
1
,179
1
,179
15
6-A,
Sha
hjam
al Co
lony,
Laho
re.
Pl
ot n
o.21
Mola
na S
hoka
t Ali R
oad
Laho
re.
9 Ah
med
Sha
h In
dust
ries
Meh
moo
d ul
Hass
an S
hah
3630
2-92
6798
6-2
Man
zoor
Ahm
ed S
hah
33,
900
1
6,83
7
317
5
1,05
4
33,
900
-
1
7,15
4
51,
054
Ch
owk
Mait
la Ja
hania
n, V
ehar
i
10
Bila
l Cot
ton
Indu
strie
s M
anso
or A
hmed
Sha
h 36
602-
1901
802-
9 M
anzo
or A
hmed
Sha
h 2
,026
2
,622
1
65
4,8
13
2,0
26
-
2,7
87
4,8
13
M
ain R
oad
Garh
a M
ore,
Veh
ari
Meh
moo
d ul
Hass
an S
hah
3630
2-92
6798
6-2
Man
zoor
Ahm
ed S
hah
11
Ittef
aq C
otto
n In
dust
ries
Man
zoor
Ahm
ed S
hah
3630
2-73
4353
6-7
Ahm
ed S
hah
2,8
44
1,4
53
130
4
,427
2
,844
-
1
,583
4
,427
Supe
r High
way J
ahan
ian
12
Ittef
aq F
lour
Mills
M
anzo
or A
hmed
Sha
h 36
302-
7343
536-
7 Ah
med
Sha
h -
1
,342
1
30
1,4
72
-
-
1,4
72
1,4
72
Su
per H
ighwa
y Jah
anian
M
ehm
ood
ul Ha
ssan
Sha
h 36
302-
9267
986-
2 M
anzo
or A
hmed
Sha
h
13
Sher
az E
nter
prise
s M
ehm
ood
ul Ha
ssan
Sha
h 36
302-
9267
986-
2 M
anzo
or A
hmed
Sha
h -
7
,858
1
00
7,9
58
-
-
7,9
58
7,9
58
Ch
owk
Mait
la Ja
hania
n
14
Usm
an C
otto
n Fa
ctor
y M
uham
mad
Zah
id Ra
fiq
3610
3-08
1589
3-9
Ch.M
uham
mad
Rafi
q 1
00
13,
027
1
00
13,
227
-
-
1
3,02
7
13,
027
Al
lahab
ad K
abirw
ala D
istt.K
hane
wal
Mst
Nus
rat R
afiq
3610
3-97
2030
9-6
Muh
amm
ad R
afiq
Mr.M
uham
mad
Am
anull
ah
3610
3-16
6459
1-1
Muh
amm
ad A
ashiq
M
st R
iffat Y
asm
een
3610
4-09
3107
8-8
Muh
amm
ad A
ashiq
15
Faisa
l Kal
eem
Fah
ad K
alee
m
Faisa
l Kale
em
3310
0-24
2051
5-5
Azm
at K
aleem
-
1
,831
7
0
1,9
01
-
-
1,6
62
1,6
62
Sh
op N
o. 1
3, K
aleem
Mar
ket,
Fa
had
Kalee
m
3310
0-42
0031
1-3
Azm
at K
aleem
Ne
ar F
acto
ry A
rea,
Fais
alaba
d.
16
Muh
amm
ad F
aroo
q &
Sons
Ha
fiz M
uham
mad
Far
ooq
3540
4-09
4393
2-9
Haji A
bdul
Ghan
i -
6
55
-
655
-
-
6
55
655
Chow
k Re
gal C
inem
a Sh
eikhu
pura
.
17
Yasir
Eja
z Ya
sir E
jaz
4230
1-11
1277
0-5
Ejaz
Ham
eed
-
2,0
98
-
2,0
98
-
-
2,0
98
2,0
98
Ho
use
# 39
, Stre
et A
/1/2
, Pha
se-4
,
Golf C
ourc
e Ro
ad-1
, DHA
Kar
achi
18
Para
mou
nt P
rintin
g Pr
ess
Mirz
a Ift
ikhar
Ahm
ed
4130
2-18
7188
5-5
Mirz
a Ra
fique
Ahm
ed
-
571
-
5
71
-
-
571
5
71
Op
psite
St:
Mer
ry’s
High
Sch
ool
Fo
ujdar
i Roa
d Hy
dera
bad
Sr. N
o Na
me
& Ad
dres
s of
the
Borro
wer
Na
me
of In
divid
uals/
Partn
ers/
Dire
ctor
s Fa
ther
’s/Hu
sban
d’s
Nam
e Ou
tsta
ndin
g Li
abilit
ies
at B
egin
ning
of Y
ear
Prin
cipa
l In
tere
st/
Othe
r Fin
. To
tal
Writ
ten
off
Mar
kup
R
elie
fs
Na
me
CNIC
No.
Pr
inci
pal
Intt/
Acc/
Mup
Ot
hers
To
tal
Writ
ten
off
Prov
ided
Stat
emen
t sho
win
g w
ritte
n-of
f loa
ns o
r any
oth
er fi
nanc
ial r
elie
f of fi
ve h
undr
ed th
ousa
nd o
r abo
ve p
rovi
ded
durin
g th
e ye
ar 2
013
(Rs.
in ‘0
00)
ANNEXURE - III

203
19
Shaf
qat Y
aqoo
b
Shaf
qat Y
aqoo
b Kh
an
6110
1-66
9260
1-5
M Y
aqoo
b Kh
an
-
2,2
80
-
2,2
80
-
-
2,2
80
2,2
80
St
reet
24/
A, F
-7 Is
lamab
ad
20
Ashr
af A
nwar
As
hraf
Anw
ar
4230
1-07
0748
8-5
Muh
amm
ad S
hafi A
lam
-
1,3
99
-
1,3
99
-
-
1,3
99
1,3
99
Of
fice
F-1,
Plot
# FL
-4/1
1, B
lock-
5,
Gu
lshan
-e-Iq
bal, K
arac
hi.As
hraf
Anw
ar
21
Rahe
em G
ul &
Co
Ra
heem
Gul
3520
2-54
3805
4-5
Haji S
heen
Gul
-
583
-
5
83
-
-
583
5
83
38
-A F
ruit M
arke
t Link
Rav
i Roa
d La
hore
22
Abdu
l Han
if Ab
dul H
anif
3520
1-12
4558
9-5
Ghula
m H
ussa
in 5
,000
1
,504
-
6
,504
-
-
1
,213
1
,213
Dece
nt H
otel,
104
-Mcle
od R
oad
Near
Au
stra
lia M
asjid
, Rail
way S
tatio
n La
hore
23
Sale
em S
arw
ar J
ora
Salee
m S
arwa
r Jor
a 35
202-
6374
072-
5 Ch
. Muh
amm
ad S
arwa
r 2
,105
3
,241
3
7
5,3
83
-
-
2,7
95
2,7
95
Ho
use
# 20
, Bloc
k H,
Mod
el To
wn, L
ahor
e
24
Tahi
r Sid
diqu
e M
ugha
l Ta
hir S
iddiqu
e M
ugha
l 35
202-
3010
051-
3 M
. Sidd
ique
Mug
hal
5,5
76
1,2
77
22
6
,875
-
-
1
,075
1
,075
Shop
No.
9-A
Indu
stria
l Bloc
k,Al
lama
Iqba
l
Town
Lah
ore
25
Jam
il Ahm
ed K
han
Jam
il Ahm
ed K
han
1310
1-30
6545
8-9
Mir
Afza
l Kha
n -
4
,257
-
4
,257
-
-
4
,257
4
,257
Suit #
303
, 3rd
Floo
r, Cr
ysta
l Cou
rt, B
lock-
5
Clifto
n K
arac
hi.
26
Naee
m A
hmed
and
Sam
ina
Naee
m
Ch. N
aeem
Ahm
ed
3520
2-22
5674
8-9
Ch. B
ashir
Ahm
ed
94
Q M
odel
Town
Lah
ore
Sam
ina N
aeem
35
202-
3322
535-
4 Ch
. Nae
em A
hmed
5
,347
2
,463
-
7
,810
-
-
2
,755
2
,755
27
Shei
kh Ij
az A
hmed
, Sh
eikh
Ijaz A
hmed
35
201-
7880
372-
7 Sh
eikh.
Sub
ah S
adiq
2,3
45
477
4
7
2,8
69
-
-
563
5
63
Ho
use
No: 2
45, B
lock
B, P
unjab
Co-
Oper
ative
Hous
ing S
ociet
y Ltd
., La
hore
.
28
Reha
n Br
othe
rs
Ragh
ib Kh
an
3520
2-65
7164
9-9
Muh
amm
ad A
sif K
han
-
1,1
42
80
1
,222
-
-
1
,222
1
,222
152-
CI F
aisal
Town
Lah
ore
Ibra
r Kah
sif
3410
1-25
1140
5-1
Mirz
a M
uham
mad
Akr
am
29
D.S.
Text
iles
Lim
ited
Ali P
erve
z Ahm
ed
3520
2-86
3378
4-5
Perv
ez A
hmed
-
7
,291
5
47
7,8
38
-
-
7,8
38
7,8
38
20
K Gu
lberg
II La
hore
Pe
rvez
Ahm
ed
3520
2-56
3783
2-7
S.K.
Ahm
ed
30
Muh
amm
ad S
hafiq
ue
Muh
amm
ad S
hafiq
ue
3520
1-58
2199
8-3
Muh
amm
ad L
atif
-
1,3
86
43
1
,429
-
-
9
58
958
Ghula
m M
uham
mad
Par
k, N
ew B
hogil
Wal,
Bund
Roa
d, L
ahor
e
31
Afza
l Ahm
ed
Afza
l Ahm
ed
3660
3-13
7282
1-5
Ghula
m R
asoo
l 8
49
1,0
23
100
1
,972
-
-
9
78
978
Chak
# 1
98 E
B Te
hsil &
Dist
t. Ve
hari
32
Abid
Meh
moo
d Ab
id M
ehm
ood
3310
0-86
1802
4-7
Mali
k Ab
dul G
hafo
or
-
470
4
8
518
-
-
5
18
518
Hous
e #
330,
Bloc
k G-
III, M
uham
mad
Ali
Jo
har T
own,
Lah
ore
33
Muh
amm
ad A
mja
d Sh
ah
Muh
amm
ad A
mjad
Sha
h 35
201-
1965
789-
9 Al
i Akb
ar S
hah
-
1,2
82
117
1
,399
-
-
1
,399
1
,399
13-A
, New
Offic
er C
olony
, Sad
ar B
azar
Cant
t, La
hore
34
Syed
Ali R
aza
Kazm
i Sy
ed A
li Raz
a Ka
zmi
3520
2-12
8415
3-3
Syed
Sar
dar A
li Sha
h 2
,102
1
,517
5
8
3,6
77
-
-
1,0
99
1,0
99
Ho
use
# 35
-C, E
duca
tion
Town
,
Wah
dat R
oad,
Lah
ore.
35
Hafiz
Muh
amm
ad Im
ran
& M
unaw
ar S
ulta
na
Hafiz
Muh
amm
ad Im
ran
35
202-
9841
148-
5
Ch. M
uham
mad
Asla
m
3,3
55
913
-
4
,268
-
-
7
49
749
Hous
e #
21, B
lock-
C, G
ulsha
n-e-
Ravi,
Lah
ore
Mun
awar
Sult
ana
3520
2-50
7443
9-0
Ch. M
uham
mad
Asla
m
36
Shaf
qat P
erve
ez R
ana
& Na
jma
Perv
eez
Rana
Na
jma
Perv
eez R
ana
35
202-
2649
668-
0 Sh
afqa
t Per
veez
Ran
a 7
27
895
8
5
1,7
07
-
-
983
9
83
35
,Main
Hab
ib Pa
rk, M
ultan
Roa
d, L
ahor
e Sh
afqa
t Per
veez
Ran
a 35
200-
1557
861-
9 M
uham
mad
Anw
ar R
ana
Sr. N
o Na
me
& Ad
dres
s of
the
Borro
wer
Na
me
of In
divid
uals/
Partn
ers/
Dire
ctor
s Fa
ther
’s/Hu
sban
d’s
Nam
e Ou
tsta
ndin
g Li
abilit
ies
at B
egin
ning
of Y
ear
Prin
cipa
l In
tere
st/
Othe
r Fin
. To
tal
Writ
ten
off
Mar
kup
R
elie
fs
Na
me
CNIC
No.
Pr
inci
pal
Intt/
Acc/
Mup
Ot
hers
To
tal
Writ
ten
off
Prov
ided
Stat
emen
t sho
win
g w
ritte
n-of
f loa
ns o
r any
oth
er fi
nanc
ial r
elie
f of fi
ve h
undr
ed th
ousa
nd o
r abo
ve p
rovi
ded
durin
g th
e ye
ar 2
013
(Rs.
in ‘0
00)
ANNEXURE - III

ANNUAL REPORT 2013
204
37
Com
mer
cial
Rad
io S
ervic
e Ch
. Muh
amm
ad A
slam
38
403-
5381
322-
3 Ch
. Laa
b Di
n
4,9
94
2,5
44
71
7
,609
-
-
2
,579
2
,579
Katc
hery
Baz
ar, S
argo
dha
Ch. T
ause
ef S
aeed
38
403-
7357
631-
3 Ch
. Muh
amm
ad S
aeed
38
Azee
m T
rade
rs
M. A
shra
f 34
403-
1946
312-
3 M
. Aze
em
-
885
2
8
913
-
-
6
84
684
Ghall
a M
andi
Dist
rict M
andi
Man
di Ba
haud
din
39
Nazir
Ahm
ed
Nazir
Ahm
ed
3430
2-68
8183
6-7
Sher
Muh
amm
ad
666
8
53
-
1,5
19
-
-
830
8
30
W
ard
# 7,
Tand
a Co
lony,
Kase
say r
oad,
Jalal
pur B
hatti
an
40
Karim
Tra
ding
& C
o Bi
lal A
hmad
36
102-
1904
859-
3 M
uham
mad
Sale
em
-
466
7
0
536
-
-
5
36
536
Post
Offic
e Ba
ggar
Sar
gana
, Kab
irwala
Khan
ewal.
41
Safd
ar H
ussa
in
Safd
ar H
ussa
in 34
803-
5493
616-
3 Su
ltan
Muh
amm
ad
-
2,8
90
-
2,8
90
-
-
2,8
90
2,8
90
Ho
use
No. 4
11/A
, Zaf
ar C
olony
, Sar
godh
a
42
Isht
iaq
Ahm
ed
Ishtia
q Ah
med
37
405-
4566
548-
7 Ab
dul R
ashe
ed
2,2
02
762
6
5
3,0
29
-
-
765
7
65
Ho
use
No 4
5, R
ose
Lane
No.
04,
Pha
se II
Ne
w La
lazar,
Raw
alpind
i
43
Soun
d an
d Vi
sion.
Sy
ed K
halid
Ali
4130
3-50
1966
9-5
Syed
Muk
htar
Ali
3,9
99
1,5
14
25
5
,538
-
-
1
,597
1
,597
F-64
3, W
ard-
F, Kh
okha
r Moh
alla,
Risa
la Ro
ad, H
yder
abad
44
Muh
amm
ad A
hmed
Naw
az K
han
Muh
amm
ad A
hmed
35
202-
3367
063-
3 Sa
adat
Naw
az k
han
316
1
,720
-
2
,036
-
-
1
,392
1
,392
Hous
e No
372
-, Bl
ock
GG, P
hase
-IV,
Nawa
z Kha
n
DHA,
Lah
ore
45
Yasir
Ali
Yasir
Ali
3633
03-1
8898
81-7
M
uham
mad
Man
sha
-
1,2
84
-
1,2
84
-
-
1,2
84
1,2
84
Ho
use
No: 9
2, B
lock
D, Ta
riq G
arde
n
Hous
ing sc
hem
e, L
ahor
e.
46
Mub
asha
r Qas
im
Mub
asha
r Qas
im
3520
1-53
0804
3-7
Muh
amm
ad Q
asim
4
,685
9
08
17
5
,610
-
-
1
,013
1
,013
26-C
Arm
y Flat
s, Sa
rfraz
Rafi
qi Ro
ad, L
ahor
e
47
Iqba
l Bro
ther
s Co
tton
Ginn
ers
Muz
affar
Iqba
l 36
302-
1019
445-
1 M
uham
mad
Iqba
l 2
,516
7
,650
1
60
10,
326
-
-
7
,764
7
,764
Moz
a No
or S
hah
Telai
Tehs
il Kot
Add
u Fu
rrukh
Iqba
l 36
302-
0479
060-
9 M
uham
mad
Iqba
l
Dist
t. M
uzaff
arga
rh
Goha
r Iqb
al 36
302-
7920
537-
3 M
uham
mad
Iqba
l
So
hail I
qbal
3630
2-04
6423
3-9
Muh
amm
ad Iq
bal
48
Qua
lity
Plas
te
Ali A
bdull
ah H
amid
3310
0-07
8519
0-3
Abdu
l Ham
id 1
,399
1
,781
6
8
3,2
48
-
-
1,8
67
1,8
67
4-
Z14,
Che
nab
Mar
ket,
Mad
ina To
wn,
Abdu
l Ham
id 33
100-
0785
189-
5 Ab
dul R
ashid
Ch
Fa
isalab
ad.
49
Qadr
i Tra
ders
Gh
ullam
Gho
us
3430
1-08
7468
2-5
Ily
as A
hmad
3
,772
9
37
4
,709
-
-
1
,193
1
,193
Shah
Jam
al Ro
ad, N
ear B
ypas
s Roa
d,
Di
stric
t Hafi
zaba
d.
50
Qudr
at U
llah
& Co
. Qu
drat
Ulla
h
3430
1-17
3587
2-5
Muh
amm
ad S
hafi
1,3
74
653
2,0
27
-
-
767
7
67
Qi
la Sa
hib S
ingh,
Sha
h Ja
mal
Road
, Hafi
zaba
d
51
Abdu
l Sha
koor
Ulfa
t Ab
dul S
hako
or U
lfat
3520
2-01
4863
3-1
Shm
eer A
hmed
9
,538
2
,154
2
16
11,
908
-
-
2
,202
2
,202
Hous
e No
.12
Sect
or B
II To
wnsh
ip La
hore
52
Ahm
ed T
ract
or S
how
room
Ra
o Ah
mad
Ali Q
amar
32
302-
1690
084-
3 Ra
o Lia
quat
Ali
719
1
,384
8
1
2,1
84
-
-
1,3
93
1,3
93
Te
rmit R
oad
Jato
i
53
Khur
shid
Bro
ther
s Ta
lat K
hurs
hid M
alik
3520
2-23
8683
8-5
Khur
shid
Ahm
ed M
alik
-
697
1
03
800
-
-
6
97
697
72-T
imbe
r Mar
ket,
Ravi
Road
, Lah
ore
Naila
Talat
35
202-
2227
258-
4 Ta
lat K
hurs
hid M
alik
54
Spec
ial L
eath
er G
arm
ents
M
aqso
od A
hmed
34
603-
2286
953-
5 Ab
dul H
aq
12,
000
2
,969
-
1
4,96
9
-
-
3,5
90
3,5
90
Si
ddiqu
i pala
ce, M
arala
Roa
d, M
urad
Sa
im M
aqso
od
3460
3-22
8697
2-5
Maq
sood
Ahm
ed
Pur,
Sialk
ot.
Sr. N
o Na
me
& Ad
dres
s of
the
Borro
wer
Na
me
of In
divid
uals/
Partn
ers/
Dire
ctor
s Fa
ther
’s/Hu
sban
d’s
Nam
e Ou
tsta
ndin
g Li
abilit
ies
at B
egin
ning
of Y
ear
Prin
cipa
l In
tere
st/
Othe
r Fin
. To
tal
Writ
ten
off
Mar
kup
R
elie
fs
Na
me
CNIC
No.
Pr
inci
pal
Intt/
Acc/
Mup
Ot
hers
To
tal
Writ
ten
off
Prov
ided
Stat
emen
t sho
win
g w
ritte
n-of
f loa
ns o
r any
oth
er fi
nanc
ial r
elie
f of fi
ve h
undr
ed th
ousa
nd o
r abo
ve p
rovi
ded
durin
g th
e ye
ar 2
013
(Rs.
in ‘0
00)
ANNEXURE - III

205
55
Wil’y
Foo
ds (P
vt) L
imite
d
Ch. N
aeem
Ahm
ed
3520
2-22
5674
8-9
Ch. B
ashir
Ahm
ed
8,7
44
2,6
28
181
1
1,55
3
-
-
2,9
65
2,9
65
23
3-S,
Indu
stria
l Est
ate,
Kot
Lak
hpat
, Lah
ore
Nasim
Ahm
ed
3520
2-22
5674
8-7
Ch. B
ashir
Ahm
ed
Nasir
Sae
ed K
han
35
202-
9328
041-
5 M
. Abd
ullah
Kha
n
56
Shah
id B
roth
ers
Muh
amm
ad Id
rees
35
204-
4564
515-
5 M
uham
mad
Ram
zan
1,2
30
1,9
88
121
3
,339
-
-
2
,060
2
,060
1271
- Ak
bari
Man
di, L
ahor
e
57
Umai
r Rub
ber W
orks
Sh
amim
Nae
em
3520
2-36
9669
3-8
Muh
amm
ad N
aeem
3
,208
3
,125
-
6
,333
-
-
3
,465
3
,465
564-
Jaha
nzeb
Um
air N
aeem
35
202-
4616
004-
9 M
uham
mad
Nae
em
Bl
ock,
Alla
ma
Hash
am Y
ousa
f 35
202-
5452
986-
3 M
uham
mad
Nae
em
Iq
bal T
own,
Lah
ore
Muh
amm
ad N
aeem
35
202-
0190
634-
7 M
uham
mad
You
saf
58
Man
soor
Ahm
ed M
aqso
od
Man
soor
Ahm
ed M
aqso
od
3520
2-88
8914
7-1
Sh M
aqso
od A
hmed
4
,025
1
,886
7
5
5,9
86
-
-
2,0
20
2,0
20
H.
No.
120
M B
lock,
M
odel
Town
, Lah
ore
59
Ahm
ad F
illing
Sta
tion
Muh
amm
ad S
hafiq
ue K
han
3310
0-67
3948
4-5
Muk
htar
Ahm
ad
2,4
86
438
1
40
3,0
64
-
-
629
6
29
Ch
ak N
o. 2
75/J
B, P
ainsr
a, F
aisala
bad.
60
Faro
oq T
rade
rs
Sarfr
az Z
ahoo
r 33
100-
8530
082-
7 Za
hoor
Ahm
ad
299
5
13
60
8
72
-
-
576
5
76
30
1- J
alvi M
arke
t, Ja
rranw
ala R
oad,
Faisa
labad
.
61
Ali C
orpo
ratio
n Sh
abbir
Ahm
ad
3540
1-82
8442
7-1
Bash
ir Ah
mad
-
6
85
-
685
-
-
6
85
685
Circ
ular R
oad,
Sha
raqp
ur S
harif.
62
Muh
amm
ad Y
ounu
s M
uham
mad
You
nus
4220
1-76
6404
7-3
Muh
amm
ad
-
1,4
98
-
1,4
98
-
-
1,4
98
1,4
98
Sh
op #
91
& 92
, Alam
Clot
h M
arke
t,
Rajve
er L
ane,
New
Nah
am R
oad,
Kar
achi.
63
Perv
aiz
Ente
rpris
es
Perv
aiz Iq
bal
3520
2-28
6539
6-9
Abdu
l Ras
heed
6
90
1,3
14
-
2,0
04
-
-
1,3
42
1,3
42
Sh
op #
40+
41, A
llah
Mali
k M
arke
t,
Chow
k M
ayo
Hosp
ital, L
ahor
e
64
Orbi
t Ass
ocia
tes
& En
terp
rises
Sy
ed S
habb
ar Z
aman
42
201-
5850
713-
7 Sy
ed M
asih-
Uz-Z
aman
-
1
,007
1
4
1,0
21
-
-
866
8
66
St
-4 1
21/1
1, F
B Ar
ea N
ear S
hada
b
Mas
jid K
arac
hi
65
SAF
Ente
rpris
es
Naza
r ul Is
lam
4220
1-07
7860
8-5
Qam
ar-u
l-Isla
m
1,0
92
1,4
14
186
2
,692
-
-
1
,610
1
,610
Plot
A-5
94 B
lock
3, G
ulsha
n-e-
Iqba
l Kar
achi
66
Gulsh
an S
izizn
g In
dust
ries
Faqir
Muh
amm
ad
3310
0-05
9415
5-5
Qadir
Bux
2
,490
2
,118
7
0
4,6
78
-
-
2,1
01
2,1
01
Re
hman
abad
, Ghu
lamm
uham
mad
abad
,
Faisa
labad
. M
uham
mad
Sha
hbaz
33
100-
5820
012-
1 Fa
qir M
uham
mad
67
Waq
as &
Com
pany
Ab
dul R
auf K
han
3630
2-08
7827
2-9
Muh
amm
ad A
jmal
Khan
5
,900
9
,069
1
23
15,
092
5
,900
-
9
,192
1
5,09
2
BCG
Chow
k M
ultan
M
uham
mad
Waq
as R
auf K
han
3630
2-81
0887
2-1
Abdu
l Rau
f Kha
n
68
M. Y
ahya
Khu
rshi
d M
. Yah
ya K
hurs
hid
3540
4-48
9316
4-3
Khur
shid
Ahm
ad
9,6
54
9,8
31
209
1
9,69
4
9,6
54
-
10,
191
1
9,84
5
1st F
loor,
Ali C
ente
r, Sh
ahala
m G
ate
Laho
re
69
Muh
amm
ad Y
ousa
f Jav
ed S
h.
Yous
af J
avaid
Sh.
35
202-
8944
897-
9 M
uham
mad
Jav
aid S
h 2
,086
8
33
155
3
,074
-
-
8
14
814
Hous
e No
311
, Bloc
k B,
Vale
ncia,
Lah
ore.
70
Raja
Muh
amm
ad A
zad
Khan
Ra
ja M
uham
mad
Aza
d Kh
an
6110
1-19
4764
3-1
Raja
Moh
amm
ad H
ayya
t Kha
n 5
,660
2
,263
9
2
8,0
15
-
-
2,3
88
2,3
88
Ad
dres
s: Ho
use
No. 3
01, S
awan
Roa
d,
G-
10/1
Islam
abad
71
ASKB
& C
O As
ghar
Ali
3520
2-23
4026
3-3
Muh
amm
ad Is
1
,425
7
28
93
2
,246
-
-
7
41
741
H# N
o 53
8, S
ituat
ed in
Kam
ran
Bloc
k,
Al
lama
Iqba
l Tow
n, L
ahor
e,
Sr. N
o Na
me
& Ad
dres
s of
the
Borro
wer
Na
me
of In
divid
uals/
Partn
ers/
Dire
ctor
s Fa
ther
’s/Hu
sban
d’s
Nam
e Ou
tsta
ndin
g Li
abilit
ies
at B
egin
ning
of Y
ear
Prin
cipa
l In
tere
st/
Othe
r Fin
. To
tal
Writ
ten
off
Mar
kup
R
elie
fs
Na
me
CNIC
No.
Pr
inci
pal
Intt/
Acc/
Mup
Ot
hers
To
tal
Writ
ten
off
Prov
ided
Stat
emen
t sho
win
g w
ritte
n-of
f loa
ns o
r any
oth
er fi
nanc
ial r
elie
f of fi
ve h
undr
ed th
ousa
nd o
r abo
ve p
rovi
ded
durin
g th
e ye
ar 2
013
(Rs.
in ‘0
00)
ANNEXURE - III

ANNUAL REPORT 2013
206
72
Muh
amm
ad J
amil C
h. /
Hass
an D
in
Muh
amm
ad J
amil C
h 35
200-
1446
992-
9 Ha
ssan
din
1,4
89
2,8
43
29
4
,361
-
-
2
,307
2
,307
59, D
1, J
ohar
Town
Lah
ore
Ch H
assa
n Di
n 35
202-
2595
326-
3 Ch
. Lal
Din
73
Mal
ik M
uham
mad
Han
if Ka
mra
n
Mali
k M
uham
mad
35
201-
9628
354-
1 M
alik
Muh
amm
ad S
harif
-
1,3
65
-
1,3
65
-
-
1,3
65
1,3
65
Mali
k Ho
use,
Bila
l Roa
d La
st M
int
Hanif
Kam
ran
St
op, R
ashid
Pur
a, L
ahor
e
74
M
uham
mad
Sha
hzad
M
uham
mad
Sha
hzad
35
202-
2961
435-
5 Ab
dul G
hafo
or
-
651
-
6
51
-
-
601
6
01
Ho
use
# 22
, Stre
et #
02,
Gru
Arju
m
Ne
ar G
awalm
andi
Laho
re
75
New
Bism
illah
Oil M
ills
Syed
Qas
im H
asna
in 36
302-
3614
025-
1 Pe
rvaiz
Has
main
Naq
vi 9
99
1,2
48
41
2
,288
-
-
8
85
885
Haji S
harif
Chow
k, C
hah
Noba
twala
76
Rao
Kazim
& C
o Ra
o Ka
zim A
li Kha
n 36
302-
2014
155-
1 Ra
o M
ozza
m A
li Kha
n
-
2,1
18
-
2,1
18
-
-
1,5
62
1,5
62
M
azha
r Aba
d Te
hsil D
epalp
ur D
istt O
kara
.
77
CD In
dust
ries
Amjad
Hus
sain
3460
3-22
8512
0-3
Muh
amm
ad R
amza
n 1
,985
2
,177
-
4
,162
-
-
1
,105
1
,105
Near
Jinn
ah Is
lamia
Colle
ge, S
ialko
t
78
Fakh
ar B
roth
ers
Muh
amm
ad Z
aman
34
302-
1264
290-
5 Na
zir A
hmed
-
1
,350
-
1
,350
-
-
1
,350
1
,350
Jalal
pur B
hatti
an, G
ujran
wala
79
Perv
ez A
hmed
Pe
rvez
Ahm
ed
3520
2-56
3783
2-7
S.K.
Ahm
ad
8,4
62
196
5
48
9,2
06
8,4
62
7
44
9,2
06
Se
curit
ies L
imite
d
Ali P
erve
z Ahm
ed
3520
2-86
3378
4-5
Perv
ez A
hmed
20-K
, Gulb
erg-
II,
Mrs
. Reh
ana
Perv
ez A
hmed
35
202-
5904
987-
0
Perv
ez A
hmed
Laho
re.
Hass
an Ib
rahim
Ahm
ad
3520
2-01
0413
6-7
Perv
ez A
hmed
Su
leman
Ahm
ed
3520
2-76
5483
7-5
Perv
ez A
hmed
M
rs. A
yesh
a Ah
med
Man
soor
35
202-
9651
743-
6 M
anso
or N
awaz
M
uham
mad
Kha
lid K
han
3520
2-26
4969
4-3
Mali
k Ka
ram
Dad
Kha
n
80
Mud
asir
Sule
man
,
Mud
asir
Sulem
an
3520
2-23
2037
1-7
Muh
amm
ad S
ulem
an S
h 4
,159
1
,432
4
5
5,6
36
-
-
1,6
78
1,6
78
Ze
esha
n Sh
, She
hzad
Sule
man
Ze
esha
n Sh
35
202-
8470
710-
1 M
uham
mad
Sule
man
Sh
31
2-B
Valan
cia To
wn L
ahor
e Sh
ehza
d Su
lman
Sh
3520
2-95
3997
6-1
Muh
amm
ad S
ulem
an S
h
81
Muh
amam
d Ta
imur
Bai
g M
uham
amd
Taim
ur B
aig
3520
2-27
9847
1-7
Nusr
at P
erav
iz Ba
ig 2
,566
8
03
131
3
,500
-
-
9
30
930
Ho
use
# 9,
Stre
et #
6,M
uham
mad
Nag
ar,
Gu
nj Ba
ksh
Town
, Lah
ore.
Pos
t
offic
e Ra
ilway
Hea
d Qu
arte
rs, L
ahor
e
82
Isra
ar A
hmed
Isr
aar A
hmed
35
202-
4436
001-
9 M
uham
mad
Sidd
ique
5,9
29
1,5
02
135
7
,566
-
-
1
,812
1
,812
134
F Jo
har T
own
Laho
re
83
MM
S Bu
ildin
g M
ater
ial S
tore
Ph
ineha
s Sala
mat
35
202-
1199
855-
1 Sa
lamat
Hee
ra
-
1,1
02
-
1,1
02
-
-
1,1
02
1,1
02
F-
105
Nawa
b Pl
aza
48 S
hadm
an M
arke
t
Laho
re
84
Naee
m S
teel
Cen
ter,
Na
eem
Sad
iq 34
101-
2310
614-
7 Az
iz Ah
med
1
,144
8
17
-
1,9
61
-
-
805
8
05
Ja
vaid
Stee
l Mar
ket,
Gond
alaan
wala
Road
,
Gujra
nwala
85
Hass
an J
alil R
ice,
Ha
ssan
Jali
l 34
101-
5683
041-
9 Ab
dul J
alil
1,8
80
1,2
85
-
3,1
65
-
-
1,2
27
1,2
27
Gh
alla
Man
di W
azira
bad
86
Asif
Trad
ers
Faqir
Muh
amm
ad
3530
1-19
7559
8-1
Shah
Muh
amm
ad
-
573
-
5
73
-
-
573
5
73
H.
No.
602
, Yas
ir Bl
ock
Nish
ter C
olony
, Lah
ore
87
SM S
ulm
an &
Co
Sheik
h Kh
alid
Rafiq
ue
3740
5-67
2590
7-9
Sheik
h M
. Rafi
que
-
1,2
19
27
1
,246
-
-
1
,246
1
,246
H#49
Stre
et 4
, Offic
er c
olony
Wes
trage
III,
Ra
walpi
ndi
88
KM J
ewel
ers
Khali
d M
ehm
ood
3740
5-90
2469
8-9
Sher
Muh
amm
ad
5,5
89
2,1
47
35
7
,771
-
-
1
,977
1
,977
Mur
ree
Road
Raw
alpind
i
Sr. N
o Na
me
& Ad
dres
s of
the
Borro
wer
Na
me
of In
divid
uals/
Partn
ers/
Dire
ctor
s Fa
ther
’s/Hu
sban
d’s
Nam
e Ou
tsta
ndin
g Li
abilit
ies
at B
egin
ning
of Y
ear
Prin
cipa
l In
tere
st/
Othe
r Fin
. To
tal
Writ
ten
off
Mar
kup
R
elie
fs
Na
me
CNIC
No.
Pr
inci
pal
Intt/
Acc/
Mup
Ot
hers
To
tal
Writ
ten
off
Prov
ided
Stat
emen
t sho
win
g w
ritte
n-of
f loa
ns o
r any
oth
er fi
nanc
ial r
elie
f of fi
ve h
undr
ed th
ousa
nd o
r abo
ve p
rovi
ded
durin
g th
e ye
ar 2
013
(Rs.
in ‘0
00)
ANNEXURE - III

207
89
Muh
amm
ad R
afiq
& M
rs. T
ahira
Rafi
q
Muh
amm
ad R
afiq
4220
1-02
1837
4-1
bdul
Satta
r -
3
,142
8
7
3,2
29
-
-
3,2
29
3,2
29
Hous
e #
16/4
01, 2
6th
Stee
t, Bl
ock-
3, B
ahad
ur
Tahir
a Ra
fiq
4220
1-88
6895
0-0
AMuh
amm
ad R
afiq
Ya
r Jan
g Co
-ope
rativ
eHou
sing
Socie
ty, K
arac
hi
90
M.A
li Ent
erpr
ises
M
uham
mad
Ali K
ashif
42
101-
1888
129-
1 Sy
ed A
bdul
Wah
ab
3,9
14
3,4
53
28
7
,395
-
-
3
,170
3
,170
Shop
# B
S-02
Bloc
k 18
, F.B
. Are
a, K
arac
hi.
91
Yam
saw
Tra
ding
Sa
diq H
ussa
in 42
201-
8592
145-
7 Kh
alid
Huss
ain
4,0
90
3,5
92
31
7
,713
-
-
3
,965
3
,965
Suit #
209
, Asia
Pac
ific Tr
ade
Cent
er,
Bl
ock-
19, G
ulist
an-e
-Joh
ar, K
arac
hi.
92
Maq
bool
Ste
el R
e Ro
lling
Mill
Moe
en M
aqbo
ol 42
301-
6012
048-
7
Maq
bool
Elah
i 1
0,99
2
7,0
56
3,8
76
21,
924
-
-
1
1,74
0 11
,740
Daro
ghaw
ala B
und
Road
Lah
ore
Mob
een
Maq
bool
4200
2-25
2535
3-3
Moe
en M
aqbo
ol
93
Shah
baz
Ente
rpris
es
Shah
baz N
oor
3520
2-83
8538
3-5
Noor
Muh
amm
ad
1,5
32
1,6
02
156
3
,290
-
-
1
,107
1
,107
165-
S DH
A La
hore
94
Bach
ani S
ugar
Mills
Lim
ited
Abdu
l Sat
tar B
acha
ni 45
4-57
-081
913
Haji M
uham
mad
Sum
ar
2,6
07
19,
250
2
4
21,
881
2
,028
-
1
9,32
2
21,3
49
De
h, C
hhac
hh, T
appo
Cha
mba
r,
Abdu
l Sha
koor
Ans
ari
4130
1-38
1981
4-3
Ahm
ed K
han
Ansa
ri
Taluk
a an
d Su
b Ta
luka
and
Sub
Cd
r. (R
td.)
Najam
uddin
42
301-
6082
677-
1 M
uham
mad
Sae
ed
Di
stt.
Tand
o Al
lahya
r, Di
stt.H
yder
abad
, Sind
h.
Ansa
ri
4130
7-04
3262
2-3
Muh
amm
ad S
oom
ar
Abdu
l Jali
l Bac
hani
4130
3-40
9262
8-5
Muh
amm
ad S
oom
ar
Noor
-ul-A
min
Bach
ani
4230
1-50
0517
2-5
Haji A
bdull
ah
Sulem
an A
. Mem
on
4230
1-32
9129
4-7
Abdu
l Lat
if Ans
ari
Tariq
Lat
if Ans
ari
95
Rao
Jave
d Ya
sin
Rao
Jave
d Ya
sin
3520
1-01
7466
9-9
Rao
Moh
amm
aad
Yase
en
5,6
03
2,2
37
38
7
,878
-
-
2
,173
2
,173
97/8
0 Ni
sar C
olony
Lah
ore
Cant
t Pe
rvee
n Ta
wab
3520
1-26
3788
5-4
Rao
Abdu
l Taw
ab K
han
96
Sh
ahid
Mah
moo
d &
Riffa
t Sha
hid
Shah
id M
ahm
ood
3520
2-84
6379
9-1
Muh
amm
ad b
ashir
1
,079
-
2
0
1,0
99
-
-
1,0
93
1,0
93
H.
No.
01,
Sab
ri Es
tate
Nea
r Calt
ex
Riffa
t Sha
hid
3520
2-17
0619
3-8
Rafa
qat
De
pot P
hatk
i, Kot
Lak
hpat
, Lah
ore
97
Muh
amm
ad R
amza
n M
uham
mad
Ram
zan
3310
4-22
3416
4-9
Shah
zad
Khan
1
,892
1
,285
6
8
3,2
45
-
-
925
9
25
Sa
tiana
Ban
glow-
Jar
anwa
la Ro
ad, 3
Km,
Sa
tiana
Ban
glow.
98
Ham
za T
rade
r Ra
na M
. Ash
raf
3410
4-51
2093
4-7
Meh
moo
d-ul-
Hass
an
2,0
00
581
2,5
81
-
-
708
7
08
loc
ated
Bad
doke
Gos
anya
n, G
hakh
ar
99
Man
zoor
Ella
hi
Man
zoor
Ella
hi 61
101-
4574
483-
7 M
ehbo
ob E
llahi
643
1
,464
8
4
2,1
91
-
-
1,5
21
1,5
21
H
#109
, St #
25, S
ect G
-10/
1, Is
lamab
ad
100
Syed
Muh
amm
ad A
bbas
& Qu
ddos
i Beg
um
Syed
Muh
amm
ad A
bbas
42
201-
7130
077-
3 Qa
zi Af
tab
Ahm
ed
-
1,6
36
130
1
,766
-
-
1
,636
1
,636
Bloc
k 6,
KDA
Sch
eme
# 24
, Kar
achi.
Ho
use
# B-
114,
Guls
han
e Iq
bal,
Qu
ddos
i Beg
um
4220
1-88
5381
9-8
Syed
Muh
amm
ad A
bbas
101
Khus
ro B
in S
afda
r Kh
usro
Bin
Safd
ar
3520
2-27
0052
1-9
M S
afda
r 5
,599
2
,431
4
5
8,0
75
-
-
2,7
65
2,7
65
H.
No.
60,
Opp
. Q B
lock
Mod
el To
wn
Ex
t Ede
n Vi
llas,
Laho
re
102
Muh
amm
ad A
wai
s Sh
. M
uham
mad
Awa
is Sh
35
202-
1040
965-
7 M
uham
mad
Hus
sain
Sh.
1,1
89
743
1
55
2,0
87
-
-
748
7
48
Ho
use
No: 3
14, B
lock
B, P
akist
an E
xpat
riate
s
Co-O
p Ho
using
Soc
iety L
td
(V
alanc
ia To
wn) L
ahor
e
103
Itteh
ad Z
ari C
orpo
ratio
n
Din
Muh
amm
ad S
hakir
36
603-
9688
059-
7 Ch
. Muh
amm
ad Y
ousa
f 3
,867
1
,269
9
4
5,2
30
-
-
1,5
11
1,5
11
Pu
ll Thin
gi Di
stt.
Veha
ri Ab
dul S
atta
r 36
602-
0989
065-
5 Ch
. Fat
eh M
uham
mad
104
Fron
tier C
eram
ics
Lim
ited
Nade
em K
halid
37
405-
0319
058-
5 Na
seer
Kha
lid
-
2,7
31
-
2,7
31
-
-
2,7
31
2,7
31
29
-Indu
stria
l Est
ate,
Jam
rood
Roa
d,
Pesh
awar.
Am
eera
Kha
lid
3740
5-13
7808
9-0
Nade
em K
halid
Om
er K
halid
37
405-
3852
551-
5 Na
deem
Kha
lid
Jave
d Kh
alid
6110
1-25
4640
2-9
Nase
er K
halid
Zia
Kha
lid
3740
5-92
4280
8-5
Jave
d Kh
alid
Shaz
ia Kh
alid
3740
5-12
6574
0-8
Jave
d Kh
alid
Nam
-ud-
Din
3740
5-21
2993
7-1
Alee
m -u
d-Di
n
Sr. N
o Na
me
& Ad
dres
s of
the
Borro
wer
Na
me
of In
divid
uals/
Partn
ers/
Dire
ctor
s Fa
ther
’s/Hu
sban
d’s
Nam
e Ou
tsta
ndin
g Li
abilit
ies
at B
egin
ning
of Y
ear
Prin
cipa
l In
tere
st/
Othe
r Fin
. To
tal
Writ
ten
off
Mar
kup
R
elie
fs
Na
me
CNIC
No.
Pr
inci
pal
Intt/
Acc/
Mup
Ot
hers
To
tal
Writ
ten
off
Prov
ided
Stat
emen
t sho
win
g w
ritte
n-of
f loa
ns o
r any
oth
er fi
nanc
ial r
elie
f of fi
ve h
undr
ed th
ousa
nd o
r abo
ve p
rovi
ded
durin
g th
e ye
ar 2
013
(Rs.
in ‘0
00)
ANNEXURE - III
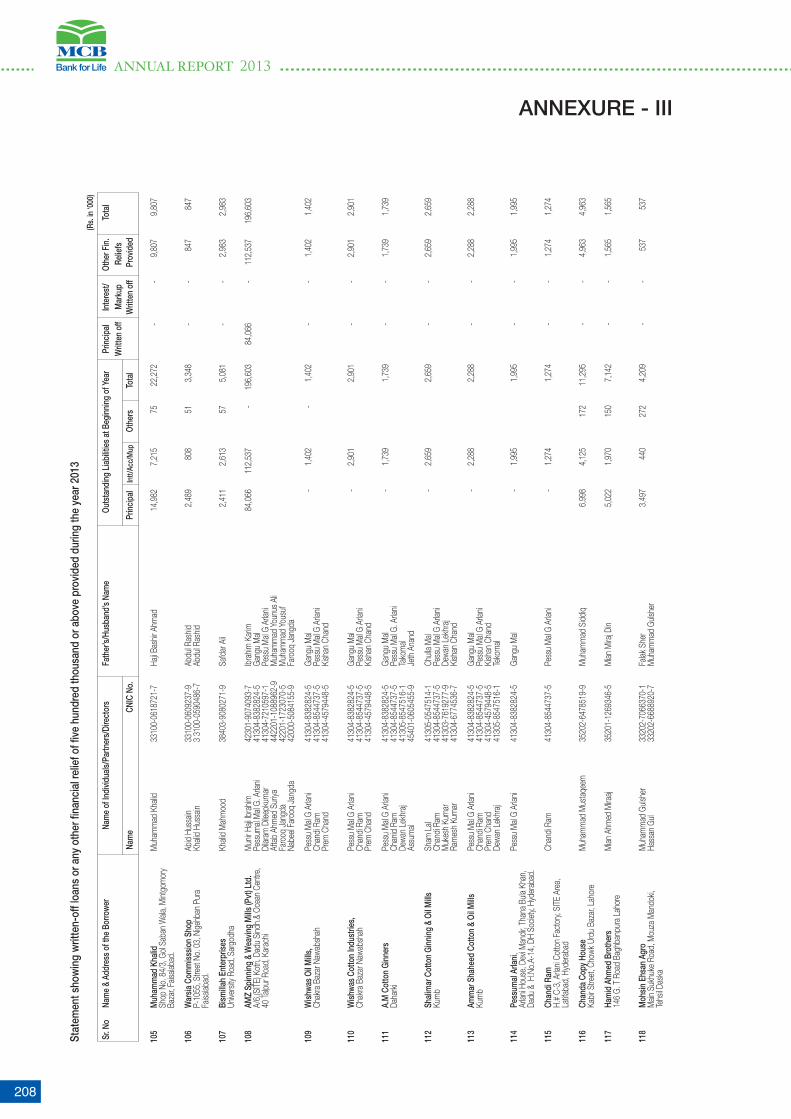
ANNUAL REPORT 2013
208
105
Muh
amm
ad K
halid
M
uham
mad
Kha
lid
3310
0-06
1872
1-7
Haji B
ashir
Ahm
ad
14,
982
7
,215
7
5
22,
272
-
-
9
,807
9
,807
Shop
No.
84/
3, G
ol Sa
ban
Wala
, Mint
gom
ory
Ba
zar,
Faisa
labad
.
106
War
sia C
omm
isssio
n Sh
op
Abid
Huss
ain
3310
0-06
0923
7-9
Abdu
l Ras
hid
2,4
89
808
5
1
3,3
48
-
-
847
8
47
P-
1055
, Stre
et N
o. 0
3, N
igehb
an P
ura
Khali
d Hu
ssain
3
3100
-059
0486
-7
Abdu
l Ras
hid
Faisa
labad
.
107
Bism
illah
Ente
rpris
es
Khali
d M
ahm
ood
3840
3-90
8027
1-9
Safd
ar A
li 2
,411
2
,613
5
7
5,0
81
-
-
2,9
83
2,9
83
Un
ivers
ity R
oad,
Sar
godh
a
108
AMZ
Spin
ning
& W
eavin
g M
ills (P
vt) L
td.
M
unir
Haji I
brah
im
4230
1-90
7409
3-7
Ibra
him K
arim
8
4,06
6
112
,537
-
1
96,6
03
84,
066
-
1
12,5
37
196,
603
A/
6,(S
ITE)
Kot
ri, D
adu
Sind
h.&
Ocea
n Ce
ntre
, Pe
ssum
al M
al G.
Arla
ni 41
304-
8382
824-
5 Ga
ngu
Mal
40
Talpu
r Roa
d, K
arac
hi Di
laram
Dile
epku
mar
41
304-
7210
597-
1 Pe
ssu
Mal
G Ar
lani
Afta
b Ah
med
Sur
iya
4422
01-1
0889
62-9
M
uham
mad
You
nus A
li
Fa
rooq
Jan
gda
4220
1-17
2307
0-5
Muh
amm
ad Y
ousu
f
Na
beel
Faro
oq J
angd
a 42
000-
5084
155-
9 Fa
rooq
Jan
gda
109
Wish
was
Oil M
ills,
Pess
u M
al G
Arlan
i 41
304-
8382
824-
5 Ga
ngu
Mal
-
1
,402
-
1
,402
-
-
1
,402
1
,402
Chak
ra B
azar
Naw
absh
ah
Chan
di Ra
m
4130
4-85
4473
7-5
Pess
u M
al G
Arlan
i
Pr
em C
hand
41
304-
4579
448-
5 Ki
shan
Cha
nd
110
Wish
was
Cot
ton
Indu
strie
s,
Pess
u M
al G
Arlan
i 41
304-
8382
824-
5 Ga
ngu
Mal
-
2
,901
2,9
01
-
-
2,9
01
2,9
01
Ch
akra
Baz
ar N
awab
shah
Ch
andi
Ram
41
304-
8544
737-
5 Pe
ssu
Mal
G Ar
lani
Prem
Cha
nd
4130
4-45
7944
8-5
Kish
an C
hand
111
A.M
Cot
ton
Ginn
ers
Pess
u M
al G
Arlan
i 41
304-
8382
824-
5 Ga
ngu
Mal
-
1
,739
1,7
39
-
-
1,7
39
1,7
39
Da
hark
i Ch
anid
Ram
41
304-
8544
737-
5 Pe
ssu
Mal
G. A
rlani
Dewa
n Le
khra
j 41
305-
8547
516-
1 Ta
kom
al
As
sum
al 45
401-
0605
455-
9 Je
th A
nand
112
Shal
imar
Cot
ton
Ginn
ing
& Oi
l Mills
Sh
am L
al 41
305-
0547
514-
1 Ch
ulla
Mal
-
2,6
59
2
,659
-
-
2
,659
2
,659
Kum
b Ch
andi
Ram
41
304-
8544
737-
5 Pe
ssu
Mal
G Ar
lani
Muk
esh
Kum
ar
4130
3-76
1927
7-9
Dewa
n Le
khra
j
Ra
mes
h Ku
mar
41
304-
6774
536-
7 Ki
shan
Cha
nd
113
Amm
ar S
hahe
ed C
otto
n &
Oil M
ills
Pess
u M
al G
Arlan
i 41
304-
8382
824-
5 Ga
ngu
Mal
-
2
,288
2,2
88
-
-
2,2
88
2,2
88
Ku
mb
Chan
di Ra
m
4130
4-85
4473
7-5
Pess
u M
al G
Arlan
i
Pr
em C
hand
41
304-
4579
448-
5 Ki
shan
Cha
nd
Dewa
n Le
khra
j 41
305-
8547
516-
1 Te
kom
al
114
Pess
umal
Arla
ni,
Pess
u M
al G
Arlan
i 41
304-
8382
824-
5 Ga
ngu
Mal
-
1
,995
1,9
95
-
-
1,9
95
1,9
95
Ar
lani H
ouse
, Dev
i Man
dir, T
hana
Bula
Kha
n,
Da
du &
H.N
o.A-
14, D
H So
ciety,
Hyd
erab
ad.
115
Chan
di R
am
Chan
di Ra
m
4130
4-85
4473
7-5
Pess
u M
al G
Arlan
i -
1
,274
1,2
74
-
-
1,2
74
1,2
74
H.
# C-
3, A
rlani
Cotto
n Fa
ctor
y, SI
TE A
rea,
Latifa
bad,
Hyd
erab
ad
116
Chan
da C
opy
Hous
e M
uham
mad
Mus
taqe
em
3520
2-64
7851
9-9
Muh
amm
ad S
iddiq
6,9
98
4,1
25
172
1
1,29
5
-
-
4,9
63
4,9
63
Ka
bir S
treet
, Cho
wk U
rdu
Baza
r, La
hore
117
Ham
id A
hmed
Bro
ther
s M
ian A
hmed
Mira
aj 35
201-
1269
346-
5 M
ian M
iraj D
in 5
,022
1
,970
1
50
7,1
42
-
-
1,5
65
1,5
65
14
6 G.
T R
oad
Bagh
banp
ura
Laho
re
118
Moh
sin E
hsan
Agr
o M
uham
mad
Guls
her
3320
2-70
6637
0-1
Falak
She
r 3
,497
4
40
272
4
,209
-
-
5
37
537
Main
Suk
huke
Roa
d, M
ouza
Man
doki,
Ha
ssan
Gul
33
202-
6688
920-
7 M
uham
mad
Guls
her
Te
hsil D
aska
Sr. N
o Na
me
& Ad
dres
s of
the
Borro
wer
Na
me
of In
divid
uals/
Partn
ers/
Dire
ctor
s Fa
ther
’s/Hu
sban
d’s
Nam
e Ou
tsta
ndin
g Li
abilit
ies
at B
egin
ning
of Y
ear
Prin
cipa
l In
tere
st/
Othe
r Fin
. To
tal
Writ
ten
off
Mar
kup
R
elie
fs
Na
me
CNIC
No.
Pr
inci
pal
Intt/
Acc/
Mup
Ot
hers
To
tal
Writ
ten
off
Prov
ided
Stat
emen
t sho
win
g w
ritte
n-of
f loa
ns o
r any
oth
er fi
nanc
ial r
elie
f of fi
ve h
undr
ed th
ousa
nd o
r abo
ve p
rovi
ded
durin
g th
e ye
ar 2
013
(Rs.
in ‘0
00)
ANNEXURE - III

209
119
Haro
on T
rade
rs
Muh
amm
ad A
fzal
3430
1-03
3325
4-1
Muh
amm
ad In
ayat
4
,666
1
,401
1
25
6,1
92
-
-
981
9
81
Al
i Aba
d, Te
hsil &
Dist
rict H
afiza
bad.
Ej
az M
ehm
ood
34
301-
0418
077-
7 Na
wab
Din
120
Naya
b Ri
ce M
ills
Aman
Ulla
h Kh
an
3440
3-83
6554
3-5
Tufa
il Muh
amm
ad
3,3
71
2,2
18
100
5
,689
-
-
2
,001
2
,001
Riak
e, Te
hsil P
halia
.
121
Mal
ik A
wai
s Pl
astic
M
uham
mad
Awa
is 35
200-
1533
519-
3 M
uham
mad
Fay
yaz
2,5
60
1,2
13
75
3
,848
-
-
1
,212
1
,212
Bark
at P
ura,
Lah
ore
122
Abdu
l Rau
f Ab
dul R
auf
3520
2-36
9072
4-7
Sira
j Din
299
5
73
72
9
44
-
-
636
6
36
H
No 4
9-B,
Mila
t Stre
et
No 3
, Has
san
Town
,
Mult
an R
oad,
Lah
ore
123
Mat
loob
Hus
sain
Jinna
h Co
lony,
Jhelu
m
Mat
loob
Huss
ain
3730
1-23
5592
7-5
Muh
amm
ad M
oula
Dad
4,1
00
1,8
21
-
5,9
21
-
-
1,9
57
1,9
57
124
Muh
amm
ad S
arfra
z Kh
an
Muh
amm
ad S
arfra
z Kha
n 61
101-
1948
209-
3 Ga
hra
Khan
1
,102
5
,178
2
02
6,4
82
1,1
02
-
5,3
80
6,4
82
H.
No.
27-
A, S
treet
No.
02
Sect
or F
-8/3
,
Islam
abad
125
Shab
ana
Asla
m
Shab
ana
Aslam
61
101-
6607
110-
4 W
/o C
h. M
uham
mad
Asla
m
14,
945
4
,412
1
88
19,
545
-
-
5
,253
5
,253
H. N
o. 3
72, S
treet
No.
26,
I-8/
2, Is
lamab
ad
126
Mas
s En
terp
rises
Dr
. Tar
iq M
ahm
ood
278-
5942
564-
8 Ab
dul H
amee
d Kh
an
2,1
50
1,8
50
247
4
,247
-
-
2
,231
2
,231
Bloc
k No
. 53,
Offic
e #
3, 1
st F
loor,
F-6/
G-6,
Ea
rnes
t Pau
l 24
4-92
0097
4-4
E Ja
ckub
F
azal-
e-Ha
q Ro
ad, I
slam
abad
Sh
. Muh
amm
ad A
kram
61
101-
6144
2485
-9
Sh. M
uham
mad
Naz
ir
127
Bism
illah
Petro
leum
Ser
vices
M
oham
mad
Nad
eem
37
102-
1219
959-
3 De
en M
oham
mad
2
,800
5
55
55
3
,410
-
-
7
71
771
Baht
ar R
oad,
Villa
ge B
ehlol
Tehs
il
Fate
hjang
Dist
rict A
ttock
128
Fine
Foo
d Co
rpor
atio
n,
Nazim
Hus
sain
3120
2-94
9996
2-1
Muh
amm
ad S
ultan
2
79
958
2
3
1,2
60
-
-
669
6
69
90
-A, M
ouza
Der
a Izz
at, A
hmed
pur E
ast R
oad,
Ba
hawa
lpur.
129
Abdu
l Qad
ir &
Narg
is
Abdu
l Qad
ir 42
301-
0994
775-
7 Ab
dul A
ziz
196
6
63
-
859
-
-
6
66
666
Shop
# 1
2, S
tar M
arke
t, Qu
eens
Cou
rt
Road
, Off
Abdu
llah
Haro
on R
oad,
Kar
achi.
130
Baw
ajee
Fou
ndry
M
uham
mad
Asla
m
3320
2-12
0781
1-3
Muh
amm
ad R
amza
n -
6
80
47
7
27
-
-
580
5
80
Da
rbar
Alia
Haz
rat S
heikh
Joh
ar P
uran
a
Chini
ot R
oad,
Tehs
il Dist
. Jha
ng
131
Al K
alee
m Te
nt S
ervic
e Gh
ulam
Muh
amm
ad
3830
2-11
9234
8-3
Muh
amm
ad S
iddiqu
e 7
91
1,0
75
39
1
,905
-
-
8
65
865
Moh
allah
Moh
ane
Khel,
Moo
ch, M
ianwa
li
132
Muh
amm
ad A
slam
& M
uham
mad
Ali
Muh
amm
ad A
slam
38
403-
8072
118-
7 Gh
ulam
Haid
er
-
627
6
2
689
-
-
6
89
689
Mur
adab
ad, U
niver
sity R
oad,
Sar
godh
a M
uham
mad
Ali
3840
3-12
5354
6-3
Muh
amm
ad A
slam
133
Anw
ar M
asoo
d An
war M
asoo
d 38
302-
2122
880-
7 Sh
er M
uham
mad
9
36
512
8
6
1,5
34
-
-
514
5
14
Ho
use
No. 3
76, M
ailk
Muz
affar
Stre
et, M
ianwa
li
134
Asfa
nd P
etro
leum
Ser
vice
Muh
amm
ad A
mee
r Kha
n 38
302-
1337
071-
1 M
uham
mad
Yaq
oob
Khan
-
1
,426
-
1
,426
-
-
7
13
713
Moh
alla
Sard
arkh
el, M
ooch
, Mian
wali
135
Qaise
r & C
o.
M. A
kbar
34
301-
7337
625-
5 Za
hoor
Ahm
ed
276
1
,043
1,3
19
-
-
798
7
98
Lis
ani R
ice M
ills, Q
ila B
aipas
s, Ha
fizab
ad
136
Asad
rice
Mills
M
. Man
sha
3430
1-17
4059
9-7
Haji G
hulam
Hus
sain
943
1
,150
2,0
93
-
-
993
9
93
Ko
t Mub
arak
, Hafi
zaba
d
Sr. N
o Na
me
& Ad
dres
s of
the
Borro
wer
Na
me
of In
divid
uals/
Partn
ers/
Dire
ctor
s Fa
ther
’s/Hu
sban
d’s
Nam
e Ou
tsta
ndin
g Li
abilit
ies
at B
egin
ning
of Y
ear
Prin
cipa
l In
tere
st/
Othe
r Fin
. To
tal
Writ
ten
off
Mar
kup
R
elie
fs
Na
me
CNIC
No.
Pr
inci
pal
Intt/
Acc/
Mup
Ot
hers
To
tal
Writ
ten
off
Prov
ided
Stat
emen
t sho
win
g w
ritte
n-of
f loa
ns o
r any
oth
er fi
nanc
ial r
elie
f of fi
ve h
undr
ed th
ousa
nd o
r abo
ve p
rovi
ded
durin
g th
e ye
ar 2
013
(Rs.
in ‘0
00)
ANNEXURE - III

ANNUAL REPORT 2013
210
137
Abdu
l Ale
em K
han
& Br
othe
rs
Abdu
l Alee
m K
han
3430
1-41
6868
5-3
Asgh
ar K
han
-
1,7
81
1
,781
-
-
1
,382
1
,382
Ghall
a M
andi
esat
, Hafi
zaba
d
138
Tariq
Tra
ders
Ar
if Meh
moo
d 34
104-
5120
934-
7 M
ehm
ood-
ul-Ha
ssan
2
,610
1
,029
3,6
39
-
-
1,1
60
1,1
60
Ba
ddok
e Go
sany
an, G
hakh
ar
139
Shah
zad
Sarw
ar a
t Moh
alla
h Po
rain
Ruk
kan,
Sh
ahza
d Sa
rwar
34
401-
2630
180-
1 M
. Sar
war
2,4
97
1,2
89
19
3
,805
-
-
9
99
999
Tehs
il Mala
kwal,
Dist
t Man
di Ba
haud
din
140
Mea
sam
Ric
e M
ills
Awais
Hay
at
3430
2-98
8245
2-7
Mian
Khiz
ar H
ayar
-
1
3,66
9
1
3,66
9
-
-
11,
169
1
1,16
9
Hafiz
abad
Roa
d, J
alalpu
r Bh
atta
in,
Qadir
Bux
34
302-
1220
737-
7 M
ian K
hizar
Hay
ar
Dist
rict H
afiza
bad
141
Shah
zad
Sidd
ique
Prin
ters
M
uham
mad
Sidd
ique
3310
2-17
7596
2-7
Muh
amm
ad B
ukhs
h -
1
,340
-
1
,340
-
-
1
,140
1
,140
59-M
ehm
ooda
bad,
Sha
dman
Roa
d, F
aisala
bad.
142
Nase
er A
hmed
Na
seer
Ahm
ad
3520
2-95
3974
2-9
Bash
ir Ah
mad
2
,017
9
24
-
2,9
41
-
-
810
8
10
Ho
use
# 14
5/6,
She
r Sha
h Ro
ad, S
had
Bagh
,
Laho
re
143
Qudr
at u
llah
Qu
drat
ulla
h
3520
2-54
5798
7-7
Ghula
m N
abi
3,0
32
2,6
59
-
5,6
91
-
-
1,6
72
1,6
72
24
Kam
ran
Bloc
k, A
llam
a Iq
bal T
own,
Lah
ore
144
Mal
ik K
halid
Meh
moo
d
Mali
k Kh
alid
meh
moo
d 35
202-
2862
435-
3 M
alik
Mira
j-Ud-
Din
1,7
50
853
-
2
,603
-
-
5
28
528
Hous
e #
53, B
lock
G, G
ulsha
n-e-
Ravi,
Lah
ore
145
Salm
an A
sgha
r & M
. Asg
har
Salm
an A
sgha
r 35
202-
2764
087-
7 M
uham
mad
Asg
har
1
2,0
99
70
2
,170
-
-
2
,167
2
,167
Hous
e #
84, M
ahar
Lab
ha R
Cha
h M
iran
Faza
l M
uham
mad
Asg
har
3520
2-91
5333
6-3
Labh
a
Town
, Lah
ore
146
Sunl
ite T
rade
rs
Nawa
b M
ashiu
ddin
4220
1-05
5896
6-9
Muh
amm
ad S
alahu
ddin
-
1,0
71
1
,071
-
-
1
,071
1
,071
Nawa
b M
ashiu
ddin
& M
usht
ri Be
gum
B-1
10,
A
fnan
Arc
ade,
Bloc
k-15
, Guli
stan
-e-J
auhe
r,
Kara
chi
147
Shah
id Iq
bal &
Muh
amm
ad S
harif
Sh
ahid
Iqba
l 42
301-
3684
817-
5 M
uham
mad
Sha
rif 2
,113
4
,416
1
00
6,6
29
-
-
4,5
32
4,5
32
13
B/1
, Kha
yaba
n-e-
Badb
an, P
hase
-VII,
DHA,
Kar
achi.
148
Muh
amm
ad N
awaz
, M
uham
mad
Naw
az
4210
1-13
7940
5-1
Muh
amm
ad A
mee
r 2
,292
6
46
-
2,9
38
-
-
983
9
83
Ho
use
# R-
809,
Sec
tor 1
5A/3
, Buf
ferz
one,
Kara
chi
149
Man
zoor
Ahm
ed,
Man
zoor
Ahm
ed
3310
0-93
4321
1-9
Haji A
bdul
Latif
-
1,0
61
449
1
,510
-
-
6
89
689
H. N
o 12
Y, L
. Mad
ina To
wn, N
ear G
ovt G
irls
Co
llege
, Fais
alaba
d
150
Soha
il Anw
ar P
asha
Kha
n,
Soha
il Anw
ar P
asha
Kha
n 35
201-
3600
206-
9 An
war U
r Haq
Kha
n -
7
67
484
1
,250
-
-
7
81
781
Moh
alah
Bast
i Pat
hana
, War
d# 2
, Ka
nna
Ne
w, L
ahor
e
151
Zuba
ida
Vira
ni,
Zuba
ida V
irani
4220
1-02
8277
3-6
Nadir
Sha
h Vi
rani
1,1
27
-
-
1,1
27
-
-
6,9
11
6,9
11
Fla
t # N
-17,
Picn
ic Ah
ys K
han
Colon
y, Ga
rden
East
Nea
r Agh
a Kh
an,
Gy
m K
hana
, Kar
achi
152
Muh
amm
ad Is
haq
M
uham
mad
Isha
q 54
400-
8409
149-
1 Kh
uda
Buks
h 9
44
552
-
1
,496
-
677
6
77
St
reet
No
5 Bi
lal C
olony
Sat
ellite
Town
- Qu
etta
Sr. N
o Na
me
& Ad
dres
s of
the
Borro
wer
Na
me
of In
divid
uals/
Partn
ers/
Dire
ctor
s Fa
ther
’s/Hu
sban
d’s
Nam
e Ou
tsta
ndin
g Li
abilit
ies
at B
egin
ning
of Y
ear
Prin
cipa
l In
tere
st/
Othe
r Fin
. To
tal
Writ
ten
off
Mar
kup
R
elie
fs
Na
me
CNIC
No.
Pr
inci
pal
Intt/
Acc/
Mup
Ot
hers
To
tal
Writ
ten
off
Prov
ided
Stat
emen
t sho
win
g w
ritte
n-of
f loa
ns o
r any
oth
er fi
nanc
ial r
elie
f of fi
ve h
undr
ed th
ousa
nd o
r abo
ve p
rovi
ded
durin
g th
e ye
ar 2
013
(Rs.
in ‘0
00)
ANNEXURE - III

211
153
Muh
amm
ad Id
rees
M
uham
mad
Idre
es
3740
5-44
1093
9-7
Muh
amm
ad S
harif
16,
144
9
,591
-
2
5,73
4
-
2
,792
2
,792
12, A
rmy O
fficer
Hou
sing
Colon
y, Na
tiona
l
Park
Roa
d, R
awalp
indi
154
Muh
amm
ad Q
adee
r Mir
Muh
amm
ad Q
adee
r Mir
3520
2-32
7659
0-3
Muh
amm
ad B
ashir
8
08
360
-
1
,167
-
-
5
63
563
15
5 Fa
heem
Ud
Din
Ahm
ed,
Fahe
em U
d Di
n Ah
med
42
101-
1427
892-
9 Ra
fee
Ud D
in Ah
mad
9
8
988
-
1
,085
9
8
-
445
5
43
H
No B
49
Bloc
k 14
Guli
stan
-E-J
ohar
Kar
achi
156
Muh
amm
ad A
kram
M
uham
mad
Akr
am
3230
4-98
4828
5-3
Khud
a Bu
ksh
918
3
56
-
1,2
74
-
-
531
5
31
Vi
ctor
ia Pa
rk N
ear N
estle
Offic
e,
Be
don
Road
, Lah
ore
157
Muh
amm
ed H
anif
Pare
kh
Muh
amm
ed H
anif P
arek
h 42
101-
5980
163-
3 M
uham
med
Qas
sim P
arek
h 2
,899
7
61
-
3,6
60
-
-
1,4
30
1,4
30
A-
99 B
lock
R Bo
mba
y Tow
n, S
hahr
ahe
Noor
Jeha
n Na
zimab
ad K
arac
hi
158
Nasir
Zaf
ar
Nasir
Zaf
ar
3740
5-02
6084
4-1
Zafa
r Meh
moo
d Kh
an
17,
562
1
95
-
17,
757
-
-
7
92
792
H No
227
/3, A
l Azm
at K
hadim
Hus
sain
Ro
ad, R
awalp
indi
159
Muh
amm
ad A
sim K
han
M
uham
mad
Asim
Kha
n 42
101-
1632
392-
3 M
uham
mad
Asla
m K
han
2,0
13
1,1
05
-
3,1
18
-
-
4,0
38
4,0
38
Ho
use
# A-
332
Bloc
k 12
F B
Are
a Ka
rach
i
160
Aziz
Lakh
ani
Az
iz La
khan
i 42
101-
1733
748-
7 Ab
dul R
ahim
Lak
hani
686
3
68
-
1,0
54
-
-
776
7
76
2n
d Flo
or P
rime
Cent
re C
s 25
F B
Area
Nea
r
Bhaij
an C
howk
Kar
achi
161
Shah
id P
erva
iz
Shah
id Pe
rvaiz
35
201-
3147
216-
5 Na
zir A
hmed
2
,098
3
71
-
2,4
68
-
-
878
8
78
H
# 6,
St#
6, N
ew C
anal
Point
,
Harb
ansp
ura,
Lah
ore
162
Rafa
t Yaz
dan
Sidd
iqui
, Ra
fat Y
azda
n Si
ddiqu
i 42
301-
8385
149-
1 An
is Ah
med
Sidd
iqui
191
1
0
-
201
-
-
1
,219
1
,219
H# A
-17,
(St-1
6), K
DA K
ehka
shan
Clift
on,
Bl
ock
5, K
arac
hi
163
Muh
amm
ad A
min
, M
uham
mad
Am
in 42
000-
0411
980-
1 Ay
ub
4,0
23
4,8
26
-
8,8
48
-
-
7,9
24
7,9
24
Fla
t# J
m-2
25, G
roun
d #
01, H
ira Te
rrace
, Am
il
Colon
y, Ga
rden
Eas
t, Ka
rach
i
164
M A
slam
M
Asla
m
3520
2-55
0556
8-1
Anay
at A
li 3
,745
1
,798
-
5
,543
-
-
1
,069
1
,069
423,
Bloc
k 1,
Sec
tor C
1,To
wnsh
ip, L
ahor
e
165
Was
eem
Akh
tar
Was
eem
Akh
tar
4220
1-77
6571
2-7
Sulta
n Ak
htar
7
,909
5
40
-
8,4
49
-
-
2,0
50
2,0
50
R-
6 St
ar S
helta
r Bloc
k 8
Gulis
tan
E
Joha
r Kar
achi
166
Muh
amm
ad S
hoai
b M
uham
mad
Sho
aib
3520
2-44
9088
0-7
Muh
amm
ad S
hafi
2,8
46
325
-
3
,171
-
-
1
,741
1
,741
24
5-J2
, Wap
da To
wn, L
ahor
e
4
96,9
83
477
,816
1
4,09
8
988
,898
1
50,0
79
-
492
,712
6
42,7
91
Sr. N
o Na
me
& Ad
dres
s of
the
Borro
wer
Na
me
of In
divid
uals/
Partn
ers/
Dire
ctor
s Fa
ther
’s/Hu
sban
d’s
Nam
e Ou
tsta
ndin
g Li
abilit
ies
at B
egin
ning
of Y
ear
Prin
cipa
l In
tere
st/
Othe
r Fin
. To
tal
Writ
ten
off
Mar
kup
R
elie
fs
Na
me
CNIC
No.
Pr
inci
pal
Intt/
Acc/
Mup
Ot
hers
To
tal
Writ
ten
off
Prov
ided
Stat
emen
t sho
win
g w
ritte
n-of
f loa
ns o
r any
oth
er fi
nanc
ial r
elie
f of fi
ve h
undr
ed th
ousa
nd o
r abo
ve p
rovi
ded
durin
g th
e ye
ar 2
013
(Rs.
In ‘0
00)
ANNEXURE - III

ANNUAL REPORT 2013
212
Disposal of operating fixed assets (refer note 11.2.3)
Description Cost/ Accumulated Book Sales Mode of disposal Particulars of Location revalued depreciation value proceeds / /settlement buyers amount insurance claim (Rupees in ‘000)
Furniture and fixture, electrical, computers and office equipment
Items having book 4,240 1,401 2,839 - Benefits Mr. M.U.A. Usmani Lahorevalue in aggregate more than 3,760 3,760 - 2,075 Auction/Quotation M/S TPTTS Islamabad IslamabadRs. 250,000 or cost of more 1,777 1,642 135 - Write Off Write Off Karachithan Rs. 1,000,000 58,583 58,583 - 649 Auction/Quotation M/S Karachi Auction Mart Karachi 5,947 5,926 21 38 Auction/Quotation M/S Chiniot Furnitures Faisalabad 13,074 11,501 1,573 2,479 Claim M/S Adam Jee Insurance Company Karachi 1,689 1,680 9 56 Auction/Quotation M/S 3rd Generation Solutions Lahore
89,070 84,493 4,577 5,297
Items having book value ofless than Rs. 250,000 or cost 8,558 7,025 1,533 2,318 Auction/Quotation Different Buyers All Pakistanof less than Rs. 1,000,000
Vehicles Items having book value in aggregate more than Rs. 250,000 or cost of more than Rs. 1,000,000
Toyota Corolla 1,005 804 201 268 Bank Car Policy Mr.Imran Maqbool LahoreToyota Corolla 1,005 804 201 950 Auction Mr. K. Zulfiqar Ahmed LahoreToyota Corolla 1,014 811 203 1,015 Auction Mr. Naveed Ahmed LahoreToyota Corolla 1,014 811 203 1,104 Auction Mr. Malik Adnan Waheed LahoreLancer 1,074 859 215 741 Auction Mr. Ashfaaq Ahmad LahoreHonda Civic 1,238 990 248 716 Auction Mr. Altaf Hussain LahoreToyota Corolla 1,370 1,096 274 400 Bank Car Policy Mr. Muhtashim Ashai LahoreToyota Corolla 1,389 1,111 278 983 Auction Mr. Khurram Ayub LahoreHonda Civic 1,422 1,138 284 453 Bank Car Policy Mr. Azhar Nabi LahoreHonda Civic 1,500 1,200 300 389 Bank Car Policy Mr. Imran Maqbool LahoreHonda Civic 1,516 1,213 303 435 Bank Car Policy Mr. Muhtashim Ashai LahoreToyota Corolla 1,525 634 891 1,375 Claim M/S Adam Jee Insurance LahoreHonda Civic 1,923 667 1,256 1,256 Bank Car Policy Mr. M.U.A. Usmani Lahore
16,995 12,138 4,857 10,085
Other Vehicles having book value of less than Rs. 250,000 or cost of less than Rs. 1,000,000 56,057 45,509 10,548 44,218 Auction/Quotation Different Buyers All Pakistan
Car IjarahItems having book value inaggregate more than Rs. 250,000 or cost of more than Rs. 1,000,000Ijarah # 62-01 ( Alto VXR ) 689 555 134 133 Purchased By Lessee Al Ameen Trading KarachiIjarah # 62-02 ( Toyota Corolla ) 1,327 1,069 258 258 Purchased By Lessee Al Ameen Trading KarachiHonda civic 1,908 1,195 713 714 Purchased By Lessee Big Bird Poultry Breeders Pvt ltd LahoreCoure 728 428 300 300 Purchased By Lessee Aysha Aziz LahoreCoure 706 369 337 337 Purchased By Lessee Salim-ul-Haq LahoreCoure 768 436 332 368 Purchased By Lessee Najam Faiz LahoreSuzuki Cultus VXRi 962 261 701 773 Purchased By Lessee Chiesi Pharmaceuticals (Pvt.) Ltd LahoreToyota Camery 3,705 2,594 1,111 1,250 Purchased By Lessee Ghani Gases Ltd LahoreToyota Camery 3,805 2,664 1,141 1,284 Purchased By Lessee Ghani Gases Ltd LahoreToyota Camery 3,755 2,466 1,289 1,454 Purchased By Lessee Ghani Gases Ltd LahoreToyota GLI 1,440 1,163 277 277 Purchased By Lessee Sharif Solvent Plant Pvt Ltd MultanHONDA VTI Orial 1,913 1,543 370 369 Purchased By Lessee Sharif Solvent Plant Pvt Ltd MultanToyota GLI 1,469 1,186 283 283 Purchased By Lessee Sharif Oil Industries Pvt Ltd MultanToyota XLI 1,314 1,187 127 127 Purchased By Lessee Interloop Faisalabad Toyota GLI 1,436 1,297 139 139 Purchased By Lessee Interloop Faisalabad Toyota GLI 1,401 1,265 136 135 Purchased By Lessee Interloop Ltd Faisalabad Toyota GLI 1,401 1,266 135 135 Purchased By Lessee Interloop Ltd Faisalabad Suzuki-Cultus 891 335 556 610 Purchased By Lessee Interloop Faisalabad Suzuki-Swift 1,042 455 587 653 Purchased By Lessee Interloop Ltd Faisalabad Toyota Corolla Altis MT 2,036 75 1,961 1,878 Stolen & claim received by Insurance company Pakistan Tobacco Company IslamabadToyota Corolla Altis MT 2,036 134 1,902 1,838 Stolen & claim received by Insurance company Pakistan Tobacco Company IslamabadToyota Corolla Altis MT 2,036 163 1,873 1,815 Declared as total loss case & claim received by Insurance company Pakistan Tobacco Company IslamabadHonda Civic Vti Oriel (65-18) 2,542 109 2,433 2,387 Stolen & claim received by Insurance company Pakistan Tobacco Company IslamabadToyota Corolla Gli (64-99) 1,749 170 1,579 1,562 Stolen & claim received by Insurance company Pakistan Tobacco Company IslamabadToyota Corolla Gli 1,749 199 1,550 1,540 Purchased By Lessee on pre-agreed purchase price Pakistan Tobacco Company IslamabadSUZUKI Cultus (62-02) 890 626 264 264 Purchased By Lessee on maturity Konnect Holden Pvt Ltd IslamabadSUZUKI Cultus (62-01) 885 629 256 255 Purchased By Lessee on maturity Konnect Holden Pvt Ltd IslamabadSUZUKI SWIFT 1,102 784 318 317 Purchased By Lessee on maturity Konnect Holden Pvt Ltd IslamabadToyota Corolla Gli 1,682 217 1,465 1,470 Purchased By LesseePakistan Tobacco Company IslamabadSUZUKI SWIFT (62-03) 1,102 719 383 408 Purchased By Lessee on pre-agreed purchase price Konnect Holden Pvt Ltd IslamabadToyota Corolla GLI 1,309 215 1,094 1,121 Stolen & claim received by Insurance company Pakistan Tobacco Company IslamabadToyota Altis A/T 1,399 347 1,052 1,080 Purchased By LesseePakistan Tobacco Company IslamabadToyota Corolla Gli 1,332 346 986 1,016 Purchased By Lessee on pre-agreed purchase price Pakistan Tobacco Company IslamabadToyota Corolla Altis 1,733 338 1,395 1,439 Purchased By Lessee on pre-agreed purchase price Pakistan Tobacco Company IslamabadToyota Corolla GLI (64-39) 1,309 371 938 984 Stolen & claim received by Insurance company Pakistan Tobacco Company IslamabadToyota Corolla Altis 1,309 526 783 833 Purchased By Lessee on pre-agreed purchase price Pakistan Tobacco Company IslamabadToyota Coroll Altis 1.6 SR (64-42) 1,485 387 1,098 1,160 Stolen & claim received by Insurance company Pakistan Tobacco Company Islamabad
58,345 28,089 30,256 30,966 Equipment Ijarah
Generator 123,000 46,494 76,506 77,864 Purchased By Lessee Ghani Glass Ltd LahoreWarp Beam Trolley 2,220 95 2,125 2,341 Sale of asset Shafi Texcel Ltd Lahore
125,220 46,589 78,631 80,205 2013 354,245 223,843 130,402 173,089
2012 91,612 56,367 35,245 57,831
ANNEXURE - IVANNEXURE - IV

213
Summarized detail of the valuation of owned properties (refer note 11.2.1)
City Land Building Total
(Rupees in ‘000)
Abbottabad 22,000 19,856 41,856 Bahawalpur 78,012 24,445 102,457 Chakwal 2,000 1,920 3,920 Dera Gazi Khan 18,450 20,000 38,450 Faisalabad 812,308 223,618 1,035,926 Gawadar 1,900 9,000 10,900 Gujranwala 221,044 172,238 393,282 Gujrat 78,500 42,216 120,716 Hafizabad 27,000 14,782 41,782 Haripur 28,453 2,958 31,411 Haroonabad 20,000 5,240 25,240 Hyderabad 185,498 87,118 272,616 Islamabad 1,317,210 416,652 1,733,862 Jehlum 55,000 32,817 87,817 Jhang 124,110 30,715 154,825 Karachi 4,666,793 2,974,623 7,641,416 Kasur 16,380 2,390 18,770 Khairpur 1,442 3,183 4,625 Khanewal 13,500 2,800 16,300 Kohat 4,650 - 4,650 Khanpur 24,040 14,420 38,460 Lahore 4,972,779 2,305,651 7,278,430 Larkana 47,735 13,601 61,336 Mianwali 19,125 35,443 54,568 Mirpurkhas 11,040 3,726 14,766 Multan 139,600 332,878 472,478 Muree 15,000 991 15,991 Muridke 45,000 25,453 70,453 Muzafarabad 128,373 52,979 181,352 Nawabshah 18,270 10,339 28,609 Okara 26,275 12,524 38,799 Peshawar 114,375 16,726 131,101 Quetta 284,696 59,803 344,499 Rahim Yar Khan 9,915 5,740 15,655 Rawalpindi 448,536 168,514 617,050 Sadiqabad 26,667 4,842 31,509 Sahiwal 52,094 13,826 65,920 Sargodha 140,986 20,825 161,811 Sheikhupura 56,000 13,112 69,112 Sialkot 94,000 20,895 114,895 Sukkur 48,288 16,656 64,944 Swat 56,500 6,715 63,215 Vehari 11,000 7,330 18,330 Wazirabad 15,000 7,274 22,274 Overseas - 82,648 82,648
Grand total 14,499,544 7,339,482 21,839,026
ANNEXURE - V

ANNUAL REPORT 2013
214
Notes

MCB Bank LimitedConsolidated Financial Statements For the year ended December 31, 2013

ANNUAL REPORT 2013
216
The Board of Directors present the report on the consolidated financial statements of MCB Bank Limited and its subsidiaries namely MCB-Arif Habib Savings & Investments Limited, MCB Financial Services Limited, MNET Services (Private) Limited, MCB Trade Services and MCB Leasing Closed Joint Stock Company for the year ended December 31, 2013.
The following appropriation of profit has been recommended by the Board of Directors
(Rs. in ‘000)
Profit before taxation 32,932,070Taxation (10,981,929)
Profit after taxation 21,950,141Profit attributable to minority interest (75,043)
Profit attributable to ordinary shareholders 21,875,098
Un-appropriated Profit Brought Forward 37,530,955Re-measurement of defined benefits plans - net of tax 49,373Transfer from Surplus on Revaluation of Fixed Assets - net of tax 36,045 37,616,373
Profit Available for Appropriation 59,491,471
Appropriations:
Statutory Reserve 2,149,534Final Cash Dividend - December 2012 2,759,581Issue of Bonus Shares - December 2012 919,860Interim Cash Dividend - March 2013 3,541,471Interim Cash Dividend - June 2013 3,541,470Interim Cash Dividend - September 2013 3,541,461
Total Appropriations 16,453,377
Un-appropriated Profit Carried Forward 43,038,094
Pattern of Shareholding
The pattern of shareholding as at December 31, 2013 is annexed in annual report.
Earnings per Share
The consolidated financial statements reflect Rs. 21.62 earnings per share for the year under review.
On behalf of Directors
Mian Mohammad ManshaFebruary 11, 2014 Chairman
Director’s ReportOn Consolidated Financial Statements

217
Auditors’ Report to the Members
We have audited the annexed consolidated financial statements comprising consolidated statement of financial position
of MCB Bank Limited and its subsidiary companies as at December 31, 2013 and the related consolidated profit and loss
account, consolidated statement of comprehensive income, consolidated cash flow statement and consolidated statement
of changes in equity together with the notes forming part thereof (hereinafter referred to as the ‘consolidated financial
statements’) for the year then ended. These consolidated financial statements include unaudited certified returns from the
branches except for fifty branches which have been audited by us and eight branches audited by auditors abroad. We have
also expressed separate opinions on the financial statements of MCB Bank Limited and MNET Services (Private) Limited.
While the subsidiary MCB - Arif Habib Savings & Investments Limited (formerly Arif Habib Investments Limited) was subject to
a limited scope review by us. The financial statements of subsidiary companies MCB Financial Services Limited, MCB Trade
Services Limited and MCB Leasing Closed Joint Stock Company were audited by other firms of chartered accountants,
whose reports have been furnished to us and our opinion, in so far as it relates to the amounts included for such companies,
is based solely on the reports of such other auditors.
These consolidated financial statements are responsibility of the Bank’s management. Our responsibility is to express our
opinion on these consolidated financial statements based on our audit.
We conducted our audit in accordance with the auditing standards as applicable in Pakistan. These standards require that we
plan and perform the audit to obtain reasonable assurance about whether the above said statements are free of any material
misstatement. An audit includes examining, on a test basis, evidence supporting the amounts and disclosures in the above
said statements. An audit also includes assessing the accounting policies and significant estimates made by management,
as well as, evaluating the overall presentation of the above said statements. We believe that our audit provides a reasonable
basis for our opinion.
In our opinion the consolidated financial statements present fairly the financial position of MCB Bank Limited and its subsidiary
companies as at December 31, 2013 and the results of their operations, their cash flows and changes in equity for the year
then ended in accordance with the approved accounting standards as applicable in Pakistan.
LahoreDated: February 28, 2014
A. F. Ferguson & Co. Chartered Accountants Engagement Partner Imran Farooq Mian

ANNUAL REPORT 2013
218
Cash and balances with treasury banks 6 59,946,218 57,420,211 53,122,620Balances with other banks 7 1,594,660 1,236,736 2,357,418Lendings to financial institutions 8 1,224,638 1,551,472 955,087 Investments - net 9 453,808,345 405,601,313 319,005,983Advances - net 10 248,521,792 239,788,511 227,573,618Operating fixed assets 11 29,005,931 24,144,242 22,418,450Deferred tax assets - net - - - Other assets - net 12 27,176,720 41,715,761 31,440,700 821,278,304 771,458,246 656,873,876
LIABILITIES
Bills payable 14 10,138,726 9,896,284 9,466,818 Borrowings 15 38,660,405 79,064,351 39,100,627 Deposits and other accounts 16 632,309,094 544,988,091 491,146,798 Sub-ordinated loan - - - Liabilities against assets subject to finance lease - - - Deferred tax liabilities - net 17 4,500,293 9,768,871 6,689,736 Other liabilities 18 20,206,991 21,265,639 18,457,835 705,815,509 664,983,236 564,861,814
NET ASSETS 115,462,795 106,475,010 92,012,062
Represented by
Share capital 19 10,118,461 9,198,601 8,362,365 Reserves 20 47,008,936 44,620,928 42,412,588 Unappropriated profit 43,038,094 37,530,955 30,617,206 100,165,491 91,350,484 81,392,159
Minority interest 489,671 501,256 492,497 100,655,162 91,851,740 81,884,656 Surplus on revaluation of assets - net of tax 21 14,807,633 14,623,270 10,127,406 115,462,795 106,475,010 92,012,062
Contingencies and commitments 22
The annexed notes 1 to 46 and Annexures I to III form an integral part of these consolidated financial statements.
Consolidated Statement of Financial PositionAs at December 31, 2013
ASSETS
Note 2013 2012 2011
Restated Restated
(Rupees in ‘000)
Imran MaqboolPresident and Chief Executive
Tariq RafiDirector
Mian Umer ManshaDirector
Muhammad Ali ZebDirector

219
Note 2013 2012
Restated
(Rupees in ‘000)
Mark-up / return / interest earned 24 65,186,388 68,443,744 Mark-up / return / interest expensed 25 27,219,433 27,503,496
Net mark-up / interest income 37,966,955 40,940,248
Provision / (reversal) for diminution in the value of investments - net 9.3 (6,834) (3,044)Provision / (reversal) against loans and advances - net 10.5.2 (2,828,783) 480,903 Bad debts written off directly 10.6.1 - 206 (2,835,617) 478,065
Net mark-up / interest income after provisions 40,802,572 40,462,183
Non-mark-up / interest income
Fee, commission and brokerage income 7,204,266 6,384,757 Dividend income 714,207 1,060,411 Income from dealing in foreign currencies 920,008 823,838 Gain on sale of securities - net 26 2,165,381 857,405 Unrealized gain on revaluation of investments classified as held for trading 21,787 30,285 Other income 27 450,879 384,459 Total non-mark-up / interest income 11,476,528 9,541,155 52,279,100 50,003,338
Non-mark-up / interest expenses
Administrative expenses 28 19,099,222 17,822,584 Other provision / (reversal) - net 12.3 (52,285) (187,305)Other charges 29 928,954 600,054 Total non-mark-up / interest expenses 19,975,891 18,235,333 Share of profit of associates 9.8 & 9.9 628,861 296,645 Extra ordinary / unusual item - -Profit before taxation 32,932,070 32,064,650
Taxation - Current year 15,220,551 9,646,189 - Prior years (2,137) 126,396 - Deferred (4,318,658) 1,288,353
Share of tax of associates 82,173 36,171
30 10,981,929 11,097,109
Profit after taxation 21,950,141 20,967,541
Profit attributable to minority interest (75,043) (82,050)Profit attributable to ordinary share holders 21,875,098 20,885,491
Unappropriated profit brought forward 37,530,955 30,617,206 Transfer from surplus on revaluation of fixed assets - net of tax 36,045 36,056 37,567,000 30,653,262 Profit available for appropriation 59,442,098 51,538,753
Basic and diluted earnings - after tax Rupees per share 33 21.62 20.64
The annexed notes 1 to 46 and Annexures I to III form an integral part of these consolidated financial statements.
Consolidated Profit and Loss AccountFor the year ended December 31, 2013
Imran MaqboolPresident and Chief Executive
Tariq RafiDirector
Mian Umer ManshaDirector
Muhammad Ali ZebDirector

ANNUAL REPORT 2013
220
2013 2012
Restated
(Rupees in ‘000)
Profit after tax for the year 21,950,141 20,967,541
Other comprehensive income
Items that will not be reclassified to profit and loss account
Remeasurement of defined benefit plans - net of tax 49,373 629,820
Items that may be reclassified to profit and loss account
Effect of translation of net investment in foreign branches and subsidiaries - Equity shareholders of the bank 211,772 (20,630) - Minority interest 737 339 212,509 (20,291)
Share of exchange translation reserve of associates 26,702 134,900
Comprehensive income transferred to equity 22,238,725 21,711,970
Components of comprehensive income not reflected in equity
Net change in fair value of available for sale securities (3,650,355) 5,248,262 Deferred tax 1,189,889 (1,451,649)Share of other comprehensive income of associates - net of tax 726,265 735,563
(1,734,201) 4,532,176
Total Comprehensive income 20,504,524 26,244,146
The annexed notes 1 to 46 and Annexures I to III form an integral part of these consolidated financial statements.
Consolidated Statement of Comprehensive IncomeFor the year ended December 31, 2013
Imran MaqboolPresident and Chief Executive
Tariq RafiDirector
Mian Umer ManshaDirector
Muhammad Ali ZebDirector

221
Consolidated Statement of Comprehensive IncomeFor the year ended December 31, 2013
Note 2013 2012
Restated
(Rupees in ‘000)
Cash flows from operating activitiesProfit before taxation 32,932,070 32,064,650 Less: Dividend income and share of profit of associates (1,343,068) (1,357,056) 31,589,002 30,707,594 Adjustments for non-cash chargesDepreciation 11.2 1,557,534 1,394,788 Amortization 11.3 263,024 261,901 Provision / (reversal) against loans and advances - net 10.5.2 (2,828,783) 480,903 Provision / (reversal) for diminution in the value of investments - net 9.3 (6,834) (3,044)Other provision / (reversal) - net 12.3 (52,285) (187,305)Bad debts written off directly 10.6.1 - 206 Provision for Workers’ Welfare Fund 29 646,123 641,155 Charge / (reversal) for defined benefit plan 28 (1,307,285) (1,606,388)Gain on disposal of fixed assets - net 27 (42,687) (22,520)Unrealized gain on revaluation of ‘held for trading’ securities 9.5 (23,400) (30,285) (1,794,593) 929,411 29,794,409 31,637,005 (Increase) / decrease in operating assetsLendings to financial institutions 326,834 (596,385)Net investments in ‘held for trading’ securities (1,689) (181,078)Advances - net (5,904,498) (13,100,201)Other assets - net (2,814,959) (1,659,033) (8,394,312) (15,536,697)Increase / (decrease) in operating liabilitiesBills payable 242,442 429,466 Borrowings (40,200,995) 39,245,333 Deposits and other accounts 87,321,003 53,841,293 Other liabilities (2,487,841) 2,073,488 44,874,609 95,589,580 66,274,706 111,689,888 Defined benefits paid (706,361) (370,756)Receipt from pension fund 14,731,898 - Income tax paid (10,398,228) (14,651,062)Net cash flows from operating activities 69,902,015 96,668,070
Cash flows from investing activitiesNet investments in ‘available for sale’ securities (51,013,745) (81,315,947)Net investments in ‘held to maturity’ securities 405,975 1,260,172 Proceeds from issue of share to minority interest - 4,963 Dividends received 848,353 1,115,332 Investments in operating fixed assets (4,682,052) (3,418,725)Sale proceeds of property and equipment disposed off 173,089 58,764 Net cash flows from investing activities (54,268,380) (82,295,441)
Cash flows from financing activitiesDividend paid (12,759,262) (11,893,820)Net cash flows from financing activities (12,759,262) (11,893,820)
Exchange differences on translation of the net investment in foreign branches and subsidiaries 212,509 (20,291)Increase in cash and cash equivalents 3,086,882 2,458,518
Cash and cash equivalents at beginning of the year 57,218,423 54,801,543 Effects of exchange rate changes on cash and cash equivalents 609,601 567,963 57,828,024 55,369,506 Cash and cash equivalents at end of the year 34 60,914,906 57,828,024
The annexed notes 1 to 46 and Annexures I to III form an integral part of these consolidated financial statements.
Consolidated Cash Flow StatementFor The Year Ended December 31, 2013
Imran MaqboolPresident and Chief Executive
Tariq RafiDirector
Mian Umer ManshaDirector
Muhammad Ali ZebDirector

ANNUAL REPORT 2013
222
Consolidated Statement of Changes in EquityFor the year ended December 31, 2013
Balance as at December 31, 2011 8,362,365 - 9,924,438 431,260 13,456,890 18,600,000 30,259,449 81,034,402 492,497 81,526,899
Effect of change in accounting policy - note 5.7 - - - - - - 357,757 357,757 - 357,757
Balance as at December 31, 2011 - restated 8,362,365 - 9,924,438 431,260 13,456,890 18,600,000 30,617,206 81,392,159 492,497 81,884,656
Profit after taxation for the year ended December 31, 2012 - - - - - - 20,967,541 20,967,541 - 20,967,541
Profit attributable to minority interest - - - - - - (82,050) (82,050) 82,050 -
Profit after taxation for the year ended December 31, 2012 attributable to ordinary shareholders of the group - - - - - - 20,885,491 20,885,491 82,050 20,967,541
Remeasurement of defined benefit plans - net of tax - - - - - - 629,820 629,820 - 629,820
Exchange differences on translation of net investment in foreign branches and subsidiaries - - - (20,630) - - - (20,630) 339 (20,291)
Share of exchange translation reserve of associates - - - 134,900 - - - 134,900 - 134,900
Transferred from surplus on revaluation of fixed assets to unappropriated profit - net of tax - - - - - - 36,056 36,056 254 36,310
Transferred to statutory reserve - - - - 2,094,070 - (2,094,070) - - -
Transfer to reserve for issue of bonus shares - 836,236 - - - - (836,236) - - -
Issue of bonus shares - December 2011 836,236 (836,236) - - - - - - - -
Share capital issued attributable to minority shareholders - - - - - - - - 4,963 4,963
Final cash dividend - December 2011 - - - - - - (2,508,709) (2,508,709) - (2,508,709)
Share of dividend attributable to minority interest - - - - - - - - (78,847) (78,847)
Interim cash dividend - March 2012 - - - - - - (2,759,581) (2,759,581) - (2,759,581)
Interim cash dividend - June 2012 - - - - - - (3,679,441) (3,679,441) - (3,679,441)
Interim cash dividend - September 2012 - - - - - - (2,759,581) (2,759,581) - (2,759,581)
Balance as at December 31, 2012 9,198,601 - 9,924,438 545,530 15,550,960 18,600,000 37,530,955 91,350,484 501,256 91,851,740
Profit after taxation for the year ended December 31, 2013 - - - - - - 21,950,141 21,950,141 - 21,950,141
Profit attributable to minority interest - - - - - - (75,043) (75,043) 75,043 -
Profit after taxation for the year ended December 31,2013 attributable to ordinary shareholders of the group - - - - - - 21,875,098 21,875,098 75,043 21,950,141
Remeasurement of defined benefit plans - net of tax - - - - - - 49,373 49,373 - 49,373
Exchange differences on translation of net investment in foreign branches and subsidiaries - - - 211,772 - - - 211,772 737 212,509
Share of exchange translation reserve of associates - - - 26,702 - - - 26,702 - 26,702
Transferred from surplus on revaluation of fixed assets to unappropriated profit - net of tax - - - - - - 36,045 36,045 243 36,288
Transferred to statutory reserve - - - - 2,149,534 - (2,149,534) - - -
Transfer to reserve for issue of bonus shares - 919,860 - - - - (919,860) - - -
Issue of bonus shares - December 2012 919,860 (919,860) - - - - - - - -
Share of dividend attributable to minority interest - - - - - - - - (87,608) (87,608)
Final cash dividend - December 2012 - - - - - - (2,759,581) (2,759,581) - (2,759,581)
Interim cash dividend - March 2013 - - - - - - (3,541,471) (3,541,471) - (3,541,471)
Interim cash dividend - June 2013 - - - - - - (3,541,470) (3,541,470) - (3,541,470)
Interim cash dividend - September 2013 - - - - - - (3,541,461) (3,541,461) - (3,541,461)
Balance as at December 31, 2013 10,118,461 - 9,924,438 784,004 17,700,494 18,600,000 43,038,094 100,165,491 489,671 100,655,162
For details of dividend declaration and appropriations, please refer note 45 to these consolidated financial statements.
The annexed notes 1 to 46 and Annexures I to III form an integral part of these consolidated financial statements.
Share Reserve for Share Exchange Statutory General Unappropriated Sub Total Minority Total Capital issue of Premium translation reserve reserve profit interest bonus shares reserve
(Rupees in ‘000)
Capital Reserves Revenue Reserves
Imran MaqboolPresident and Chief Executive
Tariq RafiDirector
Mian Umer ManshaDirector
Muhammad Ali ZebDirector

223
1. THE GROUP AND ITS OPERATIONS
The “Group” consists of:
Holding company
- MCB Bank Limited
Percentage
holding of MCB
Bank Limited
Subsidiary companies %
- MCB Financial Services Limited 99.999
- MNET Services (Private) Limited 99.950
- MCB Trade Services Limited 100.000
- MCB - Arif Habib Savings & Investments Limited 51.329
(Arif Habib Investments Limited)
- “MCB Leasing” Closed Joint Stock Company 95.000
MCB Bank Limited (the ‘Bank’) is a banking company incorporated in Pakistan and is engaged in commercial banking and related services. The Bank’s ordinary shares are listed on all the stock exchanges in Pakistan whereas its Global Depository Receipts (GDRs) representing two ordinary shares (2012: two ordinary shares) are traded on the International Order Book (IOB) system of the London Stock Exchange. The Bank’s Registered Office and Principal Office are situated at MCB -15 Main Gulberg, Lahore. The Bank operates 1,208 branches including 27 Islamic banking branches (2012: 1,179 branches including 27 Islamic banking branches) within Pakistan and 9 branches (2012: 8 branches) outside the country (including the Karachi Export Processing Zone branch).
MCB Financial Services LimitedMCB Financial Services Limited was incorporated on February 12, 1992 under the Companies Ordinance, 1984 as a private limited company. The company converted its status from Private Limited Company to Unlisted Public Limited Company on June 19, 2009. The principal objects of the company are to act as Trustee of investment trust schemes, voluntary pension schemes, real estate investment trust schemes, to provide custodian services and to act as transfer agent/share registrar of securities of listed and non listed companies and mutual funds etc. The Company’s main source of income is from trusteeship services provided to mutual funds. Its registered office is located at Karachi.
MNET Services (Private) LimitedMNET Services (Private) Limited is a private limited company incorporated in Pakistan under the Companies Ordinance, 1984 on September 7, 2001. The company’s registered office and principal place of business are situated at MCB Building, F-6 / G-6, Jinnah Avenue, Islamabad and Sheikh Sultan Trust Building, Beaumount Road, Karachi respectively. The core objective of the company is to provide services in Information Technology and to develop
computer software and other data processing equipment for planning, designing, management and execution of all types of financial, personal, organizational and institutional activities. During the current year, the Board of Directors of the Company in their meeting held on August 07, 2013 resolved to voluntarily wind up the Company (subject to supervision of the court).
MCB Trade Services LimitedThe company was incorporated under the laws of Hong Kong on February 25, 2005. The registered office of the company is located at 28 / F, BEA Harbour View Centre 56 Gloucester Road, Wan Chai, Hong Kong. The principal activity of the company is to provide agency services.
MCB - Arif Habib Savings and Investments Limited (formerly Arif Habib Investments Limited)
MCB - Arif Habib Savings and Investments Limited (the Company) was incorporated on August 30, 2000, as an unquoted public limited company under the Companies Ordinance, 1984. During 2008, the Company was listed on the Karachi Stock Exchange by way of offer for sale of shares by a few of the existing shareholders of the Company to the general public. The registered office of the Company is situated at 8th Floor, Techno City, Corporate Tower, Molana Hasrat Mohani Road, Karachi, Pakistan.
The Company is registered as an Asset Management Company and Investment Advisor under the Non-Banking Finance Companies (Establishment and Regulation) Rules, 2003 and Pension Fund Manager under Voluntary Pension System Rules 2005. The Company also manages discretionary portfolio accounts.
“MCB Leasing” Closed Joint Stock CompanyMCB Leasing was incorporated as a Closed Joint Stock Company under the laws of Azerbaijan on October 16, 2009 with 95% holding of MCB Bank Limited (a parent company). The registered office of the company is located at 49-B Tbilisi Ave. Baku AZ1065, Republic of Azerbaijan.
The Company’s principal business activity is providing lease finance within the Republic of Azerbaijan. The company leases various types of industrial equipment, equipment used in medical, public transports and real estate. In addition, the Company leases cars, trucks and rail cars. The company purchases leasing assets from suppliers in the Republic of Azerbaijan and abroad.
2. BASIS OF PRESENTATION
2.1 These consolidated financial statements include the financial statements of MCB Bank Limited and its subsidiary companies and associates.
2.2 In accordance with the directives of the Federal Government regarding the shifting of the banking system to Islamic modes, the State Bank of
Notes to the Consolidated Financial StatementsFor the year ended December 31, 2013

ANNUAL REPORT 2013
224
Notes to the Consolidated Financial StatementsFor the year ended December 31, 2013
Pakistan has issued various circulars from time to time. Permissible forms of trade-related modes of financing include purchase of goods by banks from their customers and immediate resale to them at appropriate mark-up in price on deferred payment basis. The purchases and sales arising under these arrangements are not reflected in these financial statements as such but are restricted to the amount of facility actually utilized and the appropriate portion of mark-up thereon.
2.3 The financial results of the Islamic Banking branches have been consolidated in these financial statements for reporting purposes, after eliminating material inter-branch transactions / balances. Key financial figures of the Islamic Banking branches are disclosed in Annexure II to standalone financial statements.
2.4 For the purpose of translation, rates of Rs. 105.3246 per US Dollar (2012: Rs. 97.1497), Rs. 0.8052 per LKR (2012: Rs. 0.7611) and Rs. 134.2570 per AZN (2012: Rs. 123.7576) have been used.
3. STATEMENT OF COMPLIANCE
3.1 These financial statements have been prepared in accordance with the approved accounting standards as applicable in Pakistan. Approved Accounting Standards comprise of such International Financial Reporting Standards (IFRS) issued by the International Accounting Standards Board and Islamic Financial Accounting Standards (IFAS) issued by the Institute of Chartered Accountants of Pakistan as are notified under the Companies Ordinance, 1984, provisions of and directives issued under the Companies Ordinance, 1984 and Banking Companies Ordinance, 1962. In case requirements differ, the provisions and directives given in Companies Ordinance, 1984 and Banking Companies Ordinance, 1962 shall prevail.
The State Bank of Pakistan has deferred the applicability of International Accounting Standard (IAS) 39, ‘Financial Instruments: Recognition and Measurement’ and IAS 40, ‘Investment Property’ for Banking Companies through BSD Circular No. 10 dated August 26, 2002. The Securities and Exchange Commission of Pakistan (SECP) has deferred applicability of IFRS-7 “Financial Instruments: Disclosures” on banks through S.R.O 411(1) /2008 dated April 28, 2008. Accordingly, the requirements of these standards have not been considered in the preparation of these financial statements. However, investments have been classified and valued in accordance with the requirements prescribed by the State Bank of Pakistan through various circulars.
IFRS 8, ‘Operating Segments’ is effective for the Bank’s accounting period beginning on or after January 1,
2009. All banking companies in Pakistan are required to prepare their annual financial statements in line with the format prescribed under BSD Circular No. 4 dated February 17, 2006, ‘Revised Forms of Annual Financial Statements’, effective from the accounting year ended December 31, 2006. The management of the Bank believes that as the SBP has defined the segment categorisation in the above mentioned circular, the SBP requirements prevail over the requirements specified in IFRS 8. Accordingly, segment information disclosed in these financial statements is based on the requirements laid down by the SBP.
3.2 Standards, amendments and interpretations to published approved accounting standards that are effective in the current year
The following standards, amendments and interpretations of approved accounting standards are effective for accounting periods beginning on or after January 01, 2013:
- IAS 1 ‘Financial statements presentation’ has been amended effective January 1, 2013. The main change resulting from these amendments is a requirement for entities to group items presented in ‘Other Comprehensive Income’ (OCI) on the basis of whether they are potentially reclassifiable to profit and loss subsequently reclassification adjustments). The specified changes has been made in the statements of other comprehensive income for the year.
- IAS 19 Employee Benefits (revised) which became effective for annual periods beginning on or after January 01, 2013 amends accounting for employees benefits. The amended IAS 19 includes the amendments that require actuarial gains and losses to be recognized immediately in other comprehensive income; to immediately recognize all past service costs; and to replace interest cost and expected return on plan assets with a net interest amount that is calculated by applying the discount rate to the net defined benefit liability / asset.
- There are other new and amended standards and interpretations that are mandatory for accounting periods beginning on or after January 1, 2013 but are considered not relevant or do not have a significant effect on the Bank’s operations and therefore are not detailed in the financial statements.
3.3 Standards, amendments and interpretations to published approved accounting standards that are relevant and not yet effective
The following standards, amendments and interpretations of approved accounting standards will be effective for accounting periods beginning on or after January 01, 2014.

225
Effective date (accounting periods beginning on or after)
- IAS 32 - Financial Instruments: Presentation (Amendment) January 01, 2014
- IFRS 10 ‘ Consolidated Financial statements January 01, 2014
- IFRS 12 ‘Disclosure of interest in other entities’ January 01, 2014
- IFAS 3 - Profit and Loss Sharing on Deposits January 01, 2014
There are other new and amended standards and interpretations that are mandatory for the Bank’s accounting periods beginning on or after January 1, 2014 but are considered not to be relevant or do not have any significant effect on the Bank’s operations and are therefore not detailed in these financial statements.
4. BASIS OF MEASUREMENT
4.1 These consolidated financial statements have been prepared under the historical cost convention except that certain classes of fixed assets are stated at revalued amounts and certain investments and commitments in respect of certain forward exchange contracts have been marked to market and are carried at fair value.
4.2 The consolidated financial statements are presented in Pak Rupees, which is the Group’s functional and presentation currency. The amounts are rounded off to the nearest thousand.
4.3 Critical accounting estimates and judgments The preparation of consolidated financial statements
in conformity with the approved accounting standards requires the use of certain critical accounting estimates. It also requires the management to exercise its judgment in the process of applying the Bank’s accounting policies. Estimates and judgments are continually evaluated and are based on historical experiences, including expectations of future events that are believed to be reasonable under the circumstances. The areas where various assumptions and estimates are significant to the Bank’s financial statements or where judgment was exercised in the application of accounting policies are as follows:
a) Classification of investments In classifying investments the Bank follows the
guidance provided in SBP circulars:
- Investments classified as ‘held for trading’, are securities which are acquired with an intention to trade by taking advantage of short term market / interest rate movements and are to be sold within 90 days of acquisition.
- Investments classified as ‘held to maturity’ are non-derivative financial assets with fixed or determinable payments and fixed maturity. In making this judgment, the Bank evaluates its intention and ability to hold
such investment to maturity.
- The investments which are not classified as ‘held for trading’ or ‘held to maturity’ are classified as ‘available for sale’.
b) Provision against advances
The Bank reviews its loan portfolio to assess the amount of non-performing advances and provision required there against on regular basis. While assessing this requirement various factors including the delinquency in the account, financial position of the borrowers and the requirements of the Prudential Regulations are considered.
The amount of general provision is determined in accordance with the relevant regulations and management’s judgment as explained in notes 10.5.3 and 10.5.5.
c) Impairment of ‘available for sale’ equity investments
The Bank determines that ‘available for sale’ equity investments are impaired when there has been a significant or prolonged decline in the fair value below its cost. The determination of what is significant or prolonged requires judgment. In making this judgment, the Bank evaluates among other factors, the normal volatility in share price. In addition, the impairment may be appropriate when there is an evidence of deterioration in the financial health of the investee and sector performance, changes in technology and operational/financial cash flows.
d) Taxation In making the estimates for income taxes currently
payable by the Bank, the management considers the current income tax laws and the decisions of appellate authorities on certain issues in the past.
e) Fair value of derivatives The fair values of derivatives which are not quoted
in active markets are determined by using valuation techniques. The valuation techniques take into account the relevant interest rates at the balance sheet date and the rates contracted.
f) Depreciation, amortization and revaluation of operating fixed assets
In making estimates of the depreciation / amortization method, the management uses the method which reflects the pattern in which economic benefits are expected to be consumed by the Bank. The method applied is reviewed at each financial year end and if there is a change in the expected pattern of consumption of the future economic benefits
Notes to the Consolidated Financial StatementsFor the year ended December 31, 2013

ANNUAL REPORT 2013
226
embodied in the assets, the method is changed to reflect the changed pattern. Such change is accounted for as change in accounting estimates in accordance with International Accounting Standard (IAS) 8 “Accounting Policies, Changes in Accounting Estimates and Errors”. Further, the Bank estimates the revalued amount of land and buildings on a regular basis. The estimates are based on valuations carried out by independent professional valuers under the market conditions.
g) Staff retirement benefits Certain actuarial assumptions have been adopted as
disclosed in Note 36 of these financial statements for the actuarial valuation of staff retirement benefit plans. Actuarial assumptions are entity’s best estimates of the variables that will determine the ultimate cost of providing post employment benefits. Changes in these assumptions in future years may affect the liability / asset under these plans in those years.
5. SUMMARY OF SIGNIFICANT ACCOUNTING POLICIES
5.1 Basis of consolidationa) The consolidated financial statements include the
financial statements of MCB Bank Limited and its subsidiary companies and share of the profit / reserves of associates are accounted for under the equity basis of accounting.
b) Subsidiaries are all entities over which the Group has the power to govern the financial and operating policies accompanying a shareholding of more than one half of the voting rights. The existence and effect of potential voting rights that are currently exercisable are considered when assessing whether the Group controls another entity. Subsidiaries are fully consolidated from the date on which control is transferred to the Group. They are de-consolidated from the date when control ceases / the subsidiaries are disposed off. The assets and liabilities of subsidiary companies have been consolidated on a line by line basis based on the financial statements as at December 31, 2013 and the carrying value of investments held by the Bank is eliminated against the subsidiaries’ shareholders’ equity in these consolidated financial statements. Material intra-group balances and transactions have been eliminated.
c) Associates are all entities over which the Group has significant influence but not control. Investments in associates are accounted for by the equity method of accounting and are initially recognised at cost, thereafter for the post-acquisition change in the Group’s share of net assets of the associate, the cumulative post-acquisition movements are adjusted in the carrying amount of the investment. Accounting policies of the associates have been changed
where necessary to ensure consistency with the policies adopted by the Group. The Group’s share in associates have been accounted for on the basis of the financial statements for the year ended December 31, 2013.
d) Minority interest is that part of the net results of operations and of net assets of subsidiary companies attributable to interests which are not owned by the Group.
5.2 Investments
The Bank classifies its investments as follows:
a) Held for trading These are securities, which are either acquired for
generating profit from short-term fluctuations in market prices, interest rate movements, dealers margin or are securities included in a portfolio in which a pattern of short-term profit taking exists.
b) Held to maturity These are securities with fixed or determinable
payments and fixed maturity in respect of which the Bank has the positive intent and ability to hold to maturity.
c) Available for sale These are investments, other than those in subsidiaries
and associates, that do not fall under the ‘held for trading’ or ‘held to maturity’ categories.
Investments are initially recognized at cost which in case of investments other than ‘held for trading’ include transaction costs associated with the investment.
All purchases and sales of investments that require delivery within the time frame established by regulation or market convention are recognized at the trade date. Trade date is the date on which the Bank commits to purchase or sell the investment.
In accordance with the requirements of the State Bank of Pakistan, quoted securities, other than those classified as ‘held to maturity’, investments in subsidiaries and investments in associates are subsequently re-measured to market value. Surplus / (deficit) arising on revaluation of quoted securities which are classified as ‘available for sale’, is taken to a separate account which is shown in the balance sheet below equity. Surplus / (deficit) arising on revaluation of quoted securities which are classified as ‘held for trading’, is taken to the profit and loss account, currently.
Unquoted equity securities (excluding investments in subsidiaries and associates) are valued at the lower
Notes to the Consolidated Financial StatementsFor the year ended December 31, 2013

227
of cost and break-up value. Break-up value of equity securities is calculated with reference to the net assets of the investee company as per the latest available audited financial statements. Investments classified as ‘held to maturity’ are carried at amortized cost.
Associates are all entities over which the Group has significant influence but not control. Subsidiaries are all entities over which the Group has the power to govern the financial and operating policies accompanying a shareholding of more than one half of the voting rights Investments in subsidiaries and investments in associates are carried at cost less accumulated impairment losses, if any.
Provision for impairment in the values of securities (except debentures, participation term certificates and term finance certificates) is made currently. Provisions for impairment in value of debentures, participation term certificates and term finance certificates are made as per the requirements of the Prudential Regulations issued by the State Bank of Pakistan.
Goodwill represents the excess of the cost of an acquisition over the fair value of the Group’s share of the net identifiable assets of the acquired associate and subsidiary at the date of acquisition. Goodwill on acquisitions of associates is included in ‘investments in associates’.
5.3 Sale and repurchase agreements Securities sold subject to a repurchase agreement
(repo) are retained in the financial statements as investments and the counter party liability is included in borrowings. Securities purchased under an agreement to resell (reverse repo) are not recognized in the financial statements as investments and the amount extended to the counter party is included in lendings to financial institutions. The difference between the purchase / sale and re-sale / re-purchase price is recognized as mark-up income / expense on a time proportion basis, as the case may be.
5.4 Advances Advances are stated net of specific and general
provisions. Specific provision is determined on the basis of the Prudential Regulations and other directives issued by the State Bank of Pakistan (SBP) and charged to the profit and loss account. Provisions are held against identified as well as unidentified losses. Provisions against unidentified losses include general provision against Consumer and Small Enterprise (SEs) loans made in accordance with the requirements of the Prudential Regulations issued by SBP and provision based on historical loss experience on advances. Advances are written off when there is no realistic prospect of recovery.
Leases where the Bank transfers substantially all the risks and rewards incidental to ownership of an asset to the lessee are classified as finance leases. A receivable is recognized at an amount equal to the present value of the lease payments including any guaranteed residual value. Finance lease receivables are included in advances to the customers.
5.5 Operating fixed assets and depreciation Property and equipment, other than land carrying
value of which is not amortized, are stated at cost or revalued amount less accumulated depreciation and accumulated impairment losses, if any. Land is carried at revalued amount. Cost of property and equipment of foreign operations includes exchange differences arising on currency translation at year-end rates.
Capital work-in-progress is stated at cost less accumulated impairment losses, if any. These are transferred to specific assets as and when assets become available for use.
Depreciation on all operating fixed assets is charged using the straight line method in accordance with the rates specified in note 11.2 to these financial statements and after taking into account residual value, if any. The residual values, useful lives and depreciation methods are reviewed and adjusted, if appropriate, at each balance sheet date.
Depreciation on additions is charged from the month the assets are available for use while no depreciation is charged in the month in which the assets are disposed off.
Surplus on revaluation of land and buildings is credited to the surplus on revaluation account. Revaluation is carried out with sufficient regularity to ensure that the carrying amount of assets does not differ materially from their fair value. To the extent of the incremental depreciation charged on the revalued assets, the related surplus on revaluation of land and buildings (net of deferred taxation) is transferred directly to unappropriated profit.
Gains / losses on sale of property and equipment are credited / charged to the profit and loss account currently, except that the related surplus on revaluation of land and buildings (net of deferred taxation) is transferred directly to unappropriated profit.
Subsequent costs are included in the asset’s carrying amount or are recognized as a separate asset, as appropriate, only when it is probable that future economic benefits associated with the item will flow to the Bank and the cost of the item can be measured
Notes to the Consolidated Financial StatementsFor the year ended December 31, 2013
ANNUAL REPORT 2013
228
reliably. All other repairs and maintenance are charged to the profit and loss account.
5.5.1 Intangible assets Intangible assets are stated at cost less accumulated
amortization and accumulated impairment losses, if any. Intangible assets are amortized from the month when these assets are available for use, using the straight line method, whereby the cost of the intangible assets are amortized over its estimated useful lives over which economic benefits are expected to flow to the Bank. The useful lives are reviewed and adjusted, if appropriate, at each balance sheet date.
Intangible assets with indefinite useful lives are not amortised, but are tested for impairment annually, either individually or at the cash generating unit level.
5.5.2 Leases (Ijarah) Assets leased out under ‘Ijarah’ are stated at cost
less accumulated depreciation and accumulated impairment losses, if any. Assets under Ijarah are depreciated over the period of lease term. However, in the event the asset is expected to be available for re-ijarah, depreciation is charged over the economic life of the asset using straight line basis.
5.6 Impairment The carrying amount of assets are reviewed at each
balance sheet date for impairment whenever events or changes in circumstances indicate that the carrying amounts of the assets may not be recoverable. If such indication exists and where the carrying value exceeds the estimated recoverable amount, assets are written down to their recoverable amounts. Recoverable amount is the greater of net selling price and value in use. The resulting impairment loss is taken to the profit and loss account except for impairment loss on revalued assets, which is adjusted against the related revaluation surplus to the extent that the impairment loss does not exceed the surplus on revaluation of that asset.
5.7 Staff retirement benefits MCB Bank Limited
The Bank operates the following staff retirement benefits for its employees:
a) For clerical / non-clerical staff who did not opt for the new scheme, the Bank operates the following:
- an approved contributory provident fund; - an approved gratuity scheme; and - a contributory benevolent schemeb) For clerical / non-clerical staff who joined the Bank
after the introduction of the new scheme and for others who opted for the new scheme introduced in
1975, the Bank operates the following:
an approved non-contributory - provident fund introduced in lieu of the contributory
provident fund; - an approved pension fund; and contributory
benevolent scheme
c) For officers who joined the Bank after the introduction of the new scheme and for others who opted for the new scheme introduced in 1977, the Bank operates the following:
an approved non-contributory provident
- fund introduced in lieu of the contributory provident fund; and - an approved pension fund. - contributory benevolent fund.
However, the management has replaced the pension benefits for employees in the officer category with a contributory provident fund for services rendered after December 31, 2003.
d) For executives and officers who joined the Bank on or after January 01, 2000, the Bank operates an approved contributory provident fund.
e) Post retirement medical benefits to entitled employees.
Annual contributions towards the defined benefit plans and schemes are made on the basis of actuarial advice using the Projected Unit Credit Method. The above benefits are payable to staff at the time of separation from the Bank’s services subject to the completion of qualifying period of service.
Past service cost is the change in the present value of the defined benefit obligation resulting from a plan amendment or curtailment. The Bank recognise past service cost as an expense at the earlier of the following dates:
(i) when the plan amendment or curtailment occurs
(ii) and when the Bank recognises related restructuring costs or termination benefits
MNET Services (Private) Limited The company operates an unfunded gratuity scheme for its eligible employees. Minimum qualifying period for entitlement to gratuity is five years continuous service with the Company. Accrual of charge for the year is made on the basis of actuarial valuations carried out under the projected unit credit method.
Employees’ compensated absencesLiability in respect of employees’ compensated absences is
Notes to the Consolidated Financial StatementsFor the year ended December 31, 2013

229
accounted for in the year in which these are earned on the basis of actuarial valuation carried out using the Projected Unit Credit Method.
During the current year, the Bank has changed its accounting policy in respect of post retirement defined benefits plans as required under International Accounting Standard (IAS) 19, ‘Employee Benefits’. Previously, the net cumulative actuarial gains / losses at each balance sheet date were recognized equally over a period of three years or the expected remaining average working lives of employees, whichever was lower. According to new policy actuarial gains and losses are recognized in other comprehensive income (OCI) in the periods in which they occur. Amounts recorded in the profit and loss account are limited to current and past service costs, gains or losses on settlements, and net interest income (expense). All other changes in the net defined benefit obligation are recognized directly in other comprehensive income with no subsequent recycling through the profit and loss account.
The change in accounting policy has been accounted for retrospectively in accordance with the requirements of IAS 8, ‘Accounting Policies, Changes in Accounting Estimates and Errors’ and comparative figures have been restated. The effect of the change in accounting policy on the current and prior periods financial statements have been summarised below: December 31, December 31, December 31, 2013 2012 2011
(Rupees in ‘000)
Impact on statement of financial position
Increase in other assets 1,631,876 1,175,705 549,069
Increase / (decrease) in other liabilities 448,405 68,192 (1,327)
Increase in deferred tax liabilities 414,215 387,629 192,638
Increase in Un-appropriated profit 769,256 719,883 357,757
December 31, December 31, 2013 2012
(Rupees in ‘000)
Impact on profit and loss account
Increase in administrative expenses 394,490 757,559
Decrease in profit before tax 394,490 757,559
Decrease in profit after tax 256,419 492,413
Decrease in earning per share Rupees 0.253 0.487
5.8 Taxation
Current Provision for current taxation is based on taxable
income at the current rates of taxation after taking into consideration available tax credits and rebates. The charge for current tax also includes adjustments where considered necessary, relating to prior years which arise from assessments framed / finalized during the year.
Deferred Deferred tax is recognised using the balance sheet
liability method on all temporary differences between the amounts attributed to assets and liabilities for financial reporting purposes and amounts used for taxation purposes. The Bank records deferred tax assets / liabilities using the tax rates, enacted or substantively enacted by the balance sheet date expected to be applicable at the time of its reversal. Deferred tax asset is recognised only to the extent that it is probable that future taxable profits will be available against which the asset can be utilised. Deferred tax assets are reduced to the extent that it is no longer probable that the related tax benefit will be realised. The Bank also recognises deferred tax asset / liability on deficit / surplus on revaluation of securities and deferred tax liability on surplus on revaluation of fixed assets which is adjusted against the related deficit / surplus in accordance with the requirements of International Accounting Standard (IAS) 12, ‘Income Taxes’.
Deferred tax liability is not recognized in respect of taxable temporary differences associated with exchange translation reserves of foreign operations, where the timing of the reversal of the temporary difference can be controlled and it is probable that the temporary differences will not reverse in the foreseeable future.
5.9 Provisions Provisions are recognized when the Group has a
legal or constructive obligation as a result of past events and it is probable that an outflow of resources will be required to settle the obligation and a reliable estimate of the amount can be made. Provisions are reviewed at each balance sheet date and are adjusted to reflect the current best estimates.
5.10 Foreign currencies
5.10.1 Foreign currency transactions Transactions in foreign currencies other than the
results of foreign operations discussed in note 5.10.2 are translated to Rupees at the foreign exchange rates prevailing on the transaction date. Monetary assets and liabilities in foreign currencies are expressed in Rupee terms at the rates of exchange prevailing at the balance sheet date. Foreign bills purchased and forward foreign exchange contracts other than those relating to foreign currency deposits are valued at the rates applicable to their respective maturities.
Notes to the Consolidated Financial StatementsFor the year ended December 31, 2013
ANNUAL REPORT 2013
230
5.10.2 Foreign operations The assets and liabilities of foreign branches and
subsidiaries are translated to Rupees at exchange rates prevailing at the balance sheet date. The results of foreign operations are translated to Rupees at the average rate of exchange for the year.
5.10.3 Translation gains and losses Translation gains and losses are included in the
profit and loss account, except those arising on the translation of the Bank’s net investment in foreign branches, which are taken to the capital reserve (exchange translation reserve) until the disposal of the net investment, at which time these are recognised in the profit and loss account.
5.10.4 Commitments Commitments for outstanding forward foreign
exchange contracts are disclosed in these consolidated financial statements at committed amounts. Contingent liabilities / commitments for letters of credit and letters of guarantee denominated in foreign currencies are expressed in Rupee terms at the rates of exchange prevailing at the date of the statement of financial position.
5.11 Acceptances Commitments for outstanding forward foreign
exchange contracts are disclosed in these financial statements at committed amounts. Contingent liabilities / commitments for letters of credit and letters of guarantee denominated in foreign currencies are expressed in Rupee terms at the rates of exchange prevailing at the date of the statement of financial position.
5.12 Revenue recognition - Mark-up / interest on advances and returns on
investments are recognized on a time proportion basis using the effective interest method except that mark-up / interest on non-performing advances and investments is recognized on a receipt basis, in accordance with the requirements of the Prudential Regulations issued by the State Bank of Pakistan (SBP) or as permitted by the regulations of the overseas regulatory authorities of countries where the branches operate. Where debt securities are purchased at premium or discount, such premium / discount is amortized through the profit and loss account over the remaining period of maturity.
- Financing method is used in accounting for income from lease financing. Under this method, the unearned lease income (excess of the sum of total lease rentals and estimated residual value over the cost of leased assets) is deferred and taken to income over the term of the lease period so as to
produce a constant periodic rate of return on the outstanding net investment in lease. Gains / losses on termination of lease contracts are recognized as income when these are realized.
- Ijarah income is recognized on an accrual basis as and when the rental becomes due.
- Commission income is recognized on a time proportion basis.
- Dividend income is recognized when the Group’s right to receive dividend is established.
- Gain / loss on sale of investments is credited / charged to profit and loss account currently.
- Outsourcing revenue, payment system managed service income, subscription fee in Switch product revenue and networking services revenue is recognised on an accrual basis when the related services are rendered.
- Revenue for acting as trustee is recognized on Net Assets Value (NAV) of respective funds.
- Management / advisory fee is calculated on a daily / monthly basis by charging specified rates to the net assets value / income of the Collective Investment Schemes. Advisory fee from the discretionary portfolio is calculated in accordance with the respective agreements with the clients. Management fee from the pension funds is calculated by charging the specified rates to the average net assets value.
5.13 Operating leases Operating lease rentals are recorded in profit and
loss account on a time proportion basis over the term of the lease arrangements.
5.14 Assets acquired in satisfaction of claims The Bank occasionally acquires assets in settlement
of certain advances. These are stated at lower of the carrying value or current fair value of such assets.
5.15 Cash and cash equivalents Cash and cash equivalents include cash and
balances with treasury banks and balances with other banks (net of overdrawn Nostro balances) in current and deposit accounts.
5.16 Financial instruments
5.16.1 Financial assets and financial liabilities Financial instruments carried on the statement of
financial position include cash and balances with treasury banks, balances with other banks, lendings
Notes to the Consolidated Financial StatementsFor the year ended December 31, 2013
231
to financial institutions, investments (excluding investment in associates and subsidiaries), advances, other assets, bills payable, borrowings, deposits and other liabilities. The particular recognition methods adopted for significant financial assets and financial liabilities are disclosed in the individual policy statements associated with these assets and liabilities.
5.16.2 Derivative financial instruments Derivative financial instruments are initially
recognized at fair value on the date on which a derivative contract is entered into and are subsequently remeasured at their fair value using valuation techniques. All the derivative financial instruments are carried as an asset when the fair value is positive and as a liability when the fair value is negative. Any change in the fair value of derivative financial instruments is taken to the profit and loss account currently.
5.16.3 Off setting Financial assets and financial liabilities are set off
and the net amount is reported in the financial statements when there is a legally enforceable right to set off and the Bank intends either to settle on a net basis, or to realize the assets and settle the liabilities, simultaneously.
5.17 Borrowings / deposits
Borrowings / deposits are recorded at the proceeds received. The cost of borrowings / deposits is recognized as an expense in the period in which this is incurred.
5.18 Segment reporting A segment is a distinguishable component of
the Bank that is engaged in providing products or services (business segment) or in providing products or services within a particular economic environment (geographical segment), which is subject to risks and rewards that are different from those of other segments. The Bank’s primary format of reporting is based on business segments.
5.18.1 Business segments
Corporate Finance Corporate Finance includes underwriting,
securitization, investment banking, syndications, IPO related activities (excluding investments) and secondary private placements.
Trading and Sales It includes fixed income, equity, foreign exchange
commodities, lendings to and borrowings from financial institutions and brokerage debt.
Retail and Consumer Banking It includes retail lending and deposits, banking
services, private lending and deposits, banking services and retail offered to its retail customers and small and medium enterprises.
Commercial Banking It includes project finance, export finance, trade
finance, leasing, lending, guarantees and bills of exchange relating to its corporate customers.
Asset Management It includes asset management, investment advisory,
portfolio management, equity research and underwriting.
5.18.2 Geographical segments The Bank operates in below geographic regions
being:
- Pakistan - South Asia - Middle East - Eurasia
5.19 Dividend distribution and appropriation Dividends (including bonus dividend) and other
appropriations (except appropriations which are required by law) are recognized in the period in which these are approved.
5.20 Earnings per share The Bank presents basic and diluted earnings per
share (EPS). Basic EPS is calculated by dividing the profit or loss attributable to ordinary shareholders of the Bank by the weighted average number of ordinary shares outstanding during the year.
Notes to the Consolidated Financial StatementsFor the year ended December 31, 2013

ANNUAL REPORT 2013
232
Notes to the Consolidated Financial StatementsFor the year ended December 31, 2013
Note 2013 2012
(Rupees in ‘000)
6. CASH AND BALANCES WITH TREASURY BANKS
In hand - local currency 6.1 10,189,522 10,335,283 - foreign currencies 2,161,392 1,467,923 With State Bank of Pakistan (SBP) in: Local currency current account 6.2 25,986,891 24,947,522 Foreign currency current account 6.3 142,724 366,370 Foreign currency deposit account 6.2 5,529,331 4,693,009
With other central banks in foreign currency current account 6.2 272,502 373,700
With National Bank of Pakistan in local currency current account 15,663,856 15,236,404
59,946,218 57,420,211
6.1 This includes national prize bonds amounting to Rs. 118.737 million (2012: Rs. 116.073 million).
6.2 Deposits with SBP are maintained to comply with their requirements issued from time to time. Deposits with other central banks are maintained to meet their minimum cash reserves and capital requirements pertaining to the foreign branches of the Bank.
6.3 This represents US Dollar settlement account maintained with SBP.
Note 2013 2012
(Rupees in ‘000)
7. BALANCES WITH OTHER BANKS
Inside Pakistan - current account 16,882 2,212 - deposit account 37,922 6,094
Outside Pakistan - current account 1,052,532 1,015,386 - deposit account 7.1 487,324 213,044
1,594,660 1,236,736
7.1 Balances with other banks outside Pakistan in deposit accounts carry interest rate ranging from 2.35% to 8.50% per annum (2012: 0.16% to 7.00% per annum).

233
Note 2013 2012
(Rupees in ‘000)
8. LENDINGS TO FINANCIAL INSTITUTIONS
Call money lendings 8.2 & 8.3 664,261 - Repurchase agreement lendings 8.2 & 8.3 560,377 1,551,472
1,224,638 1,551,472
8.1 Particulars of lendings In local currency 996,766 1,482,973 In foreign currencies 227,872 68,499
1,224,638 1,551,472
8.2. These carry mark up rates ranging from 6.50% to 10% per annum (2012 : 7.50% to 9.15%).
8.3 Securities held as collateral against lendings to financial institutions
2013 2012 Held by Further Total Held by Further Total bank Given as bank given as collateral collateral
(Rupees in ‘000)
Market Treasury Bills 560,377 - 560,377 1,551,472 - 1,551,472
560,377 - 560,377 1,551,472 - 1,551,472
Notes to the Consolidated Financial StatementsFor the year ended December 31, 2013

ANNUAL REPORT 2013
234
9. INVESTMENTS - NET
9.1 Investments by types
2013 2012
Note / Held by Given as Total Held by Given as Total
Annexure bank collateral bank collateral
(Rupees in ‘000)
Held for trading securities
- Units in open ended mutual funds 9.5 & Annexure I (note 2) 575,270 - 575,270 543,296 - 543,296
Available-for-sale securities
- Market Treasury Bills 9.4 304,804,941 16,631,860 321,436,801 226,894,492 63,100,246 289,994,738
- Pakistan Investment Bonds 9.4 107,615,147 - 107,615,147 83,428,081 - 83,428,081
- Shares in listed companies 9.4 & Annexure I (note 1) 7,792,448 - 7,792,448 6,807,354 - 6,807,354
- Units in open ended mutual fund 9.4 & Annexure I (note 1) 222,443 - 222,443 4,291,933 - 4,291,933
- Shares in unlisted companies 9.4 & Annexure I (note 3) 142,807 - 142,807 244,217 - 244,217
- NIT units 9.4 & Annexure I (note 1) 5,253 - 5,253 5,253 - 5,253
- Sukuk Bonds 9.4 & Annexure I (note 4) 2,700,000 - 2,700,000 3,400,000 - 3,400,000
- Term Finance Certificates (TFCs) 9.4 & Annexure I (note 4) 958,412 - 958,412 1,912,343 - 1,912,343
424,241,451 16,631,860 440,873,311 326,983,673 63,100,246 390,083,919
Held-to-maturity securities
- Market Treasury Bills 9.6 1,656,039 64,836 1,720,875 771,355 67,824 839,179
- Pakistan Investment Bonds - - - 1,676,918 - 1,676,918
- Provincial Government Securities 118 - 118 118 - 118
- Sukuk Bonds Annexure I (note 5) 442,838 - 442,838 653,616 - 653,616
- Euro Bonds Annexure I (note 5) 2,344,907 - 2,344,907 1,693,483 - 1,693,483
- Term Finance Certificates (TFCs),
Debentures, Bonds and Participation
Term Certificates (PTCs) Annexure I (note 4 & 5) 2,778,015 - 2,778,015 2,831,442 - 2,831,442
7,221,917 64,836 7,286,753 7,626,932 67,824 7,694,756
Associates Annexure I (note 6)
- Adamjee Insurance Company Limited 9.7 5,386,250 - 5,386,250 4,176,476 - 4,176,476
- Euronet Pakistan (Private) Limited 9.8 63,426 - 63,426 55,679 - 55,679
- First Women Bank Limited 9.10 63,300 - 63,300 63,300 - 63,300
5,512,976 - 5,512,976 4,295,455 - 4,295,455
Investments at cost 437,551,614 16,696,696 454,248,310 339,449,356 63,168,070 402,617,426
Less: Provision for diminution in
value of investments 9.3 (2,549,959) - (2,549,959) (2,783,347) - (2,783,347)
Investments (net of provisions) 435,001,655 16,696,696 451,698,351 336,666,009 63,168,070 399,834,079
Surplus / (Deficit) on revaluation of
available for sale securities - net 21.2 2,099,461 (12,867) 2,086,594 5,691,769 45,180 5,736,949
Surplus on revaluation of
‘held for trading’ securities - net 9.5 23,400 - 23,400 30,285 - 30,285
Investments at revalued amounts-net of provisions 437,124,516 16,683,829 453,808,345 342,388,063 63,213,250 405,601,313
Notes to the Consolidated Financial StatementsFor the year ended December 31, 2013

235
Note/Annexure 2013 2012
(Rupees in ‘000)
9.2 Investments by segments Federal Government Securities: - Market Treasury Bills 9.4 321,436,801 289,994,738 - Pakistan Investment Bonds 9.4 107,615,147 85,104,999 - Euro Bonds Annexure I (note 5) 2,344,907 1,693,483 - Sukuk Bonds Annexure I (note 4 & 5) 2,700,000 3,400,000
Overseas Government Securities - Market Treasury Bills - Sri Lanka 1,720,875 839,179 - Development Bonds Annexure I (note 5) 632,791 -
Provincial Government Securities 118 118
Associated Undertakings 9.8, 9.9, 9.10, Annexure I (note 6) 5,512,976 4,295,455
Fully Paid-up Ordinary Shares / Certificates / Units
- Listed companies / mutual funds / modarabas Annexure I (note 1) 7,729,163 6,744,069 - Unlisted companies / funds Annexure I (note 3) 142,807 144,217
Units of Open Ended Mutual Funds 797,713 4,835,229
Fully Paid-up Preference Shares:
- Listed Companies Annexure I (note 1) 63,285 63,285 - Unlisted Companies - 100,000
Term Finance Certificates, Debentures, Bonds and Participation Term Certificates:
- Listed Term Finance Certificates Annexure I (note 4) 1,267,298 2,563,200 - Unlisted Term Finance Certificates Annexure I (note 4) 1,527,553 1,979,818 - Debentures, Bonds and Participation Term Certificates (PTCs) Annexure I (note 5) 308,785 200,767 Other Investments: - Sukuk Bonds Annexure I (note 5) 442,838 653,616 - NIT Units 5,253 5,253
Total investments at cost 454,248,310 402,617,426
Less: Provision for diminution in the value of investments 9.3 (2,549,959) (2,783,347)
Investments (net of provisions) 451,698,351 399,834,079
Surplus on revaluation of available for sale securities - net 21.2 2,086,594 5,736,949 Surplus on revaluation of held for trading securities - net 9.5 23,400 30,285
Investments at revalued amounts - net of provisions 453,808,345 405,601,313
9.3 Particulars of provision
Opening balance 2,783,347 3,327,065 Charge during the year 75,299 42,637 Reversal made during the year (82,133) (45,681) (6,834) (3,044) Reversal on disposal of shares (224,353) (540,674) Reclassification (173) - Investment written off against provision (2,028) -
Closing balance 2,549,959 2,783,347
9.3.1 Particulars of provision in respect of Type and Segment
Available-for-sale securities Listed shares / Certificates / Units 1,993,913 2,215,756 Unlisted shares 74,741 71,342 2,068,654 2,287,098
Held-to-maturity securities Unlisted TFCs, Debentures, Bonds and Participation Term Certificates 481,305 496,249
2,549,959 2,783,347
Notes to the Consolidated Financial StatementsFor the year ended December 31, 2013

ANNUAL REPORT 2013
236
9.4 Quality of ‘available for sale’ securities
2013 2012 Note Market value Credit rating Market value Credit rating (Rupees in ‘000) (Rupees in ‘000)
Market Treasury Bills 9.4.1 321,150,456 Unrated 290,505,477 Unrated
Pakistan Investment Bonds 9.4.1 107,720,565 Unrated 86,166,935 Unrated
Listed Term Finance Certificates
Askari Bank Limited 253,321 AA- 275,754 AA-
Bank Alfalah Limited 527,480 AA- 522,712 AA-
Allied Bank Limited 205,081 AA 237,013 AA
United Bank Limited - - 777,380 AA
NIB Bank limited - - 167,118 A+
Pak Arab Fertilizers Limited - - 30,011 AA
985,882 2,009,988
Shares in Listed Companies
Abbott Laboratories Pakistan Limited 25,814 Not available 19,645 Not available
Aisha Steel Mills Limited 1,345 A- & A2 1,690 A- & A2
Allied Bank Limited 794,738 AA+ & A1+ 496,754 AA+ & A1+
Arif Habib Limited 3,067 Not available 2,686 Not available
Arif Habib Corporation Limited 41,188 AA & A1+ 44,650 AA & A1+
Attock Cement Pakistan Limited 2,754 Not available 1,676 Not available
Attock Petroleum Limited 494,906 Not available 420,756 Not available
Attock Refinery Limited - - 37,270 AA & A 1+
Bank Alfalah Limited 8,112 AA & A1+ 5,046 AA & A1+
Bank Al-Habib Limited 533,977 AA+ & A1+ 201,959 AA+ & A1+
Archroma Pakistan Limited
(Formerly Clariant Pakistan Limited) 34,410 Not available 14,524 Not available
Fauji Cement Company Limited 22,330 Not available -
Fauji Fertilizer Bin Qasim Company Limited 168,909 Not available 112,374 Not available
Fauji Fertilizer Company Limited 1,123,183 Not available 1,175,148 Not available
First Al - Noor Modaraba 27,766 Not available 24,990 Not available
Habib Bank Limited 111,669 AAA & A1+ 317,869 AAA & A1+
Habib Metropolitan Bank Limited 2,883 AA+ & A1+ 2,168 AA+ & A1+
Hub Power Company Limited 230,190 AA+ & A1+ 18,096 AA+ & A1+
IGI Insurance Limited 11,507 AA - AA
Indus Motors Company Limited 9,000 Not available 7,297 Not available
Kohinoor Energy Limited 1,952 AA & A1+ 1,238 AA & A1+
Kot Addu Power Company Limited 367,752 AA+ & A1+ 145,083 AA+ & A1+
Masood Textile Mills Limited - preference shares 50,000 Not available 50,000 Not available
Meezan Bank Limited 15,627 AA & A1+ 10,743 AA- & A1+
Millat Tractors Limited 29 Not available 50,582 Not available
Murree Brewery Company Limited 9,460 Not available 2,861 Not available
National Foods Limited 11,430 A+ & A1 4,941 A+ & A1
National Refinery Limited - - 44,236 AAA & A1+
National Bank of Pakistan 428,773 AAA & A1+ -
Nestle Pakistan Ltd Limited 40,378 Not available 25,314 Not available
* Next Capital Limited 9,750 Not available 9,555 Not available
Oil & Gas Development Company Limited 130,783 AAA & A1+ 27,377 AAA & A1+
Balance carried forward 4,713,682 3,276,528
Notes to the Consolidated Financial StatementsFor the year ended December 31, 2013

237
2013 2012
Note Market value Credit rating Market value Credit rating
(Rupees in ‘000) (Rupees in ‘000)
Balance brought forward 4,713,682 3,276,528
Pakistan Oil Fields Limited 592,297 Not available 510,038 Not available
Pakistan Petroleum Limited 457,001 Not available 140,515 Not available
Pakistan State Oil Company Limited 96,410 AA+ & A1+ - AA+ & A1+
Pakistan Telecommunication Company Limited 32,706 Not available - Not available
Pakistan Tobacco Company Limited 27,572 Not available 3,310 Not available
Rafhan Maize Products Limited 127,037 Not available 23,858 Not available
Rupali Polyester Limited 2,985 Not available 3,994 Not available
Samba Bank Limited 66,947 AA- & A1 75,216 AA- & A1
Searle Pakistan Limited 11,244 BBB & A-3 3,010 BBB & A-3
** Sui Northern Gas Pipelines Limited 1,174,200 AA & A1+ 1,165,180 AA- & A1+
* Trust Securities & Brokerage Limited 885 Not available 1,050 Not available
Unilever Pakistan Limited - - 799,920 Not available
Unilever Pakistan Foods Limited 8,063 Not available 3,728 Not available
United Bank Limited 602,352 AA+ & A1+ 655,173 AA+ & A1+
Zulfiqar Industries Limited 3,481 Not available 3,183 Not available
7,916,862 6,664,703
Open Ended Mutual Fund
Metro-Bank Pakistan Sovereign Fund—Perpetual (MSF) - - 4,236,489 AA(f)
MCB Dynamic Stock Fund - - 61,506 4-STAR & 4-STAR
Pakistan Pension Fund 162,546 Not Applicable 140,646 Not Applicable
Pakistan Islamic Pension Fund 164,062 Not Applicable 137,952 Not Applicable
AH Dow Jones SAFE Pakistan Titans 15 Index Fund (AHDJPF) - - 20,691 Not Applicable
326,608 4,597,284
Shares in Un-listed Companies 9.4.2
* National Investment Trust Limited 100 AM2- 100 AM2-
* SME Bank Limited 6,527 BBB & A3 10,106 BBB & A3
First Capital Investment (Private) Limited 2,500 AM4+ 2,500 AM4+
Pak Asian Fund 11,500 Not available 11,500 Not available
* Arabian Sea Country Club 2,194 Not available 3,514 Not available
* Central Depository Company of Pakistan Limited 10,000 Not available 10,000 Not available
* National Institutional Facilitation Technologies (Private) Limited 1,526 Not available 1,526 Not available
Society for Worldwide Inter Fund Transfer (SWIFT) 1,738 Not available 1,738 Not available
Fazal Cloth Mills Limited - preference share - - 100,000 A- & A2
Islamabad Stock Exchange Limited 30,346 Not available 30,346 Not available
Lanka Clearing (Private) Limited 805 Not available 761 Not available
Lanka Financial Services Bureau Limited 805 Not available 761 Not available
Credit Information Bureau of Sri Lanka 25 Not available 23 Not available
68,066 172,875
Other Investment
Sukuk Bonds 9.4.1 2,717,310 Unrated 3,412,836 Unrated
N.I.T. Units 5,502 AM2- 3,672 AM2-
440,891,251 393,533,770
Notes to the Consolidated Financial StatementsFor the year ended December 31, 2013

ANNUAL REPORT 2013
238
Notes to the Consolidated Financial StatementsFor the year ended December 31, 2013
9.4.1 These are Government of Pakistan guaranteed securities.
9.4.2 Investments in unlisted companies are stated at carrying value. The above excludes unlisted shares of companies which are fully provided for in these financial statements.
*These are the strategic investments of the Bank.
**This includes 37.292 million shares valuing Rs. 794.309 million (2012: 33.901 million shares valuing Rs. 788.207 million) which are held as strategic investment by the Bank.
9.5 Unrealized gain on revaluation of investments classified as ‘held for trading’
Unrealized gain Cost
Note 2013 2012 2013 2012
(Rupees in ‘000)
Investee Company
MCB Dynamic Cash Fund 12,921 22,774 358,985 462,749
MCB Dynamic Allocation Fund 6,053 - 173,348 -
Metro Bank-Pakistan Sovereign Fund 488 - 15,937 -
MCB Dynamic Allocation Fund - 5,897 - 53,547
Pakistan Cash Management Fund 9.5.1 3,938 1,614 27,000 27,000
23,400 30,285 575,270 543,296
2013 2012
(Rupees in ‘000)
9.5.1 At fair value through profit or loss Cost of investment 27,000 27,000 Unrealized gain 3,938 1,614
Fair value of investments 30,938 28,614
Fair value of investment Opening balance 28,614 - Purchased during the year - 27,000 Gain on fair value of remeasurement recognized in Profit & Loss 2,324 1,614
Closing balance 30,938 28,614
9.6 “Available for sale” Market Treasury Bills and Pakistan Investment Bonds are eligible for rediscounting with the State Bank of Pakistan. The market value of Market Treasury Bills classified as ‘held to maturity’ as at December 31, 2013 amounted to Rs. 1,720.875 million (2012: Rs. 839.179 million).
9.7 Investment of the Group in Adamjee Insurance Company Limited has been accounted for under the equity method of accounting in accordance with the treatment specified in International Accounting Standard 28, (IAS 28) ‘Accounting for Investments in Associates’. The market value of the investment in Adamjee Insurance Company Limited as at December 31, 2013 amounted to Rs. 3,809.906 million (2012: Rs. 2,455.336 million).
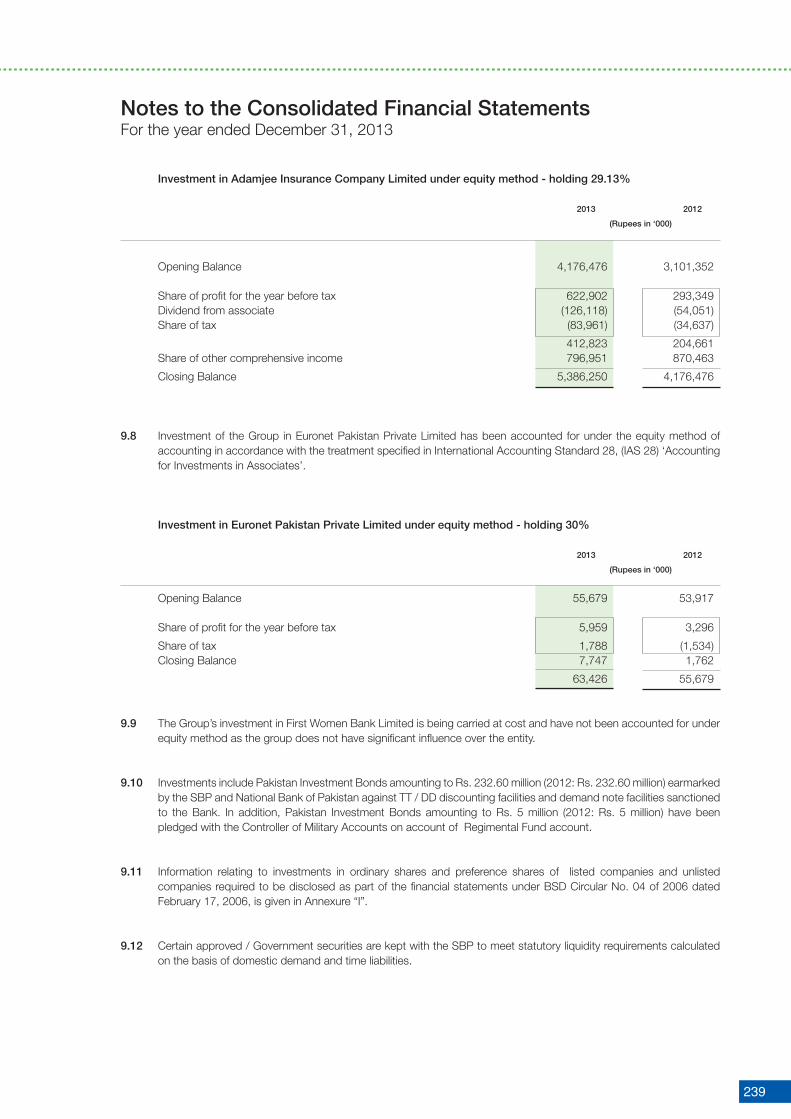
239
Notes to the Consolidated Financial StatementsFor the year ended December 31, 2013
Investment in Adamjee Insurance Company Limited under equity method - holding 29.13%
2013 2012
(Rupees in ‘000)
Opening Balance 4,176,476 3,101,352
Share of profit for the year before tax 622,902 293,349 Dividend from associate (126,118) (54,051) Share of tax (83,961) (34,637)
412,823 204,661 Share of other comprehensive income 796,951 870,463
Closing Balance 5,386,250 4,176,476
9.8 Investment of the Group in Euronet Pakistan Private Limited has been accounted for under the equity method of accounting in accordance with the treatment specified in International Accounting Standard 28, (IAS 28) ‘Accounting for Investments in Associates’.
Investment in Euronet Pakistan Private Limited under equity method - holding 30%
2013 2012
(Rupees in ‘000)
Opening Balance 55,679 53,917
Share of profit for the year before tax 5,959 3,296
Share of tax 1,788 (1,534) Closing Balance 7,747 1,762
63,426 55,679
9.9 The Group’s investment in First Women Bank Limited is being carried at cost and have not been accounted for under equity method as the group does not have significant influence over the entity.
9.10 Investments include Pakistan Investment Bonds amounting to Rs. 232.60 million (2012: Rs. 232.60 million) earmarked by the SBP and National Bank of Pakistan against TT / DD discounting facilities and demand note facilities sanctioned to the Bank. In addition, Pakistan Investment Bonds amounting to Rs. 5 million (2012: Rs. 5 million) have been pledged with the Controller of Military Accounts on account of Regimental Fund account.
9.11 Information relating to investments in ordinary shares and preference shares of listed companies and unlisted companies required to be disclosed as part of the financial statements under BSD Circular No. 04 of 2006 dated February 17, 2006, is given in Annexure “I”.
9.12 Certain approved / Government securities are kept with the SBP to meet statutory liquidity requirements calculated on the basis of domestic demand and time liabilities.

ANNUAL REPORT 2013
240
Note 2013 2012
(Rupees in ‘000)
10. ADVANCES - NET
Loans, cash credits, running finances, etc. In Pakistan 230,190,144 227,859,344 Outside Pakistan 13,419,914 12,176,644
243,610,058 240,035,988
Islamic Financing and related assets 10.2 11,303,966 9,983,417
Net investment in finance lease 10.3 In Pakistan 1,027,911 1,004,761 Outside Pakistan 911,165 850,532
1,939,076 1,855,293
Bills discounted and purchased (excluding treasury bills) Payable in Pakistan 1,455,467 830,471 Payable outside Pakistan 10,162,518 9,892,365
11,617,985 10,722,836
Advances - gross 268,471,085 262,597,534
Provision against advances 10.5 Specific provision 10.4 (19,450,148) (22,380,087) General provision 10.5.3 (267,860) (257,457) General provision against consumer loans 10.5.5 (201,354) (145,568) General provision for potential lease losses (in Sri Lanka operations) (29,931) (25,911)
(19,949,293) (22,809,023)
Advances - net of provision 248,521,792 239,788,511
10.1 Particulars of advances (gross)
10.1.1 In local currency 222,305,289 237,125,452 In foreign currencies 46,165,796 25,472,082
268,471,085 262,597,534
10.1.2 Short-term 202,403,592 200,826,481 Long-term 66,067,493 61,771,053
268,471,085 262,597,534
10.2 Islamic Financing and related assets Annexure -II
Islamic Financing 5,468,451 5,047,652 Inventories 4,580,773 3,319,863 Advance against Murabaha 756,568 1,394,444 Advance against Future Ijara 268,721 25,779 Advance against Diminishing Musharaka 229,453 195,679
11,303,966 9,983,417
Notes to the Consolidated Financial StatementsFor the year ended December 31, 2013

241
Notes to the Consolidated Financial StatementsFor the year ended December 31, 2013
10.3 Net investment in finance lease 2013 2012
Not later Later than Not later Later than
than one one and than one one and
year less than Total year less than Total five years five years
(Rupees in ‘000)
Lease rentals receivable 956,830 1,148,581 2,105,411 802,286 1,218,681 2,020,967
Guaranteed residual value 37,176 64,978 102,154 68,700 83,560 152,260
Minimum lease payments 994,006 1,213,559 2,207,565 870,986 1,302,241 2,173,227
Finance charge for future periods (150,595) (117,894) (268,489) (163,028) (154,906) (317,934)
Present value of minimum lease payments 843,411 1,095,665 1,939,076 707,958 1,147,335 1,855,293
10.4 Advances include Rs. 23,267.733 million (2012: Rs. 25,561.774 million) which have been placed under the non-performing status as detailed
below:
2013
Category of Classification Note Classified Advances Specific Provision Required Specific Provision Held
Domestic Overseas Total Domestic Overseas Total Domestic Overseas Total
(Rupees in ‘000)
Other Assets Especially
Mentioned (OAEM) 10.4.1 35,782 - 35,782 2,660 - 2,660 2,660 - 2,660
Substandard 168,423 50,438 218,861 41,200 12,610 53,810 41,200 12,610 53,810
Doubtful 1,453,012 - 1,453,012 405,827 - 405,827 405,827 - 405,827
Loss 16,584,176 4,975,902 21,560,078 16,502,626 2,485,225 18,987,851 16,502,626 2,485,225 18,987,851
18,241,393 5,026,340 23,267,733 16,952,313 2,497,835 19,450,148 16,952,313 2,497,835 19,450,148
2012
Category of Classification Note Class Advances Specific Provision Required Specific Provision Held
Domestic Overseas Total Domestic Overseas Total Domestic Overseas Total
(Rupees in ‘000)
Other Assets Especially
Mentioned (OAEM) 10.4.1 - - - - - - - - -
Substandard 285,883 - 285,883 36,090 - 36,090 36,090 - 36,090
Doubtful 845,875 4,024 849,899 421,841 2,012 423,853 421,841 2,012 423,853
Loss 19,829,029 4,596,963 24,425,992 19,714,184 2,205,960 21,920,144 19,714,184 2,205,960 21,920,144
20,960,787 4,600,987 25,561,774 20,172,115 2,207,972 22,380,087 20,172,115 2,207,972 22,380,087
10.4.1 This represents non-performing portfolio of agricultural and small enterprise financing classified as OAEM as per the requirements of the Prudential Regulation for Agricultural and Small Enterprise Financing issued by the State Bank of Pakistan.

ANNUAL REPORT 2013
242
Notes to the Consolidated Financial StatementsFor the year ended December 31, 2013
2013 Note Specific General General Leasing Total provision (general) against consumer & SMEs loans
(Rupees in ‘000)
10.5 Particulars of provision
against advances
Opening balance 22,380,087 257,457 145,568 25,911 22,809,023
Exchange adjustments 129,419 - - 1,502 130,921
Provision made during the year 1,619,488 10,403 55,786 2,518 1,688,195
Reversals (4,516,978) - - - (4,516,978)
(2,897,490) 10,403 55,786 2,518 (2,828,783)
Amounts written off 10.6.1 (161,868) - - - (161,868)
Closing balance 19,450,148 267,860 201,354 29,931 19,949,293
2012
Note Specific General General Leasing Total provision (general) against consumer & SMEs loans
(Rupees in ‘000)
Opening balance 21,869,401 248,135 198,340 17,566 22,333,442
Exchange adjustments 101,078 - - - 101,078
Provision made during the year 4,881,254 9,322 - 8,345 4,898,921
Reversals (4,365,246) - (52,772) - (4,418,018)
516,008 9,322 (52,772) 8,345 480,903
Amounts written off 10.6.1 (106,400) - - - (106,400) Closing balance 22,380,087 257,457 145,568 25,911 22,809,023
10.5.1 Particulars of provisions against advances 2013 2012
Specific General Total Specific General Total
(total) (total)
(Rupees in ‘000)
In local currency 16,952,313 469,214 17,421,527 20,172,115 403,025 20,575,140
In foreign currencies 2,497,835 29,931 2,527,766 2,207,972 25,911 2,233,883
19,450,148 499,145 19,949,293 22,380,087 428,936 22,809,023
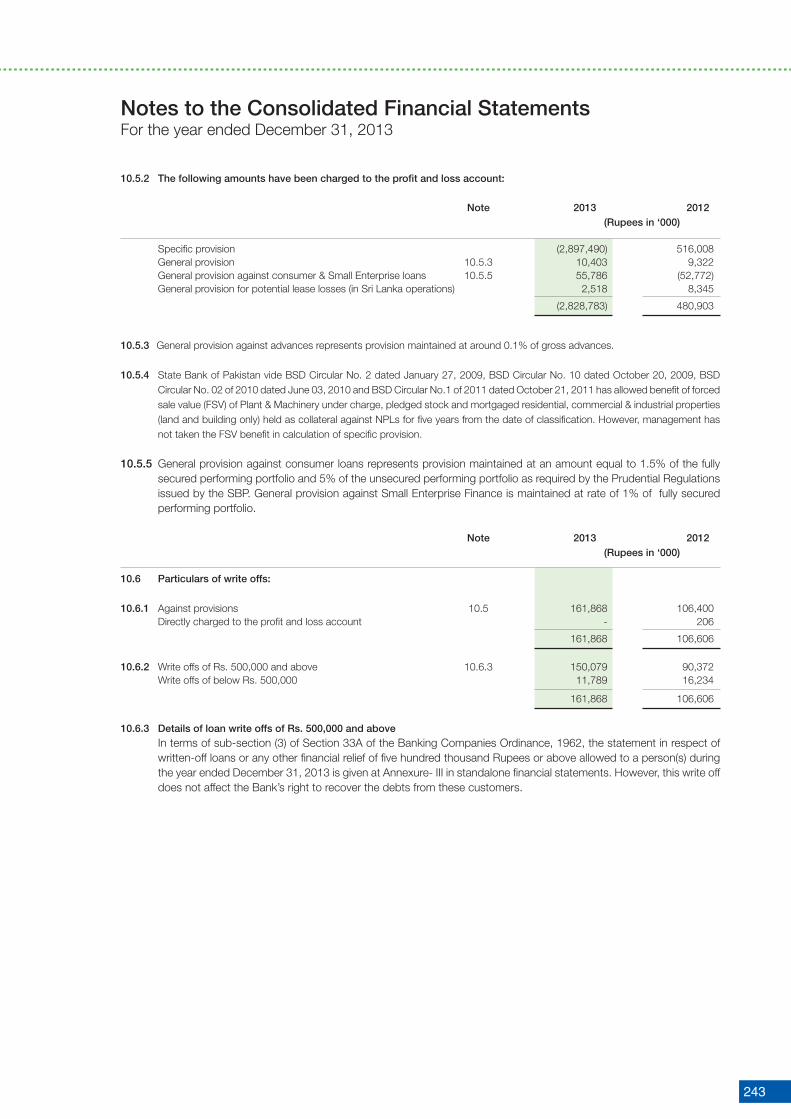
243
Notes to the Consolidated Financial StatementsFor the year ended December 31, 2013
10.5.2 The following amounts have been charged to the profit and loss account:
Note 2013 2012 (Rupees in ‘000)
Specific provision (2,897,490) 516,008 General provision 10.5.3 10,403 9,322 General provision against consumer & Small Enterprise loans 10.5.5 55,786 (52,772) General provision for potential lease losses (in Sri Lanka operations) 2,518 8,345
(2,828,783) 480,903
10.5.3 General provision against advances represents provision maintained at around 0.1% of gross advances.
10.5.4 State Bank of Pakistan vide BSD Circular No. 2 dated January 27, 2009, BSD Circular No. 10 dated October 20, 2009, BSD Circular No. 02 of 2010 dated June 03, 2010 and BSD Circular No.1 of 2011 dated October 21, 2011 has allowed benefit of forced sale value (FSV) of Plant & Machinery under charge, pledged stock and mortgaged residential, commercial & industrial properties (land and building only) held as collateral against NPLs for five years from the date of classification. However, management has not taken the FSV benefit in calculation of specific provision.
10.5.5 General provision against consumer loans represents provision maintained at an amount equal to 1.5% of the fully secured performing portfolio and 5% of the unsecured performing portfolio as required by the Prudential Regulations issued by the SBP. General provision against Small Enterprise Finance is maintained at rate of 1% of fully secured performing portfolio.
Note 2013 2012 (Rupees in ‘000)
10.6 Particulars of write offs:
10.6.1 Against provisions 10.5 161,868 106,400 Directly charged to the profit and loss account - 206
161,868 106,606
10.6.2 Write offs of Rs. 500,000 and above 10.6.3 150,079 90,372 Write offs of below Rs. 500,000 11,789 16,234
161,868 106,606
10.6.3 Details of loan write offs of Rs. 500,000 and above In terms of sub-section (3) of Section 33A of the Banking Companies Ordinance, 1962, the statement in respect of
written-off loans or any other financial relief of five hundred thousand Rupees or above allowed to a person(s) during the year ended December 31, 2013 is given at Annexure- III in standalone financial statements. However, this write off does not affect the Bank’s right to recover the debts from these customers.

ANNUAL REPORT 2013
244
Notes to the Consolidated Financial StatementsFor the year ended December 31, 2013
Note 2013 2012 (Rupees in ‘000)
10.7 Particulars of advances to directors, executives, associated companies, etc. Debts due by executives or officers of the Bank or any of them either severally or jointly with any other persons
Balance at beginning of the year 3,884,919 4,179,054 Loans granted during the year 583,827 530,074 Repayments (831,052) (824,209)
Balance at end of the year 3,637,694 3,884,919
Debts due by subsidiary companies, controlled firms, managed modarabas and other related parties
Balance at beginning of the year 156,696 131,903 Loans granted during the year 445,085 435,357 Repayments (402,105) (410,564) Balance at end of the year 199,676 156,696
3,837,370 4,041,615
11. OPERATING FIXED ASSETS
Capital work-in-progress 11.1 1,900,221 1,470,141 Property and equipment 11.2 26,234,684 21,885,408 Intangible asset 11.3 871,026 788,693
29,005,931 24,144,24211.1 Capital work-in-progress
Civil works 1,260,427 1,032,549 Advances to suppliers and contractors 161,359 240,852 Others 478,435 196,740
1,900,221 1,470,141

245
Notes to the Consolidated Financial StatementsFor the year ended December 31, 2013
11.2 Property and equipment
2013
Cost/ Revalued amount Accumulated depreciation
Description At January Additions/ Revaluation Reversal due to Transfer in / At At Charge for the year/ Reversal due to Transfer in / At Net book Annual rate of
01, 2013 (disposals) / surplus to revaluation (out) December 31, January 01, (description on revaluation (out) December 31, value at depreciation/
exchange and 2013 2013 disposal exchange) 2013 December 31, estimated
other adjustments and other 2013 useful life
adjustments
(Rupees in ‘000)
Land - Freehold 12,057,399 809,296 1,507,217 - - 14,373,912 - - - - - 14,373,912 -
Land - Leasehold 120,100 - 5,532 - 125,632 - - - - - 125,632 -
Buildings on freehold land 6,191,206 1,062,697 595,968 (538,745) 64,609 7,377,725 319,280 216,702 (538,745) 17,544 15,541 7,362,184 upto 70 years - - - - - - - - - - - - 1,990 760
Buildings on leasehold land 538,898 1,836 16,465 (14,013) (493,999) 49,996 181,563 2,007 (14,013) (170,314) - 49,996 upto 50 years - - - - - - - - - - - - 809 757
Leasehold Improvements* - 225,847 - - 436,268 663,619 154,583 - 152,770 308,206 355,413 3 years - - 1,504 853
Furniture and fixture 1,001,163 100,656 - (6,878) 1,088,171 544,725 99,097 - - 639,179 448,992 10% (9,533) (6,790) 2,763 2,147
Electrical, Computers and 7,722,797 799,170 - - - 8,440,072 5,557,447 740,918 - - 6,217,053 2,223,019 10% to 25%office Equipment (88,094) (84,727) 6,199 3,415
Vehicles 585,513 233,183 - - - 748,307 366,787 77,641 - - 389,362 358,945 20% (73,053) (57,648) 2,664 2,582Ijarah Assets
Assets held under Ijarah - Car 285,284 523,090 - - - 750,029 61,550 111,509 - - 144,970 605,059 20% (58,345) (28,089)
Assets held under Ijarah - Equipment 537,749 150,840 - - - 563,369 123,349 155,077 - - 231,837 331,532 20% (125,220) (46,589)
29,040,109 3,906,615 2,125,182 (552,758) - 34,180,832 7,154,701 1,557,534 (552,758) - 7,946,148 26,234,684 (354,245) (223,843) 15,929 10,514
* Leasehold Improvements have been classified separately from Buildings on leasehold land.
2012
Cost/ Revalued amount Accumulated depreciation Description At January Additions/ At December At January Charge for the year/ At December Net book Annual rate of 01, 2012 (disposals) / 31, 2012 01, 2012 (description on 31, 2012 value at depreciation / exchange and (disposals) /exchange December 31, 2012 estimated useful life other adjustments and other adjustments
(Rupees in ‘000)
Land - Freehold 10,788,123 1,269,276 12,057,399 - - - 12,057,399 -
Land - Leasehold 120,100 - 120,100 - - - 120,100 - Buildings on freehold land 5,632,100 559,106 6,191,206 146,330 166,405 319,280 5,871,926 upto 70 years - 6,545
Buildings on leasehold land 307,012 233,291 538,898 127,453 77,620 181,563 357,335 3 to 50 years - - (1,405) (23,510) Furniture and fixture 918,961 83,854 1,001,163 436,368 109,553 544,725 456,438 10% (2,374) (1,407) 722 211 Electrical, Computers and 7,205,306 567,874 7,722,797 4,760,614 820,438 5,557,447 2,165,350 10% to 25% office Equipment (20,032) (10,845) (30,351) (12,760)
Vehicles 568,394 59,344 585,513 330,076 68,232 366,787 218,726 20% (41,170) (31,225) (1,055) (296) Ijarah Assets Assets held under Ijarah - Car 105,537 206,629 285,284 30,031 45,172 61,550 223,734 20% (26,882) (13,653) - Assets held under Ijarah - Equipment 318,957 222,059 537,749 16,332 107,368 123,349 414,400 20% (3,267) (351)
25,964,490 3,201,433 29,040,109 5,847,204 1,394,788 7,154,701 21,885,408 (93,725) (57,481) (32,089) (29,810)

ANNUAL REPORT 2013
246
11.2.1 The land and buildings of the Bank are revalued in December 2013 by independent valuers (Arch-e-Decon & Sardar Enterprises), valuation and engineering consultants, on the basis of market value. The information relating to location of revalued assets is given in Annexure III. The details of revalued amounts are as follows:
(Rupees in ‘000)
Total revalued amount of land 14,499,544 Total revalued amount of buildings 7,412,180
Had the land and buildings not been revalued, the total carrying amounts of revalued properties as at December 31, 2013 would have been as follows:
(Rupees in ‘000)
Land 4,989,758 Buildings 4,658,522
11.2.2 The gross carrying amount (cost) of fully depreciated assets that are still in use are as follows:
Furniture and fixture 298,550 Electrical, computers and office equipment 3,770,909 Vehicles 358,023 Leasehold Improvements 98,600 Intangible asset 1,207,762
11.2.3 Details of disposal of operating fixed assets
The information relating to disposal of operating fixed assets required to be disclosed as part of the financial statements by the State Bank of Pakistan is given in Annexure III and is an integral part of these consolidated financial statements.
11.3 Intangible asset
2013
Description Cost Accumulated amortization
At At Net Book Annual
At January 01 Additions/ December At January Amortization December value at rate of
2013 exchange 31, 2013 01, 2013 for the year/ 31, 2013 December amortization
adjustments adjustments 31, 2013 %
(Rupees in ‘000)
Computer software 1,876,612 344,708 2,224,847 1,362,046 263,024 1,627,948 596,899 33.33
3,527 2,878
Goodwill 82,127 - 82,127 - - - 82,127
Management rights 192,000 - 192,000 - - - 192,000
2,150,739 344,708 2,498,974 1,362,046 263,024 1,627,948 871,026
3,527 2,878
2012
Description Cost Accumulated amortization
At At Net Book Annual
At January 01 Additions/ December At January Amortization December value at rate of
2012 adjustments 31, 2012 01, 2012 for the year/ 31, 2012 December amortization
adjustments 31, 2012 %
(Rupees in ‘000)
Computer software 1,513,604 350,382 1,876,612 1,086,169 261,901 1,362,046 514,566 33.33
12,626 13,976
Goodwill 82,127 - 82,127 - - - 82,127
Management rights 192,000 - 192,000 - - - 192,000
1,787,731 350,382 2,150,739 1,086,169 261,901 1,362,046 788,693
12,626 13,976
Notes to the Consolidated Financial StatementsFor the year ended December 31, 2013

247
Notes to the Consolidated Financial StatementsFor the year ended December 31, 2013
Note 2013 2012
Restated
(Rupees in ‘000)
12. OTHER ASSETS - NET
Income / mark-up accrued on advances and
investments - local currency 8,403,945 8,019,107
Income / mark-up accrued on advances and
investments - foreign currencies 188,298 98,249
Accrued income, advances, deposits, and other prepayments 1,065,013 975,662
Advance taxation (payments less provisions) 6,145,527 10,969,681
Compensation for delayed income tax refunds 44,802 44,802
Non-banking assets acquired in satisfaction of claims 12.1 1,939,184 1,398,703
Unrealised gain on derivative financial instruments 12.2 1,649,163 134,339
Stationery and stamps on hand 66,910 43,067
Prepaid exchange risk fee 257 169
Receivable from the pension fund 36.3 5,854,207 18,428,483
Others 2,901,129 2,735,476
28,258,435 42,847,738
Less: Provision held against other assets 12.3 1,081,715 1,131,977
27,176,720 41,715,761
12.1 The market value of non-banking assets with carrying value of Rs. 1,814.981 million (2012: Rs. 1,276.093 million) net of provision as per the valuation reports dated December 31, 2013 amounted to Rs. 1,831.591 million (2012: Based on valuation as of December 31, 2012 Rs. 1,374.399 million).
12.2 Unrealised gain on derivative financial instruments
Contract / Notional amount Unrealised gain 2013 2012 2013 2012 (Rupees in ‘000)
Unrealised gain on: FX Options 216,344 - 1,062 - Forward exchange contracts 90,769,449 22,169,486 1,648,101 134,339
90,985,793 22,169,486 1,649,163 134,339
12.3 Provision held against other assets 2013 2012 (Rupees in ‘000)
Opening balance 1,131,977 1,289,687
Charge for the year 31,376 59,858
Reversal during the year (83,661) (247,163)
(52,285) (187,305)
Write off during the year (40,091) (12,324)
Exchange adjustments / reclassification 42,114 41,919
Closing balance 1,081,715 1,131,977
13. CONTINGENT ASSETS
There were no contingent assets of the Group as at December 31, 2013 and December 31, 2012.

ANNUAL REPORT 2013
248
2013 2012 (Rupees in ‘000)
14. BILLS PAYABLE
In Pakistan 10,113,386 9,849,905
Outside Pakistan 25,340 46,379
10,138,726 9,896,284
2013 2012 (Rupees in ‘000)
15. BORROWINGS
In Pakistan 30,267,778 76,644,529
Outside Pakistan 8,392,627 2,419,822
38,660,405 79,064,351
15.1 Particulars of borrowings with respect to currencies In local currency 30,267,778 76,644,529
In foreign currencies 8,392,627 2,419,822
38,660,405 79,064,351
15.2 Details of borrowings (secured / unsecured)
Secured
Borrowings from State Bank of Pakistan
Export refinance scheme 15.3 & 15.5 8,939,210 8,780,720
Long term financing facility 15.4 & 15.5 3,832,857 3,448,638
Long term financing - export oriented projects scheme 15.4 & 15.5 213,965 555,277
Financing Facility for Storage of Agricultural Produce 670,858 768,806
13,656,890 13,553,441
Repurchase agreement borrowings 15.6 16,675,724 63,158,913
30,332,614 76,712,354
Unsecured Borrowings from other financial institution 15.7 2,751,563 405,853
Call borrowings 15.8 4,950,256 1,117,221
Overdrawn nostro accounts 625,972 828,923
8,327,791 2,351,997
38,660,405 79,064,351
15.3 The Bank has entered into agreements for financing with the State Bank of Pakistan (SBP) for extending export finance to customers. As per the agreements, the Bank has granted SBP the right to recover the outstanding amount from the Bank at the date of maturity of the finance by directly debiting the current account maintained by the Bank with SBP. These carry mark-up at rate of 8.40%.
15.4 The amount is due to SBP and has been obtained for providing long term finance to customers for export oriented projects. As per the agreements with SBP, the Bank has granted SBP the right to recover the outstanding amount from the Bank at the date of maturity of the finance by directly debiting the current account maintained by the Bank with SBP.
15.5 Borrowings from SBP under the export refinance and long term financing for export oriented projects schemes are secured against the Bank’s cash and security balances held by the SBP. These carry mark-up at rates ranging from 8.40% to 8.80% per annum.
15.6 These carry mark-up rates ranging from 7.75% to 10.25% per annum (2012: 6.50% to 12.82% per annum) and are secured against government securities of carrying value of Rs. 16,741.876 million (2012: Rs. 63,213.250 million).
15.7 These carry mark-up ranging from 1.20% to 11.50% per annum (2012: 1.50% to 11.50% per annum).
15.8 These carry mark-up ranging from 0.80% to 3% per annum (2012: 0.80% to 1.45% per annum). These are repayable by April, 2014.
Notes to the Consolidated Financial StatementsFor the year ended December 31, 2013

249
16. DEPOSITS AND OTHER ACCOUNTS 2013 2012 (Rupees in ‘000)
Customers Fixed deposits 60,524,016 80,649,846
Saving deposits 349,209,809 268,923,547
Current accounts 206,713,480 183,107,714
Margin accounts 3,937,113 3,520,404
620,384,418 536,201,511
Financial institutions Remunerative deposits 8,058,094 6,090,878
Non-remunerative deposits 3,866,582 2,695,702
11,924,676 8,786,580
632,309,094 544,988,091
16.1 Particulars of deposits
In local currency 596,295,535 515,529,011
In foreign currencies 36,013,559 29,459,080
632,309,094 544,988,091
16.2 Deposits include deposits from related parties amounting to Rs. 16,525.673 million (2012: Rs. 30,737.114 million).
17. DEFERRED TAX LIABILITY / (ASSET) - NET
The details of the tax effect of taxable and deductible temporary differences are as follows:
Note 2013 2012
Restated (Rupees in ‘000)
Taxable temporary differences on:
Surplus on revaluation of operating fixed assets 21.1 963,433 768,800
Accelerated tax depreciation 1,276,877 1,142,867
Receivable from pension fund 2,048,974 6,449,969
Investments in associates 254,886 213,604
Surplus on revaluation of securities 21.2 311,153 1,501,042
4,855,323 10,076,282
Deductible temporary differences on:
Provision for bad debts (19,766) (12,632)
Provision for gratuity - (1,519)
Taxable losses (2,467) (11,632)
Provision for post retirement benefits (332,797) (281,628)
(355,030) (307,411)
4,500,293 9,768,871
Notes to the Consolidated Financial StatementsFor the year ended December 31, 2013

ANNUAL REPORT 2013
250
18. OTHER LIABILITIES Note 2013 2012
Restated (Rupees in ‘000)
Mark-up / return / interest payable in local currency 1,982,285 7,699,278
Mark-up / return / interest payable in foreign currencies 93,932 65,112
Accrued expenses 7,217,767 5,812,141
Unclaimed dividend 1,232,896 520,567
Staff welfare fund 18,846 27,942
Unrealised loss on derivative financial instruments 18.1 1,005,305 107,194
Provision for employees’ compensated absences 36.3 934,009 594,100
Provision for post retirement medical benefits 36.3 1,340,476 1,565,634
Provision for employees’ contributory benevolent scheme 36.3 213,438 257,089
Provision for gratuity 976 4,340
Security deposits 322,371 288,471
Branch adjustment account 193,597 19,023
Retention money 25,004 31,634
Insurance payable against consumer assets 216,959 169,517
Unclaimed balances 993,264 901,578
Duties and taxes payable 897,003 305,738
Others 3,518,863 2,896,281
20,206,991 21,265,639
18.1 Unrealised loss on derivative financial instruments
Contract / Notional amount Unrealised loss
2013 2012 2013 2012
(Rupees in ‘000)
Unrealised loss on: 216,344 - 1,062 -
FX Options 61,406,865 25,074,183 1,004,243 107,194
Forward exchange contracts 61,623,209 25,074,183 1,005,305 107,194
19. SHARE CAPITAL
19.1 Authorised Capital
2013 2012 2013 2012
(Number of shares) (Rupees in ‘000)
1,500,000,000 1,000,000,000 Ordinary shares of Rs 10 each 15,000,000 10,000,000
Notes to the Consolidated Financial StatementsFor the year ended December 31, 2013
19.2 Issued, subscribed and paid-up capital
2013 2012 2013 2012
Issued for issued as Total issued for issued as Total
cash bonus share cash bonus share (Rupees in ‘000)
(Number of shares)
197,253,795 722,606,328 919,860,123 197,253,795 638,982,681 836,236,476 Opening balance 9,198,601 8,362,365
Shares issued
- 91,986,012 91,986,012 - 83,623,647 83,623,647 during the year 919,860 836,236
197,253,795 814,592,340 1,011,846,135 197,253,795 722,606,328 919,860,123 Closing balance 10,118,461 9,198,601

251
Note 2013 2012 (Rupees in ‘000)
21. SURPLUS ON REVALUATION OF ASSETS- NET OF TAX Surplus / (deficit) arising on revaluation (net of tax) of: - fixed assets 21.1 11,300,011 9,425,431 - available-for-sale securities 21.2 1,775,441 4,235,907 Surplus / (deficit) arising on revaluation of assets of associated undertaking (net of tax) 1,732,181 961,932 14,807,633 14,623,270
21.1 Surplus on revaluation of fixed assets-net of tax Surplus on revaluation of fixed assets as at January 01 10,194,231 10,250,095 Surplus during the year 2,125,182 - Transferred to unappropriated profit in respect of incremental depreciation charged during the year - net of deferred tax (36,288) (36,312) Related deferred tax liability (19,681) (19,552) (55,969) (55,864) Surplus on revaluation of fixed assets as at December 31 12,263,444 10,194,231
Less: Related deferred tax liability on: Revaluation as at January 01 768,800 788,352 Surplus during the year 214,314 - Incremental depreciation charged during the year transferred to profit and loss account (19,681) (19,552) 963,433 768,800 11,300,011 9,425,431
19.3 Number of shares held by the associated undertakings as at December 31, are as follows:
2013 2012 (Number of shares)
Adamjee Insurance Company Limited 29,914,034 28,641,486
Nishat Mills Limited 73,272,629 66,611,481
D.G. Khan Cement Company Limited 92,979,303 84,526,640
Din Leather (Private) Limited 6,305,758 5,732,508
Siddiqsons Limited 12,978,603 11,798,731
Mayban International Trust (Labuan) Berhad 202,369,225 183,972,923
417,819,552 381,283,769
20. RESERVES Note 2013 2012 (Rupees in ‘000)
Share premium 9,924,438 9,924,438
Exchange translation reserve 784,004 545,530
Statutory reserve 20.1 17,700,494 15,550,960
General reserve 18,600,000 18,600,000
47,008,936 44,620,928
20.1 Statutory reserve represents amount set aside as per the requirements of section 21 of the Banking Companies Ordinance, 1962.
Notes to the Consolidated Financial StatementsFor the year ended December 31, 2013

ANNUAL REPORT 2013
252
Note 2013 2012 (Rupees in ‘000)
21.2 Surplus / (deficit) on revaluation of available- for-sale securities - net of tax Federal Government Securities - Market Treasury Bills (286,345) 510,739 - Pakistan Investment Bonds 105,418 2,738,854 Listed Securities - Shares / Certificates / Units 2,116,420 2,071,198 - Open Ended Mutual Funds 106,321 305,677 - Term Finance Certificates 27,470 97,645 2,250,211 2,474,520 Sukuk Bonds 17,310 12,836 2,086,594 5,736,949 Add: Related deferred tax (liability) / asset 17 (311,153) (1,501,042) 1,775,441 4,235,907 22. CONTINGENCIES AND COMMITMENTS
22.1 Direct credit substitutes Contingent liabilities in respect of guarantees given favouring Government 6,488,041 5,129,432 Banks and financial institutions 2,347,585 3,585,501 Others 16,054,851 13,956,922
24,890,477 22,671,855 22.2 Transaction-related contingent liabilities Guarantees in favour of Banks and financial institutions 20,933 - Others 1,500,019 686,615 Suppliers’ credit / payee guarantee 2,489,432 2,600,833
4,010,384 3,287,448 22.3 Trade-related contingent liabilities 80,638,690 69,500,795
22.4 Other contingencies Claims against the Bank not acknowledged as debts 3,035,863 620,416 These represent certain claims by third parties against the Bank, which are being contested in the Courts of law. The management is of the view that these relate to the normal course of business and the possibility of an outflow of economic resources is remote.
22.5 Commitments to extend credit The Bank makes commitments to extend credit in the normal course of its business but these being revocable commitments do not attract any significant penalty or expense if the facility is unilaterally withdrawn.
22.6 Commitments in respect of forward foreign exchange contracts
Purchase 72,216,751 25,546,035 Sale 79,959,563 21,697,634
22.7 Commitments for the acquisition of fixed assets 243,614 555,398
22.8 Other commitments FX options (notional amount) 23.1 & 23.2 Purchase 216,344 - Sale 216,344 -
Notes to the Consolidated Financial StatementsFor the year ended December 31, 2013
253
22.9 Taxation
For assessment year 1988-89 through tax year 2012, the tax department disputed Bank’s treatment on certain issues, where the Bank’s appeals are pending at various appellate forums, entailing an additional tax liability of Rs.4,189 million (2012: Rs.9,639 million) which has been paid. Such issues inter alia principally include disallowance of expenses for non deduction of withholding tax and non availability of underlying records, provision for non performing loans, attribution of expenses to heads of income other than income from business and disallowance of credit for taxes paid in advance / deducted at source.
The Bank has filed appeals which are pending at various appellate forums. In addition, certain decisions made in favour of the Bank are being contested by the department at higher forums. No provision has been made in the financial statements regarding the aforesaid additional tax demand and already issued favourable decisions where the department is in appeal, as the management is of the view that the issues will be decided in the Bank’s favour as and when these are taken up by the Appellate Authorities.
For tax years 2003 through 2006 and tax year 2011, aggregate liability of Rs 584 million has been adjudged under section 161 of the Income Tax Ordinance, 2001 on the grounds that Bank failed to deduct applicable withholding tax while making payments on certain accounts. Such liability has not been provided for in these financial statements as Bank’s management is of the view that while departmental action for tax years 2003 through 2006 is barred by applicable limitation of time while the liability for tax year 2011 has been adjudged on an arbitrary basis.
23. DERIVATIVE INSTRUMENTS
Most corporate (counter parties) have either interest rate exposures arising from debt financing or excess liquidity or currency exposures arising out of commercial and business transactions. In the event of a shift in interest or foreign exchange (FX) rates, these corporate may incur higher borrowing costs or higher cash outflows that will adversely affect profitability
The Bank provided solutions to this conundrum through derivatives. Through this, counterparties will be hedging exposure to adverse price movements in a security, typically when the counterparty has a concentrated position in the security and is acutely exposed to movements in the underlying risk factors. The Bank is in a better position to hedge that risk, and is thus able to provide cost efficient hedging solutions to the counterparties enabling them to concentrate on their business risk.
Other Objectives include: - contribution to the development of Pakistani financial markets. - provision of financial solutions to the counterparties.
Risk management is performed at:
a) Strategic level: By senior management Assets and Liabilities Management Committee (ALCO), Risk Manage ment Committee (RMC) and the Board of Directors to institute a risk management framework and to ensure provision of all resources and support required for effective risk management on Bank-wide basis.
b) Macro Level: By Financial Institution Public Sector (FIPS) & Market Risk Management (MRM) Division, responsible for policy formulation, procedure development & implementation, monitoring and reporting.
c) Micro Level: Treasury Derivatives & Structured Product Desk and Treasury Operations, where risks are actually created.
FIPS & MRM Division is responsible for coordinating for risk management of derivatives.
The risk management system generates marked to market risk numbers (i.e. VaR, PVBP, duration, etc.) of Interest rate derivative portfolio. These numbers are reported to senior management on a daily basis.
As per the State Bank of Pakistan’s (SBP) regulations, currency options are hedged back to back and thus the risk associated with such transactions are minimal.
Risk Limits Before initiating any new derivative transaction, Treasury Division requests the FIPS & MRM Division for risk limits. Limit requests are approved by the appropriate level of authority. Presently the Bank has defined notional limits both for the portfolio and the counterparty.
Notes to the Consolidated Financial StatementsFor the year ended December 31, 2013

ANNUAL REPORT 2013
254
23.1 Product analysis 2013
Counter parties Cross Currency Swaps Interest Rate Swaps FX Options No. of Notional No. of Notional No. of Notional Contracts Principal Contracts Principal Contracts Principal (Rupees (Rupees (Rupees in ‘000) in ‘000) in ‘000)
With Banks for Hedging - - - - 2 216,344 Market Making - - - - - -
With other entities for Hedging - - - - - - Market Making - - - - 2 216,344 Total Hedging - - - - 2 216,344 Market Making - - - - 2 216,344
2012
Counter parties Cross Currency Swaps Interest Rate Swaps FX Options No. of Notional No. of Notional No. of Notional Contracts Principal Contracts Principal Contracts Principal (Rupees (Rupees (Rupees in ‘000) in ‘000) in ‘000)
With Banks for Hedging - - - - - - Market Making - - - - - -
With other entities for Hedging - - - - - - Market Making - - - - - - Total Hedging - - - - - - Market Making - - - - - - 23.2 Maturity analysis 2013 Remaining maturity No. of Notional Mark to Market Contracts Principal Negative Positive Net (Rupees in ‘000)
FX Options Over 1 to 3 months 4 432,688 (1,062) 1,062 -
2012 Remaining maturity No. of Notional Mark to Market Contracts Principal Negative Positive Net (Rupees in ‘000)
FX Options Over 1 to 3 months - - - - - -
Notes to the Consolidated Financial StatementsFor the year ended December 31, 2013

255
2013 2012 (Rupees in ‘000)
24. MARK-UP / RETURN / INTEREST EARNED On loans and advances to: Customers 25,107,486 29,086,322
On investments in: Held for trading securities 15,541 571,924 Available for sale securities 38,442,248 37,623,042 Held to maturity securities 775,352 838,773 39,233,141 39,033,739 On deposits with financial institutions 100,220 43,597 On securities purchased under resale agreements 731,612 256,648 On money at call 13,929 23,438 65,186,388 68,443,744
25. MARK-UP / RETURN / INTEREST EXPENSED Deposits 23,560,817 23,040,670 Securities sold under repurchase agreements 1,705,713 2,628,154 Other short-term borrowings 1,123,626 1,159,156 Discount, commission and brokerage 541,052 511,562 Others 288,225 163,954 27,219,433 27,503,496
26. GAIN ON SALE OF SECURITIES - NET Federal Government Securities Market Treasury Bills 37,828 37,567 Pakistan Investment Bonds 193,812 25,516 Sukuk Bonds - 3,000 Others - Shares and units- Listed 1,905,798 478,249 - Unlisted shares - 313,073 Term Finance Certificates 27,943 - 2,165,381 857,405
27. OTHER INCOME Rent on property / lockers 163,786 162,819 Net profit on sale of property and equipment 42,687 22,520 Bad debts recovered 60,522 48,817 Postal, SWIFT and other charges recovered 180,340 139,627 Switch and outsourcing revenue 3,544 10,676
450,879 384,459
Notes to the Consolidated Financial StatementsFor the year ended December 31, 2013

ANNUAL REPORT 2013
256
Notes to the Consolidated Financial StatementsFor the year ended December 31, 2013
Note 2013 2012 (Rupees in ‘000)
28. ADMINISTRATIVE EXPENSES Salaries and allowances 8,885,794 8,652,025 Charge / (reversal) for defined benefit plans and other benefits: - Approved pension fund 36.7 (1,701,451) (1,933,027) - Post retirement medical benefits 36.7 187,792 187,136 - Employees’ contributory benevolent scheme 36.7 55,269 40,192 - Employees’ compensated absences 36.7 146,623 97,691 - Gratuity scheme 4,482 1,620 (1,307,285) (1,606,388) Contributions to defined contribution plan - provident fund 198,213 188,417 Voluntary Separation Scheme 28.1 1,057,724 - Non-executive directors’ fees 31,674 33,431 Rent, taxes, insurance and electricity 2,598,334 2,490,503 Legal and professional charges 286,936 198,392 Communications 886,322 933,010 Repairs and maintenance 1,132,519 1,236,604 Stationery and printing 508,395 410,758 Advertisement and publicity 124,552 395,292 Cash transportation charges 481,736 461,504 Instrument clearing charges 124,667 187,471 Donations 28.2 25,000 31,162 Auditors’ remuneration 28.3 36,494 22,941 Depreciation 11.2 1,557,534 1,394,788 Amortization of intangible asset 11.3 263,024 261,901 Travelling, conveyance and fuel 217,581 253,604 Subscription 27,886 27,316 Entertainment 119,944 112,379 Training Expenses 41,376 30,429 Petty Capital items 34,112 34,890 Card Related Expenses 238,147 147,490 Outsourced security guards, tea services and janitorial expenses etc 1,308,558 1,701,004 CNIC verification charges 52,716 60,276 Others 167,269 163,385 19,099,222 17,822,584
28.1 During the year, the Bank announced a Voluntary Separation Scheme (VSS) for clerical & non-clerical employees. 571 employees of the Bank opted for retirement under this scheme. The above expense excludes the payments made under retirement funds.
28.2 None of the directors, executives or their spouses had any interest in the donee. Detail of donations made during the year is as follows:
2013 2012 (Rupees in ‘000)
Construction of houses in flood affected areas - 12,088 Network equipment to PSWO - 7,901 Hyderabad Relief & Rehabilitation Trust - 3,832 Al-Shifa Trust, “ Fighting Against Blindness” - 1,000 Sindh Institute of Urology & Transplantation (SIUT) - 5,000 Shoukat Khanum Memorial Trust - 100 Cost of establishing of centre of learning in collaboration with CISCO system and CARE foundation - 1,241 Prime Minister’s Earthquake Relief Fund 2013, for Baluchistan 25,000 25,000 31,162

257
2013 2012 (Rupees in ‘000)
28.3 Auditors’ remuneration Annual Audit fee 12,128 11,550 Fee for audit and other certifications of overseas branches 4,477 2,316 Fee for the audit of subsidiaries 2,428 1,390 Fee for the audit of overseas subsidiary 1,836 993 Tax and other sundry services 14,736 6,002 Out-of-pocket expenses 889 690 36,494 22,941
29. OTHER CHARGES
Provision for Penalties of State Bank of Pakistan - 220,000 Workers welfare fund 646,123 641,155 VAT and Crop Insurance Levy - Sri Lanka 57,611 43,643 Education cess 4,693 - Provision against balance with banks - (304,744) Impairment loss on Non-Banking assets 210,428 - Loss on sale of Non-Banking assets 10,099 - 928,954 600,054 30. TAXATION For the year Current 15,220,551 9,646,189 Deferred (4,318,658) 1,288,353 10,901,893 10,934,542 Prior years Current (2,137) 126,396 Deferred - - (2,137) 126,396 Share of tax of associates 82,173 36,171 10,981,929 11,097,109
30.1 Relationship between tax expense and accounting profit Accounting profit for the year 32,932,070 32,064,650
Tax rate 35% 35%
Tax on income 11,526,225 11,222,628 Tax effect on separate block of income (taxable at reduced rate) (456,439) (226,188) Tax effect of permanent differences - 87,907 Tax effect of prior years provisions (2,137) 126,396 Others (85,720) (113,634)
Tax charge for the year 10,981,929 11,097,109 31. CREDIT RATING PACRA through its notification dated February 04, 2013, has upgraded bank’s long term credit rating from AA+ [double A plus] to AAA [Triple A] and maintained short-term credit rating of A1+ [A one plus].
Notes to the Consolidated Financial StatementsFor the year ended December 31, 2013

ANNUAL REPORT 2013
258
32. BASIC AND DILUTED EARNINGS PER SHARE - PRE TAX Profit before taxation 32,932,070 32,064,650
(Number of shares)
Weighted average number of shares outstanding during the year 1,011,846,135 1,011,846,135
(Rupees)
Basic and diluted earnings per share - pre tax 32.55 31.69
(Number of shares)
33. BASIC AND DILUTED EARNINGS PER SHARE - AFTER TAX Profit after taxation attributable to ordinary shareholders 21,875,098 20,885,491
(Number of shares)
Weighted average number of shares outstanding during the year 1,011,846,135 1,011,846,135
(Rupees)
Basic and diluted earnings per share - after tax 21.62 20.64
Weighted average number of shares outstanding for 2012 have been restated to give effect of bonus shares issued during the year. Note 2013 2012
(Rupees in ‘000)
34. CASH AND CASH EQUIVALENTS Cash and balances with treasury banks 6 59,946,218 57,420,211 Balances with other banks 7 1,594,660 1,236,736 Overdrawn nostro accounts 15 (625,972) (828,923)
60,914,906 57,828,024
Note 2013 2012 (Numbers)
35. STAFF STRENGTH Permanent 10,479 10,867 Temporary/contractual basis 81 71 Bank’s own staff strength at the end of the year 10,560 10,938 Outsourced 35.1 1,549 1,996 Total staff strength 12,109 12,934
35.1 This excludes outsourced security guards and tea services staff.
36. DEFINED BENEFIT PLANS AND OTHER BENEFITS
36.1 General description
The Bank operates the following retirement benefits for its employees:
- Pension fund (final salary plan) - funded - Benevolent scheme - unfunded - Post retirement medical benefits - unfunded - Employees compensated absence - unfunded
The plan assets and defined benefit obligations are based in Pakistan.
2013 2012 (Rupees in ‘000)
Notes to the Consolidated Financial StatementsFor the year ended December 31, 2013

259
36.2 Principal actuarial assumptions The latest actuarial valuations of the approved pension fund, employees’ contributory benevolent scheme, post retirement medical benefits and employee’s compensated absences were carried out at December 31, 2013. The principal actuarial assumptions used are as follows:
Approved pension fund Employees’ contributory Post retirement Employees’ benevolent scheme medical benefits compensated absences
2013 2012 2013 2012 2013 2012 2013 2012
(%)
Valuation discount rate 13 12 13 12 13 12 13 12
Expected rate of return on plan assets 13 12 - - - - - -
Salary increase rate 11 9 11 9 11 9 11 9
Medical cost inflation rate - - - - 13 6 - -
Exposure inflation rate - - - - 3 3 - -
The expected return on plan assets is based on the market expectations and depends on the asset portfolio of the Bank, at the beginning of the period, for returns over the entire life of the related obligation. 36.3 (Receivable from) / payable to defined benefit plans and other benefits
Approved pension fund Employees’ contributory Post retirement Employees’ Note benevolent scheme medical benefits compensated absences
2013 2012 2013 2012 2013 2012 2013 2012
Restated Restated Restated Restated
(Rupees in ‘000)
Present value of defined
benefit obligations 36.5 3,834,422 4,259,671 213,438 257,089 1,340,476 1,565,634 934,009 594,100
Fair value of plan assets 36.6 (9,688,629) (22,688,154) - - - - - -
Net (receivable) / payable recognised as at the year-end (5,854,207) (18,428,483) 213,438 257,089 1,340,476 1,565,634 934,009 594,100
The effect of increase of one percent and the effect of a decrease of one percent in the medical trend rates on the present value of medial obligation at December 31, 2013 would be Rs. 48.492 million (2012: Rs. 95.010 million) and Rs. 43.458 million (2012: Rs. 80.020 million) respectively.
36.4 Movement in balance (receivable) / payable
Approved pension fund Employees’ contributory Post retirement Employees’ Note benevolent scheme medical benefits compensated absences
2013 2012 2013 2012 2013 2012 2013 2012
Restated Restated Restated Restated
(Rupees in ‘000)
Opening balance of (receivable) / payable (18,428,483) (15,280,967) 257,089 283,477 1,565,634 1,388,970 594,100 535,870
Expense recognised 36.7 (1,701,451) (1,933,027) 55,269 40,192 187,792 187,136 146,623 97,691
Employees’ contribution - - 7,564 8,708 - - - -
Benefits paid - - (101,510) (48,953) (234,011) (140,422) (370,840) (181,381)
Other Comprehensive income (456,171) (1,214,489) (4,974) (26,335) (178,939) 129,950 564,126 141,920
Refund / withdrawn from fund 14,731,898 - - - - - - -
Closing balance of (receivable) / payable (5,854,207) (18,428,483) 213,438 257,089 1,340,476 1,565,634 934,009 594,100
Notes to the Consolidated Financial StatementsFor the year ended December 31, 2013

ANNUAL REPORT 2013
260
36.5 Reconciliation of the present value of the defined benefit obligations
Approved pension fund Employees’ contributory Post retirement Employees’ benevolent scheme medical benefits compensated absences
2013 2012 2013 2012 2013 2012 2013 2012
Restated Restated Restated Restated
(Rupees in ‘000)
Present value of obligation as at January 01, 4,259,671 4,262,421 257,089 283,477 1,565,634 1,388,970 594,100 535,870
Current service cost 53,739 53,499 13,826 15,230 13,773 15,697 36,447 62,860
Interest cost 451,727 518,091 24,760 33,670 173,835 171,439 49,042 34,831
Benefits paid (990,554) (554,210) (101,510) (48,953) (234,011) (140,422) (370,840) (181,381)
Loss / (gain) on settlement (23,251) - 24,247 - 184 - 61,134 -
-(Gain) / loss from change in
demographic assumptions 22,670 - 5,824 - 39,965 - (6,687) -
-(Gain) / loss from change in
financial assumptions 34,000 (143,163) 12,141 (14,400) 30,238 (47,162) (62,754) 1,599
-Experience (gains) / losses 26,420 123,033 (22,939) (11,935) (249,142) 177,112 633,567 140,321
83,090 (20,130) (4,974) (26,335) (178,939) 129,950 564,126 141,920
Present value of obligation
as at December 31, 3,834,422 4,259,671 213,438 257,089 1,340,476 1,565,634 934,009 594,100
36.6 Changes in fair values of plan assets
Approved pension fund Employees’ contributory Post retirement Employees’ Note benevolent scheme medical benefits compensated absences
2013 2012 2013 2012 2013 2012 2013 2012
Restated Restated Restated Restated
(Rupees in ‘000)
Net assets as at January 01, 22,688,154 19,543,388 - - - - - -
Expected return on plan assets 2,183,666 2,504,617 - - - - - -
Refund / withdrawn from fund (14,731,898) - - - - - - -
Benefits paid (990,554) (554,210) - - - - - -
Actuarial gain / (loss) 539,261 1,194,359 - - - - - -
Net assets as at December31, 36.9 9,688,629 22,688,154 - - - - - -
36.7 Charge for defined benefit plans and other benefits
The following amounts have been charged to the profit and loss account in respect of defined benefit plans and other benefits:
Approved pension fund Employees’ contributory Post retirement Employees’ Note benevolent scheme medical benefits compensated absences
2013 2012 2013 2012 2013 2012 2013 2012
Restated Restated Restated Restated
(Rupees in ‘000)
Current service cost 53,739 53,499 13,826 15,230 13,773 15,697 36,447 62,860
Interest cost 451,727 518,091 24,760 33,670 173,835 171,439 49,042 34,831
Expected return on plan assets (2,183,666) (2,504,617) - - - - - -
Contributions employees - - (7,564) (8,708) - - - -
Loss / (gain) on settlement (23,251) - 24,247 - 184 - 61,134 -
(1,701,451) (1,933,027) 55,269 40,192 187,792 187,136 146,623 97,691
The effect of increase of one percent and the effect of a decrease of one percent in the medical trend rates on the aggregate of the current service cost and interest cost components of net period post - employment medical costs would be Rs. 6.129 million (2012: Rs. 13.369 million) and Rs. 5.496 million (2012: Rs. 11.207 million) respectively.
36.8 Actual return on plan assets
Approved pension fund Employees’ contributory Post retirement Employees’ benevolent scheme medical benefits compensated absences
2013 2012 2013 2012 2013 2012 2013 2012
Restated Restated Restated Restated
(Rupees in ‘000)
Actual return on plan assets 2,722,927 3,698,976 - - - - - -
Notes to the Consolidated Financial StatementsFor the year ended December 31, 2013

261
36.9 Composition of fair value of plan assets Approved Pension Fund
2013 2012
Fair value Percentage Fair value Percentage
(Rupees (%) (Rupees (%)
in ‘000) in ‘000)
Term deposit receipts - - 15,528,023 68.44 Listed equity shares 5,322,463 54.94 3,610,176 15.91 Open ended mutual funds units 264,434 2.73 234,619 1.03 Term Finance certificates - - 198,923 0.88 Cash and bank balances 4,101,732 42.33 3,116,413 13.74 Fair value of plan total assets 9,688,629 100 22,688,154 100
36.9.1 Fair value of the Bank’s financial instruments included in plan assets:
Shares of MCB 4,368,136 2,962,492 TDRs with MCB - 15,528,023 Bank balance with MCB 4,101,732 3,100,321 8,469,868 21,590,836
36.10 Other relevant details of above funds are as follows:
36.10.1 Pension Fund 2013 2012 2011 2010 2009
(Rupees in ‘000)
Present value of defined benefit obligation 3,834,422 4,259,671 4,262,421 4,217,507 4,072,653
Fair value of plan assets (9,688,629) (22,688,154) (19,543,388) (19,303,801) (18,254,967)
(Surplus) / deficit (5,854,207) (18,428,483) (15,280,967) (15,086,294) (14,182,314)
Actuarial gain / (loss) on obligation (83,090) 20,130 (190,661) (191,752) (368,717)
Actuarial gain / (loss) on assets 539,261 1,194,359 (1,529,469) (852,657) 1,400,023
36.10.2 Employees’ Contributory Benevolent Scheme
Present value of defined benefit obligation 213,438 257,089 283,477 314,414 299,388
Fair value of plan assets - - - - -
213,438 257,089 283,477 314,414 299,388
Actuarial gain / (loss) on obligation 4,974 26,335 19,979 (25,282) (53,700)
Actuarial gain / (loss) on assets - - - - -
36.10.3 Post Retirement Medical Benefits
Present value of defined benefit obligation 1,340,476 1,565,634 1,388,970 1,320,933 1,287,348
Fair value of plan assets - - - - -
1,340,476 1,565,634 1,388,970 1,320,933 1,287,348
Actuarial gain / (loss) on obligation 178,939 (129,950) (19,198) 30,671 2,101
Notes to the Consolidated Financial StatementsFor the year ended December 31, 2013
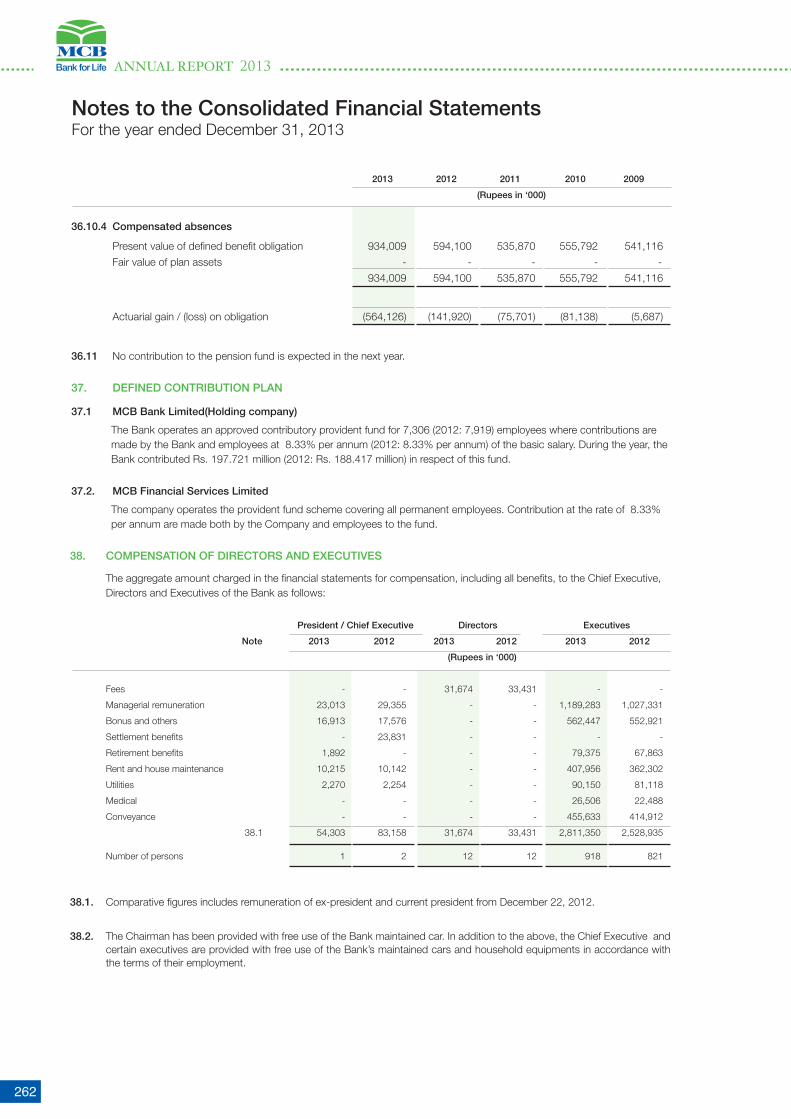
ANNUAL REPORT 2013
262
2013 2012 2011 2010 2009
(Rupees in ‘000)
36.10.4 Compensated absences
Present value of defined benefit obligation 934,009 594,100 535,870 555,792 541,116
Fair value of plan assets - - - - -
934,009 594,100 535,870 555,792 541,116
Actuarial gain / (loss) on obligation (564,126) (141,920) (75,701) (81,138) (5,687)
36.11 No contribution to the pension fund is expected in the next year.
37. DEFINED CONTRIBUTION PLAN
37.1 MCB Bank Limited(Holding company)
The Bank operates an approved contributory provident fund for 7,306 (2012: 7,919) employees where contributions are made by the Bank and employees at 8.33% per annum (2012: 8.33% per annum) of the basic salary. During the year, the Bank contributed Rs. 197.721 million (2012: Rs. 188.417 million) in respect of this fund.
37.2. MCB Financial Services Limited
The company operates the provident fund scheme covering all permanent employees. Contribution at the rate of 8.33% per annum are made both by the Company and employees to the fund.
38. COMPENSATION OF DIRECTORS AND EXECUTIVES
The aggregate amount charged in the financial statements for compensation, including all benefits, to the Chief Executive, Directors and Executives of the Bank as follows:
President / Chief Executive Directors Executives
Note 2013 2012 2013 2012 2013 2012
(Rupees in ‘000)
Fees - - 31,674 33,431 - -
Managerial remuneration 23,013 29,355 - - 1,189,283 1,027,331
Bonus and others 16,913 17,576 - - 562,447 552,921
Settlement benefits - 23,831 - - - -
Retirement benefits 1,892 - - - 79,375 67,863
Rent and house maintenance 10,215 10,142 - - 407,956 362,302
Utilities 2,270 2,254 - - 90,150 81,118
Medical - - - - 26,506 22,488
Conveyance - - - - 455,633 414,912
38.1 54,303 83,158 31,674 33,431 2,811,350 2,528,935
Number of persons 1 2 12 12 918 821
38.1. Comparative figures includes remuneration of ex-president and current president from December 22, 2012.
38.2. The Chairman has been provided with free use of the Bank maintained car. In addition to the above, the Chief Executive and certain executives are provided with free use of the Bank’s maintained cars and household equipments in accordance with the terms of their employment.
Notes to the Consolidated Financial StatementsFor the year ended December 31, 2013

263
39. FAIR VALUE OF FINANCIAL INSTRUMENTS
The fair value of traded investments is based on quoted market prices, except for tradable securities classified by the Bank as ‘held to maturity’. Fair value of unquoted equity investments is determined on the basis of break up value of these investments as per the latest available audited financial statements.
Fair value of fixed term loans, other assets, other liabilities and fixed term deposits cannot be calculated with sufficient reliability due to absence of current and active market for such assets and liabilities and reliable data regarding market rates for similar instruments. The provision for impairment of loans and advances has been calculated in accordance with the Bank’s accounting policy as stated in note 5.4 to these consolidated financial statements.
The maturity and repricing profile and effective rates are stated in notes 43.3, 43.4.1 and 43.4.2 respectively.
In the opinion of the management, the fair value of the remaining financial assets and liabilities are not significantly different from their carrying
values since assets and liabilities are either short-term in nature or in the case of customer loans and deposits are frequently re-priced.
40. SEGMENT DETAILS WITH RESPECT TO BUSINESS ACTIVITIES
The segment analysis with respect to business activity is as follows:
Inter Corporate Trading and Retail & Commercial Asset segment/ Total Finance Sales Consumer Banking Management group Banking elimination
(Rupees in ‘000)
2013
Total income 171,289 7,970,392 33,999,672 7,530,014 455,614 (54,637) 50,072,344
Total expenses (54,381) (1,192,313) (14,584,308) (1,109,566) (254,343) 54,637 (17,140,274)
Income tax expense - - - - - - (10,981,929)
Net income 116,908 6,778,079 19,415,364 6,420,448 201,271 - 21,950,141
Segment assets - (Gross of NPL’s provision) 483,485 494,892,926 697,975,826 203,531,529 1,504,746 (563,805,587) 834,582,925
Advance taxation (payments less provisions) - - - - - - 6,145,527
Total assets 483,485 494,892,926 697,975,826 203,531,529 1,504,746 (563,805,587) 840,728,452
Segment non performing loans - - 9,600,755 13,666,978 - - 23,267,733
Segment specific provision required - - 9,565,097 9,885,051 - - 19,450,148
Segment liabilities 49,592 469,547,401 623,681,467 171,643,706 198,637 (563,805,587) 701,315,216
Provision for taxation - - - - - - -
Deferred tax liability - - - - - - 4,500,293
Total liabilities - net 49,592 469,547,401 623,681,467 171,643,706 198,637 (563,805,587) 705,815,509
Segment return on assets (ROA) (%) 35.43% 1.61% 4.94% 3.89% 30.28% - -
Segment cost of fund (%) - 9.27% 5.41% 8.94% - - -
Notes to the Consolidated Financial StatementsFor the year ended December 31, 2013

ANNUAL REPORT 2013
264
Inter Corporate Trading and Retail & Commercial Asset segment/ Total Finance Sales Consumer Banking Management group Banking elimination
(Rupees in ‘000)
2012
Total income 130,022 3,574,615 38,830,448 7,541,138 484,968 (79,788) 50,481,403
Total expenses (50,448) (655,746) (15,196,367) (2,635,887) (254,738) 79,788 (18,713,398)
Income tax expense - - - - - - (11,097,109)
Net income 79,574 2,918,869 23,634,081 4,905,251 230,230 - 20,670,896
Segment assets - (Gross of NPL’s provision) 303,924 432,586,260 643,766,247 202,698,772 1,415,967 (497,902,518) 782,868,652
Advance taxation (payments less provisions) - - - - - - 10,969,681
Total assets 303,924 432,586,260 643,766,247 202,698,772 1,415,967 (497,902,518) 793,838,333
Segment non performing loans - - 11,220,265 14,341,509 - - 25,561,774
Segment specific provision required - - 11,264,958 11,115,129 - - 22,380,087
Segment liabilities 26,424 417,756,714 558,905,159 176,299,347 129,239 (497,902,518) 655,214,365
Deferred tax liability - - - - - - 9,768,871
Total liabilities - net 26,424 417,756,714 558,905,159 176,299,347 129,239 (497,902,518) 664,983,236
Segment return on assets (ROA) (%) 42.78% 0.83% 6.14% 3.94% 34.25% - -
Segment cost of fund (%) - 11.36% 6.10% 10.71% - - -
Total income = Net markup income + non-markup income
Total expenses = Non Mark up expenses + Provisions
Segment assets and liabilities include inter segment balances.
Transactions between reportable segments are based on an appropriate transfer pricing mechanism using agreed rates.
Segment cost of funds have been computed based on the average balances.
41. RELATED PARTY TRANSACTIONS AND BALANCES
The Group has related party relationship with its associates, employee benefit plans and its key management personnel (including their associates) and companies with common directors. The detail of investment in associates are stated in Annexure I (note 5 & 6) to these consolidated financial statements.
The Group enters into transactions with related parties in the normal course of business. Contributions to and accruals in respect of staff retirement benefits and other benefit plans are made in accordance with the actuarial valuations / terms of the contribution plan. Remuneration to the executives / officers is determined in accordance with the terms of their appointment. Remuneration to Chief Executive, Directors and Executives is disclosed in note 38 to these consolidated financial statements.
Notes to the Consolidated Financial StatementsFor the year ended December 31, 2013

265
Directors Associates Other related parties Key management
2013 2012 2013 2012 2013 2012 2013 2012
(Rupees in ‘000)
A. Balances Deposits
Opening balance 2,863,874 4,398,756 976,642 766,387 26,850,559 25,393,804 46,039 50,178
Received during the year 4,273,706 4,888,505 18,859,601 11,121,938 61,543,210 38,267,581 1,176,959 1,168,053
Withdrawn during the year (6,205,915) (6,423,387) (18,857,835) (10,911,683) (73,903,366) (36,810,826) (1,097,801) (1,172,192)
Closing balance 931,665 2,863,874 978,408 976,642 14,490,403 26,850,559 125,197 46,039
Advances (secured )
Opening balance 2,795 - - - 98,056 81,302 53,865 49,743
Additions / adjustments during the year - 3,367 - - 406,354 415,889 38,731 12,436
Repaid during the year (610) (572) - - (387,826) (399,135) (13,669) (8,314)
Closing balance 2,185 2,795 - - 116,584 98,056 78,927 53,865
Outstanding Balance of credit card 545 852 - - 2 - 2,635 951
Receivable from Pension fund - - - - 5,854,207 18,428,483 - -
B. Other transactions (including profit and loss related transactions)
Outstanding commitments and contingent liabilities - - 10,805 8,365 90,171 819,873 - -
Forward foreign exchange contracts (Notional) - outstanding - - - - 5,623,351 - - -
Unrealized gain on forward foreign exchange contracts - outstanding - - - - 19,424 - - -
Forward contracts during the year - - - - 34,665,422 - - -
Repo deals during the year - - 39,742,107 - - - - -
Borrowings - - - - 3,159,738 - - -
Trade payable - - 7,594 14,321 27,498 7,574 - -
Investments in units - - - - 297,000 608,248 - -
Redemption of units - - - - 347,268 488,615 - -
Retention money - - - - 3,612 - - -
Markup payable - 504 405 12,645 1,071,287 1,045,622 80 541
Other receivable - - - - 210,076 88,871 2,819 1,980
Markup Receivable - - - - 5,121 2,237 - -
Receivable for other expenses - - - - - - - -
Trade Debts - - 280 314 1,345 - - -
Outstanding Investments in mutual funds - - - - 877,915 4,994,256 - -
Divestment in Khushali Bank Limited - - - - - 300,000 - -
Insurance premium paid- net of refund - - 247,803 309,472 4,124 1,471 - -
Insurance claim settled - - 95,645 39,193 - - - -
Markup income - - - - 8,216 7,780 7,475 4,153
Rent Income Received - - 2,025 2,430 - - - -
Dividend Income - - 126,118 54,051 159,570 408,639 - -
Capital gain / (loss) - - - - 303,215 (33,916) - -
Commission income - - 751,069 509,698 14,410 10,204 - -
Management fee - - - - 503,526 585,668 - -
Reimbursement of expenses - - - - 1,571 929 - -
Brokerage expense - - - - - 354 - -
Proceeds from sale of fixed assets - - - - 57,970 - 2,896 562
Gain / (loss) on sale of fixed assets - - - - - - (2,307) -
ATM Outsourcing Expense - - 161,486 131,972 - - - -
Service fee and IBFT - - 43,843 - - - - -
Switch Expense - - - - - - - -
Cash sorting expenses - - - 49,915 42,528 - -
Stationery Expenses - - - 207,063 194,565 - -
Security guard expenses - - - - 298,394 255,033 - -
Remuneration and non-executive directors fee 85,977 116,589 - - - - 377,743 373,430
Mark-up expense 103,394 321,897 71,275 55,657 2,080,760 2,983,890 2,317 3,333
Clearing expenses paid to NIFT - - - - 124,315 115,958 - -
Contribution to provident fund - - - - 202,355 188,257 - -
Gas Charges - - - - 10,939 12,770 - -
Miscellaneous expenses and payments - - 177,089 119,432 124,196 45,181 - -
The details of director’s compensations are given in note 38 to these financial statements.
Notes to the Consolidated Financial StatementsFor the year ended December 31, 2013

ANNUAL REPORT 2013
266
42. CAPITAL ASSESSMENT AND ADEQUACY
42.1 Scope of Applications
The Basel-III Framework is applicable to the bank both at the consolidated level (comprising of wholly/partially owned subsidiaries & associates) and also on a stand alone basis. Consolidation for capital adequacy is based on con-solidated financial statements of MCB Bank Limited and its subsidiaries and associates. Subsidiaries are included while calculating Consolidated Capital Adequacy for the Bank using full consolidation method whereas associates in which the bank has significant influence on equity method. Standardized Approach is used for calculating the Capital Adequacy for Credit and Market risk, whereas, Basic Indicator Approach (BIA) is used for Operational Risk Capital Adequacy purposes.
42.2 Capital Management
Objectives and goals of managing capital
The Bank manages its capital to attain following objectives and goals:
- an appropriately capitalized status, as defined by banking regulations;
- acquire strong credit ratings that enable an optimized funding mix and liquidity sources at lesser costs;
- cover all risks underlying business activities;
- retain flexibility to harness future investment opportunities; build and expand even in stressed times.
Statutory minimum capital requirement and Capital Adequacy Ratio
The State Bank of Pakistan through its BSD Circular No. 07 of 2009 dated April 15, 2009 requires the minimum paid up capital (net of losses) for all locally incorporated banks to be raised to Rs. 10 billion by the year ended on December 31, 2013. The raise is to be achieved in a phased manner requiring Rs.10 billion paid up capital (net of losses) by the end of the financial year 2013. The paid up capital of the Bank for the year ended December 31, 2013 stands at Rs. 10.118 billion and is in compliance with the SBP requirement for the said year.
The capital adequacy ratio of the Bank was subject to the Basel III capital adequacy guidelines stipulated by the State Bank of Pakistan through its circular BPRD Circular No. 06 of 2013 dated August 15, 2013. These instructions are ef-fective from December 31, 2013 in a phased manner with full implementation intended by December 31, 2019. Under Basel III guidelines banks are required to maintain the following ratios on an ongoing basis:
Phase-in arrangement and full implementation of the minimum capital requirements:
Year End As of Dec 31
Sr. No Ratio 2013 2014 2015 2016 2017 2018 31-12-2019
1 CET1 5.00% 5.50% 6.00% 6.00% 6.00% 6.00% 6.00%
2 ADT-1 1.50% 1.50% 1.50% 1.50% 1.50% 1.50% 1.50%
3 Tier 1 6.50% 7.00% 7.50% 7.50% 7.50% 7.50% 7.50%
4 Total Capital 10.00% 10.00% 10.00% 10.00% 10.00% 10.00% 10.00%
5 *CCB - - 0.25% 0.65% 1.275% 1.90% 2.50%
Total Capital
6 plus CCB 10.00% 10.00% 10.25% 10.65% 11.275% 11.90% 12.50%
- *(Consisting of CET1 only)
Notes to the Consolidated Financial StatementsFor the year ended December 31, 2013

267
Bank’s regulatory capital is analysed into three tiers.
- Common Equity Tier 1 capital (CET1), which includes fully paid up capital (including the bonus shares), balance in share premium account, general reserves, statutory reserves as per the financial statements, minority interest and net unappropriated profits after all regulatory adjustments applicable on CET1 (refer to note 42.3 )
- Additional Tier 1 Capital (AT1), which includes perpetual non-cumulative preference shares and Share premium resulting from the issuance of preference shares balance in share premium account after all regulatory adjustments applicable on AT1 (refer to note 42.3 )
- Tier 2 capital, which includes Subordinated debt/ Instruments, share premium of issuance of Subordinated debt/ Instruments, general provisions for loan losses (up to a maximum of 1.25 % of credit risk weighted assets), Net of tax reserves on revaluation of fixed assets and equity investments up to a maximum of 45 % of the balance and foreign exchange translation reserves after all regulatory adjustments applicable on Tier-2 (refer to note 42.3 )
The required capital adequacy ratio (10% of the risk-weighted assets) is achieved by the Bank through improvement in the asset quality at the existing volume level, ensuring better recovery management and composition of as set mix with low risk. Banking operations are categorized as either trading book or banking book and risk-weighted assets are determined according to specified requirements of the State Bank of Pakistan that seek to reflect the varying levels of risk attached to assets and off-balance sheet exposures. The total risk-weighted exposures comprise of the credit risk, market risk and operational risk.
Basel-III Framework enables a more risk-sensitive regulatory capital calculation to promote long term viability of the Bank. As the Bank carry on the business on a wide area network basis, it is critical that it is able to continuously monitor the exposure across entire organization and aggregate the risks so as to take an integrated approach/view. Maximization of the return on risk-adjusted capital is the principal basis to be used in determining how capital is allocated within the Bank to particular operations or activities.
The Bank remained compliant with all externally imposed capital requirements through out the year. Further, there has been no material change in the Bank’s management of capital during the year.
Notes to the Consolidated Financial StatementsFor the year ended December 31, 2013

ANNUAL REPORT 2013
268
42.3 Capital Structure
2013 2012
Amounts subject to Pre - Basel III treatment
(Rupees in ‘000)
Common Equity Tier 1 capital (CET1): Instruments and reserves1. Fully Paid-up Capital 10,118,461 9,198,601 2 Balance in Share Premium Account 9,924,438 9,924,438 3 Reserve for issue of Bonus Shares - - 4 General/ Statutory Reserves 36,300,494 34,150,960 5 Gain/(Losses) on derivatives held as Cash Flow Hedge - - 6 Unappropriated profits 43,038,094 37,530,955 7 Minority Interests arising from CET1 capital instruments issued to third party by consolidated bank subsidiaries (amount allowed in CET1 capital of the consolidation group 489,671 501,256 8 CET 1 before Regulatory Adjustments 99,871,158 91,306,210 Common Equity Tier 1 capital: Regulatory adjustments
9 Goodwill (net of related deferred tax liability) 82,127 82,127 10 All other intangibles (net of any associated deferred tax liability) 1,048,023 824,362 11 Shortfall of provisions against classified assets - - 12 Deferred tax assets that rely on future profitability excluding those arising from temporary differences (net of related tax liability) - - 13 Defined-benefit pension fund net assets 3,805,233 - 14 Reciprocal cross holdings in CET1 capital instruments - 10,777 15 Cash flow hedge reserve - - 16 Investment in own shares/ CET1 instruments - - 17 Securitization gain on sale - - 18 Capital shortfall of regulated subsidiaries - - 19 Deficit on account of revaluation from bank’s holdings of property/ AFS - - 20 Investments in the capital instruments of banking, financial and insurance entities that are outside the scope of regulatory consolidation, where the bank does not own more than 10% of the issued share capital (amount above 10% threshold) - - 21 Significant investments in the capital instruments issued by banking, financial and insurance entities that are outside the scope of (amount above 10% threshold) - - 22 Deferred Tax Assets arising from temporary differences (amount above 10% threshold, net of related tax liability) - - 23 Amount exceeding 15% threshold - -24 of which: significant investments in the common stocks of financial entities - - 25 of which: deferred tax assets arising from temporary differences - - 26 National specific regulatory adjustments applied to CET1 capital - -27 Investment in TFCs of other banks exceeding the prescribed limit - -28 Any other deduction specified by SBP (mention details) - -29 Regulatory adjustment applied to CET1 due to insufficient - - AT1 and Tier 2 to cover deductions* 2,780,942 2,132,383 30 Total regulatory adjustments applied to CET1 3,911,092 3,049,649 Common Equity Tier 1 (a) 95,960,066 88,256,561
Additional Tier 1 (AT 1) Capital31 Qualifying Additional Tier-1 instruments plus any related share premium - - 32 of which: Classified as equity - - 33 of which: Classified as liabilities - - 34 Additional Tier-1 capital instruments issued by consolidated subsidiaries and held by third parties (amount allowed in group AT 1) - - 35 of which: instrument issued by subsidiaries subject to phase out - - 36 AT1 before regulatory adjustments - -
Notes to the Consolidated Financial StatementsFor the year ended December 31, 2013

269
2013 2012
Amounts subject to Pre - Basel III treatment
(Rupees in ‘000)
Additional Tier 1 Capital: regulatory adjustments
37 Investment in mutual funds exceeding the prescribed limit (SBP specific adjustment) 87,817 - 38 Investment in own AT1 capital instruments - - 39 Reciprocal cross holdings in Additional Tier 1 capital instruments - - 40 Investments in the capital instruments of banking, financial and insurance entities that are outside the scope of regulatory consolidation, where the bank does not own more than 10% of the issued share capital (amount above 10% threshold) - - 41 Significant investments in the capital instruments issued by banking, financial and insurance entities that are outside the scope of regulatory consolidation - - 42 Portion of deduction applied 50:50 to core capital and supplementary capital based on pre-Basel III treatment which, during transitional period, remain subject to deduction from tier-1 capital* 2,693,125 2,132,383 43 Regulatory adjustments applied to Additional Tier 1 due to insufficient Tier 2 to cover deductions44 Total of Regulatory Adjustment applied to AT1 capital 2,780,942 2,132,383 45 Additional Tier 1 capital 46 Additional Tier 1 capital recognized for capital adequacy (b) - - Tier 1 Capital (CET1 + admissible AT1) (c=a+b) 95,960,066 88,256,561 Tier 2 Capital47 Qualifying Tier 2 capital instruments under Basel III - - 48 Capital instruments subject to phase out arrangement from tier 2 (Pre-Basel III instruments) - - 49 Tier 2 capital instruments issued to third party by consolidated subsidiaries (amount allowed in group tier 2) - - 50 of which: instruments issued by subsidiaries subject to phase out - - 51 General Provisions or general reserves for loan losses-up to maximum of 1.25% of Credit Risk Weighted Assets 499,145 428,936 52 Revaluation Reserves 6,663,435 7,834,984 53 of which: Revaluation reserves on Property 5,128,943 4,624,551 54 of which: Unrealized Gains/Losses on AFS 1,534,492 3,210,433 55 Foreign Exchange Translation Reserves 784,004 545,530 56 Undisclosed/Other Reserves (if any) - - 57 T2 before regulatory adjustments 7,946,584 8,809,450
Tier 2 Capital: regulatory adjustments58 Portion of deduction applied 50:50 to core capital and supplementary capital based on pre-Basel III treatment which, during transitional period, remain subject to deduction from tier-2 capital 2,693,125 2,132,383 59 Reciprocal cross holdings in Tier 2 instruments - - 60 Investment in own Tier 2 capital instrument - - 61 Investments in the capital instruments of banking, financial and insurance entities that are outside the scope of regulatory consolidation, where the bank does not own more than 10% of the issued share capital (amount above 10% threshold) - - 62 Significant investments in the capital instruments issued by banking, financial and insurance entities that are outside the scope of regulatory consolidation - - 63 Amount of Regulatory Adjustment applied to T2 capital 2,693,125 2,132,383
64 Tier 2 capital (T2) 5,253,459 6,677,067 65 Tier 2 capital recognized for capital adequacy 5,253,459 6,677,067 66 Excess Additional Tier 1 capital recognized in Tier 2 capital - - 67 Total Tier 2 capital admissible for capital adequacy (d) 5,253,459 6,677,067
TOTAL CAPITAL (T1 + admissible T2) (e=c+d) 101,213,525 94,933,628
Notes to the Consolidated Financial StatementsFor the year ended December 31, 2013

ANNUAL REPORT 2013
270
2013 2012
Amounts subject to Pre - Basel III treatment
(Rupees in ‘000)
Total Risk Weighted Assets (RWA) (i=f+g+h) 456,836,518 426,333,702
68 Total Credit Risk Weighted Assets (f) 313,106,728 273,349,110 69 Risk weighted assets in respect of amounts subject to Pre-Basel III Treatment70 of which: recognized portion of investment in capital of banking, financial and insurance entities where holding is more than 10% of the issued common share capital of the entity - - 71 of which: deferred tax assets - - 72 of which: Defined-benefit pension fund net assets 3,805,233 - 73 of which: Others - - 74 Total Market Risk Weighted Assets (g) 50,464,006 62,530,913 75 Total Operational Risk Weighted Assets (h) 93,265,784 90,453,679 Capital Ratios and buffers (in percentage of risk weighted assets) 76 CET1 to total RWA (a/i) 21.01% 20.70%77 Tier-1 capital to total RWA (c/i) 21.01% 20.70%78 Total capital to RWA (e/i) 22.16% 22.27%79 Bank specific buffer requirement (minimum CET1 requirement plus capital conservation buffer plus any other buffer requirement) - - 80 of which: capital conservation buffer requirement - - 81 of which: countercyclical buffer requirement - - 82 of which: D-SIB or G-SIB buffer requirement - - 83 CET1 available to meet buffers (as a percentage of risk weighted assets) - - National minimum capital requirements prescribed by SBP84 CET1 minimum ratio 5.00% - 85 Tier 1 minimum ratio 6.50% - 86 Total capital minimum ratio 10.00% 10.00%
Amounts below the thresholds for deduction (before risk weighting)87 Non-significant investments in the capital of other financial entities - - 88 Significant investments in the common stock of financial entities - - 89 Deferred tax assets arising from temporary differences (net of related tax liability) - -
Applicable caps on the inclusion of provisions in Tier 290 Provisions eligible for inclusion in Tier 2 in respect of exposures subject to standardized approach (prior to application of cap) 499,145 428,936 91 Cap on inclusion of provisions in Tier 2 under standardized approach 3,913,834 3,416,864 92 Provisions eligible for inclusion in Tier 2 in respect of exposures subject to internal ratings-based approach (prior to application of cap) - - 93 Cap for inclusion of provisions in Tier 2 under internal ratings-based approach - -
*As the Bank has not Tier 1 capital, deduction was made from CET1. **2012 based on BASEL II framework.
Notes to the Consolidated Financial StatementsFor the year ended December 31, 2013

271
42.4 Capital Structure Reconciliation
Step 1 As per published Under financial regulatory statements scope of consolidation
2013 2013
(Rupees in ‘000)
Assets
Cash and balances with treasury banks 59,946,218 59,946,218 Balanced with other banks 1,594,660 1,594,660 Lending to financial institutions 1,224,638 1,224,638 Investments 453,808,345 453,808,345 Advances 248,521,792 248,521,792 Operating fixed assets 29,005,931 29,005,931 Deferred tax assets - - Other assets 27,176,720 27,176,720 Total assets 821,278,304 821,278,304
Liabilities & Equity
Bills payable 10,138,726 10,138,726 Borrowings 38,660,405 38,660,405 Deposits and other accounts 632,309,094 632,309,094 Sub-ordinated loans - - Liabilities against assets subject to finance lease - - Deferred tax liabilities 4,500,293 4,500,293 Other liabilities 20,206,991 20,206,991 Total liabilities 705,815,509 705,815,509
Share capital 10,118,461 10,118,461 Reserves 47,008,936 47,008,936 Unappropriated profit 43,038,094 43,038,094 Minority Interest 489,671 489,671 Surplus on revaluation of assets 14,807,633 14,807,633 Total Equity 115,462,795 115,462,795
Total liabilities & equity 821,278,304 821,278,304
Step 2 As per published Under financial regulatory statements scope of consolidation
2013 2013
(Rupees in ‘000)
Assets
Cash and balances with treasury banks 59,946,218 59,946,218 Balanced with other banks 1,594,660 1,594,660 Lending to financial institutions 1,224,638 1,224,638 Investments 453,808,345 453,808,345 of which: Non-significant capital investments in capital of other financial institutions exceeding 10% threshold - - of which: significant capital investments in financial sector entities exceeding regulatory threshold - 102,566 of which: Mutual Funds exceeding regulatory threshold - of which: reciprocal crossholding of capital instrument - of which: others Advances 248,521,792 248,521,792 shortfall in provisions/ excess of total EL amount over eligible provisions under IRB - - general provisions reflected in Tier 2 capital 499,145 499,145
Notes to the Consolidated Financial StatementsFor the year ended December 31, 2013
a
bcde
fg
Ref
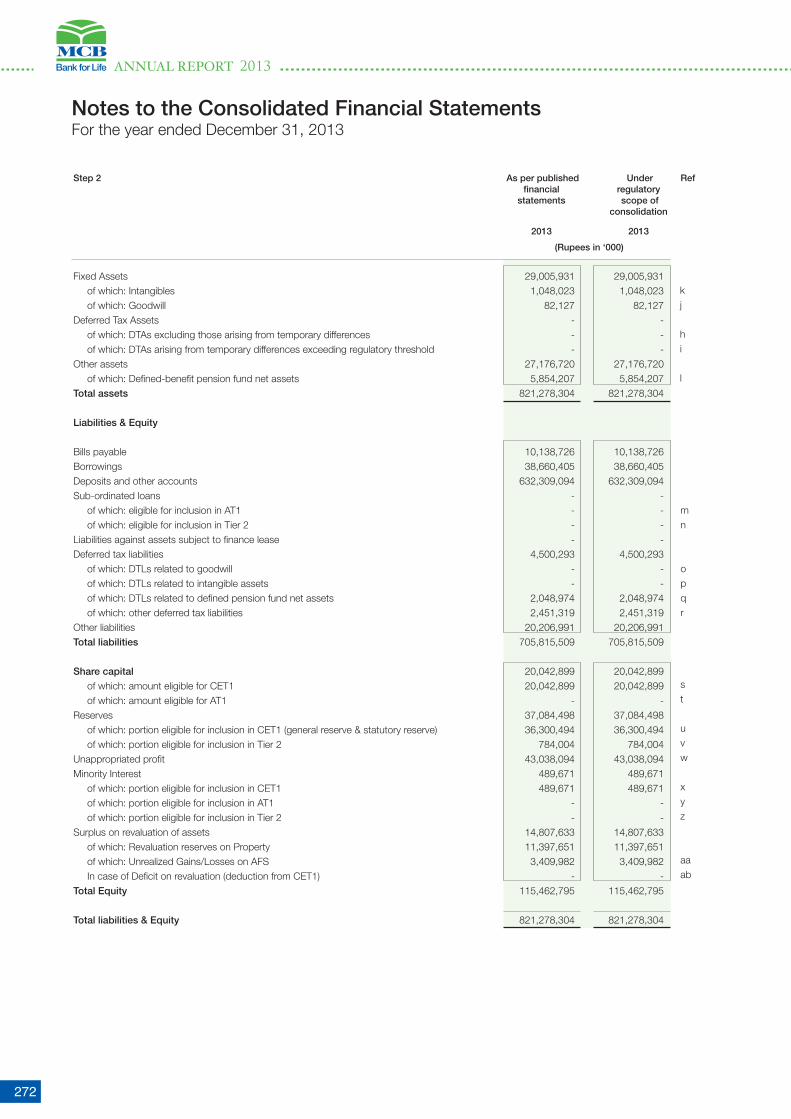
ANNUAL REPORT 2013
272
Step 2 As per published Under financial regulatory statements scope of consolidation
2013 2013
(Rupees in ‘000)
Fixed Assets 29,005,931 29,005,931 of which: Intangibles 1,048,023 1,048,023 of which: Goodwill 82,127 82,127 Deferred Tax Assets - - of which: DTAs excluding those arising from temporary differences - - of which: DTAs arising from temporary differences exceeding regulatory threshold - - Other assets 27,176,720 27,176,720 of which: Defined-benefit pension fund net assets 5,854,207 5,854,207 Total assets 821,278,304 821,278,304
Liabilities & Equity
Bills payable 10,138,726 10,138,726 Borrowings 38,660,405 38,660,405 Deposits and other accounts 632,309,094 632,309,094 Sub-ordinated loans - - of which: eligible for inclusion in AT1 - - of which: eligible for inclusion in Tier 2 - - Liabilities against assets subject to finance lease - - Deferred tax liabilities 4,500,293 4,500,293 of which: DTLs related to goodwill - - of which: DTLs related to intangible assets - - of which: DTLs related to defined pension fund net assets 2,048,974 2,048,974 of which: other deferred tax liabilities 2,451,319 2,451,319 Other liabilities 20,206,991 20,206,991 Total liabilities 705,815,509 705,815,509
Share capital 20,042,899 20,042,899 of which: amount eligible for CET1 20,042,899 20,042,899 of which: amount eligible for AT1 - - Reserves 37,084,498 37,084,498 of which: portion eligible for inclusion in CET1 (general reserve & statutory reserve) 36,300,494 36,300,494 of which: portion eligible for inclusion in Tier 2 784,004 784,004 Unappropriated profit 43,038,094 43,038,094 Minority Interest 489,671 489,671 of which: portion eligible for inclusion in CET1 489,671 489,671 of which: portion eligible for inclusion in AT1 - - of which: portion eligible for inclusion in Tier 2 - - Surplus on revaluation of assets 14,807,633 14,807,633 of which: Revaluation reserves on Property 11,397,651 11,397,651 of which: Unrealized Gains/Losses on AFS 3,409,982 3,409,982 In case of Deficit on revaluation (deduction from CET1) - - Total Equity 115,462,795 115,462,795
Total liabilities & Equity 821,278,304 821,278,304
Notes to the Consolidated Financial StatementsFor the year ended December 31, 2013
kj
hi
l
mn
opqr
st
uvw
xyz
aaab
Ref

273
Step 3 Component of Source based regulatory on reference capital reported number from by bank step 2
2013 2013
(Rupees in ‘000)
Common Equity Tier 1 capital (CET1): Instruments and reserves1 Fully Paid-up Capital 10,118,461 (s) 2 Balance in Share Premium Account 9,924,438 3 Reserve for issue of Bonus Shares - 4 General/ Statutory Reserves 36,300,494 (u) 5 Gain/(Losses) on derivatives held as Cash Flow Hedge - 6 Unappropriated/unremitted profits/(losses) 43,038,094 (w) 7 Minority Interests arising from CET1 capital instruments issued to third party by consolidated bank subsidiaries (amount allowed in CET1 capital of the consolidation group 489,671 (x)
8 CET 1 before Regulatory Adjustments 99,871,158 Common Equity Tier 1 capital: Regulatory adjustments 9 Goodwill (net of related deferred tax liability) 82,127 (j) - (o) 10 All other intangibles (net of any associated deferred tax liability) 1,048,023 (k) - (p) 11 Shortfall of provisions against classified assets - (f) 12 Deferred tax assets that rely on future profitability excluding those arising from temporary differences (net of related tax liability) - {(h) - (r} * 0% 13 Defined-benefit pension fund net assets - {(l) - (q)} * 0% 14 Reciprocal cross holdings in CET1 capital instruments - (d) 15 Cash flow hedge reserve - 16 Investment in own shares/ CET1 instruments - 17 Securitization gain on sale - 18 Capital shortfall of regulated subsidiaries - 19 Deficit on account of revaluation from bank’s holdings of property/ AFS - (ab) 20 Investments in the capital instruments of banking, financial and insurance entities that are outside the scope of regulatory consolidation, where the bank does not own more than 10% of the issued share capital (amount above 10% threshold) - (a) - (ac) - (ae) 21 Significant investments in the capital instruments issued by banking, financial and insurance entities that are outside the scope of regulatory consolidation (amount above 10% threshold) - (b) - (ad) - (af) 22 Deferred Tax Assets arising from temporary differences (amount above 10% threshold, net of related tax liability) - (i) 23 Amount exceeding 15% threshold - 24 of which: significant investments in the common stocks of financial entities - 25 of which: deferred tax assets arising from temporary differences - 26 National specific regulatory adjustments applied to CET1 capital - 27 Investment in TFCs of other banks exceeding the prescribed limit - 28 Any other deduction specified by SBP (mention details) - 29 Regulatory adjustment applied to CET1 due to insufficient AT1 and Tier 2 to cover deductions 2,780,942
30 Total regulatory adjustments applied to CET1 3,911,092
Common Equity Tier 1 95,960,066
Additional Tier 1 (AT 1) Capital31 Qualifying Additional Tier-1 instruments plus any related share premium - 32 of which: Classified as equity - (t) 33 of which: Classified as liabilities - (m) 34 Additional Tier-1 capital instruments issued by consolidated subsidiaries and held by third parties (amount allowed in group AT 1) - (y) 35 of which: instrument issued by subsidiaries subject to phase out - 36 AT1 before regulatory adjustments - Additional Tier 1 Capital: regulatory adjustments
Notes to the Consolidated Financial StatementsFor the year ended December 31, 2013

ANNUAL REPORT 2013
274
Notes to the Consolidated Financial StatementsFor the year ended December 31, 2013
Step 3 Component of Source based regulatory on reference capital reported number from by bank step 2
2013 2013
(Rupees in ‘000)
37 Investment in mutual funds exceeding the prescribed limit (SBP specific adjustment) 87,817 38 Investment in own AT1 capital instruments - 39 Reciprocal cross holdings in Additional Tier 1 capital instruments - 40 Investments in the capital instruments of banking, financial and insurance entities that are outside the scope of regulatory consolidation, where the bank does not own more than 10% of the issued share capital (amount above 10% threshold) - (ac) 41 Significant investments in the capital instruments issued by banking, financial and insurance entities that are outside the scope of regulatory consolidation - (ad) 42 Portion of deduction applied 50:50 to core capital and supplementary capital based on pre-Basel III treatment which, during transitional period, remain subject to deduction from tier-1 capital 2,693,125 43 Regulatory adjustments applied to Additional Tier 1 due to insufficient Tier 2 to cover deductions - 44 Total of Regulatory Adjustment applied to AT1 capital 2,780,942 45 Additional Tier 1 capital -
46 Additional Tier 1 capital recognized for capital adequacy -
Tier 1 Capital (CET1 + admissible AT1) 95,960,066
Tier 2 Capital47 Qualifying Tier 2 capital instruments under Basel III - 48 Capital instruments subject to phase out arrangement from tier 2 (Pre-Basel III instruments) - (n)49 Tier 2 capital instruments issued to third party by consolidated subsidiaries (amount allowed in group tier 2) - (z) 50 of which: instruments issued by subsidiaries subject to phase out - 51 General Provisions or general reserves for loan losses-up to maximum of 1.25% of Credit Risk Weighted Assets 499,145 (g) 52 Revaluation Reserves eligible for Tier 2 6,663,435 53 of which: portion pertaining to Property 5,128,943 54 of which: portion pertaining to AFS securities 1,534,492 portion of (aa)55 Foreign Exchange Translation Reserves 784,004 (v) 56 Undisclosed/Other Reserves (if any) - 57 T2 before regulatory adjustments 7,946,584 Tier 2 Capital: regulatory adjustments
58 Portion of deduction applied 50:50 to core capital and supplementary capital based on pre-Basel III treatment which, during transitional period, remain subject to deduction from tier-2 capital 2,693,125 59 Reciprocal cross holdings in Tier 2 instruments - 60 Investment in own Tier 2 capital instrument - 61 Investments in the capital instruments of banking, financial and insurance entities that are outside the scope of regulatory consolidation, where the bank does not own more than 10% of the issued share capital (amount above 10% threshold) - (ae) 62 Significant investments in the capital instruments issued by banking, financial and insurance entities that are outside the scope of regulatory consolidation - (af) 63 Amount of Regulatory Adjustment applied to T2 capital 2,693,125 64 Tier 2 capital (T2) 5,253,459 65 Tier 2 capital recognized for capital adequacy 5,253,459 66 Excess Additional Tier 1 capital recognized in Tier 2 capital - 67 Total Tier 2 capital admissible for capital adequacy 5,253,459
TOTAL CAPITAL (T1 + admissible T2) 101,213,525

275
42.5 Main Features Template of Regulatory Capital Instruments
1 Issuer MCB Bank Limited
2 Unique identifier (eg KSE Symbol or Bloomberg identifier etc.) MCB
3 Governing law(s) of the instrument Law applicable in Pakistan
Regulatory treatment
4 Transitional Basel III rules Common equity Tier 1
5 Post-transitional Basel III rules Common equity Tier 1
6 Eligible at solo/ group/ group & solo Group & standalone
7 Instrument type Common Shares
8 Amount recognized in regulatory capital (Currency in PKR thousands, as of reporting date) 95,960,066
9 Par value of instrument PKR 10
10 Accounting classification Shareholder equity
11 Original date of issuance 1947
12 Perpetual or dated Perpetual
13 Original maturity date No maturity
14 Issuer call subject to prior supervisory approval No
15 Optional call date, contingent call dates and redemption amount Not applicable
16 Subsequent call dates, if applicable Not applicable
Coupons / dividends
17 Fixed or floating dividend/ coupon Not applicable
18 coupon rate and any related index/ benchmark Not applicable
19 Existence of a dividend stopper No
20 Fully discretionary, partially discretionary or mandatory Fully discretionary
21 Existence of step up or other incentive to redeem No
22 Noncumulative or cumulative Not applicable
23 Convertible or non-convertible Non-convertible
24 If convertible, conversion trigger (s) Not applicable
25 If convertible, fully or partially Not applicable
26 If convertible, conversion rate Not applicable
27 If convertible, mandatory or optional conversion Not applicable
28 If convertible, specify instrument type convertible into Not applicable
29 If convertible, specify issuer of instrument it converts into Not applicable
30 Write-down feature Not applicable
31 If write-down, write-down trigger(s) Not applicable
32 If write-down, full or partial Not applicable
33 If write-down, permanent or temporary Not applicable
34 If temporary write-down, description of write-upmechanism Not applicable
35 Position in subordination hierarchy in liquidation (specify instrument type immediately senior to instrument) Not applicable
36 Non-compliant transitioned features Not applicable
37 If yes, specify non-compliant features Not applicable
Notes to the Consolidated Financial StatementsFor the year ended December 31, 2013
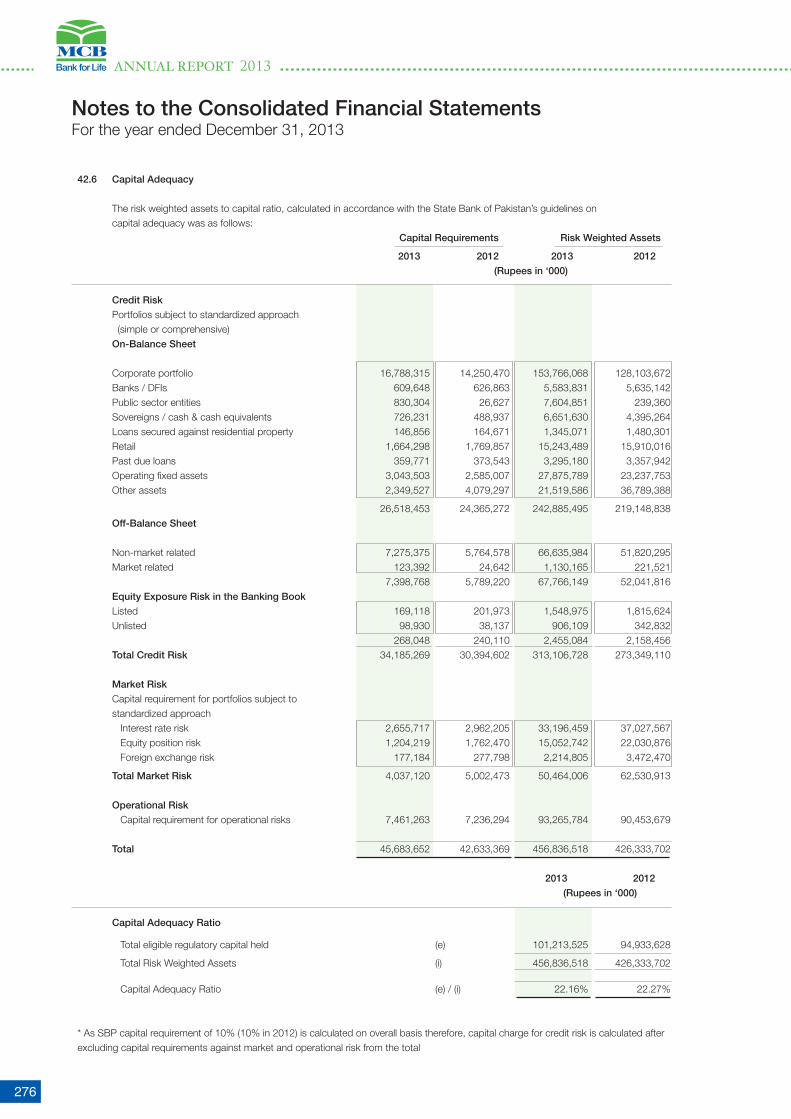
ANNUAL REPORT 2013
276
42.6 Capital Adequacy
The risk weighted assets to capital ratio, calculated in accordance with the State Bank of Pakistan’s guidelines on capital adequacy was as follows: Capital Requirements Risk Weighted Assets
2013 2012 2013 2012
(Rupees in ‘000)
Credit Risk
Portfolios subject to standardized approach (simple or comprehensive) On-Balance Sheet
Corporate portfolio 16,788,315 14,250,470 153,766,068 128,103,672 Banks / DFIs 609,648 626,863 5,583,831 5,635,142 Public sector entities 830,304 26,627 7,604,851 239,360 Sovereigns / cash & cash equivalents 726,231 488,937 6,651,630 4,395,264 Loans secured against residential property 146,856 164,671 1,345,071 1,480,301 Retail 1,664,298 1,769,857 15,243,489 15,910,016 Past due loans 359,771 373,543 3,295,180 3,357,942 Operating fixed assets 3,043,503 2,585,007 27,875,789 23,237,753 Other assets 2,349,527 4,079,297 21,519,586 36,789,388
26,518,453 24,365,272 242,885,495 219,148,838 Off-Balance Sheet
Non-market related 7,275,375 5,764,578 66,635,984 51,820,295 Market related 123,392 24,642 1,130,165 221,521 7,398,768 5,789,220 67,766,149 52,041,816 Equity Exposure Risk in the Banking Book
Listed 169,118 201,973 1,548,975 1,815,624 Unlisted 98,930 38,137 906,109 342,832 268,048 240,110 2,455,084 2,158,456 Total Credit Risk 34,185,269 30,394,602 313,106,728 273,349,110 Market Risk
Capital requirement for portfolios subject to standardized approach Interest rate risk 2,655,717 2,962,205 33,196,459 37,027,567 Equity position risk 1,204,219 1,762,470 15,052,742 22,030,876 Foreign exchange risk 177,184 277,798 2,214,805 3,472,470
Total Market Risk 4,037,120 5,002,473 50,464,006 62,530,913 Operational Risk Capital requirement for operational risks 7,461,263 7,236,294 93,265,784 90,453,679 Total 45,683,652 42,633,369 456,836,518 426,333,702
2013 2012
(Rupees in ‘000)
Capital Adequacy Ratio
Total eligible regulatory capital held (e) 101,213,525 94,933,628
Total Risk Weighted Assets (i) 456,836,518 426,333,702
Capital Adequacy Ratio (e) / (i) 22.16% 22.27%
* As SBP capital requirement of 10% (10% in 2012) is calculated on overall basis therefore, capital charge for credit risk is calculated after excluding capital requirements against market and operational risk from the total
Notes to the Consolidated Financial StatementsFor the year ended December 31, 2013

277
43. RISK MANAGEMENT
Risk is an inherent part of banking business activities. The risk management framework and governance structure at MCB helps to mitigate and counter any foreseeable risk in its various lines of business. Risk awareness forms an integral part of strategic and operational activities of risk management. Through its risk management policy the Bank sets the best course of action under uncertainty by identifying, prioritiz-ing, mitigating and monitoring risk issues, with the goal of enhancing shareholders’ value. Bank’s risk management structure is based on the following five guiding principles:
• Optimizingrisk/returninacontrolledmanner • Establishingclearresponsibilityandaccountability • Establishingindependentandproperlyresourcedriskmanagementfunction. • Promotingopenriskculture • Adoptinginternationalbestpracticesinriskmanagement
Keeping in view dynamics of internal and external environment, the bank regularly reviews and updates policy manuals / frameworks and procedures in accordance with domestic regulatory environment and international standards.
The Bank executes its risk strategy and undertakes controlled risk-taking activities within its risk management framework. The Board of Directors and its relevant committee, i.e. the Risk Management & Portfolio Review Committee (RM&PRC), the senior management and its relevant committees, i.e. the Risk Management Committee (RMC), Asset Liability Committee (ALCO), etc., are responsible to ensure formulation and implementation of comprehensive Risk Management Framework. This framework is based on prudent risk identification, measurement, management and monitoring process which are closely aligned with the activities of the bank.. The framework combines core policies, procedures and process designs with broad oversight and is supported by an efficient monitoring mechanism across the bank to ensure that risks are kept within an acceptable level.
The Bank ensures that not only the relevant risks are identified but their implications are also considered and basis provided for managing and measuring the risks. Through Internal Control units, the Bank ensures that effective controls are in place to mitigate each of the identified risk.
Independent from business groups, Head of Risk Management reports functionally to the Risk Management & Portfolio Review Committee (RM&PRC) and administratively to the President; the RM&PRC committee convenes regularly to evaluate bank’s risk and portfolio concentrations. The Risk Management Group performs the following critical functions:
• CreditRiskManagement • CreditReview • CreditRiskControl • MarketRiskManagement • LiquidityRiskManagement • OperationalRiskManagement
Keeping in view the international best practices and SBP requirements, Board of Directors of the Bank has approved a Risk Appetite Statement, which takes into account quantitative and qualitative risk indicators, covering target ratios, credit, market, operational, liquidity and business risks.
43.1 Credit Risk
Credit risk arises from our dealings with individuals, corporate borrowers, financial institutions, sovereigns etc. The Bank is exposed to credit risk through its lending and investment activities. It stems from Bank’s both on and off-balance sheet activities. Credit risk makes up the largest part of the Bank’s exposure. Purpose of Credit Risk Management function is to identify, measure, manage, monitor and mitigate credit risk. Organizational structure of this function ensures pre and post-facto management of credit risk. While, Credit Review function provides pre-fact evaluation of counterparties, the Credit Risk Control (CRC) performs post-fact evaluation of financing facilities and reviews clients’ performance on an ongoing process.
The Bank has adopted Standardized Approach to measure Credit risk regulatory capital charge in compliance with Basel-II requirements. The approach mainly takes into account the assessment of external credit rating agencies. In line with SBP guidelines on Internal Credit Ratings Systems, the Bank has developed a system and all its corporate and commercial borrowers are internally rated. Bank is in the process of continuously improving the system and bringing it inline with the Basel framework requirements.
Notes to the Consolidated Financial StatementsFor the year ended December 31, 2013

ANNUAL REPORT 2013
278
In order to manage bank’s credit risk, following policies and procedures are in place:
• IndividualswhotakeormanagerisksclearlyunderstandtheminordertoprotecttheBankfromavoidablerisks; • Theapprovalofcreditlimitstocounterpartiesaresubjecttopre-factreview; • Extensionincreditfacilityormaterialchangetothecreditfacilityissubjecttocreditreview; • ApprovalandreviewprocessisreviewedbyRM&PRCandinternalaudit; • Managementperiodicallyreviewsthepowersofcreditapprovingandcreditreviewingauthorities.
As a part of credit assessment Bank uses internal rating framework as well as the ratings assigned by the external credit rating agencies, wherever available.
Ongoing administration of the credit portfolio is an essential part of the credit process that supports and controls extension and maintenance of credit. The Bank’s Credit Risk Control, being an independent function from the business and operations groups, is responsible for performing following activities:
• Creditdisbursementauthorization; • Collateralcoverageandmonitoring; • Complianceofloancovenants/termsofapproval; • Maintenance/custodyofcollateralandsecuritydocumentation.
Credit Risk Monitoring is based on a comprehensive reporting framework. Continuous monitoring of the credit portfolio and the risks attached thereto are carried out at different levels including businesses, Audit & Risk Assets Review, Credit Risk Control, Credit Risk Management Division, etc.
To ensure a prudent distribution of asset portfolio, the Bank manages its lending and investment activities within an appropriate limits framework. Per party exposure limit is maintained in accordance with SBP Prudential Regulation R-1.
The Bank creates specific provision against Non-Performing Loans (NPLs) in accordance with the Prudential Regulations and other directives issued by the State Bank of Pakistan (SBP) and charged to the profit and loss account. Provisions are held against identified as well as unidentified losses. Provisions against unidentified losses include general provision against consumer loans made in accordance with the requirements of the Prudential Regulations issued by SBP and provision based on historical loss experience on advances. Please refer note No. 10.5 for reconciliation of changes in specific and general provisions.
Management of Non Performing Loans
The Bank has a Special Asset Management Group (SAMG), which is responsible for management of non-performing loans. SAMG undertakes restructuring / rescheduling of problem loans, as well as litigation of both civil and criminal cases for collection of debt.
Stress Testing
Credit Risk stress testing is a regular exercise. Bank’s all credit exposures including funded and non-funded facilities are subject to stress test. This exercise is conducted on a quarterly basis through assigning shocks to all assets of the Bank and assessing its resulting affect on capital adequacy inline with SBP requirements.
Notes to the Consolidated Financial StatementsFor the year ended December 31, 2013

279
43.1.1 Segmental information
Segmental Information is presented in respect of the class of business and geographical distribution of advances (gross), deposits, contingencies and commitments.
2013
Advances (Gross) Deposits Contingencies and commitments
(Rupees in ‘000) (%) (Rupees in ‘000) (%) (Rupees in ‘000) (%)
43.1.1.1 Segments by class of business
Agriculture, forestry, hunting and fishing 3,057,169 1.14 52,085,320 8.24 2,365,835 0.89 Mining and quarrying 5,000 0.00 1,233,151 0.20 2,136,618 0.80 Textile 41,120,102 15.32 2,436,221 0.39 9,611,601 3.62 Chemical, Petroleum and pharmaceuticals 36,888,331 13.74 21,103,199 3.34 31,780,773 11.97 Cement 894,170 0.33 830,008 0.13 1,596,090 0.60 Sugar 15,537,248 5.79 2,314,203 0.37 1,474,420 0.56 Footwear and leather garments 4,682,822 1.74 386,090 0.06 1,718,371 0.65 Automobile and transportation equipment 586,303 0.22 2,063,712 0.33 1,532,315 0.58 Electronics and electrical appliances 2,935,545 1.09 534,111 0.08 1,365,650 0.51 Construction 714,696 0.27 3,181,489 0.50 3,640,172 1.37 Power (electricity), gas, water, sanitary 26,224,336 9.77 37,509,966 5.93 1,651,373 0.62 Wholesale and Retail Trade 21,688,938 8.08 29,441,765 4.66 1,639,982 0.62 Exports / imports 8,644,043 3.22 1,283,752 0.20 4,035,185 1.52 Transport, storage and communication 26,260,405 9.78 2,914,036 0.46 9,164,468 3.45 Financial 2,120,471 0.79 10,286,017 1.63 143,262,515 53.97 Insurance 60,415 0.02 1,617,467 0.26 11,282 0.00 Services 6,480,676 2.41 97,366,136 15.40 19,073,590 7.19 Individuals 13,851,499 5.16 351,396,962 55.57 43,385 0.02 Others 56,718,916 21.13 14,325,489 2.25 29,324,405 11.06 268,471,085 100 632,309,094 100 265,428,030 100 2012
Advances (Gross) Deposits Contingencies and commitments
(Rupees in ‘000) (%) (Rupees in ‘000) (%) (Rupees in ‘000) (%)
Agriculture, forestry, hunting and fishing 2,474,463 0.94 46,722,076 8.57 1,362,196 0.95 Mining and quarrying 510,819 0.19 762,435 0.14 1,957,783 1.36 Textile 37,796,532 14.39 2,839,175 0.52 9,675,745 6.72 Chemical, Petroleum and pharmaceuticals 13,536,095 5.15 3,972,062 0.73 24,413,483 16.97 Cement 1,340,198 0.51 545,143 0.10 812,238 0.56 Sugar 11,373,856 4.33 1,246,046 0.23 1,126,804 0.78 Footwear and leather garments 3,351,288 1.28 185,094 0.03 1,211,665 0.84 Automobile and transportation equipment 350,182 0.13 1,655,254 0.30 883,112 0.61 Electronics and electrical appliances 2,581,319 0.98 1,442,975 0.26 1,133,798 0.79 Construction 512,732 0.20 2,504,747 0.46 1,718,908 1.19 Power (electricity), gas, water, sanitary 29,778,732 11.34 10,474,169 1.92 5,596,136 3.89 Wholesale and Retail Trade 16,155,626 6.15 31,693,748 5.82 1,669,454 1.16 Exports / imports 4,374,769 1.67 1,155,293 0.21 3,464,399 2.41 Transport, storage and communication 60,303,139 22.96 2,963,980 0.54 8,605,809 5.98 Financial 2,830,378 1.08 7,456,797 1.37 43,797,027 30.44 Insurance 100,145 0.04 1,933,344 0.35 9,428 0.01 Services 8,408,320 3.20 103,086,339 18.92 15,323,823 10.65 Individuals 14,525,679 5.52 304,770,547 55.91 27,556 0.01 Others 52,293,262 19.95 19,578,867 3.62 21,090,217 14.68
262,597,534 100 544,988,091 100 143,879,581 100
Notes to the Consolidated Financial StatementsFor the year ended December 31, 2013

ANNUAL REPORT 2013
280
2013
Advances (Gross) Deposits Contingencies and commitments
(Rupees in ‘000) (%) (Rupees in ‘000) (%) (Rupees in ‘000) (%)
43.1.1.2 Segment by sector
Public / Government 50,019,400 18.63 47,467,154 7.51 82,894,499 31.23 Private 218,451,685 81.37 584,841,940 92.49 182,533,531 68.77 268,471,085 100 632,309,094 100 265,428,030 100
2012
Advances (Gross) Deposits Contingencies and commitments
(Rupees in ‘000) (%) (Rupees in ‘000) (%) (Rupees in ‘000) (%)
Public / Government 61,853,400 23.55 14,204,857 2.61 64,122,798 44.57 Private 200,744,134 76.45 530,783,234 97.39 79,756,783 55.43 262,597,534 100 544,988,091 100 143,879,581 100
43.1.1.3 Details of non-performing advances and specific provisions by class of business segment
2013 2012
Classified Specific Classified Specific
Advances Provision Advances Provision
Held Held
(Rupees in ‘000)
Agriculture, forestry, hunting and fishing 254,545 241,739 312,154 312,154 Mining and quarrying - - - - Textile 4,122,275 4,079,378 5,209,642 5,198,660 Chemical and pharmaceuticals 183,434 183,434 196,304 196,304 Cement 130,950 130,950 295,603 295,603 Sugar 428,224 428,224 1,035,221 1,035,221 Footwear and leather garments 85,595 85,595 103,951 103,951 Automobile and transportation equipment 26,155 25,337 54,984 47,781 Electronics and electrical appliances 374,522 374,522 451,436 451,436 Construction 118,363 118,363 127,365 127,365 Power (electricity), gas, water, sanitary - - 180,086 90,070 Wholesale and retail trade 3,490,188 3,401,412 4,075,703 4,075,582 Exports / imports 548,372 548,017 596,963 596,796 Transport, storage and communication 593,413 589,033 645,059 335,919 Financial 814,600 814,600 1,107,782 918,893 Services 594,830 590,498 721,978 721,978 Individuals 3,188,170 3,117,058 3,393,709 3,265,164 Others 8,314,097 4,721,988 7,053,834 4,607,210
23,267,733 19,450,148 25,561,774 22,380,087
43.1.1.4 Details of non-performing advances and
specific provisions by sector
Public/ Government 639,825 - - - Private 22,627,908 19,450,148 25,561,774 22,380,087
23,267,733 19,450,148 25,561,774 22,380,087
Notes to the Consolidated Financial StatementsFor the year ended December 31, 2013
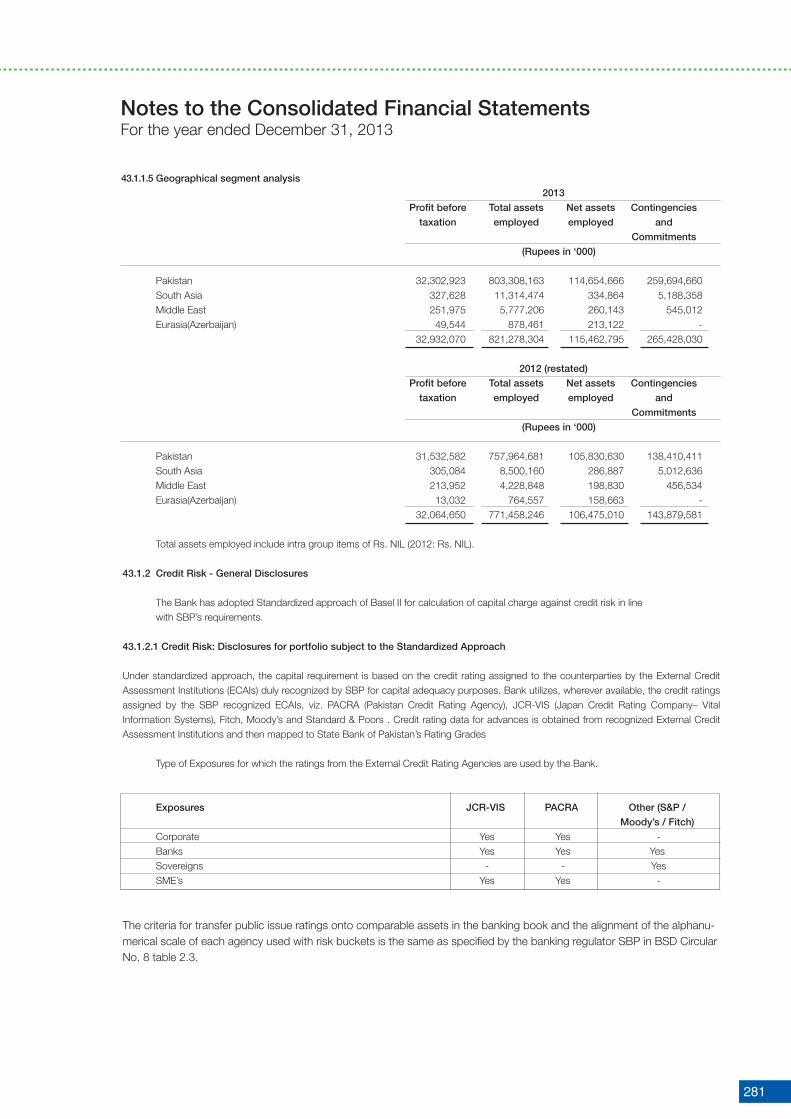
281
43.1.1.5 Geographical segment analysis
2013
Profit before Total assets Net assets Contingencies
taxation employed employed and
Commitments
(Rupees in ‘000)
Pakistan 32,302,923 803,308,163 114,654,666 259,694,660 South Asia 327,628 11,314,474 334,864 5,188,358 Middle East 251,975 5,777,206 260,143 545,012 Eurasia(Azerbaijan) 49,544 878,461 213,122 - 32,932,070 821,278,304 115,462,795 265,428,030
2012 (restated)
Profit before Total assets Net assets Contingencies
taxation employed employed and
Commitments
(Rupees in ‘000)
Pakistan 31,532,582 757,964,681 105,830,630 138,410,411 South Asia 305,084 8,500,160 286,887 5,012,636 Middle East 213,952 4,228,848 198,830 456,534 Eurasia(Azerbaijan) 13,032 764,557 158,663 - 32,064,650 771,458,246 106,475,010 143,879,581
Total assets employed include intra group items of Rs. NIL (2012: Rs. NIL).
43.1.2 Credit Risk - General Disclosures
The Bank has adopted Standardized approach of Basel II for calculation of capital charge against credit risk in line with SBP’s requirements.
43.1.2.1 Credit Risk: Disclosures for portfolio subject to the Standardized Approach
Under standardized approach, the capital requirement is based on the credit rating assigned to the counterparties by the External Credit Assessment Institutions (ECAIs) duly recognized by SBP for capital adequacy purposes. Bank utilizes, wherever available, the credit ratings assigned by the SBP recognized ECAIs, viz. PACRA (Pakistan Credit Rating Agency), JCR-VIS (Japan Credit Rating Company– Vital Information Systems), Fitch, Moody’s and Standard & Poors . Credit rating data for advances is obtained from recognized External Credit Assessment Institutions and then mapped to State Bank of Pakistan’s Rating Grades
Type of Exposures for which the ratings from the External Credit Rating Agencies are used by the Bank.
Exposures JCR-VIS PACRA Other (S&P /
Moody’s / Fitch)
Corporate Yes Yes - Banks Yes Yes Yes Sovereigns - - Yes SME’s Yes Yes -
The criteria for transfer public issue ratings onto comparable assets in the banking book and the alignment of the alphanu-merical scale of each agency used with risk buckets is the same as specified by the banking regulator SBP in BSD Circular No. 8 table 2.3.
Notes to the Consolidated Financial StatementsFor the year ended December 31, 2013

ANNUAL REPORT 2013
282
Long - Term Ratings Grades Mapping
“SBP Rating Grade” PACRA JCR-VIS Fitch Moody’s S&P ECA Scores
1 AAA AAA AAA Aaa AAA 1
AA+ AA+ AA+ Aa1 AA+
AA AA AA Aa2 AA
AA- AA- AA- Aa3 AA-
2 A+ A+ A+ A1 A+ 2
A A A A2 A
A- A- A- A3 A-
3 BBB+ BBB+ BBB+ Baa1 BBB+ 3
BBB BBB BBB Baa2 BBB
BBB- BBB- BBB- Baa3 BBB-
4 BB+ BB+ BB+ Ba1 BB+ 4
BB BB BB Ba2 BB
BB- BB- BB- Ba3 BB-
5 B+ B+ B+ B1 B+ 5,6
B B B B2 B
B- B- B- B3 B-
6 CCC+ and CCC+ and CCC+ and Caa1 and CCC+ and 7
below below below Below below
Short - Term Ratings Grades Mapping
SBP PACRA JCR-VIS Fitch Moody’s S&P
S1 A-1 A-1 F1 P-1 A-1+, A-1
S2 A-2 A-2 F2 P-2 A-2
S3 A-3 A-3 F3 P-3 A-3
S4 Others Others Others Others Others
Notes to the Consolidated Financial StatementsFor the year ended December 31, 2013

283
Notes to the Consolidated Financial StatementsFor the year ended December 31, 2013
Credit Exposures subject to Standardized approach
2013 2012
Exposures Rating Amount Deduction Net amount Amount Deduction Net Outstanding CRM Outstanding CRM amount
(Rupees in ‘000)
Corporate 1 12,965,194 - 12,965,194 19,892,545 - 19,892,545
2 16,023,019 - 16,023,019 18,297,215 - 18,297,215
3,4 666,209 - 666,209 60,937 - 60,937
5,6 - - - 61,960 - 61,960
Unrated 142,495,310 - 142,495,310 114,822,679 - 114,822,679
Bank 1 18,745,447 - 18,745,447 17,955,785 - 17,955,785
2,3 1,263,692 - 1,263,692 2,245,114 - 2,245,114
4,5 540,960 - 540,960 438,213 - 438,213
6 18,718 - 18,718 306,199 - 306,199
Unrated 1,486,260 - 1,486,260 156,116 - 156,116
Public Sector Entities in Pakistan 1 - - - 218,872 - 218,872
2,3 - - - - - -
4,5 - - - - - -
6
Unrated 47,872,322 32,662,619 15,209,703 60,212,217 59,821,046 391,171
Sovereigns and on Government of Pakistan 1 45,126,975 - 45,126,975 44,378,210 - 44,378,210
or provincial governments or SBP or Cash 2 - - - - - -
3 - - - - - -
4.5 3,571,381 - 3,571,381 1,212,879 - 1,212,879
6 478,848 - 478,848 2,075,915 - 2,075,915
Unrated 2,361,976 - 2,361,976 68,513 - 68,513
Mortgage 3,843,059 - 3,843,059 4,229,432 - 4,229,432
Retail 20,324,653 - 20,324,653 21,213,354 - 21,213,354

ANNUAL REPORT 2013
284
43.1.3 Credit Risk: Disclosures with respect to Credit Risk Mitigation for Standardized Approach
The Bank does not make use of on and off-balance sheet netting in capital charge calculations under Basel-II’s Standardized Approach for Credit Risk.
43.1.3.1 Credit Risk: Disclosures for portfolio subject to the Standardized Approach
The Bank has strong policies and processes for collateral valuation and collateral management thus ensuring that collateral valuation happens at regular defined intervals. Collaterals are normally held for the life of exposure. Regular monitoring of coverage of exposure by the collateral and lien/ charge registered over the collaterals is carried out besides ensuring that collateral matches the purpose, nature and structure of the transaction and also reflect the form and capacity of the obligor, its operations, nature of business and economic environment. The Bank mitigates its risk by taking collaterals that may include assets acquired through the funding provided, as well as cash, government securities, marketable securities, current assets, fixed assets, and specific equipment, commercial and personal real estate.
The Standardized Approach of Basel-II guidelines allows the Bank to take benefit of credit risk mitigation of financial collaterals against total exposures in the related loan facilities. As a prudent and conservative measure while calculating capital charge for credit risk of on balance sheet activities, bank has taken only the benefit of Sovereign guarantees.
MCB manages limits and controls concentrations of credit risk as identified, in particular, to individual counterparties and groups, and also reviews exposure to industry sectors and geographical regions on a regular basis. Limits are applied in a variety of forms to portfolios or sectors where MCB considers it appropriate to restrict credit risk concentrations or areas of higher risk, or to control the rate of portfolio growth.
Concentration of risk
Out of the total financial assets of Rs. 776,290.225 million (2012: Rs. 722,160.736 million) the financial assets which are subject to credit risk amounting to Rs. 763,939.311 million (2012: Rs. 710,357.530 million). To manage credit risk the Bank applies credit limits to its customers and obtains adequate collaterals. Investments amounting to Rs. 434,096.855 million (2012: Rs. 380,193.220 million) are guaranteed by the Government of Pakistan. In addition, an amount of Rs. 31,931.448 million (2012: Rs. 30,380.601 million) are held by the Bank with the State Bank of Pakistan and central banks of other countries.
43.1.3.2 Equity position risk in the banking book
The Bank takes proprietary equity positions for both trading and strategic purposes. The Bank has invested in its subsidiaries and associated companies to achieve long term strategic objectives. As of December 31, 2013 the composition of equity investments and associated companies is as follows:
Composition of equity investments Exposures Held for trading Available for Sale Associates
(Rupees in ‘000)
Equity investments – publicly traded 575,270 7,797,701 5,386,250
Equity investments - others - 365,250 126,726
Total value 575,270 8,162,951 5,512,976
Classification of equity investments
Banks classify its equity investment portfolio in accordance with the directives of SBP as follows:
• Investments-Heldfortrading
• Investments-Availableforsale
• InvestmentsinAssociates
Notes to the Consolidated Financial StatementsFor the year ended December 31, 2013

285
Policies, valuation and accounting of equity investments
The accounting policies for equity investments are designed and their valuation is carried out under the provisions and directives of State Bank of Pakistan, Securities and Exchange Commission of Pakistan and the requirements of approved International Accounting Standards as applicable in Pakistan.
In accordance with the requirements of the State Bank of Pakistan, quoted securities, other than investments in subsidiaries and investments in associates are subsequently re-measured to market value. Surplus / (deficit) arising on revaluation of quoted securities which are classified as ‘available for sale’, is taken to a separate account which is shown in the statement of financial position below equity. Surplus / (deficit) arising on revaluation of quoted securities which are classified as ‘held for trading’, is taken to the profit and loss account directly.
Unquoted equity securities are valued at the lower of cost and break-up value. Break-up value of equity securities is calculated with reference to the net assets of the investee company as per the latest available audited financial statements.
The cumulative realized gain of Rs. 1,905.798 million has been charged to profit & loss account from sale of equity securities; however unrealized gain of Rs. 2,222.741 million was recognized in the balance sheet in respect of “AFS” equity securities. Further a provision for impairment in value of equity investments amounting to Rs. 5.909 million has been charged to profit and loss account.
43.2 Market Risk Management
Market Risk arises from changes in market rates such as Interest Rates, Foreign Exchange Rates, Equity Prices, credit spreads and/or commodity prices as well as their correlations and volatilities resulting in a loss to earnings and capital. MCB is exposed to market risk primarily through its trading activities, which are centered in the Treasury and Foreign Exchange Group and the Capital Market Group. Market risk exposure also arises from market-making, facilitation of client business and proprietary positions in equities, fixed income and interest rate products and foreign exchange, which exposes bank to interest rate risk, foreign exchange risk and equity price risk.
The Bank’s Market Risk Management structure consists of Risk Management & Portfolio Review Committee (RM&PRC) of the Board, Risk Management Committee of management, ALCO and independent Market Risk Management Division reporting directly to Group Head Risk Management. Market Risk is an independent risk management function that works in close partnership with the business segments to identify and monitor market risks throughout the Bank and to define market risk policies and procedures. Market Risk Division seeks to facilitate efficient risk/return decisions, reduce volatility in operating performance and provide transparency in reporting the Bank’s market risk profile to the senior management, the Board of Directors and regulator. Market risk management authority, including approval of market risk limits and exposure levels is vested in the ALCO.
In line with regulatory requirements, MCB has clearly defined, in its Risk Management policy, the positions which shall be subject to market risk. The definition covers the accounting classifications as well as positions booked by different business groups under “Available for Sale” category. The assets subject to trading book treatment are frequently, mostly on daily basis, valued and actively managed. The positions which does not fulfill the criteria of Trading book falls under the Banking Book and are treated as per SBP requirements.
The Bank measures and manages Market Risk by using conventional methods i.e. notional amounts, sensitivity and combinations of various limits. Bank as established a specific Market Risk Limit Policy providing guideline for assuming controlled market risk, its monitoring and management. These Limits are compared with the numbers generated by the market risk management systems based on the trading activity and the outstanding positions.
Beside conventional methods, the Bank also uses VaR (Value at Risk) technique for market risk assessment of positions assumed by its treasury and capital market groups. In-house solutions are used for calculating mark to market value of positions and generating VaR (value at risk) and sensitivity numbers. Thresholds for different positions are established to compare the expected losses at a given confidence level and over a specified time horizon.
A framework of stress testing, scenario analysis and reverse stress tests of both banking and trading books as per SBP guidelines is also in place. The results of the stress tests are reviewed by the Senior Management and also reported to the SBP.
Notes to the Consolidated Financial StatementsFor the year ended December 31, 2013

ANNUAL REPORT 2013
286
The Bank is also exposed to interest rate risk both in trading and banking books. Risk numbers along with the marked to market values of government securities held by the Bank’s treasury are generated on daily basis. The risk numbers include duration, PVBP, and VaR on individual security basis as well as on portfolio basis. These reports are presented to the senior management for review on a daily basis.
43.2.1 Foreign Exchange Risk Management
Foreign exchange risk exposes the bank to changes in the values of current holdings and future cash flows denominated in currencies other than home currency due to the exchange rate fluctuation and volatility. The types of instruments exposed to this risk include investments in foreign branches, foreign currency-denominated loans, foreign currency-denominated deposits, future cash flows in foreign currencies arising from foreign exchange transactions, etc.
The core objective of foreign exchange risk management is to ensure the foreign exchange exposure of the Bank
remain within defined risk appetite and insulate bank against undue losses that may arise due to volatile movements in foreign exchange rates or interest rates.
Limit structure to manage Foreign exchange risk is in place. Gap limits on different tenors in major currencies are in place to control risk. Bank’s net open position and Foreign exchange exposure limit (FEEL) is monitored and reported on daily basis. Additionally, daily reports are generated to evaluate the exposure in different currencies. Risk management system generates VaR numbers for foreign exchange portfolio to estimate the potential loss under normal conditions. Stress testing of foreign exchange portfolio is also performed and reported to senior management. All these activities are performed on a daily basis.
2013
Assets Liabilities Off-balance Net foreign sheet items currency exposure
(Rupees in ‘000)
Pakistan Rupee 762,751,477 654,607,438 6,922,673 115,066,712
Sri Lankan Rupee 11,049,130 11,099,250 45,462 (4,658)
United States Dollar 44,688,222 31,711,553 (12,854,354) 122,315
Pound Sterling 876,537 3,495,434 2,630,109 11,212
Japanese Yen 10,881 51,448 53,717 13,150
Euro 993,614 4,185,047 3,202,393 10,960
Other currencies 908,443 665,339 - 243,104
821,278,304 705,815,509 - 115,462,795
2012 (Restated)
Assets Liabilities Off-balance Net foreign sheet items currency
exposure
(Rupees in ‘000)
Pakistan Rupee 739,523,223 629,369,140 (3,931,941) 106,222,142 Sri Lankan Rupee 8,115,171 8,159,735 18,620 (25,944) United States Dollar 22,693,261 20,998,827 (1,510,732) 183,702 Pound Sterling 481,165 2,857,211 2,383,939 7,893 Japanese Yen 42,693 70 (40,618) 2,005 Euro 548,178 3,598,253 3,080,732 30,657 Other currencies 54,555 - - 54,555 771,458,246 664,983,236 - 106,475,010
Notes to the Consolidated Financial StatementsFor the year ended December 31, 2013

287
43.2.2 Equity Price Risk
Bank’s proprietary positions in the equity instruments expose it to the equity price risk in its trading and banking books. Equity price risk is managed by applying trading limit, scrip-wise and portfolio wise nominal limits. VaR analysis and stress testing of the equity portfolio are also performed and reported to senior management on daily basis. The stress test for equity price risk assesses the impact of the decline in market prices of scrips under certain assumptions. Additionally, historical scenario analysis on equities is also performed periodically as advised by the State Bank of Pakistan through Guideline on Stress Testing.
43.2.3 Country Risk
The world is changing rapidly and interdependencies and inter linkages of banks operating in different countries are ever increasing. Thus the banks having cross border exposures whether on-balance sheet or off-balance sheet are susceptible to the changing conditions in various countries of the world. Therefore, it becomes very important for institutions to effectively manage their cross border exposures to avoid any unfavorable situation.
MCB understands the risks involved in taking cross border exposure. The risk is managed under the umbrella of Board approved Country Risk Policy. The Policy not only envisages a centralized approach to measure, monitor and manage country risk but also strengthen overall risk management framework in the Bank.
Country Exposure Limits are in place, which broadly capture direct exposure on sovereigns and exposures on foreign domiciled counter parties. Additionally, business product wise sub limits involving cross border exposure are also implemented. Monitoring of these limits is a regular feature of Risk Management.
Notes to the Consolidated Financial StatementsFor the year ended December 31, 2013

ANNUAL REPORT 2013
288
Notes to the Consolidated Financial StatementsFor the year ended December 31, 2013
Yiel
d /
inte
rest
rate
sen
sitiv
ity p
ositi
on fo
r on-
bala
nce
shee
t ins
trum
ents
is b
ased
on
the
earli
er o
f con
tract
ual r
e-pr
icin
g or
mat
urity
dat
e an
d fo
r off-
bala
nce
shee
t ins
trum
ents
is
base
d on
set
tlem
ent d
ate.
20
13
Ef
fect
ive
Tota
l E
xpos
ed to
Yie
ld/ I
nter
est r
isk
Not e
xpos
ed
Yi
eld/
Up
to
Ove
r 1
Ove
r 3
Ove
r 6
Ove
r 1
Ove
r 2
Ove
r 3
Ove
r 5
Abo
ve
to Y
ield
/
Inte
rest
1 m
onth
to
3
to 6
m
onth
s to
to
2
to 3
to
5
to 1
0
10
year
s
Inte
rest
rate
m
onth
s
mon
ths
1
yea
r y
ears
y
ears
y
ears
y
ears
Risk
(R
upee
s in
‘000
)
On-b
alan
ce s
heet
fina
ncia
l inst
rum
ents
Asse
ts
Cash
and
bala
nces
with
trea
sury
ban
ks
0%
59,
946,
218
4
,146
,998
-
-
-
-
-
-
-
-
5
5,79
9,22
0 Ba
lance
s with
oth
er b
anks
2.
35%
1
,594
,660
5
42,1
28
-
-
-
-
-
-
-
-
1,0
52,5
32
Lend
ings t
o fin
ancia
l inst
itutio
ns
6.5%
to 1
0%
1,2
24,6
38
1,2
24,6
38
-
-
-
-
-
-
-
-
-
Inves
tmen
ts -
net
8.93
% to
13.
20%
4
48,2
95,3
69
102
,012
,978
2
11,4
91,0
20
16,
915,
652
1
1,32
7,08
9
21,
398,
565
3
9,06
6,34
2
24,
125,
404
1
3,09
2,61
1
-
8,8
65,7
08
Adva
nces
- ne
t 10
.77%
2
48,5
21,7
92
210
,483
,644
1
8,07
3,29
9
4,2
90,7
33
1,7
84,7
94
5,6
15,9
18
2,1
17,6
76
3,1
11,6
16
2,4
42,3
67
601
,745
-
Ot
her a
sset
s - n
et
1
6,70
7,54
8
-
-
-
-
-
-
-
-
-
16,
707,
548
776
,290
,225
3
18,4
10,3
86
229
,564
,319
2
1,20
6,38
5
13,
111,
883
2
7,01
4,48
3
41,
184,
018
2
7,23
7,02
0
15,
534,
978
6
01,7
45
82,
425,
008
Liab
ilitie
s
Bills
pay
able
1
0,13
8,72
6
-
-
-
-
-
-
-
-
-
10,
138,
726
Borro
wing
s 0.
8% to
10.
25%
3
8,66
0,40
5
19,
312,
395
1
0,00
5,13
5
4,4
69,6
05
2,3
96,6
84
2,4
34,3
06
42,
280
-
-
-
-
De
posit
s and
oth
er a
ccou
nts
7% to
10.
75%
6
32,3
09,0
94
373
,704
,833
1
9,13
6,27
5
8,7
14,2
75
15,
472,
801
2
17,1
57
219
,938
3
26,6
64
-
-
214
,517
,151
Ot
her l
iabilit
ies
1
6,20
5,86
7
-
-
-
-
-
-
-
-
-
16,
205,
867
697
,314
,092
3
93,0
17,2
28
29,
141,
410
1
3,18
3,88
0
17,
869,
485
2
,651
,463
2
62,2
18
326
,664
-
-
2
40,8
61,7
44
On-b
alan
ce s
heet
gap
78,
976,
133
(7
4,60
6,84
2)
200
,422
,909
8
,022
,505
(4
,757
,602
) 2
4,36
3,02
0
40,
921,
800
2
6,91
0,35
6
15,
534,
978
6
01,7
45
(158
,436
,736
)
Off-b
alan
ce s
heet
fina
ncia
l inst
rum
ents
FX o
ption
s pur
chas
e
216
,344
-
2
16,3
44
-
-
-
-
-
-
-
-
Fore
ign e
xcha
nge
cont
ract
s Pur
chas
e
72,
216,
751
4
2,58
3,68
3
23,
239,
215
6
,393
,853
-
-
-
-
-
-
-
72,
433,
095
4
2,58
3,68
3
23,
455,
559
6
,393
,853
-
-
-
-
-
-
-
FX o
ption
s sale
216
,344
-
2
16,3
44
-
-
Fo
reign
exc
hang
e co
ntra
cts S
ale
7
9,95
9,56
3
44,
369,
336
2
5,26
6,53
1
9,9
57,4
17
366
,279
-
-
-
-
-
-
80,
175,
907
4
4,36
9,33
6
25,
482,
875
9
,957
,417
3
66,2
79
-
-
-
-
-
-
Off-b
alan
ce s
heet
gap
(7,7
42,8
12)
(1,7
85,6
53)
(2,0
27,3
16)
(3,5
63,5
64)
(366
,279
) -
-
-
-
-
-
Tota
l yie
ld /
inte
rest
risk
sen
sitivi
ty g
ap
(76,
392,
495)
1
98,3
95,5
93
4,4
58,9
41
(5,1
23,8
81)
24,
363,
020
4
0,92
1,80
0
26,
910,
356
1
5,53
4,97
8
601
,745
Cum
ulat
ive y
ield
/ in
tere
st ri
sk s
ensit
ivity
gap
(7
6,39
2,49
5)
122
,003
,098
1
26,4
62,0
39
121
,338
,158
1
45,7
01,1
78
186
,622
,978
2
13,5
33,3
34
229
,068
,312
2
29,6
70,0
57
43.3
M
ism
atch
of I
nter
est
Rat
e S
ensi
tive
Ass
ets
and
Lia
bili
ties
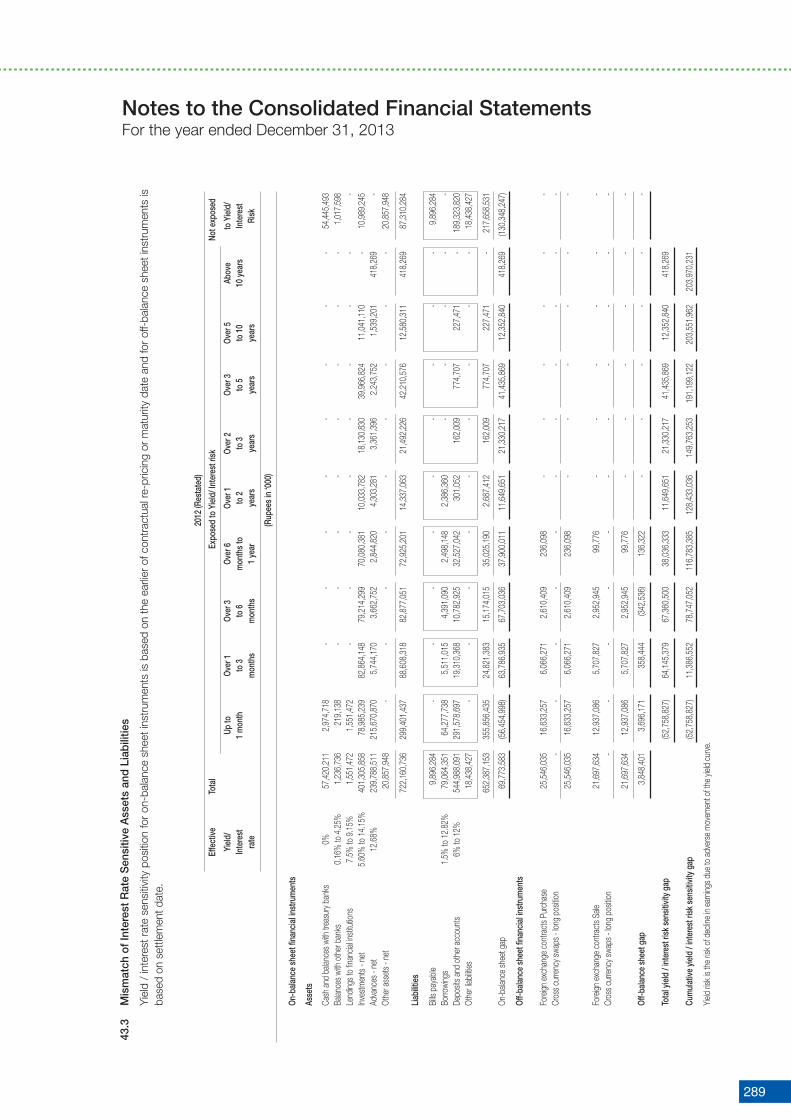
289
Notes to the Consolidated Financial StatementsFor the year ended December 31, 2013
Yiel
d /
inte
rest
rate
sen
sitiv
ity p
ositi
on fo
r on-
bala
nce
shee
t ins
trum
ents
is b
ased
on
the
earli
er o
f con
tract
ual r
e-pr
icin
g or
mat
urity
dat
e an
d fo
r off-
bala
nce
shee
t ins
trum
ents
is
base
d on
set
tlem
ent d
ate.
20
12 (R
esta
ted)
Ef
fect
ive
Tota
l E
xpos
ed to
Yie
ld/ I
nter
est r
isk
Not e
xpos
ed
Yi
eld/
Up
to
Ove
r 1
Ove
r 3
Ove
r 6
Ove
r 1
Ove
r 2
Ove
r 3
Ove
r 5
Abo
ve
to Y
ield
/
Inte
rest
1 m
onth
to
3
to 6
m
onth
s to
to
2
to 3
to
5
to 1
0
10
year
s
Inte
rest
rate
m
onth
s
mon
ths
1
yea
r y
ears
y
ears
y
ears
y
ears
Risk
(R
upee
s in
‘000
)
On-b
alan
ce s
heet
fina
ncia
l inst
rum
ents
Asse
ts
Cash
and
bala
nces
with
trea
sury
ban
ks
0%
57,
420,
211
2
,974
,718
-
-
-
-
-
-
-
-
5
4,44
5,49
3 Ba
lance
s with
oth
er b
anks
0.
16%
to 4
.25%
1
,236
,736
2
19,1
38
-
-
-
-
-
-
-
-
1,0
17,5
98
Lend
ings t
o fin
ancia
l inst
itutio
ns
7.5%
to 9
.15%
1
,551
,472
1
,551
,472
-
-
-
-
-
-
-
-
-
Inv
estm
ents
- ne
t 5.
60%
to 1
4.15
%
401
,305
,858
7
8,98
5,23
9
82,
864,
148
7
9,21
4,29
9
70,
080,
381
1
0,03
3,78
2
18,
130,
830
3
9,96
6,82
4
11,
041,
110
-
1
0,98
9,24
5 Ad
vanc
es -
net
12.6
8%
239
,788
,511
2
15,6
70,8
70
5,7
44,1
70
3,6
62,7
52
2,8
44,8
20
4,3
03,2
81
3,3
61,3
96
2,2
43,7
52
1,5
39,2
01
418
,269
-
Ot
her a
sset
s - n
et
2
0,85
7,94
8
-
-
-
-
-
-
-
-
-
20,
857,
948
722
,160
,736
2
99,4
01,4
37
88,
608,
318
8
2,87
7,05
1
72,
925,
201
1
4,33
7,06
3
21,
492,
226
4
2,21
0,57
6
12,
580,
311
4
18,2
69
87,
310,
284
Liab
ilitie
s
Bills
pay
able
9
,896
,284
-
-
-
-
-
-
-
-
-
9
,896
,284
Bo
rrowi
ngs
1.5%
to 1
2.82
%
79,
064,
351
6
4,27
7,73
8
5,5
11,0
15
4,3
91,0
90
2,4
98,1
48
2,3
86,3
60
-
-
-
-
-
Depo
sits a
nd o
ther
acc
ount
s 6%
to 1
2%
544
,988
,091
2
91,5
78,6
97
19,
310,
368
1
0,78
2,92
5
32,
527,
042
3
01,0
52
162
,009
7
74,7
07
227
,471
-
1
89,3
23,8
20
Othe
r liab
ilities
18,
438,
427
-
-
-
-
-
-
-
-
-
1
8,43
8,42
7
652
,387
,153
3
55,8
56,4
35
24,
821,
383
1
5,17
4,01
5
35,
025,
190
2
,687
,412
1
62,0
09
774
,707
2
27,4
71
-
217
,658
,531
On-b
alanc
e sh
eet g
ap
6
9,77
3,58
3
(56,
454,
998)
6
3,78
6,93
5
67,
703,
036
3
7,90
0,01
1
11,
649,
651
2
1,33
0,21
7
41,
435,
869
1
2,35
2,84
0
418
,269
(1
30,3
48,2
47)
Off-b
alan
ce s
heet
fina
ncia
l inst
rum
ents
Fore
ign e
xcha
nge
cont
ract
s Pur
chas
e
25,
546,
035
1
6,63
3,25
7
6,0
66,2
71
2,6
10,4
09
236
,098
-
-
-
-
-
-
Cr
oss c
urre
ncy s
waps
- lon
g po
sition
- -
- -
- -
- -
- -
-
25
,546
,035
1
6,63
3,25
7
6,0
66,2
71
2,6
10,4
09
236
,098
-
-
-
-
-
-
Fore
ign e
xcha
nge
cont
ract
s Sale
21,
697,
634
1
2,93
7,08
6
5,7
07,8
27
2,9
52,9
45
99,
776
-
-
-
-
-
-
Cr
oss c
urre
ncy s
waps
- lon
g po
sition
- -
- -
- -
- -
- -
-
21,6
97,6
34
12,
937,
086
5
,707
,827
2
,952
,945
9
9,77
6
-
-
-
-
-
-
Off-b
alan
ce s
heet
gap
3,8
48,4
01
3,6
96,1
71
358
,444
(3
42,5
36)
136
,322
-
-
-
-
-
-
To
tal y
ield
/ in
tere
st ri
sk s
ensit
ivity
gap
(5
2,75
8,82
7)
64,
145,
379
6
7,36
0,50
0
38,
036,
333
1
1,64
9,65
1
21,
330,
217
4
1,43
5,86
9
12,
352,
840
4
18,2
69
Cum
ulat
ive y
ield
/ in
tere
st ri
sk s
ensit
ivity
gap
(5
2,75
8,82
7)
11,
386,
552
7
8,74
7,05
2
116
,783
,385
1
28,4
33,0
36
149
,763
,253
1
91,1
99,1
22
203
,551
,962
2
03,9
70,2
31
Yield
risk
is th
e ris
k of
dec
line
in ea
rning
s due
to a
dver
se m
ovem
ent o
f the
yield
cur
ve.
43.3
M
ism
atch
of I
nter
est
Rat
e S
ensi
tive
Ass
ets
and
Lia
bili
ties

ANNUAL REPORT 2013
290
Notes to the Consolidated Financial StatementsFor the year ended December 31, 2013
Reconciliation to total assets 2013 2012 Reconciliation to total liabilities 2013 2012 (Rupees in ‘000) (Rupees in ‘000)
Balance as per balance sheet 821,278,304 771,458,246 Balance as per balance sheet 705,815,509 664,983,236
Less: Non financial assets Less: Non financial liabilities
Investments 5,512,976 4,295,455 Other liabilities 4,001,124 2,827,212
Operating fixed assets 29,005,931 24,144,242 Deferred tax liability 4,500,293 9,768,871
Other assets 10,469,172 20,857,813 8,501,417 12,596,083
44,988,079 49,297,510
Total financial assets 776,290,225 722,160,736 Total financial liabilities 697,314,092 652,387,153
43.4 Liquidity Risk
Liquidity represents the ability to fund assets and meet obligations as they become due. The Bank understands that liquidity does not come for free, and surplus liquidity has an opportunity cost which needs to be recognized. Liquidity risk is a risk of not being able to obtain funds at a reasonable price within a reasonable time period to meet obligations as they become due. Liquidity is essential to the ability to operate financial services businesses and, therefore, the ability to maintain surplus levels of liquidity through economic cycles is crucial, particularly during periods of adverse conditions, liquidity management is among the most important activities that the MCB conducts during both normal and stress periods. MCB recognizes that liquidity risk can arise from the Bank’s activities and can be grouped into three categories:
- Inflows/Outflows from on-balance sheet items (other than marketable securities and wholesale borrowings) and off-balance sheet items;
- Marketability of trading securities; and
- Capacity to borrow from the wholesale markets for funding as well as trading activities.
Liquidity Management
Asset Liability Management Committee of the bank has the responsibility for the formulation of overall strategy and oversight of the Asset Liability management function. Board has approved a comprehensive Liquidity Risk Policy (part of Risk Management Policy), which stipulates policies regarding maintenance of various ratios, funding preferences, and evaluation of Banks’ liquidity under normal and crisis situation. MCB Bank monitors and assesses the impact of increase in NPLs, deposits concentration, deposits withdrawal, decline in earnings, expanded business opportunities, acquisitions and negative reputation on its liquidity positions. Liquidity Strategy is also in place, to ensure that the Bank can meet its temporal liquidity needs and optimize the contribution towards the profitability of the Bank. A framework to assess the maturity profile of non-contractual assets and liabilities is in place to supplement the liquidity management. As per preliminary assessments, the Bank’s Liquidity Coverage Ratio and Net Stable Funding Ratio as per Basel III are well within the prescribed limits.
MCB’s liquidity risk management framework is designed to identify, measure and manage in a timely manner the liquidity risk position of the Bank. The underlying policies and procedures include: Risk Management policy, Treasury Policy, Investment policy, Contingency Funding Plan, Liquidity Strategy and Limit Structure which are reviewed and approved regularly by the senior management /Board members. MCB Bank also conducts Liquidity Risk Analysis on regular basis. MCB liquidity Risk Policy envisages to project the Bank’s funding position during temporary and long-term liquidity changes, including those caused by liability erosion and explicitly identifying, quantifying and ranking all sources of funding preferences, such as reducing assets, modifying or increasing liability structure; and using other alternatives for controlling statement of financial position changes. MCB performs regular liquidity stress tests as part of its liquidity monitoring activities. The purpose of the liquidity stress tests is intended to ensure sufficient liquidity for the Bank under both idiosyncratic and systemic market stress conditions. MCB’s liquidity risk management approach involves intraday liquidity management, managing funding sources and evaluation of structural imbalances in balance sheet structure.
Intraday Liquidity Management
Intraday liquidity management is about managing the daily payments and cash flows. Bank has policies to ensure that sufficient cash is maintained during the day to make payments through local payment system. The policy of the Bank is to maintain adequate liquidity at all times, in all geographical locations and for all currencies and hence to be in a position, in the normal course of business, to meet obligations, repay depositors and fulfill commitments.
Managing Funding Sources
Managing funding sources, as per policy MCB maintain a portfolio of marketable securities that can either be sold outright or sold through a repurchase agreement to generate cash flows for meeting unexpected liquidity requirement. As a part of liquidity management MCB maintains borrowing relationships to ensure the continued access to diverse market of funding sources. MCB’s sound credit rating together with excellent market reputation has enabled MCB to secure ample call lines with local and foreign banks. The level of liquidity reserves as per regulatory requirements also mitigates risks. MCB’s investment in marketable securities is much higher than the Statutory Liquidity requirements.

291
20
13
To
tal
Up
to 1
O
ver
1
Ove
r 3
O
ver
6
Ove
r 1
O
ver
2
Ove
r 3
O
ver
5
Abo
ve
mon
th
to 3
t
o 6
m
onth
s to
to
2
to 3
to
5
to 1
0
10
year
s
mon
ths
m
onth
s
1 y
ear
y
ears
y
ears
y
ears
y
ears
(R
upee
s in
‘000
)
Asse
ts
Cas
h an
d ba
lanc
es w
ith tr
easu
ry b
anks
5
9,94
6,21
8
59,
946,
218
-
-
-
-
-
-
-
-
Ba
lanc
es w
ith o
ther
ban
ks
1,5
94,6
60
1,5
94,6
60
-
-
-
-
-
-
-
-
Lend
ings
to fi
nanc
ial in
stitu
tions
1
,224
,638
1
,224
,638
-
-
-
-
-
-
-
-
In
vest
men
ts -
net
453
,808
,345
1
01,4
75,7
86
213
,459
,894
1
1,77
3,57
7
13,
209,
949
2
6,93
8,52
9
39,
459,
204
2
6,77
0,12
4
15,
208,
304
5
,512
,978
Ad
vanc
es -
net
248
,521
,792
5
4,75
5,87
6
34,
665,
006
2
4,56
4,08
5
6,5
14,2
33
42,
079,
364
3
5,28
6,03
6
36,
780,
148
1
3,19
2,80
9
684
,235
O
pera
ting
fixed
ass
ets
29,
005,
931
1
51,7
13
303
,427
4
55,1
40
919
,689
1
,820
,558
1
,820
,558
3
,641
,116
9
,102
,790
1
0,79
0,94
0 D
efer
red
tax
asse
ts
355
,030
6
,825
1
3,65
1
20,
476
6
3,18
5
81,
904
1
68,9
89
-
-
-
Oth
er a
sset
s - n
et
27,
176,
720
7
,253
,873
8
,838
,558
1
,732
,474
2
,653
,299
-
-
6
,698
,516
-
-
8
21,6
33,3
34
226
,409
,589
2
57,2
80,5
36
38,
545,
752
2
3,36
0,35
5
70,
920,
355
7
6,73
4,78
7
73,
889,
904
3
7,50
3,90
3
16,
988,
153
Liab
ilitie
s
Bills
pay
able
1
0,13
8,72
6
10,
138,
726
-
-
-
-
-
-
-
-
Bo
rrow
ings
3
8,66
0,40
5
19,
312,
395
1
0,00
5,13
5
4,4
69,6
05
2,4
72,1
49
2,4
01,1
21
-
-
-
-
Dep
osits
and
oth
er a
ccou
nts
632
,309
,094
5
88,2
21,9
84
19,
136,
275
8
,714
,275
1
5,47
2,80
1
217
,157
2
19,9
38
326
,664
-
-
D
efer
red
tax
liabi
lities
4
,855
,323
4
1,36
8
9,1
14
19,
953
1
02,7
77
378
,637
3
35,6
93
2,2
84,8
33
616
,778
1
,066
,170
O
ther
liabi
lities
2
0,20
6,99
1
6,2
26,0
43
2,8
66,4
85
4,7
22,9
81
2,0
10,0
04
2,6
70,4
42
677
,980
2
71,8
94
761
,162
-
7
06,1
70,5
39
623
,940
,516
3
2,01
7,00
9
17,
926,
814
2
0,05
7,73
1
5,6
67,3
57
1,2
33,6
11
2,8
83,3
91
1,3
77,9
40
1,0
66,1
70
Net
ass
ets
115
,462
,795
(3
97,5
30,9
27)
225
,263
,527
2
0,61
8,93
8
3,3
02,6
24
65,
252,
998
7
5,50
1,17
6
71,
006,
513
3
6,12
5,96
3
15,
921,
983
Shar
e ca
pita
l 1
0,11
8,46
1
Rese
rves
4
7,00
8,93
6
Una
ppro
pria
ted
profi
t 4
3,03
8,09
4
Min
ority
inte
rest
4
89,6
71
Surp
lus
on re
valu
atio
n of
ass
ets
- ne
t of t
ax
14,
807,
633
1
15,4
62,7
95
43.4
.1 M
atur
ities
of A
sset
s an
d L
iab
ilitie
s -
Bas
ed o
n co
ntra
ctua
l mat
urity
of t
he a
sset
s an
d li
abili
ties
of t
he B
ank
Notes to the Consolidated Financial StatementsFor the year ended December 31, 2013

ANNUAL REPORT 2013
292
20
12 (R
esta
ted)
To
tal
Up
to 1
O
ver
1
Ove
r 3
O
ver
6
Ove
r 1
O
ver
2
Ove
r 3
O
ver
5
Abo
ve
mon
th
to 3
t
o 6
m
onth
s to
to
2
to 3
to
5
to 1
0
10
year
s
m
onth
s
mon
ths
1
yea
r
yea
rs
yea
rs
yea
rs
yea
rs
(R
upee
s in
‘000
)
Asse
ts
Cas
h an
d ba
lanc
es w
ith tr
easu
ry b
anks
5
7,42
0,21
1
57,
420,
211
-
-
-
-
-
-
-
-
Ba
lanc
es w
ith o
ther
ban
ks
1,2
36,7
36
1,2
36,7
36
-
-
-
-
-
-
-
-
Lend
ings
to fi
nanc
ial in
stitu
tions
1
,551
,472
1
,551
,472
-
-
-
-
-
-
-
-
In
vest
men
ts -
net
405
,601
,313
7
3,12
7,01
5
82,
924,
144
8
0,85
3,81
0
73,
501,
106
1
5,15
6,95
4
18,
368,
469
4
2,70
1,81
9
14,
672,
541
4
,295
,455
Ad
vanc
es -
net
239
,788
,511
5
5,28
1,11
5
23,
144,
163
1
4,37
4,33
0
5,5
58,2
82
45,
739,
667
3
8,74
6,48
8
42,
185,
744
1
4,18
8,31
7
570
,405
O
pera
ting
fixed
ass
ets
24,
144,
242
1
36,5
75
273
,150
4
09,7
26
819
,451
1
,638
,902
1
,638
,902
3
,602
,792
8
,194
,510
7
,430
,234
D
efer
red
tax
asse
ts
307
,411
1
7,24
7
8,1
91
12,
287
3
7,20
6
49,
148
4
9,14
8
98,
296
3
5,88
8
-
Oth
er a
sset
s - n
et
41,
715,
761
1
0,07
1,90
3
10,
914,
951
9
,608
1
,014
,723
-
-
1
9,70
4,57
6
-
-
7
71,7
65,6
57
198
,842
,274
1
17,2
64,5
99
95,
659,
761
8
0,93
0,76
8
62,
584,
671
5
8,80
3,00
7
108
,293
,227
3
7,09
1,25
6
12,
296,
094
Liab
ilitie
s
Bills
pay
able
9
,896
,284
9
,896
,284
-
-
-
-
-
-
-
-
Bo
rrow
ings
7
9,06
4,35
1
64,
277,
738
5
,511
,015
4
,391
,090
2
,498
,148
2
,386
,360
-
-
-
-
D
epos
its a
nd o
ther
acc
ount
s 5
44,9
88,0
91
480
,902
,517
1
9,31
0,36
8
10,
782,
924
3
2,52
7,04
2
301
,053
1
62,0
09
774
,707
2
27,4
71
-
Def
erre
d ta
x lia
biliti
es
10,
076,
282
5
0,00
1
59,
965
9
2,97
0
285
,599
3
41,2
60
179
,674
6
,829
,697
1
,002
,328
1
,234
,788
O
ther
liabi
lities
2
1,26
5,63
9
10,
179,
166
2
,007
,045
3
,697
,902
1
,607
,731
2
,128
,401
3
39,8
90
275
,533
1
,029
,971
-
6
65,2
90,6
47
565
,305
,706
2
6,88
8,39
3
18,
964,
886
3
6,91
8,52
0
5,1
57,0
74
681
,573
7
,879
,937
2
,259
,770
1
,234
,788
Net
ass
ets
106
,475
,010
(3
66,4
63,4
32)
90,
376,
206
7
6,69
4,87
5
44,
012,
248
5
7,42
7,59
7
58,
121,
434
1
00,4
13,2
90
34,
831,
486
1
1,06
1,30
6
Shar
e ca
pita
l 9
,198
,601
Re
serv
es
44,
620,
928
U
napp
ropr
iate
d pr
ofit
37,
530,
955
M
inor
ity in
tere
st
501
,256
Su
rplu
s on
reva
luat
ion
of a
sset
s -
net o
f tax
1
4,62
3,27
0
1
06,4
75,0
10
43.4
.1 M
atur
ities
of A
sset
s an
d L
iab
ilitie
s -
Bas
ed o
n co
ntra
ctua
l mat
urity
of t
he a
sset
s an
d li
abili
ties
of t
he B
ank
Notes to the Consolidated Financial StatementsFor the year ended December 31, 2013

293
Notes to the Consolidated Financial StatementsFor the year ended December 31, 2013
43.4
.2 M
atur
ities
of A
sset
s an
d L
iab
ilitie
s -
Bas
ed o
n th
e w
orki
ng p
rep
ared
by
the
Ass
et a
nd L
iab
ilitie
s M
anag
emen
t C
omm
ittee
(ALC
O) o
f the
Ban
k
20
13
To
tal
Up
to 1
O
ver
1
Ove
r 3
O
ver
6
Ove
r 1
O
ver
2
Ove
r 3
O
ver
5
Abo
ve
mon
th
to 3
t
o 6
m
onth
s to
to
2
to 3
to
5
to 1
0
10
year
s
mon
ths
m
onth
s
1 y
ear
y
ears
y
ears
y
ears
y
ears
(R
upee
s in
‘000
)
Asse
ts
Cas
h an
d ba
lanc
es w
ith tr
easu
ry b
anks
5
9,94
6,21
8
59,
946,
218
-
-
-
-
-
-
-
-
Ba
lanc
es w
ith o
ther
ban
ks
1,5
94,6
60
1,5
94,6
60
-
-
-
-
-
-
-
-
Lend
ings
to fi
nanc
ial in
stitu
tions
1
,224
,638
1
,224
,638
-
-
-
-
-
-
-
-
In
vest
men
ts -
net
453
,808
,345
1
01,4
75,7
86
213
,459
,894
1
1,77
3,57
7
13,
209,
949
2
6,93
8,52
9
39,
459,
204
2
6,77
0,12
4
15,
208,
304
5
,512
,978
Ad
vanc
es -
net
248
,521
,792
5
4,75
5,87
6
34,
665,
006
2
4,56
4,08
5
6,5
14,2
33
42,
079,
364
3
5,28
6,03
6
36,
780,
148
1
3,19
2,80
9
684
,235
O
pera
ting
fixed
ass
ets
29,
005,
931
1
51,7
13
303
,427
4
55,1
40
919
,689
1
,820
,558
1
,820
,558
3
,641
,116
9
,102
,790
1
0,79
0,94
0 D
efer
red
tax
asse
ts
355
,030
6
,825
1
3,65
1
20,
476
6
3,18
5
81,
904
1
68,9
89
-
-
-
Oth
er a
sset
s - n
et
27,
176,
720
7
,253
,873
8
,838
,558
1
,732
,474
2
,653
,299
-
-
6
,698
,516
-
-
8
21,6
33,3
34
226
,409
,589
2
57,2
80,5
36
38,
545,
752
2
3,36
0,35
5
70,
920,
355
7
6,73
4,78
7
73,
889,
904
3
7,50
3,90
3
16,
988,
153
Liab
ilitie
s
Bills
pay
able
1
0,13
8,72
6
10,
138,
726
-
-
-
-
-
-
-
-
Bo
rrow
ings
3
8,66
0,40
5
19,
312,
395
1
0,00
5,13
5
4,4
69,6
05
2,4
72,1
49
2,4
01,1
21
-
-
-
-
Dep
osits
and
oth
er a
ccou
nts
632
,309
,094
4
9,15
5,72
7
55,
423,
957
3
3,75
3,51
2
15,
945,
255
1
43,3
69,6
62
143
,214
,959
1
43,6
36,6
55
47,8
09,3
67
-
D
efer
red
tax
liabi
lities
4
,855
,323
4
1,36
8
9,1
14
19,
953
1
02,7
77
378
,637
3
35,6
93
2,2
84,8
33
616
,778
1
,066
,170
O
ther
liabi
lities
2
0,20
6,99
1
6,2
26,0
43
2,8
66,4
85
4,7
22,9
81
2,0
10,0
04
2,6
70,4
42
677
,980
2
71,8
94
761
,162
-
7
06,1
70,5
39
84,
874,
259
6
8,30
4,69
1
42,
966,
051
2
0,53
0,18
5
148,
819,
862
1
44,2
28,6
32
146
,193
,392
49
,187
,304
1
,066
,170
Net
ass
ets
115
,462
,795
1
41,5
35,3
30
188
,975
,845
(4
,420
,299
) 2,
830,
170
(7
7,89
9,50
7)
(67,
493,
845)
(7
2,30
3,47
8)
(11,
683,
404)
1
5,92
1,98
3 Sh
are
capi
tal
10,
118,
461
Rese
rves
4
7,00
8,93
6 U
napp
r opr
iate
d pr
ofit
43,
038,
094
Min
ority
inte
rest
4
89,6
71
Surp
lus
on re
valu
atio
n of
ass
ets
- ne
t of t
ax
14,
807,
633
1
15,4
62,7
95

ANNUAL REPORT 2013
294
Notes to the Consolidated Financial StatementsFor the year ended December 31, 2013
20
12 (R
esta
ted)
To
tal
Up
to 1
O
ver
1
Ove
r 3
O
ver
6
Ove
r 1
O
ver
2
Ove
r 3
O
ver
5
Abo
ve
mon
th
to 3
t
o 6
m
onth
s to
to
2
to 3
to
5
to 1
0
10
year
s
mon
ths
m
onth
s
1 y
ear
y
ears
y
ears
y
ears
y
ears
(R
upee
s in
‘000
)
Asse
ts
Cas
h an
d ba
lanc
es w
ith tr
easu
ry b
anks
5
7,42
0,21
1
57,
420,
211
-
-
-
-
-
-
-
-
Ba
lanc
es w
ith o
ther
ban
ks
1,2
36,7
36
1,2
36,7
36
-
-
-
-
-
-
-
-
Lend
ings
to fi
nanc
ial in
stitu
tions
1
,551
,472
1
,551
,472
-
-
-
-
-
-
-
-
In
vest
men
ts -
net
405
,601
,313
7
3,12
7,01
5
82,
924,
144
8
0,85
3,81
0
73,
501,
106
1
5,15
6,95
4
18,
368,
469
4
2,70
1,81
9
14,
672,
541
4
,295
,455
Ad
vanc
es -
net
239
,788
,511
5
5,28
1,11
5
23,
144,
163
1
4,37
4,33
0
5,5
58,2
82
45,
739,
667
3
8,74
6,48
8
42,
185,
744
1
4,18
8,31
7
570
,405
O
pera
ting
fixed
ass
ets
24,
144,
242
1
36,5
75
273
,150
4
09,7
26
819
,451
1
,638
,902
1
,638
,902
3
,602
,792
8
,194
,510
7
,430
,234
D
efer
red
tax
asse
ts
307
,411
1
7,24
7
8,1
91
12,
287
3
7,20
6
49,
148
4
9,14
8
98,
296
3
5,88
8
-
Oth
er a
sset
s - n
et
41,
715,
761
1
0,07
1,90
3
10,
914,
951
9
,608
1
,014
,723
-
-
1
9,70
4,57
6
-
-
7
71,7
65,6
57
198
,842
,274
1
17,2
64,5
99
95,
659,
761
8
0,93
0,76
8
62,
584,
671
5
8,80
3,00
7
108
,293
,227
3
7,09
1,25
6
12,
296,
094
Liab
ilitie
s
Bills
pay
able
9
,896
,284
9
,896
,284
-
-
-
-
-
-
-
-
Bo
rrow
ings
7
9,06
4,35
1
64,
277,
738
5
,511
,015
4
,391
,090
2
,498
,148
2
,386
,360
-
-
-
-
D
epos
its a
nd o
ther
acc
ount
s 5
44,9
88,0
91
37,
775,
422
3
6,10
3,02
6
46,
614,
760
3
2,94
9,49
1
117
,300
,456
1
17,0
20,5
96
117
,914
,926
3
9,30
9,41
4
-
Def
erre
d ta
x lia
biliti
es
10,
076,
282
5
0,00
1
59,
965
9
2,97
0
285
,599
3
41,2
60
179
,674
6
,829
,697
1
,002
,328
1
,234
,788
O
ther
liabi
lities
2
1,26
5,63
9
10,
179,
166
2
,007
,045
3
,697
,902
1
,607
,731
2
,128
,401
3
39,8
90
275
,533
1
,029
,971
-
6
65,2
90,6
47
122
,178
,611
4
3,68
1,05
1
54,
796,
722
3
7,34
0,96
9
122
,156
,477
1
17,5
40,1
60
125
,020
,156
4
1,34
1,71
3
1,2
34,7
88
Net
ass
ets
106
,475
,010
7
6,66
3,66
3
73,
583,
548
4
0,86
3,03
9
43,
589,
799
(5
9,57
1,80
6)
(58,
737,
153)
(1
6,72
6,92
9)
(4,2
50,4
57)
11,
061,
306
Shar
e ca
pita
l 9
,198
,601
Re
serv
es
44,
620,
928
Una
ppro
pria
ted
profi
t 3
7,53
0,95
5 M
inor
ity in
tere
st
501
,256
Su
rplu
s on
reva
luat
ion
of a
sset
s - n
et o
f tax
1
4,62
3,27
0
1
06,4
75,0
10
Liqu
idity
Gap
Rep
ortin
g
Whe
n an
ass
et o
r lia
bilit
y do
es n
ot h
ave
any
cont
ract
ual m
atur
ity d
ate,
the
perio
d in
whi
ch th
ese
are
assu
med
to m
atur
e ha
s be
en ta
ken
as th
e ex
pect
ed d
ate
of m
atur
ity. B
ank
regu
larly
con
duct
s an
obj
ectiv
e an
d sy
stem
atic
beh
avio
ral s
tudy
usi
ng re
gres
sion
ana
lysi
s te
chni
que
to a
scer
tain
the
mat
urity
of i
ts n
on-c
ontra
ctua
l ass
ets
and
liabi
litie
s. C
ore
and
non-
core
par
ts o
f the
non
-con
tract
ual a
sset
s an
d lia
bilit
ies
are
segr
egat
ed
thro
ugh
the
beha
vior
al s
tudy
. Non
Cor
e pa
rt is
pla
ced
amon
g th
e sh
ort t
erm
mat
urity
buc
kets
i.e.
up
to 1
Yea
r bas
ed o
n th
e m
odel
resu
lts, w
here
as c
ore
part
is d
istri
bute
d am
ong
the
long
er te
rms
buck
ets
base
d on
th
e di
scus
sion
and
dec
isio
n by
the
ALC
O. F
ollo
win
g pe
rcen
tage
s ar
e us
ed to
dis
tribu
te th
e co
re a
sset
s an
d lia
bilit
ies
amon
g lo
nger
term
buc
kets
:
O
ver
1 to
2 Y
ears
O
ver
2 to
3 Y
ears
O
ver
3 to
5 Y
ears
O
ver
5 to
10
Year
s
30
%
30%
30
%
10%
43.4
.2 M
atur
ities
of A
sset
s an
d L
iab
ilitie
s -
Bas
ed o
n th
e w
orki
ng p
rep
ared
by
the
Ass
et a
nd L
iab
ilitie
s M
anag
emen
t C
omm
ittee
(ALC
O) o
f the
Ban
k
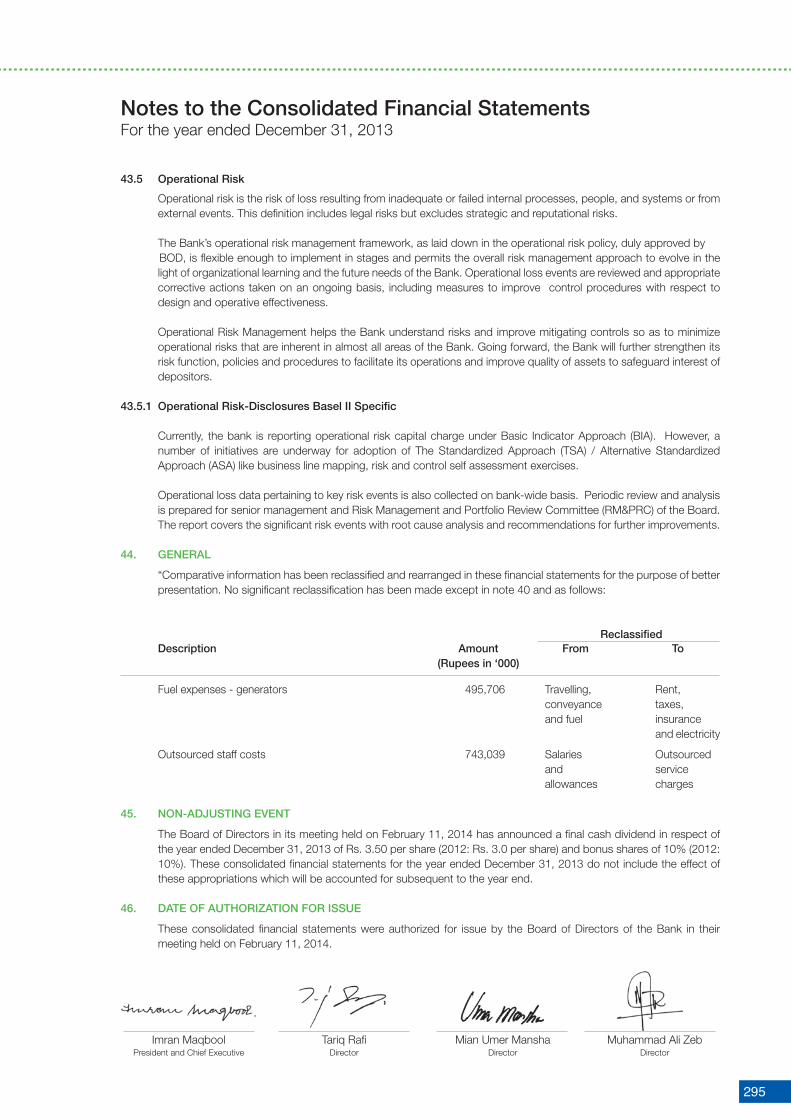
295
Notes to the Consolidated Financial StatementsFor the year ended December 31, 2013
43.5 Operational Risk
Operational risk is the risk of loss resulting from inadequate or failed internal processes, people, and systems or from external events. This definition includes legal risks but excludes strategic and reputational risks.
The Bank’s operational risk management framework, as laid down in the operational risk policy, duly approved by BOD, is flexible enough to implement in stages and permits the overall risk management approach to evolve in the light of organizational learning and the future needs of the Bank. Operational loss events are reviewed and appropriate corrective actions taken on an ongoing basis, including measures to improve control procedures with respect to design and operative effectiveness.
Operational Risk Management helps the Bank understand risks and improve mitigating controls so as to minimize operational risks that are inherent in almost all areas of the Bank. Going forward, the Bank will further strengthen its risk function, policies and procedures to facilitate its operations and improve quality of assets to safeguard interest of depositors.
43.5.1 Operational Risk-Disclosures Basel II Specific
Currently, the bank is reporting operational risk capital charge under Basic Indicator Approach (BIA). However, a number of initiatives are underway for adoption of The Standardized Approach (TSA) / Alternative Standardized Approach (ASA) like business line mapping, risk and control self assessment exercises.
Operational loss data pertaining to key risk events is also collected on bank-wide basis. Periodic review and analysis is prepared for senior management and Risk Management and Portfolio Review Committee (RM&PRC) of the Board. The report covers the significant risk events with root cause analysis and recommendations for further improvements.
44. GENERAL
“Comparative information has been reclassified and rearranged in these financial statements for the purpose of better presentation. No significant reclassification has been made except in note 40 and as follows:
Reclassified Description Amount From To (Rupees in ‘000)
Fuel expenses - generators 495,706 Travelling, Rent, conveyance taxes, and fuel insurance and electricity
Outsourced staff costs 743,039 Salaries Outsourced and service allowances charges
45. NON-ADJUSTING EVENT
The Board of Directors in its meeting held on February 11, 2014 has announced a final cash dividend in respect of the year ended December 31, 2013 of Rs. 3.50 per share (2012: Rs. 3.0 per share) and bonus shares of 10% (2012: 10%). These consolidated financial statements for the year ended December 31, 2013 do not include the effect of these appropriations which will be accounted for subsequent to the year end.
46. DATE OF AUTHORIZATION FOR ISSUE
These consolidated financial statements were authorized for issue by the Board of Directors of the Bank in their meeting held on February 11, 2014.
Imran MaqboolPresident and Chief Executive
Tariq RafiDirector
Mian Umer ManshaDirector
Muhammad Ali ZebDirector

ANNUAL REPORT 2013
296
1. Particulars of Investments in listed companies, mutual funds and modarabas-available for sale
Number of Ordinary and preference Paid-up Total paid- shares/ value per up/ Cost as at certificates share/certificate nominal December Investee Entities Note /units held /unit value 31, 2013 Rupees (Rupees in ‘000)
1 Fully Paid-up Preference Shares
Azgard Nine Limited 1,160,241 10 11,602 11,602 Aisha Steel Mills Limited 168,286 10 1,683 1,683 Masood Textile Mills Limited 1.1 5,000,000 10 50,000 50,000 63,285 Fully Paid-up Ordinary Shares Abbott Laboratories Pakistan Limited 65,600 10 656 12,191 Allied Bank Limited 8,830,421 10 88,304 547,664 Arif Habib Limited 95,745 10 957 13,908 Arif Habib Corporation Limited 1,851,148 10 18,511 214,004 Attock Cement Pakistan Limited 19,308 10 193 1,329 Attock Petroleum Limited 990,426 10 9,904 387,524 Bank Alfalah Limited 300,000 10 3,000 5,404 Bank Al-Habib Limited 12,851,435 10 128,514 355,237 Archroma Pakistan Limited (Formerly Clariant Pakistan Limited) 127,550 10 1,276 28,456 Fauji Cement Company Limited 1,400,000 10 14,000 20,212 Fauji Fertilizer Bin Qasim Company Limited 3,855,500 10 38,555 151,135 Fauji Fertilizer Company Limited 10,032,000 10 100,320 738,906 Habib Bank Limited 670,163 10 6,702 101,477 Habib Metropolitan Bank Limited 115,000 10 1,150 3,195 Hub Power Company Limited 3,791,000 10 37,910 233,294 Indus Motor Company Limited 27,027 10 270 5,566 IGI Insurance Limited 70,000 10 700 10,893 Kohinoor Energy Limited 55,000 10 550 1,566 Kot Addu Power Company Limited 5,955,500 10 59,555 349,779 Meezan Bank Limited 396,825 10 3,968 10,831 Mehr Dastagir Textile Mills Limited 1,616,912 10 16,169 16,169 Millat Tractors Limited 60 10 1 23 Murree Brewery Company Limited 23,650 10 237 2,818 National Foods Limited 25,875 10 259 5,811 National Bank of Pakistan 7,385,000 10 73,850 378,334 Nestle Pakistan Limited 5,348 10 53 21,613 Next Capital Limited 1,950,000 10 19,500 19,500 Oil & Gas Development Company Limited 473,235 10 4,732 113,446 Pakistan Oilfields Limited 1,190,045 10 11,900 509,427 Pakistan Petroleum Limited 2,135,918 10 21,359 432,009 Pakistan State Oil Company Limited 290,200 10 2,902 93,860 Pakistan Telecommunication Company Limited 1,150,000 10 11,500 30,129 Pakistan Tobacco Company Limited 49,000 10 490 7,962 Rafhan Maize Products Limited 15,747 10 157 53,364 Rupali Polyester Limited 153,045 10 1,530 10,801 Samba Bank Limited 14,183,601 10 141,836 119,551 Searle Pakistan Limited 91,000 10 910 2,903 Sui Northern Gas Pipelines Limited 55,126,789 10 551,268 2,205,253 Trust Securities & Brokerage Limited 300,000 10 3,000 3,000 Unilever Food Pakistan Limited 867 10 9 1,364 United Bank Limited 4,544,340 10 45,443 445,093 Zulfiqar Industries Limited 30,537 10 305 3,556 Total 7,668,557
Annexure - I

297
Investee Entities Name of Number of Paid-up value per Total paid-up/ Cost as at
Management Ordinary and share/certificate/ nominal value December Company preference shares/ unit 31, 2013 certificates/ units held (Rupees) (Rupees in ‘000)
Fully Paid-up Modaraba Certificates
Al-Noor Modaraba
Management
First Al-Noor Modaraba (Private) Limited 5,553,270 10 55,532.70 60,606
Total 60,606
Carrying value (before revaluation and provision) Listed Shares ‘available for sale’ 7,792,448
Provision for diminution in value of investments (1,992,006)
Surplus on revaluation of securities 2,116,420
Market value as at December 31, 2013 7,916,862
Fully Paid-up Ordinary Certificate/ Name of Number of Paid-up Total paid-up/ Cost as at Units of Mutual Funds Management Units value per nominal value December Company held unit 31, 2013
(Rupees) (Rupees in ‘000)
National Investments Trust National Investment Trust Limited 110,602 50 5,530 5,253
Pakistan Pension Fund MCB Arif Habib Savings & Investments Limited 866,858 100 86,686 109,909
Pakistan Islamic Pension Fund MCB Arif Habib Savings & Investments Limited 905,160 50 45,258 112,534
Carrying value before revaluation & provision 227,696
Provision for diminution in value of investments (1,907)
Surplus on revaluation of securities 106,321
Market value as at December 31, 2013 332,110
1.1 These are redeemable after the end of the fourth year from June 2005 at the option of the issuer either in whole or multiples of 10% of outstanding issue at a price of Rs. 10 per share plus any accumulated preference dividend. Dividend rate is 6 months KIBOR + 200 bps per annum.
2. Particulars of Investments in mutual funds - held for trading
Number of Paid-up/ Total paid up/ Cost as at units held per number nominal value December of unit 31, 2013
(Rupees) (Rupees in ‘000)
MCB Dynamic Cash Fund 3,679,536 100 367,954 358,985
MCB Dynamic Allocation Fund 2,412,161 100 241,216 173,348
Metro Bank-Pakistan Sovereign Fund 328,311 50 16,416 15,937
Pakistan Cash Management Fund 618,459 50 30,923 27,000
656,509 575,270
Annexure - I

ANNUAL REPORT 2013
298
3. Particulars of Investment held in unlisted companies-available for sale
Company Name Percentage of Number of shares / Cost as at Net Asset Based on audited Name of Chief Executive holding certificates held December Value of total financial statements (%) 31, 2013 investment as at
(Rupees in ‘000)
Shareholding more than 10%
Fully paid up Ordinary Shares/ Certificates/ Units
Pak Asian Fund Limited 10.22% 1,150,000 11,500 19,462 June 30, 2013 Mr. Ashfaq A. Berdi
Central Depository Company of Pakistan Limited 10.00% 6,500,000 10,000 174,624 June 30, 2013 Mr. Mohammad Hanif Jakhura
21,500
Shareholding upto 10%
Fully paid up Ordinary Shares/ Certificates/ Units
First Capital Investment Limited 275,000 2,500 2,982 June 30, 2013 Mr. Shahzad Jawahar
National Institute of Facilitation Technology Private Limited 1,478,227 1,526 91,014 June 30, 2013 Mr. M.M. Khan
National Investment Trust Limited 79,200 100 178,348 June 30, 2012 Mr. Manzoor Ahmed
SME Bank Limited 1,490,619 10,106 6,527 September 30, 2013 Mr. Naseer Durrani
Arabian Sea Country Club 500,000 5,000 2,194 June 30, 2013 Mr. Arif Ali Khan Abbasi
Islamabad Stock Exchange Limited 3,034,603 30,346 32,663 September 30, 2013 Mian Ayyaz Afzal
Society for Worldwide Inter Fund Transfer (SWIFT) 18 1,738 5,941 December 31, 2012 Mr. Gottfried Leibbrandt
Credit Information Bureau of Srilanka 300 25 14,200 December 31, 2012 Mr. G. P. Karunaratne
Lanka Clear (Private) Limited 100,000 805 4,945 March 31, 2013 Mr. S. B. Weerasooriya
Lanka Financial Services Bureau Limited 100,000 805 802 March 31, 2013 Mr. Minindu Rajaratne
Pakistan Agro Storage and Services corporation* 2,500 2,500 - - -
Al-Ameen Textile Mills Limited.* 19,700 197 - - -
Ayaz Textile Mills Limited.* 225,250 2,252 - - -
Custodian Management Services* 100,000 1,000 - - -
Musarrat Textile Mills Limited.* 3,604,500 36,045 - - -
Sadiqabad Textile Mills Limited.* 2,636,100 26,362 - - -
121,307
Cost of unlisted shares/ certificates/ units 142,807
Provision against unlisted shares (74,741)
Carrying value of unlisted shares/ certificates/ units 68,066
* These are fully provided unlisted shares.
Annexure - I

299
Annexure - I
4. Particulars of investments in Term Finance Certificates and Sukuk Bonds- (refer note 9)
Investee Number of Paid up Total Paid up Profit Principal Redemption Balance as at Name of certificates held value per Value (before December Chief Executive certificate redemption) 31, 2013
(Rupees) (Rupees in’000)
LISTED TERM FINANCE CERTIFICATES - available for sale
Askari Bank Limited - issue no. III 50,000 5,000 250,000,000 6 months KIBOR + 2.5% p.a. 0.32% of principal amount in the 249,600 Syed Majeedullah Husaini for first five years & 6 month 96 months and remaining KIBOR +2.95% for next principal in four equal semi annual five years installments starting from the 102nd month from issue.
Bank Alfalah Limited - issue no. IV 100,000 5,000 500,000,000 6 months KIBOR + 2.5% p.a. 0.26% of principal amount in the 499,200 Mr. Atif Bajwa installment first 78 months and remaining principal in three semi -annual staring from the 84th month. Allied Bank Limited - issue no. I 11,196 5,000 55,980,000 6 months KIBOR + 1.90% 0.38% of principal amount 27,902 Mr. Tariq Mahmood in the first 114 months and remaining principal will be paid at maturity Allied Bank Limited - issue no. II 37,000 5,000 185,000,000 6 months KIBOR + 0.85% p.a. 0.38% of principal amount 181,710 Mr. Tariq Mahmood for first five years & 6 months in the first 114 months and KIBOR+1.30% for next 5 years. remaining principal will be paid at maturity
Carrying value before revaluation 958,412
Surplus on revaluation of securities 27,470
Market value of listed TFCs (revalued amount) 985,882
SUKUK BONDS - available for sale Terms of Redemption Rate of Interest Currency
Principal Interest Government of Pakistan Ijara Sukuks At maturity Half-yearly 6-Month MTB PKR 2,700,000 Auction Weighted Average Yield. Surplus on revaluation of securities 17,310
Market value of Sukuk bonds 2,717,310

ANNUAL REPORT 2013
300
TERM FINANCE CERTIFICATES - held to maturity Investee Number of Paid up value Total Paid up Profit Principal Redemption Balance as at Name of certificates held Value per Value (before December Chief Executive certificate redemption) 31, 2013
(Rupees) (Rupees in’000)
Bank Alfalah Limited - issue no. V 100,000 5,000 500,000,000 6 months KIBOR + 1.25% p.a. 0.3% of the principal will be redeemed in the first 90 months and remaining principal of 99.70% at maturity first maturity in the 96th month 482,114 Mr. Atif Bajwa
Bank Al Habib Limited- - issue no. IV 20,000 5,000 100,000,000 Payable six monthly at 15.00% p.a. for first 5 years 6th - 108th month: 0.36%; 99,900 Mr. Abbas D. Habib and 15.50% p.a. for 114th and 120th next 5 years month: 49.82% each
Jahangir Siddiqui and Company Limited 56 5,000,000 280,000,000 6 months KIBOR + 1.5% In 4 equal semi-annual installments, to 2.2% p.a. over 10 years starting from 8-1/2 years from December 2004. 69,776 Mr. Suleman Lalani
United Bank Limited - issue no. III 56,978 5,000 284,890,000 6 months KIBOR + 1.7% p.a. 0.2% of the principal in the first 60 months and remaining principal in 6 equal semi annual installments from September 2006. 94,343 Mr. Atif R. Bokhari
Allied Bank Limited - issue no. II 46,400 5,000 232,000,000 6 months KIBOR + 0.85% p.a. 0.38% of principal amount for first five years & 6 months in the first 114 months KIBOR+1.30% for next 5 years. and remaining principal will be paid at maturity 231,629 Mr. Tariq Mahmood
JDW Sugar Mills Limited 45,000 5,000 225,000,000 3 months KIBOR + 1.25% p.a. Quarterly installments starting from March 23, 2010 25,000 Mr. Jehangir Khan Tareen
Azgard Nine Limited 13,878 5,000 69,390,000 NIL In 7 semi-annual installments starting from 24th month 69,390 Mr. Ahmed Shaikh
Shakarganj Mills Limited 16,000 5,000 80,000,000 6 Month KIBOR +2.25% p.a. In 10 equal semi-annual installments from March 2012 starting from March 2012 . 48,000 Mr. Ahsan Saleem
Pakistan Mobile Communication Limited 200,000 5,000 1,000,000,000 3 Month KIBOR +2.65% p.a. In 17 equal quarterly installments starting from 12th month after first disbursement and subsequently every three months. 705,881 Mr. Rashid Khan
Carrying value of TFCs - HTM 1,826,033
The above excludes unlisted term finance certificates, debentures, bonds and participation term certificates of companies which are fully provided for in these financial statements.
Annexure - I

301
6. Summarized financial information of associates (refer note 9)
The gross amount of assets, liabilities, revenue, profit and net assets of associates are as follows: Name of associates Country of Assets Liabilities Net assets Revenue Profit / (loss)
after tax % of interest
incorporation (Rupees in ‘000)
held
2013
Euronet Pakistan (Private) Limited (unaudited based on December 31, 2013) Pakistan 249,379 37,962 211,417 25,823 30.00% First Women Bank Limited (unaudited based on September 30, 2013) Pakistan 19,120,022 17,452,030 1,667,992 (157,631) 15.46% Adamjee Insurance Company Limited (unaudited based on September 30, 2013) Pakistan 27,321,610 14,457,637 12,863,973 1,735,188 29.13% 2012
Euronet Pakistan (Private) Limited (unaudited based on December 31, 2012) Pakistan 222,073 36,480 185,593 8,589 30.00% First Women Bank Limited (unaudited based on September 30, 2012) Pakistan 17,822,172 15,716,519 2,105,653 71,746 15.46% Adamjee Insurance Company Limited (unaudited based on September 30, 2012) Pakistan 25,372,524 13,630,640 11,741,884
266,718
613,719*
4,099,609**
200,242
663,988*
4,300,489** 841,941 29.13% * Represents net mark-up / interest income and non mark up income
** Represents net premium revenue
5. Details of Bonds, Debentures and Federal Government Securities (refer note 9) – held to maturity
Description Terms of Redemption Rate of interest Currency Foreign Currency Carrying value as Principal Interest Amount at December 31, 2013 (‘000) (Rupees in ‘000)
Debentures
Bank of Ceylon At maturity Half-yearly Weighted Average LKR 250,000 201,300
At maturity Half-yearly 13.40% LKR 64,610
62,760
785,880
52.024
Six Month T Bill Rate (Before Tax) + 0.75 % Sampath Bank
Development Bonds
NDB Bank At maturity Half-yearly 13.40% LKR 50,534
Government of Sri Lanka Sukuk Bonds
At maturity Half-yearly 6 Month LIBOR+400 BP LKR 632,791
Maple Leaf Cement Factory Limited Sukuk Bonds
In 8 unequal semi-annual installments.
Half-yearly 6 Month KIBOR+1.70% PKR - 327,328
Quetta Textile Mills Limited Sukuk Bonds In 12 equal semi-annual installments.
Half-yearly 6 Month KIBOR+1.50% PKR - 53,793
J.D.W Sugar Mills Limited Sukuk Bonds In 18 unequal quarterlyinstallments.
Quarterly 3 Month KIBOR+1.25% PKR - 19,444
In 8 equal semi-annualinstallments.
Half-yearly 6 Month KIBOR+1.15% PKR
-
42,273
442,838
Sitara Energy Limited
-
Euro Bonds
Pakistan Euro Bonds At maturity Half-yearly 7.125% & 6.875% US$ 22,264 2,344,907
Annexure - I

ANNUAL REPORT 2013
302
Disposal of operating fixed assets (refer note 11.2.3)
Description Cost/revalued Accumulated Book Sales proceeds Mode of disposal Particulars of Location amount depreciation value /insurance claim /settlement buyers
(Rupees in ‘000)
Furniture and fixture, electrical, computers and office equipment
Items having book value in aggregate more 4,240 1,401 2,839 - Benefits Mr. M.U.A. Usmani Lahorethan Rs. 250,000 or cost of more than Rs. 1,000,000 3,760 3,760 - 2,075 Auction/Quotation M/S TPTTS Islamabad Islamabad 1,777 1,642 135 - Write Off Write Off Karachi 58,583 58,583 - 649 Auction/Quotation M/S Karachi Auction Mart Karachi 5,947 5,926 21 38 Auction/Quotation M/S Chiniot Furnitures Faisalabad 13,074 11,501 1,573 2,479 Claim M/S Adam Jee Insurance Company Karachi 1,689 1,680 9 56 Auction/Quotation M/S 3rd Generation Solutions Lahore 89,070 84,493 4,577 5,297
Items having book value ofless than Rs. 250,000 or cost 8,558 7,025 1,533 2,318 Auction/Quotation Different Buyers All Pakistanof less than Rs. 1,000,000
Vehicles Items having book value in aggregate more than Rs. 250,000 or cost of more than Rs. 1,000,000
Toyota Corolla 1,005 804 201 268 Bank Car Policy Mr.Imran Maqbool LahoreToyota Corolla 1,005 804 201 950 Auction Mr. K. Zulfiqar Ahmed LahoreToyota Corolla 1,014 811 203 1,015 Auction Mr. Naveed Ahmed LahoreToyota Corolla 1,014 811 203 1,104 Auction Mr. Malik Adnan Waheed LahoreLancer 1,074 859 215 741 Auction Mr. Ashfaaq Ahmad LahoreHonda Civic 1,238 990 248 716 Auction Mr. Altaf Hussain LahoreToyota Corolla 1,370 1,096 274 400 Bank Car Policy Mr. Muhtashim Ashai LahoreToyota Corolla 1,389 1,111 278 983 Auction Mr. Khurram Ayub LahoreHonda Civic 1,422 1,138 284 453 Bank Car Policy Mr. Azhar Nabi LahoreHonda Civic 1,500 1,200 300 389 Bank Car Policy Mr. Imran Maqbool LahoreHonda Civic 1,516 1,213 303 435 Bank Car Policy Mr. Muhtashim Ashai LahoreToyota Corolla 1,525 634 891 1,375 Claim M/S Adam Jee Insurance LahoreHonda Civic 1,923 667 1,256 1,256 Bank Car Policy Mr. M.U.A. Usmani Lahore 16,995 12,138 4,857 10,085
Other Vehicles having book value of less than Rs. 250,000 or cost of less than Rs. 1,000,000 56,057 45,509 10,548 44,218 Auction/Quotation Different Buyers All Pakistan
Car IjarahItems having book value inaggregate more than Rs. 250,000 or cost of more than Rs. 1,000,000
Ijarah # 62-01 ( Alto VXR ) 689 555 134 133 Purchased By Lessee Al Ameen Trading KarachiIjarah # 62-02 ( Toyota Corolla ) 1,327 1,069 258 258 Purchased By Lessee Al Ameen Trading KarachiHonda civic 1,908 1,195 713 714 Purchased By Lessee Big Bird Poultry Breeders Pvt ltd LahoreCoure 728 428 300 300 Purchased By Lessee Aysha Aziz LahoreCoure 706 369 337 337 Purchased By Lessee Salim-ul-Haq LahoreCoure 768 436 332 368 Purchased By Lessee Najam Faiz LahoreSuzuki Cultus VXRi 962 261 701 773 Purchased By Lessee Chiesi Pharmaceuticals (Pvt.) Ltd LahoreToyota Camery 3,705 2,594 1,111 1,250 Purchased By Lessee Ghani Gases Ltd LahoreToyota Camery 3,805 2,664 1,141 1,284 Purchased By Lessee Ghani Gases Ltd LahoreToyota Camery 3,755 2,466 1,289 1,454 Purchased By Lessee Ghani Gases Ltd Lahore Toyota GLI 1,440 1,163 277 277 Purchased By Lessee Sharif Solvent Plant Pvt Ltd Multan HONDA VTI Oriel 1,913 1,543 370 369 Purchased By Lessee Sharif Solvent Plant Pvt Ltd Multan Toyota GLI 1,469 1,186 283 283 Purchased By Lessee Sharif Oil Industries Pvt Ltd Multan Toyota XLI 1,314 1,187 127 127 Purchased By Lessee Interloop Faisalabad Toyota GLI 1,436 1,297 139 139 Purchased By Lessee Interloop Faisalabad Toyota GLI 1,401 1,265 136 135 Purchased By Lessee Interloop Ltd Faisalabad Toyota GLI 1,401 1,266 135 135 Purchased By Lessee Interloop Ltd Faisalabad Suzuki-Cultus 891 335 556 610 Purchased By Lessee Interloop Faisalabad Suzuki-Swift 1,042 455 587 653 Purchased By Lessee Interloop Ltd Faisalabad Toyota Corolla Altis MT 2,036 75 1,961 1,878 Stolen & claim received by Insurance company Pakistan Tobacco Company IslamabadToyota Corolla Altis MT 2,036 134 1,902 1,838 Stolen & claim received by Insurance company Pakistan Tobacco Company IslamabadToyota Corolla Altis MT 2,036 163 1,873 1,815 Declared as total loss case & claim received by Insurance company Pakistan Tobacco Company IslamabadHonda Civic Vti Oriel (65-18) 2,542 109 2,433 2,387 Stolen & claim received by Insurance company Pakistan Tobacco Company IslamabadToyota Corolla Gli (64-99) 1,749 170 1,579 1,562 Stolen & claim received by Insurance company Pakistan Tobacco Company IslamabadToyota Corolla Gli 1,749 199 1,550 1,540 Purchased By Lessee on pre-agreed purchase price Pakistan Tobacco Company IslamabadSUZUKI Cultus (62-02) 890 626 264 264 Purchased By Lessee on maturity Konnect Holden Pvt Ltd IslamabadSUZUKI Cultus (62-01) 885 629 256 255 Purchased By Lessee on maturity Konnect Holden Pvt Ltd IslamabadSUZUKI SWIFT 1,102 784 318 317 Purchased By Lessee on maturity Konnect Holden Pvt Ltd IslamabadToyota Corolla Gli 1,682 217 1,465 1,470 Purchased By Lessee Pakistan Tobacco Company IslamabadSUZUKI SWIFT (62-03) 1,102 719 383 408 Purchased By Lessee on pre-agreed purchase price Konnect Holden Pvt Ltd IslamabadToyota Corolla GLI 1,309 215 1,094 1,121 Stolen & claim received by Insurance company Pakistan Tobacco Company IslamabadToyota Altis A/T 1,399 347 1,052 1,080 Purchased By Lessee Pakistan Tobacco Company IslamabadToyota Corolla Gli 1,332 346 986 1,016 Purchased By Lessee on pre-agreed purchase price Pakistan Tobacco Company IslamabadToyota Corolla Altis 1,733 338 1,395 1,439 Purchased By Lessee on pre-agreed purchase price Pakistan Tobacco Company IslamabadToyota Corolla GLI (64-39) 1,309 371 938 984 Stolen & claim received by Insurance company Pakistan Tobacco Company IslamabadToyota Corolla Altis 1,309 526 783 833 Purchased By Lessee on pre-agreed purchase price Pakistan Tobacco Company IslamabadToyota Coroll Altis 1.6 SR (64-42) 1,485 387 1,098 1,160 Stolen & claim received by Insurance company Pakistan Tobacco Company Islamabad 58,345 28,089 30,256 30,966 Equipment IjarahGenerator 123,000 46,494 76,506 77,864 Purchased By Lessee Ghani Glass Ltd LahoreWarp Beam Trolley 2,220 95 2,125 2,341 Sale of asset Shafi Texcel Ltd Lahore 125,220 46,589 78,631 80,205 2013 354,245 223,843 130,402 173,089 2012 93,725 57,481 36,244 58,764
Annexure - II

303
Summarized detail of the valuation of owned properties (refer note 11.2.1)
City Land Building Total
(Rupees in ‘000)
Abbottabad 22,000 19,856 41,856 Bahawalpur 78,012 24,445 102,457 Chakwal 2,000 1,920 3,920 Dera Gazi Khan 18,450 20,000 38,450 Faisalabad 812,308 223,618 1,035,926 Gawadar 1,900 9,000 10,900 Gujranwala 221,044 172,238 393,282 Gujrat 78,500 42,216 120,716 Hafizabad 27,000 14,782 41,782 Haripur 28,453 2,958 31,411 Haroonabad 20,000 5,240 25,240 Hyderabad 185,498 87,118 272,616 Islamabad 1,317,210 416,652 1,733,862 Jehlum 55,000 32,817 87,817 Jhang 124,110 30,715 154,825 Karachi 4,666,793 2,974,623 7,641,416 Kasur 16,380 2,390 18,770 Khairpur 1,442 3,183 4,625 Khanewal 13,500 2,800 16,300 Kohat 4,650 - 4,650 Khanpur 24,040 14,420 38,460 Lahore 4,972,779 2,305,651 7,278,430 Larkana 47,735 13,601 61,336 Mianwali 19,125 35,443 54,568 Mirpurkhas 11,040 3,726 14,766 Multan 139,600 332,878 472,478 Muree 15,000 991 15,991 Muridke 45,000 25,453 70,453 Muzafarabad 128,373 52,979 181,352 Nawabshah 18,270 10,339 28,609 Okara 26,275 12,524 38,799 Peshawar 114,375 16,726 131,101 Quetta 284,696 59,803 344,499 Rahim Yar Khan 9,915 5,740 15,655 Rawalpindi 448,536 168,514 617,050 Sadiqabad 26,667 4,842 31,509 Sahiwal 52,094 13,826 65,920 Sargodha 140,986 20,825 161,811 Sheikhupura 56,000 13,112 69,112 Sialkot 94,000 20,895 114,895 Sukkur 48,288 16,656 64,944 Swat 56,500 6,715 63,215 Vehari 11,000 7,330 18,330 Wazirabad 15,000 7,274 22,274 Overseas - 82,648 82,648 MCB Arif Habib Savings & Investments Limited (subsidiary company) - 72,698 72,698
Grand total 14,499,544 7,412,180 21,911,724
Annexure - III

ANNUAL REPORT 2013
304
RETAIL BANKING GROUP - SOUTH
No. of No. ofCircle / No. of Branches Region Branches Sub Branches
Retail Banking Group – South
1. KARACHI CITY 01. Karachi City 21 - 45 02. Karachi North 24 -
2. KARACHI EAST 03. Karachi East 21 - 41 04. Karachi South 20 -
3. KARACHI WEST 05. Karachi Central 21 - 42 06. Karachi West 21 -
4. HYDERABAD 07. Hyderabad 36 - 65 08. Nawabshah 29 1
5. QUETTA 09.10.
Makran 10 - 41 Quetta Circle 31 -
TOTAL RBG - SOUTH 234 01
Retail Banking Group – East
1. BAHAWALPUR 01. Bahawalpur 33 - 90 02. Rahim Yar Khan 29 - 03. Vehari 28 -
2. MULTAN 04. Dera Ghazi Khan 32 - 102 05. Multan 33 - 06. Sahiwal 37 -
3. SUKKUR 07. Larkana 34 - 67 08. Sukkur 33 -
TOTAL RBG - EAST 259 -
Retail Banking Group – Central
1. LAHORE 01. Lahore Central 24 - 97 02. Lahore City 23 - 03. Lahore East 26 - 04. Lahore West 24 -
2. FAISALABAD 05. Faisalabad 36 - 101 06. Faisalabad City 37 - 07. Sheikhupura 28 -
3. GUJRANWALA 08. Gujranwala 27 1 94 09. Gujrat 35 1 10. Sialkot 32 -
4. SARGODHA 11. Jhang 30 1 92 12. Mianwali 29 - 13. Sargodha 33 -
TOTAL RBG - CENTRAL 384 03
Retail Banking Group – North
1. ISLAMABAD 01. Chakwal 25 - 83 02. Islamabad 29 - 03. Rawalpindi 29 -
2. JHELUM 04. Jhelum 24 - 55 05. Muzaffarabad A.K. 31 -
3. PESHAWAR 06. Kohat 22 - 73 07. Mardan 25 1 08. Peshawar 26 1
4. ABBOTTABAD 09. Abbottabad 27 - 73 10. Attock 28 3 11. Swat 18 -
TOTAL RBG - NORTH 284 05
Branch NetworkAs on December 31, 2013
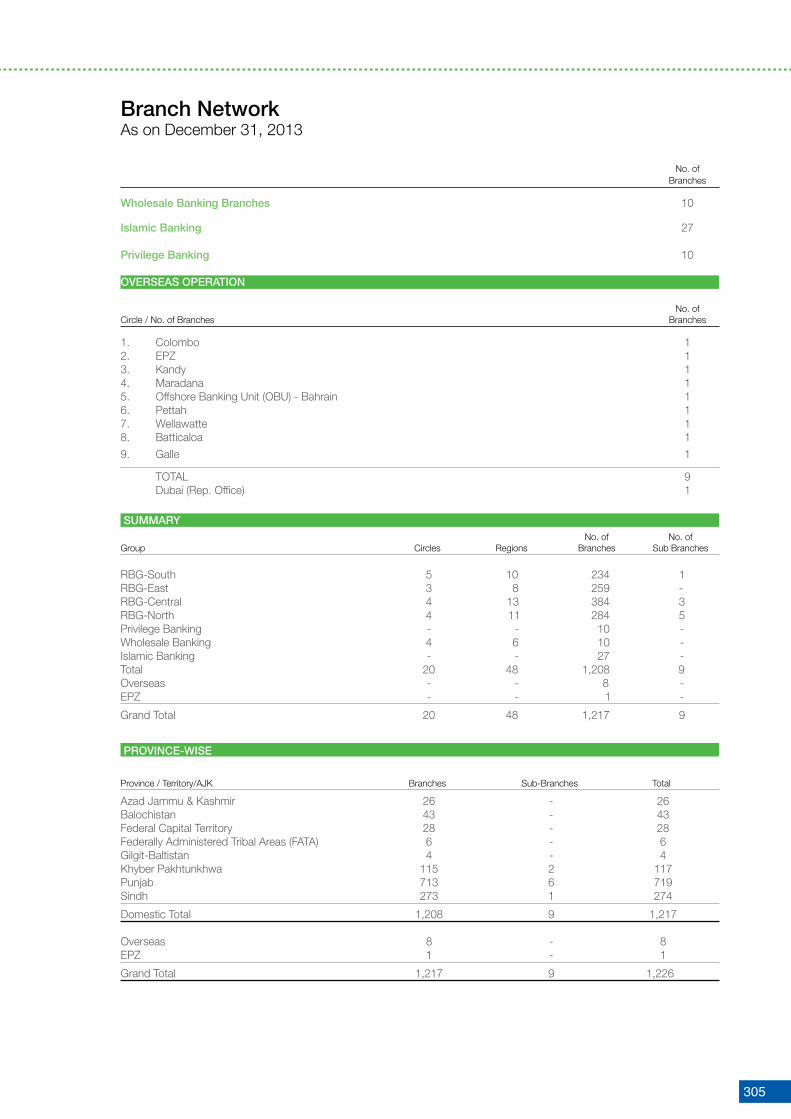
305
No. of Branches
Wholesale Banking Branches 10
Islamic Banking 27
Privilege Banking 10 OVERSEAS OPERATION No. ofCircle / No. of Branches Branches
1. Colombo 12. EPZ 13. Kandy 14. Maradana 15. Offshore Banking Unit (OBU) - Bahrain 16. Pettah 17. Wellawatte 18. Batticaloa 1
9. Galle 1
TOTAL 9 Dubai (Rep. Office)
1
SUMMARY No. of No. ofGroup Circles Regions Branches Sub Branches
RBG-South 5 10 234 1 RBG-East 3 8 259 - RBG-Central 4 13 384 3 RBG-North 4 11 284 5 Privilege Banking - - 10 - Wholesale Banking 4 6 10 - Islamic Banking - - 27 - Total 20 48 1,208 9 Overseas - - 8 - EPZ - - 1 -
Grand Total 20 48 1,217 9
PROVINCE-WISE
Province / Territory/AJK Branches Sub-Branches Total
Azad Jammu & Kashmir 26 - 26 Balochistan 43 - 43 Federal Capital Territory 28 - 28 Federally Administered Tribal Areas (FATA) 6 - 6 Gilgit-Baltistan 4 - 4 Khyber Pakhtunkhwa 115 2 117 Punjab 713 6 719 Sindh 273 1 274
Domestic Total 1,208 9 1,217
Overseas 8 - 8 EPZ 1 - 1
Grand Total 1,217 9 1,226
Branch NetworkAs on December 31, 2013

ANNUAL REPORT 2013
306
Categories of shareholders
Having Shares Shareholders From To No. of Shares Percentage
15,024 1 100 606,021 0.0599%
12,541 101 500 3,164,450 0.3127%
5,597 501 1,000 4,161,621 0.4113%
7,575 1,001 5,000 12,324,088 1.2180%
267 5,001 10,000 1,920,083 0.1898%
224 10,001 50,000 4,532,307 0.4479%
56 50,001 100,000 4,044,172 0.3997%
64 100,001 500,000 17,126,117 1.6926%
27 500,001 1,000,000 21,559,774 2.1307%
56 1,000,001 5,000,000 131,792,218 13.0249%
4 5,000,001 10,000,000 24,621,402 2.4333%
4 10,000,001 15,000,000 51,172,334 5.0573%
3 15,000,001 25,000,000 50,120,295 4.9534%
12 25,000,001 Above 684,701,253 67.6685%
41,454 1,011,846,135 100.0000%
No of Shareholders Shares held Percentage Directors, CEO & Children 15 108,819,891 10.7546%
Associated Companies 5 215,450,327 21.2928%
NIT & ICP 2 104,236 0.0103%
Banks, DFI & NBFI 24 3,671,303 0.3628%
Insurance Companies 10 65,372,303 6.4607%
Modarabas & Mutual Funds 37 3,741,979 0.3698%
Public Sector Companies & Corporations 11 29,739,906 2.9392%
General Public (Local) 37,712 144,813,015 14.3118%
General Public (Foreign) 3,374 2,370,518 0.2343%
Foreign Companies 103 374,275,601 36.9894%
Others 161 63,487,056 6.2744%
Company Total 41,454 1,011,846,135 100.0000%
Pattern of ShareholdingAs of December 31, 2013

307
Pattern of Shareholding under Code of Corporate GovernanceAs of December 31, 2013
Associated Companies, Undertakings and Related Parties
Maybank International Trust (Labuan) Berhad 202,369,225
D. G. Khan Cement Company Limited 92,979,303
Nishat Mills Limited 73,272,629
Trustee - MCB Provident Fund Pak Staff 30,896,146
Adamjee Insurance Company Limited 29,914,034
Trustee - MCB Employees Pension Fund 15,535,568
Siddiqsons Limited 12,978,603
Din Leather (Pvt) Ltd 6,305,758
Trustees Nishat Mills Ltd. Emp. Prov. Fund 3,789,206
Nishat Mills Ltd. Employees Provident Fund Trust 3,742,059
Trustees D. G. Khan Cement Co.Ltd. Emp. P.F 242,000
Trustees of Adamjee Insurance Company Ltd. Emp. Prov. Fund 80,525
CDC - Trustee Pak Strategic Alloc. Fund 30,100
CDC - Trustee Pakistan Stock Market Fund 21,000
CDC - Trustee MCB Dynamic Stock Fund 15,000
CDC - Trustee Pakistan Premier Fund 10,000
Trustee, Nishat (Chunian) Limited Employees Provident Fund 8,052
Mutual Funds:
MC FSL - Trustee JS Growth Fund 1,115,900
CDC - Trustee HBL - Stock Fund 700,000
CDC - Trustee NIT-Equity Market Opportunity Fund 458,160
MCBFSL - Trustee JS Value Fund 418,400
CDC - Trustee UBL Stock Advantage Fund 264,000
CDC - Trustee Unit Trust Of Pakistan 195,000
CDC - Trustee HBL Multi - Asset Fund 100,000
CDC - Trustee AKD Index Tracker Fund 99,880
CDC - Trustee AKD Aggressive Income Fund - MT 57,600
CDC - Trustee NAFA Savings Plus Fund - MT 53,800
CDC - Trustee First Habib Stock Fund 42,200
CDC - Trustee Pak Strategic Alloc. Fund 30,100
CDC - Trustee Lakson Equity Fund 22,000
CDC - Trustee Pakistan Stock Market Fund 21,000
CDC - Trustee PICIC Income Fund - MT 21,000
CDC - Trustee KASB Asset Allocation Fund 20,600
MC FSL - Trustee JS KSE-30 Index Fund 18,532
CDC - Trustee First Capital Mutual Fund 17,500
MCBFSL - Trustee URSF-Equity Sub Fund 17,355
CDC - Trustee MCB Dynamic Stock Fund 15,000
CDC - Trustee HBL PF Equity Sub Fund 14,000
CDC - Trustee Pakistan Premier Fund 10,000
CDC - Trustee JS Pension Savings Fund - Equity Account 8,100
CDC - Trustee Crosby Dragon Fund 7,000
CDC - Trustee Atlas Stock Market Fund 5,000
MCBFSL - Trustee Pak Oman Advantage Asset Allocation Fund 3,000
Safeway Fund (Pvt) Ltd. 1,501
Tri. Star Mutual Fund Ltd. 686
Growth Mutual Fund Limited 276
Prudential Stock Fund Ltd. 163
Pak Asian Fund Limited 148
CDC - Trustee NAFA Multi Asset Fund 22

ANNUAL REPORT 2013
308
Directors, spouse(s) and minor children:
MIAN MOHAMMAD MANSHA 7,122
NAZ MANSHA 5,840,052
S. M. MUNEER 1,872
SAEEDA PARVEEN 2,207,260
TARIQ RAFI 29,098,968
NIGHAT TARIQ 5,195,540
SHAHZAD SALEEM 820
SARMAD AMIN 2,592
MIAN RAZA MANSHA 11,510,624
AMMIL RAZA 25,873,969
MIAN UMER MANSHA 29,078,526
AFTAB AHMAD KHAN 832
AHMAD ALMAN ASLAM 605
DATO’ SERI ISMAIL SHAHUDIN 609
MUHAMMAD ALI ZEB 500
Executives 15,269
Public Sector Companies and Corporations: 29,739,906
Banks, Development Finance Institutions, Non-Banking
Finance Companies, Insurance Companies, Takaful,
Modarabas and Pension funds: 124,184,362
Shareholders holding Five percent (5%) or more:
MAYBANK INTERNATIONAL TRUST (LABUAN) BERHAD 202,369,225
D. G. KHAN CEMENT COMPANY LIMITED 92,979,303
NISHAT MILLS LIMITED 73,272,629
All trades in shares carried out by Directors, Executives and their spouses and minor children is reported as under:
Name No. of Shares Purchase / Sale / Transfer
Muhammad Ali Zeb 500 Purchased
Pattern of Shareholding under Code of Corporate GovernanceAs of December 31, 2013

309
Notice is hereby given that 66th Annual General Meeting of the members of MCB Bank Limited will be held at Pearl-Continental Hotel, Shahrah-e-Quaid-e-Azam, Lahore, on Thursday, March 27, 2014, at 11:00 AM to transact the following business:
Ordinary Business:
1. To confirm the minutes of 65th Annual General Meeting held on March 27, 2013.
2. To receive, consider and adopt the Annual Audited Financial Statements of MCB Bank Limited & consolidated accounts of MCB Bank Limited and its subsidiaries for the year ended December 31, 2013 together with the Directors’ and Auditors’ reports thereon.
3. To appoint auditors for the year ending December 31, 2014 till the conclusion of next Annual General Meeting and fix their remuneration. The retiring Auditors, M/s A.F. Ferguson & Company, Chartered Accountants, being eligible, have offered themselves for re-appointment.
4. To approve, as recommended by the Directors, payment of Final Cash Dividend @ 35% i.e., PKR 3.50 per share for the financial year 2013, in addition to 105% (35% for 1st, 2nd and 3rd quarter each) Interim Cash Dividends already paid.
Special Business:
5. To approve the issue of Bonus Shares in the ratio of 10 shares for every 100 shares held (i.e. 10%) as declared and recommended by the Board of Directors, and if thought fit, pass the following resolutions as Ordinary Resolutions:
“Resolved that a sum of PKR 1,011,846,130/- (Rupees One billion eleven million eight hundred forty six thousand one hundred and thirty only) out of reserves of the Bank available for appropriation as at December 31, 2013, be capitalized and applied for issue of 101,184,613 Ordinary Shares of PKR 10/- each allotted as fully paid bonus shares to the members of the Company whose names appear on the register of members as at close of business on March 17, 2014 in the proportion of ten shares for every hundred shares held (i.e. 10%) and that such shares shall rank pari-passu in every respect with the existing ordinary shares of the Bank.”
“Further Resolved that the bonus shares so allotted shall not be entitled for final cash dividend for the year 2013.”
“Further Resolved that fractional entitlement of the members shall be consolidated into whole shares and sold on the Karachi Stock Exchange and the Company Secretary is authorized to pay the proceeds of sale when realized, to any recognized charitable institution(s).”
“Further Resolved that the Company Secretary be and is hereby authorized and empowered to give effect to this ordinary resolution and to do or cause to do all acts, deeds and things that may be necessary or required for issue, allotment and distribution of bonus shares.”
6. To consider and pass the following Ordinary Resolutions as recommended by the Board of Directors of the Bank:
a. “Resolved that post facto approval be and is hereby accorded for donation of PKR 25 million (Rupees Twenty Five Million only) to ‘Prime Minister’s Earthquake Relief Fund, 2013 for Baluchistan’ as Bank’s Corporate Social Responsibility.”
b. “Resolved that the post fact approval be and is hereby granted for the replacement of Vehicle (Toyota Land Cruiser AXG-4 Door SUV-4.6LIT with Armor Conversion) which was in the use of the Chairman with (BMW x5 x Drive 501 HRD with Armor Conversion) fully maintained by the Bank.”
“Further Resolved that the approval be and is hereby accorded for purchasing an appropriate armor vehicle, fully maintained by the Bank, for the Chairman’s security as a replacement from time to time.”
7. To consider and if deemed fit, pass the following resolutions as ‘Special Resolutions’ with or without modification and to approve alteration in the Articles of Association of the Bank in accordance with the provisions of Section 28 of the Companies Ordinance, 1984:
a. Substitution of Para 4 of Article 94 of the
Articles of Association:
“Resolved that the approval be and is hereby granted to increase the limit of six chartered plane round trips (domestic and/or international) by the Chairman for Bank’s business in a calendar year to twelve chartered plane round trips (domestic and/or international) starting January, 2014 and any additional such trips
Notice of 66th Annual General Meeting

ANNUAL REPORT 2013
310
may be paid by the Chairman out of his annual compensation/pocket.”
“Further Resolved that the Para 4 of Article 94 of the Articles of Association of the Bank be and is hereby substituted as follows:
The chartered plane round trips (domestic and/or international) by the Chairman for Bank business will be limited to twelve in a calendar year starting January, 2014 and any additional trips may be paid by the Chairman out of his annual compensation/pocket. The details of the twelve chartered plane round trips (domestic and/or international) by the Chairman, allowed by the Board on annual basis and approved by the shareholders, shall be placed before the Board for its information and record.”
b) Addition of Article 119 (a) after Article 119 of the Articles Association:
“Resolved that a sum of PKR 10,000/- for providing electronic copy and PKR 20/- per page or fractional part thereof (subject to minimum fee of five thousands rupees) of the register of members, register of debenture-holders along with Indexes thereof and annual list of members of the Bank and also inspection of the said registers and Indexes thereof, a fee of PKR 200/- for electronic inspection and PKR 500/- for physical inspection should be charged as per applicable laws, rules and regulations as amended from time to time, be and is hereby APPROVED.”
“Further Resolved that a new Article 119(a) after Article 119 of the Articles of Association of the Bank be and is hereby inserted as follows:
Inspection and copying fee:
The sum of PKR 10,000/- for providing electronic copy and PKR 20/- per page or fractional part thereof (subject to minimum fee of five thousands rupees) of the list/register of members, debenture-holders along with Indexes thereof and annual list of members of the Bank and also inspection of the said registers and Indexes thereof, a fee of PKR 200/- for electronic inspection and PKR 500/- for physical inspection should be charged as per applicable laws, rules and regulations as amended from time to time.”
“Further Resolved that the Company Secretary be and is hereby authorized to take all steps necessary, ancillary and incidental for registering and altering the Articles of Association of the Bank as mentioned at (a) and (b) above,
but not limited to filing of all requisite documents/statutory forms as may be required to be filed with the Registrar of Companies and complying with all other regulatory requirements so as to effectuate the alterations in the Articles of Association.”
8. To transact any other business with the permission of the Chair.
A Statement under Section 160(1)(b) of the Companies Ordinance, 1984 setting forth all material facts pertaining to the Special Business referred to above is annexed to this Notice being sent to the members.
By Order of the Board,
SYED MUDASSAR HUSSAIN NAQVICompany Secretary
March 05, 2014Lahore.
Notice of 66th Annual General Meeting

311
Notes:
1. The Shares Transfer Books of MCB Bank Limited will remain closed from March 18, 2014 to March 27, 2014 (both days inclusive). Share Transfers received at the Bank’s Share Registrar and Transfer Agent at the below mentioned address, at the close of business hours on March 17, 2014 will be treated as being in time for the purpose of the entitlement of cash dividend and bonus shares.
2. A member entitled to attend and vote at the Annual General Meeting is entitled to appoint another member as a proxy to attend and vote on his/her behalf. A corporation being a member may appoint as its proxy any of its official or any other person whether a member of the Bank or not.
3. The instrument appointing a proxy and the power of attorney or other authority (if any) under which it is signed, or a notarized certified copy of the power of attorney or authority in order to be effective must be deposited at the Share Registrar and Transfer Agent Office of the Bank not less than 48 hours before the time for holding the meeting, and must be duly stamped, signed and witnessed.
4. Members are requested to immediately notify the change, if any, in their registered addresses to the Share Registrar and Transfer Agent of the Bank.
5. CDC Accountholders will further have to follow the under mentioned guidelines as laid down by Circular No. 1, dated January 26, 2000, issued by Securities and Exchange Commission of Pakistan.
For Attending of Meeting:
i. In case of individuals, the Accountholder and/or Sub-Accountholder whose registration details are uploaded as per the CDC regulations, shall authenticate his/her identity by showing his/her original CNIC or original passport at the time of attending the meeting.
ii. In case of corporate entity, the Board of Directors’ resolution/power of attorney with specimen signature of the nominee shall be produced (unless it has been provided earlier) at the time of the meeting.
For Appointing of Proxies:
i. In case of individuals, the Accountholder and/or Sub-Accountholder whose registration details are uploaded as per the CDC regulations, shall submit the proxy form as per above requirements.
ii. The proxy form shall be witnessed by the two persons whose name, addresses and CNIC numbers shall be mentioned on the form.
iii. Attested copy of CNIC or the passport of the beneficial owners and the proxy shall be furnished with the proxy form.
iv. The proxy shall produce his/her original CNIC or passport at the time of the meeting.
v. In case of entity, the Board of Directors’ resolution/power of attorney with specimen signature shall be submitted along with proxy form of the Bank.
6. Payment of Cash Dividend Electronically (e-Dividend mechanism):
The Securities & Exchange Commission of Pakistan (SECP) vide its Notification No. 8(4)SM/CDC 2008, dated April 05, 2013 has advised that the shareholders who have provided bank mandate should be paid dividend by transferring directly to their respective bank accounts (e-dividend mechanism); therefore, the registered shareholders of MCB Bank Ltd, who have not provided us dividend mandate, are requested to provide the details of their bank account including Title of Account, Account Number, Bank name, Branch name & Code and Address, in order to credit their cash dividends, as and when declared, directly to their respective bank accounts. This information is to be provided to: (i) in case of book-entry securities in Central Depository System (CDS), to CDS Participants; and (ii) In case of physical securities to our Share Registrar at the below mentioned address.
M/s THK Associates (Pvt) Limited, Share Registrar, Second Floor, State Life Building-3, Dr. Ziauddin Ahmed Road, Karachi-75530. UAN +92(21) 111-000-322. Email: [email protected]
Notice of 66th Annual General Meeting

ANNUAL REPORT 2013
312
Statement under Section 160 (1)(b) of the Companies Ordinance, 1984 pertaining to Special Business:
This Statement sets out the material facts pertaining to the Special Business to be transacted at the 66th Annual General Meeting of the Bank.
Agenda No. 5 – Issue of Bonus Shares:
The Directors are of the view that the reserves/profits are adequate for capitalization of a sum of PKR 1,011,846,130/- for issue of the proposed 10% bonus shares; and in this regard compliance has been made under Rule 6 of the Companies (Issue of Capital) Rules, 1996. External Auditors’ certificate in respect of adequacy of reserves has also been obtained. The Directors are interested in this business to the extent of their entitlement to the bonus shares as shareholders.
Agenda No. 6 – Donations to Prime Minister’s Earthquake Relief Fund/Replacement of Chairman’s Armor Conversion Vehicle:
a. The Board, to support the deprived people of affected area of Awaraan (Baluchistan) on account of earthquake, approved a donation for ‘Prime Minister’s Earthquake Relief Fund 2013, for Baluchistan’ considering Bank’s philanthropic and Corporate Social Responsibility.
b. The Bank, on the basis of specific security warnings received from Ministry of Defence, as well as Ministry of Interior, Government of Pakistan, provided a vehicle (Toyota Land Cruiser AXG-4 Door SUV-4.6LIT with Armor Conversion), to the Chairman of the Bank, which was approved by the Bank’s shareholders in their meeting held on March 31, 2011. As the said vehicle was more than three years old and was causing trouble; therefore, the Chairman surrendered the vehicle to the Bank for its use. The Board, on the basis of specific security warnings, provided the Chairman with an appropriate Bank’s maintained Vehicle (BMW x5 x Drive 501 HRD with Armor Conversion) in lieu of surrendered vehicle. The shareholders’ post facto approval is solicited for the replacement of Vehicle (Toyota Land Cruiser AXG-4 Door SUV-4.6LIT with Armour Conversion) which was in the use of the Chairman with (BMW x5 x Drive 501 HRD with Armor Conversion) fully maintained by the Bank. The shareholders are also requested to approve the purchase of an appropriate armour vehicle, fully maintained by the Bank, for the Chairman’s security as a replacement from time to time.
Agenda No. 7:
Chairman’s Travel on Official Visits on Chartered Flights:
During the year 2013, the Chairman visited many national/ international business forums out of which expenses of six (6) trips were charged to the Bank as approved by the Board of Directors and the shareholders; however, expenses pertaining to other visits were borne by the Chairman from his annual compensation/pocket. Further, the Bank as part of its long term strategy is going for overseas expansions and the Chairman has to hold meetings with the Chairmen and/or Board of Governors of Central Banks of such countries; therefore, the number of trips already approved are insufficient to meet the requirements of his visits. As the Bank’s business under the dynamic leadership of the Chairman has made unparallel progress; therefore, the shareholders are requested to increase the limit of chartered plane trips (domestic and/or International) to twelve (12) in a calendar year starting January, 2014.
Fixation of Fee for provision of copies and inspection of Bank’s Members’ Register etc:
The management often receives the requests from different quarters to provide copy of the members’ register of the Bank or its inspection either electronically or in printed form. In order to determine the seriousness of a request, the management has proposed inspection as well as copying fee for the register of members, register of debenture-holders along with Indexes thereof and annual list of members of the Bank.
The Directors have no direct or indirect interest in above mentioned Agenda Item No. 6 and 7.
Notice of 66th Annual General Meeting

313
Important terms and formulae used for calculation in Financial Statements are briefly described here;
Breakup Value per share
Represents the total worth (equity) of the business per share, calculated as shareholders’ equity or Net Assets excluding the impact of revaluation on fixed assets, divided by the total number of share outstanding at year end.
BSD
Banking Surveillance Department
Capital Adequacy Ratio (CAR)
The relationship between capital and risk weighted assets as defined in the framework developed by the State Bank of Pakistan.
Cash Reserve Ratio (CRR)
Cash Reserve Ratio is the amount of funds that the banks have to keep with SBP.
Cash Equivalents
Short-term highly liquid investments that are readily convertible to known amounts of cash and which are subject to an insignificant risk of changes in value.
Cost to Income Ratio
The proportion of total operating costs excluding total provisions and write-offs, to total income, represented as combination of net interest income and non interest income.
Credit Risk Spread
The credit spread is the yield spread between securities with the same coupon rate and maturity structure but with different associated credit risks, with the yield spread rising as the credit rating worsens. It is the premium over the benchmark or risk-free rate required by the market to take on a lower credit quality.
Dividend Payout Ratio
Dividends (cash dividend plus bonus shares) paid per share as a fraction of earnings per share (EPS).
Dividend Yield Ratio
Dividend per share divided by the market value of share.
Forced Sale Value (FSV)
Forced Sale Value means the value which fully reflects the possibility of price fluctuations and can currently be obtained by selling the mortgaged / pledged assets in a forced / distressed sale conditions.
Government Securities
Government Securities shall include such types of Pak. Rupee obligations of the Federal Government or a
Provincial Government or of a Corporation wholly owned or controlled, directly or indirectly, by the Federal Government or a Provincial Government and guaranteed by the Federal Government as the Federal Government may, by notification in the Official Gazette, declare, to the extent determined from time to time, to be Government Securities.
Impairment allowances
A provision held on the balance sheet as a result of the raising of a charge against profit for the incurred loss inherent in the lending book. An impairment allowance may either be identified or unidentified and individual or collective.
Foreign Exchange Options(FX Options)
Contracts that give the buyer the right, but not the obligation, to buy or sell one currency against the other, at a predetermined price and on or before a predetermined date. The buyer of a call/put FX option has the right to buy/sell a currency against another at a specified rate.
Forward Purchase Contract
Forward purchase contract is one in which the exporter enters into the forward booking contract to protect himself from the exchange rate fluctuation at the time of receiving payment.
Forward Sale Contract
In a forward sale contract the importer enters into a transaction to buy foreign currency from the Bank at the predetermined rate to protect himself from the exchange fluctuation at the date the payment.
IAS
International Accounting Standards
IFRS
International Financial Reporting Standards
IFRIC
International Financial Reporting Interpretation Committee
Loan losses and provisions
Amount set aside against identified and possible losses on loans, advances and other credit facilities as a result of their becoming party or wholly uncollectible.
Liquid Assets
The assets which are readily convertible into cash without recourse to a court of law and mean encashment / realizable value of government securities, bank deposits, certificates of deposit, shares of listed companies which are actively traded on the stock exchange, NIT Units, certificates of mutual funds, Certificates of Investment (COIs) issued by DFIs / NBFCs rated at least ‘A’ by a credit rating agency on the approved panel of State Bank of Pakistan, listed TFCs rated at least ‘A’ by a credit rating agency on the
Glossary of Terms

ANNUAL REPORT 2013
314
approved panel of State Bank of Pakistan and certificates of asset management companies for which there is a book maker quoting daily offer and bid rates and there is active secondary market trading. These assets with appropriate margins should be in possession of the banks / DFIs with perfected lien.
Market Capitalisation
Number of ordinary shares in issue multiplied by the market value of share as at the year end.
Net Interest Income (NII)
Net interest income is the difference between the interest earned on assets and interest expensed on liabilities.
NPLs to Gross Advances/Loans
Represents the infected portfolio of the bank and iscalculated by dividing the total non-performing loans by gross advances.
Non Performing Loan-Substandard Category
Where markup/interest or principal is overdue by 90 days or more from the due date.
Non Performing Loan-Doubtful Category
Where markup/interest or principal is overdue by 180 days or more from the due date.
Non Performing Loan-Loss Category
Where mark-up/interest or principal is overdue by one year or more from the due date and Trade Bill (Import/ Export or Inland Bills) are not paid/adjusted within 180 days of the due date.
Repo / Reverse Repo
A repurchase agreement, or repo, is a short term funding agreements which allow a borrower to sell a financial asset, such as ABS or government bonds as collateral for cash. As part of the agreement the borrower agrees to repurchase the security at some later date, usually less than 30 days, repaying the proceeds of the loan. For the party on the other end of the transaction (buying the security and agreeing to sell in the future) it is a reverse repurchase agreement or reverse repo.
Return on Equity (ROE)
Represents the ratio of the current year’s profit available for distribution to the weighted average shareholders equity over the period under review, calculated by dividing the net profit (profit after tax) to the average equity (before surplus) for the period.
Return on Assets (ROA)
Indicator of profitability of the business relative to the value of its assets, calculated by dividing the net profit (profit after
tax) to the average total assets for the period.
Basel III
Basel III (or the Third Basel Accord) is a global, voluntary regulatory standard on bank capital adequacy, stress testing and market liquidity risk.
Strategic Investment
Strategic Investment is an investment which a bank / DFI makes with the intention to hold it for a period of minimum 5 years.
The following must be noted further in respect of strategic investment:
• Thebankshouldmarkstrategicinvestmentassuchatthe time of investment
• Ifthereareaseriesofpurchasesofstocksofacompany,the minimum retention period of 5 years shall be counted from the date of the last purchase.
• Thebanks/DFlswillreporttheirinvestmentinstrategicportfolio to the Banking Policy Department, within 2 working days from the date of such investment.
SRO
Statutory Regulatory Order
KIBOR
Karachi Interbank Offer Rate
VaR
Value at Risk is an estimate of the potential loss which might arise from market movements under normal market conditions, if the current positions were to be held unchanged for one business day, measured to a confidence level of 97.5 per cent.
Weighted Average Cost of DepositsPercentage of the total interest expense on average deposit of the bank for the period.
Glossary of Terms

315
Form of Proxy66th Annual General Meeting
I/We
of
of vide Folio/CDC Account No.
or failing him / her
As witness my / our hand/Seal this
In the presence of
Folio No.CDC Account No.
Participant I.D. Account No.Signature onFive-Rupees
Revenue Stamp
The signature should agree with the specimen registered
with the Bank.
Signed by
day of 2014
of the Bank, video Folio / CDC Account No.
as my / our proxy in my / our absence to attend, speak and vote for me / us and on my / our behalf at the 66th Annual General
Meeting of the Bank to be held on Thursday, March 27, 2014 at 11:00 AM at Pearl-Continental Hotel, Shahrah-e-Quaid-e-
Azam, Lahore, and at any adjournment thereof.
Important:
1. This Proxy Form, duly completed and signed, must be deposited in the office of M/s THK Associates (Pvt) Limited, the Share Registrar and Transfer Agent, situated at Second Floor, State Life Building No. 3, Dr. Ziauddin Ahmed Road, Karachi, not less than 48 hours before the time of holding the meeting.
2. If a member appoints more than one proxy and more than one instrument of proxies are deposited by a member with the Share Registrar, all such instruments of proxy shall be rendered invalid.
3. For CDC Account Holders / Corporate Entities
In addition to the above the following requirements have to be met:
• AttestedcopiesofCNICorthepassportofthebeneficialownersandtheproxyshallbeprovidedwiththeproxy
form.
• TheproxyshallproducehisoriginalCNICorpassportatthetimeofthemeeting.
• Incaseofcorporateentity,theBoardofDirectors’resolution/powerofattorneywithspecimensignatureshallbe
submitted along with proxy form to the Company.
of who is also a member
being a member (s) of MCB Bank Limited, and holder of
ordinary shares, do hereby appoint


