Embed Size (px)
Citation preview
STRUCTURAL AND FUNCTIONAL CHARACTERIZATION OF
NONCODING RNAS IN MAMMALIAN CELLS
by
Sungyul Lee
A dissertation submitted to Johns Hopkins University in conformity with the requirements for the degree of Doctor of Philosophy
Baltimore, Maryland
December, 2015
© 2015 Sungyul Lee
All Rights Reserved
ii
Abstract
Francis Crick proposed the central dogma of molecular biology more than a half century
ago focusing on the role of RNA as a messenger which delivers genetic information from
DNA to protein. However, it is now clear that RNA constitute a major player in every
aspects of biological processes as much as protein does, through their noncoding
functions. While early studies of RNA biology were mostly centered around abundant
and constitutive noncoding RNAs in ribosome, spliceosome, transcriptional machinery
and telomere, recent studies are now shifting their heads toward less abundant and
dynamically regulated tissue or developmental time specific noncoding RNAs such as
microRNAs (miRNAs) and long noncoding RNAs (lncRNAs). With advent of new
analytic tools and massive amount of sequencing data, there have been continued
unexpected discoveries revealing how our genome is written and read inside the cell.
MicroRNAs are ~22 nt small RNAs that guide RISC proteins to their target genes
through their base complementary thereby achieve posttranscriptional gene repression.
The mechanism of repression is almost universal in animals but the regulation of their
expression is one of big questions in the field. In order to facilitate investigations of
expression control of miRNAs in mammals, we annotated genome-wide primary miRNA
transcripts of mouse and human. We undertook this endeavor to provide most
comprehensive transcriptional pictures across human and mouse genomes, which is a
major bottleneck in the elucidation of mechanisms that controls miRNA abundance. To
do this, we had to overcome 3 obstacles. First, we expressed dominant-negative
DROSHA mutant to suppress efficient hairpin cropping of microprocessor thefore
enriched un-processed primary transcripts for sequencing. Second, we used panel of
iii
human and mouse cell lines of diverse origin to increase coverage of miRNAs that are
expressed tissue specifically. Lastly, we collaborated with Steven Salzberg’s lab to
employ recently developed assembly algorithm, StringTie, which outperforms other
existing assembly tools for this application. Together these, we uncovered
unanticipated features and new potential regulatory mechanisms, including link between
pri-miRNAs and distant mRNAs, and alternative splicing and alternative promoter usage
that can produce transcripts carrying subsets of miRNAs encoded by polycistronic
clusters. These results provide a valuable resource for the study of mammalian miRNA
regulation.
Another class of emerging regulatory noncoding RNA is long noncoding RNA (lncRNA).
Although current human genome annotation predicts almost similar number of genes
encoding lncRNA as protein coding genes, the question remains how many of them are
indeed plays integral part of diverse biological functions. Unlike miRNA, mechanisms of
lncRNAs are quite unique in each case, making it difficult to predict their function based
on primary sequence. One of very limited number of ways to find their functions is to
investigate their phenotype in cellular or organismal level after introducing genetic
ablation. Through the screening of lncRNA that are induced after DNA damage, we
identified NORAD which suggested its functionality given their high conservation in
mammals, high abundance, and association with an interesting biological cue (i.e.
induction after DNA damage). Surprisingly, cells inactivated NORAD expression
showed increased level of numerical and structural chromosomal instability. We found
this transcript harbors unusually high number of PUMILIO binding motifs allowing it to
sequester this RNA binding protein (RBP), thereby suppressing its repressive activity on
its targets. PUMILIO targets includes factors important for DNA damage response, DNA
iv
repair, and mitosis. Overexpression of PUMILIO also showed suppression of these
target genes and phenocopied NORAD knockout cells. I also generated knockout
mouse of clear NORAD ortholog Norad, using CRISPR/Cas9 technology. It might be
very interesting to see the same phenotype in this animal, and possibly other
phenotypes that we couldn’t observe due to simplicity of cultured cells. Altogether this
study shows novel mechanism of genomic stability maintenance through sequestrating
PUMILIO by a lncRNA, NORAD.
Advisor: Joshua T. Mendell, M.D., Ph.D.
Reader: Ben Ho Park, M.D., Ph.D. and Haig H. Kazazian, M.D., Ph.D.

v
Preface
My dissertation work written in this book only partially reflects what I was given and
supported from wonderful people and institutions around me. Without helps and
influences from them, this work could never been materialized. First and foremost, I’m
immensely grateful to my mentor Joshua Mendell, and I’m truly indebted for his scientific
acumen and critical thinking. His enthusiasm for unknowns and pursuit of perfection
always inspired me and motivated my scientific creativity. I believe his influence and
legacy will continue to be remained on my future career. My thesis committee members,
Haig Kazazian and Ben Ho Park provided me valuable guidance throughout my thesis
work. I could only continue to be professionally nurtured through our annual meetings,
with their constructive criticisms and solutions for problems each time I had. I also thank
my colleagues in Mendell lab. In particular, Tsung-Cheng Chang taught me so many
useful experimental technics and Florian Kopp was always there with me to discuss and
perform exciting works together. I thank my graduate program Pathobiology at Johns
Hopkins for giving me administrative and financial support. Lab manager Ana Doughty
was the most helpful people I ever met and Molecular biology department in UT
Southwestern enabled me to continue my work in Dallas. I thank our excellent
collaboration groups including Stephen Salzberg lab, Yang Xie lab, and Hongtao Yu lab.
Finally, I can’t finish my acknowledgements without saying thank you to my family. My
parents Se-il and Young-sook inherited in me their appreciation of hard-work and
thankfulness for everything happening around me. My proud son, Shihoo is the energy
that always drives me go and the best motivation of my life. This dissertation is
dedicated to Jung Hee, mother of my son and wife of mine, who shares every sorrows
and joys of my life with me.
vi
Table of Contents
Abstract ........................................................................................................................... ii
Preface ............................................................................................................................ v
Table of Contents ........................................................................................................... vi
List of Tables ................................................................................................................. vii
List of Figures ............................................................................................................... viii
Chapter 1: Introduction ................................................................................................... 1
Chapter 2: Genome-wide annotation of microRNA primary transcript structures ...........10
Introduction ................................................................................................................10
Results .......................................................................................................................14
Discussion .................................................................................................................61
Materials and methods ...............................................................................................64
Chapter 3: Characterization and loss of function study of a human long noncoding RNA
induced by DNA damage, NORAD ................................................................................74
Introduction ................................................................................................................74
Results .......................................................................................................................77
Discussion ............................................................................................................... 107
Materials and Methods ............................................................................................. 109
Chapter 4: Mechanism of chromosome instability in NORAD depleted cells ................ 120
Introduction .............................................................................................................. 120
Results ..................................................................................................................... 123
Discussion ............................................................................................................... 156
Materials and Methods ............................................................................................. 161
Chapter 5: Generation of Norad knockout mouse using CRISPR/Cas9 genome editing
system ......................................................................................................................... 175
Introduction .............................................................................................................. 175
Results ..................................................................................................................... 176
Discussion ............................................................................................................... 181
Materials and Methods ............................................................................................. 182
Chapter 6: Future directions ........................................................................................ 188
Appendix ..................................................................................................................... 195
References .................................................................................................................. 196
Curriculum Vitae .......................................................................................................... 214
vii
List of Tables
Table 2.1 Conserved miRNAs encoded by newly annotated pri-miRNAs ......................17 Table 2.2 Evaluation of the performance of four transcriptome assembly programs on
pri-miRNAs that are annotated in Refseq ......................................................................21 Table 2.3 RNAseq mapping statistics ............................................................................28 Table 2.4 Novel potential regulatory mechanisms for conserved human non-protein
coding pri-miRNAs.........................................................................................................47 Table 2.5 Novel potential regulatory mechanisms for conserved mouse non-protein
coding pri-miRNAs.........................................................................................................48 Table 2.6 Primer sequences for mutagenesis ................................................................65 Table 2.7 Primer sequences for real-time RT-PCR ........................................................66 Table 2.8 Primer sequences for RACE in Fig 2.11 ........................................................67 Table 2.9 Primer sequences for RACE in Fig 2.17 ........................................................68 Table 2.10 Primer sequences for RACE in Fig 2.20.......................................................69 Table 2.11 Primer sequences for RT-PCR ....................................................................70 Table 2.7 Transfection methods ....................................................................................72 Table 3.1 TALEN RVDs and target sequences for NORAD ......................................... 110 Table 3.2 Primers used to amplify homology arms for NORAD LSL knock-in .............. 111 Table 3.3 Primers used for genotyping genome edited single cell derived clones ........ 113 Table 3.4 siRNA target sequences .............................................................................. 114 Table 3.5 Primers used to generate northern blot probe .............................................. 116 Table 3.6 Primers used for 3’ RACE ............................................................................ 119 Table 4.1 PUM target genes that are downregulated in NORAD−/− cells and required for
genomic stability .......................................................................................................... 155 Table 4.2 Primers used for in vitro transcription for NORAD affinity purification ........... 163 Table 4.3 Oligos for cloning sgRNA into CRISPR/Cas9 plasmids ................................ 170 Table 4.4 TA cloning of PUM CRISPR/Cas9 targeted alleles ...................................... 171 Table 4.5 siRNA target sequence of PUM ................................................................... 172 Table 4.6 qPCR primers .............................................................................................. 173 Table 5.1 Oligos used for CRISPR/Cas9 plasmid construction .................................... 183 Table 5.2 Primers used for T7 Endonuclease I cleavage assay ................................... 185 Table 5.3 Primers used for in vitro transcription of sgRNA and Cas9 mRNA ............... 187
viii
List of Figures
Figure 2.1 Overview of the organization and existing annotation of conserved human
miRNA genes ................................................................................................................15 Figure 2.2 DROSHA inhibition enables capturing primary microRNA transcripts ...........19 Figure 2.3 DROSHA inhibition facilitates pri-miRNA assembly ......................................23 Figure 2.4 RT-PCR validation of newly assembled primary transcripts encoding human
miR-221 and miR-222. ..................................................................................................25 Figure 2.5 Overview of the experimental workflow used to generate pri-miRNA
assemblies. ...................................................................................................................27 Figure 2.6 General characteristics of human and mouse pri-miRNAs ............................30 Figure 2.7 Examples of evolutionarily conserved pri-miRNAs ........................................32 Figure 2.8 RT-PCR validation of newly assembled primary transcripts encoding human
and mouse miR-101-1. ..................................................................................................34 Figure 2.9 RT-PCR validation of newly assembled primary transcripts encoding mouse
miR-101-1 .....................................................................................................................35 Figure 2.10 Classification of newly annotated miRNA genes .........................................38
Figure 2.11 5 and 3 RACE analysis of newly assembled primary transcripts encoding
human miR-30a and miR-30c-2 .....................................................................................39 Figure 2.12 RT-PCR validation of newly assembled primary transcripts encoding human
miR-30a and miR-30c-2. ...............................................................................................40 Figure 2.13 RT-PCR validation of newly assembled primary transcripts encoding human
miR-505 .........................................................................................................................42 Figure 2.14 Additional examples of human miRNAs that are transcribed as extensions of
annotated protein-coding genes ....................................................................................43 Figure 2.15 RT-PCR validation of the newly assembled primary transcript encoding
human miR-99b, let-7e, and miR-125a ..........................................................................45 Figure 2.16 Examples of newly-identified miRNA regulatory mechanisms .....................50
Figure 2.17 5 RACE analysis of primary transcripts encoding human let-7a-3 and let-7b
......................................................................................................................................51 Figure 2.18 RT-PCR validation of newly assembled primary transcripts encoding human
let-7a-3 and let-7b .........................................................................................................52 Figure 2.19 Host genes for miRNA cluster .....................................................................54
Figure 2.20 5 RACE analysis of primary transcripts encoding human miR-100, let-7a-2,
and miR-125b-1 .............................................................................................................56 Figure 2.21 RT-PCR validation of newly assembled primary transcripts encoding human
miR-100, let-7a-2, and miR-125b-1 ...............................................................................57 Figure 2.22 miRNA biogenesis can be affected by alternative splicing ..........................59 Figure 2.23 RT-PCR validation of primary transcripts encoding human miR-205 ...........60 Figure 3.1 Evolutionary conservation of mammalian noncoding RNA, NORAD .............79 Figure 3.2 NORAD expression in human tissues ...........................................................80 Figure 3.3 NORAD is induced by DNA damage and expressed abundantly in multiple
human cell lines .............................................................................................................82 Figure 3.4 NORAD shows very low coding potential as determined by codon substitution
frequency ......................................................................................................................84
ix
Figure 3.5 Genome editing to inactive NORAD and validation of edited alleles by
Southern blot .................................................................................................................86 Figure 3.6 Validation of NORAD targeting in HCT116 cells ...........................................87 Figure 3.7 DNA damage-induced G1 and G2 checkpoints are grossly intact in NORAD−/−
HCT116 cells .................................................................................................................89 Figure 3.8 Genetic inactivation of NORAD results in chromosomal instability in human
cells ...............................................................................................................................90 Figure 3.9 Chromosome instability can be measured by interphase DNA FISH for
statistical analyses.........................................................................................................92 Figure 3.10 Time-lapse image of mitotic defects in NORAD−/− HCT116 cells .................93 Figure 3.11 Non-recurrent de novo chromosomal rearrangements in NORAD−/− clones 94 Figure 3.12 Inactivation of NORAD in nontransformed BJ-5ta cells results in
chromosomal instability .................................................................................................97 Figure 3.13 TALEN-mediated genome editing is not a general cause of chromosomal
instability .......................................................................................................................99 Figure 3.14 NORAD knock-down using siRNA shows similar phenotype as TALEN-
mediated NORAD inactivation ..................................................................................... 101 Figure 3.15 Cre-induced de-repression of NORAD rescues chromosomal instability ... 104 Figure 3.16 Tetraploidy is a stable state in NORAD−/− cells whereas diploid cells lacking
NORAD generate new tetraploid subclones ................................................................ 106 Figure 4.1 NORAD is localized predominantly to the cytoplasm .................................. 124 Figure 4.2 Domain structure of NORAD ....................................................................... 126 Figure 4.3 NORAD interacts with PUMILIO proteins .................................................... 129 Figure 4.4 PAR-CLIP identifies NORAD as a major PUM2 target ................................ 131 Figure 4.5 NORAD and Norad pseudogenes in human and mouse genomes ............. 134 Figure 4.6 PUM2 PAR-CLIP reveals NORAD as the most preferred PUM2 binding
transcript ..................................................................................................................... 136 Figure 4.7 Conserved 15 PUMILIO binding sites in NORAD ........................................ 138 Figure 4.8 PUM2 PAR-CLIP reads clusters on predicted PRE consensus motifs of
NORAD ....................................................................................................................... 139 Figure 4.9 Measurement of the number of PUM1 and PUM2 protein molecules per
HCT116 cell................................................................................................................. 141 Figure 4.10 PUM2 targets are down-regulated in NORAD−/− cells ............................... 143 Figure 4.11 PUMILIO overexpression phenocopies both the molecular and phenotypic
consequences of NORAD inactivation. ........................................................................ 146 Figure 4.12 PUMILIO knockout masks the phenotype of NORAD inactivation. ............ 148 Figure 4.13 PUMILIO knockdown rescues phenotype of NORAD inactivation. ............ 149 Figure 4.14 Genes required for the maintenance of chromosomal stability are repressed
in NORAD−/− and PUM1/2-overexpressing cells........................................................... 152 Figure 4.15 Genes required for the maintenance of chromosomal stability are repressed
in NORAD−/− and PUM1/2-overexpressing cells........................................................... 154 Figure 4.16 A novel NORAD-PUMILIO axis that regulates genomic stability ............... 157 Figure 5.1 Two flanking gRNAs were designed to generate Norad deletion allele ....... 177 Figure 5.2 Assessment of CRISPR/Cas9 activity in mouse ES cells ............................ 178 Figure 5.3 Injectable form of RNAs into one-cell mouse embryo .................................. 180 Figure 6.1 Graphical summary of NORAD function...................................................... 191
1
Chapter 1: Introduction
Early studies of RNA biology
After initial demonstrations that DNA is the genetic material (Avery et al., 1944; Hershey
and Chase, 1952), “messenger” function of RNA for protein synthesis was proposed
(Jacob and Monod, 1961) embodying a fundamental concept of molecular biology – The
central dogma (Crick, 1970). Yet, this simplicity of genetic information flow has been
challenged many times by continued discoveries of various types of RNA species that
are different from messenger RNA (mRNA) (Cech and Steitz, 2014). In early days,
heteronuclear RNA (hnRNA) were isolated from HeLa cell nuclei (Warner et al., 1966)
and later found that some fractions were dissociated from polyribosomes and doesn’t
contribute to mRNA (Salditt-Georgieff et al., 1981; Salditt-Georgieff and Darnell, 1982).
One could have conceived these non-ribosome bound RNA might have some non-
coding function until they turned out to be temporary precursors of mRNA before splicing
event (Berget et al., 1977; Chow et al., 1977). However, there are overwhelming
2
numbers of example that significant portions of RNA molecules in cells are bona fide
noncoding transcripts.
Instead of merely being scaffold of protein components of ribosome, ribosomal RNA
(rRNA) has been shown to have catalytic functions for protein synthesis (Dahlberg,
1989) while transfer RNA (tRNA) plays adapter function bridging mRNA codon and
amino acid (Hoagland et al., 1958). In nucleoli, small nucleolar RNA (snoRNA) were
identified (Zieve and Penman, 1976) and later found they utilize base-paring to guide
small nucleolar ribonucleoprotein (snoRNP) for rRNA and other types of RNA for their
chemical modifications and processing (Kiss-Laszlo et al., 1996; Ni et al., 1997) which
are important steps for ribosome biogenesis. Since the report of highly abundant U-rich
small RNA in HeLa cells (Weinberg and Penman, 1968) rich literatures have been
accumulated describing how U-rich small nuclear RNA (U snRNA) functions in splicing
by base-paring with splice sites and induce catalytic activity in the spliceosome (Busch
et al., 1982). At the tip of linear eukaryotic chromosome, ribonucleoprotein (RNP)
telomerase maintains length of telomere by synthesizing telomere repeats (Greider and
Blackburn, 1989) and RNA components of this RNP (TR, TER, or TERC) functions as a
“flexible scaffold” bringing accessary proteins required for telomerase reverse
transcriptase (TERT) activity (Zappulla and Cech, 2004). 7SK is also known to function
as scaffolding different protein components required for another important biological
process - elongation phase of pol II transcription. This highly structured RNA binds to
Hexim1 and LARP7 and regulate P-TEFb elongation factor (Yik et al., 2003).
3
Noncoding functions of RNA are not only limited in the cell nucleus. 7SL RNA scaffolds
formation of signal recognition particle (SRP) that enables translocation of nascent
proteins across the endoplasmic reticulum (ER) (Walter and Blobel, 1982). This RNA
component is known to stabilize SRP complex and enhances interaction between SRP
and SRP receptor (Doudna and Batey, 2004). More recently, small RNAs in the
cytoplasm that regulate post-transcriptional gene expression were discovered (Lee et al.,
1993; Wightman et al., 1993). Instead of constitutive cellular functions such as mRNA
production and maturation, protein synthesis and transport, and telomere maintenance,
these tiny RNA species are known to fine-tune levels of mRNAs. Their expression
patterns are usually tissue and/or developmental time-specific, explaining such a long
time it had been taken before its existence and mechanism of actions were revealed in
the history of RNA biology.
Discovery of microRNA and functions in human physiology and disease
The phenomenon of RNA interference (RNAi) was first hinted from RNA delivery
experiments in plants (Napoli et al., 1990) and later discovered by Andrew Fire and
Craig Mello that double-stranded RNA is responsible reagent for this sequence-specific
gene silencing effect (Fire et al., 1998). In the meantime, two independent groups, led
by Victor Ambros and Gary Ruvkun, found 22 nucleotide (nt) small RNA encoded by lin-
4 regulates lin-14 posttranscriptionally in developmental timing of nematode worm, C.
elegans (Lee et al., 1993; Wightman et al., 1993). However, due to lack of sequence
homology of lin-4 in other animals, these ground-breaking findings were not fully
appreciated until the discovery of 21 nt RNA let-7 (Reinhart et al., 2000) which is deeply
conserved in all bilaterian animals (Pasquinelli et al., 2000) suggesting similar
posttranscriptional gene silencing (PTGS) mediated by these small RNAs might be a
4
general gene regulatory mechanism (Lagos-Quintana et al., 2001; Lau et al., 2001; Lee
and Ambros, 2001), evolved from very early evolutionary time. Collectively classified as
microRNA (miRNA), these small RNAs were further found to be conserved in animals,
plants, fungi and protozoa (Bartel, 2004).
Animal miRNAs are transcribed by RNA polymerase II as primary transcripts (pri-
miRNAs) (Lee et al., 2004 ; Cai et al., 2004) and their biogenesis involves two steps of
endonuclease processing (Lee et al., 2002). Initial transcript with characteristic hairpin
structure is co-transcriptionally cropped by group of proteins called microprocessor
which includes RNase III-type endonuclease, Drosha and DGCR8 in the nucleus (Lee et
al., 2003). This ~70 nt precursor microRNA (pre-miRNA) is then exported to the
cytoplasm by exportin 5 (XPO5), mediated by RanGTP (Yi et al., 2003; Bohnsack et al.,
2004). Subsequently this intermediate precursor is further processed by another RNase
III protein, Dicer (Ketting et al., 2001; Knight and Bass, 2001) and cleaved into ~22 nt
small dsRNA. One of two strands, called guide RNA is preferentially selected and
loaded onto Argonaute (Ago) proteins which is catalytic component of the RNA-induced
silencing complex, or RISC (Hammond et al., 2000). RISC utilize sequence
complementary of guide RNA to target sequences at 3’ UTR of mRNA (Bartel, 2009),
leading to destabilization of target (Guo et al., 2010), mostly through de-adenylation (Wu
et al., 2006; Giraldez et al., 2006).
Initially discovered in animal developmental process (Lee et al., 1993; Wightman et al.,
1993), gene regulatory mechanism by miRNAs were also found to be important for other
diverse biological processes and human diseases. For example, miR-15a/16-1 cluster
was frequently found to be deleted in B-cell chronic lymphocytic leukemia (B-CLL)
5
patient samples (Calin et al., 2002). Many followed literatures suggested miRNA
profiling can be utilized for diagnosis, stratification, and prognosis of cancer (Calin et al.,
2005; Calin and Croce, 2006; Lu et al., 2005) and even as a therapeutic measure
(Chivukula and Hollands, 2012). miRNA dysfunction is also known to be linked to
cardiovascular disease and genetic disorders in human (Mendell and Olson, 2012).
Now that it becomes evident that these small RNAs are integral components of human
physiology and disease, it instantaneously begs the following question. How each
miRNA expression is regulated in particular spatiotemporal settings? In order to address
this question, we first need to know how genes encoding miRNAs are structured into our
genome and wired into transcriptional and posttranscriptional regulatory networks, which
is far from being carefully studied systemically. Our lab and others have invested great
efforts to demonstrate that well-established transcription factors, such as Myc and p53
are functionally intergraded into their oncogenic or tumor-suppressive signaling circuitry
(He et al., 2007; O'Donnell et al., 2005; Chang et al., 2008). However, without a
comprehensive map describing in which configuration these genes are embedded and
transcribed, such studies cannot be accelerated any further. Therefore, chapter 2 of this
dissertation aims to provide a valuable resource of genome-wide annotation of miRNA
primary transcripts and classify each type of transcripts, enabling further researches in
the field.
Long noncoding RNAs transcribed in the human genome
The human genome carries nearly three billion bases of information but only a tiny
fraction of less than 2% is known to be protein coding (Lander et al., 2001 ; Consortium
6
et al., 2007). However, recent genome-wide interrogations of mammalian transcriptome
enabled by genome tiling array and next-generation sequencing (NGS) technology
revealed that transcription is pervasive in genomes (Bertone et al., 2004 ; Carninci et al.,
2005 ; Djebali et al., 2012) implying thousands of noncoding transcripts are being
actively generated at least in some tissues and cell types. The exploration of the human
transcriptome has paved the way for the discovery of a variety of new noncoding RNA
classes and their multiple biological functions, revolutionizing the thoughts on the role of
the non-protein coding space in the human genome (Cech and Steitz, 2014). One of
these emerging types of RNA is the class of long noncoding RNA (lncRNA), which is a
heterogeneous group of transcripts that is defined by a sequence length of more than
200 nucleotides and by the lack of any obvious open reading frame (ORF) (Guttman et
al., 2013).
Unveiling the roles of lncRNAs in physiology, including developmental processes,
epigenetic regulation, tissue differentiation and homeostasis (Pauli et al., 2011; Ulitsky et
al., 2011 ; Fatica and Bozzoni, 2014), as well as in pathophysiology, including cancer
and neurological disorders (Wapinski and Chang, 2011 ; Iyer et al., 2015 ; Faghihi et al.,
2008 ; Ziats and Rennert, 2013), contributed to the growing appreciation of their
importance in diverse aspects of biology. There has been many attempts to
comprehensively identify lncRNAs in the human genome, and many thousands of
transcripts with varying numbers were reported depending on the method used for
transcript construction (i.e. cDNAs, tiling array, or RNA-seq), the criteria utilized to
assess the coding potential (CSF, ORF length, or Pfam) and the types of cell lines or
tissue panels tested ((Ulitsky and Bartel, 2013). The current version of GENCODE (Ver
22) estimates 15,900 lncRNA genes (http://www.gencodegenes.org/) (Harrow et al.,
7
2012), and a recent meta-analysis of the human transcriptome predicted an even higher
and surprising number of 58,648 (Iyer et al., 2015), which represents more than twice
the number of protein coding genes. However, the exact number of lncRNAs in the
human genome is still under debate, and the biological role and functionality of the
overwhelming majority of these transcripts remain largely elusive.
Functional lncRNAs in mammals
Compared to other known noncoding RNA classes, lncRNAs stand out due to their
enormous diversity in terms of their evolutionary conservation, expression level,
molecular function, and genomic and cellular localization (Hung et al., 2014; Ulitsky and
Bartel, 2013). In the nucleus, lncRNAs such as XIST, HOTAIR and HOTTIP are known
to regulate gene expression at the transcriptional level by associating with chromatin
remodeling complexes in cis or trans. Other types of nuclear lncRNAs include Firre and
PCGEM1, which modify three-dimensional nuclear architecture by mediating the
formation of interchromosomal domains or enhancer-promoter interactions (Rinn and
Chang, 2012; Quinodoz and Guttman, 2014; Bonasio and Shiekhattar, 2014).
Collectively, many nuclear lncRNAs have been reported to influence the genome (Sabin
et al., 2013). On the other hand, cytoplasmic lncRNAs post-transcriptionally regulate
gene expression by base pairing to their target mRNAs (Yoon et al., 2013; Fatica and
Bozzoni, 2014). For instance, BACE1-AS and TINCR stabilize their target mRNAs
(Faghihi et al., 2008; Kretz et al., 2013), whereas 1/2sbsRNA facilitates target mRNA
degradation (Gong and Maquat, 2011). Interestingly, lincRNA-p21 is known to repress
translation of target genes in the cytoplasm (Yoon et al., 2012) while also having cis-
regulatory activity in the nucleus (Dimitrova et al., 2014).
8
Although an expanding number of lncRNAs has been identified over recent years and
evidences for their important implications in human diseases are rapidly growing, studies
on lncRNAs are still in early infancy. As yet, there have been only a few extensive
genetic studies that provide strong evidence for the biological relevance of a small
number of lncRNAs. There are still doubts about the functionality of many lncRNAs due
to their relatively low abundance as compared to protein coding genes (Cabili et al.,
2011) and due to their marginal sequence conservation through evolution (Ulitsky and
Bartel, 2013), suggesting that many, if not most, of them might be by-products of
promiscuous Pol II transcription (Schultes et al., 2005; Struhl, 2007). Therefore, it is
critical to rigorously study each potential lncRNA of interest with loss-of-function
experiments followed by a thorough identification of the underlying mechanism to prove
its biological function and significance.
Through chapter 3 and chapter 4, we describe the characterization and functional
dissection of a poorly described lncRNA which we termed NORAD. Unlike many other
lncRNAs, NORAD is expressed as abundant as several housekeeping genes with a
ubiquitous expression pattern across multiple tissues, high sequence homology in
mammals and conserved synteny, implicating an important biological role. Interestingly,
NORAD loss-of-function results in increased structural and numerical aneuploidy. We
show that NORAD harbors an unusually high number of PREs and binds with high
affinity to PUMILIO, suggesting that NORAD can sequester the cellular pool of PUMILIO
proteins. Accordingly, PUMILIO overexpression phenocopies the CIN phenotype
caused by NORAD loss-of-function suggesting the following model: loss of NORAD
leads to hyperactivity of PUMILIO and in consequence to the suppression of PUMILIO-
regulated CIN suppressor genes, which renders cells susceptible to chromosome

9
segregation errors. Our findings provide a new genetic axis important for the
maintenance of chromosomal stability, in which a novel lncRNA modulates the activity of
a key regulatory protein of mRNA expression.
10
Chapter 2: Genome-wide annotation of microRNA primary
transcript structures
Introduction
microRNAs (miRNAs) are a broad class of ~18-24 nucleotide RNA molecules that play a
critical role in regulating gene expression in diverse physiologic settings and diseases by
negatively regulating the translation and stability of target messenger RNAs (mRNAs)
(Bartel, 2009). Over the past decade, significant progress has been made in identifying
miRNA targets and dissecting the mechanisms through which they are regulated by
miRNA-directed protein complexes (Gurtan and Sharp, 2013; Pasquinelli, 2012).
However, much less is known about how miRNA expression is regulated (Winter et al.,
2009; Schanen and Li, 2011). Through examination of mature miRNA levels, it is well
established that miRNA abundance is tightly controlled during development and across
tissues (Chiang et al., 2010; Landgraf et al., 2007). Moreover, dysregulated expression
11
of specific miRNAs plays a causative role in a number of human diseases, including
cancer and cardiovascular disease (Di Leva et al., 2014; Olson, 2014). Indeed, key
transcription factors and signaling pathways have been shown to strongly regulate
miRNA expression under diverse physiologic and pathophysiologic conditions
(Lotterman et al., 2008). Nevertheless, a major bottleneck in the dissection of the
mechanisms through which these pathways control miRNA levels has been our
incomplete understanding of miRNA gene structures.
miRNAs are initially transcribed by RNA polymerase II as long primary transcripts (pri-
miRNAs) that can extend hundreds of kilobases in length (Lee et al., 2004; Cai et al.,
2004). The mature miRNA sequences are located in introns or exons of pri-miRNAs,
within regions that fold into imperfect hairpin structures (Rodriguez et al., 2004). The
RNA-binding protein DGCR8 and the RNase III enzyme DROSHA together recognize
and cleave the hairpins, generating ~60-80 nucleotide precursors (pre-miRNAs) that are
subsequently exported to the cytoplasm where they are processed into mature miRNAs
by DICER. Once loaded into the Argonaute family of RNA-binding proteins, miRNAs
select mRNA targets for repression (Ha and Kim, 2014). While a subset of miRNAs are
hosted in well characterized protein-coding genes, the majority of pri-miRNAs are
transcribed as poorly-characterized noncoding transcripts (Rodriguez et al., 2004). Due
to the nature of rapid and efficient DROSHA/DGCR8 processing, the abundance of pri-
miRNAs is very low at steady-state. Therefore, elucidation of pri-miRNA structure has
remained a significant challenge. A further understanding of the organization of miRNA
transcription units will likely reveal new transcriptional and post-transcriptional regulatory
mechanisms that influence miRNA biogenesis and potentially uncover new opportunities
to manipulate miRNA expression for experimental or therapeutic applications.
12
Previous studies have systematically identified genomic locations of the promoters and
transcription start sites (TSSs) of miRNAs by integrating chromatin signatures such
H3K4me3 histone modifications, nucleosome position, cap analysis of gene expression
(CAGE) tags, and high-throughput TSS sequencing (TSS-Seq) (Chien et al., 2011;
Ozsolak et al., 2008; Georgakilas et al., 2014; Xiao et al., 2014; Marsico et al., 2013;
Megraw et al., 2009; Marson et al., 2008). Nevertheless, while providing valuable
information regarding the boundaries of miRNA transcription units, these approaches do
not provide annotation of the often complex splicing patterns of miRNA primary
transcripts and thus provide an incomplete picture of miRNA gene structure. Moreover,
miRNA promoters that are located at great distances from the mature miRNA sequence
are not easily associated with a given miRNA transcription unit and alternative promoter
usage can be difficult to discern. Finally, without an understanding of the structure of the
pri-miRNA itself, it is impossible to determine whether miRNAs encoded by polycistronic
clusters are always co-transcribed or whether transcripts carrying subsets of the
clustered miRNAs are produced through use of alternative promoters, polyadenylation
sites, or even through alternative splicing.
In recent years, high-throughput RNA sequencing (RNA-seq) has emerged as a
powerful tool for transcriptome reconstruction (Martin and Wang, 2011; McGettigan,
2013). Unfortunately, due to their low abundance, pri-miRNAs are poorly represented in
standard RNA-seq datasets, thus preventing comprehensive annotation of their
structures using existing methodologies. To overcome this limitation, we developed a
highly effective experimental and computational approach that allows genome-wide
mapping of miRNA primary transcript structures. By performing deep RNA-seq in cells
expressing a dominant negative DROSHA mutant protein, we demonstrated dramatic
enrichment of intact pri-miRNAs, resulting in much greater coverage of these transcripts
13
compared to standard RNA-seq. This strategy permitted the reconstruction of pri-
miRNA structures in a high-throughput manner. We applied this approach to human and
mouse cell lines of diverse origins, thereby significantly improving the existing annotation
of mammalian miRNA genes. These new assemblies revealed new regulatory
mechanisms for many miRNAs, including previously unknown connections between pri-
miRNAs and distant protein coding genes, alternative pri-miRNA splicing, and pri-miRNA
transcripts that produce subsets of miRNAs encoded by polycistronic clusters. This new
genome-wide map of pri-miRNA structure provides a valuable resource for investigating
the mechanisms that control miRNA expression in normal physiology and disease.
14
Results
Pri-miRNAs are poorly represented in standard RNA-seq datasets
In order to globally reconstruct pri-miRNA structures, we first examined existing RNA-
seq datasets to determine whether they could be used for this purpose. The Illumina
BodyMap 2.0 represents a collection of RNA-seq datasets generated from 16 human
tissues, each sequenced very deeply (~80 million 50 bp paired-end reads per sample)
(www.ebi.ac.uk/arrayexpress; ArrayExpress ID: E-MTAB-513). As described in greater
detail below, we determined that StringTie, a transcriptome assembler that we recently
described (Pertea et al., 2015), outperforms other existing assembly algorithms for pri-
miRNA reconstruction. We therefore employed StringTie to assess pri-miRNA assembly
using Illumina BodyMap data.
Although assemblies were attempted for all human pri-miRNAs, the quality and extent of
pri-miRNA reconstruction was assessed by examining a well-annotated set of miRNAs
that are highly conserved among mammals (Chiang et al., 2010). Non-conserved
human miRNAs were excluded from this performance analysis since these are
frequently expressed at low levels and there is no current consensus regarding which of
these represent bona fide miRNAs as opposed to non-functional RNAs that spuriously
enter the miRNA processing pathway (Chiang et al., 2010; Kozomara and Griffiths-
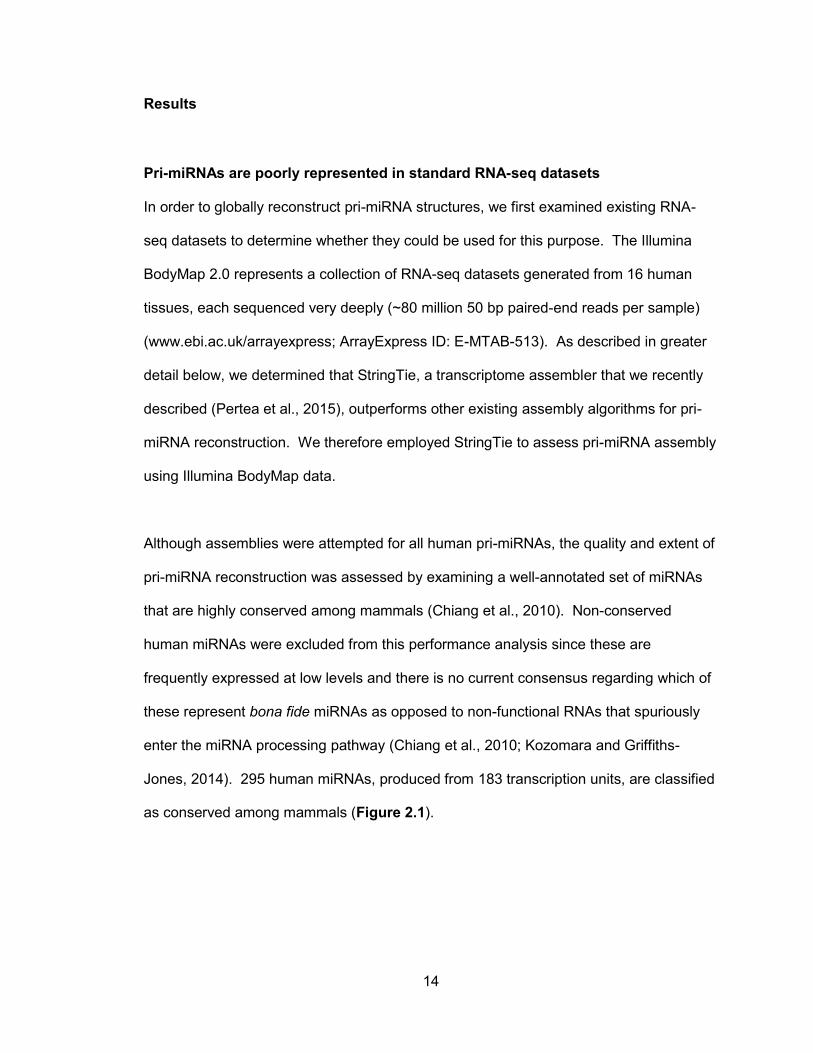
Jones, 2014). 295 human miRNAs, produced from 183 transcription units, are classified
as conserved among mammals (Figure 2.1).
15
Figure 2.1 Overview of the organization and existing annotation of conserved human miRNA genes
16
Of these 183 transcription units, 80 represent well-annotated protein coding genes,
whereas the remaining 103 are intergenic. While the structures of 29 of these intergenic
pri-miRNAs are annotated in RefSeq, the majority (74 of 103) have no existing
annotation. Assembly of all 16 BodyMap datasets using StringTie, which comprised the
analysis of over 1.2×10⁹ reads, resulted in the assembly of only 11 additional novel pri-
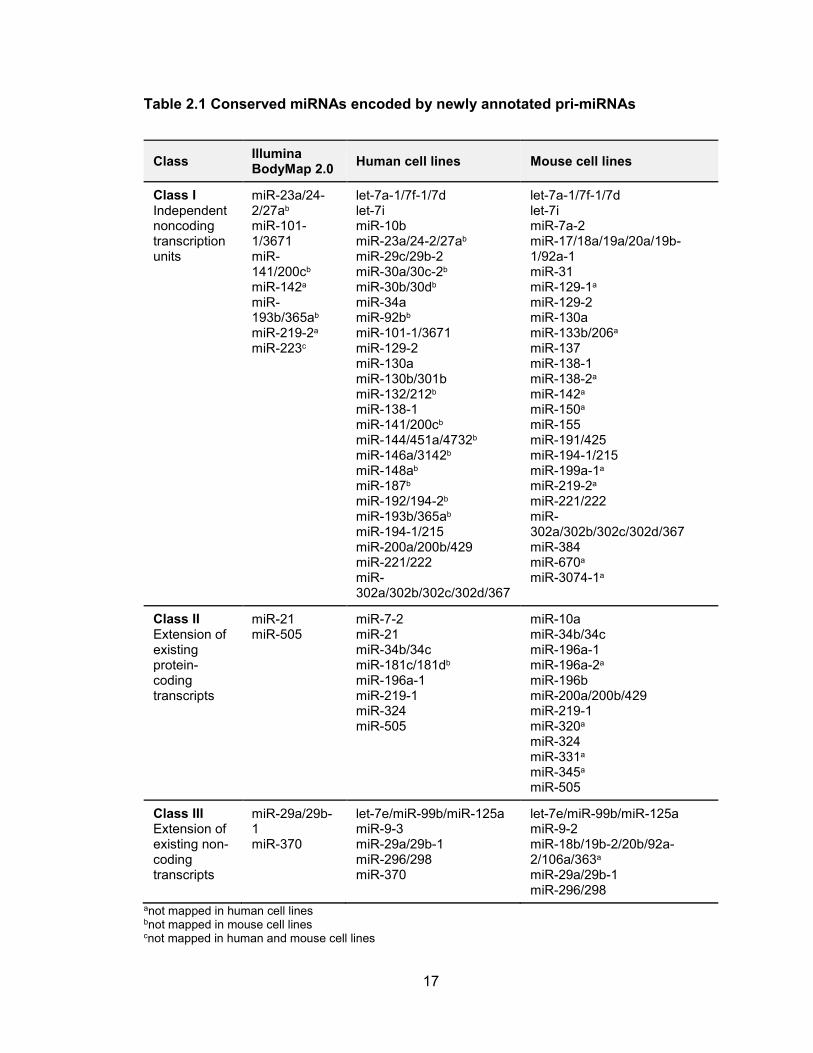
miRNA structures covering the set of conserved miRNAs (Table 2.1). These results
indicate that standard RNA-seq libraries are inadequate for transcriptome-wide
reconstruction of pri-miRNA structures.
17
Table 2.1 Conserved miRNAs encoded by newly annotated pri-miRNAs
Class Illumina BodyMap 2.0
Human cell lines Mouse cell lines
Class I Independent noncoding transcription units
miR-23a/24-2/27ab miR-101-1/3671 miR-141/200cb miR-142a miR-193b/365ab miR-219-2a miR-223c
let-7a-1/7f-1/7d let-7i miR-10b miR-23a/24-2/27ab miR-29c/29b-2 miR-30a/30c-2b miR-30b/30db miR-34a miR-92bb miR-101-1/3671 miR-129-2 miR-130a miR-130b/301b miR-132/212b miR-138-1 miR-141/200cb miR-144/451a/4732b miR-146a/3142b miR-148ab miR-187b miR-192/194-2b miR-193b/365ab miR-194-1/215 miR-200a/200b/429 miR-221/222 miR-302a/302b/302c/302d/367
let-7a-1/7f-1/7d let-7i miR-7a-2 miR-17/18a/19a/20a/19b-1/92a-1 miR-31 miR-129-1a miR-129-2 miR-130a miR-133b/206a miR-137 miR-138-1 miR-138-2a miR-142a miR-150a miR-155 miR-191/425 miR-194-1/215 miR-199a-1a miR-219-2a miR-221/222 miR-302a/302b/302c/302d/367 miR-384 miR-670a miR-3074-1a
Class II Extension of existing protein-coding transcripts
miR-21 miR-505
miR-7-2 miR-21 miR-34b/34c miR-181c/181db miR-196a-1 miR-219-1 miR-324 miR-505
miR-10a miR-34b/34c miR-196a-1 miR-196a-2a miR-196b miR-200a/200b/429 miR-219-1 miR-320a miR-324 miR-331a miR-345a miR-505
Class III Extension of existing non-coding transcripts
miR-29a/29b-1 miR-370
let-7e/miR-99b/miR-125a miR-9-3 miR-29a/29b-1 miR-296/298 miR-370
let-7e/miR-99b/miR-125a miR-9-2 miR-18b/19b-2/20b/92a-2/106a/363a miR-29a/29b-1 miR-296/298
anot mapped in human cell lines bnot mapped in mouse cell lines cnot mapped in human and mouse cell lines
18
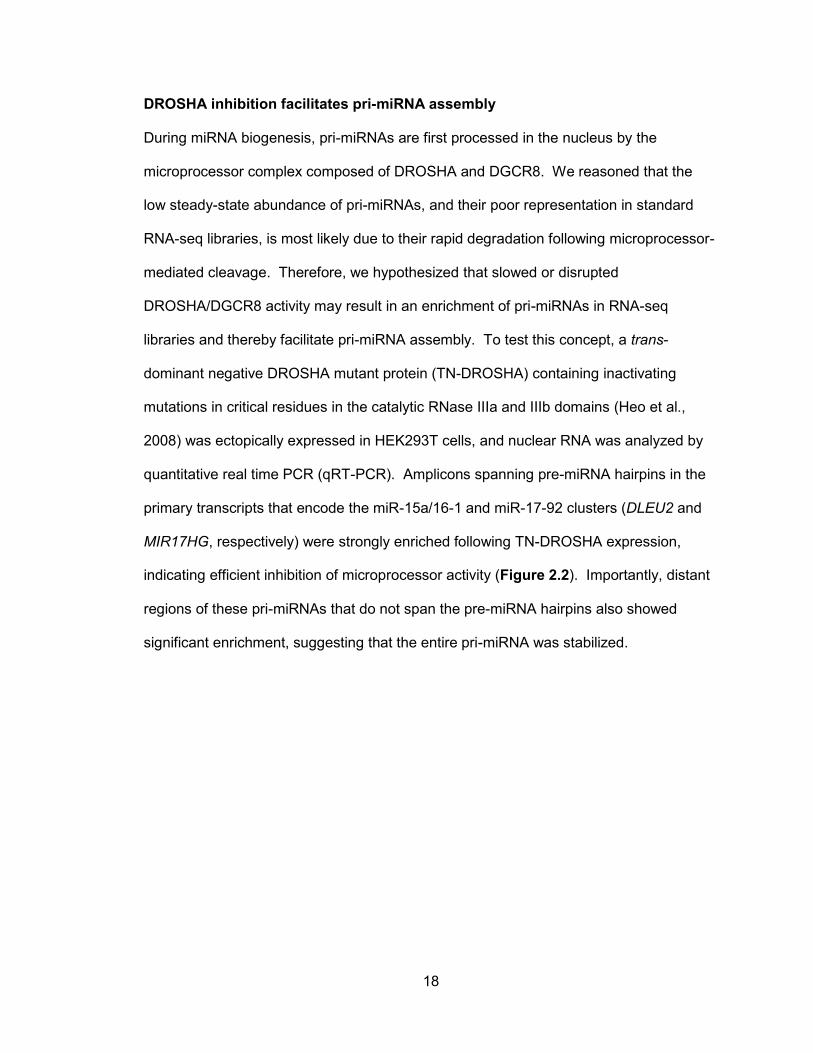
DROSHA inhibition facilitates pri-miRNA assembly
During miRNA biogenesis, pri-miRNAs are first processed in the nucleus by the
microprocessor complex composed of DROSHA and DGCR8. We reasoned that the
low steady-state abundance of pri-miRNAs, and their poor representation in standard
RNA-seq libraries, is most likely due to their rapid degradation following microprocessor-
mediated cleavage. Therefore, we hypothesized that slowed or disrupted
DROSHA/DGCR8 activity may result in an enrichment of pri-miRNAs in RNA-seq
libraries and thereby facilitate pri-miRNA assembly. To test this concept, a trans-
dominant negative DROSHA mutant protein (TN-DROSHA) containing inactivating
mutations in critical residues in the catalytic RNase IIIa and IIIb domains (Heo et al.,
2008) was ectopically expressed in HEK293T cells, and nuclear RNA was analyzed by
quantitative real time PCR (qRT-PCR). Amplicons spanning pre-miRNA hairpins in the
primary transcripts that encode the miR-15a/16-1 and miR-17-92 clusters (DLEU2 and
MIR17HG, respectively) were strongly enriched following TN-DROSHA expression,
indicating efficient inhibition of microprocessor activity (Figure 2.2). Importantly, distant
regions of these pri-miRNAs that do not span the pre-miRNA hairpins also showed
significant enrichment, suggesting that the entire pri-miRNA was stabilized.
19
Figure 2.2 DROSHA inhibition enables capturing primary microRNA transcripts
qPCR analysis of pri-miRNA abundance in HEK293T cells with or without expression of TN-DROSHA. The assayed transcripts DLEU2 and MIR17HG are depicted in the upper panel with green arrows indicating the location of primers. qPCR results are shown in the lower panel with error bars representing standard deviations derived from three independent measurements.
20
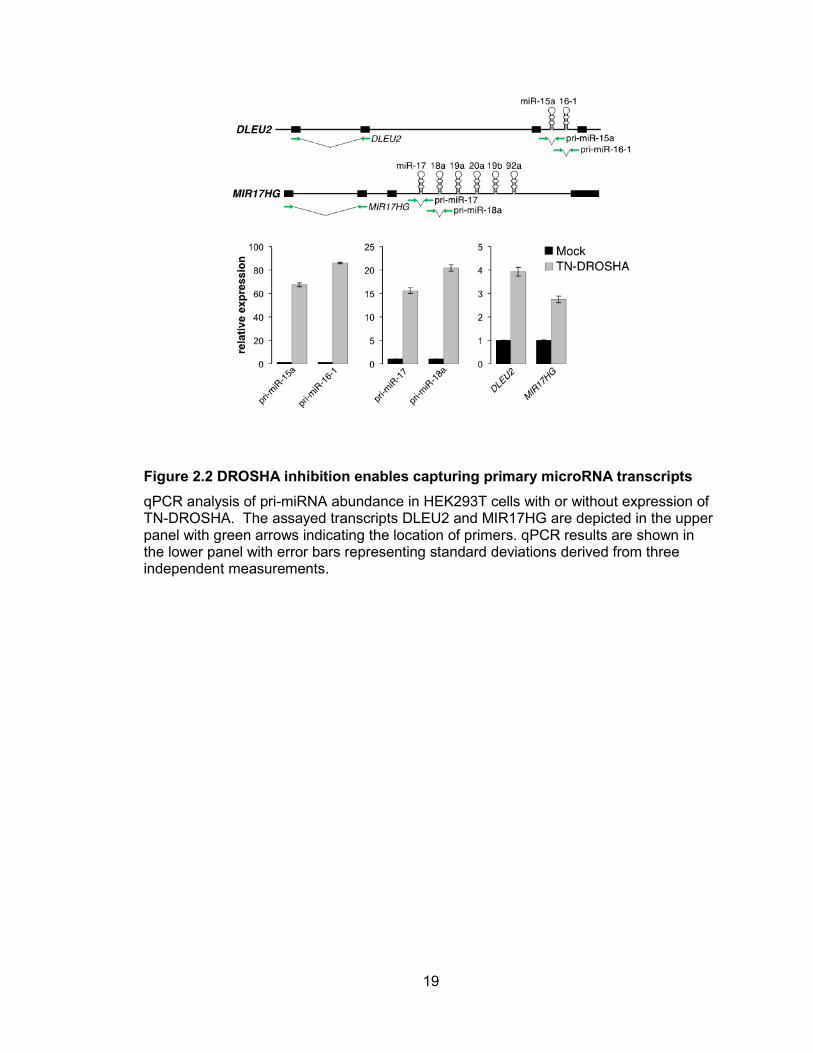
Next, we subjected the same nuclear RNA from TN-DROSHA expressing HEK293T
cells to Illumina RNA sequencing to test its suitability for transcriptome-wide pri-miRNA
assembly. After generating a very deep RNA-seq dataset (193,346,087 100bp paired-
end reads), we evaluated several transcriptome assemblers, such as StringTie, Cufflinks
(Trapnell et al., 2010), IsoLasso (Li et al., 2011), and Scripture (Guttman et al., 2010), to
assess their performance for this application (Table 2.2). By evaluating the assembly of
pri-miRNAs that are annotated in RefSeq, we found that StringTie correctly assembled
the highest number of pri-miRNA transcripts in considerably less time than the other
assemblers. We therefore used StringTie for all subsequent pri-miRNA assembly
experiments.

21
Table 2.2 Evaluation of the performance of four transcriptome assembly programs on pri-miRNAs that are annotated in Refseq1
Program Number of predicted pri-miRNA transcripts matching the RefSeq annotation
Number of RefSeq pri-miRNAs for which at least one transcript was assembled correctly by the program
Running Time (hours:minutes
:seconds)
StringTie 561 467 1:13:23
Cufflinks 378 337 21:01:08
IsoLasso 90 82 14:36:04
Scripture 293 200 65:57:32
1 Note: There are 788 Refseq genes (1,836 transcripts) that overlap 876 miRNAs annotated in miRBase release 20 (out of 1,871 total miRNAs).
22
When RNA-seq data from TN-DROSHA expressing HEK293T cells were used, pri-
miRNA assembly was dramatically improved compared to results obtained using the
Illumina BodyMap. From this single cell line, 24/74 conserved intergenic pri-miRNAs
that lack existing annotation were assembled. When combined with RefSeq annotation,
53/103 conserved intergenic pri-miRNAs in total were defined, essentially doubling the
available annotation of conserved non-protein coding pri-miRNAs. Reads mapping to
miRNA loci were highly enriched for those that span splice sites, allowing reconstruction
of multi-exonic pri-miRNA structures. Illustrative of these improved assemblies, 3 multi-
exonic transcripts that encode miR-221 and miR-222 were reconstructed using RNA-seq
data generated from TN-DROSHA-expressing HEK293T cells, while few reads mapping
to these transcripts were present in Illumina BodyMap data (Figure 2.3).

23
Figure 2.3 DROSHA inhibition facilitates pri-miRNA assembly
Visualization of RNA-seq data from Illumina Human BodyMap 2.0 (kidney and liver) and TN-DROSHA-transfected HEK293T cells. The Integrative Genomics Viewer (IGV) was used to visualize mapped read alignments. Segments of reads that are aligned to the genome are shown in grey, while blue lines represent spliced sequences. StringTie assembled transcripts produced from this locus are shown at the bottom of the panel. Plots representing H3K4Me3 histone marks and evolutionary conservation were generated using the UCSC Genome Browser (human genome GRCh37/hg19 assembly). The y-axes for UCSC Genome Browser tracks shown in this and all other figures represent the default vertical viewing range settings.
24
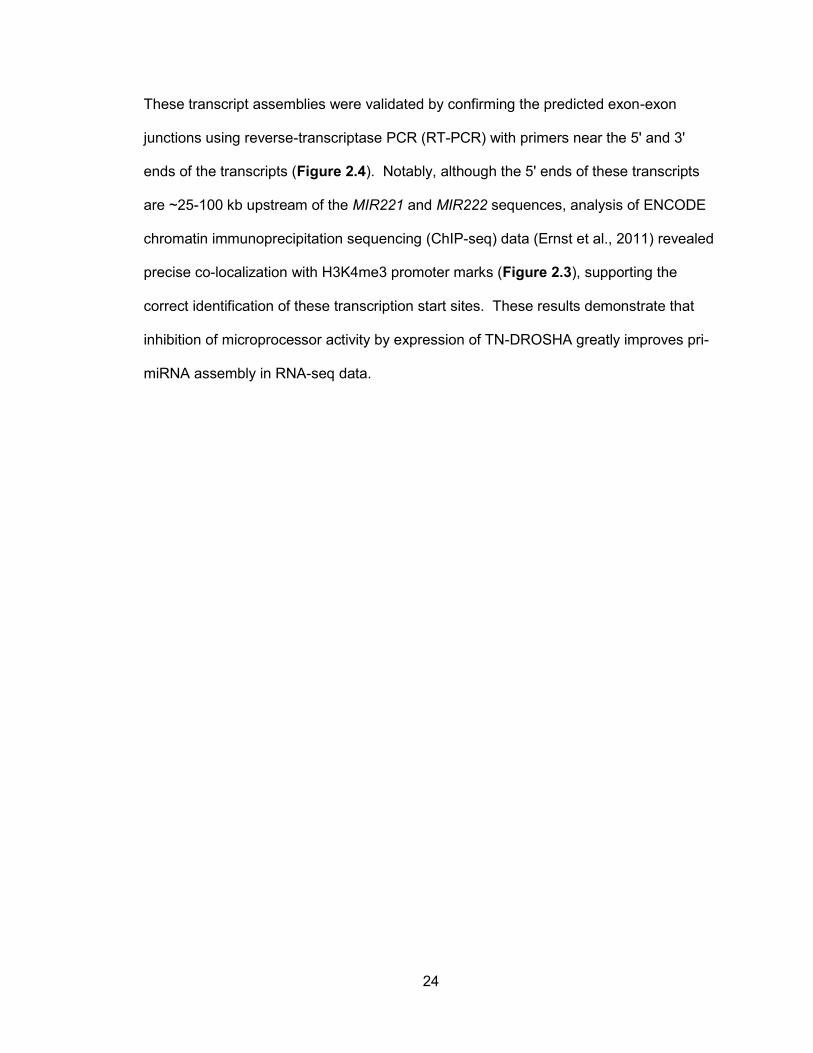
These transcript assemblies were validated by confirming the predicted exon-exon
junctions using reverse-transcriptase PCR (RT-PCR) with primers near the 5' and 3'
ends of the transcripts (Figure 2.4). Notably, although the 5' ends of these transcripts
are ~25-100 kb upstream of the MIR221 and MIR222 sequences, analysis of ENCODE
chromatin immunoprecipitation sequencing (ChIP-seq) data (Ernst et al., 2011) revealed
precise co-localization with H3K4me3 promoter marks (Figure 2.3), supporting the
correct identification of these transcription start sites. These results demonstrate that
inhibition of microprocessor activity by expression of TN-DROSHA greatly improves pri-
miRNA assembly in RNA-seq data.
25
Figure 2.4 RT-PCR validation of newly assembled primary transcripts encoding human miR-221 and miR-222.
Green arrows indicate the location of primers. RT-PCR results are shown below the transcript alignments with PCR products corresponding to the assembled transcripts highlighted with red arrowheads. Identities of all PCR products were verified by DNA sequencing. Nonspecific PCR product indicated with asterisk.
26
Genome-wide annotation of pri-miRNAs
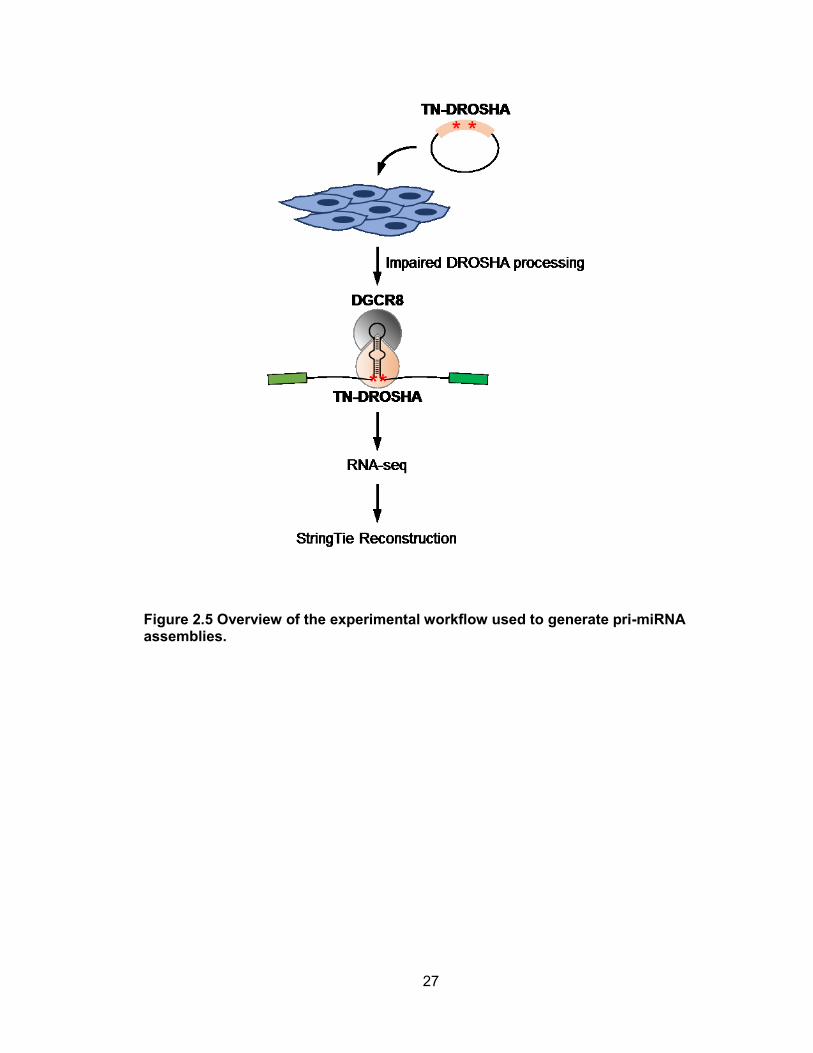
Having established an experimental and computational strategy suitable for pri-miRNA
reconstruction, we next sought to apply this approach to generate a genome-wide map
of human and mouse pri-miRNA structures. Since miRNA expression is often cell-type
and tissue specific (Olive et al., 2015), we selected for analysis a panel of 8 human cell
lines (A-172, A-673, HCT116, HEK293T, HepG2, MCF-7, NCCIT, and primary
fibroblasts) and 6 mouse cell lines (C2C12, CT-26, Hepa1-6, Neuro-2a, mouse
embryonic fibroblasts (MEF), and E14TG2a embryonic stem cells) derived from a
diverse array of cell-types. Transfection conditions were optimized for each cell line and
TN-DROSHA was introduced, followed by RNA-seq and StringTie transcriptome
reconstruction (Figure 2.5). On average, approximately 180 million 100bp paired-end
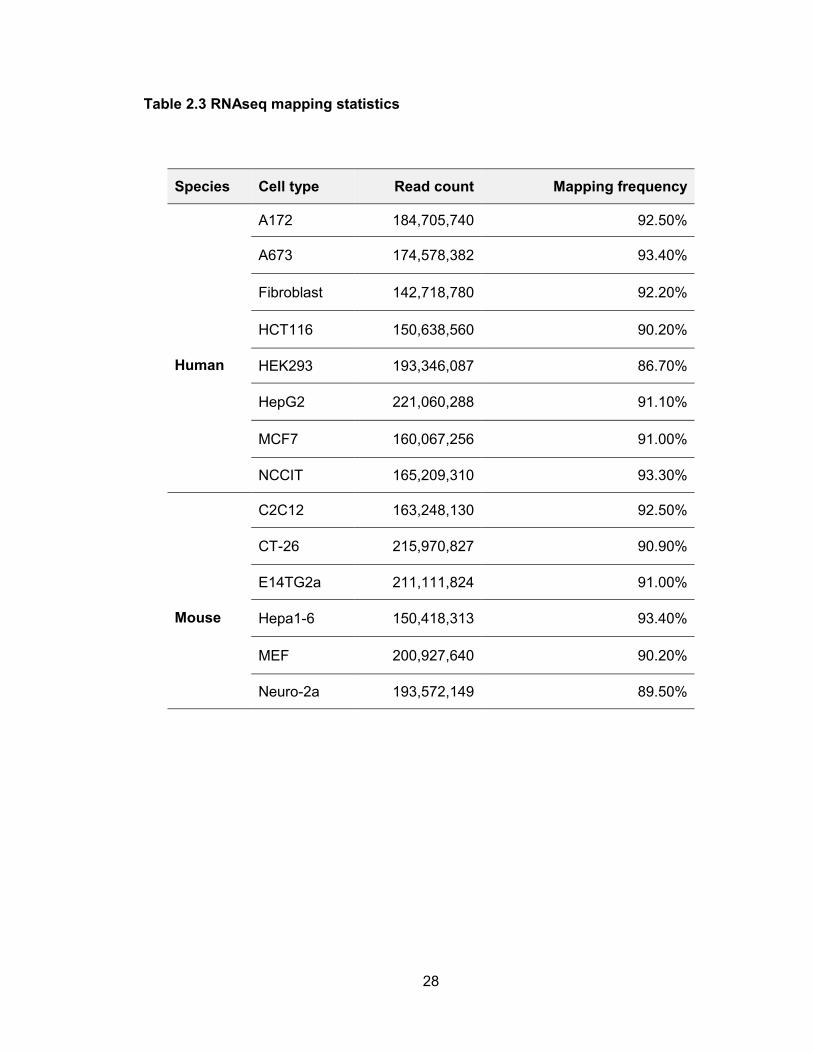
reads were generated per sample (Table 2.3).
27
Figure 2.5 Overview of the experimental workflow used to generate pri-miRNA assemblies.
28
Table 2.3 RNAseq mapping statistics
Species Cell type Read count Mapping frequency
Human
A172 184,705,740 92.50%
A673 174,578,382 93.40%
Fibroblast 142,718,780 92.20%
HCT116 150,638,560 90.20%
HEK293 193,346,087 86.70%
HepG2 221,060,288 91.10%
MCF7 160,067,256 91.00%
NCCIT 165,209,310 93.30%
Mouse
C2C12 163,248,130 92.50%
CT-26 215,970,827 90.90%
E14TG2a 211,111,824 91.00%
Hepa1-6 150,418,313 93.40%
MEF 200,927,640 90.20%
Neuro-2a 193,572,149 89.50%
29
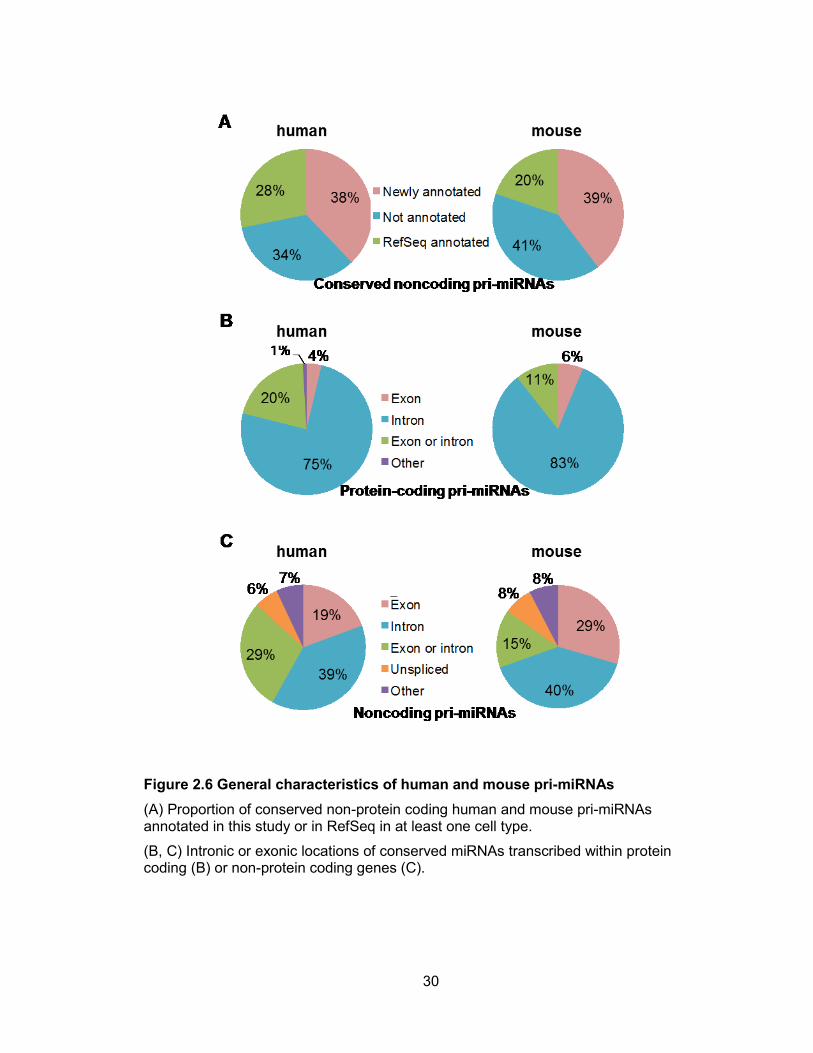
Using these data, pri-miRNA assemblies were provided for 1291/1871 (69%) of human
miRNAs and 888/1181 (75%) of mouse miRNAs that are annotated in miRBase version
20. This includes assemblies for 594 human and 425 mouse miRNAs that are not
hosted by annotated protein-coding genes. As mentioned above, non-conserved
intergenic miRNAs are generally very low in abundance and consensus is lacking
regarding which of these represent true miRNA genes. Therefore, to more accurately
assess the quality of these pri-miRNA assemblies, we focused on the pri-miRNA
transcripts that encode the set of 295 human and 297 mouse miRNAs that are
conserved among mammals (Chaing et al, 2010), which represents a more reliable set
of bona fide miRNAs. 38% (39 of 103) of human and 39% (41 of 104) of mouse
conserved non-protein coding pri-miRNAs were successfully reconstructed in at least
one cell line (Figure 2.6). When combined with existing RefSeq data, annotation for
66% and 59% of conserved intergenic miRNA genes was provided in total for human
and mouse, respectively.
30
Figure 2.6 General characteristics of human and mouse pri-miRNAs
(A) Proportion of conserved non-protein coding human and mouse pri-miRNAs annotated in this study or in RefSeq in at least one cell type.
(B, C) Intronic or exonic locations of conserved miRNAs transcribed within protein coding (B) or non-protein coding genes (C).
31
General characteristics and conservation of pri-miRNAs
Using these improved pri-miRNA maps, we examined the characteristics that typify
miRNA-encoding genes. As expected, of the conserved miRNAs that are hosted within
protein-coding genes, a large majority of pre-miRNA hairpins are located in introns (75%
in human and 83% in mouse, Figure 2.6B). For conserved intergenic miRNAs, the
frequency of intronic miRNAs drops to approximately 40% with the remainder in exons
or regions that may be intronic or exonic due to alternative splicing (Figure 2.6C). In
some cases, intergenic miRNAs are hosted in unspliced noncoding RNAs (6% in human
and 8% in mouse).
In cases where orthologous human and mouse intergenic pri-miRNAs were assembled,
we frequently observed conservation of the organization of these miRNA-encoding loci.
The locations of pri-miRNA promoters were particularly highly conserved, with the 5
ends of these transcripts almost always mapping to orthologous regions in the human
and mouse genomes when pri-miRNA assemblies were available for both species.
Representative examples of conserved pri-miRNAs are shown in Figure 2.7.
32
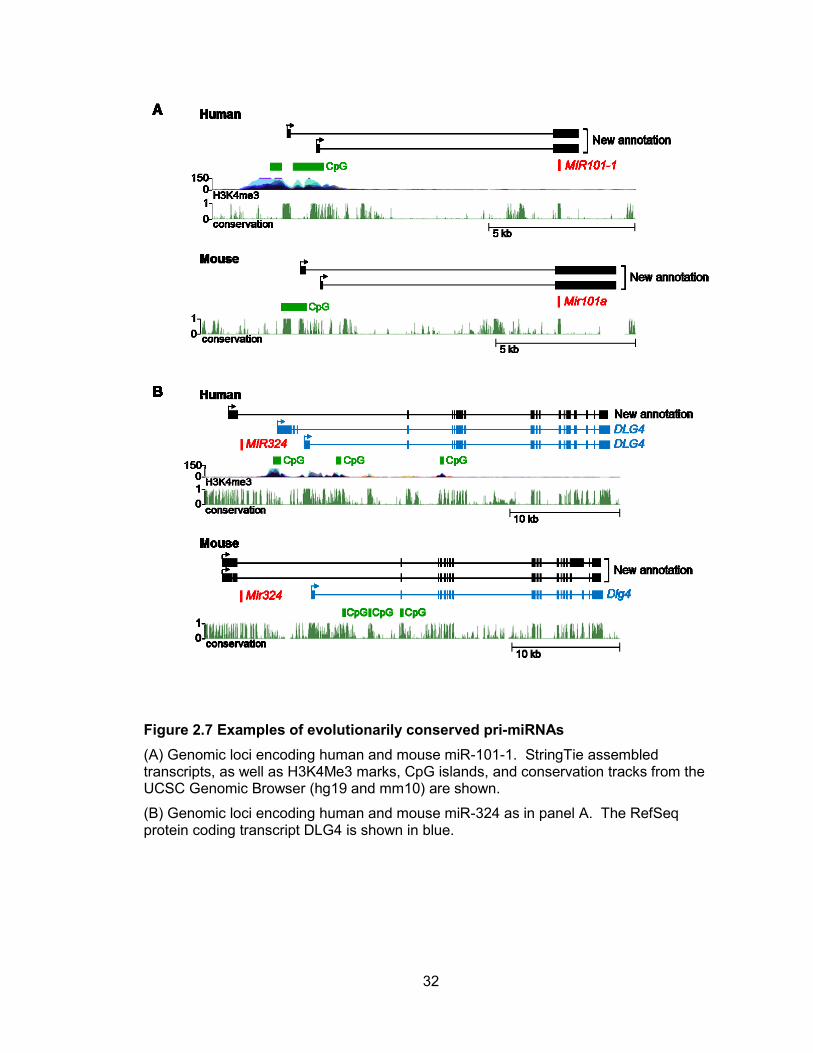
Figure 2.7 Examples of evolutionarily conserved pri-miRNAs
(A) Genomic loci encoding human and mouse miR-101-1. StringTie assembled transcripts, as well as H3K4Me3 marks, CpG islands, and conservation tracks from the UCSC Genomic Browser (hg19 and mm10) are shown.
(B) Genomic loci encoding human and mouse miR-324 as in panel A. The RefSeq protein coding transcript DLG4 is shown in blue.
33
For instance, we identified two distinct pri-miRNAs that encode human miR-101-1 that
each utilized different transcription start sites located approximately 9 kb upstream of the
miRNA (Figure 2.7A). The presence of CpG islands and H3K4me3 histone marks near
the transcript 5 ends support these assemblies. Likewise, two transcription start sites
were also mapped to a GC-rich region 9 kb upstream of the sequence that encodes
mouse miR-101a (Figure 2.7A). Both the human and mouse pri-miRNA transcripts are
composed of 2 exons, with the miRNA located in exon 2. These transcript structures
were confirmed by RT-PCR (Figure 2.8, 2.9). Human and mouse miR-324 are also
representative of miRNAs encoded by transcription units with conserved organization,
and, as discussed in greater detail below, represent a class of pri-miRNAs that are
transcribed as 5 extensions of annotated protein coding genes (Figure 2.7B).
34
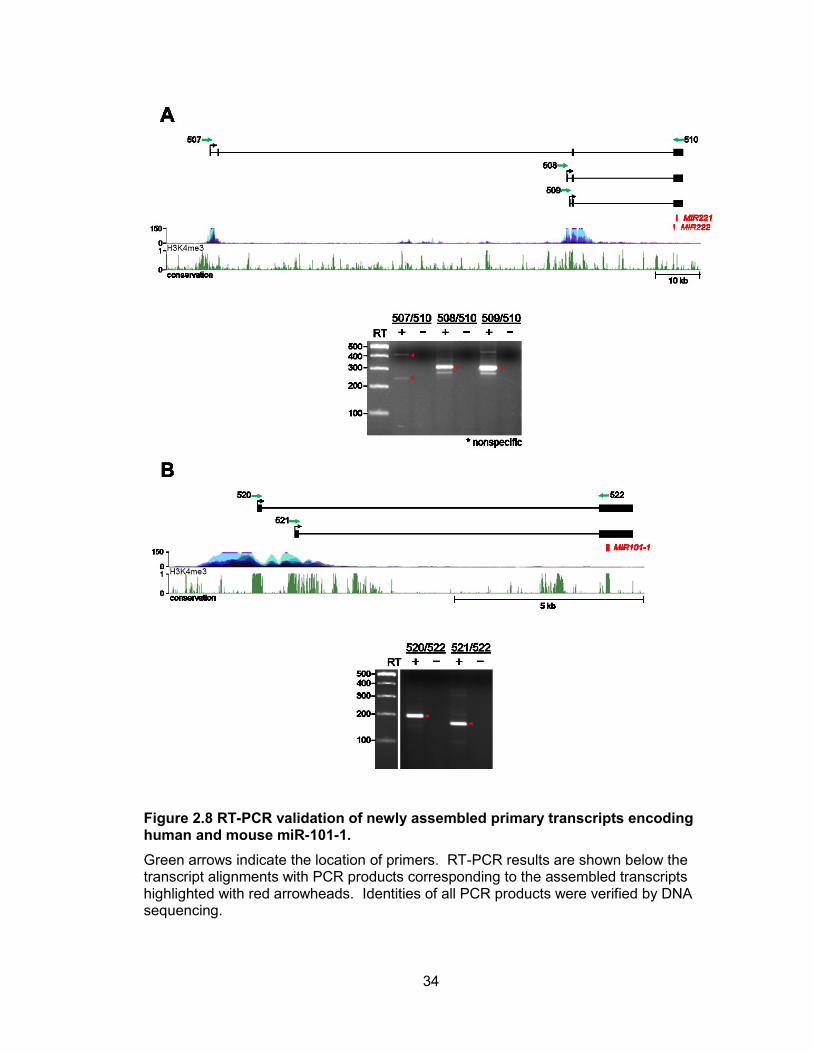
Figure 2.8 RT-PCR validation of newly assembled primary transcripts encoding human and mouse miR-101-1.
Green arrows indicate the location of primers. RT-PCR results are shown below the transcript alignments with PCR products corresponding to the assembled transcripts highlighted with red arrowheads. Identities of all PCR products were verified by DNA sequencing.
35
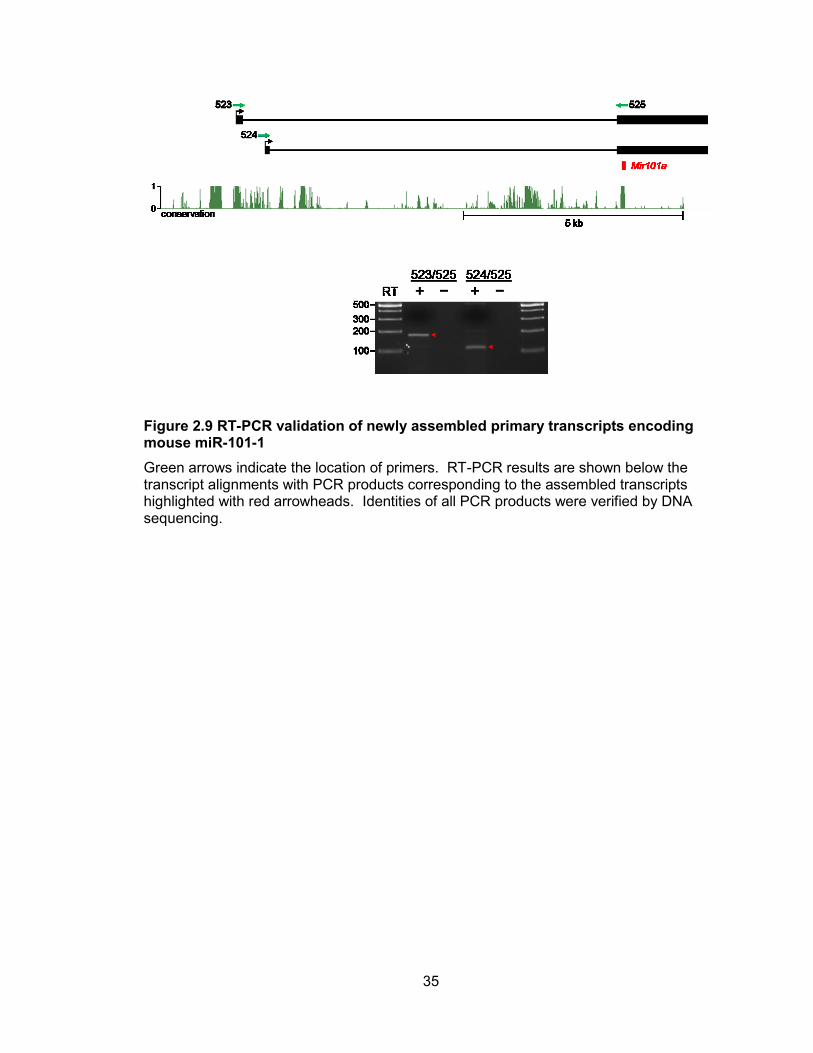
Figure 2.9 RT-PCR validation of newly assembled primary transcripts encoding mouse miR-101-1
Green arrows indicate the location of primers. RT-PCR results are shown below the transcript alignments with PCR products corresponding to the assembled transcripts highlighted with red arrowheads. Identities of all PCR products were verified by DNA sequencing.
36
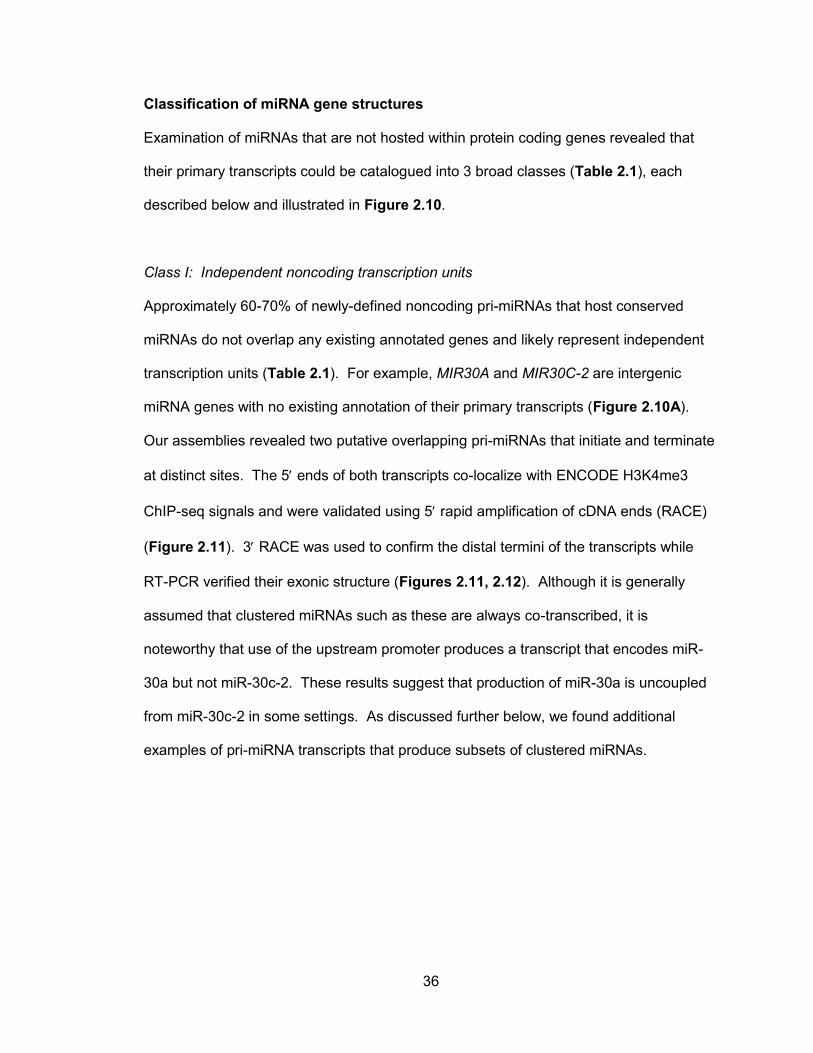
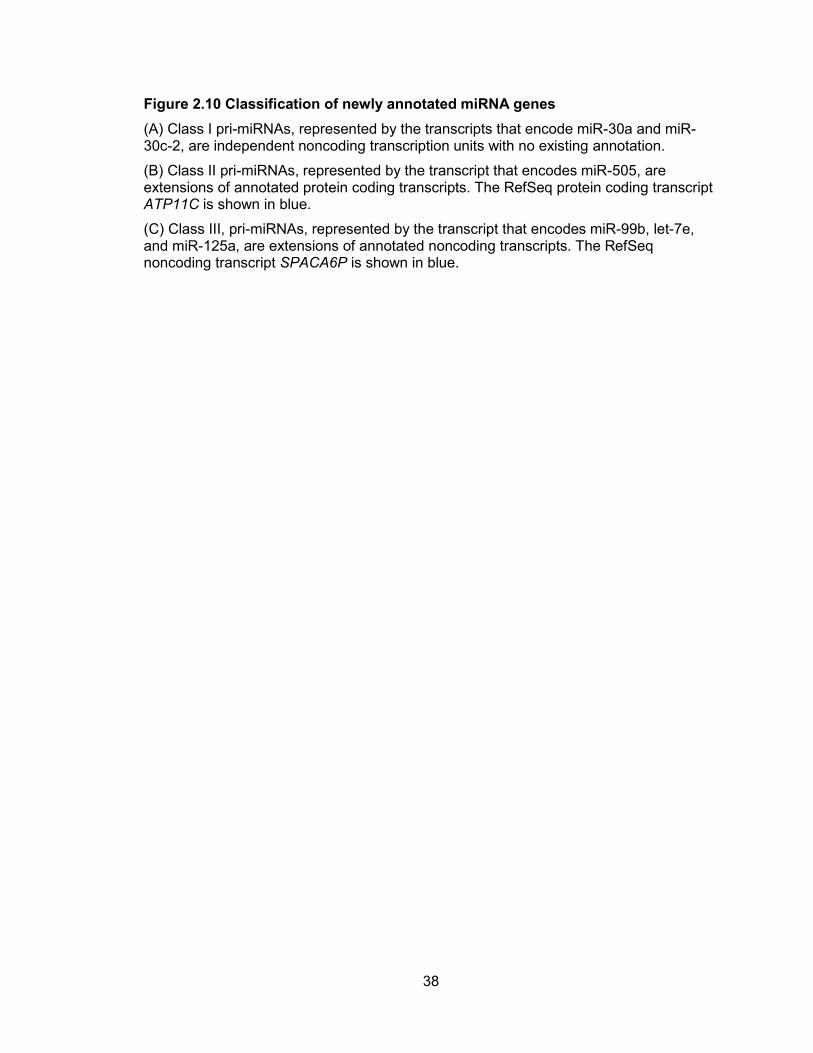
Classification of miRNA gene structures
Examination of miRNAs that are not hosted within protein coding genes revealed that
their primary transcripts could be catalogued into 3 broad classes (Table 2.1), each
described below and illustrated in Figure 2.10.
Class I: Independent noncoding transcription units
Approximately 60-70% of newly-defined noncoding pri-miRNAs that host conserved
miRNAs do not overlap any existing annotated genes and likely represent independent
transcription units (Table 2.1). For example, MIR30A and MIR30C-2 are intergenic
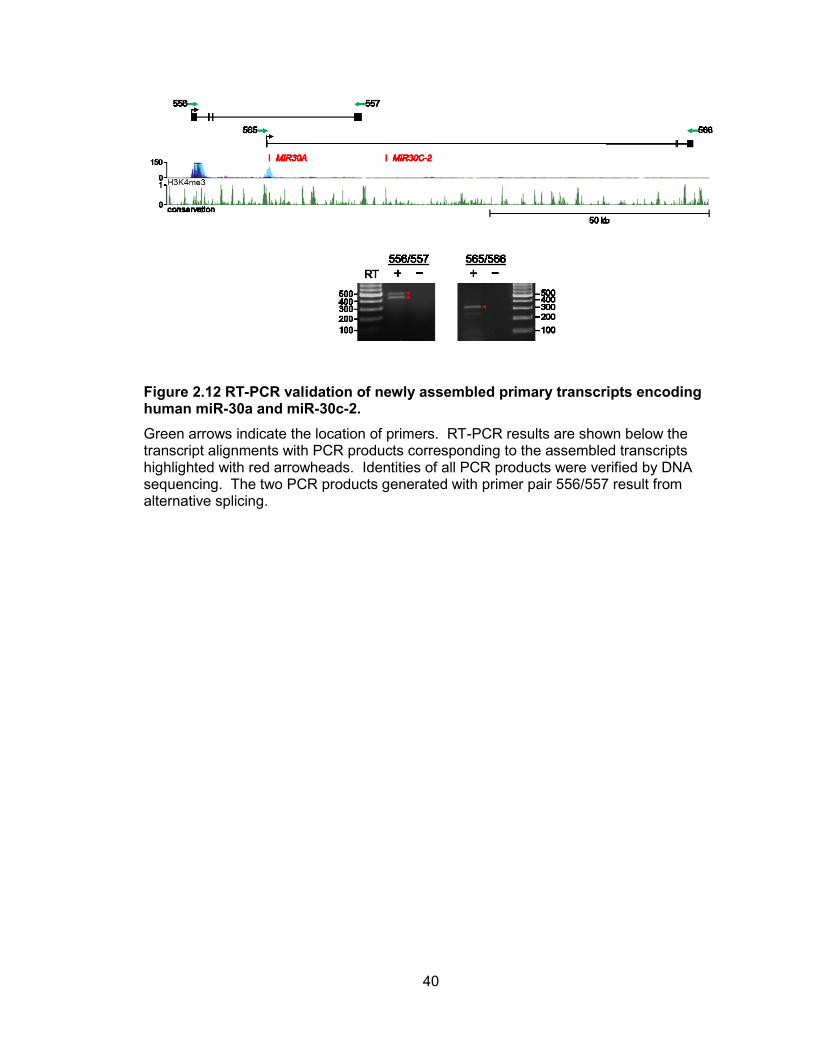
miRNA genes with no existing annotation of their primary transcripts (Figure 2.10A).
Our assemblies revealed two putative overlapping pri-miRNAs that initiate and terminate
at distinct sites. The 5 ends of both transcripts co-localize with ENCODE H3K4me3
ChIP-seq signals and were validated using 5 rapid amplification of cDNA ends (RACE)
(Figure 2.11). 3 RACE was used to confirm the distal termini of the transcripts while
RT-PCR verified their exonic structure (Figures 2.11, 2.12). Although it is generally
assumed that clustered miRNAs such as these are always co-transcribed, it is
noteworthy that use of the upstream promoter produces a transcript that encodes miR-
30a but not miR-30c-2. These results suggest that production of miR-30a is uncoupled
from miR-30c-2 in some settings. As discussed further below, we found additional
examples of pri-miRNA transcripts that produce subsets of clustered miRNAs.
37
38
Figure 2.10 Classification of newly annotated miRNA genes
(A) Class I pri-miRNAs, represented by the transcripts that encode miR-30a and miR-30c-2, are independent noncoding transcription units with no existing annotation.
(B) Class II pri-miRNAs, represented by the transcript that encodes miR-505, are extensions of annotated protein coding transcripts. The RefSeq protein coding transcript ATP11C is shown in blue.
(C) Class III, pri-miRNAs, represented by the transcript that encodes miR-99b, let-7e, and miR-125a, are extensions of annotated noncoding transcripts. The RefSeq noncoding transcript SPACA6P is shown in blue.
39
Figure 2.11 5 and 3 RACE analysis of newly assembled primary transcripts encoding human miR-30a and miR-30c-2
The upper panel summarizes the overall transcript structures while the lower panel shows primer locations (green arrows) with red ticks indicating the end of each individual sequenced RACE clone. Putative polyadenylation signals are shown in blue.
40
Figure 2.12 RT-PCR validation of newly assembled primary transcripts encoding human miR-30a and miR-30c-2.
Green arrows indicate the location of primers. RT-PCR results are shown below the transcript alignments with PCR products corresponding to the assembled transcripts highlighted with red arrowheads. Identities of all PCR products were verified by DNA sequencing. The two PCR products generated with primer pair 556/557 result from alternative splicing.
41
Class II: Extended protein-coding transcripts
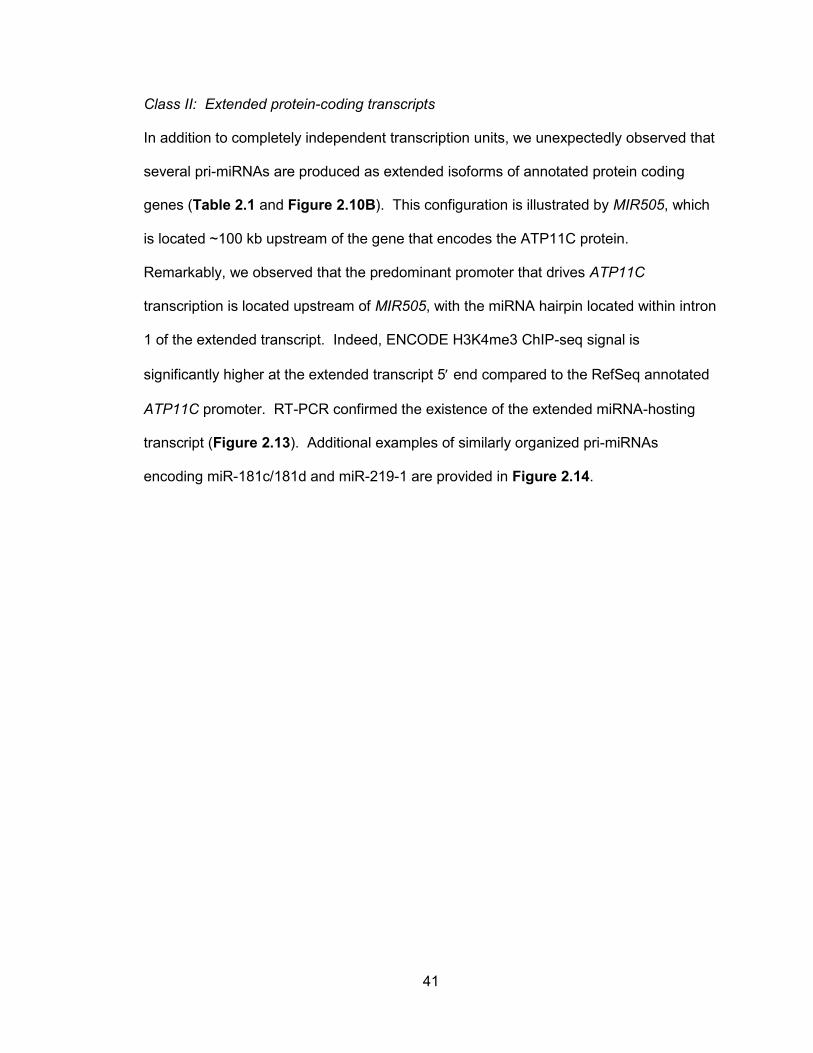
In addition to completely independent transcription units, we unexpectedly observed that
several pri-miRNAs are produced as extended isoforms of annotated protein coding
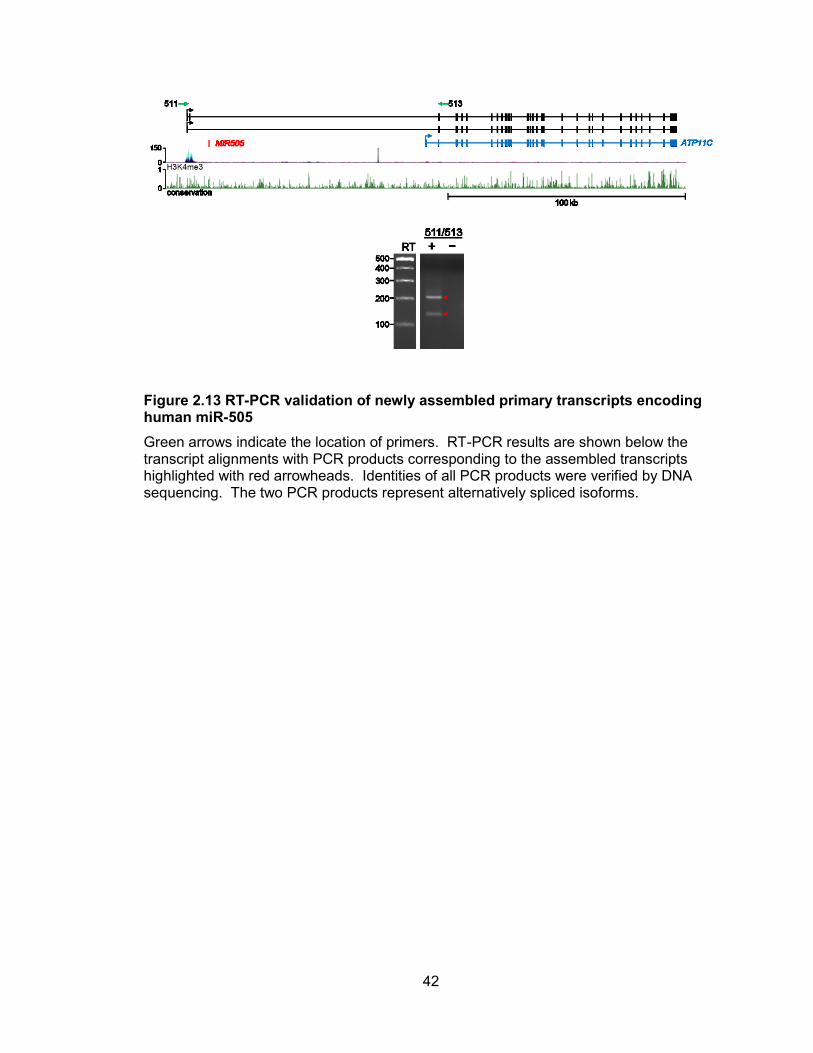
genes (Table 2.1 and Figure 2.10B). This configuration is illustrated by MIR505, which
is located ~100 kb upstream of the gene that encodes the ATP11C protein.
Remarkably, we observed that the predominant promoter that drives ATP11C
transcription is located upstream of MIR505, with the miRNA hairpin located within intron
1 of the extended transcript. Indeed, ENCODE H3K4me3 ChIP-seq signal is
significantly higher at the extended transcript 5 end compared to the RefSeq annotated
ATP11C promoter. RT-PCR confirmed the existence of the extended miRNA-hosting
transcript (Figure 2.13). Additional examples of similarly organized pri-miRNAs
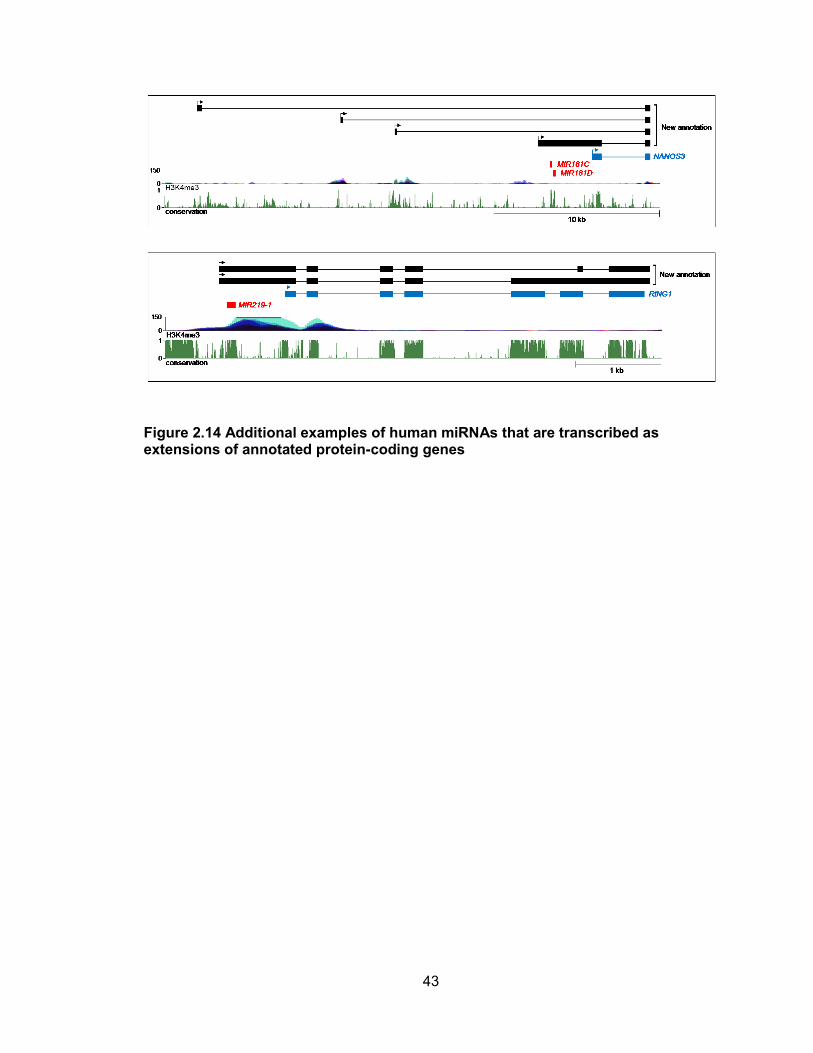
encoding miR-181c/181d and miR-219-1 are provided in Figure 2.14.
42
Figure 2.13 RT-PCR validation of newly assembled primary transcripts encoding human miR-505
Green arrows indicate the location of primers. RT-PCR results are shown below the transcript alignments with PCR products corresponding to the assembled transcripts highlighted with red arrowheads. Identities of all PCR products were verified by DNA sequencing. The two PCR products represent alternatively spliced isoforms.
43
Figure 2.14 Additional examples of human miRNAs that are transcribed as extensions of annotated protein-coding genes
44
Class III: Extended annotated noncoding transcripts
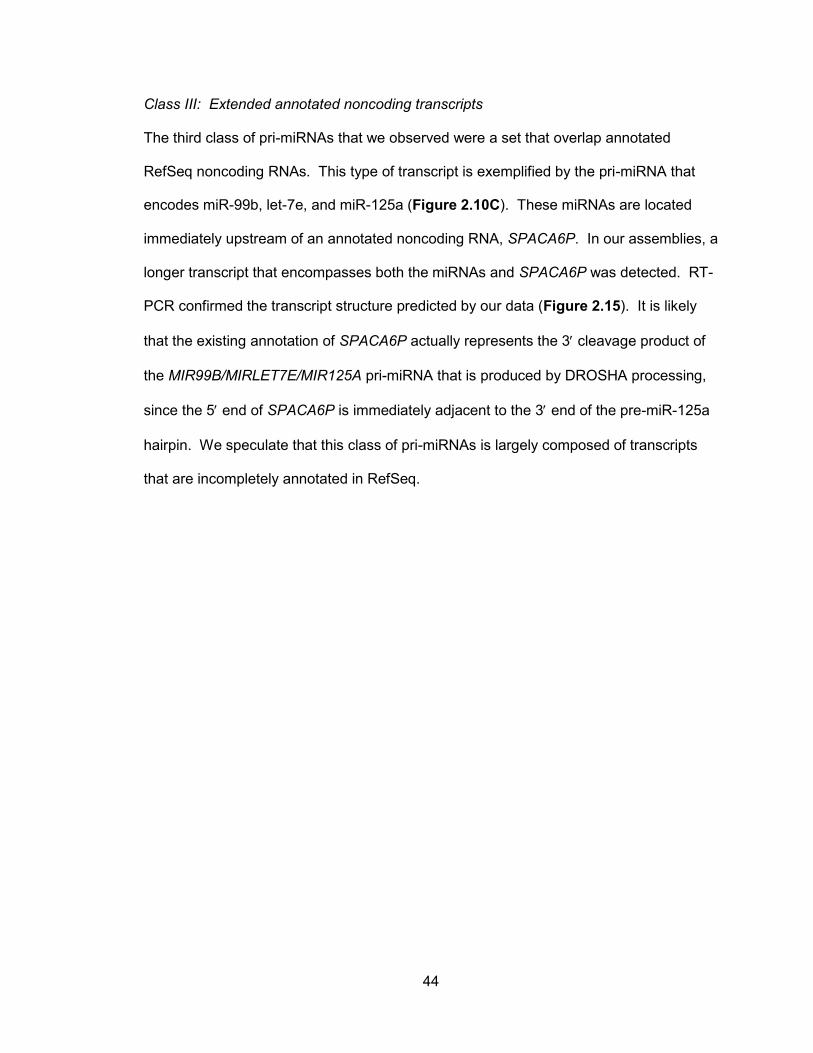
The third class of pri-miRNAs that we observed were a set that overlap annotated
RefSeq noncoding RNAs. This type of transcript is exemplified by the pri-miRNA that
encodes miR-99b, let-7e, and miR-125a (Figure 2.10C). These miRNAs are located
immediately upstream of an annotated noncoding RNA, SPACA6P. In our assemblies, a
longer transcript that encompasses both the miRNAs and SPACA6P was detected. RT-
PCR confirmed the transcript structure predicted by our data (Figure 2.15). It is likely
that the existing annotation of SPACA6P actually represents the 3 cleavage product of
the MIR99B/MIRLET7E/MIR125A pri-miRNA that is produced by DROSHA processing,
since the 5 end of SPACA6P is immediately adjacent to the 3 end of the pre-miR-125a
hairpin. We speculate that this class of pri-miRNAs is largely composed of transcripts
that are incompletely annotated in RefSeq.
45
Figure 2.15 RT-PCR validation of the newly assembled primary transcript encoding human miR-99b, let-7e, and miR-125a
Green arrows indicate the location of primers. RT-PCR results are shown below the transcript alignments with the PCR product corresponding to the assembled transcript highlighted with a red arrowhead. The identity of the PCR product was verified by DNA sequencing.
46
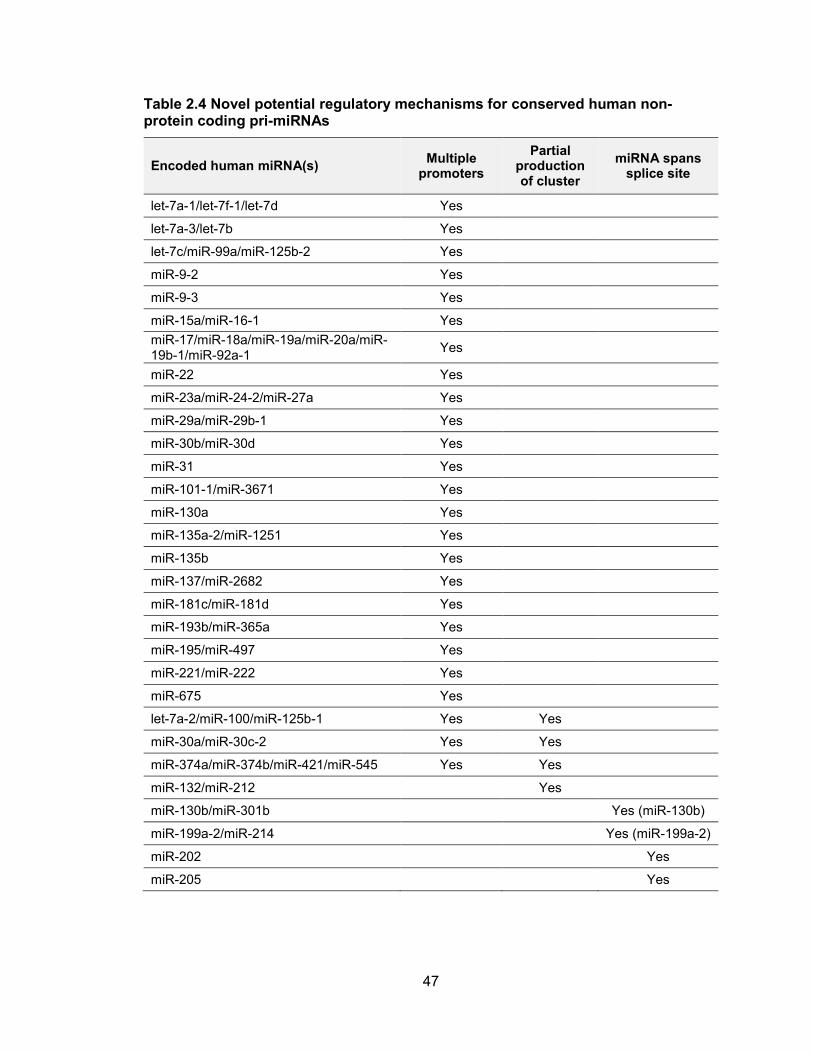
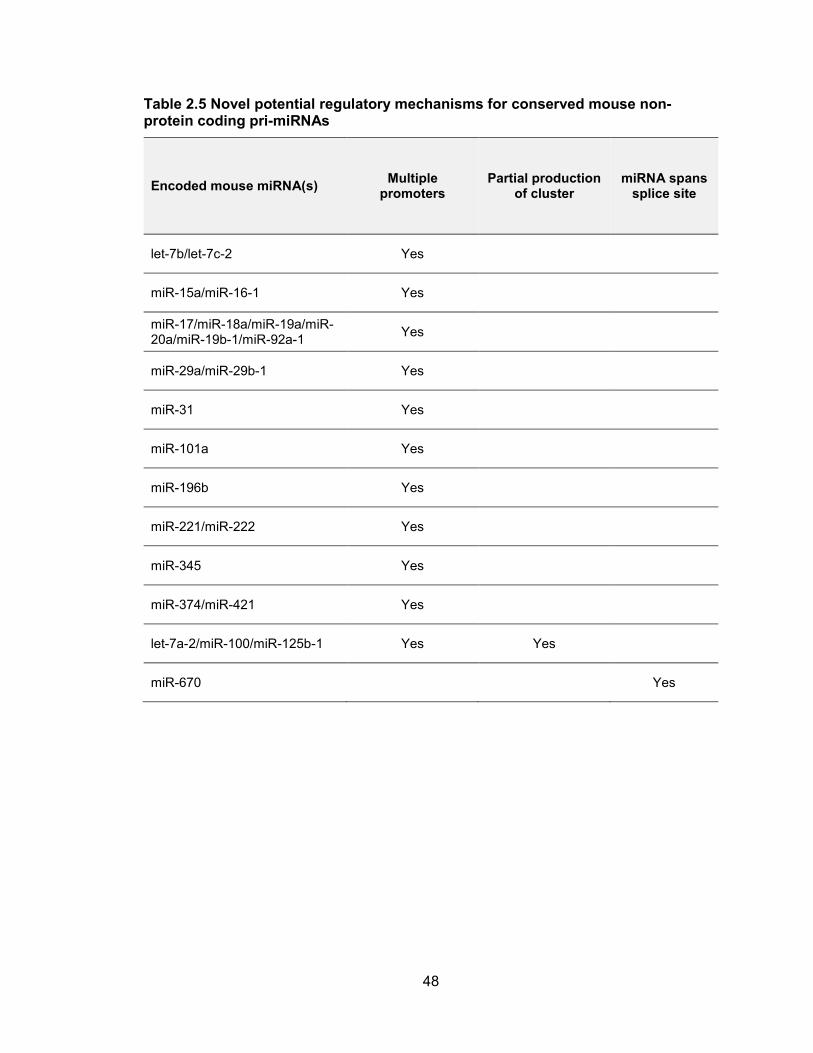
Pri-miRNA structures reveal novel regulatory mechanisms
Inspection of pri-miRNA gene structure using our assemblies uncovered new potential
regulatory mechanisms that likely influence the production of specific miRNAs. These
mechanisms include alternative promoters, partially-transcribed miRNA clusters, and
alternative splicing, each discussed in turn below and summarized in Tables 2.4 and
2.5.
47
Table 2.4 Novel potential regulatory mechanisms for conserved human non-protein coding pri-miRNAs
Encoded human miRNA(s) Multiple
promoters
Partial production of cluster
miRNA spans splice site
let-7a-1/let-7f-1/let-7d Yes
let-7a-3/let-7b Yes
let-7c/miR-99a/miR-125b-2 Yes
miR-9-2 Yes
miR-9-3 Yes
miR-15a/miR-16-1 Yes
miR-17/miR-18a/miR-19a/miR-20a/miR-19b-1/miR-92a-1
Yes
miR-22 Yes
miR-23a/miR-24-2/miR-27a Yes
miR-29a/miR-29b-1 Yes
miR-30b/miR-30d Yes
miR-31 Yes
miR-101-1/miR-3671 Yes
miR-130a Yes
miR-135a-2/miR-1251 Yes
miR-135b Yes
miR-137/miR-2682 Yes
miR-181c/miR-181d Yes
miR-193b/miR-365a Yes
miR-195/miR-497 Yes
miR-221/miR-222 Yes
miR-675 Yes
let-7a-2/miR-100/miR-125b-1 Yes Yes
miR-30a/miR-30c-2 Yes Yes
miR-374a/miR-374b/miR-421/miR-545 Yes Yes
miR-132/miR-212 Yes
miR-130b/miR-301b Yes (miR-130b)
miR-199a-2/miR-214 Yes (miR-199a-2)
miR-202 Yes
miR-205 Yes
48
Table 2.5 Novel potential regulatory mechanisms for conserved mouse non-protein coding pri-miRNAs
Encoded mouse miRNA(s) Multiple
promoters Partial production
of cluster miRNA spans
splice site
let-7b/let-7c-2 Yes
miR-15a/miR-16-1 Yes
miR-17/miR-18a/miR-19a/miR-20a/miR-19b-1/miR-92a-1
Yes
miR-29a/miR-29b-1 Yes
miR-31 Yes
miR-101a Yes
miR-196b Yes
miR-221/miR-222 Yes
miR-345 Yes
miR-374/miR-421 Yes
let-7a-2/miR-100/miR-125b-1 Yes Yes
miR-670 Yes
49
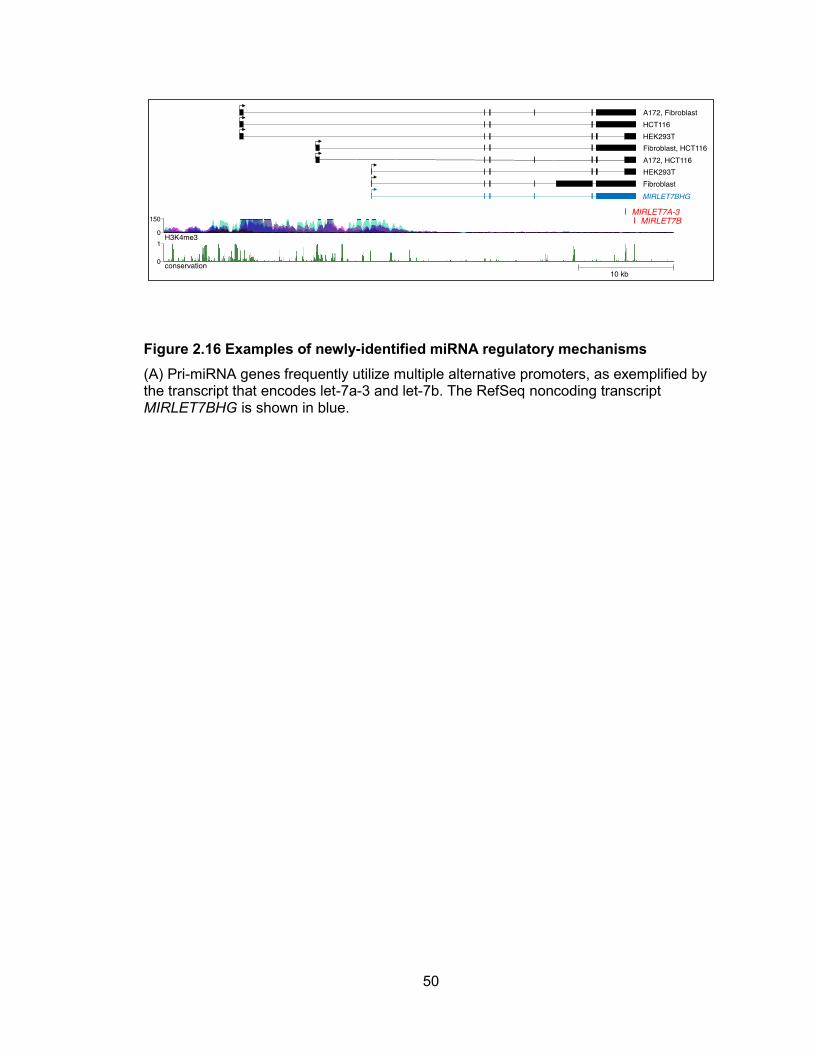
Alternative promoters
Perhaps unsurprisingly given the incomplete existing annotation of pri-miRNA genes, our
assemblies frequently identified alternative promoters that drive miRNA expression in
different cell types. This phenomenon is exemplified by the gene that encodes let-7a-3
and let-7b. This pri-miRNA, annotated in RefSeq as MIRLET7BHG, initiates 27 kb
upstream of the miRNA sequences, in a region rich in H3K4me3-modified histones
(Figure 2.16). We observed two additional transcription start sites further upstream,
also associated with H3K4me3. These transcript structures and 5 ends were validated
by RT-PCR and RACE (Figures 2.17, 2.18). While all cell lines tested used the most
upstream promoter, the alternative downstream transcription start sites were
differentially utilized in a cell-line specific manner. These results suggest that these
distinct promoters may be differentially regulated. Of the 103 human intergenic
conserved miRNA transcription units, we documented that at least 25 have multiple
alternative promoters (Table 2.4), indicating that this is a very common mode of miRNA
regulation.
50
Figure 2.16 Examples of newly-identified miRNA regulatory mechanisms
(A) Pri-miRNA genes frequently utilize multiple alternative promoters, as exemplified by the transcript that encodes let-7a-3 and let-7b. The RefSeq noncoding transcript MIRLET7BHG is shown in blue.
51
Figure 2.17 5 RACE analysis of primary transcripts encoding human let-7a-3 and let-7b
The upper panel summarizes the overall transcript structures while the lower panel shows primer locations (green arrows) with red ticks indicating the end of each individual sequenced RACE clone.
52
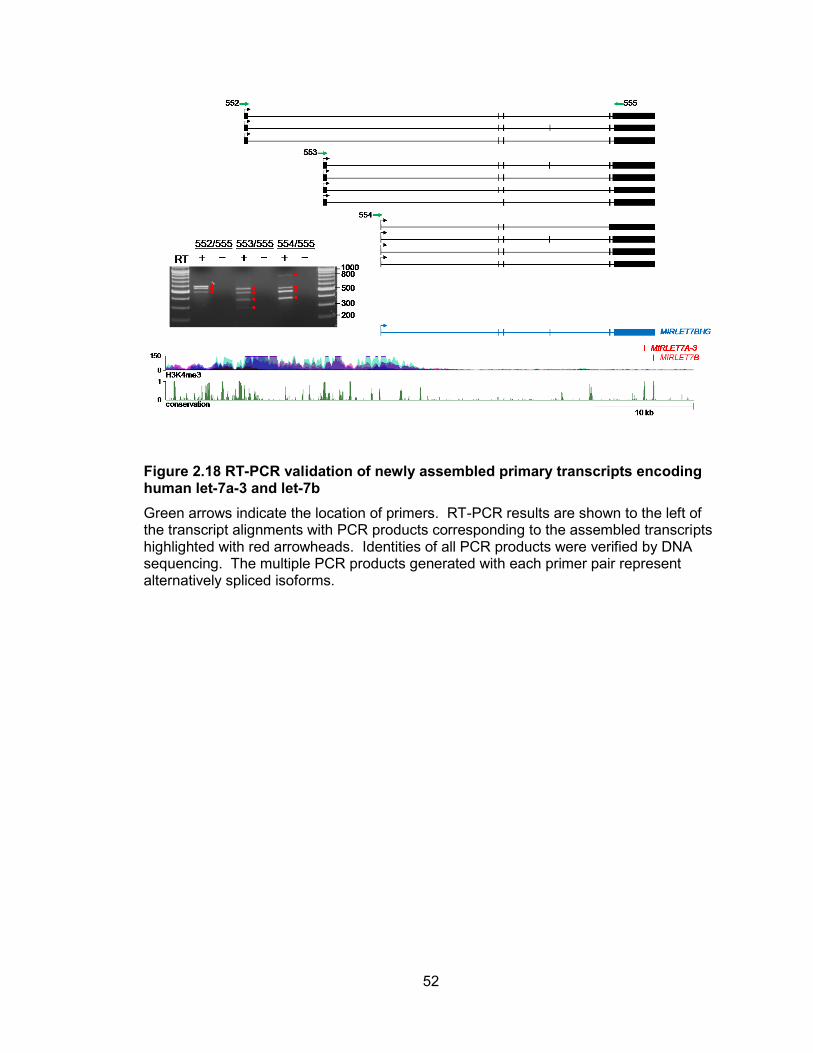
Figure 2.18 RT-PCR validation of newly assembled primary transcripts encoding human let-7a-3 and let-7b
Green arrows indicate the location of primers. RT-PCR results are shown to the left of the transcript alignments with PCR products corresponding to the assembled transcripts highlighted with red arrowheads. Identities of all PCR products were verified by DNA sequencing. The multiple PCR products generated with each primer pair represent alternatively spliced isoforms.
53
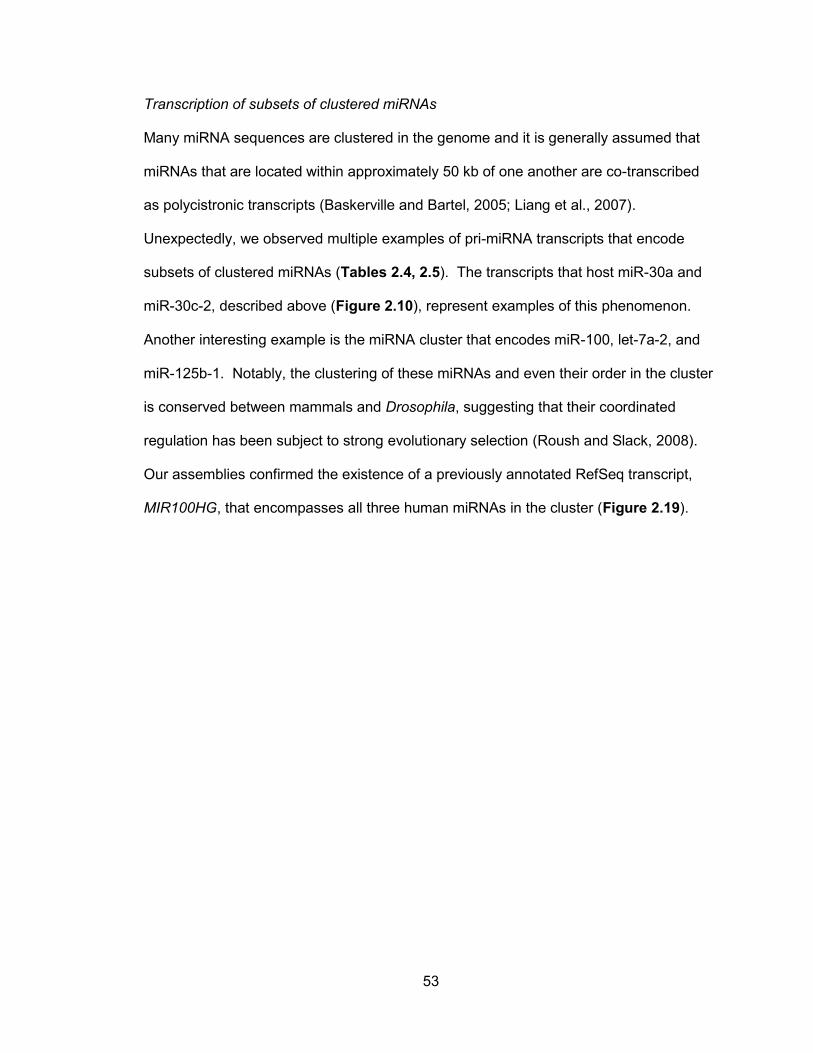
Transcription of subsets of clustered miRNAs
Many miRNA sequences are clustered in the genome and it is generally assumed that
miRNAs that are located within approximately 50 kb of one another are co-transcribed
as polycistronic transcripts (Baskerville and Bartel, 2005; Liang et al., 2007).
Unexpectedly, we observed multiple examples of pri-miRNA transcripts that encode
subsets of clustered miRNAs (Tables 2.4, 2.5). The transcripts that host miR-30a and
miR-30c-2, described above (Figure 2.10), represent examples of this phenomenon.
Another interesting example is the miRNA cluster that encodes miR-100, let-7a-2, and
miR-125b-1. Notably, the clustering of these miRNAs and even their order in the cluster
is conserved between mammals and Drosophila, suggesting that their coordinated
regulation has been subject to strong evolutionary selection (Roush and Slack, 2008).
Our assemblies confirmed the existence of a previously annotated RefSeq transcript,
MIR100HG, that encompasses all three human miRNAs in the cluster (Figure 2.19).
54
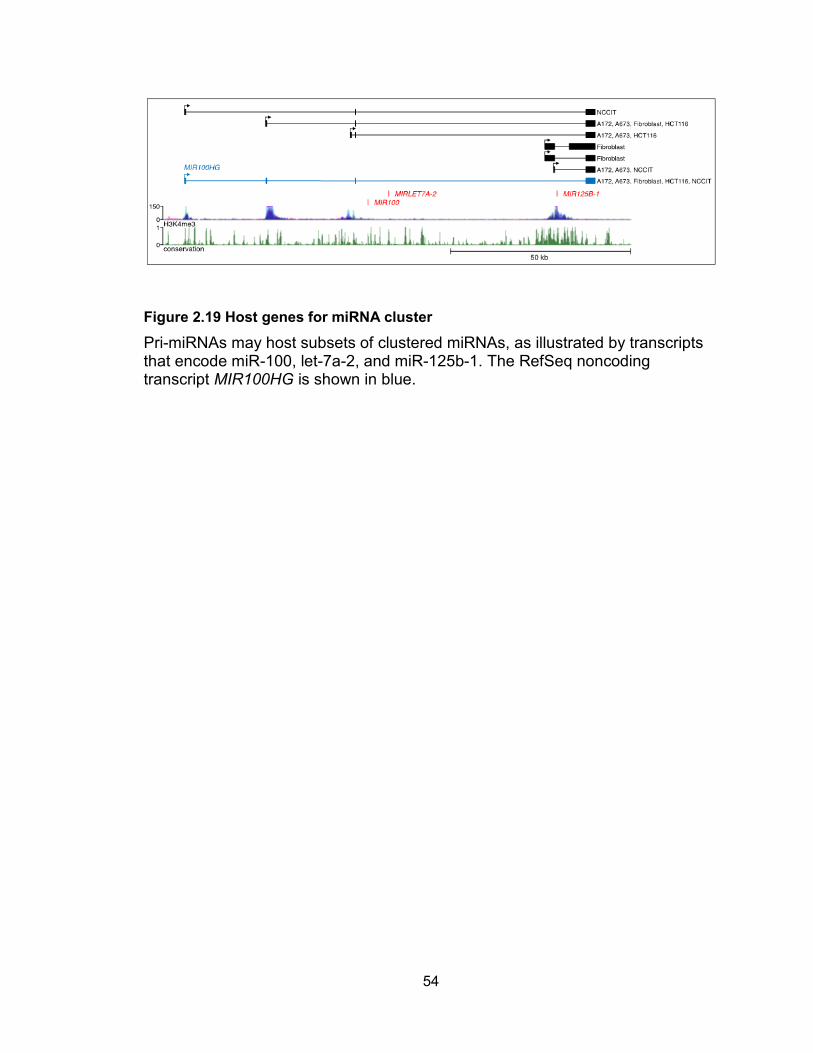
Figure 2.19 Host genes for miRNA cluster
Pri-miRNAs may host subsets of clustered miRNAs, as illustrated by transcripts that encode miR-100, let-7a-2, and miR-125b-1. The RefSeq noncoding transcript MIR100HG is shown in blue.
55
The 5 end of this pri-miRNA is supported by H3K4me3 data. In addition, we identified 3
additional alternative transcription start sites also corroborated by H3K4me3 histone
modifications. Use of the most downstream promoter produces a transcript that
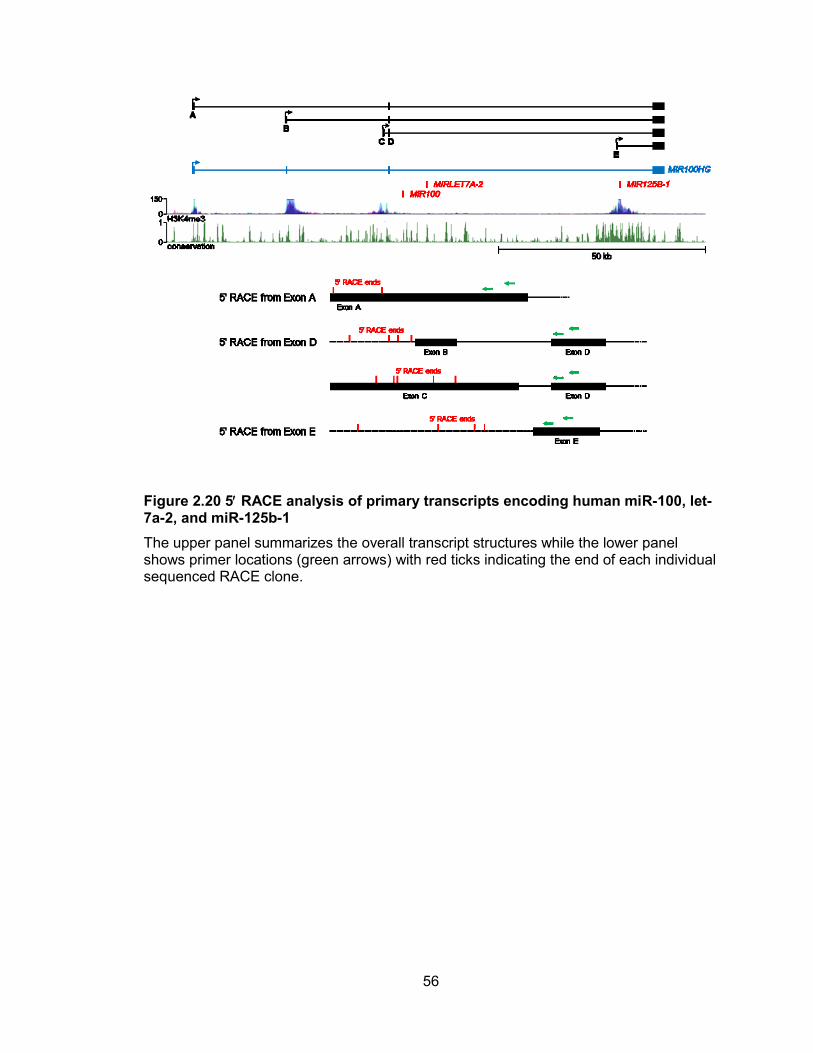
encodes only miR-125b-1. RT-PCR and 5 RACE confirmed the accuracy of all of these
pri-miRNA transcript assemblies (Figures 2.20, 2.21). These findings demonstrate that
production of individual miRNAs in polycistronic clusters can be uncoupled through the
use of alternative promoters.
56
Figure 2.20 5 RACE analysis of primary transcripts encoding human miR-100, let-7a-2, and miR-125b-1
The upper panel summarizes the overall transcript structures while the lower panel shows primer locations (green arrows) with red ticks indicating the end of each individual sequenced RACE clone.
57
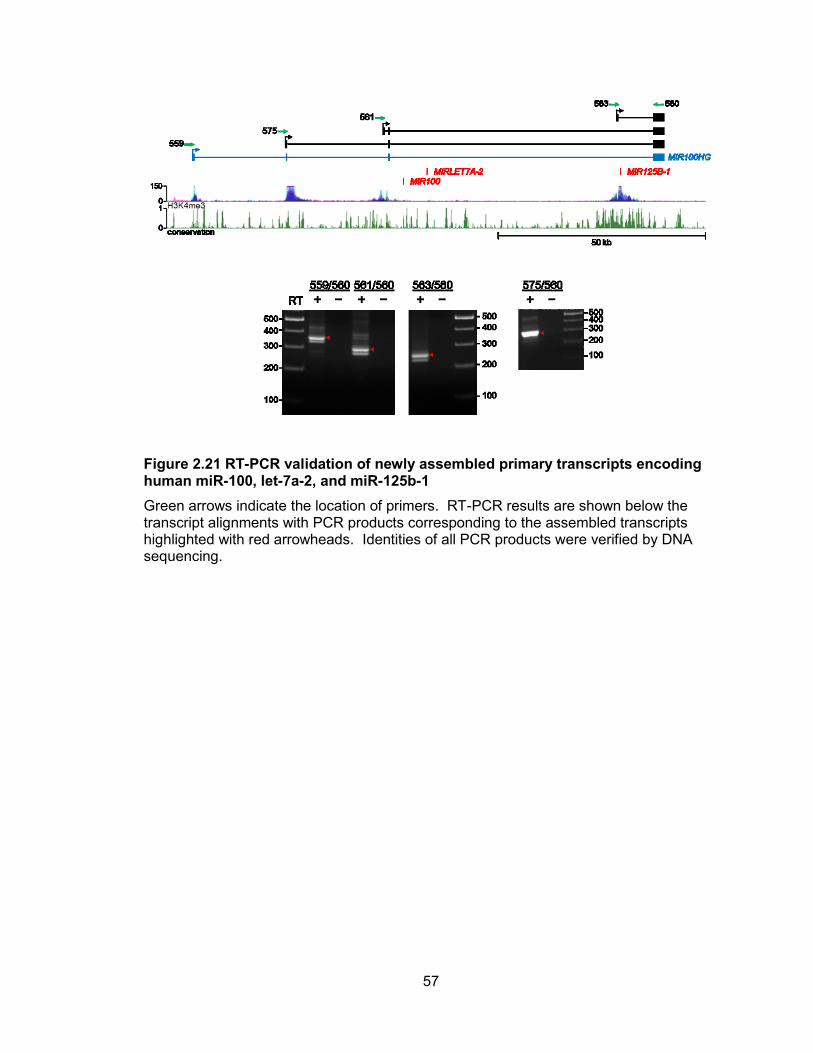
Figure 2.21 RT-PCR validation of newly assembled primary transcripts encoding human miR-100, let-7a-2, and miR-125b-1
Green arrows indicate the location of primers. RT-PCR results are shown below the transcript alignments with PCR products corresponding to the assembled transcripts highlighted with red arrowheads. Identities of all PCR products were verified by DNA sequencing.
58
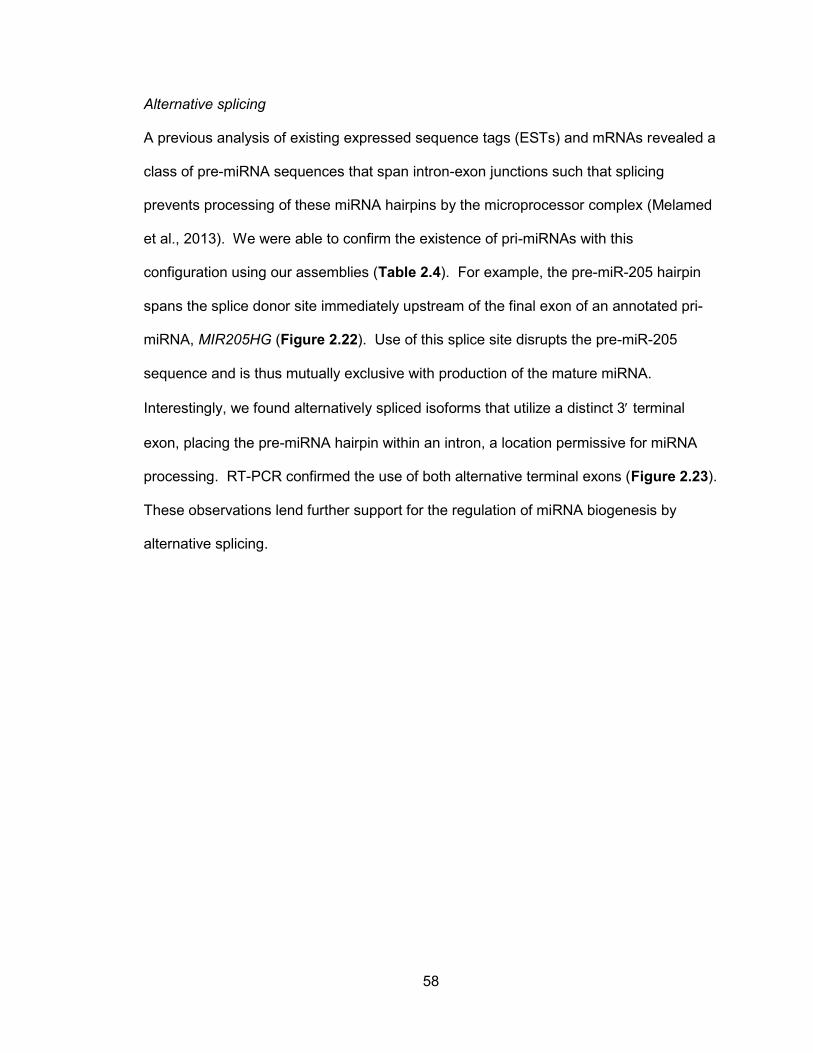
Alternative splicing
A previous analysis of existing expressed sequence tags (ESTs) and mRNAs revealed a
class of pre-miRNA sequences that span intron-exon junctions such that splicing
prevents processing of these miRNA hairpins by the microprocessor complex (Melamed
et al., 2013). We were able to confirm the existence of pri-miRNAs with this
configuration using our assemblies (Table 2.4). For example, the pre-miR-205 hairpin
spans the splice donor site immediately upstream of the final exon of an annotated pri-
miRNA, MIR205HG (Figure 2.22). Use of this splice site disrupts the pre-miR-205
sequence and is thus mutually exclusive with production of the mature miRNA.
Interestingly, we found alternatively spliced isoforms that utilize a distinct 3 terminal
exon, placing the pre-miRNA hairpin within an intron, a location permissive for miRNA
processing. RT-PCR confirmed the use of both alternative terminal exons (Figure 2.23).
These observations lend further support for the regulation of miRNA biogenesis by
alternative splicing.
59
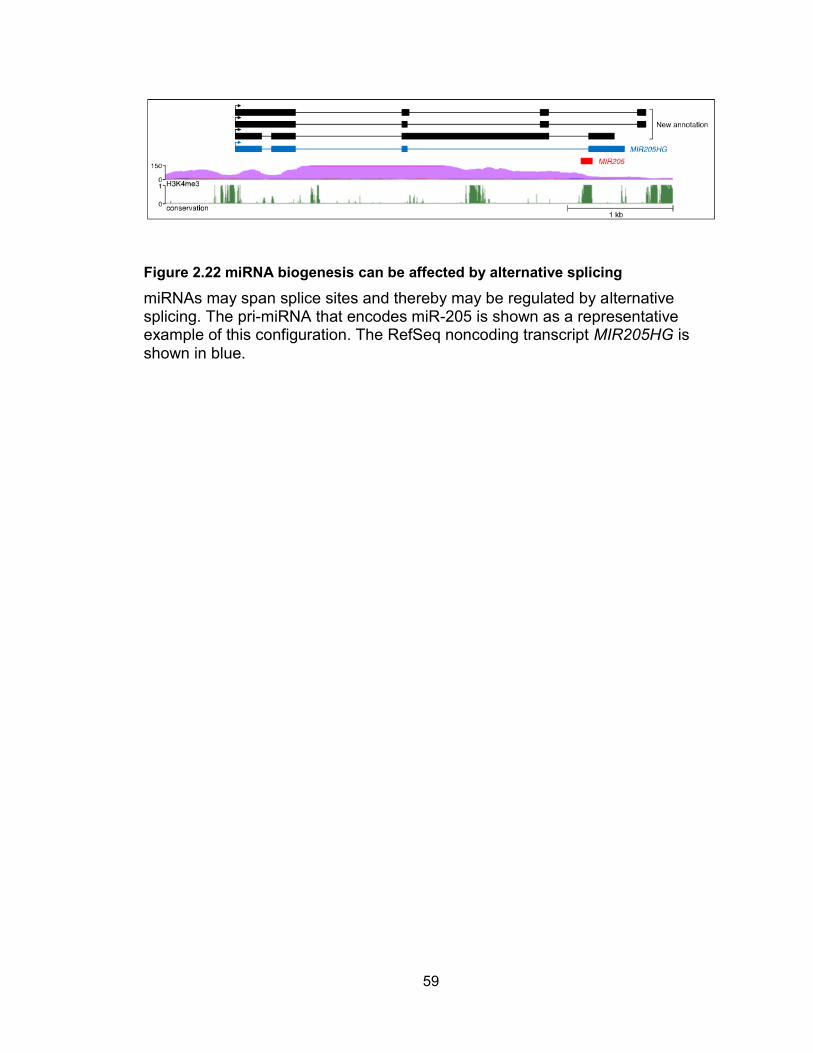
Figure 2.22 miRNA biogenesis can be affected by alternative splicing
miRNAs may span splice sites and thereby may be regulated by alternative splicing. The pri-miRNA that encodes miR-205 is shown as a representative example of this configuration. The RefSeq noncoding transcript MIR205HG is shown in blue.
60
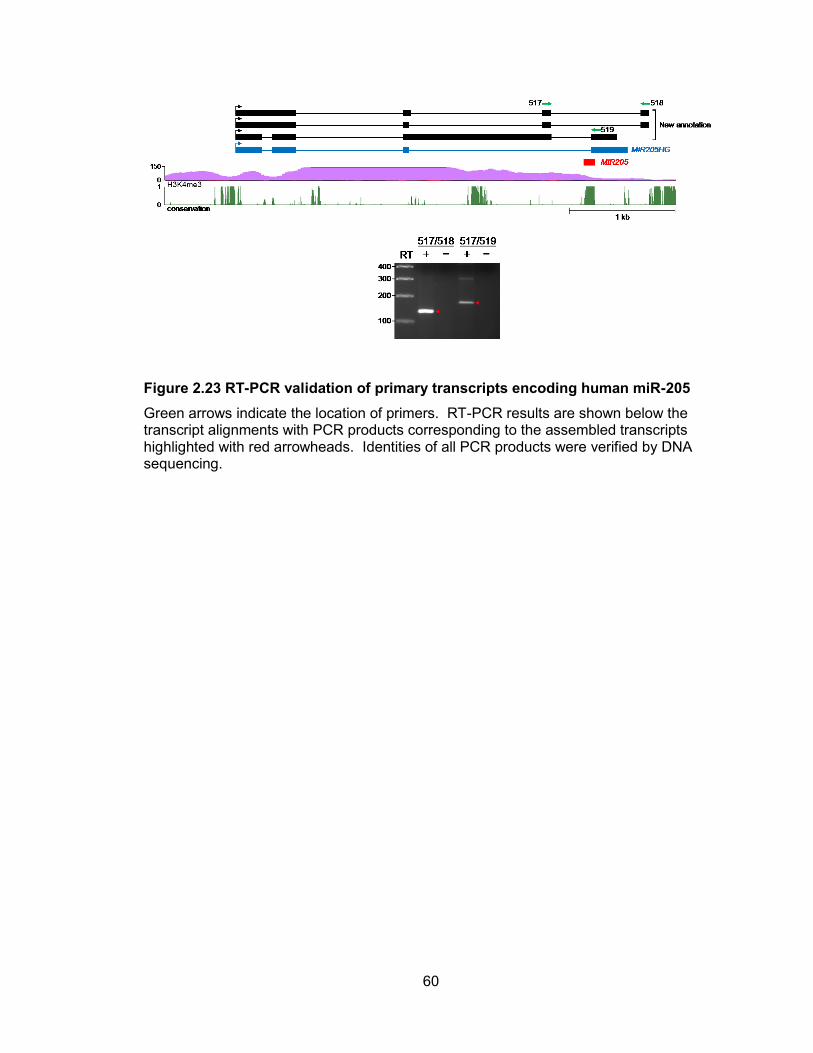
Figure 2.23 RT-PCR validation of primary transcripts encoding human miR-205
Green arrows indicate the location of primers. RT-PCR results are shown below the transcript alignments with PCR products corresponding to the assembled transcripts highlighted with red arrowheads. Identities of all PCR products were verified by DNA sequencing.
61
Discussion
Investigation of miRNA functions in numerous biological settings has advanced our
understanding of the roles of miRNAs in development and disease and the downstream
targets that they regulate (Vidigal and Ventura, 2015). On the other hand, considerably
less is known about the pathways that govern miRNA biogenesis at transcriptional and
post-transcriptional levels. Elucidation of such miRNA regulatory mechanisms has been
hindered by the poor annotation of pri-miRNA gene structures. Indeed, a frequent
misperception is that miRNA promoters are located in the genomic sequence
immediately adjacent to pre-miRNA hairpins when, in fact, these promoters are often
located 10’s to 100’s of kilobases upstream (Chang et al., 2007; Cai et al., 2004).
Clearly, dissection of cis- and trans-regulation of miRNA transcription requires an
accurate description of the relevant transcription units. Putative post-transcriptional
regulatory mechanisms may also be overlooked without an understanding of the splicing
patterns or polyadenylation sites of pri-miRNA transcripts. In light of these limitations,
we set out to establish a resource of miRNA gene structures that could be easily
accessed by investigators in the field in order to improve the study of miRNA regulation.
Herein, we describe a novel experimental and computational approach that we
developed to achieve this goal.
Having demonstrated that comprehensive pri-miRNA annotation cannot be easily
accomplished using existing RNA-seq data, we devised a multi-step strategy to enable
genome-wide pri-miRNA reconstruction. First, a dominant negative DROSHA protein
that globally impairs pri-miRNA processing is expressed, thereby stabilizing pri-miRNA
transcripts and dramatically improving their coverage in RNA-seq libraries. Next,
StringTie, an advanced transcriptome assembler that is capable of accurately
62
reconstructing pri-miRNAs, is employed. Since miRNA expression is often cell-type
specific, we applied this strategy to a panel of human and mouse cell lines of diverse
origins, thereby successfully annotating ~70% of pri-miRNAs in these species. We
anticipate that near complete assembly of annotated miRNAs is possible by applying this
approach to additional cell types.
Multiple lines of evidence support the accuracy of the new pri-miRNA annotations
provided here. First, the 5 ends of the assembled transcripts are frequently located
within regions enriched in H3K4me3 histone marks and CpG islands, features that are
associated with RNA polymerase II promoters (Mikkelsen et al., 2007). Moreover, we
extensively validated new pri-miRNA assemblies using 5 and 3 RACE as well as RT-
PCR, demonstrating strong concordance between predicted and actual pri-miRNA
structures. Additionally, mature miRNAs are highly conserved and we reasoned that
their gene structures would tend to be conserved as well. Indeed, in cases where
orthologous pri-miRNAs were annotated in human and mouse, we frequently found
similar gene structures and promoter locations. Overall, these findings support the
reliability of these new pri-miRNA assemblies.
This new map of pri-miRNA structure has revealed previously unrecognized potential
regulatory mechanisms for many miRNAs. In particular, we found that alternative
promoter usage is a frequent feature of miRNA genes, underscoring the need for a
thorough understanding of a given miRNA transcription unit to fully dissect its cis- and
trans-regulation. Unexpectedly, we also found several examples of pri-miRNAs that are
contiguous with downstream protein-coding genes, suggesting possible coordinated
expression. In light of these findings, it will be interesting to investigate whether the
63
miRNAs and proteins encoded by these linked transcripts function within or control
common cellular or developmental pathways. In addition, analysis of pri-miRNAs
spanning polycistronic clusters revealed that these miRNAs are not always co-
transcribed, even in cases where the clustered organization is deeply conserved, such
as the miRNA cluster that encodes miR-100, let-7a-2, and miR-125b-1. These results
indicate that expression of these apparently linked miRNAs may be uncoupled in some
settings. Finally, our data confirm previous analyses that identified miRNAs that span
splice-sites (Melamed et al., 2013), supporting a role for alternative splicing in regulating
the expression of specific miRNAs.
In summary, our results highlight the importance of precise annotation of miRNA gene
structures, provide assemblies for a large majority of human and mouse pri-miRNAs,
and offer an experimental framework for further reconstruction of the remaining pri-
miRNAs yet-to-be described. We anticipate that these annotations will be highly
valuable for ongoing efforts to dissect mechanisms of miRNA regulation in diverse
biological settings.
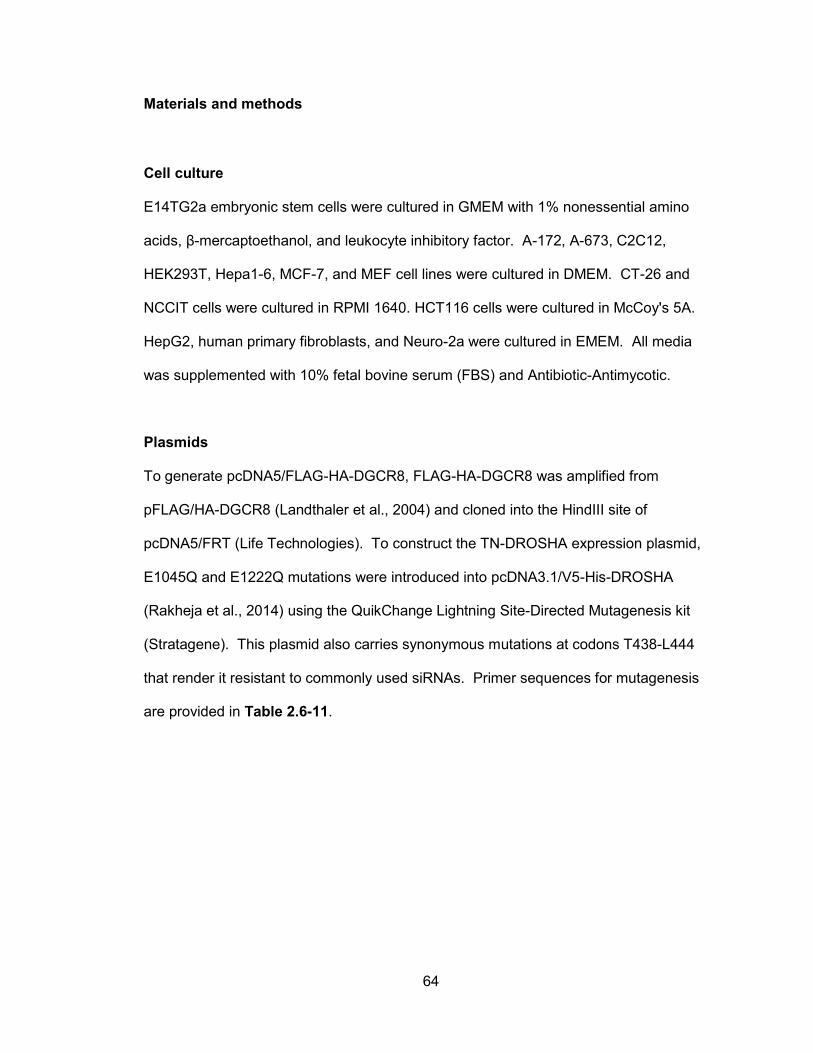
64
Materials and methods
Cell culture
E14TG2a embryonic stem cells were cultured in GMEM with 1% nonessential amino
acids, β-mercaptoethanol, and leukocyte inhibitory factor. A-172, A-673, C2C12,
HEK293T, Hepa1-6, MCF-7, and MEF cell lines were cultured in DMEM. CT-26 and
NCCIT cells were cultured in RPMI 1640. HCT116 cells were cultured in McCoy's 5A.
HepG2, human primary fibroblasts, and Neuro-2a were cultured in EMEM. All media
was supplemented with 10% fetal bovine serum (FBS) and Antibiotic-Antimycotic.
Plasmids
To generate pcDNA5/FLAG-HA-DGCR8, FLAG-HA-DGCR8 was amplified from
pFLAG/HA-DGCR8 (Landthaler et al., 2004) and cloned into the HindIII site of
pcDNA5/FRT (Life Technologies). To construct the TN-DROSHA expression plasmid,
E1045Q and E1222Q mutations were introduced into pcDNA3.1/V5-His-DROSHA
(Rakheja et al., 2014) using the QuikChange Lightning Site-Directed Mutagenesis kit
(Stratagene). This plasmid also carries synonymous mutations at codons T438-L444
that render it resistant to commonly used siRNAs. Primer sequences for mutagenesis
are provided in Table 2.6-11.
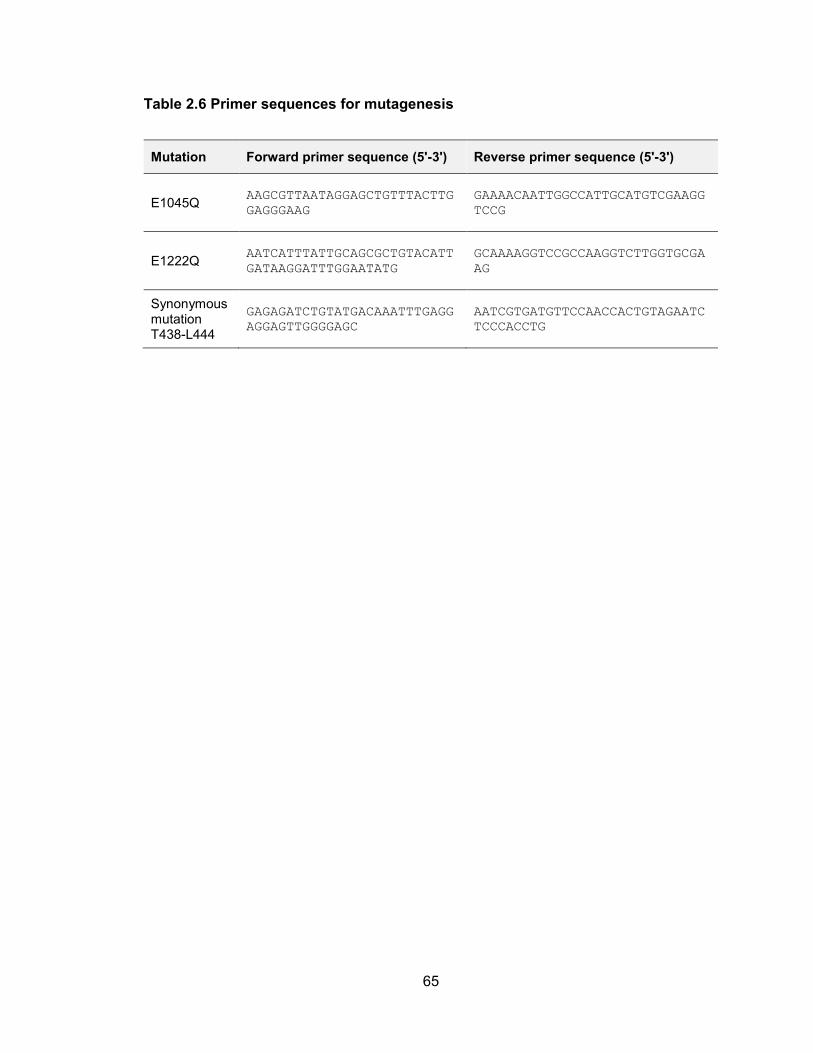
65
Table 2.6 Primer sequences for mutagenesis
Mutation Forward primer sequence (5'-3') Reverse primer sequence (5'-3')
E1045Q AAGCGTTAATAGGAGCTGTTTACTTG
GAGGGAAG
GAAAACAATTGGCCATTGCATGTCGAAGG
TCCG
E1222Q AATCATTTATTGCAGCGCTGTACATT
GATAAGGATTTGGAATATG
GCAAAAGGTCCGCCAAGGTCTTGGTGCGA
AG
Synonymous mutation T438-L444
GAGAGATCTGTATGACAAATTTGAGG
AGGAGTTGGGGAGC
AATCGTGATGTTCCAACCACTGTAGAATC
TCCCACCTG
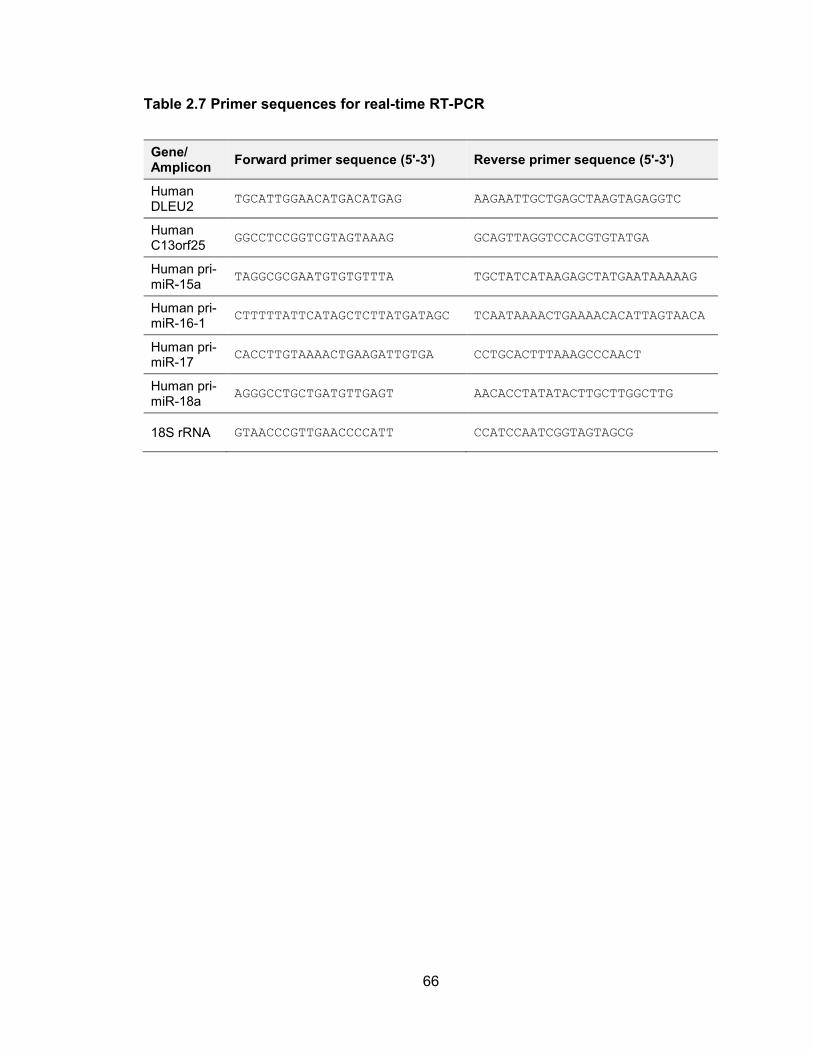
66
Table 2.7 Primer sequences for real-time RT-PCR
Gene/ Amplicon
Forward primer sequence (5'-3') Reverse primer sequence (5'-3')
Human DLEU2
TGCATTGGAACATGACATGAG AAGAATTGCTGAGCTAAGTAGAGGTC
Human C13orf25
GGCCTCCGGTCGTAGTAAAG GCAGTTAGGTCCACGTGTATGA
Human pri-miR-15a
TAGGCGCGAATGTGTGTTTA TGCTATCATAAGAGCTATGAATAAAAAG
Human pri-miR-16-1
CTTTTTATTCATAGCTCTTATGATAGC TCAATAAAACTGAAAACACATTAGTAACA
Human pri-miR-17
CACCTTGTAAAACTGAAGATTGTGA CCTGCACTTTAAAGCCCAACT
Human pri-miR-18a
AGGGCCTGCTGATGTTGAGT AACACCTATATACTTGCTTGGCTTG
18S rRNA GTAACCCGTTGAACCCCATT CCATCCAATCGGTAGTAGCG
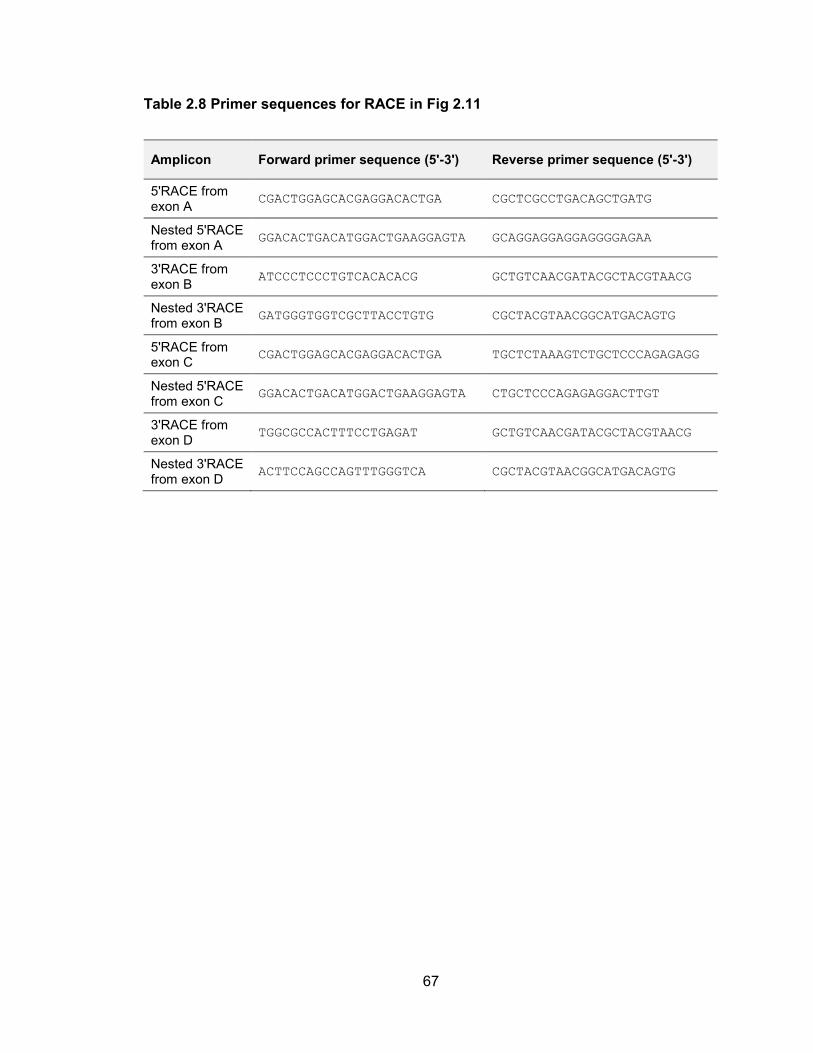
67
Table 2.8 Primer sequences for RACE in Fig 2.11
Amplicon Forward primer sequence (5'-3') Reverse primer sequence (5'-3')
5'RACE from exon A
CGACTGGAGCACGAGGACACTGA CGCTCGCCTGACAGCTGATG
Nested 5'RACE from exon A
GGACACTGACATGGACTGAAGGAGTA GCAGGAGGAGGAGGGGAGAA
3'RACE from exon B
ATCCCTCCCTGTCACACACG GCTGTCAACGATACGCTACGTAACG
Nested 3'RACE from exon B
GATGGGTGGTCGCTTACCTGTG CGCTACGTAACGGCATGACAGTG
5'RACE from exon C
CGACTGGAGCACGAGGACACTGA TGCTCTAAAGTCTGCTCCCAGAGAGG
Nested 5'RACE from exon C
GGACACTGACATGGACTGAAGGAGTA CTGCTCCCAGAGAGGACTTGT
3'RACE from exon D
TGGCGCCACTTTCCTGAGAT GCTGTCAACGATACGCTACGTAACG
Nested 3'RACE from exon D
ACTTCCAGCCAGTTTGGGTCA CGCTACGTAACGGCATGACAGTG
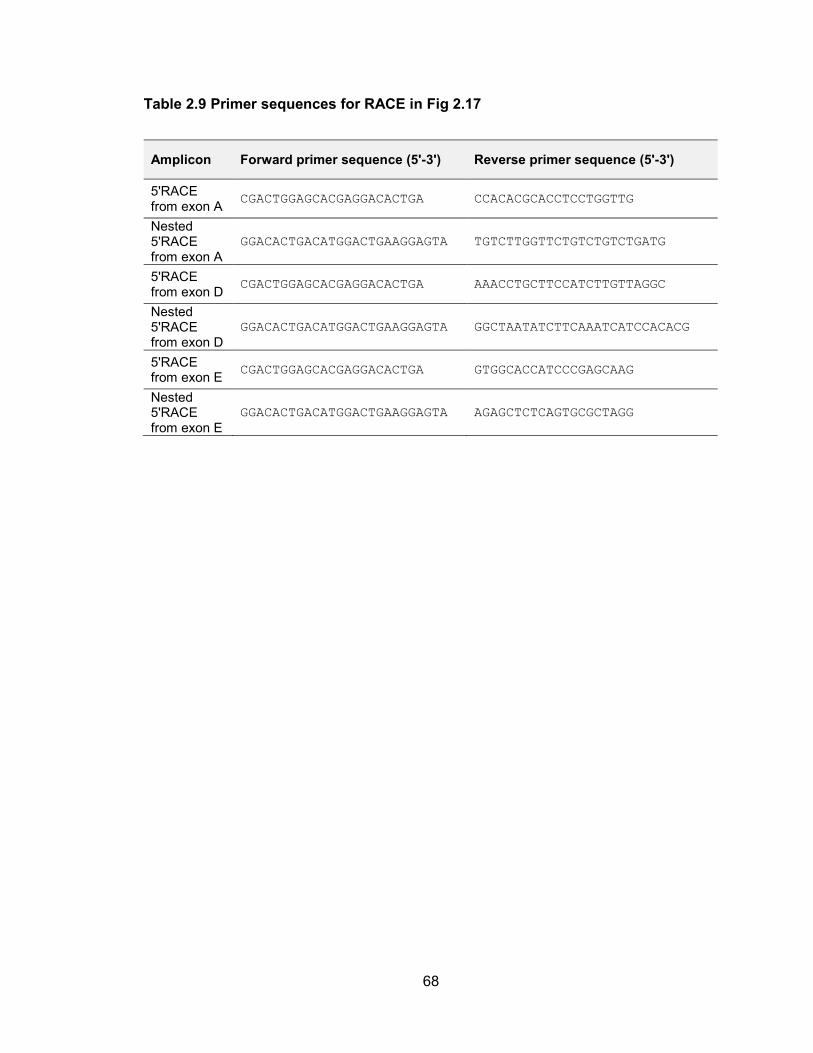
68
Table 2.9 Primer sequences for RACE in Fig 2.17
Amplicon Forward primer sequence (5'-3') Reverse primer sequence (5'-3')
5'RACE from exon A
CGACTGGAGCACGAGGACACTGA CCACACGCACCTCCTGGTTG
Nested 5'RACE from exon A
GGACACTGACATGGACTGAAGGAGTA TGTCTTGGTTCTGTCTGTCTGATG
5'RACE from exon D
CGACTGGAGCACGAGGACACTGA AAACCTGCTTCCATCTTGTTAGGC
Nested 5'RACE from exon D
GGACACTGACATGGACTGAAGGAGTA GGCTAATATCTTCAAATCATCCACACG
5'RACE from exon E
CGACTGGAGCACGAGGACACTGA GTGGCACCATCCCGAGCAAG
Nested 5'RACE from exon E
GGACACTGACATGGACTGAAGGAGTA AGAGCTCTCAGTGCGCTAGG
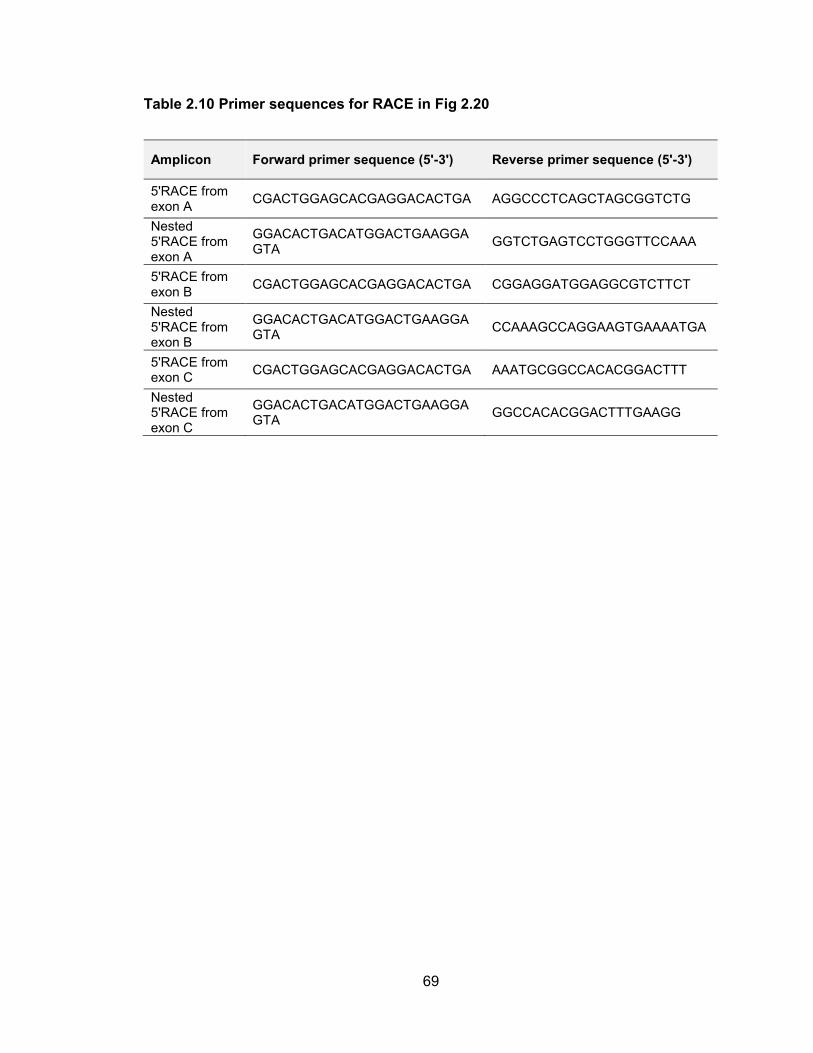
69
Table 2.10 Primer sequences for RACE in Fig 2.20
Amplicon Forward primer sequence (5'-3') Reverse primer sequence (5'-3')
5'RACE from exon A
CGACTGGAGCACGAGGACACTGA AGGCCCTCAGCTAGCGGTCTG
Nested 5'RACE from exon A
GGACACTGACATGGACTGAAGGAGTA
GGTCTGAGTCCTGGGTTCCAAA
5'RACE from exon B
CGACTGGAGCACGAGGACACTGA CGGAGGATGGAGGCGTCTTCT
Nested 5'RACE from exon B
GGACACTGACATGGACTGAAGGAGTA
CCAAAGCCAGGAAGTGAAAATGA
5'RACE from exon C
CGACTGGAGCACGAGGACACTGA AAATGCGGCCACACGGACTTT
Nested 5'RACE from exon C
GGACACTGACATGGACTGAAGGAGTA
GGCCACACGGACTTTGAAGG
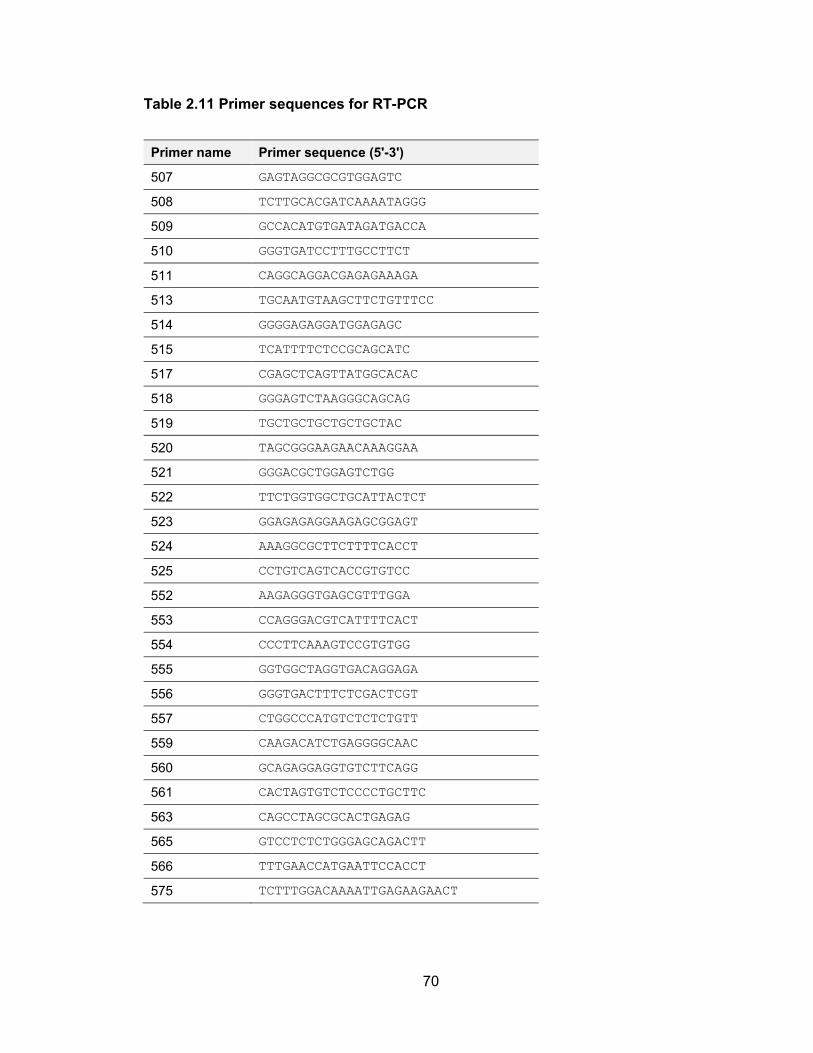
70
Table 2.11 Primer sequences for RT-PCR
Primer name Primer sequence (5'-3')
507 GAGTAGGCGCGTGGAGTC
508 TCTTGCACGATCAAAATAGGG
509 GCCACATGTGATAGATGACCA
510 GGGTGATCCTTTGCCTTCT
511 CAGGCAGGACGAGAGAAAGA
513 TGCAATGTAAGCTTCTGTTTCC
514 GGGGAGAGGATGGAGAGC
515 TCATTTTCTCCGCAGCATC
517 CGAGCTCAGTTATGGCACAC
518 GGGAGTCTAAGGGCAGCAG
519 TGCTGCTGCTGCTGCTAC
520 TAGCGGGAAGAACAAAGGAA
521 GGGACGCTGGAGTCTGG
522 TTCTGGTGGCTGCATTACTCT
523 GGAGAGAGGAAGAGCGGAGT
524 AAAGGCGCTTCTTTTCACCT
525 CCTGTCAGTCACCGTGTCC
552 AAGAGGGTGAGCGTTTGGA
553 CCAGGGACGTCATTTTCACT
554 CCCTTCAAAGTCCGTGTGG
555 GGTGGCTAGGTGACAGGAGA
556 GGGTGACTTTCTCGACTCGT
557 CTGGCCCATGTCTCTCTGTT
559 CAAGACATCTGAGGGGCAAC
560 GCAGAGGAGGTGTCTTCAGG
561 CACTAGTGTCTCCCCTGCTTC
563 CAGCCTAGCGCACTGAGAG
565 GTCCTCTCTGGGAGCAGACTT
566 TTTGAACCATGAATTCCACCT
575 TCTTTGGACAAAATTGAGAAGAACT
71
RNA preparation
Cells were co-transfected with pcDNA3.1/V5-His-TN-DROSHA and pcDNA5/FLAG-HA-
DGCR8 under optimized conditions (Table 2.7), and harvested 48 h after transfection.
To isolate nuclear RNA, cells were lysed on ice for 5 min in 10 mM Tris-HCl pH 7.5, 10
mM NaCl, 0.2 mM EDTA, 0.05% NP-40, and nuclei were spun at 2500 xg for 3 min and
then resuspended in QIAzol for RNA isolation using miRNeasy kit with DNase I digestion
according to the manufacturer’s instructions (Qiagen).
RT-PCR, qPCR, and RACE
RNA was reverse-transcribed using the QuantiTect Reverse Transcription Kit (Qiagen)
prior to PCR amplification. qPCR was performed using an ABI 7900HT Sequence
Detection System with the SYBR Green PCR core reagent kit (Life Technologies).
Eukaryotic 18S rRNA endogenous control (Life Technologies) was used as an internal
standard. RACE was performed using the GeneRacer kit (Life Technologies). Primer
sequences are provided in Table S6.
RNA-seq library preparation and sequencing
RNA-seq libraries were generated using the Illumina TruSeq RNA Sample Preparation
Kit v2 according to the manufacturer’s protocol, and sequenced in one lane of a HiSeq
2000 using the 100 bp paired-end protocol.
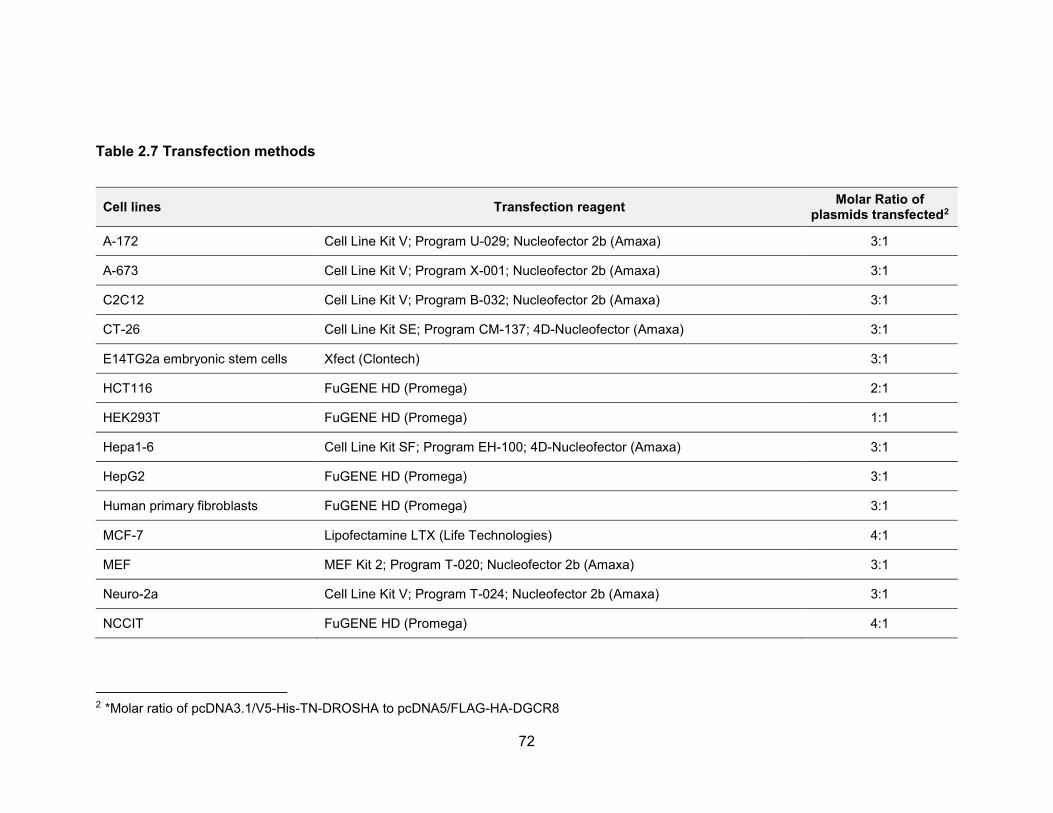
72
Table 2.7 Transfection methods
Cell lines Transfection reagent Molar Ratio of
plasmids transfected2
A-172 Cell Line Kit V; Program U-029; Nucleofector 2b (Amaxa) 3:1
A-673 Cell Line Kit V; Program X-001; Nucleofector 2b (Amaxa) 3:1
C2C12 Cell Line Kit V; Program B-032; Nucleofector 2b (Amaxa) 3:1
CT-26 Cell Line Kit SE; Program CM-137; 4D-Nucleofector (Amaxa) 3:1
E14TG2a embryonic stem cells Xfect (Clontech) 3:1
HCT116 FuGENE HD (Promega) 2:1
HEK293T FuGENE HD (Promega) 1:1
Hepa1-6 Cell Line Kit SF; Program EH-100; 4D-Nucleofector (Amaxa) 3:1
HepG2 FuGENE HD (Promega) 3:1
Human primary fibroblasts FuGENE HD (Promega) 3:1
MCF-7 Lipofectamine LTX (Life Technologies) 4:1
MEF MEF Kit 2; Program T-020; Nucleofector 2b (Amaxa) 3:1
Neuro-2a Cell Line Kit V; Program T-024; Nucleofector 2b (Amaxa) 3:1
NCCIT FuGENE HD (Promega) 4:1
2 *Molar ratio of pcDNA3.1/V5-His-TN-DROSHA to pcDNA5/FLAG-HA-DGCR8
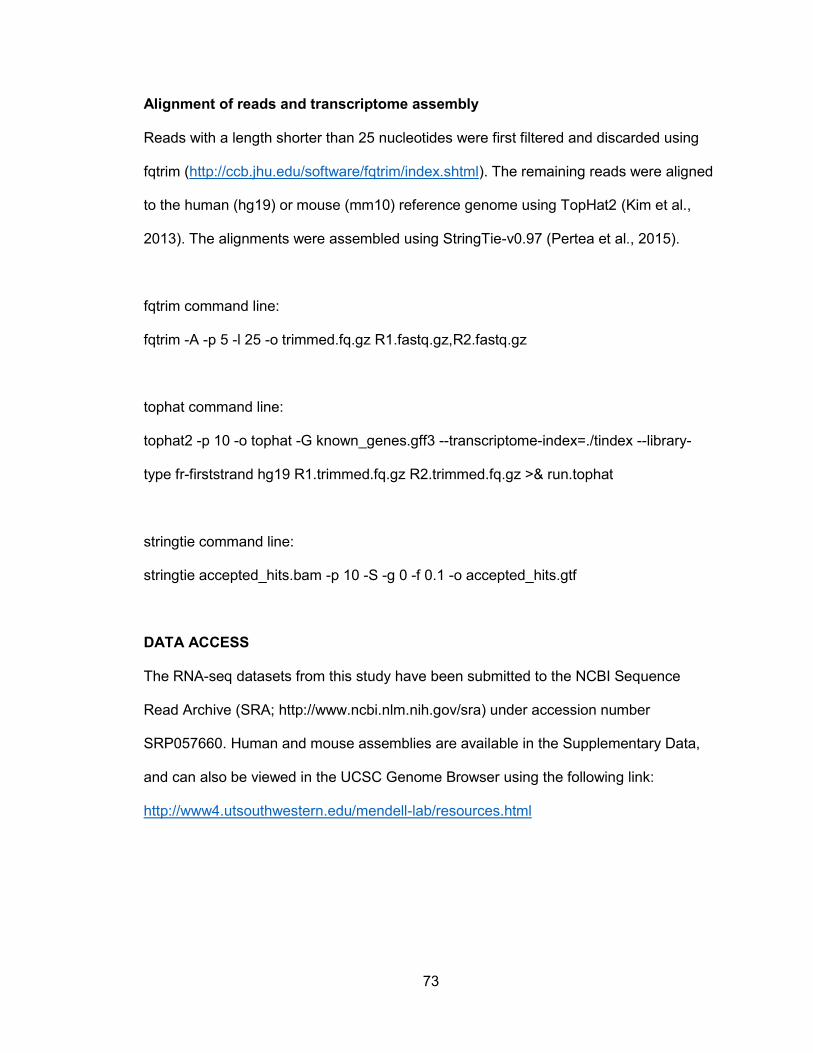
73
Alignment of reads and transcriptome assembly
Reads with a length shorter than 25 nucleotides were first filtered and discarded using
fqtrim (http://ccb.jhu.edu/software/fqtrim/index.shtml). The remaining reads were aligned
to the human (hg19) or mouse (mm10) reference genome using TopHat2 (Kim et al.,
2013). The alignments were assembled using StringTie-v0.97 (Pertea et al., 2015).
fqtrim command line:
fqtrim -A -p 5 -l 25 -o trimmed.fq.gz R1.fastq.gz,R2.fastq.gz
tophat command line:
tophat2 -p 10 -o tophat -G known_genes.gff3 --transcriptome-index=./tindex --library-
type fr-firststrand hg19 R1.trimmed.fq.gz R2.trimmed.fq.gz >& run.tophat
stringtie command line:
stringtie accepted_hits.bam -p 10 -S -g 0 -f 0.1 -o accepted_hits.gtf
DATA ACCESS
The RNA-seq datasets from this study have been submitted to the NCBI Sequence
Read Archive (SRA; http://www.ncbi.nlm.nih.gov/sra) under accession number
SRP057660. Human and mouse assemblies are available in the Supplementary Data,
and can also be viewed in the UCSC Genome Browser using the following link:
http://www4.utsouthwestern.edu/mendell-lab/resources.html
74
Chapter 3: Characterization and loss of function study of a
human long noncoding RNA induced by DNA damage, NORAD
Introduction
A large body of evidence has demonstrated that eukaryotic genomes are extensively
transcribed outside of protein-coding genes (Djebali et al., 2012). Among non-protein
coding transcripts are a class referred to as long noncoding RNAs, or lncRNAs, which
have attracted significant attention due to their emerging functions in development and
disease (Fatica and Bozzoni, 2014; Li and Chang, 2014). lncRNAs represent a
heterogeneous family of RNAs that are defined by a length of greater than 200
nucleotides and by the lack of any detectable open reading frame (ORF). The exact
number of lncRNAs encoded in the human genome is a matter of debate, but most
estimates place the number in the tens of thousands (Ulitsky and Bartel, 2013; Iyer et
75
al., 2015). The biological roles and molecular functions of the overwhelming majority of
these transcripts remain unexplored or elusive.
Compared to other known noncoding RNA classes, lncRNAs stand out due to their
enormous diversity with respect to evolutionary conservation, expression level,
molecular function, and cellular localization (Ulitsky and Bartel, 2013). In the nucleus,
lncRNAs such as XIST, HOTAIR, and HOTTIP have been shown to regulate gene
expression at the transcriptional level in cis or trans by associating with and directing the
activity of chromatin remodeling complexes (Rinn and Chang, 2012). Other types of
nuclear lncRNAs organize subnuclear structure, including Firre, which mediates
interchromosomal interactions (Hacisuleyman et al., 2014), and NEAT1, which is
essential for paraspeckle formation (Clemson et al., 2009). Cytoplasmic lncRNAs, in
contrast, have been shown to post-transcriptionally regulate gene expression by base
pairing with target mRNAs. lncRNA:mRNA interactions can result in target stabilization,
as is the case for the noncoding RNAs BACE1-AS and TINCR (Faghihi et al., 2008;
Kretz et al., 2013), whereas other noncoding RNAs such as1/2sbsRNA can trigger target
mRNA degradation (Gong and Maquat, 2011). LncRNAs may also modulate the activity
of interacting proteins in the cytoplasm (Liu et al., 2015; Kino et al., 2010). Despite
these well-characterized examples, studies of lncRNA function are still at an early stage.
Due to their generally low abundance and modest evolutionary conservation relative to
protein-coding genes (Cabili et al., 2011; Ulitsky and Bartel, 2013), it has been
suggested that a large fraction of lncRNAs represent products of promiscuous
transcription rather than independently functional RNAs (Struhl, 2007). To resolve this
issue, detailed functional studies, including the use of genetic loss-of-function

76
approaches, are needed to establish the biological role and molecular activity of putative
lncRNAs of interest.
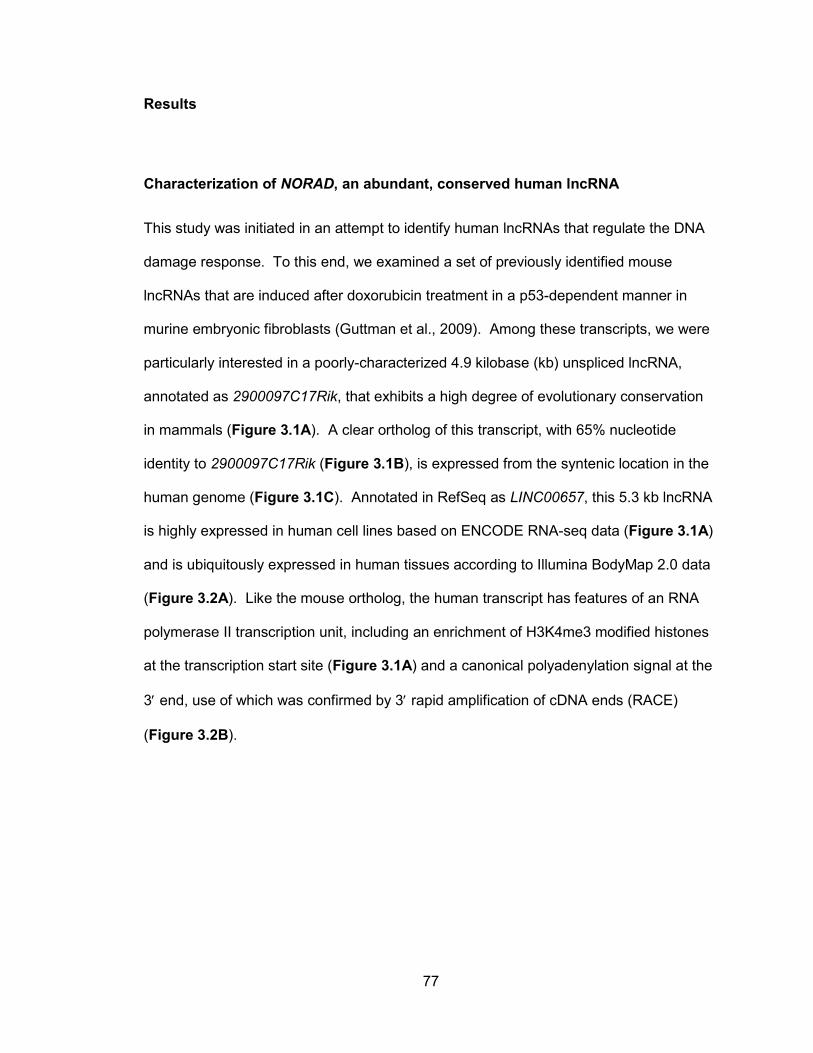
77
Results
Characterization of NORAD, an abundant, conserved human lncRNA
This study was initiated in an attempt to identify human lncRNAs that regulate the DNA
damage response. To this end, we examined a set of previously identified mouse
lncRNAs that are induced after doxorubicin treatment in a p53-dependent manner in
murine embryonic fibroblasts (Guttman et al., 2009). Among these transcripts, we were
particularly interested in a poorly-characterized 4.9 kilobase (kb) unspliced lncRNA,
annotated as 2900097C17Rik, that exhibits a high degree of evolutionary conservation
in mammals (Figure 3.1A). A clear ortholog of this transcript, with 65% nucleotide
identity to 2900097C17Rik (Figure 3.1B), is expressed from the syntenic location in the
human genome (Figure 3.1C). Annotated in RefSeq as LINC00657, this 5.3 kb lncRNA
is highly expressed in human cell lines based on ENCODE RNA-seq data (Figure 3.1A)
and is ubiquitously expressed in human tissues according to Illumina BodyMap 2.0 data
(Figure 3.2A). Like the mouse ortholog, the human transcript has features of an RNA
polymerase II transcription unit, including an enrichment of H3K4me3 modified histones
at the transcription start site (Figure 3.1A) and a canonical polyadenylation signal at the
3 end, use of which was confirmed by 3 rapid amplification of cDNA ends (RACE)
(Figure 3.2B).
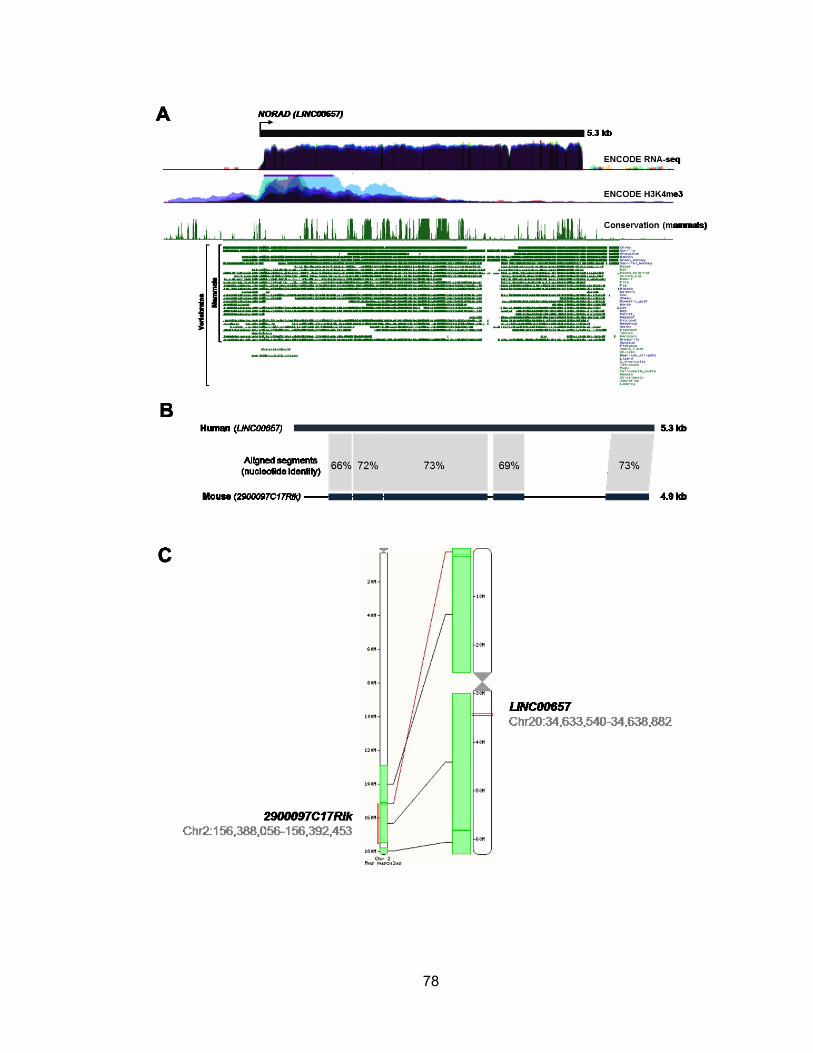
78
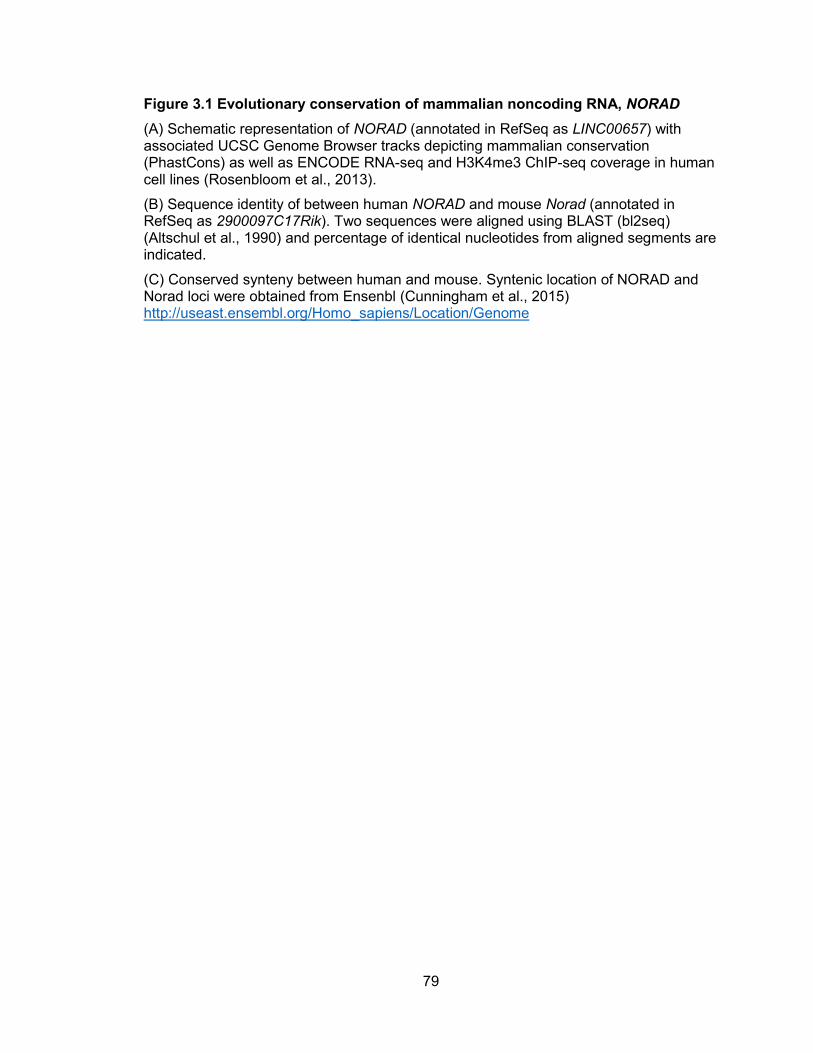
79
Figure 3.1 Evolutionary conservation of mammalian noncoding RNA, NORAD
(A) Schematic representation of NORAD (annotated in RefSeq as LINC00657) with associated UCSC Genome Browser tracks depicting mammalian conservation (PhastCons) as well as ENCODE RNA-seq and H3K4me3 ChIP-seq coverage in human cell lines (Rosenbloom et al., 2013).
(B) Sequence identity of between human NORAD and mouse Norad (annotated in RefSeq as 2900097C17Rik). Two sequences were aligned using BLAST (bl2seq) (Altschul et al., 1990) and percentage of identical nucleotides from aligned segments are indicated.
(C) Conserved synteny between human and mouse. Syntenic location of NORAD and Norad loci were obtained from Ensenbl (Cunningham et al., 2015) http://useast.ensembl.org/Homo_sapiens/Location/Genome
80
Figure 3.2 NORAD expression in human tissues
(A) Illumina BodyMap 2.0 1X75bp RNA-seq data were downloaded from The Galaxy Project (https://usegalaxy.org/library/index), aligned to hg19 using Tophat2 (Trapnell et al., 2009), and FPKM values were calculated using Cufflinks (Trapnell et al., 2010).
(B) Major polyadenylation site at the 3 end of NORAD identified by 3 RACE.
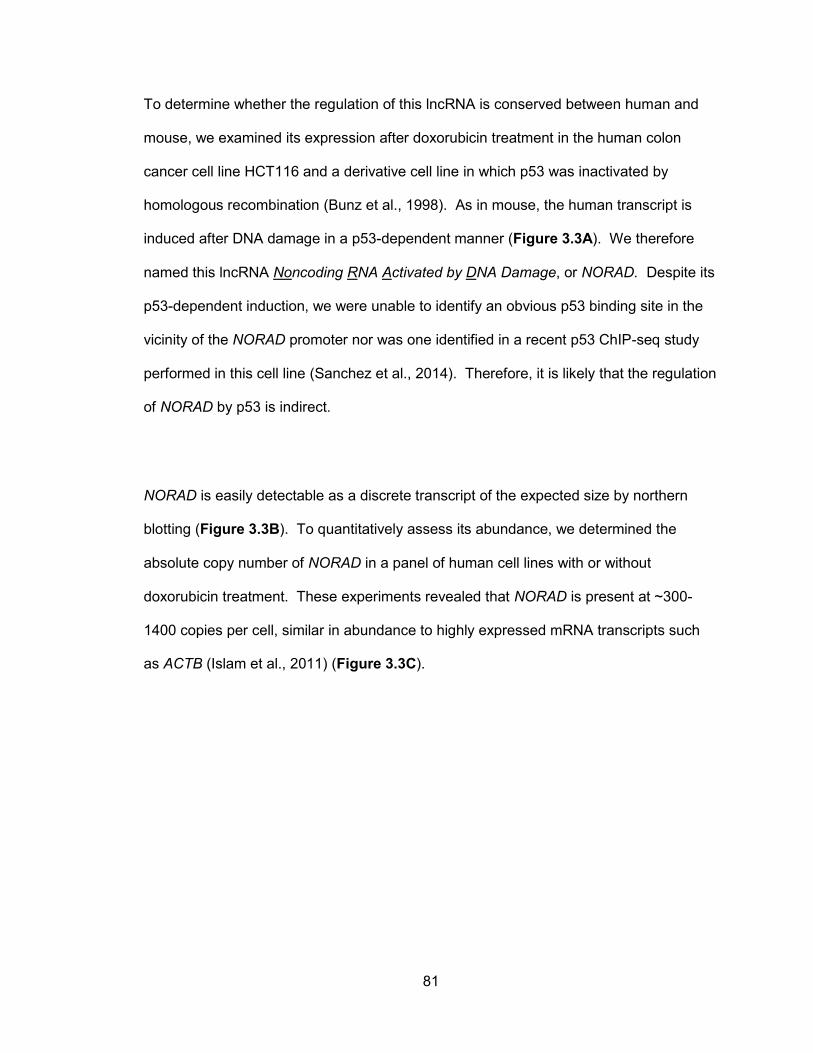
81
To determine whether the regulation of this lncRNA is conserved between human and
mouse, we examined its expression after doxorubicin treatment in the human colon
cancer cell line HCT116 and a derivative cell line in which p53 was inactivated by
homologous recombination (Bunz et al., 1998). As in mouse, the human transcript is
induced after DNA damage in a p53-dependent manner (Figure 3.3A). We therefore
named this lncRNA Noncoding RNA Activated by DNA Damage, or NORAD. Despite its
p53-dependent induction, we were unable to identify an obvious p53 binding site in the
vicinity of the NORAD promoter nor was one identified in a recent p53 ChIP-seq study
performed in this cell line (Sanchez et al., 2014). Therefore, it is likely that the regulation
of NORAD by p53 is indirect.
NORAD is easily detectable as a discrete transcript of the expected size by northern
blotting (Figure 3.3B). To quantitatively assess its abundance, we determined the
absolute copy number of NORAD in a panel of human cell lines with or without
doxorubicin treatment. These experiments revealed that NORAD is present at ~300-
1400 copies per cell, similar in abundance to highly expressed mRNA transcripts such
as ACTB (Islam et al., 2011) (Figure 3.3C).
82
Figure 3.3 NORAD is induced by DNA damage and expressed abundantly in multiple human cell lines
(A) qRT-PCR analysis of NORAD expression relative to 18S rRNA in p53+/+ and p53−/−
HCT116 cells with or without treatment with 1 M doxorubicin for 24 hours. For this and all subsequent qPCR figures, error bars represent standard deviations from 3 independent measurements. (B) Northern blot analysis of NORAD expression in total RNA in HCT116 cells. (C) Absolute quantification of NORAD transcript copy number per cell, determined by qRT-24 hours.
83
Because annotated lncRNAs may encode conserved peptides (Anderson et al., 2015;
Bazzini et al., 2014), we examined the coding potential of NORAD using PhyloCSF,
which has been widely used to discriminate protein coding from noncoding transcripts
based on their evolutionary signatures (Lin et al., 2011). This analysis confirmed the
absence of a detectable conserved open reading frame (ORF) in the NORAD transcript,
with the highest scoring ORF receiving a codon substitution frequency (CSF) value
similar to other well characterized lncRNAs such as NEAT1 and XIST (Figure 3.4).
NORAD also lacks the potential to encode any recognizable protein domains, based on
a BLASTX analysis of all possible reading frames throughout the transcript. These
results support a noncoding function for NORAD. Based on these findings that
established NORAD as a highly conserved, ubiquitously expressed, abundant lncRNA,
we set out to investigate its functions in human cells.
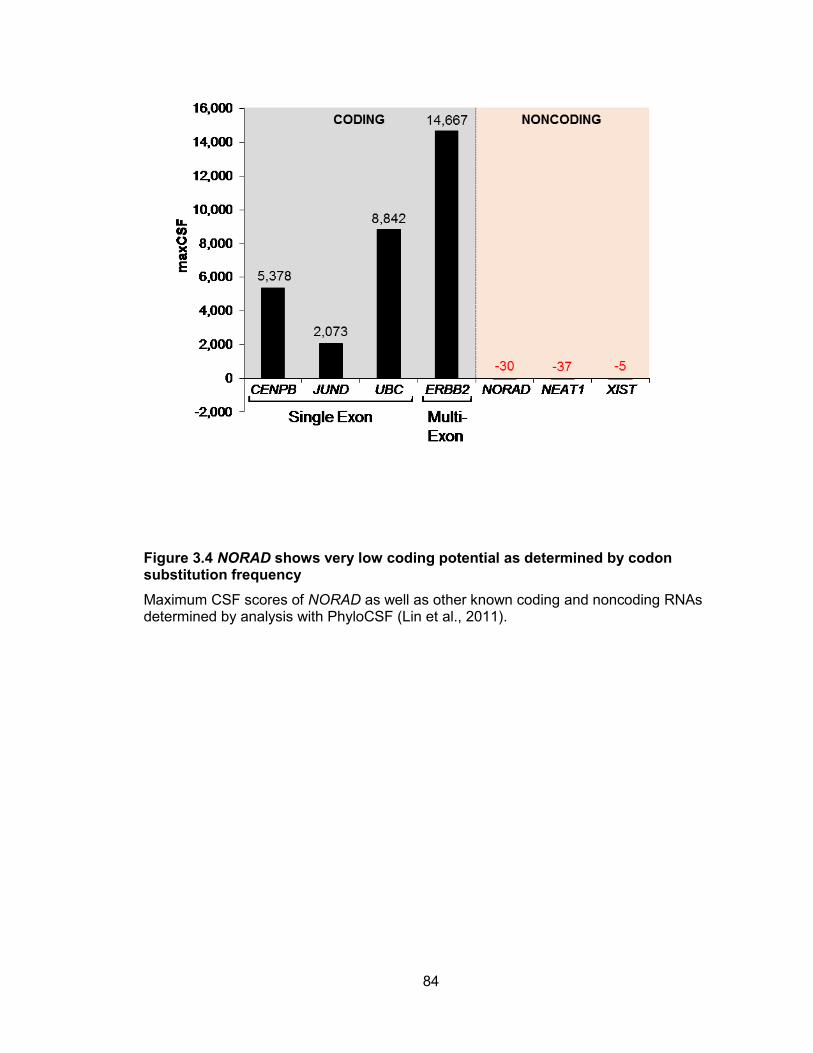
84
Figure 3.4 NORAD shows very low coding potential as determined by codon substitution frequency
Maximum CSF scores of NORAD as well as other known coding and noncoding RNAs determined by analysis with PhyloCSF (Lin et al., 2011).
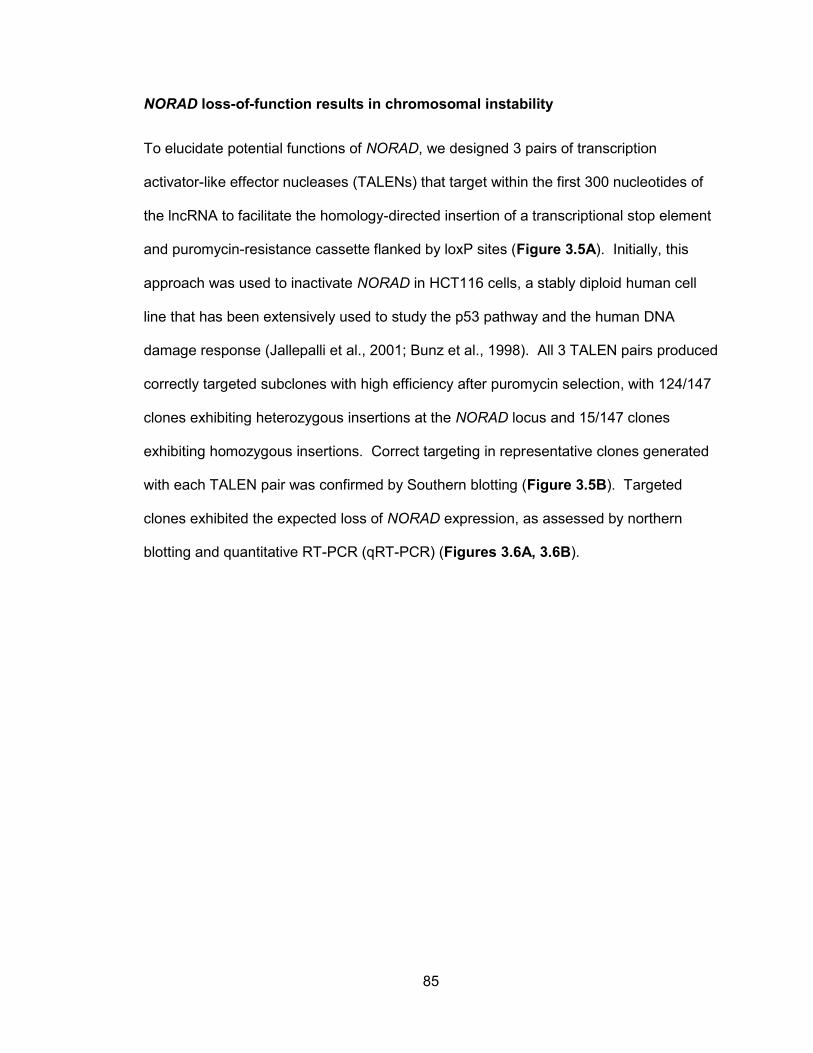
85
NORAD loss-of-function results in chromosomal instability
To elucidate potential functions of NORAD, we designed 3 pairs of transcription
activator-like effector nucleases (TALENs) that target within the first 300 nucleotides of
the lncRNA to facilitate the homology-directed insertion of a transcriptional stop element
and puromycin-resistance cassette flanked by loxP sites (Figure 3.5A). Initially, this
approach was used to inactivate NORAD in HCT116 cells, a stably diploid human cell
line that has been extensively used to study the p53 pathway and the human DNA
damage response (Jallepalli et al., 2001; Bunz et al., 1998). All 3 TALEN pairs produced
correctly targeted subclones with high efficiency after puromycin selection, with 124/147
clones exhibiting heterozygous insertions at the NORAD locus and 15/147 clones
exhibiting homozygous insertions. Correct targeting in representative clones generated
with each TALEN pair was confirmed by Southern blotting (Figure 3.5B). Targeted
clones exhibited the expected loss of NORAD expression, as assessed by northern
blotting and quantitative RT-PCR (qRT-PCR) (Figures 3.6A, 3.6B).
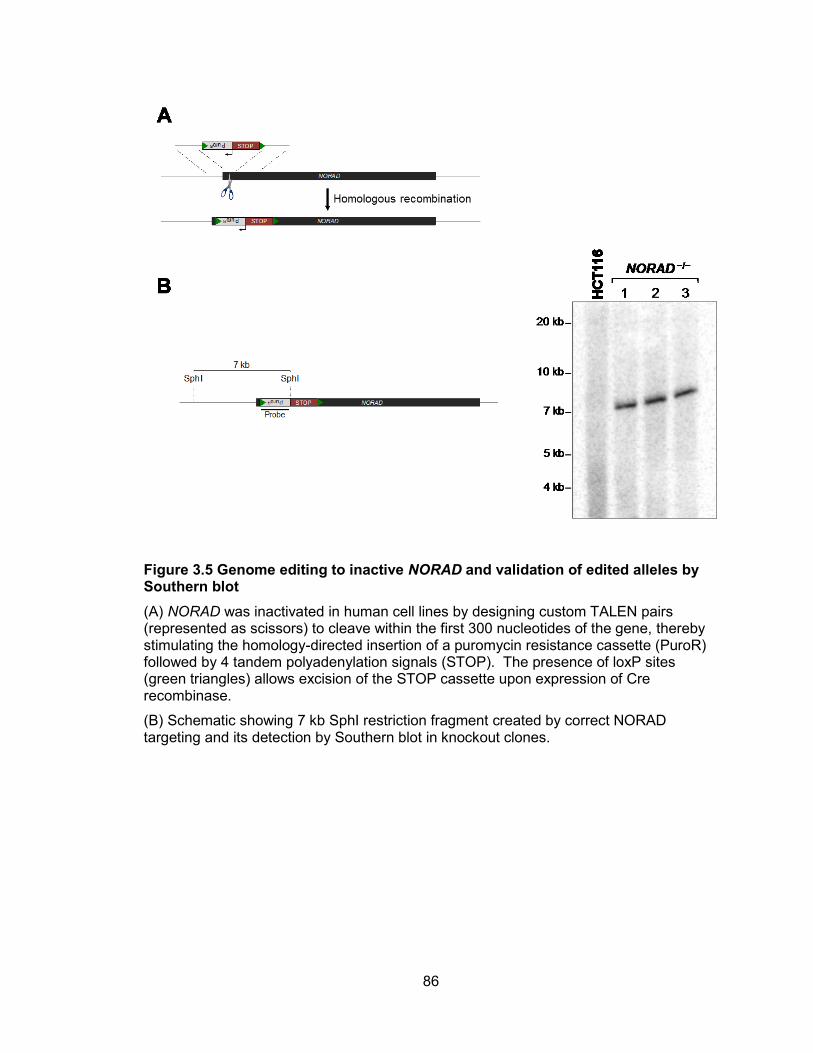
86
Figure 3.5 Genome editing to inactive NORAD and validation of edited alleles by Southern blot
(A) NORAD was inactivated in human cell lines by designing custom TALEN pairs (represented as scissors) to cleave within the first 300 nucleotides of the gene, thereby stimulating the homology-directed insertion of a puromycin resistance cassette (PuroR) followed by 4 tandem polyadenylation signals (STOP). The presence of loxP sites (green triangles) allows excision of the STOP cassette upon expression of Cre recombinase.
(B) Schematic showing 7 kb SphI restriction fragment created by correct NORAD targeting and its detection by Southern blot in knockout clones.
87
Figure 3.6 Validation of NORAD targeting in HCT116 cells
(A) Northern blot analysis of NORAD in HCT116 clones of the indicated genotypes.
(B) qRT-PCR analysis of NORAD expression relative to 18S rRNA in targeted HCT116 clones of the indicated genotypes.
88
Because NORAD is upregulated after DNA damage, we first determined whether the
DNA damage-activated cell cycle checkpoints are intact in NORAD−/− cells. HCT116
cells undergo a well-documented p53-dependent G1 and G2 arrest after treatment with
doxorubicin or ionizing radiation (Bunz et al., 1998). We observed no consistent defect
in either the G1 or G2 checkpoints in independent NORAD−/− clones (Figure 3.7),
indicating that NORAD is not required for these aspects of the DNA damage response.
These analyses rely upon flow cytometric measurements of DNA content as cells
progress through the cell cycle. Unexpectedly, these assays revealed that 2/15
NORAD−/− clones appeared to have stably tetraploid DNA content (Figure 3.8A). These
findings were confirmed by examining metaphase chromosome spreads. Wild-type
HCT116 cells uniformly had 45 chromosomes, consistent with the reported karyotype
(Masramon et al., 2000) (Figure 3.8B). In contrast, tetraploid NORAD−/− cells had
variable chromosome numbers, with DNA content approaching 4N. As described below,
our subsequent experiments have demonstrated that the spontaneous generation of
tetraploid HCT116 subclones is exceedingly rare and we have never observed stable
tetraploidization of these cells without NORAD inactivation, despite the analysis of over
100 subclones produced after control manipulations. Even apparently diploid NORAD−/−
clones displayed a range of chromosome numbers (Figure 3.8B), suggesting that this
karyotypically-stable cell line had adopted a chromosomal instability (CIN) phenotype,
defined as the frequent loss or gain of whole chromosomes (Geigl et al., 2008).
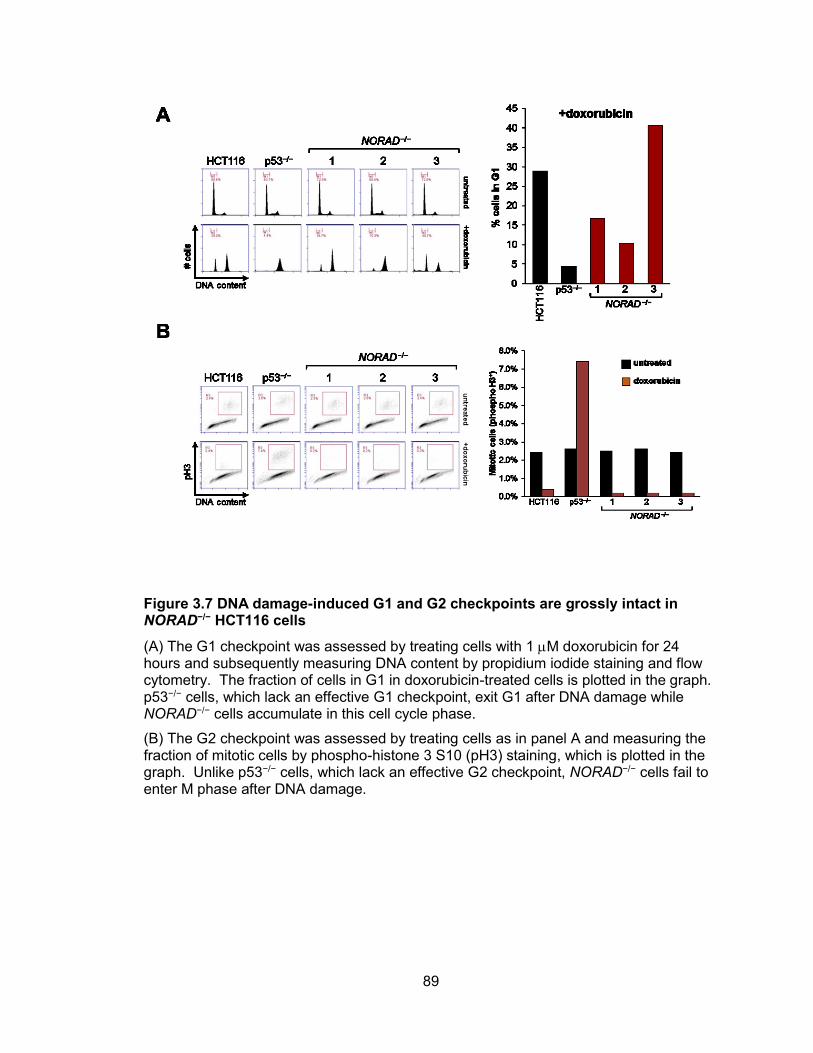
89
Figure 3.7 DNA damage-induced G1 and G2 checkpoints are grossly intact in NORAD−/− HCT116 cells
(A) The G1 checkpoint was assessed by treating cells with 1 M doxorubicin for 24 hours and subsequently measuring DNA content by propidium iodide staining and flow cytometry. The fraction of cells in G1 in doxorubicin-treated cells is plotted in the graph. p53−/− cells, which lack an effective G1 checkpoint, exit G1 after DNA damage while NORAD−/− cells accumulate in this cell cycle phase.
(B) The G2 checkpoint was assessed by treating cells as in panel A and measuring the fraction of mitotic cells by phospho-histone 3 S10 (pH3) staining, which is plotted in the graph. Unlike p53−/− cells, which lack an effective G2 checkpoint, NORAD−/− cells fail to enter M phase after DNA damage.
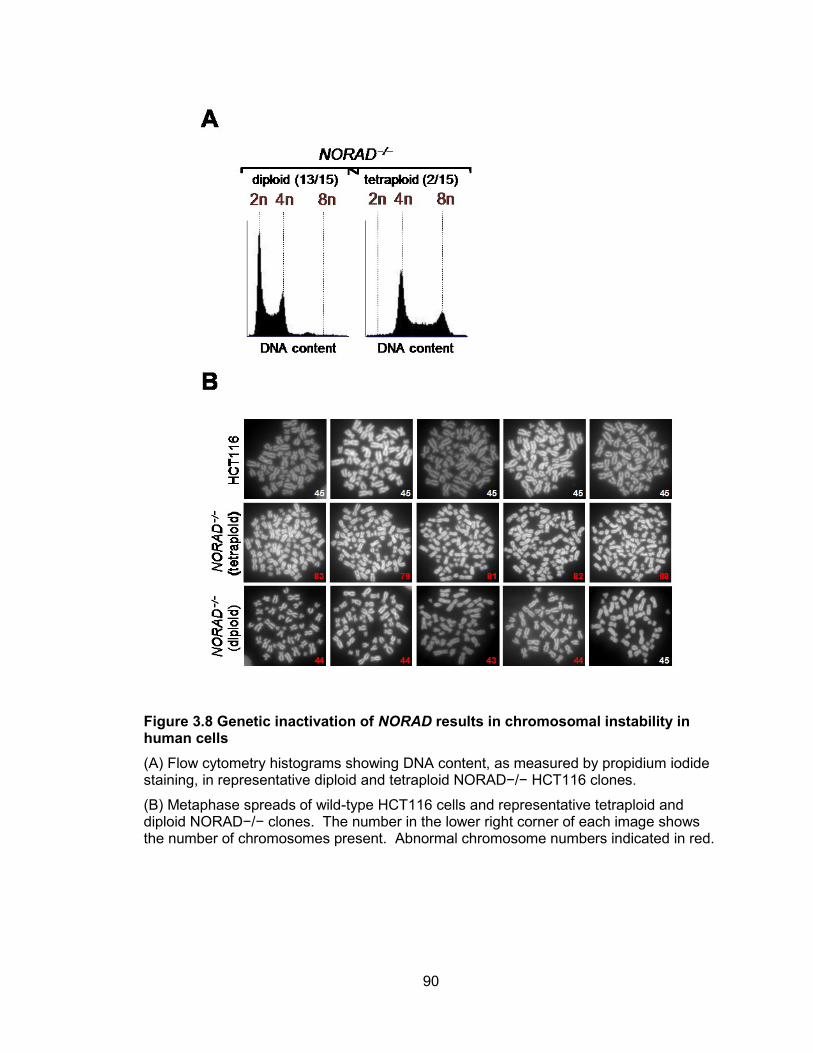
90
Figure 3.8 Genetic inactivation of NORAD results in chromosomal instability in human cells
(A) Flow cytometry histograms showing DNA content, as measured by propidium iodide staining, in representative diploid and tetraploid NORAD−/− HCT116 clones.
(B) Metaphase spreads of wild-type HCT116 cells and representative tetraploid and diploid NORAD−/− clones. The number in the lower right corner of each image shows the number of chromosomes present. Abnormal chromosome numbers indicated in red.
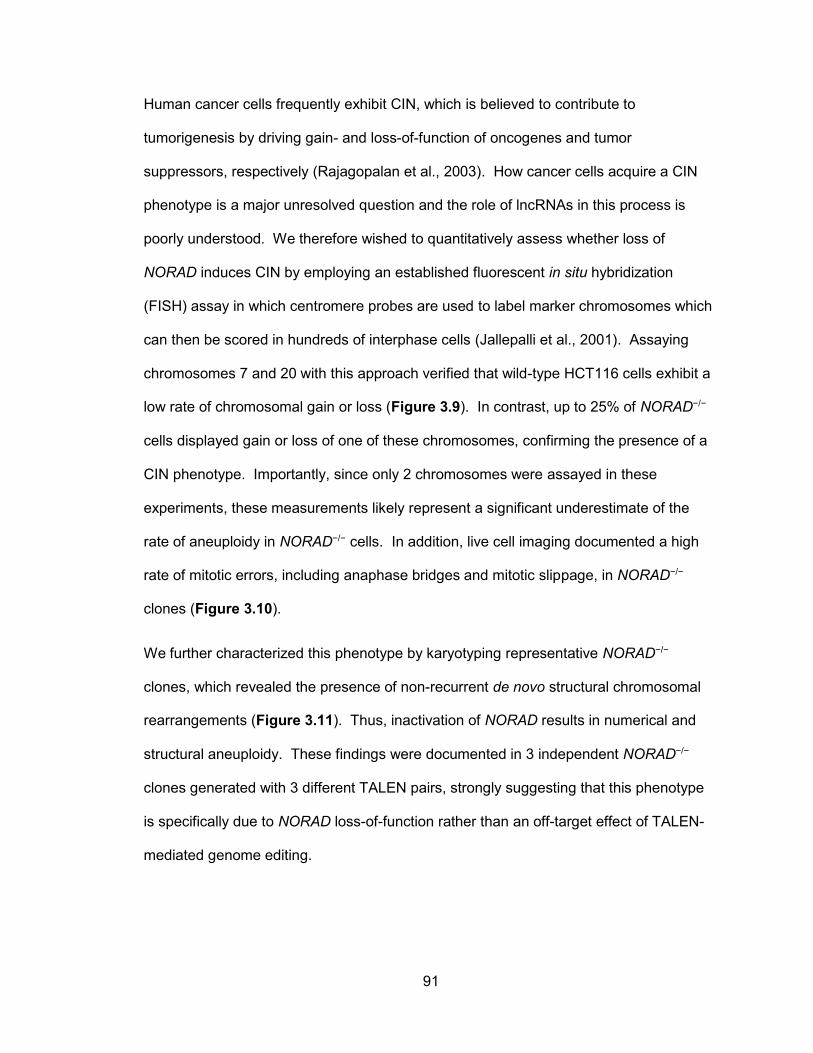
91
Human cancer cells frequently exhibit CIN, which is believed to contribute to
tumorigenesis by driving gain- and loss-of-function of oncogenes and tumor
suppressors, respectively (Rajagopalan et al., 2003). How cancer cells acquire a CIN
phenotype is a major unresolved question and the role of lncRNAs in this process is
poorly understood. We therefore wished to quantitatively assess whether loss of
NORAD induces CIN by employing an established fluorescent in situ hybridization
(FISH) assay in which centromere probes are used to label marker chromosomes which
can then be scored in hundreds of interphase cells (Jallepalli et al., 2001). Assaying
chromosomes 7 and 20 with this approach verified that wild-type HCT116 cells exhibit a
low rate of chromosomal gain or loss (Figure 3.9). In contrast, up to 25% of NORAD−/−
cells displayed gain or loss of one of these chromosomes, confirming the presence of a
CIN phenotype. Importantly, since only 2 chromosomes were assayed in these
experiments, these measurements likely represent a significant underestimate of the
rate of aneuploidy in NORAD−/− cells. In addition, live cell imaging documented a high
rate of mitotic errors, including anaphase bridges and mitotic slippage, in NORAD−/−
clones (Figure 3.10).
We further characterized this phenotype by karyotyping representative NORAD−/−
clones, which revealed the presence of non-recurrent de novo structural chromosomal
rearrangements (Figure 3.11). Thus, inactivation of NORAD results in numerical and
structural aneuploidy. These findings were documented in 3 independent NORAD−/−
clones generated with 3 different TALEN pairs, strongly suggesting that this phenotype
is specifically due to NORAD loss-of-function rather than an off-target effect of TALEN-
mediated genome editing.
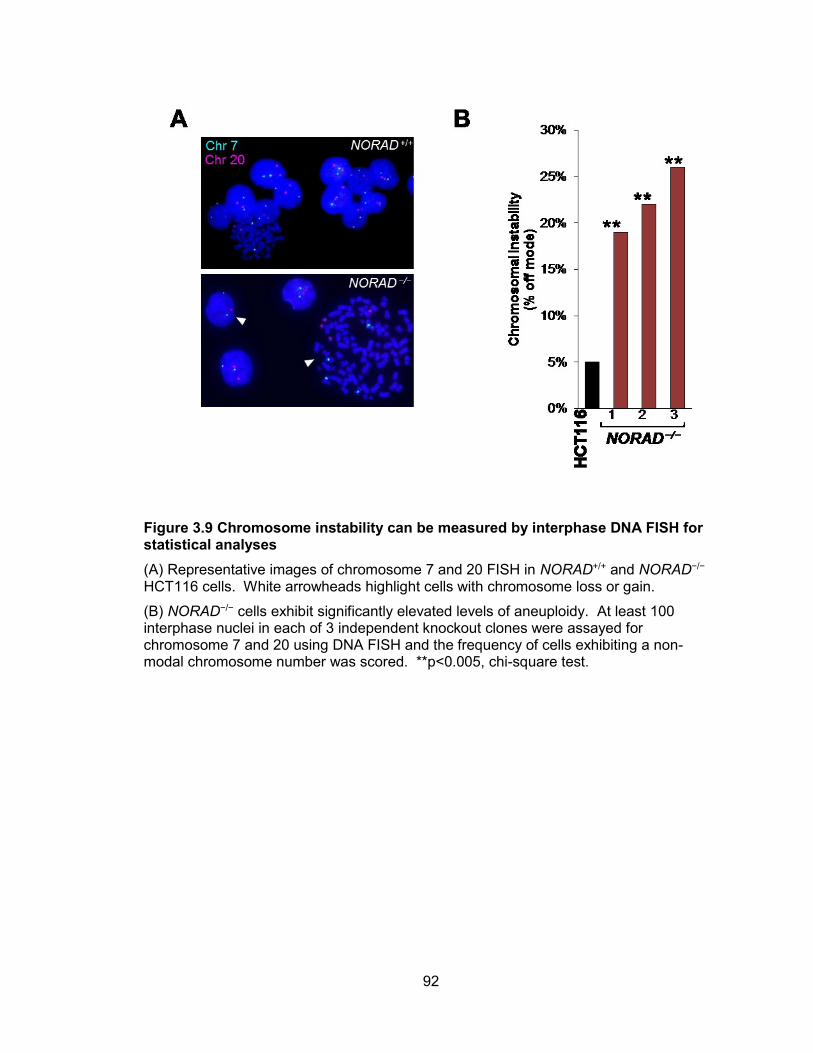
92
Figure 3.9 Chromosome instability can be measured by interphase DNA FISH for statistical analyses
(A) Representative images of chromosome 7 and 20 FISH in NORAD+/+ and NORAD−/− HCT116 cells. White arrowheads highlight cells with chromosome loss or gain.
(B) NORAD−/− cells exhibit significantly elevated levels of aneuploidy. At least 100 interphase nuclei in each of 3 independent knockout clones were assayed for chromosome 7 and 20 using DNA FISH and the frequency of cells exhibiting a non-modal chromosome number was scored. **p<0.005, chi-square test.
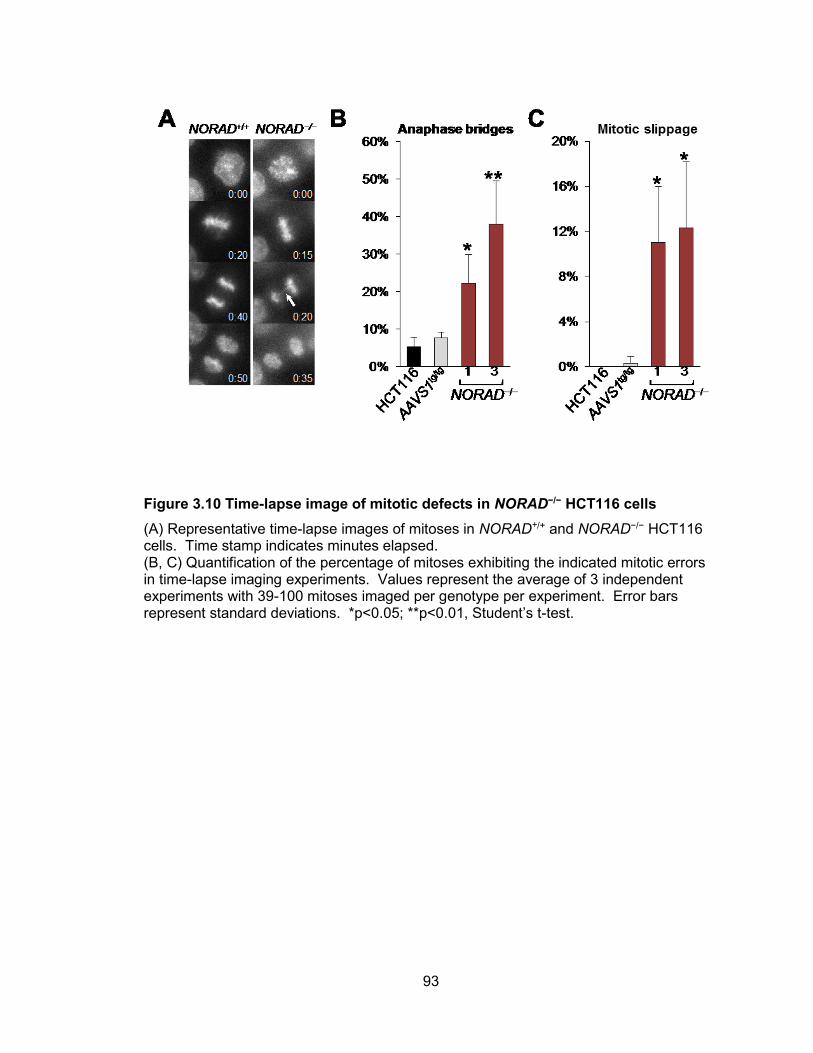
93
Figure 3.10 Time-lapse image of mitotic defects in NORAD−/− HCT116 cells
(A) Representative time-lapse images of mitoses in NORAD+/+ and NORAD−/− HCT116 cells. Time stamp indicates minutes elapsed. (B, C) Quantification of the percentage of mitoses exhibiting the indicated mitotic errors in time-lapse imaging experiments. Values represent the average of 3 independent experiments with 39-100 mitoses imaged per genotype per experiment. Error bars represent standard deviations. *p<0.05; **p<0.01, Student’s t-test.
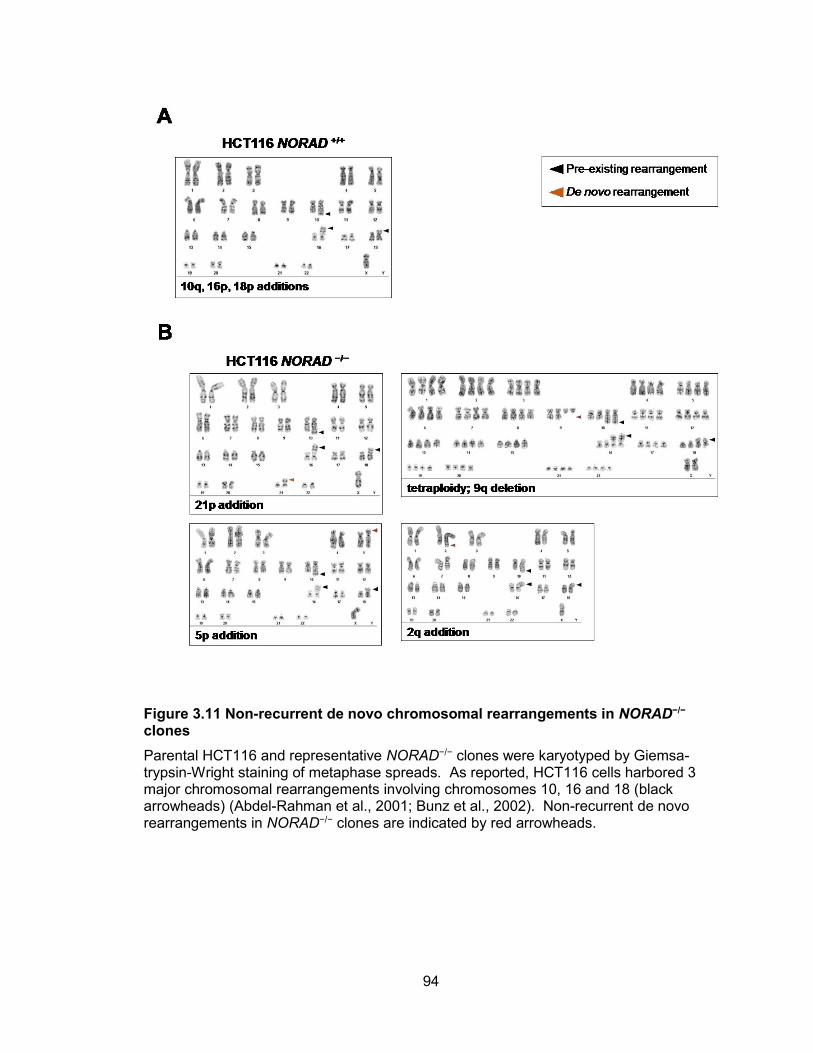
94
Figure 3.11 Non-recurrent de novo chromosomal rearrangements in NORAD−/− clones
Parental HCT116 and representative NORAD−/− clones were karyotyped by Giemsa-trypsin-Wright staining of metaphase spreads. As reported, HCT116 cells harbored 3 major chromosomal rearrangements involving chromosomes 10, 16 and 18 (black arrowheads) (Abdel-Rahman et al., 2001; Bunz et al., 2002). Non-recurrent de novo rearrangements in NORAD−/− clones are indicated by red arrowheads.
95
To determine whether the regulation of genomic stability by NORAD is unique to
HCT116 cells, we again used TALEN-stimulated homologous recombination to introduce
the transcriptional stop cassette into the NORAD locus in BJ-5ta cells, a telomerase-
immortalized, non-transformed diploid fibroblast cell line (Figure 3.12A-B). Targeting
was much less efficient in this cell line, with 2/393 clones harboring homozygous
insertions in NORAD. Although these NORAD−/− BJ-5ta cells were grossly diploid by
flow cytometric analysis of DNA content (data not shown), they exhibited significantly
elevated levels of aneuploidy, as determined by centromere FISH and quantification of
chromosomes 7 and 20 (Figure 3.12C). Thus, the regulation of chromosomal stability
by NORAD occurs in both transformed and non-transformed human cell lines.
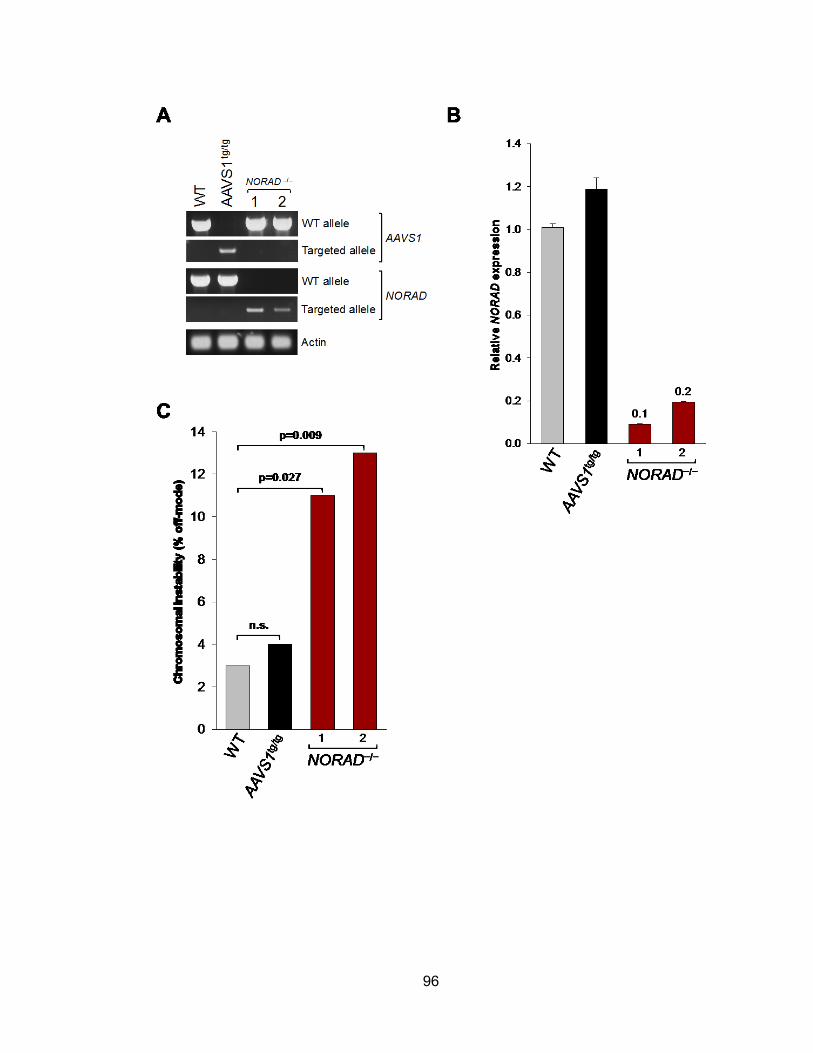
96
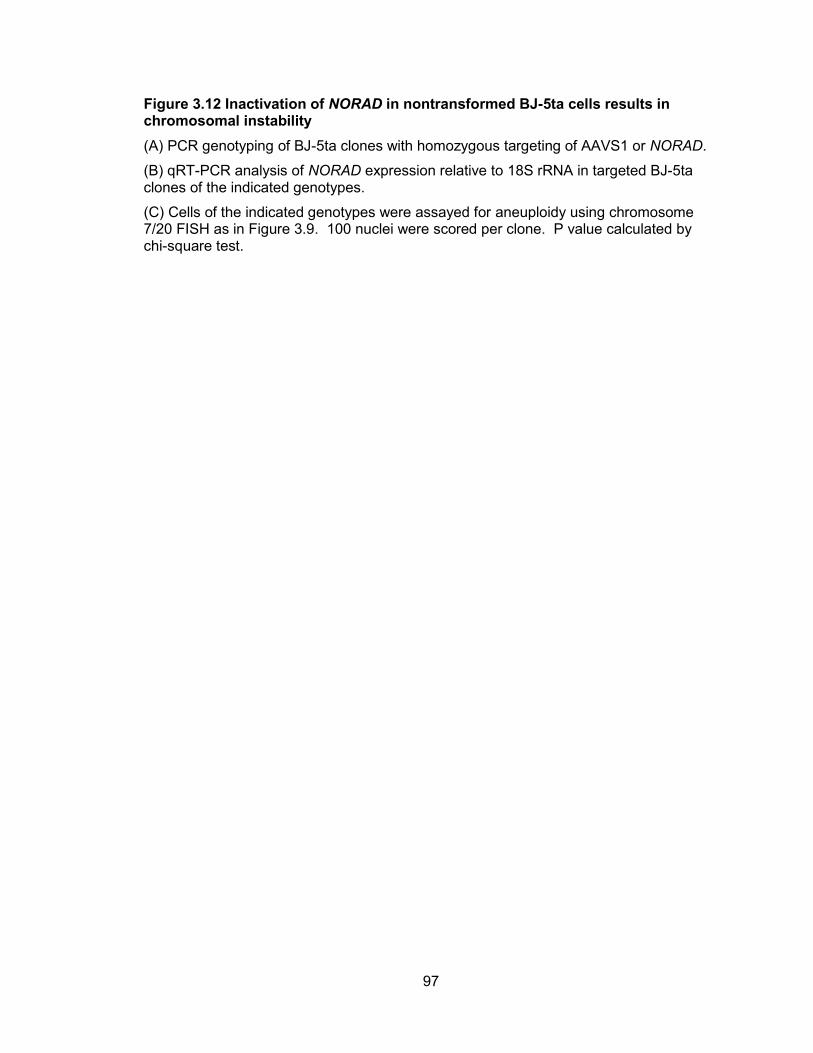
97
Figure 3.12 Inactivation of NORAD in nontransformed BJ-5ta cells results in chromosomal instability
(A) PCR genotyping of BJ-5ta clones with homozygous targeting of AAVS1 or NORAD.
(B) qRT-PCR analysis of NORAD expression relative to 18S rRNA in targeted BJ-5ta clones of the indicated genotypes.
(C) Cells of the indicated genotypes were assayed for aneuploidy using chromosome 7/20 FISH as in Figure 3.9. 100 nuclei were scored per clone. P value calculated by chi-square test.
98
Chromosomal instability is specifically due to NORAD loss-of-function
Given that the effects of TALEN-mediated genome editing on chromosomal stability in
human cell lines has not been extensively examined, we performed a series of
experiments to confirm that the CIN phenotype that we observed in NORAD−/− cells was
specifically due to loss of this lncRNA rather than a general consequence of genome
manipulation with TALENs. First, we obtained a published TALEN pair that targets the
AAVS1/PPP1R12C locus (Sanjana et al., 2012) and used it to generate clones with
homozygous insertions of a puromycin resistance cassette at this site. Quantification of
chromosomes 7 and 20 documented normal chromosome numbers in targeted HCT116
and BJ-5ta cells (Figures 3.13, 3.12C). HCT116 cells transfected with these TALENs
were further subcloned and ploidy was examined using flow cytometry. 0/70 analyzed
clones acquired tetraploid DNA content (data not shown). Thus, neither CIN nor
tetraploidy is a general property of cells that have undergone TALEN-mediated genome
editing.

99
Figure 3.13 TALEN-mediated genome editing is not a general cause of chromosomal instability
Insertion of a puromycin resistance cassette at the AAVS1/PPP1R12C locus was performed using a published TALEN pair (Hockemeyer et al., 2009; Sanjana et al., 2012) and the frequency of aneuploidy in homozygous targeted HCT116 clones was assessed using DNA FISH as in Figure 3.9B. n.s., not significant (chi-square test)
100
Next, we depleted the NORAD transcript using 2 distinct siRNAs to recapitulate the
NORAD-deficient state using an unrelated method (Figure 3.14). After 12 days of
subsequent growth, populations of NORAD knockdown cells were assessed for
chromosome content by FISH. As observed following TALEN-mediated inactivation of
NORAD, knockdown of this transcript resulted in significantly elevated chromosomal
instability (Figure 3.14B). Subclones of control or NORAD knockdown cells were then
produced, revealing infrequent but reproducible de novo generation of tetraploid lines
derived specifically from cells transfected with NORAD targeting siRNAs (Figure 3.14C).
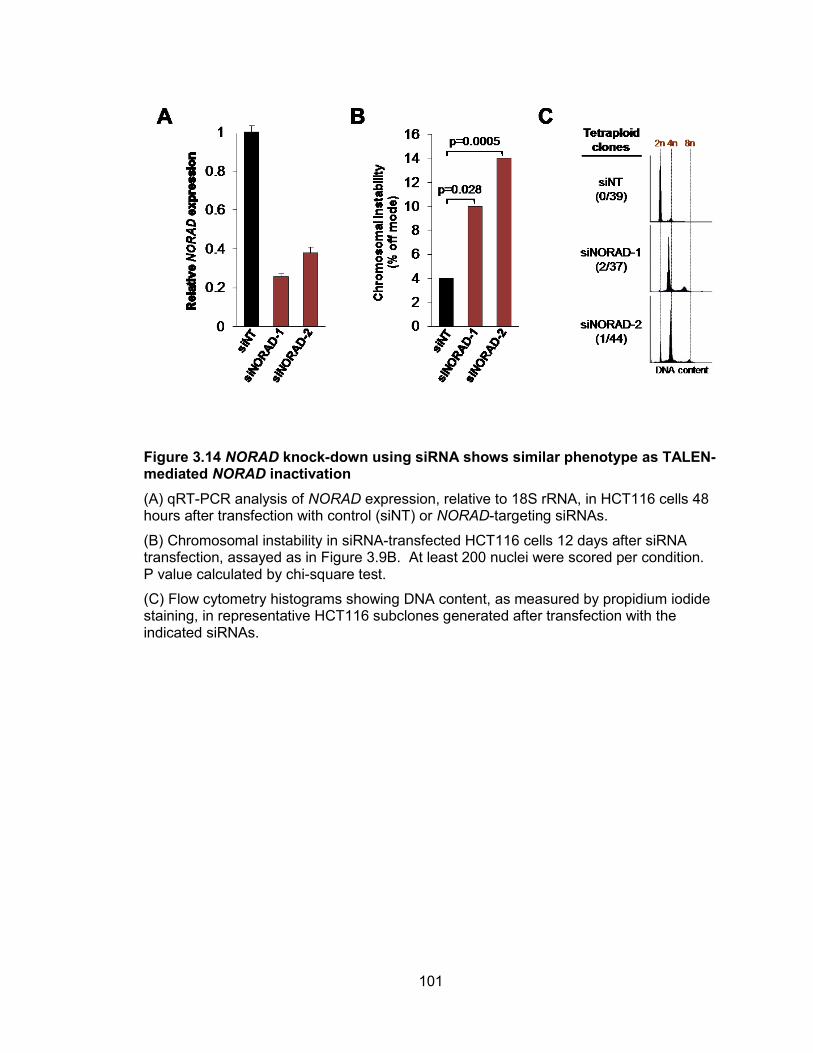
101
Figure 3.14 NORAD knock-down using siRNA shows similar phenotype as TALEN-mediated NORAD inactivation
(A) qRT-PCR analysis of NORAD expression, relative to 18S rRNA, in HCT116 cells 48 hours after transfection with control (siNT) or NORAD-targeting siRNAs.
(B) Chromosomal instability in siRNA-transfected HCT116 cells 12 days after siRNA transfection, assayed as in Figure 3.9B. At least 200 nuclei were scored per condition. P value calculated by chi-square test.
(C) Flow cytometry histograms showing DNA content, as measured by propidium iodide staining, in representative HCT116 subclones generated after transfection with the indicated siRNAs.
102
Lastly, we took advantage of our targeting strategy in NORAD−/− cells, which allowed
excision of the transcriptional stop cassette by Cre recombinase. As expected,
adenoviral delivery of Cre resulted in restoration of NORAD expression (Figure 3.15A).
10 subclones were generated from NORAD−/− cells with or without Cre expression and
chromosome content was assessed by centromere FISH (Figure 3.15B). Cells with
rescued NORAD expression exhibited significantly lower levels of aneuploidy. These
findings confirmed that NORAD is essential for the maintenance of genomic stability in
human cells.
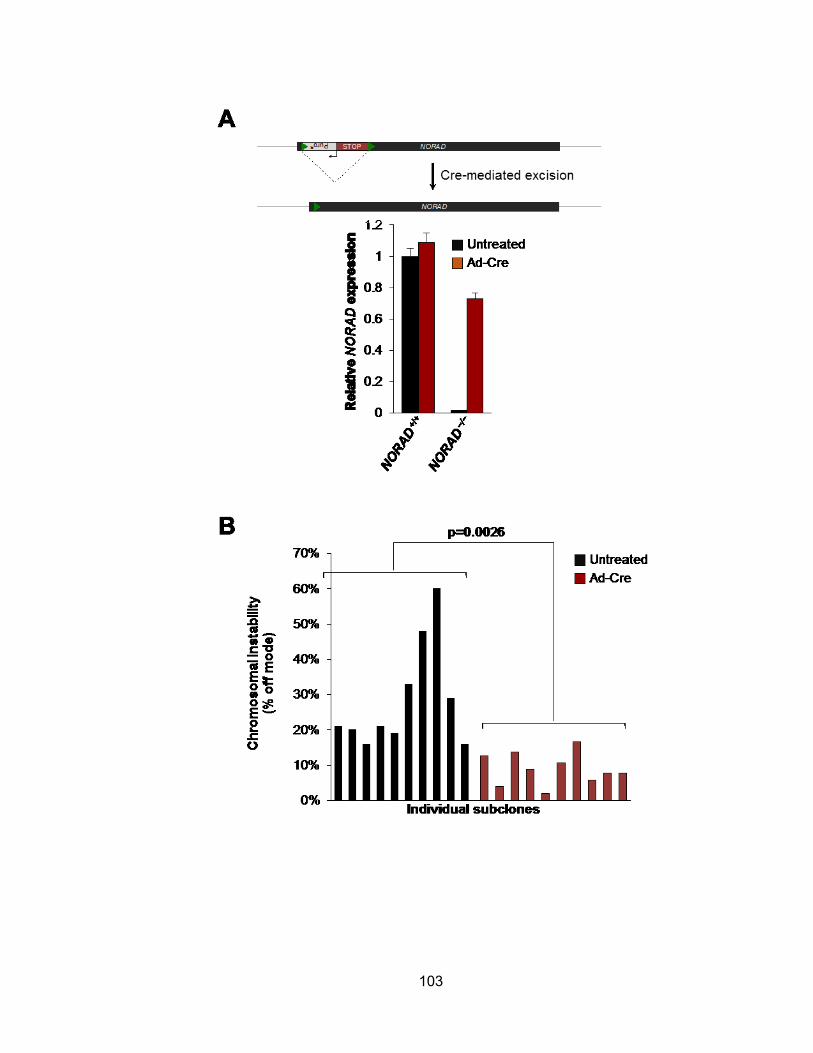
103
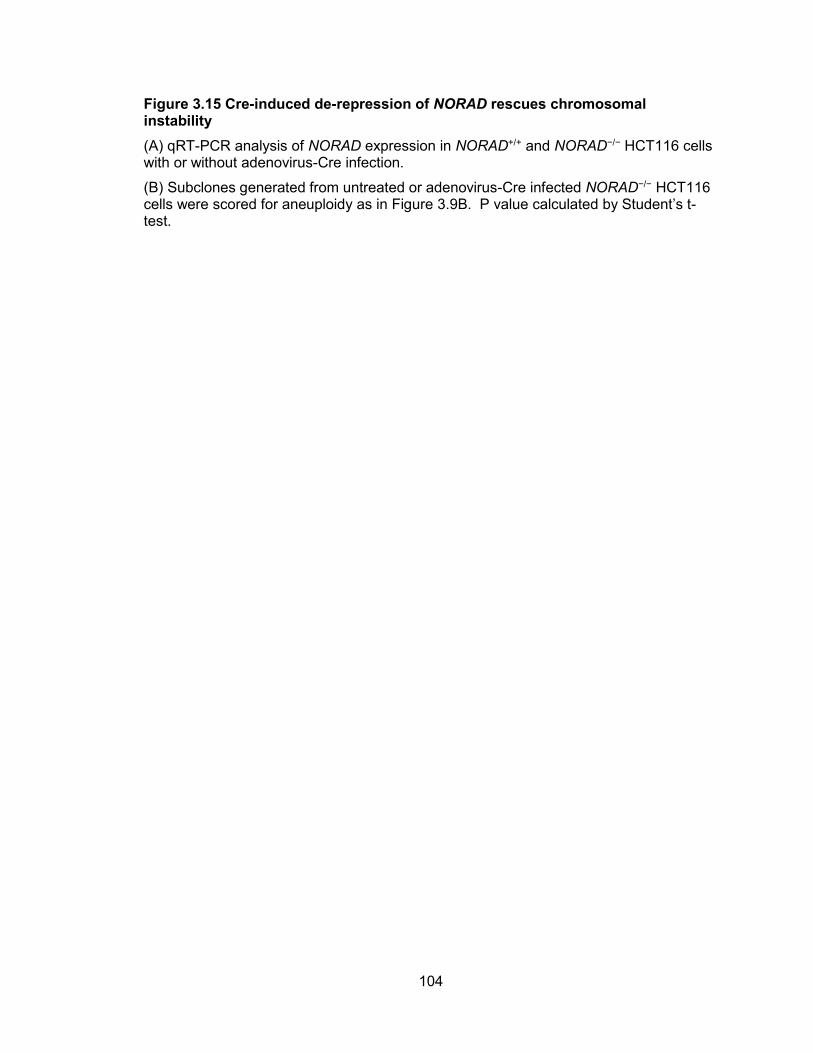
104
Figure 3.15 Cre-induced de-repression of NORAD rescues chromosomal instability
(A) qRT-PCR analysis of NORAD expression in NORAD+/+ and NORAD−/− HCT116 cells with or without adenovirus-Cre infection.
(B) Subclones generated from untreated or adenovirus-Cre infected NORAD−/− HCT116 cells were scored for aneuploidy as in Figure 3.9B. P value calculated by Student’s t-test.

105
NORAD directly regulates both ploidy and chromosomal stability
It has been proposed that in some cancer cells, CIN results from whole genome
duplication events that produce a transient tetraploid state that subsequently resolves
into an unstable pseudo-diploid state (Ganem et al., 2007). Therefore, since we
recovered both tetraploid and diploid NORAD−/− clones that each exhibited CIN, it was
unclear whether loss of NORAD primarily causes tetraploidization which then results in
CIN as a secondary consequence of this event, or whether NORAD directly regulates
both ploidy and chromosomal stability. The fact that CIN can be rescued by NORAD
reactivation in diploid knockout cells (Figure 3.15) supports the latter possibility. If CIN
were due to a prior, now resolved, tetraploid state, restoration of NORAD should no
longer have the capacity to revert genomic instability in diploid cells. Furthermore, if the
CIN phenotype of NORAD−/− cells is solely a secondary consequence of polyploidization,
tetraploid knockout cells should revert to a diploid state at a measureable frequency.
However, analysis of 32 subclones derived from tetraploid NORAD−/− cells demonstrated
that these cells do not detectably revert to diploidy (Figure 3.16A). In contrast,
approximately 10% of subclones of diploid NORAD−/− cells gain tetraploid DNA content
(Figure 3.16B). These results support a primary role for NORAD in regulating both
ploidy and chromosomal stability in diploid cells.
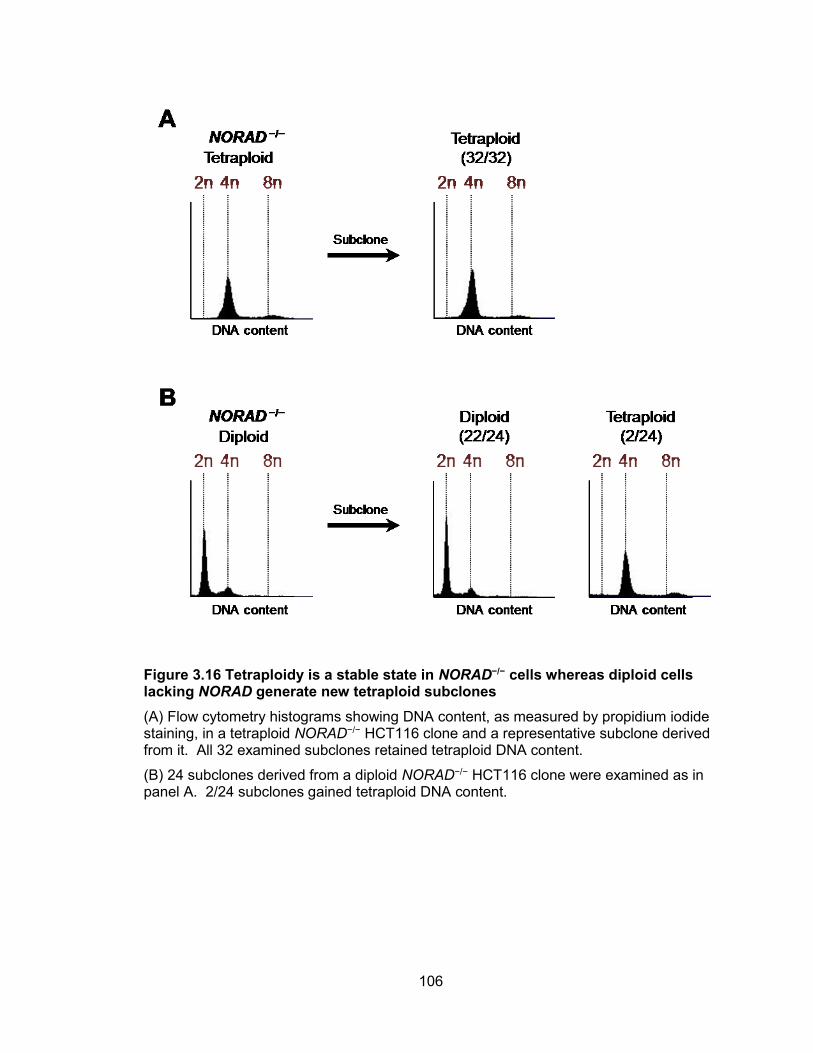
106
Figure 3.16 Tetraploidy is a stable state in NORAD−/− cells whereas diploid cells lacking NORAD generate new tetraploid subclones
(A) Flow cytometry histograms showing DNA content, as measured by propidium iodide staining, in a tetraploid NORAD−/− HCT116 clone and a representative subclone derived from it. All 32 examined subclones retained tetraploid DNA content.
(B) 24 subclones derived from a diploid NORAD−/− HCT116 clone were examined as in panel A. 2/24 subclones gained tetraploid DNA content.
107
Discussion
As opposed to many other lncRNAs (Ponting et al., 2009; Khalil et al., 2009), NORAD
stands out due to its high conservation in mammals and abundant and ubiquitous
expression in various cell types and tissues. Although initial identification of this
transcript in our Doxorubicin screening suggested its role in a p53 dependent DNA
damage response, the induction after DNA damage that we observed here is likely to be
indirect, based on a recently published CHIPseq study (Sanchez et al., 2014) as well as
no p53 binding site in the proximity of the NORAD promoter. Its exact role in the DNA
damage response pathway will be an important question that has to be addressed in the
future. Additionally, it was recently reported that NORAD (LINC00657) is induced by
hypoxia in human endothelial cells (Michalik et al., 2014), suggesting broader roles for
NORAD in cellular stress responses. How NORAD regulation influences the functional
outputs of these and other stress response pathways represents an important area for
future research.
While regulation of NORAD expression is still elusive, genetic loss-of-function study
identified clear and interesting phenotype of NORAD – regulation of genomic stability.
The fidelity of chromosome segregation during cell division must be maintained at a high
level to ensure the accurate transmission of genetic information to daughter cells as well
as to avoid severe pathologic consequences. CIN, a phenotype characterized by the
frequent gain or loss of chromosomes during mitosis, is a hallmark of cancer cells
(Hanahan and Weinberg, 2011; Kops et al., 2005) and is a key mechanism that
contributes to gain- and loss-of-function of oncogenes and tumor suppressors.
108
Accordingly, most solid tumors show rapidly evolving structural and numerical
aneuploidy (Albertson et al., 2003; Gerlinger et al., 2012), which is often associated with
poor patient prognosis (Carter et al., 2006). Therefore, the mechanisms through which
cells maintain accurate chromosome transmission and how this process goes awry in
cancer have been the subject of decades of intensive research. Various mechanisms
are known to contribute to chromosomal instability, including defects in the mitotic
checkpoint (Kops et al., 2005), deficiencies in sister chromatid cohesion (Manning et al.,
2014), spindle abnormalities (Cimini, 2008), the presence of supernumerary
centrosomes (Ganem et al., 2009), and replication stress (Burrell et al., 2013).
More recently, noncoding RNAs including numerous miRNAs as well as some lncRNAs,
such as PANDA, ANRIL or lincRNA-p21, are reported to be involved in DNA damage
response and thus in maintaining genome integrity (reviewed in (Wan et al., 2014)). In a
recent study, the noncoding RNA CCAT2 has been demonstrated to be upregulated in
microsatellite-stable colon cancer and to promote tumorigenesis and chromosomal
instability by activating MYC and WNT signaling (Ling et al., 2013). However, whether
lncRNAs can be an integral part of this essential cellular process have been largely
unexplored. Therefore, discovery of CIN phenotype in NORAD−/− cells provides valuable
evidence that not only proteins involved in mitotic checkpoint but also long noncoding
RNAs plays important roles in this biological process, adding additional regulatory layer.
Since defects in the maintenance of genome integrity are implied in multiple complex
diseases, developmental defects, aging and almost all types of cancer (Iourov et al.,
2010; Kops et al., 2005; Zeman and Cimprich, 2014), it will be of great interest and
importance to investigate phenotypes that are caused by NORAD loss-of-function in
animal level.
109
Materials and Methods
TALENs and targeting constructs for genome editing
3 pairs of TALENs targeting NORAD were designed using ZiFit Targeter v4.1 (Sander et
al., 2010) and constructed using the Restriction Enzyme And Ligation (REAL) assembly
method (Sander et al., 2011) with Addgene Kit #1000000017. Sequences of target
genomic DNA (gDNA) and TALEN RVDs are provided in Table 3.1. To construct donor
templates for homologous recombination (HR), homology arms were amplified from
gDNA (primers in Table 3.2) and cloned into Lox-Stop-Lox TOPO (Addgene plasmid
#11584) (Jackson et al., 2001) using the In-Fusion HD cloning Kit (Clontech). A
previously described TALEN pair targeting the AAVS1/PPP1R12C locus (Sanjana et al.,
2012) and an AAVS1/PPP1R12C targeting construct (Hockemeyer et al., 2009) were
obtained from Addgene (hAAVS1 1L TALEN, Plasmid #35431; hAAVS1 1R TALEN,
Plasmid #35432; AAVS1 hPGK-PuroR-pA donor, Addgene plasmid #22072).
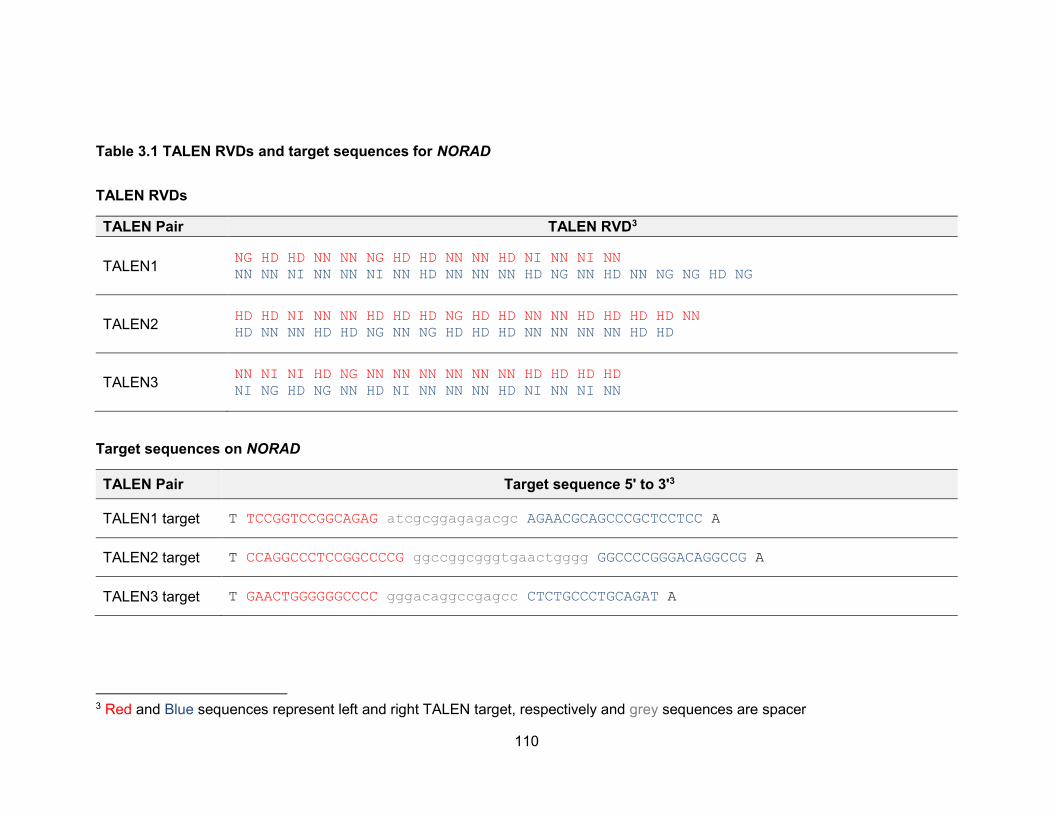
110
Table 3.1 TALEN RVDs and target sequences for NORAD
TALEN RVDs
TALEN Pair TALEN RVD3
TALEN1 NG HD HD NN NN NG HD HD NN NN HD NI NN NI NN
NN NN NI NN NN NI NN HD NN NN NN HD NG NN HD NN NG NG HD NG
TALEN2 HD HD NI NN NN HD HD HD NG HD HD NN NN HD HD HD HD NN
HD NN NN HD HD NG NN NG HD HD HD NN NN NN NN HD HD
TALEN3 NN NI NI HD NG NN NN NN NN NN NN HD HD HD HD
NI NG HD NG NN HD NI NN NN NN HD NI NN NI NN
Target sequences on NORAD
TALEN Pair Target sequence 5' to 3'3
TALEN1 target T TCCGGTCCGGCAGAG atcgcggagagacgc AGAACGCAGCCCGCTCCTCC A
TALEN2 target T CCAGGCCCTCCGGCCCCG ggccggcgggtgaactgggg GGCCCCGGGACAGGCCG A
TALEN3 target T GAACTGGGGGGCCCC gggacaggccgagcc CTCTGCCCTGCAGAT A
3 Red and Blue sequences represent left and right TALEN target, respectively and grey sequences are spacer
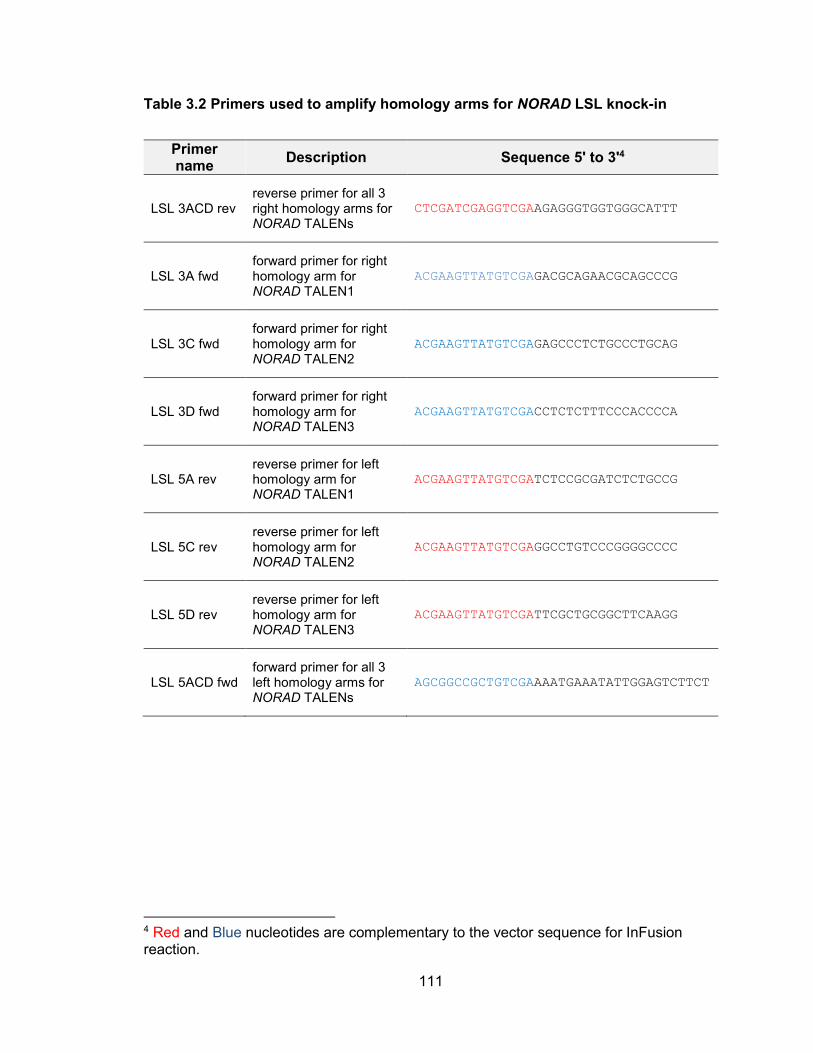
111
Table 3.2 Primers used to amplify homology arms for NORAD LSL knock-in
Primer name
Description Sequence 5' to 3'4
LSL 3ACD rev reverse primer for all 3 right homology arms for NORAD TALENs
CTCGATCGAGGTCGAAGAGGGTGGTGGGCATTT
LSL 3A fwd forward primer for right homology arm for NORAD TALEN1
ACGAAGTTATGTCGAGACGCAGAACGCAGCCCG
LSL 3C fwd forward primer for right homology arm for NORAD TALEN2
ACGAAGTTATGTCGAGAGCCCTCTGCCCTGCAG
LSL 3D fwd forward primer for right homology arm for NORAD TALEN3
ACGAAGTTATGTCGACCTCTCTTTCCCACCCCA
LSL 5A rev reverse primer for left homology arm for NORAD TALEN1
ACGAAGTTATGTCGATCTCCGCGATCTCTGCCG
LSL 5C rev reverse primer for left homology arm for NORAD TALEN2
ACGAAGTTATGTCGAGGCCTGTCCCGGGGCCCC
LSL 5D rev reverse primer for left homology arm for NORAD TALEN3
ACGAAGTTATGTCGATTCGCTGCGGCTTCAAGG
LSL 5ACD fwd forward primer for all 3 left homology arms for NORAD TALENs
AGCGGCCGCTGTCGAAAATGAAATATTGGAGTCTTCT
4 Red and Blue nucleotides are complementary to the vector sequence for InFusion reaction.
112
Cell culture, transfection, and adenovirus transduction
HCT116 and BJ-5ta cells were obtained from ATCC and cultured in either McCoy’s 5a or
a 4:1 mixture of DMEM and Medium199 respectively, supplemented with 10% FBS and
1X Antibiotic-Antimycotic (Life Technologies). HCT116 cells were transfected with
Fugene HD (Promega). 10 g DNA and 30 L of the transfection reagent were used per
10 cm dish. For BJ-5ta, 4×10⁶ cells were suspended in 100 L nucleofector solution SE
with 3 g DNA and transferred to 100 L cuvettes, followed by nucleofection using a 4D-
Nucleofector System (Lonza) with program EN-150. For genome editing experiments,
plasmids were mixed at molar ratio of Left-TALEN:Right-TALEN:HR-donor = 1:1:8.
Transfected cells were then selected with 1 g/mL puromycin for at least 7 days and
surviving cells were plated in 96 well plates at single cell density. Genomic DNA was
isolated from single-cell clones with the DNeasy kit (Qiagen) and genotyped by PCR
with primers provided in Table 3.3. Ad-Cre was obtained from the UT Southwestern
Vector Core and cells were transduced with an MOI of 200 for 2 days. siRNAs
(sequences in Table 3.4) were transfected using DharmaFECT 2 (GE Healthcare).

113
Table 3.3 Primers used for genotyping genome edited single cell derived clones
Primer name
Description Sequence 5' to 3'
NORAD HR 5' fwd
forward primer outside of left homology arms for NORAD lox-Stop-lox knock-in allele
CTCTCCCGCACTGCAGTTCA
NORAD LOC HR 5' rev
reverse primer inside PuroR cassette
AGGGCCAGCTCATTCCTCCC
NORAD HR 3' fwd
forward primer inside STOP cassette
GAATTCCGCAAGCTAGCCAC
NORAD HR 3' rev
reverse primer outside of right homology arms for NORAD lox-Stop-lox knock-in allele
ACGTGGACGTATCGCTTCCA
AAVS1 fwd
forward primer outside of left homology arm for AAVS1 locus knock-in allele
CTCTCCTGAGTCCGGACCACTTTG
AAVS1 rev
reverse primer for untargeted WT AAVS1 allele
CAAGCTCTCCCTCCCAGGAT
AAVS1 TA rev
reverse primer inside PuroR cassette
CACAAGGGTAGCGGCGAAGAT
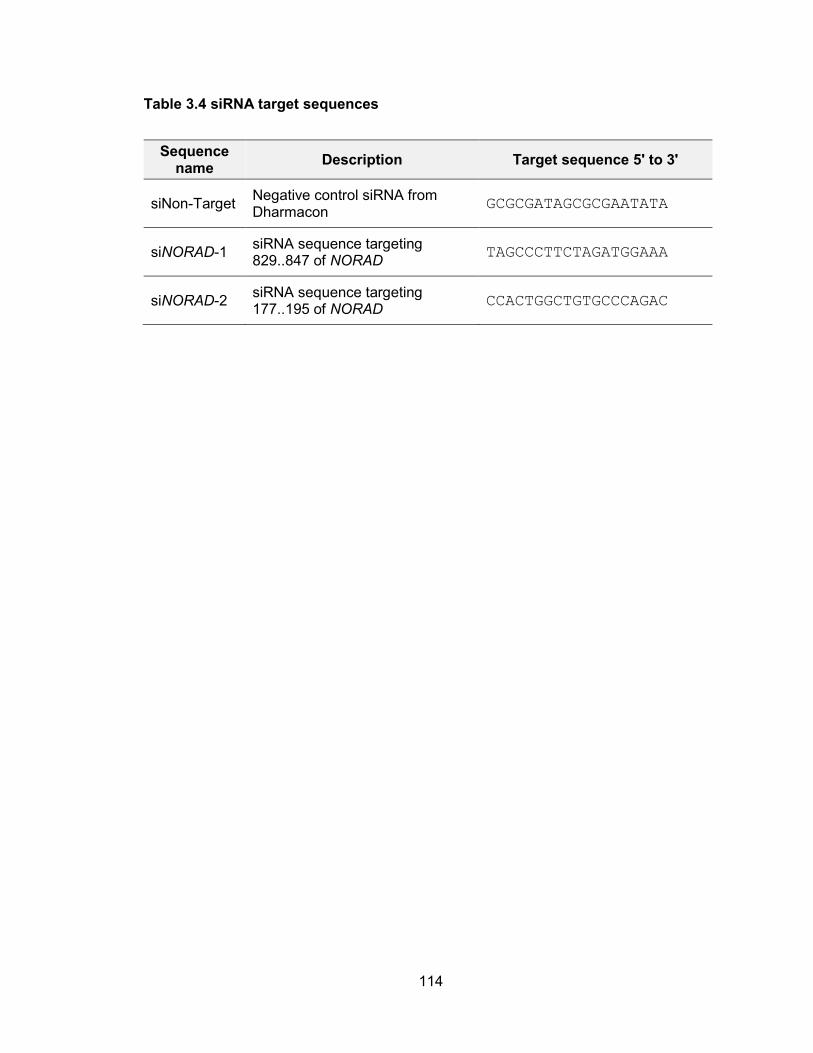
114
Table 3.4 siRNA target sequences
Sequence name
Description Target sequence 5' to 3'
siNon-Target Negative control siRNA from Dharmacon
GCGCGATAGCGCGAATATA
siNORAD-1 siRNA sequence targeting 829..847 of NORAD
TAGCCCTTCTAGATGGAAA
siNORAD-2 siRNA sequence targeting 177..195 of NORAD
CCACTGGCTGTGCCCAGAC
115
RNA isolation, qPCR, and northern blotting
Total RNA was extracted from cultured cells with Trizol (Invitrogen) or the RNeasy kit
(Qiagen) and contaminating gDNA was digested with RNase-free DNase (Qiagen). For
qRT-PCR experiments, the Taqman One-Step RT-PCR Master Mix (Life Technologies)
was used with a custom NORAD Taqman assay or a commercial 18S rRNA Taqman
assay (Life Technologies). For all other qPCR assays, RNA was reverse-transcribed
with SuperScript III (Invitrogen) and Power SYBR Green PCR Master Mix (Life
Technologies) was used. Primers and probes used for qPCR are provided in Table S5.
To measure NORAD copies per cell, NORAD was first amplified from HCT116 cDNA
and cloned into pcDNA3.1. This plasmid was then used to generate a standard curve
for absolute quantification of NORAD abundance in defined numbers of cells. For
northern blotting, 20 g total RNA was separated on a 0.7% denaturing agarose gel
containing formaldehyde and transferred to Hybond N+ membranes. The NORAD probe
was PCR amplified with primers provided in Table 3.5 and radiolabeled using the
Random Primed DNA Labeling Kit (Roche).
Southern blotting
Genomic DNA was isolated using DNeasy (Qiagen) and digested with SphI. 10 g of
digested DNA was electrophoresed on a 0.7% agarose gel and transferred to Hybond
N+ membrane (Amersham). The probe was generated by purifying the 483 bp BsaI-
HindIII fragment of Lox-Stop-Lox TOPO (Addgene plasmid #11584) (Jackson et al.,
2001) and radiolabeled using the Random Primed DNA Labeling Kit (Roche).
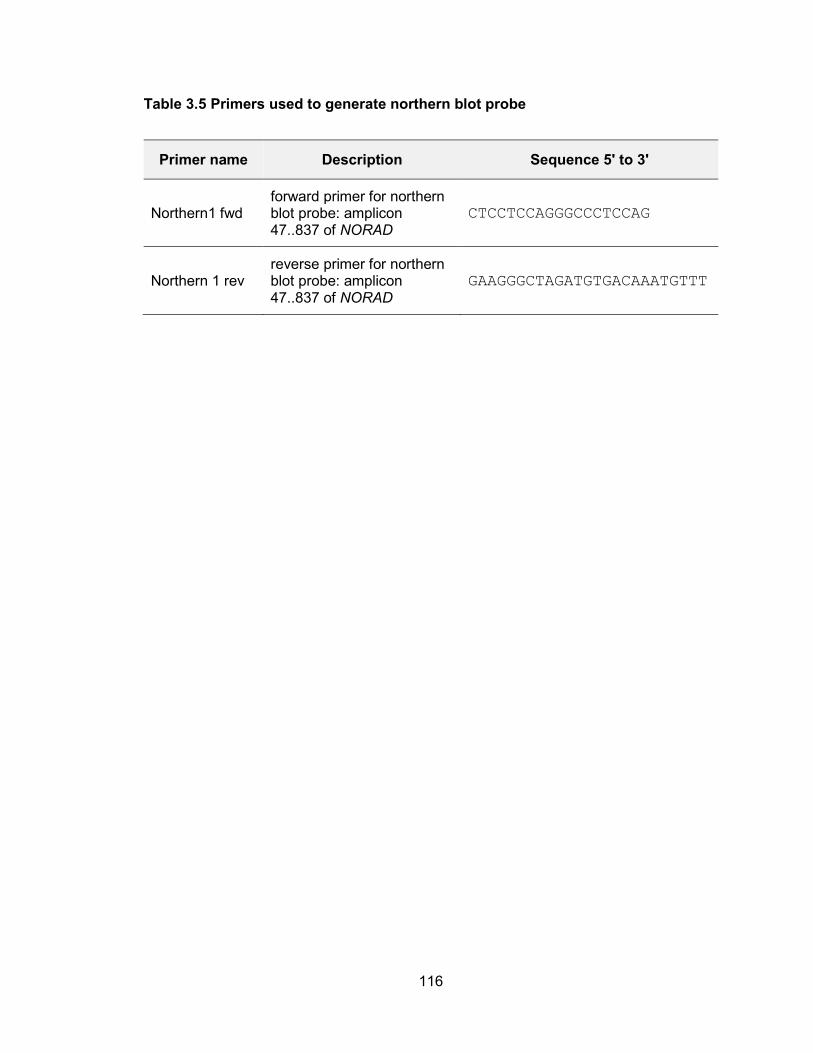
116
Table 3.5 Primers used to generate northern blot probe
Primer name Description Sequence 5' to 3'
Northern1 fwd forward primer for northern blot probe: amplicon 47..837 of NORAD
CTCCTCCAGGGCCCTCCAG
Northern 1 rev reverse primer for northern blot probe: amplicon 47..837 of NORAD
GAAGGGCTAGATGTGACAAATGTTT
117
Time-lapse imaging
Cells were grown on NUNC chambered coverglasses (Thermo). To visualize DNA in
HCT116 cells, a cell permeable Hoechst dye (33342; Invitrogen) was used at 25-50
ng/mL. Time-lapse fluorescence images were collected every 5 minutes for 24-48 hours
using a Leica inverted microscope equipped with an environmental chamber that
controls temperature and CO2, a 63X oil-objective, an Evolve 512 Delta EMCCD
camera, and Metamorph software (MDS Analytical Technologies).
DNA FISH and Karyotyping
Chromosome enumeration probes for Chromosome 7 (CHR7-10-GR) and chromosome
20 (CHR20-10-RE) were purchased from Empire Genomics. For interphase DNA FISH,
cells were harvested with trypsin, washed with PBS, and incubated in hypotonic solution
(0.4% KCl) for 10 minutes. Cells were then resuspended in fixation buffer (3:1 mix of
methanol:glacial acetic acid) and spread on slides pre-treated with 1M HCl for 24 hours,
then 70% EtOH for 24 hours and stored in distilled water. For analyzing metaphase
spreads, cells were treated with 1 g/mL colcemid (Roche) for 30 minutes, harvested
and fixed as described above, and spread on slides in a climate-controlled hood, set at
25°C and 40% humidity. DNA FISH hybridizations and karyotype analyses were
performed by the Veripath Cytogenetics laboratory at UT Southwestern.
Flow cytometry
Assessment of DNA content by propidium iodide staining and flow cytometry was
performed as previously described (Hwang et al., 2007). For phospho-Histone H3
118
(Ser10) staining, trypsinized cells were fixed in 4% formaldehyde for 10 min, washed
with PBS, and incubated with 100 L incubation buffer (1% BSA and 0.1% Triton X-100
in PBS) with antibody (9701, Cell Signaling) diluted at 1:50 followed by staining with goat
anti-rabbit antibody conjugated to AlexaFluor 488 (Life Technologies).
Prediction of coding potential with PhyloCSF
A Multiz alignment of 46 vertebrates aligned to GRCh37/hg19 for CENPB, JUND, UBC,
ERBB2, NEAT1, XIST, and NORAD (LINC00657) in multiple alignment format (MAF)
and BED files containing strand-specific genomic coordinates for the exons in each gene
were downloaded from the UCSC Table Browser and uploaded to Galaxy
(https://usegalaxy.org/) (Blankenberg et al., 2010). These files were used with the ‘Stitch
MAF blocks’ followed by ‘Concatenate FASTA alignment by species’ functions of Galaxy
to generate FASTA alignments for each gene in the 29 mammals specified by the
PhyloCSF phylogeny (http://mlin.github.io/PhyloCSF/29mammals.nh.png). PhyloCSF
(Lin et al., 2011) was run with the resulting FASTA file using the following parameters: [--
orf=ATGStop --frames=3 --removeRefGaps --aa --allScores].
3 RACE
3 RACE was performed using the GeneRacer kit (Life Technologies) and primers listed
in Table 3.6.
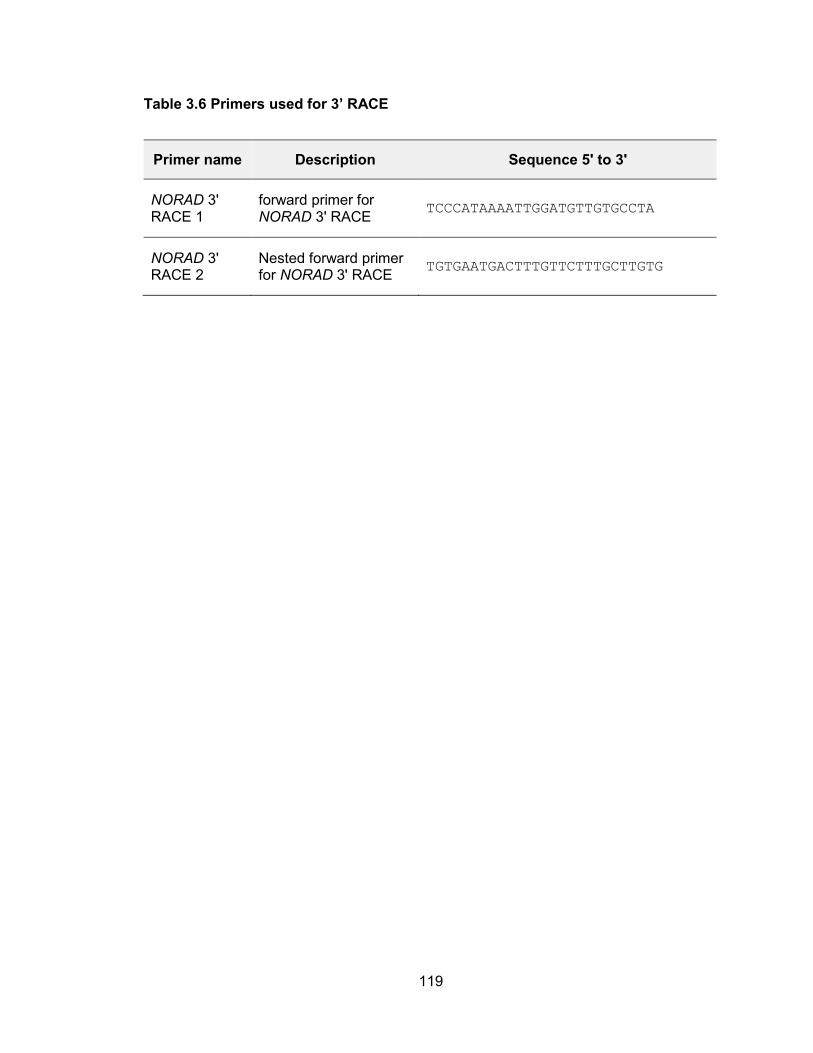
119
Table 3.6 Primers used for 3’ RACE
Primer name Description Sequence 5' to 3'
NORAD 3' RACE 1
forward primer for NORAD 3' RACE
TCCCATAAAATTGGATGTTGTGCCTA
NORAD 3' RACE 2
Nested forward primer for NORAD 3' RACE
TGTGAATGACTTTGTTCTTTGCTTGTG
120
Chapter 4: Mechanism of chromosome instability in NORAD
depleted cells
Introduction
Pumilio-Fem3-binding factor (PUF) proteins represent a deeply conserved family of RNA
binding proteins that act as negative regulators of gene expression (Wickens et al.,
2002). PUF proteins bind with high specificity to sequences in the 3 UTRs of target
mRNAs through their PUMILIO homology domains (Zamore et al., 1997) and stimulate
deadenylation and decapping, resulting in accelerated turnover and decreased
translation (Miller and Olivas, 2011). There are two human and mouse PUF proteins,
PUMILIO1 (PUM1) and PUMILIO2 (PUM2), that bind to target transcripts containing an
eight nucleotide sequence (UGUANAUA), referred to as the PUMILIO response element
(PRE). Many mammalian PUM targets have been identified using high-throughput
approaches (Chen et al., 2012; Galgano et al., 2008; Hafner et al., 2010; Morris et al.,
121
2008), revealing diverse functions for these proteins in germline homeostasis (Chen et
al., 2012; Spassov and Jurecic, 2003), cell cycle control (Kedde et al., 2010; Miles et al.,
2012) and neuronal activity and function (Driscoll et al., 2013; Vessey et al., 2010).
Notably, Pum1 haploinsufficiency in mice has recently been reported to result in
spinocerebellar ataxia type 1 (SCA1)-like neurodegeneration due to increased levels of
the PUM-target Ataxin1 (Gennarino et al., 2015), demonstrating that PUM dosage must
be precisely controlled in vivo to avoid significant pathologic consequences.
Nevertheless, the mechanisms through which PUM activity is regulated remain
unknown.
Here we describe the unexpected finding that a poorly characterized mammalian
lncRNA, which we termed NORAD, functions as a major regulator of PUM activity in
human cells. This lncRNA initially came to our attention due to its induction after DNA
damage, its strong evolutionary conservation, and its ubiquitous, abundant expression in
human tissues and cell lines. Surprisingly, inactivation of NORAD using a genome
editing approach resulted in chromosomal instability and dramatic aneuploidy in
previously karyotypically-stable human cell lines. Identification of NORAD-interacting
proteins revealed that this lncRNA functions as a multivalent binding platform for PUM
proteins. With at least 15 conserved PREs, NORAD has the capacity to sequester a
significant fraction of the total cellular pool of PUM1 and PUM2. We further showed for
the first time that PUM proteins regulate a large set of target transcripts that play a
critical role in maintaining the fidelity of chromosome transmission including key factors
necessary for mitosis, DNA replication, and DNA repair. In the absence of NORAD,
PUM hyperactivity leads to repression of these targets, resulting in genomic instability.
These findings have revealed a lncRNA-dependent mechanism that regulates a highly
122
dosage-sensitive family of RNA binding proteins, uncovering a new post-transcriptional
regulatory axis that maintains genomic stability in mammalian cells.
123
Results
NORAD is a cytoplasmic multivalent PUMILIO binding platform
To begin to elucidate the mechanism through which NORAD regulates genomic stability,
we first examined its subcellular localization. Fractionation revealed that NORAD is
nearly exclusively cytoplasmic, with a subcellular distribution comparable to ACTB
mRNA and clearly distinct from the established nuclear lncRNA NEAT1 (Figure 4.1A).
Cytoplasmic localization of NORAD was confirmed by single molecule RNA FISH
(Figure 4.1B). These findings suggest that NORAD interacts with a factor in the
cytoplasm through which it regulates faithful chromosome transmission.
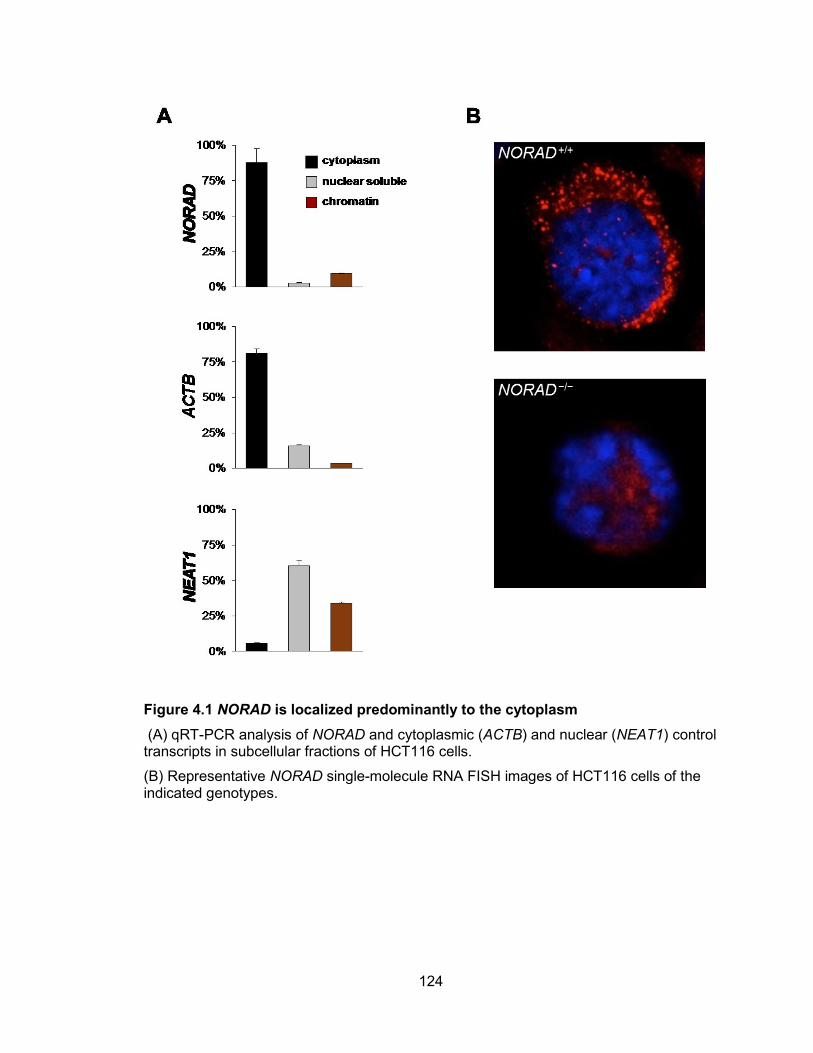
124
Figure 4.1 NORAD is localized predominantly to the cytoplasm
(A) qRT-PCR analysis of NORAD and cytoplasmic (ACTB) and nuclear (NEAT1) control transcripts in subcellular fractions of HCT116 cells.
(B) Representative NORAD single-molecule RNA FISH images of HCT116 cells of the indicated genotypes.
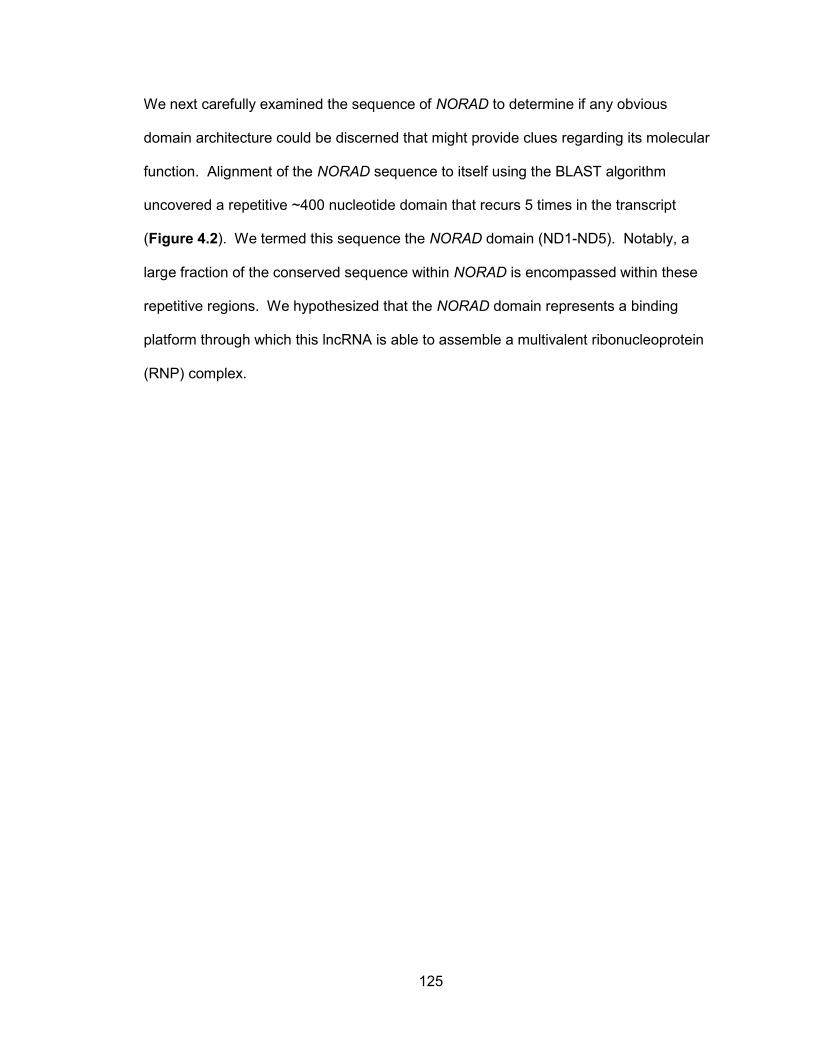
125
We next carefully examined the sequence of NORAD to determine if any obvious
domain architecture could be discerned that might provide clues regarding its molecular
function. Alignment of the NORAD sequence to itself using the BLAST algorithm
uncovered a repetitive ~400 nucleotide domain that recurs 5 times in the transcript
(Figure 4.2). We termed this sequence the NORAD domain (ND1-ND5). Notably, a
large fraction of the conserved sequence within NORAD is encompassed within these
repetitive regions. We hypothesized that the NORAD domain represents a binding
platform through which this lncRNA is able to assemble a multivalent ribonucleoprotein
(RNP) complex.
126
Figure 4.2 Domain structure of NORAD
(A) Dot plot of nucleotide identity generated by aligning the NORAD sequence to itself using BLAST (discontinuous megablast; http://blast.ncbi.nlm.nih.gov/). This alignment revealed multiple repetitive regions within the NORAD sequence.
(B) Schematic of the NORAD transcript, showing the locations of the repetitive regions, termed NORAD domains (ND1-5). The mammalian conservation plot was obtained from the UCSC Genome Browser (PhastCons track).
(C) NORAD fragments used for in vitro transcription and RNA pull-down experiments.
127
To identify components of this putative NORAD RNP, we synthesized 7 biotinylated
RNA fragments encompassing each NORAD domain as well as the 5 and 3 segments
of the transcript (Figure 4.2C). These 7 fragments, along with corresponding antisense
sequences, were used to recover associated proteins in HCT116 lysates, which were
subsequently identified by mass spectrometry (Figure 4.3A). Candidate interactors
were filtered for those that were detectable above background in all five NORAD domain
pull downs with at least 5-fold enrichment compared to each corresponding antisense
pull down. Only a single protein, PUMILIO 2 (PUM2), fulfilled these criteria (Figure
4.3B). We confirmed the binding of PUM2 to all five NORAD domains as well as the 5
end of NORAD using western blotting (Figure 4.3C). Western blotting also revealed
detectable interaction of NORAD with the related protein PUMILIO 1 (PUM1). We
further assessed PUM1/2-NORAD interactions by immunoprecipitating endogenous
PUM proteins, which confirmed highly significant enrichment of endogenous NORAD
(Figure 4.3D). Consistent with these data, both NORAD (Figure 4.1) as well as
PUM1/PUM2 (Morris et al., 2008; Ponten et al., 2008; Narita et al., 2014) are
predominantly localized to the cytoplasm.
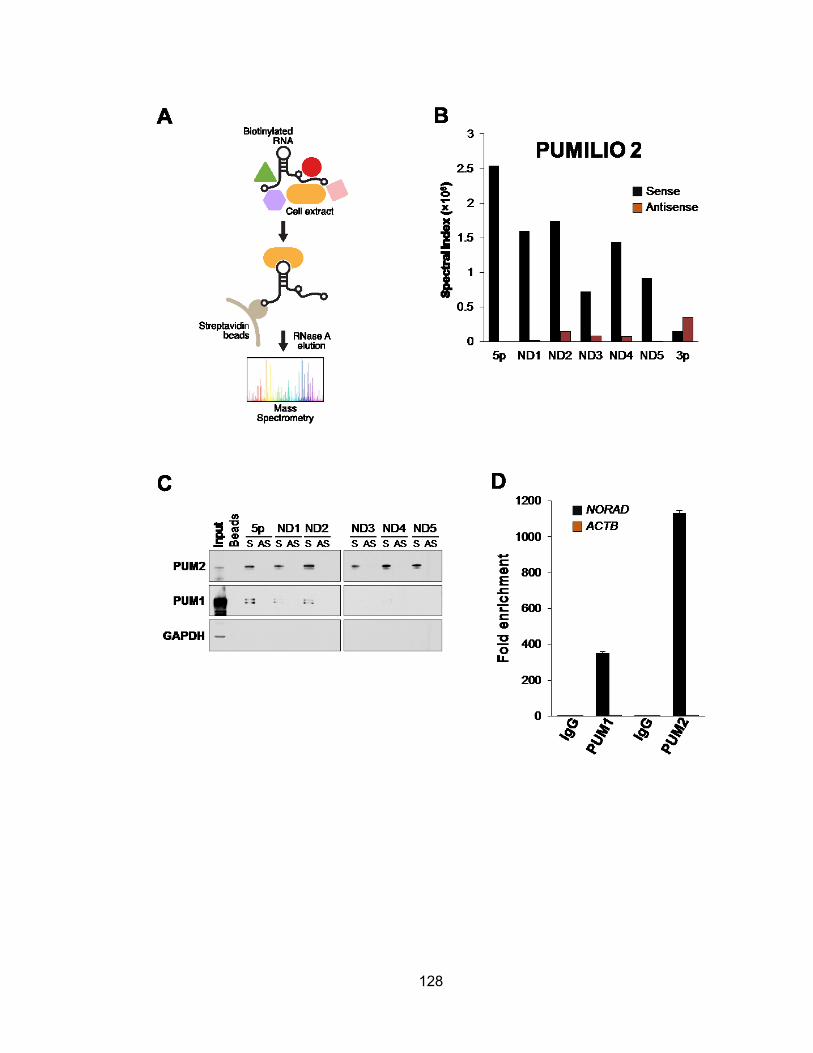
128
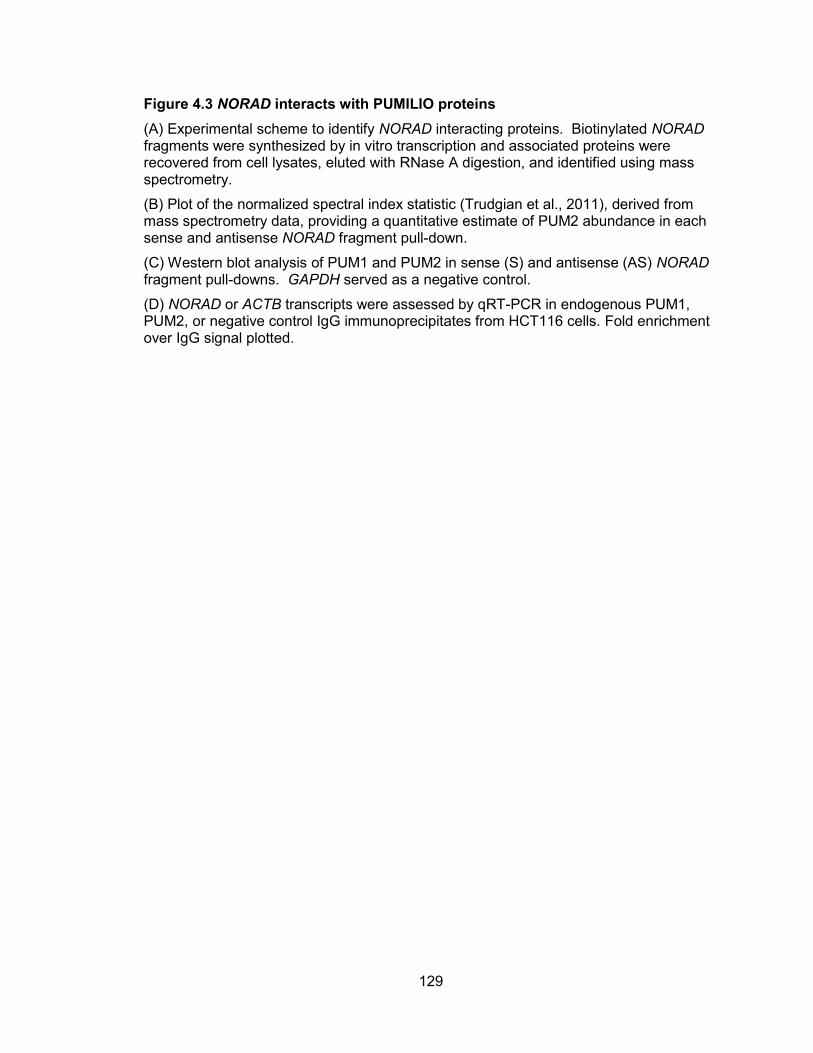
129
Figure 4.3 NORAD interacts with PUMILIO proteins
(A) Experimental scheme to identify NORAD interacting proteins. Biotinylated NORAD fragments were synthesized by in vitro transcription and associated proteins were recovered from cell lysates, eluted with RNase A digestion, and identified using mass spectrometry.
(B) Plot of the normalized spectral index statistic (Trudgian et al., 2011), derived from mass spectrometry data, providing a quantitative estimate of PUM2 abundance in each sense and antisense NORAD fragment pull-down.
(C) Western blot analysis of PUM1 and PUM2 in sense (S) and antisense (AS) NORAD fragment pull-downs. GAPDH served as a negative control.
(D) NORAD or ACTB transcripts were assessed by qRT-PCR in endogenous PUM1, PUM2, or negative control IgG immunoprecipitates from HCT116 cells. Fold enrichment over IgG signal plotted.
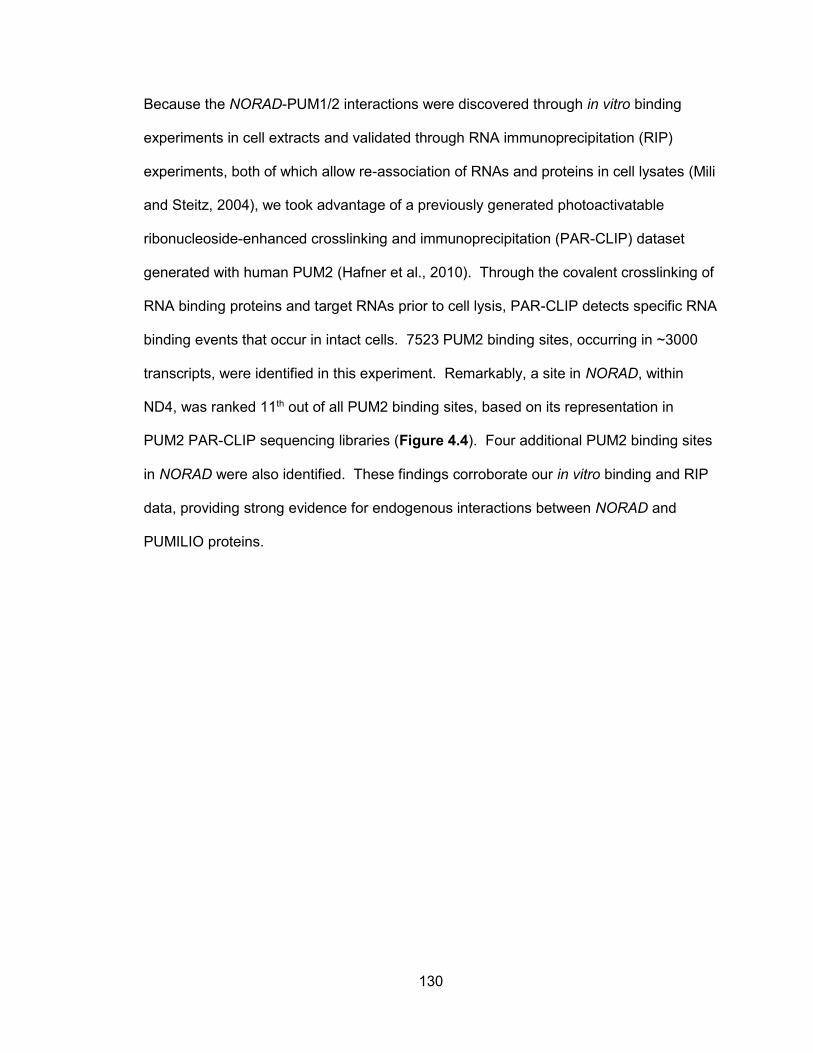
130
Because the NORAD-PUM1/2 interactions were discovered through in vitro binding
experiments in cell extracts and validated through RNA immunoprecipitation (RIP)
experiments, both of which allow re-association of RNAs and proteins in cell lysates (Mili
and Steitz, 2004), we took advantage of a previously generated photoactivatable
ribonucleoside-enhanced crosslinking and immunoprecipitation (PAR-CLIP) dataset
generated with human PUM2 (Hafner et al., 2010). Through the covalent crosslinking of
RNA binding proteins and target RNAs prior to cell lysis, PAR-CLIP detects specific RNA
binding events that occur in intact cells. 7523 PUM2 binding sites, occurring in ~3000
transcripts, were identified in this experiment. Remarkably, a site in NORAD, within
ND4, was ranked 11th out of all PUM2 binding sites, based on its representation in
PUM2 PAR-CLIP sequencing libraries (Figure 4.4). Four additional PUM2 binding sites
in NORAD were also identified. These findings corroborate our in vitro binding and RIP
data, providing strong evidence for endogenous interactions between NORAD and
PUMILIO proteins.

131
Figure 4.4 PAR-CLIP identifies NORAD as a major PUM2 target
(A) Histogram of the number of sequence tags per PUM2 PAR-CLIP cluster (Hafner et al., 2010). Red lines show NORAD CLIP clusters. Data obtained from http://www.mirz.unibas.ch/restricted/clipdata/RESULTS/PUM2/PUM2.html.
(B) Locations of the PUM2 PAR-CLIP clusters in the NORAD transcript. Numbers above each cluster represent the ranking based on the number of sequence tags per cluster (cluster 1 was the most frequently crosslinked site in NORAD).
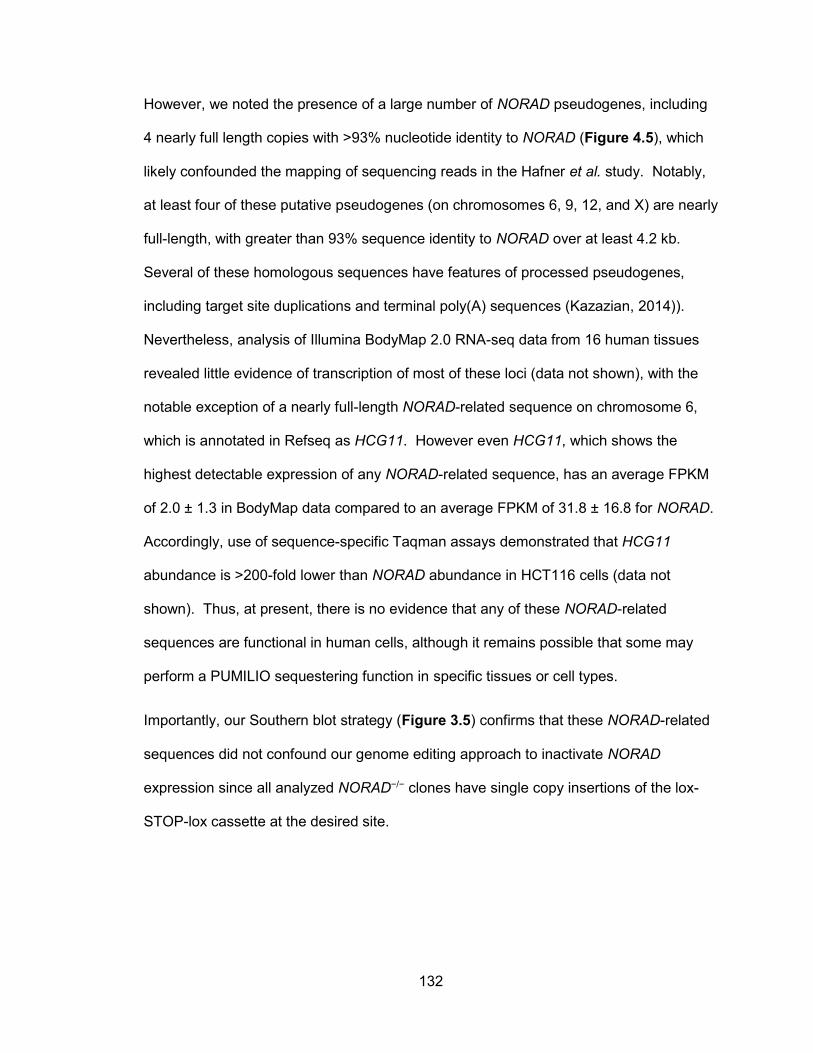
132
However, we noted the presence of a large number of NORAD pseudogenes, including
4 nearly full length copies with >93% nucleotide identity to NORAD (Figure 4.5), which
likely confounded the mapping of sequencing reads in the Hafner et al. study. Notably,
at least four of these putative pseudogenes (on chromosomes 6, 9, 12, and X) are nearly
full-length, with greater than 93% sequence identity to NORAD over at least 4.2 kb.
Several of these homologous sequences have features of processed pseudogenes,
including target site duplications and terminal poly(A) sequences (Kazazian, 2014)).
Nevertheless, analysis of Illumina BodyMap 2.0 RNA-seq data from 16 human tissues
revealed little evidence of transcription of most of these loci (data not shown), with the
notable exception of a nearly full-length NORAD-related sequence on chromosome 6,
which is annotated in Refseq as HCG11. However even HCG11, which shows the
highest detectable expression of any NORAD-related sequence, has an average FPKM
of 2.0 ± 1.3 in BodyMap data compared to an average FPKM of 31.8 ± 16.8 for NORAD.
Accordingly, use of sequence-specific Taqman assays demonstrated that HCG11
abundance is >200-fold lower than NORAD abundance in HCT116 cells (data not
shown). Thus, at present, there is no evidence that any of these NORAD-related
sequences are functional in human cells, although it remains possible that some may
perform a PUMILIO sequestering function in specific tissues or cell types.
Importantly, our Southern blot strategy (Figure 3.5) confirms that these NORAD-related
sequences did not confound our genome editing approach to inactivate NORAD
expression since all analyzed NORAD−/− clones have single copy insertions of the lox-
STOP-lox cassette at the desired site.

133
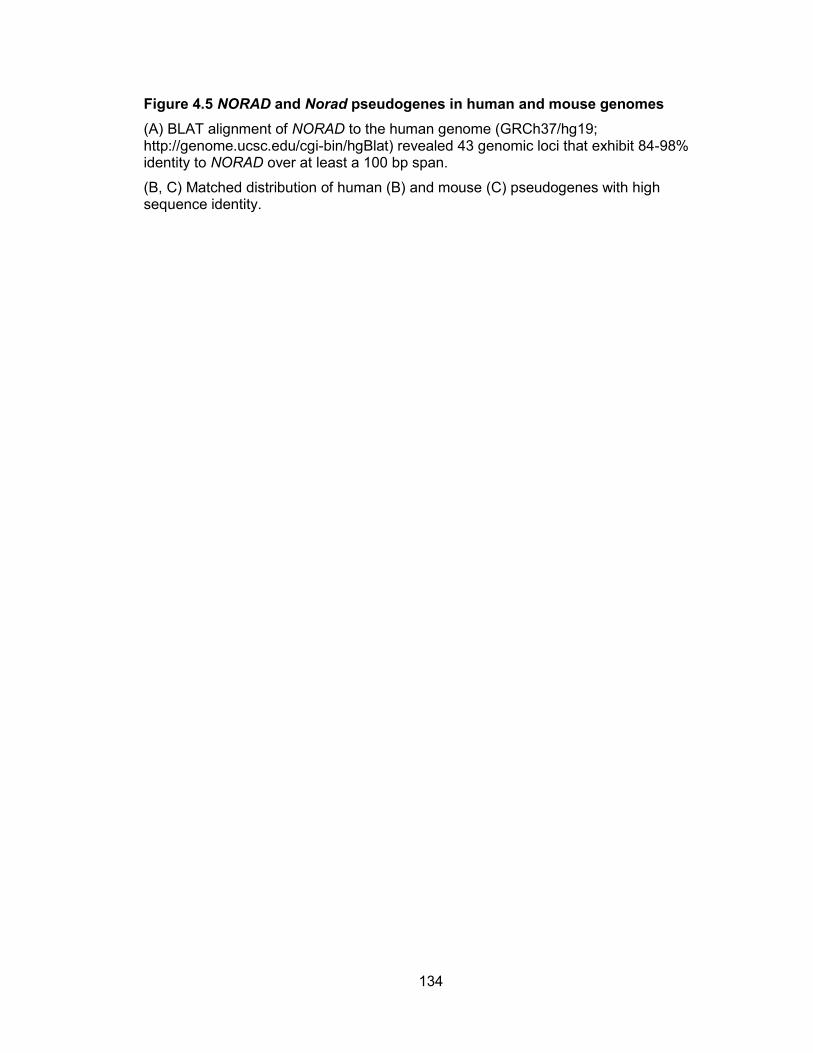
134
Figure 4.5 NORAD and Norad pseudogenes in human and mouse genomes
(A) BLAT alignment of NORAD to the human genome (GRCh37/hg19; http://genome.ucsc.edu/cgi-bin/hgBlat) revealed 43 genomic loci that exhibit 84-98% identity to NORAD over at least a 100 bp span.
(B, C) Matched distribution of human (B) and mouse (C) pseudogenes with high sequence identity.
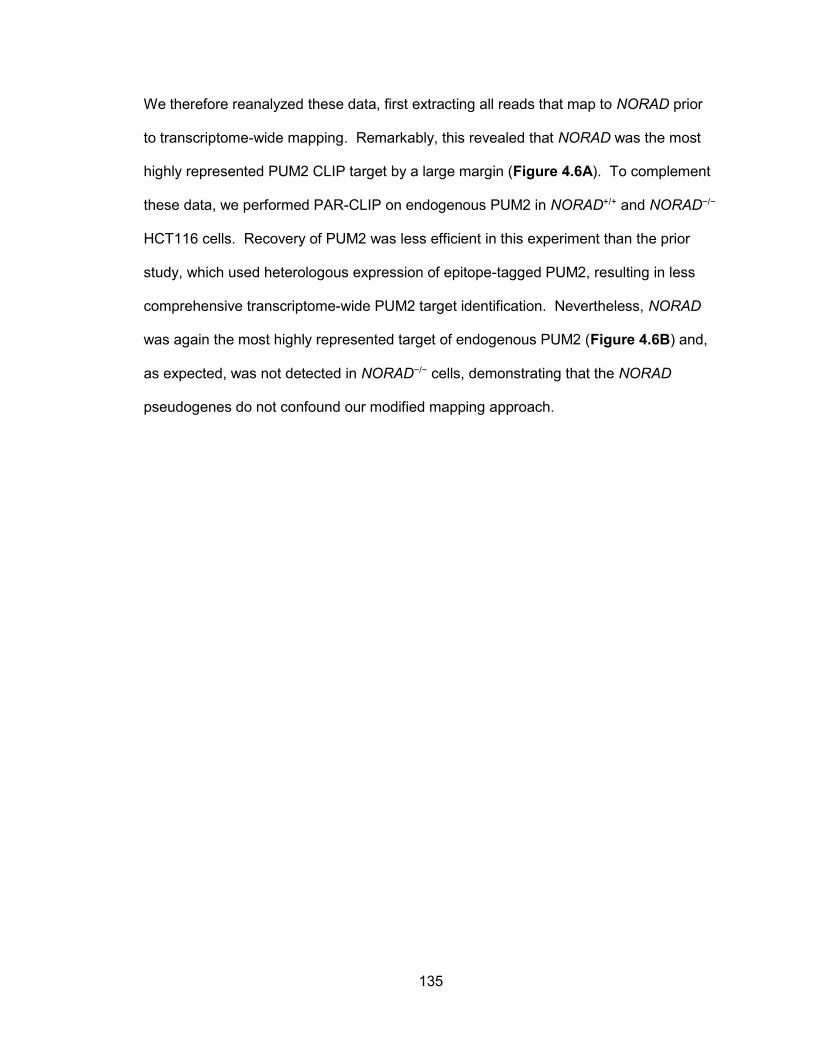
135
We therefore reanalyzed these data, first extracting all reads that map to NORAD prior
to transcriptome-wide mapping. Remarkably, this revealed that NORAD was the most
highly represented PUM2 CLIP target by a large margin (Figure 4.6A). To complement
these data, we performed PAR-CLIP on endogenous PUM2 in NORAD+/+ and NORAD−/−
HCT116 cells. Recovery of PUM2 was less efficient in this experiment than the prior
study, which used heterologous expression of epitope-tagged PUM2, resulting in less
comprehensive transcriptome-wide PUM2 target identification. Nevertheless, NORAD
was again the most highly represented target of endogenous PUM2 (Figure 4.6B) and,
as expected, was not detected in NORAD−/− cells, demonstrating that the NORAD
pseudogenes do not confound our modified mapping approach.
136
Figure 4.6 PUM2 PAR-CLIP reveals NORAD as the most preferred PUM2 binding transcript
(A) Histogram of the total number of CLIP reads per PUM2 target transcript in PAR-CLIP data generated with FLAG-PUM2 (Hafner et al., 2010) (A) or endogenous PUM2 (B). Number of NORAD CLIP reads shown in red text in parentheses.
137
Human PUM1 and PUM2 represent members of the deeply conserved PUF family of
RNA binding proteins that negatively regulate the stability and translation of target
mRNAs to which they bind (Wickens et al., 2002). PUF proteins are known for highly
specific binding to target RNAs, with human PUM1 and PUM2 exhibiting a strong
preference to bind to the PUMILIO response element (PRE) sequence UGUANAUA
(Galgano et al., 2008; Wang et al., 2002). This element is expected to occur 1 time in
approximately 16 kb of random sequence. Strikingly, there are 15 conserved sequences
perfectly matching the PRE in the 5.3 kb NORAD transcript, with the large majority
clustering in or near the NORAD domains (Figure 4.7). This is in stark contrast to other
PUM-bound transcripts, 90% of which have 2 or fewer PREs (Galgano et al., 2008).
Analysis of CLIP cluster distribution on NORAD confirmed the binding of endogenous
PUM2 to 7/15 PREs and heterologously-expressed PUM2 to 15/15 PREs (Figure 4.8).
Together, these data provide compelling evidence demonstrating multivalent interaction
of PUMILIO proteins with NORAD and indicate that NORAD is the preferred PUM2
target transcript in human cells. Thus, in vitro binding data, RIP and PAR-CLIP
interaction studies, and the identification of a large number of conserved PREs together
provide compelling evidence demonstrating multivalent interaction of NORAD with
PUMILIO proteins in human cells.
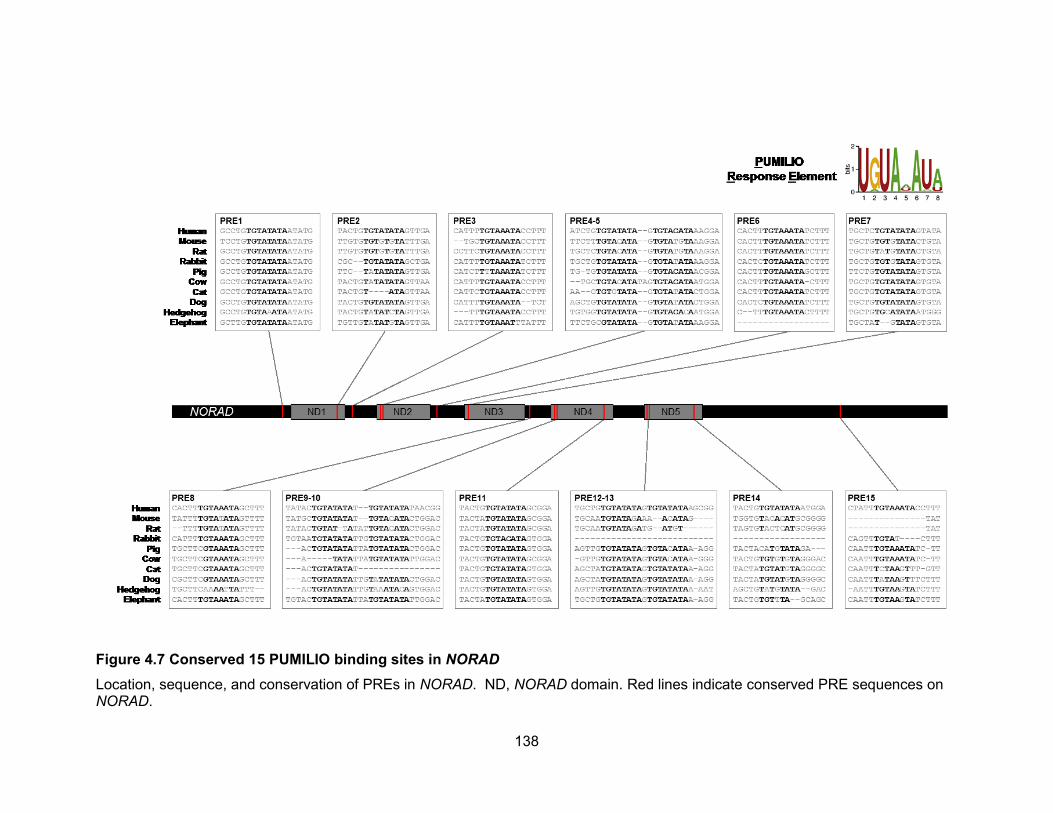
138
Figure 4.7 Conserved 15 PUMILIO binding sites in NORAD
Location, sequence, and conservation of PREs in NORAD. ND, NORAD domain. Red lines indicate conserved PRE sequences on NORAD.
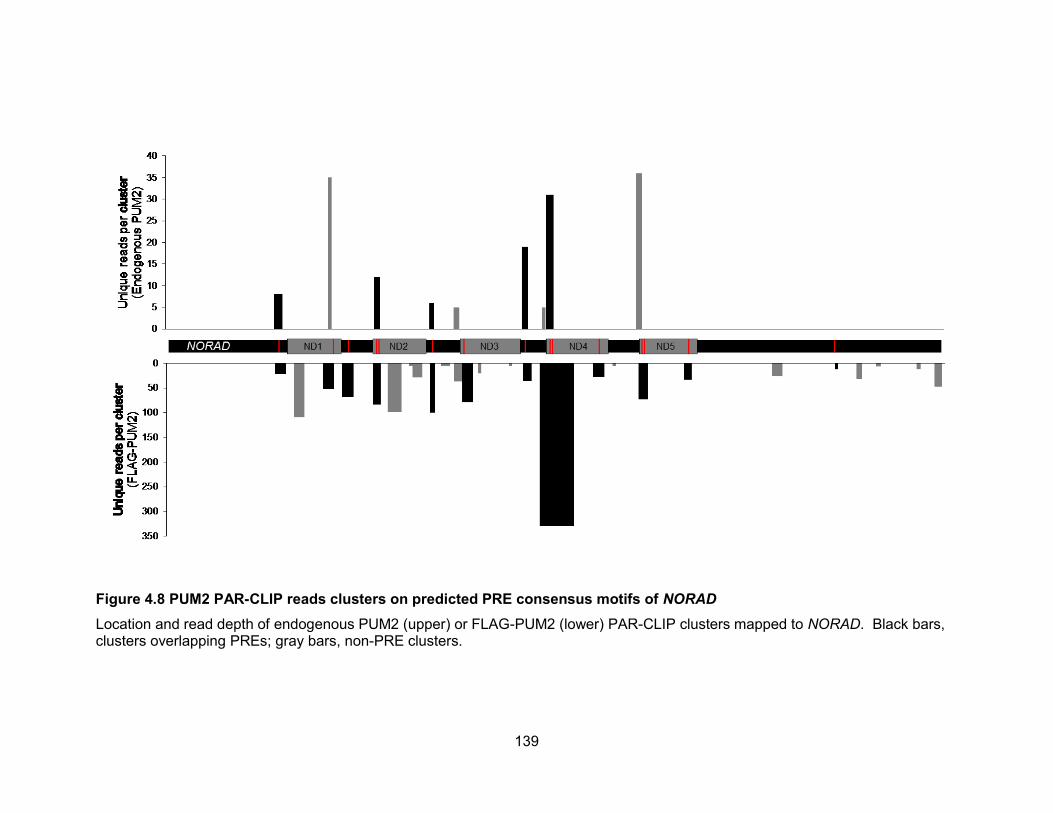
139
Figure 4.8 PUM2 PAR-CLIP reads clusters on predicted PRE consensus motifs of NORAD
Location and read depth of endogenous PUM2 (upper) or FLAG-PUM2 (lower) PAR-CLIP clusters mapped to NORAD. Black bars, clusters overlapping PREs; gray bars, non-PRE clusters.
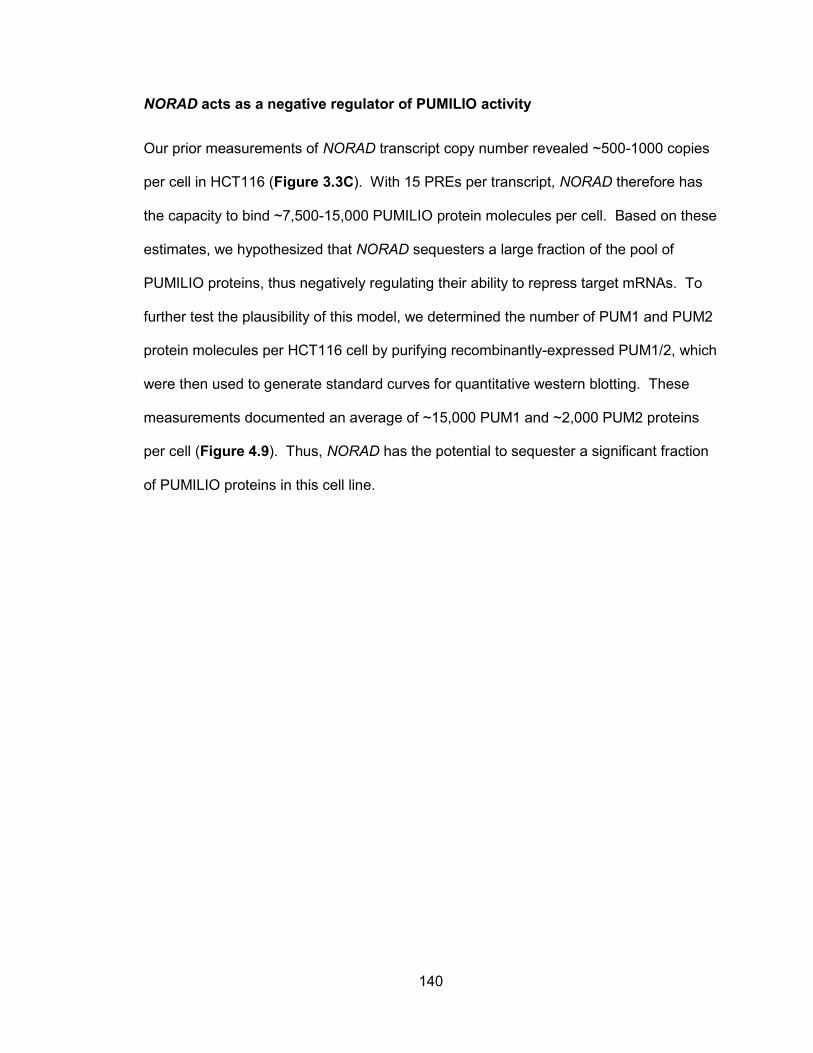
140
NORAD acts as a negative regulator of PUMILIO activity
Our prior measurements of NORAD transcript copy number revealed ~500-1000 copies
per cell in HCT116 (Figure 3.3C). With 15 PREs per transcript, NORAD therefore has
the capacity to bind ~7,500-15,000 PUMILIO protein molecules per cell. Based on these
estimates, we hypothesized that NORAD sequesters a large fraction of the pool of
PUMILIO proteins, thus negatively regulating their ability to repress target mRNAs. To
further test the plausibility of this model, we determined the number of PUM1 and PUM2
protein molecules per HCT116 cell by purifying recombinantly-expressed PUM1/2, which
were then used to generate standard curves for quantitative western blotting. These
measurements documented an average of ~15,000 PUM1 and ~2,000 PUM2 proteins
per cell (Figure 4.9). Thus, NORAD has the potential to sequester a significant fraction
of PUMILIO proteins in this cell line.
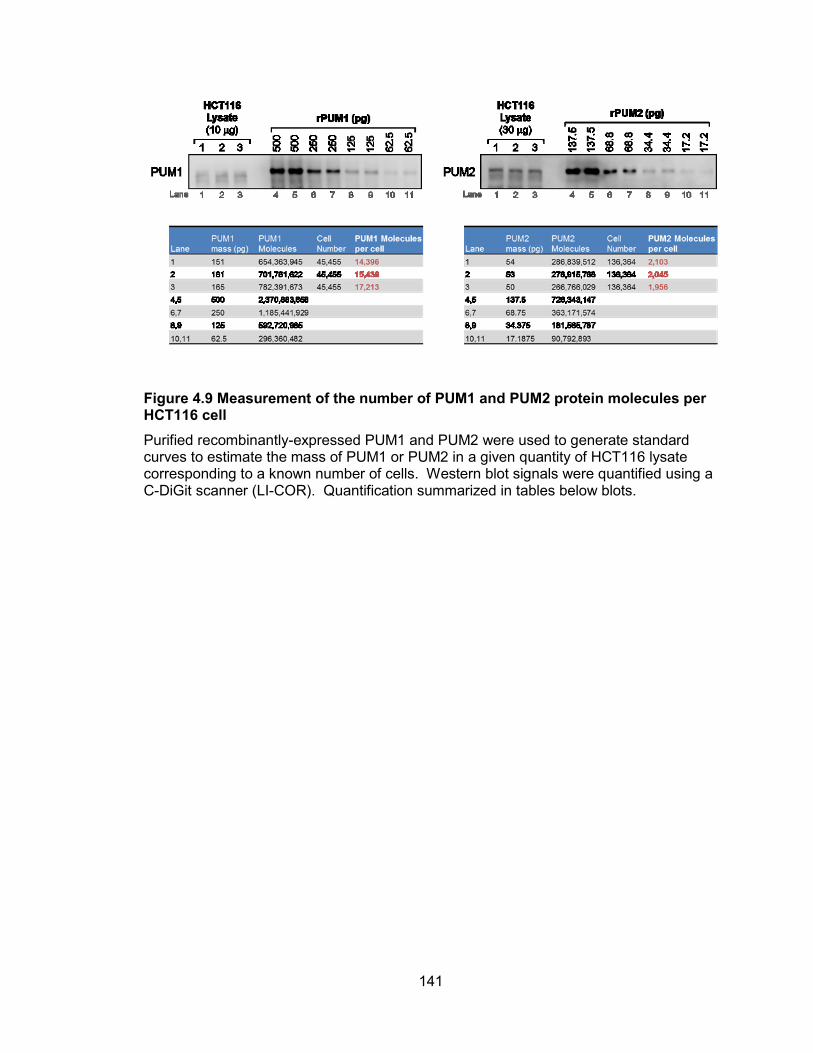
141
Figure 4.9 Measurement of the number of PUM1 and PUM2 protein molecules per HCT116 cell
Purified recombinantly-expressed PUM1 and PUM2 were used to generate standard curves to estimate the mass of PUM1 or PUM2 in a given quantity of HCT116 lysate corresponding to a known number of cells. Western blot signals were quantified using a C-DiGit scanner (LI-COR). Quantification summarized in tables below blots.
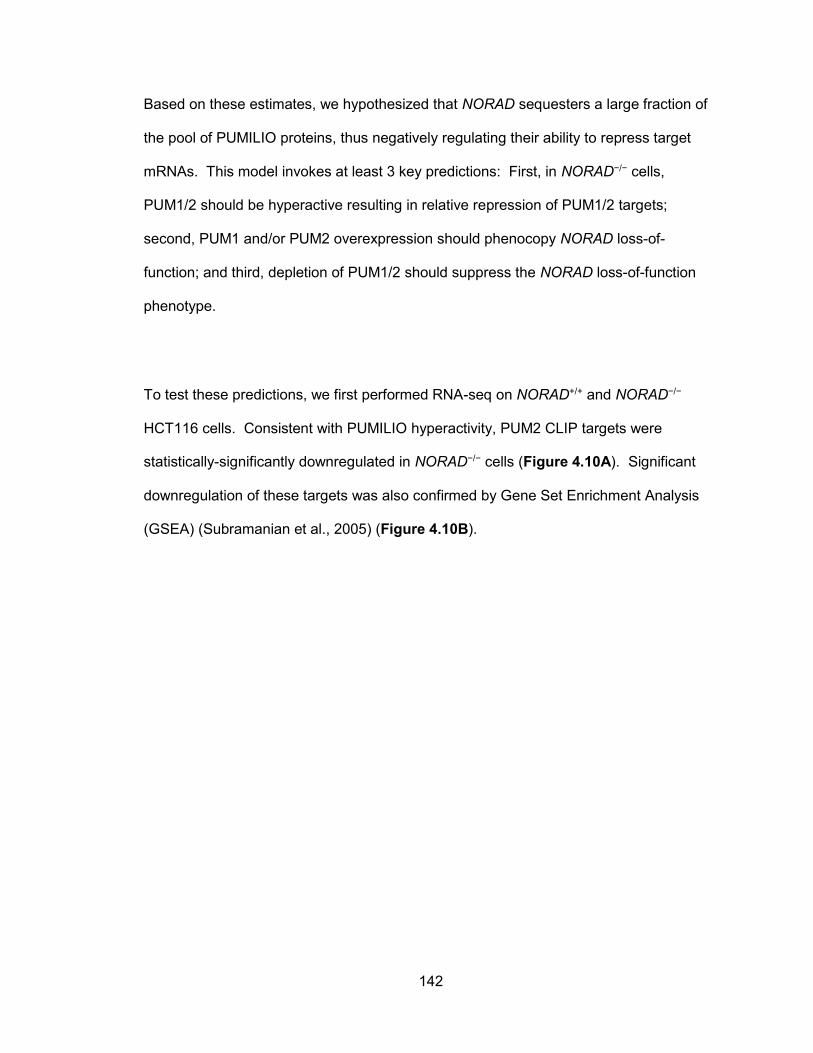
142
Based on these estimates, we hypothesized that NORAD sequesters a large fraction of
the pool of PUMILIO proteins, thus negatively regulating their ability to repress target
mRNAs. This model invokes at least 3 key predictions: First, in NORAD−/− cells,
PUM1/2 should be hyperactive resulting in relative repression of PUM1/2 targets;
second, PUM1 and/or PUM2 overexpression should phenocopy NORAD loss-of-
function; and third, depletion of PUM1/2 should suppress the NORAD loss-of-function
phenotype.
To test these predictions, we first performed RNA-seq on NORAD+/+ and NORAD−/−
HCT116 cells. Consistent with PUMILIO hyperactivity, PUM2 CLIP targets were
statistically-significantly downregulated in NORAD−/− cells (Figure 4.10A). Significant
downregulation of these targets was also confirmed by Gene Set Enrichment Analysis
(GSEA) (Subramanian et al., 2005) (Figure 4.10B).
143
Figure 4.10 PUM2 targets are down-regulated in NORAD−/− cells
(A) Cumulative distribution plots depicting behavior of PUM2 CLIP targets, as defined in Hafner et al. and this study, versus non-PUM2-targets in the indicated RNA-seq experiments. P value calculated by Kolmogorov–Smirnov test demonstrates significant repression of PUM2 targets in all tested datasets. (B) GSEA using RNA-seq data from NORAD−/− cells demonstrates significant downregulation of custom genesets consisting of 591 genes containing the top 1,000 PUM2 PAR-CLIP clusters identified by Hafner et al. (Hafner et al., 2010) (upper) or the 463 PUM2 PAR-CLIP targets identified in the present study (lower). NES, normalized enrichment score; FDR, false discovery rate.
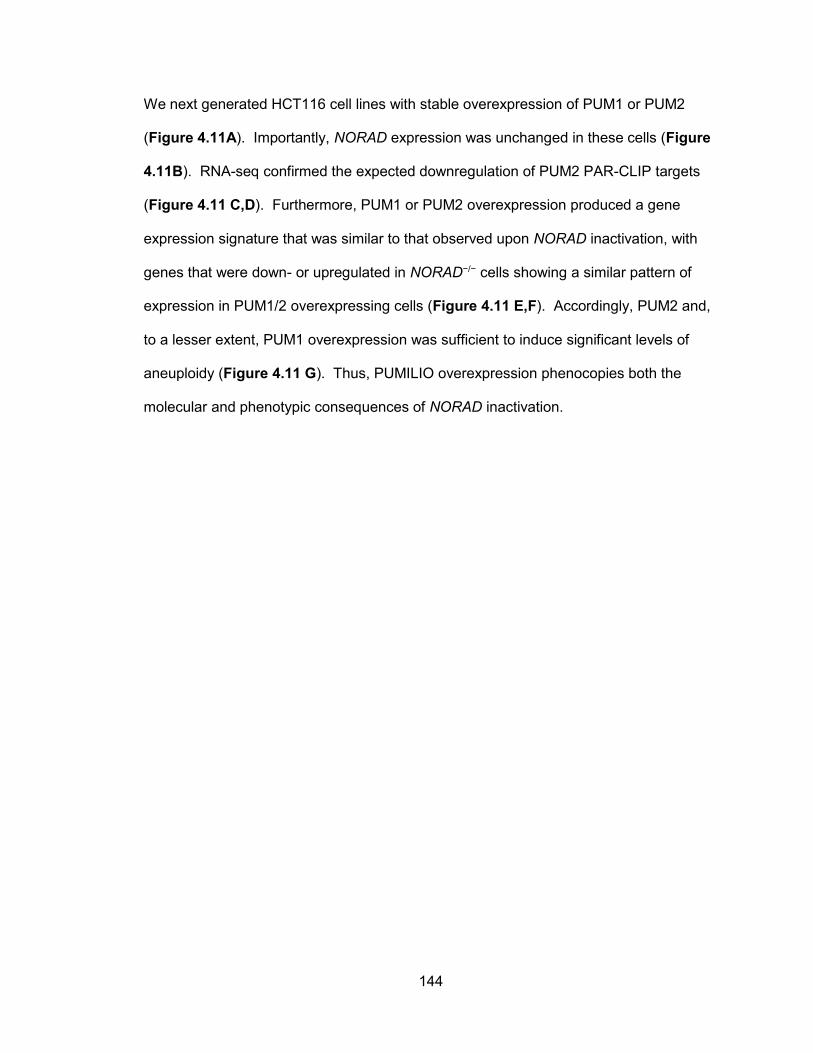
144
We next generated HCT116 cell lines with stable overexpression of PUM1 or PUM2
(Figure 4.11A). Importantly, NORAD expression was unchanged in these cells (Figure
4.11B). RNA-seq confirmed the expected downregulation of PUM2 PAR-CLIP targets
(Figure 4.11 C,D). Furthermore, PUM1 or PUM2 overexpression produced a gene
expression signature that was similar to that observed upon NORAD inactivation, with
genes that were down- or upregulated in NORAD−/− cells showing a similar pattern of
expression in PUM1/2 overexpressing cells (Figure 4.11 E,F). Accordingly, PUM2 and,
to a lesser extent, PUM1 overexpression was sufficient to induce significant levels of
aneuploidy (Figure 4.11 G). Thus, PUMILIO overexpression phenocopies both the
molecular and phenotypic consequences of NORAD inactivation.
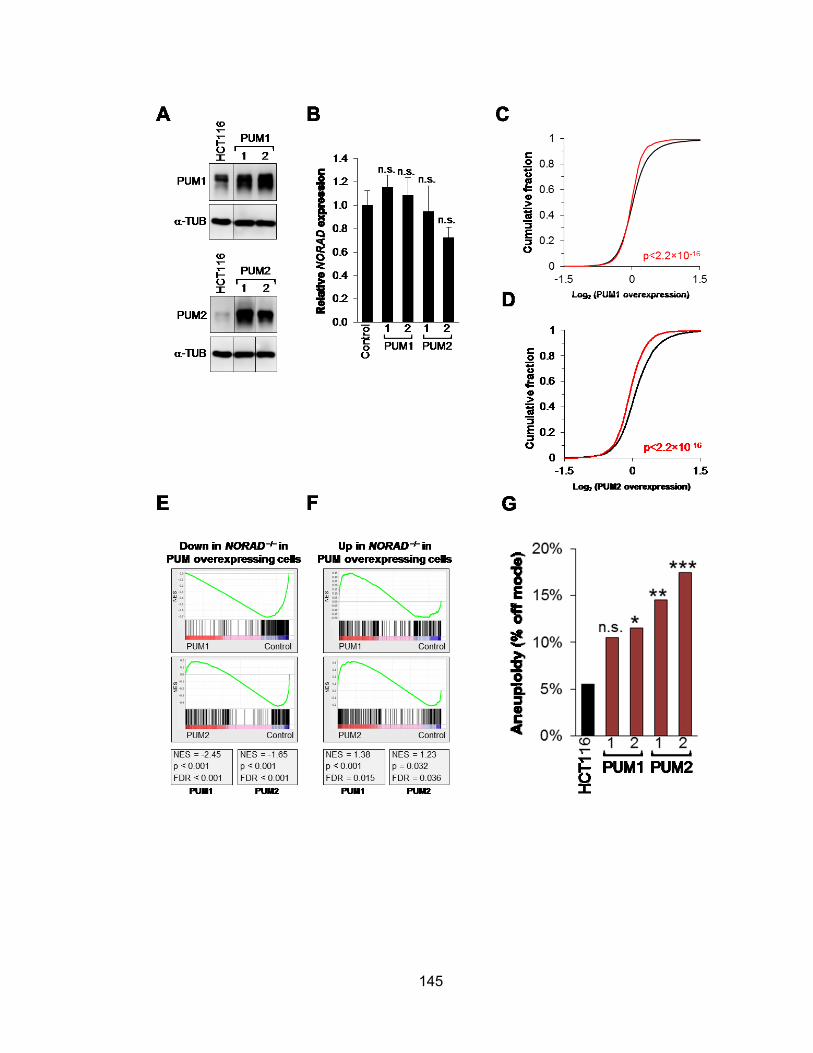
145
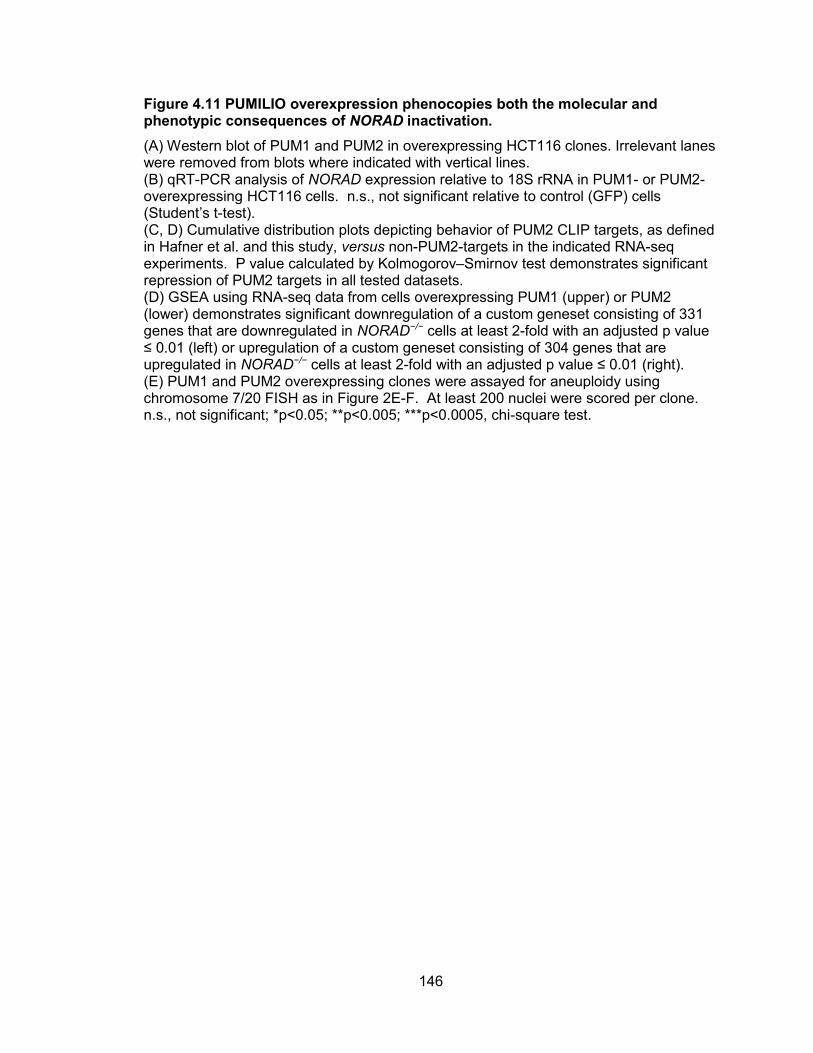
146
Figure 4.11 PUMILIO overexpression phenocopies both the molecular and phenotypic consequences of NORAD inactivation.
(A) Western blot of PUM1 and PUM2 in overexpressing HCT116 clones. Irrelevant lanes were removed from blots where indicated with vertical lines. (B) qRT-PCR analysis of NORAD expression relative to 18S rRNA in PUM1- or PUM2-overexpressing HCT116 cells. n.s., not significant relative to control (GFP) cells (Student’s t-test). (C, D) Cumulative distribution plots depicting behavior of PUM2 CLIP targets, as defined in Hafner et al. and this study, versus non-PUM2-targets in the indicated RNA-seq experiments. P value calculated by Kolmogorov–Smirnov test demonstrates significant repression of PUM2 targets in all tested datasets. (D) GSEA using RNA-seq data from cells overexpressing PUM1 (upper) or PUM2 (lower) demonstrates significant downregulation of a custom geneset consisting of 331 genes that are downregulated in NORAD−/− cells at least 2-fold with an adjusted p value ≤ 0.01 (left) or upregulation of a custom geneset consisting of 304 genes that are upregulated in NORAD−/− cells at least 2-fold with an adjusted p value ≤ 0.01 (right). (E) PUM1 and PUM2 overexpressing clones were assayed for aneuploidy using chromosome 7/20 FISH as in Figure 2E-F. At least 200 nuclei were scored per clone. n.s., not significant; *p<0.05; **p<0.005; ***p<0.0005, chi-square test.
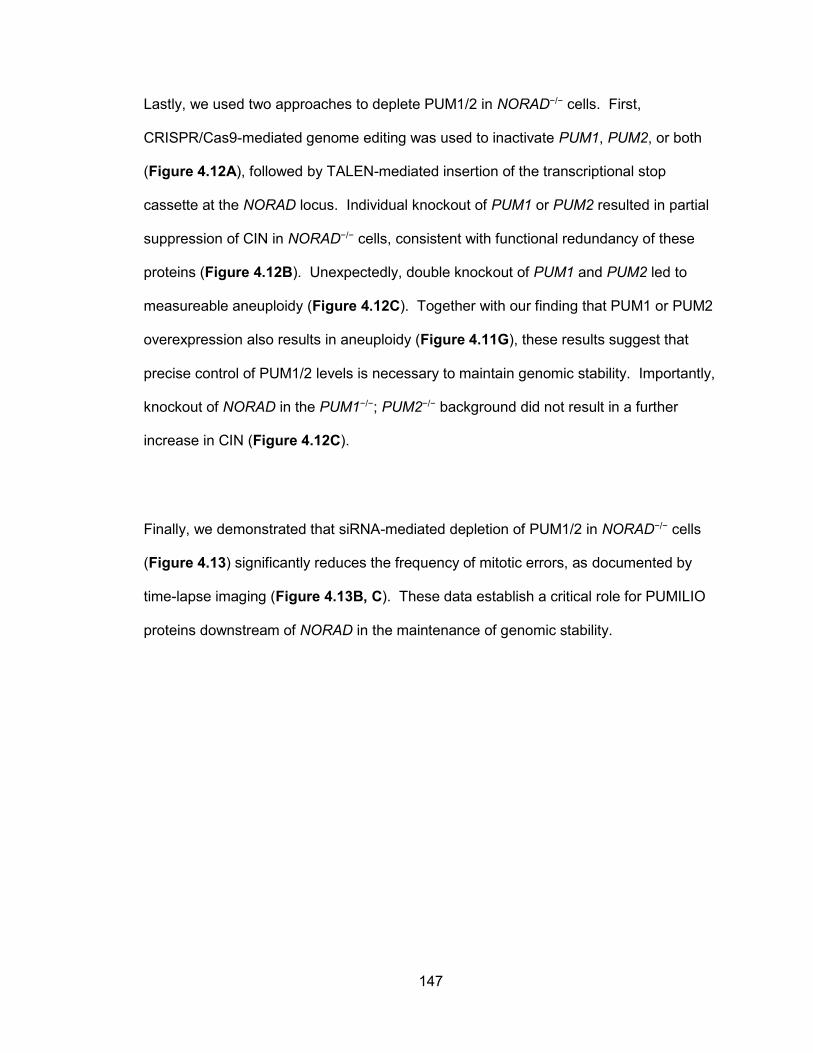
147
Lastly, we used two approaches to deplete PUM1/2 in NORAD−/− cells. First,
CRISPR/Cas9-mediated genome editing was used to inactivate PUM1, PUM2, or both
(Figure 4.12A), followed by TALEN-mediated insertion of the transcriptional stop
cassette at the NORAD locus. Individual knockout of PUM1 or PUM2 resulted in partial
suppression of CIN in NORAD−/− cells, consistent with functional redundancy of these
proteins (Figure 4.12B). Unexpectedly, double knockout of PUM1 and PUM2 led to
measureable aneuploidy (Figure 4.12C). Together with our finding that PUM1 or PUM2
overexpression also results in aneuploidy (Figure 4.11G), these results suggest that
precise control of PUM1/2 levels is necessary to maintain genomic stability. Importantly,
knockout of NORAD in the PUM1−/−; PUM2−/− background did not result in a further
increase in CIN (Figure 4.12C).
Finally, we demonstrated that siRNA-mediated depletion of PUM1/2 in NORAD−/− cells
(Figure 4.13) significantly reduces the frequency of mitotic errors, as documented by
time-lapse imaging (Figure 4.13B, C). These data establish a critical role for PUMILIO
proteins downstream of NORAD in the maintenance of genomic stability.
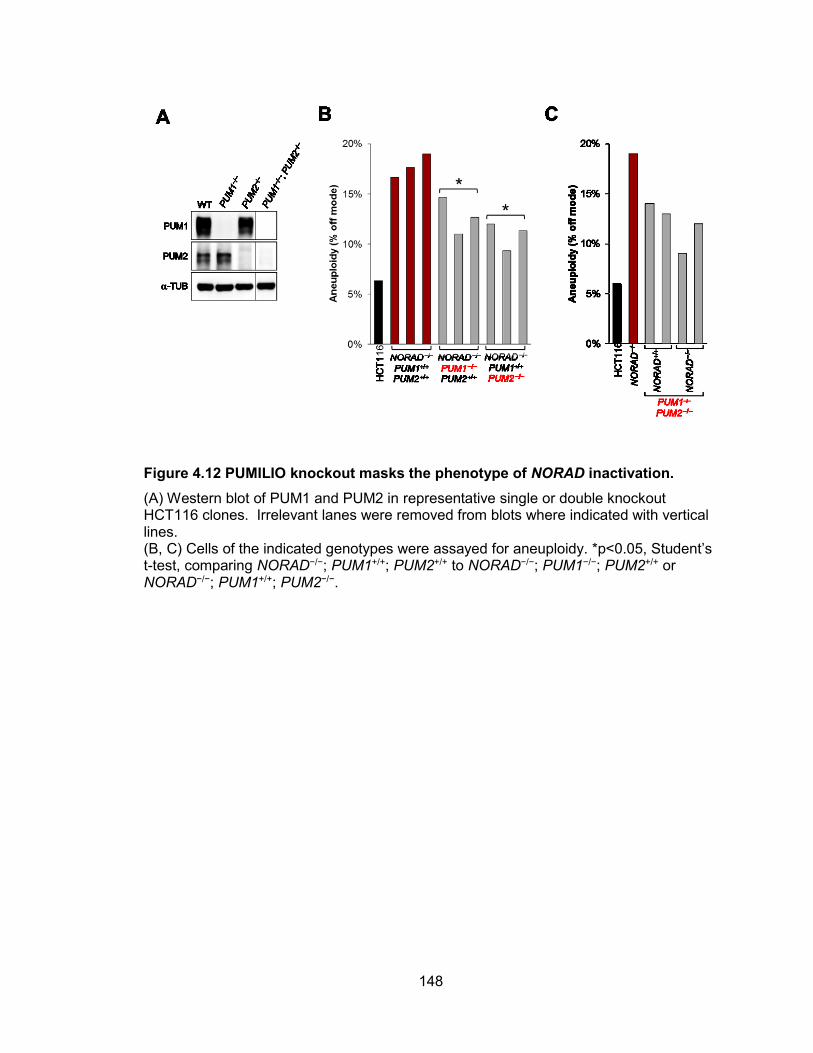
148
Figure 4.12 PUMILIO knockout masks the phenotype of NORAD inactivation.
(A) Western blot of PUM1 and PUM2 in representative single or double knockout HCT116 clones. Irrelevant lanes were removed from blots where indicated with vertical lines. (B, C) Cells of the indicated genotypes were assayed for aneuploidy. *p<0.05, Student’s t-test, comparing NORAD−/−; PUM1+/+; PUM2+/+ to NORAD−/−; PUM1−/−; PUM2+/+ or NORAD−/−; PUM1+/+; PUM2−/−.
149
Figure 4.13 PUMILIO knockdown rescues phenotype of NORAD inactivation.
(A) Western blot of PUM1 and PUM2 in HCT116 cells following transfection with a control siRNA (siNonTarget) or 2 independent sets of PUM1/PUM2-targeting siRNAs.
(B,C) Quantification of the percentage of mitoses exhibiting the indicated mitotic errors in time-lapse imaging experiments after transfection with control siRNA (siNT) or two distinct sets of siRNAs targeting PUM1 and PUM2. Values represent the average of 3 independent experiments with 85-200 mitoses imaged per condition per experiment. Error bars represent standard deviations. *p<0.05; **p<0.01, Student’s t-test.
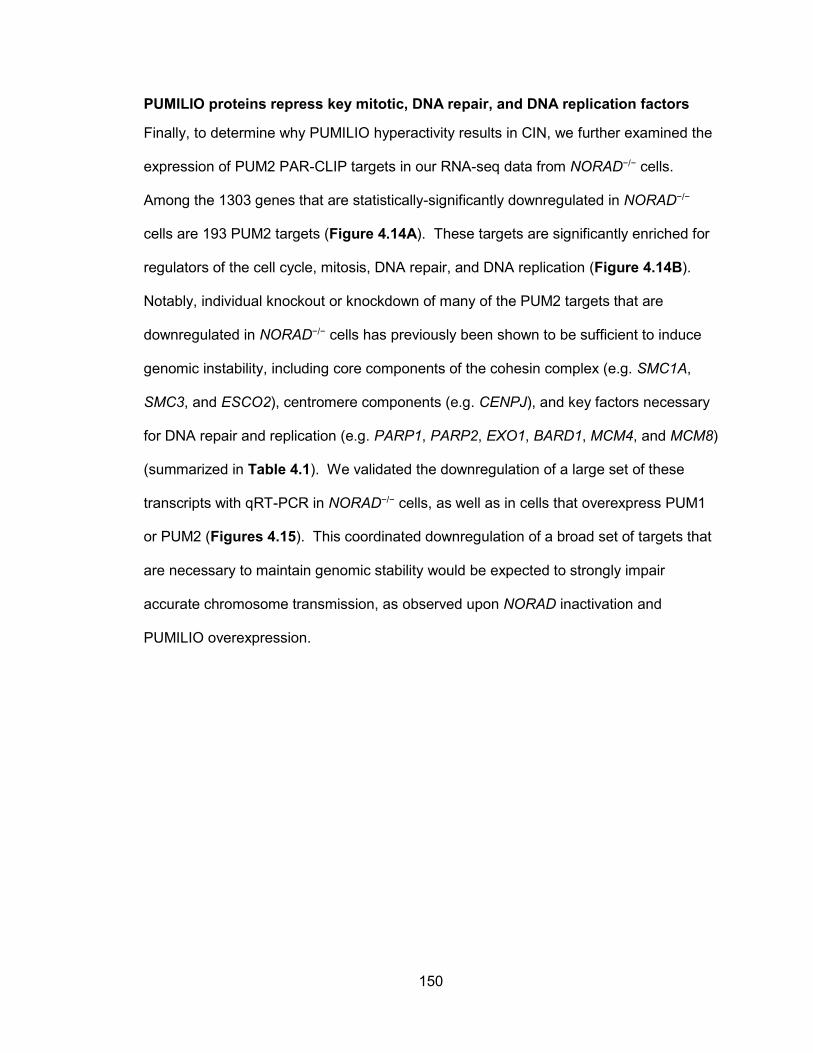
150
PUMILIO proteins repress key mitotic, DNA repair, and DNA replication factors
Finally, to determine why PUMILIO hyperactivity results in CIN, we further examined the
expression of PUM2 PAR-CLIP targets in our RNA-seq data from NORAD−/− cells.
Among the 1303 genes that are statistically-significantly downregulated in NORAD−/−
cells are 193 PUM2 targets (Figure 4.14A). These targets are significantly enriched for
regulators of the cell cycle, mitosis, DNA repair, and DNA replication (Figure 4.14B).
Notably, individual knockout or knockdown of many of the PUM2 targets that are
downregulated in NORAD−/− cells has previously been shown to be sufficient to induce
genomic instability, including core components of the cohesin complex (e.g. SMC1A,
SMC3, and ESCO2), centromere components (e.g. CENPJ), and key factors necessary
for DNA repair and replication (e.g. PARP1, PARP2, EXO1, BARD1, MCM4, and MCM8)
(summarized in Table 4.1). We validated the downregulation of a large set of these
transcripts with qRT-PCR in NORAD−/− cells, as well as in cells that overexpress PUM1
or PUM2 (Figures 4.15). This coordinated downregulation of a broad set of targets that
are necessary to maintain genomic stability would be expected to strongly impair
accurate chromosome transmission, as observed upon NORAD inactivation and
PUMILIO overexpression.
151
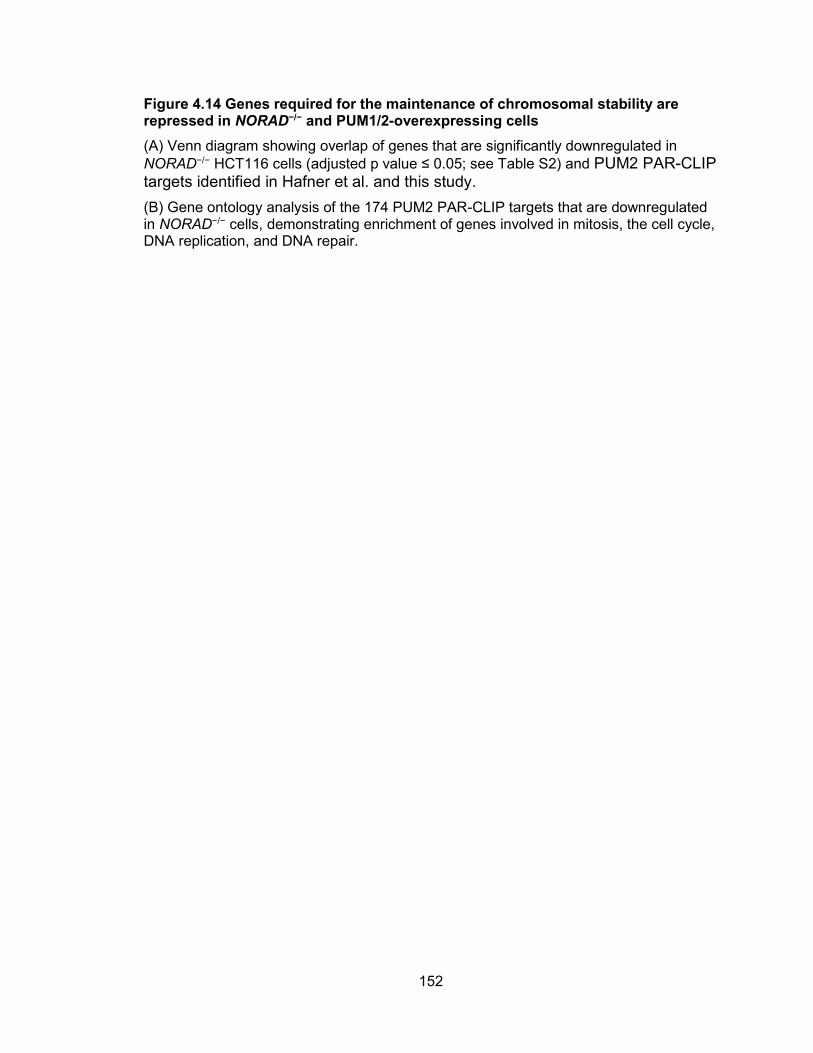
152
Figure 4.14 Genes required for the maintenance of chromosomal stability are repressed in NORAD−/− and PUM1/2-overexpressing cells
(A) Venn diagram showing overlap of genes that are significantly downregulated in
NORAD−/− HCT116 cells (adjusted p value ≤ 0.05; see Table S2) and PUM2 PAR-CLIP targets identified in Hafner et al. and this study.
(B) Gene ontology analysis of the 174 PUM2 PAR-CLIP targets that are downregulated in NORAD−/− cells, demonstrating enrichment of genes involved in mitosis, the cell cycle, DNA replication, and DNA repair.
153
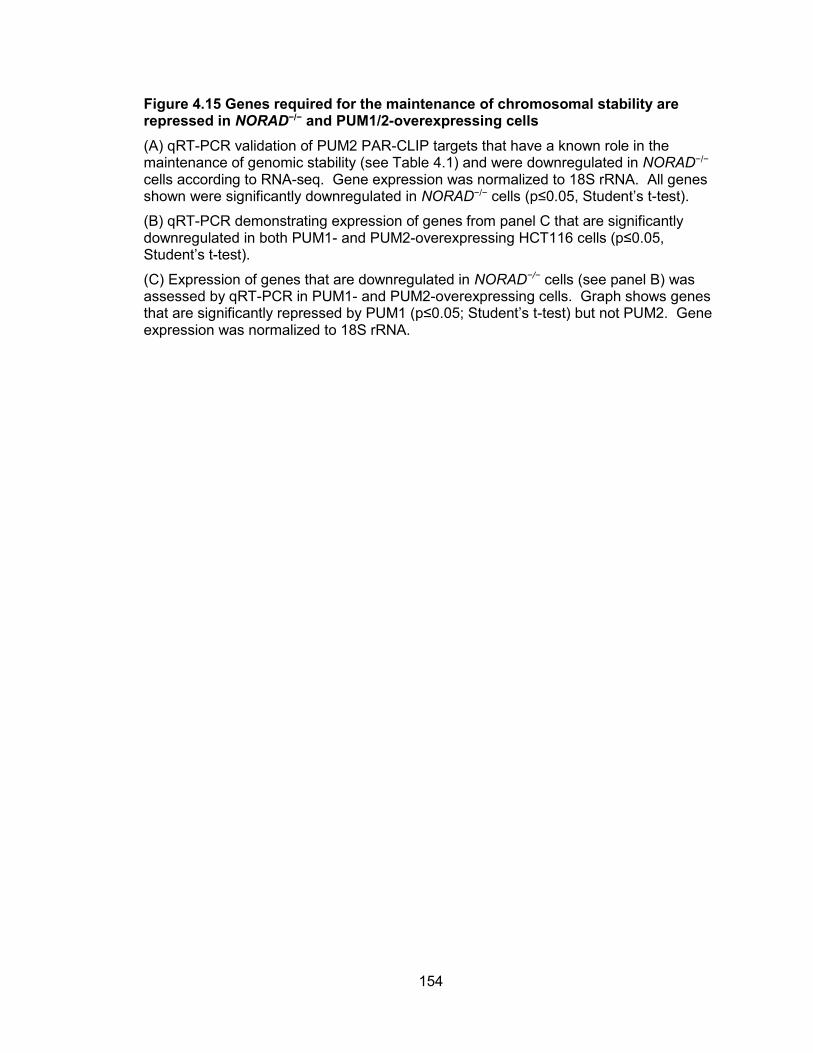
154
Figure 4.15 Genes required for the maintenance of chromosomal stability are repressed in NORAD−/− and PUM1/2-overexpressing cells
(A) qRT-PCR validation of PUM2 PAR-CLIP targets that have a known role in the maintenance of genomic stability (see Table 4.1) and were downregulated in NORAD−/− cells according to RNA-seq. Gene expression was normalized to 18S rRNA. All genes shown were significantly downregulated in NORAD−/− cells (p≤0.05, Student’s t-test).
(B) qRT-PCR demonstrating expression of genes from panel C that are significantly downregulated in both PUM1- and PUM2-overexpressing HCT116 cells (p≤0.05, Student’s t-test).
(C) Expression of genes that are downregulated in NORAD−/− cells (see panel B) was assessed by qRT-PCR in PUM1- and PUM2-overexpressing cells. Graph shows genes that are significantly repressed by PUM1 (p≤0.05; Student’s t-test) but not PUM2. Gene expression was normalized to 18S rRNA.
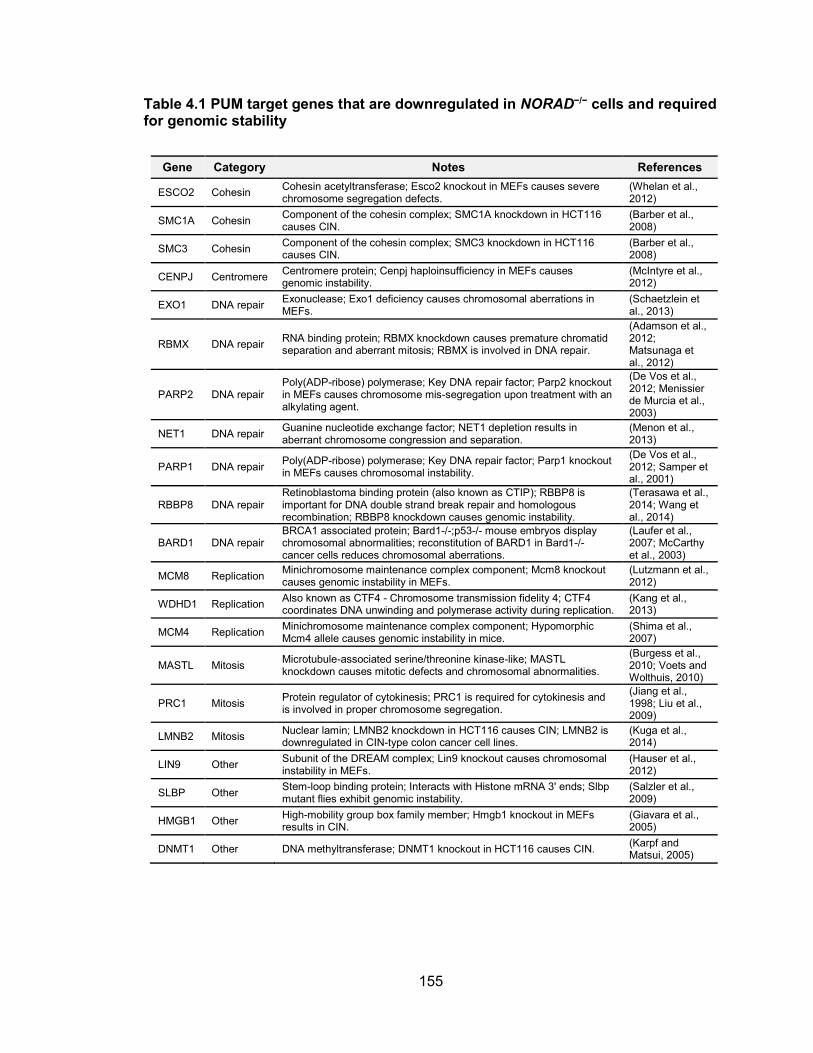
155
Table 4.1 PUM target genes that are downregulated in NORAD−/− cells and required for genomic stability
Gene Category Notes References
ESCO2 Cohesin Cohesin acetyltransferase; Esco2 knockout in MEFs causes severe chromosome segregation defects.
(Whelan et al., 2012)
SMC1A Cohesin Component of the cohesin complex; SMC1A knockdown in HCT116 causes CIN.
(Barber et al., 2008)
SMC3 Cohesin Component of the cohesin complex; SMC3 knockdown in HCT116 causes CIN.
(Barber et al., 2008)
CENPJ Centromere Centromere protein; Cenpj haploinsufficiency in MEFs causes genomic instability.
(McIntyre et al., 2012)
EXO1 DNA repair Exonuclease; Exo1 deficiency causes chromosomal aberrations in MEFs.
(Schaetzlein et al., 2013)
RBMX DNA repair RNA binding protein; RBMX knockdown causes premature chromatid separation and aberrant mitosis; RBMX is involved in DNA repair.
(Adamson et al., 2012; Matsunaga et al., 2012)
PARP2 DNA repair Poly(ADP-ribose) polymerase; Key DNA repair factor; Parp2 knockout in MEFs causes chromosome mis-segregation upon treatment with an alkylating agent.
(De Vos et al., 2012; Menissier de Murcia et al., 2003)
NET1 DNA repair Guanine nucleotide exchange factor; NET1 depletion results in aberrant chromosome congression and separation.
(Menon et al., 2013)
PARP1 DNA repair Poly(ADP-ribose) polymerase; Key DNA repair factor; Parp1 knockout in MEFs causes chromosomal instability.
(De Vos et al., 2012; Samper et al., 2001)
RBBP8 DNA repair Retinoblastoma binding protein (also known as CTIP); RBBP8 is important for DNA double strand break repair and homologous recombination; RBBP8 knockdown causes genomic instability.
(Terasawa et al., 2014; Wang et al., 2014)
BARD1 DNA repair BRCA1 associated protein; Bard1-/-;p53-/- mouse embryos display chromosomal abnormalities; reconstitution of BARD1 in Bard1-/- cancer cells reduces chromosomal aberrations.
(Laufer et al., 2007; McCarthy et al., 2003)
MCM8 Replication Minichromosome maintenance complex component; Mcm8 knockout causes genomic instability in MEFs.
(Lutzmann et al., 2012)
WDHD1 Replication Also known as CTF4 - Chromosome transmission fidelity 4; CTF4 coordinates DNA unwinding and polymerase activity during replication.
(Kang et al., 2013)
MCM4 Replication Minichromosome maintenance complex component; Hypomorphic Mcm4 allele causes genomic instability in mice.
(Shima et al., 2007)
MASTL Mitosis Microtubule-associated serine/threonine kinase-like; MASTL knockdown causes mitotic defects and chromosomal abnormalities.
(Burgess et al., 2010; Voets and Wolthuis, 2010)
PRC1 Mitosis Protein regulator of cytokinesis; PRC1 is required for cytokinesis and is involved in proper chromosome segregation.
(Jiang et al., 1998; Liu et al., 2009)
LMNB2 Mitosis Nuclear lamin; LMNB2 knockdown in HCT116 causes CIN; LMNB2 is downregulated in CIN-type colon cancer cell lines.
(Kuga et al., 2014)
LIN9 Other Subunit of the DREAM complex; Lin9 knockout causes chromosomal instability in MEFs.
(Hauser et al., 2012)
SLBP Other Stem-loop binding protein; Interacts with Histone mRNA 3' ends; Slbp mutant flies exhibit genomic instability.
(Salzler et al., 2009)
HMGB1 Other High-mobility group box family member; Hmgb1 knockout in MEFs results in CIN.
(Giavara et al., 2005)
DNMT1 Other DNA methyltransferase; DNMT1 knockout in HCT116 causes CIN. (Karpf and Matsui, 2005)
156
Discussion
Although thousands of lncRNAs have been identified, the molecular functions of the vast
majority remain unknown. Here we report the initial functional characterization of a
highly conserved lncRNA that we termed NORAD, which is broadly and abundantly
expressed in mammalian cells and tissues. Our studies of this lncRNA have yielded
several important and unexpected findings. First, as demonstrated in the previous
chapter, inactivation of NORAD is sufficient to produce a chromosomal instability (CIN)
phenotype in previously karyotypically-stable cell lines. To our knowledge, these results
provide the first demonstration of an essential role for a lncRNA in the maintenance of
chromosomal stability in mammalian cells. Second, we show that NORAD preserves
genomic stability by acting as a multivalent binding platform for the PUMILIO family of
RNA binding proteins. Due to its high abundance and multitude of PUMILIO binding
sites, NORAD is able to sequester a significant fraction of the total cellular pool of
PUMILIO proteins, thereby greatly limiting their ability to repress target mRNAs. Among
PUMILIO targets are a large set of factors that are critical for mitosis, DNA repair, and
DNA replication whose excessive repression in the absence of NORAD perturbs
accurate chromosome segregation and can induce tetraploidization (Figure 4.16). The
elucidation of this novel lncRNA:PUMILIO regulatory interaction has expanded our
understanding of lncRNA functions and has uncovered a heretofore-unknown role for
PUMILIO proteins in the regulation of genomic stability in mammals.
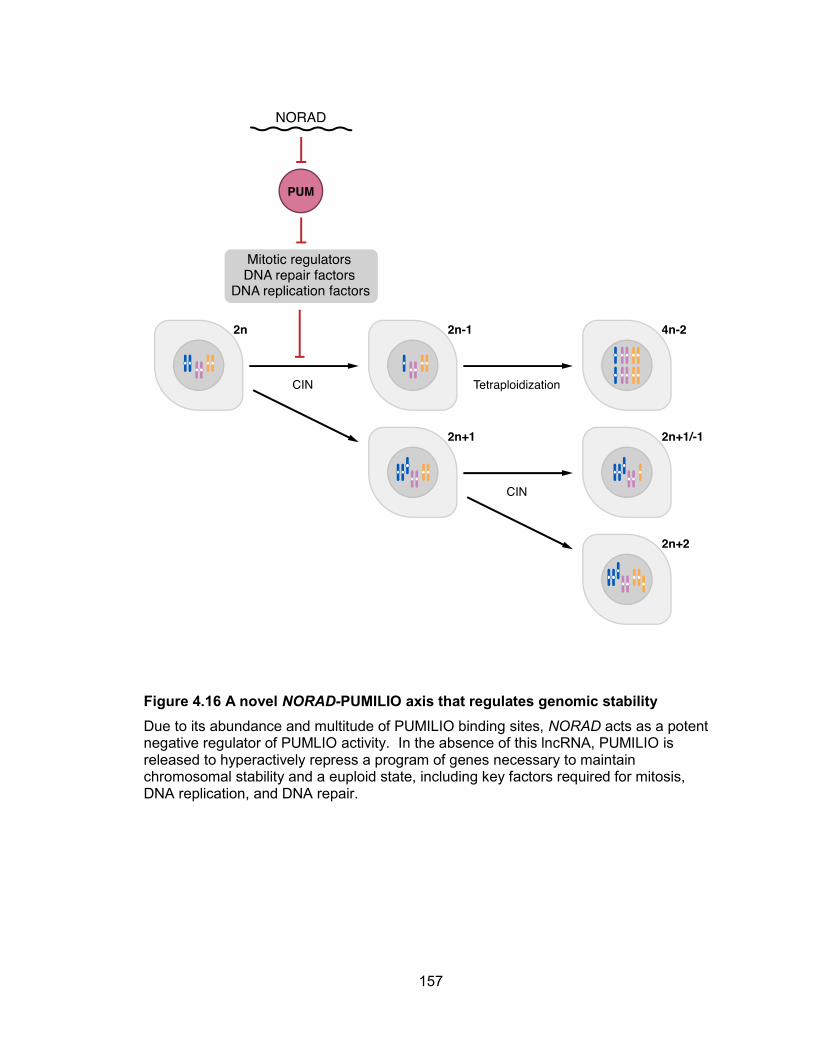
157
Figure 4.16 A novel NORAD-PUMILIO axis that regulates genomic stability
Due to its abundance and multitude of PUMILIO binding sites, NORAD acts as a potent negative regulator of PUMLIO activity. In the absence of this lncRNA, PUMILIO is released to hyperactively repress a program of genes necessary to maintain chromosomal stability and a euploid state, including key factors required for mitosis, DNA replication, and DNA repair.
158
Our discovery that NORAD sequesters PUMILIO proteins contributes to an emerging
concept that a major class of lncRNAs function as molecular decoys. For example,
noncoding transcripts that sequester microRNAs (miRNAs), referred to as competing
endogenous RNAs (ceRNAs), have been proposed to act as broad regulators of gene
expression (Salmena et al., 2011). lncRNAs that inhibit proteins through competitive
binding have also been reported, such as GAS5 and the glucocorticoid receptor (Kino et
al., 2010), GADD7 and TDP-43 (Liu et al., 2012), and PANDA and NF-YA (Hung et al.,
2011). Nevertheless, due to the generally low abundance of lncRNAs and the frequent
promiscuity of protein-RNA interactions, the extent to which lncRNAs function through
this mechanism has been heavily debated. Importantly, several features of NORAD
distinguish it from the majority of lncRNAs and strongly support its function as a bona
fide molecular decoy. First, NORAD is unusually abundant with expression in the range
of ~500-1000 copies per cell in human cell lines, comparable to abundant housekeeping
transcripts such as ACTB. Moreover, the presence of at least 15 PUMLIIO response
elements (PREs) per NORAD transcript further amplifies, by more than an order of
magnitude, the number of competitive binding sites provided by this lncRNA. Indeed,
careful measurements of the number of PUM1 and PUM2 protein molecules per cell
revealed that NORAD has the potential to sequester 50-100% of the total PUMILIO
protein pool in HCT116 cells. Finally, it is noteworthy that unlike many RNA binding
proteins that interact with loosely defined consensus sequences, PUMILIO proteins are
known for their exquisite specificity (Wang et al., 2002). Thus, NORAD provides an
optimized binding platform that would be expected to efficiently assemble a multivalent
PUMILIO RNP, thereby greatly reducing the availability of PUMILIO proteins to act upon
mRNA targets.
159
These results also establish a novel role for PUMILIO proteins as important regulators of
genomic stability. Our finding that PUMILIO proteins repress a program of genes whose
expression is necessary to maintain chromosomal stability reveals a previously
unrecognized pathway to CIN. Prominent among PUMILIO targets are many genes that
function in DNA replication and repair as well as key mitotic factors. Previous studies
have demonstrated that individual knockdown or knockout of a large number of these
genes is sufficient to produce a CIN phenotype (summarized in Table 4.1). It is
therefore highly plausible that the coordinated repression of these targets under
conditions of PUMILIO hyperactivity would produce a state of severe genomic instability,
as observed upon NORAD loss-of-function. Importantly, it is presently unclear whether
PUMILIO hyperactivity contributes to CIN in human cancer cells since abnormal
expression or activity of PUMILIO or NORAD has not been reported in human tumors.
Nevertheless, in light of our findings, a more thorough examination of this pathway in
cancer is merited.
These findings contribute to a growing appreciation that the activity of PUMILIO proteins
must be maintained within a narrow range to maintain homeostasis in mammals. For
example, Pum1 haploinsufficiency results in neurodegeneration in mice due to
upregulation of the PUMILIO target Ataxin1 (Gennarino et al., 2015). Our data
document that hyperactivity of PUM1 or PUM2 also has deleterious consequences.
Nevertheless, little is known regarding how PUMILIO activity is regulated. The
emergence of NORAD in mammals provides a robust mechanism to buffer PUMILIO
activity and maintain it within tolerable limits. A major unresolved question, however, is
whether NORAD functions primarily as a static buffer or whether its levels are modulated
in order to further titrate PUMILIO activity under certain conditions. Importantly, since
160
each NORAD transcript has the capacity to bind at least 15 PUMILIO protein molecules,
even small changes in NORAD levels can profoundly influence PUMILIO availability.
For example, NORAD initially came to our attention due to its modest induction after
DNA damage (~2 fold; see Figure 3.3). Yet this small increase generates ~7000
additional PREs, representing sufficient binding sites to sequester nearly half of the total
pool of PUMILIO proteins in HCT116 cells. Notably, since transcripts encoding several
key DNA repair factors are PUM1/PUM2 targets (Figure 4.14), upregulation of NORAD
and a concomitant enhancement of PUMILIO sequestration would be expected to de-
repress these targets, thereby augmenting cellular DNA repair capacity.
In summary, characterization of the noncoding RNA NORAD has revealed a potent
molecular decoy for PUMILIO proteins, uncovering an unexpected mechanism through
which the activity of these highly-dosage sensitive post-transcriptional regulators is
controlled in mammalian cells. These results have also established the existence of a
newly-defined PUMILIO regulon that includes a program of genes whose expression is
essential for the maintenance of genomic stability. Since chromosomal instability, as
observed upon NORAD inactivation and consequent PUMILIO hyperactivity, can
produce developmental defects, accelerated aging, cancer, and other pathologies
(Iourov et al., 2010; Kops et al., 2005; Zeman and Cimprich, 2014), examination of
NORAD regulation and activity in normal physiology and disease will be of great interest.
161
Materials and Methods
Subcellular fractionation
Cytoplasmic, nuclear soluble, and chromatin-associated fractions were generated as
described previously (Cabianca et al., 2012). Briefly, cells were harvested by
trypsinization and lysed in RLN1 solution (50 mM Tris-HCl pH 8.0, 140 mM NaCl, 1.5
mM MgCl2, 0.5% NP-40, 2 mM VRC) in ice for 5 min. After centrifugation, the
supernatant was collected as the cytoplasmic fraction while the pellet was further
extracted with RLN2 solution (50 mM Tris-HCl pH 8.0, 500 mM NaCl, 1.5 mM MgCl2,
0.5% NP-40, 2 mM VRC). Further centrifugation yielded the nuclear-soluble fraction as
supernatant and chromatin-associated fraction as pellet. RNA was extracted from
fractions with Trizol (Life Technologies).
RNA FISH
A Stellaris single molecule FISH probe for NORAD was designed using the Stellaris
Probe designer (https://www.biosearchtech.com/stellarisdesigner/). Each probe consists
of a pool of 48 oligonucleotides, each labeled with CAL Fluor Red 610. Cells were
grown on Nunc Lab-Tek II CC2 chambered slides (Thermo) and fixed with 4%
formaldehyde for 10 min. Fixed cells were permeabilized in 70% EtOH for 1 hour and
dehydrated for 2 min each in 70%, 80%, 95%, and 100% EtOH, then air-dried. Slides
were washed in PBS with 0.1% Tween 20 and hybridized at 37°C overnight in 100 L
hybridization buffer (100 mg/mL dextran sulfate, 10% formamide in 2X SSC) containing
125 nM probe per each 22 mm x 22 mm surface under a coverglass sealed with rubber
cement. Slides were washed with 10% formamide in 2X SSC and mounted with
ProLong Gold Antifade with DAPI (Molecular probes).
162
NORAD affinity purification and mass spectrometry
NORAD fragments were amplified with primers containing T7 and SP6 promoter
sequences (Table 4.2) and used as templates for the MEGAscript T7/SP6 Transcription
Kit (Ambion) with the Biotin RNA labeling mix (Roche). In vitro transcribed RNA was
treated with DNase I and purified with the RNeasy kit (Qiagen). 30 pmol purified
biotinylated RNA was heated to 90°C in 60 L RNA structure buffer (10 M Tris-Cl pH
7.0, 0.1 M KCl, 10 mM MgCl2) for 2 minutes then put on ice for 2 minutes. 2×10⁷ cells
were harvested by scraping and snap-frozen before resuspension in 1.2 mL lysis buffer
[150 mM NaCl, 50 mM Tris-Cl pH 7.5, 0.5% Triton X-100, 1mM PMSF, 1x protease
inhibitor cocktail (Roche), and 100 U/ml of SUPERaseIN (Ambion)]. Lysates were
sonicated using a Bioruptor (Diagenode) for 10 min with 30 sec on/off cycles and pre-
cleared with 50 L washed streptavidin C1 Dynabeads (Invitrogen) at 4°C for 1 hour. 30
pmol biotinylated RNA was then added to pre-cleared lysates and rotated at 4°C for 2
hours, followed by addition of 50 L streptavidin C1 Dynabeads and further rotation for 1
hour. Beads were washed 6 times with lysis buffer at 4°C and proteins were eluted by
incubating in RNase A buffer (50 mM Tris-Cl pH 7.5, 150 mM NaCl, 100 g/mL RNase
A) for 35 minutes at 37°C. Eluted proteins were subjected to label-free quantification
using mass spectrometry and SINQ spectral index analysis (Trudgian et al., 2011) at the
UT Southwestern Proteomics core. Proteins detectable in at least 1 sense NORAD
fragment pull-down with ≥5 spectral counts were included in subsequent analyses.
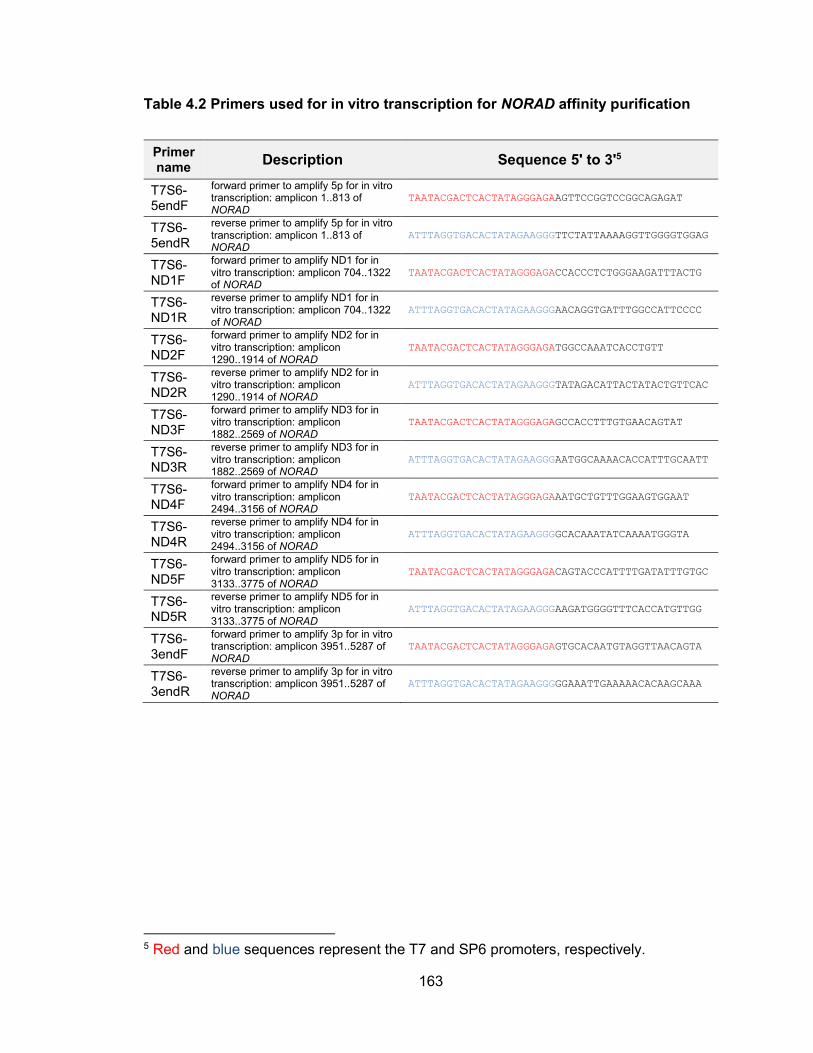
163
Table 4.2 Primers used for in vitro transcription for NORAD affinity purification
Primer name
Description Sequence 5' to 3'5
T7S6-5endF
forward primer to amplify 5p for in vitro transcription: amplicon 1..813 of NORAD
TAATACGACTCACTATAGGGAGAAGTTCCGGTCCGGCAGAGAT
T7S6-5endR
reverse primer to amplify 5p for in vitro transcription: amplicon 1..813 of NORAD
ATTTAGGTGACACTATAGAAGGGTTCTATTAAAAGGTTGGGGTGGAG
T7S6-ND1F
forward primer to amplify ND1 for in vitro transcription: amplicon 704..1322 of NORAD
TAATACGACTCACTATAGGGAGACCACCCTCTGGGAAGATTTACTG
T7S6-ND1R
reverse primer to amplify ND1 for in vitro transcription: amplicon 704..1322 of NORAD
ATTTAGGTGACACTATAGAAGGGAACAGGTGATTTGGCCATTCCCC
T7S6-ND2F
forward primer to amplify ND2 for in vitro transcription: amplicon 1290..1914 of NORAD
TAATACGACTCACTATAGGGAGATGGCCAAATCACCTGTT
T7S6-ND2R
reverse primer to amplify ND2 for in vitro transcription: amplicon 1290..1914 of NORAD
ATTTAGGTGACACTATAGAAGGGTATAGACATTACTATACTGTTCAC
T7S6-ND3F
forward primer to amplify ND3 for in vitro transcription: amplicon 1882..2569 of NORAD
TAATACGACTCACTATAGGGAGAGCCACCTTTGTGAACAGTAT
T7S6-ND3R
reverse primer to amplify ND3 for in vitro transcription: amplicon 1882..2569 of NORAD
ATTTAGGTGACACTATAGAAGGGAATGGCAAAACACCATTTGCAATT
T7S6-ND4F
forward primer to amplify ND4 for in vitro transcription: amplicon 2494..3156 of NORAD
TAATACGACTCACTATAGGGAGAAATGCTGTTTGGAAGTGGAAT
T7S6-ND4R
reverse primer to amplify ND4 for in vitro transcription: amplicon 2494..3156 of NORAD
ATTTAGGTGACACTATAGAAGGGGCACAAATATCAAAATGGGTA
T7S6-ND5F
forward primer to amplify ND5 for in vitro transcription: amplicon 3133..3775 of NORAD
TAATACGACTCACTATAGGGAGACAGTACCCATTTTGATATTTGTGC
T7S6-ND5R
reverse primer to amplify ND5 for in vitro transcription: amplicon 3133..3775 of NORAD
ATTTAGGTGACACTATAGAAGGGAAGATGGGGTTTCACCATGTTGG
T7S6-3endF
forward primer to amplify 3p for in vitro transcription: amplicon 3951..5287 of NORAD
TAATACGACTCACTATAGGGAGAGTGCACAATGTAGGTTAACAGTA
T7S6-3endR
reverse primer to amplify 3p for in vitro transcription: amplicon 3951..5287 of NORAD
ATTTAGGTGACACTATAGAAGGGGGAAATTGAAAAACACAAGCAAA
5 Red and blue sequences represent the T7 and SP6 promoters, respectively.
164
Immunoprecipitation and antibodies
For PUM immunoprecipitation, 1×10⁷ cells were resuspended in 1 mL Polysome Lysis
Buffer (PLB; 15 mM Tris-Cl pH 7.4, 300 mM NaCl, 15 mM MgCl2, 1% Triton X-100, 1
mM DTT, 100 U/ml SUPERase-IN, 1 mM PMSF, 1X Roche protease inhibitor cocktail)
and incubated on ice for 30 min. Lysates were pre-cleared with washed Protein G
magnetic beads (Novex) at 4°C for 30 minutes. 10 g of PUM1 antibody (sc-135049,
Santa Cruz), PUM2 antibody (sc-31535, Santa Cruz), rabbit IgG (sc-2027, Santa Cruz),
or goat IgG (sc-2028, Santa Cruz) were incubated with 200 L Protein G magnetic
beads in PBS with 0.02% Tween-20 for 30 min at room temperature and added to the
pre-cleared lysates, followed by rotation at 4°C for 4 hours and 3 washes in PLB on ice.
10% of beads were resuspended in Laemmli buffer for western blotting and RNA was
isolated from the remaining beads using Trizol. Antibodies used for western blotting
were PUM1 (ab92545, Abcam), PUM2 (ab92390, Abcam), -Tubulin (T9026, Sigma),
and GAPDH (2118, Cell Signaling).
RNA-seq and analysis
RNA-seq libraries were prepared using the TruSeq Stranded Total RNA with Ribo-Zero
Human/Mouse/Rat Sample Preparation kit (Illumina) and sequenced using the 100 bp
paired-end protocol on an Illumina HiSeq 2000 in the McDermott Center Next
Generation Sequencing Core at UT Southwestern. For comparing NORAD+/+ and
NORAD−/− HCT116 cells, 3 biological replicates per genotype were sequenced with an
average paired-read depth of 52×106. For PUM overexpression experiments, 3
replicates of GFP-expressing HCT116 cells (negative control) and 2 independent PUM1-
or PUM2-overexpressing clones (2 replicates each) were sequenced. An average of
165
27×106 paired-reads were generated per sample. Quality assessment of the RNA-seq
data was performed with NGS-QC-Toolkit (Patel and Jain, 2012). Reads with mean
Phred quality scores of less than 20 were removed from further analysis. Filtered reads
were then aligned to the human reference genome (hg19) using Tophat2 (v2.0.10) (Kim
et al., 2013) with library type setting ‘fr-firststranded’ and other parameters set to default.
Differential gene expression analysis was performed using the R package edgeR
(v1.10.1) (Robinson et al., 2010) following a published protocol (Anders et al., 2013).
Gene ontology analysis was performed using DAVID (http://david.abcc.ncifcrf.gov)
(Huang et al., 2007).
Recombinant PUMILIO protein purification
Human PUM1 and PUM2 UltimateORF clones (Life Technologies) were subcloned into
destination vector pDEST17 (Life Technologies) using Gateway LR Clonase II Enzyme
mix (Life Technologies) for expression of 6Xhistidine tagged-recombinant proteins.
Plasmids were transformed into Rosetta 2(DE3)pLysS competent cells (Novagen) and
recombinant proteins were induced with 0.2 mM IPTG at 20°C. Bacteria were lysed in 8
M urea lysis buffer (100 mM NaH2PO4, 10 mM Tris-Cl, 8 M urea, pH 8.0) and bound
proteins were recovered on Ni-NTA agarose resin, washed with lysis buffer at pH 6.3,
and eluted with 250 mM imidazole at pH 4.5. The concentration of purified proteins was
determined by electrophoresis alongside a serial dilution of BSA standards (Pierce) with
coomassie staining.
166
Time-lapse imaging
Mitotic cells were recorded and evaluated as described in Chapter 2. Briefly, cells were
grown on NUNC chambered coverglasses (Thermo). To visualize DNA in HCT116 cells,
a cell permeable Hoechst dye (33342; Invitrogen) was used at 25-50 ng/mL. Time-lapse
fluorescence images were collected every 5 minutes for 24-48 hours using a Leica
inverted microscope equipped with an environmental chamber that controls temperature
and CO2, a 63X oil-objective, an Evolve 512 Delta EMCCD camera, and Metamorph
software (MDS Analytical Technologies).
PAR-CLIP
PAR-CLIP was performed essentially as described in (Spitzer et al., 2014). Briefly,
HCT116 cells and isogenic NORAD−/− cells were grown to ~80% confluence at which
point 4-thiouridine (Sigma) was added to the media at final concentration of 100 M.
After 18 hours, 4-thiouridine-labeled cells were washed with cold PBS and crosslinked
using 365 nm UV with 150 mJ/cm2 total energy in a Spectrolinker XL-1500 (Spectroline).
A total of ~720 million cells (36 150 mm dishes) per CLIP condition were collected and
resuspended in NP-40 lysis buffer (50 mM HEPES-KOH, pH 7.5, 150 mM KCl, 2mM
EDTA-NaOH, pH 8.0, 1 mM NaF, 0.5% NP-40 substitute, 0.5 mM DTT, and Complete
EDTA-free protease inhibitor cocktail). After centrifugation, the soluble fraction was
filtered through a 5 m syringe filter and incubated with 1 U/
min. 100 g PUM2 antibody (K-14, sc-31535, Santa Cruz) was conjugated to Protein G
magnetic beads and incubated with RNase-treated lysate at 4ºC for 4 hours. Bead-
bound PUM2 RNP complexes were washed with IP wash buffer (50 mM HEPES-KOH,
pH 7.5, 300 mM KCl, 0.05% NP-40 substitute, 0.5 mM DTT and Complete EDTA-free
167
protease inhibitor cocktail) followed by an additional RNase T1 treatment (1 U/L at
22ºC for 15 min). Beads were further washed with high-salt wash buffer (50 mM
HEPES-KOH, pH 7.5, 500 mM KCl, 0.05% NP-40 substitute, 0.5 mM DTT and Complete
EDTA-free protease inhibitor cocktail) and the 5 ends of PUM2 bound RNAs were
labeled with 32P using calf intestinal alkaline phosphatase followed by T4 PNK and [-
32P]-ATP. 100 M unlabeled ATP was added after radiolabeling to ensure all RNA
species were 5-phosphorylated. Labeled RNP complexes were eluted from beads by
boiling in 1X SDS-PAGE loading buffer (62.5 mM Tris HCl pH 6.8, 1.5% SDS, 8.3%
Glycerol, 0.005% Bromophenol blue) and resolved on an SDS-PAGE gel. After
autoradiography, bands corresponding to the PUM2 RNP size (~120 kDa) were excised
and electro-eluted using D-tube dialyzer tubes (Milipore) in MOPS-SDS running buffer.
Eluted samples were then digested with 1.2 mg/mL Proteinase K (Sigma) at 55ºC for 30
min. RNA was isolated using phenol/chloroform extraction followed by ethanol
precipitation. Sequencing libraries were constructed using the TruSeq Small RNA
Library Preparation Kit (Illumina). Sequencing was performed on a NextSeq 500
(Illumina).
Quality assessment of the CLIP-Seq data was done using NGS-QC-Toolkit (Patel and
Jain, 2012). Reads with mean phred quality scores of less than 20 were removed from
further analysis. Cutadapt (v1.2.1) (Martin, 2011) was used to remove the sequencing
adapters using default settings and all reads 15 nt or longer were aligned to repeat
masked NORAD and the human transcriptome (Ensembl GRCh37.75) in two-steps:
First, all reads were aligned to NORAD using Bowtie (v1.0.0) (Langmead et al., 2009),
requiring unique mapping within NORAD and allowing up to 1 mismatch (-v 1 -m 1).
Then the rest of the reads were aligned to the transcriptome using Bowtie with the
168
settings (-a -m 1). CLIP crosslinking sites were identified as follows: 1) All transcriptome
coordinates were converted to genomic coordinates and all reads with unique genomic
location were kept; 2) PCR duplicates were removed; 3) Reads with at least 1 nt overlap
were clustered; 4) All clusters with at least 5 reads and at least 1 T to C mutation were
defined as CLIP clusters.
PUMILIO overexpression
Human PUM1 and PUM2 UltimateORF clones (Life technologies), or eGFP as a
negative control, were subcloned into pLX302 (Addgene plasmid #25896) (Yang et al.,
2011) using Gateway LR Clonase II Enzyme mix (Invitrogen). The resulting lentiviral
backbones were packaged in HEK293T cells by co-transfection with psPAX2 and
pMD2.G (Addgene plasmids #12260 and #12259). Viral supernatants were passed
through a 0.45 micron filter and used to transduce HCT116 cells in the presence of 8
g/mL polybrene (EMD Milipore). Beginning 48 hours after transduction, cells were
selected with 1 g/mL puromycin for at least 7 days and single cell-derived clones were
screened for PUM expression by western blot.
Generation of PUM1 and PUM2 knockout cells
PUM1−/− and PUM2−/− cells were generated using the CRISPR/Cas9 system to introduce
frameshift mutations in exons upstream of the sequence encoding PUMILIO homology
domains (PUM-HD), which are essential for target binding. To generate PUM1 and
PUM2 individual knockouts, single guide RNAs (sgRNAs) targeting exon 7 for PUM1
and exon 8 for PUM2 were designed (Table 4.3) and cloned into pX459 (Addgene
plasmid, #48139) followed by transfection into HCT116 and puromycin selection. Single
169
cell clones were screened by western blotting using PUM antibodies (Abcam ab92545
for PUM1 and ab92390 for PUM2) and validated by sequencing of mutant alleles after
amplification and TA cloning of CRISPR/Cas9 target sites, using primer pairs provided in
Table 4.4. To generate PUM1−/−; PUM2−/− double knockout cells, pX458 (Addgene
plasmid, #48138) expressing the sgRNA used for single PUM1 knockout was
transfected into PUM2−/− cells followed by FACS sorting of GFP+ cells and single cell
cloning. Screening of double knockout cells was performed by western and sequencing
as described above. Finally, to knockout NORAD in PUM1−/−, PUM2−/−, and PUM1−/−;
PUM2−/− cells, TALEN-mediated homologous recombination (HR) was used using a
modified lox-STOP-lox cassette carrying a hygromycin resistance cassette instead of a
puromycin resistance cassette.
PUM1/PUM2 knockdown experiments
ON-TARGETplus siRNAs (GE-Dharmacon) targeting human PUM1 (9696) and PUM2
(23369) were purchased from GE Dharmacon and tested to identify those that yielded
the most efficient knockdown. Two siRNAs for PUM1 and two siRNAs for PUM2 were
selected (target sequences provided in Table 4.5). HCT116 cells were transfected once
per day for 3 consecutive days. 5 days after the first transfection, cells were plated on
chambered coverglasses and mitoses were recorded by time-lapse imaging as
described above.
qPCR validation of PUM target genes repressed in NORAD−/− cells
Primers are provided in Table 4.6.
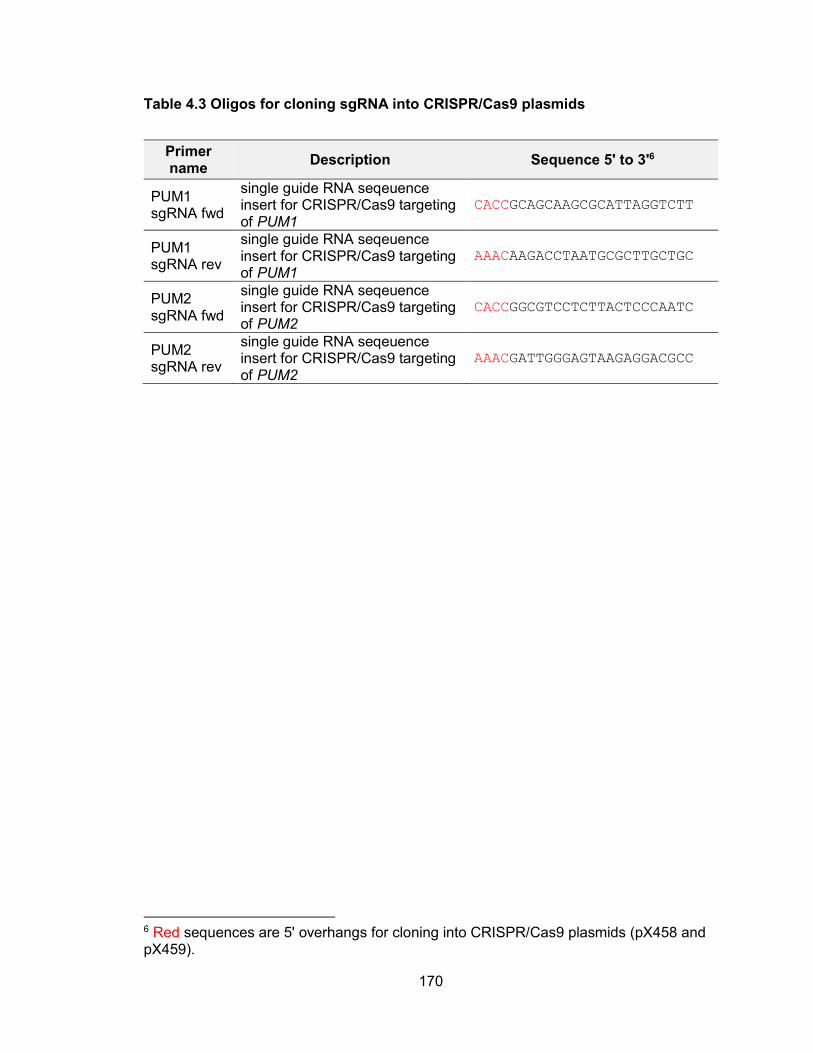
170
Table 4.3 Oligos for cloning sgRNA into CRISPR/Cas9 plasmids
Primer name
Description Sequence 5' to 3'6
PUM1 sgRNA fwd
single guide RNA seqeuence insert for CRISPR/Cas9 targeting of PUM1
CACCGCAGCAAGCGCATTAGGTCTT
PUM1 sgRNA rev
single guide RNA seqeuence insert for CRISPR/Cas9 targeting of PUM1
AAACAAGACCTAATGCGCTTGCTGC
PUM2 sgRNA fwd
single guide RNA seqeuence insert for CRISPR/Cas9 targeting of PUM2
CACCGGCGTCCTCTTACTCCCAATC
PUM2 sgRNA rev
single guide RNA seqeuence insert for CRISPR/Cas9 targeting of PUM2
AAACGATTGGGAGTAAGAGGACGCC
6 Red sequences are 5' overhangs for cloning into CRISPR/Cas9 plasmids (pX458 and pX459).
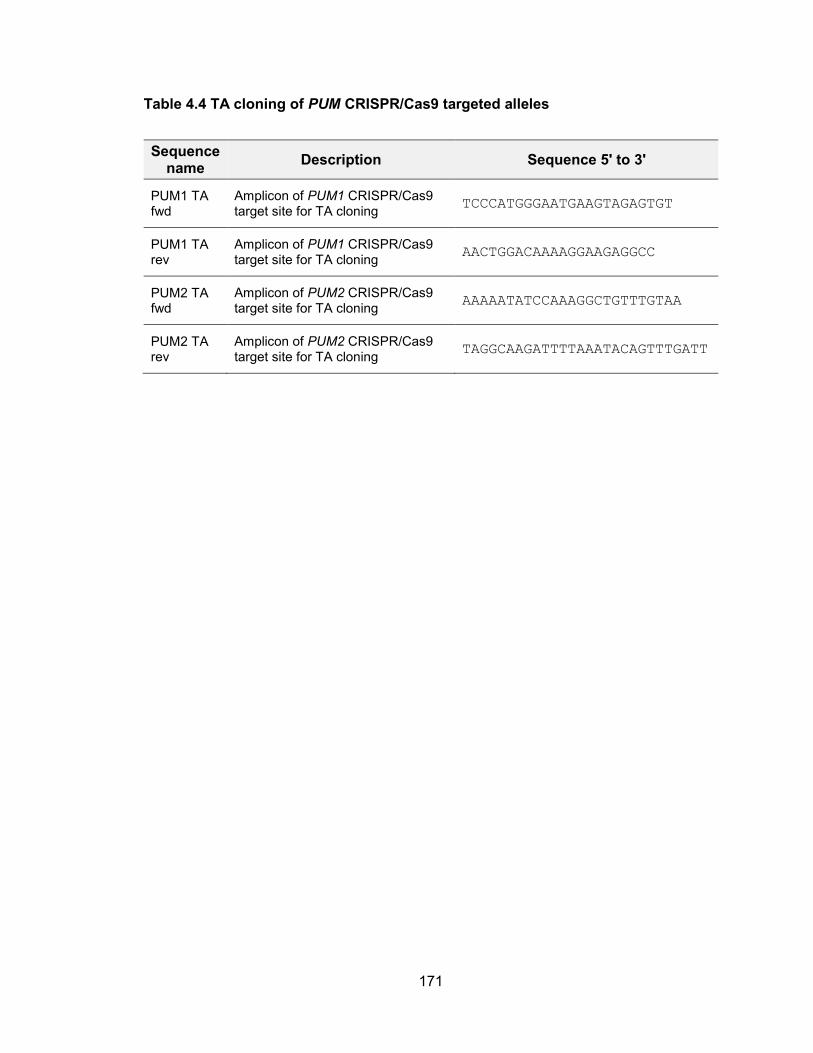
171
Table 4.4 TA cloning of PUM CRISPR/Cas9 targeted alleles
Sequence name
Description Sequence 5' to 3'
PUM1 TA fwd
Amplicon of PUM1 CRISPR/Cas9 target site for TA cloning
TCCCATGGGAATGAAGTAGAGTGT
PUM1 TA rev
Amplicon of PUM1 CRISPR/Cas9 target site for TA cloning
AACTGGACAAAAGGAAGAGGCC
PUM2 TA fwd
Amplicon of PUM2 CRISPR/Cas9 target site for TA cloning
AAAAATATCCAAAGGCTGTTTGTAA
PUM2 TA rev
Amplicon of PUM2 CRISPR/Cas9 target site for TA cloning
TAGGCAAGATTTTAAATACAGTTTGATT
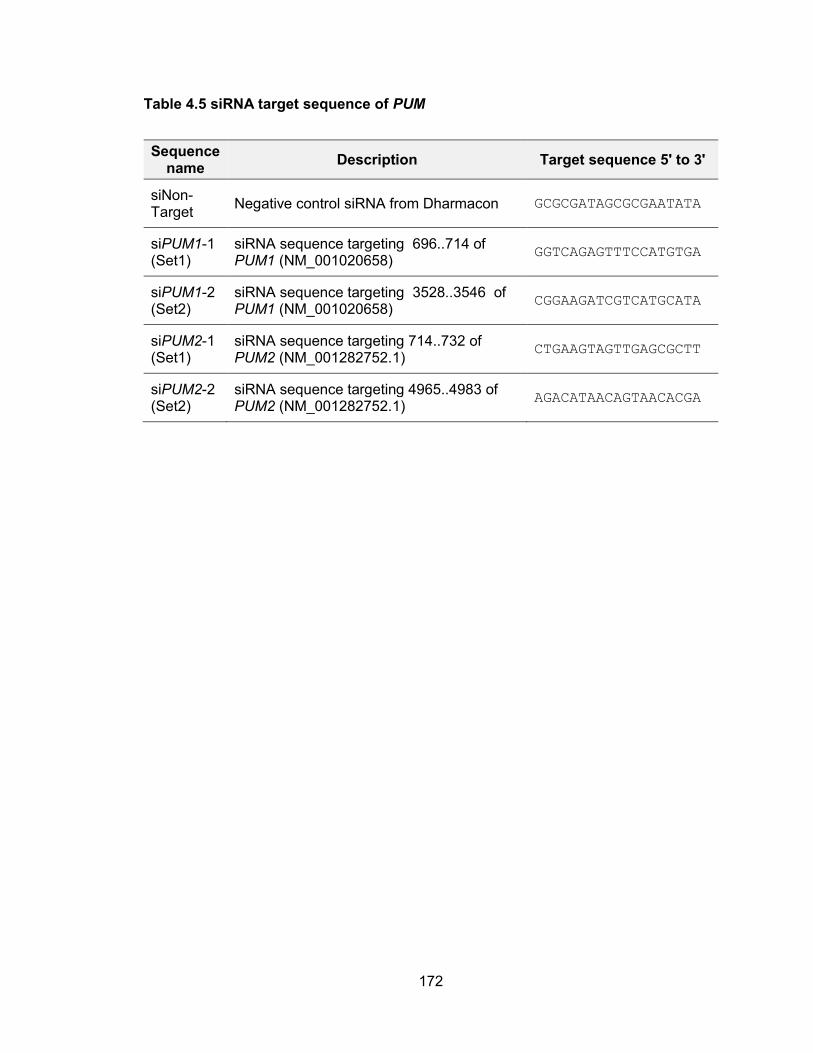
172
Table 4.5 siRNA target sequence of PUM
Sequence name
Description Target sequence 5' to 3'
siNon-Target
Negative control siRNA from Dharmacon GCGCGATAGCGCGAATATA
siPUM1-1 (Set1)
siRNA sequence targeting 696..714 of PUM1 (NM_001020658)
GGTCAGAGTTTCCATGTGA
siPUM1-2 (Set2)
siRNA sequence targeting 3528..3546 of PUM1 (NM_001020658)
CGGAAGATCGTCATGCATA
siPUM2-1 (Set1)
siRNA sequence targeting 714..732 of PUM2 (NM_001282752.1)
CTGAAGTAGTTGAGCGCTT
siPUM2-2 (Set2)
siRNA sequence targeting 4965..4983 of PUM2 (NM_001282752.1)
AGACATAACAGTAACACGA
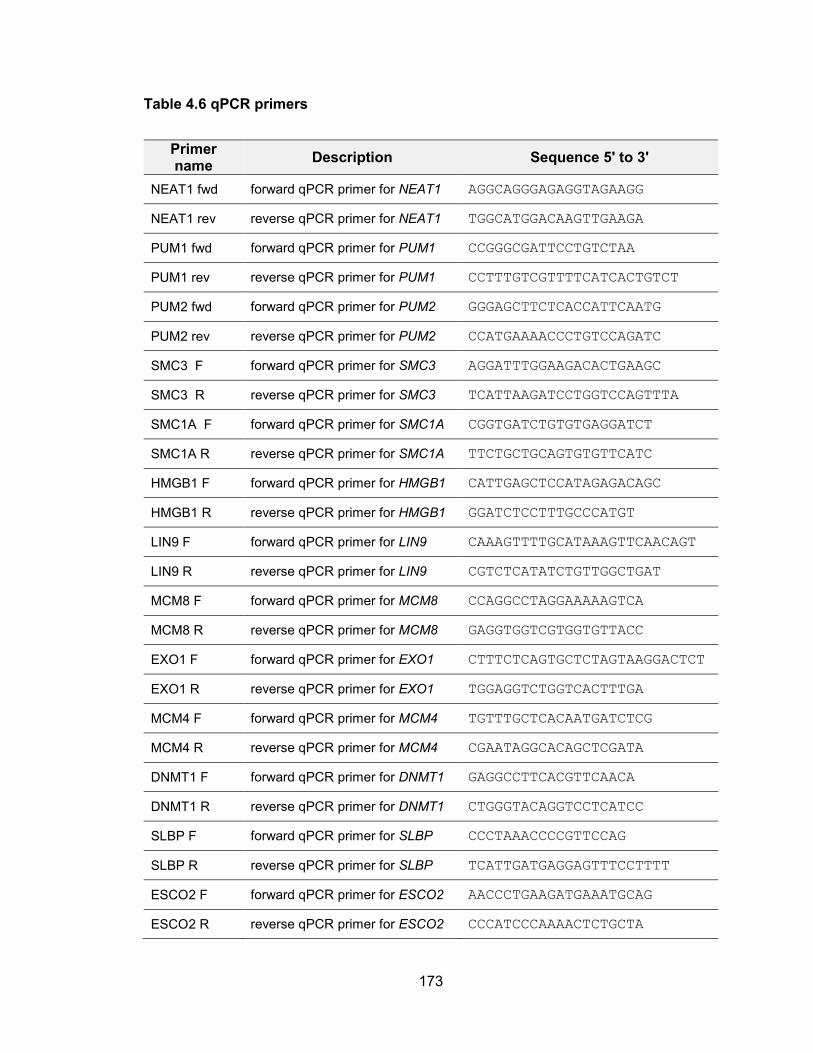
173
Table 4.6 qPCR primers
Primer name
Description Sequence 5' to 3'
NEAT1 fwd forward qPCR primer for NEAT1 AGGCAGGGAGAGGTAGAAGG
NEAT1 rev reverse qPCR primer for NEAT1 TGGCATGGACAAGTTGAAGA
PUM1 fwd forward qPCR primer for PUM1 CCGGGCGATTCCTGTCTAA
PUM1 rev reverse qPCR primer for PUM1 CCTTTGTCGTTTTCATCACTGTCT
PUM2 fwd forward qPCR primer for PUM2 GGGAGCTTCTCACCATTCAATG
PUM2 rev reverse qPCR primer for PUM2 CCATGAAAACCCTGTCCAGATC
SMC3 F forward qPCR primer for SMC3 AGGATTTGGAAGACACTGAAGC
SMC3 R reverse qPCR primer for SMC3 TCATTAAGATCCTGGTCCAGTTTA
SMC1A F forward qPCR primer for SMC1A CGGTGATCTGTGTGAGGATCT
SMC1A R reverse qPCR primer for SMC1A TTCTGCTGCAGTGTGTTCATC
HMGB1 F forward qPCR primer for HMGB1 CATTGAGCTCCATAGAGACAGC
HMGB1 R reverse qPCR primer for HMGB1 GGATCTCCTTTGCCCATGT
LIN9 F forward qPCR primer for LIN9 CAAAGTTTTGCATAAAGTTCAACAGT
LIN9 R reverse qPCR primer for LIN9 CGTCTCATATCTGTTGGCTGAT
MCM8 F forward qPCR primer for MCM8 CCAGGCCTAGGAAAAAGTCA
MCM8 R reverse qPCR primer for MCM8 GAGGTGGTCGTGGTGTTACC
EXO1 F forward qPCR primer for EXO1 CTTTCTCAGTGCTCTAGTAAGGACTCT
EXO1 R reverse qPCR primer for EXO1 TGGAGGTCTGGTCACTTTGA
MCM4 F forward qPCR primer for MCM4 TGTTTGCTCACAATGATCTCG
MCM4 R reverse qPCR primer for MCM4 CGAATAGGCACAGCTCGATA
DNMT1 F forward qPCR primer for DNMT1 GAGGCCTTCACGTTCAACA
DNMT1 R reverse qPCR primer for DNMT1 CTGGGTACAGGTCCTCATCC
SLBP F forward qPCR primer for SLBP CCCTAAACCCCGTTCCAG
SLBP R reverse qPCR primer for SLBP TCATTGATGAGGAGTTTCCTTTT
ESCO2 F forward qPCR primer for ESCO2 AACCCTGAAGATGAAATGCAG
ESCO2 R reverse qPCR primer for ESCO2 CCCATCCCAAAACTCTGCTA
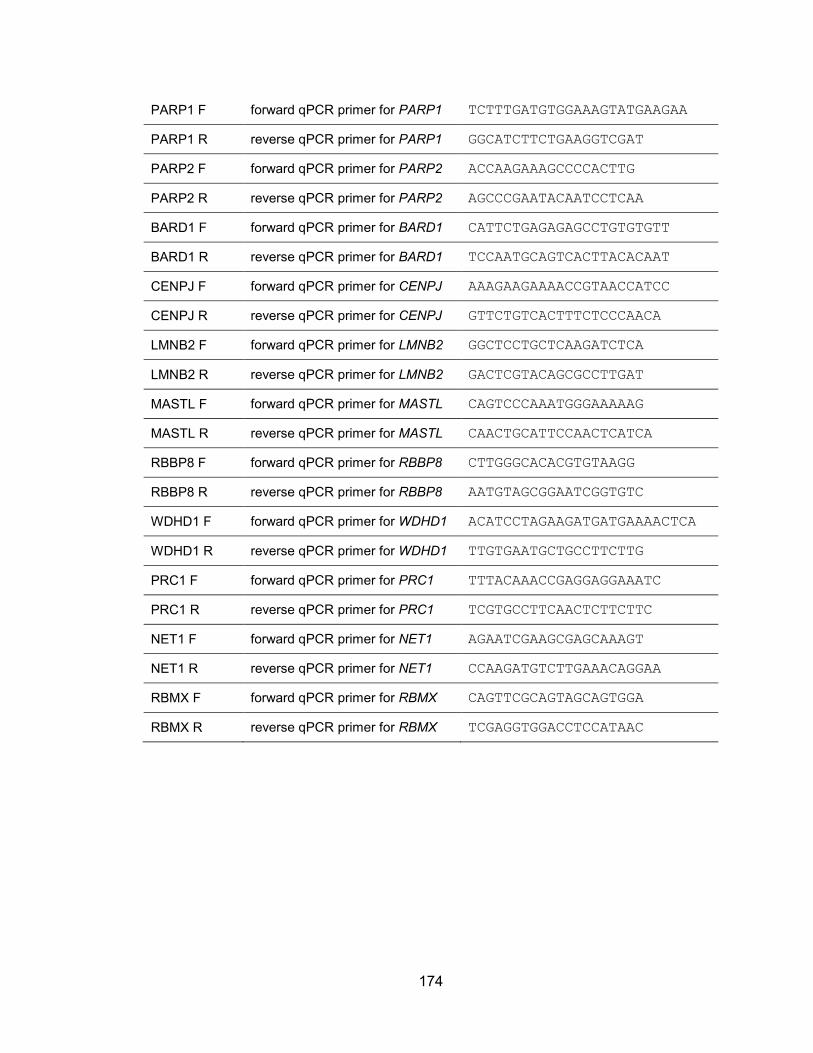
174
PARP1 F forward qPCR primer for PARP1 TCTTTGATGTGGAAAGTATGAAGAA
PARP1 R reverse qPCR primer for PARP1 GGCATCTTCTGAAGGTCGAT
PARP2 F forward qPCR primer for PARP2 ACCAAGAAAGCCCCACTTG
PARP2 R reverse qPCR primer for PARP2 AGCCCGAATACAATCCTCAA
BARD1 F forward qPCR primer for BARD1 CATTCTGAGAGAGCCTGTGTGTT
BARD1 R reverse qPCR primer for BARD1 TCCAATGCAGTCACTTACACAAT
CENPJ F forward qPCR primer for CENPJ AAAGAAGAAAACCGTAACCATCC
CENPJ R reverse qPCR primer for CENPJ GTTCTGTCACTTTCTCCCAACA
LMNB2 F forward qPCR primer for LMNB2 GGCTCCTGCTCAAGATCTCA
LMNB2 R reverse qPCR primer for LMNB2 GACTCGTACAGCGCCTTGAT
MASTL F forward qPCR primer for MASTL CAGTCCCAAATGGGAAAAAG
MASTL R reverse qPCR primer for MASTL CAACTGCATTCCAACTCATCA
RBBP8 F forward qPCR primer for RBBP8 CTTGGGCACACGTGTAAGG
RBBP8 R reverse qPCR primer for RBBP8 AATGTAGCGGAATCGGTGTC
WDHD1 F forward qPCR primer for WDHD1 ACATCCTAGAAGATGATGAAAACTCA
WDHD1 R reverse qPCR primer for WDHD1 TTGTGAATGCTGCCTTCTTG
PRC1 F forward qPCR primer for PRC1 TTTACAAACCGAGGAGGAAATC
PRC1 R reverse qPCR primer for PRC1 TCGTGCCTTCAACTCTTCTTC
NET1 F forward qPCR primer for NET1 AGAATCGAAGCGAGCAAAGT
NET1 R reverse qPCR primer for NET1 CCAAGATGTCTTGAAACAGGAA
RBMX F forward qPCR primer for RBMX CAGTTCGCAGTAGCAGTGGA
RBMX R reverse qPCR primer for RBMX TCGAGGTGGACCTCCATAAC
175
Chapter 5: Generation of Norad knockout mouse using
CRISPR/Cas9 genome editing system
Introduction
At least three evidences are supporting the hypothesis that an annotated lncRNA,
2900097C17Rik is the functional ortholog of human NORAD. First of all, like in case of
NORAD, many paralogs of 2900097C17Rik can be found in mouse genome, while only
2900097C17Rik shows conserved synteny to NORAD (Figure 3.1, 4.5). Secondly, a
previous study of mouse Pumilio targets identified 2900097C17Rik as one of Pum
interacting transcripts (Chen et al., 2012). As expected from the sequence similarity to
human ortholog, 2900097C17Rik also harbors 15 PREs as potential binding sites for
Pumilio proteins. For these reasons, we hypothesized the annotated transcript
2900097C17Rik is a functional mouse ortholog of NORAD, therefore we named it as
Norad and decided to generate mice with genetic ablation of this allele.
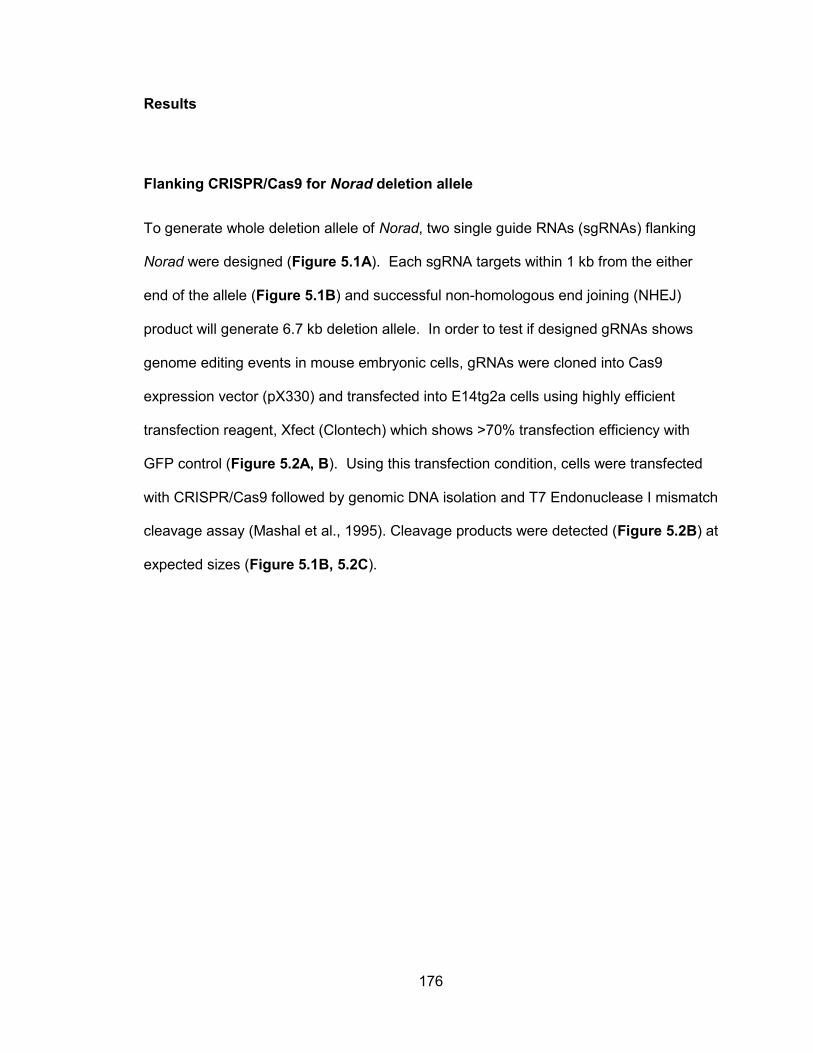
176
Results
Flanking CRISPR/Cas9 for Norad deletion allele
To generate whole deletion allele of Norad, two single guide RNAs (sgRNAs) flanking
Norad were designed (Figure 5.1A). Each sgRNA targets within 1 kb from the either
end of the allele (Figure 5.1B) and successful non-homologous end joining (NHEJ)
product will generate 6.7 kb deletion allele. In order to test if designed gRNAs shows
genome editing events in mouse embryonic cells, gRNAs were cloned into Cas9
expression vector (pX330) and transfected into E14tg2a cells using highly efficient
transfection reagent, Xfect (Clontech) which shows >70% transfection efficiency with
GFP control (Figure 5.2A, B). Using this transfection condition, cells were transfected
with CRISPR/Cas9 followed by genomic DNA isolation and T7 Endonuclease I mismatch
cleavage assay (Mashal et al., 1995). Cleavage products were detected (Figure 5.2B) at
expected sizes (Figure 5.1B, 5.2C).
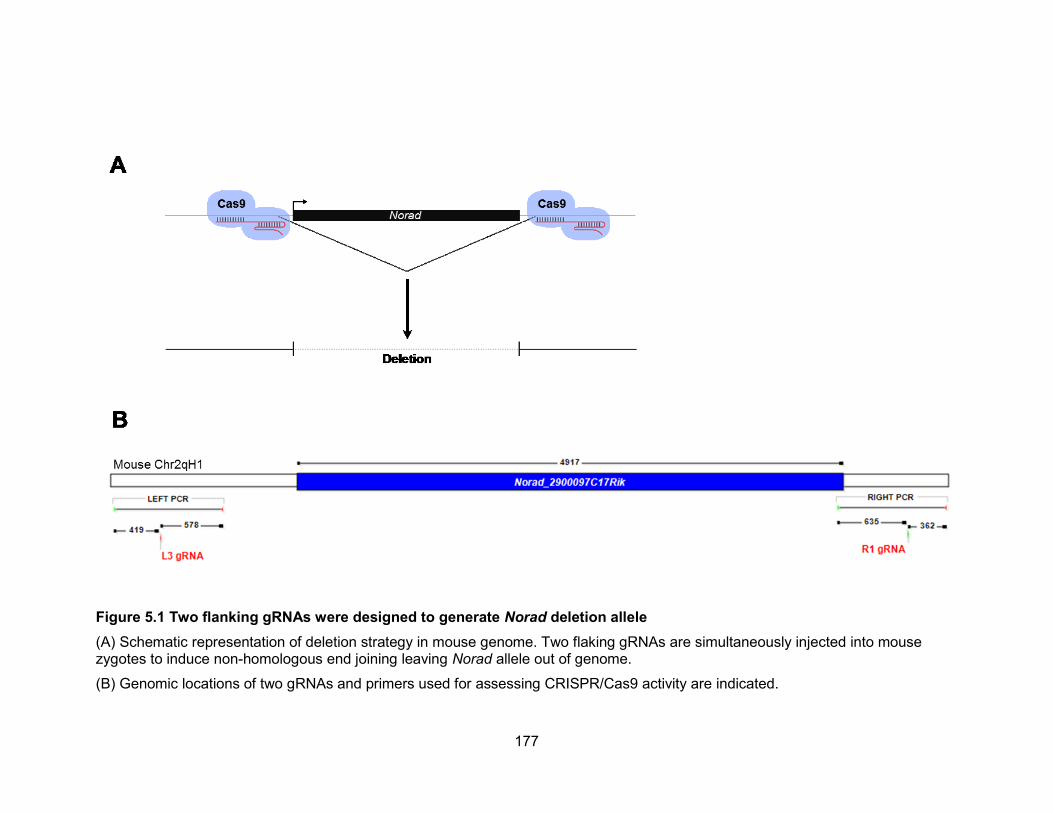
177
Figure 5.1 Two flanking gRNAs were designed to generate Norad deletion allele
(A) Schematic representation of deletion strategy in mouse genome. Two flaking gRNAs are simultaneously injected into mouse zygotes to induce non-homologous end joining leaving Norad allele out of genome.
(B) Genomic locations of two gRNAs and primers used for assessing CRISPR/Cas9 activity are indicated.
178
Figure 5.2 Assessment of CRISPR/Cas9 activity in mouse ES cells
(A) Fluorescence microscope image of mouse ES cells transfected with GFP plasmid and (B) Flow-cytometry of GFP transfected cells shows more than 72% cells are transfected and express GFP protein.
(C) T7E1 cleavage assay to assess presence of mutations at targeted genomic loci after CRISPR/Cas9 expression. Cleavage product from T7Endonuclease1 as show as predicted from Figure 5.1B.
179
In vitro transcription and RNA modification for zygotic injection
Genetically engineered mice provides useful information about particular gene functions
in an organismal level (Capecchi, 2005). However, traditional methods of generating
knockout mice takes long time (> 1 year) and effort, and sometimes even impossible
when embryonic stem cells (ES cells) are not available for that animal. However, Rudolf
Jaenisch group recently demonstrated high-efficiency, multiplexed genome modification
by co-injection of single guide RNAs (sgRNAs) and Cas9 mRNA directly into one-cell
mouse (Yang et al., 2013; Wang et al., 2013) and this new application of CRISPR/Cas9
technology created a major breakthrough in animal studies (Hsu et al., 2014). In order
to apply same methodology to generate Norad knockout mouse, we synthesized sgRNA
from pX330 we tested in Figure 5.2. Along with sgRNA, Cas9 mRNA was also
synthesized from the same plasmids, followed by 5’ capping and poly-adenylation for
efficient translation inside mouse zygote (Weill et al., 2012). Size and quantity of
prepared RNA were verified by running them on denaturing gels (Figure5.3) and
subjected to one-cell mouse embryo injection from the Transgenic core.
180
Figure 5.3 Injectable form of RNAs into one-cell mouse embryo
sgRNAs targeting flanking intergentic sequences of Norad and poly-adenylated Cas9
mRNA were synthesized in vitro using T7 polymerase. After RNA purification, size of
each RNA components were validated on denaturing urea gel (A) or agarose gel (B).
sgRNAs are ~100 nt and capped Cas9 mRNA is 4.3 kb. Poly-A tailed mRNA is shown
at around 6 kb.
181
Discussion
We initially designed conditional alleles which can be generated by co-injecting single
stranded DNA targeting constructs containing loxP sites, flanked by homology arms on
either side that can be utilized as a donor templates for homologous recombination
(Yang et al., 2013). However this strategy requires very efficient targeting efficiency
since all 4 targeting sites need to be recombined simultaneously at one-cell stage.
Through screening of mice derived from injected embryo, we found some founders of
doubly inserted loxP allele on one strand, but no case were observed that carries both
alleles inserted (Data not shown). Instead, we found deletion events as described in
Figure 5.1A at some frequency and could cross these founders to generated knockout
mice. It will be very interesting if these mice also shows some levels of chromosomal
instability and see what physiologic outcome of this is.
Injection of RNA into one-cell embryo for genome editing is very innovative and
fascinating method that now being applied to other animals including monkeys (Niu et
al., 2014). However, there are still major caveat that zygotic RNA injection is not the
best option because inefficient translation of Cas9 mRNA can lead to genetic mosaicism,
as we observed through genotyping of our mice (Data not shown). As suggested from
elsewhere (Hsu et al., 2014), future efforts to optimize injecting protein Cas9 loaded with
sgRNA which can presumably yield more efficiency at true one-cell stage might improve
this gene targeting technology.
182
Materials and Methods
CRISPR/Cas9 sgRNA designing and cloning into expression vector
CRISPR/Cas9 target sites were selected from web-based designer tool provided by
Feng Zhang Laboratory (http://crispr.mit.edu/). Genomic DNA sequences flanking Norad
allele was searched for target sequences with high “quality score” with minimum off-
target sites. Six sgRNAs targeting left side (5’ flanking) and two sgRNAs targeting right
side (3’ flanking) were tested for best performing sgRNA based on T7 Endonuclease
cleavage assay (Mashal et al., 1995) after cloning into BbsI site of bicistronic expression
vector encoding Cas9 and sgRNA, pX330 (Cong et al., 2013) using oligos provided in
Table 5.1.
Mouse ES cell culture and transfection
E14TG2a embryonic stem cells were cultured in GMEM with 1% nonessential amino
acids, β-mercaptoethanol, and leukocyte inhibitory factor (LIF). Transfection was
performed with Xfect (Clontech) according to manufacturer’s instruction. Briefly,
500,000 ES cells were plated on 6 well plate coated with 0.2% geletin, 5 hours before
transfection. 5 g DNA was mixed with 2.5 l Xfect polymer in 200 l reaction buffer.
After 10 minutes incubation, these nanoparticle solutions were added to ES cells.
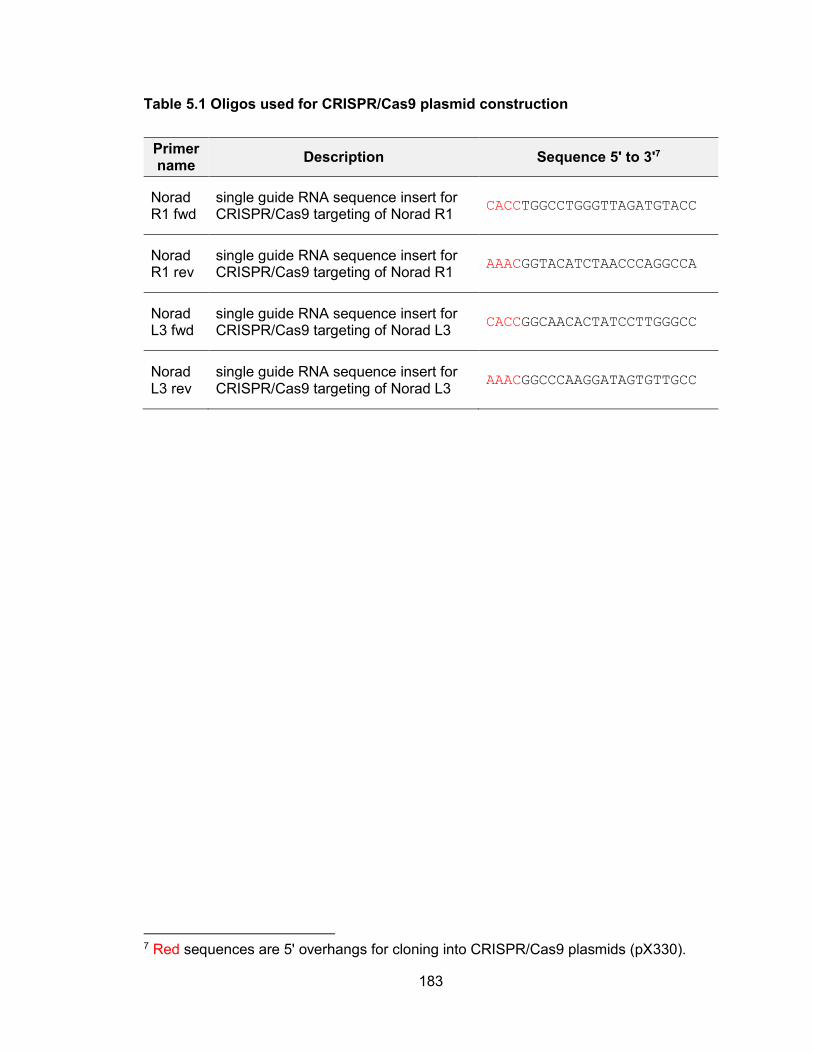
183
Table 5.1 Oligos used for CRISPR/Cas9 plasmid construction
Primer name
Description Sequence 5' to 3'7
Norad R1 fwd
single guide RNA sequence insert for CRISPR/Cas9 targeting of Norad R1
CACCTGGCCTGGGTTAGATGTACC
Norad R1 rev
single guide RNA sequence insert for CRISPR/Cas9 targeting of Norad R1
AAACGGTACATCTAACCCAGGCCA
Norad L3 fwd
single guide RNA sequence insert for CRISPR/Cas9 targeting of Norad L3
CACCGGCAACACTATCCTTGGGCC
Norad L3 rev
single guide RNA sequence insert for CRISPR/Cas9 targeting of Norad L3
AAACGGCCCAAGGATAGTGTTGCC
7 Red sequences are 5' overhangs for cloning into CRISPR/Cas9 plasmids (pX330).
184
Genomic DNA isolation and T7 Endonuclease I cleavage assay
Two Days after transfection, cells were harvested for genomic DNA isolation by using
DNeasy Blood and Tissue Kit (Qiagen) according to manufacturer’s instruction. This
gDNA was used as template for PCR amplification for either side of Norad allele using
primer provided in Table 5.2. PCR products were purified with QIAquick PCR
Purification Kit (Qiagen) and quantified by NanoDrop2000 (Thermo). 200 ng DNA was
suspended in 1x NEB2 buffer (New England Biolabs) then denatured at 95ºC for 5
minutes followed by cooling from 95ºC to 85ºC, at ramping speed at -2ºC/sec, then slow
annealing 85ºC to 25ºC, at ramping speed at -0.1ºC/sec, allowing hybrid generation of
wild type and mutant DNA heteroduplex. 10 units of T7 Endonuclease I (NEB) were
added and incubated at 37ºC for 15 minutes. Reaction was stopped by adding 2 l of
0.25 M EDTA then ran on EtBr stained agarose gels.
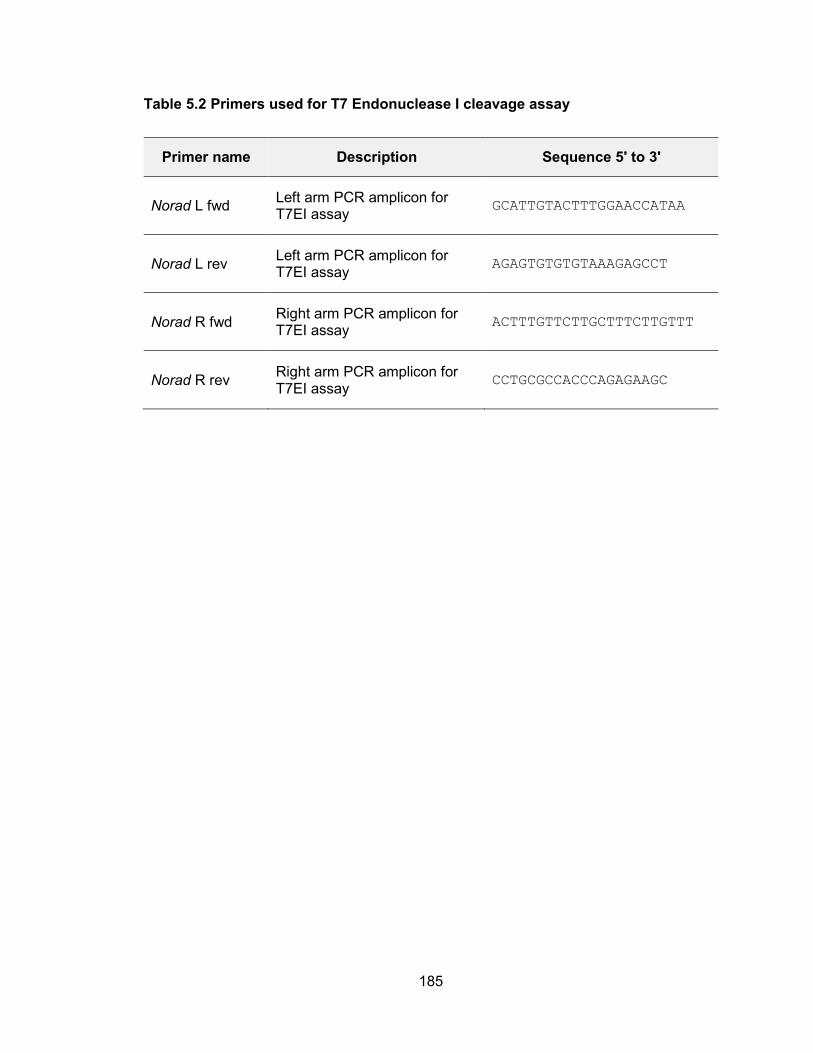
185
Table 5.2 Primers used for T7 Endonuclease I cleavage assay
Primer name Description Sequence 5' to 3'
Norad L fwd Left arm PCR amplicon for T7EI assay
GCATTGTACTTTGGAACCATAA
Norad L rev Left arm PCR amplicon for T7EI assay
AGAGTGTGTGTAAAGAGCCT
Norad R fwd Right arm PCR amplicon for T7EI assay
ACTTTGTTCTTGCTTTCTTGTTT
Norad R rev Right arm PCR amplicon for T7EI assay
CCTGCGCCACCCAGAGAAGC
186
In vitro transcription and RNA purification for one-cell embryo injection
DNA template for sgRNA transcripts and Cas9 mRNA were PCR amplified from guide
RNA inserted pX330 vectors using primers provided in Table 5.3. DNA products at
expected sizes were gel extracted and purified using QIAquick Gel Extraction Kit
(Qiagen) and quantified by Nanodrop. 200 ng Cas9 mRNA was transcribed using
mMESSAGEmMACHINE T7 Ultra Kit (Ambion) according to manufacturer’s instruction,
followed by DNase I digestion for 15 min. After further poly-adenylation reaction using
the same kit, injectable form or mRNA was purified using MEGAclear kit (Ambion). For
in vitro transcription of sgRNA, 500 ng above purified DNA templates were transcribed
using MEGAshortscirpt kit (Ambion) according to manufacturer’s instruction. DNase I
treated RNA were further purified using MEGAclear kit (Ambion). All RNAs were
provided to the Transgenic core at UT Southwestern Medical Center and injected into
one-cell embryo by Mylinh Nguyen.
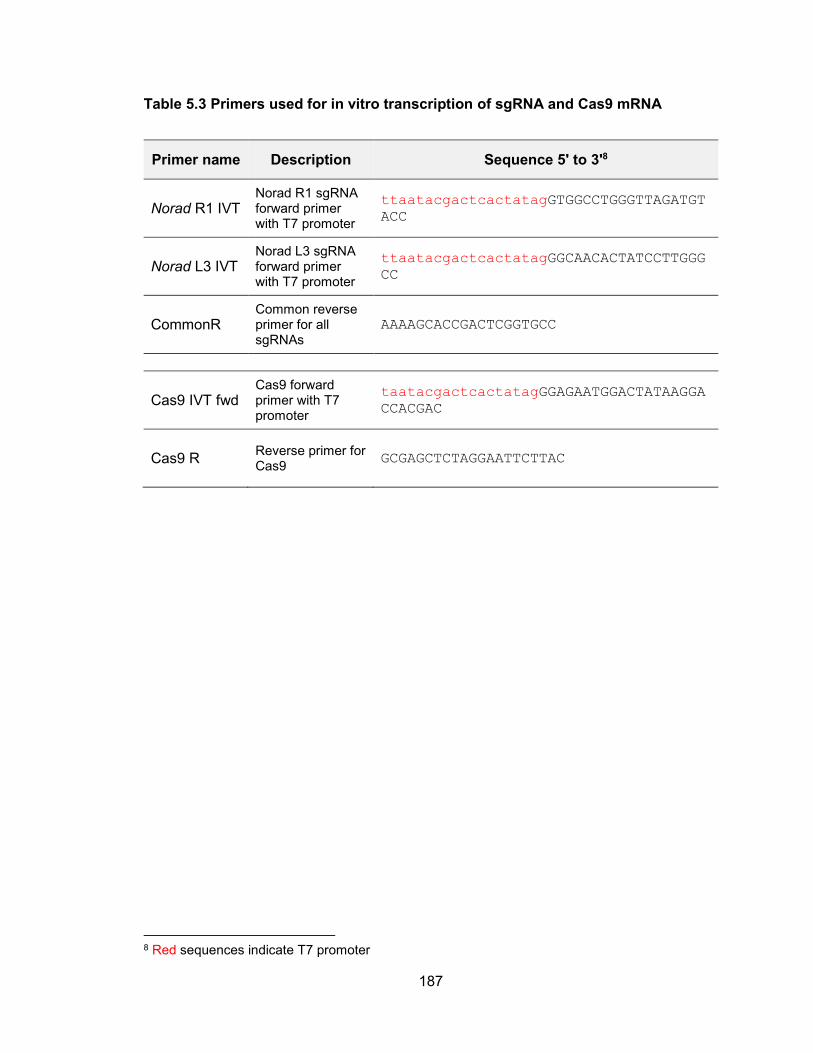
187
Table 5.3 Primers used for in vitro transcription of sgRNA and Cas9 mRNA
Primer name Description Sequence 5' to 3'8
Norad R1 IVT Norad R1 sgRNA forward primer with T7 promoter
ttaatacgactcactatagGTGGCCTGGGTTAGATGT
ACC
Norad L3 IVT Norad L3 sgRNA forward primer with T7 promoter
ttaatacgactcactatagGGCAACACTATCCTTGGG
CC
CommonR Common reverse primer for all sgRNAs
AAAAGCACCGACTCGGTGCC
Cas9 IVT fwd Cas9 forward primer with T7 promoter
taatacgactcactatagGGAGAATGGACTATAAGGA
CCACGAC
Cas9 R Reverse primer for Cas9
GCGAGCTCTAGGAATTCTTAC
8 Red sequences indicate T7 promoter
188
Chapter 6: Future directions
Transcriptome of primary miRNA in mammalian cells
MicroRNA (miRNA) expression is dynamically regulated during development, across
tissues, and in various human diseases. While a subset of miRNAs are hosted in
protein-coding genes, the majority of pri-miRNAs are transcribed as poorly-characterized
noncoding transcripts. Due to the efficiency of DROSHA processing, the abundance of
pri-miRNAs is very low at steady-state. Therefore, elucidation of pri-miRNA structure
has remained a significant challenge. To address this problem, we developed an
experimental and computational approach that allows rapid transcriptome-wide mapping
of pri-miRNA structures. By performing deep RNA-seq in cells expressing a dominant-
negative DROSHA mutant protein, we demonstrated dramatic enrichment of intact pri-
miRNAs, resulting in greater coverage of these transcripts compared to standard RNA-
seq.
189
While we attempted to utilize currently best available tools and materials as much as we
could, there are multiple reasons we still might have missed important pieces of puzzles
rendering our transcriptomic map to be incomplete or even distorted in some cases. For
example, our lab reported miRNA expression is globally changed in different cell
densities (Hwang et al., 2009) and it can be also true in 3 dimensional cultures, not to
mention in a situation when cells are interacting with other types of cells (i.e. immune
cells or stem cells in their niche). 2 dimensional cultured cells were the best option we
had for its ease of obtaining large amount of materials in a condition when DROSHA
activity is suppressed. If technical advances allow, transcriptome study in more
physiologically relevant cultures or tissues might provide more accurate data. Another
point worthy of re-consideration is use of DROSHA mutant. Obviously, introduction of
this microprocessor inhibitor enhanced our mapping coverage. However, this is under
the assumption that processing of primary miRNA transcript is largely DROSHA
dependent. Therefore, miRNAs that are cropped from primary transcripts more
efficiently, independent from DROSHA activity might have been easily missed from our
mapping effort. In an extension of this criticism, one could also imagine some noncoding
RNAs being actively transcribe but their discovery have been elusive due to their
peculiarity of biogenesis and lack of current sequencing methodology to capture such
RNA species.
Rush for more functional long noncoding RNAs
The fidelity of chromosome segregation must be maintained at a high level to ensure the
accurate transmission of genetic information as well as to avoid severe pathologic
consequences. Chromosomal instatbiity (CIN), a phenotype characterized by the
frequent gain or loss of chromosomes during mitosis, is a hallmark of cancer cells and is
190
a key mechanism that contributes to gain- and loss-of-function of oncogenes and tumor
suppressors. Long noncoding RNAs (lncRNAs) have emerged as regulators of diverse
biological processes, yet their roles in the maintenance of genomic stability remain
poorly understood. In a screen for human lncRNAs that are regulated by DNA damage,
we identified a poorly characterized noncoding transcript that we termed Noncoding
RNA Activated by DNA Damage (NORAD) that is essential for the maintenance of
genomic stability in human cells.
In chapter 3, we showed that NORAD is a broadly expressed, highly abundant, and
conserved mammalian lncRNA. Inactivation of NORAD in human cells triggers dramatic
aneuploidy. Furthermore, throughout chapter 4, we also demonstrated NORAD
functions as a potent molecular decoy for PUMILIO proteins, which repress a program of
genes necessary to maintain genomic stability (Figure 6.1). This functional and
mechanistic study was impossible without serendipitous discovery of its phenotype in
NORAD−/− cells.
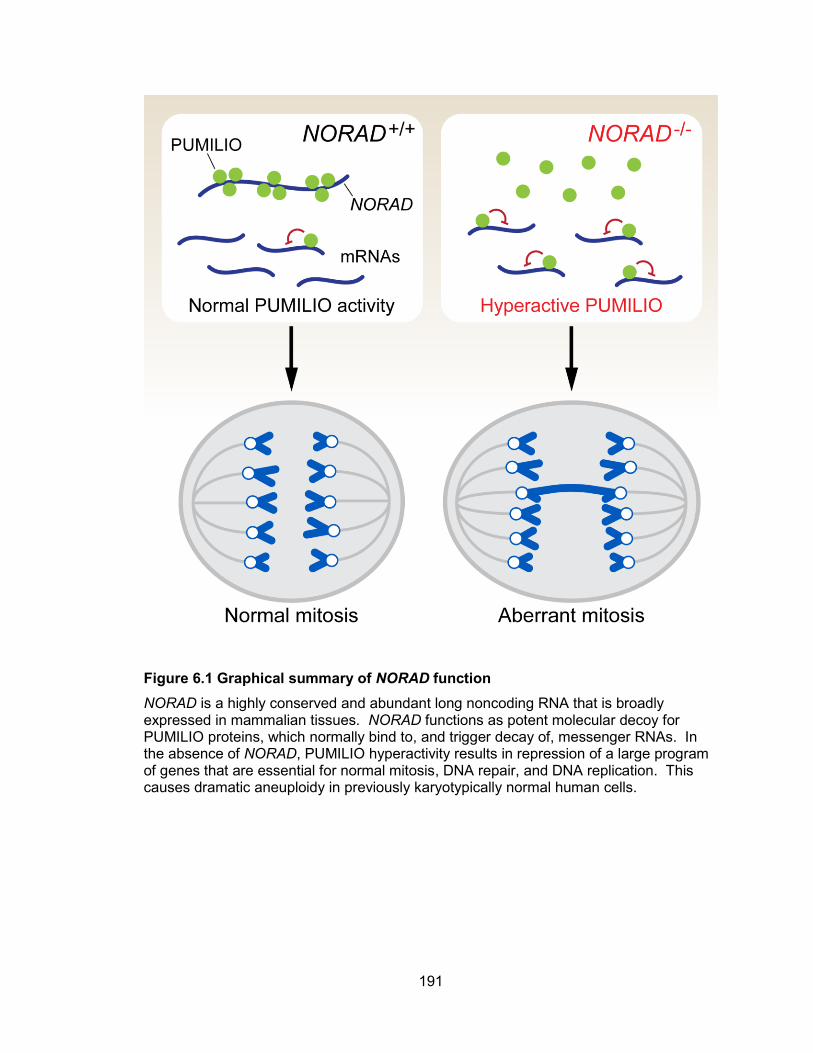
191
Figure 6.1 Graphical summary of NORAD function
NORAD is a highly conserved and abundant long noncoding RNA that is broadly expressed in mammalian tissues. NORAD functions as potent molecular decoy for PUMILIO proteins, which normally bind to, and trigger decay of, messenger RNAs. In the absence of NORAD, PUMILIO hyperactivity results in repression of a large program of genes that are essential for normal mitosis, DNA repair, and DNA replication. This causes dramatic aneuploidy in previously karyotypically normal human cells.
192
It’s becoming more and more cliché that transcription of genome is pervasive and such
transcripts from previously overlooked “junk DNA” might be encoding functional
noncoding RNAs (Guttman and Rinn, 2012). Possible functionality of these unexplored
and currently unknown transcripts are supported by multiple lines of evidence, including
their regulated patterns of expression (Cawley et al., 2004). While increasing number or
literatures are beginning to elucidate some of their functions, pending number of
untouched lncRNAs seems overwhelming. Major impediment in mining more
biologically and physiologically relevant noncoding RNAs in a systemic level more
rapidly is because one, most noncoding RNA will be resistant to mutagens as used in
traditional genetic screening since out-of-frame or nonsense mutations might be
meaningless, and two, it’s hard to set the screening readout or decide which phenotype
to look at, after applying genetic perturbations (Willingham et al., 2005). Given the
diversity of possible mechanisms and lack of prediction tool, screening lncRNAs through
association with particular biological responses is currently among limited options for
initial approach (Guttman et al., 2009) and have been demonstrated by multiple studies
(Huarte et al., 2010; Hung et al., 2011). As data accumulates by this “guilt-by-
association” study, more generalized themes will emerge and accelerate further
discovery. In the meantime, careful examination of their causality might need to be
accompanied to these investigations.
Era of redefining regulatory RNAs
Since 1950s, after molecular biologists discovered messenger RNAs, big assumption
that most genetic information is enacted by proteins may have led us to long and wrong
ways of our understanding of genetic programs in multi-cellular life forms (Morris and
Mattick, 2014). Not to mention their fundamental and constitutive roles involved in
193
translation and transcription, noncoding RNAs are rising to be a major player as
epigenetic regulator, chromosomal organizer, gene transcriptional controller, and fine-
tuning gene titrator. For example, at least 20% of human genes are under miRNA
regulation (Xie et al., 2005) and number of literatures describing novel regulatory
functions of lncRNAs are ever expanding.
As much as their mechanistic designs are immensely different from how proteins
perform, study of regulatory noncoding RNAs also need to be approached in different
ways. For instance, many in vivo studies have shown that deletion of individual miRNAs
often leads to subtle or no phenotypic consequences (Mendell and Olson, 2012; Vidigal
and Ventura, 2015) and there are only handful of functional demonstration by transgenic
or knockout animals for lncRNAs (Li and Chang, 2014). One explanation could be high
levels of redundancy of noncoding RNAs, possibly due to existence of functional
homologs without substantial sequence homology. Unlike proteins, there’s little studies
on domain structure of functional noncoding RNAs or general catalytic mechanisms.
Protein folding studies and enzymology has long history of research while study of RNA
secondary structure is at only its infancy.
Another emerging consensus in this field is that miRNAs buffer gene expression against
internal and external perturbations and cellular stresses (Mendell and Olson, 2012;
Vidigal and Ventura, 2015) and this concept might be extended to lncRNA. In multi-
cellular organisms that encounters diverse influences and challenges from outside may
have evolved to have complicated networks of fine-tuning regulatory nodes such that
overt changes in phenotype is only becomes apparent when the challenge excels its
threshold, as opposed to simple binary switches. This hypothesis leaves a lot of

194
homework to biologist and yet again we may all have to admit we don’t know much more
then what we know now, and even don’t realize what we don’t know.
195
Appendix
Chapter 2 was published on Genome Research in 2015 (Chang et al., 2015)
Chang, T.C., Pertea, M., Lee, S., Salzberg, S.L., and Mendell, J.T. (2015). Genome-wide annotation of microRNA primary transcript structures reveals novel regulatory mechanisms. Genome Res 25, 1401-1409.
Chapter 3 and 4 is in press and will be published on Cell in 2016
Lee, S., Kopp, F., Chang, T.C., Sataluri, A., Chen, B., Sivakumar S., Yu H., Xie, Y., Mendell J.T. (2016) Noncoding RNA NORAD regulates genomic stability by sequestering PUMILIO proteins. Cell 164, 1-12. In press
196
References
Adamson, B., Smogorzewska, A., Sigoillot, F.D., King, R.W., and Elledge, S.J. (2012). A genome-wide homologous recombination screen identifies the RNA-binding protein RBMX as a component of the DNA-damage response. Nat. Cell Biol. 14, 318-328.
Albertson, D.G., Collins, C., McCormick, F., and Gray, J.W. (2003). Chromosome aberrations in solid tumors. Nat. Genet. 34, 369-376.
Altschul, S.F., Gish, W., Miller, W., Myers, E.W., and Lipman, D.J. (1990). Basic local alignment search tool. J Mol Biol 215, 403-410.
Anders, S., McCarthy, D.J., Chen, Y., Okoniewski, M., Smyth, G.K., Huber, W., and Robinson, M.D. (2013). Count-based differential expression analysis of RNA sequencing data using R and Bioconductor. Nat Protoc 8, 1765-1786.
Anderson, D.M., Anderson, K.M., Chang, C.L., Makarewich, C.A., Nelson, B.R., McAnally, J.R., Kasaragod, P., Shelton, J.M., Liou, J., Bassel-Duby, R., et al. (2015). A micropeptide encoded by a putative long noncoding RNA regulates muscle performance. Cell 160, 595-606.
Avery, O.T., Macleod, C.M., and McCarty, M. (1944). Studies on the Chemical Nature of the Substance Inducing Transformation of Pneumococcal Types : Induction of Transformation by a Desoxyribonucleic Acid Fraction Isolated from Pneumococcus Type Iii. J Exp Med 79, 137-158.
Barber, T.D., McManus, K., Yuen, K.W., Reis, M., Parmigiani, G., Shen, D., Barrett, I., Nouhi, Y., Spencer, F., Markowitz, S., et al. (2008). Chromatid cohesion defects may underlie chromosome instability in human colorectal cancers. Proc. Natl. Acad. Sci. U. S. A. 105, 3443-3448.
Bartel, D.P. (2004). MicroRNAs: genomics, biogenesis, mechanism, and function. Cell 116, 281-297.
Bartel, D.P. (2009). MicroRNAs: target recognition and regulatory functions. Cell 136, 215-233.
Baskerville, S., and Bartel, D.P. (2005). Microarray profiling of microRNAs reveals frequent coexpression with neighboring miRNAs and host genes. RNA 11, 241-247.
Bazzini, A.A., Johnstone, T.G., Christiano, R., Mackowiak, S.D., Obermayer, B., Fleming, E.S., Vejnar, C.E., Lee, M.T., Rajewsky, N., Walther, T.C., et al. (2014). Identification of small ORFs in vertebrates using ribosome footprinting and evolutionary conservation. EMBO J. 33, 981-993.
Berget, S.M., Moore, C., and Sharp, P.A. (1977). Spliced segments at the 5' terminus of adenovirus 2 late mRNA. Proc Natl Acad Sci U S A 74, 3171-3175.
197
Bertone, P., Stolc, V., Royce, T.E., Rozowsky, J.S., Urban, A.E., Zhu, X., Rinn, J.L., Tongprasit, W., Samanta, M., Weissman, S., et al. (2004). Global identification of human transcribed sequences with genome tiling arrays. Science 306, 2242-2246.
Blankenberg, D., Von Kuster, G., Coraor, N., Ananda, G., Lazarus, R., Mangan, M., Nekrutenko, A., and Taylor, J. (2010). Galaxy: a web-based genome analysis tool for experimentalists. Curr Protoc Mol Biol Chapter 19, Unit 19 10 11-21.
Bohnsack, M.T., Czaplinski, K., and Gorlich, D. (2004). Exportin 5 is a RanGTP-dependent dsRNA-binding protein that mediates nuclear export of pre-miRNAs. RNA 10, 185-191.
Bonasio, R., and Shiekhattar, R. (2014). Regulation of transcription by long noncoding RNAs. Annu Rev Genet 48, 433-455.
Bunz, F., Dutriaux, A., Lengauer, C., Waldman, T., Zhou, S., Brown, J.P., Sedivy, J.M., Kinzler, K.W., and Vogelstein, B. (1998). Requirement for p53 and p21 to sustain G2 arrest after DNA damage. Science 282, 1497-1501.
Burgess, A., Vigneron, S., Brioudes, E., Labbe, J.C., Lorca, T., and Castro, A. (2010). Loss of human Greatwall results in G2 arrest and multiple mitotic defects due to deregulation of the cyclin B-Cdc2/PP2A balance. Proc. Natl. Acad. Sci. U. S. A. 107, 12564-12569.
Burrell, R.A., McClelland, S.E., Endesfelder, D., Groth, P., Weller, M.C., Shaikh, N., Domingo, E., Kanu, N., Dewhurst, S.M., Gronroos, E., et al. (2013). Replication stress links structural and numerical cancer chromosomal instability. Nature 494, 492-496.
Busch, H., Reddy, R., Rothblum, L., and Choi, Y.C. (1982). SnRNAs, SnRNPs, and RNA processing. Annu Rev Biochem 51, 617-654.
Cabianca, D.S., Casa, V., Bodega, B., Xynos, A., Ginelli, E., Tanaka, Y., and Gabellini, D. (2012). A long ncRNA links copy number variation to a polycomb/trithorax epigenetic switch in FSHD muscular dystrophy. Cell 149, 819-831.
Cabili, M.N., Trapnell, C., Goff, L., Koziol, M., Tazon-Vega, B., Regev, A., and Rinn, J.L. (2011). Integrative annotation of human large intergenic noncoding RNAs reveals global properties and specific subclasses. Genes Dev. 25, 1915-1927.
Cai, X., Hagedorn, C.H., and Cullen, B.R. (2004). Human microRNAs are processed from capped, polyadenylated transcripts that can also function as mRNAs. RNA 10, 1957-1966.
Calin, G.A., and Croce, C.M. (2006). MicroRNA signatures in human cancers. Nat Rev Cancer 6, 857-866.
Calin, G.A., Dumitru, C.D., Shimizu, M., Bichi, R., Zupo, S., Noch, E., Aldler, H., Rattan, S., Keating, M., Rai, K., et al. (2002). Frequent deletions and down-regulation of micro- RNA genes miR15 and miR16 at 13q14 in chronic lymphocytic leukemia. Proc Natl Acad Sci U S A 99, 15524-15529.
198
Calin, G.A., Ferracin, M., Cimmino, A., Di Leva, G., Shimizu, M., Wojcik, S.E., Iorio, M.V., Visone, R., Sever, N.I., Fabbri, M., et al. (2005). A MicroRNA signature associated with prognosis and progression in chronic lymphocytic leukemia. N Engl J Med 353, 1793-1801.
Capecchi, M.R. (2005). Gene targeting in mice: functional analysis of the mammalian genome for the twenty-first century. Nat Rev Genet 6, 507-512.
Carninci, P., Kasukawa, T., Katayama, S., Gough, J., Frith, M.C., Maeda, N., Oyama, R., Ravasi, T., Lenhard, B., Wells, C., et al. (2005). The transcriptional landscape of the mammalian genome. Science 309, 1559-1563.
Carter, S.L., Eklund, A.C., Kohane, I.S., Harris, L.N., and Szallasi, Z. (2006). A signature of chromosomal instability inferred from gene expression profiles predicts clinical outcome in multiple human cancers. Nat. Genet. 38, 1043-1048.
Cawley, S., Bekiranov, S., Ng, H.H., Kapranov, P., Sekinger, E.A., Kampa, D., Piccolboni, A., Sementchenko, V., Cheng, J., Williams, A.J., et al. (2004). Unbiased mapping of transcription factor binding sites along human chromosomes 21 and 22 points to widespread regulation of noncoding RNAs. Cell 116, 499-509.
Cech, T.R., and Steitz, J.A. (2014). The noncoding RNA revolution-trashing old rules to forge new ones. Cell 157, 77-94.
Chang, T.C., Pertea, M., Lee, S., Salzberg, S.L., and Mendell, J.T. (2015). Genome-wide annotation of microRNA primary transcript structures reveals novel regulatory mechanisms. Genome Res 25, 1401-1409.
Chang, T.C., Wentzel, E.A., Kent, O.A., Ramachandran, K., Mullendore, M., Lee, K.H., Feldmann, G., Yamakuchi, M., Ferlito, M., Lowenstein, C.J., et al. (2007). Transactivation of miR-34a by p53 broadly influences gene expression and promotes apoptosis. Mol Cell 26, 745-752.
Chang, T.C., Yu, D., Lee, Y.S., Wentzel, E.A., Arking, D.E., West, K.M., Dang, C.V., Thomas-Tikhonenko, A., and Mendell, J.T. (2008). Widespread microRNA repression by Myc contributes to tumorigenesis. Nat Genet 40, 43-50.
Chen, D., Zheng, W., Lin, A., Uyhazi, K., Zhao, H., and Lin, H. (2012). Pumilio 1 suppresses multiple activators of p53 to safeguard spermatogenesis. Curr. Biol. 22, 420-425.
Chiang, H.R., Schoenfeld, L.W., Ruby, J.G., Auyeung, V.C., Spies, N., Baek, D., Johnston, W.K., Russ, C., Luo, S., Babiarz, J.E., et al. (2010). Mammalian microRNAs: experimental evaluation of novel and previously annotated genes. Genes Dev 24, 992-1009.
Chien, C.H., Sun, Y.M., Chang, W.C., Chiang-Hsieh, P.Y., Lee, T.Y., Tsai, W.C., Horng, J.T., Tsou, A.P., and Huang, H.D. (2011). Identifying transcriptional start sites of human microRNAs based on high-throughput sequencing data. Nucleic Acids Res 39, 9345-9356.
199
Chivukula, K.K., and Hollands, C. (2012). Human Acellular Dermal Matrix for Neonates with Complex Abdominal Wall Defects: Short- and Long-Term Outcomes. American Surgeon 78, E346-E348.
Chow, L.T., Gelinas, R.E., Broker, T.R., and Roberts, R.J. (1977). An amazing sequence arrangement at the 5' ends of adenovirus 2 messenger RNA. Cell 12, 1-8.
Cimini, D. (2008). Merotelic kinetochore orientation, aneuploidy, and cancer. Biochim. Biophys. Acta 1786, 32-40.
Clemson, C.M., Hutchinson, J.N., Sara, S.A., Ensminger, A.W., Fox, A.H., Chess, A., and Lawrence, J.B. (2009). An architectural role for a nuclear noncoding RNA: NEAT1 RNA is essential for the structure of paraspeckles. Mol. Cell 33, 717-726.
Consortium, E.P., Birney, E., Stamatoyannopoulos, J.A., Dutta, A., Guigo, R., Gingeras, T.R., Margulies, E.H., Weng, Z., Snyder, M., Dermitzakis, E.T., et al. (2007). Identification and analysis of functional elements in 1% of the human genome by the ENCODE pilot project. Nature 447, 799-816.
Crick, F. (1970). Central dogma of molecular biology. Nature 227, 561-563.
Cunningham, F., Amode, M.R., Barrell, D., Beal, K., Billis, K., Brent, S., Carvalho-Silva, D., Clapham, P., Coates, G., Fitzgerald, S., et al. (2015). Ensembl 2015. Nucleic Acids Res 43, D662-669.
Dahlberg, A.E. (1989). The functional role of ribosomal RNA in protein synthesis. Cell 57, 525-529.
De Vos, M., Schreiber, V., and Dantzer, F. (2012). The diverse roles and clinical relevance of PARPs in DNA damage repair: current state of the art. Biochem Pharmacol 84, 137-146.
Di Leva, G., Garofalo, M., and Croce, C.M. (2014). MicroRNAs in cancer. Annu Rev Pathol 9, 287-314.
Dimitrova, N., Zamudio, J.R., Jong, R.M., Soukup, D., Resnick, R., Sarma, K., Ward, A.J., Raj, A., Lee, J.T., Sharp, P.A., et al. (2014). LincRNA-p21 activates p21 in cis to promote Polycomb target gene expression and to enforce the G1/S checkpoint. Mol. Cell 54, 777-790.
Djebali, S., Davis, C.A., Merkel, A., Dobin, A., Lassmann, T., Mortazavi, A., Tanzer, A., Lagarde, J., Lin, W., Schlesinger, F., et al. (2012). Landscape of transcription in human cells. Nature 489, 101-108.
Doudna, J.A., and Batey, R.T. (2004). Structural insights into the signal recognition particle. Annu Rev Biochem 73, 539-557.
Driscoll, H.E., Muraro, N.I., He, M., and Baines, R.A. (2013). Pumilio-2 regulates translation of Nav1.6 to mediate homeostasis of membrane excitability. J. Neurosci. 33, 9644-9654.
200
Ernst, J., Kheradpour, P., Mikkelsen, T.S., Shoresh, N., Ward, L.D., Epstein, C.B., Zhang, X., Wang, L., Issner, R., Coyne, M., et al. (2011). Mapping and analysis of chromatin state dynamics in nine human cell types. Nature 473, 43-49.
Faghihi, M.A., Modarresi, F., Khalil, A.M., Wood, D.E., Sahagan, B.G., Morgan, T.E., Finch, C.E., St Laurent, G., 3rd, Kenny, P.J., and Wahlestedt, C. (2008). Expression of a noncoding RNA is elevated in Alzheimer's disease and drives rapid feed-forward regulation of beta-secretase. Nat. Med. 14, 723-730.
Fatica, A., and Bozzoni, I. (2014). Long non-coding RNAs: new players in cell differentiation and development. Nat Rev Genet 15, 7-21.
Fire, A., Xu, S., Montgomery, M.K., Kostas, S.A., Driver, S.E., and Mello, C.C. (1998). Potent and specific genetic interference by double-stranded RNA in Caenorhabditis elegans. Nature 391, 806-811.
Galgano, A., Forrer, M., Jaskiewicz, L., Kanitz, A., Zavolan, M., and Gerber, A.P. (2008). Comparative analysis of mRNA targets for human PUF-family proteins suggests extensive interaction with the miRNA regulatory system. PLoS One 3, e3164.
Ganem, N.J., Godinho, S.A., and Pellman, D. (2009). A mechanism linking extra centrosomes to chromosomal instability. Nature 460, 278-282.
Ganem, N.J., Storchova, Z., and Pellman, D. (2007). Tetraploidy, aneuploidy and cancer. Curr. Opin. Genet. Dev. 17, 157-162.
Geigl, J.B., Obenauf, A.C., Schwarzbraun, T., and Speicher, M.R. (2008). Defining 'chromosomal instability'. Trends Genet. 24, 64-69.
Gennarino, V.A., Singh, R.K., White, J.J., De Maio, A., Han, K., Kim, J.Y., Jafar-Nejad, P., di Ronza, A., Kang, H., Sayegh, L.S., et al. (2015). Pumilio1 haploinsufficiency leads to SCA1-like neurodegeneration by increasing wild-type Ataxin1 levels. Cell 160, 1087-1098.
Georgakilas, G., Vlachos, I.S., Paraskevopoulou, M.D., Yang, P., Zhang, Y., Economides, A.N., and Hatzigeorgiou, A.G. (2014). microTSS: accurate microRNA transcription start site identification reveals a significant number of divergent pri-miRNAs. Nat Commun 5, 5700.
Gerlinger, M., Rowan, A.J., Horswell, S., Larkin, J., Endesfelder, D., Gronroos, E., Martinez, P., Matthews, N., Stewart, A., Tarpey, P., et al. (2012). Intratumor heterogeneity and branched evolution revealed by multiregion sequencing. N. Engl. J. Med. 366, 883-892.
Giavara, S., Kosmidou, E., Hande, M.P., Bianchi, M.E., Morgan, A., d'Adda di Fagagna, F., and Jackson, S.P. (2005). Yeast Nhp6A/B and mammalian Hmgb1 facilitate the maintenance of genome stability. Curr. Biol. 15, 68-72.
Giraldez, A.J., Mishima, Y., Rihel, J., Grocock, R.J., Van Dongen, S., Inoue, K., Enright, A.J., and Schier, A.F. (2006). Zebrafish MiR-430 promotes deadenylation and clearance of maternal mRNAs. Science 312, 75-79.
201
Gong, C., and Maquat, L.E. (2011). lncRNAs transactivate STAU1-mediated mRNA decay by duplexing with 3' UTRs via Alu elements. Nature 470, 284-288.
Greider, C.W., and Blackburn, E.H. (1989). A telomeric sequence in the RNA of Tetrahymena telomerase required for telomere repeat synthesis. Nature 337, 331-337.
Guo, H., Ingolia, N.T., Weissman, J.S., and Bartel, D.P. (2010). Mammalian microRNAs predominantly act to decrease target mRNA levels. Nature 466, 835-840.
Gurtan, A.M., and Sharp, P.A. (2013). The role of miRNAs in regulating gene expression networks. J Mol Biol 425, 3582-3600.
Guttman, M., Amit, I., Garber, M., French, C., Lin, M.F., Feldser, D., Huarte, M., Zuk, O., Carey, B.W., Cassady, J.P., et al. (2009). Chromatin signature reveals over a thousand highly conserved large non-coding RNAs in mammals. Nature 458, 223-227.
Guttman, M., Garber, M., Levin, J.Z., Donaghey, J., Robinson, J., Adiconis, X., Fan, L., Koziol, M.J., Gnirke, A., Nusbaum, C., et al. (2010). Ab initio reconstruction of cell type-specific transcriptomes in mouse reveals the conserved multi-exonic structure of lincRNAs. Nat Biotechnol 28, 503-510.
Guttman, M., and Rinn, J.L. (2012). Modular regulatory principles of large non-coding RNAs. Nature 482, 339-346.
Guttman, M., Russell, P., Ingolia, N.T., Weissman, J.S., and Lander, E.S. (2013). Ribosome profiling provides evidence that large noncoding RNAs do not encode proteins. Cell 154, 240-251.
Ha, M., and Kim, V.N. (2014). Regulation of microRNA biogenesis. Nat Rev Mol Cell Biol 15, 509-524.
Hacisuleyman, E., Goff, L.A., Trapnell, C., Williams, A., Henao-Mejia, J., Sun, L., McClanahan, P., Hendrickson, D.G., Sauvageau, M., Kelley, D.R., et al. (2014). Topological organization of multichromosomal regions by the long intergenic noncoding RNA Firre. Nat. Struct. Mol. Biol. pu21, 198-206.
Hafner, M., Landthaler, M., Burger, L., Khorshid, M., Hausser, J., Berninger, P., Rothballer, A., Ascano, M., Jr., Jungkamp, A.C., Munschauer, M., et al. (2010). Transcriptome-wide identification of RNA-binding protein and microRNA target sites by PAR-CLIP. Cell 141, 129-141.
Hammond, S.M., Bernstein, E., Beach, D., and Hannon, G.J. (2000). An RNA-directed nuclease mediates post-transcriptional gene silencing in Drosophila cells. Nature 404, 293-296.
Hanahan, D., and Weinberg, R.A. (2011). Hallmarks of cancer: the next generation. Cell 144, 646-674.
Harrow, J., Frankish, A., Gonzalez, J.M., Tapanari, E., Diekhans, M., Kokocinski, F., Aken, B.L., Barrell, D., Zadissa, A., Searle, S., et al. (2012). GENCODE: the reference human genome annotation for The ENCODE Project. Genome Res. 22, 1760-1774.
202
Hauser, S., Ulrich, T., Wurster, S., Schmitt, K., Reichert, N., and Gaubatz, S. (2012). Loss of LIN9, a member of the DREAM complex, cooperates with SV40 large T antigen to induce genomic instability and anchorage-independent growth. Oncogene 31, 1859-1868.
He, L., He, X., Lim, L.P., de Stanchina, E., Xuan, Z., Liang, Y., Xue, W., Zender, L., Magnus, J., Ridzon, D., et al. (2007). A microRNA component of the p53 tumour suppressor network. Nature 447, 1130-1134.
Heo, I., Joo, C., Cho, J., Ha, M., Han, J., and Kim, V.N. (2008). Lin28 mediates the terminal uridylation of let-7 precursor MicroRNA. Mol Cell 32, 276-284.
Hershey, A.D., and Chase, M. (1952). Independent functions of viral protein and nucleic acid in growth of bacteriophage. J Gen Physiol 36, 39-56.
Hoagland, M.B., Stephenson, M.L., Scott, J.F., Hecht, L.I., and Zamecnik, P.C. (1958). A soluble ribonucleic acid intermediate in protein synthesis. J Biol Chem 231, 241-257.
Hockemeyer, D., Soldner, F., Beard, C., Gao, Q., Mitalipova, M., DeKelver, R.C., Katibah, G.E., Amora, R., Boydston, E.A., Zeitler, B., et al. (2009). Efficient targeting of expressed and silent genes in human ESCs and iPSCs using zinc-finger nucleases. Nat. Biotechnol. 27, 851-857.
Hsu, P.D., Lander, E.S., and Zhang, F. (2014). Development and applications of CRISPR-Cas9 for genome engineering. Cell 157, 1262-1278.
Huang, D.W., Sherman, B.T., Tan, Q., Kir, J., Liu, D., Bryant, D., Guo, Y., Stephens, R., Baseler, M.W., Lane, H.C., et al. (2007). DAVID Bioinformatics Resources: expanded annotation database and novel algorithms to better extract biology from large gene lists. Nucleic Acids Res 35, W169-175.
Huarte, M., Guttman, M., Feldser, D., Garber, M., Koziol, M.J., Kenzelmann-Broz, D., Khalil, A.M., Zuk, O., Amit, I., Rabani, M., et al. (2010). A large intergenic noncoding RNA induced by p53 mediates global gene repression in the p53 response. Cell 142, 409-419.
Hung, C.L., Wang, L.Y., Yu, Y.L., Chen, H.W., Srivastava, S., Petrovics, G., and Kung, H.J. (2014). A long noncoding RNA connects c-Myc to tumor metabolism. Proc Natl Acad Sci U S A 111, 18697-18702.
Hung, T., Wang, Y., Lin, M.F., Koegel, A.K., Kotake, Y., Grant, G.D., Horlings, H.M., Shah, N., Umbricht, C., Wang, P., et al. (2011). Extensive and coordinated transcription of noncoding RNAs within cell-cycle promoters. Nat Genet 43, 621-629.
Hwang, H.W., Wentzel, E.A., and Mendell, J.T. (2007). A hexanucleotide element directs microRNA nuclear import. Science 315, 97-100.
Hwang, H.W., Wentzel, E.A., and Mendell, J.T. (2009). Cell-cell contact globally activates microRNA biogenesis. Proc Natl Acad Sci U S A 106, 7016-7021.
203
Iourov, I.Y., Vorsanova, S.G., and Yurov, Y.B. (2010). Somatic genome variations in health and disease. Curr Genomics 11, 387-396.
Islam, S., Kjallquist, U., Moliner, A., Zajac, P., Fan, J.B., Lonnerberg, P., and Linnarsson, S. (2011). Characterization of the single-cell transcriptional landscape by highly multiplex RNA-seq. Genome Res. 21, 1160-1167.
Iyer, M.K., Niknafs, Y.S., Malik, R., Singhal, U., Sahu, A., Hosono, Y., Barrette, T.R., Prensner, J.R., Evans, J.R., Zhao, S., et al. (2015). The landscape of long noncoding RNAs in the human transcriptome. Nat. Genet. 47, 199-208.
Jackson, E.L., Willis, N., Mercer, K., Bronson, R.T., Crowley, D., Montoya, R., Jacks, T., and Tuveson, D.A. (2001). Analysis of lung tumor initiation and progression using conditional expression of oncogenic K-ras. Genes Dev 15, 3243-3248.
Jacob, F., and Monod, J. (1961). Genetic regulatory mechanisms in the synthesis of proteins. J Mol Biol 3, 318-356.
Jallepalli, P.V., Waizenegger, I.C., Bunz, F., Langer, S., Speicher, M.R., Peters, J.M., Kinzler, K.W., Vogelstein, B., and Lengauer, C. (2001). Securin is required for chromosomal stability in human cells. Cell 105, 445-457.
Jiang, W., Jimenez, G., Wells, N.J., Hope, T.J., Wahl, G.M., Hunter, T., and Fukunaga, R. (1998). PRC1: a human mitotic spindle-associated CDK substrate protein required for cytokinesis. Mol. Cell 2, 877-885.
Kang, Y.H., Farina, A., Bermudez, V.P., Tappin, I., Du, F., Galal, W.C., and Hurwitz, J. (2013). Interaction between human Ctf4 and the Cdc45/Mcm2-7/GINS (CMG) replicative helicase. Proc. Natl. Acad. Sci. U. S. A. 110, 19760-19765.
Karpf, A.R., and Matsui, S. (2005). Genetic disruption of cytosine DNA methyltransferase enzymes induces chromosomal instability in human cancer cells. Cancer Res. 65, 8635-8639.
Kazazian, H.H., Jr. (2014). Processed pseudogene insertions in somatic cells. Mob DNA 5, 20.
Kedde, M., van Kouwenhove, M., Zwart, W., Oude Vrielink, J.A., Elkon, R., and Agami, R. (2010). A Pumilio-induced RNA structure switch in p27-3' UTR controls miR-221 and miR-222 accessibility. Nat. Cell Biol. 12, 1014-1020.
Ketting, R.F., Fischer, S.E., Bernstein, E., Sijen, T., Hannon, G.J., and Plasterk, R.H. (2001). Dicer functions in RNA interference and in synthesis of small RNA involved in developmental timing in C. elegans. Genes Dev 15, 2654-2659.
Khalil, A.M., Guttman, M., Huarte, M., Garber, M., Raj, A., Rivea Morales, D., Thomas, K., Presser, A., Bernstein, B.E., van Oudenaarden, A., et al. (2009). Many human large intergenic noncoding RNAs associate with chromatin-modifying complexes and affect gene expression. Proc. Natl. Acad. Sci. U. S. A. 106, 11667-11672.
204
Kim, D., Pertea, G., Trapnell, C., Pimentel, H., Kelley, R., and Salzberg, S.L. (2013). TopHat2: accurate alignment of transcriptomes in the presence of insertions, deletions and gene fusions. Genome Biol 14, R36.
Kino, T., Hurt, D.E., Ichijo, T., Nader, N., and Chrousos, G.P. (2010). Noncoding RNA gas5 is a growth arrest- and starvation-associated repressor of the glucocorticoid receptor. Science signaling 3, ra8.
Kiss-Laszlo, Z., Henry, Y., Bachellerie, J.P., Caizergues-Ferrer, M., and Kiss, T. (1996). Site-specific ribose methylation of preribosomal RNA: a novel function for small nucleolar RNAs. Cell 85, 1077-1088.
Knight, S.W., and Bass, B.L. (2001). A role for the RNase III enzyme DCR-1 in RNA interference and germ line development in Caenorhabditis elegans. Science 293, 2269-2271.
Kops, G.J., Weaver, B.A., and Cleveland, D.W. (2005). On the road to cancer: aneuploidy and the mitotic checkpoint. Nat. Rev. Cancer 5, 773-785.
Kozomara, A., and Griffiths-Jones, S. (2014). miRBase: annotating high confidence microRNAs using deep sequencing data. Nucleic Acids Res 42, D68-73.
Kretz, M., Siprashvili, Z., Chu, C., Webster, D.E., Zehnder, A., Qu, K., Lee, C.S., Flockhart, R.J., Groff, A.F., Chow, J., et al. (2013). Control of somatic tissue differentiation by the long non-coding RNA TINCR. Nature 493, 231-235.
Kuga, T., Nie, H., Kazami, T., Satoh, M., Matsushita, K., Nomura, F., Maeshima, K., Nakayama, Y., and Tomonaga, T. (2014). Lamin B2 prevents chromosome instability by ensuring proper mitotic chromosome segregation. Oncogenesis 3, e94.
Lagos-Quintana, M., Rauhut, R., Lendeckel, W., and Tuschl, T. (2001). Identification of novel genes coding for small expressed RNAs. Science 294, 853-858.
Lander, E.S., Linton, L.M., Birren, B., Nusbaum, C., Zody, M.C., Baldwin, J., Devon, K., Dewar, K., Doyle, M., FitzHugh, W., et al. (2001). Initial sequencing and analysis of the human genome. Nature 409, 860-921.
Landgraf, P., Rusu, M., Sheridan, R., Sewer, A., Iovino, N., Aravin, A., Pfeffer, S., Rice, A., Kamphorst, A.O., Landthaler, M., et al. (2007). A mammalian microRNA expression atlas based on small RNA library sequencing. Cell 129, 1401-1414.
Landthaler, M., Yalcin, A., and Tuschl, T. (2004). The human DiGeorge syndrome critical region gene 8 and Its D. melanogaster homolog are required for miRNA biogenesis. Curr Biol 14, 2162-2167.
Lau, N.C., Lim, L.P., Weinstein, E.G., and Bartel, D.P. (2001). An abundant class of tiny RNAs with probable regulatory roles in Caenorhabditis elegans. Science 294, 858-862.
Laufer, M., Nandula, S.V., Modi, A.P., Wang, S., Jasin, M., Murty, V.V., Ludwig, T., and Baer, R. (2007). Structural requirements for the BARD1 tumor suppressor in
205
chromosomal stability and homology-directed DNA repair. J. Biol. Chem. 282, 34325-34333.
Lee, R.C., and Ambros, V. (2001). An extensive class of small RNAs in Caenorhabditis elegans. Science 294, 862-864.
Lee, R.C., Feinbaum, R.L., and Ambros, V. (1993). The C. elegans heterochronic gene lin-4 encodes small RNAs with antisense complementarity to lin-14. Cell 75, 843-854.
Lee, Y., Ahn, C., Han, J., Choi, H., Kim, J., Yim, J., Lee, J., Provost, P., Radmark, O., Kim, S., et al. (2003). The nuclear RNase III Drosha initiates microRNA processing. Nature 425, 415-419.
Lee, Y., Jeon, K., Lee, J.T., Kim, S., and Kim, V.N. (2002). MicroRNA maturation: stepwise processing and subcellular localization. EMBO J 21, 4663-4670.
Lee, Y., Kim, M., Han, J., Yeom, K.H., Lee, S., Baek, S.H., and Kim, V.N. (2004). MicroRNA genes are transcribed by RNA polymerase II. EMBO J 23, 4051-4060.
Li, L., and Chang, H.Y. (2014). Physiological roles of long noncoding RNAs: insight from knockout mice. Trends Cell Biol. 24, 594-602.
Li, W., Feng, J., and Jiang, T. (2011). IsoLasso: a LASSO regression approach to RNA-Seq based transcriptome assembly. J Comput Biol 18, 1693-1707.
Liang, Y., Ridzon, D., Wong, L., and Chen, C. (2007). Characterization of microRNA expression profiles in normal human tissues. BMC Genomics 8, 166.
Lin, M.F., Jungreis, I., and Kellis, M. (2011). PhyloCSF: a comparative genomics method to distinguish protein coding and non-coding regions. Bioinformatics 27, i275-282.
Ling, H., Spizzo, R., Atlasi, Y., Nicoloso, M., Shimizu, M., Redis, R.S., Nishida, N., Gafa, R., Song, J., Guo, Z., et al. (2013). CCAT2, a novel noncoding RNA mapping to 8q24, underlies metastatic progression and chromosomal instability in colon cancer. Genome Res. 23, 1446-1461.
Liu, B., Sun, L., Liu, Q., Gong, C., Yao, Y., Lv, X., Lin, L., Yao, H., Su, F., Li, D., et al. (2015). A cytoplasmic NF-kappaB interacting long noncoding RNA blocks IkappaB phosphorylation and suppresses breast cancer metastasis. Cancer Cell 27, 370-381.
Liu, J., Wang, Z., Jiang, K., Zhang, L., Zhao, L., Hua, S., Yan, F., Yang, Y., Wang, D., Fu, C., et al. (2009). PRC1 cooperates with CLASP1 to organize central spindle plasticity in mitosis. J Biol Chem 284, 23059-23071.
Liu, X., Li, D., Zhang, W., Guo, M., and Zhan, Q. (2012). Long non-coding RNA gadd7 interacts with TDP-43 and regulates Cdk6 mRNA decay. EMBO J. 31, 4415-4427.
Lotterman, C.D., Kent, O.A., and Mendell, J.T. (2008). Functional integration of microRNAs into oncogenic and tumor suppressor pathways. Cell Cycle 7, 2493-2499.
206
Lu, J., Getz, G., Miska, E.A., Alvarez-Saavedra, E., Lamb, J., Peck, D., Sweet-Cordero, A., Ebert, B.L., Mak, R.H., Ferrando, A.A., et al. (2005). MicroRNA expression profiles classify human cancers. Nature 435, 834-838.
Lutzmann, M., Grey, C., Traver, S., Ganier, O., Maya-Mendoza, A., Ranisavljevic, N., Bernex, F., Nishiyama, A., Montel, N., Gavois, E., et al. (2012). MCM8- and MCM9-deficient mice reveal gametogenesis defects and genome instability due to impaired homologous recombination. Mol. Cell 47, 523-534.
Manning, A.L., Yazinski, S.A., Nicolay, B., Bryll, A., Zou, L., and Dyson, N.J. (2014). Suppression of genome instability in pRB-deficient cells by enhancement of chromosome cohesion. Mol. Cell 53, 993-1004.
Marsico, A., Huska, M.R., Lasserre, J., Hu, H., Vucicevic, D., Musahl, A., Orom, U., and Vingron, M. (2013). PROmiRNA: a new miRNA promoter recognition method uncovers the complex regulation of intronic miRNAs. Genome Biol 14, R84.
Marson, A., Levine, S.S., Cole, M.F., Frampton, G.M., Brambrink, T., Johnstone, S., Guenther, M.G., Johnston, W.K., Wernig, M., Newman, J., et al. (2008). Connecting microRNA genes to the core transcriptional regulatory circuitry of embryonic stem cells. Cell 134, 521-533.
Martin, J.A., and Wang, Z. (2011). Next-generation transcriptome assembly. Nat Rev Genet 12, 671-682.
Mashal, R.D., Koontz, J., and Sklar, J. (1995). Detection of mutations by cleavage of DNA heteroduplexes with bacteriophage resolvases. Nat Genet 9, 177-183.
Masramon, L., Ribas, M., Cifuentes, P., Arribas, R., Garcia, F., Egozcue, J., Peinado, M.A., and Miro, R. (2000). Cytogenetic characterization of two colon cell lines by using conventional G-banding, comparative genomic hybridization, and whole chromosome painting. Cancer Genet. Cytogenet. 121, 17-21.
Matsunaga, S., Takata, H., Morimoto, A., Hayashihara, K., Higashi, T., Akatsuchi, K., Mizusawa, E., Yamakawa, M., Ashida, M., Matsunaga, T.M., et al. (2012). RBMX: a regulator for maintenance and centromeric protection of sister chromatid cohesion. Cell reports 1, 299-308.
McCarthy, E.E., Celebi, J.T., Baer, R., and Ludwig, T. (2003). Loss of Bard1, the heterodimeric partner of the Brca1 tumor suppressor, results in early embryonic lethality and chromosomal instability. Mol. Cell. Biol. 23, 5056-5063.
McGettigan, P.A. (2013). Transcriptomics in the RNA-seq era. Curr Opin Chem Biol 17, 4-11.
McIntyre, R.E., Lakshminarasimhan Chavali, P., Ismail, O., Carragher, D.M., Sanchez-Andrade, G., Forment, J.V., Fu, B., Del Castillo Velasco-Herrera, M., Edwards, A., van der Weyden, L., et al. (2012). Disruption of mouse Cenpj, a regulator of centriole biogenesis, phenocopies Seckel syndrome. PLoS genetics 8, e1003022.
207
Megraw, M., Pereira, F., Jensen, S.T., Ohler, U., and Hatzigeorgiou, A.G. (2009). A transcription factor affinity-based code for mammalian transcription initiation. Genome Res 19, 644-656.
Melamed, Z., Levy, A., Ashwal-Fluss, R., Lev-Maor, G., Mekahel, K., Atias, N., Gilad, S., Sharan, R., Levy, C., Kadener, S., et al. (2013). Alternative splicing regulates biogenesis of miRNAs located across exon-intron junctions. Mol Cell 50, 869-881.
Mendell, J.T., and Olson, E.N. (2012). MicroRNAs in stress signaling and human disease. Cell 148, 1172-1187.
Menissier de Murcia, J., Ricoul, M., Tartier, L., Niedergang, C., Huber, A., Dantzer, F., Schreiber, V., Ame, J.C., Dierich, A., LeMeur, M., et al. (2003). Functional interaction between PARP-1 and PARP-2 in chromosome stability and embryonic development in mouse. EMBO J. 22, 2255-2263.
Menon, S., Oh, W., Carr, H.S., and Frost, J.A. (2013). Rho GTPase-independent regulation of mitotic progression by the RhoGEF Net1. Mol. Biol. Cell 24, 2655-2667.
Michalik, K.M., You, X., Manavski, Y., Doddaballapur, A., Zornig, M., Braun, T., John, D., Ponomareva, Y., Chen, W., Uchida, S., et al. (2014). Long noncoding RNA MALAT1 regulates endothelial cell function and vessel growth. Circ. Res. 114, 1389-1397.
Mikkelsen, T.S., Ku, M., Jaffe, D.B., Issac, B., Lieberman, E., Giannoukos, G., Alvarez, P., Brockman, W., Kim, T.K., Koche, R.P., et al. (2007). Genome-wide maps of chromatin state in pluripotent and lineage-committed cells. Nature 448, 553-560.
Miles, W.O., Tschop, K., Herr, A., Ji, J.Y., and Dyson, N.J. (2012). Pumilio facilitates miRNA regulation of the E2F3 oncogene. Genes Dev. 26, 356-368.
Mili, S., and Steitz, J.A. (2004). Evidence for reassociation of RNA-binding proteins after cell lysis: implications for the interpretation of immunoprecipitation analyses. RNA 10, 1692-1694.
Miller, M.A., and Olivas, W.M. (2011). Roles of Puf proteins in mRNA degradation and translation. Wiley interdisciplinary reviews. RNA 2, 471-492.
Morris, A.R., Mukherjee, N., and Keene, J.D. (2008). Ribonomic analysis of human Pum1 reveals cis-trans conservation across species despite evolution of diverse mRNA target sets. Mol. Cell. Biol. 28, 4093-4103.
Morris, K.V., and Mattick, J.S. (2014). The rise of regulatory RNA. Nat Rev Genet 15, 423-437.
Napoli, C., Lemieux, C., and Jorgensen, R. (1990). Introduction of a Chimeric Chalcone Synthase Gene into Petunia Results in Reversible Co-Suppression of Homologous Genes in trans. Plant Cell 2, 279-289.
Narita, R., Takahasi, K., Murakami, E., Hirano, E., Yamamoto, S.P., Yoneyama, M., Kato, H., and Fujita, T. (2014). A novel function of human Pumilio proteins in cytoplasmic sensing of viral infection. PLoS Pathog. 10, e1004417.

208
Ni, J., Tien, A.L., and Fournier, M.J. (1997). Small nucleolar RNAs direct site-specific synthesis of pseudouridine in ribosomal RNA. Cell 89, 565-573.
Niu, Y., Shen, B., Cui, Y., Chen, Y., Wang, J., Wang, L., Kang, Y., Zhao, X., Si, W., Li, W., et al. (2014). Generation of gene-modified cynomolgus monkey via Cas9/RNA-mediated gene targeting in one-cell embryos. Cell 156, 836-843.
O'Donnell, K.A., Wentzel, E.A., Zeller, K.I., Dang, C.V., and Mendell, J.T. (2005). c-Myc-regulated microRNAs modulate E2F1 expression. Nature 435, 839-843.
Olive, V., Minella, A.C., and He, L. (2015). Outside the coding genome, mammalian microRNAs confer structural and functional complexity. Sci Signal 8, re2.
Olson, E.N. (2014). MicroRNAs as therapeutic targets and biomarkers of cardiovascular disease. Sci Transl Med 6, 239ps233.
Ozsolak, F., Poling, L.L., Wang, Z., Liu, H., Liu, X.S., Roeder, R.G., Zhang, X., Song, J.S., and Fisher, D.E. (2008). Chromatin structure analyses identify miRNA promoters. Genes Dev 22, 3172-3183.
Pasquinelli, A.E. (2012). MicroRNAs and their targets: recognition, regulation and an emerging reciprocal relationship. Nat Rev Genet 13, 271-282.
Pasquinelli, A.E., Reinhart, B.J., Slack, F., Martindale, M.Q., Kuroda, M.I., Maller, B., Hayward, D.C., Ball, E.E., Degnan, B., Muller, P., et al. (2000). Conservation of the sequence and temporal expression of let-7 heterochronic regulatory RNA. Nature 408, 86-89.
Patel, R.K., and Jain, M. (2012). NGS QC Toolkit: a toolkit for quality control of next generation sequencing data. PLoS One 7, e30619.
Pauli, A., Rinn, J.L., and Schier, A.F. (2011). Non-coding RNAs as regulators of embryogenesis. Nature reviews. Genetics 12, 136-149.
Pertea, M., Pertea, G.M., Antonescu, C.M., Chang, T.C., Mendell, J.T., and Salzberg, S.L. (2015). StringTie enables improved reconstruction of a transcriptome from RNA-seq reads. Nat Biotechnol 33, 290-295.
Ponten, F., Jirstrom, K., and Uhlen, M. (2008). The Human Protein Atlas - a tool for pathology. J. Pathol. 216, 387-393.
Ponting, C.P., Oliver, P.L., and Reik, W. (2009). Evolution and functions of long noncoding RNAs. Cell 136, 629-641.
Quinodoz, S., and Guttman, M. (2014). Long noncoding RNAs: an emerging link between gene regulation and nuclear organization. Trends Cell Biol 24, 651-663.
Rajagopalan, H., Nowak, M.A., Vogelstein, B., and Lengauer, C. (2003). The significance of unstable chromosomes in colorectal cancer. Nat. Rev. Cancer 3, 695-701.
209
Rakheja, D., Chen, K.S., Liu, Y., Shukla, A.A., Schmid, V., Chang, T.C., Khokhar, S., Wickiser, J.E., Karandikar, N.J., Malter, J.S., et al. (2014). Somatic mutations in DROSHA and DICER1 impair microRNA biogenesis through distinct mechanisms in Wilms tumours. Nat Commun 2, 4802.
Reinhart, B.J., Slack, F.J., Basson, M., Pasquinelli, A.E., Bettinger, J.C., Rougvie, A.E., Horvitz, H.R., and Ruvkun, G. (2000). The 21-nucleotide let-7 RNA regulates developmental timing in Caenorhabditis elegans. Nature 403, 901-906.
Rinn, J.L., and Chang, H.Y. (2012). Genome regulation by long noncoding RNAs. Annu. Rev. Biochem. 81, 145-166.
Robinson, M.D., McCarthy, D.J., and Smyth, G.K. (2010). edgeR: a Bioconductor package for differential expression analysis of digital gene expression data. Bioinformatics 26, 139-140.
Rodriguez, A., Griffiths-Jones, S., Ashurst, J.L., and Bradley, A. (2004). Identification of mammalian microRNA host genes and transcription units. Genome Res 14, 1902-1910.
Rosenbloom, K.R., Sloan, C.A., Malladi, V.S., Dreszer, T.R., Learned, K., Kirkup, V.M., Wong, M.C., Maddren, M., Fang, R., Heitner, S.G., et al. (2013). ENCODE data in the UCSC Genome Browser: year 5 update. Nucleic Acids Res. 41, D56-63.
Roush, S., and Slack, F.J. (2008). The let-7 family of microRNAs. Trends Cell Biol 18, 505-516.
Sabin, L.R., Delas, M.J., and Hannon, G.J. (2013). Dogma derailed: the many influences of RNA on the genome. Mol. Cell 49, 783-794.
Salditt-Georgieff, M., and Darnell, J.E., Jr. (1982). Further evidence that the majority of primary nuclear RNA transcripts in mammalian cells do not contribute to mRNA. Mol Cell Biol 2, 701-707.
Salditt-Georgieff, M., Harpold, M.M., Wilson, M.C., and Darnell, J.E., Jr. (1981). Large heterogeneous nuclear ribonucleic acid has three times as many 5' caps as polyadenylic acid segments, and most caps do not enter polyribosomes. Mol Cell Biol 1, 179-187.
Salmena, L., Poliseno, L., Tay, Y., Kats, L., and Pandolfi, P.P. (2011). A ceRNA hypothesis: the Rosetta Stone of a hidden RNA language? Cell 146, 353-358.
Salzler, H.R., Davidson, J.M., Montgomery, N.D., and Duronio, R.J. (2009). Loss of the histone pre-mRNA processing factor stem-loop binding protein in Drosophila causes genomic instability and impaired cellular proliferation. PLoS One 4, e8168.
Samper, E., Goytisolo, F.A., Menissier-de Murcia, J., Gonzalez-Suarez, E., Cigudosa, J.C., de Murcia, G., and Blasco, M.A. (2001). Normal telomere length and chromosomal end capping in poly(ADP-ribose) polymerase-deficient mice and primary cells despite increased chromosomal instability. J. Cell Biol. 154, 49-60.
Sanchez, Y., Segura, V., Marin-Bejar, O., Athie, A., Marchese, F.P., Gonzalez, J., Bujanda, L., Guo, S., Matheu, A., and Huarte, M. (2014). Genome-wide analysis of the
210
human p53 transcriptional network unveils a lncRNA tumour suppressor signature. Nature communications 5, 5812.
Sander, J.D., Cade, L., Khayter, C., Reyon, D., Peterson, R.T., Joung, J.K., and Yeh, J.R. (2011). Targeted gene disruption in somatic zebrafish cells using engineered TALENs. Nat. Biotechnol. 29, 697-698.
Sander, J.D., Maeder, M.L., Reyon, D., Voytas, D.F., Joung, J.K., and Dobbs, D. (2010). ZiFiT (Zinc Finger Targeter): an updated zinc finger engineering tool. Nucleic Acids Res. 38, W462-468.
Sanjana, N.E., Cong, L., Zhou, Y., Cunniff, M.M., Feng, G., and Zhang, F. (2012). A transcription activator-like effector toolbox for genome engineering. Nat. Protoc. 7, 171-192.
Schaetzlein, S., Chahwan, R., Avdievich, E., Roa, S., Wei, K., Eoff, R.L., Sellers, R.S., Clark, A.B., Kunkel, T.A., Scharff, M.D., et al. (2013). Mammalian Exo1 encodes both structural and catalytic functions that play distinct roles in essential biological processes. Proc. Natl. Acad. Sci. U. S. A. 110, E2470-2479.
Schanen, B.C., and Li, X. (2011). Transcriptional regulation of mammalian miRNA genes. Genomics 97, 1-6.
Schultes, E.A., Spasic, A., Mohanty, U., and Bartel, D.P. (2005). Compact and ordered collapse of randomly generated RNA sequences. Nat Struct Mol Biol 12, 1130-1136.
Shima, N., Alcaraz, A., Liachko, I., Buske, T.R., Andrews, C.A., Munroe, R.J., Hartford, S.A., Tye, B.K., and Schimenti, J.C. (2007). A viable allele of Mcm4 causes chromosome instability and mammary adenocarcinomas in mice. Nat. Genet. 39, 93-98.
Spassov, D.S., and Jurecic, R. (2003). The PUF family of RNA-binding proteins: does evolutionarily conserved structure equal conserved function? IUBMB life 55, 359-366.
Struhl, K. (2007). Transcriptional noise and the fidelity of initiation by RNA polymerase II. Nat. Struct. Mol. Biol. 14, 103-105.
Subramanian, A., Tamayo, P., Mootha, V.K., Mukherjee, S., Ebert, B.L., Gillette, M.A., Paulovich, A., Pomeroy, S.L., Golub, T.R., Lander, E.S., et al. (2005). Gene set enrichment analysis: a knowledge-based approach for interpreting genome-wide expression profiles. Proc. Natl. Acad. Sci. U. S. A. 102, 15545-15550.
Terasawa, M., Shinohara, A., and Shinohara, M. (2014). Canonical non-homologous end joining in mitosis induces genome instability and is suppressed by M-phase-specific phosphorylation of XRCC4. PLoS genetics 10, e1004563.
Trapnell, C., Pachter, L., and Salzberg, S.L. (2009). TopHat: discovering splice junctions with RNA-Seq. Bioinformatics 25, 1105-1111.
Trapnell, C., Williams, B.A., Pertea, G., Mortazavi, A., Kwan, G., van Baren, M.J., Salzberg, S.L., Wold, B.J., and Pachter, L. (2010). Transcript assembly and
211
quantification by RNA-Seq reveals unannotated transcripts and isoform switching during cell differentiation. Nat Biotechnol 28, 511-515.
Ulitsky, I., and Bartel, D.P. (2013). lincRNAs: genomics, evolution, and mechanisms. Cell 154, 26-46.
Ulitsky, I., Shkumatava, A., Jan, C.H., Sive, H., and Bartel, D.P. (2011). Conserved function of lincRNAs in vertebrate embryonic development despite rapid sequence evolution. Cell 147, 1537-1550.
Vessey, J.P., Schoderboeck, L., Gingl, E., Luzi, E., Riefler, J., Di Leva, F., Karra, D., Thomas, S., Kiebler, M.A., and Macchi, P. (2010). Mammalian Pumilio 2 regulates dendrite morphogenesis and synaptic function. Proc. Natl. Acad. Sci. U. S. A. 107, 3222-3227.
Vidigal, J.A., and Ventura, A. (2015). The biological functions of miRNAs: lessons from in vivo studies. Trends Cell Biol 25, 137-147.
Voets, E., and Wolthuis, R.M. (2010). MASTL is the human orthologue of Greatwall kinase that facilitates mitotic entry, anaphase and cytokinesis. Cell cycle 9, 3591-3601.
Walter, P., and Blobel, G. (1982). Signal recognition particle contains a 7S RNA essential for protein translocation across the endoplasmic reticulum. Nature 299, 691-698.
Wan, G., Liu, Y., Han, C., Zhang, X., and Lu, X. (2014). Noncoding RNAs in DNA repair and genome integrity. Antioxid Redox Signal 20, 655-677.
Wang, H., Li, Y., Truong, L.N., Shi, L.Z., Hwang, P.Y., He, J., Do, J., Cho, M.J., Li, H., Negrete, A., et al. (2014). CtIP maintains stability at common fragile sites and inverted repeats by end resection-independent endonuclease activity. Mol. Cell 54, 1012-1021.
Wang, H., Yang, H., Shivalila, C.S., Dawlaty, M.M., Cheng, A.W., Zhang, F., and Jaenisch, R. (2013). One-step generation of mice carrying mutations in multiple genes by CRISPR/Cas-mediated genome engineering. Cell 153, 910-918.
Wang, X., McLachlan, J., Zamore, P.D., and Hall, T.M. (2002). Modular recognition of RNA by a human pumilio-homology domain. Cell 110, 501-512.
Wapinski, O., and Chang, H.Y. (2011). Long noncoding RNAs and human disease. Trends Cell Biol. 21, 354-361.
Warner, J.R., Soeiro, R., Birnboim, H.C., Girard, M., and Darnell, J.E. (1966). Rapidly labeled HeLa cell nuclear RNA. I. Identification by zone sedimentation of a heterogeneous fraction separate from ribosomal precursor RNA. J Mol Biol 19, 349-361.
Weill, L., Belloc, E., Bava, F.A., and Mendez, R. (2012). Translational control by changes in poly(A) tail length: recycling mRNAs. Nature Structural & Molecular Biology 19, 577-585.
212
Weinberg, R.A., and Penman, S. (1968). Small molecular weight monodisperse nuclear RNA. J Mol Biol 38, 289-304.
Whelan, G., Kreidl, E., Wutz, G., Egner, A., Peters, J.M., and Eichele, G. (2012). Cohesin acetyltransferase Esco2 is a cell viability factor and is required for cohesion in pericentric heterochromatin. EMBO J. 31, 71-82.
Wickens, M., Bernstein, D.S., Kimble, J., and Parker, R. (2002). A PUF family portrait: 3'UTR regulation as a way of life. Trends Genet. 18, 150-157.
Wightman, B., Ha, I., and Ruvkun, G. (1993). Posttranscriptional regulation of the heterochronic gene lin-14 by lin-4 mediates temporal pattern formation in C. elegans. Cell 75, 855-862.
Willingham, A.T., Orth, A.P., Batalov, S., Peters, E.C., Wen, B.G., Aza-Blanc, P., Hogenesch, J.B., and Schultz, P.G. (2005). A strategy for probing the function of noncoding RNAs finds a repressor of NFAT. Science 309, 1570-1573.
Winter, J., Jung, S., Keller, S., Gregory, R.I., and Diederichs, S. (2009). Many roads to maturity: microRNA biogenesis pathways and their regulation. Nat Cell Biol 11, 228-234.
Wu, L., Fan, J., and Belasco, J.G. (2006). MicroRNAs direct rapid deadenylation of mRNA. Proc Natl Acad Sci U S A 103, 4034-4039.
Xiao, Y., Liu, T., Zhao, H., Li, X., Guan, J., Xu, C., Ping, Y., Fan, H., Wang, L., Zhao, T., et al. (2014). Integrating epigenetic marks for identification of transcriptionally active miRNAs. Genomics 104, 70-78.
Xie, X., Lu, J., Kulbokas, E.J., Golub, T.R., Mootha, V., Lindblad-Toh, K., Lander, E.S., and Kellis, M. (2005). Systematic discovery of regulatory motifs in human promoters and 3' UTRs by comparison of several mammals. Nature 434, 338-345.
Yang, H., Wang, H., Shivalila, C.S., Cheng, A.W., Shi, L., and Jaenisch, R. (2013). One-step generation of mice carrying reporter and conditional alleles by CRISPR/Cas-mediated genome engineering. Cell 154, 1370-1379.
Yang, X., Boehm, J.S., Yang, X., Salehi-Ashtiani, K., Hao, T., Shen, Y., Lubonja, R., Thomas, S.R., Alkan, O., Bhimdi, T., et al. (2011). A public genome-scale lentiviral expression library of human ORFs. Nat Methods 8, 659-661.
Yi, R., Qin, Y., Macara, I.G., and Cullen, B.R. (2003). Exportin-5 mediates the nuclear export of pre-microRNAs and short hairpin RNAs. Genes Dev 17, 3011-3016.
Yik, J.H., Chen, R., Nishimura, R., Jennings, J.L., Link, A.J., and Zhou, Q. (2003). Inhibition of P-TEFb (CDK9/Cyclin T) kinase and RNA polymerase II transcription by the coordinated actions of HEXIM1 and 7SK snRNA. Mol Cell 12, 971-982.
Yoon, J.H., Abdelmohsen, K., and Gorospe, M. (2013). Posttranscriptional gene regulation by long noncoding RNA. J Mol Biol 425, 3723-3730.
213
Yoon, J.H., Abdelmohsen, K., Srikantan, S., Yang, X., Martindale, J.L., De, S., Huarte, M., Zhan, M., Becker, K.G., and Gorospe, M. (2012). LincRNA-p21 suppresses target mRNA translation. Mol. Cell 47, 648-655.
Zamore, P.D., Williamson, J.R., and Lehmann, R. (1997). The Pumilio protein binds RNA through a conserved domain that defines a new class of RNA-binding proteins. RNA 3, 1421-1433.
Zappulla, D.C., and Cech, T.R. (2004). Yeast telomerase RNA: a flexible scaffold for protein subunits. Proc Natl Acad Sci U S A 101, 10024-10029.
Zeman, M.K., and Cimprich, K.A. (2014). Causes and consequences of replication stress. Nat Cell Biol 16, 2-9.
Ziats, M.N., and Rennert, O.M. (2013). Aberrant expression of long noncoding RNAs in autistic brain. J. Mol. Neurosci. 49, 589-593.
Zieve, G., and Penman, S. (1976). Small RNA species of the HeLa cell: metabolism and subcellular localization. Cell 8, 19-31.

214
Curriculum Vitae
Sungyul Lee
6000 Harry Hines Blvd, NA6.200
Dallas, TX 75390
(214) 648-5185
Education
M.S. 2006 Seoul National University, College of Medicine (Seoul, South Korea)
Graduate Program of Molecular and Clinical Oncology, Supervisor: Jung Weon Lee
B.S. 2004 Korea University, College of Life Science and Biotechnology (Seoul, South Korea)
Dept. of Biotechnology and Genetic Engineering
Career
2011 ~ present: Visiting graduate student, Howard Hughes Medical Institute / UT Southwestern
Medical Center (Dallas, TX), Supervisor: Joshua T. Mendell
2009 ~ present: Ph.D. candidate, Pathobiology program at Johns Hopkins University School of
Medicine (Baltimore, MD), Supervisor: Joshua T. Mendell
2007 ~ 2009: Research Scientist, HanAll BioPharma, Co. Ltd. (Suwon, South Korea)
2006 ~ 2007: Research Scientist, Oscotec, Inc. (Chonan, South Korea)
Fulfills military service of Republic of Korea as a Technical Research Personnel.
215
Publications
1. Lee, S., Kopp, F., Chang, T.C., Sataluri, A., Chen, B., Sivakumar S., Yu H., Xie, Y., Mendell J.T.
(2016) Noncoding RNA NORAD regulates genomic stability by sequestering PUMILIO proteins.
Cell 164, 1-12. In press
2. Chang TC, Pertea M, Lee S, Salzberg SL, Mendell JT (2015) Genome-wide annotation of
microRNA primary transcript structures reveals novel regulatory mechanisms. Genome Res 25,
1401-1409.
3. Choi S, Oh SR, Lee SA, Lee SY, Ahn K, Lee HK, Lee JW. (2008) Regulation of TM4SF5-
mediated tumorigenesis through induction of cell detachment and death by tiarellic acid. Biochim
Biophys Acta. 1783(9):1632-41.
4. Lee SY, Lee SA, Cho IH, Oh MA, Kang ES, Kim YB, Seo WD, Choi S, Nam JO, Tamamori-
Adachi M, Kitajima S, Ye SK, Kim S, Hwang YJ, Kim IS, Park KH, Lee JW (2008) Tetraspanin
TM4SF5 mediates loss of contact inhibition through epithelial-mesenchymal transition in human
hepatocarcinoma. J Clin Invest. 118(4):1354-66.
5. Kim YB, Lee SY, Ye SK, Lee JW (2007) Epigenetic regulation of integrin-linked kinase
expression depending on adhesion of gastric carcinoma cells. Am J Physiol Cell Physiol.
292(2):C857-66.
6. Lee SY, Kim YT, Lee MS, Kim YB, Chung E, Kim S, Lee JW (2006) Focal adhesion and actin
organization by a cross-talk of TM4SF5 with integrin alpha2 are regulated by serum treatment. Exp
Cell Res. 312(16):2983-99.
7. Lee MS, Kim YB, Lee SY, Kim JG, Kim SH, Ye SK, Lee JW (2006) Integrin signaling and cell
spreading mediated by phorbol 12-myristate 13-acetate treatment. J Cell Biochem. 99(1):88-95.
8. Lee MS, Kim TY, Kim YB, Lee SY, Ko SG, Jong HS, Kim TY, Bang YJ, Lee JW (2005) The
signaling network of transforming growth factor beta1, protein kinase C delta, and integrin underlies
the spreadingm and invasiveness of gastric carcinoma cells. Mol Cell Biol. 25(16):6921-36.
First-author papers
216
9. Kim YB, Yu J, Lee SY, Lee MS, Ko SG, Ye SK, Jong HS, Kim TY, Bang YJ, Lee JW (2005) Cell
adhesion status-dependent histone acetylation is regulated through intracellular contractility-
related signaling activities. J Biol Chem. 280(31):28357-64.
10. Lee MS, Ko SG, Kim HP, Kim YB, Lee SY, Kim SG, Jong HS, Kim TY, Lee JW, Bang YJ (2004)
Smad2 mediates Erk1/2 activation by TGF-beta1 in suspended, but not in adherent, gastric
carcinoma cells. Int J Oncol. 24(5):1229-34.
Presentation and Meeting Abstracts
2015 Symposium abstract: Noncoding RNA NORAD regulates genomic stability in human cells.
Innovations in Cancer Prevention and Research Conference (CPRIT), Austin, Texas USA
2015 Poster presentation: Regulation of chromosome stability by Noncoding RNA induced by
DNA damage (NORAD) in human cells. Keystone Symposia, MicroRNAs and Noncoding RNAs in
Cancer (E5), Keystone, Colorado USA
Honors and Scholarships
2013 Mogam Scholarship, Mogam Science Scholarship Foundation
2012~2013 Research Training Award from CPRIT (Cancer Prevention and Research Institute of
Texas), Cancer Intervention and Prevention Discovery Program (RP101496)
2000~2003 Semester High Honors, Korea University
2001~2003 Chungsoo Scholarships, Chungsoo Scholarship Foundation


