Embed Size (px)
Citation preview
Lecture 8:Quantitative Option Strategies
Marco Avellaneda
G63.2936.001
Spring Semester 2009

Equity Options Markets
• Single-name options
Electronic trading in 6 exchanges, cross-listing of many stocks, penny-widebid ask spreads for many contracts
• Index Options
S&P 500, NDX, Minis. Traded on the Chicago Mercantile Exchange. VIX options& futures trade in CME as well.
• ETF Options
Most of the large ETFs are optionable. Traded like stocks in multiple exchanges.SPY, QQQQ, XLF are among the most traded options in the US.
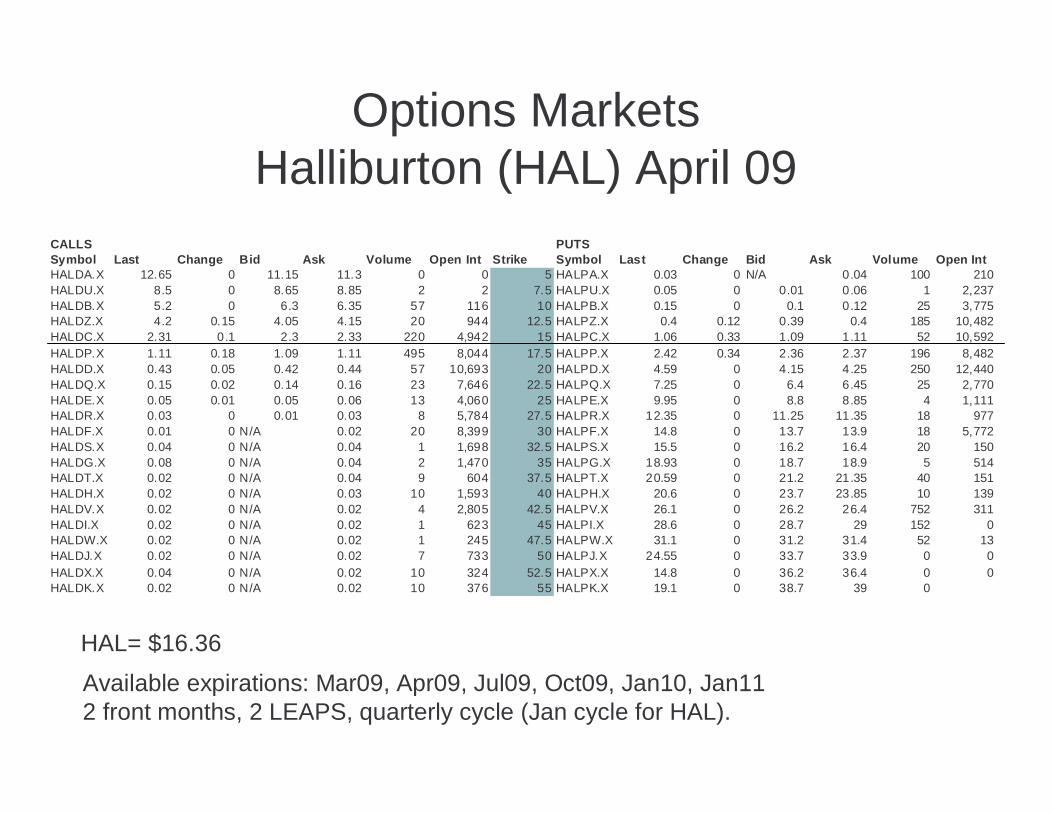
Options MarketsHalliburton (HAL) April 09
CALLS PUTSSymbol Last Change Bid Ask Volume Open Int Strike Symbol Last Change Bid Ask Volume Open IntHALDA.X 12.65 0 11.15 11.3 0 0 5 HALPA.X 0.03 0 N/A 0.04 100 210HALDU.X 8.5 0 8.65 8.85 2 2 7.5 HALPU.X 0.05 0 0.01 0.06 1 2,237HALDB.X 5.2 0 6.3 6.35 57 116 10 HALPB.X 0.15 0 0.1 0.12 25 3,775HALDZ.X 4.2 0.15 4.05 4.15 20 944 12.5 HALPZ.X 0.4 0.12 0.39 0.4 185 10,482HALDC.X 2.31 0.1 2.3 2.33 220 4,942 15 HALPC.X 1.06 0.33 1.09 1.11 52 10,592HALDP.X 1.11 0.18 1.09 1.11 495 8,044 17.5 HALPP.X 2.42 0.34 2.36 2.37 196 8,482HALDD.X 0.43 0.05 0.42 0.44 57 10,693 20 HALPD.X 4.59 0 4.15 4.25 250 12,440HALDQ.X 0.15 0.02 0.14 0.16 23 7,646 22.5 HALPQ.X 7.25 0 6.4 6.45 25 2,770HALDE.X 0.05 0.01 0.05 0.06 13 4,060 25 HALPE.X 9.95 0 8.8 8.85 4 1,111HALDR.X 0.03 0 0.01 0.03 8 5,784 27.5 HALPR.X 12.35 0 11.25 11.35 18 977HALDF.X 0.01 0 N/A 0.02 20 8,399 30 HALPF.X 14.8 0 13.7 13.9 18 5,772HALDS.X 0.04 0 N/A 0.04 1 1,698 32.5 HALPS.X 15.5 0 16.2 16.4 20 150HALDG.X 0.08 0 N/A 0.04 2 1,470 35 HALPG.X 18.93 0 18.7 18.9 5 514HALDT.X 0.02 0 N/A 0.04 9 604 37.5 HALPT.X 20.59 0 21.2 21.35 40 151HALDH.X 0.02 0 N/A 0.03 10 1,593 40 HALPH.X 20.6 0 23.7 23.85 10 139HALDV.X 0.02 0 N/A 0.02 4 2,805 42.5 HALPV.X 26.1 0 26.2 26.4 752 311HALDI.X 0.02 0 N/A 0.02 1 623 45 HALPI.X 28.6 0 28.7 29 152 0HALDW.X 0.02 0 N/A 0.02 1 245 47.5 HALPW.X 31.1 0 31.2 31.4 52 13HALDJ.X 0.02 0 N/A 0.02 7 733 50 HALPJ.X 24.55 0 33.7 33.9 0 0HALDX.X 0.04 0 N/A 0.02 10 324 52.5 HALPX.X 14.8 0 36.2 36.4 0 0HALDK.X 0.02 0 N/A 0.02 10 376 55 HALPK.X 19.1 0 38.7 39 0
HAL= $16.36
Available expirations: Mar09, Apr09, Jul09, Oct09, Jan10, Jan112 front months, 2 LEAPS, quarterly cycle (Jan cycle for HAL).
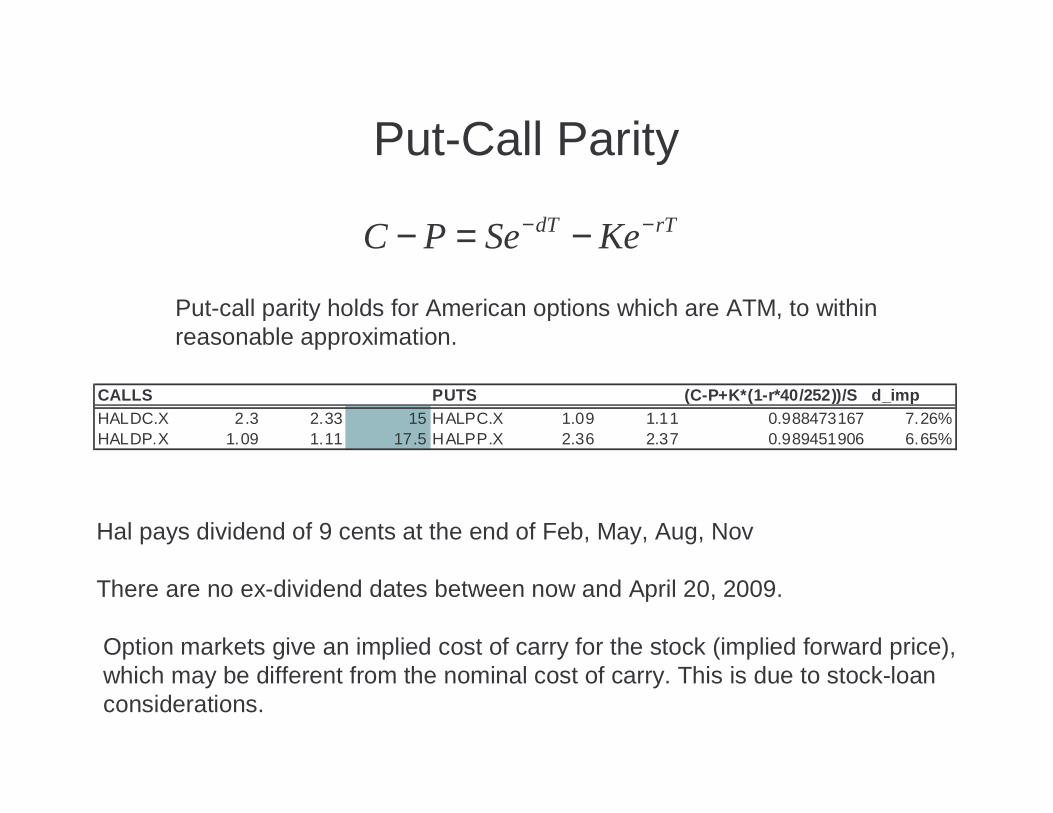
Put-Call Parity
rTdT KeSePC −− −=−
Put-call parity holds for American options which are ATM, to withinreasonable approximation.
CALLS PUTS (C-P+K*(1-r*40/252))/S d_impHALDC.X 2.3 2.33 15 HALPC.X 1.09 1.11 0.988473167 7.26%HALDP.X 1.09 1.11 17.5 HALPP.X 2.36 2.37 0.989451906 6.65%
Hal pays dividend of 9 cents at the end of Feb, May, Aug, Nov
There are no ex-dividend dates between now and April 20, 2009.
Option markets give an implied cost of carry for the stock (implied forward price),which may be different from the nominal cost of carry. This is due to stock-loanconsiderations.
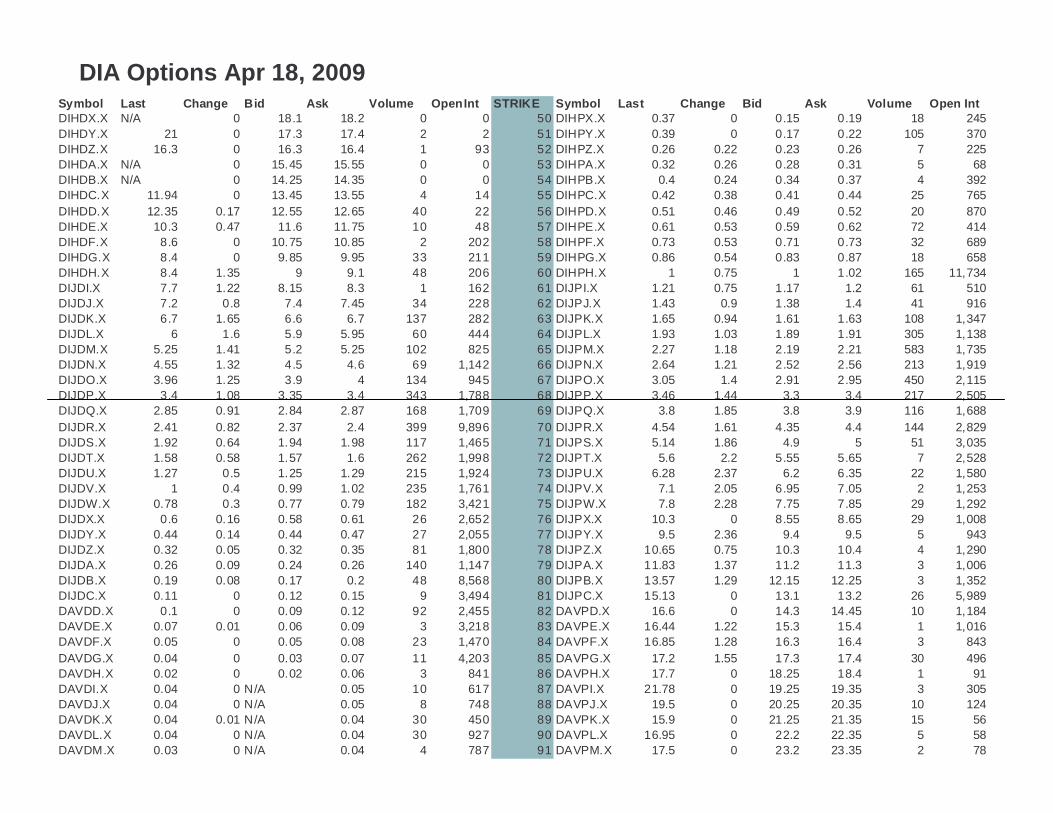
Symbol Last Change Bid Ask Volume OpenInt STRIKE Symbol Last Change Bid Ask Volume Open IntDIHDX.X N/A 0 18.1 18.2 0 0 50 DIHPX.X 0.37 0 0.15 0.19 18 245DIHDY.X 21 0 17.3 17.4 2 2 51 DIHPY.X 0.39 0 0.17 0.22 105 370DIHDZ.X 16.3 0 16.3 16.4 1 93 52 DIHPZ.X 0.26 0.22 0.23 0.26 7 225DIHDA.X N/A 0 15.45 15.55 0 0 53 DIHPA.X 0.32 0.26 0.28 0.31 5 68DIHDB.X N/A 0 14.25 14.35 0 0 54 DIHPB.X 0.4 0.24 0.34 0.37 4 392DIHDC.X 11.94 0 13.45 13.55 4 14 55 DIHPC.X 0.42 0.38 0.41 0.44 25 765DIHDD.X 12.35 0.17 12.55 12.65 40 22 56 DIHPD.X 0.51 0.46 0.49 0.52 20 870DIHDE.X 10.3 0.47 11.6 11.75 10 48 57 DIHPE.X 0.61 0.53 0.59 0.62 72 414DIHDF.X 8.6 0 10.75 10.85 2 202 58 DIHPF.X 0.73 0.53 0.71 0.73 32 689DIHDG.X 8.4 0 9.85 9.95 33 211 59 DIHPG.X 0.86 0.54 0.83 0.87 18 658DIHDH.X 8.4 1.35 9 9.1 48 206 60 DIHPH.X 1 0.75 1 1.02 165 11,734DIJDI.X 7.7 1.22 8.15 8.3 1 162 61 DIJPI.X 1.21 0.75 1.17 1.2 61 510DIJDJ.X 7.2 0.8 7.4 7.45 34 228 62 DIJPJ.X 1.43 0.9 1.38 1.4 41 916DIJDK.X 6.7 1.65 6.6 6.7 137 282 63 DIJPK.X 1.65 0.94 1.61 1.63 108 1,347DIJDL.X 6 1.6 5.9 5.95 60 444 64 DIJPL.X 1.93 1.03 1.89 1.91 305 1,138DIJDM.X 5.25 1.41 5.2 5.25 102 825 65 DIJPM.X 2.27 1.18 2.19 2.21 583 1,735DIJDN.X 4.55 1.32 4.5 4.6 69 1,142 66 DIJPN.X 2.64 1.21 2.52 2.56 213 1,919DIJDO.X 3.96 1.25 3.9 4 134 945 67 DIJPO.X 3.05 1.4 2.91 2.95 450 2,115DIJDP.X 3.4 1.08 3.35 3.4 343 1,788 68 DIJPP.X 3.46 1.44 3.3 3.4 217 2,505DIJDQ.X 2.85 0.91 2.84 2.87 168 1,709 69 DIJPQ.X 3.8 1.85 3.8 3.9 116 1,688DIJDR.X 2.41 0.82 2.37 2.4 399 9,896 70 DIJPR.X 4.54 1.61 4.35 4.4 144 2,829DIJDS.X 1.92 0.64 1.94 1.98 117 1,465 71 DIJPS.X 5.14 1.86 4.9 5 51 3,035DIJDT.X 1.58 0.58 1.57 1.6 262 1,998 72 DIJPT.X 5.6 2.2 5.55 5.65 7 2,528DIJDU.X 1.27 0.5 1.25 1.29 215 1,924 73 DIJPU.X 6.28 2.37 6.2 6.35 22 1,580DIJDV.X 1 0.4 0.99 1.02 235 1,761 74 DIJPV.X 7.1 2.05 6.95 7.05 2 1,253DIJDW.X 0.78 0.3 0.77 0.79 182 3,421 75 DIJPW.X 7.8 2.28 7.75 7.85 29 1,292DIJDX.X 0.6 0.16 0.58 0.61 26 2,652 76 DIJPX.X 10.3 0 8.55 8.65 29 1,008DIJDY.X 0.44 0.14 0.44 0.47 27 2,055 77 DIJPY.X 9.5 2.36 9.4 9.5 5 943DIJDZ.X 0.32 0.05 0.32 0.35 81 1,800 78 DIJPZ.X 10.65 0.75 10.3 10.4 4 1,290DIJDA.X 0.26 0.09 0.24 0.26 140 1,147 79 DIJPA.X 11.83 1.37 11.2 11.3 3 1,006DIJDB.X 0.19 0.08 0.17 0.2 48 8,568 80 DIJPB.X 13.57 1.29 12.15 12.25 3 1,352DIJDC.X 0.11 0 0.12 0.15 9 3,494 81 DIJPC.X 15.13 0 13.1 13.2 26 5,989DAVDD.X 0.1 0 0.09 0.12 92 2,455 82 DAVPD.X 16.6 0 14.3 14.45 10 1,184DAVDE.X 0.07 0.01 0.06 0.09 3 3,218 83 DAVPE.X 16.44 1.22 15.3 15.4 1 1,016DAVDF.X 0.05 0 0.05 0.08 23 1,470 84 DAVPF.X 16.85 1.28 16.3 16.4 3 843DAVDG.X 0.04 0 0.03 0.07 11 4,203 85 DAVPG.X 17.2 1.55 17.3 17.4 30 496DAVDH.X 0.02 0 0.02 0.06 3 841 86 DAVPH.X 17.7 0 18.25 18.4 1 91DAVDI.X 0.04 0 N/A 0.05 10 617 87 DAVPI.X 21.78 0 19.25 19.35 3 305DAVDJ.X 0.04 0 N/A 0.05 8 748 88 DAVPJ.X 19.5 0 20.25 20.35 10 124DAVDK.X 0.04 0.01 N/A 0.04 30 450 89 DAVPK.X 15.9 0 21.25 21.35 15 56DAVDL.X 0.04 0 N/A 0.04 30 927 90 DAVPL.X 16.95 0 22.2 22.35 5 58DAVDM.X 0.03 0 N/A 0.04 4 787 91 DAVPM.X 17.5 0 23.2 23.35 2 78
DIA Options Apr 18, 2009
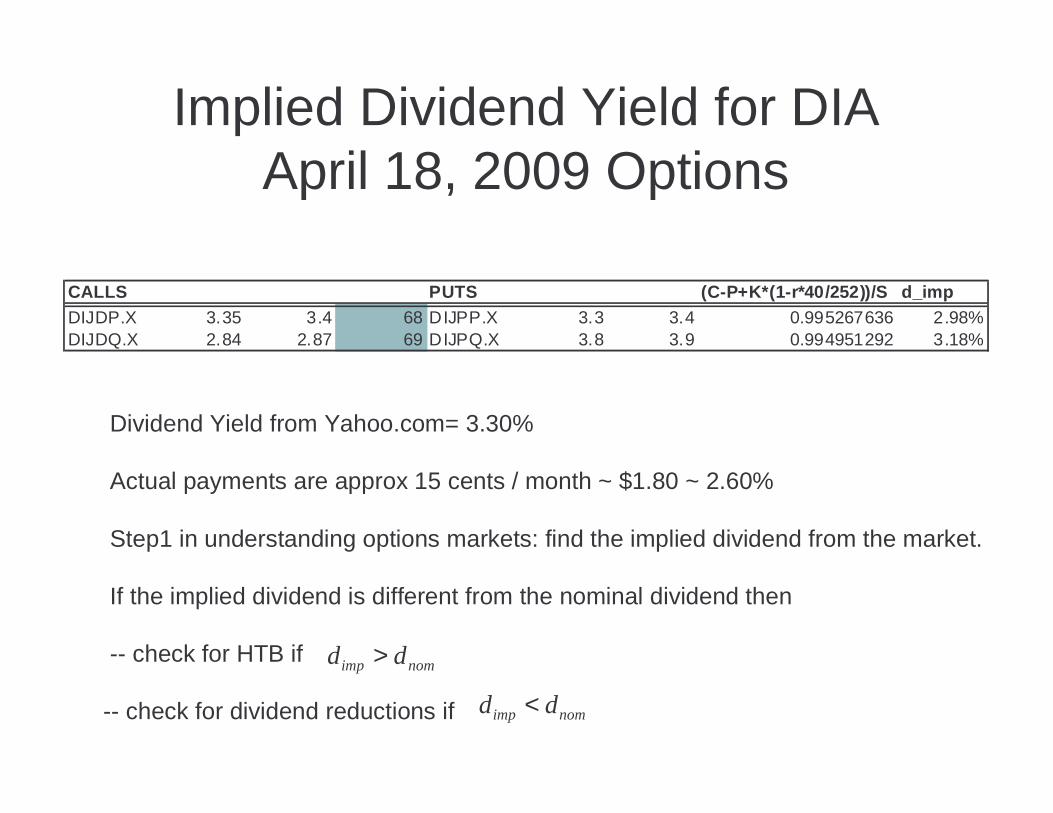
Implied Dividend Yield for DIAApril 18, 2009 Options
CALLS PUTS (C-P+K*(1-r*40/252))/S d_impDIJDP.X 3.35 3.4 68 DIJPP.X 3.3 3.4 0.995267636 2.98%DIJDQ.X 2.84 2.87 69 DIJPQ.X 3.8 3.9 0.994951292 3.18%
Dividend Yield from Yahoo.com= 3.30%
Actual payments are approx 15 cents / month ~ $1.80 ~ 2.60%
Step1 in understanding options markets: find the implied dividend from the market.
If the implied dividend is different from the nominal dividend then
-- check for HTB if
-- check for dividend reductions if
nomimp dd >
nomimp dd <
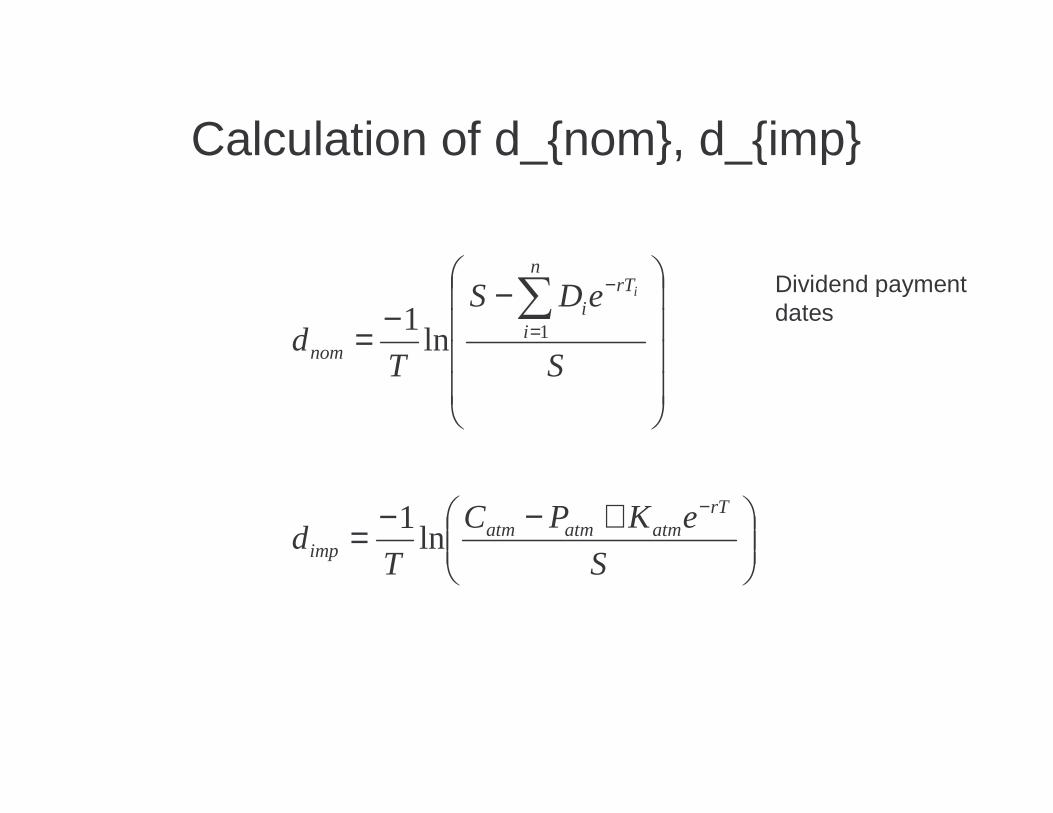
Calculation of d_{nom}, d_{imp}
+−−=
−−=
−
=
−∑
S
eKPC
Td
S
eDS
Td
rTatmatmatm
imp
n
i
rTi
nom
i
ln1
ln1 1
Dividend paymentdates

Implied VolatilityHAL April 09
CALLS PUTSSymbol Last Bid Ask IVOL Delta Strike Symbol Last Bid Ask IVOL DeltaHALDU.X 8.5 8.65 8.85 na 1.00 7.5 HALPU.X 0.05 0.01 0.06 211 0.00HALDB.X 5.2 6.3 6.35 141 0.99 10 HALPB.X 0.15 0.1 0.12 144 -0.01HALDZ.X 4.2 4.05 4.15 108 0.94 12.5 HALPZ.X 0.4 0.39 0.4 109 -0.05HALDC.X 2.31 2.3 2.33 92.4 0.76 15 HALPC.X 1.06 1.09 1.11 93 -0.24HALDP.X 1.11 1.09 1.11 85.1 0.36 17.5 HALPP.X 2.42 2.36 2.37 85 -0.63HALDD.X 0.43 0.42 0.44 82.4 0.09 20 HALPD.X 4.59 4.15 4.25 84 -0.90HALDQ.X 0.15 0.14 0.16 89.3 0.02 22.5 HALPQ.X 7.25 6.4 6.45 90 -0.97
0
50
100
150
200
250
7.5 10 12.5 15 17.5 20 22.5
Strike
Imp
lied
Vo
lati
lity
CALLS
PUTS
30
3234
3638
40
4244
4648
50
64 65 66 67 68 69 70 71 72 73
call
put
30
32
34
36
38
40
42
64 65 66 67 68 69 70 71 72 73
call
put
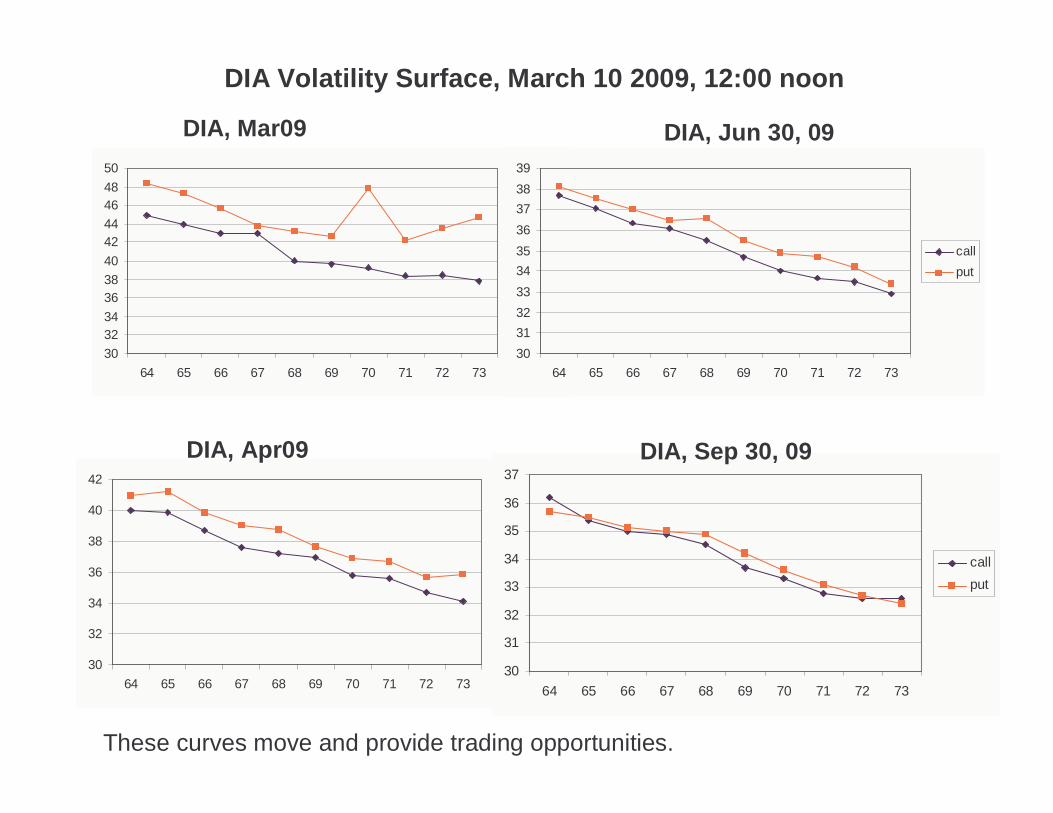
DIA, Mar09
DIA, Apr09
30
31
32
33
34
35
36
37
38
39
64 65 66 67 68 69 70 71 72 73
call
put
DIA, Jun 30, 09
30
31
32
33
34
35
36
37
64 65 66 67 68 69 70 71 72 73
call
put
DIA, Sep 30, 09
These curves move and provide trading opportunities.
DIA Volatility Surface, March 10 2009, 12:00 noon
Many different trades possible
-- Carry trades using options (implied dividend vs. actual dividend, HTB)
-- Volatility surface trades (non-directional): trading different strikes onthe same underlying asset
-- historical vol vs implied vol
-- Relative-value trades across names (non-directional)
-- single-name option versus fair-value-- dispersion trading (index option versus components)
-- Directional volatility trades (long vol/ short vol, etc)
Skewness
-- For equities, the implied volatility curve is decreasing in the strikeprice around ATM
-- The effect is more pronounced for indices and etfs than for single names
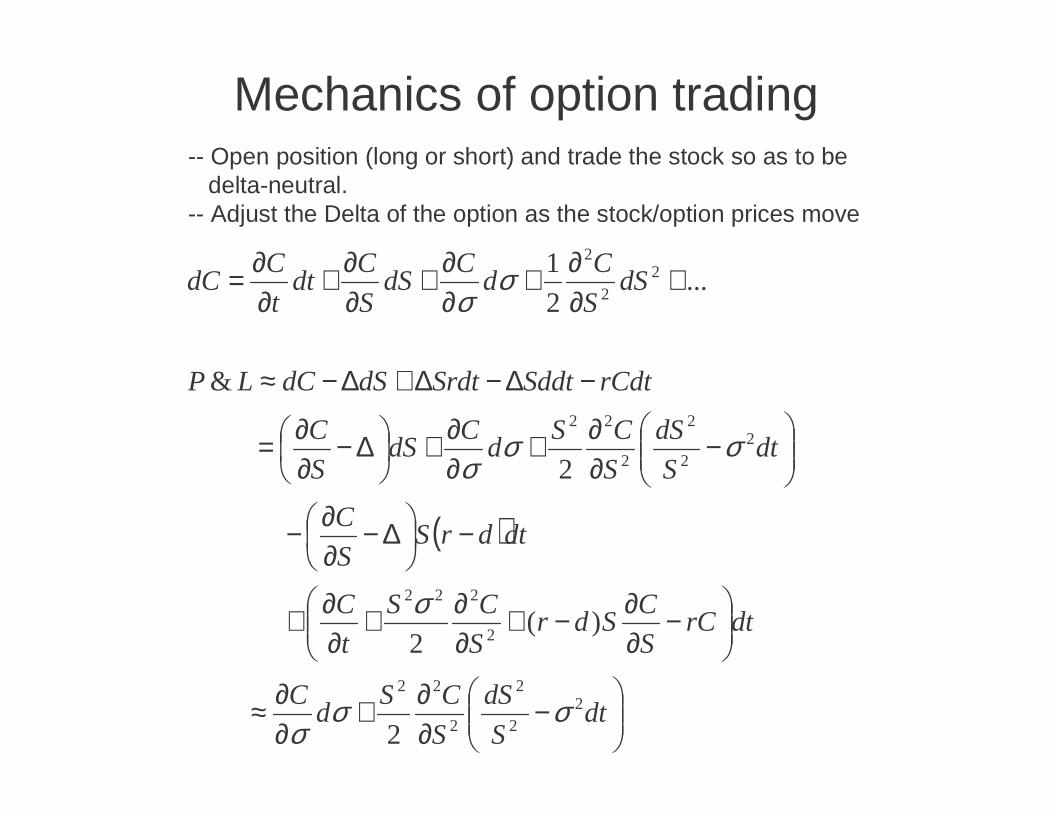
Mechanics of option trading-- Open position (long or short) and trade the stock so as to be
delta-neutral.-- Adjust the Delta of the option as the stock/option prices move
( )
−
∂∂+
∂∂≈
−
∂∂−+
∂∂+
∂∂+
−
∆−∂∂−
−
∂∂+
∂∂+
∆−∂∂=
−∆−∆+∆−≈
+∂∂+
∂∂+
∂∂+
∂∂=
dtS
dS
S
CSd
C
dtrCS
CSdr
S
CS
t
C
dtdrSS
C
dtS
dS
S
CSd
CdS
S
C
rCdtSddtSrdtdSdCLP
dSS
Cd
CdS
S
Cdt
t
CdC
22
2
2
22
2
222
22
2
2
22
22
2
2
)(2
2
&
...2
1
σσσ
σ
σσσ
σσ
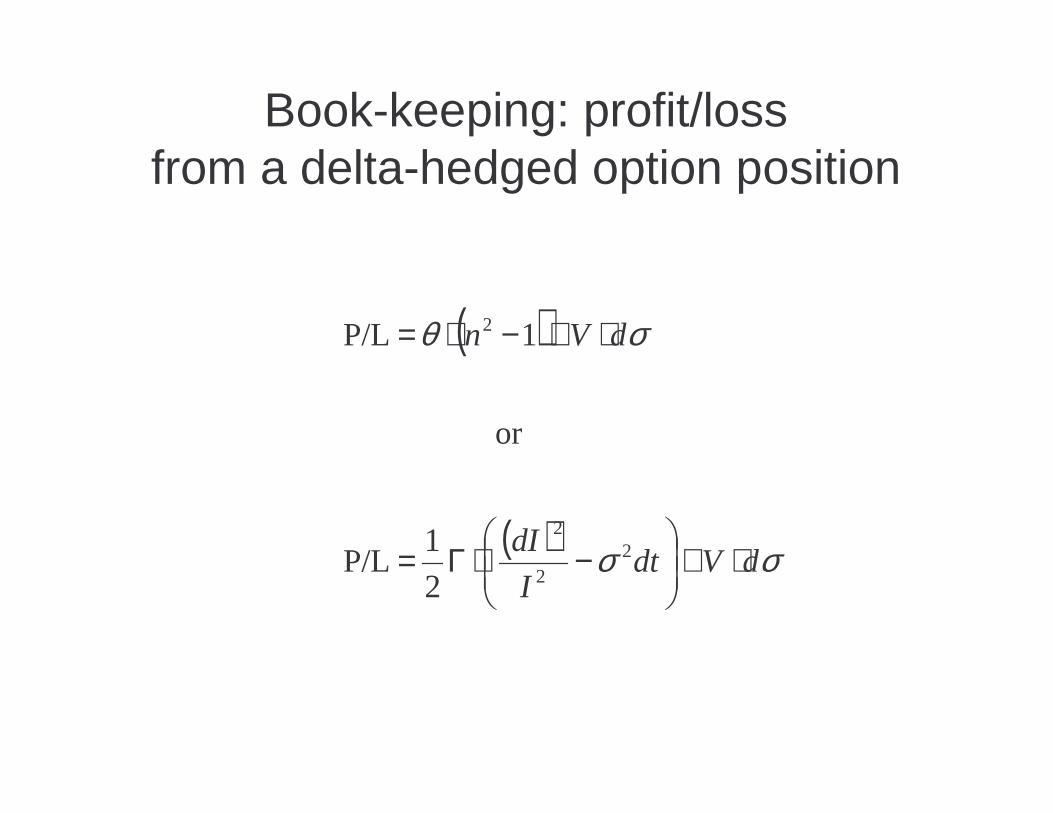
Book-keeping: profit/lossfrom a delta-hedged option position
( )
( ) σσ
σθ
dVdtI
dI
dVn
⋅+
−⋅Γ=
⋅+−⋅=
22
2
2
2
1 P/L
or
1 P/L
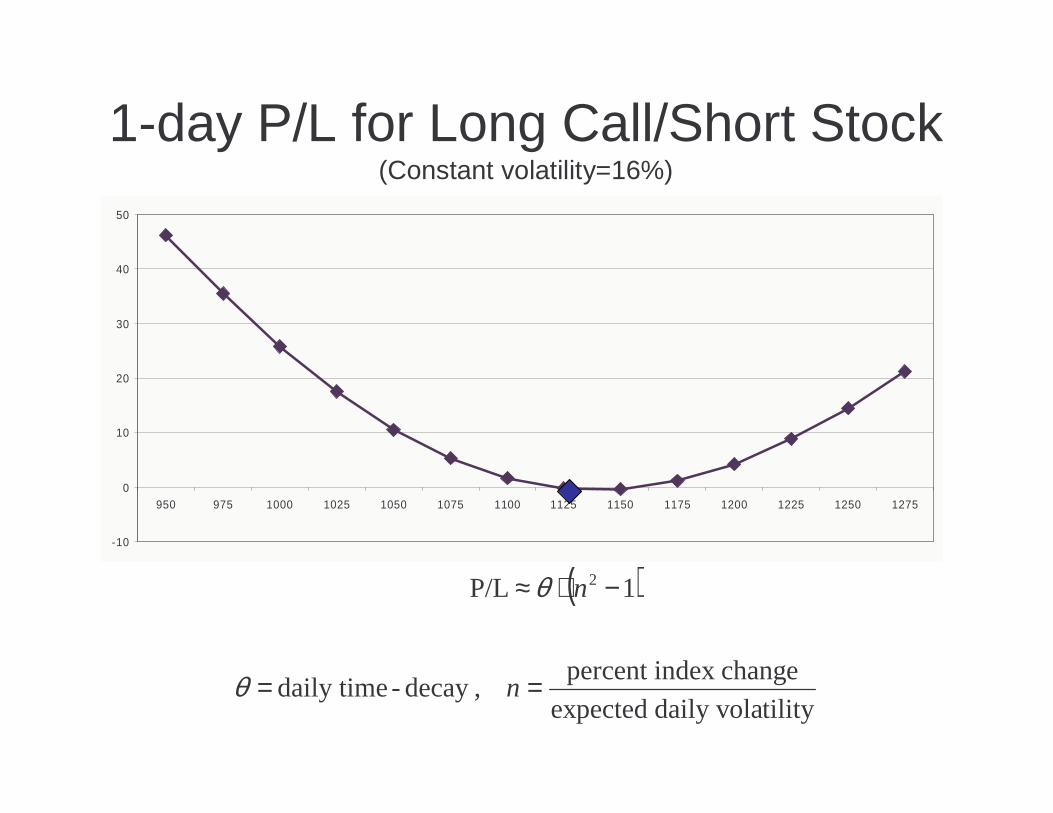
1-day P/L for Long Call/Short Stock(Constant volatility=16%)
-10
0
10
20
30
40
50
950 975 1000 1025 1050 1075 1100 1125 1150 1175 1200 1225 1250 1275
( )
tilitydaily vola expected
changeindex percent ,decay -daily time
1 P/L 2
==
−⋅≈
n
n
θ
θ

Assuming an implied volatility drop of 1%
Vol=15%
-10
0
10
20
30
40
50
950 975 1000 1025 1050 1075 1100 1125 1150 1175 1200 1225 1250 1275
3.80 loss if stock does not move and volatility drops 1%
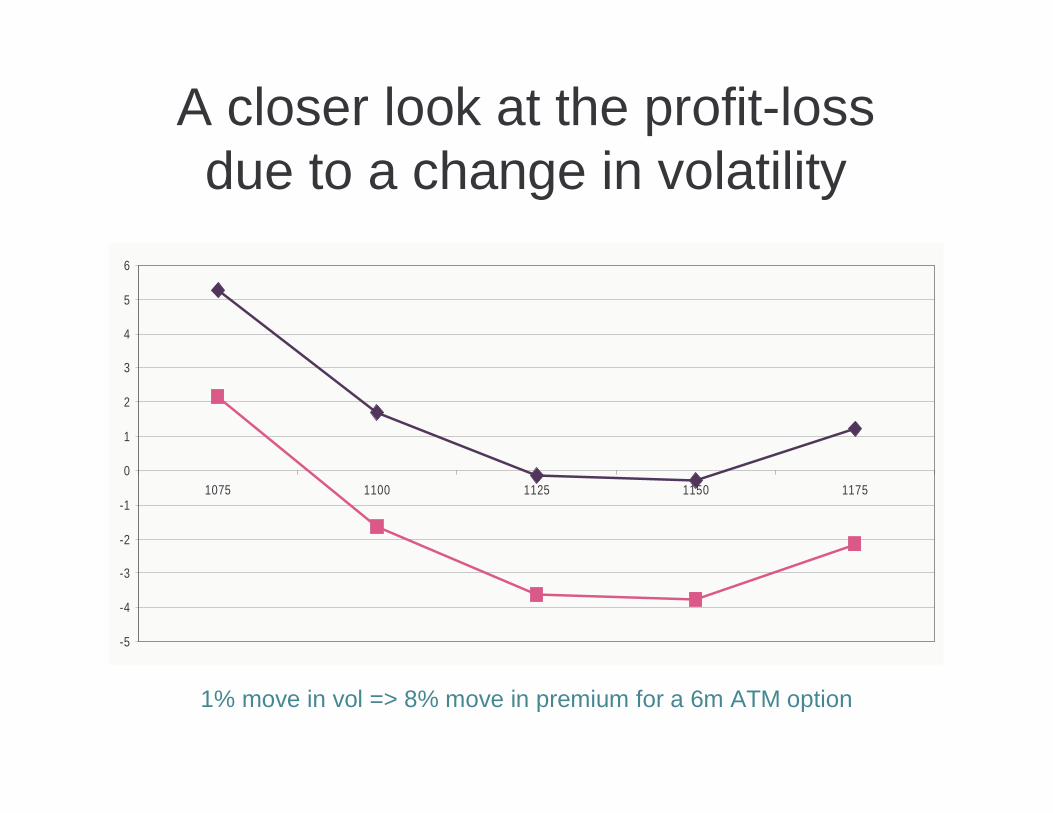
A closer look at the profit-lossdue to a change in volatility
-5
-4
-3
-2
-1
0
1
2
3
4
5
6
1075 1100 1125 1150 1175
1% move in vol => 8% move in premium for a 6m ATM option

Measuring the Risk of a Portfolio(assuming delta neutrality)
( ) ( )
( )( ) ( )
∂∂
−−++=
∆
∂∂
−−∆+∆+=∆Π
∑
∑
iiji Si
i
ijijijjiijijj
Si
ijij
ii
ijijijjiijijijjii
ijij
ijj
ij
RSS
CKTSCRKTRSCn
SS
CKTSCKTSSCn
Ti
n
N
σσ
σσσ
σ
σ ,,,1,,,1(
,,,,,,
ty volatili, expiration , stock
underlyingh option wit of contracts
stocks on options of Portfolio
Need to define a joint distribution of stock returns and volatility returns to calculate statistics of PNL
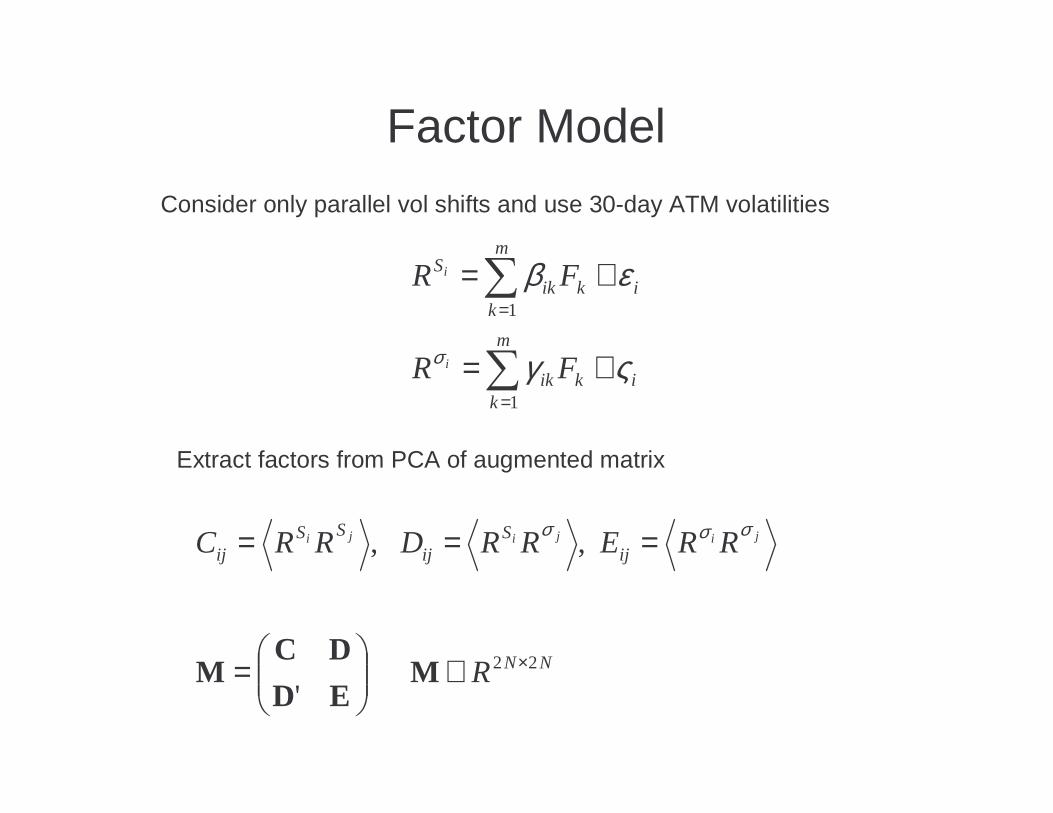
Factor Model
Consider only parallel vol shifts and use 30-day ATM volatilities
ik
m
kik
ik
m
kik
S
FR
FR
i
i
ςγ
εβ
σ +=
+=
∑
∑
=
=
1
1
NN
ijS
ijSS
ij
R
RRERRDRRC jijiji
22 '
, ,
×∈
=
===
MED
DCM
σσσ
Extract factors from PCA of augmented matrix
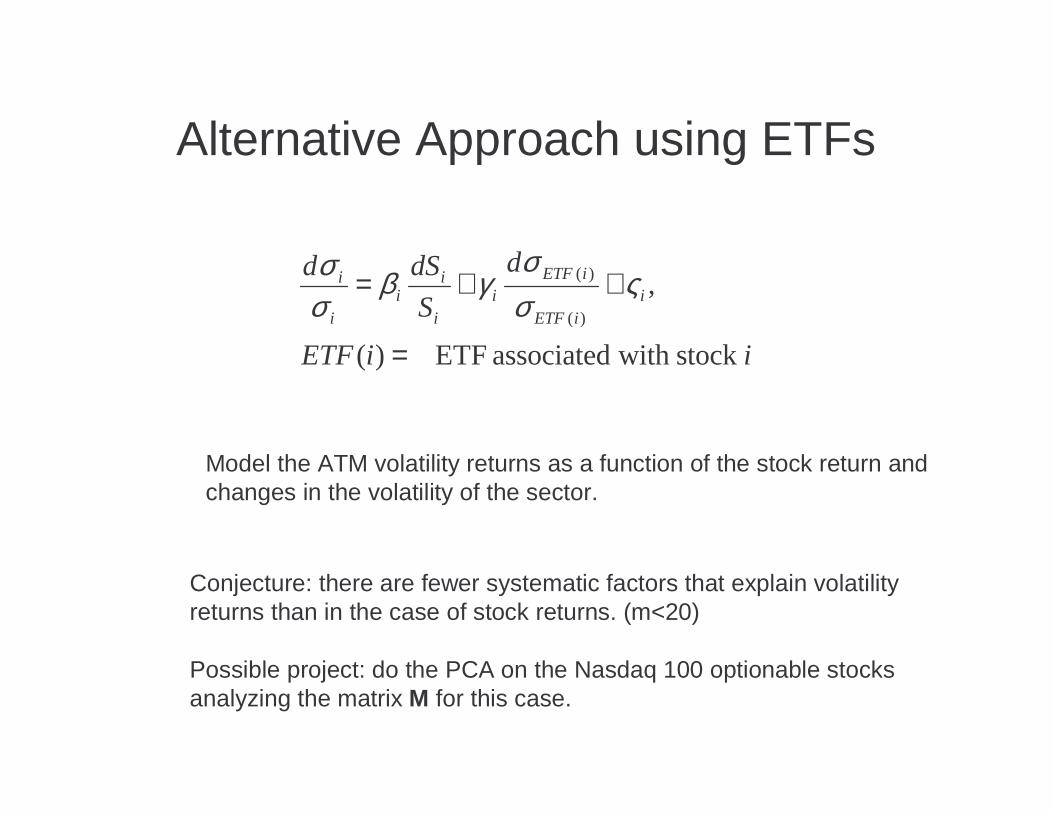
Alternative Approach using ETFs
iiETF
d
S
dSdi
iETF
iETFi
i
ii
i
i
stock with associated ETF )(
,)(
)(
=
++= ςσσ
γβσσ
Model the ATM volatility returns as a function of the stock return andchanges in the volatility of the sector.
Conjecture: there are fewer systematic factors that explain volatilityreturns than in the case of stock returns. (m<20)
Possible project: do the PCA on the Nasdaq 100 optionable stocksanalyzing the matrix M for this case.
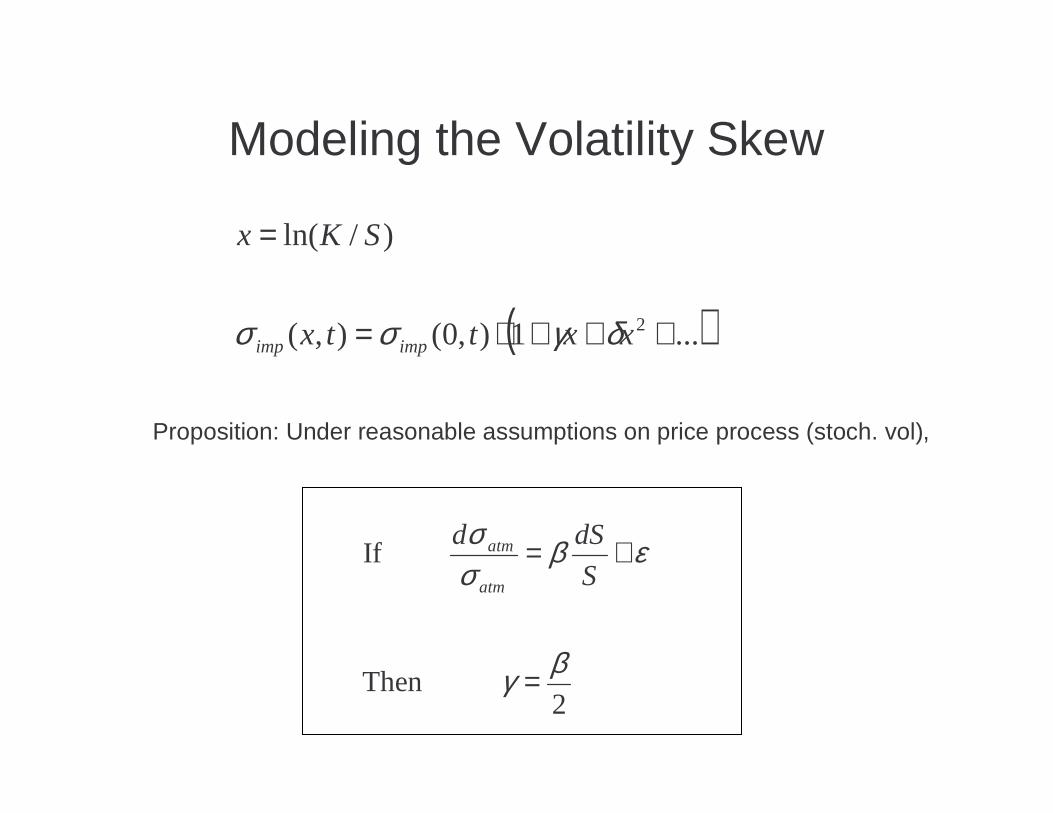
Modeling the Volatility Skew
( )...1),0(),(
)/ln(
2 +++⋅=
=
xxttx
SKx
impimp δγσσ
Proposition: Under reasonable assumptions on price process (stoch. vol),
2 Then
If
βγ
εβσσ
=
+=S
dSd
atm
atm

Evolution of the slope of the 30-day implied volatility curve, 1996-2004
Avellaneda & Lee, 2005
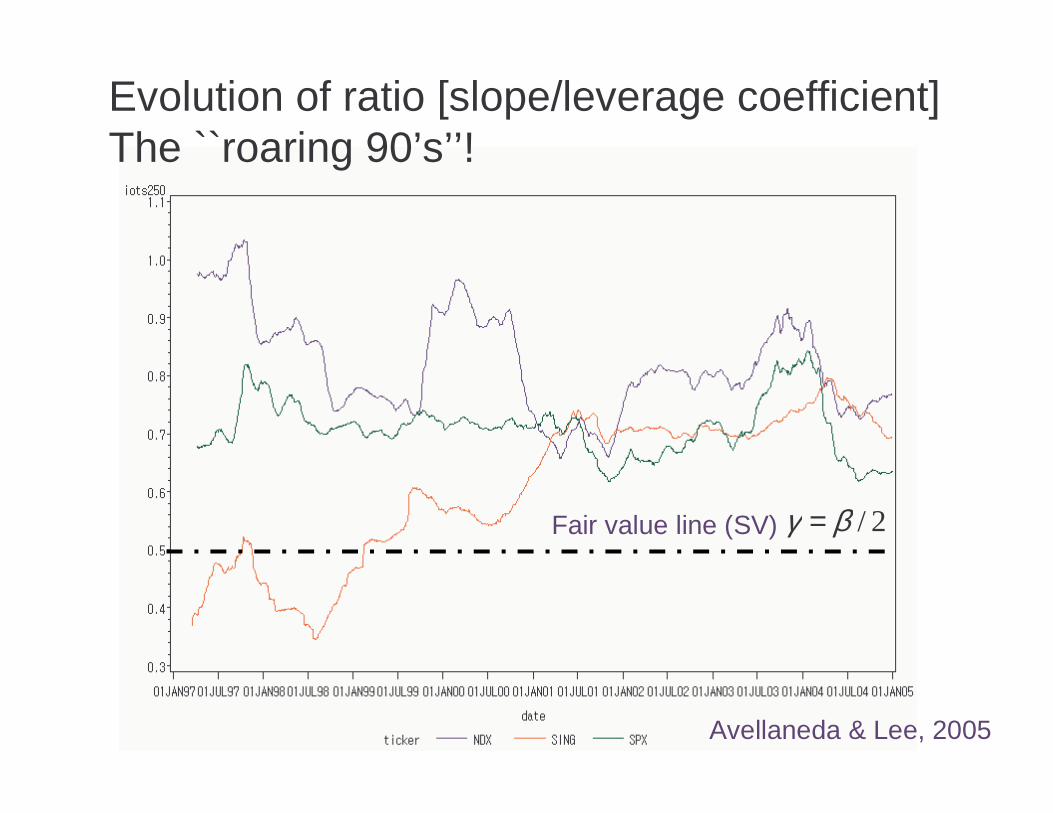
Evolution of ratio [slope/leverage coefficient]The ``roaring 90’s’’!
Fair value line (SV) 2/ βγ =
Avellaneda & Lee, 2005


