Embed Size (px)
Citation preview
Learning from SAFTA Experience :
A Way Forward for the Future FTAS of India
Tinu Joseph *
AbstractThe free trade initiatives led by SAFTA was a further step towards
strengthening the trade and economic cooperation in the region as disseminatedby SAPTA. It is almost six years since the commencement of SAFTA and theprogress made in trade between SAARC countries was not satisfactory. Theobjective of the present study is to evaluate the situation responsible for thisweak progress in trade. The study attempts to analyze the provisions in tradewithin SAFTA as well as bilateral trade treaties among south Asian countries. Ittakes into consideration the changes in the share of international trade by SAARCcountries over 1995-2011 periods. It also takes into account changes in India’sengagement with SAARC and ASEAN countries with a detailed industrial wiseanalysis. Since the larger share of international trade flows in SAARC countriesare routed through India, it should take a proactive lead role in making democracypossible within the region with increased human development, combinedprogrammes for manufacturing development, as well as enlarging the marketwith immediate business boosting among SAARC nations.
Introduction
The theories of international trade bid us believe that international trade isbeneficial to all the participating countries. The idea of gains from trade roots back tothe absolute advantage theory of Adam Smith which tells us that countries would beable to gain from trade by specializing and exporting to each other the products that itcan produce more in absolute terms over the other countries. Ricardo went a step furtherwith his comparative advantage theory and argues that even if countries have no absoluteadvantage over others in producing goods they can still gain from trade if they havedifferent relative efficiencies in production. Specialization in those products which eachone can produce more efficiently than others helps increase overall production of thecommodity and thereby more welfare. So, specialization in commodities and tradebetween countries will help in expansion of markets, reduction of costs and wideningthe range of products. In pre-Independence period, India engaged in trade with variouscountries; thereafter it began to have an inward looking policy and adopted a lot of
* Asst. Professor, St.Francis de sales’ college, Nagpur. He is grateful to Mr.D.S.Rawat,Secretary General, ASSOCHAM for valuable guidance and support.
Asian Economic Review, June 2014, Volume 56, No.2134
import restrictions. It is only after the 1980s that it began to open up its economy totrading partners. This process has gained momentum after the 1990s through theliberalization policies adopted by the Government of India. Over the years, it has gainedvarious trading partners as well as economic co-operation with regional parties.
Regional economic cooperation is considered to be a further step towards reapingthe benefits of trade. Gibb (1996) has highlighted the importance of regionalism as apowerful force fundamentally transforming the relationship between the world’s principaleconomic forces. A flexible system of production based on regionalism is in operationapart from the different mode of regulation as supported by multilateralism. Accordingto Michalak and Gibb (1997), “regionalism and multilateralism are competing but notnecessarily mutually exclusive. The end products are two potentially complementaryspecial processes of trade block formation and globalization.” Moreover, Pelagidis andPapasotiriou (2002) interpret regionalism as a strategy that reduces the state’s exposureto major shocks in the global economy and also permits them to support weak sectors oftheir economies at a regional level. Referring to Shanghai Cooperation Organisation(SCO), Gudavarthy (2009) points out that Asian experiences in regionalism are morecontrasting in a sense that recognition on one hand and realizing substantive solidarityon the other are counteracting each other. Without negotiating with culture, the newexperiences may yield positive results in the short run but may prove to becounterproductive in the long run.
Preferential Trade Agreements have been an integral part of most regional treaties.Carstens (2004) argues that PTAs are not harmful or necessarily beneficial and can bepursued in parallel with multilateral trade. He argues that PTAs have positive impactonly with a large and diverse membership, continued reduction in external tariffs,comprehensive product coverage and effective implementation. Hoadley (2007) observedthat cross-regional Free Trade Agreements (FTAs) may not lead to regional dissonancebut could contribute to trade policy harmonization and thereby deeper regionalcooperation. He concluded that cross regional FTAs will continue to emerge alongsideregional and multilateral liberalization initiatives and is driven by economic anddiplomatic interests rather than ideological or structural confirmation. Dash (1996)stressed on the low level of mutual trust, spillover effects of the ethnic and religiousconflicts, and the magnitude of bilateral disputes in South Asia and concluded that tothe extent that political tensions remain unresolved, SAARC is likely to experienceonly a “stop-and-go” pattern of growth. Dubey (2008) underlined that main obstacles todeveloping trade among SAARC members were non-tariff rather than tariff barriers.There was no commitment or deadline for doing away with non-tariff barriers. Taneja(2001) argued that bulk of India’s unofficial imports from south Asia consists of thirdcountry goods and they will not be affected by the removal of trade barriers by SAFTA.SAFTA would be ineffective in bringing about a shift from informal to formal channelsbecause of high transport cost and domestic policy distortions. What makes SAARC a
135Learning From SAFTA Experience: ..........
challenging set for cooperation in south Asia is its pragmatic and unbiasedacknowledgement and commitment to the fact that regional problems need to be tackledregionally, beyond borders and barriers. South Asia should show that politics is not animpediment but the core in the path towards peaceful co-existence (Obino,2009) .
India is now engaged in trade treaties with more than 50 countries in the world aswell as involved in various regional treaties such as SAARC, ASEAN etc. SAARC isimportant to India in that it consists of its neighboring countries. More over, India canplay an upper hand in SAARC by taking advantage of the large size of its economy. Butthe disadvantages of SAARC are lack of coordination and conflicting interests amongmember countries. Moreover, India is already a member of other free trade agreements,where some of the other members of SAARC are also involved. This questions theexistence of SAARC itself (see Annexure I). It is in this context that the present studytries to analyze the relevance of the existence of South Asian Free Trade Agreement(SAFTA), a further step after the formation of South Asian Preferential Trade Agreement(SAPTA) which is an outcome of SAARC treaties.
Endure in the overall aspects of theories of international trade and regionaleconomic co-operation, the objective of the present study is to:
(a) Distinguish between the SAFTA Agreement and other bilateral trade treaties withinthe SAARC region,
(b) Highlight the trade performance of SAARC nations in world trade as well aswithin the region,
(c) Analyze the trade performance of selected manufacturing industries in India withSAARC region,
(d) Compare the trade indicators of selected manufacturing industries betweenSAARC and ASEAN.
The data for the analysis was taken from export-import data bank of the Ministryof Commerce and Industry, Government of India and UNCTAD. Simple ratios andpercentages were used in the study.
Development of Trade Treaties within SAARC
SAARC1 was established in 1985 for promoting peace, stability, amity and progressin the region through strict adherence to the principles of United Nations Charter andNon-alignment. Apart from the seven founding members Bangladesh, Bhutan, India,Maldives, Nepal, Pakistan and Sri Lanka, Afghanistan joined the organization in 2007.It took around 12 years after the establishment of SAARC to get into a preferential trade
1. SAARC Charter, SAARC secretariat.
Asian Economic Review, June 2014, Volume 56, No.2136
agreement between its members and nine more years for a free trade agreement betweenits members. Meanwhile, some of its members were already engaged in free tradeagreements much before the SAFTA or SAPTA came into existence, for e.g., India SriLanka Free Trade Agreement (ISLFTA) was signed in 1998 and became operational in2000. Moreover, India had bilateral preferential agreements with Afghanistan (IAPTA)from 2003 and other trade treaties with Maldives, Nepal and Bangladesh. Within theseexisting treaties and agreements, SAPTA comes as a latecomer and has little more tooffer than the provisions contained in those bilateral trade treaties.
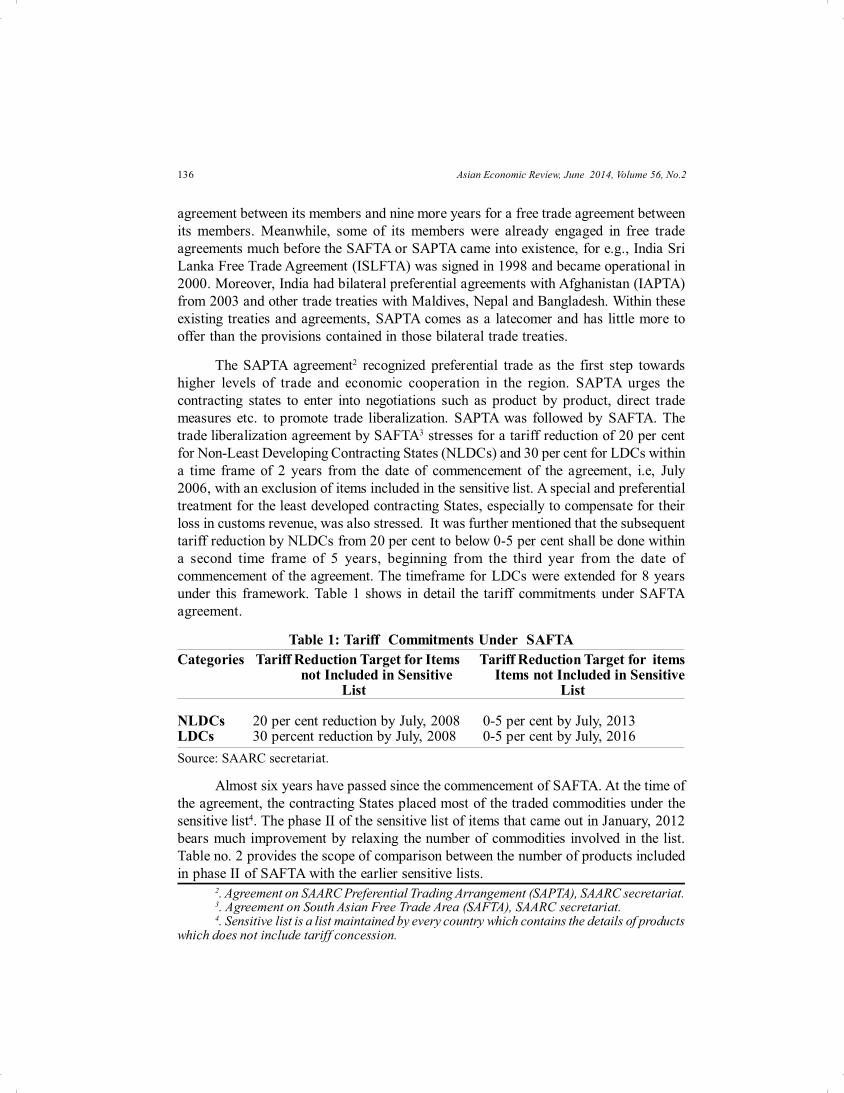
The SAPTA agreement2 recognized preferential trade as the first step towardshigher levels of trade and economic cooperation in the region. SAPTA urges thecontracting states to enter into negotiations such as product by product, direct trademeasures etc. to promote trade liberalization. SAPTA was followed by SAFTA. Thetrade liberalization agreement by SAFTA3 stresses for a tariff reduction of 20 per centfor Non-Least Developing Contracting States (NLDCs) and 30 per cent for LDCs withina time frame of 2 years from the date of commencement of the agreement, i.e, July2006, with an exclusion of items included in the sensitive list. A special and preferentialtreatment for the least developed contracting States, especially to compensate for theirloss in customs revenue, was also stressed. It was further mentioned that the subsequenttariff reduction by NLDCs from 20 per cent to below 0-5 per cent shall be done withina second time frame of 5 years, beginning from the third year from the date ofcommencement of the agreement. The timeframe for LDCs were extended for 8 yearsunder this framework. Table 1 shows in detail the tariff commitments under SAFTAagreement.
Table 1: Tariff Commitments Under SAFTACategories Tariff Reduction Target for Items Tariff Reduction Target for items not Included in Sensitive Items not Included in Sensitive
List List
NLDCs 20 per cent reduction by July, 2008 0-5 per cent by July, 2013LDCs 30 percent reduction by July, 2008 0-5 per cent by July, 2016Source: SAARC secretariat.
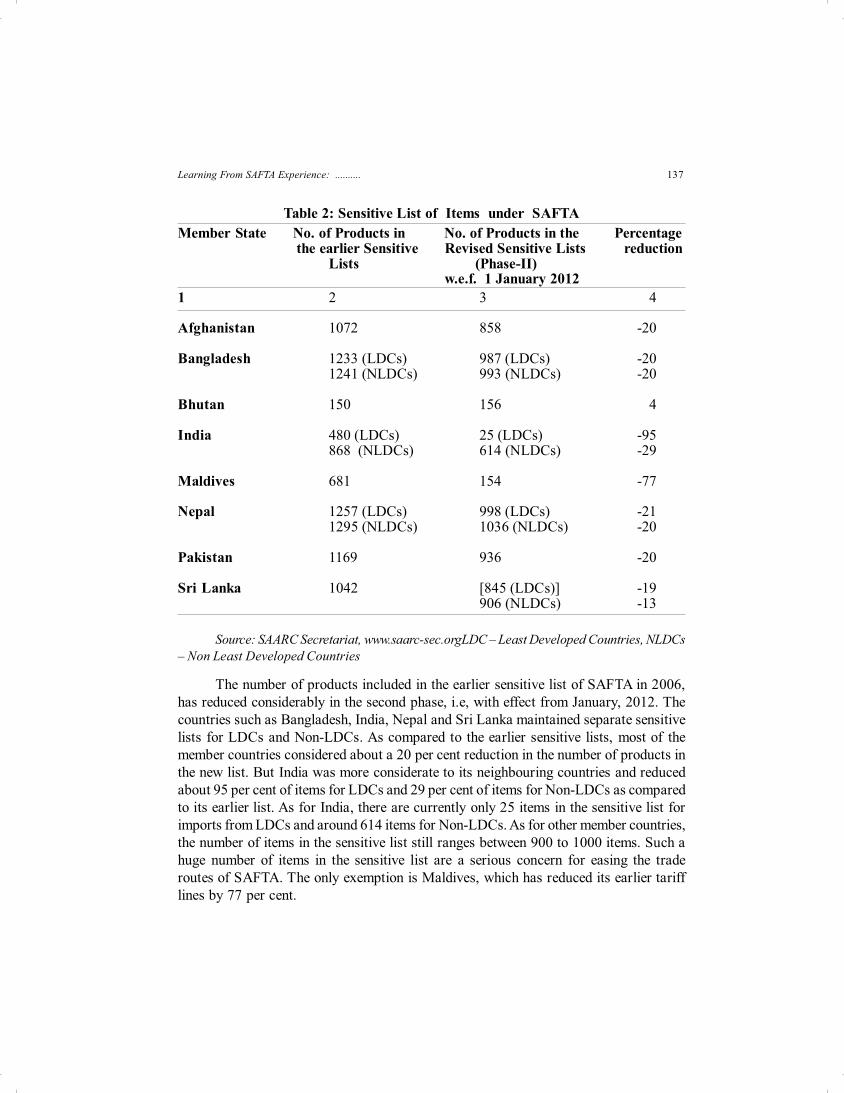
Almost six years have passed since the commencement of SAFTA. At the time ofthe agreement, the contracting States placed most of the traded commodities under thesensitive list4. The phase II of the sensitive list of items that came out in January, 2012bears much improvement by relaxing the number of commodities involved in the list.Table no. 2 provides the scope of comparison between the number of products includedin phase II of SAFTA with the earlier sensitive lists.
2. Agreement on SAARC Preferential Trading Arrangement (SAPTA), SAARC secretariat.3. Agreement on South Asian Free Trade Area (SAFTA), SAARC secretariat.4. Sensitive list is a list maintained by every country which contains the details of products
which does not include tariff concession.
137Learning From SAFTA Experience: ..........
Table 2: Sensitive List of Items under SAFTAMember State No. of Products in No. of Products in the Percentage the earlier Sensitive Revised Sensitive Lists reduction
Lists (Phase-II) w.e.f. 1 January 2012
1 2 3 4
Afghanistan 1072 858 -20
Bangladesh 1233 (LDCs) 987 (LDCs) -201241 (NLDCs) 993 (NLDCs) -20
Bhutan 150 156 4
India 480 (LDCs) 25 (LDCs) -95868 (NLDCs) 614 (NLDCs) -29
Maldives 681 154 -77
Nepal 1257 (LDCs) 998 (LDCs) -211295 (NLDCs) 1036 (NLDCs) -20
Pakistan 1169 936 -20
Sri Lanka 1042 [845 (LDCs)] -19906 (NLDCs) -13
Source: SAARC Secretariat, www.saarc-sec.orgLDC – Least Developed Countries, NLDCs– Non Least Developed Countries
The number of products included in the earlier sensitive list of SAFTA in 2006,has reduced considerably in the second phase, i.e, with effect from January, 2012. Thecountries such as Bangladesh, India, Nepal and Sri Lanka maintained separate sensitivelists for LDCs and Non-LDCs. As compared to the earlier sensitive lists, most of themember countries considered about a 20 per cent reduction in the number of products inthe new list. But India was more considerate to its neighbouring countries and reducedabout 95 per cent of items for LDCs and 29 per cent of items for Non-LDCs as comparedto its earlier list. As for India, there are currently only 25 items in the sensitive list forimports from LDCs and around 614 items for Non-LDCs. As for other member countries,the number of items in the sensitive list still ranges between 900 to 1000 items. Such ahuge number of items in the sensitive list are a serious concern for easing the traderoutes of SAFTA. The only exemption is Maldives, which has reduced its earlier tarifflines by 77 per cent.
Asian Economic Review, June 2014, Volume 56, No.2138
Bilateral Trade Treaties within SAARC Region
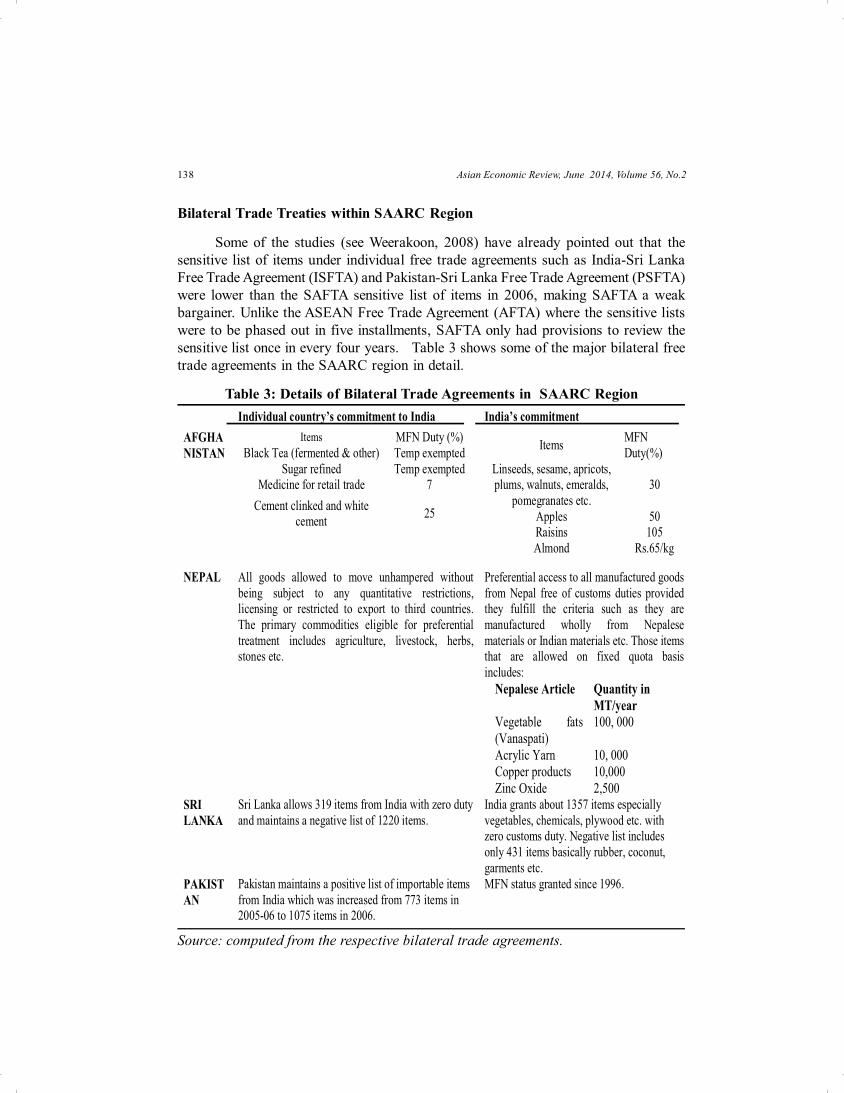
Some of the studies (see Weerakoon, 2008) have already pointed out that thesensitive list of items under individual free trade agreements such as India-Sri LankaFree Trade Agreement (ISFTA) and Pakistan-Sri Lanka Free Trade Agreement (PSFTA)were lower than the SAFTA sensitive list of items in 2006, making SAFTA a weakbargainer. Unlike the ASEAN Free Trade Agreement (AFTA) where the sensitive listswere to be phased out in five installments, SAFTA only had provisions to review thesensitive list once in every four years. Table 3 shows some of the major bilateral freetrade agreements in the SAARC region in detail.
Table 3: Details of Bilateral Trade Agreements in SAARC Region
Source: computed from the respective bilateral trade agreements.
Individual country’s commitment to India India’s commitment AFGHANISTAN
Items MFN Duty (%) Black Tea (fermented & other) Temp exempted
Sugar refined Temp exempted Medicine for retail trade 7
Cement clinked and white cement 25
Items MFN Duty(%)
Linseeds, sesame, apricots, plums, walnuts, emeralds,
pomegranates etc. 30
Apples 50 Raisins 105 Almond Rs.65/kg
NEPAL All goods allowed to move unhampered without being subject to any quantitative restrictions, licensing or restricted to export to third countries. The primary commodities eligible for preferential treatment includes agriculture, livestock, herbs, stones etc.
Preferential access to all manufactured goods from Nepal free of customs duties provided they fulfill the criteria such as they are manufactured wholly from Nepalese materials or Indian materials etc. Those items that are allowed on fixed quota basis includes:
Nepalese Article Quantity in MT/year
Vegetable fats (Vanaspati)
100, 000
Acrylic Yarn 10, 000 Copper products 10,000 Zinc Oxide 2,500
SRI LANKA
Sri Lanka allows 319 items from India with zero duty and maintains a negative list of 1220 items.
India grants about 1357 items especially vegetables, chemicals, plywood etc. with zero customs duty. Negative list includes only 431 items basically rubber, coconut, garments etc.
PAKISTAN
Pakistan maintains a positive list of importable items from India which was increased from 773 items in 2005-06 to 1075 items in 2006.
MFN status granted since 1996.
139Learning From SAFTA Experience: ..........
The India-Sri Lanka Free Trade Agreement (ISFTA) was signed in December,1999. India grants about 1357 items from Sri Lanka especially vegetables, chemicals,plywood etc. with zero customs duty, and maintained a negative list of 431 items fromSri Lanka which basically includes coconut, rubber, ensembles of wool, garments,clothing accessories etc. Sri Lanka’s negative list includes around 1220 items whichincludes agricultural items such as butter, maize, broken rice, buck wheat etc. andmanufactured products such as fully automatic machines, plastic furniture, metals,radiators, footwear etc.
The India-Maldives agreement5 that came into force in March 1981 outlined thatthe Government of the Republic of Maldives will furnish to the Government of theRepublic of India a list of the essential commodities required by the former in a calendaryear by the end of the month of November of the year preceding the year to which therequirement relates. The India-Bangladesh trade agreement, which came into existencein March 2006 highlights the scope of resulting advantages from a free trade area whicheither of the two Governments may conclude in future.
Overall, a number of bilateral trade agreements within the SAARC countriesalready exists, most of them more liberal in concessions than SAFTA, and makes itdifficult for SAFTA to take off. Either there should be a standardization between thesetreaties and SAFTA rules or all routes of trade should be channeled through SAFTAagreements making SAFTA a valid trade facilitation agreement in the region.
Significance of SAARC Countries in Foreign Trade
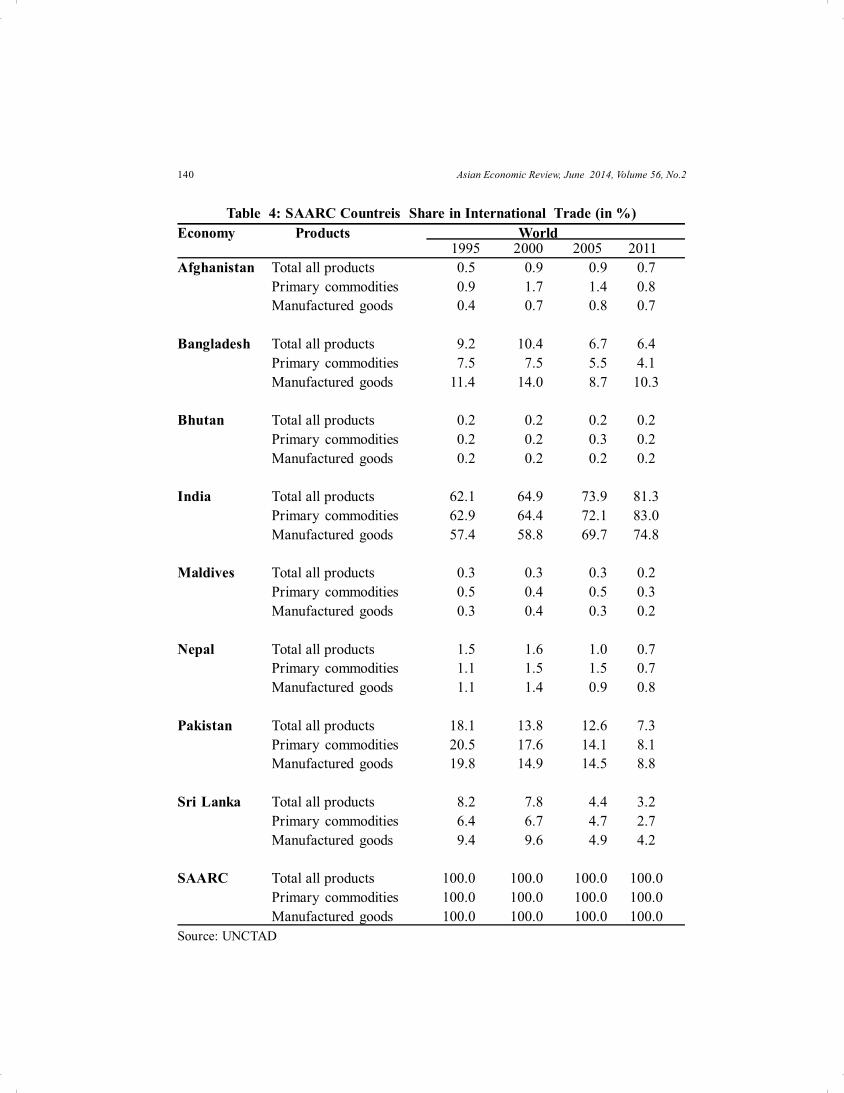
While assessing the role to be played by SAFTA in the coming years within theregion, it is important to recognize the role of SAARC countries in international trade.Adopting a vector auto regression (VAR) methodology, Jayaraman and Choong (2012)investigated macroeconomic interdependence in the South Asian region. Their studyrevealed that India has been influencing economic growth in the region, as its outputvariability has been affecting outputs in other member countries. Here an attempt hasbeen made to analyse the role of foreign trade among SAARC nations. Table 4 providesa detailed analysis of engagement in international trade by SAARC countries.
5. Trade Agreement Between The Government of the Republic of India And The Governmentof the Republic of Maldives, Ministry of Commerce & Industry, Government of India.
Asian Economic Review, June 2014, Volume 56, No.2140
Table 4: SAARC Countreis Share in International Trade (in %)Economy Products World
1995 2000 2005 2011Afghanistan Total all products 0.5 0.9 0.9 0.7
Primary commodities 0.9 1.7 1.4 0.8Manufactured goods 0.4 0.7 0.8 0.7
Bangladesh Total all products 9.2 10.4 6.7 6.4Primary commodities 7.5 7.5 5.5 4.1Manufactured goods 11.4 14.0 8.7 10.3
Bhutan Total all products 0.2 0.2 0.2 0.2Primary commodities 0.2 0.2 0.3 0.2Manufactured goods 0.2 0.2 0.2 0.2
India Total all products 62.1 64.9 73.9 81.3Primary commodities 62.9 64.4 72.1 83.0Manufactured goods 57.4 58.8 69.7 74.8
Maldives Total all products 0.3 0.3 0.3 0.2Primary commodities 0.5 0.4 0.5 0.3Manufactured goods 0.3 0.4 0.3 0.2
Nepal Total all products 1.5 1.6 1.0 0.7Primary commodities 1.1 1.5 1.5 0.7Manufactured goods 1.1 1.4 0.9 0.8
Pakistan Total all products 18.1 13.8 12.6 7.3Primary commodities 20.5 17.6 14.1 8.1Manufactured goods 19.8 14.9 14.5 8.8
Sri Lanka Total all products 8.2 7.8 4.4 3.2Primary commodities 6.4 6.7 4.7 2.7Manufactured goods 9.4 9.6 4.9 4.2
SAARC Total all products 100.0 100.0 100.0 100.0Primary commodities 100.0 100.0 100.0 100.0Manufactured goods 100.0 100.0 100.0 100.0
Source: UNCTAD
141Learning From SAFTA Experience: ..........
It is clear from the table that India’s share in world trade from the SAARC regionhas been increasing over the years, while other countries have experienced a decliningtrend in their share in world trade. India’s share has increased from about 60 per cent ofthe total contribution in 1995 to more than 80 per cent in 2011. This shows that Indiahas more than proportionate increase in world trade as compared to other SAARCcountries. The share of countries such as Afghanistan, Bhutan, Maldives and Nepal inthe total contribution from SAARC countries in world trade was almost negligible.Bangladesh and Pakistan contributed about 10 per cent and 9 per cent respectively ofshares of manufactured goods, but by a declining rate of contribution as compared tothe year 2000.
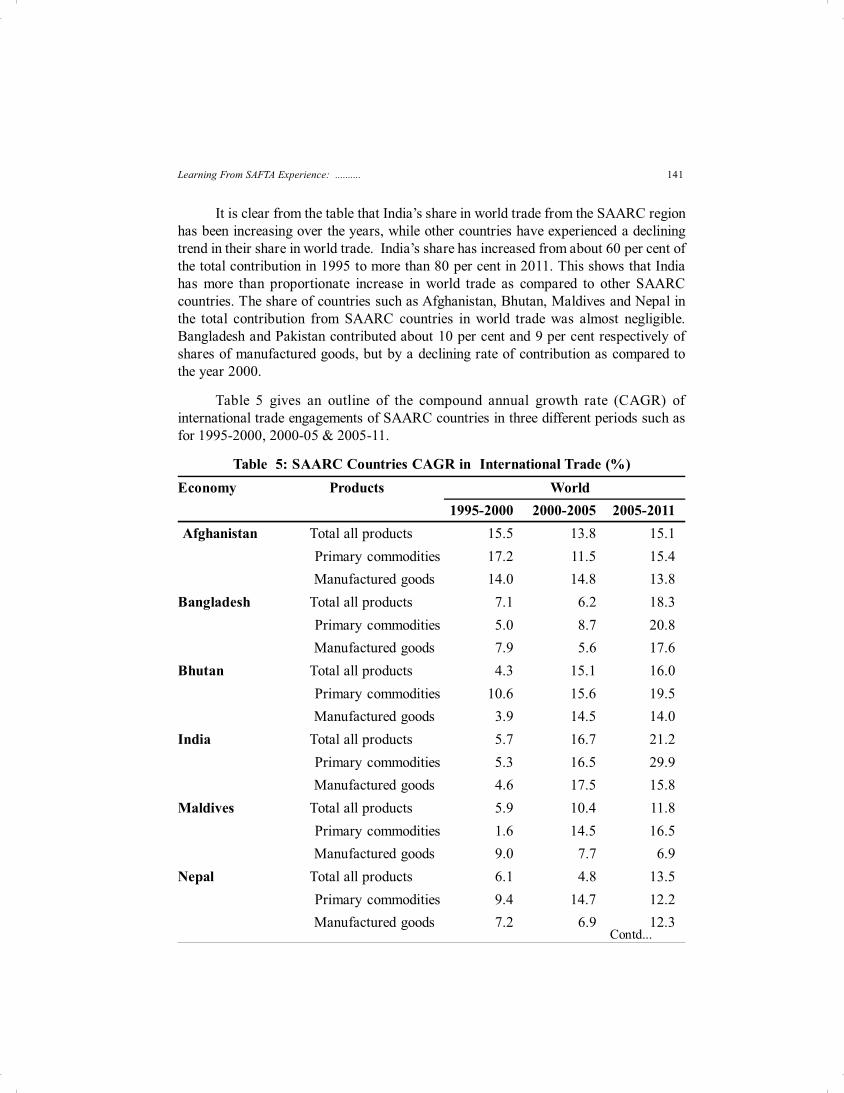
Table 5 gives an outline of the compound annual growth rate (CAGR) ofinternational trade engagements of SAARC countries in three different periods such asfor 1995-2000, 2000-05 & 2005-11.
Table 5: SAARC Countries CAGR in International Trade (%)Economy Products World 1995-2000 2000-2005 2005-2011 Afghanistan Total all products 15.5 13.8 15.1
Primary commodities 17.2 11.5 15.4 Manufactured goods 14.0 14.8 13.8
Bangladesh Total all products 7.1 6.2 18.3 Primary commodities 5.0 8.7 20.8 Manufactured goods 7.9 5.6 17.6
Bhutan Total all products 4.3 15.1 16.0 Primary commodities 10.6 15.6 19.5 Manufactured goods 3.9 14.5 14.0
India Total all products 5.7 16.7 21.2 Primary commodities 5.3 16.5 29.9 Manufactured goods 4.6 17.5 15.8
Maldives Total all products 5.9 10.4 11.8 Primary commodities 1.6 14.5 16.5 Manufactured goods 9.0 7.7 6.9
Nepal Total all products 6.1 4.8 13.5 Primary commodities 9.4 14.7 12.2 Manufactured goods 7.2 6.9 12.3
Contd...
Asian Economic Review, June 2014, Volume 56, No.2142
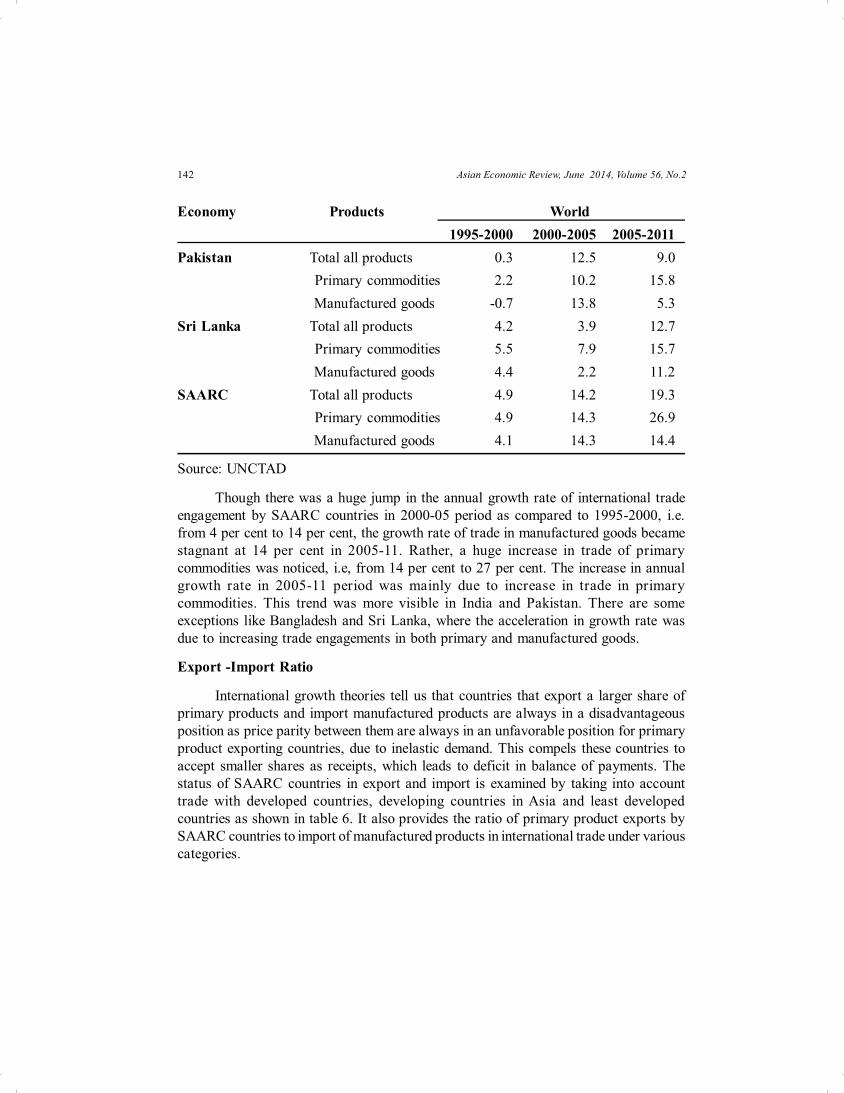
Economy Products World 1995-2000 2000-2005 2005-2011Pakistan Total all products 0.3 12.5 9.0
Primary commodities 2.2 10.2 15.8 Manufactured goods -0.7 13.8 5.3
Sri Lanka Total all products 4.2 3.9 12.7 Primary commodities 5.5 7.9 15.7 Manufactured goods 4.4 2.2 11.2
SAARC Total all products 4.9 14.2 19.3 Primary commodities 4.9 14.3 26.9 Manufactured goods 4.1 14.3 14.4
Source: UNCTAD
Though there was a huge jump in the annual growth rate of international tradeengagement by SAARC countries in 2000-05 period as compared to 1995-2000, i.e.from 4 per cent to 14 per cent, the growth rate of trade in manufactured goods becamestagnant at 14 per cent in 2005-11. Rather, a huge increase in trade of primarycommodities was noticed, i.e, from 14 per cent to 27 per cent. The increase in annualgrowth rate in 2005-11 period was mainly due to increase in trade in primarycommodities. This trend was more visible in India and Pakistan. There are someexceptions like Bangladesh and Sri Lanka, where the acceleration in growth rate wasdue to increasing trade engagements in both primary and manufactured goods.
Export -Import Ratio
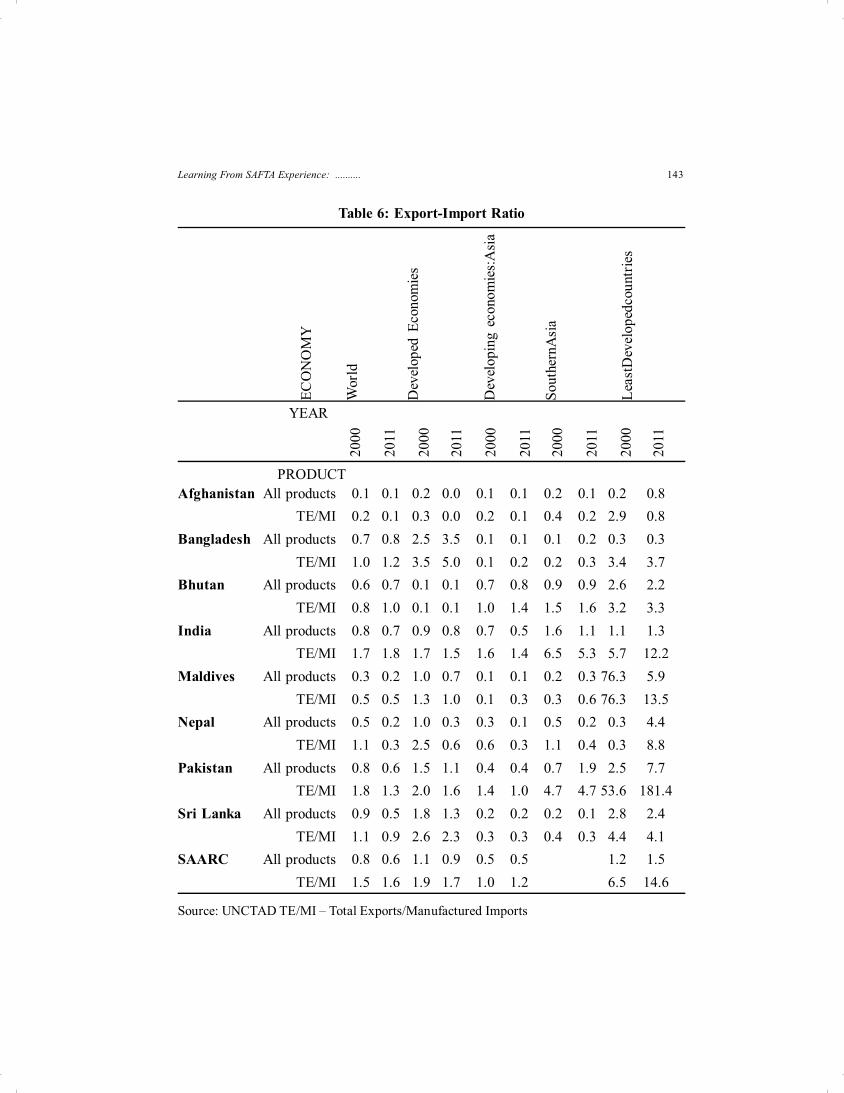
International growth theories tell us that countries that export a larger share ofprimary products and import manufactured products are always in a disadvantageousposition as price parity between them are always in an unfavorable position for primaryproduct exporting countries, due to inelastic demand. This compels these countries toaccept smaller shares as receipts, which leads to deficit in balance of payments. Thestatus of SAARC countries in export and import is examined by taking into accounttrade with developed countries, developing countries in Asia and least developedcountries as shown in table 6. It also provides the ratio of primary product exports bySAARC countries to import of manufactured products in international trade under variouscategories.
143Learning From SAFTA Experience: ..........
Table 6: Export-Import Ratio
Ratio
YEAR
PRODUCTAfghanistan All products 0.1 0.1 0.2 0.0 0.1 0.1 0.2 0.1 0.2 0.8
TE/MI 0.2 0.1 0.3 0.0 0.2 0.1 0.4 0.2 2.9 0.8Bangladesh All products 0.7 0.8 2.5 3.5 0.1 0.1 0.1 0.2 0.3 0.3
TE/MI 1.0 1.2 3.5 5.0 0.1 0.2 0.2 0.3 3.4 3.7Bhutan All products 0.6 0.7 0.1 0.1 0.7 0.8 0.9 0.9 2.6 2.2
TE/MI 0.8 1.0 0.1 0.1 1.0 1.4 1.5 1.6 3.2 3.3India All products 0.8 0.7 0.9 0.8 0.7 0.5 1.6 1.1 1.1 1.3
TE/MI 1.7 1.8 1.7 1.5 1.6 1.4 6.5 5.3 5.7 12.2Maldives All products 0.3 0.2 1.0 0.7 0.1 0.1 0.2 0.3 76.3 5.9
TE/MI 0.5 0.5 1.3 1.0 0.1 0.3 0.3 0.6 76.3 13.5Nepal All products 0.5 0.2 1.0 0.3 0.3 0.1 0.5 0.2 0.3 4.4
TE/MI 1.1 0.3 2.5 0.6 0.6 0.3 1.1 0.4 0.3 8.8Pakistan All products 0.8 0.6 1.5 1.1 0.4 0.4 0.7 1.9 2.5 7.7
TE/MI 1.8 1.3 2.0 1.6 1.4 1.0 4.7 4.7 53.6 181.4Sri Lanka All products 0.9 0.5 1.8 1.3 0.2 0.2 0.2 0.1 2.8 2.4
TE/MI 1.1 0.9 2.6 2.3 0.3 0.3 0.4 0.3 4.4 4.1SAARC All products 0.8 0.6 1.1 0.9 0.5 0.5 1.2 1.5
TE/MI 1.5 1.6 1.9 1.7 1.0 1.2 6.5 14.6
Source: UNCTAD TE/MI – Total Exports/Manufactured Imports
2000
2011
2000
2011
2000
2011
2000
2011
2000
2011
ECO
NO
MY
Wor
ld
Dev
elop
ed E
cono
mie
s
Dev
elop
ing
econ
omie
s:A
sia
Sout
hern
Asi
a
Leas
tDev
elop
edco
untr
ies
Asian Economic Review, June 2014, Volume 56, No.2144
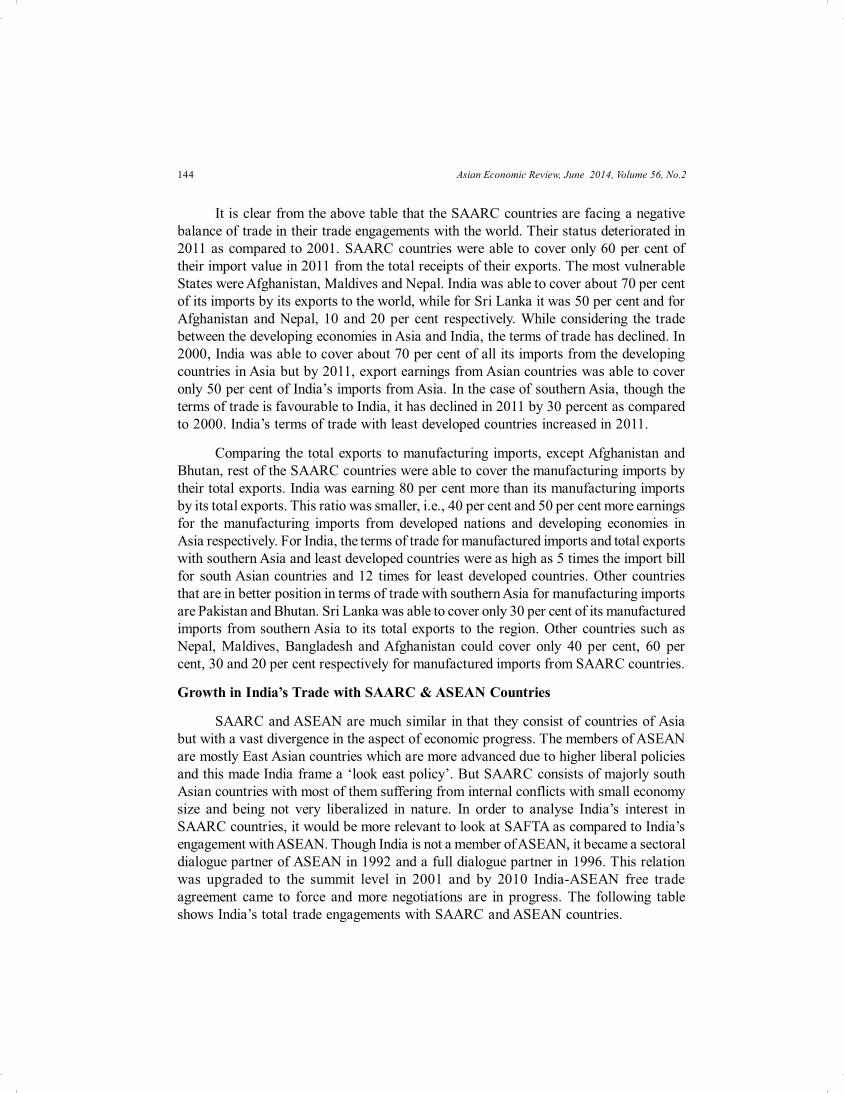
It is clear from the above table that the SAARC countries are facing a negativebalance of trade in their trade engagements with the world. Their status deteriorated in2011 as compared to 2001. SAARC countries were able to cover only 60 per cent oftheir import value in 2011 from the total receipts of their exports. The most vulnerableStates were Afghanistan, Maldives and Nepal. India was able to cover about 70 per centof its imports by its exports to the world, while for Sri Lanka it was 50 per cent and forAfghanistan and Nepal, 10 and 20 per cent respectively. While considering the tradebetween the developing economies in Asia and India, the terms of trade has declined. In2000, India was able to cover about 70 per cent of all its imports from the developingcountries in Asia but by 2011, export earnings from Asian countries was able to coveronly 50 per cent of India’s imports from Asia. In the case of southern Asia, though theterms of trade is favourable to India, it has declined in 2011 by 30 percent as comparedto 2000. India’s terms of trade with least developed countries increased in 2011.
Comparing the total exports to manufacturing imports, except Afghanistan andBhutan, rest of the SAARC countries were able to cover the manufacturing imports bytheir total exports. India was earning 80 per cent more than its manufacturing importsby its total exports. This ratio was smaller, i.e., 40 per cent and 50 per cent more earningsfor the manufacturing imports from developed nations and developing economies inAsia respectively. For India, the terms of trade for manufactured imports and total exportswith southern Asia and least developed countries were as high as 5 times the import billfor south Asian countries and 12 times for least developed countries. Other countriesthat are in better position in terms of trade with southern Asia for manufacturing importsare Pakistan and Bhutan. Sri Lanka was able to cover only 30 per cent of its manufacturedimports from southern Asia to its total exports to the region. Other countries such asNepal, Maldives, Bangladesh and Afghanistan could cover only 40 per cent, 60 percent, 30 and 20 per cent respectively for manufactured imports from SAARC countries.
Growth in India’s Trade with SAARC & ASEAN Countries
SAARC and ASEAN are much similar in that they consist of countries of Asiabut with a vast divergence in the aspect of economic progress. The members of ASEANare mostly East Asian countries which are more advanced due to higher liberal policiesand this made India frame a ‘look east policy’. But SAARC consists of majorly southAsian countries with most of them suffering from internal conflicts with small economysize and being not very liberalized in nature. In order to analyse India’s interest inSAARC countries, it would be more relevant to look at SAFTA as compared to India’sengagement with ASEAN. Though India is not a member of ASEAN, it became a sectoraldialogue partner of ASEAN in 1992 and a full dialogue partner in 1996. This relationwas upgraded to the summit level in 2001 and by 2010 India-ASEAN free tradeagreement came to force and more negotiations are in progress. The following tableshows India’s total trade engagements with SAARC and ASEAN countries.
145Learning From SAFTA Experience: ..........
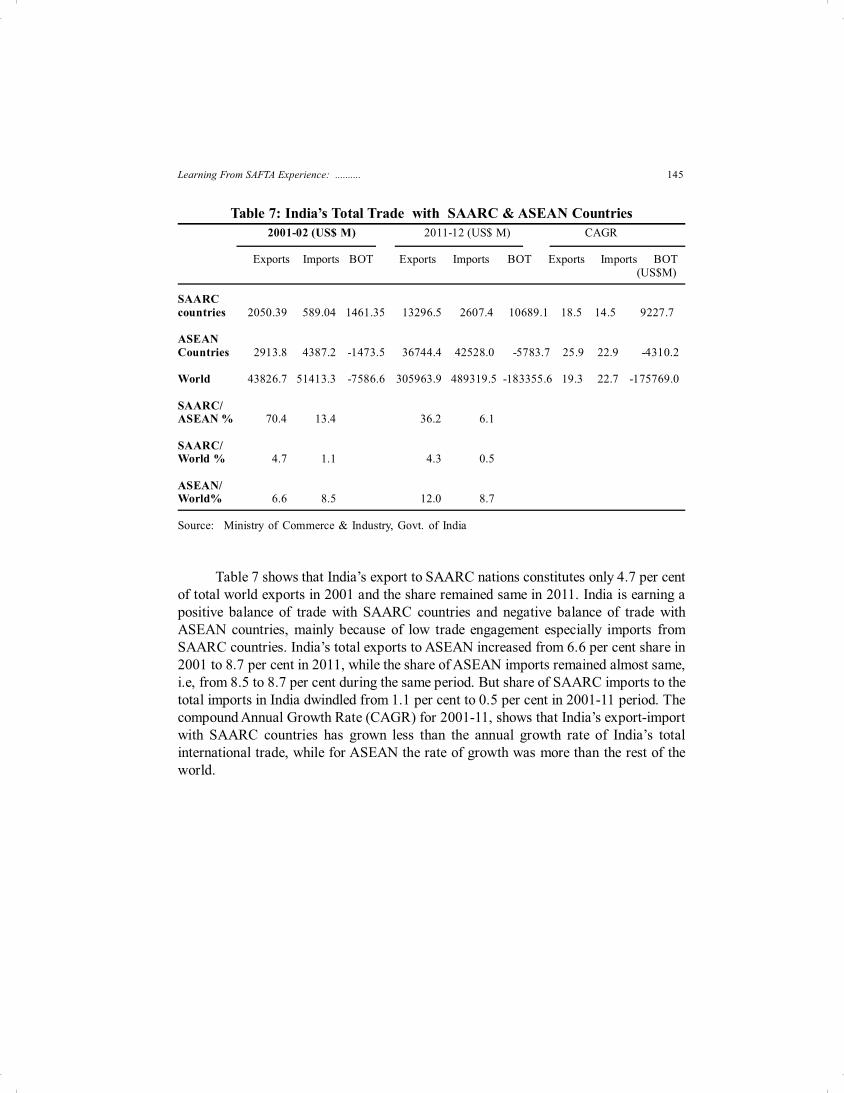
Table 7: India’s Total Trade with SAARC & ASEAN Countries 2001-02 (US$ M) 2011-12 (US$ M) CAGR
Exports Imports BOT Exports Imports BOT Exports Imports BOT (US$M)
SAARCcountries 2050.39 589.04 1461.35 13296.5 2607.4 10689.1 18.5 14.5 9227.7
ASEANCountries 2913.8 4387.2 -1473.5 36744.4 42528.0 -5783.7 25.9 22.9 -4310.2
World 43826.7 51413.3 -7586.6 305963.9 489319.5 -183355.6 19.3 22.7 -175769.0
SAARC/ASEAN % 70.4 13.4 36.2 6.1
SAARC/World % 4.7 1.1 4.3 0.5
ASEAN/World% 6.6 8.5 12.0 8.7 Source: Ministry of Commerce & Industry, Govt. of India
Table 7 shows that India’s export to SAARC nations constitutes only 4.7 per centof total world exports in 2001 and the share remained same in 2011. India is earning apositive balance of trade with SAARC countries and negative balance of trade withASEAN countries, mainly because of low trade engagement especially imports fromSAARC countries. India’s total exports to ASEAN increased from 6.6 per cent share in2001 to 8.7 per cent in 2011, while the share of ASEAN imports remained almost same,i.e, from 8.5 to 8.7 per cent during the same period. But share of SAARC imports to thetotal imports in India dwindled from 1.1 per cent to 0.5 per cent in 2001-11 period. Thecompound Annual Growth Rate (CAGR) for 2001-11, shows that India’s export-importwith SAARC countries has grown less than the annual growth rate of India’s totalinternational trade, while for ASEAN the rate of growth was more than the rest of theworld.
Asian Economic Review, June 2014, Volume 56, No.2146
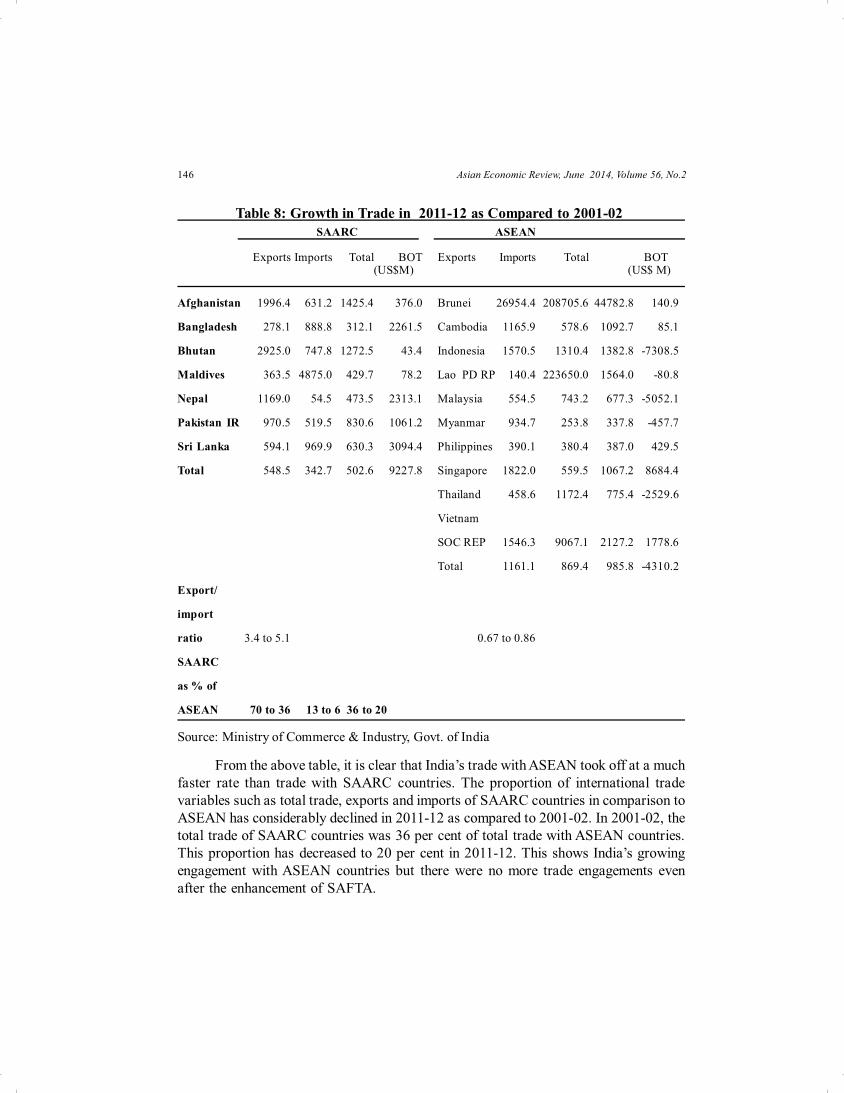
Table 8: Growth in Trade in 2011-12 as Compared to 2001-02 SAARC ASEAN Exports Imports Total BOT Exports Imports Total BOT
(US$M) (US$ M)
Afghanistan 1996.4 631.2 1425.4 376.0 Brunei 26954.4 208705.6 44782.8 140.9
Bangladesh 278.1 888.8 312.1 2261.5 Cambodia 1165.9 578.6 1092.7 85.1
Bhutan 2925.0 747.8 1272.5 43.4 Indonesia 1570.5 1310.4 1382.8 -7308.5
Maldives 363.5 4875.0 429.7 78.2 Lao PD RP 140.4 223650.0 1564.0 -80.8
Nepal 1169.0 54.5 473.5 2313.1 Malaysia 554.5 743.2 677.3 -5052.1
Pakistan IR 970.5 519.5 830.6 1061.2 Myanmar 934.7 253.8 337.8 -457.7
Sri Lanka 594.1 969.9 630.3 3094.4 Philippines 390.1 380.4 387.0 429.5
Total 548.5 342.7 502.6 9227.8 Singapore 1822.0 559.5 1067.2 8684.4
Thailand 458.6 1172.4 775.4 -2529.6
Vietnam
SOC REP 1546.3 9067.1 2127.2 1778.6
Total 1161.1 869.4 985.8 -4310.2
Export/
import
ratio 3.4 to 5.1 0.67 to 0.86
SAARC
as % of
ASEAN 70 to 36 13 to 6 36 to 20
Source: Ministry of Commerce & Industry, Govt. of India
From the above table, it is clear that India’s trade with ASEAN took off at a muchfaster rate than trade with SAARC countries. The proportion of international tradevariables such as total trade, exports and imports of SAARC countries in comparison toASEAN has considerably declined in 2011-12 as compared to 2001-02. In 2001-02, thetotal trade of SAARC countries was 36 per cent of total trade with ASEAN countries.This proportion has decreased to 20 per cent in 2011-12. This shows India’s growingengagement with ASEAN countries but there were no more trade engagements evenafter the enhancement of SAFTA.
147Learning From SAFTA Experience: ..........
Within SAARC nations, a higher growth in trade with India was noticed amongnations such as Afghanistan, Bhutan and Pakistan in 2011 as compared to 2001. Thegrowth in exports from India was much higher than imports for Afghanistan, Bhutan,Nepal and Pakistan. The growth in imports from Bangladesh, Maldives and Sri Lankahas increased at a higher rate than growth in exports to these countries. India maintaineda favourable balance of trade with SAARC nations. Trade surplus from Sri Lanka, Nepaland Bangladesh increased by US$ 3094, 2313 and 2261 respectively as compared to2001. The total trade surplus with SAARC countries increased by US$ 9227 million in2001-11 period, adding up to US$ 10689 millions in 2011.
In 2011, there was considerable increase in India’s engagement with ASEANcountries such as Brunei, Cambodia, Indonesia, Laos, Vietnam and Singapore ascompared to 2001. The growth in imports were higher than exports for Lao, Malaysia,Thailand and Vietnam. This led to an increase of trade deficit for India with ASEANcountries by more than US$ 4000 million as compared to 2001 and adding up to US$5783 millions.
Trade in Manufactured Commodities
This section explains in detail the export-import between India and SAARC aswell as ASEAN countries for selected manufactured products such as iron and steel,pharmaceuticals, organic chemicals, vehicles and electrical machinery equipments.
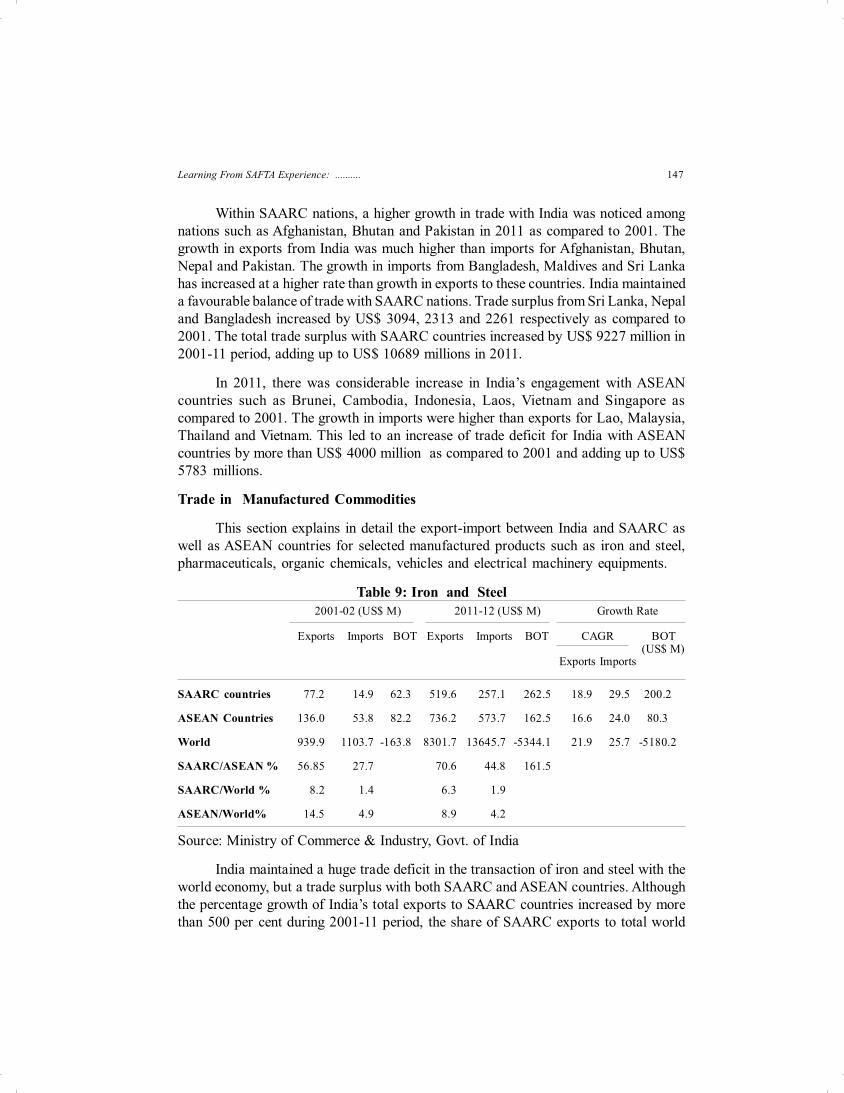
Table 9: Iron and Steel 2001-02 (US$ M) 2011-12 (US$ M) Growth Rate
Exports Imports BOT Exports Imports BOT CAGR BOT (US$ M)
Exports Imports
SAARC countries 77.2 14.9 62.3 519.6 257.1 262.5 18.9 29.5 200.2
ASEAN Countries 136.0 53.8 82.2 736.2 573.7 162.5 16.6 24.0 80.3
World 939.9 1103.7 -163.8 8301.7 13645.7 -5344.1 21.9 25.7 -5180.2
SAARC/ASEAN % 56.85 27.7 70.6 44.8 161.5
SAARC/World % 8.2 1.4 6.3 1.9
ASEAN/World% 14.5 4.9 8.9 4.2
Source: Ministry of Commerce & Industry, Govt. of India
India maintained a huge trade deficit in the transaction of iron and steel with theworld economy, but a trade surplus with both SAARC and ASEAN countries. Althoughthe percentage growth of India’s total exports to SAARC countries increased by morethan 500 per cent during 2001-11 period, the share of SAARC exports to total world
Asian Economic Review, June 2014, Volume 56, No.2148
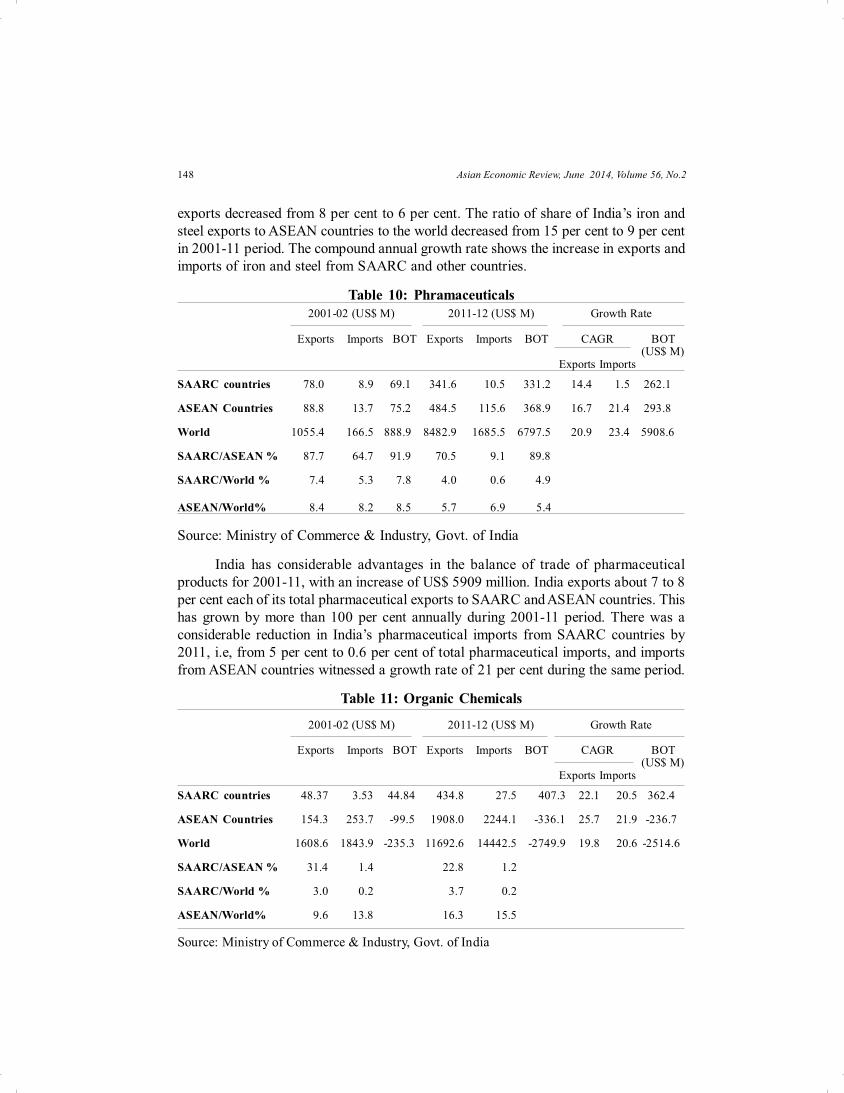
exports decreased from 8 per cent to 6 per cent. The ratio of share of India’s iron andsteel exports to ASEAN countries to the world decreased from 15 per cent to 9 per centin 2001-11 period. The compound annual growth rate shows the increase in exports andimports of iron and steel from SAARC and other countries.
Table 10: Phramaceuticals 2001-02 (US$ M) 2011-12 (US$ M) Growth Rate
Exports Imports BOT Exports Imports BOT CAGR BOT (US$ M)
Exports Imports
SAARC countries 78.0 8.9 69.1 341.6 10.5 331.2 14.4 1.5 262.1
ASEAN Countries 88.8 13.7 75.2 484.5 115.6 368.9 16.7 21.4 293.8
World 1055.4 166.5 888.9 8482.9 1685.5 6797.5 20.9 23.4 5908.6
SAARC/ASEAN % 87.7 64.7 91.9 70.5 9.1 89.8
SAARC/World % 7.4 5.3 7.8 4.0 0.6 4.9
ASEAN/World% 8.4 8.2 8.5 5.7 6.9 5.4
Source: Ministry of Commerce & Industry, Govt. of India
India has considerable advantages in the balance of trade of pharmaceuticalproducts for 2001-11, with an increase of US$ 5909 million. India exports about 7 to 8per cent each of its total pharmaceutical exports to SAARC and ASEAN countries. Thishas grown by more than 100 per cent annually during 2001-11 period. There was aconsiderable reduction in India’s pharmaceutical imports from SAARC countries by2011, i.e, from 5 per cent to 0.6 per cent of total pharmaceutical imports, and importsfrom ASEAN countries witnessed a growth rate of 21 per cent during the same period.
Table 11: Organic Chemicals
2001-02 (US$ M) 2011-12 (US$ M) Growth Rate
Exports Imports BOT Exports Imports BOT CAGR BOT (US$ M)
Exports Imports
SAARC countries 48.37 3.53 44.84 434.8 27.5 407.3 22.1 20.5 362.4
ASEAN Countries 154.3 253.7 -99.5 1908.0 2244.1 -336.1 25.7 21.9 -236.7
World 1608.6 1843.9 -235.3 11692.6 14442.5 -2749.9 19.8 20.6 -2514.6
SAARC/ASEAN % 31.4 1.4 22.8 1.2
SAARC/World % 3.0 0.2 3.7 0.2
ASEAN/World% 9.6 13.8 16.3 15.5
Source: Ministry of Commerce & Industry, Govt. of India
149Learning From SAFTA Experience: ..........
India is facing a trade deficit in international trade of organic chemicals but itkeeps a surplus with SAARC countries while maintaining a deficit with ASEAN. Withthe SAARC nations, the exports of organic chemicals constituted only 3.7 per cent ofIndia’s total organic chemical exports and imports constituted a negligible 0.2 per centin 2011. But the share of exports to ASEAN increased from 10 to 16 per cent in 2001-11and imports to 15.5 per cent. This shows India’s growing involvement with ASEANcountries rather than SAARC in case of organic chemicals.
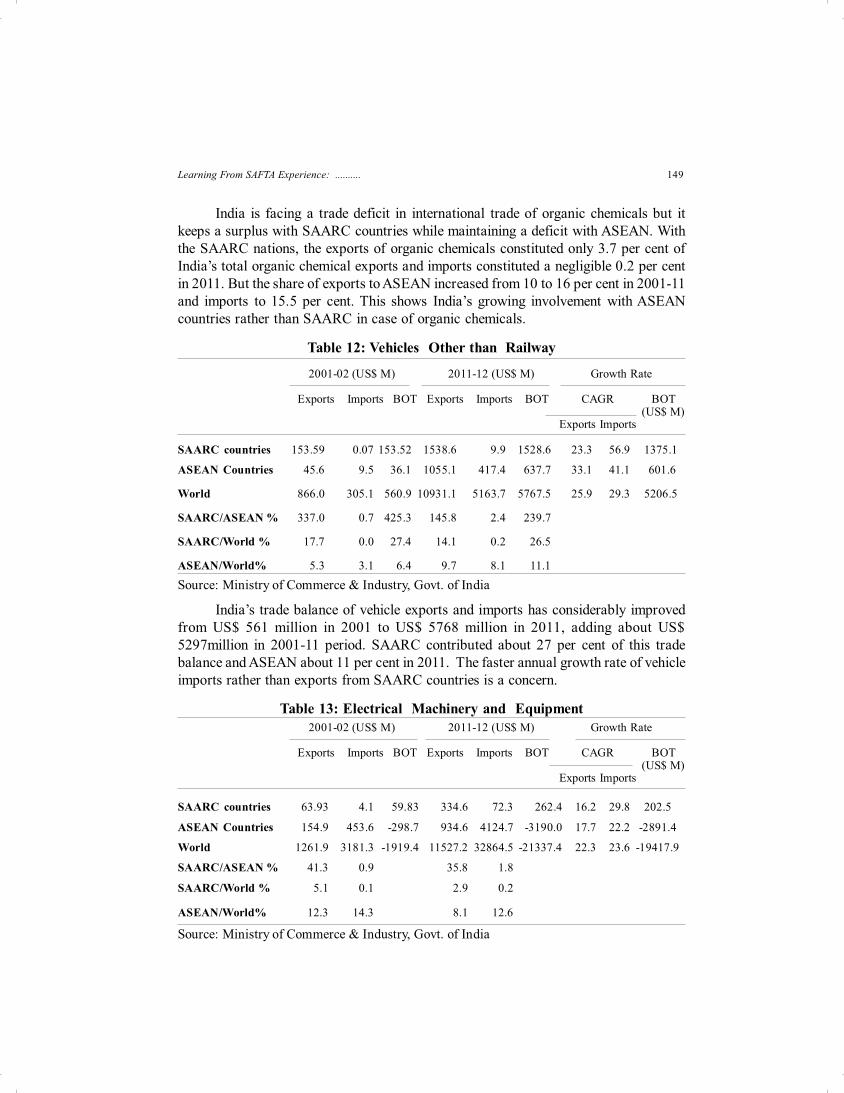
Table 12: Vehicles Other than Railway
2001-02 (US$ M) 2011-12 (US$ M) Growth Rate
Exports Imports BOT Exports Imports BOT CAGR BOT (US$ M)
Exports Imports
SAARC countries 153.59 0.07 153.52 1538.6 9.9 1528.6 23.3 56.9 1375.1
ASEAN Countries 45.6 9.5 36.1 1055.1 417.4 637.7 33.1 41.1 601.6
World 866.0 305.1 560.9 10931.1 5163.7 5767.5 25.9 29.3 5206.5
SAARC/ASEAN % 337.0 0.7 425.3 145.8 2.4 239.7
SAARC/World % 17.7 0.0 27.4 14.1 0.2 26.5
ASEAN/World% 5.3 3.1 6.4 9.7 8.1 11.1
Source: Ministry of Commerce & Industry, Govt. of India
India’s trade balance of vehicle exports and imports has considerably improvedfrom US$ 561 million in 2001 to US$ 5768 million in 2011, adding about US$5297million in 2001-11 period. SAARC contributed about 27 per cent of this tradebalance and ASEAN about 11 per cent in 2011. The faster annual growth rate of vehicleimports rather than exports from SAARC countries is a concern.
Table 13: Electrical Machinery and Equipment 2001-02 (US$ M) 2011-12 (US$ M) Growth Rate
Exports Imports BOT Exports Imports BOT CAGR BOT (US$ M)
Exports Imports
SAARC countries 63.93 4.1 59.83 334.6 72.3 262.4 16.2 29.8 202.5
ASEAN Countries 154.9 453.6 -298.7 934.6 4124.7 -3190.0 17.7 22.2 -2891.4
World 1261.9 3181.3 -1919.4 11527.2 32864.5 -21337.4 22.3 23.6 -19417.9
SAARC/ASEAN % 41.3 0.9 35.8 1.8
SAARC/World % 5.1 0.1 2.9 0.2
ASEAN/World% 12.3 14.3 8.1 12.6
Source: Ministry of Commerce & Industry, Govt. of India
Asian Economic Review, June 2014, Volume 56, No.2150
India had a positive balance of trade with SAARC for electrical machinery andequipment and a negative balance of trade with ASEAN and rest of the world. Thecontribution of ASEAN countries in this negative trade deficit was 15 per cent of totaldeficit of US$ 21337 million in 2011. India’s export share of electrical equipment toSAARC countries decreased from 5 per cent in 2001 to 3 per cent in 2011. In 2011,India had a much larger share of trade with ASEAN countries in both export and importof electrical equipment, which stood at 8 per cent and 13 per cent respectively.
Overall, the share of exports of Iron & steel, pharmaceuticals, vehicles andelectrical machinery to SAARC nations depleted in 2011 as compared to 2001. At thesame time, the share of organic chemicals increased slightly. The share of exports toASEAN countries also showed a decline for iron & steel, pharmaceuticals and electricalequipment. But a higher export growth to ASEAN was noticed for organic chemicalsand vehicles. India was having a higher volume of exports to ASEAN countries ratherthan SAARC except for vehicle exports. India maintained a favourable balance of tradewith SAARC countries for the above mentioned manufactured products. The balanceof trade surplus with ASEAN was noticed only for Iron& steel, pharmaceuticals andvehicles.
Other Issues
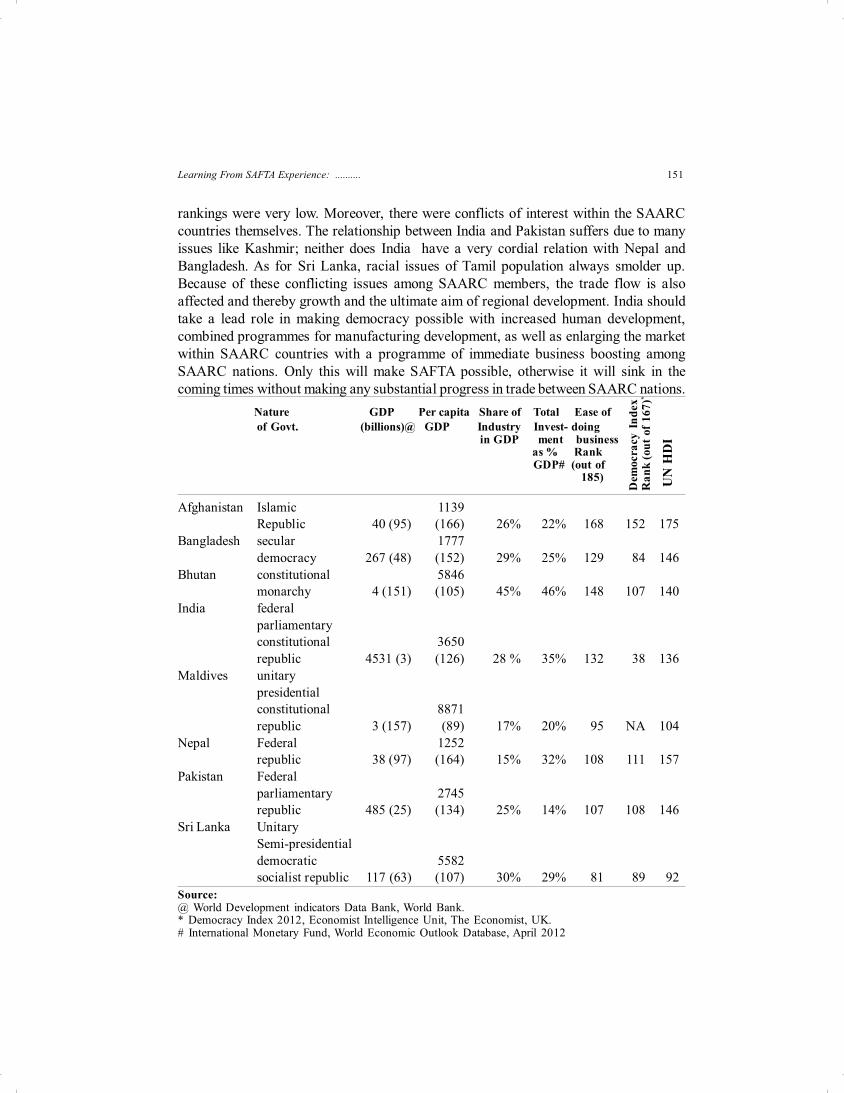
The current section gives an analysis of some basic necessary conditions for theSAFTA member countries to accelerate international trade as well as to gain from trade.A similar size of economy may give the countries an opportunity to bargain in equalterms. But the size of economy among SAFTA countries ranges from India’s 4500 billiondollar economy, which ranks 3rd in the world, to a meagre 3 billion dollar economy ofMaldives ranking 157th in the world out of 180 countries. This makes SAARC countriesunequal in bargaining power. Moreover, the share of industrial manufacturing to GDPwas lowest at 15 per cent in Nepal but higher in Bhutan, Sri Lanka, India and Bangladesh.Countries with higher manufacturing share could engage in trade with high valueproducts, while the primary exporting commodities could be in a disadvantaged positionin parity of the gains from trade. The total investment as percentage of GDP, a measureof growth in future output varies widely among SAARC countries. This shows thatinvestment promotion measures are weak in most of the SAARC countries except Bhutan,India and Nepal. Existence of democracy is a major ingredient for boosting businessenvironment. Out of 167 countries, except for India the ranking of most of the SAARCcountries in democracy index were as low as 152 for Afghanistan, 111 for Nepal and108 and 107 for Pakistan and Bhutan respectively. The ease of doing business is a majorfactor that boosts the entrepreneurs’ urge to invest. The rankings of most of the SAARCcountries in ‘Doing business report’ as prepared by World Bank were lower. Per capitaGDP and Human Development Index show the standard of living of human resourcesin a country. Human resources with higher standard of living are believed to be highlyproductive. Except for Maldives and Sri Lanka, the per capita GDP as well as HDI
151Learning From SAFTA Experience: ..........
rankings were very low. Moreover, there were conflicts of interest within the SAARCcountries themselves. The relationship between India and Pakistan suffers due to manyissues like Kashmir; neither does India have a very cordial relation with Nepal andBangladesh. As for Sri Lanka, racial issues of Tamil population always smolder up.Because of these conflicting issues among SAARC members, the trade flow is alsoaffected and thereby growth and the ultimate aim of regional development. India shouldtake a lead role in making democracy possible with increased human development,combined programmes for manufacturing development, as well as enlarging the marketwithin SAARC countries with a programme of immediate business boosting amongSAARC nations. Only this will make SAFTA possible, otherwise it will sink in thecoming times without making any substantial progress in trade between SAARC nations. Nature GDP Per capita Share of Total Ease of
of Govt. (billions)@ GDP Industry Invest- doing in GDP ment business as % Rank
GDP# (out of 185)
Afghanistan Islamic 1139Republic 40 (95) (166) 26% 22% 168 152 175
Bangladesh secular 1777democracy 267 (48) (152) 29% 25% 129 84 146
Bhutan constitutional 5846monarchy 4 (151) (105) 45% 46% 148 107 140
India federalparliamentaryconstitutional 3650republic 4531 (3) (126) 28 % 35% 132 38 136
Maldives unitarypresidentialconstitutional 8871republic 3 (157) (89) 17% 20% 95 NA 104
Nepal Federal 1252republic 38 (97) (164) 15% 32% 108 111 157
Pakistan Federalparliamentary 2745republic 485 (25) (134) 25% 14% 107 108 146
Sri Lanka UnitarySemi-presidentialdemocratic 5582socialist republic 117 (63) (107) 30% 29% 81 89 92
Source:@ World Development indicators Data Bank, World Bank.* Democracy Index 2012, Economist Intelligence Unit, The Economist, UK.# International Monetary Fund, World Economic Outlook Database, April 2012
Dem
ocra
cy I
ndex
Ran
k (o
ut o
f 167
)*
UN
HD
I
Asian Economic Review, June 2014, Volume 56, No.2152
Drawing Lessons for the On Going FTA’S from the SAFTA Experience
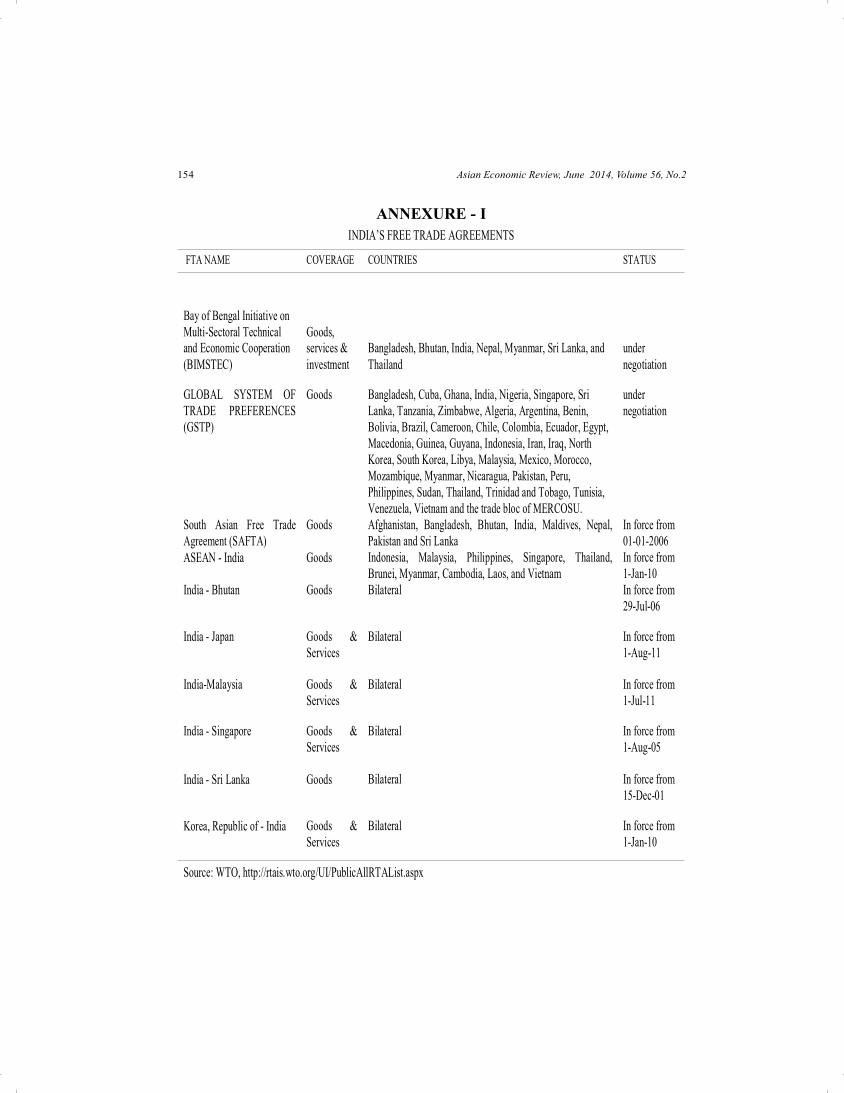
Apart from SAFTA, the undergoing free trade agreements in process include Bayof Bengal Initiative on Multi-Sectoral Technical and Economic Cooperation (BIMSTEC)and Global System of Trade Preferences (GSTP). Except Bhutan, Nepal and Myanmar,most of the members in BIMSTEC are also part of GSTP. GSTP is quite a large groupwith about 48 member countries. But BIMSTEC consists of only 7 member states, ofwhich Bangladesh, Bhutan, India, Nepal and Sri Lanka are members of SAFTA . Someof the lessons that can be drawn from SAFTA which can be useful for the ongoingnegotiating FTAs include:
(i) SAFTA was a late comer in the South Asian region where bilateral free tradeagreements such as ISLFTA, preferential trade agreements (IAPTA) and economiccooperation treaties such as those between India and Maldives, Bangladesh and Nepalalready existed, but has little more to offer than these treaties. Under ISLFTA, India isalready granting zero duty to 1357 items from Sri Lanka.
(ii) An analysis of six years (2006-12) of SAFTA shows that only fewer countries suchas India and Maldives are taking initiatives to ease the trade flow within SAARC byreducing the number of items in the sensitive list. India reduced the list of sensitiveitems by 95 per cent and Maldives by 77 per cent, while the rest of the countries wereready to sacrifice only a little, by reducing 20 per cent of items from the sensitive list.
(iii) SAARC countries protect agricultural commodities more than non-agriculturalcommodities by keeping the final bound duties much higher. Even the MFN duty foragricultural commodities was higher than 25 per cent, while it was as low as less than10 per cent for non-agricultural commodities. The scope of SAFTA is limited due to thefact that most of the agricultural commodities are kept in the sensitive list of the membercountries.
(iv) India’s share in world trade from SAARC region has been increasing over theyears, while other countries have been experiencing a declining trend in their share inworld trade. India’s share in total world trade from SAARC region has increased fromabout 60 per cent of the total contribution in 1995 to more than 80 per cent in 2011. Theshare of countries such as Afghanistan, Bhutan, Maldives and Nepal among the totalcontribution from SAARC countries in world trade was almost negligible.
(v) Though there was a huge jump in the annual growth rate of international tradeengagements by SAARC countries in 2000-05 period as compared to 1995-2000, thegrowth rate of trade in manufactured goods became stagnant at 14 per cent upto 2011.The increase in annual growth rate in 2005-11 period was mainly due to increase intrade in primary commodities. There was a huge increase in international trade
153Learning From SAFTA Experience: ..........
engagements of primary commodities with SAARC, i.e, from 14 per cent to 27 percent. This trend was more visible for/between India and Pakistan.
(vi) SAARC countries maintained a negative balance of trade with the rest of theworld and their status deteriorated in 2011 as compared to 2000. SAARC countrieswere able to cover only 60 per cent of their import value in 2011 from the total receiptsof their exports. India, Bhutan and Bangladesh were a little advantaged, covering 70percent each. Afghanistan and Nepal could cover only 10 per cent of their imports byexport receipts in 2011.
(vii) India was able to maintain a favourable terms of trade only with SAARC countriesand least developed countries, but the terms of trade with SAARC countries declinedby 30 per cent in 2011 as compared to 2000.
(viii) India’s total trade engagements with SAARC as a percentage of those withASEAN declined considerably, i.e, 36 per cent in 2001 to 20 per cent in 2011 showinga greater engagement with ASEAN countries and lesser involvement with SAARCcountries.
(ix) A higher growth in trade with India was noticed among nations such as Afghanistan,Bhutan and Pakistan in 2011 as compared to 2001. India maintained a favourable balanceof trade with SAARC nations. Trade surplus from Sri Lanka, Nepal and Bangladeshincreased by US$ 3094, 2313 and 2261 respectively as compared to 2001. As for ASEAN,the growth in imports was higher than exports for Lao, Malaysia, Thailand and Vietnam.This led to an increase of trade deficit for India with ASEAN countries by more than 4thousand million US dollars as compared to 2001.
(x) Among the selected manufacturing products such as iron & steel, pharmaceuticals,organic chemicals, vehicles, electrical machinery, India was having a higher volume ofexports to ASEAN countries rather than SAARC except for vehicle exports. Exports oforganic chemicals, electrical machinery to SAARC accounted for only 22 per cent and36 per cent of exports to ASEAN in 2011.
(xi) The unequal size of the economies in SAARC region makes it difficult for somecountries left with low bargaining power. SAARC countries consist of India whichranks 3rd in the world to a meager 3 billion dollar economy of Maldives ranking 157th inthe world out of 180 countries.
(xii) India should take a lead role in making democracy possible with increased humandevelopment, combined programmes for manufacturing development, as well asenlarging the market within SAARC countries with a programme of immediate businessboosting among SAARC nations.
Asian Economic Review, June 2014, Volume 56, No.2154
ANNEXURE - IINDIA’S FREE TRADE AGREEMENTS
FTA NAME COVERAGE COUNTRIES STATUS
Bay of Bengal Initiative on Multi-Sectoral Technical and Economic Cooperation (BIMSTEC)
Goods, services & investment
Bangladesh, Bhutan, India, Nepal, Myanmar, Sri Lanka, and Thailand
under negotiation
GLOBAL SYSTEM OF TRADE PREFERENCES (GSTP)
Goods Bangladesh, Cuba, Ghana, India, Nigeria, Singapore, Sri Lanka, Tanzania, Zimbabwe, Algeria, Argentina, Benin, Bolivia, Brazil, Cameroon, Chile, Colombia, Ecuador, Egypt, Macedonia, Guinea, Guyana, Indonesia, Iran, Iraq, North Korea, South Korea, Libya, Malaysia, Mexico, Morocco, Mozambique, Myanmar, Nicaragua, Pakistan, Peru, Philippines, Sudan, Thailand, Trinidad and Tobago, Tunisia, Venezuela, Vietnam and the trade bloc of MERCOSU.
under negotiation
South Asian Free Trade Agreement (SAFTA)
Goods Afghanistan, Bangladesh, Bhutan, India, Maldives, Nepal, Pakistan and Sri Lanka
In force from 01-01-2006
ASEAN - India Goods Indonesia, Malaysia, Philippines, Singapore, Thailand, Brunei, Myanmar, Cambodia, Laos, and Vietnam
In force from 1-Jan-10
India - Bhutan Goods Bilateral In force from 29-Jul-06
India - Japan Goods & Services
Bilateral In force from 1-Aug-11
India-Malaysia Goods & Services
Bilateral In force from 1-Jul-11
India - Singapore Goods & Services
Bilateral In force from 1-Aug-05
India - Sri Lanka Goods Bilateral In force from 15-Dec-01
Korea, Republic of - India Goods & Services
Bilateral In force from 1-Jan-10
Source: WTO, http://rtais.wto.org/UI/PublicAllRTAList.aspx
155Learning From SAFTA Experience: ..........
References
Carstens Agustin (2004): “Making regional economic integration work”, The PakistanDevelopment Review, Vol.43, No.4, pp.335-352.
Dash K.C (1996), “The Political Economy of Regional Cooperation in South Asia”,Pacific Affairs, Vol. 69, No. 2, pp. 185-209.
Dubey M. (2008): SAARC towards Greater Connectivity, Conference Report, Instituteof Peace and Conflict studies, Konrad Adenauer Foundation & India International Centre,New Delhi.
Gudavarthy A.( 2009): “Globalisation and Regionalisation: Mapping the NewContinental Drift”, Economic and Political Weekly, Vol.44, No.24, pp. 93-100.
Hoadley S. (2007): “Southeast Asian Cross-Regional FTAs: Origins, Motives andAims”, Pacific Affairs, Vol. 80, No. 2, East Asian Cross-Regionalism, pp. 303-325.
Jayaraman T.K & Choong K (2012): “Economic Integration in the IndianSubcontinent: A Study of Macroeconomic Interdependence”, Journal of EconomicIntegration, Vol. 27, No. 4, pp.584-608.
Michalak W. & Gibb R.(1997): “ Trading Blocs and Multilateralism in the WorldEconomy”, Annals of the Association of American Geographers, Vol. 87, No. 2, pp.264-279.
————-—(1996): “ Regionalism in the World Economy”,Vol. 28, No. 4 (Dec.,1996), pp. 446-458.
Obino F. (2009): “The political challenge for South Asia and beyond”, Economicand Political Weekly, Vol. 44, No. 9, pp. 118-125.
Pelagidis T. & Papasotiriou H (2002): “ Globalisation or Regionalism? States, Marketsand the Structure of International Trade”, Review of International Studies, Vol. 28, No.3, pp. 519-535.
Taneja N.(2001): “Informal Trade in SAARC Region”, Economic and PoliticalWeekly, Vol. 36, No. 11 (Mar. 17-23, 2001), pp. 959-964.
Weerakoon D. (2008): “The South Asian Free Trade Agreement: Which WayForward?”, Journal of South Asian Development ,Vol. 3, June, pp. 135-149.


