Embed Size (px)
Citation preview

1

2
Foreword
The conventional Internal Combustion Engine (ICE) vehicles form the
backbone of the transport sector and contributes to 23% of global CO2
emissions. These vehicles are also responsible for high levels of air pollution
in large cities, leading to major health concerns. As a result, policy makers and
concerned authorities are looking towards electric vehicles (EVs) to help
tackle air pollution problems and the climate change issues. However, one
of the major drivers for growth in the number of EVs is the easy access to
charging infrastructure as well as the enabling environment for the
consumers in order to purchase them. In this regard, the electric utility and
supply companies have to play a major role in planning and in providing EV
charging infrastructure, as they are the enablers of this infrastructure. Electric utilities can start leveraging
the existing infrastructure to find additional sources of revenues or improve the way they manage their
energy grids. It is important that electric utilities act fast and tap into innovative business models to make
use of this opportunity, as the existing relationship with grid customers puts electric utilities in an
advantageous position.
The SAARC Energy Centre, recognising this challenge, has decided to chart a course towards a sustainable,
secure and prosperous future based more heavily on transport sector electrification. Accordingly, two
studies related to the introduction of EVs within the SAARC region were carried out in 2017 and 2018. In
2019, SAARC Energy Centre decided to streamline its efforts to produce substantive results for the SAARC
region, and decided to coordinate with selected electric utilities of the SAARC member states and facilitate
them in formulating action plans for introducing EV charging infrastructure. The objective was to develop
medium to long term action plans and to create awareness among the stakeholders including decision
makers, regulators, project developers, utility companies etc. on the importance of EV charging
infrastructure. The current study report presents the Centre’s efforts in that direction, with an ambition to
embed the issue of EV charging infrastructure high on the agenda of the member states, and to become a
driver for a positive change in SAARC.
This report is a result of substantial investment in time, effort and dedication of the SEC staff, experts and
the peer reviewers. I would like to acknowledge their contributions in hope that you will enjoy reading this
report, but above all, benefit from its findings. SAARC Energy Centre stands ready to support SAARC
member states in charting out this exciting journey as they work together to build a secure, accessible,
affordable and sustainable energy future.
Mohammad Naeem Malik
Director
SAARC Energy Centre

3
Executive Summary
This report has assessed the EV market in the three SAARC Member States (SMS), namely Bhutan, India
and Pakistan, and devised an action plan for an electric utility in each of the three geographies to deploy
EV charging infrastructure in their respective licensee areas. Electric utilities, which have been in the
business of selling power to their customers, have a new business opportunity ahead as electricity becomes
the new oil for vehicles. However, conventionally, utilities across the world (albeit exceptions) tend to take
a conservative “wait and watch” approach in the initial phases of EV adoption, and due to bureaucratic
structures, lack of government interest (for state-owned utilities) and unpreparedness towards changing
business areas, their participation is this new business opportunity is affected. The report intends to allay
some of the uncertainties of such utilities by enumerating scalable business models based on feasibility
and practicability. Following are the study outcomes for the three member states:
Bhutan
The uptake of EVs in Bhutan has been slow with only ~102 EVs plying in the country and four charging
stations as of June 2019. The Royal Government of Bhutan (RGoB) plans to roll out 300 EVs in the country
by 2021. As per study author’s estimates, population of EVs will reach ~700 by CY 2024 and ~2100 by CY
2030 majorly due to replacement of taxi fleet in cities, tax incentives/ tax rebates given out by the
government and rise in fossil fuel prices.
The study authors have worked with Bhutan Power Corporation Ltd. (BPC) which is the only power
distribution utility in the country. Based on two different scenarios of low EV and high EV uptake in the
country, it is estimated that ~47 and ~104 charging stations would be required by 2030 respectively. This
entails capital investment required is Nu 101,333,895 (US$ 1,447,627) for low uptake and Nu 190,522,472
(US$ 2,721,749) for high uptake. Furthermore, an OPEX (operating expense) requirement of Nu 16,071,677
(US$ 229,595) and Nu 16,262,046 (US$ 232,315) for low and high uptake respectively would be
necessitated.
Financial viability studies of a Public Charging System (PCS) in Bhutan shows that at least 77.5% station
utilisation levels is required for electricity selling price of Nu 7/ kWh, which reduces mildly to ~68% for
electricity selling price of Nu 7.5/ kWh. This shows that station utilisation levels need to be high enough to
cover front leaded capital expenditure (CAPEX) costs.
Based on discussions with BPC and market participants, four business models have been highlighted:

4
Table 1: Summary of Business Models for EV Charging Stations in Bhutan
Initial Investment Operation & Maintenance Risk
Government Government Unsustainable
Government Government Unsustainable
Government Private company/BPC Low
BPC alone or through PPP BPC alone or through PPP Risky
The third business model is found to be the most sustainable model. Here, the government takes the
responsibility to install Electric Vehicle Charging Station (EVCS) and leases out to a private company or BPC
to manage, operate and maintain for a fixed term with a condition that at the end of the lease period the
lessee has to restore the EVCS to its original condition. Here, the government does not have any risk and
will also be able to recover the investment at the end of the lease period. Similarly, it will be a good
opportunity for BPC to enter into the e-mobility space without adopting the associated risks and
uncertainties in its entirety.
India
While there are close to 1.7 million EVs in the country (with majority being e-rickshaws), the same is
expected to reach ~80.4 million by fiscal 2030. This is led by conducive economics (total cost of ownership
benefits), declining battery prices, subsidy support from government and development of a strong enabling
ecosystem (charging station development, domestic EV manufacturing). The exponential rise in EVs, albeit
majorly in the two wheeler (2W) and three wheeler (3W) segments (which charge at home/ office), needs
to be supplemented by adequate PCS deployment.
A benchmarking study was carried out in which all major electric utilities in the country were assessed on
major financial and operational parameters to assess the readiness of utilities for setting up PCS
infrastructure in their respective licensee areas. Post the benchmarking study author has worked with BSES
Yamuna Private Limited (BYPL), a private utility supplying power to Eastern and Central Delhi.
As per estimates, the requirement of additional load in lieu of EV charging will reach ~250 gigawatt hour
(GWh) in fiscal 2024 and ~750 GWh in fiscal 2030. This effect can be alleviated by distribution network
planning and effective ToU implementation. Based on model of location planning for charging station
deployment, each of BYPL’s fourteen (14) circles were studied closely in consultation with the senior
leadership of the utility on several parameters. Six out of 14 divisions were found to be suitable for charging
station deployment. Furthermore, financial viability of PCS was assessed based on two underliers/ risks:
delivered cost of power and station utilisation. It was found that a PCS with fast chargers will not be viable
in today’s time due to high upfront charger costs and potential stranded costs (owing to non-utilisation).

5
In fact, for a PCS of 6 chargers (3 fast chargers and 3 slow chargers), a federal subsidy of ~65%-70% on
Electric Vehicle Supply Equipment (EVSE) would be required for breaking even in 5 years. However,
economics are expected to be more conducive as EV sales grow and market matures, thereby bringing
down charger costs and improving station utilisation.
The summary of business models as proposed are as follows:
Table 2: Summary of Business Models for EV Charging Stations in India
Business Model Modalities Risk
Make-ready The utility invests in ‘make-ready’ installations by providing electrical
infrastructure Minimal
Rebates for EVSEs Utilities provide host sites with financial incentives Moderate
Public-private partnerships
(PPP)
Both entities cover a portion of the infrastructure cost, as mutually
agreed, through a joint venture or a special purpose vehicle Moderate
Owner and operator The utility engages in electric grid enhancements and upgrades as well
as full build-out and operation of EVSEs at host sites. High
The electric utility, based on market conditions and viability, has been advised to set up PCS, either through
the PPP mode or by making strategic investments in make-ready installations in phase 1 (fiscals 2020-2024).
Locations with early EV adopters needs to be tapped to avoid low usage. In phase 2 (fiscals 2025-2030), as
battery technologies mature, the owner-operator route may be explored in strategic locations while
keeping the PPP model as the main stay.
Pakistan
While the population of full-fledged electric vehicles in the country is miniscule, that of the hybrid cars
imported into Pakistan has risen steadily. As of June 2019, a total of 250 plug-in hybrids and full EVs were
registered in Pakistan, with 90% being plug-in hybrid cars. As per estimates by study authors, electric cars
density by 2030 is expected to be 15%, i.e., four electric cars per 1000 people with close to 1 million EVs
on the roads cumulatively during the same time. This will be led by government push, policy incentives and
rise in per capita income in the country.
Post financial benchmarking of electric utilities, the study authors worked with Islamabad Electric Supply
Company (IESCO), a state utility supplying power to Islamabad region and to districts of Rawalpindi, Jhelum,
Attock and Chakwal. Based on market interactions and discussions with the leadership team of IESCO, a
total of 46 potential charging station locations have been identified, with 23 in Phase 1 (CY 2020 – 2025)
and the rest in phase 2 (CY 2026 - 2030). Based on the same, the utility has laid out plans for upgradation

6
of its power systems, totalling ~44,256 million PKR till 2030, with Distribution System Expansion (DOP)
entailing ~ 12,294 million PKR. The proposed business models for entering the EV charging station
deployment are as follows:
Table 3: Summary of Business Models for EV Charging Stations in Pakistan
Business Model Modalities Risk
Public Private
Partnership
Long-term contract (~15 years) between the public party and the private party,
for the development and management of PCS, with proposed equity share
between public and private parties of 70% and 30%, respectively
High
Build operate
transfer (BOT)
The public party delegates to a private sector entity to design and build
infrastructure and to operate as well as maintain these facilities for a certain
concession period
Low
Based on practicality and feasibility, it is suggested that IESCO invest in make-ready PCS installations by
setting up necessary distribution networks, transformers, meters and other electrical equipment. The
charger costs and other EVSE will be set up by interested private parties. The O&M of the sites will be the
responsibility of the host of the EV chargers, where the maintenance can be sublet to service companies
and these costs can be incorporated in the tariff models. The total CAPEX required by IESCO to invest in
ready-to-build sites for the period of next 10 years will be approximately 70.4 million PKR. Delivering power
to ready-to-build sites is a more practical approach to give a push-start for setting up charging
infrastructure in the licensee area. This will shield the electric utility from unwanted risks and uncertainties
in the EV space.
Overall, it is observed that the market preparedness and acceptance for EVs is different for the three SMS.
While India looks to be well-poised to make the EV transition in the next decade, uncertainties hog Pakistan
due to lack of federal policy and weak economy. Bhutan’s small size and mountainous terrain, on the other
hand, make wide acceptance of EVs as personal commute questionable. Different risks alter suitability of
business models from one geography to the other. The models, devised in close consultation with market
participants and shortlisted electric utility, take into account country level risks without compromising on
global uncertainties.
7
Table of Contents
Foreword ............................................................................................................................................ 2
Executive Summary ............................................................................................................................. 3
List of Figures .................................................................................................................................... 10
List of Tables ..................................................................................................................................... 12
Abbreviations .................................................................................................................................... 15
1 Approach and Methodology ................................................................................................... 18
2 Global EV Market: Size, Outlook and Opportunities ................................................................. 22
2.1 Evolution ................................................................................................................................. 22
2.2 Rise in Popularity .................................................................................................................... 22
2.3 Factors Driving the Change ..................................................................................................... 24
2.4 Barriers Against Adoption ....................................................................................................... 27
3 Evolution of Battery Technologies and Chemistries.................................................................. 28
4 Battery Swapping ................................................................................................................... 30
5 Global EV Charging Standards ................................................................................................. 32
6 Impact on Grid for High Scale EV Adoption .............................................................................. 37
6.1 Outcome of the Study ............................................................................................................. 41
7 Considerations for Selecting EV Charging Locations ................................................................. 42
7.1 Number and Types of Stations Needed................................................................................... 42
8 Country in Focus: Bhutan ........................................................................................................ 44
8.1 Present EV Sales and Charging Infrastructure ......................................................................... 44
8.2 Regulations and Federal Policies Driving EV Adoption ............................................................ 45
8.3 Outlook on EV Sales ................................................................................................................ 47
8.4 Assessment of Power Distribution Utilities ............................................................................. 48
8.4.1 Country Macros and Policy Frameworks Guiding Utilities’ Overall Performance ................ 48
8.4.2 Shortlisted Utility ................................................................................................................ 52
8.5 Planning for the Transition ...................................................................................................... 52
8.5.1 Charging Standards ............................................................................................................. 52

8
8.5.2 Number of Chargers ............................................................................................................ 53
8.5.3 Grid Augmentation.............................................................................................................. 54
8.5.4 Charging Locations .............................................................................................................. 60
8.5.5 CAPEX Requirement ............................................................................................................ 64
8.5.6 Financial Viability of a Charging Station .............................................................................. 70
8.5.7 Business Models for Setting up EV Charging Stations ......................................................... 74
8.5.8 Organisational Capacity Planning ........................................................................................ 83
8.5.9 Challenges and Barriers ....................................................................................................... 85
8.5.10 Concluding Remarks ............................................................................................................ 86
9 Country in Focus: India ........................................................................................................... 87
9.1 Present EV Sales and Charging Infrastructure ......................................................................... 87
9.2 Regulations and Federal Policies Driving EV Adoption ............................................................ 89
9.3 Outlook on EV Sales ................................................................................................................ 94
9.4 Assessment of Power Distribution Utilities ............................................................................. 97
9.4.1 Country Macros and Policy Frameworks Guiding Utilities’ Overall Performance ................ 97
9.4.2 Benchmarking of Utilities .................................................................................................. 100
9.4.3 Shortlisted Utility .............................................................................................................. 102
9.5 Gap Analysis for the Shortlisted Utility ................................................................................. 103
9.6 Planning for the Transition .................................................................................................... 104
9.6.1 Charging Standards and Charger Type .............................................................................. 104
9.6.2 Battery Swapping .............................................................................................................. 108
9.6.3 Grid Augmentation............................................................................................................ 110
9.6.4 Charging Locations ............................................................................................................ 114
9.6.5 CAPEX Requirement .......................................................................................................... 119
9.6.6 Financial Viability of Charging Stations ............................................................................. 120
9.6.7 Business Models for Setting Up EV Charging Stations ....................................................... 122
9.6.8 Final Outcome ................................................................................................................... 127
9.6.9 Organisational Capacity Planning ...................................................................................... 129
10 Country in Focus: Pakistan .................................................................................................... 131
10.1 Present EV Sales and Charging Infrastructure ....................................................................... 131

9
10.2 Regulations and Federal Policies Driving EV Adoption .......................................................... 134
10.3 Outlook on EV Sales .............................................................................................................. 135
10.4 Assessment of Power Distribution Utilities ........................................................................... 137
10.4.1 Country Macros and Policy Frameworks Guiding Utilities’ Overall Performance .............. 137
10.4.2 Benchmarking of Utilities .................................................................................................. 140
10.4.3 Shortlisted Utility .............................................................................................................. 144
10.5 Planning for the Transition .................................................................................................... 145
10.5.1 Charging Standards and Charger Type .............................................................................. 145
10.5.2 Grid Augmentation............................................................................................................ 146
10.5.3 Charging Locations ............................................................................................................ 151
10.5.4 CAPEX Requirement .......................................................................................................... 156
10.5.5 Financial Viability of Charging Stations ............................................................................. 158
10.5.6 Business Model for Setting up EV Charging Stations ......................................................... 165
10.5.7 Organisational Capacity Planning ...................................................................................... 176
11 Benchmarking with International Utilities ............................................................................. 181
12 EV Traction in Other SAARC Member States .......................................................................... 185
12.1 Bangladesh ............................................................................................................................ 185
12.2 Sri Lanka ................................................................................................................................ 186
12.3 Nepal ..................................................................................................................................... 187
12.4 Afghanistan and Maldives ..................................................................................................... 189
13 Annexure ............................................................................................................................. 190
13.1 Overview of Meetings and Discussions Held ......................................................................... 190
13.1.1 Bhutan ............................................................................................................................... 190
13.1.2 India .................................................................................................................................. 191
13.1.3 Pakistan ............................................................................................................................. 193
14 Bibliography ......................................................................................................................... 196

10
List of Figures
Figure 1: Methodology of Forecasting EV Sales in a Geography ................................................................. 18
Figure 2: Methodology of Financial Benchmarking of Distribution Utilities ............................................... 19
Figure 3: Approach for Market Assessment of EV Charging Stations .......................................................... 20
Figure 4: Difference between Hybrid and Plug-in Cars ............................................................................... 23
Figure 5: Global EV Fleet ............................................................................................................................. 24
Figure 6: Various Charging Standards for EVSE ........................................................................................... 33
Figure 7: Installation Points of Existing and Proposed QCs in Thimphu ...................................................... 45
Figure 8: Fuel Consumed in a Year by Different Vehicles in Bhutan in 2015 (in Litre) ................................ 47
Figure 9: Generation, Import, Domestic Supply and Export of Electricity in Bhutan (MUs) ........................ 50
Figure 10: Revenue, Expenditure, and Profit for the Sale of Electricity in Bhutan (Million Ngultrum) ....... 50
Figure 11: System Peak Demand in Bhutan ................................................................................................ 51
Figure 12: Existing and Recommended QC Station in Bhutan ..................................................................... 53
Figure 13: Outlook of Domestic Load of Thimphu ...................................................................................... 55
Figure 14: Overview of 33 kV Thimphu Distribution Network .................................................................... 56
Figure 15: Single Line Diagram of 33 kV Ring Network of Thimphu ............................................................ 57
Figure 16: Voltage Profile Before & After Compensation with Shunt Capacitors (Low Uptake Level) ........ 57
Figure 17: Voltage Profile Before & After Compensation with Shunt Capacitors (High Uptake Level) ....... 59
Figure 18: Architecture of EV QC and HC on the Distribution Network ..................................................... 60
Figure 19: Power Supply Topology for QC Station at Memorial Chorten .................................................... 61
Figure 20: Monthly Energy Consumption and Energy Charges of Two QC Stations in Thimphu ................. 70
Figure 21: Sensitivity of NPV to EVCS Utilisation Rate and Electricity Selling Price ..................................... 74
Figure 22: NPV Variation with Utilisation Rate and Different Electricity Selling Price ................................ 78
Figure 23: NPV Variation with Utilisation Rate and Different Electricity Selling Price ................................ 81
Figure 24: Current Organisational Structure of BPC ................................................................................... 84
Figure 25: Proposed Organisational Structure of EVCS Division ................................................................. 85
Figure 26: Aggregate Power Demand and Supply (in Billion kWh) ............................................................. 98
Figure 27: Major Problems Faced by Electric Utilities in India .................................................................... 99
Figure 28: Suggested Organogram for BYPL ............................................................................................. 130
Figure 29: Total Number of Motor Vehicles Registered in Pakistan ......................................................... 131
Figure 30: Percentage Distribution of Vehicles in Pakistan ....................................................................... 132
Figure 31: Locally Manufactured Cars vs. Imported Hybrid Cars .............................................................. 133
Figure 32: Projection of Cars on Roads of Pakistan by 2030 ..................................................................... 136
Figure 33: Organogram of Pakistan’s Power Sector .................................................................................. 138
11
Figure 34: Power Demand Supply Projections of Pakistan ....................................................................... 139
Figure 35: Electricity Generation by Type (2017-18)................................................................................. 139
Figure 36: Simulation Results from Impact of EV Charging ....................................................................... 148
Figure 37: Power System Forecast of Pakistan ......................................................................................... 149
Figure 38: Energy Requirement Estimations for EV by 2020..................................................................... 149
Figure 39: Energy Requirement Estimations for EV by 2025..................................................................... 150
Figure 40: Energy Requirement Estimations for EVs by 2030 ................................................................... 150
Figure 41: Proposed Locations for Charging Stations in Rawalpindi-Islamabad Region ............................ 154
Figure 42: Cost Breakdown of EV Charging Infrastructure ........................................................................ 157
Figure 43: Cost Breakdown of the EV Charging Infrastructure – Slow Charger ......................................... 159
Figure 44: Return on Investment vs Capacity Utilisation Factor – Slow Charger ...................................... 160
Figure 45: Cost Breakdown of EV Charging Infrastructure – Semi-fast Charger........................................ 161
Figure 46: Return on Investment vs Capacity Utilisation Factor – Semi-fast Charger ............................... 162
Figure 47: Cost Breakdown of EV Charging Infrastructure – Fast Charger ................................................ 163
Figure 48: Return on Investment Versus Capacity Utilisation Factor – Fast Charger ................................ 164
Figure 50: Business Model – Ready-to-build Sites by DISCOs ................................................................... 172
12
List of Tables
Table 1: Summary of Business Models for EV Charging Stations in Bhutan .................................................. 4
Table 2: Summary of Business Models for EV Charging Stations in India ..................................................... 5
Table 3: Summary of Business Models for EV Charging Stations in Pakistan ................................................ 6
Table 4: Approach for Business Plan Development .................................................................................... 20
Table 5: The Amounts of Grants for Different EV Classes in the UK ........................................................... 25
Table 6: Transition to Electric Cars by Major Manufacturers ...................................................................... 26
Table 7: Major Challenges for EV Adoption ................................................................................................ 27
Table 8: Battery Chemistries Required Across Different EV Segments ....................................................... 28
Table 9: Battery Technologies Across Different Li-ion Battery Packs .......................................................... 29
Table 10: Trade-offs of Five Principal Li-ion Battery Technologies ............................................................. 29
Table 11: Advantages for a BSS ................................................................................................................... 30
Table 12: Challenges for Deployment of BSS .............................................................................................. 31
Table 13: Chargers and Protocols for EV Charging ...................................................................................... 32
Table 14: Modes of EV Charging in Europe ................................................................................................. 34
Table 15: Levels of EV Charging in the US ................................................................................................... 35
Table 16: Typical Battery Sizes and Number of Charges Requirement According to Vehicle Type ............. 35
Table 17: Typical Battery Voltage and Current Limits Across Classes of EVs ............................................... 36
Table 18: Measures of Reliability for an Electric Grid ................................................................................. 37
Table 19: Scenarios Pertaining to Residential Load .................................................................................... 39
Table 20: Scenarios Pertaining to Commercial Load ................................................................................... 39
Table 21: Outcome Pertaining to Residential Load ..................................................................................... 40
Table 22: Voltage Drop and Increase in Peak Demand with Change in EV Load ......................................... 40
Table 23: Outcome Pertaining to Commercial Load ................................................................................... 41
Table 24: Modalities of Node and Flow-based Approaches ........................................................................ 42
Table 25: Growth in EVs in Bhutan ............................................................................................................. 44
Table 26: Taxes Levied on Vehicle Categories in Bhutan ............................................................................ 45
Table 27: Forecast of EVs in Bhutan............................................................................................................ 48
Table 28: Number of Projected QC Stations in Bhutan ............................................................................... 54
Table 29: Voltage Compensation Requirement for Each Substation for Low Uptake Level (2030)............. 58
Table 30: Voltage Compensation Requirement for Substation for High Uptake Level (2030) .................... 58
Table 31: Tentative Location of EVCS by 2021 ............................................................................................ 61
Table 32: Tentative Location of EVCS for Low Uptake by 2030 in Bhutan .................................................. 62

13
Table 33: Tentative location of EVCS for High Uptake by 2030 in Bhutan .................................................. 63
Table 34: CAPEX Requirement for Low Uptake ........................................................................................... 65
Table 35: CAPEX Requirement for High Uptake .......................................................................................... 66
Table 36: OPEX Requirement for Low Uptake ............................................................................................ 68
Table 37: OPEX Requirement for High Uptake ............................................................................................ 69
Table 38: Revenue Model for Low Uptake .................................................................................................. 71
Table 39: NPV Variation with EVCS Utilisation ........................................................................................... 72
Table 40: NPV Variation with EVCS Utilisation ............................................................................................ 72
Table 41: Revenue Model for High Uptake ................................................................................................. 73
Table 42: Total Annual Cost of EVCS (CAPEX + OPEX) ................................................................................. 75
Table 43: Cash Flow and Net Revenue ........................................................................................................ 76
Table 44: Payback Period of EV ................................................................................................................... 76
Table 45: Cash Flow and Net Revenue at 33.33% EVCS Utilisation Rate ..................................................... 78
Table 46: Sensitivity of NPV ($ x 1000) with EVCS Utilisation Rate and Margin on Electricity Tariff ........... 79
Table 47: Payback Period of EV ................................................................................................................... 79
Table 48: Sensitivity of NPV ($ x 1000) at 33.33% EVCS Utilisation Rate with Margin on
Electricity Tariff and Loan Interest ................................................................................................. 80
Table 49: Summary of Business Model Options ......................................................................................... 82
Table 50: Detailed CAPEX and OPEX over 9-years Period ........................................................................... 82
Table 51: EV Population and Sales in India for 2019 ................................................................................... 87
Table 52: Number of Charging Stations in India (state-wise) ...................................................................... 88
Table 53: Companies and Charging Station Portfolio in India ..................................................................... 88
Table 54: Ongoing Projects/ Proposals for EV Charging Stations in India Under FAME II Scheme .............. 89
Table 55: Charging Infrastructure Requirements for Self-use ..................................................................... 90
Table 56: Charging Infrastructure Requirements for Commercial Use ....................................................... 91
Table 57: Charger Model Standards (India) ................................................................................................ 91
Table 58: Custom Duties Proposed on EV Parts .......................................................................................... 92
Table 59: Number of E-buses Sanctioned (city-wise) .................................................................................. 94
Table 60: Outlook on EV Sales in India ........................................................................................................ 96
Table 61: Outlook on EV Population in India .............................................................................................. 96
Table 62: Parameters adopted for Benchmarking of Utilities ................................................................... 101
Table 63: Gap Analysis for BYPL for Implementing Charging Infrastructure ............................................. 103
Table 64: Standards Pertaining to EVCS .................................................................................................... 104
Table 65: Charger Types and Rated Voltages for EV Charging (as per the MoP’s Notification) ................ 105
Table 66: Charger Types and Rated Voltages for EV Charging .................................................................. 106
14
Table 67: Potential Roadmap for EV Charger Adoption in the Country .................................................... 108
Table 68: Charging Methods and Power Ratings for Different Power Ratings .......................................... 110
Table 69: Additional Load Emanating from EV Charging in BYPL Licensee Area ....................................... 111
Table 70: Typical Locations that can be Considered for a PCS in India ..................................................... 114
Table 71: Division-wise Profiling in BYPL Area .......................................................................................... 116
Table 72: Devising Priority of PCS Locations in BYPL Licensee Area .......................................................... 117
Table 73: Tentative Locations in Shortlisted Divisions of BYPL ................................................................. 118
Table 74: Typical Costs for Different Types of Chargers (Voltage Output, Current Rating)....................... 119
Table 75: Other Costs Associated with Setting up a PCS ........................................................................... 119
Table 76: CAPEX and OPEX Components Considered by the Model ......................................................... 121
Table 77: Assumptions Taken for Financial Viability ................................................................................. 121
Table 78: Scenarios Developed from the Assumptions and Forecasted Cashflows .................................. 121
Table 79: Major Risks for Public Charging Station Business ...................................................................... 127
Table 80: Operational Performance Indicators of DISCO’s in Pakistan ..................................................... 140
Table 81: Performance of Power Transformers of DISCO’s in Pakistan .................................................... 142
Table 82: Over Loaded 11kV Feeders of DISCO’s in Pakistan .................................................................... 143
Table 83: Over Loaded Distribution Transformers of DISCO’s in Pakistan ................................................ 143
Table 84: Type of Charger in Potential Sites ............................................................................................. 155
Table 85: Battery Capacity of EVs ............................................................................................................. 165
Table 86: Total CAPEX and OPEX Requirements for Potential Locations till 2030 (in Pakistani Rupee) .... 167
Table 87: Total CAPEX and OPEX Requirements for PPP Mode in Pakistan (in Pakistani Rupees) ............ 170
Table 88: Associated Cost Breakdown by a DISCO for Potential Locations (Pakistani Rupee) ................. 173
15
Abbreviations
ARAI Automotive Research Association of India
ACS Average Cost of Supply
AENS Average Energy Not Supplied
AEV Autonomous Electric Vehicle
BCD Basic Customs Duty
BPC Bhutan Power Corporation Ltd
BYPL BSES Yamuna Power Limited
BOT Build Operate Transfer
BIS Bureau of Indian Standards
BRT Bus Rapid Transit
CAPEX Capital Expenditure
CEA Central Electric Authority
CEB Ceylon Electricity Board
CPPA Central Power Purchasing Agency
CHAdeMO CHArge de MOve
CPEC China Pakistan Economic Corridor
CCS Combined Charging System
CBU Completely Built Unit
CAGR Compounded Annual Growth Rate
CNG Compressed Natural Gas
CE Consumers Energy
CAN Control Area Network
CAIDI Customer Average Interruption Duration Index
CKD Completely Knocked Down
DHI Department of Heavy Industry
DC Direct Charging
DISCO Distribution Company
DMRC Delhi Metro Railway Corporation
DT Distribution Transformer
DGPC Druk Green Power Corporation
DHI Druk Holding and Investment Limited
DRE Distributed Renewable Energy
EV Electric Vehicle
EVCS Electric Vehicle Charging Station

16
EVSE Electric Vehicle Supply Equipment
eMIP eMobility Inter-Operation Protocol
EESL Energy Efficiency Services Limited
EoI Expression of Interest
FESCO Faisalabad Electric Supply Company
FAME Faster Adoption and Manufacturing of (Hybrid &) Electric Vehicles in India
FACT Flexible Alternating Current Transmission System
GENCO Generation Company
GEF Global Environment Facility
GoI Government of India
GDP Gross Domestic Product
GEPCO Gujranwala Electric Power Company
HEV Hybrid Electric Vehicle
HESCO Hyderabad Electric Supply Company
ICAT International Centre for Automotive Technology
IEC International Electrotechnical Committee
IEA International Energy Agency
IESCO Islamabad Electric Supply Company
KEL K-Electric
LECO Lanka Electricity Company
LESCO Lahore Electric Supply Company
LFP Lithium Iron Phosphate
LTO Lithium Titanate
LT Low Tension
LUMS Lahore University of Management Sciences
MoU Memorandum of Understanding
MOIC Ministry of Information and Communication
MEPCO Multan Electric Power Company
MHI Ministry of Heavy Industries
NCT National Capital Territory
NEPRA National Electricity and Power Regulatory Authority
NTPC National Thermal Power Corporation
NTDC National Transmission and Dispatch Company
NPV Net Present Value
NYPA New York Power Authority
NMC Nickel-manganese-cobalt
OCHP Open Clearing House Protocol
17
OICP Open Inter Change Protocol
OSCP Open Smart Charging Protocol
OCPP Open Charge Point Protocol
OEM Original Equipment Manufacturers
OPEX Operational Expenditure
PKR Pakistani Rupee
PESCO Peshawar Electric Power Company
PV Photovoltaic
PEV Plug-in Electric Vehicle
PHEV Plug-in Hybrid Electric Vehicle
PCS Public Charging Station
PCT Pakistan Customs Tariff
PPP Public Private Partnership
PUCSL Public Utilities Commission of Sri Lanka
QESCO Quetta Electric Supply Company
QC Quick Charger
RGoB Royal Government of Bhutan
SEB State Electricity Board
SKD Semi Knocked Down
STU State Transport Undertaking
SEPCO Sukkur Electric Power Company
SAIDI System Average Interruption Duration Index
SAIFI System Average Interruption Frequency Index
3W Three Wheeler
ToD Time of Day
ToU Time of Use
TCO Total Cost of Ownership
TESCO Tribal Electric Supply Company
2W Two Wheeler
UK United Kingdom
UNDP United Nations Development Programme
VG Variable Generation
WAPDA Water and Power Development Authority

18
1 Approach and Methodology
The objective of the study is to develop an action plan for a shortlisted power distribution utility in Bhutan,
India and Pakistan to introduce public charging infrastructure for EVs. In order to do that, the first step is
to understand the overall ecosystem of the EV market in each of the three geographies. This was done by
reading up relevant country reports and speaking to stakeholders across the value chain (suppliers, original
equipment manufacturers, operations, distributers, retailers, and buyers). Further, a market readiness
assessment was done by looking at the policy level, industry level and end-user level interest in the EV
segment. Overall EV sales were studied and projections were given for the next 10 years (till 2030) by
benchmarking to major underliers such as rise in consumer interest, change in EV economics and
effectiveness of federal policies governing e-mobility.
Figure 1: Methodology of Forecasting EV Sales in a Geography
In the second step, the power distribution utilities in India and Pakistan were evaluated through a financial
benchmarking study to objectively shortlist one utility each from both the countries. Key parameters for
utilities in India and Pakistan were collated and subsequently a utility scoring model was prepared. The
scoring model has three major heads: operational metrics, financial metrics and other key parameters.
Using the collated data, each utility has been rated 1/2/3/4 on each parameter based on the pre-decided
Long-term forecast for EVs Outcome
Improvement in battery
technology
Present and future trends
in raw material
Present and future trends in crude oil
Effectiveness of federal policies
Outlook on total cost of ownership
across vehicle categories
19
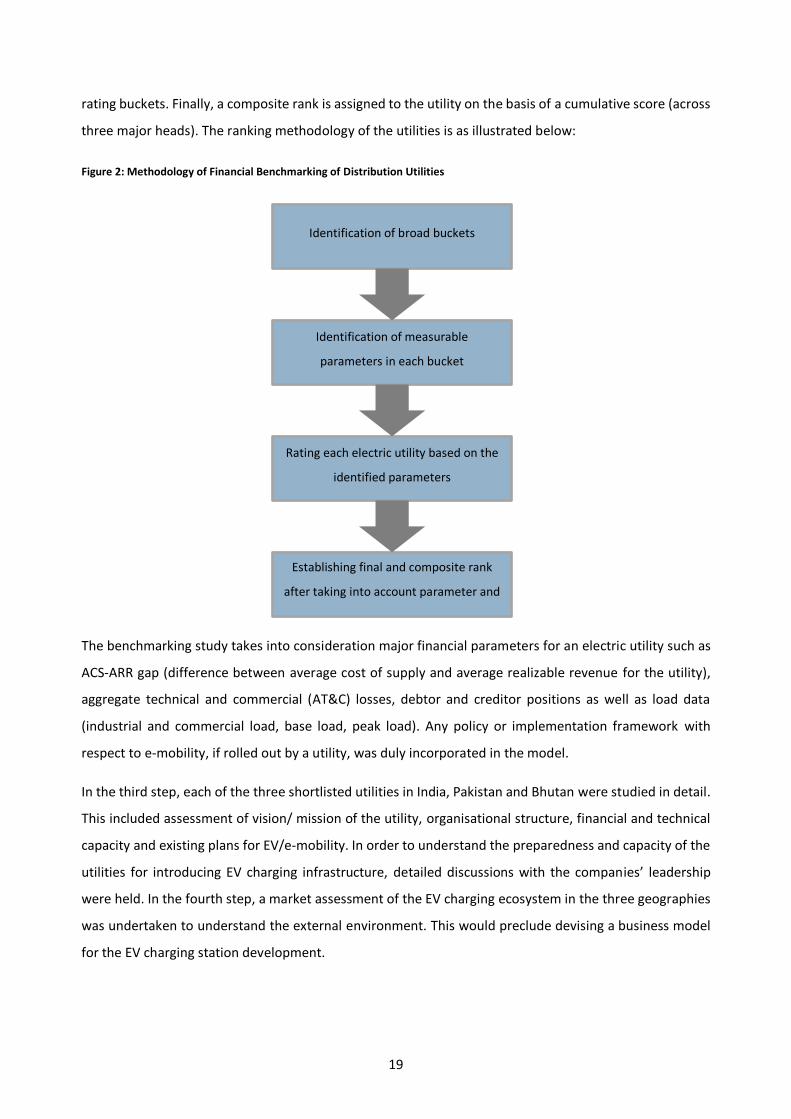
rating buckets. Finally, a composite rank is assigned to the utility on the basis of a cumulative score (across
three major heads). The ranking methodology of the utilities is as illustrated below:
Figure 2: Methodology of Financial Benchmarking of Distribution Utilities
The benchmarking study takes into consideration major financial parameters for an electric utility such as
ACS-ARR gap (difference between average cost of supply and average realizable revenue for the utility),
aggregate technical and commercial (AT&C) losses, debtor and creditor positions as well as load data
(industrial and commercial load, base load, peak load). Any policy or implementation framework with
respect to e-mobility, if rolled out by a utility, was duly incorporated in the model.
In the third step, each of the three shortlisted utilities in India, Pakistan and Bhutan were studied in detail.
This included assessment of vision/ mission of the utility, organisational structure, financial and technical
capacity and existing plans for EV/e-mobility. In order to understand the preparedness and capacity of the
utilities for introducing EV charging infrastructure, detailed discussions with the companies’ leadership
were held. In the fourth step, a market assessment of the EV charging ecosystem in the three geographies
was undertaken to understand the external environment. This would preclude devising a business model
for the EV charging station development.
Identification of broad buckets
Identification of measurable
parameters in each bucket
Rating each electric utility based on the
identified parameters
Establishing final and composite rank
after taking into account parameter and
bucket scores

20
Figure 3: Approach for Market Assessment of EV Charging Stations
The fifth step was to devise a mutually-agreed business plan for the utility to enter the business of EV
charging station deployment.
Table 4: Approach for Business Plan Development
Sr. no. Area of study Coverage
1 Charging standards
and types of chargers
Detailed study of EV charging standards in the world
• Technical specifications
• Communication protocols
Federal regulations on EV charging standards
• Charging standards (as specified), rated voltage and current specifications
• Policy clarifications awaited
Major factors on which charger requirements depend
Assessment of charger requirements in the country and creation of a potential roadmap
for EV charger adoption
2 Requirements for grid
augmentation
Finalisation of EV charging station locations and assessment of transformer loading levels
in residential/ commercial feeders in close vicinity of EV charging stations
Assessment of voltage level fluctuations and rise in peak load demand based on different
scenarios of cumulative EV charging
Devise remediation strategies taking into consideration outlook on EV charging station
utilisation as well as outlook on power demand in the area

21
Sr. no. Area of study Coverage
3 Locations for setting
up a charging station
Suggest locations for prospective EV charging stations based on:
• Static EV population in an area
• Floating EV population in an area
• Charging behaviour of EV buyers
4 CAPEX requirement
Assessment of CAPEX requirement for a charging station. Major cost heads: (a) charger
costs (b) new electricity connection and grid upgradation costs (c) civil works (d) EVSE
management software (e) other miscellaneous equipment
Determination of number of charging stations to be set up by the utility each year
Determination of capital outlays each year
5
Assessment of
financial viability of a
charging station
Assessment of three major risks: (a) upfront costs of a charging station (b) uncertainty
about station utilisation (c) role of federal, state and local government in driving the
charging station’s overall viability
Devising a viability model based on (a) utilisation factor of a charging station (b) margin
on electricity tariff
Sensitivity analysis of Net Present Value (NPV) and payback period of a charging station
based on underliers
6
Business models for
setting up EV charging
station
Analysis of the CAPEX side and revenue side interventions for the utility
Assessment of cost recovery methods for the utility
Benchmarking with international utilities across the world that have invested in the EV
ecosystem
Possible business models for charging stations in the country
7 Organisational
capacity planning
Assessment of external factors, knowledge management programmes
Proposal of changes in the utility at an organisational level
The business model development has taken into consideration all possible facets and has been validated
by each of the three utilities in India, Pakistan and Bhutan.
22
2 Global EV Market: Size, Outlook and Opportunities
2.1 Evolution
The first EV was built by Dr Ferdinand Porsche for an auto race in 1896. The fruits of the industrial revolution
were beginning to loom and people’s rising income and available technologies pushed individuals and
companies to experiment with nascent technologies with respect to newer forms of transport. At that point
in time, steam was a matured and majorly-used technology in automobiles. Electric powertrains were seen
in concept cars only for demonstrative purposes. Companies were beginning to consider electric cars as
the third alternative for transportation (after steam and horse-powered) owing to ease of driving (no gear-
changing), zero emissions and silent to drive. However, in the early 1900s, when the Ford Model T began
mass production, it sounded a death knell for electric car production. A Model T in 1912 cost $650 against
an EV that costed three times more at ~$1,750. Slowly, road networks began to improve and abundant
reserves of crude oil were discovered. This propelled rise in combustion engines globally and contributed
to the fall of EVs, at least for the next 50 years.
The oil crisis in the 1970s was the first big jolt to internal combustion cars, when supply of oil was curtailed
and prices skyrocketed following an embargo against the United States by the Organization of Petroleum
Exporting Countries (OPEC). This destabilised oil prices and the innate energy security of oil-procuring
nations. The US Congress passed the Electric and Hybrid Vehicle Research, Development, and
Demonstration Act, 1976, to support and seed-fund research and development in electric as well as hybrid
vehicles. Fast-forwarding 20 years, the passage of new federal and state policies by several countries
pertaining to protection of environment renewed interest among small and big automakers. Although fuel
prices bottomed in the 1990s, a rising middle class and booming economies caused a psychological shift
among consumers to fuel-efficient and cleaner vehicles. More and more consumers were ready to pay a
premium and adopt electric cars. The market was getting ready to take the next big leap in the automotive
industry.
2.2 Rise in Popularity
The Toyota Prius, launched in 1997, was the world’s first mass-produced hybrid electric vehicle. It became
a hit worldwide and achieved an aspirational stature among all, despite the high price. EV technologies
were still in their early stages of development and battery storage (the heart of an electric car) was still to
pick up. The Toyota Prius used a nickel metal hydride battery, a technology supported by the US energy
department’s research. In 2006, a small Silicon Valley start-up, Tesla Motors, announced that it would begin
producing luxury electric sports cars. Its first completely electric car, the Roadster, debuted in 2008 and
evinced immense interest among prospective buyers.
23
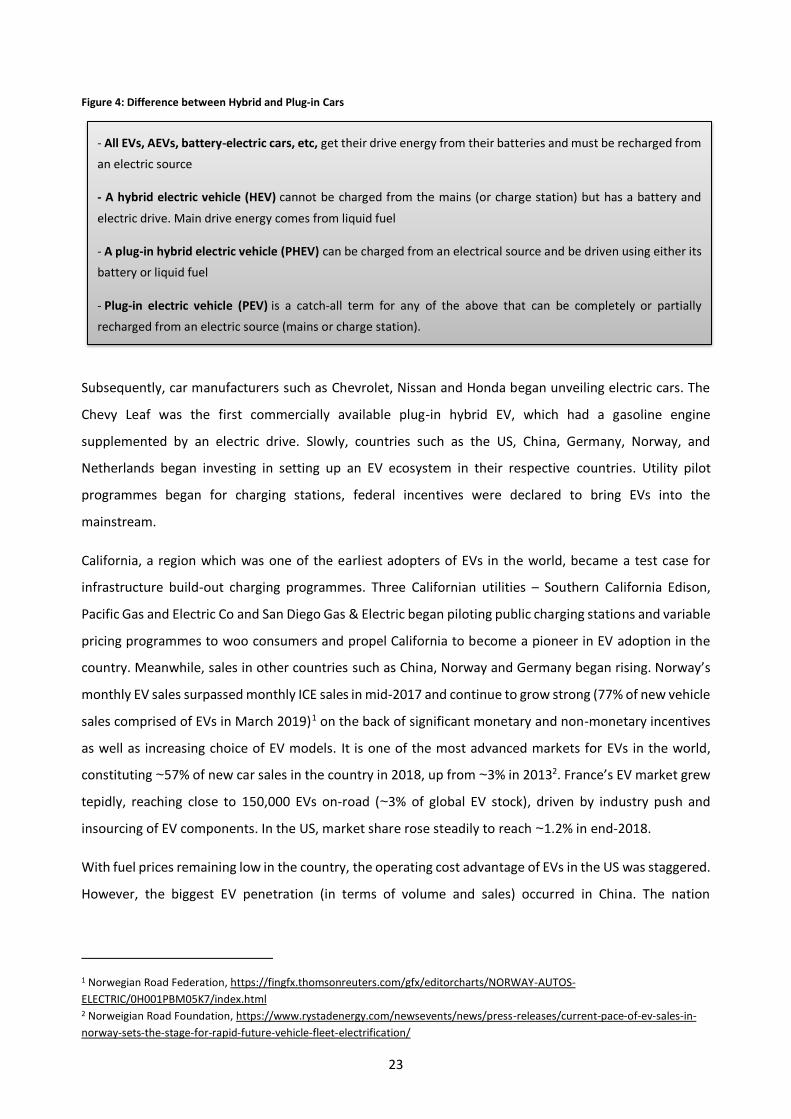
Figure 4: Difference between Hybrid and Plug-in Cars
Subsequently, car manufacturers such as Chevrolet, Nissan and Honda began unveiling electric cars. The
Chevy Leaf was the first commercially available plug-in hybrid EV, which had a gasoline engine
supplemented by an electric drive. Slowly, countries such as the US, China, Germany, Norway, and
Netherlands began investing in setting up an EV ecosystem in their respective countries. Utility pilot
programmes began for charging stations, federal incentives were declared to bring EVs into the
mainstream.
California, a region which was one of the earliest adopters of EVs in the world, became a test case for
infrastructure build-out charging programmes. Three Californian utilities – Southern California Edison,
Pacific Gas and Electric Co and San Diego Gas & Electric began piloting public charging stations and variable
pricing programmes to woo consumers and propel California to become a pioneer in EV adoption in the
country. Meanwhile, sales in other countries such as China, Norway and Germany began rising. Norway’s
monthly EV sales surpassed monthly ICE sales in mid-2017 and continue to grow strong (77% of new vehicle
sales comprised of EVs in March 2019)1 on the back of significant monetary and non-monetary incentives
as well as increasing choice of EV models. It is one of the most advanced markets for EVs in the world,
constituting ~57% of new car sales in the country in 2018, up from ~3% in 20132. France’s EV market grew
tepidly, reaching close to 150,000 EVs on-road (~3% of global EV stock), driven by industry push and
insourcing of EV components. In the US, market share rose steadily to reach ~1.2% in end-2018.
With fuel prices remaining low in the country, the operating cost advantage of EVs in the US was staggered.
However, the biggest EV penetration (in terms of volume and sales) occurred in China. The nation
1 Norwegian Road Federation, https://fingfx.thomsonreuters.com/gfx/editorcharts/NORWAY-AUTOS-
ELECTRIC/0H001PBM05K7/index.html 2 Norweigian Road Foundation, https://www.rystadenergy.com/newsevents/news/press-releases/current-pace-of-ev-sales-in-
norway-sets-the-stage-for-rapid-future-vehicle-fleet-electrification/
- All EVs, AEVs, battery-electric cars, etc, get their drive energy from their batteries and must be recharged from
an electric source
- A hybrid electric vehicle (HEV) cannot be charged from the mains (or charge station) but has a battery and
electric drive. Main drive energy comes from liquid fuel
- A plug-in hybrid electric vehicle (PHEV) can be charged from an electrical source and be driven using either its
battery or liquid fuel
- Plug-in electric vehicle (PEV) is a catch-all term for any of the above that can be completely or partially
recharged from an electric source (mains or charge station).

24
outperformed all other countries on both the market side (EV sales, available models, investment in
charging infrastructure) as well as the industry side (component manufacturing).
Figure 5: Global EV Fleet
Source: IEA
As of end-2018, the global stock of EVs surpassed 5 million, an increase of 63% (3.14 million in 2017) from
the previous year (IEA estimates). China led the deployment, accounting for ~45% of the electric car fleet,
followed by Europe (24%) and the US (22%).
2.3 Factors Driving the Change
Following are some of the factors driving the change towards:
1. Financial incentives: The rise in EV adoption is mainly governed by policy and regulations (federal and
state). Financial incentives such as vehicle registration, exemption of applicable taxes and free access
to toll roads are the most influential parameters. In Norway, EVs are exempt from acquisition tax,
value-added tax and enjoy privileges such as free ferry rides and free parking in some cities. In the UK,
government gives subsidies to buyers of EVs based on vehicle category. The amounts of grants for
different EV classes are given below:
0
1
2
3
4
5
6
2013 2014 2015 2016 2017 2018
mill
ions
China BEV China PHEV Europe BEV Europe PHEV
United States BEV United States PHEV Other BEV Other PHEV

25
Table 5: The Amounts of Grants for Different EV Classes in the UK
Category Name Basis of classification Grant
Car CO2 emissions of less than 50g/km and can travel at
least 112km (70 miles) without any emissions at all
35% of the purchase price for these
vehicles, up to a maximum of £3,500
Motorcycles The grant will pay for 20% of the purchase price for
these vehicles, up to a maximum of £1,500
20% of the purchase price for these
vehicles, up to a maximum of £1,500
Mopeds No CO2 emissions and can travel at least 30km (19
miles) between charges
20% of the purchase price for these
vehicles, up to a maximum of £1,500
Vans CO2 emissions of less than 75g/km and can travel at
least 16km (10 miles) without any emissions
20% of the purchase price for these
vehicles, up to a maximum of £8,000
Taxis
purpose-built taxis and have CO2 emissions of less than
50g/km and can travel at least 112km (70 miles)
without any emissions at all
20% of the purchase price for these
vehicles, up to a maximum of £7,500
Large vans and
trucks
CO2 emissions of at least 50% less than the equivalent
conventional Euro VI vehicle that can carry the same
capacity. They can travel at least 16km (10 miles)
without any emissions at all
For the first 200 orders the grant will pay
for 20% of the purchase price for these
vehicles, up to a maximum of £20,000.
The grant will then pay for 20% of the
purchase price for these vehicles, up to
a maximum of £8,000
Category 2 cars CO2 emissions of less than 50g/km and can travel at
least 16km (10 miles) without any emissions at all No plug-in grant
Category 3 cars CO2 emissions of 50 to 75g/km and can travel at least
32km (20 miles) without any emissions at all No plug-in grant
Source: Government of the UK
France has put in place purchase subsidies of 6,300 euros for EVs and 4,000 euros for plug-in hybrids
(only private car, van or specialized motor vehicle with CO2 emissions between 0 to 20 g are eligible),3
and a diesel scrappage plan with offers up to 2,500 euros for new plug-in hybrid and 3,700 euros for
new EVs while trading with an old diesel vehicle, aged over 13 years4. Germany introduced a purchase
incentive in 2016, earmarking 600 million pounds to rake up EV sales. In China, the national Electric
Vehicle Subsidy Program grants subsidies for purchase of EVs, depending on vehicle range, battery pack
size and energy efficiency.
3 European Alternative Fuels Observatory, https://www.eafo.eu/countries/france/1733/incentives 4 Economist Intelligence Unit, https://www.eiu.com/industry/article/1547321338/france-expands-diesel-car-scrappage-
scheme/2018-11-07

26
2. Fuel economy: Several economies have mandated fuel economy and emission regulations governing
the transport sector. With nations moving towards more stringent regulations (Euro 6 in the EU region,
BS-VI in India), vehicle manufacturers are incentivised to invest in emission-free EVs. The European
Union has stiff penalties under the 2021 emission reduction program to enable phase-out of
conventional, fossil fuel-driven vehicles. China has brought in stiff standards for electric two-wheelers
from April 2019, which will propel transition to Li-ion scooters from the more polluting lead-acid ones.
The UK has hinted at introducing congestion charges in more cities (Leeds, Birmingham, Derby) after
London and non-EVs are liable to pay higher charges than EVs. Several manufacturers across the globe
have come up with elaborate plans to move away from internal combustion engines and embrace EVs.
Table 6: Transition to Electric Cars by Major Manufacturers
Manufacturer Plans to Transition to Electric Fleet
General Motors • Plans to phase out petrol and diesel-powered engines, to have an “all-electric future”. No
timelines provided, however will introduce 20 EVs by 2023
Ford
• Created “Team Edison” to focus on research and development of electric cars. Pledged to
invest close to $4.5 billion over the next 5 years, starting from 2018 and aims to release 13
new all-electric models by 2023
VW Group • To invest $84 billion for EV development, with ~$60 billion for battery production. Plans to
offer close to 300 EVs (all electric and hybrid versions) by 2030
Volvo • Plans to electrify entire vehicle line-up by 2019, with five all-electric models to be rolled
out from 2019 to 2021
Renault, Nissan, Mitsubishi • The alliance intends to work jointly to develop new systems for use in upcoming EV lines.
Plans to release 12 EVs by 2022
Daimler (parent company
of Mercedes-Benz)
• To invest $1 billion in Alabama plant for production of all-electric SUVs and a battery
facility. A total of $10 billion shall be infused in EV development. Plans to electrify its
complete portfolio by 2022, offering 50 electric and hybrid models
Toyota and Mazda • Jointly develop EV technology for use in future electric models. Pledged $1.6 billion to build
a plant in the US, dedicated to development of electric and hybrid vehicles
Source: Company disclosures
3. Customer demand: EVs being offered today come with a gamut of features: performance, quiet ride,
low running cost, unique exterior and interior styling. This technological progress has instilled trust
among customers to make a jump from conventional vehicles to EVs. Rise in disposable income,
improvement in ancillary services (charging infrastructure, flexible power rates) and the associated
status quotient of owning an EV has pushed down the stratum of EVs from being “elusive” to
“aspirational”.
27
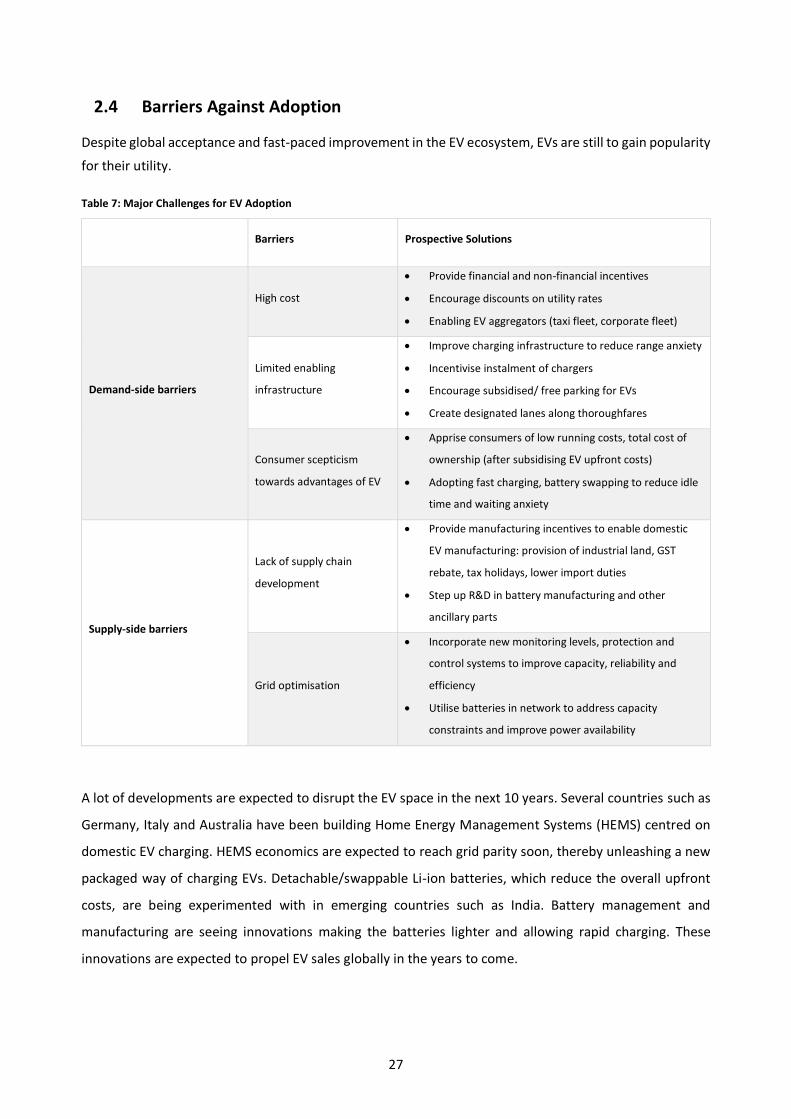
2.4 Barriers Against Adoption
Despite global acceptance and fast-paced improvement in the EV ecosystem, EVs are still to gain popularity
for their utility.
Table 7: Major Challenges for EV Adoption
Barriers Prospective Solutions
Demand-side barriers
High cost
• Provide financial and non-financial incentives
• Encourage discounts on utility rates
• Enabling EV aggregators (taxi fleet, corporate fleet)
Limited enabling
infrastructure
• Improve charging infrastructure to reduce range anxiety
• Incentivise instalment of chargers
• Encourage subsidised/ free parking for EVs
• Create designated lanes along thoroughfares
Consumer scepticism
towards advantages of EV
• Apprise consumers of low running costs, total cost of
ownership (after subsidising EV upfront costs)
• Adopting fast charging, battery swapping to reduce idle
time and waiting anxiety
Supply-side barriers
Lack of supply chain
development
• Provide manufacturing incentives to enable domestic
EV manufacturing: provision of industrial land, GST
rebate, tax holidays, lower import duties
• Step up R&D in battery manufacturing and other
ancillary parts
Grid optimisation
• Incorporate new monitoring levels, protection and
control systems to improve capacity, reliability and
efficiency
• Utilise batteries in network to address capacity
constraints and improve power availability
A lot of developments are expected to disrupt the EV space in the next 10 years. Several countries such as
Germany, Italy and Australia have been building Home Energy Management Systems (HEMS) centred on
domestic EV charging. HEMS economics are expected to reach grid parity soon, thereby unleashing a new
packaged way of charging EVs. Detachable/swappable Li-ion batteries, which reduce the overall upfront
costs, are being experimented with in emerging countries such as India. Battery management and
manufacturing are seeing innovations making the batteries lighter and allowing rapid charging. These
innovations are expected to propel EV sales globally in the years to come.

28
3 Evolution of Battery Technologies and Chemistries
Battery technologies play a pivotal role in delivering advancements in several industries, from power
storage to EVs. The fast growth of the EV market is hinged on the development of new battery technologies
that help make more efficient and advanced vehicle powertrains. There are three major groups of EVs in
the market – hybrid EVs (HEVs), plug-in HEVs (PHEVs), full electric vehicles (EVs). HEVs are just like
conventional ICE vehicles in which the propulsion systems are connected with electro motors, driven by
batteries that charge through regenerative braking. A PHEV has a battery that can be charged through an
external electricity source and also by its on-board engine and generator. Full EVs rely solely on electricity
for charging. The batteries used in these three classes of vehicles vary owing to difference in degree of
reliability on on-board battery systems.
Table 8: Battery Chemistries Required Across Different EV Segments
EV Class Power Density Charging time Lifecycle
HEV High Extremely short Long
PHEV Medium Short Of less concern
Full EV High Short Long
There are majorly three types of batteries used in EVs now.
1. Lead acid batteries
2. Nickel metal hydride (NiMH batteries)
3. Li-ion batteries
While lead acid and NiMH batteries are mature technologies, these types were originally used in early EVs.
Lead acid batteries are heavy due to poor specific energy (34 Wh/kg) and are relatively inexpensive at
present. NiMH batteries are considered superior, due to higher specific energy (68 Wh/ kg), leading to
lighter weight and lesser energy costs. However, due to low charging efficiencies and self-discharge
properties (can discharge up to 12.5% per day under normal room temperature conditions), NiMH batteries
have not been able to become mainstream.
Lithium ion (li-ion) batteries are now considered to be the standard for all modern EVs. Owing to
advantages such as good specific gravity (140 Wh/kg), energy density and a low self-discharge rate (~5%
per month), it has longer life and faster charging capabilities. There are several types of li-ion batteries,
each having different characteristics and chemistries. Each combination has their own advantages and
disadvantages in terms of cost, performance, safety and other parameters. The most prominent li-ion

29
battery technologies used in automobiles are lithium-nickel-cobalt-aluminium (NCA), lithium-nickel-
manganese-cobalt (NMC), lithium-manganese-spinel (LMO), lithium titanate (LTO) and lithium iron
phosphate (LFP).
Table 9: Battery Technologies Across Different Li-ion Battery Packs
Li-ion Battery Technologies Specific Energy
(Wh/ kg) Charge Rate Cycle Life Thermal Runaway
NCA 200-260 0.7C 500 150°C
NMC 150–220 0.7–1C 1000–2000 210°C
LMO 100–150 0.7–1C typical, 3C
maximum 300–700 250°C
LTO 50–80 1C typical; 5C
maximum 3,000–7,000
One of safest Li-ion
batteries
LFP 90–120 1C typical 2000 and higher 270°C
Source: Energy Materials Industrial Research Initiative (EMIRI) Report
Although there is no single pertinent li-ion battery technology prevalent today, manufacturers design
batteries keeping in mind five major trade-offs: a) Specific energy, which is the capacity of storing energy
per kilogram of weight; b) specific power, which is the amount of power that batteries can deliver per
kilogram of mass; c) performance, which means endurance of a battery during extreme climates and
difficult terrains; d) life span; and e) cost.
Table 10: Trade-offs of Five Principal Li-ion Battery Technologies
Specific Energy Specific Power Performance Life Span Cost per watt-hour
NCA High High Moderate-High High Moderate
NMC High Moderate-High Moderate-High Moderate-High Moderate-High
LMO Moderate-High Moderate-High Moderate Moderate Moderate-High
LTO Moderate Moderate-High High High Low
LFP Moderate Moderate-High Moderate-High High Moderate-High
Li-ion is expected to be the battery technology that will prevail at least for the next one decade. However,
it is very likely that new and better li-ion generations will emerge in the meantime.
30
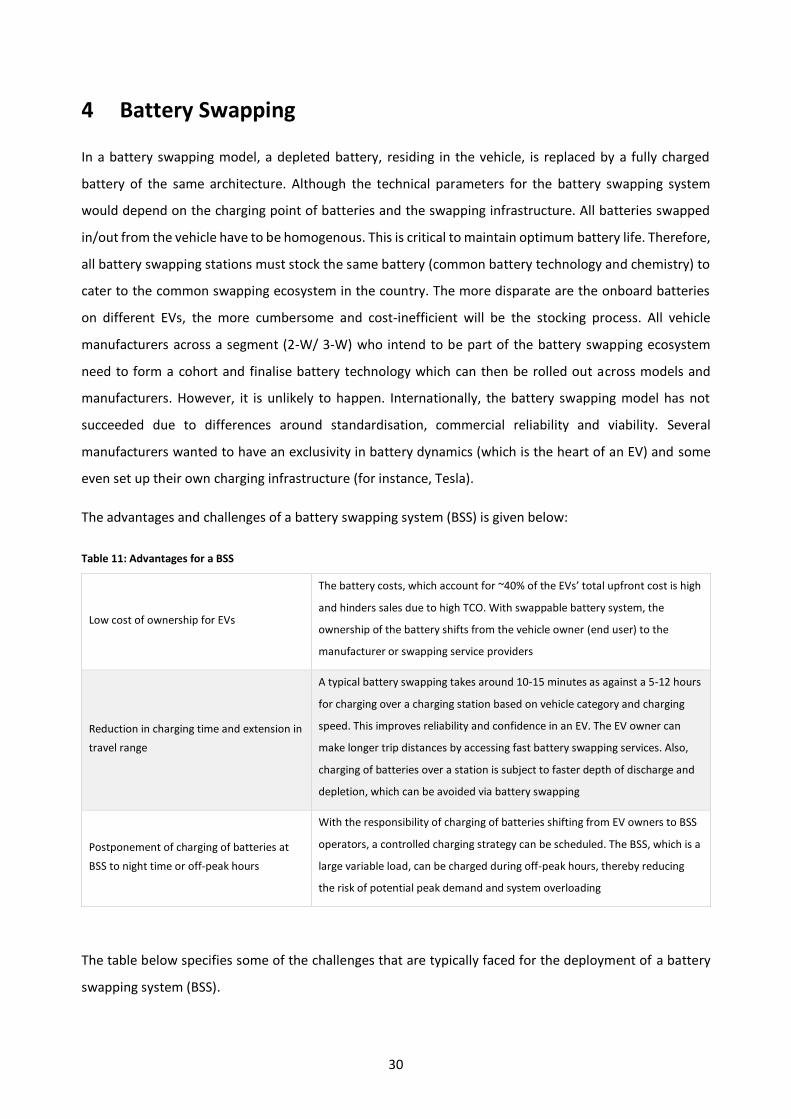
4 Battery Swapping
In a battery swapping model, a depleted battery, residing in the vehicle, is replaced by a fully charged
battery of the same architecture. Although the technical parameters for the battery swapping system
would depend on the charging point of batteries and the swapping infrastructure. All batteries swapped
in/out from the vehicle have to be homogenous. This is critical to maintain optimum battery life. Therefore,
all battery swapping stations must stock the same battery (common battery technology and chemistry) to
cater to the common swapping ecosystem in the country. The more disparate are the onboard batteries
on different EVs, the more cumbersome and cost-inefficient will be the stocking process. All vehicle
manufacturers across a segment (2-W/ 3-W) who intend to be part of the battery swapping ecosystem
need to form a cohort and finalise battery technology which can then be rolled out across models and
manufacturers. However, it is unlikely to happen. Internationally, the battery swapping model has not
succeeded due to differences around standardisation, commercial reliability and viability. Several
manufacturers wanted to have an exclusivity in battery dynamics (which is the heart of an EV) and some
even set up their own charging infrastructure (for instance, Tesla).
The advantages and challenges of a battery swapping system (BSS) is given below:
Table 11: Advantages for a BSS
Low cost of ownership for EVs
The battery costs, which account for ~40% of the EVs’ total upfront cost is high
and hinders sales due to high TCO. With swappable battery system, the
ownership of the battery shifts from the vehicle owner (end user) to the
manufacturer or swapping service providers
Reduction in charging time and extension in
travel range
A typical battery swapping takes around 10-15 minutes as against a 5-12 hours
for charging over a charging station based on vehicle category and charging
speed. This improves reliability and confidence in an EV. The EV owner can
make longer trip distances by accessing fast battery swapping services. Also,
charging of batteries over a station is subject to faster depth of discharge and
depletion, which can be avoided via battery swapping
Postponement of charging of batteries at
BSS to night time or off-peak hours
With the responsibility of charging of batteries shifting from EV owners to BSS
operators, a controlled charging strategy can be scheduled. The BSS, which is a
large variable load, can be charged during off-peak hours, thereby reducing
the risk of potential peak demand and system overloading
The table below specifies some of the challenges that are typically faced for the deployment of a battery
swapping system (BSS).

31
Table 12: Challenges for Deployment of BSS
Standardisation of EV li-ion battery packs
It has not yet happened globally. Majority of the auto OEMs prefer to keep
tight control over their design strategies of battery packs as it is at the core of
an EV
Reliability of leased/ rented battery packs
In case of a BSS, the auto manufacturer sells/ leases/ rents batteries to the BSS
operator. However, the authenticity of the BSS operator, in terms of customer
service, is questionable. Any short change, on behalf of the operator, will lead
to loss of credibity and trust
Commercially viable business models
Governments in SAARC Member States (SMS) have not given any clarity on
policy with respect to battery swapping in the country. There is no precedence
of commercially sound business models for battery swapping as well. This
leaves significant risk and uncertainty

32
5 Global EV Charging Standards
An EV can be charged through AC (alternate current) or DC (direct current) charging devices. The battery
of an EV requires DC, therefore a DC charger can be directly plugged into the vehicle to initiate charging.
Alternatively, the vehicle can be connected to an AC charger where the input AC supply is converted to DC
using an on-board AC-DC converter. The time required to charge an EV through AC charging depends on
the single-phase AC output (220 V standard for India and 120 V for the US), current rating of the charger
and output rating of the AC-DC converter. For example, a 220 V AC, 15 Amperes supply will lead to AC
output of 3.3 kW, which subsequently connected to an EV with a 10 kW on-board battery pack through an
AC-DC converter of output 1 kW DC will take 10 hours to fully charge the battery. On the other hand, DC
fast chargers (DCFC) have higher power output and charge an EV battery much faster due to loss aversion
in the AC-DC converter side.
Typically, there are different types of AC and DC chargers with different communication protocols. It is
important that the battery pack in the vehicle communicate with the charger (irrespective of type and
protocol) through a “handshake” mechanism. The different chargers and protocols being followed for EV
charging are as follows:
Table 13: Chargers and Protocols for EV Charging
Charger Type Geographical Usage Maximum Power Output and
Communication Protocols
A. AC Chargers
Type 1 with Yazaki Socket Japan, USA Up to 7.4 kW
Type 2 with Mennekes Socket Europe (majorly Germany) Up to 44 kW
Type 3 with Le Grand Socket France, Italy Up to 22 kW
B. DC Chargers
CHAdeMO Originated in Japan, most popular DC
charger globally, used in US and Europe
Up to 400 kW DC charging; Control Area
Network (CAN) for communication
GB/T China, Bharat Chargers in India Up to 237.5 kW DC charging; CAN for
communication
Tesla Super Charger The US and Europe wherever Tesla cars
are sold in large numbers
Up to 135 kW DC charging; CAN for
communication
C. Combined (AC and DC) Chargers
Combined charging system (CCS)
CCS-1 and CCS-2 versions are available -
the same plug is used for both AC and
DC charging; used majorly in Europe
Up to 43 kW AC and up to 400 kW DC
(1000 Volt x 400 Amp); Power Line
Communication (PLC) for
communication

33
Japan and Korea have adopted CHAdeMO, Europe has adopted CCS, while US has all four types of DC
chargers. Many EV manufacturers sell adapters to connect to other chargers (Nissan Leaf is sold with CCS
adapters in Europe and Tesla sells CHAdeMo adapters) to improve interoperability.
The charging standards for EVSE not only take into consideration charging stations and communication
protocol between EV and stations, but also include an entire gamut of ancillary services. The complete
scope of standards is shown below:
Figure 6: Various Charging Standards for EVSE
Note: IEC: International Electrotechnical Committee, OCPP: Oper Charge Point Protocol, OSCP: Open Smart Charging Protocol, OCHP: Opern Clearing House Protocol, OICP: Open Inter Change Protocol, eMIP: eMobility Inter-Operation Protocol
The standards discussed earlier pertain to standards and communication protocol between points A and B,
i.e. the EV and the charging station which sits outside the system and provides DC/ AC as per configuration.
Part 24 of IS 17017 or IEC 15118 pertains to digital communication systems over ethernet protocol.
The OCPP or IEC 63110 pertains to the communation protocol between B and C, i.e. the charging station
and the charging management system (CMS). Considering the charging station (B) to be an internet of
things (IoT) device, there is an embedded controller inside the charging station which communicates with
a CMS system, which in turn communicates with several other IoT-enabled charging stations. The entire
mesh of stations communicates through OCPP/ IEC 63100 with the CMS, drawing power from the grid or
transacting with the grid utility. While OCPP is an open source protocol, IEC 63100 takes into consideration
several security measures such as cyber security to ensure over-the-air secure contracting. The
communication between B to C gives the utility direct control over all charging stations remotely.
Communication protocols such as OSCP, OCHP, nOICP and eMIP enable communication between a CMS
and other market makers. Protocols can be used for data gathering (charging profiles of EVs, time of use,
and peer to peer communication between market players such as clearing house and grid operators). This
will help the utility manage the load by monitoring important parameters such as degree of power drawl,

34
degree of stress in the local sub station, etc. Through digital communication channels with the stations,
grid support functions (load management/ tariff-based controls for peak shaving) can be implemented.
Further, by enabling energy flow from EV to the grid during peak period, demand-side response as well as
smart charging can be enabled, building an ecosystem for vehicle to grid (V2G).
Globally, there are no universal charging standards for EVs. Europe defines four charging modes; each
mode varying in power rating, type of connection (AC/DC) and charging speeds. They are illustrated below:
Table 14: Modes of EV Charging in Europe
Mode 1: Household socket and extension cord
⚫ Vehicle is connected through standard three-pin
socket in residences
⚫ Charger in vehicle converts AC to DC and controls
battery charging
⚫ Allows for a maximum power delivery of 11A
Usability: Small motorcycles, electric bicycles
Mode 2 : Non-dedicated socket with cable-incorporated protection device
⚫ Connected to power grid through household
socket outlets
⚫ Deploys an adapter in charging cable to improve
reliability
⚫ Charging is done in a single-phase or three-phase
network and installation of an earthing cable
Usability: Transitional solution before mode 3 was
mainstreamed
Mode 3 : Fixed, dedicated circuit socket
⚫ Connected to electrical network thorugh specific
socket, plug and dedicated circuit
⚫ Maximum power output is 7.4 kW in a single phase
and 22 kW in three phases
Usability: Recommended day-to-day AC charging
method
Mode 4: DC connection
⚫ Charging done in DC through an off-board charger,
allowing the system to withstand high power
⚫ Maximum power output is 50 kW for CHAdeMO,
120 kW for Tesla and 350 kW for CCS
Usability: Commercial fast charging stations

35
Additionally, advanced EV charging methods like pulse charging, inductive charging (uses an
electromagnetic field to transfer electricity to a PEV without a cord) are being used.
The US, on the other hand, classifies standards of EVSEs based on charging power output, commonly known
as “levels”.
Table 15: Levels of EV Charging in the US
Level 1 Level 2 Level 3
Outlet Standard High voltage circuit Very high voltage circuit
and three-phase power
Type of charging AC AC DC
Maximum power range (kW) 1.4 19.2 90
Voltage rating (V) 120 240 480V and above
While levels 1 and 2 are for charging through a single-phase voltage in residential and commercial buildings,
level 3 charging is through three-phase voltage, via AC or DC.
China has adopted its own charging standards - GB/T - which is capable of fast charging at a maximum of
237.5 kW. The country is working on a new GB/T standard which will be made available in 2019/2020.
Furthermore, China is working with the CHAdeMO network to jointly develop an ultra fast charging
standard.
The type of charging requirements for a vehicle is mainly driven by the vehicle architecture, i.e. the battery
size and chemistry, and these are explained in the table below:
Table 16: Typical Battery Sizes and Number of Charges Requirement According to Vehicle Type
Vehicle Type
Battery Size Vehicle
Efficiency
Avg. km
Run km per Charge No of Charges Required
kWh/vehicle km/kWh km/day km/charge charges/year
e-2W 1.5 50 20 60 120
e-3W 4.5 20 100 70 515
e-4W (personal) 15 8 40 100 144
e-4W (fleet) 15 8 200 100 720
e-Bus (intra city) 120 1 200 100 720
An e-2W will require charging every three days, whereas a commercial e-4W and an e-bus will require
charging thrice every day.
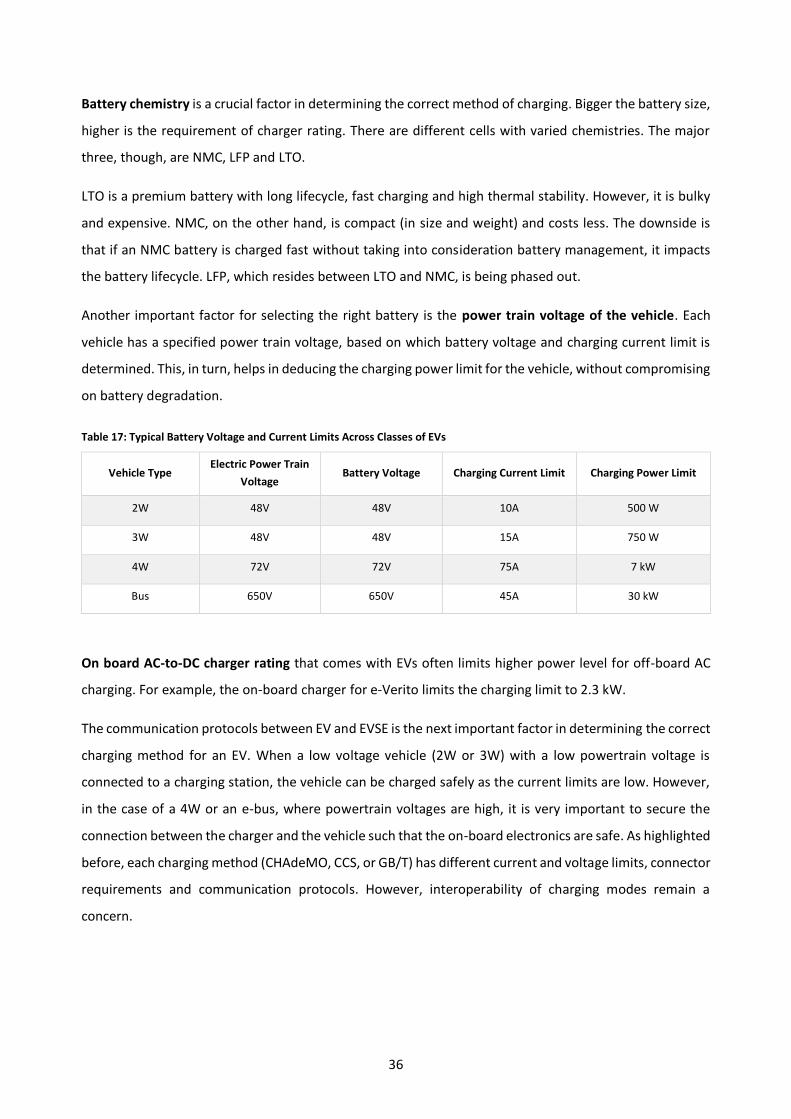
36
Battery chemistry is a crucial factor in determining the correct method of charging. Bigger the battery size,
higher is the requirement of charger rating. There are different cells with varied chemistries. The major
three, though, are NMC, LFP and LTO.
LTO is a premium battery with long lifecycle, fast charging and high thermal stability. However, it is bulky
and expensive. NMC, on the other hand, is compact (in size and weight) and costs less. The downside is
that if an NMC battery is charged fast without taking into consideration battery management, it impacts
the battery lifecycle. LFP, which resides between LTO and NMC, is being phased out.
Another important factor for selecting the right battery is the power train voltage of the vehicle. Each
vehicle has a specified power train voltage, based on which battery voltage and charging current limit is
determined. This, in turn, helps in deducing the charging power limit for the vehicle, without compromising
on battery degradation.
Table 17: Typical Battery Voltage and Current Limits Across Classes of EVs
Vehicle Type Electric Power Train
Voltage Battery Voltage Charging Current Limit Charging Power Limit
2W 48V 48V 10A 500 W
3W 48V 48V 15A 750 W
4W 72V 72V 75A 7 kW
Bus 650V 650V 45A 30 kW
On board AC-to-DC charger rating that comes with EVs often limits higher power level for off-board AC
charging. For example, the on-board charger for e-Verito limits the charging limit to 2.3 kW.
The communication protocols between EV and EVSE is the next important factor in determining the correct
charging method for an EV. When a low voltage vehicle (2W or 3W) with a low powertrain voltage is
connected to a charging station, the vehicle can be charged safely as the current limits are low. However,
in the case of a 4W or an e-bus, where powertrain voltages are high, it is very important to secure the
connection between the charger and the vehicle such that the on-board electronics are safe. As highlighted
before, each charging method (CHAdeMO, CCS, or GB/T) has different current and voltage limits, connector
requirements and communication protocols. However, interoperability of charging modes remain a
concern.
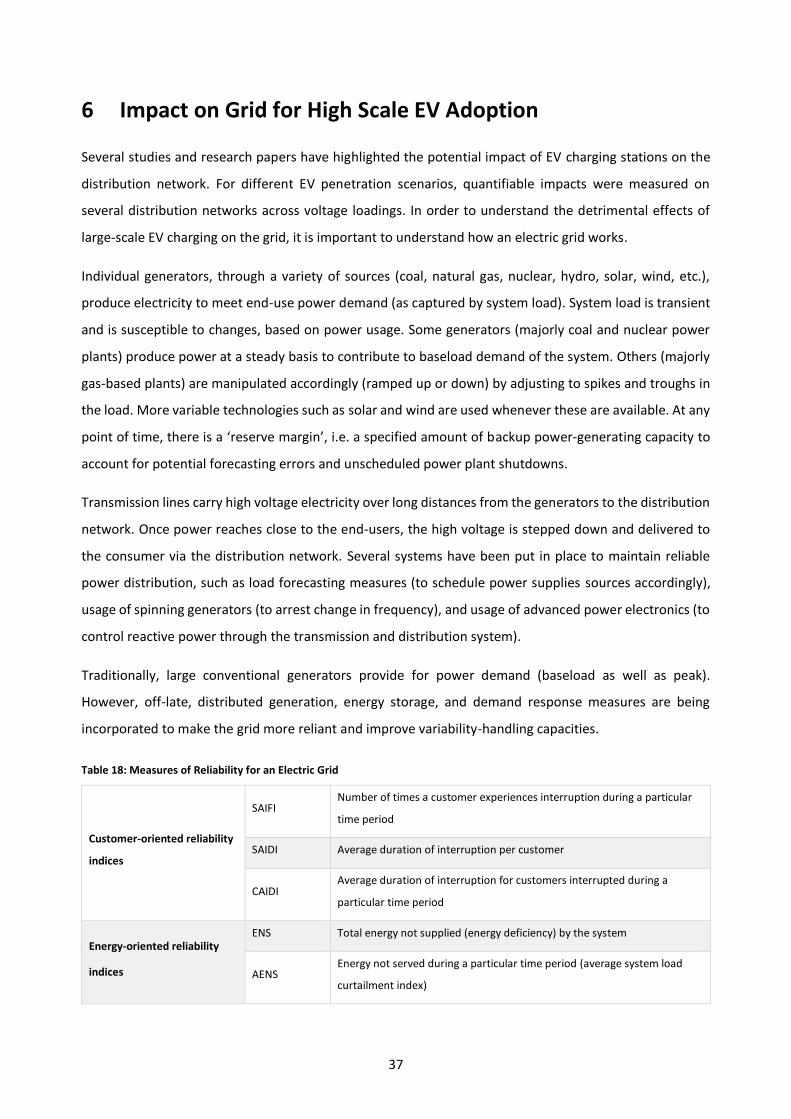
37
6 Impact on Grid for High Scale EV Adoption
Several studies and research papers have highlighted the potential impact of EV charging stations on the
distribution network. For different EV penetration scenarios, quantifiable impacts were measured on
several distribution networks across voltage loadings. In order to understand the detrimental effects of
large-scale EV charging on the grid, it is important to understand how an electric grid works.
Individual generators, through a variety of sources (coal, natural gas, nuclear, hydro, solar, wind, etc.),
produce electricity to meet end-use power demand (as captured by system load). System load is transient
and is susceptible to changes, based on power usage. Some generators (majorly coal and nuclear power
plants) produce power at a steady basis to contribute to baseload demand of the system. Others (majorly
gas-based plants) are manipulated accordingly (ramped up or down) by adjusting to spikes and troughs in
the load. More variable technologies such as solar and wind are used whenever these are available. At any
point of time, there is a ‘reserve margin’, i.e. a specified amount of backup power-generating capacity to
account for potential forecasting errors and unscheduled power plant shutdowns.
Transmission lines carry high voltage electricity over long distances from the generators to the distribution
network. Once power reaches close to the end-users, the high voltage is stepped down and delivered to
the consumer via the distribution network. Several systems have been put in place to maintain reliable
power distribution, such as load forecasting measures (to schedule power supplies sources accordingly),
usage of spinning generators (to arrest change in frequency), and usage of advanced power electronics (to
control reactive power through the transmission and distribution system).
Traditionally, large conventional generators provide for power demand (baseload as well as peak).
However, off-late, distributed generation, energy storage, and demand response measures are being
incorporated to make the grid more reliant and improve variability-handling capacities.
Table 18: Measures of Reliability for an Electric Grid
Customer-oriented reliability
indices
SAIFI Number of times a customer experiences interruption during a particular
time period
SAIDI Average duration of interruption per customer
CAIDI Average duration of interruption for customers interrupted during a
particular time period
Energy-oriented reliability
indices
ENS Total energy not supplied (energy deficiency) by the system
AENS Energy not served during a particular time period (average system load
curtailment index)

38
The typical charging load profile for a 15 kWh Li-ion car battery using AC-001 and DC-001 chargers are
shown below. The AC charger uses a 3.3 kW charger and requires ~five hours to charge, whereas a DC
charger uses a 15 kW charger and requires less than two hours.
The AC mode is a constant current charging where power continuously keeps rising, after which the power
settles during a settling time period. The impact of the charging method will be a 3.3 kW charging load on
the peak load for a duration of five hours. In case of the DC mode, the battery is charged to ~80% in one
hour, and the peak contributed by the charging is ~15 kW.
Therefore, depending on individual chargers, load profiles, and voltage and current profiles, peak
contribution will vary. When aggregated across different vehicles and different chargers deployed at
different time periods over a day, the load contribution from EV chargers in a region can be deduced at a
regional grid level.
The major consequences of uncoordinated charging of EVs are:
• Distortion of voltage profile
• Change in system harmonics
• Increase/ change in peak load behaviour
Forum of Regulators (India) had assessed the impact on a transformer due to charging of EVs (slow as well
as fast charging). Several scenario-based analyses were carried out through system simulation over a period
of 24 hours.
In order to simulate a system of varying sizes, two sets of inductance and resistance parameters were
selected. Set one consisted of a small network of renewable energy generators located within 5 km from a
diesel generator located within 1 km from the point of demand. Set two had generators located at different
points, with a wind generator located farthest at 25 km from the load.
The major scenarios and output results have been tabulated below:

39
Table 19: Scenarios Pertaining to Residential Load
Case 1 (slow charging) Case 2 (Fast DC
Charging)
Case 3 (Fast DC
Charging)
Case 4 (Fast DC
Charging)
Impedance Impedance values from Set
2
- Impedance values
from set 1
Impedance values
from set 2
Baseline Residential load (10 kW) Residential load (10
kW)
Residential load (10
kW)
Residential load (10
kW)
Scenario 1 Baseline load + 0.66 MW
EV load (24 kWh battery
capacity, 100 EVs)
Baseline load + 4 MW
EV load (85 kWh
battery capacity)
Baseline load + 4 MW
EV load (85 kWh
battery capacity)
Varying EV and
residential loads
Scenario 2 Baseline load + 0.66 MW
EV load (85 kWh battery
capacity, 100 EVs)
Baseline load + 8 MW
EV load (85 kWh
battery capacity)
Baseline load + 8 MW
EV load (85 kWh
battery capacity)
Scenario 3 Baseline load + 1.32 MW
EV load (24 kWh battery
capacity, 200 EVs)
Baseline load + 8 MW
EV load (24 kWh
battery capacity)
Baseline load + 8 MW
EV load (24 kWh
battery capacity)
Scenario 4 Baseline load + 1.32 MW
EV load (85 kWh battery
capacity, 200 EVs)
Baseline load + 4 MW
EV load (24 kWh
battery capacity)
Baseline load + 4 MW
EV load (24 kWh
battery capacity)
Scenario 5
(Peak coincident
charging)
- - Baseline load + 4 MW
EV load (85 kWh
battery capacity)
-
Source: Forum of Regulators (India)
For a commercial feeder, the impact of EVs on the distribution network was assessed on a transformer with
95% loading. The commercial load was also simulated for two power ratings of 6.6 kW and 40 kW with two
battery capacities of 24 kWh and 85 kWh.
Table 20: Scenarios Pertaining to Commercial Load
Case 1 (No Impedance) Case 2 (Set 1 Impedance)
Baseline Commercial load (10 MW) Commercial load (10 MW)
Scenario 6 Baseline + EV load (4 MW 85 kWh) Baseline + EV load (4 MW 85 kWh)
Scenario 7 Baseline + EV load (0.66 MW 24 kWh)
Scenario 8 Baseline + EV load (0.66 MW 85 kWh)
Source: Forum of Regulators (India)

40
Table 21: Outcome Pertaining to Residential Load
Case 1 Case 2 Case 3
Scenario 1
Voltage drop (%) 0.013% 1.70% 1.60%
Rise in maximum demand (%) -0.08% 16% 13%
Scenario 2
Voltage drop (%) 0.002% 2.20% 2.00%
Rise in maximum demand (%) 0.15% 39% 36%
Scenario 3
Voltage drop (%) -0.006% 2.20% 1.80%
Rise in maximum demand (%) 0.72% 36% 35%
Scenario 4
Voltage drop (%) 0.002% 1.70% 1.50%
Rise in maximum demand (%) 1.64% 12% 11%
Scenario 5
Voltage drop (%) 11.7%
Rise in maximum demand (%) 38.6%
Note: Scenario where distortion in voltage was greater than 6% has been highlighted in red
Source: Forum of Regulators (India)
For cases 1, 2 and 3, the residential load was kept constant at 10 kW. For Case 4, EV load was varied from
4 MW to 20 MW, and residential load was varied from 4 MW to 20 MW.
The results are as follows:
Table 22: Voltage Drop and Increase in Peak Demand with Change in EV Load
Residential Load (MW) Voltage Drop Increase in Max. Demand
4 8 12 4 8 12
Ele
ctri
c ve
hic
le lo
ad
(MW
)
4 1.036% 0.465% 2.374% 36% 16% 13%
8 1.196% 1.913% 5.043% 85% 36% 27%
12 2.323% 3.672% 8.69% 139% 57% 41%
16 3.130% 5.304% 12.67% 153% 65% 52%
Note: Scenarios where distortions in voltage were greater than 6% have been highlighted in red
Source: Forum of Regulators (India)
With the model being simulated on a commercial load of 10 MW, an EV load of 4 MW (40 kW rated capacity
charger) was used for Scenario 6 and 0.66 MW (6.6 kW rated capacity charger) was used for simulation.

41
Table 23: Outcome Pertaining to Commercial Load
Scenarios Parameters Case 1 Case 2
Scenario 6 Voltage drop (%) 0.64% 0.66%
Rise in max. demand (%) 36% 23%
Scenario 7 Voltage drop (%) - 0.56%
Rise in max. demand (%) - 1.31%
Scenario 8 Voltage drop (%) - 0.56%
Rise in max. demand (%) - 1.31%
Note: Scenario where distortions in voltage were greater than 6% has been highlighted in red
Source: Forum of Regulators (India)
6.1 Outcome of the Study
Allowable variations on supply of low voltage is +6% to -6%. In residential feeders, on several occasions,
the voltage drops surpassed 6%. It was observed that for transformers with less than 50% baseline load,
rise in ~20% of EV load will not lead to voltage deviations beyond allowable limits. For transformer loadings
beyond 90%, occurrences of transient fluctuations rise significantly. Slow charging does not have any
adverse impact on any of the feeders. However, DC fast charging causes significant rise in peak loads and
drop in voltage levels.

42
7 Considerations for Selecting EV Charging Locations
The key factor for setting up a charging station is usability of the station. There have been several research
studies conducted to assess the key elements for determining charging station locations in a geographical
area. The major determinants for planning a charging network vary on type of geographical area under
consideration.
Station planning for a metropolitan area would follow a node-based approach, whereas areas on major
inter-city thoroughfares could use a flow-based approach.
Metropolitan regions serve as congregation of EVs, where charging demands are at the origin or the
destination for intra-city travel. Therefore, node-based planning uses the origination-destination (OD)
approach, where charging stations are strategically placed to optimise usage emanating from intra-city
travel (which constitutes majority of travel behaviour in a city). Flow-based approach, on the other hand,
is suited for station planning at a state level. This entails mapping of major inter-city highways and
expressways passing through the region and subsequently assessing the traffic demand across the routes.
Upcoming industrial and commercial clusters, and development of smart cities along a road corridor are
major considerations while forecasting incremental traffic. The approach is equivalent to planning of
pumping stations along a highway.
The major differences between the two approaches are:
Table 24: Modalities of Node and Flow-based Approaches
Parameters Node-based Approach Flow-based Approach
Usability Cities, metropolitan regions At state level, excluding cities
Charging demand type Origination-Destination Top-ups between origination-
destination
Major determinants Number of EVs in the city Traffic volume passing through the
area
Considerations for location planning Major residential and commercial
areas, parking availability
Traffic demand on highways, node
spacing in transportation network
7.1 Number and Types of Stations Needed
Demand-side planning to assess the number of PCS within a geographical area will take into consideration:
• Static EV population in an area: Assessment of end-use demand of charging is paramount in
planning the trunk infrastructure. This needs to take into consideration average miles driven by an

43
EV, average time to recharge, and travel behaviour of EV owners (used for short intra-city trips/
long duration trips)
• Floating EV population in an area: A commercial hotspot of a city attracts vehicles far more than
the static EV population of the region. This necessitates additional charging requirement
• Charging behaviour of EV buyers: While majority of the charging (~95%) in the US is done at home
and office, the presence of PCS provides psychological comfort to EV owners. Hence, the degree of
charging via PCS needs to be objectively deduced before planning for the same. The number of PCS
per EV also starkly varies between geographies, ranging from five in Europe to ~40 in China. This
shows variation in usage of PCS among countries
Once the average charging demand and, therefore, the aggregate PCS is determined, site and location
planning are key determinants to assess a station’s business viability.

44
8 Country in Focus: Bhutan
8.1 Present EV Sales and Charging Infrastructure
The government of Bhutan introduced electric vehicles (EVs) in the country in 2013 in keeping with its
policy to remain carbon neutral and reduce import of fossil fuel. Since then, the government has offered
fiscal incentives, devised policy regulations, and set up quick charging (QC) stations with free charging
where the users need not pay to charge their EVs. However, the uptake of the EVs has been rather slow.
According to the record maintained by the Road Safety and Transport Authority (RSTA) of Bhutan, there
are only 102 EVs in the country as of June 2019.
Table 25: Growth in EVs in Bhutan
Year Total Vehicles
2013 7
2014 7
2015 7
2016 97
2017 93
2018 93
2019 102
Source: RSTA, 2019
All the EVs in Bhutan are in capital Thimphu and Paro. For 102 EVs, there are four quick charging stations,
two each in both the cities. It is assumed that all the EV owners have home chargers (HCs) which enable
charging of the vehicle at home. In Thimphu, the QCs are located at Bhutan Post and memorial Chorten.
The existing QC is CHAdEMO for the Nissan Leaf model. There are three models of EVs available in the
country – the Nissan Leaf, Mahindra Rewa and Mitsubishi Outlander (PHEV). The Rewa and Outlander do
not have specific QC model of their own and uses CHAdEMO. The government plans to install eight more
QCs in core Thimphu in 2019. Bhutan is expected to have 10 QCs in Thimphu and two in Paro by the end of
2019.

45
Figure 7: Installation Points of Existing and Proposed QCs in Thimphu
8.2 Regulations and Federal Policies Driving EV Adoption
The Royal Government of Bhutan, in an endeavour to push EV sales, has not imposed any taxes on EVs. The
existing taxes on different classes of vehicles are as follows:
Table 26: Taxes Levied on Vehicle Categories in Bhutan
Vehicle Category Taxes Levied
Light vehicles below 1,500 cc 100% tax (45% customs duty, 45% sales tax, and 10% green tax)
1,500cc – 1,799cc 115%
1,799 – 2,500 cc 120%
2,500cc – 3,000 cc 125%
Above 3,000 cc 180%
EV 0%
Hybrid vehicles up to 1,500 cc 45% (20% customs duty, 20% sales tax, and 5% green tax)
Hybrid vehicles greater than 1,500 cc 50%
Source: Income tax Act of Bhutan

46
Moreover, the Bhutan Sustainable Low-emission Urban Transport System project offers subsidy of $5,500
for EVs. The total tax on hybrid vehicles increases by 5% for higher engine capacity.
The following are some of the government policies:
• Bhutan’s Vision 2020, a 20-year strategy for national development, places transport and
infrastructure development at the core of its strategy and, inter alia, highlights the need for the
development of a safe, reliable and comfortable system of public transport. A national strategy and
action plan for low carbon development has been prepared, which seeks to reduce GHG emission
significantly – by 15% by 2040, which is on top of the expected decrease of 8% in the business-as-
usual scenario
• Bhutan National Transport Policy 2017 seeks to provide “the entire population with a safe, reliable,
affordable, convenient, cost-effective and environment-friendly transport system in support of
strategies for socio-economic development”5. The policy supports the principles of inclusiveness,
sustainability, sound asset management, effective governance and an emphasis on low carbon
transport solutions such as EVs
• The Nationally Determined Contribution (NDC) submitted in 2015 affirmed the government’s
target of remaining carbon neutral pledged in 2009 at the 15th session of the United Nations
Framework Convention on Climate Change (UNFCCC). The NDC notes that the emissions from the
transport sector are showing a rapidly increasing trend and identifies the promotion of low carbon
transport system as a key mitigation measure. Bhutan’s First National Communication (2000) and
Second National Communication (2011) to the UNFCCC both report significant contributions of the
energy sector to the national GHG emissions. Options for the transport sector included promotion
of alternative fuels, electric and hybrid technologies and mass transport systems
• The 11th Five-Year Plan (2013-2018) includes ‘carbon neutral/green and climate resilient
development’ as one of its 16 key results and the plan envisages the introduction of eco-friendly,
safe, reliable, affordable and alternative modes of transport. The draft 12th Five-Year Plan (2019-
2024) also identifies promotion of EVs as one of the key programmes of the transport sector to
address environmental issues and reduce dependency on fossil fuels, and contribute to national
key results, such as remaining carbon neutral and enhancing climate and disaster resilient
development
• In order to establish clean, safe and affordable and reliable mass transportation systems, the
Economic Development Policy (EDP) 2017 explicitly recommends the introduction of an
5 MoIC, “National Transport Policy 2017”, Second draft, Ministry of Information and Communication, Royal Government of
Bhutan, 2017.
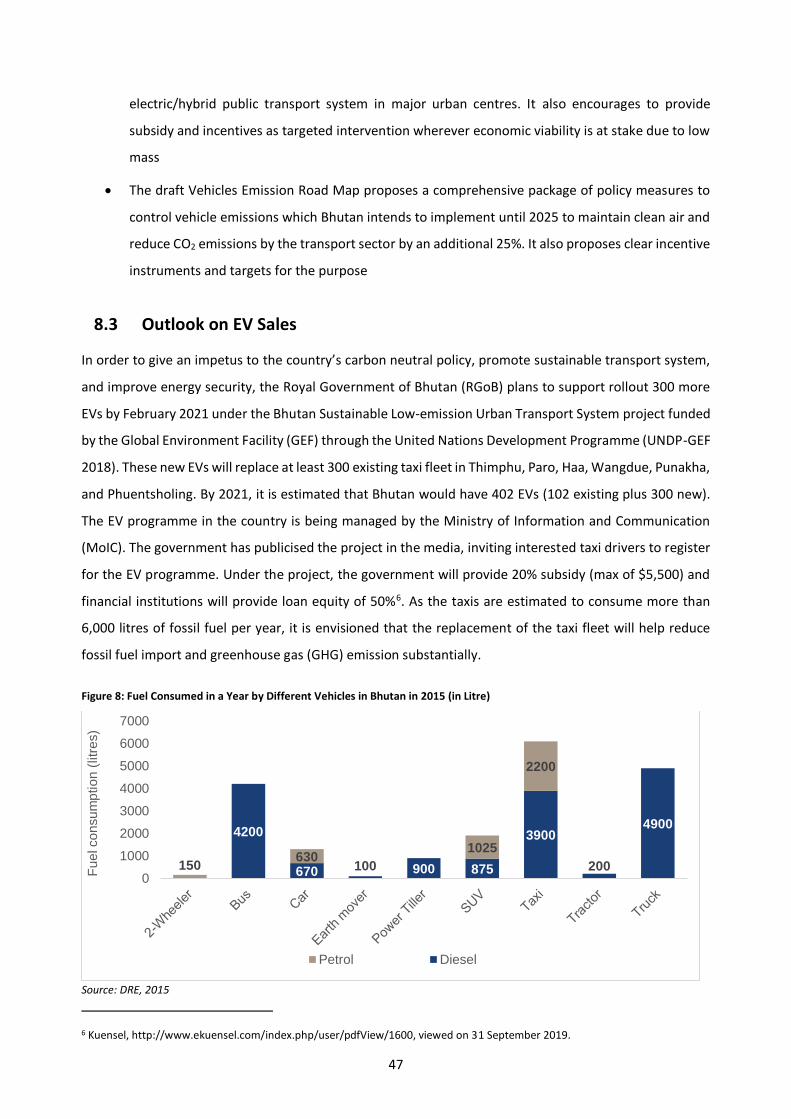
47
electric/hybrid public transport system in major urban centres. It also encourages to provide
subsidy and incentives as targeted intervention wherever economic viability is at stake due to low
mass
• The draft Vehicles Emission Road Map proposes a comprehensive package of policy measures to
control vehicle emissions which Bhutan intends to implement until 2025 to maintain clean air and
reduce CO2 emissions by the transport sector by an additional 25%. It also proposes clear incentive
instruments and targets for the purpose
8.3 Outlook on EV Sales
In order to give an impetus to the country’s carbon neutral policy, promote sustainable transport system,
and improve energy security, the Royal Government of Bhutan (RGoB) plans to support rollout 300 more
EVs by February 2021 under the Bhutan Sustainable Low-emission Urban Transport System project funded
by the Global Environment Facility (GEF) through the United Nations Development Programme (UNDP-GEF
2018). These new EVs will replace at least 300 existing taxi fleet in Thimphu, Paro, Haa, Wangdue, Punakha,
and Phuentsholing. By 2021, it is estimated that Bhutan would have 402 EVs (102 existing plus 300 new).
The EV programme in the country is being managed by the Ministry of Information and Communication
(MoIC). The government has publicised the project in the media, inviting interested taxi drivers to register
for the EV programme. Under the project, the government will provide 20% subsidy (max of $5,500) and
financial institutions will provide loan equity of 50%6. As the taxis are estimated to consume more than
6,000 litres of fossil fuel per year, it is envisioned that the replacement of the taxi fleet will help reduce
fossil fuel import and greenhouse gas (GHG) emission substantially.
Figure 8: Fuel Consumed in a Year by Different Vehicles in Bhutan in 2015 (in Litre)
Source: DRE, 2015
6 Kuensel, http://www.ekuensel.com/index.php/user/pdfView/1600, viewed on 31 September 2019.
4200
670 100 900 875
3900
200
4900
150630
1025
2200
0
1000
2000
3000
4000
5000
6000
7000
Fu
el co
nsu
mp
tio
n (
litr
es)
Petrol Diesel

48
Two scenarios were considered while estimating the number of EVs likely to be added over 2022-30 – low
uptake and high uptake. In the low uptake scenario, it was assumed the EVs will clock 10% compounded
annual growth rate (CAGR) and in high uptake 20% CAGR. The forecast is based on the following
assumptions and limitations:
• CAGR of 10% was based on the historical growth rate of vehicles over 2013-2018
• The forecast includes both replacement and new vehicle registrations
• The government continues to support with financial subsidy/tax rebate and policy regulations to
make EVs affordable to general public
• Vehicle fuel price is steadily increasing and there is no subsidy on fossil fuel
• There are adequate and easily accessible public electric vehicle charging stations (EVCS) and the
EV users do not face operational challenges
• The country’s GDP is steadily rising and people can afford and are willing to switch over from
conventional vehicles to EVs
• There are enough and willing takers for EVs
Table 27: Forecast of EVs in Bhutan
Year Low Uptake High Uptake
2022 442 482
2023 486 579
2024 535 695
2025 589 834
2026 647 1000
2027 712 1200
2028 783 1440
2029 862 1729
2030 948 2074
8.4 Assessment of Power Distribution Utilities
8.4.1 Country Macros and Policy Frameworks Guiding Utilities’ Overall Performance
Bhutan is a small country in South Asia, sandwiched between China and India in the Himalayas. Because of
its geographical location, it is endowed with huge hydropower potential. Only about 2.335 GW of the total
24 GW potential is utilised till date. The generating stations are managed by Druk Green Power Corporation

49
(DGPC). The Bhutan Power Corporation Ltd (BPC) is the operator of the transmission and distribution
network. The transmission network is interconnected with the Indian grid for exporting power to Indian
states.
Currently, power is transmitted across the country mostly through 132 kV and 66 kV transmission lines.
More high voltage transmission lines are expected to come up by 2020. These lines have the potential to
reduce the losses incurred. Around 59% of the lines in the country are 132 kV and 30% 220 kV. The 400 kV
lines were established in 2015 and they transmit power from Tala hydropower station to Malbase and Pagli
which is interconnected with Indian grid for exporting power to India. The transmission and distribution
network is not only indicative of the access to electricity but also serves to demonstrate the probable loss
in the system. Longer lines with lower voltage can lead to greater losses in the system. There are very few
high voltage lines except Tala-Malbase and Tala-Pugli. Setting up high voltage lines across the country is a
challenge due to the difficult terrain. Reaching some of the less populated pockets is highly cost-intensive.
Economically, it is more feasible for those regions to generate power through pico, micro, mini and small
hydel projects or through other stand-alone renewable resources such as solar and wind.
BPC was formed as an offshoot of the erstwhile Department of Power, the then Ministry of Trade and
Industry and was launched as a public utility on July 1, 2002. The corporatisation of the utility was expected
to result in greater efficiency and better delivery of services in the power sector. Later the ownership of
BPC was transferred to Druk Holding and Investment Ltd (DHI), the commercial arm of the government
established through the Royal Charter in 2007 “to hold and manage the existing and future investments of
the Royal Government for the long-term benefit of the people of Bhutan”.
DGPC is a company that operates and maintains hydropower assets of Bhutan. It was established in January
2008 by merging the three hydropower corporations of Basochhu, Chhukha, and Kurichhu under DHI. Tala
was merged with DGPC in 2009. Since then, DGPC has grown significantly. Bhutan’s current hydropower
installed capacity is 1,615 MW. With about 70% of the generated energy exported to India, hydropower
revenue forms 27% of the country’s exchequer and offsets much of the balance of payments with India.
The sector accounts for about 13% of the country’s gross domestic product. The total electric power
generation amounted to 6,573.990 million units (MU) in 2018. The net energy exported to India, including
the royalty7 energy, was 4,053.588 MU. The quantum of electricity supplied to BPC for domestic use was
2,454.306 MU. The national coincidental peak load during the year was 399.35 MW.
7 Basochhu, Chhukha, Kurichhu, and Tala hydropower plants which are fully owned by the RGoB have to provide 15% of the
annual generation as royalty energy to RGoB free of charge.
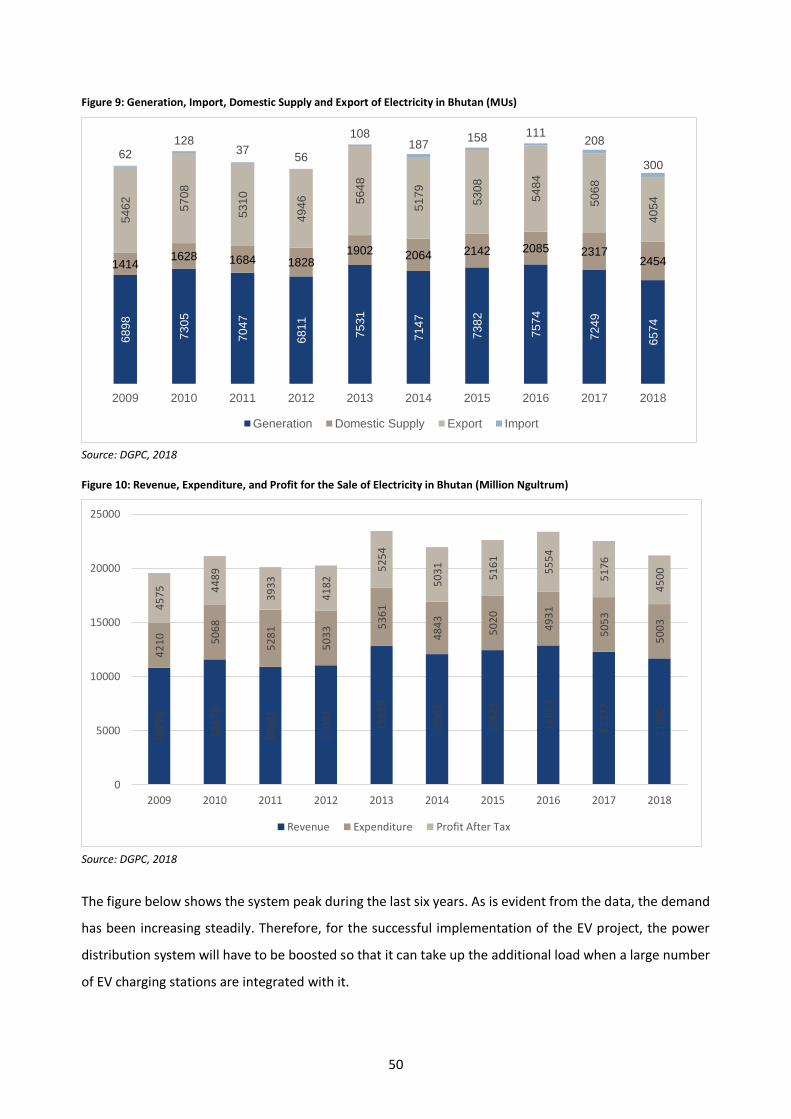
50
Figure 9: Generation, Import, Domestic Supply and Export of Electricity in Bhutan (MUs)
Source: DGPC, 2018
Figure 10: Revenue, Expenditure, and Profit for the Sale of Electricity in Bhutan (Million Ngultrum)
Source: DGPC, 2018
The figure below shows the system peak during the last six years. As is evident from the data, the demand
has been increasing steadily. Therefore, for the successful implementation of the EV project, the power
distribution system will have to be boosted so that it can take up the additional load when a large number
of EV charging stations are integrated with it.
6898
7305
7047
6811
7531
7147
7382
7574
7249
6574
14141628 1684 1828
1902 2064 2142 2085 23172454
5462
5708
5310
4946 5648
5179
5308
5484
5068
4054
62128
3756
108187
158 111208
300
2009 2010 2011 2012 2013 2014 2015 2016 2017 2018
Generation Domestic Supply Export Import
10
77
9
11
57
8
10
88
1
11
03
1
12
81
9
12
06
2
12
42
3
12
88
3
12
27
7
11
68
2
42
10 50
68
52
81
50
33 5
36
1
48
43
50
20
49
31
50
53
50
03
45
75 44
89
39
33
41
82
52
54
50
31
51
61
55
54
51
76
45
00
0
5000
10000
15000
20000
25000
2009 2010 2011 2012 2013 2014 2015 2016 2017 2018
Revenue Expenditure Profit After Tax

51
Figure 11: System Peak Demand in Bhutan
Source: NSB, 2018 and BPC, 2018
The domestic demand for electricity has been steady and the peak demand recorded was 399.35 MW on
December 27, 2018, at 1818 hours. The second highest was 362.09 MW recorded November 14, 2017 at
1900 hours. BPC’s customers are categorised as high voltage (HV), medium voltage (MV), low voltage bulk
(LV bulk) and low voltage (LV) customers. The 16 HV customers remained same in 2017 and 2018.
Meanwhile, its MV customers increased from 59 in 2017 to 63 in 2018 and LV bulk reduced from 778 to
775. The company has seen steady increase in LV customers over the years even after completion of major
Renewable Energy (RE) programs. The LV customers increased from 184,277 in 2017 to 191,998 in 2018,
an addition of 7,722 customers. BPC today serves more than 192,852 customers in the country. The
increase was mostly a result of electrification of rural homes through continuing RE programs.
In order to meet the domestic demand for electricity, 2.5 GWh of energy was purchased from DGPC in the
year 2018 compared with 2,326.384 MU in the previous year. The internal generation from embedded mini
and micro hydel plants owned by the company, including generation from diesel generation sets was 19.24
MU during the year 2018. BPC also imported 0.064 MU from Assam State Electricity Board (ASEB) and 0.258
MU from West Bengal State Electricity Board (WBSEB).
The total sale during the year 2018 was 2,328.44 MU, up 6.5% from 2,185.75 MU in the previous year. The
energy wheeled for export to India for DGPC decreased to 4,437.920 MU from 5,306.564 MU in the
previous year largely due to lower power generation by DGPC and some increase in domestic consumption.
BPC has been maintaining its transmission and distribution (T&D) losses in limits comparable within the
region. Of the total energy of 6,919.03 MU received by the system during the year 2018, 6,766.36 MU was
utilised. This translates the global energy loss for the year 2018 to 2.21% compared with 2.00% in the
313.94333.41 336.52 335.87
362.09
399.35
0
100
200
300
400
500
2013 2014 2015 2016 2017 2018
Pe
ak d
em
an
d (
MW
)

52
previous year. The domestic T&D loss (excluding wheeling) in 2018 was 6.15% compared with 6.54% in
2017. The company has been able to maintain its losses within permissible limits due to timely preventive
and planned maintenance and up gradation of its network system.
The total value of the company’s assets increased to Nu. 30,056.79 million from Nu. 28,964.16 million in
2017. There is a decrease in the net worth of the company from Nu. 22,984.53 in the previous year to Nu.
21,965.80 million in 2018 due to adjustments in investment reserved on transfer of Dungsam Cement
Corporation Ltd. shares to DHI. The gross assets added during the year are Nu. 3,583.70 million compared
with Nu.1,262.49 million in 2017.
In order to improve power reliability and, most importantly, to meet the increasing demand, distribution
planning and system expansion are carried out across the country whenever required. The expansion of
the primary distribution system is usually carried out as turnkey projects. Some of the noticeable works
carried in the current year are the supply and construction of 33/11kv, 2 x 5MVA GIS substation at
Tshongdue, Paro and the upgradation of 33/11 kV, 1x2.5 MV AIS substation to 2x2.5 MVA GIS substation,
Phobjikha, Wangduephodrang. Some of the new projects in progress are the supply and construction of
33/11kV, 2x2.5MVA substation at Denchi, Pemagatshel, and conversion of 33kV AIS to GIS Panels at
33/11kV Changangkha Substation, Thimphu.
8.4.2 Shortlisted Utility
In Bhutan, the sole distribution utility, BPC was selected for detailed study and development of roadmap
of EV charging infrastructure in the country.
8.5 Planning for the Transition
8.5.1 Charging Standards
Broadly, there are two types of EV chargers – the conventional charger or the home chargers, usually
attached to the residential buildings, and QCs, located at the charging station. The type and standard of EV
chargers vary with the region where it is used. There are three recommended QCs for EVs – combined
charging system (CCS), CHAdeMO, surface vehicle recommended (SAE) combined charging system. For the
convenience of EV owners, slow charger such as the home charger and on-board chargers are equipped
with the vehicles so that the user can charge at home or at the workplace. The quick charger takes about
20-30 minutes while the home charger takes three-four hours.
Based on the specification of the EVs currently plying in Bhutan and proposed EV taxi project funded by the
UNDP-GEF, it is recommended to have either CCS Combo-2 QC or CHAdeMO fast DC chargers. During the
course of this study, we talked to a few taxi drivers and also drivers who used EVs in the past. One of the
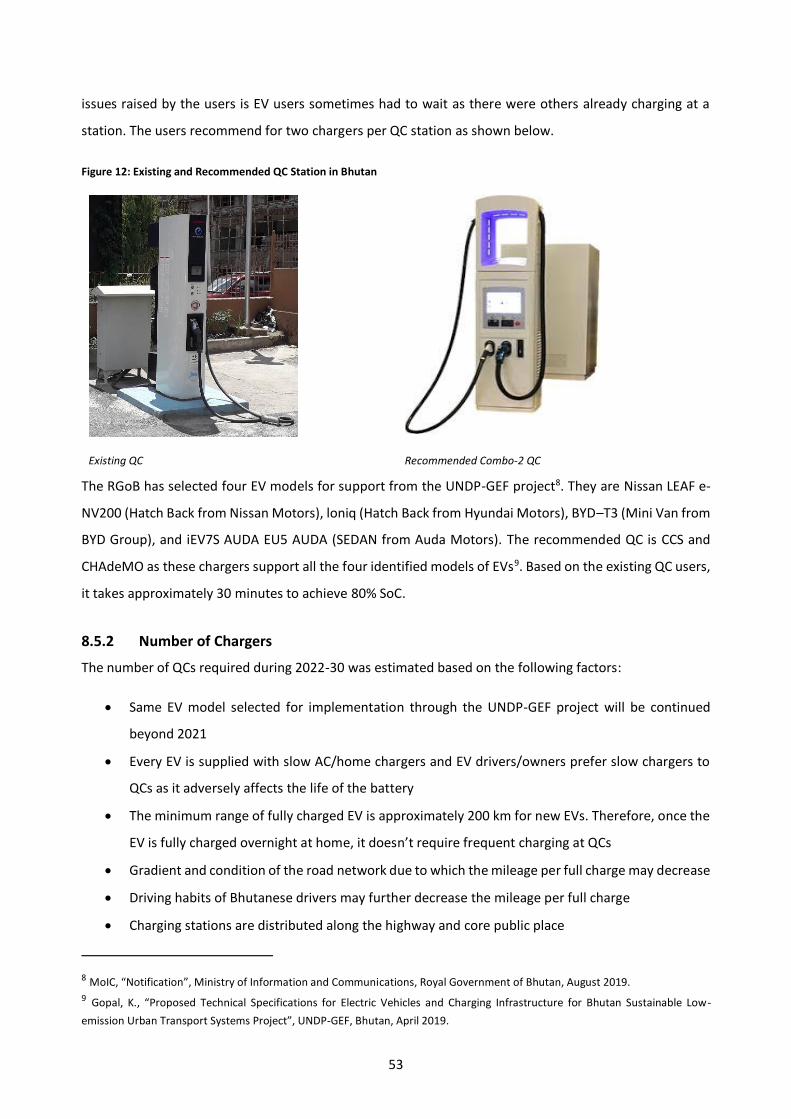
53
issues raised by the users is EV users sometimes had to wait as there were others already charging at a
station. The users recommend for two chargers per QC station as shown below.
Figure 12: Existing and Recommended QC Station in Bhutan
Existing QC Recommended Combo-2 QC
The RGoB has selected four EV models for support from the UNDP-GEF project8. They are Nissan LEAF e-
NV200 (Hatch Back from Nissan Motors), loniq (Hatch Back from Hyundai Motors), BYD–T3 (Mini Van from
BYD Group), and iEV7S AUDA EU5 AUDA (SEDAN from Auda Motors). The recommended QC is CCS and
CHAdeMO as these chargers support all the four identified models of EVs9. Based on the existing QC users,
it takes approximately 30 minutes to achieve 80% SoC.
8.5.2 Number of Chargers
The number of QCs required during 2022-30 was estimated based on the following factors:
• Same EV model selected for implementation through the UNDP-GEF project will be continued
beyond 2021
• Every EV is supplied with slow AC/home chargers and EV drivers/owners prefer slow chargers to
QCs as it adversely affects the life of the battery
• The minimum range of fully charged EV is approximately 200 km for new EVs. Therefore, once the
EV is fully charged overnight at home, it doesn’t require frequent charging at QCs
• Gradient and condition of the road network due to which the mileage per full charge may decrease
• Driving habits of Bhutanese drivers may further decrease the mileage per full charge
• Charging stations are distributed along the highway and core public place
8 MoIC, “Notification”, Ministry of Information and Communications, Royal Government of Bhutan, August 2019.
9 Gopal, K., “Proposed Technical Specifications for Electric Vehicles and Charging Infrastructure for Bhutan Sustainable Low-
emission Urban Transport Systems Project”, UNDP-GEF, Bhutan, April 2019.
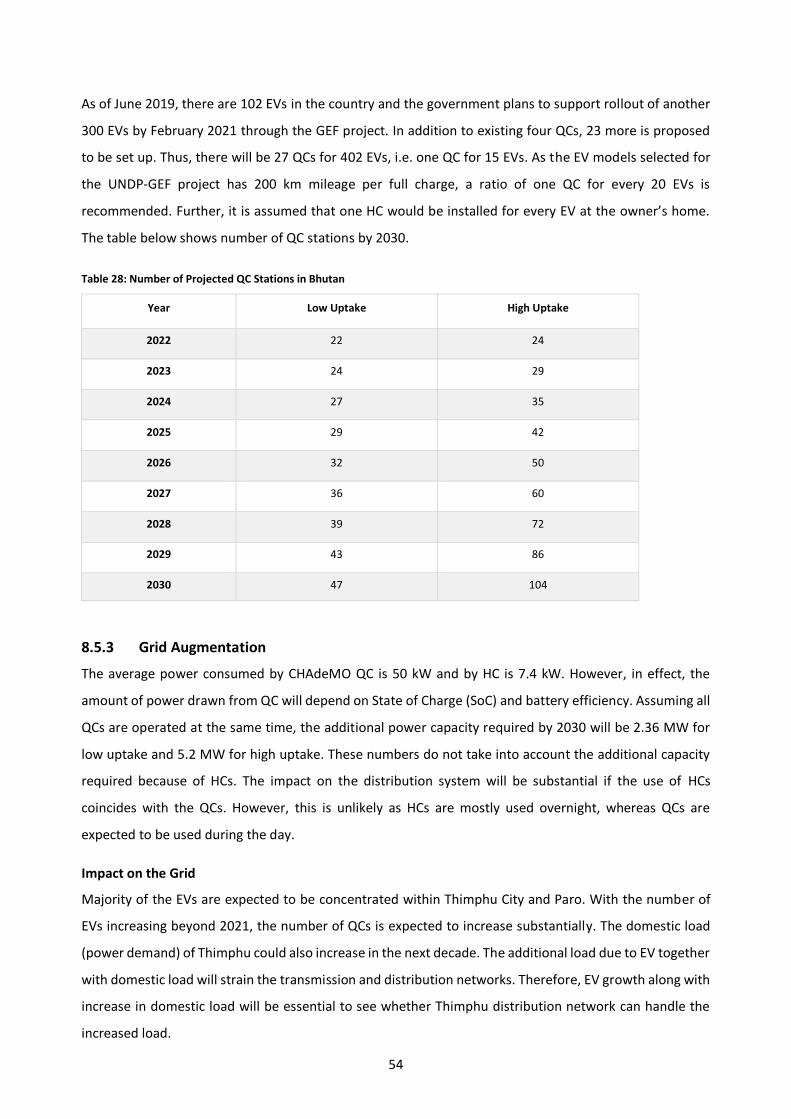
54
As of June 2019, there are 102 EVs in the country and the government plans to support rollout of another
300 EVs by February 2021 through the GEF project. In addition to existing four QCs, 23 more is proposed
to be set up. Thus, there will be 27 QCs for 402 EVs, i.e. one QC for 15 EVs. As the EV models selected for
the UNDP-GEF project has 200 km mileage per full charge, a ratio of one QC for every 20 EVs is
recommended. Further, it is assumed that one HC would be installed for every EV at the owner’s home.
The table below shows number of QC stations by 2030.
Table 28: Number of Projected QC Stations in Bhutan
Year Low Uptake High Uptake
2022 22 24
2023 24 29
2024 27 35
2025 29 42
2026 32 50
2027 36 60
2028 39 72
2029 43 86
2030 47 104
8.5.3 Grid Augmentation
The average power consumed by CHAdeMO QC is 50 kW and by HC is 7.4 kW. However, in effect, the
amount of power drawn from QC will depend on State of Charge (SoC) and battery efficiency. Assuming all
QCs are operated at the same time, the additional power capacity required by 2030 will be 2.36 MW for
low uptake and 5.2 MW for high uptake. These numbers do not take into account the additional capacity
required because of HCs. The impact on the distribution system will be substantial if the use of HCs
coincides with the QCs. However, this is unlikely as HCs are mostly used overnight, whereas QCs are
expected to be used during the day.
Impact on the Grid
Majority of the EVs are expected to be concentrated within Thimphu City and Paro. With the number of
EVs increasing beyond 2021, the number of QCs is expected to increase substantially. The domestic load
(power demand) of Thimphu could also increase in the next decade. The additional load due to EV together
with domestic load will strain the transmission and distribution networks. Therefore, EV growth along with
increase in domestic load will be essential to see whether Thimphu distribution network can handle the
increased load.
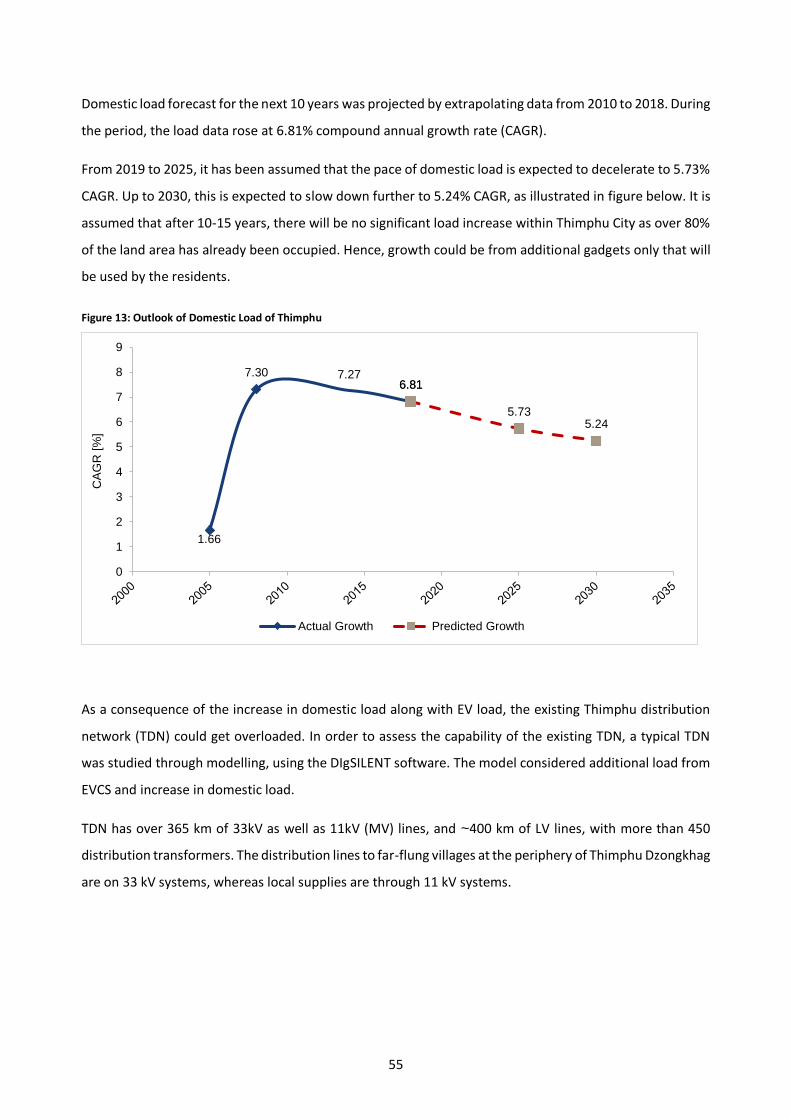
55
Domestic load forecast for the next 10 years was projected by extrapolating data from 2010 to 2018. During
the period, the load data rose at 6.81% compound annual growth rate (CAGR).
From 2019 to 2025, it has been assumed that the pace of domestic load is expected to decelerate to 5.73%
CAGR. Up to 2030, this is expected to slow down further to 5.24% CAGR, as illustrated in figure below. It is
assumed that after 10-15 years, there will be no significant load increase within Thimphu City as over 80%
of the land area has already been occupied. Hence, growth could be from additional gadgets only that will
be used by the residents.
Figure 13: Outlook of Domestic Load of Thimphu
As a consequence of the increase in domestic load along with EV load, the existing Thimphu distribution
network (TDN) could get overloaded. In order to assess the capability of the existing TDN, a typical TDN
was studied through modelling, using the DIgSILENT software. The model considered additional load from
EVCS and increase in domestic load.
TDN has over 365 km of 33kV as well as 11kV (MV) lines, and ~400 km of LV lines, with more than 450
distribution transformers. The distribution lines to far-flung villages at the periphery of Thimphu Dzongkhag
are on 33 kV systems, whereas local supplies are through 11 kV systems.
1.66
7.30 7.276.816.81
5.735.24
0
1
2
3
4
5
6
7
8
9
CA
GR
[%
]
Actual Growth Predicted Growth

56
Figure 14: Overview of 33 kV Thimphu Distribution Network
Steady-state stability study is normally conducted to ensure that the systems are running at optimal
efficiency and satisfying the demand of customers, without overloading the lines and equipment. Stability
studies were conducted to confirm the health of the power elements, such as the voltage profiles, and the
status of loading of each transmission and distribution lines, and transformers in various operating
conditions.
Power flow studies are useful in selecting the right equipment, such as transformers and switchgear, and
selecting the capacity of conductors and cables. These studies are essential before any major investment
decisions are taken to assess economic viability. Voltage instability is caused by increase in load demand of
end-users (demand for reactive power) or change in the system conditions that lead to uncontrollable
voltage drop.
TDN was modelled in DIgSILENT Power Factory software. Figure 10 shows a single line diagram of 33/11 kV
ring network, which represents the main supply source for 11 kV outgoing feeders. Existing loads as well
as QCs up to 2030 were considered in the model. The assessment was conducted for worst-case scenario,
where all QCs are assumed to be operated simultaneously. Under status quo, i.e., up to 2021 (with 402
EVs), there is no impact on TDN, and there is no need for a contingency plan.

57
Figure 15: Single Line Diagram of 33 kV Ring Network of Thimphu
Low-Scale Adoption
Under this scenario, the voltage at Motithang and Royal Insurance Corporation of Bhutan (RICB)
substations will drop below the permitted level of 0.95 per unit (p.u), as illustrated in Figure 11. This can
be corrected by connecting one 0.96 mega volt amps (reactive) (MVAr) capacitor bank for Motithang
substation and a 3.84 MVAr for the RICB substation.
Figure 16: Voltage Profile Before & After Compensation with Shunt Capacitors (Low Uptake Level)
The revised voltage at each substation after connecting the capacitor banks is shown in table below. By
connecting one 0.96 MVAr capacitor bank at Motithang substation, its voltage could be improved from
0.95 p.u. to 0.97 p.u. Similarly, by connecting one 3.84 MVAr capacitor bank at the RICB substation, its
voltage could be improved from 0.95 p.u. to 0.99 p.u.
0.980.97
0.960.98
0.95 0.95
0.990.98
0.98 0.980.98
0.99
0.970.99
0.99 0.99
0.7
0.8
0.9
1
Babesa Chubachu DPH L/Phu Motithang RICB D/Choling TMH
Voltage [p.u
]
Before compensation After compensation

58
Table 29: Voltage Compensation Requirement for Each Substation for Low Uptake Level (2030)
Substation Shunt Compensator Voltage [p.u]
Remarks No [Mvar] Before After
Babesa 0 0 0.98 0.98 Not required
Chubachu 0 0 0.97 0.98 Not required
Diesel Power House 0 0 0.96 0.98 Not required
Lungtenphu 0 0 0.98 0.99 Not required
Motithang 1 0.96 0.95 0.97 End customer voltage improved
from 0.95 p.u to 0.97 p.u
RICB 4 3.84 0.95 0.99 End customer voltage improved
from 0.95 p.u to 0.99 p.u
Dechencholing 0 0 0.99 0.99 Not required
Thimphu Mini Hydel 0 0 0.98 0.99 Not required
High-Scale Adoption
The voltage profiles for each substation before and after the compensation is shown in Table 5. Low voltage
below 0.95 p.u. indicates a requirement for voltage compensation on that particular feeder. The capacitor
bank required is 0.96 MVAr for Diesel Power House (DPH), 1.92 MVAr for Motithang, and 4.8 MVAr for
RICB.
Table 30: Voltage Compensation Requirement for Substation for High Uptake Level (2030)
Substation Shunt Compensator Voltage [per unit]
Remarks No [Mvar] Before After
Babesa 0 0 0.97 0.98 Not required
Chubachu 0 0 0.97 0.98 Not required
Diesel Power House 1 0.96 0.95 0.96 All customers voltages are brought
back to 0.96 p.u
Lungtenphu 0 0 0.98 0.98 Not required
Motithang 2 1.92 0.94 0.98 All customer voltages brought back
from 0.94 p.u to 0.98 p.u
RICB 5 4.8 0.94 0.98
Majority of customer voltages
improved from 0.94 p.u to 0.96 p.u
but still for some customers tap
changing of transformer is required

59
After adding the capacitor bank, the model was re-simulated and the values obtained are presented in
Figure 12. The voltage level at all three affected substations could be restored to the permissible limit by
adding capacitor banks.
Figure 17: Voltage Profile Before & After Compensation with Shunt Capacitors (High Uptake Level)
Power Demand of EV and its Impact at the Household Level
HCs rated at 7.2 kW used by existing household connections would have a substantial impact on the
household’s power consumption. The aggregated power demand of HCs alone will rise to 6.81 MW and
14.93 MW for low and high uptake, respectively. However, as the HCs will be used at night, it will not have
any impact on the utility’s distribution network.
Impact on Power Generation and Import
Additional loads due to EVs can have an impact on power generation and electricity imports during the
lean winter months, when generation is low because of reduced flow of rivers. Bhutan imported ~110.64
MU and 207.89 MU of energy from India in 2016 and 2017, respectively, to meet its domestic load
consumption (DGPC, 2017). By 2025, power demand will increase with the growth of EVs, with estimated
demand for low and high uptakes at ~2.36 MW and 5.2 MW, respectively. The extra power generation
requirement could lead to extra cost. However, the increased cost of power import could be substituted
by the reduction in diesel import. On an average, a conventional taxi is estimated to consume 6000 litres
of petrol/year10. To cover same distance with EV, the charging cost is Nu 112,500 @Nu 10/kWh which gives
10 DRE, “Energy Efficiency in Transport Sector”, Department of Renewable Energy, Ministry of Economic Affairs, Royal Government
of Bhutan, December 2015.
0.97 0.97 0.950.98
0.94 0.940.99 0.98
0.98 0.98 0.96 0.98 0.98 0.980.99 0.98
0.1
0.3
0.5
0.7
0.9
1.1
Babesa Chubachu DPH L/Phu Motithang RICB D/Choling TMH
Vo
lta
ge
[p
.u]
Before compensation After compensation

60
a total savings of Nu 271,500/car/year. Thus, for 300 new EVs, it has potential to save Nu 81.45 million/year
which is equivalent to 1.8 million litres of petrol/year.
8.5.4 Charging Locations
QCs are connected on the local distribution grid through 11 kV sub-transmission lines. The figure below
provides the architecture of how the QC is connected at the various locations on the distribution network.
Figure 18: Architecture of EV QC and HC on the Distribution Network
QC is typically connected through a dedicated transformer 11/0.415kV of 63 kVA, with three-phase system.
The supply line is further connected using underground (UG) cable (four core, 150 mm2) to the low voltage
distribution pillar (DP) of four ways, 400A with an inbuilt switch fuse unit for protection. A smart meter is
also installed in the DP near the transformer to record the energy consumption of the EV.
The figure below shows the existing topology of the supply system to the existing QC station at Memorial
Chorten. It is expected that connection of the upcoming QCs will have similar topology.

61
Figure 19: Power Supply Topology for QC Station at Memorial Chorten
Strategic location of EVCS could not only enable use of EVs without any operational challenges but also
improve the viability of EVCS business. Apart from the initial cost of EV and its operational range, the
accessibility to EVCS and cost of charging will have a direct impact on the adoption of EV. Therefore, the
location of EVCS is critical to improve the adoption of EV as well to enhance business viability of EVCS. The
RGoB has decided the location of 23 EVCS to be installed through UNDP-GEF funding (in Table)11. The
locations include both the core city areas as well as highways.
Table 31: Tentative Location of EVCS by 2021
Region Location No. of EVCS
Paro
Core area 1
Taktsang Base 1
Punakha Khuruthang 1
Thimphu-Wangdue highway Menchuna 1
Wangdue Core area 1
Thimphu
Core area 8
Dechencholing 1
Tango base 1
Khasadrupchu 1
11 Project Management Unit of EV, “Personal Communication”, MoIC, August 2019.
33/11 kV SS DPH 5 MVA
I/C
500 kVA Hospital SS
Motithang
QC Memorial Chorten (63 kVA)
Hospital SS RMU
Essential feeder

62
Region Location No. of EVCS
Thimphu-Phuentsholing highway Wangkha 2
Gedu 1
Phuentsholing Core area 2
Paro-Haa highway Bitekha 1
Haa Core area 1
Tentative location of EVCS beyond the year 2022 is presented in below tables for low and high uptake
respectively. The locations were chosen based on the visibility, likely utilisation rate, distance between the
charging stations, and importance of the location area as this would have direct impact on the number of
people driving to the area and use EVCS.
Table 32: Tentative Location of EVCS for Low Uptake by 2030 in Bhutan
Region Location
No of EVCS Total No of EVCS
by 2030 As of 2022
Additional between 2022-30
Paro Core area 1 2 3
Taktsang Base 1 1 2
Punakha Dzong parking - 1 1
Khuruthang 1 1 2
Thimphu-Wangdue highway
Dochula - 1 1
Hongtsho - 1 1
Menchuna 1 1 2
Wangdue Bajo - 1 1
Metsina 1 1 2
Thimphu
Core area 8 2 10
Dechencholing 1 1 2
Tango base 1 1 2
Buddha point - 1 1
Motithang Takin Reserve - 1 1
Khasadrupchu 1 1 2
Thimphu - Phuentsholing highway
Wangkha 2 1 3
Taktikothi - 1 1
Gedu 1 1 2
Phuentsholing Core area 2 1 3
Paro-Haa highway Bitekha 1 1 2
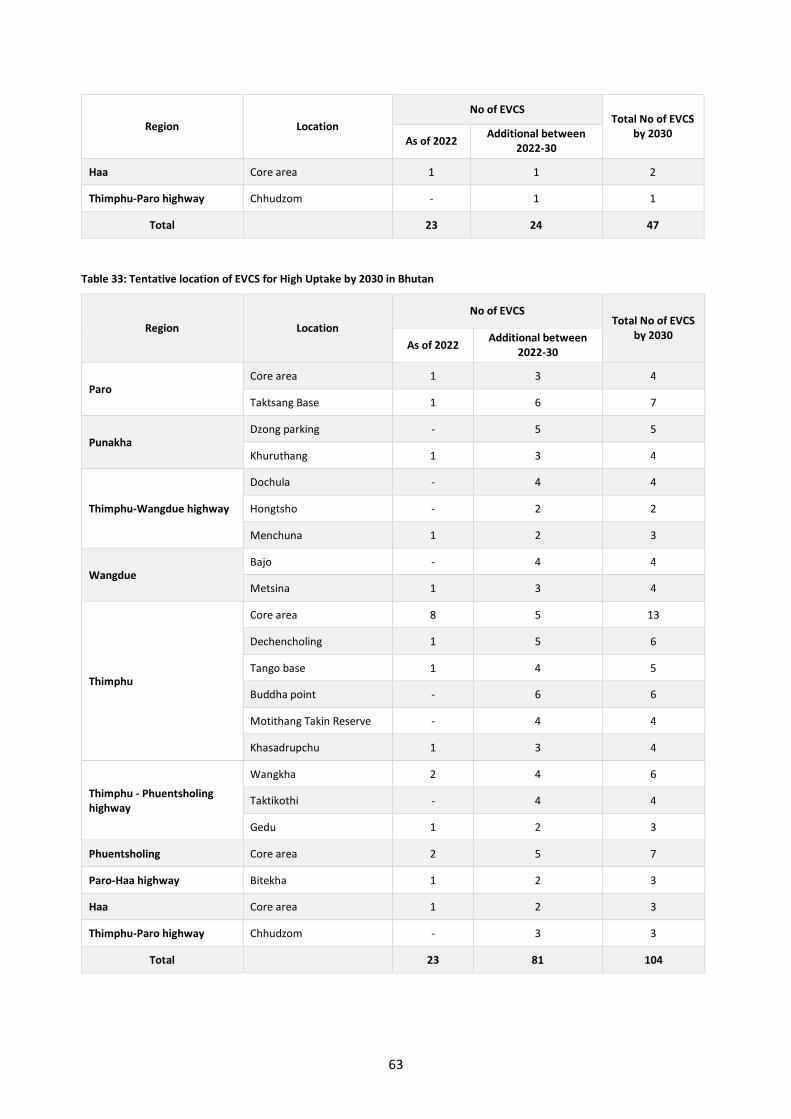
63
Region Location
No of EVCS Total No of EVCS
by 2030 As of 2022
Additional between 2022-30
Haa Core area 1 1 2
Thimphu-Paro highway Chhudzom - 1 1
Total 23 24 47
Table 33: Tentative location of EVCS for High Uptake by 2030 in Bhutan
Region Location
No of EVCS Total No of EVCS
by 2030 As of 2022
Additional between 2022-30
Paro Core area 1 3 4
Taktsang Base 1 6 7
Punakha Dzong parking - 5 5
Khuruthang 1 3 4
Thimphu-Wangdue highway
Dochula - 4 4
Hongtsho - 2 2
Menchuna 1 2 3
Wangdue Bajo - 4 4
Metsina 1 3 4
Thimphu
Core area 8 5 13
Dechencholing 1 5 6
Tango base 1 4 5
Buddha point - 6 6
Motithang Takin Reserve - 4 4
Khasadrupchu 1 3 4
Thimphu - Phuentsholing highway
Wangkha 2 4 6
Taktikothi - 4 4
Gedu 1 2 3
Phuentsholing Core area 2 5 7
Paro-Haa highway Bitekha 1 2 3
Haa Core area 1 2 3
Thimphu-Paro highway Chhudzom - 3 3
Total 23 81 104

64
8.5.5 CAPEX Requirement
Total investment required to install charging stations was determined based on the following assumptions:
• Although 23 QCs will be installed between 2019 and 2021 by RGoB through UNDP-GEF, the cost of
these QCs was considered from 2022 for the convenience of financial analysis. It was further
assumed that the cost of 23 QCs will be transferred to the QC station operator.
• Separate cost scenarios were considered for low and high uptake of EVs.
• Cost of QC is Nu 1,820,000.00 (US$ 26,000 @ US$ 1 = Nu 70). The cost was derived based on
average cost of a QC, as estimated for the UNDP-GEF project.
• Constant annual inflation rate of 3% for five years.
• Each station needs a leased line internet connection @Nu 1300/Mbps, based on existing rate from
the internet service provider.
• Each QC requires 5 m2 land, but the assumption is that there is no land lease rental as it is on the
government owned land.
• Installation cost of QC is the same in all districts.
• Financial analysis was done at a discount rate of 10%.
Based on these assumptions, the total present value of the capital investment required is Nu 101,333,895
(US$ 1,447,627) for low uptake and Nu 190,522,472 (US$ 2,721,749) for high uptake. The detailed CAPEX
is provided in Tables 9 and 10 for low and high uptake, respectively.
The CAPEX requirement is substantial, and may not be attractive to the private companies as such a project
is being undertaken for the first time in the country.

65
Table 34: CAPEX Requirement for Low Uptake
Year
2022 2023 2024 2025 2026 2027 2028 2029 2030
Year 0* Year 1** Year 2 Year 3 Year 4 Year 5 Year 6 Year 7 Year 8
No of QCs 22 24 27 29 32 36 39 43 47
Charger cost 40,040,000 3,749,200 5,623,800 3,749,200 5,623,800 7,498,400 5,623,800 7,498,400 7,498,400
New electricity
connection,
transformer, cabling
(100 meters), panels,
breakers, energy
meter
17,367,922 1,626,269 2,439,404 1,626,269 2,439,404 3,252,538 2,439,404 3,252,538 3,252,538
Civil works (flooring,
boards, painting,
brandings, shed/
cover, etc)
2,220,054 201,823 302,735 201,823 302,735 403,646 302,735 403,646 403,646
Electric Vehicle Supply
Equipment (EVSE)
management software
- Integration with
chargers and payment
gateways
1,057,200 31,200 46,800 31,200 46,800 62,400 46,800 62,400 62,400
Total CAPEX (Nu) 60,685,176 5,608,492 8,412,738 5,608,492 8,412,738 11,216,984 8,412,738 11,216,984 11,216,984
Total CAPEX (US$) 866,931 80,121 120,182 80,121 120,182 160,243 120,182 160,243 160,243
* RGoB would have installed 23 QCs by 2022, so there won’t be actual CAPEX on the part of BPC.
** From 2023 onwards, CAPEX is only for incremental increase of QCs

66
Table 35: CAPEX Requirement for High Uptake
Year
2022 2023 2024 2025 2026 2027 2028 2029 2030
Year 0* Year 1** Year 2 Year 3 Year 4 Year 5 Year 6 Year 7 Year 8
No of QCs 24 29 35 42 50 60 72 86 104
Charger cost 43,680,000 9,373,000 11,247,600 13,122,200 14,996,800 18,746,000 22,495,200 26,244,400 33,742,800
New electricity
connection, transformer,
cabling (100 meters),
panels, breakers, energy
meter
18,946,824 4,065,673 4,878,807 5,691,942 6,505,076 8,131,345 9,757,614 11,383,883 14,636,422
Civil works (flooring,
boards, painting,
brandings, shed/ cover,
etc)
2,421,878 504,558 605,469 706,381 807,293 1,009,116 1,210,939 1,412,762 1,816,408
Electric Vehicle Supply
Equipment (EVSE)
management software -
Integration with chargers
and payment gateways
1,088,400 78,000 93,600 109,200 124,800 156,000 187,200 218,400 280,800
Total CAPEX (Nu) 66,137,102 14,021,230 16,825,477 19,629,723 22,433,969 28,042,461 33,650,953 39,259,445 50,476,430
Total CAPEX (US$) 944,816 200,303 240,364 280,425 320,485 400,607 480,728 560,849 721,092
* RGoB would have installed 23 QCs by 2022, so there won’t be actual CAPEX on the part of BPC.
** From 2023 onwards, CAPEX is only for incremental increase of QCs

67
Operating cost of the QCs was calculated based on the following baseline assumptions:
• To manage the QCs, it is recommended to employ six technicians along with a deputy manager as
shown in Figure 16.
• Each vehicle charges for 30 minutes per charge, which is equal to 25 kWh of electricity
consumption, given a QC is rated at 50 kW
• An EV charges at least once per day at any of the QCs
• Capital equity of 50% from the state banks at a minimal lending interest rate for a loan of 10 years
• Utilisation of QC station is 33.33%
• BPC charges the QC station the same tariff as other low voltage consumers, i.e., block tariff at Nu
1.28/kWh up to 100 kWh, Nu 2.68/kWh for 100-300 kWh, and Nu 3.53/kWh for more than 300
kWh
• The QC station will sell power at Nu 7/kWh or Nu 175/charge of 30 minutes
Based on these assumptions, the total present value of the OPEX requirement are Nu 16,071,677 (US$
229,595) and Nu 16,262,046 (US$ 232,315) for low and high uptake, as shown in the tables below.

68
Table 36: OPEX Requirement for Low Uptake
Year
2022 2023 2024 2025 2026 2027 2028 2029 2030
Year 0 Year 1 Year 2 Year 3 Year 4 Year 5 Year 6 Year 7 Year 8
Technicians (1 technician @25k/month considered
for first 6 months 150,000 154,500 159,135 163,909 168,826 173,891 179,108 184,481 190,016
Site maintenance staff (1 personnel @25k/month
throughout year) 1,800,000 1,854,000 1,909,620 1,966,909 2,025,916 2,086,693 2,149,294 2,213,773 2,280,186
Network service provider fee 60,000 61,800 63,654 65,564 67,531 69,556 71,643 73,792 76,006
EVSE management software fee (considered as 10%
of net margin on electricity charges) 212,291 238,538 268,356 288,234 318,051 357,807 387,625 427,381 467,138
Payment gateway fee (1-2% of total money
collected) - - - - - - - - -
Land lease rental - - - - - - - - -
Advertising 60,000 61,800 63,654 65,564 67,531 69,556 71,643 73,792 76,006
Total OPEX (Nu) 2,282,291 2,370,638 2,464,419 2,550,179 2,647,854 2,757,505 2,859,313 2,973,220 3,089,352
Total OPEX (US$) 32,604 33,866 35,206 36,431 37,826 39,393 40,847 42,475 44,134
Total cost (Nu) 62,967,468 7,979,130 10,877,157 8,158,671 11,060,593 13,974,489 11,272,051 14,190,204 14,306,336
Total cost (US$) 899,535 113,988 155,388 116,552 158,008 199,636 161,029 202,717 204,376

69
Table 37: OPEX Requirement for High Uptake
Year
2022 2023 2024 2025 2026 2027 2028 2029 2030
Year 0 Year 1 Year 2 Year 3 Year 4 Year 5 Year 6 Year 7 Year 8
Technicians (1 technician @25k/month considered
for first 6 months 150,000 154,500 159,135 163,909 168,826 173,891 179,108 184,481 190,016
Site maintenance staff (1 personnel @25k/month
throughout year) 1,800,000 1,854,000 1,909,620 1,966,909 2,025,916 2,086,693 2,149,294 2,213,773 2,280,186
Network service provider fee 60,000 61,800 63,654 65,564 67,531 69,556 71,643 73,792 76,006
EVSE management software fee (considered as 10%
of net margin on electricity charges) 231,591 288,234 347,868 417,442 496,955 596,346 715,615 854,762 1,033,666
Payment gateway fee (1-2% of total money
collected) - - - - - - - - -
Land lease rental - - - - - - - - -
Advertising 60,000 61,800 63,654 65,564 67,531 69,556 71,643 73,792 76,006
Total OPEX (Nu) 2,301,591 2,420,334 2,543,931 2,679,387 2,826,758 2,996,043 3,187,303 3,400,601 3,655,880
Total OPEX (US$) 32,880 34,576 36,342 38,277 40,382 42,801 45,533 48,580 52,227
Total cost (Nu) 68,438,692 16,441,564 19,369,408 22,309,110 25,260,727 31,038,504 36,838,256 42,660,046 54,132,310
Total cost (US$) 977,696 234,879 276,706 318,702 360,868 443,407 526,261 609,429 773,319
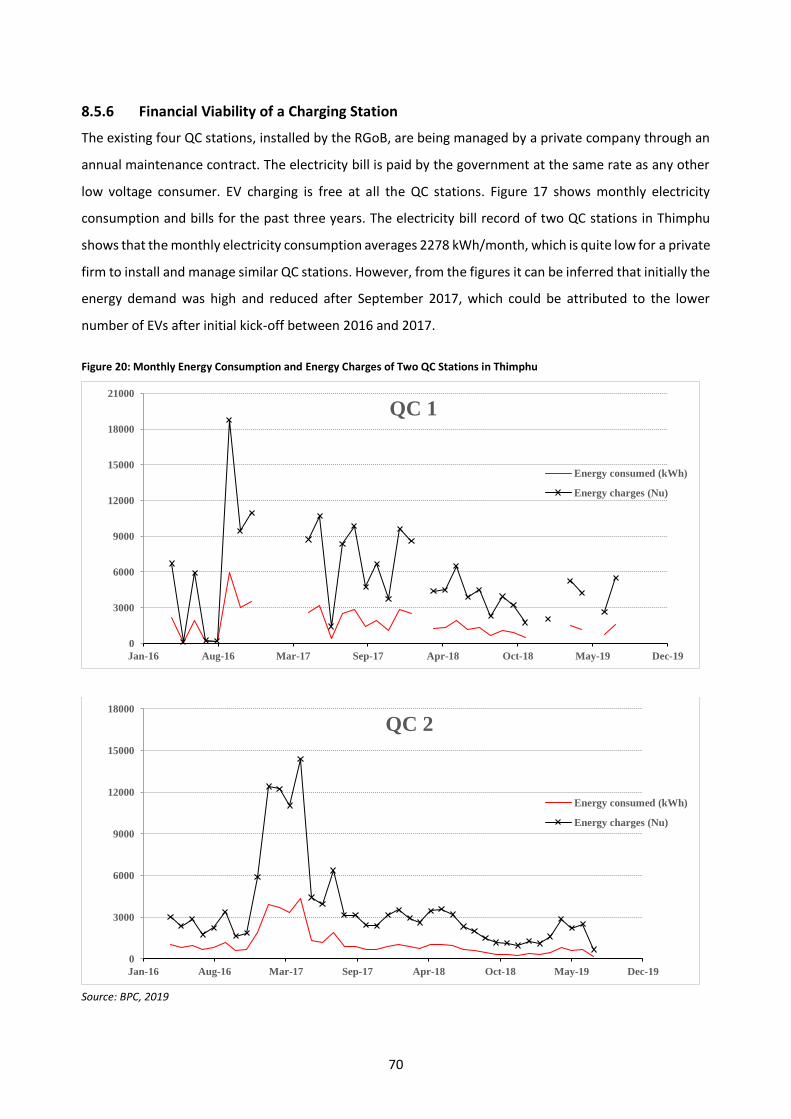
70
8.5.6 Financial Viability of a Charging Station
The existing four QC stations, installed by the RGoB, are being managed by a private company through an
annual maintenance contract. The electricity bill is paid by the government at the same rate as any other
low voltage consumer. EV charging is free at all the QC stations. Figure 17 shows monthly electricity
consumption and bills for the past three years. The electricity bill record of two QC stations in Thimphu
shows that the monthly electricity consumption averages 2278 kWh/month, which is quite low for a private
firm to install and manage similar QC stations. However, from the figures it can be inferred that initially the
energy demand was high and reduced after September 2017, which could be attributed to the lower
number of EVs after initial kick-off between 2016 and 2017.
Figure 20: Monthly Energy Consumption and Energy Charges of Two QC Stations in Thimphu
Source: BPC, 2019
0
3000
6000
9000
12000
15000
18000
21000
Jan-16 Aug-16 Mar-17 Sep-17 Apr-18 Oct-18 May-19 Dec-19
QC 1
Energy consumed (kWh)
Energy charges (Nu)
0
3000
6000
9000
12000
15000
18000
Jan-16 Aug-16 Mar-17 Sep-17 Apr-18 Oct-18 May-19 Dec-19
QC 2
Energy consumed (kWh)
Energy charges (Nu)

71
Table below shows the revenue model for low and high take, respectively. The model considered principal
repayment over a 10-year loan term, 10% interest per annum and depreciation of 10% per year. Equations
1, 2 & 3 show the method used to analyse the revenue for EVCSs.
Total revenue from power sold = Equation (1)
Margin on power sold = - Equation (2)
Net revenue = Margin on power sold - Equation (3)
Revenue Model for Low Uptake
At an EVCS utilisation rate of 33.33%, loan equity of 50% at 10% lending rate, and electricity selling rate of
Nu 175/30 minutes charging, net revenue is negative in the first two years. However, net revenue increases
as the EV number increases. The break-even number is approximately 587 EVs at 33.33% utilisation rate as
shown in table below.
Table 38: Revenue Model for Low Uptake
Year
2022 2023 2024 2025 2026 2027 2028 2029 2030
Year 0 Year 1 Year 2 Year 3 Year 4 Year 5 Year 6 Year 7 Year 8
Number of EVs
charged 442 486 537 587 646 711 782 860 946
Total power
sold (Nu) 22,276,800 24,494,400 27,064,800 29,584,800 32,558,400 35,834,400 39,412,800 43,344,000 47,678,400
Margin on
power sold
(Nu)
11,042,928 12,142,224 13,416,408 14,665,608 16,139,664 17,763,624 19,537,488 21,486,240 23,634,864
EVCS
Utilisation rate 33.33% 33.33% 33.33% 33.33% 33.33% 33.33% 33.33% 33.33% 33.33%
Net revenue
(Nu) -2,119,635 -1,108,686 71,718 1,235,158 2,611,538 4,125,848 6,642,573 8,477,418 10,509,911
principal repayment/year + loan
interest/year + depreciation
amount/year + operational cost/year
No of EVs x power consumed/charge x 365 days
x Rate of EV using QC x EVCS power selling rate
No of EVs x Power demand per
charge x 365 days x Rate of EV
using QC x electricity tariff
Total revenue
from power
sold

72
The above table shows that at a discount rate of 10%, the net present value (NPV) of the investment is Nu
2,004,785 (US$ 28,640), indicating a viable business with 10% internal rate of return (IRR).
To ascertain a maximum threshold for the rate of utilisation of EVCS at the above assumptions, a sensitivity
analysis was carried out as shown in Table below. NPV is negative at 32.23% utilisation of EVCS. This
indicates that business may not be viable if the overall utilisation rate of EVCS is below 32.44% at stated
assumptions.
Table 39: NPV Variation with EVCS Utilisation
EVCS Utilisation (%) NPV (US$)
33.33 28,640
33.10 17,886
32.65 7133
32.44 1756
32.23 -3,620
The NPV is highly sensitive to the rate at which the EV users are charged for using the EVCS. At 33.33%
EVCS utilisation, the minimum electricity selling rate should be Nu 7/kWh or Nu 175/30 minutes charging.
Below this, the NPV is negative indicating that the business is not viable. The table below illustrates the
variation of NPV with EVS utilisation at electricity selling price of Nu 7.5 and 8/kWh.
Table 40: NPV Variation with EVCS Utilisation
Electricity Selling Price = Nu 7.5/kWh Electricity Selling Price = Nu 8/kWh
EVCS utilisation rate (%) NPV (US$) EVCS utilisation rate (%) NPV (US$)
33.33 152,599 33.33 276,558
31.39 91,084 31.39 207,296
29.30 29,570 29.30 138,034
28.88 17,267 27.21 68,772
28.46 4,964 26.37 41,067
28.04 -7,339 25.95 27,214
27.63 -19,642 25.53 13,362
27.21 -31,945 25.11 -490

73
At an assumed electricity selling price of Nu 7.5/kWh and 8/kWh, the minimum utilisation rate of EVCS
should be 28.46% and 25.53% below which the NPV is negative. This shows that with Nu 0.5 increase in
electricity selling price, the threshold EVCS utilisation rate is reduced from 33.33% to 28.46%. While the
increased electricity selling price is good from a business perspective, it could have a negative impact on
the uptake of EVs.
For example, it has been estimated that, on average, taxis consume 6,000 litres of fossil fuel/year (DRE,
2015). This translates to 90,000 km a year assuming 15 km/litre. Assuming an average price of both diesel
and petrol as Nu 60/litre, taxis spend Nu 360,000/year on fuel alone. On the other hand, the new model
EV approved by the RGoB for use in Bhutan would have a minimum mileage of 200 km/full charge. For a
distance of 90,000 km, EVs need to be recharged 450 times/year at a cost of Nu 78,750/year at electricity
selling price of Nu 7/kWh. This is 4.6 times cheaper than fossil fuel cost. An increase of Nu 0.5/kWh is equal
to Nu 5,625/year for EV users. Given the high initial cost of EVs, it must result in substantial saving in
running cost otherwise people may be reluctant to switch to EVs. Therefore, an increase in the selling price
of electricity beyond Nu 7/kWh is not recommended.
Revenue Model for High Uptake
At the same EVCS utilisation rate, loan equity and lending rate, and electricity power selling rate as that of
low uptake, net revenue is positive from the second year onwards. NPV of the investment at a 10% discount
rate is Nu 23,893,357 (US$ 341,334), indicating a viable business with 17% IRR.
Table 41: Revenue Model for High Uptake
Year
2022 2023 2024 2025 2026 2027 2028 2029 2030
Year 0 Year 1 Year 2 Year 3 Year 4 Year 5 Year 6 Year 7 Year 8
Number
of EVs
charged
482 578 694 833 1000 1200 1440 1728 2074
Total
power
sold (Nu)
24,292,800 29,131,200 34,977,600 41,983,200 50,400,000 60,480,000 72,576,000 87,091,200 104,529,600
Margin on
power
sold (Nu)
12,042,288 14,440,752 17,338,896 20,811,672 24,984,000 29,980,800 35,976,960 43,172,352 51,816,816
EVCS
Utilisation
rate
33.33% 33.33% 33.33% 33.33% 33.33% 33.33% 33.33% 33.33% 33.33%
Net
revenue
(Nu)
-1,139,574 1,140,147 3,914,693 7,252,014 11,276,970 16,104,485 22,754,055 29,736,149 38,125,334

74
Like in the case of low uptake scenario, a sensitivity analysis was carried out, as illustrated in Figure 18, to
ascertain the threshold level of EVCS utilisation. For the business to be attractive, EVCS utilisation should
be 23.86% at Nu 7/kWh, 20.93% at Nu 7.5/kWh and 18.84% at Nu 8/kWh. Compared with low uptake, the
EVCS utilisation rate could be much lower in high uptake.
Figure 21: Sensitivity of NPV to EVCS Utilisation Rate and Electricity Selling Price
8.5.7 Business Models for Setting up EV Charging Stations
All four QC stations were constructed by the government through a private contractor. The stations are
maintained by a private enterprise through an annual maintenance contract, but the electricity bill is paid
by the government to BPC. While there is no plan for privatisation of the charging stations, with the
increase of EVs following an increase of QCs, it may not be sustainable post 2021. Four different business
models are being explored to make EVCS sustainable and at the same time benefit EV owners/users.
Option-1: Business as usual (BAU) - The first option is to continue with the current system, i.e. the
government installs EVCS, manages and provides free charging to EV users. While this option would
promote and encourage the use of EVs, the initial investment and operational costs are substantial as
shown in Tables 9 and 11. By 2030, the government has to invest US$ 2,211,230 and US$ 4,521,266 for low
and high uptake, respectively. Under this option, the EV owners/users may be able to recover the
differential cost of EV within four years and the total cost of EV within seven years based on the calculations
and assumptions as follows:
i. The price of a new Nissan Leaf EV in Bhutan is US$ 32,857.
ii. Total fuel cost/year for a taxi is US$ 5,143 (Nu 360,000 for 6,000 litres/year @ Nu 60/litre of
diesel/petrol). This amount is saved if EV users need not pay for charging.
(200)
-
200
400
600
800
10 15 20 25 30 35
NP
V (
x 1
00
0 U
S$
)
EVCS utilisation rate (%)
7.5/kWh 8/kWh 7/kWh
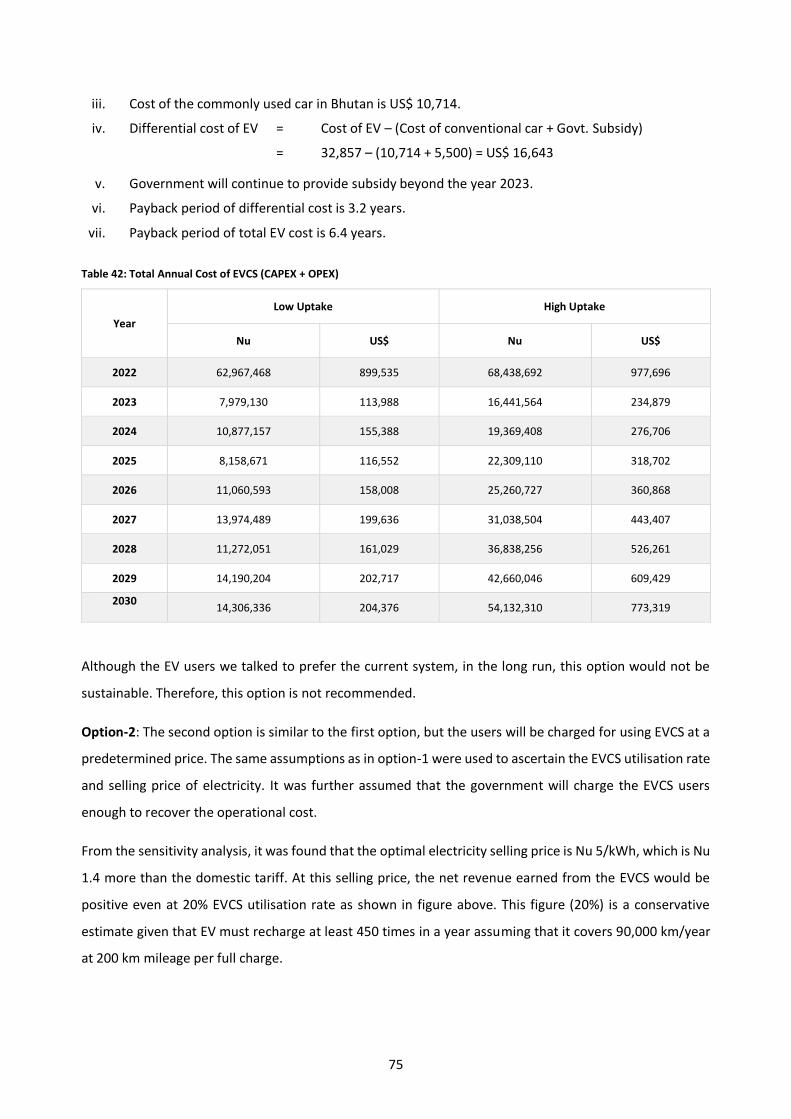
75
iii. Cost of the commonly used car in Bhutan is US$ 10,714.
iv. Differential cost of EV = Cost of EV – (Cost of conventional car + Govt. Subsidy)
= 32,857 – (10,714 + 5,500) = US$ 16,643
v. Government will continue to provide subsidy beyond the year 2023.
vi. Payback period of differential cost is 3.2 years.
vii. Payback period of total EV cost is 6.4 years.
Table 42: Total Annual Cost of EVCS (CAPEX + OPEX)
Year
Low Uptake High Uptake
Nu US$ Nu US$
2022 62,967,468 899,535 68,438,692 977,696
2023 7,979,130 113,988 16,441,564 234,879
2024 10,877,157 155,388 19,369,408 276,706
2025 8,158,671 116,552 22,309,110 318,702
2026 11,060,593 158,008 25,260,727 360,868
2027 13,974,489 199,636 31,038,504 443,407
2028 11,272,051 161,029 36,838,256 526,261
2029 14,190,204 202,717 42,660,046 609,429
2030 14,306,336 204,376 54,132,310 773,319
Although the EV users we talked to prefer the current system, in the long run, this option would not be
sustainable. Therefore, this option is not recommended.
Option-2: The second option is similar to the first option, but the users will be charged for using EVCS at a
predetermined price. The same assumptions as in option-1 were used to ascertain the EVCS utilisation rate
and selling price of electricity. It was further assumed that the government will charge the EVCS users
enough to recover the operational cost.
From the sensitivity analysis, it was found that the optimal electricity selling price is Nu 5/kWh, which is Nu
1.4 more than the domestic tariff. At this selling price, the net revenue earned from the EVCS would be
positive even at 20% EVCS utilisation rate as shown in figure above. This figure (20%) is a conservative
estimate given that EV must recharge at least 450 times in a year assuming that it covers 90,000 km/year
at 200 km mileage per full charge.
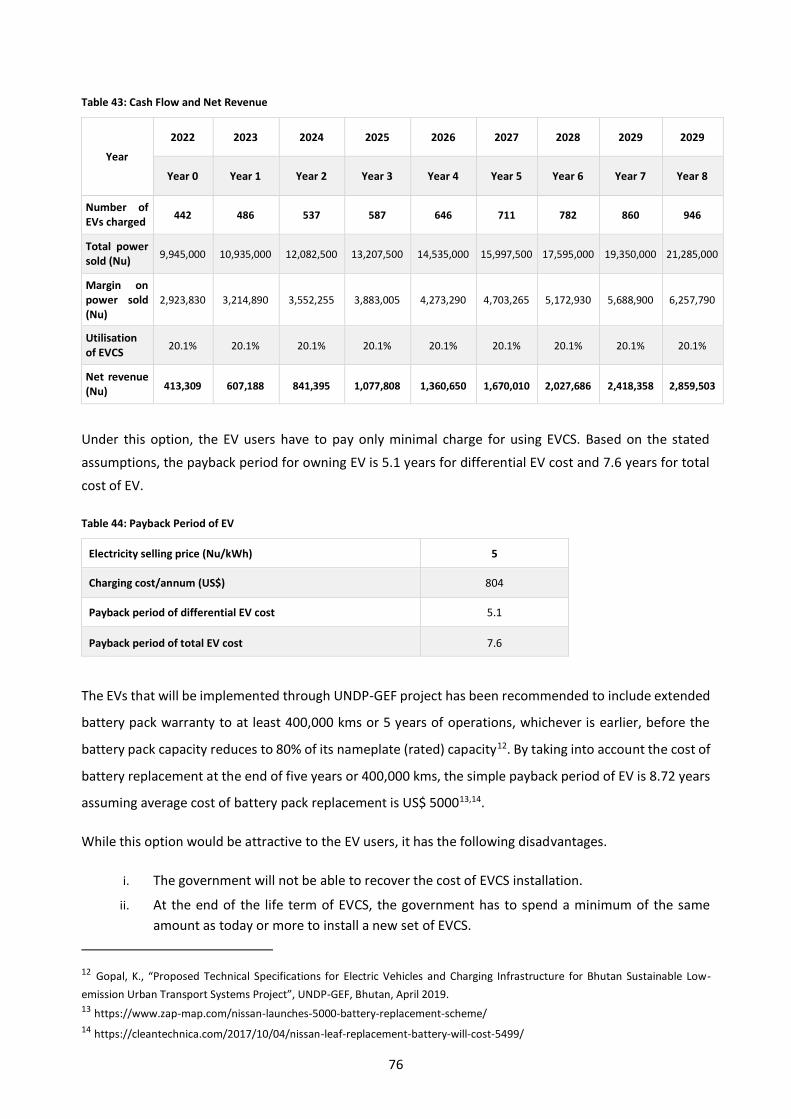
76
Table 43: Cash Flow and Net Revenue
Year
2022 2023 2024 2025 2026 2027 2028 2029 2029
Year 0 Year 1 Year 2 Year 3 Year 4 Year 5 Year 6 Year 7 Year 8
Number of EVs charged
442 486 537 587 646 711 782 860 946
Total power sold (Nu)
9,945,000 10,935,000 12,082,500 13,207,500 14,535,000 15,997,500 17,595,000 19,350,000 21,285,000
Margin on power sold (Nu)
2,923,830 3,214,890 3,552,255 3,883,005 4,273,290 4,703,265 5,172,930 5,688,900 6,257,790
Utilisation of EVCS
20.1% 20.1% 20.1% 20.1% 20.1% 20.1% 20.1% 20.1% 20.1%
Net revenue (Nu) 413,309 607,188 841,395 1,077,808 1,360,650 1,670,010 2,027,686 2,418,358 2,859,503
Under this option, the EV users have to pay only minimal charge for using EVCS. Based on the stated
assumptions, the payback period for owning EV is 5.1 years for differential EV cost and 7.6 years for total
cost of EV.
Table 44: Payback Period of EV
Electricity selling price (Nu/kWh) 5
Charging cost/annum (US$) 804
Payback period of differential EV cost 5.1
Payback period of total EV cost 7.6
The EVs that will be implemented through UNDP-GEF project has been recommended to include extended
battery pack warranty to at least 400,000 kms or 5 years of operations, whichever is earlier, before the
battery pack capacity reduces to 80% of its nameplate (rated) capacity12. By taking into account the cost of
battery replacement at the end of five years or 400,000 kms, the simple payback period of EV is 8.72 years
assuming average cost of battery pack replacement is US$ 500013,14.
While this option would be attractive to the EV users, it has the following disadvantages.
i. The government will not be able to recover the cost of EVCS installation.
ii. At the end of the life term of EVCS, the government has to spend a minimum of the same
amount as today or more to install a new set of EVCS.
12 Gopal, K., “Proposed Technical Specifications for Electric Vehicles and Charging Infrastructure for Bhutan Sustainable Low-
emission Urban Transport Systems Project”, UNDP-GEF, Bhutan, April 2019. 13 https://www.zap-map.com/nissan-launches-5000-battery-replacement-scheme/
14 https://cleantechnica.com/2017/10/04/nissan-leaf-replacement-battery-will-cost-5499/
77
iii. This option doesn’t encourage private sector development.
iv. EV users do not share the cost of EVCS.
Therefore, based on the above drawbacks, this option is also not recommended.
Option-3: Under the third option, the government takes the responsibility to install the EVCS and leases
out to a private company or BPC to manage, operate and maintain for a fixed term with a condition that at
the end of the lease period the leasee has to restore the EVCS to its original condition. This option has the
following advantages:
i. The government would be able to recover the cost of installation, but without the interest on
investment at the end of the lease period.
ii. The government need not maintain the system and can focus on EV policy initiatives and
regulations than on operating EVCS.
iii. Business risk is transferred to leasee and there is a guarantee that the government will get back
the initial investment amount.
The business model also seems viable even at 27% EVCS utilisation rate and electricity selling price of Nu
7/kWh as illustrated in figure below for low uptake. At an electricity selling price of Nu 8/kWh, the EVCS
utilisation rate could be as low as 21%.
Utilisation rate of EVCS is defined as number of hours of QC used within 24 hours expressed as a
percentage, i.e. if EVCS is used for 8 hours in a day, then utilisation rate is 33.33%. Considering the following
factors, the maximum EVCS utilisation rate in this report was assumed to be 33.33%, with the following
assumptions:
• Every EV will have a home charger for which user will pay domestic tariff.
• EV users prefer slow charger to quick charger.
• The minimum mileage for a fully charged battery is 200 km, so more than one quick charging may
not be required in a day.
• Taxis will not be used in the night.

78
Figure 22: NPV Variation with Utilisation Rate and Different Electricity Selling Price
Under this option, net revenue is positive from the second year with high NPV at 33.33% EVCS utilisation
rate as illustrated below. This option seems financially feasible from both perspectives - business and the
government.
Table 45: Cash Flow and Net Revenue at 33.33% EVCS Utilisation Rate
Year 2022 2023 2024 2025 2026 2027 2028 2029 2030
Year 0 Year 1 Year 2 Year 3 Year 4 Year 5 Year 6 Year 7 Year 8
Depreciation (US$) 144,763 144,763 144,763 144,763 144,763 144,763 144,763 144,763 144,763
Operational cost (US$) 32,604 33,866 35,206 36,431 37,826 39,393 40,847 42,475 44,134
Total cost (US$) 177,367 178,629 179,969 181,194 182,589 184,156 185,610 187,237 188,896
Cash flow (US$) 157,756 173,460 191,663 209,509 230,567 253,766 279,107 306,946 337,641
Net revenue at Nu 7/kWh
(US$) -19,611 -5,169 11,694 28,315 47,977 69,610 93,497 119,709 148,745
Net revenue at Nu
7.5/kWh (US$) 3,121 19,826 39,311 58,503 81,200 106,176 133,714 163,938 197,396
Net revenue at Nu 8/kWh
(US$) 25,852 44,820 66,929 88,692 114,423 142,742 173,931 208,166 246,047
(400)
(200)
-
200
400
600
10 15 20 25 30 35
NP
V (
x 1
00
0 U
S$
)
EVCS utilisation rate (%)
7/kWh 7.5/kWh 8/kWh

79
Table 46: Sensitivity of NPV ($ x 1000) with EVCS Utilisation Rate and Margin on Electricity Tariff
Electricity
Selling Price
(Nu/kWh)
Margin on
Electricity Tariff
(Nu/kWh)
EVCS Utilisation Rate
35% 30% 25% 20% 15%
4.0 0.47 -652 -697 -741 -786 -831
4.5 0.97 -479 -549 -618 -688 -757
5.0 1.47 -306 -401 -495 -589 -683
5.5 1.97 -134 -253 -371 -490 -609
6.0 2.47 39 -105 -248 -392 -535
6.5 2.97 212 43 -125 -293 -461
7.0 3.47 384 191 -1 -194 -387
7.5 3.97 557 339 122 -96 -313
8.0 4.47 730 487 245 3 -239
8.5 4.97 903 635 369 102 -165
9.0 5.47 1075 783 492 200 -91
9.5 5.97 1248 931 615 299 -17
10.0 6.47 1421 1079 739 397 57
The table above presents sensitivity of NPV with the EVCS utilisation rate and margin on electricity tariff.
At 35% EVCS utilisation rate, NPV is positive at electricity selling price of Nu 6/kWh. Whereas at 15% EVCS
utilisation rate, NPV is positive at electricity selling price of Nu 10/kWh which means Nu 6.47 more than
what a domestic consumer would pay. Higher electricity selling price would not be attractive to the EV
users and thus dissuade common people from switching to EV. At electricity selling price of Nu 8/kWh, i.e.
margin of Nu 4.47/kWh seems reasonable with NPV of US$ 245,00 even at 25% EVCS utilisation rate.
With the same assumptions as in Option-1, the EV owners/users could recover the differential cost and the
total cost of EV as shown in table below.
Table 47: Payback Period of EV
Electricity selling price (Nu/kWh) 7 7.5 8 9
Charging cost/annum (US$) 1125 1205 1286 1446
Payback period of differential EV cost 4.27 4.35 4.44 5..99
Payback period of total EV cost 9.42 9.61 9.81 10.24
Option-4: The fourth option is to build and operate by the utility company or through Public Private
Partnership (PPP). In this option, the utility company or through PPP will invest in EVCS, operate, collect
charging fee from the users and upkeep the EVCS. In order to avoid an exorbitant electricity selling price,
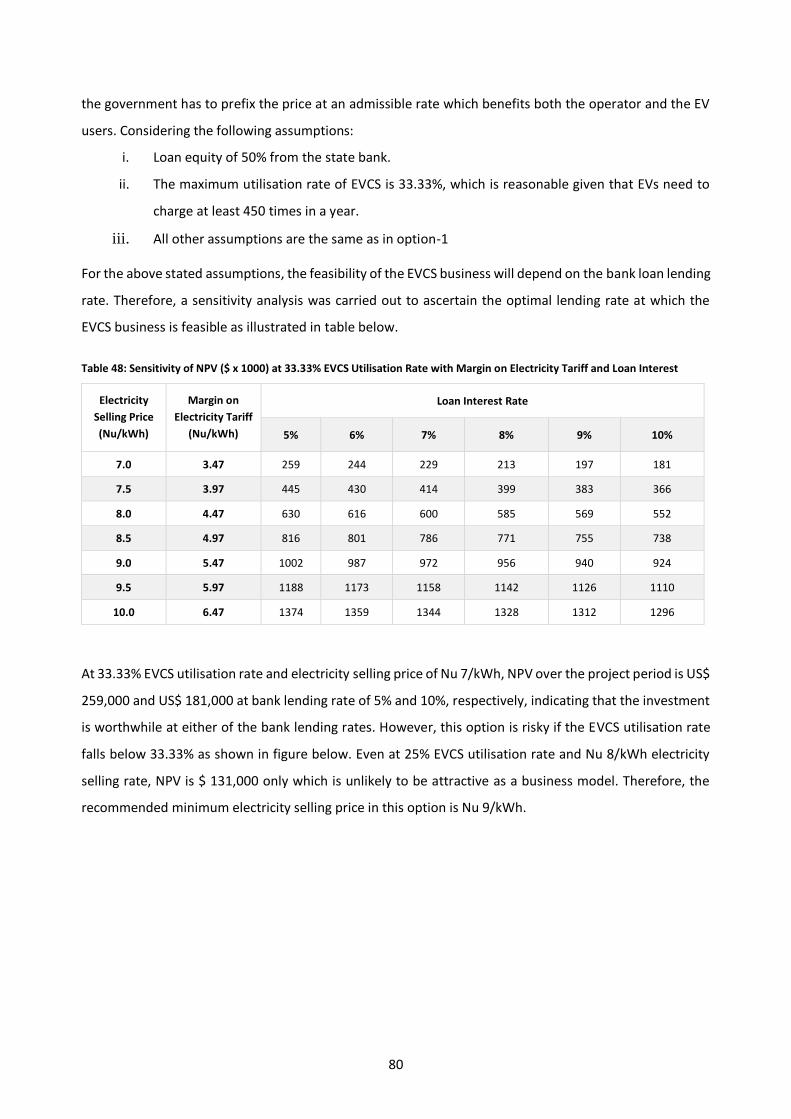
80
the government has to prefix the price at an admissible rate which benefits both the operator and the EV
users. Considering the following assumptions:
i. Loan equity of 50% from the state bank.
ii. The maximum utilisation rate of EVCS is 33.33%, which is reasonable given that EVs need to
charge at least 450 times in a year.
iii. All other assumptions are the same as in option-1
For the above stated assumptions, the feasibility of the EVCS business will depend on the bank loan lending
rate. Therefore, a sensitivity analysis was carried out to ascertain the optimal lending rate at which the
EVCS business is feasible as illustrated in table below.
Table 48: Sensitivity of NPV ($ x 1000) at 33.33% EVCS Utilisation Rate with Margin on Electricity Tariff and Loan Interest
Electricity
Selling Price
(Nu/kWh)
Margin on
Electricity Tariff
(Nu/kWh)
Loan Interest Rate
5% 6% 7% 8% 9% 10%
7.0 3.47 259 244 229 213 197 181
7.5 3.97 445 430 414 399 383 366
8.0 4.47 630 616 600 585 569 552
8.5 4.97 816 801 786 771 755 738
9.0 5.47 1002 987 972 956 940 924
9.5 5.97 1188 1173 1158 1142 1126 1110
10.0 6.47 1374 1359 1344 1328 1312 1296
At 33.33% EVCS utilisation rate and electricity selling price of Nu 7/kWh, NPV over the project period is US$
259,000 and US$ 181,000 at bank lending rate of 5% and 10%, respectively, indicating that the investment
is worthwhile at either of the bank lending rates. However, this option is risky if the EVCS utilisation rate
falls below 33.33% as shown in figure below. Even at 25% EVCS utilisation rate and Nu 8/kWh electricity
selling rate, NPV is $ 131,000 only which is unlikely to be attractive as a business model. Therefore, the
recommended minimum electricity selling price in this option is Nu 9/kWh.

81
Figure 23: NPV Variation with Utilisation Rate and Different Electricity Selling Price
Risks in EVCS Business
One of the main risks of EVCS business is the lack of EV users coming to use QCs. With every EV having a
HC and preference of slow charging to fast charging, business is dependent on the number of EV users
using QCs and frequency of use. The other risk is change in technology of charging. If the car manufacturer
or EV regulators change the standard and type of EVCS, then the current EVCS would be invalid and cost of
switching to new type and standard would be substantial.
Summary of Business Models
The proposed business models can be summarised as follows:
i. Although option-1 could promote and encourage people to switch from a conventional vehicle to
an EV, as there is potential for substantial saving in fuel cost, it is not recommended as this option
would not be sustainable in the long run.
ii. Under option-2, EVCS users have to pay a minimal price but the government will not be able to
recover the investment. Therefore, it is also not recommended.
iii. Under option-3, the government does not have any risk and will also be able to recover the
investment at the end of the lease period. Therefore, this option is recommended as a good
business model.
iv. The last option to invest and operate by utility company or through PPP also seems to show a
reasonably good business perspective. But there is associated risk of failure if the EVCS utilisation
rate is below 33.33% and the banks charge a high lending rate. Therefore, this option could be
pursued with caution.
-1000
-500
0
500
1000
1500
2000
10152025303540
NP
V (
US
$ x
10
00
)
EVCS utilisation rate (%)
Nu7/kWh Nu 8/kWH
Nu 9/kWh Nu 10.kWh
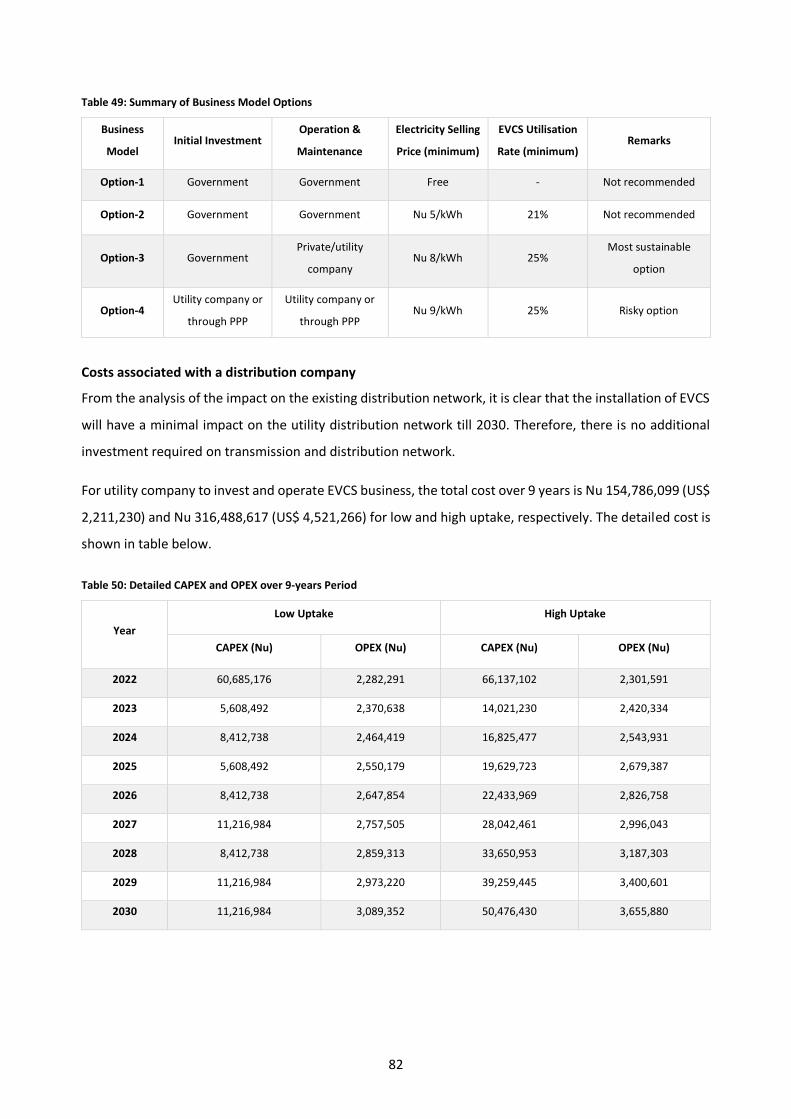
82
Table 49: Summary of Business Model Options
Business
Model Initial Investment
Operation &
Maintenance
Electricity Selling
Price (minimum)
EVCS Utilisation
Rate (minimum) Remarks
Option-1 Government Government Free - Not recommended
Option-2 Government Government Nu 5/kWh 21% Not recommended
Option-3 Government Private/utility
company Nu 8/kWh 25%
Most sustainable
option
Option-4 Utility company or
through PPP
Utility company or
through PPP Nu 9/kWh 25% Risky option
Costs associated with a distribution company
From the analysis of the impact on the existing distribution network, it is clear that the installation of EVCS
will have a minimal impact on the utility distribution network till 2030. Therefore, there is no additional
investment required on transmission and distribution network.
For utility company to invest and operate EVCS business, the total cost over 9 years is Nu 154,786,099 (US$
2,211,230) and Nu 316,488,617 (US$ 4,521,266) for low and high uptake, respectively. The detailed cost is
shown in table below.
Table 50: Detailed CAPEX and OPEX over 9-years Period
Year
Low Uptake High Uptake
CAPEX (Nu) OPEX (Nu) CAPEX (Nu) OPEX (Nu)
2022 60,685,176 2,282,291 66,137,102 2,301,591
2023 5,608,492 2,370,638 14,021,230 2,420,334
2024 8,412,738 2,464,419 16,825,477 2,543,931
2025 5,608,492 2,550,179 19,629,723 2,679,387
2026 8,412,738 2,647,854 22,433,969 2,826,758
2027 11,216,984 2,757,505 28,042,461 2,996,043
2028 8,412,738 2,859,313 33,650,953 3,187,303
2029 11,216,984 2,973,220 39,259,445 3,400,601
2030 11,216,984 3,089,352 50,476,430 3,655,880
83
8.5.8 Organisational Capacity Planning
Bhutan Power Corporation (BPC) with the vision “To be innovative and efficient power utility driving the
socio-economic transformation of Bhutan”15 is the only utility company responsible to operate and
maintain the power transmission and distribution networks in Bhutan. And their mission is “To provide
affordable, adequate, reliable and quality electricity services to customers”. BPC is a Nu 30 billion company
with more than 2500 employees and a strong balance sheet. So, it is well suited to invest in EVCS
infrastructure as it would have access to low-cost capital, skilled human resource, experience of large-scale
projects, and in-house training division. Currently, the EV project is managed by a separate Project
Management Unit (PMU) under the Ministry of Information and Communications (MoIC). The existing EVCS
is managed by the MoIC through a private company who is responsible for upkeep of the system. The EV
users need not pay any fees for using EVCS. This modality may not be sustainable in long run as the number
of EV increases.
As the EV deployment grows in next few years, the number of home chargers (HC) will also increase. The
unprecedented increase of HCs could lead to uncertainty regarding the residential power demand. If EVCS
infrastructure is owned and operated by utility company then, it would be able to manage peak demand
due to QCs and HCs, modulate the power flows between the grid and EVCSs to help balance electricity
supply and demand, regulate standard and type of EVCS in the country, and utility regulators will be able
to fix the price of energy sold to the EV users.
EVCS installed by RGoB through the UNDP-GEF project may be transferred to BPC by 2022. The current
organisational structure of BPC is illustrated in figure below.
15 https://www.bpc.bt/vision-mission/

84
Figure 24: Current Organisational Structure of BPC16
Source: BPC, 2018
In case if BPC decides to venture into EVCS infrastructure or Royal Government mandates BPC to be
involved, then there is a need to create a separate division under the Distribution and Customer Service
Department of Distribution Services. In order to operate and manage EVCS business, 7 additional staff are
required. The number of staff is considered based on the number of EVCS, and distance between the EVCS.
The proposed organisational structure is illustrated in Figure 16. The additional staff will be responsible for
upkeep of the system in their respective regions.
16 https://www.bpc.bt/organogram/
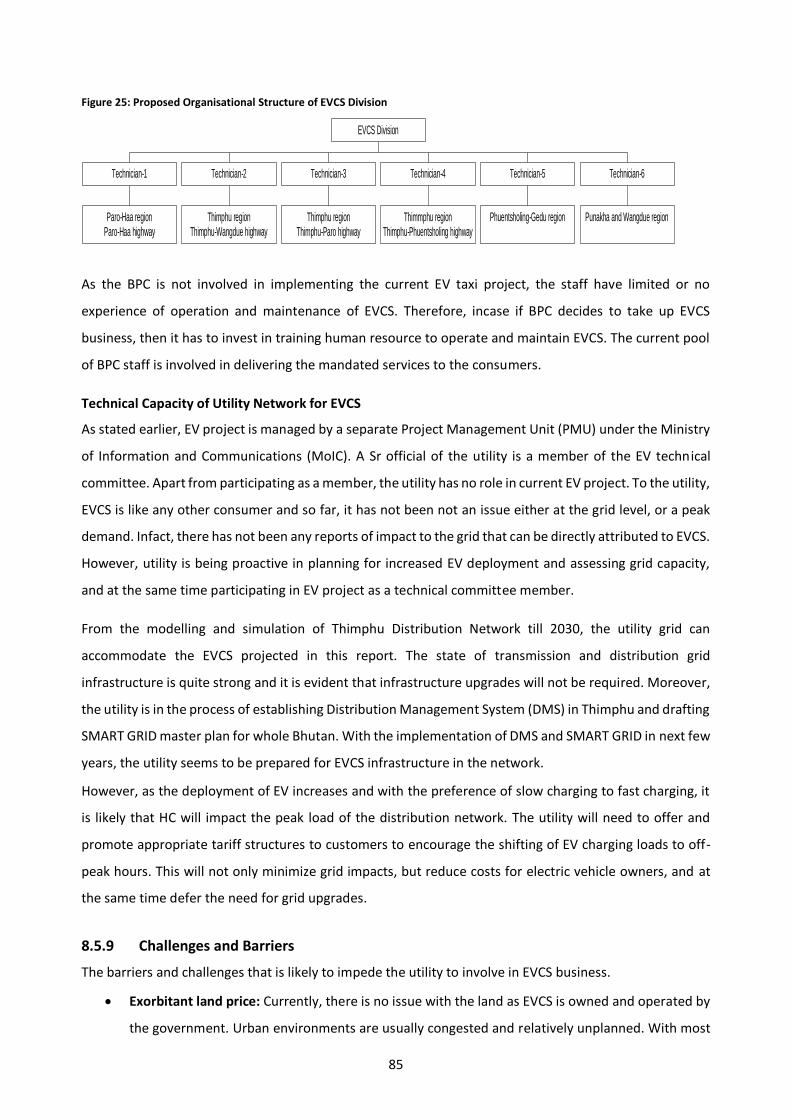
85
Figure 25: Proposed Organisational Structure of EVCS Division
Paro-Haa region
Paro-Haa highway
Technician-1
Thimphu region
Thimphu-Wangdue highway
Technician-2
Thimphu region
Thimphu-Paro highway
Technician-3
Thimmphu region
Thimphu-Phuentsholing highway
Technician-4
Phuentsholing-Gedu region
Technician-5
Punakha and Wangdue region
Technician-6
EVCS Division
As the BPC is not involved in implementing the current EV taxi project, the staff have limited or no
experience of operation and maintenance of EVCS. Therefore, incase if BPC decides to take up EVCS
business, then it has to invest in training human resource to operate and maintain EVCS. The current pool
of BPC staff is involved in delivering the mandated services to the consumers.
Technical Capacity of Utility Network for EVCS
As stated earlier, EV project is managed by a separate Project Management Unit (PMU) under the Ministry
of Information and Communications (MoIC). A Sr official of the utility is a member of the EV technical
committee. Apart from participating as a member, the utility has no role in current EV project. To the utility,
EVCS is like any other consumer and so far, it has not been not an issue either at the grid level, or a peak
demand. Infact, there has not been any reports of impact to the grid that can be directly attributed to EVCS.
However, utility is being proactive in planning for increased EV deployment and assessing grid capacity,
and at the same time participating in EV project as a technical committee member.
From the modelling and simulation of Thimphu Distribution Network till 2030, the utility grid can
accommodate the EVCS projected in this report. The state of transmission and distribution grid
infrastructure is quite strong and it is evident that infrastructure upgrades will not be required. Moreover,
the utility is in the process of establishing Distribution Management System (DMS) in Thimphu and drafting
SMART GRID master plan for whole Bhutan. With the implementation of DMS and SMART GRID in next few
years, the utility seems to be prepared for EVCS infrastructure in the network.
However, as the deployment of EV increases and with the preference of slow charging to fast charging, it
is likely that HC will impact the peak load of the distribution network. The utility will need to offer and
promote appropriate tariff structures to customers to encourage the shifting of EV charging loads to off-
peak hours. This will not only minimize grid impacts, but reduce costs for electric vehicle owners, and at
the same time defer the need for grid upgrades.
8.5.9 Challenges and Barriers
The barriers and challenges that is likely to impede the utility to involve in EVCS business.
• Exorbitant land price: Currently, there is no issue with the land as EVCS is owned and operated by
the government. Urban environments are usually congested and relatively unplanned. With most

86
urban land already built up and devoted to other use, finding appropriate sites for charging
infrastructure where vehicles could be parked for the duration needed to charge can be
challenging. If the land needs to be leased from private owners, then the urban land is very
expensive and it will increase the electricity selling price. As a consequence, EV users may be
dissuaded from using QCs.
• Up-front cost of EVCS: The cost of QC is quite significant and could present a significant barrier to
charging infrastructure deployment for the utility. Taking loan from the financial institutes will
further increase the electricity selling price to EV users. As a consequence, EV users may be
dissuaded from using QCs.
• Lack of trained technicians for EV charging infrastructure installation and maintenance: For the
projected EV, six technicians will be required for installing and maintaining EV charging
infrastructure. As the utility has no experience of running EVCS, it needs to train the technicians.
• Business viability: One of the motivating factors to shift from conventional ICE cars to EV is free
charging provided by the government. Unless the government allows the utility to charge the EV
users for using EVCS, the utility may not be keen to take up EVCS. On the other hand, if EV users
are charged for using EVCS, then this may dissuade EV users from using EVCS.
8.5.10 Concluding Remarks
From the current trend of EV deployment, it is unlikely that environmental benefits alone will convince the
public to switch to EV unless supported with strong cost benefits over ICE. A modest deployment of EV was
projected till 2030. While the utility has not been involved in implementation of EV and associated
infrastructure so far, it is prepared and can accommodate EVCS infrastructure till 2030. From modelling
and simulation of Thimphu Distribution Network, no additional investment is required to support EVCS
infrastructure. Thus, there is no any pressing issues to the utility for the planned deployment of EV in the
country.
It is concluded that while the utility is technically ready for EVCS, it has no or limited experience of operation
and maintenance of EVCS infrastructure. Therefore, in case if utility decides (or the government mandates
it to do so) to venture into EVCS, then, it need to invest in human resource. If at all, the utility decides to
venture into EVCS infrastructure, then the most viable business model is Option-4. In this option, electricity
selling price is recommended at Nu 8/kWh. However, this may dissuade public from switching to EV as free
charging seems to be one of the motivating factors.

87
9 Country in Focus: India
9.1 Present EV Sales and Charging Infrastructure
The EV market in India is nascent and small with respect to other nations, both in terms of EV market
acceptance and industry dynamics. The country still does not have any significant EV charging
infrastructure and demand is mostly driven by policy incentives. Although the government has rolled out
several benefits, EV acceptance is yet to percolate through the “price sensitive” Indian consumer. EV sales
stand at less than 1% and domestic original equipment manufacturers (OEMs) are only starting to launch
EV models. Such offerings are both priced higher (despite government subsidies) and show lower
performance. Technology adoption is slow and local manufacturing of EV components (batteries, electric
powertrains) is almost non-existent.
In fiscal 2019, total EV sales crossed 0.75 million, with electric three-wheelers comprising ~83% and electric
two-wheelers accounting for close to 16%. Four-wheeler EV sales continued to linger at ~3,600 in fiscal
2019. Only two domestic manufacturers are invested in the EV space - Mahindra Electric and Tata Motors.
Owing to high initial costs, global manufacturers have been bringing models through completely built units
(CBUs), leading to high prices and poor sales.
Table 51: EV Population and Sales in India for 2019
Vehicle type Population in FY19 Sales in FY19
E rickshaw17 1,509,259 450,000
E autos 100 100
2-W 227,250 126,000
Cars & UVs 5,039 3,600
Bus 610 500
Total 1,742,258 580,200
Source: Society of Manufacturers of Electric Vehicles
In order to address the challenges pertaining to EV adoption in the country, the Government of India (GoI)
had announced several schemes and policies (discussed in the next section). In 2017, the Indian automotive
industry had released a white paper, proposing a pathway towards all-new vehicle sales being electric by
2047 and 100% of intra-city public transport as all electric by 2030. However, with hardly any charging
infrastructure in place, OEMs are sceptical about investing in EV manufacturing in the country. A
17 E-rickshaws are non-motorised, smaller e-autos which ply majorly as an alternative to hand-held and cycle-rickshaws

88
framework for India’s charging infrastructure is being worked upon by the Ministry of Power and is
expected to be released in 2019. This is expected to be a key monitorable for all EV stakeholders in the
country.
EV charging stations are sparse in the country and have mostly been set up for incubation and pilot
purposes. There are ~350 charging stations in India; highest concentration being in the Delhi-NCR region.
Table 52: Number of Charging Stations in India (state-wise)
State No. of Slow AC Chargers No. of Fast DC Chargers
Delhi 141 83
Andhra Pradesh 20 29
Jharkhand 15 7
Gujarat 10 2
The Andaman and Nicobar Islands 8 4
Telangana 8 2
Madhya Pradesh 3 2
Maharashtra 2 2
Uttar Pradesh 2 1
Total 209* 132
*Note: Does not include charging networks set up by private entities like Ola Electric-32, Ather Energy- 35
Some of the companies that have set up EV charging stations in the country are given below:
Table 53: Companies and Charging Station Portfolio in India
Companies No. of Operational Charging Stations No. of Planned Charging Stations
EV Motors India 1 6,500 (long term plan)
Magenta Power 32 450 (by next two years)
Ola Electric 32 100
Ather Energy 35 200 (by 2019)
Fortum India 36 700 (by 2020)
Energy Efficiency Services Ltd (EESL) 55 1000 (next three years
Tata Power 3 100 (in short term)
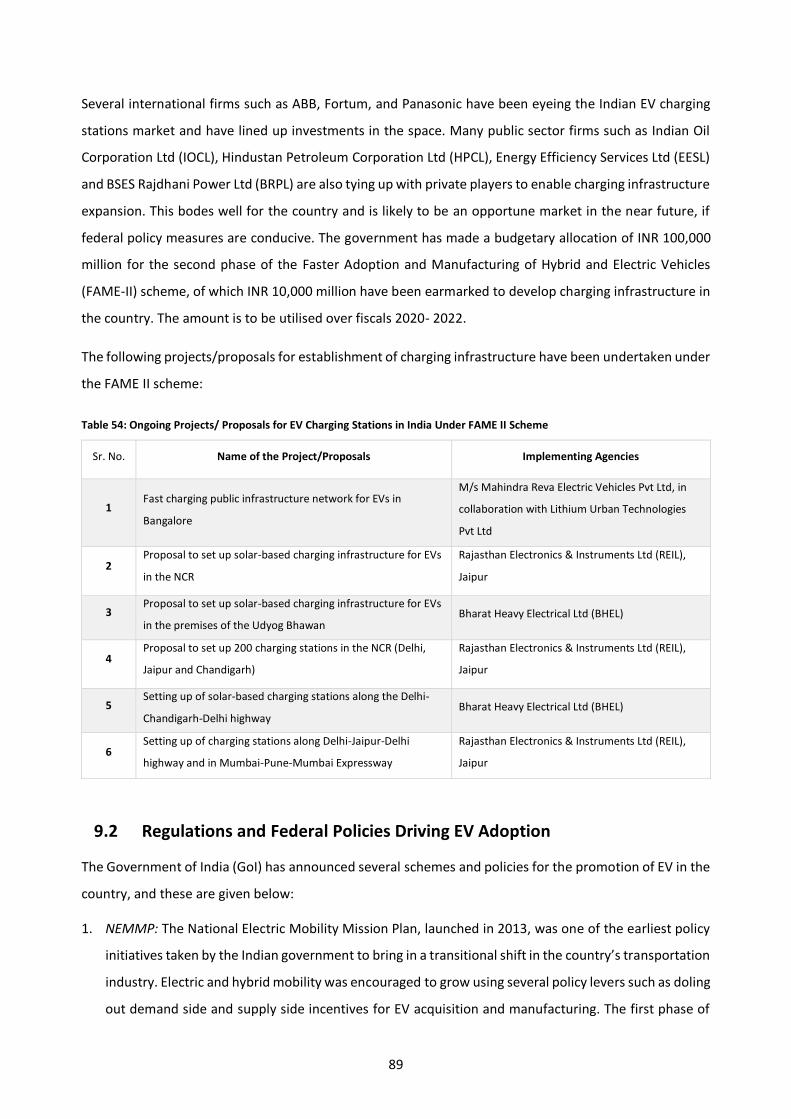
89
Several international firms such as ABB, Fortum, and Panasonic have been eyeing the Indian EV charging
stations market and have lined up investments in the space. Many public sector firms such as Indian Oil
Corporation Ltd (IOCL), Hindustan Petroleum Corporation Ltd (HPCL), Energy Efficiency Services Ltd (EESL)
and BSES Rajdhani Power Ltd (BRPL) are also tying up with private players to enable charging infrastructure
expansion. This bodes well for the country and is likely to be an opportune market in the near future, if
federal policy measures are conducive. The government has made a budgetary allocation of INR 100,000
million for the second phase of the Faster Adoption and Manufacturing of Hybrid and Electric Vehicles
(FAME-II) scheme, of which INR 10,000 million have been earmarked to develop charging infrastructure in
the country. The amount is to be utilised over fiscals 2020- 2022.
The following projects/proposals for establishment of charging infrastructure have been undertaken under
the FAME II scheme:
Table 54: Ongoing Projects/ Proposals for EV Charging Stations in India Under FAME II Scheme
Sr. No. Name of the Project/Proposals Implementing Agencies
1 Fast charging public infrastructure network for EVs in
Bangalore
M/s Mahindra Reva Electric Vehicles Pvt Ltd, in
collaboration with Lithium Urban Technologies
Pvt Ltd
2 Proposal to set up solar-based charging infrastructure for EVs
in the NCR
Rajasthan Electronics & Instruments Ltd (REIL),
Jaipur
3 Proposal to set up solar-based charging infrastructure for EVs
in the premises of the Udyog Bhawan Bharat Heavy Electrical Ltd (BHEL)
4 Proposal to set up 200 charging stations in the NCR (Delhi,
Jaipur and Chandigarh)
Rajasthan Electronics & Instruments Ltd (REIL),
Jaipur
5 Setting up of solar-based charging stations along the Delhi-
Chandigarh-Delhi highway Bharat Heavy Electrical Ltd (BHEL)
6 Setting up of charging stations along Delhi-Jaipur-Delhi
highway and in Mumbai-Pune-Mumbai Expressway
Rajasthan Electronics & Instruments Ltd (REIL),
Jaipur
9.2 Regulations and Federal Policies Driving EV Adoption
The Government of India (GoI) has announced several schemes and policies for the promotion of EV in the
country, and these are given below:
1. NEMMP: The National Electric Mobility Mission Plan, launched in 2013, was one of the earliest policy
initiatives taken by the Indian government to bring in a transitional shift in the country’s transportation
industry. Electric and hybrid mobility was encouraged to grow using several policy levers such as doling
out demand side and supply side incentives for EV acquisition and manufacturing. The first phase of
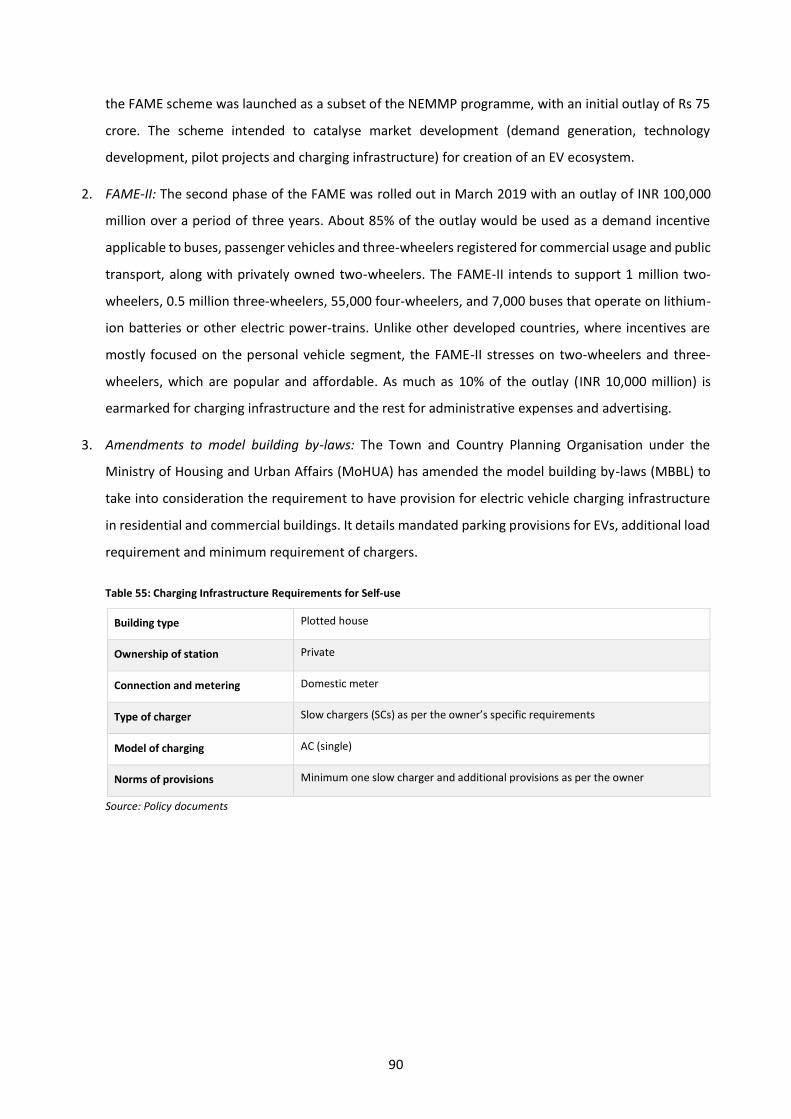
90
the FAME scheme was launched as a subset of the NEMMP programme, with an initial outlay of Rs 75
crore. The scheme intended to catalyse market development (demand generation, technology
development, pilot projects and charging infrastructure) for creation of an EV ecosystem.
2. FAME-II: The second phase of the FAME was rolled out in March 2019 with an outlay of INR 100,000
million over a period of three years. About 85% of the outlay would be used as a demand incentive
applicable to buses, passenger vehicles and three-wheelers registered for commercial usage and public
transport, along with privately owned two-wheelers. The FAME-II intends to support 1 million two-
wheelers, 0.5 million three-wheelers, 55,000 four-wheelers, and 7,000 buses that operate on lithium-
ion batteries or other electric power-trains. Unlike other developed countries, where incentives are
mostly focused on the personal vehicle segment, the FAME-II stresses on two-wheelers and three-
wheelers, which are popular and affordable. As much as 10% of the outlay (INR 10,000 million) is
earmarked for charging infrastructure and the rest for administrative expenses and advertising.
3. Amendments to model building by-laws: The Town and Country Planning Organisation under the
Ministry of Housing and Urban Affairs (MoHUA) has amended the model building by-laws (MBBL) to
take into consideration the requirement to have provision for electric vehicle charging infrastructure
in residential and commercial buildings. It details mandated parking provisions for EVs, additional load
requirement and minimum requirement of chargers.
Table 55: Charging Infrastructure Requirements for Self-use
Building type Plotted house
Ownership of station Private
Connection and metering Domestic meter
Type of charger Slow chargers (SCs) as per the owner’s specific requirements
Model of charging AC (single)
Norms of provisions Minimum one slow charger and additional provisions as per the owner
Source: Policy documents
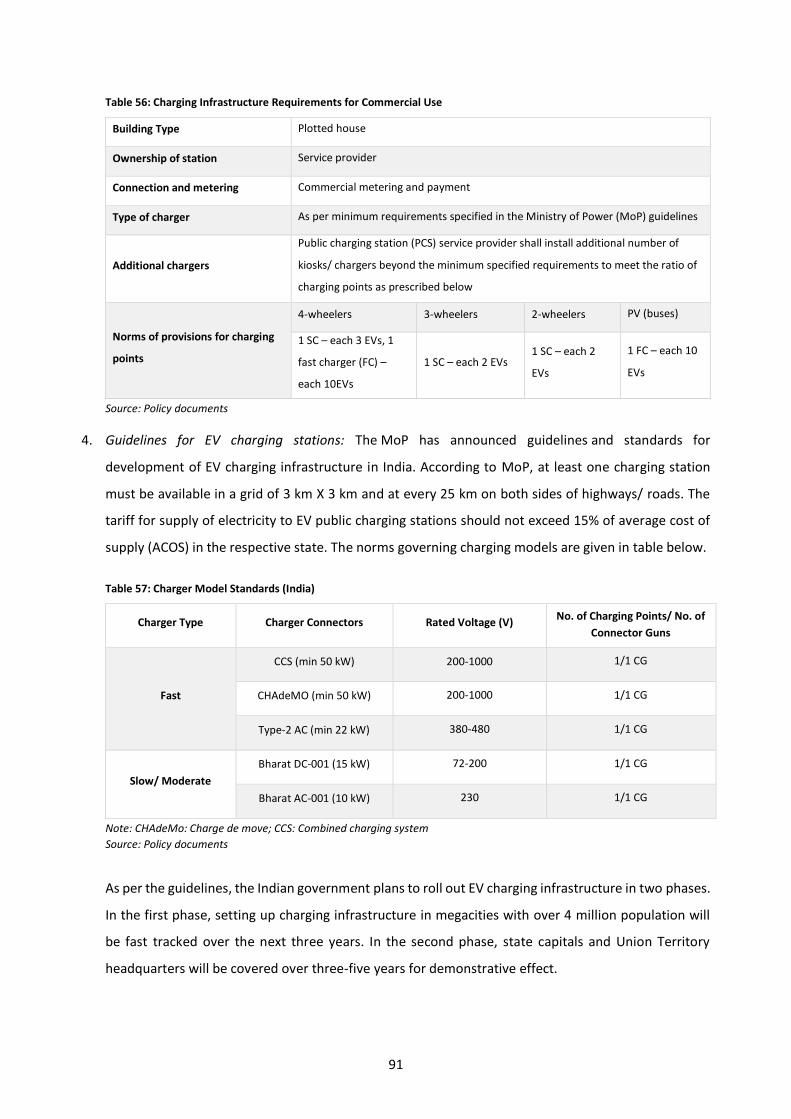
91
Table 56: Charging Infrastructure Requirements for Commercial Use
Building Type Plotted house
Ownership of station Service provider
Connection and metering Commercial metering and payment
Type of charger As per minimum requirements specified in the Ministry of Power (MoP) guidelines
Additional chargers
Public charging station (PCS) service provider shall install additional number of
kiosks/ chargers beyond the minimum specified requirements to meet the ratio of
charging points as prescribed below
Norms of provisions for charging
points
4-wheelers 3-wheelers 2-wheelers PV (buses)
1 SC – each 3 EVs, 1
fast charger (FC) –
each 10EVs
1 SC – each 2 EVs 1 SC – each 2
EVs
1 FC – each 10
EVs
Source: Policy documents
4. Guidelines for EV charging stations: The MoP has announced guidelines and standards for
development of EV charging infrastructure in India. According to MoP, at least one charging station
must be available in a grid of 3 km X 3 km and at every 25 km on both sides of highways/ roads. The
tariff for supply of electricity to EV public charging stations should not exceed 15% of average cost of
supply (ACOS) in the respective state. The norms governing charging models are given in table below.
Table 57: Charger Model Standards (India)
Charger Type Charger Connectors Rated Voltage (V) No. of Charging Points/ No. of
Connector Guns
Fast
CCS (min 50 kW) 200-1000 1/1 CG
CHAdeMO (min 50 kW) 200-1000 1/1 CG
Type-2 AC (min 22 kW) 380-480 1/1 CG
Slow/ Moderate
Bharat DC-001 (15 kW) 72-200 1/1 CG
Bharat AC-001 (10 kW) 230 1/1 CG
Note: CHAdeMo: Charge de move; CCS: Combined charging system
Source: Policy documents
As per the guidelines, the Indian government plans to roll out EV charging infrastructure in two phases.
In the first phase, setting up charging infrastructure in megacities with over 4 million population will
be fast tracked over the next three years. In the second phase, state capitals and Union Territory
headquarters will be covered over three-five years for demonstrative effect.

92
5. Reduction of taxes for EVs and spare parts: The Central Board of Indirect Taxes and Customs (CBIC) has
lowered customs duty on import of EV components to 10-15% from 15-30%. The government also
slashed applicable Goods and Services Tax (GST) on lithium ion batteries from 28% to 18%. On EVs, the
GST has been slashed to 5% from 12% in order to bolster market sentiment and sales.
6. Focus on domestic manufacturing of EVs: In order to encourage vehicle manufacturers to produce EVs
in the country, the government plans to raise custom duties on EV parts and batteries in a phased
manner. As part of the phased manufacturing program (PMP) of the Department of Heavy Industries,
basic customs duties on completely built units of electric buses and trucks will be doubled from 25% to
50% from April 2020. Further, basic custom duty on lithium ion cells will be increased to 10% from April
2021 onwards from a present 5%. EV parts such as AC and DC chargers, motor controllers and power
control units shall be taxed at 15% from 2021 as per the department’s notification on the PMP.
Table 58: Custom Duties Proposed on EV Parts
Item Description Current BCD Proposed BCD Proposed Date of PMP
CBU Bus, trucks 25%
April 2020 onwards SKD
PV, 3W
15%
30%
2W 25%
Bus 25%
Truck 25%
CKD Bus, PV, 2W, 3W, Truck 10% 15%
Lithium ion cells 5% 10%
April 2021 onwards
Battery Packs 5% 15%
Parts for use in manufacture of EVs
AC/ DC charger, AC/ DC motor, power control unit,
energy monitor, contactor, brake system, electric
compressor
0% 15% April 2021 onwards
Note: CKD: Completed knocked down, SKD: Semi-knocked down, CBU: Completely built units
Source: Department of Heavy Industries notification dated March, 2019
7. De-licensing EV charging station operations: The MoP has clarified that no licence is required to operate
EV charging stations in the country. In order to distribute power, a distributor licence is required from
respective state electricity regulatory commissions (SERC) as per the Electricity Act 2003. The Act
stipulates that sale of electricity can be carried out only by licensed electric utilities, and their
franchisees/ licensees. However, the MoP contested than an EV charging station is not involved in
transmission or distribution and the electricity is consumed at the charging station premises itself.
93
Therefore, EV charging station is considered as a service and not selling electricity. Thus, the
government abrogated the requirement of a licence to operate an EV charging station.
8. Subsidy support for setting up EV charging stations: The Indian government plans to offer subsidy
support to states for deployment of 5,000 EV charging stations in cities and highways. Separate
expressions of interest (EoIs) will be floated for cities and highways. The Department of Heavy
Industries has already issued EoIs for setting up of 1,000 public charging stations in cities. The cities
that come under the programme are: a) Cities with more than a million population as per 2011 Census;
b) smart cities as notified by the MoHUA; c) satellite towns connected to seven metros – Delhi,
Mumbai, Kolkata, Chennai, Hyderabad, Bangalore and Ahmedabad; d) major cities of special category
state/UTs; and e) the capital cities of all states/UTs not covered in the above categories. The ministry
is expected to issue the EoI for highways soon. The charging stations in cities are to be built across
various locations, divided into three categories. The first category (Category A) is commercial
establishments such as petrol pumps, malls, and market complexes. The second category (Category B)
is state or central government establishments such as offices of public sector companies. And the third
(Category C) covers semi-restricted establishments such as housing complexes. For securing subsidy
for deployment of charging stations within cities, states, through their nodal agencies, will have to
submit their proposals to the department. Companies willing to set up charging stations will be eligible
for subsidies covering 50-100% of the costs, based on location and category as stated below:
Category A: 70% of the cost of EVSE
Category B: 100% of the cost of EVSE
Category C: 50% of the cost of EVSE
For setting up EV charging stations along highways, 100% subsidy will be given to EVSE, including cost
of chargers, as per industry sources. Additionally, only central public sector entities can submit
proposals for setting up charging stations along highways.
9. Subsidy support for electric buses: The Ministry of Heavy Industries (MHI) has issued an EoI to invite
proposals from states, government departments, transportation departments, and municipal bodies
for procurement of 5,000 electric buses across 55 cities. The central government will offer subsidy
worth INR 25,000 million in order to bring down the upfront vehicle costs. The minimum number of
buses mandated under each category are as follows:

94
Table 59: Number of E-buses Sanctioned (city-wise)
Category of City Minimum Number of
Buses
Number of Target
Cities
Number of Cities to
be Selected
No of Buses Planned to
be Sanctioned
4 million plus cities 300 8 5 1,500
1 million plus cities 100 45 20 2,000
Special category of
states 50 20 10 500
Other cities 50 50 20 1,000
Total 55 5,000
Eighty-six proposals from 26 states/UTs for the deployment of 14,988 e-buses were received. After
evaluation of these proposals as per EoI, the Government sanctioned 5,095 electric buses to 64 Cities/
State Transport Corporations for intra-city operation, 400 electric buses for intercity operation and 100
electric buses for last mile connectivity to Delhi Metro Rail Corporation (DMRC).
The charging infrastructure, including cost of charging equipment required, necessary transformer and
other civil cost for installation of required charging infrastructure for buses have to be incurred by the
operator/OEM.
Furthermore, different states have brought out EV policies under which fiscal incentives and non-fiscal
incentives (waiver or reduction in road taxes, toll tax, parking fees, registration charges, etc.) have been
announced.
9.3 Outlook on EV Sales
The EV market in India is in its nascent stage. However, going forward, EV penetration is expected to
deepen. Although the NITI Aayog (policy think tank of the Government of India) is pushing for 30%
penetration by 2030, it seems to be over-optimistic. The biggest chunk of EVs will be two- and three-
wheelers. Further, government companies and cab aggregators, such as Ola and Uber, are expected to
pioneer EV adoption in the four-wheeler category.
As the enabling environment for electric two-wheeler (e-2W) adoption seems favourable in the medium
term, we compared the cost of ownership of an e-2W with that of an internal combustion engine (ICE)
motorcycle and scooter. Lower battery prices in fiscal 2024 are likely to make cost of acquisition for e-2W
more favourable than current levels. In the case of e-scooters, while the cost of acquisition will be
marginally more favourable in fiscal 2024, their cost of ownership is expected to slightly inch up due to lack
of subsidy. On the whole, the lower battery cost is expected to offset the lack of the FAME subsidy and it
will help maintain the competitiveness of e-scooter against its ICE counterparts.
95
Currently, supply issues, range anxiety and lack of large presence of OEMs are hindering EV adoption. We
expect these to ease by fiscal 2024. As per study author estimates, by fiscal 2024, ~15% of the domestic
two-wheeler sales will be e-2Ws, largely driven by scooters. The scooter segment accounts for ~34% of
two-wheeler sales now and has a higher urban penetration of around 65%. Motorcycle demand is largely
driven by rural customers. Major OEMs are already in the process of developing EVs in-house or acquiring
stakes in EV start-ups in order to diversify their offerings. Beyond fiscal 2024, scooters will predominantly
shift to EVs while motorcycles below 125 cc will begin conversion, majorly in the urban and semi urban
regions owing to conducive economics.
In the four-wheeler segment, as per study author estimates, electric passenger vehicles (e-PV) are expected
to account for ~4% of domestic sales by fiscal 2024, led by higher adoption within the commercial use
segment. The FAME-II subsidy is only for commercial use and no benefits are provided to personal car
owners. Presently, the cost of acquisition (COA) of EVs for cab aggregators are lower compared with diesel
(~4% lower) or CNG (~2% lower) alternatives (taking into account battery life of 5 years, battery capacity
of 16.5 kWh and present FAME subsidies of Rs. 115,336 for commercial 4W EV). The Total Cost of
Ownership (TCO) for both are also lower due to increased running of vehicles in the cab aggregator segment
(~28% lower than diesel variants and ~10% lower than CNG variants). In fiscal 2024, the COA and TCO will
be lower for BEVs compared with diesel and CNG variants. The lower battery cost is expected to offset the
lack of the FAME subsidy and it will help maintain the competitiveness of BEVs against diesel and CNG
variants for cab aggregators. The taxi segment accounts for ~10-15% of sales within passenger cars. Within
the taxi segment, cab aggregators are expected to lead EV adoption. We estimate ~25% of EVs in the taxi
segment will be with cab aggregators in fiscal 2024 (provided adequate infrastructure is available). At
present, the TCO of electric cars for personal use is ~30% higher than a petrol variant and COA ~18% (after
considering subsidy benefits towards 4W EV under FAME scheme), due to their lower running. Thus, EVs
are not a viable alternative for personal use. In fiscal 2024 too, the comparable costs would remain high
for EVs. As such, electric four-wheelers are not viable for adoption in the personal car segment. Thus, the
share of EVs in the total passenger car sales is expected to remain low at ~4% in fiscal 2024 (~0.1% as of
fiscal 2019). Beyond fiscal 2024, the commercial segment is expected to shift majorly to electric while the
personal segment will start showing improved traction towards EV due to lowering cost, improved
economics, better products in the market and change in consumer preferences.
In the 3W segment, significantly strong traction towards push in EV is expected due to better running cost
advantage (autos ply ~100 km daily, making running costs of electric auto much lower than a conventional
or CNG based auto). EV sales in the segment are expected to rise to ~43%-48% of total segmental sales by
FY24 and ~70% in fiscal 2030. Further, with government push, a potential scrappage policy will drive
electric adoption.

96
Buses and LCVs are expected to be laggards, due to higher upfront costs and lesser TCO advantage. Electric
bus adoption will be driven by State Transport undertakings (STUs), which will be mandated to buy E-buses
by the government going forward. Going forward, adoption is expected to rise led by subsequent
procurement schemes by the government.
LCV segment will show gradual shift to EVs with rise in diesel prices, however not more than 10% of yearly
sales is expected to emanate from EVs from this segment by fiscal 2030.
Table 60: Outlook on EV Sales in India
Vehicle Type FY19 FY24 FY30
E rickshaw 450,000 875,391 985,832
3W 100 296,733 931,510
2-W 126,000 3,497,211 13,168,198
Cars & UVs 3,600 176,042 1,299,852
Bus 500 4,557 42,713
LCV 0 24,384 86,895
Total 580,200 4,874,318 16,515,000
Table 61: Outlook on EV Population in India
Vehicle type FY19 FY24 FY30
E rickshaw 1,509,259 4,923,066 10,555,580
3W 100 719,196 4,646,598
2-W 227,250 8,720,413 59,318,340
Cars & UVs 5,039 366,224 5,295,937
Bus 610 17,783 158,222
LCV 50,901 425,870
Total 1,742,258 14,797,583 80,400,546
97
9.4 Assessment of Power Distribution Utilities
9.4.1 Country Macros and Policy Frameworks Guiding Utilities’ Overall Performance
With population of over 1.3 billion and estimated GDP of USD 2.75 trillion in fiscal 2019, India is the third-
largest economy, adjusted for purchasing-power parity (PPP). Also, India has favourable demographics with
the largest working population – 66.2% of the total population – in the working age group of 15-64 years
in 2017 (source: World Bank), and more than half the population below 25 years of age. In fact, India’s
working population is more than total population of countries such as Russia, Brazil and the US. Going
forward, the working population, which logged 2% CAGR over 2007-2017, is expected to increase further,
thereby driving consumption and growth.
The power sector in India is governed by the central and state regulatory agencies. The sector is highly
regulated with various functions distributed between multiple implementing agencies. The three chief
regulators for the sector are the Central Electricity Regulatory Commission, the Central Electricity Authority
and the state electricity regulatory commissions.
The total installed generation capacity as of March 2019 was 356 GW, of which approximately 123 GW was
added during the period from fiscal 2013. Coal-based installed power generation capacity has maintained
its dominant position over the years and accounted for 56% as of March 2019. However, renewable energy
installations have more than doubled to ~78 GW capacity, compared with 32 GW as on fiscal 2014,
constituting ~22% of total installed generation capacity. In particular, this growth has been led by solar
power, which grew at a break-neck speed to ~28 GW from ~3 GW over the same period.
Energy requirement clocked 4.2% CAGR over fiscals 2014-2019. However, the growth was volatile given
the market conditions. Fiscals 2012 and 2013 saw healthy growth of 8.8% and 6.5%, respectively, on the
back of robust growth in economic activity and improved power availability supported by capacity addition
of around 20 GW in each year. However, the demand stagnated in fiscal 2014 on account of lower off-take
due to weak financial health of electric utilities and slowing GDP growth. In fiscal 2015, the demand growth
revived to 6.7% led by a pick-up in economic activity. Moreover, power off take in seven states improved
in fiscals 2014 and 2015 post financial restructuring of electric utilities in those states. The growth tapered
subsequently to 4.3% in fiscal year 2016 and 2.5% in fiscal 2017 owing to slowdown in manufacturing. In
fiscal 2018 and 2019, the demand grew 5.5% and 5.8% respectively, mainly driven by increased connections
through the rural electrification and Saubhagya schemes.

98
Figure 26: Aggregate Power Demand and Supply (in Billion kWh)
Energy demand increased at a CAGR of 4.2%, while power supply rose at a faster pace of 5.7% CAGR over
fiscals 2013 and 2018 on the back of strong capacity additions and improvement in transmission
infrastructure. Though energy deficit (difference between electricity requirement and supply) has been on
a downward spiral, India remains a power deficit country in a growing demand scenario. Energy deficit
declined to 0.7% in fiscal 2018 and to 0.6% in fiscal 2019 from a high of 4.2% in fiscal 2014.
Distribution is the last and critical leg in the supply of electricity - to reach end consumers such as
residential, commercial, agricultural and industrial segments. With more than 200 million consumers and
a connected load of ~400 GW, power distribution caters to one of the largest consumer bases in the world.
The distribution business is largely dominated by state government-promoted electric utilities; private
participation is marginal (5-7%). There are close to 73 distribution utilities – 13 electricity departments, 41
corporatised distribution companies, 17 private distribution companies, and two state electricity boards
(SEBs).
However, the financial position of the distribution sector has significantly deteriorated over the past
decade owing to irregular tariff hikes, high aggregate technical and commercial (AT&C) losses, and delays
in subsidy payments by state governments. This has adversely impacted power offtake by electric utilities
and led to a delay in payments to generation companies. The key problems faced by electric utilities are
highlighted below:
1,0021,069
1,1141,142
1,2051,275
9601,031
1,091
1,135 1,1971,267
-4.2%
-3.6%
-2.1%
-0.6% -0.7% -0.6%
-4.5%
-4.0%
-3.5%
-3.0%
-2.5%
-2.0%
-1.5%
-1.0%
-0.5%
0.0%
0
200
400
600
800
1000
1200
1400
FY14 FY15 FY16 FY17 FY18 FY19
bill
ion K
Wh
Energy Requirement Energy Availability Deficit (RHS)
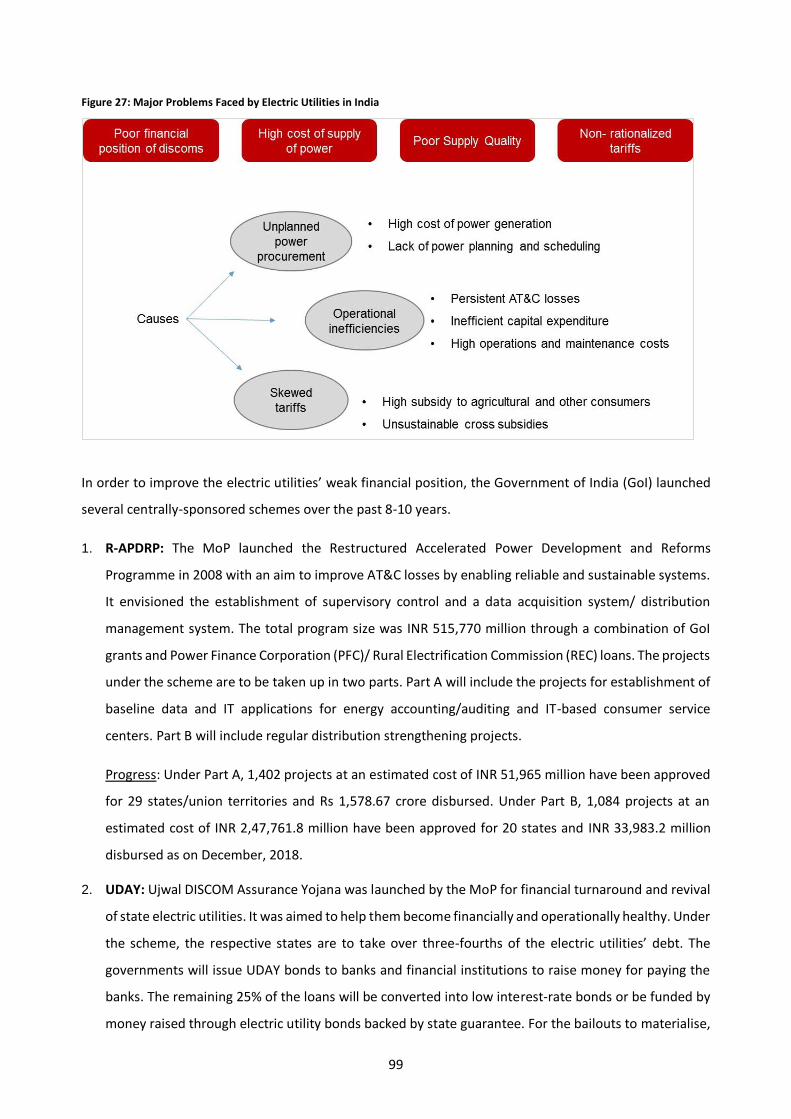
99
Figure 27: Major Problems Faced by Electric Utilities in India
In order to improve the electric utilities’ weak financial position, the Government of India (GoI) launched
several centrally-sponsored schemes over the past 8-10 years.
1. R-APDRP: The MoP launched the Restructured Accelerated Power Development and Reforms
Programme in 2008 with an aim to improve AT&C losses by enabling reliable and sustainable systems.
It envisioned the establishment of supervisory control and a data acquisition system/ distribution
management system. The total program size was INR 515,770 million through a combination of GoI
grants and Power Finance Corporation (PFC)/ Rural Electrification Commission (REC) loans. The projects
under the scheme are to be taken up in two parts. Part A will include the projects for establishment of
baseline data and IT applications for energy accounting/auditing and IT-based consumer service
centers. Part B will include regular distribution strengthening projects.
Progress: Under Part A, 1,402 projects at an estimated cost of INR 51,965 million have been approved
for 29 states/union territories and Rs 1,578.67 crore disbursed. Under Part B, 1,084 projects at an
estimated cost of INR 2,47,761.8 million have been approved for 20 states and INR 33,983.2 million
disbursed as on December, 2018.
2. UDAY: Ujwal DISCOM Assurance Yojana was launched by the MoP for financial turnaround and revival
of state electric utilities. It was aimed to help them become financially and operationally healthy. Under
the scheme, the respective states are to take over three-fourths of the electric utilities’ debt. The
governments will issue UDAY bonds to banks and financial institutions to raise money for paying the
banks. The remaining 25% of the loans will be converted into low interest-rate bonds or be funded by
money raised through electric utility bonds backed by state guarantee. For the bailouts to materialise,

100
there are a few caveats such as reduction of AT&C losses to 15% by fiscal 2019, installing smart
metering, revising power tariffs in tandem with power purchase and other operations and maintenance
(O&M) costs incurred.
Progress: With INR 2.3 trillion worth of bonds being issued (86.3% of target) as of March 2019, debt
and interest burden on electric utilities has been reduced, resulting in higher liquidity. Aggregate
electric utility debt fell from INR 2.7 trillion in September 2015 to INR 1.9 trillion in fiscal 2016 and INR
1.5 trillion in fiscal 2017. However, the declining debt trend is expected to reverse from fiscal 2019
onwards as capital expenditure to improve distribution infrastructure and operational losses is largely
funded through external debt by electric utilities. ACS-ARR gap for UDAY states reduced to INR 0.17
per kWh in fiscal 2018 from INR 0.41 per kWh in fiscal 2017, but expanded to INR 0.22 per kWh at the
end of fiscal 2019 (as per provisional numbers reported on the UDAY portal), indicating reversal of
some of the gains achieved through reduction in power purchase costs, interest burden and AT&C loss
reduction over the past three years.
9.4.2 Benchmarking of Utilities
Objective
The broad scope of this project is to develop an action plan for distribution utilities on the introduction of
EV public charging infrastructure in three geographies: India, Pakistan and Bhutan. As a first step,
distribution utilities in India and Pakistan should be benchmarked on financial, operational and other key
parameters (preparation of regulatory framework, assessing utilities with the existing charging
infrastructure, etc.). The utilities will be graded on the parameters and one utility from each geography will
be shortlisted based on a final composite score. With Bhutan having only one distribution utility, the same
set of parameters will be a starting point for developing an elaborative action plan for introduction of
charging infrastructure in the country.
Methodology
In order to shortlist an electric utility in India, it is imperative that different utilities are benchmarked and
ranked. There are 73 electric utilities in India. Therefore, in order to compare the utilities on an aggregate
basis, a comprehensive set of parameters, grouped in buckets, have been selected. Each parameter has
been assessed for significance, materiality and degree of explanatory power with respect to the final
desirable outcome. A few parameters were dropped owing to data paucity across the utilities or being non-
comparable due to unavailability of data across the same timescale. The final set of parameters is given
below along with the rationale for selection:

101
Table 62: Parameters adopted for Benchmarking of Utilities
Bucket Parameter Rationale for Selection
Operational
Metrics
AT&C losses
Provides a realistic picture of loss situation for the utility by taking into
account energy loss (Technical loss + Theft + inefficiency in billing) &
commercial loss (Default in payment + inefficiency in collection)
Distribution losses Measure of power lost during transit as a percentage of power injected into
the distribution grid
Collection efficiency Indicator of proportion of amount that has been collected from consumers
with respect to amount billed to them
Billing efficiency
Indicator of proportion of energy that has been billed (includes both
metered and unmetered sales) to consumers with respect to energy
supplied to an area
Financial
Metrics
Total power sales Assessment of revenue strength, number of consumers and geographical
coverage for the utility
ARR/sales Indicator of realized revenue for each unit of power sold to consumer.
Measure of inefficiencies in realization
O&M/sales
Operation and maintenance cost as a percentage of utility total revenue.
Too low O&M cost may result in a need in very high investment and O&M
cost in the future. Too high O&M cost indicate generic problems for the
utility
Gap (as % of ARR) Percentage of gap with respect to realizable revenue
ACS-ARR gap Gap between average cost of supply and average realizable revenue.
Indicator of tariff irregularities and/or realizations
APPC per unit of energy
sales
Measure of cost incurred by the utility to procure power from generating
sources
Age of creditors Measure of financial performance and liquidity position
Other Key
Parameters
Surplus (+)/ deficit (-) of
the state
Measure of power supply position in the state with respect to demand.
Peak surplus (+)/ deficit (-)
of the state
Indicator of the state’s capability to meet peak demand scenarios through
short term power arrangements
Upcoming industrial and
commercial clusters
Indicator of rise in financial situation of the state/ area, growth in per capita
income and propensity to buy high valued items (like EVs)
Policy/ implementation
framework rolled out by
the utility
Federal/ state support for enablement of EV ecosystem in the area

102
The benchmarking study covers 17 parameters across three buckets to establish the position of each
electric utility in the country among its peers. The intended outcome of the study is to determine the
current position of the utilities (as measured by the final and composite rank). Each utility has been rated
as 1/2/3/4 on each parameter based on the pre-decided rating buckets. Finally, a composite rank is
assigned to the utilities on the basis of the cumulative score (across three major buckets). The electric utility
which fares the best (rank 1) will be selected for detailed assessment in the respective geography.
The benchmarking study consists of statistical and non-statistical parameters to ensure finality. In the
context of introspection and authenticity, the study has utilised data only from authentic sources:
government reports or disclosures/tariff orders by electric utilities available in the public domain.
Readiness of Electric Utilities to Set Up EV Charging Stations
In India, 37 major electric utilities have been assessed, benchmarked and ranked. The rest were left out as
they were inconsequential and did not alter the results in the study. Out of the 37 utilities, some performed
significantly well across categories and buckets, while a few lagged consistently. The exercise has found
several electric utilities at the helm of the study results with a little differentiation. The two non-
quantitative parameters - upcoming industrial & commercial clusters, and policy/ implementation
framework rolled out by the utility - were given more weightage to eliminate the clustering effect at the
top. This makes logical sense as the two factors are typically proxies of demand and supply drivers of EV
charging infrastructure in a region. Higher the industrial and commercial development, higher the affluence
in the region, leading to a greater propensity of residents to buy an EV. With EVs still expensive and
considered exclusive in the country, wealth and improved disposable income are expected to govern initial
sales. The second parameter (policy/ implementation framework rolled out by the utility) has been selected
and each utility has been ranked taking into account policy formulations made by the state and/or utility
pertaining to EVs. Karnataka, Maharashtra, Telangana, Andhra Pradesh, and Gujarat have already
formulated EV polices, while a few other states such as Uttar Pradesh are on the drafting table. Many
electric utilities in Telangana, Andhra Pradesh, Karnataka, Madhya Pradesh, Chhattisgarh, and Delhi have
declared tariff structures for EV charging stations. Such developments were taken into account for ranking.
9.4.3 Shortlisted Utility
The following electric utilities have been identified from India (based on the top three final rankings):
Name of Electric Utility Area of Operation
Tata Power Mumbai
Maharashtra State Electricity Distribution Company Ltd (MSEDCL) Maharashtra (except Mumbai region)
BSES Yamuna Private Ltd South-East, North-East & Central
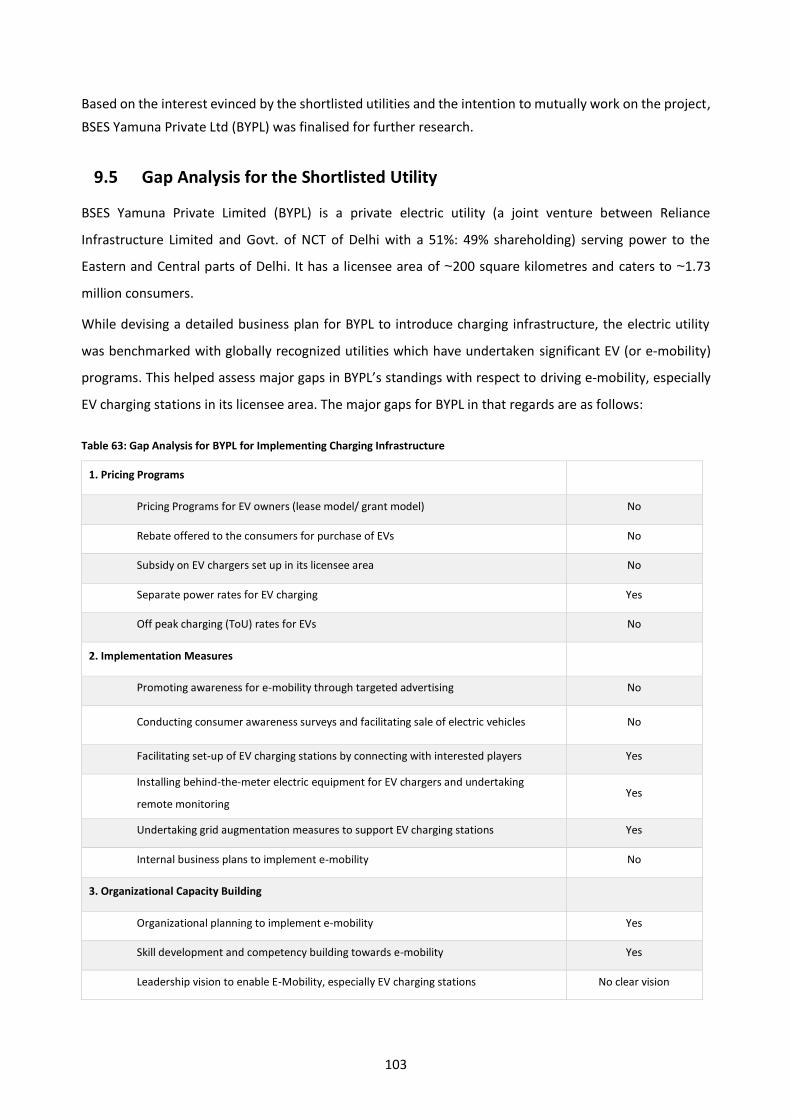
103
Based on the interest evinced by the shortlisted utilities and the intention to mutually work on the project,
BSES Yamuna Private Ltd (BYPL) was finalised for further research.
9.5 Gap Analysis for the Shortlisted Utility
BSES Yamuna Private Limited (BYPL) is a private electric utility (a joint venture between Reliance
Infrastructure Limited and Govt. of NCT of Delhi with a 51%: 49% shareholding) serving power to the
Eastern and Central parts of Delhi. It has a licensee area of ~200 square kilometres and caters to ~1.73
million consumers.
While devising a detailed business plan for BYPL to introduce charging infrastructure, the electric utility
was benchmarked with globally recognized utilities which have undertaken significant EV (or e-mobility)
programs. This helped assess major gaps in BYPL’s standings with respect to driving e-mobility, especially
EV charging stations in its licensee area. The major gaps for BYPL in that regards are as follows:
Table 63: Gap Analysis for BYPL for Implementing Charging Infrastructure
1. Pricing Programs
Pricing Programs for EV owners (lease model/ grant model) No
Rebate offered to the consumers for purchase of EVs No
Subsidy on EV chargers set up in its licensee area No
Separate power rates for EV charging Yes
Off peak charging (ToU) rates for EVs No
2. Implementation Measures
Promoting awareness for e-mobility through targeted advertising No
Conducting consumer awareness surveys and facilitating sale of electric vehicles No
Facilitating set-up of EV charging stations by connecting with interested players Yes
Installing behind-the-meter electric equipment for EV chargers and undertaking
remote monitoring Yes
Undertaking grid augmentation measures to support EV charging stations Yes
Internal business plans to implement e-mobility No
3. Organizational Capacity Building
Organizational planning to implement e-mobility Yes
Skill development and competency building towards e-mobility Yes
Leadership vision to enable E-Mobility, especially EV charging stations No clear vision

104
9.6 Planning for the Transition
9.6.1 Charging Standards and Charger Type
In order to create an ecosystem of EV charging stations, it is imperative to have a standard for all EV supply
equipment (EVSE), as required. The purpose of standards is (a) to act as a guiding principle for
manufacturers to meet necessary specifications, (b) set a reference for testing agencies such as ARAI and
ICAT to carry out required tests, and (c) facilitate talking (communicating) between different charging
systems that may co-exist in a country.
The Bureau of Indian Standards (BIS) had set up the ETD 51 Committee for forrmulating the standards
pertaining to EV charging (sockets, plugs, and vehicle couplers). It has already finalised and released the
IS:17017 standards, which pertain to charging systems in the country.
Table 64: Standards Pertaining to EVCS
Standards Description
IS:17017 series of standards Based on IEC 61851; IEC 62196 and ISO 15118 series of standards
IS:17017-1 General requirements and definitions of EVSE (adapted from IEC
61851-1)
IS:17017-21 EV requirements for connection to AC/DC supply (adapted from
IEC 61851-21)
IS:17017-22 AC EVSE (adapted from IEC 61851-22)
IS:17017-23 DC EVSE (adapted from IEC 61851-23)
IS:17017-24 Digital communication protocol between DC EVSE (fast charging
systems) and EV
IS/ISO:15118 Digital communication protocol between CCS-based EVSE and EV
Source: BIS, DHI
The IS-17017 recommends CHAdeMO and CCS charging protocol and has adopted the same for rolling out
DC charging systems. In 2017, the Department of Heavy Industries (DHI) issued Bharat Charger
specifications for AC [Bharat Chargers AC-001 (15A, 3.3kW, IEC 60309 connector)] as well as DC chargers
[Bharat Chargers DC-001 (200A, 15kW, GB/T 20234 connector)] based on the Chinese standard - GB/T.
However, Bharat Chargers are for vehicle architecture lower than 100V.
Initially, two-wheelers (personal or ride sharing), autorickshaws and cab aggregators (Ola and Uber) are
expected to go electric. While personal vehicles can make do with AC slow chargers for the timebeing, the
same is not feasible for commercial vehicles (CVs).
The most viable solution for CVs would be battery swapping, but it is subject to battery standardisation
and creation of a well-connected ecosystem across the country. There are no national or international

105
standards for battery swapping because different vehicles use batteries of a different make, configuration
and technical parameters, which require different charging modes (voltage and current levels). In order to
bring out a battery swapping regulation in the country, vehicle manufacturers and battery suppliers will
need to build a cohort and install standardised batteries. Regulators can go to work once the ecosystem is
in place.
In late 2018, the government had asked public charging stations to install all three fast charging platforms,
CCS CHAdeMO and type 2 AC, as well as two slow/moderate chargers - Bharat DC and Bharat AC. The
charging standards as highlighted in the MoP's notification titled “Charging infrastructure for Electric
Vehicles – Guidelines and Standards” dated December 2018, are as follows:
Table 65: Charger Types and Rated Voltages for EV Charging (as per the MoP’s Notification)
Charger Type Charger Connectors Rated Voltage (V) No. of Charging Points/ No of
Connector Guns (CG)
Fast
CCS (min 50 kW) 200-1000 1/1 CG
CHAdeMO (min 50 kW) 200-1000 1/1 CG
Type 2 AC (min 22 kW) 380-480 1/1 CG
Slow/ Moderate
Bharat DC-001 (15 kW) 72-200 1/1 CG
Bharat AC-001 (10 kW) 230 3/3 CG of 3.3 kW each
Source: Ministry of Power, India
Deployement of all charger types will lead to escalation in costs as plugs and communication protocols,
which adhere to prescribed standards, have to be deployed. Residential and captive charging infrastructure
for internal use of a company’s own/ leased fleet is not required to install all types of chargers. Lack of
clarity on charging standards had earlier forced Energy Efficiency Services Ltd (EESL) to annul the tender
for buying 10,000 EVs in 2018. The tender had a 20% quota for luxury sedans, which would have required
incorporation of fixed charging standards in the country.
In July 2019, the DHI had issued an EoI for setting up 1,000 EV charging stations in cities. As per the
notification, the charging stations must have at least six chargers – four fast and two slow. The charging
technologies must include CHAdeMO, CCS, Bharat Standard and Type 2 AC. The rated voltages of these
charger types as recommended by the DHI’s EoI are given in the table below:
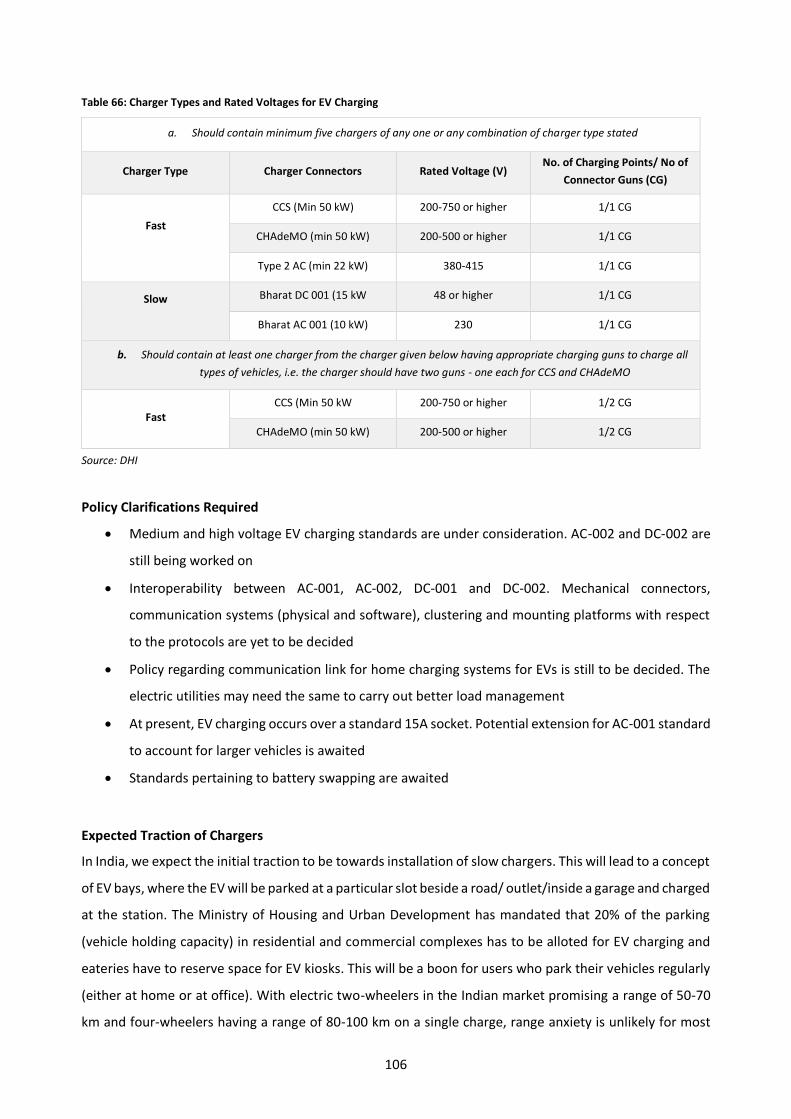
106
Table 66: Charger Types and Rated Voltages for EV Charging
a. Should contain minimum five chargers of any one or any combination of charger type stated
Charger Type Charger Connectors Rated Voltage (V) No. of Charging Points/ No of
Connector Guns (CG)
Fast
CCS (Min 50 kW) 200-750 or higher 1/1 CG
CHAdeMO (min 50 kW) 200-500 or higher 1/1 CG
Type 2 AC (min 22 kW) 380-415 1/1 CG
Slow
Bharat DC 001 (15 kW 48 or higher 1/1 CG
Bharat AC 001 (10 kW) 230 1/1 CG
b. Should contain at least one charger from the charger given below having appropriate charging guns to charge all
types of vehicles, i.e. the charger should have two guns - one each for CCS and CHAdeMO
Fast CCS (Min 50 kW 200-750 or higher 1/2 CG
CHAdeMO (min 50 kW) 200-500 or higher 1/2 CG
Source: DHI
Policy Clarifications Required
• Medium and high voltage EV charging standards are under consideration. AC-002 and DC-002 are
still being worked on
• Interoperability between AC-001, AC-002, DC-001 and DC-002. Mechanical connectors,
communication systems (physical and software), clustering and mounting platforms with respect
to the protocols are yet to be decided
• Policy regarding communication link for home charging systems for EVs is still to be decided. The
electric utilities may need the same to carry out better load management
• At present, EV charging occurs over a standard 15A socket. Potential extension for AC-001 standard
to account for larger vehicles is awaited
• Standards pertaining to battery swapping are awaited
Expected Traction of Chargers
In India, we expect the initial traction to be towards installation of slow chargers. This will lead to a concept
of EV bays, where the EV will be parked at a particular slot beside a road/ outlet/inside a garage and charged
at the station. The Ministry of Housing and Urban Development has mandated that 20% of the parking
(vehicle holding capacity) in residential and commercial complexes has to be alloted for EV charging and
eateries have to reserve space for EV kiosks. This will be a boon for users who park their vehicles regularly
(either at home or at office). With electric two-wheelers in the Indian market promising a range of 50-70
km and four-wheelers having a range of 80-100 km on a single charge, range anxiety is unlikely for most
107
regular office commuters. This will enable usage of EVs by making do with slow chargers. Small vehicles
(two- and three-wheelers ) can charge through three-pin type 1 chargers whereas larger vehicles (four-
wheelers) can charge through seven-pin type 2 or type 3 chargers. The EV charging stations will have to be
equipped with different sockets that are compatible with the chargers.
However, slow charging will not be compatible with vehicles deployed for commercial use. Although
battery swapping is an efficient solution, as per industry sources, it requires an expensive and intensive
infrastructure which is not expected to materialise in the country soon. Also, it requires standardisation of
batteries (size/ power output/ charging methodology).
From an Indian perspective, NMC batteries are best-positioned taking into account the usage pattern.
Hence, further uptake of the battery in EVs is projected.
As per guidelines from the Ministry of Power dated December 2018, public charging stations (PCS) are
required to have three fast charger connectors (CCS, CHAdeMO, and Type-2 AC) and two slow charger
connectors (Bharat DC 001 and Bharat AC 001). However, upfront costs pertaining to installation of five
chargers at a PCS is prohibitive and, hence, may not be feasible in the short-to-medium term. Therefore, it
is to be seen how the policy takes shape to assuage the high CAPEX cost. In October 2019, the government
had brought out an amendment to the charging station guidelines, stating that PCS owners have the
freedom to install the chargers (type as well as number) as per the market requirement.
Fast charging standards, which are being worked out for India (AC 002 and DC 002), are still awaiting
standardisation. Internationally, PCS do not deploy all connectors, and no two connectors are
interoperable. China has built scale by defining and adopting its own charging standards. The opportunity
for India is to do the same by leveraging existing technologies and taking into consideration India-specific
needs. Sound policies, clear standards, and private participation will pave the way for faster adoption of EV
chargers.
DC charging (through CHAdeMO or CCS) entails several issues for a nascent EV market like India:
• High CAPEX: DC fast chargers are currently expensive, involving a CAPEX of ~INR 2.5 million. Also,
appropriate devices that allow fast charging are not readily available. These are disincentives for
companies looking to install fast chargers. Additionally, EVs currently available in the market have
small batteries, and, hence, do not need fast charging to the same extent as larger battery-fitted
vehicles do
• Unavailability of vehicles: Globally, EV manufacturers have pushed for larger batteries to improve
usability and range. The first generation Nissan Leaf had a battery size of 24 kWh, which has
undergone several upgrades to reach 62 kWh in 2019. The Tesla Model X 100D has pushed the

108
limits, packing in 100 kWh. In comparison, the two Indian EV cars, Mahindra e2o and Tata Tigor EV,
use 16 kWh battery packs. Even the new Tigor, launched in October 2019 has a battery capacity of
21.5 kWh. Only one car, Hyundai Kona (battery capacity: 39.2 kWh) might require fast charging
owing to its large battery size. It will take at least some more years for Indian manufacturers to
introduce batteries of ~50 kWh, and another 2-3 years to make these cost-competitive as prices of
battery packs reduce.
Although standardisation of chargers and protocols are mostly in place, usability remains a concern. This is
because the standards, borrowed from developed EV markets, are difficult to replicate in the Indian
context, at least for another 5-6 years. The EVs expected to come up (2W/3W/4W) in the near future will
deploy small battery packs (<50 kWh) for which slow charging standards will be more suitable. The Bharat
AC and DC standards will cater to charging requirements for the time-being. Charging will predominantly
be through home-installed chargers and EV parking bays (installed in garages, housing societies,
commercial spaces) deploying slow charging systems.
For households, the supply is typically limited to ~15 kW. An average (single phase) house can install an
appropriate EVSE, subtracting household usage from other connected load. In the US, a residence has
options of installing a 3.6 kW or 7 kW EVSE. For EV parking bays, slow AC chargers can be used to top up
the vehicle while it is parked.
As the Indian market gains traction with new EV availability, better consumer electronics and bigger Li-ion
battery packs, the fast charging infrastructure will develop.
Table 67: Potential Roadmap for EV Charger Adoption in the Country
Initial phase Slow chargers EV parking bays equipped with charging facilities; vehicles
will be charged at home / office/ parking lots
Intermediate phase Fast chargers EV charging stations on major highways, thoroughfares in
tier 1 cities
Maturity phase Fast chargers with CMS Connected EV charging stations enabling smart charging,
secure transactions, V2G
9.6.2 Battery Swapping
India is a very nascent market for EVs. Going forward, the advent of EVs in the country is expected to be in
the 2W and 3W segments, owing to favourable TCO economics, lower COA, and higher government
subsidies. With the Indian automobile sector comprising majorly of 2Ws and 3Ws (~80% and ~3% of the
overall vehicle population, respectively), the ramifications of these vehicle categories going electric is
significant.

109
While 2Ws are mostly used for personal usage, commercial usage of 2Ws in the form of shared mobility,
last mile delivery of goods (food, shipments, etc) is gaining prevalence. With already 0.2 million e-2W and
1.5 million e-3W (including e-rickshaws) on Indian roads, the business case of electrification is strong. Niti
Aayog in its policy document on EVs has also highlighted that India needs to focus initially, at least for the
first few years, on 2Ws and 3Ws.
Commercial 2Ws and 3Ws will require quick charging systems and will not want to wait for 3-5 hours for
charging vehicle’s batteries as it will hamper business. This is why Ola Mobiliy’s pilot EV project failed to
gain traction in the Indian city of Nagpur. Several taxi owners who had leased the EVs from Ola at Rs 1,000
per day were finding it difficult to meet revenue targets owing to less battery mileage and high charging
times. Building an EV with bigger battery is also counter intuitive as prohibitive cost and lack of fast charging
will not encourage sales. Battery swapping can be the sweet spot to achieve scale where public charging
infrastructure is unviable.
With government support and industry trends favouring e-2Ws and e-3Ws, battery swapping stations to
cater to the categories can help accelerate commercial usage.
Ecosystem of Battery Swapping in the Country
Although there is no mention of swapping stations in the policy documents so far, certain companies in
India are exploring the opportunity of setting up BSS in the country. Some forays that have been done by
companies in India are:
• Sun Mobility is working with Ashok Leyland on its pure electric buses plying in Ahmedabad, and
with Delhi-based e-rickshaw startup, SmartE. In Ahmedabad, 18 buses are presently equipped with
swappable batteries, with the swapping infrastructure handled by Sun Mobility. In Delhi, it provides
swap solutions to SmartE’s fleet of 45 electric 3Ws, which is expected to be ramped up to 500 e-
rickshaws soon
• Sun Mobility is also working with Pune-based Piaggio Vehicles to co-develop a business model
around electric 3Ws. Piaggio intends to separate the battery of the 3W to reduce upfront cost. Sun
Mobility has been mandated to supply batteries to Piaggio along with swapping solutions
• Exicom Power Solutions has an order book to set up ~120 battery swapping stations in Delhi NCR
over the next two years. Majority of these stations will cater to the commercial e-2Ws and e-3Ws
• 22Kymco, a collaboration between India-based 22 Motors and South Korea-based Kymco, recently
launched the iFlow electric scooter. It plans to set up ~240 swap stations (and fast charging units)
in six cities - Ahmedabad, Bengaluru, Delhi, Hyderabad, Kolkata, and Pune - by March 2020

110
• Ola Electric has been working towards developing an electric mobility ecosystem in the country,
which includes charging stations, swapping solutions and other products. The company intends to
focus on 2Ws and 3Ws in the short-to-medium term
• Panasonic India has been conducting pilot programmes on battery swaps in the NCR
9.6.3 Grid Augmentation
Although a shift from ICE vehicles to EVs is crucial to minimise greenhouse gas emissions of the transport
sector and reduce India’s dependence on fossil fuels (petrol and diesel), one needs to bear in mind the
challenges that will accompany the transition. One of the major challenges is the imposition of additional
burden on the power grid, as increasing number of charging stations and drawl of power will degrade the
operating parameters of the distribution network, making it unreliable and inefficient.
Power Requirement for EV Charging Stations
EV penetration is minuscule in the country, at <0.5%. To build a comprehensive framework for a utility to
augment the EV charging infrastructure in the country, taking into account the expected growth in EV sales,
the ramifications needs to be looked into.
Low voltage architecture vehicles like e-2Ws and e-3Ws utilise AC charging, which is typically slow. For high
powered fast charging, current drawl is higher.
Slow charging is majorly used for personal charging systems (home/ office) while fast (DC) charging can be
used at public charging/ dedicated fleet charging points. The power rating for DC charging is significantly
higher, as it allows the charger to pump more power into the battery in a short time.
Table 68: Charging Methods and Power Ratings for Different Power Ratings
Power Rating (as per SAE) AC Charging DC Charging
Level 1 <2 kW (single phase AC) <36 kW (80 A)
Level 2 <22 kW (single phase AC) <90 kW (200 A)
Level 3 <43 kW (three phase AC) <240 kW (400 A)
Impact on Grid for BYPL
In order to understand the impact of EV charging on the grid, a detailed analysis of the prospective number
of EVs which are expected to charge in the BYPL area was performed. Judgment calls on EV growth (vehicle
wise) till FY30 was taken not only for the National Capital Territory (NCT) but also for neighboring cities of
Ghaziabad and Noida (due to close proximity with the BYPL area). Cumulative charging requirement owing
to native EVs (EVs owned by residents in the BYPL area) as well as guest EVs (travelling from other parts of
Delhi and adjoining cities of Ghaziabad and Noida) was calculated. The methodology is as given below:
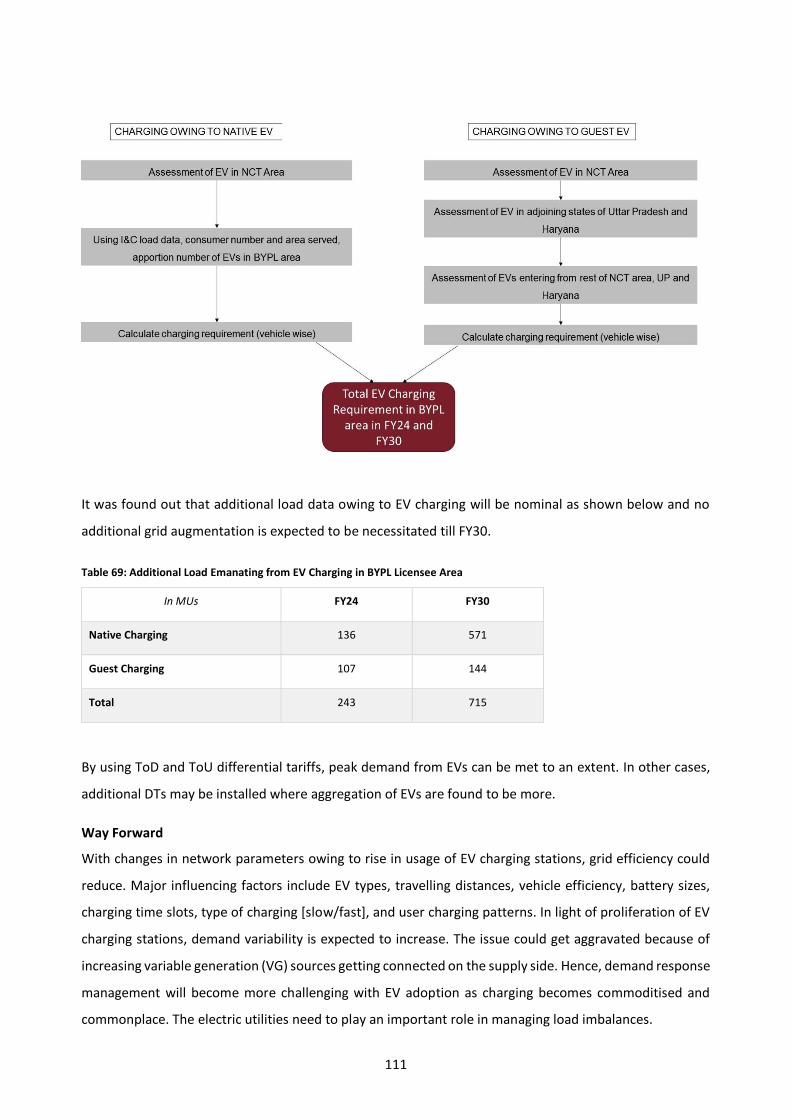
111
It was found out that additional load data owing to EV charging will be nominal as shown below and no
additional grid augmentation is expected to be necessitated till FY30.
Table 69: Additional Load Emanating from EV Charging in BYPL Licensee Area
In MUs FY24 FY30
Native Charging 136 571
Guest Charging 107 144
Total 243 715
By using ToD and ToU differential tariffs, peak demand from EVs can be met to an extent. In other cases,
additional DTs may be installed where aggregation of EVs are found to be more.
Way Forward
With changes in network parameters owing to rise in usage of EV charging stations, grid efficiency could
reduce. Major influencing factors include EV types, travelling distances, vehicle efficiency, battery sizes,
charging time slots, type of charging [slow/fast], and user charging patterns. In light of proliferation of EV
charging stations, demand variability is expected to increase. The issue could get aggravated because of
increasing variable generation (VG) sources getting connected on the supply side. Hence, demand response
management will become more challenging with EV adoption as charging becomes commoditised and
commonplace. The electric utilities need to play an important role in managing load imbalances.

112
The prospective solutions and way-ahead strategies are:
Remediation Strategies
Similar to rooftop solar photovoltaic (PV) projects, EV charging stations have a problem of peak energy
requirements due to uncertain charging and discharging patterns of consumers. This uncertainty makes it
difficult to accurately assess impact on the local distribution network. The transmission and distribution
network will require adequate augmentation with rising penetration in EV chargers. Hence, the electric
utilities are required to have special planning and intervention to address challenges emanating from EV
charger adoption:
• Optimal placement of charging stations – An electric utility has the onus to ensure seamless and
reliable power supply to all charging stations set up under its distribution area. For this, the utility
must undertake a techno-commercial feasibility study before providing electricity to the station.
This should include detailed studies on the impact on the grid, peak load, and transformer loading
owing to additional EV load. The utility needs to take into consideration the ideal number of fast
and slow charging stations that can be catered to by the network without compromising on
reliability. The committee on Technical Aspects of Charging Infrastructure for Electric Vehicles, led
by the CEA, has stated that in view of effective grid and network management, permission from
the utility before setting up a PCS is mandatory. Additionally, the CEA has said that the location for
the PCS will be decided by the electric utility, state road transport department, and urban
development department of the state
• Distribution network planning along with adoption of distributed generation: Adoption of EVs
generally have a clustering effect, with significant uptake in upscale neighbourhoods of a
metropolis. This makes EV integration more challenging. Neighbourhood clustering puts significant
pressure on the local grid network. Hence, infrastructure upgradation requires strategic planning.
As per a UK study, ~32% of low voltage feeders will require reinforcement by 2050 to cope with
the EV clustering effect. This amounts to GBP 2.2 billion of investments by 2050, which may further
be exacerbated if consumers opt for high capacity DC chargers.
• Network reinforcement investments can be reduced via distributed generation. This will reduce
distribution losses, improve reliability issues, and encourage bidirectional flow of power in the grid.
Instead of the conventional method of augmenting upstream electricity systems (additional power
plants), distributed generation will lead to network reinforcements at low-voltage levels, thereby
averting high power losses at the distribution level
• Reconfiguration of distribution networks: Typically, distribution transformers between 10-50 kVA
will serve majority of the EV charging stations. The clustering phenomenon will cause damage/
outage from overloading of the DTs, thereby degrading the power quality in other connected

113
residential/ commercial feeders. Also, intermittent voltage fluctuations will lead to rampant
heating up and cooling down of transformers, impacting their life and reliability. This will, in turn,
affect SAIFI and SAIDI of the network. Therefore, in order to manage the EV load on a network, the
electric utility must forecast EV peak load and build central monitoring systems for DTs. Feeders
that have tendencies of high transformer loadings need to be upgraded. As per the CEA, a CMS
will be set up by the utility to enable maximum charging rate, which will be controlled based on
availability of power in the grid
• Time of use charging: Network loads can be managed though special EV tariffs with lower prices
during off-peak times. This can help shift the EV load through peak shaving (during times of high
load) and valley filling (during times of low to moderate load). ToU can help electric utilities avert
buying costly short-term power from the open market to cater to peak demand. Instead, through
gradual valley filling, demand load can be met via power generation from base load stations.
However, this solution may be tenable at low EV adoption times and not at high penetration levels,
as seen in the case of California, USA. At high EV levels, ToU charging in California had led to
crowding behaviour, leading to sharp load ramps, thereby defeating the purpose of demand-side
load management
• Managed charging: Although ToU intends to assuage / dissuade consumers to charge at a
particular time slot, aggregation of charging at the particular time slot will again lead to overloading
of DTs and sudden valley filling. Managed charging is to tackle the problem of crowding through
gradual valley filling. Also known as intelligent or smart charging, managed charging entails a
combination of infrastructure and communication signals. Messages will be sent directly to a
vehicle via the charger, thereby influencing the decision of charge timing. Through managed
charging, the end-user will have information of present EV charging tariffs at a current location as
well as in neighbouring areas. The variation in tariffs will be governed by current DT loading in the
respective areas, and the user will have the option to choose the right time and location of
charging. Through this mechanism, governed by a real time CMS, users will be incentivised to
charge in areas that are under-loaded.
• The degree of incentivisation will be decided based on an intelligent algorithm and not on a pre-
determined ToD rate. This will make customer charging behaviour elastic, reducing the need of
polluting thermal peaking plants. A study titled “Digitization and Energy”, published by the IEA,
quantified the benefits of managed charging at a global level. The study found that in a medium
growth EV scenario, 150 million EVs will be on the road by 2040, and 140 GW will be required to
cater to the charging requirements if standard EV charging is deployed. However, if managed
charging is implemented, the capacity requirement will be cut by half (65 GW), thereby saving $280

114
billion for transmission and distribution investments and $100 billion for power generation
capacity commissioning
• Vehicle to grid: It is one of the most advanced methods of smart charging, by which energy stored
in EV batteries is discharged back to the grid, thereby making EVs virtual power plants. This two-
way charging can help EV owners to charge their vehicles when power is the cheapest and
discharge during peak load demand. This takes the value proposition of demand response to
greater heights, improving asset utilisation, and increasing reliability and resiliency of network
parameters, such as voltage control, frequency regulation, etc. A Nissan-led V2G trial in Denmark
in 2017 found that EV owners could earn up to 1,300 euros a year by supporting grid balancing.
Another trial run, sponsored by the United States Department of Defense, undertaken to assess
the economic benefits of V2G from a network of 42 EVs, found it to be between $1,800-2,500
annually to EV owners by providing capacity-based services to the system operator, California
Independent System Operator. Although V2G is a far-fetched concept for India, the utility must
work towards implementing managed charging (supply-side incentive) and ensure that the local
distribution network does not get overloaded, by setting up a CMS to manage DT loading positions
on real-time basis. Supply to charging stations must be ensured, and captive generation as well as
open access at EV stations must be expedited.
9.6.4 Charging Locations
Table 70: Typical Locations that can be Considered for a PCS in India
Type of Area Prospective Locations for Charging Stations
Urban Areas
Parking lots of residential complexes/ housing societies
Premises of public offices/ government hospitals/ government
educational institutions
Near commercial establishments (coffee shops, restaurants, movie
theatres, shopping malls, eateries, market complexes)
Technology parks
Municipal parking lots
Petrol pumps
Dedicated parking spots on roads
Highways
Rest areas
Wayside amenities (coffee shops, restaurants, eateries)
Petrol pumps

115
In the initial stage, India can consider setting up PCSs at/ near commercial centres and dedicated parking
spots in upscale areas. For this, utilisation levels need to be assessed before and strategies developed.
Although the government has proposed setting up a charging station every 3 km in cities and 25 km on
highways, moving towards the target one step at a time is important. Building a lot of charging stations
anticipating EV demand to grow in future, seems farfetched in the early years, when EV population is low,
charging stations are expected to be underutilised. As EV sales grow and utilisation of existing stations
improves, newer stations may be planned at strategic locations. This will keep a balance between the
“chicken” and the “egg”. However, as EV population rises significantly, there may not be a direct
relationship between incremental EV sales and usage per EV charging station. As per a 2018 study
conducted by the International Council on Clean Transportation, in several developed EV cities like San
Jose, Seattle, and Amsterdam, usage per PCS has reduced despite rise in EV population. This introduces the
idea of coverage versus capacity. Capacity planning takes into consideration more divergent factors like
charging behaviour, driving pattern, and proximity of PCSs to end users, to determine ideal charging
locations. Capacity planning is required when EV penetration is high and coverage of charging station is no
longer the only factor determining station location.
Fast charging is mostly required along highways and expressways where EV users can quickly top up their
vehicles before continuing their journey. The propensity to pay higher for charging is also greater on
highways due to the psychological fear of getting stuck or running out of battery. This can, to some extent,
assuage project viability risks even if utilisation levels are not optimum. The expectation that price premium
charged to users will be able to cover the higher CAPEX (due to fast charging) and incremental OPEX may
encourage prospective PCS owners to set up more stations.
In cities, however, pricing pressures are expected to dissuade rampant PCS expansion. The type of chargers
(slow/fast) to be used will be dictated by government rules in case subsidy support is sought. Otherwise,
the type and make of chargers to be used will be based on the end-use demand and policy intervention.
Typically, in cities, slow chargers may be used where cars can be parked for several hours.
In India, like other developed markets, majority of the EV charging will happen at home, followed by
charging at workplace. However, PCSs will be required to top up for trips beyond home or workplace.
Further, plug-in hybrids may use PCSs to reduce running costs by powering the vehicle through its batteries.
As per the US Department of Energy’s Clean Cities Program, the presence and visibility of PCSs in a country
will enhance the confidence among EV consumers as well as encourage prospective buyers to adopt EVs.
For a country like India, where consumers are not receptive to technology, development of trunk
infrastructure can lead to faster adoption of EVs.
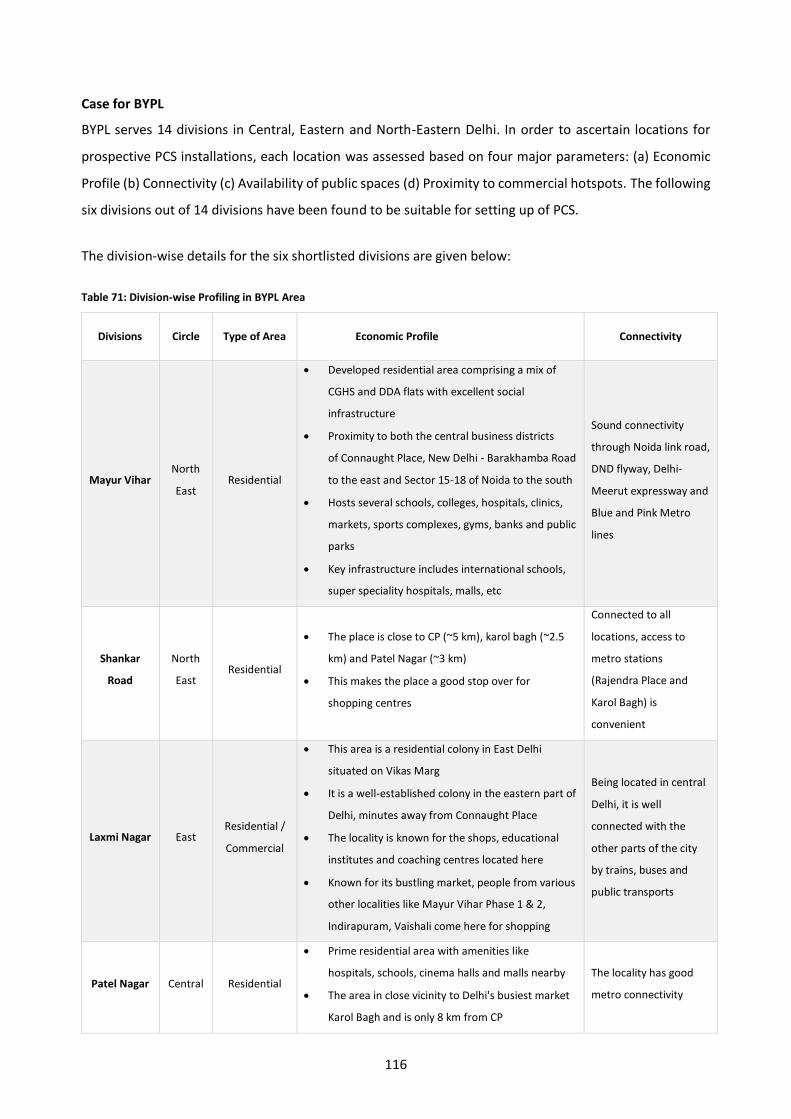
116
Case for BYPL
BYPL serves 14 divisions in Central, Eastern and North-Eastern Delhi. In order to ascertain locations for
prospective PCS installations, each location was assessed based on four major parameters: (a) Economic
Profile (b) Connectivity (c) Availability of public spaces (d) Proximity to commercial hotspots. The following
six divisions out of 14 divisions have been found to be suitable for setting up of PCS.
The division-wise details for the six shortlisted divisions are given below:
Table 71: Division-wise Profiling in BYPL Area
Divisions Circle Type of Area Economic Profile Connectivity
Mayur Vihar North
East Residential
• Developed residential area comprising a mix of
CGHS and DDA flats with excellent social
infrastructure
• Proximity to both the central business districts
of Connaught Place, New Delhi - Barakhamba Road
to the east and Sector 15-18 of Noida to the south
• Hosts several schools, colleges, hospitals, clinics,
markets, sports complexes, gyms, banks and public
parks
• Key infrastructure includes international schools,
super speciality hospitals, malls, etc
Sound connectivity
through Noida link road,
DND flyway, Delhi-
Meerut expressway and
Blue and Pink Metro
lines
Shankar
Road
North
East Residential
• The place is close to CP (~5 km), karol bagh (~2.5
km) and Patel Nagar (~3 km)
• This makes the place a good stop over for
shopping centres
Connected to all
locations, access to
metro stations
(Rajendra Place and
Karol Bagh) is
convenient
Laxmi Nagar East Residential /
Commercial
• This area is a residential colony in East Delhi
situated on Vikas Marg
• It is a well-established colony in the eastern part of
Delhi, minutes away from Connaught Place
• The locality is known for the shops, educational
institutes and coaching centres located here
• Known for its bustling market, people from various
other localities like Mayur Vihar Phase 1 & 2,
Indirapuram, Vaishali come here for shopping
Being located in central
Delhi, it is well
connected with the
other parts of the city
by trains, buses and
public transports
Patel Nagar Central Residential
• Prime residential area with amenities like
hospitals, schools, cinema halls and malls nearby
• The area in close vicinity to Delhi's busiest market
Karol Bagh and is only 8 km from CP
The locality has good
metro connectivity

117
Divisions Circle Type of Area Economic Profile Connectivity
Yamuna
Vihar
North
East Residential
• Well planned, residential colony with good
amenities
• Proximity to ISBT Kashmere Gate (~7 km), DU
North Campus (~7 km) and Anand Vihar Train
Station
• It is well connected
by trains, buses
and public
transports
• Connected to
Outer Ring Road
Daryaganj Central Commercial
• Commercial hub with wholesale market of
booksellers and publishers
• It is open from all directions making entry-exit
smooth
• Close to Raj Ghat, Red Fort, Jama Masjid, Chandni
Chowk
• Close to wholesale markets like Lajpat Rai Market,
Bhagirath Place, Dariban, Cycle Market, Meena
Bazar and proximity to Firoz Shah Kotla Stadium
Good road and public
transport connectivity
Using a detailed feasibility analysis, each of the shortlisted division was ranked and based on a composite
score, the priorities for setting up a PCS was decided. The outcome is as shown below:
Table 72: Devising Priority of PCS Locations in BYPL Licensee Area
Division Economic
Profile Connectivity
Public Spaces available
Proximity to Commercial
Hotspots Priority
Mayur Vihar Medium HIgh High Medium P1
Shankar Road Medium High Medium Medium P2
Laxmi Nagar Medium High Medium Medium P3
Patel Nagar Medium Medium Medium Medium P3
Yamuna Vihar Medium High Medium High P3
Daryaganj Medium High Medium Medium P3
Furthermore, in each location, major areas for prospective PCS installations have been mapped. While
devising locations, few key points like type of surrounding area, availability of parking, economic strata of
people visiting the place have been kept in mind.

118
Table 73: Tentative Locations in Shortlisted Divisions of BYPL
Division Malls Markets Municipality
Parking Lots
Metro
Stations
Public
Institutions/
Offices
Hospitals
Mayur
Vihar
• Star City
Mall
• Galleria Mall
• Acharya
Niketan
Market
• DDA Main
Market
• Metro Station
• Mayur Vihar 1
Metro Station
• Mayur Vihar
Extension
• Mayur
Vihar 1
• Mayur
Vihar
Extension
Delhi Jal Board Lal Bahadur
Shastri Hospital
Shankar
Road
Shankar
Road
Market
Rajendra
Place
• Sir Ganga Ram
Hospital
• BLK Hospital
Laxmi
Nagar
• V3S Mall
• Cinepolis
Laxmi Nagar
Market
11 DDA authorised
parking lots [single
lane parking along
roads]
Laxmi Nagar
East Municipal
Corporation of
Delhi Head
Quarters
Makkar
Multispeciality
Hospital
Patel Nagar Moment Mall
• Campa Cola
Factory
• Galaxy Toyota
Near Moment
Mall
• Patel
Nagar
• Rajendra
Place
Shadipur
• CSIR
• National
Physical
Laboratory
• Indian
Agricultural
Research
Institute
Sardar Patel
Hospital
Yamuna
Vihar
• BYPL Grid
Substation at
Bhagirath
• BYPL office
Directorate of
Education, Delhi
Daryaganj
• Ghata Masjid,
under Building of
Sales Tax
• SDMC Parking
Opposite B7
• Sanjeecan
Hospital
Additionally, railway station parking lots, bus depots, fuel stations of Oil Marketing Companies (OMCs) can
be used as locations for setting up of PCS in the 6 divisions.

119
9.6.5 CAPEX Requirement
With charger cost contributing to ~80% of the total CAPEX for a PCS, it is important to assess its viability
and usage before deciding on the type of installation required. Guidelines issued by the MoP in December
2018 dictates PCSs should have one or more electric kiosks/boards with installation of all charger models.
Based on industry interactions and study author’s estimates, this would entail installation of five chargers
and an upfront cost of INR 1.7-2.0 million.
Table 74: Typical Costs for Different Types of Chargers (Voltage Output, Current Rating)
Type of Charger Power Output (kW) Approximate Cost (Rs Thousand)
CCS 25 700-800
CHAdeMO 25 700-800
Type 2 AC 22 110-130
Bharat DC 001 15 200-300
Bharat AC 001 3.3 20-50
Total Cost 1,700-2,000
Additionally, close to INR 0.3-0.35 million will be incurred towards new electricity connection, grid up
gradation (setting up new transformer, LT cabling, installing new panels, breakers, energy meter), civil
works, deployment of EVSE software (for integration with chargers and payment gateway) and other
miscellaneous costs.
Table 75: Other Costs Associated with Setting up a PCS
Parameters Approximate Cost (Rs Thousand)
New electricity connection and grid up gradation cost 200
Civil works 75
EVSE management software 30
Miscellaneous cost 25
Total cost 330
This leads to a total CAPEX of INR 2.0-2.4 million. Assuming that the land will be taken on lease, land costs
have not been included in CAPEX. Power outputs for DC fast chargers have been considered to be 25 kW
(and not 50 kW), taking into consideration high costs and lack of large battery powered EVs in the Indian
market. However, going by the MoP notification and the EoI issued for setting up EVCSs in cities, DCFCs
need to have a minimum power output of 50 kW. This would lead to an additional burden of INR 0.7-0.8
million per charger model.
120
In the current market scenario, where EV sales have not picked up in the country and proliferation of e-
four wheelers is at least five years away, PCSs with all charger models seem to be unviable. However,
government support, in the form of subsidies and grants, can drastically bring down costs. The GoI may
initially take the subsidy route to develop the bare bone charging infrastructure with the hope that EV sales
will rise and private entities will find the PCS business attractive, driving the market forward.
Using the charger requirements set out in the EoI issued by the DHI for PCSs in Indian cities, the
approximate CAPEX comes close to INR 4.35 million. With 50% government subsidy, it leads to an upfront
cost of ~INR 2.22 million.
9.6.6 Financial Viability of Charging Stations
The financial viability of a charging station depends on:
1. Upfront cost of setting up a station
2. Station utilisation
3. Federal, state and local government support in driving the charging station’s overall viability
Assuming that EV adoption will pick up pace in the next decade, the utility has already determined the
number of PCSs that need to be set up in its licensee area along with the prospective locations. The next
major hurdle for the utility is to assess the viability of setting up charging stations. Financial viability can be
determined using two parameters:
1. Capacity utilisation factor of the charging station
2. Margin on electricity tariff
The capacity utilisation factor (or demand-side driver) is the most important parameter that can make or
break a PCS’s success. Sound location planning and business model planning are paramount to alleviate
this risk.
Cash flow simulation has been used to assess the viability of setting up a PCS in India. It is based on the
following assumptions:
1. The PCS has three fast chargers and two slow chargers, as per the guidelines and standards set by
the MoP in December 2018
2. No cost of debt has been considered for model simplicity
3. Electricity tariffs at delivered point of the PCS are passed on to the EV charging user
4. Grid upgrade costs in lieu of EVCS set up, are not passed on to the consumer
The model takes into consideration the following CAPEX and OPEX components:

121
Table 76: CAPEX and OPEX Components Considered by the Model
CAPEX
1 Charger cost
2 New electricity connection, transformer, cabling (100 m), panels, breakers, energy meter
3 Civil works (flooring, boards, painting, brandings, shed/ cover, etc.)
4 EVSE management software - Integration with chargers and payment gateway
OPEX
1 Technicians (1 technician @INR 25,000/month for first 6 months)
2 Site maintenance staff (1 personnel @INR 15,000/month throughout year)
3 Network service provider fee
4 EVSE management software fee (10% of net margin on electricity charges)
5 Payment gateway fee (1-2% of total money collected)
6 Land lease rental
7 Advertising cost
Using the CAPEX costs calculations for setting up of a PCS using 6 chargers (3 fast chargers and 3 slow
chargers) as set out in the recent EoI by DHI for PCS installations in Indian cities, it was found that a charging
station is not viable in the present scenario. The assumptions used to derive financial viability are given
below:
Table 77: Assumptions Taken for Financial Viability
Power Sold Projections Year 1 Year 2 Year 3 Year 4 Year 5
Utilisation levels of PCS 15% 25% 40% 40% 50%
Margin on Electricity Tariff (Rs./unit) 2.5 2.5 2.5 2.5 2.5
Using the aforementioned assumptions and forecasting cash flows, the flowing outcome is deduced:
Table 78: Scenarios Developed from the Assumptions and Forecasted Cashflows
Level of Subsidisation IRR (for 5 years)
SCENARIO 1 0% of EVSE subsidised -25%
SCENARIO 2 50% of EVSE subsidised -14%
SCENARIO 3 70% of EVSE subsidised -5%
SCENARIO 4 100% of EVSE subsidised 36%
122
9.6.7 Business Models for Setting Up EV Charging Stations
As discussed earlier, the major impediments to EV charging station development are high upfront cost and
inadequate charging station utilisation. While the former can be alleviated through upfront federal
subsidies, the second challenge is more fundamental in nature. Governments across the world dole out
financial incentives to market makers during the technology adoption phase in the hope that these will
have a knock-down effect and lure more people to adopt the technology. Therefore, the government intent
is paramount in developing the EV charging infrastructure. However, initial traction in EV sales and charging
station development is not expected to set the ball rolling. In developed economies like the US and Europe,
EV owners use public charging for only ~5% of their total charging requirements. This poses a challenge for
nascent EV markets like India, where utilisation will be very low in the initial stage. Therefore, direct
revenue streams from PCSs are not enough to earn investor payback. Additionally, the uncertain demand
from a station can bode additional risks to the PCS.
Under the current market conditions, it is unlikely that the initial investment will be recovered within the
investor’s preferred duration of five years, by relying solely on direct revenue from the provision of charging
services. Following business models can help enhance the financial viability of charging station projects in
India:
CAPEX-Side Interventions
1. Grants: Public grants can significantly lower the upfront cost of a charging station project and allow
an owner-operator to achieve an attractive payback.
2. Low interest loans: State governments’ access to low-cost capital, through either interest
subvention or greater credit cycles, can improve the financial performance of PCSs.
3. EV incentives: Vehicle incentives can aid the growth of the EV market, and thus increase charging
station utilisation. Increasing usage will make PCS projects profitable.
Revenue-Side Interventions
1. Sales boost: This model is based on the partnership between a charging station developer and an
automaker. Under the terms of agreement, the automaker, which benefits from the improved
access to EV charging, subsidises the deployment of the charging network. The automaker and the
charging network developer jointly promote EV usage through advertising and awareness
programmes. The degree of subsidisation is decided based on the agreement modalities and the
targets met.
2. Revenue sharing: In this model, a group of businesses located in close proximity (in case of tourism
or shopping destination, commercial centre) contribute to a funding pool that provides an annual
subsidy to a charging network owner-operator. The assumption is that the deployment of an EV
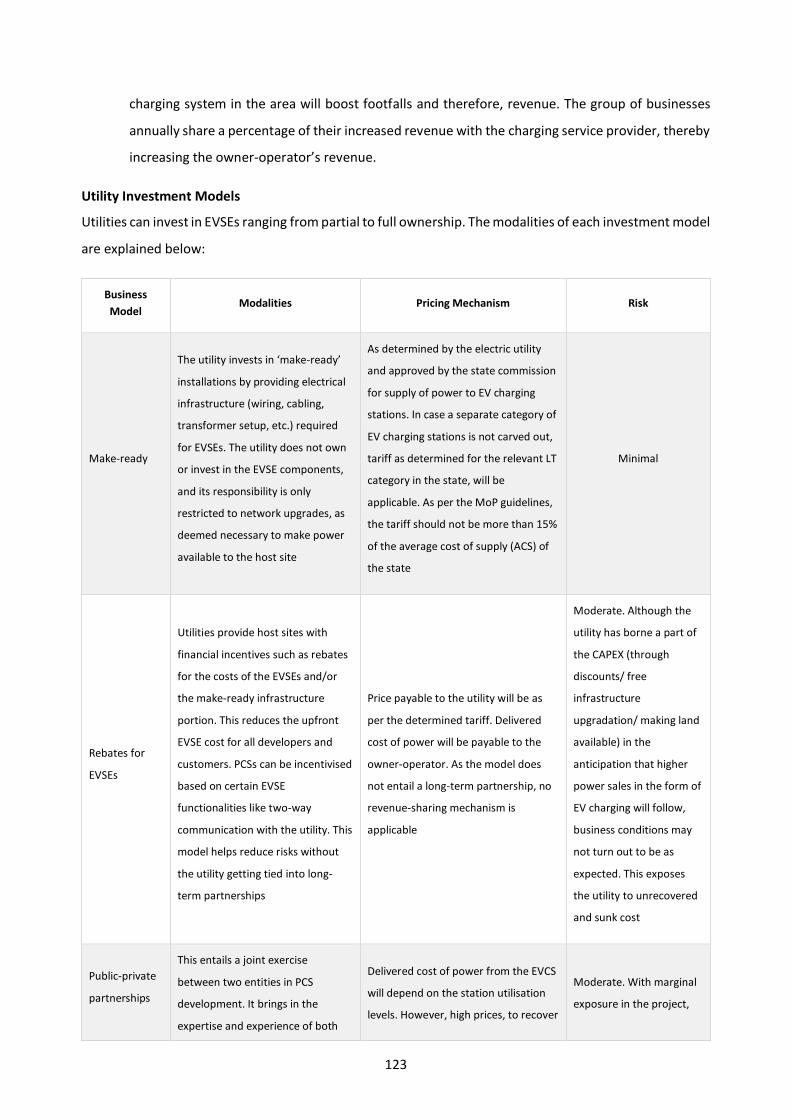
123
charging system in the area will boost footfalls and therefore, revenue. The group of businesses
annually share a percentage of their increased revenue with the charging service provider, thereby
increasing the owner-operator’s revenue.
Utility Investment Models
Utilities can invest in EVSEs ranging from partial to full ownership. The modalities of each investment model
are explained below:
Business
Model Modalities Pricing Mechanism Risk
Make-ready
The utility invests in ‘make-ready’
installations by providing electrical
infrastructure (wiring, cabling,
transformer setup, etc.) required
for EVSEs. The utility does not own
or invest in the EVSE components,
and its responsibility is only
restricted to network upgrades, as
deemed necessary to make power
available to the host site
As determined by the electric utility
and approved by the state commission
for supply of power to EV charging
stations. In case a separate category of
EV charging stations is not carved out,
tariff as determined for the relevant LT
category in the state, will be
applicable. As per the MoP guidelines,
the tariff should not be more than 15%
of the average cost of supply (ACS) of
the state
Minimal
Rebates for
EVSEs
Utilities provide host sites with
financial incentives such as rebates
for the costs of the EVSEs and/or
the make-ready infrastructure
portion. This reduces the upfront
EVSE cost for all developers and
customers. PCSs can be incentivised
based on certain EVSE
functionalities like two-way
communication with the utility. This
model helps reduce risks without
the utility getting tied into long-
term partnerships
Price payable to the utility will be as
per the determined tariff. Delivered
cost of power will be payable to the
owner-operator. As the model does
not entail a long-term partnership, no
revenue-sharing mechanism is
applicable
Moderate. Although the
utility has borne a part of
the CAPEX (through
discounts/ free
infrastructure
upgradation/ making land
available) in the
anticipation that higher
power sales in the form of
EV charging will follow,
business conditions may
not turn out to be as
expected. This exposes
the utility to unrecovered
and sunk cost
Public-private
partnerships
This entails a joint exercise
between two entities in PCS
development. It brings in the
expertise and experience of both
Delivered cost of power from the EVCS
will depend on the station utilisation
levels. However, high prices, to recover
Moderate. With marginal
exposure in the project,
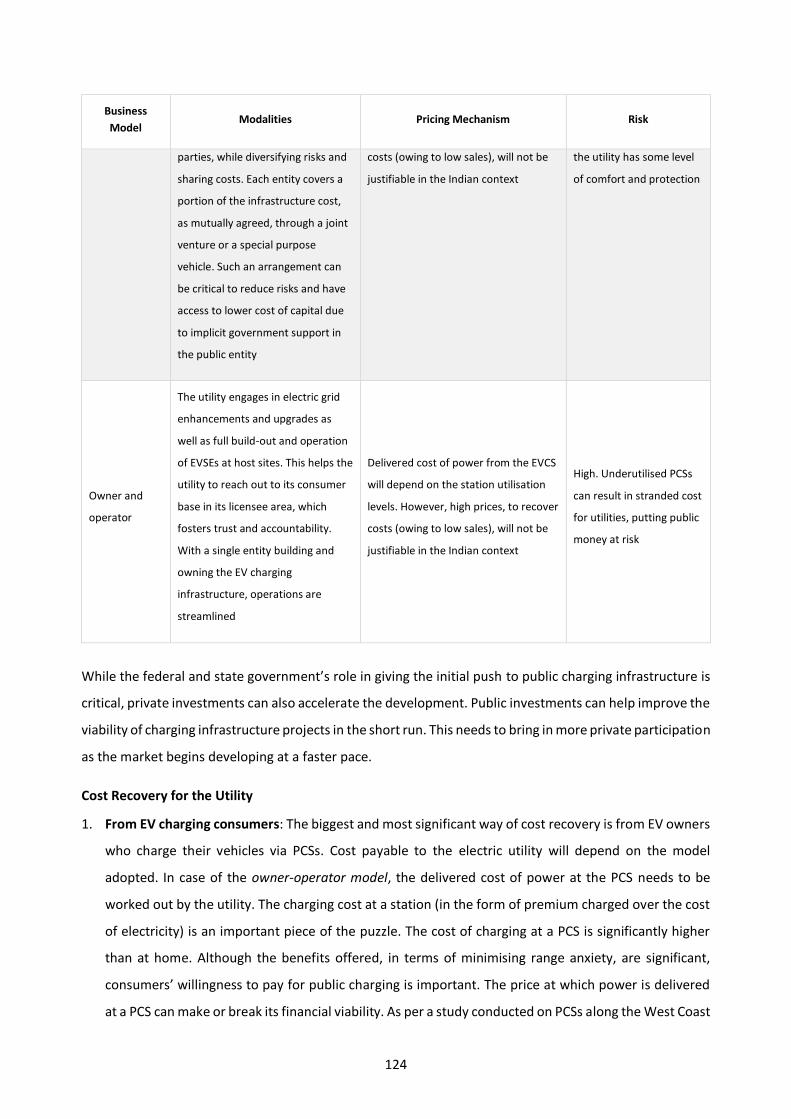
124
Business
Model Modalities Pricing Mechanism Risk
parties, while diversifying risks and
sharing costs. Each entity covers a
portion of the infrastructure cost,
as mutually agreed, through a joint
venture or a special purpose
vehicle. Such an arrangement can
be critical to reduce risks and have
access to lower cost of capital due
to implicit government support in
the public entity
costs (owing to low sales), will not be
justifiable in the Indian context
the utility has some level
of comfort and protection
Owner and
operator
The utility engages in electric grid
enhancements and upgrades as
well as full build-out and operation
of EVSEs at host sites. This helps the
utility to reach out to its consumer
base in its licensee area, which
fosters trust and accountability.
With a single entity building and
owning the EV charging
infrastructure, operations are
streamlined
Delivered cost of power from the EVCS
will depend on the station utilisation
levels. However, high prices, to recover
costs (owing to low sales), will not be
justifiable in the Indian context
High. Underutilised PCSs
can result in stranded cost
for utilities, putting public
money at risk
While the federal and state government’s role in giving the initial push to public charging infrastructure is
critical, private investments can also accelerate the development. Public investments can help improve the
viability of charging infrastructure projects in the short run. This needs to bring in more private participation
as the market begins developing at a faster pace.
Cost Recovery for the Utility
1. From EV charging consumers: The biggest and most significant way of cost recovery is from EV owners
who charge their vehicles via PCSs. Cost payable to the electric utility will depend on the model
adopted. In case of the owner-operator model, the delivered cost of power at the PCS needs to be
worked out by the utility. The charging cost at a station (in the form of premium charged over the cost
of electricity) is an important piece of the puzzle. The cost of charging at a PCS is significantly higher
than at home. Although the benefits offered, in terms of minimising range anxiety, are significant,
consumers’ willingness to pay for public charging is important. The price at which power is delivered
at a PCS can make or break its financial viability. As per a study conducted on PCSs along the West Coast
125
Electric Highway in the US, when several Level 2 and DC fast charging stations, which were earlier free
for public use, began levying fees, consumers immediately reduced EV charging at PCSs and changed
their charging patterns completely. This suggests that when required to pay a fee for charging at PCSs,
users will not charge their EVs unless they are forced to. Therefore, the pricing of electricity must be
done judiciously, and charging locations should be well interspersed such that utilisation levels are
high.
Different utilities across the world have been using innovative fee structures for their charging units.
The fee structure typically includes one or more of the following components: energy-based fee,
monthly subscription fee, per-session access fee, and time-based fee.
Rate designs need to be devised in such a way that utilities can influence charging behaviour, and in
turn, minimise costs to operate the distribution system (peak load demand mitigation) while
maximising economic benefits. For states with high renewable generation, utilities can manage loads
in a way that coordinates peak RE generation with increased EV charging, thereby using excess power
to service additional load and reducing curtailment. The optimal pricing structure will vary from
location to location based on a number of site characteristics, including anticipated utilisation, charger
type, and ownership of charging station (site owned/ utility owned).
2. From the EVSE host: This is applicable when the utility has invested in PCSs via the public-private
partnership model. With the utility sharing capital expenditure with another entity, the former is liable
to share revenue with the latter based on the ‘percentage of total’ method. Although this route of
recovery has higher upside in case of strong station utilisation, the utility is also exposed to downside
risks, owing to sub-optimal station utilisation and longer payback period.
3. From electricity consumers: This is mostly used when the utility invests in PCSs through the make-
ready or PPP mode. Recovering costs from consumers through standard, set rates is a well-established
utility practice, employed for the development of the renewable energy and energy efficiency markets
in all developed markets. Cost recovery from consumers over a long tenure is a useful tool to overcome
uncertain revenue potential from PCSs. Recovering costs through power customers, rather than
directly from EV charging customers, also helps lower the barriers to EV adoption. However, in a
regulated market like India, such cross subsidisation and cost escalation may not be suitable and will
be subject to the state commission’s approval.
Source of Funds for the Utility
While the utility files a tariff petition by predicting load growth and power purchase requirements for its
conventional business (i.e. power sales), the charging station business entails different business models,
revenue streams and CAPEX requirements. In the initial phases, when the electric utility will invest in make-
ready PCS installations (by setting up necessary network augmentation, distribution transformers, meters),

126
it can include the associated costs in the multi-year tariff (MYT) petitions as it has been doing now.
However, investments made through PPP mode or owner-operator mode would require change in business
modalities for the utility. Subject to approvals from regulatory authorities, the utility can raise money either
through internal accruals or from private investors. However, till the PCS business becomes a self-
sustaining business area for the utility, funds need to be obtained through grants, loans from banks or
through strategic investors, like private equity (PE) players. As the PCS business churns more revenue,
incremental CAPEX can be invested through realised profits.
Business Models for Setting Up PCSs in India
A PCS is not viable in India presently. With a miniscule number of EVs on the road, the capacity utilisation
factor of a charging station is not expected to be greater than 5%, even in the most conservative scenario.
No level of government support (sops or subsidies) can enhance project viability. Many public sector
companies (e.g., NTPC, EESL), private companies (e.g., Vakranjee, Amara Raja), and private utilities (e.g.,
Tata Power, BSES Yamuna) have set up PCSs on a pilot basis, mostly for demonstration effect. However,
utilisations are low and unattractive. The GoI has been taking steps in the right direction to bolster EV sales
through FAME subsidies and a phased manufacturing programme. However, with the slowdown in the
automobile sector, manufacturers are expected to go slow on EV programmes. Even if EV sales does pick
up, mostly two-wheelers, three-wheelers and buses will be the biggest contributors, which do not
necessarily require PCSs. E-passenger vehicles, which need PCSs, are not expected to catch up before 2025.
Therefore, the modalities of business model need to be assessed carefully.
Based on international best practices and industry views, the following business models may be considered
by federal agencies/ public companies/ private entities:
1. Grants and subsidies from the government, to reduce CAPEX towards station deployment
2. EV owners to pay a monthly fee to EV manufacturers that will be bundled in the initial cost of EVs
3. City governments / municipalities / highway authorities may be mandated to allot space on long
lease at concessional rates/ for free
4. Bundle EVCSs in new buildings making it mandatory for residential/commercial centres exceeding
a certain built-up area. The impact of EVSE infrastructure cost as a proportion of total per square
meter cost of buildings will be negligible
5. EVSE infrastructure may be clubbed with highway construction cost – again it will have a negligible
impact on per kilometre cost of highways
6. Oil distribution companies may be mandated to create EVSE infrastructure in their retail outlets
7. Public sector undertakings and large private companies (above a certain turnover) may be
mandated to set up (or contribute towards) EVSE infrastructure in their area of operation

127
8. EV manufacturers consortiums may promote EVSE networks and collect monthly subscription from
EV owners and pay to the EVSE owners and operators
9. Fleet operators and car rental companies may be allowed to set up EVSE networks
10. Allot land and licences to set up large EVSE stations at strategic locations, which will have other
facilities like café, gaming stations, convenient stores and grocery/vegetables shops. Revenue
generation from the entire commercial centre can be aggregated, covering the costs of EVCSs
9.6.8 Final Outcome
Although PCS is a new and lucrative business opportunity, it is fraught with risks and uncertainties. In a
country like India, where the automobile sector is entirely ICE-driven with no established ecosystem of EV,
neither from the manufacturers nor from the consumers, EV is still many years away. Furthermore, with
negligible battery manufacturing base in the country, the case of domestic manufacturing is still elusive.
The auto industry, which contributes close to ~ 8% of the manufacturing GDP of the country, is experiencing
a worst slowdown in two decades. Any forward-looking policies, on behalf of the government to speed up
e-mobility is now in the backburner, owing to slack in sales from the segment and risk of further disrupting
the segment from forward-looking EV policy, which is not exactly the need of the hour. Therefore, uptick
in EV sales in the country is going to be gradual, at best. Utilities like BYPL need to assess market risks
judiciously and adopt the best business model suitable for PCS to keep sunk costs to the minimum. Some
of the major risks hogging the PCS business are as given below:
Table 79: Major Risks for Public Charging Station Business
Sr. No. Risk Outcome Impact
1 Differential of electricity and gasoline prices
rise
Low running costs of EV vis-à-vis an ICS;
adoption improve for EV Positive
2 Improvements in battery technologies Reduction in upfront costs of EVs Positive
3 Lack of indigenisation and domestic
manufacturing of EV/ EV parts
Transition from ICE based Indian auto industry
to EV to take longer Negative
4 Low station utilisation High stranded costs of PCS Negative
5 Lack of subsidies by the government towards
PCS
Sluggish development of bare bone PCS
infrastructure Negative
6 Lack of federal support in the form of
conducive polices
Slacking of investor sentiment, sluggish
development of PCS Negative
7 Lack of private investment in the PCS space PCS as a business do not scale up Negative
8 High cost of funds, lack of financing options for
setting up of PCS
Prohibitive CAPEX costs thereby hampering
investor sentiment Negative
9 Improvement in battery swapping ecosystem New business opportunity; to enable faster EV
adoption in 2W, 3W and e-bus space Positive

128
The recommended roadmap, as suggested, is given as below:
Phase 1 (FY20-FY24): Traction in EVs is expected to be slow with the majority of incremental sales coming
from 2W and 3W. As discussed earlier, the two segments do not necessitate PCS installations as majority
of the charging takes place at home or at workplace (for those commuting to office in e-2W). Some charging
may require PCS, especially from 3W segment (if charged inside business hours) or from 2W (if used to
travel long distances, like intercity tours). In both cases, consumers will prefer DC charging requirements
as the role of PCS would be for quick top-ups such that the EV owners can continue their onward journeys
without significant delays. PV segment is not expected to make any significant headway while e-buses may
show traction, majorly owing to government STU’s auctions from procurement of electric buses.
Role of BYPL: With station utilisation questionable and risky, PCS installations under the owner-operator
model should be avoided. In strategic locations, where congregation of EV (either natively or incoming from
other areas), is expected in the early stages, the utility can look at setting up PCS, either through the PPP
mode or by making strategic investments in make-ready installations. Probable locations to look at are
Mayur Vihar and Shankar Road due to strong possibilities of the places being early EV adopters. The utility
may look at participating in tenders for PCS installations floated by the Central or state government in order
to avail subsidy benefits. This will help reduce high CAPEX costs as well as position the utility in being an
early mover in the PCS space. The battery swapping ecosystem, despite nascent presently, may evolve due
to government push and industry interests. Although a typical battery swapping station (BSS) involves the
partnership between a vehicle manufacturer and battery maker, the utility can look at strategically
investing in BSS installations, if a business case exists.
Phase 2 (FY25-FY30): More accelerated development of EVs is expected as cost economics become
conducive and vehicle manufacturers bring in more products in the market. Consumers will become more
likely to take the EV jump as the overall ecosystem improves. Battery technologies will mature and costs
will plummet (Li-ion battery pack prices expected to reach ~$116/ kWh in 2030 from $230/ kWh in 2018)
making EV products more competitive and suitable for the masses. The 2W and 3W will continue to be
frontrunners in EV sales, while PV and buses will begin the electric transition faster than before. The
commercial segment (fleet taxis) and intra city buses will show strong growth owing to federal push.
Role of BYPL: The utility can look at investing in the PCS space more aggressively with reduction in CAPEX
costs of chargers and more certainty in station utilisation levels. The owner-operator route may be
explored in strategic locations where charging requirements are expected to become high. In other
locations, PCS installations through the PPP mode can be a safe bet. As the market matures, government
subsidies on PCS will subside allowing the market to drive itself and discovering prices based on dynamics.
The PCS set up in Phase 1 shall see higher utilisation levels. The rise in revenue from the old stations can

129
be utilised in setting up newer stations. The premium charged on electricity prices (delivered cost) from
the high-utilisation stations may be kept slightly higher to support the new stations till the time the latter
become self-sustaining. As a second option, a part of stake in the older stations may be divested to fuel
more CAPEX towards newer stations, allowing the utility to drive its PCS business as a self-sustaining unit.
BYPL can engage in advertising activities to promote EVs in collaboration with auto manufacturers on a
revenue sharing mechanism. Different digital as well as print media options needs to be looked at for a
holistic engagement program.
9.6.9 Organisational Capacity Planning
Before entering the EV charging station business, it is important that the organisational structure and
processes of the utility are aligned towards achieving the e-mobility goal. The organisational structure
needs to take into consideration the following facets:
1. Legal and regulatory framework of the organisation
2. Incentive system
3. People management system
The conventional scope of utilities does not align with the PCS business. However, with the market moving
towards faster adoption of EVs, it is in the interest of the utilities to expand beyond the conventional power
distribution business. This requires business repositioning and diversification, and re-assessment of the
organisational structure to focus on new value pools.
Internationally, utilities have carved out a different vertical overlooking the EV business as they consider e-
mobility to be a core business area. The vertical, majorly an unregulated business in most advanced
economies, is kept separate from the other conventional and regulated businesses. The leadership team
closely monitors the EV vertical, and performance measures have been put in place by allocating financial
targets. New talent, with experience in the EV space, is hired to drive the business.
However, in India, the ecosystem is completely different. The role of utilities in the EV charging space is still
being worked upon, and the sector continues to face several regulatory hurdles. Though a few utilities are
watching the space closely and some pilot projects have been launched by BYPL and Tata Power,
distribution utilities in India are yet to set up a full-fledged business based on PCS development.
The organisational structure of the utility needs to be rejigged to align resources and skill sets towards the
new areas of interest. We do not propose creating a new vertical for EVs and e-mobility at present as it is
a niche market. Utilities in the country are still studying the sector in terms of viability and business interest.
Therefore, a carve-out at this juncture does not make economic sense. We however propose creating a
new horizontal under the operational portfolio of the utility, which will look after new energy business
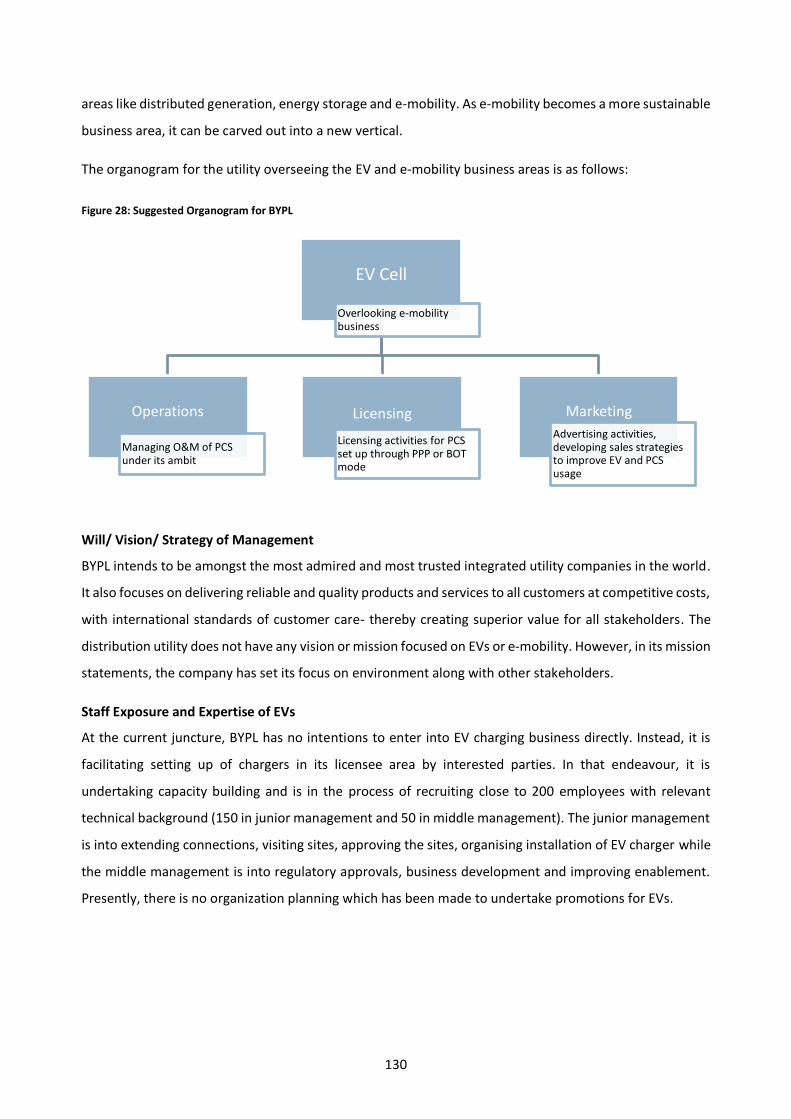
130
areas like distributed generation, energy storage and e-mobility. As e-mobility becomes a more sustainable
business area, it can be carved out into a new vertical.
The organogram for the utility overseeing the EV and e-mobility business areas is as follows:
Figure 28: Suggested Organogram for BYPL
Will/ Vision/ Strategy of Management
BYPL intends to be amongst the most admired and most trusted integrated utility companies in the world.
It also focuses on delivering reliable and quality products and services to all customers at competitive costs,
with international standards of customer care- thereby creating superior value for all stakeholders. The
distribution utility does not have any vision or mission focused on EVs or e-mobility. However, in its mission
statements, the company has set its focus on environment along with other stakeholders.
Staff Exposure and Expertise of EVs
At the current juncture, BYPL has no intentions to enter into EV charging business directly. Instead, it is
facilitating setting up of chargers in its licensee area by interested parties. In that endeavour, it is
undertaking capacity building and is in the process of recruiting close to 200 employees with relevant
technical background (150 in junior management and 50 in middle management). The junior management
is into extending connections, visiting sites, approving the sites, organising installation of EV charger while
the middle management is into regulatory approvals, business development and improving enablement.
Presently, there is no organization planning which has been made to undertake promotions for EVs.
EV Cell
Overlooking e-mobility business
Operations
Managing O&M of PCS under its ambit
Licensing
Licensing activities for PCS set up through PPP or BOT mode
Marketing
Advertising activities, developing sales strategies to improve EV and PCS usage

131
10 Country in Focus: Pakistan
10.1 Present EV Sales and Charging Infrastructure
The transportation sector is critical Pakistan’s economy as it contributes ~10% to the country’s GDP. The
country’s total road network is ~264,401 km, including national highways, motorways, expressway and
strategic routes. Roads are the predominant mode of transport in Pakistan, accounting for over 92% of
passenger and 96% of freight traffic. According to National Transport Corridor Improvement Program
(NTCIP) objectives, the National Transport Policy aims to provide a safe, reliable, effective, efficient,
affordable, accessible, sustainable and fully integrated transport system that meets freight and passenger
mobility requirements. It plans to offer improved services in a cost-effective way that supports the
government’s goal of increasing public welfare through economic growth, social improvement, poverty
reduction and infrastructure development, while being environmentally and economically sustainable.
In the last five years, the transport sector has been transformed by a road network expansion, and building
of new motorways and mass transit systems. The country has three operational Bus Rapid Transit (BRT)
corridors in major cities i.e. Lahore, Islamabad-Rawalpindi and Multan18, with a total length of 70 km, and
catering to more than 400,000 passengers every day. Three similar projects are under construction and
more than 80% work has been completed on all three projects. These new corridors are in Peshawar,
Karachi and Islamabad (phase II) with a total length of 165 km and will cater to ~530,000 commuters daily.
By 2018, 21,506,64119 motor vehicles were estimated to have been registered, of which the major share is
of two-wheelers, followed by cars. A breakup of the registered vehicles (2018) has been depicted below:
Figure 29: Total Number of Motor Vehicles Registered in Pakistan
Source: Pakistan Automotive Manufacturers Association (PAMA)
18 Punjab Mass Transit Authority, https://pma.punjab.gov.pk 19 Pakistan Automotive Manufacturers Association (PAMA)
Cars & Jeeps13.4%
Cabs/Taxi0.8%
Buses/ Mini Buses1.1%
Trucks1.3%
2 Wheelers72.8%
3 Wheelers10.6%

132
As seen in the figure above, two-wheelers dominate the total number of registered vehicles in Pakistan,
with cars & jeeps only constituting 13.4 % of the same. The figure below shows the trends in adoption of
types of vehicles over the last eight years (2010 – 2018).
Figure 30: Percentage Distribution of Vehicles in Pakistan
Source: Pakistan Bureau of Statistics, Statistical Yearbook 2018
It is also evident from the figure above that the penetration of two-wheelers is increasing rapidly, mainly
due to the support for local bike manufacturers. In the case of cars & jeeps, the absolute number is
increasing while the overall percentage is decreasing. Over the last eight years, cars and jeeps have
accounted for an average 17.6% of all registered vehicles in Pakistan. For cars and jeeps, only three
manufacturers monopolise demand; other manufacturers have very limited penetration. Over the years,
used Japanese cars have gained traction in urban centres, as these used cars are better equipped and have
better safety features as compared to the local manufactured cars in Pakistan.
EV readiness is a community-wide effort, requiring planning, charging infrastructure, policies, support
services, etc. There is no way to accurately predict the exact number of EVs or Plug-in Hybrid Electric
Vehicles (PHEV’s) that will be operating in Pakistan in the next two or five years or to estimate the potential
future charging needs. One approach to predicting future EV demand is to analyse the experience of hybrid
vehicles and their early adopters. Hybrid vehicles have gained traction over the past five years due to
government subsidies in taxes and duties. Consumer inclination towards PHEV is slow because of the
capital associated with it, but a few PHEVs are still seen on roads. Pakistan’s market is opening up as almost
all the auto manufacturers globally have started producing cost-effective electric cars. The graph below
shows the statistics of local cars versus used hybrid cars imported each year.
25%
22%
19%
18%
17%
15%
14%
14%
13%
49%
55%
60%
64%
66%
69%
71%
72%
73%
18%
16%
15%
14%
12%
12%
11%
11%
11%8% 7% 6% 5% 4% 4% 4%
3% 3%
0%
10%
20%
30%
40%
50%
60%
70%
80%
90%
100%
2010 2011 2012 2013 2014 2015 2016 2017 2018
%age of cars of all vehicles %age of 2 wheelers of all vehicles
%age of 3 wheelers of all vehicles Other registered vehicles (Buses & Trucks)

133
Figure 31: Locally Manufactured Cars vs. Imported Hybrid Cars
Source: Pakistan Automotive Manufacturers Association (PAMA)
Currently, the imports of hybrid cars constitute more than 70% of the vehicles imported into Pakistan. The
above graph shows the exponential increase in import of hybrid vehicles. In the case of plug-in hybrids or
full electric vehicles, the numbers are not very promising. Till June 30, 2019, a total of only 250 plug-in
hybrids and full EVs were registered in Pakistan. Of these, 90% were plug-in hybrid20 cars.
BMW has tried to set up EV charging stations in seven cities21 across Pakistan. Three of them were installed
and others are planned, and one of them was in the Islamabad Electric Supply Company (IESCO) region.
The charging stations are only for BMW consumers and free of charge. The set-up cost and operational
expenses are borne by BMW dealership (Dewan Farooque Motors). No other public charging stations are
currently installed or planned.
According to global trends, hybrid car owners are early adopters of plug-in and full electric cars. Recently,
Hyundai launched its IONIQ electric model in Pakistan which has been received well. Another MoU has
been signed between Rahmat Group and BYD China for assembly and manufacture of EVs in Pakistan.
According to available information, various EVs, including buses, passenger cars and vans, as well as
batteries, chargers and related components will not only be made for Pakistani market, but will export to
the region as well. These statistics support the growth and adoption of EVs in Pakistan. Apart from cars, we
do not see much traction for two and three-wheelers in Pakistan. There is also news that the Khyber
Pakhtunkhwa provincial government plans plug-in hybrid busses for the mass transit system in Peshawar22.
20 All Pakistan Motor Dealers Association (APMDA) 21 Dewan Farooque Motors, Pakistan 22 Peshawar Bus Rapid Transit 2019
151,134
181,145 185,781
216,786
4,960 15,300
23,400
44,000
-
50,000
100,000
150,000
200,000
250,000
2015 2016 2017 2018
Total Number of New Manufactured Cars Sold Number of Hybrid Cars Imported

134
10.2 Regulations and Federal Policies Driving EV Adoption
The regulatory status of the EV charging infrastructure has been indicated in the Pakistan’s first EV policy
2019, but it only indicates the subsidies on import of EV charging equipment. The policy is still not very
detailed to cover different aspect of the EV market. Electric utilities and other stakeholders foresee a
number of issues relevant to EVs and grid planning that is important to consider as EV infrastructure grows.
Policy formulation is the key driver for the EV market to take off, and all stakeholders concerns need to be
addressed in the policy at large.
According to the Auto Development Policy 2016-21 23, the federal government has announced an
exemption on customs duty, sales tax and withholding tax on import of hybrid electric vehicles (HEVs)
falling under Pakistan Customs Tariff (PCT) Code 87.03, up to 50%. To support the uptake of EVs, there is
an exemption of 50% customs duty and taxes on import of HEVs up to 1800 CC, and 25% on HEVs exceeding
1800 CC. Even in the new EV policy it is stated that, the policy of EV import will remain intact as per Auto
Development Policy 2016-21. Only the support to local manufacturers is indicated in the new EV policy.
In May 2019, the prime minister of Pakistan announced a target for EVs to constitute 30% of total vehicular
traffic by 2030. The Ministry of Climate Change was tasked with drafting an action plan to achieve the said
target. The draft EV policy has been approved by the cabinet. According the press release of the Ministry
of Climate Change24, the EV policy is focused on offsetting the emissions from the transport sector. The
first phase will be focused on the two and three-wheeler market segment. The implementation is expected
to start from two cities i.e. Islamabad (federal capital) and Sialkot.
Regulatory authority or distribution companies have yet to work on policy for the development of the EV
market. No tariff regimes or incentives for early adopters have been worked out. Load flow studies and
required planning to accommodate the power requirement for charging has yet to be done by DISCOs.
While global EV sales remain low, only in a few countries have EVs gained traction. Countries that gained
traction have four common indicators that helped them adopt EVs. These indicators may also help in
determining the pace of EV penetration in Pakistan.
Regulations & Incentives
While early adopters of EVs encouraged e-mobility through a range of incentives, these alone did not drive
EV penetration. They provided a supportive environment that established strict regulations on carbon
emissions, indirectly stimulating the higher adoption of EVs. In fiscal 2019, the government allocated a
subsidy on import of EVs, their associated components and charging infrastructure equipment. On the
23 Pakistan Auto Development Policy 2016-21 24 Ministry of Climate Change, Pakistan. www.mocc.gov.pk
135
instructions of the Prime Minister, the Ministry of climate change has been given directives to formulate a
roadmap for 30% EVs by 203025.
Technology
As a large component of overall EV cost, high battery prices influence manufacturing and sales. Technology
improvements help reduce battery costs, increasing efficiency and driving range, making EVs more
accessible and attractive to potential customers. Two manufacturers, Hyundai and BYD, have signed MoUs
to manufacture EVs in Pakistan. According to the MoU of BYD, they will not only produce for Pakistan’s
market, in fact this manufacturing unit will supply EV’s in neighbouring countries. Local manufacturing units
will help in cost reduction and technology upgrades, as per to local requirements.
Infrastructure
Easy and affordable access to charging infrastructure, both standard AC and rapid DC charging, is key to
supporting the growth of EVs. Distribution companies, private investors and auto manufacturers will have
to play their role in developing the charging infrastructure. On the other hand, the government also needs
to outline policies that support all the stakeholders in development of a charging network for EVs.
Customer Demand
Creating a compelling cost proposition will be critical in encouraging customers to invest in EVs. The
government may offer rebates on capital cost to encourage the early adopters. Annual renewal fees may
be waived and credits in terms of tax exemptions provided to encourage people to opt for EVs
10.3 Outlook on EV Sales
The transport sector in Pakistan is growing at a double-digit rate due to a number of factors. The overall
population in the country is growing at an annual growth rate of 2.1% Currently, Pakistan is going through
rapid expansion in the network of highways (motorways and expressways). The commencement of China-
Pakistan Economic Corridor (CPEC) has revitalized the construction and rehabilitation of the network of
highways under the ‘belt and road’ initiative. Cumulatively, the aforementioned factors will add
tremendous burden on the existing road network. The density of cars per 1,000 people in Pakistan is 1426.
This number is estimated to reach 22 cars per 1,000 people by 2030. Additionally, various international
automakers have also discerned such projected increase in number of vehicles. Over the next few years,
up to 10 new automobile manufacturers have plans to install their production units in Pakistan that include
Hyundai, Renault and Kia Motors, of which two manufacturers intend to produce electric vehicles.
Introduction of new automobile manufacturers, accompanied by an escalating expansion in the network
of highways and rapid urbanization, are bound to increase the number of automobiles in the country.
25 Ministry of Climate Change, Pakistan. www.mocc.gov.pk 26 Pakistan Automotive Manufacturers Association, PAMA Statistics 2019

136
Currently, the total number of vehicles on roads is 21.5 million (cars, bikes, buses and trucks), of which 2.9
million are cars. The total number of vehicles is estimated to reach 63.5 million by 2030, with only 5.6
million cars.
With the increase in population, consistent GDP growth, increase in foreign direct investment and new
auto manufacturers coming in, conservative estimates show that Pakistan will have about 1 million electric
vehicles by 2030. Of these one million EVs, 90% will constitute cars/jeeps/SUVs. The rest will be 2-3
wheelers and a small number of hybrid busses for mass transit. These 90% electric cars will be about 15%
of total cars by 2030. The estimations are based realistic figures and indicators. Apart from these indicators,
the government bought a fleet of 1,000 hybrid cars for highway patrolling police and intends to procure 65
hybrid busses for the Peshawar BRT. Such initiatives also aid to achieve the milestone of 1 million EVs by
2030. According to import statistics, a few units of electric bikes and rickshaws are being imported every
year over the past 10 years, but they have not been able to make a market. The reason for such a low
number of two- and three-wheeler penetration is their low range and mileage on full charge. As a result,
the estimates show low penetration.
Based on the estimated statistics, we see that almost 6 million cars will be on roads by 2030 in Pakistan. As
the country is still a virgin market for plug-in hybrids and full-electric vehicles, in the next two to three
years, we do not see much traction for EV adoption. But as time passes, the government should plan and
announces clear policies and targets for EVs, as a result of which EVs should get better traction in the
coming years. The below graph shows how EVs will gain traction over years in Pakistan.
Figure 32: Projection of Cars on Roads of Pakistan by 2030
Source: Pakistan Automotive Manufacturers Association (PAMA)
3,0
62,8
70
3,2
46,6
42
3,4
41,4
41
3,6
47,9
27
3,8
66,8
03
4,0
98,8
11
4,3
44,7
40
4,6
05,4
24
4,8
81,7
49
5,1
74,6
54
5,4
85,1
34
5,8
14,2
42
250
20,0
00
53,2
00
79,8
00
119,7
00
179,5
50
269,3
25
350,1
23
455,1
59
591,7
07
769,2
19
999,9
85
-
1,000,000
2,000,000
3,000,000
4,000,000
5,000,000
6,000,000
2019 2020 2021 2022 2023 2024 2025 2026 2027 2028 2029 2030
Total Cars on Roads Expected PHEV + EV on Roads

137
The figures shown above are estimates based on previous data trends and policies for import and new
manufacturers coming in Pakistan. Initially we see very few EVs in coming years as it will be totally based
on imports. As new entrants for manufacturing of EVs start production in Pakistan, the EV sector will grow
by 40% annually from 2022 onwards according to their production capacities. By 2030, electric cars will
constitute around 15% of total cars on the road. According to the figure the electric cars density by 2030
will also be 15%, i.e., four electric cars per 1000 people.
10.4 Assessment of Power Distribution Utilities
10.4.1 Country Macros and Policy Frameworks Guiding Utilities’ Overall Performance
In newly-independent Pakistan, the entire electricity infrastructure was in the hands of the public sector.
However, in the early 90s, following the global drive towards unbundling the power sector, reforms were
introduced to ensure performance. The Strategic Plan for Restructuring the Pakistan Power Sector was
introduced. Under these reforms, the power sector was split into various entities, with Water and Power
Development Authority (WAPDA) only responsible for hydro power. Generation companies (GENCOs) and
independent power producers (IPPs) were responsible, along with WAPDA, for power generation. National
Transmission and Dispatch Company (NTDC) was created to oversee transmission. The National Power
Control Centre (NPCC) was to manage voltage and frequency control of the transmission grid and to match
demand with supply. On the distribution side, 10 distribution companies (DISCOs) were created to
distribute power to consumers. A separate independent body, National Electricity and Power Regulatory
Authority (NEPRA)27 was formed to oversee fairness among various stakeholders. Central Power Purchase
Agency (CPPA) was made responsible for the purchase of wholesale power and its sale to distribution
companies. It is to be noted that apart from the IPPs, all the entities involved are state owned. K-Electric is
the only privately-owned vertically integrated utility in Pakistan with its own mandate. It generates its own
power and also purchases power from CPPA like other utilities. A few years back, another DISCO was split
and now Pakistan has 11 DISCOs in total.
In order to purchase electricity, the DISCOs communicate their demands to NTDC. The NPCC allots power
to the DISCOs from various generation sources according to an economic merit order on a daily basis. The
economic merit order lists the available generation sources according to their costs. The cheapest sources
are utilised first and transactions are made through the CPPA. The generation companies are paid according
to the electricity they supply. Besides that, in order to provide them with incentives to invest, they are
guaranteed capacity payments even if they don’t supply any electricity.
27 NEPRA, State of Industry Report 2018 https://www.nepra.org.pk

138
In the late 2000s and early 2010s Pakistan suffered a major electricity shortage. As a result, long hours of
load shedding were experienced even in major cities of the country. In order to overcome the problem, a
large number of power plants were commissioned. This led to overcompensation, such that Pakistan now
faces an electricity supply glut for the next several years. Already, the installed capacity of 33,000MW in
2018 was more than the demand which varied from 8,000 to 26,000MW during the year. By 2025, the peak
generation capacity will be ~62,000 MW while demand might touch 34,000MW28.
Figure 33: Organogram of Pakistan’s Power Sector
Source: Ministry of Energy (Power Division)
The data about generation capability and future demand, as reported by NTDC, is shown in the following
table. It may be noted that sufficient generation capability would be available in the NTDC system to meet
future demand at peak times, representing a power surplus scenario.
28 National Transmission & Dispatch Co. (NTDC)

139
Figure 34: Power Demand Supply Projections of Pakistan
Source: NTDC, Power System Statistics 2019
The above graph shows an increase of 9% in annual generation capacity addition. Future additions will be
based more on renewable energy and thermal (gas) power plants. NTDC has also planned transmission
expansion according to capacity additions. These capacity additions don’t include the distributed
generation (roof-top solar, micro-hydro, etc.) It is projected that roof-top solar alone will reach 5 GW by
2025. Distributed generation is gaining pace, but DISCOs have expressed concern over greater power
availability than that planned/purchased from CPPA.
Figure 35: Electricity Generation by Type (2017-18)
Source: Ministry of Energy (Petroleum Division), HDIP
20,000
25,000
30,000
35,000
40,000
45,000
50,000
55,000
60,000
65,000
2018 2019 2020 2021 2022 2023 2024 2025
Installed Capacity (NTDC - MW)
Planned Generation Capability (NTDC - MW)
NTDC's Projected Demand During Peak Hours(MW)
Gas , 30.0%
RLNG, 7.4%
Hydel , 21.3%
Oil , 22.5%Coal , 8.3%
Renewables , 3.0%
Nuclear , 7.5%
Total - 131,275 GWh

140
10.4.2 Benchmarking of Utilities
The same benchmarking model, as applied on India has been replicated in case of Pakistan as well.
Readiness of Utilities to Set Up EV Charging Stations
The unbundling of WAPDA through power sector reforms resulted in creation of ten (10) DISCOs owned by
the federal government. Currently, assets of 132 kV transmission networks and 11 kV and below
distribution networks are allocated to DISCOs, which include 25,068 km of 132 kV transmission lines; 760
(seven hundred sixty) 132 kV Grid Stations that consist of 1,828 power transformers having transformation
capacity of 45,324 MVA; 8,454 11 kV feeders; 323,961 km of 11 kV lines; 681,805 distribution transformers
having transformation capacity of 43,295 MVA and 232,042 km of LT lines. In addition to above, K - Electric
is a vertically-integrated company having a distribution license granted by NEPRA. K – Electric is responsible
for 338 km of 220 kV transmission lines, 8 (eight) 220 kV grid stations with transformation capacity of 3,080
MVA, 766 km of 132 kV transmission lines, 63 (sixty three) 132 kV grid stations having transformation
capacity of 5,648 MVA, 1,653 11 kV Feeders, 9,363 Km of 11 kV lines, 25,667 distribution transformers
having 7,230 MVA and 19,962 km of LT lines29.
The T&D losses of DISCOs are among the most discussed and debated issues in the context of the power
sector. The Regulator (NEPRA) has also been advising and directing the DISCOs to take operational and
managerial steps to rein in their losses to more prudent levels. NEPRA has also allowed huge fund
investments every year into DISCOs so that new and critical projects are initiated and completed on time.
Since all DISCOs are owned and controlled by the Ministry of Energy (Power Division), the Regulator has
been pointing out this critical issue to relevant quarters at all fora. The table below shows the operational
parameters of DISCOs’ performance for fiscal 201830.
Table 80: Operational Performance Indicators of DISCO’s in Pakistan
Operational Metrics AT&C Losses (%) Distribution Losses (%) Collection Efficiency (%) Billing Efficiency (%)
IESCO 9.0 7.3 91.9 92.9
GEPCO 10.2 8.9 96.0 91.3
FESCO 10.6 8.8 97.2 91.3
TESCO 15.4 12.3 82.9 87.7
MEPCO 16.9 14.6 96.2 85.8
LESCO 22.7 12.8 92.9 86.2
QESCO 23.1 21.5 43.6 78.9
29 K - Electric Annual Report 2017-18 30 DISCO’s; NEPRA Tariff Petitions 2017-18
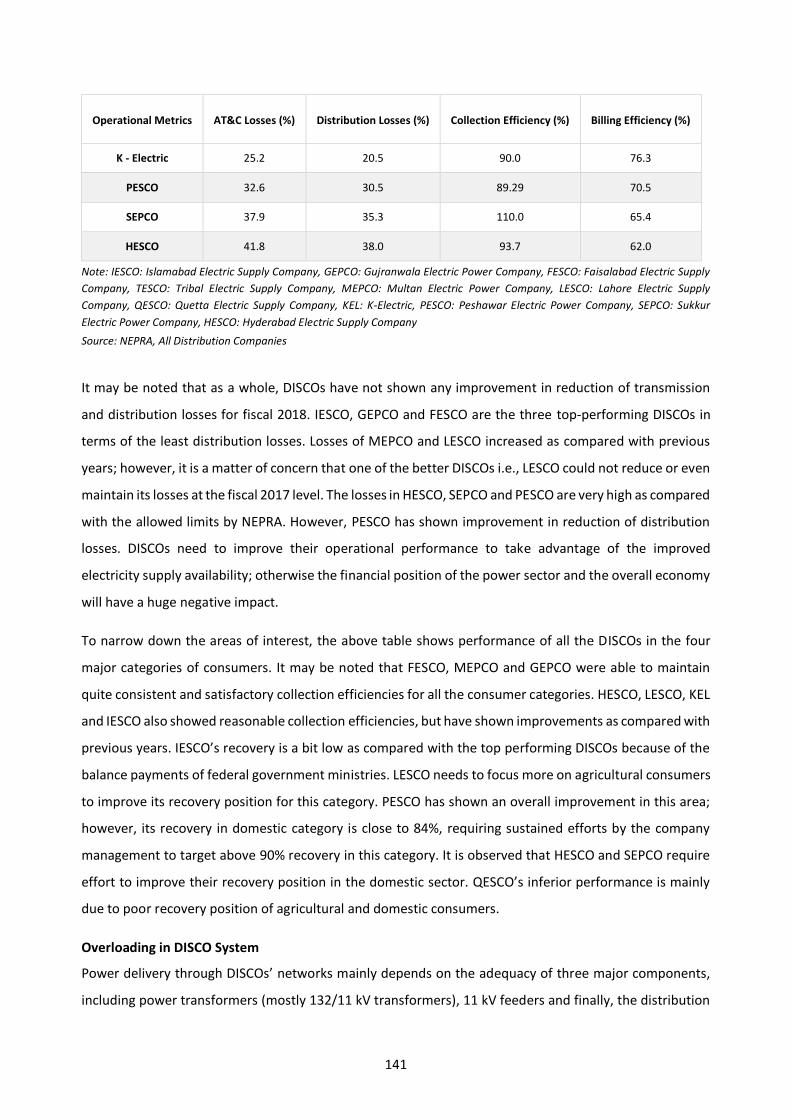
141
Operational Metrics AT&C Losses (%) Distribution Losses (%) Collection Efficiency (%) Billing Efficiency (%)
K - Electric 25.2 20.5 90.0 76.3
PESCO 32.6 30.5 89.29 70.5
SEPCO 37.9 35.3 110.0 65.4
HESCO 41.8 38.0 93.7 62.0
Note: IESCO: Islamabad Electric Supply Company, GEPCO: Gujranwala Electric Power Company, FESCO: Faisalabad Electric Supply
Company, TESCO: Tribal Electric Supply Company, MEPCO: Multan Electric Power Company, LESCO: Lahore Electric Supply
Company, QESCO: Quetta Electric Supply Company, KEL: K-Electric, PESCO: Peshawar Electric Power Company, SEPCO: Sukkur
Electric Power Company, HESCO: Hyderabad Electric Supply Company
Source: NEPRA, All Distribution Companies
It may be noted that as a whole, DISCOs have not shown any improvement in reduction of transmission
and distribution losses for fiscal 2018. IESCO, GEPCO and FESCO are the three top-performing DISCOs in
terms of the least distribution losses. Losses of MEPCO and LESCO increased as compared with previous
years; however, it is a matter of concern that one of the better DISCOs i.e., LESCO could not reduce or even
maintain its losses at the fiscal 2017 level. The losses in HESCO, SEPCO and PESCO are very high as compared
with the allowed limits by NEPRA. However, PESCO has shown improvement in reduction of distribution
losses. DISCOs need to improve their operational performance to take advantage of the improved
electricity supply availability; otherwise the financial position of the power sector and the overall economy
will have a huge negative impact.
To narrow down the areas of interest, the above table shows performance of all the DISCOs in the four
major categories of consumers. It may be noted that FESCO, MEPCO and GEPCO were able to maintain
quite consistent and satisfactory collection efficiencies for all the consumer categories. HESCO, LESCO, KEL
and IESCO also showed reasonable collection efficiencies, but have shown improvements as compared with
previous years. IESCO’s recovery is a bit low as compared with the top performing DISCOs because of the
balance payments of federal government ministries. LESCO needs to focus more on agricultural consumers
to improve its recovery position for this category. PESCO has shown an overall improvement in this area;
however, its recovery in domestic category is close to 84%, requiring sustained efforts by the company
management to target above 90% recovery in this category. It is observed that HESCO and SEPCO require
effort to improve their recovery position in the domestic sector. QESCO’s inferior performance is mainly
due to poor recovery position of agricultural and domestic consumers.
Overloading in DISCO System
Power delivery through DISCOs’ networks mainly depends on the adequacy of three major components,
including power transformers (mostly 132/11 kV transformers), 11 kV feeders and finally, the distribution

142
transformers. The following tables provide a comparison of overloaded components in all DISCOs for fiscal
2017. Overloading of these three components show the stability of the distribution system of DISCOs.
Power transformers: On an overall country basis, overloading on power transformers has slightly reduced
in fiscal 2017 but is still very high as 38% of the total power transformers in the DISCOs are overloaded,
pointing to potential problems. On a DISCO to DISCO comparison, FESCO and QESCO have more than their
50% power transformers overloaded above 80%, followed by HESCO, PESCO and SEPCO having more than
40% of their transformers overloaded. IESCO has the lowest percentage of overloading of power
transformers31.
Table 81: Performance of Power Transformers of DISCO’s in Pakistan
Name of DISCO Total No of Power
Transformers
Total No of Overloaded Power
Transformers (Above 80%)
Percentage of Total Overloaded
Power Transformers (Above
80%)
QESCO 133 75 56.40%
FESCO 195 100 51.30%
HESCO 119 59 49.60%
PESCO 230 113 49.10%
SEPCO 118 53 44.90%
LESCO 351 127 36.20%
TESCO 38 13 34.20%
MEPCO 282 75 26.60%
GEPCO 160 34 21.30%
IESCO 202 24 11.90%
*Power Transformers Include 132kV, 66kV and 33kV Voltage Level
Source: NEPRA, All Distribution Companies
11 KV Feeders: Overloading on 11 kV feeders has increased, as 34% of the total feeders are loaded above
80% compared to 28.14% last year. On the DISCO level, PESCO and TESCO have the highest percentage
(more than 50%) of overloaded feeders, followed by QESCO, SEPCO, MEPCO and LESCO (more than 30%).
IESCO, GEPCO and FESCO has the lowest percentage of overloaded feeders32.
31 State of Industry Report 2017-18, NEPRA 32 DISCO’s Performance Report 2017-18, NEPRA
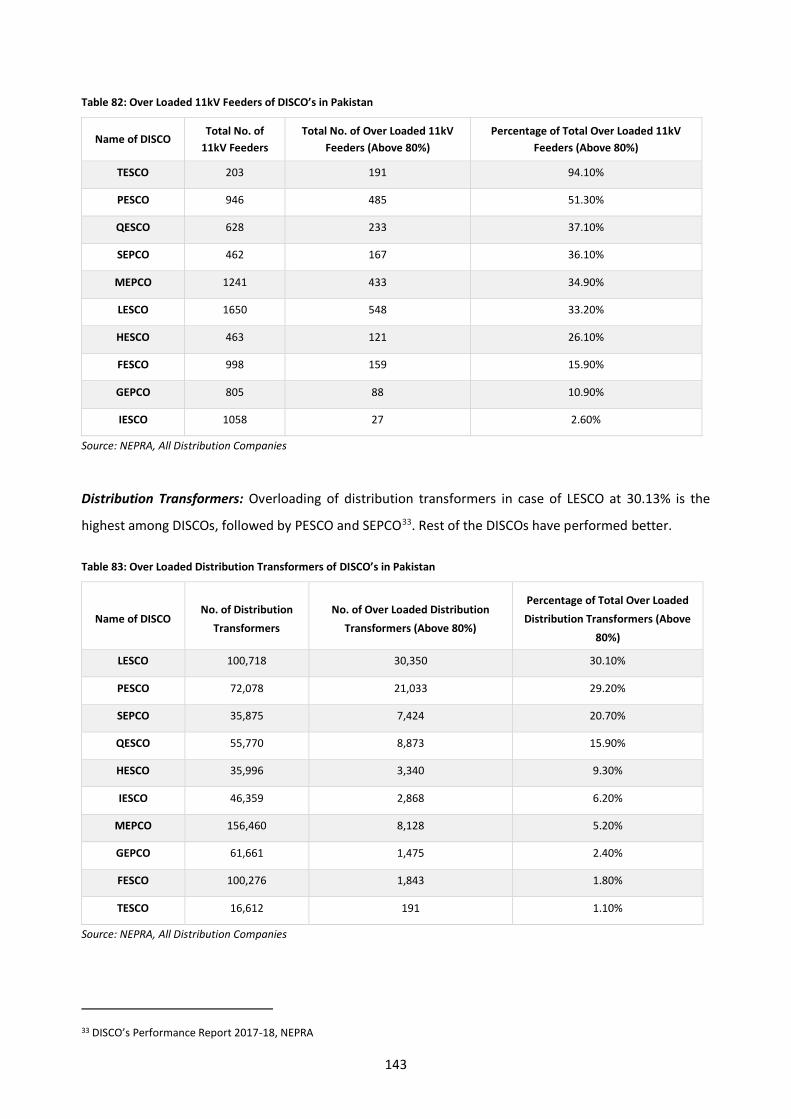
143
Table 82: Over Loaded 11kV Feeders of DISCO’s in Pakistan
Name of DISCO Total No. of
11kV Feeders
Total No. of Over Loaded 11kV
Feeders (Above 80%)
Percentage of Total Over Loaded 11kV
Feeders (Above 80%)
TESCO 203 191 94.10%
PESCO 946 485 51.30%
QESCO 628 233 37.10%
SEPCO 462 167 36.10%
MEPCO 1241 433 34.90%
LESCO 1650 548 33.20%
HESCO 463 121 26.10%
FESCO 998 159 15.90%
GEPCO 805 88 10.90%
IESCO 1058 27 2.60%
Source: NEPRA, All Distribution Companies
Distribution Transformers: Overloading of distribution transformers in case of LESCO at 30.13% is the
highest among DISCOs, followed by PESCO and SEPCO33. Rest of the DISCOs have performed better.
Table 83: Over Loaded Distribution Transformers of DISCO’s in Pakistan
Name of DISCO No. of Distribution
Transformers
No. of Over Loaded Distribution
Transformers (Above 80%)
Percentage of Total Over Loaded
Distribution Transformers (Above
80%)
LESCO 100,718 30,350 30.10%
PESCO 72,078 21,033 29.20%
SEPCO 35,875 7,424 20.70%
QESCO 55,770 8,873 15.90%
HESCO 35,996 3,340 9.30%
IESCO 46,359 2,868 6.20%
MEPCO 156,460 8,128 5.20%
GEPCO 61,661 1,475 2.40%
FESCO 100,276 1,843 1.80%
TESCO 16,612 191 1.10%
Source: NEPRA, All Distribution Companies
33 DISCO’s Performance Report 2017-18, NEPRA

144
From above it is noted that although PESCO, SEPCO, TESCO and QESCO have generally been accepted as
those DISCOs, which have consistently shown poor performance levels, what is more worrying however, is
that according to the above statistics, the so called better performers like LESCO and MEPCO have a poor
record for 11 kV overloaded feeders. LESCO has the worst record of overloading of distribution
transformers. Similarly, FESCO has very serious issues to tackle with the overloading of its power
transformers. Considering the share of these DISCOs in the overall energy consumption, further delays in
overcoming these issues will be disastrous for the power sector. KEL’s failure to add adequate number of
power transformers was among the major reasons for frequent tripping and prolonged load-shed hours.
LESCO, KEL and FESCO have highest industrial and commercial consumer penetration, which supports
financial stability and future expansion. IESCO is the only DISCO having the highest number of domestic
consumers and the highest recovery rate from them. Rest of the DISCO’ have fairly low industrial and
commercial consumer penetration. These figures may change in coming years, as new industrial clusters
are announced under China Pakistan Economic Corridor (CPEC). NEPRA has emphasized on all forums to
enhance the capability of DISCOs for self-sustainable business models, but due to inefficiencies and low
collection ratios the DISCOs are contributing to the increase of circular debt. In the annual tariff petition by
DISCOs, CAPEX is set for expansion of network as well as to enhance the efficiencies of the system, still few
DISCOs are unable to meet the standards set by NEPRA.
10.4.3 Shortlisted Utility
The following DISCOs have been identified from Pakistan (based on the top three final rankings):
Name of DISCO Area of Operation
Islamabad Electric Supply Company (IESCO) Islamabad region
Faisalabad Electric Supply Company (FESCO) Faisalabad region
Gujranwala Electric Power Company (GEPCO) Gujranwala region, Punjab
Based on the interest evinced by the shortlisted utilities and the intention to mutually work on the project,
Islamabad Electric Supply Company (IESCO) was finalised for further research.

145
10.5 Planning for the Transition
10.5.1 Charging Standards and Charger Type
Poor range and higher capital costs have long been the two biggest bottlenecks to EV uptake. Now,
however, every auto manufacturer is launching EV models to debut by 2025, with ranges that progressively
top 300-plus kilometre (200 miles). These attributes pose less of a hurdle in gaining global traction. If
consumers purchase EVs at the expected rates in the next five to ten years, a lack of charging infrastructure
could become an obstacle to EV adoption. Assuming Pakistan’s scenario, the lack of charging infrastructure
may not be a hurdle even until 2030.
Along with different levels of EV adoption across the country, structural considerations will make charging-
station demand highly localised. Combined home, work, and long-distance charging could in theory cover
an EV owner’s entire energy demand. For instance, drivers without chargers at home or work, drivers who
exceed their battery range, and drivers who forget to charge at home or don’t have home chargers must
rely on other options such as public charging and making the situation for public charging. Initially a mix of
fast and medium chargers will make more economical sense, and as time passes with the increase in
number of EVs, the density of charging infrastructure may be upgraded according to growth.
Different countries/regions follow different charger configurations according to their charging capabilities.
The kilowatt capacity of a charger defines the rate at which the battery will be charged, and it also defines
that at which place such chargers can be deployed.
It is difficult to analyse the uptake of EVs in the new markets for the type of charger to be used in the
future. For the purpose of analysis, the type of chargers is generalised and distributed in three categories,
i.e., slow chargers, semi-fast chargers, and fast chargers. For the Pakistan market, a detailed deployment
plan has been chalked out in the section of potential charging locations, showing what type of chargers will
be deployed in different locations.
Charging Stations Suitable for Pakistan
Plug-in hybrids are more popular than full-electric cars, as there is a lack of awareness for adoption in the
market. People are a bit reluctant in taking the risk and higher capital costs are also a factor of slow take-
off. Pakistan’s auto sector is highly influenced by Japanese auto manufacturers, but after the Auto Policy
2016, new entrants are coming in that will change the market shares. Looking at the used-car statistics,
almost 90% of the used hybrid cars were imported from Japan last year. For plug-in hybrids and full-electric
cars, the trends cannot be gauged as the number total number of cars is very less. Till date only handful of
plug-in hybrid and full-electric cars are registered in Pakistan. Assuming the pace of adoption of hybrid cars,
analysing the available data of previous 5 years, we can assume that the plug-in hybrids will gain traction
in the coming years, followed by the transition to full-electric cars. Pakistan’s market will be dependent on

146
the import of plug-in hybrids and battery electric vehicles in coming years, but according to the signed
MoUs with BYD, China and Hyundai, they will start assembly lines in Pakistan, which will change the
dynamics of EV adoption in Pakistan.
Two and three-wheeler electric vehicles in Pakistan are not in the picture yet, but in future two-wheelers
may get more traction. The two- and three-wheeler segments use low-voltage slow-charging technology.
So, it is likely that they will be charged at homes or work places. For busses and other segments, public
charging stations are technically not viable.
For electric cars, there are multiple auto manufacturers with different charging configurations. Pakistan’s
public charging infrastructure will be driven by the players with large market share in future. For the initial
five years, there will be a combination of different charging options. Probably medium or semi-fast chargers
will dominate the charging infrastructure with CHAdeMO or CCS. As the density of EVs increase, the next
phase will require the installation of fast chargers for electric car owners with higher power ratings. The
suggestion to go with the most popular charging technologies, which are likely most widely available, will
be an intelligent choice. Hyundai recently launched the first electric car IONIQ in Pakistan, which uses
CHAdeMO technology. Toyota is marketing its JDM model of Prius Prime (a plug-in hybrid) in Pakistan with
CHAdeMO technology. New entrants have models that support the CCS technology. This makes the case
for both CHAdeMO and CCS technology viable options for Pakistan. Additionally, public-charging
infrastructure will be a combination of both widely used technologies.
Another avenue may be to develop own charging standards for Pakistan. But this option only favors those
countries that either have good EV penetration or expect large EV penetration in the near future.
10.5.2 Grid Augmentation
The expected rise of electric vehicles will lead to significant additional demand on low-voltage (LV)
distribution systems. Uncontrolled charging could lead to problems, such as thermal overload of
transformers and lines, voltage fluctuation, harmonics, and phase unbalance. The utilities will have to
respond to these challenges upfront and plan the strategies to combat accordingly.
Power Requirement for EV Charging Stations
Due to rapid urbanization, the possibility of land squeeze will be much greater than expected. Today’s
power facilities can accommodate tomorrow’s significant rise in the number of EVs, as long as the vehicles
are charged off peak. Faster charging during peak demand, however, will indeed have an impact on the
power system.
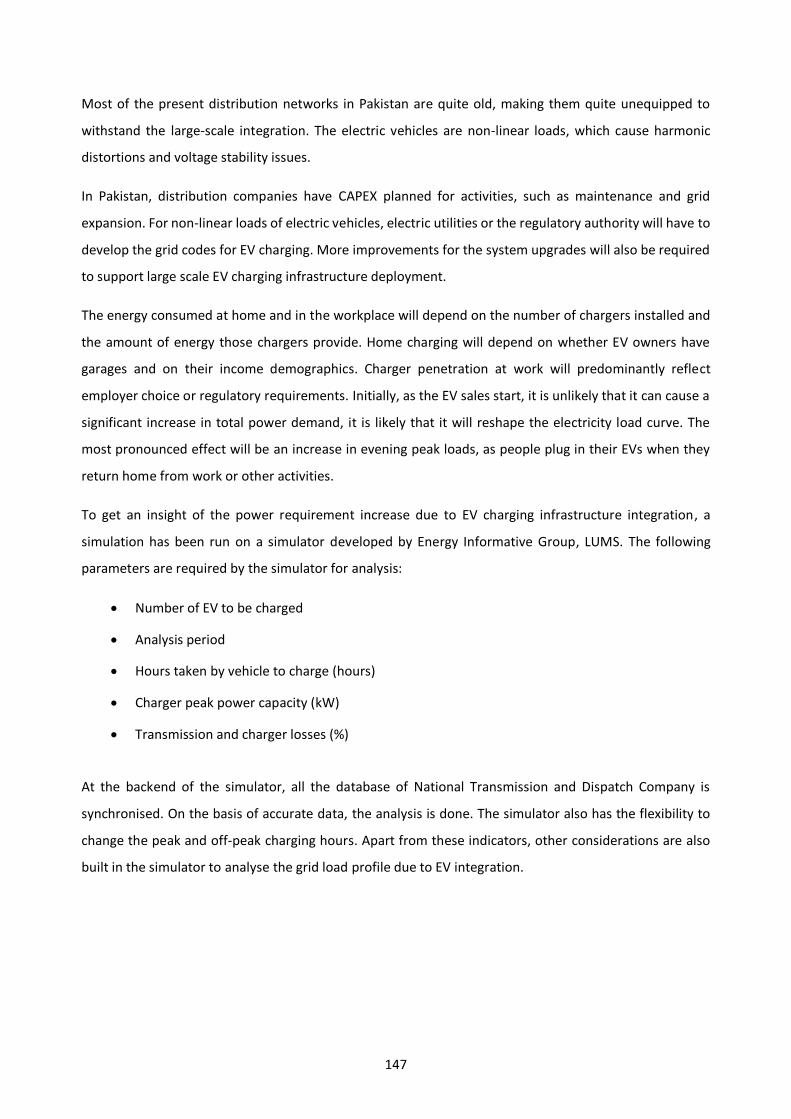
147
Most of the present distribution networks in Pakistan are quite old, making them quite unequipped to
withstand the large-scale integration. The electric vehicles are non-linear loads, which cause harmonic
distortions and voltage stability issues.
In Pakistan, distribution companies have CAPEX planned for activities, such as maintenance and grid
expansion. For non-linear loads of electric vehicles, electric utilities or the regulatory authority will have to
develop the grid codes for EV charging. More improvements for the system upgrades will also be required
to support large scale EV charging infrastructure deployment.
The energy consumed at home and in the workplace will depend on the number of chargers installed and
the amount of energy those chargers provide. Home charging will depend on whether EV owners have
garages and on their income demographics. Charger penetration at work will predominantly reflect
employer choice or regulatory requirements. Initially, as the EV sales start, it is unlikely that it can cause a
significant increase in total power demand, it is likely that it will reshape the electricity load curve. The
most pronounced effect will be an increase in evening peak loads, as people plug in their EVs when they
return home from work or other activities.
To get an insight of the power requirement increase due to EV charging infrastructure integration, a
simulation has been run on a simulator developed by Energy Informative Group, LUMS. The following
parameters are required by the simulator for analysis:
• Number of EV to be charged
• Analysis period
• Hours taken by vehicle to charge (hours)
• Charger peak power capacity (kW)
• Transmission and charger losses (%)
At the backend of the simulator, all the database of National Transmission and Dispatch Company is
synchronised. On the basis of accurate data, the analysis is done. The simulator also has the flexibility to
change the peak and off-peak charging hours. Apart from these indicators, other considerations are also
built in the simulator to analyse the grid load profile due to EV integration.
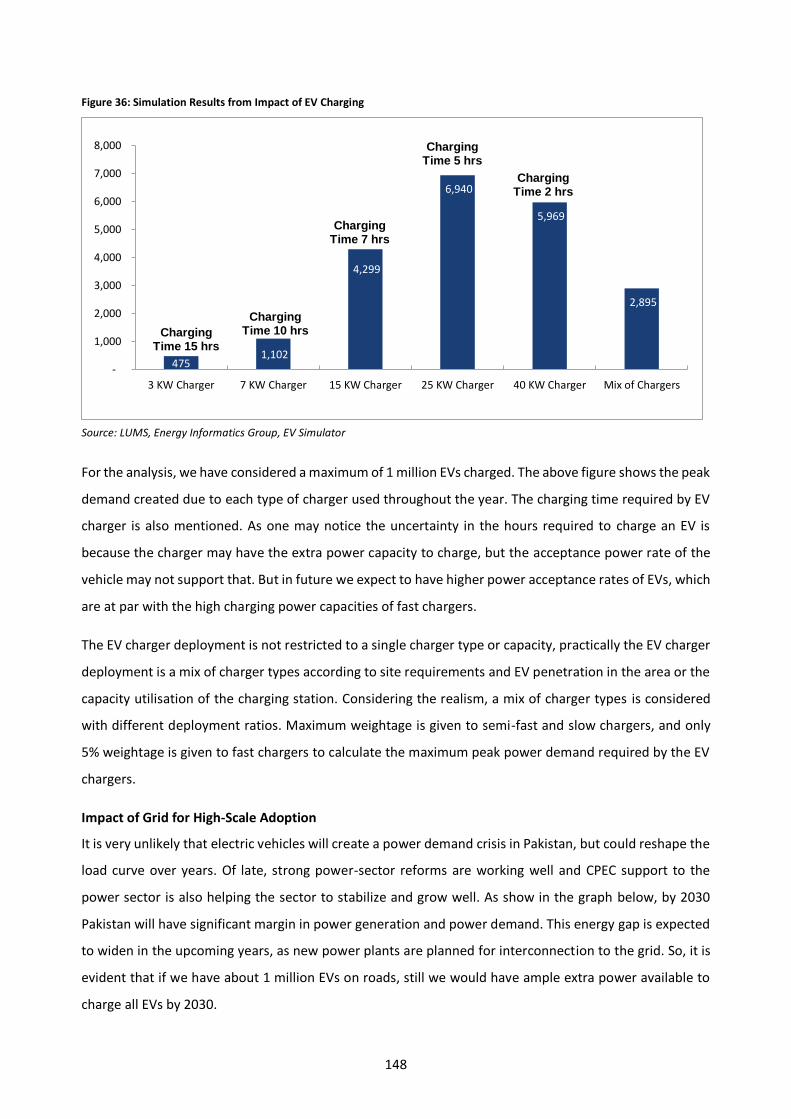
148
Figure 36: Simulation Results from Impact of EV Charging
Source: LUMS, Energy Informatics Group, EV Simulator
For the analysis, we have considered a maximum of 1 million EVs charged. The above figure shows the peak
demand created due to each type of charger used throughout the year. The charging time required by EV
charger is also mentioned. As one may notice the uncertainty in the hours required to charge an EV is
because the charger may have the extra power capacity to charge, but the acceptance power rate of the
vehicle may not support that. But in future we expect to have higher power acceptance rates of EVs, which
are at par with the high charging power capacities of fast chargers.
The EV charger deployment is not restricted to a single charger type or capacity, practically the EV charger
deployment is a mix of charger types according to site requirements and EV penetration in the area or the
capacity utilisation of the charging station. Considering the realism, a mix of charger types is considered
with different deployment ratios. Maximum weightage is given to semi-fast and slow chargers, and only
5% weightage is given to fast chargers to calculate the maximum peak power demand required by the EV
chargers.
Impact of Grid for High-Scale Adoption
It is very unlikely that electric vehicles will create a power demand crisis in Pakistan, but could reshape the
load curve over years. Of late, strong power-sector reforms are working well and CPEC support to the
power sector is also helping the sector to stabilize and grow well. As show in the graph below, by 2030
Pakistan will have significant margin in power generation and power demand. This energy gap is expected
to widen in the upcoming years, as new power plants are planned for interconnection to the grid. So, it is
evident that if we have about 1 million EVs on roads, still we would have ample extra power available to
charge all EVs by 2030.
475 1,102
4,299
6,940
5,969
2,895
-
1,000
2,000
3,000
4,000
5,000
6,000
7,000
8,000
3 KW Charger 7 KW Charger 15 KW Charger 25 KW Charger 40 KW Charger Mix of Chargers
Charging Time 15 hrs
Charging Time 10 hrs
Charging Time 7 hrs
Charging Time 5 hrs
Charging Time 2 hrs
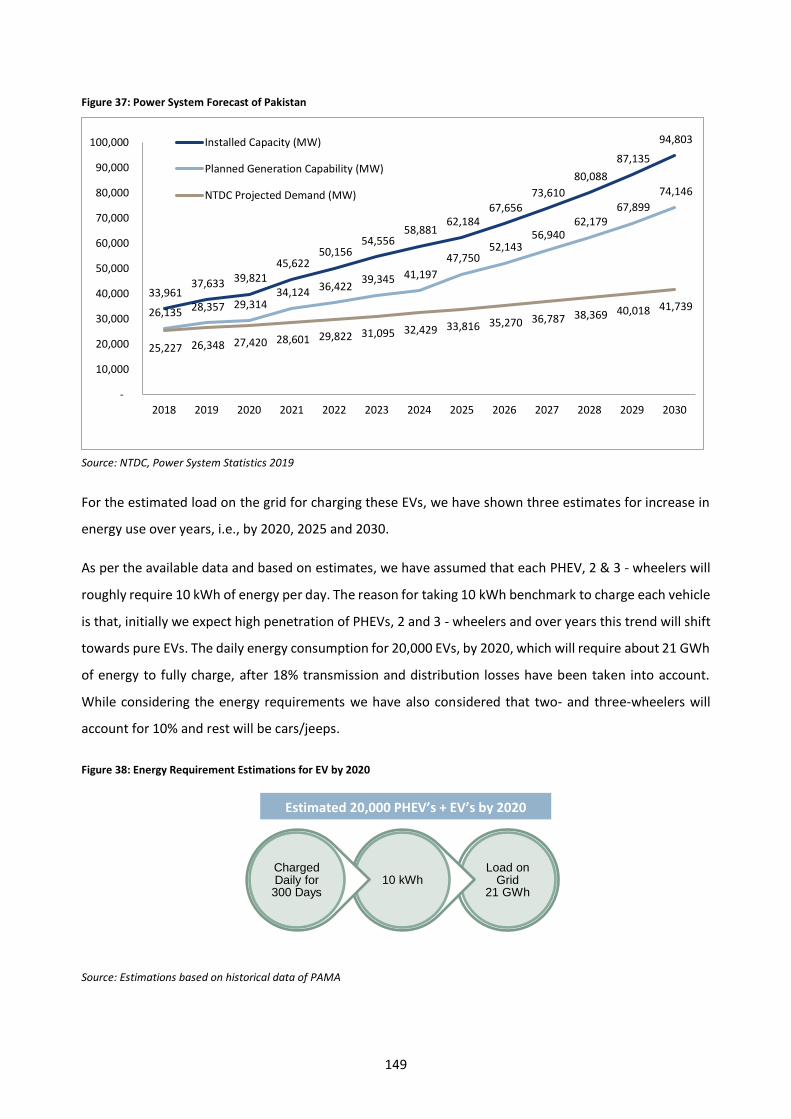
149
Figure 37: Power System Forecast of Pakistan
Source: NTDC, Power System Statistics 2019
For the estimated load on the grid for charging these EVs, we have shown three estimates for increase in
energy use over years, i.e., by 2020, 2025 and 2030.
As per the available data and based on estimates, we have assumed that each PHEV, 2 & 3 - wheelers will
roughly require 10 kWh of energy per day. The reason for taking 10 kWh benchmark to charge each vehicle
is that, initially we expect high penetration of PHEVs, 2 and 3 - wheelers and over years this trend will shift
towards pure EVs. The daily energy consumption for 20,000 EVs, by 2020, which will require about 21 GWh
of energy to fully charge, after 18% transmission and distribution losses have been taken into account.
While considering the energy requirements we have also considered that two- and three-wheelers will
account for 10% and rest will be cars/jeeps.
Figure 38: Energy Requirement Estimations for EV by 2020
Source: Estimations based on historical data of PAMA
33,961 37,633 39,821
45,622 50,156
54,556 58,881
62,184 67,656
73,610
80,088
87,135
94,803
26,135 28,357 29,314 34,124 36,422
39,345 41,197
47,750 52,143
56,940 62,179
67,899
74,146
25,227 26,348 27,420 28,601 29,822 31,095 32,429 33,816 35,270 36,787 38,369 40,018 41,739
-
10,000
20,000
30,000
40,000
50,000
60,000
70,000
80,000
90,000
100,000
2018 2019 2020 2021 2022 2023 2024 2025 2026 2027 2028 2029 2030
Installed Capacity (MW)
Planned Generation Capability (MW)
NTDC Projected Demand (MW)
Load on Grid
21 GWh10 kWh
Charged Daily for 300 Days
Estimated 20,000 PHEV’s + EV’s by 2020
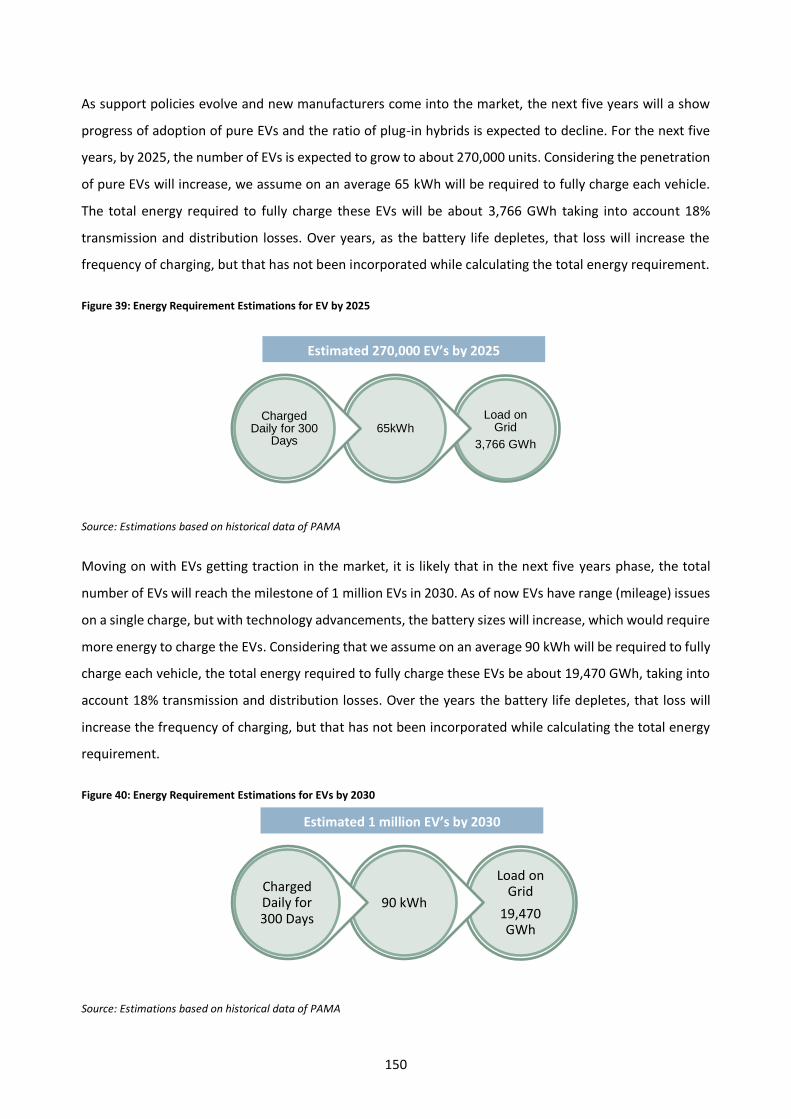
150
As support policies evolve and new manufacturers come into the market, the next five years will a show
progress of adoption of pure EVs and the ratio of plug-in hybrids is expected to decline. For the next five
years, by 2025, the number of EVs is expected to grow to about 270,000 units. Considering the penetration
of pure EVs will increase, we assume on an average 65 kWh will be required to fully charge each vehicle.
The total energy required to fully charge these EVs will be about 3,766 GWh taking into account 18%
transmission and distribution losses. Over years, as the battery life depletes, that loss will increase the
frequency of charging, but that has not been incorporated while calculating the total energy requirement.
Figure 39: Energy Requirement Estimations for EV by 2025
Source: Estimations based on historical data of PAMA
Moving on with EVs getting traction in the market, it is likely that in the next five years phase, the total
number of EVs will reach the milestone of 1 million EVs in 2030. As of now EVs have range (mileage) issues
on a single charge, but with technology advancements, the battery sizes will increase, which would require
more energy to charge the EVs. Considering that we assume on an average 90 kWh will be required to fully
charge each vehicle, the total energy required to fully charge these EVs be about 19,470 GWh, taking into
account 18% transmission and distribution losses. Over the years the battery life depletes, that loss will
increase the frequency of charging, but that has not been incorporated while calculating the total energy
requirement.
Figure 40: Energy Requirement Estimations for EVs by 2030
Source: Estimations based on historical data of PAMA
Load on Grid
3,766 GWh
65kWhCharged
Daily for 300 Days
Estimated 270,000 EV’s by 2025
Load on Grid
19,470 GWh
90 kWhCharged Daily for 300 Days
Estimated 1 million EV’s by 2030

151
Remediation Strategies
Based on estimations for the energy required to charge EVs, the peak power demand may not be too much
to handle in terms of power available. As shown in the figure titled “Power system forecast of Pakistan”,
there is ample difference between planned power generation and the expected load profile till 2030. In
terms of power generation, the network can easily adapt to the increasing power demand owing to EV
integration. However, utilities will have to respond to the increase in power demand and its impact on
power quality, grid expansion, etc.
For increase in demand, the electric utilities will have to request the Central Power Purchasing Authority
(CPPA) to increase their sanctioned load according to their demand. The utilities will have to run the
demand side management drill incorporating the impact of EVs on their system. For the required technical
upgrades, the following remedial measures may help utilities in future:
• Use of Flexible Alternating Current Transmission System (FACT) devices in the distribution system
for improved power quality
• Upgradation of the distribution network, i.e., power transformers, cables, etc.
• Re-conductoring of distribution lines for stability of the system
• Upgradation of system software for planning and analysis
• Capacity building of staff/ technicians/engineers
10.5.3 Charging Locations
To promote accessibility for EV charging within all communities, stringent strategic mapping of locations
to EV charging infrastructure is very important. The installation of EV infrastructure, if properly done, can
encourage the uptake of EVs across Pakistan. This assessment of identifying the potential locations will
help determine when and to what extent governments and private sector entities need to invest in charging
infrastructure to enable EV adoption.
The financial investments associated with these choices are enormous. Thus, a paradigm shift in
transportation and mobility thinking towards a low-carbon future requires the most optimal, strategic and
efficient investments into EVs. This is a complex process to map potential locations, given the current lack
of general EV adoption today. PHEVs / EVs still represent less than 1% of all new vehicle purchases in
Pakistan.
One indicator while identifying potential areas will be the placement of the stations in locations that can
result in the most efficient usage/utilisation. Other indicators include determining the number of charging
stations, grid availability, required grid side investments, and communications standards.

152
Apart from the above indicators, one other factor also affects the process of identifying the quantity and
placement of the EV infrastructure. Global studies have shown “early adopters” among EV owners are
predominantly male, highly educated, and high-income earners. The problem is if the EV deployment
strategy is solely based on areas within which “early adopters” reside or charge their vehicles, it will tend
to favour the privileged sectors of society rather than society at large. So, it is important to keep all factors
in view while developing a strategy for an unexplored market such as Pakistan. In early years, deploying
public chargers that target the privileged sector may give an edge to EV usage. However, in the long term,
the deployment plan should be to cover all areas under the jurisdiction of IESCO.
Distance Considerations in EVSE Placements
The purpose of this methodology is to fill gaps in the EV network. This will help place EV chargers at equi-
distance from one another to ensure drivers have access to public chargers throughout the community and
never find themselves too far away from a charging site. Long distances between chargers make longer-
range driving infeasible.
EV Consumer Density Consideration
To determine optimal locations for fast charging, easily accessible sites needed to be located. The types of
destinations shortlisted are supermarkets, department stores, shopping malls, restaurants, and short-term
parking spots. After assessment, we determined the following places that would attract drivers to travel
“medium-to-long” distances from their home and remain parked for at least one hour. This was deemed
to be generally sufficient time to charge an EV using a public charger to complete a return trip home. This
assessment included locations such as shopping malls, restaurants, amusement parks, parking lots,
libraries, universities, and hospitals.
Based on all the assessments, indicators and local dynamics, the following criteria have been finalized for
the selection of potential areas where public EV chargers can be deployed in the twin cities of Islamabad
and Rawalpindi under IESCO, the power distribution company.
• Distance consideration (10 km radius)
• Efficient utilisation (minimum 20% utilisation)
• Land availability (at least three parking lots vacant for EV charging)
• Grid availability and excess power availability on the 11KV distribution feeder
• Required minimum investment for grid integration (associated costs)
EV Chargers Deployment Plan in IESCO Region
With detailed coordination with the IESCO planning team, the proposal is split in two phases. The first
phase deals with locations having excess available power at the 11KV distribution level and locations which

153
satisfy the above five indicators. In phase two, deployments will be undertaken to increase the density of
the charging infrastructure. As EVs take off, the charging needs will most likely be satisfied with home
charging. As time passes and EVs start getting traction, public charging requirements will increase. With
the increase in demand, implementation of phase two will start. This topology will help reduce initial
investments when the utilisation factor of each charging facility is less, and will make the investment more
financially viable. The potential deployment will be done as a mix of slow and semi-fast chargers, according
to the locations and their utilisation factors.
The analysis in shows IESCO is the top-performing utility. IESCO not only covers the urban area of the
federal capital of Islamabad and Rawalpindi, but it also covers other circles and adjacent rural areas. While
locating potential sites, only urban areas were considered as they would have a greater utilisation factor.
In addition, the distribution infrastructure is also more stable to cater to the additional load on different
nodes of potential sites.
For identifying the suitable locations, the installation recommendations are divided in two phases, i.e.,
phase 1 from 2020 to 2025 and phase 2 from 2025 to 2030. The main focus on location selection will be on
urban centres to maximise the utilisation factor.
Phase 1 (2020-25)
This is the phase when the EV market is expected to take off. The number of vehicles will be very less
initially, and would increase gradually. The increase may not be linear, as most of the vehicles will be
imported. To promote public chargers among EV consumers, the stakeholders investing in charging
infrastructure are recommended to have same protocols for identification of cars, billing systems, and
service systems based upon open source protocols. This will promote interoperability and allow all EV
drivers to freely use all charging stations available. The potential sites identified for the first phase are
shopping malls, parks, hospitals and restaurants, keeping in view the above-mentioned criteria for
shortlisting.

154
Figure 41: Proposed Locations for Charging Stations in Rawalpindi-Islamabad Region
The picture above shows a complete map of the twin cities of Islamabad and Rawalpindi. The selected
locations for phase 1 are marked in red and those for phase 2 are marked in black. Details of all potential
locations, the category and proposed year of installation can be seen in table below.
Phase 2 (2026-30)
In the next phase, we expect the EV market to grow, creating demand for more public chargers. So, the
next deployment plan will be focused on increasing the density of public EV chargers. Some deployments
will be at new locations, decreasing the distance between available chargers, and some installations will
be upgrading/increasing the charging ports at existing locations. The growth of EVs is based on the
assumption of new EV manufacturers coming into Pakistan. According to their announced plans, they will
be operational by 2022. By that time, the manufacturers will also start making efforts to establish their
own charging networks to facilitate their own consumers. A detailed deployment plan, depicting the year-
on-year deployment, is shown in the table below.

155
Table 84: Type of Charger in Potential Sites
Year Sr No Phase Location
Category Potential Location
Slow
Charger
(max 15 kW)
Semi-Fast
Charger (20-
25 kW)
Fast
Charger
(>25 kW)
2020
1 Phase 1 Parking Airport 2 1
2 Phase 1 Parking Bahria Town Civic Center 1
3 Phase 1 Mall Centaurus Mall 2 1
4 Phase 1 Parking F- 9 Park (Mega Zone) 2
5 Phase 1 Parking G-5 Government Offices 3
6 Phase 1 Mall Jinnah Park 3
7 Phase 1 Parking Murree Road - Metro Park & Ride 3 1
8 Phase 1 Parking Saddar Parking Plaza 3 1
9 Phase 1 Hospital Shifa International Hospital 2
2021 10 Phase 1 Mall Giga Mall RWP 2
11 Phase 1 Parking Saidpur Cultural Village 2 1
2022 12 Phase 1 Parking Daewoo Terminal 2 1
2023 13 Phase 1 Parking DHA Main Market 1
14 phase 1 Parking G-5 Government Offices 3
2024
15 Phase 1 Parking E-11 Markaz/ Marquees 2 0
16 Phase 1 Parking Fawara Chowk Parking Plaza 2
17 Phase 1 Parking Islamic University 1
18 Phase 1 Parking Lake View Park 2 1
19 Phase 1 Parking NUST University H-12 1
2025
20 Phase 1 Parking COMSATS University 1
21 Phase 1 Parking NARC 2
22 Phase 1 Hospital PIMS Hospital 2
23 Phase 1 Parking Pir Sohawa/ Daman e Koh 2
2026
24 Phase 2 Parking Airport 2 1
25 Phase 2 Parking Centaurus Mall 2
26 Phase 2 Hospital Polyclinic Hospital 2
27 Phase 2 Parking PWD Main Market 1
2027
28 Phase 2 Parking F- 9 Park (Mega Zone) 2
29 Phase 2 Parking Lok Virsa 1
30 Phase 2 Hospital NESCOM Hospital 2
31 Phase 2 Parking Saddar Parking Plaza 2 0
2028
32 Phase 2 Parking Daewoo Terminal 2
33 Phase 2 Parking F -11 Markaz 2
34 Phase 2 Parking Fast University 1
35 Phase 2 Parking G-9 Markaz 1

156
Year Sr No Phase Location
Category Potential Location
Slow
Charger
(max 15 kW)
Semi-Fast
Charger (20-
25 kW)
Fast
Charger
(>25 kW)
36 Phase 2 Parking I - 8 Markaz 1
37 Phase 2 Parking Lake View Park 3
38 Phase 2 Parking Metro Cash & Carry 1
39 Phase 2 Parking Murree Road (Metro Park & Ride) 2
2029
40 Phase 2 Parking F-7 Markaz 2
41 Phase 2 Mall Jinnah Park 1
42 Phase 2 Parking PIEAS + Nilore 1
2030
43 Phase 2 Parking Abpara Market 1
44 Phase 2 Parking F -6 Markaz 2
45 Phase 2 Parking G-10 Markaz 1
46 Phase 2 Parking Westridge 1
Source: IESCO database of 11KV feeders, distribution transformers
10.5.4 CAPEX Requirement
Though a growing EV charging station infrastructure seems predictable, the EV ecosystem faces a financing
dilemma. The installation of a public charging infrastructure on a large scale requires a significant amount
of capital. It is not viable for the government or the utility to bear the cost alone. However, to minimize
costs, consideration is given to a design that doesn’t require more power than the available electrical
capacity in the 11 KV feeder. If electrical upgrades are necessary, the costs can be minimized by placing the
EV charging station close to the electrical service area. A long distance from the charging station to the
electrical service can lead to higher auxiliary component costs such as wire and trenching.
From the data provided by IESCO, it is observed from power transformers to the distribution system, IESCO
has maintained its system well and system upgrades are timely. With an increase in power demand owing
to EV charging, system upgrades may be required at substation levels. According to IESCO officials, they
have already planned a CAPEX till 2030 for upgradation of the power system. The CAPEX is planned under
three categories, i.e., Secondary Transmission & Grid (STG), Distribution System Rehabilitation (ELR), and
Distribution System Expansion (DOP). The total CAPEX planned for these categories till 2030 is
approximately 44,256 million PKR, and, if required, a separate budget can be requested for EV charging
requirements. The officials were of the view that the implementation cannot only be done by IESCO; all
stakeholders will have to play their role in rolling out EVs in Pakistan.
Setting up an EV charging station does not only include charger cost. Auxiliary component costs and
operational expenses are also associated with it. The component cost covers the cost of EV charger,
distribution transformer, cabling, electrical panel, energy meter, and the EVSE management software fee.

157
The auxiliary cost covers the cost of installation and civil works. The ongoing expenses cover the cost of the
network service provider fee, payment gateway fee, land lease rental, technicians, and site staff fee. The
EVSE management software may be considered in two different ways of payment; either it can be an
annual subscription fee or the software can be purchased as part of CAPEX. To minimize the operational
cost, allocating the maintenance staff in clusters for two or three EV charging sites is considered.
The implementation plan for deployment of EV chargers is divided into two phases. The first phase reflects
the creation of EV chargers’ network in the twin cities. The next phase focuses on increasing the charger
density in the potential areas.
For phase 1, CAPEX required by IESCO is approximately 55.4 million PKR and the operational expense is
around 20.6 million PKR. For phase 2, the CAPEX required by IESCO is approximately 36.5 million PKR and
the operational expense is around 36 million PKR. The detailed cost breakdown of the required capital and
operation cost to run the EV charging stations are given in section below
Figure 42: Cost Breakdown of EV Charging Infrastructure
The figure above shows the CAPEX of the total project till 2030 is around 70% of the total cost; the rest is
the operational cost. The major portion of the investment will be required for EV chargers and the auxiliary
equipment to set up a charging station. The cost will be spent in phases according to the growth of demand
for public EV chargers.
The cost of chargers varies with its peak charging capacity and on equipment supplier. The costs of different
suppliers were assessed and while analysing an average cost has been taken into account. The average cost
of a slow public charger (up to 20 kW) is assumed to be approximately 0.3 million PKR. The unit cost of a
Charger28.4%
Transformer, cabling etc
25.3%
Civil Works5.1%
EVSE Management Software2.8%
Technicians Salary0.2%
Site Maintenance Staff29.4%
Network Service Provider Fee
0.9%
EVSE Management Software Fee
0.5%
Payment Gateway Fee 2.5%
Land Lease Rental2.7%
Advertising2.2%
Other38.3%
Charger Transformer, cabling etc Civil Works
EVSE Management Software Technicians Salary Site Maintenance Staff
Network Service Provider Fee EVSE Management Software Fee Payment Gateway Fee
Land Lease Rental Advertising

158
semi-fast charger (up to 25 kW) is assumed to be around 1 million PKR. For fast chargers, the capacity goes
up to 100 kW, but it may not be feasible to deploy such oversized chargers for a new market. So, we
assume a maximum 40 kW fast charger can be deployed in future if required. But, according to the charging
acceptance rate of EVs, the charging power acceptance rate fluctuates between 7 kW to 15 kW across the
mass-producing EVs.
The other major cost in setting up a charging station is the cost of the distribution transformer. The
proposed distribution transformers for supporting the EV chargers are in the range of 25 kVA to 200 kVA
according to the requirement of the location. It is an obligation on the commercial consumer by the utility
to have a separate distribution transformer for a commercial activity. Few proposed sites have oversized
distribution transformers to cater to new chargers according to future growth. The cost varies from 0.1
million to 1 million PKR for a 25 to 200 kVA distribution transformer. Usually, for the distribution system
expansion, the electric utility provides the distribution transformer. However, in the case of commercial
activity, the business entity will have to bear the cost of the required transformer.
The installation cost, cabling, trenching, and civil works cost varies according to each site. The costs depend
upon the location, distance from electric service area, etc. Therefore, the costs are based on assumptions
that all sites are within 40 meters of the electric service area. Civil works are also dependent on each
individual site. For example, installation cost in a parking lot may also require a re-pavement cost. Installing
a multiport station or multiple stations reduces the cost per charger, but the demand must exist to justify
the extra capacity.
The other important cost is to have advanced EV management software which is capable of identifying a
consumer, and has an online billing system and server communication. The cost of software can be a lump
sum amount for the purchase of chargers from same supplier or it can have a monthly subscription-based
model. For Pakistan, we have assumed 10% of net margin to be considered as a monthly EV management
software fee.
10.5.5 Financial Viability of Charging Stations
The economics of setting up a charging station is the deciding factor to take it to the level of
implementation. Several economic indicators are involved while checking the financial viability of the
project. In case of setting up charging stations in the twin cities, the analysis is based on the historical data
forecast for the future growth of EVs. To analyse and get a better understanding of each charger category,
we have done a separate analysis for realistic modelling. Few assumptions have been derived to minimize
the annual operational cost of the charger. A single individual as site maintenance staff can handle three
chargers at one site. The network provider fee remains fixed even if a maximum of three chargers are
installed at one site.

159
Slow Chargers (Max 15 kW)
To deploy a slow public charger, the cost breakdown is shown in figure below. To analyse the economic
viability, the capital cost and operational costs are expressed separately.
Figure 43: Cost Breakdown of the EV Charging Infrastructure – Slow Charger
As shown in the above figure, the CAPEX constitutes 83% and first-year operational cost constitutes for
~17%. With such a high CAPEX, most of the cost is for the equipment. With government support in terms
of subsidies and tax incentives, the costs can be reduced to promote the use of public chargers in the initial
years.
To get a financial insight, the utilisation factor of each charger is the major indicator to make it financially
viable. The graph below shows the return on investment at different utilisation factors.
Charger49%
Transformer, cabling etc
19%
Civil Works10%
EVSE Management Software
5%Site Maintenance Staff
9%
Network Service Provider Fee
2%
EVSE Management Software Fee
2%
Payment Gateway Fee 1%
Land Lease Rental
1%
Advertising2%
Other17%
Slow charger (15 kW)

160
Figure 44: Return on Investment vs Capacity Utilisation Factor – Slow Charger
The analysis shows the annual return on investment can be higher at higher revenue (PKR/kWh), i.e., 4
PKR/kWh. However, at such higher charging costs, the EV consumers may be discouraged to use public
chargers. So, a balance will have to be established between the return on investment according to the
expected utilisation factors. In general, it is expected the utilisation factor in the initial years can be 10-
20%. However, as the EVs gain traction, the average utilisation factor can be ~30%. As seen in the analysis,
for 30% utilisation factor, the revenue per kWh can be PKR 2-3 and the return on investment can be 12-
18%. For technology-oriented projects globally, the return on investment is 15-20%. This supports the case
of slow public chargers being financially viable for investment. If the government can offer specialized tariff
for EVs, then both the consumer and investor can benefit, promoting the adoption of EVs in Pakistan.
Comparing this business model with the renewable energy projects in Pakistan, few projects were
committed a return on investment of 17%. Similar policies can be introduced for the infrastructure
development for EVs to promote and encourage private investment in this sector.
Semi-fast Chargers (20 to 25 kW)
To deploy a semi-fast public charger, the cost breakdown is shown in figure below. To analyse the economic
viability, the capital and operational costs are expressed separately.
2.0%4.1%
6.1%8.2%
4.1%
8.2%
12.3%
16.4%
6.1%
12.3%
18.4%
24.5%
8.2%
16.4%
24.5%
32.7%
10.2%
20.5%
30.7%
40.9%
0%
10%
20%
30%
40%
50%
1 2 3 4
Re
turn
on
In
vest
me
nt
Revenue (PKR. /kWh)
Slow charger (15 kW)
10%
20%
30%
40%
50%
Capacity Utilisation

161
Figure 45: Cost Breakdown of EV Charging Infrastructure – Semi-fast Charger
As shown in the above figure, the CAPEX constitutes 90% and first-year operational cost constitutes ~10%
of the amount. With such a high CAPEX, majority of the cost is for the equipment, and the cost of charger
is approximately 61%. With government support in terms of subsidies and tax incentives, costs can be
reduced to promote the use of public chargers in the initial years. Or, indigenous solutions can be
developed locally to reduce the cost of chargers to make them more financially viable. Having seen that,
61% cost is only for a semi-fast charger; a 5% premium tariff for semi-fast chargers for revenue collection
is assumed. The premium is given keeping in view two factors: it can supply same amount of kWh in less
time and have higher CAPEX incurred.
To get a financial insight, the utilisation factor of each charger is the major indicator to make it financially
viable. The graph below shows the return on investment at different utilisation factors.
Charger; 61%
Transformer, cabling etc; 19%
Civil Works; 4%
EVSE Management Software; 6%
Site Maintenance Staff; 4%
Network Service Provider Fee ; 1%
EVSE Management Software Fee ; 3%
Payment Gateway Fee ; 1%
Land Lease Rental; 0%
Advertising; 1%
Other10%
Semi-fast charger (Max 25 kW)
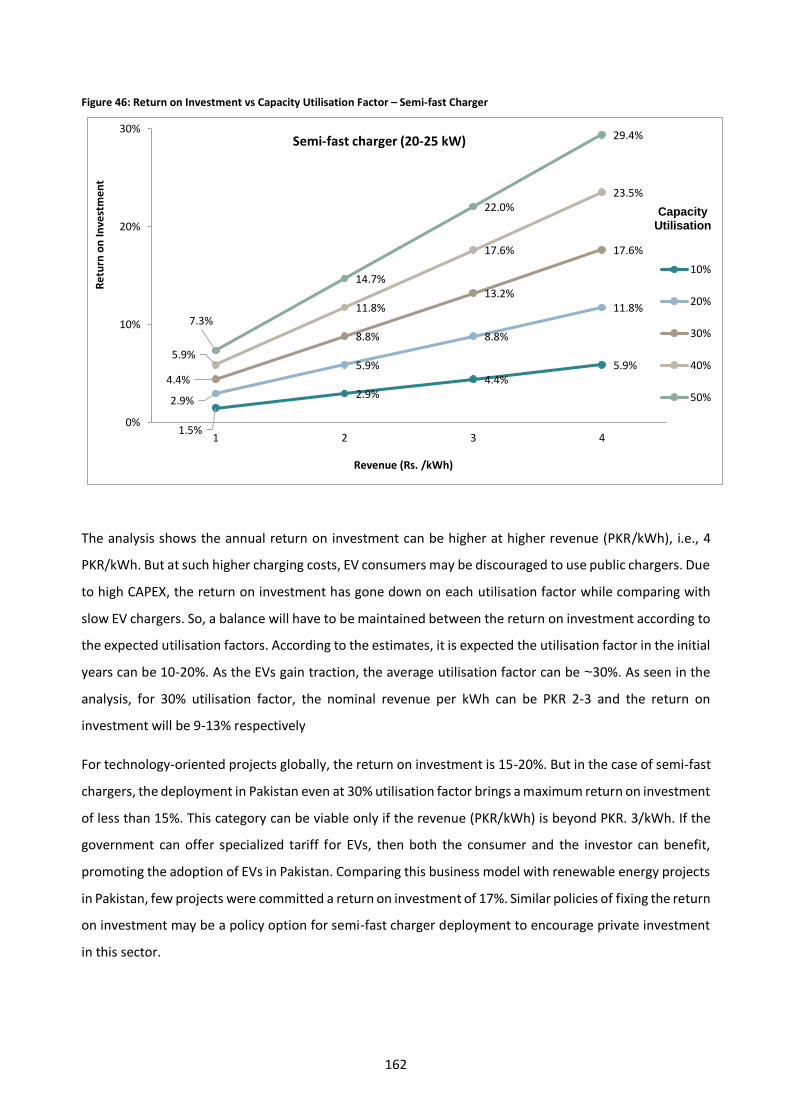
162
Figure 46: Return on Investment vs Capacity Utilisation Factor – Semi-fast Charger
The analysis shows the annual return on investment can be higher at higher revenue (PKR/kWh), i.e., 4
PKR/kWh. But at such higher charging costs, EV consumers may be discouraged to use public chargers. Due
to high CAPEX, the return on investment has gone down on each utilisation factor while comparing with
slow EV chargers. So, a balance will have to be maintained between the return on investment according to
the expected utilisation factors. According to the estimates, it is expected the utilisation factor in the initial
years can be 10-20%. As the EVs gain traction, the average utilisation factor can be ~30%. As seen in the
analysis, for 30% utilisation factor, the nominal revenue per kWh can be PKR 2-3 and the return on
investment will be 9-13% respectively
For technology-oriented projects globally, the return on investment is 15-20%. But in the case of semi-fast
chargers, the deployment in Pakistan even at 30% utilisation factor brings a maximum return on investment
of less than 15%. This category can be viable only if the revenue (PKR/kWh) is beyond PKR. 3/kWh. If the
government can offer specialized tariff for EVs, then both the consumer and the investor can benefit,
promoting the adoption of EVs in Pakistan. Comparing this business model with renewable energy projects
in Pakistan, few projects were committed a return on investment of 17%. Similar policies of fixing the return
on investment may be a policy option for semi-fast charger deployment to encourage private investment
in this sector.
1.5%
2.9%4.4%
5.9%
2.9%
5.9%
8.8%
11.8%
4.4%
8.8%
13.2%
17.6%
5.9%
11.8%
17.6%
23.5%
7.3%
14.7%
22.0%
29.4%
0%
10%
20%
30%
1 2 3 4
Re
turn
on
In
vest
me
nt
Revenue (Rs. /kWh)
Semi-fast charger (20-25 kW)
10%
20%
30%
40%
50%
Capacity Utilisation

163
Another factor of the location of the charger may also impact the 10% increase in capacity utilisation,
generating more revenue than calculated. But this will only be true for locations with higher penetration
of EVs.
Fast Chargers (25 to 40 kW)
The cost breakdown to deploy a fast public charger is shown in the figure below. To analyse the economic
viability of deploying a fast public charger, the capital cost and operational costs are expressed separately.
Figure 47: Cost Breakdown of EV Charging Infrastructure – Fast Charger
As shown in the above figure, the CAPEX constitutes 95% and first-year operational cost accounts for only
5% of the amount. Majority of the cost incurred is for the equipment. The cost of the charger accounts for
~64%, followed by the cost of the transformer, cabling and electric panel. Without government support in
terms of subsidies and tax incentives, the costs cannot be reduced to promote the use of public chargers
in the initial years. Indigenous solutions can be developed locally to reduce the cost of chargers to make
them more financially viable. Considering high CAPEX required for a semi fast charger and distribution
transformer, it is assumed to give a 10% premium tariff for fast chargers for revenue collection. The
premium is charged by fast chargers because of two factors, first, it can supply the same amount of kWh
in lesser time than slow- and semi-fast chargers, and second, the CAPEX incurred is higher in fast chargers.
Charger; 64.0%
Transformer, cabling etc; 23.2%
Civil Works; 1.7%
EVSE Management Software; 6.4%
Site Maintenance Staff; 1.6%
Network Service Provider Fee ; 0.3%
EVSE Management Software Fee ; 1.9%
Payment Gateway Fee ; 0.5%
Land Lease Rental; 0.3%
Advertising; 0.3%
Other; 4.7%
Fast charger (25-40 kW)
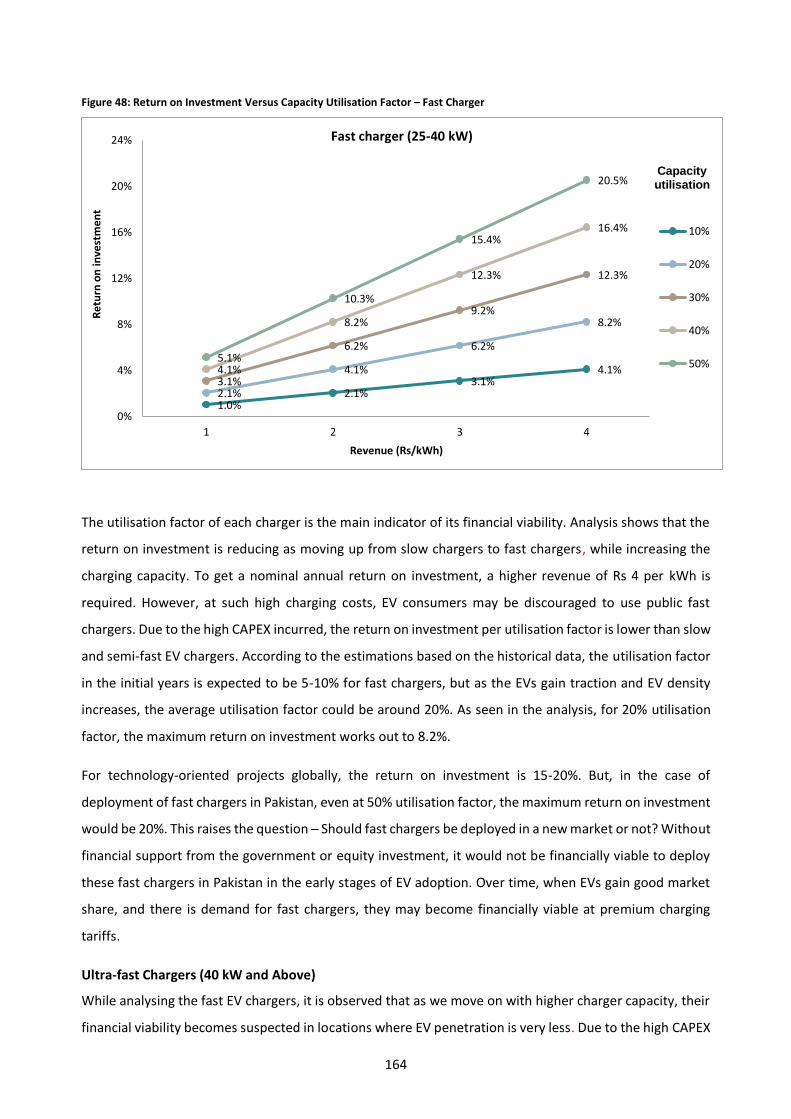
164
Figure 48: Return on Investment Versus Capacity Utilisation Factor – Fast Charger
The utilisation factor of each charger is the main indicator of its financial viability. Analysis shows that the
return on investment is reducing as moving up from slow chargers to fast chargers, while increasing the
charging capacity. To get a nominal annual return on investment, a higher revenue of Rs 4 per kWh is
required. However, at such high charging costs, EV consumers may be discouraged to use public fast
chargers. Due to the high CAPEX incurred, the return on investment per utilisation factor is lower than slow
and semi-fast EV chargers. According to the estimations based on the historical data, the utilisation factor
in the initial years is expected to be 5-10% for fast chargers, but as the EVs gain traction and EV density
increases, the average utilisation factor could be around 20%. As seen in the analysis, for 20% utilisation
factor, the maximum return on investment works out to 8.2%.
For technology-oriented projects globally, the return on investment is 15-20%. But, in the case of
deployment of fast chargers in Pakistan, even at 50% utilisation factor, the maximum return on investment
would be 20%. This raises the question ─ Should fast chargers be deployed in a new market or not? Without
financial support from the government or equity investment, it would not be financially viable to deploy
these fast chargers in Pakistan in the early stages of EV adoption. Over time, when EVs gain good market
share, and there is demand for fast chargers, they may become financially viable at premium charging
tariffs.
Ultra-fast Chargers (40 kW and Above)
While analysing the fast EV chargers, it is observed that as we move on with higher charger capacity, their
financial viability becomes suspected in locations where EV penetration is very less. Due to the high CAPEX
1.0%2.1%
3.1%4.1%
2.1%
4.1%
6.2%
8.2%
3.1%
6.2%
9.2%
12.3%
4.1%
8.2%
12.3%
16.4%
5.1%
10.3%
15.4%
20.5%
0%
4%
8%
12%
16%
20%
24%
1 2 3 4
Re
turn
on
inve
stm
en
t
Revenue (Rs/kWh)
Fast charger (25-40 kW)
10%
20%
30%
40%
50%
Capacity utilisation

165
involved, they become technically and financially unviable to be deployed in new markets. Another reason
for lesser acceptability of ultra-fast chargers is that auto manufacturers have limitations in absorbing high
power while charging electric cars. Only few cars are available globally that can absorb more than 20 kW
of power while charging. For plug-in hybrid electric cars, the average charger acceptance rate is even lower
and not more than 3.3 kW.
Table 85: Battery Capacity of EVs
Sr. No. Electric Car Model Battery Capacity (kWh) Max Power Acceptance Rate (kW)
1 BMW i3 32 7.4
2 Hyundai IONIQ 28 6.6
3 Mercedes B250e 28 9.6
4 Nissan Leaf 40 6.6
5 Tesla Model 3 70 11.5
6 Tesla Model S 60 Dual 60 19.2
Source: BMW, Hyundai Mercedes, Nissan, Tesla
The table above shows that the electric cars available in the market have limitations in accepting power
while charging. Even if the charger has a capacity of more than 40 kW, the electric car can only absorb
power according to its maximum power acceptance rate. So, at a given point of time, even if advanced
technology to charge electric cars in shorter time is available, if it cannot be utilised, it will not be
economically viable. But, with improvement in the electric cars manufactured and increase in utilisation of
fast chargers, they may become financially viable.
10.5.6 Business Model for Setting up EV Charging Stations
Every technology needs a financial and technical assessment before its implementation. In the previous
sections, different indicators have been assessed and their impact has been determined in different
scenarios. Different models need to be analysed to come up with the best suitable business model that
suits the dynamics of Pakistan’s market.
Usually commercial technology-oriented projects are undertaken in public private partnership under the
build-and-operate model with private investment. The public parties could be Capital Development
Authority (CDA) or IESCO, whereas the private parties could be private investors, auto manufacturers who
could be the stakeholders in setting up EV charging infrastructure.
Out of the total EV charging infrastructure setting up cost, the cost of distribution transformer, cabling, etc,
constitutes ~25% of the total project cost. If the federal government aims to support this initiative, it can
allocate budget for bearing the 25% cost as mentioned above. This will help in reducing the capital required,
thus making it more economically viable.

166
Different modes of implementation have been discussed in the section below. Some light is shed on the
possible options which may be practical according to the country dynamics and limitations of electric
utilities in Pakistan. The approvals from the National Electric Power Regulatory Authority (NEPRA) may be
required for the electric utilities to build and operate EV charging infrastructure. NEPRA may also will have
to announce the specialized tariffs for public EV charging stations.
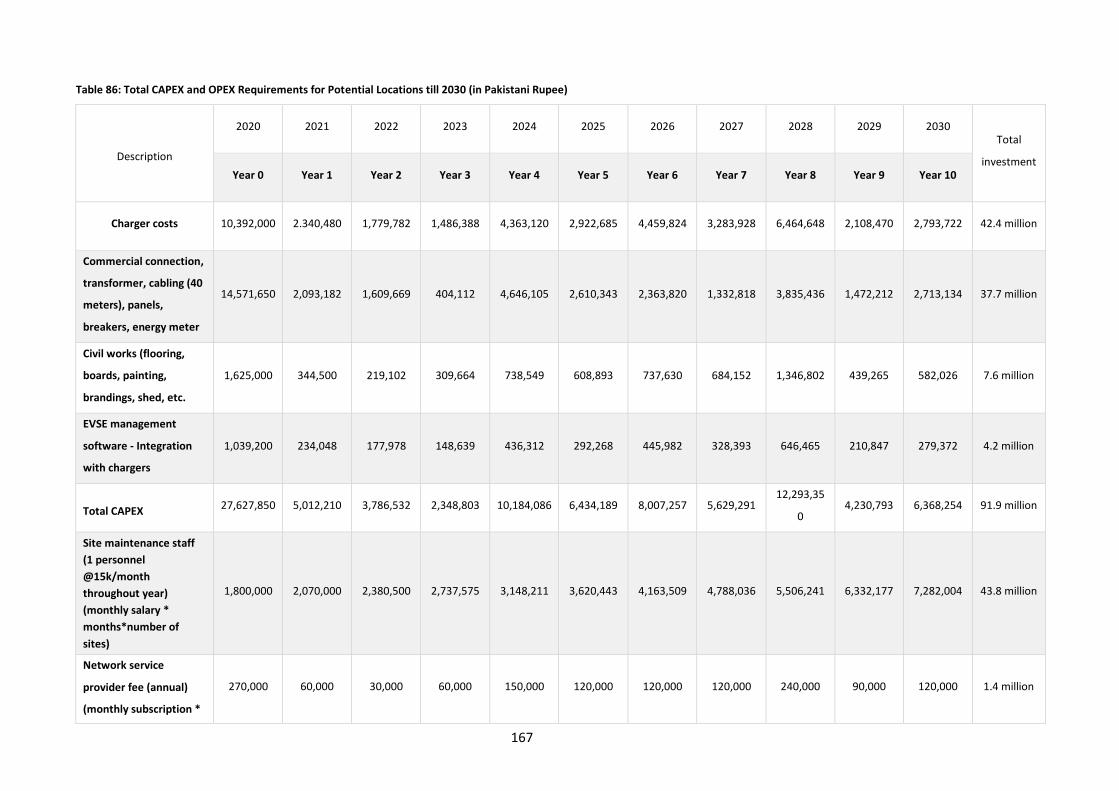
167
Table 86: Total CAPEX and OPEX Requirements for Potential Locations till 2030 (in Pakistani Rupee)
Description
2020 2021 2022 2023 2024 2025 2026 2027 2028 2029 2030 Total
investment Year 0 Year 1 Year 2 Year 3 Year 4 Year 5 Year 6 Year 7 Year 8 Year 9 Year 10
Charger costs 10,392,000 2.340,480 1,779,782 1,486,388 4,363,120 2,922,685 4,459,824 3,283,928 6,464,648 2,108,470 2,793,722 42.4 million
Commercial connection,
transformer, cabling (40
meters), panels,
breakers, energy meter
14,571,650 2,093,182 1,609,669 404,112 4,646,105 2,610,343 2,363,820 1,332,818 3,835,436 1,472,212 2,713,134 37.7 million
Civil works (flooring,
boards, painting,
brandings, shed, etc.
1,625,000 344,500 219,102 309,664 738,549 608,893 737,630 684,152 1,346,802 439,265 582,026 7.6 million
EVSE management
software - Integration
with chargers
1,039,200 234,048 177,978 148,639 436,312 292,268 445,982 328,393 646,465 210,847 279,372 4.2 million
Total CAPEX 27,627,850 5,012,210 3,786,532 2,348,803 10,184,086 6,434,189 8,007,257 5,629,291 12,293,35
0 4,230,793 6,368,254 91.9 million
Site maintenance staff
(1 personnel
@15k/month
throughout year)
(monthly salary *
months*number of
sites)
1,800,000 2,070,000 2,380,500 2,737,575 3,148,211 3,620,443 4,163,509 4,788,036 5,506,241 6,332,177 7,282,004 43.8 million
Network service
provider fee (annual)
(monthly subscription *
270,000 60,000 30,000 60,000 150,000 120,000 120,000 120,000 240,000 90,000 120,000 1.4 million

168
months*number of
sites)
EVSE management
software fee
(considered as 10% of
net margin on electricity
charges)
50,625 53,156 55,814 58,605 61,535 64,612 67,842 71,234 74,796 78,536 82,463 0.7 million
Payment gateway fee
(1-2% of total money
collected) 2.5% in
Pakistan
12,656 20,250 32,400 51,840 82,944 132,710 212,337 339,739 543,582 869,731 1,391,569 3.7 million
Land lease rental 214,500 235,950 259,545 285,500 314,049 345,454 380,000 418,000 459,800 505,780 556,358 4 million
Advertising 214,500 227,370 241,012 255,473 270,801 287,049 304,272 322,529 341,880 362,393 384,137 3.2 million
Total OPEX 2,862,281 2,666,726 2,999,271 3,448,992 4,027,541 4,570,269 5,247,961 6,059,537 7,166,299 8,238,617 9,816,531 57.1 million
Total costs 30.5
million 7.7 million 6.7 million 5.8 million
14.2
million 11 million
13.3
million
11.7
million
19.5
million
12.5
million
16.2
million 149 million
169
Prospective Business Models
Public Private Partnership (PPP)
Effective supply of charging infrastructure is a necessary requirement for the development of EVs and an
important strategic measure to promote EV adoption. PPPs may offer a promising way forward and
accelerate the development of charging infrastructure by tapping the private sector’s financial resources
and professional skills.
Charging infrastructure is important for supplying energy to electric vehicles and it needs to be provided in
a reasonable manner with a moderately advanced layout. Due to large-scale investment, unclear financing
mechanism, interlinked risks, and other factors may be a hurdle for private investors in early stages of
deployment of public charging stations. The PPP model may be an effective tool to leverage social capital,
ease the burden on local financier enhance the level of project management and profitability, and reduce
construction and operation risks.
As there are no clear policy guidelines for EV sales, adoption, promotion, and setting up charging
infrastructure, it would be premature for a virgin EV market like Pakistan, to discuss the modalities of the
PPP mode such as responsibilities, project planning, construction arrangement, risk-sharing, profit
distribution, and supervision at this stage. At the entry level, it is difficult to evaluate market dynamics and
forecast sales. Keeping in mind such concerns of private investors, government support may be required
to meet revenue gaps in the initial years of EV charging infrastructure deployment. The government may
also contribute in terms of financial subsidies, tax preferences, and concessionary credits to promote
investment in this sector.
This will be a long-term contract (~15 years) between the public party and the private party, for the
development and management of a public asset and services. It is proposed that the public and private
parties have an equity share of 70% and 30%, respectively. Both parties are proposed to share the
investment and returns with respective ratios. Infrastructure will be developed by a third party through a
tendering process as this is the most effective way of project execution. In Pakistan, bureaucratic delays
may affect the management and operations of charging stations. Moreover, the public sector also does not
have the prerequisite experience for operation and management of such systems. So, it is proposed to give
the responsibility of operations and management to the private party. The risk of the project may be
undertaken by the public party to attract private party investment in such projects in the early years to
stimulate EV growth.
The above-mentioned modalities are proposed, based on the previous PPP mode projects in Pakistan, but
the terms of financial expenditure, defining responsibilities in terms of all aspects, operation and
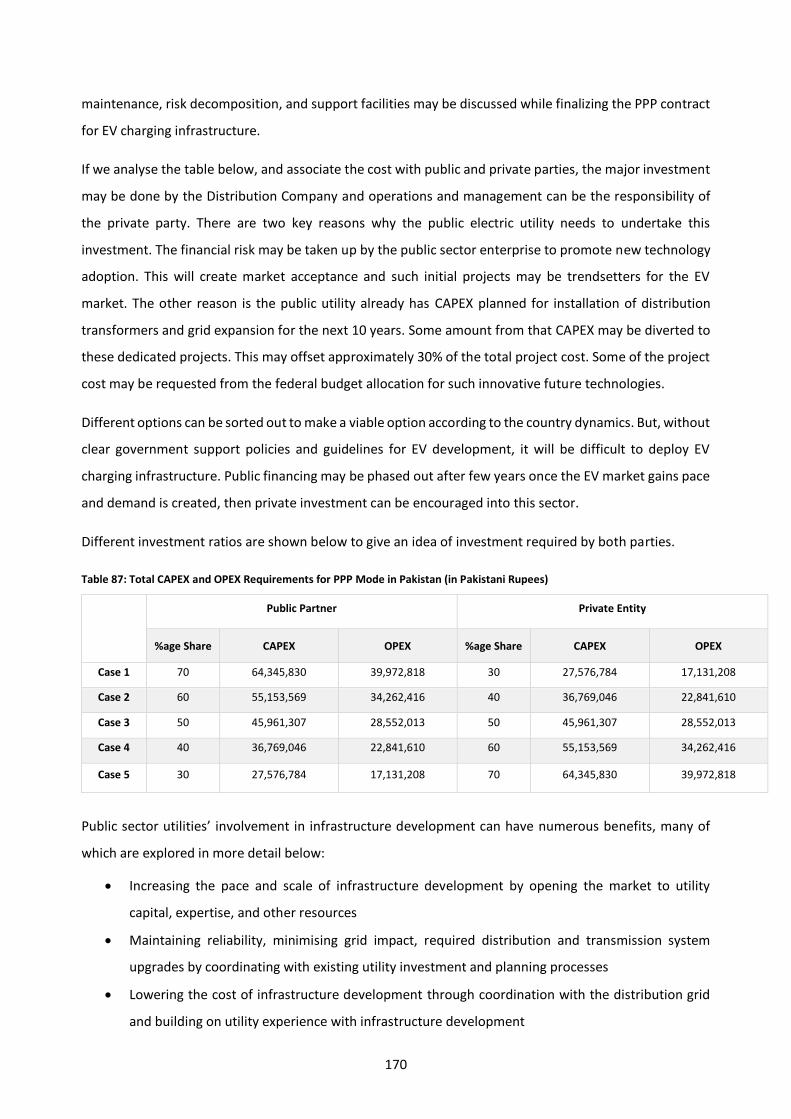
170
maintenance, risk decomposition, and support facilities may be discussed while finalizing the PPP contract
for EV charging infrastructure.
If we analyse the table below, and associate the cost with public and private parties, the major investment
may be done by the Distribution Company and operations and management can be the responsibility of
the private party. There are two key reasons why the public electric utility needs to undertake this
investment. The financial risk may be taken up by the public sector enterprise to promote new technology
adoption. This will create market acceptance and such initial projects may be trendsetters for the EV
market. The other reason is the public utility already has CAPEX planned for installation of distribution
transformers and grid expansion for the next 10 years. Some amount from that CAPEX may be diverted to
these dedicated projects. This may offset approximately 30% of the total project cost. Some of the project
cost may be requested from the federal budget allocation for such innovative future technologies.
Different options can be sorted out to make a viable option according to the country dynamics. But, without
clear government support policies and guidelines for EV development, it will be difficult to deploy EV
charging infrastructure. Public financing may be phased out after few years once the EV market gains pace
and demand is created, then private investment can be encouraged into this sector.
Different investment ratios are shown below to give an idea of investment required by both parties.
Table 87: Total CAPEX and OPEX Requirements for PPP Mode in Pakistan (in Pakistani Rupees)
Public Partner Private Entity
%age Share CAPEX OPEX %age Share CAPEX OPEX
Case 1 70 64,345,830 39,972,818 30 27,576,784 17,131,208
Case 2 60 55,153,569 34,262,416 40 36,769,046 22,841,610
Case 3 50 45,961,307 28,552,013 50 45,961,307 28,552,013
Case 4 40 36,769,046 22,841,610 60 55,153,569 34,262,416
Case 5 30 27,576,784 17,131,208 70 64,345,830 39,972,818
Public sector utilities’ involvement in infrastructure development can have numerous benefits, many of
which are explored in more detail below:
• Increasing the pace and scale of infrastructure development by opening the market to utility
capital, expertise, and other resources
• Maintaining reliability, minimising grid impact, required distribution and transmission system
upgrades by coordinating with existing utility investment and planning processes
• Lowering the cost of infrastructure development through coordination with the distribution grid
and building on utility experience with infrastructure development

171
• Improving ability to communicate with customers through existing channels, developing customer
pricing models, and creating incentives to promote vehicle charging at times that provide grid
benefits—including load balancing and integration of renewable energy sources
But, in the long run, the involvement of public electric utilities could have disadvantages in the eventuality
that the government decides to privatize electric utilities, etc. This needs to be addressed by the federal
government while drafting EV policies for Pakistan.
Build Operate Transfer (BOT) Model
A BOT project is typically used to develop a discrete asset rather than a whole network. In a BOT project,
the private company or operator generally obtains its revenue from a fee charged to the utility/
government rather than tariffs charged to consumers. In the BOT framework, a third party, for example
the public administration, delegates to a private sector entity to design and build infrastructure and to
operate and maintain these facilities for a certain concession period. During this period, the private party
has the responsibility to raise finance for the project, is entitled to retain all revenue generated by the
project and is the owner of the regarded facilities. The facility is then transferred to the public
administration at the end of the concession agreement free of cost.
The difference between this and the previous model discussed is that, in the previous model, both parties
had equity share of the project, but this one is independent of the public utility’s involvement. For the
agreement period, the private party will invest and locate investment opportunities for funding the project.
The government may announce policies such as soft loans for EV charging infrastructure deployment for
long periods. This could expand the primary benefits of easy access to capital financing, thus helping to
increase the scale of EV charging infrastructure development. It may also oversee other program
components, including marketing and host site rental lending, and ongoing operations and maintenance
of the infrastructure in a dedicated manner.
Another important component is that with public electric utility support, operation of stations may provide
additional opportunities for more sophisticated vehicle-grid integration and the use of dynamic and
innovative rates designed to promote grid-optimized charging.
Suggested Business Model
The two business models have been discussed above keeping in mind the country dynamics and the
possible options that can be executed with minor changes. After analysing all the indicators and their
impacts, a simplified model is suggested for adoption. This model will be more practical to implement,
which would require less effort, time and finances for the execution of EV charging infrastructure under
the jurisdiction of IESCO. This model may also be adopted by other electric utilities in Pakistan to expand
the EV charging network across Pakistan.
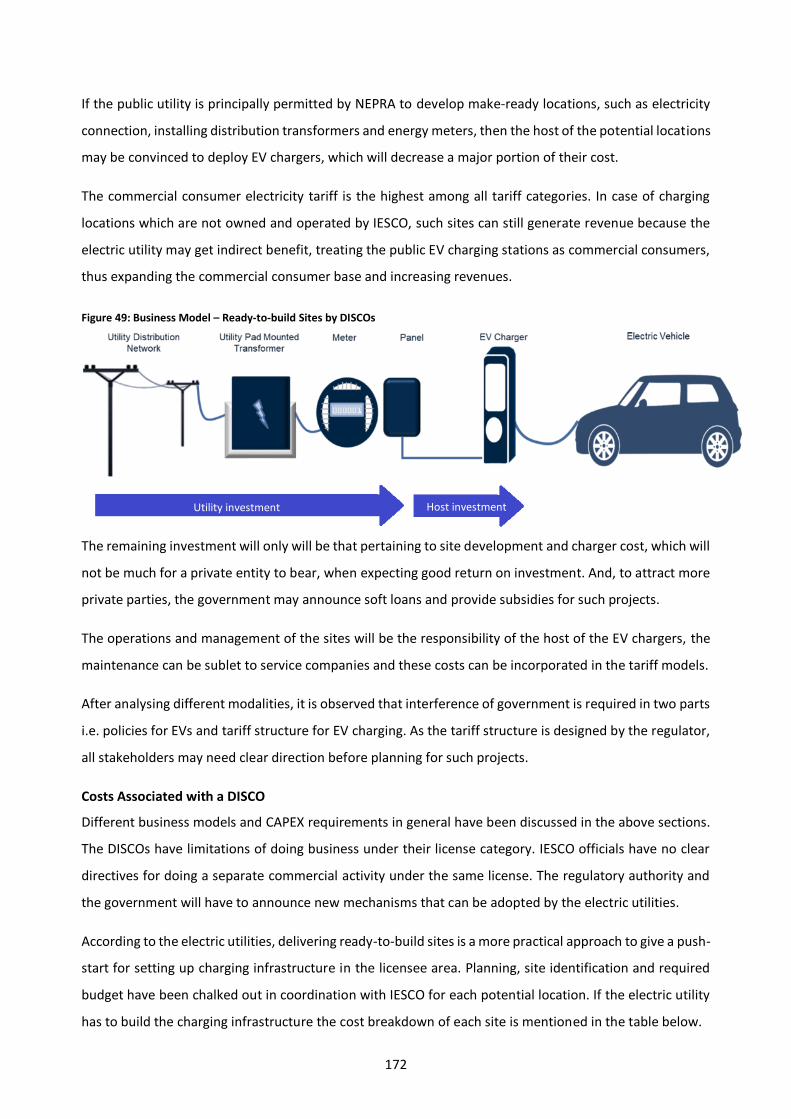
172
If the public utility is principally permitted by NEPRA to develop make-ready locations, such as electricity
connection, installing distribution transformers and energy meters, then the host of the potential locations
may be convinced to deploy EV chargers, which will decrease a major portion of their cost.
The commercial consumer electricity tariff is the highest among all tariff categories. In case of charging
locations which are not owned and operated by IESCO, such sites can still generate revenue because the
electric utility may get indirect benefit, treating the public EV charging stations as commercial consumers,
thus expanding the commercial consumer base and increasing revenues.
Figure 49: Business Model – Ready-to-build Sites by DISCOs
The remaining investment will only will be that pertaining to site development and charger cost, which will
not be much for a private entity to bear, when expecting good return on investment. And, to attract more
private parties, the government may announce soft loans and provide subsidies for such projects.
The operations and management of the sites will be the responsibility of the host of the EV chargers, the
maintenance can be sublet to service companies and these costs can be incorporated in the tariff models.
After analysing different modalities, it is observed that interference of government is required in two parts
i.e. policies for EVs and tariff structure for EV charging. As the tariff structure is designed by the regulator,
all stakeholders may need clear direction before planning for such projects.
Costs Associated with a DISCO
Different business models and CAPEX requirements in general have been discussed in the above sections.
The DISCOs have limitations of doing business under their license category. IESCO officials have no clear
directives for doing a separate commercial activity under the same license. The regulatory authority and
the government will have to announce new mechanisms that can be adopted by the electric utilities.
According to the electric utilities, delivering ready-to-build sites is a more practical approach to give a push-
start for setting up charging infrastructure in the licensee area. Planning, site identification and required
budget have been chalked out in coordination with IESCO for each potential location. If the electric utility
has to build the charging infrastructure the cost breakdown of each site is mentioned in the table below.
Utility investment Host investment

173
Table 88: Associated Cost Breakdown by a DISCO for Potential Locations (Pakistani Rupee)
Year Potential Location Cost of
Chargers
Cost of Distribution
Transformer
Cost of Wire/ Panel/
Energy Meter
Cost of Connection/
Installation & Civil Works
Total Expected
Cost
2020
Airport 1,584,000 1,099,750 817,600 225,000 3,726,350
Bahria Town Civic Centre 312,000 174,500 342,600 85,000 914,100
Centaurus Mall 1,584,000 1,099,750 817,600 225,000 3,726,350
F- 9 Park (Mega Zone) 624,000 870,000 532,600 155,000 2,181,600
G-5 Government Offices 936,000 1,099,750 817,600 225,000 3,078,350
Jinnah Park 936,000 870,000 532,600 225,000 2,563,600
Murree Road - Metro Park & Ride 1,896,000 1,099,750 817,600 295,000 4,108,350
Saddar Parking Plaza 1,896,000 1,099,750 817,600 295,000 4,108,350
Shifa International Hospital 624,000 870,000 532,600 155,000 2,181,600
2021 Giga Mall RWP 624,000 174,500 342,600 155,000 1,296,100
Saidpur Cultural Village 1,584,000 870,000 532,600 225,000 3,211,600
2022 Daewoo Terminal 1,584,000 870,000 532,600 225,000 3,211,600
2023 DHA Main Market 312,000 136,700 167,600 85,000 701,300
G-5 Government Offices 936,000 - - 210,000 1,146,000
2024
E-11 Markaz/ Marquees 624,000 174,500 342,600 155,000 1,296,100
Fawara Chowk Parking Plaza 624,000 174,500 342,600 155,000 1,296,100
Islamic University 312,000 136,700 167,600 85,000 701,300
Lake View Park 1,584,000 1,099,750 817,600 225,000 3,726,350
NUST University H-12 312,000 136,700 167,600 85,000 701,300
2025
COMSATS University 312,000 136,700 167,600 85,000 701,300
NARC 624,000 174,500 342,600 155,000 1,296,100
PIMS Hospital 624,000 174,500 342,600 155,000 1,296,100
Pir Sohawa/ Daman e Koh 624,000 174,500 342,600 155,000 1,296,100
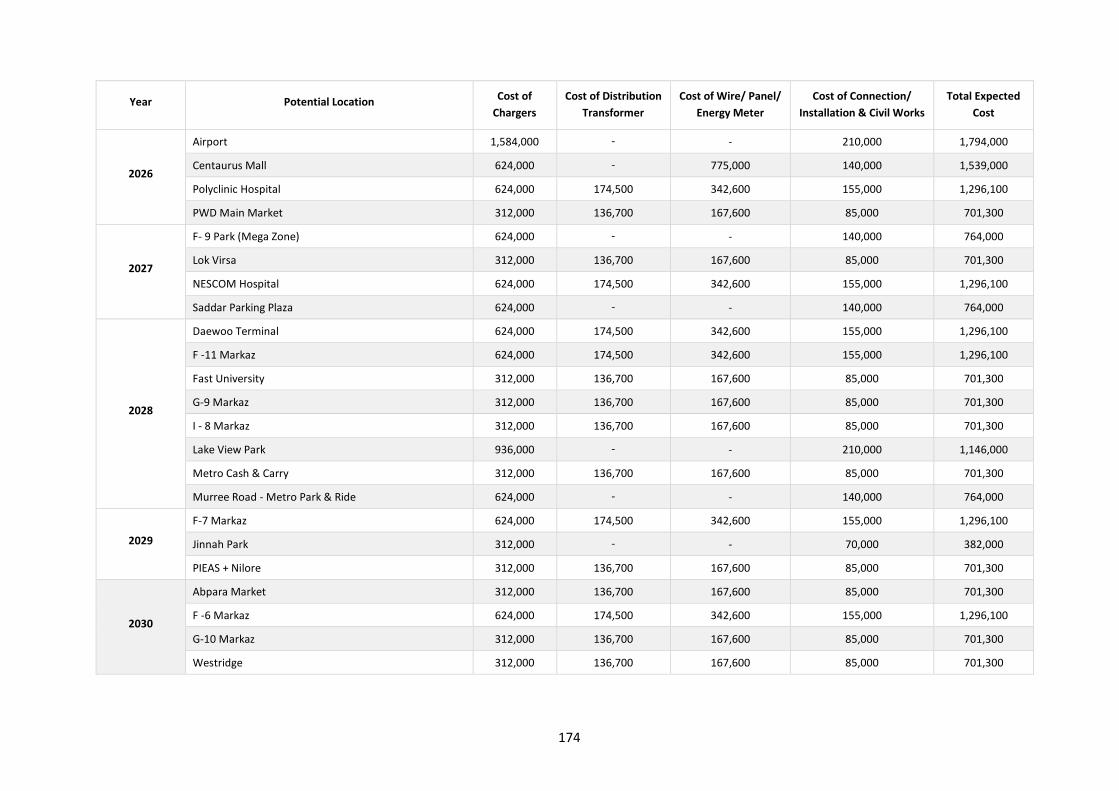
174
Year Potential Location Cost of
Chargers
Cost of Distribution
Transformer
Cost of Wire/ Panel/
Energy Meter
Cost of Connection/
Installation & Civil Works
Total Expected
Cost
2026
Airport 1,584,000 - - 210,000 1,794,000
Centaurus Mall 624,000 - 775,000 140,000 1,539,000
Polyclinic Hospital 624,000 174,500 342,600 155,000 1,296,100
PWD Main Market 312,000 136,700 167,600 85,000 701,300
2027
F- 9 Park (Mega Zone) 624,000 - - 140,000 764,000
Lok Virsa 312,000 136,700 167,600 85,000 701,300
NESCOM Hospital 624,000 174,500 342,600 155,000 1,296,100
Saddar Parking Plaza 624,000 - - 140,000 764,000
2028
Daewoo Terminal 624,000 174,500 342,600 155,000 1,296,100
F -11 Markaz 624,000 174,500 342,600 155,000 1,296,100
Fast University 312,000 136,700 167,600 85,000 701,300
G-9 Markaz 312,000 136,700 167,600 85,000 701,300
I - 8 Markaz 312,000 136,700 167,600 85,000 701,300
Lake View Park 936,000 - - 210,000 1,146,000
Metro Cash & Carry 312,000 136,700 167,600 85,000 701,300
Murree Road - Metro Park & Ride 624,000 - - 140,000 764,000
2029
F-7 Markaz 624,000 174,500 342,600 155,000 1,296,100
Jinnah Park 312,000 - - 70,000 382,000
PIEAS + Nilore 312,000 136,700 167,600 85,000 701,300
2030
Abpara Market 312,000 136,700 167,600 85,000 701,300
F -6 Markaz 624,000 174,500 342,600 155,000 1,296,100
G-10 Markaz 312,000 136,700 167,600 85,000 701,300
Westridge 312,000 136,700 167,600 85,000 701,300
175
The total CAPEX required by IESCO to set up ready-to-build sites for the period of next 10 years will be
approximately 70.4 million PKR. IESCO has allocated 12,294 million PKR for their Distribution System
Expansion (DOP) activities. The required amount for setting up charging infrastructure is just 0.6% of the
planned DOP budget for the next 10 years. This shows how easily an electric utility can develop the sites to
support the uptake of EV charging infrastructure. The government’s support and commitment may also be
required as electric utilities have limitations. To make the case of EVs stronger in Pakistan, all stakeholders
should be involved in the process and show commitment to push-start the emerging EV market in Pakistan.
Sources of Funds Required
All the power utility companies submit their short, medium and long-term plans to the regulatory authority
for validation. A combined meeting of all DISCOs is arranged by the Central Power Purchasing Authority
(CPPA), National Transmission and Distribution Co. (NTDC) to map all the future demand, forecast load
profiles and upgrades required to cater to the load growth. The planned CAPEX is also submitted to the
regulatory authority after combined planning efforts.
A tariff petition by each electric utility is submitted to the regulatory authority, in which, indicators such as
decrease in losses, expected revenue collection, margin (PKR/kWh), planned CAPEX, etc., are characterized
for a period of 5 years and is revised every year, if needed. Based on the figures provided by the electric
utility, the regulatory authority approves a tariff for the electric utility. The approved tariff is broken down,
out of which, some portion is dedicated towards the CAPEX for upgradation, expansion and maintenance
activities. For the above-mentioned regular activities, all the power distribution companies generate their
own funds. But, for extra projects such as evacuation of a large power plant, special economic zones, etc.,
the funds are provided by the federal government under different financial mechanisms. For specialized
projects, the utilities also seek financial grants from Asian Development Bank (ADB) and World Bank. Some
projects have also been financed by development agencies such as United States Agency for International
Development (USAID), Deutsche Gesellschaft für Internationale Zusammenarbeit (GIZ), etc, in the past.
According to the statistics provided by IESCO, they have planned CAPEX for the next 10 years till 2029 under
three different heads. The total CAPEX planned for expansion, upgradation and maintenance is
approximately 44,256 million PKR. In the next tariff petition, IESCO may incorporate the cost of setting up
the necessary infrastructure for the EV charging stations. Resources may be sought from the federal
government for infrastructure development of EV charging stations, or they can be financed by
development banks as done in the past for specialized projects. Another option is to submit a PC-1 to the
government, so as to get budget allocation for EV charging infrastructure development.
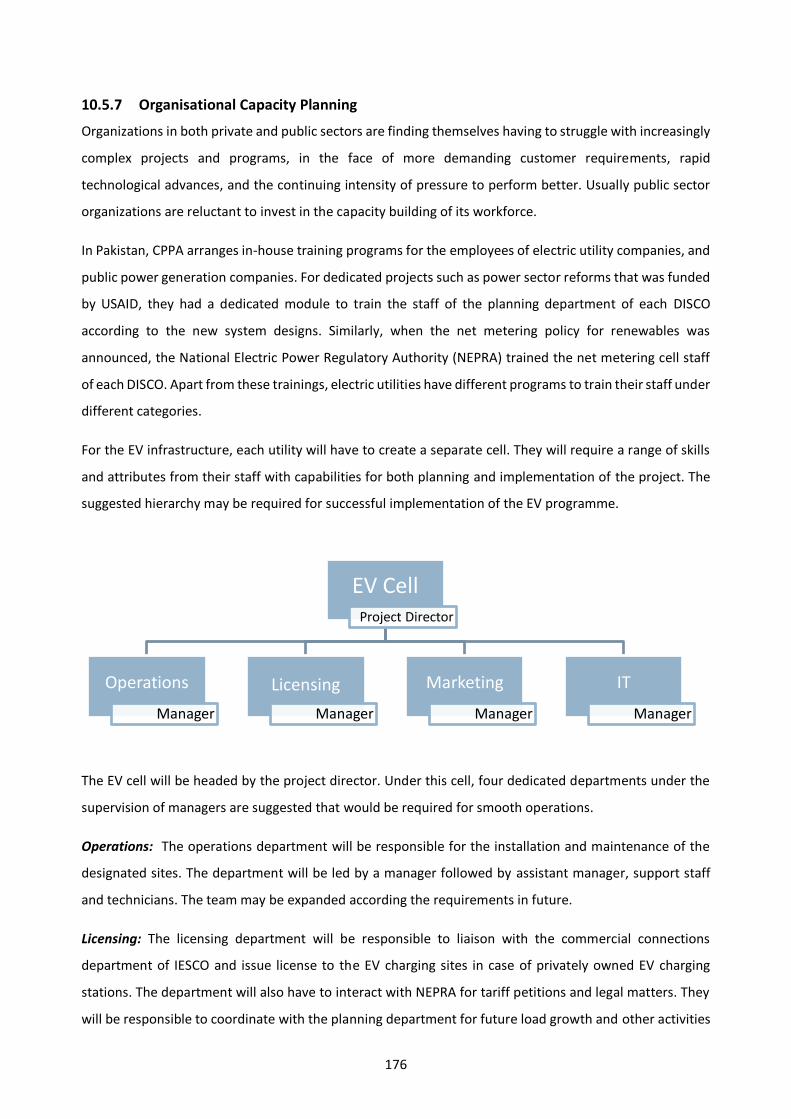
176
10.5.7 Organisational Capacity Planning
Organizations in both private and public sectors are finding themselves having to struggle with increasingly
complex projects and programs, in the face of more demanding customer requirements, rapid
technological advances, and the continuing intensity of pressure to perform better. Usually public sector
organizations are reluctant to invest in the capacity building of its workforce.
In Pakistan, CPPA arranges in-house training programs for the employees of electric utility companies, and
public power generation companies. For dedicated projects such as power sector reforms that was funded
by USAID, they had a dedicated module to train the staff of the planning department of each DISCO
according to the new system designs. Similarly, when the net metering policy for renewables was
announced, the National Electric Power Regulatory Authority (NEPRA) trained the net metering cell staff
of each DISCO. Apart from these trainings, electric utilities have different programs to train their staff under
different categories.
For the EV infrastructure, each utility will have to create a separate cell. They will require a range of skills
and attributes from their staff with capabilities for both planning and implementation of the project. The
suggested hierarchy may be required for successful implementation of the EV programme.
The EV cell will be headed by the project director. Under this cell, four dedicated departments under the
supervision of managers are suggested that would be required for smooth operations.
Operations: The operations department will be responsible for the installation and maintenance of the
designated sites. The department will be led by a manager followed by assistant manager, support staff
and technicians. The team may be expanded according the requirements in future.
Licensing: The licensing department will be responsible to liaison with the commercial connections
department of IESCO and issue license to the EV charging sites in case of privately owned EV charging
stations. The department will also have to interact with NEPRA for tariff petitions and legal matters. They
will be responsible to coordinate with the planning department for future load growth and other activities
EV CellProject Director
Operations
Manager
Licensing
Manager
Marketing
Manager
IT
Manager

177
for long- and medium-term planning. The department will be led by a manager followed by assistant
manager and support staff. The team may be expanded according the requirements in future.
Marketing: The marketing department will be responsible for awareness campaigns in public,
advertisement and other related activities. It is very important to establish this department to ensure that
the new technology adoption awareness is publicized in a professional manner. The department will be led
by a manager followed by assistant manager, a public relation officer and support staff. The team may be
expanded according the requirements in future.
IT: The IT department will be responsible to setup internet connectivity, installation and troubleshooting
of softwares of EV chargers, online billing system etc. They will also coordinate with the internet service
provider for smooth operations. They may also need to setup an online monitoring system of all the EV
charging stations under the jurisdiction of IESCO. The department will be led by a manager followed by
assistant manager, networking expert, and support staff. The team may be expanded according the
requirements in future.
All these departments will have to work in close coordination with other departments of IESCO such as
procurement, billing, accounts etc.
In IESCO, capacity development program is a part of the central HR system designed to ensure that the
electric utility has a coherent way of assessing and planning how it will ensure that its staff has the skills,
knowledge and abilities it needs to successfully deliver its goals and objectives. To ensure successful
implementation of the EV program, IESCO will require the following upgrades in terms of organizational
capacity enhancement:
Understand the nature of complexity, and the skills necessary to manage the implementation of
the EV program
Develop role and skill profiles of staff relative to the requirement of the project
Ensure the team managers have proper project management skills in order to achieve the KPIs
The planning staff should be trained to analyse the impact on grid, site evaluation, etc.
Monitoring, evaluation and audit team to be trained for the program
Dedicated team of software management staff to be trained according to the country dynamics
Will/Vision /Strategy of Management
The future of electric utilities sustainability is planning for future. Good engineering judgment and
technological advancements, however, will prevail as future system requirements are defined. As per the
analysis done for electric utilities across Pakistan, among all 11 DISCOs, IESCO was the top performing
DISCO.

178
After the engagement with the officials of IESCO, their commitment to grow, deliver and ensure customer
service was evident. Below are the details of their vision, mission, customer satisfaction and employ
development are as follows:
Vision
To be the most admired public utility in Pakistan, an undisputed leader in the power sector, efficient and
profitable.
Mission
To provide uninterrupted power supply to our customers enabling trade and industry, commerce,
educational & social activities to flourish and enrich the lives of our customers.
• To be the most efficient public utility in Pakistan.
• To achieve the lowest line losses in the distribution sector.
• To generate profits for our stakeholders.
• Acquire, learn and apply state-of-the-art technology
• Have well-defined SOPs with specific ownerships and accountability.
Customer Satisfaction
• Continuously improve quality of service and responsiveness to maintain a satisfied customer base.
• Demonstrating professionalism in all customer dealings and ensuring that all business actions are
driven by customer needs.
• Improve reliability and efficiency of supply of electricity to the customers.
Employee Development
• Improve skill set of employees according to market demands.
• Focus on recruiting, developing and retaining best professionals.
• Empower people to maximize their potential and contribution.
• Promote open and honest communication.
• Fill the competency gaps within the organization.
Staff Exposure and Expertise of EVs
Workers from a variety of educational and employment backgrounds are employed in the electric utilities
in various departments. All the departments have trained staff for required skill sets. Electric utilities
comprise of teams of project managers, engineers, sales & marketing experts, technicians etc., who look
after day to day matters as well as medium- and long-term planning. Team leaders, project directors and
higher authorities have experts with very diverse experiences who have managed large scale new
initiatives, its project designing, financial modelling etc.

179
As the adoption of EV’s roll out, the electricity demand, requirement of charging infrastructure will
increase, and integration of public chargers with centralized communication will also be required. With
these requirements of manpower/experts, the electric utilities will also need to enhance the capacity of
their staff accordingly.
On discussion with the IESCO officials, they have experts working in all departments who are associated
with different projects and programmes with required aforementioned expertise. They have a dedicated
department and expert teams in the following domains:
• Planning and execution of power distribution, transmission system
• Procurement of equipment and supplies
• Engineers and technicians for troubleshooting, operation & maintenance of power system
• Policy and regulatory matters
But even having said that, IESCO has expertise to cater to the technology of EV’s, they would still require
to enhance the capacity of their existing employees. Apart from capacity building of employees, they would
also require to hire few experts dedicated for the EV program.
IESCO/electric utilities in Pakistan would require to have trained technical staff in the domain of accessing
the impact on grid because of EV charging, the technology for public chargers, communication system to
analyse the performance/occupancy of public chargers etc. IESCO/electric utilities may also require the
following to be successful in supporting the role out of EV’s:
• Conduct internal education on EV’s, especially for leadership
• Understand industry and technology trends, stakeholder’s views on EV’s
• Designate staff/team to focus on EV’s
• Explore partnerships with municipalities, industry organizations, equipment manufacturers.
• Conduct deeper financial and system modelling to assess impacts of EV adoption
• Build partnerships or programs with original equipment manufacturers or dealerships
Organisational Planning to Promote Use of EV Among Consumers
Strategic planning helps the electric utilities to identify the direction where they need to go and what’s the
best way to achieve their goals. The electric utilities have separate departments to perform their
specialized tasks such as power planning, load forecast, operation & maintenance and outreach programs.
Utility’s policy implementation is planned in such a way, to see if they reflect the needs of their customers,
ensure regulatory compliance, and generate sufficient financial resources to be sustainable.
IESCO has a separate department for outreach of their initiatives and activities. To support and promote
new initiatives proper strategy is devised for all the programs. Without a strategy a to help connect more
vehicles to the grid, IESCO will see slow growth and lower occupancy levels at public charging stations
resulting in lower return on investment. Marketing and promotion of available public charging station,

180
incentives on public charging and monetary benefits will be some initial steps for the promotion of public
EV charging infrastructure.
The planning to promote the use of EVs would require the engagement all the stakeholders i.e. planning
team, sales & marketing team and IT services team to develop a combined strategy to disseminate the
information regarding the adoption of EV’s among the consumers. Below are few of the recommendations
to off take and promote the initiative of EV charging stations:
• Promotional campaign on official website
• Promotion through consumer electricity bills
• Roadshows in different locations of IESCO jurisdiction
• Engagement with Capital Development Authority (CDA)
• Social Media Cell for promotion and outreach of the EV Program
• Pilot Project with free EV charging
• Engagement with Auto Manufacturers for compatibility of EV charging equipment
• Engagement with regulatory authorities for development of Rebate programs for EV purchase and
vehicle charging

181
11 Benchmarking with International Utilities
In order to devise action plans for the 3 utilities in India, Pakistan and Bhutan, a benchmarking study has
been done on international utilities, which have been industry leaders in adopting e-mobility programs.
They are as shown below.
Name of Utility Consumers Energy (CE)
Region Michigan
Country US
CE has been a strong promoter of EV and e-mobility in the Michigan region. It has been incentivising the
deployment of EV chargers at homes, apartments, schools, workplaces and other public places. The utility
is also working closely with automakers like Ford and General Motors as well as the local government to
build a strong EV ecosystem.
Pricing Strategies:
1. The utility was one of the first companies in the US to offer special charging rates for EVs. It had
also piloted an incentive programme for home charging stations
2. Presently, the utility has several pricing programmes for EV owners, who intend to use home
charging. It has a standard rate plan, where charges are levied based on normal rates, and a
residential time of day plan, where special time of day charges are levied if EV is charged during
off-peak hours (lower-cost evening, early morning and/or weekend hours)
3. Through its PowerMIDrive rebate programme, a 3-year $10 million effort, Consumer Electric
provides rebates for drivers to install EV charging stations at their homes, and to businesses who
install public chargers
The rebate programme includes the following:
• Rebates for residential EV owners of $400-500 for installing eligible 240 V chargers at
homes across the state. So far, 35 rebates for home chargers have been approved
• Rebates for 200 Level 2 vehicle chargers in public places and at workplaces throughout
Michigan, with a rebate of up to $5,000 per charger
• Rebates of up to $70,000 for 24 DC fast chargers along highways and travel routes in
Michigan, working with state-wide entities to ensure a unified network across the state.
As part of the programme, close to 125 rebates for EV charging stations across Michigan,
worth $5,000 apiece, have been approved
4. Low off-peak electricity rates between 7 pm and 6 am, and a super off-peak period of 11 pm to 6
am, to encourage drivers to charge at night when power is cheap and plentiful, and to avoid

182
charging during peak afternoon or summer hours. Up to 3,000 of those who sign up for the special
rate also can also receive a $500 rebate for each EV.
CAPEX programmes:
1. CAPEX programmes are funded majorly by the utility along with occasional state and donor
support. Funding a CAPEX-intensive programme like incentivising and installing EV chargers needs
resources. And this has been obtained majorly through rate hikes
2. The utility typically recovers the EV programme costs over a longer tenure through a deferred
accounting mechanism. With the help of targeted awareness and advertising, the utility expects
recovery to the tune higher uptake of EVs will materialise sooner than expected. Through
continuous investments in demand response measures and energy efficiency initiatives,
consumers intend to improve supply and service, thereby creating a stick effect among customers
and businesses
3. For the latest PowerMIDrive, the Michigan Public Service Commission has approved a rate increase
to help fund the programme and other utility activities. As per estimates, this translates into an
increase of $1.62 per month for a residential customer who uses 500 kilowatt hours of electricity
Name of Utility New York Power Authority
Region New York
Country US
The New York Power Authority (NYPA) is the largest state public power organisation in the US, operating
16 generating facilities and more than 1,400 circuit miles of transmission lines. The NYPA has been
instrumental in developing and encouraging EV charging ecosystem in the country. Through its innovative
programmes including EVolve NY, the utility intends to address infrastructure and market gaps and advance
the adoption of EVs in the New York state. Close to 200 DC fast chargers will be deployed in airport charging
hubs, along interstate highways and communities at an initial investment of $40 million. The state has a
goal of installing at least 10,000 charging stations by the end of 2021.
Pricing Strategies:
1. With most of the charging stations being built in New York's investor-owned utility territory (Con
Edison, Orange and Rockland, Central Hudson, Niagara Mohawk, New York State Electric & Gas and
Rochester Gas & Electric), it ends up paying demand charges to the Public Service Commission. The
NYPA has been negotiating with the commission to reduce demand charges, at least till the time
adoption rates improve

183
2. Time of use charges, introduced by the Public Service Commission in early 2019, will apply to The
NYPA and will improve EV charging behaviour through load shifting to off-peak hours.
3. The NYPA works in tandem with the New York state to improve EV adoption. Under the Drive Clean
Rebate programme, more than 11,000 rebates, totalling over $15 million, have been approved by
the state to help New Yorkers to purchase e-cars. The NYPA complements the EV buying behaviour
through rapid charging infrastructure development
CAPEX Programmes
• The NYPA has been ‘the first mover and the first tester’ of new clean-tech initiatives like EV
charging. As the utility is government controlled, it has access to state funds and resources in
addition to internal accrual. Additional taxes levied on gasoline-powered vehicles, like congestion
taxes, are collected by the state and partially passed on to the utility to drive EV programmes
• In addition to internal resources, the NYPA receives funding through university grants, the
Department of Energy and other multilateral agencies to drive CAPEX-heavy EV programmes. In
2018, the utility received $2.67 million in funding from the Department of Energy along with the
ABB Group and North Carolina State University to develop an intelligent, grid-friendly, modular,
extreme fast charging system for EVs
• The EVolve NY programme, which is a $250 million commitment through 2025, will initially be
driven by the NYPA in the first phase and subsequently delivered through public-private
partnerships
Name of Utility Électricité de France
Country France
The state-controlled utility, Électricité de France (EDF) aims to be a leader in e-mobility in Europe. Its target
is to achieve 30% market share in EV charging in France, Belgium, Italy and the United Kingdom (UK) by
2022. The company’s subsidiary, Izivia (ex-Sodetrel) already operates ~5,000 charge points and has access
to 60,000 more for customers with a Sodetrel Pass. EDF intends to operate 75,000 EV charging stations in
Europe by 2022.
Pricing Strategies
A. The utility sells the entire bouquet of products from EVs to home chargers along with
complementary installations. It charges consumers based on standard, ToU or customised V2G
rates
B. EDF runs the Workplace Charging Scheme for charger installations at workplace, which allows
businesses, charities and local authorities to claim 75%, up to a maximum of £500, of the total
184
cost of a charging station, with a maximum of 20 sockets per site. Eligible businesses are given
subsidy support
CAPEX Programmes
1. Most charging stations are installed in cooperation with e-mobility partners and municipalities, via
car-sharing EV service providers, or partnerships with private companies and e-mobility partners.
This revenue-sharing model helps improve project viability and profitability
2. The utility has made several strategic partnerships with firms in the e-mobility space. These include
V2G startup Nuvve (a San Diego-based startup that intends to roll out 1,500 V2G-capable chargers
in the UK), and European EV-roaming platform GIREVE
3. EDF, along with Germany’s E.ON and Italy’s Enel (both major e-utilities), has been collaborating
with Nuvve and Nissan on V2G pilots in Europe
4. The utility major has also entered into partnerships with auto manufacturers like Renault and
Toyota, where both parties mutually work towards enhancing EV sales and deepening the market
5. EDF and Valeo, the leader in high- and medium-voltage electrification, have formed a partnership
to monitor the development of future battery technologies and charging solutions, as well as the
development of mobility service
6. EDF and German-based start-up Ubitricity, through a partnership model, have developed solutions
to convert existing streetlights into charging points and have delivered several projects in Europe
and across the world. Citelum (100% affiliate of the EDF Group) and Ubitricity have also been
partnering to integrate this solution with Citelum’s ‘Smart City’ range of products

185
12 EV Traction in Other SAARC Member States
12.1 Bangladesh
With no EV registration guidelines in the country present, there is no official figure of EVs plying in the
country. The Bangladesh Road Transport Authority has drafted guidelines on EVs stipulating registration,
fitness certificate and tax token in January 2019. However, there are close to 1 million battery-powered
three-wheelers called Easy Bikes plying in the country. With absence of widespread PCSs in the country,
they are charged in households or from illegal outlets of 11 kV. This has led to a loss in revenue and pressure
on the power grid. There are about five charging stations for Easy Bikes, with all of them being solar
powered. While the Bangladesh Rural Electrification Board has installed two charging stations, the
Bangladesh Power Development Board, Dhaka Power Supply Company, Dhaka Power Distribution
Company have each set up one charging station each. The charging stations are located in Chittagong,
Sylhet and Keraniganj. The stations have been set up as pilot phase, and a lumpsum amount is charged for
each usage at the stations. At present, the distribution utilities do not have any plan to develop PCSs in the
country due to lack of federal policies as well as end-use EVs on the roads.
Policy front: Bangladesh Road Transport Authority (BRTA) has issued draft guidelines on EVs, making
registration, fitness certificate and tax token mandatory. The draft policy also specifies the lifespan of
various modes of electric mobility — two wheelers, three-wheelers, and light and heavy-duty vehicles.
Tax incentives: Recently, government has been promoting hybrid vehicles by providing substantial tax
incentives, apart from having various tax exemptions for electric two wheelers and three wheelers.
Promotion of charging infrastructure: Bangladesh Energy Regulatory Commission (BERC) has introduced a
new tariff category for charging stations – setting energy charge of 7.70 Tk./kWh along with an additional
demand charge of 40 Tk./kW/month. In addition, Bangladesh Rural Electrification Board (BREB) is installing
solar powered charging stations, hence promoting renewable energy for EV charging stations.
Challenges towards fast adoption of e-mobility:
• Lack of charging points across the country
• Lack of fiscal incentives and supportive policy measures for import of Li-ion batteries and local
production
• No mandatory procurement of EVs for players having large vehicle fleets
• No soft loan facilities given by the government to operators for buying e-buses
• Electric 2W and electric 3W have incidental taxes of 89.4% each. Further reduction may be required
to improve sales traction
186
Potential Models for EV charging infrastructure development
The country is in a very nascent stage to develop a model for EV charging station development. The
government needs to put impetus for initial market development. The major chunk of EVs are 3W operating
on its rural roads, which can be charged through home-based chargers at night or when they are not plying
on the road. However, charging stations at strategic locations (stands/ depots) can help increase running
time of the 3Ws, if the charging time is not high and do not hamper business. The government can look
tying up with e-3W manufacturers, distribution utilities through a Joint Venture (JV) to develop charging
infrastructure, which can in turn push more e-3W sales. The JV can look at mobilising funds through
government grants, CAPEX programs of utilities as well as manufacturers to set up charging stations. While
the PPP mechanism will allocate funds, O&M can be outsourced to interested parties. As more and more
EVs begin plying on the roads, the distribution utilities can look at entering full-fledged EV charging station
business. However, policies pertaining to cost of electricity at the station, standardization of chargers and
other modalities need to be ironed out before the private entities may want to enter the business.
12.2 Sri Lanka
There are ~4,600 EVs plying in the country. In order to complement the EV growth, several MoUs and tie-
ups have been made in the last few years, with Japanese company Electore and Swedish manufacturing
major ABB for increasing PCS installations. Presently, the country has 30-50 charging stations, mostly
operated by private players. The Ceylon Electricity Board has set up two charging stations in Kandy and will
set up another three in Nuwara Eliya, Kegalle and Dambulla. Further, ABB will set up six DC fast chargers in
Colombo city. Lanka IOC PLC, Sri Lanka’s privately owned petroleum distributor, is planning to set up close
to 12 charging stations, mostly at their retail outlets. The government has taken a strategic decision of
setting up 100 EV charging stations in the country by 2020.
Policy front: Sri Lanka announced plans to replace all state-owned vehicles with electric or hybrid models
by 2025, a move that will be extended to private vehicles by 2040.
Tax incentives: The government has evinced interest to cut taxes on EVs by at least one million rupees.
Furthermore, import duties on EVs, including 3W and buses is also expected to be reduced. The
government has also slashed taxes on EVs from 25% to 5% in its interim budget of 2015. On the contrary,
import duties for conventional vehicles will be increased by ~50,000 rupees. A carbon tax has also been
proposed at around 17 Cents, 1.78 rupees and 2.74 rupees per day for a motor cycle, car and a passenger
bus respectively.
Promotion of charging infrastructure: The Sri Lankan government has made a strategic decision to install
more than 100 EV charging stations by 2020 to align with the country’s plan to obtain a minimum 20

187
percent of its energy from renewable sources. The Government has empowered Public Utilities
Commission of Sri Lanka (PUCSL) to establish a register of EVCS at each distribution licensee- CEB and LECO,
issue code of practice for EVCS, determine end user tariffs, issue safety and other technical standards for
EVCS. Privately owned charging stations have been encouraged, with ~75 such stations existing in the
country. ABB is developing the country’s EV fast charging infrastructure with more than 10 CCS and
CHAdeMO compatible chargers deployed till date in Colombo and the greater Colombo areas, as well as a
few other major locations including Kandy, Kurunegala and Kegalle
Challenges towards fast adoption of e-mobility:
• Despite tax concessions on EVs, taxations are inconsistent across EV categories. The Government
had offered tax concessions on EVs with a motor capacity of 70 Kilo-watts (Kw) or below as well as
exempting EVs from the new carbon tax. However, vehicles with a capacity of over 150 Kw are hit
with a 150% tax making imports of most EVs not competitive or feasible.
• Lack of necessary charging infrastructure to use an EV in the country.
• Lack of government program to dispose, recycle or export used batteries. Additionally, regulations
in Sri Lanka prohibit the import of used batteries. This affects resale values of EVs
Potential Models for EV charging infrastructure development
The island nation is self-sufficient in its power needs. This gives an opportunity for the country for
accelerated development of EVs. The charging stations set up in the country have majorly been through
private investments. Although the Government has encouraged electric mass transportation in cities like
Colombo and Galle, deployment is slow. A public-private partnership model between government and
private parties can help improve development of EV charging stations in the country. Presently, no
distribution utility has entered into EV charging business. The number of EVs on the road are small for a
positive business case. Therefore, the initial push through subsidies, grants from the government can help
garner interest from utilities. The utilities do not have experience or expertise to enter into the business
though the full ownership mode. Private investment along with government stake can help garner utilities’
interest.
12.3 Nepal
The government, in a bid to promote EVs in the country, has set out a target of setting up 200 EVCSs in the
country. The Nepal Electricity Authority (NEA) will be responsible for building the stations and providing
electricity for the same. In May 2019, the NEA had sent out a notice seeking to rent land for building 10
EVCSs. With the country expected to be power surplus by fiscal 2021, the NEA expects to set up additional
188
charging stations in Pokhara, Nepalgunj, Chitwan and Biratnagar along with the capital city Kathmandu.
Additionally, Kathmandu plans to replace its entire fleet of gasoline-powered buses with e-buses by 2030.
Policy front: As per a new action plan, the government intends to turn at least 20% of public vehicles into
EVs by 2020. After the country becomes power surplus through hydropower, it aims to make electricity
cheap enough to make EVs more viable commercially, thereby displacing dirty and imported fuel with the
domestically-generated clean energy.
Tax incentives: To further accelerate EV growth in Nepal, the government has reduced import duties on
public EVs to 1% from 30% and on private EVs to 10% from 30%. Additionally, EVs are exempt from road
tax, which can be Rs 30-50,000 per year for fossil-fuel cars. No excise duties are levied on EVs as well. While
the retail price of petrol and diesel reaches up to 261% above the cost price, electric vehicles carry just
a 10% tax on the purchase price. Electric cars are exempt from road tax, which can be Rs30-50,000 per
year for fossil-fuel cars. Nepal is the only country in the world with such a huge relative tax difference.
Promotion of charging infrastructure: The Government intends to o set up more than 200 EV charging
stations across the country over the next 2-3 years. The stations will be operated in places such as
government offices, parking areas of public schools and other public areas. The proposed stations will
recharge EVs using any of the three ports – CHAdeMO, CCS and GB/T. Presently, Cimex Inc. has installed
12 charging ports while Korean auto manufacturer has set up 2-4 charging stations.
Challenges towards fast adoption of e-mobility:
• High cost of charging stations: A fast-charge electric station costs a minimum of $30,000 and can
charge only 25 vehicles a day. Establishing one requires a government subsidy as well as a regulator
to permit the charging of different EV models
• Lack of tax incentives for bikes and scooters similar to those for private cars. Kathmandu Valley
alone has 750,000 motorcycles and any tax breaks towards e-bikes may help improve sales
• Lack of policies for electric public transport. Although local and provincial governments had shown
an interest in providing financial support to develop electric public transport, concrete plans have
not been made yet. The high investment cost of electric public transport requires government to
step in with subsidies. Despite revenue from the petroleum tax has grown to a whopping Rs. 5.2
billion, not much is invested in a clean-energy electric transportation strategy
Potential Models for EV Charging Infrastructure Development
The country, with its rich hydropower potential along with rising EVs, has a strong case of going green from
generation to consumption. Presently around 4-5 charging stations exist in the country, all of which are
privately owned. Of late, the government has shown interest with Nepal Electricity Authority planning to

189
install close to 50 charging stations across all seven provinces in the country. Model of development, in the
initial phase, will be driven by CAPEX allocation from the government and interest from private
stakeholders. The government can give land to station developers at concessional rates as well as enable
setting up of necessary infrastructure (transformer, meter etc.). Through a viability gap funding, more
private investments can be mobilized. However, the role of state as owner-operator is not expected to be
viable in the initial stages of market development. Utilities can tie up with major EV players whose models
are in use in the country to co-develop charging infrastructure. As acceptance of EVs improve and public
transportation begin moving to EVs, the role of utilities and government can be increased, based on
business viability.
12.4 Afghanistan and Maldives
There have been no major developments so far in these two countries in the e-mobility space. Maldives
intends to be a part of the Global Electric Mobility Program to understand and develop demonstration
projects in the e-mobility space. Afghanistan, given the present state of the economy, is not in a position
to adopt EVs anytime soon.

190
13 Annexure
13.1 Overview of Meetings and Discussions Held
13.1.1 Bhutan
Meeting with EV Taxi Drivers and Users
The meeting was held in order to understand the issues faced by EV taxi drivers in the country. The issues
raised in the meeting are:
• Encouraged to use EV due to free charging
• Need more no of EVCS at different locations
• Need of separate parking space for EVs
• Limited mileage of EV battery
• High maintenance cost
• Difficult to get EV spare parts
• Subsidy from government could encourage more EV users
• To avoid monopoly of EV supply.
• Need of twin EV chargers in one EVCS
• Not ready to pay for charging EV
• If required to pay for using EVCS, then there will be limited or no users switching over to EV
• Taxis prefer fast chargers to slow chargers
• Need for home chargers as a backup
• Need to retrofit existing buildings to accommodate home chargers
Meeting with EV Project Manager and Team from College of Science and Technology (CST), Phuntsholing, Bhutan
Following issues were discussed briefly:
• EV is multi-sectoral project.
• EV project in Bhutan is targeted to replace taxi fleet.
• One of the important parameters for taxi is mileage per full charged battery.
• Minimum mileage for EV in Bhutan would be 200 km.
• EV specification finalized.
• Proposal to provide 20% of the total cost subsidy to the taxi.
• A total of 300 taxis to be supported.
• 23 charging stations in three years.
• Operational modality of EVCS is not yet decided.
• Received enquiries from private individuals for subsidy.
• No subsidy to private individuals.
• Plan for EV roadmap.

191
• Business model.
• Battery model and disposal strategies.
• Proposal for vehicle registration fee waive off.
• Proposal for free parking or designated parking for EV.
• Proposal to allow EV in no entry zones.
• Separate vehicle number plate for EV.
• Support to import spare parts with multiple vendors.
• Frequency of EV maintenance is low but there is plan for human resource training of EV mechanics.
• Liaising with Technical Training Institutes to train EV maintenance staff.
• Looking forward for collaboration with the university.
Meeting with Bhutan Power Corporation (BPC)
The following points were discussed during the three hours meeting.
• The ongoing EV project in Bhutan is executed by the Ministry of Information & Communication
(MoIC).
• The senior official of BPC is a member of the EV project technical committee.
• BPC is not directly involved in implementing EV project.
• BPC is currently limiting its role to providing technical support and access to electricity for the
charging stations to be installed in the current EV project.
• The cost of supply extensions to the new charging stations is in the scope of the
• EV project.
• While the BPC has plans to diversify its revenue sources, it does not have any immediate plan to
venture into installing and operating the EVCS business.
• BPC is regularly monitoring the voltage/load profiles of the existing network to ensure that the system
is able to accommodate charging stations coming up in future.
13.1.2 India
Meeting with EV Charging Station Developers
The following inputs were received at meeting with several EV charging station developers in India
• Power company, distribution utilities should consider EV charging business as a new vertical
• Charging infra will require more private investment
• Bigger PSUs have evinced interest and slowly entering charging infra business
• Private sector like Volttic, Fortum, some European companies have begun operating EV charging
stations
• Going to be a big number game for EV charging by 2030

192
• On-the-ground expertise to set up EV charging for Indian companies still lacking
• Number of charging stations in the country is ~300-400. Major traction in Delhi
• The country is taking proactive steps to bring EV charging-friendly policies. Some charging
guidelines still missing
• Lack of enough compatible cars in the country.
• Guidelines regarding minimum number of charging station installation is hindering business. MoP
guidelines should be amended.
• The 2W and 3W which are the frontrunners of EV adoption are facing problems to charge their
vehicles. AC chargers are slow and time-consuming and therefore, not making business sense for
the stakeholder
• The major concern to set up an EV charging station are associated costs and finding a suitable
location. This is hampering return on investment.
• The rent/ lease model of setting up EV stations is costly in Tier 1 cities like Mumbai or Delhi,
where EV traction is high.
• Presently, the cost of charging is ~Rs. 10-11/ kWh, which is not viable for an EV buyer
• Adding location cost to the model, EV station is not viable. Location cost and cost of power to EV
station should be at concessional rates for the time EV adoption do not scale up
• CAPEX cost is very high, costing ~26-30 lakhs now
• Adding new EV charging stations incurs huge costs to the party who is putting in CAPEX, therefore
players are sceptical
• Expecting good growth numbers in B2B going forward
• With government presently not regulating charging costs, margins are low
• Going forward, margin will depend on location and station utilisations
• EV charging business is expected to be an attractive business 10 years from now
• The business case for EV charging will evolve only after 2022. Presently, India is in early market
development stage
• Expecting a target of ~500 charging station in the next 4-5 years
• All players are intending to set up a few charging stations in major cities and along major
highways
• EV charging is a long RoI business
• States need to be more accommodative. Delhi, NCR area, Maharashtra, Andhra Pradesh, Kerala,
Tamil Nadu to be major key states
• Business is investment heavy in nature. Subsidies would be required from government.
• Different states have different EV tariffs. It should not be more than Rs. 5.5-6/ kWh, otherwise,
margins will be hampered by station owners

193
• If utilisation is good, end use cost can be close to Rs. 9/ kWh excluding land costs. If station usage
is less, it will be a burden on infra developing companies
• Lot of potential in the EV charging space. Private investments need to pick up.
Meeting with BSES Yamuna Power Limited (BYPL)
The following inputs were received when we had discussions with officials of BYPL including head of
sustainability and Manager (EV Projects) at BYPL.
• The utility is following the EV charging space closely
• A lot of traction is expected, given the recent government interest
• Delhi is expected to be the epicentre for EV charging infrastructure development initially
• Station utilisation rates not expected to be strong in the initial years for EV charging to be a full-
fledged business model
• Charging stations, when clubbed with other revenue streams, may be feasible. Commercial
establishments or parties having excess land should come forward to be parties to the EV station
business
• 2W and 3W to be predominantly converted to EVs in the initial phase
• Battery swapping is a good business proposition but the utility does not intend to enter into it
• As far as EV charging is concerned, the utility will not enter directly into charging business in the
near term.
• It is in touch with interested parties who intend to set up charging stations in its licensee area
• The utility is expanding its team of officials who will enable more charging station development
through business development, licensing and metering
13.1.3 Pakistan
Several meetings were held with different stakeholders such as IESCO, BMW Dealership (Islamabad),
Ministry of Climate Change, National Electric Power Regulatory Authority (NEPRA), and academic
institutions. The discussions were held with different levels of officials, depending on the required
information. Summary of discussions with different stakeholders is explained below:
Meeting with IESCO fficials
The highest number of meetings were held with officials of IESCO, especially with the planning department.
Planning department was very cooperative in discussing and providing the required information and data

194
for the analysis. They were engaged in different parts of the report were ever their input was required or
consultation was required to formalize the agenda item. Summary of meetings is mentioned below:
• Discussed different technical parameters, such as jurisdictions, sanctioned load, distribution
transformers, power transformers, loading conditions of feeders, CAPEX planning, medium- and
long-term plans etc. The planning department did not provide the raw data for analysis, but
allowed to analyse their set of data points in the presence of their officials on their system.
• Technical team was involved in identifying the potential locations for the installation of public EV
chargers. One of the parameters for potential locations was the availability of excess power on
power transformer and feeder for that area.
• Technical team was involved in load forecasting over the period of ten years and assessing the
impact of EV charging on the grid.
• Discussions regarding the organizational capacity and planning for future in terms of capacity
development program.
• Discussion regarding the dedicated team and department to facilitate the adoption of EV’s.
For the CAPEX planning and business model development the basic unit costs were taken from the CAPEX
planning team. For the business model options, the meeting was held with the Project Director of Advance
Metering Infrastructure. His valuable inputs were incorporated in developing the model. The officials of
IESCO had some reservations and limitations in developing the business model as it was not clearly defined
in the mandate of IESCO. The basic reservation was the availability of funds for the new initiative and the
support of federal government required to facilitate the electric utility for this project.
Meeting with BMW
Two meetings were held with the officials of the dealership to get the insight of how their EV charging
setup is working. Outcomes of the meeting are as follows:
• The EV charger was setup to promote their upcoming models, but the EV charger is not operation
now.
• It was a dedicated BMW charger to facilitate users of BMW i-series owners.
• The charger was free to use for any BMW owner.
• There was no charging fee, and the cost of electricity consumed for charging was paid by the
dealership to IESCO.
• For sales and roll out of EV’s in Pakistan they feel that the time has come when people have started
taking interest in plug-in hybrids and pure electric cars.
• They feel that government needs to be more supportive and incentivize the purchase of EV’s.
Separate regulatory reforms for import and local manufacturing are needed to speed up the
adoption of EV’s in Pakistan.

195
Meeting with Ministry of Climate Change
Only one unofficial meeting was held. At that time the ministry was preparing the draft of Pakistan’s 1st EV
policy so they were reluctant to share and information or talk about the issue.
Meeting with Academic Institutions
Had very limited conversation with the team who published the report on electric vehicles in Pakistan.
Their academic research work was more focused on the power system modelling and impact of load due
to public charging. Their research group was also in the initial phases and trying to address more issues in
the field of e-mobility.

196
14 Bibliography
(KESCO), K. E. (2017). Report on the Benchmarking of performance (Electricity Distribution in India)
parameters.
2019 Guide On How To Charge Your Electric Car With Charging Stations. (n.d.). Retrieved from
https://chargehub.com/en/electric-car-charging-guide.html
Aayog, N. (n.d.). Proposal for a Quick Pilot on EV Charging.
Aayog, N. (n.d.). Zero Emission Vehicles (ZEV): Towards a Policy Framework.
Agency, I. E. (2017). Digitalization and Energy.
Agency, I. E. (2019). Global EV Outlook 2019.
Anders Hove, D. S. (n.d.). Electric Vehicle Charging In China And The United States.
Bagdia, R. (n.d.). Power requirement for charging stations and impact on grid for high scale EV adoption.
Bálint Csonka, C. C. (2017). Determination of charging infrastructure location for electric vehicles.
BPC. (n.d.). BPC Annual Report.
Bradley, M. (n.d.). Accelerating EV market India. Retrieved from
https://www.mjbradley.com/sites/default/files/MJBA_Accelerating_the_Electric_Vehicle_Market
_FINAL.pdf/
Central Electric Authority, I. (2017). Minutes of Meeting of Committee to develop Approach Paper for Ev
and charging station standards.
Corporation, B. P. (n.d.). Personal Communication. 2019.
Creating the charging infrastructure to power EVs in India. (n.d.). Retrieved from
https://www.teriin.org/article/creating-charging-infrastructure-power-evs-india
Department of Heavy Industry, M. o. (n.d.). Expression of Interest Inviting Proposals for availing incentives
under Fame India Scheme Phase II For deployment of EV charging infrastructure within cities.
Department of Renewable Energy, M. o. (2015). Energy Efficiency in Transport Sector.
DGPC. (2017). Annual Report 2017. Thimphu: Druk Green Power Corporation Limited. Retrieved from
http://www.drukgreen.bt/about-us/publications/36-annual-reports
Diwan, P. (n.d.). Is Battery Swapping a Viable Option for Public Transportation EVs. Retrieved from
https://medium.com/@pdiwan/is-battery-swapping-a-viable-option-for-public-transportation-
evs-adb4ced74ff2
Dr. Josipa G. Petrunic, D. A. (2018). Feasibility Study: EVSE Data Mapping & Analysis in Support of Oxford
County’s Electric Vehicle Accessibility Plan (EVAP).
Drivers of EV Adoption. (n.d.). Retrieved from http://www.ekuensel.com/index.php/user/pdfView/1600
ElaadNL. (n.d.). EV related Protocol Study.

197
Electric Car Charging 101 — Types Of Charging, Charging Networks, Apps, & More. (n.d.). Retrieved from
https://evobsession.com/electric-car-charging-101-types-of-charging-apps-more/
Electricity Generation Remains 22,700MW Against Demand of 23,055 MW. (n.d.). Retrieved from
https://www.pakistantoday.com.pk/2018/06/27/electricity-generation-remains-22700mw-
against-demand-of-23055-power-division/
Energuide.be. (n.d.). How Much Power Does an Electric Car Use. Retrieved from
https://www.energuide.be/en/questions-answers/how-much-power-does-an-electric-car-
use/212/
Energy, U. D. (n.d.). Charging Plug In Electric Vehicles at Home.
Energy, U. D. (n.d.). Strategic Planning To Implement Publicly Available Ev Charging Stations: A Guide For
Businesses And Policymakers.
Environment, T. &. (2018). Roll-out of public EV charging infrastructure in the EU.
Feyijimi Adegbohun, A. v. (2019). Autonomous Battery Swapping System and Methodologies of Electric
Vehicles. Department of Electrical and Computer Engineering, Baylor University, Waco.
Forum, I. S. (n.d.). Study on Infrastructure and Enabling Environment for Road Electric Transport in SAARC
Member States.
Group, P. E. (2018). Electricity Distribution Companies in India.
Hall, M. N. (2018). Lessons Learned On Early Electric Vehicle Fast-charging Deployments. The International
Council on Clean Transportation.
Hauke Engel, R. H. (n.d.). Medium Term Forecast based on Power Market Survey (PMS) for base year 2018.
India, T. A. (n.d.). Electric Vehicle Conductive DC Charging System.
Industries, E. D. (2017). Exports/ Imports Statistics Of Engineering Industry Of Pakistan.
Kalman Gyimesi, R. V. (n.d.). The shift to electric vehicles. IBM Institute for Business Value.
Kettles, D. (2015). Electric Vehicle Charging Technology Analysis and Standards.
Kun Wang, Y. K. (2018). Public-Private Partnerships in the Electric Vehicle Charging Infrastructure in China:
An Illustrative Case Study.
Laboratory, I. N. (n.d.). Comparing Energy Costs per Mile for Electric and Gasoline-Fueled Vehicles.
LeasePlan. (2019). EV Readiness Index.
Limited, U. P. (2017). Benchmarking Study for Electricity Distribution Companies of Uttar Pradesh.
Ltd., D. P. (2018). Annual Report 2018.
Margaret Smith, J. C. (2015). Costs Associated with Non-Residential Electric Vehicle Supply Equipment
Factors to consider in the implementation of electric vehicle charging stations.
Ministry of Information and Communication, R. G. (2017). National Transport Policy 2017.
Ministry Of Power, i. (2018). Charging Infrastructure for Electric Vehicles - Guidelines and Standards.
198
Mubashir, D. S. (n.d.). Standardizing Charging of Electric Vehicles, Benefits, Opprtunities and Challenges.
WRI India, Shakti Foundation.
Muhammad Arslan, M. H. (2019). Electric Vehicles in Pakistan: Policy Recommendations.
National Environment Commission, R. G. (2015). Kingdom of Bhutan Intended Nationally Determined
Contribution.
National Statistics Bureau, R. G. (2018). Statistical Yearbook of Bhutan 2018.
NEPRA. (2018). State of Industry Report.
Paul Allen, G. V. (2017). Utility Investment In Electric Vehicle Charging Infrastructure: Key Regulatory
Considerations.
(n.d.). Phased manufacturing Program to promote indigenous manufacturing of EV, its assemblies and part/
sub parts .
Power, M. o. (n.d.). Quarterly Performance Report Power Distribution Companies.
Ranjan, A. (n.d.). Power requirements for EV charging stations and impact on grid for high scale adoption.
Asia Power Quality Initiative.
Regulators, F. O. (n.d.). Study On Impact Of Electric Vehicles On The Grid . 2017.
Road Safety and Transport Authority, M. o. (2019). Vehicle Statistics 2018.
Sanchari Deb, K. T. (n.d.). Impact of Electric Vehicle Charging Station Load on Distribution Network.
Shafqat, H. (2016). Study on Import of Used Vehicles, Pakistan Institute of Trade & Development .
Shyamasis Das, C. S. (n.d.). Charging India's bus Transport. Shakti Sustainable Energy Foundation.
Statistics, P. B. (2019). Monthly Bulletin of Statistics.
Statistics, P. B. (n.d.). Pakistan Statistical Yearbook .
Tong Yang, R. L. (2016). Innovative Application of the Public–Private Partnership Model to the Electric
Vehicle Charging Infrastructure in China.
Town and Country Planning Organization Ministry of Housing and Urban Affairs, G. o. (2019). Amendments
in Model Building Bye-Laws (MBBL - 2016) for Electric Vehicle Charging Infrastructure .
Transport Department, G. (2018). Delhi Electric Vehicle Policy 2018.
UNDP-GEF. (2018). Bhutan Sustainable Low-emission Urban Transport Systems Project Report.
UNDP-GEF. (2019). Proposed Technical Specifications for Electric Vehicles and Charging Infrastructure for
Bhutan Sustainable Low-emission Urban Transport Systems Project.
Vector. (n.d.). EV Network Integration.


