Embed Size (px)
Citation preview
Construction Safety & Quality Consensus Guidelines
Leading Safety Indicator Program Guidance
Document Revision Date
CS-G-08 0 May 2019
Page 1 of 15
1.0 ACTIVITY DESCRIPTION
1.1. The construction industry has recognized the value of investing in and creating a sound safety culture that is proactive and forward-thinking. The goal of this guidance document is to provide the owner/operator and contractor companies alike, an evidence-based framework with tools and guidance to better measure and improve future safety behaviors and performance results.
1.2. Safety may be the only organizational function that traditionally measures its performance in terms of failure. Familiarity with and simplicity of the Total Recordable Injury Rate (TRIR) has led organizations to over-rely on the metric as the primary descriptor of safety. Leading indicators offer an opportunity to measure the activities that, when performed consistently, frequently, and in a high-quality manner, will yield positive results.
1.3. This document is not meant to supersede or replace regulatory requirements, nor is it intended to be all-inclusive of the applicable regulatory requirements. It is intended to be supportive and complimentary to such requirements.
2.0 PURPOSE AND APPLICABILITY
2.1. At present, the dominant safety metric measuring how “safe” a company performs is Total Recordable Injury Rate (TRIR). This metric is frequently used to compare organizations, projects, and work teams; identify strengths and weaknesses in performance; and, ostensibly, to improve future performance. However, there is scientific evidence that measuring and addressing TRIR alone is not enough to affect or predict future performance or achieve world-class results. To use a metaphor, measuring lagging indicators alone is like driving while only looking through the rear-view mirror.
2.2. The guidance provided in this document is intended to lead an approach where the quality and quantity of the activities performed to keep workers safe (i.e., leading inputs) is balanced with an assessment of whether these activities reliably achieve the desired results (i.e., lagging outputs). There is emerging consensus among researchers that both leading and lagging indicators are needed but currently throughout the industry there is an over-reliance on lagging indicators such as TRIR. This imbalance between the use of leading and lagging indicators to measure and drive higher levels of safety performance can be a barrier to the very performance organizations are striving to achieve.
2.3. There is no universal definition of a leading safety indicator (LSI) nor is there consistency in how leading indicators are applied. The purpose of this document is to clearly and practically define and provide examples of effective leading indicators based upon recent research and objective evidence and give guidance on leading indicator program implementation.
Construction Safety & Quality Consensus Guidelines
Leading Safety Indicator Program Guidance
Document Revision Date
CS-G-08 0 May 2019
Page 2 of 15
3.0 ROLES AND RESPONSIBILITIES
3.1. Health and Safety Professionals
3.1.1. Provide support and assistance (training if needed) in developing and implementing leading indicators and the tracking thereof,
3.1.2. Perform routine audits to ensure consistency and quality of the data being inputted and/or collected in support of the organizations leading indicators,
3.1.3. Review program routinely and identify successes and/or improvement opportunities and report those to organizational and program leaders. Consider lagging indicators when measuring overall effectiveness of leading indicators program.
3.2. Organizational Leaders
3.2.1. Participate in the development and implementation of a leading indicator program,
3.2.2. Support and enforce the leading indicator program(s) and hold supervisors accountable for their contributions to the program,
3.2.3. Review program and product(s) of said program to ensure continuous improvement as an organization.
3.3. Transmission Pipeline Operators and Operator Supply Chain Personnel
3.3.1. Support leading indicators and the role they play in gauging a company’s potential performance,
3.3.2. Utilize leading indicators balanced with lagging indicators as part of bid evaluation to measure performance and performance capabilities of contractors and service providers.
4.0 DEFINITIONS AND ACRONYMS
4.1. Lagging Indicators - Lagging indicators are measurements and data from the past. They are reactive in nature and measure how many people were injured and how severely over a specified period of time. These indicators are the bottom-line descriptors of safety within an organization; however, they do not provide a strong method of determining the overall safety capability of a company or future performance. But, without such information, organizations would not know if their safety efforts ultimately yield long-term improvements in the target objective: completing long periods of work without incident. Lagging indicators are better for a healthy safety culture when measured and communicated positively (e.g., number of worker-hours completed reliably without incident).

Construction Safety & Quality Consensus Guidelines
Leading Safety Indicator Program Guidance
Document Revision Date
CS-G-08 0 May 2019
Page 3 of 15
4.2. Examples of lagging indicators include:
• Fatality rate
• Days Away Restricted or Transferred (DART) case rate
• First aid rate
• Near miss rate
• Occupational Safety & Health Administration (OSHA) citation rate
• Experience modification ratio (EMR)
• Number of and severity of workers compensation claims
4.3. Leading Indicators - There is no single definition of a safety leading indicator and the use of the term is inconsistent and hotly debated. In this guide, the definition set forth by Construction Industry Institute Research Team 284 was adopted, which defines leading indicators as, “Safety-related practices or systems that can be measured during work and trigger positive responses.” Here, we contend that leading indicators are not simply predictors; rather, they are measures of the activities that yield future performance. In other words, safety leading indicators are more than just predictive, they are the proactive agents of change.
4.4. Predictive - Predictive validity is the extent to which a score on a scale or test predicts scores on some criterion measure. The goal of a leading indicators program is to invest time and resources in the safety activities that afford the best chance of future success. As such, the best indicators are those that have shown correlation through predictive validity. A list of indicators that have been validated as predictive is provided later in this Guidance.
5.0 APPROACH AND METHODOLOGY
5.1. Research
5.1.1. Lagging indicators are relatively easy to use in measuring data consistently. Their use is constantly re-enforced via common business practices such as company pre-qualification programs, performance scorecards/metrics, and basic trend analyses. Though their use is important they are susceptible to a host of limitations when used alone. The primary limitation of the sole use of lagging indicators is they do not describe why the performance – good or bad – was achieved and what can be done to create change. This leaves organizations wondering, ‘Am I truly good, or simply lucky?’ or worse - ‘Am I truly bad, do I simply need to log more man-hours?’
5.1.2. Some specific problems with the sole use of lagging indicators include:
● They are reactive rather than proactive - All lagging indicators are aggregate measures of past failures. Once the events have occurred, they cannot be prevented.
Construction Safety & Quality Consensus Guidelines
Leading Safety Indicator Program Guidance
Document Revision Date
CS-G-08 0 May 2019
Page 4 of 15
● They measure failure rather than performance - Lagging indicators alone do not consider the quality and quantity of safety activities that were implemented to prevent injuries. Instead of measuring performance, they measure failure.
● They do not account for the relative risk of the work - Some work involves greater risks, hazards, and exposures than others. Traditional lagging indicators do not account for the risks of the job, which makes comparisons across teams, projects, and organizations problematic.
● They are unstable over short and medium timeframes - TRIR is not a meaningful metric over short exposure times. In fact, recent research suggests that millions of worker hours, typically over 6 or more months, is needed to produce a stable TRIR value. Finally, and perhaps most importantly, past TRIR does not necessarily predict future TRIR.
● There is no indication of the extent to which the outcome was the product of sheer luck or misfortune. When TRIR goals are met, it is impossible to know if the outcome was achieved because of strong safety activities or random luck. Because of the long-term nature of safety, organizations with world-class safety programs can have a string of incidents and organizations with poor safety programs can have strings of good fortune.
● They foster complacency and ambiguity in future planning. If lagging indicators alone are used to measure safety, organizations cannot effectively respond when goals are not met. If a series of injuries occur, it is not possible to systematically identify deficiencies in the safety management system with a lagging metric.
● The aggregate metrics do not account for the actual or potential severity of the injuries. TRIR accounts for a stitch the same as a permanent disablement. Further, near misses and events that could have been more severe are not included or properly considered. Thus, lagging indicators provide an incomplete picture of an organization's safety performance.
● They are not the change agent - Lagging indicators are often the reason why change is desired but is never how the change is achieved. The safety activities that the organization performs causes the change rather than tracking the outcome. This is like tracking the maximum speed of a racecar without knowing how the engine is performing. One cannot go faster by simply knowing how fast one has gone in the past.
● They are historically underreported - Lagging indicators like TRIR are notoriously underreported. In fact, Federal OSHA estimates that nearly 60% of organizations systematically fail to record or misclassify injuries. Error rates in reporting less severe injuries like first aid and near misses are estimated to be even higher.
Construction Safety & Quality Consensus Guidelines
Leading Safety Indicator Program Guidance
Document Revision Date
CS-G-08 0 May 2019
Page 5 of 15
5.1.3. Despite the limitations, lagging indicators are critical to a balanced approach. They can provide important business intelligence as incidents are investigated and injury prevention campaigns are initiated. Lagging indicators can also serve as an impetus for change. The change agents, however, are the proactive safety activities that an organization performs to keep workers safe. The measures of these inputs are safety leading indicators.
5.1.4. The distinction between leading and lagging indicators can be blurry. To establish a clear boundary, we consider leading indicators to be “before-the-fact” and lagging indicators to be “after-the-fact” measures. For example, having a flat tire is akin to a lagging indicator and may prompt a driver to change their tires if they are discovered to be worn. Such action may prevent future flat tires. However, a regular pre-drive inspection that prompts a tire replacement before a flat occurs is akin to a leading indicator. The subtle but significant difference is that the lagging indicator uses an event to initiate change while the leading indicator catalyzes change before any event occurs. If we wait to make a change until after an event occurs, we have missed an opportunity for prevention.
5.1.5. As organizations develop leading indicator programs, one of the biggest challenges is selecting the right indicators. Research has shown that some indicators are far better than others. The most effective leading indicators meet all the following research-validated criteria:
● Measurable. The safety practice must be quantifiable. Most commonly, measures involve the rate at which the organization performs a specific activity like an audit or a safety meeting. Although more difficult, the quality of safety activities can also be measured but consistency in measurement can be problematic without well-defined scorecards and training.
● Consistent. The safety activity must be measured the same by all stakeholders. Frequency-based metrics can be measured consistently with ease as they generally involve counting the number of activities performed over time. It becomes more difficult when the quality of the activity is considered as well. To be useful, everyone must have a common understanding of the minimum requirements for the activity. For example, do you give credit for a poor safety meeting? How about an audit that is performed by someone who is not familiar with the work? As indicated, scorecards can be helpful.
● Actionable. The activity being measured must be something that can be changed and improved over short time periods. For example, if safety meetings are not being attended by management as frequently as desired, additional participation can be mandated. Although important for sustained organizational performance, measures of big-picture constructs like safety culture surveys are not good leading indicators because meaningful change occurs over time periods that are longer than typical projects.
Construction Safety & Quality Consensus Guidelines
Leading Safety Indicator Program Guidance
Document Revision Date
CS-G-08 0 May 2019
Page 6 of 15
● Positive. Leading indicators are the measures of the activities performed to keep people safe. In other words, they are measures of the positive input to the safety system. Injuries, risky exposures, unsafe behaviors observed, property damage, and near misses are not positive metrics.
● Unidirectional. A common mistake is to include an indicator that cannot be judged as positive or negative based on the metric alone. It must be clear whether the observed value is good or not. Nearly every published guide includes at least one indicator that is problematic in this regard. For example, stop work authority has been promoted as a good leading indicator. However, in practice this indicator is problematic because two constructs are confounded in one metric: (1) organizations want their workers to feel empowered to stop work if conditions arise and (2) they want conditions to be well-planned and free of hazards so that work does not need to be stopped. If there is a low rate of stop work, the crews may not be stopping work frequently because either the work is well planned or because they do not feel comfortable exercising their authority. So, is it better to see more use of stop work authority or less use? In short, leading indicators must have one direction (e.g., higher score is always better or lower score is always better). To assess this criterion for a specific indicator ask yourself, “When I take measurements, will I be sure that we are going in the right direction?”
● Predictive. The goal of a leading indicators program is to invest time and resources in the safety activities that afford the best chance of future success. As such, the best indicators are those that have shown to predict future performance. A list of indicators that have been validated as predictive is provided later in this guide.
5.1.6. Although not strict criteria, there are some attributes of leading indicators that make them preferred over others. The following attributes of strong indicators are lessons learned by organizations that have successfully implemented leading indicators for several years:
● Have achievable goals. The goals set for each leading indicator must be achievable. For example, it is tempting to set a 100% compliance goal for all safety audits. However, anything less than perfect will be considered failure. Goals that are consistently achievable and that can be adjusted to promote continuous improvement are much more effective.
● Show timely improvements in performance. Organizations succeed when their employees can take action and see results from their actions without significant delay. The best indicators are those where action can be taken, and performance improves rapidly. For organizations that are initiating a leading indicator program, those that have been shown in research to have predictive time horizons of a month or shorter (safety audits, drug tests, and pre-job meetings) are worth considering.
● Enable frequent feedback to all stakeholders. It is critical that those conducting the safety activities are informed of their leading indicator scores, where they fall relative to goals, and are provided with specific recommendations for improvement

Construction Safety & Quality Consensus Guidelines
Leading Safety Indicator Program Guidance
Document Revision Date
CS-G-08 0 May 2019
Page 7 of 15
or are celebrated for their success. In addition to using leading indicators to make corrections, it is important to use the metrics to celebrate success.
● Are easy to communicate. Indicators are easy to communicate when they are clearly and consistently defined and measured. If the organization has clear metrics, honest reporting, and accessible scorecards for more subjective assessments, it is easy to explain how metrics were achieved and how they compare to expectations. In fact, if an organization is transparent and communicative, any individual in the organization should be able to measure and report the indicator and make recommendations to others.
5.2. Examples
Below are two examples of potential leading indicators. According to the guidance set forth in this document, one is good, and the other is not. Frequency of near misses is used as the example of a bad safety leading indicator because it is counterintuitive and appears frequently in online reports.
● Good Indicator: Frequency of pre-job safety meetings. This is a good indicator because: (1) it can be measured as the proportion of work periods with a pre-job safety meeting; (2) expectations of a good meeting can be communicated to ensure consistency in measurement; (3) the organization can control the indicator by mandating more or improved meetings if the goals are not met; (4) it measures a positive aspect of safety that yields improved performance; (5) it is unidirectional because more frequent meetings is better; and (6) it has been research-validated as predictive (see below). This quantitative indicator is even better if coupled with measures of the quality of the pre-job safety meeting. Ideally, the organization has many high-quality meetings.
● Bad Indicator: Frequency of near misses. This is not a good indicator because (1) it measures a negative outcome of the safety system that has already occurred; (2) research shows that, even within organizations, near misses are not consistently defined or measured (i.e., what is a near miss and what is not? What is the threshold for reporting?); (3) it is bi-directional because, on one hand, organizations want to have few near misses but, on the other, they want strong near miss reporting; and (4) they are not research-validated as predictive. Although near misses are not a good leading indicator per the definitions and criteria in this guide, they can still be useful as intelligence for future corrections.
5.2.1. Research shows that the indicators listed below are predictive. These indicators all meet the definition set forth in this Guidance, meet all six criteria, and have been field validated. The validation has occurred in a longitudinal study over 5 years in the US oil and gas industry and Australian transit projects. The results have been published in academic journals and are considered the state-of-the-art. This list is by no means exhaustive as research is still ongoing to test and validate new indicators. Organizations are encouraged to use these indicators below when initiating a program and to try new indicators that meet the definition and criteria for inclusion in a program. (See Appendix 9.1)
● Frequency of safety observations
Construction Safety & Quality Consensus Guidelines
Leading Safety Indicator Program Guidance
Document Revision Date
CS-G-08 0 May 2019
Page 8 of 15
● Contractor safety audits
● Frequency of Job Safety Assessments (JSAs)
● Frequency of Project Manager (PM) safety engagements
● Frequency of client walkthroughs
● Frequency of subcontractor audits
● Frequency of contractor leadership attending orientation sessions
● Proportion of observations with corrective action items
● Frequency of project risk assessments
● Frequency of non-compliance observations
● Frequency of client participation in safety orientations
● Frequency of drug tests
5.2.2. Research has shown that organizations must remain vigilant when implementing a leading indicators program. It is important to establish bounds and make regular observations to meet targets, even when lagging indicators show that injury rates are low. A common misstep is for managers to become complacent with leading indicators during period of low injury rates, which causes performance to regress back to previous, higher levels.
5.3. Initiating a leading indicator program
Starting a leading indicator program can be daunting, when there are dozens to consider. The following steps are a basic method for creating a leading indicator program:
5.3.1. STEP 1: Begin by selecting 2-3 safety activities that, when performed well, are the core of the organization’s safety program. Once selected, the organization should consider how the activities can be measured.
Some helpful questions to consider are:
● How often should the activity be performed?
● By whom?
● Who should be in attendance?
● What observations indicate strong performance?
● What are your expectations for the conduct of this activity (i.e., what does good look like?).
Initially, measures of frequency or basic scores (e.g., % compliance) are suggested because they are easy to measure and track. These may be considered “quick wins”. As the leading indicator program matures, the organizations can begin to measure

Construction Safety & Quality Consensus Guidelines
Leading Safety Indicator Program Guidance
Document Revision Date
CS-G-08 0 May 2019
Page 9 of 15
quality of the activities (i.e., to what extent are the activities being performed to expectation?).
5.3.2. STEP 2: Once indicators are selected and measures are created, reasonable and achievable goals must be set. Although tempting, it is best to avoid perfection goals where tolerance is set at 100%.
5.3.3. STEP 3: Finally, the organization should regularly measure each indicator (e.g., aggregate weekly or monthly), compare against targets, and celebrate success or make micro-corrections if needed.
5.3.4. EXAMPLE: Let’s take an organization that performs safety audits and considers this activity to be a core component of their safety program. The organization performs this activity weekly. Like many safety leading indicators, audits may have several possible metrics. Research has shown that the best forecast of future performance is achieved when multiple measures of the same activity are used in combination. For audits, the organization may consider measuring: (1) the frequency with which audits are performed; (2) percent of observations in compliance; (3) frequency of audits with upper management involved; and (4) quality of the audit based on the auditor’s familiarity with the work and ability to engage with the workforce. The metrics are likely to have different targets. For example, the organization may expect that the audits are held weekly but may only target to have upper management involved once per month. It is also important to set reasonable goals. Before the indicator is implemented it is critical to set an action plan for instances when targets are not met. It is far easier to follow a plan when a target is missed rather than reacting in an ad hoc manner. The same is true when celebrating the successful achievement of the target. When monitoring the program, it is important to record the metrics and track performance over time. One observation, like a low compliance score on an audit, may not be cause for concern. However, a pattern of declining scores may warrant a strong reaction. Finally, it is very important to maintain control over the audit performance scores even when lagging indicators are low/acceptable. Research shows that organizations are most vulnerable to regressing in performance shortly following periods of low injury rates.
5.4. Operator Supply Chain
Certainly, personnel safety is the primary motivating factor for pipeline construction contractors, but we must recognize that market motivation can encourage (or even discourage) participation in a leading safety indicator program. Pipeline Operator companies and their Supply Chain partners should look for opportunities to ensure credit is given to the pipeline construction companies who put resources into the development of an LSI program.
One way Operators can incentivize the industry towards leading safety indicators is through the bid request and evaluation process. Two actions for consideration are suggested:
● Request LSI Program Plans in Request for Price templates for pipeline construction bid events.
Construction Safety & Quality Consensus Guidelines
Leading Safety Indicator Program Guidance
Document Revision Date
CS-G-08 0 May 2019
Page 10 of 15
● Give preference to construction companies with LSI Programs within Bid Evaluation calculations.
6.0 TRAINING Organizations implementing a leading indicator program should educate personnel throughout the company hierarchy on the purpose of a leading indicator program and the metrics to be monitored and utilized within their organization. Transitioning to a positive behavior focused program (in most cases) will only be possible with a cultural transition. Such a conversion is possible through consistent and repetitive communication and reinforcement.
7.0 REFERENCES Hallowell, M.R., Hinze, J., Baud, K., Wehle, A. (2013). “Pro-active construction safety control: Measuring, monitoring, and responding to safety leading indicators.” Journal of Construction Engineering and Management, ASCE, 139(10): 04013010-1 to 04013010-8.
Hinze, J., Hallowell, M.R., and Baud, K. (2013). “Construction safety best practices and relationships to safety performance.” Journal of Construction Engineering and Management, ASCE, 139(10): 04013006-1 to 04013006-8.
Inouye J. Campbell Institute Practical Guide to Leading Indicators: Metrics, Case Studies & Strategies. 2015 http://www.nsc.org/CambpellInstituteandAwardDocuments/WPPracticalGuidetoLI. pdf.
Lingard, H., Hallowell, M.R., Salas, R., Prizadeh, P. (2017). “Leading or lagging? Temporal analysis of safety indicators on a large infrastructure construction project. Safety Science, 91, 206-220.
National Safety Council Campbell Institute. Practical Guide to Leading Indicators: Metrics, Case Studies & Strategies Sept. 2014 National Safety Council Campbell Institute. Transforming EHS performance measurement through leading indicators Sept. 2013.
Salas, R. and Hallowell, M.R. (2016). “Predictive validity of safety leading indicators: An empirical assessment in the oil and gas industry.” Journal of Construction Engineering and Management, ASCE, 04016052-1 to 04016052-11.
Sinelnkov, S., Inouye, J., Kerper, S. Transforming EHS Performance Measurement through Leading Indicators. 2013. http://www.nsc.org/CambpellInstituteandAwardDocuments/WP-Transforming-EHS-through-Leading-Indicators.pdf.
8.0 HISTORY OF REVISIONS
Number Date Description
0 May 2019 Initial publication of this INGAA Foundation Construction Safety & Quality Consensus Standard.

Construction Safety & Quality Consensus Guidelines
Leading Safety Indicator Program Guidance
Document Revision Date
CS-G-08 0 May 2019
Page 11 of 15
APPENDIX
Examples: Leading Safety Indicators for Pipeline Construction
Below are examples of Safety Leading Indicators (SLI) that positively compare against the criteria for LSI’s detailed in the Leading Safety Indicator Program Guidance. These LSI’s were compiled using submissions from Interstate Natural Gas Association of America (INGAA) Foundation member companies (November 2018), a Pipeline Contractors Safety Roundtable Workshop (Houston, October 2018) and literature reviews performed by Dr. Hallowell (U of Colorado at Boulder, Fall 2018). This appendix has been assembled to provide the reader with supporting information for implementing and/or modifying Foundation member companies’ leading safety indicators.
This list is not all inclusive and is only a sampling of sound candidate Safety Leading Indicators. The INGAA Foundation encourages those interested in this topic and seeking additional indicators to review the reference material listed in this report (Section 7.0).
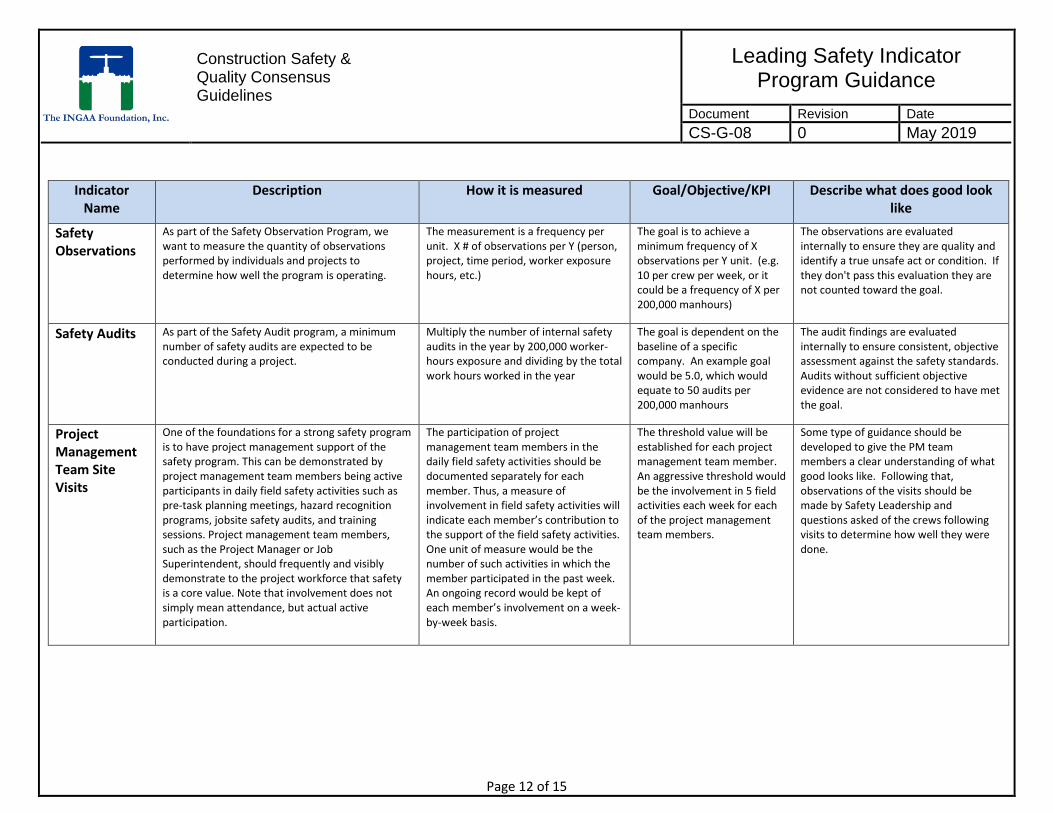
When viewing the table, note the following brief explanations of each heading and use it as guidance for developing your own.
Indicator Name: This can be short or long depending on the Indicator. Use it to quickly identify the general topic of the indicator.
Description: This needs to contain enough information to describe what is being measured and why. Consider it background information on the indicator.
How is it measured: This should contain enough detail to clearly describe any calculations, input and outputs that will be used to turn the indicator into an objective, quantitative measure.
Goal/Objective/KPI: This should relate directly to the section on “How is it measured”. Rather than describing what you hope the indicator influences or changes, this is purely the quantitative metric used to target the desired level of achievement.
What does good look like: This is a place to describe how to evaluate the “qualitative” aspects of what is being measured. The intent is to have something in place to determine some level of quality for the items being measured. The examples provide good guidance on what this might look like for different indicators.
Construction Safety & Quality Consensus Guidelines
Leading Safety Indicator Program Guidance
Document Revision Date
CS-G-08 0 May 2019
Page 12 of 15
Indicator Name
Description How it is measured Goal/Objective/KPI Describe what does good look like
Safety Observations
As part of the Safety Observation Program, we want to measure the quantity of observations performed by individuals and projects to determine how well the program is operating.
The measurement is a frequency per unit. X # of observations per Y (person, project, time period, worker exposure hours, etc.)
The goal is to achieve a minimum frequency of X observations per Y unit. (e.g. 10 per crew per week, or it could be a frequency of X per 200,000 manhours)
The observations are evaluated internally to ensure they are quality and identify a true unsafe act or condition. If they don't pass this evaluation they are not counted toward the goal.
Safety Audits As part of the Safety Audit program, a minimum number of safety audits are expected to be conducted during a project.
Multiply the number of internal safety audits in the year by 200,000 worker-hours exposure and dividing by the total work hours worked in the year
The goal is dependent on the baseline of a specific company. An example goal would be 5.0, which would equate to 50 audits per 200,000 manhours
The audit findings are evaluated internally to ensure consistent, objective assessment against the safety standards. Audits without sufficient objective evidence are not considered to have met the goal.
Project Management Team Site Visits
One of the foundations for a strong safety program is to have project management support of the safety program. This can be demonstrated by project management team members being active participants in daily field safety activities such as pre-task planning meetings, hazard recognition programs, jobsite safety audits, and training sessions. Project management team members, such as the Project Manager or Job Superintendent, should frequently and visibly demonstrate to the project workforce that safety is a core value. Note that involvement does not simply mean attendance, but actual active participation.
The participation of project management team members in the daily field safety activities should be documented separately for each member. Thus, a measure of involvement in field safety activities will indicate each member’s contribution to the support of the field safety activities. One unit of measure would be the number of such activities in which the member participated in the past week. An ongoing record would be kept of each member’s involvement on a week-by-week basis.
The threshold value will be established for each project management team member. An aggressive threshold would be the involvement in 5 field activities each week for each of the project management team members.
Some type of guidance should be developed to give the PM team members a clear understanding of what good looks like. Following that, observations of the visits should be made by Safety Leadership and questions asked of the crews following visits to determine how well they were done.
Construction Safety & Quality Consensus Guidelines
Leading Safety Indicator Program Guidance
Document Revision Date
CS-G-08 0 May 2019
Page 13 of 15
Indicator Name
Description How it is measured Goal/Objective/KPI Describe what does good look like
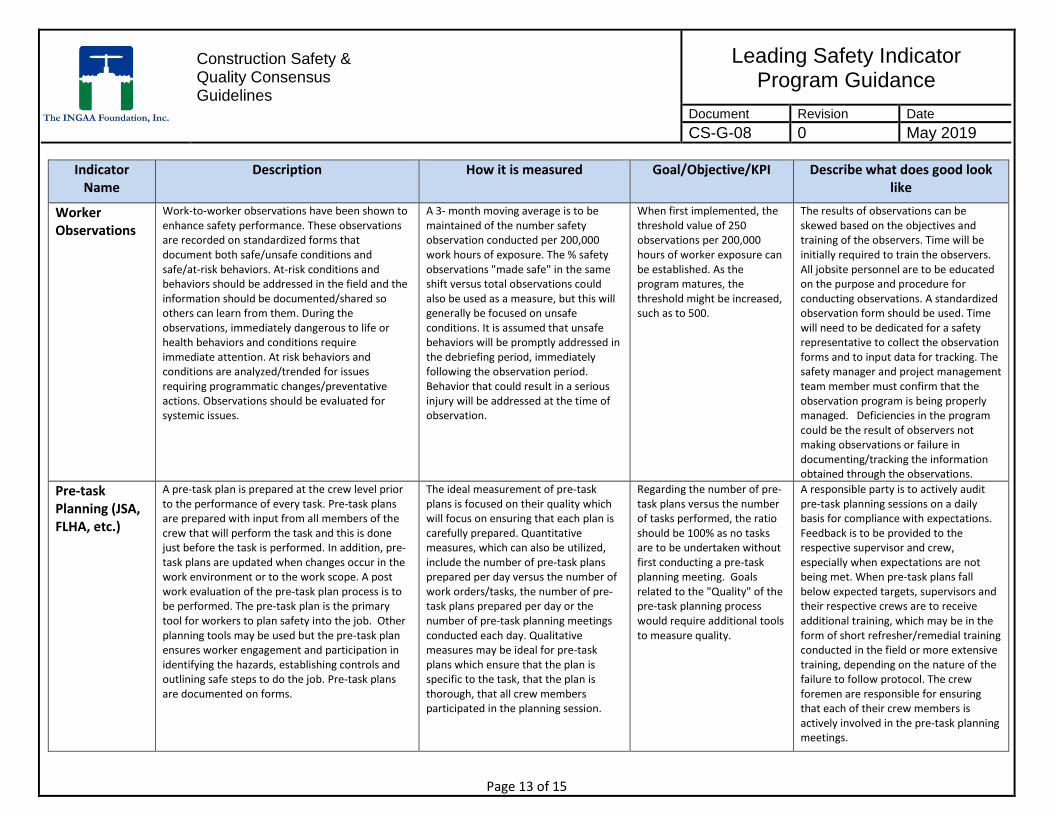
Worker Observations
Work-to-worker observations have been shown to enhance safety performance. These observations are recorded on standardized forms that document both safe/unsafe conditions and safe/at-risk behaviors. At-risk conditions and behaviors should be addressed in the field and the information should be documented/shared so others can learn from them. During the observations, immediately dangerous to life or health behaviors and conditions require immediate attention. At risk behaviors and conditions are analyzed/trended for issues requiring programmatic changes/preventative actions. Observations should be evaluated for systemic issues.
A 3- month moving average is to be maintained of the number safety observation conducted per 200,000 work hours of exposure. The % safety observations "made safe" in the same shift versus total observations could also be used as a measure, but this will generally be focused on unsafe conditions. It is assumed that unsafe behaviors will be promptly addressed in the debriefing period, immediately following the observation period. Behavior that could result in a serious injury will be addressed at the time of observation.
When first implemented, the threshold value of 250 observations per 200,000 hours of worker exposure can be established. As the program matures, the threshold might be increased, such as to 500.
The results of observations can be skewed based on the objectives and training of the observers. Time will be initially required to train the observers. All jobsite personnel are to be educated on the purpose and procedure for conducting observations. A standardized observation form should be used. Time will need to be dedicated for a safety representative to collect the observation forms and to input data for tracking. The safety manager and project management team member must confirm that the observation program is being properly managed. Deficiencies in the program could be the result of observers not making observations or failure in documenting/tracking the information obtained through the observations.
Pre-task Planning (JSA, FLHA, etc.)
A pre-task plan is prepared at the crew level prior to the performance of every task. Pre-task plans are prepared with input from all members of the crew that will perform the task and this is done just before the task is performed. In addition, pre-task plans are updated when changes occur in the work environment or to the work scope. A post work evaluation of the pre-task plan process is to be performed. The pre-task plan is the primary tool for workers to plan safety into the job. Other planning tools may be used but the pre-task plan ensures worker engagement and participation in identifying the hazards, establishing controls and outlining safe steps to do the job. Pre-task plans are documented on forms.
The ideal measurement of pre-task plans is focused on their quality which will focus on ensuring that each plan is carefully prepared. Quantitative measures, which can also be utilized, include the number of pre-task plans prepared per day versus the number of work orders/tasks, the number of pre-task plans prepared per day or the number of pre-task planning meetings conducted each day. Qualitative measures may be ideal for pre-task plans which ensure that the plan is specific to the task, that the plan is thorough, that all crew members participated in the planning session.
Regarding the number of pre-task plans versus the number of tasks performed, the ratio should be 100% as no tasks are to be undertaken without first conducting a pre-task planning meeting. Goals related to the "Quality" of the pre-task planning process would require additional tools to measure quality.
A responsible party is to actively audit pre-task planning sessions on a daily basis for compliance with expectations. Feedback is to be provided to the respective supervisor and crew, especially when expectations are not being met. When pre-task plans fall below expected targets, supervisors and their respective crews are to receive additional training, which may be in the form of short refresher/remedial training conducted in the field or more extensive training, depending on the nature of the failure to follow protocol. The crew foremen are responsible for ensuring that each of their crew members is actively involved in the pre-task planning meetings.
Construction Safety & Quality Consensus Guidelines
Leading Safety Indicator Program Guidance
Document Revision Date
CS-G-08 0 May 2019
Page 14 of 15
Indicator Name
Description How it is measured Goal/Objective/KPI Describe what does good look like
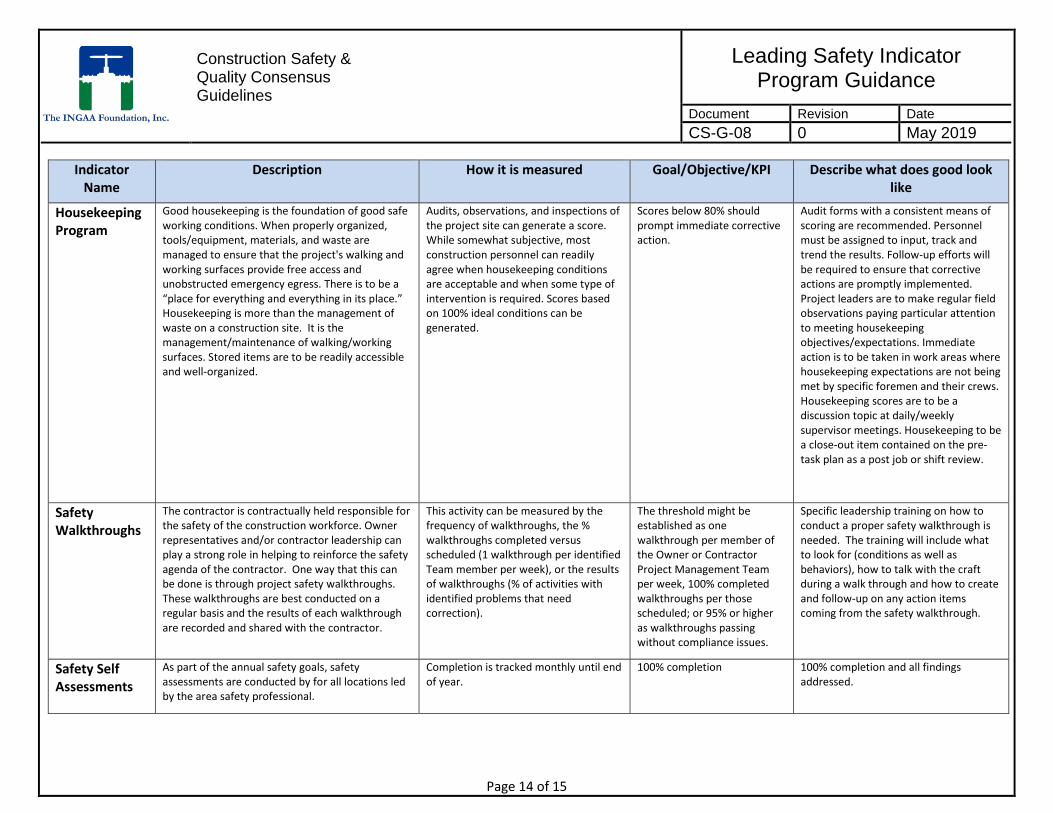
Housekeeping Program
Good housekeeping is the foundation of good safe working conditions. When properly organized, tools/equipment, materials, and waste are managed to ensure that the project's walking and working surfaces provide free access and unobstructed emergency egress. There is to be a “place for everything and everything in its place.” Housekeeping is more than the management of waste on a construction site. It is the management/maintenance of walking/working surfaces. Stored items are to be readily accessible and well-organized.
Audits, observations, and inspections of the project site can generate a score. While somewhat subjective, most construction personnel can readily agree when housekeeping conditions are acceptable and when some type of intervention is required. Scores based on 100% ideal conditions can be generated.
Scores below 80% should prompt immediate corrective action.
Audit forms with a consistent means of scoring are recommended. Personnel must be assigned to input, track and trend the results. Follow-up efforts will be required to ensure that corrective actions are promptly implemented. Project leaders are to make regular field observations paying particular attention to meeting housekeeping objectives/expectations. Immediate action is to be taken in work areas where housekeeping expectations are not being met by specific foremen and their crews. Housekeeping scores are to be a discussion topic at daily/weekly supervisor meetings. Housekeeping to be a close-out item contained on the pre-task plan as a post job or shift review.
Safety Walkthroughs
The contractor is contractually held responsible for the safety of the construction workforce. Owner representatives and/or contractor leadership can play a strong role in helping to reinforce the safety agenda of the contractor. One way that this can be done is through project safety walkthroughs. These walkthroughs are best conducted on a regular basis and the results of each walkthrough are recorded and shared with the contractor.
This activity can be measured by the frequency of walkthroughs, the % walkthroughs completed versus scheduled (1 walkthrough per identified Team member per week), or the results of walkthroughs (% of activities with identified problems that need correction).
The threshold might be established as one walkthrough per member of the Owner or Contractor Project Management Team per week, 100% completed walkthroughs per those scheduled; or 95% or higher as walkthroughs passing without compliance issues.
Specific leadership training on how to conduct a proper safety walkthrough is needed. The training will include what to look for (conditions as well as behaviors), how to talk with the craft during a walk through and how to create and follow-up on any action items coming from the safety walkthrough.
Safety Self Assessments
As part of the annual safety goals, safety assessments are conducted by for all locations led by the area safety professional.
Completion is tracked monthly until end of year.
100% completion 100% completion and all findings addressed.
Construction Safety & Quality Consensus Guidelines
Leading Safety Indicator Program Guidance
Document Revision Date
CS-G-08 0 May 2019
Page 15 of 15
Indicator Name
Description How it is measured Goal/Objective/KPI Describe what does good look like
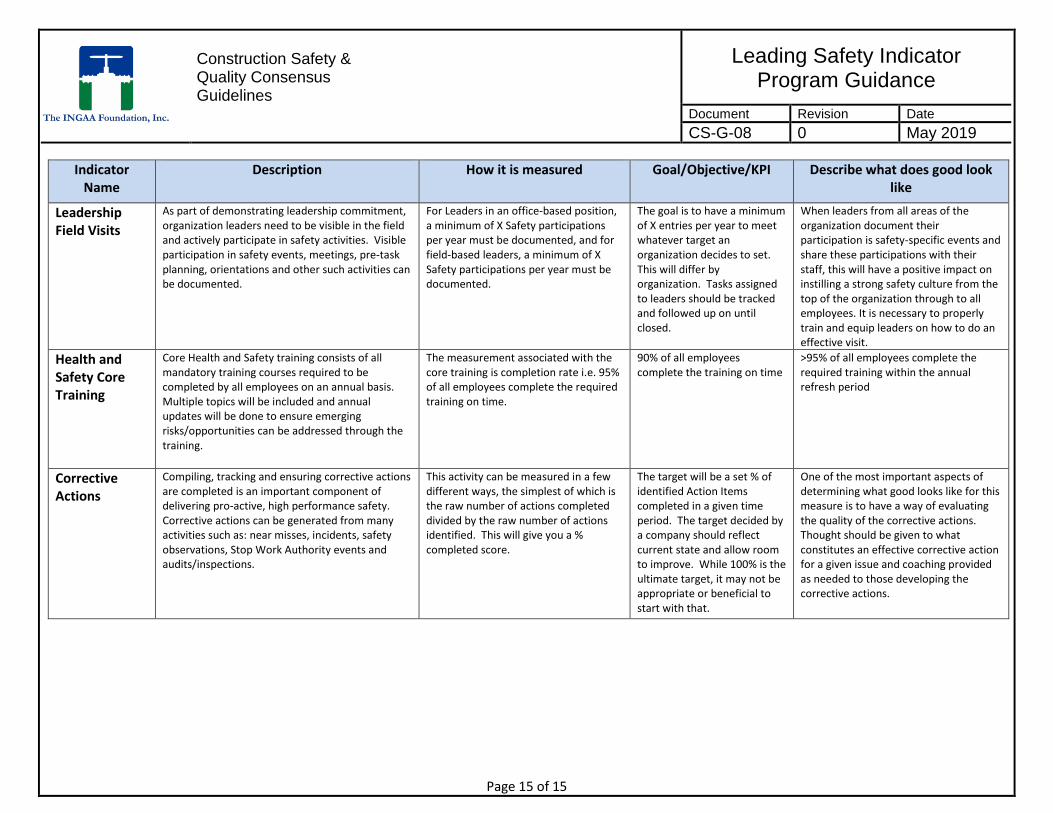
Leadership Field Visits
As part of demonstrating leadership commitment, organization leaders need to be visible in the field and actively participate in safety activities. Visible participation in safety events, meetings, pre-task planning, orientations and other such activities can be documented.
For Leaders in an office-based position, a minimum of X Safety participations per year must be documented, and for field-based leaders, a minimum of X Safety participations per year must be documented.
The goal is to have a minimum of X entries per year to meet whatever target an organization decides to set. This will differ by organization. Tasks assigned to leaders should be tracked and followed up on until closed.
When leaders from all areas of the organization document their participation is safety-specific events and share these participations with their staff, this will have a positive impact on instilling a strong safety culture from the top of the organization through to all employees. It is necessary to properly train and equip leaders on how to do an effective visit.
Health and Safety Core Training
Core Health and Safety training consists of all mandatory training courses required to be completed by all employees on an annual basis. Multiple topics will be included and annual updates will be done to ensure emerging risks/opportunities can be addressed through the training.
The measurement associated with the core training is completion rate i.e. 95% of all employees complete the required training on time.
90% of all employees complete the training on time
>95% of all employees complete the required training within the annual refresh period
Corrective Actions
Compiling, tracking and ensuring corrective actions are completed is an important component of delivering pro-active, high performance safety. Corrective actions can be generated from many activities such as: near misses, incidents, safety observations, Stop Work Authority events and audits/inspections.
This activity can be measured in a few different ways, the simplest of which is the raw number of actions completed divided by the raw number of actions identified. This will give you a % completed score.
The target will be a set % of identified Action Items completed in a given time period. The target decided by a company should reflect current state and allow room to improve. While 100% is the ultimate target, it may not be appropriate or beneficial to start with that.
One of the most important aspects of determining what good looks like for this measure is to have a way of evaluating the quality of the corrective actions. Thought should be given to what constitutes an effective corrective action for a given issue and coaching provided as needed to those developing the corrective actions.


