Embed Size (px)
Citation preview
FINANCE FOR
H A N D B O O K
CITY LEADERS

FINANCE FOR
H A N D B O O K
CITY LEADERS
FINANCE FOR CITY LEADERSFirst published in Nairobi in 2016 by UN-HabitatCopyright © United Nations Human Settlements Programme, 2016
All rights reservedUnited Nations Human Settlements Programme (UN-Habitat)P. O. Box 30030, 00100 Nairobi GPO KENYATel: 254-020-7623120 (Central Office)www.unhabitat.org
HS Number: HS/059/16EISBN Number(Series): ISBN Number:(Volume) 978-92-1-132721-2
DisclaimerThe designations employed and the presentation of the material in this publication do not imply the expression of any opinion whatsoever on the part of the Secretariat of the United Nations concerning the legal status of any country, territory, city or area or of its authorities, or concerning the delimitation of its frontiers of boundaries.
Views expressed in this publication do not necessarily reflect those of the United Nations Human Settlements Programme, the United Nations, or its Member States.
Excerpts may be reproduced without authorization, on condition that the source is indicated.
Cover Photo © Flickr/Kevin Wong
Editors: Marco Kamiya, Le-Yin Zhang
External leading contributors: Lars Andersson, Dominic Burbidge, Greg Clark, Doug Carr, Nic Cheeseman, Skye d’Almeida, Lourdes German, Pavel Kochanov, Leonardo Letelier, Tim Moonen, Armando Morales, Miquel Morell, Daniel Platz, Dmitry Pozhidaev, Yasuo Konishi, Devashree Saha, Yoel Siegel, Lawrence Walters
UN-Habitat Contributors: Katja Dietrich, Muhammad Farid, Elizabeth Glass, Liz Paterson Gauntner, Melissa Permezel, Douglas Ragan, Kerstin Sommer, Younghoon Moon
Project Coordinator: Elizabeth Glass
Editorial Consultant: Michael McCarthy
Design and Layout: Eric Omaya
Partners: International City Leaders, Oxford University, University College London
FINANCE FOR CITY LEADERS HANDBOOK v
ContentsForeword .................................................................................................................................................... vii
About the Authors ...................................................................................................................................... ix
Introduction ................................................................................................................................................ xii
PART 1: PRINCIPLES OF MUNICIPAL FINANCE .....................................................................2
CHAPTER 1: Principles of Municipal Finance ..............................................................................................4
CHAPTER 2: Expanding Municipal Revenues ............................................................................................16
CHAPTER 3: Decentralization and Local Government Financing ..............................................................28
PART 2: DESIGNING FINANCIAL PRODUCTS......................................................................46
CHAPTER 4: Non-Tax Own-Source Municipal Revenues ..........................................................................48
CHAPTER 5: Green Municipal Bonds .......................................................................................................64
CHAPTER 6: Municipal Pooled Financing Mechanisms ............................................................................86
CHAPTER 7: Public–Private Partnerships ..................................................................................................98
CHAPTER 8: Financing Planned City Extension ..................................................................................... 111
CHAPTER 9: Sharing the Wealth: Private Land Value and Public Benefit .............................................. 132
CHAPTER 10: The Role of Real Estate Development in Urbanizing Cities ............................................. 156
CHAPTER 11: Improving Capital Markets for Municipal Finance in Least Developed Countries ........... 178
CHAPTER 12: Developing and Managing Municipal Infrastructure Development Plans ....................... 194
PART 3: CROSSCUTTING ISSUES ......................................................................................208
CHAPTER 13: Financing Investments in Slums and Informal Settlements ............................................. 210
CHAPTER 14: The Cross-Cutting Issues of Human Rights, Gender Equality, and Youth ....................... 226
CHAPTER 15: Local Governments and Local Economic Development, Productive Capacity,
and Spatial Analysis ............................................................................................................................... 258

FINANCE FOR CITY LEADERS HANDBOOK vii
Foreword
tion contributes to the growing conversation on
how cities can look inward to finance major capital
expenditures, infrastructure maintenance and oper-
ation, and public services.
It is essential that the new approach to urbaniza-
tion put forth at Habitat III rises to the challenge
presented by changing urban dynamics. It is with
enormous pride and a united voice that the United
Nations Human Settlements Programme (UN-Habi-
tat) presents Finance for City Leaders—a landmark
publication that draws on the combined expertise
of over 30 contributing authors from more than
15 public, private, and multilateral institutions all
working towards equipping cities with the tools
they need to build and sustain urban prosperity.
Dr. Joan Clos
Secretary-General of Habitat III
Executive Director, UN-Habitat
The rapid growth of cities across the globe, and
cities’ essential role as drivers of economic develop-
ment, require that city leaders from both the public
and private sectors come together in the financ-
ing, design, and implementation of urban policies
that ensure sustainable and inclusive urbanization.
Providing city leaders with adequate financing
mechanisms and frameworks that fit the economic,
social, and regulatory context is the foundation on
which city leaders will achieve the goals of the New
Urban Agenda.
A study on financing sustainable urbanization
cannot come at a better moment as world leaders
are discussing the New Urban Agenda that will
be adopted at Habitat III in Quito. The New Urban
Agenda is an action-oriented plan that aims at effec-
tively addressing the complex challenges of urban-
ization, including its financing. It is a set of five strat-
egies consisting of National Urban Policies, Urban
Legislation, Urban Planning and Design, Planned City
Extensions, and Financing Urbanization. The Habitat
III process offers an exceptional opportunity to build
a new model of urban development promoting
equity, welfare, and shared prosperity.
Finance for City Leaders presents an up-to-date,
comprehensive, and in-depth analysis of the chal-
lenges posed by rapid urbanization and the various
financing tools municipalities have at their disposal.
By providing city leaders with a wide array of
financing solutions that emphasize sustainability,
inclusion, and financial autonomy, this publica-
viii FINANCE FOR CITY LEADERS HANDBOOK
About the editors and contributors
External leading contributors
Lars M. Andersson is a local government finance
expert. In 1986 he started the Swedish Local
Government Funding Agence (Kommuninvest). He
currently sits on the board of the Agence France
Locale (LGFA) and the Global Fund for Cities
Devel-opment (FMDV) and is global advisor for
several governments and institutions.
Dominic Burbidge is departmental lecturer in the
School of Interdisciplinary Area Studies at Oxford
University and a researcher in the Department of
Politics & International Relations. He is author of
The Shadow of Kenyan Democracy: Widespread
Expectations of Widespread Corruption (Rout-
ledge, 2016), and has published numerous journal
articles relating to social trust, local government,
and constitutional design. In addition, he lectures
in law at Strathmore University in Kenya.
Doug Carr is a New York–based vice president for
Jones Lang LaSalle (JLL) in the Public Institutions
Group, focused on providing real estate planning
and development advisory services on behalf of
government, educational, and nonprofit organiza-
tions, with a particular expertise in public–private
partnerships and transit-oriented development
projects.
Editors
Marco Kamiya is head of the Urban Economy
and Finance Branch of UN-Habitat, headquar-
tered in Nairobi, Kenya. In addition to working on
field projects with UN-Habitat, Kamiya conducts
research on municipal finance, the economics of
urban expansion, and local infrastructure invest-
ment policy. Prior to joining UN-Habitat, he worked
at the Development Bank of Latin America (CAF)
and the Inter-American Development Bank, and
was director of international development projects
with PADECO Co., Ltd., a consulting firm based in
Tokyo. He studied international development at
Harvard University.
Le-Yin Zhang is a senior lecturer and course
director of M.Sc. Urban Economic Development at
the Bartlett Development Planning Unit of Universi-
ty College London. Specialized in the management
of city economies, she has a wide range of research
interests including low-carbon transitions, green
finance, and China’s fiscal regime. Her publications
include Managing the City Economy: Challeng-
es and Strategies in Developing Countries (Rout-
ledge, 2015) and numerous journal articles, book
chapters, and reports. She has a B.Sc. from Beijing
Normal University and a Ph.D. from the University
of London.
FINANCE FOR CITY LEADERS HANDBOOK ix
About the editors and contributors
Nic Cheeseman is associate professor of African
Politics at Oxford University, the founding editor of
the Oxford Encyclopedia of African Politics, and a
former editor of the journal African Affairs. He is
also the coeditor of the collections Our Turn to Eat
(2010) and The Handbook of African Politics (2013).
More recently, he published his first monograph,
Democracy in Africa, with Cambridge University
Press (2015). He runs the popular website www.
democracyinafrica.org, is a columnist for Kenya’s
Sunday Nation newspaper and is an advisor to, and
writer for, Kofi Annan’s African Progress Panel.
Greg Clark is honorary professor and co-chairman
of the advisory board at the City Leadership Initia-
tive, University College London. His other current
roles include senior fellow at the Urban Land Insti-
tute (ULI), Europe; global fellow at the Metropolitan
Policy Program, Brookings Institution; chairman of
the JLL Cities Research Centre; strategic advisor to
the OECD LEED Programme; and global fellow at
LSE Cities. He has led 20 reviews of city and regional
development for the OECD, and has advised on
national urban policies in 13 countries.
Skye d’Almeida manages the Financing Sustain-
able Cities Initiative at C40 Cities Climate Leadership
Group, a joint initiative of C40, the Citi Founda-
tion and WRI Ross Center for Sustainable Cities. In
this role, she manages a network of cities working
together to scale-up finance for sustainable urban
infrastructure and services. Her experience includes
designing and implementing climate finance mech-
anisms; advising on energy, economic, and regulato-
ry policy; and working with the U.S. Department of
Energy to develop an inter-national network of clean
energy policymakers. She holds degrees in business
and science from the University of Queensland.
Lourdes Germán is an expert in municipal finance
and director of international and institute-wide
initiatives at the Lincoln Institute of Land Policy,
where she advances the institute’s global municipal
fiscal health campaign. Prior to joining the Lincoln
Institute of Land Policy, she worked for a number
of public and private institutions on issues related
to municipal finance and also taught at North-
eastern University. She is the founder and director
of the Civic Innovation Project, serves as chair of
the Massachusetts Governor’s State Finance and
Governance Board, and is an appointee to a City of
Boston committee focused on the city’s audit and
finance matters.
Pavel Kochanov is a senior subnational specialist
at the International Finance Corporation (IFC). His
primary area of expertise is credit and governance
risks of subsovereign government entities globally.
Prior to his current position at IFC, he worked at
Standard & Poor’s, focusing on development of
credit risk criteria and governance assessment
products. He holds a Ph.D. in economics from
Moscow State University.
Yasuo Konishi is the managing director of Global
Development Solutions LLC (GDS). He has over 30
years of experience working in the private sector
and advising major international organizations like
the World Bank/IFC, United Nations, EBRD, and
the Inter-American Development Bank. At GDS,
he works on value/supply chain analysis and local
economic development across the world. Konishi
x FINANCE FOR CITY LEADERS HANDBOOK
holds a master’s degree from The Fletcher School of
Law and Diplomacy at Tufts University.
Leonardo Letelier is an associate professor and
the director of graduate studies at the Institute of
Public Affairs at the University of Chile. He special-
izes in fiscal decentralization and is the author
of Fiscal Decentralization in Theory and Practice
(2012). He has worked as a consultant for the
United Nations, the Inter-American Development
Bank, and the World Bank. He holds a Ph.D. in
economics from the University of Sussex.
Tim Moonen is the director of intelligence at The
Business of Cities Ltd, an advisory firm based in
London. Tim specializes in the governance, leader-
ship, and comparative performance of cities. Project
clients and content partners include the Brookings
Institution, Future Cities Catapult, OECD LEED, the
Oslo Region, and the Greater Sydney Commission.
He also manages the biannual review of over 200
city benchmarks and indexes, in partnership with
Jones Lang LaSalle. Tim has a Ph.D. in politics and
international studies from the University of Bristol.
Armando Morales is the International Monetary
Fund Resident Representative in Kenya, where he
has served as coordinator of the African Depart-
ment Monetary Policy Network and team leader for
a project on the harmonization of monetary policy
frameworks across East Africa. Prior to serving
as the IMF Resident Representative in Kenya, he
was the IMF Resident Representative in Indone-
sia. He has also served as senior economist for the
Emerging Europe Research Group at the Deutsche
Bank, Central Bank of Peru, as well as several other
organizations.
Miquel Morell is an economist with expertise in
spatial planning, urban planning, and housing. He
is a member of the Technical Report of the Commis-
sion of Territorial Planning of the Central Regions,
representing the Association of Economists of
Catalonia. He also works on financial feasibility and
sustainability analysis of public and private invest-
ment projects related with urban development. He
holds an M.B.A. from ESADE Business School.
Daniel Platz is an economist at the United Nations
Department of Economic and Social Affairs Financ-
ing for Development Office, where he is part of a
team that monitors and promotes the implementa-
tion of the Addis Ababa Action Agenda, the Doha
Declaration on Financing for Development, and
the Monterrey Consensus. He has over 15 years
of experience supporting UN intergovernmental
processes and extensive experience in the area of
municipal finance and financial inclusion. He holds
a Ph.D. in economics and an M.A. in global political
economy and finance from The New School.
Dmitry Pozhidaev is the regional technical advisor
for the United Nations Capital Development Fund
(UNCDF). He is responsible for UNCDF program-
ming in Southern and East Africa. He holds a
master’s degree in finance from the London School
of Business and a Ph.D. in quantitative research and
statistics from Moscow University.
Devashree Saha is an associate fellow at the Brook-
ings Institution Metropolitan Policy Program. She has
nearly 10 years of policy research and analysis expe-
rience, specializing in sources of state and regional
economic growth and prosperity with a focus on the
intersection of clean energy and economic develop-
ment policy. She has authored a number of publica-
tions on issues related to clean energy financing that
have informed state and metropolitan policymaking
in the United States. She holds a Ph.D. in public
policy from the University of Texas at Austin.
FINANCE FOR CITY LEADERS HANDBOOK xi
Yoel Siegel is a senior consultant in the Urban
Economy and Finance Branch of UN-Habitat. In
addition to his work with UN-Habitat, he consults
local governments on sustainable local economic
development projects. He has several years of expe-
rience setting up community-based employment
centers, developing industrial parks, facilitating
training workshops, and promoting inclusive urban
development.
Lawrence Walters is the Stewart Grow Professor
of Public Management at the Romney Institute of
Public Management at Brigham Young Universi-
ty. He recently completed a co-edited volume on
property tax policy and administration, a property
tax policy guide for developing countries, and a
book on managing environmental problems. His
most recent work is focused on developing land-
based financing tools and training materials for
developing countries. He has a Ph.D. from the
Wharton School at the University of Pennsylvania.
UN-Habitat contributors
Katja Dietrich is a regional program manager
for the Housing and Slum Upgrading Branch of
UN-Habitat. She is currently involved in the develop-
ment of the participatory slum upgrading program.
Prior to joining UN-Habitat, she worked with the
German Development Cooperation. She holds a
master’s degree in economic geography and urban
planning from RWTH Aachen University.
Muhammad Farid is an urban researcher in the
Knowledge Management Unit of UN-Habitat in
Afghanistan. Prior to joining the United Nations, he
was an urban advisor to the Ministry of Urban Devel-
opment and Housing in Afghanistan. He also teaches
part time at Kardan University Kabul. He holds an
M.Sc. in Economics from City University London.
Liz Paterson Gauntner is a consultant for the
Urban Economy and Finance Branch at UN-Habitat.
She has worked on urban projects in Africa, Latin
America and the Caribbean, and North America in
partnership with UN-Habitat and other internation-
al agencies. Formerly, she worked for the Metropol-
itan Transportation Commission in the San Francis-
co Bay Area. She holds a master’s degree in urban
and regional planning and an M.P.H. from Portland
State University.
Elizabeth Glass is a consultant for the Urban
Economy and Finance Branch at UN-Habitat. Prior
to joining UN-Habitat, she worked at the Washing-
ton, D.C.–based Economic Policy Institute. She has
also worked with a number of international devel-
opment organizations on education decentraliza-
tion in developing countries and economic develop-
ment research. She holds an M.A. in international
economic development from The New School.
Younghoon Moon is a consultant in the Urban
Economy and Finance Branch at UN-Habitat support-
ing subnational governments in promoting local
economic development and urban prosperity. His
work focuses on integrating productive sector effi-
ciency and spatial analysis. Prior to joining UN-Habi-
tat, Younghoon worked at the World Bank on sector
competitiveness in Kenya and the Korean Exchange
Banks as a foreign direct investment analyst. He
holds an M.P.A. from Colombia University.
Melissa Permezel is a policy and development tool
advisor in the Housing and Slum Upgrading Branch
of UN-Habitat. She specializes in urbanization and
development specifically in slums. Prior to joining
UN-Habitat, she worked with municipal govern-
ments, other UN entities, and also in the private
sector. She holds a Ph.D. in urban planning from the
University of Melbourne.

xii FINANCE FOR CITY LEADERS HANDBOOK
Douglas Ragan is the unit leader for Youth and
Livelihoods at UN-Habitat. He manages UN-Hab-
itat’s global portfolio on youth development in
developing countries. He also manages three
flagship youth programs for UN-Habitat: the Urban
Youth Fund, the Youth 21 initiative, and the One
Stop Youth Resource Centers. He holds a master’s
degree in management from McGill University and
is currently a Ph.D. candidate in architecture and
design, with a focus on youth-led organizations in
slums, at the University of Colorado.
Kerstin Sommer is the unit leader of the Slum
Upgrading Unit at UN-Habitat, where she is respon-
sible for coordinating the agency’s slum upgrading
flagship program in 35 African, Caribbean, and
Pacific countries. Previously, she supported UN-Hab-
itat’s Regional Office for Africa and Arab States
with urban profiling, slum upgrading, housing, and
capacity building. She holds a master’s degree in
applied geography from the University of Trier.
Considerable effort was provided by a multidisciplinary team who prepared the cross-cutting issues chapter
on gender, youth, and human rights. Thanks to Sonja Ghaderi, Judith Mulwa, Brian Olunga, Javan
Ombado, Rocío Armillas-Tiseyra, Taib Boyce, and Hazel Kuria.
The editors would also like to thank Elizabeth Glass, the Finance for City Leaders project coordinator, in
addition to Moges Beyene and Juan Luis Arango, who provided expert research assistance in preparing
this book for publication.
FINANCE FOR CITY LEADERS HANDBOOK xiii
Overview of municipal finance
Cities are a driving force of the 21st century. Through
bringing large numbers of people into close proxim-
ity, they spark economic growth, foster innovation,
and generate prosperity. But they face the pressing
challenges of creating a livable environment for
their residents, enabling economic activity that
benefits all citizens, and fostering urban develop-
ment that is environmentally sustainable, equitable,
and resilient to disruptive forces. Particularly urgent
is the need to finance this development: To achieve
the Sustainable Development Goals, an estimated
$3 trillion to $4 trillion is needed annually. In an
increasingly urban world, cities play a pivotal role in
closing this financial gap.
Decentralization of authority is critical to surmount-
ing all of these challenges. Decentralization
provides a path towards responsive governance,
enabling local governments to address the specific
needs of residents and businesses. However, in
many countries, increased local responsibility has
not been accompanied by a proportionate increase
in local financial resources. In the context of an
urbanizing world, cities are being asked to do more
with less. In particular, as cities grow (especially in
Africa and Asia), the need for infrastructure and
basic services also increases—sometimes at a pace
even more rapid than population growth, due to
low-density sprawling development and dispropor-
tionate expansion of the urban footprint. While the
need for new capital investments is pressing, the
cost of ongoing service provision and maintenance
of existing infrastructure is also growing—and is
often unmet. As a result, in many places the social
contract between citizens and their local govern-
ments has frayed.
Given their finite resources, local governments are
asked to make difficult choices, balancing a range
of urgent needs. Their actions must promote funda-
mental human rights for housing and basic services;
consider the needs of women, youth, and the poor;
and be environmentally sustainable and support-
ive of economic growth. Moreover, deficiencies in
technical capacity, legal frameworks, and gover-
nance are high barriers preventing many cities from
fulfilling their mandates. Though for cities political
issues are intractable and sometimes overwhelm-
ing, many other issues are technical in nature and
are thus possible for city leaders to overcome.
Indeed, many tools exist to help cities improve
their financial situations. The first steps for many
cities are to improve basic financial management,
including administration of local and endogenous
revenues, and to match good planning for a better
urban future with the required budgets and finan-
cial plans. Local governments must find ways to link
revenue generation with their ongoing activities
and with urban growth in order for local finances
to be sustainable in the long term. National govern-
ments can support capacity building in this area,
as well as create supportive regulatory frameworks
and national-level institutions.
Introduction
xiv FINANCE FOR CITY LEADERS HANDBOOK
Once basic financial management has begun to be
addressed, opportunities for borrowing to support
much-needed urban investments become available.
These opportunities come in a variety of forms,
including municipal bonds, commercial bank loans,
and loans from national and regional develop-
ment banks. Cities, with the assistance of national
governments, should match borrowing instruments
to their capacity to service debt, ability to bear risk,
and capital investment needs.
In addition to traditional financing instruments,
there are a range of innovative financing options
that have been increasingly tested in middle-income
countries. These include green bonds, inter-munic-
ipal coordination for pooled financing, and land-
based financing instruments.
Cities’ immense financial challenges cannot be met
through public sector actions alone. The private
sector plays a critical role in creating socially,
economically, and environmentally sustainable
urban development. There are a multitude of ways
for cities to work with the private sector to achieve
this goal, including various public–private part-
nership (PPP) structures. Furthermore, improved
municipal finance must be integrated with other
elements of responsive governance and urban
management, including urban planning and regu-
latory frameworks, in order to support the coordi-
nated realization of a common urban vision by all
involved stakeholders.
City leaders’ increased familiarity with these various
municipal finance instruments can increase the like-
lihood that these tools are implemented successful-
ly. This is the primary purpose of this publication.
Overview of the publication
Finance for City Leaders is organized into three
parts: Principles of Municipal Finance (Chapters
1–3), Designing Financial Products (Chapters
4–12), and Crosscutting Issues (Chapters 13–15).
In Chapters 1 and 2, Dominic Burbidge and Nic
Cheeseman set the context for the rest of Finance
for City Leaders. They lay out the guiding princi-
ples of municipal finance, explain why municipal
finance matters, and introduce a number of tools
for raising local own-source revenues discussed in
greater detail in Part 2.
Chapter 3, authored by Armando Morales, Daniel
Platz, and Leonardo Elias Letelier, examines the
theory behind, arguments for and against, and
success factors of fiscal decentralization. The
authors argue that fiscal decentralization is an
important component of sustainable and auton-
omous municipal finance, and that it must take
place within a regulatory and legal context that
empowers municipal governments while also
holding them responsible for their expenditures
and own-source revenue.
Part 2 (Designing Financial Products) begins with
Chapter 4, by Lourdes Germán and Elizabeth
Glass, who discuss non-tax own-source munici-
pal revenues. They introduce a number of non-tax
tools for generating own-source revenues includ-
ing, among others, user fees, fines, and land use
fees. This chapter argues that non-tax own-source
revenues are essential to boosting municipal
revenues and supporting municipal fiscal autonomy.
In Chapter 5, Devashree Saha and Skye d’Almeida
argue that green municipal bonds are an effective
financing tool for projects that stand to benefit both
the environment and society. The authors begin by

FINANCE FOR CITY LEADERS HANDBOOK xv
explaining what green bonds are and examine the
current state of the green bond market. The last
half of the chapter reviews some of the challeng-
es to obtaining green municipal bonds and how
municipalities can access this important source of
financing.
Chapter 6, by Lars M. Andersson and Pavel
Kochanov, discusses pooled financing mechanisms
in which a group of municipalities aggregate their
borrowing needs and raise their total financing
needs together on the capital market. The authors
argue that this form of raising capital is especial-
ly important for small to medium-sized cities to be
able to access long-term and fairly priced debt.
In Chapter 7, Le-Yin Zhang and Marco Kamiya
discuss the pros and cons of public–private part-
nerships (PPPs). The authors argue argues that PPPs
are important financing mechanisms that have
had widespread success in both developing and
developed countries. Despite having their own set
of regulatory challenges, they have proven to be a
powerful tool for financing important infrastructure
projects.
Chapter 8, by Liz Paterson Gauntner and Miquel
Morell, develops a methodology for financing
planned city extension (PCE). The authors argue
that PCE provides the necessary framework for
sustainable urban growth, which must be imple-
mented following a “three-pronged approach,”
incorporating urban planning and design, rules and
regulations, and public financial management.
In Chapter 9, Lawrence C. Walters and Liz Paterson
Gauntner review the instruments commonly used
to engage in land value sharing and raise revenue
based on land value and land attributes. The
authors argue that while both theory and practice
support the use of land-based revenue sources,
challenges to successful land value sharing must be
understood when implementing it.
In Chapter 10, Greg Clark, Tim Moonen, and
Doug Carr examine the role of real estate devel-
opment in developing cities. The chapter begins
with a discussion of the merits of managed urban
growth, followed by an explanation of how cities
can use planning and asset management to create
and capture value. The authors then assess the
emerging role of city growth planning and the need
for analytical frameworks for intelligent planning,
followed by an overview of the role and value of
coordinated land use planning. The chapter then
explores ways in which public authorities can attract
private capital co-investment, which is followed by
a discussion of the need to acknowledge underly-
ing issues that often affect real estate investment
in developing cities. The chapter concludes with an
examination of the role of real estate planning and
development in making cities competitive.
Chapter 11, authored by Dmitry Pozhidaev and
Mohammad Farid, provides an overview of tools
for improving capital markets for municipal finance
in least developed countries (LDCs). After examin-
ing the various methods of using capital markets
for municipal finance in LDCs, the authors describe
financial and non-financial mechanisms most suitable
for municipalities in LDCs. The chapter concludes
with a discussion of the decision-making process
and specific steps used by municipalities to access
market-based funds (conventional or otherwise).
Yoel Siegel and Marco Kamiya conclude the second
part with Chapter 12 on local infrastructure devel-
opment funds in small and medium-sized cities. The
chapter presents both a background and imple-
mentation framework for financing local infrastruc-
xvi FINANCE FOR CITY LEADERS HANDBOOK
ture using local infrastructure development funds.
The authors emphasize the need for an appropriate
legal and regulatory framework for infrastructure
development funds, as well as a comprehensive
approach to long-term sustainable financing.
Part 3 concludes the book with three chapters on
crosscutting issues. In Chapter 13, Kerstin Sommer,
Katja Dietrich, and Melissa Permezel explain how
financing participatory slum upgrading promotes
inclusive urbanization, adequate living condi-
tions, and prosperity for all. They also examine the
challenges of creating inclusive urban spaces and
detail UN-Habitat’s Participatory Slum Upgrading
Programme, a promising template that exemplifies
many of the concepts discussed in the chapter.
Chapter 14, by Taib Boyce, Sonja Ghaderi, Brian
Olunga, Javan Ombado, Rocío Armillas-Tiseyra,
Judith Mulwa, Douglas Ragan, Imogen Howells,
and Hazel Kuria, explains how youth, gender, and
human rights—major mandates of the United
Nations and issues at the core of the Sustainable
Development Goals—relate to municipal finance
and why they matter for city leaders. The chapter
offers frameworks and specific examples to help
city leaders incorporate these issues into their local
agenda for promoting city prosperity.
Chapter 15, authored by Younghoon Moon,
Marco Kamiya, and Yasuo Konishi, examines local
economic development from the perspective of
spatial analysis and urban layout bringing value
chains and supply analysis into the urban devel-
opment realm. The chapter introduces an innova-
tive local economic development methodology to
help city leaders spur economic growth, promote
competitive sectors, and generate jobs, which
provides the foundation for sustainable local
own-source revenue generation.
Notes of appreciation
A majority of the chapters in this handbook were
made possible by voluntary contributions; our
greatest gratitude goes to the authors. Ranking
from very senior to young researchers, they have
combined their experience and insight with great
tenacity and dedication. To all authors we extend
our sincere appreciation.
This publication would not have been possible
without financial contributions from UN-Habitat,
sponsorship from International City Leaders, and
Oxford University, and the support of UN-Habitat
Executive Director Dr. Joan Clos, who is a major
advocate of getting the finances right as part of
sustainable development policies. We also extend
special recognition to UN-Habitat’s former Urban
Economy branch coordinator, Gulelat Kebede,
whose support was decisive in moving this project
forward.
We received technical contributions from authors
from Oxford University, African Studies Center;
Bartlett Development Planning Unit, Universi-
ty College London; Jones Lang LaSalle (JLL); C40
Cities; the Brookings Institution; and the Interna-
tional Monetary Fund. The ideas provided in this
handbook do not compromise their organizations.
We thank all contributors, sponsors, and partner
organizations for making this publication possible.
Marco Kamiya is coordinator of the Urban
Economy branch of the United Nations Human
Settlements Programme (UN-Habitat).
Le-Yin Zhang is a senior lecturer and course
director of MSc Urban Economic Development at
the Bartlett Development Planning Unit, University
College London.


01:Part
FINANCE FOR CITY LEADERS HANDBOOK 3
Principles of Municipal Finance
Principles of Municipal Finance
Introduction
The world’s population is becoming increasingly urbanized, with esti-
mates suggesting that by 2050, two-thirds of humanity will live in cities
and towns.1 This shift will require governmental reforms—particularly on
the part of local governments, which will be responsible for managing
many of the socioeconomic consequences of large-scale urbanization.
The scope and complexity of this transformation precludes a fully accurate
prediction of the changes it will require of a particular local government.
Nonetheless, by comparing experiences and discussing strategies, it is
possible to establish principles that can serve as general guides for reform.
It is crucial that this reform process remain grounded in formulating and
implementing policy changes that benefit citizens.
01
FINANCE FOR CITY LEADERS HANDBOOK 5
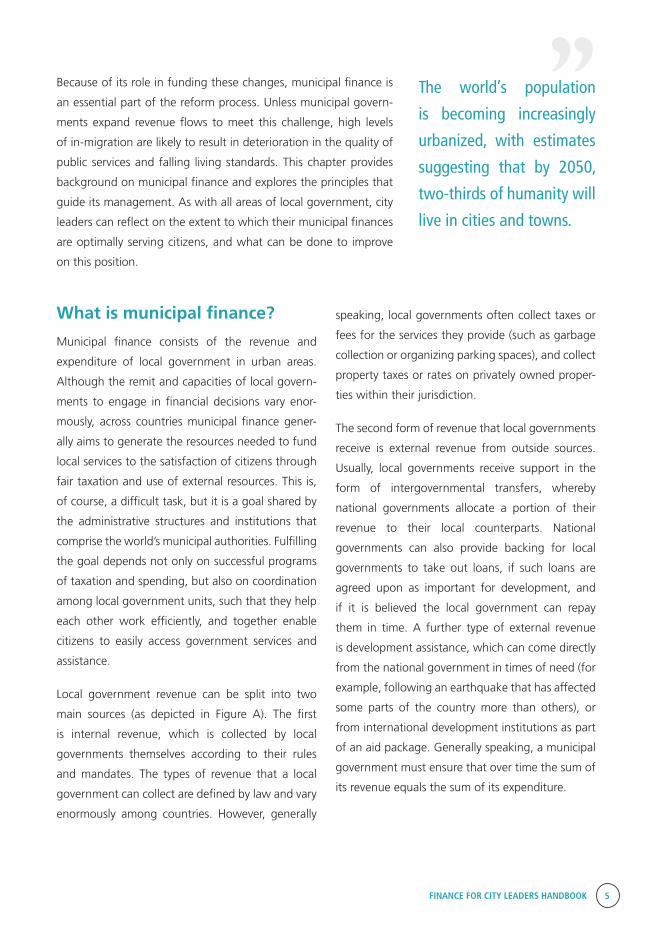
Because of its role in funding these changes, municipal finance is
an essential part of the reform process. Unless municipal govern-
ments expand revenue flows to meet this challenge, high levels
of in-migration are likely to result in deterioration in the quality of
public services and falling living standards. This chapter provides
background on municipal finance and explores the principles that
guide its management. As with all areas of local government, city
leaders can reflect on the extent to which their municipal finances
are optimally serving citizens, and what can be done to improve
on this position.
What is municipal finance?
Municipal finance consists of the revenue and
expenditure of local government in urban areas.
Although the remit and capacities of local govern-
ments to engage in financial decisions vary enor-
mously, across countries municipal finance gener-
ally aims to generate the resources needed to fund
local services to the satisfaction of citizens through
fair taxation and use of external resources. This is,
of course, a difficult task, but it is a goal shared by
the administrative structures and institutions that
comprise the world’s municipal authorities. Fulfilling
the goal depends not only on successful programs
of taxation and spending, but also on coordination
among local government units, such that they help
each other work efficiently, and together enable
citizens to easily access government services and
assistance.
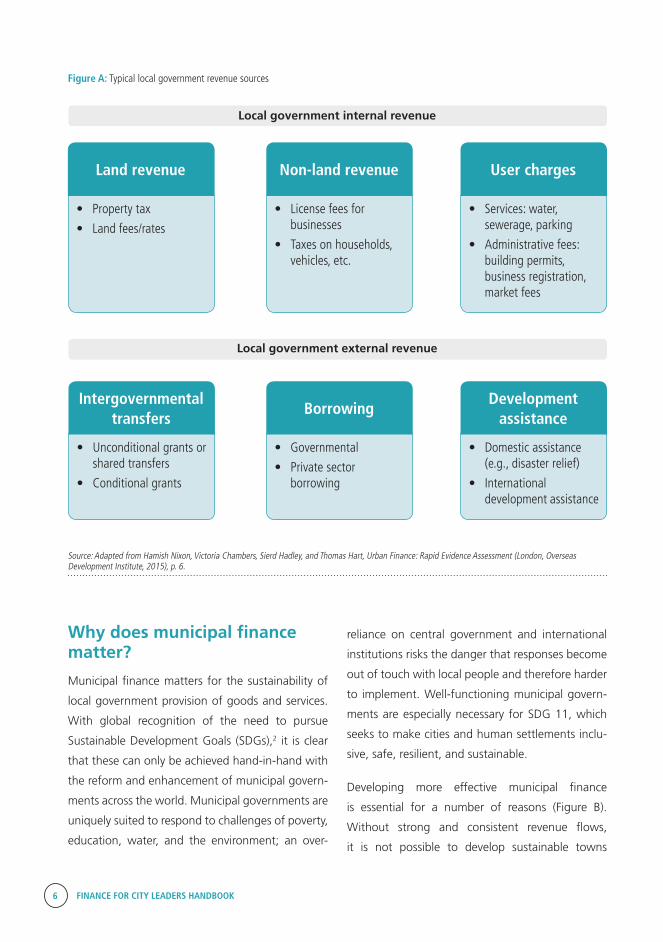
Local government revenue can be split into two
main sources (as depicted in Figure A). The first
is internal revenue, which is collected by local
governments themselves according to their rules
and mandates. The types of revenue that a local
government can collect are defined by law and vary
enormously among countries. However, generally
speaking, local governments often collect taxes or
fees for the services they provide (such as garbage
collection or organizing parking spaces), and collect
property taxes or rates on privately owned proper-
ties within their jurisdiction.
The second form of revenue that local governments
receive is external revenue from outside sources.
Usually, local governments receive support in the
form of intergovernmental transfers, whereby
national governments allocate a portion of their
revenue to their local counterparts. National
governments can also provide backing for local
governments to take out loans, if such loans are
agreed upon as important for development, and
if it is believed the local government can repay
them in time. A further type of external revenue
is development assistance, which can come directly
from the national government in times of need (for
example, following an earthquake that has affected
some parts of the country more than others), or
from international development institutions as part
of an aid package. Generally speaking, a municipal
government must ensure that over time the sum of
its revenue equals the sum of its expenditure.
The world’s population
is becoming increasingly
urbanized, with estimates
suggesting that by 2050,
two-thirds of humanity will
live in cities and towns.
“
6 FINANCE FOR CITY LEADERS HANDBOOK
Figure A: Typical local government revenue sources
Why does municipal finance matter?
Municipal finance matters for the sustainability of
local government provision of goods and services.
With global recognition of the need to pursue
Sustainable Development Goals (SDGs),2 it is clear
that these can only be achieved hand-in-hand with
the reform and enhancement of municipal govern-
ments across the world. Municipal governments are
uniquely suited to respond to challenges of poverty,
education, water, and the environment; an over-
reliance on central government and international
institutions risks the danger that responses become
out of touch with local people and therefore harder
to implement. Well-functioning municipal govern-
ments are especially necessary for SDG 11, which
seeks to make cities and human settlements inclu-
sive, safe, resilient, and sustainable.
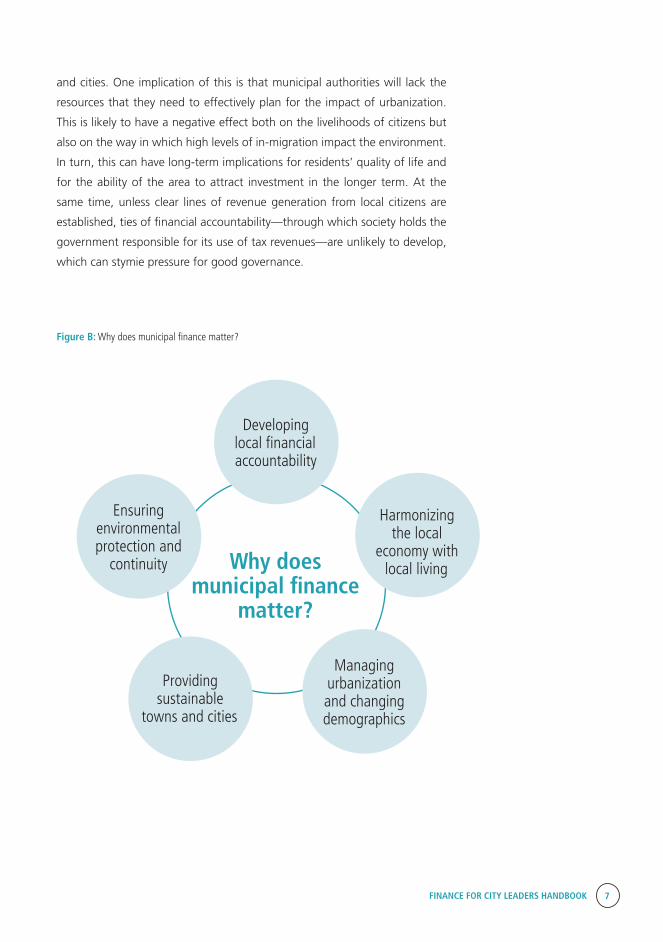
Developing more effective municipal finance
is essential for a number of reasons (Figure B).
Without strong and consistent revenue flows,
it is not possible to develop sustainable towns
Source: Adapted from Hamish Nixon, Victoria Chambers, Sierd Hadley, and Thomas Hart, Urban Finance: Rapid Evidence Assessment (London, Overseas Development Institute, 2015), p. 6.
• Property tax
• Land fees/rates
• Unconditional grants or shared transfers
• Conditional grants
• License fees for businesses
• Taxes on households, vehicles, etc.
• Governmental
• Private sector borrowing
• Services: water, sewerage, parking
• Administrative fees: building permits, business registration, market fees
• Domestic assistance (e.g., disaster relief)
• International development assistance
Land revenue
Intergovernmental transfers
Non-land revenue
Borrowing
User charges
Development assistance
Local government external revenue
Local government internal revenue
FINANCE FOR CITY LEADERS HANDBOOK 7
and cities. One implication of this is that municipal authorities will lack the
resources that they need to effectively plan for the impact of urbanization.
This is likely to have a negative effect both on the livelihoods of citizens but
also on the way in which high levels of in-migration impact the environment.
In turn, this can have long-term implications for residents’ quality of life and
for the ability of the area to attract investment in the longer term. At the
same time, unless clear lines of revenue generation from local citizens are
established, ties of financial accountability—through which society holds the
government responsible for its use of tax revenues—are unlikely to develop,
which can stymie pressure for good governance.
Figure B: Why does municipal finance matter?
Why does municipal finance
matter?
Developing local financial accountability
Harmonizing the local
economy with local living
Managing urbanization and changing demographics
Providing sustainable
towns and cities
Ensuring environmental protection and
continuity
8 FINANCE FOR CITY LEADERS HANDBOOK
How can local authorities enhance the sustainability of municipal finance?
There is a great need to improve the sustainability
of municipal government finances across the world.
Given how much depends on the successful perfor-
mance of local governments, poor finances can
make local service delivery faulty and inconsistent,
and can damage future development prospects.
Unfortunately, attempts at reforming local govern-
ment revenue through decentralization have often
proven more challenging than originally envisaged.
International expert Paul Smoke writes:
“Fiscal decentralization has been particularly disap-
pointing given how much consensus there has
been on specific reform advice, with own source
revenue generation arguably being the most prob-
lematic of fiscal concerns. Available empirical liter-
ature strongly indicates that subnational revenue
generation, more often than not, falls short of
expectations.”3
If subnational revenue generation often falls short of
expectations, how can it be improved to become a
more sustainable feature of municipal government?
This question is not easy to answer. To begin, it
is important to realize that there are many differ-
ent ways in which countries decentralize political
administration to allow for local decision-mak-
ing. This means it is not always appropriate to
recommend the same policy across the board.
Some countries allow very little discretion for local
governments, while others allow a great deal. The
level of discretion afforded depends on the consti-
tutional provisions of what municipal governments
can and cannot do.
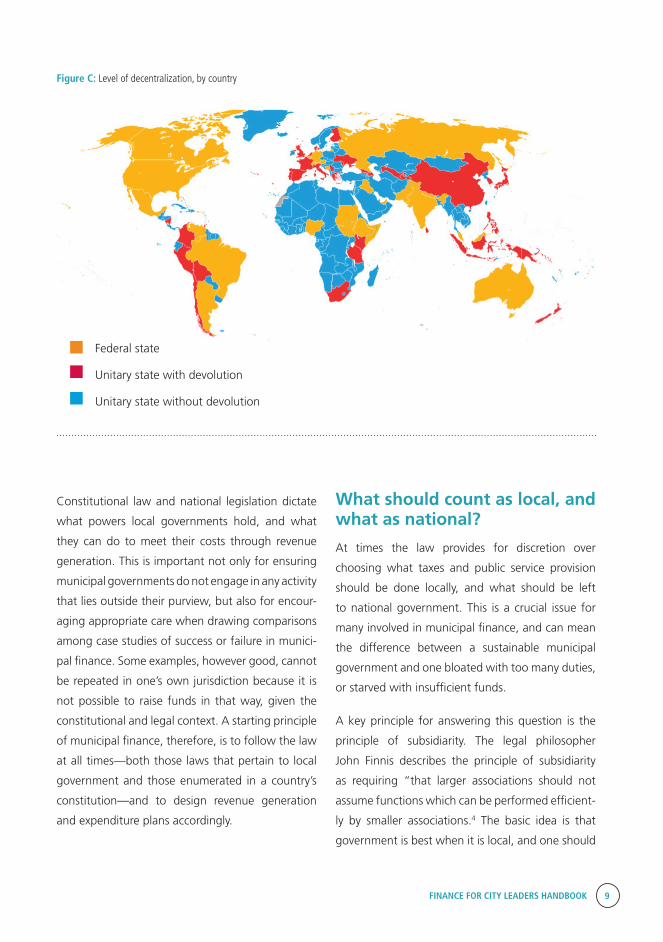
Figure C illustrates the different levels of decen-
tralization around the world. Those in yellow are
federal states: countries where most decision-mak-
ing power is held at the level of regions, provinc-
es, or sub-national states. Some of the most well-
known examples of federal states include Nigeria,
the United States of America, and Brazil. Federal
constitutions usually provide the greatest degree
of regional autonomy, allowing local governments
wide discretion over the types of taxes they collect.
Those countries displayed in red are unitary states
with a centralized political administration, but
whose constitutions provide for devolution. Devo-
lution is a constitutional provision that allows for
regional decision-making over a set list of govern-
ment functions. The functions for which there is
local political autonomy are established by the
political center, and usually cannot be changed
without difficulty (for example, requiring constitu-
tional amendment). In terms of local government
finance, some discretion is usually given under
devolution for local political actors to set budgets
and decide the taxation levels to be implemented.
While, like under federalism, this has the poten-
tial complication of varied tax rates and levels of
spending among different provinces or counties,
large benefits can be realized by involving citizens
in decision-making through electing local represen-
tatives, and through engaging in public participa-
tion when planning how to carry out local govern-
ment functions.
In blue, the map shows non-federal and non-de-
volved unitary states. This kind of heavily central-
ized political system prevails in Africa and the
Middle East.
FINANCE FOR CITY LEADERS HANDBOOK 9
Figure C: Level of decentralization, by country
Constitutional law and national legislation dictate
what powers local governments hold, and what
they can do to meet their costs through revenue
generation. This is important not only for ensuring
municipal governments do not engage in any activity
that lies outside their purview, but also for encour-
aging appropriate care when drawing comparisons
among case studies of success or failure in munici-
pal finance. Some examples, however good, cannot
be repeated in one’s own jurisdiction because it is
not possible to raise funds in that way, given the
constitutional and legal context. A starting principle
of municipal finance, therefore, is to follow the law
at all times—both those laws that pertain to local
government and those enumerated in a country’s
constitution—and to design revenue generation
and expenditure plans accordingly.
Federal state
Unitary state with devolution
Unitary state without devolution
What should count as local, and what as national?
At times the law provides for discretion over
choosing what taxes and public service provision
should be done locally, and what should be left
to national government. This is a crucial issue for
many involved in municipal finance, and can mean
the difference between a sustainable municipal
government and one bloated with too many duties,
or starved with insufficient funds.
A key principle for answering this question is the
principle of subsidiarity. The legal philosopher
John Finnis describes the principle of subsidiarity
as requiring “that larger associations should not
assume functions which can be performed efficient-
ly by smaller associations.4 The basic idea is that
government is best when it is local, and one should
10 FINANCE FOR CITY LEADERS HANDBOOK
only take away the decision-making of local actors
when there are clear efficiency gains to be realized.
As Finnis describes further, “[T]he proper function of
association is to help the participants in the associa-
tion to help themselves or, more precisely, to consti-
tute themselves through the individual initiatives of
choosing commitments […] and of realizing these
commitments through personal inventiveness and
effort in projects.”5 The need for cherishing indi-
vidual initiative is not just a case of citizens versus
government, but among government institutions
themselves. At times, the greater authority of those
higher up in government can be used to nullify
individual creativity among local government prac-
titioners, and this can harm municipal governments’
capacity to grow their revenue base.
Principles of municipal finance: The “benefit principle” and the “ability-to-pay” principle
There are two main principles around which systems
of taxation can be arranged. One is the “benefit
principle,” a long-held idea put forward by public
finance theorists, which argues that “an equita-
ble tax system is one under which each taxpayer
contributes in line with the benefits which he or she
receives from public services.”6 This approach ties
taxation to public service delivery, helping develop
a close correlation between the money generated
in tax revenue and the money spent delivering the
particular good or service.
To help understand the benefit principle, it can be
contrasted with an alternative approach, the “abil-
ity-to-pay principle.” As the name suggests, this
principle entails that “each taxpayer is asked to
contribute in line with his or her ability to pay.”7 The
difference between this and the benefit principle
is that there is no direct connection with what is
being paid for. Citizens contribute according to their
ability without necessarily seeing the results of their
contributions.
In reality, most tax systems combine elements of
both approaches, with wealthier citizens contrib-
uting more, but some contributions being directly
linked to services. The advantage of this approach
is that linking taxation to services helps to generate
a social contract between citizens and the govern-
ment, such that citizens know what they are
contributing to and are able to witness its effects.
This, it is believed, will help increase compliance
in taxpaying. There is an element of fairness in
consumers of a publicly provided service being the
ones who pay for it.8
In order to maximize the advantages of the benefit
principle, some practitioners have recommended
earmarking certain taxes for specific uses.9 This can
make citizens more willing to pay the tax because
they know exactly where the money goes, and
can also help reduce corruption. Tax expert Wilson
Prichard writes:
“The aim of such tax earmarking is to build greater
trust between governments and taxpayers, while
providing a foundation for improved monitoring of
public expenditures. The case for such tax earmark-
ing is particularly strong in low-income countries
where trust is frequently limited and monitoring
particularly difficult.”10
Prichard describes the example of increases in
value-added tax (VAT) in Ghana, which was imple-
mented by connecting VAT to the provision of
specific public services, and “served to increase trust
amongst taxpayers while also making it somewhat
easier for the public to monitor government perfor-
mance.”11
FINANCE FOR CITY LEADERS HANDBOOK 11
Nevertheless, criticism has been levied at the
benefits approach. Some counterargue that tying
taxes to specific benefits restricts governments’
spending autonomy. Because a government’s hands
are tied by the decision to earmark the money, it
cannot change the way in which the money is used
if something more urgent arises. Secondly, this
approach may lead to favoritism in the provision
of public services; if only some are paying for the
service, why should anyone else gain access? Such
arguments threaten to turn the public good into a
“club” good received only by a select group. Finally,
public service provision is good for development in
the long term because it can solve coordination
problems by adopting a multi-sector approach and
providing services on a large scale that generates
greater efficiency and reduces costs. However,
providing more public services to those who pay
more taxes can exacerbate economic inequalities
over time by developing more public services in rich
areas than in poor areas.
For all of these reasons, a mixture of the benefits
approach and the ability-to-pay approach is often
thought to be the most suitable.
Principles of municipal finance: Local government autonomy
To meet some of the shortcomings of the benefits
approach, theorists have begun placing greater
emphasis on the need for local governments to be
given the autonomy to determine what works best
for their local economy. Among these suggestions
are the following:
Local governments should be allowed to set
local tax rates.
The tax rate should be in line with expenditure
responsibilities across the area of jurisdiction.
Incentives should be in place to help local
governments be fiscally responsible.12
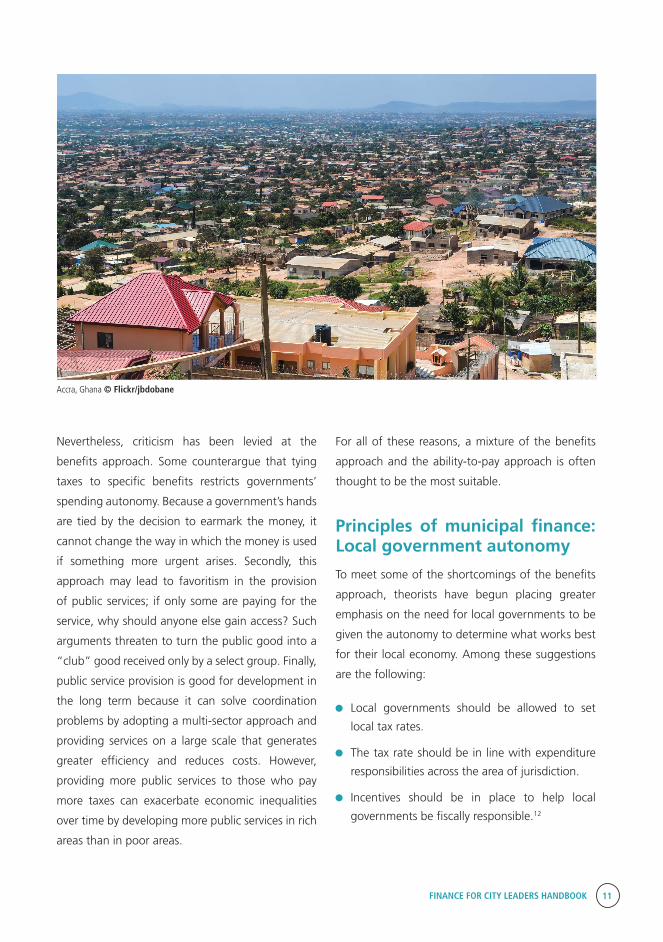
Accra, Ghana © Flickr/jbdobane
12 FINANCE FOR CITY LEADERS HANDBOOK
Development economists such as Amartya Sen
believe that it is not just a question of fiscal
autonomy, but of providing the freedom for citizens
and public policy practitioners to engage with local
notions of development when making governance
decisions.13 If local government is to work for
citizens, it must be in dialogue with the goals and
aims of local residents.
When it comes to the principles of municipal
finance, this new emphasis takes the form of advo-
cating greater freedoms for local governments to
experiment, so as to determine what works and
what does not in their area. This is not, however,
a license for bureaucrats to do whatever they feel
like; the aim is to promote a sense of responsibil-
ity for decision-making among local government
personnel. As much as possible, city leaders should
know the revenue coming in and the costs of the
services currently provided, and be able to nurture
the link between these two so that all involved act
with responsibility and care—citizens and bureau-
crats alike. Ilias Dirie, a municipal finance expert,
explains:
“The development of responsible and respon-
sive local government is thus dependent on local
government having at least some degree of
freedom with respect to local revenues, including
the freedom to make mistakes and be held account-
able for them. This means that local government
must have control over the rates of some significant
revenue source if they are to be fiscally responsible
and able to innovate as to the way they finance
basic services.”14
For federal or devolved states, fiscal responsibility
can also involve political responsibility as citizens
vote on representatives who are in a position to lead
and direct local governments. When this is the case,
it is all the more important that a social contract is
developed between citizens and the government,
where both sides understand their duties towards
the common good, and both realize the benefits of
good governance.
Political representatives also have a responsibility to
ensure that national–local relations are fostered in
support of the sustainability of municipal finances.
As a 2015 UN-Habitat report explains:
“Where local authorities are able to derive revenues
from property taxes and service charges, meaning-
ful tax increases are sometimes refused or delayed
by central governments for fear of eroding polit-
ical support from the urban population; or even
rejected by the local authorities themselves for fear
of political backlash from local taxpayers.”15
It can be difficult to achieve sustainable municipal
finances within the narrow time of an electoral
cycle. However, the accountability provided by elec-
tions can act as an excellent check on corruption,
and the disruptive impact of elections often declines
over time.16 In addition, changes in leadership can
create new opportunities for thorough monitoring
and evaluation of systems of municipal finance by
city leaders.
FINANCE FOR CITY LEADERS HANDBOOK 13
Conclusion
The demands placed on municipal governments are
likely to increase with the growing urbanization of
the world’s population. At the same time, there are
clear principles that allow local government practi-
tioners to guide their finances towards a position
of self-sustainability. Robust municipal finances are
integral to development, and play a unique role
in governance because of the closeness of local
governments to citizen needs.
The discussion in this first chapter has generated
the following checklist that can foster reflection on
the sustainability of one’s municipal finances:
Are the powers of taxation exercised by my
government lawful and in line with the constitu-
tion?
Is my government reliant more on internal or
external revenue sources?
Have the benefits of the goods and services my
government provides been tied to specific taxes
or service fees?
Do government decision-makers feel they have
the freedom to change policies based on citizen
needs? Do they have room for experimentation
in seeing what might work better?
Have we given sufficient care and attention to
the need to build citizen support for our taxes
and fees, and to the question of how we can
form an effective social contract?
Could our relations with the national govern-
ment be improved to avoid unnecessary volatility
in our budget?
In the midst of all of these concerns and decisions, it
is important to keep in mind the principle of subsid-
iarity: Those duties carried out locally are done so
because they can be implemented with efficiency
and local creativity. This principle can aid in assess-
ing the appropriateness of government duties at
the local level.
14 FINANCE FOR CITY LEADERS HANDBOOK
Dominic Burbidge is departmental lecturer in the School of Interdisciplinary Area Studies, Oxford Univer-
sity, and researcher at the Department of Politics & International Relations.
Nic Cheeseman is associate professor of African politics at Oxford University, the former editor
of African Affairs, and the author of Democracy in Africa (Cambridge University Press, 2015).
countability in Sub-Saharan Africa: The Dynamics of Tax Bargaining (Cambridge, Cambridge University Press, 2015), p. 257.
11 Wilson Prichard, Taxation, Responsiveness and Ac-countability in Sub-Saharan Africa: The Dynamics of Tax Bargaining (Cambridge, Cambridge University Press, 2015), p. 257.
12 Hamish Nixon, Victoria Chambers, Sierd Hadley, and Thomas Hart, Urban Finance: Rapid Evidence Assessment (London, Overseas Development Institute, 2015), p. 6.
13 Amartya Sen, Development as Freedom (Oxford, Oxford University Press, 1999). For an explanation and defense of the wideness of Sen’s acceptable notions of development, see Sabina Alkire, Valuing Freedoms: Sen’s Capability Approach and Poverty Reduction (Oxford, Oxford University Press, 2002), pp. 8–10.
14 Ilias Dirie, Municipal Finance: Innovative Resourcing for Municipal Infrastructure and Service Provision (London, Commonwealth Local Government Forum, 2006), p. 260. Quoted in Hamish Nixon, Victoria Chambers, Sierd Hadley, and Thomas Hart, Urban Finance: Rapid Evidence Assess-ment (London, Overseas Development Institute, 2015), p. 6.
15 UN-Habitat, The Challenge of Local Government Financing in Developing Countries (Nairobi, United Nations Human Settlements Programme, 2015), p. 8.
16 Staffan I. Lindberg, Democracy and Elections in Africa (Baltimore, John Hopkins University Press, 2006).
Endnotes1 UN-Habitat, Guide to Municipal Finance (Nairobi, United Nations Settlements Programme, 2009), p. vii.
2 Available from https://sustainabledevelopment.un-.org/?menu=1300.
3 Paul Smoke, “Urban Government Revenues: Political Economy Challenges and Opportunities,” in The Challenge of Local Government Financing in Developing Countries (n.p., United Nations Human Settlements Programme, 2014), p. 9.
4 John Finnis, Natural Law & Natural Rights, 2nd ed. (Oxford, Oxford University Press, 2011), pp. 146–147.
5 John Finnis, Natural Law & Natural Rights, 2nd ed. (Oxford, Oxford University Press, 2011), p. 146.
6 Richard A. Musgrave and Peggy B. Musgrave, Public Finance in Theory and Practice, 5th ed. (New York, Mc-Graw-Hill Book Company, 1989), p. 219.
7 Richard A. Musgrave and Peggy B. Musgrave, Public Finance in Theory and Practice, 5th ed. (New York, Mc-Graw-Hill Book Company, 1989), p. 219.
8 Harvey S. Rosen and Ted Gayer, Public Finance, 10th ed. (Maidenhead, United Kingdom, McGraw-Hill Education, 2014), p. 355.
9 Richard A. Musgrave and Peggy B. Musgrave, Public Finance in Theory and Practice, 5th ed. (New York, Mc-Graw-Hill Book Company, 1989), p. 222.
10 Wilson Prichard, Taxation, Responsiveness and Ac-

FINANCE FOR CITY LEADERS HANDBOOK 15
Espargos City, Sal municipality, Cape Verde © UN-Habitat/A.Grimard
Introduction
The costs that municipal governments face are likely to increase every year
in line with the processes of urbanization taking place around the world.
Thus, raising municipal revenues is among the most pressing challenges
facing city leaders today. It would normally be assumed that a growing
population increases the tax base proportionately, with a greater number
of local residents simply paying in line with the greater number of services
provided. However, this common assumption has been proven wrong on
two counts. First, changing demographics go hand-in-hand with changes
in lifestyle, economic specializations, and income distribution. These
shifts mean that citizens do not always have the same needs from their
local governments as before, and will change how they contribute to the
funding of local government services. Second, local population increases
do not usually lead to immediate adjustments by central governments in
the amounts transferred to the municipal level. As the “front line” when
Expanding Municipal Revenues02
FINANCE FOR CITY LEADERS HANDBOOK 17
What generates local government revenue?
Municipal revenues are raised from taxes or fees
charged to local residents, usually in return for the
goods and services the local government provides.
The amount generated varies enormously among
countries, as there is wide variety in countries’ legal
provisions concerning what taxes and levies are
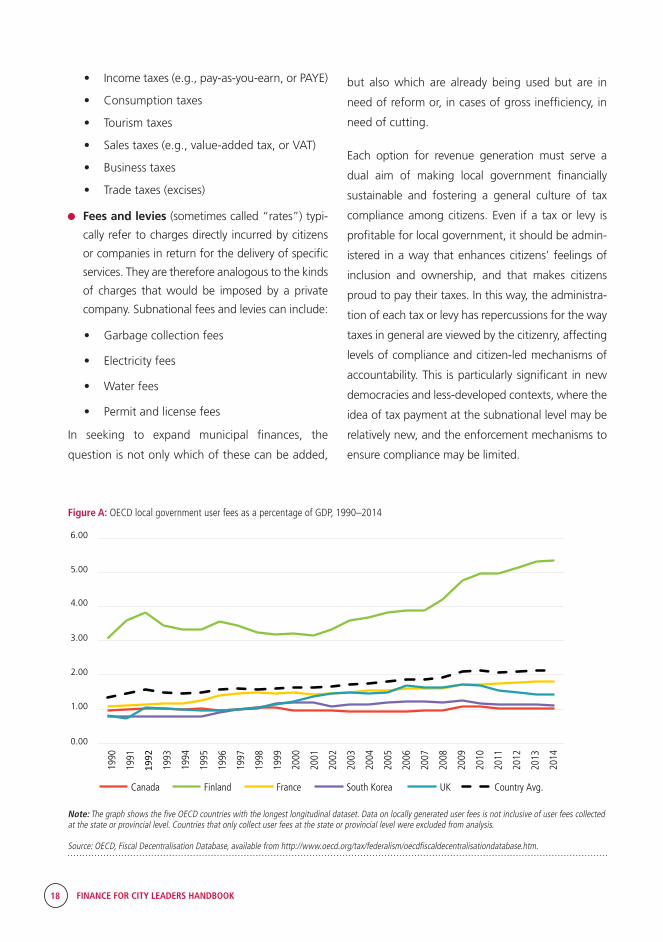
allowed to be collected locally. Figure A displays the
percentage of GDP collected through local govern-
ment fees, with data taken from five OECD coun-
tries. The gradual upward trajectory over the past 15
years reflects the growing relevance of these types of
fees and taxes for 21st century governance.
it comes to delivering public goods and services, local governments often need to respond
immediately to changing circumstances while there are time lags in altering rates of national
government transfers.
In the face of this dilemma, municipal revenues are city leaders’ best asset. Because they are
under the control of local authorities themselves, they can be made to shift in proportion
to changing demographics and lifestyles in a way that strengthens the provision of public
services. As a population changes, local governments are able to change too.
There are a number of different ways city leaders can increase the funds at their disposal,
including new taxes on tourism, property taxes, levies on businesses, and fees linked to
the provision of specific services. What is possible depends on careful navigation of legal,
technical, and political constraints, which are different in each case. The chapter explains
the options available to city leaders and weighs the pros and cons of different strategies. It
considers how city leaders can best build public support for revenue generation, which is
often critical to the success of their initiatives. To help guide the reader, the chapter provides
three different perspectives on tackling
this challenge: local government admin-
istration, economics, and local politics.
Success in achieving stable expansion
of municipal revenues depends on
balancing these three perspectives and
harnessing each of their strengths.
At this point it is important to delineate the differ-
ences between taxes and fees, and to provide
examples of each:
Taxes refer to charges levied on citizens and
businesses to enable the government to fund its
core activities. Although taxes may be enforced
for a specific purpose, such as to fund a particu-
lar infrastructure project or to deal with a specific
challenge, they typically generate income that
the government can allocate to a range of
different activities as it sees fit. Depending on
a country’s constitutional and legal framework,
subnational taxes can include:
• Property taxes
“
Municipal revenues are city leaders’ best asset. Because they are under the control of local author-ities themselves, they can be made to shift in proportion to changing demographics and life-styles in a way that strengthens the provision of public services.
18 FINANCE FOR CITY LEADERS HANDBOOK
• Income taxes (e.g., pay-as-you-earn, or PAYE)
• Consumption taxes
• Tourism taxes
• Sales taxes (e.g., value-added tax, or VAT)
• Business taxes
• Trade taxes (excises)
Fees and levies (sometimes called “rates”) typi-
cally refer to charges directly incurred by citizens
or companies in return for the delivery of specific
services. They are therefore analogous to the kinds
of charges that would be imposed by a private
company. Subnational fees and levies can include:
• Garbage collection fees
• Electricity fees
• Water fees
• Permit and license fees
In seeking to expand municipal finances, the
question is not only which of these can be added,
but also which are already being used but are in
need of reform or, in cases of gross inefficiency, in
need of cutting.
Each option for revenue generation must serve a
dual aim of making local government financially
sustainable and fostering a general culture of tax
compliance among citizens. Even if a tax or levy is
profitable for local government, it should be admin-
istered in a way that enhances citizens’ feelings of
inclusion and ownership, and that makes citizens
proud to pay their taxes. In this way, the administra-
tion of each tax or levy has repercussions for the way
taxes in general are viewed by the citizenry, affecting
levels of compliance and citizen-led mechanisms of
accountability. This is particularly significant in new
democracies and less-developed contexts, where the
idea of tax payment at the subnational level may be
relatively new, and the enforcement mechanisms to
ensure compliance may be limited.
0.00
1.00
2.00
3.00
4.00
5.00
6.00
1990
1991
1992
1993
1994
1995
1996
1997
1998
1999
2000
2001
2002
2003
2004
2005
2006
2007
2008
2009
2010
2011
2012
2013
2014
Canada Finland France South Korea UK Country Avg.
Figure A: OECD local government user fees as a percentage of GDP, 1990–2014
Note: The graph shows the five OECD countries with the longest longitudinal dataset. Data on locally generated user fees is not inclusive of user fees collected at the state or provincial level. Countries that only collect user fees at the state or provincial level were excluded from analysis. Source: OECD, Fiscal Decentralisation Database, available from http://www.oecd.org/tax/federalism/oecdfiscaldecentralisationdatabase.htm.
FINANCE FOR CITY LEADERS HANDBOOK 19
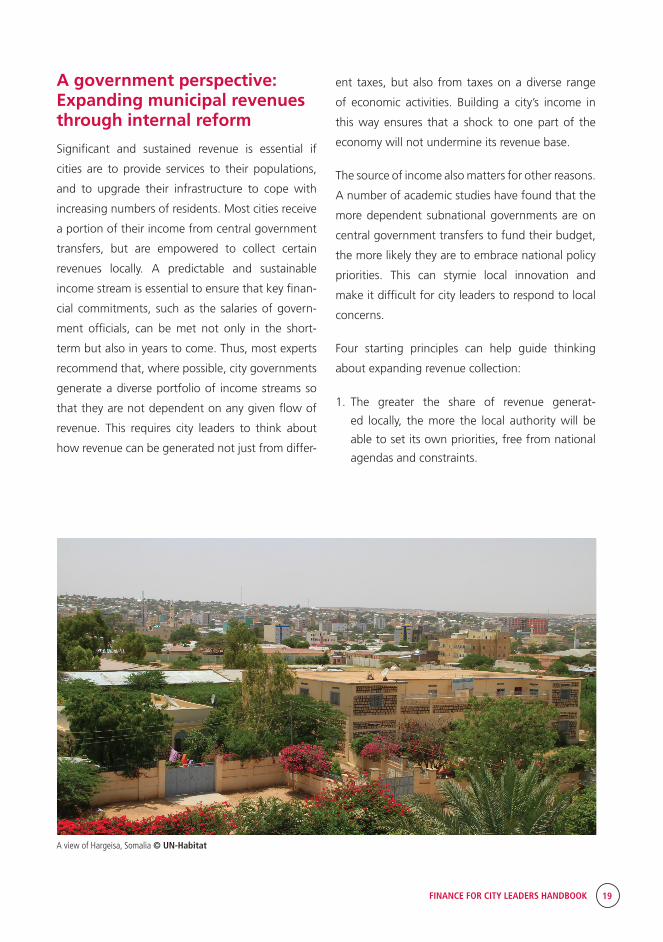
A view of Hargeisa, Somalia © UN-Habitat
A government perspective: Expanding municipal revenues through internal reform
Significant and sustained revenue is essential if
cities are to provide services to their populations,
and to upgrade their infrastructure to cope with
increasing numbers of residents. Most cities receive
a portion of their income from central government
transfers, but are empowered to collect certain
revenues locally. A predictable and sustainable
income stream is essential to ensure that key finan-
cial commitments, such as the salaries of govern-
ment officials, can be met not only in the short-
term but also in years to come. Thus, most experts
recommend that, where possible, city governments
generate a diverse portfolio of income streams so
that they are not dependent on any given flow of
revenue. This requires city leaders to think about
how revenue can be generated not just from differ-
ent taxes, but also from taxes on a diverse range
of economic activities. Building a city’s income in
this way ensures that a shock to one part of the
economy will not undermine its revenue base.
The source of income also matters for other reasons.
A number of academic studies have found that the
more dependent subnational governments are on
central government transfers to fund their budget,
the more likely they are to embrace national policy
priorities. This can stymie local innovation and
make it difficult for city leaders to respond to local
concerns.
Four starting principles can help guide thinking
about expanding revenue collection:
1. The greater the share of revenue generat-
ed locally, the more the local authority will be
able to set its own priorities, free from national
agendas and constraints.
20 FINANCE FOR CITY LEADERS HANDBOOK
2. A diverse portfolio of revenue sources is impor-
tant to ensure a local authority can cope with
shocks to any specific income stream.
3. The greater the share of revenues raised through
fees and levies, the more careful and account-
able local authorities are likely to be in their
expenditures.
4. Long-term stability and self-sufficiency is key, so
government should manage expectations of tax
and levy generation to ensure that targets given
to tax collectors can be communicated reasona-
bly to citizens.
As discussed in Chapter 1, many governments
have found it beneficial to earmark certain tax or
fee payments towards specific goods that citizens
enjoy, because voluntary compliance is more likely
when citizens consider their payments worthwhile.
In a local government context, this link is often
already present when fees are paid by citizens
for specific services such as garbage collection or
parking spaces. However, it is important to note
that the manner in which money is collected can
also greatly affect citizen perceptions. For example,
issuing receipts for parking fees can help citizens
feel that the money is accounted for and less likely
to be misappropriated. When public infrastruc-
ture is being developed, a simple sign saying the
upgrade is funded by the city’s tax contributions
can go a long way towards helping local residents
see the benefits of paying their taxes.
However, one of the least explored strategies for
expanding municipal revenues has nothing to do
with choosing what fees to charge but, instead,
looks at enhancing the training of tax collectors.
Collecting taxes is a difficult job, and one that lies
at the forefront of many citizens’ dissatisfaction
with poor local public service provision. As such,
it is important to bear in mind that government
employees can suffer from:
Lack of awareness of the good things the collect-
ed money goes towards
Lack of training on how best to collect taxes and
fees, especially those fees newly introduced
A preference to do things according to an
outdated system, even though that older
method may involve serious costs and impose
an undue bureaucratic burden on local residents
A low opinion of their profession in the eyes of
citizens, and a feeling that there is little to no
upward career trajectory
A low salary, increasing the attractiveness of
short-term gain through corruption
A feeling that some policies they are implement-
ing are ultimately unfair to citizens, without
knowing of a safe route for communicating this
to their superiors
These challenges to the work of tax collection can
be allayed through additional training, the widening
of channels of communication with superiors, and
affirmation of the value of tax collectors’ work. In
this way, effective public relations exercises about
the benefits of tax payment can help both taxpay-
ers and tax collectors fulfil their roles.
An economics perspective: Expanding municipal revenues through efficient taxation
In addition to administrative feasibility, it is import-
ant to think about taxes’ economic impact. Econ-
omists ask whether a tax is being collected effi-
ciently. By this, they do not mean whether the tax
is being collected quickly, but rather how it affects
other parts of the economy. It may be that a tax is
so high that it is slowing the economy as a whole,
or placing an undue burden on doing business in
particular sectors. To succeed in expanding munic-
ipal revenues, it is crucial to be aware of taxes’
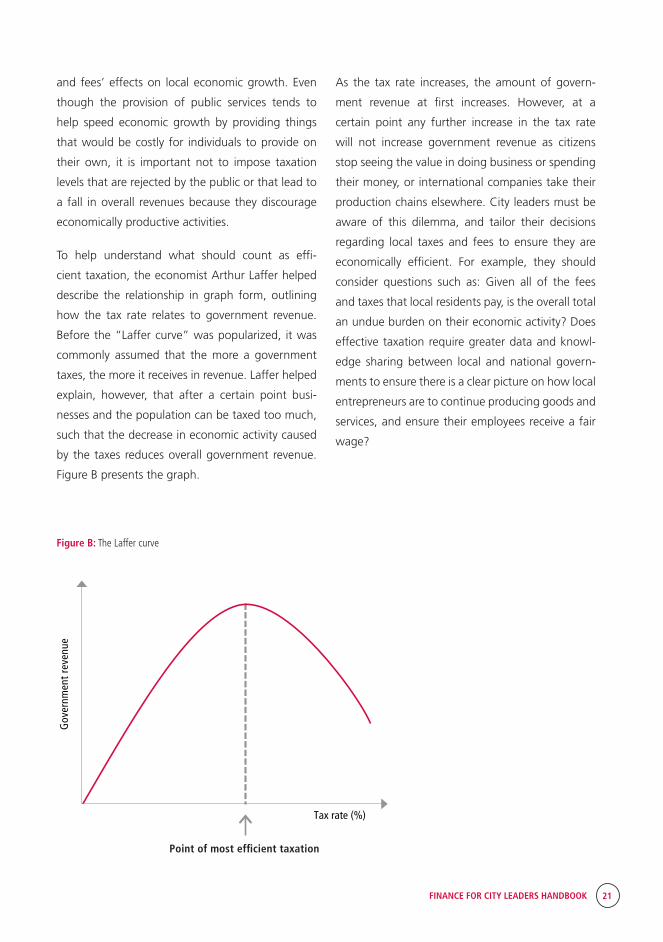
FINANCE FOR CITY LEADERS HANDBOOK 21
Tax rate (%)
Gov
ernm
ent r
even
ue
Point of most ef�cient taxation
and fees’ effects on local economic growth. Even
though the provision of public services tends to
help speed economic growth by providing things
that would be costly for individuals to provide on
their own, it is important not to impose taxation
levels that are rejected by the public or that lead to
a fall in overall revenues because they discourage
economically productive activities.
To help understand what should count as effi-
cient taxation, the economist Arthur Laffer helped
describe the relationship in graph form, outlining
how the tax rate relates to government revenue.
Before the “Laffer curve” was popularized, it was
commonly assumed that the more a government
taxes, the more it receives in revenue. Laffer helped
explain, however, that after a certain point busi-
nesses and the population can be taxed too much,
such that the decrease in economic activity caused
by the taxes reduces overall government revenue.
Figure B presents the graph.
As the tax rate increases, the amount of govern-
ment revenue at first increases. However, at a
certain point any further increase in the tax rate
will not increase government revenue as citizens
stop seeing the value in doing business or spending
their money, or international companies take their
production chains elsewhere. City leaders must be
aware of this dilemma, and tailor their decisions
regarding local taxes and fees to ensure they are
economically efficient. For example, they should
consider questions such as: Given all of the fees
and taxes that local residents pay, is the overall total
an undue burden on their economic activity? Does
effective taxation require greater data and knowl-
edge sharing between local and national govern-
ments to ensure there is a clear picture on how local
entrepreneurs are to continue producing goods and
services, and ensure their employees receive a fair
wage?
Figure B: The Laffer curve
22 FINANCE FOR CITY LEADERS HANDBOOK
It is also important to consider the different
costs of collecting taxes, which vary depending
on the type of tax. After reviewing the costs of
collection, it may become evident that a certain
tax or fee does not generate sufficient revenue
for the local authority. This is not necessarily a
reason for immediately abandoning it, however.
The following checklist should be consulted
before deciding to abandon a tax:
Is the decrease in revenue from this tax a
short-term dip or a long-term trend? If the
former, it could be advisable to avoid whole-
sale change until the longer-term trends
become clear.
Is the tax’s lack of profitability caused by
unnecessarily high collection costs? Rather
than abandoning the tax, it could be that a
different way of collecting would render its
relatively low revenue stream profitable.
Is the tax connected to the provision of a
good or service that citizens deem essential?
If so, although the removal of the tax could
save money, there could be large and poten-
tially destructive repercussions in removing
its associated services, which could under-
mine confidence in the local government as
a whole.
Will the current costs of administering the tax
be entirely removed if the tax is abandoned?
At times, employee and institutional costs
are not eliminated when a tax is cancelled.
There must be some evaluation, therefore,
of whether the network of personnel, insti-
tutions, and administration will remain a
burden on local government even if a tax is
cancelled. If so, the municipal government
will not save money overall by abandoning
the tax.
A political perspective: Expanding municipal revenues through democratic dialogue
A third, again complementary, point of view can be
found by examining the challenge from the perspec-
tive of local populations and their relationship to
the political sphere. Most constitutions encourage
a clear distinction between the civil service and
politicians. This is, of course, a very positive thing,
as it helps avoid the manipulation of government
employees for the purposes of short-term political
goals. A clear separation of roles also helps protect
civil servants by making sure they are chosen based
not on their political opinions or party affiliations,
but on their professional expertise. These lines of
distinct professional roles should not be crossed.
However, there is still a need for understanding
different actors’ goals in order to implement any
reform successfully. Nowhere is this more the case
than in expanding municipal revenues. Taxes are
often unpopular, which makes an increase in local
taxes or fees something that a local politician will
often want to oppose. In the context of local polit-
ical leadership, how can a tax increase find public
support?
Increasing municipal revenues and garnering public
support need not be in opposition to one another.
Indeed, the two can run in tandem if there is the
right leadership on the part of city leaders. The
provision of public goods and information about
how tax revenue is being used can have a strongly
positive impact on citizens’ willingness to pay taxes.
If citizens feel the fees, levies, and taxes they pay are
being put to good use, this increases trust in, and
support for, the government itself. This makes sense
both for purposes of tax compliance and for obtain-
ing support for tax reform from local politicians.
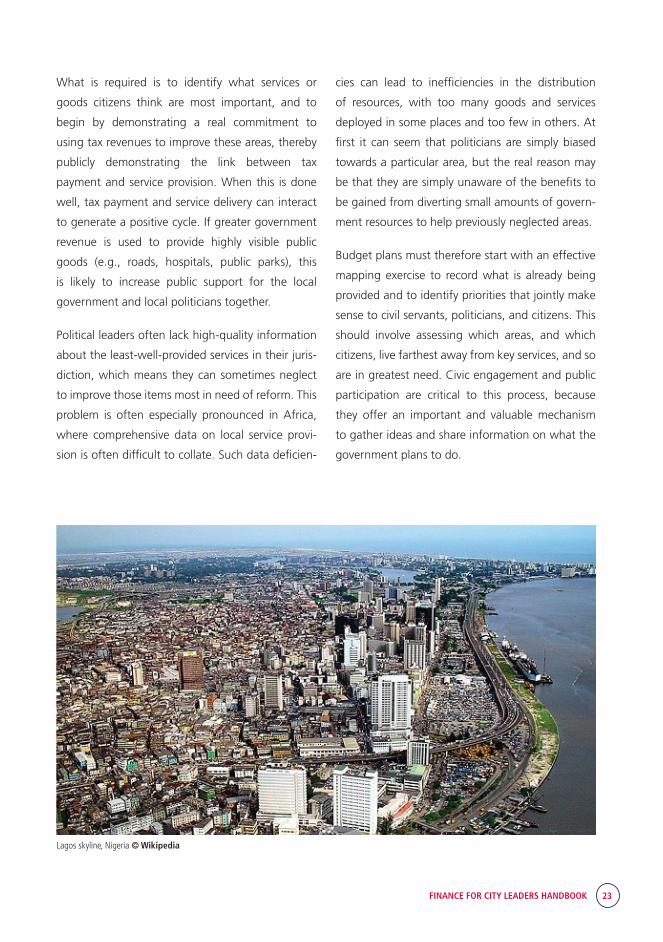
FINANCE FOR CITY LEADERS HANDBOOK 23
What is required is to identify what services or
goods citizens think are most important, and to
begin by demonstrating a real commitment to
using tax revenues to improve these areas, thereby
publicly demonstrating the link between tax
payment and service provision. When this is done
well, tax payment and service delivery can interact
to generate a positive cycle. If greater government
revenue is used to provide highly visible public
goods (e.g., roads, hospitals, public parks), this
is likely to increase public support for the local
government and local politicians together.
Political leaders often lack high-quality information
about the least-well-provided services in their juris-
diction, which means they can sometimes neglect
to improve those items most in need of reform. This
problem is often especially pronounced in Africa,
where comprehensive data on local service provi-
sion is often difficult to collate. Such data deficien-
cies can lead to inefficiencies in the distribution
of resources, with too many goods and services
deployed in some places and too few in others. At
first it can seem that politicians are simply biased
towards a particular area, but the real reason may
be that they are simply unaware of the benefits to
be gained from diverting small amounts of govern-
ment resources to help previously neglected areas.
Budget plans must therefore start with an effective
mapping exercise to record what is already being
provided and to identify priorities that jointly make
sense to civil servants, politicians, and citizens. This
should involve assessing which areas, and which
citizens, live farthest away from key services, and so
are in greatest need. Civic engagement and public
participation are critical to this process, because
they offer an important and valuable mechanism
to gather ideas and share information on what the
government plans to do.
Lagos skyline, Nigeria © Wikipedia
24 FINANCE FOR CITY LEADERS HANDBOOK
Civic engagement and public participation offer
a range of very important benefits to municipal
governments. Recent research shows that “greater
access to public information together with effec-
tive public engagement can help reduce corruption
and enhance socioeconomic development.”1 Most
obviously, effective participation and communica-
tion means that local governments are more likely
to implement policies that match citizens’ prefer-
ences, and are more likely to be given credit for
doing so. Less obviously, significant benefits can be
reaped in terms of revenue generation and popular
support for the government. The case study
explains how Governor Fashola of Lagos, Nigeria,
successfully expanded local government revenue
generation while increasing his vote share through
successfully communicating the value of these tax
increases to local citizens.2
One of the most important issues to keep in mind
when seeking to build a social contract and increase
tax payment is the difference between regressive
and progressive forms of taxation. Regressive taxes
are those that have a uniform rate, applied to
everyone regardless of each person’s income level
(e.g., sales tax or value added tax [VAT]). Progres-
sive taxes modify the rate of payment based on the
payees’ income or wealth level (e.g., income tax).
Regressive taxes are generally understood to affect
poorer citizens disproportionately. There is also a
second important difference when it comes to the
form of taxation: Citizens tend to be more aware
that they are paying direct taxes, such as income
tax, than indirect taxes, such as VAT. As a result,
researchers have often suggested that direct taxes
are more significant when it comes to forming an
effective social contract around tax payment and
public service delivery.
These variations are relevant because when evaluat-
ing which local taxes or fees will expand municipal
revenues, it is important to pay attention to citizen
Case Study 1: Lagos, Nigeria, under Governor Fashola
In 2007, Babatunde Fashola won the governor-
ship, having been chosen as successor to the
previous governor, Bola Tinubu, with a modest
majority. In the years that followed, he furthered
Tinubu’s earlier efforts to expand state revenues
by introducing a new consumption tax on hotels
and eateries, and pursuing higher levels of tax
enforcement throughout Lagos State. These
measures initially drew criticism from some
sectors, but because these resources were chan-
nelled into issues of major public concern—
reducing crime, improving roads, providing
health clinics, etc.—they actually increased his
popularity over time. Significantly, his political
strategy, including a heavy emphasis on the
link between tax payment and public service
delivery, built support for the expansion of the
tax net. Ultimately, he won the 2011 elections
with a significantly increased majority, securing
just over 80 percent of the vote.
FINANCE FOR CITY LEADERS HANDBOOK 25
perceptions of fairness, which can be connected
to whether the tax is being progressively or regres-
sively administered. At the same time, it is not as
simple a question as saying that all progressive
taxes are fairer than their regressive counterparts.
For example, while a sales tax on diamonds affects
everyone who buys diamonds, it is mainly the rich
who buy diamonds in the first place, and so it is
they who will pay the regressive tax in this case. It is
also possible to make certain goods, such as food,
books, or shoes, exempt from regressive taxes alto-
gether, which means an increase in regressive taxes
need not affect all consumption groups in the same
way. All these points help to demonstrate how deci-
sions regarding the expansion of municipal revenue
must keep in mind the effect on the local economy
as a whole, and local citizens’ perceptions of the
fairness of taxes and fees.
Public–private partnerships: Costs versus benefits
Public–private partnerships (PPPs) came into
vogue in the late 1980s as a way to help expand
government activities while avoiding the ineffi-
ciencies normally associated with government
service delivery and procurement processes. For the
purposes of expanding municipal revenues, there
are many potential benefits to partnering with the
private sector—for example, when it comes to the
difficult job of tax collection—but also some poten-
tial pitfalls.
The benefits include gaining efficiency in tax collec-
tion by incentivizing collection performance, and
encouraging competition among tax collection
service providers. Further, PPPs can allow public
sector employees to learn management and lead-
ership skills from their counterparts in the private
sector. Additionally, partners usually share in the
risks of failure, which is particularly relevant when
deploying a new tax collection initiative.
In terms of potential costs, PPPs generate fresh
ideas and manpower for the government, but mean
that a cut of revenues goes to private providers in
order to cover their fees. This reduces the overall
amount that goes to local government—although
of course this may still increase through a PPP if
the total amount of revenue collected goes up by a
greater amount. The use of the private sector can
also give the impression among citizens that the tax
or levy is not going to the government at all but to
a third party, reducing citizen trust in government.
Additionally, the private sector may have less-direct
channels for citizen accountability. This is relevant
in cases where private operators break the law,
where there is an increase in corruption, or where
citizens feel themselves to have been mistreated.
Because private partners cannot be removed by
citizens through normal democratic channels, it can
take longer to identify these issues. It is thus partic-
ularly important for the government to establish
good oversight mechanisms where this strategy is
pursued. Finally, private actors often have less legal
authority over citizens who fail to comply with tax
payments, which means that they can struggle to
enforce the collection of unpopular taxes. This can
increase the costs to local government of following
up on cases of tax evasion.
These pros and cons show that the choice to
engage in PPPs should be guided by an informed
awareness of how suitable a particular tax or fee is
for third-party implementation, and how partner-
ships can be established to ensure transparency and
effective coordination.
26 FINANCE FOR CITY LEADERS HANDBOOK
Conclusion
This chapter has reviewed various mechanisms
and strategies for expanding municipal revenues.
In particular, it has explored the issue from three
distinct, but complementary, perspectives: govern-
ment, economists, and political leaders. Each helps
us to see core issues at stake. Expanding munici-
pal revenues is not simply a question of increasing
the number of taxes and fees, but also of exploring
how taxes can be implemented that are both effi-
cient and locally popular. Ideally, local government
revenue should be considered by citizens to be fair,
appreciated by the whole economy as conducive
to growth, and understood by politicians to be a
necessary part of their communication strategies
and relationships with voters.
The preceding discussion has generated the follow-
ing checklist for considering how a city leader can
increase his or her municipality’s revenues:
Are there taxes, levies, or fees that other countries
regularly use that my municipality could adopt?
Do local residents of my area view the taxes
and fees we charge as fair? Do they feel they
are getting something back for what they are
charged?
Are the collectors of taxes and fees in my local
area properly trained? Do they see the purpose
behind the money they collect? Are they paid
enough to ensure they do not need to seek
supplementary income?
Are the taxes and fees that we charge efficient?
Do they lead to a decline in overall revenues, or
inhibit the growth of the economy and therefore
stifle future tax revenue?
Do local politicians understand the value of
local government revenue generation? Are they
committed to communicating the work done
by local government in this regard, and do
they realize the political capital they can obtain
through showing citizens how important tax
payments have been to the provision of services
and infrastructure?
FINANCE FOR CITY LEADERS HANDBOOK 27
Dominic Burbidge is departmental lecturer in the School of Interdisciplinary Area Studies, Oxford Univer-
sity, and researcher at the Department of Politics & International Relations.
Nic Cheeseman is associate professor of African politics at Oxford University, the former editor
of African Affairs, and the author of Democracy in Africa (Cambridge University Press, 2015).
Endnotes1 Transparency & Accountability Initiative, Budgets: A Guide to Best Practice in Transparency, Accountability and Civic Engagement Across the Public Sector (London, Transparency & Accountability Initiative, 2011).
2 For further description of the Lagos case study, see Nic Cheeseman, “Why Lagos Is the Best Stop for Governors Out to Transform Counties,” Daily Nation, 30 August 2013. Available from http://mobile.nation.co.ke/News/Why+La-gos+is+the+best+stop+for+governors/-/1950946/1974342/-/format/xhtml/-/wc5t6f/-/index.html. See also Diane de Gramont, Governing Lagos: Unlocking the Politics of Reform (Washington, Carnegie Endowment for International Peace, 2015).

Introduction
Fiscal decentralization—which entails shifting some responsibilities for
expenditures and/or revenues to lower levels of government—has become
a mainstream alternative framework for fiscal policy. It is generally a
response to unsatisfied political demand for greater regional autonomy,
or the result of a large economic divide between rich and poor regions.
In a few cases, linguistic and cultural divides explain such trends. In many
emerging and low-income countries, all these factors play a role, with
tensions among ethnic groups an additional factor exerting pressure for
decentralized public service delivery.
The debate over decentralization entails political, administrative, and
fiscal dimensions. The philosophical debate can be traced to Alexander
Hamilton and Tocqueville in the 18th and 19th centuries. A new wave
of academic and political interest in the subject arose in the wake of
Decentralization and Local Government Financing
03
FINANCE FOR CITY LEADERS HANDBOOK 29
lower levels of government responsible for service
delivery. For example, the technical specifications
for bridge construction might come from a higher
level of government, with the local government
being in charge of construction and maintenance
at the local level.
The allocation of resources to local governments
must be consistent with their expenditure respon-
sibility, as this will result in better accountability for
service delivery. Additional institutional arrange-
ments are needed for intergovernmental coordi-
nation, planning, budgeting, financial reporting,
and implementation. For such arrangements to
work, transparency and accountability to local
constituencies should be encouraged by adequate
reporting and oversight of local fiscal perfor-
mance. By contrast, detailed central control may
render decentralization ineffective. Clear rules for
the transfer and use of fiscal resources combined
with appropriate coordination between different
levels of government could go a long way towards
ensuring efficient use of resources thanks to more
effective service delivery.
the Soviet collapse as a framework to assess policy options for
the so-called transition economies. Soon after, the wave hit Latin
American countries, coinciding with the recovery of democracy in
some cases, and the end of violent internal conflicts in others. Some
conservative governments in Europe also promoted decentralization
in the 1980s and 1990s, in part because of a pro-market impulse
promoted by globalization.1
More recently, fiscal decentralization has emerged as an effective
policy tool for improving the efficiency of public expenditures and revenue generation.
This chapter reviews how fiscal decentralization is implemented, arguments for and
against fiscal decentralization, challenges facing subnational governments in managing
their local finances, tools that local governments can use to enhance their fiscal autonomy,
and international experience with fiscal decentralization in both developed and develop-
ing countries.
How does fiscal decentralization work?
The fiscal decentralization process varies by
country. Unitary and federal governments differ
in the way that central governments interact with
local governments. In unitary governments, some
degree of decentralization is possible, depending
on the framework for interaction among central
and subordinate levels of government (e.g., central,
provincial, and district levels). In comparison,
federal governments, by definition, are composed
of subnational governments with greater autonomy
granted in legislation. Decentralized decision-mak-
ing allows for local participation in development in
line with national objectives.
Public services are allocated to local or regional
governments based on the combination of differ-
ent criteria. These may include population size,
fiscal capacity, development needs, and idiosyn-
cratic socio-economic features. Specific functions
are usually shared between higher levels of govern-
ment, which exercise a regulatory or policy role, and
Fiscal decentralization has
emerged as an effective
policy tool for improving
the efficiency of public
expenditures and revenue
generation.
“
30 FINANCE FOR CITY LEADERS HANDBOOK
Pros and cons of fiscal decentralization
Two questions are useful for understanding the pros
and cons of fiscal decentralization: (1) Why are some
countries more fiscally decentralized than others?
and (2) What are the potential effects of decentraliza-
tion on the quality of the delivery of public goods? If
decentralization were the result of exogenous factors
such as median voter income, the degree of demo-
graphic heterogeneity, or the type of political insti-
tutions involved, there would be little room for the
national government to promote decentralization
from above. If instead decentralization is seen as the
best way to ensure optimal public service delivery, it
should be treated as an integral part of fiscal policy.
Arguments in favor of fiscal decentralization
One of the powerful normative arguments in favor of
decentralization is the proper representation of local
voters. Limited knowledge of individual preferences
by central government officers has often translated
into sub-optimal decisions on the best allocation of
public resources. This line of thought is an extension
of Hayek’s lucid defense of the market economy.2
In this view, local bureaucrats and political leaders
are likely to know more about people’s preferences
than are central government officers. A variation of
this argument is that, while centralization is asso-
ciated with the homogenous provision of public
services for all citizens across the nation,3 this may
collide with heterogeneous local preferences across
jurisdictions. Thus, devolution of fiscal and political
powers to lower tiers of government would be a
way to promote an efficient allocation of resources
through which local demands are fully understood
and properly attended to at the local (subnational)
level of government.
A second strand of normative arguments sees local
political jurisdictions as operating in the same way
as an efficient and competitive private market.4
Local governments come to exist in the same way as
private firms enter a particular industry, in response
to demands from a particular community. Likewise,
they can eventually be removed from the “local
public goods industry” if the administrative cost of
operating a particular jurisdiction becomes too high
with respect to residents’ tax-revenue-generation
capacity. Local jurisdictions may become “spatial-
ized” by providing specific types of local services
in the same way as different firms produce differ-
ent varieties in line with differences in consumer
desires and in the intended use of market products.
Autonomous jurisdictions would compete in the
provision of local public services tailored for differ-
ent communities based on their own preferences.
Conceptually, voters would “reveal their prefer-
ence” for local public goods through the political
process, by supporting (penalizing) good (poor)
performance of local governments, holding them
accountable for the quality of local service delivery.
This “accountability advantage” would be diluted
at the national level, in which political responsibili-
ties are widespread, and voters’ capacity to oversee
government performance is weaker.5
An alternative view depicts the government as
a “rent seeking” economic agent trying to take
advantage of its power to extract Ricardian rents
from taxpayers. Following this line of reasoning,
decentralization may be seen as an institutional
device to protect individuals from governments,6 in
the same way as central banks safeguard monetary
policy from undue influence from government.
National governments are regarded as being no
different from private monopolies, to the extent
that they are the sole entities collecting taxes and/
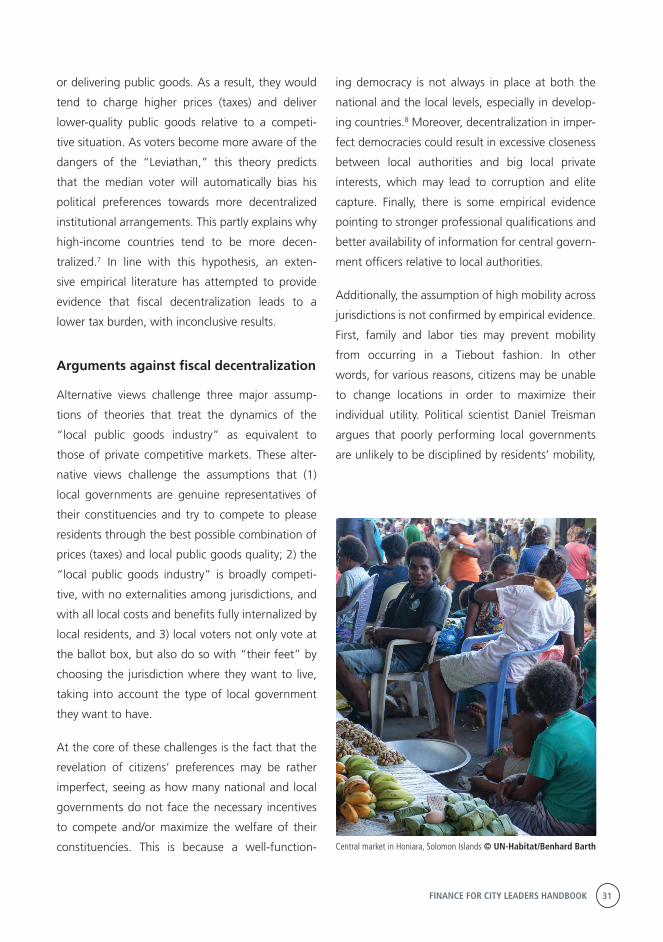
FINANCE FOR CITY LEADERS HANDBOOK 31
or delivering public goods. As a result, they would
tend to charge higher prices (taxes) and deliver
lower-quality public goods relative to a competi-
tive situation. As voters become more aware of the
dangers of the “Leviathan,” this theory predicts
that the median voter will automatically bias his
political preferences towards more decentralized
institutional arrangements. This partly explains why
high-income countries tend to be more decen-
tralized.7 In line with this hypothesis, an exten-
sive empirical literature has attempted to provide
evidence that fiscal decentralization leads to a
lower tax burden, with inconclusive results.
Arguments against fiscal decentralization
Alternative views challenge three major assump-
tions of theories that treat the dynamics of the
“local public goods industry” as equivalent to
those of private competitive markets. These alter-
native views challenge the assumptions that (1)
local governments are genuine representatives of
their constituencies and try to compete to please
residents through the best possible combination of
prices (taxes) and local public goods quality; 2) the
“local public goods industry” is broadly competi-
tive, with no externalities among jurisdictions, and
with all local costs and benefits fully internalized by
local residents, and 3) local voters not only vote at
the ballot box, but also do so with “their feet” by
choosing the jurisdiction where they want to live,
taking into account the type of local government
they want to have.
At the core of these challenges is the fact that the
revelation of citizens’ preferences may be rather
imperfect, seeing as how many national and local
governments do not face the necessary incentives
to compete and/or maximize the welfare of their
constituencies. This is because a well-function-
ing democracy is not always in place at both the
national and the local levels, especially in develop-
ing countries.8 Moreover, decentralization in imper-
fect democracies could result in excessive closeness
between local authorities and big local private
interests, which may lead to corruption and elite
capture. Finally, there is some empirical evidence
pointing to stronger professional qualifications and
better availability of information for central govern-
ment officers relative to local authorities.
Additionally, the assumption of high mobility across
jurisdictions is not confirmed by empirical evidence.
First, family and labor ties may prevent mobility
from occurring in a Tiebout fashion. In other
words, for various reasons, citizens may be unable
to change locations in order to maximize their
individual utility. Political scientist Daniel Treisman
argues that poorly performing local governments
are unlikely to be disciplined by residents’ mobility,
Central market in Honiara, Solomon Islands © UN-Habitat/Benhard Barth
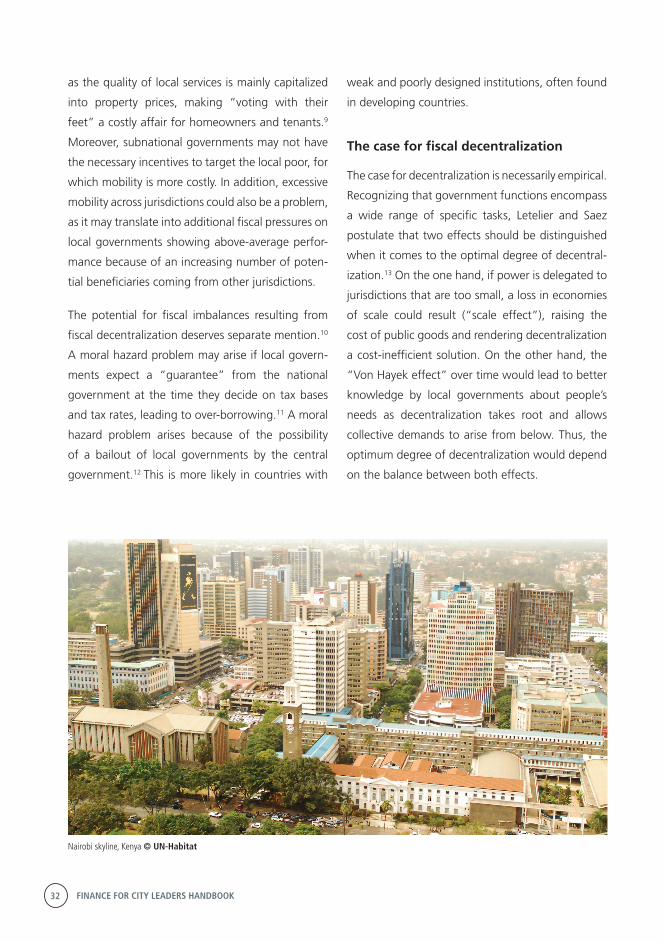
32 FINANCE FOR CITY LEADERS HANDBOOK
as the quality of local services is mainly capitalized
into property prices, making “voting with their
feet” a costly affair for homeowners and tenants.9
Moreover, subnational governments may not have
the necessary incentives to target the local poor, for
which mobility is more costly. In addition, excessive
mobility across jurisdictions could also be a problem,
as it may translate into additional fiscal pressures on
local governments showing above-average perfor-
mance because of an increasing number of poten-
tial beneficiaries coming from other jurisdictions.
The potential for fiscal imbalances resulting from
fiscal decentralization deserves separate mention.10
A moral hazard problem may arise if local govern-
ments expect a “guarantee” from the national
government at the time they decide on tax bases
and tax rates, leading to over-borrowing.11 A moral
hazard problem arises because of the possibility
of a bailout of local governments by the central
government.12 This is more likely in countries with
weak and poorly designed institutions, often found
in developing countries.
The case for fiscal decentralization
The case for decentralization is necessarily empirical.
Recognizing that government functions encompass
a wide range of specific tasks, Letelier and Saez
postulate that two effects should be distinguished
when it comes to the optimal degree of decentral-
ization.13 On the one hand, if power is delegated to
jurisdictions that are too small, a loss in economies
of scale could result (“scale effect”), raising the
cost of public goods and rendering decentralization
a cost-inefficient solution. On the other hand, the
“Von Hayek effect” over time would lead to better
knowledge by local governments about people’s
needs as decentralization takes root and allows
collective demands to arise from below. Thus, the
optimum degree of decentralization would depend
on the balance between both effects.
Nairobi skyline, Kenya © UN-Habitat
FINANCE FOR CITY LEADERS HANDBOOK 33
How to maximize potential benefits and contain fiscal risks in decentralized fiscal systems
Fiscal decentralization should be seen as part of a
comprehensive fiscal framework. Isolated changes
may eventually create inconsistencies across
government levels, undermining the effectiveness
of fiscal policy and increasing macroeconomic
risks.14 Case Study 1, which examines decentraliza-
tion in sub-Saharan Africa, and Case Study 2, which
looks at the decentralization process in Colombia,
illustrate the challenges entailed in containing fiscal
risks in decentralized systems.
Experience suggests that the essential elements
of a comprehensive decentralization framework
that maximizes potential benefits while minimizing
risks include (1) clarifying spending responsibilities
across levels of government, (2) allowing subna-
tional government to raise own-source revenues to
increase fiscal responsibility, (3) designing a transfer
system that aligns incentives, and (4) imposing a
hard budget constraint on subnational govern-
ments.
Clarity in spending assignments is required for
efficient provision of public services. For example,
separating investment and maintenance func-
tions risks suboptimal outlays for both categories,
as no level of government is fully accountable
for the delivery of the final good. In Mexico, for
instance, the education sector suffered a deteriora-
tion of physical infrastructure precisely because of
this vicious circle.15 Physical capital such as water
supply systems, sewerage systems, roads, and
power plants also require long-term maintenance
to ensure services provided are of high quality.
Unfortunately, asset management has often been
neglected in developing countries because of
capacity constraints.16
Pedestrians in Guadalajara, Mexico © Flickr/Carlos Rivera

34 FINANCE FOR CITY LEADERS HANDBOOK
By contrast, a prolonged mismatch between
spending responsibilities and the allocation of
resources could lead to waste and/or to deteriora-
tion in the quality of service delivery. In some cases
(e.g., China and Brazil) the devolution of resourc-
es significantly outpaced that of spending, leading
to inefficiencies in the use of resources. In other
cases (e.g., the transition economies in the early
1990s) available resources were not consistent with
spending mandates, leading to the accumulation of
debt or arrears and/or the significant deterioration
in the quality of decentralized public services.
Potential incentives to relax fiscal discipline in
the process of fiscal decentralization should be
addressed. A common pool problem opens up
when local governments have a reasonable expec-
tation of receiving significant transfers from the
central government over a sufficiently long period
of time and therefore are encouraged to spend
beyond their nominal budget constraints.17 In
addition, soft budget constraints, interregional
competition, unfunded mandates, and short elec-
toral cycles could make the common pool problem
even more complex.18
Market discipline should be instilled by limiting
government financing or guarantees within a
well-defined transfer framework. However, this may
conflict with the aspirations for greater autonomy
by local governments. Alternatives to be considered
include administrative constraints (debt ceilings,
government guarantees); the introduction of fiscal
rules at the county level in an effort to minimize the
risk of reporting distortions aimed at escaping the
rule (such as off-balance transactions in the case
of China, or improper reclassification of current
spending as capital expenditure in Denmark); and/
or cooperative schemes to raise awareness among
local governments of the implications of their deci-
sions (e.g., Australia). A combination of all these
alternatives would require strong leadership by the
central government and high management stan-
dards to avoid a bureaucratization of the process.
A particular problem arises in the case of countries
with sizable actual or potential natural resourc-
es. The challenge of managing resource revenue
exhaustibility and volatility while transforming
sub-soil assets into financial, physical, and human
capital assets becomes more complex for federal
or decentralized systems. Regions feel entitled to
benefit directly from fiscal resources coming from
the exploitation of natural resources in their juris-
diction. This may lead to a detraction of resources
from their optimal use, especially in the absence of
fiscal rules addressing demand management (short
term) and inter-temporal solvency (long term). The
fiscal policy framework should be country-specific
by incorporating particularities of regional needs,
the resource horizon (temporary versus long-last-
ing), sensitivity to revenue volatility (high or low),
domestic capital scarcity/development needs,
absorption capacity, and public investment efficien-
cy. As a general rule, a high proportion of resource
revenue should go to savings and domestic invest-
ment, while smoothing spending by delinking it
from resource revenue dynamics.19
Financing arrangements for subnational governments
Increased urbanization and political decentraliza-
tion have led to large subnational infrastructure
financing needs around the globe. Successful
decentralization will increase local expenditure
responsibilities as well as local governments’
capacity to fund them, including financing
arrangements to enable subnational govern-
FINANCE FOR CITY LEADERS HANDBOOK 35
ments to mobilize sufficient resources for capital
investments. Capital investment is needed to
construct, retrofit, restore, or upgrade capital
assets related to the provision of social infrastruc-
ture (water supply, sanitation, sewage disposal,
education, and health) and physical infrastruc-
ture (transportation, power, and information and
communication technologies). Implementing the
2030 Agenda for Sustainable Development at the
local level, including the mitigation of or adapta-
tion to climate change, will further increase the
need for green infrastructure investments.
Long-term finance can help address large
upfront costs of infrastructure projects and their
long amortization periods. Access to long-term
finance would also allow local governments to
smooth out the pro-cyclicality of intergovern-
mental capital transfers or excessive volatility of
revenue sources. However, when municipalities
take out loans to finance their infrastructure
requirements, local own-source revenues and
intergovernmental transfers need to be suffi-
cient to cover repayment in the long term. Local
revenues need to be strengthened before local
authorities can become creditworthy borrowers.
Domestic financial markets need to be devel-
oped as well, since even the most creditworthy
municipalities may be ill-equipped to borrow
sufficiently from international markets without
additional guarantees. Thus, lack of creditwor-
thiness at the local level is the major demand-
side constraint to optimal decentralization, while
shallow financial markets constitute a major
supply-side constraint. As demand- and supply-
side constraints are removed, well-designed and
engineered financing arrangements can unlock
the long-term funds needed for local infrastruc-
ture investments.20
Overcoming demand constraints: Achieving creditworthiness
Raising subnational borrowing necessarily requires
a demonstrated ability to maintain a reliable surplus
of revenues over expenditures. Local revenue
sources may include user fees and charges, taxes/
levies, and intergovernmental transfers, sometimes
supplemented by bilateral or multilateral develop-
ment assistance. Further potential sources include
investment income, property sales, land value
capture, and licenses. User charges and fees are
mostly levied where people pay for the benefits and
utilities they receive (e.g., water supply, sanitation,
energy, parking space). At the same time, taxes are
the more appropriate tool to finance the provision
of public goods for the entire community, such as
police, ambulance, firefighters, streetlights, etc.
Local governments in developing countries remain
largely dependent on intergovernmental fiscal
transfers and tax-sharing mechanisms to fund
priority investments. Resource flows from higher
to lower tiers of governments average 70–72 per
cent of local government funding in developing
countries and 38–39 per cent in developed coun-
tries.21 If well-designed, these transfers may further
crowd-in local revenue generation. In Tanzania, a
one per cent increase in intergovernmental trans-
fers has led to an extra 0.3–0.6 per cent increase
in own-source revenue generation for local govern-
ment authorities.22 Governments and donors
should provide incentives for local governments to
improve their capacity for revenue generation. For
example, performance-based grants and subsidized
lending followed by market-based incentives would
help local governments develop borrowing practic-
es over time, empowering them to fund the capital
investment needed to meet their sustainable devel-
opment objectives.23
36 FINANCE FOR CITY LEADERS HANDBOOK
Sound management will support local govern-
ments’ financial health. The four tenets of sound
financial management include budgeting, account-
ing, reporting, and auditing. Funds should not only
be appropriately spent and monitored, but availabil-
ity of information should be adequate for proper
planning and budgeting. More broadly, good
management has a direct impact on the quality
of services that may translate into higher revenue
potential. A successful experience in Kampala,
Uganda, shows significant progress in expand-
ing the city’s rates and fees base by updating its
property register, licencing taxis and other business-
es, and improving debt collection, which translated
into an 80 per cent increase in internal revenue in
two years.
Strengthening the supply side: Building inclusive and resilient local credit markets
Policies that build active government bond
markets create benchmarks for investors interest-
ed in subnational debt. In the Addis Ababa Action
Agenda, countries agreed to strengthen long-term
bond markets as a source of development finance,
along with capital market regulations designed
to reduce excess volatility and promote long-term
investment aligned with sustainable development.
Recent research shows that local currency bond
market development is positively related to sound
regulatory frameworks, adequate rule of law, and
greater trade openness.
A proper legal and regulatory environment is crucial
for a sustainable municipal credit market. Effective
judicial frameworks, including a government bank-
ruptcy framework (e.g., Chapter 9 in the United
States), help sustain the municipal bond market by
protecting the rights and obligations of creditors
and debtors at the subnational level. In some coun-
tries, mandatory provisions for municipal revenue
cushions (“master trusts”) and mandatory issuer
ratings have promoted investor interest in munic-
ipal bonds and increased municipalities’ access to
long-term bank loans.
Rating agencies can help overcome the lack of
investor familiarity with the risk profile of local
capital investments. At the local level, the challenge
is the municipalities’ lack of engagement (Figure
A). Indeed, even in developed countries outside the
United States (where over 12,000 municipalities
are rated by S&P alone), few subnational entities
have requested ratings from any of the three major
rating agencies. For subnational entities in many
low-income countries, ratings are simply not afford-
able, as the major agencies are not active in these
countries. International development agencies can
play a critical role in lowering the entry barrier of
rating agencies by paying for the first few municipal
credit ratings so that the first issuers do not have to
bear the costs.

FINANCE FOR CITY LEADERS HANDBOOK 37
020406080100
120
140
160
180
200
ArgentinaAustralia
AustriaBelgiumCanadaCroatia
Czech RepublicEstoniaFrance
GermanyGreece
HungaryItaly
JapanSouth Korea
LatviaLithuania
New ZealandNorwayPoland
PortugalRussian Federation
Slovak RepublicSpain
SwedenSwitzerland
United Arab EmiratesUnited Kingdom
BelarusBosnia and Herzegovina
BrazilBulgaria
ColombiaEquador
KazakhstanMacedonia
MalaysiaMexico
PeruRomania
SerbiaSouth Africa
TurkeyBolivia
MoroccoNigeriaUkraine
2009
2015
Hig
h in
com
eU
pper
-mid
dle
inco
me
Low
er-m
iddl
e in
com
e
Figu
re A
: Num
ber o
f loc
al a
utho
ritie
s th
at h
ave
rece
ived
ratin
gs fr
om a
t lea
st o
ne o
f the
thre
e m
ajor
glo
bal a
genc
ies,
by c
ount
ry a
nd in
com
e gr
oup
(200
9 an
d 20
15)
Not
e: In
the
Unite
d St
ates
(not
inclu
ded
in th
e fig
ure)
, ove
r 12,
000
mun
icipa
litie
s ar
e ra
ted
by o
ne o
f thr
ee m
ajor
age
ncie
s.
Sour
ce: I
nfor
mat
ion
prov
ided
by
Fitc
h, M
oody
’s, S
&P.
38 FINANCE FOR CITY LEADERS HANDBOOK
Promoting local rating agencies could create a more
favorable environment to rate local governments less
familiar with international agencies. For example,
in recent years a few regional rating agencies have
emerged in Africa and gained reputational capital
with investors, such as the West African Ratings
Agency (established in 2005) and Bloomfield Finan-
cial (established in 2007), joining the ranks of older
agencies such as Agusto and Co. (1992) and the
Global Credit Ratings Company (GCR). Dakar and
Kampala in Uganda have received high ratings from
local agencies. Kampala received an A in the long
term from GCR, its highest global rating.
Entering the municipal credit market
Lending from banks—often government-owned
financial institutions and development banks—is
the primary source of local credit financing in most
advanced economies outside the United States.
Municipal bonds are dominant in the United
States, where even the smallest of towns can raise
millions of dollars in bond issuances. Its US$3.7
trillion municipal bond market remains unique in
the world. Other large cities have only gradually
entered the municipal bond market. In middle- and
low-income countries, subnational access to capital
markets is circumscribed to larger cities; some
municipal bonds are floating in African markets
such as South Africa, Nigeria, and Cameroon. Local
governments without access to private or public
credit rely entirely on capital grants from central
governments to fund large-scale investments.
Project design matters. General creditworthiness
of the municipality is crucial, but infrastructure
projects need to be carefully planned, engineered,
and costed to be successfully financed. This
requires upfront investment in project development
services from market demand analysis to detailed
engineering design. Many municipalities and public
utilities, especially in developing countries, do not
have the resources to pay for this initial work.
Specialized “project development facilities” could
help overcome this problem. They can play differ-
ent roles depending on specific needs. For instance,
in the early 2000s, bilateral donors supported the
Municipal Infrastructure Investment Unit (MIIU)
in South Africa, which then successfully provided
financial, technical, and managerial support to
municipalities and public utilities. More recently,
the Rockefeller Foundation and the Internation-
al Finance Corporation have created a “Project
Development Facility for Resilient Infrastructure”
to finance legal, technical, and financial advice
from highly skilled consultants for cities seeking to
finance infrastructure projects.
Different forms of credit enhancements can further
help subsovereign issuers lower default risk. Credit
enhancement mechanisms can take the form
of revenue cushions for payback (e.g., “sinking
funds” in the United States, “federal tax-sharing
grants” in Mexico, or “bond service funds” in Tamil
Nadu, India), partial or 100 per cent external guar-
antees for bond repayment (e.g., USAID partial
guarantees for repayment of the first Johannesburg
bond), or the use of pooled financing. A well-struc-
tured bank loan or bond may make use of several
credit enhancement mechanisms at the same time.
Complementarily, national, regional, and multilat-
eral development banks play a crucial role, as they
can lend to municipalities directly under favorable
conditions (both in terms of rates and maturities).
Development banks can build investor confidence
by underwriting, guaranteeing, or investing in
municipal debt, including securities, enabling local
governments to build up their credit histories.
FINANCE FOR CITY LEADERS HANDBOOK 39
The global landscape of municipal credit markets
Advanced municipal finance tools are available once
demand- and supply-side barriers are overcome (see
Table 1). These include local government-based
financing options (e.g., general obligation bonds,
revenue bonds, green bonds), development exactions
(e.g., linkage fees, impact fees), public and private
options (e.g., public–private partnerships [PPPs], pay
for performance), and mechanisms to leverage the
private sector (e.g., loan guarantees, tax increment
financing). Although the use of such market-based
financing mechanisms is growing, they are largely
confined to prosperous municipalities in advanced
economies (e.g., the United States, Western Europe,
and some other OECD countries). Some require the
participation of several partners, including private
capital, and others largely rely on the coercive power
of local governments.
A number of borrowing mechanisms have been used
by municipalities that are not yet investment-grade
creditworthy but have undertaken significant efforts
in this direction:
Municipal development funds operated by
national or state government entities mobilize
resources from private lenders, the central
government, and donor agencies, and on-lend
these resources to subnational governments
to finance capital investment programs. Terms
are normally concessional, although capacity to
repay debt obligations is an important criterion to
access these funds. More complex arrangements
may pursue the dual objective of financing local
infrastructure investments and strengthening
local credit markets. In Colombia, the Findeter
Fund used external borrowing to rediscount
loans made by private commercial banks to
public local authorities and local private entities
for investing in urban services and utilities. The
success of a model like Findeter depends on
the depth of the local financial markets and the
availability of capable financial institutions that
can take on credit risk related to municipal and
urban services loans at a substantial scale.
In poor countries, hybrid financing, a combi-
nation of market loans and grants, helps local
authorities keep debt service affordable. In
Burkina Faso, the hybrid financing for the
reconstruction of Ouagadougou following
the destruction of its central market by fire,
comprised access to long-term resources from
the Agence Française de Développement (AFD)
and a €3 million grant, without using a central
government guarantee.24
Many large cities across the globe have used
land-based revenues to finance capital invest-
ments. For example, in Shanghai, 46 per
cent of urban growth was funded through
land-based financing mechanisms by which
the city sold developed land to operators of
commercial or industrial zones, and revenues Pedestrians in New York, USA © Flickr/Stefane Georgi
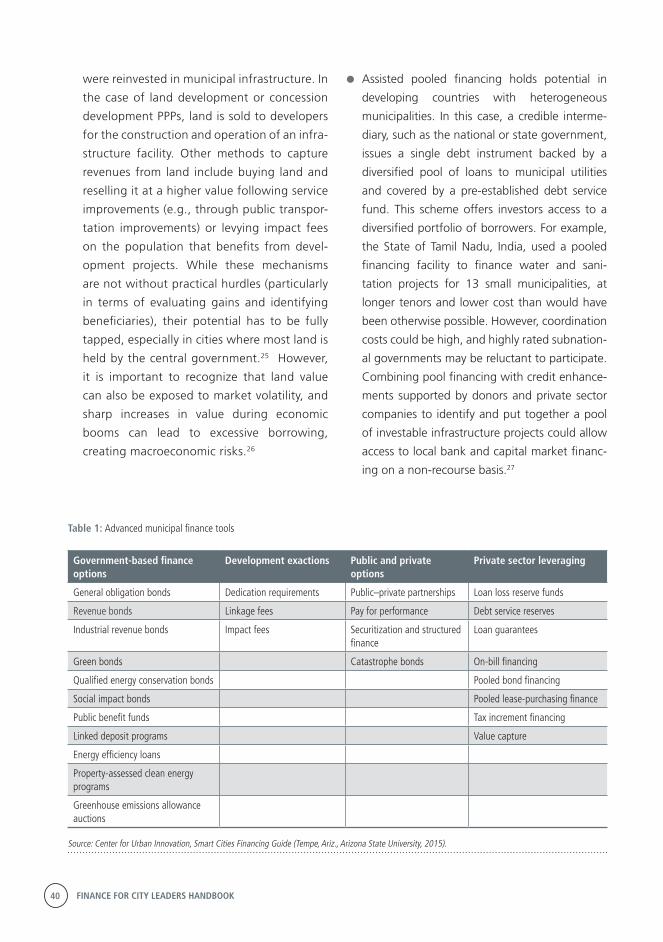
40 FINANCE FOR CITY LEADERS HANDBOOK
were reinvested in municipal infrastructure. In
the case of land development or concession
development PPPs, land is sold to developers
for the construction and operation of an infra-
structure facility. Other methods to capture
revenues from land include buying land and
reselling it at a higher value following service
improvements (e.g., through public transpor-
tation improvements) or levying impact fees
on the population that benefits from devel-
opment projects. While these mechanisms
are not without practical hurdles (particularly
in terms of evaluating gains and identifying
beneficiaries), their potential has to be fully
tapped, especially in cities where most land is
held by the central government.25 However,
it is important to recognize that land value
can also be exposed to market volatility, and
sharp increases in value during economic
booms can lead to excessive borrowing,
creating macroeconomic risks.26
Assisted pooled financing holds potential in
developing countries with heterogeneous
municipalities. In this case, a credible interme-
diary, such as the national or state government,
issues a single debt instrument backed by a
diversified pool of loans to municipal utilities
and covered by a pre-established debt service
fund. This scheme offers investors access to a
diversified portfolio of borrowers. For example,
the State of Tamil Nadu, India, used a pooled
financing facility to finance water and sani-
tation projects for 13 small municipalities, at
longer tenors and lower cost than would have
been otherwise possible. However, coordination
costs could be high, and highly rated subnation-
al governments may be reluctant to participate.
Combining pool financing with credit enhance-
ments supported by donors and private sector
companies to identify and put together a pool
of investable infrastructure projects could allow
access to local bank and capital market financ-
ing on a non-recourse basis.27
Table 1: Advanced municipal finance tools
Government-based finance options
Development exactions Public and private options
Private sector leveraging
General obligation bonds Dedication requirements Public–private partnerships Loan loss reserve funds
Revenue bonds Linkage fees Pay for performance Debt service reserves
Industrial revenue bonds Impact fees Securitization and structured finance
Loan guarantees
Green bonds Catastrophe bonds On-bill financing
Qualified energy conservation bonds Pooled bond financing
Social impact bonds Pooled lease-purchasing finance
Public benefit funds Tax increment financing
Linked deposit programs Value capture
Energy efficiency loans
Property-assessed clean energy programs
Greenhouse emissions allowance auctions
Source: Center for Urban Innovation, Smart Cities Financing Guide (Tempe, Ariz., Arizona State University, 2015).
FINANCE FOR CITY LEADERS HANDBOOK 41
Conclusion
Fiscal decentralization can serve as an effective policy
tool for improving the quality and provision of public
services, government accountability, and the effi-
cient use of local financial resources. However, in
order to achieve successful fiscal decentralization,
central and local governments must be strategic in
how they decentralize fiscal responsibilities to local
governments both in terms of revenue generation
and expenditures. Moreover, the decentralization
of fiscal authority to subnational governments must
consider both the local capacity of municipal govern-
ments and the legal and regulatory framework in
which they will assume these responsibilities.
Delegating local expenditure and revenue gener-
ation responsibilities to municipal governments
connects the consumers of public goods and
services directly with local government officials who
determine how public funds are allocated and what
tax policies are implemented. If strong institutions,
good governance, and a supportive legal and regu-
latory framework are in place, fiscal decentraliza-
tion can support and enhance municipal finance.
Case Study 1: Challenges in building institutions in sub-Saharan Africa
apartheid system in 1994. Initial capacity
limitations in South Africa led to the introduc-
tion of a reporting system by subnationals,
which eventually led to the implementation
of a multi-year budget framework. In Kenya,
initial challenges pertaining to service delivery
are being addressed, but there are lingering
budget preparation problems at the national
level and particularly at the county level.
Efforts to improve budget processes appear
more urgent in the face of fiscal decentraliza-
tion. Kenya and South Africa addressed simul-
taneously the problems of capacity, informa-
tion, and financial management. In South
Africa, the authorities showcased the subna-
tional governments that had demonstrat-
ed their capacity to perform through a peer
learning and mentorship approach, combined
with benchmarking to identify and address
the main cost drivers. In that context, improv-
In the case of sub-Saharan Africa, rapid fiscal
decentralization has been introduced in part as
a way to defuse ethnic tensions. In sub-Saha-
ran African countries there is a clear legal defi-
nition of powers and functions in the various
levels of government. Functions assigned to
the national level relate mainly to policy and
standard setting, and the provision of public
goods such as national security. Subnational
governments, on the other hand, are responsi-
ble for policy implementation and local service
delivery, such as health, water, local roads
and transportation, most agriculture exten-
sion services, and primary education (except
for Kenya, where only preschool education
is provided by subnational governments). In
Kenya (2010) and Nigeria (1967) devolution
started as an alternative to ethnic dominance
in centralized systems, while in Uganda (1986)
it followed a civil war. In South Africa fiscal
decentralization followed the collapse of the

42 FINANCE FOR CITY LEADERS HANDBOOK
requires a guarantee in the case of Kenya and
Nigeria), and there is an overall cap on the stock
of debt for subnational governments in both
countries (20 per cent of last year’s audited
revenue in Kenya, 50 per cent in Nigeria, and
25 per cent in Uganda). In South Africa, legisla-
tion prohibits the guaranteeing of subnational
government debt by the national government.
Instead, a transparent mechanism for public
bankruptcies is in place, complemented by
tough sanctions if subnational governments
ignore public finance management rules. In
Nigeria, sharing oil proceeds with oil-producing
states has exposed the latter to large swings
in revenue, undermining the regional income
equalization objective. As a result, the reduc-
tion in federal and state revenue has been
larger than the related fall in oil prices.28 This
has conspired against a sound budget process,
often leading to salary arrears, default on bank
obligations, and partial bailouts by the federal
government.
ing budget formats, introducing a new fiscal
classification system, improving accounting
standards, and reforming the chart of accounts
were essential elements for reforming the
financial management system, and improving
information for benchmarking. In Kenya, inter-
governmental coordination during the transi-
tion has been supported by a Transition Author-
ity and by the Intergovernmental Budget and
Economic Council, with the participation of all
47 county governors and the cabinet secretary
for the National Treasury, chaired by Kenya’s
Deputy President of the Republic.
Sound fiscal rules have been generally success-
ful so far at preventing excessive borrowing by
subnational governments. Specifically, borrow-
ing by subnational governments is limited to
financing development projects and for short-
term liquidity management. In addition, any
long-term borrowing in Kenya, Nigeria (for
external debt only), and Uganda is subject
to approval by the national government (this
Downtown Nairobi, Kenya © UN-Habitat/Baraka Mwau
FINANCE FOR CITY LEADERS HANDBOOK 43
Case Study 2: Improving fiscal management
and decentralization in Colombia29
During the 1990s, fiscal decentralization policies
in Colombia mandated sizeable intergovern-
mental transfers to subnational governments.
While there is good reason to believe that
subnational governments are better positioned
to provide local public goods and services and
respond to local needs, intergovernmental trans-
fers should be matched with spending mandates
that reinforce subnational expenditure account-
ability. In the absence of such mandates, fiscal
discipline at the subnational level was signifi-
cantly weakened. Moreover, Colombia’s fiscal
decentralization policy lacked incentive mecha-
nisms that would support own-source revenue
generation at the local level.
In an effort to address these policy shortcom-
ings, several reforms were implemented begin-
ning in the mid 1990s. For example:
“Law 819 improved fiscal coordination among
different levels of government, requiring both
the central administration and local govern-
ments to present each year a consistent 10-year
macroeconomic framework…budgets would
need to be balanced over a 10-year period. It
further stipulated that fiscal management at
all levels of government, including expenditure
authorization and revenue collection, had to be
consistent with the medium-term macroeco-
nomic framework.”30
Other reforms addressed incentive mecha-
nisms for subnational governments to generate
own-source revenues, municipal expenditure
requirements, and earmarking policies that had
proven ineffective.
The case of Colombia demonstrates the impor-
tance of establishing a legal and regulatory
framework that aligns the goals of fiscal decen-
tralization with expenditure incentives and
accountability mechanisms. Moreover, this case
highlights the importance of reforming fiscal
decentralization policies over time and incor-
porating lessons learned into policy design and
implementation.
Rocinha in Rio de Janeiro, Brazil © Wikipedia
44 FINANCE FOR CITY LEADERS HANDBOOK
Armando Morales is the IMF resident representative in Kenya, and has worked on different multi-country
studies on economic policy issues in Latin America, Asia, and Africa.
Leonardo Letelier S. is the director of graduate studies at the Institute of Public Affairs at the University of
Chile, and has published extensively on fiscal decentralization, a field in which he has worked as a consul-
tant for the UN, the Inter-American Development Bank, and the World Bank.
Daniel Platz is the focal point for stakeholder engagement in the Financing for Development Office of the
UN, where he is part of a team that monitors and promotes the implementation of the Addis Ababa Action
Agenda, the Doha Declaration on Financing for Development, and the Monterrey Consensus.
Endnotes
1 V. Tanzi, “The Future of Fiscal Federalism,” European Journal of Political Economy, vol. 24 (2008), pp. 705–712.
2 Friedrich Hayek, “The Use of Knowledge in Society,” American Economic Review, vol. 35, no. 4 (1945), pp. 519–530.
3 W. Oates, Fiscal Federalism (New York, Harcourt Brace Jovanovich, 1972).
4 J. Tirole, “The Internal Organization of Government,” Oxford Economic Papers, vol. 46 (1994), pp. 1–29; C. M. Tiebout, “A Pure Theory of Local Expenditures,” Journal of Political Economy, vol. 64 (1956), pp. 416–424.
5 P. Seabright, “Accountability and Decentralisation in Government: An Incomplete Contracts Model,” European Economic Review, vol. 40, issue 1 (1996), pp. 61–89.
6 G. Brennan and J. Buchanan, The Power to Tax: Ana-lytic Foundations of a Fiscal Constitution (New York, Cam-bridge University Press, 1980).
7 S. L. Letelier, “Explaining Fiscal Decentralization,” Public Finance Review, vol. 33, no. 2 (2005), pp. 155–183; U. Panizza, “On the Determinants of Fiscal Centralization: Theory and Evidence,” Journal of Public Economics, vol. 74, issue 1 (1999), pp. 97–139; S. L. Letelier and J. M. Saez Lozano, “Fiscal Decentralization in Specific Areas of Govern-ment: An Empirical Evaluation Using Country Panel Data,” Government and Policy: Environment and Planning, vol. 33, issue 6 (2014), pp. 1344–1360.
8 R. Prud’homme, “The Dangers of Decentralization,” World Bank Research Observer, vol. 10, no. 2 (1995), pp. 201–220.
9 D. Treisman, The Architecture of Government: Re-thinking Political Decentralization (Cambridge, Cambridge University Press, 2007).
10 T. Terminassian and J. Craig, “Control of Subnational Government Borrowing,” in Fiscal Federalism in Theory and Practice, ed. T. Terminassian (Washington, IMF, 1997).
11 S. L. Letelier, “Theory and Evidence of Municipal Bor-rowing in Chile,” Public Choice, vol. 146, no. 3–4 (2011), pp. 395–411.
12 A. Alesina, E. Glaesser, and B. Sacerdote, Why Doesn’t the US Have a European-Style Welfare State? (Washington, D.C., Brookings Institution, 2001); Signe Krogstrup and Charles Wyplosz, “A Common Pool Theory of Supranational Deficit Ceilings,” European Economic Review, vol. 54, issue 2 (2010), pp. 269–278; G. Pisauro, Fiscal Decentralization and the Budget Process: A Simple Model of Common Pool and Bailouts (Perugia, Italy, Societa Italiana di Economia Pubblica, 2013).
13 S. L. Letelier and J. M. Saez Lozano, “Fiscal Decentral-ization in Specific Areas of Government: A Technical Note,” Economía Mexicana NUEVA EPOCA, vol. 22, issue 2 (2013), pp. 357–373.
14 International Monetary Fund, Macro Policy Lessons for a Sound Design of Fiscal Decentralization—Background Studies (Washington, IMF, 2009).
15 World Bank, “Conflict, Security and Development,” in World Development Report (Washington, World Bank, 2011).
FINANCE FOR CITY LEADERS HANDBOOK 45
16 World Bank, Municipal Finances: A Handbook for Local Governments (Washington, World Bank, 2014).
17 C. Wyplosz, Fiscal Rules: Theoretical Issues and His-torical Experiences (Cambridge, Mass., National Bureau of Economic Research, 2012).
18 A. Plekanov and R. Singh, How Should Subnational Borrowing Be Regulated: Some Cross-Country Empirical Evidence (Washington, IMF, 2007).
19 International Monetary Fund, Macroeconomic Policy Frameworks for Resource-Rich Developing Countries (Wash-ington, IMF, 2012).
20 Daniel Platz and David Painter, Sub-Sovereign Bonds for Infrastructure Investment (Washington, G24, 2010).
21 Munawwar Alam, Intergovernmental Fiscal Transfers in Developing Countries: Case Studies from the Common-wealth (London, Commonwealth Secretariat, 2014).
22 Takaaki Masaki, The Impact of Intergovernmental Grants on Local Revenues in Africa: Evidence from Tanzania (Ithaca, N.Y., Cornell University, 2015).
23 Paul Smoke, “Financing Urban and Local Devel-opment: The Missing Link in Sustainable Development Finance: A Briefing on the Position of the Role of Local and Subnational Governments in the Deliberations Related to the Financing for Development Conference,” United Na-tions, “The Addis Ababa Action Agenda,” 2015.
24 Thierry Paulais, Financing Africa’s Cities: The Impera-tive of Local Investment (Washington, Agence Française de Développement and the World Bank, 2012), p. 43
25 Thierry Paulais, Financing Africa’s Cities: The Impera-tive of Local Investment (Washington, Agence Française de Développement and the World Bank, 2012), p. 43
26 World Bank, Planning, Connecting, and Financing Cities—New Priorities for City Leaders (Washington, World Bank, 2013).
27 Daniel Bond, Daniel Platz, and Magnus Magnusson, Financing Small-Scale Infrastructure Investments in Devel-oping Countries (New York, United Nations Department of Economic and Social Affairs, 2012).
28 E. Ahmad and R. Singh, Political Economy of Oil-Rev-enue Sharing in a Developing Country: Illustrations from Nigeria (Washington, IMF, 2003).
29 A. Fedelino and T. Ter-Minassian, Macro Policy Lessons for a Sound Design of Fiscal Decentralization (Washington, D.C., International Monetary Fund Fiscal Affairs Depart-ment, 2009). Available from http://www.imf.org/external/np/pp/eng/2009/072709.pdf.
30 Annalisa Fedelino, Making Fiscal Decentralization Work: Cross-Country Experiences (Washington, D.C., Inter-national Monetary Fund, 2010).

02:Part

FINANCE FOR CITY LEADERS HANDBOOK 47
Designing Financial Products
Introduction
The revenue available to local governments is a key determinant of a
city’s ability to provide the services citizens need and to meet expen-
diture requirements. In cases where revenue is constrained, infrastruc-
ture investments often suffer, and government services are reduced.1
Consequently, the need to diversify, grow, and mobilize revenues is
one of the most pressing challenges city leaders face in various regions
of the developed and developing world. Building a solid revenue base
depends on a number of factors, including empowering city leaders
to grow and diversify their own-source revenue pool to complement
external revenue flows (e.g., intergovernmental transfers) over which
local government officials lack direct control. It also requires enabling
city leaders to mobilize own-source revenues, after they are raised,
by harnessing financial tools that can support their strategic priorities
Non-Tax Own-Source Municipal Revenues
04
FINANCE FOR CITY LEADERS HANDBOOK 49
(e.g., land-based financing instruments, debt instruments, and public–private part-
nerships, among others).
This chapter examines how city leaders can mobilize non-tax own-source revenues
to help establish a strong foundation for fiscal governance.2 It focuses on a wide
variety of non-tax own-source revenues, ranging from charges and fees directly
related to citizens’ use of a service (e.g., consumption of water, removal of trash,
etc.), to charges levied on the value or physical attributes of the property being
serviced, in order to capture some of the benefits resulting from public investments
in land (e.g., betterments).3 To that end, the chapter begins with a typology and
overview of the various sources and types of non-tax own-source revenues used by
cities across the world. It then examines the global variation in revenue reliance at
the subnational government level.
It is clear that reliance on non-tax own-source revenues, particularly
charges and fees, is not the only path to sound fiscal stewardship.
This chapter advances the principle that a combination of all munici-
pal revenue sources is important for achieving strong municipal fiscal
health. The chapter identifies select key considerations that can be
instructive to government officials who seek to evolve and reform
the non-tax own-source revenue components within their jurisdic-
tion. The aim is to highlight the merit of empowering city leaders
with strategies that help them harness non-tax own-source revenues
appropriately for the maximum benefit of their municipalities.
To guide the reader who seeks a bridge from theory to practice, this chapter includes
illustrative case studies of jurisdictions that have successfully grown and mobilized
non-tax own-source revenues to support different strategic priorities.
Overview of the types of non-tax own-source revenues
Non-tax own-source revenues are often raised from charges, fees, fines, and other
special assessments related to a variety of government services and assets. Examples
include rent collected from government-owned property, charges for goods and
services, business licence fees, and marriage licence fees, to name only a few. While it
is impossible to classify all the types of non-tax own-source revenues that exist across
the developed and developing world, Table 1 presents a selection of different revenue
types, their general characteristics, and representative jurisdictional examples.
The revenue available
to local governments is
a key determinant of a
city’s ability to provide
the services citizens need
and to meet expenditure
requirements.
“

50 FINANCE FOR CITY LEADERS HANDBOOK
Table 1. Select examples of government non-tax own-source revenues4
Revenue source General characteristics Jurisdictional example
Utility and service charges
Charges for sewer, water, publicly provided electricity, and other similar services (paid by a citizen, organization, or institution) where the benefits accrue to specific individuals and payment for the service varies according to consumption.
South Africa Water User Charges and Rights Policy; Constitution of 1996; Constitution Act 1085
User fees Fees for voluntary services such as entry to public museums, marriage licences, tolls, motor vehicle registration, permits, and others paid by a citizen, organization, or institution. Cost is typically set at specific market prices, and subsidies are at times offered to certain users.
Kingdom of Bahrain, Municipal Urban Planning Building Permits & Commer-cial Companies Laws6
Fines A penalty assessed on a citizen, organization, or institution as a result of a violation of law, or as a consequence of a civil or criminal infraction.
State of Michigan (United States) Municipal Civil Infraction Legislation7
Surcharges An additional sum added to a particular, pre-existing charge, such as a tax, fee, fine, or penalty paid by a citizen, organization, or institu-tion.
Commonwealth of Massachusetts (United States) Surcharge for Motor Vehicle Infractions8
Special assessments Compulsory payments, in the form of development fees or better-ments, imposed on the owners of real property for specific benefits generated from public investments. Costs imposed are typically aligned with the benefits received.
Colombia Contribucion De Valorizacion Betterment Levies Framework, includ-ing the Law 388 of 129979
Payments in-lieu of taxes (PILOTS)
Voluntary payments made by private non-profits and other tax-exempt entities to compensate a local government for the loss of tax revenue due to the nature of the ownership or use of a particular piece of real property.
Canada’s PILOTS system for federally and provincially owned real property10
Royalties Payments arising from the assignment of the right to harvest and exploit naturally occurring resources (oil, gas, minerals, etc.) by cit-izens, institutions, or organizations. Royalties may be structured via agreement or in the form of a lease.
United States Mineral Leasing Act of 192011
Rents and land-use fees
Payments arising from the right to use and occupy government prop-erty or land by citizens, institutions, or organizations. Often structured pursuant to a lease or other agreement providing for the payment of fees for specific land-use rights.
China Urban Land Management Prac-tices, and Land Administration Law12
The autonomy to grow and mobilize the various
classes of non-tax own-source revenues described
in Table 1, and others, often depends upon a partic-
ular municipality’s experience with the twin process-
es of urbanization and fiscal decentralization. For
instance, does the legal enabling framework autho-
rize local governments to mobilize various types of
non-tax own-source revenues? Where enabling
authority is present, does the municipality have
autonomy to implement, control, and manage the
administration of the non-tax own-source revenue
base? When a local government is tasked with new
expenditure requirements, is there a parallel devo-
lution of financial resources to support the expen-
ditures via the mobilization of non-tax own-source
revenues?13 Answers to these questions depend on
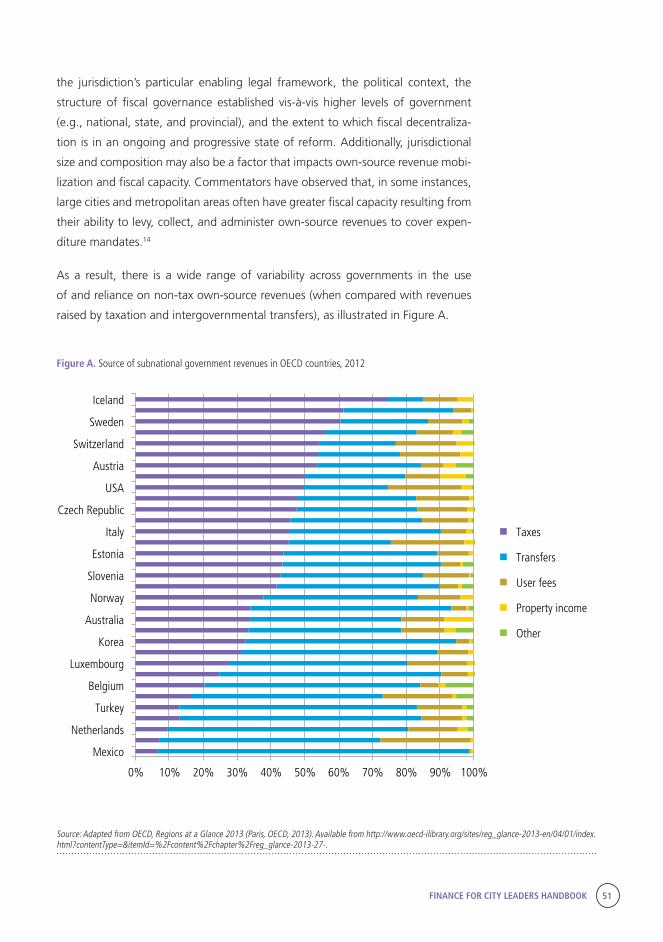
FINANCE FOR CITY LEADERS HANDBOOK 51
the jurisdiction’s particular enabling legal framework, the political context, the
structure of fiscal governance established vis-à-vis higher levels of government
(e.g., national, state, and provincial), and the extent to which fiscal decentraliza-
tion is in an ongoing and progressive state of reform. Additionally, jurisdictional
size and composition may also be a factor that impacts own-source revenue mobi-
lization and fiscal capacity. Commentators have observed that, in some instances,
large cities and metropolitan areas often have greater fiscal capacity resulting from
their ability to levy, collect, and administer own-source revenues to cover expen-
diture mandates.14
As a result, there is a wide range of variability across governments in the use
of and reliance on non-tax own-source revenues (when compared with revenues
raised by taxation and intergovernmental transfers), as illustrated in Figure A.
Figure A. Source of subnational government revenues in OECD countries, 2012
Source: Adapted from OECD, Regions at a Glance 2013 (Paris, OECD, 2013). Available from http://www.oecd-ilibrary.org/sites/reg_glance-2013-en/04/01/index.html?contentType=&itemId=%2Fcontent%2Fchapter%2Freg_glance-2013-27-.
0% 10% 20% 30% 40% 50% 60% 70% 80% 90% 100%
Mexico
Netherlands
Turkey
Belgium
Luxembourg
Korea
Australia
Norway
Slovenia
Estonia
Italy
Czech Republic
USA
Austria
Switzerland
Sweden
Iceland
Taxes
Transfers
User fees
Property income
Other

52 FINANCE FOR CITY LEADERS HANDBOOK
Evaluating non-tax own-source revenues
Each class and type of non-tax own-source
revenues carries different strategic considerations
that are important to evaluate when framing policy
recommendations.15 At present, among the most
widely used types are user charges and fees related
to government services.16 User charges are most
appropriate for public goods and services such as
public transit, water, sanitation, tolls (as described
in Case Study 1), and others where the majority of
the benefits of the particular good or service are
confined to the consumer.17
Proponents of the “benefit principle” support the
idea that a citizen who benefits from a govern-
ment service should pay for it. Charges and fees are
often determined based on the quantity consumed.
This provides local governments an indication of
service needs and therefore allows local officials to
maximize efficiency by proactively matching supply
and demand.18 Additionally, when effectively imple-
mented, user charges and fees provide information
to consumers about how much public goods and
services cost, thereby enhancing the efficient allo-
cation of services and achieving pricing transparen-
cy. This can produce an added benefit of boosting
fiscal transparency and local government account-
ability, ultimately resulting in more effective and
responsive government entities.
However, an additional important consideration is
the potential for charges and fees to disproportion-
ately impact the citizens least able to pay, particularly
low-income citizens.19 This concern is magnified in
the context of essential government services, such
as water, sewer, sanitation services, and others. This
gives rise to the important question of whether the
provision of these goods and services should have a
redistributive focus, or whether it should instead be
guided by cost-based principles (including marginal
cost pricing and others focused on efficiency).20
Civic engagement dynamics can also potentially play
a role in the success of non-tax own-source revenue
frameworks that are reliant on charges and fees,
particularly where there is a visible disagreement
between governments and citizens with respect
to the price citizens pay for public services. This
dynamic can deter the establishment of a “users-
pay” culture, which can be necessary for non-tax
own-source revenue frameworks to succeed from
an administrative and collections standpoint. This
dynamic is particularly visible in the widespread
resistance to the payment of user fees within the
impoverished segments of some countries’ urban
populations.21
The political climate surrounding a particular
public-service pricing regime, as well as the regime’s
perceived legitimacy, can also impact the strength
of a charges and fees framework.22 In some jurisdic-
tions, a user charge can help support services that
would otherwise be financed in a general fund and
shift the funding of those activities to a self-sup-
porting enterprise fund. Scholars have commented
on this phenomenon, observing that
“municipalities facing financial and political obsta-
cles often use the fee-supported service model for
many of their public services outside of the tax-sup-
ported general fund services, because fee-support-
ed services charge customers, not the community
as a whole, and possibly generate profits. … Since
a user charge is a market-like financing which shifts
general fund activities to fee-supported enterprise
fund activities, the usage of user fee-supported
goods and services has become a popular strategic
effort for cities.”23
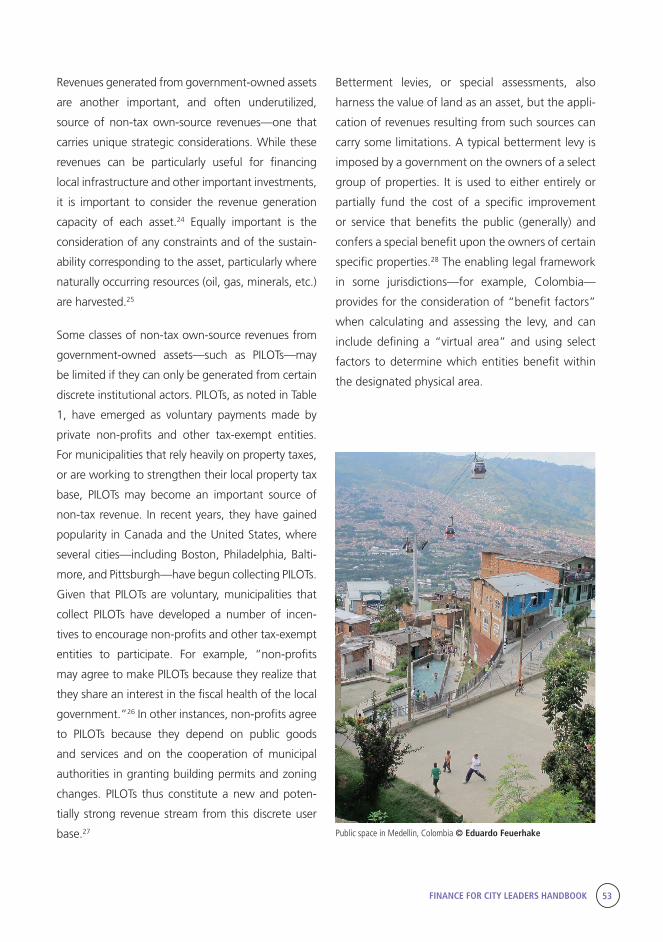
FINANCE FOR CITY LEADERS HANDBOOK 53
Revenues generated from government-owned assets
are another important, and often underutilized,
source of non-tax own-source revenues—one that
carries unique strategic considerations. While these
revenues can be particularly useful for financing
local infrastructure and other important investments,
it is important to consider the revenue generation
capacity of each asset.24 Equally important is the
consideration of any constraints and of the sustain-
ability corresponding to the asset, particularly where
naturally occurring resources (oil, gas, minerals, etc.)
are harvested.25
Some classes of non-tax own-source revenues from
government-owned assets—such as PILOTs—may
be limited if they can only be generated from certain
discrete institutional actors. PILOTs, as noted in Table
1, have emerged as voluntary payments made by
private non-profits and other tax-exempt entities.
For municipalities that rely heavily on property taxes,
or are working to strengthen their local property tax
base, PILOTs may become an important source of
non-tax revenue. In recent years, they have gained
popularity in Canada and the United States, where
several cities—including Boston, Philadelphia, Balti-
more, and Pittsburgh—have begun collecting PILOTs.
Given that PILOTs are voluntary, municipalities that
collect PILOTs have developed a number of incen-
tives to encourage non-profits and other tax-exempt
entities to participate. For example, “non-profits
may agree to make PILOTs because they realize that
they share an interest in the fiscal health of the local
government.”26 In other instances, non-profits agree
to PILOTs because they depend on public goods
and services and on the cooperation of municipal
authorities in granting building permits and zoning
changes. PILOTs thus constitute a new and poten-
tially strong revenue stream from this discrete user
base.27
Betterment levies, or special assessments, also
harness the value of land as an asset, but the appli-
cation of revenues resulting from such sources can
carry some limitations. A typical betterment levy is
imposed by a government on the owners of a select
group of properties. It is used to either entirely or
partially fund the cost of a specific improvement
or service that benefits the public (generally) and
confers a special benefit upon the owners of certain
specific properties.28 The enabling legal framework
in some jurisdictions—for example, Colombia—
provides for the consideration of “benefit factors”
when calculating and assessing the levy, and can
include defining a “virtual area” and using select
factors to determine which entities benefit within
the designated physical area.
Public space in Medellin, Colombia © Eduardo Feuerhake
54 FINANCE FOR CITY LEADERS HANDBOOK
Developing a checklist of best practices for expanding and harnessing non-tax own-source revenues
As noted previously, city leaders’ ability to harness
non-tax own-source revenues can depend on the
enabling legal framework that establishes the
system of fiscal governance; the degree of fiscal,
administrative, and public sector decentraliza-
tion; the political climate and history; and rela-
tions with higher levels of government. Accord-
ingly, policy reform in this realm should begin
with an evaluation of these elements to chart
a tenable and politically feasible path forward.
The following checklist can guide city leaders
who are considering reform in a wide range of
global socio-political contexts. It is followed by
expanded recommendations and best practices
related to each item.
First, determine the areas where policy reform
is necessary. Focus on policies aimed at achiev-
ing revenue sufficiency, supporting the sound
operations of government, and meeting
citizen needs.
Second, evaluate how, and whether, policy
reform can enhance the local government’s
ability to use non-tax own-source revenues to
help support infrastructure investments (which
typically require large-scale capital raised via
external financing mechanisms, including
debt, land-based financing tools, and public–
private partnerships).29
Third, create a technical roadmap to carry out
the desired policy reforms.
Fourth, identify ways to build the local govern-
ment’s technical capacity to implement the
desired reforms, as well as future reforms.
First, to determine the areas ripe for policy
reform, a city leader must first clearly articulate
the goals of reform (e.g., revenue sufficiency,
supporting the sound operation of government,
or meeting citizen needs) and assess the current
framework. Next, city leaders should examine
the current presence and function of each type
of non-tax own-source revenue currently used
by the municipal government. It may then be
prudent to evaluate current and past trends in
collection rates, and compare these with the
costs of collecting each type of revenue, among
other factors. This will assist in evaluating the
extent to which the existing non-tax own-source
revenue framework generates the funds neces-
sary to finance service delivery and the day-to-
day operations of government.
Key questions to ask in this regard include: Should
user charges or benefit charges be structured to
support cost recovery, especially in the cases of
transportation and public utilities? Should certain
user charges that form the financial backbone of
public enterprises evolve to support the delivery
of urban services on an area-wide basis? If so,
this will require an understanding of current
expenditure needs (relating to both capital and
government operations) and forecasted needs
(informed by projections of population growth,
externalities, and other factors). This process
can identify potential gaps in funding and also
evaluate the efficiency of the current revenue
collection system. This can be measured by a
number of criteria, including “cost of collection”
ratios that provide insight into how efficiently
revenue is collected.30
Second, when evaluating the scope of reform,
city leaders may want to consider how non-tax
own-source revenues can enhance access to, and
use of, financial instruments to fund major infra-
FINANCE FOR CITY LEADERS HANDBOOK 55
structure investments. Many local governments
cannot fund large infrastructure projects via
“pay-as-you-go” funding from current revenues
and must resort to loans, debt, public–private
partnerships, or land-based financing instru-
ments.31 As a result, a strong base of non-tax
own-source revenues can position a municipal
government to leverage several of these financial
tools.
For example, a municipality can expand the
base of capital for water and sewer projects via
issuance of municipal revenue bonds support-
ed by local water and sewer fees.32 Municipal
revenue bonds are bonds funded from a specific
revenue source. They allow municipalities to
dedicate discrete streams of revenues to support
multi-year borrowings that produce capital for
infrastructure investment.33 To pay principal and
interest on the bonds, such borrowings require
a pledge of specific assessments and charges—
in this case, those related to water and sewer
services.
It is important to note that debt finance is not an
additional source of revenue––it is a mechanism
for raising large-scale capital by dedicating current
and future revenues to debt service payments.34
The local government seeking to expand use of
debt instruments should consider reforms to the
pricing regime of the dedicated revenue source
pledged to support revenue bonds (i.e., water
fee, sewer assessments, tolls, etc.) and ensure
that such revenue streams are not inhibited by
any superior claims on the assessments, as well as
other factors.35 (See Case Study 2 for an illustra-
tion of the intersection of these principles in the
context of municipal bonds.)
Third, once priority areas for reform have been
identified, city leaders should attempt to create the
technical roadmap that will guide the implemen-
tation of the desired reforms. The path to reform
begins by answering certain foundational ques-
tions that include: What changes are necessary to
the legal framework governing the jurisdiction? Is
a constitutional or statutory change required? To
support reform, should the level of decentraliza-
tion present in the jurisdiction be re-examined or
changed? What role do higher-level governments
play in ensuring reform is successful? Is the politi-
cal will to implement reform present?
Finally, an important component of the implemen-
tation process is supporting city leaders charged
with administering new and existing programs
or policies by providing avenues for technical
capacity building. Significant impediments to
the harnessing of non-tax own-source revenues
can include the burden and costs of administra-
tion, collection, and enforcement of the user fees
(or related fines), particularly where institution-
al capacity is low and relevant training for local
officials charged with implementation is absent.36
Areas of capacity building can include reforms
to improve revenue administration, assessment,
and collection; and introducing means-testing to
make revenue generation more progressive, while
retaining a high level of revenues. An integrated
plan for technical capacity building that is aligned
with broader financial management principles can
help local government officials steward resources
effectively so they can meet their short- and long-
term financial and operational obligations—and
do so with accountability.37
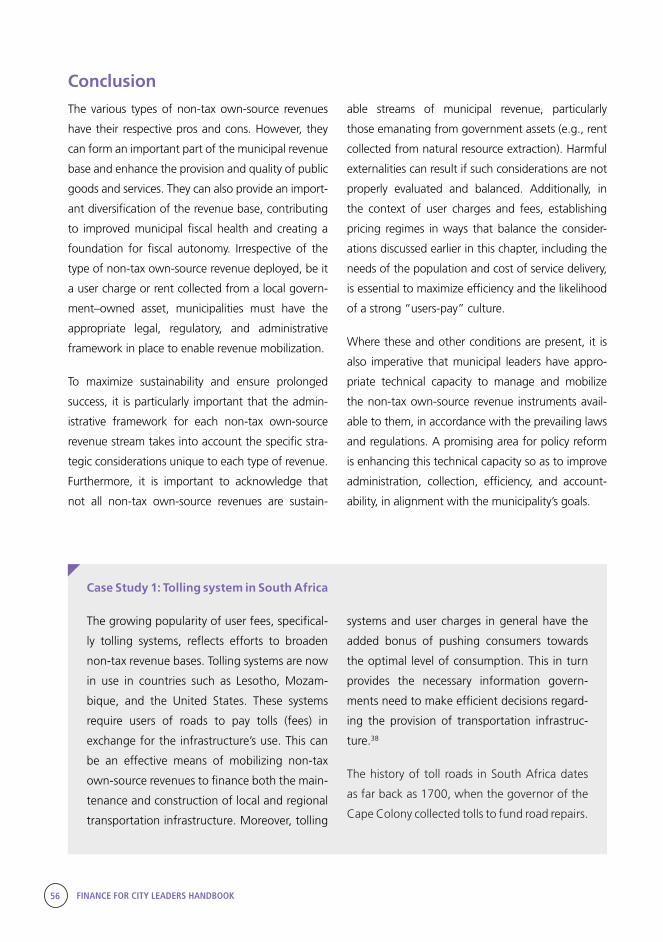
56 FINANCE FOR CITY LEADERS HANDBOOK
Conclusion
The various types of non-tax own-source revenues
have their respective pros and cons. However, they
can form an important part of the municipal revenue
base and enhance the provision and quality of public
goods and services. They can also provide an import-
ant diversification of the revenue base, contributing
to improved municipal fiscal health and creating a
foundation for fiscal autonomy. Irrespective of the
type of non-tax own-source revenue deployed, be it
a user charge or rent collected from a local govern-
ment–owned asset, municipalities must have the
appropriate legal, regulatory, and administrative
framework in place to enable revenue mobilization.
To maximize sustainability and ensure prolonged
success, it is particularly important that the admin-
istrative framework for each non-tax own-source
revenue stream takes into account the specific stra-
tegic considerations unique to each type of revenue.
Furthermore, it is important to acknowledge that
not all non-tax own-source revenues are sustain-
able streams of municipal revenue, particularly
those emanating from government assets (e.g., rent
collected from natural resource extraction). Harmful
externalities can result if such considerations are not
properly evaluated and balanced. Additionally, in
the context of user charges and fees, establishing
pricing regimes in ways that balance the consider-
ations discussed earlier in this chapter, including the
needs of the population and cost of service delivery,
is essential to maximize efficiency and the likelihood
of a strong “users-pay” culture.
Where these and other conditions are present, it is
also imperative that municipal leaders have appro-
priate technical capacity to manage and mobilize
the non-tax own-source revenue instruments avail-
able to them, in accordance with the prevailing laws
and regulations. A promising area for policy reform
is enhancing this technical capacity so as to improve
administration, collection, efficiency, and account-
ability, in alignment with the municipality’s goals.
Case Study 1: Tolling system in South Africa
systems and user charges in general have the
added bonus of pushing consumers towards
the optimal level of consumption. This in turn
provides the necessary information govern-
ments need to make efficient decisions regard-
ing the provision of transportation infrastruc-
ture.38
The history of toll roads in South Africa dates
as far back as 1700, when the governor of the
Cape Colony collected tolls to fund road repairs.
The growing popularity of user fees, specifical-
ly tolling systems, reflects efforts to broaden
non-tax revenue bases. Tolling systems are now
in use in countries such as Lesotho, Mozam-
bique, and the United States. These systems
require users of roads to pay tolls (fees) in
exchange for the infrastructure’s use. This can
be an effective means of mobilizing non-tax
own-source revenues to finance both the main-
tenance and construction of local and regional
transportation infrastructure. Moreover, tolling
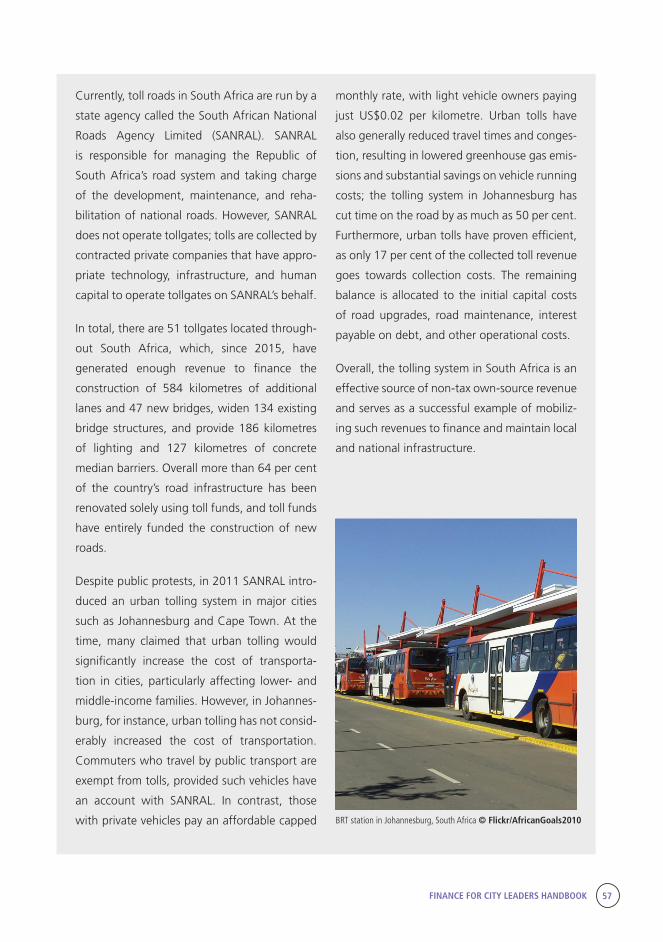
FINANCE FOR CITY LEADERS HANDBOOK 57
Currently, toll roads in South Africa are run by a
state agency called the South African National
Roads Agency Limited (SANRAL). SANRAL
is responsible for managing the Republic of
South Africa’s road system and taking charge
of the development, maintenance, and reha-
bilitation of national roads. However, SANRAL
does not operate tollgates; tolls are collected by
contracted private companies that have appro-
priate technology, infrastructure, and human
capital to operate tollgates on SANRAL’s behalf.
In total, there are 51 tollgates located through-
out South Africa, which, since 2015, have
generated enough revenue to finance the
construction of 584 kilometres of additional
lanes and 47 new bridges, widen 134 existing
bridge structures, and provide 186 kilometres
of lighting and 127 kilometres of concrete
median barriers. Overall more than 64 per cent
of the country’s road infrastructure has been
renovated solely using toll funds, and toll funds
have entirely funded the construction of new
roads.
Despite public protests, in 2011 SANRAL intro-
duced an urban tolling system in major cities
such as Johannesburg and Cape Town. At the
time, many claimed that urban tolling would
significantly increase the cost of transporta-
tion in cities, particularly affecting lower- and
middle-income families. However, in Johannes-
burg, for instance, urban tolling has not consid-
erably increased the cost of transportation.
Commuters who travel by public transport are
exempt from tolls, provided such vehicles have
an account with SANRAL. In contrast, those
with private vehicles pay an affordable capped
monthly rate, with light vehicle owners paying
just US$0.02 per kilometre. Urban tolls have
also generally reduced travel times and conges-
tion, resulting in lowered greenhouse gas emis-
sions and substantial savings on vehicle running
costs; the tolling system in Johannesburg has
cut time on the road by as much as 50 per cent.
Furthermore, urban tolls have proven efficient,
as only 17 per cent of the collected toll revenue
goes towards collection costs. The remaining
balance is allocated to the initial capital costs
of road upgrades, road maintenance, interest
payable on debt, and other operational costs.
Overall, the tolling system in South Africa is an
effective source of non-tax own-source revenue
and serves as a successful example of mobiliz-
ing such revenues to finance and maintain local
and national infrastructure.
BRT station in Johannesburg, South Africa © Flickr/AfricanGoals2010
58 FINANCE FOR CITY LEADERS HANDBOOK
Case Study 2: Municipal bonds supported by non-tax own-source revenues
modate and improve the livelihoods of approxi-
mately 3,000 vendors.44
To position itself to raise capital from investors,
Dakar had to take several steps. In most African
countries where subnational entities are allowed
to borrow, they face significant challenges estab-
lishing creditworthiness due to limited cash
flows, lack of debt management experience, and
other factors.45 Dakar faced several challenges in
this regard, including self-generated income and
resources that were considered small, as well as
a budget substantially dependent on a central
government and limited technical capacity.46
From 2008 to 2012, the city increased its own
revenues by almost 40 per cent, mostly from
advertising billboard fees.47 The city accomplished
this despite challenges posed by low levels of
fiscal decentralization; the city had control over
less than 10 per cent of its total revenues. The
city also established a Department of Planning
and Sustainable Development capable of demon-
strating that Dakar had a credible development
strategy.48 Additionally, the city augmented its
technical capacity by partnering with a number
of institutions—including The Bill and Melinda
Gates Foundation (managed by the Cities Alliance
Initiative), USAID, the Public-Private Infrastructure
Advisory Facility (PPIAF), and the French Develop-
ment Agency (AfD)—to create a comprehensive
program that included rigorous fiscal training and
that developed detailed assessments of potential
investment projects.49 It also institutionalized a
participatory process that gave voice to the urban
Cities face increasingly complex responsibilities,
complicated by chronically insufficient funding to
meet local needs.39 In Latin America, Africa, and
the United States, municipal governments are
using project revenue bonds and general obliga-
tion bonds with greater frequency as a source of
infrastructure financing, particularly when private
capital is needed to close multi-billion-dollar short-
falls in spending for needed infrastructure.40 Debt
financing is feasible only where municipalities have
the ability to service their debt from own-source
revenues in a sustainable manner and where a
robust enabling regulatory framework for munici-
pal borrowing is in place.41 The City of Dakar illus-
trates how one municipality adopted a compre-
hensive strategy to enhance its credit profile and
build a sustainable revenue base that will position
it to potentially leverage municipal securities to
raise capital for infrastructure investment.
In 2011, the City of Dakar launched the Dakar
Municipal Finance Program (DMFP) to begin to
strategically position itself as a creditworthy
issuer that could attract funding from investors
in regional capital markets.42 Proceeds from
municipal borrowing were expected to be in
the range of approximately CFA20 billion/US$40
million, and would have enabled the municipal-
ity to finance a large market that would benefit
the economically active poor.43 Specifically, the
financing would provide for the relocation of city
markets currently located in informal commerce
zones, such as sidewalks and roadways, to a
central market that will be constructed to accom-
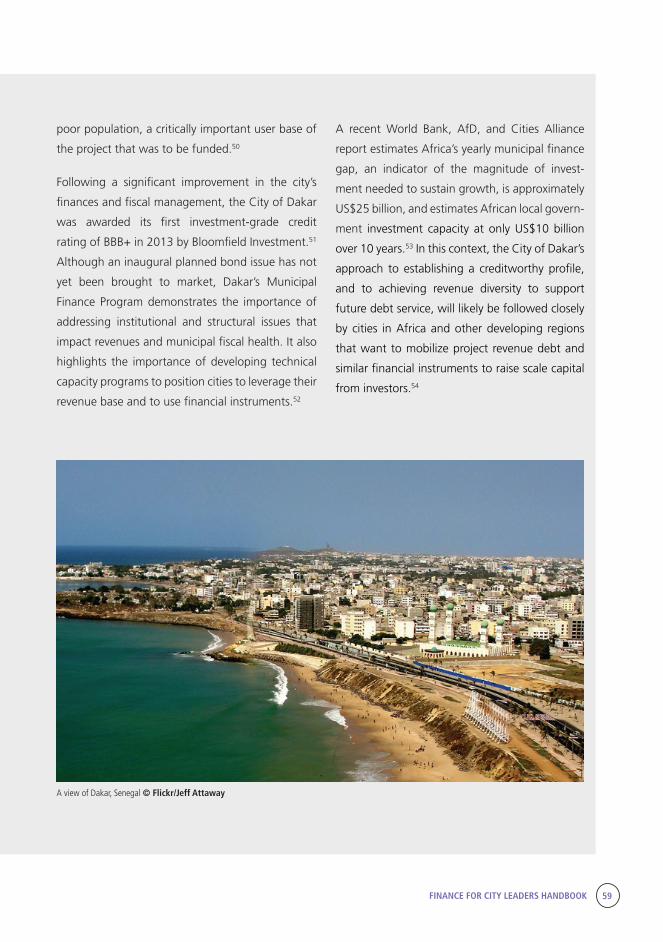
FINANCE FOR CITY LEADERS HANDBOOK 59
poor population, a critically important user base of
the project that was to be funded.50
Following a significant improvement in the city’s
finances and fiscal management, the City of Dakar
was awarded its first investment-grade credit
rating of BBB+ in 2013 by Bloomfield Investment.51
Although an inaugural planned bond issue has not
yet been brought to market, Dakar’s Municipal
Finance Program demonstrates the importance of
addressing institutional and structural issues that
impact revenues and municipal fiscal health. It also
highlights the importance of developing technical
capacity programs to position cities to leverage their
revenue base and to use financial instruments.52
A recent World Bank, AfD, and Cities Alliance
report estimates Africa’s yearly municipal finance
gap, an indicator of the magnitude of invest-
ment needed to sustain growth, is approximately
US$25 billion, and estimates African local govern-
ment investment capacity at only US$10 billion
over 10 years.53 In this context, the City of Dakar’s
approach to establishing a creditworthy profile,
and to achieving revenue diversity to support
future debt service, will likely be followed closely
by cities in Africa and other developing regions
that want to mobilize project revenue debt and
similar financial instruments to raise scale capital
from investors.54
A view of Dakar, Senegal © Flickr/Jeff Attaway
60 FINANCE FOR CITY LEADERS HANDBOOK
Lourdes Germán is director of international and institute-wide initiatives at the Lincoln Institute of Land
Policy.
Elizabeth Glass is a consultant for the Urban Economy Branch of the United Nations Human Settlements
Programme.
8 Commonwealth of Massachusetts Department of Revenue, Municipal Finance Glossary (n.p., 2008). Available from http://www.mass.gov/dor/docs/dls/publ/misc/dlsmfgl.pdf.
9 Lawrence C. Walters, Land Value Capture in Policy and Practice (Provo, Utah, Brigham Young University, n.d.). Available from http://www.landandpoverty.com/agenda/pdfs/paper/walters_full_paper.pdf. For a full discussion of land-based financing tools, consult Chapter 9.
10 Advisory Commission on Intergovernmental Relations, Payments in Lieu of Taxes on Federal Real Property (Wash-ington, D.C., 1981). Available from http://www.library.unt.edu/gpo/acir/Reports/brief/B-5.pdf.
11 See Mark T. Kremzner, “Managing Urban Land in China: The Emerging Legal Framework and Its Role in De-velopment,” Pacific Rim Law and Policy Journal, vol. 7, no. 3, available from https://digital.lib.washington.edu/dspace-law/bitstream/handle/1773.1/871/7PacRimLPolyJ611.pd-f?sequence=1; and U.S. Department of the Interior Bureau of Land Management, Qs&As About Oil and Gas Leasing, available from http://www.blm.gov/wo/st/en/prog/energy/oil_and_gas/questions_and_answers.html.
12 See Chengri Ding, “Property Tax Development in Chi-na,” Land Lines, vol. 17, no. 3 (July 2005), available from-http://www.lincolninst.edu/pubs/1041_Property-Tax-De-velopment-in-China; Peter Ho, “Who Owns China’s Land? Policies, Property Rights and Deliberate Institutional Ambi-guity,” The China Quarterly, vol. 166 (June 2001), available from http://mearc.eu/resources/tcqholand.pdf. For a full discussion of land-based financing tools, consult Chapter 9.
13 V. Ezeabasili and W. Herbert, “Fiscal Responsibility Law, Fiscal Discipline and Macroeconomic Stability: Lessons from Brazil and Nigeria,” International Journal of Econom-ics and Management Sciences, vol. 2, no. 6 (2013). A full discussion of decentralization is beyond the scope of this chapter. For a discussion of decentralization, please refer to Chapter 3.
Endnotes1 UN-Habitat, Guide to Municipal Finance (Nairobi, UN-Habitat, 2009). Available from http://unhabitat.org/books/guide-to-municipal-finance/.
2 This chapter’s focus is limited to examining non-tax own-source revenues. As such, this chapter does not cover the other important classes of revenues that municipal governments rely on, including intergovernmental transfers, or own-source revenues derived via taxation (which are dis-cussed in Chapter 2). A discussion of strategies to broaden municipal revenues also appears in Chapter 2.
3 Roy W. Bahl and Johannes F. Linn, Governing and Financing Cities in the Developing World (Cambridge, Mass., Lincoln Institute of Land Policy, 2014). Available from https://www.lincolninst.edu/pubs/2389_Governing-and-Financ-ing-Cities-in-the-Developing-World.
4 This table reflects materials from the following sources: R. M. Bird and F. Vaillancourt, eds., Perspectives on Fiscal Federalism (Washington, D.C., World Bank, 2006); Roy W. Bahl and Johannes F. Linn, Governing and Financing Cities in Developing Countries (Cambridge, Mass., Lincoln Institute of Land Policy, 2013); Advisory Commission on Intergovernmental Relations, Local Revenue Diversification: User Charges (n.p., 1987); Arindam Das-Gupta, Non-Tax Revenues in Indian States: Principles and Case Studies (n.p., Asian Development Bank, 2005).
5 Alix Gowlland-Gualtieri, South Africa’s Water Law and Policy Framework: Implications for the Right to Water (Ge-neva, International Environmental Law & Research Center, 2007). Available from http://www.ielrc.org/content/w0703.pdf.
6 Kingdom of Bahrain, Ministry of Works, Municipalities Affairs and Urban Planning. Available from http://www.municipality.gov.bh/mun/index_en.html.
7 Michigan Municipal League, Municipal Civil Infractions (Ann Arbor, Mich., n.d.). Available from http://www.mml.org/resources/publications/one_pagers/opp_civil_infractions.pdf.
FINANCE FOR CITY LEADERS HANDBOOK 61
14 UN-Habitat, Guide to Municipal Finance (Nairobi, UN-Habitat, 2009). Available from http://unhabitat.org/books/guide-to-municipal-finance/.
15 Roy W. Bahl and Johannes F. Linn, Governing and Financing Cities in the Developing World (Cambridge, Mass., Lincoln Institute of Land Policy, 2014). Available from https://www.lincolninst.edu/pubs/2389_Governing-and-Fi-nancing-Cities-in-the-Developing-World.
16 Mila Freire and Richard Stren, eds., The Challenge of Urban Government: Policies and Practices (Washington, D.C., World Bank, 2001).
17 R. M. Bird and F. Vaillancourt, eds., Perspectives on Fiscal Federalism (Washington, D.C., World Bank, 2006).
18 Mary Edwards, State and Local Revenues: Beyond the Property Tax (Cambridge, Mass., Lincoln Institute of Land Policy, 2006).
19 Katherine Barrett and Richard Greene, “The Risks of Relying on User Fees,” Governing Magazine, April 2013. Available from http://www.governing.com/columns/smart-mgmt/col-risks-of-raising-non-tax-revenue.html.
20 UN-Habitat, Guide to Municipal Finance (Nairobi, UN-Habitat, 2009). Available from http://unhabitat.org/books/guide-to-municipal-finance/.
21 Odd-Helge Fjeldstad, “Local Revenue Mobilization in Urban Settings in Africa,” in Karin Millett, Dele Olowu, and Robert Cameron, eds., Local Governance and Poverty Re-duction in Africa (n.p., Joint Africa Institute, 2006). Available from http://www.cmi.no/publications/file/2338-local-reve-nue-mobilization-in-urban-settings-in.pdf.
22 Roy W. Bahl and Johannes F. Linn, Governing and Financing Cities in the Developing World (Cambridge, Mass., Lincoln Institute of Land Policy, 2014). Available from https://www.lincolninst.edu/pubs/2389_Governing-and-Fi-nancing-Cities-in-the-Developing-World.
23 Hee Soun Jang and Myungjung Kwon, “Enterprising Government: The Political and Financial Effects of Fee-Sup-ported Municipal Services,” Public Administration Quarterly, vol. 38, no. 2 (2014). Available from https://www.questia.com/library/journal/1G1-369461703/enterprising-govern-ment-the-political-and-financial.
24 A. Das-Gupta, Non-Tax Revenues in Indian States: Principles and Case Studies (Manila, Asian Development Bank, 2005).
25 For a full discussion of considerations related to land-based financing, see Chapter 9.
26 D. A. Kenyon and A. H. Langley, Payments in Lieu of Taxes: Balancing Municipal and Non-Profit Interests (Cam-bridge, Mass., Lincoln Institute of Land Policy, 2010).
27 D. A. Kenyon and A. H. Langley, Payments in Lieu of Taxes: Balancing Municipal and Non-Profit Interests (Cam-bridge, Mass., Lincoln Institute of Land Policy, 2010).
28 Oscar Borrero Ochoa, “Betterment Levy in Colombia: Relevance, Procedures, and Social Acceptability,” Land Lines (April 2011), p. 14. Available from https://www.lincolninst.edu/pubs/dl/1899_1213_LLA110404.pdf.
29 Roy W. Bahl and Johannes F. Linn, Governing and Fi-nancing Cities in the Developing World (Cambridge, Mass., Lincoln Institute of Land Policy, 2014), p. 36. Available from https://www.lincolninst.edu/pubs/dl/2389_1731_Govern-ing_and_Financing_Cities_web.pdf.
30 OECD, Government at a Glance 2013 (Paris, 2013). The report observes that the “cost of collection” ratio is a standard measure of efficiency often adopted by revenue bodies, comparing the annual costs of administration with the total revenue collected over the fiscal year. A downward trend of the ratio can constitute, all other things equal, ev-idence of a reduction in relative costs (improved efficiency) or improved tax compliance (improved effectiveness).
31 For an expanded discussion of the role non-tax own-source revenues can play in supporting public–private partnerships, please see Chapter 7.
32 Consider, for example, the revenue bond issuances to support water and sewer infrastructure by the New York City Municipal Water Finance Authority, Massachusetts Wa-ter Resources Authority, or the Metropolitan Water District Authority of Southern California, whose information are presented in the United States Electronic Municipal Market-place (www.emma.msrb.org).
33 Municipal Securities Rulemaking Board, Market Edu-cation Center. Available from www.emma.msrb.org.
34 United Nations Conference on Housing and Sustain-able Urban Development, Municipal Finance and Local Fiscal Systems (n.p., Habitat III, 2016). Available from http://www.csb.gov.tr/db/habitat/editordosya/file/POLICY%20PA-PER-SON/PU5-municipal%20finance%20and%20local%20fiscal%20systems.pdf.
62 FINANCE FOR CITY LEADERS HANDBOOK
35 It is important to distinguish revenue bonds from general obligation bonds that are issued by a government unit and are payable from its general funds. Most general obligation bonds are secured by the full faith and credit of the issuer, depending on applicable law. Municipal Securi-ties Rulemaking Board, Market Education Center. Available from www.emma.msrb.org.
36 United Nations Conference on Housing and Sustain-able Urban Development, Municipal Finance and Local Fiscal Systems (n.p., Habitat III, 2016). Available from http://www.csb.gov.tr/db/habitat/editordosya/file/POLICY%20PA-PER-SON/PU5-municipal%20finance%20and%20local%20fiscal%20systems.pdf.
37 United Nations Conference on Housing and Sustain-able Urban Development, Municipal Finance and Local Fiscal Systems (n.p., Habitat III, 2016). Available from http://www.csb.gov.tr/db/habitat/editordosya/file/POLICY%20PA-PER-SON/PU5-municipal%20finance%20and%20local%20fiscal%20systems.pdf.
38 R. M. Bird and E. Slack, “An Approach to Metropolitan Governance and Finance,” Environment and Planning C: Government and Policy, vol. 25, no. 5 (2007), pp. 729–755.
39 United Nations Conference on Housing and Sustain-able Urban Development, Municipal Finance and Local Fiscal Systems (n.p., Habitat III, 2016). Available from http://www.csb.gov.tr/db/habitat/editordosya/file/POLICY%20PA-PER-SON/PU5-municipal%20finance%20and%20local%20fiscal%20systems.pdf.
40 Carlos Viana, et al., Why Project Bonds Are on the Rise in Latin America (n.p., White & Case, 2015). Available from http://www.whitecase.com/publications/insight/why-project-bonds-are-rise-latin-america.
41 United Nations Conference on Housing and Sustain-able Urban Development, Municipal Finance and Local Fiscal Systems (n.p., Habitat III, 2016). Available from http://www.csb.gov.tr/db/habitat/editordosya/file/POLICY%20PA-PER-SON/PU5-municipal%20finance%20and%20local%20fiscal%20systems.pdf.
42 Dakar Municipal Finance Program, “Support the City of Dakar’s Economic Development.” Available from http://www.dakarmfp.com.
43 Dakar Municipal Finance Program, “Support the City of Dakar’s Economic Development.” Available from http://www.dakarmfp.com.
44 Edward Paice, Dakar’s Municipal Bond Issue: A Tale of Two Cities (London, Africa Research Institute, 2016). Avail-
able from http://www.africaresearchinstitute.org/newsite/wp-content/uploads/2016/05/ARI_Dakar_BN_final-final.pdf.
45 Edward Paice, Dakar’s Municipal Bond Issue: A Tale of Two Cities (London, Africa Research Institute, 2016). Avail-able from http://www.africaresearchinstitute.org/newsite/wp-content/uploads/2016/05/ARI_Dakar_BN_final-final.pdf.
46 Edward Paice, Dakar’s Municipal Bond Issue: A Tale of Two Cities (London, Africa Research Institute, 2016). Avail-able from http://www.africaresearchinstitute.org/newsite/wp-content/uploads/2016/05/ARI_Dakar_BN_final-final.pdf.
47 Edward Paice, Dakar’s Municipal Bond Issue: A Tale of Two Cities (London, Africa Research Institute, 2016). Avail-able from http://www.africaresearchinstitute.org/newsite/wp-content/uploads/2016/05/ARI_Dakar_BN_final-final.pdf.
48 Edward Paice, Dakar’s Municipal Bond Issue: A Tale of Two Cities (London, Africa Research Institute, 2016). Avail-able from http://www.africaresearchinstitute.org/newsite/wp-content/uploads/2016/05/ARI_Dakar_BN_final-final.pdf.
49 Omar Siddique, West Africa’s First Municipal Bond Enables Pro-Poor Investment in Dakar (n.p., Cities Alliance for Action, n.d.). Available from http://www.citiesalliance.org/sites/citiesalliance.org/files/CA-in-Action-Municipal-Fi-nancing-Dakar_Final.pdf.
50 Omar Siddique, West Africa’s First Municipal Bond Enables Pro-Poor Investment in Dakar (n.p., Cities Alliance for Action, n.d.). Available from http://www.citiesalliance.org/sites/citiesalliance.org/files/CA-in-Action-Municipal-Fi-nancing-Dakar_Final.pdf.
51 Christopher Swope and Tidiane Kasse, “How Dakar (Almost) Got Its First Municipal Bond to Market,” Citiscope, 19 February 2015. Available from http://citiscope.org/story/2015/how-dakar-almost-got-its-first-municipal-bond-market.
52 Dakar Municipal Finance Program, “Support the City of Dakar’s Economic Development.” Available from http://www.dakarmfp.com.
53 SAIS Perspectives, “Interview: Municipal Finance in Dakar and the Global South,” 29 March 2015. Available from http://www.saisperspectives.com/2015issue/munici-pal-finance-in-dakar.
54 Ibid. See also Edward Paice, Dakar’s Municipal Bond Issue: A Tale of Two Cities (London, Africa Research Insti-tute, 2016). Available from http://www.africaresearchin-stitute.org/newsite/wp-content/uploads/2016/05/ARI_Da-kar_BN_final-final.pdf.

FINANCE FOR CITY LEADERS HANDBOOK 63
Gonguptop Rotary in Ulsan, South Korea © Flickr_Scott Rotzoll
Introduction
The rapid growth of the market for green bonds—the proceeds of which
are used to finance projects that will improve the environment—has
sparked interest among stakeholders worldwide. Municipalities, cities,
and state-owned utility companies have begun to emerge as strategic
issuers of green bonds in the United States, Europe, and South Africa.
The growth in green bonds comes amid greater awareness of climate
change and expanding investor appetite for environmentally friendly
investment products. Green municipal bonds are an important area for
future growth as cities and other sub-national entities look to low-cost
and long-term sources of capital to finance climate mitigation and adap-
tation infrastructure requirements.
This chapter explains what green municipal bonds are, describes the
growth and composition of the green municipal bond market, examines
Green Municipal Bonds05
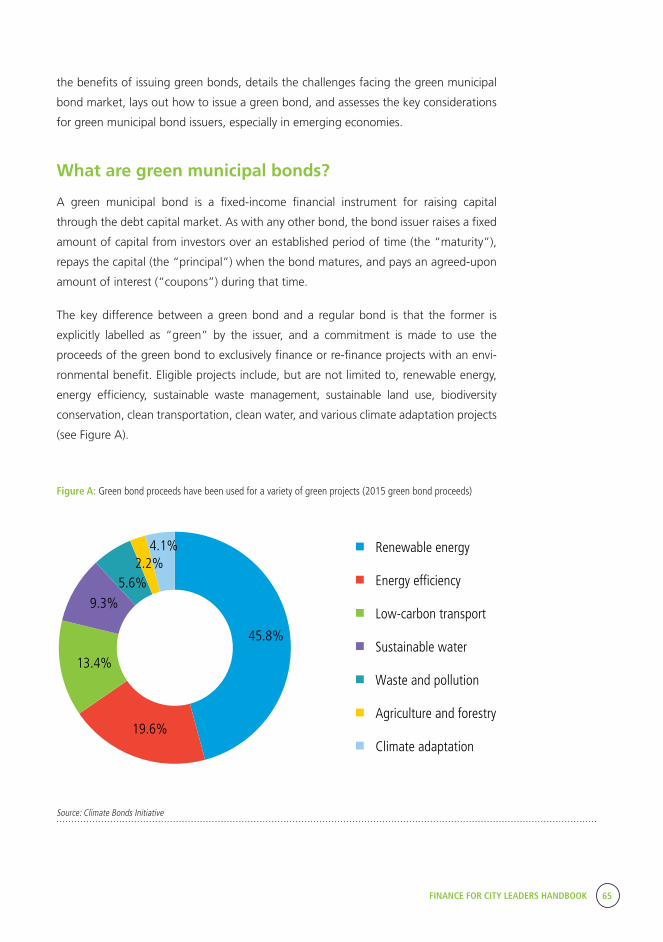
FINANCE FOR CITY LEADERS HANDBOOK 65
the benefits of issuing green bonds, details the challenges facing the green municipal
bond market, lays out how to issue a green bond, and assesses the key considerations
for green municipal bond issuers, especially in emerging economies.
What are green municipal bonds?
A green municipal bond is a fixed-income financial instrument for raising capital
through the debt capital market. As with any other bond, the bond issuer raises a fixed
amount of capital from investors over an established period of time (the “maturity”),
repays the capital (the “principal”) when the bond matures, and pays an agreed-upon
amount of interest (“coupons”) during that time.
The key difference between a green bond and a regular bond is that the former is
explicitly labelled as “green” by the issuer, and a commitment is made to use the
proceeds of the green bond to exclusively finance or re-finance projects with an envi-
ronmental benefit. Eligible projects include, but are not limited to, renewable energy,
energy efficiency, sustainable waste management, sustainable land use, biodiversity
conservation, clean transportation, clean water, and various climate adaptation projects
(see Figure A).
Figure A: Green bond proceeds have been used for a variety of green projects (2015 green bond proceeds)
45.8%
19.6%
13.4%
9.3%5.6%
2.2%4.1% Renewable energy
Energy ef�ciency
Low-carbon transport
Sustainable water
Waste and pollution
Agriculture and forestry
Climate adaptation
Source: Climate Bonds Initiative

66 FINANCE FOR CITY LEADERS HANDBOOK
Except for the above-mentioned difference, green
municipal bonds are similar to regular bonds and
to date have been largely identical in structure, risk,
and return to regular bonds.
There is also the need to differentiate labelled green
bonds from the unlabelled green bond market.
Unlabelled green bonds are those that are not
explicitly marketed and branded as green but none-
theless help finance projects that provide environ-
mental benefits. The labelled green bond market is
valued at US$118 billion and is small relative to the
larger universe of bonds financing climate-aligned
assets that do not carry a green label, which is
valued at US$576 billion (see Figure B).1
Green bonds can be categorized into four types
(see Table 1). The majority of green bonds issued
are green general obligation bonds backed by the
issuer’s entire balance sheet. The other types are
green revenue bonds, green project bonds, and
green securitized bonds.
Figure B: Labelled green bonds account for 17 per cent of climate-aligned bond universe
$576bn
$118bn
Unlabelled climate-aligned bond marketLabelled green bond market
Table 1: Types of green municipal bonds
Type Use of proceeds Debt recourse Example
General obligation bond
Earmarked for green projects
Full recourse to the issuer; same credit rating applies as to the issuer’s other bonds
City of Johannesburg issued a US$143 million general obligation bond in June 2014. The 10-year bond was rated BBB, based on the rating of Johannesburg as an issuer.
Revenue bond Earmarked for green projects
Revenue streams from the issuer, such as taxes or user fees, provide repayment for the bond
Arizona State University issued US$182.6 million of green revenue U.S. muni bonds in April 2015. The issuance was backed by the university’s revenues, including student tuition and fees and facilities revenues, instead of the full balance sheet of the university.
Project bond Ring-fenced for the specific underlying green project(s)
Recourse is only to the project’s assets and revenue
No issuance seen in the market yet
Securitized bond
Either (1) earmarked for green projects or (2) go directly into the underlying green projects
Recourse is to a group of financial assets that have been grouped together as collateral
Hawaii state government issued US$150 million, AAA-rated green asset-backed securities in November 2014. The bonds were backed by a Green Infrastructure Fee applied to the bills of the state utility’s electricity customers. The securities were issued in two tranches: US$50 million, 8-year, 1.467 per cent coupon, and US$100 million, 17-year, 3.242 per cent coupon.
Source: Adapted from Climate Bonds Initiative
Source: Climate Bonds Initiative
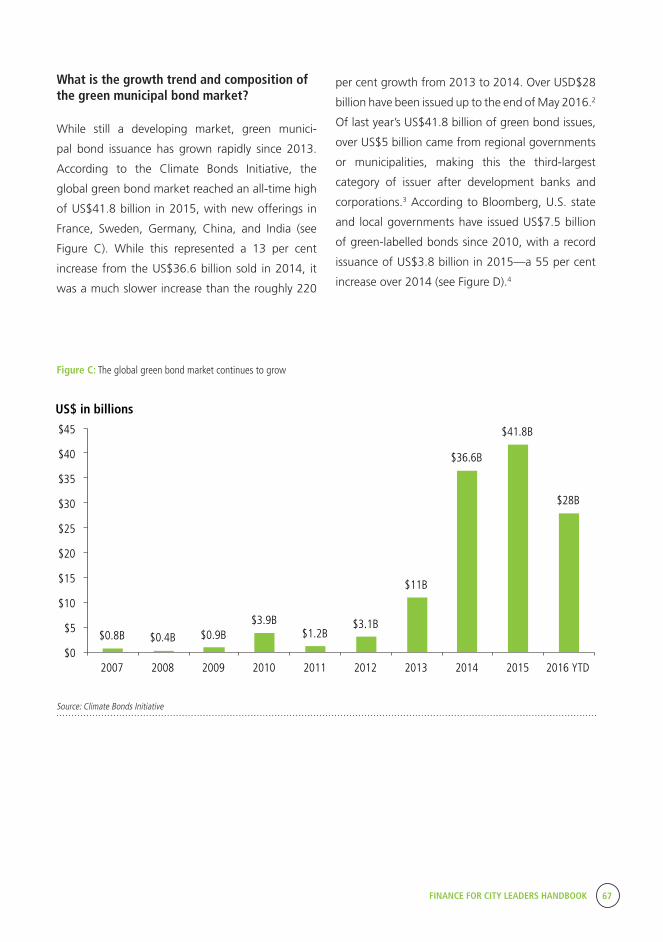
FINANCE FOR CITY LEADERS HANDBOOK 67
What is the growth trend and composition of the green municipal bond market?
While still a developing market, green munici-
pal bond issuance has grown rapidly since 2013.
According to the Climate Bonds Initiative, the
global green bond market reached an all-time high
of US$41.8 billion in 2015, with new offerings in
France, Sweden, Germany, China, and India (see
Figure C). While this represented a 13 per cent
increase from the US$36.6 billion sold in 2014, it
was a much slower increase than the roughly 220
per cent growth from 2013 to 2014. Over USD$28
billion have been issued up to the end of May 2016.2
Of last year’s US$41.8 billion of green bond issues,
over US$5 billion came from regional governments
or municipalities, making this the third-largest
category of issuer after development banks and
corporations.3 According to Bloomberg, U.S. state
and local governments have issued US$7.5 billion
of green-labelled bonds since 2010, with a record
issuance of US$3.8 billion in 2015—a 55 per cent
increase over 2014 (see Figure D).4
Figure C: The global green bond market continues to grow
$0.8B $0.4B $0.9B$3.9B
$1.2B$3.1B
$11B
$36.6B
$41.8B
$28B
$0
$5
$10
$15
$20
$25
$30
$35
$40
$45
2007 2008 2009 2010 2011 2012 2013 2014 2015 2016 YTD
US$ in billions
Source: Climate Bonds Initiative
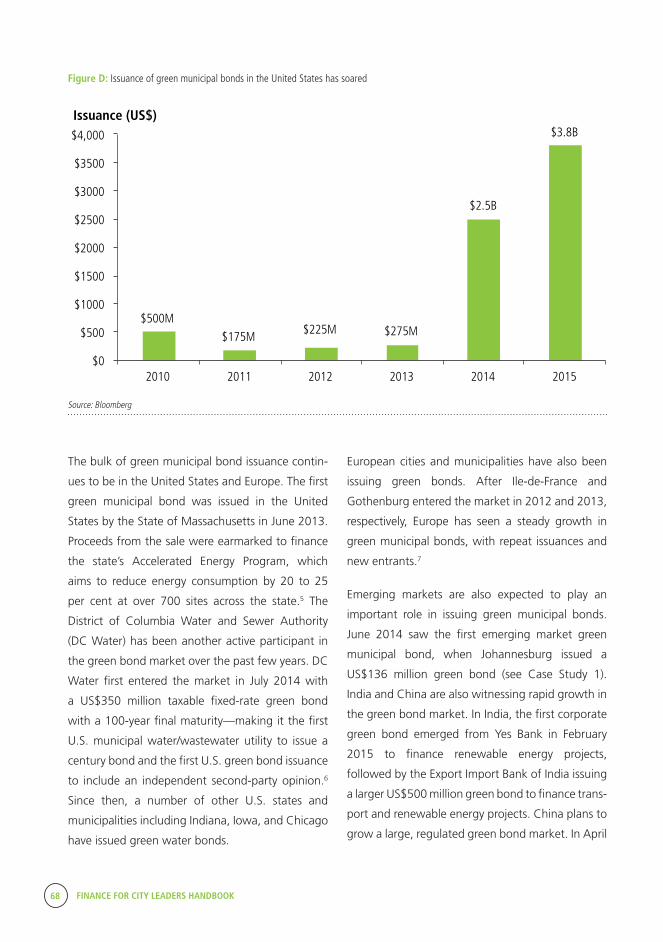
68 FINANCE FOR CITY LEADERS HANDBOOK
Figure D: Issuance of green municipal bonds in the United States has soared
$500M
$175M $225M $275M
$2.5B
$3.8B
$0
$500
$1000
$1500
$2000
$2500
$3000
$3500
$4,000
2010 2011 2012 2013 2014 2015
Issuance (US$)
The bulk of green municipal bond issuance contin-
ues to be in the United States and Europe. The first
green municipal bond was issued in the United
States by the State of Massachusetts in June 2013.
Proceeds from the sale were earmarked to finance
the state’s Accelerated Energy Program, which
aims to reduce energy consumption by 20 to 25
per cent at over 700 sites across the state.5 The
District of Columbia Water and Sewer Authority
(DC Water) has been another active participant in
the green bond market over the past few years. DC
Water first entered the market in July 2014 with
a US$350 million taxable fixed-rate green bond
with a 100-year final maturity—making it the first
U.S. municipal water/wastewater utility to issue a
century bond and the first U.S. green bond issuance
to include an independent second-party opinion.6
Since then, a number of other U.S. states and
municipalities including Indiana, Iowa, and Chicago
have issued green water bonds.
European cities and municipalities have also been
issuing green bonds. After Ile-de-France and
Gothenburg entered the market in 2012 and 2013,
respectively, Europe has seen a steady growth in
green municipal bonds, with repeat issuances and
new entrants.7
Emerging markets are also expected to play an
important role in issuing green municipal bonds.
June 2014 saw the first emerging market green
municipal bond, when Johannesburg issued a
US$136 million green bond (see Case Study 1).
India and China are also witnessing rapid growth in
the green bond market. In India, the first corporate
green bond emerged from Yes Bank in February
2015 to finance renewable energy projects,
followed by the Export Import Bank of India issuing
a larger US$500 million green bond to finance trans-
port and renewable energy projects. China plans to
grow a large, regulated green bond market. In April
Source: Bloomberg
FINANCE FOR CITY LEADERS HANDBOOK 69
2015, China’s central bank announced ambitious
proposals that cover the development of green
definitions, an evaluation system for allocation of
funds and environmental impacts of green bonds,
tax incentives, preferential risk weighting in bank
capital requirements, and fast track issuance of
green bonds.8
While green municipal bonds account for a very
small share of the broader $3.7 trillion bond
market, this market is expected to grow as issuers
look to diversify their buyer base and appeal to
the expanding investor class using environmen-
tal, social, and governance criteria to screen their
investments (“ESG investors”). Investor demand for
sustainable debt is a key factor driving the growth
of the green bond market. Mission driven, institu-
tional investors are increasingly seeking to combine
financial and environmental goals into their deci-
sion-making and, in the process, embracing green
bonds. In December 2014, an investor statement
to support the green bond market was signed by
asset owners and fund managers with a combined
US$2.62 trillion in assets under management.9
There are other indicators too of the strong investor
appetite for green bonds, as evidenced in a high
level of over-subscription. For instance, Massachu-
setts’s first US$100 million green bond was over-
subscribed by 30 per cent and its second green
bond issuance by 185 per cent.10
Growing global awareness of climate change risks
and desire to invest in environmentally friendly
projects and assets will further fuel the develop-
ment of this burgeoning segment of the fixed-
income market. The growing need for energy effi-
cient and clean technologies globally, especially in
emerging economies, will help drive issuance going
forward.
What are the benefits of issuing a green bond?
Most cities have a pipeline of projects they are
seeking to finance in the areas of water, waste,
transit, land use, and energy. Green bonds offer
municipal governments the opportunity to raise
large-scale capital to invest in sustainable infra-
structure and services in these sectors in accor-
dance with the Green Bond Principles—voluntary
guidelines developed by a group of banks in early
2014 that recommend transparency, integrity, and
disclosure in the development of the green bond
market. The instrument is relatively straightforward
for cities with experience issuing bonds and can
offer additional benefits relative to regular munic-
ipal bonds.11 Green bonds are useful for:
Growing or diversifying the investor base.
By issuing a green bond, municipalities have
attracted investors who do not typically buy
municipal bonds, including environmental,
social, and governance (ESG) investors and insti-
tutional investors. For example, ESG investors
purchased US$100 million of the US$350 million
green bond issuance by DC Water in 2014, and
the chief financial officer of DC Water stated
this would not have occurred with a regular,
non-green bond.12 Investors who have signed
up to ESG investment principles under the
United Nations Principles for Responsible Invest-
ment are estimated to manage US$45 trillion in
assets, and green bonds can help cities attract
this investor class.13
Generating greater cross-agency collabo-
ration. The process of structuring and issuing
a green bond can also promote cross-agency
cooperation within a city by bringing together
departments responsible for finance, sustain-
ability, infrastructure, and planning. Cities
70 FINANCE FOR CITY LEADERS HANDBOOK
like Johannesburg have reported this as a key
benefit, helping to break down information silos
and promoting greater teamwork across differ-
ent areas of government.
Publicly promoting a commitment to sustain-
able development. Green bonds can also help
cities send a strong, public signal regarding their
commitment to sustainable development, with
green bond issuances commonly reported in
online and print media. Johannesburg received
international sustainability awards and consid-
erable positive media coverage for its 2014
green bond issuance (see Case Study 1). Some
municipal issuers have also generated aware-
ness and engagement among their citizens by
making the green bonds available for purchase
by retail investors. For example, retail investors
purchased an unprecedented US$260 million of
the US$350 million Commonwealth of Massa-
chusetts green bond in September 2014.14
Leveraging demand to achieve better bond
terms. The demand for green bonds currently
outstrips supply, and green bond issuances are
regularly oversubscribed. The issuer can try to
leverage this demand to seek more favourable
terms. Some issuers have achieved a better price
(cheaper debt) through green bonds, though
most green bonds have a similar price to their
“non-green” equivalents. There is also anecdo-
tal evidence to suggest that green bond inves-
tors may be willing to accept a longer term to
maturity (i.e., a later principal repayment date).
A good example of this is the $350 million
100-year bond issued by DC Water in 2014 to
fund construction of a stormwater and sewage
tunnel to a treatment plant to reduce sewage
overflows to waterways. DC Water was also able
to increase the size of the issuance and the price,
reducing the interest payable by 15 basis points
(or 0.15 per cent).15
What are the challenges facing the green municipal bond market?
The remarkable growth of the green bond
market—including green municipal bonds—has
not come without a number of challenges, many
of which are still to be resolved. The future growth
of the green bond market hinges on many factors.
This includes policy and regulatory frameworks that
create demand for green projects, as well as future
market conditions, such as interest rate develop-
ment and the credit cycle.16 These conditions will
vary across jurisdictions and geographies.
Key challenges facing this market include:
Lack of commonly accepted green stand-
ards. The absence of clear and widely accepted
guidelines around what is green has given rise
to concerns about a risk of “greenwashing,”
where bond proceeds are allocated to projects
and assets that have little or dubious environ-
mental value.17 The lack of commonly accepted
standards means investors and governments can
incur significant transaction costs in evaluating
the environmental credentials of labelled green
bonds. In addition, there is also a wide range
of technology and infrastructure whose green
credentials are in doubt, such as nuclear power,
natural gas extraction and generation, and
biofuels.
For the green bond market to grow, a more
standardized approach to defining what is
“green” is necessary. Investors must be able
to discern what they are buying, compare
products, and ensure that products meet their
financial and environmental investment goals
and mandates.
In response to this challenge, a significant
amount of market-led effort has gone into
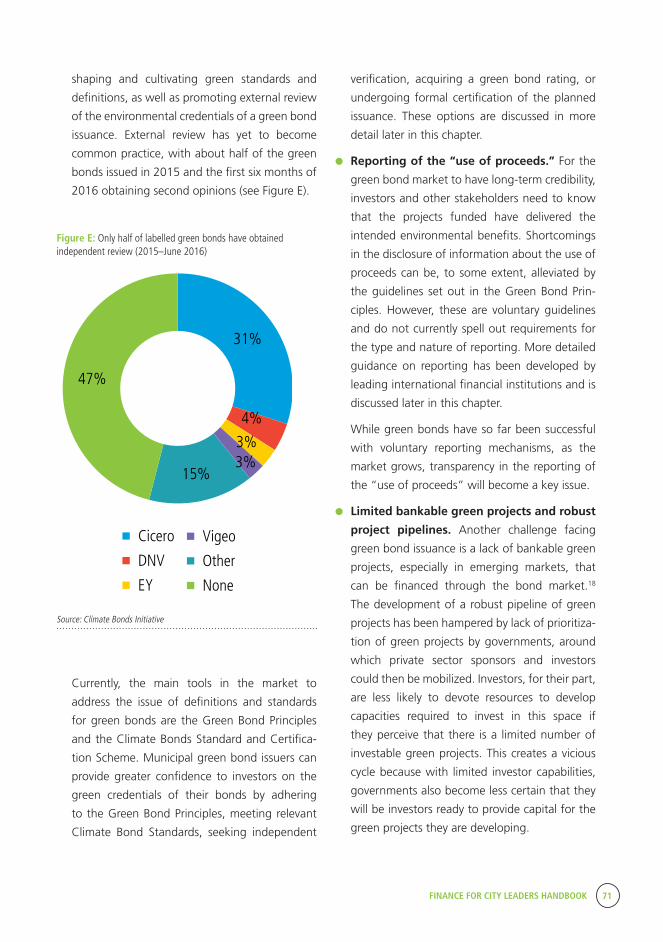
FINANCE FOR CITY LEADERS HANDBOOK 71
shaping and cultivating green standards and
definitions, as well as promoting external review
of the environmental credentials of a green bond
issuance. External review has yet to become
common practice, with about half of the green
bonds issued in 2015 and the first six months of
2016 obtaining second opinions (see Figure E).
Figure E: Only half of labelled green bonds have obtained independent review (2015–June 2016)
verification, acquiring a green bond rating, or
undergoing formal certification of the planned
issuance. These options are discussed in more
detail later in this chapter.
Reporting of the “use of proceeds.” For the
green bond market to have long-term credibility,
investors and other stakeholders need to know
that the projects funded have delivered the
intended environmental benefits. Shortcomings
in the disclosure of information about the use of
proceeds can be, to some extent, alleviated by
the guidelines set out in the Green Bond Prin-
ciples. However, these are voluntary guidelines
and do not currently spell out requirements for
the type and nature of reporting. More detailed
guidance on reporting has been developed by
leading international financial institutions and is
discussed later in this chapter.
While green bonds have so far been successful
with voluntary reporting mechanisms, as the
market grows, transparency in the reporting of
the “use of proceeds” will become a key issue.
Limited bankable green projects and robust
project pipelines. Another challenge facing
green bond issuance is a lack of bankable green
projects, especially in emerging markets, that
can be financed through the bond market.18
The development of a robust pipeline of green
projects has been hampered by lack of prioritiza-
tion of green projects by governments, around
which private sector sponsors and investors
could then be mobilized. Investors, for their part,
are less likely to devote resources to develop
capacities required to invest in this space if
they perceive that there is a limited number of
investable green projects. This creates a vicious
cycle because with limited investor capabilities,
governments also become less certain that they
will be investors ready to provide capital for the
green projects they are developing.
31%
4%
3%3%
15%
47%
Cicero
DNV
EY
Vigeo
Other
None
Source: Climate Bonds Initiative
Currently, the main tools in the market to
address the issue of definitions and standards
for green bonds are the Green Bond Principles
and the Climate Bonds Standard and Certifica-
tion Scheme. Municipal green bond issuers can
provide greater confidence to investors on the
green credentials of their bonds by adhering
to the Green Bond Principles, meeting relevant
Climate Bond Standards, seeking independent
72 FINANCE FOR CITY LEADERS HANDBOOK
Many cities have projects that could be eligible
for green bonds that they have previously
funded through vanilla bonds, including mass
transit and water projects. New projects will
also emerge through the Compact of Mayors,
Habitat III, and other international and domestic
initiatives where cities are making significant
climate change and sustainable development
commitments, which will help to grow the
pipeline of projects eligible for green bonds.
Additionally, project preparation support is
increasing through initiatives like the C40 Cities
Finance Facility to develop a pipeline of green,
bankable projects.
Small-scale projects and lack of aggrega-
tion mechanisms. A significant challenge in
scaling up the green bond market is the lack of
aggregation mechanisms such as asset-backed
securities and covered bonds.19 Without suitable
aggregation mechanisms, the typical small-scale
green projects can find it difficult to tap into the
bond market. In developed bond markets, inves-
tors generally look for issuance sizes of US$200
million and above, preferably US$1 billion deals,
while in emerging markets smaller sizes of
US$100 million are acceptable. Most renewable
energy and energy efficiency projects are much
smaller than this.
Currently barriers exist that prevent governments
and private market actors from using aggrega-
tion mechanisms at scale. The development of
securitization and covered bond markets for any
asset requires the creation of a sufficient pipeline
of underlying assets and standardization of the
underlying asset. In emerging economies, the
challenge is further complicated by the fact that
legal frameworks have to be created to enable
asset-backed securities and covered bonds as
financial instruments.
New aggregators are expected to emerge if there
are suitable market or government incentives. For
example, aggregators may enter the market to
act as an intermediary between projects and bond
investors to aggregate, manage, and underwrite
renewable energy or energy efficiency projects in
the presence of high energy prices where there
are favorable project payback periods.20
Low credit ratings for potential green bond
issuers and green projects, especially in
emerging economies.21 In addition to aggre-
gation challenges, green bonds are often not
as competitive on risk–return as other similar
projects in more established sectors such as oil
and gas. For the green bond market to take
off, the risk–return of green bonds must be as
attractive to institutional investors as non-green
bonds. However, the green bond market is still
in early stages of development, with unknown
risks associated with new technologies, which
make green projects potentially higher risk from
the investor perspective. Furthermore, even
though green general obligation bonds—where
the risk–return of the bond is independent of the
risk associated with the green project and the
credit risk is based on the full balance sheet of
the issuer—make up the majority of the market
to date, it can be challenging to achieve a suffi-
ciently high credit rating for green municipal
bond issuers in emerging markets. The World
Bank and others are working with municipal
governments to help improve their creditwor-
thiness, but more support is needed to scale up
these efforts.
Underdeveloped bond markets in emerging
economies. Weak and underdeveloped bond
markets in emerging economies can slow the
pace of green bond growth. Except for select
larger emerging economies such as China, India,
and Malaysia, the bond market in the remain-
ing developing countries is often very small,
with access limited to a small range of partic-
ipants. These capacity constraints of the local

FINANCE FOR CITY LEADERS HANDBOOK 73
bond market can determine how far and fast
the green bond market can grow in emerging
economies.
However, the development of the general bond
market and the green bond market can happen
in parallel and can even be mutually reinforcing.
Emerging economies can identify their green
infrastructure needs early on as key regulations
guiding the development of their bond market
are put into place. At the same time, green
infrastructure players can form a part of the
issuer base, growing the overall bond market.
In short, the development of green bonds can
allow emerging economies to hit two birds with
one stone—facilitate investment in climate-
friendly projects and enable the growth of a
robust domestic debt capital market.
In short, for all the benefits provided by green
bonds in financing low carbon and climate resilient
projects, the market is not without its own risks
and challenges. All of these challenges need to be
addressed if the market is to build credibility and
continue its rapid growth.
How is a green municipal bond issued?
As the green municipal bond market grows, it is
important that issuers understand the process of
issuing green bonds before entering into a transac-
tion. Generally speaking, issuing a green municipal
bond involves five phases:22
Identifying qualifying green projects and
assets. Municipalities, city governments, and
states should first define the kind of green
projects they seek to support with green bonds,
while clearly stipulating that the proceeds from
the green bond sale would be earmarked for
green projects or assets.
Similar to the process of re-financing, proceeds
of a green bond can be applied to existing
assets, such as public transportation assets. For
instance, a municipality can issue a green munic-
ipal bond to refinance an existing metro rail line
project and use the funds to repay or increase
the existing financing for the rail line. Proceeds
can also be allocated to upcoming capital invest-
ment, though investors generally prefer that
the funds are used within a reasonable period
in order to achieve green impact in a timely
manner.
The identification of qualifying projects and
assets will entail close cooperation among
different municipal agencies, such as the
finance, transport, energy, or environmental
departments. Establishing effective coordination
among all stakeholders early on will save time
and eliminate unnecessary confusion down the
road.
Guidance about qualifying projects and assets
can be obtained from the Green Bond Principles,
which set out broad green asset categories, and
the Climate Bond Standards Scheme, which sets Kuala Lumpur skyline, Malaysia © Flickr/Daniel Hoherd

74 FINANCE FOR CITY LEADERS HANDBOOK
out more specific standards for what qualifies
within these asset categories. It is important
to note that these are all currently voluntary. It
is, therefore, recommended that green munic-
ipal bond issuers apply the most rigorous and
transparent approach they can to the selec-
tion of green criteria within the guidance and
standards to promote environmental integrity of
the green bond issuance and generate investor
confidence.
Arranging independent review. Issuers of
green municipal bonds should use independent
review to further increase investor confidence
in funded projects. Ultimately green investors
want to make sure that their investment is being
used to support genuinely green projects. Inde-
pendent reviewers look at the green credibility
of the proposed green municipal bond invest-
ments and the processes established for tracking
funds and for reporting. Independent reviewers
can also help identify green projects and assets,
and help set up a green bond framework for the
issuer.
Independent reviews are funded by the issuer
and are not a requirement. The cost depends
on the firm conducting the review, the type
of review undertaken, the complexity of the
issuance, and other factors, but generally ranges
from US$10,000 to US$50,000. The firms
CICERO, Vigeo Rating, and DNV GL have under-
taken the majority of independent reviews for
green bonds to date.
Different independent review options are avail-
able that vary in terms of their rigor and level
of assurance. Issuers can engage a consultant
with climate expertise to undertake second-
party consultation on eligible green projects
and choose whether to make the results of the
consultation public. A more rigorous approach
involves engaging an expert consultant or
auditor to verify the criteria and processes in
place for tracking proceeds, evaluating environ-
mental outcomes, and preparing reports. The
latter approach is generally conducted in line
with professional standards such as the Inter-
national Standard on Assurance Engagements
3000 (ISAE 3000) to ensure the integrity and
independence of the review.23
Issuers can go even further to verify and certify
their bond against a set of climate bond stand-
ards available for solar, wind, geothermal, low
carbon transport, and low carbon building
projects and assets. The Climate Bond Standards
Advisory Board oversees a certification system
and verification process for potential municipal
issuers.
Setting up tracking and reporting. It is crit-
ically important that issuers of green municipal
bonds always maintain full disclosure on the
allocation of proceeds. A few key rules should be
kept in mind: (1) Since the proceeds from green
municipal bonds must be used only for specified
projects, there should be systems in place to
segregate green municipal bond proceeds and
keep track of their use; (2) monitoring proce-
dures must be set up to make sure proceeds are
not placed in non-green investments throughout
the life of the green bond; and (3) the nominal
value of the pool of assets or projects must
stay equal to or greater than the amount of
the bond. Municipal issuers should be tracking
all this and also be able to show how they are
tracking; transparency is essential.
In this regard, green bond issuers should design
monitoring and evaluation processes in advance,
and implement key performance indicators and
data collection systems to monitor environmen-
tal outcomes of projects over time. Issuers may
also benefit from quantifying the environmental
and social value created by their bonds in finan-
cial terms using one of the emerging quantifica-
tion methodologies, such as KPMG True Value.24
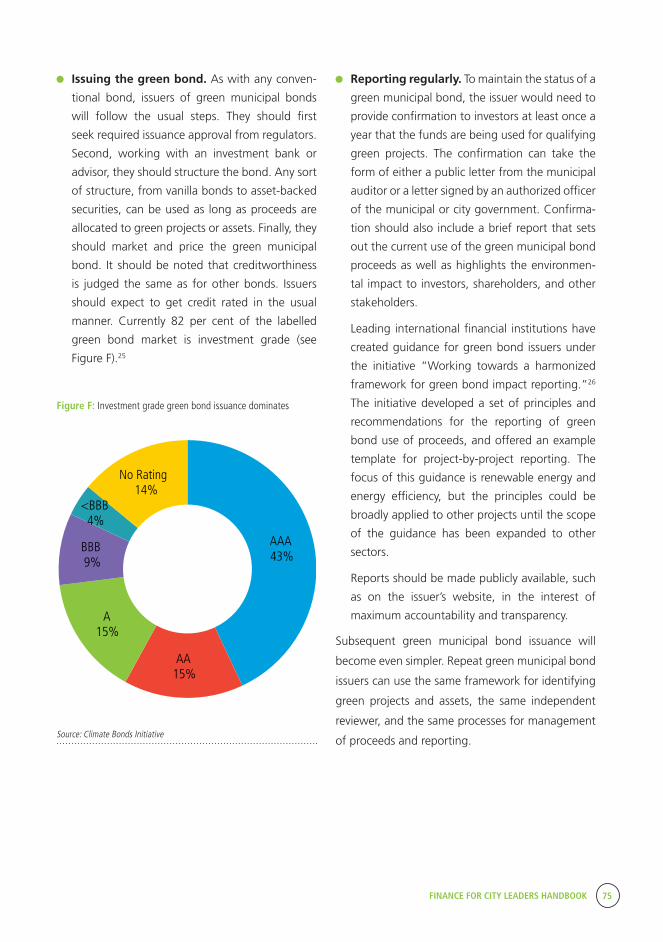
FINANCE FOR CITY LEADERS HANDBOOK 75
Issuing the green bond. As with any conven-
tional bond, issuers of green municipal bonds
will follow the usual steps. They should first
seek required issuance approval from regulators.
Second, working with an investment bank or
advisor, they should structure the bond. Any sort
of structure, from vanilla bonds to asset-backed
securities, can be used as long as proceeds are
allocated to green projects or assets. Finally, they
should market and price the green municipal
bond. It should be noted that creditworthiness
is judged the same as for other bonds. Issuers
should expect to get credit rated in the usual
manner. Currently 82 per cent of the labelled
green bond market is investment grade (see
Figure F).25
Figure F: Investment grade green bond issuance dominates
Reporting regularly. To maintain the status of a
green municipal bond, the issuer would need to
provide confirmation to investors at least once a
year that the funds are being used for qualifying
green projects. The confirmation can take the
form of either a public letter from the municipal
auditor or a letter signed by an authorized officer
of the municipal or city government. Confirma-
tion should also include a brief report that sets
out the current use of the green municipal bond
proceeds as well as highlights the environmen-
tal impact to investors, shareholders, and other
stakeholders.
Leading international financial institutions have
created guidance for green bond issuers under
the initiative “Working towards a harmonized
framework for green bond impact reporting.”26
The initiative developed a set of principles and
recommendations for the reporting of green
bond use of proceeds, and offered an example
template for project-by-project reporting. The
focus of this guidance is renewable energy and
energy efficiency, but the principles could be
broadly applied to other projects until the scope
of the guidance has been expanded to other
sectors.
Reports should be made publicly available, such
as on the issuer’s website, in the interest of
maximum accountability and transparency.
Subsequent green municipal bond issuance will
become even simpler. Repeat green municipal bond
issuers can use the same framework for identifying
green projects and assets, the same independent
reviewer, and the same processes for management
of proceeds and reporting.
AAA43%
AA15%
A15%
BBB9%
<BBB4%
No Rating14%
Source: Climate Bonds Initiative
76 FINANCE FOR CITY LEADERS HANDBOOK
What are key considerations for green municipal bond issuers, especially in emerging economies?
To begin with, issuers of green municipal bonds
need to determine, based on potential benefits and
drawbacks of issuing green bonds, whether they
should label a bond as green. There is a wider market
of bonds that also has environmental benefits but
is not specifically labelled as green. As such, state
and municipal issuers should figure out whether a
green bond is the most appropriate financing tool
to raise capital. As discussed earlier, the benefits of
green bonds can be significant. Green bonds can
give issuers access to a wider range of investors,
especially those focused on environmental, social,
and governance performance, than regular bonds
or other asset classes. Over time, increased demand
can drive favourable terms and a better price for
the issuer, compared with a regular bond from the
same issuer. For instance, Massachusetts issued
both a green bond and a regular corporate bond
in 2013 that were priced identically. Yet the green
bond was 30 per cent oversubscribed while the
regular bond was undersubscribed. Despite these
benefits, there are challenges associated with green
bonds that issuers should be aware of. As compared
with a regular bond, there could be additional costs
associated with tracking, monitoring, and reporting
processes as well as up-front investment to define
the bond’s green criteria. In addition, issuers risk
subjecting themselves to criticisms and accusations
of greenwashing if they do not meet their green
objectives.
Issuers of green municipal bonds should follow the
most rigorous standards in defining what makes
the bond green. As discussed earlier, there are
several voluntary, evolving standards and sources of
guidance on green bonds that issuers can follow,
such as the Green Bond Principles and the Climate
Bonds Standard. In addition, public sector and
various market actors in emerging economies can
develop country-specific definitions and standards.
China has made considerable progress in creating
country-specific green bond guidelines. At the end
of 2015, the People’s Bank of China released its
Green Financial Bond Guidelines—making China
the first country in the world to create official rules
for the issuance of green bonds.27 In January 2016,
India’s capital markets regulator—the Securities
and Exchange Board of India—finalized its official
green bond requirements after going through a
public consultation process late last year.28 While
country-specific frameworks can be beneficial in
meeting the environmental priorities of the country
in question, it should be recognized that too much
country-specific focus can lead to fragmented
markets and increase transaction costs for global
investors.
Finally, issuers of green municipal bonds in
emerging economies should also invest in capacity
building for investors.29 Currently the majority of
proven investor demand is in developed countries,
while the institutional investor base is weak in
emerging markets. It is therefore critical that public
sector entities engage in capacity building to facili-
tate private investment in green bonds. To that end,
the public sector can provide educational materi-
als, workshops, and support market-led initiatives
for green bond investor engagement and training.
Facilitating investor demand can also encourage
more green bond issuance into the market.
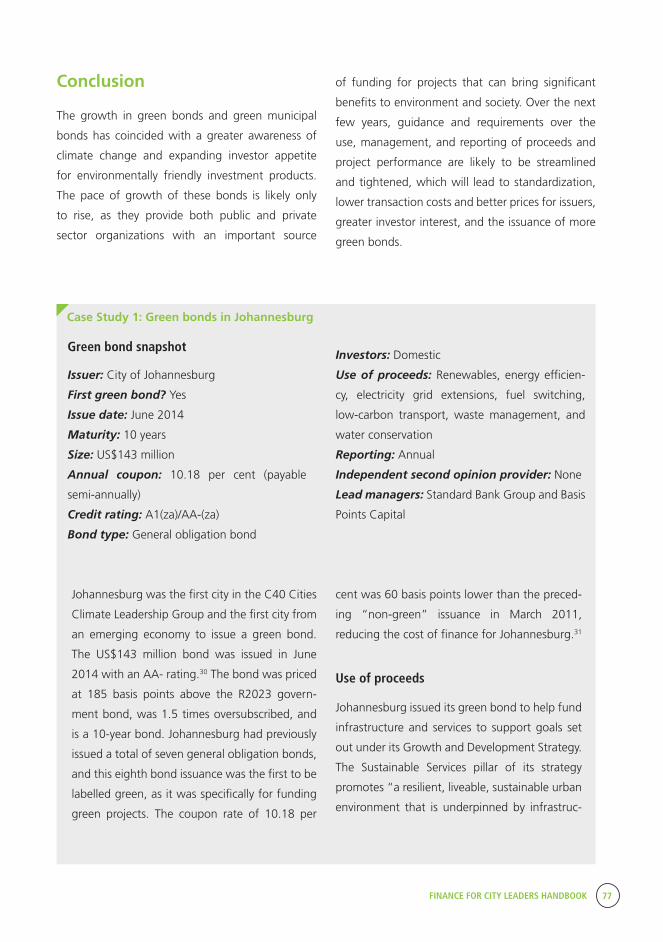
FINANCE FOR CITY LEADERS HANDBOOK 77
Conclusion
The growth in green bonds and green municipal
bonds has coincided with a greater awareness of
climate change and expanding investor appetite
for environmentally friendly investment products.
The pace of growth of these bonds is likely only
to rise, as they provide both public and private
sector organizations with an important source
of funding for projects that can bring significant
benefits to environment and society. Over the next
few years, guidance and requirements over the
use, management, and reporting of proceeds and
project performance are likely to be streamlined
and tightened, which will lead to standardization,
lower transaction costs and better prices for issuers,
greater investor interest, and the issuance of more
green bonds.
Case Study 1: Green bonds in Johannesburg
Investors: Domestic
Use of proceeds: Renewables, energy efficien-
cy, electricity grid extensions, fuel switching,
low-carbon transport, waste management, and
water conservation
Reporting: Annual
Independent second opinion provider: None
Lead managers: Standard Bank Group and Basis
Points Capital
Green bond snapshot
Johannesburg was the first city in the C40 Cities
Climate Leadership Group and the first city from
an emerging economy to issue a green bond.
The US$143 million bond was issued in June
2014 with an AA- rating.30 The bond was priced
at 185 basis points above the R2023 govern-
ment bond, was 1.5 times oversubscribed, and
is a 10-year bond. Johannesburg had previously
issued a total of seven general obligation bonds,
and this eighth bond issuance was the first to be
labelled green, as it was specifically for funding
green projects. The coupon rate of 10.18 per
Issuer: City of Johannesburg
First green bond? Yes
Issue date: June 2014
Maturity: 10 years
Size: US$143 million
Annual coupon: 10.18 per cent (payable
semi-annually)
Credit rating: A1(za)/AA-(za)
Bond type: General obligation bond
cent was 60 basis points lower than the preced-
ing “non-green” issuance in March 2011,
reducing the cost of finance for Johannesburg.31
Use of proceeds
Johannesburg issued its green bond to help fund
infrastructure and services to support goals set
out under its Growth and Development Strategy.
The Sustainable Services pillar of its strategy
promotes “a resilient, liveable, sustainable urban
environment that is underpinned by infrastruc-
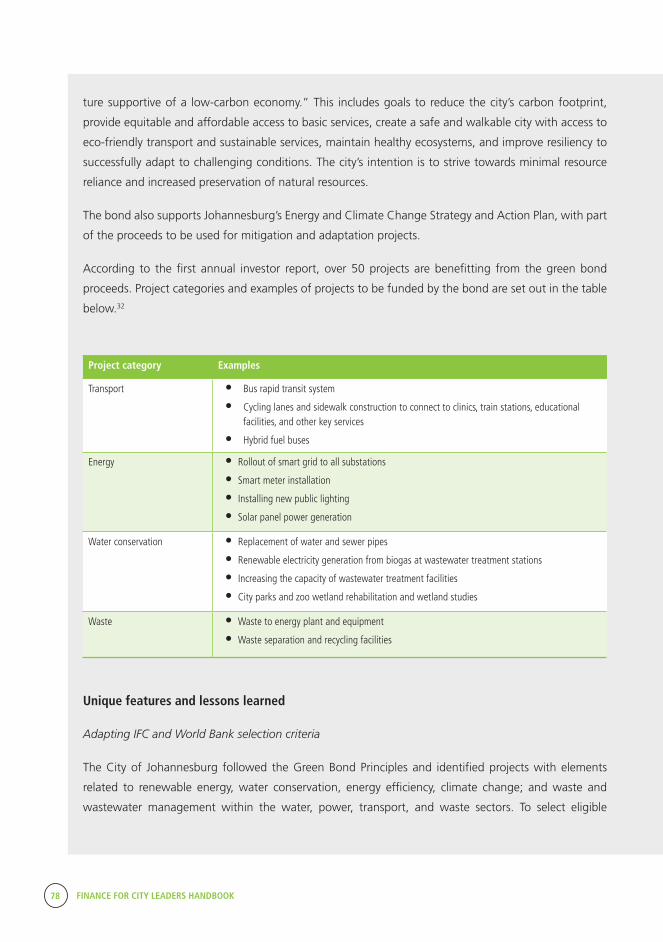
78 FINANCE FOR CITY LEADERS HANDBOOK
ture supportive of a low-carbon economy.” This includes goals to reduce the city’s carbon footprint,
provide equitable and affordable access to basic services, create a safe and walkable city with access to
eco-friendly transport and sustainable services, maintain healthy ecosystems, and improve resiliency to
successfully adapt to challenging conditions. The city’s intention is to strive towards minimal resource
reliance and increased preservation of natural resources.
The bond also supports Johannesburg’s Energy and Climate Change Strategy and Action Plan, with part
of the proceeds to be used for mitigation and adaptation projects.
According to the first annual investor report, over 50 projects are benefitting from the green bond
proceeds. Project categories and examples of projects to be funded by the bond are set out in the table
below.32
Project category Examples
Transport • Bus rapid transit system
• Cycling lanes and sidewalk construction to connect to clinics, train stations, educational facilities, and other key services
• Hybrid fuel buses
Energy • Rollout of smart grid to all substations
• Smart meter installation
• Installing new public lighting
• Solar panel power generation
Water conservation • Replacement of water and sewer pipes
• Renewable electricity generation from biogas at wastewater treatment stations
• Increasing the capacity of wastewater treatment facilities
• City parks and zoo wetland rehabilitation and wetland studies
Waste •Waste to energy plant and equipment
•Waste separation and recycling facilities
Unique features and lessons learned
Adapting IFC and World Bank selection criteria
The City of Johannesburg followed the Green Bond Principles and identified projects with elements
related to renewable energy, water conservation, energy efficiency, climate change; and waste and
wastewater management within the water, power, transport, and waste sectors. To select eligible
FINANCE FOR CITY LEADERS HANDBOOK 79
Benefits
Investor base diversification: New types of inves-
tors who have not previously purchased Johannes-
burg’s regular bonds invested in this green bond
issuance. This includes those with environmental,
social, and governance investment criteria. Issuing
a green bond therefore helped Johannesburg by
diversifying the city’s investor base and growing
the potential market for future issuances.
Access to finance: The city had a pipeline of
planned projects that could not be undertaken due
to insufficient capital. The green bond issuance
enabled the city to finance these projects, which
are expected to deliver considerable benefits to its
citizens in terms of waste and water management,
reduced traffic congestion, better air quality, and
lower energy costs in low-income areas.
Promoting cross-agency collaboration: The process
of preparing a green bond for issuance required
Johannesburg to engage multiple city government
agencies to work together to identify suitable
projects to be funded by the proceeds. Johannes-
burg identified this as one of the key benefits of
its first green bond, creating new and productive
connections between the finance team and the
environment team that had not existed previously.
Putting Johannesburg on the map as a sustainable
city leader: The issuance generated considerable
positive domestic and international media coverage
highlighting the city as a leader in promoting
sustainable development. The Mayor of Johan-
nesburg was honored in Paris in December 2015
during COP21, receiving the C40 Cities Climate
Leadership Award for the green bond issuance.
projects, the city defined criteria based on the
IFC Performance Standards on Environmental and
Social Sustainability and the World Bank criteria
related to climate change mitigation and adapta-
tion projects.
Establishing a framework for performance
reporting
Environmental Resources Management (ERM)
assisted the City of Johannesburg with establish-
ing a green bond reporting framework to monitor
and annually report performance to the investment
stakeholders. The environmental indicators used for
reporting are monitoring indicators based on inter-
national reporting practices. Impact reporting will
include details regarding the progress of projects
against environmental-related metrics and, where
specific indicators cannot be measured directly for
certain projects, the numbers will be estimated.
When asked what advice Johannesburg would give
to other cities based on their experience issuing their
first green bond, the city offered the following:
Quantify carbon emission reductions for each
project upfront.
Have a green project implementation strategy.
Transparency and communication breeds confi-
dence—sell the credit and talk to investors.
The quality of leadership and management of an
issuer goes a long way towards providing confi-
dence and comfort—cities need to know their
problems, have a plan to deal with them, and
show some progress.
Keep the market abreast of developments in the
municipality. This could also be facilitated by a
good long-term strategy and planning.
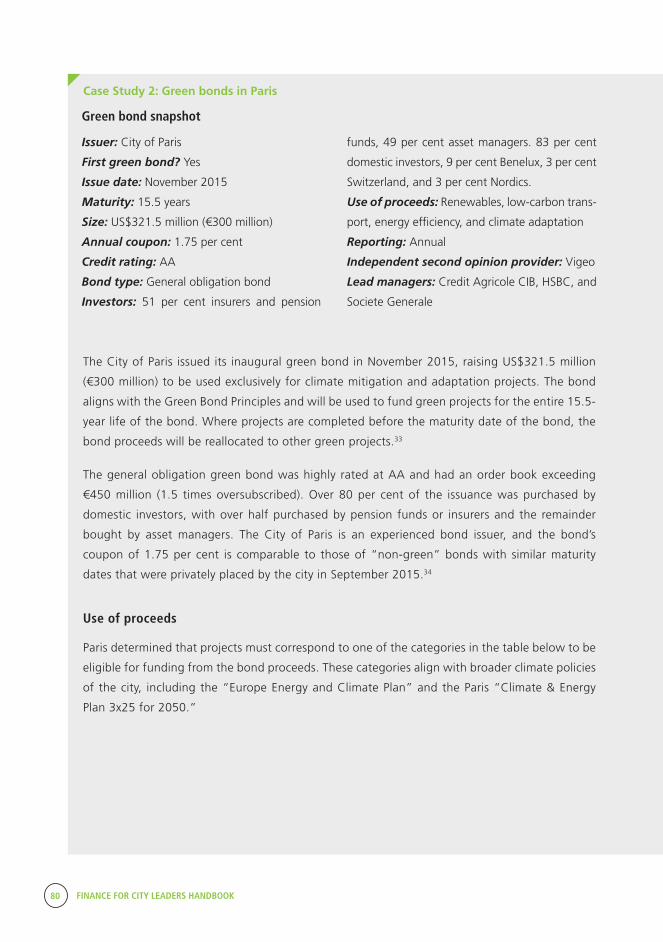
80 FINANCE FOR CITY LEADERS HANDBOOK
The City of Paris issued its inaugural green bond in November 2015, raising US$321.5 million
(€300 million) to be used exclusively for climate mitigation and adaptation projects. The bond
aligns with the Green Bond Principles and will be used to fund green projects for the entire 15.5-
year life of the bond. Where projects are completed before the maturity date of the bond, the
bond proceeds will be reallocated to other green projects.33
The general obligation green bond was highly rated at AA and had an order book exceeding
€450 million (1.5 times oversubscribed). Over 80 per cent of the issuance was purchased by
domestic investors, with over half purchased by pension funds or insurers and the remainder
bought by asset managers. The City of Paris is an experienced bond issuer, and the bond’s
coupon of 1.75 per cent is comparable to those of “non-green” bonds with similar maturity
dates that were privately placed by the city in September 2015.34
Use of proceeds
Paris determined that projects must correspond to one of the categories in the table below to be
eligible for funding from the bond proceeds. These categories align with broader climate policies
of the city, including the “Europe Energy and Climate Plan” and the Paris “Climate & Energy
Plan 3x25 for 2050.”
Case Study 2: Green bonds in Paris
Green bond snapshot
Issuer: City of Paris
First green bond? Yes
Issue date: November 2015
Maturity: 15.5 years
Size: US$321.5 million (€300 million)
Annual coupon: 1.75 per cent
Credit rating: AA
Bond type: General obligation bond
Investors: 51 per cent insurers and pension
funds, 49 per cent asset managers. 83 per cent
domestic investors, 9 per cent Benelux, 3 per cent
Switzerland, and 3 per cent Nordics.
Use of proceeds: Renewables, low-carbon trans-
port, energy efficiency, and climate adaptation
Reporting: Annual
Independent second opinion provider: Vigeo
Lead managers: Credit Agricole CIB, HSBC, and
Societe Generale

FINANCE FOR CITY LEADERS HANDBOOK 81
Project Categories Definition Sub-categories (examples of projects) Climate benefits
Reduction of GHG emissions
Projects aiming at developing low-carbon energy transport (bicycle, electric vehicles, etc.) and public transport
• Public transport: high quality transit line, tramway line extension
•Alternative transport: cycling plan
• Electric vehicles: support for the development of electric cars for residents and professionals, network of charging stations for electric and GNV vehicles
Reduction of GHG emis-sions, due to low-carbon transport
Energy efficiency and savings
Projects aiming at reducing the energy consumption of build-ings and public lighting, while maintaining equivalent level of service (existing situation vs. standard), with performance goals and energy poverty focus
• Buildings: construction of energy efficient, thermal insulation for buildings (schools, social housing, nursing homes, etc.)
• Public lighting and signals: replacement of energy consuming appliances
• Renovation of heating systems
Energy savings
Production of renew-able energy
Projects aiming at developing local renewable energy produc-tion and/or energy recovery
• Renewable energy power plants (solar panels)
•Geothermal energy
• Energy recovery (from wastewater networks, data centers, etc.)
• STEGC’s heating network
Increased production of renewable energy
Reduction of GHG emis-sion, due to low-carbon energy use and/or energy recovery
Adaptation to climate change
Projects aiming at reducing the impacts of climate change, especially the heat island effect, through the expansion of green area surfaces in Paris
•New green areas: areas opened to the public, green roofs, facades, and walls
• Tree planting programmes
Increased green areas and biodiversity in Paris
Source: Vigeo, Second Party Opinion on Sustainability of City of Paris “Climate Bond” (Paris, Vigeo, 2015).
Unique features
Projects must meet environment, social and
governance (ESG) criteria
The project selection process also involves evalua-
tion against ESG criteria consistent with the city’s
Sustainability Policy. To be eligible, the projects
must meet 12 sustainability criteria relating to
biodiversity, air and water quality, environmental
management, waste management, social cohesion,
improved living conditions, local sustainable devel-
opment, human rights, and business ethics.
Independent opinion to provide investor
confidence
Some green bond issuers have sought second-par-
ty verification to provide investors with confi-
dence that the green bond will meet minimum
standards for environmental sustainability. The
City of Paris is one of the few municipal issuers to
have undertaken this verification process.
Vigeo was commissioned by the city to provide
its opinion on the sustainable credentials of the
green bond, and its analysis confirmed that the

82 FINANCE FOR CITY LEADERS HANDBOOK
bond was in line with the Green Bond Principles.
In forming its opinion, Vigeo analysed:
the sustainability credentials of the city;
the framework for selecting projects to be
funded by the bond; and
the framework in place to report the use of
proceeds.
Comprehensive reporting framework
The City of Paris has committed to detailed
reporting on the use of proceeds, providing a
high level of transparency to investors on the
progress and impact of the projects supported
by the green bond proceeds. Its annual reports
will include detailed project-level information on
the environmental and ESG performance of each
project supported by the bond. It will also report
the estimated environmental impacts at the
project and aggregate bond level, including the
reduction of greenhouse gas emissions, energy
savings, and extension of green areas.
Benefits
Diversifying their investor base: The green bond
attracted domestic and international inves-
tors, with international institutional investors
from Benelux, Switzerland, and the Nordics
collectively purchasing close to one-fifth of the
issuance.
Promoting Paris’ commitment to tackle climate
change: Paris hosted the COP21 climate nego-
tiations in December 2015 and issued its green
bond in the preceding month, sending a strong
signal about the city’s climate leadership.
Funding adaptation and resilience: The bond
includes dedicated funding for the city to
increase its climate change resilience by
reducing urban heat island effects. This enables
the city to access finance to increase green
areas in the city by aggregating them with
other climate mitigation projects to be funded
through the bond.
FINANCE FOR CITY LEADERS HANDBOOK 83
Devashree Saha is an associate fellow at the Brookings Institution Metropolitan Policy Program.
Skye d’Almeida manages the Financing Sustainable Cities Initiative at C40 Cities Climate Leadership
Group, a joint initiative of the Citi Foundation and WRI Ross Center.
9 Climate Bonds Initiative, Investor Statement re: Green Bonds & Climate Bonds (London, Climate Bonds Initiative, 2014). Available from https://www.climatebonds.net/get-in-volved/investor-statement.
10 Statehouse News Service, “Investors Gobble up Mass. ‘Green Bonds,’” Worcester Business Journal, 23 September 2014. Available from http://www.wbjournal.com/arti-cle/20140923/NEWS01/140929987/investors-gobble-up-mass-green-bonds.
11 Climate Bonds Initiative et al., How to Issue a Green Muni Bond: The Green Muni Bonds Playbook (n.p., City Green Bonds Coalition, 2015). Available from https://www.nrdc.org/sites/default/files/greencitybonds-ib.pdf.
12 Climate Bonds Initiative et al., How to Issue a Green Muni Bond: The Green Muni Bonds Playbook (n.p., City Green Bonds Coalition, 2015). Available from https://www.nrdc.org/sites/default/files/greencitybonds-ib.pdf.
13 Luke Spajic, “Green Bonds: The Growing Market for Environment-Focused Investment,” Insights, September 2014. Available from https://www.pimco.com/insights/view-points/viewpoints/green-bonds-the-growing-market-for-en-vironment-focused-investment.
14 Climate Bonds Initiative et al., How to Issue a Green Muni Bond: The Green Muni Bonds Playbook (n.p., City Green Bonds Coalition, 2015). Available from https://www.nrdc.org/sites/default/files/greencitybonds-ib.pdf.
15 Climate Bonds Initiative et al., How to Issue a Green Muni Bond: The Green Muni Bonds Playbook (n.p., City Green Bonds Coalition, 2015). Available from https://www.nrdc.org/sites/default/files/greencitybonds-ib.pdf.
16 OECD, Green Bonds: Mobilizing the Debt Capital Markets for a Low-Carbon Transition (Paris, OECD, 2015). Available from https://www.oecd.org/environment/cc/Green%20bonds%20PP%20[f3]%20[lr].pdf.
Endnotes
1 Climate Bonds Initiative, Bonds and Climate Change: State of the Market (London, Climate Bonds Initiative, 2016). Available from https://www.climatebonds.net/files/files/CBI%20State%20of%20the%20Market%202016%20A4.pdf.
2 Climate Bonds Initiative, Bonds and Climate Change: State of the Market (London, Climate Bonds Initiative, 2016). Available from https://www.climatebonds.net/files/files/CBI%20State%20of%20the%20Market%202016%20A4.pdf.
3 Climate Bonds Initiative, 2015 Green Bond Market Roundup (London, Climate Bonds Initiative, 2016). Avail-able from http://www.climatebonds.net/files/files/2015%20GB%20Market%20Roundup%2003A.pdf.
4 Stephen Liberatore and Joel Levy, Green Muni Bonds: Responsible Investing in a Centuries-Old Asset Class (New York, TIAA Global Asset Management, 2016). Available from https://www.tiaa.org/public/pdf/C29869_TGAM_whitepaper_muni_bonds.pdf.
5 Elizabeth Daigneau, “Massachusetts Uses Popularity of Environmental Stewardship to Pad its Bottom line,” Governing, July 2013. Available from http://www.govern-ing.com/topics/transportation-infrastructure/gov-massachu-setts-green-bonds-a-first.html.
6 Mike Cherney, “D.C. Water Authority to Issue 100-Year ‘Green Bond,’” Wall Street Journal, 2 July 2014.
7 Climate Bonds Initiative, Bonds and Climate Change: The State of the Market in 2015 (London, Climate Bonds Initiative, 2015). Available from https://www.climatebonds.net/files/files/CBI-HSBC%20report%207July%20JG01.pdf.
8 Climate Bonds Initiative, Growing a Green Bonds Market in China (London, Climate Bonds Initiative, 2015). Available from https://www.climatebonds.net/files/files/Growing%20a%20green%20bonds%20market%20in%20China.pdf.

84 FINANCE FOR CITY LEADERS HANDBOOK
17 KPMG International, Gearing up for Green Bonds: Key Considerations for Bond Issuers (n.p., KPMG International, 2015). Available from https://www.kpmg.com/Global/en/IssuesAndInsights/ArticlesPublications/sustainable-insight/Documents/gearing-up-for-green-bonds-v2.pdf.
18 Climate Bonds Initiative, Scaling up Green Bond Mar-kets for Sustainable Development (London, Climate Bonds Initiative, 2015). Available from http://www.climatebonds.net/files/files/GB-Public_Sector_Guide-Final-1A.pdf.
19 As You Sow and Cornell University, Green Bonds in Brief: Risk, Reward, and Opportunity (n.p., As You Sow and Cornell University, 2014).
20 Sean Kidney, Alex Veys, Christopher Flensbourg, and Bryn Jones, “Environmental Theme Bonds: A New Fixed Income Asset Class,” in IFR Intelligence Report, Sustainable Banking: Risk, Reward and the Future of Finance (London, Climate Bonds Initiative, n.d.). Available from https://www.climatebonds.net/files/files/SustBanking_Ch14_p219-232.pdf.
21 Climate Bonds Initiative, Scaling up Green Bond Mar-kets for Sustainable Development (London, Climate Bonds Initiative, 2015). Available from http://www.climatebonds.net/files/files/GB-Public_Sector_Guide-Final-1A.pdf.
22 Climate Bonds Initiative et al., How to Issue a Green Muni Bond: The Green Muni Bonds Playbook (n.p., City Green Bonds Coalition, 2015). Available from https://www.nrdc.org/sites/default/files/greencitybonds-ib.pdf.
23 KPMG International, Gearing up for Green Bonds: Key Considerations for Bond Issuers (n.p., KPMG International, 2015). Available from https://www.kpmg.com/Global/en/IssuesAndInsights/ArticlesPublications/sustainable-insight/Documents/gearing-up-for-green-bonds-v2.pdf.
24 KPMG International, Gearing up for Green Bonds: Key Considerations for Bond Issuers (n.p., KPMG International, 2015). Available from https://www.kpmg.com/Global/en/IssuesAndInsights/ArticlesPublications/sustainable-insight/Documents/gearing-up-for-green-bonds-v2.pdf.
25 Climate Bonds Initiative, Bonds and Climate Change: State of the Market (London, Climate Bonds Initiative, 2016). Available from https://www.climatebonds.net/files/files/CBI%20State%20of%20the%20Market%202016%20A4.pdf.
26 For more information, see World Bank et al., Green Bonds: Working Towards a Harmonized Framework for Impact Reporting (Washington, World Bank et al., 2015).
Available from http://treasury.worldbank.org/cmd/pdf/Infor-mationonImpactReporting.pdf.
27 For more information see International Capital Mar-ket Association, New – Official Rules for Chinese Green Bond Market (Zurich, ICMA, 2015). Available: http://www.icmagroup.org/News/news-in-brief/new-official-rules-for-chinese-green-bond-market/.
28 Climate Bonds Initiative, India’s Securities’ Regulator Finalizes Official Green Bond Listing Requirements + Says Green Bonds are a Tool to Finance India’s INDC (National Climate Change Plan) – Yes They Are! (London, Climate Bonds Initiative, 2016). Available from https://www.climatebonds.net/2016/01/india%E2%80%99s-securi-ties%E2%80%99-regulator-finalises-oficial-green-bond-listing-requirements-says-green
29 Climate Bonds Initiative, Scaling Up Green Bond Mar-kets for Sustainable Development (London, Climate Bonds Initiative, 2015). Available from http://www.climatebonds.net/files/files/GB-Public_Sector_Guide-Final-1A.pdf.
30 City of Johannesburg, Green Bond Roadshow (Johan-nesburg, 2014).
31 Johannesburg Executive Mayor Councillor Mpho Parks Tau, “Speech at the Listing of the First Ever Listed Green Bond in South Africa,” 9 June 2014. Available from http://www.joburg.org.za/images/stories/2014/June/em_speech_jse%20listing%20final.pdf.
32 ERM on behalf of the City of Johannesburg Metropol-itan Municipality, Green Bonds Investor Report (Johannes-burg, ERM, 2015).
33 Sean Kidney, “Update: Vive Paris! Green Bond Mkt Builds with COP21 Host City Paris Issuing Inaugural Green Bond €300m ($321.5m). Vermont, NRW Bank and KfW Issue Green Bonds & More Gossip!,” Climate Bonds Ini-tiative, 16 November 2015. Available from https://www.climatebonds.net/2015/11/update-vive-paris-green-bond-mkt-builds-cop21-host-city-paris-issuing-inaugural-green-bond-.
34 Marie de Paris, “City of Paris – Climate Bond Investor Presentation,” November 2015. Available from https://api-site.paris.fr/images/75091.
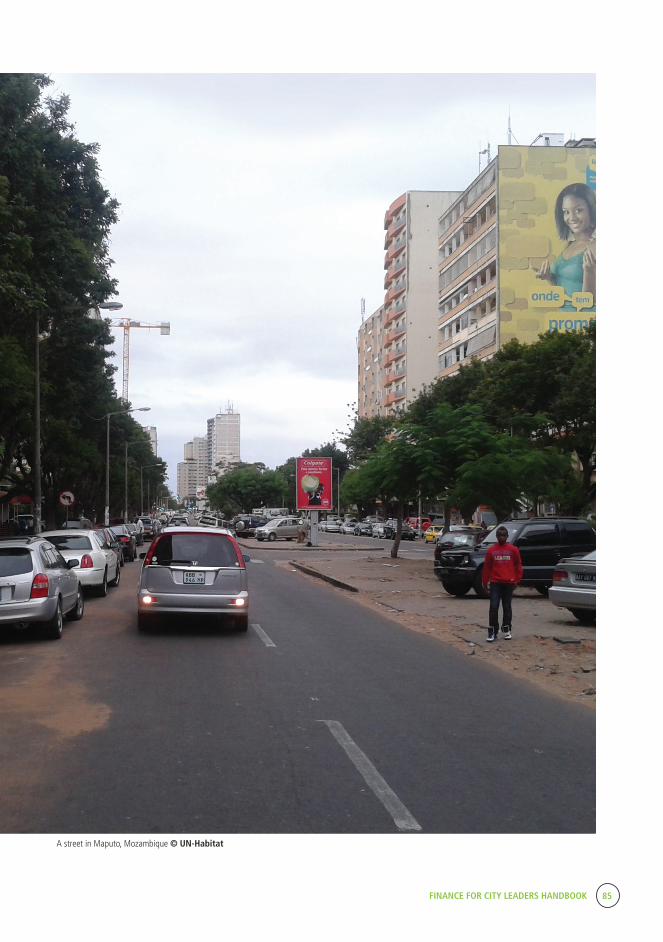
FINANCE FOR CITY LEADERS HANDBOOK 85
A street in Maputo, Mozambique © UN-Habitat
Municipal Pooled Financing Mechanisms
06Introduction
As the world’s population becomes increasingly urbanized—driven
largely by population and migration trends in Africa and Asia—
demand is rising for mechanisms to finance the requisite infrastruc-
ture development. One tool with great potential for many cities in the
developing world is municipal pooled financing mechanisms (PFMs).
Broadly speaking, pooled financing entails gathering the borrowing
needs of a group of municipalities and raising the combined debt on
the capital market or from other sources of finance. This can be done
either through a state governmental agency or through cooperation
among local authorities.
PFMs do not remove the decision-making power of the individual local
authority, and should be viewed as a complement to other funding
FINANCE FOR CITY LEADERS HANDBOOK 87
sources. Large local governments like capital cities
and their close peers can continue to benefit from
direct access to bank financing and bond markets,
choosing the most efficient source at a particular
point in time. However, for most medium-sized and
small local governments, municipal pooled financ-
ing may be the only mechanism that provides access
to long-term and adequately priced debt financing.
PFMs have mainly been applied in the developed
world; in the last 10–15 years, there have been few
PFM experiments in developing countries. However,
there is nothing preventing PFMs from becoming
a much more common strategy around the world
if the trend towards decentralization in developing
countries continues; PFMs are a by-product of fiscal
decentralization and the growing importance of
local governments. Moreover, PFMs can be proac-
tively initiated and implemented by policymakers in
developing countries to deepen fiscal decentraliza-
tion and increase its benefits. Thus, PFMs can play a
crucial role in financing growing local infrastructure
needs by giving local governments access to capital
markets and by providing institutional investors
with a new, attractive asset class. PFMs also foster
participating local governments’ financial manage-
ment capacity, accountability, and creditworthiness,
making them stronger and more capable institu-
tions. Financing infrastructure and building inde-
pendent capacities in local authorities are particu-
larly crucial concerns in the OECD economies, but
even more so in places that are less economically
developed.
Theoreticians did not create the PFM concept.
It emerged organically and matured in several
different economic and institutional environments
through collaboration among local authorities
and negotiations with other stakeholders. When
thinking of the transfer of this experience to devel-
oping countries, the PFM concept should be viewed
as malleable and variable in composition consider-
ing the economic situation, local government struc-
ture, and other factors on the ground. It is not a
one-size-fits-all scheme, but a project that needs
to grow from the bottom-up to service particular
contexts.
This chapter examines different types of PFMs
around the world and describes how they function,
explains how to develop PFMs, outlines the advan-
tages and challenges entailed in implementing
PFMs, and discusses the prerequisites for PFMs.
PFMs around the world
PFMs exist in many countries and have many
different forms. In Europe, local government
funding agencies (LGFAs) dominate. An LGFA is
a special-purpose agency owned and, in most
cases, guaranteed by local authorities and, in some
instances, with minority shareholding by central
government or other public stakeholders. It issues
bonds in capital markets, domestically and interna-
tionally, and on-lends the proceeds to local author-
ities that are members/shareholders of the agency.
LGFAs have a long and successful history in
Northern Europe. The oldest is the Danish agency
Kommunekredit (see Case Study 1), created in
1898. The newest additions in Table 1 are the
French Agence France Locale and the UK Municipal
Bond Agency, created during the last few years.
As the world’s population becomes increas-ingly urbanized—driven largely by popu-lation and migration trends in Africa and Asia—demand is rising for mechanisms to finance the requisite infrastructure devel-opment.
“
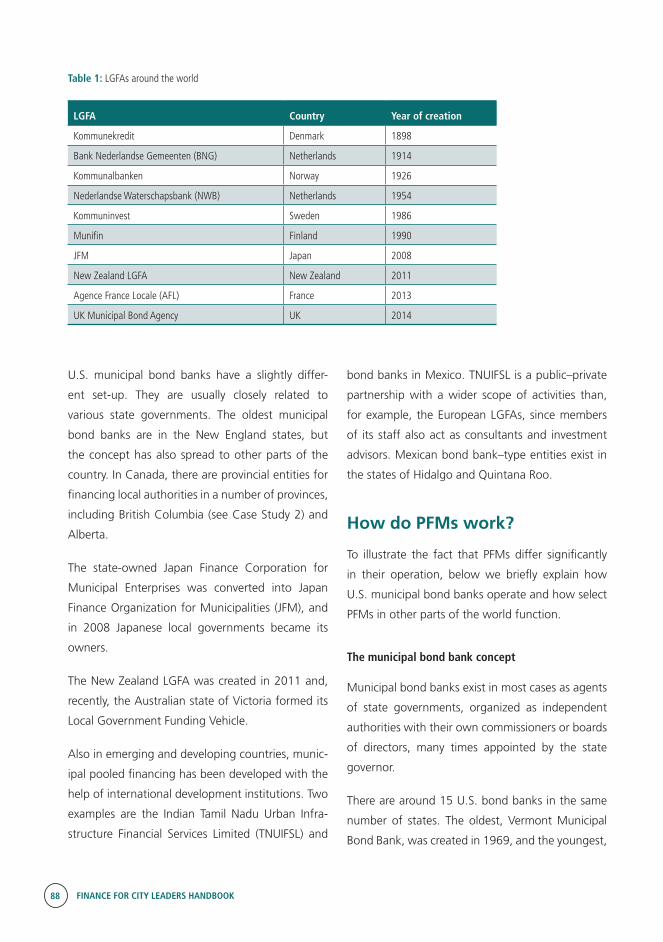
88 FINANCE FOR CITY LEADERS HANDBOOK
Table 1: LGFAs around the world
LGFA Country Year of creation
Kommunekredit Denmark 1898
Bank Nederlandse Gemeenten (BNG) Netherlands 1914
Kommunalbanken Norway 1926
Nederlandse Waterschapsbank (NWB) Netherlands 1954
Kommuninvest Sweden 1986
Munifin Finland 1990
JFM Japan 2008
New Zealand LGFA New Zealand 2011
Agence France Locale (AFL) France 2013
UK Municipal Bond Agency UK 2014
U.S. municipal bond banks have a slightly differ-
ent set-up. They are usually closely related to
various state governments. The oldest municipal
bond banks are in the New England states, but
the concept has also spread to other parts of the
country. In Canada, there are provincial entities for
financing local authorities in a number of provinces,
including British Columbia (see Case Study 2) and
Alberta.
The state-owned Japan Finance Corporation for
Municipal Enterprises was converted into Japan
Finance Organization for Municipalities (JFM), and
in 2008 Japanese local governments became its
owners.
The New Zealand LGFA was created in 2011 and,
recently, the Australian state of Victoria formed its
Local Government Funding Vehicle.
Also in emerging and developing countries, munic-
ipal pooled financing has been developed with the
help of international development institutions. Two
examples are the Indian Tamil Nadu Urban Infra-
structure Financial Services Limited (TNUIFSL) and
bond banks in Mexico. TNUIFSL is a public–private
partnership with a wider scope of activities than,
for example, the European LGFAs, since members
of its staff also act as consultants and investment
advisors. Mexican bond bank–type entities exist in
the states of Hidalgo and Quintana Roo.
How do PFMs work?
To illustrate the fact that PFMs differ significantly
in their operation, below we briefly explain how
U.S. municipal bond banks operate and how select
PFMs in other parts of the world function.
The municipal bond bank concept
Municipal bond banks exist in most cases as agents
of state governments, organized as independent
authorities with their own commissioners or boards
of directors, many times appointed by the state
governor.
There are around 15 U.S. bond banks in the same
number of states. The oldest, Vermont Municipal
Bond Bank, was created in 1969, and the youngest,
FINANCE FOR CITY LEADERS HANDBOOK 89
Michigan Finance Authority, was the result of the
merging of various public finance authorities in the
state in 2010. The most intense period of creation
of bond banks was in the 1970s and 1980s, with
only four bond banks created over 1990–2015.
Bond banks are generally small and under the
ownership and control of state governments. They
are also directly or indirectly guaranteed by the
states, and/or their bond issues are secured with
interbudgetary transfers. Bond banks are predomi-
nantly found in smaller states.
The largest bond bank in terms of liabilities is the
recently amalgamated Michigan Finance Authori-
ty. This entity has a broad scope, lending not only
to municipalities, but also to schools (public and
private), healthcare providers, and private colleges
and universities. It also handles student loans in
the state. The second-largest bond bank, Virginia
Resources Authority, has a more typical set of
customers and raises funds mainly for local infra-
structure.
Overall, the size of U.S. bond banks’ activities is
limited. Many bond banks administer statewide
revolving funds from which loans are supplied
to local authorities for specific purposes, often
clean-water projects.
The cooperational approach
The cooperational approach is based on coopera-
tion in the country in question among local author-
ities that have voluntarily joined forces to achieve
long-term cost-efficient funding of local infrastruc-
ture projects.
The European LGFAs are examples of the coopera-
tional approach. These agencies are frequent issuers
in capital markets and are often market leaders in
municipal loans in their respective countries.
Another example is found in Japan. Japan Finance
Corporation for Municipal Enterprises was originally
created as a central government institution in 1957.
In 2008 this company was transformed into a new
entity with the capital fully contributed by all local
governments (prefectures, cities, towns, villages,
and special wards of Tokyo) and became a joint
fundraising organization for local governments.
Another example is found in New Zealand. The
New Zealand Local Government Funding Agency
(NZLGFA) was created in December 2011, after
three years of preparations. Local authorities own
80 per cent of NZLGFA, and the central government
retains the remainder. There are 31 shareholding
local authorities; among these are the Auckland
Council, the Christchurch City Council, and the
Wellington City Council.
How is a PFM developed?
Development of a PFM can be divided into three
levels: the preliminary level, the basic level, and the
advanced level.
Preliminary level
A number of actions can be taken to prepare for
the introduction of a PFM. A first step is the estab-
lishment of close cooperation among local author-
ities focused on financial issues, without actually
borrowing together. This could entail the coordina-
tion of borrowing activities and exchange of best
practices regarding, for example, risk policies. This
can include using similar procurement processes in
relation to banks and other creditors.
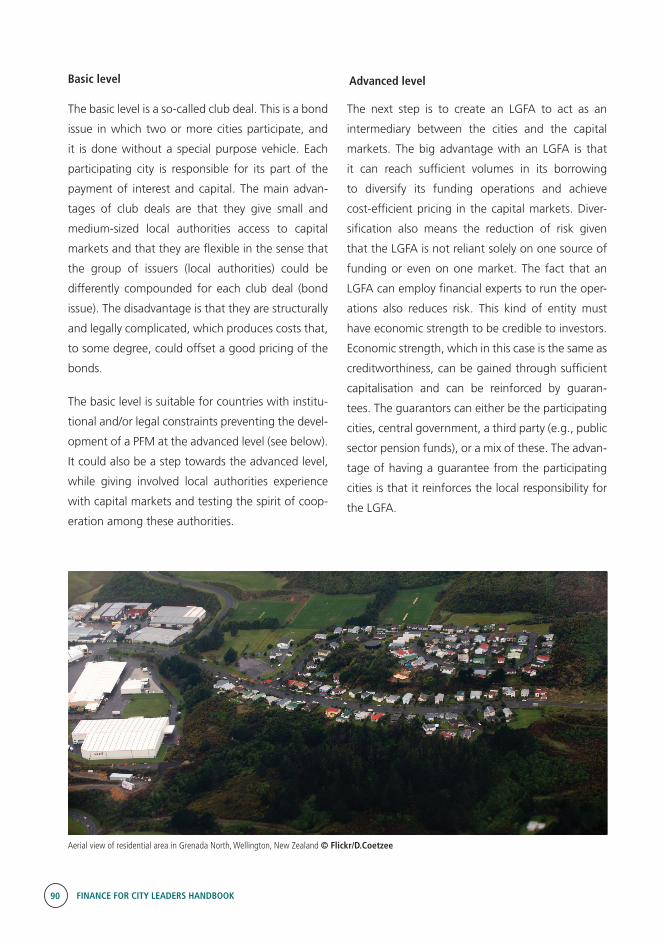
90 FINANCE FOR CITY LEADERS HANDBOOK
Basic level
The basic level is a so-called club deal. This is a bond
issue in which two or more cities participate, and
it is done without a special purpose vehicle. Each
participating city is responsible for its part of the
payment of interest and capital. The main advan-
tages of club deals are that they give small and
medium-sized local authorities access to capital
markets and that they are flexible in the sense that
the group of issuers (local authorities) could be
differently compounded for each club deal (bond
issue). The disadvantage is that they are structurally
and legally complicated, which produces costs that,
to some degree, could offset a good pricing of the
bonds.
The basic level is suitable for countries with institu-
tional and/or legal constraints preventing the devel-
opment of a PFM at the advanced level (see below).
It could also be a step towards the advanced level,
while giving involved local authorities experience
with capital markets and testing the spirit of coop-
eration among these authorities.
Advanced level
The next step is to create an LGFA to act as an
intermediary between the cities and the capital
markets. The big advantage with an LGFA is that
it can reach sufficient volumes in its borrowing
to diversify its funding operations and achieve
cost-efficient pricing in the capital markets. Diver-
sification also means the reduction of risk given
that the LGFA is not reliant solely on one source of
funding or even on one market. The fact that an
LGFA can employ financial experts to run the oper-
ations also reduces risk. This kind of entity must
have economic strength to be credible to investors.
Economic strength, which in this case is the same as
creditworthiness, can be gained through sufficient
capitalisation and can be reinforced by guaran-
tees. The guarantors can either be the participating
cities, central government, a third party (e.g., public
sector pension funds), or a mix of these. The advan-
tage of having a guarantee from the participating
cities is that it reinforces the local responsibility for
the LGFA.
Aerial view of residential area in Grenada North, Wellington, New Zealand © Flickr/D.Coetzee
FINANCE FOR CITY LEADERS HANDBOOK 91
What are the advantages and challenges of PFMs?
Applying PFMs has several potential advantages:
It gives small and medium-sized local
authorities access to capital markets. Capital
markets require volume, and PFMs make it
possible for small and medium-sized local
authorities to coordinate their borrowing in
bond issues that have the size required to attract
investors.
It reduces borrowing costs. In all countries
where PFMs for local authorities are applied,
the cost of borrowing has been substantially
reduced.
It reduces processing costs. Processing costs
for pooled financing are considerably lower than
if the local entities borrowed on their own.
It reduces market risk through diversi-
fication. Diversification of borrowing can
be achieved by the use of different markets
and different instruments, and by targeting a
number of different investor groups. Because
of the size of its operations, a PFM entity has
far more potential to diversify its funding than
a single local authority. Diversification can be
achieved by using a number of loan products,
loan programmes, and markets.
It improves debt management capacity by
providing financial expertise. Financial exper-
tise is often scarce in local authorities, since their
primary focus is on providing appropriate basic
services to the public. Cooperation provides
opportunity to employ financial experts, which
reduces risks.
It provides incentives to improve credit-
worthiness. The participating local authorities
have to agree to be supervised by their peers,
because local authorities’ creditworthiness is the
enterprise’s most important asset. This supervi-
sion can result in peer pressure to increase local
creditworthiness. Peer pressure has often proven
to be the most efficient way of improving local
performance.
It is a conduit for the transfer of knowledge.
The existing PFM entities regularly organize
conferences, workshops, and consultations.
It increases transparency. A PFM entity has
to apply a high degree of transparency for a
number of reasons. First, the capital markets and
international credit rating agencies will require
full disclosure of financial information of the
agency and participating authorities. Second,
the most important asset of a PFM entity is its
creditworthiness. The latter, in turn, is built upon
the creditworthiness of the participating cities,
which is why the financial status of these has
to be monitored on an ongoing basis. It is also
essential that the entity is transparent and that
it issues comprehensive reports of its activities
for the benefit of the involved cities and other
stakeholders. Thus, financial information has
to be freely supplied by the cities in the PFM. A
large portion of this information will be public,
which means that it will enhance public under-
standing of the authorities’ activities and thus
support local democracy.
There are also several challenges entailed in
applying PFMs:
Administrative challenges: The central
government has in many countries shown an
initial hesitation to support local government
initiatives to introduce PFMs. It is crucial that
the central government is aware of the project’s
benefits to the country’s development and hence
to economic growth. It should also be made
clear that a PFM entity’s activities will be guided
by strict internal risk management regulations.
92 FINANCE FOR CITY LEADERS HANDBOOK
Market challenges: If there is one or a group of
dominating lenders to local authorities, they are
likely to feel challenged and to find weaknesses
in the PFM plan. It is thus important to find ways
to cooperate with existing lenders. The other
market challenge is to raise interest among
investors for bonds issued by a PFM entity.
Contacts with investors should be made at an
early stage to investigate how investors’ inter-
ests could be accommodated within the project
and to give the investors time to prepare for
the first bond issue. This might mean amending
their internal investment regulations, among
other things. Well before the first bond issue, an
extensive program of so-called road shows must
be executed.
Cooperation challenges: In many countries,
local authorities are not accustomed to coop-
erating with each other. Clear governance rules
have to be put in place. In addition, a need to
supervise the creditworthiness of the participat-
ing local authorities could complicate coopera-
tion. It is crucial that every member/shareholder
fully accepts the need for continuous scrutiny
and acknowledges that membership/sharehold-
ing does not secure an unconditional right to
borrow from the entity.
For entities in emerging and developing coun-
tries, a further challenge is to build a system
for secure repayment of the loans. This might
mean that the entity and its members create a
fund to secure future payment of the borrowing
activities and/or acquire a third-party guarantee,
which could be underwritten by other domestic
stakeholders (central government, developing
banks, etc.) or by development finance institu-
tions. It should be stressed that external guaran-
tees will have to be structured in a way that does
not remove the responsibility of the local author-
ities that have created the entity. For example,
a partial credit guarantee with recourse claim
may help to improve the credit rating of the
debt issued by the entity to make it eligible for
institutional investors, without alleviating credit
pressure on local governments.
What are the prerequisites for a PFM?
In order to introduce a PFM, the following basic
conditions should be in place:
A willingness among the local authorities to
cooperate
Sufficient creditworthiness of the participating
local authorities
A legal system that allows local authorities to
borrow, even though it could be within limits
set by the central government or other central
authorities
A legal system that allows local authorities to
cooperate and to jointly assume commitments
A domestic capital market that has reached a
certain degree of maturity with investors that
could potentially be interested in local govern-
ment bonds with medium- and long-term
maturities
Even if all these conditions are met, non-market or
concessional lending of national and international
development institutions, state-owned banks, or
central governments themselves can potentially
undermine a PFM. Although concessional financing
is not sufficient and not flexible enough to cover all
the borrowing needs of local governments, it still
makes it more difficult for local authorities to justify
the development of market-based borrowing prac-
tices. And PFMs are indeed market-based mecha-
nisms, which significantly reduce a need for debt
interventions by central governments and develop-
ment finance institutions.
FINANCE FOR CITY LEADERS HANDBOOK 93
These are the basic conditions, but above all there
must be a need, obvious to local authorities, for
new financing solutions. These local authorities
must also be convinced that pooled financing
could be a way forward. The next step is to get the
support from central government.
Unfortunately, in many countries there has been
an initial hesitation for municipalities to cooper-
ate. This is probably because municipalities often
see themselves as competitors to the neighboring
local authority. Sometimes there could also be an
element of distrust among municipalities. This can
stem from different political parties being in power
or a number of other reasons.
In countries where municipal funding agencies have
been created, these challenges have been present.
Fairly soon in the process it is recognized by the
local authorities that a PFM is for the benefit of all
participants, but it is still important to, in different
ways, enhance trust among municipalities. The
process needs to start with a few motivated stake-
holders that can lead the way for others. These
initiators must clearly state their interest in studying
the introduction of a PFM in order to build a strong
enough foundation for a project.
The work to create a PFM entity should be properly
organized. A local government association could
host the project and supply administrative support.
It is important to remember that it is the local
authorities that should drive the project. A step
that is key in this type of process is the recruitment
of leaders, both political and professional. A need
for entrepreneurial skills cannot be underestimat-
ed. It is a question of breaking new ground, and
it requires hard work and creativity combined with
diplomacy.
The value of the process
All uses of financial markets for borrowing purposes
are built upon good creditworthiness. The situation
for local authorities varies greatly among different
countries. For some developing countries a PFM
is perfectly feasible, while other countries’ local
authorities lack steady income streams and a solid
regulatory framework. Nevertheless, all countries
and their local authorities could make substantial
gains from the process towards a PFM.
A project that aims to put in place financial coop-
eration among cities in a developing country
addresses almost all the questions that are vital for
well-functioning local authorities. These include:
What is the relationship between local author-
ities and central government, both legal and
financial?
What is the flow of income (including stability,
predictability, diversification, trends [especially of
tax bases], system for collection, collection rates,
and the possibilities to tap new local taxes)?
What is the cost structure?
What is the debt outlook (e.g., size, interest
payments, maturities, payment record, and
central government restrictions)?
What institutional factors are present (e.g.,
organization, accounting system, audit, level of
knowledge, and skills)?
All of the above constitute a well-functioning local
authority with high creditworthiness.
Asking these questions in connection with a project
that aims to solve a major problem, such as financ-
ing infrastructure investment, can be very efficient. It
would enable putting needed reforms in the context
of a vision for the future. A project would be orga-
94 FINANCE FOR CITY LEADERS HANDBOOK
nized in a way that makes clear the inter-relations
among the different steps required for a stronger
city. The fact that this kind of project encompasses
a group of cities means that the demands on the
central government could be stronger and more
stringent. The negotiating power that such a project
would gather is great, because it strives to resolve an
undisputable need for financing for local infrastruc-
ture and it would be formed by a group of strong
local authorities with comparably high creditworthi-
ness.
In the global arena, the implementation of munici-
pal pooled financing mechanisms is still to be recog-
nized as an essential element of an effective fiscal
decentralization—one that is intended to make local
government fiscally stronger, more creditworthy,
and more capable of addressing local infrastructure
challenges. Otherwise, decentralization can only
shift greater responsibility for infrastructure to local
governments without helping equip them with the
proper tools, such as access to capital markets.
Conclusion
The use of PFMs has the potential to not only
provide cost-efficient funding for local infrastruc-
ture investments, but also to increase transparency
and facilitate capacity-building among local author-
ities. The creation of PFM schemes is always depen-
dent on the specific circumstances of each country.
And there are many ways to organize PFMs, from
a first step of inter-city cooperation to the creation
of a special vehicle or agency. Such agencies can
assume the role of local infrastructure development
agencies, which would, together with cities and
other local authorities, play the important role of
facilitating efficient and resilient local infrastructure
investment activities, with the potential to promote
countrywide growth.
Case Study 1: Kommunekredit, LGFA of
Denmark
Denmark has a population of 5.6 million and
is divided into 98 local authorities. The country
is one of the most decentralized in the world.
Danish local authorities created Kommunekredit
in 1898 as a cooperative society. It is voluntary
to join and over time all local authorities have
become members.
Kommunekredit’s business model is similar to
that of other European LGFAs. It issues bonds
in domestic and international capital markets
and on-lends the proceeds to local authorities
and to related entities (for example, munici-
pal-owned companies). When bond issues are
made in foreign currencies, they are exchanged
into domestic currency by the agency through
the use of swaps. All lending is made in domestic
currency. Kommunekredit has now achieved
almost a 100 per cent market share in lending to
local authorities.
Like the Swedish Kommuninvest, Kommunekredit
is backed by a joint-and-several guarantee signed
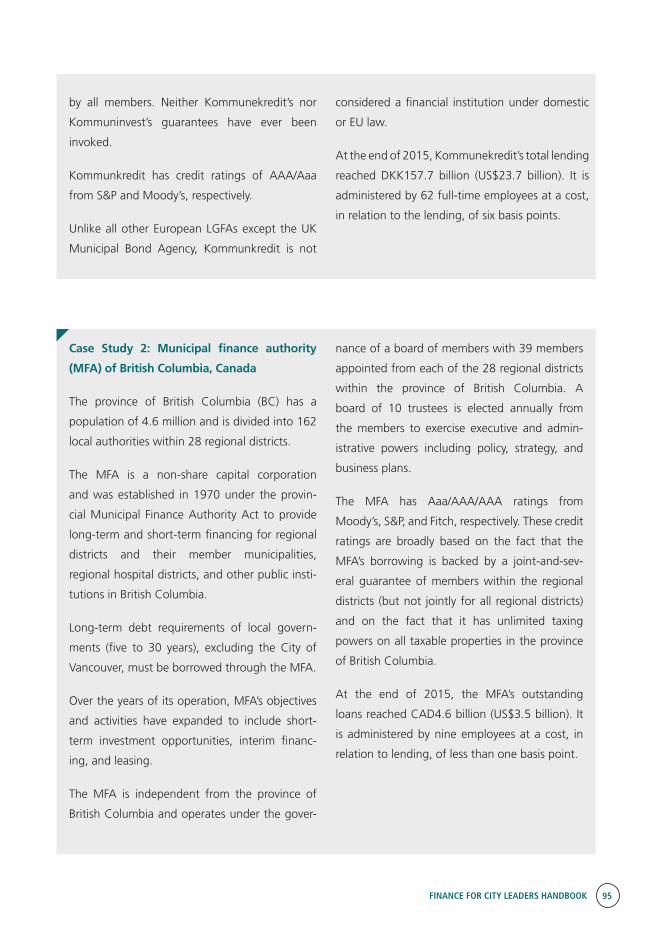
FINANCE FOR CITY LEADERS HANDBOOK 95
by all members. Neither Kommunekredit’s nor
Kommuninvest’s guarantees have ever been
invoked.
Kommunkredit has credit ratings of AAA/Aaa
from S&P and Moody’s, respectively.
Unlike all other European LGFAs except the UK
Municipal Bond Agency, Kommunkredit is not
considered a financial institution under domestic
or EU law.
At the end of 2015, Kommunekredit’s total lending
reached DKK157.7 billion (US$23.7 billion). It is
administered by 62 full-time employees at a cost,
in relation to the lending, of six basis points.
Case Study 2: Municipal finance authority
(MFA) of British Columbia, Canada
The province of British Columbia (BC) has a
population of 4.6 million and is divided into 162
local authorities within 28 regional districts.
The MFA is a non-share capital corporation
and was established in 1970 under the provin-
cial Municipal Finance Authority Act to provide
long-term and short-term financing for regional
districts and their member municipalities,
regional hospital districts, and other public insti-
tutions in British Columbia.
Long-term debt requirements of local govern-
ments (five to 30 years), excluding the City of
Vancouver, must be borrowed through the MFA.
Over the years of its operation, MFA’s objectives
and activities have expanded to include short-
term investment opportunities, interim financ-
ing, and leasing.
The MFA is independent from the province of
British Columbia and operates under the gover-
nance of a board of members with 39 members
appointed from each of the 28 regional districts
within the province of British Columbia. A
board of 10 trustees is elected annually from
the members to exercise executive and admin-
istrative powers including policy, strategy, and
business plans.
The MFA has Aaa/AAA/AAA ratings from
Moody’s, S&P, and Fitch, respectively. These credit
ratings are broadly based on the fact that the
MFA’s borrowing is backed by a joint-and-sev-
eral guarantee of members within the regional
districts (but not jointly for all regional districts)
and on the fact that it has unlimited taxing
powers on all taxable properties in the province
of British Columbia.
At the end of 2015, the MFA’s outstanding
loans reached CAD4.6 billion (US$3.5 billion). It
is administered by nine employees at a cost, in
relation to lending, of less than one basis point.
96 FINANCE FOR CITY LEADERS HANDBOOK
Lars M. Andersson is a local government finance expert, who in 1986 initiated the creation of the Swedish
LGFA, Kommuninvest, and is now a board member of both the French LGFA, Agence France Locale, and
the Global Fund for Cities Development (Le Fonds Mondial pour le Dévelopment des Villes, or FMDV).
Pavel Kochanov is a senior subnational specialist at the International Finance Corporation, where he
specializes in credit and governance risks of sub-sovereign government entities.
Further reading
For more information about PMFs, please see these resources:
Lars M. Andersson, Finance Cooperation Between Local Authorities in Developing Countries (Stockholm, Mårten Andersson Productions, 2014).
Lars M. Andersson, Local Government Finance in Europe: Trends to Create Local Government Funding Agencies (Stockholm, Mårten Andersson Productions, 2014).
Lars M. Andersson, What the World Needs Now… Is Local Infrastructure Investments Challenges and Solutions with a Focus on Finance (Stockholm, Mårten Andersson Productions, 2014).
Lars M. Andersson, Overview of Municipal Pooled Financing Practices (Washington, International Finance Corporation, 2015).
Barbara Samuels, The Potential Catalytic Role of Subnational Pooled, Financing Mechanisms (Paris, FMDV, 2015).

FINANCE FOR CITY LEADERS HANDBOOK 97
A street in Maputo, Mozambique © UN-Habitat
Public–Private Partnerships07Introduction
Urbanization in developing countries is projected to add between 68
million and 71 million people to the world’s urban population annually
between 2015 and 2025.1 This will only exacerbate the large infrastruc-
ture gaps already affecting the developing world.2 Remedying this situ-
ation and meeting Sustainable Development Goals require increased
infrastructure investment, especially from the private sector.3 Of many
methods of private financing of infrastructure, public–private partner-
ships (PPPs) have shown much promise in recent decades.
Private-sector involvement in developing countries’ infrastructure has
risen from less than US$20 billion in 1990 to more than $200 billion in
2012—an all-time high—thanks to the growing popularity of PPPs as an
investment model (see Figure A). However, the private sector currently
contributes less than 10 per cent of the total estimated investment needs
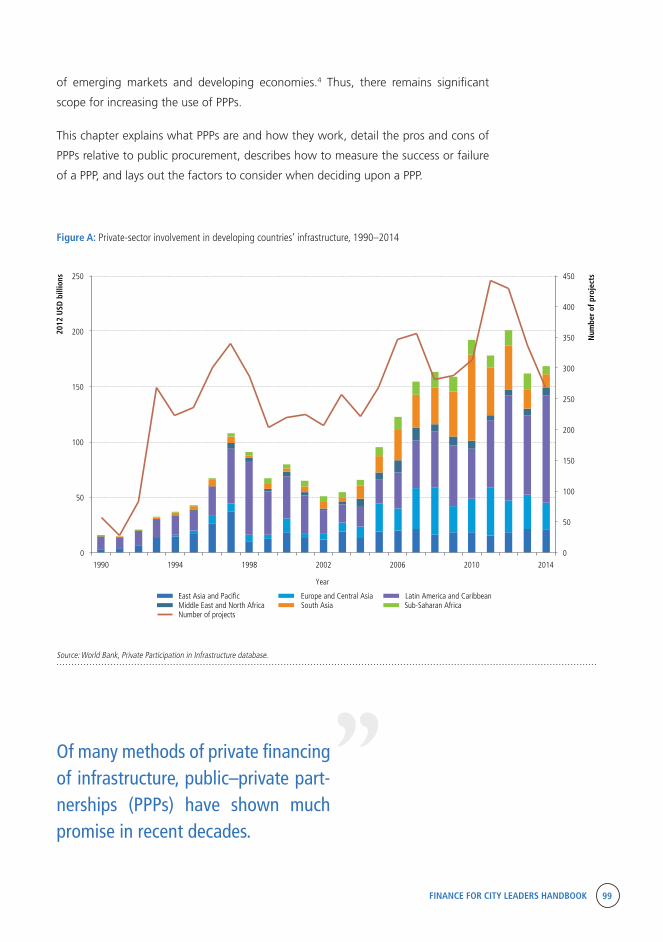
FINANCE FOR CITY LEADERS HANDBOOK 99
0
50
100
150
200
250
300
350
400
450
0
50
100
150
200
250
1990 1994 1998 2002 2006 2010 2014
Num
ber
of p
roje
cts
2012
USD
bill
ions
East Asia and Paci�c Europe and Central Asia
Year
Latin America and CaribbeanMiddle East and North Africa South Asia Sub-Saharan AfricaNumber of projects
of emerging markets and developing economies.4 Thus, there remains significant
scope for increasing the use of PPPs.
This chapter explains what PPPs are and how they work, detail the pros and cons of
PPPs relative to public procurement, describes how to measure the success or failure
of a PPP, and lays out the factors to consider when deciding upon a PPP.
Figure A: Private-sector involvement in developing countries’ infrastructure, 1990–2014
Source: World Bank, Private Participation in Infrastructure database. “
Of many methods of private financing of infrastructure, public–private part-nerships (PPPs) have shown much promise in recent decades.
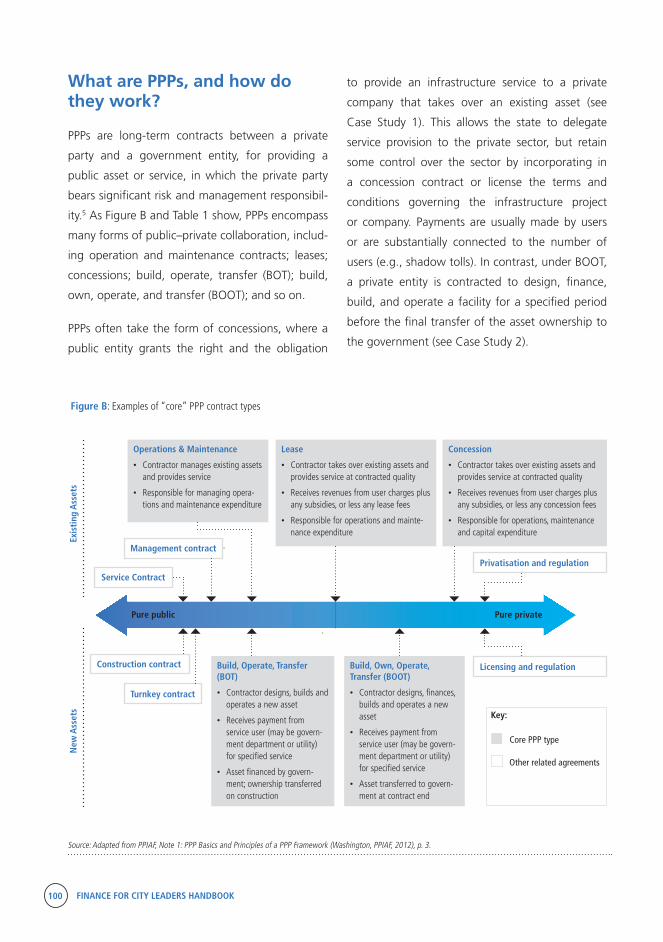
100 FINANCE FOR CITY LEADERS HANDBOOK
Source: Adapted from PPIAF, Note 1: PPP Basics and Principles of a PPP Framework (Washington, PPIAF, 2012), p. 3.
What are PPPs, and how do they work?
PPPs are long-term contracts between a private
party and a government entity, for providing a
public asset or service, in which the private party
bears significant risk and management responsibil-
ity.5 As Figure B and Table 1 show, PPPs encompass
many forms of public–private collaboration, includ-
ing operation and maintenance contracts; leases;
concessions; build, operate, transfer (BOT); build,
own, operate, and transfer (BOOT); and so on.
PPPs often take the form of concessions, where a
public entity grants the right and the obligation
to provide an infrastructure service to a private
company that takes over an existing asset (see
Case Study 1). This allows the state to delegate
service provision to the private sector, but retain
some control over the sector by incorporating in
a concession contract or license the terms and
conditions governing the infrastructure project
or company. Payments are usually made by users
or are substantially connected to the number of
users (e.g., shadow tolls). In contrast, under BOOT,
a private entity is contracted to design, finance,
build, and operate a facility for a specified period
before the final transfer of the asset ownership to
the government (see Case Study 2).
Figure B: Examples of “core” PPP contract types
Operations & Maintenance
• Contractor manages existing assets and provides service
• Responsible for managing opera-tions and maintenance expenditure
Lease
• Contractor takes over existing assets and provides service at contracted quality
• Receives revenues from user charges plus any subsidies, or less any lease fees
• Responsible for operations and mainte-nance expenditure
Build, Operate, Transfer (BOT)
• Contractor designs, builds and operates a new asset
• Receives payment from service user (may be govern-ment department or utility) for specified service
• Asset financed by govern-ment; ownership transferred on construction
Concession
• Contractor takes over existing assets and provides service at contracted quality
• Receives revenues from user charges plus any subsidies, or less any concession fees
• Responsible for operations, maintenance and capital expenditure
Build, Own, Operate, Transfer (BOOT)
• Contractor designs, finances, builds and operates a new asset
• Receives payment from service user (may be govern-ment department or utility) for specified service
• Asset transferred to govern-ment at contract end
Privatisation and regulation
Management contract
Construction contract
Service Contract
Turnkey contract
Licensing and regulation
Pure public Pure private
Exis
ting
Ass
ets
New
Ass
ets
Key:
Core PPP type
Other related agreements
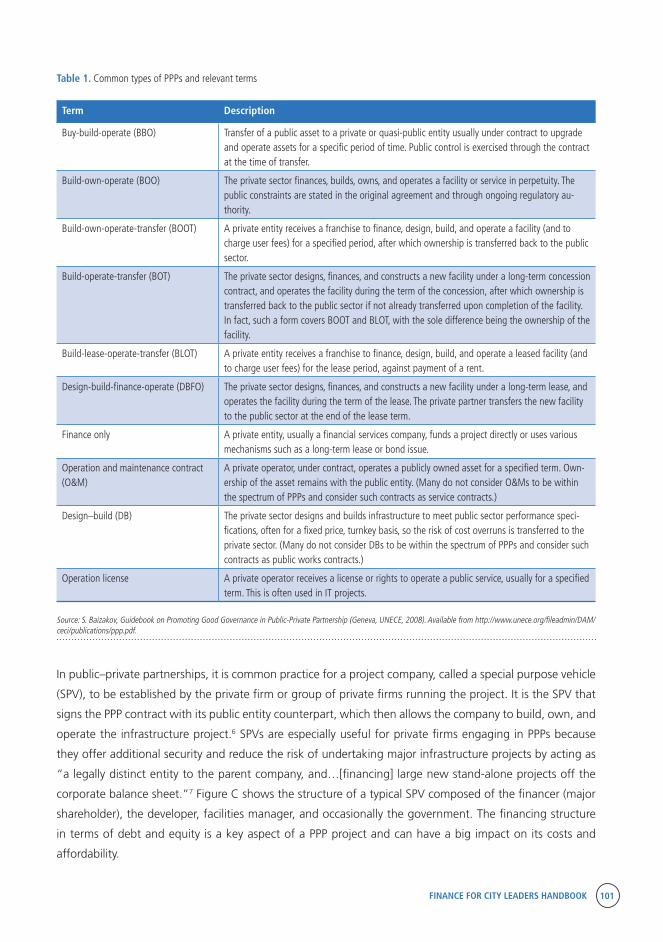
FINANCE FOR CITY LEADERS HANDBOOK 101
Table 1. Common types of PPPs and relevant terms
Term Description
Buy-build-operate (BBO) Transfer of a public asset to a private or quasi-public entity usually under contract to upgrade and operate assets for a specific period of time. Public control is exercised through the contract at the time of transfer.
Build-own-operate (BOO) The private sector finances, builds, owns, and operates a facility or service in perpetuity. The public constraints are stated in the original agreement and through ongoing regulatory au-thority.
Build-own-operate-transfer (BOOT) A private entity receives a franchise to finance, design, build, and operate a facility (and to charge user fees) for a specified period, after which ownership is transferred back to the public sector.
Build-operate-transfer (BOT) The private sector designs, finances, and constructs a new facility under a long-term concession contract, and operates the facility during the term of the concession, after which ownership is transferred back to the public sector if not already transferred upon completion of the facility. In fact, such a form covers BOOT and BLOT, with the sole difference being the ownership of the facility.
Build-lease-operate-transfer (BLOT) A private entity receives a franchise to finance, design, build, and operate a leased facility (and to charge user fees) for the lease period, against payment of a rent.
Design-build-finance-operate (DBFO) The private sector designs, finances, and constructs a new facility under a long-term lease, and operates the facility during the term of the lease. The private partner transfers the new facility to the public sector at the end of the lease term.
Finance only A private entity, usually a financial services company, funds a project directly or uses various mechanisms such as a long-term lease or bond issue.
Operation and maintenance contract (O&M)
A private operator, under contract, operates a publicly owned asset for a specified term. Own-ership of the asset remains with the public entity. (Many do not consider O&Ms to be within the spectrum of PPPs and consider such contracts as service contracts.)
Design–build (DB) The private sector designs and builds infrastructure to meet public sector performance speci-fications, often for a fixed price, turnkey basis, so the risk of cost overruns is transferred to the private sector. (Many do not consider DBs to be within the spectrum of PPPs and consider such contracts as public works contracts.)
Operation license A private operator receives a license or rights to operate a public service, usually for a specified term. This is often used in IT projects.
Source: S. Baizakov, Guidebook on Promoting Good Governance in Public-Private Partnership (Geneva, UNECE, 2008). Available from http://www.unece.org/fileadmin/DAM/ceci/publications/ppp.pdf.
In public–private partnerships, it is common practice for a project company, called a special purpose vehicle
(SPV), to be established by the private firm or group of private firms running the project. It is the SPV that
signs the PPP contract with its public entity counterpart, which then allows the company to build, own, and
operate the infrastructure project.6 SPVs are especially useful for private firms engaging in PPPs because
they offer additional security and reduce the risk of undertaking major infrastructure projects by acting as
“a legally distinct entity to the parent company, and…[financing] large new stand-alone projects off the
corporate balance sheet.”7 Figure C shows the structure of a typical SPV composed of the financer (major
shareholder), the developer, facilities manager, and occasionally the government. The financing structure
in terms of debt and equity is a key aspect of a PPP project and can have a big impact on its costs and
affordability.
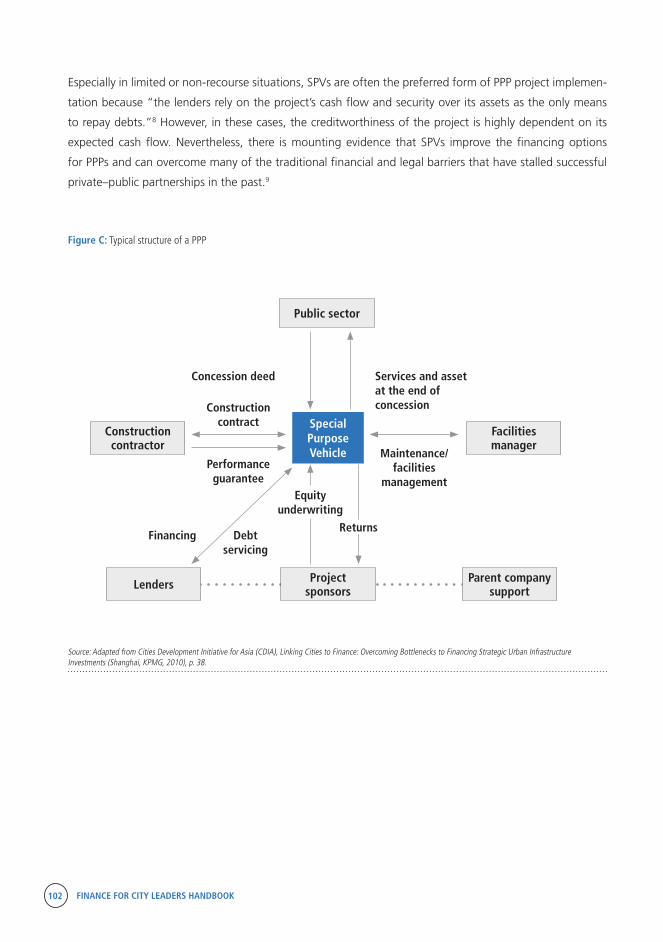
102 FINANCE FOR CITY LEADERS HANDBOOK
Especially in limited or non-recourse situations, SPVs are often the preferred form of PPP project implemen-
tation because “the lenders rely on the project’s cash flow and security over its assets as the only means
to repay debts.”8 However, in these cases, the creditworthiness of the project is highly dependent on its
expected cash flow. Nevertheless, there is mounting evidence that SPVs improve the financing options
for PPPs and can overcome many of the traditional financial and legal barriers that have stalled successful
private–public partnerships in the past.9
Figure C: Typical structure of a PPP
Source: Adapted from Cities Development Initiative for Asia (CDIA), Linking Cities to Finance: Overcoming Bottlenecks to Financing Strategic Urban Infrastructure Investments (Shanghai, KPMG, 2010), p. 38.
Public sector
Facilitiesmanager
Special Purpose Vehicle
Constructioncontractor
Parent company support
ProjectsponsorsLenders
Maintenance/ facilities
management
Services and asset at the end of concession
Concession deed
Construction contract
Performance guarantee
Debt servicing
Equity underwriting
ReturnsFinancing
FINANCE FOR CITY LEADERS HANDBOOK 103
The pros and cons of PPPs, relative to public procurement
To provide a service or build an asset, a public entity
can either use a traditional mode of public procure-
ment or enter into a PPP. A distinctive feature of
PPP projects is that their requirements are defined
in terms of outputs rather than inputs. This allows
the public sector to focus on specifying the level
and standards of the services required, giving the
private entity the task of meeting the requirements.
This enables the public sector to transfer certain
project risks relating to designing, building, operat-
ing, and financing the project to the private sector.10
The pros of PPPs include better value for money
(VfM), project sustainability, and additionality. As
for cons, questions regarding the accountability
and flexibility of PPPs have raised some concern
among academics and policymakers.11
PPPs can improve the VfM of some projects. The
VfM criterion of PPPs is defined as the expected
reduction of life cycle cost and the estimated
value of the risk transferred.12 This is evident in a
higher positive net present value (NPV) in cost–
benefit analysis (CBA). To establish whether a PPP
represents better VfM, it is usually compared with
a hypothetical public sector alternative, also known
as a public sector comparator (PSC), which delivers
the same service. The theory behind improved VfMs
via PPPs is based on the assumption that the private
sector is more effective at managing construction
processes and risk.
PPPs can improve the sustainability of public
services by reducing the overall costs and the vari-
ability of the cost of that service to government.
Again this arises from sharing the risks of service
provision with the private sector.13 The reverse side
of the coin is that flexibility is limited in PPPs.14 This
can be a problem if government wishes to intro-
duce regulatory changes or alter the nature of the
asset after the signing of a PPP deal. Renegotiation
and cancellations of PPP contracts are costly.
In addition, commercial confidentiality and the
work of SPVs as closed companies may diminish
the accountability of PPPs.15 On the other hand,
the reverse has also been argued; by transferring
service delivery risk to the private sector, account-
ability may be improved.16
Finally, PPPs provide an alternative source of finance
to traditional government borrowing, thus offering
the benefit of additionality. This is especially import-
ant for developing countries, where domestic
resources are limited and the cost of doing nothing
is high due to lost economic growth (and develop-
ment) incurred when infrastructure is absent and/
or inadequate.17
How to measure the success or failure of a PPP?
In measuring the success or failure of a PPP, a crucial
question is whether it has produced the benefits
that PPPs are supposed to generate.
First, a successful PPP should deliver better VfM in
comparison with a PSC. This depends on whether
risks have been effectively transferred to the private
sector at a reasonable cost. This is not always easy
to establish though, as the comparison relies on a
counterfactual (i.e., a PSC). Through a PPP, the public
sector is effectively buying an insurance policy from
the SPV for the project, the price of which is the
difference between the base cost and what is paid
to the SPV.18 Due to limited competition among
the SPVs, there is high risk that the public sector

104 FINANCE FOR CITY LEADERS HANDBOOK
Public space in Shanghai, China © Flickr/Setiadi
may pay too high a premium. Research shows that
the estimated premium is about 25 per cent, not
so different from those quoted for the overrun on
publicly financed projects.19
Neither CBA nor PSC analysis is straightforward. The
choice of the discount rate in CBA can significantly
impact the NPV. Moreover, the CBA exercise tends
to favour a PPP relative to a PSC when the discount
rate is high, since many of the costs for a PSC would
occur early on, but later for a PPP. In terms of a PSC,
it is not always possible to find one comparable to a
PPP in terms of outputs.20 On the other hand, ex-ante
VfM analyses focus on the risk-adjusted financial
costs and may underestimate the non-financial
benefits of PPPs.21 These “socio-economic” benefits
to service users or wider society from a PPP may take
three forms: accelerated delivery (delivering service
earlier), enhanced delivery (delivering service to a
higher standard), and wider social impacts (greater
benefits to society as a whole).22
A total cost approach is needed in this assessment. A
project represents better VfM only if the PPP option
delivers the same level of services at less cost to the
public after all costs, benefits, and risks are taken
into account. It is important to assess whether the
greater operational efficiency of the PPP option is
likely to outweigh factors that might make the PPP
option more costly due to the latter’s high transac-
tion, monitoring, and financing costs.
Second, a successful PPP ensures additionality and
sustainability that provides the long-term availabili-
ty of investment capital. A PPP that is aborted, that
delivers poor service at too high a price, or that
excludes large sections of the population cannot be
considered as successful.

FINANCE FOR CITY LEADERS HANDBOOK 105
What are the prerequisites for PPPs?
There are two principal requirements for success-
ful PPPs. First, the local government must have the
authorization of upper-level government to do so.
Usually, this means that the national government
would have an established regulatory framework
for such undertakings, including rules regarding
contract enforcement and disagreement resolution.
Second, the project must offer a good risk-adjust-
ed return that is attractive for the private sector.
This may involve good cash flow based on project
revenue (paid by users) or service fees (paid by
authority). PPPs are considered less viable for the
provision of basic infrastructure, as there might be a
problem of affordability. In the event of debt financ-
Table 2. PPP project cycle: phases, stages, and steps
Phases Stages Steps
1. Project identification 1.1 Project selection and definition ■ Identification
■ Output identification
1.2 Assessment of the PPP option ■ Affordability
■ Risk allocation
■ Bankability
■ Value for money
■ Tax and public finance treatment
2. Detailed preparation 2.1 Getting organised …
2.2 Before launching the tender …
3. Procurement 3.1 Bidding process …
3.2 PPP contract and financial close …
4. Project implementation 4.1 Contract management …
4.2 Ex post evaluation …
Source: Adapted from European PPP Expertise Centre (EPEC), The Guide to Guidance: How to Prepare, Procure and Deliver PPP Projects (Luxembourg, EPEC, 2011), p. 7.
ing, the public sector might be asked to provide
guarantees. Alternatively, the public entity can
either purchase a guarantee from private provid-
ers or access an increasing number of guarantee
schemes that multilateral and bilateral agencies
have set up.
Key steps and considerations in deciding a PPP
The PPP project cycle involves four phases: 1) project
identification, 2) detailed preparation, 3) procure-
ment, and 4) project implementation (see Table 2).
Each phase can in turn be broken down into further
stages and steps.23 The first phase (project identifi-
cation) is crucial and, therefore, is the primary focus
here. It involves two stages and a series of steps, as
shown in Table 2.
106 FINANCE FOR CITY LEADERS HANDBOOK
The first stage involves project selection and defi-
nition. A key task here is to specify the outputs, as
altering this specification will involve expensive rene-
gotiation.
In assessing the PPP option, in the second stage, the
authority and its financial advisors need to answer
four key questions:24
1. Is the project affordable? This considers the capacity
of the project to pay by either the users of the services
or the authority (or a combination of both). Services
can be paid in two different ways: the user-pays
type, or the unitary charge type.25 The first type trans-
fers more risk to the private sector. Investors will be
interested in the “annual debt service cover ratio”
(ADSCR), which is defined as the ratio of free cash
(i.e., cash left to the project after payment of oper-
ating and essential capital costs) available to meet
annual interest and principal payments on the debt.26
2. What are the key sources of risks of the project?
What are the optimal risk allocation and risk manage-
ment strategies? There are three broad types of risks:
commercial (including supply-side and demand-side
risks), legal, and political. Best-practice principles of
risk management suggest that risks should be allo-
cated to the party best-placed to manage or absorb
them. Thus, the private sector assumes the commer-
cial risks, while the public sector assumes legal and
political risks.
3. What are the financing sources for the project?
Questions include whether it is bankable (i.e.,
whether lenders would be willing to finance it) and
whether it would attract equity capital or public
funding. A bankable project would be cheaper to
finance, but it requires a healthy cash flow.
4. Even if the project is affordable and bankable,
does the project represent value for money? This
requires the conduct of the CBA and PSC exercises
described earlier.
In addition, depending on the institutional and
regulatory context of the country, it is necessary to
consider the tax and public finance treatment of the
PPP. For example, returns on bonds may be exempt
from capital gains tax, thus reducing the financing
cost of the PPP deal.
Conclusion
PPPs provide a financing mechanism by which local
governments and private firms partner together to
deliver important infrastructure projects and improve
the efficiency and quality of public facilities and
services. Various PPP arrangements exist to satisfy the
specific requirements and context of the proposed
project and protect private sector interests that want
to finance important public infrastructure projects.
While the private sector holds a large share of the
responsibility for financing and arranging PPPs, the
public sector and municipal authorities must critically
assess the long-term viability of the PPP project and its
capacity to generate adequate returns on investment.
The success of PPPs in developed and developing
countries alike confirms the broad applicability and
effectiveness of this financing instrument. While PPPs
present their own legal and regulatory challenges, the
success of PPPs in financing a wide range of projects
from transportation infrastructure to hospitals make
them a promising financing instrument for municipal
authorities to consider.
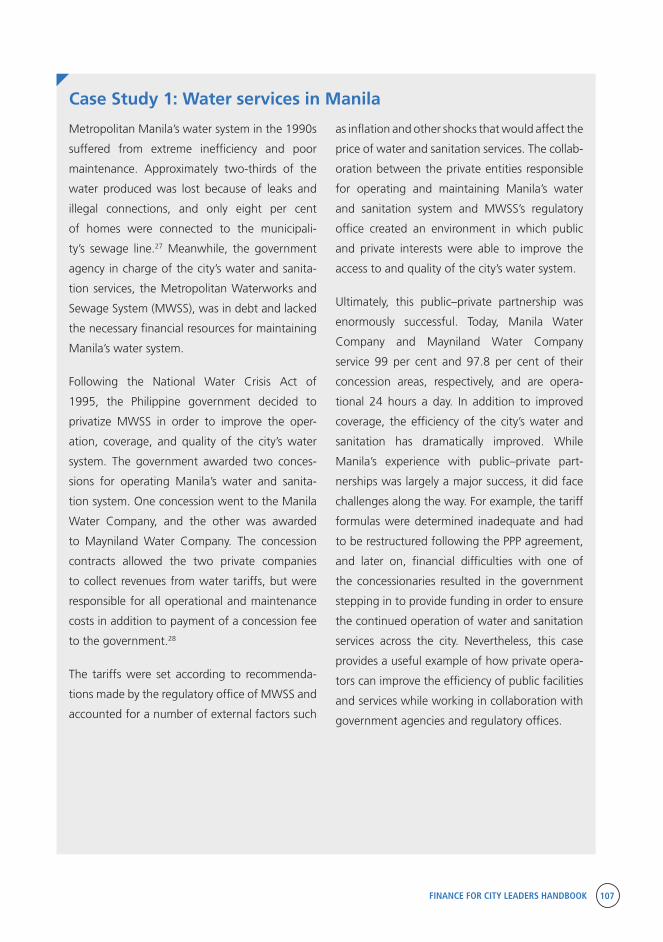
FINANCE FOR CITY LEADERS HANDBOOK 107
Case Study 1: Water services in Manila
as inflation and other shocks that would affect the
price of water and sanitation services. The collab-
oration between the private entities responsible
for operating and maintaining Manila’s water
and sanitation system and MWSS’s regulatory
office created an environment in which public
and private interests were able to improve the
access to and quality of the city’s water system.
Ultimately, this public–private partnership was
enormously successful. Today, Manila Water
Company and Mayniland Water Company
service 99 per cent and 97.8 per cent of their
concession areas, respectively, and are opera-
tional 24 hours a day. In addition to improved
coverage, the efficiency of the city’s water and
sanitation has dramatically improved. While
Manila’s experience with public–private part-
nerships was largely a major success, it did face
challenges along the way. For example, the tariff
formulas were determined inadequate and had
to be restructured following the PPP agreement,
and later on, financial difficulties with one of
the concessionaries resulted in the government
stepping in to provide funding in order to ensure
the continued operation of water and sanitation
services across the city. Nevertheless, this case
provides a useful example of how private opera-
tors can improve the efficiency of public facilities
and services while working in collaboration with
government agencies and regulatory offices.
Metropolitan Manila’s water system in the 1990s
suffered from extreme inefficiency and poor
maintenance. Approximately two-thirds of the
water produced was lost because of leaks and
illegal connections, and only eight per cent
of homes were connected to the municipali-
ty’s sewage line.27 Meanwhile, the government
agency in charge of the city’s water and sanita-
tion services, the Metropolitan Waterworks and
Sewage System (MWSS), was in debt and lacked
the necessary financial resources for maintaining
Manila’s water system.
Following the National Water Crisis Act of
1995, the Philippine government decided to
privatize MWSS in order to improve the oper-
ation, coverage, and quality of the city’s water
system. The government awarded two conces-
sions for operating Manila’s water and sanita-
tion system. One concession went to the Manila
Water Company, and the other was awarded
to Mayniland Water Company. The concession
contracts allowed the two private companies
to collect revenues from water tariffs, but were
responsible for all operational and maintenance
costs in addition to payment of a concession fee
to the government.28
The tariffs were set according to recommenda-
tions made by the regulatory office of MWSS and
accounted for a number of external factors such
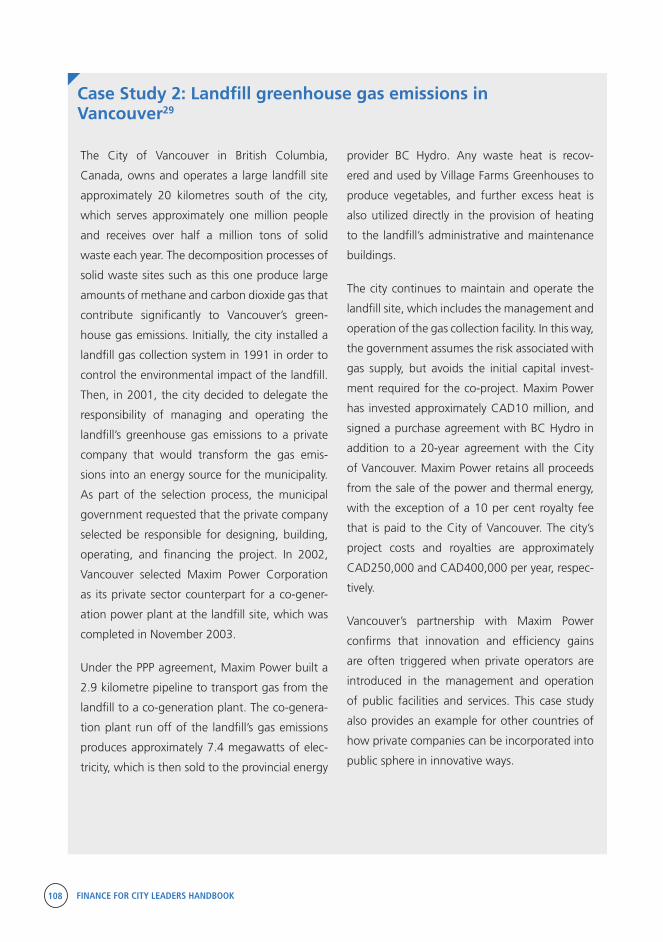
108 FINANCE FOR CITY LEADERS HANDBOOK
Case Study 2: Landfill greenhouse gas emissions in Vancouver29
The City of Vancouver in British Columbia,
Canada, owns and operates a large landfill site
approximately 20 kilometres south of the city,
which serves approximately one million people
and receives over half a million tons of solid
waste each year. The decomposition processes of
solid waste sites such as this one produce large
amounts of methane and carbon dioxide gas that
contribute significantly to Vancouver’s green-
house gas emissions. Initially, the city installed a
landfill gas collection system in 1991 in order to
control the environmental impact of the landfill.
Then, in 2001, the city decided to delegate the
responsibility of managing and operating the
landfill’s greenhouse gas emissions to a private
company that would transform the gas emis-
sions into an energy source for the municipality.
As part of the selection process, the municipal
government requested that the private company
selected be responsible for designing, building,
operating, and financing the project. In 2002,
Vancouver selected Maxim Power Corporation
as its private sector counterpart for a co-gener-
ation power plant at the landfill site, which was
completed in November 2003.
Under the PPP agreement, Maxim Power built a
2.9 kilometre pipeline to transport gas from the
landfill to a co-generation plant. The co-genera-
tion plant run off of the landfill’s gas emissions
produces approximately 7.4 megawatts of elec-
tricity, which is then sold to the provincial energy
provider BC Hydro. Any waste heat is recov-
ered and used by Village Farms Greenhouses to
produce vegetables, and further excess heat is
also utilized directly in the provision of heating
to the landfill’s administrative and maintenance
buildings.
The city continues to maintain and operate the
landfill site, which includes the management and
operation of the gas collection facility. In this way,
the government assumes the risk associated with
gas supply, but avoids the initial capital invest-
ment required for the co-project. Maxim Power
has invested approximately CAD10 million, and
signed a purchase agreement with BC Hydro in
addition to a 20-year agreement with the City
of Vancouver. Maxim Power retains all proceeds
from the sale of the power and thermal energy,
with the exception of a 10 per cent royalty fee
that is paid to the City of Vancouver. The city’s
project costs and royalties are approximately
CAD250,000 and CAD400,000 per year, respec-
tively.
Vancouver’s partnership with Maxim Power
confirms that innovation and efficiency gains
are often triggered when private operators are
introduced in the management and operation
of public facilities and services. This case study
also provides an example for other countries of
how private companies can be incorporated into
public sphere in innovative ways.
FINANCE FOR CITY LEADERS HANDBOOK 109
10 European PPP Expertise Centre (EPEC), The Guide to Guidance: How to Prepare, Procure and Deliver PPP Projects (Luxembourg, EPEC, 2011).
11 PPIAF, Note 1: PPP Basics and Principles of a PPP Framework (Washington, PPIAF, 2012); G. M. Winch, M. Onishi, and S. Schmidt, eds., Taking Stock of PPP and PFI Around the World (London, The Association of Chartered Certified Accountants, 2012).
12 G. M. Winch, M. Onishi, and S. Schmidt, eds., Taking Stock of PPP and PFI Around the World (London, The Asso-ciation of Chartered Certified Accountants, 2012).
13 PPIAF, Note 1: PPP Basics and Principles of a PPP Framework (Washington, PPIAF, 2012).
14 O. Merk, S. Saussier, C. Staropoli, E. Slack, J-H. Kim, Financing Green Urban Infrastructure (Paris, OECD Re-gional Development, 2010). Available from http://dc.doi.org/10.1787/5k92p0c6j6r0-en.
15 G. M. Winch, M. Onishi, and S. Schmidt, eds., Taking Stock of PPP and PFI Around the World (London, The Asso-ciation of Chartered Certified Accountants, 2012).
16 PPIAF, Note 1: PPP Basics and Principles of a PPP Framework (Washington, PPIAF, 2012).
17 G. M. Winch, M. Onishi, and S. Schmidt, eds., Taking Stock of PPP and PFI Around the World (London, The Asso-ciation of Chartered Certified Accountants, 2012).
18 G. M. Winch, M. Onishi, and S. Schmidt, eds., Taking Stock of PPP and PFI Around the World (London, The Asso-ciation of Chartered Certified Accountants, 2012), p. 14.
19 G. M. Winch, M. Onishi, and S. Schmidt, eds., Taking Stock of PPP and PFI Around the World (London, The Asso-ciation of Chartered Certified Accountants, 2012), p. 14.
Le-Yin Zhang is a senior lecturer and course director of M.Sc. Urban Economic Development at the Bartlett
Development Planning Unit of University College London.
Marco Kamiya is coordinator of the Urban Economy branch of the United Nations Human Settlements
Programme (UN-Habitat).
Endnotes
1 United Nations Department of Economic and Social Affairs, World Urbanization Prospects (New York, United Nations, 2015).
2 United Nations, The Millennium Development Goals Report 2013 (New York, United Nations, 2013).
3 United Nations Conference on Trade and Develop-ment (UNCTAD), World Investment Report 2014: Investing in the SDGs: An Action Plan (New York and Geneva, United Nations, 2014).
4 B. G. Inderst and F. Stewart, Institutional Investment in Infrastructure in Emerging Markets and Developing Econo-mies (Washington, PPIAF, 2014).
5 World Bank, Private Participation in Infrastructure database, available from http://ppp.worldbank.org/pub-lic-private-partnership/.
6 L. Turley and A. Semple, Financing Sustainable Pub-lic-Private Partnerships (Winnipeg, International Institute for Sustainable Development, 2013).
7 L. Turley and A. Semple, Financing Sustainable Pub-lic-Private Partnerships (Winnipeg, International Institute for Sustainable Development, 2013).
8 UNESCAP, “Special Purpose Vehicle (SPV),” in A Primer to Public-Private Partnerships in Infrastructure Devel-opment (Bangkok, UNESCAP, 2008). Available from http://www.unescap.org/ttdw/ppp/ppp_primer/211_special_pur-pose_vehicle_spv.html.
9 A. N. Chowdhury and P. H. Chen, “Special Purpose Vehicle (SPV) of Public Private Partnership Projects in Asia and Mediterranean Middle East: Trends and Techniques,” Institutions and Economies (formerly known as Interna-tional Journal of Institutions and Economies), vol. 2, no. 1 (2010), pp. 64–88.
110 FINANCE FOR CITY LEADERS HANDBOOK
20 J. Loxley, Asking the Right Questions: A Guide for Municipalities Considering P3s (Ottawa, Canadian Union of Public Employees, 2012).
21 European PPP Expertise Centre (EPEC), The Non-Fi-nancial Benefits of PPPs: A Review of Concepts and Meth-odology (Luxembourg, EPCE, 2011).
22 European PPP Expertise Centre (EPEC), The Non-Fi-nancial Benefits of PPPs: A Review of Concepts and Meth-odology (Luxembourg, EPCE, 2011), p. 6.
23 These are explained in more detail in European PPP Expertise Centre (EPEC), The Guide to Guidance: How to Prepare, Procure and Deliver PPP Projects (Luxembourg, EPEC, 2011).
24 European PPP Expertise Centre (EPEC), The Guide to Guidance: How to Prepare, Procure and Deliver PPP Projects (Luxembourg, EPEC, 2011). This list can be extended. For a set of 10 critical questions, see J. Loxley, Asking the Right Questions: A Guide for Municipalities Considering P3s (Ottawa, Canadian Union of Public Employees, 2012).
25 G. M. Winch, M. Onishi, and S. Schmidt, eds., Taking Stock of PPP and PFI Around the World (London, The Asso-ciation of Chartered Certified Accountants, 2012), p. 9.
26 European PPP Expertise Centre (EPEC), The Guide to Guidance: How to Prepare, Procure and Deliver PPP Projects (Luxembourg, EPEC, 2011), p. 48, footnote 12.
27 M. Verougstraete and I. Enders, Efficiency Gains: The Case of Water Services in Manila (Bangkok, UNESCAP, 2014). Available from http://www.unescap.org/sites/default/files/Case%202%20-%20Efficiency%20Gains%20-%20Manila%20Water.pdf.
28 M. Verougstraete and I. Enders, Efficiency Gains: The Case of Water Services in Manila (Bangkok, UNESCAP, 2014). Available from http://www.unescap.org/sites/default/files/Case%202%20-%20Efficiency%20Gains%20-%20Manila%20Water.pdf.
29 The Canadian Council for Public-Private Partnerships, Private-Public Partnerships: A Guide for Municipalities (To-ronto, The Canadian Council for Public-Private Partnerships, 2011). Available from http://www.p3canada.ca/~/media/english/resources-library/files/p3%20guide%20for%20municipalities.pdf.

FINANCE FOR CITY LEADERS HANDBOOK 111
Financing Planned City Extension08Introduction
In the world’s rapidly urbanizing countries, the question is not if cities
will grow, but how. Planned city extension (PCE) is an alternative to
unplanned urban expansion. In many countries, the pace of urban
expansion is surpassing what is planned and served by public infra-
structure. The result is informal, unplanned, segregated, and sprawling
developments on the urban periphery. Wealthier communities create
disconnected private infrastructure surrounded by walls, and poorer
communities form neighborhoods without access to basic services.
Planned extension strategies are explicitly called for in the New Urban
Agenda as a means to improve connectivity, enhance productivity, and
support resource efficiency.
It is critical that cities begin to plan in advance of urban expansion.
Such planning must specify the urban spatial patterns that reinforce
FINANCE FOR CITY LEADERS HANDBOOK 113
economic efficiency, social integration, and environmental
protection. These patterns are compact, connected, and mixed.
They include the provision of a quality and connected street
network, sufficient public space, a mixture of land uses, socially
mixed neighborhoods, and adequate density.
PCE is a methodology to address sustainable urban growth at a
required scale, creating an adequate supply of serviced buildable plots to accommo-
date population growth without the loss of affordability or the creation of informal
settlements. In short, PCE sets the stage for sustainable urban growth.1
Implementation of PCE should follow an integrated “three-pronged approach,”
incorporating urban planning and design, rules and regulations, and public financial
management. If these three elements are not well-integrated, implementation will be
disjointed or piecemeal, and the vision of the PCE will be divorced from reality.
Local governments in particular sometimes struggle to pay for what they plan, and
should integrate a financial strategy into the planning process in order to support
improved prioritization and leveraging of available resources. As such, creating a real-
istic financial implementation strategy for PCE is the subject of this chapter.
The chapter begins by explaining the self-financing PCE approach, wherein PCE pays
for itself. The chapter then discusses how to tailor financial planning to a city’s finan-
cial and economic capacity. Next it explains how to conduct a rapid financial feasibility
assessment to help ensure the plan is realistic. This is followed by a discussion of
various ways to calculate private sector potential, as in many instances the imple-
mentation of a PCE falls to private actors. The chapter concludes with a list of key
considerations for making an initial analysis of financial feasibility.
Linking development with revenues: The self-financing PCE approach
In an ideal situation, planned city extension will pay for itself. As development occurs,
it should generate tax revenues to pay the municipality for services, including suffi-
cient revenue to cover debt service on investments in infrastructure. For this situation
to materialize there are two core requirements:
Financial capacity: There must be a source of sufficient upfront capital funds for
initial investments in public infrastructure and services through borrowing, grants,
a revolving fund, or other sources, as well as a functioning mechanism to generate
revenue from land or activities in the PCE as it develops.
In many countries, the pace of
urban expansion is surpassing
what is planned and served by
public infrastructure.
“
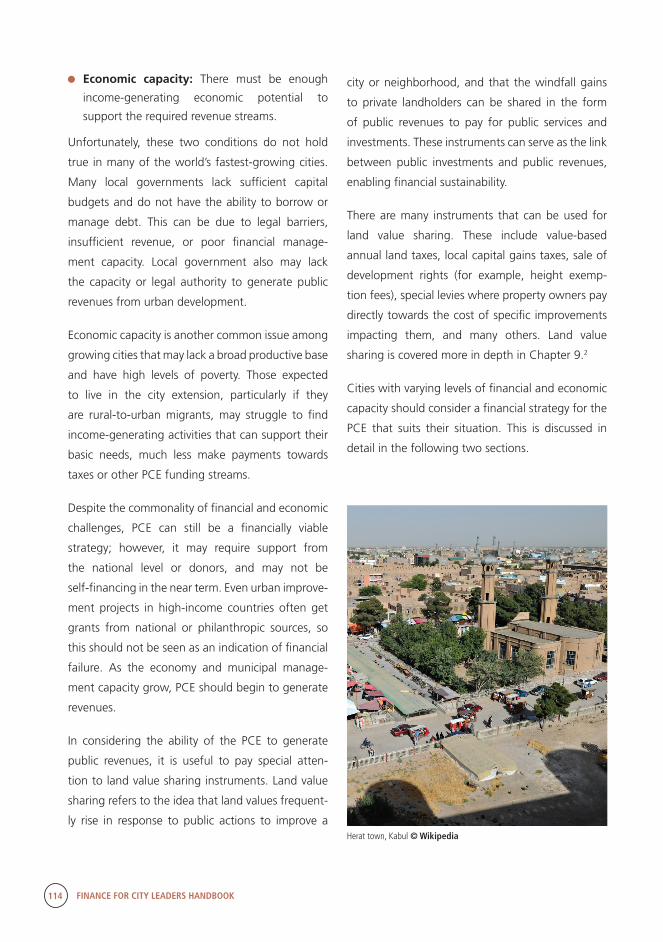
114 FINANCE FOR CITY LEADERS HANDBOOK
Economic capacity: There must be enough
income-generating economic potential to
support the required revenue streams.
Unfortunately, these two conditions do not hold
true in many of the world’s fastest-growing cities.
Many local governments lack sufficient capital
budgets and do not have the ability to borrow or
manage debt. This can be due to legal barriers,
insufficient revenue, or poor financial manage-
ment capacity. Local government also may lack
the capacity or legal authority to generate public
revenues from urban development.
Economic capacity is another common issue among
growing cities that may lack a broad productive base
and have high levels of poverty. Those expected
to live in the city extension, particularly if they
are rural-to-urban migrants, may struggle to find
income-generating activities that can support their
basic needs, much less make payments towards
taxes or other PCE funding streams.
Despite the commonality of financial and economic
challenges, PCE can still be a financially viable
strategy; however, it may require support from
the national level or donors, and may not be
self-financing in the near term. Even urban improve-
ment projects in high-income countries often get
grants from national or philanthropic sources, so
this should not be seen as an indication of financial
failure. As the economy and municipal manage-
ment capacity grow, PCE should begin to generate
revenues.
In considering the ability of the PCE to generate
public revenues, it is useful to pay special atten-
tion to land value sharing instruments. Land value
sharing refers to the idea that land values frequent-
ly rise in response to public actions to improve a
city or neighborhood, and that the windfall gains
to private landholders can be shared in the form
of public revenues to pay for public services and
investments. These instruments can serve as the link
between public investments and public revenues,
enabling financial sustainability.
There are many instruments that can be used for
land value sharing. These include value-based
annual land taxes, local capital gains taxes, sale of
development rights (for example, height exemp-
tion fees), special levies where property owners pay
directly towards the cost of specific improvements
impacting them, and many others. Land value
sharing is covered more in depth in Chapter 9.2
Cities with varying levels of financial and economic
capacity should consider a financial strategy for the
PCE that suits their situation. This is discussed in
detail in the following two sections.
Herat town, Kabul © Wikipedia
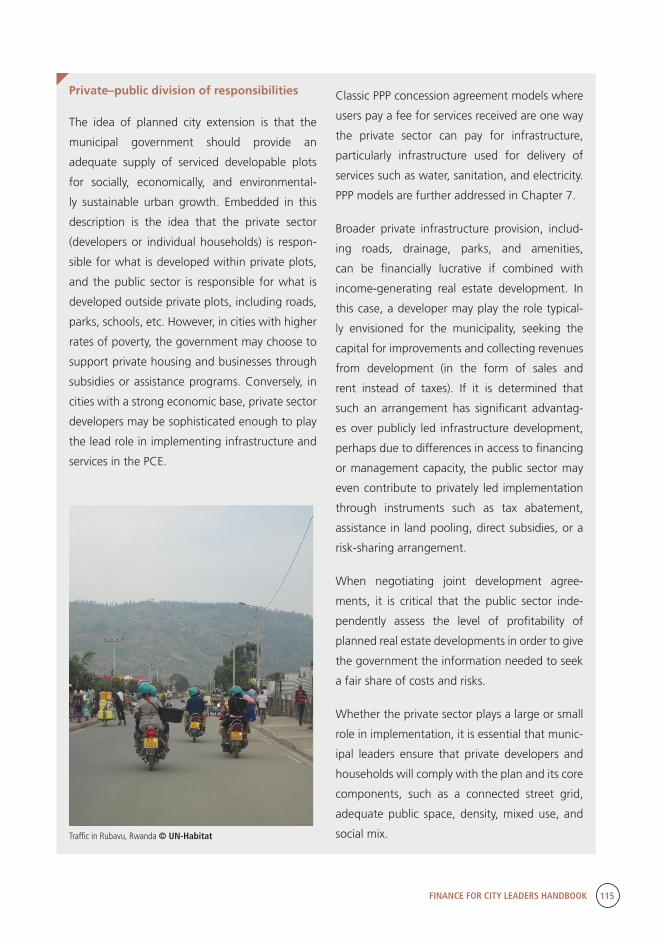
FINANCE FOR CITY LEADERS HANDBOOK 115
Private–public division of responsibilities
The idea of planned city extension is that the
municipal government should provide an
adequate supply of serviced developable plots
for socially, economically, and environmental-
ly sustainable urban growth. Embedded in this
description is the idea that the private sector
(developers or individual households) is respon-
sible for what is developed within private plots,
and the public sector is responsible for what is
developed outside private plots, including roads,
parks, schools, etc. However, in cities with higher
rates of poverty, the government may choose to
support private housing and businesses through
subsidies or assistance programs. Conversely, in
cities with a strong economic base, private sector
developers may be sophisticated enough to play
the lead role in implementing infrastructure and
services in the PCE.
Classic PPP concession agreement models where
users pay a fee for services received are one way
the private sector can pay for infrastructure,
particularly infrastructure used for delivery of
services such as water, sanitation, and electricity.
PPP models are further addressed in Chapter 7.
Broader private infrastructure provision, includ-
ing roads, drainage, parks, and amenities,
can be financially lucrative if combined with
income-generating real estate development. In
this case, a developer may play the role typical-
ly envisioned for the municipality, seeking the
capital for improvements and collecting revenues
from development (in the form of sales and
rent instead of taxes). If it is determined that
such an arrangement has significant advantag-
es over publicly led infrastructure development,
perhaps due to differences in access to financing
or management capacity, the public sector may
even contribute to privately led implementation
through instruments such as tax abatement,
assistance in land pooling, direct subsidies, or a
risk-sharing arrangement.
When negotiating joint development agree-
ments, it is critical that the public sector inde-
pendently assess the level of profitability of
planned real estate developments in order to give
the government the information needed to seek
a fair share of costs and risks.
Whether the private sector plays a large or small
role in implementation, it is essential that munic-
ipal leaders ensure that private developers and
households will comply with the plan and its core
components, such as a connected street grid,
adequate public space, density, mixed use, and
social mix.Traffic in Rubavu, Rwanda © UN-HabitatHerat town, Kabul © Wikipedia
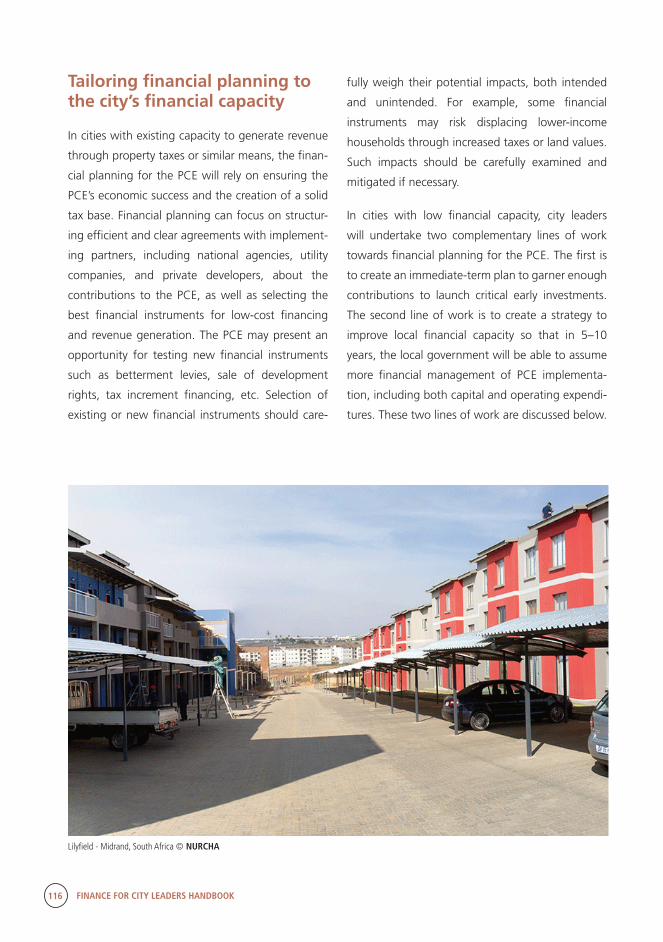
116 FINANCE FOR CITY LEADERS HANDBOOK
Tailoring financial planning to the city’s financial capacity
In cities with existing capacity to generate revenue
through property taxes or similar means, the finan-
cial planning for the PCE will rely on ensuring the
PCE’s economic success and the creation of a solid
tax base. Financial planning can focus on structur-
ing efficient and clear agreements with implement-
ing partners, including national agencies, utility
companies, and private developers, about the
contributions to the PCE, as well as selecting the
best financial instruments for low-cost financing
and revenue generation. The PCE may present an
opportunity for testing new financial instruments
such as betterment levies, sale of development
rights, tax increment financing, etc. Selection of
existing or new financial instruments should care-
fully weigh their potential impacts, both intended
and unintended. For example, some financial
instruments may risk displacing lower-income
households through increased taxes or land values.
Such impacts should be carefully examined and
mitigated if necessary.
In cities with low financial capacity, city leaders
will undertake two complementary lines of work
towards financial planning for the PCE. The first is
to create an immediate-term plan to garner enough
contributions to launch critical early investments.
The second line of work is to create a strategy to
improve local financial capacity so that in 5–10
years, the local government will be able to assume
more financial management of PCE implementa-
tion, including both capital and operating expendi-
tures. These two lines of work are discussed below.
Lilyfield - Midrand, South Africa © NURCHA
FINANCE FOR CITY LEADERS HANDBOOK 117
Immediate-term financial coordination plan
The major hurdle in the minds of many local leaders
is the first task, involving financial planning for PCE
investments in the immediate term. These contribu-
tions must be secured without any promise that they
will be repaid through PCE-generated revenues. This
may sound like an impossible undertaking, but can
often be seen as a matter of coordination of existing
grants from donors and national agencies.
One example of such a situation is a planned city
extension in Rubavu, Rwanda, where the district
government is only generating 17 per cent of
the local budget through own-source revenues,
amounting to less than US$7 per district resident.
The district’s capital budget, the main source of
funds available for the PCE, is 100 per cent funded
through national transfers. In order to create a
feasible PCE financial strategy, the PCE plan was
adjusted to reduce costs by making changes to the
highest-cost planned investments (for example, one
change was the recommendation to pave only some
roads). Contributions from private developers and
potential for a water concession agreement were
explored. Under the proposed scenario, the bulk
of initial investments in the PCE will be paid for by
central transfers to the district’s capital budget, in
coordination with some developer contributions to
infrastructure, and a pilot water concession agree-
ment. Water tariff levels were determined by a prior
UN-Habitat study at levels that could both cover
costs (including investments costs) and be afford-
able for lower-income households. Simultaneously,
the national government is pursuing major reforms
to tax administration to make decentralized revenue
generation more effective.3
A PCE with even fewer resources is that in Naca-
la-al-Velha District, in northern Mozambique, where
the district has a capital budget that is only able to
cover 4 per cent of the Phase 1 cost and has no
authority to collect taxes due to its administrative
classification. Key stakeholders met to discuss PCE
implementation, and the district was able to identify
funding to pay for an additional 29 per cent of the
investment costs for Phase I from national agencies
working in the area. Even these funds will rely on the
ability of stakeholders to agree to direct their invest-
ments in ways that comply with the PCE rather than
previously planned uncoordinated investments. The
remaining funding gap (67 per cent) can potentially
be met by two large private-sector funding sources.
One is the Nacala Logistics Corridor Consortium
led by Vale, which has expressed interest in the
PCE and willingness to fund investments that will
contribute to the sustainable development of the
area through their Social Investment Plan. Another
is infrastructure planned and implemented through
GAZEDA, Mozambique’s agency in charge of indus-
trial development, which has significant activities in
the region and has not yet coordinated funding or
planned investments with the District’s PCE. After
a recent stakeholders meeting, an action plan was
agreed upon that includes formation of an Imple-
mentation Working Group composed of key stake-
holder agencies, a fundraising conference, and a
legal examination of the district’s possibilities for
own-source revenue generation.4
Takeaways from the experiences of Rubavu and
Nacala-al-Velha are that the most critical capital
investments for success of the PCE can be funded
through coordination of existing funding streams
from (a) local capital budgets, (b) national funding
agencies and infrastructure funds, and (c) the private
sector, which has an economic interest in the orderly
development of the city. However, coordination of
these funding sources is critical, and the capacity of
the lead coordinating agency must therefore be an
immediate focus of financial planning actions.
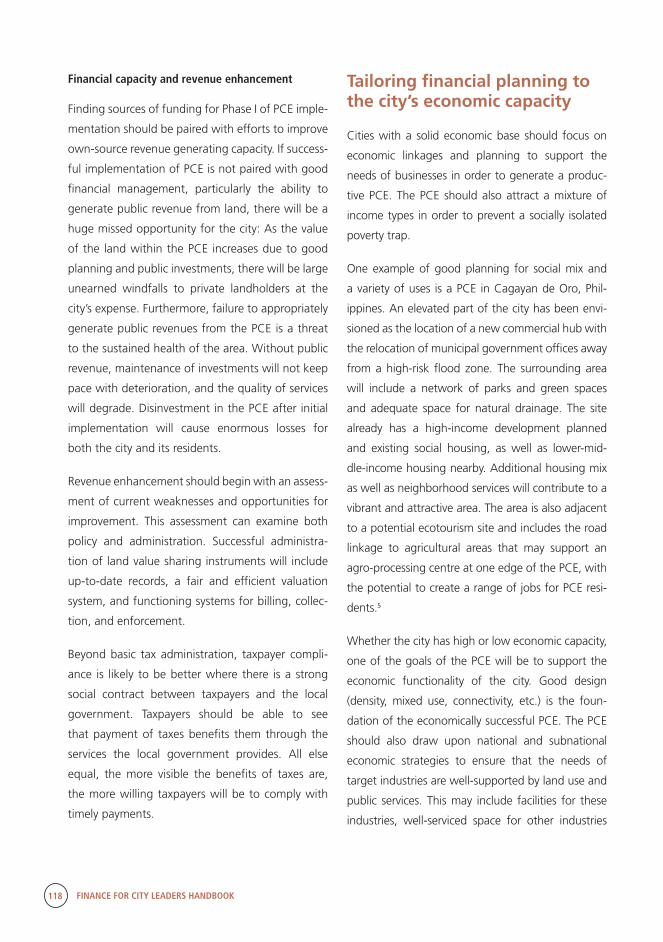
118 FINANCE FOR CITY LEADERS HANDBOOK
Financial capacity and revenue enhancement
Finding sources of funding for Phase I of PCE imple-
mentation should be paired with efforts to improve
own-source revenue generating capacity. If success-
ful implementation of PCE is not paired with good
financial management, particularly the ability to
generate public revenue from land, there will be a
huge missed opportunity for the city: As the value
of the land within the PCE increases due to good
planning and public investments, there will be large
unearned windfalls to private landholders at the
city’s expense. Furthermore, failure to appropriately
generate public revenues from the PCE is a threat
to the sustained health of the area. Without public
revenue, maintenance of investments will not keep
pace with deterioration, and the quality of services
will degrade. Disinvestment in the PCE after initial
implementation will cause enormous losses for
both the city and its residents.
Revenue enhancement should begin with an assess-
ment of current weaknesses and opportunities for
improvement. This assessment can examine both
policy and administration. Successful administra-
tion of land value sharing instruments will include
up-to-date records, a fair and efficient valuation
system, and functioning systems for billing, collec-
tion, and enforcement.
Beyond basic tax administration, taxpayer compli-
ance is likely to be better where there is a strong
social contract between taxpayers and the local
government. Taxpayers should be able to see
that payment of taxes benefits them through the
services the local government provides. All else
equal, the more visible the benefits of taxes are,
the more willing taxpayers will be to comply with
timely payments.
Tailoring financial planning to the city’s economic capacity
Cities with a solid economic base should focus on
economic linkages and planning to support the
needs of businesses in order to generate a produc-
tive PCE. The PCE should also attract a mixture of
income types in order to prevent a socially isolated
poverty trap.
One example of good planning for social mix and
a variety of uses is a PCE in Cagayan de Oro, Phil-
ippines. An elevated part of the city has been envi-
sioned as the location of a new commercial hub with
the relocation of municipal government offices away
from a high-risk flood zone. The surrounding area
will include a network of parks and green spaces
and adequate space for natural drainage. The site
already has a high-income development planned
and existing social housing, as well as lower-mid-
dle-income housing nearby. Additional housing mix
as well as neighborhood services will contribute to a
vibrant and attractive area. The area is also adjacent
to a potential ecotourism site and includes the road
linkage to agricultural areas that may support an
agro-processing centre at one edge of the PCE, with
the potential to create a range of jobs for PCE resi-
dents.5
Whether the city has high or low economic capacity,
one of the goals of the PCE will be to support the
economic functionality of the city. Good design
(density, mixed use, connectivity, etc.) is the foun-
dation of the economically successful PCE. The PCE
should also draw upon national and subnational
economic strategies to ensure that the needs of
target industries are well-supported by land use and
public services. This may include facilities for these
industries, well-serviced space for other industries
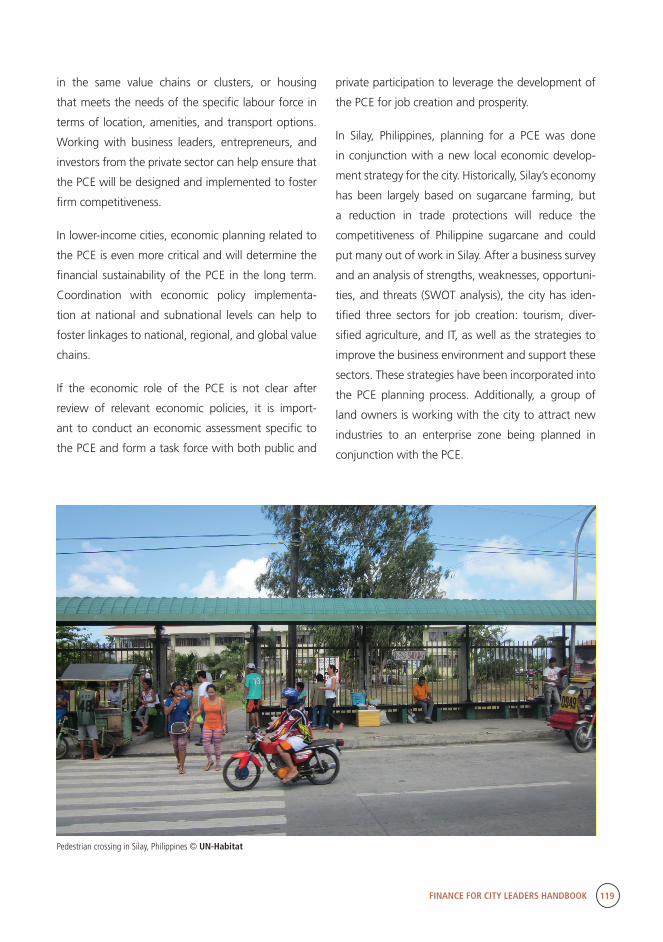
FINANCE FOR CITY LEADERS HANDBOOK 119
in the same value chains or clusters, or housing
that meets the needs of the specific labour force in
terms of location, amenities, and transport options.
Working with business leaders, entrepreneurs, and
investors from the private sector can help ensure that
the PCE will be designed and implemented to foster
firm competitiveness.
In lower-income cities, economic planning related to
the PCE is even more critical and will determine the
financial sustainability of the PCE in the long term.
Coordination with economic policy implementa-
tion at national and subnational levels can help to
foster linkages to national, regional, and global value
chains.
If the economic role of the PCE is not clear after
review of relevant economic policies, it is import-
ant to conduct an economic assessment specific to
the PCE and form a task force with both public and
private participation to leverage the development of
the PCE for job creation and prosperity.
In Silay, Philippines, planning for a PCE was done
in conjunction with a new local economic develop-
ment strategy for the city. Historically, Silay’s economy
has been largely based on sugarcane farming, but
a reduction in trade protections will reduce the
competitiveness of Philippine sugarcane and could
put many out of work in Silay. After a business survey
and an analysis of strengths, weaknesses, opportuni-
ties, and threats (SWOT analysis), the city has iden-
tified three sectors for job creation: tourism, diver-
sified agriculture, and IT, as well as the strategies to
improve the business environment and support these
sectors. These strategies have been incorporated into
the PCE planning process. Additionally, a group of
land owners is working with the city to attract new
industries to an enterprise zone being planned in
conjunction with the PCE.
Pedestrian crossing in Silay, Philippines © UN-Habitat
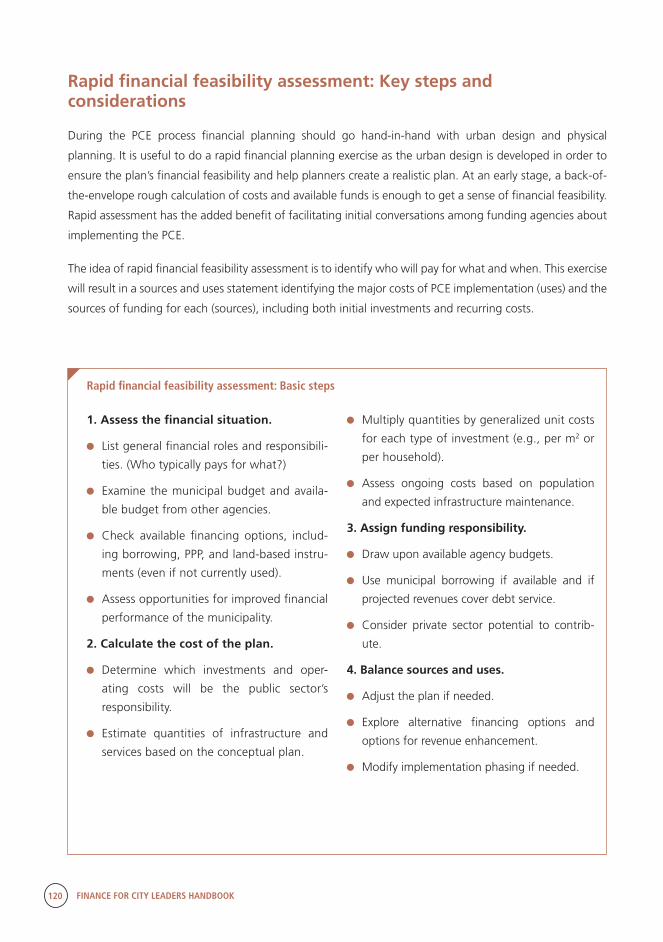
120 FINANCE FOR CITY LEADERS HANDBOOK
Rapid financial feasibility assessment: Key steps and considerations
During the PCE process financial planning should go hand-in-hand with urban design and physical
planning. It is useful to do a rapid financial planning exercise as the urban design is developed in order to
ensure the plan’s financial feasibility and help planners create a realistic plan. At an early stage, a back-of-
the-envelope rough calculation of costs and available funds is enough to get a sense of financial feasibility.
Rapid assessment has the added benefit of facilitating initial conversations among funding agencies about
implementing the PCE.
The idea of rapid financial feasibility assessment is to identify who will pay for what and when. This exercise
will result in a sources and uses statement identifying the major costs of PCE implementation (uses) and the
sources of funding for each (sources), including both initial investments and recurring costs.
Rapid financial feasibility assessment: Basic steps
1. Assess the financial situation.
List general financial roles and responsibili-
ties. (Who typically pays for what?)
Examine the municipal budget and availa-
ble budget from other agencies.
Check available financing options, includ-
ing borrowing, PPP, and land-based instru-
ments (even if not currently used).
Assess opportunities for improved financial
performance of the municipality.
2. Calculate the cost of the plan.
Determine which investments and oper-
ating costs will be the public sector’s
responsibility.
Estimate quantities of infrastructure and
services based on the conceptual plan.
Multiply quantities by generalized unit costs
for each type of investment (e.g., per m2 or
per household).
Assess ongoing costs based on population
and expected infrastructure maintenance.
3. Assign funding responsibility.
Draw upon available agency budgets.
Use municipal borrowing if available and if
projected revenues cover debt service.
Consider private sector potential to contrib-
ute.
4. Balance sources and uses.
Adjust the plan if needed.
Explore alternative financing options and
options for revenue enhancement.
Modify implementation phasing if needed.
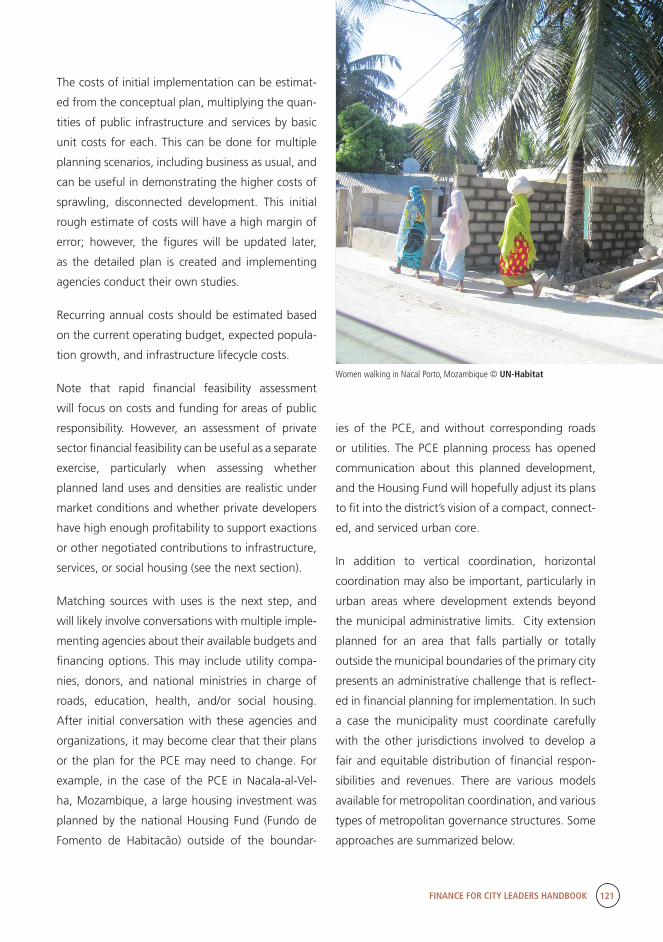
FINANCE FOR CITY LEADERS HANDBOOK 121
The costs of initial implementation can be estimat-
ed from the conceptual plan, multiplying the quan-
tities of public infrastructure and services by basic
unit costs for each. This can be done for multiple
planning scenarios, including business as usual, and
can be useful in demonstrating the higher costs of
sprawling, disconnected development. This initial
rough estimate of costs will have a high margin of
error; however, the figures will be updated later,
as the detailed plan is created and implementing
agencies conduct their own studies.
Recurring annual costs should be estimated based
on the current operating budget, expected popula-
tion growth, and infrastructure lifecycle costs.
Note that rapid financial feasibility assessment
will focus on costs and funding for areas of public
responsibility. However, an assessment of private
sector financial feasibility can be useful as a separate
exercise, particularly when assessing whether
planned land uses and densities are realistic under
market conditions and whether private developers
have high enough profitability to support exactions
or other negotiated contributions to infrastructure,
services, or social housing (see the next section).
Matching sources with uses is the next step, and
will likely involve conversations with multiple imple-
menting agencies about their available budgets and
financing options. This may include utility compa-
nies, donors, and national ministries in charge of
roads, education, health, and/or social housing.
After initial conversation with these agencies and
organizations, it may become clear that their plans
or the plan for the PCE may need to change. For
example, in the case of the PCE in Nacala-al-Vel-
ha, Mozambique, a large housing investment was
planned by the national Housing Fund (Fundo de
Fomento de Habitacão) outside of the boundar-
ies of the PCE, and without corresponding roads
or utilities. The PCE planning process has opened
communication about this planned development,
and the Housing Fund will hopefully adjust its plans
to fit into the district’s vision of a compact, connect-
ed, and serviced urban core.
In addition to vertical coordination, horizontal
coordination may also be important, particularly in
urban areas where development extends beyond
the municipal administrative limits. City extension
planned for an area that falls partially or totally
outside the municipal boundaries of the primary city
presents an administrative challenge that is reflect-
ed in financial planning for implementation. In such
a case the municipality must coordinate carefully
with the other jurisdictions involved to develop a
fair and equitable distribution of financial respon-
sibilities and revenues. There are various models
available for metropolitan coordination, and various
types of metropolitan governance structures. Some
approaches are summarized below.
Women walking in Nacal Porto, Mozambique © UN-Habitat
122 FINANCE FOR CITY LEADERS HANDBOOK
The main models and approaches to metropoli-
tan governance are the following:
Cooperation among local governments
• Case-by-case joint initiatives
• Contracting among local governments
• Committees, commissions, working groups,
partnerships, consultative platforms, etc.
Regional authorities (sometimes called
“special purpose districts”)
• A metropolitan council of governments
(COG)
Approaches to metropolitan governance
Excerpt from M. Andersson, “Metropolitan Governance and Finance,” in C. Farvacque-Vitkovic and M. Kopanyi, eds., Municipal Finances: A Handbook for Local Governments (Washington, World Bank, 2014), p. 51.6
• A regional planning authority
• A regional service delivery authority
• A regional planning and service delivery
authority
Metropolitan-level government
• Metropolitan-level local government
• A regional government established by a
higher tier of government (federal, state,
or provincial)
Annexation of territory or amalgamation of
local governments.
If debt financing is an option, the municipality will need to assess whether the
PCE will generate sufficient revenues to cover debt service. Risk assessment, as
well as sensitivity testing under scenarios where revenue projections fail to mate-
rialize, is prudent to ensure that the municipality will be able to meet its financial
obligations. In cities where debt financing is an option, legal regulations and
internal procedures governing borrowing will play a role in assessing whether
debt financing is a viable alternative for the PCE. For example, planners who
designed a city extension in Iloilo, Philippines, could count on good compliance
with property taxes from residential and commercial developments in the PCE.
This opened the option of borrowing to finance a portion of public investments
with plans to pay debt service through property tax revenues. This borrowing
will comply with debt service limits established by the legal code.
After an initial attempt to match costs and funding, adjustments may need to be
made to achieve financial feasibility. These adjustments can fall into three cate-
gories: changes to planned expenditures, development of alternative financing
strategies, or changes to implementation phasing.
“After an initial attempt to match costs and funding, adjustments may need to be made to achieve financial feasibility.
FINANCE FOR CITY LEADERS HANDBOOK 123
Changes to planned expenditures
It may be necessary to alter the plan or forgo some
planned improvements due to their cost. This prior-
itization process must consider economic, social,
and environmental goals. The views and priorities
of key stakeholder groups, including vulnerable
populations such as women, youth, and low-in-
come households, should be considered.
One example of adjusting planned expenditures
is the PCE in Rubavu District, Rwanda. The initial
plan far exceeded the district’s capital budget.
To improve feasibility, UN-Habitat recommended
that the three largest capital costs be reduced.
The first was the piped sewerage system origi-
nally planned, which would require huge invest-
ments, including a costly wastewater treatment
facility. Instead, subsidies for high-quality on-site
sanitation would reduce capital costs while still
providing adequate sanitation for the city. As the
city grows economically and in population, both
the need and the revenue for a piped sanitation
system will increase.
The second major planned expense was for social
housing. UN-Habitat recommended that instead of
providing fully built houses for low-income house-
holds, the district could instead facilitate access
to low-cost serviced land, allowing households to
build incrementally on well-planned plots that will
transform over time. Under such an arrangement,
the dramatic reduction of costs would allow the
district to reach more households while ensuring
that funding for basic infrastructure and services
remains. While housing quality will likely be low
at first, access to services and security of tenure
provide stability for gradual self-upgrading. At the
same time, the lowest-income families may still
need support to obtain a basic dwelling.
The third major cost reduction was based on the
idea that the district doesn’t need to pave all Phase
I roads immediately, but can leave local connections
unpaved as well as some of the width of major
roads. Importantly, adequate space for street paving
and widening for the long-term transformation of
the district will still be reserved and protected from
private development. In cases like Rubavu, less-than-
ideal services should be planned in a way to allow for
upgrading at a later stage of development.
Another example of alterations to an extension
plan based on financial analysis is the City of Galt,
California, U.S.A. Galt is a small agricultural town,
but in 2011 decided to update its land use plan due
to projected population growth that will likely more
than double the city’s size by 2030. The city analyzed
the public expenditures and revenues associated
with a residential expansion plan and found that its
initial plan was not financially feasible. From there,
the City considered alternative scenarios involving
higher densities and a mixture of uses, and deter-
mined that mixed-use development was the best
option from the standpoint of public finances,
providing enough revenues to complete payback
of public loans within the required 30-year time
limit. The financial model showed a fiscal gap of
approximately US$600 per unit for the original fully
residential plan, showing that the city could imple-
ment it only with additional fees totaling $600 per
new unit.7
Development of alternative financing strategies
A planned city extension provides an opportunity to
pilot new financing strategies. Because the govern-
ment will be creating value through good planning
and public services, this value can be leveraged to
generate public revenues or in-kind private sector
124 FINANCE FOR CITY LEADERS HANDBOOK
contributions. The municipality should consider the
possibility of developer exactions and public–private
partnerships, in addition to land-based financing
instruments such as betterment levies and sale of
development rights. In most cases, some of the
PCE’s residents will be less able to bear the burden
of taxes and fees than others. This should be incor-
porated into financial planning for the sake of both
financial feasibility and social equity. A community
serving only middle- to high-income households
does not serve the core purpose of a PCE, which is
to serve as an alternative to informal, unplanned,
and unserviced development. If the PCE excludes
poor households, they will settle elsewhere.
Piloting of new financial instruments may require
creation of a new agency or coalition with capacity
to manage implementation, such as a municipal
development corporation or a special purpose
vehicle. If the municipality lacks authority or capacity
to use new financial instruments, the new agency
may need to exist at a higher level of government,
with municipal representation.
Changes to implementation phasing
The buildout of infrastructure and services can be
spread over time to reduce the financial burden
and make revenues from the initial phases avail-
able for reinvestment in later phases. This can be
particularly useful where investments in Phase I
will provide a substantial increase in local revenue.
Some PCE-wide investments will be necessary early
on (for example, connector roads or a solid waste
facility), while others may be built out at a pace to
match population growth and avoid unplanned
development spillover.
Typically, delineating road and public space reserves
for the entire extension during the first phase of
implementation is a shrewd tactic to ensure that if
unplanned development does occur, public spaces
will be protected. It can be legally, financially, and
socially difficult to reclaim this space later if it
becomes occupied.
Calculating private sector potential
As previously noted, the implementation of the
PCE may fall to either public or private actors, or
some combination of the two. Many times, the
private sector focuses on the development of built
real estate products within publicly serviced plots.
Government leaders may still wish to conduct a
financial assessment of planned private devel-
opment in order to (a) ensure that planned land
uses can be supported by the private real estate
market and (b) check the level of profitability for
the sake of negotiating developer exactions. This
type of private sector feasibility assessment should
be based on traditional methods of analysing real
estate investment. These will be influenced by the
basic concepts examined briefly below.
Risk and time as the basic financial principles
Every planned city extension project is implemented
over a period of time that, in many cases, spans
several decades.
Bearing this in mind, the time factor takes on crucial
importance in these kinds of projects, and must be
taken into account and incorporated as another
cost to be considered in the feasibility of the PCE.
There are two fundamental financial principles
that illustrate the importance of time and risk as
indispensable variables to be taken into consider-
ation: 1) A dollar today is worth more than a dollar
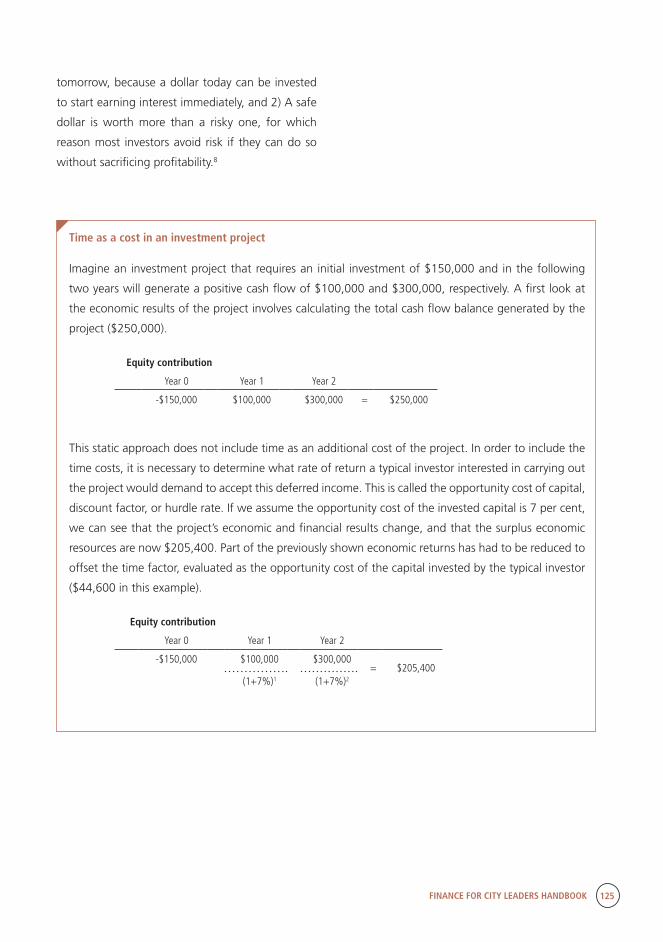
FINANCE FOR CITY LEADERS HANDBOOK 125
tomorrow, because a dollar today can be invested
to start earning interest immediately, and 2) A safe
dollar is worth more than a risky one, for which
reason most investors avoid risk if they can do so
without sacrificing profitability.8
Time as a cost in an investment project
Imagine an investment project that requires an initial investment of $150,000 and in the following
two years will generate a positive cash flow of $100,000 and $300,000, respectively. A first look at
the economic results of the project involves calculating the total cash flow balance generated by the
project ($250,000).
Equity contribution
Year 0 Year 1 Year 2
-$150,000 $100,000 $300,000 = $250,000
This static approach does not include time as an additional cost of the project. In order to include the
time costs, it is necessary to determine what rate of return a typical investor interested in carrying out
the project would demand to accept this deferred income. This is called the opportunity cost of capital,
discount factor, or hurdle rate. If we assume the opportunity cost of the invested capital is 7 per cent,
we can see that the project’s economic and financial results change, and that the surplus economic
resources are now $205,400. Part of the previously shown economic returns has had to be reduced to
offset the time factor, evaluated as the opportunity cost of the capital invested by the typical investor
($44,600 in this example).
Equity contribution
Year 0 Year 1 Year 2
-$150,000 $100,000 $300,000= $205,400
(1+7%)1 (1+7%)2

126 FINANCE FOR CITY LEADERS HANDBOOK
Risk as a cost in an investment project
There are a number of risk factors involved in investments related to the development of a particular
area (e.g., management risk, liquidity risk, legislative risk, inflation risk, interest rate risk, environmental
risk, archaeological risk, etc.), and not all investments entail the same level and type of risk. Real estate
development is, generally speaking, more risky than government bonds (i.e., gilt-edged securities), and
the development of rural land into serviced urban parcels is likely even more risky than the construction
of the final real estate product.
Therefore, depending on the risk inherent in each investment project, we need to add a risk premium
to the opportunity cost of the capital, as appropriate for that particular project.
r = RFR [Risk Free Rate] + RP [Risk Premium]
Net present value and internal rate of return as metrics of financial feasibility
Net present value (NPV) is the indicator par excellence, and its purpose is to update, at any given moment,
all cash flows generated by the investment project under analysis:
CF = Estimated cash flow for each time unit (year, six-month period, etc.)
i = Discount factor applied to each time unit
n = Number of time units estimated for the investment project (years, six-month periods, etc.)
A project with a positive NPV means that:
1. It has returned all capital invested.
2. It has paid back the cost of all resources used to fund it.
3. It has generated an additional surplus equivalent to the volume indicated by the NPV in question.
NPV is the best indicator for the economic and financial assessment of any urban transformation project
since it is the indicator, along with the internal rate of return (discussed below), that takes into account the
time value of money and that is based solely on the inflow and outflow of economic resources provided for
in the project and on their opportunity cost.
( ) ( ) ( )nn
iCF
iCF
iCFCFNVA
+++
++
++=
1.........
11. 2
21
10
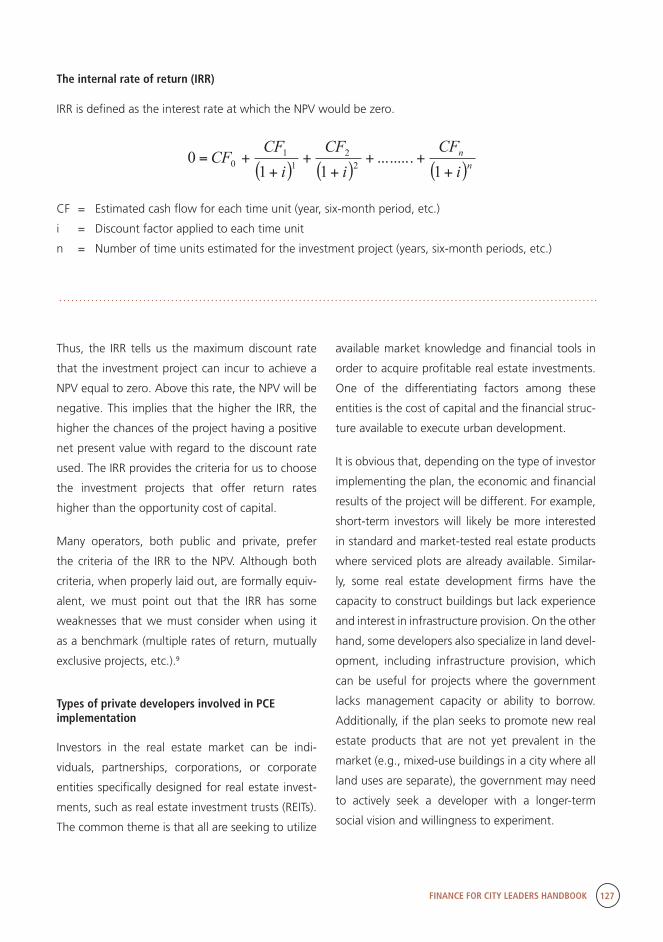
FINANCE FOR CITY LEADERS HANDBOOK 127
The internal rate of return (IRR)
IRR is defined as the interest rate at which the NPV would be zero.
CF = Estimated cash flow for each time unit (year, six-month period, etc.)
i = Discount factor applied to each time unit
n = Number of time units estimated for the investment project (years, six-month periods, etc.)
( ) ( ) ( )nn
iCF
iCF
iCF
CF+
+++
++
+=1
.........11
0 22
11
0
Thus, the IRR tells us the maximum discount rate
that the investment project can incur to achieve a
NPV equal to zero. Above this rate, the NPV will be
negative. This implies that the higher the IRR, the
higher the chances of the project having a positive
net present value with regard to the discount rate
used. The IRR provides the criteria for us to choose
the investment projects that offer return rates
higher than the opportunity cost of capital.
Many operators, both public and private, prefer
the criteria of the IRR to the NPV. Although both
criteria, when properly laid out, are formally equiv-
alent, we must point out that the IRR has some
weaknesses that we must consider when using it
as a benchmark (multiple rates of return, mutually
exclusive projects, etc.).9
Types of private developers involved in PCE implementation
Investors in the real estate market can be indi-
viduals, partnerships, corporations, or corporate
entities specifically designed for real estate invest-
ments, such as real estate investment trusts (REITs).
The common theme is that all are seeking to utilize
available market knowledge and financial tools in
order to acquire profitable real estate investments.
One of the differentiating factors among these
entities is the cost of capital and the financial struc-
ture available to execute urban development.
It is obvious that, depending on the type of investor
implementing the plan, the economic and financial
results of the project will be different. For example,
short-term investors will likely be more interested
in standard and market-tested real estate products
where serviced plots are already available. Similar-
ly, some real estate development firms have the
capacity to construct buildings but lack experience
and interest in infrastructure provision. On the other
hand, some developers also specialize in land devel-
opment, including infrastructure provision, which
can be useful for projects where the government
lacks management capacity or ability to borrow.
Additionally, if the plan seeks to promote new real
estate products that are not yet prevalent in the
market (e.g., mixed-use buildings in a city where all
land uses are separate), the government may need
to actively seek a developer with a longer-term
social vision and willingness to experiment.
128 FINANCE FOR CITY LEADERS HANDBOOK
The sources of real estate capital are diverse,
ranging from individuals to large organizations and
institutions and, depending on the financial cost of
these sources of capital, the economic and financial
results of the transformation project may be larger
or smaller. For example, a real estate project that is
executed by an asset-based operator that makes its
profit in the long term by renting its assets along
with equity-based financing will not produce the
same result if it is implemented by a real estate
operator whose profits are based on the sale of
housing off-plan and a liability structure based on
bank debt.
The financing structure of an urban transformation
project is usually based on one of the two main
sources of finance, debt and equity, and there
are numerous financial actors involved in each of
these two sources. In the case of debt financing,
for example, the actors include banks, commercial
mortgage-backed securities, insurance compa-
nies, mortgage REITs, government credit agencies,
pension funds, and private, nonbank, untraded
funds. In the case of equity financing, there are
other actors, such as private investors (develop-
er assets and equity, local investors, landowners,
opportunity funds, hedge funds, sovereign funds,
private financial institutions, family offices, etc.),
equity REITs, and pension funds. To ensure the
success of a project, it would be advisable for it to
be undertaken by a specific operator that can guar-
antee the capital cost of the operation.
The financing structure of an urban transformation project is usually based on one of the two main sources of finance, debt and equity, and there are numerous financial actors involved in each of these two sources.
“The ability to forecast future market behaviour
When assessing the financial feasibility of real
estate projects, it is important to forecast the sales
price of the final constructed units. To do this
requires forecasting future supply and demand
scenarios of real estate products; however, even a
meticulous analysis will never be able to reduce the
risk of future uncertainty to zero. This component
of uncertainty is an integral part of an investment
project, equivalent to risk—a cost that, as explained
earlier, must be included if the intention is to attract
private resources to execute the urban planning
project.
Forecasting future real estate prices can begin by
examining market trends, population growth,
and whether the supply of real estate has gener-
ally kept up with housing demand. Population
projections paired with economic projections can
help determine the demand forecast, and previous
supply-side behaviour can be projected forward.
Information about other real estate units entering
the market, the land management and planning
regulations in force, future planning strategies,
the market absorption rate for current real estate
products, the phase of the real estate cycle, the
ability of households to purchase a property or to
acquire one by alternative means such as renting,
etc., can also influence projections.
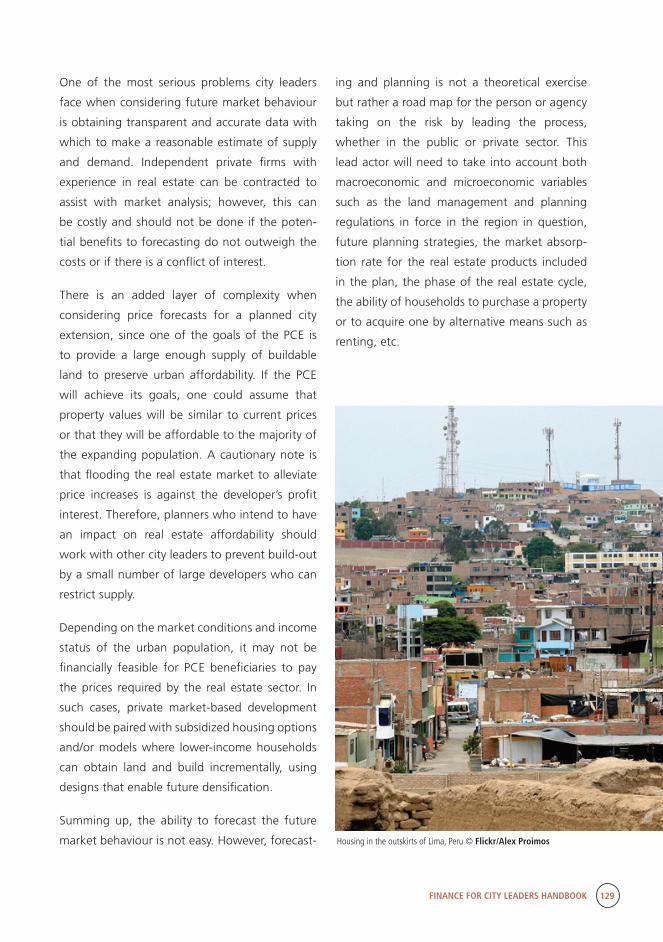
FINANCE FOR CITY LEADERS HANDBOOK 129
One of the most serious problems city leaders
face when considering future market behaviour
is obtaining transparent and accurate data with
which to make a reasonable estimate of supply
and demand. Independent private firms with
experience in real estate can be contracted to
assist with market analysis; however, this can
be costly and should not be done if the poten-
tial benefits to forecasting do not outweigh the
costs or if there is a conflict of interest.
There is an added layer of complexity when
considering price forecasts for a planned city
extension, since one of the goals of the PCE is
to provide a large enough supply of buildable
land to preserve urban affordability. If the PCE
will achieve its goals, one could assume that
property values will be similar to current prices
or that they will be affordable to the majority of
the expanding population. A cautionary note is
that flooding the real estate market to alleviate
price increases is against the developer’s profit
interest. Therefore, planners who intend to have
an impact on real estate affordability should
work with other city leaders to prevent build-out
by a small number of large developers who can
restrict supply.
Depending on the market conditions and income
status of the urban population, it may not be
financially feasible for PCE beneficiaries to pay
the prices required by the real estate sector. In
such cases, private market-based development
should be paired with subsidized housing options
and/or models where lower-income households
can obtain land and build incrementally, using
designs that enable future densification.
Summing up, the ability to forecast the future
market behaviour is not easy. However, forecast-
ing and planning is not a theoretical exercise
but rather a road map for the person or agency
taking on the risk by leading the process,
whether in the public or private sector. This
lead actor will need to take into account both
macroeconomic and microeconomic variables
such as the land management and planning
regulations in force in the region in question,
future planning strategies, the market absorp-
tion rate for the real estate products included
in the plan, the phase of the real estate cycle,
the ability of households to purchase a property
or to acquire one by alternative means such as
renting, etc.
Housing in the outskirts of Lima, Peru © Flickr/Alex Proimos
130 FINANCE FOR CITY LEADERS HANDBOOK
Concluding recommendations
PCE implementation can be expressed as a succes-
sion of expenditure flows corresponding to the cost
of land development and subsequent real estate
development, in addition to the revenue flows
corresponding to the income obtained from the
real estate products once placed on the market. The
temporary balances between negative and positive
flows demand a financing proposal that determines
the profitability of the urban development.
There are a variety of methodologies available,
some more complex than others, for evaluating the
financial feasibility of implementation, but which-
ever is used must be adapted to the specific circum-
stances of the particular plan. If common sense is
not used, a rigid analysis could lead to a misleading
or even nonsensical outcome.
The following is a list of key considerations for
making an initial analysis of financial feasibility:
1. The public and private sector actors responsi-
ble for each planned element
2. Phasing of implementation allocating the
investments in each phase
3. The total costs attributable to each element of
plan implementation
4. The potential revenue to both the public sector
(taxes and fees) and private sector (rents and
sales)
5. The options available for financing invest-
ments, and the financial cost/cost of capital
6. Metrics of financial feasibility, such as NPV, IRR,
or other metrics of private developer profitabil-
ity
7. The ability of implementing actors to finance
and manage planned implementation
8. The ability of intended beneficiaries to utilize
the PCE based on their needs and income
status
9. The tax balance sheet for the plan measured
in terms that guarantee future sustainable
economic management
10. The balance between the investments assigned
by the proposal to the different public admin-
istrations involved and their economic and
financial capacity to assume them throughout
the planned timescale
With these considerations in mind, local govern-
ments can test whether their plans are financially
feasible for those who will implement the plan. If
PCE adjustments are required, it is better to discover
this while still in the planning process and to make
necessary adjustments.
FINANCE FOR CITY LEADERS HANDBOOK 131
Liz Paterson Gauntner is a consultant in urban development, including economic development, public
finance, and transportation modelling, with experience providing technical assistance to projects in over
10 countries.
Miquel Morell is an economist with more than 10 years of experience in urban planning consulting.
5 For more information, see UN-Habitat, Cagayan de Oro Planned City Extension (PCE) Final Report (Manila, UN-Habitat, 2015); and UN-Habitat, Planning City Exten-sions for Sustainable Urban Development: A Quick Guide for Philippine Local Governments (Manila, UN-Habitat, 2016).
6 For a more in-depth look at models of metropolitan government, including international examples, see E. Slack, “Innovative Governance Approaches in Metropolitan Ar-eas of Developing Countries,” in The Challenge of Local Government Financing in Developing Countries (Nairobi, UN-Habitat, 2015). Available from http://unhabitat.org/books/the-challenge-of-local-government-financing-in-de-veloping-countries/.
7 Sacramento Council of Governments (SACOG) & AECOM, Utilizing the Integrated Model for Planning and Cost Scenarios Tool to Understand the Fiscal Impacts of Development: A Spotlight on the City of Galt (Sacramento, SACOG, 2011).
8 B.A. Brealey and S.C. Myers, Principles of Corporate Finance, 5th Edition (n.p. McGraw-Hill/Interamericana de España, SAU, 2001).
9 For detailed information see UN-Habitat, Draft Tech-nical Guidebook for Financing Planned City Extension: The Economic and Financial Feasibility of Urban Planning (Nai-robi, UN-Habitat, 2016).
Endnotes
1 Complementary to planned extension, planned infill and redevelopment of the existing urban core can and should also contribute to the absorption of expanding urban populations. This is particularly important for cities with insufficient density or large amounts of underutilized land in the existing urban area. Regulatory and land issues are often at the heart of whether redevelopment and infill are attractive to the private real estate sector. Infill can be a legally and politically complex process in cities with land titling issues, speculation, or political control of land. The existence of ground pollution or unusable structures on potential brownfield redevelopment sites can add cost and complexity to infill. Due to differences in financial and legal issues related to planned city infill, this chapter only focuses on PCE.
2 Additional resources on this topic include UN-Habitat & GLTN, Land and Property Tax: A Policy Guide (Nairobi, UN-Habitat, 2011), available from http://unhabitat.org/books/land-and-property-tax/; and UN-Habitat & GLTN, Le-veraging Land; Land-Based Finance for Local Governments (Nairobi, UN-Habitat, 2016).
3 For more information, see Paterson, Morell, Kamiya, and Möhlmann, Rubavu District Planned City Extension Phase I (2015-2025) Financial Plan (Nairobi, UN-Habitat, 2015).
4 For more information, see UN-Habitat, “Rapid Fi-nancial Feasibility Assessment for Planned City Extensions (PCE)” (Nairobi, UN-Habitat, 2016).
Sharing the Wealth: Private Land Value and Public Benefit
09Introduction
Sustainable development includes the public financial resources to invest
in and maintain the physical infrastructure and urban services necessary to
support urban living. The need for additional resources to meet the demands
of urban growth is nearly ubiquitous. This need has led many thoughtful
observers to advocate greater use of land as a basis for raising additional
revenues. For example, the editors of The Economist recently argued:
“[G]overnments should impose higher taxes on the value of land. In most
rich countries, land-value taxes account for a small share of total revenues.
Land taxes are efficient. They are difficult to dodge; you cannot stuff land
into a bank-vault in Luxembourg. Whereas a high tax on property can
discourage investment, a high tax on land creates an incentive to develop
unused sites. Land-value taxes can also help cater for newcomers. New infra-
structure raises the value of nearby land, automatically feeding through into
revenues—which helps to pay for the improvements.”1
FINANCE FOR CITY LEADERS HANDBOOK 133
The need for additional resources to fund growth-related needs is not limited to
developing countries. In 2014, the National Bank of Canada published a discus-
sion paper promoting land value capture to fund public transit for Montreal.2
That report concludes in part:
“There is significant evidence to show that the improved connectivity supplied by
new transit services generates increased land and development value. This is well
recognized by the development industry. It therefore seems fair and equitable that
a proportion of this additional wealth, generated by the new transit, should go to
funding the transportation facility.”
This chapter briefly reviews the instruments commonly used to engage in land value
sharing and raise revenue based on land value and land attributes. Both theory and
practice support the use of land-based revenue sources. However, the challenges
associated with effective implementation should not be understated.
Land value sharing: Theory
In the fields of urban public finance and international devel-
opment, the concept of land value sharing (also commonly
referred to as land value capture) has become a standard
argument for implementing or reforming taxes based on land.
Often the value of privately held land increases as a result
of public investments in infrastructure, publicly approved
changes in land use, or broader changes in the community,
such as population growth. Proponents of land value sharing argue that governments
should use taxes and fees to collect some share of this increase in value for public
purposes, including funding infrastructure and service improvements. The concept of
land value sharing has been in circulation at least since 1776 when Adam Smith wrote
The Wealth of Nations. Smith considered the topic of taxes on agricultural land (which
he called “the ordinary rent of land”), houses (“house-rents”), and residential land
values (“ground-rents”) and concluded:
“Ground-rents, so far as they exceed the ordinary rent of land, are altogether owing to
the good government of the sovereign, which, by protecting the industry either of the
whole people, or of the inhabitants of some particular place, enables them to pay so
much more than its real value for the ground which they build their houses upon. …
Nothing can be more reasonable than that a fund, which owes its existence to the good
government of the state should be taxed peculiarly, or should contribute something
more than the greater part of other funds, towards the support of that government.”3
The need for additional resources to meet the demands of urban growth is nearly ubiquitous.
“
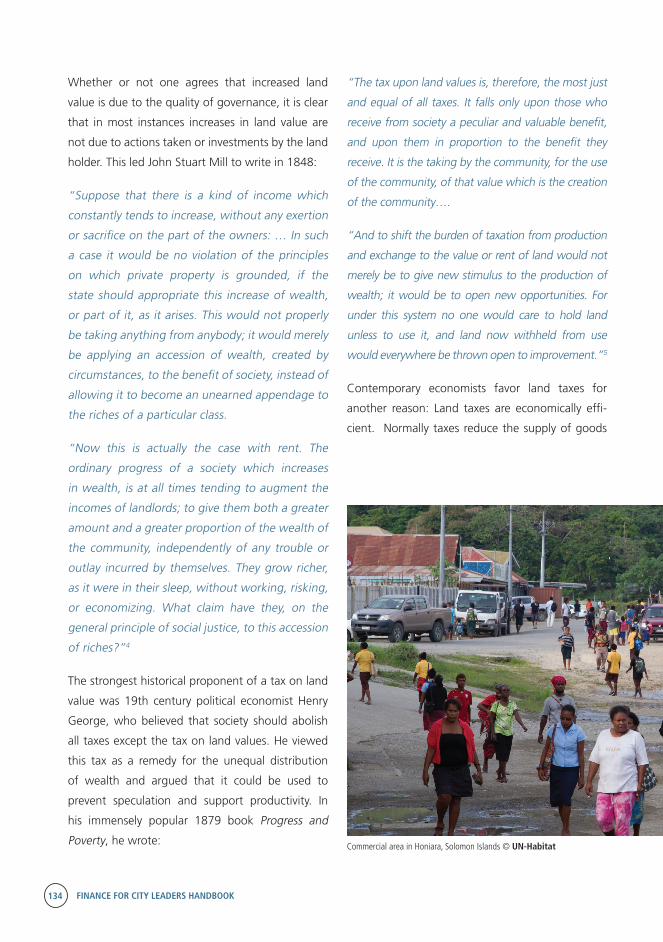
134 FINANCE FOR CITY LEADERS HANDBOOK
Whether or not one agrees that increased land
value is due to the quality of governance, it is clear
that in most instances increases in land value are
not due to actions taken or investments by the land
holder. This led John Stuart Mill to write in 1848:
“Suppose that there is a kind of income which
constantly tends to increase, without any exertion
or sacrifice on the part of the owners: … In such
a case it would be no violation of the principles
on which private property is grounded, if the
state should appropriate this increase of wealth,
or part of it, as it arises. This would not properly
be taking anything from anybody; it would merely
be applying an accession of wealth, created by
circumstances, to the benefit of society, instead of
allowing it to become an unearned appendage to
the riches of a particular class.
“Now this is actually the case with rent. The
ordinary progress of a society which increases
in wealth, is at all times tending to augment the
incomes of landlords; to give them both a greater
amount and a greater proportion of the wealth of
the community, independently of any trouble or
outlay incurred by themselves. They grow richer,
as it were in their sleep, without working, risking,
or economizing. What claim have they, on the
general principle of social justice, to this accession
of riches?”4
The strongest historical proponent of a tax on land
value was 19th century political economist Henry
George, who believed that society should abolish
all taxes except the tax on land values. He viewed
this tax as a remedy for the unequal distribution
of wealth and argued that it could be used to
prevent speculation and support productivity. In
his immensely popular 1879 book Progress and
Poverty, he wrote:
“The tax upon land values is, therefore, the most just
and equal of all taxes. It falls only upon those who
receive from society a peculiar and valuable benefit,
and upon them in proportion to the benefit they
receive. It is the taking by the community, for the use
of the community, of that value which is the creation
of the community….
“And to shift the burden of taxation from production
and exchange to the value or rent of land would not
merely be to give new stimulus to the production of
wealth; it would be to open new opportunities. For
under this system no one would care to hold land
unless to use it, and land now withheld from use
would everywhere be thrown open to improvement.”5
Contemporary economists favor land taxes for
another reason: Land taxes are economically effi-
cient. Normally taxes reduce the supply of goods
Commercial area in Honiara, Solomon Islands © UN-Habitat
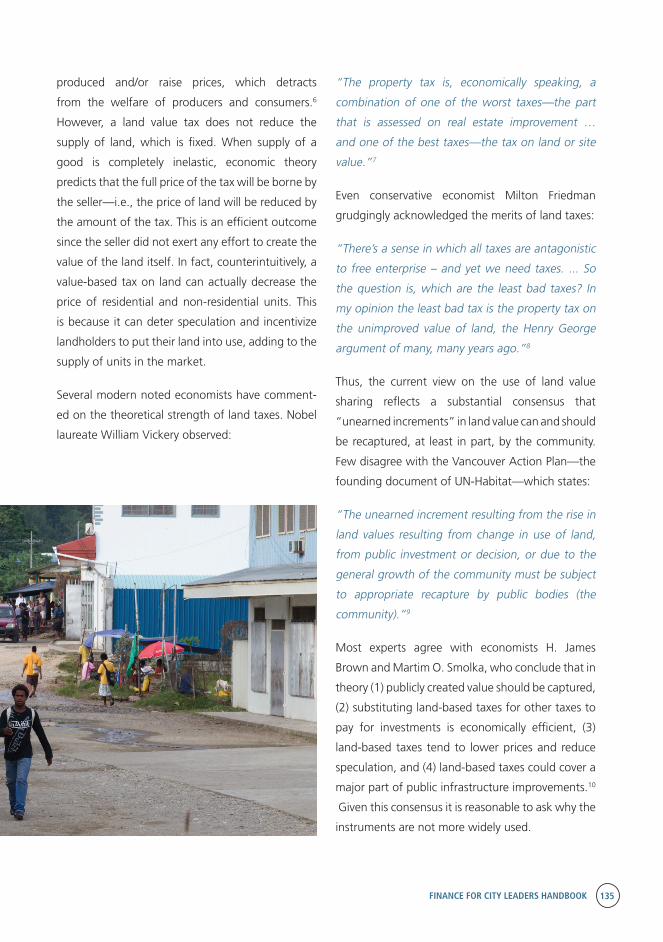
FINANCE FOR CITY LEADERS HANDBOOK 135
Commercial area in Honiara, Solomon Islands © UN-Habitat
produced and/or raise prices, which detracts
from the welfare of producers and consumers.6
However, a land value tax does not reduce the
supply of land, which is fixed. When supply of a
good is completely inelastic, economic theory
predicts that the full price of the tax will be borne by
the seller—i.e., the price of land will be reduced by
the amount of the tax. This is an efficient outcome
since the seller did not exert any effort to create the
value of the land itself. In fact, counterintuitively, a
value-based tax on land can actually decrease the
price of residential and non-residential units. This
is because it can deter speculation and incentivize
landholders to put their land into use, adding to the
supply of units in the market.
Several modern noted economists have comment-
ed on the theoretical strength of land taxes. Nobel
laureate William Vickery observed:
“The property tax is, economically speaking, a
combination of one of the worst taxes—the part
that is assessed on real estate improvement …
and one of the best taxes—the tax on land or site
value.”7
Even conservative economist Milton Friedman
grudgingly acknowledged the merits of land taxes:
“There’s a sense in which all taxes are antagonistic
to free enterprise – and yet we need taxes. ... So
the question is, which are the least bad taxes? In
my opinion the least bad tax is the property tax on
the unimproved value of land, the Henry George
argument of many, many years ago.”8
Thus, the current view on the use of land value
sharing reflects a substantial consensus that
“unearned increments” in land value can and should
be recaptured, at least in part, by the community.
Few disagree with the Vancouver Action Plan—the
founding document of UN-Habitat—which states:
“The unearned increment resulting from the rise in
land values resulting from change in use of land,
from public investment or decision, or due to the
general growth of the community must be subject
to appropriate recapture by public bodies (the
community).”9
Most experts agree with economists H. James
Brown and Martim O. Smolka, who conclude that in
theory (1) publicly created value should be captured,
(2) substituting land-based taxes for other taxes to
pay for investments is economically efficient, (3)
land-based taxes tend to lower prices and reduce
speculation, and (4) land-based taxes could cover a
major part of public infrastructure improvements.10
Given this consensus it is reasonable to ask why the
instruments are not more widely used.
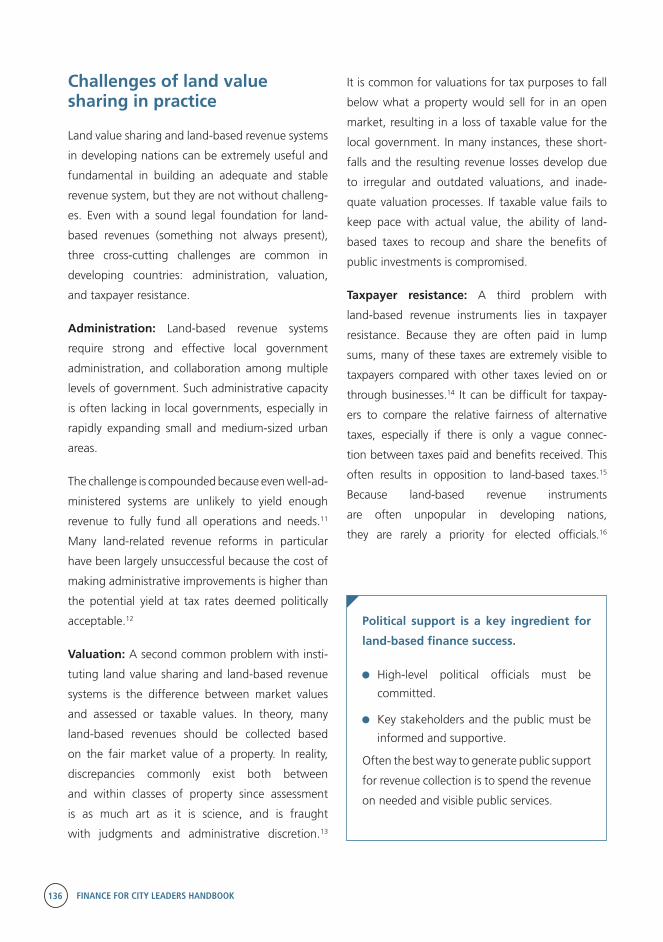
136 FINANCE FOR CITY LEADERS HANDBOOK
Challenges of land value sharing in practice
Land value sharing and land-based revenue systems
in developing nations can be extremely useful and
fundamental in building an adequate and stable
revenue system, but they are not without challeng-
es. Even with a sound legal foundation for land-
based revenues (something not always present),
three cross-cutting challenges are common in
developing countries: administration, valuation,
and taxpayer resistance.
Administration: Land-based revenue systems
require strong and effective local government
administration, and collaboration among multiple
levels of government. Such administrative capacity
is often lacking in local governments, especially in
rapidly expanding small and medium-sized urban
areas.
The challenge is compounded because even well-ad-
ministered systems are unlikely to yield enough
revenue to fully fund all operations and needs.11
Many land-related revenue reforms in particular
have been largely unsuccessful because the cost of
making administrative improvements is higher than
the potential yield at tax rates deemed politically
acceptable.12
Valuation: A second common problem with insti-
tuting land value sharing and land-based revenue
systems is the difference between market values
and assessed or taxable values. In theory, many
land-based revenues should be collected based
on the fair market value of a property. In reality,
discrepancies commonly exist both between
and within classes of property since assessment
is as much art as it is science, and is fraught
with judgments and administrative discretion.13
It is common for valuations for tax purposes to fall
below what a property would sell for in an open
market, resulting in a loss of taxable value for the
local government. In many instances, these short-
falls and the resulting revenue losses develop due
to irregular and outdated valuations, and inade-
quate valuation processes. If taxable value fails to
keep pace with actual value, the ability of land-
based taxes to recoup and share the benefits of
public investments is compromised.
Taxpayer resistance: A third problem with
land-based revenue instruments lies in taxpayer
resistance. Because they are often paid in lump
sums, many of these taxes are extremely visible to
taxpayers compared with other taxes levied on or
through businesses.14 It can be difficult for taxpay-
ers to compare the relative fairness of alternative
taxes, especially if there is only a vague connec-
tion between taxes paid and benefits received. This
often results in opposition to land-based taxes.15
Because land-based revenue instruments
are often unpopular in developing nations,
they are rarely a priority for elected officials.16
Political support is a key ingredient for
land-based finance success.
High-level political officials must be
committed.
Key stakeholders and the public must be
informed and supportive.
Often the best way to generate public support
for revenue collection is to spend the revenue
on needed and visible public services.
FINANCE FOR CITY LEADERS HANDBOOK 137
While there are noteworthy challenges to effective
use of land-based finance instruments, none is insur-
mountable. Land-based tools are used effectively in
various countries around the world, and many devel-
oping countries are making significant progress in
implementing or improving such instruments.
Defining and classifying land-based financing instruments
Land-based finance instruments are called by differ-
ent names in different countries and settings. No
attempt is made here to provide a comprehensive
list of synonymous names or to cover local varia-
tions of the instruments. Rather, the basic features
of the instruments are set forth in this section, and
the reader is simply cautioned to be aware that
ambiguity in names exists. Table 1 summarizes the
land-based finance instruments commonly in use.
For each instrument, the table provides:
A very brief description of what the instrument is
The “timing” of the instrument, meaning when
the tax or fee is assessed and with what frequency
The initial incidence of the tax or fee, meaning
who is required to actually pay the obligation
The issue of incidence, or who pays the tax
or fee, requires a bit more explanation. Public
finance economists draw a distinction between
statutory incidence and economic incidence.17
Statutory incidence refers to who must pay the
tax or fee to the government. Economic incidence
refers to who must ultimately bear the economic
burden of the tax.
Since the statutory incidence does not describe who
really bears the burden of the tax, from a policy
perspective, the economic incidence is the more
important concept. Consider the following example.
One-time versus ongoing revenues
Some land-based finance instruments seem
to have an advantage because they can fund
capital projects upfront (e.g., sale of public land
and sale of development rights).
However, a system that successfully collects an
ongoing revenue stream from land can open
the door to creditworthiness and give local
governments options to finance capital projects
through borrowing.
Suppose that a developer purchases additional residen-
tial development rights from a city. The statutory inci-
dence of the cost of those rights falls on the developer.
But if the developer simply increases the price charged
for finished residential flats by the amount paid for the
development rights, it is the final purchaser of the flat
who bears the economic incidence. In terms of assessing
equity and social impacts, the economic incidence is thus
of greater interest than the statutory incidence.
Unfortunately, determining the economic incidence of
land-based finance instruments is not always straightfor-
ward. For example, there is an unresolved debate about
the economic incidence of the annual tax on land and
buildings.18 The economic burden of an annual property
tax may depend upon whether public services are
transparently delivered in proportion to tax payments,
whether there is good information available to buyers
and sellers about present and future taxes, and whether
real estate markets have the time and ability to respond
to incentives for the expansion of the supply of built
units. In any event, Table 1 reports the statutory inci-
dence. In a subsequent section, the economic incidence
and social impacts of the instruments are discussed in
greater detail.
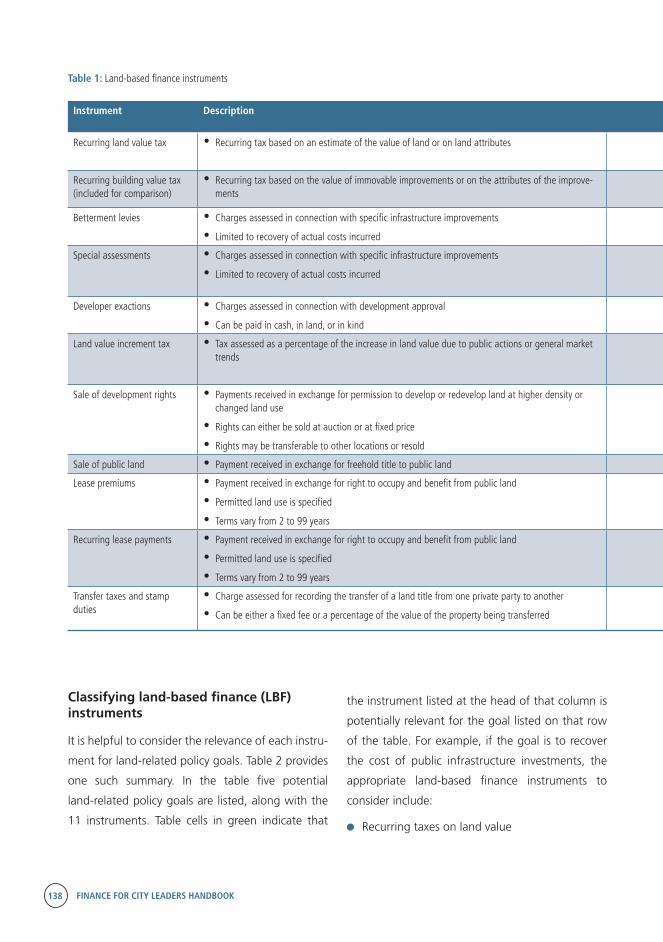
138 FINANCE FOR CITY LEADERS HANDBOOK
Table 1: Land-based finance instruments
Instrument Description Timing Statutory incidence
Recurring land value tax •Recurring tax based on an estimate of the value of land or on land attributes •Assessed annually
•Can be collected in installments
Either the landowner or the occupant
Recurring building value tax (included for comparison)
•Recurring tax based on the value of immovable improvements or on the attributes of the improve-ments
•Assessed annually
•Can be collected in installments
Either the landowner or the occupant
Betterment levies •Charges assessed in connection with specific infrastructure improvements
• Limited to recovery of actual costs incurred
•Assessed and collected as a one-time charge Existing landholders whose land benefits from the improvements
Special assessments •Charges assessed in connection with specific infrastructure improvements
• Limited to recovery of actual costs incurred
•Assessed once
•Collected over a period of time, often as a temporary addition to the recurring property tax
Existing landholders whose land benefits from the improvements
Developer exactions •Charges assessed in connection with development approval
•Can be paid in cash, in land, or in kind
•Assessed once
•Collected as project is approved and completed
Land developers seeking city approval
Land value increment tax • Tax assessed as a percentage of the increase in land value due to public actions or general market trends
•Can be assessed when land title transfers or when specific public actions result in increased land values
•Collected when land title transfers or by special billing
• Either the original title holder, the new title holder, or both if tied to title transfer
• Existing landholders if by special billing
Sale of development rights • Payments received in exchange for permission to develop or redevelop land at higher density or changed land use
•Rights can either be sold at auction or at fixed price
•Rights may be transferable to other locations or resold
•Collected once Purchaser of the development right
Sale of public land • Payment received in exchange for freehold title to public land •Collected once Purchaser of the land
Lease premiums • Payment received in exchange for right to occupy and benefit from public land
• Permitted land use is specified
• Terms vary from 2 to 99 years
•Assessed and collected once Purchaser of the leasehold
Recurring lease payments • Payment received in exchange for right to occupy and benefit from public land
• Permitted land use is specified
• Terms vary from 2 to 99 years
•Recurring payments
• Payment amount reviewed and updated periodically
Purchaser of the leasehold
Transfer taxes and stamp duties
•Charge assessed for recording the transfer of a land title from one private party to another
•Can be either a fixed fee or a percentage of the value of the property being transferred
•Assessed and collected once Either the original title holder, the new title holder, or both
Classifying land-based finance (LBF) instruments
It is helpful to consider the relevance of each instru-
ment for land-related policy goals. Table 2 provides
one such summary. In the table five potential
land-related policy goals are listed, along with the
11 instruments. Table cells in green indicate that
the instrument listed at the head of that column is
potentially relevant for the goal listed on that row
of the table. For example, if the goal is to recover
the cost of public infrastructure investments, the
appropriate land-based finance instruments to
consider include:
Recurring taxes on land value
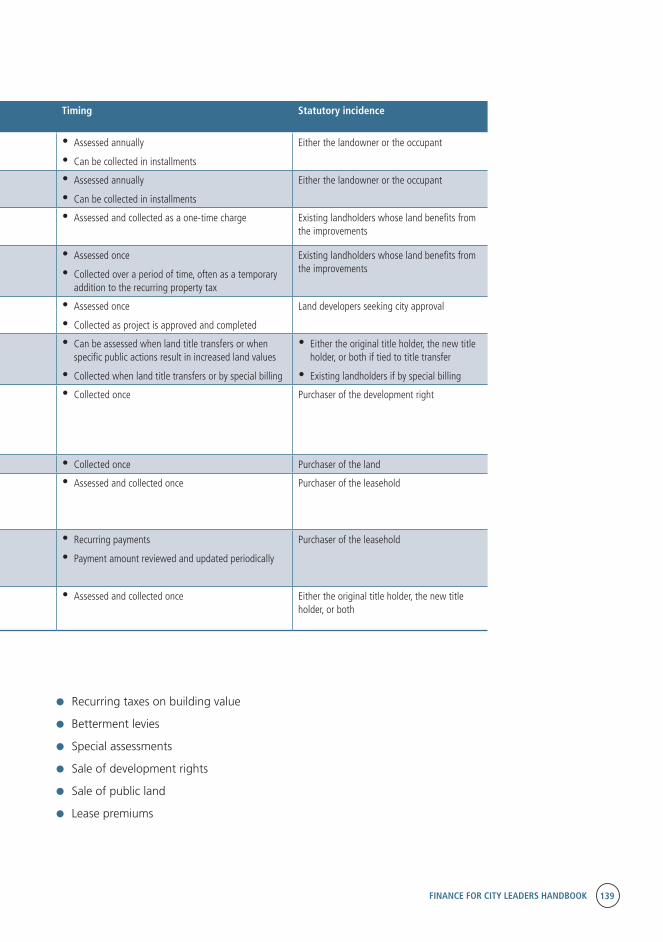
FINANCE FOR CITY LEADERS HANDBOOK 139
Table 1: Land-based finance instruments
Instrument Description Timing Statutory incidence
Recurring land value tax •Recurring tax based on an estimate of the value of land or on land attributes •Assessed annually
•Can be collected in installments
Either the landowner or the occupant
Recurring building value tax (included for comparison)
•Recurring tax based on the value of immovable improvements or on the attributes of the improve-ments
•Assessed annually
•Can be collected in installments
Either the landowner or the occupant
Betterment levies •Charges assessed in connection with specific infrastructure improvements
• Limited to recovery of actual costs incurred
•Assessed and collected as a one-time charge Existing landholders whose land benefits from the improvements
Special assessments •Charges assessed in connection with specific infrastructure improvements
• Limited to recovery of actual costs incurred
•Assessed once
•Collected over a period of time, often as a temporary addition to the recurring property tax
Existing landholders whose land benefits from the improvements
Developer exactions •Charges assessed in connection with development approval
•Can be paid in cash, in land, or in kind
•Assessed once
•Collected as project is approved and completed
Land developers seeking city approval
Land value increment tax • Tax assessed as a percentage of the increase in land value due to public actions or general market trends
•Can be assessed when land title transfers or when specific public actions result in increased land values
•Collected when land title transfers or by special billing
• Either the original title holder, the new title holder, or both if tied to title transfer
• Existing landholders if by special billing
Sale of development rights • Payments received in exchange for permission to develop or redevelop land at higher density or changed land use
•Rights can either be sold at auction or at fixed price
•Rights may be transferable to other locations or resold
•Collected once Purchaser of the development right
Sale of public land • Payment received in exchange for freehold title to public land •Collected once Purchaser of the land
Lease premiums • Payment received in exchange for right to occupy and benefit from public land
• Permitted land use is specified
• Terms vary from 2 to 99 years
•Assessed and collected once Purchaser of the leasehold
Recurring lease payments • Payment received in exchange for right to occupy and benefit from public land
• Permitted land use is specified
• Terms vary from 2 to 99 years
•Recurring payments
• Payment amount reviewed and updated periodically
Purchaser of the leasehold
Transfer taxes and stamp duties
•Charge assessed for recording the transfer of a land title from one private party to another
•Can be either a fixed fee or a percentage of the value of the property being transferred
•Assessed and collected once Either the original title holder, the new title holder, or both
Recurring taxes on building value
Betterment levies
Special assessments
Sale of development rights
Sale of public land
Lease premiums

140 FINANCE FOR CITY LEADERS HANDBOOK
The other four instruments are better suited for
achieving other goals. Further, the text in some of
the cells indicates any special issues that should
be considered in pursuing the instrument in that
column with the desired goal listed in the row.
Some of the Table 2 entries also suggest that some
instruments are more appropriate than others for
some settings. For example, if the goal is to collect
a user charge for private use of public land (last row
Table 2: Land-based finance instruments and land-related policy goals
Land-related goal Land-based finance instrument
Recurring land value tax
Recurring build-ing value tax
Betterment levies Special assess-ments
Developer exactions Land value increment tax Sale of develop-ment rights
Sale of public land
Lease premiums Recurring lease payments
Transfer taxes and stamp duties
Recover the cost of public infrastructure investment
May need to be paired with local borrowing
Requires land-holder approval
If priced appro-priately
Claim a portion of increased private land value created by public action
If the tax rate is high enough
If law permits exactions beyond those that benefit the site
If local government ad-ministers and retains the revenue
If tax is high; see land value increment tax
Collect payments for public services proportional to the benefits provided to land-holders
Can be combined with land use charge
If tax is modest
Avoid direct expenditures for new infrastructure
If the sale takes place before new infrastructure is installed
Collect a “use charge” for private use of public land
Informal settle-ments
Formal occupancy
in the table), it makes a difference whether the land
occupancy is formal or informal. If the land use is
authorized, it makes more sense to use recurring
lease payments built into the agreement that grants
the right to use the land. On the other hand, if it
is an informal settlement on public land, a formal
lease agreement is not practical. However, some
cities have been successful in levying a land value
tax, especially if paying the tax is linked to eventual
regularization of tenure.

FINANCE FOR CITY LEADERS HANDBOOK 141
Table 2: Land-based finance instruments and land-related policy goals
Land-related goal Land-based finance instrument
Recurring land value tax
Recurring build-ing value tax
Betterment levies Special assess-ments
Developer exactions Land value increment tax Sale of develop-ment rights
Sale of public land
Lease premiums Recurring lease payments
Transfer taxes and stamp duties
Recover the cost of public infrastructure investment
May need to be paired with local borrowing
Requires land-holder approval
If priced appro-priately
Claim a portion of increased private land value created by public action
If the tax rate is high enough
If law permits exactions beyond those that benefit the site
If local government ad-ministers and retains the revenue
If tax is high; see land value increment tax
Collect payments for public services proportional to the benefits provided to land-holders
Can be combined with land use charge
If tax is modest
Avoid direct expenditures for new infrastructure
If the sale takes place before new infrastructure is installed
Collect a “use charge” for private use of public land
Informal settle-ments
Formal occupancy
Note that sometimes the design of the land-based
finance instrument can change its achievement of
policy goals. For example, recurring lease payments
could be used to recover the cost of public infra-
structure investments if priced accordingly and used
to repay loans for an investment project. The ability
to adapt instrument design is important in settings
where the best-suited instrument for the policy goals
is unavailable, requiring adjustment of other instru-
ments to fit the intended purpose.
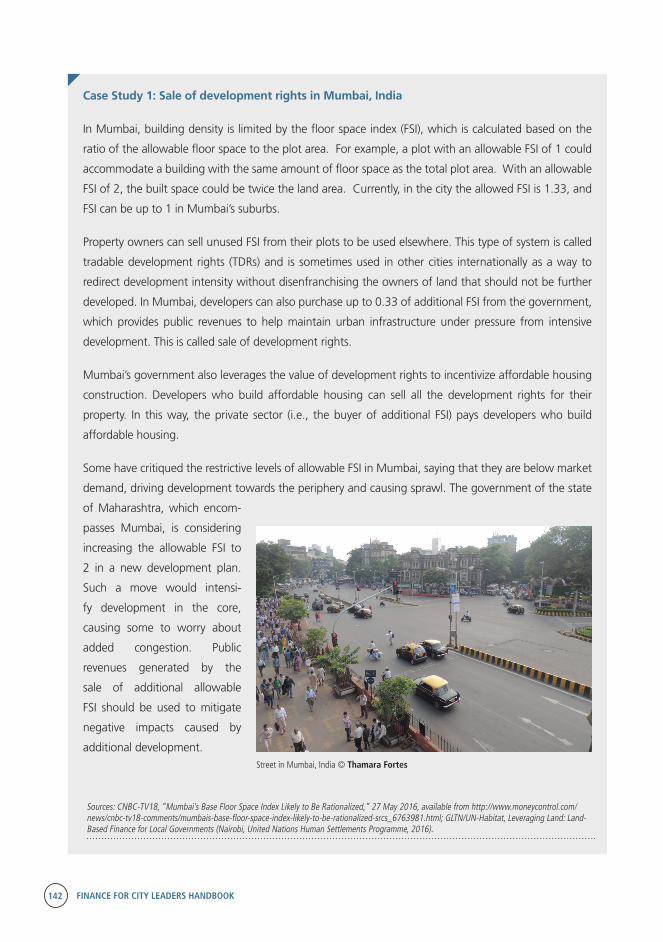
142 FINANCE FOR CITY LEADERS HANDBOOK
Case Study 1: Sale of development rights in Mumbai, India
Sources: CNBC-TV18, “Mumbai’s Base Floor Space Index Likely to Be Rationalized,” 27 May 2016, available from http://www.moneycontrol.com/news/cnbc-tv18-comments/mumbais-base-floor-space-index-likely-to-be-rationalized-srcs_6763981.html; GLTN/UN-Habitat, Leveraging Land: Land-Based Finance for Local Governments (Nairobi, United Nations Human Settlements Programme, 2016).
In Mumbai, building density is limited by the floor space index (FSI), which is calculated based on the
ratio of the allowable floor space to the plot area. For example, a plot with an allowable FSI of 1 could
accommodate a building with the same amount of floor space as the total plot area. With an allowable
FSI of 2, the built space could be twice the land area. Currently, in the city the allowed FSI is 1.33, and
FSI can be up to 1 in Mumbai’s suburbs.
Property owners can sell unused FSI from their plots to be used elsewhere. This type of system is called
tradable development rights (TDRs) and is sometimes used in other cities internationally as a way to
redirect development intensity without disenfranchising the owners of land that should not be further
developed. In Mumbai, developers can also purchase up to 0.33 of additional FSI from the government,
which provides public revenues to help maintain urban infrastructure under pressure from intensive
development. This is called sale of development rights.
Mumbai’s government also leverages the value of development rights to incentivize affordable housing
construction. Developers who build affordable housing can sell all the development rights for their
property. In this way, the private sector (i.e., the buyer of additional FSI) pays developers who build
affordable housing.
Some have critiqued the restrictive levels of allowable FSI in Mumbai, saying that they are below market
demand, driving development towards the periphery and causing sprawl. The government of the state
of Maharashtra, which encom-
passes Mumbai, is considering
increasing the allowable FSI to
2 in a new development plan.
Such a move would intensi-
fy development in the core,
causing some to worry about
added congestion. Public
revenues generated by the
sale of additional allowable
FSI should be used to mitigate
negative impacts caused by
additional development. Street in Mumbai, India © Thamara Fortes
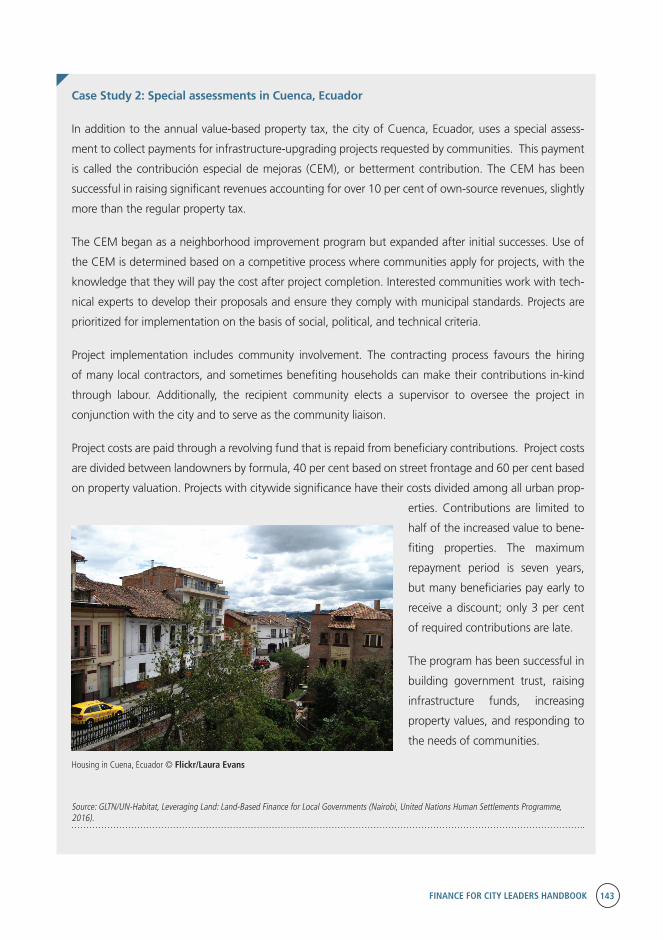
FINANCE FOR CITY LEADERS HANDBOOK 143
Housing in Cuena, Ecuador © Flickr/Laura Evans
Case Study 2: Special assessments in Cuenca, Ecuador
In addition to the annual value-based property tax, the city of Cuenca, Ecuador, uses a special assess-
ment to collect payments for infrastructure-upgrading projects requested by communities. This payment
is called the contribución especial de mejoras (CEM), or betterment contribution. The CEM has been
successful in raising significant revenues accounting for over 10 per cent of own-source revenues, slightly
more than the regular property tax.
The CEM began as a neighborhood improvement program but expanded after initial successes. Use of
the CEM is determined based on a competitive process where communities apply for projects, with the
knowledge that they will pay the cost after project completion. Interested communities work with tech-
nical experts to develop their proposals and ensure they comply with municipal standards. Projects are
prioritized for implementation on the basis of social, political, and technical criteria.
Project implementation includes community involvement. The contracting process favours the hiring
of many local contractors, and sometimes benefiting households can make their contributions in-kind
through labour. Additionally, the recipient community elects a supervisor to oversee the project in
conjunction with the city and to serve as the community liaison.
Project costs are paid through a revolving fund that is repaid from beneficiary contributions. Project costs
are divided between landowners by formula, 40 per cent based on street frontage and 60 per cent based
on property valuation. Projects with citywide significance have their costs divided among all urban prop-
erties. Contributions are limited to
half of the increased value to bene-
fiting properties. The maximum
repayment period is seven years,
but many beneficiaries pay early to
receive a discount; only 3 per cent
of required contributions are late.
The program has been successful in
building government trust, raising
infrastructure funds, increasing
property values, and responding to
the needs of communities.
Source: GLTN/UN-Habitat, Leveraging Land: Land-Based Finance for Local Governments (Nairobi, United Nations Human Settlements Programme, 2016).
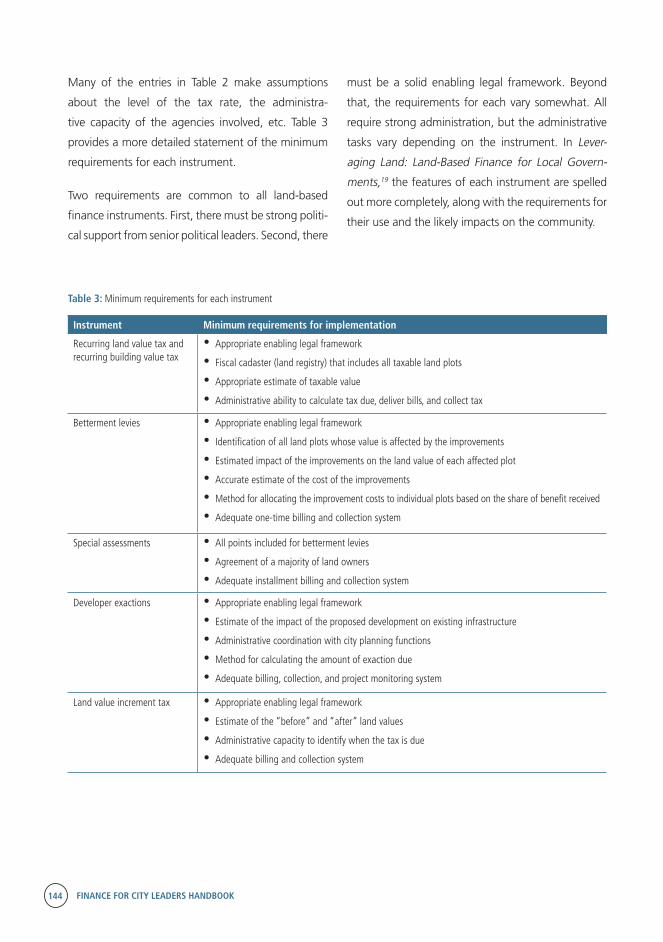
144 FINANCE FOR CITY LEADERS HANDBOOK
Many of the entries in Table 2 make assumptions
about the level of the tax rate, the administra-
tive capacity of the agencies involved, etc. Table 3
provides a more detailed statement of the minimum
requirements for each instrument.
Two requirements are common to all land-based
finance instruments. First, there must be strong politi-
cal support from senior political leaders. Second, there
Table 3: Minimum requirements for each instrument
Instrument Minimum requirements for implementation
Recurring land value tax and recurring building value tax
•Appropriate enabling legal framework
• Fiscal cadaster (land registry) that includes all taxable land plots
•Appropriate estimate of taxable value
•Administrative ability to calculate tax due, deliver bills, and collect tax
Betterment levies •Appropriate enabling legal framework
• Identification of all land plots whose value is affected by the improvements
• Estimated impact of the improvements on the land value of each affected plot
•Accurate estimate of the cost of the improvements
•Method for allocating the improvement costs to individual plots based on the share of benefit received
•Adequate one-time billing and collection system
Special assessments •All points included for betterment levies
•Agreement of a majority of land owners
•Adequate installment billing and collection system
Developer exactions •Appropriate enabling legal framework
• Estimate of the impact of the proposed development on existing infrastructure
•Administrative coordination with city planning functions
•Method for calculating the amount of exaction due
•Adequate billing, collection, and project monitoring system
Land value increment tax •Appropriate enabling legal framework
• Estimate of the “before” and “after” land values
•Administrative capacity to identify when the tax is due
•Adequate billing and collection system
must be a solid enabling legal framework. Beyond
that, the requirements for each vary somewhat. All
require strong administration, but the administrative
tasks vary depending on the instrument. In Lever-
aging Land: Land-Based Finance for Local Govern-
ments,19 the features of each instrument are spelled
out more completely, along with the requirements for
their use and the likely impacts on the community.
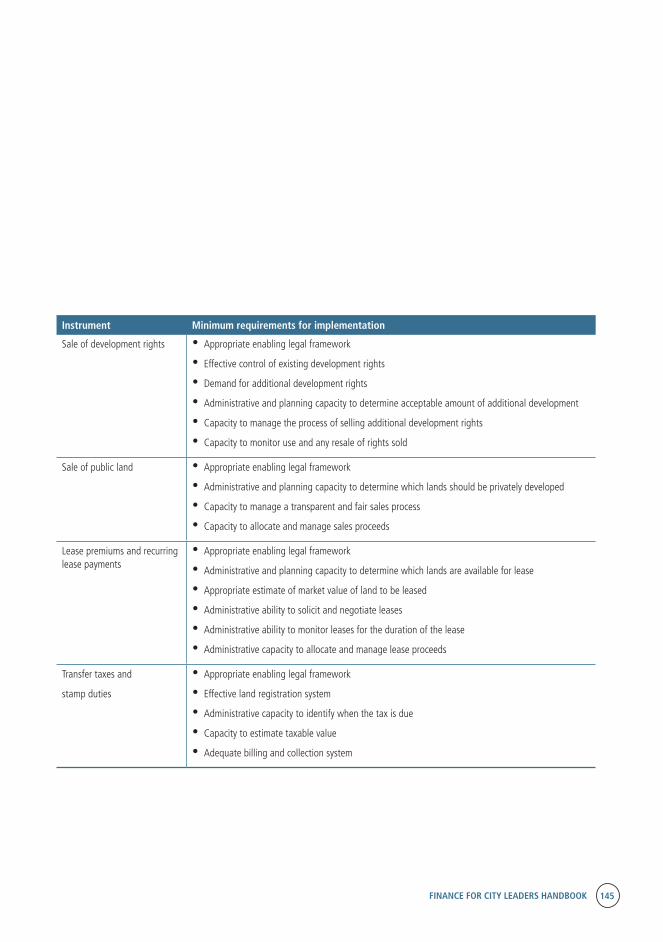
FINANCE FOR CITY LEADERS HANDBOOK 145
Instrument Minimum requirements for implementation
Sale of development rights •Appropriate enabling legal framework
• Effective control of existing development rights
•Demand for additional development rights
•Administrative and planning capacity to determine acceptable amount of additional development
•Capacity to manage the process of selling additional development rights
•Capacity to monitor use and any resale of rights sold
Sale of public land •Appropriate enabling legal framework
•Administrative and planning capacity to determine which lands should be privately developed
•Capacity to manage a transparent and fair sales process
•Capacity to allocate and manage sales proceeds
Lease premiums and recurring lease payments
•Appropriate enabling legal framework
•Administrative and planning capacity to determine which lands are available for lease
•Appropriate estimate of market value of land to be leased
•Administrative ability to solicit and negotiate leases
•Administrative ability to monitor leases for the duration of the lease
•Administrative capacity to allocate and manage lease proceeds
Transfer taxes and
stamp duties
•Appropriate enabling legal framework
• Effective land registration system
•Administrative capacity to identify when the tax is due
•Capacity to estimate taxable value
•Adequate billing and collection system
146 FINANCE FOR CITY LEADERS HANDBOOK
Actions for implementation or improvement of land value sharing
The administrative capacity of those public
agencies charged with implementing the land
value sharing and land-based finance system.
Most recently, GLTN and UN-Habitat have
produced extensive training materials for
local and national leaders on land value
sharing and land-based finance, including a
reader, case studies, and a trainer’s guide.22
Much of the material presented in this chapter is
derived from this publication.
Steps towards initial implementation
For city leaders interested in implementing land
value sharing for the first time or in a new form,
there are some generalized steps that can be
followed towards initial implementation, includ-
ing goal identification, assessment, instrument
design, action planning, implementation, and
monitoring. These basic activities can be tailored
to fit the city’s specific situation. These are each
discussed in turn:
(1) Goal identification: Carefully selected
goals can guide the choice of the appropri-
ate instrument. Potential goals may include
improving ongoing revenues, raising revenue
for a capital improvement project, or incen-
tivizing more productive and sustainable land
use. City leaders may also identify intended
impacts (social, economic, and environmen-
tal) to guide both the assessment of potential
instruments and the design of selected instru-
ments.
(2) Legal assessment: City leaders should check
to see which land value sharing instruments
are available according to the legal code,
likely with the assistance of legal counsel.
In the past several years, the Global Land Tool
Network (GLTN) and UN-Habitat have part-
nered in the production of three notable
works with recommendations and guidance
for implementing land value sharing and,
more broadly, on land-based finance. The
first was a land value sharing scoping study,20
which concludes in part that:
Effective land value sharing and land-based
finance systems require a political champion,
good property tax law, and decentralized
authority to implement the system.
The effectiveness of the land value sharing and
land-based finance system is greatly improved
if it is embedded in an effective land use
management system.
Land value sharing and land-based finance
systems require adequate training for at least
three separate groups (policymakers, adminis-
trators, and land developers).
Efficient, accurate, and timely land valuation is
essential.
Countries should consider and evaluate all the
available tools for land value sharing.
The second work is Land and Property Tax: A
Policy Guide.21 This guide notes that in designing
the land value sharing and land-based finance
system, decision-makers should carefully consider
four aspects of the local environment:
How land and property rights are defined in
the community
How such rights are publicly recorded, or at
least recognized, and defended
The maturity of local land and property markets
FINANCE FOR CITY LEADERS HANDBOOK 147
They should also take note of the regula-
tions governing the available instruments.
Of particular note are regulations specifying
what is taxable and exempt, how value is
determined, statutory incidence, the specified
rate or rate-setting process, agencies respon-
sible for administrative functions, and the
allocation of revenues received. City leaders
should also note which land value sharing
instruments (if any) are specifically prohibit-
ed and which instruments are not explicitly
mentioned in existing laws.
(3) Administrative assessment: Evaluating
current administrative capacities will inform
city leaders of potential implementation
issues related to various land value sharing
instruments and will identify areas that must
be improved before implementation. Table 3
lists specific areas of administrative capacity
required for each instrument.
(4) Assessment of political will: Successful
implementation of land value sharing will rely
on high-level political commitment as well
as the political acceptability to those subject
to the tax or fee. Some immediate gauge of
both types of political will should be done
early on, with further engagement about the
potential benefits of land value sharing and
opportunities for success as specific ideas are
developed.
(5) Instrument selection and design: Stake-
holders such as municipal agencies, national
ministries, and the private sector should
provide input into this process. Selection of
the right instrument is important, but just as
important are decisions about who will be
required to pay the tax or fee, how contribu-
tions will be calculated, and which agencies
will be involved in assessment and collec-
tion. These details can determine whether
the instrument is fair, socially equitable,
revenue-generating, and administratively
feasible.23
(6) Action planning for implementation: An
action plan should specify the critical steps to
be taken for implementation, the responsible
parties, and the timeline. Potential actions
may include the drafting of a local ordinance.
Revision of a national law may also be desired;
however, this will likely require more lead time
and commitment from a broader group of
national stakeholders. One option for instru-
ments requiring national policy revision is to
obtain legal permission for a pilot case at the
local level. The action plan should also assign
responsibility for monitoring and evalua-
tion. A single agency or working group may
oversee execution of the action plan in order
to keep responsible parties on track.
(7) Instrument implementation: Implementa-
tion may be phased or begin in a pilot area.
It will require training for administrators and
an information campaign targeting those
responsible for tax or fee payments.
(8) Monitoring, evaluation, and adjust-
ment: It is critical that local leaders track the
functionality and impacts of administration
(including unintended impacts) to ensure that
the instrument is achieving its goals.
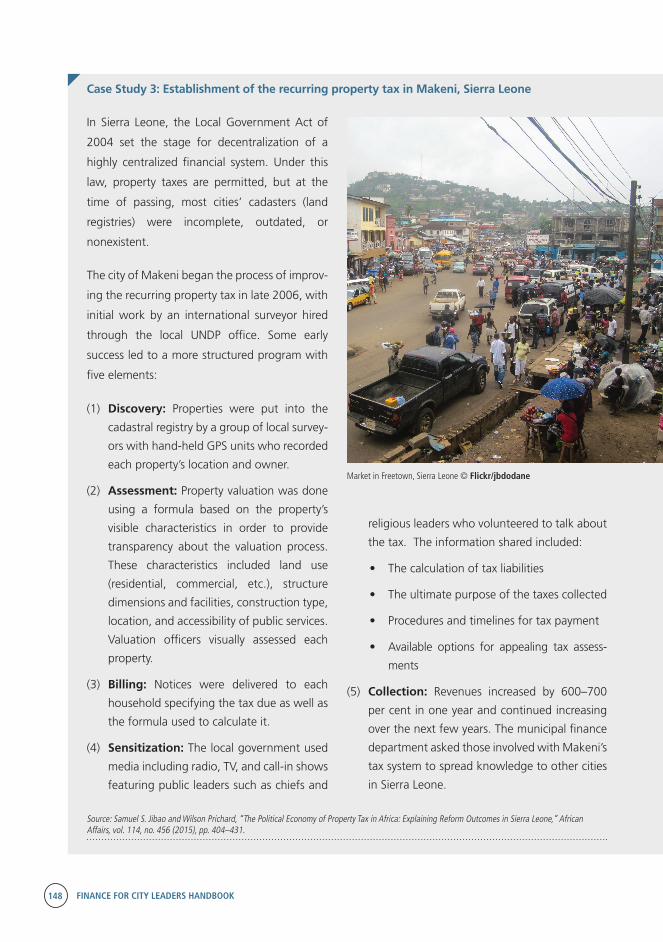
148 FINANCE FOR CITY LEADERS HANDBOOK
In Sierra Leone, the Local Government Act of
2004 set the stage for decentralization of a
highly centralized financial system. Under this
law, property taxes are permitted, but at the
time of passing, most cities’ cadasters (land
registries) were incomplete, outdated, or
nonexistent.
The city of Makeni began the process of improv-
ing the recurring property tax in late 2006, with
initial work by an international surveyor hired
through the local UNDP office. Some early
success led to a more structured program with
five elements:
(1) Discovery: Properties were put into the
cadastral registry by a group of local survey-
ors with hand-held GPS units who recorded
each property’s location and owner.
(2) Assessment: Property valuation was done
using a formula based on the property’s
visible characteristics in order to provide
transparency about the valuation process.
These characteristics included land use
(residential, commercial, etc.), structure
dimensions and facilities, construction type,
location, and accessibility of public services.
Valuation officers visually assessed each
property.
(3) Billing: Notices were delivered to each
household specifying the tax due as well as
the formula used to calculate it.
(4) Sensitization: The local government used
media including radio, TV, and call-in shows
featuring public leaders such as chiefs and
Source: Samuel S. Jibao and Wilson Prichard, “The Political Economy of Property Tax in Africa: Explaining Reform Outcomes in Sierra Leone,” African Affairs, vol. 114, no. 456 (2015), pp. 404–431.
Case Study 3: Establishment of the recurring property tax in Makeni, Sierra Leone
religious leaders who volunteered to talk about
the tax. The information shared included:
• Thecalculationoftaxliabilities
• Theultimatepurposeofthetaxescollected
• Proceduresandtimelinesfortaxpayment
• Available options for appealing tax assess-
ments
(5) Collection: Revenues increased by 600–700
per cent in one year and continued increasing
over the next few years. The municipal finance
department asked those involved with Makeni’s
tax system to spread knowledge to other cities
in Sierra Leone.
Market in Freetown, Sierra Leone © Flickr/jbdodane
FINANCE FOR CITY LEADERS HANDBOOK 149
Market in Freetown, Sierra Leone © Flickr/jbdodane
Improving administration of existing land value sharing instruments
Many cities already have land value sharing instruments in place, but they are not achieving their full
potential. This is particularly common with the recurring property tax since it is frequently assigned to local
governments, but those governments may not have adequate capacity or incentives for successful admin-
istration. See the box titled “The revenue relationship” for an overview of the elements behind collection
efficiency of the recurring property tax.
The revenue relationship
The actual revenue collected through the annual tax on land and/or improvements is a function of
two policy variables:
• Thevalueofthepropertytaxbaseaslegallydefined(base)
• Thepropertytaxrateassetbylawandpolicy(rate)
And three administrative factors:
• Theproportionofalllandthatshouldlegallyappearonthetaxrollsthatactuallyisincludedin
the fiscal cadaster (coverage)
• Theproportionoftaxablevalueidentifiedbythevaluationprocess(valuation)
• Theproportionofthetaxleviedthatisactuallycollected(collection)
The total revenue collected will be the product of all these factors. This mathematical identity
defines the revenue relationship:
Revenue = Base * Rate * Coverage * Valuation * Collection
For example, suppose that the base is defined as market value and the legal tax rate is 1 per cent.
But:
• Only70percentofthepropertythatshouldbeonthetaxrollshasactuallybeenregistered(70
per cent coverage rate)
• Thevaluationsareout-of-dateandreflectonly80percentofactualmarketvalue(80percent
valuation rate)
• Only80percentofthetaxbilledisactuallycollected(80percentcollectionrate)
Under these conditions, the revenue actually collected will be less than 45 per cent of what should
be collected (0.7 x 0.8 x 0.8 = 0.448).
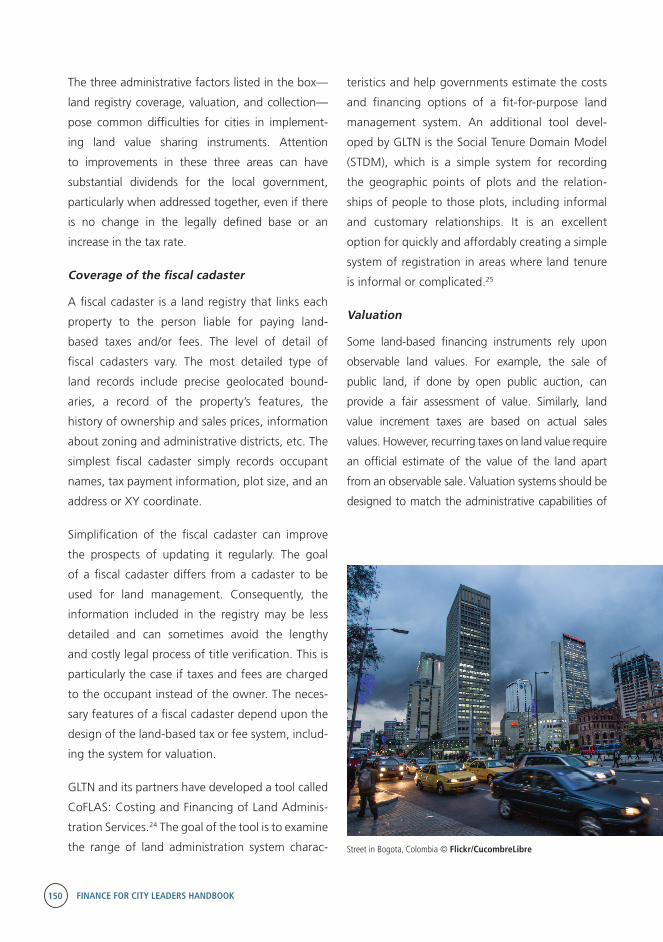
150 FINANCE FOR CITY LEADERS HANDBOOK
The three administrative factors listed in the box—
land registry coverage, valuation, and collection—
pose common difficulties for cities in implement-
ing land value sharing instruments. Attention
to improvements in these three areas can have
substantial dividends for the local government,
particularly when addressed together, even if there
is no change in the legally defined base or an
increase in the tax rate.
Coverage of the fiscal cadaster
A fiscal cadaster is a land registry that links each
property to the person liable for paying land-
based taxes and/or fees. The level of detail of
fiscal cadasters vary. The most detailed type of
land records include precise geolocated bound-
aries, a record of the property’s features, the
history of ownership and sales prices, information
about zoning and administrative districts, etc. The
simplest fiscal cadaster simply records occupant
names, tax payment information, plot size, and an
address or XY coordinate.
Simplification of the fiscal cadaster can improve
the prospects of updating it regularly. The goal
of a fiscal cadaster differs from a cadaster to be
used for land management. Consequently, the
information included in the registry may be less
detailed and can sometimes avoid the lengthy
and costly legal process of title verification. This is
particularly the case if taxes and fees are charged
to the occupant instead of the owner. The neces-
sary features of a fiscal cadaster depend upon the
design of the land-based tax or fee system, includ-
ing the system for valuation.
GLTN and its partners have developed a tool called
CoFLAS: Costing and Financing of Land Adminis-
tration Services.24 The goal of the tool is to examine
the range of land administration system charac-
teristics and help governments estimate the costs
and financing options of a fit-for-purpose land
management system. An additional tool devel-
oped by GLTN is the Social Tenure Domain Model
(STDM), which is a simple system for recording
the geographic points of plots and the relation-
ships of people to those plots, including informal
and customary relationships. It is an excellent
option for quickly and affordably creating a simple
system of registration in areas where land tenure
is informal or complicated.25
Valuation
Some land-based financing instruments rely upon
observable land values. For example, the sale of
public land, if done by open public auction, can
provide a fair assessment of value. Similarly, land
value increment taxes are based on actual sales
values. However, recurring taxes on land value require
an official estimate of the value of the land apart
from an observable sale. Valuation systems should be
designed to match the administrative capabilities of
Street in Bogota, Colombia © Flickr/CucombreLibre
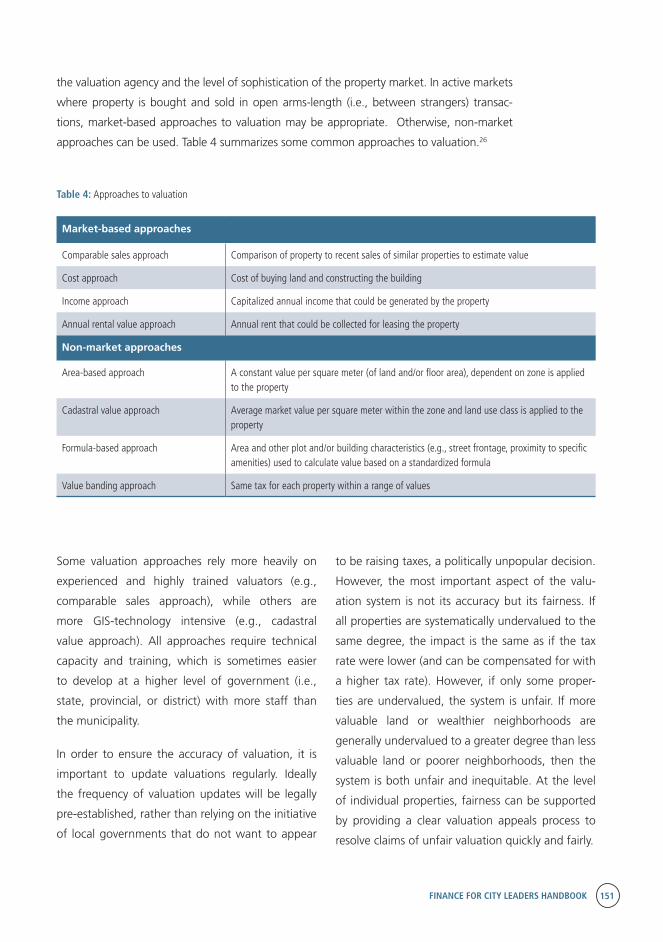
FINANCE FOR CITY LEADERS HANDBOOK 151
Street in Bogota, Colombia © Flickr/CucombreLibre
Some valuation approaches rely more heavily on
experienced and highly trained valuators (e.g.,
comparable sales approach), while others are
more GIS-technology intensive (e.g., cadastral
value approach). All approaches require technical
capacity and training, which is sometimes easier
to develop at a higher level of government (i.e.,
state, provincial, or district) with more staff than
the municipality.
In order to ensure the accuracy of valuation, it is
important to update valuations regularly. Ideally
the frequency of valuation updates will be legally
pre-established, rather than relying on the initiative
of local governments that do not want to appear
the valuation agency and the level of sophistication of the property market. In active markets
where property is bought and sold in open arms-length (i.e., between strangers) transac-
tions, market-based approaches to valuation may be appropriate. Otherwise, non-market
approaches can be used. Table 4 summarizes some common approaches to valuation.26
to be raising taxes, a politically unpopular decision.
However, the most important aspect of the valu-
ation system is not its accuracy but its fairness. If
all properties are systematically undervalued to the
same degree, the impact is the same as if the tax
rate were lower (and can be compensated for with
a higher tax rate). However, if only some proper-
ties are undervalued, the system is unfair. If more
valuable land or wealthier neighborhoods are
generally undervalued to a greater degree than less
valuable land or poorer neighborhoods, then the
system is both unfair and inequitable. At the level
of individual properties, fairness can be supported
by providing a clear valuation appeals process to
resolve claims of unfair valuation quickly and fairly.
Table 4: Approaches to valuation
Market-based approaches
Comparable sales approach Comparison of property to recent sales of similar properties to estimate value
Cost approach Cost of buying land and constructing the building
Income approach Capitalized annual income that could be generated by the property
Annual rental value approach Annual rent that could be collected for leasing the property
Non-market approaches
Area-based approach A constant value per square meter (of land and/or floor area), dependent on zone is applied to the property
Cadastral value approach Average market value per square meter within the zone and land use class is applied to the property
Formula-based approach Area and other plot and/or building characteristics (e.g., street frontage, proximity to specific amenities) used to calculate value based on a standardized formula
Value banding approach Same tax for each property within a range of values
152 FINANCE FOR CITY LEADERS HANDBOOK
Case Study 4: Updating property valuations in Bogotá, Colombia
valuation standard specified independent assess-
ments for buildings and land, with building value
based on a mathematic model using physical char-
acteristics of the structure, and land value requiring
assignment to zones based on location and acces-
sibility factors.
The city hired approximately 830 additional staff to
assist with the valuation. The total project cost was
US$7.8 million, with 47 per cent of costs associated
with fieldwork. However, the effort paid off, raising
an additional US$171 million in tax revenues over
two years.
Since the 2009 valuation update, the city has
worked to streamline the valuation process so
that it can be done without excessive costs on an
annual basis.
Bogotá has a well-functioning value-based
property tax that generates 40 per cent of local
revenues. However, in 2008, property taxes only
accounted for 20 per cent of revenues, and valua-
tions had fallen behind markets, with listed values
only representing about 68 per cent of market
values.
Mayor Antanas Mockus needed to improve the
performance of the local property tax in order to
finance a new subway transit system for the city.
He decided to pursue a valuation update, despite
its political unpopularity.
A complex method for valuation, established by a
previous law, added time and cost to the process
and decreased the transparency of valuations,
leading to complaints and valuation appeals. The
Source: GLTN/UN-Habitat, Leveraging Land: Land-Based Finance for Local Governments (Nairobi, United Nations Human Settlements Programme, 2016).
Collection and taxpayer compliance
Poor taxpayer compliance can be related to a number
of issues. Sometimes there are barriers connected to
billing and the ease of payments. Taxpayers should
be provided good information about their tax bill,
including amount, due date, how to make payments,
and penalties for late payment. The process to make
payments should be as easy as possible, ideally with
an online or mobile money option. Requiring tax
payments be made in person at central government
offices puts an undue burden on taxpayers if lines
are long, offices have inconvenient hours or location,
or the payment process is unclear. Additionally, such
difficulties may create openings for corruption as
middlemen become involved.
Compliance will also be more likely where there
are operational and fair enforcement mecha-
nisms, including a credible penalty for nonpay-
ment. Property confiscation should be a real threat,
although it should be put into practice infrequently.
In order to achieve this balance, there should be a
set of clearly communicated steps before confisca-
tion takes place, and opportunities for delinquent
taxpayers to settle their outstanding bill in a way
they can reasonably afford (such as negotiating a
payment plan). In cases where the property owner
or resident objectively cannot afford to pay the tax,
exemptions should be possible; however, this should
be established in advance of delinquent payment.
FINANCE FOR CITY LEADERS HANDBOOK 153
Conclusion
Many thoughtful observers are calling for increased
use of financing instruments that allow public
entities to share in the private wealth created by
public actions. Economists have advocated the use
of land taxes for over 200 years. Of course, there
are both political and practical reasons why such
instruments have not been more widely used in the
past. But the challenges associated with effective
use of land value sharing are not insurmountable.
How the instruments can work is well understood
and demonstrated. How to adapt and apply them
in a given context requires political champions, an
understanding of the relevant context, and often
a bit of outside coaching from experienced prac-
titioners. Well-designed and effectively adminis-
tered land value sharing instruments are efficient
and fair mechanisms for raising revenues needed
to meet the demands faced by urban govern-
ments. In addition to the revenue generated, the
use of land value sharing improves land use and
enhances access to land for vulnerable populations.
Every urban government should carefully consider
whether land value sharing can be implemented or
improved in their community.
In cultures that consider access to land as funda-
mental to the achievement of human rights, confis-
cation of land for nonpayment of taxes may not be
feasible. In such cases, a national taxpayer identifi-
cation system that links all banking, motor vehicle,
and other asset accounts to the landholder can
be an effective alternative. After exhausting other
remedies, the tax authority may be able to seize
bank accounts, motor vehicles, or other assets in lieu
of seizing property.
It should be stressed that seizing land or other assets
is a last resort and should only be pursued in cases
where taxpayers are seriously delinquent over an
extended period of time. Other options can and
should be employed early in the collection process.
At a more fundamental level, taxpayers are general-
ly more willing to pay taxes when they can see the
benefits of publicly funded services to their commu-
nity. In places where the social contract between
the local government and citizens is broken, there
is likely to be resistance to attempts to improve tax
collection. To improve trust in government, provi-
sion of services should be visible and address the felt
needs of communities. An information campaign
may help to highlight the link between taxes and
local services. Another method for building commu-
nity trust is participatory budgeting, where local
communities vote to determine how a portion of tax
revenue is spent.
Many thoughtful observers are calling for increased use of financing instruments that allow public entities to share in the private wealth created by public actions.
“
154 FINANCE FOR CITY LEADERS HANDBOOK
Lawrence Walters is emeritus professor of public management at Brigham Young University (Provo, Utah,
USA). His research and consulting have focused on land-based revenues around the globe.
Liz Paterson Gauntner is a consultant in urban development, including economic development, public
finance, and transportation modelling, with experience providing technical assistance to projects in over
10 countries.
Endnotes
1 The Economist, “Space and the City,” 4 April 2015.
2 George Hazel, Land Value Capture As a Source of Funding of Public Transit for Greater Montreal (Montreal, National Bank of Canada, 2014).
3 Adam Smith, An Inquiry into the Nature and Causes of the Wealth of Nations, 5th Edition (London, Methuen & Co. Ltd, 1776), Book 5, Chapter 2.
4 John Stuart Mill, The Principles of Political Econo-my, Book 5 (Kitchener, Ontario, Canada, Batoche Book, 1848/2001).
5 Henry George, Progress and Poverty (Garden City, N.Y.: Doubleday, Page & Co, 1920), Book VIII, Chapter 3.
6 In fact, whether there is an overall social welfare loss will also depend on what the government does with the tax revenue collected. It is quite possible that the benefits to society generated through public action will more than offset private losses due to the tax.
7 Quoted in John L. Mikesell, Fiscal Administration, 9th Edition (Boston, Wadworth CENAGE Learning, 2013), p. 491.
8 Quoted in Jeffrey P. Cohen and Cletus C. Coughlin, “An Introduction to Two-Rate Taxation of Land and Buildings,” Review, Federal Reserve Bank of St. Louis, vol. 87, no. 3 (2005), pp. 359–374.
9 UN-Habitat, The Vancouver Declaration on Human Settlements and the Vancouver Action Plan (Nairobi, UN Habitat, 1976).
10 H. James Brown and Martim O. Smolka, “Capturing Public Value from Public Investments,” in Land Use and Taxation: Applying the Insights of Henry George, H.J. Brown, ed. (Cambridge, Mass.: Lincoln Institute of Land Policy, 1997).
11 Roy Bahl and Richard M. Bird, “Subnational Taxes in Developing Countries: The Way Forward,” Public Budgeting & Finance, vol. 28, no. 4 (2008), pp. 1–25.
12 Roy Bahl and Sally Wallace, Reforming the Property Tax in Developing Countries: A New Approach (Atlanta, Interna-tional Studies Program at Georgia State University, 2008).
13 Roy Bahl and Richard M. Bird, “Subnational Taxes in Developing Countries: The Way Forward,” Public Budgeting & Finance, vol. 28, no. 4 (2008), pp. 1–25.
Resources for more information
A 2011 UN-Habitat policy guide on land value sharing, Land and Property Tax, can be found at http://unhabitat.org/books/land-and-property-tax/.
Bahl, Martinez-Vazquez, and Youngman’s 2013 book, Making the Property Tax Work: Experiences in Developing and Transi-tional Countries, provides further information on administration of property taxes and can be found at http://www.lincoln-inst.edu/pubs/1374_Making-the-Property-Tax-Work.
For information on tools related to land management and cadastral updates, see www.gltn.net.
FINANCE FOR CITY LEADERS HANDBOOK 155
14 Roy Bahl and Richard M. Bird, “Subnational Taxes in Developing Countries: The Way Forward,” Public Budgeting & Finance, vol. 28, no. 4 (2008), pp. 1–25.
15 Roy Bahl, Jorge Martinez-Vazquez, and Joan Young-man, “The Property Tax in Practice,” in Making the Property Tax Work: Experiences in Developing and Transitional Coun-tries, R. Bahl, J. Martinez-Vazquez, and J. Youngman, eds. (Cambridge, Mass., Lincoln Institute of Land Policy, 2008).
16 Roy Bahl and Musharraf Rasool Cyan, “Tax Assign-ment: Does the Practice Match the Theory?” Environment and Planning C: Government and Policy, vol. 29, no. 2 (2011), pp. 264–280.
17 Jonathan Gruber, Public Finance and Public Policy: 3rd Edition (New York, Worth Publishers, 2011).
18 George Zodrow, “Who Pays the Property Tax?” Land Lines, vol. 18, no. 2 (2006), pp. 14–19.
19 GLTN/UN-Habitat, Leveraging Land: Land-Based Finance for Local Governments (Nairobi, United Nations Human Settlements Programme, 2016).
20 Moegsien Hendricks and Anzabeth Tonkin, Land Value Capture/Taxation (LVC/T) Scoping Study: Final Report (Cape Town, Development Action Group, 2010).
21 Lawrence C. Walters, Land and Property Tax: A Policy Guide (Nairobi, United Nations Human Settlements Pro-gramme, 2011).
22 GLTN/UN-Habitat, Leveraging Land: Land-Based Finance for Local Governments (Nairobi, United Nations Human Settlements Programme, 2016).
23 Note that UN-Habitat and GLTN have designed a training workshop to teach national and local stakeholders about land value sharing instruments and to assist them in instrument selection, design, and action planning for implementation. See GLTN/UN-Habitat, Leveraging Land: Land-Based Finance for Local Governments (Nairobi, United Nations Human Settlements Programme, 2016).
24 Antony Burns, Framework for Costing and Financing Land Administration Services (CoFLAS) (Nairobi, United Nations Human Settlement Programme and Global Land Tool Network, 2015).
25 For more information, see www.stdm.gltn.net.
26 For more detailed information about these valuation approaches, see GLTN/UN-Habitat, Leveraging Land: Land-Based Finance for Local Governments (Nairobi, United Nations Human Settlements Programme, 2016).
The Role of Real Estate Development in Urbanizing Cities
10Introduction
The world is more than halfway through a 200-year cycle of popu-
lation growth and urbanization, at the end of which close to 85 per
cent of humanity is projected to live in cities. Leaders, planners, and
policymakers in cities and urban regions are increasingly recognizing
the accelerated pace of urban change, and in particular the challenge
of spiralling demand coupled with supply-side constraints. City leaders
must cope with unprecedented enthusiasm for urban living and urban
jobs, but with limited fiscal tools, institutional frameworks, and polit-
ical will.
Urbanization and economic growth are major drivers of real estate
markets; the rate of building construction is currently faster than at
any time in recorded history. There has been an enormous increase in
demand for private capital investment for real estate and surrounding
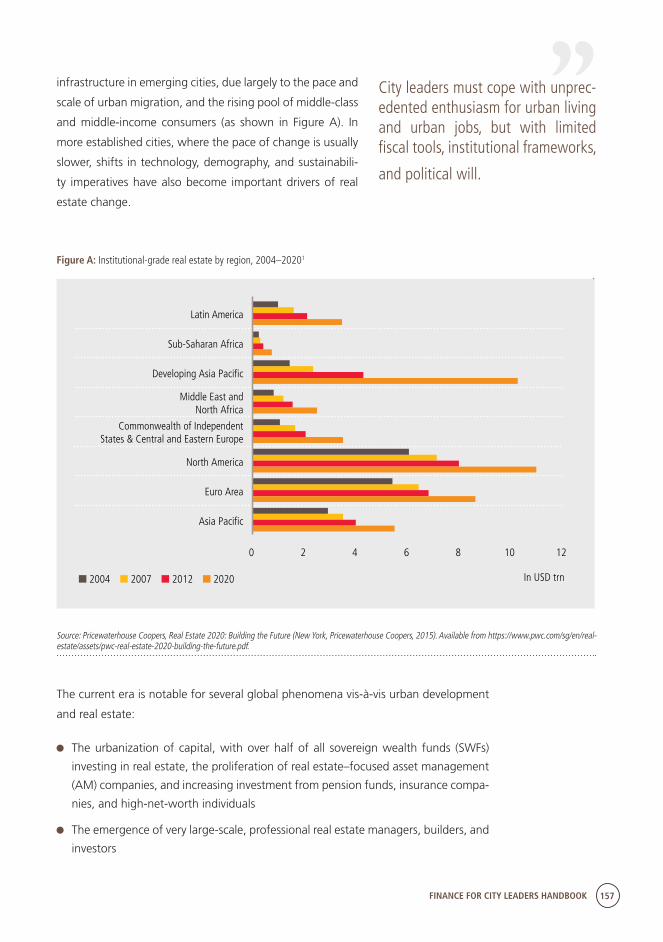
FINANCE FOR CITY LEADERS HANDBOOK 157
infrastructure in emerging cities, due largely to the pace and
scale of urban migration, and the rising pool of middle-class
and middle-income consumers (as shown in Figure A). In
more established cities, where the pace of change is usually
slower, shifts in technology, demography, and sustainabili-
ty imperatives have also become important drivers of real
estate change.
Figure A: Institutional-grade real estate by region, 2004–20201
■ 2004 ■ 2007 ■ 2012 ■ 2020
0 2 4 6 8 10 12
Sub-Saharan Africa
Developing Asia Paci�c
North America
Euro Area
Asia Paci�c
Latin America
In USD trn
Commonwealth of Independent States & Central and Eastern Europe
Middle East and North Africa
Source: Pricewaterhouse Coopers, Real Estate 2020: Building the Future (New York, Pricewaterhouse Coopers, 2015). Available from https://www.pwc.com/sg/en/real-estate/assets/pwc-real-estate-2020-building-the-future.pdf.
The current era is notable for several global phenomena vis-à-vis urban development
and real estate:
The urbanization of capital, with over half of all sovereign wealth funds (SWFs)
investing in real estate, the proliferation of real estate–focused asset management
(AM) companies, and increasing investment from pension funds, insurance compa-
nies, and high-net-worth individuals
The emergence of very large-scale, professional real estate managers, builders, and
investors
City leaders must cope with unprec-edented enthusiasm for urban living and urban jobs, but with limited fiscal tools, institutional frameworks,
and political will.
“
158 FINANCE FOR CITY LEADERS HANDBOOK
A wider range of risk and return, from low-risk/
low-yield opportunities in established cities to
high-risk/high-yield potential in emerging cities
Increasing cost of urban land assets per square
metre and scarcity of developable land, resulting
in increased urban density, demand for smaller
apartments, and pressures to optimize space
Increased role of next-horizon technologies (e.g.,
prefabrication, modular units, 3-D printing)
enabling faster, more affordable, and more
sustainable developments
Disruption to production and consumption
models that is changing the demand for real
estate
Private and institutional investment offers a number
of important benefits and advantages to cities
pursuing long-term goals. First, these investors are
critical suppliers of capital in the context of under-in-
vestment from the public sector. Second, their
experience and interest in long-term value creation
means they provide access to valuable financing
and development expertise. Third, they can help
signal the maturity of financial/banking systems,
which can result in lower long-term interest rates.
Fourth, international capital adds diverse perspec-
tives, ideas, and solutions to city development,
which can influence other important areas such as
city design, education, and industrial development.
And fifth, such capital is often patient, seeking
long-term returns and income to support pensions
and insurance systems or underpin diversification
from national assets.
This chapter examines the role real estate devel-
opment plays in emerging cities. It begins with a
discussion of the merits of managed urban growth.
It then discusses how cities can use planning and
asset management to create and capture value.
The chapter next discusses the emerging role of city
growth planning and the need for analytical frame-
works for intelligent planning. This is followed by
an overview of the role and value of coordinated
land use planning. The chapter then explores ways
in which public authorities can attract private capital
co-investment, which is followed by a discussion of
the need to acknowledge underlying issues that
often affect real estate investment in developing
cities. It concludes with an examination of the role
of real estate planning and development in making
cities competitive.
Managed growth versus unmanaged growth
Cities today rarely face a choice between having
growth or not having growth. Rather, the real
choice is between whether growth is managed
and complemented by investment, adaptation,
and infrastructure, or whether it is unmanaged and
stresses the existing infrastructure and natural and
built environments.
As cities grow, the myriad challenges facing them
sometimes lead analysts to be critical of misman-
aged growth.2 Yet for many cities, the challenge
has become one of dealing with externalities asso-
ciated with success and prosperity, which can stress
housing markets as well as infrastructure networks.
For example, housing demand is a reflection of
cities’ attractiveness, and increased demand can
present issues of affordability while also taxing
existing infrastructure capacity. Congested infra-
structure results when high employment density
is not properly aligned with public transport and
other infrastructure systems. Yet these phenomena
are a reflection, usually, of urbanizing cities experi-
encing consequences of unmanaged growth. City
FINANCE FOR CITY LEADERS HANDBOOK 159
leaders are increasingly facing pressures of balanc-
ing quality of life and sustainability with produc-
tivity and growth. This requires a shift towards a
managed growth model, which leads to more
sustainable long-term development and improved
quality of life, which is a key indicator of city attrac-
tiveness and health. Attention to cities’ progress
towards these goals is one reason for the rise of
city benchmarking and index exercises around the
world.3
Features of more managed cities and metropolises
include their ability to:
Meet the needs resulting from new and sustained
population growth and recognize the long-term
character of this growth and the need to plan
differently and adopt a new planning paradigm
Grasp opportunities and compete in a globalized
system of trade and investment and participate
in sectors that are increasingly traded globally
Address investment deficits resulting from insti-
tutional weakness or lack of coordination at the
city, regional, state, or national level
Withstand and bounce back from shocks
that result from vulnerability to events such
as extreme weather, terrorism, public health
epidemics, and civil unrest
Adjust to a change of circumstances or percep-
tions about existing patterns of development
and employ innovative approaches to new
problems
The consequences of mismanaged growth are exac-
erbated by trends and forces of urbanization. Poor
planning and decision-making are magnified and
become costlier as population densities increase.
In contrast, steady management resulting from a
methodical approach to property and land devel-
opment can provide a measure of stability, which
is a key to attracting private capital and external
investment. This presents the best opportunity to
leverage and maximize government investments,
by exploiting synergies with real estate develop-
ment opportunities.
Managed growth is critical for cities to compete
in an era of globalization and to achieve broader
economic development goals. These goals present
new imperatives for cities to optimize their assets
and leverage private investment for improving
sustainability, growing entrepreneurship, creating
critical mass in new sub-centres, and increasing
housing supply.4
Using planning and asset management to create value
The objective of real estate development and
investment is value creation. The public sector plays
a key role in value creation, whether through land
use approvals using planning and regulatory tools,
infrastructure and utilities provision, environmental
improvements, or creating a business environment
conducive to commerce. The private sector, includ-
ing real estate professionals, may also add and
unlock value, first during the process of assessing
project feasibility, undertaking design and develop-
ment management, defining a targeted tenant mix,
and beginning dialogue with potential tenants,
followed by the stage of direct investment in new
buildings and facilities, comprehensive master-plan-
ning, and destination branding and marketing.
A key challenge for cities is therefore how to
increase, and capture, asset value so it can be put
to use for the public good. One way for cities to
optimize their assets is value capture finance (VCF).
VCF has emerged as an important tool for driving
sustainable urban development because its finance
160 FINANCE FOR CITY LEADERS HANDBOOK
mechanisms, when properly structured, share both
the risks and rewards of urban projects among
public and private actors.
VCF can take on many forms and transaction
structures (such as public–private partnerships and
joint ventures), but the ultimate goal remains the
same: to identify a way to capture and leverage
increases in land and property values. The public
sector captures enhanced asset values, whether in
the form of land transfers, local taxation and tax
increments that enable revenues to be reinvested,
development levies and infrastructure tariffs, local
service agreements, or private-led local amenity
provision and enhancement. Then, the captured
value (in monetary form or “credit” to leverage
in-kind contributions from the private sector) can
be recycled or reinvested in the same development
scheme for the public good.5
There have been many examples of using value
capture to finance urban projects over the past
20 years. Most commonly it is used to finance rail
projects, as has occurred frequently in Japan, Hong
Kong, Canada, Germany, the United States, and the
United Kingdom.6 Beyond transport, value capture
has also been employed to fund other urban
infrastructure and public space improvements,
most notably in Latin America, where betterment
contributions and development rights charges are
increasingly common.7 Reviews of value capture
in developing countries show it is often very effec-
tive in cities that have an inadequate property
tax system.8 Value capture holds great promise,
although many other parts of the world have not
yet recognized the opportunity associated with
these finance models, partly due to political opposi-
tion, regulatory opacity, and the technical and oper-
ational complexity of these projects.9
The emerging role of city growth planning
Urban planning plays an essential role in the urban
growth management process and the successful
creation and capture of value. Planning plays a
pivotal role in regulating urban land use and devel-
opment, but also has a key “place-shaping” role in
the built environment, which is a source of value
and benefit to real estate developers. Confidence
in a city’s urban planning approach can reduce
planning and development risks, which are key
factors for private investors as they assess risk/
reward opportunities. The ability of planning to
manage the components of the built and natural
environments so that they work together properly
is at the heart of how developments can achieve
efficiencies, cost-effectiveness, and added value.
Planning is not just the means to zone land and to
identify what is desired or permissible in a certain
location. It plays a key role in upholding the value
of investment in real estate by protecting it from
unforeseen or unplanned competition or from
unwanted neighbouring uses. It encourages devel-
opment that meets economic market demands, as
well as public demands, to ensure planned uses
are absorbed and put to productive use. For inves-
tors, planning is the main means to ensure that the
market in which an investment is made remains
stable.
The role and esteem of urban planning systems
around the world varies. Planning is sometimes
viewed as unnecessarily slow, restrictive, and
costly.10 But there is a growing sense of the imper-
ative to recognize the potential and benefits of
joined-up planning to support physical and spatial
change in cities. Over time it has become recog-
nized that the management of a largely built-out

FINANCE FOR CITY LEADERS HANDBOOK 161
urban landscape in a sustainable manner requires
collaboration between urban planners and real
estate professionals. This collaboration is key, since
interactions with real estate professionals can
offer insight into the private sector’s approach to
risk evaluation and mitigation. The fundamental
perspective on how to approach property develop-
ment and land valuations can be helpful when eval-
uating a variety of development proposals.
Analytical frameworks for intelligent planning
Increasingly, cities are engaging real estate profes-
sionals to assist throughout the planning stages,
and in part to ensure development initiatives repre-
sent optimal uses of land. This type of analysis, often
referred to as a “highest and best use” study, can
offer an analytical framework to help understand
value and make informed decisions about issues
such as zoning changes, resource allocation and
prioritization, development phasing, and accom-
modating public sector needs. Figure B illustrates
a typical approach to large-scale development
planning, and the steps involved when analyzing a
development’s highest and best use.
Figure B: Typical approach to performing a highest and best use study
Stage Category Sections Conclusions
PESTLE Analysis
SWOT Analysis
Market Overview Potential Project
Demand Size
Site Specific Demand Identification
Development Brief
Financial FeasibilityFinancing
Financing Costs
Residential
Project Vision & Objectives
Economic
Location
Zoning
Office
Site Concept Component DesignComponent Specifications
Legal
Investments
Revenues
Retail
Guiding Considerations
Investment
Access & Egress
Area Overview
Stock & Supply
Supply & Demand Analysis
Outlook & Opportunities
Performance Case Studies
Asset Classes:
•Residential
•Office
•Retail
•Hospitality
Land Use
Proximity to Demand Generators
Factors Influencing
Demand
Site Comparables
Tourism
Hotel
Demographic
Taxes
Strategy
General Market Study
Site Analysis
Real Estate Market Study
Demand Determination
Development Advisory Phase
Financial Feasibility
Assessments
1
2
3
4
5
6
Source: JLL Public Institutions - Municipal Advisory Practice
“
Urban planning plays an essential role in the urban growth manage-ment process and the successful creation and capture of value.
162 FINANCE FOR CITY LEADERS HANDBOOK
Establishing an analytical framework based on
market data—where various development propos-
als and scenarios can be evaluated and compared—
can help urban planners and city leaders better
understand project values and potential. Urban
planning best practices show that taking a disci-
plined and analytical approach to urban planning
and development can help preserve and maximize
development values. Overall, strong property and
land values stand to benefit both public and private
sectors alike.
The role and value of coordinated land use planning
It is common in many cities for haphazard land use
patterns to emerge from ad-hoc and informal deci-
sions about where to locate new developments,
or whether or not to consider re-zoning requests.
The integration of these decisions into a coherent
vision, considerate of broader development initia-
tives, is one of the most important tasks for cities
today. Coordinated land use master planning is an
important means to this end.
Planning and local government: Key tools for shaping managed growth
Master planning and land use coordination has been
a key spatial planning objective in many parts of the
world. In European cities especially, the concentration
of spatial development within “activity centres” or
“opportunity areas” has been an important enabler
of redevelopment and densification. This is especially
important as policies, plans, and regulations prolif-
erate in a complex environment. Meanwhile master
planning powers may reside with municipalities, or
with separate planning authorities in place of munic-
ipalities, which can provide a “one-stop shop” for
investors and developers seeking advice and planning
permission. Among the most successful examples of
citywide and metropolitan master planning are Hong
Kong and Tokyo. These cities have clearly identified
rail systems as the backbone of urban development,
designated satellite centres accordingly, and formu-
lated plans for future corridors and nodes based
on market demand, developable land availability,
and long-term transport investment. They also have
prioritized public transport–oriented policies and
investment throughout sector plans and local master
plans.11
Land assembly is a core element of how land use
is coordinated, and is often a necessary precursor
to initiating large-scale development. Local govern-
ments usually have land acquisition authorities, and
can serve as a catalyst to spur complex and large-
scale development projects. In addition, a govern-
ment’s ability to establish and regulate zoning can
be a mechanism that can drive financial value and
feasibility.
The utilization of zoning to permit and encourage
new uses is a key trigger of redevelopment and
adjustment in cities. It is common in many cities to
find exclusionary zoning that forbids rezoning from
industrial purposes in order to preserve a certain mix
of uses that may no longer be viable. The existing
use designations of public land can sometimes delay
attempts to adapt sites for new uses and develop-
ment. Equally, re-designation can provide permis-
sion for taller buildings, while form-based zoning to
regulate form rather than use is also popular, as it
allows the market to select the most appropriate use.
A clear delegation of land use powers to local and
city governments has become important to cities
because it allows different actors to take a strategic
approach to future land uses.
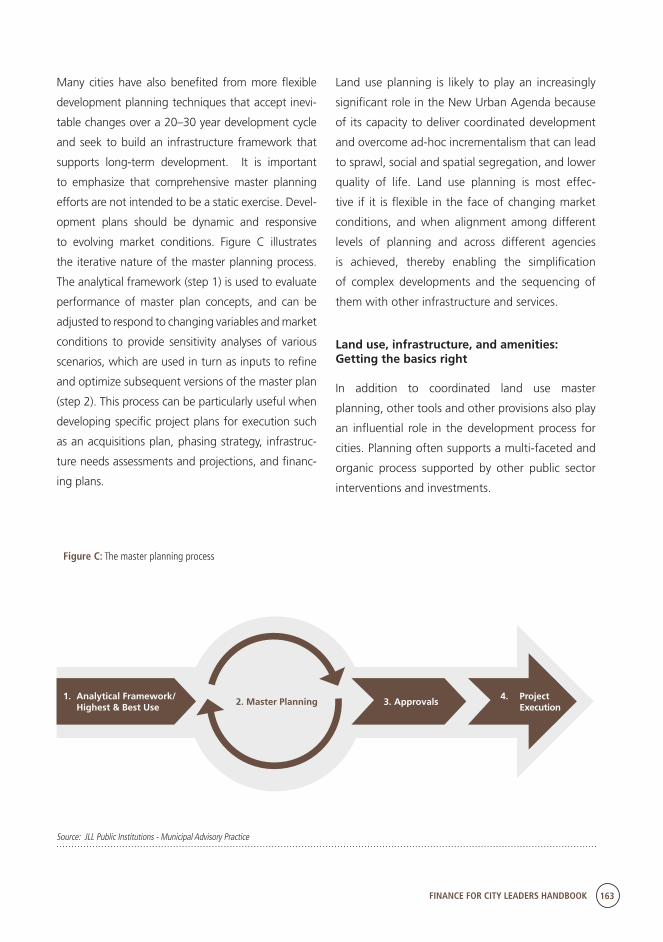
FINANCE FOR CITY LEADERS HANDBOOK 163
Many cities have also benefited from more flexible
development planning techniques that accept inevi-
table changes over a 20–30 year development cycle
and seek to build an infrastructure framework that
supports long-term development. It is important
to emphasize that comprehensive master planning
efforts are not intended to be a static exercise. Devel-
opment plans should be dynamic and responsive
to evolving market conditions. Figure C illustrates
the iterative nature of the master planning process.
The analytical framework (step 1) is used to evaluate
performance of master plan concepts, and can be
adjusted to respond to changing variables and market
conditions to provide sensitivity analyses of various
scenarios, which are used in turn as inputs to refine
and optimize subsequent versions of the master plan
(step 2). This process can be particularly useful when
developing specific project plans for execution such
as an acquisitions plan, phasing strategy, infrastruc-
ture needs assessments and projections, and financ-
ing plans.
Land use planning is likely to play an increasingly
significant role in the New Urban Agenda because
of its capacity to deliver coordinated development
and overcome ad-hoc incrementalism that can lead
to sprawl, social and spatial segregation, and lower
quality of life. Land use planning is most effec-
tive if it is flexible in the face of changing market
conditions, and when alignment among different
levels of planning and across different agencies
is achieved, thereby enabling the simplification
of complex developments and the sequencing of
them with other infrastructure and services.
Land use, infrastructure, and amenities: Getting the basics right
In addition to coordinated land use master
planning, other tools and other provisions also play
an influential role in the development process for
cities. Planning often supports a multi-faceted and
organic process supported by other public sector
interventions and investments.
Figure C: The master planning process
Source: JLL Public Institutions - Municipal Advisory Practice
1. Analytical Framework/ Highest & Best Use
2. Master Planning 3. Approvals4. Project
Execution
164 FINANCE FOR CITY LEADERS HANDBOOK
Perhaps most important among these is infrastruc-
ture investment. Infrastructure systems are the
backbone of city competitiveness and long-term
success and are critical especially in emerging cities,
where metropolitan infrastructure is often the most
severe deficit.12 For example, rail transport with rapid
links to residential and employment districts, and to
nearby port and airport infrastructure, is perhaps
the most potent catalyst to unlock new develop-
ment and densification. Integrated public transport
and road connections can spread demand across a
city and improve access for different communities.
In addition, upfront capital investment in digital
and utilities infrastructure provides an importance
source of attractiveness and long-term efficiency
that is a solid platform for future development.
High-quality amenity investments are also central
to place shaping and development. Investment in
public spaces and parks, waterfront development,
and environmental improvements is necessary to
provide a welcoming environment for businesses
and workers, and can open up new or under-used
sub-centres in cities. Amenities improve the relative
attractiveness of city areas but also encourage more
mixed-use and “live/work” neighbourhoods, which
have other knock-on effects including a reduction
in peak travel demand, lower energy use, and
smaller environmental footprint.
Together, infrastructure and amenity investments
can help improve land values by providing sites with
key competitive advantages, thus increasing site
desirability while also offering broader social and
environmental benefits.
District development agencies are also created in
many cities to manage the complex process of
economic transition and building re-use. Develop-
ment agencies help build a consistent brand and
identity for areas, as well as offer professional
management of key assets.
Additionally, district management has become an
important element of maintaining the attractive-
ness of areas. Street-scaping, security, marketing,
and business partnerships are increasingly special-
ized and influential activities. Business improvement
districts (BIDs) are a common model that has played
a very important role in many cities, especially in
North America and Europe, but also in South Africa
and Latin America. BIDs have even become statuto-
ry consultees on local planning. They also provide
leadership, place-making management, and even
small-scale capital investment.
Relocation incentives or negotiations to persuade
the relocation of “urban anchors” such as univer-
sities, teaching hospitals, airports, stadia, or
high-profile companies are also noted catalysts of
development. Coherent branding and messaging
of neighbourhoods is also an important function
that can bring international visibility and activity to
an area.
Benefits of strategic, proactive planning
Effective and strategic planning can have a number
of important social and economic benefits over the
long term. In addition to achieving a balance of
environmental, economic, and social interests, the
benefits of planning include:
Minimizing uncertainty: Planning adds
certainty to the market, by stating within local
plans and other guidance the kind of devel-
opment that may be planned and built. This
includes identifying areas of opportunity or
intensification, preventing oversaturation of a
certain use class, or offering reassurance about
what may be built nearby.
FINANCE FOR CITY LEADERS HANDBOOK 165
Coordination: Planning helps coordinate and
sequence effectively with other kinds of devel-
opment.
Cost management: Planning can help reduce
high upfront infrastructure costs, which may act
as a barrier to development.
Balanced, mixed-use centres: Planning helps
minimize housing and job mismatches and the
social and economic costs these create.
Catalyst for social amenities: Planning triggers
investment in social infrastructure, helping to
create communities that are attractive to resi-
dents and businesses, thereby raising value.
Increased competitiveness: Planning can
enhance an area’s competitive advantage as
businesses cluster to benefit from supply chains,
skilled labour, and competitors.
A metropolitan perspective: Planning can
encourage growth decisions to take place at the
functional economic level.
Cross-sector partnership: Effective planning
can improve cooperation and a sense of duty
and responsibility between public and private
sectors.
The consequences of poor development
planning
The effects of poor development planning include:
Oversupply: A common planning failure of city
governments is the failure to protect investments
made by retailers and retail property sector
companies, by embracing multiple retail parks
and shopping malls. This causes oversupply that
limits yields and leads to investor frustration and
withdrawal.
Overly hasty lowering of barriers for new
businesses: Loose planning can assign locations
that later become obsolete or detached from
cluster formations.
Short-termism and lack of flexible space:
There are many examples of when cities fail to
consider how commercial sites will evolve over
a whole business cycle, denying start-ups the
ability for future growth.
Lowering of environmental standards:
Zoning for industrial investment can have
negative environmental externalities, which
aside from the immediate impact on local popu-
lations, also leave strategic sites unattractive and
subsequently constrain growth when cities try to
move up the value chain.
Inefficiencies: Poor planning can result in inef-
ficient travel patterns, higher costs, and disecon-
omies of agglomeration.
Fiscal disparities: As business activity and tax
retention is concentrated in a small proportion
of municipalities, fiscal disparities can result.
How public authorities attract private capital co-investment
For cities around the world, the sources and
systems of investment in real estate, infrastructure,
and other hard assets have changed quickly and
dramatically. Cities must negotiate this new pattern
of investment with different risk and return patterns
from the past, and with investment cycles that have
changed time frames and dynamics. These changes
require them to become more focused on the
conditions that will attract investment.
What is an investment-ready city?
Investment-readiness has become an important
attribute to ensure flows of investment can achieve
wider social and sustainable development goals.
Investment-readiness has been defined as:
166 FINANCE FOR CITY LEADERS HANDBOOK
“The demonstrated capacity of a city to prime itself
towards the needs of external investors, by providing
a credible and efficient framework and process for
external investment, coupled with a development
pipeline of bankable propositions and opportunities
that meet the specific process, asset, scale, and risk
management requirements of the investors”13
Investment-ready cities cultivate a reliable supply
of opportunities for inbound capital. To accomplish
this they prepare the opportunities and assets to
meet investor funding demands and risk/scale appe-
tites, and seek to understand how different forms
of investment capital need to be structured. It is
critical for city leaders to plan ahead and prepare an
analytical framework that will help understand the
implications of various capital structures and trans-
actions structures. Similarly, in public–private part-
nership transactions, where there is some form of
shared ownership stake between public and private
entities, it is imperative to understand both invest-
ment perspectives, and the meaning of partner-
ship, to structure mutually beneficial arrangements.
Working with experienced real estate profession-
als throughout the planning and partner solicita-
tion phases can streamline the project financing
and development phases. Once a city is invest-
ment-ready, they then look to maintain conditions
to ensure projects are bankable.
Governance framework and transparency
The quest for cities to become ready for investment
has invited concern that they are engaged either
in a destructive race to the bottom, or in a pursuit
of a quick windfall that does not protect business
and investor interests over the longer term. There
are certainly many instances where cities have inad-
vertently compromised their ability to compete
across whole cycles or multiple cycles by impulsively
accepting business investments of all types, in any
requested location and at any time.
Busan, Korea © United Nations
FINANCE FOR CITY LEADERS HANDBOOK 167
This raises the question of the right governance
framework for cities to be effectively invest-
ment-ready. City governments have to be mindful
of the investment demands of today’s firms, so that
core framework attractiveness can be complement-
ed with real channels for capital to find its way into
the city. They also need a full understanding of the
market and market evolution, and how it can be
shaped over whole business cycles.
Investors are responsive and supportive towards
coherent city visions that provide a clear and
evidence-led pathway for sector and spatial growth.
Credible leadership at the city level is almost always
a key concern. The experience of cities such as
Manchester and Brisbane shows that cities need to
have not just a clear plan and vision but also a “chief
negotiator” who acts as a high-profile single point
of contact and is able to reach a binding agreement
with an investor or locator that produces durable
benefits on both sides.
For a city to have hard assets that are invest-
ment-ready, it tends to need:
a stable, predictable, transparent, and consist-
ent environment for external investment, with
planning that minimizes the risk of oversupply,
or firm cannibalization;
a process for investment characterised by low
risks and predictable costs;
attractive risk-adjusted returns for different
classes of investors; and
the ability to leverage its own assets, including
public land and contracts.
Cities cannot achieve all of these outcomes by
themselves. The national system remains pivotal for
providing the transparency, political stability, and
legal predictability to attract rather than deter invest-
ment. Any overlap and friction between city-level
and national-level policies can create serious regu-
latory complexity, especially if it is accompanied by
governance misalignments. The challenge is for
cities to be strategically open for investment while
maintaining consistency and coherence among the
legal, regulatory, and legislative institutions at the
local and national levels. Cities whose governance
and institutional frameworks have been rated most
highly for business and investment attractiveness
include Singapore, Vancouver, and Auckland.14
Developing a pipeline of bankable projects
The potential of investors to commit capital hinges
on the availability of investible sites and on the regu-
latory and planning frameworks that support and
enable such investment to take place.15 Many cities
have developed an investment framework that
identifies and prioritizes a pipeline of commercial
and physical projects according to a wider growth
strategy and measurable impact. A robust pipeline
of financially viable propositions and opportuni-
ties is one that meets the specific process, asset,
scale, and risk management requirements of inves-
tors, including institutional investors (e.g., pension
funds). This means that cities need the technical
capacity to mount their own programme of devel-
opment.
How to capitalize on private capital’s interest in diversification
Diversification is widely viewed as a hallmark of a
strong investment portfolio. Long-term investments
in urban real estate are opportunities to diversify a
portfolio of stocks and bonds, and pool risk. This
option is also pursued by smaller scale investors
who may prefer to invest in real estate investment
trusts (REITs), limited partnerships, mutual funds, or
168 FINANCE FOR CITY LEADERS HANDBOOK
exchange-traded funds. Today institutional inves-
tors rarely allocate more than 10 per cent of their
portfolio to real estate.
Investors also increasingly prefer to diversify their
own real estate portfolio. Diversification is achieved
by location, property type, tenant, sector, or lease
term. This allows different investment strategies
to take form whereby capital is deployed accord-
ing to different combinations of risk appetite. As
this diversification approach takes hold, more cities
have an opportunity to benefit from real estate
investment.
Underlying issues
It is crucial to acknowledge underlying issues
that often affect real estate investment in devel-
oping cities. These include spatial development
in fast-growing cities, densification, technology,
and metropolitan areas with multiple jurisdic-
tions. Adapting plans to take into account these
often-unavoidable realities is essential.
Spatial development in fast-growing cities
With the global population currently growing at a
rate of 75 million people a year, urban populations
are accommodated in a number of different ways.
The default mode is sprawl and metropolitaniza-
tion, with cities expanding into a regional hinterland
developing a new polycentric and dispersed growth
pattern. Over the last two decades most cities in
the world have become less dense because they are
growing outwards. Cities in developing countries,
where almost all urban growth will take place, are
expected to triple their land area between 2005
and 2030. Urban footprint growth is expected to
be almost as significant in industrialized countries
(2.5 times overall growth), despite overall slower
rates of population growth.16
Especially in Asia and the Middle East, it is also
common to plan and construct new cities or
districts from scratch in order to absorb part of the
urbanizing labour force. However, there is increas-
ing consensus around the need to accommodate
more people and activities through an increase of
density within existing boundaries. When thinking
carefully about how to support population growth,
the preferred choice is well-managed and well-ser-
viced densification, especially among those cities
that have not yet reached their natural sizes, or
matched previous population peaks. But many
cities struggle to accommodate their rising popu-
lation growth, and do not easily find space for new
housing, schools, amenities, and parks. They resist
density and additional population, and they fear
over-crowding, loss of privacy, or the insecurity of
a more anonymous city.
Intensification, densification, and mixed use
It is widely agreed that densifying cities can accom-
modate population growth within a contained
environmental footprint, and that they can enjoy
better connectivity, amenities, open spaces, and
social interaction. (For an overview of the outcomes
of good density versus those of bad density, see
Figure D.) A joint ULI/Centre for Liveable Cities
report notes that the lower-density cities of the
United States use about five times more energy per
capita in gasoline than the cities of Europe, which
are in turn about five times denser on average.17
Dense cities in principle are able to become more
productive and host innovation. Significantly, dense
cities are also more investment-ready because of
their ability to assemble and package large sites to
institutional investors and other sources of capital.
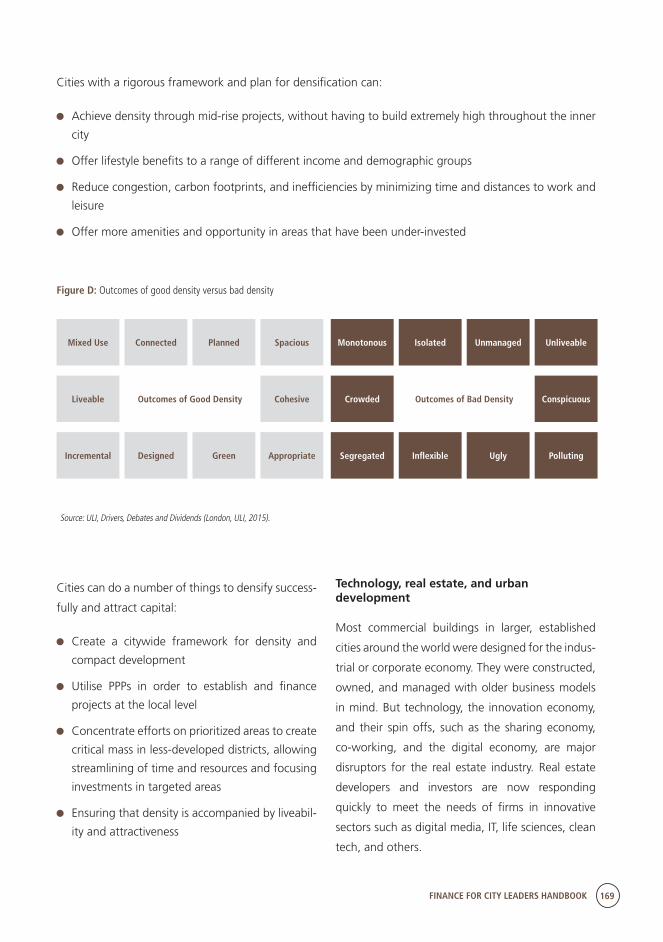
FINANCE FOR CITY LEADERS HANDBOOK 169
Cities with a rigorous framework and plan for densification can:
Achieve density through mid-rise projects, without having to build extremely high throughout the inner
city
Offer lifestyle benefits to a range of different income and demographic groups
Reduce congestion, carbon footprints, and inefficiencies by minimizing time and distances to work and
leisure
Offer more amenities and opportunity in areas that have been under-invested
Cities can do a number of things to densify success-
fully and attract capital:
Create a citywide framework for density and
compact development
Utilise PPPs in order to establish and finance
projects at the local level
Concentrate efforts on prioritized areas to create
critical mass in less-developed districts, allowing
streamlining of time and resources and focusing
investments in targeted areas
Ensuring that density is accompanied by liveabil-
ity and attractiveness
Technology, real estate, and urban development
Most commercial buildings in larger, established
cities around the world were designed for the indus-
trial or corporate economy. They were constructed,
owned, and managed with older business models
in mind. But technology, the innovation economy,
and their spin offs, such as the sharing economy,
co-working, and the digital economy, are major
disruptors for the real estate industry. Real estate
developers and investors are now responding
quickly to meet the needs of firms in innovative
sectors such as digital media, IT, life sciences, clean
tech, and others.
Figure D: Outcomes of good density versus bad density
Source: ULI, Drivers, Debates and Dividends (London, ULI, 2015).
Mixed Use
Liveable Crowded
Incremental Segregated
MonotonousConnected
Outcomes of Good Density Outcomes of Bad Density
Designed Inflexible
IsolatedPlanned
Green Ugly
UnmanagedSpacious
Cohesive Conspicuous
Appropriate Polluting
Unliveable
170 FINANCE FOR CITY LEADERS HANDBOOK
The rise of high-tech, innovation-led industries is a
disruptor across the spectrum. At the macro-scale,
the innovation economy is fuelling the demand to
locate in cities. Cities are the 21st century “labora-
tories” for commercial innovation and cross-fertil-
ization. They bring together a wide range of sectors,
deep international networks, customer and client
opportunities, and cultural and artistic quality. At
the meso-scale, areas or neighbourhoods are being
re-built to serve innovation as part of a broader
process of re-urbanization and re-densification.
The management and design of real estate have
therefore become key ingredients to support and
leverage this process for shared benefit. And at the
micro-scale, many of the existing buildings in cities
need to be re-purposed to fit the needs of new
occupiers. For the innovation economy, workplace
is a key enabler of organizational success, talent
attraction, and company brand.
Innovation in particular sectors today has specific
real estate requirements. In pharmaceutical and
biotech, for example, the rise of independent
research and development (R&D) providers means
there is demand for wet and dry lab space. Almost
all occupiers will have exacting technology needs,
including high-quality fibre broadband connectiv-
ity and power systems. These new requirements
are no longer solely the demands of innovators, as
their influence is now stretching to more traditional
occupiers in business and financial services firms. In
short, the innovation economy has kick-started a
revolution in real estate demand.
Meeting the new demands of the innovation
economy (and increasingly of other sectors that
are following its lead) presents challenges for the
business models of real estate owners and land-
lords. The real estate industry—developers, inves-
tors, owners, and planners—has had to re-think
spatial form and business models. Many are making
project and property adaptations to enhance the
attractiveness and utility of their real estate assets
to innovation firms—workspace innovations, new
kinds of commercial space, adaptable buildings,
and advice and support for start-ups. As part of
real estate’s shift towards providing stewardship,
management, and services in addition to the raw
asset, real estate is becoming more active to create
a more supportive operating framework for inno-
vation, for improving finance and access to capital,
and enhancing city- and district-wide attractiveness
by managing housing, social infrastructure, and
civic and public space.
The overall impact of technological change on real
estate is that the industry is beginning to adopt
more of a service-provider mindset and align inter-
ests and transparency between owners and occu-
piers. New imperatives have emerged to ensure
commercial buildings have a robust technology
platform, that routes to capital for growing firms
are clear, encourage collaboration with mature
institutions, and grow value over time through
involved property management.18 These needs align
with those of cities more broadly. Cities that seek to
become centres of innovation require high-quality
IT and utilities infrastructure. This will help univer-
sities and knowledge systems attract and support
innovators and the next generation of technolo-
gy-oriented workers.
Multi-jurisdictional metropolitan areas and real estate development
Real estate does not only look for investable sites
and willing development partners in cities. The
typical investor also looks for particular qualities
in their public sector partners. They look to invest
in cities that act in predictable ways—that have
FINANCE FOR CITY LEADERS HANDBOOK 171
a well-defined long-term vision, clear planning
frameworks, and rational land use policies. Cities
that have good infrastructure that is appropri-
ately supported by revenues are desirable, as are
places that can leverage their own assets, including
publicly owned land. And although clear frame-
works are essential, investors will inevitably favour
cities that have the ability and desire to be flexible
in their approach to planning in order to reach their
development goals. Finally, cities with competent,
efficient, and investment-savvy management teams
make strong partners.
Most cities do not yet represent this “model”
partner. They may have opaque spatial policies, or
inefficient processes for investment that can lead
them to act unpredictably or unproductively. They
may be limited by underpowered or inexperienced
decision-makers.
For cities that embrace a “managed metropolis”
approach, there is the promise of improved tools to
promote urban development and attract property
investment. These tools can include:
A move towards spatial development strategies
and longer-term planning that provides greater
vision and clarity to future development. Cities
that are empowered to develop and deliver
their own long-term strategic plans have a
mechanism through which to crystallize clear
and defined, spatially and sectorally integrated
options for the future. Long-term plans can act
as an investment prospectus for private sector
sources of investment capital.
Elected mayors with increased land use planning
decision-making powers and roles in housing,
transport, and economic development. Strong,
visible metropolitan leaders, elected with a clear
mandate, can provide reassuring certainty to
investors as a single “go-to” accountable figure,
as opposed to the opacity of local authorities.
Better-integrated capital investment budgets. Fiscal devolution can lead to a greater certainty
of funds for local governments, enabling inte-
grated capital investment budgets and long-
term capital planning. Integrated budgets make
the use of single appraisal frameworks possible
and facilitate prioritization of projects in line
with strategic objectives. In this way devolution
can be an important catalyst for cities to develop
their capacity to manage their funding and
become more competent partners for private
finance.
Better integration of transport investment
with land use planning. Transport and land
use planning under centralized systems are too
often subject to silo-based thinking, with indi-
vidual ministries creating rigid frameworks for
local decision-making. Devolution of responsibil-
ity provides the potential for a more joined-up
approach, which can result in efficient transport
systems that are a major factor in quality-of-life
assessments and a city’s broader attractiveness
to talent and firms.
Greater coordination of public land portfoli-
os for development. Devolution of powers can
enable local authorities to proactively assemble
land parcels of the necessary scale to stimu-
late the market and create attractive projects
for investors. Hafen City in Hamburg is one of
many examples of autonomous local author-
ities creating attractive mega-sites for private
sector investment. A city or metro’s devolved
powers might also include the ability to desig-
nate special development corporations for major
parcels of redevelopment land that can be more
nimble partners for the private sector.
Increased access to business rates and value
capture financing techniques. Retaining business
rates at the local level both incentivizes local
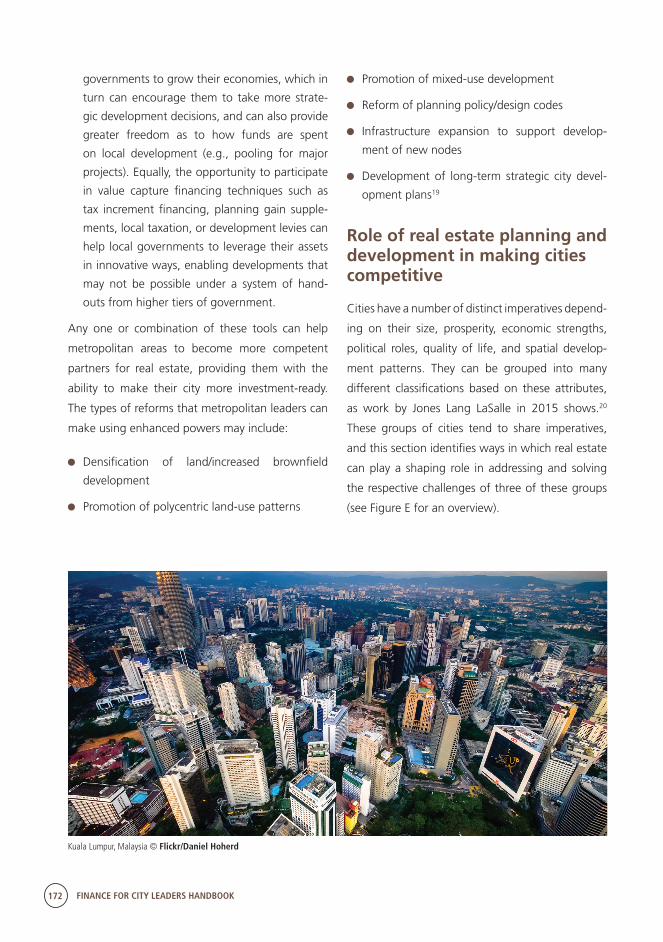
172 FINANCE FOR CITY LEADERS HANDBOOK
governments to grow their economies, which in
turn can encourage them to take more strate-
gic development decisions, and can also provide
greater freedom as to how funds are spent
on local development (e.g., pooling for major
projects). Equally, the opportunity to participate
in value capture financing techniques such as
tax increment financing, planning gain supple-
ments, local taxation, or development levies can
help local governments to leverage their assets
in innovative ways, enabling developments that
may not be possible under a system of hand-
outs from higher tiers of government.
Any one or combination of these tools can help
metropolitan areas to become more competent
partners for real estate, providing them with the
ability to make their city more investment-ready.
The types of reforms that metropolitan leaders can
make using enhanced powers may include:
Densification of land/increased brownfield
development
Promotion of polycentric land-use patterns
Promotion of mixed-use development
Reform of planning policy/design codes
Infrastructure expansion to support develop-
ment of new nodes
Development of long-term strategic city devel-
opment plans19
Role of real estate planning and development in making cities competitive
Cities have a number of distinct imperatives depend-
ing on their size, prosperity, economic strengths,
political roles, quality of life, and spatial develop-
ment patterns. They can be grouped into many
different classifications based on these attributes,
as work by Jones Lang LaSalle in 2015 shows.20
These groups of cities tend to share imperatives,
and this section identifies ways in which real estate
can play a shaping role in addressing and solving
the respective challenges of three of these groups
(see Figure E for an overview).
Kuala Lumpur, Malaysia © Flickr/Daniel Hoherd
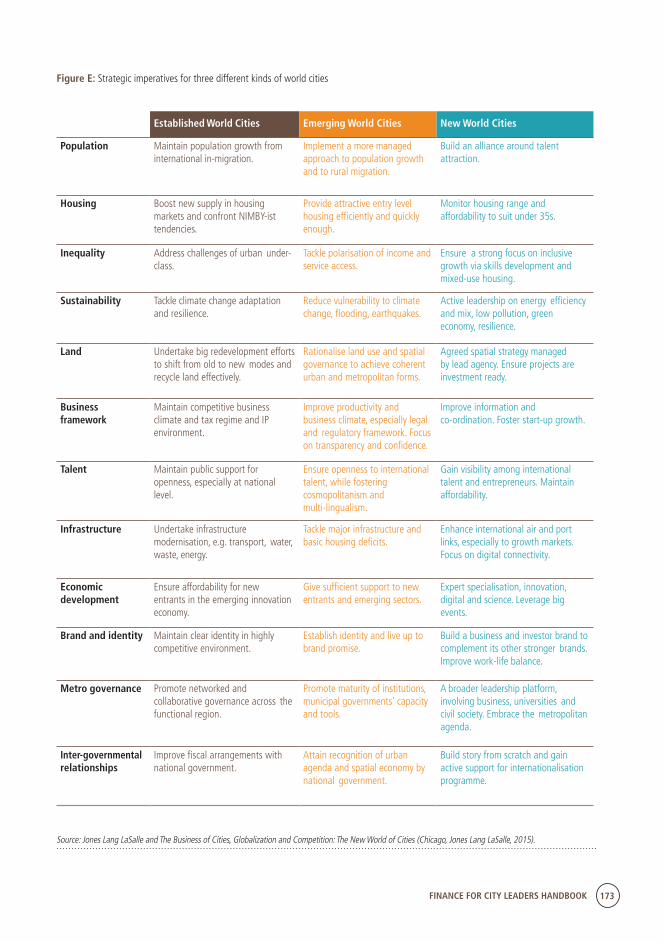
FINANCE FOR CITY LEADERS HANDBOOK 173
Established World Cities Emerging World Cities New World Cities
Population Maintain population growth from international in-migration.
Implement a more managed approach to population growth and to rural migration.
Build an alliance around talent attraction.
Housing Boost new supply in housing markets and confront NIMBY-ist tendencies.
Provide attractive entry level housing efficiently and quickly enough.
Monitor housing range and affordability to suit under 35s.
Inequality Address challenges of urban under-class.
Tackle polarisation of income and service access.
Ensure a strong focus on inclusive growth via skills development and mixed-use housing.
Sustainability Tackle climate change adaptation and resilience.
Reduce vulnerability to climate change, flooding, earthquakes.
Active leadership on energy efficiency and mix, low pollution, green economy, resilience.
Land Undertake big redevelopment efforts to shift from old to new modes and recycle land effectively.
Rationalise land use and spatial governance to achieve coherent urban and metropolitan forms.
Agreed spatial strategy managed by lead agency. Ensure projects are investment ready.
Business framework
Maintain competitive business climate and tax regime and IP environment.
Improve productivity and business climate, especially legal and regulatory framework. Focus on transparency and confidence.
Improve information andco-ordination. Foster start-up growth.
Talent Maintain public support for openness, especially at national level.
Ensure openness to international talent, while fostering cosmopolitanism andmulti-lingualism.
Gain visibility among international talent and entrepreneurs. Maintain affordability.
Infrastructure Undertake infrastructure modernisation, e.g. transport, water, waste, energy.
Tackle major infrastructure and basic housing deficits.
Enhance international air and port links, especially to growth markets. Focus on digital connectivity.
Economic development
Ensure affordability for new entrants in the emerging innovation economy.
Give sufficient support to new entrants and emerging sectors.
Expert specialisation, innovation, digital and science. Leverage big events.
Brand and identity Maintain clear identity in highly competitive environment.
Establish identity and live up to brand promise.
Build a business and investor brand to complement its other stronger brands. Improve work-life balance.
Metro governance Promote networked and collaborative governance across the functional region.
Promote maturity of institutions, municipal governments’ capacity and tools.
A broader leadership platform, involving business, universities and civil society. Embrace the metropolitan agenda.
Inter-governmental relationships
Improve fiscal arrangements with national government.
Attain recognition of urban agenda and spatial economy by national government.
Build story from scratch and gain active support for internationalisation programme.
Figure E: Strategic imperatives for three different kinds of world cities
Source: Jones Lang LaSalle and The Business of Cities, Globalization and Competition: The New World of Cities (Chicago, Jones Lang LaSalle, 2015).
174 FINANCE FOR CITY LEADERS HANDBOOK
Established World Cities’ imperatives
Established world cities (e.g., London, New York,
and Paris)—the large globalized cities that have
experienced significant international demand
from people, firms, investors, and visitors—face a
number of critical issues as they look to manage
their growth. Most pertinently, they need to boost
new supply in housing markets and confront oppo-
sition of existing asset-owners to new develop-
ment, if they seek to avoid becoming prohibitively
expensive to the younger workforce. The role of
real estate here is multi-faceted, as they are valued
partners in the effort to increase the rate of housing
supply in collaboration with public authorities. Real
estate can drive a diversification of ownership
models, and institutional investment can increase
the viability of long-term rental.
Real estate also has a role to play in densifying
to bring forward mixed-income and mixed-use
developments, and for undertaking redevel-
opment efforts to shift from old to new modes
and recycle land effectively. And for this group of
cities to maintain a competitive business climate
and affordability for new entrants, it is important
real estate provides innovative, affordable, and
flexible office solutions for the growing innovation
sectors. Finally, real estate will be a critical partner
in the process of infrastructure modernization for
these aging cities, and for undertaking integrat-
ed projects that span several jurisdictions in those
established cities that lack a proper metropolitan
leadership.
Emerging World Cities’ imperatives
For major cities in emerging economies (e.g.,
Shanghai, Sao Paulo, and Mumbai), a very different
set of challenges is visible for which real estate will
play an important role in addressing. This group of
cities urgently relies on a more managed approach
to population growth and to rural migration. Real
estate planning has a big contribution to make
in terms of the provision of mass housing, and
place-making and renewal in monolithic suburbs
and ribbon development. These cities also expe-
rience severe polarization of income and service
access, and here real estate planning requires
projects that build in public amenities and social
infrastructure (child care, schools, health), and
which militate against enclave urbanism.
Real estate development must also support these
cities’ attempts to reduce vulnerability to climate
change, flooding, and earthquakes through
first-mover adaptation to resilient and sustainable
building design. The sector also has a role to play
to improve transparency, and to establish these
cities’ identities so that they live up to and exceed
their promise to international markets.
New World Cities’ imperatives
The most recent cycle of globalization since 2008
has seen a large number of cities become more
intentionally global in their economic orientation.
These “new” world cities (e.g., Auckland, Tel Aviv,
and Vienna) are usually medium-sized cities, with
a small number of distinct specializations, and a
reputation for high quality of life. Their challeng-
es revolve around increasing their connectivity to
international markets, and creating a more metro-
politan approach to adjust to increased scale,
become more polycentric, and manage the exter-
nalities of growth.
Real estate planning and development can help
these cities create critical mass in new sub-cen-
tres by sequencing infrastructure, amenities, and
FINANCE FOR CITY LEADERS HANDBOOK 175
housing to achieve the necessary level of vibrancy
and demand. Because these cities rely on their
capacity to host entrepreneurship, real estate
planning can also play a role in ensuring avail-
ability of housing in inner-city locations, near the
main “innovation districts.” The need for these
cities to cultivate expert specialization in innova-
tion, digital, and science means planning should
promote synergies among universities, civil society,
and firms. These cities also take an active leader-
ship role in terms of energy efficiency and mix, and
low pollution and green economy initiatives, and
real estate planning has to accelerate the shift to
compact growth within a wider strategy.
Conclusion
The process of urbanization is one of the most
significant trends of the 21st century, and is inex-
tricably linked to land use, property development,
and real estate markets. Cities now influence social,
political, and economic relations at every level and
are major factors in creating land use agendas and
priorities. Employing a coordinated, disciplined
approach to planning across both public and private
sectors, and supporting those efforts with a trans-
parent regulatory environment, are fundamental
factors in reducing development-related risks and
attracting investment capital. Managed growth
and effective planning approaches can positively
impact and preserve a balance of key social, envi-
ronmental, and economic interests.
176 FINANCE FOR CITY LEADERS HANDBOOK
Greg Clark is Hon Professor, and co-chairman of the advisory board at the City Leadership Initiative,
University College London, and the author of 10 books on global city and regional development.
Tim Moonen is director of intelligence at The Business of Cities, an advisory firm based in London, and
specializes in the governance, financing, and comparative performance of cities.
Doug Carr is a New York–based vice president for Jones Lang LaSalle in the Public Institutions Group,
focused on providing real estate planning and development advisory services on behalf of government,
educational, and nonprofit organizations, with a particular expertise in public-private partnerships and
transit-oriented development projects.
Endnotes
1 Pricewaterhouse Coopers, Real Estate 2020: Building the Future (New York, Pricewaterhouse Coopers, 2015). Available from http://www.pwc.com/sg/en/real-estate/as-sets/pwc-real-estate-2020-building-the-future.pdf.
2 Paul Kantor, Christian Lefèvre, Asato Saito, H. V. Savitch, and Andy Thornley, Struggling Giants: City-Region Governance in London, New York, Paris, and Tokyo (Minne-apolis, University of Minnesota Press, 2012); George Ritzer and Paul Dean, Globalization: A Basic Text (London, Wiley, 2015).
3 Jones Lang LaSalle and The Business of Cities, Bench-marking the Future World of Cities (Chicago, Jones Lang LaSalle, 2016); Jones Lang LaSalle and The Business of Cities, Globalization, Competition, and The New World of Cities (Chicago, Jones Lang LaSalle, 2015).
4 Jones Lang LaSalle and The Business of Cities, Bench-marking the Future World of Cities (Chicago, Jones Lang LaSalle, 2016).
5 Joe Huxley, Value Capture Finance: Making Urban Development Pay Its Way (London, ULI Europe, 2009). Available from http://uli.org/wp-content/uploads/ULI-Docu-ments/Value-Capture-Finance-Report.pdf.
6 Melanie Kembrie, “Hong Kong Metro System Oper-ators MTR Spread ‘Value Capture’ Message to Australia,” Sydney Morning Herald, 18 December 2015, available from www.smh.com.au/national/hong-kong-metro-system-op-erators-mtr-spread-value-capture-message-to-australia-20151215-glo0wq.html; Blanca Fernandez Milan, “Local Financing Schemes for Urban Mobility Planning,” Mercator Research Institute on Global Commons and Climate
Change, presentation at Civitas Forum 2015, available from www.civitas.eu/sites/default/files/documents/fernan-dez2015_civitas2015.pdf.
7 Martim Smolka, “Value Capture: A Land Based Tool to Finance Urban Development,” Lincoln Institute of Land Policy, presentation delivered 2 February 2015.
8 Hiroaki Suzuki, Jin Murakami, Yu-Hung Hong, and Beth Tamayose, Financing Transit-Oriented Development with Land Values (Washington, D.C., World Bank, 2015).
9 Sabariah Eni, Urban Regeneration Financing and Land Value Capture in Malaysia (Ulster, University of Ulster, 2014). Available from http://eprints.uthm.edu.my/7901/.
10 Royal Town Planning Institute, Fostering Growth: Understanding and Strengthening the Economic Benefits of Planning (London, RTPI, 2014). Available from www.rtpi.org.uk/media/1020786/rtpi_fostering_growth_june_2014.pdf.
11 Hiroaki Suzuki, Jin Murakami, Yu-Hung Hong, and Beth Tamayose, Financing Transit-Oriented Development with Land Values (Washington, World Bank, 2015).
12 Jones Lang LaSalle and The Business of Cities, Global-ization, Competition, and The New World of Cities (Chicago, Jones Lang LaSalle, 2015).
13 Greg Clark, Business-Friendly and Investment-Ready Cities (London, Urban Land Institute, 2014). Available from http://europe.uli.org/wp-content/uploads/sites/3/ULI-Docu-ments/Business-Friendly-Report-final.pdf.
FINANCE FOR CITY LEADERS HANDBOOK 177
14 Economist Intelligence Unit, Hotspots (London, Economist Intelligence Unit, 2013). Available from www.citigroup.com/citi/citiforcities/pdfs/hotspots2025.pdf.
15 Greg Clark, Business-Friendly and Investment-Ready Cities (London, Urban Land Institute, 2014). Available from http://europe.uli.org/wp-content/uploads/sites/3/ULI-Docu-ments/Business-Friendly-Report-final.pdf.
16 Greg Clark and Emily Moir, Density: Drivers, Dividends, Debates (London, ULI Europe, 2015).
17 Centre for Liveable Cities and Urban Land Institute, 10 Principles for Liveable High-Density Cities: Lessons from Singapore (Singapore, Centre for Liveable Cities, 2013). Available from http://uli.org/wp-content/uploads/ULI-Docu-ments/10PrinciplesSingapore.pdf.
18 Greg Clark and Tim Moonen, Technology, Real Estate and the Innovation Economy (London, ULI Europe, 2015).
19 Rosemary Feenan, Greg Clark, Emily Moir, Tim Moonen, Metro Governance, Devolution and the Real Es-tate Friendly City (unpublished, 2016).
20 Jones Lang LaSalle and The Business of Cities, Global-ization, Competition, and The New World of Cities (Chicago, Jones Lang LaSalle, 2015).
Improving Capital Markets for Municipal Finance in Least Developed Countries
11Introduction
Adopted in September 2015, the United Nations’ Sustainable Develop-
ment Goals (SDGs) established an agenda for the next 15 years for devel-
oping and developed countries alike. These goals place a special emphasis
on environmental issues in addition to reducing poverty and promoting
quality education, good health, and gender equality.1
Over 80 per cent of the world’s population lives in less-developed
regions—13 per cent of them in least developed countries (LDCs) that lag
significantly in key social and economic indicators. It is especially import-
ant to ensure effective SDG implementation in these LDCs.
A key challenge for LDCs is financing the implementation of the SDGs.
Modern infrastructure is a key component in achieving the SDGs, and
meeting only the basic infrastructure investment needs of developing
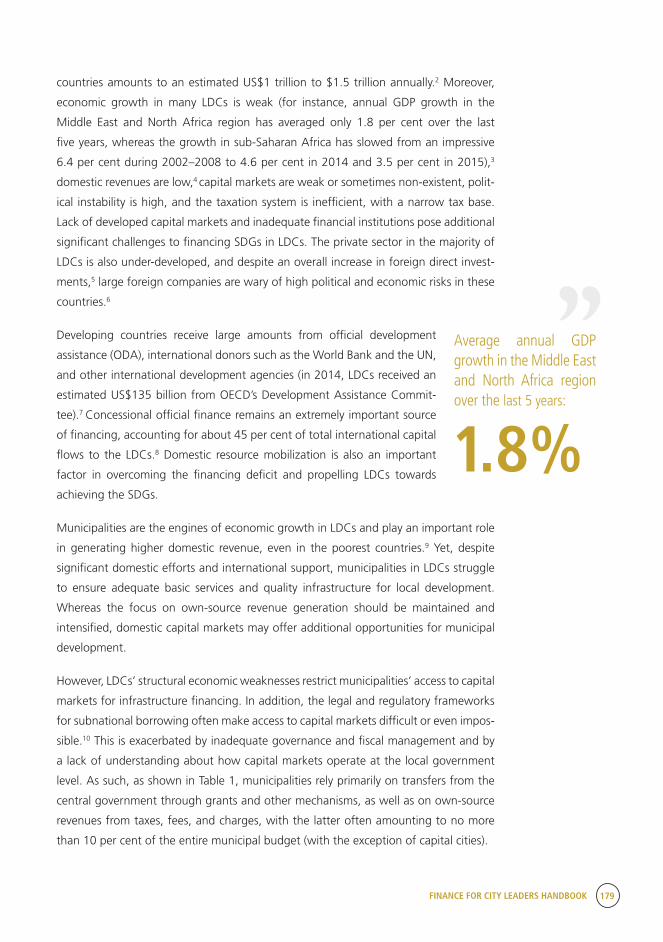
FINANCE FOR CITY LEADERS HANDBOOK 179
countries amounts to an estimated US$1 trillion to $1.5 trillion annually.2 Moreover,
economic growth in many LDCs is weak (for instance, annual GDP growth in the
Middle East and North Africa region has averaged only 1.8 per cent over the last
five years, whereas the growth in sub-Saharan Africa has slowed from an impressive
6.4 per cent during 2002–2008 to 4.6 per cent in 2014 and 3.5 per cent in 2015),3
domestic revenues are low,4 capital markets are weak or sometimes non-existent, polit-
ical instability is high, and the taxation system is inefficient, with a narrow tax base.
Lack of developed capital markets and inadequate financial institutions pose additional
significant challenges to financing SDGs in LDCs. The private sector in the majority of
LDCs is also under-developed, and despite an overall increase in foreign direct invest-
ments,5 large foreign companies are wary of high political and economic risks in these
countries.6
Developing countries receive large amounts from official development
assistance (ODA), international donors such as the World Bank and the UN,
and other international development agencies (in 2014, LDCs received an
estimated US$135 billion from OECD’s Development Assistance Commit-
tee).7 Concessional official finance remains an extremely important source
of financing, accounting for about 45 per cent of total international capital
flows to the LDCs.8 Domestic resource mobilization is also an important
factor in overcoming the financing deficit and propelling LDCs towards
achieving the SDGs.
Municipalities are the engines of economic growth in LDCs and play an important role
in generating higher domestic revenue, even in the poorest countries.9 Yet, despite
significant domestic efforts and international support, municipalities in LDCs struggle
to ensure adequate basic services and quality infrastructure for local development.
Whereas the focus on own-source revenue generation should be maintained and
intensified, domestic capital markets may offer additional opportunities for municipal
development.
However, LDCs’ structural economic weaknesses restrict municipalities’ access to capital
markets for infrastructure financing. In addition, the legal and regulatory frameworks
for subnational borrowing often make access to capital markets difficult or even impos-
sible.10 This is exacerbated by inadequate governance and fiscal management and by
a lack of understanding about how capital markets operate at the local government
level. As such, as shown in Table 1, municipalities rely primarily on transfers from the
central government through grants and other mechanisms, as well as on own-source
revenues from taxes, fees, and charges, with the latter often amounting to no more
than 10 per cent of the entire municipal budget (with the exception of capital cities).
Average annual GDP growth in the Middle East and North Africa region over the last 5 years:
1.8%
“
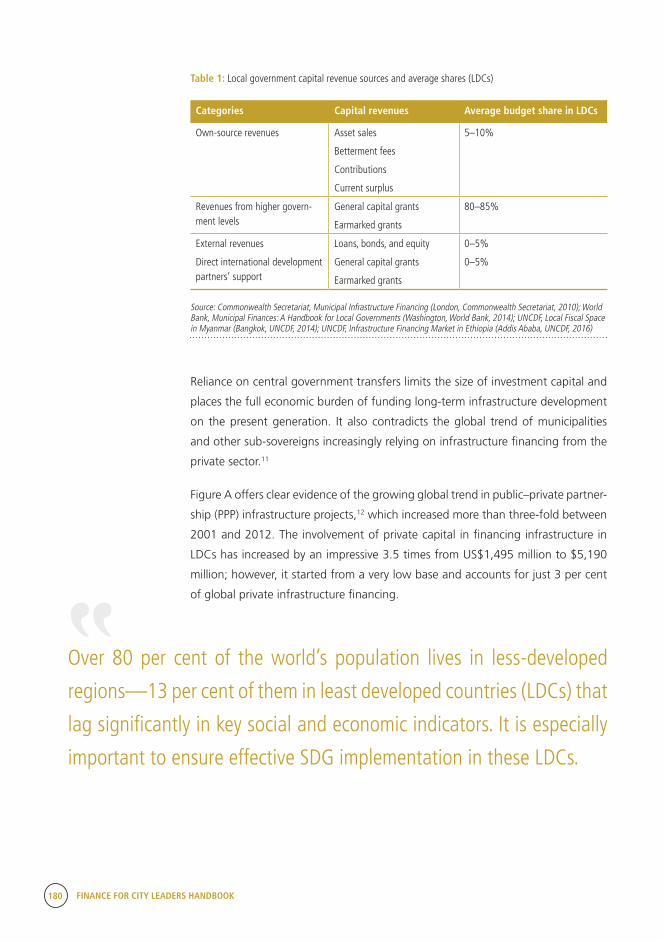
180 FINANCE FOR CITY LEADERS HANDBOOK
Table 1: Local government capital revenue sources and average shares (LDCs)
Categories Capital revenues Average budget share in LDCs
Own-source revenues Asset sales
Betterment fees
Contributions
Current surplus
5–10%
Revenues from higher govern-ment levels
General capital grants
Earmarked grants
80–85%
External revenues
Direct international development partners’ support
Loans, bonds, and equity
General capital grants
Earmarked grants
0–5%
0–5%
Source: Commonwealth Secretariat, Municipal Infrastructure Financing (London, Commonwealth Secretariat, 2010); World Bank, Municipal Finances: A Handbook for Local Governments (Washington, World Bank, 2014); UNCDF, Local Fiscal Space in Myanmar (Bangkok, UNCDF, 2014); UNCDF, Infrastructure Financing Market in Ethiopia (Addis Ababa, UNCDF, 2016)
Reliance on central government transfers limits the size of investment capital and
places the full economic burden of funding long-term infrastructure development
on the present generation. It also contradicts the global trend of municipalities
and other sub-sovereigns increasingly relying on infrastructure financing from the
private sector.11
Figure A offers clear evidence of the growing global trend in public–private partner-
ship (PPP) infrastructure projects,12 which increased more than three-fold between
2001 and 2012. The involvement of private capital in financing infrastructure in
LDCs has increased by an impressive 3.5 times from US$1,495 million to $5,190
million; however, it started from a very low base and accounts for just 3 per cent
of global private infrastructure financing.
Over 80 per cent of the world’s population lives in less-developed
regions—13 per cent of them in least developed countries (LDCs) that
lag significantly in key social and economic indicators. It is especially
important to ensure effective SDG implementation in these LDCs.
“
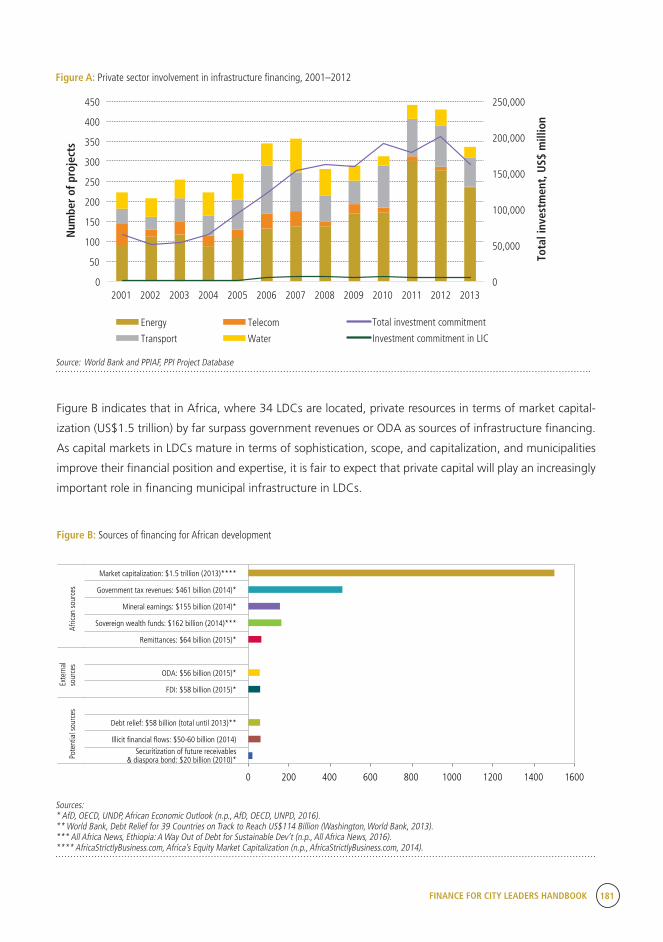
FINANCE FOR CITY LEADERS HANDBOOK 181
0
50,000
100,000
150,000
200,000
250,000
0
50
100
150
200
250
300
350
400
450
2001 2002 2003 2004 2005 2006 2007 2008 2009 2010 2011 2012 2013
Tota
l inv
estm
ent,
US$
mill
ion
Num
ber
of p
roje
cts
Energy Telecom
Transport Water
Total investment commitment
Investment commitment in LIC
Figure A: Private sector involvement in infrastructure financing, 2001–2012
Source: World Bank and PPIAF, PPI Project Database
Figure B indicates that in Africa, where 34 LDCs are located, private resources in terms of market capital-
ization (US$1.5 trillion) by far surpass government revenues or ODA as sources of infrastructure financing.
As capital markets in LDCs mature in terms of sophistication, scope, and capitalization, and municipalities
improve their financial position and expertise, it is fair to expect that private capital will play an increasingly
important role in financing municipal infrastructure in LDCs.
Figure B: Sources of financing for African development
0 200 400 600 800 1000 1200 1400 1600
Securitization of future receivables& diaspora bond: $20 billion (2010)*
Illicit �nancial �ows: $50-60 billion (2014)
Debt relief: $58 billion (total until 2013)**
FDI: $58 billion (2015)*
ODA: $56 billion (2015)*
Remittances: $64 billion (2015)*
Sovereign wealth funds: $162 billion (2014)***
Mineral earnings: $155 billion (2014)*
Government tax revenues: $461 billion (2014)*
Market capitalization: $1.5 trillion (2013)****
Pote
ntia
l sou
rces
Exte
rnal
sour
ces
Afric
an s
ourc
es
Sources: * AfD, OECD, UNDP, African Economic Outlook (n.p., AfD, OECD, UNPD, 2016). ** World Bank, Debt Relief for 39 Countries on Track to Reach US$114 Billion (Washington, World Bank, 2013). *** All Africa News, Ethiopia: A Way Out of Debt for Sustainable Dev’t (n.p., All Africa News, 2016). **** AfricaStrictlyBusiness.com, Africa’s Equity Market Capitalization (n.p., AfricaStrictlyBusiness.com, 2014).
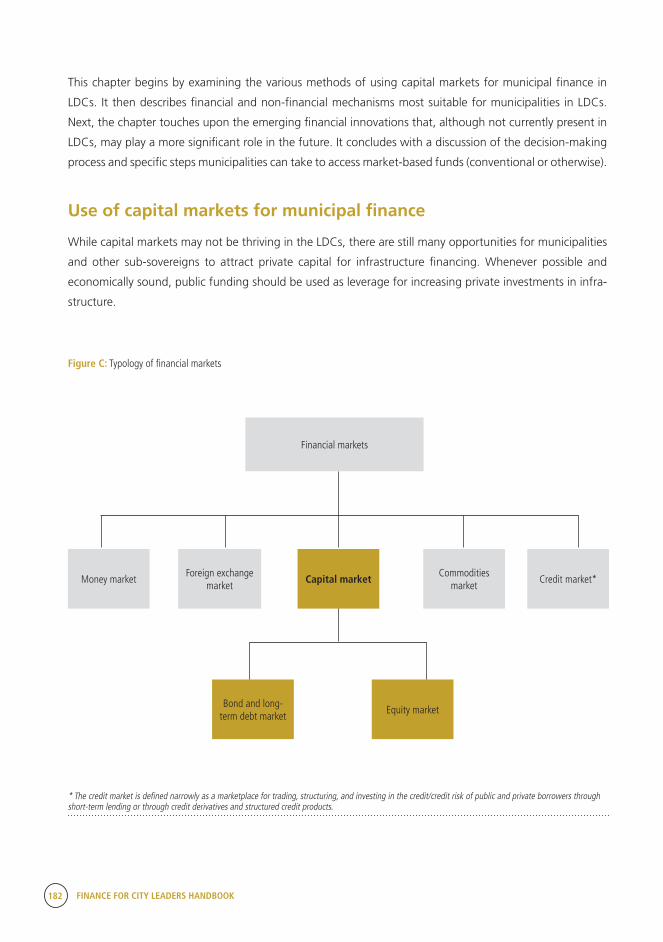
182 FINANCE FOR CITY LEADERS HANDBOOK
This chapter begins by examining the various methods of using capital markets for municipal finance in
LDCs. It then describes financial and non-financial mechanisms most suitable for municipalities in LDCs.
Next, the chapter touches upon the emerging financial innovations that, although not currently present in
LDCs, may play a more significant role in the future. It concludes with a discussion of the decision-making
process and specific steps municipalities can take to access market-based funds (conventional or otherwise).
Use of capital markets for municipal finance
While capital markets may not be thriving in the LDCs, there are still many opportunities for municipalities
and other sub-sovereigns to attract private capital for infrastructure financing. Whenever possible and
economically sound, public funding should be used as leverage for increasing private investments in infra-
structure.
Financial markets
Capital market
Bond and long-term debt market
Foreign exchange market
Commodities market
Equity market
Money market Credit market*
* The credit market is defined narrowly as a marketplace for trading, structuring, and investing in the credit/credit risk of public and private borrowers through short-term lending or through credit derivatives and structured credit products.
Figure C: Typology of financial markets
As shown in Figure C, private finance comes in two
basic forms: equity and debt. Equity is financial
interest in an infrastructure project that is sold to
private investors by the project owner (a public or
private entity). Unlike debt, equity does not have to
be repaid, but it is much more difficult to acquire
and more expensive than debt. In more developed
countries, municipal companies are listed on the
stock exchange and issue equity either for public or
private placement with targeted institutional inves-
tors (such as pension funds). However, this avenue
is only available for established and well-capital-
ized companies and requires well-developed and
thriving venture capital and stock markets.
In comparison, in LDCs, private equity may be
attracted through non-market mechanisms, such
as when a private entity (including an institution-
al investor) commits equity to a new infrastruc-
ture project through a project-based partner-
ship arrangement with a municipality. In its most
general form, such an arrangement would involve
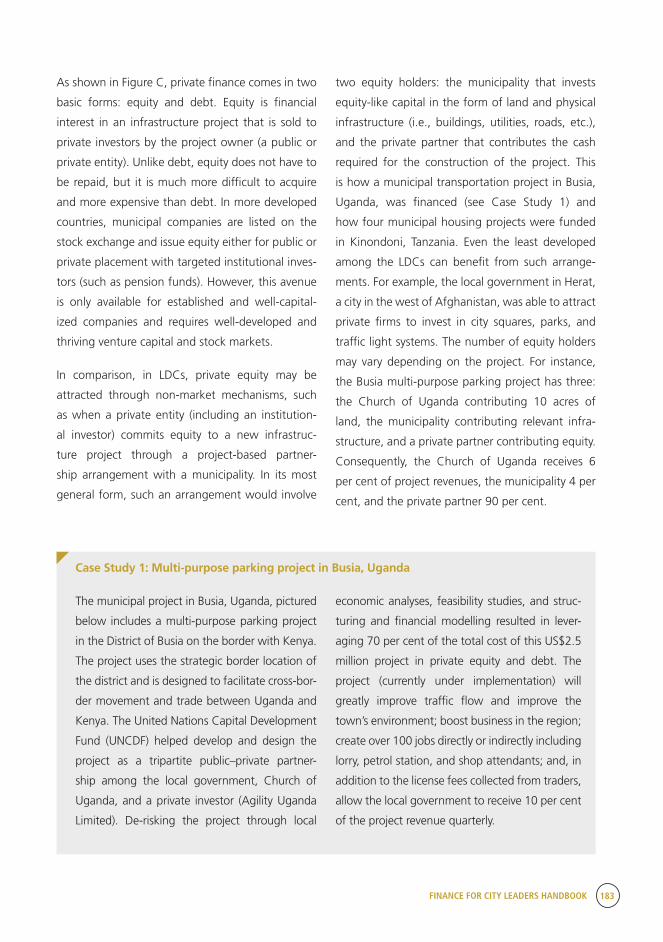
FINANCE FOR CITY LEADERS HANDBOOK 183
As shown in Figure C, private finance comes in two
basic forms: equity and debt. Equity is financial
interest in an infrastructure project that is sold to
private investors by the project owner (a public or
private entity). Unlike debt, equity does not have to
be repaid, but it is much more difficult to acquire
and more expensive than debt. In more developed
countries, municipal companies are listed on the
stock exchange and issue equity either for public or
private placement with targeted institutional inves-
tors (such as pension funds). However, this avenue
is only available for established and well-capital-
ized companies and requires well-developed and
thriving venture capital and stock markets.
In comparison, in LDCs, private equity may be
attracted through non-market mechanisms, such
as when a private entity (including an institution-
al investor) commits equity to a new infrastruc-
ture project through a project-based partner-
ship arrangement with a municipality. In its most
general form, such an arrangement would involve
two equity holders: the municipality that invests
equity-like capital in the form of land and physical
infrastructure (i.e., buildings, utilities, roads, etc.),
and the private partner that contributes the cash
required for the construction of the project. This
is how a municipal transportation project in Busia,
Uganda, was financed (see Case Study 1) and
how four municipal housing projects were funded
in Kinondoni, Tanzania. Even the least developed
among the LDCs can benefit from such arrange-
ments. For example, the local government in Herat,
a city in the west of Afghanistan, was able to attract
private firms to invest in city squares, parks, and
traffic light systems. The number of equity holders
may vary depending on the project. For instance,
the Busia multi-purpose parking project has three:
the Church of Uganda contributing 10 acres of
land, the municipality contributing relevant infra-
structure, and a private partner contributing equity.
Consequently, the Church of Uganda receives 6
per cent of project revenues, the municipality 4 per
cent, and the private partner 90 per cent.
Case Study 1: Multi-purpose parking project in Busia, Uganda
The municipal project in Busia, Uganda, pictured
below includes a multi-purpose parking project
in the District of Busia on the border with Kenya.
The project uses the strategic border location of
the district and is designed to facilitate cross-bor-
der movement and trade between Uganda and
Kenya. The United Nations Capital Development
Fund (UNCDF) helped develop and design the
project as a tripartite public–private partner-
ship among the local government, Church of
Uganda, and a private investor (Agility Uganda
Limited). De-risking the project through local
economic analyses, feasibility studies, and struc-
turing and financial modelling resulted in lever-
aging 70 per cent of the total cost of this US$2.5
million project in private equity and debt. The
project (currently under implementation) will
greatly improve traffic flow and improve the
town’s environment; boost business in the region;
create over 100 jobs directly or indirectly including
lorry, petrol station, and shop attendants; and, in
addition to the license fees collected from traders,
allow the local government to receive 10 per cent
of the project revenue quarterly.
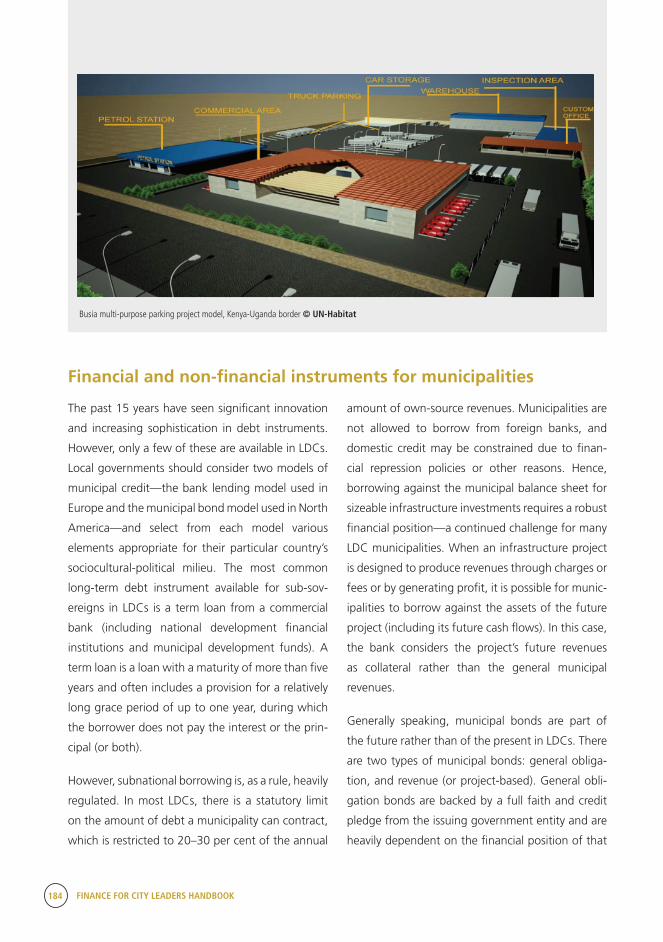
184 FINANCE FOR CITY LEADERS HANDBOOK
Financial and non-financial instruments for municipalities
amount of own-source revenues. Municipalities are
not allowed to borrow from foreign banks, and
domestic credit may be constrained due to finan-
cial repression policies or other reasons. Hence,
borrowing against the municipal balance sheet for
sizeable infrastructure investments requires a robust
financial position—a continued challenge for many
LDC municipalities. When an infrastructure project
is designed to produce revenues through charges or
fees or by generating profit, it is possible for munic-
ipalities to borrow against the assets of the future
project (including its future cash flows). In this case,
the bank considers the project’s future revenues
as collateral rather than the general municipal
revenues.
Generally speaking, municipal bonds are part of
the future rather than of the present in LDCs. There
are two types of municipal bonds: general obliga-
tion, and revenue (or project-based). General obli-
gation bonds are backed by a full faith and credit
pledge from the issuing government entity and are
heavily dependent on the financial position of that
Busia multi-purpose parking project model, Kenya-Uganda border © UN-Habitat
The past 15 years have seen significant innovation
and increasing sophistication in debt instruments.
However, only a few of these are available in LDCs.
Local governments should consider two models of
municipal credit—the bank lending model used in
Europe and the municipal bond model used in North
America—and select from each model various
elements appropriate for their particular country’s
sociocultural-political milieu. The most common
long-term debt instrument available for sub-sov-
ereigns in LDCs is a term loan from a commercial
bank (including national development financial
institutions and municipal development funds). A
term loan is a loan with a maturity of more than five
years and often includes a provision for a relatively
long grace period of up to one year, during which
the borrower does not pay the interest or the prin-
cipal (or both).
However, subnational borrowing is, as a rule, heavily
regulated. In most LDCs, there is a statutory limit
on the amount of debt a municipality can contract,
which is restricted to 20–30 per cent of the annual
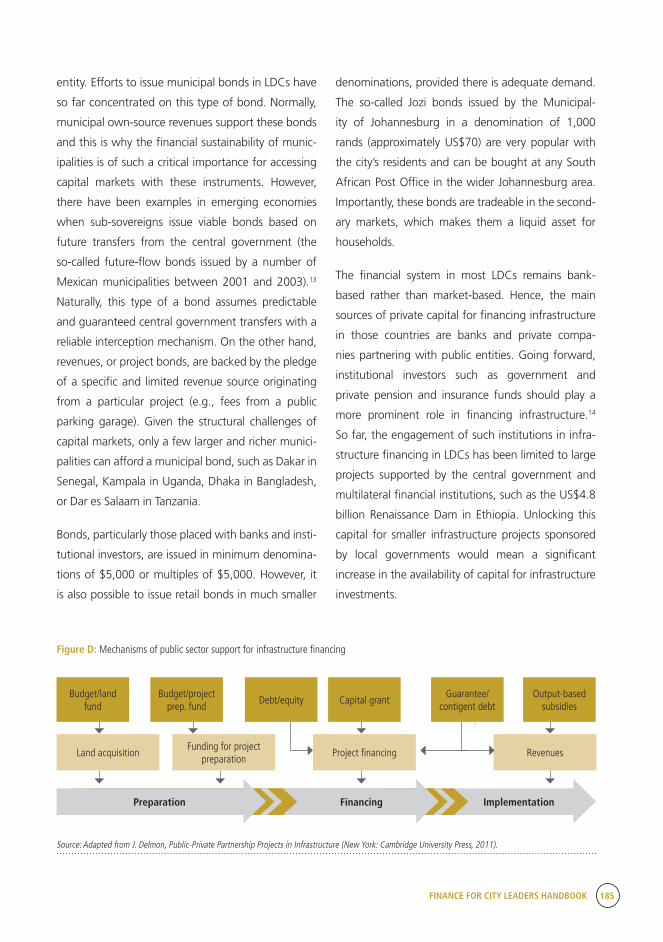
FINANCE FOR CITY LEADERS HANDBOOK 185
entity. Efforts to issue municipal bonds in LDCs have
so far concentrated on this type of bond. Normally,
municipal own-source revenues support these bonds
and this is why the financial sustainability of munic-
ipalities is of such a critical importance for accessing
capital markets with these instruments. However,
there have been examples in emerging economies
when sub-sovereigns issue viable bonds based on
future transfers from the central government (the
so-called future-flow bonds issued by a number of
Mexican municipalities between 2001 and 2003).13
Naturally, this type of a bond assumes predictable
and guaranteed central government transfers with a
reliable interception mechanism. On the other hand,
revenues, or project bonds, are backed by the pledge
of a specific and limited revenue source originating
from a particular project (e.g., fees from a public
parking garage). Given the structural challenges of
capital markets, only a few larger and richer munici-
palities can afford a municipal bond, such as Dakar in
Senegal, Kampala in Uganda, Dhaka in Bangladesh,
or Dar es Salaam in Tanzania.
Bonds, particularly those placed with banks and insti-
tutional investors, are issued in minimum denomina-
tions of $5,000 or multiples of $5,000. However, it
is also possible to issue retail bonds in much smaller
denominations, provided there is adequate demand.
The so-called Jozi bonds issued by the Municipal-
ity of Johannesburg in a denomination of 1,000
rands (approximately US$70) are very popular with
the city’s residents and can be bought at any South
African Post Office in the wider Johannesburg area.
Importantly, these bonds are tradeable in the second-
ary markets, which makes them a liquid asset for
households.
The financial system in most LDCs remains bank-
based rather than market-based. Hence, the main
sources of private capital for financing infrastructure
in those countries are banks and private compa-
nies partnering with public entities. Going forward,
institutional investors such as government and
private pension and insurance funds should play a
more prominent role in financing infrastructure.14
So far, the engagement of such institutions in infra-
structure financing in LDCs has been limited to large
projects supported by the central government and
multilateral financial institutions, such as the US$4.8
billion Renaissance Dam in Ethiopia. Unlocking this
capital for smaller infrastructure projects sponsored
by local governments would mean a significant
increase in the availability of capital for infrastructure
investments.
Figure D: Mechanisms of public sector support for infrastructure financing
Source: Adapted from J. Delmon, Public-Private Partnership Projects in Infrastructure (New York: Cambridge University Press, 2011).
Project financingFunding for project
preparationLand acquisition
Budget/land fund
Budget/project prep. fund
Debt/equityGuarantee/
contigent debtCapital grant
Output-based subsidies
Revenues
Preparation Financing Implementation

186 FINANCE FOR CITY LEADERS HANDBOOK
At the same time, municipalities and other local
governments in LDCs can benefit from existing mech-
anisms of public sector support to attract private
capital for infrastructure financing (these mech-
anisms are illustrated in Figure D). Public support
extended by government and multilateral and bilat-
eral development agencies includes financial instru-
ments that can be used to mobilize private sector
infrastructure investment, such as (1) grants and
other subsidies (e.g., output-based aid to comple-
ment or reduce user fees and tax relief) as well as
interest-free loans; (2) various types of guarantees;
and (3) concessional loans. The public sector offers
a wide range of specialized de-risking instruments
designed to address the challenges of infrastructure
financing in developing countries, such as political
and currency risks, and include political insurance,
synthetic local currency loans, currency swaps, and
interest rate swaps. Municipalities and other local
governments need to develop a good understanding
of the available public support instruments and gain
relevant expertise in their application.
Table 2: Type of financing, capital providers, and instruments for municipal infrastructure financing
Type of financing Capital providers Instruments
Equity financing •Wealthy individuals
• Private equity and venture capital firms
• Public sector entities (dedicated funds, agencies, and institutions)
•Commercial banks
•Non-listed ordinary shares
• Listed ordinary shares
• Listed preference shares
•Quasi-equity (convertible loan instruments, unsecured loans, preference shares, mezzanine and subordinated loans)
• Islamic equity-based contracts (Musharakah and Mudarabah)
Debt financing •Commercial banks
• Thrifts
• Investment banks and finance com-panies
• Institutional investors (pension funds, insurance funds, etc.)
• Term loans
•Municipal and other local government bonds (general obliga-tion bonds, revenue bonds, and structured bonds)
•Corporate bonds (for municipal companies)
•Mortgage loans
Lease financing • Leasing companies •Non-tax-oriented lease
• Tax-oriented lease (single-investor and leveraged)
• Islamic lease (Ijarah)
Public sector financing •Global and regional multi-lateral development banks
•Government aid agencies
•Bilateral development banks, export credit agencies, specialized funds
•National development banks, gov-ernment ministries, and specialized agencies
• Sovereign wealth funds
• Interest-free and concessional loans
•Grants and other subsidies, such as output-based aid and tax relief
•Guarantees (market, price, performance, cost, etc.)
• Insurance
• Interest rate swaps
•Direct and indirect equity investments
• Equity-like contributions (land physical structures, equipment)
Sources: K. Seidman, Economic Development Finance (Thousand Oaks, Calif., Sage Publications, 2005); J. Delmon, Public-Private Partnership Projects in Infrastructure (New York: Cambridge University Press, 2011); K. van Wyk, Z. Botha, I. Goodspeed, Understanding South African Financial Markets (Pretoria, Van Schaik, 2012).
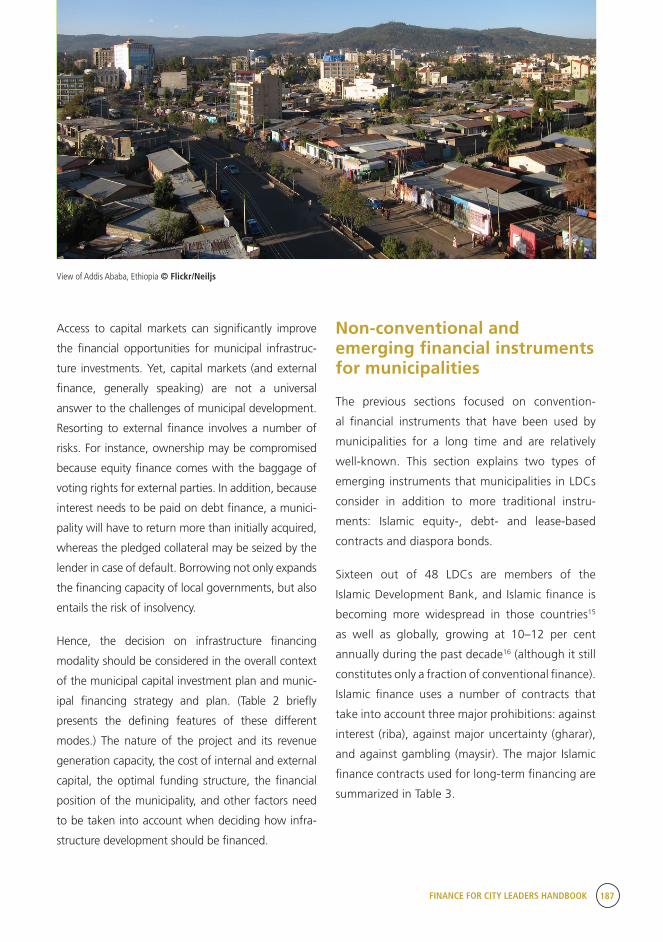
FINANCE FOR CITY LEADERS HANDBOOK 187
Access to capital markets can significantly improve
the financial opportunities for municipal infrastruc-
ture investments. Yet, capital markets (and external
finance, generally speaking) are not a universal
answer to the challenges of municipal development.
Resorting to external finance involves a number of
risks. For instance, ownership may be compromised
because equity finance comes with the baggage of
voting rights for external parties. In addition, because
interest needs to be paid on debt finance, a munici-
pality will have to return more than initially acquired,
whereas the pledged collateral may be seized by the
lender in case of default. Borrowing not only expands
the financing capacity of local governments, but also
entails the risk of insolvency.
Hence, the decision on infrastructure financing
modality should be considered in the overall context
of the municipal capital investment plan and munic-
ipal financing strategy and plan. (Table 2 briefly
presents the defining features of these different
modes.) The nature of the project and its revenue
generation capacity, the cost of internal and external
capital, the optimal funding structure, the financial
position of the municipality, and other factors need
to be taken into account when deciding how infra-
structure development should be financed.
Non-conventional and emerging financial instruments for municipalities
The previous sections focused on convention-
al financial instruments that have been used by
municipalities for a long time and are relatively
well-known. This section explains two types of
emerging instruments that municipalities in LDCs
consider in addition to more traditional instru-
ments: Islamic equity-, debt- and lease-based
contracts and diaspora bonds.
Sixteen out of 48 LDCs are members of the
Islamic Development Bank, and Islamic finance is
becoming more widespread in those countries15
as well as globally, growing at 10–12 per cent
annually during the past decade16 (although it still
constitutes only a fraction of conventional finance).
Islamic finance uses a number of contracts that
take into account three major prohibitions: against
interest (riba), against major uncertainty (gharar),
and against gambling (maysir). The major Islamic
finance contracts used for long-term financing are
summarized in Table 3.
View of Addis Ababa, Ethiopia © Flickr/Neiljs
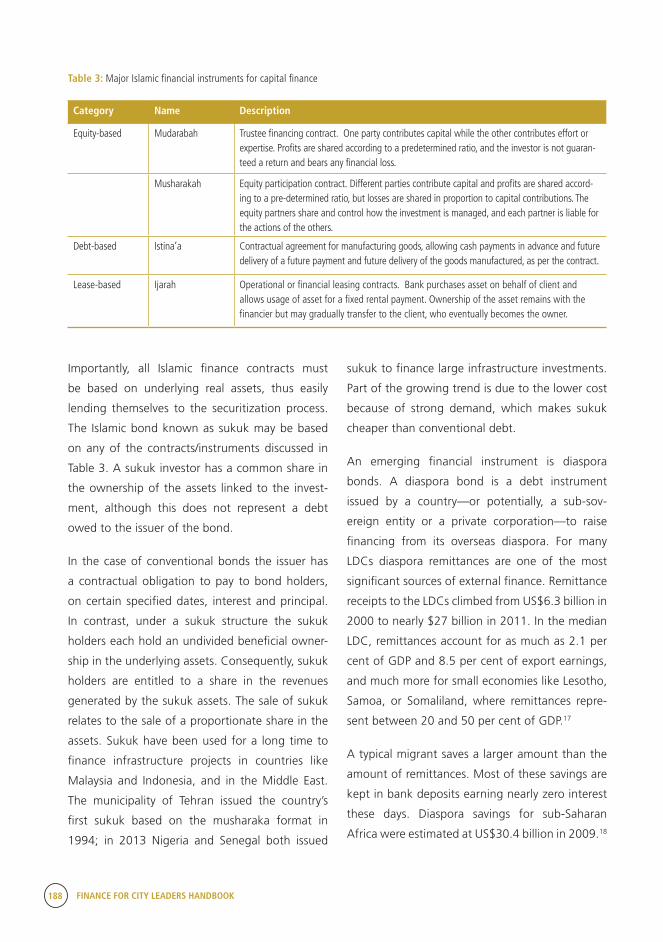
188 FINANCE FOR CITY LEADERS HANDBOOK
Table 3: Major Islamic financial instruments for capital finance
Category Name Description
Equity-based Mudarabah Trustee financing contract. One party contributes capital while the other contributes effort or expertise. Profits are shared according to a predetermined ratio, and the investor is not guaran-teed a return and bears any financial loss.
Musharakah Equity participation contract. Different parties contribute capital and profits are shared accord-ing to a pre-determined ratio, but losses are shared in proportion to capital contributions. The equity partners share and control how the investment is managed, and each partner is liable for the actions of the others.
Debt-based Istina’a Contractual agreement for manufacturing goods, allowing cash payments in advance and future delivery of a future payment and future delivery of the goods manufactured, as per the contract.
Lease-based Ijarah Operational or financial leasing contracts. Bank purchases asset on behalf of client and allows usage of asset for a fixed rental payment. Ownership of the asset remains with the financier but may gradually transfer to the client, who eventually becomes the owner.
Importantly, all Islamic finance contracts must
be based on underlying real assets, thus easily
lending themselves to the securitization process.
The Islamic bond known as sukuk may be based
on any of the contracts/instruments discussed in
Table 3. A sukuk investor has a common share in
the ownership of the assets linked to the invest-
ment, although this does not represent a debt
owed to the issuer of the bond.
In the case of conventional bonds the issuer has
a contractual obligation to pay to bond holders,
on certain specified dates, interest and principal.
In contrast, under a sukuk structure the sukuk
holders each hold an undivided beneficial owner-
ship in the underlying assets. Consequently, sukuk
holders are entitled to a share in the revenues
generated by the sukuk assets. The sale of sukuk
relates to the sale of a proportionate share in the
assets. Sukuk have been used for a long time to
finance infrastructure projects in countries like
Malaysia and Indonesia, and in the Middle East.
The municipality of Tehran issued the country’s
first sukuk based on the musharaka format in
1994; in 2013 Nigeria and Senegal both issued
sukuk to finance large infrastructure investments.
Part of the growing trend is due to the lower cost
because of strong demand, which makes sukuk
cheaper than conventional debt.
An emerging financial instrument is diaspora
bonds. A diaspora bond is a debt instrument
issued by a country—or potentially, a sub-sov-
ereign entity or a private corporation—to raise
financing from its overseas diaspora. For many
LDCs diaspora remittances are one of the most
significant sources of external finance. Remittance
receipts to the LDCs climbed from US$6.3 billion in
2000 to nearly $27 billion in 2011. In the median
LDC, remittances account for as much as 2.1 per
cent of GDP and 8.5 per cent of export earnings,
and much more for small economies like Lesotho,
Samoa, or Somaliland, where remittances repre-
sent between 20 and 50 per cent of GDP.17
A typical migrant saves a larger amount than the
amount of remittances. Most of these savings are
kept in bank deposits earning nearly zero interest
these days. Diaspora savings for sub-Saharan
Africa were estimated at US$30.4 billion in 2009.18
FINANCE FOR CITY LEADERS HANDBOOK 189
A number of countries have attempt-
ed, with differing degrees of success, to
leverage these significant financial resourc-
es through diaspora bonds. Israel and India
have raised $35–40 billion using these bonds.19
Other countries, such as Zimbabwe, Ethiopia,
and Kenya, have also tried this method. Diaspora
bonds are often sold at a premium to the diaspora
members, thus fetching a “patriotic” discount in
borrowing costs. Besides patriotism or the desire
to do good in the investor’s country of origin, such
a discount can also be explained by the fact that
diaspora investors may be more willing and able to
take on sovereign risks of default in hard currency
as well as devaluation, as they may have local
currency liabilities and they may be able to influ-
ence the borrower’s decision to service such debt.
According to the World Bank, there is a potential
for raising $100 billion per year in development
financing via diaspora bonds.20
Accessing market-based capital finance
The first decision to be made by the municipali-
ty is whether an infrastructure project should be
financed from internal or external funds. External
funds (unless they come as grants) have a cost,
and the municipality needs to decide if this cost is
affordable given the nature of the infrastructure
to be financed. The projects likely to be financed
with market-based funds include revenue-gener-
ating projects and larger infrastructure projects
that cannot be financed from regular municipal
resources. Even when the decision is taken to tap
into market-based funds (conventional or other-
wise), the municipality should explore options for
hybrid finance that combine own-source revenues
and grants with external equity and debt.
Once the decision on funding with market-based
capital has been made, the municipality has to
consider the following options:
Borrowing from financial institutions or special-
ized development banks
Accessing capital markets or issuing bonds
Engaging private sector participation through
contracts, leases, and concessions
Borrowing from financial institutions, particularly
for smaller projects, may be the most straightfor-
ward and easiest option for most municipalities. It
is particularly attractive when concessional funding
is available from development banks or municipal
development funds (MDFs). However, the munici-
pality needs to decide (1) whether this borrowing
should be made against the municipal balance
sheet or against a particular project (if it is a reve-
nue-generating project) and (2) whether borrowing
is required at all, or if instead the requisite funding
can be provided by a private partner in the context
of a joint venture or a concession. If it is decided that
the infrastructure investment will be funded with a
loan (possibly in combination with other types of
finance as discussed), a scan of the credit market
will help identify the best credit providers in terms
of the loan interest rate, tenor, and other conditions
(such as a grace period). Whereas the municipality’s
bank may seem like the natural choice, it may be
possible to secure better credit conditions from a
different financial institution based on the charac-
teristics of the investment.
If the nature of the project allows a partnership
with a private entity, the municipality has to choose
the optimal contractual arrangements and the type
of business structure (e.g., an SPV) best suited to
the characteristics of the projects. Further analysis
will help decide on the financial structure of this
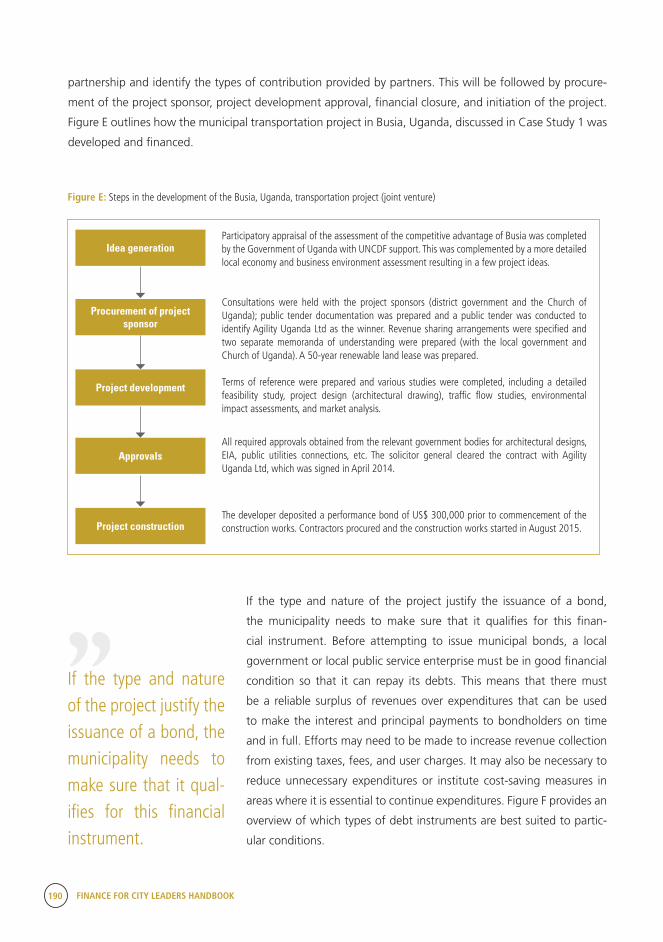
190 FINANCE FOR CITY LEADERS HANDBOOK
Participatory appraisal of the assessment of the competitive advantage of Busia was completed by the Government of Uganda with UNCDF support. This was complemented by a more detailed local economy and business environment assessment resulting in a few project ideas.
Consultations were held with the project sponsors (district government and the Church of Uganda); public tender documentation was prepared and a public tender was conducted to identify Agility Uganda Ltd as the winner. Revenue sharing arrangements were specified and two separate memoranda of understanding were prepared (with the local government and Church of Uganda). A 50-year renewable land lease was prepared.
Terms of reference were prepared and various studies were completed, including a detailed feasibility study, project design (architectural drawing), traffic flow studies, environmental impact assessments, and market analysis.
All required approvals obtained from the relevant government bodies for architectural designs, EIA, public utilities connections, etc. The solicitor general cleared the contract with Agility Uganda Ltd, which was signed in April 2014.
The developer deposited a performance bond of US$ 300,000 prior to commencement of the construction works. Contractors procured and the construction works started in August 2015.
partnership and identify the types of contribution provided by partners. This will be followed by procure-
ment of the project sponsor, project development approval, financial closure, and initiation of the project.
Figure E outlines how the municipal transportation project in Busia, Uganda, discussed in Case Study 1 was
developed and financed.
Idea generation
Procurement of project sponsor
Project development
Approvals
Project construction
If the type and nature of the project justify the issuance of a bond,
the municipality needs to make sure that it qualifies for this finan-
cial instrument. Before attempting to issue municipal bonds, a local
government or local public service enterprise must be in good financial
condition so that it can repay its debts. This means that there must
be a reliable surplus of revenues over expenditures that can be used
to make the interest and principal payments to bondholders on time
and in full. Efforts may need to be made to increase revenue collection
from existing taxes, fees, and user charges. It may also be necessary to
reduce unnecessary expenditures or institute cost-saving measures in
areas where it is essential to continue expenditures. Figure F provides an
overview of which types of debt instruments are best suited to partic-
ular conditions.
Figure E: Steps in the development of the Busia, Uganda, transportation project (joint venture)
If the type and nature of the project justify the issuance of a bond, the municipality needs to make sure that it qual-ifies for this financial instrument.
“
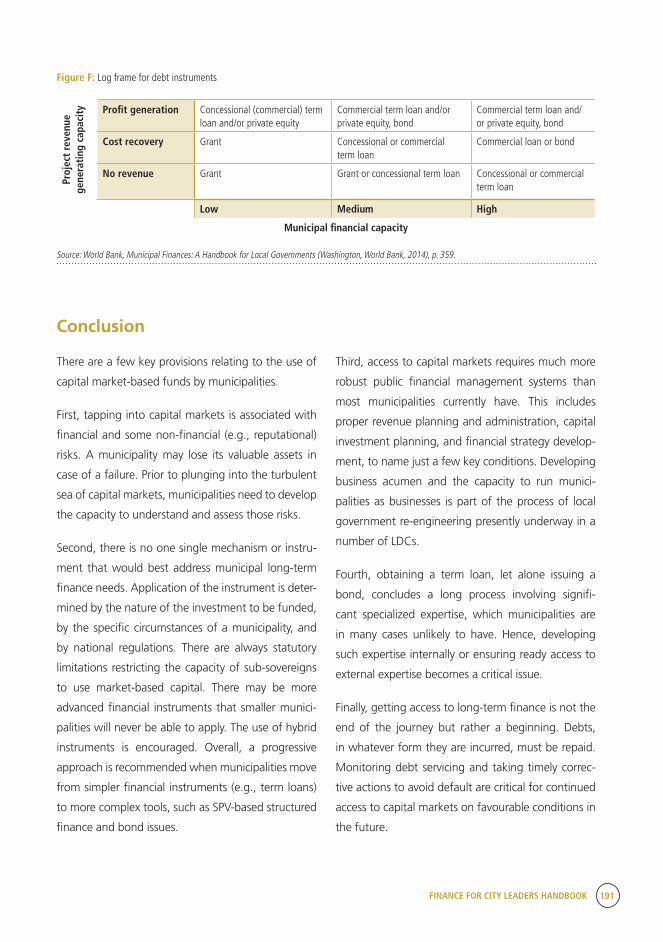
FINANCE FOR CITY LEADERS HANDBOOK 191
Figure F: Log frame for debt instrumentsPr
ojec
t re
venu
e ge
nera
ting
cap
acit
y Profit generation Concessional (commercial) term loan and/or private equity
Commercial term loan and/or private equity, bond
Commercial term loan and/or private equity, bond
Cost recovery Grant Concessional or commercial term loan
Commercial loan or bond
No revenue Grant Grant or concessional term loan Concessional or commercial term loan
Low Medium High
Municipal financial capacity
Source: World Bank, Municipal Finances: A Handbook for Local Governments (Washington, World Bank, 2014), p. 359.
Conclusion
There are a few key provisions relating to the use of
capital market-based funds by municipalities.
First, tapping into capital markets is associated with
financial and some non-financial (e.g., reputational)
risks. A municipality may lose its valuable assets in
case of a failure. Prior to plunging into the turbulent
sea of capital markets, municipalities need to develop
the capacity to understand and assess those risks.
Second, there is no one single mechanism or instru-
ment that would best address municipal long-term
finance needs. Application of the instrument is deter-
mined by the nature of the investment to be funded,
by the specific circumstances of a municipality, and
by national regulations. There are always statutory
limitations restricting the capacity of sub-sovereigns
to use market-based capital. There may be more
advanced financial instruments that smaller munici-
palities will never be able to apply. The use of hybrid
instruments is encouraged. Overall, a progressive
approach is recommended when municipalities move
from simpler financial instruments (e.g., term loans)
to more complex tools, such as SPV-based structured
finance and bond issues.
Third, access to capital markets requires much more
robust public financial management systems than
most municipalities currently have. This includes
proper revenue planning and administration, capital
investment planning, and financial strategy develop-
ment, to name just a few key conditions. Developing
business acumen and the capacity to run munici-
palities as businesses is part of the process of local
government re-engineering presently underway in a
number of LDCs.
Fourth, obtaining a term loan, let alone issuing a
bond, concludes a long process involving signifi-
cant specialized expertise, which municipalities are
in many cases unlikely to have. Hence, developing
such expertise internally or ensuring ready access to
external expertise becomes a critical issue.
Finally, getting access to long-term finance is not the
end of the journey but rather a beginning. Debts,
in whatever form they are incurred, must be repaid.
Monitoring debt servicing and taking timely correc-
tive actions to avoid default are critical for continued
access to capital markets on favourable conditions in
the future.
192 FINANCE FOR CITY LEADERS HANDBOOK
Muhammad Farid is an urban researcher at UN-Habitat and engages in policy oriented research. He has
a master’s degree in economics from City University London.
Dmitry Pozhidaev is UNCDF Regional Technical Advisor responsible for UNCDF programming in Southern
and East Africa. He has a master’s in finance from London School of Business and a Ph.D. in quantitative
research and statistics from Moscow University.
9 The municipality of Kabul in 2011 collected 2.9 billion AFN (US$42 million) in revenue for its population of about 3.5 million people. An additional 30 per cent of revenue is estimated to be generated by registering all the properties in Kabul city and collecting property-based taxes. See GoIRA, The State of Afghan Cities (Kabul, GoIRA, 2015), p. 42.
10 A number of LDCs issued regulations on municipal bonds and PPPs for sub-sovereigns, including Uganda (2013) and Tanzania (2014).
11 For example, Uganda enacted a bill allowing Islamic finance in January 2016.
12 World Bank, Islamic Finance Brief (Washington, World Bank, 2015). Available from http://www.world-bank.org/en/topic/financialsector/brief/islamic-finance.
13 J. Leigland, Municipal Future-Flow Bonds in Mexico Lessons for Emerging Economies (The Journal of Struc-tured Finance, Summer 2004, Vol. 10, No. 2: pp. 24-35)
14 According to the African Development Bank, Africa’s pension funds currently hold US$380 billion in assets, thanks to a decade of economic growth. Even then, only very few countries, including South Africa, have pension systems that are broad-based, relatively transparent, and protect beneficiary rights. See United Nations, Africa Renewal, vol. 28, no. 3 (December 2014), p. 7.
15 For example, Uganda enacted a bill allowing Islamic finance in January 2016.
16 World Bank, Islamic Finance Brief (Washington, World Bank, 2015). Available from http://www.world-bank.org/en/topic/financialsector/brief/islamic-finance.
Endnotes
1 World Bank, World Development Indicators, Fea-turing the Sustainable Development Goals (Washington, World Bank, 2016).
2 United Nations, Addis Ababa Action Agenda (New York, United Nations, 2015).
3 World Bank, World Development Indicators (Wash-ington, World Bank, 2016); International Monetary Fund, Regional Economic Outlook: Sub-Saharan Africa: Time for a Policy Reset (Washington, IMF, 2016).
4 LDCs on average (over 2009–2011) collect only 14.8 per cent of their revenue as a share of GDP. See World Bank, World Development Indicators (Washington, World Bank, 2016).
5 FDI in low-income countries increased from 2.5 per cent of GDP to 4.4 per cent between 2006 and 2014. See World Bank, World Development Indicators (Washington, World Bank, 2016).
6 Antonio Estache, “Infrastructure Finance in Devel-oping Countries: An Overview,” EIB Papers, vol. 15, no. 2, pp. 60–88.
7 United Nations, Third International Conference on Financing for Development: Taking Stock of Aid to Least Developed Countries (LDCs) (Addis Ababa, United Na-tions, 2015).
8 UNCTAD, The Least Developed Countries Report 2014: Growth With Structural Transformation:
A Post-2015 Development Agenda (Gevena, UNCTAD, 2014). Available from http://unctad.org/en/PublicationsLi-brary/ldc2014_en.pdf.
FINANCE FOR CITY LEADERS HANDBOOK 193
17 UNCTAD, The Least Developed Countries Report 2012: Harnessing Remittances and Diaspora Knowledge for Productive Capacities (Gevena, UNCTAD, 2014).
18 S. Ketkar and D. Ratha, Diaspora Bonds for Edu-cation (Washington, World Bank, n.d.). Available from http://siteresources.worldbank.org/FINANCIALSECTOR/Resources/282044-1257537401267/DiasporaBondsEdu-cation.pdf
19 S. Ketkar and D. Ratha, Development Finance Via Diaspora Bonds Track Record and Potential (Washington, World Bank, 2007).
20 S. Ketkar and D. Ratha, Development Finance Via Diaspora Bonds Track Record and Potential (Washington, World Bank, 2007).
Developing and Managing Municipal Infrastructure Development Plans
12Introduction
Managing rapid urbanization is a primary challenge facing many cities, and
particularly pressing is the need to provide adequate infrastructure in trans-
portation, water treatment, housing, sewage, and solid waste. However,
many local governments—particularly in small and medium-sized cities in
developing countries—lack the organizational structures and authority to
undertake infrastructure development initiatives. For example, they might
lack properly staffed departments of finance, and the proper mechanisms
and regulations for public–private investment are often not in place. Similar-
ly, many cities lack the capacity for financing these investments, even when
these assets have the potential to become sources of revenue generation.
There are a variety of ways local governments can finance infrastructure
development. These include tax increment financing and municipal bonds
as well as other land value capture mechanisms. In many cases, land use
FINANCE FOR CITY LEADERS HANDBOOK 195
planning regulations require developers to fund
infrastructure construction as a condition for receiv-
ing permits to undertake residential or commercial
building projects. The primary problem for small and
medium-sized cities in developing countries is the
large time lag between the initial investment in infra-
structure and the return on this investment in the
form of development fees and tax revenues reaped
from infrastructure-enabled economic growth. In
the case of large-scale water and sewage facilities,
this lag can be especially long—10 to 20 years.
Particularly in developing countries, it is difficult
to secure the necessary interim financing because
local governments have neither the credit rating,
nor a history of responsible fiscal management, nor
appropriate legal or institutional mechanisms (e.g.,
development levies, betterment taxes, development
corporations).
The challenge lies not in the invention of new munici-
pal finance models, but rather in creating the specific
local government institutional mechanisms needed
to undertake local government–led infrastructure
development.1
This chapter provides background on city-led infra-
structure development and presents a practical
framework for how local governments can create the
conditions for mobilizing private sector resources to
finance infrastructure and construct the appropriate
facilities. This framework includes feasibility analysis
to determine how infrastructure development can
be designed to be feasible in a given city; legislation
that sets and enforces standards and that provides
legal mechanisms for local government to finance
infrastructure construction; financing strategies; and
organizational platforms for local development (e.g.,
legal subsidiary entities/development companies)
that have the professional capacity to manage these
complex projects.
Mandate for local government in infrastructure development
The provision of adequate infrastructure and
services is necessary to provide both a high quality
of life and an environment conducive to business.
This includes everything from safety in the streets,
proper sewage drainage, and quality schools to
health care, roads, and public parks.
Adam Smith, who laid the intellectual foundation
for free-market capitalism, clearly argues on behalf
of governmental responsibility for critical infra-
structure, writing that among government’s funda-
mental duties is “erecting and maintaining certain
public works and certain public institutions which
it can never be for the interest of any individual, or
small number of individuals, to erect and maintain;
because the profit could never repay the expense
to any individual or small number of individuals,
though it may frequently do much more than repay
it to a great society.”2
While infrastructure provision has traditionally been
the job of national government, the complexities,
nuances, and dynamics of urban life have led local
government to play an increasingly prominent
role. Yet, local governments are still often without
the legal mandates, the organizational structures,
and financing capacity needed to take on these
functions. Especially in developing countries, local
governments do not usually have the local ordi-
nances and related legislation that enable them to
collect development fees and other taxes that serve
as the foundation for financing infrastructure devel-
opment. Nor do they have suitable organizational
frameworks that can function in an entrepreneurial
manner necessary to carry out the complex tasks
of project management and fiscal management of
infrastructure development.
196 FINANCE FOR CITY LEADERS HANDBOOK
The action strategy
The main challenge facing local government is how
to create the conditions for mobilizing private sector
resources to finance infrastructure and construct
the appropriate facilities. This is not an abdication
of public sector responsibility—quite the opposite,
in fact. Local governments need to set standards,
develop enforceable procedures, and anchor devel-
opment fees/levies in specific by-laws/ordinances.
They must establish dedicated organizational and
institutional frameworks to manage infrastructure
development in a way that enables them to harness
often-hidden local economic resources.
Developing and implementing such a strategy of
action should have four primary components: a
feasibility analysis, authorizing legislation, financing
strategies, and organizational platforms for local
development.
Feasibility analysis
A feasibility analysis determines not whether infra-
structure development is feasible in a given city, but
rather how it can be designed to be feasible. This
type of analysis involves:
Assessing the scope of need of different types of
infrastructure (roads, sewage treatment, water
treatment, waste disposal, power generation,
etc.). This needs to be based upon population
projections, the number of housing units, and
existing infrastructure capacity. This assessment
must also identify the city’s strategic assets and
assess what types of infrastructure are needed to
link these assets to each other and to different
population groups.
Assessing the economic capacity of the differ-
ent populations moving into the city. This entails
determining how much different communities
can pay for housing and related infrastructure,
what share of the housing costs would go
towards infrastructure, and what part of infra-
structure costs residents should pay versus what
part should be transferred to the business sector.
Determining the standards and technologies
best suited to meet the demands for urban
growth for both residents and businesses.
Estimating the overall costs for the differ-
ent types of infrastructure required, as well
as specific costs for different geographic and
socio-economic areas.
It is important to ensure that the municipal level of
infrastructure planning dovetails with regional- and
national-level infrastructure projects. This is critical
both for ensuring that infrastructure development
is coordinated and to properly divide the different
levels of funding responsibilities.
Authorizing legislation
In the past, infrastructure solutions—septic tanks,
wells, runoff drainage, and even dirt roads—were
tenable at the household level. But this is no longer
feasible given today’s rapidly growing urban areas.
Although there are regional/county-level initiatives
for water purification, sewage treatment, and other
types of infrastructure, the legal authority for local
government to set and enforce standards is often
weak. Equally, if not more critically, there are often
no legal mechanisms for local government to finance
the cost of infrastructure construction. (For example,
there are no legislated provisions for deficit financ-
ing or for entering international financial markets.) In
many instances, there are no legal statutes that give
local governments the authority to make provision of
infrastructure, or payment for the provision of infra-
structure (through development fees), a condition
for approval of building permits.
FINANCE FOR CITY LEADERS HANDBOOK 197
The transition here is not only one of setting and
enforcing standards, but a change in the position
and role of local government. It places the burden
of infrastructure provision on the municipality and
necessitates that it has the authority to finance
infrastructure development. In the reality of devo-
lution, local government today is often already
accountable to the residents, but without the tools
to deliver.
Passing a bill for the levying of development fees is
one possible legislative remedy. Such a bill would
not only integrate the different legal anchors, but
also give the municipal government a mechanism
for enforcement. Local government legislation
(ordinances or bylaws) is needed to mandate devel-
opment fees and give local government the author-
ity to do the following:3
1. To make granting a building permit conditional
upon payment of a development fee or provi-
sion of the infrastructure as set by municipal
standards (secured by some form of collateral or
bank guarantee).
2. To give the municipality the authority to levy
development fees for roads, water supply,
sewage treatment, and drainage, and for these
fees to be paid to the local government in a
closed account (specifically for the given area
of development or the related regional system)
in keeping with the pace of infrastructure
construction. This is to be done in stages and
kept in accounts separate from the regular local
budgets.
3. To give the municipality the power to finance
infrastructure through different mechanisms—
bank loans; bonds; joint ventures; build,
operate, transfers (BOTs)—that are based upon
investment today against future generation of
revenues. This type of legislation also needs
to include the institutional safeguards and
economic guarantees that provide investors with
the security needed to protect their investment.
The intention here is not necessarily for local
government to go into the business of infrastruc-
ture construction across the board, but rather to
give it the authority to do so when private devel-
opers do not meet standards. Private developers
may very well be the ones to construct commu-
nity sewage treatment or lay pipes to connect to
regional sewage treatment systems, but a munic-
ipality needs to have the option to contract out
for the construction of infrastructure when the
developers cannot provide adequate solutions or
when the solutions are required at the regional
or sub-regional level. Developers will need to pay
the municipality a development fee for those infra-
structure components that they themselves are not
providing.
Financing strategies
Infrastructure development requires a comprehen-
sive approach. Cities are far from homogeneous;
different socio-economic circumstances greatly
influence citizens’ and businesses’ ability to pay for
infrastructure costs. Additionally, many elements
of infrastructure cut across geographic and demo-
graphic boundaries. Likewise, different groups have
different levels of use even of the same type of
infrastructure. This requires mixed funding sources
and differential fees that are equitable and progres-
sive (see Table 1).
Funding sources can in part be based upon the
ability of economically wealthier populations to
contribute, especially with regard to regional-level
infrastructure such as water and sewage treatment
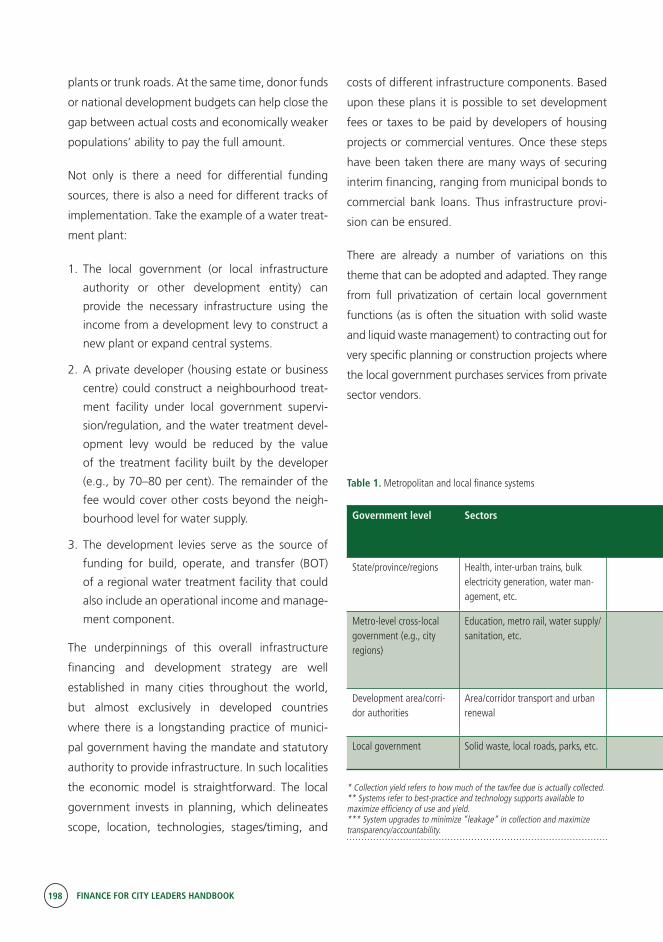
198 FINANCE FOR CITY LEADERS HANDBOOK
plants or trunk roads. At the same time, donor funds
or national development budgets can help close the
gap between actual costs and economically weaker
populations’ ability to pay the full amount.
Not only is there a need for differential funding
sources, there is also a need for different tracks of
implementation. Take the example of a water treat-
ment plant:
1. The local government (or local infrastructure
authority or other development entity) can
provide the necessary infrastructure using the
income from a development levy to construct a
new plant or expand central systems.
2. A private developer (housing estate or business
centre) could construct a neighbourhood treat-
ment facility under local government supervi-
sion/regulation, and the water treatment devel-
opment levy would be reduced by the value
of the treatment facility built by the developer
(e.g., by 70–80 per cent). The remainder of the
fee would cover other costs beyond the neigh-
bourhood level for water supply.
3. The development levies serve as the source of
funding for build, operate, and transfer (BOT)
of a regional water treatment facility that could
also include an operational income and manage-
ment component.
The underpinnings of this overall infrastructure
financing and development strategy are well
established in many cities throughout the world,
but almost exclusively in developed countries
where there is a longstanding practice of munici-
pal government having the mandate and statutory
authority to provide infrastructure. In such localities
the economic model is straightforward. The local
government invests in planning, which delineates
scope, location, technologies, stages/timing, and
costs of different infrastructure components. Based
upon these plans it is possible to set development
fees or taxes to be paid by developers of housing
projects or commercial ventures. Once these steps
have been taken there are many ways of securing
interim financing, ranging from municipal bonds to
commercial bank loans. Thus infrastructure provi-
sion can be ensured.
There are already a number of variations on this
theme that can be adopted and adapted. They range
from full privatization of certain local government
functions (as is often the situation with solid waste
and liquid waste management) to contracting out for
very specific planning or construction projects where
the local government purchases services from private
sector vendors.
Table 1. Metropolitan and local finance systems
Government level Sectors Revenue sources for Collection yield* Systems** Systems to maximize net revenue***Capital expenditures Operating
expenditures
State/province/regions Health, inter-urban trains, bulk electricity generation, water man-agement, etc.
General taxes (e.g., income & VAT), bonds, project loans
User fees, taxes Rarely fully cost recover-able, but relatively easy to police payment
Health cards, smart grid, water auctions
Transparent bidding for conces-sions/ suppliers/use rights
Metro-level cross-local government (e.g., city regions)
Education, metro rail, water supply/sanitation, etc.
Shares of general taxes, property tax levies, bonds, project loans
User charges, CSO transfer revenue
With the exception of water supply, rarely cost recoverable, but more difficult to police access
Integrated ticketing, smart metering
GIS-based property tax monitoring and automated billing and other IT systems to maximize yield. Crowd sourcing of service issues and responses.
Development area/corri-dor authorities
Area/corridor transport and urban renewal
Property taxes, project loans
As above Commercial basis; corporation should be in surplus
Eminent domain, area-based tax sur-charges
Land banking/performance-based bids
Local government Solid waste, local roads, parks, etc. As above, plus limit-ed bonds, transfers
As above As for metro level Cost recovery pricing As for metro and development area levels
* Collection yield refers to how much of the tax/fee due is actually collected. ** Systems refer to best-practice and technology supports available to maximize efficiency of use and yield. *** System upgrades to minimize “leakage” in collection and maximize transparency/accountability.
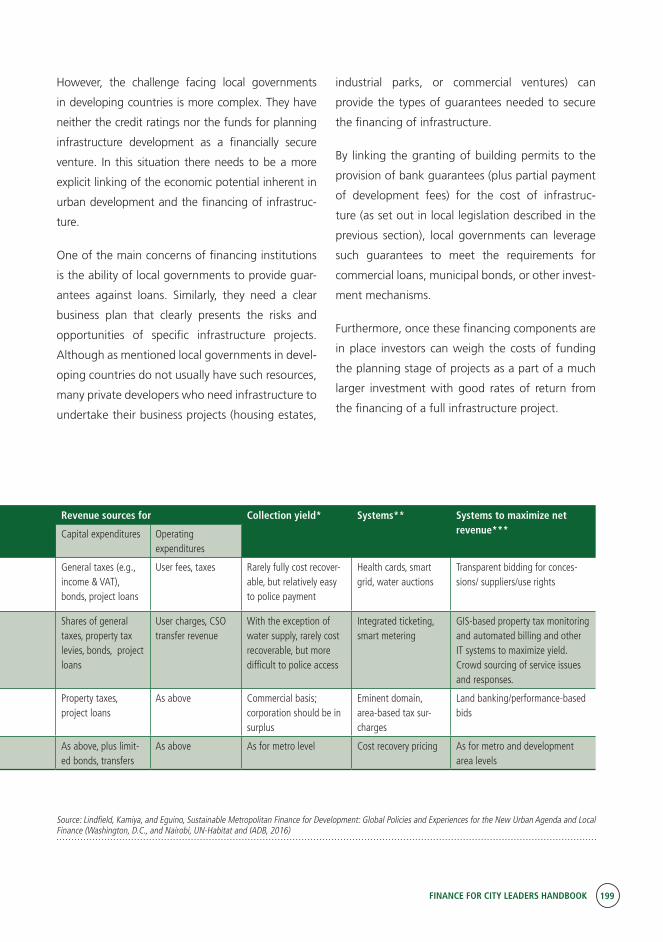
FINANCE FOR CITY LEADERS HANDBOOK 199
Table 1. Metropolitan and local finance systems
Government level Sectors Revenue sources for Collection yield* Systems** Systems to maximize net revenue***Capital expenditures Operating
expenditures
State/province/regions Health, inter-urban trains, bulk electricity generation, water man-agement, etc.
General taxes (e.g., income & VAT), bonds, project loans
User fees, taxes Rarely fully cost recover-able, but relatively easy to police payment
Health cards, smart grid, water auctions
Transparent bidding for conces-sions/ suppliers/use rights
Metro-level cross-local government (e.g., city regions)
Education, metro rail, water supply/sanitation, etc.
Shares of general taxes, property tax levies, bonds, project loans
User charges, CSO transfer revenue
With the exception of water supply, rarely cost recoverable, but more difficult to police access
Integrated ticketing, smart metering
GIS-based property tax monitoring and automated billing and other IT systems to maximize yield. Crowd sourcing of service issues and responses.
Development area/corri-dor authorities
Area/corridor transport and urban renewal
Property taxes, project loans
As above Commercial basis; corporation should be in surplus
Eminent domain, area-based tax sur-charges
Land banking/performance-based bids
Local government Solid waste, local roads, parks, etc. As above, plus limit-ed bonds, transfers
As above As for metro level Cost recovery pricing As for metro and development area levels
* Collection yield refers to how much of the tax/fee due is actually collected. ** Systems refer to best-practice and technology supports available to maximize efficiency of use and yield. *** System upgrades to minimize “leakage” in collection and maximize transparency/accountability.
However, the challenge facing local governments
in developing countries is more complex. They have
neither the credit ratings nor the funds for planning
infrastructure development as a financially secure
venture. In this situation there needs to be a more
explicit linking of the economic potential inherent in
urban development and the financing of infrastruc-
ture.
One of the main concerns of financing institutions
is the ability of local governments to provide guar-
antees against loans. Similarly, they need a clear
business plan that clearly presents the risks and
opportunities of specific infrastructure projects.
Although as mentioned local governments in devel-
oping countries do not usually have such resources,
many private developers who need infrastructure to
undertake their business projects (housing estates,
industrial parks, or commercial ventures) can
provide the types of guarantees needed to secure
the financing of infrastructure.
By linking the granting of building permits to the
provision of bank guarantees (plus partial payment
of development fees) for the cost of infrastruc-
ture (as set out in local legislation described in the
previous section), local governments can leverage
such guarantees to meet the requirements for
commercial loans, municipal bonds, or other invest-
ment mechanisms.
Furthermore, once these financing components are
in place investors can weigh the costs of funding
the planning stage of projects as a part of a much
larger investment with good rates of return from
the financing of a full infrastructure project.
Source: Lindfield, Kamiya, and Eguino, Sustainable Metropolitan Finance for Development: Global Policies and Experiences for the New Urban Agenda and Local Finance (Washington, D.C., and Nairobi, UN-Habitat and IADB, 2016)
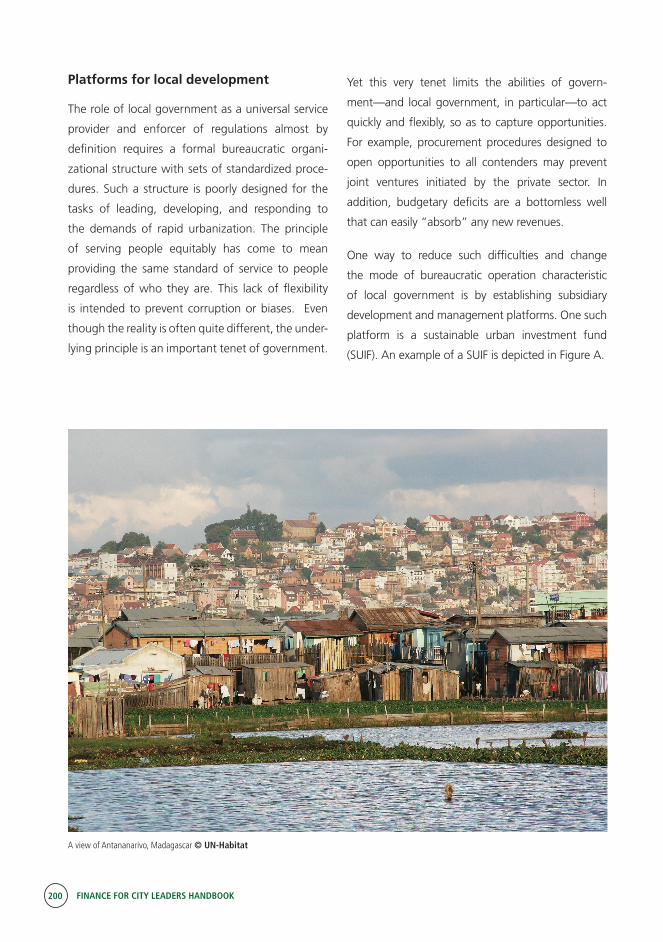
200 FINANCE FOR CITY LEADERS HANDBOOK
Platforms for local development
The role of local government as a universal service
provider and enforcer of regulations almost by
definition requires a formal bureaucratic organi-
zational structure with sets of standardized proce-
dures. Such a structure is poorly designed for the
tasks of leading, developing, and responding to
the demands of rapid urbanization. The principle
of serving people equitably has come to mean
providing the same standard of service to people
regardless of who they are. This lack of flexibility
is intended to prevent corruption or biases. Even
though the reality is often quite different, the under-
lying principle is an important tenet of government.
Yet this very tenet limits the abilities of govern-
ment—and local government, in particular—to act
quickly and flexibly, so as to capture opportunities.
For example, procurement procedures designed to
open opportunities to all contenders may prevent
joint ventures initiated by the private sector. In
addition, budgetary deficits are a bottomless well
that can easily “absorb” any new revenues.
One way to reduce such difficulties and change
the mode of bureaucratic operation characteristic
of local government is by establishing subsidiary
development and management platforms. One such
platform is a sustainable urban investment fund
(SUIF). An example of a SUIF is depicted in Figure A.
A view of Antananarivo, Madagascar © UN-Habitat
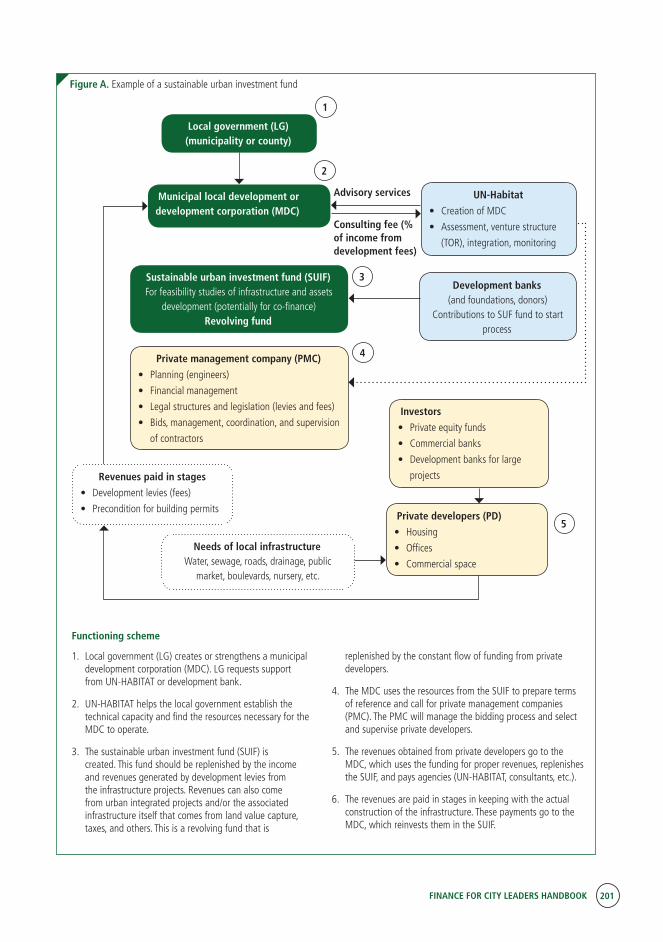
FINANCE FOR CITY LEADERS HANDBOOK 201
Figure A. Example of a sustainable urban investment fund
Functioning scheme
1. Local government (LG) creates or strengthens a municipal development corporation (MDC). LG requests support from UN-HABITAT or development bank.
2. UN-HABITAT helps the local government establish the technical capacity and find the resources necessary for the MDC to operate.
3. The sustainable urban investment fund (SUIF) is created. This fund should be replenished by the income and revenues generated by development levies from the infrastructure projects. Revenues can also come from urban integrated projects and/or the associated infrastructure itself that comes from land value capture, taxes, and others. This is a revolving fund that is
replenished by the constant flow of funding from private developers.
4. The MDC uses the resources from the SUIF to prepare terms of reference and call for private management companies (PMC). The PMC will manage the bidding process and select and supervise private developers.
5. The revenues obtained from private developers go to the MDC, which uses the funding for proper revenues, replenishes the SUIF, and pays agencies (UN-HABITAT, consultants, etc.).
6. The revenues are paid in stages in keeping with the actual construction of the infrastructure. These payments go to the MDC, which reinvests them in the SUIF.
Local government (LG)(municipality or county)
UN-Habitat
• CreationofMDC
• Assessment,venturestructure
(TOR), integration, monitoring
Municipal local development or development corporation (MDC)
Sustainable urban investment fund (SUIF)For feasibility studies of infrastructure and assets
development (potentially for co-finance)Revolving fund
Development banks(and foundations, donors)
Contributions to SUF fund to start process
Private management company (PMC)
• Planning(engineers)
• Financialmanagement
• Legalstructuresandlegislation(leviesandfees)
• Bids,management,coordination,andsupervision
of contractors
Revenues paid in stages
• Developmentlevies(fees)
• Preconditionforbuildingpermits
Investors
• Privateequityfunds
• Commercialbanks
• Developmentbanksforlarge
projects
Private developers (PD)
• Housing
• Offices
• Commercialspace
Needs of local infrastructure Water, sewage, roads, drainage, public
market, boulevards, nursery, etc.
1
2
3
4
5
Advisory services
Consulting fee (% of income from development fees)
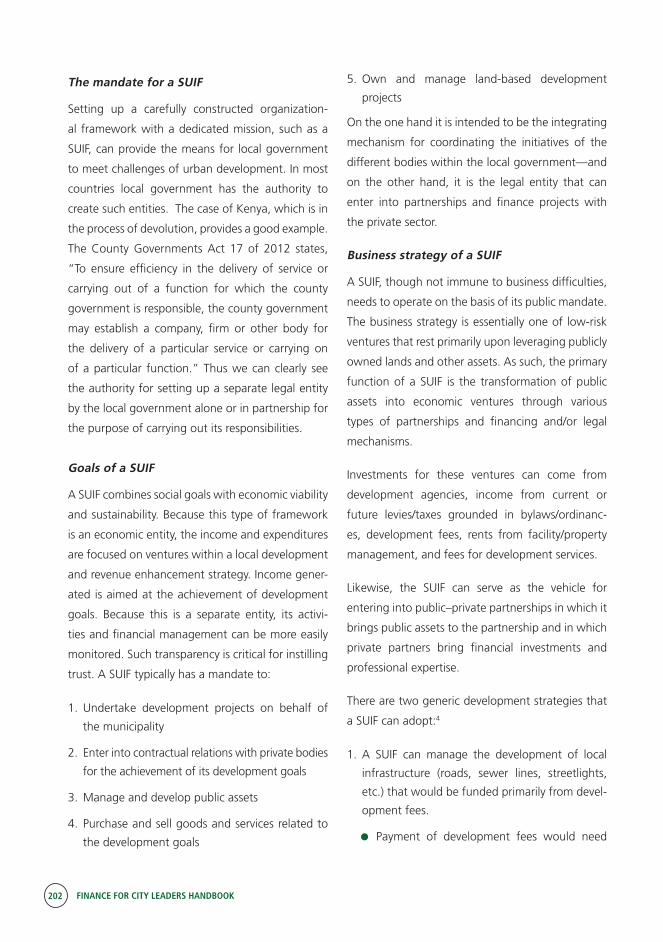
202 FINANCE FOR CITY LEADERS HANDBOOK
The mandate for a SUIF
Setting up a carefully constructed organization-
al framework with a dedicated mission, such as a
SUIF, can provide the means for local government
to meet challenges of urban development. In most
countries local government has the authority to
create such entities. The case of Kenya, which is in
the process of devolution, provides a good example.
The County Governments Act 17 of 2012 states,
“To ensure efficiency in the delivery of service or
carrying out of a function for which the county
government is responsible, the county government
may establish a company, firm or other body for
the delivery of a particular service or carrying on
of a particular function.” Thus we can clearly see
the authority for setting up a separate legal entity
by the local government alone or in partnership for
the purpose of carrying out its responsibilities.
Goals of a SUIF
A SUIF combines social goals with economic viability
and sustainability. Because this type of framework
is an economic entity, the income and expenditures
are focused on ventures within a local development
and revenue enhancement strategy. Income gener-
ated is aimed at the achievement of development
goals. Because this is a separate entity, its activi-
ties and financial management can be more easily
monitored. Such transparency is critical for instilling
trust. A SUIF typically has a mandate to:
1. Undertake development projects on behalf of
the municipality
2. Enter into contractual relations with private bodies
for the achievement of its development goals
3. Manage and develop public assets
4. Purchase and sell goods and services related to
the development goals
5. Own and manage land-based development
projects
On the one hand it is intended to be the integrating
mechanism for coordinating the initiatives of the
different bodies within the local government—and
on the other hand, it is the legal entity that can
enter into partnerships and finance projects with
the private sector.
Business strategy of a SUIF
A SUIF, though not immune to business difficulties,
needs to operate on the basis of its public mandate.
The business strategy is essentially one of low-risk
ventures that rest primarily upon leveraging publicly
owned lands and other assets. As such, the primary
function of a SUIF is the transformation of public
assets into economic ventures through various
types of partnerships and financing and/or legal
mechanisms.
Investments for these ventures can come from
development agencies, income from current or
future levies/taxes grounded in bylaws/ordinanc-
es, development fees, rents from facility/property
management, and fees for development services.
Likewise, the SUIF can serve as the vehicle for
entering into public–private partnerships in which it
brings public assets to the partnership and in which
private partners bring financial investments and
professional expertise.
There are two generic development strategies that
a SUIF can adopt:4
1. A SUIF can manage the development of local
infrastructure (roads, sewer lines, streetlights,
etc.) that would be funded primarily from devel-
opment fees.
Payment of development fees would need
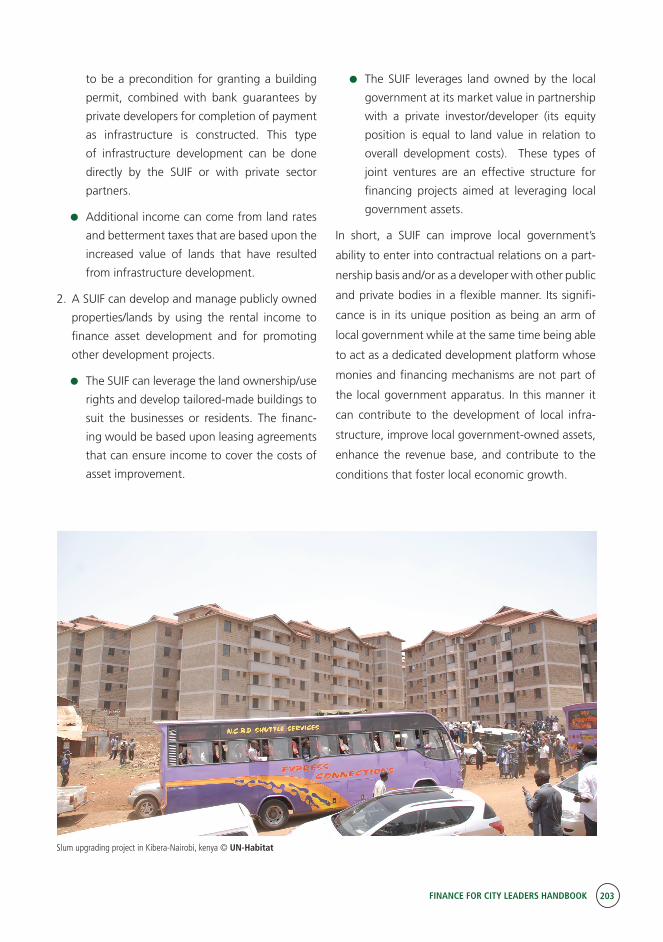
FINANCE FOR CITY LEADERS HANDBOOK 203
to be a precondition for granting a building
permit, combined with bank guarantees by
private developers for completion of payment
as infrastructure is constructed. This type
of infrastructure development can be done
directly by the SUIF or with private sector
partners.
Additional income can come from land rates
and betterment taxes that are based upon the
increased value of lands that have resulted
from infrastructure development.
2. A SUIF can develop and manage publicly owned
properties/lands by using the rental income to
finance asset development and for promoting
other development projects.
The SUIF can leverage the land ownership/use
rights and develop tailored-made buildings to
suit the businesses or residents. The financ-
ing would be based upon leasing agreements
that can ensure income to cover the costs of
asset improvement.
The SUIF leverages land owned by the local
government at its market value in partnership
with a private investor/developer (its equity
position is equal to land value in relation to
overall development costs). These types of
joint ventures are an effective structure for
financing projects aimed at leveraging local
government assets.
In short, a SUIF can improve local government’s
ability to enter into contractual relations on a part-
nership basis and/or as a developer with other public
and private bodies in a flexible manner. Its signifi-
cance is in its unique position as being an arm of
local government while at the same time being able
to act as a dedicated development platform whose
monies and financing mechanisms are not part of
the local government apparatus. In this manner it
can contribute to the development of local infra-
structure, improve local government-owned assets,
enhance the revenue base, and contribute to the
conditions that foster local economic growth.
Slum upgrading project in Kibera-Nairobi, kenya © UN-Habitat
204 FINANCE FOR CITY LEADERS HANDBOOK
Conclusion
Due to global trends towards devolution, the role
of local governments has greatly expanded. They
are now responsible for numerous development
initiatives, including infrastructure development.
However, local governments, particularly those in
developing countries, lack the authority to finance
and coordinate infrastructure development through
levying development fees, issuing municipal bonds,
and mobilizing private sector resources. In order to
increase the provision of sustainable urban infra-
structure, however, this must be altered so munic-
ipalities are empowered to finance infrastructure
through various mechanisms.
As a result of the large time lag between the initial
investment in infrastructure and the associated
return on the investment, securing interim financ-
ing from municipal bonds or commercial bank loans
can be difficult. For local governments in develop-
ing countries, this is extremely challenging, as most
have neither the credit ratings nor the guarantee
to secure loans. Regardless, there are other mech-
anisms that allow local governments to secure
interim financing. For instance, most private devel-
opers who need infrastructure to undertake their
business projects (housing estates, industrial parks,
or commercial ventures) can guarantee loans. By
linking the granting of building permits and other
permits to the provision of bank guarantees for the
cost of infrastructure, local governments can then
meet their guarantee requirements.
The resources of the private sector should also be
adequately mobilized to finance infrastructure devel-
opment. One way of doing this is through a sustain-
able urban investment fund (SUIF), which is a subsid-
iary development and management platform. As a
separate entity, a SUIF is charged with undertaking
development projects by managing and developing
public assets on behalf of the municipality. It enters
into contractual relations with private bodies for the
achievement of its development goals and serves as
the vehicle for entering into public–private partner-
ships in which local governments bring public assets
and private partners bring financial investments and
professional expertise.
Local governments, particularly those in developing countries, lack the authority to finance and coordinate infrastructure develop-ment through levying development fees, issuing municipal bonds, and mobilizing private sector resources. In order to increase the provision of sustainable urban infrastructure, however, this must be altered so municipalities are empowered to finance infrastructure through various mechanisms.
“
FINANCE FOR CITY LEADERS HANDBOOK 205
Case Study 1: Megiddo Regional Council (a small local regional government in Northern Israel)5
The context
Like most local authorities, the goal of the
Megiddo Regional Council was to develop an
industrial park as part of its economic devel-
opment strategy. The financing was to come
from the national government to prepare a stat-
utory zoning plan, build the roads, and put in
a sewage system, electric lines, drainage, etc.
This would then provide an attractive site for
expanding local businesses and attracting new
businesses, and would similarly be a significant
source of land tax income to improve services.
The local government was successful in having
the national government cover the costs of
a land use plan. However, for over five years
after the completion of the plan, the Megiddo
Regional Council was not successful in receiving
the necessary national government funds for
infrastructure development. This led the mayor
to consider a more entrepreneurial strategy.
Interim financing alternatives
A preliminary feasibility analysis concluded that
the cost of the infrastructure, approximately
US$20 million, could be covered from develop-
ment fees over a 10-year period.
Initially there were three possible finance alterna-
tives:
Bank loan: This would carry an interest rate of
at least 6 per cent and would require national
government approval. The primary source of
revenue would come from the payment of
development fees paid by the businesses as
they requested building permits.
Municipal bond: This would be an approx-
imately 5.5 per cent interest-bearing bond
to the public, which would cost less to the
municipal government but would also require
national government approval. Furthermore,
this option would be a precedent with all the
related complexities and bureaucratic proce-
dures of being “first.”
Joint venture with a private developer: This
option was designed as a bid to a private
management company (PMC) that would be
given the rights to undertake the infrastruc-
ture development. The PMC would take on
the burden of interim financing and in return
would receive all of the development fees and
a per cent of the land tax revenues for 10 years.
Taxing the national government as “landowner”
After a series of considerations, a strategic decision
was made by the Regional Council to radically
change the local government–national govern-
ment relationship by fully using the statutory regu-
lations mandated to local government, giving it
the authority to levy development fees for infra-
structure construction to be paid by landowners.
Rather than request a development allocation for
the industrial park from the national government,
the local government taxed the national govern-
ment US$20 million as the “landowner.” (In Israel,
the national land authority is the primary owner of
lands, which are leased to residents and business-
es on a 49-year renewable basis.)
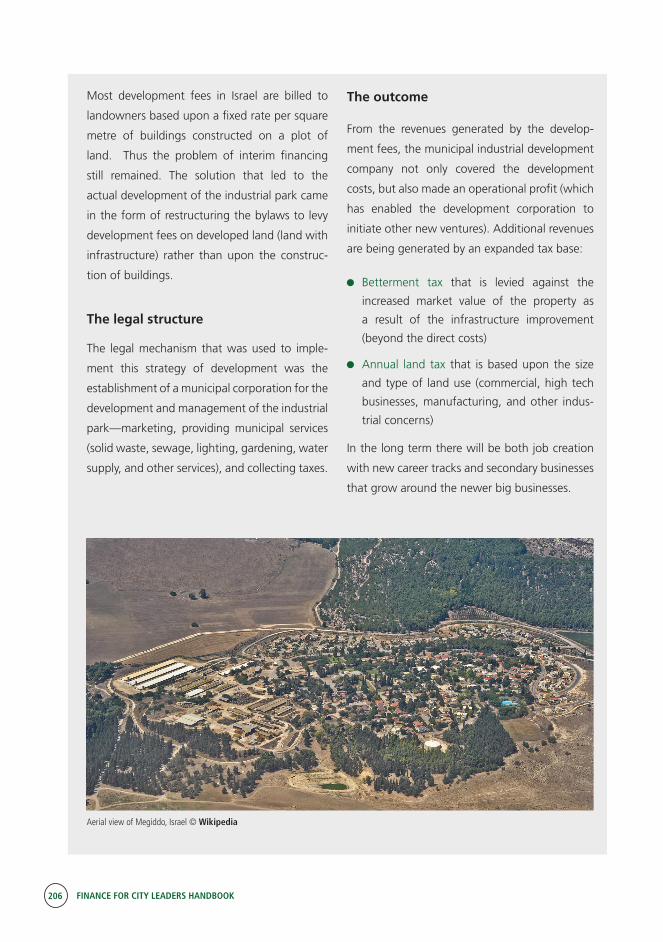
206 FINANCE FOR CITY LEADERS HANDBOOK
Most development fees in Israel are billed to
landowners based upon a fixed rate per square
metre of buildings constructed on a plot of
land. Thus the problem of interim financing
still remained. The solution that led to the
actual development of the industrial park came
in the form of restructuring the bylaws to levy
development fees on developed land (land with
infrastructure) rather than upon the construc-
tion of buildings.
The legal structure
The legal mechanism that was used to imple-
ment this strategy of development was the
establishment of a municipal corporation for the
development and management of the industrial
park—marketing, providing municipal services
(solid waste, sewage, lighting, gardening, water
supply, and other services), and collecting taxes.
The outcome
From the revenues generated by the develop-
ment fees, the municipal industrial development
company not only covered the development
costs, but also made an operational profit (which
has enabled the development corporation to
initiate other new ventures). Additional revenues
are being generated by an expanded tax base:
Betterment tax that is levied against the
increased market value of the property as
a result of the infrastructure improvement
(beyond the direct costs)
Annual land tax that is based upon the size
and type of land use (commercial, high tech
businesses, manufacturing, and other indus-
trial concerns)
In the long term there will be both job creation
with new career tracks and secondary businesses
that grow around the newer big businesses.
Aerial view of Megiddo, Israel © Wikipedia
FINANCE FOR CITY LEADERS HANDBOOK 207
Yoel Siegel is a senior consultant for the Urban Economy Branch of the United Nations Human Settlements
Programme.
Marco Kamiya is coordinator of the Urban Economy Branch of the United Nations Human Settlements
Programme.
Endnotes
1 Elinor Ostrom, “Crafting Institutions for Self-Governing Irrigation Systems” (n.p., Ics Pr, 1992); Todd Sandler, Global Collective Action (Cambridge, U.K., Cambridge University Press, 2004).
2 Adam Smith, An Inquiry into the Nature and Causes of the Wealth of Nations (London, W. Strahan and T. Cadell, 1776).
3 Natan Meir, Infrastructure Development and Municipal Corporations (n.p., Municipal Corporations, 1992).
4 Yoel Siegel, Concept Note - Kibos Industrial Park (Nairobi, UN-Habitat, 2010).
5 Yoel Siegel, Principles for Establishing the Megiddo Industrial Park (Regional Council of Megido, Israel, 2010).

03:Part
FINANCE FOR CITY LEADERS HANDBOOK 209
Crosscutting Issues
Financing Investments in Slums and Informal Settlements
13Introduction
Slums and informal settlements remain a significant challenge for many
urban centres around the world, and the implications for municipal and
local governments are profound. In many regions, the numbers of people
living in slums are growing—a trend with significant implications for
urban sustainability. Around one-quarter of the world’s urban population
lives in slums, and since 1990, the number of people living in slums has
risen by 213 million, to close to one billion.1
Over 90 per cent of urban growth is occurring in the developing world,
and an estimated 70 million new residents are added to urban areas of
developing countries each year. Over the next two decades, the urban
population of the world’s two poorest regions—South Asia and sub-Saha-
ran Africa—is expected to double.2 This suggests dramatic growth in the
number of residents of informal settlements and slums in these regions.3
FINANCE FOR CITY LEADERS HANDBOOK 211
“
In sub-Saharan Africa, in 2014 over half of the
urban population (55.9 per cent) lived in slums,
and by 2050, Africa’s urban dwellers are project-
ed to have increased from 201 million in 2014 to
1.2 billion. In Asia, home to half of the world’s
urban dwellers (53.2 per cent in 2014), about
27 per cent of the urban population resides in
slums.4 Globally, if no immediate action is taken,
the number of people without adequate housing
living in slum conditions will triple to three billion
by 2050.5
The challenge posed by a growing global slum
population is compounded by the fact that an
increasing number of countries and cities struggle
with the effects of conflict, natural disasters, or
environmental degradation. These calamities
have resulted in 40.8 million6 internally displaced
persons (IDPs) and 21.3 million international
refugees,7 who mainly settle in camps along the
city periphery or in cities themselves. In addition,
recent large-scale urban development projects have
forcibly displaced 65.3 million people, pushing
them into socially, culturally, and economically
vulnerable situations. Integrating IDPs, refugees,
and forcibly displaced persons into the urban fabric
and providing adequate support poses significant
challenges for many city administrations.
Slum upgrading is essential for the quality of life
and social and economic future not just of those
living in slums, but of all city inhabitants. This is
because widespread slums and informal settle-
ments undermine the prosperity and sustainabil-
ity prospects of all urban residents—even the
comparatively wealthy living in the developed
portions of the city. It is thus necessary to rethink
municipal financing priorities and approaches in
order to reduce urban poverty and achieve more
inclusive and sustainable urbanization.
This chapter explains how financing participatory
slum upgrading promotes inclusive urbanization,
adequate living conditions, and prosperity for all.
The chapter begins by explaining the need for large-
scale, well-targeted investments to finance inclu-
sive and sustainable urbanization. It then analyzes
various instruments for ensuring up-scaling of
participatory slum upgrading through creating
an enabling environment for local authorities and
communities. These tools include national urban
policies, people-centred citywide strategies, and
locally managed funds and partnership strategies.
The chapter concludes by examining a promising
template, UN-Habitat’s Participatory Slum Upgrad-
ing Programme, and detailing its financing models
and partnerships.
The need for large-scale and well-targeted investments to finance inclusive and sustainable urbanization
Investment in both slum upgrading and adequate
housing has been neglected in many world regions
in the last 20 years, despite having been identified
as a global development priority by the Millenni-
um Development Goals. The Sustainable Develop-
ments Goals—which seek to, among many other
things, “ensure access for all to adequate, safe and
affordable housing and basic services, and upgrade
slums” by 2030 (Target 11.1)—provide opportuni-
ties to address this unfinished business. So too does
Slums and informal settlements remain a significant challenge for many urban centres around the world, and the impli-cations for municipal and local govern-ments are profound.
212 FINANCE FOR CITY LEADERS HANDBOOK
the New Urban Agenda, which places municipal
and local government in a key role for promoting
partnerships and governance structures for sustain-
able urbanization. It also calls for innovative and
partnership-based financing arrangements and for
governance arrangements that promote a range of
financing options—both top–down and bottom–up.
For a number of countries, the scale of the chal-
lenge has been a barrier in addressing this issue.
Not many governments can manage the levels of
investment required, nor do they have the legal
supporting framework in place or show political will
to prioritize this. In particular, many local authori-
ties are not financially or institutionally empowered
to respond directly to the challenge, and many still
lack inclusive governance systems that connect
slum dwellers to the formal city.
Remedying this is especially important because
slums and informal settlements generate a large
majority of economic activity in cities and towns.
In many countries, this share is around 90 per
cent. Furthermore, although slum dwellers might
not pay fees such as property tax and land tax,
they do contribute to the overall national budget
through their often low-paid work and the fees
they pay (such as market fees and value-added
taxes on goods). In addition, slum dwellers often
pay 10 times more for basic services—such as water
supply, for example—than residents of the formal
city. In short, slum dwellers play a significant role in
broader urban economic dynamics in many towns
and cities—a role that could be enhanced through
investments in slum upgrading.
Financing slum upgrading, then, is as much about
direct investment in urban infrastructure as it is
about providing a “leg up” to slum and informal
settlement dwellers so that they can overcome
poverty, benefit from living in an intact urban envi-
ronment, and contribute even more fully to the
urban economy.
Moreover, investing in improving slum dwellers’
lives is an investment in human rights reflective
of globally agreed-upon frameworks that say all
urban dwellers must be engaged and included. It
is also critical for the urban sustainability agenda.
No country has ever achieved economic growth
without urbanizing, and those urban areas that
engage and include slums and slum dwellers are
more likely to be prosperous, equitable, and socially
sustainable.
Furthermore, it is important to note that practices
such as forced evictions, unlawful re-locations, or
the “do nothing” approach ultimately cost towns
and cities money and entrench negative spatial and
social divides in urban areas that result in danger-
ous health and security risks. In other words, not
investing creates a larger, more intractable chal-
lenge, which ultimately demands more investment
and risks social unrest.
In many countries and for many national and local
governments, this broader approach to financing
slum upgrading is a significant departure from
conventional understandings—but an important
one. While national governments play a key role in
policy, legislation, and financing of urban develop-
ment and even slum upgrading, local governments
often lead efforts to address the growth of slums
and to integrate slum dwellers into the city (see
Case Study 1). Addressing slum upgrading must
be seen as part of the local investment agenda for
social, economic, and environmental sustainabili-
ty—and not as a one-off project unrelated to other
major municipal goals.
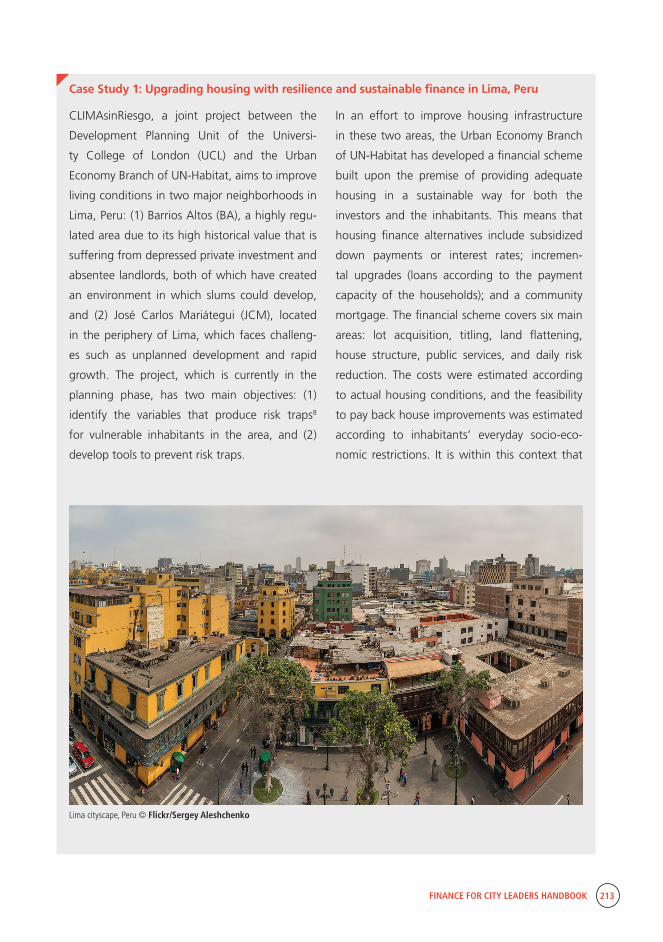
FINANCE FOR CITY LEADERS HANDBOOK 213
Case Study 1: Upgrading housing with resilience and sustainable finance in Lima, Peru
In an effort to improve housing infrastructure
in these two areas, the Urban Economy Branch
of UN-Habitat has developed a financial scheme
built upon the premise of providing adequate
housing in a sustainable way for both the
investors and the inhabitants. This means that
housing finance alternatives include subsidized
down payments or interest rates; incremen-
tal upgrades (loans according to the payment
capacity of the households); and a community
mortgage. The financial scheme covers six main
areas: lot acquisition, titling, land flattening,
house structure, public services, and daily risk
reduction. The costs were estimated according
to actual housing conditions, and the feasibility
to pay back house improvements was estimated
according to inhabitants’ everyday socio-eco-
nomic restrictions. It is within this context that
CLIMAsinRiesgo, a joint project between the
Development Planning Unit of the Universi-
ty College of London (UCL) and the Urban
Economy Branch of UN-Habitat, aims to improve
living conditions in two major neighborhoods in
Lima, Peru: (1) Barrios Altos (BA), a highly regu-
lated area due to its high historical value that is
suffering from depressed private investment and
absentee landlords, both of which have created
an environment in which slums could develop,
and (2) José Carlos Mariátegui (JCM), located
in the periphery of Lima, which faces challeng-
es such as unplanned development and rapid
growth. The project, which is currently in the
planning phase, has two main objectives: (1)
identify the variables that produce risk traps8
for vulnerable inhabitants in the area, and (2)
develop tools to prevent risk traps.
Lima cityscape, Peru © Flickr/Sergey Aleshchenko

214 FINANCE FOR CITY LEADERS HANDBOOK
the different financial alternatives were devel-
oped, leaving space for interventions from both
the private and the public sector.
Moving forward, UN-Habitat and UCL plan to
partner with a local financial institution in the
implementation of this project, which will impact
more than 3,000 people with limited access to
the traditional banking sector, and who live in
an environment typified by rock slides, unautho-
rized access to houses, and a high propensity for
contracting diseases (respiratory diseases are the
most common, with cases in more than 30 per
cent of the houses). A house upgrade will cost
on average PEN11,267.41, which is approximate-
ly US$3,390—an amount that a household will
not be able to access in the traditional financial
sector or through community saving schemes,
and which will represent a huge expense for the
municipal or national government.
“
Investing in slum upgrading is clearly necessary for social, economic, and environmental sustainability.
Financing must be considered in terms of capital
investment but also in terms of other resources—
labour, time, and other community assets. Financ-
ing is needed not only for physical improvement but
also for capacity building, legislative adjustments,
and institutional changes. The latter are usually
much smaller amounts but tend to be forgotten
in budgeting and work plans for slum upgrading.
Financing must also—and perhaps most important-
ly—be considered in terms of a mindset requiring
governance and institutional arrangements that
can support a “financing approach” to improving
the lives of slum dwellers.
People-centred citywide strategies for slum upgrading
Investing in slum upgrading is clearly necessary for
social, economic, and environmental sustainability.
As local governments undertake these investments,
it must be acknowledged that slums and informal
settlements cannot change overnight. Such a wide-
scale transformation requires long-term engage-
ment and calls for sustainable incremental trans-
formation in several neighbourhoods at the same
time (see Case Study 2). Too often national and
city leaders seek quick solutions like resettlement,
eviction, large investment in one particular neigh-
bourhood that then becomes unafford-
able to most of its residents (resulting in
gentrification), or city beautification that
hides the reality of slums through walls
or other barriers. All of these approach-
es exacerbate social divides, exclu-
sion, inequality, and urban poverty and
increase the costs of overcoming these
societal ills at later stages.
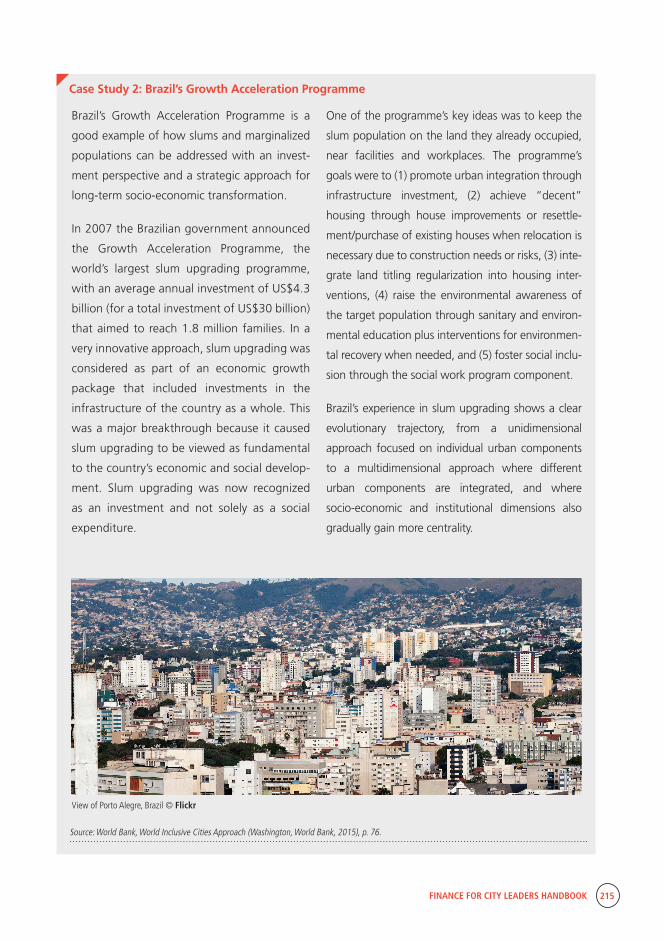
FINANCE FOR CITY LEADERS HANDBOOK 215
Case Study 2: Brazil’s Growth Acceleration Programme
One of the programme’s key ideas was to keep the
slum population on the land they already occupied,
near facilities and workplaces. The programme’s
goals were to (1) promote urban integration through
infrastructure investment, (2) achieve “decent”
housing through house improvements or resettle-
ment/purchase of existing houses when relocation is
necessary due to construction needs or risks, (3) inte-
grate land titling regularization into housing inter-
ventions, (4) raise the environmental awareness of
the target population through sanitary and environ-
mental education plus interventions for environmen-
tal recovery when needed, and (5) foster social inclu-
sion through the social work program component.
Brazil’s experience in slum upgrading shows a clear
evolutionary trajectory, from a unidimensional
approach focused on individual urban components
to a multidimensional approach where different
urban components are integrated, and where
socio-economic and institutional dimensions also
gradually gain more centrality.
Brazil’s Growth Acceleration Programme is a
good example of how slums and marginalized
populations can be addressed with an invest-
ment perspective and a strategic approach for
long-term socio-economic transformation.
In 2007 the Brazilian government announced
the Growth Acceleration Programme, the
world’s largest slum upgrading programme,
with an average annual investment of US$4.3
billion (for a total investment of US$30 billion)
that aimed to reach 1.8 million families. In a
very innovative approach, slum upgrading was
considered as part of an economic growth
package that included investments in the
infrastructure of the country as a whole. This
was a major breakthrough because it caused
slum upgrading to be viewed as fundamental
to the country’s economic and social develop-
ment. Slum upgrading was now recognized
as an investment and not solely as a social
expenditure.
Source: World Bank, World Inclusive Cities Approach (Washington, World Bank, 2015), p. 76.
View of Porto Alegre, Brazil © Flickr
216 FINANCE FOR CITY LEADERS HANDBOOK
Forced evictions and unlawful relocations have
major impacts on slums and slum dwellers. These
include the interruption or destruction of socio-eco-
nomic networks—consequences that negative-
ly affect not only individual livelihoods, but also
potentially the entire city.
Therefore UN-Habitat promotes inclusive pro-poor
policies and participatory citywide slum upgrad-
ing and prevention strategies which emphasize
in-situ upgrading. The concepts discussed in this
section enable linkages to broader economic
goals and to community investment and improve-
ment programmes undertaken at various levels of
government. Furthermore, they help to leverage
the potential of the whole city and enable inclusive
growth and development. Additionally, they allow
for more-focused prioritization and the engage-
ment of diverse investment partners.
Benefits of a participatory, citywide approach
To achieve sustainable transformation, city leaders
should take a participatory citywide approach that
engages all relevant stakeholders. This allows for
joint agreement on principles, aims, and strat-
egies and fosters mutual understanding of the
abilities and limitations of each stakeholder. This
approach secures commitment from all stake-
holders at the outset and makes everyone part of
the process, which fosters shared risk-taking. By
enabling citizens to take on public responsibilities,
it also promotes democratic values. Furthermore, a
participatory citywide approach has the potential
to trigger engagement of often underrepresented
groups, such as women and youth, in urban devel-
opment and management processes.
A people-centred approach to slum upgrading also
fosters economic, social, and environmental resil-
ience among individuals and communities. It iden-
tifies the barriers to prosperity communities face
and increases their economic potential by providing
services and infrastructure, thereby improving the
business environment and linking slums’ economic
activities to those in the rest of the city. It strength-
ens social connections by creating a sense of owner-
ship among citizens. And it improves environmental
conditions by reducing the potential for damage
by floods, landslides, and hurricanes, which can
upend several years of development for people and
communities in minutes or even seconds.
Multi-level governance coordination mechanisms and capacity development
A people-centred approach to slum upgrading should
be complemented by multi-level governance coordi-
nation mechanisms and capacity development. In the
past, national governments often took the lead in
implementing slum upgrading programs. For example,
previous slum upgrading programs such as Cities
Without Slums in Morocco, the Kenya Slum Upgrading
Programme (KENSUP), and Minha Casa Minha Vida in
Brazil were national schemes rather than city-specific
undertakings. Increasing human and financial capacity
as well as progressive decentralization and devolution
have enabled many cities to take the lead in urban
development and management processes, includ-
ing slum upgrading. Therefore, creating a strong link
between national and local government for develop-
ing and implementing slum upgrading is essential. In
addition, local development committees can support
the process by highlighting the issues that need to be
addressed, proposing indigenous solutions, and taking
part in implementation.
Using the comparative advantage of every level of
government has the potential to create complemen-
tary top–down and bottom–up efforts to efficient-
FINANCE FOR CITY LEADERS HANDBOOK 217
ly address slum upgrading. Central governments
should ensure national laws and regulations are in
place to facilitate slum upgrading, such as land acts,
national housing finance schemes, planning regula-
tions, and building codes. Often they are also able to
set aside funds for slum upgrading based on general
tax revenues and other central government revenue
sources, which can then be distributed to local govern-
ments. They are also often the stakeholder that nego-
tiates with international development partners for
grants and loans. For their part, local governments
should ensure that local development plans and strat-
egies address the city-specific issues pertaining to
slums and ensure there is sufficient capacity to address
them. Local government should also be the main body
to coordinate a participatory approach that facilitates
exchange among all stakeholders. Their local knowl-
edge of the situation and of the abilities and liabili-
ties of stakeholders is vital to the success of a citywide
slum upgrading approach. This also includes ensuring
the participation of service providers, which (depend-
ing on the country) can be governmental, parastatal,
or private entities.
In addition, capacity development and commu-
nity empowerment are necessary to facilitate full
participation in community-driven socio-economic
transformation and to leverage local knowledge
and experience. Capacity development encom-
passes, among other things, participatory planning
and human rights; community organization; neigh-
bourhood planning; community-driven projects;
community data collection, analysis, monitoring,
and evaluation; inclusion of vulnerable groups and
their particular needs; incremental housing; and
strategic projects that build resilience in communi-
ties (see Case Study 3).
Women should play an integral part in the capac-
ity-development process, as women are crucial to
families’ livelihoods in slum communities. Many
households are headed by single women with
children and are particularly vulnerable. Special
attention should also be given to youths’ potential
to boost prosperity and adapt quickly to change
and economic opportunities.
Case Study 3: Harnessing “people power” to create inclusive microfinance mechanisms in Thailand
not only to community organizations formed by
the urban poor but also to their networks. This
allows them to work with city authorities and other
local actors and with national agencies on citywide
upgrading programmes. It seeks to “go to scale”
by supporting thousands of community-driven
initiatives within citywide programmes designed
and managed by networks working in partnership
with local actors. With regard to financing, Baan
Mankong provides micro-financing through the
local community networks that became part of
The success of the Government of Thailand’s Baan
Mankong program, implemented by the Commu-
nity Organizations Development Institute (CODI),
illustrates that small-scale micro-financing efforts
and networks can be harnessed and turned into
effective tools to finance citywide slum upgrading.
Baan Mankong centres on providing infrastruc-
ture subsidies and housing loans to low-income
communities to support slum upgrading in situ
wherever possible. Support for projects is provided
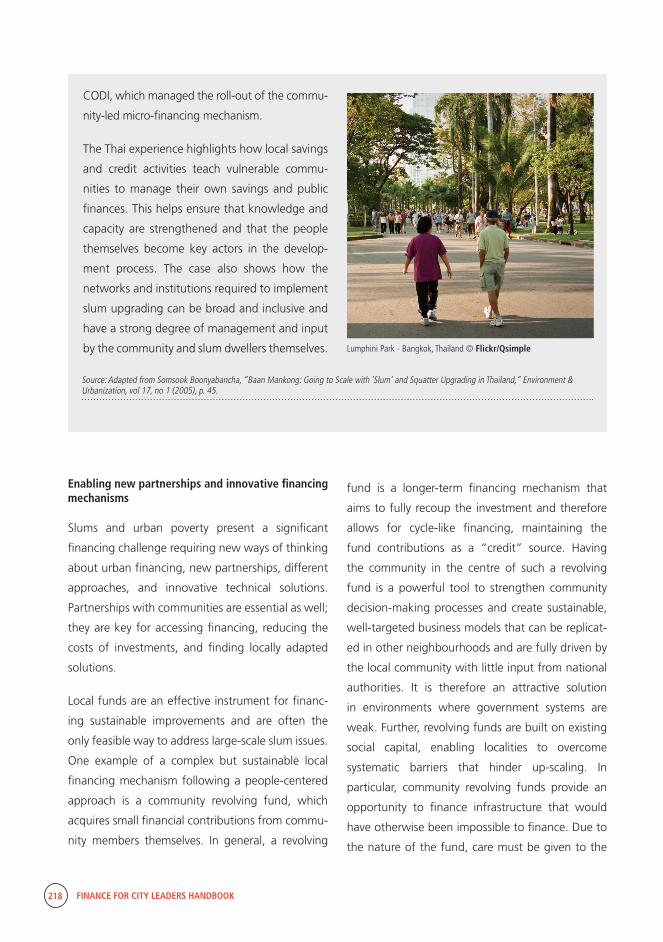
218 FINANCE FOR CITY LEADERS HANDBOOK
Source: Adapted from Somsook Boonyabancha, “Baan Mankong: Going to Scale with ‘Slum’ and Squatter Upgrading in Thailand,” Environment & Urbanization, vol 17, no 1 (2005), p. 45.
CODI, which managed the roll-out of the commu-
nity-led micro-financing mechanism.
The Thai experience highlights how local savings
and credit activities teach vulnerable commu-
nities to manage their own savings and public
finances. This helps ensure that knowledge and
capacity are strengthened and that the people
themselves become key actors in the develop-
ment process. The case also shows how the
networks and institutions required to implement
slum upgrading can be broad and inclusive and
have a strong degree of management and input
by the community and slum dwellers themselves. Lumphini Park - Bangkok, Thailand © Flickr/Qsimple
Enabling new partnerships and innovative financing mechanisms
Slums and urban poverty present a significant
financing challenge requiring new ways of thinking
about urban financing, new partnerships, different
approaches, and innovative technical solutions.
Partnerships with communities are essential as well;
they are key for accessing financing, reducing the
costs of investments, and finding locally adapted
solutions.
Local funds are an effective instrument for financ-
ing sustainable improvements and are often the
only feasible way to address large-scale slum issues.
One example of a complex but sustainable local
financing mechanism following a people-centered
approach is a community revolving fund, which
acquires small financial contributions from commu-
nity members themselves. In general, a revolving
fund is a longer-term financing mechanism that
aims to fully recoup the investment and therefore
allows for cycle-like financing, maintaining the
fund contributions as a “credit” source. Having
the community in the centre of such a revolving
fund is a powerful tool to strengthen community
decision-making processes and create sustainable,
well-targeted business models that can be replicat-
ed in other neighbourhoods and are fully driven by
the local community with little input from national
authorities. It is therefore an attractive solution
in environments where government systems are
weak. Further, revolving funds are built on existing
social capital, enabling localities to overcome
systematic barriers that hinder up-scaling. In
particular, community revolving funds provide an
opportunity to finance infrastructure that would
have otherwise been impossible to finance. Due to
the nature of the fund, care must be given to the
FINANCE FOR CITY LEADERS HANDBOOK 219
Lumphini Park - Bangkok, Thailand © Flickr/Qsimple
type of investments made, and priority should be
given to projects that generate income, such as the
upgrading of local markets whereby the fund will
profit from market fees.
Citywide slum upgrading also provides entry points
for diverse investment partners. It provides direct,
highly visible investment opportunities. This assists
in mobilizing private sector investments as well
as attracting multilateral and bilateral financing
partners.9 For example, the European Commission
has expressed interest in piloting the EU’s blended
financing mechanism for participatory slum upgrad-
ing in countries in Africa, the Caribbean, and the
Pacific islands. The innovation of the EU blending
mechanism is to combine EU grants with loans or
equity from public and private financiers. The EU
grant element can be used in a strategic way to
attract additional financing for important invest-
ments in EU partner countries by reducing exposure
to risk.
A further interesting new partnership can be built
with the insurance sector. Various maladies that
affect slums—such as crime, pollution, and dete-
riorating infrastructure—also negatively impact
this sector. For this reason, the insurance sector
has realized that it can ultimately be less costly
to proactively invest in preventing some of these
scourges from occurring in the first place.10
UN-Habitat’s Participatory Slum Upgrading Programme, its financing model, and its partnerships
A promising template that exemplifies many
of the concepts discussed in this chapter—one
that has mobilized partnerships in implementing
participatory slum upgrading to achieve inclu-
sive urbanization, adequate living conditions,
and prosperity for all—is UN-Habitat’s Participa-
tory Slum Upgrading Programme (PSUP). It was
designed over 2008–2016 through continuous
learning. It is based on a tripartite partnership
initiated by the Secretariat of the African, Carib-
bean, and Pacific Group of States, as well as the
European Commission as financing partner and
UN-Habitat as implementing partner.
Two fundamental concepts are at the core
of PSUP: A mix of instruments is necessary to
address the strategy’s variety of needs, and
at the city level no single stakeholder has the
capacity (financial or otherwise) to address slum
upgrading alone.
PSUP uses and recommends a variety of tools and
approaches to finance slum upgrading. In partic-
ular, it takes a participatory approach, which
has implications for financing opportunities. A
participatory approach makes all urban stake-
holders aware of the challenge, builds capacity
for addressing city-specific issues, fosters mutual
understanding of all partners’ abilities, creates
partnerships, determines ownership, and opens
up collaboration opportunities. The creation of
a sense of common ownership of the process
and the outputs is key for discussions on financ-
ing the slum upgrading intervention (see Case
Study 4).
Two fundamental concepts are at the core of PSUP: A mix of instruments is necessary to address the strategy’s variety of needs, and at the city level no single stakeholder has the capacity (financial or otherwise) to address slum upgrading alone.
“
220 FINANCE FOR CITY LEADERS HANDBOOK
PSUP addresses the ownership question through
early co-funding requirements on the part of local
and national governments. This is in line with the
programme’s sustainability principle, which holds
that interventions should be planned in a manage-
able way and should first rely on locally and nation-
ally available resources. Basing slum upgrading on
locally available funds also ensures planning inter-
ventions that are later able to be maintained by the
local government, the community, or other local
mechanisms are in place, which contributes to the
sustainability of the interventions. The co-funding
discussion with national and local governments
is important for lobbying within the national and
local budgeting process. Also important is the
creation of a budget line for slum upgrading, an
expenditure that many ministries and local govern-
ments overlook. National and local governments
must also be ready to receive, administer, and
spend funding received for slum upgrading, which
PSUP’s experience has proven not to be a given.
Therefore PSUP supports governments’ attempts
to remedy this weakness and releases funds for
programme implementation to national accounts
where possible.
A successful slum upgrading strategy also requires
institutional and policy interventions to be identified
early in the process. Some activities, such as policy
and regulatory reviews, can be scheduled in regular
work plans and budgets of ministries and local
governments. An important financing strategy for
addressing required institutional changes such as
capacity building, restructuring, and infrastructure
improvement is strategic partnerships. As the issues
at hand are mostly very concrete, time-bound, and
visible, this presents an opportunity for city-to-city
partnerships, corporate social responsibility activ-
ities, and philanthropic contributions whereby
the partner can gain visibility. Often the financing
of physical infrastructure is the largest and most
challenging issue. Therefore the strategy has to be
two-fold: (1) finding options that are adapted to
the city situation and are cost realistic, and (2) iden-
tifying the right financing mechanism. Depending
on the ability of the city, there are plenty of avail-
able mechanisms, including redistributive taxes/
charges, lending, blending, and drawing together
sector budgets into one common project/program
budget.
A last point on slum upgrading finance is to look
at the way projects—especially physical projects—
are implemented. There are a variety of options,
ranging from large-scale international contractors
to national companies to community-managed
funds.11 All have their advantages and disadvan-
tages in terms of management and financial impli-
cations. PSUP advocates implementing a capaci-
ty-building approach by working together as much
as possible with national institutions, NGOs, consul-
tants, and the community. It is advisable to imple-
ment a pilot project, wherein a process driven by
the national or local governments with significant
involvement of the target community is implement-
ed. This addresses capacity building on the three
governance levels, often proves more cost-effec-
tive, creates a link between indigenous solutions
and livelihoods, and builds trust among stakehold-
ers for larger-scale undertakings.
Basing slum upgrading on locally available funds ensures planning interventions that are later able to be maintained by the local government, the community, or other local mechanisms are in place, which contributes to the sustainability of the interventions.
“
FINANCE FOR CITY LEADERS HANDBOOK 221
Case Study 4: Cameroon’s experience with PSUP
nancing and other investments in the slum
neighbourhoods, and most importantly have
assisted in leveraging financial contributions
from community members. For example, a trash
collection and recycling service was established
by youth. The local authority provided the public
equipment for the service, including special-
ly designed vehicles to access the dense slum
neighbourhood in Yaounde. The community
pays around US$2 per household per week for
trash collection. PSUP provides the potential for
communities to invest in small-scale business
initiatives such as these.
In addition, the private sector was mobilized
from the beginning and has been made respon-
sible for providing infrastructure. In return, it will
be able to sell services, such as water and elec-
tricity.
Further, a high priority for communities has been
to create local economic mobility by connecting
the neighbourhood to the formal city and by
creating public space for economic activities.
Women in particular have benefited; it facili-
tates care for their children as well as small-scale
economic activities within the city (products
are often bought in the formal city and sold in
smaller, more affordable amounts in the slum
neighbourhood).
Thus Cameroon has leveraged participatory slum
upgrading to create financial engagement at all
governance levels and to respond to community
needs through a bottom-up approach.
The Government of Cameroon has partnered
with the UN Secretariat of the African, Caribbe-
an, and Pacific Group of States; the European
Commission; and UN-Habitat on PSUP since
2008. Initially the country undertook no
slum-upgrading activities, nor did it allocate
funds for this purpose. Further, eviction seemed
to be the country’s only approach towards
slums. Since 2008 the PSUP approach, including
the financing component, has been fully institu-
tionalized. Slum upgrading has been delegated
to local authorities through a review of legisla-
tion, a pro-poor urban policy is on the way, and
most importantly a diverse resource base for
slum upgrading has been established.
At the national level the Ministry of Housing and
Urban Development allocated funds for policy
and legislation review, as well as for technical
support to local authorities for PSUP. Further, it
lobbied the Ministry of Finance and FEICOM, a
national financing institution that aims to equip
local authorities with financing for sustainable
development. PSUP was selected as a funding
priority, which enabled the approach to be
replicated in two more cities. Further, a broad
coordination mechanism was established with
representatives from several national and local
authorities, NGOs, residents, and the private
sector.
PSUP has therefore managed to foster owner-
ship and investment among all parties. All
local authorities have allocated funds for slum
upgrading. NGOs have provided in-kind co-fi-
Source: Sipliant Takougang, UN-Habitat Participatory Slum Upgrading Programme implementation experience and report
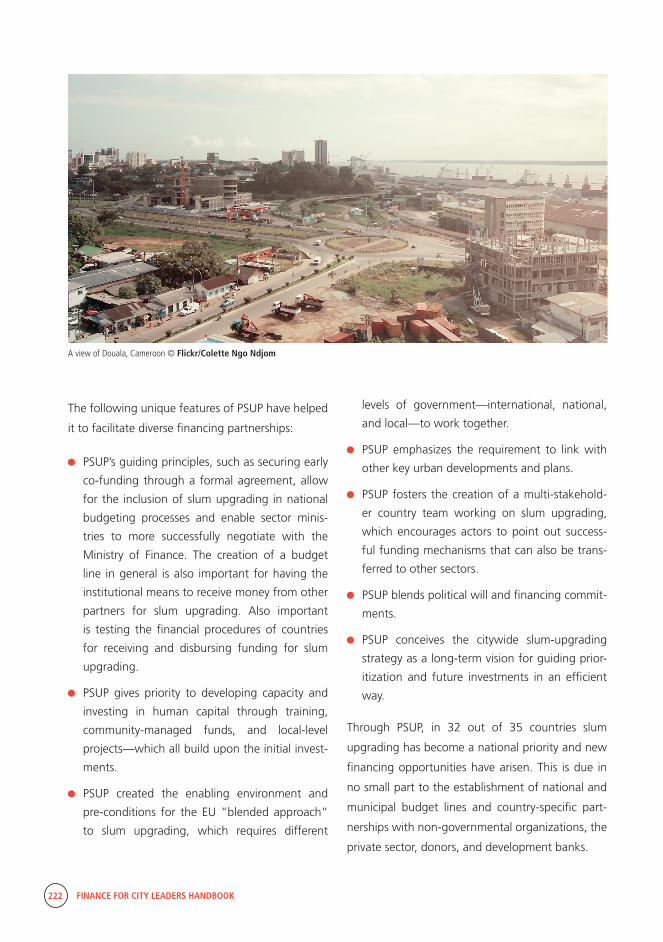
222 FINANCE FOR CITY LEADERS HANDBOOK
The following unique features of PSUP have helped
it to facilitate diverse financing partnerships:
PSUP’s guiding principles, such as securing early
co-funding through a formal agreement, allow
for the inclusion of slum upgrading in national
budgeting processes and enable sector minis-
tries to more successfully negotiate with the
Ministry of Finance. The creation of a budget
line in general is also important for having the
institutional means to receive money from other
partners for slum upgrading. Also important
is testing the financial procedures of countries
for receiving and disbursing funding for slum
upgrading.
PSUP gives priority to developing capacity and
investing in human capital through training,
community-managed funds, and local-level
projects—which all build upon the initial invest-
ments.
PSUP created the enabling environment and
pre-conditions for the EU “blended approach”
to slum upgrading, which requires different
levels of government—international, national,
and local—to work together.
PSUP emphasizes the requirement to link with
other key urban developments and plans.
PSUP fosters the creation of a multi-stakehold-
er country team working on slum upgrading,
which encourages actors to point out success-
ful funding mechanisms that can also be trans-
ferred to other sectors.
PSUP blends political will and financing commit-
ments.
PSUP conceives the citywide slum-upgrading
strategy as a long-term vision for guiding prior-
itization and future investments in an efficient
way.
Through PSUP, in 32 out of 35 countries slum
upgrading has become a national priority and new
financing opportunities have arisen. This is due in
no small part to the establishment of national and
municipal budget lines and country-specific part-
nerships with non-governmental organizations, the
private sector, donors, and development banks.
A view of Douala, Cameroon © Flickr/Colette Ngo Ndjom
FINANCE FOR CITY LEADERS HANDBOOK 223
Conclusion
Overcoming inequality, exclusion, and inadequate
living conditions in slums requires inclusive gover-
nance systems. This demands the full engagement
of national governments through participatory slum
upgrading and affordable housing programmes,
municipal leadership guided by citywide slum
upgrading strategies, and people-centred
approaches strengthened through locally managed
funds and community upgrading plans.
Resources for slum upgrading remain scarce;
therefore, a strategic, multi-level governance, and
multi-partnership approach is absolutely essential.
While this approach requires a larger input in time
and human resources, it provides the opportunity
for up-scaling and replication. An inclusive citywide
slum upgrading strategy is therefore a key instru-
ment for integrating the informal city with the
formal city and for targeted and efficient long-term
engagement and investment.
Locally managed funds, participatory budgeting,
and community-led projects are particularly import-
ant, and are new recommendations for sustain-
able transformation and slum upgrading.12 Locally
managed funds have the potential to overcome
barriers to citywide transformation and large-scale
investments, thereby enabling large-scale and
long-term transformation through replication and
up-scaling.13
Additionally, community-driven resource implemen-
tation reduces costs. “Authentic partnerships” are
the most feasible set-up for long-term transforma-
tion and incremental improvements in line with the
financial capacity of slum dwellers in developing
countries. In short, participatory approaches pave
the way to achieve more with limited resources.
However, in tandem with the creation of bottom-
up investment, it is important to create innovative
large-scale financing mechanisms with long-term
vision in order to facilitate citywide transformation
and full integration of marginalized and poor neigh-
bourhoods. Large-scale financing mechanisms that
enable multi-sectoral investment and basic infra-
structure projects are needed, and the international
community and development banks as well as the
private sector need to fulfil their roles in providing
required funds to transform slums and the lives of
slum dwellers in a sustainable manner.
224 FINANCE FOR CITY LEADERS HANDBOOK
Kerstin Sommer is the unit leader of the Slum Upgrading Unit of the United Nations Human Settlements
Programme.
Katja Dietrich is a regional program manager for the Housing and Slum Upgrading Branch of the United
Nations Human Settlements Programme.
Melissa Permezel is a policy and development tool advisor in the Housing and Slum Upgrading Branch of
the United Nations Human Settlements Programme.
7 International Displacement Monitoring Centre and Norwegian Refugee Council, Global Report on Internal Displacement 2015 (n.p., International Displacement Moni-toring Centre and Norwegian Refugee Council, 2015).
8 A risk trap is associated with the economic concept of a poverty trap, in which everyday hazards and episodic, small-scale disasters accumulate.
9 Skye Dobson, Hellen Nyamweru, and David Dodman, “Local and Participatory Approaches to Building Resilience in Informal Settlements in Uganda,” Environment and Urbanization, vol. 27, no. 2, pp. 605–620.
10 Vanessa Otto-Mentz, remarks delivered at ICLEI Resil-ience Conference, Bonn, June 2016.
11 Vanessa Otto-Mentz, remarks delivered at ICLEI Resil-ience Conference, Bonn, June 2016.
12 Skye Dobson, Hellen Nyamweru, and David Dodman, “Local and Participatory Approaches to Building Resilience in Informal Settlements in Uganda,” Environment and Urbanization, vol. 27, no. 2, pp. 605–620.
13 Diane Mitlin, Locally Managed Funds: A Route to Pro-Poor Urban Development (London, IIED, 2013). Available from http://pubs.iied.org/pdfs/17154IIED.pdf.
Endnotes
1 UN-Habitat, Slum Almanac 2015/2016: Tracking Im-provement in the Lives of Slum Dwellers (Nairobi, UN-Hab-itat, 2015). Since 2003, UN member states have defined a slum household as a group of individuals living under the same roof lacking one or more of the following: 1) access to improved water, 2) access to improved sanitation facili-ties, 3) sufficient living area, 4) structural quality/durability of dwellings, and 5) security of tenure. Agreement upon these “five deprivations” has enabled the measuring and tracking of slum demographics, though a significant data gap exists.
2 World Bank, Urban Poverty (Washington, D.C., World Bank, 2008).
3 UN-Habitat, Slums and Cities Prosperity Index (Nairo-bi, UN-Habitat, 2014).
4 UN-Habitat, World Cities Report (Nairobi, UN-Habitat, 2016).
5 UN-DESA, World Economic and Social Survey 2013 (New York, UN-DESA, 2013).
6 International Displacement Monitoring Centre and Norwegian Refugee Council, Global Report on Internal Displacement 2015 (n.p., International Displacement Moni-toring Centre and Norwegian Refugee Council, 2015).
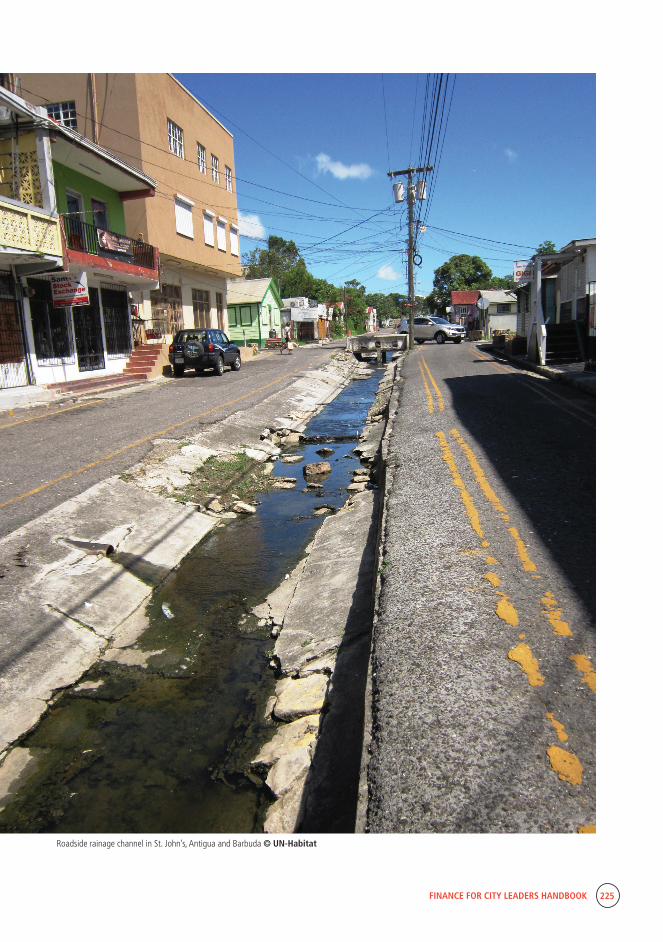
FINANCE FOR CITY LEADERS HANDBOOK 225
Roadside rainage channel in St. John’s, Antigua and Barbuda © UN-Habitat
The Cross-Cutting Issues of Human Rights, Gender Equality, and Youth
14Introduction
Urbanization reflects transformations in national economies—most
notably growing numbers of people moving away from working directly
with natural resources and towards industry and services.1 Indeed, 70
to 80 per cent of economic activity is generated in cities.2 Thus, urban-
ization is associated with increasing prosperity and enjoyment of social,
economic, cultural, civil, and political rights for men and women.3 In
this sense, urbanization is also associated with the right to an adequate
standard of living.4
However, urbanization does not necessarily translate into an adequate
standard of living for all. In some countries, it is generally associated with
inequality, exclusion and segregation, a spike in urban poverty rates,
growth of slums, and unequal access to the services and benefits of
urbanization. The challenges of urbanization, such as rising inequalities,
FINANCE FOR CITY LEADERS HANDBOOK 227
“
inadequate housing conditions, and the proliferation of slums, are symptoms of a larger
deficit of the realization of human rights in cities. Only when all dimensions of the right
to adequate housing and other human rights are respected will urbanization realize its
full transformational potential.
The cross-cutting issues of human rights, gender equality, and youth are key to wealth
and employment creation in cities and towns that realize their full potential as drivers of
economic development, and where all residents can contribute to urban life. In view of
the 2030 Agenda’s call to “leave no one behind” and “reach the furthest behind first,”
these cross-cutting social safeguards seek to ensure inclusion of all urban residents as
contributors to urban life and the urban economy.
The 2030 Agenda for Sustainable Development and Urban Economy
Via the 2030 Agenda, the UN member states have declared their vision of “a world of
universal respect for human rights and human dignity, the rule of law, justice, equality
and non-discrimination; of respect for race, ethnicity and cultural diversity.”5 Strong
emphasis is put on the importance of promoting gender equality, as well as establish-
ing specific targets directed towards women’s and girls’ empowerment in the pursuit
of gender equality. Youth-responsive approaches are also highlighted throughout the
agenda.
Many of the 17 Sustainable Development Goals (SDGs) in the 2030 Agenda for Sustain-
able Development are of relevance for city leaders engaging in urban financing policies
and interventions (see Box 1). The agenda and its goals emphasize that development
should focus on and prioritize marginalized, disadvantaged, and excluded groups, in an
effort to reach the furthest behind first. Those most often left behind in urbanization
processes include, but are not limited to, the urban poor, residents of slums and informal
settlements, homeless persons, people experi-
encing—or under the threat of—forced evic-
tions, children, youth, the elderly, persons with
disabilities, refugees, migrants and displaced
persons, indigenous peoples, persons with HIV/
AIDS, persons of diverse sexual orientations and
gender identities, and women. Many persons will
experience intersecting forms of marginalization
and disadvantage as a result of overlaps in their
identities, e.g., young poor women or indige-
nous youth with disabilities.
Urbanization is associated with increasing prosperity and enjoyment of social, economic, cultural, civil, and political rights for men and women.

228 FINANCE FOR CITY LEADERS HANDBOOK
Box 1: Some of the Sustainable Development Goals relevant for city leaders
Sustainable Development Goal 5: Gender equality
• Target 5.1: End all forms of discrimination against all women and girls everywhere
• Target 5.5: Ensure women’s full and effective participation and equal opportunities for leadership at all levels of deci-sion-making in political, economic, and public life
• Target 5.9: Adopt and strengthen sound policies and enforce-able legislation for the promotion of gender equality and the empowerment of all women and girls at all levels
Sustainable Development Goal 9: Infrastructure and industrialization
• Target 9.1: Develop quality, reliable, sustainable, and resilient infrastructure, including regional and trans-border infrastruc-ture, to support economic development and human well-be-ing, with a focus on affordable and equitable access for all
• Target 9.4: Upgrade infrastructure and retrofit industries to make them sustainable, with increased resource-use efficien-cy and greater adoption of clean and environmentally sound technologies and industrial processes, with all countries tak-ing action in accordance with their respective capabilities
Sustainable Development Goal 11: Sustainable cities and communities
• Target 11.1: Ensure access for all to adequate, safe, and af-fordable housing and basic services, and upgrade slums
• Target 11.3: Enhance inclusive and sustainable urbanization and capacity for participatory, integrated, and sustainable human settlement planning and management in all countries
• Target 11.a: Support positive economic, social, and environ-mental links between urban, peri-urban, and rural areas by strengthening national and regional development planning
• Target 11.c: Support least-developed countries, including through financial and technical assistance, in building sustain-able and resilient buildings utilizing local materials
Sustainable Development Goal 16: Peace, justice, and strong institutions
• Target 16.3: Promote the rule of law at the national and in-ternational levels and ensure equal access to justice for all
• Target 16.5: Substantially reduce corruption and bribery in all their forms
• Target 16.6: Develop effective, accountable, and transparent institutions at all levels
Human rights
Human rights are universal legal guarantees that protect individuals, and to a certain extent groups, from
interference with their freedoms. Human rights are inherent to all human beings and are designed to
protect the human values of freedom, equality, and dignity. They are grounded in international norms and
standards and are legally binding for states upon ratification of human rights treaties.
What human rights are relevant for city leaders?
Human rights relevant in the context of urban economy include, but are not limited to:
the right to an adequate standard of living;6
the right to adequate housing;7
the right to water and sanitation;8
the right to work;9
the right to health;10
the right to education;11
the right to access to information;12
the right to hold property;13 and
land rights.14
FINANCE FOR CITY LEADERS HANDBOOK 229
Financing for development
“Financing for development must satisfy the demands of all persons to have their most basic needs
met in a world that does not lack the means, but has failed to demonstrate the will, to make human
rights a reality for all.”
Zeid Ra’ad Al Hussein
UN High Commissioner for Human Rights
The added value of a Human Rights–Based Approach to municipal finance
The Human Rights–Based Approach (HRBA) is
composed of programming principles that can be
used by city leaders to seek to ensure that their
decision-making contributes to sustainable and
inclusive urbanization processes.15 HRBA seeks to
address capacity gaps of decision-makers such as
city leaders, mayors, local government officials,
and ministry officials so they can fulfil their human
rights duties, and so urban residents can enjoy their
human rights entitlements.
The benefits of a Human Rights–Based Approach
include the following:
Financial policies take into account the knowl-
edge and experiences of all urban residents with
increased potential for success, sustainability,
and cost-effectiveness.
Tax policies can be developed in a way that
promotes equality and combats exclusion.
Financing schemes include and yield benefits for
all, including urban residents who might be left
behind in urban processes.
The participation of both decision-makers and
urban residents in the decision-making process
enables holistic analyses of financial challenges.
It provides communities ownership and under-
standing of the intervention, which builds trust.
This increases the chances of acceptance of the
process and outcomes, and successful comple-
tion of the intervention.
The duties of city leaders in the protection and promotion of human rights
A human right can be understood as a relation-
ship between individuals or a group who has
human rights entitlements, and decision-mak-
ers and others with corresponding human rights
duties or obligations (see Figure A). Urban resi-
dents with human rights entitlements are in this
way “rights-holders.” Rights-holders include those
living in slums and informal settlements without
security of tenure and availability of services, as well
as those living in formal settlements. Rights-holders
include people of different sexes and ages. People
in situations of vulnerability are also rights-holders,
including the urban poor, persons experiencing
(or under the threat of) forced evictions, homeless
persons, persons with disabilities, indigenous
peoples, minorities, refugees, migrants and inter-
nally displaced persons, persons with HIV/AIDS, and
persons of diverse sexual orientations and gender
identities.
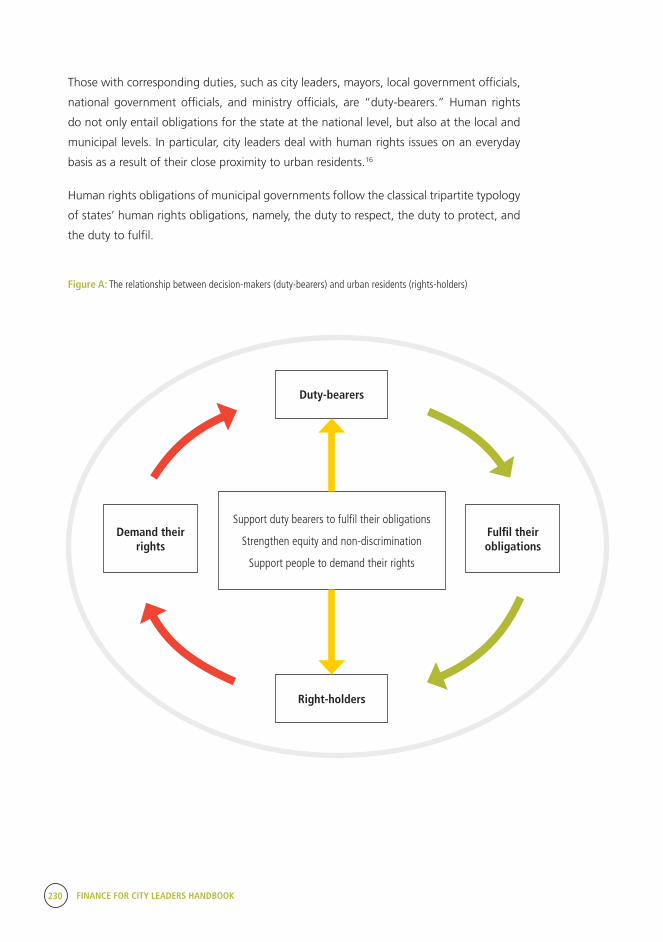
230 FINANCE FOR CITY LEADERS HANDBOOK
Those with corresponding duties, such as city leaders, mayors, local government officials,
national government officials, and ministry officials, are “duty-bearers.” Human rights
do not only entail obligations for the state at the national level, but also at the local and
municipal levels. In particular, city leaders deal with human rights issues on an everyday
basis as a result of their close proximity to urban residents.16
Human rights obligations of municipal governments follow the classical tripartite typology
of states’ human rights obligations, namely, the duty to respect, the duty to protect, and
the duty to fulfil.
Figure A: The relationship between decision-makers (duty-bearers) and urban residents (rights-holders)
Demand their rights
Fulfil their obligations
Right-holders
Duty-bearers
Support duty bearers to fulfil their obligations
Strengthen equity and non-discrimination
Support people to demand their rights
FINANCE FOR CITY LEADERS HANDBOOK 231
The duty/obligation to respect means that city
leaders should refrain from interfering with the
enjoyment of the rights and freedoms of all persons
within their jurisdiction. For example:
Specific barriers to women’s access to finance
must be eliminated, and women and girls must
have equal access to financial services, and the
right to own land and other assets.17
City leaders need to ensure that taxes and fees
are not beyond people’s capacity to pay and
will not have adverse impacts on their ability to
enjoy their human rights to adequate housing,
water and sanitation, education, etc.18
City leaders need to assess how financial instru-
ments affect various groups. For example,
if property valuation undervalues expensive
properties systematically, it can place an undue
burden on poor urban residents in comparison
to higher-income households.
The duty/obligation to protect requires measures to
ensure that third parties do not violate the rights
and freedoms of the individual. For example:
City leaders are required to ensure that busi-
nesses do no harm to the individual. In working
together, city leaders and businesses should
subject public–private partnerships to human
rights safeguards and due diligence, including
human rights impact assessments.19
People should have access to fair judicial
proceedings regarding the payment of taxes
and fees.
The duty/obligation to fulfil requires the adoption
of appropriate legislative, administrative, budget-
ary, judicial, promotional, and other measures
towards the full realization of human rights. Also,
city leaders should strive to ensure universal and
transparent access to affordable and appropriate
financial services across income levels, genders,
geographical divisions, ages, and other groups.20
For example:
City leaders need to ensure that adequate
local revenue generation can be spent on the
progressive realization of housing, water, sani-
tation, etc.
The added value of participatory budgeting processes
The distribution of public spending can promote
the realization of human rights, and city leaders
need to assess how financial instruments affect
various groups so as to ensure that certain individu-
als or groups are not affected adversely. The United
Nations Human Settlements Programme (UN-Hab-
itat) is working with participatory approaches
to promote inclusive and transparent budgeting
processes, where the communities themselves set
priorities together with decision-makers (see Case
Study 1).
Participatory budgeting processes add value in
these ways:
The lived experiences by the community
members inform the process and increase the
relevance of public spending or development
of the financial instrument, and identification
of cost- and time-saving strategies.
The processes build trust and increase sense of
ownership, which increases the likelihood that
decisions on tax collection, financial instru-
ments, and public spending will be accepted
by the targeted communities.
The processes increase the likelihood that the
communities will protect and take care of the
products built or installed.
232 FINANCE FOR CITY LEADERS HANDBOOK
Case Study 1: UN-Habitat local participatory budgeting in Democratic Republic of Congo,
Mozambique, and Senegal
patory budgeting formulation, resource mobili-
zation and budget adoption, budget execution,
monitoring, and evaluation. In this way, strategic
projects were selected by the residents and local
decision-makers, who promoted infrastructure
and public space projects, and the progressive
realization of the human rights to water and
sanitation, work, and adequate housing.
The benefits from the participatory budgeting
process included the following:
Gender inclusivity and sensitivity to local
cultural practices was achieved.
Co-funding from the participating munici-
palities was triggered.
Participating municipalities contributed
towards the execution of the projects.
Local counterparts assumed a high level of
ownership.
Accountability of local and national policy-
makers was reinforced.
The programme contributed to democracy
and decentralization.21
How human rights principles can benefit financial processes
To ensure that financial policies contribute to inclusive and sustainable cities and towns where human rights
are realized for all, human rights principles should guide all phases of the policy process. Human rights
principles—such as interdependence and indivisibility, equality and non-discrimination, participation and
inclusion, and accountability and rule of law—represent the procedural safeguards to ensure that financial
processes integrate a human rights perspective. According to the Human Rights–Based Approach, equal
attention needs to be paid to both processes and outcomes.
UN-Habitat’s programme “Capacity Building
for Local Participatory Planning, Budgeting, and
Gender Mainstreaming,” carried out in collabora-
tion with the Government of Spain, focused on
developing capacities of local councilors, municipal
staff, non-governmental organizations, communi-
ty-based organizations, and local training institu-
tions to carry out strategic planning and budget-
ing in a participatory manner. The programme
combined and applied a number of participato-
ry planning tools and governance methods in a
sequential manner to best serve the needs iden-
tified in eight municipalities in the Democratic
Republic of Congo, Mozambique, and Senegal.
To ensure a gender perspective, gender consider-
ations were mainstreamed in decision-making and
implementation, with a focus of enhancing the
capacities and roles of women in the processes.
Participatory budgeting committees were put in
place, and the participation of residents of the
municipality was ensured, as was the represen-
tation of women. Through the committees, a
participatory planning and budgeting process was
established to contribute to preparation, partici-
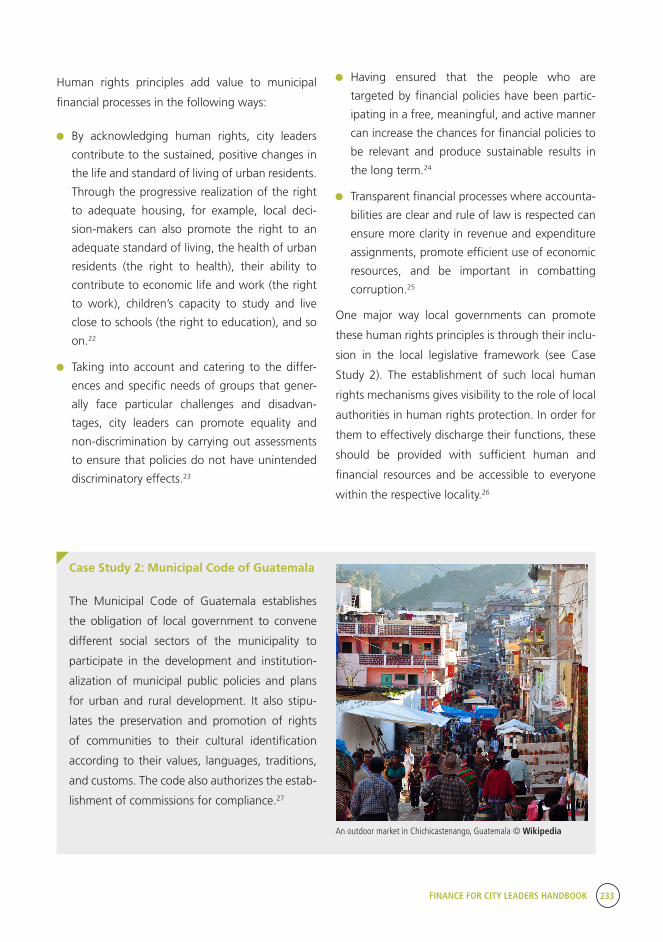
FINANCE FOR CITY LEADERS HANDBOOK 233
Human rights principles add value to municipal
financial processes in the following ways:
By acknowledging human rights, city leaders
contribute to the sustained, positive changes in
the life and standard of living of urban residents.
Through the progressive realization of the right
to adequate housing, for example, local deci-
sion-makers can also promote the right to an
adequate standard of living, the health of urban
residents (the right to health), their ability to
contribute to economic life and work (the right
to work), children’s capacity to study and live
close to schools (the right to education), and so
on.22
Taking into account and catering to the differ-
ences and specific needs of groups that gener-
ally face particular challenges and disadvan-
tages, city leaders can promote equality and
non-discrimination by carrying out assessments
to ensure that policies do not have unintended
discriminatory effects.23
Having ensured that the people who are
targeted by financial policies have been partic-
ipating in a free, meaningful, and active manner
can increase the chances for financial policies to
be relevant and produce sustainable results in
the long term.24
Transparent financial processes where accounta-
bilities are clear and rule of law is respected can
ensure more clarity in revenue and expenditure
assignments, promote efficient use of economic
resources, and be important in combatting
corruption.25
One major way local governments can promote
these human rights principles is through their inclu-
sion in the local legislative framework (see Case
Study 2). The establishment of such local human
rights mechanisms gives visibility to the role of local
authorities in human rights protection. In order for
them to effectively discharge their functions, these
should be provided with sufficient human and
financial resources and be accessible to everyone
within the respective locality.26
Case Study 2: Municipal Code of Guatemala
The Municipal Code of Guatemala establishes
the obligation of local government to convene
different social sectors of the municipality to
participate in the development and institution-
alization of municipal public policies and plans
for urban and rural development. It also stipu-
lates the preservation and promotion of rights
of communities to their cultural identification
according to their values, languages, traditions,
and customs. The code also authorizes the estab-
lishment of commissions for compliance.27
An outdoor market in Chichicastenango, Guatemala © Wikipedia

234 FINANCE FOR CITY LEADERS HANDBOOK
Gender equality
Within the current urban environment, women face
unique challenges due to gender-based discrimina-
tion. For example, urban settlements are associated
with increased incidence of public space gender-
based violence (GBV) and challenges in mobility due
to gender-neutral urban planning, which fails to
acknowledge and accommodate the informal and care
economies.28 Specifically, urban poverty has distinctive
gendered dimensions, aggravated by the gendered-di-
vision of labour, poor representation in urban gover-
nance, and unequal access to public spaces.29
Therefore, urbanization’s potential to deliver sustain-
able development and an adequate standard of living
for all depends on an intersectional approach that
recognizes that the urban poor, and especially women,
face daunting challenges in the form of environmental
hazards, inadequate shelter, insufficient provision of
water and sanitation, and limited access to services,
resulting in the overall challenge that their human
rights are violated or at risk of being violated.30 In order
to meet these challenges, city leaders will have to
draw on tools for socially inclusive urbanization, which
recognize the participation and rights of all.
Gender equality and women’s empowerment (GEWE), and gender mainstreaming
The implementation of sound and inclusive munici-
pal finance will define the achievement of the 2030
Agenda in cities and the New Urban Agenda (NUA).
In short, transparent, effective municipal finance
will be the source for financing for SDG 11 and the
NUA.32 In the same vein, it is paramount to recognize
that women’s livelihoods are key drivers of the urban
economy, and essential to effective finance and imple-
mentation of sustainable urban growth.
At its core, GEWE is about behavioral change and an
overarching long-term development goal. Empow-
erment relies on a woman’s ability to plan and
control her own life. Therefore, in order to become
empowered, women must not only have equal capa-
bilities (i.e., education and health) and equal rights
and access to resources and opportunities (i.e., land
and employment), they must also have the agency
to deploy those rights and capabilities and to be
included in societal decision-making processes (i.e.,
through leadership and participation at the institu-
tional levels).33
Gender mainstreaming is the process of assessing the
implications for women and men of planned actions
in all areas, and at all levels (for a specific example,
see Case Study 3). Therefore, all activities should
be defined so that gender differences can be diag-
nosed; gender-neutrality is never the case.34 Gender
mainstreaming is the main international approach
to promoting equality between men and women.35
Women’s crucial role
“The subordinate role of women … enables
the minimal maintenance of [the city’s]
housing, transport and public facilities …
because women guarantee unpaid trans-
portation, because they repair their homes,
because they make meals when these are no
canteens … because they look after others’
children when there are no nurseries. … [I]f
women who ‘do nothing’ ever stopped to do
’only that’, the whole urban structure as we
know it would become completely incapable
of maintaining its functions.”31
FINANCE FOR CITY LEADERS HANDBOOK 235
Its objective is to make women’s and men’s needs
and experiences an integral dimension of the design,
execution, budgetary process, and audit of policies
and programmes in all political, economic, and
societal spheres.36 In order for this to be achieved,
women’s participation at all levels of decision-mak-
ing must be broadened and fulfilled, in line with SDG
5.5. In the long term, gender mainstreaming aims
to transform discriminatory social institutions, laws,
cultural norms, and community practices, such as
those limiting women’s access to property rights or
restricting their access to public space.
Finally, there is a continued need to complement
gender mainstreaming with targeted interventions
for women’s empowerment, particularly where there
are instances of persistent discrimination against
women and inequality between women and men.
Hence, gender mainstreaming does not replace
the need for targeted, women-specific policies and
programmes or positive legislation.38
Supporting gender mainstreaming to mitigate gender-neutral macroeconomic analysis
Gender mainstreaming requires sufficient human
and financial resources.39 If these are not made
available, gender-responsive policies cannot trans-
late to on-the-ground realities. For this reason,
gender-responsive budgeting (GRB) is essential
to ensure that human and financial resources are
available for gender mainstreaming and empow-
erment activities. As a point of departure, it is
paramount to take into account that macroeco-
nomic analysis is oftentimes gender-neutral for the
following reasons:
Economic institutions carry and transmit
gender biases: Often, economic institutions
ignore male biases in employment legislation,
property rights, and inheritance laws, all of
which restrict and determine the economic
activity of women.
Case Study 3: Mainstreaming gender in Ethiopia37
In 1993, in Ethiopia, a National Women’s Affairs Policy was
adopted. The policy established Women Focal Points in each
ministry at federal and state levels. The main purpose of these
focal points is to mainstream gender into the activities of each
sector and authority, which includes engendering the budget.
There is also a Women’s Affairs Committee in parliament that
is one of nine standing committees. The role of this committee
is to ensure that every piece of legislation passed by parlia-
ment has incorporated the proper gender balance. In addition,
the committee tries to monitor how effective the activities of
various ministries and agencies are in gradually ensuring real
gender equality.
Urban poverty has distinctive gendered dimensions, aggra-vated by the gendered-division of labour, poor representation in urban governance, and unequal access to public spaces.
“
236 FINANCE FOR CITY LEADERS HANDBOOK
The cost of reproducing and maintaining the
labour force is invisible because economic
analysis does not consider unpaid labour:
Women are disproportionately burdened with
care-work responsibilities; although it is unpaid, it
is vital for maintaining and reproducing the labour
force.
Gender relations play an important role in
the division of labour and the distribution of
employment, income, wealth, and produc-
tive inputs: There are a number of occupations
dominated by one of the genders, and regardless
of education or skill level required, occupations
dominated by women usually have lower earnings
than those dominated by men.40
In order to remedy these gender-neutral dimensions
in macroeconomic analysis, there are three import-
ant phases to consider in gender mainstreaming in
budgets:41
Raise awareness and understanding of gender
and impacts of budgets.
Ensure governments are accountable for
upholding commitments to gender budgets and
policy.
Amend and reform budgets and policy to
promote gender equality.
The feminization of urban poverty and gender dimension of labour markets
It goes without saying that urbanization engen-
ders changes in national economies, with growing
numbers of people moving away from employment
in the primary sector and towards the secondary and
tertiary sectors.42 As noted previously, at present, 70
to 80 per cent of economic production is generated
in cities.43
However, urbanization does not necessarily translate
into an adequate standard of living for all. In some
countries, it is generally associated with inequali-
ty, exclusion, segregation, increased urban poverty
rates, slum proliferation, and unequal access to the
services and benefits of urbanization. Currently, 54
per cent of the world’s population resides in urban
settlements.44 This is expected to rise to 66 per cent
by 2050 and surpass the six billion mark by 2045.45
Since urban economies are heavily associated with
the secondary and tertiary sectors, wage labour domi-
nates the means for meeting essential needs. There-
fore, urban poverty has a distinctive gender dimen-
sion, as it puts a disproportionate burden on those
members of communities and households responsi-
ble for unpaid care-work: predominately women.46
Consequently, combined with unequal rights to
adequate housing, to minimum economic welfare, to
vote, and to freedom of movement in public spaces,
efforts to balance paid work and unpaid care-work
disproportionately affect women, and in some case,
even girls.47
This reality raises concerns about the growing femini-
zation of urban poverty48 and the inability of national
and local governments to provide services to all
the residents of their growing cities. Consequently,
women’s poverty is directly related to the absence
of economic opportunities and autonomy; lack of
access to economic resources, land ownership, and
inheritance; lack of access to education and support
services; and their minimal participation in deci-
sion-making processes.49 In this sense, SDG 1, SDG 5,
and SDG 11 are inextricably linked.
As a result of the disproportionate burden of care-
work, women are vulnerable to time-poverty, and
this can cause a crowding of flexible work economies
(i.e., home-based, flexible working hours), which are
predominantly associated with the informal sector. In
short, women’s care-work responsibilities—the result
FINANCE FOR CITY LEADERS HANDBOOK 237
of gendered division of labour—can cause women to
crowd the informal sector in search of flexible work
arrangements. Indeed, addressing and engaging the
informal sector is oftentimes a challenge for local
authorities; therefore, engaging with women’s grass-
roots organizations and civil society organizations is
paramount.
In light of women’s position in the urban economy, and
their relative position in the reality of urban poverty, it
is fundamental that urban finance managers consider
GEWE as paramount in strategic plans and budgets,
thus bringing together SDG 1.4 (“[to] ensure that
all men and women, in particular the poor and the
vulnerable, have equal rights to economic resourc-
es…”), 5.a (“[to] undertake reforms to give women
equal rights to economic resources, as well as access
to ownership and control over land and other forms
of property, financial services, inheritance and natural
resources, in accordance with national laws”), and
SDG 11 (“[to] make cities and human settlements
inclusive, safe, resilient and sustainable”).
Transparent municipal institutions via GRB: Achieving SDGs 1, 5, and 16 in cities
Recent trends in municipal finance have led to
increased recognition of the different needs of men
and women in financing and budgeting. These trends
include decentralization policies to ensure more effi-
cient public service delivery;50 greater emphasis on
land property taxation to raise revenue and imple-
ment urban development; growing popularity of
public–private partnerships; and increasing demands
for accountability and transparency of local gover-
nance, including increased implementation of trans-
parent participatory budgeting methods.51
Institutional transparency denotes the availability and
accessibility of information to citizens on all decisions
and actions made by government; as such, budgets
are an ideal area to focus on governance and
accountability.52 The inclusion of a gender perspec-
tive in decision-making enhances the legitimacy
of governance, in line with SDG 16.7 (“[to] ensure
responsive, inclusive, participatory and representa-
tive decision-making at all levels”) and 16.b (“[to]
promote and enforce non-discriminatory laws and
policies for sustainable development”). It enriches
political processes by contributing new skills, styles,
and visions (see Case Study 4).
Case Study 4: Including women in
decision-making processes53
In Bacolod city in the Philippines, the NGO
Development Through Active Women
Networking (DAWN) Foundation first
helped women stand for and fight local
elections. As a result of DAWN’s activi-
ties, the number of women councilors
increased. The executive director of DAWN
was one of the new councilors. She and
her colleagues recognized the importance
of budgets, and worked together with
gender activists from two other cities in
a GRB initiative. Soon after the research
was finished, a leading member of DAWN
(who was one of the budget researchers)
became the city administrator—the top
official in local government. She and her
colleagues in DAWN and the administra-
tion are now working to implement the
gender-sensitive policies and budgets that
they advocated in their research.
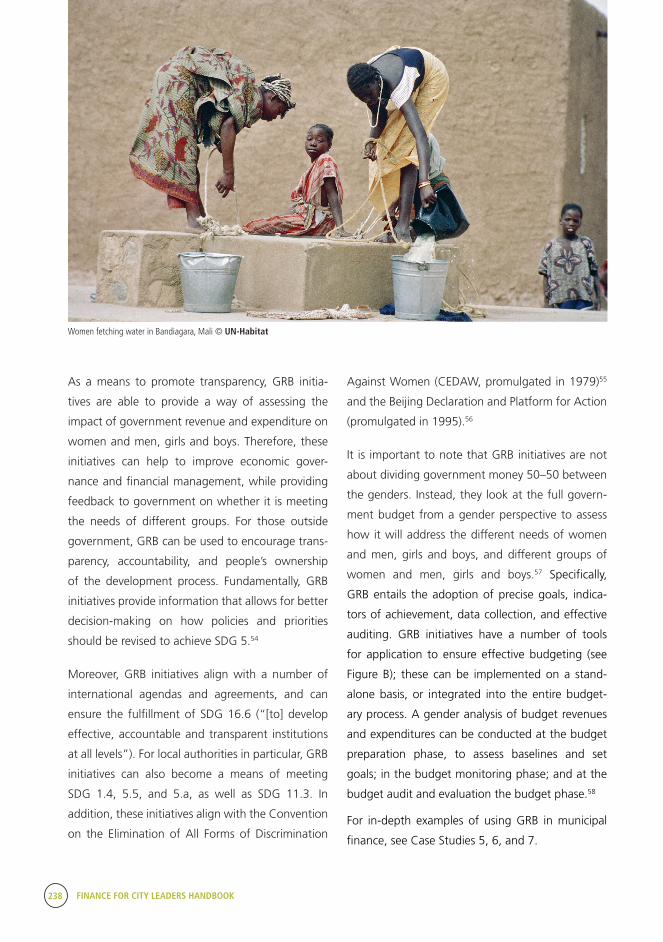
238 FINANCE FOR CITY LEADERS HANDBOOK
Against Women (CEDAW, promulgated in 1979)55
and the Beijing Declaration and Platform for Action
(promulgated in 1995).56
It is important to note that GRB initiatives are not
about dividing government money 50–50 between
the genders. Instead, they look at the full govern-
ment budget from a gender perspective to assess
how it will address the different needs of women
and men, girls and boys, and different groups of
women and men, girls and boys.57 Specifically,
GRB entails the adoption of precise goals, indica-
tors of achievement, data collection, and effective
auditing. GRB initiatives have a number of tools
for application to ensure effective budgeting (see
Figure B); these can be implemented on a stand-
alone basis, or integrated into the entire budget-
ary process. A gender analysis of budget revenues
and expenditures can be conducted at the budget
preparation phase, to assess baselines and set
goals; in the budget monitoring phase; and at the
budget audit and evaluation the budget phase.58
For in-depth examples of using GRB in municipal
finance, see Case Studies 5, 6, and 7.
As a means to promote transparency, GRB initia-
tives are able to provide a way of assessing the
impact of government revenue and expenditure on
women and men, girls and boys. Therefore, these
initiatives can help to improve economic gover-
nance and financial management, while providing
feedback to government on whether it is meeting
the needs of different groups. For those outside
government, GRB can be used to encourage trans-
parency, accountability, and people’s ownership
of the development process. Fundamentally, GRB
initiatives provide information that allows for better
decision-making on how policies and priorities
should be revised to achieve SDG 5.54
Moreover, GRB initiatives align with a number of
international agendas and agreements, and can
ensure the fulfillment of SDG 16.6 (“[to] develop
effective, accountable and transparent institutions
at all levels”). For local authorities in particular, GRB
initiatives can also become a means of meeting
SDG 1.4, 5.5, and 5.a, as well as SDG 11.3. In
addition, these initiatives align with the Convention
on the Elimination of All Forms of Discrimination
Women fetching water in Bandiagara, Mali © UN-Habitat

FINANCE FOR CITY LEADERS HANDBOOK 239
Figure B: Applying GBR in municipal finance, and expected outcomes59
Whe
re t
o ap
ply
GRB
Whole budgetüAnalysis of whole budget
üStudy of impact on gender equality and beneficiaries
Specific unitüAnalysis of specific ministry, department, or programmes
üStudy of impact on gender equality and beneficiaries
Programme designüAnalysis of budget allocation to new programmes
üStudy of impact on gender equality and beneficiaries
Revenue source üAnalysis of impact of different revenue sources on men and women
Law/policyüAnalysis of new legislation or policy
üStudy of impact on gender equality and beneficiaries
Out
com
es o
f GRB
Gender neutralüNo impact on existing gender relations
üNo sex-disaggregation of data or analysis
Gender-responsive
üBudget takes into account men and women’s different needs and priorities
üSpecifies gender of target stakeholders
Empowers women üBudget includes women empowerment activities
üFunds set aside specifically to close gender equality gap through women’s empowerment
TransformativeüBudget aims to promote gender equality
üGender equality mainstreamed across all funded activities
Youth training by UN-Habitat in Port-au-Prince, Haiti © UN-Habitat/Julius Mwelu

240 FINANCE FOR CITY LEADERS HANDBOOK
Case Study 5: Strengthening local councils in Cameroon to respond to women’s and girls’
needs60
In Cameroon, UN Women provided support to a
local civil society organization, Municipal Develop-
ment Counseling Group (MUDEC), for institution-
alizing GRB in local councils. Building on previous
work, the project provided support to improve the
technical capacities of local councils to integrate
gender priorities into the planning and budgeting
processes. MUDEC also contributed to developing
the capacities of women’s groups to monitor and
enforce output-based budgets in councils.
As a result of these efforts, municipal decisions
bearing on increasing financing for gender equality
have been adopted in 10 out of the 16 targeted
councils. The project facilitated the creation and
functioning of women foundations for inclusive
governance (WOFIG) and gender committees
in 16 councils. At least three WOFIG members
in each council area were elected as councilors
during the 30 September 2013 local elections.
In addition, seven WOFIG members were elected
as alternate members of the National Assembly
(MPs). These members now play a key role in local
decision-making, especially on the allocation of
resources and budgets.
To strengthen accountability and transparency
towards gender equality in targeted councils, data
on allocations for gender equality was collected
and widely disseminated to ensure that the local
administrators openly commit to increase the
levels of financing for gender equality. Support
was provided to WOFIG members to strengthen
linkages with the gender committees for contin-
uous lobbying on increasing accountability for
financing gender equality. The project also facili-
tated gender public hearings and other engage-
ment forums (face-to-face discussions) between
the electorate and the elected within the project
area.
Traders at Foumban market, Cameroon © Flickr/Elin B

FINANCE FOR CITY LEADERS HANDBOOK 241
Case Study 6: CSOs in Serbia demand gender responsive local plans and budgets61
Women-led civil society organizations (CSOs)
play a crucial role in gender responsive budget-
ing processes, and this fact has been the moti-
vating force behind the project led by Associa-
tion Fenomena in Serbia. Association Fenomena
led an initiative in 2013 that contributes to
strengthening the role and engagement of
women’s organizations from less-developed
areas in Serbia to influence local policies and
advocate for local GRB processes. It worked
with eight women’s CSOs from seven towns/
municipalities in western, central, and southern
Serbia (Novi Pazar, Kraljevo, Kragujevac, Užice,
Kruševac, Niš, and Leskovac).
The targeted municipalities focused on a wide
range of sectors and issues that pertain to
women’s needs and demands. For example,
in Prijepolje and Novi Pazar, the focus was on
gender analysis of funds allocated to sports to
address women’s needs and to assess whether
women and men benefit equally from current
budget allocations. In Kraljevo, a gender
analysis of the municipal budget assessed
aspects of transparency in budgeting processes,
including budget preparation, implementation,
and reporting. In Kragujevac, a gender analysis
of budget allocations for welfare services
addressed the needs of survivors of violence
against women (VAW).
Leveraging the existing potential and experience
of Serbia’s women-led CSOs, Fenomena brought
a common agenda to influence local policy and
GRB processes more effectively at the targeted
sub-national level. The approach also account-
ed for the need to develop the capacities of
the network to demand and monitor financing
for gender equality as a common concern of
western, central, and southern Serbia.
These efforts contribute to increased account-
ability of the local government in targeted
areas to increase financing for gender equality
by promoting gender-responsive planning and
budgeting. The project strengthened advocacy
skills of women’s organizations on gender
responsive investments and financing in their
respective municipalities. The project built
crucial partnerships among local actors and
strengthened networks of women organiza-
tions from targeted towns and municipalities. It
brought together local authority representatives
including finance officers; local gender equality
council representatives; and stakeholders from
the national level, such as the ministries of
Finance and Labour, Employment and Social
Policy, and the Gender Equality Directorate.
Cyclist in Leskovac, Serbia © Flickr/Gagarin Miljkovich

242 FINANCE FOR CITY LEADERS HANDBOOK
Case Study 7: Morocco’s successful experience with implementing gender responsive
budgets62
Morocco has a long history of gender responsive
budgeting work with sustained, high-level polit-
ical will to address gender equality. Since the
adoption of a new finance law in January 2014,
the needs of women and girls are increasingly
being reflected in how governments spend, and
gender priorities are integrated throughout the
budgeting process.
Ongoing efforts have resulted in GRB being
progressively anchored in Morocco’s budget
reform process. Experience with results-based
and gender-responsive public finance manage-
ment for more than 10 years in Morocco
resulted in the adoption of the new organic
law of finance, by the Council of Government,
which legally institutionalizes gender equality
throughout budget processes. Taking the GRB
processes a step forward, the new legislation
explicitly mentions that gender equality must
be taken into account in the definition of objec-
tives, results, and indicators of performance
of the line budgets. The new organic law also
institutionalizes a gender report as an official
document that is part of the annual finance
bill—an important achievement.
Annually, Morocco produces a gender report
that contains information on the work conduct-
ed by each sector disaggregated by gender
(where data allows), which has become an
important accountability and monitoring tool,
advancing implementation of GRB from one
year to the next. By 2012, a total of 27 depart-
ments joined the report, corresponding to more
than 80 per cent of the state’s overall budget.
The report is successful in requiring reporting
from more traditional sectors (for GRB), such as
health and education, as well as non-traditional
sectors, such as ministries of infrastructure and
transport.
The Department of Literacy now conducts
budget planning of its programmes based on
its “targets,” which are largely women, who
now constitute 85 per cent of the beneficiaries
of such literacy programmes in Morocco. This
approach, which began in 2009, has allowed
the department to better adapt to the needs
of its beneficiaries. As a result, several different
programmes are also being developed accord-
ing to age (15–24, 25–45, and 45+), as well as
employment status (employee or looking for
employment).
Another breakthrough was the inclusion of
provisions in favor of gender equality in the
country’s new constitution in July 2011. Article
19 explicitly enshrines gender equality in the
enjoyment of civil, political, economic, social,
cultural, and environmental rights. The new
constitution also introduces the principle of
gender equality in fact through several articles
that mention the commitment of governments
to work towards the creation of conditions to
allow the achievement of gender equality and
equal representation of women and men in all
areas, and access to decision-making bodies.
FINANCE FOR CITY LEADERS HANDBOOK 243
Youth
Youth63 as a cross-cutting issue is fundamental
to ensuring sustainable urbanization in cities for
several reasons. First, youth constitute the majority
of the population in a number of cities. Urban-
ization, as represented in the 2030 Agenda for
Sustainable Development, in particular Sustainable
Development Goal 11,64 is the engine that propels
the world towards economic and social prosperi-
ty in the 21st century, and youth are its engineers.
The “youth bulge,” a manifestation of reductions
in infant mortality simultaneously with high fertil-
ity rates, creates a stage of development where a
majority of a country’s population are children and
young adults. Most developing countries now have
more people under the age of 25 today than ever,
totaling nearly three billion, or almost half of the
total global population; 1.8 billion of that total are
between age 12 and 24. They represent a group
of change agents—the most active and dynamic,
yet the most volatile and vulnerable segment of the
population.
Most of these youth live in cities and towns; the
cities of the developing world account for over 90
per cent of the world’s urban growth, and youth
account for a large percentage of those inhabi-
tants. It is estimated that as many as 60 per cent
of all urban dwellers will be under age 18 by
2030.65 Based on these statistics, youth is evidently
an untapped economic resource and needs to be
viewed and treated as an asset and driver of safe,
resilient, and sustainable cities.
Municipal finance for and by youth
Municipal finance can be defined as a model for
financing the process of urbanization in a sustain-
able way in cities. Contrary to challenges that cities
face, the new model of urbanization hopes to
create cities and human settlements that are inclu-
sive, safe, resilient, and sustainable. As a result,
local authorities should embrace urbanization as
not only an outcome of development, but also a
formidable engine to achieve development in cities.
Youth can play a key role in realizing this promise;
in many instances they have risen above the chal-
lenges facing developing cities and provided urban
solutions that could improve the social, economic,
and environmental conditions of cities. However,
this is only the case in inclusive cities66 that provide
youth with equal opportunities. It is important to
mobilize their talent for the benefit of society as a
whole.
However, the fundamental problem confronting
most local authorities, especially those managing
cities in developing countries, is the widening gap
between the availability of financial resources and
municipal spending needs. One of the main reasons
for this increasing fiscal gap is the rapid growth of
urban populations, which creates an ever-increas-
ing demand for public services, new public infra-
structure, and its maintenance.
This therefore creates a rift between different parts
of urban centers in developing countries, hence
creating a mix of relatively wealthy areas and poor
areas, leading to growing disparities in the level
of service and provision across the city. Due to
having low or no income, among other challenges,
the majority of youth live in informal settlements.
Informal settlements67 are inviting to the urban
poor and especially youth, as they offer affordable
but substandard housing and mostly lack basic
services. Consequently, informal settlements host
most of cities’ social injustices but are also labora-
tories of innovation, as residents seek solutions to
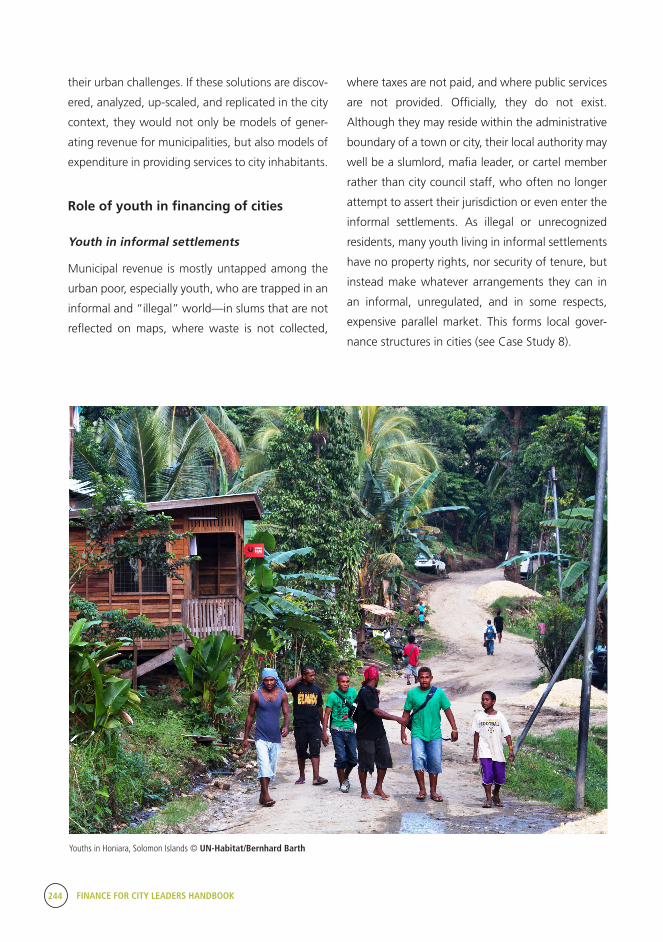
244 FINANCE FOR CITY LEADERS HANDBOOK
their urban challenges. If these solutions are discov-
ered, analyzed, up-scaled, and replicated in the city
context, they would not only be models of gener-
ating revenue for municipalities, but also models of
expenditure in providing services to city inhabitants.
Role of youth in financing of cities
Youth in informal settlements
Municipal revenue is mostly untapped among the
urban poor, especially youth, who are trapped in an
informal and “illegal” world—in slums that are not
reflected on maps, where waste is not collected,
where taxes are not paid, and where public services
are not provided. Officially, they do not exist.
Although they may reside within the administrative
boundary of a town or city, their local authority may
well be a slumlord, mafia leader, or cartel member
rather than city council staff, who often no longer
attempt to assert their jurisdiction or even enter the
informal settlements. As illegal or unrecognized
residents, many youth living in informal settlements
have no property rights, nor security of tenure, but
instead make whatever arrangements they can in
an informal, unregulated, and in some respects,
expensive parallel market. This forms local gover-
nance structures in cities (see Case Study 8).
Youths in Honiara, Solomon Islands © UN-Habitat/Bernhard Barth
FINANCE FOR CITY LEADERS HANDBOOK 245
Case Study 8: The profitability of slum business
on average a monthly rent of 790 Ksh (US$11),
accounting for 12 per cent of the average
monthly income.74 If Kenya’s Rent Restriction Act
were applied effectively in Nairobi’s slums, “rents
would decrease by 70 percent.”75 This “high cost
low quality trap”76 allows landlords to make a
100 per cent (tax-free) return on rental invest-
ment in only three years.77
Provision of basic infrastructure services in
Nairobi’s slums
Access to basic public services in Nairobi’s slums
is far lower than Nairobi-level data suggests.78
Less than one-fifth of slum households have
access to piped water (i.e., private in-house
connections or yard taps).79 The vast majority of
slum dwellers rely on water kiosks to buy water
from private providers. By comparison, studies
reporting data for Nairobi as a whole place the
proportion of households with access to piped
water at 71 per cent.80 The inequality in access to
basic services also applies to electricity connec-
tions: One in five households in Nairobi’s slums
(22 per cent) is connected to electricity and uses
it as a lighting fuel. In contrast, in the city as a
whole, 52 per cent have electricity connections.81
Despite the negative externalities of garbage, less
than one in 100 slum households (0.9 per cent)
is served by a publicly provided collection system.
The vast majority of the households in informal
settlements dispose of solid waste by dumping,
burning, or burying it. On the level of Nairobi
province, six per cent of the households are at
least infrequently served by a publicly provided
garbage collection system.82
Nairobi City houses Kibera, the biggest slum in
Africa. The city is one of the most important
economic hubs of the continent and contributes
60 per cent of Kenya’s GDP (which had an annual
growth rate of 5.6 per cent in 2016).68 Youth and
children constitute a large proportion of Kenya’s
population, with those between 15 and 34
years accounting for 7.9 million, of whom 2.6
million live in urban areas (32.3 per cent). Of this
latter group, some 49 per cent live in poverty in
urban areas, and youth in this group live in slum
communities.69
This is a case study of the top services offered
in informal settlements in Nairobi. The study
discusses income generated from the housing
sector, provision of basic infrastructure services,
and private service providers.
Housing sector
Informal rental housing in Nairobi is dominated by
large-scale landlordism.70 In Kibera, six per cent of
all landlords own 25 per cent of all rooms.71 This
indicates a high degree of ownership concentra-
tion. Furthermore, increasing densities in Nairo-
bi’s slums suggest that structure owners, bypass-
ing official regulations, maximize their income
by constructing an increasing number of units
on plots.72 As a consequence, densities in Nairo-
bi’s slums have reached 250 units per hectare.73
Additionally, the rampant illegal construction of
extensions in plots and the resulting problems
of providing basic services have turned many of
the formerly planned low-cost estates in Nairobi
into slums. Particularly in light of the poor quality
of housing, rents are high: Slum households pay
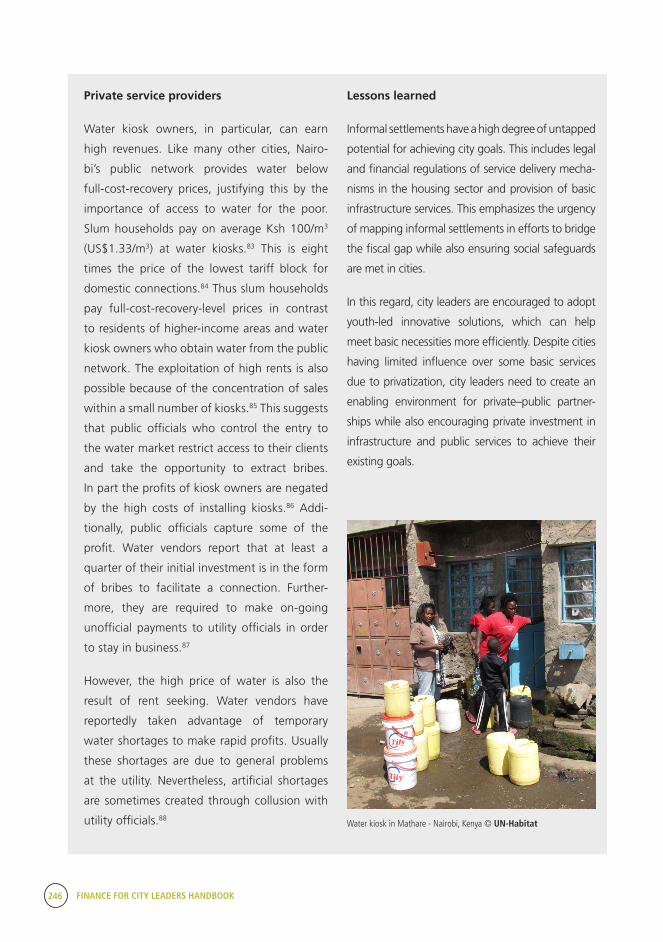
246 FINANCE FOR CITY LEADERS HANDBOOK
Private service providers
Water kiosk owners, in particular, can earn
high revenues. Like many other cities, Nairo-
bi’s public network provides water below
full-cost-recovery prices, justifying this by the
importance of access to water for the poor.
Slum households pay on average Ksh 100/m3
(US$1.33/m3) at water kiosks.83 This is eight
times the price of the lowest tariff block for
domestic connections.84 Thus slum households
pay full-cost-recovery-level prices in contrast
to residents of higher-income areas and water
kiosk owners who obtain water from the public
network. The exploitation of high rents is also
possible because of the concentration of sales
within a small number of kiosks.85 This suggests
that public officials who control the entry to
the water market restrict access to their clients
and take the opportunity to extract bribes.
In part the profits of kiosk owners are negated
by the high costs of installing kiosks.86 Addi-
tionally, public officials capture some of the
profit. Water vendors report that at least a
quarter of their initial investment is in the form
of bribes to facilitate a connection. Further-
more, they are required to make on-going
unofficial payments to utility officials in order
to stay in business.87
However, the high price of water is also the
result of rent seeking. Water vendors have
reportedly taken advantage of temporary
water shortages to make rapid profits. Usually
these shortages are due to general problems
at the utility. Nevertheless, artificial shortages
are sometimes created through collusion with
utility officials.88
Lessons learned
Informal settlements have a high degree of untapped
potential for achieving city goals. This includes legal
and financial regulations of service delivery mecha-
nisms in the housing sector and provision of basic
infrastructure services. This emphasizes the urgency
of mapping informal settlements in efforts to bridge
the fiscal gap while also ensuring social safeguards
are met in cities.
In this regard, city leaders are encouraged to adopt
youth-led innovative solutions, which can help
meet basic necessities more efficiently. Despite cities
having limited influence over some basic services
due to privatization, city leaders need to create an
enabling environment for private–public partner-
ships while also encouraging private investment in
infrastructure and public services to achieve their
existing goals.
Water kiosk in Mathare - Nairobi, Kenya © UN-Habitat
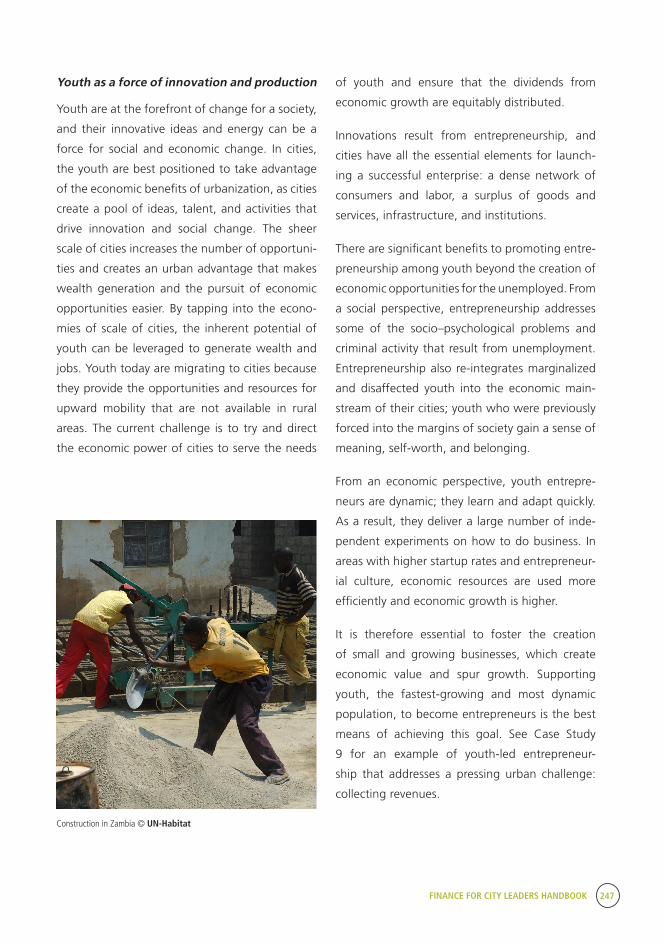
FINANCE FOR CITY LEADERS HANDBOOK 247
Youth as a force of innovation and production
Youth are at the forefront of change for a society,
and their innovative ideas and energy can be a
force for social and economic change. In cities,
the youth are best positioned to take advantage
of the economic benefits of urbanization, as cities
create a pool of ideas, talent, and activities that
drive innovation and social change. The sheer
scale of cities increases the number of opportuni-
ties and creates an urban advantage that makes
wealth generation and the pursuit of economic
opportunities easier. By tapping into the econo-
mies of scale of cities, the inherent potential of
youth can be leveraged to generate wealth and
jobs. Youth today are migrating to cities because
they provide the opportunities and resources for
upward mobility that are not available in rural
areas. The current challenge is to try and direct
the economic power of cities to serve the needs
of youth and ensure that the dividends from
economic growth are equitably distributed.
Innovations result from entrepreneurship, and
cities have all the essential elements for launch-
ing a successful enterprise: a dense network of
consumers and labor, a surplus of goods and
services, infrastructure, and institutions.
There are significant benefits to promoting entre-
preneurship among youth beyond the creation of
economic opportunities for the unemployed. From
a social perspective, entrepreneurship addresses
some of the socio–psychological problems and
criminal activity that result from unemployment.
Entrepreneurship also re-integrates marginalized
and disaffected youth into the economic main-
stream of their cities; youth who were previously
forced into the margins of society gain a sense of
meaning, self-worth, and belonging.
From an economic perspective, youth entrepre-
neurs are dynamic; they learn and adapt quickly.
As a result, they deliver a large number of inde-
pendent experiments on how to do business. In
areas with higher startup rates and entrepreneur-
ial culture, economic resources are used more
efficiently and economic growth is higher.
It is therefore essential to foster the creation
of small and growing businesses, which create
economic value and spur growth. Supporting
youth, the fastest-growing and most dynamic
population, to become entrepreneurs is the best
means of achieving this goal. See Case Study
9 for an example of youth-led entrepreneur-
ship that addresses a pressing urban challenge:
collecting revenues.
Construction in Zambia © UN-Habitat
248 FINANCE FOR CITY LEADERS HANDBOOK
Case Study 9: MatQ, an innovative revenue collection system for Nairobi authorities
The Innovation Marketplace is aimed at
harnessing three key dynamics in our world
today: the growing number of young urban
citizens, information and communications
technology (ICT) proliferation, and the devo-
lution process. UN-Habitat, in consultations
with local authorities of participating counties,
youth groups, and the private sector, iden-
tified collection of revenue from the public
transport system as one of the most pressing
urban challenges facing Kiambu County,
Kenya. Various urban challenges were formu-
lated into challenge statements, which were
used to inform a two-day innovation “hack-
athon.” The “hackathon” aimed at getting
youth and local government representatives
to work together to identify ICT innovations
to support local governance.
MatQ, a digital queue management and
revenue collection system, was selected as
the winning innovation. The innovation aims
to improve the transport system for Kiambu
County, which is crucial given the millions of
residents residing in the county but working
in Nairobi. MatQ provides an accountable
revenue collection system for the local authori-
ty, in contrast to the ineffective analog terminal
management and fee collection vulnerable to
manipulation by route managers and drivers.
The operationalization of the system involves
the following: A Matatu (a privately owned
public service vehicle) checks in its designated
terminal and the route manager, through the
system, queues it. Depending on the number
of check-ins, each Matatu is supposed to pay a
fee to the route manager (as stipulated in the
municipality’s by-laws) and remit the amount
collected to the respective Savings and Credit
Cooperative Society (SACCO).89 The SACCO in
turn remits tax to the local authority. Through
the app, the Kiambu residents are able to locate
their favorite Matatus, book seats, and view
their locations in real time.
Lessons learned
Cities need to provide public services more
efficiently while at the same time supporting
sustainable and long-term economic growth.
The latest thinking suggests that the best way
to do this is by becoming “smart.” This gener-
ally means using new technology (mainly infor-
mation and communication technologies) and
data to improve service delivery and address
various economic, social, and environmental
challenges.
MatQ illustrates the innovative power of youth
and can be defined as a smart mechanism that
can be leveraged to improve efficiency of finan-
cial flows, strengthen accountability systems,
and improve service delivery in municipalities.
Such interventions could potentially transform
how city inhabitants live, play, and do business.
City authorities benefit most when they integrate
such initiatives within their existing economic
development and public service plans and
identify how new technologies can help them
achieve their goals.
FINANCE FOR CITY LEADERS HANDBOOK 249
Need for youth empowerment as an enabler of municipal financing
Evidently, it is imperative for local authorities and
other relevant stakeholders to consider the needs
of young people with an aim to not only generate
revenue and expenditure in their municipalities, but
also to empower them as enablers of financing. Young
people have raw entrepreneurial talent, but launch-
ing and building a successful business that can add
economic value requires technical skills, knowledge,
networks, and resources that many youth do not have
access to. It is therefore essential to create an entrepre-
neurial ecosystem that promotes a thriving entrepre-
neurial culture that can drive innovation, production,
and employment. There are three essential elements
to creating this ecosystem: strengthening education-
al systems with a focus on entrepreneurship training;
developing a supportive and enabling environment
that makes it easier to launch a business, particu-
larly via financing businesses owned and operated
by youth; and strengthening accountability within
systems.
Access to credit and capital alone is far from suffi-
cient to leverage the opportunities of youth-owned
businesses. Youth entrepreneurs must develop the
skills to run modern, sustainable businesses that can
compete and grow in a competitive environment.
Formal training in such areas as business plan devel-
opment, management, financial management, and
opportunity identification and capitalization provide
the foundation for launching and growing successful
enterprises. Education programs also need to focus on
transferable and marketable entrepreneurial skills that
can be directed towards the creation of new and small
businesses that leverage the benefits of the urban
economy.
It is also essential to create an enabling environment
with rules, policies, and regulations that make it
easier for youth to launch businesses. These policies
should include implementing legislation to encourage
young entrepreneurs to become involved in social
and economic development and increasing the ease
of doing business through easier business registration
and set-up processes. A youth-centric regulatory envi-
ronment that is conducive to innovation and experi-
mentation with low discovery costs is essential.
In addition, youth entrepreneurs lack the collater-
al to obtain loans and are usually unable to obtain
anything more than microfinance loans, which may
not be sufficient to meet the needs of a new and
growing business. The lack of long-term business
histories, which are often required by risk-averse cred-
itors seeking to make loans or investments, acts as a
further significant barrier keeping youth from launch-
ing businesses. Access to financing for youth entre-
preneurs needs to be expanded, and government-sup-
ported capital is needed to supplement private sources
of funding. Investing capital in new and innovative
youth-owned businesses could also have a multiplier
effect on development.
Transparent and accountable municipalities through youth mainstreaming
Governance determines how efficiently costs are
shared throughout the metropolitan area, how
service delivery is coordinated across local govern-
ment boundaries, how effectively local residents and
businesses can access governments and influence
their decisions, how accountable local governments
are to their citizens, and how responsive they are to
their demands. It is therefore evident that for a city
to succeed economically and socially, youth should be
mainstreamed. In other words, owing to their multi-
disciplinary and trans-sectoral nature, youth should be
considered and integrated into all programmes and
initiatives (see Figure C).

250 FINANCE FOR CITY LEADERS HANDBOOK
Figure C: Youth mainstreaming
Source: Adapted from World Bank Development Report 2007
Explanation of the lens approach
• It is important for institutions and practitioners to consider all three lenses; they are not mutually exclusive. Youthparticipation in development is often a combination of all three (see Table 1 for de�nitions).
• This approach is dynamic: depending on the local context and the development intervention one particular lens may bemore appropriate or have more prominence/focus.
• The di�erent lenses may be used with di�erent groups of young people during an intervention/initiative, i.e., youngleaders may be reaching out to new groups of young people as targets.
• It might appear that youth participation is just about young partners or leaders, and not young bene�ciaries. However,participation mus t also develop from a foundational base.
• The ultimate aim is to develop youth as partners and leaders in development. This is based on youth having agency:their c apacity to act, their skills and capabilities and their ability to change their own lives.
• Youth operating as partners and leaders are inherently bene�ciaries too.
3
F OCUS ON WORKING WITH AND FOR YOUTH TOWARDS EFFECTIVE DEVELOPMENT
Working for youth as
BENEFICIARIES
Engaging with youth as PARTNERS
Supporting youth as
LEADERS
TARGET GROUPS
COLLABORATORS
PARTICIPATORY PRACTICES
YOUTH INITIATORS
Working for youth as beneficiaries De�ned as the basics of a good intervention for young people:• Youth as bene�ciaries implies they are a target group and are
adequately informed;• Explicitly focuses on youth issues through documentation; • Can prepare the ground for working with youth as partners.
Engaging with youth as partners De�ned as:• Collaborative interventions, where young people are fully consulted
and informed;• Implies mutual co-operation and responsibility;• Recognises that young people generally need experience working at
this level before progressing to becoming leaders and initiators ofdevelopment (if appropriate) – a progression which not all will want orbe able to make.
Supporting youth as leaders De�ned as:• Enabling youth-initiated and directed interventions;• Opening up a space for youth-led decision-making (delegation) within
existing structures, systems and processes.
Table 1: Definitions of beneficiaries, partners and leaders
Figure 1: The three-lens approach to youth participation
Adapted from: World Bank Development report 2007
6962_1_Prelims_Intro:Layout 1 16/03/2010 14:26 Page 3
This means building social accountability mechanisms at city levels where citizens and civil society,
particularly the poorest and most marginalized, play a decisive and formal role in the monitoring and
accountability system. This relates well with the youth in cities. In doing so, leaders will be giving a voice
to those traditionally excluded from development processes whilst strengthening government’s own
monitoring efforts, especially when addressing gaps in the implementation of policy affecting youth.
To achieve institutionalized youth mainstreaming, city leaders should consider practices that are youth
specific and that address and are responsive to specific youth needs (see Box 2) in achieving transparent
and accountable mechanisms.
Youth entrepreneurs lack the collateral to obtain loans and are usually unable to obtain anything more than microfinance loans, which may not be sufficient to meet the needs of a new and growing business.
“
FINANCE FOR CITY LEADERS HANDBOOK 251
Box 2: Youth-specific practices for achieving institutionalized youth mainstreaming
youth in governance, and that ensure politi-
cal decision-making processes include youth
in critical numbers in key institutions (e.g.,
parliaments and local governments).
Ensure delivery of services in key sectors
enhances participatory and transparent
decision-making, institutional accounta-
bility, and responsiveness to youth-specific
needs.
Set up youth-specific monitoring and evalu-
ation systems.
Enact policies and practices that support
youths’ ability to realize their duties, rights,
and access to services as citizens.
Ensure effective legal and judicial systems
address youth status and protections under
the law.
Ensure public expenditures reflect govern-
ments’ explicit youth goals and target
high-quality services for all citizens.
Design structures and implement process-
es that ensure the effective participation of
Conclusion
The implementation of sound and inclusive municipal
finance is crucial for the achievement of the 2030
Agenda in cities and the NUA. Transparent, effective
municipal finance will be the source for financing for
SDG 11 and the NUA.90 In the same vein, it is para-
mount to recognize that cities’ often-marginalized
groups are key drivers of the urban economy, and are
essential for effective finance and implementation of
sustainable urban growth.
Urbanization offers the potential to improve people’s
lives but, with inadequate urban management,
based on inaccurate or biased perceptions, opportu-
nity can become mischance.91 In order to fulfil the
potential of urbanization, is it paramount to pursue
socially inclusive strategies that reduce alienation and
exclusion and pave the way for empowerment and
engagement of all social groups, particularly the most
marginalized. These efforts will be the cornerstone of
the 2030 Agenda as it promotes the right and ability
of every individual to influence and/or participate in
the decisions that affect their lives.92
Human rights are inherent to all human beings
and are designed to protect the human values of
freedom, equality, and dignity. City leaders can
address capacity gaps and ensure that their deci-
sion-making contributes to sustainable and inclu-
sive urbanization processes by applying the Human
Rights–Based Approach (HRBA).
A participatory approach to the distribution of public
spending has benefits such as increased relevance
of financial instruments, increased sense of public
ownership, and increased likelihood that commu-
nities will protect and maintain products built or
installed. Municipal finance should be transparent,
participatory, and human rights–based. Financing
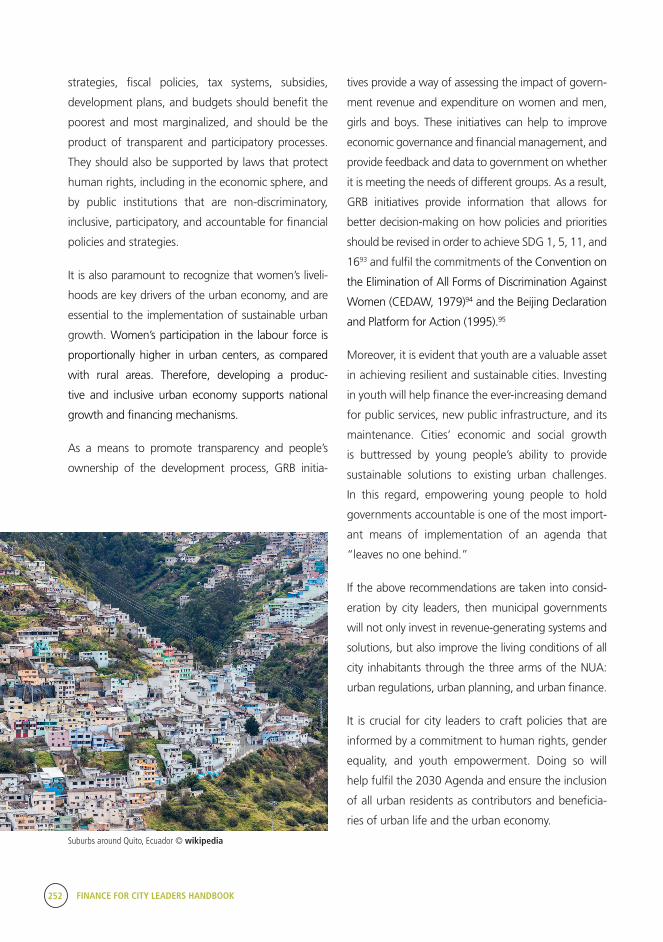
252 FINANCE FOR CITY LEADERS HANDBOOK
strategies, fiscal policies, tax systems, subsidies,
development plans, and budgets should benefit the
poorest and most marginalized, and should be the
product of transparent and participatory processes.
They should also be supported by laws that protect
human rights, including in the economic sphere, and
by public institutions that are non-discriminatory,
inclusive, participatory, and accountable for financial
policies and strategies.
It is also paramount to recognize that women’s liveli-
hoods are key drivers of the urban economy, and are
essential to the implementation of sustainable urban
growth. Women’s participation in the labour force is
proportionally higher in urban centers, as compared
with rural areas. Therefore, developing a produc-
tive and inclusive urban economy supports national
growth and financing mechanisms.
As a means to promote transparency and people’s
ownership of the development process, GRB initia-
tives provide a way of assessing the impact of govern-
ment revenue and expenditure on women and men,
girls and boys. These initiatives can help to improve
economic governance and financial management, and
provide feedback and data to government on whether
it is meeting the needs of different groups. As a result,
GRB initiatives provide information that allows for
better decision-making on how policies and priorities
should be revised in order to achieve SDG 1, 5, 11, and
1693 and fulfil the commitments of the Convention on
the Elimination of All Forms of Discrimination Against
Women (CEDAW, 1979)94 and the Beijing Declaration
and Platform for Action (1995).95
Moreover, it is evident that youth are a valuable asset
in achieving resilient and sustainable cities. Investing
in youth will help finance the ever-increasing demand
for public services, new public infrastructure, and its
maintenance. Cities’ economic and social growth
is buttressed by young people’s ability to provide
sustainable solutions to existing urban challenges.
In this regard, empowering young people to hold
governments accountable is one of the most import-
ant means of implementation of an agenda that
“leaves no one behind.”
If the above recommendations are taken into consid-
eration by city leaders, then municipal governments
will not only invest in revenue-generating systems and
solutions, but also improve the living conditions of all
city inhabitants through the three arms of the NUA:
urban regulations, urban planning, and urban finance.
It is crucial for city leaders to craft policies that are
informed by a commitment to human rights, gender
equality, and youth empowerment. Doing so will
help fulfil the 2030 Agenda and ensure the inclusion
of all urban residents as contributors and beneficia-
ries of urban life and the urban economy.
Suburbs around Quito, Ecuador © wikipedia
FINANCE FOR CITY LEADERS HANDBOOK 253
This chapter was prepared by a multidisciplinary team composed of Taib Boyce, Sonja Ghaderi, Brian
Olunga, Javan Ombado, Rocio Armillas-Tiseyra, Judith Mulwa, Douglas Ragan, Imogen Howells,
and Hazel Kuria
pp. 43–48.
15 For further reading on the Human Rights–Based Ap-proach, consult UN-Habitat, Programmatic Guidance Note on the Promotion and Protection of Human Rights (Nairobi, UN-Habitat, 2015).
16 Human Rights Council, Role of Local Government in the Promotion and Protection of Human Rights – Final report of the Human Rights Council Advisory Committee (New York, Human Rights Council, 2015).
17 OHCHR, Key Messages on Human Rights and Fi-nancing for Development (New York, OHCHR, 2015). Avail-able from http://www.ohchr.org/Documents/Issues/MDGs/Post2015/HRAndFinancingForDevelopment.pdf.
18 Affordability is a human rights standard, and defines the core content of human rights. Facilities, goods, and services must be affordable and expenses must not dis-proportionally burden poorer households. See UN-Habitat, Programmatic Guidance Note on the Promotion and Protec-tion of Human Rights (Nairobi, UN-Habitat, 2015), p. 11.
19 OHCHR, Key Messages on Human Rights and Fi-nancing for Development (New York, OHCHR, 2015). Avail-able from http://www.ohchr.org/Documents/Issues/MDGs/Post2015/HRAndFinancingForDevelopment.pdf.
20 UN-Habitat, Programmatic Guidance Note on the Promotion and Protection of Human Rights (Nairobi, UN-Habitat, 2015), p. 7.
21 UN-Habitat Regional Office for Africa, Research and Capacity Development Branch, Capacity Building for Local Participatory Planning, Budgeting and Gender Mainstream-ing Programme: DRC, Mozambique, Senegal – Final Report (Nairobi, UN-Habitat, 2012).
22 The human rights principle of interdependence im-plies that the realization of each human right contributes to the realization of a person’s dignity through the satisfaction of her or his developmental, physical, and spiritual needs. The human rights principle of interrelatedness means that
Endnotes1 IIED and UNFPA, Urbanization, Gender and Urban Poverty: Paid Work and Unpaid Care Work in the City (n.p., IIED & UNFPA, 2012).
2 World Bank, Planning, Connecting, and Financing Cities-Now: Priorities for City Leaders (Washington, World Bank, 2013).
3 Refers to the level of wealth, comfort, and material goods and necessities available to a certain socioeconomic class in a certain geographic location.
4 IIED and UNFPA, Urbanization, Gender and Urban Poverty: Paid Work and Unpaid Care Work in the City (n.p., IIED & UNFPA, 2012).
5 United Nations, Transforming Our World: The 2030 Agenda for Sustainable Development (New York, United Nations, 2015), para. 8.
6 Enshrined in the Universal Declaration of Human Rights (UDHR) Article 25 and International Covenant on Economic, Social and Cultural Rights (ICESCR) Article 11.
7 UDHR Article 25 and ICESCR Article 11.
8 Committee on Economic, Social and Cultural Rights, General Comment No. 15 on the Right to Water (Geneva, United Nations, 2002).
9 ICESCR Article 6.
10 UDHR Article 25 and ICESCR Article 12.
11 UDHR Article 26(1), ICESCR Article 13, Convention on the Rights of the Child (CRC) Article 28, 29.
12 UDHR Article 19, International Covenant on Civil and Political Rights (ICCPR) Article 19(2).
13 UDHR Article 17.
14 For further reading on land rights, consult UN-Hab-itat, Programmatic Guidance Note on the Promotion and Protection of Human Rights (Nairobi, UN-Habitat, 2015),
254 FINANCE FOR CITY LEADERS HANDBOOK
the fulfillment of one right often depends, wholly or in part, upon the fulfillment of other rights. UN-Habitat, Program-matic Guidance Note on the Promotion and Protection of Human Rights (Nairobi, UN-Habitat, 2015), p. 10.
23 The human rights principles of equality and non-dis-crimination mean that individuals are equal as human be-ings by virtue of the inherent dignity of each human person, and that every individual is entitled to enjoy human rights without discrimination of any kind, such as discrimination due to race, religion, political or other opinion, national or social origin, disability, property, birth, or other status. UN-Habitat, Programmatic Guidance Note on the Promo-tion and Protection of Human Rights (Nairobi, UN-Habitat, 2015), p. 10.
24 The human rights principles of participation and inclusion imply that all stakeholders, duty-bearers, and rights-holders, including slum dwellers and other urban residents in vulnerable situations, should be given the opportunity to participate in activities and interventions that affect them. UN-Habitat, Programmatic Guidance Note on the Promotion and Protection of Human Rights (Nairobi, UN-Habitat, 2015), p. 10.
25 The human rights principle of accountability requires that duty-bearers, including city leaders, mayors, and local government officials, be answerable for the observance of human rights. Rule of law means that all persons, institu-tions and entities, public and private, including the state itself, are accountable to laws that are publicly promulgat-ed, equally enforced, independently adjudicated, and which are consistent with international human rights norms and standards. UN-Habitat, Programmatic Guidance Note on the Promotion and Protection of Human Rights (Nairobi, UN-Habitat, 2015), p. 10.
26 Human Rights Council, Role of Local Government in the Promotion and Protection of Human Rights – Final report of the Human Rights Council Advisory Committee (New York, Human Rights Council, 2015), para. 37.
27 Human Rights Council, Role of Local Government in the Promotion and Protection of Human Rights – Final report of the Human Rights Council Advisory Committee (New York, Human Rights Council, 2015), para. 41.
28 Vienna City Council, Gender Mainstreaming in Ur-ban Planning and Urban Development (Vienna, Vienna City Council, 2013).
29 UN-Habitat, State of Women in Cities 2012/13 (Nairobi, UN-Habitat, 2013).
30 UNFPA, State of the World Population 2007: Un-leashing the Potential of Urban Growth (New York, UNFPA, 2007).
31 M. Castells, City, Class and Power (London, Macmil-lan, 1978), pp. 177–178.
32 UN-Habitat, World Cities Report 2016 (Nairobi, UN-Habitat, 2016).
33 UNICEF, UNFPA, UNDP, UN Women, “Gender Equal-ity, UN Conference and You” [training module]. Available from http://www.unicef.org/gender/training/content/scoIn-dex.html.
34 ECOSOC Resolution 1997/2.
35 D. Budlender and G. Hewitt, Engendering Budgets: A Practitioners’ Guide to Understanding and Implementing Gender-Responsive Budgets (London, Commonwealth Secretariat, 2003).
36 GA Resolution S-23/3 (2000) annex, paragraph 73[c].
37 Case study available in D. Budlender and G. Hewitt, Engendering Budgets: A Practitioners’ Guide to Under-standing and Implementing Gender-Responsive Budgets (London, Commonwealth Secretariat, 2003).
38 ECOSOC Resolution 1997/2
39 D. Budlender and G. Hewitt, Engendering Budgets: A Practitioners’ Guide to Understanding and Implementing Gender-Responsive Budgets (London, Commonwealth Secretariat, 2003).
40 D. Elson and N. Cagatay, Engendering Macro-Eco-nomic Policy and Budgets for Sustainable Human Develop-ment (New York, Human Development Report Office, 1999).
41 Rhonda Sharp, Moving Forward: Multiple Strategies and Guiding Goals (New York, UNIFEM, 2002).
42 IIED and UNFPA, Urbanization, Gender and Urban Poverty: Paid Work and Unpaid Care Work in the City (n.p., IIED & UNFPA, 2012).
43 World Bank, Planning, Connecting, and Financing Cities-Now: Priorities for City Leaders (Washington, World Bank, 2013).
44 UN-Habitat, World Cities Report (WCR): Emerging Futures (Nairobi, UN-Habitat, 2016).
FINANCE FOR CITY LEADERS HANDBOOK 255
45 UNDESA, World Urbanization Prospects (New York, UN DESA, 2014).
46 IIED and UNFPA, Urbanization, Gender and Urban Poverty: Paid Work and Unpaid Care Work in the City (n.p., IIED & UNFPA, 2012).
47 IIED and UNFPA, Urbanization, Gender and Urban Poverty: Paid Work and Unpaid Care Work in the City (n.p., IIED & UNFPA, 2012).
48 S. Chant and C. McIlwaine, Cities, Slums and Gender in the Global South: Towards a Feminised Urban Future (New York, Routledge, 2016).
49 Beijing Declaration and Platform for Action, Strategic Objectives and Actions: A. Women and Poverty, 49–51.
50 G.K. Ingram and Y. Hong, Land Policies and their Outcomes (Cambridge, Mass., Lincoln Institute of Land Policy, 2007).
51 UN-Habitat, Guide to Municipal Finance (Nairobi, UN-Habitat, 2009).
52 D. Budlender and G. Hewitt, Engendering Budgets: A Practitioners’ Guide to Understanding and Implementing Gender-Responsive Budgets (London, Commonwealth Secretariat, 2003).
53 Case study available in D. Budlender and G. Hewitt, Engendering Budgets: A Practitioners’ Guide to Under-standing and Implementing Gender-Responsive Budgets (London, Commonwealth Secretariat, 2003).
54 D. Budlender and G. Hewitt, Engendering Budgets: A Practitioners’ Guide to Understanding and Implementing Gender-Responsive Budgets (London, Commonwealth Secretariat, 2003).
55 To view countries that have ratified the Convention, see: https://treaties.un.org/Pages/ViewDetails.aspx?s-rc=TREATY&mtdsg_no=IV-8&chapter=4&lang=en.
56 Supported by GA Resolution S-23/3 (2000) annex, paragraph 73[c].
57 D. Budlender and G. Hewitt, Engendering Budgets: A Practitioners’ Guide to Understanding and Implementing Gender-Responsive Budgets (London, Commonwealth Secretariat, 2003).
58 Austrian Development Cooperation, Making Budgets Gender-Sensitive: A Checklist for Programme-Based Aid (Vienna, Austrian Development Cooperation, 2009).
59 Adapted from HELVETAS Swiss Intercooperation, Gender in Municipal Plans and Budgets: Manual with Practical Guidelines on Gender Responsive Planning and Budgeting at Local Level, Based on Experiences with Mu-nicipalities in Kosovo (Vernier, Switzerland, HELVETAS Swiss Intercooperation, 2012).
60 UN Women, “Strengthening Local Councils in Cameroon to Respond to Women and Girls Needs,” 2014, available from http://gender-financing.unwomen.org/en/highlights/local-governance-in-cameroon.
61 UN Women, “CSOs in Serbia Demand for Gender Responsive Local Plans and Budgets,” 2014, available from http://gender-financing.unwomen.org/en/highlights/csos-in-serbia-demand-for-gender-responsive-local-plans-and-bud-gets.
62 UN Women, “Morocco’s Successful Case in Imple-menting Gender Responsive Budgets,” 2014, available from http://gender-financing.unwomen.org/en/highlights/gender-responsive-budgets-case-of-morocco.
63 Youth does not have a defined age. Youth is defined differently in different countries, organizations, and con-texts. The UN defines youth as between the ages of 15–32 years.
64 Sustainable Development Goal 11: “Make cities inclusive, safe, resilient and sustainable.”
65 UN DESA, World Urbanization Prospects: The 2014 Revision (New York, UN DESA, 2014); Douglas Ragan, Cities of Youth, Cities of Prosperity (Nairobi, UN-Habitat, 2012).
66 An inclusive city promotes a model of interaction that upholds the rights of every inhabitant.
67 UN-Habitat defines informal settlement as character-ized by inadequate access to safe water, inadequate access to sanitation and other infrastructure, poor structural quali-ty of housing, overcrowding, and insecure residential status.
68 Kenya National Bureau of Statistics, Economic Survey (Nairobi, Kenya National Bureau of Statistics, 2016).
69 Kenya National Bureau of Statistics, Economic Survey (Nairobi, Kenya National Bureau of Statistics, 2016).
70 P. Amis, “Squatters or Tenants: The Commer-cialization of Unauthorized Housing in Nairobi,” World Development, vol. 12, no. 1, 1984, p. 88; P. Syagga, W. Mitullah, and S. Karirah-Gitau. Nairobi Situation Analyses Supplementary Study: A Rapid Economic Appraisal of Rents
256 FINANCE FOR CITY LEADERS HANDBOOK
in Slums and Informal Settlements (Nairobi, Government of Kenya and UN-Habitat, 2001), p. 93.
71 P. Amis, A Shanty Town of Tenants: The Commer-cialization of Unauthorized Housing in Nairobi 1960-1980 (Canterbury, University of Kent, 1983), p. 206.
72 P. Syagga, W. Mitullah, and S. Karirah-Gitau, Nairobi Situation Analyses Supplementary Study: A Rapid Economic Appraisal of Rents in Slums and Informal Settlements (Nai-robi, Government of Kenya and UN-Habitat, 2001), p. 96.
73 P. Syagga, W. Mitullah, and S. Karirah-Gitau, Nairobi Situation Analyses Supplementary Study: A Rapid Economic Appraisal of Rents in Slums and Informal Settlements (Nai-robi, Government of Kenya and UN-Habitat, 2001), p. 21.
74 S. Gulyani, D. Talukdar, and C. Potter, Inside Informal-ity: Poverty, Jobs, Housing and Services in Nairobi’s Slums (Washington, D.C., World Bank, 2006), p.37.
75 P. Syagga, W. Mitullah, and S. Karirah-Gitau, Nairobi Situation Analyses Supplementary Study: A Rapid Economic Appraisal of Rents in Slums and Informal Settlements (Nai-robi, Government of Kenya and UN-Habitat, 2001), p. 5.
76 S. Gulyani, D. Talukdar, and C. Potter, Inside Informal-ity: Poverty, Jobs, Housing and Services in Nairobi’s Slums (Washington, D.C., World Bank, 2006), p. 43.
77 M. Huchzermeyer, “Slum Upgrading in Nairobi With-in the Housing and Basic Services Market: A Housing Rights Concern,” Journal of Asian and African Studies (2008), p. 30.
78 S. Gulyani, D. Talukdar, and C. Potter, Inside Informal-ity: Poverty, Jobs, Housing and Services in Nairobi’s Slums (Washington, D.C., World Bank, 2006), pp. 49–53.
79 S. Gulyani, D. Talukdar, and C. Potter, Inside Informal-ity: Poverty, Jobs, Housing and Services in Nairobi’s Slums (Washington, D.C., World Bank, 2006), p. 50.
80 S. Gulyani, D. Talukdar, and M. Kariuki, “Universal (Non)service? Water Markets, Household Demand and the Poor in Urban Kenya,” Urban Studies, vol. 42, no. 8 (2005), p. 1252.
81 S. Gulyani, D. Talukdar, and C. Potter, Inside Informal-ity: Poverty, Jobs, Housing and Services in Nairobi’s Slums (Washington, D.C., World Bank, 2006), p. 51.
82 Central Bureau of Statistics Kenya, Demographic and Health Survey. Available from http://www.measuredhs.com/
pubs/pub_details.cfm?ID=462&ctry_id=20&SrchTp=type (accessed 25 August 2008).
83 S. Gulyani, D. Talukdar, and C. Potter, Inside Informal-ity: Poverty, Jobs, Housing and Services in Nairobi’s Slums (Washington, D.C., World Bank, 2006), p. 50.
84 S. Mehrotra, Rogues No More? Water Kiosk Oper-ators Achieve Credibility in Kibera (Nairobi, World Bank, 2005), p. 6.
85 S. Mehrotra, Rogues No More? Water Kiosk Oper-ators Achieve Credibility in Kibera (Nairobi, World Bank, 2005), p. 7.
86 S. Mehrotra, Rogues No More? Water Kiosk Oper-ators Achieve Credibility in Kibera (Nairobi, World Bank, 2005), p. 5.
87 S. Mehrotra, Rogues No More? Water Kiosk Oper-ators Achieve Credibility in Kibera (Nairobi, World Bank, 2005), p. 7.
88 S. Mehrotra, Rogues No More? Water Kiosk Oper-ators Achieve Credibility in Kibera (Nairobi, World Bank, 2005), p. 7.
89 A Savings and Credit Cooperative Society (SACCO) is a member-owned financial cooperative whose primary objective is to mobilize savings and afford members access to loans (productive and provident) on competitive terms as a way of enhancing their socio-economic well-being.
90 UN-Habitat, World Cities Report 2016 (Nairobi, UN-Habitat, 2016).
91 UNFPA, State of the World Population 2007: Un-leashing the Potential of Urban Growth (New York, UNFPA, 2007).
92 M. Kaldor, Our Global Institutions Are Not Fit for Purpose. It’s Time for Reform (London, World Economic Forum, 2016).
93 D. Budlender and G. Hewitt, Engendering Budgets: A Practitioners’ Guide to Understanding and Implementing Gender-Responsive Budgets (London, Commonwealth Secretariat, 2003).
94 To see which countries have ratified the convention, visit https://treaties.un.org/Pages/ViewDetails.aspx?s-rc=TREATY&mtdsg_no=IV-8&chapter=4&lang=en.
95 Supported by GA Resolution S-23/3 (2000) annex, paragraph 73[c].

FINANCE FOR CITY LEADERS HANDBOOK 257
Brick making by women in Malawi © UN-Habitat
Local Governments and Local Economic Development, Productive Capacity, and Spatial Analysis
15
Introduction
Economies of agglomeration and economies of scale are the two major
benefits of urbanization, but despite a global trend towards urbanization,
high population density—a key condition for realizing economies of agglom-
eration—is far from ubiquitous. Even the cities that do experience a rapid rise
in density could suffer from negative externalities such as traffic congestion,
environmental degradation, crime, violence, and slum formation. Likewise,
unsustainable levels of density constrain cities from reaping the benefits of
agglomeration and make provision of services inefficient and expensive. For
cities with high population density to remain competitive and relevant, there
is a growing need to devise plans to boost efficiency and supplement existing
infrastructure, while cities with low populations must promote sustainable
FINANCE FOR CITY LEADERS HANDBOOK 259
expansion. This calls for policy interventions to help ensure that cities grow in a spatially
and economically efficient and sustainable manner.
Dense, compact, and connected cities are hubs of ideas, knowledge, and investments. By
facilitating interactions among people, they stimulate job growth, wealth, and innovation,
which in turn enhance the quality of life of their residents.1 Increasingly, cities are asserting
themselves as major nodes for global supply chains, and competitiveness of a city is often
defined by its level of connectivity. Some cities are gradually upending the conventional
economic hierarchy by exerting more influence in the global economy than many coun-
tries. Cities can increase their influence by creating a business climate more conducive to
investment and growth, and by implementing various development and planning tools to
ensure this growth is sustainable and inclusive. Unfortunately, many fall short of fully inte-
grating relevant economic dimensions into the urban planning process.
Previous chapters have focused on ways to diversify financing in order for local govern-
ments to provide better infrastructure and services. This chapter introduces an innova-
tive local economic development (LED) methodology to help city leaders spur economic
growth and generate jobs. Productive and competitive cities have
demonstrated higher propensity to retain existing enterprises and
talents while attracting new investors and skilled labour. A thriving
local economy expands and diversifies the municipal tax base,
which fosters sustainable local financial management. To this end,
we propose an integrative approach of combining productivity
analysis with spatial analysis to maximize the benefits of agglom-
eration while pursuing spatial sustainability.
What is local economic development?
Local economic development (LED) is a participatory process in which various local
stakeholders combine their efforts towards building a vibrant, resilient, inclusive, and
sustainable economy by creating jobs and improving quality of life for all. LED is not a
silver bullet or about “quick fixes”; rather, it is a strategic planning exercise that requires
a long process of developing a deep understanding of a city’s economic assets and
potential, identifying strategic growth industry sectors and their champions, and design-
ing strategies and efficiently allocating resources to improve the competitiveness of the
targeted sectors. The scope of the approach is broad and inclusive in nature; it engages
both public and private, and formal and informal sectors of the economy. It aims at
increasing the rate of economic growth and enlarging the size of the economy, while
leveling the playing field for investment and generating productive employment oppor-
tunities for all.2
“For cities with high population density to remain competitive and relevant, there is a growing need to devise plans to boost efficiency and supple-ment existing infrastructure, while cities with low populations must promote sustainable expansion.
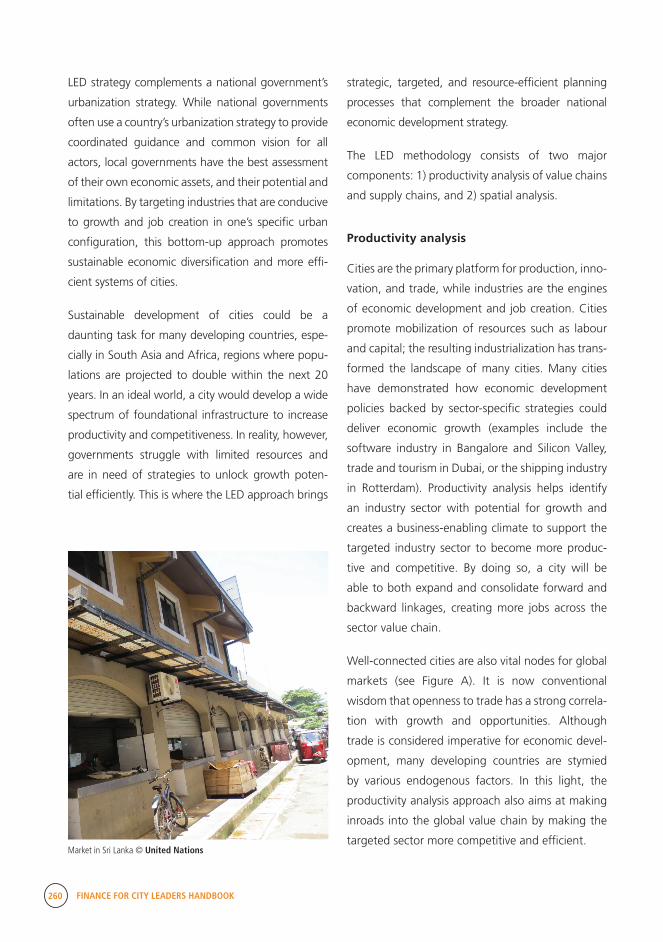
260 FINANCE FOR CITY LEADERS HANDBOOK
LED strategy complements a national government’s
urbanization strategy. While national governments
often use a country’s urbanization strategy to provide
coordinated guidance and common vision for all
actors, local governments have the best assessment
of their own economic assets, and their potential and
limitations. By targeting industries that are conducive
to growth and job creation in one’s specific urban
configuration, this bottom-up approach promotes
sustainable economic diversification and more effi-
cient systems of cities.
Sustainable development of cities could be a
daunting task for many developing countries, espe-
cially in South Asia and Africa, regions where popu-
lations are projected to double within the next 20
years. In an ideal world, a city would develop a wide
spectrum of foundational infrastructure to increase
productivity and competitiveness. In reality, however,
governments struggle with limited resources and
are in need of strategies to unlock growth poten-
tial efficiently. This is where the LED approach brings
strategic, targeted, and resource-efficient planning
processes that complement the broader national
economic development strategy.
The LED methodology consists of two major
components: 1) productivity analysis of value chains
and supply chains, and 2) spatial analysis.
Productivity analysis
Cities are the primary platform for production, inno-
vation, and trade, while industries are the engines
of economic development and job creation. Cities
promote mobilization of resources such as labour
and capital; the resulting industrialization has trans-
formed the landscape of many cities. Many cities
have demonstrated how economic development
policies backed by sector-specific strategies could
deliver economic growth (examples include the
software industry in Bangalore and Silicon Valley,
trade and tourism in Dubai, or the shipping industry
in Rotterdam). Productivity analysis helps identify
an industry sector with potential for growth and
creates a business-enabling climate to support the
targeted industry sector to become more produc-
tive and competitive. By doing so, a city will be
able to both expand and consolidate forward and
backward linkages, creating more jobs across the
sector value chain.
Well-connected cities are also vital nodes for global
markets (see Figure A). It is now conventional
wisdom that openness to trade has a strong correla-
tion with growth and opportunities. Although
trade is considered imperative for economic devel-
opment, many developing countries are stymied
by various endogenous factors. In this light, the
productivity analysis approach also aims at making
inroads into the global value chain by making the
targeted sector more competitive and efficient. Market in Sri Lanka © United Nations

FINANCE FOR CITY LEADERS HANDBOOK 261
Figure A: Air connectivity and participation in the global value chain a specific example). It is one of the most powerful
tools in today’s globalized economy for creating
an enabling business environment. By dissecting
and analyzing how much cost and value is added
at each segment of the production process—from
the raw materials stage until a product reaches end
consumers—it allows us to measure the efficiency
of each of these stages. VCA also identifies distor-
tions caused by policies, regulations, and market
and human resources that hinder industries from
becoming more competitive.4
The process of VCA can be simplified into three
stages:
1) Map out the industry value chain ranging from
raw material to end users in qualitative and
quantitative terms.
2) Set benchmarks against international competi-
tion and best practices in order to understand
which specific segment of the value chain or
policy is presenting challenges vis-à-vis the
competition.
3) Combine this knowledge with the understanding
of the institutional and regulatory factors that
underlie performance measures to enable both
the public and private sector to design strategies
to mitigate hindrances while enhancing compet-
itiveness.5
Some identified constraints may be industry-specific,
while others may be cross-cutting across all indus-
tries. A proper VCA’s scope goes beyond industry
to integrate aspects of the policy and regulatory
environment that bind enterprises’ operations (as
mentioned above). Hence, the analysis has signif-
icant implications for both the public and private
sectors in designing strategies for growth and
competitiveness. Thus, this calls for a participatory
and integrated approach engaging a wide range of
stakeholders.
The graph demonstrates a strong correlation between air connectivity and participation in the global value chain. As connectivity increases, so does the share of exports composed of parts and components. This finding provides a basis for countries and cities to improve their logistics and connectivity to global networks while mitigating inefficiencies.
Source: World Bank, Connecting to Compete: Trade Logistics in the Global Economy (Washington, World Bank, 2014). Available from http://www.worldbank.org/content/dam/Worldbank/document/Trade/LPI2014.pdf.
Value chain analysis and supply chain analysis3
Productivity analysis takes into account both value
chain analysis (VCA) and supply chain analysis (SCA).
In general, a value chain/supply chain is considered
more competitive if it can deliver high-quality goods
and services at the lowest cost and in the least
amount of time.
VCA is an accounting tool that deconstructs how
value is created and added as a product flows from
raw material to final product (see Case Study 1 for
Parts and components in total exports (%)
Source: Arvis and Shepherd 2013.
0 0.05 0.10 0.15 0.20 0.250
5
10
15
20
25
Air Connectivity Index
Better air connectivity increases participation in global value chains
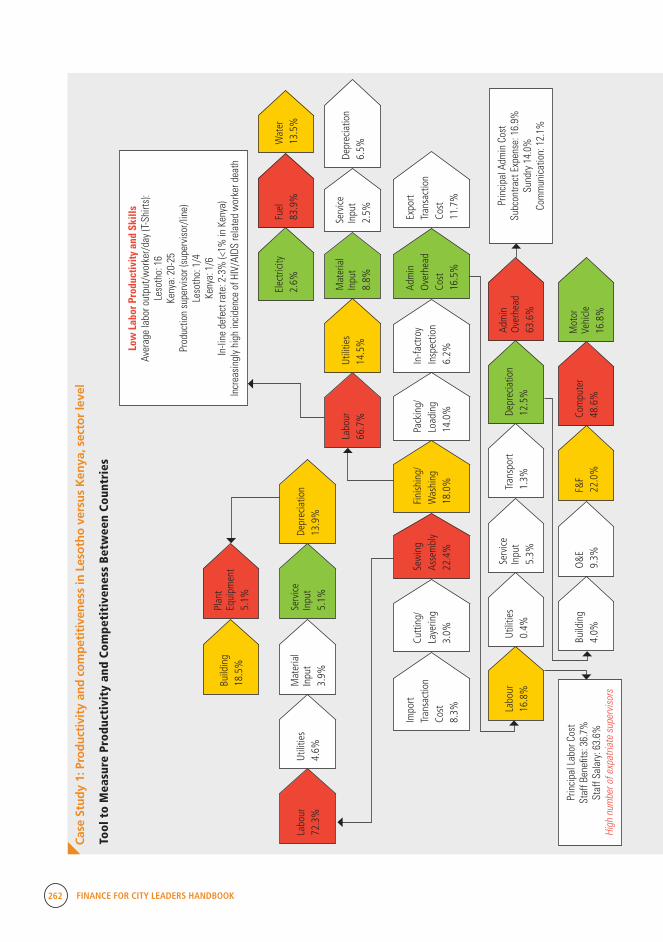
262 FINANCE FOR CITY LEADERS HANDBOOK
Cas
e St
ud
y 1:
Pro
du
ctiv
ity
and
co
mp
etit
iven
ess
in L
eso
tho
ver
sus
Ken
ya, s
ecto
r le
vel
Labo
ur72
.3%
Impo
rt Tr
ansa
ctio
n Co
st8.
3%
Cutti
ng/
Laye
ring
3.0%
Sew
ing
Asse
mbl
y22
.4%
Fini
shin
g/
Was
hing
18.0
%
Pack
ing/
Lo
adin
g14
.0%
In-fa
ctro
y In
spec
tion
6.2%
Adm
in
Ove
rhea
d Co
st16
.5%
Expo
rt Tr
ansa
ctio
n Co
st11
.7%
Utili
ties
4.6%
Mat
eria
l In
put
3.9%
Build
ing
18.5
%
Serv
ice
Inpu
t 5.
1%
Wat
er13
.5%
Fuel
83
.9%
Plan
t Eq
uipm
ent
5.1%
Depr
ecia
tion
13.9
%
Labo
ur66
.7%
Utili
ties
14.5
%
Mat
eria
l In
put
8.8%
Serv
ice
Inpu
t 2.
5%
Depr
ecia
tion
6.5%
Elec
tricit
y 2.
6%
Prin
cipa
l Lab
or C
ost
Staf
f Ben
efits
: 36.
7%St
aff S
alar
y: 6
3.6%
High
num
ber o
f exp
atria
te s
uper
viso
rs
Prin
cipa
l Adm
in C
ost
Subc
ontra
ct E
xpen
se: 1
6.9%
Sund
ry 1
4.0%
Com
mun
icat
ion:
12.
1%
Low
Lab
or P
rodu
ctiv
ity a
nd S
kills
Aver
age
labo
r out
put/
wor
ker/
day
(T-Sh
irts)
:Le
soth
o: 1
6Ke
nya:
20-
25Pr
oduc
tion
supe
rvis
or (s
uper
viso
r/lin
e)Le
soth
o: 1
/4Ke
nya:
1/6
In-li
ne d
efec
t rat
e: 2
-3%
(<1%
in K
enya
)In
crea
sing
ly h
igh
inci
denc
e of
HIV
/AID
S re
late
d w
orke
r dea
th
Labo
ur16
.8%
Utili
ties
0.4%
Build
ing
4.0%
Serv
ice
Inpu
t 5.
3%
O&E
9.
3%
Tran
spor
t1.
3%
F&F
22.0
%
Depr
ecia
tion
12.5
%
Com
pute
r48
.6%
Adm
inO
verh
ead
63.6
%
Mot
or
Vehi
cle16
.8%
Tool
to
Mea
sure
Pro
duct
ivit
y an
d Co
mpe
titi
vene
ss B
etw
een
Coun
trie
s

FINANCE FOR CITY LEADERS HANDBOOK 263
The
abov
e fig
ure
prov
ides
an
exam
ple
of a
val
ue c
hain
ana
lysi
s m
ap f
or
the
prod
uctio
n of
t-s
hirt
s in
Les
otho
for
the
U.S
. mar
ket.
As
the
figur
e in
dica
tes,
the
pro
duct
ion
of a
t-s
hirt
tak
es p
lace
in
eigh
t va
lue-
add-
ing
stag
es, n
amel
y im
port
tra
nsac
tion
cost
(im
port
ing
cott
on m
ater
ial),
cu
ttin
g an
d la
yerin
g, s
ewin
g an
d as
sem
bly,
fini
shin
g an
d w
ashi
ng,
pack
ing
and
load
ing,
in-
fact
ory
insp
ectio
n, a
dmin
istr
ativ
e ov
erhe
ad,
and
expo
rt t
rans
actio
n co
st (r
ail c
ost
to D
urba
n po
rt, a
nd s
hipp
ing
cost
to
the
Uni
ted
Stat
es).
The
VC
A m
ap s
how
s th
at s
ewin
g an
d as
sem
bly
(hig
hlig
hted
in
red)
is
the
bigg
est
cost
driv
er f
or t
he p
rodu
ctio
n of
a
t-sh
irt,
follo
wed
by
fin
ishi
ng
and
was
hing
(y
ello
w
high
light
), an
d ad
min
istr
ativ
e ov
erhe
ad c
osts
(gr
een
high
light
). W
hen
each
of
thes
e
key
cost
driv
ers
are
furt
her
disa
ggre
gate
d, t
he a
naly
sis
draw
s at
ten-
tion
to t
he w
eak
labo
ur s
kills
ass
ocia
ted
with
t-s
hirt
pro
duct
ion,
whi
ch
are
unde
rmin
ing
labo
ur p
rodu
ctiv
ity (
wor
kers
in
Leso
tho
prod
uce,
on
aver
age,
16
t-sh
irts/
pers
on/d
ay,
whi
le w
orke
rs in
Ken
ya p
rodu
cing
the
sa
me
t-sh
irt a
vera
ge a
bout
20–
25 t
-shi
rts/
pers
on/d
ay).
This
sug
gest
s th
at t
arge
ted
trai
ning
in s
kills
dev
elop
men
t sp
ecifi
cally
for
sew
ing
and
asse
mbl
y, a
nd fi
nish
ing
and
was
hing
wou
ld i
mpr
ove
the
com
petit
ive-
ness
of
the
garm
ent
sect
or i
n Le
soth
o. S
uch
anal
ysis
hel
ps f
ocus
the
at
tent
ion
of p
olic
ymak
ers
and
priv
ate
sect
or o
pera
tors
on
spec
ific
inte
r-ve
ntio
ns t
o he
lp im
prov
e se
ctor
com
petit
iven
ess.
6
Sour
ce: G
loba
l Dev
elop
men
t Sol
utio
ns, M
easu
ring
the
Cost
of T
rade
Log
istics
on
Agrib
usin
ess
(Res
ton,
Va.
, Glo
bal D
evel
opm
ent S
olut
ions
, 201
3).
Citie
s ar
e th
e pr
imar
y pl
atfo
rm f
or p
rodu
ctio
n, i
nnov
atio
n, a
nd
trade
, whi
le in
dust
ries
are
the
engi
nes
of e
cono
mic
deve
lopm
ent
and
job
crea
tion.
Citi
es p
rom
ote
mob
iliza
tion
of re
sour
ces
such
as
labo
ur a
nd c
apita
l; th
e re
sulti
ng in
dust
rializ
atio
n ha
s tra
nsfo
rmed
th
e la
ndsc
ape
of m
any
citie
s.
“
264 FINANCE FOR CITY LEADERS HANDBOOK
While VCA helps us to understand the cost effi-
ciency at each value-adding segment along a
production system, supply chain analysis assesses
the efficiency of the flow of goods and services
from producers of raw inputs to end consum-
ers both within and out of the country. A supply
chain is an institutional arrangement that links a
set of activities in which firms engage in a specific
industry as they move from producers, packag-
ers, marketers, and to consumers. It is a conduit
through which products, services, information,
and capital move from one segment of the chain
to another until they reach the final consumer.7 For
example, a supply chain mapping exercise captures
the flow, cost, time, and efficiency of an agricul-
tural crop from farm gate to the final consumer.
This exercise provides insights into specific trade
logistics constraints hindering competitiveness, and
helps identify both policy- and market-based inter-
ventions to improve efficiency and competitiveness.
Supply chain efficiency is bound by both physical
and trade logistics infrastructure, which are often
defined by urban planning.
Many consider improving functions of supply
chains and logistics as central to global value
chain participation and economic growth. Based
on the findings from the value chain analysis, one
can identify particular value-adding segments or a
sector that could be plugged into the global value
chain. The objective of this exercise is to improve
logistical performance on the premise that strong
correlations exist between connectivity and global
value chain participation.8 However, supply chains
are often fragmented, especially in developing
countries. Fragmentation results in, among other
things, waste, income loss, increased product
price, and lack of product availability in the market.
For example, one can witness a domestic market
importing agricultural products despite having
farmers available domestically.
The proposed methodological framework high-
lights key factors that affect cost, time, and
quality of goods and services required for operat-
ing a competitive sector. The entire flow from raw
material to the arrival of final products and services
into the hands of both domestic and foreign
consumers needs to be considered in conducting
the analysis. The process entails finding out the
economic cost of each step along the flow. Figure
B, for example, maps the logistical flow of imports/
exports and the key factors involved in different
geographies.
A supply chain is an institutional arrangement that links a set of activities in which firms engage in a specific industry as they move from producers, packagers, marketers, and to consumers.
“
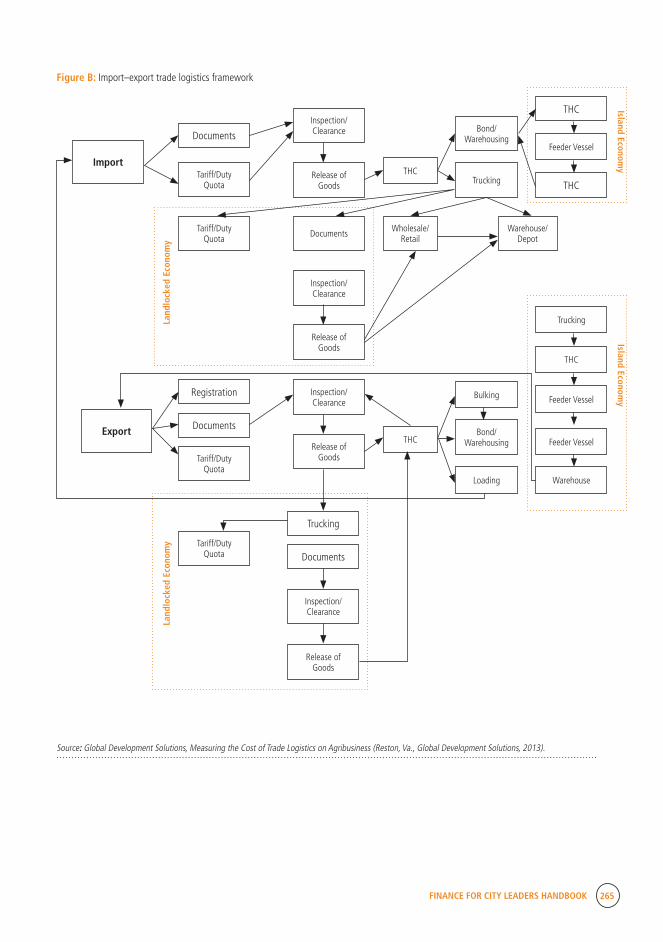
FINANCE FOR CITY LEADERS HANDBOOK 265
Island Economy
Island Economy
Import
Documents
THC
THC
Registration
Trucking
Documents
Documents
Tariff/Duty Quota
Feeder Vessel
Trucking
THC
Feeder Vessel
Feeder Vessel
Warehouse
Tariff/Duty Quota
Tariff/Duty Quota
Tariff/Duty Quota
Inspection/ Clearance Bond/
Warehousing
Bond/ Warehousing
Inspection/ Clearance
Inspection/ Clearance
Release of Goods Trucking
Bulking
Loading
THC
THCRelease of
Goods
Release of Goods
Release of Goods
Documents Wholesale/Retail
Warehouse/ Depot
Inspection/ Clearance
Export
Land
lock
ed E
cono
my
Land
lock
ed E
cono
my
Figure B: Import–export trade logistics framework
Source: Global Development Solutions, Measuring the Cost of Trade Logistics on Agribusiness (Reston, Va., Global Development Solutions, 2013).
266 FINANCE FOR CITY LEADERS HANDBOOK
The steps taken in the analysis parallel those of value
chain analysis. Once the economic costs of key factors
in the product flow are collected, we compare the
efficiency of the targeted supply chain with compet-
itors and global standards. Prior to designing strat-
egies to overcome supply chain bottlenecks, devel-
oping a thorough understanding of institutional and
infrastructural frameworks is crucial.
Likewise, developing a thorough understanding
of how well a value/supply chain works demands
primary and up-to-date information. Secondary desk
research could suffice for understanding global and
regional trends and demand. However, collecting
data and information on domestic markets could
be a great challenge, especially in developing coun-
tries due to limited data availability. It is both cost-
and time-efficient to first look for already-existing
relevant reports. In case such reports are not available
or require updating, it is possible to build an estimate
from scratch by conducting chain-wide surveys and
interviews with stakeholders from relevant public
and private institutions. In doing so, there are myriad
factors to be taken into account.
Variables to consider for value/supply chain
competitiveness
Value/supply chain analysis requires analyzing several
variables that buttress a sector and, therefore, deter-
mine its competitiveness. They are broadly catego-
rized into hard and soft infrastructure. The former
includes:
Transport infrastructure: There are three main
modes of transport: land, air, and sea. A well-de-
veloped and connected network of roads, air
links, and maritime shipping combined with an
efficient trucking and cargo system will facilitate
the movement of goods and services, while any
poorly designed mode of transport will result in
slow movement and higher shipping costs. The
quality of transport infrastructure heavily influ-
ences the true economic distance9 along the
value chain.10
Logistics: This refers to warehouses, refrigeration
and distribution facilities, and cold-chain facilities.
The importance of such facilities is greater for
value chains that move time-sensitive and perish-
able goods, such as in agribusiness.
The following variables that fall under soft infrastruc-
ture are as critical to sector competitiveness as those
of hard infrastructure:
Human resources: This refers to labour skills
(including both life skills and job- and task-spe-
cific skills) and wages, which determine labour
productivity. It also includes formal educational
institutions as well as vocational training insti-
tutions, which are responsible for disseminating
technology, technical and managerial skills, and
knowledge. Without strong support of these
institutions, a sector will not be able to compete,
even with advanced transport infrastructure.
Financial institutions: While physical infrastruc-
ture is crucial for moving goods and services
from producers to consumers, the financial sector
plays a pivotal role in the efficient allocation of
resources and in facilitating payments. The finan-
cial services industry consists of five broad catego-
ries of services: banks, insurance, securities, asset
management, and financial information. The
importance of financial services becomes ampli-
fied if an industry engages in international trade;
these services are also important for the growth
of enterprises.11
Customs and freight forwarding: Moving goods
from producers to consumers along the supply
chain also depends on the quality of transport
and associated services, such as customs and
freight forwarding.12

FINANCE FOR CITY LEADERS HANDBOOK 267
Legal/regulatory framework: Governmental
institutions provide services or set regulations
that impact the competitiveness of trade logis-
tics. Also, anticompetitive behavior and restric-
tive regulations towards transport services and
infrastructure could increase transport costs and
ultimately may undermine trade and market
share. The private sector could play a major role
in infrastructure investments as well as services,
provided it gets the necessary credit for invest-
ments. Access to affordable credit by the private
sector is particularly low in developing econ-
omies due to lack of strong institutions, poor
enforcement of contacts, and weak rule of law.
A weak regulatory framework makes investors
apprehensive to invest in places where invest-
ments are most needed.13
Information and computer technology (ICT): ICT
is a cross-cutting issue that facilitates information
and knowledge sharing along the value chain.
For example, the development of computerized
customs systems significantly lowers human
error, corruption, and the length of clearance
processes. Also, improved communication along
the supply chain lowers inconsistency and unex-
pectedness while improving inventory manage-
ment.14
Business climate: In order for any sector to
expand and grow, an economy needs invest-
ments and startups that could transform and
support the development of existing and new
products and services. In this regard, it is essen-
tial to have a business-enabling environment
that promotes and rewards entrepreneurship
and risk-taking.
Safety and security: Security is a key prerequisite
for economic growth. When there is an actual
or perceived risk in security arising from military
forces, terrorism, or religious fundamentalists,
there is less likelihood for any future investment
commitment. As the cost of doing business in an
unstable environment is high, very little, if any,
investment will flow in.
In addition to the aforementioned endogenous vari-
ables, there are other factors, such as geography
and climate change, that fall beyond the jurisdiction
of city or national governments and that also affect
supply chain and trade efficiency. Although the
effects must not be overlooked, improving on the
above endogenous variables will bring significant
improvement to a city’s supply chain and logistics
performance. An efficient supply chain and logistics
within a country is the gateway for participation in
a global value chain.
Action-oriented participatory process
As the saying “a chain is as strong as its weakest link”
suggests, components of the same value/supply
chain are highly interdependent. The efficiency of
one segment heavily influences the competitive-
ness of another. For example, if a leather tannery
produces leather sheets at high cost, leather shoe
manufacturers are likely to increase the market
price for their finished leather shoes. Overall coordi-
nation that generates trust and predictability along
the value/supply chain also enhances the efficiency
of a sector. This gives supply chain–wide incentives
to collaborate to bring about a more integrated
value chain approach. Thus, from the outset, it is
important to engage the wide range of members
of the value chain and supply chain from both
the private and public sectors. This will allow the
sectors to develop a common vision and thus bring
about an integrated, sustainable, and competitive
value chain and supply chain.
Analyzing a sector through a value chain and supply
chain lens allows us to identify and plug the gap
along the chain. Combined with the findings from
global and regional trends and demand, local sectors
268 FINANCE FOR CITY LEADERS HANDBOOK
could explore opportunities for value addition or
expand their market share. In today’s globalized
economic landscape, specialization of a competitive
sector or a segment of a sector could allow a city to
plug itself into a global value chain while productively
connecting its people to the world.
Spatial economic analysis
The principal objective of spatial analysis is to help
cities design an urban layout that is compact, inte-
grated, and connected. Urban reconfiguration
brought about by ongoing urbanization has put
local governments under pressure to provision
essential services. Current research indicates that
six out of seven cities in developing countries are
undergoing a decline in population density, which
incurs significant costs for governments.15 There is a
growing need for better spatial allocation of services
and infrastructure to enable cities to become livable
and sustainable economic powerhouses.
The second component of our integrative LED
approach examines the spatial and cartographic
perspectives of a city and its key industrial sector.
This not only allows us to develop a spatial under-
standing of a city, but more importantly, aids in
improving cohesion among various infrastructure
projects that connect and buttress industries.
Conducting spatial analysis
If productivity analysis is an exercise in uncovering
the linkages among, and determining the efficien-
cy of, stakeholders in a value/supply chain, spatial
analysis is a visualization of the findings from the
productivity analysis. This can be simplified into
four stages:
1) Map the fundamental elements of the city, such
as roads, ports, and warehouses.
2) View the findings of productivity analysis
through a spatial perspective: Map out the
sector players as well as the flow of products,
services, and labour among stakeholders of the
targeted sector.16
3) Identify production hubs/clusters where there
are concentrated business activities and enter-
prises.
4) Develop both immediate and long-term strat-
egies to further integrate the supply chain and
optimize the movement of production factors by
combining the previous three steps with project-
ed urban expansion. For example, by identifying
key production hubs to support, subnational
governments can plan city extension around the
region to accommodate population expansion,
facilitate the supply of skilled labour, improve
infrastructure, and provide public transporta-
tion.
Key factors to consider in spatial analysis
The following are three of the key factors to
consider while conducting spatial analysis to
optimize its use:
Mobility: The goal is to maximize mobility of
production factors—people and goods—while
minimizing economic distance. The intricate
linkages and the flow of input and output
among value/supply chain members will be iden-
tified during productivity analysis. Mapping the
flow of products and services by using geospatial
tools enables us to understand distance traveled
by inputs. This exercise begets numerous poten-
tial activities in respect to improving mobility. For
example, it allows sector stakeholders to detect
whether there are any economic opportunities
being lost by proximate suppliers. By analyzing
the trend, stakeholders along a value chain can
efficiently increase business transactions among

FINANCE FOR CITY LEADERS HANDBOOK 269
local companies. As a result, a sector will witness
growth in production while making the flow of
goods more economically efficient.
The same concept applies to labour. Labour is
one of the key factors of production, and the
ease of mobility affects productivity of a city.17
Increased mobility of labour brings econo-
my-wide productivity gain by enabling a higher
degree of skills matching. Furthermore, on the
premise of increased mobility boosting accessi-
bility, less time spent commuting allows people
to pursue other productive activities. In develop-
ing countries where public transportation could
be a major constraint and having multiple jobs is
common, increased labour mobility and accessi-
bility could yield significant economic benefit for
individuals and the economy.
Indicators such as accessibility to arterial roads,
intersection density, land use mix, and the
presence of dedicated and safe pedestrian spaces
can contribute to measuring the level of labour
and product mobility in a given urban layout.
UN-Habitat views sustainable mobility as a
means of realizing accessibility rather than an
end in itself. The notion of accessibility surpasses
simple physical distance; it encompasses access
to opportunities and empowers people to fully
exercise their human rights.18
Connectivity: Connectivity of a city is measured
by how central a city is to global markets and
transportation and logistics networks. Connec-
tivity is increasingly considered as one of the
more powerful proxies for gauging a city’s
development potential. Being better and more
efficiently connected to or having access to
big markets lowers economic costs. Moreover,
the more connected a city is, the higher is the
propensity to access new ideas, technologies,
innovations, etc. While connectivity is often
defined by geographic location, it does not
necessarily determine competitiveness of a
sector in a given location. Infrastructure also is
a key variable, and spatial analysis allows us to
assess the level of connectivity as well as identify
areas for infrastructure investments and service
provisions. There are indices, such as UNCTAD’s
Liner Shipping Connectivity Index, that measure
countries’ connectivity.19
Inclusiveness: One objective of spatial analysis
is to promote inclusive economic growth. It has
been demonstrated over the years that urbaniza-
tion is a powerful tool for economic development.
Without proper planning and efforts, however,
such positive externalities of urbanization will
not be shared equally and may fail to reach
vulnerable populations. Application of spatial
analysis ensures that the new configurations of
expanding urban areas are well-integrated into
the existing urban network and are not alienat-
ed from the urban economy and basic amenities.
Rush hour in Port Moresby, Papua New Guinea © UN-Habitat
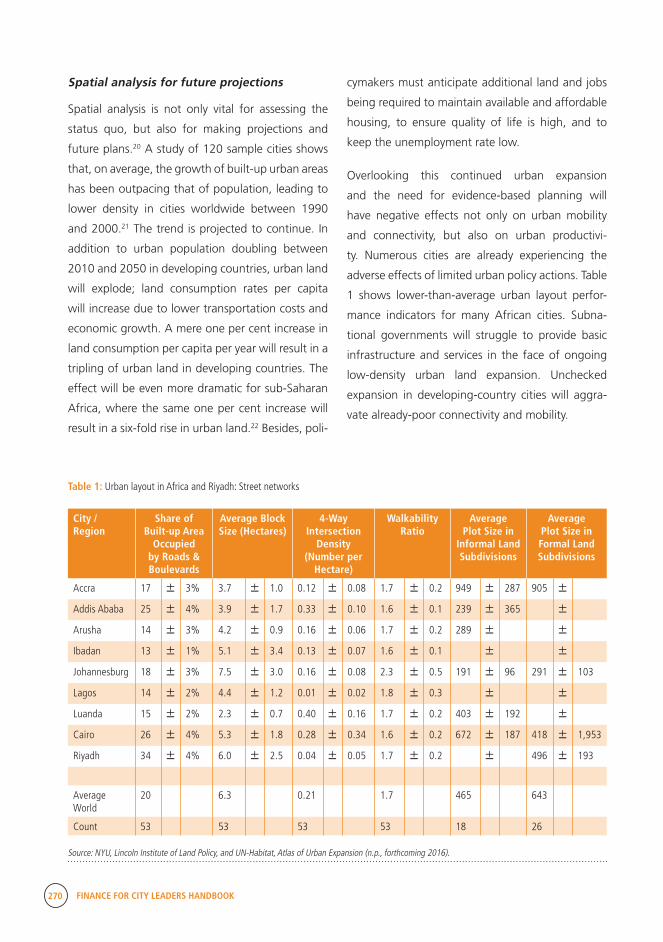
270 FINANCE FOR CITY LEADERS HANDBOOK
Spatial analysis for future projections
Spatial analysis is not only vital for assessing the
status quo, but also for making projections and
future plans.20 A study of 120 sample cities shows
that, on average, the growth of built-up urban areas
has been outpacing that of population, leading to
lower density in cities worldwide between 1990
and 2000.21 The trend is projected to continue. In
addition to urban population doubling between
2010 and 2050 in developing countries, urban land
will explode; land consumption rates per capita
will increase due to lower transportation costs and
economic growth. A mere one per cent increase in
land consumption per capita per year will result in a
tripling of urban land in developing countries. The
effect will be even more dramatic for sub-Saharan
Africa, where the same one per cent increase will
result in a six-fold rise in urban land.22 Besides, poli-
cymakers must anticipate additional land and jobs
being required to maintain available and affordable
housing, to ensure quality of life is high, and to
keep the unemployment rate low.
Overlooking this continued urban expansion
and the need for evidence-based planning will
have negative effects not only on urban mobility
and connectivity, but also on urban productivi-
ty. Numerous cities are already experiencing the
adverse effects of limited urban policy actions. Table
1 shows lower-than-average urban layout perfor-
mance indicators for many African cities. Subna-
tional governments will struggle to provide basic
infrastructure and services in the face of ongoing
low-density urban land expansion. Unchecked
expansion in developing-country cities will aggra-
vate already-poor connectivity and mobility.
Table 1: Urban layout in Africa and Riyadh: Street networks
City / Region
Share of Built-up Area
Occupied by Roads & Boulevards
Average Block Size (Hectares)
4-Way Intersection
Density (Number per
Hectare)
Walkability Ratio
Average Plot Size in
Informal Land Subdivisions
Average Plot Size in Formal Land Subdivisions
Accra 17 3% 3.7 1.0 0.12 0.08 1.7 0.2 949 287 905
Addis Ababa 25 4% 3.9 1.7 0.33 0.10 1.6 0.1 239 365
Arusha 14 3% 4.2 0.9 0.16 0.06 1.7 0.2 289
Ibadan 13 1% 5.1 3.4 0.13 0.07 1.6 0.1
Johannesburg 18 3% 7.5 3.0 0.16 0.08 2.3 0.5 191 96 291 103
Lagos 14 2% 4.4 1.2 0.01 0.02 1.8 0.3
Luanda 15 2% 2.3 0.7 0.40 0.16 1.7 0.2 403 192
Cairo 26 4% 5.3 1.8 0.28 0.34 1.6 0.2 672 187 418 1,953
Riyadh 34 4% 6.0 2.5 0.04 0.05 1.7 0.2 496 193
Average World
20 6.3 0.21 1.7 465 643
Count 53 53 53 53 18 26
Source: NYU, Lincoln Institute of Land Policy, and UN-Habitat, Atlas of Urban Expansion (n.p., forthcoming 2016).
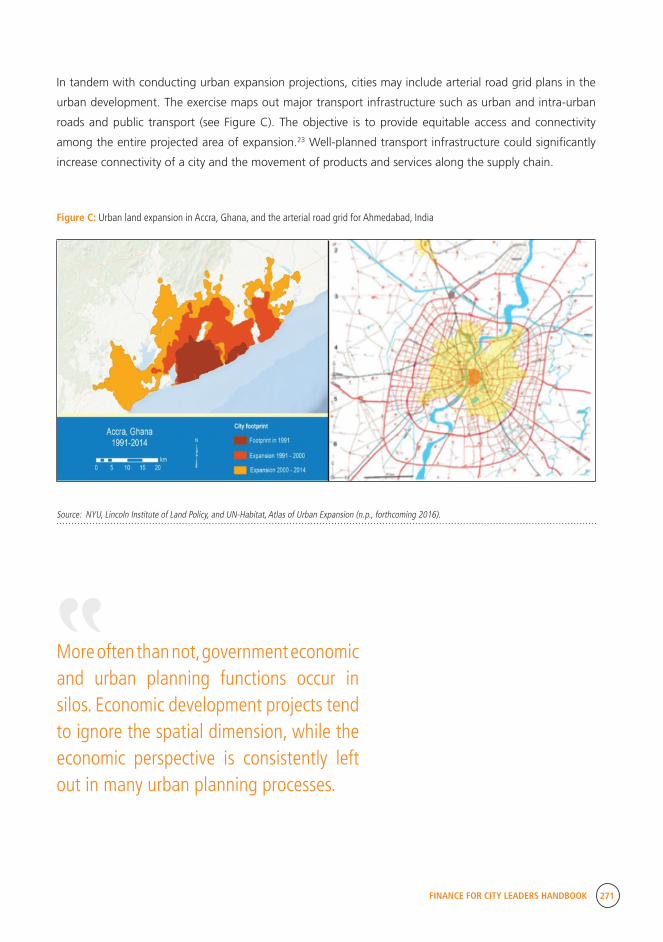
FINANCE FOR CITY LEADERS HANDBOOK 271
In tandem with conducting urban expansion projections, cities may include arterial road grid plans in the
urban development. The exercise maps out major transport infrastructure such as urban and intra-urban
roads and public transport (see Figure C). The objective is to provide equitable access and connectivity
among the entire projected area of expansion.23 Well-planned transport infrastructure could significantly
increase connectivity of a city and the movement of products and services along the supply chain.
Figure C: Urban land expansion in Accra, Ghana, and the arterial road grid for Ahmedabad, India
Source: NYU, Lincoln Institute of Land Policy, and UN-Habitat, Atlas of Urban Expansion (n.p., forthcoming 2016).
More often than not, government economic and urban planning functions occur in silos. Economic development projects tend to ignore the spatial dimension, while the economic perspective is consistently left out in many urban planning processes.
“
272 FINANCE FOR CITY LEADERS HANDBOOK
Conclusion: An integrative approach
tive and integrated sectors will benefit the private
sector and city inhabitants by creating value-add-
ing jobs and fostering a vibrant local economy. It
also benefits local governments by providing a
sound foundation for evidence-based policymak-
ing, enhancing local governance, and by expanding
opportunities for revenue enhancement.
The discussed LED tool proposes a sector-specific
approach to enhancing local economic compet-
itiveness and spatial sustainability. As opposed to
spreading subnational governments’ limited budget
thinly across multiple industries, a sector-specific
approach delivers greater impact in a more effi-
cient manner. However, the question around sector
identification is critical. Cities have to identify an
emerging sector prior to applying the proposed
LED toolkit. Although the identification process is
a critical prerequisite for successful LED implemen-
tation, it may not be a trivial task for subnation-
al governments, requiring technical analysis and
a joint effort from the private sector. This can be
done by combining trade data, sector value–added
statistics, and labour intensity data; however, this
information is not always available. Describing and
developing this approach is beyond the scope of
this chapter, but is part of an upcoming study by
UN-Habitat.
More often than not, government economic and
urban planning functions occur in silos. Economic
development projects tend to ignore the spatial
dimension, while the economic perspective is consis-
tently left out in many urban planning processes.
This integrative LED approach brings together the
two critical dimensions of urban development. On
the one hand, it conducts more of a conventional
economic competitiveness assessment using value
chains and supply chains to identify key players in
a targeted sector and factors constraining it. The
analysis then puts forward regulatory and sector
policy recommendations to address the identified
bottlenecks. On the other hand, the approach
applies the spatial element of urban planning to
visualize the functional aspect of the value/supply
chain and to explore ways to harness the expansion
of urban population and urban land consumption
to be of the optimum use to industries and the
economy.
By integrating economic and design aspects of
urban development, the proposed LED approach
surveys urban competitiveness and sustainability
in a comprehensive manner that very few existing
development tools can match. It provides a partici-
patory framework for the public and private sectors
to collaborate from the stage of problem identifi-
cation to solution implementation. More competi-
FINANCE FOR CITY LEADERS HANDBOOK 273
Younghoon Moon is a consultant for the Urban Economy Branch of the United Nations Human
Settlements Programme.
Marco Kamiya is coordinator of the Urban Economy Branch of the United Nations Human Settlements
Programme.
Yasou Konishi is the managing director of Global Development Solutions LLC.
9 Economic distance is the time and cost of transport-ing goods between departure to destination. It could be measured by the costs incurred or the time required.
10 Global Development Solutions, Measuring the Cost of Trade Logistics on Agribusiness (Reston, Va., Global Devel-opment Solutions, 2013).
11 Global Development Solutions, Measuring the Cost of Trade Logistics on Agribusiness (Reston, Va., Global Devel-opment Solutions, 2013).
12 Global Development Solutions, Measuring the Cost of Trade Logistics on Agribusiness (Reston, Va., Global Devel-opment Solutions, 2013).
13 Global Development Solutions, Measuring the Cost of Trade Logistics on Agribusiness (Reston, Va., Global Devel-opment Solutions, 2013).
14 Global Development Solutions, Measuring the Cost of Trade Logistics on Agribusiness (Reston, Va., Global Devel-opment Solutions, 2013).
15 UN-Habitat, State of the World Cities (Nairobi, UN-Habitat, 2012). Available from http://mirror.unhabitat.org/pmss/listItemDetails.aspx?publicationID=3387.
16 UN-Habitat. First Steps Towards Strategic Urban Planning (Nairobi, UN-Habitat, 2008). Available from http://unhabitat.org/books/garowe-first-steps-towards-strate-gic-urban-planning/.
17 Mobility of capital is also crucial for the reasons men-tioned in the financial institutions section under value chain analysis.
Endnotes
1 Edward L. Glaeser, Triumph of Cities (New York, Pen-guin Press, 2011).
2 UN-Habitat, Promoting Local Economic Development Through Strategic Planning (Nairobi, UN-Habitat, 2005).
3 VCA is often used interchangeably with supply chain analysis. The minor difference resides in the fact that supply chain analysis focuses on the movement of products, ma-terials, services, and information, from one point of value addition to the next, while VCA focuses specifically on accounting for each stage of value addition for a good or service.
4 Foreign Investment Advisory Service (FIAS), Moving Toward Competitiveness: A Value-Chain Approach (Wash-ington, Foreign Investment Advisory Service, 2007).
5 Foreign Investment Advisory Service (FIAS), Moving Toward Competitiveness: A Value-Chain Approach (Wash-ington, Foreign Investment Advisory Service, 2007).
6 Since the analysis was conducted, skills development programmes were introduced in the garment sector in Lesotho, which has contributed greatly to improve sector competitiveness, and Lesotho continues to be the sec-ond-largest exporter of garments to the U.S. market under the African Growth and Opportunity Act.
7 Martha C. Cooper, Douglas M. Lambert, and Janus D. Pagh, “Supply Chain Management: More Than a New Name for Logistics,” International Journal of Logistics Man-agement, vol. 8, issue 1 (1997).
8 World Bank, Connecting to Compete: Trade Logistics in the Global Economy (Washington, World Bank, 2014). Available from http://www.worldbank.org/content/dam/Worldbank/document/Trade/LPI2014.pdf.
274 FINANCE FOR CITY LEADERS HANDBOOK
18 UN-Habitat, Planning and Design for Sustainable Urban Mobility (Nairobi, UN-Habitat, 2013). Available from http://unhabitat.org/planning-and-design-for-sus-tainable-urban-mobility-global-report-on-human-settle-ments-2013/.
19 UNCTAD, Liner Shipping Connectivity Index (Geneva, UNCTAD, 2016). Available from http://unctadstat.unctad.org/wds/TableViewer/tableView.aspx?ReportId=92.
20 There are a number of ongoing studies and platforms for urban spatial data and analysis that can be accessed by the public. City leaders are encouraged to explore platforms such as Lincoln Institute’s Atlas of Urban Expansion and World Bank’s Platform for Urban Management and Analysis (PUMA) to understand global urbanization trends and to compare urbanization across countries and cities.
21 S. J. Angel, D. Parent, L. Civco, and A. M. Blei, Atlas of Urban Expansion (Cambridge, Mass., Lincoln Institute of Land Policy, 2010). Available from http://www.lincolninst.edu/subcenters/atlas-urban-expansion/.
22 NYU Urban Expansion Program, Monitoring the Quantity and Quality of Global Urban Expansion (New York, New York University, 2015). Available from http://marroninstitute.nyu.edu/uploads/content/Monitoring_the_Quantity_and_Quality_of_Urban_Expansion,_22_Septem-ber_2015_WP24.pdf.
23 NYU, Lincoln Institute of Land Policy, and UN-Habitat, Atlas of Urban Expansion (n.p., forthcoming 2016).


276 FINANCE FOR CITY LEADERS HANDBOOK
United Nations Human Settlements ProgrammeP. O. Box 30030, Nairobi 00100, KENYATelephone: +254-20-7623120, Fax: +254-20-7624266/7Email: [email protected] www.unhabitat.org
HS Number: HS/059/16EISBN Number(Series): ISBN Number:(Volume) 978-92-1-132721-2
www.unhabitat.org
United Nations Human Settlements ProgrammeP. O. Box 30030, Nairobi 00100, KENYATelephone: +254-20-7623120, Fax: +254-20-7624266/7Email: [email protected]
HS Number: HS/059/16EISBN Number(Series): ISBN Number:(Volume) 978-92-1-132721-2