Embed Size (px)
Citation preview
int. j. remote sensing, 1999, vol. 20, no. 2, 421 ± 443
Landsat TM mapping of evidence for current wind activity in
northern Fennoscandia
J. KAÈ YHKOÈ ²Department of Geography, University of Turku, FIN-20014, Turku, Finland
A. VUORELASatellite Image Centre, National Land Survey of Finland, P.O. Box 84,FIN-00521 Helsinki, Finland
K. PYE and P. WORSLEY³Postgraduate Research Institute for Sedimentology, The University of Reading,RG66AB, England, UK
Abstract. Hybrid classi® cation of 11 Landsat TM quarter images (circa81 000km2 ) was performed in an attempt to locate and quantify areas of sandtransported by wind in Lapland. The data were employed in the k-means clusteringalgorithm after grey-level thresholding, and the resulting normal distributionparameters were used in a maximum likelihood classi® cation. In order to achievean unbiased classi® cation result, post-classi® cational manual interpretation wasused for selecting the best possible class combination with the aid of ground dataand ® eld checks. Wind activity was found on early Holocene anchored inlanddunes, glacio¯ uvial deposits, and in localised areas on fell slopes. Aeolian processesare mainly operative in the mountain birch woodland and treeless tundra northof the Scots Pine forest zone. Sixty-three current localities with a total area ofde¯ ated surfaces of circa 10km2 (1000 ha) were identi® ed in the study region.
1. Introduction
Evidence of contemporary wind activity, expressed by de¯ ated surfaces and dune-like depositional features, is a common geomorphological phenomenon of the Borealforest-tundra ecotone. Many reports of such features from the subarctic areas ofNorth-America and Europe have been published (e.g. Filion 1984, Be langer andFilion 1991, SeppaÈ laÈ 1995, Tikkanen and Heikkinen 1995). The location of thisecotonal boundary is known to be extremely sensitive to gradual environmentalchanges such as climate (e.g. Lavoie and Payette 1994, SeppaÈ 1996), but also rapidones such as forest ® res (e.g. Arseneault and Payette 1992). The active de¯ ationfeatures in the forest-tundra ecotone have been ascribed to forest ® res and delayedpost-® re vegetation recovery due to climatic factors (e.g. Filion et al. 1991, SeppaÈ laÈ
² Previously: Postgraduate Research Institute for Sedimentology, The University ofReading, RG6 6AB, England, UK.
³ Also at: Centre for Quaternary Research, Royal Holloway, University of London, Egham,TW20 0EX, England, UK
International Journal of Remote SensingISSN 0143-1161 print/ISSN 1366-5901 online Ñ 1999 Taylor & Francis Ltd
http://www.tandf.co.uk/JNLS/res.htmhttp://www.taylorandfrancis.com/JNLS/res.htm
J. KaÈ yhkoÈ et al.422
1995). However, in northern Fennoscandia it has not been possible to identify thereason or reasons for the phenomena with any certainty although intensive herdingof domestic reindeer (Rangifer tarandus domesticus) alters the vegetation (e.g. Oksanenet al. 1995) and has frequently been suggested as a potential cause of increased soilerosion (e.g. Kotilainen 1991, SeppaÈ laÈ 1995, Tikkanen and Heikkinen 1995). One ofthe main restrictions on the study of aeolian activity in Lapland has been the limitedinformation about the spatial distribution of active areas. The vast area involved,combined with a sparse road network, makes ® eld mapping di� cult, and only a fewattempts to systematically map the active aeolian features have been made. Detailedinformation on the spatial distribution of aeolian activity would aid further ® eldinvestigations. It would also allow the use of GIS techniques to com-bine data relating to various environmental parameters such as reindeer density,vegetation, relief (DEM), etc.
Previously, mapping of aeolian processes in northern Fennoscandia has beendone on a national basis only. Some studies have been undertaken as part of a widerremit, for example general geomorphological mapping, or restricted to speci® c dune® elds only (e.g. Klemsdal 1969, SeppaÈ laÈ 1972, Sollid et al. 1973, Aartolahti 1976,Bergqvist 1981, Tikkanen and Heikkinen 1995), but the mapping of wind formedfeatures with respect to environmental parameters beyond national borders has notpreviously been attempted. Earlier work used aerial photography, creating limitationson the size of study area and concentrating attention on areas presumed to besuitable for aeolian activity. Consequently, any de¯ ation occurring in an unsuspectedarea is missed. Measurements of the areal extent of aeolian activity from aerialphotography are time-consuming, and require either manual point counting orscanning the photographs into digital form for further computer-based imageanalyses. Furthermore, determination of barren sand surfaces on black and whitephotographs can be di� cult, as Cladina lichen heaths, for example, also appearpale-coloured on visible wavelengths.
Previously published reports on the distribution of aeolian activity in northernFennoscandia include Klemsdal’s (1969) study of aeolian forms in parts of Norway.He classi® ed the sizes of entire aeolian areas (dune ® elds) into three broad classes:(1) <1000 m2 , (2) 1000± 2000 m2 and (3) >2000 m2 . Present-day activity was indi-cated qualitatively as being either present or absent. No areal estimates were given.SeppaÈ laÈ (1972) investigated the inland dunes of northern Sweden with selected aerialphotography. He classi® ed the intensity of present-day de¯ ation as: (1) very strong,(2) strong, (3) weak, and (4) non-existent, according to how many light patchescould be detected on the aerial photograph of each dune area. No determination ofthe actual number of light patches in each class, nor any areal estimates were given.The sole published estimate of the total area of aeolian activity in Lapland isTikkanen and Heikkinen’s (1995) 280 ha for de¯ ated surfaces on the dune ® elds ofFinnish Lapland. This ® gure was derived from map and aerial photograph evidence.
The rationale of the present study was to map aeolian activity in northernFennoscandia independent of national borders and ecological zones. The use ofsatellite imagery facilitated a wide areal coverage, and also allowed areal estimatesof the activity. Satellite-based data have not previously been used solely for mappingpresent day aeolian activity in the subarctic environment. However, many otheraspects of the subarctic ecosystem have been investigated with the aid of satellitedata. For example, in recent years such data have aided the mapping of reindeerpastures in northern Fennoscandia e.g. Tù mmervik and Lauknes (1987 ), Rantanen
Fourth Circumpolar Remote Sensing Symposium 423
et al. (1989 ), Johansen and Tù mmervik (1990), Nieminen and Kumpula (1991),KaÈ yhkoÈ and Pellikka (1994), Colpaert et al. (1994). Land use studies in general havebeen undertaken, e.g. Colpaert (1993), as well as forest inventories e.g. SeppaÈ laÈ andRastas (1980), Tomppo (1990), HaÈ me (1984, 1991), Vuorela (1997a, b), Olsson (1994),and analyses of vegetation damage due to pollution emissions in the Kola Peninsula(Mikkola 1996).
The speci® c research objectives of this study were:
1. To separate barren surfaces from green vegetation.2. To separate active aeolian surfaces from other types of barren ground like
boulder ® elds, ¯ uvial and beach forms and anthropogenic features.3. To decipher the location, size and type of these active aeolian surfaces.
2. Study area and data sources
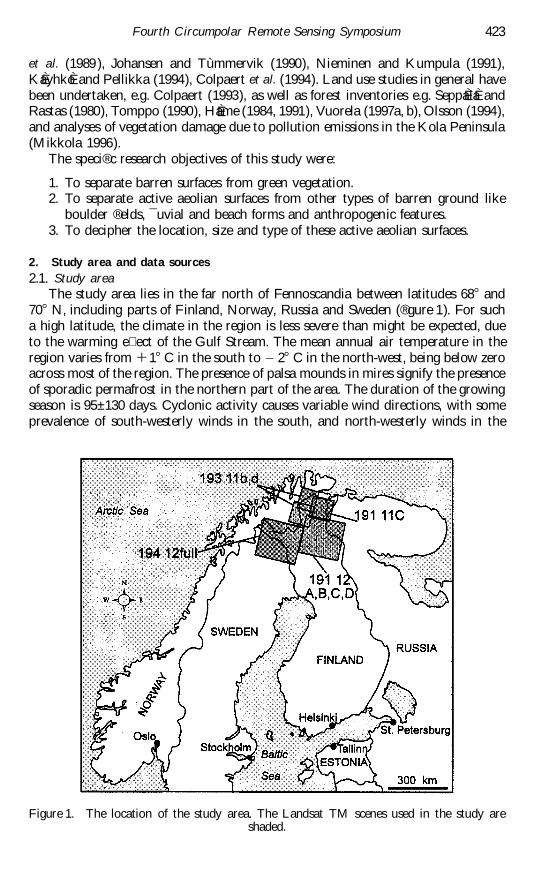
2.1. Study areaThe study area lies in the far north of Fennoscandia between latitudes 68ß and
70ß N, including parts of Finland, Norway, Russia and Sweden (® gure 1). For sucha high latitude, the climate in the region is less severe than might be expected, dueto the warming e� ect of the Gulf Stream. The mean annual air temperature in theregion varies from +1ß C in the south to Õ 2ß C in the north-west, being below zeroacross most of the region. The presence of palsa mounds in mires signify the presenceof sporadic permafrost in the northern part of the area. The duration of the growingseason is 95± 130 days. Cyclonic activity causes variable wind directions, with someprevalence of south-westerly winds in the south, and north-westerly winds in the
Figure 1. The location of the study area. The Landsat TM scenes used in the study areshaded.
J. KaÈ yhkoÈ et al.424
north. Precipitation follows a gradient from humid coastal to drier inland areas. Formost of the study region, the annual precipitation is 500± 550mm, approximatelyhalf of which falls as snow (Helminen 1987). The annual potential evaporation variesbetween 100 and 225 mm across the area. Snow covers the ground for 200± 220 daysper year, and the average maximum snow depth is between 50± 60 cm (Solantie 1987).
Vegetationally, the area is part of the northern boreal ecotone zone (Ahti et al.1968, Oksanen and Virtanen 1995). Both Scots Pine (Pinus sylvestris) and NorwaySpruce (Picea abies) have their polar forest limits running across the study region.Further north, or at higher elevations in the hills, the forest vegetation consists ofmountain birch (Betula pubescens subsp. tortuosa), which forms a sparse park-likescrub with a ¯ ourishing lichen ground layer. Due to intensive reindeer herding, manyareas are currently almost devoid of important forage lichens such as Cladina stellarisand C. mitis. These have been replaced by dwarf-shrubs and other lichen species(KaÈ yhkoÈ and Pellikka 1994).
2.2. Data sourcesThe only readily available satellite data suitable for the study were SPOT and
Landsat imagery and since the Satellite Image Centre of the National Land Surveyof Finland, Helsinki, keeps archives of selected Landsat data, it was decided to usethese. SPOT XS or PAN data would have been an attractive option due to their® ner spatial resolution. For detection of the smallest features, smaller instantaneous® eld of view (IFOV) would potentially have been useful. On the other hand, thenumber of SPOT images needed to cover the whole study area would have beenconsiderably larger than in the case of TM. Additionally, Landsat TM data o� erbetter spectral resolution than SPOT.
One full system corrected Landsat TM scene and seven quarter scenes wereinterpreted (table 1, ® gure 1). The total areal coverage of the images is circa
86500 km2 , but with about 6 per cent overlap, the size of the study area is approx.81000 km2 . A 20 per cent portion of one quarter image (193 11b) was excludedbecause an extensive snow cover on the Norwegian highlands would have biasedthe clustering procedure, and since the surface soil type underneath the snow coverwould not have been revealed. Of the total coverage, 60 per cent lies in Finland, 14per cent in Norway, 10 per cent in Russia and 16 per cent in Sweden. All imageswere cloud free and acquired in summer periods (cf table 1).
3. Spectral properties of bare soils and vegetated surfaces
In terms of satellite data, the spectral properties of barren soil and vegetatedsurfaces are generally easily distinguishable. The spectral re¯ ectance curve for healthy,green vegetation almost always shows a peak-and-valley’ con® guration due tochlorophyll absorption peaks at blue (400± 500 nm) and red (600± 700 nm) wave-
Table 1. List of the TM scenes used in the study.
Path Row Quarter Date acquired
191 11 C (= Q3) 20 July 1987191 12 A, B, C, D 20 July 1987193 11 b, d (¯ oating) 18 July 1987194 12 full image 4 June 1992
Fourth Circumpolar Remote Sensing Symposium 425
lengths. In between, at the green wavelength region (500± 600 nm), the absorption isweaker, causing a minor peak in the re¯ ection curve. In the near-infrared red (NIR)region (700± 1300 nm), the absorption ceases because leaf scattering mechanismscause a strong re¯ ectance due to refractive index di� erences between intercellularair spaces, hydrated cell and air cuticle (Hodanova 1985, Tucker and Sellers 1986).Beyond 1300 nm, water in the leaf cells causes dips in re¯ ectance at the waterabsorption bands (Ho� er 1978).
Soils, in general, show much less peak-and-valley variation with re¯ ectance thanvegetation. Dry soils generally show an increasing level of re¯ ectance with increasingwavelength. Some of the factors a� ecting soil re¯ ectance are mineral compositionsuch as presence of iron oxide (cf. Hunt 1977), moisture content (cf. Ritari andSaukkola 1985), soil texture, surface roughness and organic matter content.Generally, in the case of iron, moisture and organic matter, a higher content resultsin lower re¯ ectance. Coarse textured (rough) soils also appear darker than ® netextured (smooth) soils, at the same moisture content, largely because of the shadowscreated by the particles. The e� ect of texture is almost wavelength independent(Jacquemond et al. 1992). As with vegetation, the water absorption peaks can bedistinguished in moist soils (Price 1990 ).
Aeolian sands in Lapland are well drained and the soil surface dries in a matterof hours after rain. On a cloudless day, like the ones when the TM data wereacquired, the sand surfaces can be considered dry. In this case the water absorptionbands are almost undetectable, and there is an increase of re¯ ectance across thewhole spectrum, as demonstrated by Jacquemond et al. (1992). Although in principlea range of possibilities exist for distinguishing minerals with the aid of multi-spectraldata, in the ® eld, minerals are assembled in variable proportions and, often havethin veneers of weathering products. Since TM bands (except TM-6) only interactwith the outer few micrometers of the mineral surface, spectra of fresh minerals arerarely distinguished in the re¯ ected radiation used in satellite remote sensing (Drury1993). Weathering processes in¯ uence both the re¯ ectance level and the shape of thespectral response curve. The e� ect will vary according to the precise mineralogy ofthe rock, and can result in either decreased or increased re¯ ectance (Rollin et al. 1994).
In Lapland, de¯ ated barren surfaces consist mainly of ® ne sands (125± 250 mm),but also include glacio¯ uvial gravels with very little organic matter. The mineralcomposition of the exposed sands is a fairly uniform mixture of silicate mineralsover the whole of the study region, and consequently variations in the re¯ ectancepattern are due to factors other than di� erences in mineralogy. These include: (a)mixed pixels (sand± vegetation) close to the edges of blowouts, (b) shadows and slopeaspect (often due to steep relief close to edges), (c) variation in moisture content(related to proximity of the groundwater table), (d) textural variations e.g., betweendune blowouts and esker de¯ ation, and (e) small amounts of vegetation (mosses,algae, lichens, dwarf-shrubs, grasses) on sandy surfaces.
Lichens partly, or completely cover many of the blowouts in Lapland. They arepart of the pioneer colonisation of blowouts if aeolian processes cease for somereason (Tobolski 1975). Many species are light in colour, and may be misinterpretedas pure sand on black and white air photographs. Boulder ® elds also support alichen cover. Reasonably stable rocks on the fells are normally largely covered withcrustose lichens (eg, Rhizocarpon sp., Umbilicaria sp.) causing the spectral signatureof boulder ® elds to be a complex mixture of mineral and lichen (and shadow)responses. However, even with completely lichen-covered surfaces, the underlying
J. KaÈ yhkoÈ et al.426
rock contributes to re¯ ectance signatures (Rivard and Arvidson 1992). Particularattention was given in this study to the distinction between the extensive lichencovered surfaces and bare sand surfaces.
Studies of the spectral re¯ ectance of lichens and the in¯ uence of lichens on there¯ ectance spectra of rock surfaces are not numerous, but they include Satterwhiteet al. (1985 ), Petzold and Goward (1988), Rivard and Arvidson (1992), and Rollinet al. (1994 ). Petzold and Goward (1988) measured re¯ ectance properties of foursubarctic lichens (Cladina stellaris , Cetraria nivalis , Stereocaulon paschale andAlectoria ochroleuca ) under ® eld conditions over 350± 1050 nm wavelengths. In gen-eral, lichens exhibited a stepped re¯ ectance pattern similar to green plants, exceptthat the step between visible and near-infrared was smaller. They also found thatthe absorption at the blue wavelength by C. stellaris was relatively stronger. Rollinet al. (1994 ) covered 400± 2500 nm wavelengths in their study of the in¯ uence oflichen cover on the spectral re¯ ectance properties of granitic rocks. The four lichenspecies included in the study (Haematomma ventosum , Rhizocarpon geographicum ,Fuscidea cyathoides and Parmelia saxatilis ) generally increased the re¯ ectance. Thelichens possessed ® ve absorption features, three of which were located within atmo-spheric windows. Owing to the small water content (in dry weather) of lichensgrowing on rock surfaces, it can be reasonably assumed that the spectral responseshows vague minima at water absorption bands, making the re¯ ectance of thesesurfaces more similar to typical bare soil values. This calls for care in the distinctionbetween sandy and rocky surfaces.
4. Methods
4.1. Band selectionThe discussion above suggests that sandy surfaces and lichen covered surfaces
could be discriminated spectrally using Landsat TM data. Pure sand surfaces showhigh re¯ ectance values across the spectrum with a gradual increase from visible toinfrared wavelengths, a maximum between the subtle water absorption features at1450 nm and 1930 nm, and a slight decrease towards longer wavelengths. Commonlyoccurring subarctic lichens on sandy surfaces (e.g. Cladonia sp., Stereocaulon sp.,Cetraria sp.) reveal (i ) steeper increases across the visible part of the spectrum, withdistinctive minima at the blue wavelength in some cases, (ii ) ® ve absorption featuresdue to carbohydrates and hemicellulose polysaccharides in the near- to mid-infraredregion, (iii ) re¯ ectance maxima at around 1800 nm, and (iv) a gradual decreasetowards longer wavelengths. Boulder ® elds with lichen covers have values quitesimilar to the lichen re¯ ectance just described, but with lower re¯ ectances all acrossthe spectrum. This latter property is due to a combination of slightly darker lichenspecies (e.g. Rhizocarpon sp.) and shadows as a result of a coarser surface texture,both of which are wavelength-independent with respect to lichen spectra.
Visible wavelengths are powerful in separating green vegetation from sandysurfaces due to the higher energy absorbance of plants. Further, the middle-infraredregion can be used if the sand surface is dry, as green vegetation appears darkbecause of water absorption. Lichens and barren sand are also best separated in thevisible wavelengths, and because of the small step at the red edge, the shorter thewavelength (i.e. blue) the better. The infrared region is not very useful because ofthe high re¯ ectance of lichens due to lack of water absorption. In termsof distinguishing sediment spectral properties arising from texture, moisture andmineralogy, the middle infrared (MIR) is the most useful wavelength region.
Fourth Circumpolar Remote Sensing Symposium 427
The ® nal decision concerning band selection was made by examining grey-scaleimages and image histograms for di� erent bands. Some previously known de¯ ationsites were viewed, and compared with aerial photography. De¯ ated areas appearedbright on all visible wavelength bands TM-1, TM-2 and TM-3, and also on MIRbands TM-5 and TM-7. In the NIR band TM-4, de¯ ated areas were less easilydistinguished from the vegetation, because of the re¯ ectance patterns discussed above.Due to poor spatial resolution of TM-6, and its limited use in interpreting immediatesurface properties (Kenk et al. 1988), this was excluded in the ® rst instance.
Initially, a three-band combination TM-1, TM-5, TM-7 was chosen for classi® ca-tion (scenes 193 11d and 194 12). From the visible wavelength bands, TM-1 wasselected because of its superior separation potential between lichen and sand. TM-5was chosen in order to di� erentiate de¯ ation from snow patches, and together withTM-7, to aid in the interpretation of sediment textural and soil moisture properties.Later, a fourth band, TM-3, was added to the combination, as subsequent histogramevaluation showed that this band has slightly more deviationÐ and thus potentiallymore informationÐ amongst the brightest de¯ ation pixels than the other visiblewavelength bands. In TM-4, de¯ ated areas showed only minor di� erences inre¯ ectance pattern compared with that of green vegetation. The impact of thedi� erences between TM-4 and the other TM bands on the clustering result wasnot tested.
4.2. Classi® cation procedureImage interpretation was undertaken at the Satellite Image Centre of the National
Land Survey of Finland (NLSF), Helsinki. The software used for the interpretationwas DISIMP Version 5.3 (DISIMP 1990), in the HP Apollo Domain/OS environ-ment. Within the system con® guration used at NLSF, the DISIMP software o� eredsubroutines and programs for image processing, but some of the classi® cation pro-grams used in this study have actually been developed at NLSF, VTT TechnicalResearch Centre of Finland, and the Finnish Environment Institute (FEI).
No ® eld or laboratory measurements of re¯ ectance properties of di� erent surfacetypes were made. The use of ® eld spectroscopy would have necessitated complex® eld logistics and image analyses, e.g. the calculation of atmospheric corrections.For this preliminary study, general re¯ ectance properties of soil and vegetation werederived from the literature. The main factor behind this decision was to keep theapproach as simple as possible. Hence, no multi-temporal approach or statisticalfeature selection, or extraction, for TM channels was experimented with either. Fieldspectroscopy, on the other hand, might have given an opportunity to use spectralmixture models in order to reveal sub-pixel size surface properties, an applicationwhich would probably improve the area estimates of the aeolian activity.
The mapping of aeolian activity could not be undertaken purely with automatedspectral pattern recognition. This is because many non-aeolian features possessspectral characteristics identical to those of de¯ ated surfaces. These include man-made features like gravel roads and waste-disposal sites, as well as natural featureslike river bars and beaches. Thus, rather than trying to detect aeolian activity sensu
stricto , a broader approach to detect areas of bare sandy surface was adopted. Asubsequent spatial pattern recognition procedure was undertaken manually after theclassi® cation process. Features classi® ed as bare sand surfaces were examined withthe aid of aerial photographs, maps and ® eld checks.
The supervised approach to mapping the de¯ ated areas was experimented with
J. KaÈ yhkoÈ et al.428
® rst. Training areas were carefully delineated with the aid of large-scale aerialphotography. Care was taken to ensure that the data set was both adequate andrepresentative for use in the classi® cation stage. A Gaussian maximum likelihoodclassi® er and a linear discriminant function classi® er were used in this procedure.The supervised approach proved, however, to be unsuitable for mapping aeolianactivity. The main reason for the unsatisfactory classi® cation result was the small(narrow) size of the identi® ed de¯ ation features as compared with the IFOV of TM,and the resulting mixed pixel problem. The complex nature of mixed pixels made itimpossible to produce spectral classes that would represent narrowly de® ned informa-tion categories (land cover types), which is the key factor in supervised classi® cation.
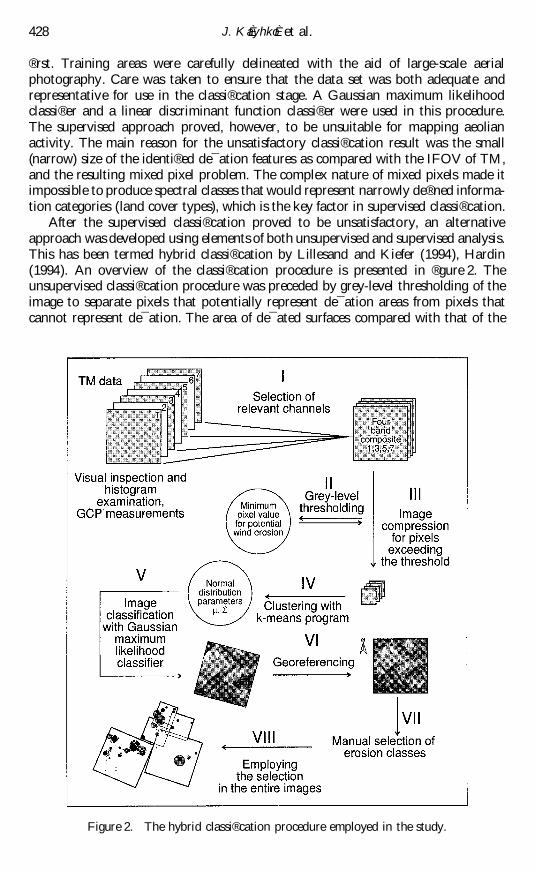
After the supervised classi® cation proved to be unsatisfactory, an alternativeapproach was developed using elements of both unsupervised and supervised analysis.This has been termed hybrid classi® cation by Lillesand and Kiefer (1994), Hardin(1994). An overview of the classi® cation procedure is presented in ® gure 2. Theunsupervised classi® cation procedure was preceded by grey-level thresholding of theimage to separate pixels that potentially represent de¯ ation areas from pixels thatcannot represent de¯ ation. The area of de¯ ated surfaces compared with that of the
Figure 2. The hybrid classi® cation procedure employed in the study.
Fourth Circumpolar Remote Sensing Symposium 429
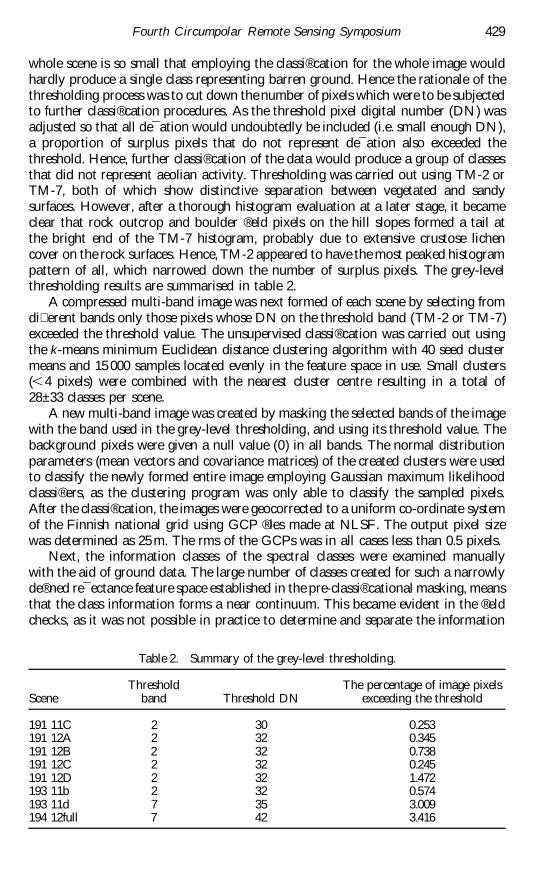
whole scene is so small that employing the classi® cation for the whole image wouldhardly produce a single class representing barren ground. Hence the rationale of thethresholding process was to cut down the number of pixels which were to be subjectedto further classi® cation procedures. As the threshold pixel digital number (DN) wasadjusted so that all de¯ ation would undoubtedly be included (i.e. small enough DN),a proportion of surplus pixels that do not represent de¯ ation also exceeded thethreshold. Hence, further classi® cation of the data would produce a group of classesthat did not represent aeolian activity. Thresholding was carried out using TM-2 orTM-7, both of which show distinctive separation between vegetated and sandysurfaces. However, after a thorough histogram evaluation at a later stage, it becameclear that rock outcrop and boulder ® eld pixels on the hill slopes formed a tail atthe bright end of the TM-7 histogram, probably due to extensive crustose lichencover on the rock surfaces. Hence, TM-2 appeared to have the most peaked histogrampattern of all, which narrowed down the number of surplus pixels. The grey-levelthresholding results are summarised in table 2.
A compressed multi-band image was next formed of each scene by selecting fromdi� erent bands only those pixels whose DN on the threshold band (TM-2 or TM-7)exceeded the threshold value. The unsupervised classi® cation was carried out usingthe k-means minimum Euclidean distance clustering algorithm with 40 seed clustermeans and 15000 samples located evenly in the feature space in use. Small clusters(<4 pixels) were combined with the nearest cluster centre resulting in a total of28± 33 classes per scene.
A new multi-band image was created by masking the selected bands of the imagewith the band used in the grey-level thresholding, and using its threshold value. Thebackground pixels were given a null value (0) in all bands. The normal distributionparameters (mean vectors and covariance matrices) of the created clusters were usedto classify the newly formed entire image employing Gaussian maximum likelihoodclassi® ers, as the clustering program was only able to classify the sampled pixels.After the classi® cation, the images were geocorrected to a uniform co-ordinate systemof the Finnish national grid using GCP ® les made at NLSF. The output pixel sizewas determined as 25m. The rms of the GCPs was in all cases less than 0.5 pixels.
Next, the information classes of the spectral classes were examined manuallywith the aid of ground data. The large number of classes created for such a narrowlyde® ned re¯ ectance feature space established in the pre-classi® cational masking, meansthat the class information forms a near continuum. This became evident in the ® eldchecks, as it was not possible in practice to determine and separate the information
Table 2. Summary of the grey-level thresholding.
Threshold The percentage of image pixelsScene band Threshold DN exceeding the threshold
191 11C 2 30 0.253191 12A 2 32 0.345191 12B 2 32 0.738191 12C 2 32 0.245191 12D 2 32 1.472193 11b 2 32 0.574193 11d 7 35 3.009194 12full 7 42 3.416
J. KaÈ yhkoÈ et al.430
content of all spectral classes in terms of sediment substrate and vegetation. It was,however, possible to form groups of classes, as discussed below.
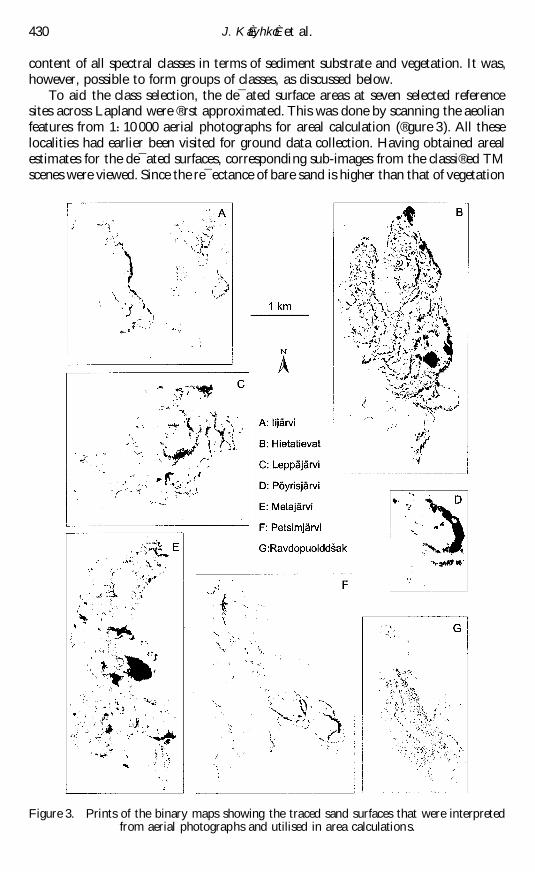
To aid the class selection, the de¯ ated surface areas at seven selected referencesites across Lapland were ® rst approximated. This was done by scanning the aeolianfeatures from 1510000 aerial photographs for areal calculation (® gure 3). All theselocalities had earlier been visited for ground data collection. Having obtained arealestimates for the de¯ ated surfaces, corresponding sub-images from the classi® ed TMscenes were viewed. Since the re¯ ectance of bare sand is higher than that of vegetation
Figure 3. Prints of the binary maps showing the traced sand surfaces that were interpretedfrom aerial photographs and utilised in area calculations.
Fourth Circumpolar Remote Sensing Symposium 431
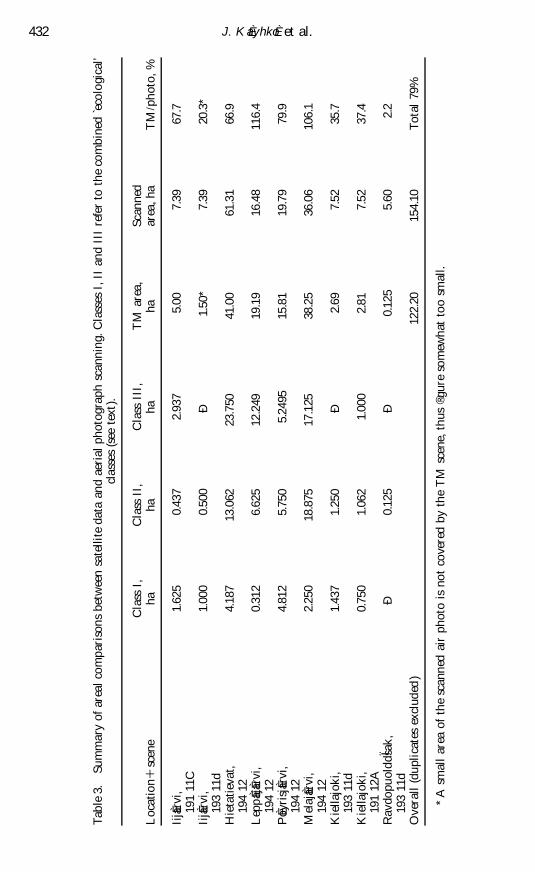
in the bands employed, the most distinctive bare sand classes will, in general, showthe highest mean vector values in the normal distribution parameters. When theproportion of vegetation or other land cover type increased in a mixed pixel, thisresulted in lower mean vector values. Hence, by examining the mean vector valuesof di� erent classes and evaluating the corresponding ground data, it was possible toinclude classes one by one, and to select a set of classes that best delineated de¯ ation.Using the ERDAS raster attribute editor (ERDAS 1994) while viewing the imageon the screen, classes were added one by one while observing the resulting growthin area and the conformity with ground data. Because of the di� erence in the scalefactor between the scanned binary mask and the TM data (approx. 1m versus. 25m)no perfect match should be expected in the comparison even if the inspected areaswere truly identical i.e. no classi® cation errors (cf. Woodcock and Strahler 1987,Marceau et al. 1994 a, b). For all seven reference sites, the most satisfactory classcombination for each scene resulted on average in a 20 per cent under-estimate ofthe TM areas compared with the aerial photograph scanning result (table 3).Comparison of di� erent area percentages in table 3 (TM/photo per cent) with thespatial pattern of barren areas in ® gure 3, clearly demonstrates the problem withmixed pixels.
After a satisfactory combination of classes for each scene was established usingthe above described interactive method (table 4), the whole scenes were examinedby viewing them at a large scale on the screen, and checking each sand pixel, orgroup of pixels, that was found. The inspection was carried out with the aid of mapsand literature and if a speci® c feature was considered to be aeolian, then the datafor that area were cut out and saved as a subset data ® le for further inspection.
Basically, all anthropogenic features were excluded, except some areas subject toreindeer herding activities. This included features which were clearly man-made, suchas roads (very long and narrow), settlements (from maps, but also a typical spatialpattern), forest clear-cuttings (based on geometric shape, sharp edges, and occasion-ally on map evidence), and gravel pits (small, spherical, single, in the vicinity of aroad). The possible in¯ uences by non-aeolian geomorphic processes were considered,depending upon the environmental context. Most of these features were either¯ uvially related, e.g. river bars, or lacustrine, e.g. beaches, and the interpretation ofthese did not cause a signi® cant problem.
The number of classes ® nally determined as representing aeolian activity in theTM scenes varied from a total of 4 to 11, and were then aggregated into fourecological’ classes as discussed by De Jong (1994), see tables 3 and 4:
1. Pure sand surface (high re¯ ectance values across the spectrum).2. Sand with lichen or some green vegetation (intermediate re¯ ectance in the 3.3
visible, high values allowed in the IR).3. Sand or gravel with an edge e� ect’, i.e. mixed sand/green vegetation (low
re¯ ectance values in the visible, high values allowed in TM-5, intermediatein TM-7).
4. Dismissed classes (values below or above the analyst-de® ned threshold for theclass mean vector values, which varied from scene to scene).
Figure 4 summarises in a visual form an example of the data used in the study,and for comparison, shows the ® nal classi® cation result from the same locality.
J. KaÈ yhkoÈ et al.432
Tabl
e3.
Sum
mar
yof
area
lcom
pari
sons
betw
een
sate
llite
data
and
aeri
alph
otog
raph
scan
ning
.Cla
sses
I,II
and
III
refe
rto
the
com
bine
dec
olog
ical
’cl
asse
s(s
eete
xt).
Cla
ssI,
Cla
ssII
,C
lass
III,
TM
area
,Sc
anne
dL
ocat
ion+
scen
eha
haha
haar
ea,h
aT
M/ p
hoto
,%
Iija È
rvi,
1.62
50.
437
2.93
75.
007.
3967
.719
111
CIi
ja Èrv
i,1.
000
0.50
0Ð
1.50
*7.
3920
.3*
193
11d
Hie
tatie
vat,
4.18
713
.062
23.7
5041
.00
61.3
166
.919
412
Lep
paÈj
a Èrvi
,0.
312
6.62
512
.249
19.1
916
.48
116.
419
412
Po Èy
risj
a Èrvi
,4.
812
5.75
05.
2495
15.8
119
.79
79.9
194
12M
elaj
a Èrvi
,2.
250
18.8
7517
.125
38.2
536
.06
106.
119
412
Kie
llajo
ki,
1.43
71.
250
Ð2.
697.
5235
.719
311
dK
iella
joki
,0.
750
1.06
21.
000
2.81
7.52
37.4
191
12A
Rav
dopu
oldd
sÏ ak,
Ð0.
125
Ð0.
125
5.60
2.2
193
11d
Ove
rall
(dup
licat
esex
clud
ed)
122.
2015
4.10
Tota
l79
%
*A
smal
lar
eaof
the
scan
ned
air
phot
ois
not
cove
red
byth
eT
Msc
ene,
thus
®gur
eso
mew
hat
too
smal
l.
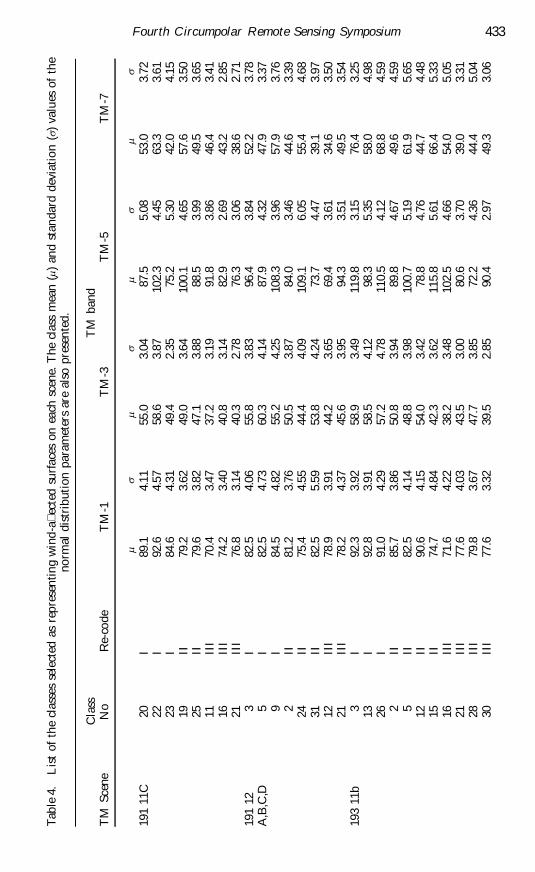
Fourth Circumpolar Remote Sensing Symposium 433Ta
ble
4.L
ist
ofth
ecl
asse
sse
lect
edas
repr
esen
ting
win
d-a�
ecte
dsu
rfac
eson
each
scen
e.T
hecl
ass
mea
n(m
)an
dst
anda
rdde
viat
ion
(s)
valu
esof
the
norm
aldi
stri
buti
onpa
ram
eter
sar
eal
sopr
esen
ted.
Cla
ssT
Mba
ndT
MSc
ene
No
Re-
code
TM
-1T
M-3
TM
-5T
M-7
ms
ms
ms
ms
191
11C
20I
89.1
4.11
55.0
3.04
87.5
5.08
53.0
3.72
22I
92.6
4.57
58.6
3.87
102.
34.
4563
.33.
6123
I84
.64.
3149
.42.
3575
.25.
3042
.04.
1519
II79
.23.
6249
.03.
6410
0.1
4.65
57.6
3.50
25II
79.6
3.82
47.1
3.88
88.5
3.99
49.5
3.65
11II
I70
.43.
4737
.23.
1991
.83.
8646
.43.
4116
III
74.2
3.40
40.8
3.14
82.9
2.69
43.2
2.85
21II
I76
.83.
1440
.32.
7876
.33.
0638
.62.
7119
112
3I
82.5
4.06
55.8
3.83
96.4
3.84
52.2
3.78
A,B
,C,D
5I
82.5
4.73
60.3
4.14
87.9
4.32
47.9
3.37
9I
84.5
4.82
55.2
4.25
108.
33.
9657
.93.
762
II81
.23.
7650
.53.
8784
.03.
4644
.63.
3924
II75
.44.
5544
.44.
0910
9.1
6.05
55.4
4.68
31II
82.5
5.59
53.8
4.24
73.7
4.47
39.1
3.97
12II
I78
.93.
9144
.23.
6569
.43.
6134
.63.
5021
III
78.2
4.37
45.6
3.95
94.3
3.51
49.5
3.54
193
11b
3I
92.3
3.92
58.9
3.49
119.
83.
1576
.43.
2513
I92
.83.
9158
.54.
1298
.35.
3558
.04.
9826
I91
.04.
2957
.24.
7811
0.5
4.12
68.8
4.59
2II
85.7
3.86
50.8
3.94
89.8
4.67
49.6
4.59
5II
82.5
4.14
48.8
3.98
100.
75.
1961
.95.
6512
II90
.64.
1554
.03.
4278
.84.
7644
.74.
4815
II74
.74.
8442
.33.
6211
5.8
5.61
66.4
5.33
16II
I71
.64.
2238
.23.
4810
2.5
4.66
54.0
5.05
21II
I77
.64.
0343
.53.
0080
.63.
7039
.03.
3128
III
79.8
3.67
47.7
3.85
72.2
4.36
44.4
5.04
30II
I77
.63.
3239
.52.
8590
.42.
9749
.33.
06
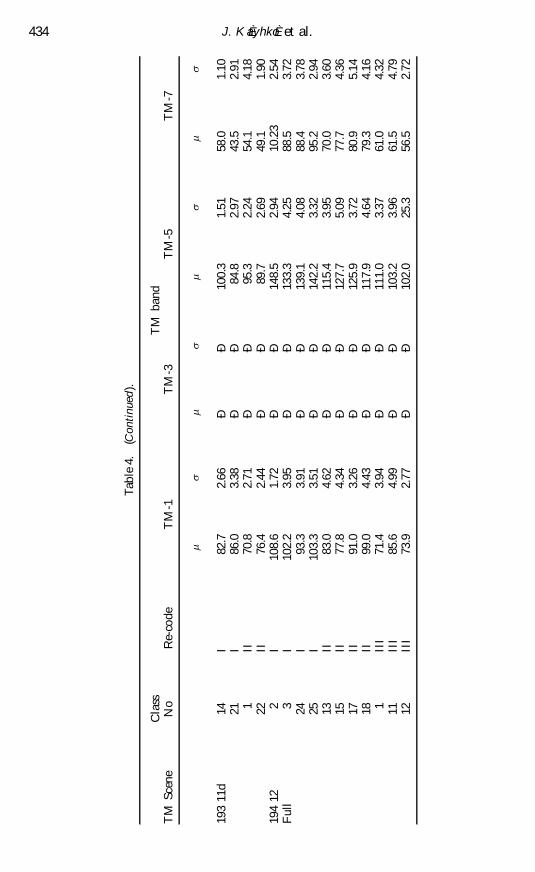
J. KaÈ yhkoÈ et al.434
Tabl
e4.
(Con
tinu
ed).
Cla
ssT
Mba
ndT
MSc
ene
No
Re-
code
TM
-1T
M-3
TM
-5T
M-7
ms
ms
ms
ms
193
11d
14I
82.7
2.66
ÐÐ
100.
31.
5158
.01.
1021
I86
.03.
38Ð
Ð84
.82.
9743
.52.
911
II70
.82.
71Ð
Ð95
.32.
2454
.14.
1822
II76
.42.
44Ð
Ð89
.72.
6949
.11.
9019
412
2I
108.
61.
72Ð
Ð14
8.5
2.94
10.2
32.
54F
ull
3I
102.
23.
95Ð
Ð13
3.3
4.25
88.5
3.72
24I
93.3
3.91
ÐÐ
139.
14.
0888
.43.
7825
I10
3.3
3.51
ÐÐ
142.
23.
3295
.22.
9413
II83
.04.
62Ð
Ð11
5.4
3.95
70.0
3.60
15II
77.8
4.34
ÐÐ
127.
75.
0977
.74.
3617
II91
.03.
26Ð
Ð12
5.9
3.72
80.9
5.14
18II
99.0
4.43
ÐÐ
117.
94.
6479
.34.
161
III
71.4
3.94
ÐÐ
111.
03.
3761
.04.
3211
III
85.6
4.99
ÐÐ
103.
23.
9661
.54.
7912
III
73.9
2.77
ÐÐ
102.
025
.356
.52.
72
Fourth Circumpolar Remote Sensing Symposium 435
5. Results
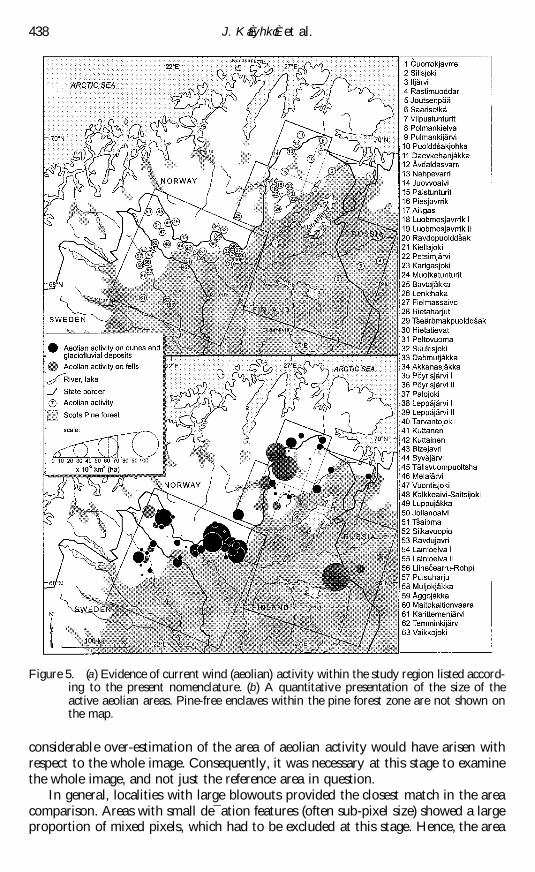
The hybrid classi® cation of the Landsat TM data identi® ed some 928 ha of landsurface with aeolian activity (® gure 5, table 5). This value was derived from thesummation of sixty three separate sites. Also recorded were the site descriptions (i.e.small dunes adjacent to an esker), the corner coordinates of the areas showingactivity, the coordinates of the largest active features, the area of barren surface foreach of the ecological classes plus total area, elevation above sea level, map sheetreference and vegetation type. These data will be fully reported elsewhere. Theaeolian features were associated with three di� erent environments:
1. Fine grained glacio¯ uvial deposits forming deltas or glaciolacustrine featureson reasonably ¯ at terrain, usually with dune forms.
2. Coarse-grained glacio¯ uvial formations, mostly eskers, with poorly de® nedprimary aeolian deposits.
3. Coarse grained winnowed surfaces on the hills. Frequently, these features relateto former glacial lake shorelines, and occur as narrow belts parallel to thecontours.
In north-west Finland, aeolian activity is concentrated on the glacio¯ uvial andglaciolacustrine sediments which were deposited some 9000 years ago between anice margin retreating towards the south-south-west and the watershed close to theFinnish± Norwegian border; Kujansuu (1967). The largest active aeolian area islocated in the surroundings of the lake PoÈ yrisjaÈ rvi, adjacent to a glacio¯ uvialformation that extends from the watershed to the PalojaÈ rvi-LeppaÈ jaÈ rvi delta depositssome 40 km to the south-west. This formation includes sites 35± 39 (® gure 5), sus-taining approximately 2 km2 (200 ha) of active aeolian surfaces. On the southernshore of PoÈ yrisjaÈ rvi, a large sand bank is being eroded to form a de¯ ation basinsome 1km long and 150 m wide. This particular basin is the largest known inLapland. It is parabolic in shape and opens towards WNW, suggesting that it hasbeen formed along the crest of a large parabolic dune. The deepest part of the basincurrently supports mosses and lichens, due to the close vicinity of the groundwatertable. The area of the active portion of the de¯ ation basin, measured from thesatellite image, is approximately 0.14 km2 (14 ha).
Another striking locality is at AÊ vdaldasvarri in Norway, in the northernmost partof the study region (sites 11 and 12; ® gure 5) covering at least 0.4km2 (40 ha) ofactivity. In Sweden, the largest area of aeolian activity covers about 0.44 km2 (44ha) in the vicinity of the river Lainioelva. Sites 52± 58 (® gure 5) are related to thisglacio¯ uvial formation which displays some dune forms.
On the fells some 3.5km2 (350 ha) of aeolian activity was identi® ed. Fell de¯ ation,however, was di� cult to interpret unambiguously, since at higher elevations soilsurfaces may be barren due to a complex mixture of factors, including overland ¯ ow,frost action and mass movement processes, in addition to wind e� ects. Often, fellslope barren surfaces consist of material too coarse for aeolian transport. These maybe consequent to wind winnowing of ® nes leaving the coarsest sediment as a lagdeposit. The largest concentration of de¯ ated surfaces was found in the SaariselkaÈfell region in eastern Finland, amounting to just over 1km2 (100 ha) (site 6; ® gure 5).The location and shape of the eroded features suggest that these are related to formerglacial lake shorelines (cf. PenttilaÈ 1963, Johansson 1995). Interesting di� erences inthe amount of aeolian activity between di� erent high-ground areas were observed.For example, the Muotkatunturit area (around site 24; cf. ® gure 5) showed only few
J. KaÈ yhkoÈ et al.436
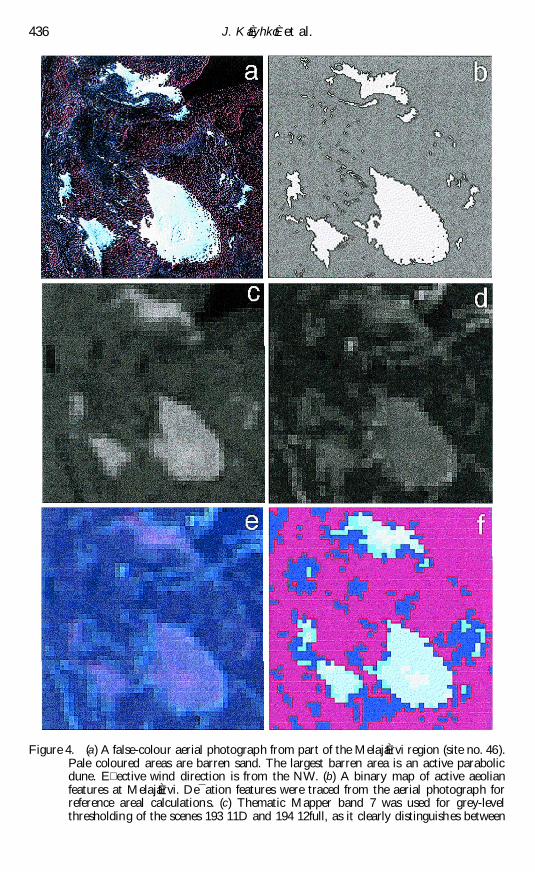
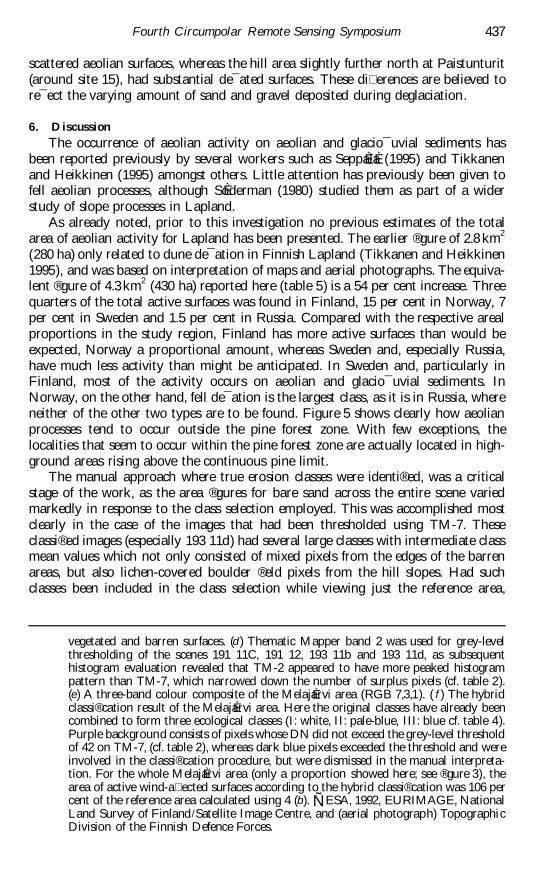
Figure 4. (a) A false-colour aerial photograph from part of the MelajaÈ rvi region (site no. 46).Pale coloured areas are barren sand. The largest barren area is an active parabolicdune. E� ective wind direction is from the NW. (b) A binary map of active aeolianfeatures at MelajaÈ rvi. De¯ ation features were traced from the aerial photograph forreference areal calculations. (c) Thematic Mapper band 7 was used for grey-levelthresholding of the scenes 193 11D and 194 12full, as it clearly distinguishes between
Fourth Circumpolar Remote Sensing Symposium 437
scattered aeolian surfaces, whereas the hill area slightly further north at Paistunturit(around site 15), had substantial de¯ ated surfaces. These di� erences are believed tore¯ ect the varying amount of sand and gravel deposited during deglaciation.
6. Discussion
The occurrence of aeolian activity on aeolian and glacio¯ uvial sediments hasbeen reported previously by several workers such as SeppaÈ laÈ (1995) and Tikkanenand Heikkinen (1995) amongst others. Little attention has previously been given tofell aeolian processes, although SoÈ derman (1980) studied them as part of a widerstudy of slope processes in Lapland.
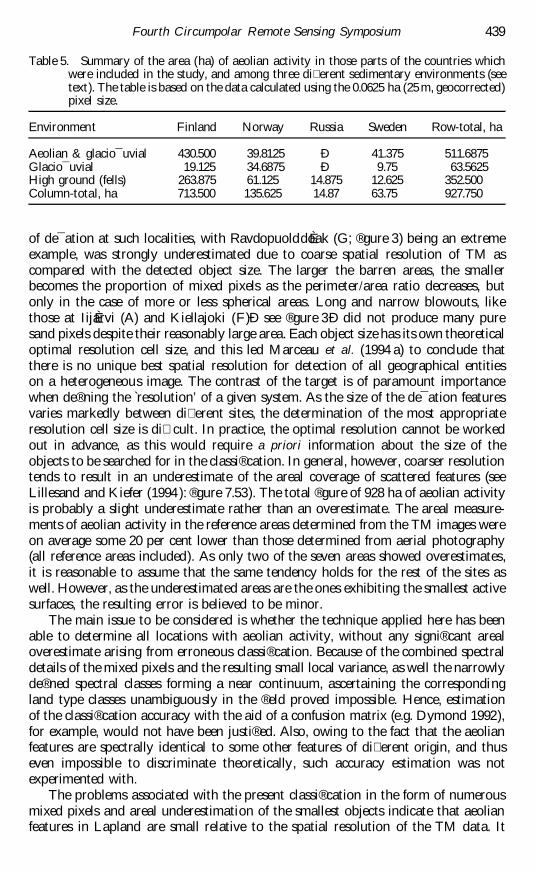
As already noted, prior to this investigation no previous estimates of the totalarea of aeolian activity for Lapland has been presented. The earlier ® gure of 2.8 km2
(280 ha) only related to dune de¯ ation in Finnish Lapland (Tikkanen and Heikkinen1995), and was based on interpretation of maps and aerial photographs. The equiva-lent ® gure of 4.3km2 (430 ha) reported here (table 5) is a 54 per cent increase. Threequarters of the total active surfaces was found in Finland, 15 per cent in Norway, 7per cent in Sweden and 1.5 per cent in Russia. Compared with the respective arealproportions in the study region, Finland has more active surfaces than would beexpected, Norway a proportional amount, whereas Sweden and, especially Russia,have much less activity than might be anticipated. In Sweden and, particularly inFinland, most of the activity occurs on aeolian and glacio¯ uvial sediments. InNorway, on the other hand, fell de¯ ation is the largest class, as it is in Russia, whereneither of the other two types are to be found. Figure 5 shows clearly how aeolianprocesses tend to occur outside the pine forest zone. With few exceptions, thelocalities that seem to occur within the pine forest zone are actually located in high-ground areas rising above the continuous pine limit.
The manual approach where true erosion classes were identi® ed, was a criticalstage of the work, as the area ® gures for bare sand across the entire scene variedmarkedly in response to the class selection employed. This was accomplished mostclearly in the case of the images that had been thresholded using TM-7. Theseclassi® ed images (especially 193 11d) had several large classes with intermediate classmean values which not only consisted of mixed pixels from the edges of the barrenareas, but also lichen-covered boulder ® eld pixels from the hill slopes. Had suchclasses been included in the class selection while viewing just the reference area,
vegetated and barren surfaces. (d ) Thematic Mapper band 2 was used for grey-levelthresholding of the scenes 191 11C, 191 12, 193 11b and 193 11d, as subsequenthistogram evaluation revealed that TM-2 appeared to have more peaked histogrampattern than TM-7, which narrowed down the number of surplus pixels (cf. table 2).(e) A three-band colour composite of the MelajaÈ rvi area (RGB 7,3,1). ( f ) The hybridclassi® cation result of the MelajaÈ rvi area. Here the original classes have already beencombined to form three ecological classes (I: white, II: pale-blue, III: blue cf. table 4).Purple background consists of pixels whose DN did not exceed the grey-level thresholdof 42 on TM-7, (cf. table 2), whereas dark blue pixels exceeded the threshold and wereinvolved in the classi® cation procedure, but were dismissed in the manual interpreta-tion. For the whole MelajaÈ rvi area (only a proportion showed here; see ® gure 3), thearea of active wind-a� ected surfaces according to the hybrid classi® cation was 106 percent of the reference area calculated using 4 (b). Ñ ESA, 1992, EURIMAGE, NationalLand Survey of Finland/Satellite Image Centre, and (aerial photograph) TopographicDivision of the Finnish Defence Forces.
J. KaÈ yhkoÈ et al.438
Figure 5. (a) Evidence of current wind (aeolian) activity within the study region listed accord-ing to the present nomenclature. (b) A quantitative presentation of the size of theactive aeolian areas. Pine-free enclaves within the pine forest zone are not shown onthe map.
considerable over-estimation of the area of aeolian activity would have arisen withrespect to the whole image. Consequently, it was necessary at this stage to examinethe whole image, and not just the reference area in question.
In general, localities with large blowouts provided the closest match in the areacomparison. Areas with small de¯ ation features (often sub-pixel size) showed a largeproportion of mixed pixels, which had to be excluded at this stage. Hence, the area
Fourth Circumpolar Remote Sensing Symposium 439
Table 5. Summary of the area (ha) of aeolian activity in those parts of the countries whichwere included in the study, and among three di� erent sedimentary environments (seetext). The table is based on the data calculated using the 0.0625 ha (25m, geocorrected)pixel size.
Environment Finland Norway Russia Sweden Row-total, ha
Aeolian & glacio¯ uvial 430.500 39.8125 Ð 41.375 511.6875Glacio¯ uvial 19.125 34.6875 Ð 9.75 63.5625High ground (fells) 263.875 61.125 14.875 12.625 352.500Column-total, ha 713.500 135.625 14.87 63.75 927.750
of de¯ ation at such localities, with RavdopuolddoÈ ak (G; ® gure 3) being an extremeexample, was strongly underestimated due to coarse spatial resolution of TM ascompared with the detected object size. The larger the barren areas, the smallerbecomes the proportion of mixed pixels as the perimeter/area ratio decreases, butonly in the case of more or less spherical areas. Long and narrow blowouts, likethose at IijaÈ rvi (A) and Kiellajoki (F)Ð see ® gure 3Ð did not produce many puresand pixels despite their reasonably large area. Each object size has its own theoreticaloptimal resolution cell size, and this led Marceau et al. (1994 a) to conclude thatthere is no unique best spatial resolution for detection of all geographical entitieson a heterogeneous image. The contrast of the target is of paramount importancewhen de® ning the resolution’ of a given system. As the size of the de¯ ation featuresvaries markedly between di� erent sites, the determination of the most appropriateresolution cell size is di� cult. In practice, the optimal resolution cannot be workedout in advance, as this would require a priori information about the size of theobjects to be searched for in the classi® cation. In general, however, coarser resolutiontends to result in an underestimate of the areal coverage of scattered features (seeLillesand and Kiefer (1994 ): ® gure 7.53). The total ® gure of 928 ha of aeolian activityis probably a slight underestimate rather than an overestimate. The areal measure-ments of aeolian activity in the reference areas determined from the TM images wereon average some 20 per cent lower than those determined from aerial photography(all reference areas included). As only two of the seven areas showed overestimates,it is reasonable to assume that the same tendency holds for the rest of the sites aswell. However, as the underestimated areas are the ones exhibiting the smallest activesurfaces, the resulting error is believed to be minor.
The main issue to be considered is whether the technique applied here has beenable to determine all locations with aeolian activity, without any signi® cant arealoverestimate arising from erroneous classi® cation. Because of the combined spectraldetails of the mixed pixels and the resulting small local variance, as well the narrowlyde® ned spectral classes forming a near continuum, ascertaining the correspondingland type classes unambiguously in the ® eld proved impossible. Hence, estimationof the classi® cation accuracy with the aid of a confusion matrix (e.g. Dymond 1992),for example, would not have been justi® ed. Also, owing to the fact that the aeolianfeatures are spectrally identical to some other features of di� erent origin, and thuseven impossible to discriminate theoretically, such accuracy estimation was notexperimented with.
The problems associated with the present classi® cation in the form of numerousmixed pixels and areal underestimation of the smallest objects indicate that aeolianfeatures in Lapland are small relative to the spatial resolution of the TM data. It
J. KaÈ yhkoÈ et al.440
would be interesting to compare the present outcome with results obtained using® ner spatial resolution, for example the new IRS-1C data. Fusion of high resolutionimagery would probably aid the detection of narrow blowouts.
The observation that aeolian activity mainly occurs on aeolian-glaciolacustrinesurfaces outside the pine forest zone explains the uneven spatial distribution of thephenomenon. Suitable combinations of sediment substrate and vegetation seemalmost always to lead to some degree of aeolian activity. The fact that the largestand most extensive aeolian areas are located on the Finnish side of the border withNorway may be explained by the presence of extensive beds of ® ne glaciolacustrinesediment that were deposited on the proximal side of the watershed during the latestdeglaciation, with the absence of pine forest ascribed to climatic cooling. Detailedsedimentological studies of the stratigraphy and age structure of the aeolian depositsdemonstrate that these features have been episodically active during the post-glacialtime (KaÈ yhkoÈ 1997, Clarke and KaÈ yhkoÈ 1997). This, however, does not rule out thepossibility of human in¯ uences on the process at present, as most of the area isheavily grazed by domestic reindeer. Further analyses using GIS and geoecological® eld techniques will be needed to quantify the role of speci® c environmentalparameters on aeolian processes in Lapland.
7. Conclusions
With the aid of the Landsat TM hybrid classi® cation undertaken in this study,the following conclusions can be drawn with respect to aeolian activity in northernFennoscandia:
1. Approximately 10km2 (1000 ha) of active aeolian surfaces are present.2. With few exceptions, active aeolian surfaces occur on aeolian/glacio¯ uvial/
glaciolacustrine sediments outside the pine forest zone, in areas characterisedby mountain birch scrub and dwarf-shrub heath.
3. The largest concentration of active aeolian surfaces is in north-west Finlanddue to the combination of an absence of pine forest, and widespread occurrenceof ® ne glaciolacustrine sediments in the region.
4. Despite the clear connection between natural environmental factors and aeol-ian activity, the possibility of a human in¯ uence on the distribution cannotbe eliminated at present.
Acknowledgments
This work is part of a Ph.D. research programme undertaken by JK at TheUniversity of Reading, UK. The work was funded by The British Council, EmilAaltonen Foundation, The Academy of Finland (project nos 1012238 and 2247),Maj and Tor Nessling Foundation, University of Helsinki and Alfred KordelinFoundation. Mr Tapio Siltala (NLSF) made the data accessible for the study. MrSakari Palo tirelessly assisted in the long ® eld sessions and Professor R. A. G.Savigear kindly contributed a thoughtful critical review of a draft of the manuscript.Reading University PRIS contribution no. 560.
References
Aartolahti, T. , 1976, Lentohiekka Suomessa. Suomalainen T iedeakatemia. EsitelmaÈ t japoÈ ytaÈ kirjat, 83± 95.
Ahti, T., H amet-Ahti, L., and Jalas, J., 1968, Vegetation zones and their sections innorthwestern Europe. Annales Botanici Fennici, 5, 169± 211.
Fourth Circumpolar Remote Sensing Symposium 441
Arseneault, D ., and Payette, S., 1992, A post® re shift from lichen-spruce to lichen-tundravegetation at tree line. Ecology, 73, 1067± 1081.
Be’langer, S., and Filion, L., 1991, Niveo-aeolian sand deposition in subarctic dunes, easterncoast of Hudson Bay, Que bec, Canada. Journal of Quaternary Science, 6, 27± 37.
Bergqvist, E., 1981, Svenska inlandsdyner. OÈ versikt och foÈ rslag till dynreservat.NaturvaÊ rdsverket Rapport 1412. Solna, Sweden.
Clarke, M . L., and K ayhko, J., 1997. Evidence of Holocene aeolian activity in sand dunesfrom Lapland. Quaternary Science Reviews (Quaternary Geochronology) 16, 341± 348.
Colpaert, A., 1993, Land use mapping with Landsat 5 TM imagery: a case study fromHailuoto, Finland. Fennia, 171, 1± 23.
Colpaert, A., Kumpula, J., and N ieminen, M ., 1994, Remote sensing, a tool for reindeerrange land management. Polar Record, 31, 235± 244.
De Jong, S. M ., 1994, Derivation of vegetative variables from a Landsat TM image formodelling soil erosion. Earth Surface Processes & L andforms, 19, 165± 178.
D isimp, 1990, Device Independent Software for Image Processing, Version 5.1. Updates toUtilities Reference Manual (Canberra: CSIRO).
Drury, S. A., 1993, Image Interpretation in Geology (London: Chapman and Hall ).Dymond, J. R., 1992, How accurately do image classi® ers estimate area? International Journal
of Remote Sensing , 13, 1735± 1742.Erdas, 1994, Erdas IMAGINE v. 8.1. (Atlanta: ERDAS Inc.).Filion, L., 1984, A relationship between dunes, ® re and climate recorded in the Holocene
deposits of Que bec. Nature , 309, 543± 546.Filion, L., Saint-Laurent, D ., Desponts, M ., and Payette, S., 1991, The late Holocene
record of aeolian and ® re activity in northern Que bec, Canada. T he H olocene, 1,
201± 208.H ame, T., 1984, Landsat-aided forest site type mapping. Photogrammetric Engineering &
Remote Sensing, 50, 1175± 1183.H ame, T., 1991, Spectral interpretation of changes in forest using satellite scanner images.
Acta Forestalia Fennica, 222, 111 pp.Hardin, P. J., 1994, Parametric and nearest-neighbor methods for hybrid classi® cation: a
comparison of pixel assignment accuracy. Photogrammetric Engineering & RemoteSensing, 60, 1439± 1448.
Helminen, V. A., 1987, Temperature and precipitation. In Atlas of Finland, Folio 131: Climate.(Helsinki: National Board of Survey and Geographical Society of Finland), pp. 4± 10.
Hodanova, D ., 1985, Leaf optical properties. In Photosynthesis during leaf development, editedby Z. Sestak (Prague: W. Junk Publishers), pp. 107± 127.
Hoffer, R. M ., 1978, Biological and physical considerations in applying computer-aidedanalysis techniques to remote sensor data. In Remote sensing: T he quantitativeapproach , edited by P. H. Swain and S. M. Davis (New York: McGraw-Hill ),pp. 227± 289.
Hunt, G . R., 1977, Spectral signatures of particulate minerals in the visible and near infrared.Geophysics, 42, 501± 513.
Jacquemond, S., Baret, F., and Hanocq, J. F., 1992, Modeling spectral and bidirectionalsoil re¯ ectance. Remote Sensing of Environment, 41, 123± 132.
Johansen, B., and Tømmervik, H ., 1990, Mapping winter grazing areas for reindeer inFinnmark county, Northern Norway, using Landsat 5 TM data. Abstracts of IGARSS1990, the 10th Annual International Geoscience & Remote Sensing Symposium(Washington D.C.: IGARSS), pp. 613± 616.
Johansson, P., 1995, The deglaciation in the eastern part of the Weichselian ice divide inFinnish Lapland. Geological Survey of Finland, Bulletin 383, 72 pp.
K ayhko, J., 1997, Aeolian activity in subarctic FennoscandiaÐ distribution, history andmodern processes. Unpublished PhD thesis. Postgraduate Research Institute forSedimentology, The University of Reading, UK.
K ayhko, J., and Pellikka, P., 1994, Remote sensing of the impact of reindeer grazing onvegetation in northern Fennoscandia using SPOT XS data. Polar Research, 13,
115± 124.Kenk, E., Sondheim, M ., and Yee, B., 1988, Methods for improving accuracy of Thematic
Mapper ground cover classi® cations. Canadian Journal of Remote Sensing, 14, 17± 31.
J. KaÈ yhkoÈ et al.442
Klemsdal, T., 1969, Eolian forms in parts of Norway. Norsk Geogra® sk T idsskrift, 23, 49± 66.Kotilainen, M ., 1991, Some reactivated dune® elds in Northern Finland (in Finnish with
English summary). Geological Survey of Finland, Report of Investigation 105, 105± 113.Kujansuu, R., 1967, On the deglaciation of western Finnish Lapland. Bulletin de la Commission
Ge ologique de Finlande, 232, 98 pp.Lavoie, C., and Payette, S., 1994, Recent ¯ uctuations of the lichen± spruce forest limit in
subarctic Que bec. Journal of Ecology, 82, 725± 734.Lillesand, T. M ., and K iefer, R. W ., 1994, Remote Sensing and Image Interpretation (New
York: John Wiley & Sons).Marceau, D . J., Howarth, P. J., and Gratton, D . J., 1994 a, Remote sensing and the
measurement of geographical entities in a forested environment 1. The scale andspatial aggregation problem. Remote Sensing of Environment, 49, 93± 104.
Marceau, D . J., Gratton, D . J., Fournier, R. A., and Fortin, J.-P., 1994 b, Remote sensingand the measurement of geographical entities in a forested environment 2. The optimalspatial resolution. Remote Sensing of Environment, 49, 105± 117.
M ikkola, K ., 1996, A remote sensing analysis of vegetation damage around metal smeltersin the Kola Peninsula, Russia. International Journal of Remote Sensing, 17, 3675± 3690.
N ieminen, M ., and Kumpula, J., 1991, Porolaidunten kartoitus onnistuu satelliittikuvienavulla. Poromies, for 1991(2), 28± 32.
Oksanen, L., and Virtanen, R., 1995, Topographic, altitudinal and regional patterns incontinental and suboceanic heath vegetation of northern Fennoscandia. Acta BotanicaFennica, 153, 1± 80.
Oksanen, L., Moen, J., and Helle, T., 1995, Timberline patterns in northermostFennoscandia. Relative importance of climate and grazing. Acta Botanica Fennica,153, 93± 105.
Olsson, H ., 1994, Changes in satellite-measured re¯ ectances caused by thinning cuttings inboreal forest. Remote Sensing of Environment, 50, 221± 230.
Penttila, S., 1963, The deglaciation of the Laanila area, Finnish Lapland. Bulletin de laCommission Ge ologique de Finlande, 203, 71 pp.
Petzold, D . L., and Goward, S. M ., 1988, Re¯ ectance spectra of subarctic lichens. RemoteSensing of Environment, 24, 481± 492.
Price, J. C., 1990, On the information content of soil re¯ ectance spectra. Remote Sensing ofEnvironment, 33, 113± 121.
Rantanen, M ., Tomppo, E., Nenonen, S., and N ieminen, M ., 1989, Porolaidunten inventointikaukokartoitusta kaÈ yttaÈ en. Research report. Finnish Game and Fisheries ResearchInstitute, Reindeer Research Unit. Rovaniemi, Finland.
Ritari, A., and Saukkola, P., 1985, Spectral re¯ ectance as an indicator of ground vegetationand soil properties in northern Finland. Communicationes instituti forestalis Fenniae,132, 1± 37.
Rivard, B., and Arvidson, R. E., 1992, Utility of imaging spectrometry for lithologicalmapping in Greenland. Photogrammetric Engineering and Remote Sensing, 58, 945± 949.
Rollin, E. M ., M ilton, E. J., and Roche, P., 1994, The in¯ uence of weathering and lichencover on the re¯ ectance spectra of granitic rocks. Remote Sensing of Environment,50, 194± 199.
Satterwhite, M . B., Henley, J. P., and Carey, J. M ., 1985, The e� ect of lichens on there¯ ectance spectra of granitic rock surfaces. Remote Sensing of Environment, 18,
105± 112.Seppa, H ., 1996, Post-glacial dynamics of vegetation and tree-lines in the far north of
Fennoscandia. Fennia, 174, 1± 96.Seppala, M ., 1972, Location, morphology and orientation of inland dunes in Northern
Sweden. Geogra® ska Annaler, 54, 85± 104.Seppala, M ., 1995, De¯ ation and redeposition of sand dunes in Finnish Lapland. Quaternary
Science Reviews, 14, 799± 809.Seppala, M ., and Rastas, J., 1980, Vegetation map of northermost Finland with special
reference to subarctic forest limits and natural hazards. Fennia, 158, 41± 61.Soderman, G ., 1980, Slope processes in cold environments of northern Finland. Fennia,
158, 83± 152.Solantie, R ., 1987, Snow conditions. In Atlas of Finland, Folio 131: Climate. (Helsinki:
National Board of Survey and Geographical Society of Finland), pp. 18± 22.
Fourth Circumpolar Remote Sensing Symposium 443
Sollid, J. L., Andersen, S., Hamre, N ., Kjeldsen, O., Salvigsen, O., Sturød, S., Tveita· ,S., and W ilhelmsen, T., 1973, Deglaciation of Finnmark, North Norway. NorskGeogra® sk T idsskrift, 27, 233± 325.
Tikkanen, M ., and Heikkinen, O., 1995, Aeolian landforms and processes in the timberlineregion of northern Finnish Lapland. Zeszyty Naukowe Uniwersytetu Jagiellonskiego.Prace Geogra® czne Ð Zeszyt, 98, 68± 90.
Tobolski, K ., 1975, Succession of vegetation on drifting sands of Finnish Lapland dunes.Quaestiones Geographicae, 2, 157± 168.
Tømmervik, H ., and Lauknes, I., 1987, Kartlegging av reinbeiter ved hjelp av Landsat 5/TMdata i Kautokeino, Nord-Norge. Rangifer, 7, 2± 14.
Tomppo, E., 1990, Satellite image based national forest inventory of Finland. T he
Photogrammetric Journal of Finland, 12, 115± 120.Tucker, C. J., and Sellers, P. J., 1986, Satellite remote sensing of primary production.
International Journal of Remote Sensing, 7, 1139± 1416.Vuorela, A., 1992, On developing the land cover and forest classi® cation in the National
Land Survey of Finland (in Finnish). Unpublished MSc thesis, Helsinki University ofTechnology.
Vuorela, A., 1997 a, Satellite image based land cover and forest classi® cation of Finland. InProceedings of the Finnish-Russian Seminar on Remote Sensing Helsinki, 29 August± 1September 1994 , edited by R. Kuittinen. Reports of the Finnish Geodetic Institute,97:2, pp. 42± 52.
Vuorela, A., 1997 b, Land cover and forest classi® cation of Finland based on LandsatThematic Mapper (TM) images and digital map data. In Proceedings of Sixth UnitedNations Regional Cartographic Conference for the Americas, New York, 2± 6 June 1997 .
Woodcock, C. E., and Strahler, A. H ., 1987, The factor of scale in remote sensing. RemoteSensing of Environment, 21, 311± 332.


