Embed Size (px)
Citation preview

Land Reform versus Inequality in Nadur Village, KeralaAuthor(s): Richard W. FrankeSource: Journal of Anthropological Research, Vol. 48, No. 2 (Summer, 1992), pp. 81-116Published by: University of New MexicoStable URL: http://www.jstor.org/stable/3630406 .
Accessed: 09/05/2013 13:52
Your use of the JSTOR archive indicates your acceptance of the Terms & Conditions of Use, available at .http://www.jstor.org/page/info/about/policies/terms.jsp
.JSTOR is a not-for-profit service that helps scholars, researchers, and students discover, use, and build upon a wide range ofcontent in a trusted digital archive. We use information technology and tools to increase productivity and facilitate new formsof scholarship. For more information about JSTOR, please contact [email protected].
.
University of New Mexico is collaborating with JSTOR to digitize, preserve and extend access to Journal ofAnthropological Research.
http://www.jstor.org
This content downloaded from 130.68.1.203 on Thu, 9 May 2013 13:52:49 PMAll use subject to JSTOR Terms and Conditions

JOURNAL OF ANTHROPOLOGICAL RESEARCH
(Formerly Southwestern Journal of Anthropology)
VOLUME 48 * NUMBER 2 * SUMMER * 1992
LAND REFORM VERSUS INEQUALITY IN NADUR VILLAGE, KERALA
Richard W. Franke
Montclair State College, Upper Montclair, NJ 07043
Kerala's 1969 land reform law abolished tenancy in both rice land and house compound plots. Using a household survey in the central Kerala village of Nadur from 1971 (just before the reform was inmplemented), this paper examines the reform's effects by 1987 on a restudy of 170 households. Among the major consequences of the reform are: abolition of landlord and tenant classes, reduction in land ownershi and income inequality as measured by the Gini index, and reduction in caste inequality as measured by comparisons of averages and selected correlations between land ownership and income. Individual household examples supplement the statistical findings to illustrate how the land reform has interacted with other features of Kerala's economy to produce upward or downward mobility within the sample population.
CAN LAND REFORM redistribute land from the biggest owners to smallholders and the landless? Can it reduce income inequality in a poor agrarian society? Can it avoid ruining those at the top? Can it undermine rigid social categories such as caste and class? Can it foster improved possibilities for social and economic mobility of the poor? Can it reduce exploitation of the poor by the rich?
One of the most radical land reforms in recent decades took place in Kerala State, India. The Kerala Land Reforms Act Amendment of 1969 struck down tenancy, attacked the holdings of large high-caste landlords, and attempted to redistribute land rights and landholdings to lower caste tenants and laborers.
Although much has been written about Kerala's land reform (Herring 1980, 1983, 1989; Oomen 1985; Paulini 1979; Saradamoni 1981, 1982, 1983; Thar- amangalam 1981), very little village evidence has been gathered (Radhakrishnan 1989). This paper assesses the social and economic consequences of the land reform in a particular village.1
(Journal ofAnthropological Research, vol. 48, 1992)
81
This content downloaded from 130.68.1.203 on Thu, 9 May 2013 13:52:49 PMAll use subject to JSTOR Terms and Conditions

82 JOURNAL OF ANTHROPOLOGICAL RESEARCH
THE FIELD RESEARCH
From November 15, 1986, to July 15, 1987, we conducted research in the central Kerala village we shall call Nadur ("Centerville"). This village had previously been studied by Professor Joan Mencher, who kindly made copies of her 1971 household survey available to us." The Kerala land reform was enacted in 1969 and went into effect on January 1, 1970. Land titles in 1971 were still held by landlords, however, and several households were paying rent. If a few assumptions are made, the 1971 survey can be regarded as representing pre-land reform conditions. Our 1986-87 survey describes the situation after all land reform transfers had been completed. By comparing the two surveys, we can analyze how the reform affected land ownership, income distribution by caste and class, and upward and downward income mobility of selected households.
Mencher's survey included 356 households of a census block used by the Indian Census Bureau. The block is neither a whole village nor a random sample. Kerala villages are dispersed, and administrative boundaries do not coincide with social or geographic units. But the Nadur census block includes many of Kerala's major caste and class groups who live in close proximity and who shared the kinds of landlord/tenant/farm laborer relationships which the land reform was intended to alter. During preliminary visits to Nadur in 1986, we took copies of the 1971 survey sheets and asked follow-up questions of a few households. Because the principal village researcher from 1971 was still living in Nadur and knew many of the households well, we could locate them easily, and he could explain our purpose to the potential respondents. This researcher and his son, also resident in Nadur, became our principal ques- tionnaire administrators, checkers, and suppliers of supplementary information. A talented female economics student joined us in Nadur from February to July 1987.
In resurveying the 1971 households, we made an expanding set of circles outwards from the research assistants' house in order to make best use of time. When we saw that time was running short, we added outcaste households from three of the four outcaste colonies in Nadur by going to each from the closest to the farthest and interviewing whichever household heads or spouses were available. Any other sampling technique might not have been successful without expending large amounts of time, as the low-caste households are mostly made up of laborers who are not easily reached at home until very late in the evening.
The field methods described above enabled us to produce a 1986-87 subset of 170 households from the 356 households studied in 1971. For these 170 households, there were 160 data sheets for 1971, since 10 new households had been created by partitioning when adult children moved into separate houses. We left those households in the 1986-87 sample; they represent a
This content downloaded from 130.68.1.203 on Thu, 9 May 2013 13:52:49 PMAll use subject to JSTOR Terms and Conditions

LAND REFORM 83
real process that took place between the two surveys. Caste ratios were held constant across the two surveys.
Despite the drawbacks of the sampling technique and village definition, we believe this comparative study can draw out many of the consequences of the Kerala land reform. It is unusual to have a baseline survey of the breadth and depth of the 1971 data collected by Mencher. Furthermore, both surveys were conducted by highly capable research assistants who themselves live in Nadur. This allowed for substantial cross-checking and error removal, especially in sources and amounts of household income, one of the most difficult data sets to gather in an agrarian setting where households have multiple sources of income.
DATA ANALYSIS
The main quantitative data are the amount of land owned and income in pre (1971) and post (1986-87) land reform surveys. Prior to settling in Nadur, we had entered the basic data from the 1971 survey onto a database. During the field study, data for 1986-87 were entered into a separate set of files. Partway through our village stay, we organized land, income, and other quantitative data into various printouts which allowed testing for internal consistency. When data problems appeared, we returned to the relevant household to ask for clarification. The additional information thereby acquired greatly improved the accuracy of the surveys. After returning to the U.S., we entered and proofread the remaining data from which the various averages, cross-tabulations, counts, and correlations in this paper have been obtained. Narrative data were gathered in both surveys. From the preliminary analysis done while in the village, we were able to pinpoint particularly interesting or typical households from which to acquire further narrative information.
NADUR VILLAGE
Nadur village is typical of Kerala in many historical, geographical, and so- ciological features. The village lies in the former princely state of Cochin. In terms of land reforms, Cochin falls between the former princely state of Tra- vancore, now southern Kerala, in which many changes took place in the nine- teenth century, and Malabar, now northern Kerala, where the most protracted and bitter land struggles occurred. Nadur was the scene neither of intense battles between tenants and landlords in past decades nor of the land occu- pations by radical peasant groups in the late 1960s which took place in some other villages. At the same time, Nadur has had its share of land reform militants and Communist organizers so that it represents a kind of midway point in land reform struggles in Kerala.
Geographically, Nadur lies in the lower foothills of the Western Ghat Moun- tains. It contains intensive wet-rice paddy fields typical of the lowland areas
This content downloaded from 130.68.1.203 on Thu, 9 May 2013 13:52:49 PMAll use subject to JSTOR Terms and Conditions

84 JOURNAL OF ANTHROPOLOGICAL RESEARCH
of Kerala, as well as cashew and coconut gardens and hillside fields more common in the central midlands. Like the parts of Kerala in the higher elevations to the east, it also contains some upland rubber and forest lands. In both history and geography, therefore, Nadur lies in the middle of the range of types found in Kerala.
Nadur's five thousand plus residents include all the major castes of Kerala except the Christians. Like many Cochin villages, Nadur has a higher than average percentage of Nambudiri Brahmins, one of the most important landlord groups in Kerala. It also has Nair caste members in several occupations, craft castes, Ezhava coconut tree climbers, and former untouchable Pulaya agri- cultural laborers. The castes and their landholdings are discussed in detail below. The Nadur sample contains only 2 households with workers sending large remittances from the Persian Gulf states, which might overwhelm a statistical analysis of the economic effects of land reform. Nadur's near absence of such households makes it a controlled case in which the redistribution of the land reform should show up more clearly than in those areas where re- mittances have flooded the village economy.
THE HISTORICAL CONTEXT
One of the difficulties in assessing the Kerala land reform is the complexity of the system it attempted to abolish. For rice land there was at the top a class of landlords (jenmies), mostly of the Brahmin (Nambudiri) caste, who owned the land but did not cultivate it. Below them was a class of "superior" tenants (kanamdar) who leased the land from the jenmies and subleased part to all of it to a third class of "inferior" tenants (verumpattamdar) who were the actual cultivators. Kanam leases were generally in writing and usually had a twelve-year term that the jenmies were somewhat obliged to renew if asked. Verumpattam leases were usually verbal and could be easily terminated by the landlord or the superior tenant (Sankaranarayanan and Karunakaran 1985:69- 91; Varghese 1970). The cultivators often employed members of the lowest caste untouchables (Pulaya), who did most of the hard field labor. In some villages, a great deal of land was officially owned by Hindu temples, but this was rented at a nominal fee to Brahmin landlords, who effectively added it to their already large estates.
In addition to the tenancies for rice fields, the same landlords owned the sites on which other villagers built their houses. Those renting rice land from a particular landlord also lived on house compound land held by that landlord. The landlords' threats of eviction from either type of land constituted a powerful lever to pry high rents and cheap labor from tenants. One is reminded of a U.S. company town.
The three regions of Kerala had different versions of this tenure system and different land histories (Sathyamurthy 1985:174-88). In Travancore, land reforms introduced by nineteenth-century royal reformers mostly eliminated
This content downloaded from 130.68.1.203 on Thu, 9 May 2013 13:52:49 PMAll use subject to JSTOR Terms and Conditions

LAND REFORM 85
tenancy, creating a fairly large class of small owners. By contrast, Malabar witnessed the ossification of the superior-inferior tenant relationship.
In Cochin, an intermediate development took place. Here kanam tenancies were to be given permanent use-rights under influence of the Travancore reforms, but landlords bypassed the law by turning many kanam leases into verumpattam, or inferior, leases. In this way, Cochin landlords managed to evade most of the provisions of the moderate "Cochin Tenancy Bill" of 1914 (Slater 1918:128-29). Additional Cochin Tenancy Acts were passed in 1938, 1943, and 1944, along with three proclamations on the rights of house compound tenants (1937, 1947, and 1949), all attempting to provide security of tenure (Sankaranarayanan and Karunakaran 1985:85-86; Varghese 1970:134-36). They were ineffective. A study from Cochin in the 1940s found that cultivator house- holds were paying at least 60 percent and sometimes even above 80 percent of their gross returns to the classes above them. The split between jenmies and the kanamdars is not given (cited in United Nations 1975:58; Herring 1983:161).
Statistics gathered on the eve of the 1969 land reform act indicate that owners of more than 5 acres constituted only 8.1 percent of landowning house- holds, but they controlled 44.4 percent of all leased land and 61.8 percent of leased wet-rice lands (Herring 1980:A67). When only the 8,000 households for whom rent could have been the main source of income from land were considered, economists estimated they held nearly 30 percent of the total area and over 80 percent of the area leased out (United Nations 1975:68). Land- holding inequality among cultivating households in Kerala in 1971 was expressed by a Gini index of 68,3 making it the third most unequal state in India at that time (Mukherjee 1979:6-9), but this study probably greatly underestimated actual land inequality.
THE LAND REFORM
Kerala's 1969 land reform contained three major components: 1. A ceiling on the absolute size of holdings, with excess to be redistributed
to the landless. 2. The abolition of rice land tenancy and thus the abolition of rental payments
from actual operators to noncultivating landlords. Stays of eviction pre- vented landlords from using this provision to throw tenants off the land.
3. The abolition of tenancy in house garden lands and thus the abolition of rents to the landlords who held title to them. As with provision 2, eviction stays kept tenants from being thrown off the land.
Observers agree that the ceiling provision was not extensively applied (United Nations 1975:49-51, 60-64; Herring 1980:A65-66). Statewide, only 85,000 households received rice land averaging 0.59 acres under the ceiling provision (Radhakrishnan 1989:176). We found no evidence in Nadur of its implemen- tation. Provisions 2 and 3, however, have resulted in a massive redistribution
This content downloaded from 130.68.1.203 on Thu, 9 May 2013 13:52:49 PMAll use subject to JSTOR Terms and Conditions

86 JOURNAL OF ANTHROPOLOGICAL RESEARCH
of land rights. Across Kerala, 1,290,000 tenant households gained titles to 1,967,593 acres of rice land. House compound tenancies of 21,522 acres were transferred to 269,028 households. Several thousand tenants in more radical areas seized their house compounds without filing transfer papers, bringing the total house compound beneficiaries to about 340,000 (Radhakrishnan 1989:174-76; United Nations 1975:65). Various land surveys have collected widely different types of information, however, rendering precise statewide measurement of the social and economic effects difficult (United Nations 1975:65). We shall take up the problem of rice land first and follow with a consideration of house compound land.
Redistribution of Rice Land The 1971 survey of all 356 Nadur households indicates that Brahmin caste
landlords totaling 7.6 percent of the population directly controlled 50 percent of the rice land, while the local temple board--controlled traditionally by the same Brahmin households-held title to another 37 percent of the rice fields. Another 7 percent of the land was owned by Brahmin households living outside the village, leaving only 6 percent of the rice land owned by members of other castes.
How much rice land was redistributed? The sources of information create a problem. Landlords in 1971 were reporting smaller holdings than were their tenants. One landlord told the researcher that he held no agricultural land as a jenmy, but tenants' reports indicated that he owned more than 7 acres. With house compound land, even larger discrepancies occurred. In addition, land- lords were not reporting their access to temple lands, but tenants were doing so. For these reasons, we used the tenants' figures in our analysis.
Among the 160 households in the 1971 sample, 7 jenmies (4.4 percent) lost an average of 7.5 acres each, while 47 households (29.4 percent) gained title to an average of 0.74 acres each. The losses do not equal the gains because land was passing within, into, and out of the sample. As they held no tenancy rights, 103 households (64.4 percent) were not directly affected by the rice land redistributions. The largest jenmy loss was 19.42 acres by a single land- lord. At 1971 production and price levels, this land would have been worth 3,903 rupees in rent, a figure 6.6 times the per capita income in Kerala of 594 rupees in that year. If all 36.70 sample acres of jenmied land were receiving rent, a total of 7,377 rupees was being generated, equal to 3 percent of the total income generated by the entire sample of 160 households, 14 percent of the entire value generated by rice fields in that year, and 91 percent of the income earned by all the agricultural laborers in the sample during the two seasons of that year. These comparisons give some idea of the burden which rents represented in the local economy. In decades prior to 1971, the holdings were far larger and rent levels higher.
The same large landlord also lost 12 of 13 acres to which he claimed owner- operator rights in 1971. Some of this land may have been passed to offspring
This content downloaded from 130.68.1.203 on Thu, 9 May 2013 13:52:49 PMAll use subject to JSTOR Terms and Conditions

LAND REFORM 87
in partitions-in part to bypass the land reform. The largest total single rice field holding in the sample was thus 32.42 acres in 1971. In 1987 the largest rice landholding in the sample was 2.8 acres, held by a non-Brahmin household that was never a landlord.
How did the land reform affect land inequality? To measure this, we employed both unit distribution data and the Gini index of inequality (see note 3). Com- paring the various types of rice land tenure in 1971 with the one direct form of ownership in 1987, we get the results shown in Table 1.
TABLE 1 Rice Land Tenure Patterns in Nadur Village, 1971 and 1987:
Percentage Held by Landholding Quartiles
1971 (N = 48) 1987
Owner- Combined (N =
60) Jenmy Operator Jenmy/Owner-Operator Tenant Owner
Landholding quartiles Top 100% 100% 98.2%a 57.0% 50.7% 2nd 0 0 1.7 26.9 26.1 3rd 0 0 0 14.5 15.5 4th 0 0 0 1.7 7.6
Gini indicesb For landholders 99.4 95.7 94.5 54.4 41.4 For all households
(landless included) 100 100 100 91.6 85.0
Total acres 36.70 27.95 64.65 44.30 52.15
a. The two figures of 100 percent in the top quartile for 1971 produce a combined figure of 98.2% because membership in the top quartile varies slightly by type of tenure.
b. Ginis on this table are computed with l/s units rather than quartiles.
In 1971, 48 of 160 households, or 30 percent, held rice land in some form of tenure. This included 7 jenmies, 10 owner-operators, and 39 tenants, a few of whom held land under more than one form of tenure. The average holding was 1.4 acres, close to the all-Kerala average for that year of 1.2 acres (George 1979:15). The total sample acreage for each category is given at the bottom of Table 1. The tenancy total (44.30 acres) does not equal that of the land under jenmy control (36.70 acres) because some jenmies had tenants outside the sample, while tenants likewise had landlords outside the sample. Similarly, the total for the combined ownership category in 1971 (64.65 acres) does not equal the total simple ownership sum in 1987 (52.14 acres) because land was redistributed to tenants both within and outside of the sample. Household partitions and other processes such as market purchases have also redistributed
This content downloaded from 130.68.1.203 on Thu, 9 May 2013 13:52:49 PMAll use subject to JSTOR Terms and Conditions

88 JOURNAL OF ANTHROPOLOGICAL RESEARCH
land in ways that confound the precise measurement of the effects of the land reform. Thus, the cross section represented by the data is not a closed system.
Inequality data are commonly presented in equal population units of 10 (dec- iles) or 5 (quintiles). The 48 rice landholders in 1971 do not divide into whole number quintiles or deciles, so we have constructed four equal quartiles of 12 households each. The 61 owners in 1987 (36 percent) break down into four equal quartiles of 15 households each (one smallholder was dropped to simplify the calculations). These 61 owners held a total of 52.15 acres, or 0.85 acres on average, a large decline from the 1.4 acres average in 1971. The over- whelming concentration of land ownership in 1971 is indicated by the Ginis ranging from 94.5 to 99.4, approaching "perfect" inequality. Tenancies were more evenly distributed with a Gini of 54.4. If rice land landless households are included in the calculations, the Gini for tenancies was 91.6.
By 1987, 61 owners held land in a single ownership category. Using the 1971 Jenmy, Owner-Operator, or Combined columns for comparison, we find the Gini index had dropped to 41.4, at least a 50 percent decline. Using the Tenancy column, we observe a 13-point, or 24 percent, decline. If the rice land landless are included in the calculation, the Gini changes from 91.6 to 85.0, down 6.6 points, or 7.2 percent, from 1971.
From Table 1 it can also be seen that the households in the top landholding quartile were the major losers of land; these were the high-caste landlords. The table hides a number of important things, however. The top 20 percent of holders of rice land are now no longer pure landlords but must at least manage the land to which they hold title. They may hire a foreman and thus avoid actual field labor or even supervisory work, but they can no longer simply receive rent. One large rice landlord household which held 60 total acres in 1954, now has 1.65 acres which it manages directly and on which the younger male Brahmin family members sometimes even work during the peak labor demand periods such as harvesttime.
The redistribution of rice land appears to have benefited mainly those in the second to fourth landholding quartiles. Ten new landowning households have been created in the sample. The percentage of households not paying rent increased from 7.6 percent of the sample households (the landlords) to 35.9 percent in the sixteen-year period.
Redistribution of House Compound Land An important component of Kerala's land reform was the abolition of house
compound tenancy. Before land reform, kudikidappukaran and kudiyirippu tenants paid rent to the landlords for the space on which their huts (kudi) were built. House compound land in Kerala is often of great agricultural and economic value. Bananas, coconuts, cashews, arecanuts, mangoes, cassava, and other crops are grown there. The threat of eviction from these lands was a powerful weapon in the hands of landlords for setting exorbitant rents on rice fields. Thus part of the rice land rent was derived indirectly from house compound
This content downloaded from 130.68.1.203 on Thu, 9 May 2013 13:52:49 PMAll use subject to JSTOR Terms and Conditions

LAND REFORM 89
tenancy relations. Our survey indicates that kudiyirippu tenants-the type found in Cochin--paid large amounts of the produce from their gardens to their landlords. Interviews with former tenants yielded examples such as "fifty strings of bananas," "several bunches of vegetables," and so forth. Written landlord records gave money figures, which indicate that house compound rent averaged 50 rupees per acre of land in 1969.
Prior to the land reform, all households had either tenancy or ownership rights to their house compound land. Following the land reform, all households have title to their house compound land. It is thus not necessary to distinguish between landless and landed households. In 1971, the Gini index, for jenmies and owner-operators, was 100; by 1987 it had dropped to 61.0, a 39 percent reduction in inequality. This change can be seen in Table 2.
TABLE 2 House Compound Land Tenure Patterns in Nadur Village, 1971 and 1987:
Percentage Held by Landholding Quintiles
1971 (N = 160) 1987
Owner- Combined (N = 170)
Jenmy Operator Jenmy/Owner-Operator Tenant Owner
Landholding quintiles Top 100% 100% 100% 50.3% 61.4% 2nd 0 0 0 25.9 18.3 3rd 0 0 0 14.2 10.7 4th 0 0 0 8.0 6.7 5th 0 0 0 1.6 3.0
Gini indicesa 100 100 100 53.4 61.0
Total acres 47.84 27.37 75.21 72.75 92.64
a. Ginis here and on all subsequent tables are computed with deciles rather than quintiles.
The land reform's effects on the distribution of house compound land are different from those on rice fields. The Gini has declined more in relative terms than for rice land, but the index is still 61.0. The reason for this is that much house compound land was not officially tenanted and was exempt from land reform; only lands on which people had built huts and which they could claim as their house compound lands were redistributed. Some large tracts of forest and coconut groves in Nadur remained in the hands of the wealthiest former landlords. Rubber, areca, and cashew groves are common recent investments on these lands.
How much house compound land was redistributed? In 1971, 7 jenmies owned 47.84 acres as landlords, averaging 6.83 acres; 15 households held
This content downloaded from 130.68.1.203 on Thu, 9 May 2013 13:52:49 PMAll use subject to JSTOR Terms and Conditions

90 JOURNAL OF ANTHROPOLOGICAL RESEARCH
direct ownership of 27.37 acres, to average 1.82 acres each; and 142 house- holds were tenants on 72.75 acres, for an average tenancy of 0.51 acres. One jenmy held 27.15 acres as landlord and 12 acres in simple ownership. This jenmy-also the largest rice land jenmy-lost the greatest single amount in the sample: 31.35 acres, of which 27.15 were from the land reform.
By 1987, 170 households held title to a total of 92.64 acres, for an average of 0.54 acres. Unlike rice land, for which the sample as a whole showed an overall loss, the sample households gained 13.94 acres, owing again to the particular configuration of relationships with jenmies within and outside the sample. In 1987 the largest single holding was 7.8 acres, land remaining to the largest jenmy of 1971. During the sixteen-year period, 12 households lost an average of 4.72 acres, while 147 households gained an average of 0.48 acres each. The largest gainer added 5.5 acres, resulting from a family partition, while the second largest gainer received 2.45 acres in the land reform.
In all, 91.9 percent of Nadur households received title to some house com- pound land. As can be seen by comparing the Combined column for 1971 with the Owner column for 1987 on Table 2, the second through fifth landholding quintiles, including even agricultural laborers and members of the lowest, (for- merly) untouchable castes, received all of what was distributed. The lowest quintile, however, received very little. Households in that category were mostly agricultural laborers living on small hillside plots in the outcaste, or untouchable, colonies on the edges of the village. These plots became theirs, but few coconut, mango, or other trees will grow there. Thus, the statistics on the land reform do not fully reflect the continuing poverty of the resources of this poorest group.
Combining both rice field and house compound land, we can summarize the effects of the Kerala land reform in the Nadur sample as follows: 14 households lost land totaling 105.83 acres to their former tenants, while 145 households gained 102.14 acres, averaging 0.70 acres each. One household neither lost nor gained land, and 10 households in the 1987 sample derived their holdings from partitions of the households in the 1971 sample.
LAND REFORM AND INCOME INEQUALITY
The main purpose of the land reform was to redistribute agrarian resources to produce wealth. How much effect on income has it had? As with land, comparison of income distributions presents methodological problems. On the one hand, Kerala's many reforms make it difficult to sort out precisely to what extent any measurable changes in overall income inequality are attributable to the land reform alone.4 On the other hand, outside forces of change, such as economic growth, inflation, changes in the job market, and remittances, also influence income patterns. In addition, the household partition process con- tributes in ways for which it is difficult to control.
This content downloaded from 130.68.1.203 on Thu, 9 May 2013 13:52:49 PMAll use subject to JSTOR Terms and Conditions

LAND REFORM 91
One problem is to estimate the rent intake by the landlords. Although the land reform act was passed in 1969 and went into effect in 1971, both transfer of title from landlord to tenant and ending of rental payments for many house- holds took place either earlier or later. Because of the many decades of militant tenant and farm worker struggles starting in the 1930s, some tenants stopped paying part or all of their rent before the official reform enactment date. Similarly, some landlords-sensing the inevitability of some kind of reform- sold title to tenancies to some or all of their tenants prior to enactment. Others filed jointly with their tenants on January 1, 1970, to avoid court costs and improve their chances of getting compensation. On the other hand, many households did not actually receive title to their land until the late 1970s and might have been coerced into paying rent beyond the reform enactment date to jenmies who had powerful local political connections. There is no completely satisfactory solution to this problem, but the fact that two of our three major research assistants were residents of Nadur made it possible to cross-check much of the household survey information. Since some land had already been transferred by 1971, the comparison of this survey date with 1987, when all transactions had been completed, indicates the minimum effects of land reform and does not exaggerate the degree of redistribution.
Another problem is that none of the many land reform studies provides actual rental rates or payments. Rent and harvest data were not collected in the 1971 Nadur survey. To get the most meaningful estimate of the income effects of the reform, we made the following assumptions for 1971:
1. All farmers in the sample were producing the Kerala State average rice output per unit of land.'
2. Tenants were paying the rental rates last locally recorded in Nadur (1969): 33 percent of the gross.
3. Rents on one-crop land were for one harvest only, while rents were for both harvests on two-crop land. The amounts have been adjusted in the income figures. (One-crop and two-crop land categories are not shown on Table 1.)
4. Tenants were paying the last locally recorded rental rates (1969) for house compound land: 0.50 rupees for each cent of land (.01 acres).
To limit extraneous variables as much as possible, we employed a number of techniques. In comparing 1987 incomes with those of 1971, we subtracted all income from post-1971 welfare programs such as agricultural labor pensions. This practice makes the 1987 income inequality patterns as unequal as possible, or, in other words, indicates the minimum effect of the land reform. In addition, by studying the changing income patterns in detail (much of it not reported in this paper), we conclude that outside changes in the job market have tended to increase levels of inequality. Thus, outside forces can be thought of as having counteracted the land reform, again making our statistical findings reflective of the minimum effects of the reform on income inequality. We are not able to
This content downloaded from 130.68.1.203 on Thu, 9 May 2013 13:52:49 PMAll use subject to JSTOR Terms and Conditions

92 JOURNAL OF ANTHROPOLOGICAL RESEARCH
separate out the possible consequences of wage increases for agricultural laborers won by Kerala's militant trade unions. Important increases did occur during the period between the two household surveys, especially as a con- sequence of the 1974 Kerala Agricultural Workers Act. As many small land- owners also work as farm laborers, some of the income inequality data are affected by that act.'
We also concluded that the parity index did not shift significantly in favor of farmers. This index expresses the ratio of prices received by farmers to prices paid by them. If the index is 100, farmers break even. In 1971, the parity index was 93; in 1987, it was 96. The average over the period between the surveys was 96, with a low of 83 in 1983 and a high of 109 in 1974. The index was over 100 in only six of the sixteen years between the surveys (computed from George 1982:149; Herring 1989:108; Government of Kerala 1989:14, 1990:16). These figures would not raise the incomes of former tenants in such a way as to influence the Gini index independently.
We distinguish two forms of change in the patterns of income inequality. One form is the general degree of inequality which can be expressed by com- paring units such as income quintiles and computing the Gini index. The other form is mobility among individual households. In this section we look at quintiles of household income. In the following two sections we examine caste and class, and in a later section we consider individual cases of mobility in relation to the land reform.
Table 3 shows the quintile distribution of household income for both surveys. The 1987 data have welfare payments and agricultural labor pensions removed. The Gini index was reduced by 5.3 points, or 10.4 percent, between the two surveys.
Comparing Tables 1, 2, and 3, we see that inequality declined mostly where advocates of land reform wanted: the middle to poorest Nadur households. The middle households got most of their increases from the land reform. But those in the bottom division benefited only by receiving title to their garden lands, which, as noted above, are not always productive. Much of the redis- tribution in this bottom division probably came from wage increases.
LAND REFORM AND CASTE INEQUALITY
Like the land system to which it was traditionally tied, Kerala's caste system is highly complex. In Nadur, the Brahmins are represented by a group known as Nambudiris, the main temple priests and landlords. Below them rank the Nairs, a large caste group with many subcastes, some of high status, others, known as Sudras, who functioned as servants or laborers. Between the Nam- budiris and Nairs is a small caste of temple servants known as Ambalavasi, of whom the Nadur subcaste is the Variars. The central Kerala region of Cochin is the heartland of the Nambudiri Brahmins, who formed the main landlord
This content downloaded from 130.68.1.203 on Thu, 9 May 2013 13:52:49 PMAll use subject to JSTOR Terms and Conditions

LAND REFORM 93
TABLE 3 Distribution of Household Income by Income Quintiles
in Nadur Village, 1971 versus 1987
1971 1987 (N = 160) (N = 170)
Income percentage by income quintiles Top 52.6% 48.3% 2nd 21.2 21.3 3rd 12.6 14.0 4th 8.7 10.1 5th 4.9 6.4
Gini indices 50.7 45.4
Average household income 1,717 6, 793 (in rupees)
Average per capita income 300 1,117 (in rupees)
Kerala State per capita income 594 2,371 (in rupees)
All India per capita income 633 2,975 (in rupees)
Source: Government of Kerala (1988:9) for household and per capita incomes.
caste there. In Malabar (northern Kerala) many (upper) Nair caste households were the traditional landlords, while in southern Kerala (Travancore) castes such as Tamil Brahmins from Tamil Nadu held much of the rental lands along with Nairs.
Below these castes come middle castes including the Ezhuthasan teachers and laborers, Chetty merchants, the craft castes, the Muslims (who work in petty trade and as field laborers), and the Ezhavas, who were the traditional coconut tree climbers and tappers as well as field laborers.
At the bottom of the caste hierarchy was a set of untouchable castes who did the dirtiest labor. In Nadur these castes are represented by the Mannans, who traditionally cleaned garments, and the Pulayas, who were almost exclu- sively agricultural field laborers.
Has the relationship between land and caste been altered by the land reform? In Table 4 we compare the percentage of each caste in the village sample population with percentages of types of rice land tenure in each survey period.
From Table 4 we see that major changes in rice land tenure by caste have taken place. The concentrated holdings of the Nambudiri landlords were re- distributed across several other castes, particularly the Nairs, who had been
This content downloaded from 130.68.1.203 on Thu, 9 May 2013 13:52:49 PMAll use subject to JSTOR Terms and Conditions

94 JOURNAL OF ANTHROPOLOGICAL RESEARCH
TABLE 4 Changes in Tenure of Rice Land in Nadur Village, 1971 and 1987:
Percentage of Sample Total Held by Caste
1971 Land Tenure 1987 Percentages Land Ownership
Percentage Owner- Percentage of Gain/Loss Caste of Sample Jenmy Operator Tenant Land Owned (in acres)
Nambudiri 8% 100% 85% 3% 18% - 52.25 Nair/Variar 49 0 15 79 53 23.30 Craft 6 0 0 0 1 .20 Ezhuthasan/Chetty 8 0 0 14 12 4.31 Muslim 13 0 0 2 12 4.35 Ezhava 8 0 0 1 1 .70 Mannan* 2 0 0 2 2 .76 Pulaya* 6 0 0 0 2 1.00
Total acres 36.70 27.95 44.30 52.15 - 17.63
Notes: Caste ratios within the sample were held constant between 1971 and 1987. Household partitioning, however, created minor variations in the Percentage of Sample figures, shown here as constants. Castes are listed from top to bottom in their approximate order of Hindu ritual status.
*Former Untouchables
the main tenant group in Nadur. One of the major castes gaining rice land was the Muslims. Of the former untouchable castes, Mannans turned their tenancies into equal amounts of owned rice land. Because no Nadur Pulayas in 1971 were rice land tenants, they did not qualify for direct rice land transfers in the land reform. During the sixteen-year period between surveys, however, one Pulaya household saved enough money from members' work outside the village to purchase land from a household of another caste. The land reform created the land market to make this change possible, but the financial resources to ac- complish it came from processes outside the reform.
With house compound land, the situation is similar. As with rice land, Table 5 shows that house compound land in 1971 was highly concentrated within the Nambudiri Brahmin caste. The tenancies were distributed fairly proportionately among the other castes, except that the Nairs held somewhat more than their proportionate share, while the Pulayas were distinctly underrepresented.
Following the land reform, the Nambudiris still retain an enormous advantage over the other castes, owning 25 percent of the house compound land while constituting only 8 percent of the sample population. Other castes had their tenancies converted to private holdings on which they no longer must pay rent. Rent income to Nambudiris was removed from 47.87 acres, almost exactly
This content downloaded from 130.68.1.203 on Thu, 9 May 2013 13:52:49 PMAll use subject to JSTOR Terms and Conditions
LAND REFORM 95
TABLE 5 Changes in Tenure of House Compound Land in Nadur Village, 1971 and
1987: Percentage of Sample Total Held by Caste
1971 Land Tenure 1987 Percentages Land Ownership
Percentage Owner- Percentage of Gain/Loss Caste of Sample Jenmy Operator Tenant Land Owned (in acres)
Nambudiri 8% 100% 82% 6% 25% - 47.87 Nair/Variar 49 0 6 59 41 35.38 Craft 6 0 0 3 3 2.27 Ezhuthasan/Chetty 8 0 0 8 8 6.72 Muslim 13 0 10 12 13 8.43 Ezhava 8 0 2 7 7 5.66 Mannan* 2 0 0 2 1 1.31 Pulaya* 6 0 0 3 2 2.02
Total acres 47.84 27.37 72.75 92.64 13.92
*Former Untouchables
equal to the 1971 jenmied house compound land of 47.84 acres. The sample as a whole received 13.94 more acres than were lost by its landlords. As with rice land, these discrepancies reflect land transfers into and out of the sample population as well as some postreform buying and selling of land.
LAND REFORM, CASTE, AND INCOME INEQUALITY
How has the land reform influenced the relationship between caste and income? One way to approach this question is to look at the income breakdown by caste in both pre- and postreform surveys (Table 6).
From Table 6 we can see that the Nambudiri Brahmins' share of the sample household ince ne dropped. By contrast, Nairs increased their share to almost exactly their proportion of the population. Muslims and Pulayas held even while Mannans raised their level.
Looking at the columns on the right of the table, we see that Nambudiri average income increased 245 percent (1987 income divided by 1971 income times 100; Index column on Table 6), while Nair income increased 479 percent. The all-India inflation rate between 1971 and 1987 was about 368 percent, so the former wealthiest Nambudiris lost relative to prices during this period, while most other groups gained, including even the Pulayas who received the least from the land reform.
Because the data by caste do not lend themselves well to Gini calculations,
This content downloaded from 130.68.1.203 on Thu, 9 May 2013 13:52:49 PMAll use subject to JSTOR Terms and Conditions

TABLE 6 Caste and Income Inequality in Nadur Village, 1971 and 1987
Average Household Income in Rupees (minus welfare)
Percentage of Total 1971 1987 Percentage Sample Household Income 1971 Income/Average 1987 Income/Average Gain Index
Caste N of Sample 1971 1987 (rupees) Income Ratio (rupees) Income Ratio (rupees) (1971 = 100)
Nambudiri 13 8% 20% 13% 4,699 2.7 11,527 1.7 4, 855 245 Nair/Variar 83 49 41 48 1,379 0.8 6,606 1.0 5, 259 479 Craft 11 6 10 7 2,664 1.6 7,840 1.2 5,480 294 Ezhuthasan/Chetty 13 8 6 7 1,496 0.9 6, 177 0.9 4, 926 413 Muslim 22 13 10 10 1,457 0.8 5, 254 0.8 3,895 361 Ezhava 13 8 6 5 1,352 0.8 4,477 0.7 3,181 331 Mannan* 4 2 4 6 2,435 1.4 17,284 2.5 14,850 710 Pulaya* 11 6 4 4 896 0.5 4,235 0.6 3,339 473
Total and averages 170 100 101 100 1,717 1.0 6,814 1.0 5,016 397
Note: Total percentages and sums of averages vary slightly on this and other tables due to rounding errors. *Former Untouchables
This content downloaded from 130.68.1.203 on Thu, 9 May 2013 13:52:49 PMAll use subject to JSTOR Terms and Conditions

LAND REFORM 97
we have computed instead the ratio of the average income for each caste to the average income of the total sample for each survey year. Use of this technique identifies a reduction in inequality. The 1971 ratios range from 2.7 for the Nambudiris to 0.5 for the Pulayas. In 1987, the range was from 1.7 for Nambudiris to 0.6 for Pulayas. While there was some movement by other castes, such as Nairs, the most dramatic change is the rise of the Mannans to the top position with 2.5 times the sample average income in 1987.
Correlation coefficients confirm these land and income relationships. For 12 Nambudiri households in 1971, the Pearson coefficient for household income with rice land jenmied or owned was 0.8622**; for house compound land jenmied or owned the coefficient was 0.8938**.7 By contrast, coefficients for the other castes were very low, while those for tenancies were all below 0.20.
In 1987, these coefficients had changed substantially. The 13 Nambudiri household incomes correlated with rice land owned at -0.09 and with house compound land at -0.19. For all 61 rice landowning households, income cor- related with rice land at 0.36*, but of the individual castes, only the Nairs, the former main tenants, had significant correlations-0.29* for household income with rice land and 0.36** for house compound land with household income.
These correlations indicate that for the Nambudiri caste in 1971, land was the main determinant of income; by 1987 this was no longer the case. The rupee change in Nambudiri household income correlates 0.50 with the change in rice land ownership and 0.55 with the change in house compound ownership. Nair caste household income changes correlate 0.23 with rice land changes and 0.38** with house compound changes. Among the other castes, only the Ezhuthasans showed a significant relationship between income and land changes owing to a few large land transfers to a small number of households, including one that is now the largest rice landowner in the sample with 2.8 acres. Thus, the highly concentrated land-based wealth of the Nambudiris was distributed across a sufficiently wide spectrum of other castes so that we can measure statistically the income associations mainly for this former landlord elite and somewhat less clearly for the Nairs, who include most of the former tenants.
LAND REFORM AND CLASS INEQUALITY
Castes are both emic and etic groups. They are recognized by respondents who all agree about their own caste membership and that of other members of the village. In contrast, class is often a purely etic category, imposed by the researcher for certain analytic purposes. Questionnaire respondents do not have the same sense of their class membership as they do of caste. Among researchers, there are several competing ways of conceptualizing class: in- come, occupation, relation to the means of production, and life-style.
A satisfactory definition of class in agrarian societies remains elusive because many households have multiple income sources. In Nadur the husband may
This content downloaded from 130.68.1.203 on Thu, 9 May 2013 13:52:49 PMAll use subject to JSTOR Terms and Conditions

98 JOURNAL OF ANTHROPOLOGICAL RESEARCH
work in the service sector, the wife may have an agricultural-laboring job, some of the children may have incomes from skilled labor sources, an aged parent may be receiving a pension, and the household may also garner income from the coconut trees on their house compound or from the sale of milk from their goats or cow. We have chosen to define class by means of the primary income source of the household. Operationally this definition becomes the main oc- cupation of the main earner in the household, usually the household head. It partially subsumes both traditional sociological (occupational) and Marxist (means of production) approaches.
For 1971, we distinguish ten classes; for 1987 data, landlord and tenant classes are absent, as these were abolished by the land reform. The remaining classes in both periods include professionals who earn very high incomes from employment requiring advanced education such as teachers, ayurvedic (Hindu medicine) doctors, managers, and so on. These are followed in income levels by service workers such as police, bus drivers, etc.; the craft classes including carpenters, goldsmiths, and tailors; farmers who earn most of their income from rice, coconut, or rubber sales, other house compound crop sales, or a combination of these; petty traders who primarily run small produce, stationery, or tea shops; recipients who live off pensions or remittances from household members working-mostly as laborers-in other parts of Kerala or in nearby Indian states; general laborers, who work in house compound lands, road repair, or tree cutting; and, finally, agricultural laborers who derive most of their income from plowing, transplanting, harvesting, and threshing rice.
An important problem with class analysis is that class membership is not static over time. Unlike castes, which are closed units into or out of which households do not move,8 classes are theoretically open and may experience changing membership over time. In the Nadur sample between 1971 and 1987, 32 households (20 percent) changed their class membership, with 22 moving "up" according to the income/status hierarchy we have used and 10 moving "down." In 1987, 67 households had remained in the class of their ancestor household of 1971, and 61 had moved to a class so near that we consider such movement to be "sideways."
The existence of class mobility means that, unlike caste, we cannot hold the variable (here, class) constant. At each time period, the population percentages vary, and the particular households in each class can be different even if the class population percentage is the same. In this section, we shall ignore the class mobility of individual households and focus on the population percentages and characteristics of the occupational classes as groups in the pre- and post- reform periods. In a later section, class mobility, land reform, and income mobility are considered.
With these qualifications in mind, we examine the changing patterns of land tenure by occupational class in Nadur between 1971 and 1987. First, as shown on Table 7, are the ownership patterns by class membership in 1971. As can
This content downloaded from 130.68.1.203 on Thu, 9 May 2013 13:52:49 PMAll use subject to JSTOR Terms and Conditions

LAND REFORM 99
TABLE 7 Changes in Tenure of Rice Land in Nadur Village, 1971 and 1987: Percentage of Sample Total Owned by 1971 Occupational Classes
1971 Land Tenure 1987 Percentages Land Ownership
1971 Percentage Owner- Percentage of Gain/Loss Occupational Classes of Sample Jenmy Operator Tenant Land Owned (in acres)
Landlord 1% 72% 46% 0% (2%) - 38.48 Professional 7 17 26 9 (14) - 6.28 Service 4 0 5 3 (4) .60 Craft 6 0 0 0 (1) .20 Farmer 7 8 12 5 (16) 2.17 Petty trade 15 0 5 5 (12) 4.62 Tenant 13 0 0 66 (25) 12.80 Recipient 16 2 3 11 (9) 2.98 Laborer 27 0 0 0 (6) 3.20 Agricultural
laborer 4 0 1 1 (2) .56 (Partitions) (6) - - - (9) -
Total acres 36.70 27.95 44.30 52.15 - 17.63
Note: Numbers in parentheses refer back to former categories, i.e., land held in 1987 by members of the former classes.
be seen from this table, those living off landlordism controlled most rice lands, although they were but 1 percent of the sample population. A few other house- holds with some jenmy lands were deriving most of their income from other sources, mostly professional employment. The 13 percent of the sample (N = 20) who were living mostly off tenancy held no jenmy lands and no owner- operated lands.
If we follow out the progress of these households (the two right-hand columns of Table 7), we see that by 1987 the former landlords held owner-operator title to a mere 2 percent of the rice land owned by members of the sample. This figure is shown in parentheses to indicate that it refers back to a former category. The landlord class did not exist in 1987. The 2 former landlord households lost 38.48 acres of rice land to their tenants. We also see that the former tenants gained 12.80 acres as a group, or 0.64 acres each on average. Other classes gained smaller average amounts of land.
Reversing the numbers, we can look backwards from the 1987 occupational classes, as shown on Table 8. Here a remarkably altered picture emerges. Those who were former major jenmies have joined the farmer class but have lost 34.44 acres. All other classes except recipients have gained some land,
This content downloaded from 130.68.1.203 on Thu, 9 May 2013 13:52:49 PMAll use subject to JSTOR Terms and Conditions

100 JOURNAL OF ANTHROPOLOGICAL RESEARCH
TABLE 8 Changes in Tenure of Rice Land in Nadur Village, 1971 and 1987: Percentage of Sample Total Owned by 1987 Occupational Classes
1971 Land Tenure 1987 Percentages Land Ownership
1987 Percentage Owner- Percentage of Gain/Loss Occupational Classes of Sample Jenmy Operator Tenant Land Owned (in acres)
Professional 7% (2%) (5%) (12%) 11% 2.13 Service 5 (0) (3) (12) 10 4.09 Craft 8 (0) (0) (1) 2 .90 Farmer 14 (85) (68) (21) 34 - 34.44 Petty trade 11 (0) (0) (11) 16 6.61 Recipient 18 (13) (22) (14) 17 - 2.36 Laborer 34 (0) (1) (26) 9 4.24 Agricultural
laborer 5 (0) (0) (4) 2 1.20
Total acres 36.70 27.95 44.30 52.15 - 17.63
Note: Numbers in parentheses refer back to former categories, i.e., land held in 1971 by members of the present classes.
but the craft and agricultural laborer classes have gained little. Laborers own only 9 percent of rice land for their 34 percent of the population, while agri- cultural laborers hold 2 percent with 5 percent of the households. By contrast, professionals hold 11 percent of the rice land against their 7 percent of the sample population, while service workers have 10 percent with only 5 percent of the population.
These data indicate that privileged workers such as managers, doctors, teachers, bus drivers, police, and office clerks are investing some of their stable incomes in rice land. Some petty traders may be doing the same. Land is a valuable investment in Nadur. Despite high farming costs and low farm prices, rice land means security against inflation and is probably a safer in- vestment than the savings bank or the investment pools (chitties) which a few Nadur households also try as ways to get a good return on the money they earn on the job.
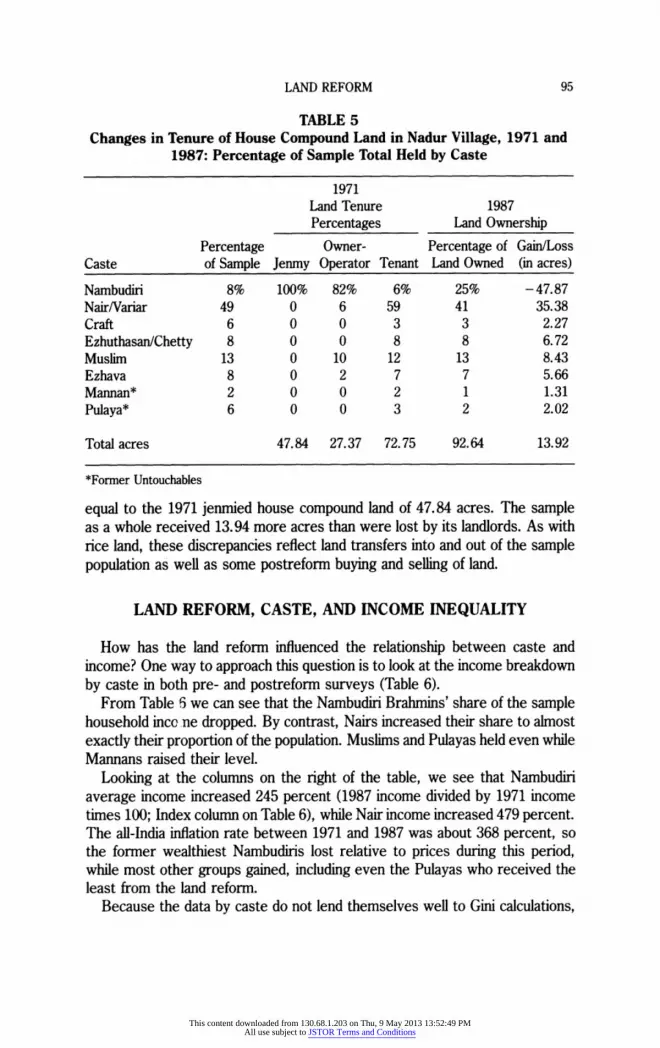
But what of the house compound land? Table 9 indicates what happened to the 1971 occupational classes. As with rice land, we see a high concentration in 1971 among the 2 landlords. Looking forward from 1971 on Table 9, we see that by 1987 the former landlords held 9 percent of the house compounds after having lost 37.63 acres through the land reform. All other groups except the professionals gained land in this category.
This content downloaded from 130.68.1.203 on Thu, 9 May 2013 13:52:49 PMAll use subject to JSTOR Terms and Conditions
LAND REFORM 101
TABLE 9 Changes in Tenure of House Compound Land in Nadur Village, 1971 and 1987: Percentage of Sample Total Owned by 1971 Occupational Classes
1971 Land Tenure 1987 Percentages Land Ownership
1971 Percentage Owner- Percentage of Gain/Loss Occupational Classes of Sample Jenmy Operator Tenant Land Owned (in acres)
Landlord 1% 70% 47% 0% (9%) - 37.63 Professional 7 27 33 7 (17) - 6.02 Service 4 0 4 3 (4) 2.79 Craft 6 0 0 3 (2) 2.27 Farmer 7 4 2 6 (7) 4.40 Petty trade 15 0 4 17 (13) 10.66 Tenant 13 0 2 15 (12) 10.81 Recipient 16 0 1 25 (13) 11.74 Laborer 27 0 7 21 (16) 12.87 Agricultural
laborer 4 0 0 3 (2) 2.05 (Partitions) (6) - - - (5) -
Total acres 47.84 27.37 72.75 92.64 13.94
Note: Numbers in parentheses refer back to former categories, i.e., land held in 1987 by members of the former classes.
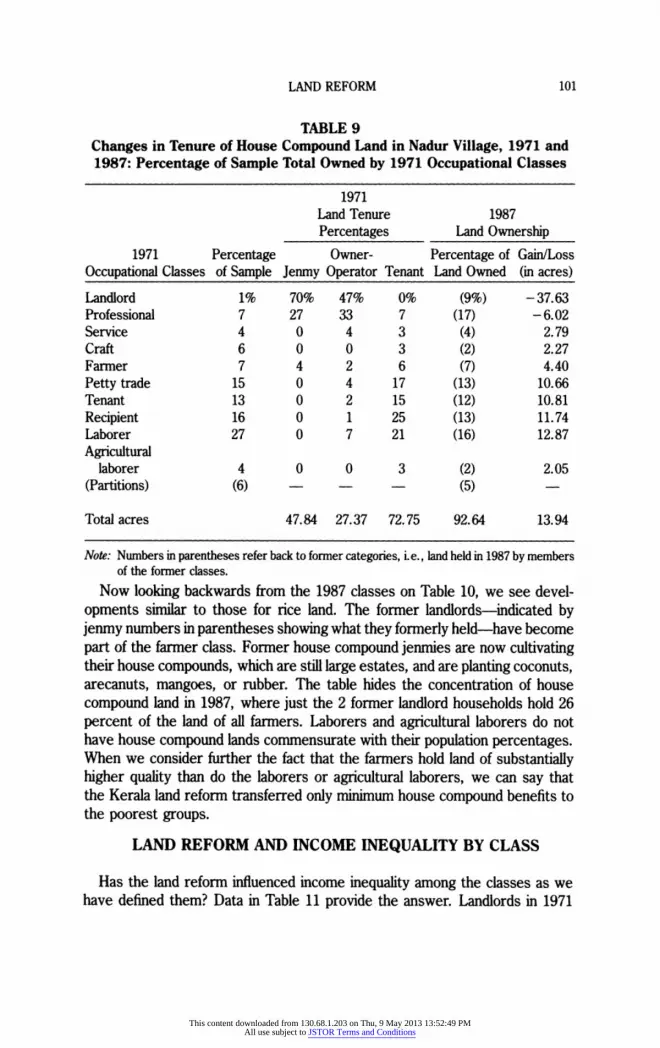
Now looking backwards from the 1987 classes on Table 10, we see devel- opments similar to those for rice land. The former landlords--indicated by jenmy numbers in parentheses showing what they formerly held-have become part of the farmer class. Former house compound jenmies are now cultivating their house compounds, which are still large estates, and are planting coconuts, arecanuts, mangoes, or rubber. The table hides the concentration of house compound land in 1987, where just the 2 former landlord households hold 26 percent of the land of all farmers. Laborers and agricultural laborers do not have house compound lands commensurate with their population percentages. When we consider further the fact that the farmers hold land of substantially higher quality than do the laborers or agricultural laborers, we can say that the Kerala land reform transferred only minimum house compound benefits to the poorest groups.
LAND REFORM AND INCOME INEQUALITY BY CLASS
Has the land reform influenced income inequality among the classes as we have defined them? Data in Table 11 provide the answer. Landlords in 1971
This content downloaded from 130.68.1.203 on Thu, 9 May 2013 13:52:49 PMAll use subject to JSTOR Terms and Conditions
102 JOURNAL OF ANTHROPOLOGICAL RESEARCH
TABLE 10 Changes in Tenure of House Compound Land in Nadur Village, 1971 and 1987: Percentage of Sample Total Owned by 1987 Occupational Classes
1971 Land Tenure 1987 Percentages Land Ownership
1987 Percentage Owner- Percentage of Gain/Loss Occupational Classes of Sample Jenmy Operator Tenant Land Owned (in acres)
Professional 7% (0%) (0)% (8%) 8% 7.06 Service 5 (0) (0) (9) 9 8.37 Craft 8 (0) (4) (6) 5 3.33 Farmer 14 (95) (78) (18) 34 - 36.34 Petty trade 11 (0) (0) (12) 11 9.12 Recipient 18 (5) (8) (20) 12 6.53 Laborer 34 (0) (8) (27) 19 15.10 Agricultural
laborer 5 (0) (2) (1) 1 .77
Total acres 47.84 27.37 72.75 92.64 13.94
Note: Numbers in parentheses refer back to former categories, i.e., land held in 1971 by members of the present classes.
had 6.5 times the sample average income. Tenants and agricultural laborers had only half of the average. By 1987 former landlord households had 1.5 times the average income. Former tenants had raised their share of total income by 14 percent, but they still had only 0.6 of the average 1987 income. Agricultural laborers raised their share of the income 43 percent, not counting welfare programs outside the land reform.
We see here, as with caste, that income once highly concentrated in a few hands has been distributed across many households so that the negative ec- onomic effects of land reform are clear at the top. The benefits are harder to measure because they are spread across a larger group of households. Nev- ertheless, the Kerala land reform has reduced class inequality by moving income from the most privileged classes to some of those lower on the hierarchy. This income redistribution can also be seen by looking at the far right-hand columns of Table 11. The 2 landlord households maintained only 88 percent of their 1971 incomes, while former tenants had, on average, 447 percent of their 1971 income, a gain of 5 times more than the former landlords.
A dramatic finding computed from the table is the ratio of income between landlords and tenants. In 1971 the landlord households had, on average, 12.6 times the incomes of their tenants; by 1987 the former landlords had only 2.5 times the income of their former tenants.9 Similar patterns obtain between the landlords and the laborer and agricultural laborer classes. At the same time,
This content downloaded from 130.68.1.203 on Thu, 9 May 2013 13:52:49 PMAll use subject to JSTOR Terms and Conditions

TABLE 11 Occupational Class and Income Inequality in Nadur Village, 1971 and 1987
Average Household Income in Rupees 1971 1987 (minus welfare)
Occupational Percentage Percentage Percentage Pecentage 1971 1987 Classes of of of of 1971 Income/Average 1987 Income/Average Gain/Loss Index
Sample Income Sample Income (rupees) Income Ratio (rupees) Income Ratio (rupees) (1971= 100)
Landlord 1.3% 8.1% 0% (1.8%) 11,135 6.5 (9,850) (1.5) (-1,285) (88)
Professional 6.9 16.3 6.5 23.6 4,067 2.4 24,792 3.7 20,725 610
Service 4.4 8.1 5.3 9.3 3,187 1.9 11,946 1.8 8,759 375
Craft 6.3 9.7 8.2 8.7 2,664 1.6 7,153 1.1 4,489 268
Farmer 6.9 4.3 13.5 12.2 1,069 0.6 6,137 0.9 5,068 574
Petty trade 15.0 13.9 10.6 10.5 1,596 0.9 6,744 1.0 5,148 423
Recipient 15.6 13.9 17.6 11.5 1,530 0.9 4,432 0.7 2,902 290
Laborer 26.9 17.1 33.5 21.4 1,092 0.6 4,280 0.6 3,188 392
Tenant 12.5 6.4 0 (7.3) 883 0.5 (3,949) (0.6) (3,066) (447)
Agricultural 4.4 2.1 4.7 3.0 824 0.5 4,291 0.6 3,467 521 laborer
Totals and 100.2 99.9 99.9 100.2 1,717 1.0 6,789 1.0 5,016 395 averages
Note: Numbers in parenthesis refer back to former categories, i.e., how much of 1987 income is held by the former landlord and tenant class households.
This content downloaded from 130.68.1.203 on Thu, 9 May 2013 13:52:49 PMAll use subject to JSTOR Terms and Conditions

104 JOURNAL OF ANTHROPOLOGICAL RESEARCH
new forms of income inequality have been created or strengthened: profes- sionals had 4.6 times the income of tenants in 1971, but by 1987 their income advantage had gone up to 6.3. Professional incomes have clearly replaced landlordism as the main source of extreme income inequality, but with three differences: (1) the new inequality is not (yet?) as great as it was with the landlordism of the past, (2) professionals do not require the direct exploitation of other members of the community as did landlords, and (3) professionals contribute to the development of the economy as teachers or government officers in ways far more useful and less parasitic than did landlords.
Income inequality has also declined in terms of rice land ownership. In 1971, owners or jenmies of 1 acre or more of rice land had incomes more than 3 times that of tenants and 3.6 times that of all nonowners. Tenants with more than 1 acre had 1.22 times the income of the landless, while smaller tenancy holders had almost exactly the average income of the landless. In 1987 those owning 1 acre or more had 1.9 times the average income of the landless, while those owning less than 1 acre had 1.05 times the income of the landless.
With house compound land almost exactly the same situation obtains. Owners or jenmies of house compounds of 1 or more acres had 3.6 times the income of nonowners in 1971, while for owners of less than 1 acre, the ratio was 1.8. In 1987 owners of the larger house compounds had 1.7 times the income of those owning less than 1 acre. With house compounds, there are no landless in Nadur.
These observations can be supported statistically with correlation coeffi- cients, as was done with the caste analysis above, and qualitatively with nar- rative data. In 1971 the 2 landlord households had incomes correlating almost 1 to 1 with each type of landholding, while in 1987 the correlation was almost - 1 in both cases. 0 The correlation of income change with land change is also about 1. For 1971, the recipient class had the highest correlation of rice land tenancy and income at 0.59*, while the 20 tenants had a figure of 0.44. In 1987 the former tenants' incomes correlated 0.57* with rice land owned and 0. 74** with house compound land owned. The correlations of change in income for the former tenants are 0.57* with change in rice land held and 0.65* with change in house compound land held. By contrast, farmers in 1971 had low correlations between land and income; those in 1987 also had low correlations, indicating the importance of nonfarm sources of income at both periods, even for those making their most important income from the land.
Petty traders had high correlations of land and income in both periods, suggesting either that they were investing profits in land for security or that returns from the land were helping put them into business. In fact, both processes were taking place, the former primarily with small Muslim shop- keepers and the latter with a couple of Nambudiri households that used past landlord incomes to start such enterprises as bottled soda distribution. Service workers also had high correlations of land ownership and income in both periods:
This content downloaded from 130.68.1.203 on Thu, 9 May 2013 13:52:49 PMAll use subject to JSTOR Terms and Conditions

LAND REFORM 105
they, too, have used the land reform as a means of security. One bus driver, for example, holds 1.69 acres of rice land and 2.45 acres of house compound, both received from the land reform. The rice land produced 2,916 rupees in 1987 before production costs, which left rice worth 1,637 rupees as profit. The house compound land contains thirty coconut trees, eight mango trees, and several other crops. The job of the household head's son as bus driver brings in 800 rupees per month, or 9,600 rupees per year, while another household member's job at a bank is worth 2,400 rupees per year. The 12,000 rupees derived from service sector employment far outweigh the income from the substantial landholdings of the household, but the land provides security and food for household consumption. This example and the correlations un- derscore the importance of the land reform not for creating a new class of small farmers dependent mostly on the land they received, but rather for spreading small amounts of rice land for security or supplementary investment among households bringing in income from many other sources.
LAND REFORM AND INCOME MOBILITY
Has Kerala's land reform significantly influenced income mobility patterns? To answer this question, we return to the income quintiles which appeared in earlier sections.
Table 12 compares the household income quintiles with rice land tenure at each survey period. As can be seen, in 1971 most jenmied and owner-operated land was held by households in the highest quintile. Correlation coefficients with income overall were 0.64** and 0.68**, respectively. Land held by ten- ants, in contrast, was rather evenly distributed across the income quintiles and had an overall correlation coefficient with income of 0.02.
In 1987 there is still a statistically significant overall correlation of 0.28** between rice land owned and household income (not counting welfare pay- ments), but it is much lower than previously. The correlation between the change in land ownership and the change in income is 0.19*.
Table 13 contains the parallel data for house compound land. Here we see very similar paitterns among the quintiles in 1971 and 1987, along with very similar correlation coefficients. The correlation of change in income with change in house compound ownership is 0.21*, very close to that for rice land.
Land owned, income, and changes in both are all strongly associated with each other. But how much income mobility has occurred among particular households and can that mobility be related to the land reform? For this analysis, we need to compare land gained or lost with the absolute and relative incomes of the household at two points in time. Simultaneously, we need to assess the relationship between changes in landholdings and in income. Comparing the position of each of the 160 households for which we have data from both surveys, we find that 52 households (32.5 percent) remained in the same
This content downloaded from 130.68.1.203 on Thu, 9 May 2013 13:52:49 PMAll use subject to JSTOR Terms and Conditions

106 JOURNAL OF ANTHROPOLOGICAL RESEARCH
TABLE 12 Changes in Tenure of Rice Land in Nadur Village, 1971 and 1987:
Percentage of Sample Total Held by Income Quintiles
1971 Land Tenure 1987 Percentages Land Ownership
Owner- Percentage of Gain/Loss Jenmy Operator Tenant Land Owned (in acres)
1971 Household Income Quintiles
Top 90% 83% 22% (32%) - 41.21 2nd 0 11 13 (13) 3.06 3rd 10 5 14 (13) .78 4th 0 1 26 (24) 11.06 5th 0 0 25 (19) 8.68
Correlation coefficient 0.64** 0.68** 0.02
1987 Household Income Quintiles
Top (80) (74) (28) 39 - 30.36 2nd (9) (7) (4) 20 3.12 3rd (3) (19) (22) 16 1.85 4th (8) (0) (14) 15 2.65 5th (0) (0) (32) 10 5.11
Correlation coefficient 0. 28*
Note: Numbers in parenthesis refer back to previous categories. Those in upper right show what percentage was owned in 1987 by members of the 1971 quintiles. Those below indicate what percentage was held in 1971 by members of the 1987 quintiles.
*Significant at the 0.01 level. **Significant at the 0.001 level.
income quintile in 1987 as in 1971. An additional 52 households moved up or down only one quintile-movement which we shall consider nonmobility. This means that 65 percent of households stayed in about the same position.
Of the remaining 56 households, 25 dropped two or more quintiles--down- ward mobility-while 31 rose two or more quintiles-upward mobility. We shall consider briefly some of the characteristics of three types of households: the former landlords, households illustrating downward mobility, and households illustrating upward mobility.
Case Studies: Two Large Landlords The largest landlord in the Nadur sample in 1971 held 32.42 acres of rice
land and 39.15 acres of house compound land. Not long before that the house- hold had held 61 acres of rice land, from which it was receiving rent of about
This content downloaded from 130.68.1.203 on Thu, 9 May 2013 13:52:49 PMAll use subject to JSTOR Terms and Conditions

LAND REFORM 107
TABLE 13 Changes in Tenure of House Compound Land in Nadur Village, 1971 and
1987: Percentage of Sample Total Held by Income Quintiles
1971 Land Tenure 1987 Percentages Land Ownership
Owner- Percentage of Gain/Loss Jenmy Operator Tenant Land Owned (in acres)
1971 Household Income Quintiles
Top 96% 81% 21% (40%) - 33.25 2nd 2 7 25 (18) 13.04 3rd 2 6 19 (12) 7.99 4th 0 1 24 (18) 15.73 5th 0 4 12 (13) 10.43
Correlation coefficient 0.68** 0.66** -0.02
1987 Household Income Quintiles
Top (73) (51) (24) 37 - 15.53 2nd (7) (11) (19) 25 15.51 3rd (18) (31) (21) 13 - 5.46 4th (2) (1) (19) 12 9.00 5th (0) (6) (17) 13 10.42
Correlation coefficient 0.16 Total 13.94
Note: Numbers in parenthesis refer back to former categories, i.e., what percentage of land was owned in 1987 by members of the quintiles of 1971, and what former percentage was held in 1971 by members of the 1987 quintiles.
**Significant at the 0.001 level.
4,500 paras (32,400 kg) of rice annually. In 1987 such a rent would have been worth 76,500 rupees, or about 1.4 times the total household income of the richest household in the sample that year. This household lost 31.42 acres of rice land and 31.35 acres of house compound land in the land reform, retaining 1 acre of rice land and 7.8 acres of house compound. The remaining rice land is farmed for subsistence, while thirty coconut trees on the house compound land produced more than two-thirds of the 1987 income. Five acres of house compound land were recently planted in rubber, which could yield big returns in the future. Although the household has lost income since the land reform, it remains in the first quintile. The splendid mansion is maintained with its seventeen rooms, verandah, and private well. The household owns four cows and several consumer items, such as a radio, electric iron, fans, and books. Two of the sons live outside Nadur, where they earn good incomes from
This content downloaded from 130.68.1.203 on Thu, 9 May 2013 13:52:49 PMAll use subject to JSTOR Terms and Conditions

108 JOURNAL OF ANTHROPOLOGICAL RESEARCH
professional work. According to its own account, this landlord-turned-farmer household has received about half the compensation owed to it from the land reform committees and former tenants. Nevertheless, it is surviving the loss of its giant rental estates and is doing well by local standards.
The other landlord household has a tragic story. In 1971 it held 7.06 acres of rice land and 7.13 acres of house compound land according to sample tenants. Its holdings had once been far more extensive, but the household head began selling off land to tenants a few years before the land reform. In 1987 the household retained 0.85 acres of house compound on which its members lived in a decaying mansion. No rice land was left, but fifty coconut trees provided income, as did payments for religious services to the household head and income from bank interest on a fund set up with the prereform sales of rice and house compound lands to tenants. After 1971, the household experienced a series of personal tragedies and business failures. One son went to work in the Middle East Gulf states and returned with a lot of money. But the tire retreading business he started failed, as did investments in a bus and taxi. Health problems also plagued several members, including the household head. Despite these personal tragedies, the household remains in the top income quintile, with an annual income of 10,000 rupees from their coconut sales and from the household head's work cooking for weddings and other formal events-a speciality of many Nambudiri former priests after land reform. Several of the adult children have advanced educations but are unemployed."1
Case Studies: Mobility and Land Looking at the cases of greatest mobility, we find that downwardly mobile
households include 2 rice land losers, 5 which gained rice land, and 18 which neither gained nor lost rice land. Among upwardly mobile households are 1 rice land loser, 16 which gained, and 14 which neither gained nor lost. Down- wardly mobile landowning households lost 0.16 acres on average; upwardly mobile households gained 0.87 acres. These figures suggest that the land reform is associated with mobility but is not its only cause. Closer examination of cases of mobility in both directions indicates the additional factors at work.
Case Studies: Downward Mobility Nine households from the top income quintile in 1971 dropped in 1987 to
the third to fifth quintiles. Two of these were Nambudiri landowners with professional incomes in 1971 and some jenmy holdings. They lost 1.8 and 2.82 acres of rice land and 0.18 and 14.88 acres of house compound land but retained 0.9 acres and 0.93 acres of rice land and 0.32 acres and 1.4 acres of house compound land, respectively. Both households experienced severe income declines from the loss of rents. In 1 household, a partition by a professional earner set up a separate household. In the other, retirement by a teacher caused a decline in income from a wage to a pension. In both these cases, we
This content downloaded from 130.68.1.203 on Thu, 9 May 2013 13:52:49 PMAll use subject to JSTOR Terms and Conditions
LAND REFORM 109
could say that the land reform has played a role in the families' decline, but in conjunction with other factors: the land reform removed the rental cushion from the households, subjecting them more directly to the unpredictable forces faced by the rest of the households in the village.
Of the remaining 7 downwardly mobile households of the top quintile, 6 were and are entirely without rice land. They experienced various downward pres- sures, such as a retiring main earner, loss of remittances from outside, partition, or replacement of a good job by a worse one.
Sixteen other households in the 1971 sample suffered downward mobility. Of these, 1 lost 2.69 acres of rice land and 0.25 acres of house compound, while 6 were among rice land gainers. These households represent a cross section of castes, and most stayed in the same occupational class or dropped one or more levels lower. Only 2 were former tenants which became farmers. One of these is the older section of a partitioned household in which the younger branch is doing well. The other is a Nair household with 0.8 acres of double- crop rice land on which it is just breaking even with production costs and producing half of the subsistence needs for its seven members. In 1971, the household head made a fair income from plowing the rice fields of others with his bullock team, but this work has been replaced by tractor plowing, which is cheaper and more effective and can be done in a greater range of weather and soil conditions. The household has begun planting vegetables for sale on its 0.6 acres of house compound land, but it has not derived much income from this.
Case Studies: Upward Mobility What of upward mobility? Six households moved from the third to the first
quintile. One lost 0.82 acres of rice land during the period between surveys and does not now engage in farming. This Nambudiri household, however, has two adult professional wage earners, both teachers at the village school, where each earns 1,000 rupees per month. In addition, the husband worked for a few years in Bombay, where he saved money. The household has built a new house recently with a water tank on the roof and one of Nadur's few indoor plumbing setups. Two other households in this group received land in the land reform. One Nair household got 0.55 acres of rice land and 0.45 acres of house com- pound. It also received 0.75 acres of low-quality one-crop rice land on which it plants vegetables and bananas. This was added to 1.45 acres already owner- operated in 1971. In 1980 the household paid 400 rupees for land transferred from two former jenmies. In the 1986-87 season, the household produced 380 paras (2,736 kg) of rice worth 6,460 rupees, of which 105 paras were sold on the market. It was one of the few households in Nadur to sell surplus rice. The after-cost value of the harvest was 5,330 rupees. The household also sold 1,500 rupees worth of vegetables and bananas. In sum, this household is clearly benefiting directly from the land reform. Much of its income increase, however,
This content downloaded from 130.68.1.203 on Thu, 9 May 2013 13:52:49 PMAll use subject to JSTOR Terms and Conditions

110 JOURNAL OF ANTHROPOLOGICAL RESEARCH
comes from remittances sent by two sons who are working in Bombay and Bahrain. Thus, while the household got most of its income from agricultural production in both 1971 and 1987, in recent years it has come to depend increasingly on remittances.
Other cases of upward mobility include a Nair household in which the husband has a job in a local court; another Nair household with four earners, two of them in white-collar jobs obtained between 1971 and 1987; and a Mannan caste household where the owners of an ayurvedic pharmacy were able to put their children into high-paying jobs as bus conductor, government supervisor, and nursing assistant while the household head became an ayurvedic physician. This household's mobility derives from special programs of the Kerala gov- ernment to promote former untouchable caste members. In Nadur the Mannans have made extensive use of these programs. The household also received 0.76 acres of rice land, on which it produced an after-cost income of 1,437 rupees, and 0.20 acres of house compound, on which the doctor's consulting office and pharmacy stand alongside a large house.
Twenty-six other households increased their incomes sufficiently to move from the fourth or fifth quintile to as high as the first. Among these households, 15 (58 percent) received rice land, including 6 who got more than 1 acre. The land reform played an important part in catapulting them upwards. Many of these households supplement their rice land and house compound gains with incomes from children whose education helped them get into government service or through other changes such as access to skilled labor training and jobs for low-caste farm workers. One such case is an Ezhava household that got 0.70 acres of rice land and 0.60 acres of house compound in the land reform. In 1987 it produced 90 paras (648 kg) of rice, from which it got a net return worth 1,222 rupees. It also has three yielding coconut trees on the house compound. The mother works as an agricultural laborer, but the main source of income is from the son who has become a tailor. A daughter is a nursing student, and one aged aunt receives a Kerala government agricultural laborer's pension. The future prospects for the household are pretty good if the nursing student finds employment. This household illustrates how the transfer of resources in the land reform combines with other processes such as education to move households upwards.
Three of the 11 Pulaya (former untouchable) caste agricultural laborer house- holds experienced upward mobility, 2 from the fifth to the second quintile and 1 from the fifth to the third. In one case, the household was able to purchase 1 acre of one-crop rice land with money saved from the labor of a household member working in a Madras tea shop. The 0.1 acre house compound contains two coconut trees, and the rice land produced 90 paras (648 kg) in 1987 for a net value of 1,065 rupees. The household continues, as in 1971, to get most of its income from plowing, field labor, and work in the house compounds of wealthier households. None of the older children have gone past the level of
This content downloaded from 130.68.1.203 on Thu, 9 May 2013 13:52:49 PMAll use subject to JSTOR Terms and Conditions

LAND REFORM 111
the village school, not even for technical training, so this household's future prospects are not as good as its recent mobility might imply.
The other two Pulaya cases of upward mobility are completely unrelated to land ownership. Both households received very small amounts of house com- pound land but have increased their incomes through higher wages. Eight of the 11 Pulaya households did not move up. They benefited the least among all the castes in Nadur from the land reform.
The biggest single gainer in the land reform in Nadur was an Ezhuthasan household that received 2.8 acres of rice land and 2.24 acres of house com- pound. The land was transferred partly in 1973 and partly in 1975, after which the father died leaving the land reform benefits to his son. Despite its extent, the house compound has only four coconut trees because the land is rocky and not well watered. On the 2.8 acres of double-crop rice land, the household produced 440 paras (3,168 kg) in 1986-87, of which 105 paras (756 kg) were sold, the remainder being used for local consumption worth 8,310 rupees. Without the land reform, 2,767 rupees would have gone to rent. In addition to this, the household runs a road repair contracting business that brings in 10,000 rupees per year. The household has moved from farmer to petty trade class membership. Through abolition of tenancy and investment in a lucrative small business, the household moved from the fourth to the first quintile.
CONCLUSIONS
At the beginning of this paper, we posed six questions about Kerala's land reform. The Nadur data offer some tentative answers.
Can land reform actually redistribute land from the biggest owners to small- holders and the landless? Kerala's land reform failed to implement the ceiling provisions over large areas. In Nadur, abolition of rice land tenancy, however, resulted in the transfer of 52.25 acres of land from 2 large landlords and 5 smaller jenmies (4 percent of the sample) to 47 tenants (29 percent) who became fully entitled smallholders. Not affected by the rice land reform were 103 landless households (64 percent).
The abolition of house compound tenancy benefited 92 percent of the sample households. Rights to 47.87 acres were transferred to 156 households. How- ever, the poorest laboring families gained title only to small and often inferior plots.
Can land reform reduce income inequality? In Nadur, the Gini index for rice land ownership inequality dropped 13 points and that for house compound land dropped by 39 points between the two surveys. During the same sixteen-year period, the Gini index for income inequality declined by 5.3 points. Although forces outside the land reform pulled towards both greater and less inequality, land reform must have caused much of this decline in income inequality. Now
This content downloaded from 130.68.1.203 on Thu, 9 May 2013 13:52:49 PMAll use subject to JSTOR Terms and Conditions

112 JOURNAL OF ANTHROPOLOGICAL RESEARCH
that the reform is complete, small landowners have the difficult task of pro- ducing enough income from their plots to keep pace with rising professional and other incomes; otherwise the effects of the reform will be swallowed up in the next generation.
Can land reform avoid ruining those at the top? Nadur's Nambudiri caste landlord households adopted effective strategies to survive the land reform and maintain their high incomes. Some sold land to tenants before the reform to acquire capital for investment in other undertakings. All got their children into higher education to make professional employment the chief landlord response to the reform. This response has benefited Nadur because formerly parasitic landlords have become teachers, administrators, and small business people who contribute to the economy in ways their ancestors did not.
Can land reform undermine rigid social categories such as caste and class? In Nadur, a reduction in caste inequality is one of the clearest consequences of the land reform. The Nambudiri Brahmin hold on land and high incomes has been broken. The land basis for caste inequality and caste exploitation has been entirely eliminated by the land reform. Brahmin incomes have risen far less rapidly than those of other castes. Nair and Mannan caste households have gained the most, while the lowest caste Pulayas have raised their relative position only slightly. Mannans and Pulayas probably have gained more from programs outside the land reform, such as affirmative action. The political conditions for these programs, however, were fostered by the power of tenants and their allies in the land reform movement. Land reform struggles reinforced the leverage of these lowest caste groups and allowed them to move upwards economically.
Nadur's class structure has been altered dramatically by the elimination of landlord and tenant classes. Former landlords dropped from garnering 6.5 times the sample average income to 1.5 times the average. Former tenants did not gain much on average, but several occupational groups slightly improved their economic position. Professionals raised their share of income from 2.4 to 3.7 times the sample average in the land reform period. Households depending primarily on farming raised their relative share of income from 60 percent of the average to 90 percent. Land reform played an important, but not exclusive, role in these class changes.
Can land reform increase social and economic mobility? In Nadur, upward mobility occurred in 16 households that gained land but in only 1 that lost land. Downwardly mobile households included 2 that lost land and 5 that gained. Many other factors interacted with the reform to influence mobility. These include access to highly paid wage labor, age and health of household head, number of wage earners in the household, and access to affirmative action programs. Land reform in Nadur helped foster upward mobility in combination with other social and economic processes.
This content downloaded from 130.68.1.203 on Thu, 9 May 2013 13:52:49 PMAll use subject to JSTOR Terms and Conditions

LAND REFORM 113
Can land reform reduce exploitation of the poor by the rich? One of the most effective components of Kerala's land reform has been the elimination of land- lords' threats of eviction of tenants from either rice land or house compounds (Kannan 1988:256). The success of the land reform, however, has produced new tensions. In place of the struggle between tenants and landlords, former tenants are now at odds with their hired agricultural laborers (Herring 1989). Where once the poor were pitted against the rich, now the poor are pitted against the slightly less poor.
Problems for Future Research Problems for future research concern trends in land use and agricultural
productivity. From 1974 to 1983, the amount of land devoted to rice production in Kerala declined by 16 percent from 881,000 hectares to 740,000 hectares (George and Mukherjee 1986:7). Much of the lost rice land was planted in coconuts, which were relatively more valuable during that period (George and Mukherjee 1986:49, 74-75).
From 1986 to 1989 this trend continued. Coconuts replaced rice as the crop taking the largest amount of cultivable land in Kerala (Government of Kerala 1990:38). At the farm level, these data indicate that Kerala's post-land reform producers are responding to relative price and cost incentives to maximize individual incomes. At the state level, the decline in rice production poses policy problems. Rice not produced in Kerala must be purchased elsewhere. The long-term implications of this cropping trend, along with the new post- land reform labor relations at the village level, constitute important subjects for future research.
NOTES
1. The research on which this article is based was financed by National Science Foundation Grant no. BNS 85 18440, by released time for research grants from Mont- clair State College, and through the collaboration of the Centre for Development Studies in Trivandrum (now known as Thiruvanandapuram), Kerala, which provided us with facilities to conduct the study. Barbara H. Chasin, professor of sociology at Montclair State College, served as coresearcher. We benefited from the excellent research as- sistance of Nadur residents M. Subramanian Nambudiri and M.S. Ravikumar Nambudiri. The former had also been in charge of gathering data for Joan Mencher's 1971 survey of the households. Further expert research assistance came from Sreekumari M.G. of Calicut, who worked with us in Nadur from February to July 1987. Local market prices were gathered by Ramkumar Nambudiri. Data entry was accomplished by Mira A. Franke and Lorraine Zaepfel. Statistical advice came from Professor Gilbert Klajman of the Department of Sociology, Montclair State College. Helpful comments on this manuscript were offered by Stephen Rosskamm Shalom, Ronald Herring, and Barbara H. Chasin, as well as by JAR's anonymous reviewers.
2. Dr. Mencher's offer of her data is one of the highest forms of collegiality, for
This content downloaded from 130.68.1.203 on Thu, 9 May 2013 13:52:49 PMAll use subject to JSTOR Terms and Conditions

114 JOURNAL OF ANTHROPOLOGICAL RESEARCH
which we are extremely grateful. Naturally, her sharing of the 1971 survey does not necessarily indicate her agreement with any of our methods or findings. A map of the Nadur census block appears in Mencher (1966:140).
3. The Gini index expresses the difference over a whole population between perfect equality (each household has the same income, G = 0) and perfect inequality (one household has all the income, G = 1). Following a common practice, we present the Gini as a number between 0 and 100. The closer to 100, the more unequal; the closer to 0, the more equal. For a formal statistical definition and discussion, see Jenkins (1991:15); for a calculation example not requiring statistical sophistication, see Smith (1979:364-65).
4. The other programs include fair price food shops, agricultural laborer pensions, unemployment insurance, school lunches, infant and pregnant women's feeding pro- grams, house construction for landless laborers, and affirmative action (reservation) policies to benefit the lowest castes (Franke and Chasin 1989).
5. For the 1987 survey we have respondent data on costs and output which are factored into the 1987 income data. An input-output analysis of post-land reform ag- riculture in Nadur is planned.
6. The larger study in preparation indicates that the Gini index for income inequality declined by 0.6 points from welfare payments such as agricultural workers' pensions, by 0.4 points from free school lunches, and by 1.4 points from the redistributive effects of the fair price shop for food. Overall the Gini dropped 8.3 points, or 16.4 percent, between 1971 and 1987, with more than half this decline accounted for by the combined effects of the land reform and higher wages.
7. Following common statistical practice, we add a single asterisk for significance at the 0.01 level and two asterisks for significance at the 0.001 level. However, strength of the association may be more informative than significance levels.
8. Intercaste marriages do not turn up in the Nadur sample households. 9. Herring (1983:182) cites Kerala government statistics indicating that landlords
averaged only 2.6 times the income of their tenants in the mid-1960s. Those statistics may greatly underestimate the advantage of the landlords, who probably could hide much of their income to researchers doing large-scale surveys.
10. In 1971 the correlation of rice land owned or jenmied with house compound land owned or jenmied was 0.9498**, while for rice land tenancies and house compound tenancies, it was only 0.1766. In 1987 the correlation of house compound with rice land was 0.3786**.
11. Saradamoni (1983:88) offers the case of a Nambudiri widow apparently ruined by the reform, but her example shows that other forces were at work as well. According to the widow's account, her sons had left the village and were not sending any money. Chasin (1990) gives a more comprehensive view on the relation between the land reform and women's work and roles.
REFERENCES CITED
Chasin, B. H., 1990, Land Reform and Women's Work in a Kerala Village. Michigan State University, Working Papers on Women in International Development no. 207. East Lansing.
This content downloaded from 130.68.1.203 on Thu, 9 May 2013 13:52:49 PMAll use subject to JSTOR Terms and Conditions

LAND REFORM 115
Franke, R.W., and B.H. Chasin, 1989, Kerala: Radical Reform as Development in an Indian State. San Francisco: Institute for Food and Development Policy.
George, P.S., 1979, Public Distribution of Foodgrains in Kerala: Income Distribution Implications and Effectiveness. International Food Policy Research Institute, Research Report 7. Washington, D.C.
George, P.S., 1982, Agricultural Price Movements in Kerala. Pp. 142-57 in Agri- cultural Development in Kerala (ed. by P.P. Pillai). New Delhi: Agricole Publishing Company.
George, P.S., and C. Mukherjee, 1986, Rice Economy of Kerala: A Disaggregate Analysis of Performance. Centre for Development Studies, Working Paper no. 213. Trivandrum, India.
Government of Kerala, 1988, Economic Review: 1987. Trivandrum, India: State Planning Board.
Government of Kerala, 1989, Economic Review: 1988. Trivandrum, India: State Planning Board.
Government of Kerala, 1990, Economic Review: 1989. Trivandrum, India: State Planning Board.
Herring, R.J., 1980, Abolition of Landlordism in Kerala: A Redistribution of Privilege. Economic and Political Weekly 15(26):A59-69.
Herring, R.J., 1983, Land to the Tiller: The Political Economy of Agrarian Reform in South Asia. New Haven, Conn.: Yale University Press.
Herring, R.J., 1989, Dilemmas of Agrarian Communism: Peasant Differentiation, Sectoral and Village Politics. Third World Quarterly 11(1):89-115.
Jenkins, S., 1991, The Measurement of Income Inequality. Pp. 3-38 in Economic Inequality and Poverty: International Perspectives (ed. by L. Osberg). Armonk, N.Y.: M.E. Sharpe, Inc.
Kannan, K.P., 1988, Of Rural Proletarians: Mobilization and Organization of Rural Workers in South-West India. Delhi: Oxford University Press.
Mencher, J., 1966, Kerala and Madras: A Comparative Study of Ecology and Social Structure. Ethnology 5(2):135-71.
Mukherjee, C., 1979, Lorenz Ratios for Distribution of Rural Ownership and Op- erational Land Holdings, India, 1971-72. Centre for Development Studies, Working Paper no. 94. Trivandrum, India.
Oomen, T.K., 1985, From Mobilization to Institutionalization: The Dynamics of Agrarian Movement in Twentieth-Century Kerala. Bombay: Popular Prakashan.
Paulini, T., 1979, Agrarian Movements and Reforms in India: The Case of Kerala. Saarbriicken, Ger.: Verlag Breitenbach.
Radhakrishnan, P., 1989, Peasant Struggles, Land Reforms, and Social Change: Malabar, 1836-1982. New Delhi: Sage Publications
Sankaranarayanan, K.C., and V. Karunakaran, 1985, Kerala Economy. Delhi: Oxford University Press.
Saradamoni, K., 1981, Divided Poor: Study of a Kerala Village. Delhi: Ajanta Books. Saradamoni, K., 1982, Women's Status in Changing Agrarian Relations: A Kerala
Experience. Economic and Political Weekly 17(5):155-62. Saradamoni, K., 1983, Changing Land Relations and Women: A Case Study of Palghat
District, Kerala. Pp. 33-171 in Women and Rural Transformation: Two Studies (ed. by R. Mehra and K. Saradamoni). New Delhi: Concept Publishing Company.
This content downloaded from 130.68.1.203 on Thu, 9 May 2013 13:52:49 PMAll use subject to JSTOR Terms and Conditions

116 JOURNAL OF ANTHROPOLOGICAL RESEARCH
Sathyamurthy, T.V., 1985, India Since Independence: Studies in the Development of the Power of the State, vol. 1: Centre-State Relations, the Case of Kerala. Delhi: Ajanta.
Slater, G., 1918, Some South Indian Villages. University of Madras Economic Studies 1. Madras, India.
Smith, D.M., 1979, Where the Grass is Greener: Living in an Unequal World. Baltimore, Md.: Johns Hopkins University Press.
Tharamangalam, J., 1981, Agrarian Class Conflict: The Political Mobilization of Ag- ricultural Labourers in Kuttanad, South India. Vancouver: University of British Columbia Press.
United Nations, 1975, Poverty, Unemployment and Development Policy: A Case Study of Selected Issues with Reference to Kerala. United Nations Department of Economic and Social Affairs, Document ST/ESA/29. New York.
Varghese, T. C., 1970, Agrarian Change and Economic Consequences: Land Tenures in Kerala, 1850-1960. Bombay: Allied Publishers.
This content downloaded from 130.68.1.203 on Thu, 9 May 2013 13:52:49 PMAll use subject to JSTOR Terms and Conditions