Embed Size (px)
Citation preview

LAKE TAHOE GOLF COURSE ECONOMIC FEASIBILITY ANALYSIS
HANSFORD ECONOMIC CONSULTING
A Report Prepared For:
The Upper Truckee River Restoration and Golf Course Reconfiguration Project
September 8, 2008 HEC Project #60631
DRAFT Environmental Impact Report (EIR) / Environmental Impact Statement (EIS)/EIS


HANSFORD ECONOMIC CONSULTING Regional and Resource Economics
CCOONNTTAACCTT IINNFFOORRMMAATTIIOONN
LLaakkee TTaahhooee GGoollff CCoouurrssee EEccoonnoommiicc FFeeaassiibbiilliittyy AAnnaallyyssiiss
September 8, 2008
This report was prepared by Hansford Economic Consulting (HEC), under subcontract to EDAW, Inc. This report (HEC Project No. 60631) was prepared to accompany the Draft Environmental Impact Report (EIR)/Environmental Impact Statement (EIS)/EIS for the ‘Upper Truckee River Restoration and Golf Course Reconfiguration Project, Lake Valley State Recreation Area and Washoe Meadows State Park, Meyers’, a joint project of the Tahoe Regional Planning Agency, California State Parks, and the United States Department of the Interior, Bureau of Reclamation. EDAW, Inc. is responsible for preparation of the complete Draft EIR/EIS/EIS. The analyses, opinions, and findings contained within this report are based on primary data provided by responsible parties, as well as additional research documents available as of the date of this report. Updates to information obtained for this report could change or invalidate the findings contained herein. The contents of this report are based, in part, on data from secondary sources. While it is believed that these sources are accurate, this is not guaranteed. The findings presented in this report are limited to documentation necessary in the EIR/EIS/EIS process for aiding in planning decisions. This report should not be relied upon as sole input for decision-making; it should be utilized strictly for the purposes of the scope and objectives of the commissioned study. Questions regarding information contained within this report should be directed to: Catherine Hansford Hansford Economic Consulting PO Box 10384 Truckee, CA 96162 Ph: 530 412 3676 [email protected]


Prepared by HEC Page i September 8, 2008 HEC Project #60631
TTAABBLLEE OOFF CCOONNTTEENNTTSS
SECTION 1: INTRODUCTION AND SUMMARY FEASIBILITY FINDINGS ........ 1
INTRODUCTION ........................................................................................ 1
KEY FEASIBILITY FINDINGS ............................................................................ 3
SECTION 2: PROJECT OVERVIEW AND STUDY APPROACH .......................... 10
PROJECT OVERVIEW ................................................................................ 10
FEASIBILITY ANALYSIS APPROACH ................................................................. 16
METHODOLOGY ..................................................................................... 18
SECTION 3: BASE DATA .................................................................................... 19
FACILITY USE ......................................................................................... 19
REVENUES ............................................................................................ 20
EXPENDITURES ....................................................................................... 23
SECTION 4: COMPETITIVE MARKET ANALYSIS ............................................. 26
NATIONAL GOLF TRENDS .......................................................................... 26
GOLF PLAY AND EVENTS AT LAKE TAHOE GOLF COURSE ..................................... 28
2007 STATE PARKS SURVEY ........................................................................ 28
COMPETITIVE GOLF COURSES (SCENARIOS 1A AND 1B) ....................................... 32
NON-TRADITIONAL LENGTH GOLF COURSES (SCENARIO 2) .................................. 38
MARKET ANALYSIS FINDINGS....................................................................... 43
SECTION 5: FINANCIAL FEASIBILITY ANALYSIS ............................................ 44
FEASIBILITY MODEL GENERAL ASSUMPTIONS .................................................... 44
ESTIMATED REVENUES BY ECONOMIC SCENARIO ............................................... 48
ECONOMIC SCENARIO 3 POTENTIAL ADDITIONAL REVENUES ................................. 51
ESTIMATED EXPENSES BY ECONOMIC SCENARIO ................................................ 53
FINANCIAL FEASIBILITY FINDINGS .................................................................. 55
SECTION 6: IMPACTS ON THE SOUTH LAKE TAHOE ECONOMY.................. 60
IMPACT ON SOUTH SHORE ECONOMY FINDINGS ................................................ 62
DETAILED MODEL ANALYSIS PRESENTED IN APPENDIX D ...................................... 63
BIBLIOGRAPHY ................................................................................................ 66
AAPPPPEENNDDIICCEESS
APPENDIX A: LTGC Historic Financial Performance Support Tables APPENDIX B: 2007 State Parks Survey Questionnaire and Interviewee Comments APPENDIX C: Descriptions of Competitor Courses for Scenarios 1A and 1B APPENDIX D: LTGC Economic Impacts on South Lake Tahoe Support Tables

Prepared by HEC Page ii September 8, 2008 HEC Project #60631
LLIISSTT OOFF TTAABBLLEESS
Table 1: Summary of Economic Scenarios ......................................................... 2
Table 2: Estimated Revenues and Expenditures by Scenario ................................... 3
Table 3: Summary of Direct LTGC Economic Impacts by Scenario ........................... 4
Table 4: Summary of South Shore Economy Impacts by Scenario ............................. 6
Table 5: LTGC Gross Revenues by Calendar Year ............................................. 13
Table 6: LTGC Gross Revenue and Rent to State Parks in 2007 Dollars ................... 15
Table 7: Base Data – Annual Facility Use ........................................................ 20
Table 8: Base Data – Annual Revenues .......................................................... 22
Table 9: Snowmobile Revenues and Sublease Payments ...................................... 24
Table 10: Base Data – Annual Expenditures .................................................... 25
Table 11: National Golf Trends Implications for LTGC ...................................... 27
Table 12: Summary Statistics from 2007 State Parks Survey ................................. 29
Table 13: Origination and Mode of Transportation of LTGC Visitors ...................... 34
Table 15: Green Fees at Competitor Courses ................................................... 36
Table 14: Competitive Courses (Scenarios 1A and 1B) ....................................... 37
Table 16: Number of Rounds and Green Fees Data for Scenario 2 Comparison Courses 39
Table 17: National Golf Course Supply .......................................................... 39
Table 18: Golf 20/20 Report Findings and Implications for Scenario 2 .................... 42
Table 19: General Assumptions used for Projecting Revenues and Expenses .............. 45
Table 20: Estimated Employees by Economic Scenario ....................................... 47
Table 21: Revenue Multipliers Used to Project Revenues by Scenario ..................... 49
Table 22: Projected Revenues by Scenario ...................................................... 49
Table 23: Estimated Potential Additional Event Facility Revenue ........................... 52
Table 24: Expense Multipliers used to Project Expenses by Scenario ....................... 53
Table 25: Projected Expenditures by Economic Scenario ..................................... 57
Table 26: Net Revenues and Payments to State Parks by Scenario .......................... 59
Table 27: Visitation, Spending, Earnings and Jobs by Scenario .............................. 61
Table 28: Sales Tax, Property Tax and Transient Occupancy Taxes by Scenario ......... 62

Prepared by HEC Page iii September 8, 2008 HEC Project #60631
LLIISSTT OOFF MMAAPPSS
Map 1: Public Golf Courses in the Region ....................................................... 33
Map 2: Location of Scenarios 1A and 1B Competitor Golf Courses ......................... 35
Map 3: Location of Scenario 2 Comparison Non-traditional Length Golf Courses ....... 41
LLIISSTT OOFF FFIIGGUURREESS
Figure 1: LTGC Gross Revenues by Calendar Year, 1995 – 2006 .......................... 11
Figure 2: Concessionaire Percent of Annual Gross Revenues by Month .................... 14
Figure 3: Winter and Summer Operations Gross Revenues, 1995 - 2006 ................. 14
Figure 4: Survey Responses – Reasons for Choosing LTGC .................................. 30
Figure 5: Survey Responses - Preference for Golf Course Type and Layout ............... 31
Figure 6: Estimated Income to State Parks ...................................................... 58

Prepared by HEC Page 1 September 8, 2008 HEC Project #60631
SSEECCTTIIOONN 11:: IINNTTRROODDUUCCTTIIOONN AANNDD SSUUMMMMAARRYY
FFEEAASSIIBBIILLIITTYY FFIINNDDIINNGGSS
IINNTTRROODDUUCCTTIIOONN This economic feasibility analysis for Lake Tahoe Golf Course (LTGC) is a separate companion document to the Upper Truckee River Restoration and Golf Course Reconfiguration Project (UTRGCR) environmental document. The environmental document for this project includes an Environmental Impact Report (EIR) for the California Department of Parks and Recreation (State Parks) pursuant to the California Environmental Quality Act (CEQA), an Environmental Impact Statement (EIS) for the U.S. Bureau of Reclamation (Reclamation) pursuant to the National Environmental Policy Act (NEPA), and an EIS to meet the Tahoe Regional Planning Agency (TRPA) Code of Ordinances requirements. It is described herein as an EIR/EIS/EIS or environmental document. Objectives of the UTRGCR project that relate to the golf course include:
A. Improve the golf course layout, infrastructure, and management to reduce the environmental impact of the golf course on the river‟s water quality and riparian habitat by integrating environmentally-sensitive design concepts.
B. Maintain golf recreation opportunity and quality of play.
C. Maintain revenue level of the golf course to State Parks.
D. In the stream environment zone, reduce the area occupied by the golf course and improve the quality and increase the extent of riparian and meadow habitat.
The purpose of the analysis contained within this report is to study the feasibility of continued operations at Lake Valley State Recreation Area (SRA) both with and without a golf course, which may occur as a result of river restoration, in light of the objectives stated above. The analysis examines three scenarios for configurations of the golf course, as described below. It addresses the revenue and operating expenditures of each scenario, as well as the changes in revenues to be received by State Parks, changes in revenues received by the concessionaire, and economic impacts within the surrounding community (which, for purposes of this study, is the South Shore portion of the Lake Tahoe Basin).
LLaakkee TTaahhooee GGoollff CCoouurrssee ((LLTTGGCC)) The LTGC is on State Parks-owned property within the Lake Valley SRA. It is located in the community of Meyers just south of the City of South Lake Tahoe on the west side of U.S. Highway 50 (US 50) and State Route 89 (SR 89). The area is part of the South Shore portion of the Lake Tahoe Basin. The golf course is an 18-hole regulation-play golf course

Prepared by HEC Page 2 September 8, 2008 HEC Project #60631
operated by American Golf Corporation through a concession contract with State Parks. The golf course is situated on the valley floor with holes on both sides of the Upper Truckee River. The mountains of the Desolation Wilderness area of the Sierra Nevada provide a picturesque backdrop to the scenic golf course. There are three golf course economic scenarios studied in the economic feasibility model for LTGC:
1. An 18-hole regulation golf facility (with two sub-options, one of which includes the potential changes to course layout),
2. A reduced-play area (non-traditional length) course with all golf located on the east side of the river. This scenario is modeled with a range of potential green fees resulting in a low to high range of financial projections, and
3. No golf course, but with retention of the clubhouse for an events facility.
It is important to distinguish that EIR/EIS/EIS analyses are referred to as „Alternatives‟ and economic analyses are referred to as „Scenarios‟. The reason for these different labels is that more than one environmental alternative can be captured under one economic scenario. Table 1 shows how the environmental alternatives correspond to the economic scenarios being examined in this report. Table 1: Summary of Economic Scenarios
Scenario
River
Restoration Golf Course Golf Course Layout Snowmobiling
1A (Base Case) NO 18-hole regulation No change Yes 1 No Action
1B YES 18-hole regulation No change /
relocation of 7 or 8
holes west of river
Yes 2, 4 Stabilize in place or
full river restoration
2 YES Non-traditional
(18-hole
executive, 9-hole,
or par 3)
All golf east of river Yes 3 Full river restoration
3 YES No golf course No course; clubhouse
operates as an event
facility
No 5 Full river restoration
EIR Alternative(s)

Prepared by HEC Page 3 September 8, 2008 HEC Project #60631
KKEEYY FFEEAASSIIBBIILLIITTYY FFIINNDDIINNGGSS This report makes the following key findings and observations:
DDiirreecctt LLTTGGCC FFiinnaanncciiaall IImmppaaccttss Revenues and expenditures projected for each economic scenario are shown in Table 2. There are four columns of results shown under Scenario 2. These columns model a range of potential number of rounds played and green fees achieved at a reduced-play area golf course. These two variables are the key drivers of financial feasibility under Scenario 2. In summary:
Operation of LTGC with a reconfigured 18-hole regulation course is estimated to be feasible (i.e., golf course revenue would exceed operating expenditures after making concession payments to State Parks),
A reduced-play area course is estimated to be infeasible under all but the most optimistic of circumstances. A reduced-play area course would not meet Objectives B and C of the project regarding retention of regulation-quality play and maintenance of golf revenue.
Operation of Lake Valley SRA clubhouse for events only is estimated to be infeasible, even if the number of events is doubled per year. Concessionaire operations would have to cease because operating expenditures would exceed revenues.
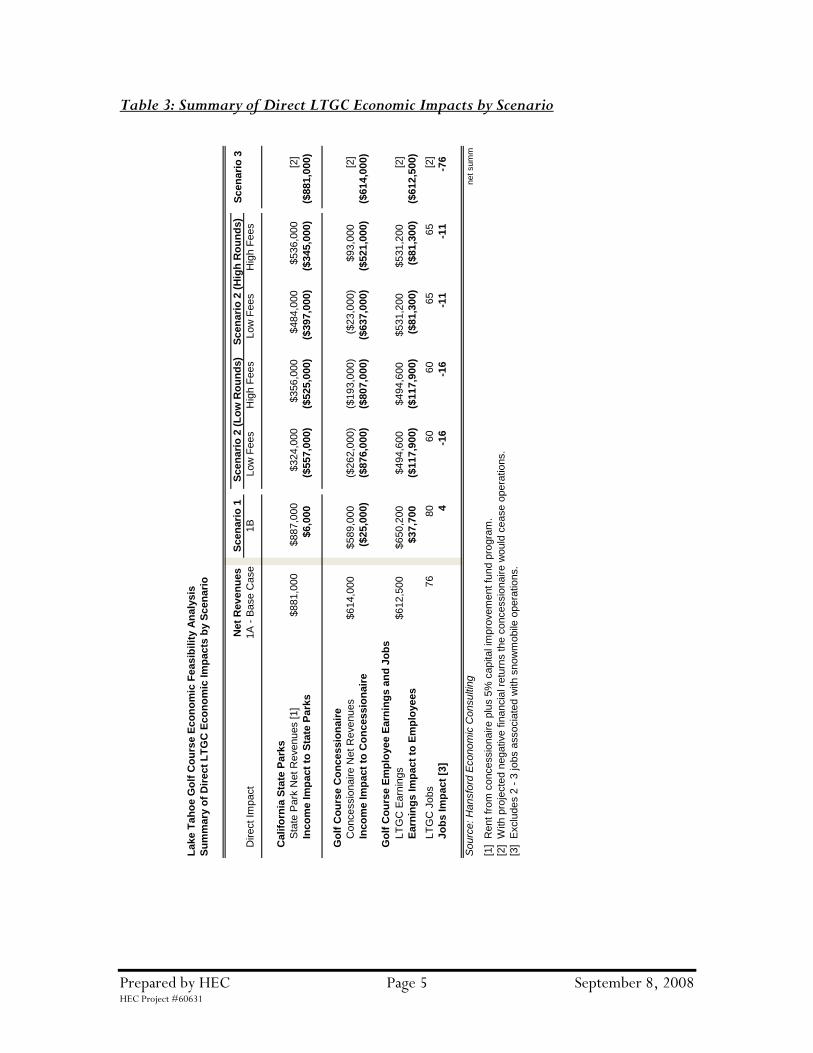
A summary of direct financial impacts, including revenues and earnings, and number of jobs caused by reconfigurations to the layout of, and changes in the operations of LTGC are shown in Table 3. Estimated impacts include:
Potential annual loss of income (rent and capital improvement program fund) to State Parks from decommissioning and removing the LTGC of $881,000.
A reduced-play area (non-traditional length) course at LTGC is most likely financially infeasible because the concessionaire would have a negative cash flow after making payments to State Parks. If the reconfigured golf course can achieve more than 25,000 rounds annually and command green fees above the median rack rate for comparable Tahoe non-traditional length facilities, it may be financially feasible; however, the concessionaire‟s net revenues would be marginal, making the golf course susceptible to closure.

Prepared by HEC Page 4 September 8, 2008 HEC Project #60631
Table 2: Estimated Revenues and Expenditures by Scenario
Lake T
ah
oe G
olf
Co
urs
e E
co
no
mic
Feasib
ilit
y A
naly
sis
Su
mm
ary
LT
GC
Rev
en
ues a
nd
Exp
en
dit
ure
s b
y E
co
no
mic
Scen
ari
o
Revenue o
r E
xpense
1A
- B
ase C
ase
1B
Low
Fees
Hig
h F
ees
Low
Fees
Hig
h F
ees
[1]
Estim
ate
d R
evenues
$2,7
89,0
00
$2,8
09,0
00
$1,0
27,0
00
$1,1
28,0
00
$1,5
30,0
00
$1,6
98,0
00
$256,0
00
Scenario 3
Pote
ntial E
vent R
evenues
$131,0
00
To
tal E
sti
mate
d R
ev
en
ues
$2,7
89,0
00
$2,8
09,0
00
$1,0
27,0
00
$1,1
28,0
00
$1,5
30,0
00
$1,6
98,0
00
$387,0
00
Estim
ate
d E
xpenditure
s$1,2
94,0
00
$1,3
33,0
00
$965,0
00
$965,0
00
$1,0
69,0
00
$1,0
69,0
00
$461,0
00
Rev
en
ues less E
xp
en
dit
ure
s$1,4
95,0
00
$1,4
76,0
00
$62,0
00
$163,0
00
$461,0
00
$629,0
00
($
74,0
00)
Paym
ents
to S
tate
Park
s (
Rent and C
IP)
[2]
$881,0
00
$887,0
00
$324,0
00
$356,0
00
$484,0
00
$536,0
00
[3
]
Net
Co
ncessio
nair
e R
ev
en
ues
$614,0
00
$589,0
00
($
262,0
00)
($193,0
00)
($23,0
00)
$93,0
00
($
74,0
00)
Sourc
e: H
ansfo
rd E
conom
ic C
onsultin
gltgc s
um
[1] B
ase C
ase d
ata
uses a
vera
ge o
f ye
ars
2003 -
2006.
[2] B
ase C
ase p
aym
ents
to S
tate
Park
s d
iffe
rs f
rom
Table
6 d
ue to the d
iscontinuation o
f th
e N
ike L
earn
ing C
ente
r.
[3] W
ith p
roje
cte
d n
egative f
inancia
l re
turn
s the c
oncessio
naire w
ould
cease o
pera
tions. T
his
result w
ould
be e
xacerb
ate
d b
y incre
ased e
xpenditure
s
associa
ted w
ith incre
ased e
vents
, w
hic
h is n
ot re
flecte
d in this
table
.
Scen
ari
o 2
(L
ow
Ro
un
ds)
Scen
ari
o 2
(H
igh
Ro
un
ds)
Scen
ari
o 1
Scen
ari
o 3
Prepared by HEC Page 5 September 8, 2008 HEC Project #60631
Table 3: Summary of Direct LTGC Economic Impacts by Scenario
La
ke
Ta
ho
e G
olf
Co
urs
e E
co
no
mic
Fe
as
ibil
ity A
na
lys
is
Su
mm
ary
of
Dir
ect
LT
GC
Ec
on
om
ic I
mp
acts
by S
cen
ari
o
Ne
t R
ev
en
ue
sS
cen
ari
o 1
Dire
ct
Imp
act
1A
- B
ase
Case
1B
Low
Fe
es
Hig
h F
ee
sL
ow
Fe
es
Hig
h F
ee
s
Ca
lifo
rnia
Sta
te P
ark
s
Sta
te P
ark
Ne
t R
eve
nu
es [
1]
$881,0
00
$887,0
00
$324,0
00
$356,0
00
$484,0
00
$536,0
00
[2
]
Inc
om
e I
mp
act
to S
tate
Pa
rks
$6,0
00
($
55
7,0
00
)
($52
5,0
00
)
($39
7,0
00
)
($34
5,0
00
)
($88
1,0
00
)
Go
lf C
ou
rse C
on
ces
sio
na
ire
Co
nce
ssio
na
ire
Net
Re
ve
nu
es
$614,0
00
$589,0
00
($
26
2,0
00
)
($19
3,0
00
)
($23
,00
0)
$93,0
00
[2
]
Inc
om
e I
mp
act
to C
on
ces
sio
na
ire
($25
,00
0)
($
87
6,0
00
)
($80
7,0
00
)
($63
7,0
00
)
($52
1,0
00
)
($61
4,0
00
)
Go
lf C
ou
rse E
mp
loye
e E
arn
ing
s a
nd
Jo
bs
LT
GC
Ea
rnin
gs
$612,5
00
$650,2
00
$494,6
00
$494,6
00
$531,2
00
$531,2
00
[2
]
Ea
rnin
gs
Im
pa
ct
to E
mp
loye
es
$37,7
00
($
11
7,9
00
)
($11
7,9
00
)
($81
,30
0)
($
81
,30
0)
($
61
2,5
00
)
LT
GC
Jo
bs
76
80
60
60
65
65
[2]
Jo
bs
Im
pa
ct
[3]
4
-16
-1
6
-1
1
-1
1
-7
6
So
urc
e: H
an
sfo
rd E
co
no
mic
Co
nsu
ltin
gnet
sum
m
[1] R
ent
fro
m c
once
ssio
na
ire
plu
s 5
% c
apita
l im
pro
ve
me
nt
fund
pro
gra
m.
[2] W
ith
pro
jecte
d n
eg
ative
fin
an
cia
l re
turn
s t
he
co
nce
ssio
na
ire
wo
uld
ce
ase
op
era
tio
ns.
[3] E
xclu
de
s 2
- 3
jo
bs a
sso
cia
ted
with
sn
ow
mo
bile
op
era
tio
ns.
Sc
en
ari
o 3
Sc
en
ari
o 2
(L
ow
Ro
un
ds
)S
cen
ari
o 2
(H
igh
Ro
un
ds
)

Prepared by HEC Page 6 September 8, 2008 HEC Project #60631
A well-designed reconfigured 18-hole regulation course that takes maximum advantage of the terrain and vistas is projected to have financial performance similar to that currently experienced at LTGC. Because revenues are projected to increase slightly over the Base Case, State Parks may receive a slight increase in revenues with a reconfigured 18-hole regulation course. Impact to the golf course concessionaire is estimated to be a decrease of approximately $25,000 annually because expenses associated primarily with labor are estimated to increase.
No financial impact is estimated for winter operations (i.e., snowmobile rides on a circuit course around the driving range) with changes to the golf course under Scenarios 1B and 2. Operations are anticipated to cease if Lake Valley SRA becomes a State managed and operated site with no golf course. Snowmobiling revenues and costs are variable, primarily a function of the weather (snowfall), and are minor compared to golf course revenue.
Earnings by employees at LTGC are estimated to increase $37,700 per year with a reconfigured 18-hole regulation course, and decrease approximately $81,300 to $117,900 per year with a reduced-play area (non-traditional length) course. Earnings impacts from potential cessation of snowmobile ride operations are not estimated in this study. Earnings impacts of the snowmobile ride operations would be minor compared to the earnings impacts of changes in golf operations.
AAddddiittiioonnaall DDiirreecctt IImmppaaccttss ttoo tthhee SSoouutthh SShhoorree EEccoonnoommyy Additional direct impacts to the South Shore economy accrue from spending by LTGC visitors within the local economy generating additional sales tax, transient occupancy tax, and property taxes. Other impacts include additional jobs that are created in support of these visitors, and associated earnings. A summary of impacts to the South Shore economy, including job impacts outside of LTGC, are shown in Table 4.
The following findings are made:
Total additional LTGC revenues and taxes benefiting the local economy are estimated at $6.1 million annually. These revenues would be lost if the golf course closed, and reduced to between approximately $3.5 million and $5.2 million with a reduced-play area (non-traditional length) course. Reconfiguration of the 18-hole regulation course may increase these revenues slightly, but not significantly.
Earnings by employees generated elsewhere in South Shore by visitors to LTGC are estimated to decrease by $287,000 to $880,000 annually with a reduced-play area (non-traditional length) course, and $2.0 million with no golf course.

Prepared by HEC Page 7 September 8, 2008 HEC Project #60631
Table 4: Summary of South Shore Economy Impacts by Scenario
La
ke
Ta
ho
e G
olf
Co
urs
e E
co
no
mic
Fe
as
ibil
ity A
na
lys
is
Su
mm
ary
of
So
uth
Sh
ore
Ec
on
om
y I
mp
acts
by S
cen
ari
o
Ne
t R
ev
en
ue
sS
cen
ari
o 1
Dire
ct
Imp
act
1A
- B
ase
Case
1B
Low
Ro
un
ds
Hig
h R
oun
ds
Re
ve
nu
es a
nd
Ta
xe
s
Vis
ito
r S
pen
din
g [
1]
$5,5
68,0
80
$5,5
54,4
12
$3,1
81,1
67
$4,8
07,8
97
[4
]
Imp
act
of
Vis
ito
r S
pe
nd
ing
($13
,66
8)
($
2,3
86
,91
3)
($
76
0,1
83
)
($5,5
68
,08
0)
Sa
les T
axe
s G
ene
rate
d$271,0
00
$273,0
00
$147,0
00
$216,0
00
[4
]
Imp
act
on
Sa
les
Ta
x [
2]
$2,0
00
($
12
4,0
00
)
($55
,00
0)
($
27
1,0
00
)
Tra
nsie
nt
Occu
pa
ncy T
ax G
ene
rate
d$157,0
00
$157,0
00
$82,0
00
$123,0
00
[4
]
Imp
act
on
Tra
ns
ien
t O
ccu
pa
nc
y T
ax
$0
($
75
,00
0)
($
34
,00
0)
($
15
7,0
00
)
Pro
pe
rty T
ax G
ene
rate
d$65,0
00
$65,0
00
$65,0
00
$65,0
00
[4
]
Imp
act
on
Pro
pe
rty T
ax [
3]
$0
$0
$0
($
65
,00
0)
To
tal A
dd
itio
na
l S
ou
th S
ho
re R
ev
en
ue
s &
Ta
xe
s$6,0
61,0
80
$6,0
49,4
12
$3,4
75,1
67
$5,2
11,8
97
[4
]
Imp
act
to S
ou
th S
ho
re R
ev
en
ue
s &
Ta
xe
s($
11
,66
8)
($
2,5
85
,91
3)
($
84
9,1
83
)
($6,0
61
,08
0)
Em
plo
ye
e E
arn
ing
s a
nd
Jo
bs
So
uth
Sh
ore
Em
plo
yee E
arn
ings
$2,0
53,6
33
$2,0
48,5
92
$1,1
73,2
86
$1,7
65,9
61
[4
]
Imp
act
to S
ou
th S
ho
re E
mp
loye
e E
arn
ing
s [
1]
($5,0
41
)
($88
0,3
47
)
($28
7,6
72
)
($2,0
53
,63
3)
Jo
bs in
So
uth
Sh
ore
92
92
53
74
0
Jo
bs
Im
pa
ct
to S
ou
th S
ho
re [
1]
0
-39
-1
8
-9
2
So
urc
e: H
an
sfo
rd E
co
no
mic
Co
nsu
ltin
geconom
y
[1] E
xclu
de
s d
ire
ct
imp
acts
at L
TG
C s
how
n in
Ta
ble
3.
[2] Inclu
des s
pendin
g a
t LT
GC
.
[3] P
rope
rty t
ax g
en
era
ted
by L
TG
C.
[4] W
ith
pro
jecte
d n
eg
ative
fin
an
cia
l re
turn
s t
he
co
nce
ssio
na
ire
wo
uld
ce
ase
op
era
tio
ns.
Sc
en
ari
o 3
Sc
en
ari
o 2

Prepared by HEC Page 8 September 8, 2008 HEC Project #60631
The closure of the golf course at Lake Valley SRA would result in the loss of approximately 168 full and part-time jobs (76 at LTGC and 92 elsewhere). Closure of winter operations would result in the loss of approximately 3 jobs.
If LTGC was reduced in length of play, as in Scenario 2, 29 to 55 jobs (11 to 16 of which at LTGC) would be removed from the local economy. Reconfiguration of the 18-hole regulation course may result in 4 additional jobs at LTGC.
OObbsseerrvvaattiioonnss RReelleevvaanntt ttoo tthhee FFuuttuurree ooff LLTTGGCC
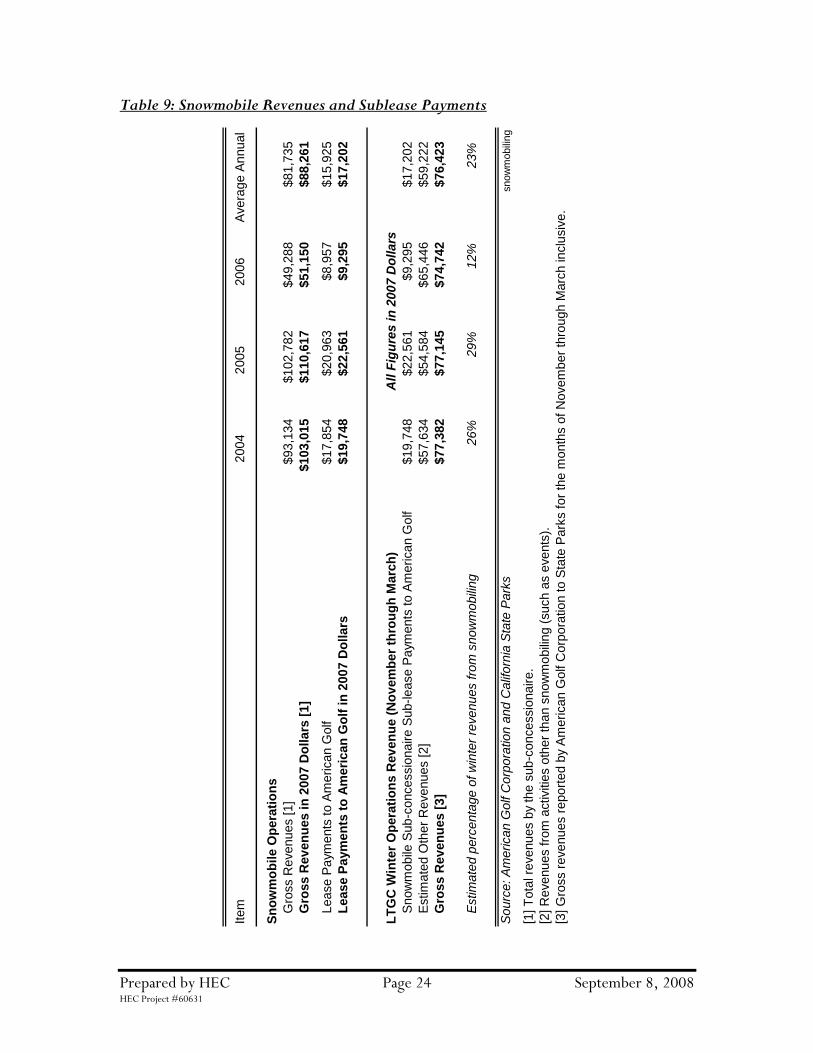
The feasibility of LTGC is heavily affected by national leisure trends and the national and regional economy. Approximately two-thirds of rounds played are estimated to be made by visitors to the area. Of the estimated 22,219 rounds played by visitors, 8,942 rounds are estimated to be made by visitors with the specific purpose of visiting the Tahoe Basin to play golf at LTGC.
Population growth and participation rates for golf both regionally and nationally will affect demand for golf at LTGC, because players are primarily from out of the region.
Although the local population only plays about one-third of the golf rounds at LTGC, they may be described as „avid‟ or „core‟ golfers, and are important contributors to early and late season spending at LTGC.
Reduced-play area courses already exist within a 60-minute drive of South Lake Tahoe; however, there are no public par-3 / pitch and putt courses. The net revenues estimated for each scenario in this study indicate that a reduced-play area (non-traditional length) course is financially infeasible. An increased number of events held at the clubhouse could potentially enhance the revenue stream of a reduced-play area (non-traditional length) golf course; this analysis was not undertaken as part of the study.
An increase in food and beverage sales in recent years indicates potential to expand facilities for events in the future; however, comparison with data from the North Tahoe Conference Center indicates that even with a doubling of the number of events currently held at LTGC, a no-golf scenario is financially infeasible.
LTGC is the most affordable golf course for 18-hole regulation play in the region. The maximum allowables fees are controlled by State Parks. Because the majority of players are visitors who have already allocated leisure time to recreate, and because the local golfers are unlikely to be able to play twice as much even if the price is halved, demand at LTGC is likely to fairly price inelastic, meaning a
Prepared by HEC Page 9 September 8, 2008 HEC Project #60631
moderate price increase would not greatly decrease demand for play, and vice-versa, a moderate price decrease would not greatly increase rounds played.
A recent trend of declining number of rounds played at LTGC is partly a function of increased competition, most particularly from the golf courses located at the base of the mountains in Nevada, and decreased visitation to the area as evidenced by increased vacancy rates at hotels, motels and vacation rentals, as described in other economic studies for South Lake Tahoe. Occasional fluctuations in number of rounds (as opposed to a trend) are more likely attributable to the advent and departure of playable weather, which influences the length of the playing season.
Personal income is a major determinant of rounds played at LTGC since the majority of players are visitors whose total trip costs are largely spent on transportation costs. The increased number of baby boomers reaching retirement age is projected to increase rounds played nationally in the near future, but it is not necessarily helpful to LTGC because retired persons tend to have more fixed incomes.
RReeppoorrtt OOrrggaanniizzaattiioonn Section 2 provides project overview, description of the management and operations structure at Lake Valley SRA, and approach to the study. Section 3 describes the methodology used to estimate financial impacts to State Parks and American Golf Corporation (the concessionaire). Section 4 is a competitive market analysis of factors that affect demand for rounds and pricing at the golf course. The analysis accounts for relevant national and regional golf statistics and their relationship to this project as well as key information from local competitive golf courses. Detailed estimates of financial impacts to State Parks and its concessionaires of a reconfigured golf course, and no golf scenarios associated with the river restoration alternatives are presented in Section 5. The final section of this report, Section 6, provides detailed estimates of direct economic impacts to the South Shore economy generated by LTGC. Appendix A presents tables of LTGC performance and rent to State Parks since 1995 that support the analysis. Appendix B provides a copy of the questionnaire and summary interviewee comments from surveys conducted by State Parks at LTGC during the 2007 golf season. Appendix C contains descriptions of competitor golf courses. Appendix D includes detailed estimates of LTGC‟s economic impacts on the South Shore for each scenario modeled.

Prepared by HEC Page 10 September 8, 2008 HEC Project #60631
SSEECCTTIIOONN 22:: PPRROOJJEECCTT OOVVEERRVVIIEEWW AANNDD SSTTUUDDYY
AAPPPPRROOAACCHH
PPRROOJJEECCTT OOVVEERRVVIIEEWW As part of the EIR/EIS/EIS process to restore the Upper Truckee River, various restoration alternatives are evaluated for their environmental and economic impacts. The river restoration and golf course reconfiguration alternatives have been determined based on input from stakeholders and the public. The economic analysis of these alternatives is provided in this report as input to the EIR/EIS/EIS process. Three economic scenarios were modeled, as shown in Table 1.
SSttrruuccttuurree ooff LLaakkee VVaalllleeyy SSRRAA MMaannaaggeemmeenntt aanndd OOppeerraattiioonnss LTGC was owned and operated by a private enterprise from 1962 until it was purchased by California State Parks in 1985 (California State Parks, July 1, 2006). A General Plan for Lake Valley SRA was prepared that still governs the management of the area today. The declaration of purpose for Lake Valley SRA (California State Parks) is as follows: “The purpose of Lake Valley State Recreation Area is to make available to the people for their enjoyment and inspiration the 18-hole golf course, and the scenic Upper Truckee River and its environs.” The General Plan calls for State Parks to:
Balance the objectives of providing optimum recreational opportunities and maintaining the highest standards of environmental protection.
Define and execute a program of management that perpetuates established values for Lake Valley SRA, providing for golfing along with other compatible summer and winter recreation opportunities while restoring the natural character and ecological values of the Upper Truckee River, protecting its water quality, and protecting and interpreting significant natural, cultural, and scientific values.
Since 1989 the golf course has been operated by American Golf Corporation under a concessionaire contract with State Parks. The clubhouse and maintenance structures, approximately 7,000 square feet and 2,000 square feet respectively were built under American Golf Corporation‟s guidance and opened in 1992. In keeping with the General Plan, the concessionaire contract (State of California, 1989, amended 1995) explicitly states that, “Of prime importance under this contract is the requirement to balance the dual objectives of providing a quality golfing experience and

Prepared by HEC Page 11 September 8, 2008 HEC Project #60631
protecting the ecologically sensitive Upper Truckee River and the natural environment of Lake Valley State Recreation Area.” A key consideration of State Parks with regards to the operation of the golf course is affordability. Per Section 7 of the concessionaire contact, “It is the intent of the State under this contract to provide the general public with the opportunity to enjoy quality golfing and winter recreational opportunities at reasonable and affordable prices. Service to the public, with goods, merchandise, and services of the best quality and at reasonable charges, is of prime concern to the State……” Under terms of the concession contract, amended in 1995, a maximum green fee of $40.00 was considered by the State to be fair and reasonable. Increases to this green fee benchmark are made based on changes in the California Consumer Price Index, or other extraordinary circumstances justified by the concessionaire and approved by the State. Telephone interviews were conducted with State Parks personnel to provide perspective on the impact of LTGC revenues on the State Parks system. Revenues generated by LTGC are very important to State Parks. The revenue of LTGC operations is the fifth largest source of concession revenue in the State Parks system (California State Parks, Fiscal Year 2006/07). The Sierra District of State Parks uses a combination of concession revenues, user fees, and other revenue sources allocated by State Parks to support District operations.
HHiissttoorriicc FFiinnaanncciiaall PPeerrffoorrmmaannccee ooff LLTTGGCC In real terms (i.e., using constant 2007 dollars), LTGC has experienced declining gross revenues since 1997, as charted in Figure 1. Figure 1: LTGC Gross Revenues by Calendar Year, 1995 – 2006
$0
$1,000,000
$2,000,000
$3,000,000
$4,000,000
1995 1997 1999 2001 2003 2005
Calendar Year Gross Revenues
gross revenues not adjusted for inflation
gross revenues adjusted for inflation

Prepared by HEC Page 12 September 8, 2008 HEC Project #60631
One of the reasons for this decline is the terms of the concession contract which restricts pricing to what is considered fair and reasonable by State Parks. American Golf Corporation has also noted that the number of rounds played has declined, which they attribute primarily to increased supply of golf courses (competition) both regionally and nationally and a national decline in golf demand. A small portion of declining gross revenues from golf operations has been made up by increased revenues from events held at the clubhouse. Gross revenues with and without inflation adjustments are detailed in Table 5.
PPaayymmeennttss ttoo SSttaattee PPaarrkkss American Golf Corporation signed a 20-year concessionaire contract with State Parks in 1989 which is due to expire March 31 2009. Per the terms of the agreement, American Golf Corporation must allocate 5% of gross annual receipts to a Capital Improvements Program (CIP) fund, which is interest-bearing and administered by the concessionaire for capital improvements or resource management projects with direction by and approval of the State1. Monthly rents are calculated based on gross revenues; either 29% of monthly gross receipts or minimum monthly rents of $22,690 April through September and 10% of winter operations gross receipts or $4,538 October through March, whichever is greater. The minimum monthly rental amounts are adjusted every 5 years to reflect changes in the California Consumer Price Index. „Gross receipts‟ refers to all monies, property, or any other thing of value received by the concessionaire and any sub-concessionaire from any business carried upon the premises. It excludes sales taxes. Payments to State Parks since 1995 are also shown in Table 5. The percentage distribution of gross revenues generated by operations at LTGC by month is illustrated in Figure 2. Over 80% of annual gross revenues are from golf during the months of June through September. Weather and other factors can cause annual fluctuations in revenues. Data in 2007 were not used for this report because of the Angora fire, a large wildfire near LTGC that severely affected businesses in South Shore. The drop in golf rounds due to that fire would skew analysis performed in this study by pulling revenues artificially down. Figure 3 charts gross revenues generated by summer and winter operations by year since 1995. Winter operations include snowmobile sublease payments and event revenues. Golf operations revenues have been relatively stable in recent years; however, the golf course has not recovered from a particularly poor performance in 2001 (this coincides with decreased lodging occupancy rates in South Shore – see Section 3 of this report).
1 The State may elect to receive all or part of the CIP funds, including accrued interest, as additional rent.

Prepared by HEC Page 13 September 8, 2008 HEC Project #60631
Table 5: LTGC Gross Revenues by Calendar Year
Item
1995
1996
1997
1998
1999
2000
2001
2002
2003
2004
2005
2006
LT
GC
Fin
an
cia
l P
erf
orm
an
ce
LT
GC
Gro
ss R
evenues
$2,4
09,2
21
$2,5
25,0
72
$2,7
84,1
77
$2,7
36,2
21
$2,8
02,1
09
$2,8
58,3
13
$2,6
61,5
77
$2,7
56,5
13
$2,7
15,4
72
$2,6
40,0
30
$2,4
61,8
38
$2,4
88,8
88
Paym
ents
to S
tate
Park
s$549,5
33
$630,0
13
$693,3
64
$681,3
47
$699,3
20
$715,9
47
$664,3
72
$672,9
07
$790,3
06
$702,0
68
$616,1
88
$626,5
52
CIP
Fund
$120,4
61
$126,2
54
$139,2
09
$136,8
11
$140,1
05
$142,9
16
$133,0
79
$137,8
26
$135,7
74
$132,0
02
$123,0
92
$124,4
44
LT
GC
Fin
an
cia
l P
erf
orm
an
ce in
2007 D
ollars
LT
GC
Gro
ss R
evenues
$3,3
41,0
27
$3,4
42,9
72
$3,7
23,8
36
$3,5
88,8
63
$3,6
14,6
50
$3,5
82,5
83
$3,2
18,9
09
$3,2
07,7
80
$3,0
84,1
08
$2,9
20,1
20
$2,6
49,5
06
$2,5
82,9
05
Paym
ents
to S
tate
Park
s$762,0
74
$859,0
32
$927,3
75
$893,6
64
$902,1
05
$897,3
62
$803,4
90
$783,0
68
$897,5
93
$776,5
53
$663,1
60
$650,2
19
CIP
Fund
$167,0
51
$172,1
49
$186,1
92
$179,4
43
$180,7
32
$179,1
29
$160,9
45
$160,3
89
$154,2
05
$146,0
06
$132,4
75
$129,1
45
Perc
en
t C
han
ge in
Gro
ss R
ev
en
ues (
2007 D
ollars
)
Annual %
change [1]
3.1
%
8.2
%
-3.6
%
0.7
%
-0.9
%
-10.2
%
-0.3
%
-3.9
%
-5.3
%
-9.3
%
-2.5
%
Sourc
e: C
alif
orn
ia S
tate
Park
s
[1] P
erc
enta
ge incre
ase o
r decre
ase in G
ross R
evenues f
rom
year
to y
ear.
[2] A
vera
ge a
nnual perc
enta
ge c
hange in G
ross R
evenues o
ver
the p
eriod.
LT
GC
Gro
ss R
ev
en
ues
Paym
en
ts t
o S
tate
Park
s
CIP
Fu
nd
An
nu
al %
Ch
an
ge [
2]
year
sum
$817,9
75
$162,3
22
-2.3
%
$2,8
09,1
60
$746,8
82
$140,4
58
-5.7
%
Av
era
ge A
nn
ual R
ev
en
ues (
2007 $
s)
1995 -
2006
2003 -
2006
$3,2
46,4
38

Prepared by HEC Page 14 September 8, 2008 HEC Project #60631
It is not known why a 13% decrease in revenues between 2000 and 2001 occurred (speculation about an influence of the 9/11 attack may or may not be well founded, because its immediate economic effects occurred after the peak summer period). Due to early snow fall, 2005 also saw a significant drop in revenues from 2004, with a decrease of 10% (almost $300,000) in revenues. Annual revenue changes are shown in Table 6. Support tables for LTGC‟s historic financial performance are presented in Appendix A of this report. Figure 2: Concessionaire Percent of Annual Gross Revenues by Month
Figure 3: Winter and Summer Operations Gross Revenues, 1995 - 2006
0.8%
0.7%
0.8%
1.6%
7.7%
16.2%
24.4%
23.1%
16.3%
7.3%
0.3%
0.8%
January
February
March
April
May
June
July
August
September
October
November
December
Average Distribution of LTGC Monthly Gross Revenues
$0
$500,000
$1,000,000
$1,500,000
$2,000,000
$2,500,000
$3,000,000
$3,500,000
$4,000,000
1995 1997 1999 2001 2003 2005
Winter (Nov - Mar) and Summer (Apr - Oct) 1
Gross Revenues in 2007 DollarsSummer Operations (Apr - Oct) Winter Operations (Nov - Mar)
1 Opening and closing dates for summer and winter operations dependent on weather.

Prepared by HEC Page 15 September 8, 2008 HEC Project #60631
Table 6: LTGC Gross Revenue and Rent to State Parks in 2007 Dollars
La
ke
Ta
ho
e G
olf
Co
urs
e E
co
no
mic
Fe
as
ibil
ity A
na
lys
is
Ca
len
da
r Y
ear
LT
GC
Gro
ss R
ev
en
ue
an
d R
en
t to
Sta
te P
ark
s A
dju
ste
d f
or
Infl
ati
on
(in
20
07
Do
lla
rs)
Av
era
ge
Item
1995
1996
1997
1998
1999
2000
2001
2002
2003
2004
2005
2006
200
3 -
200
6
Ca
len
da
r Y
ear
Re
ve
nu
es i
n 2
007
Do
lla
rs
Su
mm
er
Op
era
tio
ns
(A
pri
l th
rou
gh
Oc
tob
er)
[1
]
Gro
ss R
ev
en
ue
s [
2]
$3,1
83,8
42
$3,3
43,8
59
$3,5
93,0
44
$3,4
19,4
06
$3,4
90,0
79
$3,5
54,2
81
$3,0
85,9
72
$3,0
17,6
92
$3,0
25,2
39
$2,8
42,7
38
$2,5
72,3
60
$2,5
08,1
63
$2,7
37,1
25
An
nu
al C
han
ge
in
Reve
nu
es
$160,0
17
$249,1
86
($17
3,6
39
)$70,6
73
$64,2
02
($46
8,3
09
)($
68
,28
0)
$7,5
47
($18
2,5
01
)($
27
0,3
78
)($
64
,19
7)
An
nu
al P
erc
ent
Ch
an
ge
5%
7
%
-5%
2
%
2%
-1
3%
-2
%
0%
-6
%
-10%
-2
%
Win
ter
Op
era
tio
ns
(N
ov
em
be
r th
rou
gh
Ma
rch
) [1
]
Gro
ss R
ev
en
ue
s [
3]
$157,1
85
$99,1
14
$130,7
92
$169,4
57
$124,5
71
$28,3
02
$132,9
37
$190,0
88
$58,8
69
$77,3
82
$77,1
45
$74,7
42
$72,0
35
An
nu
al C
han
ge
in
Reve
nu
es
($58
,07
2)
$31,6
78
$38,6
65
($44
,88
6)
($96
,26
9)
$104,6
35
$57,1
51
($13
1,2
18
)$18,5
13
($23
7)
($2,4
04
)
An
nu
al P
erc
ent
Ch
an
ge
-37%
3
2%
3
0%
-2
6%
-7
7%
3
70
%
43%
-6
9%
3
1%
0
%
-3%
Gro
ss R
ev
en
ue
s b
y C
ale
nd
ar
Ye
ar
$3,3
41,0
27
$3,4
42,9
72
$3,7
23,8
36
$3,5
88,8
63
$3,6
14,6
50
$3,5
82,5
83
$3,2
18,9
09
$3,2
07,7
80
$3,0
84,1
08
$2,9
20,1
20
$2,6
49,5
06
$2,5
82,9
05
$2,8
09,1
60
Pa
ym
en
ts t
o S
tate
Pa
rks
Ca
pita
l Im
pro
ve
me
nt
Pro
jects
Fu
nd
$167,0
51
$172,1
49
$186,1
92
$179,4
43
$180,7
32
$179,1
29
$160,9
45
$160,3
89
$154,2
05
$146,0
06
$132,4
75
$129,1
45
$140,4
58
Pe
rce
nt
of
Gro
ss R
eve
nu
es
5%
5%
5%
5%
5%
5%
5%
5%
5%
5%
5%
5%
5%
Re
nt to
Sta
te P
ark
s$762,0
74
$859,0
32
$927,3
75
$893,6
64
$902,1
05
$897,3
62
$803,4
90
$783,0
68
$897,5
93
$776,5
53
$663,1
60
$650,2
19
$746,8
82
Pe
rce
nt
of
Gro
ss R
eve
nu
es
23%
25%
25%
25%
25%
25%
25%
24%
29%
27%
25%
25%
27%
To
tal P
aym
en
ts t
o S
tate
Pa
rks
$929,1
25
$1,0
31,1
80
$1,1
13,5
67
$1,0
73,1
07
$1,0
82,8
37
$1,0
76,4
91
$964,4
36
$943,4
57
$1,0
51,7
99
$922,5
59
$795,6
36
$779,3
65
$887,3
39
So
urc
e: C
alif
orn
ia S
tate
Pa
rks
season r
ents
[1] S
tart
and
clo
se
da
tes o
f su
mm
er
an
d w
inte
r o
pe
ratio
ns a
re d
ep
en
de
nt
on
we
ath
er.
[2] S
um
me
r o
pera
tio
ns g
ross r
eve
nu
es in
clu
de
s g
olf c
ours
e o
pera
tio
n r
eve
nu
es p
lus e
ve
nt
reve
nu
es.
[3] W
inte
r o
pe
ratio
ns g
ross r
eve
nu
es in
clu
de
s a
ll g
olf c
ours
e c
once
ssio
na
ire
re
ve
nu
es f
rom
sn
ow
mo
bile
op
era
tio
ns s
uble
ase
pa
ym
ents
and
eve
nt
reve
nu
es.
DRAF
T

Prepared by HEC Page 16 September 8, 2008 HEC Project #60631
FFEEAASSIIBBIILLIITTYY AANNAALLYYSSIISS AAPPPPRROOAACCHH The purpose of golf course feasibility studies is to analyze major factors affecting the feasibility of a course by reviewing elements influencing demand, which include:
Market area population and growth potential (demographic trends),
Price of a round of golf,
Income of players,
Number of, and pricing of existing and planned courses in the area,
Consumer tastes and preferences,
Consumer time available for leisure, and
Transportation costs to the golf course. The feasibility of a reconfigured golf course includes the quality and condition of the modified course, amenities offered, and competing golf courses. This study examines these factors with the knowledge that LTGC is an established and popular golf course.
EEccoonnoommiicc SScceennaarriiooss MMooddeelleedd iinn tthhiiss SSttuuddyy This study models revenues and expenditures using the most recent data available from the golf course concessionaire, as well as data provided by State Parks and other pertinent sources. The three economic scenarios analyzed in this report (see Table 1) are described in more detail below. Scenario 1 Under Scenario 1 LTGC remains an 18-hole regulation golf facility. The definition of a regulation golf course is (www.golf2020.com): “any nine-hole or 18-hole golf course that includes a variety of par-three, par-four and par-five holes, and is of traditional length and par; a nine-hole facility must be at least 2,600 yards in length and at least par 33, and an 18-hole facility at least 5,200 yards in length and at least par 66”.2 This scenario has two versions:
Scenario 1A is the „Base Case‟ under which there is no change to the golf course layout and no river restoration (No Action Alternative in the EIR/EIS/EIS). The Base Case scenario portrays the current feasibility of LTGC.
2 Some definitions of alternative golf courses also include driving ranges.

Prepared by HEC Page 17 September 8, 2008 HEC Project #60631
Scenario 1B has river restoration, which may be either stabilize in place (Alternative 4 of the EIR/EIS/EIS), or full geomorphic and ecological restoration (Alternative 2 of the EIR/EIS/EIS or off-site relocation). The golf course layout would remain as it currently is under the „stabilize in place‟ form of river management, but under the full geomorphic and ecological restoration alternative 7 or 8 holes would be reconfigured and placed on the west side of the river. Potential alternative locations for the golf course are also being reviewed in the EIR/EIS/EIS: for this report it is assumed that the economics would be the same as under Scenario 1B. Total yardage of the golf course under Scenario 1B would remain similar to or the same as the Base Case.
Scenario 2 Under Scenario 2 LTGC becomes a reduced-play area (non-traditional length) golf facility, which may be an alternative (par-3, short-fairway, pitch and putt) or 9-hole regulation golf facility. Alternative-length golf courses include (www.golf2020.com):
Par-three Courses - consisting exclusively of par-three holes averaging at least 100 yards in length;
Executive Courses – short-fairway courses with a variety of par-three, par-four and/or par-five holes. Eighteen-hole executive courses are 5,200 yards in length or less, with a par of 65 or less; 9-hole executive courses are par 33 or less. The only physical difference between an executive golf course and a full-sized course is the length of fairways. Tees, greens, sand traps, water hazards, and mounds are identical in size, shape, and appearance to 18-hole regulation courses (Hurdzan, 1996).
Pitch and Putt Courses - short par-three courses where the holes average less than 100 yards in length.
Courses of Nontraditional Hole Configuration - the holes are of traditional length in something other than a nine or 18-hole configuration.
Because course layout under Scenario 2 is not yet determined, this report does not specify which type of alternative golf facility or 9-hole regulation course would be constructed. Scenario 3 There is no golf course under Scenario 3; however, the clubhouse is proposed to remain as an events facility. Without a driving range to use for winter activities (snowmobile operations), these are not expected to continue. Included in the analysis for this scenario is potential additional revenue from increased number of events at the clubhouse. This scenario is comparable to Alternative 5 in the EIR/EIS/EIS.

Prepared by HEC Page 18 September 8, 2008 HEC Project #60631
MMEETTHHOODDOOLLOOGGYY There are two separate methodologies employed to estimate the financial and other economic impacts reported in this study. These are:
1. Financial Analysis Step 1: Establish the base data used as a platform on which to project revenues
and expenditures under each economic scenario. See Section 3 for description of this step.
Step 2: Establish general assumptions to be used for projections. General
assumptions used in this second step of the analysis are based on findings of the competitive market analysis provided in Section 4.
Step 3: Determine revenue and expense multipliers for revenue and cost line
items. Using the base data and developed multipliers, estimate projections of revenues and expenses under each scenario, as detailed in Section 5.
2. Economic Impacts to South Shore
Estimate annual visitation to LTGC and utilize available direct spending data from secondary sources to estimate additional economic benefits of LTGC-generated visitation to the South Shore economy. This methodology and results of the analysis are presented in Section 6.

Prepared by HEC Page 19 September 8, 2008 HEC Project #60631
SSEECCTTIIOONN 33:: BBAASSEE DDAATTAA In this section of the report the base data used to estimate potential revenues and expenses of the modified 18-hole course, reduced-play area (non-traditional length) course, and no golf course economic scenarios are described. The goal of this study is to project revenues and expenses under each economic scenario based on an average year, thereby accounting for good and poor years of financial performance. The base data used in this analysis is the average of years 2003 – 2006 because:
1. Revenues “bounce” from year to year, largely due to course conditions resulting
from weather and other outside influences (for example, the Angora fire, which severely skews 2007 statistics negating their use in the study). Using the most recent five-year period allows for revenue fluctuation due to variations in weather and corresponding annually changing number of rounds played.
2. LTGC is particularly susceptible to swings in annual revenue per round due to its
reliance on visitor golfers (i.e., golfers not originating from South Shore). Factors affecting the numbers of visitors that are outside of LTGC‟s control include, among others, travel costs and the attractiveness / competitiveness of the South Shore with other destinations for visitors. Increased travel costs, particularly for gasoline, may also reduce the number of visitors and golfers to the area. Improvement of South Shore‟s appeal to tourists can greatly improve LTGC‟s financial performance. Since it is impossible to project these types of factors with any accuracy, this analysis relies on the most recent 5-year historical financial performance of the golf course (with the omission of 2007 data which is invalid for the study‟s purpose).
FFAACCIILLIITTYY UUSSEE The golf course concessionaire provided the facility use data for calendar years 2003 through 2006 as shown in Table 7. (Data from 2007 were not used to contribute to the Base Case, because of the anomalous demand dampening influence of the Angora fire). Over this time period, LTGC averaged generation of 76 full and part-time jobs, the majority of which for food and beverage activities, and 27,864 regular rounds and 5,299 tournament rounds, for a total of 33,163 rounds. An annual average of 37 events were held generating visitation by 3,663 wedding and banquet guests. The facility use data shows a trend of declining number of rounds played over the four-year period. This trend is in line with recent analysis of visitor lodging data conducted for the City of South Lake Tahoe (RRC Associates, 2006) which observed that the average annual

Prepared by HEC Page 20 September 8, 2008 HEC Project #60631
occupancy rate of hotels, motels and vacation rentals has declined significantly since 2000, slipping from 43 percent to 29 percent. Length of season of play can cause number of rounds to fluctuate periodically, but is not cause for the trend in declining number of rounds. LTGC facility use data also shows increased visitation by non-golfers corresponding to an increased number of events held at the clubhouse.
RREEVVEENNUUEESS Revenues for the 2003 through 2006 time period are used as the basis upon which to project long-term revenues generated under each economic scenario and are shown in Table 8. All figures are shown in 2007 dollars. Revenues are broken down by the various revenue-generating categories:
green fees,
carts,
driving range,
merchandise,
food and beverage (both golf-related and events-related), and
other.
The average revenues in 2007 dollars are $2,012,000 for golf activities, $780,000 for concessions and other activities, and $17,000 for snowmobile sublease payments for a total of $2,809,000. Total revenue by year matches the historical data given earlier in Table 5. Seventy two percent of total annual revenues are generated by golf activities, 28% by concessions and other activities (which include merchandise and food and beverage sales by golf-related activities), and 1% by snowmobile sublease payments. Total revenues are approximately $85 per round (with golf operations-only revenues $61 per round). According the National Golf Foundation (NGF), in 2001 the average 18-hole daily fee golf course in Region 9 (covering the Tahoe area, and Northern California to Washington State) recorded 35,000 rounds per year, employed a total of 34 full and part-time employees and generated about $1,249,000 in revenues, (National Golf Foundation, 2001). This data compared to the facility use and revenue data affirms that LTGC is a competitive course, and employs more persons than the average course (although the majority of these are minimum wage jobs associated with food and beverage for events).

Prepared by HEC Page 21 September 8, 2008 HEC Project #60631
Table 7: Base Data – Annual Facility Use
LTGC‟s driving range generates only 5% of its annual revenues from golf activities, and 4% of total revenues; however, its presence is essential for LTGC to offer instruction and is important to overall golf course operations. NGF data compiled in 2002 show that 84% of daily fee courses had driving ranges (National Golf Foundation, 2002). Research conducted by Sportometrics in 2001 for non-traditional length courses determined that driving ranges increase both play and fees commanded at both traditional and non-traditional length golf courses. As of the writing of that research 50% of non-traditional length courses had a driving range (Sportometrics, 2001).
SSnnoowwmmoobbiillee ((SSuubblleeaassee)) OOppeerraattiioonnss RReevveennuuee Consistent with permitted uses at Lake Valley SRA, winter recreational activities may occur at the golf course from November through March. Winter recreation activities may include snowmobiling, cross-country skiing, ski rentals and equipment sales. Currently, the driving range area of the property is used as a snowmobile track. Guests can rent a snowmobile to ride for 30-minute increments around an oval track located in the driving range3.
3 Snowmobiles are not permitted anywhere else on the property, except by golf course staff. Staff periodically patrols the golf course and checks course conditions.

Prepared by HEC Page 22 September 8, 2008 HEC Project #60631
Table 8: Base Data – Annual Revenues
2003 -
2006
Revenues
2003
2004
2005
2006
Av
era
ge
Activity
Revenue
Go
lf C
on
cessio
nair
e O
pera
tio
ns
[1]
Go
lf A
cti
vit
ies
Gre
en F
ees
$1,5
14,1
62
$1,4
34,5
86
$1,2
62,7
50
$1,2
62,1
18
$1,3
68,0
00
68%
49%
Cart
Renta
l$580,3
00
$551,6
07
$462,7
66
$474,8
12
$517,0
00
26%
18%
Drivin
g R
ange
$116,7
21
$120,8
04
$97,7
15
$94,0
11
$107,0
00
5%
4%
Nik
e G
olf L
earn
ing C
ente
r$26,7
52
$29,0
84
$14,0
27
$11,6
71
$20,0
00
1%
1%
Su
bto
tal G
olf
Acti
vit
ies [
2]
$2,2
37,9
35
$2,1
36,0
80
$1,8
37,2
58
$1,8
42,6
12
$2,0
12,0
00
100%
72%
Co
ncessio
ns/O
ther
Merc
handis
e$239,3
14
$174,7
45
$157,5
90
$150,8
12
$181,0
00
23%
6%
Food
$303,0
66
$310,1
25
$315,6
09
$290,0
52
$305,0
00
39%
11%
Bevera
ge
$186,1
06
$201,8
62
$194,6
04
$184,4
86
$192,0
00
25%
7%
Serv
ice c
harg
es, fe
es &
oth
er
$117,6
88
$77,5
59
$121,8
83
$105,6
47
$102,0
00
13%
4%
Su
bto
tal C
on
cessio
ns/O
ther
$846,1
73
$764,2
92
$789,6
86
$730,9
97
$780,0
00
100%
28%
Su
bto
tal A
nn
ual R
ev
en
ue
$3,0
84,1
08
$2,9
00,3
72
$2,6
26,9
45
$2,5
73,6
09
$2,7
92,0
00
Snow
mobile
Sub-lease P
aym
ents
to A
merican G
olf [3]
n.a
.
$19,7
48
$22,5
61
$9,2
95
$17,0
00
1%
To
tal A
nn
ual R
ev
en
ue [
4]
$3,0
84,1
08
$2,9
20,1
20
$2,6
49,5
06
$2,5
82,9
05
$2,8
09,0
00
100%
Rounds P
laye
d34,7
09
34,0
08
31,0
82
32,8
53
33,1
63
Rev
en
ues (
in 2
007 D
ollars
) p
er
Ro
un
d P
layed
[4]
$89
$86
$85
$79
$85
Sourc
e: A
merican G
olf C
orp
ora
tion
rev
[1] F
igure
s m
ay
not add e
xactly
due to r
oundin
g.
[2] T
he N
ike G
olf L
earn
ing C
ente
r no longer
opera
tes, re
ducin
g the a
nnual avera
ge g
olf a
ctivity
revenue f
rom
$2,0
12,0
00 to $
1,9
92,0
00.
[3] S
ee T
able
9.
[4] Inclu
des n
on-g
olf a
ctivity
revenue s
uch a
s s
now
mobili
ng s
ub-lease p
aym
ents
to A
merican G
olf C
orp
ora
tion a
nd n
on-g
olf r
ela
ted e
vents
revenue.
Cale
ndar
Year
[1]
Perc
ent of
All F
igu
res in
2007 D
ollars

Prepared by HEC Page 23 September 8, 2008 HEC Project #60631
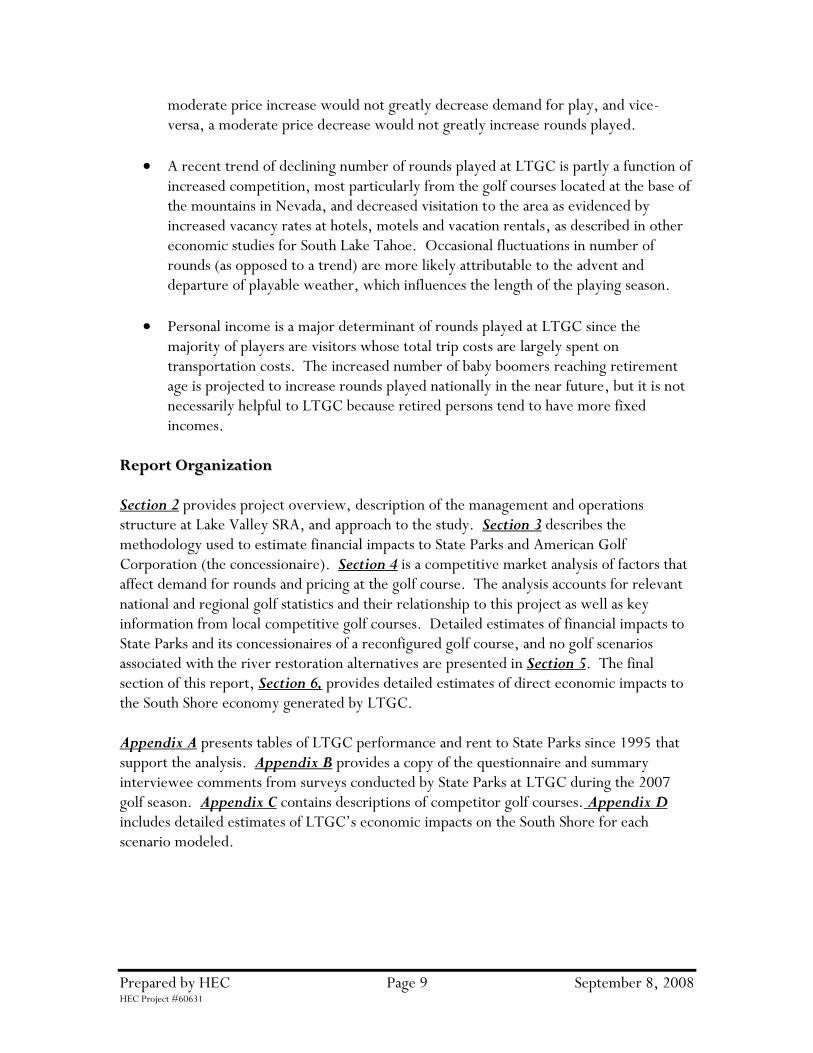
American Golf Corporation has subleased snowmobile operations since 2000, and recently executed a new sublease agreement with Sierra Mountain Sports for two years, which started with the 2007-08 winter season. Under terms of the lease, sublease rent is paid to American Golf Corporation at an increasing percentage as revenue increases4. Winter operations revenue for calendar years 2004, 2005, and 2006 is shown in Table 9. During these years, sublease payments to American Golf Corporation fluctuated between $9,000 and $23,000 in 2007 dollars, with an average rent of $17,200 per year. Using this data, approximately 23% of American Golf Corporation‟s average annual winter gross revenues are from snowmobile operations, with the remaining revenues generated by events held at the clubhouse. Snowmobile revenues are highly variable from year to year due to variation in the amount and timing of snowfall. Snowmobile operations are typically conducted by two or three employees; however, staffing is determined by projected demand.
EEXXPPEENNDDIITTUURREESS Expenditures for the 2003 through 2006 time period are shown in Table 10. All figures are shown in 2007 dollars. Expenses are broken down by the various expense-generating categories:
cost of goods,
payroll,
operating expenses (including utilities),
equipment leases and rentals, and
fixed costs of taxes and insurance.
Average annual expenditures in 2007 dollars are $233,000 for cost of goods, $628,000 for payroll, $286,000 for operating expenses, $89,000 for leases and replacement of equipment, and $79,000 for taxes and insurance. The greatest share of expenditures is payroll, at 48% of total average annual expenditures.
4 Rent is 16% for the first $75,000 in revenues, 20% for the next $50,000, and 23% for all revenue exceeding $125,000.
Prepared by HEC Page 24 September 8, 2008 HEC Project #60631
Table 9: Snowmobile Revenues and Sublease Payments
Item
2004
2005
2006
Avera
ge A
nnual
Sn
ow
mo
bile O
pera
tio
ns
Gro
ss R
evenues [1]
$93,1
34
$102,7
82
$49,2
88
$81,7
35
Gro
ss R
ev
en
ues in
2007 D
ollars
[1]
$103,0
15
$110,6
17
$51,1
50
$88,2
61
Lease P
aym
ents
to A
merican G
olf
$17,8
54
$20,9
63
$8,9
57
$15,9
25
Lease P
aym
en
ts t
o A
meri
can
Go
lf in
2007 D
ollars
$19,7
48
$22,5
61
$9,2
95
$17,2
02
LT
GC
Win
ter
Op
era
tio
ns R
ev
en
ue (
No
vem
ber
thro
ug
h M
arc
h)
Snow
mobile
Sub-c
oncessio
naire S
ub-lease P
aym
ents
to A
merican G
olf
$19,7
48
$22,5
61
$9,2
95
$17,2
02
Estim
ate
d O
ther
Revenues [2]
$57,6
34
$54,5
84
$65,4
46
$59,2
22
Gro
ss R
ev
en
ues [
3]
$77,3
82
$77,1
45
$74,7
42
$76,4
23
Estim
ate
d p
erc
enta
ge o
f w
inte
r re
venues fro
m s
now
mobili
ng
26%
29%
12%
23%
Sourc
e: A
merican G
olf C
orp
ora
tion a
nd C
alif
orn
ia S
tate
Park
ssnow
mobili
ng
[1] T
ota
l re
venues b
y th
e s
ub-c
oncessio
naire.
[2] R
evenues f
rom
activitie
s o
ther
than s
now
mobili
ng (
such a
s e
vents
).
[3] G
ross r
evenues r
eport
ed b
y A
merican G
olf C
orp
ora
tion to S
tate
Park
s f
or
the m
onth
s o
f N
ovem
ber
thro
ugh M
arc
h inclu
siv
e.
All F
igu
res in
2007 D
ollars

Prepared by HEC Page 25 September 8, 2008 HEC Project #60631
Table 10: Base Data – Annual Expenditures
200
3 -
200
6
Exp
en
se
Ite
m2003
2004
2005
2006
Av
era
ge
Activity
To
tal C
ost
Co
st
of
Go
od
s[1
]
Merc
han
dis
e$154,7
08
$101,9
40
$93,8
41
$81,2
36
$108,0
00
4
6%
8%
Fo
od
an
d B
eve
rag
e$126,2
10
$124,6
66
$121,0
31
$129,6
24
$125,0
00
5
4%
9%
Su
bto
tal C
os
t o
f G
oo
ds
$280,9
17
$226,6
05
$214,8
72
$210,8
60
$233,0
00
1
00
%
1
8%
Pa
yro
ll
Go
lf a
nd
Fa
cili
tie
s$87,6
62
$58,8
29
$51,2
69
$42,9
24
$60,0
00
1
0%
5%
Ca
rts &
Ra
ng
e$42,4
18
$38,8
22
$27,5
10
$40,1
17
$37,0
00
6
%
3
%
Nik
e G
olf L
ea
rnin
g C
ente
r$28,8
27
$26,4
09
$18,0
65
$5,1
25
$20,0
00
3
%
2
%
Co
urs
e M
ain
ten
an
ce
$234,9
61
$240,5
55
$234,9
39
$215,9
57
$232,0
00
3
7%
18%
Fo
od
an
d B
eve
rag
e$183,7
39
$179,5
70
$173,3
74
$172,2
96
$177,0
00
2
8%
13%
Ge
ne
ral a
nd
Ad
min
istr
ative
$95,0
77
$108,7
77
$110,2
17
$94,7
85
$102,0
00
1
6%
8%
Su
bto
tal P
ayro
ll$672,6
84
$652,9
61
$615,3
74
$571,2
05
$628,0
00
1
00
%
4
8%
Op
era
tin
g E
xp
en
ses
(in
clu
din
g U
tili
tie
s)
Go
lf$8,7
77
$6,0
04
$8,8
04
$6,2
17
$7,0
00
2
%
1
%
Ca
rts &
Ra
ng
e$10,2
85
$18,7
27
$14,4
27
$12,6
47
$14,0
00
5
%
1
%
Nik
e G
olf L
ea
rnin
g C
ente
r$619
$72
$491
$5,7
39
$2,0
00
1
%
0
%
Nik
e G
olf M
em
bers
hip
$19,2
68
$670
$0
$0
$5,0
00
2
%
0
%
Co
urs
e M
ain
ten
an
ce
$60,1
11
$74,5
00
$68,8
02
$67,0
12
$68,0
00
2
4%
5%
Fo
od
an
d B
eve
rag
e$15,4
41
$15,3
33
$20,8
89
$18,6
66
$18,0
00
6
%
1
%
Ge
ne
ral a
nd
Ad
min
istr
ative
$76,7
87
$84,3
67
$100,9
36
$86,6
60
$87,0
00
3
0%
7%
Fa
cili
tie
s$11,5
04
$14,1
83
$16,7
32
$14,9
42
$14,0
00
5
%
1
%
Wa
ter
$5,8
15
$5,3
09
$6,5
33
$5,8
47
$6,0
00
2
%
0
%
Po
we
r$29,4
31
$35,6
26
$49,9
68
$52,5
67
$42,0
00
1
5%
3%
Ph
on
e /
TV
/ In
tern
et
Pro
vid
ers
$13,0
10
$10,1
96
$7,4
03
$7,5
46
$10,0
00
3
%
1
%
So
lid W
aste
$12,8
34
$15,5
41
$13,4
71
$14,5
15
$14,0
00
5
%
1
%
Su
bto
tal O
pe
rati
ng
Ex
pe
ns
es
$263,8
82
$280,5
29
$308,4
56
$292,3
60
$286,0
00
1
00
%
2
2%
Le
as
es
an
d R
en
tals
, E
qu
ipm
en
t R
ep
lac
em
en
t
Ca
rts
$54,0
74
$59,2
77
$62,3
87
$62,7
46
$60,0
00
6
7%
5%
Main
ten
an
ce
$38,1
25
$19,4
33
$15,5
61
$24,5
15
$24,0
00
2
7%
2%
Kitch
en
$11,3
09
$4,0
31
$2,1
37
$2,6
18
$5,0
00
6
%
0
%
Su
bto
tal L
eas
es
an
d R
en
tals
, E
qu
ipm
en
t R
ep
lac
em
en
t$103,5
08
$82,7
40
$80,0
86
$89,8
80
$89,0
00
9
4%
6%
Ta
xe
s a
nd
In
su
ran
ce
Pro
pe
rty T
ax
$64,7
41
$64,0
98
$65,8
47
$64,6
70
$65,0
00
8
2%
5%
Insu
ran
ce
$24,5
72
$16,8
64
$23,2
12
$21,1
70
$21,0
00
2
7%
2%
Oth
er
($5,9
68
)
($4,3
22
)
($18
,13
8)
$0
($
7,0
00
)
-9%
-1%
Su
bto
tal T
axe
s a
nd
In
su
ran
ce
$83,3
45
$76,6
40
$70,9
21
$85,8
40
$79,0
00
1
00
%
6
%
To
tal A
nn
ua
l E
xp
en
ses
$1,4
04,3
37
$1,3
19,4
76
$1,2
89,7
09
$1,2
50,1
43
$1,3
16,0
00
1
00
%
So
urc
e: A
merica
n G
olf C
orp
ora
tio
n a
nd
Han
sfo
rd E
co
no
mic
Co
nsu
ltin
gexp
[1] P
erc
enta
ge
s m
ay
not
ad
d e
xa
ctly
due
to
ro
und
ing.
Ca
lend
ar
Ye
ar
[1]
Pe
rce
nt
of
All
Fig
ure
s i
n 2
007
Do
lla
rs

Prepared by HEC Page 26 September 8, 2008 HEC Project #60631
SSEECCTTIIOONN 44:: CCOOMMPPEETTIITTIIVVEE MMAARRKKEETT AANNAALLYYSSIISS
The findings of the competitive market analysis affect the demand for play and pricing variables under each economic scenario modeled in Section 5. This section of the report first discusses national golf trends then describes the competitive market region, golf courses within that region, and statistics associated with those golf courses. Independent evaluation is made as to how the characteristics of these golf courses influence desirability of play and pricing at LTGC.
NNAATTIIOONNAALL GGOOLLFF TTRREENNDDSS
Since 1950, the number of American golfers has grown tenfold, from 3.5 million to roughly 30 million. The percentage of Americans playing has risen from 3.5% to 12.6%. The number of golf facilities has more than tripled, from about 5,000 to 16,000. With golf now considered a major sport, the golf industry is big business in America. To put it in perspective, the golf industry sector is approximately the same economic size as the motion picture industry in the United States (SRI International and the World Golf Foundation, 2002).
In 2000, golf accounted for $62 billion of goods and services in the United States, of which $20.5 billion in revenues were generated at golf facilities, primarily through green fees (National Golf Foundation). During the first Zagat golf survey period (2006-2007), golfers reported spending an average of nearly $775 per person on equipment. According to the NGF's 2007 golf participation study (National Golf Foundation, Second Quarter 2007), there were 28.7 million golfers in the U.S. ages 6 and above in 2006. The total number of golfers is driven by two key variables, 1) population growth and 2) participation rate growth. Golf participation5 is affected by several factors including ethnicity, age, and gender of players. Per the NGF, the number of frequent golfers and rounds played has leveled off over the past several years6. The NGF‟s perspective on the future of golf (National Golf Foundation, 2006) is that continued increase in rounds played will occur based on population growth and the aging of the population (older persons tend to play more since they have more time available for leisure). A potentially better future exists if the industry can increase participation rates, particularly among non-traditional golfing segments by capturing latent demand. Latent demand includes golfers who want to play more, former golfers who want to try again, and persons interested in playing golf. NGF estimates participation rates will
5 Participation Rate definition: The percentage of a given population or demographic group who are golfers. 6 Round of Golf definition: A round of golf is defined by one person who tees off in an authorized “start” on a golf course. The round is not defined by the number of holes played or the fees paid.

Prepared by HEC Page 27 September 8, 2008 HEC Project #60631
decrease without increased programs aimed at maintaining and increasing participation rates. Population growth in the future may not be favorable for golf because the fastest growing segments of population are Hispanic and African-American which have lower participation rates than the non-Hispanic white population. Trends noted by NGF since 1986 and implications for LTGC include these shown in Table 11. Table 11: National Golf Trends Implications for LTGC
National Golf Trends Implications for LTGC
The 5-17 age group has experienced the greatest increase in golf participation, indicating that golf has become more of a family activity. (The trend of golf to a more family sport was confirmed by the Zagat Survey of 2007/2008).
Primary audience is vacationers and day trip visitors; however, under terms of the concession agreement, discount programs may be offered for junior and senior golfers to encourage increased participation by these age groups.
Caucasians have the highest participation rate of any ethnic group.
Participation rates at LTGC are more a function of income because the majority of players are visitors.
Core golfers (those aged 18 years and older who play eight or more rounds per year) are responsible for 91 percent of all rounds played and 87 percent of all golf-related spending. The number of core golfers has not increased since 1992, but the number of occasional golfers has.
The implication for LTGC is the same as for all golf courses; greater revenues can be realized by capturing more core golfers than occasional golfers.
Avid golfers (25+ rounds annually) make up the smallest player segment (23 percent), but accounted for 63 percent of all golf-related spending in 2002.
Avid golfers are most likely to be locals in LTGC‟s market; important contributors to the golf course, particularly during the early and late portions of the season.
The recent leveling-off of rounds played may be temporarily negated by baby boomers who have more time for leisure
Not necessarily true for LTGC since older persons have more fixed incomes; increased travel costs have a greater influence on number of rounds played.

Prepared by HEC Page 28 September 8, 2008 HEC Project #60631
GGOOLLFF PPLLAAYY AANNDD EEVVEENNTTSS AATT LLAAKKEE TTAAHHOOEE GGOOLLFF CCOOUURRSSEE LTGC is located approximately three and a half miles south of the City of South Lake Tahoe on the west side of US 50 / SR 89 on California State Parks property within Lake Valley SRA. LTGC is a daily fee public course offering 18-hole regulation play with clubhouse facilities used to host weddings and banquets. Golfers may rent powered carts and golf clubs and utilize the driving range and practice greens to warm up. The golf course is a par 71 course with a total playing distance of 6,707 yards. LTGC hosts a variety of golf tournaments and outings each season. In total, about 16% of rounds played at LTGC are tournament rounds, where tournament rounds may include parties of large corporate outings, traveling golf clubs, civic associations, government agencies, bachelor parties, reunions, and memorial events. Pricing for golf events differs from open play rounds. Open play rounds typically pay $80 per player, which consists of a $55 greens fee and a $25 cart fee. Tournament / event golf packages start at $95 per player and include greens fees, cart fees, range balls, reservations, and tournament services (such as contests, scoring, cart signs, and other personal attention as needed). In addition, LTGC will provide customized packages with food and beverage depending on the needs of the party. Throughout the year, LTGC hosts a variety of non-golf functions, such as weddings and banquets. The average number of events has been 37 per year. Of the approximately 37 events per year, about 15 of these occur during the winter months. According to American Golf Corporation, the non-golf segment of the business has grown over the past few years as a result of the quality of the venue and the tremendous scenery and views from the clubhouse grounds. Banquet events consist of civic events, meetings, reunions, memorials services, holiday parties, birthday parties, and any other type of event other than a wedding. Approximately 15% of food and beverage sales are made at the snack bar. As previously discussed, winter operations at LTGC include snowmobile rides on the driving range.
22000077 SSTTAATTEE PPAARRKKSS SSUURRVVEEYY During the 2007 golf season, State Parks conducted an on-site survey of golfers (see Appendix B for a copy of the questionnaire). A total of 227 complete surveys were collected. The surveys represent responses from less than 1% of the total player population; therefore, the results are not statistically valid. Nevertheless, they are still useful and indicative of the total player population profile and preferences.
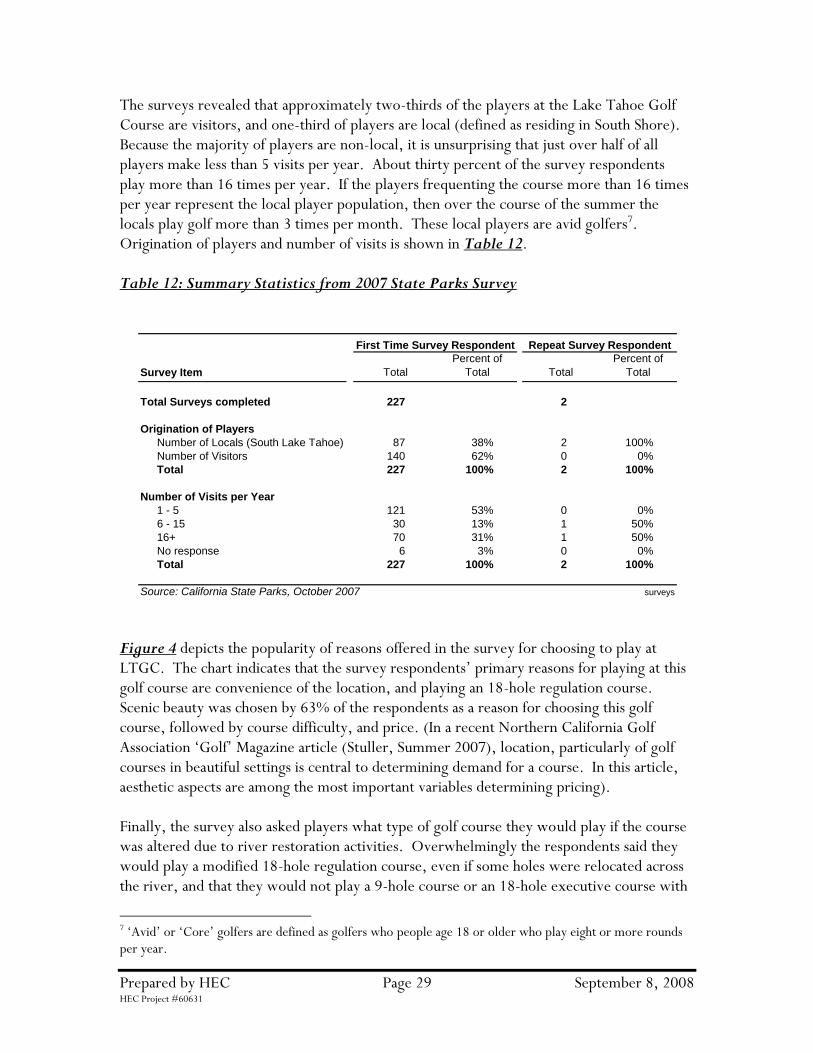
Prepared by HEC Page 29 September 8, 2008 HEC Project #60631
The surveys revealed that approximately two-thirds of the players at the Lake Tahoe Golf Course are visitors, and one-third of players are local (defined as residing in South Shore). Because the majority of players are non-local, it is unsurprising that just over half of all players make less than 5 visits per year. About thirty percent of the survey respondents play more than 16 times per year. If the players frequenting the course more than 16 times per year represent the local player population, then over the course of the summer the locals play golf more than 3 times per month. These local players are avid golfers7. Origination of players and number of visits is shown in Table 12. Table 12: Summary Statistics from 2007 State Parks Survey
Figure 4 depicts the popularity of reasons offered in the survey for choosing to play at LTGC. The chart indicates that the survey respondents‟ primary reasons for playing at this golf course are convenience of the location, and playing an 18-hole regulation course. Scenic beauty was chosen by 63% of the respondents as a reason for choosing this golf course, followed by course difficulty, and price. (In a recent Northern California Golf Association „Golf‟ Magazine article (Stuller, Summer 2007), location, particularly of golf courses in beautiful settings is central to determining demand for a course. In this article, aesthetic aspects are among the most important variables determining pricing). Finally, the survey also asked players what type of golf course they would play if the course was altered due to river restoration activities. Overwhelmingly the respondents said they would play a modified 18-hole regulation course, even if some holes were relocated across the river, and that they would not play a 9-hole course or an 18-hole executive course with
7 „Avid‟ or „Core‟ golfers are defined as golfers who people age 18 or older who play eight or more rounds per year.
Survey Item Total
Percent of
Total Total
Percent of
Total
Total Surveys completed 227 2
Origination of Players
Number of Locals (South Lake Tahoe) 87 38% 2 100%
Number of Visitors 140 62% 0 0%
Total 227 100% 2 100%
Number of Visits per Year
1 - 5 121 53% 0 0%
6 - 15 30 13% 1 50%
16+ 70 31% 1 50%
No response 6 3% 0 0%
Total 227 100% 2 100%
Source: California State Parks, October 2007 surveys
First Time Survey Respondent Repeat Survey Respondent

Prepared by HEC Page 30 September 8, 2008 HEC Project #60631
all holes located on the clubhouse side of the river8. Responses to these questions are shown in pie charts in Figure 5. Figure 4: Survey Responses – Reasons for Choosing LTGC
Comments and suggestions made by survey respondents were grouped together by topic area and summarized and are presented in Appendix B. The comments reflect a diversity of opinions regarding the golf course and restoration of the Upper Truckee River.
8 These survey respondents are likely to be biased regarding changes made to LTGC; a reduced-play area golf course would likely appeal to a different group of golfers.
Scenic Beauty
18 Hole Regulation Course
Course Difficulty
Price
Convenient Location
0 50 100 150 200
Number of Survey Responses (of total 227)
Reasons for Choosing LTGC
79%
63%
79%
48%
37%

Prepared by HEC Page 31 September 8, 2008 HEC Project #60631
Figure 5: Survey Responses - Preference for Golf Course Type and Layout
Yes82%
No6%
Not Sure12%
Would you Play a Modified 18-hole Regulation Course?
(Some holes across river)
Yes15%
No77%
Not Sure8%
Would you Play an 18-hole Executive Course?(All on Clubhouse side of river)
Yes10%
No80%
Not Sure10%
Would you Play a 9-hole Course(All on Clubhouse side of river)

Prepared by HEC Page 32 September 8, 2008 HEC Project #60631
CCOOMMPPEETTIITTIIVVEE GGOOLLFF CCOOUURRSSEESS ((SSCCEENNAARRIIOOSS 11AA AANNDD 11BB)) There are numerous golfing opportunities in the Lake Tahoe Region. Map 1 displays the public 18-hole regulation courses (in black) and non-traditional length golf courses (in red) within this region. Not all of these golf courses are considered to be competitors of LTGC, as explained below. The Tahoe interregional/intraregional transit study prepared for TRPA (LSC Consultants, 2006) reports that a 2004 survey of South Lake Tahoe visitors indicated that the summer visitor population originates from:
The Bay Area - 21.8% (of which 76% arrive by private auto)
Southern California – 19.8% (of which 59% arrive by private auto)
Central California – 15.4% (of which 76% arrive by private auto)
Other, including Nevada (43.0%) (of which 40% arrive by private auto)
If two-thirds of rounds played at LTGC are by non-locals, and the above percentages are applied to rounds played, then approximately 80% of LTGC‟s business arrives by automobile and approximately 20% of business arrives by air. Table 13 shows this calculation. Given this information and the fact that most visitor (non-local) players will travel to South Lake Tahoe by vehicle on US 50, this report does not consider the numerous golf courses in Truckee and around the California side of north Lake Tahoe to be in competition with LTGC. Visitors to the area arriving via Interstate 80 have no economic rationale to bypass these golf courses and continue to drive to South Lake Tahoe for golf9. This report considers competitive golf courses to be:
Public 18-hole courses,
18-hole courses that offer a similar experience to LTGC in terms of aesthetic appeal, and
Courses located within a 60-minute drive from South Lake Tahoe.
Map 2 shows the competitive golf courses based on these criteria.
9 Local players may drive to the North Shore to play new courses offered in this area; however, no attempt has been made to quantify this because the bulk of golf revenues are generated by visitor players (more than 80% of golf revenues are generated during the June through September months when visitors are estimated to make up more than two-thirds of the players).

Prepared by HEC Page 33 September 8, 2008 HEC Project #60631
Map 1: Public Golf Courses in the Region

Prepared by HEC Page 34 September 8, 2008 HEC Project #60631
Table 13: Origination and Mode of Transportation of LTGC Visitors
LT
GC
Vis
itors
Perc
ent of
Tota
l
Sum
mer
Vis
itation
Perc
ent of
Vis
itors
by
Auto
Perc
ent of
Tota
l V
isitors
arr
ivin
g b
y
Auto
Calc
ula
tion
LT
GC
Rounds
Pla
yed
Perc
ent of
Tota
l
Rounds
Ori
gin
ati
on
of
Vis
ito
rs t
o S
ou
th L
ake T
ah
oe in
Su
mm
er
Bay
Are
a22%
87%
19%
South
ern
Calif
orn
ia19%
70%
13%
Centr
al C
alif
orn
ia15%
83%
13%
Oth
er
and O
ut of
Sta
te44%
58%
25%
To
tal
100%
70%
a =
70%
To
tal R
ou
nd
s P
layed
at
Lake T
ah
oe G
olf
Co
urs
eb
33,1
63
Estim
ate
d R
ounds P
laye
d b
y V
isitors
c =
b*6
7%
22,2
19
67%
Estim
ate
d R
ounds P
laye
d b
y Locals
d =
b*3
3%
10,9
44
33%
To
tal R
ou
nd
s P
layed
33,1
63
100%
Esti
mate
d L
TG
C V
isit
or
Go
lfers
arr
ivin
g b
y A
uto
e =
a*c
15,6
51
Sourc
e: H
ansfo
rd E
conom
ic C
onsultin
g a
nd T
ahoe Inte
rregio
nal/In
trare
gio
nal T
ransit S
tudy,
vis
it s
hore
p
repare
d b
y L
SC
tra
nsport
ation c
onsultants
, 2006.

Prepared by HEC Page 35 September 8, 2008 HEC Project #60631
Map 2: Location of Scenarios 1A and 1B Competitor Golf Courses

Prepared by HEC Page 36 September 8, 2008 HEC Project #60631
Table 14 on the following page lists attributes of competitive golf courses sorted by distance from the intersection of Emerald Bay Road and Lake Tahoe Boulevard in South Lake Tahoe. Of the seven competitive courses, two are non-traditional length 18-hole golf courses. The non-traditional length courses are Tahoe Paradise, which is also the closest golf course to LTGC, and the Mountain Course at Incline Village. Three of the golf courses are outside the Tahoe Basin but offer spectacular views of the Eastern Sierra in meadow settings, and are closer than the competitive courses on the Nevada-side north shore of Lake Tahoe. These golf courses, located in Genoa and Gardnerville, are open year-round.
Green fees for the identified competitor golf courses are shown in Table 15 and represent rack rate fees for peak season weekend play with a cart. LTGC has the lowest fees of the 18-hole regulation courses with the exception of Carson Valley Golf Course. Given the caliber of Carson Valley Golf Course, this golf course is only considered to be in competition with LTGC for its share of local, rather than visitor players. Descriptions of LTGC‟s competitors are provided in Appendix C of this report.
Table 15: Green Fees at Competitor Public Golf Courses
The median rack rate for LTGC‟s competitors is $85 for 18 holes. In 2008 the NGF reported the average cost of a round of golf at 18-hole public courses (daily fee and municipal) to be $51 indicating that the region commands higher fees that the national average.
Public Golf Course 18 Holes Twilight Cart Rental
Lake Tahoe Golf Course R $80 $60 Included in green fee
Tahoe Paradise N $58 $39 Included in green fee
Edgewood Tahoe R $225 $175 Included in green fee
Genoa Lakes Resort (Lakes Course) R $120 $85 Included in green fee
Genoa Lakes Resort Course R $90 $65 Included in green fee
Carson Valley Golf Course R $30 $25 Included in green fee
The Championship Course at Incline Village R $169 $99 Included in green fee
The Mountain Course at Incline Village N $62 $40 Included in green fee
Median Rack Rate $85 $63
Source: The Weekly Magazine, June 2007, individual golf course websites comp fees
[1] Peak season rates for weekend play. These rates do not reflect revenue per round realized by the golf course.
Rack Rate [1]Regulation (R) or
Non-traditional (N)
Facility

Prepared by HEC Page 37 September 8, 2008 HEC Project #60631
Table 14: Competitive Courses (Scenarios 1A and 1B)
Lake T
ah
oe G
olf
Co
urs
e E
co
no
mic
Feasib
ilit
y A
naly
sis
Co
mp
eti
tiv
e P
ub
lic G
olf
Co
urs
es (
Scen
ari
os 1
A a
nd
1B
)S
ho
wn
in
Map
2
Golf C
ours
e
Num
ber
of
Hole
s
Regula
tion (
R)
or
Non-t
raditio
nal
(N)
Facili
ty
Year
Opened
Estim
ate
d
Num
ber
of
Rounds
Tahoe B
asin
(T
B)
or
Easte
rn S
ierr
a
(ES
)
Cours
e
Length
(Yard
s)
Par
Dis
tance
(Mile
s)
[1]
Estim
ate
d
Tra
vel T
ime
(Min
ute
s)
[2]
Desig
ned B
y
Lake T
ah
oe G
olf
Co
urs
e18
R1960
33,1
63
T
B6,7
07
71
3
6
William
Bell
Tahoe P
ara
dis
e18
N1960
n.a
.T
B4,0
28
66
5
8
Bru
ce B
eem
an
Edgew
ood T
ahoe
18
R1968
n.a
.T
B7,5
32
72
6
15
Georg
e F
azio
Genoa L
akes R
esort
(Lakes C
ours
e)
18
R1993
n.a
.E
S7,2
63
72
20
37
Pete
r Jacobsen
Genoa L
akes R
esort
Cours
e18
R1998
n.a
.E
S7,3
58
72
22
38
John H
arb
ottle
Cars
on V
alle
y G
olf C
ours
e18
R1960
n.a
.E
S6,0
23
71
25
43
Red S
wift
The C
ham
pio
nship
Cours
e a
t In
clin
e V
illage
18
R1964
26,6
65
T
B6,9
32
72
30
50
Robert
Tre
nt Jones J
r and S
r
The M
ounta
in C
ours
e a
t In
clin
e V
illage
18
N1968
18,7
39
T
B3,5
13
58
32
55
Robert
Tre
nt Jones J
r and S
r
Sourc
e: G
oogle
Maps, R
eno T
ahoe V
isitor
and C
onvention B
ure
au, G
olfC
ours
esG
uid
e.c
om
,and H
ansfo
rd E
conom
ic C
onsultin
gcom
petitive
[1] D
ista
nce is m
easure
d in r
oad m
iles o
rigin
ating f
rom
the inte
rsection o
f E
mera
ld B
ay
Road a
nd L
ake T
ahoe B
oule
vard
in S
outh
Lake T
ahoe.
[2] T
ravel tim
e is e
stim
ate
d b
y G
oogle
Maps f
rom
the inte
rsection o
f E
mera
ld B
ay
Road a
nd L
ake T
ahoe B
oule
vard
in S
outh
Lake T
ahoe.

Prepared by HEC Page 38 September 8, 2008 HEC Project #60631
NNOONN--TTRRAADDIITTIIOONNAALL LLEENNGGTTHH GGOOLLFF CCOOUURRSSEESS ((SSCCEENNAARRIIOO 22)) As already described more fully in Section 2 of this report, a non-traditional length golf course is a 9-hole regulation course or an alternative length course, which includes par-3 courses, executive courses, pitch and putt courses, and other courses of nontraditional hole configuration. Map 3 shows locations of non-traditional length golf courses within the wider region that may be used as comparables for Scenario 2. There are no public par 3 or pitch and putt courses in the region. Both Tahoe Paradise and The Mountain Course at Incline Village are executive 18-hole courses. Ponderosa golf course in Truckee, Old Brockway in Kings Beach, and Tahoe City golf course are the best 9-hole comparison courses. All of these 9-hole courses are of regulation length. Attributes including number of rounds played and rack rate green fees of these courses are listed in Table 16. Since this analysis does not presume a golf course layout under Scenario 2 (it could be a 9-hole course or an 18-hole executive course, or some other configuration), a low to high range of potential rounds played and green fees charged for the reduced-play area course is modeled to provide a range of potential revenues and expenditures.
SScceennaarriioo 22 PPootteennttiiaall RRoouunnddss PPllaayyeedd The low end of the range of number of rounds played under Scenario 2 is 15,000 rounds which is the lowest number of rounds of the comparison courses listed in Table 16. The high end of the range is 25,000 rounds, which is the highest number of rounds of the comparison courses listed in Table 16. Number of rounds data was provided by each of the comparison golf courses.
SScceennaarriioo 22 PPootteennttiiaall RRaannggee ooff FFeeeess The average rack rate (greens fee) to play 18-holes at the Tahoe comparable courses with a cart is $78; however, when comparing green fees per round, the median rack rate is 71% of the rack rate at LTGC. (The rack rate is the published rate charged which is greater than the actual fee charged per round). According to the NGF (National Golf Foundation, 2007), the median rack rate for a round of golf at non-traditional golf facilities (excluding resort public facilities) cost $22.00. The median rack rate for a round of golf at public 18-hole regulation facilities cost $40.00. At the national level, non-traditional facilities command 55% of the greens fees at 18-hole regulation course facilities. The difference in the range is the rack rate as a percentage of LTGC‟s rack rate. At the low end of the range the rack rate is 55% of LTGC‟s rack rate per NGF statistics. At the high end of the range the rack rate is the median price point of the comparable Tahoe golf courses as a percentage of LTGC‟s rack rate (71%).

Prepared by HEC Page 39 September 8, 2008 HEC Project #60631
Map 3: Location of Scenario 2 Comparison Non-traditional Length Golf Courses

Prepared by HEC Page 40 September 8, 2008 HEC Project #60631
Table 16: Number of Rounds and Green Fees Data for Scenario 2 Comparison Courses
Lake T
ah
oe G
olf
Co
urs
e E
co
no
mic
Feasib
ilit
y A
naly
sis
Co
mp
ari
so
n C
ou
rses f
or
Scen
ari
o 2
(N
on
-tra
dit
ion
al G
olf
Co
urs
e C
on
fig
ura
tio
n)
Walk
9
hole
s
Walk
18
hole
s
9 h
ole
s
with c
art
18 h
ole
s
with c
art
9 h
ole
s18 h
ole
s
Co
mp
ari
so
n N
on
-tra
dit
ion
al L
en
gth
Co
urs
e
Tahoe C
ity G
olf C
ours
eP
9-h
ole
regula
tion
1917
n.a
.9
2,6
31
66
$35
$65
$53
$95
$18
$30
Pondero
sa [3]
P9-h
ole
regula
tion
1961
15,0
00
93,0
22
70
$32
$52
$50
$78
$18
$26
Bro
ckw
ay
Golf C
ours
eP
9-h
ole
regula
tion
1926
25,0
00
93,4
18
72
$40
$70
$57
$96
$17
$26
Tahoe P
ara
dis
eP
18-h
ole
altern
ative
1960
n.a
.18
4,0
28
66
$30
$40
$42
$58
$12
$18
The M
ounta
in C
ours
e [4]
P18-h
ole
altern
ative
1968
18,7
39
18
3,5
13
58
$38
$62
$38
$62
Av
era
ge o
f C
om
pari
so
n C
ou
rses
19,5
80
$35
$58
$48
$78
$16
$25
Lake T
ahoe G
olf C
ours
eP
18-h
ole
regula
tion
1960
33,1
63
18
6,7
07
71
$25
$55
$35
$80
$10
$25
Rate
fo
r a R
ou
nd
of
Go
lf a
s a
Perc
en
t o
f L
TG
C
Tahoe C
ity G
olf C
ours
e66%
72%
Pondero
sa [3]
63%
72%
Bro
ckw
ay
Golf C
ours
e71%
68%
Tahoe P
ara
dis
e73%
72%
The M
ounta
in C
ours
e [4]
78%
Med
ian
Rate
of
Tah
oe C
om
pari
so
n C
ou
rses
Med
ian
Gre
en
Fee f
or
No
n-t
rad
itio
nal co
urs
es in
th
e U
S (
2006)
per
the N
GF
[5]
Sourc
e: H
EC
tele
phone c
onvers
ations w
ith lis
ted g
olf c
ours
es a
nd the N
GF
Golf Industr
y R
eport
First Q
uart
er
2007
alt c
ours
es
[1] N
um
ber
of
rounds is c
ounte
d a
s tota
l num
ber
of
pla
yers
payin
g to tee o
ff there
fore
18 h
ole
s a
t th
e 9
-hole
facili
ties c
ounts
as o
ne r
ound. E
stim
ate
s (
rounded)
and a
ctu
als
p
rovid
ed b
y e
ach g
olf c
ours
e.
[2] 2007 R
ate
s.
[3] In
June 2
008 the T
ruckee T
ahoe A
irport
Dis
tric
t (w
ith f
inancia
l assis
tance f
rom
the T
ow
n o
f T
ruckee, T
ruckee T
rails
Foundation a
nd T
ruckee D
onner
Land T
rust)
p
urc
hased the P
ondero
sa G
olf C
ours
e. It is
now
managed b
y th
e T
ruckee D
onner
Recre
ation a
nd P
ark
Dis
tric
t and f
ees a
re a
nticip
ate
d to d
ecre
ase.
R
ounds p
laye
d w
ere
estim
ate
d a
t 23,0
00 in 2
007 b
y g
olfcours
esguid
e.c
om
; new
managem
ent anticip
ate
s a
nnual ro
unds to b
e n
o less than 1
5,0
00.
[4] T
he M
ounta
in C
ours
e c
harg
es the s
am
e w
heth
er
a c
art
is r
ente
d o
r not.
[5] N
on-t
raditio
nal fa
cili
ties -
either
sta
nd-a
lone 9
-hole
regula
tion o
r short
cours
es (
executive o
r par
3)
gre
en f
ees a
s a
perc
enta
ge o
f gre
en f
ees f
or
facili
ties w
ith o
nly
18 r
egula
tion h
ole
s.
G
reen f
ees a
re p
eak s
eason f
ull
rate
weekend f
ees w
ith c
art
. C
art
may
not be r
equired a
t all
cours
es. F
ull
rate
s a
re r
are
ly c
harg
ed.
72%
Rack R
ate
s [
2]
Sh
ow
n in
Map
3
55%
Cart
Ren
tal R
ate
s
Item
Public
or
Munic
ipal
Cours
e T
ype
Year
Built
Num
ber
of
Rounds [1]
Num
ber
of
Hole
sY
ard
age
Par
(18
hole
s)
71%
55%

Prepared by HEC Page 41 September 8, 2008 HEC Project #60631
As of December 31, 2006, there were 904 18-hole equivalent (includes 9-hole, 18-hole, and 27-hole) golf courses in California, and 108 in Nevada (National Golf Foundation, 2007). Daily fee courses constituted 46% of total supply in California, and 61% in Nevada. Of all courses, including municipal and private, 84% were regulation length, and the remaining 16% executive or par-3 length courses in California. The share of regulation length courses is greater in Nevada. Table 17 shows these statistics for California, Nevada, and the U.S. The data suggests consumer preference for regulation golf courses. Table 17: National Golf Course Supply
Nationwide the current outlook for 9-hole courses is not favorable. In both 2005 and 2006 golf course closures were disproportionately short courses (National Golf Foundation, 2007). In 2007 stand-alone 9-holers or short courses (executive or par-3) accounted for 43% of total closures (20% of the US supply). This trend in short course closings is largely accounted for by higher and better economic uses of land rather than business failure. As described by the NGF (National Golf Foundation, January 2008), “Courses may be sold to developers when the underlying land has greater commercial real estate value than cash flow value as a golf course”. In a 2001 Golf 20/20 publication (Sportometrics, 2001) twelve major findings were made with regard to the feasibility of alternative golf facilities. These major findings and implications for LTGC are summarized in Table 18.
Area Total Daily Fee Regulation Executive Par 3
California 904 413 763 84 57
Percent of Total 46% 84% 9% 6%
Nevada 108 66 102 4 3
Percent of Total 61% 94% 4% 2%
US Total 14,968 8,321 13,702 724 542
Percent of Total 56% 92% 5% 4%
Source: NGF Golf Industry Report, First Quarter 2007 supply

Prepared by HEC Page 42 September 8, 2008 HEC Project #60631
Table 18: Golf 20/20 Report Findings and Implications for Scenario 2
Report Findings for Alternative (Non-traditional Length) Courses
Implication for LTGC Scenario 2
1. Golfers pay more at facilities with a full bar. Favorable, LTGC has a full bar
2. Golfers prefer a club with a beverage cart, snack bar, and restaurant.
Favorable, all available
3. Golfers like a club that accepts tee times. Favorable, tee times can be booked
4. Golfers pay and play more at clubs with driving ranges, and fees are higher at courses with mats.
Favorable, all available
5. Fees are higher where dress codes require a collared shirt and eliminate denim.
Golf attire preferred but not mandatory
6. Fees are slightly higher in more affluent more densely population and better-educated communities.
Not relevant, primarily a tourist-destination course
7. Rounds are higher in more affluent communities, but education appears to have no impact on rounds played.
Not relevant
8. Golfers prefer newer and longer alternative facilities.
Favorable, sufficient space at LTGC for longer alternative course
9. Fees and average rounds per day are higher in regions where courses are closed some portion of the year because of weather.
Applies to LTGC
10. 18-hole green fees are 48 percent higher than 9-hole fees, on average.
Not borne out by data in this study due to being a tourist destination
11. Green fees are just over 10 percent higher on weekends than they are during the week.
Already reflected in LTGC‟s pricing
12. Rounds and fees are higher at alternative facilities where there are more traditional courses.
Tahoe Paradise already captures this; may be difficult to do given proximity to this course

Prepared by HEC Page 43 September 8, 2008 HEC Project #60631
MMAARRKKEETT AANNAALLYYSSIISS FFIINNDDIINNGGSS
FFiinnddiinnggss The following findings influence the demand for play (number of rounds) and green fees pricing assumptions used in the economic feasibility model for changes in the reconfiguration and operation of LTGC:
Convenience of location and scenic beauty are the major assets of LTGC. These factors influencing demand are permanent and may even be leveraged to increase rounds played with a modified course layout if the modifications make the most of potential vistas. Seventy nine percent of LTGC golfers interviewed in 2007 said they chose to play at LTGC because it is an 18-hole regulation course, which suggests strong return golfer demand with reconfiguration of the golf course under Scenario 1B.
The financial model assumes number of rounds played to remain the same under Scenario 1B as under the Base Case. A reconfigured 18-hole regulation length LTGC may potentially command greater greens fees; however, this analysis conservatively applies the Base Case fees to Scenario 1B.
Given the close proximity of an executive golf course (Tahoe Paradise) to LTGC it is possible that golfers who enjoy this type of course are already being captured making an executive course less feasible than other types of reduced-play area golf courses; however, this potential assumption is not used in the analysis because the many potential configurations of a reduced-play area are not analyzed.
The financial model does not specify the type of reduced-play area golf course under Scenario 2. The estimates of variables, including number of rounds played, affecting revenues and expenditures under Scenario 2 are based on data from comparable Tahoe non-traditional length golf courses and other sources as more fully described in the following section of this report.
Pricing at existing non-traditional courses within the wider region may provide good indication of green fees that may be charged at a reduced-play area reconfigured LTGC; however, given uncertainty as to the configuration of this potential type of golf course, providing a range of potential green fees is more prudent.
The financial model estimates a range of green fees that may be charged for a round of golf at a reduced-play area golf course. The low end of the range uses the median rack rate of non-traditional golf facilities across the US and the high end of the range uses the median rack rate of Tahoe comparable golf courses.

Prepared by HEC Page 44 September 8, 2008 HEC Project #60631
SSEECCTTIIOONN 55:: FFIINNAANNCCIIAALL FFEEAASSIIBBIILLIITTYY AANNAALLYYSSIISS
The financial feasibility model estimates a projection of revenues and costs under each economic scenario based on a set of general assumptions and the base data developed in Section 3 of this report.
FFEEAASSIIBBIILLIITTYY MMOODDEELL GGEENNEERRAALL AASSSSUUMMPPTTIIOONNSS Table 19 summarizes the general assumptions used to project revenues and expenses under each economic scenario. Assumptions for each of the variables are explained in detail below and are based in part on research (already presented in Section 4) and in part on discussion with American Golf Corporation and State Parks. Each of the general assumptions used in the projections of revenue and expenses under each scenario is described below.
GGoollff CCoouurrssee LTGC continues to be an 18-hole regulation course under Scenarios 1A and 1B but is assumed to have a reduced-play area under Scenario 2. Various non-traditional length golf courses could potentially be built under Scenario 2 including an 18-hole executive course, 9-hole regulation course, and other configurations. The model does not specify which type of course would be built under Scenario 2. A four-combination approach is used to assess the full range of conditions related to the number of potential rounds and green fees (the two assumptions that most significantly affect results of the analysis).
Low Rounds – Low Fees High Rounds – Low Fees
Low Rounds – High Fees High Rounds – High Fees
NNuummbbeerr ooff GGoollff RRoouunnddss Scenario 1A reflects the average annual number of rounds played at LTGC 2003 through 2006, as previously calculated in Table 7. Extensive research into whether a modified / renovated 18-hole regulation course would increase, decrease, or have no effect on total number of rounds played yielded no definitive evidence what the outcome might be. Reconfiguration of the Championship Course in Incline Village during the 2003/04 seasons does not appear to have significantly influenced the number of rounds played at that golf course. Based on the research conducted the number of rounds under Scenario 1B is not altered from the Base Case. Ultimately, the number of rounds will be determined based on customer preferences and excellence of course design. Although number of rounds is not increased in this analysis under Scenario 1B it should be noted that there is potential for a price increase which could improve the projected revenues beyond those shown in this analysis.

Prepared by HEC Page 45 September 8, 2008 HEC Project #60631
The range of number of rounds played at a reduced-play area golf course under Scenario 2 is 15,000 to 25,000 rounds. Number of rounds information was obtained via telephone interview with each of the listed courses. Some golf courses declined to provide this information and some do not keep track of this information. The number of tournament rounds to total rounds is assumed to stay proportionately the same under Scenarios 1B as under Scenario 1A, and none are estimated under Scenario 2.
NNuummbbeerr ooff EEmmppllooyyeeeess The estimation of full and part-time jobs provided in Table 19 is detailed in Table 20 for each scenario. Projected number of employees under scenarios 1B, 2, and 3 are based on rounds per employee for golf-activity employees, with the exception of golf course maintenance employees (based on number of major pieces of equipment per employee), and events per employee for food and beverage employees. The estimated number of rounds is described above. Total number of employees is estimated to increase from 76 to 80 under Scenario 1B, decrease to 60 employees under Scenario 2 (Low Rounds), 65 employees under Scenario 2 (High Rounds), and decrease to 32 employees under Scenario 3.
GGrreeeenn FFeeeess Given the difficulty of estimating green fees and other associated golf facility charges under each scenario, a ratio was used to reduce or increase prices proportionate to current fees at LTGC. It is assumed that under Scenario 1B green fees would remain at their current level. Under Scenario 2 the green fees are estimated to range from a low of 55% of Base Case fees based on NGF data to a high of 71% of Base Case fees based on the median fee of Tahoe comparable non-traditional length courses (see Tables 15 and 16). Traditionally, golf has been considered to be an activity with elastic demand because it is considered a luxury expense rather than a necessity. Having elastic demand means that if the price is lowered then demand for play increases; however, golf is unusual in that it is not only an expense to play in terms of monetary value, but is also time-expensive because a round of golf takes four to five hours to play. Instead of increasing revenues, reducing prices can actually lower the top line and hurt the bottom line (European Golf Course Owners Association). Lacking empirical evidence, it is suggested that demand for play at LTGC is fairly inelastic since the majority of players are visitors who have already allocated leisure time to recreate, and since the locals are unlikely to be able to play twice as much even if the price is halved.
EEvveennttss aanndd GGuueessttss The number of weddings and banquets was assumed to remain the same under each scenario.

Prepared by HEC Page 46 September 8, 2008 HEC Project #60631
Table 19: General Assumptions used for Projecting Revenues and Expenses
Assu
mp
tio
ns
1A
- B
ase
Case
1B
Low
Fee
sH
igh F
ee
sL
ow
Fe
es
Hig
h F
ees
Go
lf C
ou
rse
Acre
ag
e o
f M
an
icu
red
La
nd
sca
pe
100
90
50
50
50
50
0
Nu
mb
er
of
Go
lf C
art
s L
ea
se
d85
85
45
45
45
45
0
Pie
ce
s o
f M
ajo
r M
ain
ten
an
ce
Eq
uip
me
nt
17
19
14
14
14
14
0
Em
plo
ye
es
(fu
ll a
nd
pa
rt-t
ime
)
Go
lf A
ctivity
Em
plo
yees
42
46
28
28
33
33
0
Eve
nt
Activity
Em
plo
yees
31
31
31
31
31
31
31
Ad
min
istr
atio
n3
3
1
1
1
1
1
To
tal E
mp
loye
es
- (
see
Ta
ble
20
)76
80
60
60
65
65
32
Nu
mb
er
of
go
lf r
ou
nd
s p
laye
d
Re
gula
r R
ou
nds
27,8
64
27,8
64
15,0
00
15,0
00
25,0
00
25,0
00
0
To
urn
am
ent
Ro
un
ds [
1]
5,2
99
5,2
99
0
0
0
0
0
Su
bto
tal N
um
be
r o
f R
ou
nd
s P
laye
d [
2],
[3
]33,1
63
33,1
63
15,0
00
15,0
00
25,0
00
25,0
00
0
Gre
en
Fe
es
co
mp
are
d t
o B
ase
Cas
e [
4]
100
%
100
%
55%
71%
5
5%
7
1%
0
%
Ca
rt R
en
tal R
ate
s c
om
pa
red
to
Ba
se
Cas
e [
5]
100
%
100
%
55%
72%
5
5%
7
2%
0
%
Ev
en
ts
Nu
mb
er
of
We
dd
ings
29
29
29
29
29
29
29
Nu
mb
er
of
Ba
nq
ue
ts8
8
8
8
8
8
8
To
tal N
um
be
r o
f E
ve
nts
[6
]37
37
37
37
37
37
37
Gu
ests
Gu
ests
at W
edd
ings
3,0
91
3,0
91
3,0
91
3,0
91
3,0
91
3,0
91
3,0
91
Gu
ests
at B
anq
ue
ts573
573
573
573
573
573
573
To
tal G
ue
sts
at
Ev
en
ts [
6]
3,6
63
3,6
63
3,6
63
3,6
63
3,6
63
3,6
63
3,6
63
So
urc
e: H
an
sfo
rd E
co
no
mic
Co
nsu
ltin
gto
t assum
ps
[1] T
ourn
am
ent
rou
nds in
clu
de
gro
up
ou
tin
gs a
nd
eve
nts
su
ch
as b
ach
elo
r p
art
ies.
No t
ou
rnam
ent
rou
nds a
re p
roje
cte
d u
nd
er
Sce
na
rio 2
.
[2] H
EC
sp
en
t e
xte
nsiv
e tim
e r
ese
arc
hin
g w
heth
er
a m
odifie
d /
re
novate
d 1
8-h
ole
reg
ula
tio
n c
ours
e w
ould
incre
ase, d
ecre
ase
, o
r h
ave
no
eff
ect
on
to
tal
num
ber
of
rounds p
laye
d. T
his
researc
h y
ield
ed n
o d
efinitiv
e e
vid
ence w
hat th
e o
utc
om
e m
ight be. U
ltim
ate
ly the n
um
ber
of
rounds w
ill b
e
dete
rmin
ed b
ased o
n c
usto
mer
pre
fere
nces, and e
xcelle
nce o
f cours
e d
esig
n.
[3] L
ow
range a
nd h
igh r
ange r
ounds b
ased o
n d
ata
fro
m n
on-t
raditio
nal le
ngth
cours
es in the T
ahoe r
egio
n (
see T
able
16).
[4] P
er
the
NG
F 2
00
6 t
he
me
dia
n g
ree
n f
ee a
t n
on
-tra
ditio
nal fa
cili
ties in
the U
S is 5
5%
of
the a
ve
rage
gre
en
fee t
o p
lay
18-h
ole
fa
cili
tie
s.
Th
e N
GF
's e
stim
ate
acco
un
ts f
or
a w
ide v
ariety
of
typ
es o
f co
urs
es a
nd
is u
sed f
or
the
low
range o
f p
ote
ntial fe
es. H
EC
has u
se
d the
ave
rag
e
fees o
f n
on
-tra
ditio
na
l le
ng
th c
ours
es in
th
e T
aho
e r
egio
n t
o r
educe g
reen
fe
es f
or
the h
igh r
ange o
f p
ote
ntia
l fe
es (
se
e T
able
16
).
[5] L
ow
range f
ees u
se N
GF
2006 d
ata
and h
igh r
ange f
ees u
se d
ata
fro
m n
on-t
raditio
nal le
ngth
cours
es in the T
ahoe r
egio
n (
see T
able
16).
[6] N
um
ber
of
eve
nts
and
gu
ests
assu
me
d c
onsta
nt fo
r a
ll sce
narios.
Sc
en
ari
o 2
(L
ow
Ro
un
ds
)S
cen
ari
o 2
(H
igh
Ro
un
ds
)S
cen
ari
o 1
Sc
en
ari
o
3

Prepared by HEC Page 47 September 8, 2008 HEC Project #60631
Table 20: Estimated Employees by Economic Scenario
La
ke
Ta
ho
e G
olf
Co
urs
e E
co
no
mic
Fe
asib
ilit
y A
naly
sis
Es
tim
ate
d N
um
be
r o
f E
mp
loye
es
by E
co
no
mic
Scen
ari
o
2006
Em
plo
yees
Em
plo
yees
Nu
mera
tor
Multip
lier
1A
- B
ase
Ca
se
1B
Low
Fees
Hig
h
Fees
Low
Fe
es
Hig
h
Fe
es
Nu
mb
er
of
Go
lf-a
cti
vit
y E
mp
loye
es
Pro
Sh
op
11
33,1
63
Rounds p
er
Em
plo
yee
3,0
15
11
11
5
5
8
8
0
Ca
rts [
1]
7
33,1
63
Rounds p
er
Em
plo
yee
4,7
38
7
8
3
3
5
5
0
Main
ten
an
ce
24
17
Majo
r P
ieces o
f E
quip
ment
per
Em
plo
yee
0.7
08
24
27
20
20
20
20
0
Su
bto
tal G
olf
-acti
vit
y E
mp
loye
es
42
42
46
28
28
33
33
0
Nu
mb
er
of
Ev
en
t-a
cti
vit
y E
mp
loye
es
Fo
od
& B
eve
rag
e31
37
Events
per
Em
plo
yee
1.2
31
31
31
31
31
31
31
Su
bto
tal E
ve
nt-
acti
vit
y E
mp
loye
es
31
31
31
31
31
31
31
31
Ad
min
istr
atio
n [
2]
3
n.a
.
n.a
.
3
3
1
1
1
1
1
To
tal E
mp
loye
es
76
76
80
60
60
65
65
32
So
urc
e: H
an
sfo
rd E
cono
mic
Co
nsu
ltin
gem
p e
st
[1] A
n a
dditio
na
l e
mplo
yee is a
dd
ed
un
der
Sce
nario 1
B to a
llow
for
incre
ased s
nack c
art
serv
ice
.
[2] C
urr
ently
there
are
3 a
dm
inis
tra
tive
sta
ff p
ositio
ns. H
EC
estim
ate
d a
dm
inis
trative
positio
ns w
ould
re
duce to 1
und
er
Sce
na
rios 2
and 3
.Sc
en
ari
o 2
(L
ow
S
cen
ari
o 1
Scen
ari
o
3
Sc
en
ari
o 2
(H
igh

Prepared by HEC Page 48 September 8, 2008 HEC Project #60631
EESSTTIIMMAATTEEDD RREEVVEENNUUEESS BBYY EECCOONNOOMMIICC SSCCEENNAARRIIOO A step by step description of projection of revenues is presented here:
1. Revenue multipliers were developed for each revenue-generating activity to project revenues by economic scenario. Revenue multipliers are shown in Table 21 and are derived by dividing average annual revenues from Table 8 by unit for each line item.
2. All golf activities (green fees, cart rental, and driving range) revenue multipliers are
based on rounds played. The revenue multiplier is revenues in 2007 dollars divided by rounds played. There is no revenue multiplier for the Nike Golf Learning Center because this no longer operates. Merchandise, food and beverage and other charges related to golf are also based on rounds played. Golf-related food and beverage revenues are also partially based on the number of cart employees to reflect snack bar sales.
3. Food and beverage related to weddings and banquets, and other revenues (such as
wedding and banquet fees and service charges), are estimated on a per event basis.
4. The revenue multipliers are applied to the relevant unit for each revenue activity to estimate total revenues under each scenario. The unit assumptions (total rounds played and number of events) are taken from Table 19 for each economic scenario. Green fees are multiplied by „green fees compared to base case‟ ratios to account for changed pricing between the scenarios.
Resulting total revenues by activity are shown for each scenario in Table 22. Base Case total revenues are $20,000 less than in Table 21 due to the omission of the Nike Golf Learning Center in the revenue projections. Golf activity revenues are estimated to remain at $2.0 million under Scenario 1B and range from $0.5 to $1.0 million under Scenario 2. Because there is no golf course under Scenario 3, golf-activity revenues are zero. Concessions and other revenues are estimated to increase slightly from $0.78 million under Scenario 1A to $0.80 million under Scenario 1B. Under Scenario 2 (Low Rounds) these revenues decrease to $0.49 million or $0.65 million under Scenario 2 (High Rounds). Events facility only revenues are estimated at $0.26 million under Scenario 3. Winter operations are not estimated to change between scenarios except they would be eliminated along with the golf course in Scenario 3. As previously noted, winter operations are most heavily dependent on weather conditions.

Prepared by HEC Page 49 September 8, 2008 HEC Project #60631
Table 21: Revenue Multipliers Used to Project Revenues by Scenario
Re
ve
nu
es
Re
ve
nu
es in
2007 $
s
Multip
lier
Basis
Unit
Re
ve
nu
e
Multip
lier
Go
lf A
cti
vit
ies
(Se
e T
ab
le 8
)
Gre
en
Fe
es
$1,3
68,0
00
33,1
63
Rounds P
layed
$41.2
5
Ca
rt R
enta
l$517,0
00
33,1
63
Rounds P
layed
$15.5
9
Drivin
g R
ang
e$107,0
00
33,1
63
Rounds P
layed
$3.2
3
Nik
e G
olf L
ea
rnin
g C
ente
r [1
]$20,0
00
n.a
.N
o lo
nger
opera
tin
gn.a
.
Su
bto
tal G
olf
Ac
tiv
itie
s [
2]
$2,0
12,0
00
Co
nc
es
sio
ns
/Oth
er
Merc
han
dis
e$181,0
00
33,1
63
Rounds P
layed
$5.4
6
Fo
od
an
d B
eve
rag
e -
Go
lf [
2]
$285,0
00
33,1
63
50%
Rounds P
layed
$4
[3]
7
50%
cart
em
plo
yees
$20,3
57
Se
rvic
e c
harg
es,
fees &
oth
er
- G
olf
$58,0
00
33,1
63
Rounds P
layed
$1.7
5
Fo
od
an
d B
eve
rag
e -
Eve
nts
[2]
$212,0
00
37
Event
$5,6
91.2
8
Se
rvic
e c
harg
es,
fees &
oth
er
- E
ve
nts
$44,0
00
37
Event
$1,1
81.2
1
Su
bto
tal C
on
ces
sio
ns
/Oth
er
$780,0
00
To
tal A
nn
ua
l R
ev
en
ue
$2,7
92,0
00
So
urc
e: H
an
sfo
rd E
co
no
mic
Co
nsu
ltin
gre
v m
ult
[1] T
he le
arn
ing c
ente
r is
no lo
ng
er
ope
ratin
g h
en
ce
it
is o
mitte
d f
rom
the
re
ve
nue m
ultip
liers
.
[2] L
TG
C e
stim
ate
s f
ood
an
d b
eve
rag
e r
eve
nu
es o
f $
21
2,0
00
fro
m n
on
-go
lf c
ate
red e
ve
nts
in
2008
.

Prepared by HEC Page 50 September 8, 2008 HEC Project #60631
Table 22: Projected Revenues by Scenario
Lake T
ah
oe G
olf
Co
urs
e E
co
no
mic
Feasib
ilit
y A
naly
sis
Pro
jecte
d R
ev
en
ues b
y E
co
no
mic
Scen
ari
o
LT
GC
Revenues
1A
- B
ase
Case
1B
Low
Fees
Hig
h F
ees
Low
Fees
Hig
h F
ees
Go
lf A
cti
vit
ies
Gre
en F
ees [1]
$1,3
68,0
00
$1,3
68,0
00
$340,3
00
$440,9
00
$567,2
00
$734,8
00
$0
Cart
Renta
l [2
]$517,0
00
$517,0
00
$128,6
00
$128,6
00
$214,4
00
$214,4
00
$0
Drivin
g R
ange
$107,0
00
$107,0
00
$48,4
00
$48,4
00
$80,7
00
$80,7
00
$0
Nik
e G
olf L
earn
ing C
ente
r [1
]$0
$0
$0
$0
$0
$0
$0
Su
bto
tal G
olf
Acti
vit
ies [
2]
$1,9
92,0
00
$1,9
92,0
00
$517,3
00
$617,9
00
$862,3
00
$1,0
29,9
00
$0
Co
ncessio
ns/O
ther
Merc
handis
e$181,0
00
$181,0
00
$81,9
00
$81,9
00
$136,4
00
$136,4
00
$0
Food, B
evera
ge, E
vents
(G
olf R
ela
ted)
$343,0
00
$363,4
00
$155,1
00
$155,1
00
$258,6
00
$258,6
00
$0
Food, B
evera
ge, E
vents
(N
on-G
olf R
ela
ted)
$256,0
00
$256,0
00
$256,0
00
$256,0
00
$256,0
00
$256,0
00
$256,0
00
Su
bto
tal C
on
cessio
ns/O
ther
$780,0
00
$800,4
00
$493,0
00
$493,0
00
$651,0
00
$651,0
00
$256,0
00
Snow
mobile
Lease P
aym
ents
[3]
$17,0
00
$17,0
00
$17,0
00
$17,0
00
$17,0
00
$17,0
00
$0
To
tal E
sti
mate
d L
TG
C R
ev
en
ues (
rou
nd
ed
)$2,7
89,0
00
$2,8
09,0
00
$1,0
27,0
00
$1,1
28,0
00
$1,5
30,0
00
$1,6
98,0
00
$256,0
00
Sourc
e: H
ansfo
rd E
conom
ic C
onsultin
gto
t re
v
[1] T
o e
stim
ate
gre
en f
ees, estim
ate
d r
ounds p
laye
d is m
ultip
lied b
y th
e r
evenue m
ultip
lier
in T
able
21 a
nd b
y th
e
'Gre
en F
ees c
om
pare
d to B
ase C
ase' m
ultip
lier
show
n in T
able
19.
[2] T
o e
stim
ate
cart
renta
l re
venue, estim
ate
d r
ounds p
laye
d is m
ultip
lied b
y th
e r
evenue m
ultip
lier
in T
able
21 a
nd b
y th
e
'Cart
Renta
l R
ate
s c
om
pare
d to B
ase C
ase' m
ultip
lier
show
n in T
able
19.
[3] S
now
mobile
lease p
aym
ents
to A
merican G
olf C
orp
ora
tion p
rim
arily
dependent on w
eath
er.
Scen
ari
o 3
Scen
ari
o 2
(L
ow
Ro
un
ds)
Scen
ari
o 2
(H
igh
Ro
un
ds)
Scen
ari
o 1

Prepared by HEC Page 51 September 8, 2008 HEC Project #60631
EECCOONNOOMMIICC SSCCEENNAARRIIOO 33 PPOOTTEENNTTIIAALL AADDDDIITTIIOONNAALL RREEVVEENNUUEESS Between 2003 and 2006 LTGC averaged 37 wedding and banquet events per year and hosted about 3,663 guests. In addition, other golfing-related events and tournaments were catered. These events were catered onsite at the clubhouse. LTGC‟s clubhouse is 7,000 square feet with about 2,000 square feet of indoor space to host events. In addition, there is a patio area of about 1,600 square feet. Total revenues generated during this time period were $599,000 in 2007 dollars10. With 2,000 square feet of space, this equates to sales of approximately $300 per square foot, which is a healthy figure comparable to other eating and drinking places11. Of the total event-generated revenue, approximately $256,000 was generated by non-golf events (weddings and banquets). The estimation of this amount is shown in Table 21 (see footnote [2]). With 2,000 square feet of indoor space, non-golf events generate approximately $128 per square foot per year. The presence of the golf course currently gives LTGC a competitive edge over many of the numerous wedding and banquet venues around Lake Tahoe. Competitors for weddings and banquets are currently Edgewood at Tahoe, Harvey‟s Casino, Kirkwood Resort, Genoa Lakes Resort, and The Chateau at Incline Golf Courses. With the loss of an operating golf course under Scenario 3, LTGC would no longer compete with these locations but compete with other municipally-run and non-profit operated wedding sites. The Thunderbird Lodge, Valhalla, and North Tahoe Conference Center (NTCC) would be good comparables under Scenario 3; however, of these comparables only NTCC provides catering. Outside catering is brought in for events at Valhalla and Thunderbird Lodge. NTCC provided revenue information for weddings and banquets at their facility for the base data years (2003 through 2006) used in this analysis. Data was adjusted for inflation to provide an apples-to-apples comparison with LTGC. The data revealed that NTCC caters almost double the number of events of LTGC currently, serves approximately 6,300 guests annually, and, because there is 2,000 square feet of space used for these events, generates sales of about $194 per square foot. Although NTCC generates higher sales per square foot from weddings and events ($194 per square foot compared to $128 per square foot at LTGC), because it caters more events per year, revenue per event/party is lower than at LTGC. This data is presented in Table 23.12 If LTGC could generate the same revenues as NTCC for non-golf related events it could capture an additional $131,000 under Scenario 3.
10 In comparison, the top 5% of daily fee golf courses generating $1.0 - $1.7 million annually reported an average of $603,000 in revenue (National Golf Foundation, 2002). 11 US median for eating and drinking establishments is $280 per square foot (The Urban Land Institute, 2004). 12 Thunderbird Lodge hosted 27 events in 2007, 10 of which were weddings. In addition, many dinners are hosted, seating about 120 guests per dinner.

Prepared by HEC Page 52 September 8, 2008 HEC Project #60631
Table 23: Estimated Potential Additional Event Facility Revenue
Lake T
ah
oe G
olf
Co
urs
e E
co
no
mic
Feasib
ilit
y A
naly
sis
LT
GC
Ev
en
t F
acilit
y D
ata
Event F
acili
ty
Estim
ate
d A
nnual
Revenue G
enera
ted
by E
vents
Square
Feet of
Events
Facili
ty
Space
Estim
ate
d A
nnual
Revenue p
er
Square
Foot
Num
ber
of
Weddin
gs /
Private
Part
ies
Appro
xim
ate
Num
ber
of
Guests
Estim
ate
d
Revenue p
er
Part
y
[1]
[2]
[3]
[3]
ab
c =
a/b
de
f =
a/d
LT
GC
To
tal E
ven
t R
ev
en
ues (
see T
ab
le 2
1)
$599,0
00
2,0
00
$300
LT
GC
No
n-g
olf
Ev
en
t-re
late
d R
ev
en
ues
Food a
nd B
evera
ge -
Events
[2]
$212,0
00
2,0
00
$106
Serv
ice c
harg
es, fe
es &
oth
er
- E
vents
$44,0
00
2,0
00
$22
Su
bto
tal L
TG
C$256,0
00
2,0
00
$128
37
3,6
63
$6,8
72
No
rth
Tah
oe C
on
fere
nce C
en
ter
(NT
CC
)
Weddin
g a
nd E
vent R
ela
ted R
evenue
$387,0
00
2,0
00
$194
63
6,2
67
$6,1
76
Po
ten
tial A
dd
itio
nal R
ev
en
ue t
o L
TG
C$131,0
00
Sourc
e: N
ort
h T
ahoe C
onfe
rence C
ente
r and A
merican G
olf C
orp
ora
tion.
event
com
p
[1] D
ata
period 2
003 -
2006.
[3] D
ata
period 2
003 -
2006 f
or
LT
GC
, and 2
004 -
2006 f
or
NT
CC
.
[2] D
oes n
ot in
clu
de p
atio s
pace.

Prepared by HEC Page 53 September 8, 2008 HEC Project #60631
This study does not attempt to quantify potential other sources of revenue that may be generated if the clubhouse is no longer operated by a concessionaire. Public workshops held in 2007 stimulated the following revenue-generating activities suggestions from building rental:
Multi-use recreation/visitor center (with features such as a rock climbing wall),
An arts center, and
An educational center (for holding community college courses, for example).
EESSTTIIMMAATTEEDD EEXXPPEENNSSEESS BBYY EECCOONNOOMMIICC SSCCEENNAARRIIOO As for revenues, a step by step description of projection of expenditures is presented here:
1. Expenses are estimated for each economic scenario using expense multipliers developed for each expense activity. Expense multipliers are shown in Table 24 and are derived by dividing average annual expenditures from Table 10 by unit for each line item.
2. Cost of goods expense is based on the historical percentage of these costs to merchandise and food and beverage sales. Payroll expenses are based on number of employees with the exception of instruction which will cost the concessionaire a flat fee of $750 per month for an 18-hole regulation course (this cost is assumed to decrease 50% for a reduced-play area golf course).
3. Operating expenses cost multipliers are based on a combination of rounds played, acres of manicured landscape, number of events, and number of facilities. General and administrative costs are calculated as a percentage of all payroll, operating expenses, leases and rentals, and equipment replacement. Telephone/TV/Internet providers costs are estimated on a per employee basis since they generate the majority of the variable costs associated with this expense activity.
4. American Golf Corporation pays possessory interest property taxes to the El Dorado County Assessor and insurance for facility structures. Because these costs are largely fixed costs, and are not controllable by the golf course concessionaire, they are estimated on a per facility basis.

Prepared by HEC Page 54 September 8, 2008 HEC Project #60631
Table 24: Expense Multipliers used to Project Expenses by Scenario
Expenses
Expenses in
2007 $s
Multiplier
Basis Unit Cost Multiplier
Cost of Goods (See Table 10)
Merchandise $108,000 60% Percentage of Revenues [1] 60%
Food and Beverage - Golf $62,500 18% Percentage of Revenues [1] 18%
Food and Beverage - Events $62,500 24% Percentage of Revenues [1] 24%
Subtotal Cost of Goods $233,000
Payroll
Golf and Facilities $60,000 11 Pro Shop Employees $5,454.55
Carts & Range $37,000 7 Carts Employees $5,285.71
Instruction $20,000 1 Flat $750 / mo for instructors $4,500.00
Course Maintenance $232,000 24 Maintenance Employees $9,666.67
Food and Beverage $177,000 31 Event Employees $5,709.68
General and Administrative $102,000 76 Total Employees $1,342.11
Subtotal Payroll $628,000
Operating Expenses (including Utilities)
Golf $7,000 33,163 Rounds Played $0.21
Carts & Range $14,000 33,163 Rounds Played $0.42
Nike Golf Learning Center $2,000 No longer operating n.a.
Nike Golf Membership $5,000 No longer operating n.a.
Course Maintenance $68,000 100 Acres of Manicured Landscape $680.00
Food and Beverage $18,000 37 Events $483.22
General and Administrative $87,000 10% Percentage of Expenses [2] 10%
Facilities $14,000 33,163 Rounds Played $0.42
Water $6,000 1 Facility (includes all structures) $6,000.00
Power - irrigation [3] $18,900 100 Acres of Manicured Landscape $189.00
Power - structures [3] $23,100 1 Facility (includes all structures) $23,100.00
Phone / TV / Internet Providers $10,000 76 Total Employees $131.58
Solid Waste $14,000 37 Events $375.84
Subtotal Operating Expenses $287,000
Leases and Rentals, Equipment Replacement
Carts $60,000 85 Number of Carts $705.88
Maintenance $24,000 17 Major Pieces of Equipment [4] $1,411.76
Kitchen $5,000 1 Average Annual Cost $5,000.00
Subtotal Leases and Rentals, Equipment Replacement $89,000
Taxes and Insurance
Property Tax $65,000 1 Facility Structures $65,000.00
Insurance $21,000 1 Facility Structures $21,000.00
Other ($7,000) 1 Facility Structures ($7,000.00)
Subtotal Taxes and Insurance $79,000
Total Annual Expenses $1,316,000
Source: American Golf Corporation and Hansford Economic Consulting exp mult
[1] Percentage of maintenance and food and beverage revenues shown in Table 21.
[2] Percentage of payroll, operating expenses (excluding Nike golf learning center and membership), leases and rentals, and equipment replacement.
[3] Per LTGC, 53% of power bills are for the clubhouse, 6% for the maintenance building, and 41% for the pumphouse (golf course).
[4] Includes equipment such as mowers, aerators, sod cutters, front end loading tractor, and topdressers.

Prepared by HEC Page 55 September 8, 2008 HEC Project #60631
5. Maintenance costs are estimated on a per major piece of equipment basis since the costs of maintaining the course is dependent on variables including demand for play, acres of landscaping and difficulty of maintenance due to golf course layout. The number of major pieces of equipment reflects costs associated with these variables. The number of cart rentals is dependent on demand for play and is estimated to decrease under Scenario 2. Costs associated with the kitchen are likely to remain unchanged under any scenario since these costs are largely fixed costs associated with the ability to host events. There is no expenditure multiplier for the Nike Golf Learning Center and associated membership dues because this no longer operates at LTGC.
Cost multipliers are applied to the unit assumptions in Table 19 to estimate total expense impacts generated by the economic scenarios. The results are shown in Table 25. Cost of goods is not estimated to change significantly between scenarios 1A and 1B, but is estimated to be reduced under Scenarios 2 and 3. Payroll expenses increase between Scenarios 1A and 1B, reflecting the need for additional employees for additional course maintenance and increased snack bar service. Payroll expenses decrease under Scenarios 2 and 3 because the number of employees decreases under these scenarios. Operating expenses decrease slightly from $280,000 to $275,000 under Scenario 1B primarily due to decreased acreage of maintained landscape and power costs for irrigation. Operating expenses decrease to $194,000 under Scenario 2 (Low Rounds) or $210,000 under Scenario 2 (High Rounds), and are significantly less at $94,000 under Scenario 3. Leases and rentals costs change based on number of carts and major pieces of maintenance equipment needed. Taxes and insurance are fixed costs that are assumed to stay constant under each scenario.
FFIINNAANNCCIIAALL FFEEAASSIIBBIILLIITTYY FFIINNDDIINNGGSS Scenarios 1A and 1B are found to be financially feasible. Net revenues are estimated to decrease by less than $20,000 between the Base Case and Scenario 1B. Scenario 2 is only found to be feasible under the most optimistic of circumstances where number of rounds attained is at the highest range of comparable courses in Tahoe and rack rates are the median of comparable Tahoe non-traditional length facilities. Although net revenues (golf course operations revenues less expenditures) are positive under Scenario 2, the concessionaire would have a negative cash flow after making rent and CIP payments to State Parks in all but the most optimistic of the range of revenues and expenditures under Scenario 2. Net revenues are negative under Scenario 3.

Prepared by HEC Page 56 September 8, 2008 HEC Project #60631
Scenario 3 revenues include additional revenues that may potentially be generated by an increased number of events held at the clubhouse but does not include an analysis of increased expenses associated with increased events. The negative financial result produced under Scenario 3 would be exacerbated by additional expenses; concessionaire operations would cease at LTGC. Revenues and expenditures are compared in Table 26 for each economic scenario. A study of the economic impacts of golf in California (Zilberman & Templeton, 2000) made five points worthy of consideration in light of the results of the financial analysis presented in this section. 1. Revenues tend to increase with number of holes, length of course, and difficulty of
access to an 18-hole regulation course. Revenues decrease under Scenario 2.
2. Facilities with a 9-hole regulation course do not generate more revenues, on average,
than facilities with a 9-hole non-regulation course.
Revenues projected under Scenario 2 may be reasonable for various non-traditional configurations (not just 9-hole).
3. The reported quality of an 18-hole regulation course is higher, on average, than the
reported quality of an 18-hole non-regulation course and golf fees are slightly higher (this is also true for 9-hole courses with regards to fees but not quality).
Green fees are lower on a per-round basis for non-traditional courses in the competitive market area. If perceived quality is lower, the course is less likely to capture as high percentage of visitors. Local golf player rounds may increase (as a percentage of total rounds) under Scenario 2.
4. Economic drivers of number of alternative facilities are per capita income, population
density, and average green fees at both traditional courses and nontraditional facilities.
These variables are likely to have greater impact under Scenario 2 since a greater share of players is likely to be local under this scenario.
5. Food and beverage and merchandise sales tend to increase with number of holes, length
of course, and cost of a round at an 18-hole regulation course, and tend to be higher than at 18-hole non-regulation courses. Nine-hole regulation courses have greater merchandise sales than 9-hole non-regulation course.
Food and beverage, and merchandise sales decrease under Scenario 2.

Prepared by HEC Page 57 September 8, 2008 HEC Project #60631
Table 25: Projected Expenditures by Economic Scenario
Lake T
ah
oe G
olf
Co
urs
e E
co
no
mic
Feasib
ilit
y A
naly
sis
Pro
jecte
d E
xp
en
dit
ure
s b
y E
co
no
mic
Scen
ari
o
Expenses
1A
- B
ase C
ase
1B
Low
Fees
Hig
h F
ees
Low
Fees
Hig
h F
ees
Co
st
of
Go
od
s
Merc
handis
e$108,0
00
$108,0
00
$48,9
00
$48,9
00
$81,4
00
$81,4
00
$0
Food a
nd B
evera
ge -
Golf
$62,5
00
$66,2
00
$28,3
00
$28,3
00
$47,1
00
$47,1
00
$0
Food a
nd B
evera
ge -
Events
$62,5
00
$62,5
00
$62,5
00
$62,5
00
$62,5
00
$62,5
00
$62,5
00
Su
bto
tal C
ost
of
Go
od
s$233,0
00
$236,7
00
$139,7
00
$139,7
00
$191,0
00
$191,0
00
$62,5
00
Payro
ll
Golf a
nd F
acili
ties
$60,0
00
$60,0
00
$27,1
00
$27,1
00
$45,2
00
$45,2
00
$0
Cart
s &
Range
$37,0
00
$42,3
00
$16,7
00
$16,7
00
$27,9
00
$27,9
00
$0
Instr
uction [1]
$4,5
00
$4,5
00
$2,3
00
$2,3
00
$2,3
00
$2,3
00
$0
Cours
e M
ain
tenance
$232,0
00
$259,3
00
$191,1
00
$191,1
00
$191,1
00
$191,1
00
$0
Food a
nd B
evera
ge
$177,0
00
$177,0
00
$177,0
00
$177,0
00
$177,0
00
$177,0
00
$177,0
00
Genera
l and A
dm
inis
trative
$102,0
00
$107,1
00
$80,4
00
$80,4
00
$87,7
00
$87,7
00
$42,9
00
Su
bto
tal P
ayro
ll$612,5
00
$650,2
00
$494,6
00
$494,6
00
$531,2
00
$531,2
00
$219,9
00
Op
era
tin
g E
xp
en
ses (
inclu
din
g U
tiliti
es)
Golf
$7,0
00
$7,0
00
$3,2
00
$3,2
00
$5,3
00
$5,3
00
$0
Cart
s &
Range
$14,0
00
$14,0
00
$6,3
00
$6,3
00
$10,6
00
$10,6
00
$0
Nik
e G
olf L
earn
ing C
ente
rn.a
.
n.a
.
n.a
.
n.a
.
n.a
.
n.a
.
n.a
.
Nik
e G
olf M
em
bers
hip
n.a
.
n.a
.
n.a
.
n.a
.
n.a
.
n.a
.
n.a
.
Cours
e M
ain
tenance
$68,0
00
$61,2
00
$34,0
00
$34,0
00
$34,0
00
$34,0
00
$0
Food a
nd B
evera
ge
$18,0
00
$18,0
00
$18,0
00
$18,0
00
$18,0
00
$18,0
00
$18,0
00
Genera
l and A
dm
inis
trative [2]
$87,0
00
$90,1
00
$66,1
00
$66,1
00
$70,8
00
$70,8
00
$28,2
00
Facili
ties
$14,0
00
$14,0
00
$6,3
00
$6,3
00
$10,6
00
$10,6
00
$0
Wate
r$6,0
00
$6,0
00
$6,0
00
$6,0
00
$6,0
00
$6,0
00
$6,0
00
Pow
er
- irrigation
$18,9
00
$17,0
00
$9,5
00
$9,5
00
$9,5
00
$9,5
00
$0
Pow
er
- str
uctu
res
$23,1
00
$23,1
00
$23,1
00
$23,1
00
$23,1
00
$23,1
00
$23,1
00
Phone / T
V / Inte
rnet P
rovid
ers
$10,0
00
$10,5
00
$7,9
00
$7,9
00
$8,6
00
$8,6
00
$4,2
00
Solid
Waste
$14,0
00
$14,0
00
$14,0
00
$14,0
00
$14,0
00
$14,0
00
$14,0
00
Su
bto
tal O
pera
tin
g E
xp
en
ses
$280,0
00
$274,9
00
$194,4
00
$194,4
00
$210,5
00
$210,5
00
$93,5
00
Leases a
nd
Ren
tals
, E
qu
ipm
en
t R
ep
lacem
en
t
Cart
s$60,0
00
$60,0
00
$31,8
00
$31,8
00
$31,8
00
$31,8
00
$0
Main
tenance
$24,0
00
$26,8
00
$19,8
00
$19,8
00
$19,8
00
$19,8
00
$0
Kitchen
$5,0
00
$5,0
00
$5,0
00
$5,0
00
$5,0
00
$5,0
00
$5,0
00
Su
bto
tal L
eases a
nd
Ren
tals
, E
qu
ipm
en
t R
ep
lacem
en
t$89,0
00
$91,8
00
$56,6
00
$56,6
00
$56,6
00
$56,6
00
$5,0
00
Taxes a
nd
In
su
ran
ce
Pro
pert
y T
ax
$65,0
00
$65,0
00
$65,0
00
$65,0
00
$65,0
00
$65,0
00
$65,0
00
Insura
nce
$21,0
00
$21,0
00
$21,0
00
$21,0
00
$21,0
00
$21,0
00
$21,0
00
Oth
er
($7,0
00)
($
7,0
00)
($
7,0
00)
($
7,0
00)
($
7,0
00)
($
7,0
00)
($
7,0
00)
Su
bto
tal T
axes a
nd
In
su
ran
ce
$79,0
00
$79,0
00
$79,0
00
$79,0
00
$79,0
00
$79,0
00
$79,0
00
To
tal E
sti
mate
d A
nn
ual E
xp
en
ses (
rou
nd
ed
) [3
]$1,2
94,0
00
$1,3
33,0
00
$964,0
00
$964,0
00
$1,0
68,0
00
$1,0
68,0
00
$460,0
00
Sourc
e: A
merican G
olf C
orp
ora
tion a
nd H
ansfo
rd E
conom
ic C
onsultin
gto
t exp
[1] A
ssum
es h
alf the n
um
ber
of
instr
ucto
rs u
nder
scenario 2
.
[2] P
erc
enta
ge o
f payro
ll, o
pera
ting e
xpenses, le
ases a
nd r
enta
ls, and e
quip
ment re
pla
cem
ent.
[3] S
om
e c
osts
associa
ted w
ith w
inte
r opera
tions b
orn
e b
y snow
mobile
opera
tor
are
not in
clu
ded.
Scen
ari
o 2
(H
igh
Ro
un
ds)
Scen
ari
o 2
(L
ow
Ro
un
ds)
Scen
ari
o 1
Scen
ari
o 3

Prepared by HEC Page 58 September 8, 2008 HEC Project #60631
IInnccoommee IImmppaaccttss ttoo SSttaattee PPaarrkkss aanndd AAmmeerriiccaann GGoollff CCoorrppoorraattiioonn Estimated gross receipts (revenues) determine payments to State Parks. Rent to State Parks and contributions to the CIP fund are deducted from net revenues to estimate net annual concessionaire revenues. On an annual basis, rent payments to State Parks are estimated to increase from $742,000 to $747,000 under Scenario 1B, and decrease to $451,000 (high end of range) or $273,000 (low end of range) under Scenario 2. The CIP fund would experience a corresponding change, from $139,000 under the Base Case to $140,000 under Scenario 1B, and $85,000 (high end of range) or $51,000 (low end of range) under Scenario 2. Estimates of revenue to State Parks under each scenario are illustrated in Figure 6. Figure 6: Estimated Income to State Parks
„Net Annual LTGC Revenues‟ shown in Table 26 are remaining revenues to American Golf Corporation. Revenues to the concessionaire are projected to decrease from $614,000 under the Base Case to $589,000 under Scenario 1B, and be negative under Scenario 213 under all but the most optimistic of circumstances. Since Scenario 3 is projected to be financially infeasible, there is no estimate of income to State Parks and American Golf Corporation resulting from closure of the golf course.
13 Revenue estimates are based on LTGC‟s financial performance 2003 – 2006 which produces a more conservative estimate than using all historical data 1995 – 2006.
$742,000 $747,000
$273,000 $300,000 $407,000 $451,000
$139,000 $140,000
$51,000 $56,000 $77,000 $85,000
1A - Base Case 1B Low Fees High Fees Low Fees High Fees
Scenario 1 Scenario 2 (Low Rounds) Scenario 2 (High Rounds)
Estimated State Parks Incomeby Economic Scenario
Monthly Rent CIP Fund

Prepared by HEC Page 59 September 8, 2008 HEC Project #60631
Table 26: Net Revenues and Payments to State Parks by Scenario
La
ke
Ta
ho
e G
olf
Co
urs
e E
co
no
mic
Fe
as
ibil
ity A
na
lys
is
LT
GC
Re
ve
nu
es a
nd
Ex
pe
ns
es
by E
co
no
mic
Sc
en
ari
o
Re
ve
nu
e o
r E
xp
en
se
1A
- B
ase
Ca
se
1B
Low
Fe
es
Hig
h F
ee
sL
ow
Fe
es
Hig
h F
ee
s
Re
ve
nu
es (
see
Ta
ble
22
)
Go
lf A
ctivitie
sa
$1,9
92,0
00
$1,9
92,0
00
$517,0
00
$618,0
00
$862,0
00
$1,0
30,0
00
$0
Co
nce
ssio
ns/O
ther
b$780,0
00
$800,0
00
$493,0
00
$493,0
00
$651,0
00
$651,0
00
$256,0
00
Sn
ow
mo
bile
Le
ase
Pa
yme
nts
c$17,0
00
$17,0
00
$17,0
00
$17,0
00
$17,0
00
$17,0
00
$0
Su
bto
tal R
ev
en
ue
sd
= a
+b
+c
$2,7
89,0
00
$2,8
09,0
00
$1,0
27,0
00
$1,1
28,0
00
$1,5
30,0
00
$1,6
98,0
00
$256,0
00
Sce
na
rio 3
Po
ten
tia
l E
ve
nt
Re
ve
nu
es (
se
e T
able
23
)e
$131,0
00
To
tal R
ev
en
ue
sf
= d
+e
$2,7
89,0
00
$2,8
09,0
00
$1,0
27,0
00
$1,1
28,0
00
$1,5
30,0
00
$1,6
98,0
00
$387,0
00
Ex
pe
nd
itu
res (
see
Ta
ble
25
)
Co
st
of
Go
od
sg
$233,0
00
$237,0
00
$140,0
00
$140,0
00
$191,0
00
$191,0
00
$63,0
00
Pa
yro
llh
$613,0
00
$650,0
00
$495,0
00
$495,0
00
$531,0
00
$531,0
00
$220,0
00
Op
era
tin
g E
xp
en
se
s (
inclu
din
g U
tilit
ies)
i$280,0
00
$275,0
00
$194,0
00
$194,0
00
$211,0
00
$211,0
00
$94,0
00
Lea
se
s a
nd
Ren
tals
, E
quip
me
nt
Re
pla
ce
me
nt
j $89,0
00
$92,0
00
$57,0
00
$57,0
00
$57,0
00
$57,0
00
$5,0
00
Ta
xe
s a
nd
In
su
ran
ce
k$79,0
00
$79,0
00
$79,0
00
$79,0
00
$79,0
00
$79,0
00
$79,0
00
To
tal E
xp
en
dit
ure
sl=
su
m(g
:k)
$1,2
94,0
00
$1,3
33,0
00
$965,0
00
$965,0
00
$1,0
69,0
00
$1,0
69,0
00
$461,0
00
Re
ve
nu
es l
es
s E
xp
en
dit
ure
sm
= f
- l
$1,4
95,0
00
$1,4
76,0
00
$62,0
00
$163,0
00
$461,0
00
$629,0
00
($
74
,00
0)
less R
ent
to S
tate
Pa
rks [
2]
n =
f*2
7%
$742,0
00
$747,0
00
$273,0
00
$300,0
00
$407,0
00
$451,0
00
[1
]
less C
apita
l Im
pro
ve
me
nt
Fu
nd [
3]
o =
f*5
%$139,0
00
$140,0
00
$51,0
00
$56,0
00
$77,0
00
$85,0
00
[1
]
Su
bto
tal P
aym
en
ts t
o S
tate
Pa
rks [
4]
p =
n+
o$881,0
00
$887,0
00
$324,0
00
$356,0
00
$484,0
00
$536,0
00
$0
Ne
t A
nn
ua
l L
TG
C R
ev
en
ue
s [
5]
q =
m -
p$614,0
00
$589,0
00
($
26
2,0
00
) ($
19
3,0
00
) ($
23
,00
0)
$93,0
00
($
74
,00
0)
So
urc
e: H
an
sfo
rd E
co
no
mic
Co
nsu
ltin
gsum
m
[1] W
ith
pro
jecte
d n
eg
ative
fin
an
cia
l re
turn
s t
he
co
nce
ssio
na
ire
wo
uld
ce
ase
op
era
tio
ns.
[2] A
ve
rag
e a
nn
ua
l re
nt
as a
perc
enta
ge
of
gro
ss r
eve
nu
es w
as 2
7%
(se
e T
able
6)
betw
een
20
03
an
d 2
00
6.
[3] P
er
term
s o
f th
e c
once
ssio
na
ire
's c
ontr
act,
5%
of
gro
ss r
eve
nu
es a
re p
aid
in
to a
ca
pita
l im
pro
ve
me
nt
fund
.
[4] B
ase
Case
pa
yme
nts
to S
tate
Pa
rks d
oe
s n
ot
ma
tch
Ta
ble
5 (
$88
7,3
39
) b
eca
use
of
the
dis
co
ntin
ua
tio
n o
f th
e N
ike
Le
arn
ing C
ente
r a
nd r
oun
din
g o
f n
um
bers
.
[5] N
et g
olf c
ours
e c
once
ssio
na
ire
re
ve
nu
es.
Net
sn
ow
mo
bile
op
era
tor
reve
nu
es n
ot
eva
luate
d.
All
Fig
ure
s R
oun
de
d t
o n
ea
rest
$1
,00
0
Sc
en
ari
o 2
(L
ow
Ro
un
ds
)S
cen
ari
o 2
(H
igh
Ro
un
ds
)S
cen
ari
o 1
Sc
en
ari
o 3

Prepared by HEC Page 60 September 8, 2008 HEC Project #60631
SSEECCTTIIOONN 66:: IIMMPPAACCTTSS OONN TTHHEE SSOOUUTTHH LLAAKKEE TTAAHHOOEE
EECCOONNOOMMYY An additional consideration for the river restoration project is the additional economic impacts of the different project alternatives on the South Shore economy. Additional economic impacts resulting from reconfiguration and operations changes to LTGC include visitor spending elsewhere in South Shore, sales taxes generated both at LTGC and elsewhere in South Shore, transient occupancy taxes, property taxes, and jobs and earnings associated with employment to service visitor needs. The additional economic impacts estimated in this report are limited to additional direct spending into the local economy. Other multiplier effects, often referred to as „indirect‟ and „induced‟ effects14 (or ripple effects) of travel spending on the South Shore economy are not estimated in this report because this would require extensive additional modeling and analysis. In addition, other value-added impacts such as LTGC‟s contribution to real estate values of surrounding properties, for example, are not estimated. The total number of visitors generated by LTGC ranges from 3,663 guests (Base Case number of guests for events only) under Scenario 3 to 22,219 visitors under Scenario 1B. (Note: Scenario 3 was determined to be infeasible in Section 5; Scenario 3 in this section portrays the contribution of non-golfer visitors at LTGC currently). Spending generated by these visitors is estimated to range from $0.9 million under Scenario 3 (excludes golfers) to $7.5 million under Scenario 1B. Visitor spending is estimated to be spread fairly evenly between LTGC, lodging, retail and food and beverage, and less on other recreation. Total employment generated by LTGC visitors is estimated to range from 44 under Scenario 3 to 172 under Scenario 1B, and associated earnings by employees are estimated to range from $493,000 under Scenario 3 to $2.7 million under Scenario 1B. These model results are summarized in Table 27. Estimated taxes generated directly by LTGC include sales tax on merchandise and food and beverage sales, and property tax. These taxes range from $82,000 under Scenario 3 to $120,000 under Scenario 1B. Taxes generated elsewhere within the South Shore economy include transient occupancy taxes and sales tax, estimated from $128,000 under Scenario 3 to $495,000 under Scenario 1B. These model results are summarized in Table 28.
14 Indirect effects refer to the intermediate inputs used to produce the final product or service (that are manufactured in South Shore). Induced effects refer to employee-purchased goods and services attributable to direct and indirect impacts. For example, employees will buy groceries in South Shore using earnings generated by visitors.

Prepared by HEC Page 61 September 8, 2008 HEC Project #60631
Table 27: Visitation, Spending, Earnings and Jobs by Scenario
Lake T
ah
oe G
olf
Co
urs
e E
co
no
mic
Feasib
ilit
y A
naly
sis
Esti
mate
s o
f V
isit
ati
on
, S
pen
din
g, E
arn
ing
s, an
d E
mp
loym
en
t G
en
era
ted
by L
TG
C V
isit
ors
Item
1A
- B
ase C
ase
1B
Low
Rounds
Hig
h R
ounds
To
tal E
sti
mate
d V
isit
ati
on
an
d S
pen
din
gT
able
D-2
Table
D-8
Table
D-1
4T
able
D-2
0T
able
D-2
5
Estim
ate
d N
um
ber
of
LT
GC
-genera
ted V
isitors
8,9
42
8,9
42
5,0
48
7,1
92
1,8
32
Estim
ate
d S
pendin
g b
y LT
GC
-genera
ted V
isitors
[1]
$7,4
76,0
00
$7,4
76,0
00
$3,8
81,0
00
$5,8
60,0
00
$912,0
00
Esti
mate
d V
isit
or
Sp
en
din
g b
y C
ate
go
ryT
able
D-3
Table
D-9
Table
D-1
5T
able
D-2
1T
able
D-2
6
LT
GC
$1,9
07,9
20
$1,9
21,5
88
$699,8
33
$1,0
52,1
03
$171,5
20
Lodgin
g$1,5
69,9
60
$1,5
69,9
60
$815,0
10
$1,2
30,6
00
$191,5
20
Oth
er
Recre
ation
$783,4
40
$769,7
72
$697,3
27
$1,0
57,4
97
$156,8
00
Reta
il$1,6
44,7
20
$1,6
44,7
20
$853,8
20
$1,2
89,2
00
$200,6
40
Food &
Bevera
ge
$1,5
69,9
60
$1,5
69,9
60
$815,0
10
$1,2
30,6
00
$191,5
20
To
tal V
isit
or
Sp
en
din
g E
sti
mate
$7,4
76,0
00
$7,4
76,0
00
$3,8
81,0
00
$5,8
60,0
00
$912,0
00
Esti
mate
d E
arn
ing
s a
nd
Em
plo
ym
en
tT
able
D-4
Table
D-1
0T
able
D-1
6T
able
D-2
2T
able
D-2
7
Estim
ate
d D
irect E
arn
ings
$2,6
66,1
33
$2,6
98,7
92
$1,6
67,8
86
$2,2
97,1
61
$493,0
06
Estim
ate
d E
mplo
yment (J
obs)
168
172
113
139
44
Sourc
e: H
ansfo
rd E
conom
ic C
onsultin
gvis
itor
sum
m
[1] E
stim
ate
s a
re b
ased o
n the m
id-p
oin
t of
a p
ote
ntial ra
nge o
f spendin
g.
Scen
ari
o 2
Scen
ari
o 1
Scen
ari
o 3

Prepared by HEC Page 62 September 8, 2008 HEC Project #60631
Table 28: Sales Tax, Property Tax and Transient Occupancy Taxes by Scenario
La
ke
Ta
ho
e G
olf
Co
urs
e E
co
no
mic
Fe
as
ibil
ity A
na
lys
is
Es
tim
ate
s o
f T
axe
s D
ire
ctl
y G
en
era
ted
by L
TG
C V
isit
ors
Item
1A
- B
ase
Case
1B
Low
Ro
un
ds
Hig
h R
oun
ds
Es
tim
ate
d T
axe
s G
en
era
ted
at
LT
GC
Ta
ble
D-5
Ta
ble
D-1
1T
able
D-1
7T
able
D-2
3T
able
D-2
8
Sa
les T
ax
$53,0
00
$55,0
00
$33,0
00
$45,0
00
$17,0
00
Pro
pe
rty T
ax
$65,0
00
$65,0
00
$65,0
00
$65,0
00
$65,0
00
Su
bto
tal L
TG
C E
sti
ma
ted
Ta
xe
s$118,0
00
$120,0
00
$98,0
00
$110,0
00
$82,0
00
Es
tim
ate
d T
axe
s G
en
era
ted
els
ew
he
re in
So
uth
Sh
ore
Ta
ble
D-6
Ta
ble
D-1
2T
able
D-1
8T
able
D-2
4T
able
D-2
9
Tra
nsie
nt
Occu
pa
ncy T
ax
$157,0
00
$157,0
00
$82,0
00
$123,0
00
$19,0
00
Sa
les T
ax
$218,0
00
$218,0
00
$114,0
00
$171,0
00
$27,0
00
Su
bto
tal T
axe
s G
en
era
ted
Els
ew
he
re in
So
uth
Sh
ore
$375,0
00
$375,0
00
$196,0
00
$294,0
00
$46,0
00
To
tal E
sti
ma
ted
Ta
xe
s$493,0
00
$495,0
00
$294,0
00
$404,0
00
$128,0
00
So
urc
e: H
an
sfo
rd E
co
no
mic
Co
nsu
ltin
gta
x s
um
Sc
en
ari
o 1
Sc
en
ari
o 3
Sc
en
ari
o 2

Prepared by HEC Page 63 September 8, 2008 HEC Project #60631
IIMMPPAACCTT OONN SSOOUUTTHH SSHHOORREE EECCOONNOOMMYY FFIINNDDIINNGGSS
The economic impact of decommissioning LTGC and no longer providing any public services at Lake Valley SRA is approximately $7.5 million in direct visitor spending, and $0.5 million in tax, for a total of $8.0 million. A corresponding loss of about 168 full and part-time jobs in the area currently supported by LTGC visitors is estimated. The loss in earnings associated with these jobs is approximately $2.7 million, which is money no longer re-circulated within the local economy.
The impact of reducing LTGC to a reduced-play area course is estimated to be between $1.6 million and $3.6 million in visitor spending, and between $89,000 and $199,000 in tax, for a total of $1.7 to $3.8 million. Associated job loss is estimated to be between 29 and 55 jobs with a corresponding loss of $0.4 to $1.0 million in earnings.
Reconfiguration of the 18-hole regulation course at LTGC is not estimated to affect total visitor spending or total number of jobs in South Shore (outside LTGC); however, it is estimated to increase sales taxes by $2,000.
The contribution made by non-golfer visitors to LTGC is estimated at $912,000 in direct spending, $128,000 in tax, 44 additional jobs in the economy, and $493,000 in earnings.
DDEETTAAIILLEEDD MMOODDEELL AANNAALLYYSSIISS PPRREESSEENNTTEEDD IINN AAPPPPEENNDDIIXX DD Estimates of impacts to the South Shore economy are provided in Appendix D for each economic scenario. Note that economic scenario 2 does not model low fees and high fees as in the other sections of this report because fees do not impact the South Shore economy analysis. The text below describes the analysis methodology and results for the Base Case, and directs the reader to the appropriate tables in Appendix D for results of modeling economic scenarios 1B, 2 (low rounds and high rounds), and 3.
NNuummbbeerr ooff LLTTGGCC VViissiittoorr GGoollffeerrss Of the total annual average of 33,163 rounds played, approximately 22,219 rounds are made by visitors, and 10,944 rounds are made by locals. Some rounds will be played by visitors on day trips, while others will be made by vacationers or weekend visitors. See Appendix Tables D-1, D-7, D-13, and D-19.
Total visitor rounds are multiplied by percent of rounds played by visitors coming to South Shore specifically to play golf at LTGC (as opposed to playing a round for pleasure while on
Prepared by HEC Page 64 September 8, 2008 HEC Project #60631
vacation for some other reason) as a proxy for the number of LTGC golfers visiting South Shore. To estimate the number of overnight visitors the study estimated that 32% of golf rounds are made by visitors whose primary purpose is to play golf at LTGC on their trip.15
The total number of annual golf visitors whose primary purpose during their trip is to play golf at LTGC is estimated at 7,110. See Appendix Tables D-2, D-8, D-14, D-20, and D-25.
LLTTGGCC VViissiittoorr SSppeennddiinngg Using two estimation methodologies, total estimated visitor spending by LTGC golfers may range between $6.1 and $8.8 million under the Base Case. This estimate only includes additional spending in South Shore; spending by local golfers is not included since they already spend their dollars in South Shore. Spending by second homeowners is included in total visitor spending. Given that the accuracy of the two methods used to estimate this range is uncertain, the study uses the mid-point of the range for purposes of this analysis. The mid-point is $7.5 million under the Base Case and is assumed to include spending by visitors coming to LTGC for events during the winter.
Travel-related spending was estimated to total $630 million in El Dorado County in 2005 (Dean Runyan and Associates, 2007). It has been estimated (RRC Associates, 2006) that South Lake Tahoe captures approximately 70% of travel-related spending in El Dorado County. Using this estimate and inflating to 2007 dollars, approximately $474 million is spent by travelers in the Tahoe portion of El Dorado County. See Appendix Tables D-3, D-9, D-15, D-21, and D-26. As visitor spending by categories lodging, recreation, retail, and food and beverage is likely to be different in the Tahoe portion of the County, visitor spending by category is adjusted using estimates prepared by Dean Runyan Associates in 2003 for North Lake Tahoe. The contribution of LTGC golfers toward this spending is $7.5 million; by applying the adjusted percentages to the estimated total spending of $7.5 million, and adjusting the recreation category to account for spending on golf at LTGC, the estimate of spending by LTGC visitors is:
$1.9 million on golf at LTGC,
$0.8 million on other recreation,
$1.6 million on lodging,
$1.6 million on retail goods, and
$1.6 million on food and beverage.
15 It has been estimated (SRI International, 2002) that 32% of golf trips are planned with the sole intent of playing golf.
Prepared by HEC Page 65 September 8, 2008 HEC Project #60631
LLTTGGCC GGeenneerraatteedd EEaarrnniinnggss aanndd JJoobbss iinn SSoouutthh SShhoorree Based on LTGC visitor spending in South Shore, LTGC visitor golfers are estimated to generate 168 full and part-time jobs, 76 of which at LTGC and 92 elsewhere in the local economy. See Appendix Tables D-4, D-10, D-16, D-22, and D-27. Earnings generated by visitor golfers to LTGC are estimated at $2.6 million and are comprised of $0.6 million in LTGC payroll and earnings and $2.6 million elsewhere in the local economy, using the El Dorado County average of $22,296 earnings per job. Earnings per job are $8,065 per LTGC job, and $22,296 per job elsewhere in South Shore. The discrepancy in earnings per job is attributable to the many part-time jobs at the golf course because it provides seasonal occupation. This analysis assumes that local golfers would not generate additional earnings and employees because they would golf at another local course in South Shore if they did not golf at LTGC.
EEssttiimmaatteedd TTaaxxeess GGeenneerraatteedd bbyy LLTTGGCC Sales taxes are charged for food and beverage consumed at place of sale and all merchandise. Based on data provided by the golf course concessionaire, approximately 85% of food and beverage sales are taxable. Total estimated sales taxes generated are $53,000. Property taxes are paid by the golf course concessionaire for possessory interest of the property. Annual property tax payments are $65,000. LTGC generates a total of approximately $118,000 in property and sales taxes. See Appendix Tables D-5, D-11, D-17, D-23, and D-28. In addition to taxes generated by economic activity at LTGC, visitors generate additional taxes elsewhere in South Shore. Based on current tax rates additional taxes include $157,000 of transient occupancy tax, $115,000 in sales tax from retail sales (which includes other commodities such as gasoline), and $103,000 in sales tax from food and beverage sales. See Appendix Tables D-6, D-12, D-18, D-24, and D-29.

Prepared by HEC Page 66 September 8, 2008 HEC Project #60631
BBIIBBLLIIOOGGRRAAPPHHYY California State Parks. (Fiscal Year 2006/07). Concessions Annual Report. California State Parks. Lake Valley SRA General Plan. California State Parks. (July 1, 2006). Planning Milestones for the Park Units and Major
Properties Associated with the California State Parks System. California State Parks. Dean Runyan and Associates. (2007). California Travel Impacts by County 1992-2005.
California Travel and Tourism Commission. European Golf Course Owners Association. (n.d.). Retrieved from egcoa.com. Hurdzan, D. M. (1996). Golf Course Architecture, Design, Costruction and Restoration. LSC Consultants. (2006). Tahoe Intrerregional / Intraregional Transit Study. Tahoe Regional
Planning Agency. National Golf Foundation. (2006). A Strategic Perspective on the Future of Golf. National Golf Foundation. (n.d.). Frequently Asked Questions. Retrieved from ngf.org. National Golf Foundation. (2007). Golf Industry Report First Quarter 2007. National Golf Foundation. (Second Quarter 2007). Golf Participation Issue. National Golf Foundation. (January 2008). Inside the Ropes. National Golf Foundation. (2001). Operating and Financial Performance Profiles of 18-hole Golf
Facilities. National Golf Foundation. (2002). Operating and Financial Performance Profiles of 18-hole Golf
Facilities in the US. National Golf Foundation. (2002). U.S Golf Travel Market. RRC Associates. (2006). City of South Lake Tahoe Retail Market Analysis. Sportometrics. (2001). Alternative Facilities Report to Golf 20/20 Conference Attendees. Golf
20/20. SRI International and the World Golf Foundation. (2002). The Golf Economy Report. Golf
20/20. SRI International. (2002). The Golf Economy Report. State of California. (1989, amended 1995). State of California Department of Parks and
Recreation Concession Contract American Golf Corporation Lake Tahoe Golf course and Winter Recreation Area Lake Valley State Recreation Area Located In El Dorado County.
Stuller, J. (Summer 2007). Bringing in the Fees. Northern California Golf Association. The Urban Land Institute. (2004). Dollars and Cents of Shopping. www.golf2020.com. (n.d.). Retrieved from golf2020 website. Zilberman, & Templeton, H. (2000). Economic Impacts of California's Golf Course Facilities in
2000.


AAPPPPEENNDDIIXX AA
LLAAKKEE TTAAHHOOEE GGOOLLFF CCOOUURRSSEE HHIISSTTOORRIICC FFIINNAANNCCIIAALL PPEERRFFOORRMMAANNCCEE
SSUUPPPPOORRTT TTAABBLLEESS

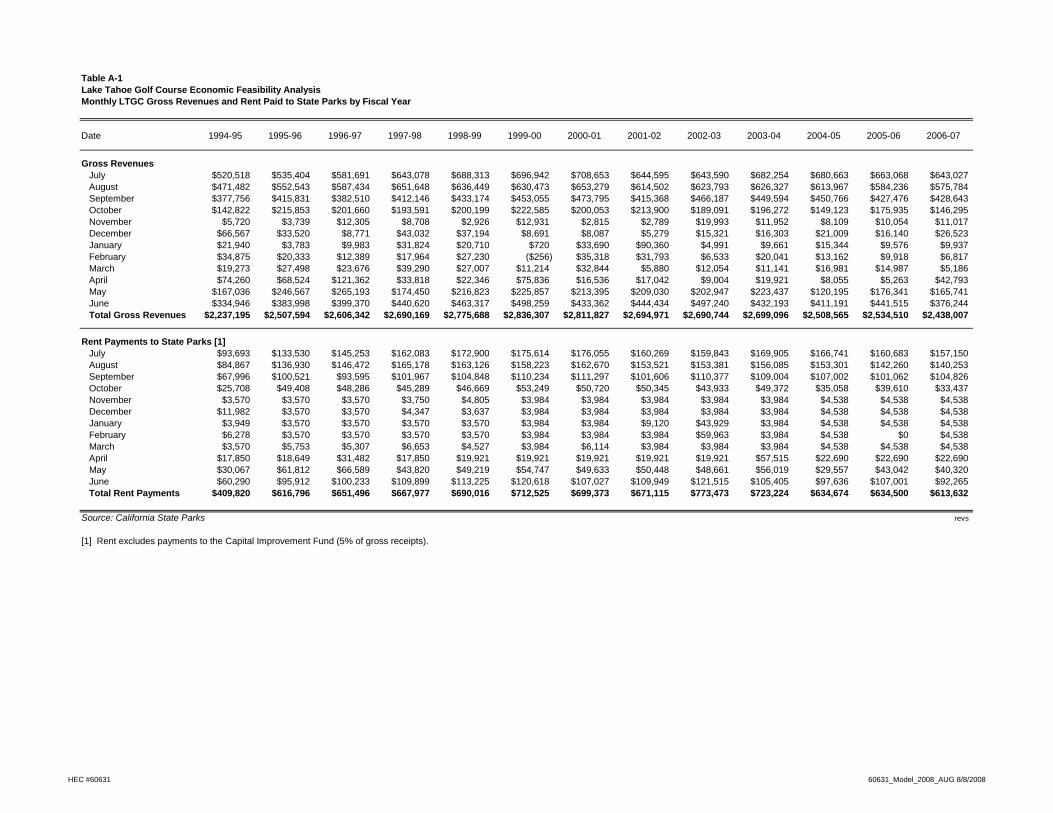
Table A-1Lake Tahoe Golf Course Economic Feasibility AnalysisMonthly LTGC Gross Revenues and Rent Paid to State Parks by Fiscal Year
Date 1994-95 1995-96 1996-97 1997-98 1998-99 1999-00 2000-01 2001-02 2002-03 2003-04 2004-05 2005-06 2006-07
Gross RevenuesJuly $520,518 $535,404 $581,691 $643,078 $688,313 $696,942 $708,653 $644,595 $643,590 $682,254 $680,663 $663,068 $643,027August $471,482 $552,543 $587,434 $651,648 $636,449 $630,473 $653,279 $614,502 $623,793 $626,327 $613,967 $584,236 $575,784September $377,756 $415,831 $382,510 $412,146 $433,174 $453,055 $473,795 $415,368 $466,187 $449,594 $450,766 $427,476 $428,643October $142,822 $215,853 $201,660 $193,591 $200,199 $222,585 $200,053 $213,900 $189,091 $196,272 $149,123 $175,935 $146,295November $5,720 $3,739 $12,305 $8,708 $2,926 $12,931 $2,815 $2,789 $19,993 $11,952 $8,109 $10,054 $11,017December $66,567 $33,520 $8,771 $43,032 $37,194 $8,691 $8,087 $5,279 $15,321 $16,303 $21,009 $16,140 $26,523January $21,940 $3,783 $9,983 $31,824 $20,710 $720 $33,690 $90,360 $4,991 $9,661 $15,344 $9,576 $9,937February $34,875 $20,333 $12,389 $17,964 $27,230 ($256) $35,318 $31,793 $6,533 $20,041 $13,162 $9,918 $6,817March $19,273 $27,498 $23,676 $39,290 $27,007 $11,214 $32,844 $5,880 $12,054 $11,141 $16,981 $14,987 $5,186April $74,260 $68,524 $121,362 $33,818 $22,346 $75,836 $16,536 $17,042 $9,004 $19,921 $8,055 $5,263 $42,793May $167,036 $246,567 $265,193 $174,450 $216,823 $225,857 $213,395 $209,030 $202,947 $223,437 $120,195 $176,341 $165,741June $334,946 $383,998 $399,370 $440,620 $463,317 $498,259 $433,362 $444,434 $497,240 $432,193 $411,191 $441,515 $376,244Total Gross Revenues $2,237,195 $2,507,594 $2,606,342 $2,690,169 $2,775,688 $2,836,307 $2,811,827 $2,694,971 $2,690,744 $2,699,096 $2,508,565 $2,534,510 $2,438,007
Rent Payments to State Parks [1]July $93,693 $133,530 $145,253 $162,083 $172,900 $175,614 $176,055 $160,269 $159,843 $169,905 $166,741 $160,683 $157,150August $84,867 $136,930 $146,472 $165,178 $163,126 $158,223 $162,670 $153,521 $153,381 $156,085 $153,301 $142,260 $140,253September $67,996 $100,521 $93,595 $101,967 $104,848 $110,234 $111,297 $101,606 $110,377 $109,004 $107,002 $101,062 $104,826
p $ , $ , $ , $ , $ , $ , $ , $ , $ , $ , $ , $ , $ ,October $25,708 $49,408 $48,286 $45,289 $46,669 $53,249 $50,720 $50,345 $43,933 $49,372 $35,058 $39,610 $33,437November $3,570 $3,570 $3,570 $3,750 $4,805 $3,984 $3,984 $3,984 $3,984 $3,984 $4,538 $4,538 $4,538December $11,982 $3,570 $3,570 $4,347 $3,637 $3,984 $3,984 $3,984 $3,984 $3,984 $4,538 $4,538 $4,538January $3,949 $3,570 $3,570 $3,570 $3,570 $3,984 $3,984 $9,120 $43,929 $3,984 $4,538 $4,538 $4,538February $6,278 $3,570 $3,570 $3,570 $3,570 $3,984 $3,984 $3,984 $59,963 $3,984 $4,538 $0 $4,538March $3,570 $5,753 $5,307 $6,653 $4,527 $3,984 $6,114 $3,984 $3,984 $3,984 $4,538 $4,538 $4,538April $17,850 $18,649 $31,482 $17,850 $19,921 $19,921 $19,921 $19,921 $19,921 $57,515 $22,690 $22,690 $22,690May $30,067 $61,812 $66,589 $43,820 $49,219 $54,747 $49,633 $50,448 $48,661 $56,019 $29,557 $43,042 $40,320June $60,290 $95,912 $100,233 $109,899 $113,225 $120,618 $107,027 $109,949 $121,515 $105,405 $97,636 $107,001 $92,265Total Rent Payments $409,820 $616,796 $651,496 $667,977 $690,016 $712,525 $699,373 $671,115 $773,473 $723,224 $634,674 $634,500 $613,632
Source: California State Parks revs
[1] Rent excludes payments to the Capital Improvement Fund (5% of gross receipts).
HEC #60631 60631_Model_2008_AUG 8/8/2008

Table A-2Lake Tahoe Golf Course Economic Feasibility AnalysisMonthly LTGC Gross Revenues and Rent Paid to State Parks by Fiscal Year in 2007 Dollars
Date 1994-95 1995-96 1996-97 1997-98 1998-99 1999-00 2000-01 2001-02 2002-03 2003-04 2004-05 2005-06 2006-07
Gross Revenues in 2007 Dollars [1]July $731,315 $742,480 $793,144 $860,116 $902,801 $899,038 $888,219 $779,573 $748,951 $774,873 $752,877 $713,615 $667,317August $662,421 $766,248 $800,974 $871,580 $834,775 $813,294 $818,814 $743,178 $725,914 $711,354 $679,105 $628,773 $597,533September $530,738 $576,661 $521,557 $551,246 $568,157 $584,429 $593,851 $502,345 $542,506 $510,629 $498,590 $460,063 $444,835October $200,661 $299,338 $274,966 $258,928 $262,583 $287,129 $250,744 $258,691 $220,047 $222,917 $164,944 $189,347 $151,821November $8,037 $5,185 $16,778 $11,647 $3,838 $16,681 $3,528 $3,373 $23,266 $13,575 $8,969 $10,820 $11,433December $93,525 $46,485 $11,959 $57,556 $48,784 $11,211 $10,136 $6,384 $17,829 $18,516 $23,237 $17,371 $27,525January $30,425 $5,159 $13,352 $41,740 $26,715 $902 $40,744 $105,153 $5,668 $10,686 $16,514 $9,938 $9,937February $48,364 $27,724 $16,570 $23,562 $35,126 ($321) $42,714 $36,998 $7,420 $22,167 $14,165 $10,293 $6,817March $26,727 $37,494 $31,667 $51,533 $34,838 $14,056 $39,722 $6,842 $13,690 $12,323 $18,275 $15,553 $5,186April $102,981 $93,434 $162,322 $44,356 $28,826 $95,052 $19,998 $19,832 $10,227 $22,034 $8,669 $5,462 $42,793May $231,641 $336,197 $354,696 $228,810 $279,696 $283,087 $258,079 $243,250 $230,498 $247,142 $129,358 $183,002 $165,741June $464,492 $523,587 $534,157 $577,923 $597,667 $624,513 $524,108 $517,192 $564,743 $478,045 $442,536 $458,193 $376,244Total Gross Revenues $3,131,326 $3,459,992 $3,532,142 $3,578,997 $3,623,806 $3,629,071 $3,490,658 $3,222,811 $3,110,758 $3,044,260 $2,757,240 $2,702,429 $2,507,183
Rent Payments in 2007 Dollars [1]July $131,637 $185,175 $198,054 $216,786 $226,778 $226,538 $220,665 $193,829 $186,010 $192,970 $184,431 $172,932 $163,087August $119,236 $189,890 $199,717 $220,925 $213,958 $204,104 $203,890 $185,668 $178,491 $177,274 $169,565 $153,104 $145,551
September $95,533 $139,400 $127,618 $136,381 $137,520 $142,199 $139,498 $122,882 $128,447 $123,802 $118,354 $108,767 $108,786October $36,119 $68,518 $65,839 $60,574 $61,211 $68,690 $63,572 $60,887 $51,125 $56,074 $38,778 $42,629 $34,700November $5,016 $4,951 $4,868 $5,016 $6,302 $5,139 $4,994 $4,818 $4,636 $4,525 $5,019 $4,884 $4,709December $16,835 $4,951 $4,868 $5,814 $4,770 $5,139 $4,994 $4,818 $4,636 $4,525 $5,019 $4,884 $4,709January $5,477 $4,868 $4,775 $4,682 $4,605 $4,994 $4,818 $10,613 $49,893 $4,407 $4,884 $4,709 $4,538February $8,705 $4,868 $4,775 $4,682 $4,605 $4,994 $4,818 $4,636 $68,103 $4,407 $4,884 $0 $4,538March $4,951 $7,844 $7,098 $8,726 $5,839 $4,994 $7,395 $4,636 $4,525 $4,407 $4,884 $4,709 $4,538April $24,754 $25,429 $42,107 $23,412 $25,698 $24,969 $24,092 $23,182 $22,625 $63,617 $24,420 $23,547 $22,690May $41,695 $84,282 $89,062 $57,475 $63,491 $68,619 $60,026 $58,707 $55,266 $61,962 $31,810 $44,668 $40,320June $83,609 $130,778 $134,062 $144,145 $146,058 $151,181 $129,439 $127,949 $138,011 $116,587 $105,079 $111,043 $92,265Total Rent Payments $573,565 $850,952 $882,842 $888,620 $900,836 $911,558 $868,200 $802,626 $891,768 $814,557 $697,127 $675,877 $630,432
Source: California State Parks rents
[1] Adjusted for inflation using the California Consumer Price Index, Urban Wage Earners and Clerical Workers, All Items, Bureau of Labor Statistics.
HEC #60631 60631_Model_2008_AUG 8/8/2008

Table A-3Lake Tahoe Golf Course Economic Feasibility AnalysisMonthly LTGC Gross Revenues and Rent Paid to State Parks by Calendar Year
Date 1995 1996 1997 1998 1999 2000 2001 2002 2003 2004 2005 2006
Gross RevenuesJanuary $21,940 $3,783 $9,983 $31,824 $20,710 $720 $33,690 $90,360 $4,991 $9,661 $15,344 $9,576 0.8%February $34,875 $20,333 $12,389 $17,964 $27,230 ($256) $35,318 $31,793 $6,533 $20,041 $13,162 $9,918 0.7%March $19,273 $27,498 $23,676 $39,290 $27,007 $11,214 $32,844 $5,880 $12,054 $11,141 $16,981 $14,987 0.8%April $74,260 $68,524 $121,362 $33,818 $22,346 $75,836 $16,536 $17,042 $9,004 $19,921 $8,055 $5,263 1.5%May $167,036 $246,567 $265,193 $174,450 $216,823 $225,857 $213,395 $209,030 $202,947 $223,437 $120,195 $176,341 7.7%June $334,946 $383,998 $399,370 $440,620 $463,317 $498,259 $433,362 $444,434 $497,240 $432,193 $411,191 $441,515 16.3%July $535,404 $581,691 $643,078 $688,313 $696,942 $708,653 $644,595 $643,590 $682,254 $680,663 $663,068 $643,027 24.5%August $552,543 $587,434 $651,648 $636,449 $630,473 $653,279 $614,502 $623,793 $626,327 $613,967 $584,236 $575,784 23.1%September $415,831 $382,510 $412,146 $433,174 $453,055 $473,795 $415,368 $466,187 $449,594 $450,766 $427,476 $428,643 16.4%October $215,853 $201,660 $193,591 $200,199 $222,585 $200,053 $213,900 $189,091 $196,272 $149,123 $175,935 $146,295 7.2%November $3,739 $12,305 $8,708 $2,926 $12,931 $2,815 $2,789 $19,993 $11,952 $8,109 $10,054 $11,017 0.3%December $33,520 $8,771 $43,032 $37,194 $8,691 $8,087 $5,279 $15,321 $16,303 $21,009 $16,140 $26,523 0.8%Total Gross Revenues $2,409,221 $2,525,072 $2,784,177 $2,736,221 $2,802,109 $2,858,313 $2,661,577 $2,756,513 $2,715,472 $2,640,030 $2,461,838 $2,488,888 100.0%
Rent Payments to State Parks [1]January $3,949 $3,570 $3,570 $3,570 $3,570 $3,984 $3,984 $9,120 $43,929 $3,984 $4,538 $4,538 1.1%February $6,278 $3,570 $3,570 $3,570 $3,570 $3,984 $3,984 $3,984 $59,963 $3,984 $4,538 $0 1.3%March $3,570 $5,753 $5,307 $6,653 $4,527 $3,984 $6,114 $3,984 $3,984 $3,984 $4,538 $4,538 0.7%April $17,850 $18,649 $31,482 $17,850 $19,921 $19,921 $19,921 $19,921 $19,921 $57,515 $22,690 $22,690 3.6%May $30 067 $61 812 $66 589 $43 820 $49 219 $54 747 $49 633 $50 448 $48 661 $56 019 $29 557 $43 042 7 3%
Percent of Annual
Revenue
May $30,067 $61,812 $66,589 $43,820 $49,219 $54,747 $49,633 $50,448 $48,661 $56,019 $29,557 $43,042 7.3%June $60,290 $95,912 $100,233 $109,899 $113,225 $120,618 $107,027 $109,949 $121,515 $105,405 $97,636 $107,001 15.5%July $133,530 $145,253 $162,083 $172,900 $175,614 $176,055 $160,269 $159,843 $169,905 $166,741 $160,683 $157,150 24.1%August $136,930 $146,472 $165,178 $163,126 $158,223 $162,670 $153,521 $153,381 $156,085 $153,301 $142,260 $140,253 22.8%September $100,521 $93,595 $101,967 $104,848 $110,234 $111,297 $101,606 $110,377 $109,004 $107,002 $101,062 $104,826 15.6%October $49,408 $48,286 $45,289 $46,669 $53,249 $50,720 $50,345 $43,933 $49,372 $35,058 $39,610 $33,437 6.8%November $3,570 $3,570 $3,750 $4,805 $3,984 $3,984 $3,984 $3,984 $3,984 $4,538 $4,538 $4,538 0.6%December $3,570 $3,570 $4,347 $3,637 $3,984 $3,984 $3,984 $3,984 $3,984 $4,538 $4,538 $4,538 0.6%Total Rent Payments to State Parks $549,533 $630,013 $693,364 $681,347 $699,320 $715,947 $664,372 $672,907 $790,306 $702,068 $616,188 $626,552 100.0%
Source: California State Parks finances
[1] Rent excludes payments to the Capital Improvement Fund (5% of gross receipts).
HEC #60631 60631_Model_2008_AUG 8/8/2008

Table A-4Lake Tahoe Golf Course Economic Feasibility AnalysisMonthly LTGC Gross Revenues and Rent Paid to State Parks by Calendar Year in 2007 Dollars
Date 1995 1996 1997 1998 1999 2000 2001 2002 2003 2004 2005 2006
Percent of Annual
Revenue
Gross Revenues in 2007 Dollars [1]January $30,425 $5,159 $13,352 $41,740 $26,715 $902 $40,744 $105,153 $5,668 $10,686 $16,514 $9,938 0.8%February $48,364 $27,724 $16,570 $23,562 $35,126 ($321) $42,714 $36,998 $7,420 $22,167 $14,165 $10,293 0.7%March $26,727 $37,494 $31,667 $51,533 $34,838 $14,056 $39,722 $6,842 $13,690 $12,323 $18,275 $15,553 0.8%April $102,981 $93,434 $162,322 $44,356 $28,826 $95,052 $19,998 $19,832 $10,227 $22,034 $8,669 $5,462 1.6%May $231,641 $336,197 $354,696 $228,810 $279,696 $283,087 $258,079 $243,250 $230,498 $247,142 $129,358 $183,002 7.7%June $464,492 $523,587 $534,157 $577,923 $597,667 $624,513 $524,108 $517,192 $564,743 $478,045 $442,536 $458,193 16.2%July $742,480 $793,144 $860,116 $902,801 $899,038 $888,219 $779,573 $748,951 $774,873 $752,877 $713,615 $667,317 24.4%August $766,248 $800,974 $871,580 $834,775 $813,294 $818,814 $743,178 $725,914 $711,354 $679,105 $628,773 $597,533 23.1%September $576,661 $521,557 $551,246 $568,157 $584,429 $593,851 $502,345 $542,506 $510,629 $498,590 $460,063 $444,835 16.3%October $299,338 $274,966 $258,928 $262,583 $287,129 $250,744 $258,691 $220,047 $222,917 $164,944 $189,347 $151,821 7.3%November $5,185 $16,778 $11,647 $3,838 $16,681 $3,528 $3,373 $23,266 $13,575 $8,969 $10,820 $11,433 0.3%December $46,485 $11,959 $57,556 $48,784 $11,211 $10,136 $6,384 $17,829 $18,516 $23,237 $17,371 $27,525 0.8%Total Gross Revenues $3,341,027 $3,442,972 $3,723,836 $3,588,863 $3,614,650 $3,582,583 $3,218,909 $3,207,780 $3,084,108 $2,920,120 $2,649,506 $2,582,905 100.0%
Payments to State Parks in 2007 Dollars [1]January $5,477 $4,868 $4,775 $4,682 $4,605 $4,994 $4,818 $10,613 $49,893 $4,407 $4,884 $4,709 1.1%February $8,705 $4,868 $4,775 $4,682 $4,605 $4,994 $4,818 $4,636 $68,103 $4,407 $4,884 $0 1.2%March $4,951 $7,844 $7,098 $8,726 $5,839 $4,994 $7,395 $4,636 $4,525 $4,407 $4,884 $4,709 0.7%April $24,754 $25,429 $42,107 $23,412 $25,698 $24,969 $24,092 $23,182 $22,625 $63,617 $24,420 $23,547 3.5%
May $41,695 $84,282 $89,062 $57,475 $63,491 $68,619 $60,026 $58,707 $55,266 $61,962 $31,810 $44,668 7.3%June $83,609 $130,778 $134,062 $144,145 $146,058 $151,181 $129,439 $127,949 $138,011 $116,587 $105,079 $111,043 15.5%July $185,175 $198,054 $216,786 $226,778 $226,538 $220,665 $193,829 $186,010 $192,970 $184,431 $172,932 $163,087 24.1%August $189,890 $199,717 $220,925 $213,958 $204,104 $203,890 $185,668 $178,491 $177,274 $169,565 $153,104 $145,551 22.8%September $139,400 $127,618 $136,381 $137,520 $142,199 $139,498 $122,882 $128,447 $123,802 $118,354 $108,767 $108,786 15.6%October $68,518 $65,839 $60,574 $61,211 $68,690 $63,572 $60,887 $51,125 $56,074 $38,778 $42,629 $34,700 6.9%November $4,951 $4,868 $5,016 $6,302 $5,139 $4,994 $4,818 $4,636 $4,525 $5,019 $4,884 $4,709 0.6%December $4,951 $4,868 $5,814 $4,770 $5,139 $4,994 $4,818 $4,636 $4,525 $5,019 $4,884 $4,709 0.6%Total Rent Payments to State Parks $762,074 $859,032 $927,375 $893,664 $902,105 $897,362 $803,490 $783,068 $897,593 $776,553 $663,160 $650,219 100.0%
Source: California State Parks finances 07
[1] Adjusted for inflation using the California Consumer Price Index, Urban Wage Earners and Clerical Workers, All Items, Bureau of Labor Statistics.
HEC #60631 60631_Model_2008_AUG 8/8/2008

AAPPPPEENNDDIIXX BB
22000077 LLTTGGCC SSTTAATTEE PPAARRKKSS SSUURRVVEEYY
QQUUEESSTTIIOONNNNAAIIRREE AANNDD IINNTTEERRVVIIEEWWEEEE CCOOMMMMEENNTTSS


Please help us with a few questions about your golf play.
This will be used to help understand golfing use of LTGC as CA State Parks considers
potential changes in the course to allow for restoration of the Upper Truckee River.
Thank you.
1. In what community/town/city do you live? ________________________
2. How many times per year do you play at LTGC? ________________________
3. How many total times per year do play golf? ________________________
4. Why do you choose LTGC? (check as many as apply: rate 1to x))
- Scenic beauty _________
- Full 18-hole regulation course _________
- Course difficulty _________
- Price _________
- Convenient location _________
- Other? (please note reason) __________________________________________
5. If the course changed, would you continue playing (circle yes/no/not sure for each)
-- 18 holes, with some dispersed across the river to west ( Y N not sure )
-- Compact 18-hole executive course on clubhouse side of river (Y N not sure )
- 9-hole course on clubhouse side of river (Y N not sure )
6. Have you previously filled out this questionnaire? Y / N
Additional comments
______________________________________________________________________________
__________________________________________________________________
If you would like to be added to the Upper Truckee Restoration Project mailing list,
please indicate address below (email preferred)
________________________________________________________________________


Table B‐1Lake Tahoe Golf Course Economic Feasibility AnalysisComments and Suggestions made by Survey Respondents regarding Course Reconfiguration and River Restoration
River Restoration Alternatives Comments Suggestions
Keep 18‐holes (full course) Will support modified 18‐hole course so long as play is not disruptedConstruct new holes to west of river prior to restoration efforts
Will not play on the 18 holes on west side if poor designKeep a full course Help the Lake by taking out Tahoe KeysDon't destroy the natural beauty of this course
Not in favor of modifying course for stream environment Divert river to sediment pond at the old Elks Club propertyLeave the course, fix the river banks
Ecological improvements should be sufficient to allow existing course to remain
Executive course (shorter length) Better as a regulation course, would play less as otherAlready have an executive course at Tahoe Paradise. Executive courses are of limited appeal.
No golf course Doesn't matter; the river will find its own wayThe land needs protectingProtecting the lake is more important than playing golf
restore comments

Table B‐2Lake Tahoe Golf Course Economic Feasibility AnalysisGrouped Comments and Suggestions made by Survey Respondents
Comment Groupings Comments Suggestions
Golf Course and Well managed by friendly staffFacilities Beautiful views and a great course Needs more water hazards
Club house looks like a barn from Hwy 50 Put the Golf Course Channel in bar area
Price Only semi‐affordable 18‐hole course in SLT Lower rates for localsGolf fees too high during poor spring conditions and in the fall Have a 9‐hole rateOnly affordable course at South ShoreOnly affordable champion course for the working manFair price, the only 18‐hole course for South Lake unless can afford Edgewood
Reasons for Not much other choicePlaying LTGC Work in SLT or has a family member who does
Tournaments and Company eventsIt's "where the locals play"
Economic Brings in huge money to South Shore. Used by so many Californians.and Other A regulation 18‐hole course is a major attraction to this area.
SLT cannot afford to lose $ to competitive areas for gas, food, rent etc (would happen if golf course goes to 9 holes)
The only course of play at Tahoe for a REAL game of golf. Otherwise go to Carson City, Genoa, or Carson Valley, hinder Lake Tahoe economyAs a year‐round resort destination ‐ needs a public full size 18‐hole course. Already have 9‐hole and 18‐hole executive courses
Winter visitors who are golfers can play in the Carson Valley, as the locals do
Some locals will sell and move if the course goes away
comments

AAPPPPEENNDDIIXX CC
DDEESSCCRRIIPPTTIIOONNSS OOFF CCOOMMPPEETTIITTOORR CCOOUURRSSEESS FFOORR
SSCCEENNAARRIIOOSS 11AA AANNDD 11BB

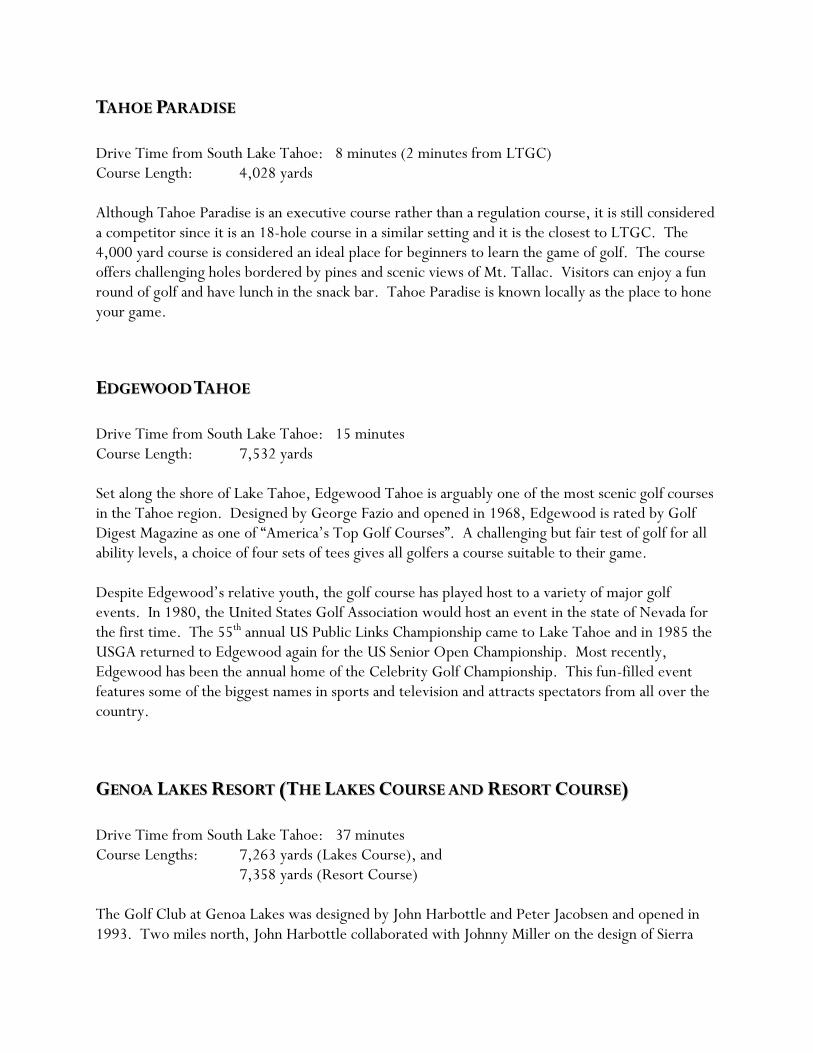
TTAAHHOOEE PPAARRAADDIISSEE
Drive Time from South Lake Tahoe: 8 minutes (2 minutes from LTGC) Course Length: 4,028 yards Although Tahoe Paradise is an executive course rather than a regulation course, it is still considered a competitor since it is an 18-hole course in a similar setting and it is the closest to LTGC. The 4,000 yard course is considered an ideal place for beginners to learn the game of golf. The course offers challenging holes bordered by pines and scenic views of Mt. Tallac. Visitors can enjoy a fun round of golf and have lunch in the snack bar. Tahoe Paradise is known locally as the place to hone your game.
EEDDGGEEWWOOOODD TTAAHHOOEE
Drive Time from South Lake Tahoe: 15 minutes Course Length: 7,532 yards Set along the shore of Lake Tahoe, Edgewood Tahoe is arguably one of the most scenic golf courses in the Tahoe region. Designed by George Fazio and opened in 1968, Edgewood is rated by Golf Digest Magazine as one of “America‟s Top Golf Courses”. A challenging but fair test of golf for all ability levels, a choice of four sets of tees gives all golfers a course suitable to their game. Despite Edgewood‟s relative youth, the golf course has played host to a variety of major golf events. In 1980, the United States Golf Association would host an event in the state of Nevada for the first time. The 55th annual US Public Links Championship came to Lake Tahoe and in 1985 the USGA returned to Edgewood again for the US Senior Open Championship. Most recently, Edgewood has been the annual home of the Celebrity Golf Championship. This fun-filled event features some of the biggest names in sports and television and attracts spectators from all over the country.
GGEENNOOAA LLAAKKEESS RREESSOORRTT ((TTHHEE LLAAKKEESS CCOOUURRSSEE AANNDD RREESSOORRTT CCOOUURRSSEE))
Drive Time from South Lake Tahoe: 37 minutes Course Lengths: 7,263 yards (Lakes Course), and
7,358 yards (Resort Course) The Golf Club at Genoa Lakes was designed by John Harbottle and Peter Jacobsen and opened in 1993. Two miles north, John Harbottle collaborated with Johnny Miller on the design of Sierra

Nevada Golf Ranch which opened in 1998. In 2005, Mario Antioci, the owner of Genoa Lakes Golf Club, joined forces with Monterey Development Group to combine Genoa Lakes Golf Club and Sierra Nevada Golf Ranch, now known as the Genoa Lakes Golf Resort. These two courses are marketed as part of the „Divine 9‟1, a set of 9 golf courses located in and around the Carson Valley. Built at the base of the Sierra Nevada Mountain Range, the Lakes Course is a par 72 golf course set amidst a residential neighborhood. The course, designed by Peter Jacobsen and John Harbottle, spans 7,263 yards and offers multiple sets of tees to accommodate players of all skill levels. The facility offers a restaurant, snack bar, banquet facility, and a tennis club in addition to golf. All golf carts have recently been upgraded with GPS technology, ice chests and ball washers. The Resort Course, formerly Sierra Nevada Golf Ranch, is located 5 minutes from Genoa Lakes Golf Club. The course is set amidst the high county desert of Nevada and offers spectacular views of the Sierra Nevada Mountains as well as the Carson Valley. The golf facility offers a world class practice area as well as a bar, grill, restaurant, banquet and pro shop areas. The Resort Course recently completed a redesign of six holes by Jack Nicklaus to incorporate a variety of challenges through native wetlands with spectacular views of the surrounding mountains2.
CCAARRSSOONN VVAALLLLEEYY GGOOLLFF CCOOUURRSSEE
Drive Time from South Lake Tahoe: 43 minutes Course Length: 6,023 yards Located two miles south of Gardnerville, Carson Valley Golf Course is the most affordable of the competitive golf courses. Arguably, this course is not in competition with LTGC for the majority of its business, however, it is a viable alternative for locals, especially those with young families, and meets the criteria for a competitive golf course in this study. The Record Courier voted Carson Valley Golf Course the best of the Carson Valley in 2007. Carson Valley is a registered Family Course with a set of tees that the whole family can play off to avoid problems with pace of play. The cool rush of the Carson River, the natural shade of our century old cottonwood trees, and the longest golfing season in the area give this course a unique character unlike anywhere in Northern Nevada3. The facility hosts men‟s, ladies, couples, and seniors golf leagues and can be reserved for events and tournaments. Facilities include a putting green, practice facility, grill and pro shop.
1 www.divine9.com 2 NCGA article by Larry Windsor, „Coming of Age‟. 3 www.carsonvalleygolf.com

IINNCCLLIINNEE VVIILLLLAAGGEE –– CCHHAAMMPPIIOONNSSHHIIPP CCOOUURRSSEE
Drive Time from South Lake Tahoe: 50 minutes Course Length: 6,932 yards This par 72 championship course stretches over 7,000 yards from the back tees and carries a course rating of 74.1, a true test of your game in a spectacular mountain setting. The property has been described by renowned golf course architect Robert Trent Jones, Sr. as the ideal mountain layout with a challenge you won‟t want to miss and views you will never forget. Completely renovated in 2003/2004, the courses offers tightly cut fairways bordered by towering pines, demanding accuracy as well as distance. The course offers a world class practice facility, 18 holes of golf, a banquet and dining facility and the new 23,000 square foot clubhouse known as the Chateau. Visitors to the property can bask in breathtaking scenery and enjoy five star service and facilities.
IINNCCLLIINNEE VVIILLLLAAGGEE –– MMOOUUNNTTAAIINN CCOOUURRSSEE
Drive Time from South Lake Tahoe: 55 minutes Course Length: 3,519 yards The Mountain Course is touted as “The Locals Favorite”, with unforgettable views of Lake Tahoe. This alternative golf facility has 18 holes of which 14 are par 3 and 4 are par 4. With spectacular green sites and contours, the Mountain Course demands more accuracy than distance. "Shot making" skills are necessary to navigate the terrain. Tournaments and group events are welcome at the course. Facilities include a very large practice green. The Mountain Course has been named one of the top ten short courses in America in multiple years by Golf Range magazine4.
4 www.golfincline.com


AAPPPPEENNDDIIXX DD
LLTTGGCC EECCOONNOOMMIICC IIMMPPAACCTTSS OONN SSOOUUTTHH LLAAKKEE TTAAHHOOEE
SSUUPPPPOORRTT TTAABBLLEESS


Table D-1Lake Tahoe Golf Course Economic Feasibility AnalysisEstimated Number of Golfers arriving by Auto at LTGC
LTGC Visitors
Percent of Total
Summer Visitation
Percent of Visitors by
Auto
Percent of Total Visitors
arriving by Auto Calculation
LTGC Rounds Played
Percent of Total
Rounds
Origination of Visitors to South Lake Tahoe in SummerBay Area 22% 87% 19%Southern California 19% 70% 13%Central California 15% 83% 13%Other and Out of State 44% 58% 25%Total 100% 70% a = 70%
Total Rounds Played at Lake Tahoe Golf Course b 33,163
Estimated Rounds Played by Visitors c = b*67% 22,219 67%Estimated Rounds Played by Locals d = b*33% 10,944 33%Total Rounds Played 33,163 100%
Estimated LTGC Visitor Golfers arriving by Auto e = a*c 15,651
Source: Hansford Economic Consulting and Tahoe Interregional/Intraregional Transit Study, visit shore prepared by LSC transportation consultants, 2006.
Scenario 1A - Base Case
HEC #60631 60631_Model_2008_SEP 9/5/2008
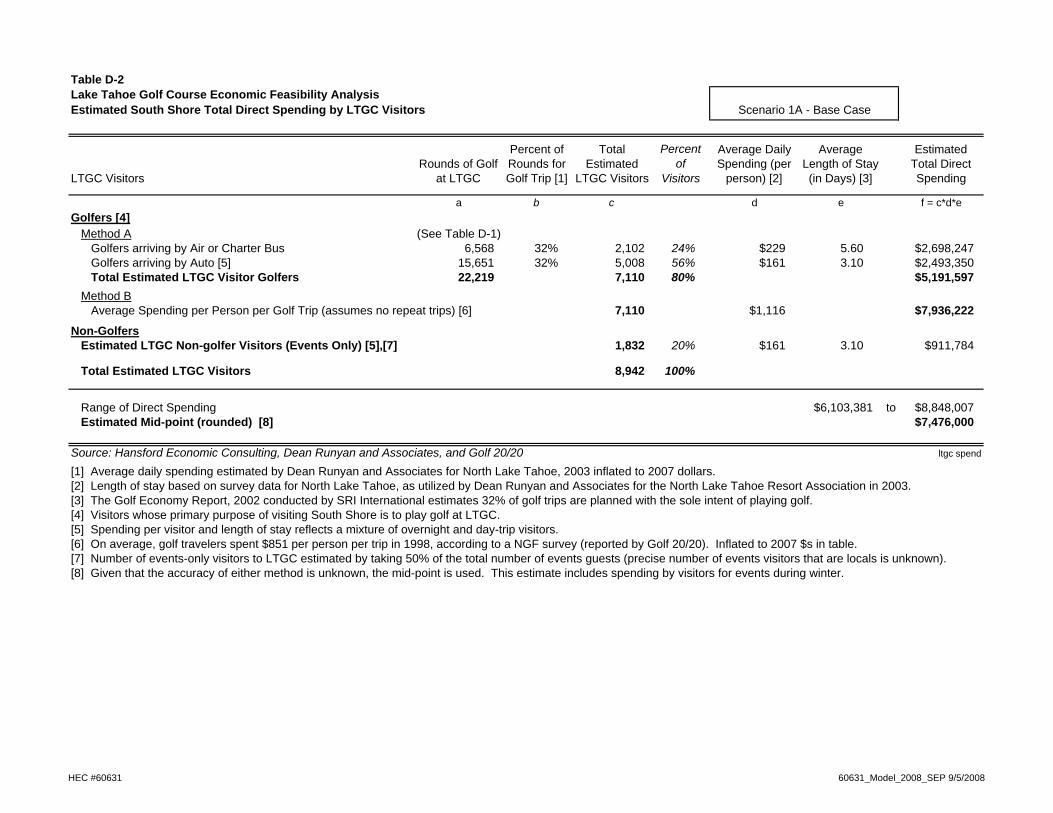
Table D-2Lake Tahoe Golf Course Economic Feasibility AnalysisEstimated South Shore Total Direct Spending by LTGC Visitors
LTGC Visitors
a b c d e f = c*d*eGolfers [4]
Method A (See Table D-1)Golfers arriving by Air or Charter Bus 6,568 32% 2,102 24% $229 5.60 $2,698,247 Golfers arriving by Auto [5] 15,651 32% 5,008 56% $161 3.10 $2,493,350 Total Estimated LTGC Visitor Golfers 22,219 7,110 80% $5,191,597
Method BAverage Spending per Person per Golf Trip (assumes no repeat trips) [6] 7,110 $1,116 $7,936,222
Non-GolfersEstimated LTGC Non-golfer Visitors (Events Only) [5],[7] 1,832 20% $161 3.10 $911,784
Total Estimated LTGC Visitors 8,942 100%
Range of Direct Spending $6,103,381 to $8,848,007 Estimated Mid-point (rounded) [8] $7,476,000
Source: Hansford Economic Consulting, Dean Runyan and Associates, and Golf 20/20 ltgc spend
[1] Average daily spending estimated by Dean Runyan and Associates for North Lake Tahoe, 2003 inflated to 2007 dollars.[2] Length of stay based on survey data for North Lake Tahoe, as utilized by Dean Runyan and Associates for the North Lake Tahoe Resort Association in 2003.[3] The Golf Economy Report, 2002 conducted by SRI International estimates 32% of golf trips are planned with the sole intent of playing golf. [4] Visitors whose primary purpose of visiting South Shore is to play golf at LTGC.[5] Spending per visitor and length of stay reflects a mixture of overnight and day-trip visitors.[6] On average, golf travelers spent $851 per person per trip in 1998, according to a NGF survey (reported by Golf 20/20). Inflated to 2007 $s in table.[7] Number of events-only visitors to LTGC estimated by taking 50% of the total number of events guests (precise number of events visitors that are locals is unknown). [8] Given that the accuracy of either method is unknown, the mid-point is used. This estimate includes spending by visitors for events during winter.
Percent of Rounds for Golf Trip [1]
Total Estimated
LTGC Visitors
Percent of
Visitors
Estimated Total Direct Spending
Average Daily Spending (per
person) [2]
Average Length of Stay (in Days) [3]
Rounds of Golf at LTGC
Scenario 1A - Base Case
HEC #60631 60631_Model_2008_SEP 9/5/2008
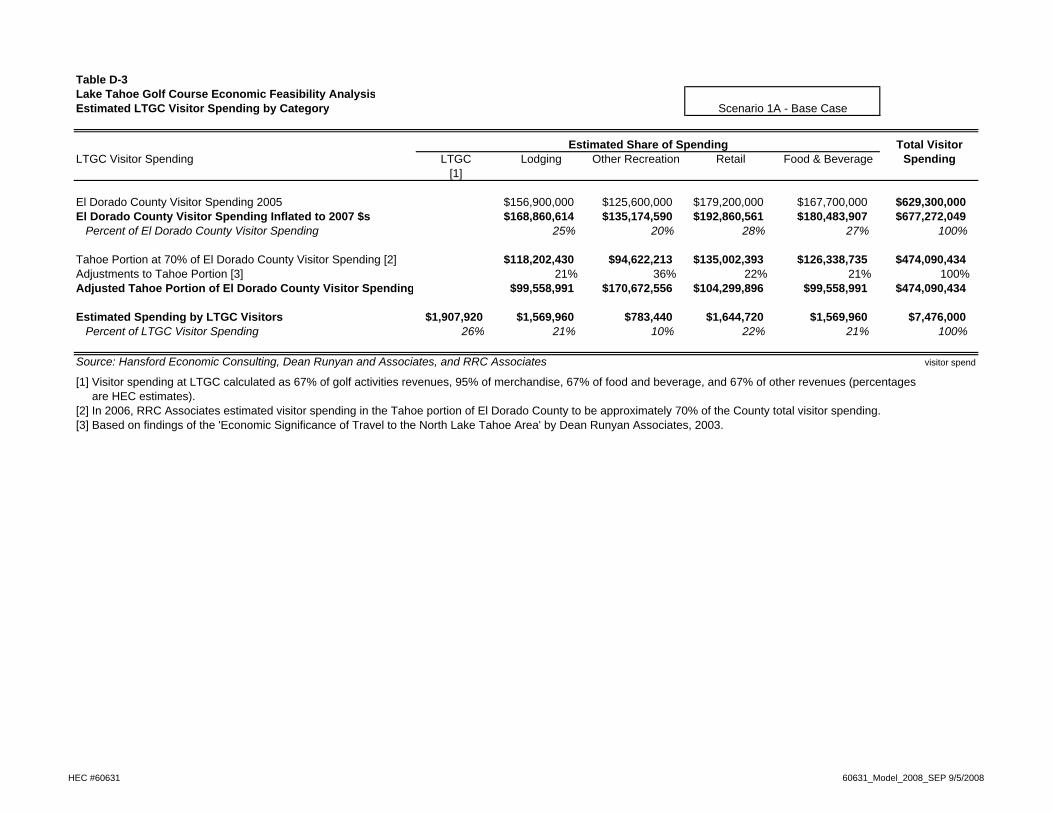
Table D-3Lake Tahoe Golf Course Economic Feasibility AnalysisEstimated LTGC Visitor Spending by Category
Total VisitorLTGC Visitor Spending LTGC Lodging Other Recreation Retail Food & Beverage Spending
[1]
El Dorado County Visitor Spending 2005 $156,900,000 $125,600,000 $179,200,000 $167,700,000 $629,300,000 El Dorado County Visitor Spending Inflated to 2007 $s $168,860,614 $135,174,590 $192,860,561 $180,483,907 $677,272,049
Percent of El Dorado County Visitor Spending 25% 20% 28% 27% 100%
Tahoe Portion at 70% of El Dorado County Visitor Spending [2] $118,202,430 $94,622,213 $135,002,393 $126,338,735 $474,090,434 Adjustments to Tahoe Portion [3] 21% 36% 22% 21% 100% Adjusted Tahoe Portion of El Dorado County Visitor Spending $99,558,991 $170,672,556 $104,299,896 $99,558,991 $474,090,434
Estimated Spending by LTGC Visitors $1,907,920 $1,569,960 $783,440 $1,644,720 $1,569,960 $7,476,000 Percent of LTGC Visitor Spending 26% 21% 10% 22% 21% 100%
Source: Hansford Economic Consulting, Dean Runyan and Associates, and RRC Associates visitor spend
[1] Visitor spending at LTGC calculated as 67% of golf activities revenues, 95% of merchandise, 67% of food and beverage, and 67% of other revenues (percentages are HEC estimates).[2] In 2006, RRC Associates estimated visitor spending in the Tahoe portion of El Dorado County to be approximately 70% of the County total visitor spending.[3] Based on findings of the 'Economic Significance of Travel to the North Lake Tahoe Area' by Dean Runyan Associates, 2003.
Estimated Share of Spending
Scenario 1A - Base Case
HEC #60631 60631_Model_2008_SEP 9/5/2008

Table D-4Lake Tahoe Golf Course Economic Feasibility AnalysisEstimated Earnings and Employment in South Shore Generated by LTGC
Earnings and Employment Direct Spending Earnings Employment(Jobs) [1]
AssumptionsEl Dorado County Visitor Spending, Earnings and Employment Estimates (2005) $629,300,000 $232,100,000 10,410
Average Earnings per Job $22,296 Jobs per $1 Million Dollars of Direct Spending 17
Estimates of Jobs and EarningsPayroll and Jobs at LTGC $1,907,920 $612,500 76 Estimated South Shore Earnings and Jobs Generated by LTGC (2007 $s) $5,568,080 $2,053,633 92
$7,476,000 $2,666,133 168
Source: Hansford Economic Consulting and Dean Runyan Associates job gen
[1] Number of jobs includes full and part-time jobs.
Total Estimates of Spending, Earnings, and Jobs Generated in South Shore by LTGC Visitors (2007 $s)
Scenario 1A - Base Case
HEC #60631 60631_Model_2008_SEP 9/5/2008

Table D-5Lake Tahoe Golf Course Economic Feasibility AnalysisEstimate of Annual Property and Sales Taxes Generated by LTGC
Sales Percent Tax Estimated TotalLTGC Generated Tax Revenue Taxable [1] Rate Sales Tax
Estimated Sales TaxesMerchandise $181,000 100% 7.75% $14,000 Food and Beverage $599,000 85% 7.75% $39,000 Subtotal Sales (rounded) $780,000 $53,000
Property Taxes (rounded) $65,000
Total Estimated Annual Sales and Property Taxes (rounded) $118,000
Source: Hansford Economic Consulting, American Golf Corporation, and CA Board of Equalization taxes
[1] HEC estimate.
Scenario 1A - Base Case
HEC #60631 60631_Model_2008_SEP 9/5/2008

Table D-6Lake Tahoe Golf Course Economic Feasibility AnalysisEstimated Additional Taxes Generated by LTGC Visitors
Non-LTGCEstimated Taxes Lodging Other Recreation Retail Food & Beverage Spending
Non-LTGC Visitor Spending by LTGC Visitors (rounded) $1,570,000 $783,000 $1,645,000 $1,570,000 $5,568,000 Tax Type Transient Occupancy Tax various Sales Tax Sales Tax
Tax Factor [1] 10.00% 7.75% 7.75% Percentage of Total Taxed [2] 100% n.a. 90% 85%
Estimated Taxes by Category (rounded) $157,000 n.a. $115,000 $103,000 $375,000
Source: Hansford Economic Consulting, City of South Lake Tahoe, and RRC Associates other taxes
[1] This estimate excludes a potential additional 2% Transient Occupancy Tax at certain redevelopment sites. It also excludes the South Lake Tahoe Tourism Improvement District Fee of $2.00 per night for hotels/motels and $3.00 per night for vacation rentals and timeshares.[2] HEC estimate based on RRC Associates "Share of Taxable Sales Analysis" prepared for the City of South Lake Tahoe, 2006.
Scenario 1A - Base Case
HEC #60631 60631_Model_2008_SEP 9/5/2008

Table D-7Lake Tahoe Golf Course Economic Feasibility AnalysisEstimated Number of Golfers arriving by Auto at LTGC
LTGC Visitors
Percent of Total
Summer Visitation
Percent of Visitors by
Auto
Percent of Total Visitors
arriving by Auto Calculation
LTGC Rounds Played
Percent of Total
Rounds
Origination of Visitors to South Lake Tahoe in SummerBay Area 22% 87% 19%Southern California 19% 70% 13%Central California 15% 83% 13%Other and Out of State 44% 58% 25%Total 100% 70% a = 70%
Total Rounds Played at Lake Tahoe Golf Course b 33,163
Estimated Rounds Played by Visitors c = b*67% 22,219 67%Estimated Rounds Played by Locals d = b*33% 10,944 33%Total Rounds Played 33,163 100%
Estimated LTGC Visitor Golfers arriving by Auto e = a*c 15,651
Source: Hansford Economic Consulting and Tahoe Interregional/Intraregional Transit Study, visit shore prepared by LSC transportation consultants, 2006.
Scenario 1B
HEC #60631 60631_Model_2008_SEP 9/5/2008

Table D-8Lake Tahoe Golf Course Economic Feasibility AnalysisEstimated South Shore Total Direct Spending by LTGC Visitors
LTGC Visitors
a b c d e f = c*d*eGolfers [4]
Method A (See Table D-7)Golfers arriving by Air or Charter Bus 6,568 32% 2,102 24% $229 5.60 $2,698,247 Golfers arriving by Auto [5] 15,651 32% 5,008 56% $161 3.10 $2,493,350 Total Estimated LTGC Visitor Golfers 22,219 7,110 80% $5,191,597
Method BAverage Spending per Person per Golf Trip (assumes no repeat trips) [6] 7,110 $1,116 $7,936,222
Non-GolfersEstimated LTGC Non-golfer Visitors (Events Only) [5],[7] 1,832 20% $161 3.10 $911,784
Total Estimated LTGC Visitors 8,942 100%
Range of Direct Spending $6,103,381 to $8,848,007 Estimated Mid-point (rounded) [8] $7,476,000
Source: Hansford Economic Consulting, Dean Runyan and Associates, and Golf 20/20 ltgc spend
[1] Average daily spending estimated by Dean Runyan and Associates for North Lake Tahoe, 2003 inflated to 2007 dollars.[2] Length of stay based on survey data for North Lake Tahoe, as utilized by Dean Runyan and Associates for the North Lake Tahoe Resort Association in 2003.[3] The Golf Economy Report, 2002 conducted by SRI International estimates 32% of golf trips are planned with the sole intent of playing golf. [4] Visitors whose primary purpose of visiting South Shore is to play golf at LTGC.[5] Spending per visitor and length of stay reflects a mixture of overnight and day-trip visitors.[6] On average, golf travelers spent $851 per person per trip in 1998, according to a NGF survey (reported by Golf 20/20). Inflated to 2007 $s in table.[7] Number of events-only visitors to LTGC estimated by taking 50% of the total number of events guests (precise number of events visitors that are locals is unknown). [8] Given that the accuracy of either method is unknown, the mid-point is used. This estimate includes spending by visitors for events during winter.
Percent of Rounds for Golf Trip [1]
Total Estimated
LTGC Visitors
Percent of
Visitors
Estimated Total Direct Spending
Average Daily Spending (per
person) [2]
Average Length of Stay (in Days) [3]
Rounds of Golf at LTGC
Scenario 1B
HEC #60631 60631_Model_2008_SEP 9/5/2008

Table D-9Lake Tahoe Golf Course Economic Feasibility AnalysisEstimated LTGC Visitor Spending by Category
Total VisitorLTGC Visitor Spending LTGC Lodging Other Recreation Retail Food & Beverage Spending
[1]
El Dorado County Visitor Spending 2005 $156,900,000 $125,600,000 $179,200,000 $167,700,000 $629,300,000 El Dorado County Visitor Spending Inflated to 2007 $s $168,860,614 $135,174,590 $192,860,561 $180,483,907 $677,272,049
Percent of El Dorado County Visitor Spending 25% 20% 28% 27% 100%
Tahoe Portion at 70% of El Dorado County Visitor Spending [2] $118,202,430 $94,622,213 $135,002,393 $126,338,735 $474,090,434 Adjustments to Tahoe Portion [3] 21% 36% 22% 21% 100% Adjusted Tahoe Portion of El Dorado County Visitor Spending $99,558,991 $170,672,556 $104,299,896 $99,558,991 $474,090,434
Estimated Spending by LTGC Visitors $1,921,588 $1,569,960 $769,772 $1,644,720 $1,569,960 $7,476,000 Percent of LTGC Visitor Spending 26% 21% 10% 22% 21% 100%
Source: Hansford Economic Consulting, Dean Runyan and Associates, and RRC Associates visitor spend
[1] Visitor spending at LTGC calculated as 67% of golf activities revenues, 95% of merchandise, 67% of food and beverage, and 67% of other revenues (percentages are HEC estimates).[2] In 2006, RRC Associates estimated visitor spending in the Tahoe portion of El Dorado County to be approximately 70% of the County total visitor spending.[3] Based on findings of the 'Economic Significance of Travel to the North Lake Tahoe Area' by Dean Runyan Associates, 2003.
Estimated Share of Spending
Scenario 1B
HEC #60631 60631_Model_2008_SEP 9/5/2008

Table D-10Lake Tahoe Golf Course Economic Feasibility AnalysisEstimated Earnings and Employment in South Shore Generated by LTGC
Earnings and Employment Direct Spending Earnings Employment(Jobs) [1]
AssumptionsEl Dorado County Visitor Spending, Earnings and Employment Estimates (2005) $629,300,000 $232,100,000 10,410
Average Earnings per Job $22,296 Jobs per $1 Million Dollars of Direct Spending 17
Estimates of Jobs and EarningsPayroll and Jobs at LTGC $1,921,588 $650,200 80 Estimated South Shore Earnings and Jobs Generated by LTGC (2007 $s) $5,554,412 $2,048,592 92
$7,476,000 $2,698,792 172
Source: Hansford Economic Consulting and Dean Runyan Associates job gen
[1] Number of jobs includes full and part-time jobs.
Total Estimates of Spending, Earnings, and Jobs Generated in South Shore by LTGC Visitors (2007 $s)
Scenario 1B
HEC #60631 60631_Model_2008_SEP 9/5/2008

Table D-11Lake Tahoe Golf Course Economic Feasibility AnalysisEstimate of Annual Property and Sales Taxes Generated by LTGC
Sales Percent Tax Estimated TotalLTGC Generated Tax Revenue Taxable [1] Rate Sales Tax
Estimated Sales TaxesMerchandise $181,000 100% 7.75% $14,000 Food and Beverage $619,400 85% 7.75% $41,000 Subtotal Sales (rounded) $800,000 $55,000
Property Taxes (rounded) $65,000
Total Estimated Annual Sales and Property Taxes (rounded) $120,000
Source: Hansford Economic Consulting, American Golf Corporation, and CA Board of Equalization taxes
[1] HEC estimate.
Scenario 1B
HEC #60631 60631_Model_2008_SEP 9/5/2008

Table D-12Lake Tahoe Golf Course Economic Feasibility AnalysisEstimated Additional Taxes Generated by LTGC Visitors
Non-LTGCEstimated Taxes Lodging Other Recreation Retail Food & Beverage Spending
Non-LTGC Visitor Spending by LTGC Visitors (rounded) $1,570,000 $770,000 $1,645,000 $1,570,000 $5,555,000 Tax Type Transient Occupancy Tax various Sales Tax Sales Tax
Tax Factor [1] 10.00% 7.75% 7.75% Percentage of Total Taxed [2] 100% n.a. 90% 85%
Estimated Taxes by Category (rounded) $157,000 n.a. $115,000 $103,000 $375,000
Source: Hansford Economic Consulting, City of South Lake Tahoe, and RRC Associates other taxes
[1] This estimate excludes a potential additional 2% Transient Occupancy Tax at certain redevelopment sites. It also excludes the South Lake Tahoe Tourism Improvement District Fee of $2.00 per night for hotels/motels and $3.00 per night for vacation rentals and timeshares.[2] HEC estimate based on RRC Associates "Share of Taxable Sales Analysis" prepared for the City of South Lake Tahoe, 2006.
Scenario 1B
HEC #60631 60631_Model_2008_SEP 9/5/2008

Table D-13Lake Tahoe Golf Course Economic Feasibility AnalysisEstimated Number of Golfers arriving by Auto at LTGC
LTGC Visitors
Percent of Total
Summer Visitation
Percent of Visitors by
Auto
Percent of Total Visitors
arriving by Auto Calculation
LTGC Rounds Played
Percent of Total
Rounds
Origination of Visitors to South Lake Tahoe in SummerBay Area 22% 87% 19%Southern California 19% 70% 13%Central California 15% 83% 13%Other and Out of State 44% 58% 25%Total 100% 70% a = 70%
Total Rounds Played at Lake Tahoe Golf Course b 15,000
Estimated Rounds Played by Visitors c = b*67% 10,050 67%Estimated Rounds Played by Locals d = b*33% 4,950 33%Total Rounds Played 15,000 100%
Estimated LTGC Visitor Golfers arriving by Auto e = a*c 7,079
Source: Hansford Economic Consulting and Tahoe Interregional/Intraregional Transit Study, visit shore prepared by LSC transportation consultants, 2006.
Scenario 2 - Low Rounds
HEC #60631 60631_Model_2008_SEP 9/5/2008

Table D-14Lake Tahoe Golf Course Economic Feasibility AnalysisEstimated South Shore Total Direct Spending by LTGC Visitors
LTGC Visitors
a b c d e f = c*d*eGolfers [4]
Method A (See Table D-13)Golfers arriving by Air or Charter Bus 2,971 32% 951 19% $229 5.60 $1,220,448 Golfers arriving by Auto [5] 7,079 32% 2,265 45% $161 3.10 $1,127,770 Total Estimated LTGC Visitor Golfers 10,050 3,216 64% $2,348,218
Method BAverage Spending per Person per Golf Trip (assumes no repeat trips) [6] 3,216 $1,116 $3,589,643
Non-GolfersEstimated LTGC Non-golfer Visitors (Events Only) [5],[7] 1,832 36% $161 3.10 $911,784
Total Estimated LTGC Visitors 5,048 100%
Range of Direct Spending $3,260,002 to $4,501,428 Estimated Mid-point (rounded) [8] $3,881,000
Source: Hansford Economic Consulting, Dean Runyan and Associates, and Golf 20/20 ltgc spend
[1] Average daily spending estimated by Dean Runyan and Associates for North Lake Tahoe, 2003 inflated to 2007 dollars.[2] Length of stay based on survey data for North Lake Tahoe, as utilized by Dean Runyan and Associates for the North Lake Tahoe Resort Association in 2003.[3] The Golf Economy Report, 2002 conducted by SRI International estimates 32% of golf trips are planned with the sole intent of playing golf. [4] Visitors whose primary purpose of visiting South Shore is to play golf at LTGC.[5] Spending per visitor and length of stay reflects a mixture of overnight and day-trip visitors.[6] On average, golf travelers spent $851 per person per trip in 1998, according to a NGF survey (reported by Golf 20/20). Inflated to 2007 $s in table.[7] Number of events-only visitors to LTGC estimated by taking 50% of the total number of events guests (precise number of events visitors that are locals is unknown). [8] Given that the accuracy of either method is unknown, the mid-point is used. This estimate includes spending by visitors for events during winter.
Percent of Rounds for Golf Trip [1]
Total Estimated
LTGC Visitors
Percent of
Visitors
Estimated Total Direct Spending
Average Daily Spending (per
person) [2]
Average Length of Stay (in Days) [3]
Rounds of Golf at LTGC
Scenario 2 - Low Rounds
HEC #60631 60631_Model_2008_SEP 9/5/2008

Table D-15Lake Tahoe Golf Course Economic Feasibility AnalysisEstimated LTGC Visitor Spending by Category
Total VisitorLTGC Visitor Spending LTGC Lodging Other Recreation Retail Food & Beverage Spending
[1]
El Dorado County Visitor Spending 2005 $156,900,000 $125,600,000 $179,200,000 $167,700,000 $629,300,000 El Dorado County Visitor Spending Inflated to 2007 $s $168,860,614 $135,174,590 $192,860,561 $180,483,907 $677,272,049
Percent of El Dorado County Visitor Spending 25% 20% 28% 27% 100%
Tahoe Portion at 70% of El Dorado County Visitor Spending [2] $118,202,430 $94,622,213 $135,002,393 $126,338,735 $474,090,434 Adjustments to Tahoe Portion [3] 21% 36% 22% 21% 100% Adjusted Tahoe Portion of El Dorado County Visitor Spending $99,558,991 $170,672,556 $104,299,896 $99,558,991 $474,090,434
Estimated Spending by LTGC Visitors $699,833 $815,010 $697,327 $853,820 $815,010 $3,881,000 Percent of LTGC Visitor Spending 18% 21% 18% 22% 21% 100%
Source: Hansford Economic Consulting, Dean Runyan and Associates, and RRC Associates visitor spend
[1] Visitor spending at LTGC calculated as 67% of golf activities revenues, 95% of merchandise, 67% of food and beverage, and 67% of other revenues (percentages are HEC estimates).[2] In 2006, RRC Associates estimated visitor spending in the Tahoe portion of El Dorado County to be approximately 70% of the County total visitor spending.[3] Based on findings of the 'Economic Significance of Travel to the North Lake Tahoe Area' by Dean Runyan Associates, 2003.
Estimated Share of Spending
Scenario 2 - Low Rounds
HEC #60631 60631_Model_2008_SEP 9/5/2008

Table D-16Lake Tahoe Golf Course Economic Feasibility AnalysisEstimated Earnings and Employment in South Shore Generated by LTGC
Earnings and Employment Direct Spending Earnings Employment(Jobs) [1]
AssumptionsEl Dorado County Visitor Spending, Earnings and Employment Estimates (2005) $629,300,000 $232,100,000 10,410
Average Earnings per Job $22,296 Jobs per $1 Million Dollars of Direct Spending 17
Estimates of Jobs and EarningsPayroll and Jobs at LTGC $699,833 $494,600 60 Estimated South Shore Earnings and Jobs Generated by LTGC (2007 $s) $3,181,167 $1,173,286 53
$3,881,000 $1,667,886 113
Source: Hansford Economic Consulting and Dean Runyan Associates job gen
[1] Number of jobs includes full and part-time jobs.
Total Estimates of Spending, Earnings, and Jobs Generated in South Shore by LTGC Visitors (2007 $s)
Scenario 2 - Low Rounds
HEC #60631 60631_Model_2008_SEP 9/5/2008

Table D-17Lake Tahoe Golf Course Economic Feasibility AnalysisEstimate of Annual Property and Sales Taxes Generated by LTGC
Sales Percent Tax Estimated TotalLTGC Generated Tax Revenue Taxable [1] Rate Sales Tax
Estimated Sales TaxesMerchandise $81,900 100% 7.75% $6,000 Food and Beverage $411,100 85% 7.75% $27,000 Subtotal Sales (rounded) $493,000 $33,000
Property Taxes (rounded) $65,000
Total Estimated Annual Sales and Property Taxes (rounded) $98,000
Source: Hansford Economic Consulting, American Golf Corporation, and CA Board of Equalization taxes
[1] HEC estimate.
Scenario 2 - Low Rounds
HEC #60631 60631_Model_2008_SEP 9/5/2008

Table D-18Lake Tahoe Golf Course Economic Feasibility AnalysisEstimated Additional Taxes Generated by LTGC Visitors
Non-LTGCEstimated Taxes Lodging Other Recreation Retail Food & Beverage Spending
Non-LTGC Visitor Spending by LTGC Visitors (rounded) $815,000 $697,000 $854,000 $815,000 $3,181,000 Tax Type Transient Occupancy Tax various Sales Tax Sales Tax
Tax Factor [1] 10.00% 7.75% 7.75% Percentage of Total Taxed [2] 100% n.a. 90% 85%
Estimated Taxes by Category (rounded) $82,000 n.a. $60,000 $54,000 $196,000
Source: Hansford Economic Consulting, City of South Lake Tahoe, and RRC Associates other taxes
[1] This estimate excludes a potential additional 2% Transient Occupancy Tax at certain redevelopment sites. It also excludes the South Lake Tahoe Tourism Improvement District Fee of $2.00 per night for hotels/motels and $3.00 per night for vacation rentals and timeshares.[2] HEC estimate based on RRC Associates "Share of Taxable Sales Analysis" prepared for the City of South Lake Tahoe, 2006.
Scenario 2 - Low Rounds
HEC #60631 60631_Model_2008_SEP 9/5/2008

Table D-19Lake Tahoe Golf Course Economic Feasibility AnalysisEstimated Number of Golfers arriving by Auto at LTGC
LTGC Visitors
Percent of Total
Summer Visitation
Percent of Visitors by
Auto
Percent of Total Visitors
arriving by Auto Calculation
LTGC Rounds Played
Percent of Total
Rounds
Origination of Visitors to South Lake Tahoe in SummerBay Area 22% 87% 19%Southern California 19% 70% 13%Central California 15% 83% 13%Other and Out of State 44% 58% 25%Total 100% 70% a = 70%
Total Rounds Played at Lake Tahoe Golf Course b 25,000
Estimated Rounds Played by Visitors c = b*67% 16,750 67%Estimated Rounds Played by Locals d = b*33% 8,250 33%Total Rounds Played 25,000 100%
Estimated LTGC Visitor Golfers arriving by Auto e = a*c 11,799
Source: Hansford Economic Consulting and Tahoe Interregional/Intraregional Transit Study, visit shore prepared by LSC transportation consultants, 2006.
Scenario 2 - High Rounds
HEC #60631 60631_Model_2008_SEP 9/5/2008

Table D-20Lake Tahoe Golf Course Economic Feasibility AnalysisEstimated South Shore Total Direct Spending by LTGC Visitors
LTGC Visitors
a b c d e f = c*d*eGolfers [4]
Method A (See Table D-19)Golfers arriving by Air or Charter Bus 4,951 32% 1,584 22% $229 5.60 $2,034,080 Golfers arriving by Auto [5] 11,799 32% 3,776 53% $161 3.10 $1,879,617 Total Estimated LTGC Visitor Golfers 16,750 5,360 75% $3,913,697
Method BAverage Spending per Person per Golf Trip (assumes no repeat trips) [6] 5,360 $1,116 $5,982,739
Non-GolfersEstimated LTGC Non-golfer Visitors (Events Only) [5],[7] 1,832 25% $161 3.10 $911,784
Total Estimated LTGC Visitors 7,192 100%
Range of Direct Spending $4,825,481 to $6,894,523 Estimated Mid-point (rounded) [8] $5,860,000
Source: Hansford Economic Consulting, Dean Runyan and Associates, and Golf 20/20 ltgc spend
[1] Average daily spending estimated by Dean Runyan and Associates for North Lake Tahoe, 2003 inflated to 2007 dollars.[2] Length of stay based on survey data for North Lake Tahoe, as utilized by Dean Runyan and Associates for the North Lake Tahoe Resort Association in 2003.[3] The Golf Economy Report, 2002 conducted by SRI International estimates 32% of golf trips are planned with the sole intent of playing golf. [4] Visitors whose primary purpose of visiting South Shore is to play golf at LTGC.[5] Spending per visitor and length of stay reflects a mixture of overnight and day-trip visitors.[6] On average, golf travelers spent $851 per person per trip in 1998, according to a NGF survey (reported by Golf 20/20). Inflated to 2007 $s in table.[7] Number of events-only visitors to LTGC estimated by taking 50% of the total number of events guests (precise number of events visitors that are locals is unknown). [8] Given that the accuracy of either method is unknown, the mid-point is used. This estimate includes spending by visitors for events during winter.
Percent of Rounds for Golf Trip [1]
Total Estimated
LTGC Visitors
Percent of
Visitors
Estimated Total Direct Spending
Average Daily Spending (per
person) [2]
Average Length of Stay (in Days) [3]
Rounds of Golf at LTGC
Scenario 2 - High Rounds
HEC #60631 60631_Model_2008_SEP 9/5/2008

Table D-21Lake Tahoe Golf Course Economic Feasibility AnalysisEstimated LTGC Visitor Spending by Category
Total VisitorLTGC Visitor Spending LTGC Lodging Other Recreation Retail Food & Beverage Spending
[1]
El Dorado County Visitor Spending 2005 $156,900,000 $125,600,000 $179,200,000 $167,700,000 $629,300,000 El Dorado County Visitor Spending Inflated to 2007 $s $168,860,614 $135,174,590 $192,860,561 $180,483,907 $677,272,049
Percent of El Dorado County Visitor Spending 25% 20% 28% 27% 100%
Tahoe Portion at 70% of El Dorado County Visitor Spending [2] $118,202,430 $94,622,213 $135,002,393 $126,338,735 $474,090,434 Adjustments to Tahoe Portion [3] 21% 36% 22% 21% 100% Adjusted Tahoe Portion of El Dorado County Visitor Spending $99,558,991 $170,672,556 $104,299,896 $99,558,991 $474,090,434
Estimated Spending by LTGC Visitors $1,052,103 $1,230,600 $1,057,497 $1,289,200 $1,230,600 $5,860,000 Percent of LTGC Visitor Spending 18% 21% 18% 22% 21% 100%
Source: Hansford Economic Consulting, Dean Runyan and Associates, and RRC Associates visitor spend
[1] Visitor spending at LTGC calculated as 67% of golf activities revenues, 95% of merchandise, 67% of food and beverage, and 67% of other revenues (percentages are HEC estimates).[2] In 2006, RRC Associates estimated visitor spending in the Tahoe portion of El Dorado County to be approximately 70% of the County total visitor spending.[3] Based on findings of the 'Economic Significance of Travel to the North Lake Tahoe Area' by Dean Runyan Associates, 2003.
Estimated Share of Spending
Scenario 2 - High Rounds
HEC #60631 60631_Model_2008_SEP 9/5/2008
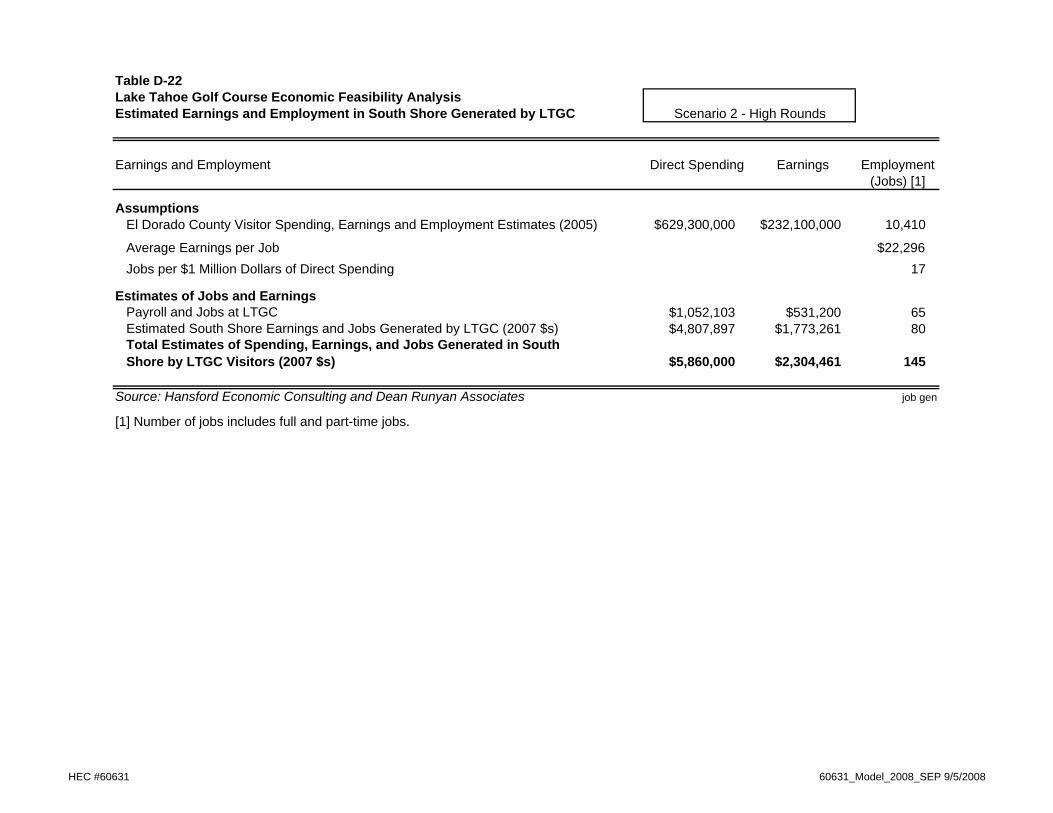
Table D-22Lake Tahoe Golf Course Economic Feasibility AnalysisEstimated Earnings and Employment in South Shore Generated by LTGC
Earnings and Employment Direct Spending Earnings Employment(Jobs) [1]
AssumptionsEl Dorado County Visitor Spending, Earnings and Employment Estimates (2005) $629,300,000 $232,100,000 10,410
Average Earnings per Job $22,296 Jobs per $1 Million Dollars of Direct Spending 17
Estimates of Jobs and EarningsPayroll and Jobs at LTGC $1,052,103 $531,200 65 Estimated South Shore Earnings and Jobs Generated by LTGC (2007 $s) $4,807,897 $1,773,261 80
$5,860,000 $2,304,461 145
Source: Hansford Economic Consulting and Dean Runyan Associates job gen
[1] Number of jobs includes full and part-time jobs.
Total Estimates of Spending, Earnings, and Jobs Generated in South Shore by LTGC Visitors (2007 $s)
Scenario 2 - High Rounds
HEC #60631 60631_Model_2008_SEP 9/5/2008

Table D-23Lake Tahoe Golf Course Economic Feasibility AnalysisEstimate of Annual Property and Sales Taxes Generated by LTGC
Sales Percent Tax Estimated TotalLTGC Generated Tax Revenue Taxable [1] Rate Sales Tax
Estimated Sales TaxesMerchandise $136,400 100% 7.75% $11,000 Food and Beverage $514,600 85% 7.75% $34,000 Subtotal Sales (rounded) $651,000 $45,000
Property Taxes (rounded) $65,000
Total Estimated Annual Sales and Property Taxes (rounded) $110,000
Source: Hansford Economic Consulting, American Golf Corporation, and CA Board of Equalization taxes
[1] HEC estimate.
Scenario 2 - High Rounds
HEC #60631 60631_Model_2008_SEP 9/5/2008

Table D-24Lake Tahoe Golf Course Economic Feasibility AnalysisEstimated Additional Taxes Generated by LTGC Visitors
Non-LTGCEstimated Taxes Lodging Other Recreation Retail Food & Beverage Spending
Non-LTGC Visitor Spending by LTGC Visitors (rounded) $1,231,000 $1,057,000 $1,289,000 $1,231,000 $4,808,000 Tax Type Transient Occupancy Tax various Sales Tax Sales Tax
Tax Factor [1] 10.00% 7.75% 7.75% Percentage of Total Taxed [2] 100% n.a. 90% 85%
Estimated Taxes by Category (rounded) $123,000 n.a. $90,000 $81,000 $294,000
Source: Hansford Economic Consulting, City of South Lake Tahoe, and RRC Associates other taxes
[1] This estimate excludes a potential additional 2% Transient Occupancy Tax at certain redevelopment sites. It also excludes the South Lake Tahoe Tourism Improvement District Fee of $2.00 per night for hotels/motels and $3.00 per night for vacation rentals and timeshares.[2] HEC estimate based on RRC Associates "Share of Taxable Sales Analysis" prepared for the City of South Lake Tahoe, 2006.
Scenario 2 - High Rounds
HEC #60631 60631_Model_2008_SEP 9/5/2008

Table D-25Lake Tahoe Golf Course Economic Feasibility AnalysisEstimated South Shore Total Direct Spending by LTGC Visitors
LTGC Visitors
a b c d e f = c*d*eGolfers [4]
Method A Golfers arriving by Air or Charter Bus 0 32% 0 0% $229 5.60 $0 Golfers arriving by Auto [5] 0 32% 0 0% $161 3.10 $0 Total Estimated LTGC Visitor Golfers 0 0 0% $0
Method BAverage Spending per Person per Golf Trip (assumes no repeat trips) [6] 0 $1,116 $0
Non-GolfersEstimated LTGC Non-golfer Visitors (Events Only) [5],[7] 1,832 100% $161 3.10 $911,784
Total Estimated LTGC Visitors 1,832 100%
Range of Direct Spending $911,784 to $911,784 Estimated Mid-point (rounded) [8] $912,000
Source: Hansford Economic Consulting, Dean Runyan and Associates, and Golf 20/20 ltgc spend
[1] Average daily spending estimated by Dean Runyan and Associates for North Lake Tahoe, 2003 inflated to 2007 dollars.[2] Length of stay based on survey data for North Lake Tahoe, as utilized by Dean Runyan and Associates for the North Lake Tahoe Resort Association in 2003.[3] The Golf Economy Report, 2002 conducted by SRI International estimates 32% of golf trips are planned with the sole intent of playing golf. [4] Visitors whose primary purpose of visiting South Shore is to play golf at LTGC.[5] Spending per visitor and length of stay reflects a mixture of overnight and day-trip visitors.[6] On average, golf travelers spent $851 per person per trip in 1998, according to a NGF survey (reported by Golf 20/20). Inflated to 2007 $s in table.[7] Number of events-only visitors to LTGC estimated by taking 50% of the total number of events guests (precise number of events visitors that are locals is unknown). [8] Given that the accuracy of either method is unknown, the mid-point is used. This estimate includes spending by visitors for events during winter.
Percent of Rounds for Golf Trip [1]
Total Estimated
LTGC Visitors
Percent of
Visitors
Estimated Total Direct Spending
Average Daily Spending (per
person) [2]
Average Length of Stay (in Days) [3]
Rounds of Golf at LTGC
Scenario 3
HEC #60631 60631_Model_2008_SEP 9/5/2008

Table D-26Lake Tahoe Golf Course Economic Feasibility AnalysisEstimated LTGC Visitor Spending by Category
Total VisitorLTGC Visitor Spending LTGC Lodging Other Recreation Retail Food & Beverage Spending
[1]
El Dorado County Visitor Spending 2005 $156,900,000 $125,600,000 $179,200,000 $167,700,000 $629,300,000 El Dorado County Visitor Spending Inflated to 2007 $s $168,860,614 $135,174,590 $192,860,561 $180,483,907 $677,272,049
Percent of El Dorado County Visitor Spending 25% 20% 28% 27% 100%
Tahoe Portion at 70% of El Dorado County Visitor Spending [2] $118,202,430 $94,622,213 $135,002,393 $126,338,735 $474,090,434 Adjustments to Tahoe Portion [3] 21% 36% 22% 21% 100% Adjusted Tahoe Portion of El Dorado County Visitor Spending $99,558,991 $170,672,556 $104,299,896 $99,558,991 $474,090,434
Estimated Spending by LTGC Visitors $171,520 $191,520 $156,800 $200,640 $191,520 $912,000 Percent of LTGC Visitor Spending 19% 21% 17% 22% 21% 100%
Source: Hansford Economic Consulting, Dean Runyan and Associates, and RRC Associates visitor spend
[1] Visitor spending at LTGC calculated as 67% of golf activities revenues, 95% of merchandise, 67% of food and beverage, and 67% of other revenues (percentages are HEC estimates).[2] In 2006, RRC Associates estimated visitor spending in the Tahoe portion of El Dorado County to be approximately 70% of the County total visitor spending.[3] Based on findings of the 'Economic Significance of Travel to the North Lake Tahoe Area' by Dean Runyan Associates, 2003.
Estimated Share of Spending
Scenario 3
HEC #60631 60631_Model_2008_SEP 9/5/2008

Table D-27Lake Tahoe Golf Course Economic Feasibility AnalysisEstimated Earnings and Employment in South Shore Generated by LTGC
Earnings and Employment Direct Spending Earnings Employment(Jobs) [1]
AssumptionsEl Dorado County Visitor Spending, Earnings and Employment Estimates (2005) $629,300,000 $232,100,000 10,410
Average Earnings per Job $22,296 Jobs per $1 Million Dollars of Direct Spending 17
Estimates of Jobs and EarningsPayroll and Jobs at LTGC $171,520 $219,900 32 Estimated South Shore Earnings and Jobs Generated by LTGC (2007 $s) $740,480 $273,106 12
$912,000 $493,006 44
Source: Hansford Economic Consulting and Dean Runyan Associates job gen
[1] Number of jobs includes full and part-time jobs.
Total Estimates of Spending, Earnings, and Jobs Generated in South Shore by LTGC Visitors (2007 $s)
Scenario 3
HEC #60631 60631_Model_2008_SEP 9/5/2008

Table D-28Lake Tahoe Golf Course Economic Feasibility AnalysisEstimate of Annual Property and Sales Taxes Generated by LTGC
Sales Percent Tax Estimated TotalLTGC Generated Tax Revenue Taxable [1] Rate Sales Tax
Estimated Sales TaxesMerchandise $0 100% 7.75% $0 Food and Beverage $256,000 85% 7.75% $17,000 Subtotal Sales (rounded) $256,000 $17,000
Property Taxes (rounded) $65,000
Total Estimated Annual Sales and Property Taxes (rounded) $82,000
Source: Hansford Economic Consulting, American Golf Corporation, and CA Board of Equalization taxes
[1] HEC estimate.
Scenario 3
HEC #60631 60631_Model_2008_SEP 9/5/2008
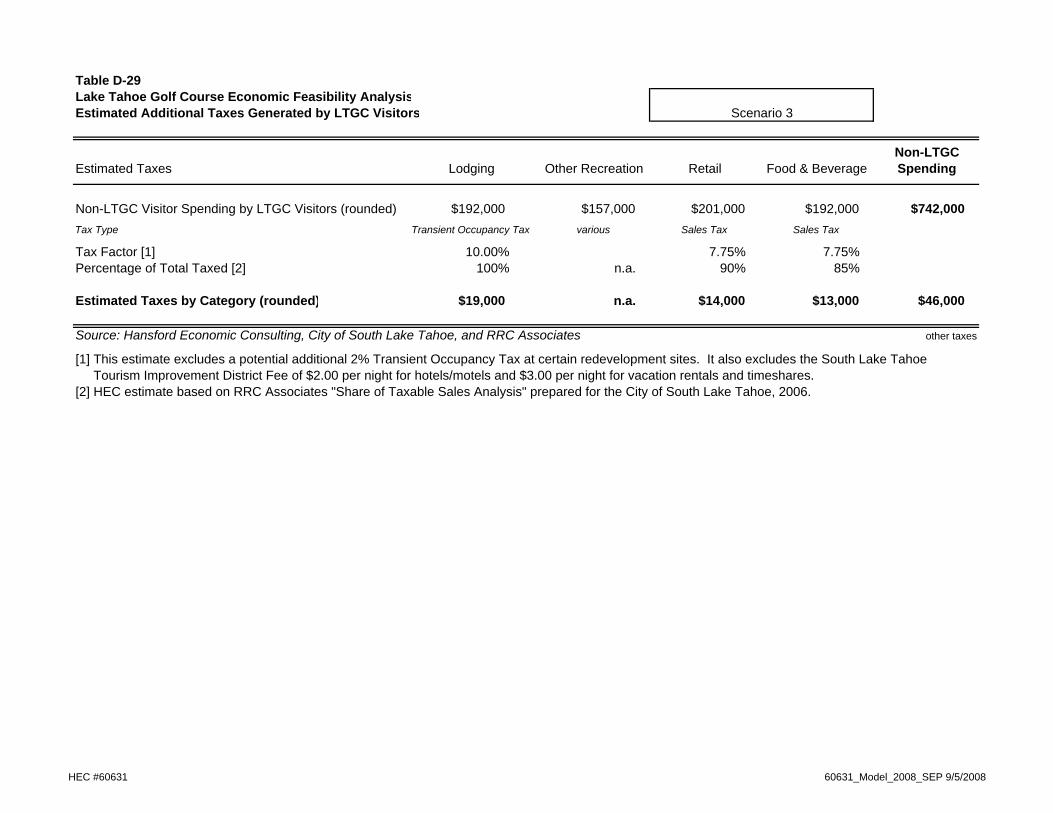
Table D-29Lake Tahoe Golf Course Economic Feasibility AnalysisEstimated Additional Taxes Generated by LTGC Visitors
Non-LTGCEstimated Taxes Lodging Other Recreation Retail Food & Beverage Spending
Non-LTGC Visitor Spending by LTGC Visitors (rounded) $192,000 $157,000 $201,000 $192,000 $742,000 Tax Type Transient Occupancy Tax various Sales Tax Sales Tax
Tax Factor [1] 10.00% 7.75% 7.75% Percentage of Total Taxed [2] 100% n.a. 90% 85%
Estimated Taxes by Category (rounded) $19,000 n.a. $14,000 $13,000 $46,000
Source: Hansford Economic Consulting, City of South Lake Tahoe, and RRC Associates other taxes
[1] This estimate excludes a potential additional 2% Transient Occupancy Tax at certain redevelopment sites. It also excludes the South Lake Tahoe Tourism Improvement District Fee of $2.00 per night for hotels/motels and $3.00 per night for vacation rentals and timeshares.[2] HEC estimate based on RRC Associates "Share of Taxable Sales Analysis" prepared for the City of South Lake Tahoe, 2006.
Scenario 3
HEC #60631 60631_Model_2008_SEP 9/5/2008


![09 20 21 GOLF 02[1]](https://img.dokumen.tips/doc/110x75/6322a77a64690856e10943f6/09-20-21-golf-021.jpg)


